UNITED STATES
SECURITIES AND EXCHANGE COMMISSION
Washington, D.C. 20549
FORM N-CSR
CERTIFIED SHAREHOLDER REPORT OF REGISTERED MANAGEMENT
INVESTMENT COMPANIES
Investment Company Act file number 811-22468
Ashmore Funds
(Exact name of registrant as specified in charter)
c/o Ashmore Investment Advisors Limited
61 Aldwych
London WC2B 4AE
England
(Address of principal executive offices) (Zip code)
Corporation Service Company
84 State Street
Boston, MA 20109
(Name and address of agent for service)
Registrant’s telephone number, including area code: 011-44-20-3077-6000
Date of fiscal year end: October 31
Date of reporting period: April 30, 2016
Item 1. Reports to Stockholders.
2
ASHMORE FUNDS
SEMI ANNUAL FINANCIAL STATEMENTS
April 30, 2016

ASHMORE FUNDS
TABLE OF CONTENTS
* Effective November 8, 2015, the Ashmore Emerging Markets Debt Fund changed its name to the Ashmore Emerging Markets Hard Currency Debt Fund and the Fund made certain related changes to its principal investment strategies. The performance information in this report was achieved using the Fund’s previous principal investment strategies. For more information, see Note 1: “Organization.”
** Effective February 29, 2016, the Ashmore Emerging Markets Equity Fund changed its name to the Ashmore Emerging Markets Value Fund. For more information, see Note 1: “Organization.”
Ashmore Investment Management (US) Corporation is the Distributor for the Ashmore Funds.
This material is authorized for use only when preceded or accompanied by the current Ashmore Funds’ prospectuses. Investors should consider the investment objectives, principal risks, charges and expenses of these Funds carefully before investing. This and other information is contained in the Funds’ prospectus. Please read the prospectus carefully before you invest or send money.
A Fund’s past performance is not necessarily an indication of how the Fund will perform in the future.
An investment in a Fund is not a deposit of a bank and is not guaranteed or insured by the Federal Deposit Insurance Corporation or any other government agency. It is possible to lose money on investments in the Funds.
ASHMORE FUNDS
INVESTMENT MANAGER’S REPORT
For the period November 1, 2015 to April 30, 2016
Overview
The reporting period got off to a difficult start as investors digested a combination of poor global growth figures and sharp sell-off in the Chinese equity markets due to concerns about the trajectory of growth of the Chinese economy. There was also a divergence in monetary policy in the developed world as the US Federal Reserve finally hiked interest rates in December while the European Central Bank further expanded its Quantitative Easing (QE) program in December and the Bank of Japan moved to negative interest rates in early 2016. Indeed, the turn of the year saw renewed market volatility with a sharp sell-off across all asset classes as concerns over growth, both globally and China, continued to be at the forefront of investors’ minds.
In the US, Fed chairwoman Janet Yellen finally bit the bullet and announced a 25 bps hike in the Fed Funds target at the December FOMC meeting, over 11 years after the start of the previous hiking cycle in 2004. Few investors were surprised, considering the benign US economic data and careful communication of intentions; investor relief was evident as the S&P rallied 1.45%, high yield spreads tightened 11 bps and the US 10 year bond yield was largely unchanged on the day of the Fed’s announcement. European Central Bank (ECB) President Draghi moved rates further into negative territory at the December 3 ECB meeting with a cut in the deposit rate to -0.30%, and fell short of expectations on the expansion of the QE program, which many attributed as a clear victory for the hawks within the Governing Council. This led to the unwinding of long Eurostoxx 50/short EUR positions. European bourses ended sharply lower on the month, with the Eurostoxx 50 down 6.8% in December.
One other important policy development was the publication by the China Foreign Exchange Trade System (CFETS) of a new currency basket comprised of 13 currencies, of which USD is 26% and EUR is 21%. This index signals that the Chinese authorities are moving away from a pure bilateral exchange rate of RMB against USD in favor of a more global reference basket for the Chinese currency. This new policy instrument, combined with weaker fixings in late December, is contributing to the de-anchoring of CNY (onshore) and CNH (offshore) from the USD.
The first four months of 2016 saw the sharpest risk reversal in global financial markets since 2009, with a very strong finish in April erasing most of the early losses, as Emerging Markets (EM) outperformed significantly across equities and fixed income markets. The year opened with the worst January since 2009 (Shanghai composite -23%, S&P -5%). Concerns about China and fears of Renminbi devaluation fueled a sharp drop in commodity prices and a dramatic widening in credit spreads. Oil prices dropped by 21% in two weeks, to below USD 30 per barrel, before recovering somewhat in late January. The US High Yield (HY) market was hit particularly hard owing to its large exposure to distressed shale oil producers and a surge in mutual fund outflows. European financials and capital securities seized up, as concerns about profitability and liquidity were exacerbated by the ECB’s second deposit rate cut to negative in December.
However, as global equity markets fell precipitously and credit markets tightened, short-dated US Treasury yields dropped by 30 bps and the market nearly entirely priced out the probability of any further Fed Fund rate hikes in 2016. This was a very important development for global currency markets; for the last three years the largest consensus view has been that the US Fed would be the only major central bank with room to hike policy rates, and that as a result the US dollar could only rise. Suddenly, the market realized that the Fed could not hike rates much further, lest global markets fall further under the weight of tighter liquidity (due to hedging needs and flight into the US dollar by global corporations and households).
A weaker Dollar and a ’truce’ in the period of monetary policy divergence that dominated most of the last year was enough to send global markets sharply higher in March. Emerging Markets (EM) currencies did especially well over the period, helped by a very favorable technical position. As soon as Emerging Markets Foreign Exchange stabilized, foreigners and domestic investors could no longer keep their long US dollar positions and hedged at extremely high costs (negative carry), precipitating a scramble to sell US dollars.
The net result for EM fixed income indices over the period was positive; the JP Morgan EMBI GD index was up 5.4%. The broad corporate bonds index (JP Morgan CEMBI BD) was up 3.8%, with the high yield index outperformed at 5.0%. The reference local currency bond index; the JP Morgan GBI-EM GD was up +8.9%, and the reference local currency FX index (JPM ELMI+) was up 3.8%.
1
ASHMORE FUNDS
INVESTMENT MANAGER’S REPORT (CONTINUED)
Portfolio Overview
Ashmore Emerging Markets Total Return Fund
The Ashmore Emerging Markets Total Return Fund (“the Fund”) seeks to achieve its objective by investing principally in the debt instruments of sovereign, quasi-sovereign, and corporate issuers, which may be denominated in any currency, including the local currency of the issuer. The Fund tactically allocates assets between external debt, corporate debt and local currency.
Over the period, the Fund’s institutional class outperformed its benchmark. Local currency was the main contributor to relative performance, while corporate debt was the largest detractor. Among the Fund’s best performing positions were Brazil, Ecuador, and Venezuela. Colombia, Mongolia, and Nigeria were the main detractors from performance.
Ecuador bonds rallied as the government adopted a pro-active stance in response to the dramatic drop in oil prices, announcing expenditure cuts and confirming agreement on a series of multilateral loans, primarily from China, that would cover the country’s financing needs. Having exited the IG index, Brazil was also a strong performer as the curve flattened, the current account deficit moderated and FDI remained resilient. Nigerian credits have been under pressure for most of the period; an offshore oil transportation company was one of the worst hit names, with pressure on daily rates for ships translating into a weak set of results for 2015. Fleet utilization decreased as well by about 25% as local and international operators have been reducing capex.
Ashmore Emerging Markets Hard Currency Debt Fund
The Ashmore Emerging Markets Hard Currency Debt Fund (“the Fund”) (formerly known as the Ashmore Emerging Markets Debt Fund) seeks to achieve its objective by investing principally in debt instruments of, and derivative instruments related to, Sovereign, Quasi-Sovereign and Corporate issuers of EM countries that are denominated in hard currencies (i.e., the U.S. dollar or any currency of a nation in the G-7).
Over the period, the Fund’s institutional class underperformed its benchmark; the JP Morgan EMBI Global Diversified index, which returned 5.35%. Among the Fund’s best performing positions were Ecuador, Venezuela, and Ukraine. Colombia, Indonesia, and Brazil were the main detractors.
As with the Ashmore Emerging Markets Total Return Fund, the Fund benefited from its positions in Ecuador bonds which rallied as the government adopted a pro-active stance in response to the dramatic drop in oil prices, announcing expenditure cuts and confirming agreement on a series of multilateral loans, primarily from China, that would cover the country’s financing needs.
Ashmore Emerging Markets Local Currency Bond Fund
The Ashmore Emerging Markets Local Currency Bond Fund (“the Fund”) seeks to achieve its objective by investing principally in the debt instruments of sovereign and quasi-sovereign EM issuers, denominated in the local currency of the issuer. The Fund’s returns are driven by EM currency appreciation, interest rate positioning and credit worthiness.
EM currencies are not only supported by stronger growth, more robust fundamentals and higher interest rates than developed markets, but it is also likely that a gradual depreciation of developed market currencies will be one mechanism by which developed markets will de-leverage and reduce their enormous debt burdens. In terms of bonds, we continue to find attractive opportunities across EM countries. EM monetary policymakers are acting in an idiosyncratic fashion to meet their particular domestic needs and local expertise is increasingly necessary to help understand the dynamics that drive local decision-making.
Over the period, the Fund’s institutional class outperformed its benchmark. The Fund’s top EM contributors for the period were gains from positions in the Brazilian Real, Chinese renminbi, and Argentine peso. The Mexican peso, Polish zloty, and South African rand were the most significant detractors from performance.
Brazilian bonds benefited from the end of the monetary tightening cycle, the weakening of the US dollar, rises in commodity prices and a higher likelihood of impeachment of the president.
2
ASHMORE FUNDS
INVESTMENT MANAGER’S REPORT (CONTINUED)
Ashmore Emerging Markets Corporate Debt Fund
The Ashmore Emerging Markets Corporate Debt Fund (“the Fund”) seeks to achieve its objective by investing principally in the debt instruments of EM corporate issuers, which may be denominated in any currency, including the local currency of the issuer. EM corporates operate in an environment that typically consists of higher growth and maturing capital markets. In many cases, EM corporates are characterized by new and growing businesses in industries such as mobile communications, technology and food production. We expect these industries to benefit from the developing economies in which they operate. Increased “south/south” trade (between EM countries as opposed to trade with developed markets) and development of domestic markets have resulted in a material structural change for EM corporates and has helped them to broaden their customer bases. We continue to focus efforts on companies that are less followed by the market and which thus allow us to add maximum value based on our views, research and global EM network capabilities.
Over the period, the Fund’s institutional class underperformed its benchmark, the JP Morgan CEMBI Broad Diversified index, which rose 3.84%. The Fund’s top contributors were positions in Brazil, Venezuela and Ecuador, while Colombia, Mongolia, Russia, and the Czech Republic were the largest detractors from performance.
An overweight position in Brazil was the largest absolute contributor to performance, notably following the loss of the country’s investment grade rating from Moody’s in late February. Holdings in Petrobras and Vale were notable contributors in a period of political turmoil and an economic downturn. The position in Venezuela also added value, especially in the short end of the curve, riding the reaction to the shift in global oil prices during the period.
Mongolia detracted from performance as bonds of a Mongolian coal mine suffered weakness over the period from declines in coal prices. The company is the largest producer of coking coal in Mongolia, but the lack of adequate infrastructure between Mongolia and China means that the company has to Transport its coal by truck to the Chinese steel plants in the north. With coal prices being so low in recent months, the shipping cost has become a real problem for the company.
Technicals remain supportive of market performance, especially given weak new issuance in the first quarter of 2016 as supply was 33% less than the year before. With USD 158bn in coupons and principal repayments scheduled for 2016 and in excess of USD 40bn of bond buybacks to be conducted by EM companies this year, total issuance for 2016 might well come in under USD 200bn for the full year, potentially leaving the market in a situation of negative net supply. International investors who exited EM last year are now underweight and are potentially looking for the right trigger to get back into the market. The fact that issuance is picking up is a good sign for the markets, because it shows that investors’ appetite for EM credit has started to come back.
Ashmore Emerging Markets Short Duration Fund
The Ashmore Emerging Markets Short Duration Fund (“the Fund”) seeks to achieve its objective by investing principally in short-term debt instruments of, and derivative instruments related to, Sovereign, Quasi-Sovereign and Corporate issuers of EM countries denominated exclusively in Hard Currencies (i.e., the U.S. dollar or any currency of a nation in the G-7). The Fund normally seeks to maintain weighted average portfolio duration of between 1 and 3 years. The Fund has no restrictions on individual security duration.
Over the period, the Fund’s institutional class outperformed its benchmark. The Fund’s top contributors for the period were gains from positions in Ecuador, Venezuela, and Brazil. Colombia, Indonesia, and Mongolia were the largest detractors from performance.
The recovery in commodity prices, especially oil, had a positive impact on credits. The Fund benefits from significant “pull to par,” as short-maturity instruments trading at a discount rapidly approach par as the maturity date approaches. The environment of spread widening offered many attractive opportunities to acquire quality credits that were adversely impacted in a general “risk off” environment.
Ashmore Emerging Markets Equity Opportunities Fund
The Ashmore Emerging Markets Equity Opportunities Fund (“the Fund”) seeks to provide exposure through a single investment vehicle to various emerging markets equity strategies managed by the Subadviser. The Fund initially allocated its portfolio approximately in the same proportion among the three existing Underlying Equity Funds: Ashmore Emerging Markets Value Fund, Ashmore Emerging Markets Small-Cap Equity Fund and Ashmore Emerging Markets Frontier Equity Fund.
3
ASHMORE FUNDS
INVESTMENT MANAGER’S REPORT (CONTINUED)
These relative allocations may vary over time, and the Fund has the flexibility to invest in other Underlying Funds (including those that may be formed in the future) and directly in securities of other issuers, derivatives and other investments in order to pursue its investment objective.
Ashmore Emerging Markets Value Fund
The Ashmore Emerging Markets Value Fund (“the Fund”) seeks to achieve its objective by investing principally in equity securities and equity-related investments of EM issuers, which may be denominated in any currency, including the local currency of the issuer.
For the six months ended April 30, 2016, EM equities moderately declined by -0.13% (MSCI EM Net), experiencing periods of mark downs and upswings during the period. The first four months of the period saw declines, especially in January 2016, when EM and global equities alike suffered as renewed fears related to lower oil prices, US growth concerns, and slower growth and currency policy uncertainty in China took center stage. In addition, the fits and starts of the use of newly implemented circuit breakers in the domestic (A-share) markets dampened investor sentiment in the early days of trading in China, including in H-share stocks. Trading halts were effectively suspended after the second run at implementing this measure. Furthermore, December FX reserve numbers recorded a sharp decline of USD 106bn, although the decline slowed in January (-USD 99.4bn). Investors’ concerns began to abate as oil and commodity prices picked up and EM currencies began to stabilize. EM equities then staged a strong recovery in March, up 13.5%. Oil prices reached some of their highest levels since November 2015, with WTI up about 20% in April 2016, and buoying sentiment in markets such as Russia and Brazil.
Politics has also been a notable factor, especially in Brazil, as well as in Peru. In Brazil, the majority of the representatives in the lower house voted to move the impeachment process to the Senate. At the time of writing, the majority of the Senate voted in favor of impeachment, causing current President Dilma Rousseff to be suspended, awaiting trial, and the Vice President taking over as Acting President. Market developments in the past few months have signaled that investor sentiment is more aligned to a change in government. In Peru, elections held on April 10 produced two candidates for the presidency largely seen as market friendly. A second-round for the presidential elections is slated for June 5.
The Fund outperformed its benchmark over the period, with country allocation being the primary source of value added, and stock selection modestly contributing. In terms of allocation, our overweight in Peru, Brazil and Russia added most value. The Peruvian economy continued to grow at a brisk pace during Q4 2015 and Q1 2016 resulting in upward revisions to GDP growth for the full year, now closer to 3.8% and driven by primary sectors: mining, construction and infrastructure. We are invested in Credicorp Ltd, the country’s largest fully integrated bank, trading at about 1.8x estimated 2017 price to book value (PBV) with a return on equity (ROE) of 19% 2017E. Investor sentiment in Brazil and Russian sharply recovered with the gain in commodity and energy prices, especially in the latter part of the reporting period. Additionally, while earnings have been in the doldrums for stocks in Brazil especially, we may be at the beginning of a recovery as the operating environment begins to stabilize, especially on the political front. Modest detraction was seen in our overweight in China and Mexico, and lack of exposure in Hungary.
Stock selection added most value in Russia, Korea and UAE, while selection in China, Indonesia and India detracted most. Aeroflot contributed the most. With margins expanding and the company gaining market share following the Transaero merger, we continue to hold onto Aeroflot, as valuations are still reasonable despite its good performance so far. Lotte Chemical (petrochemicals) and Posco (steel) in Korea added value as did Emaar Properties in UAE.
Over the period we have reduced our exposure to China and Taiwan, taking profits in specific holdings as their investment theses played out. We also reduced our allocation to Turkey, as tourism revenues are projected to decline after a spate of terrorist attacks. Tourism is a material driver of GDP growth (10% contribution to GDP) and is expected to reduce GDP growth by over one half percentage point in 2016 as visitors seek safer destinations. Early in the new year (2016), we took advantage of low valuations in Brazil adding stocks in the energy, materials and real estate sectors. We also added to our Russia and Mexico allocations, and initiated a position in the UAE, Emaar Properties.
4
ASHMORE FUNDS
INVESTMENT MANAGER’S REPORT (CONTINUED)
Many EMs have started the easing cycle, and others may well join, as stronger currencies and lower inflation than feared allows central banks to lower rates. This action is already benefiting housing, commercial and industrial real estate, and farmland throughout EMs. Energy and materials also look attractive. Although we have seen some recovery, we believe these stocks still look underpriced. Should market conditions continue to stabilize, we expect relative valuations to drive returns. In that environment, EM equities are still trading at a discount to developed market equities, and in our view still offer appreciable upside potential even after the good first quarter of 2016. Per Bloomberg data, estimated 2016 price to earnings (PE) for EM is 12x, compared to 16x for developed markets and 17x for the S&P 500.
Ashmore Emerging Markets Small-Cap Equity Fund
The Ashmore Emerging Markets Small-Cap Equity Fund (“the Fund”) seeks to achieve its objective by investing principally in equity securities and equity-related investments of small-capitalization EM issuers, which may be denominated in any currency, including the local currency of the issuer.
EM small-cap stocks had a modest decline of 0.08% during the 6 month period to April 30, 2016 according to the MSCI EM Small Cap Index Net. Markets leading the decline were Greece (-11%), Peru (-11%), Qatar (-10%) and Egypt (-8%). Bucking the trend were small caps in Colombia (+74%), Hungary (+25%), Czech Republic (+23%) and Russia (+21%). Colombia and Russia in particular staged remarkable recoveries, after having gone through a period of marked market and currency declines.
The Fund outperformed its benchmark with country allocation adding value while stock selection detracted. In terms of country, our overweight in Brazil, Colombia and Russia contributed most, while our lack of exposure in South Africa and Malaysia, as well as the allocation to Argentina, detracted.
On a stock basis, weighing most on returns were the holdings in Brazil, China and Korea, although selections in India, Taiwan and Russia helped. Agro-business Adecoagro and parts manufacturer Tupy lost value most in the Brazil holdings – their export related segments were expected to be impacted by the firming in the country’s currency over the period. However, we continue to hold as we believe the underlying businesses remain well valued. Among the China holdings, our holding in Boer Power Holdings lost most during the period. The company manufactures and supplies high tech electrical components to industry (utilities, hospitals, etc.). Following a delay in the release of results, the company restated its balance sheet by adding back certain off-balance sheet receivables factored with banks, thereby turning from a net cash position (22%) to a gearing of 77%. This hurt investor confidence resulting in a significant sell-down of the company’s shares at quarter end. While the receivables are to end clients that are expected to pay back, and the owner-CEO of the company has made an interest free loan to the company and fired the CFO to continue with ongoing capex and regain investor confidence. The firm is now looking to hire a CFO from one of the big four accounting firms. The stock has remained under pressure as investors await any improvements related to changes on the governance and financial controls front. Modetour suffered as Q4 2015 operating profits came in below consensus, although top-line growth remains sustainable. At a forward 2016 PE of 13x, we continue to see value in the company as tourist activity remains strong.
The portfolio’s Indian holdings added value especially the exposure in Balrampur Chini Mills. The company is one of the biggest sugar mills in the country, based in North India. Sugar output in the current season (October 2015 –April 2016) is lower than in recent years and will just about meet India’s local demand. In addition, government subsidies have helped export some 1.5m tons in recent months and sugar inventory is at reasonable levels. Poor rains in 2015 have hit cane farmers hard, especially in the state of Maharashtra, India’s biggest cane producing region. As a result, the outlook for sugar production in the coming season (October 2016 – April 2017) is significantly weaker. Internationally, sugar is in deficit by 5m tons after several years of surplus. All of this has helped the firming up of sugar prices in India from INR 27-28/kg to INR 32/kg over the last 6 months, while international raw sugar prices have moved up from a low of 10.5c/lb to 14.3c/lb. Higher sugar prices should allow Balrampur Chini to report significant earnings growth in the coming year. Taiwan tech holdings, Casetek (casings manufacturer), Inventec (a leading ODM for notebooks, server and mobile devices) and Inotera Memories (DRAM wafer manufacturer) contributed over the period. We sold out of Inventec and Inotera Memories by period end as our target fair value was reached.
5
ASHMORE FUNDS
INVESTMENT MANAGER’S REPORT (CONTINUED)
We reduced our allocation to Taiwan and China, ending the period with an underweight position for the latter. Early in the new year (2016), we took advantage of low valuations in Brazil adding stocks such as Cosan, a sugar/ethanol producer with solid operations and expected to benefit from any uptick in energy prices, Suzano (pulp & paper), the cheapest pulp and paper/soft tissue producer globally, Cyrela (real estate) and SLC Agricola (agriculture).
Relative company valuations continue to guide our exposures in the coverage universe, while the overall small cap universe continues to offer competitive value compared to the developed markets.
Ashmore Emerging Markets Frontier Equity Fund
The Ashmore Emerging Markets Frontier Equity Fund (“the Fund”) seeks to achieve its objective by investing principally in equity securities and equity-related investments of Frontier Market issuers, which may be denominated in any currency, including the local currency of the issuer.
Frontier Markets, according to the MSCI Frontier Markets Index Net, declined by 2.73% for the 6 months ended April 30, 2016. Markets such as Nigeria (-16%), Bahrain (-16%), Kazakhstan (-14%) and Sri Lanka (-12%) lost the most ground, although markets such as Estonia (+24%), Morocco (+16%), Kenya (+11%) and Tunisia (+10%) held up very well, serving as safe havens in a relatively weak equity environment.
In Nigeria, investors continue to price in weak oil and policy mistakes that have led to FX scarcity, shortages of goods, and stubbornly high inflation. There has been no change to the official FX rate which remains at NGN 199 to the Dollar, while the black market rate is closer to NGN 340. While a recent fuel price deregulation has lifted investor mood in the market, overall sentiment continues to be weak as expectation mounts of a potential FX devaluation. In Sri Lanka equities sold off reflecting mounting concerns on the fiscal deficit and external debt repayments over the next year. Although the economy is relatively well balanced – and is expected to grow by 5-6% this year – the risk is that cutbacks on fiscal expenditure, continued foreign capital outflows, and a weaker FX could undermine the outlook. Policy rates were increased by 50 bps in February to support the Rupee and limit credit growth/inflation. Stock specific news was limited and the sell-off was broad based.
Morocco and Kenya also performed well due, to some extent, their relative safe-haven status within Africa given the issues in Nigeria. Although in Kenya there was also some encouraging macro data that drove equity prices higher, namely 1) rising reserves, now at 4.5 months cover, 2) the recent approval of a new IMF precautionary fund of USD 1.5bn which serves as a buffer against short term shocks, and 3) falling inflation (now at 6.8% from 7.8% in January, versus a target range of 2.5-7.5%).
The Fund outperformed its index over the period with overall contribution from exposures in Pakistan, Peru and Nigeria helping most, while exposures Kazakhstan, Morocco, Egypt and Sri Lanka detracting. Our overweight in Pakistan contributed most, especially our holdings in DG Khan Cement, Maple Leaf Cement, Pakistan Oilfields and Bank Al Habib. We hold Credicorp in Peru which added value. Our underweight in Nigeria helped given the relative weakness. We hold one of the top tier banks there trading at a 2017E PBV of 0.9x. We continue to closely monitor that market. The decline in oil prices impacted our exposure in oil-exporter Kazakhstan, Halyk Savings Bank, although the bank trades at a compelling 2017E PBV of 0.5x. We do not have any holdings in Morocco, hurting relative performance. The market out-performed as a safe haven and one of the bellwether real estate businesses in that market rallied on progress made in its balance sheet restructuring plan.
During the period, we reduced and consolidated our positions in Sri Lanka, selling out of People’s Leasing and reducing the weight in Sampath Bank. We also reduced our exposure in Indonesia and Kenya. We initiated positions in Egypt (Commercial International Bank, Eastern Tobacco and IDH) and UAE (e.g., Emaar Properties, NMC Health), based on relative valuations and improved growth prospects in specific names. We also added Banco Davivienda and Gran Tierra Energy in Colombia.
Frontier Markets remain a compelling investment universe on a relative valuation basis. They tend to be less correlated with the global equity markets although providing higher than global and EM dividend yield. Continued improvement in investor sentiment towards EM and Frontier Markets should have positive implications for flows and returns.
6
IMPORTANT INFORMATION ABOUT THE FUNDS
Ashmore Investment Advisors Limited
This commentary may include statements that constitute “forward-looking statements” under the U.S. securities laws. Forward-looking statements include, among other things, projections, estimates, and information about possible or future results related to the Funds and market or regulatory developments. The views expressed above are not guarantees of future performance or economic results and involve certain risks, uncertainties and assumptions that could cause actual outcomes and results to differ materially from the views expressed herein. The views expressed above are those of Ashmore Investment Advisors Limited as of the date indicated and are subject to change at any time based upon economic, market, or other conditions and Ashmore Investment Advisors Limited undertakes no obligation to update the views expressed herein. Any discussions of specific securities or markets should not be considered a recommendation to buy or sell or invest in those securities or markets. The views expressed above may not be relied upon as investment advice or as an indication of the Funds’ trading intent. Information about the Funds’ holdings, asset allocation or country diversification is historical and is not an indication of future portfolio composition, which may vary. Direct investment in any index is not possible. The performance of any index mentioned in this commentary has not been adjusted for ongoing management, distribution and operating expenses applicable to mutual fund investments. In addition, the returns do not reflect certain charges that an investor in the Funds may pay. If these additional fees were reflected, the performance shown would have been lower.
The following disclosure provides important information regarding each Fund’s Average Annual Total Return table and Cumulative Returns chart, which appear on each Fund’s individual page in this report (the “Shareholder Report” or “Report”). Please refer to this information when reviewing the table and chart for a Fund.
On each individual Fund Summary page in this Report, the Average Annual Total Return table and Cumulative Returns chart measure performance assuming that all dividend and capital gain distributions were reinvested. Returns do not reflect the deduction of taxes that a shareholder would pay on (i) Fund distributions or (ii) the redemption of Fund shares. The Cumulative Returns Chart reflects only Institutional Class performance. Performance for Class A and Class C shares is typically lower than Institutional Class performance due to the lower expenses paid by Institutional Class shares. Except for the load-waived performance for the Class A and C shares of each Fund (as applicable), performance shown is net of fees and expenses. The load-waived performance for Class A and Class C shares does not reflect the sales charges shareholders of those classes may pay in connection with a purchase or redemption of Class A and Class C shares. The load-waived performance of those share classes is relevant only to shareholders who purchased Class A or Class C shares on a load-waived basis. The figures in the line graph are calculated at net asset value and assume the investment of $1,000,000 at the beginning of the first full month following the inception of the Institutional Class. Each Fund measures its performance against a broad-based securities market index (“benchmark index”). Each benchmark index does not take into account fees, expenses or taxes.
For periods prior to the inception date of the Class A and Class C shares (if applicable), performance information shown is based on the performance of the Fund’s Institutional Class shares, adjusted to reflect the distribution and/or service fees and other expenses paid by the Class A and Class C shares, respectively.
A Fund’s past performance, before and after taxes, is not necessarily an indication of how the Fund will perform in the future.
An investment in a Fund is not a deposit of a bank and is not guaranteed or insured by the Federal Deposit Insurance Corporation or any other government agency. It is possible to lose money on investments in the Funds.
7
IMPORTANT INFORMATION ABOUT THE FUNDS (CONTINUED)
The following disclosure provides important information regarding each Fund’s Expense Example, which appears on each Fund’s individual page in this Shareholder Report. Please refer to this information when reviewing the Expense Example for a Fund.
EXPENSE EXAMPLE
Fund Expenses
As a shareholder of the Funds, you incur two types of costs: (1) transaction costs, including sales charges (loads) on purchase payments; redemption fees; and exchange fees; and (2) ongoing costs, including management fees; distribution (12b-1) fees; and other Fund expenses. This Example is intended to help you understand your ongoing costs (in dollars) of investing in the Funds and to compare these costs with the ongoing costs of investing in other mutual funds. The Example is based on an investment of $1,000 invested at the beginning of the period and held for the entire period, from November 1, 2015 or the inception date (if later), through April 30, 2016.
Actual Expenses
The information in the table under the heading “Actual Performance” provides information based on actual performance and actual expenses. You may use the information in these columns, together with the amount you invested, to estimate the expenses that you paid over the period. Simply divide your account value by $1,000 (for example, an $8,600 account value divided by $1,000 = $8.60), then multiply the result by the number in the appropriate column for your share class, in the row titled “Expenses Paid” to estimate the expenses you paid on your account during this period.
Hypothetical Example for Comparison Purposes
The information in the table under the heading “Hypothetical Performance” provides information about hypothetical account values and hypothetical expenses based on the Fund’s actual expense ratio and an assumed rate of return of 5% per year before expenses, which is not the Fund’s actual return. The hypothetical account values and expenses may not be used to estimate the actual ending account balance or expenses you paid for the period. You may use this information to compare the ongoing costs of investing in the Fund and other funds. To do so, compare this 5% hypothetical example with the 5% hypothetical examples that appear in the shareholder reports of the other funds.
Please note that the expenses shown in the table are meant to highlight your ongoing costs only and do not reflect any transactional costs, such as sales charges (loads), redemption fees, or exchange fees. Therefore, the information under the heading “Hypothetical Performance” is useful in comparing ongoing costs only, and will not help you determine the relative total costs of owning different funds. In addition, if these transactional costs were included, your costs would have been higher.
8
UNAUDITED
FUND SUMMARY Ashmore
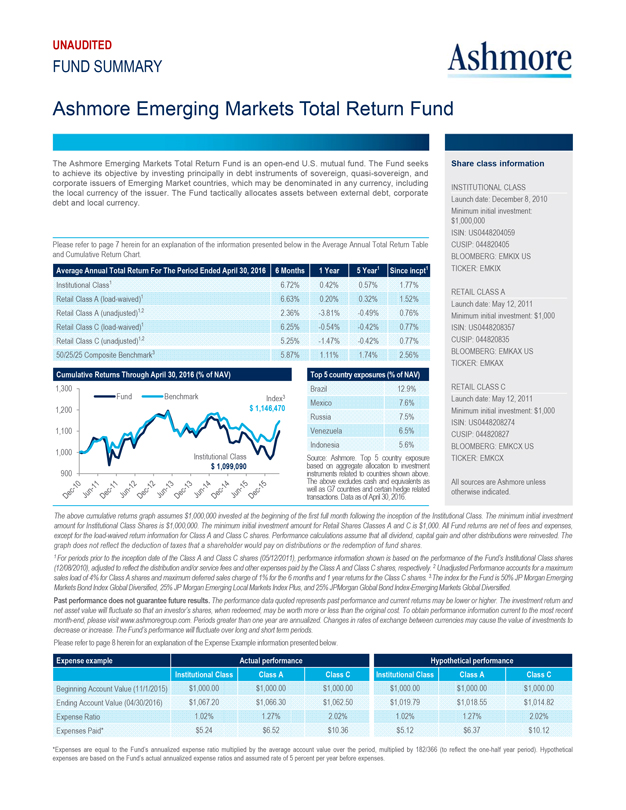
Ashmore Emerging Markets Total Return Fund
The Ashmore Emerging Markets Total Return Fund is an open-end U.S. mutual fund. The Fund seeks to achieve its objective by investing principally in debt instruments of sovereign, quasi-sovereign, and corporate issuers of Emerging Market countries, which may be denominated in any currency, including the local currency of the issuer. The Fund tactically allocates assets between external debt, corporate debt and local currency.
Please refer to page 7 herein for an explanation of the information presented below in the Average Annual Total Return Table and Cumulative Return Chart.
Average Annual Total Return For The Period Ended April 30, 2016 6 Months 1 Year 5 Year1 Since incpt1
Institutional Class1 6.72% 0.42% 0.57% 1.77%
Retail Class A (load-waived)1 6.63% 0.20% 0.32% 1.52%
Retail Class A (unadjusted)1,2 2.36% -3.81% -0.49% 0.76%
Retail Class C (load-waived)1 6.25% -0.54% -0.42% 0.77%
Retail Class C (unadjusted)1,2 5.25% -1.47% -0.42% 0.77%
50/25/25 Composite Benchmark3 5.87% 1.11% 1.74% 2.56%
Cumulative Returns Through April 30, 2016 (% of NAV)
1,300
Fund Benchmark Index3
1,200 $ 1,146,470
1,100
1,000 Institutional Class
$ 1,099,090
900
Dec-10 Jun-11 Dec-11 Jun-12 Dec-12 Jun-13 Dec-13 Jun-14 Dec-14 Jun-15 Dec-15
Top 5 country exposures (% of NAV)
Brazil 12.9% Mexico 7.6% Russia 7.5% Venezuela 6.5% Indonesia 5.6%
Source: Ashmore. Top 5 country exposure based on aggregate allocation to investment instruments related to countries shown above. The above excludes cash and equivalents as well as G7 countries and certain hedge related transactions. Data as of April 30, 2016.
Share class information
INSTITUTIONAL CLASS
Launch date: December 8, 2010
Minimum initial investment:
$1,000,000
ISIN: US0448204059
CUSIP: 044820405
BLOOMBERG: EMKIX US
TICKER: EMKIX
RETAIL CLASS A
Launch date: May 12, 2011
Minimum initial investment: $1,000
ISIN: US0448208357
CUSIP: 044820835
BLOOMBERG: EMKAX US
TICKER: EMKAX
RETAIL CLASS C
Launch date: May 12, 2011
Minimum initial investment: $1,000
ISIN: US0448208274
CUSIP: 044820827
BLOOMBERG: EMKCX US
TICKER: EMKCX
All sources are Ashmore unless otherwise indicated.
The above cumulative returns graph assumes $1,000,000 invested at the beginning of the first full month following the inception of the Institutional Class. The minimum initial investment amount for Institutional Class Shares is $1,000,000. The minimum initial investment amount for Retail Shares Classes A and C is $1,000. All Fund returns are net of fees and expenses, except for the load-waived return information for Class A and Class C shares. Performance calculations assume that all dividend, capital gain and other distributions were reinvested. The graph does not reflect the deduction of taxes that a shareholder would pay on distributions or the redemption of fund shares.
1 For periods prior to the inception date of the Class A and Class C shares (05/12/2011), performance information shown is based on the performance of the Fund’s Institutional Class shares (12/08/2010), adjusted to reflect the distribution and/or service fees and other expenses paid by the Class A and Class C shares, respectively. 2 Unadjusted Performance accounts for a maximum sales load of 4% for Class A shares and maximum deferred sales charge of 1% for the 6 months and 1 year returns for the Class C shares. 3.The index for the Fund is 50% JP Morgan Emerging Markets Bond Index Global Diversified, 25% JP Morgan Emerging Local Markets Index Plus, and 25% JPMorgan Global Bond Index-Emerging Markets Global Diversified.
Past performance does not guarantee future results. The performance data quoted represents past performance and current returns may be lower or higher. The investment return and net asset value will fluctuate so that an investor’s shares, when redeemed, may be worth more or less than the original cost. To obtain performance information current to the most recent month-end, please visit www.ashmoregroup.com. Periods greater than one year are annualized. Changes in rates of exchange between currencies may cause the value of investments to decrease or increase. The Fund’s performance will fluctuate over long and short term periods.
Please refer to page 8 herein for an explanation of the Expense Example information presented below.
Expense example Actual performance Hypothetical performance
Institutional Class Class A Class C Institutional Class Class A Class C
Beginning Account Value (11/1/2015) $1,000.00 $1,000.00 $1,000.00 $1,000.00 $1,000.00 $1,000.00
Ending Account Value (04/30/2016) $1,067.20 $1,066.30 $1,062.50 $1,019.79 $1,018.55 $1,014.82
Expense Ratio 1.02% 1.27% 2.02% 1.02% 1.27% 2.02%
Expenses Paid* $5.24 $6.52 $10.36 $5.12 $6.37 $10.12
*Expenses are equal to the Fund’s annualized expense ratio multiplied by the average account value over the period, multiplied by 182/366 (to reflect the one-half year period). Hypothetical expenses are based on the Fund’s actual annualized expense ratios and assumed rate of 5 percent per year before expenses.
9
UNAUDITED
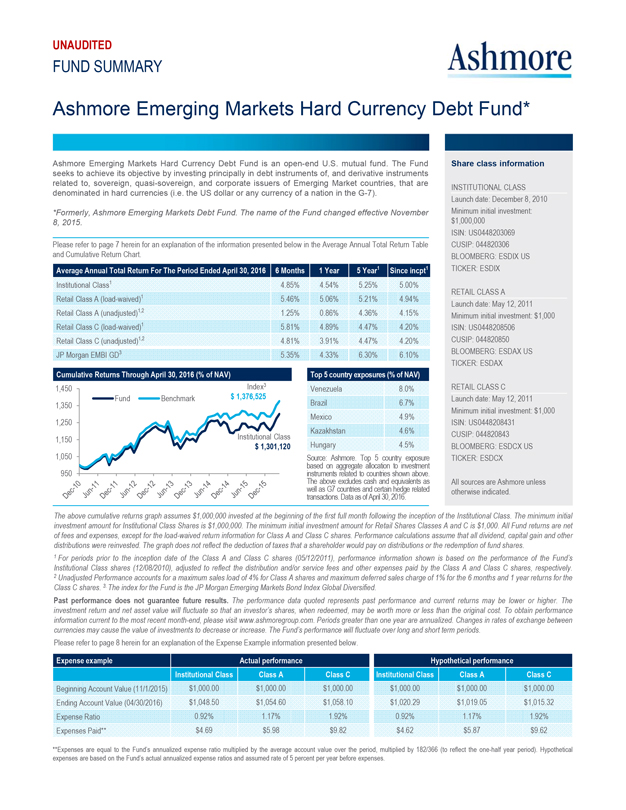
FUND SUMMARY Ashmore
Ashmore Emerging Markets Hard Currency Debt Fund*
Ashmore Emerging Markets Hard Currency Debt Fund is an open-end U.S. mutual fund. The Fund seeks to achieve its objective by investing principally in debt instruments of, and derivative instruments related to, sovereign, quasi-sovereign, and corporate issuers of Emerging Market countries, that are denominated in hard currencies (i.e. the US dollar or any currency of a nation in the G-7).
*Formerly, Ashmore Emerging Markets Debt Fund. The name of the Fund changed effective November 8, 2015.
Please refer to page 7 herein for an explanation of the information presented below in the Average Annual Total Return Table and Cumulative Return Chart.
Average Annual Total Return For The Period Ended April 30, 2016 6 Months 1 Year 5 Year1 Since incpt1
Institutional Class1 4.85% 4.54% 5.25% 5.00%
Retail Class A (load-waived)1 5.46% 5.06% 5.21% 4.94%
Retail Class A (unadjusted)1,2 1.25% 0.86% 4.36% 4.15%
Retail Class C (load-waived)1 5.81% 4.89% 4.47% 4.20%
Retail Class C (unadjusted)1,2 4.81% 3.91% 4.47% 4.20%
JP Morgan EMBI GD3 5.35% 4.33% 6.30% 6.10%
Cumulative Returns Through April 30, 2016 (% of NAV)
1,450 Index3
Fund Benchmark $ 1,376,525
1,350 1,250
1,150 Institutional Class $ 1,301,120
1,050 950
Dec-10 Jun-11 Dec-11 Jun-12 Dec-12 Jun-13 Dec-13 Jun-14 Dec-14 Jun-15 Dec-15
Top 5 country exposures (% of NAV)
Venezuela 8.0% Brazil 6.7% Mexico 4.9% Kazakhstan 4.6% Hungary 4.5%
Source: Ashmore. Top 5 country exposure based on aggregate allocation to investment instruments related to countries shown above. The above excludes cash and equivalents as well as G7 countries and certain hedge related transactions. Data as of April 30, 2016.
Share class information
INSTITUTIONAL CLASS
Launch date: December 8, 2010
Minimum initial investment:
$1,000,000
ISIN: US0448203069
CUSIP: 044820306
BLOOMBERG: ESDIX US
TICKER: ESDIX
RETAIL CLASS A
Launch date: May 12, 2011
Minimum initial investment: $1,000
ISIN: US0448208506
CUSIP: 044820850
BLOOMBERG: ESDAX US
TICKER: ESDAX
RETAIL CLASS C
Launch date: May 12, 2011
Minimum initial investment: $1,000
ISIN: US0448208431
CUSIP: 044820843
BLOOMBERG: ESDCX US
TICKER: ESDCX
All sources are Ashmore unless otherwise indicated.
The above cumulative returns graph assumes $1,000,000 invested at the beginning of the first full month following the inception of the Institutional Class. The minimum initial investment amount for Institutional Class Shares is $1,000,000. The minimum initial investment amount for Retail Shares Classes A and C is $1,000. All Fund returns are net of fees and expenses, except for the load-waived return information for Class A and Class C shares. Performance calculations assume that all dividend, capital gain and other distributions were reinvested. The graph does not reflect the deduction of taxes that a shareholder would pay on distributions or the redemption of fund shares.
1 For periods prior to the inception date of the Class A and Class C shares (05/12/2011), performance information shown is based on the performance of the Fund’s Institutional Class shares (12/08/2010), adjusted to reflect the distribution and/or service fees and other expenses paid by the Class A and Class C shares, respectively.
2 Unadjusted Performance accounts for a maximum sales load of 4% for Class A shares and maximum deferred sales charge of 1% for the 6 months and 1 year returns for the Class C shares. 3. The index for the Fund is the JP Morgan Emerging Markets Bond Index Global Diversified.
Past performance does not guarantee future results. The performance data quoted represents past performance and current returns may be lower or higher. The investment return and net asset value will fluctuate so that an investor’s shares, when redeemed, may be worth more or less than the original cost. To obtain performance information current to the most recent month-end, please visit www.ashmoregroup.com. Periods greater than one year are annualized. Changes in rates of exchange between currencies may cause the value of investments to decrease or increase. The Fund’s performance will fluctuate over long and short term periods.
Please refer to page 8 herein for an explanation of the Expense Example information presented below.
Expense example Actual performance Hypothetical performance
Institutional Class Class A Class C Institutional Class Class A Class C
Beginning Account Value (11/1/2015) $1,000.00 $1,000.00 $1,000.00 $1,000.00 $1,000.00 $1,000.00
Ending Account Value (04/30/2016) $1,048.50 $1,054.60 $1,058.10 $1,020.29 $1,019.05 $1,015.32
Expense Ratio 0.92% 1.17% 1.92% 0.92% 1.17% 1.92%
Expenses Paid** $4.69 $5.98 $9.82 $4.62 $5.87 $9.62
**Expenses are equal to the Fund’s annualized expense ratio multiplied by the average account value over the period, multiplied by 182/366 (to reflect the one-half year period). Hypothetical expenses are based on the Fund’s actual annualized expense ratios and assumed rate of 5 percent per year before expenses.
10
UNAUDITED
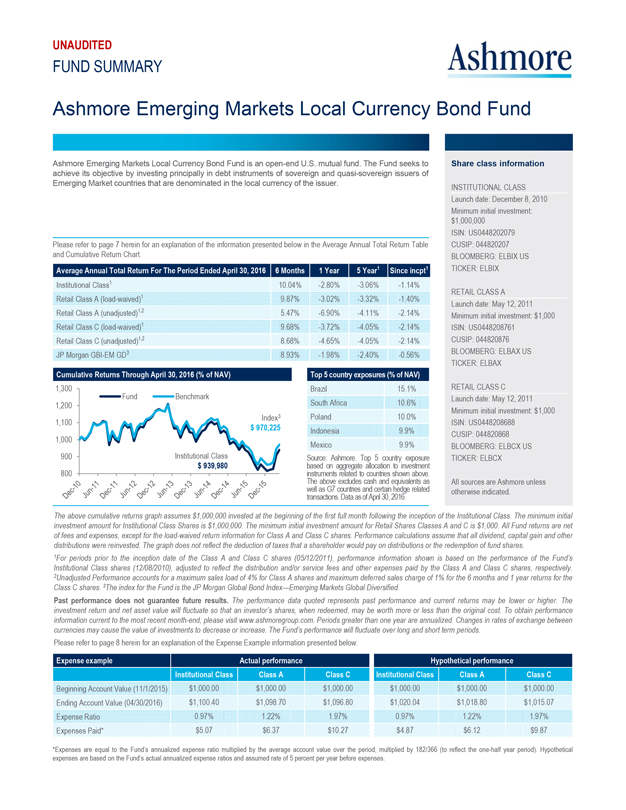
FUND SUMMARY Ashmore
Ashmore Emerging Markets Local Currency Bond Fund
Ashmore Emerging Markets Local Currency Bond Fund is an open-end U.S. mutual fund. The Fund seeks to achieve its objective by investing principally in debt instruments of sovereign and quasi-sovereign issuers of Emerging Market countries that are denominated in the local currency of the issuer.
Please refer to page 7 herein for an explanation of the information presented below in the Average Annual Total Return Table and Cumulative Return Chart.
Average Annual Total Return For The Period Ended April 30, 2016 6 Months 1 Year 5 Year1 Since incpt1
Institutional Class1 10.04% -2.80% -3.06% -1.14%
Retail Class A (load-waived)1 9.87% -3.02% -3.32% -1.40%
Retail Class A (unadjusted)1,2 5.47% -6.90% -4.11% -2.14%
Retail Class C (load-waived)1 9.68% -3.72% -4.05% -2.14%
Retail Class C (unadjusted)1,2 8.68% -4.65% -4.05% -2.14%
JP Morgan GBI-EM GD3 8.93% -1.98% -2.40% -0.56%
Cumulative Returns Through April 30, 2016 (% of NAV)
1,300
Fund Benchmark
1,200
1,100 Index3
$ 970,225
1,000
900 Institutional Class
$ 939,980
800
Dec-10 Jun-11 Dec-11 Jun-12 Dec-12 Jun-13 Dec-13 Jun-14 Dec-14 Jun-15 Dec-15
Top 5 country exposures (% of NAV)
Brazil 15.1% South Africa 10.6% Poland 10.0% Indonesia 9.9% Mexico 9.9%
Source: Ashmore. Top 5 country exposure based on aggregate allocation to investment instruments related to countries shown above. The above excludes cash and equivalents as well as G7 countries and certain hedge related transactions. Data as of April 30, 2016.
Share class information
INSTITUTIONAL CLASS
Launch date: December 8, 2010
Minimum initial investment:
$1,000,000
ISIN: US0448202079
CUSIP: 044820207
BLOOMBERG: ELBIX US
TICKER: ELBIX
RETAIL CLASS A
Launch date: May 12, 2011
Minimum initial investment: $1,000
ISIN: US0448208761
CUSIP: 044820876
BLOOMBERG: ELBAX US
TICKER: ELBAX
RETAIL CLASS C
Launch date: May 12, 2011
Minimum initial investment: $1,000
ISIN: US0448208688
CUSIP: 044820868
BLOOMBERG: ELBCX US
TICKER: ELBCX
All sources are Ashmore unless otherwise indicated.
The above cumulative returns graph assumes $1,000,000 invested at the beginning of the first full month following the inception of the Institutional Class. The minimum initial investment amount for Institutional Class Shares is $1,000,000. The minimum initial investment amount for Retail Shares Classes A and C is $1,000. All Fund returns are net of fees and expenses, except for the load-waived return information for Class A and Class C shares. Performance calculations assume that all dividend, capital gain and other distributions were reinvested. The graph does not reflect the deduction of taxes that a shareholder would pay on distributions or the redemption of fund shares.
1For periods prior to the inception date of the Class A and Class C shares (05/12/2011), performance information shown is based on the performance of the Fund’s Institutional Class shares (12/08/2010), adjusted to reflect the distribution and/or service fees and other expenses paid by the Class A and Class C shares, respectively. 2Unadjusted Performance accounts for a maximum sales load of 4% for Class A shares and maximum deferred sales charge of 1% for the 6 months and 1 year returns for the Class C shares. 3The index for the Fund is the JP Morgan Global Bond Index—Emerging Markets Global Diversified.
Past performance does not guarantee future results. The performance data quoted represents past performance and current returns may be lower or higher. The investment return and net asset value will fluctuate so that an investor’s shares, when redeemed, may be worth more or less than the original cost. To obtain performance information current to the most recent month-end, please visit www.ashmoregroup.com. Periods greater than one year are annualized. Changes in rates of exchange between currencies may cause the value of investments to decrease or increase. The Fund’s performance will fluctuate over long and short term periods.
Please refer to page 8 herein for an explanation of the Expense Example information presented below.
Expense example Actual performance Hypothetical performance
Institutional Class Class A Class C Institutional Class Class A Class C
Beginning Account Value (11/1/2015) $1,000.00 $1,000.00 $1,000.00 $1,000.00 $1,000.00 $1,000.00
Ending Account Value (04/30/2016) $1,100.40 $1,098.70 $1,096.80 $1,020.04 $1,018.80 $1,015.07
Expense Ratio 0.97% 1.22% 1.97% 0.97% 1.22% 1.97%
Expenses Paid* $5.07 $6.37 $10.27 $4.87 $6.12 $9.87
*Expenses are equal to the Fund’s annualized expense ratio multiplied by the average account value over the period, multiplied by 182/366 (to reflect the one-half year period). Hypothetical expenses are based on the Fund’s actual annualized expense ratios and assumed rate of 5 percent per year before expenses.
11
UNAUDITED
FUND SUMMARY Ashmore
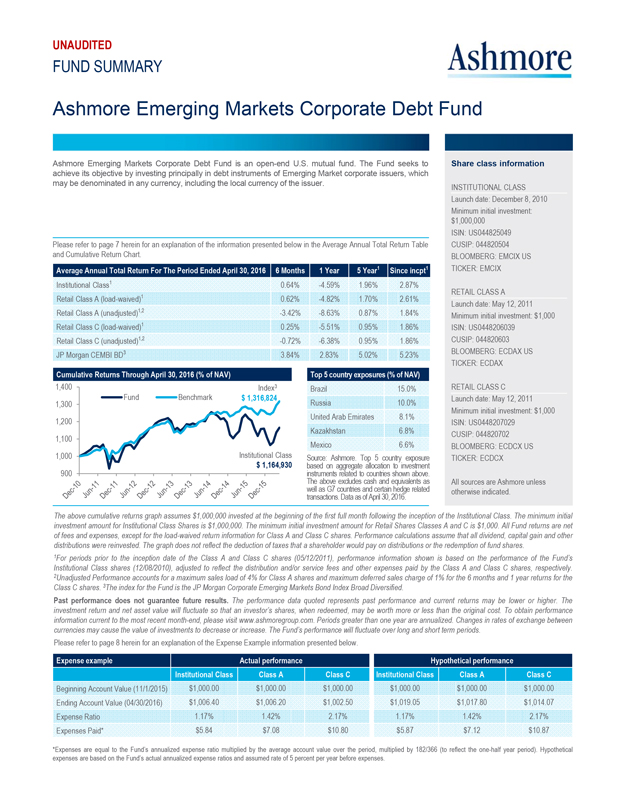
Ashmore Emerging Markets Corporate Debt Fund
Ashmore Emerging Markets Corporate Debt Fund is an open-end U.S. mutual fund. The Fund seeks to achieve its objective by investing principally in debt instruments of Emerging Market corporate issuers, which may be denominated in any currency, including the local currency of the issuer.
Please refer to page 7 herein for an explanation of the information presented below in the Average Annual Total Return Table and Cumulative Return Chart.
Average Annual Total Return For The Period Ended April 30, 2016 6 Months 1 Year 5 Year1 Since incpt1
Institutional Class1 0.64% -4.59% 1.96% 2.87%
Retail Class A (load-waived)1 0.62% -4.82% 1.70% 2.61%
Retail Class A (unadjusted)1,2 -3.42% -8.63% 0.87% 1.84%
Retail Class C (load-waived)1 0.25% -5.51% 0.95% 1.86%
Retail Class C (unadjusted)1,2 -0.72% -6.38% 0.95% 1.86%
JP Morgan CEMBI BD3 3.84% 2.83% 5.02% 5.23%
Cumulative Returns Through April 30, 2016 (% of NAV)
1,400 Index3 Fund Benchmark $ 1,316,824
1,300 1,200 1,100 1,000 Institutional Class $ 1,164,930 900
Dec-10 Jun-11 Dec-11 Jun-12 Dec-12 Jun-13 Dec-13 Jun-14 Dec-14 Jun-15 Dec-15
Top 5 country exposures (% of NAV)
Brazil 15.0% Russia 10.0% United Arab Emirates 8.1% Kazakhstan 6.8% Mexico 6.6%
Source: Ashmore. Top 5 country exposure based on aggregate allocation to investment instruments related to countries shown above. The above excludes cash and equivalents as well as G7 countries and certain hedge related transactions. Data as of April 30, 2016.
Share class information
INSTITUTIONAL CLASS
Launch date: December 8, 2010
Minimum initial investment:
$1,000,000 ISIN: US044825049 CUSIP: 044820504 BLOOMBERG: EMCIX US
TICKER: EMCIX RETAIL CLASS A Launch date: May 12, 2011 Minimum initial investment: $1,000
ISIN: US0448206039 CUSIP: 044820603 BLOOMBERG: ECDAX US TICKER: ECDAX
RETAIL CLASS C Launch date: May 12, 2011 Minimum initial investment: $1,000 ISIN: US0448207029
CUSIP: 044820702 BLOOMBERG: ECDCX US TICKER: ECDCX
All sources are Ashmore unless otherwise indicated.
The above cumulative returns graph assumes $1,000,000 invested at the beginning of the first full month following the inception of the Institutional Class. The minimum initial investment amount for Institutional Class Shares is $1,000,000. The minimum initial investment amount for Retail Shares Classes A and C is $1,000. All Fund returns are net of fees and expenses, except for the load-waived return information for Class A and Class C shares. Performance calculations assume that all dividend, capital gain and other distributions were reinvested. The graph does not reflect the deduction of taxes that a shareholder would pay on distributions or the redemption of fund shares.
1For periods prior to the inception date of the Class A and Class C shares (05/12/2011), performance information shown is based on the performance of the Fund’s Institutional Class shares (12/08/2010), adjusted to reflect the distribution and/or service fees and other expenses paid by the Class A and Class C shares, respectively.
2Unadjusted Performance accounts for a maximum sales load of 4% for Class A shares and maximum deferred sales charge of 1% for the 6 months and 1 year returns for the Class C shares. 3The index for the Fund is the JP Morgan Corporate Emerging Markets Bond Index Broad Diversified.
Past performance does not guarantee future results. The performance data quoted represents past performance and current returns may be lower or higher. The investment return and net asset value will fluctuate so that an investor’s shares, when redeemed, may be worth more or less than the original cost. To obtain performance information current to the most recent month-end, please visit www.ashmoregroup.com. Periods greater than one year are annualized. Changes in rates of exchange between currencies may cause the value of investments to decrease or increase. The Fund’s performance will fluctuate over long and short term periods.
Please refer to page 8 herein for an explanation of the Expense Example information presented below.
Expense example Actual performance Hypothetical performance
Institutional Class Class A Class C Institutional Class Class A Class C
Beginning Account Value (11/1/2015) $1,000.00 $1,000.00 $1,000.00 $1,000.00 $1,000.00 $1,000.00
Ending Account Value (04/30/2016) $1,006.40 $1,006.20 $1,002.50 $1,019.05 $1,017.80 $1,014.07
Expense Ratio 1.17% 1.42% 2.17% 1.17% 1.42% 2.17%
Expenses Paid* $5.84 $7.08 $10.80 $5.87 $7.12 $10.87
*Expenses are equal to the Fund’s annualized expense ratio multiplied by the average account value over the period, multiplied by 182/366 (to reflect the one-half year period). Hypothetical expenses are based on the Fund’s actual annualized expense ratios and assumed rate of 5 percent per year before expenses.
12
UNAUDITED
FUND SUMMARY Ashmore
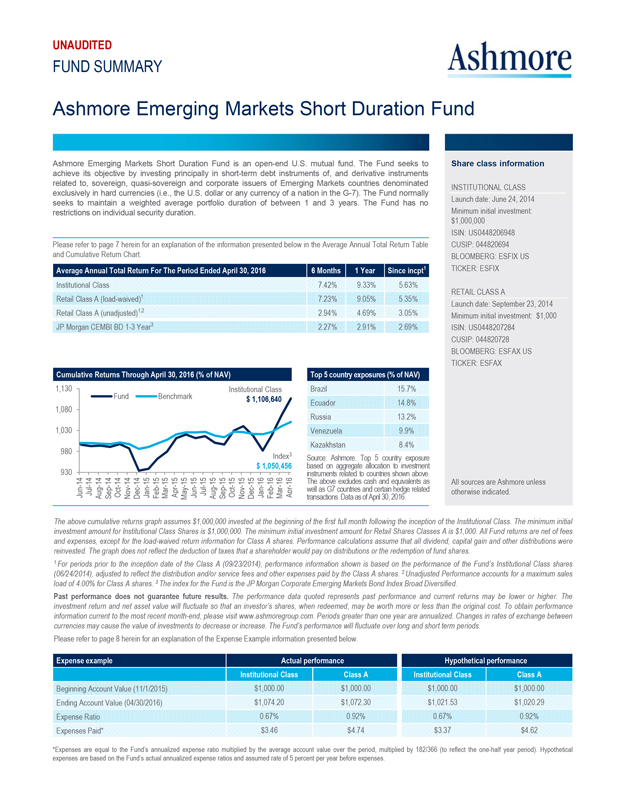
Ashmore Emerging Markets Short Duration Fund
Ashmore Emerging Markets Short Duration Fund is an open-end U.S. mutual fund. The Fund seeks to achieve its objective by investing principally in short-term debt instruments of, and derivative instruments related to, sovereign, quasi-sovereign and corporate issuers of Emerging Markets countries denominated exclusively in hard currencies (i.e., the U.S. dollar or any currency of a nation in the G-7). The Fund normally seeks to maintain a weighted average portfolio duration of between 1 and 3 years. The Fund has no restrictions on individual security duration.
Please refer to page 7 herein for an explanation of the information presented below in the Average Annual Total Return Table and Cumulative Return Chart.
Average Annual Total Return For The Period Ended April 30, 2016 6 Months 1 Year Since incpt1
Institutional Class 7.42% 9.33% 5.63%
Retail Class A (load-waived)1 7.23% 9.05% 5.35%
Retail Class A (unadjusted)1,2 2.94% 4.69% 3.05%
JP Morgan CEMBI BD 1-3 Year3 2.27% 2.91% 2.69%
Cumulative Returns Through April 30, 2016 (% of NAV)
1,130 Institutional Class
Fund Benchmark $ 1,106,640
1,080 1,030 980 Index3 $ 1,050,456 930
Jun-14 Jul-14 Aug-14 Sep-14 Oct-14 Nov-14 Dec-14 Jan-15 Feb-15 Mar-15 Apr-15
May-15 Jun-15 Jul-15 Aug-15 Sep-15 Oct-15 Nov-15 Dec-15 Jan-16 Feb-16 Mar-16 Apr-16
Top 5 country exposures (% of NAV)
Brazil 15.7% Ecuador 14.8% Russia 13.2% Venezuela 9.9% Kazakhstan 8.4%
Source: Ashmore. Top 5 country exposure based on aggregate allocation to investment instruments related to countries shown above. The above excludes cash and equivalents as transactions. well as G7 countries Data as and of April certain 30, 2016. hedge related
Share class information
INSTITUTIONAL CLASS
Launch date: June 24, 2014
Minimum initial investment:
$1,000,000 ISIN: US0448206948 CUSIP: 044820694 BLOOMBERG: ESFIX US
TICKER: ESFIX RETAIL CLASS A Launch date: September 23, 2014
Minimum initial investment: $1,000
ISIN: US0448207284 CUSIP: 044820728 BLOOMBERG: ESFAX US TICKER: ESFAX
All sources are Ashmore unless otherwise indicated.
The above cumulative returns graph assumes $1,000,000 invested at the beginning of the first full month following the inception of the Institutional Class. The minimum initial investment amount for Institutional Class Shares is $1,000,000. The minimum initial investment amount for Retail Shares Classes A is $1,000. All Fund returns are net of fees and expenses, except for the load-waived return information for Class A shares. Performance calculations assume that all dividend, capital gain and other distributions were reinvested. The graph does not reflect the deduction of taxes that a shareholder would pay on distributions or the redemption of fund shares.
1.For periods prior to the inception date of the Class A (09/23/2014), performance information shown is based on the performance of the Fund’s Institutional Class shares (06/24/2014), adjusted to reflect the distribution and/or service fees and other expenses paid by the Class A shares. 2 Unadjusted Performance accounts for a maximum sales load of 4.00% for Class A shares. 3 The index for the Fund is the JP Morgan Corporate Emerging Markets Bond Index Broad Diversified.
Past performance does not guarantee future results. The performance data quoted represents past performance and current returns may be lower or higher. The investment return and net asset value will fluctuate so that an investor’s shares, when redeemed, may be worth more or less than the original cost. To obtain performance information current to the most recent month-end, please visit www.ashmoregroup.com. Periods greater than one year are annualized. Changes in rates of exchange between currencies may cause the value of investments to decrease or increase. The Fund’s performance will fluctuate over long and short term periods.
Please refer to page 8 herein for an explanation of the Expense Example information presented below.
Expense example Actual performance Hypothetical performance
Institutional Class Class A Institutional Class Class A
Beginning Account Value (11/1/2015) $1,000.00 $1,000.00 $1,000.00 $1,000.00
Ending Account Value (04/30/2016) $1,074.20 $1,072.30 $1,021.53 $1,020.29
Expense Ratio 0.67% 0.92% 0.67% 0.92%
Expenses Paid* $3.46 $4.74 $3.37 $4.62
*Expenses are equal to the Fund’s annualized expense ratio multiplied by the average account value over the period, multiplied by 182/366 (to reflect the one-half year period). Hypothetical expenses are based on the Fund’s actual annualized expense ratios and assumed rate of 5 percent per year before expenses.
13
UNAUDITED
FUND SUMMARY Ashmore
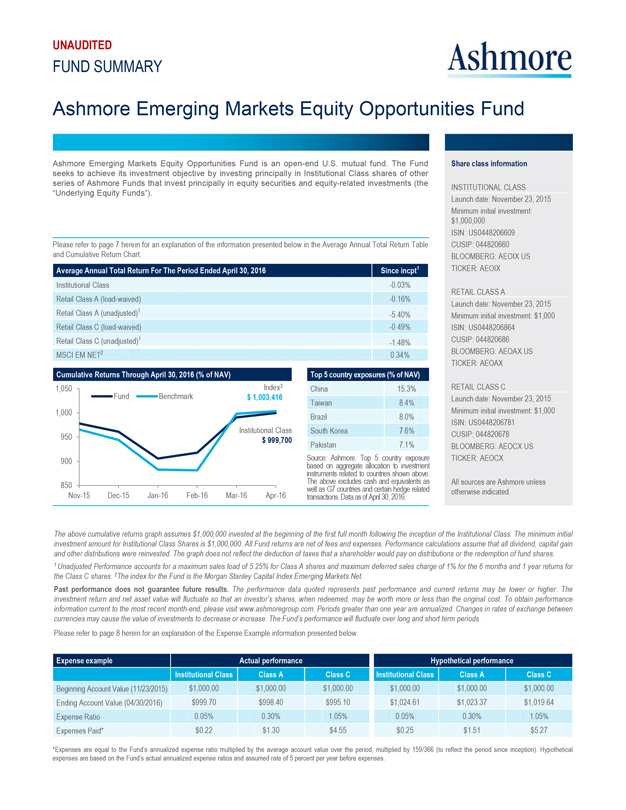
Ashmore Emerging Markets Equity Opportunities Fund
Ashmore Emerging Markets Equity Opportunities Fund is an open-end U.S. mutual fund. The Fund seeks to achieve its investment objective by investing principally in Institutional Class shares of other series of Ashmore Funds that invest principally in equity securities and equity-related investments (the “Underlying Equity Funds”).
Please refer to page 7 herein for an explanation of the information presented below in the Average Annual Total Return Table and Cumulative Return Chart.
Average Annual Total Return For The Period Ended April 30, 2016 Since incpt1
Institutional Class -0.03%
Retail Class A (load-waived) -0.16%
Retail Class A (unadjusted)1 -5.40%
Retail Class C (load-waived) -0.49%
Retail Class C (unadjusted)1 -1.48%
MSCI EM NET2 0.34%
Cumulative Returns Through April 30, 2016 (% of NAV)
1,050 Index3 Fund Benchmark $ 1,003,416
1,000 Institutional Class 950 $ 999,700 900 850
Nov-15 Dec-15 Jan-16 Feb-16 Mar-16 Apr-16
Top 5 country exposures (% of NAV)
China 15.3% Taiwan 8.4% Brazil 8.0% South Korea 7.6% Pakistan 7.1%
Source: Ashmore. Top 5 country exposure based on aggregate allocation to investment instruments related to countries shown above. The above excludes cash and equivalents as well as G7 countries and certain hedge related transactions. Data as of April 30, 2016.
Share class information
INSTITUTIONAL CLASS
Launch date: November 23, 2015
Minimum initial investment:
$1,000,000 ISIN: US0448206609 CUSIP: 044820660
BLOOMBERG: AEOIX US TICKER: AEOIX RETAIL CLASS A
Launch date: November 23, 2015
Minimum initial investment: $1,000
ISIN: US0448206864 CUSIP: 044820686
BLOOMBERG: AEOAX US TICKER: AEOAX RETAIL CLASS C
Launch date: November 23, 2015
Minimum initial investment: $1,000
ISIN: US0448206781 CUSIP: 044820678
BLOOMBERG: AEOCX US TICKER: AEOCX
All sources are Ashmore unless otherwise indicated.
The above cumulative returns graph assumes $1,000,000 invested at the beginning of the first full month following the inception of the Institutional Class. The minimum initial investment amount for Institutional Class Shares is $1,000,000. All Fund returns are net of fees and expenses. Performance calculations assume that all dividend, capital gain and other distributions were reinvested. The graph does not reflect the deduction of taxes that a shareholder would pay on distributions or the redemption of fund shares.
1 Unadjusted Performance accounts for a maximum sales load of 5.25% for Class A shares and maximum deferred sales charge of 1% for the 6 months and 1 year returns for the Class C shares. 2The index for the Fund is the Morgan Stanley Capital Index Emerging Markets Net.
Past performance does not guarantee future results. The performance data quoted represents past performance and current returns may be lower or higher. The investment return and net asset value will fluctuate so that an investor’s shares, when redeemed, may be worth more or less than the original cost. To obtain performance information current to the most recent month-end, please visit www.ashmoregroup.com. Periods greater than one year are annualized. Changes in rates of exchange between currencies may cause the value of investments to decrease or increase. The Fund’s performance will fluctuate over long and short term periods.
Please refer to page 8 herein for an explanation of the Expense Example information presented below.
Expense example Actual performance Hypothetical performance
Institutional Class Class A Class C Institutional Class Class A Class C
Beginning Account Value (11/23/2015) $1,000.00 $1,000.00 $1,000.00 $1,000.00 $1,000.00 $1,000.00
Ending Account Value (04/30/2016) $999.70 $998.40 $995.10 $1,024.61 $1,023.37 $1,019.64
Expense Ratio 0.05% 0.30% 1.05% 0.05% 0.30% 1.05%
Expenses Paid* $0.22 $1.30 $4.55 $0.25 $1.51 $5.27
*Expenses are equal to the Fund’s annualized expense ratio multiplied by the average account value over the period, multiplied by 159/366 (to reflect the period since inception). Hypothetical expenses are based on the Fund’s actual annualized expense ratios and assumed rate of 5 percent per year before expenses.
14
UNAUDITED
FUND SUMMARY Ashmore
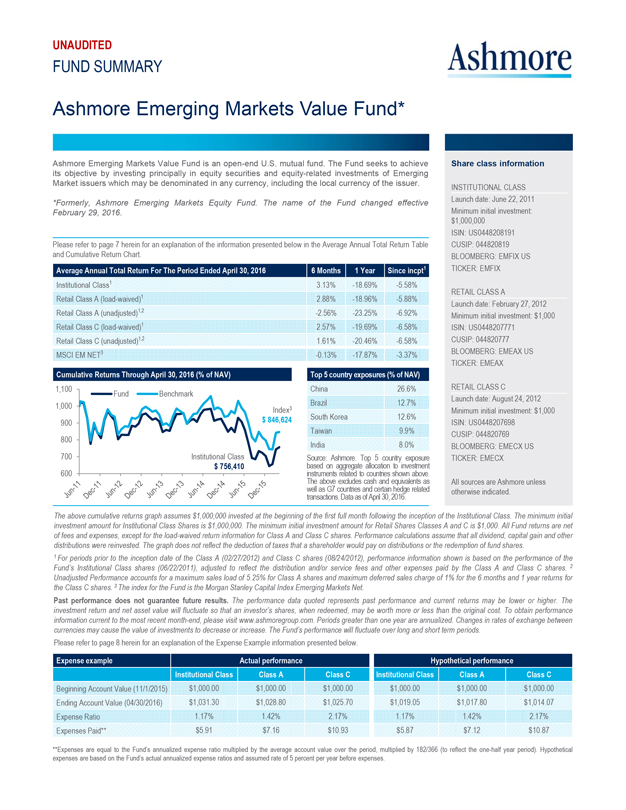
Ashmore Emerging Markets Value Fund*
Ashmore Emerging Markets Value Fund is an open-end U.S. mutual fund. The Fund seeks to achieve its objective by investing principally in equity securities and equity-related investments of Emerging Market issuers which may be denominated in any currency, including the local currency of the issuer.
*Formerly, Ashmore Emerging Markets Equity Fund. The name of the Fund changed effective February 29, 2016.
Please refer to page 7 herein for an explanation of the information presented below in the Average Annual Total Return Table and Cumulative Return Chart.
Average Annual Total Return For The Period Ended April 30, 2016 6 Months 1 Year Since incpt1
Institutional Class1 3.13% -18.69% -5.58%
Retail Class A (load-waived)1 2.88% -18.96% -5.88%
Retail Class A (unadjusted)1,2 -2.56% -23.25% -6.92%
Retail Class C (load-waived)1 2.57% -19.69% -6.58%
Retail Class C (unadjusted)1,2 1.61% -20.46% -6.58%
MSCI EM NET3 -0.13% -17.87% -3.37% Cumulative Returns Through April 30, 2016 (% of NAV)
1,100 Fund Benchmark 1,000 Index3 900 $ 846,624 800 700 Institutional Class $ 756,410 600
Jun-11 Dec-11 Jun-12 Dec-12 Jun-13 Dec-13 Jun-14 Dec-14 Jun-15 Dec-15 Top 5 country exposures (% of NAV)
China 26.6% Brazil 12.7% South Korea 12.6% Taiwan 9.9% India 8.0%
Source: Ashmore. Top 5 country exposure based on aggregate allocation to investment instruments related to countries shown above. The above excludes cash and equivalents as well as G7 countries and certain hedge related transactions. Data as of April 30, 2016.
Share class information
INSTITUTIONAL CLASS Launch date: June 22, 2011
Minimum initial investment: $1,000,000 ISIN: US0448208191 CUSIP: 044820819
BLOOMBERG: EMFIX US TICKER: EMFIX RETAIL CLASS A
Launch date: February 27, 2012 Minimum initial investment: $1,000 ISIN: US0448207771
CUSIP: 044820777 BLOOMBERG: EMEAX US TICKER: EMEAX
RETAIL CLASS C Launch date: August 24, 2012 Minimum initial investment: $1,000
ISIN: US0448207698 CUSIP: 044820769 BLOOMBERG: EMECX US TICKER: EMECX
All sources are Ashmore unless otherwise indicated.
The above cumulative returns graph assumes $1,000,000 invested at the beginning of the first full month following the inception of the Institutional Class. The minimum initial investment amount for Institutional Class Shares is $1,000,000. The minimum initial investment amount for Retail Shares Classes A and C is $1,000. All Fund returns are net of fees and expenses, except for the load-waived return information for Class A and Class C shares. Performance calculations assume that all dividend, capital gain and other distributions were reinvested. The graph does not reflect the deduction of taxes that a shareholder would pay on distributions or the redemption of fund shares.
1 For periods prior to the inception date of the Class A (02/27/2012) and Class C shares (08/24/2012), performance information shown is based on the performance of the Fund’s Institutional Class shares (06/22/2011), adjusted to reflect the distribution and/or service fees and other expenses paid by the Class A and Class C shares. 2 Unadjusted Performance accounts for a maximum sales load of 5.25% for Class A shares and maximum deferred sales charge of 1% for the 6 months and 1 year returns for the Class C shares. 3 The index for the Fund is the Morgan Stanley Capital Index Emerging Markets Net.
Past performance does not guarantee future results. The performance data quoted represents past performance and current returns may be lower or higher. The investment return and net asset value will fluctuate so that an investor’s shares, when redeemed, may be worth more or less than the original cost. To obtain performance information current to the most recent month-end, please visit www.ashmoregroup.com. Periods greater than one year are annualized. Changes in rates of exchange between currencies may cause the value of investments to decrease or increase. The Fund’s performance will fluctuate over long and short term periods.
Please refer to page 8 herein for an explanation of the Expense Example information presented below.
Expense example Actual performance Hypothetical performance
Institutional Class Class A Class C Institutional Class Class A Class C
Beginning Account Value (11/1/2015) $1,000.00 $1,000.00 $1,000.00 $1,000.00 $1,000.00 $1,000.00
Ending Account Value (04/30/2016) $1,031.30 $1,028.80 $1,025.70 $1,019.05 $1,017.80 $1,014.07
Expense Ratio 1.17% 1.42% 2.17% 1.17% 1.42% 2.17%
Expenses Paid** $5.91 $7.16 $10.93 $5.87 $7.12 $10.87
**Expenses are equal to the Fund’s annualized expense ratio multiplied by the average account value over the period, multiplied by 182/366 (to reflect the one-half year period). Hypothetical expenses are based on the Fund’s actual annualized expense ratios and assumed rate of 5 percent per year before expenses.
15
UNAUDITED
FUND SUMMARY Ashmore
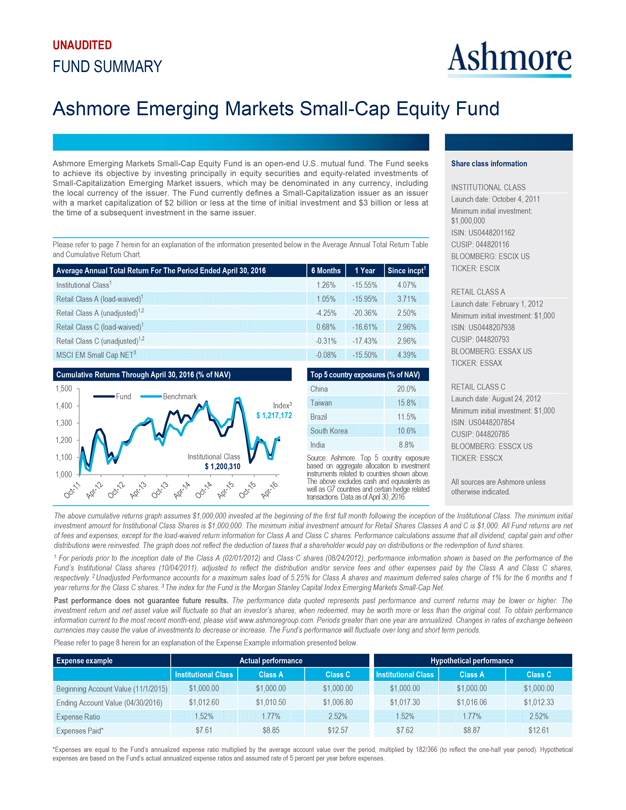
Ashmore Emerging Markets Small-Cap Equity Fund
Ashmore Emerging Markets Small-Cap Equity Fund is an open-end U.S. mutual fund. The Fund seeks to achieve its objective by investing principally in equity securities and equity-related investments of Small-Capitalization Emerging Market issuers, which may be denominated in any currency, including the local currency of the issuer. The Fund currently defines a Small-Capitalization issuer as an issuer with a market capitalization of $2 billion or less at the time of initial investment and $3 billion or less at the time of a subsequent investment in the same issuer.
Please refer to page 7 herein for an explanation of the information presented below in the Average Annual Total Return Table and Cumulative Return Chart.
Average Annual Total Return For The Period Ended April 30, 2016 6 Months 1 Year Since incpt1
Institutional Class1 1.26% -15.55% 4.07%
Retail Class A (load-waived)1 1.05% -15.95% 3.71%
Retail Class A (unadjusted)1,2 -4.25% -20.36% 2.50%
Retail Class C (load-waived)1 0.68% -16.61% 2.96%
Retail Class C (unadjusted)1,2 -0.31% -17.43% 2.96%
MSCI EM Small Cap NET3 -0.08% -15.50% 4.39%
Cumulative Returns Through April 30, 2016 (% of NAV)
Fund Benchmark Index3 1,500
1,400 $ 1,217,172 1,300 1,200 1,100 Institutional Class
$ 1,200,310 1,000 Oct-11 Apr-12 Oct-12 Apr-13 Oct-13 Apr-14 Oct-14 Apr-15 Oct-15 Apr-16
Top 5 country exposures (% of NAV) China 20.0% Taiwan 15.8% Brazil 11.5% South Korea 10.6% India 8.8%
Source: Ashmore. Top 5 country exposure based on aggregate allocation to investment instruments related to countries shown above. The above excludes cash and equivalents as well as G7 countries and certain hedge related transactions. Data as of April 30, 2016.
Share class information
INSTITUTIONAL CLASS
Launch date: October 4, 2011 Minimum initial investment: $1,000,000 ISIN: US0448201162 CUSIP: 044820116
BLOOMBERG: ESCIX US TICKER: ESCIX RETAIL CLASS A
Launch date: February 1, 2012 Minimum initial investment: $1,000
ISIN: US0448207938 CUSIP: 044820793 BLOOMBERG: ESSAX US TICKER: ESSAX RETAIL CLASS C
Launch date: August 24, 2012 Minimum initial investment: $1,000
ISIN: US0448207854 CUSIP: 044820785 BLOOMBERG: ESSCX US TICKER: ESSCX
All sources are Ashmore unless otherwise indicated.
The above cumulative returns graph assumes $1,000,000 invested at the beginning of the first full month following the inception of the Institutional Class. The minimum initial investment amount for Institutional Class Shares is $1,000,000. The minimum initial investment amount for Retail Shares Classes A and C is $1,000. All Fund returns are net of fees and expenses, except for the load-waived return information for Class A and Class C shares. Performance calculations assume that all dividend, capital gain and other distributions were reinvested. The graph does not reflect the deduction of taxes that a shareholder would pay on distributions or the redemption of fund shares.
1 For periods prior to the inception date of the Class A (02/01/2012) and Class C shares (08/24/2012), performance information shown is based on the performance of the Fund’s Institutional Class shares (10/04/2011), adjusted to reflect the distribution and/or service fees and other expenses paid by the Class A and Class C shares, respectively. 2 Unadjusted Performance accounts for a maximum sales load of 5.25% for Class A shares and maximum deferred sales charge of 1% for the 6 months and 1 year returns for the Class C shares. 3 The index for the Fund is the Morgan Stanley Capital Index Emerging Markets Small-Cap Net.
Past performance does not guarantee future results. The performance data quoted represents past performance and current returns may be lower or higher. The investment return and net asset value will fluctuate so that an investor’s shares, when redeemed, may be worth more or less than the original cost. To obtain performance information current to the most recent month-end, please visit www.ashmoregroup.com. Periods greater than one year are annualized. Changes in rates of exchange between currencies may cause the value of investments to decrease or increase. The Fund’s performance will fluctuate over long and short term periods.
Please refer to page 8 herein for an explanation of the Expense Example information presented below.
Expense example Actual performance Hypothetical performance
Institutional Class Class A Class C Institutional Class Class A Class C
Beginning Account Value (11/1/2015) $1,000.00 $1,000.00 $1,000.00 $1,000.00 $1,000.00 $1,000.00
Ending Account Value (04/30/2016) $1,012.60 $1,010.50 $1,006.80 $1,017.30 $1,016.06 $1,012.33
Expense Ratio 1.52% 1.77% 2.52% 1.52% 1.77% 2.52%
Expenses Paid* $7.61 $8.85 $12.57 $7.62 $8.87 $12.61
*Expenses are equal to the Fund’s annualized expense ratio multiplied by the average account value over the period, multiplied by 182/366 (to reflect the one-half year period). Hypothetical expenses are based on the Fund’s actual annualized expense ratios and assumed rate of 5 percent per year before expenses.
16
UNAUDITED
FUND SUMMARY Ashmore
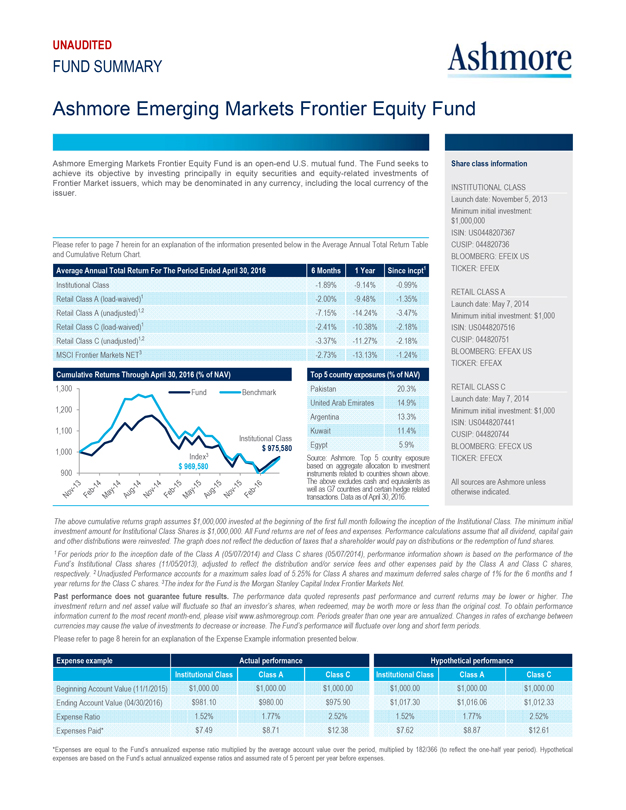
Ashmore Emerging Markets Frontier Equity Fund
Ashmore Emerging Markets Frontier Equity Fund is an open-end U.S. mutual fund. The Fund seeks to achieve its objective by investing principally in equity securities and equity-related investments of Frontier Market issuers, which may be denominated in any currency, including the local currency of the issuer.
Please refer to page 7 herein for an explanation of the information presented below in the Average Annual Total Return Table and Cumulative Return Chart.
Average Annual Total Return For The Period Ended April 30, 2016 6 Months 1 Year Since incpt1
Institutional Class -1.89% -9.14% -0.99%
Retail Class A (load-waived)1 -2.00% -9.48% -1.35%
Retail Class A (unadjusted)1,2 -7.15% -14.24% -3.47%
Retail Class C (load-waived)1 -2.41% -10.38% -2.18%
Retail Class C (unadjusted)1,2 -3.37% -11.27% -2.18%
MSCI Frontier Markets NET3 -2.73% -13.13% -1.24%
Cumulative Returns Through April 30, 2016 (% of NAV)
1,300 Fund Benchmark
1,200
1,100
Institutional Class
1,000 $ 975,580
Index3
$ 969,580
900
Nov-13 Feb-14 May-14 Aug-14 Nov-14 Feb-15 May-15 Aug-15 Nov-15 Feb-16
Top 5 country exposures (% of NAV)
Pakistan 20.3%
United Arab Emirates 14.9%
Argentina 13.3%
Kuwait 11.4%
Egypt 5.9%
Source: Ashmore. Top 5 country exposure based on aggregate allocation to investment instruments related to countries shown above. The above excludes cash and equivalents as well as G7 countries and certain hedge related transactions. Data as of April 30, 2016.
Share class information
INSTITUTIONAL CLASS
Launch date: November 5, 2013
Minimum initial investment:
$1,000,000
ISIN: US0448207367
CUSIP: 044820736
BLOOMBERG: EFEIX US
TICKER: EFEIX
RETAIL CLASS A
Launch date: May 7, 2014
Minimum initial investment: $1,000
ISIN: US0448207516
CUSIP: 044820751
BLOOMBERG: EFEAX US
TICKER: EFEAX
RETAIL CLASS C
Launch date: May 7, 2014
Minimum initial investment: $1,000
ISIN: US0448207441
CUSIP: 044820744
BLOOMBERG: EFECX US
TICKER: EFECX
All sources are Ashmore unless otherwise indicated.
The above cumulative returns graph assumes $1,000,000 invested at the beginning of the first full month following the inception of the Institutional Class. The minimum initial investment amount for Institutional Class Shares is $1,000,000. All Fund returns are net of fees and expenses. Performance calculations assume that all dividend, capital gain and other distributions were reinvested. The graph does not reflect the deduction of taxes that a shareholder would pay on distributions or the redemption of fund shares.
1 For periods prior to the inception date of the Class A (05/07/2014) and Class C shares (05/07/2014), performance information shown is based on the performance of the Fund’s Institutional Class shares (11/05/2013), adjusted to reflect the distribution and/or service fees and other expenses paid by the Class A and Class C shares, respectively. 2 Unadjusted Performance accounts for a maximum sales load of 5.25% for Class A shares and maximum deferred sales charge of 1% for the 6 months and 1 year returns for the Class C shares. 3The index for the Fund is the Morgan Stanley Capital Index Frontier Markets Net.
Past performance does not guarantee future results. The performance data quoted represents past performance and current returns may be lower or higher. The investment return and net asset value will fluctuate so that an investor’s shares, when redeemed, may be worth more or less than the original cost. To obtain performance information current to the most recent month-end, please visit www.ashmoregroup.com. Periods greater than one year are annualized. Changes in rates of exchange between currencies may cause the value of investments to decrease or increase. The Fund’s performance will fluctuate over long and short term periods.
Please refer to page 8 herein for an explanation of the Expense Example information presented below.
Expense example Actual performance Hypothetical performance
Institutional Class Class A Class C Institutional Class Class A Class C
Beginning Account Value (11/1/2015) $1,000.00 $1,000.00 $1,000.00 $1,000.00 $1,000.00 $1,000.00
Ending Account Value (04/30/2016) $981.10 $980.00 $975.90 $1,017.30 $1,016.06 $1,012.33
Expense Ratio 1.52% 1.77% 2.52% 1.52% 1.77% 2.52%
Expenses Paid* $7.49 $8.71 $12.38 $7.62 $8.87 $12.61
*Expenses are equal to the Fund’s annualized expense ratio multiplied by the average account value over the period, multiplied by 182/366 (to reflect the one-half year period). Hypothetical expenses are based on the Fund’s actual annualized expense ratios and assumed rate of 5 percent per year before expenses.
17
ASHMORE FUNDS
STATEMENTS OF ASSETS AND LIABILITIES
As of April 30, 2016 (Unaudited)
| | | | | | | | | | | | | | | | | | | | | | |
| | | | | Ashmore Emerging Markets Total Return Fund | | | | | | | Ashmore Emerging Markets Hard Currency
Debt Fund | | | | | | | Ashmore
Emerging
Markets Local Currency
Bond Fund | |
ASSETS: | | | | | | | | | | | | | | | | | | | | | | |
Investments in securities, at value | | | | $ | 498,734,356 | | | | | | | $ | 6,550,610 | | | | | | | $ | 51,944,134 | |
Investments in fully funded total return swaps, at value | | | | | 4,623,359 | | | | | | | | — | | | | | | | | 3,123,227 | |
Deposit held at broker | | | | | — | | | | | | | | — | | | | | | | | 155,736 | |
Cash | | | | | 21,195,315 | | | | | | | | 122,981 | | | | | | | | 15,679,890 | |
Foreign currency, at value | | | | | 1,283,946 | | | | | | | | 10 | | | | | | | | 1,356,994 | |
Unrealized appreciation on forward foreign currency exchange contracts | | | | | 6,136,903 | | | | | | | | — | | | | | | | | 1,065,191 | |
Variation margin receivable on centrally cleared swap contracts | | | | | — | | | | | | | | — | | | | | | | | 21,946 | |
Unrealized appreciation on interest rate swap contracts | | | | | 1,724,059 | | | | | | | | — | | | | | | | | 620,723 | |
Receivable for securities and currencies sold | | | | | 22,153,727 | | | | | | | | 287,614 | | | | | | | | 781,678 | |
Receivable for fund shares sold | | | | | 124,270 | | | | | | | | 1,000 | | | | | | | | 102,942 | |
Receivable from Investment Manager | | | | | 64,777 | | | | | | | | 8,760 | | | | | | | | 19,452 | |
Interest and dividends receivable | | | | | 10,326,917 | | | | | | | | 129,206 | | | | | | | | 1,148,096 | |
Other assets | | | | | 32,743 | | | | | | | | 19,248 | | | | | | | | 20,516 | |
Total Assets | | | | | 566,400,372 | | | | | | | | 7,119,429 | | | | | | | | 76,040,525 | |
LIABILITIES: | | | | | | | | | | | | | | | | | | | | | | |
Unrealized depreciation on forward foreign currency exchange contracts | | | | | 2,702,967 | | | | | | | | — | | | | | | | | 552,533 | |
Variation margin payable on centrally cleared swap contracts | | | | | — | | | | | | | | — | | | | | | | | 10,771 | |
Unrealized depreciation on interest rate swap contracts | | | | | 227,146 | | | | | | | | — | | | | | | | | 30,182 | |
Unrealized depreciation on currency swap contracts | | | | | 58,791 | | | | | | | | — | | | | | | | | — | |
Payable for securities and currencies purchased | | | | | 8,707,015 | | | | | | | | 184,443 | | | | | | | | 804,185 | |
Payable for when-issued securities | | | | | 2,287,157 | | | | | | | | — | | | | | | | | — | |
Payable for fund units redeemed | | | | | 85,549 | | | | | | | | 113,266 | | | | | | | | — | |
Distributions payable | | | | | 233,315 | | | | | | | | 10,663 | | | | | | | | 41,117 | |
Investment Manager fee payable | | | | | 451,663 | | | | | | | | 4,890 | | | | | | | | 60,303 | |
Trustees’ fees payable | | | | | 27,882 | | | | | | | | 353 | | | | | | | | 4,666 | |
Other liabilities | | | | | 307,124 | | | | | | | | 22,150 | | | | | | | | 68,012 | |
Total Liabilities | | | | | 15,088,609 | | | | | | | | 335,765 | | | | | | | | 1,571,769 | |
Net Assets | | | | $ | 551,311,763 | | | | | | | $ | 6,783,664 | | | | | | | $ | 74,468,756 | |
NET ASSETS: | | | | | | | | | | | | | | | | | | | | | | |
Paid in capital | | | | $ | 666,831,739 | | | | | | | $ | 7,894,216 | | | | | | | $ | 94,465,838 | |
Undistributed (distributions in excess of) net investment income (loss) | | | | | (13,325,617 | ) | | | | | | | (4,264 | ) | | | | | | | (7,801,962 | ) |
Accumulated net realized gain (loss) | | | | | (91,381,024 | ) | | | | | | | (1,067,223 | ) | | | | | | | (8,925,128 | ) |
Net unrealized appreciation (depreciation) | | | | | (10,813,335 | ) | | | | | | | (39,065 | ) | | | | | | | (3,269,992 | ) |
Net Assets | | | | $ | 551,311,763 | | | | | | | $ | 6,783,664 | | | | | | | $ | 74,468,756 | |
| | | | | | | | |
Net Assets: | | | | | | | | | | | | | | | | | | | | | | |
Class A | | | | $ | 3,028,839 | | | | | | | $ | 114,335 | | | | | | | $ | 770,761 | |
Class C | | | | | 533,039 | | | | | | | | 2,233 | | | | | | | | 68,450 | |
Institutional Class | | | | | 547,749,885 | | | | | | | | 6,667,096 | | | | | | | | 73,629,545 | |
| | | | | | | | |
Shares Issued and Outstanding (no par value, unlimited shares authorized): | | | | | | | | | | | | | | | | | | | | | | |
Class A | | | | | 394,603 | | | | | | | | 13,858 | | | | | | | | 109,174 | |
Class C | | | | | 69,514 | | | | | | | | 272 | | | | | | | | 9,713 | |
Institutional Class | | | | | 70,304,848 | | | | | | | | 813,880 | | | | | | | | 10,076,439 | |
| | | | | | | | |
Net Asset Value and Redemption Price Per Share (Net Asset Per Share Outstanding): | | | | | | | | | | | | | | | | | | | | | | |
Class A | | | | $ | 7.68 | | | | | | | $ | 8.25 | | | | | | | $ | 7.06 | |
Class C | | | | | 7.67 | | | | | | | | 8.20 | | | | | | | | 7.05 | |
Institutional Class | | | | | 7.79 | | | | | | | | 8.19 | | | | | | | | 7.31 | |
| | | | | | | | | |
Cost of Investments in securities | | | | $ | 513,553,831 | | | | | | | $ | 6,589,675 | | | | | | | $ | 56,089,638 | |
Cost of Investments in fully funded total return swaps | | | | $ | 5,623,650 | | | | | | | $ | — | | | | | | | $ | 3,406,866 | |
Cost of foreign currency held | | | | $ | 1,257,898 | | | | | | | $ | 11 | | | | | | | $ | 1,328,632 | |
See accompanying notes to the financial statements.
18
| | | | | | | | | | | | | | | | | | | | | | | | | | | | | | | | | | | | |
Ashmore Emerging Markets Corporate Debt Fund | | Ashmore
Emerging Markets
Short Duration Fund | | Ashmore
Emerging Markets
Equity
Opportunities
Fund | | Ashmore
Emerging Markets
Value Fund | | Ashmore
Emerging Markets
Small-Cap Equity Fund | | Ashmore
Emerging Markets
Frontier Equity Fund | | |
| | | | | | | | | | | | | | | | | | | | | | | | | | | | | | | | | | | |
| $ | 207,417,414 | | | | | $ | 70,150,714 | | | | | $ | 4,982,277 | | | | | $ | 8,527,186 | | | | | $ | 29,945,072 | | | | | $ | 47,987,475 | | | | |
| | — | | | | | | — | | | | | | — | | | | | | — | | | | | | — | | | | | | — | | | | |
| | — | | | | | | — | | | | | | — | | | | | | — | | | | | | — | | | | | | — | | | | |
| | 6,198,233 | | | | | | 1,144,300 | | | | | | 32,527 | | | | | | 73,312 | | | | | | 615,237 | | | | | | 1,535,888 | | | | |
| | 58,268 | | | | | | 18,674 | | | | | | — | | | | | | 2,709 | | | | | | 30,693 | | | | | | 388,214 | | | | |
| | — | | | | | | — | | | | | | — | | | | | | — | | | | | | 1,339 | | | | | | — | | | | |
| | — | | | | | | — | | | | | | — | | | | | | — | | | | | | — | | | | | | — | | | | |
| | — | | | | | | — | | | | | | — | | | | | | — | | | | | | — | | | | | | — | | | | |
| | 1,751,556 | | | | | | — | | | | | | — | | | | | | 93,419 | | | | | | 138,922 | | | | | | — | | | | |
| | 716,258 | | | | | | 810 | | | | | | 565 | | | | | | 846 | | | | | | 22,349 | | | | | | 707 | | | | |
| | 28,298 | | | | | | 9,009 | | | | | | 11,307 | | | | | | 14,350 | | | | | | 24,615 | | | | | | 18,807 | | | | |
| | 4,330,809 | | | | | | 1,618,812 | | | | | | — | | | | | | 12,117 | | | | | | 92,044 | | | | | | 47,845 | | | | |
| | 24,769 | | | | | | 17,134 | | | | | | 66,708 | | | | | | 12,765 | | | | | | 3,383 | | | | | | 1,881 | | | | |
| | 220,525,605 | | | | | | 72,959,453 | | | | | | 5,093,384 | | | | | | 8,736,704 | | | | | | 30,873,654 | | | | | | 49,980,817 | | | | |
| | | | | | | | | | | | | | | | | | | | | | | | | | | | | | | | | | | |
| | 37,361 | | | | | | 13,117 | | | | | | — | | | | | | — | | | | | | 9 | | | | | | 168 | | | | |
| | — | | | | | | — | | | | | | — | | | | | | — | | | | | | — | | | | | | — | | | | |
| | — | | | | | | — | | | | | | — | | | | | | — | | | | | | — | | | | | | — | | | | |
| | — | | | | | | — | | | | | | — | | | | | | — | | | | | | — | | | | | | — | | | | |
| | 1,374,769 | | | | | | 333,492 | | | | | | — | | | | | | 56,059 | | | | | | 492,162 | | | | | | 681,611 | | | | |
| | — | | | | | | 247,182 | | | | | | — | | | | | | — | | | | | | — | | | | | | — | | | | |
| | 92,102 | | | | | | 40,000 | | | | | | — | | | | | | — | | | | | | 15,650 | | | | | | — | | | | |
| | — | | | | | | 62,701 | | | | | | — | | | | | | — | | | | | | — | | | | | | — | | | | |
| | 203,324 | | | | | | 36,875 | | | | | | — | | | | | | 8,044 | | | | | | 44,208 | | | | | | 60,530 | | | | |
| | 13,031 | | | | | | 1,708 | | | | | | 363 | | | | | | 439 | | | | | | 2,203 | | | | | | 3,720 | | | | |
| | 117,279 | | | | | | 34,584 | | | | | | 26,461 | | | | | | 28,463 | | | | | | 59,559 | | | | | | 44,984 | | | | |
| | 1,837,866 | | | | | | 769,659 | | | | | | 26,824 | | | | | | 93,005 | | | | | | 613,791 | | | | | | 791,013 | | | | |
| $ | 218,687,739 | | | | | $ | 72,189,794 | | | | | $ | 5,066,560 | | | | | $ | 8,643,699 | | | | | $ | 30,259,863 | | | | | $ | 49,189,804 | | | | |
| | | | | | | | | | | | | | | | | | | | | | | | | | | | | | | | | | | |
| $ | 287,501,118 | | | | | $ | 71,623,884 | | | | | $ | 5,108,470 | | | | | $ | 11,640,058 | | | | | $ | 38,686,560 | | | | | $ | 54,383,778 | | | | |
| | (1,005,228 | ) | | | | | 11,233 | | | | | | (126 | ) | | | | | 7,124 | | | | | | (80,571 | ) | | | | | 239,134 | | | | |
| | (41,588,159 | ) | | | | | (809,215 | ) | | | | | — | | | | | | (2,934,464 | ) | | | | | (5,907,934 | ) | | | | | (4,961,747 | ) | | | |
| | (26,219,992 | ) | | | | | 1,363,892 | | | | | | (41,784 | ) | | | | | (69,019 | ) | | | | | (2,438,192 | ) | | | | | (471,361 | ) | | | |
| $ | 218,687,739 | | | | | $ | 72,189,794 | | | | | $ | 5,066,560 | | | | | $ | 8,643,699 | | | | | $ | 30,259,863 | | | | | $ | 49,189,804 | | | | |
| | | | | | | | | | | | | | | | | | | | | | | | | | | | | | | | | | | |
| $ | 8,160,368 | | | | | $ | 353,538 | | | | | $ | 9,972 | | | | | $ | 24,679 | | | | | $ | 454,566 | | | | | $ | 63,815 | | | | |
| | 3,694,581 | | | | | | — | | | | | | 9,941 | | | | | | 858 | | | | | | 342,486 | | | | | | 53,131 | | | | |
| | 206,832,790 | | | | | | 71,836,256 | | | | | | 5,046,647 | | | | | | 8,618,162 | | | | | | 29,462,811 | | | | | | 49,072,858 | | | | |
| | | | | | | | | | | | | | | | | | | | | | | | | | | | | | | | | | | |
| | 1,114,054 | | | | | | 36,183 | | | | | | 1,006 | | | | | | 3,291 | | | | | | 57,665 | | | | | | 8,409 | | | | |
| | 504,733 | | | | | | — | | | | | | 1,005 | | | | | | 102 | | | | | | 41,071 | | | | | | 7,100 | | | | |
| | 27,114,340 | | | | | | 7,481,764 | | | | | | 508,895 | | | | | | 1,190,805 | | | | | | 2,944,842 | | | | | | 5,696,668 | | | | |
| | | | | | | | | | | | | | | | | | | | | | | | | | | | | | | | | | | |
| $ | 7.32 | | | | | $ | 9.77 | | | | | $ | 9.91 | | | | | $ | 7.50 | | | | | $ | 7.88 | | | | | $ | 7.59 | | | | |
| | 7.32 | | | | | | — | | | | | | 9.89 | | | | | | 8.38 | | | | | | 8.34 | | | | | | 7.48 | | | | |
| | 7.63 | | | | | | 9.60 | | | | | | 9.92 | | | | | | 7.24 | | | | | | 10.00 | | | | | | 8.61 | | | | |
$ | 233,608,762 | | | | | $ | 68,774,729 | | | | | $ | 5,024,061 | | | | | $ | 8,596,267 | | | | | $ | 32,383,647 | | | | | $ | 48,458,673 | | | | |
| $ | — | | | | | $ | — | | | | | $ | — | | | | | $ | — | | | | | $ | — | | | | | $ | — | | | | |
| $ | 57,417 | | | | | $ | 18,159 | | | | | $ | — | | | | | $ | 2,656 | | | | | $ | 30,683 | | | | | $ | 232,957 | | | | |
See accompanying notes to the financial statements.
19
ASHMORE FUNDS
STATEMENTS OF OPERATIONS
For the Six Month Period Ended April 30, 2016 (Unaudited)
| | | | | | | | | | | | | | | | | | |
| | | | | Ashmore
Emerging Markets Total Return Fund | | | | | Ashmore
Emerging
Markets Hard Currency
Debt Fund | | | | | Ashmore
Emerging
Markets Local Currency
Bond Fund | |
INVESTMENT INCOME: | | | | | | | | | | | | | | | | | | |
Interest, net of foreign tax withholdings* | | | | $ | 24,070,638 | | | | | $ | 218,407 | | | | | $ | 2,130,766 | |
Dividends, net of foreign tax withholdings* | | | | | — | | | | | | — | | | | | | — | |
Total Income | | | | | 24,070,638 | | | | | | 218,407 | | | | | | 2,130,766 | |
EXPENSES: | | | | | | | | | | | | | | | | | | |
Investment Manager fees | | | | | 2,623,127 | | | | | | 25,202 | | | | | | 356,253 | |
Administration fees | | | | | 52,451 | | | | | | 560 | | | | | | 7,498 | |
Custody fees | | | | | 125,679 | | | | | | 1,601 | | | | | | 40,903 | |
Professional fees | | | | | 153,574 | | | | | | 14,955 | | | | | | 31,888 | |
Trustees’ fees | | | | | 57,082 | | | | | | 566 | | | | | | 8,027 | |
Offering expenses and registration fees | | | | | 27,499 | | | | | | 24,791 | | | | | | 24,839 | |
Insurance fees | | | | | 21,814 | | | | | | 163 | | | | | | 2,692 | |
Printing fees | | | | | 5,706 | | | | | | 5,703 | | | | | | 5,708 | |
Distribution fees - Class A | | | | | 3,316 | | | | | | 25 | | | | | | 873 | |
Distribution fees - Class C | | | | | 2,559 | | | | | | 27 | | | | | | 199 | |
Other | | | | | 15,895 | | | | | | 3,392 | | | | | | 7,284 | |
Total Expenses | | | | | 3,088,702 | | | | | | 76,985 | | | | | | 486,164 | |
Less expenses reimbursed by the Investment Manager | | | | | (407,344 | ) | | | | | (51,169 | ) | | | | | (121,670 | ) |
Net Expenses | | | | | 2,681,358 | | | | | | 25,816 | | | | | | 364,494 | |
Net Investment Income | | | | | 21,389,280 | | | | | | 192,591 | | | | | | 1,766,272 | |
NET REALIZED AND UNREALIZED GAINS (LOSSES): | | | | | | | | | | | | | | | | | | |
NET REALIZED GAIN (LOSS) ON: | | | | | | | | | | | | | | | | | | |
Investments in securities | | | | | (37,788,310 | ) | | | | | (147,860 | ) | | | | | (6,612,845 | ) |
Forward foreign currency exchange contracts | | | | | 6,287,516 | | | | | | (332 | ) | | | | | 1,113,484 | |
Currency swap contracts | | | | | 1,241 | | | | | | — | | | | | | — | |
Interest rate swap contracts | | | | | 13,449 | | | | | | — | | | | | | (146,968 | ) |
Foreign exchange transactions | | | | | (3,217,091 | ) | | | | | (30 | ) | | | | | 96,339 | |
Net Realized Gain (Loss) | | | | | (34,703,195 | ) | | | | | (148,222 | ) | | | | | (5,549,990 | ) |
NET CHANGE IN UNREALIZED APPRECIATION (DEPRECIATION) ON: | | | | | | | | | | | | | | | | | | |
Investments in securities | | | | | 42,208,769 | | | | | | 246,223 | | | | | | 8,940,335 | |
Forward foreign currency exchange contracts | | | | | 3,731,033 | | | | | | 53 | | | | | | 288,890 | |
Investments in fully funded total return swaps | | | | | 549,017 | | | | | | — | | | | | | 402,579 | |
Currency swap contracts | | | | | (69,058 | ) | | | | | — | | | | | | — | |
Interest rate and centrally cleared swap contracts | | | | | 1,560,354 | | | | | | — | | | | | | 925,731 | |
Foreign exchange translations | | | | | 134,242 | | | | | | 61 | | | | | | 130,151 | |
Change in Net Unrealized Appreciation (Depreciation) | | | | | 48,114,357 | | | | | | 246,337 | | | | | | 10,687,686 | |
Net Realized and Unrealized Gains (Losses) | | | | | 13,411,162 | | | | | | 98,115 | | | | | | 5,137,696 | |
Net Increase (Decrease) in Net Assets Resulting from Operations | | | | $ | 34,800,442 | | | | | $ | 290,706 | | | | | $ | 6,903,968 | |
* Foreign Tax Withholdings | | | | $ | 76,214 | | | | | $ | 164 | | | | | $ | 32,043 | |
See accompanying notes to the financial statements.
20
| | | | | | | | | | | | | | | | | | | | | | | | | | | | | | | | | | | | |
Ashmore
Emerging Markets Corporate Debt
Fund | | Ashmore Emerging Markets
Short Duration Fund | | Ashmore Emerging Markets Equity Opportunities Fund | | Ashmore Emerging Markets Value Fund | | Ashmore
Emerging Markets
Small-Cap Equity Fund | | Ashmore Emerging Markets Frontier Equity Fund | | |
| | | | | | | | | | | | | | | | | | | | | | | | | | | | | | | | | | | |
| $ | 12,261,243 | | | | | $ | 2,000,488 | | | | | $ | — | | | | | $ | — | | | | | $ | — | | | | | $ | — | | | | |
| | — | | | | | | — | | | | | | 38,274 | | | | | | 56,368 | | | | | | 270,884 | | | | | | 1,200,444 | | | | |
| | 12,261,243 | | | | | | 2,000,488 | | | | | | 38,274 | | | | | | 56,368 | | | | | | 270,884 | | | | | | 1,200,444 | | | | |
| | | | | | | | | | | | | | | | | | | | | | | | | | | | | | | | | | | |
| | 1,282,863 | | | | | | 113,594 | | | | | | — | | | | | | 48,057 | | | | | | 320,988 | | | | | | 363,925 | | | | |
| | 22,308 | | | | | | 3,495 | | | | | | 412 | | | | | | 836 | | | | | | 4,283 | | | | | | 4,854 | | | | |
| | 30,459 | | | | | | 3,209 | | | | | | 111 | | | | | | 11,643 | | | | | | 45,890 | | | | | | 47,249 | | | | |
| | 72,532 | | | | | | 19,261 | | | | | | 8,525 | | | | | | 14,531 | | | | | | 23,374 | | | | | | 24,219 | | | | |
| | 24,755 | | | | | | 2,813 | | | | | | 612 | | | | | | 846 | | | | | | 4,872 | | | | | | 4,680 | | | | |
| | 29,872 | | | | | | 24,851 | | | | | | 49,242 | | | | | | 24,888 | | | | | | 25,180 | | | | | | 25,504 | | | | |
| | 7,959 | | | | | | 769 | | | | | | 3,398 | | | | | | 266 | | | | | | 1,344 | | | | | | 808 | | | | |
| | 5,722 | | | | | | 5,313 | | | | | | 5,319 | | | | | | 5,315 | | | | | | 5,388 | | | | | | 5,505 | | | | |
| | 8,719 | | | | | | 492 | | | | | | 10 | | | | | | 28 | | | | | | 409 | | | | | | 61 | | | | |
| | 16,223 | | | | | | — | | | | | | 41 | | | | | | 4 | | | | | | 1,575 | | | | | | 255 | | | | |
| | 6,953 | | | | | | 2,750 | | | | | | 2,507 | | | | | | 4,224 | | | | | | 5,163 | | | | | | 4,047 | | | | |
| | 1,508,365 | | | | | | 176,547 | | | | | | 70,177 | | | | | | 110,638 | | | | | | 438,466 | | | | | | 481,107 | | | | |
| | (178,188 | ) | | | | | (58,966 | ) | | | | | (69,096 | ) | | | | | (61,726 | ) | | | | | (111,010 | ) | | | | | (109,823 | ) | | | |
| | 1,330,177 | | | | | | 117,581 | | | | | | 1,081 | | | | | | 48,912 | | | | | | 327,456 | | | | | | 371,284 | | | | |
| | 10,931,066 | | | | | | 1,882,907 | | | | | | 37,193 | | | | | | 7,456 | | | | | | (56,572 | ) | | | | | 829,160 | | | | |
| | | | | | | | | | | | | | | | | | | | | | | | | | | | | | | | | | | |
| | | | | | | | | | | | | | | | | | | | | | | | | | | | | | | | | | | |
| | (24,148,506 | ) | | | | | (727,635 | ) | | | | | — | | | | | | (1,044,469 | ) | | | | | (2,304,960 | ) | | | | | (3,894,534 | ) | | | |
| | (157,566 | ) | | | | | 2,884 | | | | | | — | | | | | | — | | | | | | — | | | | | | (3,871 | ) | | | |
| | — | | | | | | — | | | | | | — | | | | | | — | | | | | | — | | | | | | — | | | | |
| | — | | | | | | — | | | | | | — | | | | | | — | | | | | | — | | | | | | — | | | | |
| | 618,959 | | | | | | (19,028 | ) | | | | | — | | | | | | (493 | ) | | | | | 11,196 | | | | | | (87,332 | ) | | | |
| | (23,687,113 | ) | | | | | (743,779 | ) | | | | | — | | | | | | (1,044,962 | ) | | | | | (2,293,764 | ) | | | | | (3,985,737 | ) | | | |
| | | | | | | | | | | | | | | | | | | | | | | | | | | | | | | | | | | |
| | 12,304,205 | | | | | | 2,690,794 | | | | | | (41,784 | ) | | | | | 1,183,919 | | | | | | 2,310,003 | | | | | | 2,210,786 | | | | |
| | (278,763 | ) | | | | | (13,117 | ) | | | | | — | | | | | | — | | | | | | 1,330 | | | | | | — | | | | |
| | — | | | | | | — | | | | | | — | | | | | | — | | | | | | — | | | | | | — | | | | |
| | — | | | | | | — | | | | | | — | | | | | | — | | | | | | — | | | | | | — | | | | |
| | — | | | | | | — | | | | | | — | | | | | | — | | | | | | — | | | | | | — | | | | |
| | 19,769 | | | | | | 1,024 | | | | | | — | | | | | | 75 | | | | | | (1,801 | ) | | | | | 1,269 | | | | |
| | 12,045,211 | | | | | | 2,678,701 | | | | | | (41,784 | ) | | | | | 1,183,994 | | | | | | 2,309,532 | | | | | | 2,212,055 | | | | |
| | (11,641,902 | ) | | | | | 1,934,922 | | | | | | (41,784 | ) | | | | | 139,032 | | | | | | 15,768 | | | | | | (1,773,682 | ) | | | |
| $ | (710,836 | ) | | | | $ | 3,817,829 | | | | | $ | (4,591 | ) | | | | $ | 146,488 | | | | | $ | (40,804 | ) | | | | $ | (944,522 | ) | | | |
| $ | 1,036 | | | | | $ | 1,693 | | | | | $ | — | | | | | $ | 5,853 | | | | | $ | 22,504 | | | | | $ | 100,181 | | | | |
See accompanying notes to the financial statements.
21
ASHMORE FUNDS
STATEMENTS OF CHANGES IN NET ASSETS
For the Six Month Period Ended April 30, 2016 (Unaudited) and the Fiscal Year Ended October 31, 2015
| | | | | | | | | | | | | | | | | | | | | | | | | | |
| | | | | Ashmore Emerging Markets Total Return Fund | | | Ashmore Emerging Markets Hard Currency Debt Fund1 | | | Ashmore Emerging Markets Local Currency Bond Fund | |
| | | | | 2016 | | | 2015 | | | 2016 | | | 2015 | | | 2016 | | | 2015 | |
OPERATIONS: | | | | | | | | | | | | | | | | | | | | | | | | | | |
Net investment income (loss) | | | | $ | 21,389,280 | | | $ | 49,143,640 | | | $ | 192,591 | | | $ | 334,346 | | | $ | 1,766,272 | | | $ | 3,583,104 | |
Net realized gain (loss) | | | | | (34,703,195 | ) | | | (110,394,761 | ) | | | (148,222 | ) | | | (129,709 | ) | | | (5,549,990 | ) | | | (14,531,913 | ) |
Net change in unrealized appreciation (depreciation) | | | | | 48,114,357 | | | | (14,430,563 | ) | | | 246,337 | | | | (265,977 | ) | | | 10,687,686 | | | | (8,389,207 | ) |
Net Increase (Decrease) in Net Assets Resulting from Operations | | | | | 34,800,442 | | | | (75,681,684 | ) | | | 290,706 | | | | (61,340 | ) | | | 6,903,968 | | | | (19,338,016 | ) |
| | | | | | | |
DISTRIBUTIONS TO CLASS A SHAREHOLDERS: | | | | | | | | | | | | | | | | | | | | | | | | | | |
From net investment income | | | | | (104,400 | ) | | | — | | | | (761 | ) | | | (356 | ) | | | (15,707 | ) | | | — | |
From net realized gain | | | | | — | | | | — | | | | — | | | | — | | | | — | | | | — | |
Tax return of capital | | | | | — | | | | (212,099 | ) | | | — | | | | (37 | ) | | | — | | | | (29,458 | ) |
| | | | | | | | | | | | | | | | | | | | | | | | | | |
Total Distributions to Class A Shareholders | | | | | (104,400 | ) | | | (212,099 | ) | | | (761 | ) | | | (393 | ) | | | (15,707 | ) | | | (29,458 | ) |
| | | | | | | |
DISTRIBUTIONS TO CLASS C SHAREHOLDERS: | | | | | | | | | | | | | | | | | | | | | | | | | | |
From net investment income | | | | | (18,348 | ) | | | — | | | | (154 | ) | | | (48 | ) | | | (764 | ) | | | — | |
From net realized gain | | | | | — | | | | — | | | | — | | | | — | | | | — | | | | — | |
Tax return of capital | | | | | — | | | | (33,394 | ) | | | — | | | | (12 | ) | | | — | | | | (2,295 | ) |
| | | | | | | | | | | | | | | | | | | | | | | | | | |
Total Distributions to Class C Shareholders | | | | | (18,348 | ) | | | (33,394 | ) | | | (154 | ) | | | (60 | ) | | | (764 | ) | | | (2,295 | ) |
| | | | | | | |
DISTRIBUTIONS TO INSTITUTIONAL CLASS SHAREHOLDERS: | | | | | | | | | | | | | | | | | | | | | | | | | | |
From net investment income | | | | | (21,193,551 | ) | | | — | | | | (184,352 | ) | | | (263,319 | ) | | | (1,755,491 | ) | | | — | |
From net realized gain | | | | | — | | | | — | | | | — | | | | — | | | | — | | | | — | |
Tax return of capital | | | | | — | | | | (48,542,322 | ) | | | — | | | | (69,250 | ) | | | — | | | | (3,490,233 | ) |
| | | | | | | | | | | | | | | | | | | | | | | | | | |
Total Distributions to Institutional Class Shareholders | | | | | (21,193,551 | ) | | | (48,542,322 | ) | | | (184,352 | ) | | | (332,569 | ) | | | (1,755,491 | ) | | | (3,490,233 | ) |
FUND SHARE TRANSACTIONS: | | | | | | | | | | | | | | | | | | | | | | | | | | |
Net increase (decrease) in net assets resulting from Class A share transactions | | | | | 71,897 | | | | (4,565,169 | ) | | | 110,533 | | | | (33,736 | ) | | | 4,605 | | | | 15,061 | |
Net increase (decrease) in net assets resulting from Class C share transactions | | | | | 77,924 | | | | (453,745 | ) | | | 1,769 | | | | 59 | | | | 25,533 | | | | (87,947 | ) |
Net increase (decrease) in net assets resulting from Institutional Class share transactions | | | | | 541,664 | | | | (322,702,928 | ) | | | 1,074,227 | | | | 307,396 | | | | (10,937,306 | ) | | | 769,959 | |
| | | | | | | | | | | | | | | | | | | | | | | | | | |
Net Increase (Decrease) in Net Assets Resulting from Fund Share Transactions | | | | | 691,485 | | | | (327,721,842 | ) | | | 1,186,529 | | | | 273,719 | | | | (10,907,168 | ) | | | 697,073 | |
Total Increase (Decrease) in Net Assets | | | | | 14,175,628 | | | | (452,191,341 | ) | | | 1,291,968 | | | | (120,643 | ) | | | (5,775,162 | ) | | | (22,162,929 | ) |
NET ASSETS: | | | | | | | | | | | | | | | | | | | | | | | | | | |
Net Assets at the Beginning of the Period | | | | | 537,136,135 | | | | 989,327,476 | | | | 5,491,696 | | | | 5,612,339 | | | | 80,243,918 | | | | 102,406,847 | |
Net Assets at the End of the Period | | | | $ | 551,311,763 | | | $ | 537,136,135 | | | $ | 6,783,664 | | | $ | 5,491,696 | | | $ | 74,468,756 | | | $ | 80,243,918 | |
Undistributed (Distributions in Excess of) Net Investment Income (Loss) | | | | $ | (13,325,617 | ) | | $ | (13,398,598 | ) | | $ | (4,264 | ) | | $ | (11,588 | ) | | $ | (7,801,962 | ) | | $ | (7,796,272 | ) |
See accompanying notes to the financial statements.
22
| | | | | | | | | | | | | | | | | | | | | | | | | | | | | | |
| | | Ashmore Emerging Markets Corporate Debt Fund | | | Ashmore Emerging Markets Short Duration Fund | | | Ashmore Emerging Markets
Equity Opportunities Fund2 | | | Ashmore Emerging Markets Value Fund3 | | | |
| | | 2016 | | | 2015 | | | 2016 | | | 2015 | | | 2016 | | | 2016 | | | 2015 | | |
| | | | | | | | | | | | | | | | | | | | | | | | | | | | | |
| | | $ 10,931,066 | | | $ | 24,546,377 | | | $ | 1,882,907 | | | $ | 1,914,528 | | | | $ 37,193 | | | $ | 7,456 | | | $ | 47,726 | | |
| | | (23,687,113 | ) | | | (20,223,394 | ) | | | (743,779 | ) | | | (62,733 | ) | | | — | | | | (1,044,962 | ) | | | (752,570 | ) | |
| | | 12,045,211 | | | | (21,723,064 | ) | | | 2,678,701 | | | | (971,004 | ) | | | (41,784) | | | | 1,183,994 | | | | (1,229,809 | ) | |
| |
|
(710,836 |
) | | | (17,400,081 | ) | | | 3,817,829 | | | | 880,791 | | | | (4,591) | | | | 146,488 | | | | (1,934,653 | ) | |
| | | | | | | | | | | | | | | | | | | | | | | | | | | | | |
| | | (348,077 | ) | | | (372,250 | ) | | | (19,460 | ) | | | (19,616 | ) | | | (72) | | | | — | | | | (183 | ) | |
| | | — | | | | (18,884 | ) | | | — | | | | — | | | | — | | | | — | | | | — | | |
| | | — | | | | (69,976 | ) | | | — | | | | (310 | ) | | | — | | | | — | | | | (9 | ) | |
| | | | | | | | | | | | | | | | | | | | | | | | | | | | | |
| | | (348,077 | ) | | | (461,110 | ) | | | (19,460 | ) | | | (19,926 | ) | | | (72) | | | | — | | | | (192 | ) | |
| | | | | | | | | | | | | | | | | | | | | | | | | | | | | |
| | | (150,116 | ) | | | (121,913 | ) | | | — | | | | — | | | | (60) | | | | — | | | | (6 | ) | |
| | | — | | | | (3,404 | ) | | | — | | | | — | | | | — | | | | — | | | | — | | |
| | | — | | | | (28,429 | ) | | | — | | | | — | | | | — | | | | — | | | | — | | |
| | | | | | | | | | | | | | | | | | | | | | | | | | | | | |
| | | (150,116 | ) | | | (153,746 | ) | | | — | | | | — | | | | (60) | | | | — | | | | (6 | ) | |
| | | | | | | | | | | | | | | | | | | | | | | | | | | | | |
| | | (10,885,292 | ) | | | (23,014,251 | ) | | | (1,829,457 | ) | | | (1,902,761 | ) | | | (37,187) | | | | — | | | | (59,909 | ) | |
| | | — | | | | (1,963,846 | ) | | | — | | | | — | | | | — | | | | — | | | | — | | |
| | | — | | | | (2,370,968 | ) | | | — | | | | (20,794 | ) | | | — | | | | — | | | | (2,811 | ) | |
| | | | | | | | | | | | | | | | | | | | | | | | | | | | | |
| | | (10,885,292 | ) | | | (27,349,065 | ) | | | (1,829,457 | ) | | | (1,923,555 | ) | | | (37,187) | | | | — | | | | (62,720 | ) | |
| | | | | | | | | | | | | | | | | | | | | | | | | | | | | |
| |
|
1,156,771 |
| | | 6,391,685 | | | | (79,366 | ) | | | 232,701 | | | | 10,061 | | | | — | | | | 694 | | |
| |
|
605,529 |
| | | 3,075,145 | | | | — | | | | — | | | | 10,051 | | | | — | | | | 4 | | |
| |
|
(18,530,022 |
) | | | (83,452,584 | ) | | | 42,956,891 | | | | 6,697,940 | | | | 5,088,358 | | | | 871,491 | | | | (712,536 | ) | |
| | | | | | | | | | | | | | | | | | | | | | | | | | | | | |
| | | (16,767,722 | ) | | | (73,985,754 | ) | | | 42,877,525 | | | | 6,930,641 | | | | 5,108,470 | | | | 871,491 | | | | (711,838 | ) | |
| | | (28,862,043 | ) | | | (119,349,756 | ) | | | 44,846,437 | | | | 5,867,951 | | | | 5,066,560 | | | | 1,017,979 | | | | (2,709,409 | ) | |
| | | | | | | | | | | | | | | | | | | | | | | | | | | | | |
| | | 247,549,782 | | | | 366,899,538 | | | | 27,343,357 | | | | 21,475,406 | | | | — | | | | 7,625,720 | | | | 10,335,129 | | |
| | | $218,687,739 | | | $ | 247,549,782 | | | $ | 72,189,794 | | | $ | 27,343,357 | | | | $5,066,560 | | | $ | 8,643,699 | | | $ | 7,625,720 | | |
| |
|
$ (1,005,228 |
) | | $ | (552,809 | ) | | $ | 11,233 | | | $ | (22,757 | ) | | | $ (126) | | | $ | 7,124 | | | $ | (332 | ) | | |
See accompanying notes to the financial statements.
23
ASHMORE FUNDS
STATEMENTS OF CHANGES IN NET ASSETS
For the Six Month Period Ended April 30, 2016 (Unaudited) and the Fiscal Year Ended October 31, 2015
| | | | | | | | | | | | | | | | |
| | | Ashmore Emerging Markets Small-Cap Equity Fund | | | Ashmore Emerging Markets Frontier Equity Fund | |
| | | | |
| | | 2016 | | | 2015 | | | 2016 | | | 2015 | |
| | | | |
OPERATIONS: | | | | | | | | | | | | | | | | |
| | | | |
Net investment income (loss) | | $ | (56,572 | ) | | $ | 866,525 | | | $ | 829,160 | | | $ | 332,020 | |
| | | | |
Net realized gain (loss) | | | (2,293,764 | ) | | | (3,605,071 | ) | | | (3,985,737 | ) | | | (1,003,655 | ) |
| | | | |
Net change in unrealized appreciation (depreciation) | | | 2,309,532 | | | | (3,867,028 | ) | | | 2,212,055 | | | | (2,795,438 | ) |
| | | | |
Net Increase (Decrease) in Net Assets Resulting from Operations | | | (40,804 | ) | | | (6,605,574 | ) | | | (944,522 | ) | | | (3,467,073 | ) |
| | | | |
DISTRIBUTIONS TO CLASS A SHAREHOLDERS: | | | | | | | | | | | | | | | | |
| | | | |
From net investment income | | | (3,800 | ) | | | (2,670 | ) | | | (621 | ) | | | (1,940 | ) |
| | | | |
From net realized gain | | | — | | | | (13,879 | ) | | | — | | | | (13,570 | ) |
| | | | | | | | | | | | | | | | |
| | | | |
Total Distributions to Class A Shareholders | | | (3,800 | ) | | | (16,549 | ) | | | (621 | ) | | | (15,510 | ) |
| | | | |
DISTRIBUTIONS TO CLASS C SHAREHOLDERS: | | | | | | | | | | | | | | | | |
| | | | |
From net investment income | | | (4,330 | ) | | | (2,447 | ) | | | (435 | ) | | | (76 | ) |
| | | | |
From net realized gain | | | — | | | | (3,134 | ) | | | — | | | | (86 | ) |
| | | | | | | | | | | | | | | | |
| | | | |
Total Distributions to Class C Shareholders | | | (4,330 | ) | | | (5,581 | ) | | | (435 | ) | | | (162 | ) |
| | | | |
DISTRIBUTIONS TO INSTITUTIONAL CLASS SHAREHOLDERS: | | | | | | | | | | | | | | | | |
| | | | |
From net investment income | | | (552,735 | ) | | | (351,773 | ) | | | (570,918 | ) | | | (281,333 | ) |
| | | | |
From net realized gain | | | — | | | | (1,629,523 | ) | | | — | | | | (778,573 | ) |
| | | | | | | | | | | | | | | | |
| | | | |
Total Distributions to Institutional Class Shareholders | | | (552,735 | ) | | | (1,981,296 | ) | | | (570,918 | ) | | | (1,059,906 | ) |
| | | | |
FUND SHARE TRANSACTIONS: | | | | | | | | | | | | | | | | |
| | | | |
Net increase (decrease) in net assets resulting from Class A share transactions | | | 178,070 | | | | 2,267 | | | | 20,166 | | | | 49,816 | |
| | | | |
Net increase (decrease) in net assets resulting from Class C share transactions | | | 28,955 | | | | 288,746 | | | | 1,336 | | | | 55,144 | |
| | | | |
Net increase (decrease) in net assets resulting from Institutional Class share transactions | | | (12,401,334 | ) | | | 2,055,975 | | | | 634,720 | | | | 47,197,318 | |
| | | | | | | | | | | | | | | | |
| | | | |
Net Increase (Decrease) in Net Assets Resulting from Fund Share Transactions | | | (12,194,309 | ) | | | 2,346,988 | | | | 656,222 | | | | 47,302,278 | |
| | | | |
Net Increase (Decrease) in Net Assets | | | (12,795,978 | ) | | | (6,262,012 | ) | | | (860,274 | ) | | | 42,759,627 | |
| | | | |
NET ASSETS: | | | | | | | | | | | | | | | | |
| | | | |
Net Assets at the Beginning of the Period | | | 43,055,841 | | | | 49,317,853 | | | | 50,050,078 | | | | 7,290,451 | |
| | | | |
Net Assets at the End of the Period | | $ | 30,259,863 | | | $ | 43,055,841 | | | $ | 49,189,804 | | | $ | 50,050,078 | |
| | | | |
Undistributed (Distributions in Excess of) Net Investment Income (Loss) | | $ | (80,571 | ) | | $ | 536,866 | | | $ | 239,134 | | | $ | (18,052 | ) |
| 1 | Formerly the Ashmore Emerging Markets Debt Fund. |
| 2 | The Fund commenced investment operations on November 23, 2015. |
| 3 | Formerly the Ashmore Emerging Markets Equity Fund. |
See accompanying notes to the financial statements.
24
ASHMORE FUNDS
FINANCIAL HIGHLIGHTS
| | | | | | | | | | | | | | | | | | | | | | | | |
Ashmore Emerging Markets Total Return Fund | |
| | | Class A | |
| | | Six Months
Ended
April 30, 2016
(Unaudited) | | | Year Ended
October 31,
2015 | | | Year Ended
October 31,
2014 | | | Year Ended
October 31,
2013 | | | Year Ended
October 31,
2012 | | | Period
Ended
October 31,
20111 | |
| | | | |
| | | | | | |
Net asset value at beginning of period | | | $ 7.49 | | | | $ 8.75 | | | | $ 9.30 | | | | $ 10.05 | | | | $ 9.37 | | | | $10.00 | |
| | | | | | |
Income (loss) from investment operations: | | | | | | | | | | | | | | | | | | | | | | | | |
Net investment income (loss) | | | 0.29 | | | | 0.48 | 2 | | | 0.44 | | | | 0.41 | | | | 0.43 | 2 | | | 0.22 | 2 |
Net realized and unrealized gain (loss) | | | 0.19 | | | | (1.24 | ) | | | (0.42 | ) | | | (0.57 | ) | | | 0.68 | | | | (0.66 | ) |
| | | | | | | | | | | | | | | | | | | | | | | | |
Total from investment operations | | | 0.48 | | | | (0.76 | ) | | | 0.02 | | | | (0.16 | ) | | | 1.11 | | | | (0.44 | ) |
| | | | | | |
Less distributions: | | | | | | | | | | | | | | | | | | | | | | | | |
| | | | | | |
From net investment income | | | (0.29 | ) | | | — | | | | (0.33 | ) | | | (0.43 | ) | | | (0.43 | ) | | | (0.09 | ) |
From net realized gain | | | — | | | | — | | | | (0.12 | ) | | | (0.16 | ) | | | — | | | | — | |
Tax return of capital | | | — | | | | (0.50 | ) | | | (0.12 | ) | | | — | | | | — | | | | (0.10 | ) |
| | | | | | | | | | | | | | | | | | | | | | | | |
| | | | | | |
Total distributions | | | (0.29 | ) | | | (0.50 | ) | | | (0.57 | ) | | | (0.59 | ) | | | (0.43 | ) | | | (0.19 | ) |
| | | | | | | | | | | | | | | | | | | | | | | | |
Net asset value at end of period | | | $ 7.68 | | | | $ 7.49 | | | | $ 8.75 | | | | $ 9.30 | | | | $10.05 | | | | $ 9.37 | |
| | | | | | | | | | | | | | | | | | | | | | | | |
| | | | | | |
Total return3 | | | 6.63 | % | | | (8.78 | %) | | | 0.17 | % | | | (1.70 | %) | | | 12.20 | % | | | (4.40 | %) |
| | | | | | |
Portfolio turnover rate4 | | | 46 | % | | | 101 | % | | | 80 | % | | | 85 | % | | | 83 | % | | | 39 | % |
| | | | | | |
Net assets, end of period (in thousands) | | | $3,029 | | | | $2,951 | | | | $8,351 | | | | $10,344 | | | | $3,263 | | | | $ 509 | |
| | | | | | |
Ratios to average net assets:5 | | | | | | | | | | | | | | | | | | | | | | | | |
Total expenses to average net assets: | | | | | | | | | | | | | | | | | | | | | | | | |
Total expenses before reimbursements | | | 1.43 | % | | | 1.37 | % | | | 1.38 | % | | | 1.38 | % | | | 1.48 | % | | | 1.75 | % |
Total expenses after reimbursements | | | 1.27 | % | | | 1.29 | % | | | 1.30 | % | | | 1.30 | % | | | 1.30 | % | | | 1.30 | % |
| | | | | | |
Net investment income to average net assets: | | | | | | | | | | | | | | | | | | | | | | | | |
Net investment income before reimbursements | | | 7.72 | % | | | 5.91 | % | | | 4.79 | % | | | 4.55 | % | | | 3.99 | % | | | 4.21 | % |
Net investment income after reimbursements | | | 7.88 | % | | | 5.99 | % | | | 4.87 | % | | | 4.63 | % | | | 4.17 | % | | | 4.66 | % |
See accompanying notes to the financial statements.
25
ASHMORE FUNDS
FINANCIAL HIGHLIGHTS
| | | | | | | | | | | | | | | | | | | | | | | | |
Ashmore Emerging Markets Total Return Fund | | | | | | | | | | | | | | | | | | |
| | | Class C | |
| | | Six Months
Ended
April 30, 2016
(Unaudited) | | | Year Ended
October 31,
2015 | | | Year Ended
October 31,
2014 | | | Year Ended
October 31,
2013 | | | Year Ended
October 31,
2012 | | | Period Ended
October 31,
20111 | |
| | | | |
| | | | | | |
Net asset value at beginning of period | | | $ 7.48 | | | | $ 8.74 | | | | $ 9.29 | | | | $10.05 | | | | $ 9.36 | | | | $10.00 | |
| | | | | | |
Income (loss) from investment operations: | | | | | | | | | | | | | | | | | | | | | | | | |
Net investment income (loss) | | | 0.29 | | | | 0.44 | 2 | | | 0.37 | | | | 0.33 | | | | 0.39 | 2 | | | 0.19 | 2 |
Net realized and unrealized gain (loss) | | | 0.16 | | | | (1.26 | ) | | | (0.42 | ) | | | (0.57 | ) | | | 0.66 | | | | (0.66 | ) |
| | | | | | | | | | | | | | | | | | | | | | | | |
| | | | | | |
Total from investment operations | | | 0.45 | | | | (0.82 | ) | | | (0.05 | ) | | | (0.24 | ) | | | 1.05 | | | | (0.47 | ) |
| | | | | | |
Less distributions: | | | | | | | | | | | | | | | | | | | | | | | | |
| | | | | | |
From net investment income | | | (0.26 | ) | | | — | | | | (0.28 | ) | | | (0.36 | ) | | | (0.36 | ) | | | (0.08 | ) |
From net realized gain | | | — | | | | — | | | | (0.12 | ) | | | (0.16 | ) | | | — | | | | — | |
Tax return of capital | | | — | | | | (0.44 | ) | | | (0.10 | ) | | | — | | | | — | | | | (0.09 | ) |
| | | | | | | | | | | | | | | | | | | | | | | | |
| | | | | | |
Total distributions | | | (0.26 | ) | | | (0.44 | ) | | | (0.50 | ) | | | (0.52 | ) | | | (0.36 | ) | | | (0.17 | ) |
| | | | | | | | | | | | | | | | | | | | | | | | |
| | | | | | |
Net asset value at end of period | | | $ 7.67 | | | | $ 7.48 | | | | $ 8.74 | | | | $ 9.29 | | | | $10.05 | | | | $ 9.36 | |
| | | | | | | | | | | | | | | | | | | | | | | | |
| | | | | | |
Total return3 | | | 6.25 | % | | | (9.58 | %) | | | (0.45 | %) | | | (2.44 | %) | | | 11.42 | % | | | (4.79 | %) |
| | | | | | |
Portfolio turnover rate4 | | | 46 | % | | | 101 | % | | | 80 | % | | | 85 | % | | | 83 | % | | | 39 | % |
| | | | | | |
Net assets, end of period (in thousands) | | | $ 533 | | | | $ 443 | | | | $1,028 | | | | $ 969 | | | | $ 541 | | | | $ 1 | |
| | | | | | |
Ratios to average net assets:5 | | | | | | | | | | | | | | | | | | | | | | | | |
Total expenses to average net assets: | | | | | | | | | | | | | | | | | | | | | | | | |
Total expenses before reimbursements | | | 2.18 | % | | | 2.12 | % | | | 2.13 | % | | | 2.13 | % | | | 2.21 | % | | | 2.82 | % |
Total expenses after reimbursements | | | 2.02 | % | | | 2.03 | % | | | 2.05 | % | | | 2.05 | % | | | 2.05 | % | | | 2.05 | % |
| | | | | | |
Net investment income to average net assets: | | | | | | | | | | | | | | | | | | | | | | | | |
Net investment income before reimbursements | | | 7.01 | % | | | 5.35 | % | | | 4.04 | % | | | 3.83 | % | | | 2.62 | % | | | 3.32 | % |
Net investment income after reimbursements | | | 7.17 | % | | | 5.44 | % | | | 4.12 | % | | | 3.91 | % | | | 2.78 | % | | | 4.09 | % |
See accompanying notes to the financial statements.
26
ASHMORE FUNDS
FINANCIAL HIGHLIGHTS
| | | | | | | | | | | | | | | | | | | | | | | | |
Ashmore Emerging Markets Total Return Fund | | | | | | | | | | | | | | | | | | |
| | | Institutional Class | |
| | | Six Months
Ended
April 30, 2016
(Unaudited) | | | Year Ended
October 31,
2015 | | | Year Ended
October 31,
2014 | | | Year Ended
October 31,
2013 | | | Year Ended
October 31,
2012 | | | Period
Ended
October 31,
20116 | |
| | | | |
| | | | | | |
Net asset value at beginning of period | | | $ 7.60 | | | | $ 8.88 | | | | $ 9.43 | | | | $ 10.20 | | | | $ 9.50 | | | | $ 10.00 | |
| | | | | | |
Income (loss) from investment operations: | | | | | | | | | | | | | | | | | | | | | | | | |
Net investment income (loss) | | | 0.30 | | | | 0.53 | 2 | | | 0.46 | | | | 0.45 | | | | 0.44 | 2 | | | 0.46 | 2 |
Net realized and unrealized gain (loss) | | | 0.19 | | | | (1.28 | ) | | | (0.41 | ) | | | (0.60 | ) | | | 0.72 | | | | (0.34 | ) |
| | | | | | | | | | | | | | | | | | | | | | | | |
| | | | | | |
Total from investment operations | | | 0.49 | | | | (0.75 | ) | | | 0.05 | | | | (0.15 | ) | | | 1.16 | | | | 0.12 | |
| | | | | | |
Less distributions: | | | | | | | | | | | | | | | | | | | | | | | | |
| | | | | | |
From net investment income | | | (0.30 | ) | | | — | | | | (0.35 | ) | | | (0.46 | ) | | | (0.46 | ) | | | (0.29 | ) |
From net realized gain | | | — | | | | — | | | | (0.12 | ) | | | (0.16 | ) | | | — | | | | — | |
Tax return of capital | | | — | | | | (0.53 | ) | | | (0.13 | ) | | | — | | | | — | | | | (0.33 | ) |
| | | | | | | | | | | | | | | | | | | | | | | | |
| | | | | | |
Total distributions | | | (0.30 | ) | | | (0.53 | ) | | | (0.60 | ) | | | (0.62 | ) | | | (0.46 | ) | | | (0.62 | ) |
| | | | | | | | | | | | | | | | | | | | | | | | |
| | | | | | |
Net asset value at end of period | | | $ 7.79 | | | | $ 7.60 | | | | $ 8.88 | | | | $ 9.43 | | | | $ 10.20 | | | | $ 9.50 | |
| | | | | | | | | | | | | | | | | | | | | | | | |
| | | | | | |
Total return3 | | | 6.72 | % | | | (8.58 | %) | | | 0.51 | % | | | (1.48 | %) | | | 12.50 | % | | | 1.11 | % |
| | | | | | |
Portfolio turnover rate4 | | | 46 | % | | | 101 | % | | | 80 | % | | | 85 | % | | | 83 | % | | | 39 | % |
| | | | | | |
Net assets, end of period (in thousands) | | | $547,750 | | | | $533,742 | | | | $979,949 | | | | $662,412 | | | | $513,956 | | | | $101,947 | |
| | | | | | |
Ratios to average net assets:5 | | | | | | | | | | | | | | | | | | | | | | | | |
Total expenses to average net assets: | | | | | | | | | | | | | | | | | | | | | | | | |
Total expenses before reimbursements | | | 1.18 | % | | | 1.12 | % | | | 1.13 | % | | | 1.13 | % | | | 1.22 | % | | | 1.63 | % |
Total expenses after reimbursements | | | 1.02 | % | | | 1.02 | % | | | 1.02 | % | | | 1.02 | % | | | 1.02 | % | | | 1.02 | % |
| | | | | | |
Net investment income to average net assets: | | | | | | | | | | | | | | | | | | | | | | | | |
Net investment income before reimbursements | | | 7.98 | % | | | 6.40 | % | | | 5.04 | % | | | 4.81 | % | | | 4.11 | % | | | 4.63 | % |
Net investment income after reimbursements | | | 8.14 | % | | | 6.50 | % | | | 5.15 | % | | | 4.92 | % | | | 4.31 | % | | | 5.24 | % |
| 1 | Class A and Class C commenced investment operations on May 12, 2011. |
| 2 | Per share amounts are based on average number of shares outstanding during the period. |
| 3 | Assumes investment at net asset value at the beginning of the period, reinvestment of all distributions at net asset value on distribution date, and a complete redemption of the investment at net asset value at the end of the period excluding the impact of sales charges. Total return is not annualized for periods less than one year. |
| 4 | The portfolio turnover rate is calculated by dividing the lesser of cost of purchases or proceeds from sales of long term portfolio securities, including fully funded total return swaps, by the monthly average of the value of the long term portfolio securities. Portfolio turnover is not annualized for periods less than one year. |
| 5 | Annualized for periods less than one year. |
| 6 | The Institutional Class commenced investment operations on December 8, 2010. |
See accompanying notes to the financial statements.
27
ASHMORE FUNDS
FINANCIAL HIGHLIGHTS
| | | | | | | | | | | | | | | | | | | | | | | | |
Ashmore Emerging Markets Hard Currency Debt Fund1 | | | | | | | | | | | | | | | | | | |
| | | Class A | |
| | | Six Months
Ended
April 30, 2016
(Unaudited) | | | Year Ended
October 31,
2015 | | | Year Ended
October 31,
2014 | | | Year Ended
October 31,
2013 | | | Year Ended
October 31,
2012 | | | Period
Ended
October 31,
20112 | |
| | | | |
| | | | | | |
Net asset value at beginning of period | | | $ 8.13 | | | | $ 8.74 | | | | $10.15 | | | | $11.06 | | | | $10.04 | | | | $10.00 | |
| | | | | | |
Income (loss) from investment operations: | | | | | | | | | | | | | | | | | | | | | | | | |
Net investment income (loss)3 | | | 0.34 | | | | 0.49 | | | | 0.50 | | | | 0.46 | | | | 0.44 | | | | 0.19 | |
Net realized and unrealized gain (loss) | | | 0.08 | | | | (0.62 | ) | | | 0.20 | | | | (0.88 | ) | | | 1.03 | | | | 0.04 | |
| | | | | | | | | | | | | | | | | | | | | | | | |
| | | | | | |
Total from investment operations | | | 0.42 | | | | (0.13 | ) | | | 0.70 | | | | (0.42 | ) | | | 1.47 | | | | 0.23 | |
| | | | | | |
Less distributions: | | | | | | | | | | | | | | | | | | | | | | | | |
| | | | | | |
From net investment income | | | (0.30 | ) | | | (0.38 | ) | | | (0.53 | ) | | | (0.46 | ) | | | (0.45 | ) | | | (0.19 | ) |
From net realized gain | | | — | | | | — | | | | (1.58 | ) | | | (0.03 | ) | | | — | | | | — | |
Tax return of capital | | | | | | | (0.10 | ) | | | — | 4 | | | — | | | | — | | | | — | |
| | | | | | | | | | | | | | | | | | | | | | | | |
| | | | | | |
Total distributions | | | (0.30 | ) | | | (0.48 | ) | | | (2.11 | ) | | | (0.49 | ) | | | (0.45 | ) | | | (0.19 | ) |
| | | | | | | | | | | | | | | | | | | | | | | | |
| | | | | | |
Net asset value at end of period | | | $ 8.25 | | | | $ 8.13 | | | | $ 8.74 | | | | $10.15 | | | | $11.06 | | | | $10.04 | |
| | | | | | | | | | | | | | | | | | | | | | | | |
| | | | | | |
Total return5 | | | 5.46 | % | | | (1.36 | %) | | | 8.46 | % | | | (3.86 | %) | | | 15.24 | % | | | 2.26 | % |
| | | | | | |
Portfolio turnover rate6 | | | 33 | % | | | 35 | % | | | 99 | % | | | 81 | % | | | 30 | % | | | 9 | % |
| | | | | | |
Net assets, end of period (in thousands) | | | $ 114 | | | | $ 3 | | | | $ 38 | | | | $ 2 | | | | $ 14 | | | | $ 1 | |
| | | | | | |
Ratios to average net assets:7 | | | | | | | | | | | | | | | | | | | | | | | | |
Total expenses to average net assets: | | | | | | | | | | | | | | | | | | | | | | | | |
Total expenses before reimbursements | | | 2.93 | % | | | 3.81 | % | | | 3.79 | % | | | 1.66 | % | | | 1.93 | % | | | 4.61 | % |
Total expenses after reimbursements | | | 1.17 | % | | | 1.19 | % | | | 1.20 | % | | | 1.20 | % | | | 1.20 | % | | | 1.20 | % |
| | | | | | |
Net investment income to average net assets: | | | | | | | | | | | | | | | | | | | | | | | | |
Net investment income before reimbursements | | | 7.00 | % | | | 3.18 | % | | | 3.23 | % | | | 3.75 | % | | | 3.62 | % | | | 0.57 | % |
Net investment income after reimbursements | | | 8.76 | % | | | 5.80 | % | | | 5.82 | % | | | 4.21 | % | | | 4.35 | % | | | 3.98 | % |
See accompanying notes to the financial statements.
28
ASHMORE FUNDS
FINANCIAL HIGHLIGHTS
| | | | | | | | | | | | | | | | | | | | | | | | |
Ashmore Emerging Markets Hard Currency Debt Fund1 | | | | | | | | | | | | | | | | | | |
| | | Class C | |
| | | Six Months
Ended
April 30, 2016
(Unaudited) | | | Year Ended
October 31,
2015 | | | Year Ended
October 31,
2014 | | | Year Ended
October 31,
2013 | | | Year Ended
October 31,
2012 | | | Period
Ended
October 31,
20112 | |
| | | | |
| | | | | | |
Net asset value at beginning of period | | | $ 8.08 | | | | $ 8.70 | | | | $10.12 | | | | $11.04 | | | | $10.04 | | | | $10.00 | |
| | | | | | |
Income (loss) from investment operations: | | | | | | | | | | | | | | | | | | | | | | | | |
Net investment income (loss)3 | | | 0.22 | | | | 0.43 | | | | 0.44 | | | | 0.38 | | | | 0.37 | | | | 0.15 | |
Net realized and unrealized gain (loss) | | | 0.23 | | | | (0.62 | ) | | | 0.17 | | | | (0.89 | ) | | | 1.01 | | | | 0.05 | |
| | | | | | | | | | | | | | | | | | | | | | | | |
| | | | | | |
Total from investment operations | | | 0.45 | | | | (0.19 | ) | | | 0.61 | | | | (0.51 | ) | | | 1.38 | | | | 0.20 | |
| | | | | | |
Less distributions: | | | | | | | | | | | | | | | | | | | | | | | | |
| | | | | | |
From net investment income | | | (0.33 | ) | | | (0.34 | ) | | | (0.45 | ) | | | (0.38 | ) | | | (0.38 | ) | | | (0.16 | ) |
From net realized gain | | | — | | | | — | | | | (1.58 | ) | | | (0.03 | ) | | | — | | | | — | |
Tax return of capital | | | — | | | | (0.09 | ) | | | — | 4 | | | — | | | | — | | | | — | |
| | | | | | | | | | | | | | | | | | | | | | | | |
| | | | | | |
Total distributions | | | (0.33 | ) | | | (0.43 | ) | | | (2.03 | ) | | | (0.41 | ) | | | (0.38 | ) | | | (0.16 | ) |
| | | | | | | | | | | | | | | | | | | | | | | | |
| | | | | | |
Net asset value at end of period | | | $ 8.20 | | | | $ 8.08 | | | | $ 8.70 | | | | $10.12 | | | | $11.04 | | | | $10.04 | |
| | | | | | | | | | | | | | | | | | | | | | | | |
| | | | | | |
Total return5 | | | 5.81 | % | | | (2.11 | %) | | | 7.30 | % | | | (4.64 | %) | | | 14.28 | % | | | 1.90 | % |
| | | | | | |
Portfolio turnover rate6 | | | 33 | % | | | 35 | % | | | 99 | % | | | 81 | % | | | 30 | % | | | 9 | % |
| | | | | | |
Net assets, end of period (in thousands) | | | $ 2 | | | | $ 1 | | | | $ 1 | | | | $ 1 | | | | $ 1 | | | | $ 1 | |
| | | | | | |
Ratios to average net assets:7 | | | | | | | | | | | | | | | | | | | | | | | | |
Total expenses to average net assets: | | | | | | | | | | | | | | | | | | | | | | | | |
Total expenses before reimbursements | | | 3.85 | % | | | 4.49 | % | | | 4.90 | % | | | 2.41 | % | | | 2.73 | % | | | 5.35 | % |
Total expenses after reimbursements | | | 1.92 | % | | | 1.93 | % | | | 1.95 | % | | | 1.95 | % | | | 1.95 | % | | | 1.95 | % |
| | | | | | |
Net investment income (loss) to average net assets: | | | | | | | | | | | | | | | | | | | | | | | | |
Net investment income (loss) before reimbursements | | | 3.63 | % | | | 2.73 | % | | | 1.99 | % | | | 3.16 | % | | | 2.86 | % | | | (0.18 | %) |
Net investment income after reimbursements | | | 5.56 | % | | | 5.29 | % | | | 4.94 | % | | | 3.62 | % | | | 3.64 | % | | | 3.22 | % |
See accompanying notes to the financial statements.
29
ASHMORE FUNDS
FINANCIAL HIGHLIGHTS
| | | | | | | | | | | | | | | | | | | | | | | | |
Ashmore Emerging Markets Hard Currency Debt Fund1 | | | | | | | | | | | | | | | | | | |
| | | Institutional Class | |
| | | Six Months
Ended
April 30, 2016
(Unaudited) | | | Year Ended
October 31,
2015 | | | Year Ended
October 31,
2014 | | | Year Ended
October 31,
2013 | | | Year Ended
October 31,
2012 | | | Period
Ended
October 31,
20118 | |
| | | | |
| | | | | | |
Net asset value at beginning of period | | | $ 8.07 | | | | $ 8.68 | | | | $10.08 | | | | $ 10.99 | | | | $ 9.99 | | | | $ 10.00 | |
| | | | | | |
Income (loss) from investment operations: | | | | | | | | | | | | | | | | | | | | | | | | |
Net investment income (loss)3 | | | 0.27 | | | | 0.51 | | | | 0.52 | | | | 0.48 | | | | 0.48 | | | | 0.40 | |
Net realized and unrealized gain (loss) | | | 0.10 | | | | (0.62 | ) | | | 0.18 | | | | (0.87 | ) | | | 1.01 | | | | — | |
| | | | | | | | | | | | | | | | | | | | | | | | |
| | | | | | |
Total from investment operations | | | 0.37 | | | | (0.11 | ) | | | 0.70 | | | | (0.39 | ) | | | 1.49 | | | | 0.40 | |
| | | | | | |
Less distributions: | | | | | | | | | | | | | | | | | | | | | | | | |
From net investment income | | | (0.25 | ) | | | (0.40 | ) | | | (0.52 | ) | | | (0.49 | ) | | | (0.49 | ) | | | (0.41 | ) |
From net realized gain | | | — | | | | — | | | | (1.58 | ) | | | (0.03 | ) | | | — | | | | — | |
Tax return of capital | | | — | | | | (0.10 | ) | | | — | 4 | | | — | | | | — | | | | — | |
| | | | | | | | | | | | | | | | | | | | | | | | |
| | | | | | |
Total distributions | | | (0.25 | ) | | | (0.50 | ) | | | (2.10 | ) | | | (0.52 | ) | | | (0.49 | ) | | | (0.41 | ) |
| | | | | | | | | | | | | | | | | | | | | | | | |
| | | | | | |
Net asset value at end of period | | | $ 8.19 | | | | $ 8.07 | | | | $ 8.68 | | | | $ 10.08 | | | | $ 10.99 | | | | $ 9.99 | |
| | | | | | | | | | | | | | | | | | | | | | | | |
| | | | | | |
Total return5 | | | 4.85 | % | | | (1.10 | %) | | | 8.41 | % | | | (3.64 | %) | | | 15.32 | % | | | 4.15 | % |
| | | | | | |
Portfolio turnover rate6 | | | 33 | % | | | 35 | % | | | 99 | % | | | 81 | % | | | 30 | % | | | 9 | % |
| | | | | | |
Net assets, end of period (in thousands) | | | $6,667 | | | | $5,488 | | | | $5,573 | | | | $29,004 | | | | $35,025 | | | | $30,533 | |
| | | | | | |
Ratios to average net assets:7 | | | | | | | | | | | | | | | | | | | | | | | | |
Total expenses to average net assets: | | | | | | | | | | | | | | | | | | | | | | | | |
Total expenses before reimbursements | | | 2.75 | % | | | 3.49 | % | | | 3.43 | % | | | 1.41 | % | | | 1.63 | % | | | 3.63 | % |
Total expenses after reimbursements | | | 0.92 | % | | | 0.92 | % | | | 0.92 | % | | | 0.92 | % | | | 0.92 | % | | | 0.92 | % |
| | | | | | |
Net investment income to average net assets: | | | | | | | | | | | | | | | | | | | | | | | | |
Net investment income before reimbursements | | | 5.03 | % | | | 3.64 | % | | | 3.20 | % | | | 4.08 | % | | | 3.95 | % | | | 1.74 | % |
Net investment income after reimbursements | | | 6.86 | % | | | 6.21 | % | | | 5.71 | % | | | 4.57 | % | | | 4.66 | % | | | 4.45 | % |
| 1 | Formerly the Ashmore Emerging Markets Debt Fund. |
| 2 | Class A and Class C commenced investment operations on May 12, 2011. |
| 3 | Per share amounts are based on average number of shares outstanding during the period. |
| 4 | Amount is less than $0.005 per share. |
| 5 | Assumes investment at net asset value at the beginning of the period, reinvestment of all distributions at net asset value on distribution date, and a complete redemption of the investment at net asset value at the end of the period excluding the impact of sales charges. Total return is not annualized for periods less than one year. |
| 6 | The portfolio turnover rate is calculated by dividing the lesser of cost of purchases or proceeds from sales of long term portfolio securities by the monthly average of the value of the long term portfolio securities. Portfolio turnover is not annualized for periods less than one year. |
| 7 | Annualized for periods less than one year. |
| 8 | The Institutional Class commenced investment operations on December 8, 2010. |
See accompanying notes to the financial statements.
30
ASHMORE FUNDS
FINANCIAL HIGHLIGHTS
| | | | | | | | | | | | | | | | | | | | | | | | |
Ashmore Emerging Markets Local Currency Bond Fund | | | | | | | | | | | | | | | | | | |
| | | Class A | |
| | | Six Months
Ended
April 30, 2016
(Unaudited) | | | Year Ended
October 31,
2015 | | | Year Ended
October 31,
2014 | | | Year Ended
October 31,
2013 | | | Year Ended
October 31,
2012 | | | Period
Ended
October 31,
20111 | |
| | | | |
| | | | | | |
Net asset value at beginning of period | | | $ 6.57 | | | | $ 8.44 | | | | $ 9.13 | | | | $ 9.83 | | | | $ 9.43 | | | | $10.00 | |
| | | | | | |
Income (loss) from investment operations: | | | | | | | | | | | | | | | | | | | | | | | | |
Net investment income (loss) | | | 0.14 | 2 | | | 0.29 | | | | 0.37 | 2 | | | 0.44 | 2 | | | 0.43 | 2 | | | 0.13 | 2 |
Net realized and unrealized gain (loss) | | | 0.49 | | | | (1.88 | ) | | | (0.66 | ) | | | (0.74 | ) | | | 0.31 | | | | (0.48 | ) |
| | | | | | | | | | | | | | | | | | | | | | | | |
| | | | | | |
Total from investment operations | | | 0.63 | | | | (1.59 | ) | | | (0.29 | ) | | | (0.30 | ) | | | 0.74 | | | | (0.35 | ) |
| | | | | | |
Less distributions: | | | | | | | | | | | | | | | | | | | | | | | | |
| | | | | | |
From net investment income | | | (0.14 | ) | | | — | | | | — | | | | (0.22 | ) | | | (0.34 | ) | | | (0.13 | ) |
From net realized gain | | | — | | | | — | | | | — | | | | (0.01 | ) | | | — | | | | — | |
Tax return of capital | | | — | | | | (0.28 | ) | | | (0.40 | ) | | | (0.17 | ) | | | — | 3 | | | (0.09 | ) |
| | | | | | | | | | | | | | | | | | | | | | | | |
| | | | | | |
Total distributions | | | (0.14 | ) | | | (0.28 | ) | | | (0.40 | ) | | | (0.40 | ) | | | (0.34 | ) | | | (0.22 | ) |
| | | | | | | | | | | | | | | | | | | | | | | | |
| | | | | | |
Net asset value at end of period | | | $ 7.06 | | | | $ 6.57 | | | | $ 8.44 | | | | $ 9.13 | | | | $ 9.83 | | | | $ 9.43 | |
| | | | | | | | | | | | | | | | | | | | | | | | |
| | | | | | |
Total return4 | | | 9.87 | % | | | (19.17 | %) | | | (3.25 | %) | | | (3.21 | %) | | | 8.02 | % | | | (3.60 | %) |
| | | | | | |
Portfolio turnover rate5 | | | 31 | % | | | 83 | % | | | 112 | % | | | 112 | % | | | 101 | % | | | 31 | % |
| | | | | | |
Net assets, end of period (in thousands) | | | $ 771 | | | | $ 712 | | | | $ 897 | | | | $2,096 | | | | $ 413 | | | | $ 286 | |
| | | | | | |
Ratios to average net assets:6 | | | | | | | | | | | | | | | | | | | | | | | | |
Total expenses to average net assets: | | | | | | | | | | | | | | | | | | | | | | | | |
Total expenses before reimbursements | | | 1.55 | % | | | 1.51 | % | | | 1.55 | % | | | 1.47 | % | | | 1.64 | % | | | 1.99 | % |
Total expenses after reimbursements | | | 1.22 | % | | | 1.23 | % | | | 1.25 | % | | | 1.25 | % | | | 1.25 | % | | | 1.25 | % |
| | | | | | |
Net investment income to average net assets: | �� | | | | | | | | | | | | | | | | | | | | | | | |
Net investment income before reimbursements | | | 4.14 | % | | | 3.53 | % | | | 4.29 | % | | | 4.38 | % | | | 3.03 | % | | | 2.34 | % |
Net investment income after reimbursements | | | 4.47 | % | | | 3.81 | % | | | 4.59 | % | | | 4.60 | % | | | 3.42 | % | | | 3.08 | % |
See accompanying notes to the financial statements.
31
ASHMORE FUNDS
FINANCIAL HIGHLIGHTS
| | | | | | | | | | | | | | | | | | | | | | | | |
Ashmore Emerging Markets Local Currency Bond Fund | | | | | | | | | | | | | | | | | | |
| | | Class C | |
| | | Six Months
Ended
April 30, 2016
(Unaudited) | | | Year Ended
October 31,
2015 | | | Year Ended
October 31,
2014 | | | Year Ended
October 31,
2013 | | | Year Ended
October 31,
2012 | | | Period
Ended
October 31,
20111 | |
| | | | |
| | | | | | |
Net asset value at beginning of period | | | $ 6.56 | | | | $ 8.42 | | | | $ 9.13 | | | | $ 9.83 | | | | $ 9.43 | | | | $10.00 | |
| | | | | | |
Income (loss) from investment operations: | | | | | | | | | | | | | | | | | | | | | | | | |
Net investment income (loss) | | | 0.12 | 2 | | | 0.18 | | | | 0.29 | 2 | | | 0.38 | 2 | | | 0.22 | 2 | | | 0.13 | 2 |
Net realized and unrealized gain (loss) | | | 0.49 | | | | (1.82 | ) | | | (0.67 | ) | | | (0.75 | ) | | | 0.45 | | | | (0.51 | ) |
| | | | | | | | | | | | | | | | | | | | | | | | |
| | | | | | |
Total from investment operations | | | 0.61 | | | | (1.64 | ) | | | (0.38 | ) | | | (0.37 | ) | | | 0.67 | | | | (0.38 | ) |
| | | | | | |
Less distributions: | | | | | | | | | | | | | | | | | | | | | | | | |
| | | | | | |
From net investment income | | | (0.12 | ) | | | — | | | | — | | | | (0.18 | ) | | | (0.27 | ) | | | (0.11 | ) |
From net realized gain | | | — | | | | — | | | | — | | | | (0.01 | ) | | | — | | | | — | |
Tax return of capital | | | — | | | | (0.22 | ) | | | (0.33 | ) | | | (0.14 | ) | | | — | 3 | | | (0.08 | ) |
| | | | | | | | | | | | | | | | | | | | | | | | |
| | | | | | |
Total distributions | | | (0.12 | ) | | | (0.22 | ) | | | (0.33 | ) | | | (0.33 | ) | | | (0.27 | ) | | | (0.19 | ) |
| | | | | | | | | | | | | | | | | | | | | | | | |
| | | | | | |
Net asset value at end of period | | | $ 7.05 | | | | $ 6.56 | | | | $ 8.42 | | | | $ 9.13 | | | | $ 9.83 | | | | $ 9.43 | |
| | | | | | | | | | | | | | | | | | | | | | | | |
| | | | | | |
Total return4 | | | 9.68 | % | | | (19.83 | %) | | | (4.18 | %) | | | (3.92 | %) | | | 7.33 | % | | | (4.01 | %) |
| | | | | | |
Portfolio turnover rate5 | | | 31 | % | | | 83 | % | | | 112 | % | | | 112 | % | | | 101 | % | | | 31 | % |
| | | | | | |
Net assets, end of period (in thousands) | | | $ 68 | | | | $ 40 | | | | $ 147 | | | | $ 124 | | | | $ 19 | | | | $ 1 | |
| | | | | | |
Ratios to average net assets:6 | | | | | | | | | | | | | | | | | | | | | | | | |
Total expenses to average net assets: | | | | | | | | | | | | | | | | | | | | | | | | |
Total expenses before reimbursements | | | 2.31 | % | | | 2.26 | % | | | 2.31 | % | | | 2.22 | % | | | 2.47 | % | | | 2.87 | % |
Total expenses after reimbursements | | | 1.97 | % | | | 1.99 | % | | | 2.00 | % | | | 2.00 | % | | | 2.00 | % | | | 2.00 | % |
| | | | | | |
Net investment income to average net assets: | | | | | | | | | | | | | | | | | | | | | | | | |
Net investment income before reimbursements | | | 3.46 | % | | | 2.71 | % | | | 3.41 | % | | | 3.77 | % | | | 1.87 | % | | | 1.87 | % |
Net investment income after reimbursements | | | 3.80 | % | | | 2.98 | % | | | 3.72 | % | | | 3.99 | % | | | 2.34 | % | | | 2.74 | % |
See accompanying notes to the financial statements.
32
ASHMORE FUNDS
FINANCIAL HIGHLIGHTS
| | | | | | | | | | | | | | | | | | | | | | | | |
Ashmore Emerging Markets Local Currency Bond Fund | | | | | | | | | | | | | | | | | | |
| | | Institutional Class | |
| | | Six Months
Ended
April 30, 2016
(Unaudited) | | | Year Ended
October 31,
2015 | | | Year Ended
October 31,
2014 | | | Year Ended
October 31,
2013 | | | Year Ended
October 31,
2012 | | | Period
Ended
October 31,
20117 | |
| | | | |
| | | | | | |
Net asset value at beginning of period | | | $ 6.80 | | | | $ 8.73 | | | | $ 9.45 | | | | $ 10.18 | | | | $ 9.76 | | | | $ 10.00 | |
| | | | | | |
Income (loss) from investment operations: | | | | | | | | | | | | | | | | | | | | | | | | |
Net investment income (loss) | | | 0.16 | 2 | | | 0.31 | | | | 0.43 | 2 | | | 0.49 | 2 | | | 0.37 | 2 | | | 0.29 | 2 |
Net realized and unrealized gain (loss) | | | 0.51 | | | | (1.93 | ) | | | (0.71 | ) | | | (0.78 | ) | | | 0.42 | | | | 0.06 | |
| | | | | | | | | | | | | | | | | | | | | | | | |
| | | | | | |
Total from investment operations | | | 0.67 | | | | (1.62 | ) | | | (0.28 | ) | | | (0.29 | ) | | | 0.79 | | | | 0.35 | |
| | | | | | |
Less distributions: | | | | | | | | | | | | | | | | | | | | | | | | |
| | | | | | |
From net investment income | | | (0.16 | ) | | | — | | | | — | | | | (0.24 | ) | | | (0.37 | ) | | | (0.35 | ) |
From net realized gain | | | — | | | | — | | | | — | | | | (0.01 | ) | | | — | | | | — | |
Tax return of capital | | | — | | | | (0.31 | ) | | | (0.44 | ) | | | (0.19 | ) | | | — | 3 | | | (0.24 | ) |
| | | | | | | | | | | | | | | | | | | | | | | | |
| | | | | | |
Total distributions | | | (0.16 | ) | | | (0.31 | ) | | | (0.44 | ) | | | (0.44 | ) | | | (0.37 | ) | | | (0.59 | ) |
| | | | | | | | | | | | | | | | | | | | | | | | |
| | | | | | |
Net asset value at end of period | | | $ 7.31 | | | | $ 6.80 | | | | $ 8.73 | | | | $ 9.45 | | | | $ 10.18 | | | | $ 9.76 | |
| | | | | | | | | | | | | | | | | | | | | | | | |
| | | | | | |
Total return4 | | | 10.04 | % | | | (18.91 | %) | | | (3.04 | %) | | | (3.02 | %) | | | 8.39 | % | | | 3.35 | % |
| | | | | | |
Portfolio turnover rate5 | | | 31 | % | | | 83 | % | | | 112 | % | | | 112 | % | | | 101 | % | | | 31 | % |
| | | | | | |
Net assets, end of period (in thousands) | | | $73,630 | | | | $79,492 | | | | $101,363 | | | | $82,543 | | | | $72,673 | | | | $62,530 | |
| | | | | | |
Ratios to average net assets:6 | | | | | | | | | | | | | | | | | | | | | | | | |
Total expenses to average net assets: | | | | | | | | | | | | | | | | | | | | | | | | |
Total expenses before reimbursements | | | 1.29 | % | | | 1.26 | % | | | 1.32 | % | | | 1.22 | % | | | 1.39 | % | | | 1.70 | % |
Total expenses after reimbursements | | | 0.97 | % | | | 0.97 | % | | | 0.97 | % | | | 0.97 | % | | | 0.97 | % | | | 0.97 | % |
| | | | | | |
Net investment income to average net assets: | | | | | | | | | | | | | | | | | | | | | | | | |
Net investment income before reimbursements | | | 4.38 | % | | | 3.78 | % | | | 4.34 | % | | | 4.64 | % | | | 3.31 | % | | | 2.55 | % |
Net investment income after reimbursements | | | 4.70 | % | | | 4.07 | % | | | 4.69 | % | | | 4.89 | % | | | 3.73 | % | | | 3.28 | % |
| 1 | Class A and Class C commenced investment operations on May 12, 2011. |
| 2 | Per share amounts are based on average number of shares outstanding during the period. |
| 3 | Amount is less than $0.005 per share. |
| 4 | Assumes investment at net asset value at the beginning of the period, reinvestment of all distributions at net asset value on distribution date, and a complete redemption of the investment at net asset value at the end of the period excluding the impact of sales charges. Total return is not annualized for periods less than one year. |
| 5 | The portfolio turnover rate is calculated by dividing the lesser of cost of purchases or proceeds from sales of long term portfolio securities, including fully funded total return swaps, by the monthly average of the value of the long term portfolio securities. Portfolio turnover is not annualized for periods less than one year. |
| 6 | Annualized for periods less than one year. |
| 7 | The Institutional Class commenced investment operations on December 8, 2010. |
See accompanying notes to the financial statements.
33
ASHMORE FUNDS
FINANCIAL HIGHLIGHTS
| | | | | | | | | | | | | | | | | | | | | | | | |
Ashmore Emerging Markets Corporate Debt Fund | |
| | | Class A | |
| | | Six Months
Ended
April 30, 2016
(Unaudited) | | | Year Ended
October 31,
2015 | | | Year Ended
October 31,
2014 | | | Year Ended
October 31,
2013 | | | Year Ended
October 31,
2012 | | | Period Ended
October 31,
20111 | |
| | | | |
| | | | | | |
Net asset value at beginning of period | | | $ 7.66 | | | $ | 8.94 | | | $ | 9.25 | | | $ | 9.69 | | | $ | 9.09 | | | $ | 10.00 | |
| | | | | | |
Income (loss) from investment operations: | | | | | | | | | | | | | | | | | | | | | | | | |
Net investment income (loss) | | | 0.36 | | | | 0.74 | | | | 0.55 | 2 | | | 0.51 | 2 | | | 0.67 | 2 | | | 0.32 | 2 |
Net realized and unrealized gain (loss) | | | (0.33 | ) | | | (1.21 | ) | | | (0.31 | ) | | | (0.35 | ) | | | 0.67 | | | | (0.86 | ) |
| | | | | | | | | | | | | | | | | | | | | | | | |
| | | | | | |
Total from investment operations | | | 0.03 | | | | (0.47 | ) | | | 0.24 | | | | 0.16 | | | | 1.34 | | | | (0.54 | ) |
| | | | | | |
Less distributions: | | | | | | | | | | | | | | | | | | | | | | | | |
| | | | | | |
From net investment income | | | (0.37 | ) | | | (0.67 | ) | | | (0.55 | ) | | | (0.52 | ) | | | (0.69 | ) | | | (0.37 | ) |
From net realized gain | | | — | | | | (0.06 | ) | | | — | | | | (0.07 | ) | | | (0.05 | ) | | | — | |
Tax return of capital | | | | | | | (0.08 | ) | | | — | | | | (0.01 | ) | | | — | | | | — | |
| | | | | | | | | | | | | | | | | | | | | | | | |
| | | | | | |
Total distributions | | | (0.37 | ) | | | (0.81 | ) | | | (0.55 | ) | | | (0.60 | ) | | | (0.74 | ) | | | (0.37 | ) |
| | | | | | | | | | | | | | | | | | | | | | | | |
| | | | | | |
Net asset value at end of period | | | $ 7.32 | | | $ | 7.66 | | | $ | 8.94 | | | $ | 9.25 | | | $ | 9.69 | | | $ | 9.09 | |
| | | | | | | | | | | | | | | | | | | | | | | | |
| | | | | | |
Total return3 | | | 0.62 | % | | | (5.27 | %) | | | 2.53 | % | | | 1.63 | % | | | 15.54 | % | | | (5.44 | %) |
| | | | | | |
Portfolio turnover rate4 | | | 29 | % | | | 90 | % | | | 82 | % | | | 49 | % | | | 50 | % | | | 22 | % |
| | | | | | |
Net assets, end of period (in thousands) | | | $8,160 | | | $ | 7,280 | | | $ | 1,704 | | | $ | 2,852 | | | $ | 485 | | | $ | 1 | |
| | | | | | |
Ratios to average net assets:5 | | | | | | | | | | | | | | | | | | | | | | | | |
Total expenses to average net assets: | | | | | | | | | | | | | | | | | | | | | | | | |
Total expenses before reimbursements | | | 1.58 | % | | | 1.55 | % | | | 1.53 | % | | | 1.71 | % | | | 2.89 | % | | | 4.36 | % |
Total expenses after reimbursements | | | 1.42 | % | | | 1.42 | % | | | 1.45 | % | | | 1.45 | % | | | 1.45 | % | | | 1.45 | % |
| | | | | | |
Net investment income to average net assets: | | | | | | | | | | | | | | | | | | | | | | | | |
Net investment income before reimbursements | | | 9.34 | % | | | 8.77 | % | | | 5.79 | % | | | 5.15 | % | | | 5.19 | % | | | 4.35 | % |
Net investment income after reimbursements | | | 9.50 | % | | | 8.90 | % | | | 5.87 | % | | | 5.41 | % | | | 6.63 | % | | | 7.26 | % |
See accompanying notes to the financial statements.
34
ASHMORE FUNDS
FINANCIAL HIGHLIGHTS
| | | | | | | | | | | | | | | | | | | | | | | | |
Ashmore Emerging Markets Corporate Debt Fund | |
| | | Class C | |
| | | Six Months
Ended
April 30, 2016
(Unaudited) | | | Year Ended
October 31,
2015 | | | Year Ended
October 31,
2014 | | | Year Ended
October 31,
2013 | | | Year Ended
October 31,
2012 | | | Period Ended
October 31,
20111 | |
| | | | |
| | | | | | |
Net asset value at beginning of period | | | $ 7.66 | | | $ | 8.95 | | | $ | 9.25 | | | $ | 9.70 | | | $ | 9.09 | | | $ | 10.00 | |
| | | | | | |
Income (loss) from investment operations: | | | | | | | | | | | | | | | | | | | | | | | | |
Net investment income (loss) | | | 0.33 | | | | 0.64 | | | | 0.48 | 2 | | | 0.44 | 2 | | | 0.60 | 2 | | | 0.28 | 2 |
Net realized and unrealized gain (loss) | | | (0.33 | ) | | | (1.18 | ) | | | (0.30 | ) | | | (0.36 | ) | | | 0.68 | | | | (0.86 | ) |
| | | | | | | | | | | | | | | | | | | | | | | | |
| | | | | | |
Total from investment operations | | | — | | | | (0.54 | ) | | | 0.18 | | | | 0.08 | | | | 1.28 | | | | (0.58 | ) |
| | | | | | |
Less distributions: | | | | | | | | | | | | | | | | | | | | | | | | |
| | | | | | |
From net investment income | | | (0.34 | ) | | | (0.62 | ) | | | (0.48 | ) | | | (0.45 | ) | | | (0.62 | ) | | | (0.33 | ) |
From net realized gain | | | — | | | | (0.06 | ) | | | — | | | | (0.07 | ) | | | (0.05 | ) | | | — | |
Tax return of capital | | | | | | | (0.07 | ) | | | — | | | | (0.01 | ) | | | — | | | | — | |
| | | | | | | | | | | | | | | | | | | | | | | | |
| | | | | | |
Total distributions | | | (0.34 | ) | | | (0.75 | ) | | | (0.48 | ) | | | (0.53 | ) | | | (0.67 | ) | | | (0.33 | ) |
| | | | | | | | | | | | | | | | | | | | | | | | |
| | | | | | |
Net asset value at end of period | | | $ 7.32 | | | $ | 7.66 | | | $ | 8.95 | | | $ | 9.25 | | | $ | 9.70 | | | $ | 9.09 | |
| | | | | | | | | | | | | | | | | | | | | | | | |
| | | | | | |
Total return3 | | | 0.25 | % | | | (6.04 | %) | | | 1.87 | % | | | 0.80 | % | | | 14.78 | % | | | (5.78 | %) |
| | | | | | |
Portfolio turnover rate4 | | | 29 | % | | | 90 | % | | | 82 | % | | | 49 | % | | | 50 | % | | | 22 | % |
| | | | | | |
Net assets, end of period (in thousands) | | | $3,695 | | | $ | 3,226 | | | $ | 421 | | | $ | 150 | | | $ | 27 | | | $ | 1 | |
| | | | | | |
Ratios to average net assets:5 | | | | | | | | | | | | | | | | | | | | | | | | |
Total expenses to average net assets: | | | | | | | | | | | | | | | | | | | | | | | | |
Total expenses before reimbursements | | | 2.33 | % | | | 2.30 | % | | | 2.28 | % | | | 2.46 | % | | | 3.60 | % | | | 5.12 | % |
Total expenses after reimbursements | | | 2.17 | % | | | 2.17 | % | | | 2.20 | % | | | 2.20 | % | | | 2.20 | % | | | 2.20 | % |
| | | | | | |
Net investment income to average net assets: | | | | | | | | | | | | | | | | | | | | | | | | |
Net investment income before reimbursements | | | 8.58 | % | | | 8.13 | % | | | 5.15 | % | | | 4.42 | % | | | 4.73 | % | | | 3.59 | % |
Net investment income after reimbursements | | | 8.74 | % | | | 8.26 | % | | | 5.23 | % | | | 4.68 | % | | | 6.13 | % | | | 6.51 | % |
See accompanying notes to the financial statements.
35
ASHMORE FUNDS
FINANCIAL HIGHLIGHTS
| | | | | | | | | | | | | | | | | | | | | | | | |
Ashmore Emerging Markets Corporate Debt Fund | |
| | | Institutional Class | |
| | | Six Months
Ended
April 30, 2016
(Unaudited) | | | Year Ended
October 31,
2015 | | | Year Ended
October 31,
2014 | | | Year Ended
October 31,
2013 | | | Year Ended
October 31,
2012 | | | Period Ended
October 31,
20116 | |
| | | | |
| | | | | | |
Net asset value at beginning of period | | | $ 7.98 | | | $ | 9.30 | | | $ | 9.61 | | | $ | 10.07 | | | $ | 9.43 | | | $ | 10.00 | |
| | | | | | |
Income (loss) from investment operations: | | | | | | | | | | | | | | | | | | | | | | | | |
Net investment income (loss) | | | 0.38 | | | | 0.75 | | | | 0.59 | 2 | | | 0.55 | 2 | | | 0.73 | 2 | | | 0.63 | 2 |
Net realized and unrealized gain (loss) | | | (0.34 | ) | | | (1.22 | ) | | | (0.31 | ) | | | (0.36 | ) | | | 0.70 | | | | (0.60 | ) |
| | | | | | | | | | | | | | | | | | | | | | | | |
| | | | | | |
Total from investment operations | | | 0.04 | | | | (0.47 | ) | | | 0.28 | | | | 0.19 | | | | 1.43 | | | | 0.03 | |
| | | | | | |
Less distributions: | | | | | | | | | | | | | | | | | | | | | | | | |
| | | | | | |
From net investment income | | | (0.39 | ) | | | (0.71 | ) | | | (0.59 | ) | | | (0.57 | ) | | | (0.74 | ) | | | (0.60 | ) |
From net realized gain | | | — | | | | (0.06 | ) | | | — | | | | (0.07 | ) | | | (0.05 | ) | | | — | |
Tax return of capital | | | | | | | (0.08 | ) | | | — | | | | (0.01 | ) | | | — | | | | — | |
| | | | | | | | | | | | | | | | | | | | | | | | |
| | | | | | |
Total distributions | | | (0.39 | ) | | | (0.85 | ) | | | (0.59 | ) | | | (0.65 | ) | | | (0.79 | ) | | | (0.60 | ) |
| | | | | | | | | | | | | | | | | | | | | | | | |
| | | | | | |
Net asset value at end of period | | | $ 7.63 | | | $ | 7.98 | | | $ | 9.30 | | | $ | 9.61 | | | $ | 10.07 | | | $ | 9.43 | |
| | | | | | | | | | | | | | | | | | | | | | | | |
| | | | | | |
Total return3 | | | 0.64 | % | | | (5.08 | %) | | | 2.91 | % | | | 1.91 | % | | | 15.97 | % | | | 0.27 | % |
| | | | | | |
Portfolio turnover rate4 | | | 29 | % | | | 90 | % | | | 82 | % | | | 49 | % | | | 50 | % | | | 22 | % |
| | | | | | |
Net assets, end of period (in thousands) | | | $206,833 | | | $ | 237,044 | | | $ | 364,775 | | | $ | 183,567 | | | $ | 17,651 | | | $ | 11,824 | |
| | | | | | |
Ratios to average net assets:5 | | | | | | | | | | | | | | | | | | | | | | | | |
Total expenses to average net assets: | | | | | | | | | | | | | | | | | | | | | | | | |
Total expenses before reimbursements | | | 1.33 | % | | | 1.30 | % | | | 1.28 | % | | | 1.46 | % | | | 2.66 | % | | | 3.78 | % |
Total expenses after reimbursements | | | 1.17 | % | | | 1.17 | % | | | 1.17 | % | | | 1.17 | % | | | 1.17 | % | | | 1.17 | % |
| | | | | | |
Net investment income to average net assets: | | | | | | | | | | | | | | | | | | | | | | | | |
Net investment income before reimbursements | | | 9.65 | % | | | 8.63 | % | | | 6.14 | % | | | 5.37 | % | | | 6.16 | % | | | 4.60 | % |
Net investment income after reimbursements | | | 9.81 | % | | | 8.76 | % | | | 6.25 | % | | | 5.66 | % | | | 7.65 | % | | | 7.21 | % |
| 1 | Class A and Class C commenced investment operations on May 12, 2011. |
| 2 | Per share amounts are based on average number of shares outstanding during the period. |
| 3 | Assumes investment at net asset value at the beginning of the period, reinvestment of all distributions at net asset value on distribution date, and a complete redemption of the investment at net asset value at the end of the period excluding the impact of sales charges. Total return is not annualized for periods less than one year. |
| 4 | The portfolio turnover rate is calculated by dividing the lesser of cost of purchases or proceeds from sales of long term portfolio securities by the monthly average of the value of the long term portfolio securities. Portfolio turnover is not annualized for periods less than one year. |
| 5 | Annualized for periods less than one year. |
| 6 | The Institutional Class commenced investment operations on December 8, 2010. |
See accompanying notes to the financial statements.
36
ASHMORE FUNDS
FINANCIAL HIGHLIGHTS
| | | | | | | | | | | | |
| Ashmore Emerging Markets Short Duration Fund | | | | | | | | | |
| | | Class A | |
| | | Six Months
Ended
April 30, 2016
(Unaudited) | | | Year Ended
October 31,
2015 | | | Period Ended
October 31,
20141 | |
| | | | |
| | | |
Net asset value at beginning of period | | | $ 9.57 | | | | $ 9.99 | | | | $ 10.00 | |
| | | |
Income (loss) from investment operations: | | | | | | | | | | | | |
Net investment income (loss) | | | 0.46 | | | | 0.67 | | | | 0.05 | |
Net realized and unrealized gain (loss) | | | 0.20 | | | | (0.41) | | | | (0.01) | |
| | | | | | | | | | | | |
| | | |
Total from investment operations | | | 0.66 | | | | 0.26 | | | | 0.04 | |
| | | |
Less distributions: | | | | | | | | | | | | |
| | | |
From net investment income | | | (0.46) | | | | (0.67) | | | | (0.05) | |
From net realized gain | | | — | | | | — | | | | — | |
Tax return of capital | | | — | | | | (0.01) | | | | — | |
| | | | | | | | | | | | |
| | | |
Total distributions | | | (0.46) | | | | (0.68) | | | | (0.05) | |
| | | | | | | | | | | | |
| | | |
Net asset value at end of period | | | $ 9.77 | | | | $ 9.57 | | | | $ 9.99 | |
| | | | | | | | | | | | |
| | | |
Total return2 | | | 7.23% | | | | 2.98% | | | | 0.45% | |
| | | |
Portfolio turnover rate3 | | | 37% | | | | 38% | | | | 19% | |
| | | |
Net assets, end of period (in thousands) | | | $354 | | | | $425 | | | | $201 | |
| | | |
Ratios to average net assets:4 | | | | | | | | | | | | |
Total expenses to average net assets: | | | | | | | | | | | | |
Total expenses before reimbursements | | | 1.29% | | | | 1.65% | | | | 2.93% | |
Total expenses after reimbursements | | | 0.92% | | | | 0.93% | | | | 0.95% | |
| | | |
Net investment income to average net assets: | | | | | | | | | | | | |
Net investment income before reimbursements | | | 9.58% | | | | 6.50% | | | | 3.35% | |
Net investment income after reimbursements | | | 9.95% | | | | 7.22% | | | | 5.33% | |
See accompanying notes to the financial statements.
37
ASHMORE FUNDS
FINANCIAL HIGHLIGHTS
| | | | | | | | | | | | |
| Ashmore Emerging Markets Short Duration Fund | | | | | | | | | |
| | | Institutional Class | |
| | | |
| | | Six Months
Ended
April 30, 2016
(Unaudited) | | | Year Ended
October 31,
2015 | | | Period Ended
October 31,
20145 | |
| | | | |
| | | |
Net asset value at beginning of period | | | $ 9.40 | | | | $ 9.81 | | | | $ 10.00 | |
| | | |
Income (loss) from investment operations: | | | | | | | | | | | | |
Net investment income (loss) | | | 0.47 | | | | 0.68 | | | | 0.16 | |
Net realized and unrealized gain (loss) | | | 0.19 | | | | (0.39) | | | | (0.19) | |
| | | | | | | | | | | | |
| | | |
Total from investment operations | | | 0.66 | | | | 0.29 | | | | (0.03) | |
| | | |
Less distributions: | | | | | | | | | | | | |
| | | |
From net investment income | | | (0.46) | | | | (0.69) | | | | (0.16) | |
From net realized gain | | | — | | | | — | | | | — | |
Tax return of capital | | | — | | | | (0.01) | | | | — | |
| | | | | | | | | | | | |
| | | |
Total distributions | | | (0.46) | | | | (0.70) | | | | (0.16) | |
| | | | | | | | | | | | |
| | | |
Net asset value at end of period | | | $ 9.60 | | | | $ 9.40 | | | | $ 9.81 | |
| | | | | | | | | | | | |
| | | |
Total return2 | | | 7.42% | | | | 3.28% | | | | (0.25%) | |
| | | |
Portfolio turnover rate3 | | | 37% | | | | 38% | | | | 19% | |
| | | |
Net assets, end of period (in thousands) | | | $71,836 | | | | $26,918 | | | | $21,275 | |
| | | |
Ratios to average net assets:4 | | | | | | | | | | | | |
Total expenses to average net assets: | | | | | | | | | | | | |
Total expenses before reimbursements | | | 1.01% | | | | 1.41% | | | | 2.94% | |
Total expenses after reimbursements | | | 0.67% | | | | 0.67% | | | | 0.67% | |
| | | |
Net investment income to average net assets: | | | | | | | | | | | | |
Net investment income before reimbursements | | | 10.42% | | | | 6.61% | | | | 2.58% | |
Net investment income after reimbursements | | | 10.76% | | | | 7.35% | | | | 4.85% | |
| 1 | Class A commenced investment operations on September 23, 2014. |
| 2 | Assumes investment at net asset value at the beginning of the period, reinvestment of all distributions at net asset value on distribution date, and a complete redemption of the investment at net asset value at the end of the period excluding the impact of sales charges. Total return is not annualized for periods less than one year. |
| 3 | The portfolio turnover rate is calculated by dividing the lesser of cost of purchases or proceeds from sales of long term portfolio securities by the monthly average of the value of the long term portfolio securities. Portfolio turnover is not annualized for periods less than one year. |
| 4 | Annualized for periods less than one year. |
| 5 | The Institutional Class commenced investment operations on June 24, 2014. |
See accompanying notes to the financial statements.
38
ASHMORE FUNDS
FINANCIAL HIGHLIGHTS
| | | | |
| Ashmore Emerging Markets Equity Opportunities Fund | | | |
| | | Class A | |
| |
| | | Period
Ended
April 30, 2016
(Unaudited)1 | |
| |
Net asset value at beginning of period | | | $ 10.00 | |
| |
Income (loss) from investment operations: | | | | |
Net investment income (loss) | | | 0.06 | |
Net realized and unrealized gain (loss) | | | (0.08) | |
| | | | |
Total from investment operations | | | (0.02) | |
| |
Less distributions: | | | | |
| |
From net investment income | | | (0.07) | |
Tax return of capital | | | — | |
| | | | |
| |
Total distributions | | | (0.07) | |
| | | | |
Net asset value at end of period | | | $ 9.91 | |
| | | | |
| |
Total return2 | | | (0.16%) | |
| |
Portfolio turnover rate3 | | | 0% | |
| |
Net assets, end of period (in thousands) | | | $10 | |
| |
Ratios to average net assets:4 | | | | |
Total expenses to average net assets: | | | | |
Total expenses before reimbursements | | | 3.66% | |
Total expenses after reimbursements | | | 0.30% | |
| |
Net investment income (loss) to average net assets: | | | | |
Net investment loss before reimbursements | | | (1.80%) | |
Net investment income after reimbursements | | | 1.56% | |
See accompanying notes to the financial statements.
39
ASHMORE FUNDS
FINANCIAL HIGHLIGHTS
| | | | |
| Ashmore Emerging Markets Equity Opportunities Fund | | | |
| | | Class C | |
| |
| | | Period
Ended
April 30, 2016
(Unaudited)1 | |
| |
Net asset value at beginning of period | | | $ 10.00 | |
| |
Income (loss) from investment operations: | | | | |
Net investment income (loss) | | | 0.03 | |
Net realized and unrealized gain (loss) | | | (0.08) | |
| | | | |
Total from investment operations | | | (0.05) | |
| |
Less distributions: | | | | |
| |
From net investment income | | | (0.06) | |
Tax return of capital | | | — | |
| | | | |
| |
Total distributions | | | (0.06) | |
| | | | |
Net asset value at end of period | | | $ 9.89 | |
| | | | |
| |
Total return2 | | | (0.49%) | |
| |
Portfolio turnover rate3 | | | 0% | |
| |
Net assets, end of period (in thousands) | | | $10 | |
| |
Ratios to average net assets:4 | | | | |
Total expenses to average net assets: | | | | |
Total expenses before reimbursements | | | 4.40% | |
Total expenses after reimbursements | | | 1.05% | |
| |
Net investment income (loss) to average net assets: | | | | |
Net investment loss before reimbursements | | | (2.54%) | |
Net investment income after reimbursements | | | 0.81% | |
See accompanying notes to the financial statements.
40
ASHMORE FUNDS
FINANCIAL HIGHLIGHTS
| | | | |
| Ashmore Emerging Markets Equity Opportunities Fund | | | |
| | | Institutional Class | |
| |
| | | Period
Ended
April 30, 2016
(Unaudited)1 | |
| |
Net asset value at beginning of period | | | $ 10.00 | |
| |
Income (loss) from investment operations: | | | | |
Net investment income (loss) | | | 0.07 | |
Net realized and unrealized gain (loss) | | | (0.08) | |
| | | | |
Total from investment operations | | | (0.01) | |
| |
Less distributions: | | | | |
| |
From net investment income | | | (0.07) | |
Tax return of capital | | | — | |
| | | | |
| |
Total distributions | | | (0.07) | |
| | | | |
Net asset value at end of period | | | $ 9.92 | |
| | | | |
| |
Total return2 | | | (0.03%) | |
| |
Portfolio turnover rate3 | | | 0% | |
| |
Net assets, end of period (in thousands) | | | $5,047 | |
| |
Ratios to average net assets:4 | | | | |
Total expenses to average net assets: | | | | |
Total expenses before reimbursements | | | 3.40% | |
Total expenses after reimbursements | | | 0.05% | |
| |
Net investment income (loss) to average net assets: | | | | |
Net investment loss before reimbursements | | | (1.54%) | |
Net investment income after reimbursements | | | 1.81% | |
| 1 | Class A, Class C and the Institutional Class commenced investment operations on November 23, 2015. |
| 2 | Assumes investment at net asset value at the beginning of the period, reinvestment of all distributions at net asset value on distribution date, and a complete redemption of the investment at net asset value at the end of the period excluding the impact of sales charges. Total return is not annualized for periods less than one year. |
| 3 | The portfolio turnover rate is calculated by dividing the lesser of cost of purchases or proceeds from sales of long term portfolio securities by the monthly average of the value of the long term portfolio securities. Portfolio turnover is not annualized for periods less than one year. |
| 4 | Annualized for periods less than one year. |
See accompanying notes to the financial statements.
41
ASHMORE FUNDS
FINANCIAL HIGHLIGHTS
| | | | | | | | | | | | | | | | | | | | |
| Ashmore Emerging Markets Value Fund1 | | | | | | | | | | | | | | | |
| |
| | | Class A | |
| | | | | |
| | | Six Months
Ended
April 30, 2016
(Unaudited) | | | Year Ended
October 31,
2015 | | | Year Ended
October 31,
2014 | | | Year Ended
October 31,
2013 | | | Period Ended
October 31,
20122 | |
| | | | |
| | | | | |
Net asset value at beginning of period | | | $ 7.29 | | | | $ 9.24 | | | | $ 9.66 | | | | $ 9.01 | | | | $10.00 | |
| | | | | |
Income (loss) from investment operations: | | | | | | | | | | | | | | | | | | | | |
Net investment income (loss) | | | — | 3 | | | 0.03 | | | | 0.06 | | | | 0.08 | 4 | | | 0.08 | 4 |
Net realized and unrealized gain (loss) | | | 0.21 | | | | (1.92 | ) | | | (0.40 | ) | | | 0.64 | | | | (0.98 | ) |
| | | | | | | | | | | | | | | | | | | | |
| | | | | |
Total from investment operations | | | 0.21 | | | | (1.89 | ) | | | (0.34 | ) | | | 0.72 | | | | (0.90 | ) |
| | | | | |
Less distributions: | | | | | | | | | | | | | | | | | | | | |
| | | | | |
From net investment income | | | — | | | | (0.06 | ) | | | (0.08 | ) | | | (0.06 | ) | | | (0.09 | ) |
Tax return of capital | | | — | | | | — | 3 | | | — | | | | (0.01 | ) | | | — | |
| | | | | | | | | | | | | | | | | | | | |
| | | | | |
Total distributions | | | — | | | | (0.06 | ) | | | (0.08 | ) | | | (0.07 | ) | | | (0.09 | ) |
| | | | | | | | | | | | | | | | | | | | |
| | | | | |
Net asset value at end of period | | | $ 7.50 | | | | $ 7.29 | | | | $ 9.24 | | | | $ 9.66 | | | | $ 9.01 | |
| | | | | | | | | | | | | | | | | | | | |
| | | | | |
Total return5 | | | 2.88 | % | | | (20.52 | %) | | | (3.58 | %) | | | 8.11 | % | | | (8.94 | %) |
| | | | | |
Portfolio turnover rate6 | | | 68 | % | | | 106 | % | | | 130 | % | | | 92 | % | | | 95 | % |
| | | | | |
Net assets, end of period (in thousands) | | | $ 25 | | | | $ 24 | | | | $ 30 | | | | $ 28 | | | | $ 1 | |
| | | | | |
Ratios to average net assets:7 | | | | | | | | | | | | | | | | | | | | |
Total expenses to average net assets: | | | | | | | | | | | | | | | | | | | | |
Total expenses before reimbursements | | | 2.89 | % | | | 3.56 | % | | | 3.62 | % | | | 3.01 | % | | | 4.40 | % |
Total expenses after reimbursements | | | 1.42 | % | | | 1.43 | % | | | 1.45 | % | | | 1.45 | % | | | 1.45 | % |
| | | | | |
Net investment income (loss) to average net assets: | | | | | | | | | | | | | | | | | | | | |
Net investment loss before reimbursements | | | (1.54 | %) | | | (1.82 | %) | | | (1.45 | %) | | | (0.70 | %) | | | (1.60 | %) |
Net investment income (loss) after reimbursements | | | (0.07 | %) | | | 0.31 | % | | | 0.72 | % | | | 0.86 | % | | | 1.35 | % |
See accompanying notes to the financial statements.
42
ASHMORE FUNDS
FINANCIAL HIGHLIGHTS
| | | | | | | | | | | | | | | | | | | | |
| Ashmore Emerging Markets Value Fund1 | | | | | | | | | | | | | | | |
| |
| | | Class C | |
| | | | | |
| | | Six Months
Ended
April 30, 2016
(Unaudited) | | | Year Ended
October 31,
2015 | | | Year Ended
October 31,
2014 | | | Year Ended
October 31,
2013 | | | Period Ended
October 31,
20128 | |
| | | | |
| | | | | |
Net asset value at beginning of period | | | $ 8.17 | | | | $ 10.46 | | | | $11.00 | | | | $10.32 | | | | $10.00 | |
| | | | | |
Income (loss) from investment operations: | | | | | | | | | | | | | | | | | | | | |
Net investment income (loss) | | | (0.03 | ) | | | (0.04 | ) | | | (0.01 | ) | | | (0.03 | )4 | | | (0.01 | )4 |
Net realized and unrealized gain (loss) | | | 0.24 | | | | (2.19 | ) | | | (0.45 | ) | | | 0.78 | | | | 0.36 | |
| | | | | | | | | | | | | | | | | | | | |
| | | | | |
Total from investment operations | | | 0.21 | | | | (2.23 | ) | | | (0.46 | ) | | | 0.75 | | | | 0.35 | |
| | | | | |
Less distributions: | | | | | | | | | | | | | | | | | | | | |
| | | | | |
From net investment income | | | — | | | | (0.06 | ) | | | (0.08 | ) | | | (0.06 | ) | | | (0.03 | ) |
Tax return of capital | | | — | | | | — | 3 | | | — | | | | (0.01 | ) | | | — | |
| | | | | | | | | | | | | | | | | | | | |
| | | | | |
Total distributions | | | — | | | | (0.06 | ) | | | (0.08 | ) | | | (0.07 | ) | | | (0.03 | ) |
| | | | | | | | | | | | | | | | | | | | |
| | | | | |
Net asset value at end of period | | | $ 8.38 | | | | $ 8.17 | | | | $10.46 | | | | $11.00 | | | | $10.32 | |
| | | | | | | | | | | | | | | | | | | | |
| | | | | |
Total return5 | | | 2.57 | % | | | (21.38 | %) | | | (4.24 | %) | | | 7.58 | % | | | 3.26 | % |
| | | | | |
Portfolio turnover rate6 | | | 68 | % | | | 106 | % | | | 130 | % | | | 92 | % | | | 95 | % |
| | | | | |
Net assets, end of period (in thousands) | | | $ 1 | | | | $ 1 | | | | $ 1 | | | | $ 1 | | | | $ 1 | |
| | | | | |
Ratios to average net assets:7 | | | | | | | | | | | | | | | | | | | | |
Total expenses to average net assets: | | | | | | | | | | | | | | | | | | | | |
Total expenses before reimbursements | | | 3.76 | % | | | 4.31 | % | | | 4.34 | % | | | 3.77 | % | | | 5.40 | % |
Total expenses after reimbursements | | | 2.17 | % | | | 2.18 | % | | | 2.20 | % | | | 2.20 | % | | | 2.20 | % |
| | | | | |
Net investment loss to average net assets: | | | | | | | | | | | | | | | | | | | | |
Net investment loss before reimbursements | | | (2.42 | %) | | | (2.57 | %) | | | (2.25 | %) | | | (1.81 | %) | | | (3.82 | %) |
Net investment loss after reimbursements | | | (0.83 | %) | | | (0.44 | %) | | | (0.11 | %) | | | (0.24 | %) | | | (0.62 | %) |
See accompanying notes to the financial statements.
43
ASHMORE FUNDS
FINANCIAL HIGHLIGHTS
| | | | | | | | | | | | | | | | | | | | | | | | |
| Ashmore Emerging Markets Value Fund1 | | | | | | | | | | | | | | | | | | |
| |
| | | Institutional Class | |
| | | | | | |
| | | Six Months
Ended
April 30, 2016
(Unaudited) | | | Year Ended
October 31,
2015 | | | Year Ended
October 31,
2014 | | | Year Ended
October 31,
2013 | | | Year Ended
October 31,
2012 | | | Period Ended
October 31,
20119 | |
| | | | |
| | | | | | |
Net asset value at beginning of period | | | $ 7.02 | | | | $ 8.88 | | | | $ 9.27 | | | | $ 8.62 | | | | $ 8.81 | | | | $ 10.00 | |
| | | | | | |
Income (loss) from investment operations: | | | | | | | | | | | | | | | | | | | | | | | | |
Net investment income (loss) | | | 0.01 | | | | 0.05 | | | | 0.08 | | | | 0.07 | 4 | | | 0.09 | 4 | | | 0.05 | 4 |
Net realized and unrealized gain (loss) | | | 0.21 | | | | (1.85 | ) | | | (0.39 | ) | | | 0.65 | | | | (0.17 | ) | | | (1.19 | ) |
| | | | | | | | | | | | | | | | | | | | | | | | |
| | | | | | |
Total from investment operations | | | 0.22 | | | | (1.80 | ) | | | (0.31 | ) | | | 0.72 | | | | (0.08 | ) | | | (1.14 | ) |
| | | | | | |
Less distributions: | | | | | | | | | | | | | | | | | | | | | | | | |
| | | | | | |
From net investment income | | | — | | | | (0.06 | ) | | | (0.08 | ) | | | (0.06 | ) | | | (0.10 | ) | | | (0.05 | ) |
Tax return of capital | | | — | | | | — | 3 | | | — | | | | (0.01 | ) | | | (0.01 | ) | | | — | |
| | | | | | | | | | | | | | | | | | | | | | | | |
| | | | | | |
Total distributions | | | — | | | | (0.06 | ) | | | (0.08 | ) | | | (0.07 | ) | | | (0.11 | ) | | | (0.05 | ) |
| | | | | | | | | | | | | | | | | | | | | | | | |
| | | | | | |
Net asset value at end of period | | | $ 7.24 | | | | $ 7.02 | | | | $ 8.88 | | | | $ 9.27 | | | | $ 8.62 | | | | $ 8.81 | |
| | | | | | | | | | | | | | | | | | | | | | | | |
| | | | | | |
Total return5 | | | 3.13 | % | | | (20.34 | %) | | | (3.40 | %) | | | 8.48 | % | | | (0.87 | %) | | | (11.37 | %) |
| | | | | | |
Portfolio turnover rate6 | | | 68 | % | | | 106 | % | | | 130 | % | | | 92 | % | | | 95 | % | | | 75 | % |
| | | | | | |
Net assets, end of period (in thousands) | | | $8,618 | | | | $ 7,601 | | | | $10,304 | | | | $9,825 | | | | $8,742 | | | | $ 8,848 | |
| | | | | | |
Ratios to average net assets:7 | | | | | | | | | | | | | | | | | | | | | | | | |
Total expenses to average net assets: | | | | | | | | | | | | | | | | | | | | | | | | |
Total expenses before reimbursements | | | 2.65 | % | | | 3.31 | % | | | 3.37 | % | | | 2.76 | % | | | 4.09 | % | | | 5.34 | % |
Total expenses after reimbursements | | | 1.17 | % | | | 1.17 | % | | | 1.17 | % | | | 1.17 | % | | | 1.17 | % | | | 1.17 | % |
| | | | | | |
Net investment income (loss) to average net assets: | | | | | | | | | | | | | | | | | | | | | | | | |
Net investment loss before reimbursements | | | (1.30 | %) | | | (1.59 | %) | | | (1.28 | %) | | | (0.79 | %) | | | (1.84 | %) | | | (2.55 | %) |
Net investment income after reimbursements | | | 0.18 | % | | | 0.55 | % | | | 0.92 | % | | | 0.80 | % | | | 1.08 | % | | | 1.62 | % |
| 1 | Formerly the Ashmore Emerging Markets Equity Fund. |
| 2 | Class A commenced investment operations on February 27, 2012. |
| 3 | Amount is less than $0.005 per share. |
| 4 | Per share amounts are based on average number of shares outstanding during the period. |
| 5 | Assumes investment at net asset value at the beginning of the period, reinvestment of all distributions at net asset value on distribution date, and a complete redemption of the investment at net asset value at the end of the period excluding the impact of sales charges. Total return is not annualized for periods less than one year. |
| 6 | The portfolio turnover rate is calculated by dividing the lesser of cost of purchases or proceeds from sales of long term portfolio securities by the monthly average of the value of the long term portfolio securities. Portfolio turnover is not annualized for periods less than one year. |
| 7 | Annualized for periods less than one year. |
| 8 | Class C commenced investment operations on August 24, 2012. |
| 9 | The Institutional Class commenced investment operations on June 22, 2011. |
See accompanying notes to the financial statements.
44
ASHMORE FUNDS
FINANCIAL HIGHLIGHTS
| | | | | | | | | | | | | | | | | | | | |
| Ashmore Emerging Markets Small-Cap Equity Fund | | | | | | | | | | | | | | | |
| |
| | | Class A | |
| | | | | |
| | | Six Months Ended
April 30, 2016
(Unaudited) | | | Year Ended
October 31,
2015 | | | Year Ended
October 31,
2014 | | | Year Ended
October 31,
2013 | | | Period Ended
October 31,
20121 | |
| | | | |
| | | | | |
Net asset value at beginning of period | | | $ 7.92 | | | | $ 9.35 | | | | $10.61 | | | | $ 9.77 | | | | $10.00 | |
| | | | | |
Income (loss) from investment operations: | | | | | | | | | | | | | | | | | | | | |
Net investment income (loss) | | | (0.05 | ) | | | 0.16 | | | | 0.01 | 2 | | | 0.08 | 2 | | | 0.02 | 2 |
Net realized and unrealized gain (loss) | | | 0.13 | | | | (1.12 | ) | | | (0.42 | ) | | | 1.31 | | | | (0.20 | ) |
| | | | | | | | | | | | | | | | | | | | |
| | | | | |
Total from investment operations | | | 0.08 | | | | (0.96 | ) | | | (0.41 | ) | | | 1.39 | | | | (0.18 | ) |
| | | | | |
Less distributions: | | | | | | | | | | | | | | | | | | | | |
| | | | | |
From net investment income | | | (0.12 | ) | | | (0.08 | ) | | | (0.01 | ) | | | (0.03 | ) | | | (0.05 | ) |
From net realized gain | | | — | | | | (0.39 | ) | | | (0.84 | ) | | | (0.52 | ) | | | — | |
| | | | | | | | | | | | | | | | | | | | |
| | | | | |
Total distributions | | | (0.12 | ) | | | (0.47 | ) | | | (0.85 | ) | | | (0.55 | ) | | | (0.05 | ) |
| | | | | | | | | | | | | | | | | | | | |
| | | | | |
Net asset value at end of period | | | $ 7.88 | | | | $ 7.92 | | | | $ 9.35 | | | | $10.61 | | | | $ 9.77 | |
| | | | | | | | | | | | | | | | | | | | |
| | | | | |
Total return3 | | | 1.05 | % | | | (10.32 | %) | | | (3.93 | %) | | | 14.65 | % | | | (1.73 | %) |
| | | | | |
Portfolio turnover rate4 | | | 63 | % | | | 105 | % | | | 104 | % | | | 113 | % | | | 94 | % |
| | | | | |
Net assets, end of period (in thousands) | | | $ 455 | | | | $ 259 | | | | $ 332 | | | | $ 265 | | | | $ 238 | |
| | | | | |
Ratios to average net assets:5 | | | | | | | | | | | | | | | | | | | | |
Total expenses to average net assets: | | | | | | | | | | | | | | | | | | | | |
Total expenses before reimbursements | | | 2.34 | % | | | 2.33 | % | | | 2.53 | % | | | 2.35 | % | | | 3.43 | % |
Total expenses after reimbursements | | | 1.77 | % | | | 1.78 | % | | | 1.80 | % | | | 1.80 | % | | | 1.80 | % |
| | | | | |
Net investment income (loss) to average net assets: | | | | | | | | | | | | | | | | | | | | |
Net investment income (loss) before reimbursements | | | (0.63 | %) | | | 0.96 | % | | | (0.65 | %) | | | 0.25 | % | | | (1.15 | %) |
Net investment income (loss) after reimbursements | | | (0.06 | %) | | | 1.51 | % | | | 0.08 | % | | | 0.80 | % | | | 0.48 | % |
See accompanying notes to the financial statements.
45
ASHMORE FUNDS
FINANCIAL HIGHLIGHTS
| | | | | | | | | | | | | | | | | | | | |
| Ashmore Emerging Markets Small-Cap Equity Fund | | | | | | | | | | | | | | | |
| |
| | | Class C | |
| | | | | |
| | | Six Months Ended
April 30, 2016
(Unaudited) | | | Year Ended
October 31,
2015 | | | Year Ended
October 31,
2014 | | | Year Ended
October 31,
2013 | | | Period Ended
October 31,
20126 | |
| | | | |
| | | | | |
Net asset value at beginning of period | | | $ 8.40 | | | | $ 9.96 | | | | $11.33 | | | | $10.48 | | | | $10.00 | |
| | | | | |
Income (loss) from investment operations: | | | | | | | | | | | | | | | | | | | | |
Net investment income (loss) | | | (0.03 | ) | | | 0.10 | | | | (0.05 | )2 | | | (0.06 | )2 | | | (0.01 | )2 |
Net realized and unrealized gain (loss) | | | 0.09 | | | | (1.19 | ) | | | (0.47 | ) | | | 1.46 | | | | 0.54 | |
| | | | | | | | | | | | | | | | | | | | |
| | | | | |
Total from investment operations | | | 0.06 | | | | (1.09 | ) | | | (0.52 | ) | | | 1.40 | | | | 0.53 | |
| | | | | |
Less distributions: | | | | | | | | | | | | | | | | | | | | |
| | | | | |
From net investment income | | | (0.12 | ) | | | (0.08 | ) | | | (0.01 | ) | | | (0.03 | ) | | | (0.05 | ) |
From net realized gain | | | — | | | | (0.39 | ) | | | (0.84 | ) | | | (0.52 | ) | | | — | |
| | | | | | | | | | | | | | | | | | | | |
| | | | | |
Total distributions | | | (0.12 | ) | | | (0.47 | ) | | | (0.85 | ) | | | (0.55 | ) | | | (0.05 | ) |
| | | | | | | | | | | | | | | | | | | | |
| | | | | |
Net asset value at end of period | | | $ 8.34 | | | | $ 8.40 | | | | $ 9.96 | | | | $11.33 | | | | $10.48 | |
| | | | | | | | | | | | | | | | | | | | |
| | | | | |
Total return3 | | | 0.68 | % | | | (11.02 | %) | | | (4.71 | %) | | | 13.93 | % | | | 5.17 | % |
| | | | | |
Portfolio turnover rate4 | | | 63 | % | | | 105 | % | | | 104 | % | | | 113 | % | | | 94 | % |
| | | | | |
Net assets, end of period (in thousands) | | | $ 342 | | | | $ 311 | | | | $ 77 | | | | $ 12 | | | | $ 1 | |
| | | | | |
Ratios to average net assets:5 | | | | | | | | | | | | | | | | | | | | |
Total expenses to average net assets: | | | | | | | | | | | | | | | | | | | | |
Total expenses before reimbursements | | | 3.07 | % | | | 3.09 | % | | | 3.60 | % | | | 3.10 | % | | | 5.12 | % |
Total expenses after reimbursements | | | 2.52 | % | | | 2.52 | % | | | 2.55 | % | | | 2.55 | % | | | 2.55 | % |
| | | | | |
Net investment income (loss) to average net assets: | | | | | | | | | | | | | | | | | | | | |
Net investment income (loss) before reimbursements | | | (1.51 | %) | | | 1.81 | % | | | (1.53 | %) | | | (1.13 | %) | | | (3.35 | %) |
Net investment income (loss) after reimbursements | | | (0.96 | %) | | | 2.38 | % | | | (0.48 | %) | | | (0.58 | %) | | | (0.78 | %) |
See accompanying notes to the financial statements.
46
ASHMORE FUNDS
FINANCIAL HIGHLIGHTS
| | | | | | | | | | | | | | | | | | | | | | | | |
| Ashmore Emerging Markets Small-Cap Equity Fund | | | | | | | |
| |
| | | Institutional Class | |
| | | | | | |
| | | Six Months Ended
April 30, 2016
(Unaudited) | | | Year Ended
October 31,
2015 | | | Year Ended
October 31,
2014 | | | Year Ended
October 31,
2013 | | | Year Ended October 31,
2012 | | | Period Ended
October 31,
20117 | |
| | | | |
| | | | | | |
Net asset value at beginning of period | | | $ 10.01 | | | | $ 11.63 | | | | $ 12.96 | | | | $ 11.79 | | | | $ 11.58 | | | | $ 10.00 | |
| | | | | | |
Income (loss) from investment operations: | | | | | | | | | | | | | | | | | | | | | | | | |
Net investment income (loss) | | | (0.03 | ) | | | 0.20 | | | | 0.02 | 2 | | | 0.02 | 2 | | | 0.05 | 2 | | | (0.01 | )2 |
Net realized and unrealized gain (loss) | | | 0.14 | | | | (1.35 | ) | | | (0.50 | ) | | | 1.70 | | | | 0.25 | | | | 1.59 | |
| | | | | | | | | | | | | | | | | | | | | | | | |
| | | | | | |
Total from investment operations | | | 0.11 | | | | (1.15 | ) | | | (0.48 | ) | | | 1.72 | | | | 0.30 | | | | 1.58 | |
| | | | | | |
Less distributions: | | | | | | | | | | | | | | | | | | | | | | | | |
| | | | | | |
From net investment income | | | (0.12 | ) | | | (0.08 | ) | | | (0.01 | ) | | | (0.03 | ) | | | (0.05 | ) | | | — | |
From net realized gain | | | — | | | | (0.39 | ) | | | (0.84 | ) | | | (0.52 | ) | | | (0.04 | ) | | | — | |
| | | | | | | | | | | | | | | | | | | | | | | | |
| | | | | | |
Total distributions | | | (0.12 | ) | | | (0.47 | ) | | | (0.85 | ) | | | (0.55 | ) | | | (0.09 | ) | | | — | |
| | | | | | | | | | | | | | | | | | | | | | | | |
| | | | | | |
Net asset value at end of period | | | $ 10.00 | | | | $ 10.01 | | | | $ 11.63 | | | | $ 12.96 | | | | $ 11.79 | | | | $ 11.58 | |
| | | | | | | | | | | | | | | | | | | | | | | | |
| | | | | | |
Total return3 | | | 1.26 | % | | | (9.91 | %) | | | (3.74 | %) | | | 15.04 | % | | | 2.61 | % | | | 15.80 | % |
| | | | | | |
Portfolio turnover rate4 | | | 63 | % | | | 105 | % | | | 104 | % | | | 113 | % | | | 94 | % | | | 20 | % |
| | | | | | |
Net assets, end of period (in thousands) | | | $29,463 | | | | $42,486 | | | | $48,909 | | | | $30,370 | | | | $13,359 | | | | $11,576 | |
| | | | | | |
Ratios to average net assets:5 | | | | | | | | | | | | | | | | | | | | | | | | |
Total expenses to average net assets: | | | | | | | | | | | | | | | | | | | | | | | | |
Total expenses before reimbursements | | | 2.04 | % | | | 2.08 | % | | | 2.39 | % | | | 2.11 | % | | | 3.43 | % | | | 15.42 | % |
Total expenses after reimbursements | | | 1.52 | % | | | 1.52 | % | | | 1.52 | % | | | 1.52 | % | | | 1.52 | % | | | 1.52 | % |
| | | | | | |
Net investment income (loss) to average net assets: | | | | | | | | | | | | | | | | | | | | | | | | |
Net investment income (loss) before reimbursements | | | (0.77 | %) | | | 1.24 | % | | | (0.70 | %) | | | (0.42 | %) | | | (1.46 | %) | | | (14.76 | %) |
Net investment income (loss) after reimbursements | | | (0.25 | %) | | | 1.80 | % | | | 0.17 | % | | | 0.17 | % | | | 0.45 | % | | | (0.86 | %) |
| 1 | Class A commenced investment operations on February 1, 2012. |
| 2 | Per share amounts are based on average number of shares outstanding during the period. |
| 3 | Assumes investment at net asset value at the beginning of the period, reinvestment of all distributions at net asset value on distribution date, and a complete redemption of the investment at net asset value at the end of the period excluding the impact of sales charges. Total return is not annualized for periods less than one year. |
| 4 | The portfolio turnover rate is calculated by dividing the lesser of cost of purchases or proceeds from sales of long term portfolio securities by the monthly average of the value of the long term portfolio securities. Portfolio turnover is not annualized for periods less than one year. |
| 5 | Annualized for periods less than one year. |
| 6 | Class C commenced investment operations on August 24, 2012. |
| 7 | The Institutional Class commenced investment operations on October 4, 2011. |
See accompanying notes to the financial statements.
47
ASHMORE FUNDS
FINANCIAL HIGHLIGHTS
| | | | | | | | | | | | |
| Ashmore Emerging Markets Frontier Equity Fund | | | |
| | | Class A | |
| | | |
| | | Six Months Ended April 30, 2016
(Unaudited) | | | Year Ended October 31,
2015 | | | Period Ended October 31,
20141 | |
| | | | |
| | | |
Net asset value at beginning of period | | | $ 7.83 | | | | $ 10.19 | | | | $ 10.00 | |
| | | |
Income (loss) from investment operations: | | | | | | | | | | | | |
Net investment income (loss) | | | 0.132 | | | | 0.102 | | | | (0.03) | |
Net realized and unrealized gain (loss) | | | (0.28) | | | | (1.45) | | | | 0.27 | |
| | | | | | | | | | | | |
| | | |
Total from investment operations | | | (0.15) | | | | (1.35) | | | | 0.24 | |
| | | |
Less distributions: | | | | | | | | | | | | |
| | | |
From net investment income | | | (0.09) | | | | (0.15) | | | | (0.05) | |
From net realized gain | | | — | | | | (0.86) | | | | — | |
| | | | | | | | | | | | |
| | | |
Total distributions | | | (0.09) | | | | (1.01) | | | | (0.05) | |
| | | | | | | | | | | | |
| | | |
Net asset value at end of period | | | $ 7.59 | | | | $ 7.83 | | | | $ 10.19 | |
| | | | | | | | | | | | |
| | | |
Total return3 | | | (2.00%) | | | | (13.68%) | | | | 2.43% | |
| | | |
Portfolio turnover rate4 | | | 45% | | | | 91% | | | | 157% | |
| | | |
Net assets, end of period (in thousands) | | | $64 | | | | $45 | | | | $9 | |
| | | |
Ratios to average net assets:5 | | | | | | | | | | | | |
Total expenses to average net assets: | | | | | | | | | | | | |
Total expenses before reimbursements | | | 2.24% | | | | 2.73% | | | | 6.90% | |
Total expenses after reimbursements | | | 1.77% | | | | 1.79% | | | | 1.80% | |
| | | |
Net investment income (loss) to average net assets: | | | | | | | | | | | | |
Net investment income (loss) before reimbursements | | | 3.17% | | | | 0.25% | | | | (5.89%) | |
Net investment income (loss) after reimbursements | | | 3.64% | | | | 1.19% | | | | (0.79%) | |
See accompanying notes to the financial statements.
48
ASHMORE FUNDS
FINANCIAL HIGHLIGHTS
| | | | | | | | | | | | |
| Ashmore Emerging Markets Frontier Equity Fund | | | |
| | | Class C | |
| | | |
| | | Six Months Ended
April 30, 2016
(Unaudited) | | | Year Ended October 31,
2015 | | | Period Ended October 31,
20141 | |
| | | | |
| | | |
Net asset value at beginning of period | | | $ 7.73 | | | | $ 10.15 | | | | $ 10.00 | |
| | | |
Income (loss) from investment operations: | | | | | | | | | | | | |
Net investment income (loss) | | | 0.092 | | | | (0.05)2 | | | | (0.83) | |
Net realized and unrealized gain (loss) | | | (0.28) | | | | (1.36) | | | | 1.03 | |
| | | | | | | | | | | | |
| | | |
Total from investment operations | | | (0.19) | | | | (1.41) | | | | 0.20 | |
| | | |
Less distributions: | | | | | | | | | | | | |
| | | |
From net investment income | | | (0.06) | | | | (0.15) | | | | (0.05) | |
From net realized gain | | | — | | | | (0.86) | | | | — | |
| | | | | | | | | | | | |
| | | |
Total distributions | | | (0.06) | | | | (1.01) | | | | (0.05) | |
| | | | | | | | | | | | |
| | | |
Net asset value at end of period | | | $ 7.48 | | | | $ 7.73 | | | | $ 10.15 | |
| | | | | | | | | | | | |
| | | |
Total return3 | | | (2.41%) | | | | (14.51%) | | | | 2.02% | |
| | | |
Portfolio turnover rate4 | | | 45% | | | | 91% | | | | 157% | |
| | | |
Net assets, end of period (in thousands) | | | $53 | | | | $53 | | | | $1 | |
| | | |
Ratios to average net assets:5 | | | | | | | | | | | | |
Total expenses to average net assets: | | | | | | | | | | | | |
Total expenses before reimbursements | | | 2.98% | | | | 3.45% | | | | 7.71% | |
Total expenses after reimbursements | | | 2.52% | | | | 2.52% | | | | 2.55% | |
| | | |
Net investment income (loss) to average net assets: | | | | | | | | | | | | |
Net investment income (loss) before reimbursements | | | 1.99% | | | | (1.53%) | | | | (6.42%) | |
Net investment income (loss) after reimbursements | | | 2.45% | | | | (0.60%) | | | | (1.26%) | |
See accompanying notes to the financial statements.
49
ASHMORE FUNDS
FINANCIAL HIGHLIGHTS
| | | | | | | | | | | | |
| Ashmore Emerging Markets Frontier Equity Fund | | | |
| | | Institutional Class | |
| | | |
| | | Six Months Ended April 30, 2016 (Unaudited) | | | Year Ended October 31, 2015 | | | Period Ended October 31, 20146 | |
| | | | |
| | | |
Net asset value at beginning of period | | | $ 8.88 | | | | $ 11.35 | | | | $ 10.00 | |
| | | |
Income (loss) from investment operations: | | | | | | | | | | | | |
Net investment income (loss) | | | 0.142 | | | | 0.122 | | | | 0.14 | |
Net realized and unrealized gain (loss) | | | (0.31) | | | | (1.58) | | | | 1.32 | |
| | | | | | | | | | | | |
| | | |
Total from investment operations | | | (0.17) | | | | (1.46) | | | | 1.46 | |
| | | |
Less distributions: | | | | | | | | | | | | |
| | | |
From net investment income | | | (0.10) | | | | (0.15) | | | | (0.11) | |
From net realized gain | | | | | | | (0.86) | | | | — | |
| | | | | | | | | | | | |
| | | |
Total distributions | | | (0.10) | | | | (1.01) | | | | (0.11) | |
| | | | | | | | | | | | |
| | | |
Net asset value at end of period | | | $ 8.61 | | | | $ 8.88 | | | | $ 11.35 | |
| | | | | | | | | | | | |
| | | |
Total return3 | | | (1.89%) | | | | (13.29%) | | | | 14.69% | |
| | | |
Portfolio turnover rate4 | | | 45% | | | | 91% | | | | 157% | |
| | | |
Net assets, end of period (in thousands) | | | $49,073 | | | | $49,952 | | | | $7,280 | |
| | | |
Ratios to average net assets:5 | | | | | | | | | | | | |
Total expenses to average net assets: | | | | | | | | | | | | |
Total expenses before reimbursements | | | 1.98% | | | | 2.46% | | | | 6.09% | |
Total expenses after reimbursements | | | 1.52% | | | | 1.52% | | | | 1.52% | |
| | | |
Net investment income (loss) to average net assets: | | | | | | | | | | | | |
Net investment income (loss) before reimbursements | | | 2.96% | | | | 0.34% | | | | (3.68%) | |
Net investment income after reimbursements | | | 3.42% | | | | 1.28% | | | | 0.89% | |
| 1 | Class A and Class C commenced investment operations on May 7, 2014. |
| 2 | Per share amounts are based on average number of shares outstanding during the period. |
| 3 | Assumes investment at net asset value at the beginning of the period, reinvestment of all distributions at net asset value on distribution date, and a complete redemption of the investment at net asset value at the end of the period excluding the impact of sales charges. Total return is not annualized for periods less than one year. |
| 4 | The portfolio turnover rate is calculated by dividing the lesser of cost of purchases or proceeds from sales of long term portfolio securities by the monthly average of the value of the long term portfolio securities. Portfolio turnover is not annualized for periods less than one year. |
| 5 | Annualized for periods less than one year. |
| 6 | The Fund commenced investment operations on November 5, 2013. |
See accompanying notes to the financial statements.
50
ASHMORE EMERGING MARKETS TOTAL RETURN FUND
SCHEDULE OF INVESTMENTS
As of April 30, 2016 (Unaudited)
| | | | | | | | | | | | | | |
| | | Currency(1) | | Par | | | Value | | | % of Net
Assets | |
Debt Securities | | | | | | | | | | | | | | |
| | | | |
Angola (Cost $3,500,775) | | | | | | | | | | | | | | |
Angola (Rep of) 9.500%, 11/12/2025 | | | | | 690,000 | | | $ | 673,647 | | | | 0.12 | |
Angola (Rep of) Via Northern Lights III B.V. 7.000%, 08/16/2019 | | | | | 1,134,000 | | | | 1,141,314 | | | | 0.21 | |
Puma International Financing S.A. 6.750%, 02/01/2021 | | | | | 1,886,000 | | | | 1,853,184 | | | | 0.34 | |
| | | | | | | | | 3,668,145 | | | | 0.67 | |
Argentina (Cost $10,800,264) | | | | | | | | | | | | | | |
Argentina (Rep of) 8.750%, 06/02/2017 | | | | | 92,040 | | | | 96,274 | | | | 0.02 | |
Argentina (Rep of) 6.875%, 04/22/2021(2)(3) | | | | | 1,436,000 | | | | 1,477,922 | | | | 0.27 | |
Argentina (Rep of) 7.500%, 04/22/2026(2)(3) | | | | | 1,933,000 | | | | 1,961,995 | | | | 0.35 | |
Argentina (Rep of) 8.280%, 12/31/2033 | | | | | 452,657 | | | | 468,412 | | | | 0.08 | |
Argentina (Rep of), FRN 2.500%, 12/31/2038 | | | | | 2,927,446 | | | | 1,866,247 | | | | 0.34 | |
Argentina (Rep of) 7.625%, 04/22/2046(2)(3) | | | | | 1,564,000 | | | | 1,538,194 | | | | 0.28 | |
Letras del Banco Central de la Republica Argentina 0.000%, 06/15/2016(4) | | ARS | | | 14,404,834 | | | | 962,523 | | | | 0.17 | |
Letras del Banco Central de la Republica Argentina 0.000%, 07/06/2016(4) | | ARS | | | 7,840,185 | | | | 513,840 | | | | 0.09 | |
Letras del Banco Central de la Republica Argentina 0.000%, 08/10/2016(4) | | ARS | | | 4,360,575 | | | | 279,706 | | | | 0.05 | |
Letras del Banco Central de la Republica Argentina 0.000%, 08/17/2016(4) | | ARS | | | 3,107,940 | | | | 198,053 | | | | 0.04 | |
Letras del Banco Central de la Republica Argentina 0.000%, 10/05/2016(4) | | ARS | | | 4,360,575 | | | | 269,474 | | | | 0.05 | |
Letras del Banco Central de la Republica Argentina 0.000%, 10/12/2016(4) | | ARS | | | 3,302,187 | | | | 203,035 | | | | 0.04 | |
Letras del Banco Central de la Republica Argentina 0.000%, 10/26/2016(4) | | ARS | | | 4,232,966 | | | | 258,852 | | | | 0.05 | |
Letras del Banco Central de la Republica Argentina 0.000%, 12/14/2016(4) | | ARS | | | 3,809,670 | | | | 224,030 | | | | 0.04 | |
Letras del Banco Central de la Republica Argentina 0.000%, 12/28/2016(4) | | ARS | | | 9,249,224 | | | | 538,997 | | | | 0.10 | |
YPF S.A. 8.500%, 03/23/2021(2)(3) | | | | | 390,000 | | | | 407,550 | | | | 0.07 | |
| | | | | | | | | 11,265,104 | | | | 2.04 | |
Azerbaijan (Cost $4,645,013) | | | | | | | | | | | | | | |
Azerbaijan (Rep of) 4.750%, 03/18/2024 | | | | | 520,000 | | | | 504,504 | | | | 0.09 | |
International Bank of Azerbaijan OJSC 5.625%, 06/11/2019 | | | | | 230,000 | | | | 216,890 | | | | 0.04 | |
Southern Gas Corridor CJSC 6.875%, 03/24/2026(2) | | | | | 1,130,000 | | | | 1,161,357 | | | | 0.21 | |
State Oil Co. of the Azerbaijan Republic 4.750%, 03/13/2023 | | | | | 2,250,000 | | | | 2,021,882 | | | | 0.37 | |
State Oil Co. of the Azerbaijan Republic 6.950%, 03/18/2030 | | | | | 640,000 | | | | 609,600 | | | | 0.11 | |
| | | | | | | | | 4,514,233 | | | | 0.82 | |
Bangladesh (Cost $284,913) | | | | | | | | | | | | | | |
Banglalink Digital Communications Ltd. 8.625%, 05/06/2019 | | | | | 275,000 | | | | 290,950 | | | | 0.05 | |
| | | | | | | | | 290,950 | | | | 0.05 | |
Barbados (Cost $1,274,280) | | | | | | | | | | | | | | |
Columbus International, Inc. 7.375%, 03/30/2021 | | | | | 1,190,000 | | | | 1,264,018 | | | | 0.23 | |
| | | | | | | | | 1,264,018 | | | | 0.23 | |
See accompanying notes to the financial statements.
51
ASHMORE EMERGING MARKETS TOTAL RETURN FUND
SCHEDULE OF INVESTMENTS (CONTINUED)
As of April 30, 2016 (Unaudited)
| | | | | | | | | | | | | | | | |
| | | Currency(1) | | | Par | | | Value | | | % of Net
Assets | |
Belarus (Cost $3,078,182) | | | | | | | | | | | | | | | | |
Belarus (Rep of) 8.950%, 01/26/2018 | | | | | | | 3,290,000 | | | $ | 3,446,275 | | | | 0.63 | |
| | | | | | | | | | | 3,446,275 | | | | 0.63 | |
Brazil (Cost $64,156,553) | | | | | | | | | | | | | | | | |
Banco Nacional de Desenvolvimento Economico e Social 6.500%, 06/10/2019 | | | | | | | 1,310,000 | | | | 1,362,007 | | | | 0.25 | |
Brazil (Rep of) 4.875%, 01/22/2021 | | | | | | | 522,000 | | | | 531,135 | | | | 0.10 | |
Brazil (Rep of) 2.625%, 01/05/2023 | | | | | | | 680,000 | | | | 589,900 | | | | 0.11 | |
Brazil (Rep of) 8.875%, 04/15/2024 | | | | | | | 220,000 | | | | 267,850 | | | | 0.05 | |
Brazil (Rep of) 4.250%, 01/07/2025 | | | | | | | 1,591,000 | | | | 1,479,630 | | | | 0.27 | |
Brazil (Rep of) 8.250%, 01/20/2034 | | | | | | | 316,000 | | | | 364,190 | | | | 0.07 | |
Brazil (Rep of) 7.125%, 01/20/2037 | | | | | | | 1,071,000 | | | | 1,108,485 | | | | 0.20 | |
Brazil (Rep of) 5.625%, 01/07/2041 | | | | | | | 398,000 | | | | 349,245 | | | | 0.06 | |
Brazil (Rep of) 5.000%, 01/27/2045 | | | | | | | 1,552,000 | | | | 1,253,240 | | | | 0.23 | |
Brazil Letras do Tesouro Nacional 0.000%, 01/01/2018(4) | | | BRL | | | | 14,120,000 | | | | 3,363,916 | | | | 0.61 | |
Brazil Letras do Tesouro Nacional 0.000%, 07/01/2018(4) | | | BRL | | | | 15,211,000 | | | | 3,423,593 | | | | 0.62 | |
Brazil Letras do Tesouro Nacional 0.000%, 01/01/2019(4) | | | BRL | | | | 40,415,000 | | | | 8,590,225 | | | | 1.56 | |
Brazil Notas do Tesouro Nacional Serie F 10.000%, 01/01/2021 | | | BRL | | | | 27,467,000 | | | | 7,368,809 | | | | 1.34 | |
Brazil Notas do Tesouro Nacional Serie F 10.000%, 01/01/2023 | | | BRL | | | | 16,668,000 | | | | 4,342,358 | | | | 0.79 | |
Brazil Notas do Tesouro Nacional Serie F 10.000%, 01/01/2025 | | | BRL | | | | 38,148,000 | | | | 9,724,713 | | | | 1.76 | |
Itau Unibanco Holding S.A. 5.750%, 01/22/2021 | | | | | | | 100,000 | | | | 101,938 | | | | 0.02 | |
Marfrig Holdings Europe B.V. 8.375%, 05/09/2018 | | | | | | | 1,975,000 | | | | 2,034,250 | | | | 0.37 | |
Marfrig Holdings Europe B.V. 6.875%, 06/24/2019 | | | | | | | 1,933,000 | | | | 1,913,670 | | | | 0.35 | |
Marfrig Overseas Ltd. 9.500%, 05/04/2020 | | | | | | | 920,000 | | | | 943,000 | | | | 0.17 | |
Minerva Luxembourg S.A. 12.250%, 02/10/2022 | | | | | | | 1,400,000 | | | | 1,468,250 | | | | 0.27 | |
Oi S.A. 9.750%, 09/15/2016 | | | BRL | | | | 300,000 | | | | 15,701 | | | | — | |
Petrobras Global Finance B.V. 5.875%, 03/01/2018 | | | | | | | 829,000 | | | | 817,601 | | | | 0.15 | |
Petrobras Global Finance B.V. 3.000%, 01/15/2019 | | | | | | | 925,000 | | | | 832,222 | | | | 0.15 | |
Petrobras Global Finance B.V. 7.875%, 03/15/2019 | | | | | | | 397,000 | | | | 395,511 | | | | 0.07 | |
Petrobras Global Finance B.V. 5.750%, 01/20/2020 | | | | | | | 2,240,000 | | | | 2,055,200 | | | | 0.37 | |
Petrobras Global Finance B.V. 5.375%, 01/27/2021 | | | | | | | 2,020,000 | | | | 1,795,275 | | | | 0.32 | |
Petrobras Global Finance B.V. 6.250%, 03/17/2024 | | | | | | | 1,371,000 | | | | 1,196,197 | | | | 0.22 | |
Petrobras Global Finance B.V. 6.875%, 01/20/2040 | | | | | | | 2,525,000 | | | | 1,978,969 | | | | 0.36 | |
Petrobras Global Finance B.V. 6.850%, 06/05/2115 | | | | | | | 475,000 | | | | 351,500 | | | | 0.06 | |
QGOG Atlantic/Alaskan Rigs Ltd. 5.250%, 07/30/2018 | | | | | | | 2,359,552 | | | | 1,852,248 | | | | 0.33 | |
QGOG Constellation S.A. 6.250%, 11/09/2019 | | | | | | | 4,185,000 | | | | 2,259,900 | | | | 0.41 | |
Vale Overseas Ltd. 5.625%, 09/15/2019 | | | | | | | 622,000 | | | | 628,220 | | | | 0.11 | |
Vale Overseas Ltd. 4.625%, 09/15/2020 | | | | | | | 1,157,000 | | | | 1,122,290 | | | | 0.20 | |
Vale Overseas Ltd. 4.375%, 01/11/2022 | | | | | | | 504,000 | | | | 466,200 | | | | 0.08 | |
Vale Overseas Ltd. 6.875%, 11/21/2036 | | | | | | | 1,032,000 | | | | 926,220 | | | | 0.17 | |
Vale Overseas Ltd. 6.875%, 11/10/2039 | | | | | | | 1,562,000 | | | | 1,370,655 | | | | 0.25 | |
| | | | | | | | | | | 68,644,313 | | | | 12.45 | |
Chile (Cost $5,206,467) | | | | | | | | | | | | | | | | |
Banco del Estado de Chile 4.125%, 10/07/2020 | | | | | | | 330,000 | | | | 352,581 | | | | 0.06 | |
Banco del Estado de Chile 3.875%, 02/08/2022 | | | | | | | 360,000 | | | | 384,418 | | | | 0.07 | |
Bonos de la Tesoreria de la Republica en pesos 6.000%, 01/01/2020 | | | CLP | | | | 50,000,000 | | | | 80,602 | | | | 0.02 | |
Chile (Rep of) 3.125%, 01/21/2026 | | | | | | | 417,000 | | | | 429,510 | | | | 0.08 | |
Corp. Nacional del Cobre de Chile 3.750%, 11/04/2020 | | | | | | | 829,000 | | | | 874,973 | | | | 0.16 | |
Corp. Nacional del Cobre de Chile 3.875%, 11/03/2021 | | | | | | | 830,000 | | | | 869,706 | | | | 0.16 | |
Corp. Nacional del Cobre de Chile 4.875%, 11/04/2044 | | | | | | | 1,274,000 | | | | 1,257,209 | | | | 0.23 | |
See accompanying notes to the financial statements.
52
ASHMORE EMERGING MARKETS TOTAL RETURN FUND
SCHEDULE OF INVESTMENTS (CONTINUED)
As of April 30, 2016 (Unaudited)
| | | | | | | | | | | | | | | | |
| | | Currency(1) | | | Par | | | Value | | | % of Net
Assets | |
Chile - (continued) | | | | | | | | | | | | | | | | |
Empresa Nacional del Petroleo 5.250%, 08/10/2020 | | | | | | | 677,000 | | | $ | 727,549 | | | | 0.13 | |
Empresa Nacional del Petroleo 4.750%, 12/06/2021 | | | | | | | 276,000 | | | | 292,177 | | | | 0.05 | |
| | | | | | | | | | | 5,268,725 | | | | 0.96 | |
China (Cost $13,891,163) | | | | | | | | | | | | | | | | |
Amber Circle Funding Ltd. 3.250%, 12/04/2022 | | | | | | | 572,000 | | | | 590,096 | | | | 0.11 | |
Central China Real Estate Ltd. 8.750%, 01/23/2021 | | | | | | | 420,000 | | | | 425,239 | | | | 0.08 | |
China Hongqiao Group Ltd. 6.875%, 05/03/2018 | | | | | | | 200,000 | | | | 198,293 | | | | 0.04 | |
CIFI Holdings Group Co. Ltd. 7.750%, 06/05/2020 | | | | | | | 200,000 | | | | 209,497 | | | | 0.04 | |
Emerald Plantation Holdings Ltd. 6.000%, (100% Cash), 01/30/2020(5) | | | | | | | 138,547 | | | | 131,620 | | | | 0.02 | |
Far East Energy Bermuda Ltd. 13.000%, 01/15/2016(2)(3)(6)(7)(8) | | | | | | | 1,975,424 | | | | — | | | | — | |
Favor Sea Ltd. 11.750%, 02/04/2019 | | | | | | | 290,000 | | | | 224,025 | | | | 0.04 | |
ICBC Standard Bank PLC 8.125%, 12/02/2019 | | | | | | | 375,000 | | | | 415,389 | | | | 0.07 | |
Kaisa Group Holdings Ltd. 8.875%, 03/19/2018(6) | | | | | | | 1,044,000 | | | | 814,320 | | | | 0.15 | |
Kaisa Group Holdings Ltd. 10.250%, 01/08/2020(6) | | | | | | | 795,000 | | | | 620,100 | | | | 0.11 | |
Sinochem Overseas Capital Co. Ltd. 4.500%, 11/12/2020 | | | | | | | 4,262,000 | | | | 4,531,243 | | | | 0.82 | |
Sinochem Overseas Capital Co. Ltd. 6.300%, 11/12/2040 | | | | | | | 1,090,000 | | | | 1,367,020 | | | | 0.25 | |
Sino-Forest Corp. 5.000%, 08/01/2013(2)(3)(7) | | | | | | | 276,000 | | | | — | | | | — | |
Sino-Forest Corp. 10.250%, 07/28/2014(2)(3)(7) | | | | | | | 256,000 | | | | — | | | | — | |
Sino-Forest Corp. 4.250%, 12/15/2016(2)(3)(7) | | | | | | | 704,000 | | | | — | | | | — | |
Sino-Forest Corp. 6.250%, 10/21/2017(2)(3)(7) | | | | | | | 628,000 | | | | — | | | | — | |
Sunac China Holdings Ltd. 9.375%, 04/05/2018 | | | | | | | 1,970,000 | | | | 2,058,650 | | | | 0.37 | |
Times Property Holdings Ltd. 12.625%, 03/21/2019 | | | | | | | 705,000 | | | | 780,758 | | | | 0.14 | |
| | | | | | | | | | | 12,366,250 | | | | 2.24 | |
Colombia (Cost $24,803,095) | | | | | | | | | | | | | | | | |
Colombia (Rep of) 7.375%, 03/18/2019 | | | | | | | 1,650,000 | | | | 1,876,875 | | | | 0.34 | |
Colombia (Rep of) 11.750%, 02/25/2020 | | | | | | | 495,000 | | | | 647,212 | | | | 0.12 | |
Colombia (Rep of) 4.000%, 02/26/2024 | | | | | | | 730,000 | | | | 733,650 | | | | 0.13 | |
Colombia (Rep of) 8.125%, 05/21/2024 | | | | | | | 488,000 | | | | 615,612 | | | | 0.11 | |
Colombia (Rep of) 7.375%, 09/18/2037 | | | | | | | 2,725,000 | | | | 3,290,437 | | | | 0.60 | |
Colombia (Rep of) 6.125%, 01/18/2041 | | | | | | | 1,892,000 | | | | 2,029,170 | | | | 0.37 | |
Colombia (Rep of) 5.625%, 02/26/2044 | | | | | | | 1,323,000 | | | | 1,349,460 | | | | 0.24 | |
Colombia (Rep of) 5.000%, 06/15/2045 | | | | | | | 867,000 | | | | 825,817 | | | | 0.15 | |
Colombian TES 7.250%, 06/15/2016 | | | COP | | | | 2,277,500,000 | | | | 799,445 | | | | 0.14 | |
Colombian TES 10.000%, 07/24/2024 | | | COP | | | | 7,539,900,000 | | | | 2,980,596 | | | | 0.54 | |
Colombian TES 7.500%, 08/26/2026 | | | COP | | | | 6,715,900,000 | | | | 2,258,052 | | | | 0.41 | |
Colombian TES 6.000%, 04/28/2028 | | | COP | | | | 8,858,600,000 | | | | 2,589,390 | | | | 0.47 | |
Empresa de Telecomunicaciones de Bogota 7.000%, 01/17/2023 | | | COP | | | | 1,416,000,000 | | | | 359,619 | | | | 0.07 | |
Millicom International Cellular S.A. 6.625%, 10/15/2021 | | | | | | | 1,165,000 | | | | 1,179,563 | | | | 0.21 | |
Millicom International Cellular S.A. 6.000%, 03/15/2025 | | | | | | | 675,000 | | | | 646,313 | | | | 0.12 | |
| | | | | | | | | | | 22,181,211 | | | | 4.02 | |
Costa Rica (Cost $3,638,107) | | | | | | | | | | | | | | | | |
Costa Rica (Rep of) 4.250%, 01/26/2023 | | | | | | | 1,707,000 | | | | 1,578,975 | | | | 0.29 | |
Costa Rica (Rep of) 4.375%, 04/30/2025 | | | | | | | 450,000 | | | | 400,500 | | | | 0.07 | |
Costa Rica (Rep of) 5.625%, 04/30/2043 | | | | | | | 940,000 | | | | 752,000 | | | | 0.14 | |
Instituto Costarricense de Electricidad 6.950%, 11/10/2021 | | | | | | �� | 200,000 | | | | 204,000 | | | | 0.04 | |
Instituto Costarricense de Electricidad 6.375%, 05/15/2043 | | | | | | | 700,000 | | | | 525,000 | | | | 0.09 | |
| | | | | | | | | | | 3,460,475 | | | | 0.63 | |
Croatia (Cost $7,471,220) | | | | | | | | | | | | | | | | |
Croatia (Rep of) 6.250%, 04/27/2017 | | | | | | | 580,000 | | | | 602,620 | | | | 0.11 | |
Croatia (Rep of) 6.750%, 11/05/2019 | | | | | | | 950,000 | | | | 1,042,739 | | | | 0.19 | |
See accompanying notes to the financial statements.
53
ASHMORE EMERGING MARKETS TOTAL RETURN FUND
SCHEDULE OF INVESTMENTS (CONTINUED)
As of April 30, 2016 (Unaudited)
| | | | | | | | | | | | | | | | |
| | | Currency(1) | | | Par | | | Value | | | % of Net
Assets | |
Croatia - (continued) | | | | | | | | | | | | | | | | |
Croatia (Rep of) 6.625%, 07/14/2020 | | | | | | | 2,625,000 | | | $ | 2,878,313 | | | | 0.52 | |
Croatia (Rep of) 6.375%, 03/24/2021 | | | | | | | 889,000 | | | | 973,037 | | | | 0.18 | |
Croatia (Rep of) 6.000%, 01/26/2024 | | | | | | | 1,940,000 | | | | 2,121,875 | | | | 0.38 | |
| | | | | | | | | | | 7,618,584 | | | | 1.38 | |
Czech Republic (Cost $2,049,766) | | | | | | | | | | | | | | | | |
New World Resources N.V. 8.000%, 04/07/2020(5) | | | EUR | | | | 1,666,668 | | | | 28,626 | | | | 0.01 | |
New World Resources N.V. 4.000%, 10/07/2020(5) | | | EUR | | | | 619,932 | | | | 7,099 | | | | — | |
| | | | | | | | | | | 35,725 | | | | 0.01 | |
Dominican Republic (Cost $12,491,168) | | | | | | | | | | | | | | | | |
Aeropuertos Dominicanos Siglo XXI S.A., FRN 9.750%, 11/13/2019 | | | | | | | 1,760,000 | | | | 1,870,000 | | | | 0.34 | |
Dominican (Rep of) 7.500%, 05/06/2021 | | | | | | | 1,863,000 | | | | 2,039,985 | | | | 0.37 | |
Dominican (Rep of) 6.600%, 01/28/2024 | | | | | | | 640,000 | | | | 684,800 | | | | 0.12 | |
Dominican (Rep of) 5.875%, 04/18/2024 | | | | | | | 2,679,000 | | | | 2,759,370 | | | | 0.50 | |
Dominican (Rep of) 5.500%, 01/27/2025 | | | | | | | 1,530,000 | | | | 1,530,000 | | | | 0.28 | |
Dominican (Rep of) 6.875%, 01/29/2026 | | | | | | | 960,000 | | | | 1,032,000 | | | | 0.19 | |
Dominican (Rep of) 7.450%, 04/30/2044 | | | | | | | 1,100,000 | | | | 1,166,000 | | | | 0.21 | |
Dominican (Rep of) 6.850%, 01/27/2045 | | | | | | | 1,520,000 | | | | 1,520,000 | | | | 0.28 | |
| | | | | | | | | | | 12,602,155 | | | | 2.29 | |
Ecuador (Cost $21,176,601) | | | | | | | | | | | | | | | | |
Ecuador (Rep of) 10.500%, 03/24/2020 | | | | | | | 10,359,000 | | | | 9,789,255 | | | | 1.77 | |
Ecuador (Rep of) 7.950%, 06/20/2024 | | | | | | | 4,128,000 | | | | 3,581,040 | | | | 0.65 | |
EP PetroEcuador via Noble Sovereign Funding I Ltd., FRN 6.258%, 09/24/2019 | | | | | | | 10,224,421 | | | | 9,304,223 | | | | 1.69 | |
| | | | | | | | | | | 22,674,518 | | | | 4.11 | |
Egypt (Cost $902,425) | | | | | | | | | | | | | | | | |
Egypt (Rep of) 5.875%, 06/11/2025 | | | | | | | 310,000 | | | | 277,512 | | | | 0.05 | |
Egypt (Rep of) 6.875%, 04/30/2040 | | | | | | | 605,000 | | | | 520,421 | | | | 0.09 | |
| | | | | | | | | | | 797,933 | | | | 0.14 | |
El Salvador (Cost $3,267,086) | | | | | | | | | | | | | | | | |
El Salvador (Rep of) 7.375%, 12/01/2019 | | | | | | | 760,000 | | | | 761,900 | | | | 0.14 | |
El Salvador (Rep of) 5.875%, 01/30/2025 | | | | | | | 910,000 | | | | 805,350 | | | | 0.15 | |
El Salvador (Rep of) 6.375%, 01/18/2027 | | | | | | | 270,000 | | | | 237,600 | | | | 0.04 | |
El Salvador (Rep of) 8.250%, 04/10/2032 | | | | | | | 465,000 | | | | 456,862 | | | | 0.08 | |
El Salvador (Rep of) 7.650%, 06/15/2035 | | | | | | | 150,000 | | | | 134,625 | | | | 0.02 | |
El Salvador (Rep of) 7.625%, 02/01/2041 | | | | | | | 620,000 | | | | 545,600 | | | | 0.10 | |
| | | | | | | | | | | 2,941,937 | | | | 0.53 | |
Ethiopia (Cost $1,528,891) | | | | | | | | | | | | | | | | |
Ethiopia (Rep of) 6.625%, 12/11/2024 | | | | | | | 1,560,000 | | | | 1,416,012 | | | | 0.26 | |
| | | | | | | | | | | 1,416,012 | | | | 0.26 | |
Gabon (Cost $2,809,360) | | | | | | | | | | | | | | | | |
Gabon (Rep of) 6.375%, 12/12/2024 | | | | | | | 2,870,700 | | | | 2,507,901 | | | | 0.46 | |
| | | | | | | | | | | 2,507,901 | | | | 0.46 | |
Georgia (Cost $1,991,923) | | | | | | | | | | | | | | | | |
Georgia (Rep of) 6.875%, 04/12/2021 | | | | | | | 1,320,000 | | | | 1,453,650 | | | | 0.26 | |
Georgian Railway JSC 7.750%, 07/11/2022 | | | | | | | 500,000 | | | | 538,850 | | | | 0.10 | |
| | | | | | | | | | | 1,992,500 | | | | 0.36 | |
Guatemala (Cost $2,118,890) | | | | | | | | | | | | | | | | |
Comcel Trust via Comunicaciones Celulares S.A. 6.875%, 02/06/2024 | | | | | | | 1,085,000 | | | | 1,025,325 | | | | 0.19 | |
Guatemala (Rep of) 4.875%, 02/13/2028 | | | | | | | 997,000 | | | | 1,019,433 | | | | 0.18 | |
| | | | | | | | | | | 2,044,758 | | | | 0.37 | |
See accompanying notes to the financial statements.
54
ASHMORE EMERGING MARKETS TOTAL RETURN FUND
SCHEDULE OF INVESTMENTS (CONTINUED)
As of April 30, 2016 (Unaudited)
| | | | | | | | | | | | | | | | |
| | | Currency(1) | | | Par | | | Value | | | % of Net
Assets | |
Hungary (Cost $13,712,698) | | | | | | | | | | | | | | | | |
Hungary (Rep of) 4.125%, 02/19/2018 | | | | | | | 1,478,000 | | | $ | 1,531,539 | | | | 0.28 | |
Hungary (Rep of) 6.250%, 01/29/2020 | | | | | | | 1,020,000 | | | | 1,136,025 | | | | 0.21 | |
Hungary (Rep of) 5.375%, 02/21/2023 | | | | | | | 2,190,000 | | | | 2,413,227 | | | | 0.44 | |
Hungary (Rep of) 5.750%, 11/22/2023 | | | | | | | 2,834,000 | | | | 3,205,962 | | | | 0.58 | |
Hungary (Rep of) 5.375%, 03/25/2024 | | | | | | | 1,180,000 | | | | 1,311,275 | | | | 0.24 | |
Hungary (Rep of) 5.500%, 06/24/2025 | | | HUF | | | | 389,020,000 | | | | 1,686,777 | | | | 0.30 | �� |
Hungary (Rep of) 7.625%, 03/29/2041 | | | | | | | 2,080,000 | | | | 2,937,688 | | | | 0.53 | |
| | | | | | | | | | | 14,222,493 | | | | 2.58 | |
India (Cost $1,364,673) | | | | | | | | | | | | | | | | |
Export-Import Bank of India 4.000%, 08/07/2017 | | | | | | | 400,000 | | | | 409,125 | | | | 0.07 | |
Export-Import Bank of India 4.000%, 01/14/2023 | | | | | | | 528,000 | | | | 549,294 | | | | 0.10 | |
Vedanta Resources PLC 6.750%, 06/07/2016 | | | | | | | 420,000 | | | | 418,950 | | | | 0.08 | |
| | | | | | | | | | | 1,377,369 | | | | 0.25 | |
Indonesia (Cost $18,331,533) | | | | | | | | | | | | | | | | |
Enercoal Resources Pte. Ltd. 6.000%, 04/07/2018 | | | | | | | 200,000 | | | | 20,000 | | | | — | |
Golden Legacy Pte. Ltd. 9.000%, 04/24/2019 | | | | | | | 290,000 | | | | 292,900 | | | | 0.05 | |
Indonesia (Rep of) 6.875%, 01/17/2018 | | | | | | | 819,000 | | | | 887,096 | | | | 0.16 | |
Indonesia (Rep of) 11.625%, 03/04/2019 | | | | | | | 1,220,000 | | | | 1,526,912 | | | | 0.28 | |
Indonesia (Rep of) 5.875%, 03/13/2020 | | | | | | | 344,000 | | | | 383,552 | | | | 0.07 | |
Indonesia (Rep of) 4.875%, 05/05/2021 | | | | | | | 420,000 | | | | 456,195 | | | | 0.08 | |
Indonesia (Rep of) 5.625%, 05/15/2023 | | | IDR | | | | 6,128,000,000 | | | | 416,762 | | | | 0.08 | |
Indonesia (Rep of) 4.125%, 01/15/2025 | | | | | | | 470,000 | | | | 481,802 | | | | 0.09 | |
Indonesia (Rep of) 8.375%, 09/15/2026 | | | IDR | | | | 496,000,000 | | | | 39,434 | | | | 0.01 | |
Indonesia (Rep of) 7.000%, 05/15/2027 | | | IDR | | | | 809,000,000 | | | | 57,952 | | | | 0.01 | |
Indonesia (Rep of) 9.000%, 03/15/2029 | | | IDR | | | | 3,099,000,000 | | | | 257,217 | | | | 0.05 | |
Indonesia (Rep of) 8.750%, 05/15/2031 | | | IDR | | | | 42,918,000,000 | | | | 3,503,037 | | | | 0.64 | |
Indonesia (Rep of) 6.625%, 05/15/2033 | | | IDR | | | | 11,021,000,000 | | | | 736,331 | | | | 0.13 | |
Indonesia (Rep of) 8.375%, 03/15/2034 | | | IDR | | | | 9,073,000,000 | | | | 721,725 | | | | 0.13 | |
Indonesia (Rep of) 8.250%, 05/15/2036 | | | IDR | | | | 19,066,000,000 | | | | 1,500,284 | | | | 0.27 | |
Indonesia (Rep of) 7.750%, 01/17/2038 | | | | | | | 280,000 | | | | 367,555 | | | | 0.07 | |
Indonesia (Rep of) 5.125%, 01/15/2045 | | | | | | | 930,000 | | | | 947,366 | | | | 0.17 | |
Indonesia (Rep of) 5.950%, 01/08/2046 | | | | | | | 567,000 | | | | 639,194 | | | | 0.12 | |
Majapahit Holding B.V. 8.000%, 08/07/2019 | | | | | | | 570,000 | | | | 649,515 | | | | 0.12 | |
Majapahit Holding B.V. 7.750%, 01/20/2020 | | | | | | | 350,000 | | | | 400,750 | | | | 0.07 | |
Pertamina Persero PT 6.000%, 05/03/2042 | | | | | | | 469,000 | | | | 450,134 | | | | 0.08 | |
Perusahaan Listrik Negara PT 5.500%, 11/22/2021 | | | | | | | 1,860,000 | | | | 1,999,500 | | | | 0.36 | |
Perusahaan Penerbit SBSN Indonesia III 6.125%, 03/15/2019 | | | | | | | 690,000 | | | | 758,711 | | | | 0.14 | |
Perusahaan Penerbit SBSN Indonesia III 4.325%, 05/28/2025 | | | | | | | 508,000 | | | | 517,983 | | | | 0.09 | |
Perusahaan Penerbit SBSN Indonesia III 4.550%, 03/29/2026(2) | | | | | | | 1,040,000 | | | | 1,065,376 | | | | 0.19 | |
| | | | | | | | | | | 19,077,283 | | | | 3.46 | |
Iraq (Cost $882,188) | | | | | | | | | | | | | | | | |
Iraq (Rep of) 5.800%, 01/15/2028 | | | | | | | 1,030,000 | | | | 731,403 | | | | 0.13 | |
| | | | | | | | | | | 731,403 | | | | 0.13 | |
Ivory Coast (Cost $9,539,300) | | | | | | | | | | | | | | | | |
Ivory Coast (Rep of) 5.375%, 07/23/2024 | | | | | | | 686,000 | | | | 636,190 | | | | 0.12 | |
Ivory Coast (Rep of) 6.375%, 03/03/2028 | | | | | | | 596,000 | | | | 566,319 | | | | 0.10 | |
Ivory Coast (Rep of), FRN 5.750%, 12/31/2032 | | | | | | | 8,601,000 | | | | 7,827,770 | | | | 1.42 | |
| | | | | | | | | | | 9,030,279 | | | | 1.64 | |
Jamaica (Cost $9,216,770) | | | | | | | | | | | | | | | | |
Digicel Group Ltd. 8.250%, 09/30/2020 | | | | | | | 5,940,000 | | | | 5,420,250 | | | | 0.98 | |
See accompanying notes to the financial statements.
55
ASHMORE EMERGING MARKETS TOTAL RETURN FUND
SCHEDULE OF INVESTMENTS (CONTINUED)
As of April 30, 2016 (Unaudited)
| | | | | | | | | | | | | | | | |
| | | Currency(1) | | | Par | | | Value | | | % of Net
Assets | |
Jamaica - (continued) | | | | | | | | | | | | | | | | |
Digicel Group Ltd. 7.125%, 04/01/2022 | | | | | | | 1,185,000 | | | $ | 964,294 | | | | 0.18 | |
Digicel Ltd. 6.000%, 04/15/2021 | | | | | | | 1,485,000 | | | | 1,358,775 | | | | 0.25 | |
Jamaica (Rep of) 7.875%, 07/28/2045 | | | | | | | 700,000 | | | | 728,000 | | | | 0.13 | |
| | | | | | | | | | | 8,471,319 | | | | 1.54 | |
Jordan (Cost $323,295) | | | | | | | | | | | | | | | | |
Jordan (Rep of) 6.125%, 01/29/2026 | | | | | | | 320,000 | | | | 338,000 | | | | 0.06 | |
| | | | | | | | | | | 338,000 | | | | 0.06 | |
Kazakhstan (Cost $25,906,668) | | | | | | | | | | | | | | | | |
Development Bank of Kazakhstan JSC 4.125%, 12/10/2022 | | | | | | | 1,703,000 | | | | 1,549,730 | | | | 0.28 | |
Halyk Savings Bank of Kazakhstan JSC 7.250%, 01/28/2021 | | | | | | | 200,000 | | | | 205,524 | | | | 0.04 | |
KazAgro National Management Holding JSC 4.625%, 05/24/2023 | | | | | | | 1,100,000 | | | | 918,566 | | | | 0.17 | |
Kazakhstan (Rep of) 5.125%, 07/21/2025 | | | | | | | 2,280,000 | | | | 2,410,530 | | | | 0.44 | |
Kazakhstan (Rep of) 4.875%, 10/14/2044 | | | | | | | 830,000 | | | | 752,229 | | | | 0.14 | |
Kazakhstan (Rep of) 6.500%, 07/21/2045 | | | | | | | 1,420,000 | | | | 1,549,297 | | | | 0.28 | |
Kazakhstan Temir Zholy Finance B.V. 6.375%, 10/06/2020 | | | | | | | 606,000 | | | | 614,060 | | | | 0.11 | |
Kazakhstan Temir Zholy Finance B.V. 6.950%, 07/10/2042 | | | | | | | 1,681,000 | | | | 1,571,970 | | | | 0.28 | |
Kazkommertsbank JSC 7.500%, 11/29/2016 | | | | | | | 1,820,000 | | | | 1,774,864 | | | | 0.32 | |
Kazkommertsbank JSC 6.875%, 02/13/2017 | | | EUR | | | | 2,005,000 | | | | 2,221,211 | | | | 0.40 | |
Kazkommertsbank JSC 8.500%, 05/11/2018 | | | | | | | 2,045,000 | | | | 1,902,259 | | | | 0.34 | |
Kazkommertsbank JSC 5.500%, 12/21/2022 | | | | | | | 2,142,674 | | | | 1,468,417 | | | | 0.27 | |
KazMunayGas National Co. JSC 9.125%, 07/02/2018 | | | | | | | 751,000 | | | | 822,345 | | | | 0.15 | |
KazMunayGas National Co. JSC 7.000%, 05/05/2020 | | | | | | | 2,104,000 | | | | 2,241,181 | | | | 0.41 | |
KazMunayGas National Co. JSC 6.375%, 04/09/2021 | | | | | | | 240,000 | | | | 251,412 | | | | 0.05 | |
KazMunayGas National Co. JSC 5.750%, 04/30/2043 | | | | | | | 926,000 | | | | 794,045 | | | | 0.14 | |
Zhaikmunai LLP 6.375%, 02/14/2019 | | | | | | | 2,718,000 | | | | 2,239,088 | | | | 0.41 | |
Zhaikmunai LLP 7.125%, 11/13/2019 | | | | | | | 2,880,000 | | | | 2,398,176 | | | | 0.43 | |
| | | | | | | | | | | 25,684,904 | | | | 4.66 | |
Kenya (Cost $635,266) | | | | | | | | | | | | | | | | |
Kenya (Rep of) 6.875%, 06/24/2024 | | | | | | | 660,000 | | | | 620,466 | | | | 0.11 | |
| | | | | | | | | | | 620,466 | | | | 0.11 | |
Lebanon (Cost $7,213,034) | | | | | | | | | | | | | | | | |
Lebanon (Rep of) 5.150%, 11/12/2018 | | | | | | | 430,000 | | | | 428,220 | | | | 0.08 | |
Lebanon (Rep of) 5.450%, 11/28/2019 | | | | | | | 700,000 | | | | 691,208 | | | | 0.12 | |
Lebanon (Rep of) 6.375%, 03/09/2020 | | | | | | | 1,254,000 | | | | 1,269,775 | | | | 0.23 | |
Lebanon (Rep of) 8.250%, 04/12/2021 | | | | | | | 592,000 | | | | 646,819 | | | | 0.12 | |
Lebanon (Rep of) 6.100%, 10/04/2022 | | | | | | | 957,000 | | | | 949,229 | | | | 0.17 | |
Lebanon (Rep of) 6.000%, 01/27/2023 | | | | | | | 1,560,000 | | | | 1,532,076 | | | | 0.28 | |
Lebanon (Rep of) 6.600%, 11/27/2026 | | | | | | | 1,528,000 | | | | 1,507,143 | | | | 0.27 | |
| | | | | | | | | | | 7,024,470 | | | | 1.27 | |
Lithuania (Cost $4,415,850) | | | | | | | | | | | | | | | | |
Lithuania (Rep of) 7.375%, 02/11/2020 | | | | | | | 2,048,000 | | | | 2,424,115 | | | | 0.44 | |
Lithuania (Rep of) 6.125%, 03/09/2021 | | | | | | | 400,000 | | | | 463,920 | | | | 0.08 | |
Lithuania (Rep of) 6.625%, 02/01/2022 | | | | | | | 1,351,000 | | | | 1,631,333 | | | | 0.30 | |
| | | | | | | | | | | 4,519,368 | | | | 0.82 | |
Malaysia (Cost $3,575,435) | | | | | | | | | | | | | | | | |
Malaysia (Rep of) 3.418%, 08/15/2022 | | | MYR | | | | 1,037,000 | | | | 260,273 | | | | 0.05 | |
Malaysia (Rep of) 3.480%, 03/15/2023 | | | MYR | | | | 146,000 | | | | 36,716 | | | | 0.01 | |
Malaysia (Rep of) 4.181%, 07/15/2024 | | | MYR | | | | 2,027,000 | | | | 527,335 | | | | 0.09 | |
Malaysia (Rep of) 4.392%, 04/15/2026 | | | MYR | | | | 308,000 | | | | 81,773 | | | | 0.01 | |
Malaysia (Rep of) 4.498%, 04/15/2030 | | | MYR | | | | 2,659,000 | | | | 699,625 | | | | 0.13 | |
Malaysia (Rep of) 4.254%, 05/31/2035 | | | MYR | | | | 180,000 | | | | 45,743 | | | | 0.01 | |
See accompanying notes to the financial statements.
56
ASHMORE EMERGING MARKETS TOTAL RETURN FUND
SCHEDULE OF INVESTMENTS (CONTINUED)
As of April 30, 2016 (Unaudited)
| | | | | | | | | | | | | | | | |
| | | Currency(1) | | | Par | | | Value | | | % of Net
Assets | |
Malaysia - (continued) | | | | | | | | | | | | | | | | |
Malaysia (Rep of) 4.736%, 03/15/2046 | | | MYR | | | | 362,000 | | | $ | 93,716 | | | | 0.02 | |
Petronas Capital Ltd. 5.250%, 08/12/2019 | | | | | | | 570,000 | | | | 628,017 | | | | 0.11 | |
Petronas Capital Ltd. 7.875%, 05/22/2022 | | | | | | | 520,000 | | | | 668,980 | | | | 0.12 | |
Wakala Global Sukuk Bhd. 4.646%, 07/06/2021 | | | | | | | 661,000 | | | | 730,603 | | | | 0.13 | |
| | | | | | | | | | | 3,772,781 | | | | 0.68 | |
Mexico (Cost $23,866,890) | | | | | | | | | | | | | | | | |
CEMEX Espana S.A. 9.875%, 04/30/2019 | | | | | | | 1,210,000 | | | | 1,272,012 | | | | 0.23 | |
Cemex Finance LLC 9.375%, 10/12/2022 | | | | | | | 970,000 | | | | 1,064,989 | | | | 0.19 | |
Cemex S.A.B. de C.V. 6.500%, 12/10/2019 | | | | | | | 675,000 | | | | 711,281 | | | | 0.13 | |
Cemex S.A.B. de C.V. 7.250%, 01/15/2021 | | | | | | | 245,000 | | | | 261,538 | | | | 0.05 | |
Cemex S.A.B. de C.V. 7.750%, 04/16/2026(2) | | | | | | | 740,000 | | | | 788,100 | | | | 0.14 | |
Comision Federal de Electricidad 4.875%, 01/15/2024 | | | | | | | 700,000 | | | | 728,000 | | | | 0.13 | |
Comision Federal de Electricidad 5.750%, 02/14/2042 | | | | | | | 770,000 | | | | 758,450 | | | | 0.14 | |
Mexican Bonos 8.000%, 12/07/2023 | | | MXN | | | | 47,850,000 | | | | 3,179,065 | | | | 0.58 | |
Mexican Udibonos 4.000%, 06/13/2019 | | | MXN | | | | 4,150,000 | | | | 1,387,914 | | | | 0.25 | |
Mexico (Rep of) 6.050%, 01/11/2040 | | | | | | | 302,000 | | | | 357,870 | | | | 0.06 | |
Mexico (Rep of) 4.750%, 03/08/2044 | | | | | | | 1,228,000 | | | | 1,240,280 | | | | 0.22 | |
Mexico (Rep of) 5.550%, 01/21/2045 | | | | | | | 477,000 | | | | 536,625 | | | | 0.10 | |
Mexico (Rep of) 4.600%, 01/23/2046 | | | | | | | 3,204,000 | | | | 3,167,154 | | | | 0.57 | |
Mexico (Rep of) 5.750%, 10/12/2110 | | | | | | | 408,000 | | | | 420,240 | | | | 0.08 | |
Mexico (Rep of) 4.000%, 03/15/2115 | | | EUR | | | | 2,190,000 | | | | 2,176,022 | | | | 0.39 | |
Petroleos Mexicanos 6.000%, 03/05/2020 | | | | | | | 234,000 | | | | 248,918 | | | | 0.05 | |
Petroleos Mexicanos 7.190%, 09/12/2024 | | | MXN | | | | 6,470,000 | | | | 331,155 | | | | 0.06 | |
Petroleos Mexicanos 6.875%, 08/04/2026 | | | | | | | 1,435,000 | | | | 1,583,523 | | | | 0.29 | |
Petroleos Mexicanos 6.500%, 06/02/2041 | | | | | | | 1,370,000 | | | | 1,367,260 | | | | 0.25 | |
Petroleos Mexicanos 5.500%, 06/27/2044 | | | | | | | 806,000 | | | | 709,280 | | | | 0.13 | |
Petroleos Mexicanos 5.625%, 01/23/2046 | | | | | | | 930,000 | | | | 827,988 | | | | 0.15 | |
| | | | | | | | | | | 23,117,664 | | | | 4.19 | |
Mongolia (Cost $4,896,961) | | | | | | | | | | | | | | | | |
Mongolian Mining Corp. 8.875%, 03/29/2017 | | | | | | | 6,049,000 | | | | 1,134,187 | | | | 0.21 | |
| | | | | | | | | | | 1,134,187 | | | | 0.21 | |
Morocco (Cost $3,277,285) | | | | | | | | | | | | | | | | |
Morocco (Rep of) 4.250%, 12/11/2022 | | | | | | | 1,819,000 | | | | 1,880,391 | | | | 0.34 | |
Morocco (Rep of) 5.500%, 12/11/2042 | | | | | | | 1,366,000 | | | | 1,441,513 | | | | 0.26 | |
| | | | | | | | | | | 3,321,904 | | | | 0.60 | |
Namibia (Cost $497,796) | | | | | | | | | | | | | | | | |
Namibia (Rep of) 5.250%, 10/29/2025 | | | | | | | 560,000 | | | | 550,402 | | | | 0.10 | |
| | | | | | | | | | | 550,402 | | | | 0.10 | |
Nigeria (Cost $6,513,683) | | | | | | | | | | | | | | | | |
Access Bank PLC, FRN 9.250%, 06/24/2021 | | | | | | | 615,000 | | | | 506,490 | | | | 0.09 | |
First Bank of Nigeria Ltd. Via FBN Finance Co. B.V., FRN 8.250%, 08/07/2020 | | | | | | | 1,280,000 | | | | 1,012,004 | | | | 0.18 | |
First Bank of Nigeria Ltd. Via FBN Finance Co. B.V., FRN 8.000%, 07/23/2021 | | | | | | | 1,475,000 | | | | 1,088,550 | | | | 0.20 | |
GTB Finance B.V. 6.000%, 11/08/2018 | | | | | | | 410,000 | | | | 386,466 | | | | 0.07 | |
Sea Trucks Group Ltd. 9.000%, 03/26/2018(2) | | | | | | | 2,445,125 | | | | 759,211 | | | | 0.14 | |
Seven Energy Ltd. 10.250%, 10/11/2021 | | | | | | | 1,640,000 | | | | 996,300 | | | | 0.18 | |
| | | | | | | | | | | 4,749,021 | | | | 0.86 | |
Pakistan (Cost $5,961,921) | | | | | | | | | | | | | | | | |
Pakistan (Rep of) 6.875%, 06/01/2017 | | | | | | | 1,020,000 | | | | 1,056,475 | | | | 0.19 | |
Pakistan (Rep of) 7.250%, 04/15/2019 | | | | | | | 1,666,000 | | | | 1,746,928 | | | | 0.32 | |
Pakistan (Rep of) 6.750%, 12/03/2019 | | | | | | | 1,370,000 | | | | 1,426,012 | | | | 0.26 | |
Pakistan (Rep of) 8.250%, 04/15/2024 | | | | | | | 750,000 | | | | 789,853 | | | | 0.14 | |
See accompanying notes to the financial statements.
57
ASHMORE EMERGING MARKETS TOTAL RETURN FUND
SCHEDULE OF INVESTMENTS (CONTINUED)
As of April 30, 2016 (Unaudited)
| | | | | | | | | | | | | | | | |
| | | Currency(1) | | | Par | | | Value | | | % of Net
Assets | |
Pakistan - (continued) | | | | | | | | | | | | | | | | |
Pakistan (Rep of) 8.250%, 09/30/2025 | | | | | | | 1,020,000 | | | $ | 1,074,481 | | | | 0.20 | |
| | | | | | | | | | | 6,093,749 | | | | 1.11 | |
Panama (Cost $5,880,984) | | | | | | | | | | | | | | | | |
Panama (Rep of) 4.000%, 09/22/2024 | | | | | | | 470,000 | | | | 494,675 | | | | 0.09 | |
Panama (Rep of) 7.125%, 01/29/2026 | | | | | | | 646,000 | | | | 834,955 | | | | 0.15 | |
Panama (Rep of) 8.875%, 09/30/2027 | | | | | | | 597,000 | | | | 858,187 | | | | 0.16 | |
Panama (Rep of) 9.375%, 04/01/2029 | | | | | | | 421,000 | | | | 630,447 | | | | 0.11 | |
Panama (Rep of) 6.700%, 01/26/2036 | | | | | | | 762,000 | | | | 975,360 | | | | 0.18 | |
Panama (Rep of) 4.300%, 04/29/2053 | | | | | | | 990,000 | | | | 951,638 | | | | 0.17 | |
Sable International Finance Ltd. 6.875%, 08/01/2022 | | | | | | | 1,290,000 | | | | 1,323,863 | | | | 0.24 | |
| | | | | | | | | | | 6,069,125 | | | | 1.10 | |
Paraguay (Cost $628,646) | | | | | | | | | | | | | | | | |
Paraguay (Rep of) 4.625%, 01/25/2023 | | | | | | | 620,000 | | | | 633,950 | | | | 0.12 | |
| | | | | | | | | | | 633,950 | | | | 0.12 | |
Peru (Cost $8,447,303) | | | | | | | | | | | | | | | | |
Peru (Rep of) 5.700%, 08/12/2024 | | | PEN | | | | 3,234,000 | | | | 975,311 | | | | 0.18 | |
Peru (Rep of) 7.350%, 07/21/2025 | | | | | | | 2,090,000 | | | | 2,797,465 | | | | 0.51 | |
Peru (Rep of) 8.200%, 08/12/2026 | | | PEN | | | | 1,488,000 | | | | 520,196 | | | | 0.09 | |
Peru (Rep of) 6.950%, 08/12/2031 | | | PEN | | | | 291,000 | | | | 91,689 | | | | 0.02 | |
Peru (Rep of) 8.750%, 11/21/2033 | | | | | | | 1,476,000 | | | | 2,239,830 | | | | 0.41 | |
Peru (Rep of) 5.625%, 11/18/2050 | | | | | | | 1,410,000 | | | | 1,632,075 | | | | 0.29 | |
| | | | | | | | | | | 8,256,566 | | | | 1.50 | |
Philippines (Cost $9,744,887) | | | | | | | | | | | | | | | | |
Philippines (Rep of) 4.950%, 01/15/2021 | | | PHP | | | | 11,000,000 | | | | 243,402 | | | | 0.05 | |
Philippines (Rep of) 3.900%, 11/26/2022 | | | PHP | | | | 31,000,000 | | | | 656,717 | | | | 0.12 | |
Philippines (Rep of) 10.625%, 03/16/2025 | | | | | | | 417,000 | | | | 682,501 | | | | 0.12 | |
Philippines (Rep of) 5.500%, 03/30/2026 | | | | | | | 500,000 | | | | 626,096 | | | | 0.11 | |
Philippines (Rep of) 9.500%, 02/02/2030 | | | | | | | 1,235,000 | | | | 2,108,790 | | | | 0.38 | |
Philippines (Rep of) 7.750%, 01/14/2031 | | | | | | | 1,280,000 | | | | 1,974,104 | | | | 0.36 | |
Philippines (Rep of) 6.375%, 10/23/2034 | | | | | | | 1,626,000 | | | | 2,312,941 | | | | 0.42 | |
Philippines (Rep of) 6.250%, 01/14/2036 | | | PHP | | | | 15,000,000 | | | | 358,904 | | | | 0.07 | |
Power Sector Assets & Liabilities Management Corp. 7.390%, 12/02/2024 | | | | | | | 988,000 | | | | 1,331,848 | | | | 0.24 | |
| | | | | | | | | | | 10,295,303 | | | | 1.87 | |
Poland (Cost $4,989,154) | | | | | | | | | | | | | | | | |
Poland (Rep of) 5.000%, 03/23/2022 | | | | | | | 744,000 | | | | 832,350 | | | | 0.15 | |
Poland (Rep of) 3.000%, 03/17/2023 | | | | | | | 185,000 | | | | 186,619 | | | | 0.03 | |
Poland (Rep of) 4.000%, 10/25/2023 | | | PLN | | | | 5,113,000 | | | | 1,449,662 | | | | 0.26 | |
Poland (Rep of) 3.250%, 07/25/2025 | | | PLN | | | | 6,931,000 | | | | 1,863,586 | | | | 0.34 | |
Poland (Rep of) 2.500%, 07/25/2026 | | | PLN | | | | 2,351,000 | | | | 584,601 | | | | 0.11 | |
| | | | | | | | | | | 4,916,818 | | | | 0.89 | |
Romania (Cost $6,661,057) | | | | | | | | | | | | | | | | |
Romania (Rep of) 6.750%, 02/07/2022 | | | | | | | 3,612,000 | | | | 4,275,705 | | | | 0.78 | |
Romania (Rep of) 4.375%, 08/22/2023 | | | | | | | 2,130,000 | | | | 2,263,317 | | | | 0.41 | |
Romania (Rep of) 6.125%, 01/22/2044 | | | | | | | 220,000 | | | | 269,775 | | | | 0.05 | |
| | | | | | | | | | | 6,808,797 | | | | 1.24 | |
Russian Federation (Cost $20,186,279) | | | | | | | | | | | | | | | | |
Alfa Bank AO Via Alfa Bond Issuance PLC 7.500%, 09/26/2019 | | | | | | | 380,000 | | | | 401,850 | | | | 0.07 | |
CEDC Finance Corp. International, Inc., FRN 10.000%, 04/30/2018 | | | | | | | 1,293,047 | | | | 872,807 | | | | 0.16 | |
Credit Bank of Moscow Via CBOM Finance PLC 7.700%, 02/01/2018 | | | | | | | 1,076,000 | | | | 1,109,046 | | | | 0.20 | |
See accompanying notes to the financial statements.
58
ASHMORE EMERGING MARKETS TOTAL RETURN FUND
SCHEDULE OF INVESTMENTS (CONTINUED)
As of April 30, 2016 (Unaudited)
| | | | | | | | | | | | | | | | |
| | | Currency(1) | | | Par | | | Value | | | % of Net
Assets | |
Russian Federation - (continued) | | | | | | | | | | | | | | | | |
Credit Bank of Moscow Via CBOM Finance PLC 8.700%, 11/13/2018 | | | | | | | 935,000 | | | $ | 919,759 | | | | 0.17 | |
Far East Capital Ltd. S.A. 8.000%, 05/02/2018 | | | | | | | 237,000 | | | | 91,245 | | | | 0.02 | |
Far East Capital Ltd. S.A. 8.750%, 05/02/2020 | | | | | | | 641,000 | | | | 237,170 | | | | 0.04 | |
GTH Finance B.V. 6.250%, 04/26/2020(2)(3) | | | | | | | 1,235,000 | | | | 1,233,456 | | | | 0.22 | |
GTH Finance B.V. 7.250%, 04/26/2023(2)(3) | | | | | | | 600,000 | | | | 600,378 | | | | 0.11 | |
Lukoil International Finance B.V. 6.125%, 11/09/2020 | | | | | | | 310,000 | | | | 331,405 | | | | 0.06 | |
Metalloinvest Finance Ltd. 5.625%, 04/17/2020 | | | | | | | 200,000 | | | | 202,426 | | | | 0.04 | |
Russian Agricultural Bank OJSC Via RSHB Capital S.A. 7.750%, 05/29/2018 | | | | | | | 888,000 | | | | 953,737 | | | | 0.17 | |
Russian Railways via RZD Capital PLC 5.700%, 04/05/2022 | | | | | | | 1,712,000 | | | | 1,776,474 | | | | 0.32 | |
Russian Standard Ltd. 13.000%, 10/27/2022(5) | | | | | | | 1,183,321 | | | | 285,270 | | | | 0.05 | |
Sistema JSFC via Sistema International Funding S.A. 6.950%, 05/17/2019 | | | | | | | 375,000 | | | | 394,837 | | | | 0.07 | |
TMK OAO Via TMK Capital S.A. 6.750%, 04/03/2020 | | | | | | | 2,025,000 | | | | 2,025,000 | | | | 0.37 | |
Vimpel Communications Via VIP Finance Ireland Ltd. OJSC 7.748%, 02/02/2021 | | | | | | | 1,355,000 | | | | 1,476,771 | | | | 0.27 | |
VimpelCom Holdings B.V. 5.200%, 02/13/2019 | | | | | | | 810,000 | | | | 822,442 | | | | 0.15 | |
VimpelCom Holdings B.V. 7.504%, 03/01/2022 | | | | | | | 960,000 | | | | 1,024,800 | | | | 0.19 | |
Vnesheconombank Via VEB Finance PLC 5.450%, 11/22/2017 | | | | | | | 1,407,000 | | | | 1,440,374 | | | | 0.26 | |
Vnesheconombank Via VEB Finance PLC 6.902%, 07/09/2020 | | | | | | | 1,290,000 | | | | 1,354,500 | | | | 0.24 | |
Vnesheconombank Via VEB Finance PLC 6.025%, 07/05/2022 | | | | | | | 810,000 | | | | 811,669 | | | | 0.15 | |
Vnesheconombank Via VEB Finance PLC 5.942%, 11/21/2023 | | | | | | | 1,137,000 | | | | 1,132,802 | | | | 0.20 | |
Vnesheconombank Via VEB Finance PLC 6.800%, 11/22/2025 | | | | | | | 1,147,000 | | | | 1,200,049 | | | | 0.22 | |
| | | | | | | | | | | 20,698,267 | | | | 3.75 | |
Senegal (Cost $955,788) | | | | | | | | | | | | | | | | |
Senegal (Rep of) 8.750%, 05/13/2021 | | | | | | | 869,000 | | | | 943,039 | | | | 0.17 | |
| | | | | | | | | | | 943,039 | | | | 0.17 | |
Serbia (Cost $2,693,639) | | | | | | | | | | | | | | | | |
Serbia (Rep of) 5.875%, 12/03/2018 | | | | | | | 810,000 | | | | 853,821 | | | | 0.15 | |
Serbia (Rep of) 4.875%, 02/25/2020 | | | | | | | 1,450,000 | | | | 1,484,568 | | | | 0.27 | |
Serbia (Rep of) 7.250%, 09/28/2021 | | | | | | | 340,000 | | | | 385,151 | | | | 0.07 | |
| | | | | | | | | | | 2,723,540 | | | | 0.49 | |
South Africa (Cost $28,190,560) | | | | | | | | | | | | | | | | |
Eskom Holdings SOC Ltd. 5.750%, 01/26/2021 | | | | | | | 1,640,000 | | | | 1,548,134 | | | | 0.28 | |
Eskom Holdings SOC Ltd. 6.750%, 08/06/2023 | | | | | | | 1,404,000 | | | | 1,321,515 | | | | 0.24 | |
Eskom Holdings SOC Ltd. 7.125%, 02/11/2025 | | | | | | | 910,000 | | | | 857,302 | | | | 0.15 | |
South Africa (Rep of) 6.875%, 05/27/2019 | | | | | | | 1,190,000 | | | | 1,311,002 | | | | 0.24 | |
South Africa (Rep of) 5.500%, 03/09/2020 | | | | | | | 2,606,000 | | | | 2,771,762 | | | | 0.50 | |
South Africa (Rep of) 5.875%, 05/30/2022 | | | | | | | 1,408,000 | | | | 1,538,451 | | | | 0.28 | |
South Africa (Rep of) 7.750%, 02/28/2023 | | | ZAR | | | | 32,960,000 | | | | 2,190,927 | | | | 0.40 | |
South Africa (Rep of) 4.875%, 04/14/2026 | | | | | | | 590,000 | | | | 589,263 | | | | 0.11 | |
South Africa (Rep of) 10.500%, 12/21/2026 | | | ZAR | | | | 17,560,000 | | | | 1,360,466 | | | | 0.25 | |
South Africa (Rep of) 8.000%, 01/31/2030 | | | ZAR | | | | 18,070,000 | | | | 1,137,749 | | | | 0.21 | |
South Africa (Rep of) 7.000%, 02/28/2031 | | | ZAR | | | | 58,150,000 | | | | 3,301,318 | | | | 0.60 | |
South Africa (Rep of) 8.250%, 03/31/2032 | | | ZAR | | | | 24,590,000 | | | | 1,548,789 | | | | 0.28 | |
See accompanying notes to the financial statements.
59
ASHMORE EMERGING MARKETS TOTAL RETURN FUND
SCHEDULE OF INVESTMENTS (CONTINUED)
As of April 30, 2016 (Unaudited)
| | | | | | | | | | | | | | | | |
| | | Currency(1) | | | Par | | | Value | | | % of Net
Assets | |
South Africa - (continued) | | | | | | | | | | | | | | | | |
South Africa (Rep of) 6.250%, 03/31/2036 | | | ZAR | | | | 11,230,000 | | | $ | 558,611 | | | | 0.10 | |
South Africa (Rep of) 8.500%, 01/31/2037 | | | ZAR | | | | 19,840,000 | | | | 1,250,309 | | | | 0.23 | |
South Africa (Rep of) 8.750%, 01/31/2044 | | | ZAR | | | | 26,520,000 | | | | 1,686,147 | | | | 0.30 | |
South Africa (Rep of) 8.750%, 02/28/2048 | | | ZAR | | | | 39,230,000 | | | | 2,485,791 | | | | 0.45 | |
| | | | | | | | | | | 25,457,536 | | | | 4.62 | |
Thailand (Cost $2,499,746) | | | | | | | | | | | | | | | | |
Thailand (Rep of) 1.250%, 03/12/2028 | | | THB | | | | 20,270,000 | | | | 558,866 | | | | 0.10 | |
Thailand (Rep of) 3.400%, 06/17/2036 | | | THB | | | | 52,872,000 | | | | 1,774,070 | | | | 0.32 | |
Thailand (Rep of) 4.675%, 06/29/2044 | | | THB | | | | 7,997,000 | | | | 329,463 | | | | 0.06 | |
| | | | | | | | | | | 2,662,399 | | | | 0.48 | |
Turkey (Cost $12,256,431) | | | | | | | | | | | | | | | | |
Turkey (Rep of) 6.750%, 04/03/2018 | | | | | | | 1,108,000 | | | | 1,194,382 | | | | 0.22 | |
Turkey (Rep of) 7.000%, 03/11/2019 | | | | | | | 760,000 | | | | 844,293 | | | | 0.15 | |
Turkey (Rep of) 7.500%, 11/07/2019 | | | | | | | 870,000 | | | | 996,785 | | | | 0.18 | |
Turkey (Rep of) 9.400%, 07/08/2020 | | | TRY | | | | 6,190,000 | | | | 2,245,479 | | | | 0.41 | |
Turkey (Rep of) 5.625%, 03/30/2021 | | | | | | | 840,000 | | | | 910,928 | | | | 0.16 | |
Turkey (Rep of) 3.000%, 02/23/2022 | | | TRY | | | | 3,541,940 | | | | 1,801,740 | | | | 0.33 | |
Turkey (Rep of) 6.250%, 09/26/2022 | | | | | | | 670,000 | | | | 751,237 | | | | 0.14 | |
Turkey (Rep of) 10.400%, 03/20/2024 | | | TRY | | | | 2,000 | | | | 768 | | | | — | |
Turkey (Rep of) 5.750%, 03/22/2024 | | | | | | | 900,000 | | | | 987,750 | | | | 0.18 | |
Turkey (Rep of) 7.375%, 02/05/2025 | | | | | | | 627,000 | | | | 760,237 | | | | 0.14 | |
Turkey (Rep of) 6.750%, 05/30/2040 | | | | | | | 817,000 | | | | 970,188 | | | | 0.17 | |
Turkey (Rep of) 6.000%, 01/14/2041 | | | | | | | 800,000 | | | | 869,472 | | | | 0.16 | |
| | | | | | | | | | | 12,333,259 | | | | 2.24 | |
Ukraine (Cost $14,289,663) | | | | | | | | | | | | | | | | |
DTEK Finance PLC 10.375%, 03/28/2018 | | | | | | | 500,000 | | | | 200,000 | | | | 0.04 | |
DTEK Finance PLC 7.875%, 04/04/2018 | | | | | | | 2,053,000 | | | | 842,141 | | | | 0.15 | |
Ferrexpo Finance PLC 10.375%, 04/07/2019 | | | | | | | 717,000 | | | | 552,234 | | | | 0.10 | |
Metinvest B.V., FRN 10.500%, 11/28/2017 | | | | | | | 1,216,403 | | | | 742,249 | | | | 0.13 | |
Metinvest B.V., FRN 8.750%, 02/14/2018 | | | | | | | 1,562,385 | | | | 953,367 | | | | 0.17 | |
MHP S.A. 8.250%, 04/02/2020 | | | | | | | 2,565,000 | | | | 2,295,675 | | | | 0.42 | |
Oschadbank Via SSB #1 PLC, FRN 9.625%, 03/20/2025 | | | | | | | 490,000 | | | | 441,000 | | | | 0.08 | |
Ukraine (Rep of) 7.750%, 09/01/2020 | | | | | | | 1,115,000 | | | | 1,069,385 | | | | 0.19 | |
Ukraine (Rep of) 7.750%, 09/01/2021 | | | | | | | 792,000 | | | | 757,508 | | | | 0.14 | |
Ukraine (Rep of) 7.750%, 09/01/2022 | | | | | | | 562,000 | | | | 536,513 | | | | 0.10 | |
Ukraine (Rep of) 7.750%, 09/01/2023 | | | | | | | 442,000 | | | | 419,790 | | | | 0.08 | |
Ukraine (Rep of) 7.750%, 09/01/2024 | | | | | | | 438,000 | | | | 415,093 | | | | 0.07 | |
Ukraine (Rep of) 7.750%, 09/01/2025 | | | | | | | 668,000 | | | | 627,459 | | | | 0.11 | |
Ukraine (Rep of) 7.750%, 09/01/2026 | | | | | | | 436,000 | | | | 405,567 | | | | 0.07 | |
Ukraine (Rep of) 7.750%, 09/01/2027 | | | | | | | 866,000 | | | | 804,471 | | | | 0.15 | |
Ukraine (Rep of), FRN 2.723%, 05/31/2040(9) | | | | | | | 704,000 | | | | 219,852 | | | | 0.04 | |
Ukreximbank Via Biz Finance PLC 9.750%, 01/22/2025 | | | | | | | 1,550,000 | | | | 1,410,500 | | | | 0.26 | |
UKRLANDFARMING PLC 10.875%, 03/26/2018 | | | | | | | 1,172,109 | | | | 340,618 | | | | 0.06 | |
| | | | | | | | | | | 13,033,422 | | | | 2.36 | |
United Arab Emirates (Cost $3,333,773) | | | | | | | | | | | | | | | | |
Dubai Holding Commercial Operations MTN Ltd. 6.000%, 02/01/2017 | | | GBP | | | | 300,000 | | | | 443,728 | | | | 0.08 | |
Emirate of Abu Dhabi (Rep of) , 05/03/2026(2)(10) | | | | | | | 870,000 | | | | 876,525 | | | | 0.16 | |
Emirate of Dubai (Rep of) 7.750%, 10/05/2020 | | | | | | | 379,000 | | | | 452,033 | | | | 0.08 | |
Emirate of Dubai (Rep of) 5.250%, 01/30/2043 | | | | | | | 520,000 | | | | 481,104 | | | | 0.09 | |
Topaz Marine S.A. 8.625%, 11/01/2018 | | | | | | | 1,120,000 | | | | 1,058,624 | | | | 0.19 | |
| | | | | | | | | | | 3,312,014 | | | | 0.60 | |
See accompanying notes to the financial statements.
60
ASHMORE EMERGING MARKETS TOTAL RETURN FUND
SCHEDULE OF INVESTMENTS (CONTINUED)
As of April 30, 2016 (Unaudited)
| | | | | | | | | | | | | | |
| | | Currency(1) | | Par | | | Value | | | % of Net
Assets | |
Uruguay (Cost $7,368,735) | | | | | | | | | | | | | | |
Uruguay (Rep of) 4.500%, 08/14/2024 | | | | | 1,224,374 | | | $ | 1,299,367 | | | | 0.24 | |
Uruguay (Rep of) 4.250%, 04/05/2027 | | UYU | | | 6,867,000 | | | | 410,812 | | | | 0.07 | |
Uruguay (Rep of) 7.875%, 01/15/2033 | | | | | 1,546,000 | | | | 2,023,327 | | | | 0.37 | |
Uruguay (Rep of) 7.625%, 03/21/2036 | | | | | 704,000 | | | | 914,320 | | | | 0.17 | |
Uruguay (Rep of) 3.700%, 06/26/2037 | | UYU | | | 13,715,000 | | | | 714,267 | | | | 0.13 | |
Uruguay (Rep of) 4.125%, 11/20/2045 | | | | | 714,235 | | | | 614,242 | | | | 0.11 | |
Uruguay (Rep of) 5.100%, 06/18/2050 | | | | | 616,000 | | | | 577,500 | | | | 0.10 | |
| | | | | | | | | 6,553,835 | | | | 1.19 | |
Venezuela (Cost $39,140,756) | | | | | | | | | | | | | | |
Petroleos de Venezuela S.A. 5.125%, 10/28/2016 | | | | | 4,797,667 | | | | 4,221,947 | | | | 0.77 | |
Petroleos de Venezuela S.A. 5.250%, 04/12/2017 | | | | | 4,879,000 | | | | 2,671,252 | | | | 0.48 | |
Petroleos de Venezuela S.A. 8.500%, 11/02/2017 | | | | | 21,872,134 | | | | 12,795,198 | | | | 2.32 | |
Petroleos de Venezuela S.A. 9.000%, 11/17/2021 | | | | | 1,679,076 | | | | 660,716 | | | | 0.12 | |
Petroleos de Venezuela S.A. 12.750%, 02/17/2022 | | | | | 405,000 | | | | 188,325 | | | | 0.03 | |
Petroleos de Venezuela S.A. 5.375%, 04/12/2027 | | | | | 580,000 | | | | 203,870 | | | | 0.04 | |
Petroleos de Venezuela S.A. 9.750%, 05/17/2035 | | | | | 1,453,147 | | | | 581,113 | | | | 0.10 | |
Venezuela (Rep of) 7.750%, 10/13/2019 | | | | | 970,000 | | | | 389,213 | | | | 0.07 | |
Venezuela (Rep of) 6.000%, 12/09/2020 | | | | | 853,000 | | | | 311,345 | | | | 0.06 | |
Venezuela (Rep of) 12.750%, 08/23/2022 | | | | | 1,626,000 | | | | 754,058 | | | | 0.14 | |
Venezuela (Rep of) 9.000%, 05/07/2023 | | | | | 680,000 | | | | 259,250 | | | | 0.05 | |
Venezuela (Rep of) 8.250%, 10/13/2024 | | | | | 3,740,000 | | | | 1,397,825 | | | | 0.25 | |
Venezuela (Rep of) 7.650%, 04/21/2025 | | | | | 572,000 | | | | 208,065 | | | | 0.04 | |
Venezuela (Rep of) 11.750%, 10/21/2026 | | | | | 10,120,600 | | | | 4,288,604 | | | | 0.78 | |
Venezuela (Rep of) 9.250%, 09/15/2027 | | | | | 1,130,000 | | | | 481,663 | | | | 0.09 | |
Venezuela (Rep of) 9.250%, 05/07/2028 | | | | | 2,473,000 | | | | 952,105 | | | | 0.17 | |
Venezuela (Rep of) 11.950%, 08/05/2031 | | | | | 9,525,500 | | | | 4,048,338 | | | | 0.73 | |
| | | | | | | | | 34,412,887 | | | | 6.24 | |
Vietnam (Cost $3,615,042) | | | | | | | | | | | | | | |
Vietnam (Rep of) 6.750%, 01/29/2020 | | | | | 2,151,000 | | | | 2,393,592 | | | | 0.43 | |
Vietnam (Rep of) 4.800%, 11/19/2024 | | | | | 642,000 | | | | 657,140 | | | | 0.12 | |
Vingroup JSC 11.625%, 05/07/2018 | | | | | 560,000 | | | | 607,600 | | | | 0.11 | |
| | | | | | | | | 3,658,332 | | | | 0.66 | |
Zambia (Cost $3,264,830) | | | | | | | | | | | | | | |
Zambia (Rep of) 8.500%, 04/14/2024 | | | | | 1,040,000 | | | | 858,208 | | | | 0.16 | |
Zambia (Rep of) 8.970%, 07/30/2027 | | | | | 2,680,000 | | | | 2,211,000 | | | | 0.40 | |
| | | | | | | | | 3,069,208 | | | | 0.56 | |
Total Debt Securities (Cost $505,364,661) | | | | | | | | | 490,677,081 | | | | 89.00 | |
| | | | |
Bank Loans | | | | | | | | | | | | | | |
| | | | |
China (Cost $281,761) | | | | | | | | | | | | | | |
Far East Energy Bermuda Ltd. 10.000%, 03/29/2016(7)(8) | | | | | 638,734 | | | | — | | | | — | |
Far East Energy Bermuda Ltd. 25.000%, 03/29/2016(8) | | | | | 281,761 | | | | 176,918 | | | | 0.03 | |
| | | | | | | | | 176,918 | | | | 0.03 | |
United Arab Emirates (Cost $7,866,100) | | | | | | | | | | | | | | |
DP World Ltd. , 09/30/2022(10) | | | | | 4,630,452 | | | | 3,519,144 | | | | 0.64 | |
DP World Ltd. 4.250%, 09/30/2022 | | | | | 5,549,402 | | | | 4,273,040 | | | | 0.77 | |
| | | | | | | | | 7,792,184 | | | | 1.41 | |
Total Bank Loans (Cost $8,147,861) | | | | | | | | | 7,969,102 | | | | 1.44 | |
See accompanying notes to the financial statements.
61
ASHMORE EMERGING MARKETS TOTAL RETURN FUND
SCHEDULE OF INVESTMENTS (CONTINUED)
As of April 30, 2016 (Unaudited)
| | | | | | | | | | | | | | |
| | | Currency(1) | | Shares | | | Value | | | % of Net
Assets | |
Equity Securities | | | | | | | | | | | | | | |
| | | | |
China (Cost $—) | | | | | | | | | | | | | | |
Emerald Plantation Holdings Ltd. | | | | | 308,246 | | | $ | 67,814 | | | | 0.01 | |
| | | | |
Mexico (Cost $13,827) | | | | | | | | | | | | | | |
Corp. GEO S.A.B. de C.V., Series B | | MXN | | | 36,793 | | | | 20,359 | | | | 0.01 | |
| | | | |
Total Equity Securities (Cost $13,827) | | | | | | | | | 88,173 | | | | 0.02 | |
| | | | |
| | | Currency(1) | | Number
of
Warrants | | | Value | | | % of Net
Assets | |
Warrants | | | | | | | | | | | | | | |
| | | | |
China (Cost $27,482) | | | | | | | | | | | | | | |
Far East Energy Bermuda Ltd.,
Exp. 12/31/2017, Strike Price $11.92(2)(3)(7) | | | | | 1,308,684 | | | $ | — | | | | — | |
| | | | |
Total Warrants (Cost $27,482) | | | | | | | | | — | | | | — | |
| | | | |
Total Investments in Securities (Cost $513,553,831) | | | | | | | | | 498,734,356 | | | | 90.46 | |
| | | | |
| | | Currency(1) | | Par | | | Value | | | % of Net
Assets | |
Fully Funded Total Return Swaps | | | | | | | | | | | | | | |
| | | | |
Indonesia (Cost $5,623,650) | | | | | | | | | | | | | | |
Indonesia (Rep of), Issued by ANZ Banking Corp.,
8.375%, 03/15/2024 | | IDR | | | 12,660,000,000 | | | $ | 1,003,934 | | | | 0.18 | |
Indonesia (Rep of), Issued by ANZ Banking Corp.,
9.000%, 03/15/2029 | | IDR | | | 1,592,000,000 | | | | 132,136 | | | | 0.03 | |
Indonesia (Rep of), Issued by ANZ Banking Corp.,
8.375%, 03/15/2034 | | IDR | | | 262,000,000 | | | | 20,841 | | | | — | |
Indonesia (Rep of), Issued by HSBC Bank,
8.375%, 03/15/2034 | | IDR | | | 3,022,000,000 | | | | 240,390 | | | | 0.04 | |
Indonesia (Rep of), Issued by Standard Chartered,
12.800%, 06/15/2021 | | IDR | | | 1,840,000,000 | | | | 171,062 | | | | 0.03 | |
Indonesia (Rep of), Issued by Standard Chartered,
11.000%, 09/15/2025 | | IDR | | | 3,602,000,000 | | | | 333,007 | | | | 0.06 | |
Indonesia (Rep of), Issued by Standard Chartered,
8.375%, 09/15/2026 | | IDR | | | 7,600,000,000 | | | | 604,231 | | | | 0.11 | |
Indonesia (Rep of), Issued by Standard Chartered,
7.000%, 05/15/2027 | | IDR | | | 2,613,000,000 | | | | 187,181 | | | | 0.04 | |
Indonesia (Rep of), Issued by Standard Chartered,
9.000%, 03/15/2029 | | IDR | | | 11,300,000,000 | | | | 937,901 | | | | 0.17 | |
Indonesia (Rep of), Issued by Standard Chartered,
10.500%, 08/15/2030 | | IDR | | | 8,356,000,000 | | | | 775,753 | | | | 0.14 | |
See accompanying notes to the financial statements.
62
ASHMORE EMERGING MARKETS TOTAL RETURN FUND
SCHEDULE OF INVESTMENTS (CONTINUED)
As of April 30, 2016 (Unaudited)
| | | | | | | | | | | | | | |
| | | Currency(1) | | Par | | | Value | | | % of Net
Assets | |
Indonesia - (continued) | | | | | | | | | | | | | | |
Indonesia (Rep of), Issued by Standard Chartered,
8.375%, 03/15/2034 | | IDR | | | 2,727,000,000 | | | $ | 216,923 | | | | 0.04 | |
| | | | | | | | | 4,623,359 | | | | 0.84 | |
Total Fully Funded Total Return Swaps (Cost $5,623,650) | | | | | | | | | 4,623,359 | | | | 0.84 | |
| | | | |
Total Investments (Total Cost $519,177,481) | | | | | | | | | 503,357,715 | | | | 91.30 | |
| | | | |
Other Assets Less Liabilities (See Statements of Assets and Liabilities for further detail) | | | | | | | | | 47,954,048 | | | | 8.70 | |
| | | | |
Net Assets | | | | | | | | $ | 551,311,763 | | | | 100.00 | |
| (1) | Par values are stated in United States Dollars unless otherwise noted below. |
| (2) | Securities exempt from registration under Rule 144A of the Securities Act of 1933. These securities may not be publicly traded without registration under the Securities Act of 1933. |
| (3) | Restricted security that has been deemed illiquid. At April 30, 2016, the value of these restricted illiquid securities amounted to $7,219,495 or 1.3% of net assets. Additional information on each restricted illiquid security is as follows: |
| | | | | | |
| SECURITY | | ACQUISITION DATE | | ACQUISITION COST | |
Argentina (Rep of), 6.875%, 04/22/2021 | | 04/19/2016 | | | $1,436,000 | |
Argentina (Rep of), 7.500%, 04/22/2026 | | 04/19/2016 | | | 1,933,000 | |
Argentina (Rep of), 7.625%, 04/22/2046 | | 04/19/2016 | | | 1,497,655 | |
Far East Energy Bermuda Ltd., 13.000%, 01/15/2016 | | 01/14/2013-07/20/2015 | | | 1,953,742 | |
Far East Energy Bermuda Ltd., Exp. 12/31/2017, Strike Price $11.92 | | 01/14/2013 | | | 27,482 | |
GTH Finance B.V., 6.250%, 04/26/2020 | | 04/20/2016-04/28/2016 | | | 1,240,003 | |
GTH Finance B.V., 7.250%, 04/26/2023 | | 04/20/2016 | | | 600,000 | |
Sino-Forest Corp., 5.000%, 08/01/2013 | | 01/31/2013 | | | — | |
Sino-Forest Corp., 10.250%, 07/28/2014 | | 01/31/2013 | | | — | |
Sino-Forest Corp., 4.250%, 12/15/2016 | | 01/31/2013 | | | — | |
Sino-Forest Corp., 6.250%, 10/21/2017 | | 01/31/2013 | | | — | |
YPF S.A., 8.500%, 03/23/2021 | | 03/18/2016-04/12/2016 | | | 393,088 | |
| (5) | Security is a payment in-kind bond, and unless otherwise noted in the description of the security, pays its entire coupon on an in-kind basis. |
| (6) | Issuer has defaulted on terms of debt obligation. |
| (7) | Security has been deemed worthless and is a Level 3 investment. |
| (8) | Maturity has been extended under the terms of a plan of reorganization. |
| (9) | Zero coupon bond reflects effective yield on the date of purchase. |
| (10) | When Issued Security. |
See accompanying notes to the financial statements.
63
ASHMORE EMERGING MARKETS TOTAL RETURN FUND
SCHEDULE OF INVESTMENTS (CONTINUED)
As of April 30, 2016 (Unaudited)
Percentages shown are based on net assets.
At April 30, 2016, the Ashmore Emerging Markets Total Return Fund had outstanding forward foreign currency exchange contracts as follows:
| | | | | | | | | | | | | | | | | | |
Settlement Date | | Counterparty | | Currency Buy | | Currency
Buy Amount
(Local
Currency) | | | Currency Sell | | Currency
Sell Amount
(Local
Currency) | | | Unrealized Gain/(Loss) | |
05/03/2016 | | Morgan Stanley | | Brazilian Real | | | 6,912,693 | | | United States Dollar | | | 1,945,046 | | | | $62,863 | |
05/03/2016 | | Deutsche Bank | | United States Dollar | | | 904,280 | | | Brazilian Real | | | 3,300,622 | | | | (54,442 | ) |
05/03/2016 | | Morgan Stanley | | United States Dollar | | | 1,005,000 | | | Brazilian Real | | | 3,612,071 | | | | (44,187 | ) |
05/04/2016 | | BNP Paribas | | Argentine Peso | | | 10,810,800 | | | United States Dollar | | | 660,000 | | | | 93,325 | |
05/04/2016 | | BNP Paribas | | United States Dollar | | | 40,577 | | | Argentine Peso | | | 599,724 | | | | (1,214 | ) |
05/04/2016 | | BNP Paribas | | United States Dollar | | | 31,421 | | | Argentine Peso | | | 474,136 | | | | (1,619 | ) |
05/04/2016 | | BNP Paribas | | United States Dollar | | | 37,520 | | | Argentine Peso | | | 565,051 | | | | (1,854 | ) |
05/04/2016 | | BNP Paribas | | United States Dollar | | | 30,168 | | | Argentine Peso | | | 460,965 | | | | (1,953 | ) |
05/04/2016 | | BNP Paribas | | United States Dollar | | | 76,887 | | | Argentine Peso | | | 1,149,458 | | | | (3,210 | ) |
05/04/2016 | | BNP Paribas | | United States Dollar | | | 75,180 | | | Argentine Peso | | | 1,131,459 | | | | (3,663 | ) |
05/04/2016 | | BNP Paribas | | United States Dollar | | | 427,243 | | | Argentine Peso | | | 6,430,007 | | | | (20,817 | ) |
05/05/2016 | | BNP Paribas | | Chinese Offshore Yuan | | | 41,316,060 | | | United States Dollar | | | 6,268,367 | | | | 99,732 | |
05/05/2016 | | BNP Paribas | | United States Dollar | | | 6,140,000 | | | Chinese Offshore Yuan | | | 41,316,060 | | | | (228,099 | ) |
05/20/2016 | | Merrill Lynch | | Euro | | | 477,790 | | | United States Dollar | | | 538,669 | | | | 8,749 | |
05/20/2016 | | BNP Paribas | | United States Dollar | | | 708,705 | | | British Pound | | | 496,610 | | | | (16,954 | ) |
05/20/2016 | | UBS | | United States Dollar | | | 5,251,775 | | | Euro | | | 4,597,657 | | | | (15,899 | ) |
05/31/2016 | | BNP Paribas | | Chinese Offshore Yuan | | | 39,920,840 | | | United States Dollar | | | 6,042,661 | | | | 103,592 | |
05/31/2016 | | BNP Paribas | | Chinese Offshore Yuan | | | 1,424,497 | | | United States Dollar | | | 217,000 | | | | 2,317 | |
05/31/2016 | | BNP Paribas | | Chinese Offshore Yuan | | | 787,789 | | | United States Dollar | | | 120,531 | | | | 758 | |
05/31/2016 | | Merrill Lynch | | Chinese Yuan Renminbi | | | 86,864,048 | | | United States Dollar | | | 13,365,756 | | | | 16,304 | |
05/31/2016 | | Goldman Sachs | | Indian Rupee | | | 29,966,625 | | | United States Dollar | | | 438,750 | | | | 9,644 | |
05/31/2016 | | Merrill Lynch | | Indian Rupee | | | 652,563,083 | | | United States Dollar | | | 9,346,497 | | | | 417,887 | |
05/31/2016 | | BNP Paribas | | Indonesian Rupiah | | | 95,118,170,198 | | | United States Dollar | | | 7,197,743 | | | | (26,023 | ) |
05/31/2016 | | ANZ Banking | | Korean Won | | | 14,295,188,122 | | | United States Dollar | | | 11,730,829 | | | | 733,117 | |
05/31/2016 | | Barclays | | Korean Won | | | 867,237,696 | | | United States Dollar | | | 712,720 | | | | 43,423 | |
05/31/2016 | | Citibank | | Malaysian Ringgit | | | 5,703,900 | | | United States Dollar | | | 1,348,759 | | | | 106,263 | |
05/31/2016 | | Deutsche Bank | | Malaysian Ringgit | | | 6,501,400 | | | United States Dollar | | | 1,531,543 | | | | 126,915 | |
05/31/2016 | | Citibank | | Polish Zloty | | | 31,893,497 | | | United States Dollar | | | 8,180,893 | | | | 168,853 | |
05/31/2016 | | Deutsche Bank | | Polish Zloty | | | 15,654,999 | | | United States Dollar | | | 3,938,761 | | | | 159,732 | |
05/31/2016 | | Merrill Lynch | | Polish Zloty | | | 4,986,424 | | | United States Dollar | | | 1,342,620 | | | | (37,170 | ) |
05/31/2016 | | HSBC Bank | | Romanian Leu | | | 8,436,641 | | | United States Dollar | | | 2,083,739 | | | | 73,039 | |
05/31/2016 | | Credit Suisse | | Russian Ruble | | | 611,416,324 | | | United States Dollar | | | 9,123,574 | | | | 234,262 | |
05/31/2016 | | Goldman Sachs | | Russian Ruble | | | 87,441,700 | | | United States Dollar | | | 1,340,000 | | | | (1,689 | ) |
05/31/2016 | | Merrill Lynch | | Russian Ruble | | | 278,091,873 | | | United States Dollar | | | 3,555,139 | | | | 701,106 | |
05/31/2016 | | ANZ Banking | | Singapore Dollar | | | 837,350 | | | United States Dollar | | | 600,380 | | | | 21,708 | |
05/31/2016 | | Barclays | | Singapore Dollar | | | 13,882,661 | | | United States Dollar | | | 9,899,216 | | | | 414,561 | |
05/31/2016 | | Merrill Lynch | | South African Rand | | | 8,512,672 | | | United States Dollar | | | 584,335 | | | | 9,587 | |
05/31/2016 | | Merrill Lynch | | South African Rand | | | 1,367,500 | | | United States Dollar | | | 94,508 | | | | 901 | |
05/31/2016 | | Merrill Lynch | | Taiwan Dollar | | | 242,047,647 | | | United States Dollar | | | 7,487,940 | | | | 4,589 | |
05/31/2016 | | BNP Paribas | | Thai Baht | | | 534,643,327 | | | United States Dollar | | | 14,923,750 | | | | 370,440 | |
05/31/2016 | | Citibank | | Thai Baht | | | 5,442,577 | | | United States Dollar | | | 151,900 | | | | 3,792 | |
05/31/2016 | | Citibank | | Thai Baht | | | 5,109,658 | | | United States Dollar | | | 142,728 | | | | 3,441 | |
05/31/2016 | | JP Morgan | | Thai Baht | | | 28,465,241 | | | United States Dollar | | | 800,710 | | | | 13,576 | |
05/31/2016 | | HSBC Bank | | Turkish Lira | | | 8,862,195 | | | United States Dollar | | | 3,018,099 | | | | 122,156 | |
05/31/2016 | | Merrill Lynch | | Turkish Lira | | | 2,584,680 | | | United States Dollar | | | 899,689 | | | | 16,174 | |
05/31/2016 | | Merrill Lynch | | Turkish Lira | | | 3,311,845 | | | United States Dollar | | | 1,172,000 | | | | 1,528 | |
05/31/2016 | | Merrill Lynch | | Turkish Lira | | | 195,500 | | | United States Dollar | | | 68,446 | | | | 828 | |
05/31/2016 | | BNP Paribas | | United States Dollar | | | 6,250,000 | | | Chinese Offshore Yuan | | | 42,133,125 | | | | (236,858 | ) |
05/31/2016 | | Citibank | | United States Dollar | | | 167,000 | | | Indian Rupee | | | 11,192,340 | | | | (472 | ) |
05/31/2016 | | Goldman Sachs | | United States Dollar | | | 295,000 | | | Indian Rupee | | | 20,124,900 | | | | (6,132 | ) |
05/31/2016 | | Citibank | | United States Dollar | | | 253,000 | | | Indonesian Rupiah | | | 3,358,575,000 | | | | (230 | ) |
05/31/2016 | | Citibank | | United States Dollar | | | 276,000 | | | Korean Won | | | 317,896,800 | | | | (1,174 | ) |
05/31/2016 | | Citibank | | United States Dollar | | | 507,000 | | | Korean Won | | | 616,512,000 | | | | (30,536 | ) |
See accompanying notes to the financial statements.
64
ASHMORE EMERGING MARKETS TOTAL RETURN FUND
SCHEDULE OF INVESTMENTS (CONTINUED)
As of April 30, 2016 (Unaudited)
| | | | | | | | | | | | | | | | | | |
Settlement Date | | Counterparty | | Currency Buy | | Currency
Buy Amount
(Local
Currency) | | | Currency Sell | | Currency
Sell Amount
(Local
Currency) | | | Unrealized Gain/(Loss) | |
05/31/2016 | | Barclays | | United States Dollar | | | 241,000 | | | Malaysian Ringgit | | | 944,479 | | | | $71 | |
05/31/2016 | | JP Morgan | | United States Dollar | | | 106,282 | | | Malaysian Ringgit | | | 416,626 | | | | 4 | |
05/31/2016 | | HSBC Bank | | United States Dollar | | | 1,430,910 | | | Polish Zloty | | | 5,625,952 | | | | (41,969 | ) |
05/31/2016 | | Morgan Stanley | | United States Dollar | | | 534,000 | | | Polish Zloty | | | 2,078,882 | | | | (10,253 | ) |
05/31/2016 | | Citibank | | United States Dollar | | | 578,000 | | | Russian Ruble | | | 38,812,700 | | | | (16,035 | ) |
05/31/2016 | | JP Morgan | | United States Dollar | | | 194,000 | | | Singapore Dollar | | | 262,986 | | | | (1,379 | ) |
05/31/2016 | | UBS | | United States Dollar | | | 422,000 | | | Singapore Dollar | | | 585,905 | | | | (13,283 | ) |
05/31/2016 | | Citibank | | United States Dollar | | | 888,000 | | | South African Rand | | | 12,910,918 | | | | (12,783 | ) |
05/31/2016 | | Goldman Sachs | | United States Dollar | | | 91,000 | | | Taiwan Dollar | | | 2,948,400 | | | | (267 | ) |
05/31/2016 | | Barclays | | United States Dollar | | | 137,000 | | | Thai Baht | | | 4,815,550 | | | | (755 | ) |
05/31/2016 | | Citibank | | United States Dollar | | | 725,000 | | | Thai Baht | | | 25,686,750 | | | | (9,804 | ) |
05/31/2016 | | Deutsche Bank | | United States Dollar | | | 36,980 | | | Thai Baht | | | 1,291,356 | | | | 39 | |
05/31/2016 | | Deutsche Bank | | United States Dollar | | | 12,297 | | | Thai Baht | | | 431,170 | | | | (37 | ) |
05/31/2016 | | Deutsche Bank | | United States Dollar | | | 18,196 | | | Thai Baht | | | 638,500 | | | | (69 | ) |
05/31/2016 | | Deutsche Bank | | United States Dollar | | | 12,264 | | | Thai Baht | | | 431,255 | | | | (73 | ) |
05/31/2016 | | Deutsche Bank | | United States Dollar | | | 12,326 | | | Thai Baht | | | 433,679 | | | | (80 | ) |
05/31/2016 | | Deutsche Bank | | United States Dollar | | | 12,248 | | | Thai Baht | | | 431,311 | | | | (90 | ) |
05/31/2016 | | Deutsche Bank | | United States Dollar | | | 36,600 | | | Thai Baht | | | 1,289,600 | | | | (291 | ) |
05/31/2016 | | Merrill Lynch | | United States Dollar | | | 365,000 | | | Turkish Lira | | | 1,048,280 | | | | (6,450 | ) |
06/02/2016 | | JP Morgan | | Brazilian Real | | | 16,594,413 | | | United States Dollar | | | 4,657,950 | | | | 113,664 | |
06/02/2016 | | JP Morgan | | Brazilian Real | | | 10,193,276 | | | United States Dollar | | | 2,858,462 | | | | 72,547 | |
06/02/2016 | | JP Morgan | | Brazilian Real | | | 4,907,300 | | | United States Dollar | | | 1,405,000 | | | | 6,062 | |
06/02/2016 | | Morgan Stanley | | United States Dollar | | | 1,928,119 | | | Brazilian Real | | | 6,912,693 | | | | (59,580 | ) |
06/30/2016 | | UBS | | Malaysian Ringgit | | | 12,373,677 | | | United States Dollar | | | 3,033,359 | | | | 120,684 | |
06/30/2016 | | BNP Paribas | | Philippine Peso | | | 47,154,244 | | | United States Dollar | | | 1,009,187 | | | | (11,699 | ) |
06/30/2016 | | Citibank | | Polish Zloty | | | 6,957,503 | | | United States Dollar | | | 1,813,886 | | | | 6,780 | |
06/30/2016 | | Deutsche Bank | | Polish Zloty | | | 6,957,503 | | | United States Dollar | | | 1,823,532 | | | | (2,866 | ) |
06/30/2016 | | Deutsche Bank | | Romanian Leu | | | 7,628,141 | | | United States Dollar | | | 1,910,902 | | | | 40,086 | |
06/30/2016 | | Barclays | | Russian Ruble | | | 275,826,105 | | | United States Dollar | | | 3,975,299 | | | | 214,695 | |
07/01/2016 | | BNP Paribas | | Argentine Peso | | | 474,136 | | | United States Dollar | | | 29,933 | | | | 1,781 | |
07/01/2016 | | BNP Paribas | | United States Dollar | | | 30,511 | | | Argentine Peso | | | 474,136 | | | | (1,203 | ) |
07/27/2016 | | BNP Paribas | | Peruvian Nuevo Sol | | | 6,548,335 | | | United States Dollar | | | 1,985,066 | | | | (11,614 | ) |
07/28/2016 | | BNP Paribas | | Israeli Shekel | | | 7,617,461 | | | United States Dollar | | | 2,027,430 | | | | 15,042 | |
07/29/2016 | | Deutsche Bank | | Chilean Peso | | | 1,048,481,531 | | | United States Dollar | | | 1,572,644 | | | | 838 | |
07/29/2016 | | HSBC Bank | | Chilean Peso | | | 300,931,040 | | | United States Dollar | | | 448,816 | | | | 2,799 | |
07/29/2016 | | Citibank | | Colombian Peso | | | 6,434,563,909 | | | United States Dollar | | | 2,184,726 | | | | 40,620 | |
07/29/2016 | | Goldman Sachs | | Colombian Peso | | | 6,434,563,908 | | | United States Dollar | | | 2,164,698 | | | | 60,648 | |
07/29/2016 | | Barclays | | Czech Koruna | | | 98,768,948 | | | United States Dollar | | | 4,138,393 | | | | 53,197 | |
07/29/2016 | | Merrill Lynch | | Hungarian Forint | | | 2,361,429,498 | | | United States Dollar | | | 8,526,401 | | | | 133,284 | |
07/29/2016 | | Barclays | | Malaysian Ringgit | | | 45,239,066 | | | United States Dollar | | | 11,651,445 | | | | (129,972 | ) |
07/29/2016 | | BNP Paribas | | Mexican Peso | | | 35,496,473 | | | United States Dollar | | | 2,020,519 | | | | 24,515 | |
07/29/2016 | | HSBC Bank | | Mexican Peso | | | 65,121,795 | | | United States Dollar | | | 3,696,951 | | | | 54,866 | |
07/29/2016 | | Citibank | | Romanian Leu | | | 7,622,556 | | | United States Dollar | | | 1,919,701 | | | | 30,216 | |
07/29/2016 | | Goldman Sachs | | Russian Ruble | | | 124,021,988 | | | United States Dollar | | | 1,872,030 | | | | 113 | |
07/29/2016 | | Citibank | | South African Rand | | | 12,550,825 | | | United States Dollar | | | 851,007 | | | | 14,603 | |
07/29/2016 | | BNP Paribas | | Turkish Lira | | | 11,651,964 | | | United States Dollar | | | 4,021,941 | | | | 46,113 | |
07/29/2016 | | BNP Paribas | | United States Dollar | | | 371,000 | | | Colombian Peso | | | 1,108,889,914 | | | | (12,501 | ) |
07/29/2016 | | HSBC Bank | | United States Dollar | | | 683,000 | | | Mexican Peso | | | 12,023,143 | | | | (9,681 | ) |
09/20/2016 | | HSBC Bank | | Chinese Offshore Yuan | | | 23,958,440 | | | United States Dollar | | | 3,536,301 | | | | 129,729 | |
09/20/2016 | | HSBC Bank | | Chinese Offshore Yuan | | | 22,691,563 | | | United States Dollar | �� | | 3,350,792 | | | | 121,385 | |
09/20/2016 | | HSBC Bank | | Chinese Offshore Yuan | | | 3,375,149 | | | United States Dollar | | | 517,780 | | | | (1,328 | ) |
09/20/2016 | | HSBC Bank | | United States Dollar | | | 7,594,758 | | | Chinese Offshore Yuan | | | 50,025,153 | | | | (59,901 | ) |
09/22/2016 | | BNP Paribas | | Chinese Offshore Yuan | | | 5,784,110 | | | United States Dollar | | | 877,977 | | | | 6,974 | |
09/22/2016 | | BNP Paribas | | United States Dollar | | | 352,000 | | | Chinese Offshore Yuan | | | 2,296,800 | | | | 597 | |
09/22/2016 | | BNP Paribas | | United States Dollar | | | 530,833 | | | Chinese Offshore Yuan | | | 3,487,310 | | | | (2,714 | ) |
10/11/2016 | | BNP Paribas | | Chinese Offshore Yuan | | | 14,264,853 | | | United States Dollar | | | 2,101,171 | | | | 78,680 | |
10/11/2016 | | BNP Paribas | | Chinese Offshore Yuan | | | 11,253,022 | | | United States Dollar | | | 1,703,455 | | | | 16,151 | |
10/11/2016 | | BNP Paribas | | Chinese Offshore Yuan | | | 2,394,000 | | | United States Dollar | | | 350,000 | | | | 15,834 | |
10/11/2016 | | BNP Paribas | | United States Dollar | | | 4,250,000 | | | Chinese Offshore Yuan | | | 27,911,875 | | | | (15,291 | ) |
See accompanying notes to the financial statements.
65
ASHMORE EMERGING MARKETS TOTAL RETURN FUND
SCHEDULE OF INVESTMENTS (CONTINUED)
As of April 30, 2016 (Unaudited)
| | | | | | | | | | | | | | | | | | |
Settlement Date | | Counterparty | | Currency Buy | | Currency
Buy Amount
(Local
Currency) | | | Currency Sell | | Currency
Sell Amount
(Local
Currency) | | | Unrealized Gain/(Loss) | |
01/04/2017 | | Goldman Sachs | | United States Dollar | | | 3,736,338 | | | Brazilian Real | | | 16,253,071 | | | | $(651,695 | ) |
01/04/2017 | | Merrill Lynch | | United States Dollar | | | 2,036,001 | | | Brazilian Real | | | 8,096,157 | | | | (149,814 | ) |
01/06/2017 | | HSBC Bank | | Chinese Offshore Yuan | | | 19,874,389 | | | United States Dollar | | | 2,986,385 | | | | 32,167 | |
01/06/2017 | | HSBC Bank | | Chinese Offshore Yuan | | | 4,218,812 | | | United States Dollar | | | 637,861 | | | | 2,898 | |
01/06/2017 | | HSBC Bank | | United States Dollar | | | 267,470 | | | Chinese Offshore Yuan | | | 1,798,201 | | | | (5,643 | ) |
01/06/2017 | | HSBC Bank | | United States Dollar | | | 3,250,000 | | | Chinese Offshore Yuan | | | 22,295,000 | | | | (136,197 | ) |
03/02/2017 | | BNP Paribas | | United States Dollar | | | 3,971,478 | | | Brazilian Real | | | 15,643,651 | | | | (195,903 | ) |
03/06/2017 | | HSBC Bank | | Chinese Offshore Yuan | | | 26,500,860 | | | United States Dollar | | | 4,163,202 | | | | (155,317 | ) |
03/06/2017 | | HSBC Bank | | Chinese Offshore Yuan | | | 42,770,000 | | | United States Dollar | | | 6,710,599 | | | | (242,234 | ) |
03/06/2017 | | HSBC Bank | | United States Dollar | | | 4,645,000 | | | Chinese Offshore Yuan | | | 28,989,445 | | | | 260,752 | |
03/06/2017 | | HSBC Bank | | United States Dollar | | | 4,717,450 | | | Chinese Offshore Yuan | | | 30,344,995 | | | | 128,194 | |
03/06/2017 | | HSBC Bank | | United States Dollar | | | 1,560,000 | | | Chinese Offshore Yuan | | | 9,936,420 | | | | 57,255 | |
03/31/2017 | | Merrill Lynch | | Mexican Peso | | | 121,233,258 | | | United States Dollar | | | 6,785,317 | | | | 49,256 | |
03/31/2017 | | Santander | | Mexican Peso | | | 121,217,935 | | | United States Dollar | | | 6,795,108 | | | | 38,601 | |
| | | | | | | | | | | | | | | | | | |
Total | | | | | | | | | | | | | | | | | $3,433,936 | |
| | | | | | | | | | | | | | | | | | |
At April 30, 2016, the Ashmore Emerging Markets Total Return Fund had the following interest rate swap contracts outstanding:
| | | | | | | | | | | | | | | | | | | | |
Pay Rate Index/
Pay Rate | | Receive Rate/
Receive Rate Index | | Notional Amount | | | Expiration Date | | | Unrealized Gains/
(Losses) | | | Counterparty |
| | | | | | |
Brazil CETIP Interbank Deposit Rate | | 15.800% | | | BRL | | | | 8,666,252 | | | | 01/02/2018 | | | $ | 129,774 | | | BNP Paribas |
| | | | | | |
Brazil CETIP Interbank Deposit Rate | | 15.579% | | | BRL | | | | 32,410,011 | | | | 01/02/2018 | | | | 446,111 | | | BNP Paribas |
| | | | | | |
Brazil CETIP Interbank Deposit Rate | | 15.420% | | | BRL | | | | 18,283,628 | | | | 01/02/2019 | | | | 403,189 | | | HSBC Bank |
| | | | | | |
14.625% | | Brazil CETIP Interbank
Deposit Rate | | | BRL | | | | 26,125,777 | | | | 01/02/2018 | | | | (226,311 | ) | | BNP Paribas |
| | | | | | |
Brazil CETIP Interbank Deposit Rate | | 15.715% | | | BRL | | | | 8,509,458 | | | | 01/04/2021 | | | | 382,644 | | | HSBC Bank |
| | | | | | |
Brazil CETIP Interbank Deposit Rate | | 13.850% | | | BRL | | | | 37,054,198 | | | | 01/02/2019 | | | | 350,574 | | | HSBC Bank |
| | | | | | |
Brazil CETIP Interbank Deposit Rate | | 12.340% | | | BRL | | | | 6,629,467 | | | | 01/04/2021 | | | | (835 | ) | | HSBC Bank |
| | | | | | |
MXN-TIIE-BANXICO 28 Day Rate | | 6.145% | | | MXN | | | | 29,400,000 | | | | 04/16/2026 | | | | 5,996 | | | HSBC Bank |
| | | | | | |
MYR-KLIBOR-3NM 3 Month Rate | | 3.555% | | | MYR | | | | 56,198,000 | | | | 03/18/2018 | | | | 718 | | | HSBC Bank |
| | | | | | |
MYR-KLIBOR-3NM 3 Month Rate | | 3.560% | | | MYR | | | | 24,122,000 | | | | 03/22/2018 | | | | 1,133 | | | HSBC Bank |
| | | | | | |
MYR-KLIBOR-3NM 3 Month Rate | | 3.575% | | | MYR | | | | 32,078,000 | | | | 03/23/2018 | | | | 3,920 | | | HSBC Bank |
| | | | | | | | | | | | | | | | | | | | |
| | | | | | | | | | | | | | | | $ | 1,496,913 | | | |
| | | | | | | | | | | | | | | | | | | | |
See accompanying notes to the financial statements.
66
ASHMORE EMERGING MARKETS TOTAL RETURN FUND
SCHEDULE OF INVESTMENTS (CONTINUED)
As of April 30, 2016 (Unaudited)
At April 30, 2016, the Ashmore Emerging Markets Total Return Fund had the following currency swap contracts outstanding:
| | | | | | | | | | | | | | | | |
Pay Rate Index/
Pay Rate | | Currency | | Notional Amount
Currency
Delivered | | Receive Rate/
Receive Rate Index | | Currency | | Notional Amount
Currency
Received | | Expiration
Date | | Unrealized
Gains/
(Losses) | | Counterparty |
1.078% | | EUR | | 480,000 | | US 3 Month LIBOR | | USD | | 523,680 | | 06/05/2045 | | $(58,791) | | HSBC Bank |
| | | | | | | | | | | | | | | | |
| | | | | | | | | | | | | | $(58,791) | | |
| | | | | | | | | | | | | | | | |
The inputs or methodologies used for valuing securities are not necessarily an indication of the risks associated with investing in those securities and other financial instruments, if any. See note 4 in the Notes to the Financial Statements for more information regarding pricing inputs and valuation techniques. The following is a summary of the inputs used in valuing the Ashmore Emerging Markets Total Return Fund’s investments and other financial instruments, which are carried at fair value, as of April 30, 2016:
| | | | | | | | | | | | | | | | |
| | | Level 1 | | | Level 2 | | | Level 3 | | | Total | |
Investments | | | | | | | | | | | | | | | | |
Assets: | | | | | | | | | | | | | | | | |
Debt Securities | | | | | | | | | | | | | | | | |
Corporate Bonds | | $ | — | | | $ | 152,650,177 | | | $ | — | | | $ | 152,650,177 | |
Corporate Convertible Bonds | | | — | | | | 27,099 | | | | — | | | | 27,099 | |
Government Agencies | | | — | | | | 30,226,013 | | | | — | | | | 30,226,013 | |
Government Bonds | | | — | | | | 301,650,312 | | | | 797,848 | | | | 302,448,160 | |
Index Linked Government Bonds | | | — | | | | 4,873,599 | | | | — | | | | 4,873,599 | |
Municipal Bonds | | | — | | | | 452,033 | | | | — | | | | 452,033 | |
| | | | | | | | | | | | | | | | |
Total Debt Securities | | | — | | | | 489,879,233 | | | | 797,848 | | | | 490,677,081 | |
Bank Loans | | | — | | | | — | | | | 7,969,102 | | | | 7,969,102 | |
Common Stock | | | 20,359 | | | | 67,814 | | | | — | | | | 88,173 | |
Warrants | | | — | | | | — | | | | — | | | | — | |
Fully Funded Total Return Swaps | | | — | | | | 4,623,359 | | | | — | | | | 4,623,359 | |
Total Investments | | $ | 20,359 | | | $ | 494,570,406 | | | $ | 8,766,950 | | | $ | 503,357,715 | |
| | | | |
Other Financial Instruments | | | | | | | | | | | | | | | | |
Assets: | | | | | | | | | | | | | | | | |
Forward Foreign Currency Exchange Contracts | | $ | — | | | $ | 6,136,903 | | | $ | — | | | $ | 6,136,903 | |
Interest Rate Swap Contracts | | | — | | | | 1,724,059 | | | | — | | | | 1,724,059 | |
Liabilities: | | | | | | | | | | | | | | | | |
Forward Foreign Currency Exchange Contracts | | | — | | | | (2,702,967) | | | | — | | | | (2,702,967) | |
Interest Rate Swap Contracts | | | — | | | | (227,146) | | | | — | | | | (227,146) | |
Currency Swap Contracts | | | — | | | | (58,791) | | | | — | | | | (58,791) | |
Total Other Financial Instruments | | $ | — | | | $ | 4,872,058 | | | $ | — | | | $ | 4,872,058 | |
See accompanying notes to the financial statements.
67
ASHMORE EMERGING MARKETS TOTAL RETURN FUND
SCHEDULE OF INVESTMENTS (CONTINUED)
As of April 30, 2016 (Unaudited)
The Fund discloses all transfers between levels based on valuations at the end of each reporting period. At April 30, 2016, the Fund had a transfer into Level 3 as disclosed below.
The following is a reconciliation of investments in which significant unobservable inputs (Level 3) were used for the Fund during the period ending April 30, 2016:
| | | | | | | | | | | | | | | | | | | | | | | | | | | | | | | | | | | | | | | | |
| Category and Subcategory | | Beginning Balance at 10/31/2015 | | | Accrued
Discounts
(Premiums) | | | Purchases | | | Sales | | | Realized
Gains
(Losses) | | | Change in
Unrealized
Appreciation
(Depreciation) | | | Transfer
into
Level 3 | | | Transfer
out of
Level 3 | | | Ending
Balance at
04/30/2016 | | | Change in
Unrealized
Appreciation
(Depreciation)
from Investments
still held at 04/30/2016 | |
Investments, at value | | | | | | | | | | | | | | | | | | | | | | | | | | | | | | | | | | | | | | | | |
Corporate Bonds | | | | | | | | | | | | | | | | | | | | | | | | | | | | | | | | | | | | | | | | |
China | | | $1,050,531 | | | | $(20,221 | ) | | | $— | | | | $— | | | | $— | | | | $(1,030,310 | ) | | | $— | | | | $— | | | | $— | | | | $— | |
Russia | | | 166,665 | | | | 3,593 | | | | — | | | | — | | | | — | | | | 96,628 | | | | — | | | | (266,886 | ) | | | — | | | | — | |
Government Bonds | | | | | | | | | | | | | | | | | | | | | | | | | | | | | | | | | | | | | | | | |
Argentina | | | — | | | | 1,978 | | | | 805,318 | | | | — | | | | — | | | | (9,448 | ) | | | — | | | | — | | | | 797,848 | | | | (9,448 | ) |
Bank Loans | | | | | | | | | | | | | | | | | | | | | | | | | | | | | | | | | | | | | | | | |
China | | | 558,077 | | | | — | | | | — | | | | — | | | | — | | | | (381,159 | ) | | | — | | | | — | | | | 176,918 | | | | (104,843 | ) |
Ukraine | | | 123,000 | | | | — | | | | — | | | | (123,000 | ) | | | — | | | | — | | | | — | | | | — | | | | — | | | | — | |
United Arab Emirates | | | — | | | | — | | | | — | | | | — | | | | — | | | | — | | | | 7,792,184 | | | | — | | | | 7,792,184 | | | | (73,917 | ) |
Total | | | $1,898,273 | | | | $(14,650 | ) | | | $805,318 | | | | $(123,000 | ) | | | $— | | | | $(1,324,289 | ) | | | $7,792,184 | | | | $(266,886 | ) | | | $8,766,950 | | | | $(188,208 | ) |
See the table on “Quantitative information about Fair Value measurements” for information on the valuation techniques and inputs used to value Level 3 securities at April 30, 2016.
| | | | | | | | |
Quantitative Information about Level 3 Fair Value Measurements |
| | | |
| | | Fair Value at
04/30/2016 | | | Valuation
Technique | | Unobservable
Input |
Government Bonds | | | $797,848 | | | Broker quote | | Inputs to broker model |
Bank Loans | | | 176,918 | | | Indicative bid | | Bid source |
Bank Loans | | | 7,792,184 | | | Broker quote | | Inputs to broker model |
Total | | | $8,766,950 | | | | | |
The following is a summary of the fair values of the Fund’s derivative instruments*:
Fair Values of Financial Derivative Instruments on the Statements of Assets and Liabilities as of April 30, 2016:
| | | | | | | | |
| | | Derivatives Not Accounted for as
Hedging Instruments | |
| | | Foreign
Exchange | | | Swaps | |
Assets: | | | | | | | | |
Unrealized Appreciation on Interest Rate Swap Contracts | | $ | — | | | $ | 1,724,059 | |
Unrealized Appreciation on Forward Foreign Currency Exchange Contracts | | | 6,136,903 | | | | — | |
| | $ | 6,136,903 | | | $ | 1,724,059 | |
| | |
Liabilities: | | | | | | | | |
Unrealized Depreciation on Interest Rate Swap Contracts | | $ | — | | | $ | (227,146 | ) |
Unrealized Depreciation on Currency Swap Contracts | | | — | | | | (58,791 | ) |
Unrealized Depreciation on Forward Foreign Currency Exchange Contracts | | | (2,702,967 | ) | | | — | |
| | | | | | | | |
| | $ | (2,702,967 | ) | | $ | (285,937 | ) |
See accompanying notes to the financial statements.
68
ASHMORE EMERGING MARKETS TOTAL RETURN FUND
SCHEDULE OF INVESTMENTS (CONTINUED)
As of April 30, 2016 (Unaudited)
The Effect of Financial Derivative Instruments on the Statements of Operations for the Six Months Ended April 30, 2016:
| | | | | | | | |
| | | Derivatives Not Accounted for as
Hedging Instruments | |
| | | Foreign
Exchange | | | Swaps | |
Realized Gain (Loss) on Derivatives Recognized resulting from Operations: | | | | | | | | |
Net Realized Gain on Forward Foreign Currency Exchange Contracts | | $ | 6,287,516 | | | $ | — | |
Net Realized Gain on Currency Swap Contracts | | | — | | | | 1,241 | |
Net Realized Gain on Interest Rate Swap Contracts | | | — | | | | 13,449 | |
| | | | |
| | $ | 6,287,516 | | | $ | 14,690 | |
| | | | |
| | |
Net Change in Unrealized Appreciation (Depreciation) on Derivatives Recognized resulting from Operations: | | | | | | | | |
Net Change in Unrealized Appreciation on Forward Foreign Currency Exchange Contracts | | $ | 3,731,033 | | | $ | — | |
Net Change in Unrealized Depreciation on Currency Swap Contracts | | | — | | | | (69,058 | ) |
Net Change in Unrealized Appreciation on Interest Rate Swap Contracts | | | — | | | | 1,560,354 | |
| | | | |
| | $ | 3,731,033 | | | $ | 1,491,296 | |
| | | | |
| * | See note 10 in the Notes to the Financial Statements for additional information. |
At April 30, 2016, for U.S. federal income tax purposes, gross unrealized appreciation, gross unrealized depreciation, net unrealized appreciation/(depreciation) on investments in securities (including the effects of foreign currency translation) and the cost basis of investments were as follows:
| | | | |
Federal tax cost of investments | | $ | 529,033,047 | |
Gross tax appreciation of investments | | | 14,460,427 | |
Gross tax depreciation of investments | | | (40,135,759 | ) |
Net tax depreciation of investments | | $ | (25,675,332 | ) |
The difference between book basis and tax basis net unrealized appreciation or depreciation is attributable primarily to the tax deferral of losses on wash sales and other transactions.
See accompanying notes to the financial statements.
69
ASHMORE EMERGING MARKETS HARD CURRENCY DEBT FUND
SCHEDULE OF INVESTMENTS
As of April 30, 2016 (Unaudited)
| | | | | | | | | | | | | | |
| | | Currency(1) | | Par | | | Value | | | % of Net
Assets | |
Debt Securities | | | | | | | | | | | | | | |
| | | | |
Argentina (Cost $216,408) | | | | | | | | | | | | | | |
Argentina (Rep of) 8.750%, 06/02/2017 | | | | | 1,009 | | | $ | 1,056 | | | | 0.02 | |
Argentina (Rep of) 7.500%, 04/22/2026(2)(3) | | | | | 150,000 | | | | 152,250 | | | | 2.24 | |
Argentina (Rep of) 8.280%, 12/31/2033 | | | | | 9,614 | | | | 9,978 | | | | 0.15 | |
Argentina (Rep of), FRN 2.500%, 12/31/2038 | | | | | 97,232 | | | | 61,985 | | | | 0.91 | |
| | | | | | | | | 225,269 | | | | 3.32 | |
Azerbaijan (Cost $181,971) | | | | | | | | | | | | | | |
State Oil Co. of the Azerbaijan Republic 6.950%, 03/18/2030 | | | | | 200,000 | | | | 190,500 | | | | 2.81 | |
| | | | | | | | | 190,500 | | | | 2.81 | |
Belarus (Cost $118,557) | | | | | | | | | | | | | | |
Belarus (Rep of) 8.950%, 01/26/2018 | | | | | 130,000 | | | | 136,175 | | | | 2.01 | |
| | | | | | | | | 136,175 | | | | 2.01 | |
Brazil (Cost $454,567) | | | | | | | | | | | | | | |
Brazil (Rep of) 4.875%, 01/22/2021 | | | | | 50,000 | | | | 50,875 | | | | 0.75 | |
Brazil (Rep of) 4.250%, 01/07/2025 | | | | | 56,000 | | | | 52,080 | | | | 0.77 | |
Brazil (Rep of) 8.250%, 01/20/2034 | | | | | 9,000 | | | | 10,372 | | | | 0.15 | |
Brazil (Rep of) 7.125%, 01/20/2037 | | | | | 62,000 | | | | 64,170 | | | | 0.95 | |
Marfrig Overseas Ltd. 9.500%, 05/04/2020 | | | | | 100,000 | | | | 102,500 | | | | 1.51 | |
Petrobras Global Finance B.V. 7.875%, 03/15/2019 | | | | | 10,000 | | | | 9,962 | | | | 0.15 | |
Petrobras Global Finance B.V. 5.750%, 01/20/2020 | | | | | 10,000 | | | | 9,175 | | | | 0.14 | |
Petrobras Global Finance B.V. 5.375%, 01/27/2021 | | | | | 20,000 | | | | 17,775 | | | | 0.26 | |
Petrobras Global Finance B.V. 6.250%, 03/17/2024 | | | | | 19,000 | | | | 16,578 | | | | 0.24 | |
Petrobras Global Finance B.V. 6.875%, 01/20/2040 | | | | | 25,000 | | | | 19,594 | | | | 0.29 | |
Petrobras Global Finance B.V. 6.850%, 06/05/2115 | | | | | 4,000 | | | | 2,960 | | | | 0.04 | |
QGOG Atlantic/Alaskan Rigs Ltd. 5.250%, 07/30/2018 | | | | | 74,340 | | | | 58,357 | | | | 0.86 | |
Vale Overseas Ltd. 4.625%, 09/15/2020 | | | | | 6,000 | | | | 5,820 | | | | 0.09 | |
Vale Overseas Ltd. 4.375%, 01/11/2022 | | | | | 3,000 | | | | 2,775 | | | | 0.04 | |
Vale Overseas Ltd. 6.875%, 11/21/2036 | | | | | 9,000 | | | | 8,078 | | | | 0.12 | |
Vale Overseas Ltd. 6.875%, 11/10/2039 | | | | | 18,000 | | | | 15,795 | | | | 0.23 | |
| | | | | | | | | 446,866 | | | | 6.59 | |
Chile (Cost $71,762) | | | | | | | | | | | | | | |
Empresa Nacional del Petroleo 5.250%, 08/10/2020 | | | | | 70,000 | | | | 75,227 | | | | 1.11 | |
| | | | | | | | | 75,227 | | | | 1.11 | |
China (Cost $105,091) | | | | | | | | | | | | | | |
Sinochem Overseas Capital Co. Ltd. 4.500%, 11/12/2020 | | | | | 100,000 | | | | 106,317 | | | | 1.57 | |
| | | | | | | | | 106,317 | | | | 1.57 | |
Colombia (Cost $266,746) | | | | | | | | | | | | | | |
Colombia (Rep of) 11.750%, 02/25/2020 | | | | | 55,000 | | | | 71,912 | | | | 1.06 | |
Colombia (Rep of) 8.125%, 05/21/2024 | | | | | 60,000 | | | | 75,690 | | | | 1.12 | |
Colombia (Rep of) 6.125%, 01/18/2041 | | | | | 100,000 | | | | 107,250 | | | | 1.58 | |
| | | | | | | | | 254,852 | | | | 3.76 | |
Costa Rica (Cost $58,451) | | | | | | | | | | | | | | |
Costa Rica (Rep of) 4.375%, 04/30/2025 | | | | | 60,000 | | | | 53,400 | | | | 0.79 | |
| | | | | | | | | 53,400 | | | | 0.79 | |
Croatia (Cost $131,179) | | | | | | | | | | | | | | |
Croatia (Rep of) 6.625%, 07/14/2020 | | | | | 120,000 | | | | 131,580 | | | | 1.94 | |
| | | | | | | | | 131,580 | | | | 1.94 | |
Dominican Republic (Cost $266,533) | | | | | | | | | | | | | | |
Dominican (Rep of) 5.875%, 04/18/2024 | | | | | 160,000 | | | | 164,800 | | | | 2.43 | |
Dominican (Rep of) 5.500%, 01/27/2025 | | | | | 100,000 | | | | 100,000 | | | | 1.47 | |
| | | | | | | | | 264,800 | | | | 3.90 | |
See accompanying notes to financial statements.
70
ASHMORE EMERGING MARKETS HARD CURRENCY DEBT FUND
SCHEDULE OF INVESTMENTS (CONTINUED)
As of April 30, 2016 (Unaudited)
| | | | | | | | | | | | | | |
| | | Currency(1) | | Par | | | Value | | | % of Net
Assets | |
Ecuador (Cost $143,175) | | | | | | | | | | | | | | |
Ecuador (Rep of) 7.950%, 06/20/2024 | | | | | 200,000 | | | $ | 173,500 | | | | 2.56 | |
| | | | | | | | | 173,500 | | | | 2.56 | |
Egypt (Cost $37,706) | | | | | | | | | | | | | | |
Egypt (Rep of) 5.750%, 04/29/2020 | | | | | 40,000 | | | | 40,308 | | | | 0.59 | |
| | | | | | | | | 40,308 | | | | 0.59 | |
El Salvador (Cost $52,993) | | | | | | | | | | | | | | |
El Salvador (Rep of) 5.875%, 01/30/2025 | | | | | 30,000 | | | | 26,550 | | | | 0.39 | |
El Salvador (Rep of) 8.250%, 04/10/2032 | | | | | 10,000 | | | | 9,825 | | | | 0.14 | |
El Salvador (Rep of) 7.650%, 06/15/2035 | | | | | 15,000 | | | | 13,462 | | | | 0.20 | |
| | | | | | | | | 49,837 | | | | 0.73 | |
Georgia (Cost $31,564) | | | | | | | | | | | | | | |
Georgian Railway JSC 7.750%, 07/11/2022 | | | | | 30,000 | | | | 32,331 | | | | 0.48 | |
| | | | | | | | | 32,331 | | | | 0.48 | |
Hungary (Cost $281,750) | | | | | | | | | | | | | | |
Hungary (Rep of) 4.125%, 02/19/2018 | | | | | 40,000 | | | | 41,449 | | | | 0.61 | |
Hungary (Rep of) 6.250%, 01/29/2020 | | | | | 30,000 | | | | 33,412 | | | | 0.49 | |
Hungary (Rep of) 5.375%, 02/21/2023 | | | | | 72,000 | | | | 79,339 | | | | 1.17 | |
Hungary (Rep of) 5.750%, 11/22/2023 | | | | | 48,000 | | | | 54,300 | | | | 0.80 | |
Hungary (Rep of) 5.375%, 03/25/2024 | | | | | 26,000 | | | | 28,893 | | | | 0.43 | |
Hungary (Rep of) 7.625%, 03/29/2041 | | | | | 46,000 | | | | 64,968 | | | | 0.96 | |
| | | | | | | | | 302,361 | | | | 4.46 | |
Indonesia (Cost $237,067) | | | | | | | | | | | | | | |
Indonesia (Rep of) 6.875%, 01/17/2018 | | | | | 30,000 | | | | 32,495 | | | | 0.48 | |
Indonesia (Rep of) 5.875%, 03/13/2020 | | | | | 160,000 | | | | 178,396 | | | | 2.63 | |
Indonesia (Rep of) 7.750%, 01/17/2038 | | | | | 30,000 | | | | 39,381 | | | | 0.58 | |
| | | | | | | | | 250,272 | | | | 3.69 | |
Iraq (Cost $58,332) | | | | | | | | | | | | | | |
Iraq (Rep of) 5.800%, 01/15/2028 | | | | | 70,000 | | | | 49,707 | | | | 0.73 | |
| | | | | | | | | 49,707 | | | | 0.73 | |
Ivory Coast (Cost $205,850) | | | | | | | | | | | | | | |
Ivory Coast (Rep of), FRN 5.750%, 12/31/2032 | | | | | 230,000 | | | | 209,323 | | | | 3.08 | |
| | | | | | | | | 209,323 | | | | 3.08 | |
Jamaica (Cost $182,976) | | | | | | | | | | | | | | |
Digicel Group Ltd. 8.250%, 09/30/2020 | | | | | 200,000 | | | | 182,500 | | | | 2.69 | |
| | | | | | | | | 182,500 | | | | 2.69 | |
Kazakhstan (Cost $322,053) | | | | | | | | | | | | | | |
Kazakhstan Temir Zholy Finance B.V. 6.950%, 07/10/2042 | | | | | 57,000 | | | | 53,303 | | | | 0.79 | |
Kazkommertsbank JSC 5.500%, 12/21/2022 | | | | | 9,784 | | | | 6,705 | | | | 0.10 | |
KazMunayGas National Co. JSC 7.000%, 05/05/2020 | | | | | 170,000 | | | | 181,084 | | | | 2.67 | |
KazMunayGas National Co. JSC 4.400%, 04/30/2023 | | | | | 70,000 | | | | 65,275 | | | | 0.96 | |
| | | | | | | | | 306,367 | | | | 4.52 | |
Latvia (Cost $29,057) | | | | | | | | | | | | | | |
Latvia (Rep of) 2.750%, 01/12/2020 | | | | | 30,000 | | | | 30,600 | | | | 0.45 | |
| | | | | | | | | 30,600 | | | | 0.45 | |
Lebanon (Cost $158,764) | | | | | | | | | | | | | | |
Lebanon (Rep of) 5.150%, 11/12/2018 | | | | | 10,000 | | | | 9,959 | | | | 0.15 | |
Lebanon (Rep of) 5.450%, 11/28/2019 | | | | | 10,000 | | | | 9,875 | | | | 0.14 | |
Lebanon (Rep of) 6.375%, 03/09/2020 | | | | | 30,000 | | | | 30,377 | | | | 0.45 | |
Lebanon (Rep of) 8.250%, 04/12/2021 | | | | | 24,000 | | | | 26,222 | | | | 0.39 | |
Lebanon (Rep of) 6.100%, 10/04/2022 | | | | | 49,000 | | | | 48,602 | | | | 0.72 | |
Lebanon (Rep of) 6.000%, 01/27/2023 | | | | | 10,000 | | | | 9,821 | | | | 0.14 | |
Lebanon (Rep of) 6.600%, 11/27/2026 | | | | | 24,000 | | | | 23,672 | | | | 0.35 | |
| | | | | | | | | 158,528 | | | | 2.34 | |
See accompanying notes to financial statements.
71
ASHMORE EMERGING MARKETS HARD CURRENCY DEBT FUND
SCHEDULE OF INVESTMENTS (CONTINUED)
As of April 30, 2016 (Unaudited)
| | | | | | | | | | | | | | |
| | | Currency(1) | | Par | | | Value | | | % of Net
Assets | |
Lithuania (Cost $116,526) | | | | | | | | | | | | | | |
Lithuania (Rep of) 7.375%, 02/11/2020 | | | | | 100,000 | | | $ | 118,365 | | | | 1.74 | |
| | | | | | | | | 118,365 | | | | 1.74 | |
Malaysia (Cost $64,922) | | | | | | | | | | | | | | |
Petronas Capital Ltd. 7.875%, 05/22/2022 | | | | | 50,000 | | | | 64,325 | | | | 0.95 | |
| | | | | | | | | 64,325 | | | | 0.95 | |
Mexico (Cost $333,856) | | | | | | | | | | | | | | |
Mexico (Rep of) 6.750%, 09/27/2034 | | | | | 59,000 | | | | 76,700 | | | | 1.13 | |
Mexico (Rep of) 4.750%, 03/08/2044 | | | | | 64,000 | | | | 64,640 | | | | 0.95 | |
Mexico (Rep of) 5.550%, 01/21/2045 | | | | | 36,000 | | | | 40,500 | | | | 0.60 | |
Mexico (Rep of) 5.750%, 10/12/2110 | | | | | 58,000 | | | | 59,740 | | | | 0.88 | |
Petroleos Mexicanos 6.000%, 03/05/2020 | | | | | 10,000 | | | | 10,637 | | | | 0.16 | |
Petroleos Mexicanos 6.875%, 08/04/2026 | | | | | 26,000 | | | | 28,691 | | | | 0.42 | |
Petroleos Mexicanos 6.500%, 06/02/2041 | | | | | 16,000 | | | | 15,968 | | | | 0.24 | |
Petroleos Mexicanos 5.500%, 06/27/2044 | | | | | 15,000 | | | | 13,200 | | | | 0.19 | |
Petroleos Mexicanos 5.625%, 01/23/2046 | | | | | 21,000 | | | | 18,697 | | | | 0.28 | |
| | | | | | | | | 328,773 | | | | 4.85 | |
Morocco (Cost $46,897) | | | | | | | | | | | | | | |
Morocco (Rep of) 4.250%, 12/11/2022 | | | | | 50,000 | | | | 51,687 | | | | 0.76 | |
| | | | | | | | | 51,687 | | | | 0.76 | |
Pakistan (Cost $102,623) | | | | | | | | | | | | | | |
Pakistan (Rep of) 6.875%, 06/01/2017 | | | | | 100,000 | | | | 103,576 | | | | 1.53 | |
| | | | | | | | | 103,576 | | | | 1.53 | |
Panama (Cost $105,774) | | | | | | | | | | | | | | |
Panama (Rep of) 8.875%, 09/30/2027 | | | | | 25,000 | | | | 35,937 | | | | 0.53 | |
Panama (Rep of) 9.375%, 04/01/2029 | | | | | 10,000 | | | | 14,975 | | | | 0.22 | |
Panama (Rep of) 6.700%, 01/26/2036 | | | | | 45,000 | | | | 57,600 | | | | 0.85 | |
| | | | | | | | | 108,512 | | | | 1.60 | |
Peru (Cost $174,418) | | | | | | | | | | | | | | |
Peru (Rep of) 8.750%, 11/21/2033 | | | | | 78,000 | | | | 118,365 | | | | 1.74 | |
Peru (Rep of) 5.625%, 11/18/2050 | | | | | 44,000 | | | | 50,930 | | | | 0.75 | |
| | | | | | | | | 169,295 | | | | 2.49 | |
Philippines (Cost $246,689) | | | | | | | | | | | | | | |
Philippines (Rep of) 4.000%, 01/15/2021 | | | | | 50,000 | | | | 54,869 | | | | 0.81 | |
Philippines (Rep of) 10.625%, 03/16/2025 | | | | | 15,000 | | | | 24,550 | | | | 0.36 | |
Philippines (Rep of) 9.500%, 02/02/2030 | | | | | 107,000 | | | | 182,705 | | | | 2.69 | |
| | | | | | | | | 262,124 | | | | 3.86 | |
Poland (Cost $31,391) | | | | | | | | | | | | | | |
Poland (Rep of) 5.000%, 03/23/2022 | | | | | 20,000 | | | | 22,375 | | | | 0.33 | |
Poland (Rep of) 3.000%, 03/17/2023 | | | | | 10,000 | | | | 10,088 | | | | 0.15 | |
| | | | | | | | | 32,463 | | | | 0.48 | |
Romania (Cost $172,543) | | | | | | | | | | | | | | |
Romania (Rep of) 6.750%, 02/07/2022 | | | | | 82,000 | | | | 97,068 | | | | 1.43 | |
Romania (Rep of) 4.375%, 08/22/2023 | | | | | 72,000 | | | | 76,506 | | | | 1.13 | |
Romania (Rep of) 6.125%, 01/22/2044 | | | | | 4,000 | | | | 4,905 | | | | 0.07 | |
| | | | | | | | | 178,479 | | | | 2.63 | |
Russian Federation (Cost $211,219) | | | | | | | | | | | | | | |
CEDC Finance Corp. International, Inc., FRN 10.000%, 04/30/2018 | | | | | 6,000 | | | | 4,050 | | | | 0.06 | |
Vnesheconombank Via VEB Finance PLC 5.450%, 11/22/2017 | | | | | 100,000 | | | | 102,372 | | | | 1.51 | |
Vnesheconombank Via VEB Finance PLC 6.902%, 07/09/2020 | | | | | 100,000 | | | | 105,000 | | | | 1.55 | |
| | | | | | | | | 211,422 | | | | 3.12 | |
See accompanying notes to financial statements.
72
ASHMORE EMERGING MARKETS HARD CURRENCY DEBT FUND
SCHEDULE OF INVESTMENTS (CONTINUED)
As of April 30, 2016 (Unaudited)
| | | | | | | | | | | | | | |
| | | Currency(1) | | Par | | | Value | | | % of Net
Assets | |
Senegal (Cost $32,103) | | | | | | | | | | | | | | |
Senegal (Rep of) 8.750%, 05/13/2021 | | | | | 30,000 | | | $ | 32,556 | | | | 0.48 | |
| | | | | | | | | 32,556 | | | | 0.48 | |
Serbia (Cost $52,141) | | | | | | | | | | | | | | |
Serbia (Rep of) 7.250%, 09/28/2021 | | | | | 50,000 | | | | 56,640 | | | | 0.83 | |
| | | | | | | | | 56,640 | | | | 0.83 | |
South Africa (Cost $83,800) | | | | | | | | | | | | | | |
South Africa (Rep of) 5.500%, 03/09/2020 | | | | | 80,000 | | | | 85,089 | | | | 1.25 | |
| | | | | | | | | 85,089 | | | | 1.25 | |
Sri Lanka (Cost $40,188) | | | | | | | | | | | | | | |
Bank of Ceylon 6.875%, 05/03/2017 | | | | | 40,000 | | | | 40,750 | | | | 0.60 | |
| | | | | | | | | 40,750 | | | | 0.60 | |
Turkey (Cost $173,795) | | | | | | | | | | | | | | |
Turkey (Rep of) 6.750%, 04/03/2018 | | | | | 50,000 | | | | 53,898 | | | | 0.79 | |
Turkey (Rep of) 5.625%, 03/30/2021 | | | | | 40,000 | | | | 43,377 | | | | 0.64 | |
Turkey (Rep of) 6.750%, 05/30/2040 | | | | | 30,000 | | | | 35,625 | | | | 0.53 | |
Turkey (Rep of) 6.000%, 01/14/2041 | | | | | 40,000 | | | | 43,474 | | | | 0.64 | |
| | | | | | | | | 176,374 | | | | 2.60 | |
Ukraine (Cost $153,985) | | | | | | | | | | | | | | |
Ukraine (Rep of) 7.750%, 09/01/2020 | | | | | 160,000 | | | | 153,454 | | | | 2.26 | |
Ukraine (Rep of), FRN 2.731%, 05/31/2040(4) | | | | | 12,000 | | | | 3,748 | | | | 0.06 | |
| | | | | | | | | 157,202 | | | | 2.32 | |
Uruguay (Cost $137,755) | | | | | | | | | | | | | | |
Uruguay (Rep of) 4.500%, 08/14/2024 | | | | | 47,503 | | | | 50,413 | | | | 0.74 | |
Uruguay (Rep of) 7.875%, 01/15/2033 | | | | | 32,000 | | | | 41,880 | | | | 0.62 | |
Uruguay (Rep of) 7.625%, 03/21/2036 | | | | | 16,000 | | | | 20,780 | | | | 0.31 | |
Uruguay (Rep of) 4.125%, 11/20/2045 | | | | | 10,774 | | | | 9,266 | | | | 0.14 | |
Uruguay (Rep of) 5.100%, 06/18/2050 | | | | | 9,000 | | | | 8,437 | | | | 0.12 | |
| | | | | | | | | 130,776 | | | | 1.93 | |
Venezuela (Cost $643,769) | | | | | | | | | | | | | | |
Petroleos de Venezuela S.A. 5.125%, 10/28/2016 | | | | | 63,638 | | | | 56,001 | | | | 0.83 | |
Petroleos de Venezuela S.A. 5.250%, 04/12/2017 | | | | | 19,000 | | | | 10,402 | | | | 0.15 | |
Petroleos de Venezuela S.A. 8.500%, 11/02/2017 | | | | | 203,804 | | | | 119,226 | | | | 1.76 | |
Petroleos de Venezuela S.A. 9.000%, 11/17/2021 | | | | | 29,046 | | | | 11,430 | | | | 0.17 | |
Petroleos de Venezuela S.A. 12.750%, 02/17/2022 | | | | | 15,000 | | | | 6,975 | | | | 0.10 | |
Petroleos de Venezuela S.A. 5.375%, 04/12/2027 | | | | | 12,000 | | | | 4,218 | | | | 0.06 | |
Petroleos de Venezuela S.A. 9.750%, 05/17/2035 | | | | | 38,000 | | | | 15,196 | | | | 0.22 | |
Venezuela (Rep of) 7.750%, 10/13/2019 | | | | | 24,000 | | | | 9,630 | | | | 0.14 | |
Venezuela (Rep of) 6.000%, 12/09/2020 | | | | | 12,000 | | | | 4,380 | | | | 0.07 | |
Venezuela (Rep of) 12.750%, 08/23/2022 | | | | | 57,000 | | | | 26,434 | | | | 0.39 | |
Venezuela (Rep of) 9.000%, 05/07/2023 | | | | | 21,000 | | | | 8,006 | | | | 0.12 | |
Venezuela (Rep of) 8.250%, 10/13/2024 | | | | | 80,000 | | | | 29,900 | | | | 0.44 | |
Venezuela (Rep of) 7.650%, 04/21/2025 | | | | | 10,000 | | | | 3,637 | | | | 0.05 | |
Venezuela (Rep of) 11.750%, 10/21/2026 | | | | | 200,000 | | | | 84,750 | | | | 1.25 | |
Venezuela (Rep of) 9.250%, 09/15/2027 | | | | | 22,000 | | | | 9,378 | | | | 0.14 | |
Venezuela (Rep of) 9.250%, 05/07/2028 | | | | | 57,000 | | | | 21,945 | | | | 0.32 | |
Venezuela (Rep of) 11.950%, 08/05/2031 | | | | | 222,200 | | | | 94,435 | | | | 1.39 | |
| | | | | | | | | 515,943 | | | | 7.60 | |
See accompanying notes to financial statements.
73
ASHMORE EMERGING MARKETS HARD CURRENCY DEBT FUND
SCHEDULE OF INVESTMENTS (CONTINUED)
As of April 30, 2016 (Unaudited)
| | | | | | | | | | | | | | |
| | | Currency(1) | | Par | | | Value | | | % of Net
Assets | |
Vietnam (Cost $52,729) | | | | | | | | | | | | | | |
Vietnam (Rep of) 6.750%, 01/29/2020 | | | | | 50,000 | | | $ | 55,639 | | | | 0.82 | |
| | | | | | | | | 55,639 | | | | 0.82 | |
Total Debt Securities (Cost $6,589,675) | | | | | | | | | 6,550,610 | | | | 96.56 | |
| | | | |
Total Investments (Total Cost $6,589,675) | | | | | | | | | 6,550,610 | | | | 96.56 | |
| | | | |
Other Assets Less Liabilities (See Statements of Assets and Liabilities for further detail) | | | | | | | | | 233,054 | | | | 3.44 | |
| | | | |
Net Assets | | | | | | | | $ | 6,783,664 | | | | 100.00 | |
| (1) | Par values are stated in United States Dollars unless otherwise noted below. |
| (2) | Restricted security that has been deemed illiquid. At April 30, 2016, the value of this restricted illiquid security amounted to $152,250 or 2.2% of net assets. Additional information on this restricted illiquid security is as follows: |
| | | | |
| SECURITY | | ACQUISITION DATE | | ACQUISITION COST |
Argentina (Rep of), 7.500%, 4/22/2026 | | 04/19/2016 | | $150,000 |
| (3) | Securities exempt from registration under Rule 144A of the Securities Act of 1933. These securities may not be publicly traded without registration under the Securities Act of 1933. |
| (4) | Zero coupon bond reflects effective yield on the date of purchase. |
Percentages shown are based on net assets.
The inputs or methodologies used for valuing securities are not necessarily an indication of the risks associated with investing in those securities and other financial instruments, if any. See note 4 in the Notes to the Financial Statements for more information regarding pricing inputs and valuation techniques. The following is a summary of the inputs used in valuing the Ashmore Emerging Markets Debt Fund’s investments and other financial instruments, which are carried at fair value, as of April 30, 2016:
| | | | | | | | | | | | |
| | | Level 1 | | Level 2 | | | Level 3 | | Total | |
Investments | | | | | | | | | | | | |
Assets: | | | | | | | | | | | | |
Corporate Bonds | | $ — | | $ | 1,584,816 | | | $ — | | $ | 1,584,816 | |
Government Agencies | | — | | | 255,345 | | | — | | | 255,345 | |
Government Bonds | | — | | | 4,710,449 | | | — | | | 4,710,449 | |
Total Investments | | $ — | | $ | 6,550,610 | | | $ — | | $ | 6,550,610 | |
The Fund discloses all transfers between levels based on valuations at the end of each reporting period. At April 30, 2016, there were no transfers between Level 1, Level 2 and Level 3 based on levels assigned to the securities on October 31, 2015.
See accompanying notes to financial statements.
74
ASHMORE EMERGING MARKETS HARD CURRENCY DEBT FUND
SCHEDULE OF INVESTMENTS (CONTINUED)
As of April 30, 2016 (Unaudited)
The following is a summary of the fair values of the Fund’s derivative instruments*:
The Effect of Financial Derivative Instruments on the Statements of Operations for the Six Months Ended April 30, 2016:
| | |
| | | Derivatives Not Accounted for as
Hedging Instruments |
| | | Foreign Exchange |
Realized Gain (Loss) on Derivatives Recognized resulting from Operations: | | |
Net Realized Loss on Forward Foreign Currency Exchange Contracts | | $ (332) |
| | |
| |
Net Change in Unrealized Appreciation (Depreciation) on Derivatives Recognized resulting from Operations: | | |
Net Change in Unrealized Appreciation on Forward Foreign Currency Exchange Contracts | | $ 53 |
| | |
| * | See note 10 in the Notes to the Financial Statements for additional information. |
At April 30, 2016, for U.S. federal income tax purposes, gross unrealized appreciation, gross unrealized depreciation, net unrealized appreciation/(depreciation) on investments in securities (including the effects of foreign currency translation) and the cost basis of investments were as follows:
| | | | |
Federal tax cost of investments | | $ | 6,664,818 | |
Gross tax appreciation of investments | | | 176,576 | |
Gross tax depreciation of investments | | | (290,784) | |
Net tax depreciation of investments | | $ | (114,208) | |
The difference between book basis and tax basis net unrealized appreciation or depreciation is attributable primarily to the tax deferral of losses on wash sales.
See accompanying notes to financial statements.
75
ASHMORE EMERGING MARKETS LOCAL CURRENCY BOND FUND
SCHEDULE OF INVESTMENTS
As of April 30, 2016 (Unaudited)
| | | | | | | | | | | | | | |
| | | Currency(1) | | Par | | | Value | | | % of Net
Assets | |
Debt Securities | | | | | | | | | | | | | | |
| | | | |
Argentina (Cost $942,154) | | | | | | | | | | | | | | |
Letras del Banco Central de la Republica Argentina 0.000%, 06/15/2016(2) | | ARS | | | 4,044,646 | | | $ | 270,261 | | | | 0.36 | |
Letras del Banco Central de la Republica Argentina 0.000%, 07/06/2016(2) | | ARS | | | 2,126,929 | | | | 139,398 | | | | 0.19 | |
Letras del Banco Central de la Republica Argentina 0.000%, 08/10/2016(2) | | ARS | | | 1,281,483 | | | | 82,200 | | | | 0.11 | |
Letras del Banco Central de la Republica Argentina 0.000%, 08/17/2016(2) | | ARS | | | 843,139 | | | | 53,729 | | | | 0.07 | |
Letras del Banco Central de la Republica Argentina 0.000%, 10/05/2016(2) | | ARS | | | 1,281,483 | | | | 79,193 | | | | 0.11 | |
Letras del Banco Central de la Republica Argentina 0.000%, 10/12/2016(2) | | ARS | | | 895,836 | | | | 55,080 | | | | 0.07 | |
Letras del Banco Central de la Republica Argentina 0.000%, 10/26/2016(2) | | ARS | | | 1,150,951 | | | | 70,382 | | | | 0.10 | |
Letras del Banco Central de la Republica Argentina 0.000%, 12/14/2016(2) | | ARS | | | 1,035,856 | | | | 60,914 | | | | 0.08 | |
Letras del Banco Central de la Republica Argentina 0.000%, 12/28/2016(2) | | ARS | | | 2,478,699 | | | | 144,446 | | | | 0.19 | |
| | | | | | | | | 955,603 | | | | 1.28 | |
Brazil (Cost $7,275,261) | | | | | | | | | | | | | | |
Brazil Letras do Tesouro Nacional 0.000%, 01/01/2018(2) | | BRL | | | 924,000 | | | | 220,132 | | | | 0.30 | |
Brazil Letras do Tesouro Nacional 0.000%, 07/01/2018(2) | | BRL | | | 1,714,000 | | | | 385,776 | | | | 0.52 | |
Brazil Letras do Tesouro Nacional 0.000%, 01/01/2019(2) | | BRL | | | 12,486,000 | | | | 2,653,904 | | | | 3.56 | |
Brazil Notas do Tesouro Nacional Serie F 10.000%, 01/01/2021 | | BRL | | | 6,326,000 | | | | 1,697,336 | | | | 2.28 | |
Brazil Notas do Tesouro Nacional Serie F 10.000%, 01/01/2023 | | BRL | | | 3,491,000 | | | | 910,173 | | | | 1.22 | |
Brazil Notas do Tesouro Nacional Serie F 10.000%, 01/01/2025 | | BRL | | | 11,606,000 | | | | 2,958,896 | | | | 3.97 | |
| | | | | | | | | 8,826,217 | | | | 11.85 | |
Chile (Cost $44,370) | | | | | | | | | | | | | | |
Bonos de la Tesoreria de la Republica en pesos 6.000%, 01/01/2020 | | CLP | | | 20,000,000 | | | | 32,241 | | | | 0.04 | |
| | | | | | | | | 32,241 | | | | 0.04 | |
Colombia (Cost $5,771,951) | | | | | | | | | | | | | | |
Colombia (Rep of) 7.750%, 04/14/2021 | | COP | | | 644,000,000 | | | | 230,251 | | | | 0.31 | |
Colombian TES 7.250%, 06/15/2016 | | COP | | | 2,545,200,000 | | | | 893,412 | | | | 1.20 | |
Colombian TES 7.000%, 09/11/2019 | | COP | | | 800,400,000 | | | | 276,607 | | | | 0.37 | |
Colombian TES 10.000%, 07/24/2024 | | COP | | | 3,989,200,000 | | | | 1,576,970 | | | | 2.12 | |
Colombian TES 7.500%, 08/26/2026 | | COP | | | 1,810,300,000 | | | | 608,668 | | | | 0.82 | |
Colombian TES 6.000%, 04/28/2028 | | COP | | | 4,497,800,000 | | | | 1,314,718 | | | | 1.76 | |
| | | | | | | | | 4,900,626 | | | | 6.58 | |
Hungary (Cost $3,182,703) | | | | | | | | | | | | | | |
Hungary (Rep of) 6.750%, 02/24/2017 | | HUF | | | 55,360,000 | | | | 212,767 | | | | 0.28 | |
Hungary (Rep of) 6.750%, 11/24/2017 | | HUF | | | 181,290,000 | | | | 723,976 | | | | 0.97 | |
Hungary (Rep of) 6.500%, 06/24/2019 | | HUF | | | 103,850,000 | | | | 438,054 | | | | 0.59 | |
Hungary (Rep of) 3.500%, 06/24/2020 | | HUF | | | 18,350,000 | | | | 71,462 | | | | 0.10 | |
Hungary (Rep of) 7.500%, 11/12/2020 | | HUF | | | 27,590,000 | | | | 124,683 | | | | 0.17 | |
See accompanying notes to the financial statements.
76
ASHMORE EMERGING MARKETS LOCAL CURRENCY BOND FUND
SCHEDULE OF INVESTMENTS (CONTINUED)
As of April 30, 2016 (Unaudited)
| | | | | | | | | | | | | | |
| | | Currency(1) | | Par | | | Value | | | % of Net
Assets | |
Hungary - (continued) | | | | | | | | | | | | | | |
Hungary (Rep of) 7.000%, 06/24/2022 | | HUF | | | 106,100,000 | | | $ | 485,982 | | | | 0.65 | |
Hungary (Rep of) 6.000%, 11/24/2023 | | HUF | | | 108,770,000 | | | | 484,359 | | | | 0.65 | |
Hungary (Rep of) 3.000%, 06/26/2024 | | HUF | | | 36,500,000 | | | | 132,714 | | | | 0.18 | |
Hungary (Rep of) 5.500%, 06/24/2025 | | HUF | | | 100,020,000 | | | | 433,683 | | | | 0.58 | |
| | | | | | | | | 3,107,680 | | | | 4.17 | |
Indonesia (Cost $3,837,026) | | | | | | | | | | | | | | |
Indonesia (Rep of) 11.000%, 11/15/2020 | | IDR | | | 1,039,000,000 | | | | 89,623 | | | | 0.12 | |
Indonesia (Rep of) 8.375%, 03/15/2024 | | IDR | | | 3,479,000,000 | | | | 275,883 | | | | 0.37 | |
Indonesia (Rep of) 8.375%, 09/15/2026 | | IDR | | | 12,202,000,000 | | | | 970,109 | | | | 1.30 | |
Indonesia (Rep of) 7.000%, 05/15/2027 | | IDR | | | 915,000,000 | | | | 65,546 | | | | 0.09 | |
Indonesia (Rep of) 9.000%, 03/15/2029 | | IDR | | | 15,353,000,000 | | | | 1,274,300 | | | | 1.71 | |
Indonesia (Rep of) 8.750%, 05/15/2031 | | IDR | | | 8,939,000,000 | | | | 729,616 | | | | 0.98 | |
Indonesia (Rep of) 8.250%, 06/15/2032 | | IDR | | | 1,145,000,000 | | | | 89,609 | | | | 0.12 | |
Indonesia (Rep of) 6.625%, 05/15/2033 | | IDR | | | 4,037,000,000 | | | | 269,719 | | | | 0.36 | |
Indonesia (Rep of) 8.250%, 05/15/2036 | | IDR | | | 2,908,000,000 | | | | 228,828 | | | | 0.31 | |
| | | | | | | | | 3,993,233 | | | | 5.36 | |
Malaysia (Cost $3,245,373) | | | | | | | | | | | | | | |
Malaysia (Rep of) 3.654%, 10/31/2019 | | MYR | | | 319,000 | | | | 82,204 | | | | 0.11 | |
Malaysia (Rep of) 4.048%, 09/30/2021 | | MYR | | | 863,000 | | | | 224,826 | | | | 0.30 | |
Malaysia (Rep of) 3.418%, 08/15/2022 | | MYR | | | 1,272,000 | | | | 319,255 | | | | 0.43 | |
Malaysia (Rep of) 3.795%, 09/30/2022 | | MYR | | | 372,000 | | | | 95,314 | | | | 0.13 | |
Malaysia (Rep of) 3.480%, 03/15/2023 | | MYR | | | 1,966,000 | | | | 494,409 | | | | 0.66 | |
Malaysia (Rep of) 3.800%, 08/17/2023 | | MYR | | | 584,000 | | | | 149,252 | | | | 0.20 | |
Malaysia (Rep of) 4.181%, 07/15/2024 | | MYR | | | 1,265,000 | | | | 329,097 | | | | 0.44 | |
Malaysia (Rep of) 4.392%, 04/15/2026 | | MYR | | | 899,000 | | | | 238,682 | | | | 0.32 | |
Malaysia (Rep of) 4.498%, 04/15/2030 | | MYR | | | 498,000 | | | | 131,032 | | | | 0.18 | |
Malaysia (Rep of) 4.232%, 06/30/2031 | | MYR | | | 390,000 | | | | 100,175 | | | | 0.13 | |
Malaysia (Rep of) 4.254%, 05/31/2035 | | MYR | | | 1,482,000 | | | | 376,614 | | | | 0.51 | |
Malaysia Government Investment Issue 4.194%, 07/15/2022 | | MYR | | | 1,020,000 | | | | 265,116 | | | | 0.36 | |
Malaysia Government Investment Issue 3.990%, 10/15/2025 | | MYR | | | 1,623,000 | | | | 411,580 | | | | 0.55 | |
| | | | | | | | | 3,217,556 | | | | 4.32 | |
Mexico (Cost $3,328,818) | | | | | | | | | | | | | | |
Mexican Bonos 8.000%, 12/07/2023 | | MXN | | | 21,480,000 | | | | 1,427,091 | | | | 1.92 | |
Mexican Udibonos 4.000%, 06/13/2019(3) | | MXN | | | 1,140,000 | | | | 381,259 | | | | 0.51 | |
Mexican Udibonos 2.000%, 06/09/2022(3) | | MXN | | | 1,370,000 | | | | 417,643 | | | | 0.56 | |
Mexican Udibonos 4.000%, 11/15/2040(3) | | MXN | | | 1,720,000 | | | | 584,992 | | | | 0.79 | |
Petroleos Mexicanos 7.190%, 09/12/2024 | | MXN | | | 2,540,000 | | | | 130,005 | | | | 0.17 | |
| | | | | | | | | 2,940,990 | | | | 3.95 | |
Peru (Cost $1,191,346) | | | | | | | | | | | | | | |
Peru (Rep of) 5.700%, 08/12/2024 | | PEN | | | 880,000 | | | | 265,391 | | | | 0.36 | |
Peru (Rep of) 8.200%, 08/12/2026 | | PEN | | | 1,282,000 | | | | 448,179 | | | | 0.60 | |
Peru (Rep of) 6.950%, 08/12/2031 | | PEN | | | 1,123,000 | | | | 353,840 | | | | 0.47 | |
| | | | | | | | | 1,067,410 | | | | 1.43 | |
Philippines (Cost $771,826) | | | | | | | | | | | | | | |
Philippines (Rep of) 4.950%, 01/15/2021 | | PHP | | | 10,000,000 | | | | 221,274 | | | | 0.30 | |
Philippines (Rep of) 3.900%, 11/26/2022 | | PHP | | | 10,000,000 | | | | 211,844 | | | | 0.28 | |
Philippines (Rep of) 6.250%, 01/14/2036 | | PHP | | | 10,000,000 | | | | 239,270 | | | | 0.32 | |
| | | | | | | | | 672,388 | | | | 0.90 | |
Poland (Cost $2,959,176) | | | | | | | | | | | | | | |
Poland (Rep of) 3.000%, 08/24/2016(3) | | PLN | | | 367,000 | | | | 120,690 | | | | 0.16 | |
Poland (Rep of) 4.750%, 04/25/2017 | | PLN | | | 273,000 | | | | 73,797 | | | | 0.10 | |
See accompanying notes to the financial statements.
77
ASHMORE EMERGING MARKETS LOCAL CURRENCY BOND FUND
SCHEDULE OF INVESTMENTS (CONTINUED)
As of April 30, 2016 (Unaudited)
| | | | | | | | | | | | | | |
| | | Currency(1) | | Par | | | Value | | | % of Net
Assets | |
Poland - (continued) | | | | | | | | | | | | | | |
Poland (Rep of) 5.750%, 09/23/2022 | | PLN | | | 3,313,000 | | | $ | 1,033,761 | | | | 1.39 | |
Poland (Rep of) 2.750%, 08/25/2023(3) | | PLN | | | 324,000 | | | | 106,298 | | | | 0.14 | |
Poland (Rep of) 4.000%, 10/25/2023 | | PLN | | | 792,000 | | | | 224,552 | | | | 0.30 | |
Poland (Rep of) 3.250%, 07/25/2025 | | PLN | | | 3,650,000 | | | | 981,401 | | | | 1.32 | |
Poland (Rep of) 2.500%, 07/25/2026 | | PLN | | | 560,000 | | | | 139,250 | | | | 0.19 | |
Poland (Rep of) 5.750%, 04/25/2029 | | PLN | | | 230,000 | | | | 75,478 | | | | 0.10 | |
| | | | | | | | | 2,755,227 | | | | 3.70 | |
Russian Federation (Cost $3,067,154) | | | | | | | | | | | | | | |
Russian Federal Bond - OFZ 6.900%, 08/03/2016 | | RUB | | | 8,387,000 | | | | 128,572 | | | | 0.17 | |
Russian Federal Bond - OFZ 7.400%, 06/14/2017 | | RUB | | | 18,013,000 | | | | 272,535 | | | | 0.37 | |
Russian Federal Bond - OFZ 6.200%, 01/31/2018 | | RUB | | | 18,002,000 | | | | 264,450 | | | | 0.36 | |
Russian Federal Bond - OFZ 7.500%, 03/15/2018 | | RUB | | | 18,885,000 | | | | 283,250 | | | | 0.38 | |
Russian Federal Bond - OFZ 6.400%, 05/27/2020 | | RUB | | | 9,830,000 | | | | 138,938 | | | | 0.19 | |
Russian Federal Bond - OFZ 7.600%, 04/14/2021 | | RUB | | | 27,849,000 | | | | 409,099 | | | | 0.55 | |
Russian Federal Bond - OFZ 7.000%, 01/25/2023 | | RUB | | | 12,330,000 | | | | 173,798 | | | | 0.23 | |
Russian Federal Bond - OFZ 7.000%, 08/16/2023 | | RUB | | | 6,264,000 | | | | 87,907 | | | | 0.12 | |
Russian Federal Bond - OFZ 8.150%, 02/03/2027 | | RUB | | | 11,729,000 | | | | 174,290 | | | | 0.23 | |
Russian Federal Bond - OFZ 7.050%, 01/19/2028 | | RUB | | | 6,026,000 | | | | 81,869 | | | | 0.11 | |
| | | | | | | | | 2,014,708 | | | | 2.71 | |
South Africa (Cost $9,586,126) | | | | | | | | | | | | | | |
South Africa (Rep of) 8.000%, 12/21/2018 | | ZAR | | | 8,249,500 | | | | 576,829 | | | | 0.78 | |
South Africa (Rep of) 7.750%, 02/28/2023 | | ZAR | | | 16,554,600 | | | | 1,100,422 | | | | 1.48 | |
South Africa (Rep of) 10.500%, 12/21/2026 | | ZAR | | | 17,617,900 | | | | 1,364,952 | | | | 1.83 | |
South Africa (Rep of) 8.000%, 01/31/2030 | | ZAR | | | 6,510,000 | | | | 409,892 | | | | 0.55 | |
South Africa (Rep of) 7.000%, 02/28/2031 | | ZAR | | | 26,891,300 | | | | 1,526,685 | | | | 2.05 | |
South Africa (Rep of) 8.250%, 03/31/2032 | | ZAR | | | 8,120,000 | | | | 511,434 | | | | 0.69 | |
South Africa (Rep of) 6.250%, 03/31/2036 | | ZAR | | | 3,950,000 | | | | 196,484 | | | | 0.26 | |
South Africa (Rep of) 8.500%, 01/31/2037 | | ZAR | | | 9,210,000 | | | | 580,411 | | | | 0.78 | |
South Africa (Rep of) 6.500%, 02/28/2041 | | ZAR | | | 4,600,000 | | | | 227,763 | | | | 0.31 | |
South Africa (Rep of) 8.750%, 01/31/2044 | | ZAR | | | 8,300,000 | | | | 527,715 | | | | 0.71 | |
South Africa (Rep of) 8.750%, 02/28/2048 | | ZAR | | | 10,975,900 | | | | 695,483 | | | | 0.93 | |
| | | | | | | | | 7,718,070 | | | | 10.37 | |
Thailand (Cost $2,630,919) | | | | | | | | | | | | | | |
Thailand (Rep of) 3.625%, 06/16/2023 | | THB | | | 16,311,000 | | | | 527,882 | | | | 0.71 | |
Thailand (Rep of) 3.850%, 12/12/2025 | | THB | | | 13,879,000 | | | | 468,742 | | | | 0.63 | |
Thailand (Rep of) 1.250%, 03/12/2028(3) | | THB | | | 10,000,000 | | | | 275,711 | | | | 0.37 | |
Thailand (Rep of) 3.400%, 06/17/2036 | | THB | | | 36,812,000 | | | | 1,235,192 | | | | 1.66 | |
Thailand (Rep of) 4.675%, 06/29/2044 | | THB | | | 4,880,000 | | | | 201,048 | | | | 0.27 | |
| | | | | | | | | 2,708,575 | | | | 3.64 | |
Turkey (Cost $7,642,676) | | | | | | | | | | | | | | |
Turkey (Rep of) 8.300%, 06/20/2018 | | TRY | | | 1,932,000 | | | | 681,862 | | | | 0.92 | |
Turkey (Rep of) 10.400%, 03/27/2019 | | TRY | | | 694,000 | | | | 257,088 | | | | 0.35 | |
Turkey (Rep of) 8.500%, 07/10/2019 | | TRY | | | 3,640,000 | | | | 1,283,692 | | | | 1.72 | |
Turkey (Rep of) 9.400%, 07/08/2020 | | TRY | | | 2,919,200 | | | | 1,058,966 | | | | 1.42 | |
Turkey (Rep of) 9.500%, 01/12/2022 | | TRY | | | 1,187,000 | | | | 432,716 | | | | 0.58 | |
Turkey (Rep of) 3.000%, 02/23/2022(3) | | TRY | | | 1,644,200 | | | | 836,384 | | | | 1.12 | |
Turkey (Rep of) 8.500%, 09/14/2022 | | TRY | | | 1,045,000 | | | | 363,864 | | | | 0.49 | |
Turkey (Rep of) 7.100%, 03/08/2023 | | TRY | | | 2,914,700 | | | | 939,621 | | | | 1.26 | |
Turkey (Rep of) 8.800%, 09/27/2023 | | TRY | | | 2,300,000 | | | | 810,918 | | | | 1.09 | |
| | | | | | | | | 6,665,111 | | | | 8.95 | |
Uruguay (Cost $612,759) | | | | | | | | | | | | | | |
Uruguay (Rep of) 4.250%, 04/05/2027(3) | | UYU | | | 1,188,000 | | | | 71,071 | | | | 0.10 | |
Uruguay (Rep of) 4.375%, 12/15/2028(3) | | UYU | | | 4,839,353 | | | | 207,435 | | | | 0.28 | |
See accompanying notes to the financial statements.
78
ASHMORE EMERGING MARKETS LOCAL CURRENCY BOND FUND
SCHEDULE OF INVESTMENTS (CONTINUED)
As of April 30, 2016 (Unaudited)
| | | | | | | | | | | | | | |
| | | Currency(1) | | Par | | | Value | | | % of Net
Assets | |
Uruguay - (continued) | | | | | | | | | | | | | | |
Uruguay (Rep of) 3.700%, 06/26/2037(3) | | UYU | | | 1,728,000 | | | $ | 89,993 | | | | 0.12 | |
| | | | | | | | | 368,499 | | | | 0.50 | |
Total Debt Securities (Cost $56,089,638) | | | | | | | | | 51,944,134 | | | | 69.75 | |
| | | | |
Total Investments in Securities (Cost $56,089,638) | | | | | | | | $ | 51,944,134 | | | | 69.75 | |
| | | | |
Fully Funded Total Return Swaps | | | | | | | | | | | | | | |
| | | | |
Indonesia (Cost $3,406,866) | | | | | | | | | | | | | | |
Indonesia (Rep of), Issued by ANZ Banking Corp., 7.875%, 04/15/2019 | | IDR | | | 1,456,000,000 | | | $ | 112,194 | | | | 0.15 | |
Indonesia (Rep of), Issued by ANZ Banking Corp., 8.375%, 03/15/2024 | | IDR | | | 10,500,000,000 | | | | 832,647 | | | | 1.12 | |
Indonesia (Rep of), Issued by ANZ Banking Corp., 7.000%, 05/15/2027 | | IDR | | | 941,000,000 | | | | 67,408 | | | | 0.09 | |
Indonesia (Rep of), Issued by ANZ Banking Corp., 10.500%, 08/15/2030 | | IDR | | | 600,000,000 | | | | 55,703 | | | | 0.08 | |
Indonesia (Rep of), Issued by ANZ Banking Corp., 8.375%, 03/15/2034 | | IDR | | | 4,710,000,000 | | | | 374,664 | | | | 0.50 | |
Indonesia (Rep of), Issued by Deutsche Bank, 8.375%, 03/15/2034 | | IDR | | | 6,412,000,000 | | | | 510,052 | | | | 0.69 | |
Indonesia (Rep of), Issued by HSBC Bank, 10.500%, 08/15/2030 | | IDR | | | 1,949,000,000 | | | | 180,941 | | | | 0.24 | |
Indonesia (Rep of), Issued by HSBC Bank, 8.250%, 06/15/2032 | | IDR | | | 30,000,000 | | | | 2,348 | | | | — | |
Indonesia (Rep of), Issued by Standard Chartered, 8.375%, 03/15/2024 | | IDR | | | 2,600,000,000 | | | | 206,179 | | | | 0.28 | |
Indonesia (Rep of), Issued by Standard Chartered, 7.000%, 05/15/2027 | | IDR | | | 6,009,000,000 | | | | 430,452 | | | | 0.58 | |
Indonesia (Rep of), Issued by Standard Chartered, 10.500%, 08/15/2030 | | IDR | | | 1,064,000,000 | | | | 98,779 | | | | 0.13 | |
Indonesia (Rep of), Issued by Standard Chartered, 8.375%, 03/15/2034 | | IDR | | | 1,166,000,000 | | | | 92,751 | | | | 0.13 | |
Indonesia (Rep of), Issued by Standard Chartered, 8.250%, 05/15/2036 | | IDR | | | 2,022,000,000 | | | | 159,109 | | | | 0.21 | |
| | | | | | | | | 3,123,227 | | | | 4.20 | |
Total Fully Funded Total Return Swaps (Cost $3,406,866) | | | | | | | | | 3,123,227 | | | | 4.20 | |
| | | | |
Total Investments (Total Cost $59,496,504) | | | | | | | | | 55,067,361 | | | | 73.95 | |
| | | | |
Other Assets Less Liabilities (See Statements of Assets and Liabilities for further detail) | | | | | | | | | 19,401,395 | | | | 26.05 | |
| | | | |
Net Assets | | | | | | | | $ | 74,468,756 | | | | 100.00 | |
| (1) | Par values are stated in United States Dollars unless otherwise noted below. |
| (3) | Inflation-indexed bonds are shown at original par and stated coupon rate. |
Percentages shown are based on net assets.
See accompanying notes to the financial statements.
79
ASHMORE EMERGING MARKETS LOCAL CURRENCY BOND FUND
SCHEDULE OF INVESTMENTS (CONTINUED)
As of April 30, 2016 (Unaudited)
At April 30, 2016, the Ashmore Emerging Markets Local Currency Bond Fund had outstanding forward foreign currency exchange contracts as follows:
| | | | | | | | | | | | | | | | | | |
Settlement Date | | Counterparty | | Currency Buy | | Currency
Buy Amount
(Local
Currency) | | | Currency Sell | | Currency
Sell
Amount
(Local
Currency) | | | Unrealized
Gain/(Loss) | |
05/03/2016 | | Citibank | | Brazilian Real | | | 3,353,233 | | | United States Dollar | | | 915,934 | | | $ | 58,070 | |
05/03/2016 | | Morgan Stanley | | Brazilian Real | | | 795,890 | | | United States Dollar | | | 223,942 | | | | 7,238 | |
05/03/2016 | | Deutsche Bank | | United States Dollar | | | 715,550 | | | Brazilian Real | | | 2,611,758 | | | | (43,079) | |
05/03/2016 | | JP Morgan | | United States Dollar | | | 431,263 | | | Brazilian Real | | | 1,537,366 | | | | (15,291) | |
05/04/2016 | | BNP Paribas | | Argentine Peso | | | 2,948,400 | | | United States Dollar | | | 180,000 | | | | 25,452 | |
05/04/2016 | | BNP Paribas | | United States Dollar | | | 5,350 | | | Argentine Peso | | | 79,076 | | | | (160) | |
05/04/2016 | | BNP Paribas | | United States Dollar | | | 8,787 | | | Argentine Peso | | | 132,595 | | | | (453) | |
05/04/2016 | | BNP Paribas | | United States Dollar | | | 10,500 | | | Argentine Peso | | | 158,130 | | | | (519) | |
05/04/2016 | | BNP Paribas | | United States Dollar | | | 8,437 | | | Argentine Peso | | | 128,911 | | | | (546) | |
05/04/2016 | | BNP Paribas | | United States Dollar | | | 21,502 | | | Argentine Peso | | | 321,453 | | | | (898) | |
05/04/2016 | | BNP Paribas | | United States Dollar | | | 21,020 | | | Argentine Peso | | | 316,351 | | | | (1,024) | |
05/04/2016 | | BNP Paribas | | United States Dollar | | | 120,391 | | | Argentine Peso | | | 1,811,885 | | | | (5,866) | |
05/05/2016 | | BNP Paribas | | Chinese Offshore Yuan | | | 11,977,620 | | | United States Dollar | | | 1,817,214 | | | | 28,913 | |
05/05/2016 | | BNP Paribas | | United States Dollar | | | 1,780,000 | | | Chinese Offshore Yuan | | | 11,977,620 | | | | (66,127) | |
05/31/2016 | | BNP Paribas | | Chinese Offshore Yuan | | | 12,201,753 | | | United States Dollar | | | 1,846,932 | | | | 31,663 | |
05/31/2016 | | Merrill Lynch | | Hungarian Forint | | | 2,760,600 | | | United States Dollar | | | 10,026 | | | | 102 | |
05/31/2016 | | BNP Paribas | | Indonesian Rupiah | | | 2,396,501,638 | | | United States Dollar | | | 181,347 | | | | (656) | |
05/31/2016 | | BNP Paribas | | Malaysian Ringgit | | | 174,235 | | | United States Dollar | | | 44,865 | | | | (419) | |
05/31/2016 | | Citibank | | Malaysian Ringgit | | | 2,273,012 | | | United States Dollar | | | 537,482 | | | | 42,346 | |
05/31/2016 | | Deutsche Bank | | Malaysian Ringgit | | | 2,590,700 | | | United States Dollar | | | 610,294 | | | | 50,573 | |
05/31/2016 | | Citibank | | Polish Zloty | | | 5,713,750 | | | United States Dollar | | | 1,465,615 | | | | 30,250 | |
05/31/2016 | | Deutsche Bank | | Polish Zloty | | | 6,065,456 | | | United States Dollar | | | 1,526,054 | | | | 61,887 | |
05/31/2016 | | Merrill Lynch | | Polish Zloty | | | 1,546,879 | | | United States Dollar | | | 416,505 | | | | (11,531) | |
05/31/2016 | | Morgan Stanley | | Polish Zloty | | | 1,718,774 | | | United States Dollar | | | 444,030 | | | | 5,947 | |
05/31/2016 | | HSBC Bank | | Romanian Leu | | | 3,301,472 | | | United States Dollar | | | 815,420 | | | | 28,582 | |
05/31/2016 | | Goldman Sachs | | Russian Ruble | | | 18,923,950 | | | United States Dollar | | | 290,000 | | | | (366) | |
05/31/2016 | | Merrill Lynch | | Russian Ruble | | | 37,378,777 | | | United States Dollar | | | 477,852 | | | | 94,237 | |
05/31/2016 | | Merrill Lynch | | South African Rand | | | 498,200 | | | United States Dollar | | | 34,431 | | | | 328 | |
05/31/2016 | | ANZ | | Thai Baht | | | 14,901,489 | | | United States Dollar | | | 416,883 | | | | 9,394 | |
05/31/2016 | | BNP Paribas | | Thai Baht | | | 123,907,525 | | | United States Dollar | | | 3,458,689 | | | | 85,852 | |
05/31/2016 | | Citibank | | Thai Baht | | | 6,883,183 | | | United States Dollar | | | 195,483 | | | | 1,419 | |
05/31/2016 | | Citibank | | Thai Baht | | | 2,744,898 | | | United States Dollar | | | 78,000 | | | | 522 | |
05/31/2016 | | Deutsche Bank | | Thai Baht | | | 6,038,797 | | | United States Dollar | | | 171,484 | | | | 1,264 | |
05/31/2016 | | Merrill Lynch | | Thai Baht | | | 2,586,552 | | | United States Dollar | | | 74,000 | | | | (8) | |
05/31/2016 | | Merrill Lynch | | Turkish Lira | | | 344,200 | | | United States Dollar | | | 120,507 | | | | 1,458 | |
05/31/2016 | | BNP Paribas | | United States Dollar | | | 1,810,000 | | | Chinese Offshore Yuan | | | 12,201,753 | | | | (68,594) | |
05/31/2016 | | Goldman Sachs | | United States Dollar | | | 44,000 | | | Indonesian Rupiah | | | 582,780,000 | | | | 60 | |
05/31/2016 | | Goldman Sachs | | United States Dollar | | | 356,000 | | | Malaysian Ringgit | | | 1,394,808 | | | | 195 | |
05/31/2016 | | JP Morgan | | United States Dollar | | | 23,289 | | | Malaysian Ringgit | | | 91,291 | | | | 1 | |
05/31/2016 | | HSBC Bank | | United States Dollar | | | 507,780 | | | Polish Zloty | | | 1,996,454 | | | | (14,893) | |
05/31/2016 | | Credit Suisse | | United States Dollar | | | 95,100 | | | Russian Ruble | | | 6,373,109 | | | | (2,442) | |
05/31/2016 | | Deutsche Bank | | United States Dollar | | | 31,452 | | | Thai Baht | | | 1,098,295 | | | | 34 | |
05/31/2016 | | Deutsche Bank | | United States Dollar | | | 10,435 | | | Thai Baht | | | 365,893 | | | | (32) | |
05/31/2016 | | Deutsche Bank | | United States Dollar | | | 7,510 | | | Thai Baht | | | 264,229 | | | | (49) | |
05/31/2016 | | Deutsche Bank | | United States Dollar | | | 10,407 | | | Thai Baht | | | 365,964 | | | | (62) | |
05/31/2016 | | Deutsche Bank | | United States Dollar | | | 10,394 | | | Thai Baht | | | 366,011 | | | | (77) | |
05/31/2016 | | Deutsche Bank | | United States Dollar | | | 22,476 | | | Thai Baht | | | 788,700 | | | | (85) | |
05/31/2016 | | Deutsche Bank | | United States Dollar | | | 38,048 | | | Thai Baht | | | 1,340,636 | | | | (302) | |
05/31/2016 | | HSBC Bank | | United States Dollar | | | 77,000 | | | Thai Baht | | | 2,705,780 | | | | (402) | |
05/31/2016 | | HSBC Bank | | United States Dollar | | | 200,255 | | | Thai Baht | | | 7,044,782 | | | | (1,270) | |
05/31/2016 | | JP Morgan | | United States Dollar | | | 335,000 | | | Thai Baht | | | 11,788,650 | | | | (2,230) | |
05/31/2016 | | HSBC Bank | | United States Dollar | | | 529,548 | | | Turkish Lira | | | 1,554,938 | | | | (21,433) | |
06/02/2016 | | JP Morgan | | Brazilian Real | | | 5,425,092 | | | United States Dollar | | | 1,522,790 | | | | 37,159 | |
See accompanying notes to the financial statements.
80
ASHMORE EMERGING MARKETS LOCAL CURRENCY BOND FUND
SCHEDULE OF INVESTMENTS (CONTINUED)
As of April 30, 2016 (Unaudited)
| | | | | | | | | | | | | | | | | | |
Settlement Date | | Counterparty | | Currency Buy | | Currency
Buy Amount
(Local
Currency) | | | Currency Sell | | Currency Sell Amount
(Local
Currency) | | | Unrealized
Gain/(Loss) | |
06/02/2016 | | JP Morgan | | Brazilian Real | | | 3,174,435 | | | United States Dollar | | | 901,188 | | | $ | 11,600 | |
06/02/2016 | | JP Morgan | | Brazilian Real | | | 1,973,398 | | | United States Dollar | | | 565,000 | | | | 2,438 | |
06/02/2016 | | Morgan Stanley | | United States Dollar | | | 221,993 | | | Brazilian Real | | | 795,890 | | | | (6,860) | |
06/02/2016 | | Morgan Stanley | | United States Dollar | | | 1,126,530 | | | Brazilian Real | | | 4,017,882 | | | | (28,785) | |
06/30/2016 | | UBS | | Malaysian Ringgit | | | 4,362,443 | | | United States Dollar | | | 1,069,436 | | | | 42,548 | |
06/30/2016 | | Citibank | | Polish Zloty | | | 2,695,652 | | | United States Dollar | | | 702,781 | | | | 2,627 | |
06/30/2016 | | Deutsche Bank | | Polish Zloty | | | 2,695,652 | | | United States Dollar | | | 706,519 | | | | (1,110) | |
06/30/2016 | | Deutsche Bank | | Romanian Leu | | | 3,012,909 | | | United States Dollar | | | 754,755 | | | | 15,833 | |
06/30/2016 | | Barclays | | Russian Ruble | | | 37,074,231 | | | United States Dollar | | | 534,326 | | | | 28,858 | |
06/30/2016 | | BNP Paribas | | United States Dollar | | | 199,776 | | | Philippine Peso | | | 9,334,557 | | | | 2,316 | |
06/30/2016 | | Goldman Sachs | | United States Dollar | | | 45,510 | | | Philippine Peso | | | 2,138,970 | | | | 263 | |
06/30/2016 | | HSBC Bank | | United States Dollar | | | 115,135 | | | Philippine Peso | | | 5,325,000 | | | | 2,492 | |
07/01/2016 | | BNP Paribas | | Argentine Peso | | | 132,595 | | | United States Dollar | | | 8,371 | | | | 498 | |
07/01/2016 | | BNP Paribas | | United States Dollar | | | 8,532 | | | Argentine Peso | | | 132,595 | | | | (336) | |
07/27/2016 | | BNP Paribas | | Peruvian Nuevo Sol | | | 1,007,814 | | | United States Dollar | | | 305,509 | | | | (1,788) | |
07/29/2016 | | HSBC Bank | | Chilean Peso | | | 87,055,051 | | | United States Dollar | | | 129,836 | | | | 810 | |
07/29/2016 | | Citibank | | Colombian Peso | | | 1,367,748,472 | | | United States Dollar | | | 464,391 | | | | 8,634 | |
07/29/2016 | | Goldman Sachs | | Colombian Peso | | | 1,367,748,472 | | | United States Dollar | | | 460,134 | | | | 12,891 | |
07/29/2016 | | Merrill Lynch | | Hungarian Forint | | | 237,788,158 | | | United States Dollar | | | 858,580 | | | | 13,421 | |
07/29/2016 | | Barclays | | Malaysian Ringgit | | | 6,937,046 | | | United States Dollar | | | 1,786,655 | | | | (19,930) | |
07/29/2016 | | HSBC Bank | | Mexican Peso | | | 1,557,432 | | | United States Dollar | | | 90,000 | | | | (273) | |
07/29/2016 | | Merrill Lynch | | Mexican Peso | | | 3,961,781 | | | United States Dollar | | | 224,986 | | | | 3,261 | |
07/29/2016 | | UBS | | Polish Zloty | | | 783,894 | | | United States Dollar | | | 201,940 | | | | 3,090 | |
07/29/2016 | | UBS | | Polish Zloty | | | 342,014 | | | United States Dollar | | | 87,877 | | | | 1,579 | |
07/29/2016 | | Citibank | | Romanian Leu | | | 3,101,250 | | | United States Dollar | | | 781,034 | | | | 12,293 | |
07/29/2016 | | Goldman Sachs | | Russian Ruble | | | 27,543,438 | | | United States Dollar | | | 415,750 | | | | 25 | |
07/29/2016 | | Deutsche Bank | | South African Rand | | | 8,312,783 | | | United States Dollar | | | 566,772 | | | | 6,548 | |
07/29/2016 | | Deutsche Bank | | Turkish Lira | | | 1,509,927 | | | United States Dollar | | | 522,447 | | | | 4,715 | |
07/29/2016 | | Deutsche Bank | | United States Dollar | | | 174,959 | | | Chilean Peso | | | 116,645,268 | | | | (93) | |
07/29/2016 | | BNP Paribas | | United States Dollar | | | 395,530 | | | Colombian Peso | | | 1,183,628,153 | | | | (13,819) | |
07/29/2016 | | Citibank | | United States Dollar | | | 125,000 | | | Hungarian Forint | | | 34,543,638 | | | | (1,676) | |
07/29/2016 | | JP Morgan | | United States Dollar | | | 483,760 | | | Mexican Peso | | | 8,513,899 | | | | (6,745) | |
07/29/2016 | | Citibank | | United States Dollar | | | 477,360 | | | Polish Zloty | | | 1,854,099 | | | | (7,587) | |
07/29/2016 | | Merrill Lynch | | United States Dollar | | | 170,570 | | | Romanian Leu | | | 674,033 | | | | (1,854) | |
07/29/2016 | | Morgan Stanley | | United States Dollar | | | 115,000 | | | Russian Ruble | | | 7,776,369 | | | | (2,386) | |
07/29/2016 | | Citibank | | United States Dollar | | | 801,261 | | | South African Rand | | | 11,817,152 | | | | (13,749) | |
07/29/2016 | | Merrill Lynch | | United States Dollar | | | 157,000 | | | South African Rand | | | 2,265,368 | | | | 761 | |
07/29/2016 | | Morgan Stanley | | United States Dollar | | | 581,330 | | | South African Rand | | | 8,561,712 | | | | (9,157) | |
07/29/2016 | | BNP Paribas | | United States Dollar | | | 810,923 | | | Turkish Lira | | | 2,349,326 | | | | (9,298) | |
07/29/2016 | | Citibank | | United States Dollar | | | 385,520 | | | Turkish Lira | | | 1,114,576 | | | | (3,612) | |
09/20/2016 | | HSBC Bank | | Chinese Offshore Yuan | | | 6,511,705 | | | United States Dollar | | | 961,563 | | | | 34,833 | |
09/20/2016 | | HSBC Bank | | Chinese Offshore Yuan | | | 3,391,199 | | | United States Dollar | | | 500,546 | | | | 18,362 | |
09/20/2016 | | HSBC Bank | | Chinese Offshore Yuan | | | 2,316,932 | | | United States Dollar | | | 340,550 | | | | 13,978 | |
09/20/2016 | | HSBC Bank | | Chinese Offshore Yuan | | | 1,783,188 | | | United States Dollar | | | 270,000 | | | | 2,857 | |
09/20/2016 | | HSBC Bank | | United States Dollar | | | 2,125,922 | | | Chinese Offshore Yuan | | | 14,003,024 | | | | (16,769) | |
09/22/2016 | | BNP Paribas | | Chinese Offshore Yuan | | | 7,577,620 | | | United States Dollar | | | 1,118,468 | | | | 40,884 | |
09/22/2016 | | BNP Paribas | | Chinese Offshore Yuan | | | 5,868,219 | | | United States Dollar | | | 893,796 | | | | 4,023 | |
09/22/2016 | | BNP Paribas | | Chinese Offshore Yuan | | | 245,059 | | | United States Dollar | | | 36,000 | | | | 1,493 | |
09/22/2016 | | BNP Paribas | | Chinese Offshore Yuan | | | 145,427 | | | United States Dollar | | | 21,789 | | | | 461 | |
09/22/2016 | | BNP Paribas | | United States Dollar | | | 2,099,276 | | | Chinese Offshore Yuan | | | 13,836,325 | | | | (17,638) | |
10/11/2016 | | BNP Paribas | | Chinese Offshore Yuan | | | 7,271,919 | | | United States Dollar | | | 1,104,316 | | | | 6,926 | |
10/11/2016 | | BNP Paribas | | Chinese Offshore Yuan | | | 5,074,981 | | | United States Dollar | | | 772,260 | | | | 3,262 | |
10/11/2016 | | BNP Paribas | | United States Dollar | | | 1,880,000 | | | Chinese Offshore Yuan | | | 12,346,900 | | | | (6,764) | |
01/06/2017 | | HSBC Bank | | Chinese Offshore Yuan | | | 6,036,800 | | | United States Dollar | | | 912,317 | | | | 4,561 | |
01/06/2017 | | HSBC Bank | | United States Dollar | | | 880,000 | | | Chinese Offshore Yuan | | | 6,036,800 | | | | (36,878) | |
03/06/2017 | | HSBC Bank | | Chinese Offshore Yuan | | | 5,017,910 | | | United States Dollar | | | 788,298 | | | | (29,409) | |
03/06/2017 | | HSBC Bank | | Chinese Offshore Yuan | | | 10,100,000 | | | United States Dollar | | | 1,584,687 | | | | (57,203) | |
03/06/2017 | | HSBC Bank | | United States Dollar | | | 1,810,000 | | | Chinese Offshore Yuan | | | 11,296,210 | | | | 101,606 | |
See accompanying notes to the financial statements.
81
ASHMORE EMERGING MARKETS LOCAL CURRENCY BOND FUND
SCHEDULE OF INVESTMENTS (CONTINUED)
As of April 30, 2016 (Unaudited)
| | | | | | | | | | | | | | | | | | |
Settlement Date | | Counterparty | | Currency Buy | | Currency
Buy
Amount
(Local
Currency) | | | Currency Sell | | Currency
Sell
Amount
(Local
Currency) | | | Unrealized
Gain/(Loss) | |
03/06/2017 | | HSBC Bank | | United States Dollar | | | 600,000 | | | Chinese Offshore Yuan | | | 3,821,700 | | | | $ 22,021 | |
03/31/2017 | | Merrill Lynch | | Mexican Peso | | | 40,674,280 | | | United States Dollar | | | 2,276,503 | | | | 16,526 | |
03/31/2017 | | Santander | | Mexican Peso | | | 40,669,138 | | | United States Dollar | | | 2,279,788 | | | | 12,951 | |
| | | | | | | | | | | | | | | | | | |
Total | | | | | | | | | | | | | | | | | $512,658 | |
| | | | | | | | | | | | | | | | | | |
At April 30, 2016, the Ashmore Emerging Markets Local Currency Bond Fund had the following interest rate swap contracts outstanding:
| | | | | | | | | | | | | | | | | | | | |
Pay Rate Index/ Pay Rate | | Receive Rate/ Receive Rate Index | | Notional Amount | | | Expiration
Date | | | Unrealized
Gain/(Loss) | | | Counterparty |
Brazil CETIP Interbank | | | | | | | | | | | | | | | | | | | | |
Deposit Rate | | 15.720% | | | BRL | | | | 9,850,360 | | | | 01/02/2018 | | | | $157,431 | | | BNP Paribas |
Brazil CETIP Interbank | | | | | | | | | | | | | | | | | | | | |
Deposit Rate | | 14.625% | | | BRL | | | | 11,163,537 | | | | 01/02/2018 | | | | 96,702 | | | BNP Paribas |
Brazil CETIP Interbank | | | | | | | | | | | | | | | | | | | | |
Deposit Rate | | 15.715% | | | BRL | | | | 1,819,942 | | | | 01/04/2021 | | | | 81,837 | | | HSBC Bank |
Brazil CETIP Interbank | | | | | | | | | | | | | | | | | | | | |
Deposit Rate | | 13.850% | | | BRL | | | | 10,327,724 | | | | 01/02/2019 | | | | 97,712 | | | HSBC Bank |
Brazil CETIP Interbank | | | | | | | | | | | | | | | | | | | | |
Deposit Rate | | 13.055% | | | BRL | | | | 3,650,266 | | | | 01/04/2021 | | | | 31,093 | | | HSBC Bank |
Brazil CETIP Interbank | | | | | | | | | | | | | | | | | | | | |
Deposit Rate | | 15.630% | | | BRL | | | | 2,039,065 | | | | 01/02/2019 | | | | 51,593 | | | BNP Paribas |
Brazil CETIP Interbank | | | | | | | | | | | | | | | | | | | | |
Deposit Rate | | 15.571% | | | BRL | | | | 3,065,205 | | | | 01/02/2019 | | | | 75,848 | | | BNP Paribas |
| | Brazil CETIP Interbank | | | | | | | | | | | | | | | | | | |
13.165% | | Deposit Rate | | | BRL | | | | 5,584,500 | | | | 01/02/2018 | | | | (9,850) | | | HSBC Bank |
Brazil CETIP Interbank | | | | | | | | | | | | | | | | | | | | |
Deposit Rate | | 12.340% | | | BRL | | | | 3,954,419 | | | | 01/04/2021 | | | | (498) | | | HSBC Bank |
| | MXN-TIIE-BANXICO | | | | | | | | | | | | | | | | | | |
5.585% | | 28 Day Rate | | | MXN | | | | 20,490,000 | | | | 11/03/2020 | | | | (16,424) | | | BNP Paribas |
| | MXN-TIIE-BANXICO | | | | | | | | | | | | | | | | | | |
5.420% | | 28 Day Rate | | | MXN | | | | 14,740,000 | | | | 03/22/2021 | | | | (3,410) | | | HSBC Bank |
MYR-KLIBOR-BNM 3 Month | | 3.555% | | | MYR | | | | 15721000 | | | | 03/18/2018 | | | | 201 | | | HSBC Bank |
MYR-KLIBOR-BNM 3 Month | | 3.560% | | | MYR | | | | 6747300 | | | | 03/22/2018 | | | | 317 | | | HSBC Bank |
MYR-KLIBOR-BNM 3 Month | | 3.575% | | | MYR | | | | 8972700 | | | | 03/23/2018 | | | | 1,218 | | | HSBC Bank |
MYR-KLIBOR-BNM 3 Month | | 4.055% | | | MYR | | | | 5200000 | | | | 04/27/2026 | | | | 2,517 | | | HSBC Bank |
WIBOR Poland 6 Month | | 1.955% | | | PLN | | | | 6,400,000 | | | | 09/24/2020 | | | | 23,459 | | | BNP Paribas |
1.820% | | WIBOR Poland 6 Month | | | PLN | | | | 1,700,000 | | | | 10/07/2020 | | | | 795 | | | HSBC Bank |
| | | | | | | | | | | | | | | | | | | | |
| | | | | | | | | | | | | | | | | $590,541 | | | |
| | | | | | | | | | | | | | | | | | | | |
See accompanying notes to the financial statements.
82
ASHMORE EMERGING MARKETS LOCAL CURRENCY BOND FUND
SCHEDULE OF INVESTMENTS (CONTINUED)
As of April 30, 2016 (Unaudited)
At April 30, 2016, the Ashmore Emerging Markets Local Currency Bond Fund had the following centrally cleared swap contracts outstanding:
| | | | | | | | | | | | | | |
Pay Rate Index/ Pay Rate | | Receive Rate/
Receive Rate Index | | Notional Amount | | Expiration
Date | | Variation Margin
Receivable (Payable) | | | Counterparty |
Budapest Interbank | | | | | | | | | | | | | | |
6 Month Rate | | 1.820% | | HUF | | 91,600,000 | | 10/07/2020 | | | $11,098 | | | HSBC Bank |
Budapest Interbank | | | | | | | | | | | | | | |
6 Month Rate | | 1.795% | | HUF | | 93,000,000 | | 10/09/2020 | | | 10,848 | | | HSBC Bank |
MXN-TIIE-BANXICO | | | | | | | | | | | | | | |
28 Day Rate | | 6.000% | | MXN | | 35,000,000 | | 01/29/2026 | | | (8,993) | | | BNP Paribas |
WIBOR Poland 6 Month | | 2.375% | | PLN | | 1,290,000 | | 05/04/2026 | | | (207) | | | BNP Paribas |
WIBOR Poland 6 Month | | 1.853% | | PLN | | 1,300,000 | | 04/21/2021 | | | (1,132) | | | JP Morgan |
WIBOR Poland 6 Month | | 2.290% | | PLN | | 690,000 | | 11/03/2025 | | | (439) | | | Morgan Stanley |
| | | | | | | | | | | | | | |
| | | | | | | | | | | $11,175 | | | |
| | | | | | | | | | | | | | |
The inputs or methodologies used for valuing securities are not necessarily an indication of the risks associated with investing in those securities and other financial instruments, if any. See note 4 in the Notes to the Financial Statements for more information regarding pricing inputs and valuation techniques. The following is a summary of the inputs used in valuing the Ashmore Emerging Markets Local Currency Bond Fund’s investments and other financial instruments, which are carried at fair value, as of April 30, 2016:
| | | | | | | | | | | | | | | | |
| | | Level 1 | | | Level 2 | | | Level 3 | | | Total | |
Investments | | | | | | | | | | | | | | | | |
Assets: | | | | | | | | | | | | | | | | |
Debt Securities | | | | | | | | | | | | | | | | |
Corporate Bonds | | | $— | | | $ | 130,005 | | | $ | — | | | $ | 130,005 | |
Financial Certificates | | | — | | | | 265,116 | | | | — | | | | 265,116 | |
Government Agencies | | | — | | | | 161,393 | | | | — | | | | 161,393 | |
Government Bonds | | | — | | | | 48,081,317 | | | | 214,828 | | | | 48,296,145 | |
Index Linked Government Bonds | | | — | | | | 3,091,475 | | | | — | | | | 3,091,475 | |
| | | | | | | | | | | | | | | | |
Total Debt Securities | | | — | | | | 51,729,306 | | | | 214,828 | | | | 51,944,134 | |
Fully Funded Total Return Swaps | | | — | | | | 3,123,227 | | | | — | | | | 3,123,227 | |
Total Investments | | | $— | | | $ | 54,852,533 | | | $ | 214,828 | | | $ | 55,067,361 | |
| | | | |
Other Financial Instruments | | | | | | | | | | | | | | | | |
Assets: | | | | | | | | | | | | | | | | |
Forward Foreign Currency Exchange Contracts | | | $— | | | $ | 1,065,191 | | | $ | — | | | $ | 1,065,191 | |
Interest Rate Swap Contracts | | | — | | | | 620,723 | | | | — | | | | 620,723 | |
Centrally Cleared Swap Contracts | | | — | | | | 21,946 | | | | — | | | | 21,946 | |
Liabilities: | | | | | | | | | | | | | | | | |
Forward Foreign Currency Exchange Contracts | | | — | | | | (552,533) | | | | — | | | | (552,533) | |
Interest Rate Swap Contracts | | | — | | | | (30,182) | | | | — | | | | (30,182) | |
Centrally Cleared Swap Contracts | | | — | | | | (10,771) | | | | — | | | | (10,771) | |
Total Other Financial Instruments | | | $— | | | $ | 1,114,374 | | | $ | — | | | $ | 1,114,374 | |
The Fund discloses all transfers between levels based on valuations at the end of each reporting period. At April 30, 2016, there were no transfers between Level 1, Level 2 and Level 3 based on levels assigned to the securities on October 31, 2015.
See accompanying notes to the financial statements.
83
ASHMORE EMERGING MARKETS LOCAL CURRENCY BOND FUND
SCHEDULE OF INVESTMENTS (CONTINUED)
As of April 30, 2016 (Unaudited)
The following is a reconciliation of investments in which significant unobservable inputs (Level 3) were used for the Fund during the period ending April 30, 2016:
| | | | | | | | | | | | | | | | | | | | |
| Category and Subcategory | | Beginning Balance at 10/31/2015 | | Accrued
Discounts
(Premiums) | | Purchases | | Sales | | Realized
Gains (Losses) | | Change in
Unrealized
Appreciation
(Depreciation) | | Transfer
into
Level 3 | | Transfer
out of
Level 3 | | Ending
Balance at
04/30/2016 | | Change in
Unrealized
Appreciation
(Depreciation)
from Investments
still held at 04/30/2016 |
Investments, at value | | | | | | | | | | | | | | | | | | | | |
Government Bonds Argentina | | $— | | $538 | | $216,832 | | $— | | $— | | $(2,542) | | $— | | $— | | $214,828 | | $(2,542) |
Total | | $— | | $538 | | $216,832 | | $— | | $— | | $(2,542) | | $— | | $— | | $214,828 | | $(2,542) |
See the table on “Quantitative information about Fair Value measurements” for information on the valuation techniques and inputs used to value Level 3 securities at April 30, 2016.
| | | | | | | | | | | | |
Quantitative Information about Level 3 Fair Value Measurements | |
| | | |
| | | Fair Value at
04/30/2016 | | | Valuation
Technique | | | Unobservable Input | |
Government Bonds | | | $214,828 | | | | Broker quote | | | | Inputs to broker model | |
The following is a summary of the fair values of the Fund’s derivative instruments*:
Fair Values of Financial Derivative Instruments on the Statements of Assets and Liabilities as of April 30, 2016:
| | | | | | | | |
| | | Derivatives Not Accounted for as Hedging Instruments | |
| | |
| | | Foreign Exchange | | | Interest Rate | |
| | |
Assets: | | | | | | | | |
Unrealized Appreciation on Interest Rate Swap Contracts | | $ | — | | | | $ 620,723 | |
Variation Margin receivable on Centrally Cleared Swap Contracts | | | — | | | | 21,946 | |
Unrealized Appreciation on Forward Foreign Currency Exchange Contracts | | | 1,065,191 | | | | — | |
| | $ | 1,065,191 | | | | $ 642,669 | |
| | |
Liabilities: | | | | | | | | |
Unrealized Depreciation on Interest Rate Swap Contracts | | $ | — | | | | $ (30,182 | ) |
Variation Margin Payable on Centrally Cleared Swap Contracts | | | — | | | | (10,771 | ) |
Unrealized Depreciation on Forward Foreign Currency Exchange Contracts | | | (552,533 | ) | | | — | |
| | $ | (552,533 | ) | | | $ (40,953 | ) |
See accompanying notes to the financial statements.
84
ASHMORE EMERGING MARKETS LOCAL CURRENCY BOND FUND
SCHEDULE OF INVESTMENTS (CONTINUED)
As of April 30, 2016 (Unaudited)
The Effect of Financial Derivative Instruments on the Statements of Operations for the Six Months Ended April 30, 2016:
| | | | | | | | |
| | | Derivatives Not Accounted for as
Hedging Instruments | |
| | | Foreign Exchange | | | Interest Rate | |
Realized Gain (Loss) on Derivatives Recognized resulting from Operations: | | | | | | | | |
Net Realized Gain on Forward Foreign Currency Exchange Contracts | | $ | 1,113,484 | | | $ | — | |
Net Realized Loss on Interest Rate Swap Contracts | | | — | | | | (146,968 | ) |
| | | | |
| | $ | 1,113,484 | | | $ | (146,968 | ) |
| | | | |
| | |
Net Change in Unrealized Appreciation (Depreciation) on Derivatives Recognized resulting from Operations: | | | | | | | | |
Net Change in Unrealized Appreciation on Forward Foreign Currency Exchange Contracts | | $ | 288,890 | | | $ | — | |
Net Change in Unrealized Appreciation on Interest Rate and Centrally Cleared Swap Contracts | | | — | | | | 925,731 | |
| | | | |
| | $ | 288,890 | | | $ | 925,731 | |
| | | | |
| * | See note 10 in the Notes to the Financial Statements for additional information. |
At April 30, 2016, for U.S. federal income tax purposes, gross unrealized appreciation, gross unrealized depreciation, net unrealized appreciation/(depreciation) on investments in securities (including the effects of foreign currency translation) and the cost basis of investments were as follows:
| | | | |
Federal tax cost of investments | | $ | 59,767,332 | |
Gross tax appreciation of investments | | | 2,380,438 | |
Gross tax depreciation of investments | | | (7,080,409) | |
Net tax depreciation of investments | | $ | (4,699,971) | |
The difference between book basis and tax basis net unrealized appreciation or depreciation is attributable primarily to the tax deferral of losses on wash sales.
See accompanying notes to the financial statements.
85
ASHMORE EMERGING MARKETS CORPORATE DEBT FUND
SCHEDULE OF INVESTMENTS
As of April 30, 2016 (Unaudited)
| | | | | | | | | | | | | | |
| | | Currency(1) | | Par | | | Value | | | % of Net
Assets | |
Debt Securities | | | | | | | | | | | | | | |
| | | | |
Angola (Cost $1,141,378) | | | | | | | | | | | | | | |
Puma International Financing S.A. 6.750%, 02/01/2021 | | | | | 1,110,000 | | | $ | 1,090,686 | | | | 0.50 | |
| | | | | | | | | 1,090,686 | | | | 0.50 | |
Argentina (Cost $1,740,586) | | | | | | | | | | | | | | |
YPF S.A. 8.500%, 03/23/2021(2) | | | | | 800,000 | | | | 836,000 | | | | 0.38 | |
YPF S.A. 8.500%, 07/28/2025 | | | | | 950,000 | | | | 978,500 | | | | 0.45 | |
| | | | | | | | | 1,814,500 | | | | 0.83 | |
Bangladesh (Cost $1,028,386) | | | | | | | | | | | | | | |
Banglalink Digital Communications Ltd. 8.625%, 05/06/2019 | | | | | 1,000,000 | | | | 1,058,000 | | | | 0.48 | |
| | | | | | | | | 1,058,000 | | | | 0.48 | |
Barbados (Cost $2,004,220) | | | | | | | | | | | | | | |
Columbus International, Inc. 7.375%, 03/30/2021 | | | | | 1,885,000 | | | | 2,002,247 | | | | 0.92 | |
| | | | | | | | | 2,002,247 | | | | 0.92 | |
Brazil (Cost $32,509,824) | | | | | | | | | | | | | | |
BRF S.A. 4.750%, 05/22/2024 | | | | | 485,000 | | | | 469,819 | | | | 0.22 | |
Embraer Netherlands Finance B.V. 5.050%, 06/15/2025 | | | | | 515,000 | | | | 515,000 | | | | 0.24 | |
Globo Comunicacao e Participacoes S.A., FRN 4.843%, 06/08/2025 | | | | | 450,000 | | | | 424,125 | | | | 0.19 | |
Marfrig Holdings Europe B.V. 8.375%, 05/09/2018 | | | | | 1,240,000 | | | | 1,277,200 | | | | 0.58 | |
Marfrig Holdings Europe B.V. 6.875%, 06/24/2019 | | | | | 1,855,000 | | | | 1,836,450 | | | | 0.84 | |
Marfrig Overseas Ltd. 9.500%, 05/04/2020 | | | | | 1,300,000 | | | | 1,332,500 | | | | 0.61 | |
Minerva Luxembourg S.A. 12.250%, 02/10/2022 | | | | | 200,000 | | | | 209,750 | | | | 0.10 | |
Odebrecht Drilling Norbe VIII/IX Ltd. 6.350%, 06/30/2021 | | | | | 585,610 | | | | 120,343 | | | | 0.06 | |
Oi S.A. 9.750%, 09/15/2016 | | BRL | | | 1,138,000 | | | | 59,560 | | | | 0.03 | |
Petrobras Global Finance B.V., FRN 2.768%, 01/15/2019 | | | | | 720,000 | | | | 628,632 | | | | 0.29 | |
Petrobras Global Finance B.V. 7.875%, 03/15/2019 | | | | | 687,000 | | | | 684,424 | | | | 0.31 | |
Petrobras Global Finance B.V. 5.750%, 01/20/2020 | | | | | 2,250,000 | | | | 2,064,375 | | | | 0.94 | |
Petrobras Global Finance B.V. 5.375%, 01/27/2021 | | | | | 4,875,000 | | | | 4,332,656 | | | | 1.98 | |
Petrobras Global Finance B.V. 6.250%, 03/17/2024 | | | | | 3,100,000 | | | | 2,704,750 | | | | 1.24 | |
Petrobras Global Finance B.V. 6.875%, 01/20/2040 | | | | | 5,306,000 | | | | 4,158,578 | | | | 1.90 | |
Petrobras Global Finance B.V. 6.750%, 01/27/2041 | | | | | 250,000 | | | | 195,550 | | | | 0.09 | |
Petrobras Global Finance B.V. 6.850%, 06/05/2115 | | | | | 717,000 | | | | 530,580 | | | | 0.24 | |
QGOG Atlantic/Alaskan Rigs Ltd. 5.250%, 07/30/2018 | | | | | 1,892,696 | | | | 1,485,766 | | | | 0.68 | |
QGOG Constellation S.A. 6.250%, 11/09/2019 | | | | | 5,809,000 | | | | 3,136,860 | | | | 1.43 | |
Vale Overseas Ltd. 5.625%, 09/15/2019 | | | | | 344,000 | | | | 347,440 | | | | 0.16 | |
Vale Overseas Ltd. 4.625%, 09/15/2020 | | | | | 1,570,000 | | | | 1,522,900 | | | | 0.70 | |
Vale Overseas Ltd. 4.375%, 01/11/2022 | | | | | 799,000 | | | | 739,075 | | | | 0.34 | |
Vale Overseas Ltd. 6.875%, 11/21/2036 | | | | | 834,000 | | | | 748,515 | | | | 0.34 | |
Vale Overseas Ltd. 6.875%, 11/10/2039 | | | | | 2,952,000 | | | | 2,590,380 | | | | 1.18 | |
| | | | | | | | | 32,115,228 | | | | 14.69 | |
Chile (Cost $1,450,801) | | | | | | | | | | | | | | |
Cencosud S.A. 5.500%, 01/20/2021 | | | | | 150,000 | | | | 159,857 | | | | 0.07 | |
E.CL S.A. 5.625%, 01/15/2021 | | | | | 200,000 | | | | 221,914 | | | | 0.10 | |
Empresa Electrica Guacolda S.A. 4.560%, 04/30/2025 | | | | | 400,000 | | | | 377,083 | | | | 0.17 | |
Inversiones CMPC S.A. 4.375%, 05/15/2023 | | | | | 200,000 | | | | 204,295 | | | | 0.10 | |
Telefonica Chile S.A. 3.875%, 10/12/2022 | | | | | 495,000 | | | | 510,303 | | | | 0.23 | |
| | | | | | | | | 1,473,452 | | | | 0.67 | |
China (Cost $11,592,037) | | | | | | | | | | | | | | |
Alibaba Group Holding Ltd. 3.125%, 11/28/2021 | | | | | 450,000 | | | | 457,050 | | | | 0.21 | |
Baidu, Inc. 3.500%, 11/28/2022 | | | | | 400,000 | | | | 407,699 | | | | 0.19 | |
Bestgain Real Estate Ltd. 2.625%, 03/13/2018 | | | | | 500,000 | | | | 500,181 | | | | 0.23 | |
See accompanying notes to the financial statements.
86
ASHMORE EMERGING MARKETS CORPORATE DEBT FUND
SCHEDULE OF INVESTMENTS (CONTINUED)
As of April 30, 2016 (Unaudited)
| | | | | | | | | | | | | | |
| | | Currency(1) | | Par | | | Value | | | % of Net
Assets | |
China - (continued) | | | | | | | | | | | | | | |
China Forestry Holdings Co. Ltd. 10.250%, 11/17/2015(3)(4) | | | | | 60,000 | | | $ | 4,350 | | | | — | |
China Overseas Finance Cayman V Ltd. 3.950%, 11/15/2022 | | | | | 300,000 | | | | 307,743 | | | | 0.14 | |
China Railway Resources Huitung Ltd. 3.850%, 02/05/2023 | | | | | 200,000 | | | | 206,855 | | | | 0.09 | |
China SCE Property Holdings Ltd. 10.000%, 07/02/2020 | | | | | 430,000 | | | | 465,467 | | | | 0.21 | |
Emerald Plantation Holdings Ltd. 6.000%, (100% Cash), 01/30/2020(5) | | | | | 34,911 | | | | 33,166 | | | | 0.01 | |
ENN Energy Holdings Ltd. 6.000%, 05/13/2021 | | | | | 600,000 | | | | 677,361 | | | | 0.31 | |
Far East Energy Bermuda Ltd. 13.000%, 01/15/2016(2)(3)(4)(6)(7) | | | | | 282,201 | | | | — | | | | — | |
Favor Sea Ltd. 11.750%, 02/04/2019 | | | | | 750,000 | | | | 579,375 | | | | 0.26 | |
Franshion Brilliant Ltd. 5.750%, 03/19/2019 | | | | | 395,000 | | | | 421,566 | | | | 0.19 | |
ICBC Standard Bank PLC 8.125%, 12/02/2019 | | | | | 390,000 | | | | 432,004 | | | | 0.20 | |
Kaisa Group Holdings Ltd. 8.875%, 03/19/2018(3) | | | | | 1,795,000 | | | | 1,400,100 | | | | 0.64 | |
Kaisa Group Holdings Ltd. 10.250%, 01/08/2020(3) | | | | | 1,375,000 | | | | 1,072,500 | | | | 0.49 | |
Sino-Forest Corp. 5.000%, 08/01/2013(2)(6)(7) | | | | | 14,000 | | | | — | | | | — | |
Sino-Forest Corp. 5.000%, 08/01/2013(7) | | | | | 7,000 | | | | — | | | | — | |
Sino-Forest Corp. 10.250%, 07/28/2014(7) | | | | | 82,000 | | | | — | | | | — | |
Sino-Forest Corp. 10.250%, 07/28/2014(2)(6)(7) | | | | | 20,000 | | | | — | | | | — | |
Sino-Forest Corp. 4.250%, 12/15/2016(2)(7) | | | | | 113,000 | | | | — | | | | — | |
Sino-Forest Corp. 6.250%, 10/21/2017(2)(6)(7) | | | | | 152,000 | | | | — | | | | — | |
Sino-Forest Corp. 6.250%, 10/21/2017(7) | | | | | 120,000 | | | | — | | | | — | |
Sinopec Group Overseas Development 2013 Ltd. 4.375%, 10/17/2023 | | | | | 240,000 | | | | 255,671 | | | | 0.12 | |
STATS ChipPAC Ltd. 8.500%, 11/24/2020 | | | | | 500,000 | | | | 507,500 | | | | 0.23 | |
Sunac China Holdings Ltd. 9.375%, 04/05/2018 | | | | | 1,040,000 | | | | 1,086,800 | | | | 0.50 | |
Tencent Holdings Ltd. 3.375%, 05/02/2019 | | | | | 520,000 | | | | 537,801 | | | | 0.25 | |
Times Property Holdings Ltd. 12.625%, 03/21/2019 | | | | | 885,000 | | | | 980,101 | | | | 0.45 | |
Yuzhou Properties Co. Ltd. 8.625%, 01/24/2019 | | | | | 1,265,000 | | | | 1,331,429 | | | | 0.61 | |
| | | | | | | | | 11,664,719 | | | | 5.33 | |
Colombia (Cost $5,894,950) | | | | | | | | | | | | | | |
Banco Bilbao Vizcaya Argentaria Colombia S.A. 4.875%, 04/21/2025 | | | | | 550,000 | | | | 541,200 | | | | 0.25 | |
Empresa de Telecomunicaciones de Bogota 7.000%, 01/17/2023 | | COP | | | 3,260,000,000 | | | | 827,937 | | | | 0.38 | |
GrupoSura Finance S.A. 5.500%, 04/29/2026(2) | | | | | 400,000 | | | | 406,800 | | | | 0.18 | |
Millicom International Cellular S.A. 4.750%, 05/22/2020 | | | | | 400,000 | | | | 390,000 | | | | 0.18 | |
Millicom International Cellular S.A. 6.625%, 10/15/2021 | | | | | 1,200,000 | | | | 1,215,000 | | | | 0.55 | |
Millicom International Cellular S.A. 6.000%, 03/15/2025 | | | | | 1,300,000 | | | | 1,244,750 | | | | 0.57 | |
Transportadora de Gas Internacional S.A. ESP 5.700%, 03/20/2022 | | | | | 605,000 | | | | 629,200 | | | | 0.29 | |
| | | | | | | | | 5,254,887 | | | | 2.40 | |
Czech Republic (Cost $2,410,496) | | | | | | | | | | | | | | |
EP Energy A.S. 5.875%, 11/01/2019 | | EUR | | | 430,000 | | | | 536,642 | | | | 0.25 | |
New World Resources N.V. 8.000%, 04/07/2020(5) | | EUR | | | 1,448,960 | | | | 24,887 | | | | 0.01 | |
New World Resources N.V. 4.000%, 10/07/2020(5) | | EUR | | | 648,695 | | | | 7,428 | | | | — | |
| | | | | | | | | 568,957 | | | | 0.26 | |
Dominican Republic (Cost $1,229,891) | | | | | | | | | | | | | | |
Aeropuertos Dominicanos Siglo XXI S.A., FRN 9.750%, 11/13/2019 | | | | | 1,245,000 | | | | 1,322,813 | | | | 0.60 | |
| | | | | | | | | 1,322,813 | | | | 0.60 | |
See accompanying notes to the financial statements.
87
ASHMORE EMERGING MARKETS CORPORATE DEBT FUND
SCHEDULE OF INVESTMENTS (CONTINUED)
As of April 30, 2016 (Unaudited)
| | | | | | | | | | | | | | |
| | | Currency(1) | | Par | | | Value | | | % of Net
Assets | |
Ecuador (Cost $5,099,701) | | | | | | | | | | | | | | |
EP PetroEcuador via Noble Sovereign Funding I Ltd., FRN 6.258%, 09/24/2019 | | | | | 6,111,368 | | | $ | 5,561,345 | | | | 2.54 | |
| | | | | | | | | 5,561,345 | | | | 2.54 | |
Guatemala (Cost $2,377,478) | | | | | | | | | | | | | | |
Comcel Trust via Comunicaciones Celulares S.A. 6.875%, 02/06/2024 | | | | | 2,360,000 | | | | 2,230,200 | | | | 1.02 | |
| | | | | | | | | 2,230,200 | | | | 1.02 | |
Hong Kong (Cost $3,084,330) | | | | | | | | | | | | | | |
HKT Capital No. 2 Ltd. 3.625%, 04/02/2025 | | | | | 200,000 | | | | 205,652 | | | | 0.09 | |
Hutchison Whampoa International 14 Ltd. 3.625%, 10/31/2024 | | | | | 1,030,000 | | | | 1,070,096 | | | | 0.49 | |
Noble Group Ltd., FRN 6.000%, 06/24/2019 | | | | | 2,170,000 | | | | 1,025,325 | | | | 0.47 | |
PCCW-HKT Capital No. 5 Ltd. 3.750%, 03/08/2023 | | | | | 245,000 | | | | 256,738 | | | | 0.12 | |
Wharf Finance Ltd. 6.125%, 11/06/2017 | | | | | 250,000 | | | | 266,065 | | | | 0.12 | |
| | | | | | | | | 2,823,876 | | | | 1.29 | |
India (Cost $2,611,854) | | | | | | | | | | | | | | |
Bharat Petroleum Corp. Ltd. 4.000%, 05/08/2025 | | | | | 540,000 | | | | 540,078 | | | | 0.25 | |
Bharti Airtel International Netherlands B.V. 5.125%, 03/11/2023 | | | | | 730,000 | | | | 785,790 | | | | 0.36 | |
ICICI Bank Ltd. 4.750%, 11/25/2016 | | | | | 300,000 | | | | 305,072 | | | | 0.14 | |
Vedanta Resources PLC 8.250%, 06/07/2021 | | | | | 470,000 | | | | 373,650 | | | | 0.17 | |
Vedanta Resources PLC 7.125%, 05/31/2023 | | | | | 580,000 | | | | 413,250 | | | | 0.19 | |
| | | | | | | | | 2,417,840 | | | | 1.11 | |
Indonesia (Cost $5,261,098) | | | | | | | | | | | | | | |
Berau Coal Energy Tbk PT 7.250%, 03/13/2017(3) | | | | | 3,235,000 | | | | 469,075 | | | | 0.22 | |
Enercoal Resources Pte. Ltd. 6.000%, 04/07/2018 | | | | | 500,000 | | | | 50,000 | | | | 0.02 | |
Golden Legacy Pte. Ltd. 9.000%, 04/24/2019 | | | | | 600,000 | | | | 606,000 | | | | 0.28 | |
Indo Energy Finance II B.V. 6.375%, 01/24/2023 | | | | | 2,350,000 | | | | 1,121,246 | | | | 0.51 | |
| | | | | | | | | 2,246,321 | | | | 1.03 | |
Israel (Cost $2,015,753) | | | | | | | | | | | | | | |
Israel Electric Corp. Ltd. 5.625%, 06/21/2018 | | | | | 365,000 | | | | 388,020 | | | | 0.18 | |
Israel Electric Corp. Ltd. 7.250%, 01/15/2019 | | | | | 270,000 | | | | 299,200 | | | | 0.14 | |
Israel Electric Corp. Ltd. 6.875%, 06/21/2023 | | | | | 295,000 | | | | 351,503 | | | | 0.16 | |
Israel Electric Corp. Ltd. 5.000%, 11/12/2024(2)(6) | | | | | 245,000 | | | | 261,844 | | | | 0.12 | |
Teva Pharmaceutical Finance Co. B.V. 3.650%, 11/10/2021 | | | | | 335,000 | | | | 351,561 | | | | 0.16 | |
Teva Pharmaceutical Finance Co. LLC 6.150%, 02/01/2036 | | | | | 375,000 | | | | 447,876 | | | | 0.20 | |
| | | | | | | | | 2,100,004 | | | | 0.96 | |
Jamaica (Cost $14,480,199) | | | | | | | | | | | | | | |
Digicel Group Ltd. 8.250%, 09/30/2020 | | | | | 8,625,000 | | | | 7,870,313 | | | | 3.60 | |
Digicel Group Ltd. 7.125%, 04/01/2022 | | | | | 2,730,000 | | | | 2,221,537 | | | | 1.02 | |
Digicel Ltd. 6.000%, 04/15/2021 | | | | | 3,405,000 | | | | 3,115,575 | | | | 1.42 | |
| | | | | | | | | 13,207,425 | | | | 6.04 | |
Kazakhstan (Cost $15,824,980) | | | | | | | | | | | | | | |
Development Bank of Kazakhstan JSC 4.125%, 12/10/2022 | | | | | 390,000 | | | | 354,900 | | | | 0.16 | |
KazAgro National Management Holding JSC 4.625%, 05/24/2023 | | | | | 410,000 | | | | 342,374 | | | | 0.16 | |
Kazakhstan Temir Zholy Finance B.V. 6.375%, 10/06/2020 | | | | | 380,000 | | | | 385,054 | | | | 0.18 | |
Kazkommertsbank JSC 7.500%, 11/29/2016 | | | | | 1,680,000 | | | | 1,638,336 | | | | 0.75 | |
Kazkommertsbank JSC 6.875%, 02/13/2017 | | EUR | | | 1,865,000 | | | | 2,066,114 | | | | 0.94 | |
Kazkommertsbank JSC 8.500%, 05/11/2018 | | | | | 2,450,000 | | | | 2,278,990 | | | | 1.04 | |
Kazkommertsbank JSC 5.500%, 12/21/2022 | | | | | 4,468,616 | | | | 3,062,432 | | | | 1.40 | |
KazMunayGas National Co. JSC 6.375%, 04/09/2021 | | | | | 365,000 | | | | 382,356 | | | | 0.17 | |
Zhaikmunai LLP 6.375%, 02/14/2019 | | | | | 2,300,000 | | | | 1,894,740 | | | | 0.87 | |
See accompanying notes to the financial statements.
88
ASHMORE EMERGING MARKETS CORPORATE DEBT FUND
SCHEDULE OF INVESTMENTS (CONTINUED)
As of April 30, 2016 (Unaudited)
| | | | | | | | | | | | | | |
| | | Currency(1) | | Par | | | Value | | | % of Net
Assets | |
Kazakhstan - (continued) | | | | | | | | | | | | | | |
Zhaikmunai LLP 7.125%, 11/13/2019 | | | | | 2,570,000 | | | $ | 2,140,039 | | | | 0.98 | |
| | | | | | | | | 14,545,335 | | | | 6.65 | |
Kuwait (Cost $775,029) | | | | | | | | | | | | | | |
Kuwait Projects Co. 9.375%, 07/15/2020 | | | | | 315,000 | | | | 386,583 | | | | 0.18 | |
NBK Tier 1 Financing Ltd., FRN 5.750%, 04/09/2021 | | | | | 380,000 | | | | 378,745 | | | | 0.17 | |
| | | | | | | | | 765,328 | | | | 0.35 | |
Malaysia (Cost $201,654) | | | | | | | | | | | | | | |
Malayan Banking Bhd., FRN 3.250%, 09/20/2022 | | | | | 200,000 | | | | 201,522 | | | | 0.09 | |
| | | | | | | | | 201,522 | | | | 0.09 | |
Mexico (Cost $14,342,132) | | | | | | | | | | | | | | |
Alfa S.A.B. de C.V. 6.875%, 03/25/2044 | | | | | 620,000 | | | | 638,600 | | | | 0.29 | |
Alpek S.A.B. de C.V. 4.500%, 11/20/2022 | | | | | 200,000 | | | | 204,750 | | | | 0.09 | |
America Movil S.A.B. de C.V. 5.000%, 03/30/2020 | | | | | 210,000 | | | | 231,973 | | | | 0.11 | |
America Movil S.A.B. de C.V. 6.375%, 03/01/2035 | | | | | 365,000 | | | | 444,616 | | | | 0.20 | |
Banco Inbursa S.A. Institucion de Banca Multiple 4.125%, 06/06/2024 | | | | | 345,000 | | | | 341,619 | | | | 0.16 | |
CEMEX Espana S.A. 9.875%, 04/30/2019 | | | | | 1,190,000 | | | | 1,250,987 | | | | 0.57 | |
Cemex Finance LLC 9.375%, 10/12/2022 | | | | | 3,770,000 | | | | 4,143,230 | | | | 1.89 | |
Cemex S.A.B. de C.V. 5.875%, 03/25/2019 | | | | | 450,000 | | | | 460,080 | | | | 0.21 | |
Cemex S.A.B. de C.V. 6.500%, 12/10/2019 | | | | | 1,350,000 | | | | 1,422,562 | | | | 0.65 | |
Cemex S.A.B. de C.V. 7.750%, 04/16/2026(2)(6) | | | | | 1,000,000 | | | | 1,065,000 | | | | 0.49 | |
Comision Federal de Electricidad 4.875%, 05/26/2021 | | | | | 200,000 | | | | 210,500 | | | | 0.10 | |
El Puerto de Liverpool S.A.B. de C.V. 3.950%, 10/02/2024 | | | | | 600,000 | | | | 603,000 | | | | 0.28 | |
Fresnillo PLC 5.500%, 11/13/2023 | | | | | 500,000 | | | | 531,250 | | | | 0.24 | |
Gruma S.A.B. de C.V. 4.875%, 12/01/2024 | | | | | 450,000 | | | | 481,365 | | | | 0.22 | |
Grupo Bimbo S.A.B. de C.V. 3.875%, 06/27/2024 | | | | | 230,000 | | | | 234,601 | | | | 0.11 | |
Grupo Televisa S.A.B. 6.625%, 01/15/2040 | | | | | 150,000 | | | | 167,394 | | | | 0.08 | |
Grupo Televisa S.A.B. 5.000%, 05/13/2045 | | | | | 350,000 | | | | 328,849 | | | | 0.15 | |
Mexichem S.A.B. de C.V. 5.875%, 09/17/2044 | | | | | 490,000 | | | | 444,062 | | | | 0.20 | |
Mexico Generadora de Energia S. de rl 5.500%, 12/06/2032 | | | | | 484,121 | | | | 462,336 | | | | 0.21 | |
Sigma Alimentos S.A. de C.V. 4.125%, 05/02/2026(2)(6) | | | | | 200,000 | | | | 200,472 | | | | 0.09 | |
Southern Copper Corp. 7.500%, 07/27/2035 | | | | | 175,000 | | | | 188,140 | | | | 0.09 | |
Southern Copper Corp. 5.875%, 04/23/2045 | | | | | 330,000 | | | | 302,526 | | | | 0.14 | |
| | | | | | | | | 14,357,912 | | | | 6.57 | |
Mongolia (Cost $6,223,840) | | | | | | | | | | | | | | |
Mongolian Mining Corp. 8.875%, 03/29/2017 | | | | | 7,984,000 | | | | 1,497,000 | | | | 0.68 | |
| | | | | | | | | 1,497,000 | | | | 0.68 | |
Morocco (Cost $933,127) | | | | | | | | | | | | | | |
OCP S.A. 5.625%, 04/25/2024 | | | | | 305,000 | | | | 319,869 | | | | 0.14 | |
OCP S.A. 4.500%, 10/22/2025 | | | | | 330,000 | | | | 320,100 | | | | 0.15 | |
OCP S.A. 6.875%, 04/25/2044 | | | | | 320,000 | | | | 333,200 | | | | 0.15 | |
| | | | | | | | | 973,169 | | | | 0.44 | |
Nigeria (Cost $10,041,028) | | | | | | | | | | | | | | |
Access Bank PLC, FRN 9.250%, 06/24/2021 | | | | | 1,025,000 | | | | 844,149 | | | | 0.39 | |
First Bank of Nigeria Ltd. Via FBN Finance Co. B.V., FRN 8.250%, 08/07/2020 | | | | | 1,925,000 | | | | 1,521,959 | | | | 0.70 | |
First Bank of Nigeria Ltd. Via FBN Finance Co. B.V., FRN 8.000%, 07/23/2021 | | | | | 2,591,000 | | | | 1,912,158 | | | | 0.87 | |
Sea Trucks Group Ltd. 9.000%, 03/26/2018(2) | | | | | 3,432,000 | | | | 1,065,636 | | | | 0.49 | |
Seven Energy Ltd. 10.250%, 10/11/2021 | | | | | 2,675,000 | | | | 1,625,062 | | | | 0.74 | |
| | | | | | | | | 6,968,964 | | | | 3.19 | |
See accompanying notes to the financial statements.
89
ASHMORE EMERGING MARKETS CORPORATE DEBT FUND
SCHEDULE OF INVESTMENTS (CONTINUED)
As of April 30, 2016 (Unaudited)
| | | | | | | | | | | | | | |
| | | Currency(1) | | Par | | | Value | | | % of Net
Assets | |
Oman (Cost $1,119,990) | | | | | | | | | | | | | | |
National Bank of Oman S.A.O.G., FRN 7.875%, 11/18/2020 | | | | | 1,095,000 | | | $ | 1,112,630 | | | | 0.51 | |
| | | | | | | | | 1,112,630 | | | | 0.51 | |
Panama (Cost $1,481,942) | | | | | | | | | | | | | | |
Sable International Finance Ltd. 6.875%, 08/01/2022 | | | | | 1,510,000 | | | | 1,549,638 | | | | 0.71 | |
| | | | | | | | | 1,549,638 | | | | 0.71 | |
Peru (Cost $2,531,276) | | | | | | | | | | | | | | |
Banco de Credito del Peru 4.250%, 04/01/2023 | | | | | 270,000 | | | | 282,150 | | | | 0.13 | |
Banco Internacional del Peru S.A.A. 5.750%, 10/07/2020 | | | | | 290,000 | | | | 317,840 | | | | 0.15 | |
BBVA Banco Continental S.A., FRN 5.250%, 09/22/2029 | | | | | 300,000 | | | | 306,000 | | | | 0.14 | |
Lima Metro Line 2 Finance Ltd. 5.875%, 07/05/2034 | | | | | 600,000 | | | | 615,600 | | | | 0.28 | |
Minsur S.A. 6.250%, 02/07/2024 | | | | | 450,000 | | | | 437,625 | | | | 0.20 | |
Transportadora de Gas del Peru S.A. 4.250%, 04/30/2028 | | | | | 600,000 | | | | 595,500 | | | | 0.27 | |
| | | | | | | | | 2,554,715 | | | | 1.17 | |
Qatar (Cost $2,338,161) | | | | | | | | | | | | | | |
CBQ Finance Ltd. 7.500%, 11/18/2019 | | | | | 370,000 | | | | 422,459 | | | | 0.19 | |
Nakilat, Inc. 6.067%, 12/31/2033 | | | | | 460,000 | | | | 523,710 | | | | 0.24 | |
Ooredoo International Finance Ltd. 3.250%, 02/21/2023 | | | | | 465,000 | | | | 464,541 | | | | 0.21 | |
Ooredoo International Finance Ltd. 3.875%, 01/31/2028 | | | | | 220,000 | | | | 218,337 | | | | 0.10 | |
Ras Laffan Liquefied Natural Gas Co. Ltd. II 5.298%, 09/30/2020 | | | | | 414,642 | | | | 441,594 | | | | 0.20 | |
Ras Laffan Liquefied Natural Gas Co. Ltd. III 5.838%, 09/30/2027 | | | | | 250,000 | | | | 276,125 | | | | 0.13 | |
| | | | | | | | | 2,346,766 | | | | 1.07 | |
Russian Federation (Cost $22,970,456) | | | | | | | | | | | | | | |
CEDC Finance Corp. International, Inc., FRN 10.000%, 04/30/2018(5) | | | | | 4,708,214 | | | | 2,076,833 | | | | 0.95 | |
Credit Bank of Moscow Via CBOM Finance PLC 7.700%, 02/01/2018 | | | | | 511,000 | | | | 526,694 | | | | 0.24 | |
Credit Bank of Moscow Via CBOM Finance PLC 8.700%, 11/13/2018 | | | | | 1,570,000 | | | | 1,544,409 | | | | 0.71 | |
Far East Capital Ltd. S.A. 8.000%, 05/02/2018 | | | | | 252,000 | | | | 97,020 | | | | 0.04 | |
Far East Capital Ltd. S.A. 8.750%, 05/02/2020 | | | | | 1,196,000 | | | | 442,520 | | | | 0.20 | |
Gazprom Neft OAO Via GPN Capital S.A. 4.375%, 09/19/2022 | | | | | 630,000 | | | | 597,643 | | | | 0.27 | |
Gazprom OAO Via Gaz Capital S.A. 6.510%, 03/07/2022 | | | | | 1,500,000 | | | | 1,622,895 | | | | 0.74 | |
Gazprom OAO Via Gaz Capital S.A. 8.625%, 04/28/2034 | | | | | 50,000 | | | | 60,642 | | | | 0.03 | |
GTH Finance B.V. 7.250%, 04/26/2023(2) | | | | | 600,000 | | | | 600,378 | | | | 0.28 | |
Lukoil International Finance B.V. 7.250%, 11/05/2019 | | | | | 180,000 | | | | 199,679 | | | | 0.09 | |
Rosneft Oil Co. via Rosneft International Finance Ltd. 4.199%, 03/06/2022 | | | | | 1,650,000 | | | | 1,581,030 | | | | 0.72 | |
Russian Standard Ltd. 13.000%, 10/27/2022(5) | | | | | 1,280,343 | | | | 308,660 | | | | 0.14 | |
Sberbank of Russia Via SB Capital S.A. 5.125%, 10/29/2022 | | | | | 1,039,000 | | | | 1,040,704 | | | | 0.48 | |
Sberbank of Russia Via SB Capital S.A., FRN 5.500%, 02/26/2024 | | | | | 1,068,000 | | | | 1,030,620 | | | | 0.47 | |
Sistema JSFC via Sistema International Funding S.A. 6.950%, 05/17/2019 | | | | | 1,730,000 | | | | 1,821,517 | | | | 0.83 | |
TMK OAO Via TMK Capital S.A. 6.750%, 04/03/2020 | | | | | 1,150,000 | | | | 1,150,000 | | | | 0.53 | |
VEB-Leasing OAO via VEB Leasing Invest Ltd. 5.125%, 05/27/2016 | | | | | 200,000 | | | | 199,924 | | | | 0.09 | |
See accompanying notes to the financial statements.
90
ASHMORE EMERGING MARKETS CORPORATE DEBT FUND
SCHEDULE OF INVESTMENTS (CONTINUED)
As of April 30, 2016 (Unaudited)
| | | | | | | | | | | | | | |
| | | | | | | | | | | % of Net | |
| | | Currency(1) | | Par | | | Value | | | Assets | |
Russian Federation - (continued) | | | | | | | | | | | | | | |
Vimpel Communications Via VIP Finance Ireland Ltd. OJSC 7.748%, 02/02/2021 | | | | | 1,535,000 | | | $ | 1,672,947 | | | | 0.77 | |
VimpelCom Holdings B.V. 7.504%, 03/01/2022 | | | | | 1,750,000 | | | | 1,868,125 | | | | 0.85 | |
Vnesheconombank Via VEB Finance PLC 6.902%, 07/09/2020 | | | | | 200,000 | | | | 210,000 | | | | 0.10 | |
Vnesheconombank Via VEB Finance PLC 6.025%, 07/05/2022 | | | | | 1,260,000 | | | | 1,262,596 | | | | 0.58 | |
VTB Bank OJSC Via VTB Capital S.A. 6.950%, 10/17/2022 | | | | | 1,700,000 | | | | 1,691,330 | | | | 0.77 | |
| | | | | | | | | 21,606,166 | | | | 9.88 | |
Saudi Arabia (Cost $763,372) | | | | | | | | | | | | | | |
SABIC Capital II B.V. 2.625%, 10/03/2018 | | | | | 300,000 | | | | 303,435 | | | | 0.14 | |
Saudi Electricity Global Sukuk Co. 3 4.000%, 04/08/2024 | | | | | 300,000 | | | | 304,935 | | | | 0.14 | |
Saudi Electricity Global Sukuk Co. 3 5.500%, 04/08/2044 | | | | | 200,000 | | | | 198,156 | | | | 0.09 | |
| | | | | | | | | 806,526 | | | | 0.37 | |
Singapore (Cost $740,574) | | | | | | | | | | | | | | |
Global Logistic Properties Ltd. 3.875%, 06/04/2025 | | | | | 285,000 | | | | 284,712 | | | | 0.13 | |
SingTel Group Treasury Pte. Ltd. 2.375%, 09/08/2017 | | | | | 255,000 | | | | 258,254 | | | | 0.12 | |
United Overseas Bank Ltd., FRN 2.875%, 10/17/2022 | | | | | 200,000 | | | | 202,220 | | | | 0.09 | |
| | | | | | | | | 745,186 | | | | 0.34 | |
South Africa (Cost $3,457,383) | | | | | | | | | | | | | | |
Eskom Holdings SOC Ltd. 7.125%, 02/11/2025 | | | | | 2,810,000 | | | | 2,647,273 | | | | 1.21 | |
FirstRand Bank Ltd. 4.250%, 04/30/2020 | | | | | 350,000 | | | | 351,746 | | | | 0.16 | |
MTN Mauritius Investments Ltd. 4.755%, 11/11/2024 | | | | | 705,000 | | | | 654,769 | | | | 0.30 | |
| | | | | | | | | 3,653,788 | | | | 1.67 | |
South Korea (Cost $512,378) | | | | | | | | | | | | | | |
Korea Gas Corp. 2.875%, 07/29/2018 | | | | | 300,000 | | | | 307,107 | | | | 0.14 | |
SK Innovation Co. Ltd. 3.625%, 08/14/2018 | | | | | 200,000 | | | | 206,880 | | | | 0.10 | |
| | | | | | | | | 513,987 | | | | 0.24 | |
Thailand (Cost $1,035,454) | | | | | | | | | | | | | | |
Bangkok Bank PCL 3.875%, 09/27/2022 | | | | | 500,000 | | | | 532,667 | | | | 0.24 | |
PTT Global Chemical PCL 4.250%, 09/19/2022 | | | | | 510,000 | | | | 541,138 | | | | 0.25 | |
| | | | | | | | | 1,073,805 | | | | 0.49 | |
Turkey (Cost $1,275,765) | | | | | | | | | | | | | | |
Akbank T.A.S. 5.125%, 03/31/2025 | | | | | 200,000 | | | | 199,476 | | | | 0.09 | |
Turkcell Iletisim Hizmetleri A.S. 5.750%, 10/15/2025 | | | | | 200,000 | | | | 199,974 | | | | 0.09 | |
Yuksel Insaat A.S. 9.500%, 03/10/2016(3)(4) | | | | | 900,000 | | | | 517,500 | | | | 0.24 | |
| | | | | | | | | 916,950 | | | | 0.42 | |
Ukraine (Cost $14,757,594) | | | | | | | | | | | | | | |
Avangardco Investments Public Ltd. 10.000%, (100% Cash), 10/29/2018(5) | | | | | 797,371 | | | | 270,179 | | | | 0.12 | |
DTEK Finance PLC 10.375%, 03/28/2018 | | | | | 1,140,000 | | | | 456,000 | | | | 0.21 | |
DTEK Finance PLC 7.875%, 04/04/2018 | | | | | 5,205,000 | | | | 2,135,091 | | | | 0.98 | |
Ferrexpo Finance PLC 10.375%, 04/07/2019 | | | | | 1,178,000 | | | | 907,295 | | | | 0.42 | |
Metinvest B.V., FRN 10.500%, 11/28/2017 | | | | | 1,635,499 | | | | 997,982 | | | | 0.46 | |
Metinvest B.V., FRN 8.750%, 02/14/2018 | | | | | 3,031,026 | | | | 1,849,532 | | | | 0.85 | |
MHP S.A. 8.250%, 04/02/2020 | | | | | 2,160,000 | | | | 1,933,200 | | | | 0.88 | |
Privatbank CJSC Via UK SPV Credit Finance PLC 10.250%, 01/23/2018 | | | | | 545,000 | | | | 425,100 | | | | 0.19 | |
Privatbank CJSC Via UK SPV Credit Finance PLC 11.000%, 02/09/2021 | | | | | 425,000 | | | | 269,960 | | | | 0.12 | |
UKRLANDFARMING PLC 10.875%, 03/26/2018 | | | | | 2,406,731 | | | | 699,403 | | | | 0.32 | |
| | | | | | | | | 9,943,742 | | | | 4.55 | |
See accompanying notes to the financial statements.
91
ASHMORE EMERGING MARKETS CORPORATE DEBT FUND
SCHEDULE OF INVESTMENTS (CONTINUED)
As of April 30, 2016 (Unaudited)
| | | | | | | | | | | | | | |
| | | | | | | | | | | % of Net | |
| | | Currency(1) | | Par | | | Value | | | Assets | |
United Arab Emirates (Cost $7,109,967) | | | | | | | | | | | | | | |
Abu Dhabi National Energy Co. PJSC 2.500%, 01/12/2018 | | | | | 215,000 | | | $ | 215,269 | | | | 0.10 | |
Abu Dhabi National Energy Co. PJSC 5.875%, 12/13/2021 | | | | | 270,000 | | | | 300,429 | | | | 0.14 | |
ADCB Finance Cayman Ltd. 4.500%, 03/06/2023 | | | | | 235,000 | | | | 242,931 | | | | 0.11 | |
ADCB Finance Cayman Ltd., FRN 3.125%, 05/28/2023 | | | | | 400,000 | | | | 398,248 | | | | 0.18 | |
DP World Ltd. 6.850%, 07/02/2037 | | | | | 1,070,000 | | | | 1,109,440 | | | | 0.51 | |
DP World Sukuk Ltd. 6.250%, 07/02/2017 | | | | | 510,000 | | | | 533,460 | | | | 0.25 | |
Dubai Holding Commercial Operations MTN Ltd. 6.000%, 02/01/2017 | | GBP | | | 400,000 | | | | 591,637 | | | | 0.27 | |
EMG Sukuk Ltd. 4.564%, 06/18/2024 | | | | | 425,000 | | | | 437,835 | | | | 0.20 | |
Emirates Telecommunications Group Co. PJSC 3.500%, 06/18/2024 | | | | | 410,000 | | | | 421,841 | | | | 0.19 | |
MAF Global Securities Ltd. 4.750%, 05/07/2024 | | | | | 440,000 | | | | 458,051 | | | | 0.21 | |
National Bank of Abu Dhabi PJSC, FRN 5.250%, 06/17/2020 | | | | | 1,000,000 | | | | 1,011,500 | | | | 0.46 | |
Sukuk Funding No. 3 Ltd. 4.348%, 12/03/2018 | | | | | 550,000 | | | | 572,000 | | | | 0.26 | |
Topaz Marine S.A. 8.625%, 11/01/2018 | | | | | 690,000 | | | | 652,188 | | | | 0.30 | |
| | | | | | | | | 6,944,829 | | | | 3.18 | |
Venezuela (Cost $13,392,800) | | | | | | | | | | | | | | |
Petroleos de Venezuela S.A. 5.125%, 10/28/2016 | | | | | 4,735,000 | | | | 4,166,800 | | | | 1.91 | |
Petroleos de Venezuela S.A. 8.500%, 11/02/2017 | | | | | 7,760,200 | | | | 4,539,717 | | | | 2.08 | |
Petroleos de Venezuela S.A. 9.750%, 05/17/2035 | | | | | 7,520,000 | | | | 3,007,248 | | | | 1.37 | |
| | | | | | | | | 11,713,765 | | | | 5.36 | |
Vietnam (Cost $646,683) | | | | | | | | | | | | | | |
Vingroup JSC 11.625%, 05/07/2018 | | | | | 610,000 | | | | 661,850 | | | | 0.30 | |
| | | | | | | | | 661,850 | | | | 0.30 | |
Total Debt Securities (Cost $218,408,567) | | | | | | | | | 194,406,073 | | | | 88.90 | |
| | | | |
Bank Loans | | | | | | | | | | | | | | |
| | | | |
China (Cost $39,677) | | | | | | | | | | | | | | |
Far East Energy Bermuda Ltd. 10.000%, 03/29/2016(4) | | | | | 89,943 | | | | — | | | | — | |
Far East Energy Bermuda Ltd. 25.000%, 03/29/2016(4) | | | | | 39,677 | | | | 24,913 | | | | 0.01 | |
| | | | | | | | | 24,913 | | | | 0.01 | |
Czech Republic (Cost $569,811) | | | | | | | | | | | | | | |
New World Resources N.V. 8.500%, 10/07/2016 | | EUR | | | 449,999 | | | | 373,572 | | | | 0.17 | |
| | | | | | | | | 373,572 | | | | 0.17 | |
Nigeria (Cost $1,135,315) | | | | | | | | | | | | | | |
Seven Energy Ltd., FRN 10.250%, 06/30/2020 | | | | | 1,206,059 | | | | 837,849 | | | | 0.38 | |
| | | | | | | | | 837,849 | | | | 0.38 | |
Sierra Leone (Cost $1,079,422) | | | | | | | | | | | | | | |
Africell Holding SAL, FRN 8.530%, 04/16/2019 | | | | | 1,125,000 | | | | 1,108,125 | | | | 0.51 | |
| | | | | | | | | 1,108,125 | | | | 0.51 | |
United Arab Emirates (Cost $11,275,802) | | | | | | | | | | | | | | |
DP World Ltd. 3.750%, 09/30/2022 | | | | | 8,541,503 | | | | 6,491,543 | | | | 2.97 | |
DP World Ltd. 4.250%, 09/30/2022 | | | | | 437,541 | | | | 336,906 | | | | 0.15 | |
Dubai Drydocks LLC 0.100%, 10/18/2027 | | | | | 3,247,051 | | | | 584,469 | | | | 0.27 | |
Dubai Drydocks World LLC, FRN 4.000%, 10/18/2017 | | EUR | | | 1,143,631 | | | | 1,021,421 | | | | 0.47 | |
Dubai Drydocks World LLC, FRN 4.610%, 10/18/2017 | | | | | 1,838,156 | | | | 1,433,761 | | | | 0.65 | |
Dubai Drydocks World LLC 0.100%, 10/18/2027 | | | | | 3,511,370 | | | | 632,047 | | | | 0.29 | |
| | | | | | | | | 10,500,147 | | | | 4.80 | |
Total Bank Loans (Cost $14,100,027) | | | | | | | | | 12,844,606 | | | | 5.87 | |
See accompanying notes to the financial statements.
92
ASHMORE EMERGING MARKETS CORPORATE DEBT FUND
SCHEDULE OF INVESTMENTS (CONTINUED)
As of April 30, 2016 (Unaudited)
| | | | | | | | | | | | | | |
| | | | | | | | | | | % of Net | |
| | | Currency(1) | | Shares | | | Value | | | Assets | |
Equity Securities | | | | | | | | | | | | | | |
| | | | |
China (Cost $—) | | | | | | | | | | | | | | |
Emerald Plantation Holdings Ltd. | | | | | 78,275 | | | $ | 17,221 | | | | 0.01 | |
| | | | | | | | | 17,221 | | | | 0.01 | |
Czech Republic (Cost $1,093,253) | | | | | | | | | | | | | | |
New World Resources N.V.(2)(6)(7) | | EUR | | | 101,612 | | | | — | | | | — | |
New World Resources PLC, Class A | | GBP | | | 36,580,138 | | | | 145,114 | | | | 0.07 | |
| | | | | | | | | 145,114 | | | | 0.07 | |
Mexico (Cost $2,989) | | | | | | | | | | | | | | |
Corp. GEO S.A.B. de C.V., Series B | | MXN | | | 7,952 | | | | 4,400 | | | | — | |
| | | | | | | | | 4,400 | | | | — | |
Total Equity Securities (Cost $1,096,242) | | | | | | | | | 166,735 | | | | 0.08 | |
| | | | |
| | | | | Number | | | | | | | |
| | | | | of | | | | | | % of Net | |
| | | Currency(1) | | Warrants | | | Value | | | Assets | |
Warrants | | | | | | | | | | | | | | |
| | | | |
China (Cost $3,926) | | | | | | | | | | | | | | |
Far East Energy Bermuda Ltd., Exp. 12/31/2017, Strike Price $11.92(2)(6)(7) | | | | | 186,955 | | | $ | — | | | | — | |
| | | | |
Total Warrants (Cost $3,926) | | | | | | | | | — | | | | — | |
| | | | |
Total Investments (Total Cost $233,608,762) | | | | | | | | | 207,417,414 | | | | 94.85 | |
| | | |
Other Assets Less Liabilities (See Statements of Assets and Liabilities for further detail) | | | | | | | 11,270,325 | | | | 5.15 | |
| | | | |
Net Assets | | | | | | | | $ | 218,687,739 | | | | 100.00 | |
| (1) | Par values are stated in United States Dollars unless otherwise noted below. |
| (2) | Securities exempt from registration under Rule 144A of the Securities Act of 1933. These securities may not be publicly traded without registration under the Securities Act of 1933. |
| (3) | Issuer has defaulted on terms of debt obligation. |
| (4) | Maturity has been extended under the terms of a plan of reorganization. |
| (5) | Security is a payment in-kind bond, and unless otherwise noted in the description of the security, pays its entire coupon on an in-kind basis. |
See accompanying notes to the financial statements.
93
ASHMORE EMERGING MARKETS CORPORATE DEBT FUND
SCHEDULE OF INVESTMENTS (CONTINUED)
As of April 30, 2016 (Unaudited)
| (6) | Restricted security that has been deemed illiquid. At April 30, 2016, the value of these restricted illiquid securities amounted to $1,527,316 or 0.7% of net assets. Additional information on each restricted illiquid security is as follows: |
| | | | | | |
| SECURITY | | ACQUISITION DATE | | ACQUISITION COST | |
Cemex S.A.B. de C.V. 7.750%, 04/16/2016 | | 03/09/2016-03/30/2016 | | | $1,004,628 | |
Far East Energy Bermuda Ltd. 13.000%, 01/15/2016 | | 01/14/2013-07/24/2015 | | | 279,057 | |
Far East Energy Bermuda Ltd., Exp. 12/31/2017, Strike Price $11.92 | | 10/07/2014 | | | 3,926 | |
Israel Electric Corp. Ltd. 5.000%,11/12,2024 | | 02/03/2015 | | | 249,288 | |
New World Resources N.V. | | 10/07/2014 | | | — | |
Sigma Alimentos S.A. de C.V. 4.125%, 05/02/2026 | | 04/25/2016 | | | 199,594 | |
Sino-Forest Corp. 10.250%, 07/28/2014 | | 01/31/2013 | | | — | |
Sino-Forest Corp. 5.000%, 08/01/2013 | | 01/31/2013 | | | — | |
Sino-Forest Corp. 6.250%, 10/21/2017 | | 01/31/2013 | | | — | |
| (7) | Security has been deemed worthless and is a Level 3 investment. |
Percentages shown are based on net assets.
At April 30, 2016, the Ashmore Emerging Markets Corporate Debt Fund had outstanding forward foreign currency exchange contracts as follows:
| | | | | | | | | | | | | | | | | | |
| | | | | | | Currency Buy | | | | | Currency Sell | | | | |
| | | | | | | Amount | | | | | Amount | | | | |
| Settlement | | | | Currency | | (Local | | | Currency | | (Local | | | Unrealized | |
| Date | | Counterparty | | Buy | | Currency) | | | Sell | | Currency) | | | Gain/(Loss) | |
05/20/2016 | | BNP Paribas | | United States Dollar | | | 871,828 | | | British Pound | | | 610,915 | | | | $(20,856) | |
05/20/2016 | | HSBC Bank | | United States Dollar | | | 4,532,508 | | | Euro | | | 3,970,406 | | | | (16,505) | |
| | | | | | | | | | | | | | | | | | |
Total | | | | | | | | | | | | | | | | | $(37,361) | |
| | | | | | | | | | | | | | | | | | |
The inputs or methodologies used for valuing securities are not necessarily an indication of the risks associated with investing in those securities and other financial instruments, if any. See note 4 in the Notes to the Financial Statements for more information regarding pricing inputs and valuation techniques. The following is a summary of the inputs used in valuing the Ashmore Emerging Markets Corporate Debt Fund’s investments and other financial instruments, which are carried at fair value, as of April 30, 2016:
| | | | | | | | | | | | | | | | |
| | | Level 1 | | | Level 2 | | | Level 3 | | | Total | |
Investments | | | | | | | | | | | | | | | | |
Assets: | | | | | | | | | | | | | | | | |
Debt Securities | | | | | | | | | | | | | | | | |
Corporate Bonds | | $ | — | | | $ | 175,984,359 | | | $ | 4,350 | | | $ | 175,988,709 | |
Corporate Convertible Bonds | | | — | | | | 747,344 | | | | — | | | | 747,344 | |
Government Agencies | | | — | | | | 15,623,634 | | | | — | | | | 15,623,634 | |
Financial Certificates | | | — | | | | 2,046,386 | | | | — | | | | 2,046,386 | |
| | | | | | | | | | | | | | | | |
Total Debt Securities | | | — | | | | 194,401,723 | | | | 4,350 | | | | 194,406,073 | |
Bank Loans | | | | | | | | | | | | | | | | |
China | | | — | | | | — | | | | 24,913 | | | | 24,913 | |
Czech Republic | | | — | | | | — | | | | 373,572 | | | | 373,572 | |
Nigeria | | | — | | | | 837,849 | | | | — | | | | 837,849 | |
Sierra Leone | | | — | | | | — | | | | 1,108,125 | | | | 1,108,125 | |
United Arab Emirates | | | — | | | | — | | | | 10,500,147 | | | | 10,500,147 | |
| | | | | | | | | | | | | | | | |
Total Bank Loans | | | — | | | | 837,849 | | | | 12,006,757 | | | | 12,844,606 | |
Common Stock | | | | | | | | | | | | | | | | |
China | | | — | | | | 17,221 | | | | — | | | | 17,221 | |
Czeck Republic | | | — | | | | 145,114 | | | | — | | | | 145,114 | |
Russian Federation | | | 4,400 | | | | — | | | | — | | | | 4,400 | |
| | | | | | | | | | | | | | | | |
Total Common Stock | | | 4,400 | | | | 162,335 | | | | — | | | | 166,735 | |
See accompanying notes to the financial statements.
94
ASHMORE EMERGING MARKETS CORPORATE DEBT FUND
SCHEDULE OF INVESTMENTS (CONTINUED)
As of April 30, 2016 (Unaudited)
| | | | | | | | | | | | | | | | |
| | | Level 1 | | | Level 2 | | | Level 3 | | | Total | |
Warrants | | | | | | | | | | | | | | | | |
China | | $ | — | | | $ | — | | | $ | — | | | $ | — | |
Total Warrants | | | — | | | | — | | | | — | | | | — | |
| |
Total Investments | | $ | 4,400 | | | $ | 195,401,907 | | | $ | 12,011,107 | | | $ | 207,417,414 | |
| |
| | | | |
Other Financial Instruments | | | | | | | | | | | | | | | | |
Liabilities: | | | | | | | | | | | | | | | | |
Forward Foreign Currency Exchange | | | | | | | | | | | | | | | | |
Contracts | | $ | — | | | | $(37,361) | | | $ | — | | | | $(37,361) | |
| |
The Fund discloses all transfers between levels based on valuations at the end of each reporting period. At April 30, 2016, the Fund had transfers as disclosed below:
Transfers from Level 1 to Level 2
| | | | | | | | |
| Country | | Value | | | Reason | | |
Common Stock | | | | | | | |
Czech Republic | | $ | 145,114 | | | Fair value factor was applicable in the current period. | |
| |
The following is a reconciliation of investments in which significant unobservable inputs (Level 3) were used in determining fair value:
| | | | | | | | | | | | | | | | | | | | | | | | | | | | | | | | | | | | | | | | |
Category and Subcategory | | Beginning Balance at 10/31/15 | | | Accrued Discounts (Premiums) | | | Purchases | | | Sales | | | Realized
Gains
(Losses) | | | Change in
Unrealized
Appreciation/
(Depreciation) | | | Transfer
into Level 3 | | | Transfer
out of
Level 3 | | | Ending
Balance at 04/30/2016 | | | Change in
Unrealized
Appreciation
(Depreciation)
from
Investments
still held at 04/30/16 | |
Investments, at value Corporate Bonds | | | | | | | | | | | | | | | | | | | | | | | | | | | | | | | | | | | | | | | | |
China | | $ | 150,074 | | | | $(2,927) | | | | $ — | | | $ | — | | | $ | — | | | | $(147,147) | | | $ | 4,350 | | | $ | — | | | | $ 4,350 | | | | $ (196,976) | |
Russia | | | 210,331 | | | | 6,022 | | | | — | | | | (49,937 | ) | | | (126,113 | ) | | | 248,466 | | | | — | | | | (288,769 | ) | | | — | | | | — | |
Bank Loans | | | | | | | | | | | | | | | | | | | | | | | | | | | | | | | | | | | | | | | | |
China | | | 78,586 | | | | — | | | | — | | | | — | | | | — | | | | (53,673) | | | | — | | | | — | | | | 24,913 | | | | (53,673) | |
Czech Republic | | | 494,841 | | | | — | | | | — | | | | — | | | | — | | | | (121,269) | | | | — | | | | — | | | | 373,572 | | | | (121,270) | |
Sierra Leone | | | 1,101,263 | | | | 6,442 | | | | — | | | | — | | | | — | | | | 420 | | | | — | | | | — | | | | 1,108,125 | | | | 420 | |
Ukraine | | | 120,000 | | | | — | | | | — | | | | (120,000 | ) | | | — | | | | — | | | | — | | | | — | | | | — | | | | — | |
United Arab Emirates | | | 997,930 | | | | 79,789 | | | | 216,600 | | | | (584,576 | ) | | | (736 | ) | | | (76,961) | | | | 9,868,101 | | | | — | | | | 10,500,147 | | | | (779,704) | |
Warrants | | | | | | | | | | | | | | | | | | | | | | | | | | | | | | | | | | | | | | | | |
China | | | — | | | | — | | | | — | | | | — | | | | — | | | | — | | | | — | | | | — | | | | — | | | | — | |
| |
Total | | $ | 3,153,025 | | | | $89,326 | | | | $216,600 | | | $ | (754,513 | ) | | $ | (126,849 | ) | | | $(150,164) | | | $ | 9,872,451 | | | $ | (288,769 | ) | | | $12,011,107 | | | | $(1,151,203) | |
| |
See accompanying notes to the financial statements.
95
ASHMORE EMERGING MARKETS CORPORATE DEBT FUND
SCHEDULE OF INVESTMENTS (CONTINUED)
As of April 30, 2016 (Unaudited)
See the table on “Qualitative information about Fair Value measurements” for information on the valuation techniques and inputs used to value Level 3 securities at April 30, 2016.
| | | | | | | | |
| Quantitative Information about Level 3 Fair Value Measurements |
| | | Fair Value at | | | Valuation | | Unobservable |
| | | 04/30/2016 | | | Technique | | Input |
Corporate Bonds | | | $4,350 | | | Broker quote | | Inputs to broker model |
| | | | | | | | Debt structure |
Bank Loans | | | 373,572 | | | Market comparables | | of issuer |
Bank Loans | | | 11,608,272 | | | Broker quote | | Inputs to broker model |
Bank Loans | | | 24,913 | | | Indicative bid | | Bid source |
|
Total | | $ | 12,011,107 | | | | | |
|
The following is a summary of the fair values of the Fund’s derivative instruments*:
Fair Values of Financial Derivative Instruments on the Statements of Assets and Liabilities as of April 30, 2016:
| | |
| | | Derivatives Not Accounted |
| | | for as Hedging Instruments |
| | | Foreign Exchange |
Liabilities: | | |
Unrealized Depreciation on Forward Foreign Currency Exchange Contracts | | $ (37,361) |
The Effect of Financial Derivative Instruments on the Statements of Operations for the Six Months Ended April 30, 2016:
| | |
| | | Derivatives Not Accounted |
| | | for as Hedging Instruments |
| | | Foreign Exchange |
Realized Gain (Loss) on Derivatives Recognized resulting from Operations: | | |
Net Realized Loss on Forward Foreign Currency Exchange Contracts | | $ (157,566) |
| | |
| |
Net Change in Unrealized Appreciation (Depreciation) on Derivatives Recognized resulting from Operations: | | |
Net Change in Unrealized Depreciation on Forward Foreign Currency Exchange Contracts | | $ (278,763) |
| | |
* See note 10 in the Notes to the Financial Statements for additional information.
At April 30, 2016, for U.S. federal income tax purposes, gross unrealized appreciation, gross unrealized depreciation, net unrealized appreciation/(depreciation) on investments in securities (including the effects of foreign currency translation) and the cost basis of investments were as follows:
| | | | |
Federal tax cost of investments | | $ | 235,232,402 | |
| |
Gross tax appreciation of investments | | | 6,477,474 | |
Gross tax depreciation of investments | | | (34,292,462) | |
| |
Net tax depreciation of investments | | | $(27,814,988) | |
| |
The difference between book basis and tax basis net unrealized appreciation or depreciation is attributable primarily to the tax deferral of losses on wash sales.
See accompanying notes to the financial statements.
96
ASHMORE EMERGING MARKETS SHORT DURATION FUND
SCHEDULE OF INVESTMENTS
As of April 30, 2016 (Unaudited)
| | | | | | | | | | | | | | |
| | | | | | | | | | | % of Net | |
| | | Currency(1) | | Par | | | Value | | | Assets | |
Debt Securities | | | | | | | | | | | | | | |
| | | | |
Angola (Cost $1,929,824) | | | | | | | | | | | | | | |
Angola (Rep of) Via Northern Lights III B.V. 7.000%, 08/16/2019 | | | | | 1,968,750 | | | $ | 1,981,448 | | | | 2.74 | |
| | | | | | | | | 1,981,448 | | | | 2.74 | |
Argentina (Cost $600,000) | | | | | | | | | | | | | | |
YPF S.A. 8.500%, 03/23/2021(2)(3) | | | | | 600,000 | | | | 627,000 | | | | 0.87 | |
| | | | | | | | | 627,000 | | | | 0.87 | |
Azerbaijan (Cost $360,209) | | | | | | | | | | | | | | |
International Bank of Azerbaijan OJSC 5.625%, 06/11/2019 | | | | | 400,000 | | | | 377,200 | | | | 0.52 | |
| | | | | | | | | 377,200 | | | | 0.52 | |
Bangladesh (Cost $462,017) | | | | | | | | | | | | | | |
Banglalink Digital Communications Ltd. 8.625%, 05/06/2019 | | | | | 450,000 | | | | 476,100 | | | | 0.66 | |
| | | | | | | | | 476,100 | | | | 0.66 | |
Barbados (Cost $629,480) | | | | | | | | | | | | | | |
Columbus International, Inc. 7.375%, 03/30/2021 | | | | | 600,000 | | | | 637,320 | | | | 0.88 | |
| | | | | | | | | 637,320 | | | | 0.88 | |
Belarus (Cost $288,126) | | | | | | | | | | | | | | |
Belarus (Rep of) 8.950%, 01/26/2018 | | | | | 300,000 | | | | 314,250 | | | | 0.44 | |
| | | | | | | | | 314,250 | | | | 0.44 | |
Brazil (Cost $10,776,827) | | | | | | | | | | | | | | |
Itau Unibanco Holding S.A. 5.750%, 01/22/2021 | | | | | 200,000 | | | | 203,876 | | | | 0.28 | |
Marfrig Holdings Europe B.V. 8.375%, 05/09/2018 | | | | | 1,275,000 | | | | 1,313,250 | | | | 1.82 | |
Marfrig Holdings Europe B.V. 6.875%, 06/24/2019 | | | | | 1,000,000 | | | | 990,000 | | | | 1.37 | |
Marfrig Holdings Europe B.V. 11.250%, 09/20/2021 | | | | | 500,000 | | | | 480,000 | | | | 0.67 | |
Petrobras Global Finance B.V. 3.500%, 02/06/2017 | | | | | 400,000 | | | | 396,060 | | | | 0.55 | |
Petrobras Global Finance B.V. 5.875%, 03/01/2018 | | | | | 1,325,000 | | | | 1,306,781 | | | | 1.81 | |
Petrobras Global Finance B.V. 3.000%, 01/15/2019 | | | | | 1,535,000 | | | | 1,381,040 | | | | 1.91 | |
Petrobras Global Finance B.V. 5.750%, 01/20/2020 | | | | | 1,490,000 | | | | 1,367,075 | | | | 1.89 | |
QGOG Atlantic/Alaskan Rigs Ltd. 5.250%, 07/30/2018 | | | | | 2,119,433 | | | | 1,663,755 | | | | 2.31 | |
QGOG Constellation S.A. 6.250%, 11/09/2019 | | | | | 1,300,000 | | | | 702,000 | | | | 0.97 | |
Vale Overseas Ltd. 5.625%, 09/15/2019 | | | | | 875,000 | | | | 883,750 | | | | 1.23 | |
Vale Overseas Ltd. 4.625%, 09/15/2020 | | | | | 500,000 | | | | 485,000 | | | | 0.67 | |
| | | | | | | | | 11,172,587 | | | | 15.48 | |
China (Cost $5,029,578) | | | | | | | | | | | | | | |
Central China Real Estate Ltd. 8.750%, 01/23/2021 | | | | | 650,000 | | | | 658,108 | | | | 0.91 | |
China Hongqiao Group Ltd. 6.875%, 05/03/2018 | | | | | 400,000 | | | | 396,586 | | | | 0.55 | |
CIFI Holdings Group Co. Ltd. 7.750%, 06/05/2020 | | | | | 300,000 | | | | 314,245 | | | | 0.43 | |
Favor Sea Ltd. 11.750%, 02/04/2019 | | | | | 400,000 | | | | 309,000 | | | | 0.43 | |
ICBC Standard Bank PLC 8.125%, 12/02/2019 | | | | | 600,000 | | | | 664,622 | | | | 0.92 | |
KWG Property Holding Ltd. 13.250%, 03/22/2017 | | | | | 325,000 | | | | 349,781 | | | | 0.48 | |
Sunac China Holdings Ltd. 9.375%, 04/05/2018 | | | | | 675,000 | | | | 705,375 | | | | 0.98 | |
Times Property Holdings Ltd. 12.625%, 03/21/2019 | | | | | 1,200,000 | | | | 1,328,951 | | | | 1.84 | |
Yuzhou Properties Co. Ltd. 8.625%, 01/24/2019 | | | | | 300,000 | | | | 315,754 | | | | 0.44 | |
| | | | | | | | | 5,042,422 | | | | 6.98 | |
Colombia (Cost $977,035) | | | | | | | | | | | | | | |
Grupo Aval Ltd. 5.250%, 02/01/2017 | | | | | 300,000 | | | | 304,500 | | | | 0.42 | |
Millicom International Cellular S.A. 6.625%, 10/15/2021 | | | | | 665,000 | | | | 673,312 | | | | 0.93 | |
| | | | | | | | | 977,812 | | | | 1.35 | |
See accompanying notes to the financial statements.
97
ASHMORE EMERGING MARKETS SHORT DURATION FUND
SCHEDULE OF INVESTMENTS (CONTINUED)
As of April 30, 2016 (Unaudited)
| | | | | | | | | | | | | | |
| | | | | | | | | | | % of Net | |
| | | Currency(1) | | Par | | | Value | | | Assets | |
Dominican Republic (Cost $727,941) | | | | | | | | | | | | | | |
Aeropuertos Dominicanos Siglo XXI S.A., FRN 9.750%, 11/13/2019 | | | | | 700,000 | | | $ | 743,750 | | | | 1.03 | |
| | | | | | | | | 743,750 | | | | 1.03 | |
Ecuador (Cost $10,169,605) | | | | | | | | | | | | | | |
Ecuador (Rep of) 10.500%, 03/24/2020 | | | | | 4,625,000 | | | | 4,370,625 | | | | 6.06 | |
EP PetroEcuador via Noble Sovereign Funding I Ltd., FRN 6.258%, 09/24/2019 | | | | | 6,926,316 | | | | 6,302,947 | | | | 8.73 | |
| | | | | | | | | 10,673,572 | | | | 14.79 | |
Hong Kong (Cost $239,923) | | | | | | | | | | | | | | |
Noble Group Ltd. 6.750%, 01/29/2020 | | | | | 300,000 | | | | 211,470 | | | | 0.29 | |
| | | | | | | | | 211,470 | | | | 0.29 | |
India (Cost $645,884) | | | | | | | | | | | | | | |
Vedanta Resources PLC 6.750%, 06/07/2016 | | | | | 650,000 | | | | 648,375 | | | | 0.90 | |
| | | | | | | | | 648,375 | | | | 0.90 | |
Jamaica (Cost $2,933,284) | | | | | | | | | | | | | | |
Digicel Group Ltd. 8.250%, 09/30/2020 | | | | | 3,420,000 | | | | 3,120,750 | | | | 4.32 | |
| | | | | | | | | 3,120,750 | | | | 4.32 | |
Kazakhstan (Cost $5,903,411) | | | | | | | | | | | | | | |
Halyk Savings Bank of Kazakhstan JSC 7.250%, 05/03/2017 | | | | | 275,000 | | | | 280,569 | | | | 0.39 | |
Halyk Savings Bank of Kazakhstan JSC 7.250%, 01/28/2021 | | | | | 200,000 | | | | 205,524 | | | | 0.29 | |
Kazkommertsbank JSC 7.500%, 11/29/2016 | | | | | 770,000 | | | | 750,904 | | | | 1.04 | |
Kazkommertsbank JSC 6.875%, 02/13/2017 | | EUR | | | 1,355,000 | | | | 1,501,117 | | | | 2.08 | |
Kazkommertsbank JSC 8.500%, 05/11/2018 | | | | | 1,205,000 | | | | 1,120,891 | | | | 1.55 | |
Zhaikmunai LLP 6.375%, 02/14/2019 | | | | | 1,300,000 | | | | 1,070,940 | | | | 1.48 | |
Zhaikmunai LLP 7.125%, 11/13/2019 | | | | | 1,180,000 | | | | 982,586 | | | | 1.36 | |
| | | | | | | | | 5,912,531 | | | | 8.19 | |
Mexico (Cost $3,168,212) | | | | | | | | | | | | | | |
CEMEX Espana S.A. 9.875%, 04/30/2019 | | | | | 360,000 | | | | 378,450 | | | | 0.53 | |
Cemex S.A.B. de C.V. 6.500%, 12/10/2019 | | | | | 920,000 | | | | 969,450 | | | | 1.34 | |
Cemex S.A.B. de C.V. 7.250%, 01/15/2021 | | | | | 1,565,000 | | | | 1,670,638 | | | | 2.31 | |
Petroleos Mexicanos 5.500%, 02/04/2019 | | | | | 266,000 | | | | 278,103 | | | | 0.39 | |
| | | | | | | | | 3,296,641 | | | | 4.57 | |
Nigeria (Cost $664,652) | | | | | | | | | | | | | | |
GTB Finance B.V. 6.000%, 11/08/2018 | | | | | 700,000 | | | | 659,820 | | | | 0.91 | |
| | | | | | | | | 659,820 | | | | 0.91 | |
Russian Federation (Cost $9,224,966) | | | | | | | | | | | | | | |
Alfa Bank AO Via Alfa Bond Issuance PLC 7.875%, 09/25/2017 | | | | | 375,000 | | | | 396,698 | | | | 0.55 | |
Alfa Bank AO Via Alfa Bond Issuance PLC 7.500%, 09/26/2019 | | | | | 620,000 | | | | 655,650 | | | | 0.91 | |
Credit Bank of Moscow Via CBOM Finance PLC 7.700%, 02/01/2018 | | | | | 650,000 | | | | 669,963 | | | | 0.93 | |
Credit Bank of Moscow Via CBOM Finance PLC 8.700%, 11/13/2018 | | | | | 1,720,000 | | | | 1,691,964 | | | | 2.35 | |
GTH Finance B.V. 6.250%, 04/26/2020(2)(3) | | | | | 1,100,000 | | | | 1,098,625 | | | | 1.52 | |
Lukoil International Finance B.V. 6.125%, 11/09/2020 | | | | | 200,000 | | | | 213,810 | | | | 0.30 | |
Metalloinvest Finance Ltd. 5.625%, 04/17/2020 | | | | | 200,000 | | | | 202,426 | | | | 0.28 | |
SCF Capital Ltd. 5.375%, 10/27/2017 | | | | | 200,000 | | | | 203,250 | | | | 0.28 | |
Sistema JSFC via Sistema International Funding S.A. 6.950%, 05/17/2019 | | | | | 845,000 | | | | 889,700 | | | | 1.23 | |
See accompanying notes to the financial statements.
98
ASHMORE EMERGING MARKETS SHORT DURATION FUND
SCHEDULE OF INVESTMENTS (CONTINUED)
As of April 30, 2016 (Unaudited)
| | | | | | | | | | | | | | |
| | | | | | | | | | | % of Net | |
| | | Currency(1) | | Par | | | Value | | | Assets | |
Russian Federation - (continued) | | | | | | | | | | | | | | |
TMK OAO Via TMK Capital S.A. 6.750%, 04/03/2020 | | | | | 1,280,000 | | | $ | 1,280,000 | | | | 1.77 | |
Vimpel Communications Via VIP Finance Ireland Ltd. OJSC 7.748%, 02/02/2021 | | | | | 300,000 | | | | 326,960 | | | | 0.45 | |
VimpelCom Holdings B.V. 5.200%, 02/13/2019 | | | | | 1,100,000 | | | | 1,116,896 | | | | 1.55 | |
Vnesheconombank Via VEB Finance PLC 5.450%, 11/22/2017 | | | | | 274,000 | | | | 280,499 | | | | 0.39 | |
Vnesheconombank Via VEB Finance PLC 4.224%, 11/21/2018 | | | | | 400,000 | | | | 399,500 | | | | 0.55 | |
| | | | | | | | | 9,425,941 | | | | 13.06 | |
South Africa (Cost $2,242,701) | | | | | | | | | | | | | | |
Eskom Holdings SOC Ltd. 5.750%, 01/26/2021 | | | | | 2,220,000 | | | | 2,092,261 | | | | 2.90 | |
Sappi Papier Holding GmbH 7.750%, 07/15/2017 | | | | | 200,000 | | | | 209,500 | | | | 0.29 | |
| | | | | | | | | 2,301,761 | | | | 3.19 | |
Ukraine (Cost $447,165) | | | | | | | | | | | | | | |
Metinvest B.V., FRN 10.500%, 11/28/2017 | | | | | 154,267 | | | | 94,134 | | | | 0.13 | |
MHP S.A. 8.250%, 04/02/2020 | | | | | 400,000 | | | | 358,000 | | | | 0.50 | |
| | | | | | | | | 452,134 | | | | 0.63 | |
United Arab Emirates (Cost $1,608,123) | | | | | | | | | | | | | | |
Dubai Holding Commercial Operations MTN Ltd. 6.000%, 02/01/2017 | | GBP | | | 200,000 | | | | 295,819 | | | | 0.41 | |
Topaz Marine S.A. 8.625%, 11/01/2018 | | | | | 1,440,000 | | | | 1,361,088 | | | | 1.89 | |
| | | | | | | | | 1,656,907 | | | | 2.30 | |
Venezuela (Cost $6,947,576) | | | | | | | | | | | | | | |
Petroleos de Venezuela S.A. 5.125%, 10/28/2016 | | | | | 2,525,000 | | | | 2,222,000 | | | | 3.08 | |
Petroleos de Venezuela S.A. 8.500%, 11/02/2017 | | | | | 7,910,000 | | | | 4,627,350 | | | | 6.41 | |
| | | | | | | | | 6,849,350 | | | | 9.49 | |
Vietnam (Cost $914,810) | | | | | | | | | | | | | | |
Vingroup JSC 11.625%, 05/07/2018 | | | | | 850,000 | | | | 922,250 | | | | 1.28 | |
| | | | | | | | | 922,250 | | | | 1.28 | |
Total Debt Securities (Cost $66,891,349) | | | | | | | | | 68,481,391 | | | | 94.87 | |
| | | | |
Bank Loans | | | | | | | | | | | | | | |
| | | | |
United Arab Emirates (Cost $1,883,380) | | | | | | | | | | | | | | |
DP World Ltd. 09/30/2022(4) | | | | | 2,196,477 | | | | 1,669,323 | | | | 2.31 | |
| | | | |
Total Bank Loans (Cost $1,883,380) | | | | | | | | | 1,669,323 | | | | 2.31 | |
| | | | |
Total Investments (Total Cost $68,774,729) | | | | | | | | | 70,150,714 | | | | 97.18 | |
| | | | |
Other Assets Less Liabilities (See Statements of Assets and Liabilities for further detail) | | | | | | | | | 2,039,080 | | | | 2.82 | |
| | | | |
Net Assets | | | | | | | | $ | 72,189,794 | | | | 100.00 | |
| (1) | Par values are stated in United States Dollars unless otherwise noted below. |
| (2) | Securities exempt from registration under Rule 144A of the Securities Act of 1933. These securities may not be publicly traded without registration under the Securities Act of 1933. |
See accompanying notes to the financial statements.
99
ASHMORE EMERGING MARKETS SHORT DURATION FUND
SCHEDULE OF INVESTMENTS (CONTINUED)
As of April 30, 2016 (Unaudited)
| (3) | Restricted security that has been deemed illiquid. At April 30, 2016, the value of these restricted illiquid securities amounted to $1,725,625 or 2.4% of net assets. Additional information on each restricted illiquid security is as follows: |
| | | | |
| SECURITY | | ACQUISITION DATE | | ACQUISITION COST |
GTH Finance B.V., 6.250%, 04/26/2020 | | 04/20/2016 | | $1,100,000 |
YPF S.A., 8.500%, 03/23/2021 | | 03/18/2016-03/24/2016 | | 600,000 |
|
| (4) | When Issued Security. |
Percentages shown are based on net assets.
At April 30, 2016, the Ashmore Emerging Markets Short Duration Fund had outstanding forward foreign currency exchange contracts as follows:
| | | | | | | | | | | | | | | | | | |
| | | | | | | Currency | | | | | Currency | | | | |
| | | | | | | Buy | | | | | Sell | | | | |
| | | | | | | Amount | | | | | Amount | | | | |
| Settlement | | | | Currency | | (Local | | | Currency | | (Local | | | Unrealized | |
| Date | | Counterparty | | Buy | | Currency) | | | Sell | | Currency) | | | Gain/(Loss) | |
05/20/2016 | | Morgan Stanley | | United States Dollar | | | 304,286 | | | British Pound | | | 213,332 | | | | $ (7,439) | |
05/20/2016 | | HSBC Bank | | United States Dollar | | | 1,559,236 | | | Euro | | | 1,365,866 | | | | (5,678) | |
| | | | | | | | | | | | | | | | | | |
Total | | | | | | | | | | | | | | | | | $(13,117) | |
| | | | | | | | | | | | | | | | | | |
The inputs or methodologies used for valuing securities are not necessarily an indication of the risks associated with investing in those securities and other financial instruments, if any. See note 4 in the Notes to the Financial Statements for more information regarding pricing inputs and valuation techniques. The following is a summary of the inputs used in valuing the Ashmore Emerging Markets Short Duration Fund’s investments and other financial instruments, which are carried at fair value, as of April 30, 2016:
| | | | | | | | | | | | | | |
| | | Level 1 | | Level 2 | | | Level 3 | | | Total | |
Investments | | | | | | | | | | | | | | |
Assets: | | | | | | | | | | | | | | |
Debt Securities | | | | | | | | | | | | | | |
Corporate Bonds | | $ — | | $ | 52,473,957 | | | $ | — | | | $ | 52,473,957 | |
Government Agencies | | — | | | 9,341,111 | | | | — | | | | 9,341,111 | |
Government Bonds | | — | | | 6,666,323 | | | | — | | | | 6,666,323 | |
| | | | | | | | | | | | | | |
Total Debt Securities | | — | | | 68,481,391 | | | | — | | | | 68,481,391 | |
Bank Loans | | — | | | — | | | | 1,669,323 | | | | 1,669,323 | |
| |
Total Investments | | $ — | | $ | 68,481,391 | | | $ | 1,669,323 | | | $ | 70,150,714 | |
| |
| | | | |
Other Financial Instruments | | | | | | | | | | | | | | |
Liabilities: | | | | | | | | | | | | | | |
Forward Foreign Currency Exchange Contracts | | $ — | | $ | (13,117) | | | $ | — | | | $ | (13,117) | |
| |
Total Other Financial Instruments | | $ — | | $ | (13,117) | | | $ | — | | | $ | (13,117) | |
| |
See accompanying notes to the financial statements.
100
ASHMORE EMERGING MARKETS SHORT DURATION FUND
SCHEDULE OF INVESTMENTS (CONTINUED)
As of April 30, 2016 (Unaudited)
The Fund discloses all transfers between levels based on valuations at the end of each reporting period. At April 30, 2016 the Fund had a transfer into Level 3 as disclosed below.
The following is a reconciliation of investments in which significant unobservable inputs (Level 3) were used for the Fund during the period ending April 30, 2016:
| | | | | | | | | | | | | | | | | | | | |
| | | | | | | | | | | | | | | | | | | | Change in |
| | | | | | | | | | | | | | | | | | | | Unrealized |
| | | | | | | | | | | | | | | | | | | | Appreciation |
| | | | | | | | | | | Change in | | | | | | | | | (Depreciation) |
| | | Beginning | | | | | | Realized | | Unrealized | | Transfer | | | Transfer | | Ending | | from Investments |
| Category and | | Balance | | | | | | Gains | | Appreciation | | into | | | out of | | Balance | | still held |
| Subcategory | | at 10/31/2015 | | Purchases | | Sales | | (Losses) | | (Depreciation) | | Level 3 | | | Level 3 | | at 04/30/2016 | | at 04/30/2016 |
| Investments, at value Bank Loans | | $— | | $— | | $— | | $— | | $— | | | $1,669,323 | | | $— | | $1,669,323 | | $(65,914) |
|
Total | | $— | | $— | | $— | | $— | | $— | | | $1,669,323 | | | $— | | $1,669,323 | | $(65,914) |
|
See the table on “Quantitative information about Fair Value measurements” for information on the valuation techniques and inputs used to value Level 3 securities at April 30, 2016.
| | | | | | | | | | | | |
| Quantitative Information about Level 3 Fair Value Measurements | |
| | | Fair Value at | | | Valuation | | | Unobservable | |
| | | 04/30/2016 | | | Technique | | | Input | |
Bank Loans | | | $1,669,323 | | | | Broker quote | | | | Inputs to broker model | |
| |
The following is a summary of the fair values of the Fund’s derivative instruments*:
The Effect of Financial Derivative Instruments on the Statements of Assets and Liabilities as of April 30, 2016:
| | |
| | | Derivatives Not Accounted |
| | | for as Hedging Instruments |
| | | Foreign Exchange |
Liabilities: | | |
Unrealized Depreciation on Forward Foreign Currency Exchange Contracts | | $(13,117) |
| | |
The Effect of Financial Derivative Instruments on the Statements of Operations for the Six Months Ended April 30, 2016:
| | |
| | | Derivatives Not Accounted for as |
| | | Hedging Instruments |
| | | Foreign Exchange |
Realized Gain (Loss) on Derivatives Recognized resulting from Operations: | | |
Net Realized Gain on Forward Foreign Currency Exchange Contracts | | $ 2,884 |
| |
Net Change in Unrealized Appreciation (Depreciation) on Derivatives Recognized resulting from Operations: | | |
Net Change in Unrealized Depreciation on Forward Foreign Currency Exchange Contracts | | $ (13,117) |
* See note 10 in the Notes to the Financial Statements for additional information.
See accompanying notes to the financial statements.
101
ASHMORE EMERGING MARKETS SHORT DURATION FUND
SCHEDULE OF INVESTMENTS (CONTINUED)
As of April 30, 2016 (Unaudited)
At April 30, 2016, for U.S. federal income tax purposes, gross unrealized appreciation, gross unrealized depreciation, net unrealized appreciation/(depreciation) on investments in securities (including the effects of foreign currency translation) and the cost basis of investments were as follows:
| | | | |
Federal tax cost of investments | | $ | 68,777,103 | |
| |
Gross tax appreciation of investments | | | 2,016,544 | |
Gross tax depreciation of investments | | | (642,933) | |
| |
Net tax appreciation of investments | | | $1,373,611 | |
| |
The difference between book basis and tax basis net unrealized appreciation or depreciation is attributable primarily to the tax deferral of losses on wash sales.
See accompanying notes to the financial statements.
102
ASHMORE EMERGING MARKETS EQUITY OPPORTUNITIES FUND
SCHEDULE OF INVESTMENTS
As of April 30, 2016 (Unaudited)
| | | | | | | | | | | | | | |
| | | | | | | | | | | % of Net | |
| | | Currency(1) | | Shares | | | Value | | | Assets | |
Investment Companies | | | | | | | | | | | | | | |
| | | | |
Ashmore Emerging Markets Frontier Equity Fund(2) | | | | | 192,342 | | | $ | 1,656,063 | | | | 32.69 | |
Ashmore Emerging Markets Small-Cap Equity Fund(2) | | | | | 165,597 | | | | 1,655,969 | | | | 32.68 | |
Ashmore Emerging Markets Value Fund(2) | | | | | 230,697 | | | | 1,670,245 | | | | 32.97 | |
Total Investment Companies (Cost $5,024,061) | | | | | | | | | 4,982,277 | | | | 98.34 | |
| | | | |
Total Investments (Total Cost $5,024,061) | | | | | | | | | 4,982,277 | | | | 98.34 | |
| | | |
Other Assets Less Liabilities (See Statements of Assets and Liabilities for further detail) | | | | | | | 84,283 | | | | 1.66 | |
| | | | |
Net Assets | | | | | | | | $ | 5,066,560 | | | | 100.00 | |
| (1) | Par values are stated in United States Dollars unless otherwise noted below. |
| (2) | Investment in affiliated fund. |
Percentages shown are based on net assets.
At April 30, 2016, the Fund’s percentages of ownership of other funds were as follows:
| | | | |
| Ashmore Mutual Fund | | Percentage | | |
Emerging Markets Frontier Equity Fund | | 3.4% | |
Emerging Markets Small-Cap Fund | | 5.4% | |
Emerging Markets Value Fund | | 19.3% | |
| |
The inputs or methodologies used for valuing securities are not necessarily an indication of the risks associated with investing in those securities and other financial instruments, if any. See note 4 in the Notes to the Financial Statements for more information regarding pricing inputs and valuation techniques. The following is a summary of the inputs used in valuing the Ashmore Emerging Markets Equity Opportunities Fund’s investments, which are carried at fair value, as of April 30, 2016:
| | | | | | | | | | | | |
| | | Level 1 | | Level 2 | | | Level 3 | | Total | |
Investments | | | | | | | | | | | | |
Assets: | | | | | | | | | | | | |
Investment Companies | | $ — | | $ | 4,982,277 | | | $ — | | $ | 4,982,277 | |
| |
Total Investments | | $ — | | $ | 4,982,277 | | | $ — | | $ | 4,982,277 | |
| |
The Fund discloses all transfers between levels based on valuations at the end of each reporting period. From the Fund’s commencement of operation on November 23, 2015 through April 30, 2016, there were no transfers between Level 1, Level 2 and Level 3 classifications.
See accompanying notes to the financial statements.
103
ASHMORE EMERGING MARKETS EQUITY OPPORTUNITIES FUND
SCHEDULE OF INVESTMENTS (CONTINUED)
As of April 30, 2016 (Unaudited)
At April 30, 2016, for U.S. federal income tax purposes, gross unrealized appreciation, gross unrealized depreciation, net unrealized appreciation/(depreciation) on investments in securities (including the effects of foreign currency translation) and the cost basis of investments were as follows:
| | | | |
Federal tax cost of investments | | $ | 5,024,061 | |
| |
Gross tax appreciation of investments | | | 36,911 | |
Gross tax depreciation of investments | | | (78,695) | |
| |
Net tax depreciation of investments | | $ | (41,784) | |
| |
See accompanying notes to the financial statements.
104
ASHMORE EMERGING MARKETS VALUE FUND
SCHEDULE OF INVESTMENTS
As of April 30, 2016 (Unaudited)
| | | | | | | | | | | | | | |
| | | | | | | | | | | % of Net | |
| | | Currency(1) | | Shares | | | Value | | | Assets | |
Common Stock | | | | | | | | | | | | | | |
| | | | |
Argentina (Cost $192,929) | | | | | | | | | | | | | | |
Grupo Financiero Galicia S.A. ADR | | | | | 2,580 | | | $ | 73,452 | | | | 0.85 | |
YPF S.A. ADR | | | | | 7,351 | | | | 148,123 | | | | 1.71 | |
| | | | | | | | | 221,575 | | | | 2.56 | |
Brazil (Cost $334,841) | | | | | | | | | | | | | | |
Cosan Ltd., Class A | | | | | 46,900 | | | | 252,322 | | | | 2.92 | |
| | | | | | | | | 252,322 | | | | 2.92 | |
China (Cost $2,554,745) | | | | | | | | | | | | | | |
Alibaba Group Holding Ltd. ADR | | | | | 2,219 | | | | 170,730 | | | | 1.97 | |
Baidu, Inc. ADR | | | | | 930 | | | | 180,699 | | | | 2.09 | |
China Minsheng Banking Corp. Ltd., Class H | | HKD | | | 275,200 | | | | 258,293 | | | | 2.99 | |
China Pacific Insurance Group Co. Ltd., Class H | | HKD | | | 23,800 | | | | 83,514 | | | | 0.97 | |
China Taiping Insurance Holdings Co. Ltd. | | HKD | | | 30,200 | | | | 61,537 | | | | 0.71 | |
CITIC Securities Co. Ltd., Class H | | HKD | | | 57,500 | | | | 125,495 | | | | 1.45 | |
CNOOC Ltd. | | HKD | | | 158,000 | | | | 195,863 | | | | 2.27 | |
Far East Horizon Ltd. | | HKD | | | 108,000 | | | | 85,099 | | | | 0.98 | |
Guangzhou Baiyunshan Pharmaceutical Holdings Co. Ltd., Class H | | HKD | | | 22,000 | | | | 46,605 | | | | 0.54 | |
Haitong Securities Co. Ltd., Class H | | HKD | | | 50,000 | | | | 82,565 | | | | 0.96 | |
Huadian Fuxin Energy Corp. Ltd., Class H | | HKD | | | 234,000 | | | | 51,016 | | | | 0.59 | |
Ju Teng International Holdings Ltd. | | HKD | | | 438,500 | | | | 196,235 | | | | 2.27 | |
Longfor Properties Co. Ltd. | | HKD | | | 63,000 | | | | 88,180 | | | | 1.02 | |
Luye Pharma Group Ltd. | | HKD | | | 88,500 | | | | 61,225 | | | | 0.71 | |
NetEase, Inc. ADR | | | | | 531 | | | | 74,712 | | | | 0.86 | |
Ping An Insurance Group Co. of China Ltd., Class H | | HKD | | | 49,000 | | | | 228,107 | | | | 2.64 | |
Shimao Property Holdings Ltd. | | HKD | | | 75,000 | | | | 103,535 | | | | 1.20 | |
Sunac China Holdings Ltd. | | HKD | | | 148,000 | | | | 94,486 | | | | 1.09 | |
Technovator International Ltd. | | HKD | | | 50,000 | | | | 25,280 | | | | 0.29 | |
Xinjiang Goldwind Science & Technology Co. Ltd., Class H | | HKD | | | 44,600 | | | | 73,183 | | | | 0.85 | |
| | | | | | | | | 2,286,359 | | | | 26.45 | |
Czech Republic (Cost $42,925) | | | | | | | | | | | | | | |
Erste Group Bank A.G. | | EUR | | | 1,436 | | | | 41,432 | | | | 0.48 | |
| | | | | | | | | 41,432 | | | | 0.48 | |
India (Cost $116,141) | | | | | | | | | | | | | | |
Reliance Industries Ltd. GDR(2)(3) | | | | | 3,983 | | | | 118,027 | | | | 1.36 | |
| | | | | | | | | 118,027 | | | | 1.36 | |
Indonesia (Cost $144,849) | | | | | | | | | | | | | | |
Lippo Karawaci Tbk PT | | IDR | | | 985,600 | | | | 75,746 | | | | 0.88 | |
Matahari Department Store Tbk PT | | IDR | | | 59,500 | | | | 85,530 | | | | 0.99 | |
| | | | | | | | | 161,276 | | | | 1.87 | |
Mexico (Cost $683,874) | | | | | | | | | | | | | | |
Cemex S.A.B. de C.V. ADR (Participation Certificate) | | | | | 42,084 | | | | 313,523 | | | | 3.62 | |
Grupo Mexico S.A.B. de C.V., Series B | | MXN | | | 59,726 | | | | 151,913 | | | | 1.76 | |
Ternium S.A. ADR | | | | | 9,232 | | | | 188,425 | | | | 2.18 | |
| | | | | | | | | 653,861 | | | | 7.56 | |
Peru (Cost $116,815) | | | | | | | | | | | | | | |
Credicorp Ltd. | | | | | 1,300 | | | | 189,046 | | | | 2.19 | |
| | | | | | | | | 189,046 | | | | 2.19 | |
Russian Federation (Cost $463,601) | | | | | | | | | | | | | | |
Aeroflot - Russian Airlines PJSC | | | | | 143,340 | | | | 171,461 | | | | 1.99 | |
Gazprom PAO ADR | | | | | 29,263 | | | | 152,164 | | | | 1.76 | |
Moscow Exchange MICEX-RTS PJSC | | RUB | | | 76,360 | | | | 120,414 | | | | 1.39 | |
See accompanying notes to the financial statements.
105
ASHMORE EMERGING MARKETS VALUE FUND
SCHEDULE OF INVESTMENTS (CONTINUED)
As of April 30, 2016 (Unaudited)
| | | | | | | | | | | | | | |
| | | Currency(1) | | Shares | | | Value | | | % of Net
Assets | |
Russian Federation - (continued) | | | | | | | | | | | | | | |
Sberbank of Russia PJSC | | RUB | | | 77,530 | | | $ | 148,603 | | | | 1.72 | |
| | | | | | | | | 592,642 | | | | 6.86 | |
South Africa (Cost $185,621) | | | | | | | | | | | | | | |
Sasol Ltd. ADR | | | | | 5,882 | | | | 192,871 | | | | 2.23 | |
| | | | | | | | | 192,871 | | | | 2.23 | |
South Korea (Cost $1,127,635) | | | | | | | | | | | | | | |
Hana Financial Group, Inc. | | KRW | | | 8,242 | | | | 183,961 | | | | 2.13 | |
Hyundai Mipo Dockyard Co. Ltd. | | KRW | | | 1,630 | | | | 104,255 | | | | 1.21 | |
Hyundai Motor Co. | | KRW | | | 656 | | | | 82,440 | | | | 0.95 | |
Lotte Chemical Corp. | | KRW | | | 320 | | | | 81,824 | | | | 0.95 | |
POSCO | | KRW | | | 1,243 | | | | 260,663 | | | | 3.01 | |
Silicon Works Co. Ltd. | | KRW | | | 4,247 | | | | 118,599 | | | | 1.37 | |
SK Hynix, Inc. | | KRW | | | 10,382 | | | | 254,809 | | | | 2.95 | |
| | | | | | | | | 1,086,551 | | | | 12.57 | |
Taiwan (Cost $828,555) | | | | | | | | | | | | | | |
AU Optronics Corp. | | TWD | | | 658,000 | | | | 191,021 | | | | 2.21 | |
Casetek Holdings Ltd. | | TWD | | | 37,000 | | | | 165,705 | | | | 1.92 | |
Chipbond Technology Corp. | | TWD | | | 75,000 | | | | 99,620 | | | | 1.15 | |
Egis Technology, Inc. | | TWD | | | 17,434 | | | | 74,694 | | | | 0.86 | |
Largan Precision Co. Ltd. | | TWD | | | 3,000 | | | | 209,602 | | | | 2.43 | |
Phison Electronics Corp. | | TWD | | | 13,000 | | | | 108,254 | | | | 1.25 | |
| | | | | | | | | 848,896 | | | | 9.82 | |
Thailand (Cost $76,323) | | | | | | | | | | | | | | |
Kasikornbank PCL NVDR | | THB | | | 15,900 | | | | 75,324 | | | | 0.87 | |
| | | | | | | | | 75,324 | | | | 0.87 | |
Turkey (Cost $113,570) | | | | | | | | | | | | | | |
Emlak Konut Gayrimenkul Yatirim Ortakligi A.S. | | TRY | | | 43,095 | | | | 46,367 | | | | 0.54 | |
Yapi ve Kredi Bankasi A.S. | | TRY | | | 60,548 | | | | 92,629 | | | | 1.07 | |
| | | | | | | | | 138,996 | | | | 1.61 | |
United Arab Emirates (Cost $138,640) | | | | | | | | | | | | | | |
Emaar Properties PJSC | | AED | | | 100,370 | | | | 184,602 | | | | 2.14 | |
| | | | | | | | | 184,602 | | | | 2.14 | |
Total Common Stock (Cost $7,121,064) | | | | | | | | | 7,043,780 | | | | 81.49 | |
| | | | |
Preferred Stock | | | | | | | | | | | | | | |
| | | | |
Brazil (Cost $838,634) | | | | | | | | | | | | | | |
Bradespar S.A. | | BRL | | | 39,200 | | | | 96,540 | | | | 1.12 | |
Braskem S.A. ADR | | | | | 12,762 | | | | 181,858 | | | | 2.10 | |
Itau Unibanco Holding S.A. ADR | | | | | 32,800 | | | | 312,584 | | | | 3.62 | |
Suzano Papel e Celulose S.A., Class A | | BRL | | | 67,400 | | | | 257,313 | | | | 2.98 | |
| | | | | | | | | 848,295 | | | | 9.82 | |
Colombia (Cost $106,822) | | | | | | | | | | | | | | |
Avianca Holdings S.A. ADR | | | | | 10,003 | | | | 58,117 | | | | 0.67 | |
| | | | | | | | | 58,117 | | | | 0.67 | |
Total Preferred Stock (Cost $945,456) | | | | | | | | | 906,412 | | | | 10.49 | |
| | | | |
Equity-Linked Securities | | | | | | | | | | | | | | |
| | | | |
India (Cost $529,747) | | | | | | | | | | | | | | |
Adani Ports and Special Economic Zone Ltd., Issued by JP Morgan Structured Products B.V. | | | | | 42,395 | | | | 151,746 | | | | 1.75 | |
See accompanying notes to the financial statements.
106
ASHMORE EMERGING MARKETS VALUE FUND
SCHEDULE OF INVESTMENTS (CONTINUED)
As of April 30, 2016 (Unaudited)
| | | | | | | | | | | | | | |
| | | Currency(1) | | Shares | | | Value | | | % of Net
Assets | |
India - (continued) | | | | | | | | | | | | | | |
Axis Bank Ltd., Issued by Merrill Lynch
International & Co. | | | | | 21,410 | | | $ | 151,766 | | | | 1.76 | |
Bharat Petroleum Corp. Ltd., Issued by JP Morgan
Structured Products B.V. | | | | | 6,980 | | | | 103,063 | | | | 1.19 | |
Shriram Transport Finance Co. Ltd., Issued by JP Morgan
Structured Products B.V. | | | | | 5,003 | | | | 70,943 | | | | 0.82 | |
Tech Mahindra Ltd., Issued by JP Morgan Structured
Products B.V. | | | | | 13,616 | | | | 99,476 | | | | 1.15 | |
| | | | | | | | | 576,994 | | | | 6.67 | |
Total Equity-Linked Securities (Cost $529,747) | | | | | | | | | 576,994 | | | | 6.67 | |
| | | | |
Total Investments (Total Cost $8,596,267) | | | | | | | | | 8,527,186 | | | | 98.65 | |
| | | | |
Other Assets Less Liabilities (See Statements of Assets and Liabilities for further detail) | | | | | | | | | 116,513 | | | | 1.35 | |
| | | | |
Net Assets | | | | | | | | $ | 8,643,699 | | | | 100.00 | |
| (1) | Par values are stated in United States Dollars unless otherwise noted below. |
| (2) | Securities exempt from registration under Rule 144A of the Securities Act of 1933. These securities may not be publicly traded without registration under the Securities Act of 1933. |
| (3) | Restricted security that has been deemed illiquid. At April 30, 2016, the value of this restricted illiquid security amounted to $118,027 or 1.4% of net assets. Additional information on each restricted illiquid security is as follows: |
| | | | |
| SECURITY | | ACQUISITION DATE | | ACQUISITION COST |
Reliance Industries Ltd. GDR | | 08/03/2015 | | $116,141 |
Percentages shown are based on net assets.
At April 30, 2016, the industry sectors for the Ashmore Emerging Markets Equity Fund were:
| | | | |
| Sector | | Percentage of
Net Assets | |
Consumer Discretionary | | | 1.9% | |
Energy | | | 13.5 | |
Financials | | | 34.5 | |
Health Care | | | 1.2 | |
Industrials | | | 6.5 | |
Information Technology | | | 22.8 | |
Materials | | | 17.7 | |
Utilities | | | 0.6 | |
Total Investments | | | 98.7 | |
Other Assets Less Liabilities | | | 1.3 | |
Net Assets | | | 100.0% | |
| | |
See accompanying notes to the financial statements.
107
ASHMORE EMERGING MARKETS VALUE FUND
SCHEDULE OF INVESTMENTS (CONTINUED)
As of April 30, 2016 (Unaudited)
The inputs or methodologies used for valuing securities are not necessarily an indication of the risks associated with investing in those securities and other financial instruments, if any. See note 4 in the Notes to the Financial Statements for more information regarding pricing inputs and valuation techniques. The following is a summary of the inputs used in valuing the Ashmore Emerging Markets Equity Fund’s investments, as of April 30, 2016.
| | | | | | | | | | | | | | |
| | | Level 1 | | | Level 2 | | | Level 3 | | Total | |
Investments | | | | | | | | | | | | | | |
Assets: | | | | | | | | | | | | | | |
Common Stock | | | | | | | | | | | | | | |
Argentina | | $ | 221,575 | | | $ | — | | | $ — | | $ | 221,575 | |
Brazil | | | 252,322 | | | | — | | | — | | | 252,322 | |
China | | | 426,141 | | | | 1,860,218 | | | — | | | 2,286,359 | |
Czech Republic | | | — | | | | 41,432 | | | — | | | 41,432 | |
India | | | — | | | | 118,027 | | | — | | | 118,027 | |
Indonesia | | | — | | | | 161,276 | | | — | | | 161,276 | |
Mexico | | | 653,861 | | | | — | | | — | | | 653,861 | |
Peru | | | 189,046 | | | | — | | | — | | | 189,046 | |
Russian Federation | | | 171,461 | | | | 421,181 | | | — | | | 592,642 | |
South Africa | | | 192,871 | | | | — | | | — | | | 192,871 | |
South Korea | | | — | | | | 1,086,551 | | | — | | | 1,086,551 | |
Taiwan | | | — | | | | 848,896 | | | — | | | 848,896 | |
Thailand | | | — | | | | 75,324 | | | — | | | 75,324 | |
Turkey | | | — | | | | 138,996 | | | — | | | 138,996 | |
United Arab Emirates | | | — | | | | 184,602 | | | — | | | 184,602 | |
| | | | | | | | | | | | | | |
Total Common Stock | | | 2,107,277 | | | | 4,936,503 | | | — | | | 7,043,780 | |
Preferred Stock | | | | | | | | | | | | | | |
Brazil | | | 848,295 | | | | — | | | — | | | 848,295 | |
Colombia | | | 58,117 | | | | — | | | — | | | 58,117 | |
| | | | | | | | | | | | | | |
Total Preferred Stock | | | 906,412 | | | | — | | | — | | | 906,412 | |
Equity-Linked Securities | | | | | | | | | | | | | | |
India | | | — | | | | 576,994 | | | — | | | 576,994 | |
| |
Total Investments | | $ | 3,013,689 | | | $ | 5,513,497 | | | $ — | | $ | 8,527,186 | |
| |
The Fund discloses all transfers between levels based on valuations at the end of each reporting period. At April 30, 2016, the Fund had transfers as disclosed below:
Transfers from Level 1 to Level 2
| | | | | | |
| Country | | Value | | Reason | | |
|
Common Stocks | | | | | | |
China | | $1,447,382 | | Fair value factor was applicable in the current period. | | |
Czech Republic | | 41,432 | | Fair value factor was applicable in the current period. | | |
India | | 118,027 | | Fair value factor was applicable in the current period. | | |
Indonesia | | 85,530 | | Fair value factor was applicable in the current period. | | |
South Korea | | 679,736 | | Fair value factor was applicable in the current period. | | |
Taiwan | | 373,579 | | Fair value factor was applicable in the current period. | | |
Thailand | | 75,324 | | Fair value factor was applicable in the current period. | | |
Turkey | | 92,629 | | Fair value factor was applicable in the current period. | | |
|
Total | | $2,913,639 | | | | |
|
See accompanying notes to the financial statements.
108
ASHMORE EMERGING MARKETS VALUE FUND
SCHEDULE OF INVESTMENTS (CONTINUED)
As of April 30, 2016 (Unaudited)
At April 30, 2016, for U.S. federal income tax purposes, gross unrealized appreciation, gross unrealized depreciation, net unrealized appreciation/(depreciation) on investments in securities (including the effects of foreign currency translation) and the cost basis of investments were as follows:
| | | | |
Federal tax cost of investments | | $ | 8,739,759 | |
Gross tax appreciation of investments | | | 575,435 | |
Gross tax depreciation of investments | | | (788,008) | |
Net tax depreciation of investments | | | $(212,573) | |
The difference between book basis and tax basis net unrealized appreciation or depreciation is attributable primarily to the tax deferral of losses on wash sales.
See accompanying notes to the financial statements.
109
ASHMORE EMERGING MARKETS SMALL-CAP EQUITY FUND
SCHEDULE OF INVESTMENTS
As of April 30, 2016 (Unaudited)
| | | | | | | | | | | | | | |
| | | Currency(1) | | Shares | | | Value | | | % of Net
Assets | |
Common Stock | | | | | | | | | | | | | | |
| | | | |
Argentina (Cost $763,019) | | | | | | | | | | | | | | |
IRSA Inversiones y Representaciones S.A. ADR | | | | | 22,923 | | | $ | 339,948 | | | | 1.12 | |
Pampa Energia S.A. ADR | | | | | 19,002 | | | | 388,781 | | | | 1.29 | |
| | | | | | | | | 728,729 | | | | 2.41 | |
Brazil (Cost $2,475,573) | | | | | | | | | | | | | | |
Adecoagro S.A. | | | | | 84,153 | | | | 897,071 | | | | 2.96 | |
Cosan S.A. Industria e Comercio | | BRL | | | 58,400 | | | | 540,657 | | | | 1.79 | |
SLC Agricola S.A. | | BRL | | | 93,600 | | | | 422,381 | | | | 1.40 | |
Tereos Internacional S.A. | | BRL | | | 4,300 | | | | 72,078 | | | | 0.24 | |
Tupy S.A. | | BRL | | | 73,300 | | | | 290,920 | | | | 0.96 | |
| | | | | | | | | 2,223,107 | | | | 7.35 | |
Chile (Cost $1,254,998) | | | | | | | | | | | | | | |
Cia Sud Americana de Vapores S.A. | | CLP | | | 9,299,655 | | | | 195,797 | | | | 0.64 | |
Vina Concha y Toro S.A. | | CLP | | | 430,259 | | | | 722,487 | | | | 2.39 | |
| | | | | | | | | 918,284 | | | | 3.03 | |
China (Cost $7,687,578) | | | | | | | | | | | | | | |
Boer Power Holdings Ltd. | | HKD | | | 559,000 | | | | 313,103 | | | | 1.03 | |
China Lesso Group Holdings Ltd. | | HKD | | | 544,000 | | | | 298,811 | | | | 0.99 | |
China Machinery Engineering Corp., Class H | | HKD | | | 691,000 | | | | 468,016 | | | | 1.55 | |
Far East Horizon Ltd. | | HKD | | | 612,000 | | | | 482,231 | | | | 1.59 | |
Greatview Aseptic Packaging Co. Ltd. | | HKD | | | 562,000 | | | | 284,533 | | | | 0.94 | |
Huadian Fuxin Energy Corp. Ltd., Class H | | HKD | | | 798,000 | | | | 173,976 | | | | 0.58 | |
Ju Teng International Holdings Ltd. | | HKD | | | 1,863,000 | | | | 833,721 | | | | 2.76 | |
Kingsoft Corp. Ltd. | | HKD | | | 191,000 | | | | 438,779 | | | | 1.45 | |
Minth Group Ltd. | | HKD | | | 188,000 | | | | 491,022 | | | | 1.62 | |
Noah Holdings Ltd. ADR | | | | | 12,000 | | | | 294,960 | | | | 0.98 | |
Shenzhen Investment Ltd. | | HKD | | | 1,158,000 | | | | 466,887 | | | | 1.54 | |
Sinovac Biotech Ltd. | | | | | 29 | | | | 183 | | | | — | |
Sunac China Holdings Ltd. | | HKD | | | 1,381,000 | | | | 881,661 | | | | 2.91 | |
Tarena International, Inc. ADR | | | | | 27,962 | | | | 309,819 | | | | 1.02 | |
Technovator International Ltd. | | HKD | | | 306,000 | | | | 154,713 | | | | 0.51 | |
Xinchen China Power Holdings Ltd. | | HKD | | | 981,000 | | | | 152,348 | | | | 0.50 | |
| | | | | | | | | 6,044,763 | | | | 19.97 | |
Colombia (Cost $361,808) | | | | | | | | | | | | | | |
Gran Tierra Energy, Inc. | | | | | 148,100 | | | | 438,376 | | | | 1.45 | |
| | | | | | | | | 438,376 | | | | 1.45 | |
Indonesia (Cost $206,819) | | | | | | | | | | | | | | |
Berlian Laju Tanker Tbk PT | | IDR | | | 4,428,000 | | | | 16,452 | | | | 0.06 | |
Mitra Adiperkasa Tbk PT | | IDR | | | 469,300 | | | | 149,250 | | | | 0.49 | |
| | | | | | | | | 165,702 | | | | 0.55 | |
Mexico (Cost $2,337,286) | | | | | | | | | | | | | | |
Credito Real S.A.B. de C.V. SOFOM E.R. | | MXN | | | 375,372 | | | | 827,995 | | | | 2.74 | |
Grupo Aeromexico S.A.B. de C.V. | | MXN | | | 106,600 | | | | 243,131 | | | | 0.80 | |
Grupo Famsa S.A.B. de C.V., Series A | | MXN | | | 136,382 | | | | 103,210 | | | | 0.34 | |
Grupo Lamosa S.A.B. de C.V. | | MXN | | | 99,485 | | | | 210,481 | | | | 0.70 | |
Grupo Simec S.A.B. de C.V., Series B | | MXN | | | 182,662 | | | | 609,417 | | | | 2.01 | |
Vitro S.A.B. de C.V., Series A | | MXN | | | 143,058 | | | | 494,248 | | | | 1.63 | |
| | | | | | | | | 2,488,482 | | | | 8.22 | |
Pakistan (Cost $390,363) | | | | | | | | | | | | | | |
D.G. Khan Cement Co. Ltd. | | PKR | | | 266,600 | | | | 444,230 | | | | 1.47 | |
| | | | | | | | | 444,230 | | | | 1.47 | |
See accompanying notes to the financial statements.
110
ASHMORE EMERGING MARKETS SMALL-CAP EQUITY FUND
SCHEDULE OF INVESTMENTS (CONTINUED)
As of April 30, 2016 (Unaudited)
| | | | | | | | | | | | | | |
| | | Currency(1) | | Shares | | | Value | | | % of Net
Assets | |
Philippines (Cost $284,243) | | | | | | | | | | | | | | |
Century Properties Group, Inc. | | PHP | | | 10,027,001 | | | $ | 117,552 | | | | 0.39 | |
| | | | | | | | | 117,552 | | | | 0.39 | |
Poland (Cost $258,855) | | | | | | | | | | | | | | |
Kernel Holding S.A. | | PLN | | | 20,372 | | | | 274,726 | | | | 0.91 | |
| | | | | | | | | 274,726 | | | | 0.91 | |
Russian Federation (Cost $1,343,247) | | | | | | | | | | | | | | |
Aeroflot - Russian Airlines PJSC | | RUB | | | 199,560 | | | | 239,065 | | | | 0.79 | |
Aeroflot - Russian Airlines PJSC (Moscow Exchange) | | | | | 449,700 | | | | 537,925 | | | | 1.78 | |
LSR Group PJSC GDR (Registered) | | | | | 279,939 | | | | 630,589 | | | | 2.08 | |
| | | | | | | | | 1,407,579 | | | | 4.65 | |
South Africa (Cost $175,887) | | | | | | | | | | | | | | |
JSE Ltd. | | ZAR | | | 15,104 | | | | 175,069 | | | | 0.58 | |
| | | | | | | | | 175,069 | | | | 0.58 | |
South Korea (Cost $3,112,720) | | | | | | | | | | | | | | |
AfreecaTV Co. Ltd. | | KRW | | | 5,542 | | | | 140,540 | | | | 0.46 | |
Com2uSCorp | | KRW | | | 4,132 | | | | 468,054 | | | | 1.55 | |
Cosmax, Inc. | | KRW | | | 3,960 | | | | 486,352 | | | | 1.61 | |
DuzonBizon Co. Ltd. | | KRW | | | 11,729 | | | | 255,924 | | | | 0.84 | |
Hyundai Mipo Dockyard Co. Ltd. | | KRW | | | 8,821 | | | | 564,189 | | | | 1.86 | |
Interpark Corp. | | KRW | | | 17,139 | | | | 292,773 | | | | 0.97 | |
LIG Nex1 Co. Ltd. | | KRW | | | 3,625 | | | | 283,463 | | | | 0.94 | |
Modetour Network, Inc. | | KRW | | | 14,611 | | | | 371,511 | | | | 1.23 | |
Viatron Technologies, Inc. | | KRW | | | 13,404 | | | | 336,258 | | | | 1.11 | |
| | | | | | | | | 3,199,064 | | | | 10.57 | |
Taiwan (Cost $5,147,011) | | | | | | | | | | | | | | |
AcBel Polytech, Inc. | | TWD | | | 582,000 | | | | 427,337 | | | | 1.41 | |
Altek Corp. | | TWD | | | 145,900 | | | | 108,998 | | | | 0.36 | |
AU Optronics Corp. | | TWD | | | 3,001,000 | | | | 871,205 | | | | 2.88 | |
Capital Securities Corp. | | TWD | | | 135,000 | | | | 35,558 | | | | 0.12 | |
Casetek Holdings Ltd. | | TWD | | | 100,000 | | | | 447,851 | | | | 1.48 | |
Chipbond Technology Corp. | | TWD | | | 238,000 | | | | 316,126 | | | | 1.05 | |
Egis Technology, Inc. | | TWD | | | 206,244 | | | | 883,629 | | | | 2.92 | |
Fulgent Sun International Holding Co. Ltd. | | TWD | | | 376,000 | | | | 721,372 | | | | 2.38 | |
MPI Corp. | | TWD | | | 237,000 | | | | 512,108 | | | | 1.69 | |
On-Bright Electronics, Inc. | | TWD | | | 85,000 | | | | 447,461 | | | | 1.48 | |
| | | | | | | | | 4,771,645 | | | | 15.77 | |
Thailand (Cost $879,647) | | | | | | | | | | | | | | |
Amata Corp. PCL (Registered) | | THB | | | 1,061,700 | | | | 361,702 | | | | 1.19 | |
Supalai PCL (Registered) | | THB | | | 887,200 | | | | 520,687 | | | | 1.72 | |
| | | | | | | | | 882,389 | | | | 2.91 | |
Turkey (Cost $1,075,260) | | | | | | | | | | | | | | |
Kardemir Karabuk Demir Celik Sanayi ve Ticaret A.S., Class D | | TRY | | | 1,014,755 | | | | 536,604 | | | | 1.78 | |
Tekfen Holding A.S. | | TRY | | | 303,400 | | | | 648,505 | | | | 2.14 | |
| | | | | | | | | 1,185,109 | | | | 3.92 | |
Total Common Stock (Cost $27,754,314) | | | | | | | | | 25,464,806 | | | | 84.15 | |
| | | | |
Preferred Stock | | | | | | | | | | | | | | |
| | | | |
Brazil (Cost $1,266,028) | | | | | | | | | | | | | | |
Banco ABC Brasil S.A. | | BRL | | | 132,893 | | | | 457,885 | | | | 1.51 | |
Bradespar S.A. | | BRL | | | 138,500 | | | | 341,091 | | | | 1.13 | |
See accompanying notes to the financial statements.
111
ASHMORE EMERGING MARKETS SMALL-CAP EQUITY FUND
SCHEDULE OF INVESTMENTS (CONTINUED)
As of April 30, 2016 (Unaudited)
| | | | | | | | | | | | | | |
| | | Currency(1) | | Shares | | | Value | | | % of Net Assets | |
Brazil - (continued) | | | | | | | | | | | | | | |
Suzano Papel e Celulose S.A., Class A | | BRL | | | 126,000 | | | $ | 481,029 | | | | 1.59 | |
| | | | | | | | | 1,280,005 | | | | 4.23 | |
Colombia (Cost $1,016,397) | | | | | | | | | | | | | | |
Avianca Holdings S.A. ADR | | | | | 91,980 | | | | 534,404 | | | | 1.77 | |
| | | | | | | | | 534,404 | | | | 1.77 | |
Total Preferred Stock (Cost $2,282,425) | | | | | | | | | 1,814,409 | | | | 6.00 | |
| | | | |
Equity-Linked Securities | | | | | | | | | | | | | | |
| | | | |
India (Cost $2,346,908) | | | | | | | | | | | | | | |
Arvind Ltd., Issued by JP Morgan Structured Products | | | | | 140,887 | | | | 586,986 | | | | 1.94 | |
Balrampur Chini Mills Ltd., Issued by Merrill Lynch International & Co. | | | | | 453,904 | | | | 729,867 | | | | 2.41 | |
Gujarat Pipavav Port Ltd., Issued by Merrill Lynch International & Co. | | | | | 185,397 | | | | 475,221 | | | | 1.57 | |
MT Educare Ltd., Issued by Merrill Lynch International & Co. | | | | | 137,117 | | | | 348,613 | | | | 1.15 | |
Persistent Systems Ltd., Issued by JP Morgan Structured Products | | | | | 12,843 | | | | 143,323 | | | | 0.48 | |
Union Bank of India, Issued by JP Morgan Structured Products | | | | | 200,001 | | | | 381,847 | | | | 1.26 | |
| | | | | | | | | 2,665,857 | | | | 8.81 | |
Total Equity-Linked Securities (Cost $2,346,908) | | | | | | | | | 2,665,857 | | | | 8.81 | |
| | | | |
Total Investments (Total Cost $32,383,647) | | | | | | | | | 29,945,072 | | | | 98.96 | |
| | | | |
Other Assets Less Liabilities (See Statements of Assets and Liabilities for further detail) | | | | | | | | | 314,791 | | | | 1.04 | |
| | | | |
Net Assets | | | | | | | | $ | 30,259,863 | | | | 100.00 | |
| (1) | Par values are stated in United States Dollars unless otherwise noted below. |
Percentages shown are based on net assets.
See accompanying notes to the financial statements.
112
ASHMORE EMERGING MARKETS SMALL-CAP EQUITY FUND
SCHEDULE OF INVESTMENTS (CONTINUED)
As of April 30, 2016 (Unaudited)
At April 30, 2016, the Ashmore Emerging Markets Small-Cap Equity Fund had outstanding forward foreign currency exchange contracts as follows:
| | | | | | | | | | | | | | |
Settlement
Date | | Counterparty | | Currency
Buy | | Currency Buy
Amount
(Local
Currency) | | Currency Sell | | Currency Sell
Amount
(Local
Currency) | | Unrealized Gain/(Loss) | |
05/04/2016 | | Brown Brothers Harriman | | South African Rand | | 641,537 | | United States Dollar | | 44,228 | | $ | 799 | |
05/05/2016 | | Brown Brothers Harriman | | South African Rand | | 641,213 | | United States Dollar | | 44,466 | | | 528 | |
05/06/2016 | | Brown Brothers Harriman | | South African Rand | | 416,040 | | United States Dollar | | 29,175 | | | 12 | |
05/09/2016 | | Brown Brothers Harriman | | South African Rand | | 825,081 | | United States Dollar | | 57,854 | | | (9) | |
| | | | | | | | | | | | | | |
Total | | | | | | | | | | | | $ | 1,330 | |
| | | | | | | | | | | | | | |
At April 30, 2016, the industry sectors for the Ashmore Emerging Markets Small-Cap Equity Fund were:
| | | | |
| Sector | | Percentage of
Net Assets | |
Consumer Discretionary | | | 13.0% | |
Consumer Staples | | | 11.9 | |
Energy | | | 3.2 | |
Financials | | | 19.8 | |
Industrials | | | 18.0 | |
Information Technology | | | 20.7 | |
Materials | | | 10.5 | |
Utilities | | | 1.9 | |
Total Investments | | | 99.0 | |
Other Assets Less Liabilities | | | 1.0 | |
Net Assets | | | 100.0% | |
| | |
See accompanying notes to the financial statements.
113
ASHMORE EMERGING MARKETS SMALL-CAP EQUITY FUND
SCHEDULE OF INVESTMENTS (CONTINUED)
As of April 30, 2016 (Unaudited)
The inputs or methodologies used for valuing securities are not necessarily an indication of the risks associated with investing in those securities and other financial instruments, if any. See note 4 in the Notes to the Financial Statements for more information regarding pricing inputs and valuation techniques. The following is a summary of the inputs used in valuing the Ashmore Emerging Markets Small-Cap Equity Fund’s investments and other financial instruments, which are carried at fair value, as of April 30, 2016:
| | | | | | | | | | | | | | | | |
| | | Level 1 | | | Level 2 | | | Level 3 | | | Total | |
Investments | | | | | | | | | | | | | | | | |
Assets: | | | | | | | | | | | | | | | | |
Common Stock | | | | | | | | | | | | | | | | |
Argentina | | $ | 728,729 | | | $ | — | | | $ | — | | | $ | 728,729 | |
Brazil | | | 2,223,107 | | | | — | | | | — | | | | 2,223,107 | |
Chile | | | 918,284 | | | | — | | | | — | | | | 918,284 | |
China | | | 604,963 | | | | 5,439,800 | | | | — | | | | 6,044,763 | |
Colombia | | | 438,376 | | | | — | | | | — | | | | 438,376 | |
Indonesia | | | — | | | | 149,250 | | | | 16,452 | | | | 165,702 | |
Mexico | | | 2,488,482 | | | | — | | | | — | | | | 2,488,482 | |
Pakistan | | | — | | | | 444,230 | | | | — | | | | 444,230 | |
Philippines | | | — | | | | 117,552 | | | | — | | | | 117,552 | |
Poland | | | — | | | | 274,726 | | | | — | | | | 274,726 | |
Russian Federation | | | 859,441 | | | | 548,138 | | | | — | | | | 1,407,579 | |
South Africa | | | — | | | | 175,069 | | | | — | | | | 175,069 | |
South Korea | | | — | | | | 3,199,064 | | | | — | | | | 3,199,064 | |
Taiwan | | | — | | | | 4,771,645 | | | | — | | | | 4,771,645 | |
Thailand | | | — | | | | 882,389 | | | | — | | | | 882,389 | |
Turkey | | | — | | | | 1,185,109 | | | | — | | | | 1,185,109 | |
| | | | | | | | | | | | | | | | |
Total Common Stock | | | 8,261,382 | | | | 17,186,972 | | | | 16,452 | | | | 25,464,806 | |
Preferred Stock | | | | | | | | | | | | | | | | |
Brazil | | | 1,280,005 | | | | — | | | | — | | | | 1,280,005 | |
Colombia | | | 534,404 | | | | — | | | | — | | | | 534,404 | |
| | | | | | | | | | | | | | | | |
Total Preferred Stock | | | 1,814,409 | | | | — | | | | — | | | | 1,814,409 | |
Equity-Linked Securities | | | | | | | | | | | | | | | | |
India | | | — | | | | 2,665,857 | | | | — | | | | 2,665,857 | |
Total Investments | | $ | 10,075,791 | | | $ | 19,852,829 | | | $ | 16,452 | | | $ | 29,945,072 | |
| | | | |
Other Financial Instruments | | | | | | | | | | | | | | | | |
Assets: | | | | | | | | | | | | | | | | |
Forward Foreign Currency Exchange | | | | | | | | | | | | | | | | |
Contracts | | $ | — | | | $ | 1,339 | | | $ | — | | | $ | 1,339 | |
Liabilities: | | | | | | | | | | | | | | | | |
Forward Foreign Currency Exchange | | | | | | | | | | | | | | | | |
Contracts | | | — | | | | (9 | ) | | | — | | | | (9 | ) |
Total Other Financial Instruments | | $ | — | | | $ | 1,330 | | | $ | — | | | $ | 1,330 | |
See accompanying notes to the financial statements.
114
ASHMORE EMERGING MARKETS SMALL-CAP EQUITY FUND
SCHEDULE OF INVESTMENTS (CONTINUED)
As of April 30, 2016 (Unaudited)
The Fund discloses all transfers between levels based on valuations at the end of each reporting period. At April 30, 2016, the Fund had transfers as disclosed below:
Transfers from Level 1 to Level 2
| | | | | | | | |
| Country | | | | Value | | | Reason |
Common Stocks | | | | | | | | |
China | | | | | $ 4,225,466 | | | Fair value factor was applicable in the current period. |
Indonesia | | | | | 149,250 | | | Fair value factor was applicable in the current period. |
Pakistan | | | | | 444,230 | | | Fair value factor was applicable in the current period. |
Philippines | | | | | 117,552 | | | Fair value factor was applicable in the current period. |
Poland | | | | | 274,726 | | | Fair value factor was applicable in the current period. |
Russian Federation | | | | | 548,138 | | | Fair value factor was applicable in the current period. |
South Korea | | | | | 1,132,337 | | | Fair value factor was applicable in the current period. |
Taiwan | | | | | 2,589,474 | | | Fair value factor was applicable in the current period. |
Turkey | | | | | 1,185,109 | | | Fair value factor was applicable in the current period. |
Total | | | | | $10,666,282 | | | |
The following is a reconciliation of investments in which significant unobservable inputs (Level 3) were used in determining fair value:
| | | | | | | | | | | | | | | | | | |
Category and Subcategory | | Beginning
Balance at 10/31/2015 | | Purchases | | Sales | | Realized
Gains
(Losses) | | Change in Unrealized
Appreciation (Depreciation) | | Transfer
into
Level 3 | | Transfer
out of
Level 3 | | Ending
Balance at 04/30/2016 | | Change in
Unrealized
Appreciation
(Depreciation)
from Investments
still held at 04/30/2016 |
Investments, at value | | | | | | | | | | | | | | | | | | |
Common Stock | | $15,852 | | $ — | | $ — | | $ — | | $600 | | $ — | | $ — | | $16,452 | | $600 |
Total | | $15,852 | | $ — | | $ — | | $ — | | $600 | | $ — | | $ — | | $16,452 | | $600 |
See the table on “Quantitative information about Fair Value measurements” for information on the valuation techniques and inputs used to value Level 3 securities at April 30, 2016.
| | | | | | | | |
| Quantitative Information about Level 3 Fair Value Measurements |
| | | Fair Value at
04/30/2016 | | Valuation Technique | | Unobservable
Input | | Actual |
Common Stock | | $16,452 | | Discount from last
traded price | | Discount
Percentage | | 75% |
The significant unobservable inputs used in the fair value measurement of the Fund’s investments are listed above. Generally, a change in the assumptions used in any input in isolation may be accompanied by a change in another input. Significant changes in any of the unobservable inputs may significantly impact the fair value measurement. The impact is based on the relationship between each unobservable input and the fair value measurement. The increase in discount percentage reduced the value of the security.
See accompanying notes to the financial statements.
115
ASHMORE EMERGING MARKETS SMALL-CAP EQUITY FUND
SCHEDULE OF INVESTMENTS (CONTINUED)
As of April 30, 2016 (Unaudited)
The following is a summary of the fair values of the Fund’s derivative instruments*:
The Effect of Financial Derivative Instruments on the Statements of Operations for the Six Months Ended April 30, 2016:
| | |
| | | Derivatives Not Accounted
for as Hedging Instruments |
| | | Foreign Exchange |
Unrealized Gain (Loss) on Derivatives Recognized resulting from Operations: | | |
Net Unrealized Gain on Forward Foreign Currency Exchange Contracts | | $ 1,330 |
| | |
* See note 10 in the Notes to the Financial Statements for additional information.
At April 30, 2016, for U.S. federal income tax purposes, gross unrealized appreciation, gross unrealized depreciation, net unrealized appreciation/(depreciation) on investments in securities (including the effects of foreign currency translation) and the cost basis of investments were as follows:
| | | | |
Federal tax cost of investments | | $ | 32,688,048 | |
Gross tax appreciation of investments | | | 1,989,570 | |
Gross tax depreciation of investments | | | (4,732,546) | |
Net tax depreciation of investments | | $ | (2,742,976) | |
The difference between book basis and tax basis net unrealized appreciation or depreciation is attributable primarily to the tax deferral of losses on wash sales and other transactions.
See accompanying notes to the financial statements.
116
ASHMORE EMERGING MARKETS FRONTIER EQUITY FUND
SCHEDULE OF INVESTMENTS
As of April 30, 2016 (Unaudited)
| | | | | | | | | | | | | | |
| | | Currency(1) | | Shares | | | Value | | | % of Net
Assets | |
Common Stock | | | | | | | | | | | | | | |
| | | | |
Argentina (Cost $5,568,954) | | | | | | | | | | | | | | |
Banco Macro S.A. ADR | | | | | 25,232 | | | $ | 1,580,280 | | | | 3.21 | |
BBVA Banco Frances S.A. ADR | | | | | 47,149 | | | | 994,844 | | | | 2.02 | |
Grupo Financiero Galicia S.A. ADR | | | | | 55,739 | | | | 1,586,889 | | | | 3.23 | |
Pampa Energia S.A. ADR | | | | | 48,359 | | | | 989,425 | | | | 2.01 | |
YPF S.A. ADR | | | | | 69,949 | | | | 1,409,473 | | | | 2.87 | |
| | | | | | | | | 6,560,911 | | | | 13.34 | |
Bangladesh (Cost $851,299) | | | | | | | | | | | | | | |
Islami Bank Bangladesh Ltd. | | BDT | | | 2,777,274 | | | | 784,504 | | | | 1.59 | |
| | | | | | | | | 784,504 | | | | 1.59 | |
Colombia (Cost $428,299) | | | | | | | | | | | | | | |
Gran Tierra Energy, Inc. | | | | | 172,200 | | | | 509,712 | | | | 1.04 | |
| | | | | | | | | 509,712 | | | | 1.04 | |
Egypt (Cost $3,094,292) | | | | | | | | | | | | | | |
Commercial International Bank Egypt S.A.E. GDR (Registered) | | | | | 299,508 | | | | 1,117,581 | | | | 2.27 | |
Eastern Tobacco | | EGP | | | 54,389 | | | | 1,101,812 | | | | 2.24 | |
Integrated Diagnostics Holdings PLC(2) | | | | | 152,620 | | | | 711,529 | | | | 1.45 | |
| | | | | | | | | 2,930,922 | | | | 5.96 | |
Indonesia (Cost $785,085) | | | | | | | | | | | | | | |
Pakuwon Jati Tbk PT | | IDR | | | 26,845,400 | | | | 1,065,586 | | | | 2.17 | |
| | | | | | | | | 1,065,586 | | | | 2.17 | |
Kazakhstan (Cost $2,942,336) | | | | | | | | | | | | | | |
Halyk Savings Bank of Kazakhstan JSC GDR (Registered) | | | | | 428,620 | | | | 1,543,084 | | | | 3.14 | |
| | | | | | | | | 1,543,084 | | | | 3.14 | |
Kenya (Cost $850,554) | | | | | | | | | | | | | | |
KCB Group Ltd. | | KES | | | 2,016,500 | | | | 827,442 | | | | 1.68 | |
| | | | | | | | | 827,442 | | | | 1.68 | |
Kuwait (Cost $6,470,186) | | | | | | | | | | | | | | |
Agility Public Warehousing Co. K.S.C. | | KWD | | | 212,835 | | | | 357,882 | | | | 0.73 | |
Kuwait Food Co. Americana S.A.K. | | KWD | | | 125,849 | | | | 1,014,077 | | | | 2.06 | |
Mabanee Co. S.A.K. | | KWD | | | 404,492 | | | | 1,154,079 | | | | 2.35 | |
Mobile Telecommunications Co. K.S.C. | | KWD | | | 697,615 | | | | 808,533 | | | | 1.64 | |
National Bank of Kuwait S.A.K.P. | | KWD | | | 1,033,902 | | | | 2,300,711 | | | | 4.68 | |
National Gulf Holding(3) | | KWD | | | 167,379 | | | | — | | | | — | |
| | | | | | | | | 5,635,282 | | | | 11.46 | |
Nigeria (Cost $1,104,966) | | | | | | | | | | | | | | |
Zenith Bank PLC | | NGN | | | 16,416,512 | | | | 651,523 | | | | 1.32 | |
| | | | | | | | | 651,523 | | | | 1.32 | |
Oman (Cost $1,212,585) | | | | | | | | | | | | | | |
Bank Muscat S.A.O.G. | | OMR | | | 1,176,854 | | | | 1,245,793 | | | | 2.53 | |
| | | | | | | | | 1,245,793 | | | | 2.53 | |
Pakistan (Cost $9,071,524) | | | | | | | | | | | | | | |
Bank Al Habib Ltd. | | PKR | | | 1,000,500 | | | | 400,112 | | | | 0.81 | |
D.G. Khan Cement Co. Ltd. | | PKR | | | 1,029,400 | | | | 1,715,267 | | | | 3.49 | |
Engro Corp. Ltd. | | PKR | | | 433,100 | | | | 1,292,130 | | | | 2.63 | |
Hub Power (The) Co. Ltd. | | PKR | | | 1,041,500 | | | | 1,079,438 | | | | 2.20 | |
K-Electric Ltd. | | PKR | | | 14,402,500 | | | | 989,398 | | | | 2.01 | |
Maple Leaf Cement Factory Ltd. | | PKR | | | 594,000 | | | | 542,340 | | | | 1.10 | |
Oil & Gas Development Co. Ltd. | | PKR | | | 728,800 | | | | 907,882 | | | | 1.85 | |
Pakistan Oilfields Ltd. | | PKR | | | 515,400 | | | | 1,565,961 | | | | 3.18 | |
See accompanying notes to the financial statements.
117
ASHMORE EMERGING MARKETS FRONTIER EQUITY FUND
SCHEDULE OF INVESTMENTS (CONTINUED)
As of April 30, 2016 (Unaudited)
| | | | | | | | | | | | | | | | |
| | | Currency(1) | | | Shares | | | Value | | | % of Net Assets | |
Pakistan - (continued) | | | | | | | | | | | | | | | | |
United Bank Ltd. | | | PKR | | | | 831,300 | | | $ | 1,299,966 | | | | 2.64 | |
| | | | | | | | | | | 9,792,494 | | | | 19.91 | |
Peru (Cost $1,087,694) | | | | | | | | | | | | | | | | |
Credicorp Ltd. | | | | | | | 10,200 | | | | 1,483,284 | | | | 3.01 | |
| | | | | | | | | | | 1,483,284 | | | | 3.01 | |
Philippines (Cost $964,978) | | | | | | | | | | | | | | | | |
Cosco Capital, Inc. | | | PHP | | | | 5,864,100 | | | | 991,613 | | | | 2.02 | |
| | | | | | | | | | | 991,613 | | | | 2.02 | |
Poland (Cost $1,324,868) | | | | | | | | | | | | | | | | |
Kernel Holding S.A. | | | PLN | | | | 105,315 | | | | 1,420,222 | | | | 2.89 | |
| | | | | | | | | | | 1,420,222 | | | | 2.89 | |
Sri Lanka (Cost $2,385,157) | | | | | | | | | | | | | | | | |
John Keells Holdings PLC | | | LKR | | | | 1,033,333 | | | | 1,096,143 | | | | 2.23 | |
Sampath Bank PLC | | | LKR | | | | 499,471 | | | | 795,279 | | | | 1.61 | |
| | | | | | | | | | | 1,891,422 | | | | 3.84 | |
United Arab Emirates (Cost $7,002,264) | | | | | | | | | | | | | | | | |
Agthia Group PJSC | | | AED | | | | 475,199 | | | | 1,006,163 | | | | 2.05 | |
Dubai Islamic Bank PJSC | | | AED | | | | 607,452 | | | | 965,492 | | | | 1.96 | |
Emaar Properties PJSC | | | AED | | | | 1,142,005 | | | | 2,100,396 | | | | 4.27 | |
Emirates NBD PJSC | | | AED | | | | 863,739 | | | | 1,937,151 | | | | 3.94 | |
NMC Health PLC | | | GBP | | | | 86,092 | | | | 1,319,048 | | | | 2.68 | |
| | | | | | | | | | | 7,328,250 | | | | 14.90 | |
Vietnam (Cost $2,235,486) | | | | | | | | | | | | | | | | |
Military Commercial Joint Stock Bank | | | VND | | | | 1,784,530 | | | | 1,208,728 | | | | 2.46 | |
Petrovietnam Fertilizer & Chemicals JSC | | | VND | | | | 690,780 | | | | 913,398 | | | | 1.85 | |
| | | | | | | | | | | 2,122,126 | | | | 4.31 | |
Total Common Stock (Cost $47,380,527) | | | | | | | | | | | 46,784,170 | | | | 95.11 | |
| | | | |
Preferred Stock | | | | | | | | | | | | | | | | |
| | | | |
Colombia (Cost $1,078,146) | | | | | | | | | | | | | | | | |
Banco Davivienda S.A. | | | COP | | | | 127,714 | | | | 1,203,305 | | | | 2.45 | |
| | | | | | | | | | | 1,203,305 | | | | 2.45 | |
| | | | |
Total Preferred Stock (Cost $1,078,146) | | | | | | | | | | | 1,203,305 | | | | 2.45 | |
| | | | |
Total Investments (Total Cost $48,458,673) | | | | | | | | | | | 47,987,475 | | | | 97.56 | |
| | | | |
Other Assets Less Liabilities (See Statements of Assets and Liabilities for further detail) | | | | | | | | | | | 1,202,329 | | | | 2.44 | |
| | | | |
Net Assets | | | | | | | | | | $ | 49,189,804 | | | | 100.00 | |
| (1) | Par values are stated in United States Dollars unless otherwise noted below. |
| (2) | Securities exempt from registration under Rule 144A of the Securities Act of 1933. These securities may not be publicly traded without registration under the Securities Act of 1933. |
| (3) | Security has been deemed worthless and is a Level 3 investment. |
Percentages shown are based on net assets.
See accompanying notes to the financial statements.
118
ASHMORE EMERGING MARKETS FRONTIER EQUITY FUND
SCHEDULE OF INVESTMENTS (CONTINUED)
As of April 30, 2016 (Unaudited)
At April 30, 2016, the industry sectors for the Ashmore Emerging Markets Frontier Equity Fund were:
| | |
| Sector | | Percentage of
Net Assets |
Consumer Discretionary | | 2.1% |
Consumer Staples | | 9.2 |
Energy | | 8.9 |
Financials | | 53.4 |
Health Care | | 4.1 |
Industrials | | 3.0 |
Materials | | 9.1 |
Telecommunication Services | | 1.6 |
Utilities | | 6.2 |
Total Investments | | 97.6 |
Other Assets Less Liabilities | | 2.4 |
Net Assets | | 100.0% |
The inputs or methodologies used for valuing securities are not necessarily an indication of the risks associated with investing in those securities and other financial instruments, if any. See note 4 in the Notes to the Financial Statements for more information regarding pricing inputs and valuation techniques. The following is a summary of the inputs used in valuing the Ashmore Emerging Markets Frontier Equity Fund’s investments, which are carried at fair value, as of April 30, 2016:
| | | | | | | | | | | | | | |
| | | Level 1 | | | Level 2 | | | Level 3 | | Total | |
Investments | | | | | | | | | | | | | | |
Assets: | | | | | | | | | | | | | | |
Common Stock | | | | | | | | | | | | | | |
Argentina | | $ | 6,560,911 | | | $ | — | | | $ — | | $ | 6,560,911 | |
Bangladesh | | | — | | | | 784,504 | | | — | | | 784,504 | |
Colombia | | | 509,712 | | | | — | | | — | | | 509,712 | |
Egypt | | | 1,101,812 | | | | 1,829,110 | | | — | | | 2,930,922 | |
Indonesia | | | — | | | | 1,065,586 | | | — | | | 1,065,586 | |
Kazakhstan | | | — | | | | 1,543,084 | | | — | | | 1,543,084 | |
Kenya | | | — | | | | 827,442 | | | — | | | 827,442 | |
Kuwait | | | — | | | | 5,635,282 | | | — | | | 5,635,282 | |
Nigeria | | | — | | | | 651,523 | | | — | | | 651,523 | |
Oman | | | — | | | | 1,245,793 | | | — | | | 1,245,793 | |
Pakistan | | | — | | | | 9,792,494 | | | — | | | 9,792,494 | |
Peru | | | 1,483,284 | | | | — | | | — | | | 1,483,284 | |
Philippines | | | — | | | | 991,613 | | | — | | | 991,613 | |
Poland | | | — | | | | 1,420,222 | | | — | | | 1,420,222 | |
Sri Lanka | | | — | | | | 1,891,422 | | | — | | | 1,891,422 | |
United Arab Emirates | | | — | | | | 7,328,250 | | | — | | | 7,328,250 | |
Vietnam | | | — | | | | 2,122,126 | | | — | | | 2,122,126 | |
| | | | | | | | | | | | | | |
Total Common Stock | | | 9,655,719 | | | | 37,128,451 | | | — | | | 46,784,170 | |
Preferred Stock | | | | | | | | | | | | | | |
Colombia | | | 1,203,305 | | | | — | | | — | | | 1,203,305 | |
| | | | | | | | | | | | | | |
Total Preferred Stock | | | 1,203,305 | | | | — | | | — | | | 1,203,305 | |
Total Investments | | $ | 10,859,024 | | | $ | 37,128,451 | | | $ — | | $ | 47,987,475 | |
See accompanying notes to the financial statements.
119
ASHMORE EMERGING MARKETS FRONTIER EQUITY FUND
SCHEDULE OF INVESTMENTS (CONTINUED)
As of April 30, 2016 (Unaudited)
The Fund discloses all transfers between levels based on valuations at the end of each reporting period. At April 30, 2016, the Fund had transfers as disclosed below:
Transfers from Level 1 to Level 2
| | | | | | |
| Country | | Value | | | Reason |
Common Stocks | | | | | | |
Bangladesh | | | $ 784,504 | | | Fair value factor was applicable in the current period. |
Indonesia | | | 1,065,586 | | | Fair value factor was applicable in the current period. |
Kazakhstan | | | 1,543,084 | | | Fair value factor was applicable in the current period. |
Kenya | | | 827,442 | | | Fair value factor was applicable in the current period. |
Kuwait | | | 5,635,282 | | | Fair value factor was applicable in the current period. |
Pakistan | | | 6,018,685 | | | Fair value factor was applicable in the current period. |
Philippines | | | 991,613 | | | Fair value factor was applicable in the current period. |
Poland | | | 1,420,222 | | | Fair value factor was applicable in the current period. |
Sri Lanka | | | 1,891,422 | | | Fair value factor was applicable in the current period. |
United Arab Emirates | | | 2,902,643 | | | Fair value factor was applicable in the current period. |
Vietnam | | | 913,398 | | | Fair value factor was applicable in the current period. |
Total | | | $23,993,881 | | | |
The following is a summary of the fair values of the Fund’s derivative instruments*:
Fair Values of Financial Derivative Instruments on the Statements of Assets and Liabilities as of April 30, 2016:
| | |
| | | Derivatives Not Accounted
for as Hedging Instruments |
| | | Foreign Exchange |
Liabilities: | | |
Unrealized Depreciation on Forward Foreign Currency Exchange Contracts | | $ (168) |
The Effect of Financial Derivative Instruments on the Statements of Operations for the Six Months Ended April 30, 2016:
| | |
| | | Derivatives Not Accounted
for as Hedging Instruments |
| | | Foreign Exchange |
Realized Gain (Loss) on Derivatives Recognized resulting from Operations: | | |
Net Realized Loss on Forward Foreign Currency Exchange Contracts | | $ (3,871) |
| | |
* See note 10 in the Notes to the Financial Statements for additional information.
At April 30, 2016, for U.S. federal income tax purposes, gross unrealized appreciation, gross unrealized depreciation, net unrealized appreciation/(depreciation) on investments in securities (including the effects of foreign currency translation) and the cost basis of investments were as follows:
| | | | |
Federal tax cost of investments | | $ | 48,597,341 | |
Gross tax appreciation of investments | | | 3,781,683 | |
Gross tax depreciation of investments | | | (4,391,549) | |
Net tax depreciation of investments | | $ | (609,866) | |
The difference between book basis and tax basis net unrealized appreciation or depreciation is attributable primarily to the tax deferral of losses on wash sales and other transactions.
See accompanying notes to the financial statements.
120
ASHMORE FUNDS
NOTES TO FINANCIAL STATEMENTS
As of April 30, 2016 (Unaudited)
1. Organization
Ashmore Funds (the “Trust”) is a Massachusetts business trust organized under the laws of the Commonwealth of Massachusetts on August 6, 2010 (inception date) and is registered under the Investment Company Act of 1940, as amended (the “Investment Company Act” or “1940 Act”), as an open-end investment management company. The Trust follows accounting and reporting guidance under Financial Accounting Standards Codification Topic 946, “Financial Services – Investment Companies.” The Trust includes nine funds as of April 30, 2016, each with its own investment objective. The Ashmore Emerging Markets Total Return Fund, Ashmore Emerging Markets Hard Currency Debt Fund, Ashmore Emerging Markets Local Currency Bond Fund, Ashmore Emerging Markets Corporate Debt Fund, Ashmore Emerging Markets Short Duration Fund, Ashmore Emerging Markets Equity Opportunities Fund, Ashmore Emerging Markets Value Fund, Ashmore Emerging Markets Small-Cap Fund, and Ashmore Emerging Markets Frontier Equity Fund (each a “Fund” and collectively, the “Funds”) are separate series of the Trust. The Ashmore Emerging Markets Local Currency Bond Fund and the Ashmore Emerging Markets Short Duration Fund are each non-diversified funds. Non-diversified funds may invest a relatively large portion of their net assets in a single issuer or a small number of issuers. Each of the Funds’ financial statements are presented herein. Effective November 8, 2015, the Ashmore Emerging Markets Debt Fund changed its name to the Ashmore Emerging Markets Hard Currency Debt Fund and made certain related changes to its principle investment strategies. On November 23, 2015, the Trust launched the Ashmore Emerging Markets Equity Opportunities Fund by offering Class A, Class C and Institutional Class shares of the Fund. Effective February 29, 2016, the Ashmore Emerging Markets Equity Fund changed its name to the Ashmore Emerging Markets Value Fund.
Ashmore Investment Advisors Limited (“AIAL” or the “Investment Manager”) serves as investment manager to the Funds. AIAL is a wholly owned subsidiary of Ashmore Investments (UK) Limited, which is a wholly owned subsidiary of Ashmore Group plc (“Ashmore Group”). The Investment Manager has retained Ashmore Equities Investment Management (US) LLC (“AEIM” or the “Subadviser”) to manage the investment portfolios of Ashmore Emerging Markets Value Fund, Ashmore Emerging Markets Small-Cap Equity Fund and Ashmore Emerging Markets Frontier Equity Fund. The Subadviser is responsible for managing the investment of the assets of Ashmore Emerging Markets Value Fund, Ashmore Emerging Markets Small-Cap Equity Fund and Ashmore Emerging Markets Frontier Equity Fund, subject to the general oversight and supervision of the Investment Manager and the Board of Trustees of the Trust (the “Board”). Ashmore Investment Management (US) Corporation (“AIMUS”) is the principal underwriter of shares of the Funds. AIMUS is an affiliate of the Investment Manager. The Northern Trust Company (“Northern Trust”) serves as the administrator, custodian and transfer agent of the Funds.
The Funds have assessed the impact of the Alternative Investment Fund Managers Directive (the “Directive”) on the financial statements of the Trust and have concluded that the Trust is exempt from following Chapter V. Section 1. Articles 103-111 of the European Commission’s Level 2 Delegated Regulation on the basis of the operations of the Trust being (i) a Non-EEA AIF (“European Economic Area Alternative Investment Funds”), and (ii) not being marketed in the European Union, as defined by the Directive.
2. Significant accounting policies
The significant accounting policies adopted and consistently followed in the preparation of the Funds’ financial statements are set out below:
(a) Basis of preparation
The financial statements have been prepared in accordance with accounting principles generally accepted in the United States of America (“U.S. GAAP”).
(b) Use of estimates
The preparation of financial statements in accordance with U.S. GAAP requires estimates and assumptions that affect the reported amounts of assets and liabilities and the disclosure of contingent assets and liabilities at the date of the financial statements as well as the reported amounts of revenues generated and expenses incurred
121
ASHMORE FUNDS
NOTES TO FINANCIAL STATEMENTS (CONTINUED)
As of April 30, 2016 (Unaudited)
during the reporting period. Actual results could differ from these estimates. These financial statements contain all adjustments which are, in the opinion of the Trust, necessary to portray a fair statement of the period presented. Such adjustments are normal and recurring in nature. Valuation models used to determine the fair value of unlisted derivative instruments require the use of a number of market based assumptions.
(c) Determination of the Net Asset Value
The net asset value (“NAV”) of a Fund’s shares is calculated at the close of regular trading (normally 4:00 p.m. Eastern time) (the “NYSE Close”) on each day that the New York Stock Exchange (“NYSE”) is open for regular trading.
(d) Investment valuation
For the purposes of calculating NAV, portfolio securities and other assets for which market quotations are readily available are valued at market value. Market values for securities and other instruments are generally determined on the basis of closing prices or the last reported sales prices on an exchange or other market, or if no closing prices or sales are reported, based on quotes or other market information obtained from a quotation reporting system, established market makers, or pricing services. Domestic and foreign debt securities where the close of trading does not coincide with the NYSE close and non-exchange traded derivatives are normally valued on the basis of quotes obtained from brokers and dealers or pricing services using data reflecting the earlier closing of the principal markets for those securities (e.g., certain foreign securities). Prices obtained from independent pricing services are based on information provided by market makers or estimates of market values obtained from yield data relating to investments or securities with similar characteristics. Certain debt securities purchased on a delayed delivery basis are marked-to-market daily until settlement. Exchange traded options, futures and options on futures are generally valued at the settlement price determined by the exchange on which the instrument is primarily traded. With respect to any portion of a Fund’s assets that are invested in one or more open-ended investment management companies, a Fund’s NAV will be calculated based upon the NAVs of such investments. The prospectuses for these open-end investment management companies explain the circumstances under which those companies will use fair value pricing and the effects of using fair value pricing.
If a Fund believes a non-U.S. (foreign) security’s value has materially changed after the close of the security’s primary exchange or principal market but before the time as of which the Funds calculate their NAVs, the security will be valued at fair value based on procedures approved by the Board. A Fund may determine the fair value of investments based on information provided by pricing services and other third-party vendors, which may recommend fair value prices or adjustments with reference to other securities, indices or assets. The Funds may use fair value pricing more frequently for foreign securities or assets because, amongst other things, many foreign markets close well before the NAV of the Funds’ shares is next calculated. In considering whether fair value pricing is required and in determining fair values, the Fund may, amongst other things, consider significant events (which may be considered to include changes in the value of U.S. securities or securities indices) that occur after the close of the relevant market and before the time as of which the Funds calculate their NAVs. A Fund may utilize modeling tools provided by third-party vendors to determine the fair values of non-U.S. securities. Foreign exchanges may permit trading in foreign securities on days when the Trust is not open for business, which may result in the values of a Fund’s portfolio investments being affected when investors are unable to buy, sell or exchange shares of the Fund.
Investments initially valued in currencies other than the United States dollar are converted to the United States dollar using exchange rates obtained from pricing services. Foreign exchange rates are calculated as of 4:00 p.m. Eastern time on each day that the NYSE opens for regular trading. As a result, the NAV of a Fund’s shares may be affected by changes in the value of currencies in relation to the United States dollar. The value of securities traded in markets outside the United States or denominated in currencies other than the United States dollar may be affected significantly on a day that the NYSE is closed and an investor is not able to purchase, redeem or exchange shares of the Funds.
122
ASHMORE FUNDS
NOTES TO FINANCIAL STATEMENTS (CONTINUED)
As of April 30, 2016 (Unaudited)
In the event that market quotes are not readily available, and the security or asset cannot be valued pursuant to one of the Board’s approved valuation methods, the fair value of the security or asset will be determined in good faith by the Board, generally based upon recommendations provided by the Investment Manager and the Subadviser, as applicable. Market quotes are considered not readily available in circumstances where there is an absence of current or reliable market-based data (e.g., trade information, bid/asked information, broker quotes), including where events occur after the close of the relevant market, but prior to a Fund’s NAV calculation time, that materially affect the values of a Fund’s securities or assets. In addition, market quotes are considered not readily available when, due to extraordinary circumstances, the exchanges or markets on which the securities trade do not open for trading for the entire day and no other market prices are available. A Fund may also determine that market quotations are not readily available due to events relating to a single issuer (e.g., corporate actions or announcements) or events relating to multiple issuers (e.g., governmental actions or natural disasters). The Board has delegated to the Investment Manager and the Subadviser, as applicable, the responsibility for monitoring significant events that may materially affect the values of a Fund’s securities or assets and for determining whether the value of the applicable securities or assets should be re-evaluated in light of such significant events.
The Investment Manager and the Sub-Adviser, as applicable, primarily employ a market-based approach which may use related or comparable assets or liabilities, recent transactions, market multiples, book values, and other relevant information to determine the fair value of the investment. The Investment Manager and the Sub-Adviser, as applicable, may also apply a discount to the last traded price in situations where the last traded price may not represent the fair value of the security, such as if a security’s trading has been suspended on its primary trading market, a security has been de-listed from its primary trading market, a security has not traded for an extended period of time, or a security’s primary trading market is temporarily closed at a time when under normal conditions it would be open. Any such discount is based on a number of factors including but not limited to the circumstances surrounding any potential suspension or de-listing, market and industry conditions, competitor information, and the period of time since the last trading took place.
When a Fund uses fair value pricing to determine the NAV of its shares, securities may not be priced on the basis of quotes from the primary market in which they are traded, but rather may be priced by another method that the Board or persons acting at its direction believe accurately reflects fair value. Fair value pricing may require subjective determinations about the value of a security or asset. While the Funds’ policies are intended to result in a calculation of a Fund’s NAV that fairly reflects security and asset values as of the time of pricing, the Funds cannot ensure that fair values determined by the Board or persons acting at their direction accurately reflects the price that a Fund could obtain for a security or asset if it were to dispose of that security or asset at the time of pricing (for instance, in a forced or distressed sale). The prices used by a Fund may differ from the value that would be realized if the securities were sold. Also, the use of fair value pricing may not always result in adjustments to the prices of securities or other assets held by the Fund for the purpose of calculating the NAV of the Fund’s shares.
(e) Investment transactions, income and expenses
Investment transactions are recorded at the trade date. The Funds determine the gain or loss realized from investment transactions using an identified cost basis method. Interest income is recognized on an accrual basis and includes the amortization of premiums and the accretion of discounts using the effective yield method.
Dividend income is recognized on the ex-dividend date. Dividends from foreign securities are recorded on the ex-dividend date, or as soon as such information is available.
Expenses are recorded on an accrual basis. Each Fund is charged for those expenses that are directly attributable to that Fund. Certain expenses arising in connection with a class of shares are charged to that class of shares. Expenses incurred which do not specifically relate to an individual Fund are allocated amongst all the Funds in the Trust in proportion to each Fund’s relative net assets.
(f) Fully funded total return swaps
Each Fund is subject to market risk in the normal course of pursuing its investment objectives. Certain Funds enter into fully funded total return swaps (“TRS”) to manage their exposure to the market, certain sectors of the market or a particular security or reference asset, or to create exposure to certain investments to which they would otherwise not be exposed. TRS contracts involve the exchange by a Fund and a counterparty of their respective commitments to pay or receive a net amount based, in part, on the change in the value of a notional amount of a particular security, index or reference asset.
123
ASHMORE FUNDS
NOTES TO FINANCIAL STATEMENTS (CONTINUED)
As of April 30, 2016 (Unaudited)
Where a Fund enters into a TRS transaction with a swap counterparty, pursuant to which the Fund makes an initial payment equal to the estimated value of an emerging market debt or equity security, loan or other financial instrument, the TRS is considered an investment for financial statement purposes and is accounted for using the same policies as would apply to the underlying assets it represents. In addition to the market risk of the underlying security, index or reference asset, there is a risk of default by the counterparty to the transaction.
(g) Equity-Linked Securities
Certain Funds may purchase equity-linked securities, also known as participation notes. Equity-linked securities are primarily used by the Funds as an alternate means to access what is generally an emerging securities market. A Fund deposits cash with its custodian (or broker) in an amount near or equal to the value of the underlying security in exchange for an equity linked security. Upon sale, the Fund receives cash from the broker or custodian, equal to the value of the underlying security. In addition to the market risk and credit risk of the underlying securities, there is a risk of default by the counterparty to the transaction. In the event of insolvency of the counterparty, a Fund might be unable to obtain its expected benefit. In addition, while the Funds will seek to enter into such transactions only with parties that are capable of entering into closing transactions with a Fund, there can be no assurance that a Fund will be able to close out such a transaction with the counterparty or obtain an offsetting position with any counterparty at a time prior to the end of the term of the underlying agreement.
(h) Inflation Index Securities
Certain Funds may invest in inflation-indexed bonds which are fixed income securities whose principal value is periodically adjusted based on a measure of rate of inflation. The interest rate on these bonds is generally fixed at issuance at a rate lower than typical bonds. Over the life of an inflation-indexed bond interest will be paid based on a principal value which is adjusted for inflation. Any increase or decrease in the principal amount of an inflation-indexed bond will be included as interest income on the Statements of Operations, even though investors do not receive their principal until maturity. At April 30, 2016, all inflation-indexed bonds were shown on the Statement of Investments with their original par and stated coupon rate.
3. Principal Risks
In the normal course of business, the Funds trade financial instruments and enter into financial transactions where a risk of potential loss exists due to, amongst other things, changes in the market (market risk), or the failure or inability of the other party to a transaction to perform (credit and counterparty risk). See below for a summary description of select principal risks, some of which may not apply to a particular Fund. A discussion of the principal risks of investing in each Fund is included in that Fund’s prospectus.
Counterparty and Third Party Risk
Transactions involving a counterparty to a derivative or other instrument, or a third party responsible for servicing the instrument, are subject to the credit risk of the counterparty or third party, and to the counterparty’s or third party’s ability to perform in accordance with the terms of the transaction.
Credit Risk
The Funds could lose money if the issuer or guarantor of a debt security or other instrument is unable or unwilling to meet its financial obligations, and the lack of ability, or perceived lack of ability, of the issuer to make timely payments of interest and/or principal will negatively affect the value of the security or instrument.
Market Risk
The value of securities and instruments owned by the Funds may rise and fall, sometimes rapidly or unpredictably, due to factors affecting securities markets generally or particular industries or geographic areas. Recent instability in the financial markets has led governments around the world to take a number of unprecedented actions designed to support certain financial institutions and segments of the financial markets
124
ASHMORE FUNDS
NOTES TO FINANCIAL STATEMENTS (CONTINUED)
As of April 30, 2016 (Unaudited)
that have experienced extreme volatility, and in some cases a lack of liquidity. The withdrawal of this support, failure of these efforts, or investor perception that these efforts are not succeeding could negatively affect financial markets generally as well as the values and liquidity of a Fund’s portfolio securities and other assets.
Derivative financial instruments may result in off-balance sheet market and credit risk. If the markets should move against one or more positions that the Funds hold, the Funds could incur losses greater than the unrealized amounts recorded in the Statements of Assets and Liabilities. Derivative risk exposures are discussed in note 10.
Foreign/Emerging Markets Risks
Investments in foreign securities entail risks in addition to those customarily associated with investing in U.S. securities. Economic, political and social instability could disrupt financial markets in which the Fund invests and adversely affect the value of the Fund’s assets. In addition, national policies may restrict investment opportunities. In foreign markets there may be a lower degree of market volume and liquidity than in U.S. markets, and this may result in greater price volatility. The securities markets in many Emerging-Market countries are substantially smaller, less developed, less liquid and more volatile than the securities markets of developed countries. Furthermore, since the composition of each Fund will differ from that of market indexes, its performance generally will not mirror the returns provided by a specific market index
4. Fair value measurements
U.S. GAAP includes a topic which defines fair value as the price that the Fund would receive upon selling an investment in an orderly and timely transaction to a market participant in the principal or most advantageous market of the investment. This topic establishes a three-tier hierarchy to maximize the use of observable market data, minimize the use of unobservable inputs and establish classification of fair value measurements for disclosure purposes. Inputs may be observable or unobservable and refer broadly to the assumptions that market participants would use in pricing the asset or liability including assumptions about risk. Such risks include the inherent risk in a particular valuation technique which is used to measure fair value. Observable inputs are inputs that reflect the assumptions market participants would use in pricing the asset or liability developed based on market data obtained from sources independent of the reporting entity. Unobservable inputs are inputs that reflect the reporting entity’s own assumptions about the assumptions market participants would use in pricing the asset or liability, developed based on the best information available in the circumstances. The three-tier hierarchy of inputs is summarized in the three broad levels listed below.
| | • | | Level 1 – Inputs using unadjusted quoted prices in active markets or exchanges for identical assets and liabilities. |
| | • | | Level 2 – Significant observable inputs other than those used in Level 1, which may include, but are not limited to, quoted prices for similar assets or liabilities in markets that are active, quoted prices for identical or similar assets or liabilities in markets that are not active, inputs other than quoted prices that are observable for the assets or liabilities (such as interest rates, yield curves, volatilities, prepayment rates, loss severities, credit risks and default rates) or other market corroborated inputs. |
| | • | | Level 3 – Significant unobservable inputs based on the best information available in the circumstances, to the extent observable inputs are not available, which may include assumptions made by the Board or persons acting at their discretion that are used in determining the fair market value of investments. |
Fixed income securities including corporate, convertible and municipal bonds and notes, U.S. government agency securities, U.S. treasury obligations, sovereign issues, bank loans, convertible preferred securities and non-U.S. bonds are normally priced using data reflecting the earlier closing of the principal markets for those securities, subject to possible fair value adjustments. Information that becomes known to a Fund or its agents after NAV has been calculated on a particular day will not generally be used to retroactively adjust the price of a security or NAV determined earlier that day.
125
ASHMORE FUNDS
NOTES TO FINANCIAL STATEMENTS (CONTINUED)
As of April 30, 2016 (Unaudited)
Portfolio securities and other assets for which market quotations are readily available are typically categorized as Level 1 of the fair value hierarchy. Domestic and foreign debt securities where the close of trading does not coincide with the NYSE close and non-exchange traded derivatives are normally valued on the basis of quotes obtained from brokers and dealers or pricing services using data reflecting the earlier closing of the principal markets for those securities. Prices obtained from independent pricing services are based on information provided by market makers or estimates of market values obtained from yield data relating to investments or securities with similar characteristics. Securities using these valuation adjustments are typically categorized as Level 2 of the fair value hierarchy. Preferred securities, equity linked notes and other equities traded on inactive markets or valued by reference to similar instruments are also typically categorized as Level 2 of the fair value hierarchy.
With respect to any portion of a Fund’s assets that are invested in one or more open-ended investment management companies, a Fund’s NAV will be calculated based upon the NAVs of such investments. The prospectuses for these open-end investment management companies explain the circumstances under which those companies will use fair value pricing and the effects of using fair value pricing. Investments in privately held investment funds will be valued based upon the NAVs of such investments and are categorized as Level 2 of the fair value hierarchy. Investments in public open-end investment funds are categorized as Level 2.
Investments and derivatives classified within Level 3 have significant unobservable inputs, as they trade infrequently or not at all. Level 3 instruments may include bank loan agreements and less-liquid corporate debt securities (including distressed debt instruments). Also included in this category are certain bonds and loans for which independent broker prices are used and information relating to the inputs of the price models is not available.
5. Reverse repurchase agreements
Certain Funds may enter into reverse repurchase agreements. In a reverse repurchase agreement, a Fund delivers a security in exchange for cash to a financial institution, the counterparty, with a simultaneous agreement to repurchase the same or substantially the same security at an agreed upon price and date. The Fund is entitled to receive principal and interest payments, if any, made on the security delivered to the counterparty during the term of the agreement. Cash received in exchange for securities delivered plus accrued interest payments to be made by the Fund to counterparties are reflected as a liability on the Statements of Assets and Liabilities. Interest payments made by the Fund to counterparties are recorded as a component of interest expense on the Statements of Operations. In periods of increased demand for the security, the Fund may receive a fee for use of the security by the counterparty, which may result in interest income to the Fund.
As of April 30, 2016, the Funds did not hold any reverse repurchase agreements.
126
ASHMORE FUNDS
NOTES TO FINANCIAL STATEMENTS (CONTINUED)
As of April 30, 2016 (Unaudited)
6. Capital share transactions
Transactions in Class A shares for the period ended April 30, 2016, were as follows:
| | | | | | | | | | | | | | | | | | | | | | | | | | | | | | | | |
Fund | | Shares Sold | | | Proceeds
from Shares
Sold | | | Shares from
Reinvested
Distributions | | | Proceeds
from
Reinvestment
of
Distributions | | | Shares Redeemed | | | Payments for
Shares
Redeemed | | | Net
Increase/
(Decrease)
in Shares | | | Net Increase/
(Decrease) in
Net Assets | |
| | | | | | | | | |
| Ashmore Emerging Markets Total Return Fund | | | 238,200 | | | $ | 1,754,888 | | | | 7,145 | | | $ | 51,664 | | | | (244,798 | ) | | $ | (1,734,655 | ) | | | 547 | | | $ | 71,897 | |
| | | | | | | | | |
| Ashmore Emerging Markets Hard Currency Debt Fund | | | 13,532 | | | | 110,371 | | | | 64 | | | | 526 | | | | (46 | ) | | | (364 | ) | | | 13,550 | | | | 110,533 | |
| | | | | | | | | |
| Ashmore Emerging Markets Local Currency Bond Fund | | | 760 | | | | 5,202 | | | | 93 | | | | 603 | | | | (171 | ) | | | (1,200 | ) | | | 682 | | | | 4,605 | |
| | | | | | | | | |
| Ashmore Emerging Markets Corporate Debt Fund | | | 400,283 | | | | 2,905,748 | | | | 18,665 | | | | 133,801 | | | | (255,016 | ) | | | (1,882,778 | ) | | | 163,932 | | | | 1,156,771 | |
| | | | | | | | | |
| Ashmore Emerging Markets Short Duration Fund | | | 3,879 | | | | 34,800 | | | | 1,032 | | | | 9,556 | | | | (13,223 | ) | | | (123,722 | ) | | | (8,312 | ) | | | (79,366 | ) |
| | | | | | | | | |
| Ashmore Emerging Markets Equity Opportunities Fund | | | 1,000 | | | | 10,000 | | | | 6 | | | | 61 | | | | - | | | | - | | | | 1,006 | | | | 10,061 | |
| | | | | | | | | |
| Ashmore Emerging Markets Small-Cap Equity Fund | | | 30,844 | | | | 224,584 | | | | 444 | | | | 3,483 | | | | (6,245 | ) | | | (49,997 | ) | | | 25,043 | | | | 178,070 | |
| | | | | | | | | |
| Ashmore Emerging Markets Frontier Equity Fund | | | 2,665 | | | | 19,760 | | | | 55 | | | | 406 | | | | - | | | | - | | | | 2,720 | | | | 20,166 | |
|
Transactions in Class C shares for the period ended April 30, 2016, were as follows: | |
| Fund | | Shares Sold | | | Proceeds from Shares
Sold | | | Shares from
Reinvested
Distributions | | | Proceeds
from
Reinvestment
of
Distributions | | | Shares
Redeemed | | | Payments for
Shares
Redeemed | | | Net Increase/
(Decrease)
in Shares | | | Net Increase/
(Decrease) in
Net Assets | |
| Ashmore Emerging Markets Total Return Fund | | | 35,163 | | | $ | 253,780 | | | | 1,551 | | | $ | 11,155 | | | | (26,471 | ) | | $ | (187,011 | ) | | | 10,243 | | | $ | 77,924 | |
| | | | | | | | | |
| Ashmore Emerging Markets Hard Currency Debt Fund | | | 6,280 | | | | 51,001 | | | | 6 | | | | 48 | | | | (6,158 | ) | | | (49,280 | ) | | | 128 | | | | 1,769 | |
| Ashmore Emerging Markets Local Currency Bond Fund | | | 3,587 | | | | 25,001 | | | | 82 | | | | 532 | | | | - | | | | - | | | | 3,669 | | | | 25,533 | |
| Ashmore Emerging Markets Corporate Debt Fund | | | 165,468 | | | | 1,198,395 | | | | 9,763 | | | | 69,882 | | | | (91,814 | ) | | | (662,748 | ) | | | 83,417 | | | | 605,529 | |
| Ashmore Emerging Markets Equity Opportunities Fund | | | 1,000 | | | | 10,000 | | | | 5 | | | | 51 | | | | - | | | | - | | | | 1,005 | | | | 10,051 | |
| Ashmore Emerging Markets Small-Cap Equity Fund | | | 5,840 | | | | 44,136 | | | | 520 | | | | 4,330 | | | | (2,374 | ) | | | (19,511 | ) | | | 3,986 | | | | 28,955 | |
| Ashmore Emerging Markets Frontier Equity Fund | | | 123 | | | | 902 | | | | 60 | | | | 434 | | | | - | | | | - | | | | 183 | | | | 1,336 | |
127
ASHMORE FUNDS
NOTES TO FINANCIAL STATEMENTS (CONTINUED)
As of April 30, 2016 (Unaudited)
Transactions in Institutional Class shares for the period ended April 30, 2016, were as follows:
| | | | | | | | | | | | | | | | | | | | | | | | | | | | | | | | |
| Fund | | Shares Sold | | | Proceeds from
Shares Sold | | | Shares from
Reinvested Distributions | | | Proceeds from
Reinvestment
of Distributions | | | Shares
Redeemed | | | Payments for
Shares
Redeemed | | | Net Increase/
(Decrease) in
Shares | | | Net Increase/
(Decrease) in
Net Assets | |
| Ashmore Emerging Markets Total Return Fund | | | 7,357,592 | | | $ | 54,081,468 | | | | 2,814,856 | | | $ | 20,594,764 | | | | (10,093,848 | ) | | $ | (74,134,568 | ) | | | 78,600 | | | $ | 541,664 | |
| Ashmore Emerging Markets Hard Currency Debt Fund | | | 128,269 | | | | 1,035,145 | | | | 19,208 | | | | 152,355 | | | | (13,831 | ) | | | (113,273 | ) | | | 133,646 | | | | 1,074,227 | |
| Ashmore Emerging Markets Local Currency Bond Fund | | | 371,657 | | | | 2,530,008 | | | | 201,696 | | | | 1,355,355 | | | | (2,191,530 | ) | | | (14,822,669 | ) | | | (1,618,177 | ) | | | (10,937,306 | ) |
| Ashmore Emerging Markets Corporate Debt Fund | | | 10,005,385 | | | | 76,818,646 | | | | 313,998 | | | | 2,350,688 | | | | (12,914,151 | ) | | | (97,699,356 | ) | | | (2,594,768 | ) | | | (18,530,022 | ) |
| Ashmore Emerging Markets Short Duration Fund | | | 4,717,651 | | | | 43,870,614 | | | | 103,373 | | | | 965,621 | | | | (203,070 | ) | | | (1,879,344 | ) | | | 4,617,954 | | | | 42,956,891 | |
| Ashmore Emerging Markets Equity Opportunities Fund | | | 505,615 | | | | 5,056,749 | | | | 3,280 | | | | 31,609 | | | | - | | | | - | | | | 508,895 | | | | 5,088,358 | |
| Ashmore Emerging Markets Value Fund | | | 267,809 | | | | 1,893,187 | | | | - | | | | - | | | | (159,210 | ) | | | (1,021,696 | ) | | | 108,599 | | | | 871,491 | |
| Ashmore Emerging Markets Small-Cap Equity Fund | | | 1,048,058 | | | | 10,067,640 | | | | 44,260 | | | | 440,392 | | | | (2,390,833 | ) | | | (22,909,366 | ) | | | (1,298,515 | ) | | | (12,401,334 | ) |
| Ashmore Emerging Markets Frontier Equity Fund | | | 588,540 | | | | 5,006,914 | | | | 61,886 | | | | 519,163 | | | | (576,929 | ) | | | (4,892,413 | ) | | | 73,497 | | | | 633,664 | |
|
Transactions in Class A shares for the year ended October 31, 2015, were as follows: | |
| Fund | | Shares Sold | | | Proceeds from
Shares Sold | | | Shares from
Reinvested
Distributions | | | Proceeds from
Reinvestment
of
Distributions | | | Shares
Redeemed | | | Payments for
Shares
Redeemed | | | Net Increase/
(Decrease) in
Shares | | | Net Increase/
(Decrease) in
Net Assets | |
| Ashmore Emerging Markets Total Return Fund | | | 281,985 | | | $ | 2,208,170 | | | | 18,874 | | | $ | 151,369 | | | | (861,656 | ) | | $ | (6,924,708 | ) | | | (560,797 | ) | | $ | (4,565,169 | ) |
| Ashmore Emerging Markets Hard Currency Debt Fund | | | 62 | | | | 521 | | | | 39 | | | | 320 | | | | (4,121 | ) | | | (34,577 | ) | | | (4,020 | ) | | | (33,736 | ) |
| Ashmore Emerging Markets Local Currency Bond Fund | | | 1,990 | | | | 14,124 | | | | 128 | | | | 937 | | | | - | | | | - | | | | 2,118 | | | | 15,061 | |
| Ashmore Emerging Markets Corporate Debt Fund | | | 1,051,616 | | | | 8,747,215 | | | | 29,583 | | | | 238,304 | | | | (321,534 | ) | | | (2,593,834 | ) | | | 759,665 | | | | 6,391,685 | |
| Ashmore Emerging Markets Short Duration Fund | | | 24,426 | | | | 233,026 | | | | 607 | | | | 5,786 | | | | (638 | ) | | | (6,111 | ) | | | 24,395 | | | | 232,701 | |
| Ashmore Emerging Markets Value Fund | | | 166 | | | | 1,469 | | | | 14 | | | | 106 | | | | (103 | ) | | | (881 | ) | | | 77 | | | | 694 | |
| Ashmore Emerging Markets Small-Cap Equity Fund | | | 17,930 | | | | 165,248 | | | | 1,998 | | | | 16,171 | | | | (22,829 | ) | | | (179,152 | ) | | | (2,901 | ) | | | 2,267 | |
| Ashmore Emerging Markets Frontier Equity Fund | | | 20,855 | | | | 184,873 | | | | 1,836 | | | | 15,350 | | | | (17,907 | ) | | | (150,407 | ) | | | 4,784 | | | | 49,816 | |
128
ASHMORE FUNDS
NOTES TO FINANCIAL STATEMENTS (CONTINUED)
As of April 30, 2016 (Unaudited)
Transactions in Class C shares for the year ended October 31, 2015, were as follows:
| | | | | | | | | | | | | | | | | | | | | | | | | | | | | | | | |
| Fund | | Shares Sold | | | Proceeds from
Shares Sold | | | Shares from
Reinvested
Distributions | | | Proceeds from
Reinvestment
of
Distributions | | | Shares
Redeemed | | | Payments for
Shares
Redeemed | | | Net Increase/
(Decrease) in
Shares | | | Net Increase/
(Decrease) in
Net Assets | |
| Ashmore Emerging Markets Total Return Fund | | | 16,641 | | | $ | 135,467 | | | | 2,127 | | | $ | 16,842 | | | | (77,084 | ) | | $ | (606,054 | ) | | | (58,316 | ) | | $ | (453,745 | ) |
Ashmore Emerging Markets Hard Currency Debt Fund | | | - | | | | - | | | | 7 | | | | 60 | | | | — | | | | (1 | ) | | | 7 | | | | 59 | |
| Ashmore Emerging Markets Local Currency Bond Fund | | | - | | | | - | | | | 170 | | | | 1,261 | | | | (11,556 | ) | | | (89,208 | ) | | | (11,386 | ) | | | (87,947 | ) |
| Ashmore Emerging Markets Corporate Debt Fund | | | 390,454 | | | | 3,209,392 | | | | 10,344 | | | | 82,821 | | | | (26,558 | ) | | | (217,068 | ) | | | 374,240 | | | | 3,075,145 | |
| Ashmore Emerging Markets Value Fund | | | - | | | | - | | | | 1 | | | | 6 | | | | (1 | ) | | | (2 | ) | | | - | | | | 4 | |
| Ashmore Emerging Markets Small-Cap Equity Fund | | | 28,802 | | | | 285,355 | | | | 672 | | | | 5,581 | | | | (115 | ) | | | (2,190 | ) | | | 29,359 | | | | 288,746 | |
Ashmore Emerging Markets Frontier Equity Fund | | | 7,207 | | | | 58,325 | | | | 20 | | | | 163 | | | | (411 | ) | | | (3,344 | ) | | | 6,816 | | | | 55,144 | |
|
Transactions in Institutional Class shares for the year ended October 31, 2015, were as follows: | |
| Fund | | Shares Sold | | | Proceeds from
Shares Sold | | | Shares from
Reinvested
Distributions | | | Proceeds from
Reinvestment
of
Distributions | | | Shares
Redeemed | | | Payments for
Shares
Redeemed | | | Net Increase/
(Decrease) in
Shares | | | Net Increase/
(Decrease) in
Net Assets | |
Ashmore Emerging Markets Total Return Fund | | | 24,952,218 | | | $ | 205,202,753 | | | | 5,735,829 | | | $ | 46,293,720 | | | | (70,866,061 | ) | | $ | (574,199,401 | ) | | | (40,178,014 | ) | | $ | (322,702,928 | ) |
Ashmore Emerging Markets Hard Currency Debt Fund | | | 3,068 | | | | 24,540 | | | | 34,715 | | | | 283,029 | | | | (19 | ) | | | (173 | ) | | | 37,764 | | | | 307,396 | |
Ashmore Emerging Markets Local Currency Bond Fund | | | 3,255,802 | | | | 25,527,892 | | | | 360,809 | | | | 2,728,864 | | | | (3,531,240 | ) | | | (27,486,797 | ) | | | 85,371 | | | | 769,959 | |
Ashmore Emerging Markets Corporate Debt Fund | | | 26,311,974 | | | | 225,278,466 | | | | 539,048 | | | | 4,510,756 | | | | (36,380,738 | ) | | | (313,241,806 | ) | | | (9,529,716 | ) | | | (83,452,584 | ) |
Ashmore Emerging Markets Short Duration Fund | | | 629,661 | | | | 6,078,581 | | | | 67,772 | | | | 633,585 | | | | (1,546 | ) | | | (14,226 | ) | | | 695,887 | | | | 6,697,940 | |
Ashmore Emerging Markets Value Fund | | | 75,640 | | | | 548,204 | | | | 6,119 | | | | 46,574 | | | | (159,381 | ) | | | (1,307,314 | ) | | | (77,622 | ) | | | (712,536 | ) |
Ashmore Emerging Markets Small-Cap Equity Fund | | | 1,734,416 | | | | 19,772,641 | | | | 151,609 | | | | 1,538,338 | | | | (1,846,463 | ) | | | (19,255,004 | ) | | | 39,562 | | | | 2,055,975 | |
Ashmore Emerging Markets Frontier Equity Fund | | | 5,483,826 | | | | 51,905,275 | | | | 75,083 | | | | 701,587 | | | | (577,275 | ) | | | (5,409,544 | ) | | | 4,981,634 | | | | 47,197,318 | |
Capital shares
Class A shares are issued at the Fund’s relevant NAV per share plus, any applicable sales charge. Institutional Class and Class C shares are issued at the Fund’s relevant NAV per share without a sales charge. Shares confer upon the holders the right to receive notice of and attend, speak and vote at shareholder meetings of the Funds. The shares confer upon the holders the right to any or all dividends or distributions which the Trustees in their sole discretion may from time to time resolve to make or declare.
129
ASHMORE FUNDS
NOTES TO FINANCIAL STATEMENTS (CONTINUED)
As of April 30, 2016 (Unaudited)
7. Investment transactions
For the period ended April 30, 2016, the aggregate costs of purchases and proceeds from sales of investments (including fully funded TRS and excluding short-term investments) for the Funds were as follows:
| | | | | | | | |
Fund | | | Purchases | | | | Sales | |
Ashmore Emerging Markets Total Return Fund | | $ | 224,358,825 | | | $ | 231,673,539 | |
Ashmore Emerging Markets Hard Currency Debt Fund | | | 3,023,958 | | | | 1,675,196 | |
Ashmore Emerging Markets Local Currency Bond Fund | | | 17,026,058 | | | | 28,958,018 | |
Ashmore Emerging Markets Corporate Debt Fund | | | 61,913,736 | | | | 74,346,683 | |
Ashmore Emerging Markets Short Duration Fund | | | 53,811,199 | | | | 13,212,755 | |
Ashmore Emerging Markets Equity Opportunities Fund | | | 5,024,061 | | | | - | |
Ashmore Emerging Markets Value Fund | | | 6,555,224 | | | | 5,803,913 | |
Ashmore Emerging Markets Small-Cap Equity Fund | | | 26,571,848 | | | | 38,980,987 | |
Ashmore Emerging Markets Frontier Equity Fund | | | 23,664,809 | | | | 21,339,776 | |
8. Federal income taxes
No provision for U.S. federal income taxes has been made since each Fund’s policy is to comply with the requirements of Subchapter M of the Internal Revenue Code of 1986, as amended, applicable to regulated investment companies, and to distribute, each year, substantially all of its taxable income and capital gains to its shareholders.
The Regulated Investment Company Modernization Act of 2010 (the “Act”) was enacted on December 22, 2010. The Act made changes to several tax rules affecting the Funds. Although the Act provides several benefits, including the unlimited carryover of future capital losses, there may be a greater likelihood that all, or a portion of a Fund’s pre-enactment capital loss carryovers may expire without being utilized, due to the fact that post-enactment capital losses are utilized before pre-enactment capital loss carryovers.
The following Funds have available capital loss carryforwards for which there is no expiration date:
| | | | | | | | |
| Fund | | Short-Term Capital Loss
Carryforward at October
31, 2015 | | | Long-Term Capital Loss
Carryforward at October 31,
2015 | |
Ashmore Emerging Markets Total Return Fund | | $ | (15,162,978 | ) | | | $ (31,128,206 | ) |
Ashmore Emerging Markets Hard Currency Debt Fund | | | (828,660 | ) | | | (23,889 | ) |
Ashmore Emerging Markets Local Currency Bond Fund | | | (1,948,402 | ) | | | (1,120,276 | ) |
Ashmore Emerging Markets Corporate Debt Fund | | | (4,597,181 | ) | | | (9,106,535 | ) |
Ashmore Emerging Markets Short Duration Fund | | | (65,436 | ) | | | - | |
Ashmore Emerging Markets Equity Opportunities Fund | | | - | | | | - | |
Ashmore Emerging Markets Value Fund | | | (1,709,448 | ) | | | (128,759 | ) |
Ashmore Emerging Markets Small-Cap Equity Fund | | | (1,907,257 | ) | | | (811,521 | ) |
Ashmore Emerging Markets Frontier Equity Fund | | | (811,982 | ) | | | (123,464 | ) |
The Funds in the above table may offset future capital gains with these capital loss carryforwards. For the period subsequent to December 31, 2014 through the fiscal year ended October 31, 2015, the Ashmore Emerging Markets Total Return Fund and Ashmore Emerging Markets Local Currency Bond Fund incurred ordinary losses, which each Fund intends to treat as being incurred in the subsequent fiscal year of $13,008,387 and $7,448,362, respectively.
The Funds are subject to the provisions of the Financial Accounting Standards Board (“FASB”) Accounting Standards Codification (“ASC”) Topic 740-10, Income Taxes. This standard provides guidance as to how uncertain tax positions should be recognized, measured, presented and disclosed in the Funds’ financial
130
ASHMORE FUNDS
NOTES TO FINANCIAL STATEMENTS (CONTINUED)
As of April 30, 2016 (Unaudited)
statements. The Funds recognize the tax benefits of uncertain tax positions only where the position is more-likely-than-not (i.e. greater than 50-percent) to be sustained assuming examination by a tax authority based on the technical merits of the position. In evaluating whether a tax position has met the recognition threshold, the Funds must presume that the position will be examined by the appropriate taxing authority that has full knowledge of all relevant information. A tax position that meets the more-likely-than-not recognition threshold is measured to determine the amount of benefit to recognize in the Funds’ financial statements. Income tax and related interest and penalties would be recognized by the Funds as tax expense in the Statement of Operations if the tax positions were deemed not to meet the more-likely-than-not threshold. The Funds analyze all open tax years for all major taxing jurisdictions. Open tax years are those that are open to examination by taxing authorities, as defined by the Statute of Limitations in each jurisdiction. The Funds have no examinations by tax authorities in progress. The Trust has analyzed the Funds’ tax positions, and has concluded that no liability for unrecognized tax benefits should be recorded related to uncertain tax positions. Further, the Trust is not aware of any tax positions for which it is reasonably possible that the total amounts of unrecognized tax benefits will significantly change in the next twelve months.
As of October 31, 2015, the components of distributable taxable earnings, including temporary differences, were as follows:
| | | | | | | | | | | | | | | | | | | | |
| Fund | | Undistributed
Ordinary
Income | | | Undistributed
Long Term
Capital Gain | | | Accumulated
Capital Losses
and Other | | | Unrealized
Appreciation
(Depreciation) on
Investments and
Foreign Currencies | | | Total
Accumulated
Earnings (Deficit) | |
| Ashmore Emerging Markets Total Return Fund | | $ | - | | | $ | - | | | $ | (59,752,185 | ) | | $ | (69,251,934 | ) | | $ | (129,004,119 | ) |
| Ashmore Emerging Markets Hard Currency Debt Fund | | | - | | | | - | | | | (864,190 | ) | | | (351,801 | ) | | | (1,215,991 | ) |
| Ashmore Emerging Markets Local Currency Bond Fund | | | - | | | | - | | | | (10,583,704 | ) | | | (14,545,384 | ) | | | (25,129,088 | ) |
| Ashmore Emerging Markets Corporate Debt Fund | | | - | | | | - | | | | (14,021,150 | ) | | | (42,697,908 | ) | | | (56,719,058 | ) |
| Ashmore Emerging Markets Short Duration Fund | | | - | | | | - | | | | (88,193 | ) | | | (1,314,809 | ) | | | (1,403,002 | ) |
| Ashmore Emerging Markets Value Fund | | | - | | | | - | | | | (1,838,539 | ) | | | (1,304,308 | ) | | | (3,142,847 | ) |
| Ashmore Emerging Markets Small-Cap Equity Fund | | | 560,865 | | | | - | | | | (2,718,778 | ) | | | (5,667,115 | ) | | | (7,825,028 | ) |
| Ashmore Emerging Markets Frontier Equity Fund | | | 109,785 | | | | - | | | | (942,059 | ) | | | (2,845,204 | ) | | | (3,677,478 | ) |
131
ASHMORE FUNDS
NOTES TO FINANCIAL STATEMENTS (CONTINUED)
As of April 30, 2016 (Unaudited)
The taxable character of distributions paid during the fiscal year ended October 31, 2015, were as follows:
| | | | | | | | | | | | | | | | | | | | |
| | | Distributions From | | | | |
| Fund | | Ordinary
Income | | | Short-Term
Capital
Gains | | | Long-Term
Capital
Gains | | | Return of
Capital | | | Total
Distributions
Paid | |
| Ashmore Emerging Markets Total Return Fund | | $ | - | | | $ | - | | | $ | - | | | $ | 48,814,094 | | | $ | 48,814,094 | |
| Ashmore Emerging Markets Hard Currency Debt Fund | | | 262,903 | | | | - | | | | - | | | | 69,299 | | | | 332,202 | |
| Ashmore Emerging Markets Local Currency Bond Fund | | | - | | | | - | | | | - | | | | 3,524,581 | | | | 3,524,581 | |
| Ashmore Emerging Markets Corporate Debt Fund | | | 23,480,648 | | | | 1,986,134 | | | | - | | | | 2,469,373 | | | | 27,936,155 | |
| Ashmore Emerging Markets Short Duration Fund | | | 1,911,867 | | | | - | | | | - | | | | 21,104 | | | | 1,932,971 | |
| Ashmore Emerging Markets Value Fund | | | 60,098 | | | | - | | | | - | | | | 2,820 | | | | 62,918 | |
| Ashmore Emerging Markets Small-Cap Equity Fund | | | 356,890 | | | | 399,095 | | | | 1,247,441 | | | | - | | | | 2,003,426 | |
| Ashmore Emerging Markets Frontier Equity Fund | | | 283,349 | | | | 792,229 | | | | - | | | | - | | | | 1,075,578 | |
9. Distributions to shareholders
The Ashmore Emerging Markets Total Return Fund, Ashmore Emerging Markets Hard Currency Debt Fund, Ashmore Emerging Markets Local Currency Bond Fund, Ashmore Emerging Markets Corporate Debt Fund and Ashmore Emerging Markets Short Duration Fund declare distributions of their net investment income daily and pay such distributions monthly. The Ashmore Emerging Markets Equity Opportunities Fund, Ashmore Emerging Markets Value Fund, Ashmore Emerging Markets Small-Cap Equity Fund and Ashmore Emerging Markets Frontier Equity Fund declare and pay distributions of their net investment income at least quarterly.
Distributions of net realized capital gains, if any, are declared and paid at least annually. The Funds may also make a special distribution to comply with federal tax requirements. Income dividends and capital gains distributions determined in accordance with federal income tax regulations may differ from U.S. GAAP. Differences between tax regulations and U.S. GAAP may change the fiscal period in which income and capital items are recognized for tax and U.S. GAAP purposes. Examples of events that give rise to timing differences include wash sales, straddles and capital loss carryforwards. Further, the character of investment income and capital gains may be different for certain transactions under the two methods of accounting. Examples of characterization differences include the treatment of foreign currency transactions and swap transactions. As a result, income dividends and capital gain distributions declared during a fiscal period for federal tax purposes may differ significantly from the net investment income and realized capital gain reported on each Fund’s financial statements presented under U.S. GAAP. In general, to the extent that any differences which are permanent in nature result in over distributions to shareholders, the amount of the over distribution may be reported as return of capital. Temporary differences do not require reclassification. See note 8 for further details.
10. Derivative instruments and hedging activities
FASB ASC Topic 815-10 (“Topic 815-10”), Disclosures about Derivative Instruments and Hedging Activities, improves financial reporting about derivative instruments by requiring enhanced disclosures to enable investors to better understand how and why the Funds use derivative instruments, how these derivative instruments are accounted for and their effects on the Funds’ financial position and results of operations.
None of the derivatives held in the Funds have been designated as hedging instruments under Topic 815-10. A discussion of the strategies for these derivatives and their counterparty credit risk can be found below.
132
ASHMORE FUNDS
NOTES TO FINANCIAL STATEMENTS (CONTINUED)
As of April 30, 2016 (Unaudited)
In accordance with Topic 815-10, the Funds record their trading-related derivative activities on a fair value basis (as described in note 4). Fair values represent the amount at which the instrument could be exchanged in a current transaction between willing parties, other than in a forced or liquidation sale.
The following disclosures contain information on how and why the Funds used derivative financial instruments; the credit-risk-related contingent features in certain derivative financial instruments; and how derivative financial instruments affected the Funds’ financial position, results of operations and cash flows. The location and fair value of these instruments on the Statements of Assets and Liabilities and the realized, and changes in unrealized, gains and losses on the Statements of Operations, are included in tables following each Fund’s Schedule of Investments and are categorized by type of financial derivative contract.
(a) Options
Each Fund is subject to market risk in the normal course of pursuing its investment objectives. The Funds may enter into options to speculate on the price movements of the financial instrument underlying the option, for use as an economic hedge against certain equity positions held in a Fund’s portfolio holdings or for other investment purposes. Purchased option contracts give a Fund the right, but not the obligation, to buy or sell within a limited time, a financial instrument, commodity or currency at a contracted price that may also be settled in cash, based on differentials between specified indices or prices.
Options written obligate a Fund, in return for a premium, to buy or sell within a limited time, a financial instrument, commodity or currency at a contracted price that may also be settled in cash, based on differentials between specified indices or prices. Options written by a Fund may expose a Fund to the market risk of an unfavorable change in the financial instrument underlying the written option.
A Fund is exposed to counterparty risk from the potential that a seller or buyer of an option contract does not sell or purchase the underlying asset as agreed under the terms of the option contract. The maximum risk of loss from counterparty risk to a Fund holding a put or call option is generally the fair value of the contracts and the premiums paid to purchase its open option contracts. The risk of loss on call options sold by the Funds is potentially unlimited. A Fund considers the credit risk of the intermediary counterparties to its option transactions in evaluating potential credit risk.
Gains and losses associated with the valuation of options are recognized at fair value as the net change in unrealized appreciation/(depreciation) on investments in securities in the Statements of Operations. The premium on purchased put options exercised is subtracted from the proceeds of the sale of the underlying security or foreign currency in determining the realized gain or loss. The premium on purchased call options exercised is added to the cost of the securities or foreign currency purchased. Premiums paid on the purchase of options that expire unexercised are recorded as realized losses and are reflected in net realized gain/(loss) on investments in securities in the Statements of Operations.
As of April 30, 2016, the Funds did not hold options contracts.
(b) Forward foreign currency exchange contracts
A forward foreign exchange contract involves an obligation to purchase or sell a specific currency at a future date at a price set at the time the contract is made. The Funds may enter into forward foreign currency exchange contracts in connection with settling planned purchases or sales of securities, as part of an investment strategy to protect against uncertainty in the level of future foreign exchange rates in the purchase and sale of securities, or to gain or limit exposure to foreign currencies. All forward foreign currency exchange contracts are valued daily at the applicable exchange rates. Any resulting unrealized gains or losses are recorded in net change in unrealized appreciation/(depreciation) on forward foreign currency exchange contracts in the Statements of Operations. A Fund records realized gains or losses at the time the forward foreign exchange contract is offset by entering into a closing transaction with the same counterparty or is extinguished by delivery of the currency. Realized gains or losses, if any, are included in net realized gain/(loss) on forward foreign exchange contracts in the Statements of Operations.
133
ASHMORE FUNDS
NOTES TO FINANCIAL STATEMENTS (CONTINUED)
As of April 30, 2016 (Unaudited)
Risks arise upon entering into these contracts from the potential inability of counterparties to meet the terms of their contracts and from unanticipated movements in the value of a foreign currency relative to the United States dollar. The contractual amounts of forward foreign currency exchange contracts do not necessarily represent the amounts potentially subject to risk. The measurement of the risks associated with these instruments should be considered in light of all related and offsetting transactions. The Funds bear market risk from changes in foreign currency exchange rates and credit risk if the counterparty fails to perform. Further information on the impact of these positions on the Funds’ financial statements can be found in the notes to the Schedules of Investments.
As of April 30, 2016, the Ashmore Emerging Markets Total Return Fund, Ashmore Emerging Markets Hard Currency Debt Fund, Ashmore Emerging Markets Local Currency Bond Fund, Ashmore Emerging Markets Corporate Debt Fund, Ashmore Emerging Markets Short Duration Fund and the Ashmore Emerging Markets Small-Cap Equity Fund had average contract notional exposures of $2,100,207, $6,196, $514,654, $1,664,811, $299,190 and $43,931, respectively, related to forward foreign currency exchange contracts.
(c) Futures contracts
Futures contracts obligate the buyer to take and the seller to make delivery at a future date of a specified quantity of a financial instrument or an amount of cash based on the value of securities indices, commodities or the fair value in United States dollars of a foreign currency.
The Funds’ participation in the futures markets involves certain risks, including the imperfect correlation between movements in the price of the futures contracts and movements in the price of the underlying securities. Risks may arise from the potential inability of a counterparty to meet the terms of the contract.
Credit risk is mitigated to the extent that the exchange on which a particular futures contract is traded assumes the risk of a counterparty defaulting on its obligations under the contract.
At the time the Funds enter into a futures contract, the Funds deposit and maintain as collateral initial margin with the broker, as required by the exchange on which the transaction is effected. Pursuant to the contract, the Funds agree to receive from or pay to the broker an amount of cash equal to the fluctuation in the value of the contract. Such receipts or payments are determined by the rules of the futures exchange and are known as variation margin. When the contract is closed, the Funds record a realized gain or loss equal to the difference between the value of the contract at the time it was opened and the time it was closed. This amount is included in net realized gain or loss on futures contracts in the Statement of Operations. Any unrealized gains or losses on open futures contracts are included in net change in unrealized appreciation/(depreciation) on futures contracts in the Statement of Operations.
As of April 30, 2016, the Funds did not hold futures contracts.
(d) Swap Agreements
During the reporting period, certain Funds entered into swap agreements, which are arrangements between two parties to exchange cash flows based on a notional principal amount. Swap agreements are either privately negotiated in the over-the-counter market (“OTC swaps”) or may be executed in a multilateral or other trade facility platform, such as a registered exchange (“centrally cleared swaps”). Swap agreements are recorded at their fair value. The fair value is based on quoted market prices or prices obtained from a third party provider at the date of the Statements of Assets and Liabilities without any deduction for estimated future selling costs. Swap agreements are marked to market daily and the change in fair value, if any, is recorded as unrealized gain or loss. Payments made or received are recorded as part of realized gains and losses. Daily changes in valuation of centrally cleared swaps, if any, are recorded as a receivable or payable for the change in value as appropriate (“variation margin”) on the Statement of Assets and Liabilities.
The periodic payments on the swap agreements entered into by the Funds are reflected in the Statement of Operations within net realized gain/(loss) on interest rate swap contracts. Unrealized gains are reported as an asset and unrealized losses are reported as a liability in the Statements of Assets and Liabilities for over the counter swaps. Changes in the fair value are reflected in the Statements of Operations within net change in unrealized appreciation/(depreciation) on interest rate and centrally cleared swap contracts in the period in which they occur. Certain Funds could be exposed to credit or market risk due to unfavorable changes in the fluctuation of interest rates or if the counterparty defaults on its obligations to perform.
134
ASHMORE FUNDS
NOTES TO FINANCIAL STATEMENTS (CONTINUED)
As of April 30, 2016 (Unaudited)
As of April 30, 2016, the Ashmore Emerging Markets Total Return Fund and Ashmore Emerging Markets Local Currency Bond Fund had average notional exposures of $29,938,530 and $9,223,480, respectively, related to swap agreements.
The Funds may enter into transactions subject to enforceable netting agreements or other similar arrangements (“netting agreements”). Generally, netting agreements allow the Funds to offset any exposure to a specific counterparty with any collateral received or delivered to that counterparty based on the terms of the agreements. Generally, the Funds manage their cash collateral and securities collateral on a counterparty basis.
Offsetting of Financial Assets and Derivative Assets as of April 30, 2016.
(a) Exchange-Traded:
Centrally Cleared Swaps
| | | | | | | | | | | | | | | | | | | | | | |
| Ashmore Emerging Markets Local Currency Bond Fund | |
| Counterparty | | Gross Amounts of
Derivatives Assets
Presented in the Statement of
Assets and Liabilities | | | Gross Amounts of
Derivatives Liabilities
Presented in the Statement of
Assets and Liabilities | | | | | Net
Amounts | | | Collateral
(Received) Paid | | | Net
Exposure | |
BNP Paribas | | $ | - | | | $ | (9,200 | ) | | | | $ | (9,200 | ) | | $ | - | | | $ | (9,200 | ) |
HSBC Bank | | | 21,946 | | | | - | | | | | | 21,946 | | | | (21,946 | ) | | | - | |
JP Morgan | | | - | | | | (1,132 | ) | | | | | (1,132 | ) | | | - | | | | (1,132 | ) |
Morgan Stanley | | | - | | | | (439 | ) | | | | | (439 | ) | | | - | | | | (439 | ) |
| | | | | | | | | | | | | | | | | | | | | | |
Total | | $ | 21,946 | | | $ | (10,771 | ) | | | | $ | 11,175 | | | $ | (21,946 | ) | | $ | (10,771 | ) |
| | | | | | | | | | | | | | | | | | | | | | |
(b) Over-the-Counter Financial Derivative Instruments:
Forward Currency Contracts and Interest Rate Swap Contracts
| | | | | | | | | | | | | | | | |
| Ashmore Emerging Markets Total Return Fund | |
| Counterparty | | Gross Amounts of
Derivatives Assets
Presented in the Statement of
Assets and Liabilities | | | Derivatives
available
for offset | | | Collateral
Received | | | Net Amount Due
From Counterparty | |
ANZ Banking | | $ | 754,825 | | | $ | - | | | $ | - | | | $ | 754,825 | |
Barclays | | | 725,947 | | | | (130,727 | ) | | | - | | | | 595,220 | |
BNP Paribas | | | 1,451,736 | | | | (1,019,500 | ) | | | - | | | | 432,236 | |
Citibank | | | 374,568 | | | | (71,034 | ) | | | - | | | | 303,534 | |
Credit Suisse | | | 234,262 | | | | - | | | | - | | | | 234,262 | |
Deutsche Bank | | | 327,610 | | | | (57,948 | ) | | | - | | | | 269,662 | |
Goldman Sachs | | | 70,405 | | | | (70,405 | ) | | | - | | | | - | |
HSBC Bank | | | 2,133,415 | | | | (711,896 | ) | | | - | | | | 1,421,519 | |
JP Morgan | | | 205,853 | | | | (1,379 | ) | | | - | | | | 204,474 | |
Merrill Lynch | | | 1,360,193 | | | | (193,434 | ) | | | - | | | | 1,166,759 | |
Morgan Stanley | | | 62,863 | | | | (62,863 | ) | | | - | | | | - | |
Santander | | | 38,601 | | | | - | | | | - | | | | 38,601 | |
UBS | | | 120,684 | | | | (29,182 | ) | | | - | | | | 91,502 | |
| | | | | | | | | | | | | | | | |
Total | | $ | 7,860,962 | | | $ | (2,348,368 | ) | | $ | - | | | $ | 5,512,594 | |
| | | | | | | | | | | | | | | | |
135
ASHMORE FUNDS
NOTES TO FINANCIAL STATEMENTS (CONTINUED)
As of April 30, 2016 (Unaudited)
| | | | | | | | | | | | | | | | |
| Ashmore Emerging Markets Total Return Fund | |
| Counterparty | | Gross Amounts of
Derivatives Liabilities
Presented in the Statement of
Assets and Liabilities | | | Derivatives
available
for offset | | | Collateral
Pledged | | | Net Amount Due
To Counterparty | |
Barclays | | $ | 130,727 | | | $ | (130,727 | ) | | $ | - | | | $ | - | |
BNP Paribas | | | 1,019,500 | | | | (1,019,500 | ) | | | - | | | | - | |
Citibank | | | 71,034 | | | | (71,034 | ) | | | - | | | | - | |
Deutsche Bank | | | 57,948 | | | | (57,948 | ) | | | - | | | | - | |
Goldman Sachs | | | 659,784 | | | | (70,405 | ) | | | - | | | | 589,379 | |
HSBC Bank | | | 711,896 | | | | (711,896 | ) | | | - | | | | - | |
JP Morgan | | | 1,379 | | | | (1,379 | ) | | | - | | | | - | |
Merrill Lynch | | | 193,434 | | | | (193,434 | ) | | | - | | | | - | |
Morgan Stanley | | | 114,020 | | | | (62,863 | ) | | | - | | | | 51,157 | |
UBS | | | 29,182 | | | | (29,182 | ) | | | - | | | | - | |
| | | | | | | | | | | | | | | | |
Total | | $ | 2,988,904 | | | $ | (2,348,368 | ) | | $ | - | | | $ | 640,536 | |
| | | | | | | | | | | | | | | | |
| | | | |
| | | | | | | | | | | | | | | | |
| Ashmore Emerging Markets Local Currency Bond Fund | |
| Counterparty | | Gross Amounts of
Derivatives Assets Presented
in the Statement of Assets
and Liabilities | | | Derivatives
available
for offset | | | Collateral
Received | | | Net Amount Due
From Counterparty | |
ANZ | | $ | 9,394 | | | $ | - | | | $ | - | | | $ | 9,394 | |
Barclays | | | 28,858 | | | | (19,930 | ) | | | - | | | | 8,928 | |
BNP Paribas | | | 636,776 | | | | (211,329 | ) | | | - | | | | 425,447 | |
Citibank | | | 156,161 | | | | (26,624 | ) | | | - | | | | 129,537 | |
Deutsche Bank | | | 140,854 | | | | (44,889 | ) | | | - | | | | 95,965 | |
Goldman Sachs | | | 13,434 | | | | (366 | ) | | | - | | | | 13,068 | |
HSBC Bank | | | 445,792 | | | | (192,288 | ) | | | - | | | | 253,504 | |
JP Morgan | | | 51,198 | | | | (24,266 | ) | | | - | | | | 26,932 | |
Merrill Lynch | | | 130,094 | | | | (13,393 | ) | | | - | | | | 116,701 | |
Morgan Stanley | | | 13,185 | | | | (13,185 | ) | | | - | | | | - | |
Santander | | | 12,951 | | | | - | | | | - | | | | 12,951 | |
UBS | | | 47,217 | | | | - | | | | - | | | | 47,217 | |
| | | | | | | | | | | | | | | | |
Total | | $ | 1,685,914 | | | $ | (546,270 | ) | | $ | - | | | $ | 1,139,644 | |
| | | | | | | | | | | | | | | | |
136
ASHMORE FUNDS
NOTES TO FINANCIAL STATEMENTS (CONTINUED)
As of April 30, 2016 (Unaudited)
| | | | | | | | | | | | | | | | |
| Ashmore Emerging Markets Local Currency Bond Fund | |
| Counterparty | | Gross Amounts of
Derivatives Liabilities
Presented in the Statement of
Assets and Liabilities | | | Derivatives
available
for offset | | | Collateral
Pledged | | | Net Amount Due
To Counterparty | |
Barclays | | $ | 19,930 | | | $ | (19,930 | ) | | $ | - | | | $ | - | |
BNP Paribas | | | 211,329 | | | | (211,329 | ) | | | - | | | | - | |
Citibank | | | 26,624 | | | | (26,624 | ) | | | - | | | | - | |
Credit Suisse | | | 2,442 | | | | - | | | | - | | | | 2,442 | |
Deutsche Bank | | | 44,889 | | | | (44,889 | ) | | | - | | | | - | |
Goldman Sachs | | | 366 | | | | (366 | ) | | | - | | | | - | |
HSBC Bank | | | 192,288 | | | | (192,288 | ) | | | - | | | | - | |
JP Morgan | | | 24,266 | | | | (24,266 | ) | | | - | | | | - | |
Merrill Lynch | | | 13,393 | | | | (13,393 | ) | | | - | | | | - | |
Morgan Stanley | | | 47,188 | | | | (13,185 | ) | | | - | | | | 34,003 | |
| | | | | | | | | | | | | | | | |
Total | | $ | 582,715 | | | $ | (546,270 | ) | | $ | - | | | $ | 36,445 | |
| | | | | | | | | | | | | | | | |
| | | | |
| | | | | | | | | | | | | | | | |
| Ashmore Emerging Markets Corporate Debt Fund | |
| Counterparty | | Gross Amounts of
Derivatives Liabilities
Presented in the Statement of
Assets and Liabilities | | | Derivatives
available
for offset | | | Collateral
Pledged | | | Net Amount Due
To Counterparty | |
BNP Paribas | | $ | 20,856 | | | $ | - | | | $ | - | | | $ | 20,856 | |
HSBC Bank | | | 16,505 | | | | - | | | | - | | | | 16,505 | |
| | | | | | | | | | | | | | | | |
Total | | $ | 37,361 | | | $ | - | | | $ | - | | | $ | 37,361 | |
| | | | | | | | | | | | | | | | |
11. Related parties
Investment management fees
The Trust has an Investment Management Agreement (the “Agreement”) with the Investment Manager, with whom certain officers and directors of the Trust are affiliated, to furnish investment management services to the Funds. Under the terms of the Agreement, the Trust, on behalf of the Funds, compensates the Investment Manager for its investment management services at the following rates, based on each Fund’s average daily net assets:
| | | | |
| Fund | | Rate | |
Ashmore Emerging Markets Total Return Fund | | | 1.00 | % |
Ashmore Emerging Markets Hard Currency Debt Fund | | | 0.90 | % |
Ashmore Emerging Markets Local Currency Bond Fund | | | 0.95 | % |
Ashmore Emerging Markets Corporate Debt Fund | | | 1.15 | % |
Ashmore Emerging Markets Short Duration Fund | | | 0.65 | % |
Ashmore Emerging Markets Equity Opportunities Fund | | | 0 | % |
Ashmore Emerging Markets Value Fund | | | 1.15 | % |
Ashmore Emerging Markets Small-Cap Equity Fund | | | 1.50 | % |
Ashmore Emerging Markets Frontier Equity Fund | | | 1.50 | % |
137
ASHMORE FUNDS
NOTES TO FINANCIAL STATEMENTS (CONTINUED)
As of April 30, 2016 (Unaudited)
The Investment Manager has contractually agreed to waive its fees or reimburse each Fund for other expenses until February 28, 2017, to the extent that total operating expenses (other than acquired fund fees and expenses, interest expenses, taxes, extraordinary expenses and certain credits and offset arrangements) for each class of shares of each Fund exceed the rates in the table below, based on each Fund’s average daily net assets. The expense limitation arrangement may be terminated by the Board at any time.
| | | | | | | | | | | | | | | |
| Fund | | Class A | | Class C | | Institutional
Class |
Ashmore Emerging Markets Total Return Fund | | | | 1.27% | | | | | 2.02% | | | | | 1.02% | |
Ashmore Emerging Markets Hard Currency Debt Fund | | | | 1.17% | | | | | 1.92% | | | | | 0.92% | |
Ashmore Emerging Markets Local Currency Bond Fund | | | | 1.22% | | | | | 1.97% | | | | | 0.97% | |
Ashmore Emerging Markets Corporate Debt Fund | | | | 1.42% | | | | | 2.17% | | | | | 1.17% | |
Ashmore Emerging Markets Short Duration Fund | | | | 0.92% | | | | | 1.67% | | | | | 0.67% | |
Ashmore Emerging Markets Equity Opportunities Fund | | | | 0.00% | | | | | 0.00% | | | | | 0.00% | |
Ashmore Emerging Markets Value Fund | | | | 1.42% | | | | | 2.17% | | | | | 1.17% | |
Ashmore Emerging Markets Small-Cap Equity Fund | | | | 1.77% | | | | | 2.52% | | | | | 1.52% | |
Ashmore Emerging Markets Frontier Equity Fund | | | | 1.77% | | | | | 2.52% | | | | | 1.52% | |
Any such waiver or reimbursement is subject to the Investment Manager’s right to recover amounts waived or reimbursed to the extent actual fees and expenses for a future fiscal period are less than each Fund’s expense limitation cap, provided, however, that the Investment Manager shall only be entitled to recover such amounts waived or reimbursed during the previous three fiscal years. The total amounts subject to recovery in fiscal years are shown below:
| | | | | | | | | | | | | | | | | | | | |
| Fund | | 2016 | | | 2017 | | | 2018 | | | 2019 | | | Total | |
Ashmore Emerging Markets Total Return Fund | | $ | 619,476 | | | $ | 875,987 | | | $ | 768,326 | | | $ | 407,344 | | | $ | 2,671,133 | |
Ashmore Emerging Markets Hard Currency Debt Fund | | | 173,356 | | | | 165,889 | | | | 138,561 | | | | 51,169 | | | | 528,975 | |
Ashmore Emerging Markets Local Currency Bond Fund | | | 212,015 | | | | 282,751 | | | | 255,183 | | | | 121,670 | | | | 871,619 | |
Ashmore Emerging Markets Corporate Debt Fund | | | 223,515 | | | | 296,575 | | | | 353,990 | | | | 178,188 | | | | 1,052,268 | |
Ashmore Emerging Markets Short Duration Fund | | | - | | | | 155,228 | | | | 192,324 | | | | 58,966 | | | | 406,518 | |
Ashmore Emerging Markets Equity Opportunities Fund | | | - | | | | - | | | | - | | | | 69,096 | | | | 69,096 | |
Ashmore Emerging Markets Value Fund | | | 147,340 | | | | 217,452 | | | | 187,166 | | | | 61,726 | | | | 613,684 | |
Ashmore Emerging Markets Small-Cap Equity Fund | | | 158,906 | | | | 328,428 | | | | 268,940 | | | | 111,010 | | | | 867,284 | |
Ashmore Emerging Markets Frontier Equity Fund | | | - | | | | 298,073 | | | | 243,042 | | | | 109,823 | | | | 650,938 | |
Subadviser fees
For the services provided, the Investment Manager pays the Subadviser at the following rates, based on each Fund’s average daily net assets:
| | |
Fund | | Subadviser Fee |
Ashmore Emerging Markets Value Fund | | 0.92% |
Ashmore Emerging Markets Small-Cap Equity Fund | | 1.20% |
Ashmore Emerging Markets Frontier Equity Fund | | 1.20% |
138
ASHMORE FUNDS
NOTES TO FINANCIAL STATEMENTS (CONTINUED)
As of April 30, 2016 (Unaudited)
Distribution and Servicing fees
The Funds have adopted Amended Plans of Distribution and Servicing Fees pursuant to Rule 12b-1 under the 1940 Act (“Distribution and Servicing Fee Plans”). Under the Distribution and Servicing Fee Plans, each of the Funds may pay fees to the distributor on an ongoing basis as compensation for the services the distributor renders and the expenses it bears in connection with the sale and distribution of Fund shares (“distribution fees”) and/or in connection with personal services rendered to Fund shareholders and the maintenance of shareholder accounts (“servicing fees”). Class A and C shares each have a separate 12b-1 Plan. Class A shares pay only servicing fees. Class C shares pay both distribution and servicing fees. The following table lists the maximum annual rates at which the distribution and/or servicing fees may be paid under each 12b-1 Plan (calculated as a percentage of a Fund’s average daily net assets attributable to the particular class of shares):
| | | | |
| | | Servicing Fee | | Distribution Fee |
Class A shares | | 0.25% | | None |
Class C shares | | 0.25% | | 0.75% |
Investor Ownership
On November 19, 2010, Ashmore Emerging Markets Total Return Fund, Ashmore Emerging Markets Hard Currency Debt Fund, Ashmore Emerging Markets Local Currency Bond Fund, and Ashmore Emerging Markets Corporate Debt Fund were seeded. On June 22, 2011, Ashmore Emerging Markets Value Fund was seeded. On October 4, 2011, Ashmore Emerging Markets Small-Cap Equity Fund was seeded. On November 5, 2013, Ashmore Emerging Markets Frontier Equity Fund was seeded. On June 24, 2014, Ashmore Emerging Markets Short Duration Fund was seeded. On November 22, 2015, Ashmore Emerging Markets Equity Opportunities Fund was seeded. Each of the Funds was seeded by Ashmore Investments UK Limited, the parent of the Investment Manager. Ashmore Investments UK Limited seeded each Fund with $10 million, except the Ashmore Emerging Markets Total Return Fund, which was seeded with $ 20 million, and the Ashmore Emerging Markets Equity Opportunities Fund and the Ashmore Emerging Markets Frontier Equity Fund, which were seeded with $5 million, respectively.
As of April 30, 2016, Ashmore Investments UK Limited owned the following percentages of the outstanding shares of each Fund:
| | | | |
| Fund | | Institutional
Class | |
Ashmore Emerging Markets Hard Currency Debt Fund | | | 82.30 | % |
Ashmore Emerging Markets Short Duration Fund | | | 73.01 | % |
Ashmore Emerging Markets Equity Opportunities Fund | | | 98.51 | % |
Ashmore Emerging Markets Value Fund | | | 59.26 | % |
Ashmore Emerging Markets Frontier Equity Fund | | | 37.55 | % |
139
ASHMORE FUNDS
NOTES TO FINANCIAL STATEMENTS (CONTINUED)
As of April 30, 2016 (Unaudited)
In addition to the Ashmore Investments UK Limited ownership, shown in the table above, the following Funds had other investors owning of record or known by the Funds to own beneficially greater than 5% of the outstanding shares of such Funds:
| | | | | | |
| Fund | | Class | | # of Investors
Owning > 5%
of outstanding
Shares | | % of Ownership by
Investor |
Ashmore Emerging Markets Total Return Fund | | Class A | | 5 | | 15.11%, 14.99%, 13.80%, 10.79%, 5.67% |
| | Class C | | 6 | | 17.52%, 7.24%, 7.03%, 6.94%, 5.45%, 5.36% |
| | Class I | | 6 | | 7.89%, 7.39%, 7.10%, 6.67%, 6.18%, 5.29% |
Ashmore Emerging Markets Hard Currency Debt Fund | | Class A | | 7 | | 31.18%, 10.16%, 9.62%, 8.94%, 8.49%, 6.19%, 5.65% |
| | Class C | | 1 | | 100.00% |
| | Class I | | 2 | | 82.30%, 15.56% |
Ashmore Emerging Markets Local Currency Bond Fund | | Class A | | 3 | | 50.72%, 27.65%, 8.97% |
| | Class C | | 4 | | 54.56%, 26.58%, 8.08%, 6.74% |
| | Class I | | 3 | | 50.98%, 24.65%, 22.73% |
Ashmore Emerging Markets Corporate Debt Fund | | Class A | | 3 | | 34.41%, 10.87%, 8.35% |
| | Class C | | 1 | | 28.56% |
| | Class I | | 1 | | 5.87% |
140
ASHMORE FUNDS
NOTES TO FINANCIAL STATEMENTS (CONTINUED)
As of April 30, 2016 (Unaudited)
| | | | | | |
| Fund | | Class | | # of Investors
Owning > 5%
of outstanding
Shares | | % of Ownership by
Investor |
Ashmore Emerging Markets Short Duration Fund | | Class A | | 3 | | 55.55%, 21.77%, 12.20% |
| | Class I | | 2 | | 73.01%, 22.92% |
Ashmore Emerging Markets Equity Opportunities Fund | | Class A | | 1 | | 100.00% |
| | Class C | | 1 | | 100.00% |
| | Class I | | 1 | | 98.51% |
Ashmore Emerging Markets Value Fund | | Class A | | 4 | | 44.66%, 36.24%, 9.69%, 9.41% |
| | Class C | | 1 | | 100.00% |
| | Class I | | 4 | | 59.26%, 19.38%, 14.29%, 6.84% |
Ashmore Emerging Markets Small-Cap Equity Fund | | Class A | | 4 | | 59.54%, 7.04%, 5.55%, 5.45% |
| | Class C | | 7 | | 13.93%, 9.75%, 8.86%, 6.39%, 6.19%, 5.64%, 5.57% |
| | Class I | | 5 | | 20.99%, 18.29%, 9.58%, 9.50%, 5.62% |
Ashmore Emerging Markets Frontier Equity Fund | | Class A | | 5 | | 34.28%, 28.51%, 9.59%, 9.46%, 8.69% |
| | Class C | | 4 | | 31.74%, 28.21%, 26.45%, 8.64% |
| | Class I | | 2 | | 57.80%, 37.55% |
12. Subsequent events
The Trust has evaluated subsequent events for the Funds through the date the financial statements were issued, and has concluded that there are no identified subsequent events relevant for financial statement adjustment or disclosure.
141
ASHMORE FUNDS
ADVISORY AGREEMENT APPROVAL
As of April 30, 2016 (Unaudited)
ADVISORY AGREEMENT APPROVALS
At an in-person meeting of the Board of Trustees of Ashmore Funds (the “Trust”) held on March 22, 2016, the Board, including a majority of the Trustees who are not “interested persons” of the Trust within the meaning of the Investment Company Act of 1940, as amended (the “1940 Act”) (the “Independent Trustees”), voting separately, considered and unanimously approved the continuation of: (i) the Investment Management Agreement between Ashmore Investment Advisors Limited (“AIAL”) and the Trust, on behalf of each of Ashmore Emerging Markets Corporate Debt Fund, Ashmore Emerging Markets Hard Currency Debt Fund, Ashmore Emerging Markets Local Currency Bond Fund, Ashmore Emerging Markets Short Duration Fund, and Ashmore Emerging Markets Total Return Fund (the “Non-Subadvised Funds”) and Ashmore Emerging Markets Value Fund, Ashmore Emerging Markets Frontier Equity Fund and Ashmore Emerging Markets Small-Cap Equity Fund (the “Subadvised Funds,” and together with the Non-Subadvised Funds, the “Funds”); and (ii) the Sub-Advisory Agreement between AIAL and Ashmore Equities Investment Management (US) LLC, an affiliate of AIAL (“AEIM”), for the management of the Subadvised Funds (each, an “Agreement,” and collectively, the “Agreements”).
In determining to approve the continuation of the Agreements for a one-year period, the Board considered all factors that it believed, in light of the legal advice furnished to them and their own business judgment, to be relevant to the interests of shareholders, including those listed below. In evaluating the terms of the Agreements, the Board did not identify any single factor as controlling, and individual members of the Board did not necessarily attribute the same weight or importance to each factor, nor are the items described herein all encompassing of the matters considered by the Board. Throughout their review of the Agreements, the Independent Trustees were assisted by their own Independent Trustee legal counsel. The Independent Trustees had formally requested through their legal counsel, and AIAL had provided, certain information the Independent Trustees considered relevant to their evaluation. The Contracts Review Committee, which is comprised of all of the Independent Trustees, discussed the information over the course of several different occasions, without representatives of AIAL present.
Among the information and factors considered by the Board in evaluating the Agreements were the following:
NATURE, QUALITY AND EXTENT OF INVESTMENT MANAGEMENT SERVICES
The Board examined the nature, quality and extent of the services provided by AIAL to all of the Funds and by AEIM to the Subadvised Funds.
AIAL’s Services to All Funds
The Board considered information regarding the overall organization and resources of AIAL, including information regarding senior management, portfolio managers and other personnel providing investment management, administrative and other services to the Funds. The Board reviewed AIAL’s key personnel who provide investment management services to the Funds, as well as the fact that, under the Agreements, AIAL has the authority and responsibility, subject to the Board’s oversight, to make and execute investment decisions for the Funds within the framework of the Funds’ investment policies and restrictions.
The Board considered that AIAL’s duties include: (i) investment research and selection, (ii) adherence to (and monitoring compliance with) the Funds’ investment policies and restrictions, the 1940 Act and other relevant laws (iii) with respect to the Subadvised Funds, supervision of the investment management and other services provided by AEIM to the Subadvised Funds; and (iv) furnishing office space and equipment, providing bookkeeping and clerical services (excluding determination of net asset value and shareholder accounting services) and paying all salaries, fees and expenses of officers and Trustees of the Trust who are affiliated with AIAL (except to the extent such salaries, fees and expenses are paid by another AIAL affiliate other than the trust or a Fund). The Board also evaluated the significant compliance resources available to and utilized by AIAL.
142
ASHMORE FUNDS
ADVISORY AGREEMENT APPROVAL (CONTINUED)
As of April 30, 2016 (Unaudited)
AEIM’s Services to the Subadvised Funds
The Board’s consideration of the services provided by AEIM included a review of its senior management, portfolio managers and other personnel providing investment management services to the Subadvised Funds, its investment philosophy, style and processes, its approach to controlling risk, and the quality and extent of its investment capabilities and resources, including, the nature and extent of research it receives from broker-dealers. In their deliberations with respect to the Subadvised Funds, the Board considered AIAL’s relationship with AEIM. The Board also considered AEIM’s breadth and depth of experience and investment results in managing other accounts similar to the Subadvised Funds. The Board reviewed information concerning AEIM’s historical investment results in managing accounts in a manner substantially similar to the Subadvised Funds.
Investment Performance
In considering each Fund’s performance, the Board requested and received from AIAL data compiled by Lipper Inc. (“Lipper”). The Trustees also received information explaining the methodology for compilation of certain of this information and what it was intended to demonstrate. The Board considered the performance of the Funds in light of their respective investment objectives on a comparable basis relative to the Funds’ peers. The Board received performance information for Institutional Shares for the one-, two- and three-year periods ended December 31, 2015 for each Fund, other than Ashmore Emerging Markets Frontier Equity Fund (which commenced investment operations on November 5, 2013) and Ashmore Emerging Markets Short Duration Fund (which commenced investment operations on June 24, 2014). The Board received performance information for Institutional Shares for the one- and two-year periods ended December 31, 2015 for Ashmore Emerging Markets Frontier Fund and for the one-year period ended December 31, 2015 for Ashmore Emerging Markets Short Duration Fund. In considering such comparative data, the Trustees noted the specialized nature and focus of many of the Funds, and for certain Funds the limited number of peer group funds, particularly for the longer performance periods.
Ashmore Emerging Markets Total Return Fund. The Board observed that the Ashmore Emerging Markets Total Return Fund’s performance ranked sixth out of eight, seventh out of seven, and fifth out of five in its peer group for the one-, two- and three-year periods ended December 31, 2015, respectively, while ranking in the fifth quintile (first being the best) in its larger performance universe for each of the same three periods.
Ashmore Emerging Markets Hard Currency Debt Fund. The Board observed that the Ashmore Emerging Markets Hard Currency Debt Fund’s performance ranked first out of six, first out of five, and second out of two in its peer group for the one-, two- and three-year periods ended December 31, 2015, respectively, while ranking in the first, first and second quintiles (first being the best) in its larger performance universe for the same three periods.
Ashmore Emerging Markets Local Currency Bond Fund. The Board observed that the Ashmore Emerging Markets Local Currency Bond Fund’s performance ranked fifth out of six, fourth out of six, and fourth out of five in its peer group for the one-, two- and three-year periods ended December 31, 2015, respectively, while ranking in the fourth quintile (first being the best) in its larger performance universe for each of the same three periods.
Ashmore Emerging Markets Corporate Debt Fund. The Board noted that the Ashmore Emerging Markets Corporate Debt Fund’s performance ranked seventh out of ten, eighth out of nine, and sixth out of seven in its peer group for the one-, two- and three-year periods ended December 31, 2015, respectively, while ranking in the second, fourth and third quintiles (first being the best) in its larger performance universe for the same three periods.
Ashmore Emerging Markets Short Duration Fund. The Board noted that the Ashmore Emerging Markets Short Duration Fund’s performance ranked first out of four in its peer group for the one-year period ended December 31, 2015, while ranking in the first quintile (first being the best) in its larger performance universe for the same period.
Ashmore Emerging Markets Value Fund. The Board observed that Ashmore Emerging Markets Value Fund’s performance ranked twelfth out of twelve, ninth out of nine, and fifth out of five in its peer group for the one-, two- and three-year periods ended December 31, 2015, respectively, while ranking in the fifth quintile (first being the best) in its larger performance universe for each of the same three periods.
143
ASHMORE FUNDS
ADVISORY AGREEMENT APPROVAL (CONTINUED)
As of April 30, 2016 (Unaudited)
Ashmore Emerging Markets Small-Cap Equity Fund. The Board noted that the Ashmore Emerging Markets Small-Cap Equity Fund’s performance ranked second out of eleven, fourth out of seven, and second out of four in its peer group for the one-, two- and three-year periods ended December 31, 2015, respectively, while ranking in the first, second and fourth quintiles (first being the best) in its larger performance universe for the same three periods.
Ashmore Emerging Markets Frontier Equity Fund. The Board noted that the Ashmore Emerging Markets Frontier Equity Fund’s performance ranked first out of five in its peer group for the one- and two-year periods ended December 31, 2015, while ranking in the second and first quintiles (first being the best) in its larger performance universe for the same two periods.
The Board also took into account AIAL’s explanation for the comparative underperformance of certain Funds; specifically that the Funds had exposure to certain types of investments that had underperformed other types of emerging market asset classes and issuers over the relevant time periods. The Board also considered AIAL’s view that the depressed valuations in certain of these underperforming asset classes and issuers had provided what AIAL believed were attractive purchase opportunities that AIAL anticipated would position the Funds well for future returns. The Board also noted AIAL’s and AIEM’s expressed long-term approach to investment management and their favorable longer-term track record in managing accounts having similar strategies to the Funds.
The Board concluded that it was satisfied with the nature, extent and quality of services provided by AIAL to each Fund and that there was a reasonable basis on which to conclude that each Fund would continue to benefit from the services provided by AIAL. The Board separately concluded that it was satisfied with the nature, extent and quality of services provided to the Subadvised Funds by AEIM and that there was a reasonable basis on which to conclude that the Subadvised Funds would continue to benefit from the services provided by AEIM.
INVESTMENT MANAGEMENT FEES AND COST OF SERVICES
The Board also considered the contractual and actual investment management fees paid by each Fund to AIAL. In doing so, the Board compared the contractual and actual investment management fees and overall gross and net expense ratios (represented by the Funds’ Institutional Shares) to those of the Funds’ peers as determined by Lipper. They noted that several of the Funds were quite small in size relative to their peers. As with the performance comparisons, the Board also noted that, with respect to several of the Funds, there were only a limited number of peer funds with similar investment strategies. Where contractual or actual management fees or total expense ratios of a Fund were meaningfully above those of the Lipper peers, the Board also considered and took into account the extent to which AIAL had undertaken to waive a portion of its fees and/or reimburse expenses so as to otherwise limit these Funds’ ordinary operating expenses until at least February 28, 2017.
With respect to the Subadvised Funds, the Trustees also separately considered the fees paid by AIAL to AEIM in relation to the investment management services provided by AEIM, and the portion of the overall fee retained by AIAL in relation to the supervisory and administrative services provided by AIAL.
The Board reviewed AIAL’s costs and profitability as presented by it in serving as investment adviser. The Board noted that AIAL was operating at a loss with respect to Ashmore Emerging Markets Local Currency Bond Fund, Ashmore Emerging Markets Short Duration Fund, Ashmore Emerging Markets Hard Currency Debt Fund, and Ashmore Emerging Markets Value Fund. With respect to the remaining Funds, the Board concluded that AIAL’s profitability was not excessive.
In evaluating the terms of the Agreements, the Board also considered the other benefits that may inure to AIAL and AEIM as a result of their relationship with the Funds, such as the reputational benefit derived from serving as investment adviser or subadviser to the Funds.
144
ASHMORE FUNDS
ADVISORY AGREEMENT APPROVAL (CONTINUED)
As of April 30, 2016 (Unaudited)
In light of the information provided and the quality of the services rendered and anticipated to be rendered, the Board concluded that the investment management fees to be charged the Funds were appropriate.
ECONOMIES OF SCALE
The Board noted that the contractual investment management fees for the Funds do not contain breakpoints that would reduce the fee rate on assets above specified levels. The Board observed that many of the Funds remained quite small in size, and that the collective assets of all of the Funds were only approximately $970 million. The Board also observed that AIAL was subsidizing all of the Funds through fee waivers and expense reimbursements. In evaluating the Funds’ contractual investment management fees, the Board considered AIAL’s representation that the contractual investment management fees were intended to reflect achievable economies of scale and also AIAL’s continuing agreement to limit certain expenses of each Fund. The Board received and evaluated information concerning whether AIAL would realize economies of scale as the assets of individual Funds grow beyond current levels. The Board noted they intend to monitor each Fund’s asset growth in connection with future reviews of the Funds’ Agreements to determine whether breakpoints may be appropriate at such time. In light of the Funds’ current sizes and expense structures, the Board concluded that breakpoints in the Funds’ contractual investment management fees were not warranted at this time.
* * *
The Board concluded that the fees to be paid to AIAL by each Fund, and the fees to be paid by AIAL to AEIM with respect to the Subadvised Funds, were appropriate in light of the services to be provided by AIAL and AEIM, respectively, the costs to AIAL of operating the Funds, and the Funds’ current and reasonably foreseeable asset levels, and determined that the Agreements should, therefore, be approved.
* * *
145
ASHMORE FUNDS
FOR MORE INFORMATION
As of April 30, 2016 (Unaudited)
PORTFOLIO HOLDINGS
The Ashmore Funds file their complete schedule of portfolio holdings with the Securities and Exchange Commission (“SEC”) for the first and third quarters of each fiscal year on Form N-Q. The Funds’ Forms N-Q are available on the SEC’s Web site at www.sec.gov. You may also review and obtain copies at the SEC’s Public Reference Room in Washington D.C. Information about the Public Reference Room may be obtained by calling 800-SEC-0330. In addition, no later than thirty calendar days after the end of each calendar quarter, a list of all portfolio holdings in each Fund as of the end of such calendar quarter is made available at www.ashmoregroup.com.
PROXY VOTING
Ashmore Funds’ Proxy Voting Policies and Procedures and each Fund’s portfolio securities voting record for the most recent 12-month period ended June 30 are available upon request and without charge by visiting the Ashmore Funds’ Web site at www.ashmoregroup.com or the SEC’s Web site at www.sec.gov or by calling 866-876-8294.
146
ASHMORE FUNDS
PRIVACY POLICY
We consider customer privacy to be a fundamental aspect of our relationships with shareholders and are committed to maintaining the confidentiality, integrity and security of our current, prospective and former shareholders’ personal information. To ensure our shareholders’ privacy, we have developed policies that are designed to protect this confidentiality, while allowing shareholders’ needs to be served.
Obtaining Personal Information In the course of providing shareholders with products and services, we may obtain non-public personal information about shareholders, which may come from sources such as account applications and other forms, from other written, electronic or verbal correspondence, from shareholder transactions, from a shareholder’s brokerage or financial advisory firm, financial adviser or consultant, and/or from information captured on our internet web sites.
Respecting Your Privacy As a matter of policy, we do not disclose any personal or account information provided by shareholders or gathered by us to non-affiliated third parties, except as required for our everyday business purposes, such as to process transactions or service a shareholder’s account, or as otherwise permitted by law. As is common in the industry, non-affiliated companies may from time to time be used to provide certain services, such as preparing and mailing prospectuses, reports, account statements and other information, and gathering shareholder proxies. We may also retain non-affiliated financial services providers to market our shares or products and we may enter into joint-marketing arrangements with them and other financial companies. We may also retain marketing and research service firms to conduct research on shareholder satisfaction. These companies may have access to a shareholder’s personal and account information, but are permitted to use this information solely to provide the specific service or as otherwise permitted by law. We may also provide a shareholder’s personal and account information to their respective brokerage or financial advisory firm, Custodian, and/or to their financial advisor or consultant.
Sharing Information with Third Parties We reserve the right to disclose or report personal information to non-affiliated third parties where we believe in good faith that disclosure is required under law to cooperate with regulators or law enforcement authorities, to protect our rights or property or upon reasonable request by any investee entity in which a shareholder has chosen to invest. Of course, we may also share your information with your consent.
Sharing Information with Affiliates We may share shareholder information with our affiliates in connection with our affiliates’ everyday business purposes, such as servicing a shareholder’s account, but our affiliates may not use this information to market products and services to you except in conformance with applicable laws or regulations. The information we share includes information about our experiences and transactions with a shareholder and may include, for example, a shareholder’s participation in one of the Funds or in other investment programs, a shareholder’s ownership of certain types of accounts, or other data about a shareholder’s transactions or accounts. Our affiliates, in turn, are not permitted to share shareholder information with non-affiliated entities, except as required or permitted by law.
Procedures to Safeguard Private Information We take seriously the obligation to safeguard shareholder non-public personal information. In addition to this policy, we have also implemented procedures that are designed to restrict access to a shareholder’s non-public personal information only to internal personnel who need to know that information in order to provide products or services to such shareholders. In addition, we have physical, electronic, and procedural safeguards in place to guard a shareholder’s non-public personal information.
Disposal of Confidential Records We will dispose of records, if any, that are knowingly derived from data received from a consumer reporting agency regarding a shareholder that is an individual in a manner that ensures the confidentiality of the data is maintained. Such records include, among other things, copies of consumer reports and notes of conversations with individuals at consumer reporting agencies.
147
ASHMORE FUNDS
OTHER INFORMATION
Administrator, Custodian and Transfer Agent
The Northern Trust Company
50 South LaSalle Street
Chicago, Illinois 60603
312-630-6000
Investment Manager
Ashmore Investment Advisors Limited
61 Aldwych
London WC2B 4AE
United Kingdom
44-20-3077-6000
Subadviser for Ashmore Emerging Markets Value Fund,
Ashmore Emerging Markets Small-Cap Equity Fund
and Ashmore Emerging Markets Frontier Equity Fund
Ashmore Equities Investment Management (US) L.L.C.
1001 19th Street North, 15th Floor
Arlington, Virginia 22209
703-243-8800
Independent Registered Public Accounting Firm
KPMG LLP
Aon Center
Suite 5500
200 East Randolph Drive
Chicago, Illinois 60601-6436
Distributor
Ashmore Investment Management (US) Corporation
122 East 42nd Street
New York, New York 10168
212-661-0061
Legal Counsel
Ropes & Gray LLP
Prudential Tower
800 Boylston Street
Boston, Massachusetts 02199
617-951-7000
Independent Trustees’ Counsel
Dechert LLP
One International Place
40th Floor
100 Oliver Street
Boston, Massachusetts 02110
617-728-7100
148
Item 2. Code of Ethics.
Not applicable for this reporting period.
Item 3. Audit Committee Financial Expert.
Not applicable for this reporting period.
Item 4. Principal Accountant Fees and Services.
Not applicable for this reporting period.
Item 5. Audit Committee of Listed Registrants.
Not applicable.
Item 6. Investments.
| (a) | The registrant has elected to include the schedule of investments in securities of unaffiliated issuers as part of the report to shareholders filed under Item 1 of this report on Form N-CSR. |
Item 7. Disclosure of Proxy Voting Policies and Procedures for Closed-End Management Investment Companies.
Not applicable.
Item 8. Portfolio Managers of Closed-End Management Investment Companies.
Not applicable.
Item 9. Purchases of Equity Securities by Closed-End Management Investment Company and Affiliated Purchasers.
Not applicable.
Item 10. Submission of Matters to a Vote of Security Holders.
There have been no material changes to the procedures by which shareholders may recommend nominees to the registrant’s Board of Trustees.
Item 11. Controls and Procedures.
| (a) | The registrant’s principal executive and principal financial officers, or persons performing similar functions, have concluded that the registrant’s disclosure controls and |
3
| | procedures (as defined in Rule 30a-3(c) under the Investment Company Act of 1940 (the “1940 Act”)) are effective, based on the evaluation of these controls and procedures required by Rule 30a-3(b) under the 1940 Act and Rules 13a-15(b) or 15d-15(b) under the Securities Exchange Act of 1934 as of a date within 90 days of the filing date of this report. |
| (b) | There were no changes in the registrant’s internal control over financial reporting (as defined in Rule 30a-3(d) under the 1940 Act) that occurred during the second fiscal quarter of the period covered by this report that have materially affected, or are reasonably likely to materially affect, the registrant’s internal control over financial reporting. |
Item 12. Exhibits.
| (a)(1) | Not applicable for this reporting period. |
| (a)(2) | Exhibit 99.CERT: Certifications pursuant to Section 302 of the Sarbanes-Oxley Act of 2002. |
| (b) | Exhibit 99.906 CERT: Certifications pursuant to Section 906 of the Sarbanes-Oxley Act of 2002. |
4
SIGNATURES
Pursuant to the requirements of the Securities Exchange Act of 1934 and the Investment Company Act of 1940, the registrant has duly caused this report to be signed on its behalf by the undersigned, thereunto duly authorized.
Ashmore Funds
| | | | |
| By | | /s/ George Grunebaum |
| | | | George Grunebaum, President and Chief Executive Officer |
| | | | (Principal Executive Officer) |
Date: July 1, 2016
Pursuant to the requirements of the Securities Exchange Act of 1934 and the Investment Company Act of 1940, this report has been signed below by the following persons on behalf of the registrant and in the capacities and on the dates indicated.
| | | | |
| By | | /s/ George Grunebaum |
| | | | George Grunebaum, President and Chief Executive Officer |
| | | | (Principal Executive Officer) |
Date: July 1, 2016
| | | | |
| By | | /s/ Chris Tsutsui |
| | | | Chris Tsutsui, Treasurer |
| | | | (Principal Financial and Accounting Officer) |
Date: July 1, 2016
5