UNITED STATES
SECURITIES AND EXCHANGE COMMISSION
Washington, D.C. 20549
FORM N-CSR
CERTIFIED SHAREHOLDER REPORT OF REGISTERED MANAGEMENT
INVESTMENT COMPANIES
Investment Company Act file number 811-22468
Ashmore Funds
(Exact name of registrant as specified in charter)
c/o Ashmore Investment Advisors Limited
61 Aldwych
London WC2B 4AE
England
(Address of principal executive offices) (Zip code)
Corporation Service Company
84 State Street
Boston, MA 20109
(Name and address of agent for service)
Registrant’s telephone number, including area code: 011-44-20-3077-6000
Date of fiscal year end: October 31
Date of reporting period: April 30, 2018
Item 1. Reports to Stockholders.
ASHMORE FUNDS
SEMI ANNUAL FINANCIAL STATEMENTS
April 30, 2018

(THIS PAGE INTENTIONALLY LEFT BLANK)
ASHMORE FUNDS
Ashmore Investment Management (US) Corporation is the Distributor for Ashmore Funds.
This material is authorized for use only when preceded or accompanied by the current Ashmore Funds’ prospectus. Investors should consider the investment objectives, principal risks, charges and expenses of these Funds carefully before investing. This and other information is contained in the Funds’ prospectus. Please read the prospectus carefully before you invest or send money.
A Fund’s past performance is not necessarily an indication of how the Fund will perform in the future.
The performance data quoted in this report represents past performance. Investment return and principal value will fluctuate so an investor’s shares, when redeemed, may be worth more or less than the original cost. Current performance may be lower or higher than the performance data quoted in this report. For performance information current to the most recent month-end, please call 866 876 8294.
An investment in a Fund is not a bank deposit and is not guaranteed or insured by the Federal Deposit Insurance Corporation or any other government agency. It is possible to lose money on investments in the Funds.
ASHMORE FUNDS
INVESTMENT MANAGER’S REPORT
For the period November 1, 2017 to April 30, 2018
Overview
The reporting period was marked by a sharp correction in global equity markets in February triggered by a jump in the US average hourly earnings growth number for January from 2.5% to 2.9% thus leading to fears of more rapid Federal interest rate hikes. The sell-off continued into March as fears of a ‘trade war’ between China and the United States dominated market developments.
The White House first announced new tariffs on steel and aluminium imports to the US which rattled global markets and led to the resignation of President Trump’s economic advisor, Gary Cohn. Although these tariffs were eventually watered down when exemptions were negotiated by a number of large trading partners, they were followed by specific actions against China on ‘national security’ grounds for breach of intellectual property, targeting around $50 billion worth of exports to the US. The risk of escalation increased when China responded with tariffs of similar magnitude and President Trump vowed to broaden tariffs on a larger array of Chinese goods.
Newly installed Federal Open Market Committee (FOMC) Chair Jay Powell announced a 25 basis point (bps) hike in the Federal funds rate to 1.75% on March 21, 2018, but the relentless increase in US Treasury yields reversed in March, when risk aversion dominated and long-end yields came down from their highs. US two-year Treasury yields ended the period at 2.49%, while the 10-year yield ended at 2.95%.
Increase in US T-bill supply and other factors led to a spike in LIBOR spreads versus Federal funds rates and increased funding costs on the interbank market.
Emerging Markets (“EM”) were supported by healthy global economic growth, a quiet political calendar, positive developments in EM indices, and strong demand for EM assets. With regard to economics, the gradual recovery and re-balancing trend that started in 2016 continued, and inflation data remained very benign in most markets, except for a few exceptions such as Turkey and Romania.
Emerging Markets ended the reporting period with a number of political highlights. In Brazil, former President Luiz Inacio Lula da Silva was sent to jail, but the electoral outlook remains very uncertain and the Brazilian Real has failed to stabilise. In Russia, the new Office of Foreign Assets Control sanctions announced by the US Treasury went further than previous sanctions in mandating outright bond sales and sent the Ruble 8.7% weaker. In Turkey, President Erdogan called for anticipated elections in June in the hope of stopping the opposition’s momentum. Finally, in Mexico, presidential hopeful Andrés Manuel López Obrador consolidated a seemingly unassailable lead in the presidential race after an important televised debate.
With respect to bond indices, Moody’s affirmed their investment grade (IG) rating on South Africa, which allowed the country to remain in the Bloomberg Barclays Global Aggregate index. Russia was upgraded back to IG by S&P, three years after losing its high-grade status. In addition, Bloomberg and Barclays announced the likely inclusion of Chinese bonds into the flagship Global Aggregate index starting in 2019, with an eventual weight of 6%, subject to the resolution of residual operational issues. This development would more than double the weight of EM bonds in large diversified global bond indices, and may thrust EM debt investing further into the mainstream.
Improved currency performance since 2016 has helped contain inflation in Emerging Markets, which just hit a new cycle low in March, following downside surprises to inflation rates in prominent countries, including South Africa, Brazil, Malaysia, Colombia, Chile, Poland and Uruguay. EM CPI inflation, weighted by the JP Morgan GBI-EM GD, dropped to just 3.3% year-on-year (yoy) in March from 3.4% yoy in February and 4.9% yoy a year ago.
The net result for EM fixed income indices over the period was mixed, with USD denominated indices down and local currency indices up. The JP Morgan EMBI GD was down 2.4%; the broad corporate bonds index (JP Morgan CEMBI BD) was down 1.4%; the reference local currency bond index, the JP Morgan GBI-EM GD, was up 5.2%, and the reference local currency FX index (JP Morgan ELMI+) was up 3.2%.
Portfolio Overview
Ashmore Emerging Markets Total Return Fund
The Ashmore Emerging Markets Total Return Fund (the “Fund”) seeks to achieve its objective by investing principally in the debt instruments of sovereign, quasi-sovereign, and corporate issuers, which may be denominated in any currency, including the local currency of the issuer. The Fund tactically allocates assets between external debt, corporate debt and local currency.
1
ASHMORE FUNDS
INVESTMENT MANAGER’S REPORT (CONTINUED)
Over the period, the Fund’s institutional class underperformed its benchmark, returning +0.05% (net of fees) versus +0.85% for the composite 50% JP Morgan Emerging Markets Bond Index Global Diversified (“JP Morgan EMBI GD”), 25% JP Morgan Government Bond Index - Emerging Markets Global Diversified (“JP Morgan GBI-EM GD”), 25% JP Morgan Emerging Local Markets Index Plus (“JP Morgan ELMI+”). Over the period, JP Morgan EMBI GD returned -2.41%, JP Morgan GBI-EM GD returned 5.15% and JP Morgan ELMI+ returned 3.18%. Local currency contributed to performance while external debt and corporate debt detracted from performance. South Africa, Colombia, and Poland were the main contributors to Fund performance. Venezuela, Russia, and Ecuador were the main detractors from Fund performance.
South Africa was a positive contributor during the period, particularly in January and February on the back of the events that unfolded post the ANC elective conference in December. Once Cyril Ramaphosa ascended to the head of the ANC, he quickly moved to force President Zuma’s resignation, thus assuming the state presidency himself. He also reshuffled the cabinet to give it a more market friendly face, notably through the re-appearance of former (and new) Finance Minister Nhlanhla Nene as well as Pravin Gordhan as Minster of Public Enterprises (both had been fired by Zuma). These appointments increased the market’s confidence that the country will finally tackle the endemic corruption, mismanagement of SOE’s and importantly reduce fiscal slippage (which, among others, caused the country’s downgrades in October last year).
Ashmore Emerging Markets Local Currency Bond Fund
The Ashmore Emerging Markets Local Currency Bond Fund (the “Fund”) seeks to achieve its objective by investing principally in the debt instruments of sovereign and quasi-sovereign EM issuers, denominated in the local currency of the issuer. The Fund’s returns are driven by EM currency appreciation, interest rate positioning and credit worthiness.
Over the period, the Fund’s institutional class outperformed its benchmark, returning +5.31% (net of fees) versus +5.15% for the JP Morgan GBI-EM GD. Allocations to the South African Rand, Colombian Peso, and Polish Zloty were the main contributors to Fund performance. Allocations to the Indian Rupee, Argentine Peso, and Russian Ruble were the main detractors from Fund performance.
South Africa was a positive contributor during the period, particularly in January and February on the back of the events which unfolded post the ANC elective conference in December. Once Cyril Ramaphosa ascended to the head of the ANC, he quickly moved to force President Zuma’s resignation, thus assuming the state presidency himself. He also reshuffled the cabinet to give it a more market friendly face, notably through the re-appearance of former (and new) Finance Minister Nhlanhla Nene as well as Pravin Gordhan as Minster of Public Enterprises (both had been fired by Zuma). These appointments increased the market’s confidence that the country will finally tackle the endemic corruption, mismanagement of SOE’s and importantly reduce fiscal slippage (which, among others, caused the country’s downgrades in October last year).
Ashmore Emerging Markets Corporate Debt Fund
The Ashmore Emerging Markets Corporate Debt Fund (the “Fund”) seeks to achieve its objective by investing principally in the debt instruments of EM corporate issuers, which may be denominated in any currency, including the local currency of the issuer.
Over the period, the Fund’s institutional class out performed its benchmark, returning -1.26% (net of fees) versus -1.44% for the JP Morgan Corporate Emerging Markets Bond Index Broad Diversified (“JP Morgan CEMBI BD”). Ukraine, United Arab Emirates, and Nigeria were the main contributors to Fund performance. Russia, Jamaica, and Israel were the main detractors from Fund performance.
Russia was a detractor in the period due to exposure to banking credits in the country. The ongoing consolidation in the local banking system, which is being pursued aggressively by the Russian Central Bank continued to put pressure on the sector. As such, credits from the banking sector detracted from Fund performance during the earlier part of the period.
Ukraine was a contributor to performance. The positive performance in Ukraine came in part from a steel company and an integrated energy producer. The general strength in commodity prices was supportive for both credits. Also, in the case of the steel producer, the company has launched a liability management exercise aimed at retiring short term debt and replacing it with longer dated bonds and loans. This is credit positive for the company and the markets have reacted as such.
2
ASHMORE FUNDS
INVESTMENT MANAGER’S REPORT (CONTINUED)
Ashmore Emerging Markets Short Duration Fund
The Ashmore Emerging Markets Short Duration Fund (the “Fund”) seeks to achieve its objective by investing principally in short-term debt instruments of, and derivative instruments related to, Sovereign, Quasi-Sovereign and Corporate issuers of EM countries denominated exclusively in hard currencies (i.e., the U.S. dollar or any currency of a nation in the G-7). The Fund normally seeks to maintain weighted average portfolio duration of between 1 and 3 years. The Fund has no restrictions on individual security duration.
Over the period, the Fund’s institutional class underperformed its benchmark, returning +0.04% (net of fees) versus +0.34% for the JP Morgan CEMBI BD 1-3 Year. Venezuela, United Arab Emirates, and Brazil were the main contributors to Fund performance. Russia, Jamaica, and Ecuador were the main detractors from Fund performance.
Venezuela, an off benchmark allocation was a noteworthy contributor during the period. Spreads tightened in Venezuela even as arrears on the country’s bonds continued to increase. The improved sentiment is likely due to an agreement to delay presidential elections to May 20, offering an element of optimism about eventual political change. Bond prices have been trending up since the announcement of the postponement. The market also reacted positively to the announcement that Euroclear had finally released a coupon payment (nearly two months after receipt) for a Petróleos de Venezuela, S.A (PDVSA) bond, raising some hopes that Venezuela would attempt to maintain payments on other outstanding obligations, even if selectively.
Ashmore Emerging Markets Active Equity Fund
The Ashmore Emerging Markets Active Equity Fund (the “Fund”) seeks to achieve its objective by investing principally in equity securities and equity-related investments of EM issuers, which may be denominated in any currency, including the local currency of the issuer.
Over the period, the Fund’s institutional class outperformed its benchmark, returning +5.08% (net of fees) versus +4.80% for the MSCI Emerging Markets Index. China, South Korea, and South Africa were the main contributors to Fund performance. Russia, Mexico, and Indonesia were the main detractors from Fund performance.
In China, economic growth was well supported and targeted financial deleveraging is going some way to appease foreign investor concerns over China’s ability to manage its debt dynamics. In addition, the Chinese market was supported by robust economic growth and ongoing strong consumption growth trends.
Ashmore Emerging Markets Small-Cap Equity Fund
The Ashmore Emerging Markets Small-Cap Equity Fund (the “Fund”) seeks to achieve its objective by investing principally in equity securities and equity-related investments of small-capitalisation EM issuers, which may be denominated in any currency, including the local currency of the issuer.
Over the period, the Fund’s institutional class outperformed its benchmark, returning +6.92% (net of fees) versus +5.58% for the MSCI Emerging Markets Small Cap Index. South Korea, China, and Malaysia were the main contributors to Fund performance. Taiwan, Poland, and Brazil were the main detractors from Fund performance.
South Korea performed well, with investor sentiment supported by the potential for improved relations with North Korea. Later, the country’s performance was driven higher by speculation that the government would force the National Pension Service (NPS) to increase its investment in the predominantly small cap KOSDAQ index.
In China, economic growth was well supported and targeted financial deleveraging is going some way to appease foreign investor concerns over China’s ability to manage its debt dynamics. In addition, the Chinese market was supported by robust economic growth and ongoing strong consumption growth trends.
Ashmore Emerging Markets Frontier Equity Fund
The Ashmore Emerging Markets Frontier Equity Fund (the “Fund”) seeks to achieve its objective by investing principally in equity securities and equity-related investments of Frontier Market issuers, which may be denominated in any currency, including the local currency of the issuer.
3
ASHMORE FUNDS
INVESTMENT MANAGER’S REPORT (CONTINUED)
Over the period, the Fund’s institutional class outperformed its benchmark, returning +6.60% (net of fees) versus +6.20% for the MSCI Frontier Markets Index. Egypt, Nigeria, and Kenya were the main contributors to Fund performance. Philippines, Georgia, and the United Kingdom were the main detractors from Fund performance.
Egypt performed strongly as ongoing reforms under President Abdel Fattah el-Sisi begin to deliver improvement. Inflation, which peaked at 33% in July 2017 following the devaluation of the Egyptian pound in Q4 2016, moderated to 14% in February 2018. Inflation expectations are for 10-15% by year end, which has enabled monetary easing by the central bank. FX reserves, remittances and exports have all increased. Feedback from corporates in the consumer sector point to volume improvement, supporting the view that the economy is recovering. The one-sided presidential election at the end of the quarter reflected President Sisi’s strong power base.
We increased our exposure to Nigeria as growth accelerated on higher energy prices, higher hydrocarbon production, better access to foreign currency and signs of improvement in the non-oil sector. Improving fiscal and external balances are supporting planned government investments in infrastructure and lowering volatility in the exchange rate for investors. We believe that policy stimulus is likely to happen, given the start of the 2019 election cycle. However, based on feedback from corporates, private sector fixed capital investment is likely to be relatively muted until after the elections. Our holdings are broadly diverse across banks, infrastructure, consumer and energy stocks.
Ashmore Emerging Markets Equity Fund
The Ashmore Emerging Markets Equity Fund (the “Fund”) seeks to achieve its objective by investing principally in equity securities and equity-related investments of EM issuers, which may be denominated in any currency, including the local currency of the issuer.
Over the period, the Fund’s institutional class underperformed its benchmark, returning +4.67% (net of fees) versus +4.80% for the MSCI Emerging Markets Index. China, South Africa, and Brazil were the main contributors to Fund performance. Taiwan, India, and United Arab Emirates were the main detractors from Fund performance.
In China, economic growth was well supported and targeted financial deleveraging is going some way to appease foreign investor concerns over China’s ability to manage its debt dynamics. In addition, the Chinese market was supported by robust economic growth and ongoing strong consumption growth trends.
4
IMPORTANT INFORMATION ABOUT THE FUNDS
Ashmore Investment Advisors Limited
This commentary may include statements that constitute “forward-looking statements” under the U.S. securities laws. Forward-looking statements include, among other things, projections, estimates, and information about possible or future results related to the Funds and market or regulatory developments. The views expressed above are not guarantees of future performance or economic results and involve certain risks, uncertainties and assumptions that could cause actual outcomes and results to differ materially from the views expressed herein. The views expressed above are those of Ashmore Investment Advisors Limited as of the date indicated and are subject to change at any time based upon economic, market, or other conditions and Ashmore Investment Advisors Limited undertakes no obligation to update the views expressed herein. Any discussions of specific securities or markets should not be considered a recommendation to buy or sell or invest in those securities or markets. The views expressed above may not be relied upon as investment advice or as an indication of the Funds’ trading intent. Information about the Funds’ holdings, asset allocation or country diversification is historical and is not an indication of future portfolio composition, which may vary. Direct investment in any index is not possible. The performance of any index mentioned in this commentary has not been adjusted for ongoing management, distribution and operating expenses applicable to mutual fund investments. In addition, the returns do not reflect certain charges that an investor in the Funds may pay. If these additional fees were reflected, the performance shown would have been lower.
The following disclosure provides important information regarding each Fund’s Average Annual Total Return table and Cumulative Returns chart, which appear on each Fund’s individual page in this report (the “Shareholder Report” or the “Report”). Please refer to this information when reviewing the table and chart for a Fund.
On each individual Fund Summary page in this Report, the Average Annual Total Return table and Cumulative Returns chart measure performance assuming that all dividend and capital gain distributions were reinvested. Returns do not reflect the deduction of taxes that a shareholder would pay on (i) Fund distributions or (ii) the redemption of Fund shares. The Cumulative Returns Chart reflects only Institutional Class performance. Performance for Class A and Class C shares is typically lower than Institutional Class performance due to the lower expenses paid by Institutional Class shares. Except for the load-waived performance for the Class A and C shares of each Fund (as applicable), performance shown is net of fees and expenses. The load-waived performance for Class A and Class C shares does not reflect the sales charges shareholders of those classes may pay in connection with a purchase or redemption of Class A and Class C shares. The load-waived performance of those share classes is relevant only to shareholders who purchased Class A or Class C shares on a load-waived basis. The figures in the line graph are calculated at net asset value and assume the investment of $1,000,000 at the beginning of the first full month following the inception of the Institutional Class. Each Fund measures its performance against a broad-based securities market index (“benchmark index”). Each benchmark index does not take into account fees, expenses or taxes.
For periods prior to the inception date of the Class A and Class C shares (if applicable), performance information shown is based on the performance of the Fund’s Institutional Class shares, adjusted to reflect the distribution and/or service fees and other expenses paid by the Class A and Class C shares, respectively.
A Fund’s past performance, before and after taxes, is not necessarily an indication of how the Fund will perform in the future.
An investment in a Fund is not a bank deposit and is not guaranteed or insured by the Federal Deposit Insurance Corporation or any other government agency. It is possible to lose money on investments in the Funds.
5
IMPORTANT INFORMATION ABOUT THE FUNDS (CONTINUED)
The following disclosure provides important information regarding each Fund’s Expense Example, which appears on each Fund’s individual page in this Shareholder Report. Please refer to this information when reviewing the Expense Example for a Fund.
EXPENSE EXAMPLE
Fund Expenses
As a shareholder of the Funds, you incur two types of costs: (1) transaction costs, including sales charges (loads) on purchase payments; redemption fees; and exchange fees; and (2) ongoing costs, including management fees; distribution (12b-1) fees; and other Fund expenses. This Example is intended to help you understand your ongoing costs (in Dollars) of investing in the Funds and to compare these costs with the ongoing costs of investing in other mutual funds. The Example is based on an investment of $1,000 invested at the beginning of the period and held for the entire period, from November 1, 2017 or the inception date (if later), through April 30, 2018.
Actual Expenses
The information in the table under the heading “Actual Performance” provides information based on actual performance and actual expenses. You may use the information in these columns, together with the amount you invested, to estimate the expenses that you paid over the period. Simply divide your account value by $1,000 (for example, an $8,600 account value divided by $1,000 = $8.60), then multiply the result by the number in the appropriate column for your share class, in the row titled “Expenses Paid” to estimate the expenses you paid on your account during this period.
Hypothetical Example for Comparison Purposes
The information in the table under the heading “Hypothetical Performance” provides information about hypothetical account values and hypothetical expenses based on the Fund’s actual expense ratio and an assumed rate of return of 5% per year before expenses, which is not the Fund’s actual return. The hypothetical account values and expenses may not be used to estimate the actual ending account balance or expenses you paid for the period. You may use this information to compare the ongoing costs of investing in the Fund and other funds. To do so, compare this 5% hypothetical example with the 5% hypothetical examples that appear in the shareholder reports of the other funds.
Please note that the expenses shown in the table are meant to highlight your ongoing costs only and do not reflect any transactional costs, such as sales charges (loads), redemption fees, or exchange fees. Therefore, the information under the heading “Hypothetical Performance” is useful in comparing ongoing costs only, and will not help you determine the relative total costs of owning different funds. In addition, if these transactional costs were included, your costs would have been higher.
6
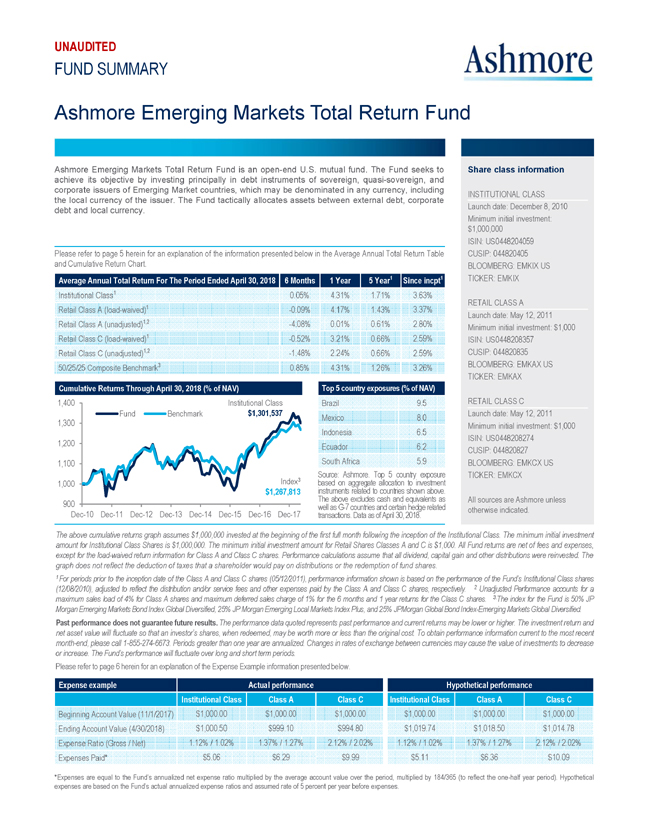
UNAUDITED FUND SUMMARY Ashmore Emerging Markets Total Return Fund Ashmore Emerging Markets Total Return Fund is an open-end U.S. mutual fund. The Fund seeks to Share class information achieve its objective by investing principally in debt instruments of sovereign, quasi-sovereign, and corporate issuers of Emerging Market countries, which may be denominated in any currency, including INSTITUTIONAL CLASS the local currency of the issuer. The Fund tactically allocates assets between external debt, corporate debt and local currency. Launch date: December 8, 2010 Minimum initial investment: $1,000,000 ISIN: US0448204059 Please refer to page 5 herein for an explanation of the information presented below in the Average Annual Total Return Table CUSIP: 044820405 and Cumulative Return Chart. BLOOMBERG: EMKIX US Average Annual Total Return For The Period Ended April 30, 2018 6 Months 1 Year 5 Year1 Since incpt1 TICKER: EMKIX Institutional Class1 0.05% 4.31% 1.71% 3.63% RETAIL CLASS A Retail Class A (load-waived)1 -0.09% 4.17% 1.43% 3.37% Launch date: May 12, 2011 Retail Class A (unadjusted)1,2 -4.08% 0.01% 0.61% 2.80% Minimum initial investment: $1,000 Retail Class C (load-waived)1 -0.52% 3.21% 0.66% 2.59% ISIN: US0448208357 Retail Class C (unadjusted)1,2 -1.48% 2.24% 0.66% 2.59% CUSIP: 044820835 50/25/25 Composite Benchmark3 0.85% 4.31% 1.26% 3.26% BLOOMBERG: EMKAX US TICKER: EMKAX Cumulative Returns Through April 30, 2018 (% of NAV) Top 5 country exposures (% of NAV) 1,400 Institutional Class Brazil 9.5 RETAIL CLASS C Fund Benchmark $1,301,537 Launch date: May 12, 2011 Mexico 8.0 1,300 Minimum initial investment: $1,000 Indonesia 6.5 ISIN: US0448208274 1,200 Ecuador 6.2 CUSIP: 044820827 1,100 South Africa 5.9 BLOOMBERG: EMKCX US Source: Ashmore. Top 5 country exposure TICKER: EMKCX 1,000 Index3 based on aggregate allocation to investment $1,267,813 instruments The above excludes related tocash countries and equivalents shown above. as All sources are Ashmore unless 900 well as G-7 countries and certain hedge related otherwise indicated. Dec-10 Dec-11 Dec-12 Dec-13 Dec-14 Dec-15 Dec-16 Dec-17 transactions. Data as of April 30, 2018. The above cumulative returns graph assumes $1,000,000 invested at the beginning of the first full month following the inception of the Institutional Class. The minimum initial investment amount for Institutional Class Shares is $1,000,000. The minimum initial investment amount for Retail Shares Classes A and C is $1,000. All Fund returns are net of fees and expenses, except for the load-waived return information for Class A and Class C shares. Performance calculations assume that all dividend, capital gain and other distributions were reinvested. The graph does not reflect the deduction of taxes that a shareholder would pay on distributions or the redemption of fund shares. 1 For periods prior to the inception date of the Class A and Class C shares (05/12/2011), performance information shown is based on the performance of the Fund’s Institutional Class shares (12/08/2010), adjusted to reflect the distribution and/or service fees and other expenses paid by the Class A and Class C shares, respectively. 2 Unadjusted Performance accounts for a maximum sales load of 4% for Class A shares and maximum deferred sales charge of 1% for the 6 months and 1 year returns for the Class C shares. 3.The index for the Fund is 50% JP Morgan Emerging Markets Bond Index Global Diversified, 25% JP Morgan Emerging Local Markets Index Plus, and 25% JPMorgan Global Bond Index-Emerging Markets Global Diversified. Past performance does not guarantee future results. The performance data quoted represents past performance and current returns may be lower or higher. The investment return and net asset value will fluctuate so that an investor’s shares, when redeemed, may be worth more or less than the original cost. To obtain performance information current to the most recent month-end, please call 1-855-274-6673. Periods greater than one year are annualized. Changes in rates of exchange between currencies may cause the value of investments to decrease or increase. The Fund’s performance will fluctuate over long and short term periods. Please refer to page 6 herein for an explanation of the Expense Example information presented below. Expense example Actual performance Hypothetical performance Institutional Class Class A Class C Institutional Class Class A Class C Beginning Account Value (11/1/2017) $1,000.00 $1,000.00 $1,000.00 $1,000.00 $1,000.00 $1,000.00 Ending Account Value (4/30/2018) $1,000.50 $999.10 $994.80 $1,019.74 $1,018.50 $1,014.78 Expense Ratio (Gross / Net) 1.12% / 1.02% 1.37% / 1.27% 2.12% / 2.02% 1.12% / 1.02% 1.37% / 1.27% 2.12% / 2.02% Expenses Paid* $5.06 $6.29 $9.99 $5.11 $6.36 $10.09 *Expenses are equal to the Fund’s annualized net expense ratio multiplied by the average account value over the period, multiplied by 184/365 (to reflect the one-half year period). Hypothetical expenses are based on the Fund’s actual annualized expense ratios and assumed rate of 5 percent per year before expenses.
7

UNAUDITED FUND SUMMARY Ashmore Emerging Markets Local Currency Bond Fund Ashmore Emerging Markets Local Currency Bond Fund is an open-end U.S. mutual fund. The Fund seeks to Share class information achieve its objective by investing principally in debt instruments of sovereign and quasi-sovereign issuers of Emerging Market countries that are denominated in the local currency of the issuer. INSTITUTIONAL CLASS Launch date: December 8, 2010 Minimum initial investment: $1,000,000 ISIN: US0448202079 Please refer to page 5 herein for an explanation of the information presented below in the Average Annual Total Return Table CUSIP: 044820207 and Cumulative Return Chart. BLOOMBERG: ELBIX US Average Annual Total Return For The Period Ended April 30, 2018 6 Months 1 Year 5 Year1 Since incpt1 TICKER: ELBIX Institutional Class1 5.31% 8.93% -2.14% 1.11% RETAIL CLASS A Retail Class A (load-waived)1 5.30% 8.65% -2.37% 0.87% Launch date: May 12, 2011 Retail Class A (unadjusted)1,2 0.64% 4.30% -3.16% 0.32% Minimum initial investment: $1,000 Retail Class C (load-waived)1 4.84% 7.97% -3.12% 0.11% ISIN: US0448208761 Retail Class C (unadjusted)1,2 3.84% 6.97% -3.12% 0.11% CUSIP: 044820876 JP Morgan GBI-EM GD3 5.15% 8.38% -1.92% 1.22% BLOOMBERG: ELBAX US TICKER: ELBAX Cumulative Returns Through April 30, 2018 (% of NAV) Top 5 country exposures (% of NAV) 1,300 South Africa 13.6 RETAIL CLASS C Fund Benchmark Index3 Launch date: May 12, 2011 Mexico 12.0 1,200 $1,093,875 Minimum initial investment: $1,000 Poland 12.0 ISIN: US0448208688 1,100 Brazil 10.8 CUSIP: 044820868 1,000 Indonesia 10.6 BLOOMBERG: ELBCX US based Source: on Ashmore. aggregate Top allocation 5 country to investment exposure TICKER: ELBCX 900 Institutional Class instruments related to countries shown above. $1,085,807 The above excludes cash and equivalents as All sources are Ashmore unless 800 well as G-7 countries and certain hedge related otherwise indicated. Dec-10 Dec-11 Dec-12 Dec-13 Dec-14 Dec-15 Dec-16 Dec-17 transactions. Data as of April 30, 2018. The above cumulative returns graph assumes $1,000,000 invested at the beginning of the first full month following the inception of the Institutional Class. The minimum initial investment amount for Institutional Class Shares is $1,000,000. The minimum initial investment amount for Retail Shares Classes A and C is $1,000. All Fund returns are net of fees and expenses, except for the load-waived return information for Class A and Class C shares. Performance calculations assume that all dividend, capital gain and other distributions were reinvested. The graph does not reflect the deduction of taxes that a shareholder would pay on distributions or the redemption of fund shares. 1For periods prior to the inception date of the Class A and Class C shares (05/12/2011), performance information shown is based on the performance of the Fund’s Institutional Class shares (12/08/2010), adjusted to reflect the distribution and/or service fees and other expenses paid by the Class A and Class C shares, respectively. 2Unadjusted Performance accounts for a maximum sales load of 4% for Class A shares and maximum deferred sales charge of 1% for the 6 months and 1 year returns for the Class C shares. 3The index for the Fund is the JP Morgan Global Bond Index - Emerging Markets Global Diversified. Past performance does not guarantee future results. The performance data quoted represents past performance and current returns may be lower or higher. The investment return and net asset value will fluctuate so that an investor’s shares, when redeemed, may be worth more or less than the original cost. To obtain performance information current to the most recent month-end, please call 1-855-274-6673. Periods greater than one year are annualized. Changes in rates of exchange between currencies may cause the value of investments to decrease or increase. The Fund’s performance will fluctuate over long and short term periods. Please refer to page 6 herein for an explanation of the Expense Example information presented below. Expense example Actual performance Hypothetical performance Institutional Class Class A Class C Institutional Class Class A Class C Beginning Account Value (11/1/2017) $1,000.00 $1,000.00 $1,000.00 $1,000.00 $1,000.00 $1,000.00 Ending Account Value (4/30/2018) $1,053.10 $1,053.00 $1,048.40 $1,019.98 $1,018.74 $1,015.03 Expense Ratio (Gross / Net) 1.28% / 0.97% 1.54% / 1.22% 2.29% / 1.97% 1.28% / 0.97% 1.54% / 1.22% 2.29% / 1.97% Expenses Paid* $4.94 $6.21 $10.01 $4.86 $6.11 $9.84 *Expenses are equal to the Fund’s annualized net expense ratio multiplied by the average account value over the period, multiplied by 184/365 (to reflect the one-half year period). Hypothetical expenses are based on the Fund’s actual annualized expense ratios and assumed rate of 5 percent per year before expenses.
8

UNAUDITED FUND SUMMARY Ashmore Emerging Markets Corporate Debt Fund Ashmore Emerging Markets Corporate Debt Fund is an open-end U.S. mutual fund. The Fund seeks to Share class information achieve its objective by investing principally in debt instruments of Emerging Market corporate issuers, which may be denominated in any currency, including the local currency of the issuer. INSTITUTIONAL CLASS Launch date: December 8, 2010 Minimum initial investment: $1,000,000 ISIN: US044825049 Please refer to page 5 herein for an explanation of the information presented below in the Average Annual Total Return Table CUSIP: 044820504 and Cumulative Return Chart. BLOOMBERG: EMCIX US Average Annual Total Return For The Period Ended April 30, 2018 6 Months 1 Year 5 Year1 Since incpt1 TICKER: EMCIX Institutional Class1 -1.26% 5.59% 4.27% 5.68% RETAIL CLASS A Retail Class A (load-waived)1 -1.32% 5.41% 4.02% 5.41% Launch date: May 12, 2011 Retail Class A (unadjusted)1,2 -5.27% 1.19% 3.18% 4.83% Minimum initial investment: $1,000 Retail Class C (load-waived)1 -1.68% 4.50% 3.23% 4.62% ISIN: US0448206039 Retail Class C (unadjusted)1,2 -2.64% 3.52% 3.23% 4.62% CUSIP: 044820603 JP Morgan CEMBI BD3 -1.44% 1.84% 3.77% 5.14% BLOOMBERG: ECDAX US TICKER: ECDAX Cumulative Returns Through April 30, 2018 (% of NAV) Top 5 country exposures (% of NAV) 1,700 Institutional Class Brazil 21.7 RETAIL CLASS C Fund Benchmark $1,504,646 Launch date: May 12, 2011 United Arab Emirates 7.3 Minimum initial investment: $1,000 1,500 China 6.7 Israel 6.5 ISIN: US0448207029 1,300 CUSIP: 044820702 Jamaica 5.8 BLOOMBERG: ECDCX US Index3 1,100 Source: Ashmore. Top 5 country exposure TICKER: ECDCX $1,448,789 based on aggregate allocation to investment instruments The above excludes related to cash countries and equivalents shown above. as All sources are Ashmore unless 900 well as G-7 countries and certain hedge related otherwise indicated. Dec-10 Dec-11 Dec-12 Dec-13 Dec-14 Dec-15 Dec-16 Dec-17 transactions. Data as of April 30, 2018. The above cumulative returns graph assumes $1,000,000 invested at the beginning of the first full month following the inception of the Institutional Class. The minimum initial investment amount for Institutional Class Shares is $1,000,000. The minimum initial investment amount for Retail Shares Classes A and C is $1,000. All Fund returns are net of fees and expenses, except for the load-waived return information for Class A and Class C shares. Performance calculations assume that all dividend, capital gain and other distributions were reinvested. The graph does not reflect the deduction of taxes that a shareholder would pay on distributions or the redemption of fund shares. 1For periods prior to the inception date of the Class A and Class C shares (05/12/2011), performance information shown is based on the performance of the Fund’s Institutional Class shares (12/08/2010), adjusted to reflect the distribution and/or service fees and other expenses paid by the Class A and Class C shares, respectively. 2Unadjusted Performance accounts for a maximum sales load of 4% for Class A shares and maximum deferred sales charge of 1% for the 6 months and 1 year returns for the Class C shares. 3The index for the Fund is the JP Morgan Corporate Emerging Markets Bond Index Broad Diversified. Past performance does not guarantee future results. The performance data quoted represents past performance and current returns may be lower or higher. The investment return and net asset value will fluctuate so that an investor’s shares, when redeemed, may be worth more or less than the original cost. To obtain performance information current to the most recent month-end, please call 1-855-274-6673. Periods greater than one year are annualized. Changes in rates of exchange between currencies may cause the value of investments to decrease or increase. The Fund’s performance will fluctuate over long and short term periods. Please refer to page 6 herein for an explanation of the Expense Example information presented below. Expense example Actual performance Hypothetical performance Institutional Class Class A Class C Institutional Class Class A Class C Beginning Account Value (11/1/2017) $1,000.00 $1,000.00 $1,000.00 $1,000.00 $1,000.00 $1,000.00 Ending Account Value (4/30/2018) $987.40 $986.80 $983.20 $1,018.99 $1,017.75 $1,014.03 Expense Ratio (Gross / Net) 1.27% / 1.17% 1.52% / 1.42% 2.27% / 2.17% 1.27% / 1.17% 1.52% / 1.42% 2.27% / 2.17% Expenses Paid* $5.77 $7.00 $10.67 $5.86 $7.10 $10.84 *Expenses are equal to the Fund’s annualized net expense ratio multiplied by the average account value over the period, multiplied by 184/365 (to reflect the one-half year period). Hypothetical expenses are based on the Fund’s actual annualized expense ratios and assumed rate of 5 percent per year before expenses.
9

UNAUDITED FUND SUMMARY Ashmore Emerging Markets Corporate Debt Fund Ashmore Emerging Markets Corporate Debt Fund is an open-end U.S. mutual fund. The Fund seeks to Share class information achieve its objective by investing principally in debt instruments of Emerging Market corporate issuers, which may be denominated in any currency, including the local currency of the issuer. INSTITUTIONAL CLASS Launch date: December 8, 2010 Minimum initial investment: $1,000,000 ISIN: US044825049 Please refer to page 5 herein for an explanation of the information presented below in the Average Annual Total Return Table CUSIP: 044820504 and Cumulative Return Chart. BLOOMBERG: EMCIX US Average Annual Total Return For The Period Ended April 30, 2018 6 Months 1 Year 5 Year1 Since incpt1 TICKER: EMCIX Institutional Class1 -1.26% 5.59% 4.27% 5.68% RETAIL CLASS A Retail Class A (load-waived)1 -1.32% 5.41% 4.02% 5.41% Launch date: May 12, 2011 Retail Class A (unadjusted)1,2 -5.27% 1.19% 3.18% 4.83% Minimum initial investment: $1,000 Retail Class C (load-waived)1 -1.68% 4.50% 3.23% 4.62% ISIN: US0448206039 Retail Class C (unadjusted)1,2 -2.64% 3.52% 3.23% 4.62% CUSIP: 044820603 JP Morgan CEMBI BD3 -1.44% 1.84% 3.77% 5.14% BLOOMBERG: ECDAX US TICKER: ECDAX Cumulative Returns Through April 30, 2018 (% of NAV) Top 5 country exposures (% of NAV) 1,700 Institutional Class Brazil 21.7 RETAIL CLASS C Fund Benchmark $1,504,646 Launch date: May 12, 2011 United Arab Emirates 7.3 Minimum initial investment: $1,000 1,500 China 6.7 Israel 6.5 ISIN: US0448207029 1,300 CUSIP: 044820702 Jamaica 5.8 BLOOMBERG: ECDCX US Index3 1,100 Source: Ashmore. Top 5 country exposure TICKER: ECDCX $1,448,789 based on aggregate allocation to investment instruments The above excludes related to cash countries and equivalents shown above. as All sources are Ashmore unless 900 well as G-7 countries and certain hedge related otherwise indicated. Dec-10 Dec-11 Dec-12 Dec-13 Dec-14 Dec-15 Dec-16 Dec-17 transactions. Data as of April 30, 2018. The above cumulative returns graph assumes $1,000,000 invested at the beginning of the first full month following the inception of the Institutional Class. The minimum initial investment amount for Institutional Class Shares is $1,000,000. The minimum initial investment amount for Retail Shares Classes A and C is $1,000. All Fund returns are net of fees and expenses, except for the load-waived return information for Class A and Class C shares. Performance calculations assume that all dividend, capital gain and other distributions were reinvested. The graph does not reflect the deduction of taxes that a shareholder would pay on distributions or the redemption of fund shares. 1For periods prior to the inception date of the Class A and Class C shares (05/12/2011), performance information shown is based on the performance of the Fund’s Institutional Class shares (12/08/2010), adjusted to reflect the distribution and/or service fees and other expenses paid by the Class A and Class C shares, respectively. 2Unadjusted Performance accounts for a maximum sales load of 4% for Class A shares and maximum deferred sales charge of 1% for the 6 months and 1 year returns for the Class C shares. 3The index for the Fund is the JP Morgan Corporate Emerging Markets Bond Index Broad Diversified. Past performance does not guarantee future results. The performance data quoted represents past performance and current returns may be lower or higher. The investment return and net asset value will fluctuate so that an investor’s shares, when redeemed, may be worth more or less than the original cost. To obtain performance information current to the most recent month-end, please call 1-855-274-6673. Periods greater than one year are annualized. Changes in rates of exchange between currencies may cause the value of investments to decrease or increase. The Fund’s performance will fluctuate over long and short term periods. Please refer to page 6 herein for an explanation of the Expense Example information presented below. Expense example Actual performance Hypothetical performance Institutional Class Class A Class C Institutional Class Class A Class C Beginning Account Value (11/1/2017) $1,000.00 $1,000.00 $1,000.00 $1,000.00 $1,000.00 $1,000.00 Ending Account Value (4/30/2018) $987.40 $986.80 $983.20 $1,018.99 $1,017.75 $1,014.03 Expense Ratio (Gross / Net) 1.27% / 1.17% 1.52% / 1.42% 2.27% / 2.17% 1.27% / 1.17% 1.52% / 1.42% 2.27% / 2.17% Expenses Paid* $5.77 $7.00 $10.67 $5.86 $7.10 $10.84 *Expenses are equal to the Fund’s annualized net expense ratio multiplied by the average account value over the period, multiplied by 184/365 (to reflect the one-half year period). Hypothetical expenses are based on the Fund’s actual annualized expense ratios and assumed rate of 5 percent per year before expenses.
10
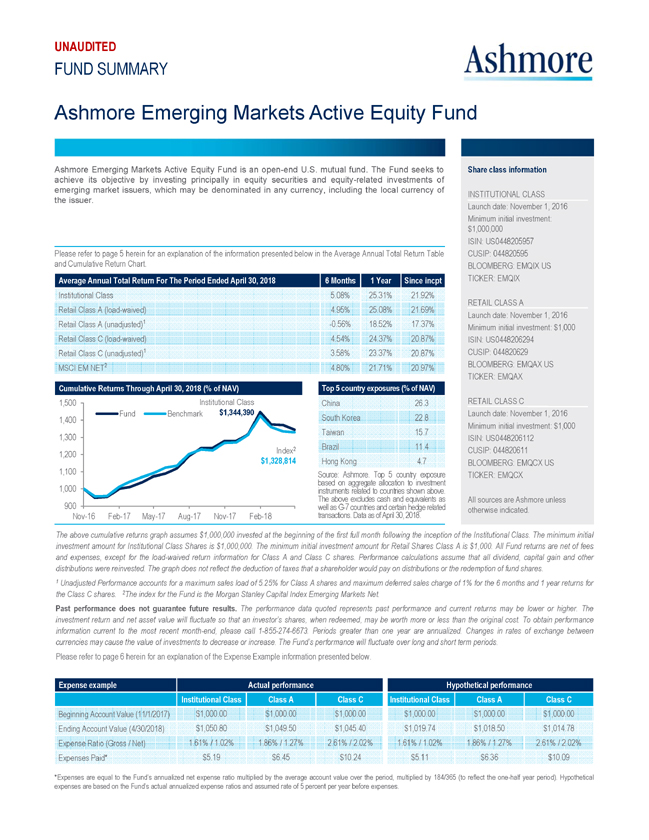
UNAUDITED FUND SUMMARY Ashmore Emerging Markets Active Equity Fund Ashmore Emerging Markets Active Equity Fund is an open-end U.S. mutual fund. The Fund seeks to Share class information achieve its objective by investing principally in equity securities and equity-related investments of emerging market issuers, which may be denominated in any currency, including the local currency of INSTITUTIONAL CLASS the issuer. Launch date: November 1, 2016 Minimum initial investment: $1,000,000 ISIN: US0448205957 Please refer to page 5 herein for an explanation of the information presented below in the Average Annual Total Return Table CUSIP: 044820595 and Cumulative Return Chart. BLOOMBERG: EMQIX US Average Annual Total Return For The Period Ended April 30, 2018 6 Months 1 Year Since incpt TICKER: EMQIX Institutional Class 5.08% 25.31% 21.92% RETAIL CLASS A Retail Class A (load-waived) 4.95% 25.08% 21.69% 1 -0.56% 18.52% 17.37% Launch date: November 1, 2016 Retail Class A (unadjusted) Minimum initial investment: $1,000 Retail Class C (load-waived) 4.54% 24.37% 20.87% ISIN: US0448206294 Retail Class C (unadjusted)1 3.58% 23.37% 20.87% CUSIP: 044820629 MSCI EM NET2 4.80% 21.71% 20.97% BLOOMBERG: EMQAX US TICKER: EMQAX Cumulative Returns Through April 30, 2018 (% of NAV) Top 5 country exposures (% of NAV) 1,500 Institutional Class China 26.3 RETAIL CLASS C Fund Benchmark $1,344,390 Launch date: November 1, 2016 1,400 South Korea 22.8 Minimum initial investment: $1,000 Taiwan 15.7 1,300 ISIN: US0448206112 Index2 Brazil 11.4 CUSIP: 044820611 1,200 $1,328,814 Hong Kong 4.7 BLOOMBERG: EMQCX US 1,100 Source: Ashmore. Top 5 country exposure TICKER: EMQCX based on aggregate allocation to investment 1,000 instruments related to countries shown above. The above excludes cash and equivalents as All sources are Ashmore unless 900 well as G-7 countries and certain hedge related otherwise indicated. Nov-16 Feb-17 May-17 Aug-17 Nov-17 Feb-18 transactions. Data as of April 30, 2018. The above cumulative returns graph assumes $1,000,000 invested at the beginning of the first full month following the inception of the Institutional Class. The minimum initial investment amount for Institutional Class Shares is $1,000,000. The minimum initial investment amount for Retail Shares Class A is $1,000. All Fund returns are net of fees and expenses, except for the load-waived return information for Class A and Class C shares. Performance calculations assume that all dividend, capital gain and other distributions were reinvested. The graph does not reflect the deduction of taxes that a shareholder would pay on distributions or the redemption of fund shares. 1 Unadjusted Performance accounts for a maximum sales load of 5.25% for Class A shares and maximum deferred sales charge of 1% for the 6 months and 1 year returns for the Class C shares. 2The index for the Fund is the Morgan Stanley Capital Index Emerging Markets Net. Past performance does not guarantee future results. The performance data quoted represents past performance and current returns may be lower or higher. The investment return and net asset value will fluctuate so that an investor’s shares, when redeemed, may be worth more or less than the original cost. To obtain performance information current to the most recent month-end, please call 1-855-274-6673. Periods greater than one year are annualized. Changes in rates of exchange between currencies may cause the value of investments to decrease or increase. The Fund’s performance will fluctuate over long and short term periods. Please refer to page 6 herein for an explanation of the Expense Example information presented below. Expense example Actual performance Hypothetical performance Institutional Class Class A Class C Institutional Class Class A Class C Beginning Account Value (11/1/2017) $1,000.00 $1,000.00 $1,000.00 $1,000.00 $1,000.00 $1,000.00 Ending Account Value (4/30/2018) $1,050.80 $1,049.50 $1,045.40 $1,019.74 $1,018.50 $1,014.78 Expense Ratio (Gross / Net) 1.61% / 1.02% 1.86% / 1.27% 2.61% / 2.02% 1.61% / 1.02% 1.86% / 1.27% 2.61% / 2.02% Expenses Paid* $5.19 $6.45 $10.24 $5.11 $6.36 $10.09 *Expenses are equal to the Fund’s annualized net expense ratio multiplied by the average account value over the period, multiplied by 184/365 (to reflect the one-half year period). Hypothetical expenses are based on the Fund’s actual annualized expense ratios and assumed rate of 5 percent per year before expenses.
11
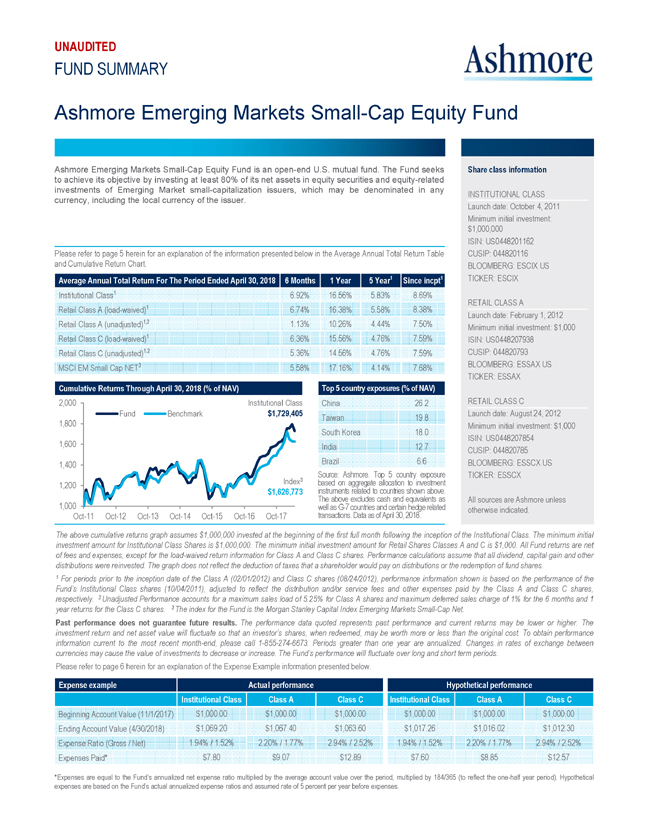
UNAUDITED FUND SUMMARY Ashmore Emerging Markets Small-Cap Equity Fund Ashmore Emerging Markets Small-Cap Equity Fund is an open-end U.S. mutual fund. The Fund seeks Share class information to achieve its objective by investing at least 80% of its net assets in equity securities and equity-related investments of Emerging Market small-capitalization issuers, which may be denominated in any INSTITUTIONAL CLASS currency, including the local currency of the issuer. Launch date: October 4, 2011 Minimum initial investment: $1,000,000 ISIN: US0448201162 Please refer to page 5 herein for an explanation of the information presented below in the Average Annual Total Return Table CUSIP: 044820116 and Cumulative Return Chart. BLOOMBERG: ESCIX US Average Annual Total Return For The Period Ended April 30, 2018 6 Months 1 Year 5 Year1 Since incpt1 TICKER: ESCIX Institutional Class1 6.92% 16.56% 5.83% 8.69% RETAIL CLASS A Retail Class A (load-waived)1 6.74% 16.38% 5.58% 8.38% Launch date: February 1, 2012 Retail Class A (unadjusted)1,2 1.13% 10.26% 4.44% 7.50% Minimum initial investment: $1,000 Retail Class C (load-waived)1 6.36% 15.56% 4.76% 7.59% ISIN: US0448207938 Retail Class C (unadjusted)1,2 5.36% 14.56% 4.76% 7.59% CUSIP: 044820793 MSCI EM Small Cap NET3 5.58% 17.16% 4.14% 7.68% BLOOMBERG: ESSAX US TICKER: ESSAX Cumulative Returns Through April 30, 2018 (% of NAV) Top 5 country exposures (% of NAV) 2,000 Institutional Class China 26.2 RETAIL CLASS C Fund Benchmark $1,729,405 Launch date: August 24, 2012 Taiwan 19.8 1,800 South Korea 18.0 Minimum initial investment: $1,000 ISIN: US0448207854 1,600 India 12.7 CUSIP: 044820785 1,400 Brazil 6.6 BLOOMBERG: ESSCX US Source: Ashmore. Top 5 country exposure TICKER: ESSCX Index3 based on aggregate allocation to investment 1,200 $1,626,773 instruments The above excludes related to cash countries and equivalents shown above. as All sources are Ashmore unless 1,000 well as G-7 countries and certain hedge related otherwise indicated. Oct-11 Oct-12 Oct-13 Oct-14 Oct-15 Oct-16 Oct-17 transactions. Data as of April 30, 2018. The above cumulative returns graph assumes $1,000,000 invested at the beginning of the first full month following the inception of the Institutional Class. The minimum initial investment amount for Institutional Class Shares is $1,000,000. The minimum initial investment amount for Retail Shares Classes A and C is $1,000. All Fund returns are net of fees and expenses, except for the load-waived return information for Class A and Class C shares. Performance calculations assume that all dividend, capital gain and other distributions were reinvested. The graph does not reflect the deduction of taxes that a shareholder would pay on distributions or the redemption of fund shares. 1 For periods prior to the inception date of the Class A (02/01/2012) and Class C shares (08/24/2012), performance information shown is based on the performance of the Fund’s Institutional Class shares (10/04/2011), adjusted to reflect the distribution and/or service fees and other expenses paid by the Class A and Class C shares, respectively. 2 Unadjusted Performance accounts for a maximum sales load of 5.25% for Class A shares and maximum deferred sales charge of 1% for the 6 months and 1 year returns for the Class C shares. 3 The index for the Fund is the Morgan Stanley Capital Index Emerging Markets Small-Cap Net. Past performance does not guarantee future results. The performance data quoted represents past performance and current returns may be lower or higher. The investment return and net asset value will fluctuate so that an investor’s shares, when redeemed, may be worth more or less than the original cost. To obtain performance information current to the most recent month-end, please call 1-855-274-6673. Periods greater than one year are annualized. Changes in rates of exchange between currencies may cause the value of investments to decrease or increase. The Fund’s performance will fluctuate over long and short term periods. Please refer to page 6 herein for an explanation of the Expense Example information presented below. Expense example Actual performance Hypothetical performance Institutional Class Class A Class C Institutional Class Class A Class C Beginning Account Value (11/1/2017) $1,000.00 $1,000.00 $1,000.00 $1,000.00 $1,000.00 $1,000.00 Ending Account Value (4/30/2018) $1,069.20 $1,067.40 $1,063.60 $1,017.26 $1,016.02 $1,012.30 Expense Ratio (Gross / Net) 1.94% / 1.52% 2.20% / 1.77% 2.94% / 2.52% 1.94% / 1.52% 2.20% / 1.77% 2.94% / 2.52% Expenses Paid* $7.80 $9.07 $12.89 $7.60 $8.85 $12.57 *Expenses are equal to the Fund’s annualized net expense ratio multiplied by the average account value over the period, multiplied by 184/365 (to reflect the one-half year period). Hypothetical expenses are based on the Fund’s actual annualized expense ratios and assumed rate of 5 percent per year before expenses.
12
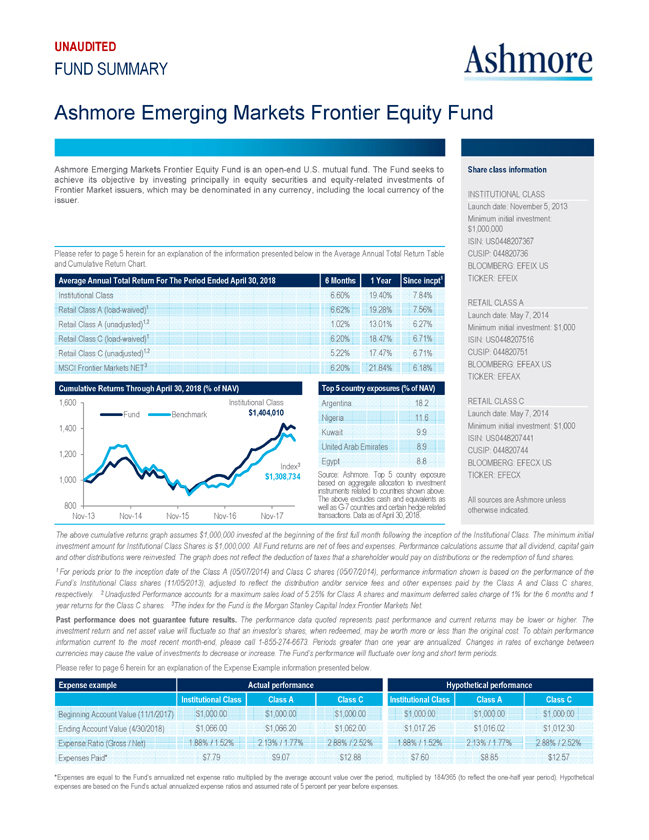
UNAUDITED FUND SUMMARY Ashmore Emerging Markets Frontier Equity Fund Ashmore Emerging Markets Frontier Equity Fund is an open-end U.S. mutual fund. The Fund seeks to Share class information achieve its objective by investing principally in equity securities and equity-related investments of Frontier Market issuers, which may be denominated in any currency, including the local currency of the INSTITUTIONAL CLASS issuer. Launch date: November 5, 2013 Minimum initial investment: $1,000,000 ISIN: US0448207367 Please refer to page 5 herein for an explanation of the information presented below in the Average Annual Total Return Table CUSIP: 044820736 and Cumulative Return Chart. BLOOMBERG: EFEIX US Average Annual Total Return For The Period Ended April 30, 2018 6 Months 1 Year Since incpt1 TICKER: EFEIX Institutional Class 6.60% 19.40% 7.84% RETAIL CLASS A Retail Class A (load-waived)1 6.62% 19.28% 7.56% Launch date: May 7, 2014 Retail Class A (unadjusted)1,2 1.02% 13.01% 6.27% Minimum initial investment: $1,000 Retail Class C (load-waived)1 6.20% 18.47% 6.71% ISIN: US0448207516 Retail Class C (unadjusted)1,2 5.22% 17.47% 6.71% CUSIP: 044820751 MSCI Frontier Markets NET3 6.20% 21.84% 6.18% BLOOMBERG: EFEAX US TICKER: EFEAX Cumulative Returns Through April 30, 2018 (% of NAV) Top 5 country exposures (% of NAV) 1,600 Institutional Class Argentina 18.2 RETAIL CLASS C Fund Benchmark $1,404,010 Launch date: May 7, 2014 Nigeria 11.6 Minimum initial investment: $1,000 1,400 Kuwait 9.9 United Arab Emirates 8.9 ISIN: US0448207441 1,200 CUSIP: 044820744 3 Egypt 8.8 BLOOMBERG: EFECX US Index Source: Ashmore. Top 5 country exposure TICKER: EFECX 1,000 $1,308,734 instruments based on aggregate related to allocation countries shown to investment above. The above excludes cash and equivalents as All sources are Ashmore unless 800 well as G-7 countries and certain hedge related otherwise indicated. Nov-13 Nov-14 Nov-15 Nov-16 Nov-17 transactions. Data as of April 30, 2018. The above cumulative returns graph assumes $1,000,000 invested at the beginning of the first full month following the inception of the Institutional Class. The minimum initial investment amount for Institutional Class Shares is $1,000,000. All Fund returns are net of fees and expenses. Performance calculations assume that all dividend, capital gain and other distributions were reinvested. The graph does not reflect the deduction of taxes that a shareholder would pay on distributions or the redemption of fund shares. 1 For periods prior to the inception date of the Class A (05/07/2014) and Class C shares (05/07/2014), performance information shown is based on the performance of the Fund’s Institutional Class shares (11/05/2013), adjusted to reflect the distribution and/or service fees and other expenses paid by the Class A and Class C shares, respectively. 2 Unadjusted Performance accounts for a maximum sales load of 5.25% for Class A shares and maximum deferred sales charge of 1% for the 6 months and 1 year returns for the Class C shares. 3The index for the Fund is the Morgan Stanley Capital Index Frontier Markets Net. Past performance does not guarantee future results. The performance data quoted represents past performance and current returns may be lower or higher. The investment return and net asset value will fluctuate so that an investor’s shares, when redeemed, may be worth more or less than the original cost. To obtain performance information current to the most recent month-end, please call 1-855-274-6673. Periods greater than one year are annualized. Changes in rates of exchange between currencies may cause the value of investments to decrease or increase. The Fund’s performance will fluctuate over long and short term periods. Please refer to page 6 herein for an explanation of the Expense Example information presented below. Expense example Actual performance Hypothetical performance Institutional Class Class A Class C Institutional Class Class A Class C Beginning Account Value (11/1/2017) $1,000.00 $1,000.00 $1,000.00 $1,000.00 $1,000.00 $1,000.00 Ending Account Value (4/30/2018) $1,066.00 $1,066.20 $1,062.00 $1,017.26 $1,016.02 $1,012.30 Expense Ratio (Gross / Net) 1.88% / 1.52% 2.13% / 1.77% 2.88% / 2.52% 1.88% / 1.52% 2.13% / 1.77% 2.88% / 2.52% Expenses Paid* $7.79 $9.07 $12.88 $7.60 $8.85 $12.57 *Expenses are equal to the Fund’s annualized net expense ratio multiplied by the average account value over the period, multiplied by 184/365 (to reflect the one-half year period). Hypothetical expenses are based on the Fund’s actual annualized expense ratios and assumed rate of 5 percent per year before expenses.
13
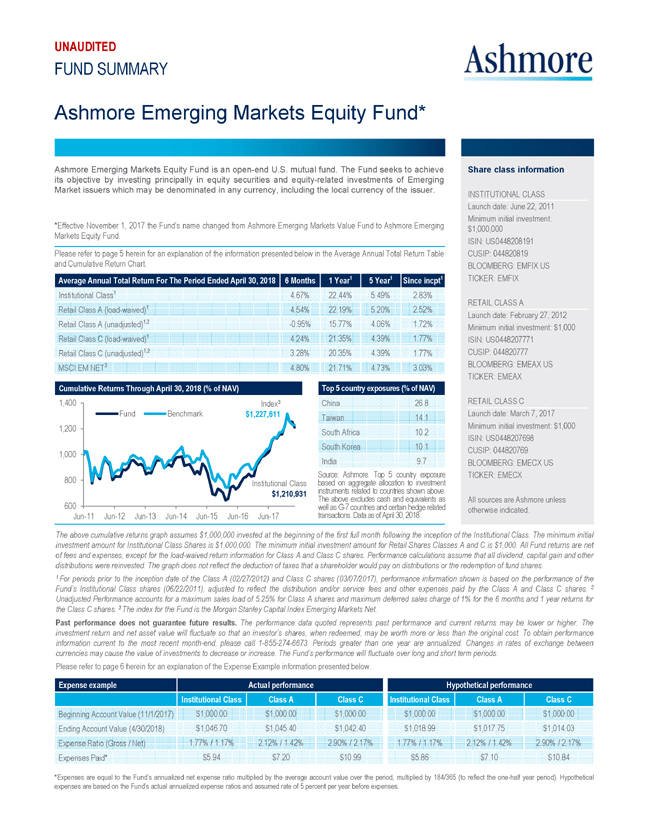
UNAUDITED FUND SUMMARY Ashmore Emerging Markets Equity Fund* Ashmore Emerging Markets Equity Fund is an open-end U.S. mutual fund. The Fund seeks to achieve Share class information its objective by investing principally in equity securities and equity-related investments of Emerging Market issuers which may be denominated in any currency, including the local currency of the issuer. INSTITUTIONAL CLASS Launch date: June 22, 2011 Minimum initial investment: *Effective November 1, 2017 the Fund’s name changed from Ashmore Emerging Markets Value Fund to Ashmore Emerging $1,000,000 Markets Equity Fund. ISIN: US0448208191 Please refer to page 5 herein for an explanation of the information presented below in the Average Annual Total Return Table CUSIP: 044820819 and Cumulative Return Chart. BLOOMBERG: EMFIX US Average Annual Total Return For The Period Ended April 30, 2018 6 Months 1 Year1 5 Year1 Since incpt1 TICKER: EMFIX Institutional Class1 4.67% 22.44% 5.49% 2.83% RETAIL CLASS A Retail Class A (load-waived)1 4.54% 22.19% 5.20% 2.52% Launch date: February 27, 2012 Retail Class A (unadjusted)1,2 -0.95% 15.77% 4.06% 1.72% Minimum initial investment: $1,000 Retail Class C (load-waived)1 4.24% 21.35% 4.39% 1.77% ISIN: US0448207771 Retail Class C (unadjusted)1,2 3.28% 20.35% 4.39% 1.77% CUSIP: 044820777 MSCI EM NET3 4.80% 21.71% 4.73% 3.03% BLOOMBERG: EMEAX US TICKER: EMEAX Cumulative Returns Through April 30, 2018 (% of NAV) Top 5 country exposures (% of NAV) 1,400 Index3 China 26.8 RETAIL CLASS C Fund Benchmark $1,227,611 Taiwan 14.1 Launch date: March 7, 2017 1,200 Minimum initial investment: $1,000 South Africa 10.2 South Korea 10.1 ISIN: US0448207698 1,000 CUSIP: 044820769 India 9.7 BLOOMBERG: EMECX US Source: Ashmore. Top 5 country exposure TICKER: EMECX 800 Institutional Class based on aggregate allocation to investment $1,210,931 The instruments above excludes related to cash countries and equivalents shown above. as All sources are Ashmore unless 600 well as G-7 countries and certain hedge related otherwise indicated. Jun-11 Jun-12 Jun-13 Jun-14 Jun-15 Jun-16 Jun-17 transactions. Data as of April 30, 2018. The above cumulative returns graph assumes $1,000,000 invested at the beginning of the first full month following the inception of the Institutional Class. The minimum initial investment amount for Institutional Class Shares is $1,000,000. The minimum initial investment amount for Retail Shares Classes A and C is $1,000. All Fund returns are net of fees and expenses, except for the load-waived return information for Class A and Class C shares. Performance calculations assume that all dividend, capital gain and other distributions were reinvested. The graph does not reflect the deduction of taxes that a shareholder would pay on distributions or the redemption of fund shares. 1 For periods prior to the inception date of the Class A (02/27/2012) and Class C shares (03/07/2017), performance information shown is based on the performance of the Fund’s Institutional Class shares (06/22/2011), adjusted to reflect the distribution and/or service fees and other expenses paid by the Class A and Class C shares. 2 Unadjusted Performance accounts for a maximum sales load of 5.25% for Class A shares and maximum deferred sales charge of 1% for the 6 months and 1 year returns for the Class C shares. 3 The index for the Fund is the Morgan Stanley Capital Index Emerging Markets Net. Past performance does not guarantee future results. The performance data quoted represents past performance and current returns may be lower or higher. The investment return and net asset value will fluctuate so that an investor’s shares, when redeemed, may be worth more or less than the original cost. To obtain performance information current to the most recent month-end, please call 1-855-274-6673. Periods greater than one year are annualized. Changes in rates of exchange between currencies may cause the value of investments to decrease or increase. The Fund’s performance will fluctuate over long and short term periods. Please refer to page 6 herein for an explanation of the Expense Example information presented below. Expense example Actual performance Hypothetical performance Institutional Class Class A Class C Institutional Class Class A Class C Beginning Account Value (11/1/2017) $1,000.00 $1,000.00 $1,000.00 $1,000.00 $1,000.00 $1,000.00 Ending Account Value (4/30/2018) $1,046.70 $1,045.40 $1,042.40 $1,018.99 $1,017.75 $1,014.03 Expense Ratio (Gross / Net) 1.77% / 1.17% 2.12% / 1.42% 2.90% / 2.17% 1.77% / 1.17% 2.12% / 1.42% 2.90% / 2.17% Expenses Paid* $5.94 $7.20 $10.99 $5.86 $7.10 $10.84 *Expenses are equal to the Fund’s annualized net expense ratio multiplied by the average account value over the period, multiplied by 184/365 (to reflect the one-half year period). Hypothetical expenses are based on the Fund’s actual annualized expense ratios and assumed rate of 5 percent per year before expenses.
14
ASHMORE FUNDS
STATEMENTS OF ASSETS AND LIABILITIES
As of April 30, 2018 (Unaudited)
| | | | | | | | | | | | | | | | | | | | | | | | |
| | | | | | Ashmore
Emerging
Markets Total Return
Fund | | | | | | Ashmore
Emerging
Markets Local Currency
Bond Fund | | | | | | Ashmore
Emerging Markets
Corporate Debt
Fund | |
ASSETS: | | | | | | | | | | | | | | | | | | | | | | | | |
Investments in securities, at value | | | | | | $ | 1,231,889,620 | | | | | | | | $59,777,522 | | | | | | | | $327,369,616 | |
Investments in fully funded total return swaps, at value | | | | | | | 3,554,221 | | | | | | | | 2,098,391 | | | | | | | | — | |
Deposit held at broker | | | | | | | 459,638 | | | | | | | | 643,103 | | | | | | | | — | |
Cash | | | | | | | 140,312,986 | | | | | | | | 13,393,643 | | | | | | | | 24,760,427 | |
Foreign currency, at value | | | | | | | 1,522,218 | | | | | | | | — | | | | | | | | 29,322 | |
Unrealized appreciation on forward foreign currency exchange contracts | | | | | | | 3,414,606 | | | | | | | | 247,618 | | | | | | | | 32,838 | |
Variation margin receivable on centrally cleared swap contracts | | | | | | | 20,614 | | | | | | | | 51 | | | | | | | | — | |
Unrealized appreciation on interest rate swap contracts | | | | | | | — | | | | | | | | 19,115 | | | | | | | | — | |
Due from broker | | | | | | | — | | | | | | | | 148,024 | | | | | | | | — | |
Receivable for securities and currencies sold | | | | | | | 268,450 | | | | | | | | 402,063 | | | | | | | | 4,951,885 | |
Receivable for fund shares sold | | | | | | | 638,166 | | | | | | | | — | | | | | | | | 387,945 | |
Receivable from Investment Manager | | | | | | | 97,213 | | | | | | | | 20,527 | | | | | | | | 32,715 | |
Interest and dividends receivable | | | | | | | 18,295,360 | | | | | | | | 1,260,756 | | | | | | | | 4,594,415 | |
Other assets | | | | | | | 38,192 | | | | | | | | 24,142 | | | | | | | | 68,167 | |
Total Assets | | | | | | | 1,400,511,284 | | | | | | | | 78,034,955 | | | | | | | | 362,227,330 | |
LIABILITIES: | | | | | | | | | | | | | | | | | | | | | | | | |
Due to custodian | | | | | | | — | | | | | | | | 114,564 | | | | | | | | — | |
Unrealized depreciation on forward foreign currency exchange contracts | | | | | | | 9,192,881 | | | | | | | | 731,776 | | | | | | | | — | |
Variation margin payable on centrally cleared swap contracts | | | | | | | 77,828 | | | | | | | | 21,553 | | | | | | | | — | |
Unrealized depreciation on interest rate swap contracts | | | | | | | — | | | | | | | | 11,008 | | | | | | | | — | |
Payable for securities and currencies purchased | | | | | | | 801,974 | | | | | | | | 654,902 | | | | | | | | 8,979,083 | |
Payable for when-issued securities | | | | | | | — | | | | | | | | — | | | | | | | | 700,000 | |
Payable for fund shares redeemed | | | | | | | 446,601 | | | | | | | | 110,056 | | | | | | | | 247,162 | |
Distributions payable | | | | | | | 2,721,352 | | | | | | | | — | | | | | | | | 644,585 | |
Due to broker | | | | | | | 3,388,472 | | | | | | | | 210,273 | | | | | | | | — | |
Investment Manager fee payable | | | | | | | 1,142,456 | | | | | | | | 59,967 | | | | | | | | 331,855 | |
Trustees’ fees payable | | | | | | | 32,567 | | | | | | | | 2,491 | | | | | | | | 8,775 | |
Deferred foreign capital gains taxes payable | | | | | | | — | | | | | | | | — | | | | | | | | — | |
Other liabilities | | | | | | | 190,072 | | | | | | | | 27,171 | | | | | | | | 57,772 | |
Total Liabilities | | | | | | | 17,994,203 | | | | | | | | 1,943,761 | | | | | | | | 10,969,232 | |
Net Assets | | | | | | $ | 1,382,517,081 | | | | | | | | $76,091,194 | | | | | | | | $351,258,098 | |
NET ASSETS: | | | | | | | | | | | | | | | | | | | | | | | | |
Paid in capital | | | | | | $ | 1,474,907,942 | | | | | | | | $77,803,099 | | | | | | | | $394,520,471 | |
Undistributed (distributions in excess of) net investment income (loss) | | | | | | | 18,327,417 | | | | | | | | 1,582,473 | | | | | | | | (148,649 | ) |
Accumulated net realized gain (loss) | | | | | | | (62,537,131 | ) | | | | | | | (1,584,810 | ) | | | | | | | (35,182,267 | ) |
Net unrealized appreciation (depreciation) | | | | | | | (48,181,147 | ) | | | | | | | (1,709,568 | ) | | | | | | | (7,931,457 | ) |
Net Assets | | | | | | $ | 1,382,517,081 | | | | | | | | $76,091,194 | | | | | | | | $351,258,098 | |
| | | | | | |
Net Assets: | | | | | | | | | | | | | | | | | | | | | | | | |
Class A | | | | | | $ | 19,495,304 | | | | | | | | $ 1,401,793 | | | | | | | | $ 9,923,831 | |
Class C | | | | | | | 5,745,627 | | | | | | | | 130,285 | | | | | | | | 9,326,838 | |
Institutional Class | | | | | | | 1,357,276,150 | | | | | | | | 74,559,116 | | | | | | | | 332,007,429 | |
| | | | | | |
Shares Issued and Outstanding (no par value, unlimited shares authorized): | | | | | | | | | | | | | | | | | | | | | | | | |
Class A | | | | | | | 2,458,052 | | | | | | | | 186,921 | | | | | | | | 1,208,519 | |
Class C | | | | | | | 725,973 | | | | | | | | 17,518 | | | | | | | | 1,137,174 | |
Institutional Class | | | | | | | 168,623,505 | | | | | | | | 9,568,223 | | | | | | | | 38,813,044 | |
| | | | | | |
Net Asset Value and Redemption Price Per Share (Net Asset Per Share Outstanding): | | | | | | | | | | | | | | | | | | | | | | | | |
Class A | | | | | | $ | 7.93 | | | | | | | | $ 7.50 | | | | | | | | $ 8.21 | |
Class C | | | | | | | 7.91 | | | | | | | | 7.44 | | | | | | | | 8.20 | |
Institutional Class | | | | | | | 8.05 | | | | | | | | 7.79 | | | | | | | | 8.55 | |
| | | | | | |
Cost of Investments in securities | | | | | | $ | 1,273,127,629 | | | | | | | | $60,876,399 | | | | | | | | $335,333,237 | |
Cost of Investments in fully funded total return swaps | | | | | | $ | 4,248,029 | | | | | | | | $ 2,336,949 | | | | | | | | $ — | |
Cost of foreign currency held | | | | | | $ | 1,492,014 | | | | | | | | $ — | | | | | | | | $ 29,985 | |
See accompanying notes to the financial statements.
15
| | | | | | | | | | | | | | | | | | | | | | | | | | | | | | | | | | | | | | | | | | | | | | | | | | |
| | | Ashmore
Emerging Markets
Short Duration Fund | | | | Ashmore
Emerging Markets
Active Equity Fund | | | | Ashmore
Emerging Markets
Small-Cap Equity Fund | | | | Ashmore
Emerging Markets
Frontier Equity Fund | | | | Ashmore
Emerging Markets
Equity Fund | | |
| | | | | | | | | | | | | | | | | | | | | | | | | | | | | | | | | | | | | | | | | | | | | | | | | | |
| | | $ | 246,576,710 | | | | | | | | | $ | 17,909,614 | | | | | | | | | $ | 43,833,538 | | | | | | | | | $ | 99,861,608 | | | | | | | | | $ | 29,896,611 | | | | | | |
| | | | — | | | | | | | | | | — | | | | | | | | | | — | | | | | | | | | | — | | | | | | | | | | — | | | | | | |
| | | | — | | | | | | | | | | — | | | | | | | | | | — | | | | | | | | | | — | | | | | | | | | | — | | | | | | |
| | | | 23,322,433 | | | | | | | | | | 1,016,142 | | | | | | | | | | 770,469 | | | | | | | | | | 2,821,169 | | | | | | | | | | 306,552 | | | | | | |
| | | | 45,554 | | | | | | | | | | 3,880 | | | | | | | | | | 8,373 | | | | | | | | | | 1,027,608 | | | | | | | | | | 10,013 | | | | | | |
| | | | — | | | | | | | | | | — | | | | | | | | | | — | | | | | | | | | | — | | | | | | | | | | — | | | | | | |
| | | | — | | | | | | | | | | — | | | | | | | | | | — | | | | | | | | | | — | | | | | | | | | | — | | | | | | |
| | | | — | | | | | | | | | | — | | | | | | | | | | — | | | | | | | | | | — | | | | | | | | | | — | | | | | | |
| | | | — | | | | | | | | | | — | | | | | | | | | | — | | | | | | | | | | — | | | | | | | | | | — | | | | | | |
| | | | 1,389,175 | | | | | | | | | | 423,974 | | | | | | | | | | 105,320 | | | | | | | | | | 434,384 | | | | | | | | | | 67,474 | | | | | | |
| | | | 610,272 | | | | | | | | | | — | | | | | | | | | | 25,000 | | | | | | | | | | 238,273 | | | | | | | | | | — | | | | | | |
| | | | 22,330 | | | | | | | | | | 9,273 | | | | | | | | | | 18,792 | | | | | | | | | | 32,637 | | | | | | | | | | 13,388 | | | | | | |
| | | | 3,395,354 | | | | | | | | | | 9,578 | | | | | | | | | | 10,305 | | | | | | | | | | 290,759 | | | | | | | | | | 31,607 | | | | | | |
| | | | 18,463 | | | | | | | | | | 7,197 | | | | | | | | | | 12,114 | | | | | | | | | | 59,168 | | | | | | | | | | 40,659 | | | | | | |
| | | | | 275,380,291 | | | | | | | | | | 19,379,658 | | | | | | | | | | 44,783,911 | | | | | | | | | | 104,765,606 | | | | | | | | | | 30,366,304 | | | | | | |
| | | | | | | | | | | | | | | | | | | | | | | | | | | | | | | | | | | | | | | | | | | | | | | | | | |
| | | | — | | | | | | | | | | — | | | | | | | | | | — | | | | | | | | | | — | | | | | | | | | | — | | | | | | |
| | | | — | | | | | | | | | | — | | | | | | | | | | — | | | | | | | | | | — | | | | | | | | | | 294 | | | | | | |
| | | | — | | | | | | | | | | — | | | | | | | | | | — | | | | | | | | | | — | | | | | | | | | | — | | | | | | |
| | | | — | | | | | | | | | | — | | | | | | | | | | — | | | | | | | | | | — | | | | | | | | | | — | | | | | | |
| | | | 8,244,104 | | | | | | | | | | 582,153 | | | | | | | | | | 366,999 | | | | | | | | | | 1,879,434 | | | | | | | | | | 376,407 | | | | | | |
| | | | — | | | | | | | | | | — | | | | | | | | | | — | | | | | | | | | | — | | | | | | | | | | — | | | | | | |
| | | | 2,553,920 | | | | | | | | | | — | | | | | | | | | | 802,720 | | | | | | | | | | 413,178 | | | | | | | | | | — | | | | | | |
| | | | 1,003,778 | | | | | | | | | | — | | | | | | | | | | — | | | | | | | | | | — | | | | | | | | | | — | | | | | | |
| | | | — | | | | | | | | | | — | | | | | | | | | | — | | | | | | | | | | — | | | | | | | | | | — | | | | | | |
| | | | 138,627 | | | | | | | | | | 15,470 | | | | | | | | | | 56,043 | | | | | | | | | | 127,279 | | | | | | | | | | 28,774 | | | | | | |
| | | | 3,264 | | | | | | | | | | 513 | | | | | | | | | | 972 | | | | | | | | | | 2,029 | | | | | | | | | | 299 | | | | | | |
| | | | — | | | | | | | | | | — | | | | | | | | | | 88,258 | | | | | | | | | | — | | | | | | | | | | — | | | | | | |
| | | | 37,550 | | | | | | | | | | 14,968 | | | | | | | | | | 21,549 | | | | | | | | | | 39,054 | | | | | | | | | | 17,078 | | | | | | |
| | | | | 11,981,243 | | | | | | | | | | 613,104 | | | | | | | | | | 1,336,541 | | | | | | | | | | 2,460,974 | | | | | | | | | | 422,852 | | | | | | |
| | | | $ | 263,399,048 | | | | | | | | | $ | 18,766,554 | | | | | | | | | $ | 43,447,370 | | | | | | | | | $ | 102,304,632 | | | | | | | | | $ | 29,943,452 | | | | | | |
| | | | | | | | | | | | | | | | | | | | | | | | | | | | | | | | | | | | | | | | | | | | | | | | | | |
| | | $ | 265,205,106 | | | | | | | | | $ | 16,212,372 | | | | | | | | | $ | 40,584,662 | | | | | | | | | $ | 90,041,832 | | | | | | | | | $ | 29,330,065 | | | | | | |
| | | | 655,081 | | | | | | | | | | (14,156 | ) | | | | | | | | | (205,081 | ) | | | | | | | | | 689,204 | | | | | | | | | | (6,844 | ) | | | | | |
| | | | (228,248 | ) | | | | | | | | | 1,707,276 | | | | | | | | | | (493,173 | ) | | | | | | | | | 3,994,907 | | | | | | | | | | 842,037 | | | | | | |
| | | | (2,232,891 | ) | | | | | | | | | 861,062 | | | | | | | | | | 3,560,962 | | | | | | | | | | 7,578,689 | | | | | | | | | | (221,806 | ) | | | | | |
| | | | $ | 263,399,048 | | | | | | | | | $ | 18,766,554 | | | | | | | | | $ | 43,447,370 | | | | | | | | | $ | 102,304,632 | | | | | | | | | $ | 29,943,452 | | | | | | |
| | | | | | | | | | |
| | | | | | | | | | | | | | | | | | | | | | | | | | | | | | | | | | | | | | | | | | | | | | | | | | |
| | | $ | 17,676,038 | | | | | | | | | $ | 13,230 | | | | | | | | | $ | 1,184,206 | | | | | | | | | $ | 8,972,517 | | | | | | | | | $ | 139,352 | | | | | | |
| | | | 776,158 | | | | | | | | | | 13,106 | | | | | | | | | | 291,883 | | | | | | | | | | 562,786 | | | | | | | | | | 1,267 | | | | | | |
| | | | 244,946,852 | | | | | | | | | | 18,740,218 | | | | | | | | | | 41,971,281 | | | | | | | | | | 92,769,329 | | | | | | | | | | 29,802,833 | | | | | | |
| | | | | | | | | | |
| | | | | | | | | | | | | | | | | | | | | | | | | | | | | | | | | | | | | | | | | | | | | | | | | | |
| | | | 1,754,543 | | | | | | | | | | 1,083 | | | | | | | | | | 109,265 | | | | | | | | | | 916,466 | | | | | | | | | | 12,116 | | | | | | |
| | | | 79,994 | | | | | | | | | | 1,082 | | | | | | | | | | 25,531 | | | | | | | | | | 58,788 | | | | | | | | | | 115 | | | | | | |
| | | | 24,767,097 | | | | | | | | | | 1,529,819 | | | | | | | | | | 3,017,667 | | | | | | | | | | 8,233,440 | | | | | | | | | | 2,682,446 | | | | | | |
| | | | | | | | | | |
| | | | | | | | | | | | | | | | | | | | | | | | | | | | | | | | | | | | | | | | | | | | | | | | | | |
| | | $ | 10.07 | | | | | | | | | $ | 12.22 | | | | | | | | | $ | 10.84 | | | | | | | | | $ | 9.79 | | | | | | | | | $ | 11.50 | | | | | | |
| | | | 9.70 | | | | | | | | | | 12.11 | | | | | | | | | | 11.43 | | | | | | | | | | 9.57 | | | | | | | | | | 11.04 | | | | | | |
| | | | | 9.89 | | | | | | | | | | 12.25 | | | | | | | | | | 13.91 | | | | | | | | | | 11.27 | | | | | | | | | | 11.11 | | | | | | |
| | | | | | | | | | |
| | | $ | 248,810,929 | | | | | | | | | $ | 17,048,371 | | | | | | | | | $ | 40,184,345 | | | | | | | | | $ | 92,335,226 | | | | | | | | | $ | 30,118,236 | | | | | | |
| | | $ | — | | | | | | | | | $ | — | | | | | | | | | $ | — | | | | | | | | | $ | — | | | | | | | | | $ | — | | | | | | |
| | | | $ | 44,226 | | | | | | | | | $ | 3,997 | | | | | | | | | $ | 8,329 | | | | | | | | | $ | 1,027,954 | | | | | | | | | $ | 10,012 | | | | | | |
See accompanying notes to the financial statements.
16
ASHMORE FUNDS
STATEMENTS OF OPERATIONS
For the Six Month Period Ended April 30, 2018 (Unaudited)
| | | | | | | | | | | | | | | | | | | | | | | | |
| | | | | | Ashmore
Emerging
Markets Total Return
Fund | | | | | | Ashmore
Emerging
Markets
Local Currency
Bond Fund | | | | | | Ashmore
Emerging Markets
Corporate Debt
Fund | |
INVESTMENT INCOME: | | | | | | | | | | | | | | | | | | | | | | | | |
Interest, net of foreign tax withholdings* | | | | | | $ | 34,159,488 | | | | | | | | $2,288,668 | | | | | | | | $11,872,020 | |
Payment-in-kind interest, net of foreign tax withholdings* | | | | | | | — | | | | | | | | — | | | | | | | | 1,305,900 | |
Dividends, net of foreign tax withholdings* | | | | | | | — | | | | | | | | — | | | | | | | | — | |
Total Income | | | | | | | 34,159,488 | | | | | | | | 2,288,668 | | | | | | | | 13,177,920 | |
EXPENSES: | | | | | | | | | | | | | | | | | | | | | | | | |
Investment Manager fees | | | | | | | 6,140,064 | | | | | | | | 355,688 | | | | | | | | 2,085,014 | |
Administration fees | | | | | | | 122,791 | | | | | | | | 7,487 | | | | | | | | 36,258 | |
Custody fees | | | | | | | 229,988 | | | | | | | | 42,093 | | | | | | | | 36,384 | |
Professional fees | | | | | | | 154,070 | | | | | | | | 26,494 | | | | | | | | 54,886 | |
Trustees’ fees | | | | | | | 63,684 | | | | | | | | 4,361 | | | | | | | | 18,505 | |
Offering expenses and registration fees | | | | | | | 81,778 | | | | | | | | 25,504 | | | | | | | | 50,424 | |
Insurance fees | | | | | | | 19,894 | | | | | | | | 2,245 | | | | | | | | 6,468 | |
Printing fees | | | | | | | 19,189 | | | | | | | | 5,328 | | | | | | | | 7,748 | |
Distribution and servicing fees - Class A | | | | | | | 24,063 | | | | | | | | 1,370 | | | | | | | | 14,848 | |
Distribution and servicing fees - Class C | | | | | | | 22,745 | | | | | | | | 580 | | | | | | | | 49,817 | |
Other | | | | | | | 32,265 | | | | | | | | 10,562 | | | | | | | | 10,734 | |
Total Expenses | | | | | | | 6,910,531 | | | | | | | | 481,712 | | | | | | | | 2,371,086 | |
Less expenses reimbursed by the Investment Manager | | | | | | | (606,348 | ) | | | | | | | (116,574 | ) | | | | | | | (185,143 | ) |
Net Expenses | | | | | | | 6,304,183 | | | | | | | | 365,138 | | | | | | | | 2,185,943 | |
Net Investment Income (Loss) | | | | | | | 27,855,305 | | | | | | | | 1,923,530 | | | | | | | | 10,991,977 | |
NET REALIZED AND UNREALIZED GAINS (LOSSES): | | | | | | | | | | | | | | | | | | | | | | | | |
NET REALIZED GAIN (LOSS) ON: | | | | | | | | | | | | | | | | | | | | | | | | |
Investments in securities | | | | | | | 968,582 | | | | | | | | (753,866 | ) | | | | | | | (2,062,572 | ) |
Forward foreign currency exchange contracts | | | | | | | 6,580,312 | | | | | | | | 679,545 | | | | | | | | 5,512 | |
Interest rate swap contracts | | | | | | | 1,646,925 | | | | | | | | 140,713 | | | | | | | | — | |
Foreign exchange transactions | | | | | | | 871,414 | | | | | | | | 145,308 | | | | | | | | 8,743 | |
Net Realized Gain (Loss) | | | | | | | 10,067,233 | | | | | | | | 211,700 | | | | | | | | (2,048,317 | ) |
NET CHANGE IN UNREALIZED APPRECIATION (DEPRECIATION) ON: | | | | | | | | | | | | | | | | | | | | | | | | |
Investments in securities (net of increase (decrease) in deferred foreign taxes of $-, $-, $-, $-, $-, $89,550, $(291,756), and $-, respectively) | | | | | | | (40,795,034 | ) | | | | | | | 1,423,233 | | | | | | | | (13,537,042 | ) |
Forward foreign currency exchange contracts | | | | | | | (2,249,528 | ) | | | | | | | 282,355 | | | | | | | | 13,245 | |
Investments in fully funded total return swaps | | | | | | | (95,126 | ) | | | | | | | (1,255 | ) | | | | | | | — | |
Interest rate swap contracts | | | | | | | (1,090,424 | ) | | | | | | | (42,453 | ) | | | | | | | — | |
Foreign exchange translations | | | | | | | 57,897 | | | | | | | | 12,995 | | | | | | | | 1,654 | |
Change in Net Unrealized Appreciation (Depreciation) | | | | | | | (44,172,215 | ) | | | | | | | 1,674,875 | | | | | | | | (13,522,143 | ) |
Net Realized and Unrealized Gains (Losses) | | | | | | | (34,104,982 | ) | | | | | | | 1,886,575 | | | | | | | | (15,570,460 | ) |
Net Increase (Decrease) in Net Assets Resulting from Operations | | | | | | $ | (6,249,677 | ) | | | | | | | $3,810,105 | | | | | | | | $ (4,578,483 | ) |
* Foreign Tax Withholdings | | | | | | $ | 650,647 | | | | | | | | $ 119,148 | | | | | | | | $ — | |
See accompanying notes to the financial statements.
17
| | | | | | | | | | | | | | | | | | | | | | | | | | | | | | | | | | | | | | | | | | | | | | | | | | |
| | | Ashmore
Emerging Markets
Short Duration Fund | | | | Ashmore
Emerging Markets
Active Equity Fund | | | | Ashmore
Emerging Markets
Small-Cap Equity Fund | | | | Ashmore
Emerging Markets
Frontier Equity Fund | | | | Ashmore
Emerging Markets
Equity Fund | | |
| | | | | | | | | | | | | | | | | | | | | | | | | | | | | | | | | | | | | | | | | | | | | | | | | | |
| | | $ | 7,756,972 | | | | | | | | | $ | 44 | | | | | | | | | $ | — | | | | | | | | | $ | 2,418 | | | | | | | | | $ | 294 | | | | | | |
| | | | — | | | | | | | | | | — | | | | | | | | | | — | | | | | | | | | | — | | | | | | | | | | — | | | | | | |
| | | | — | | | | | | | | | | 89,321 | | | | | | | | | | 239,492 | | | | | | | | | | 1,419,917 | | | | | | | | | | 148,958 | | | | | | |
| | | | | 7,756,972 | | | | | | | | | | 89,365 | | | | | | | | | | 239,492 | | | | | | | | | | 1,422,335 | | | | | | | | | | 149,252 | | | | | | |
| | | | | | | | | | | | | | | | | | | | | | | | | | | | | | | | | | | | | | | | | | | | | | | | | | |
| | | | 716,314 | | | | | | | | | | 93,945 | | | | | | | | | | 311,280 | | | | | | | | | | 705,269 | | | | | | | | | | 118,783 | | | | | | |
| | | | 22,039 | | | | | | | | | | 1,879 | | | | | | | | | | 4,150 | | | | | | | | | | 9,403 | | | | | | | | | | 2,066 | | | | | | |
| | | | 19,700 | | | | | | | | | | 9,708 | | | | | | | | | | 29,013 | | | | | | | | | | 95,092 | | | | | | | | | | 12,016 | | | | | | |
| | | | 33,692 | | | | | | | | | | 13,882 | | | | | | | | | | 16,376 | | | | | | | | | | 21,967 | | | | | | | | | | 12,962 | | | | | | |
| | | | 10,158 | | | | | | | | | | 1,006 | | | | | | | | | | 2,126 | | | | | | | | | | 4,985 | | | | | | | | | | 990 | | | | | | |
| | | | 39,568 | | | | | | | | | | 21,672 | | | | | | | | | | 26,255 | | | | | | | | | | 32,948 | | | | | | | | | | 25,605 | | | | | | |
| | | | 4,388 | | | | | | | | | | 278 | | | | | | | | | | 766 | | | | | | | | | | 1,487 | | | | | | | | | | 185 | | | | | | |
| | | | 7,551 | | | | | | | | | | 5,297 | | | | | | | | | | 5,924 | | | | | | | | | | 7,146 | | | | | | | | | | 5,311 | | | | | | |
| | | | 17,638 | | | | | | | | | | 17 | | | | | | | | | | 1,233 | | | | | | | | | | 10,270 | | | | | | | | | | 176 | | | | | | |
| | | | 2,747 | | | | | | | | | | 66 | | | | | | | | | | 1,376 | | | | | | | | | | 2,588 | | | | | | | | | | 12 | | | | | | |
| | | | 6,703 | | | | | | | | | | 3,436 | | | | | | | | | | 6,823 | | | | | | | | | | 5,472 | | | | | | | | | | 4,994 | | | | | | |
| | | | | 880,498 | | | | | | | | | | 151,186 | | | | | | | | | | 405,322 | | | | | | | | | | 896,627 | | | | | | | | | | 183,100 | | | | | | |
| | | | | (121,759 | ) | | | | | | | | | (55,589 | ) | | | | | | | | | (87,268 | ) | | | | | | | | | (169,097 | ) | | | | | | | | | (62,021 | ) | | | | | |
| | | | | 758,739 | | | | | | | | | | 95,597 | | | | | | | | | | 318,054 | | | | | | | | | | 727,530 | | | | | | | | | | 121,079 | | | | | | |
| | | | | 6,998,233 | | | | | | | | | | (6,232 | ) | | | | | | | | | (78,562 | ) | | | | | | | | | 694,805 | | | | | | | | | | 28,173 | | | | | | |
| | | | | | | | | | | | | | | | | | | | | | | | | | | | | | | | | | | | | | | | | | | | | | | | | | |
| | | | | | | | | | | | | | | | | | | | | | | | | | | | | | | | | | | | | | | | | | | | | | | | | | |
| | | | 572,477 | | | | | | | | | | 1,747,350 | | | | | | | | | | 2,098,481 | | | | | | | | | | 4,337,461 | | | | | | | | | | 1,240,796 | | | | | | |
| | | | (53,367 | ) | | | | | | | | | — | | | | | | | | | | (627 | ) | | | | | | | | | — | | | | | | | | | | 2,808 | | | | | | |
| | | | — | | | | | | | | | | — | | | | | | | | | | — | | | | | | | | | | — | | | | | | | | | | — | | | | | | |
| | | | (29,457 | ) | | | | | | | | | (8,801 | ) | | | | | | | | | (46,427 | ) | | | | | | | | | (70,121 | ) | | | | | | | | | (5,974 | ) | | | | | |
| | | | | 489,653 | | | | | | | | | | 1,738,549 | | | | | | | | | | 2,051,427 | | | | | | | | | | 4,267,340 | | | | | | | | | | 1,237,630 | | | | | | |
| | | | | | | | | | | | | | | | | | | | | | | | | | | | | | | | | | | | | | | | | | | | | | | | | | |
| | | | | | | | | | |
| | | | (7,873,258 | ) | | | | | | | | | (824,236 | ) | | | | | | | | | 599,251 | | | | | | | | | | 756,561 | | | | | | | | | | (1,710,376 | ) | | | | | |
| | | | — | | | | | | | | | | — | | | | | | | | | | — | | | | | | | | | | — | | | | | | | | | | (294 | ) | | | | | |
| | | | — | | | | | | | | | | — | | | | | | | | | | — | | | | | | | | | | — | | | | | | | | | | — | | | | | | |
| | | | — | | | | | | | | | | — | | | | | | | | | | — | | | | | | | | | | — | | | | | | | | | | — | | | | | | |
| | | | (5,081 | ) | | | | | | | | | 39 | | | | | | | | | | 12,229 | | | | | | | | | | (8,865 | ) | | | | | | | | | 234 | | | | | | |
| | | | | (7,878,339 | ) | | | | | | | | | (824,197 | ) | | | | | | | | | 611,480 | | | | | | | | | | 747,696 | | | | | | | | | | (1,710,436 | ) | | | | | |
| | | | | (7,388,686 | ) | | | | | | | | | 914,352 | | | | | | | | | | 2,662,907 | | | | | | | | | | 5,015,036 | | | | | | | | | | (472,806 | ) | | | | | |
| | | | $ | (390,453 | ) | | | | | | | | $ | 908,120 | | | | | | | | | $ | 2,584,345 | | | | | | | | | $ | 5,709,841 | | | | | | | | | $ | (444,633 | ) | | | | | |
| | | | $ | 21,859 | | | | | | | | | $ | 17,783 | | | | | | | | | $ | 29,563 | | | | | | | | | $ | 109,087 | | | | | | | | | $ | 20,697 | | | | | | |
See accompanying notes to the financial statements.
18
ASHMORE FUNDS
STATEMENTS OF CHANGES IN NET ASSETS
For the Six Month Period Ended April 30, 2018 (Unaudited) and the Fiscal Year Ended October 31, 2017
| | | | | | | | | | | | | | | | | | | | | | | | | | | | | | | | | | | | | | | | |
| | | | | |
| Ashmore
Emerging Markets Total Return
Fund |
| |
| Ashmore
Emerging Markets Local Currency Bond Fund |
| |
| Ashmore
Emerging Markets Corporate Debt Fund |
|
| | | | | | 2018 | | | | | | 2017 | | | 2018 | | | | | | 2017 | | | 2018 | | | | | | 2017 | |
OPERATIONS: | | | | | | | | | | | | | | | | | | | | | | | | | | | | | | | | | | | | | | | | |
Net investment income (loss) | | | | | | $ | 27,855,305 | | | | | | | $ | 61,296,167 | | | $ | 1,923,530 | | | | | | | $ | 4,122,082 | | | $ | 10,991,977 | | | | | | | $ | 21,082,493 | |
Net realized gain (loss) | | | | | | | 10,067,233 | | | | | | | | 30,056,490 | | | | 211,700 | | | | | | | | 2,665,136 | | | | (2,048,317 | ) | | | | | | | 4,232,565 | |
Net change in unrealized appreciation (depreciation) | | | | | | | (44,172,215 | ) | | | | | | | (10,655,233 | ) | | | 1,674,875 | | | | | | | | (1,063,110 | ) | | | (13,522,143 | ) | | | | | | | 17,153,785 | |
Net Increase (Decrease) in Net Assets Resulting from Operations | | | | | | | (6,249,677 | ) | | | | | | | 80,697,424 | | | | 3,810,105 | | | | | | | | 5,724,108 | | | | (4,578,483 | ) | | | | | | | 42,468,843 | |
| | | | | | | | | | |
DISTRIBUTIONS TO CLASS A SHAREHOLDERS: | | | | | | | | | | | | | | | | | | | | | | | | | | | | | | | | | | | | | | | | |
From net investment income | | | | | | | (409,472 | ) | | | | | | | (348,466 | ) | | | (18,606 | ) | | | | | | | (32,535 | ) | | | (336,773 | ) | | | | | | | (661,364 | ) |
From net realized gains | | | | | | | (252,574 | ) | | | | | | | — | | | | — | | | | | | | | — | | | | — | | | | | | | | — | |
Tax return of capital | | | | | | | — | | | | | | | | — | | | | — | | | | | | | | (11,983 | ) | | | — | | | | | | | | (21,620 | ) |
| | | | | | | | | | | | | | | | | | | | | | | | | | | | | | | | | | | | | | | | |
Total Distributions to Class A Shareholders | | | | | | | (662,046 | ) | | | | | | | (348,466 | ) | | | (18,606 | ) | | | | | | | (44,518 | ) | | | (336,773 | ) | | | | | | | (682,984 | ) |
| | | | | | | | | | |
DISTRIBUTIONS TO CLASS C SHAREHOLDERS: | | | | | | | | | | | | | | | | | | | | | | | | | | | | | | | | | | | | | | | | |
From net investment income | | | | | | | (84,082 | ) | | | | | | | (168,371 | ) | | | (1,830 | ) | | | | | | | (2,916 | ) | | | (248,186 | ) | | | | | | | (407,649 | ) |
From net realized gains | | | | | | | (56,438 | ) | | | | | | | — | | | | — | | | | | | | | — | | | | — | | | | | | | | — | |
Tax return of capital | | | | | | | — | | | | | | | | — | | | | — | | | | | | | | (1,194 | ) | | | — | | | | | | | | (15,724 | ) |
| | | | | | | | | | | | | | | | | | | | | | | | | | | | | | | | | | | | | | | | |
Total Distributions to Class C Shareholders | | | | | | | (140,520 | ) | | | | | | | (168,371 | ) | | | (1,830 | ) | | | | | | | (4,110 | ) | | | (248,186 | ) | | | | | | | (423,373 | ) |
| | | | | | | | | | |
DISTRIBUTIONS TO INSTITUTIONAL CLASS SHAREHOLDERS: | | | | | | | | | | | | | | | | | | | | | | | | | | | | | | | | | | | | | | | | |
From net investment income | | | | | | | (27,235,844 | ) | | | | | | | (57,767,974 | ) | | | (1,024,709 | ) | | | | | | | (2,631,755 | ) | | | (10,204,063 | ) | | | | | | | (18,700,293 | ) |
From net realized gains | | | | | | | (15,154,357 | ) | | | | | | | — | | | | — | | | | | | | | — | | | | — | | | | | | | | — | |
Tax return of capital | | | | | | | — | | | | | | | | — | | | | — | | | | | | | | (1,042,650 | ) | | | — | | | | | | | | (612,632 | ) |
| | | | | | | | | | | | | | | | | | | | | | | | | | | | | | | | | | | | | | | | |
Total Distributions to Institutional Class Shareholders | | | | | | | (42,390,201 | ) | | | | | | | (57,767,974 | ) | | | (1,024,709 | ) | | | | | | | (3,674,405 | ) | | | (10,204,063 | ) | | | | | | | (19,312,925 | ) |
FUND SHARE TRANSACTIONS: | | | | | | | | | | | | | | | | | | | | | | | | | | | | | | | | | | | | | | | | |
Net increase (decrease) in net assets resulting from Class A share transactions | | | | | | | 1,978,978 | | | | | | | | 14,843,722 | | | | 467,486 | | | | | | | | 51,796 | | | | (1,602,218 | ) | | | | | | | (155,365 | ) |
Net increase (decrease) in net assets resulting from Class C share transactions | | | | | | | 2,018,200 | | | | | | | | 1,387,298 | | | | 29,567 | | | | | | | | 26,258 | | | | 210,633 | | | | | | | | 2,985,359 | |
Net increase (decrease) in net assets resulting from Institutional Class share transactions | | | | | | | 294,904,358 | | | | | | | | 279,646,777 | | | | (12,930,727 | ) | | | | | | | 1,966,867 | | | | 8,059,483 | | | | | | | | 101,612,097 | |
| | | | | | | | | | | | | | | | | | | | | | | | | | | | | | | | | | | | | | | | |
| | | | | | | | | | |
Net Increase (Decrease) in Net Assets Resulting from Fund Share Transactions | | | | | | | 298,901,536 | | | | | | | | 295,877,797 | | | | (12,433,674 | ) | | | | | | | 2,044,921 | | | | 6,667,898 | | | | | | | | 104,442,091 | |
Total Increase (Decrease) in Net Assets | | | | | | | 249,459,092 | | | | | | | | 318,290,410 | | | | (9,668,714 | ) | | | | | | | 4,045,996 | | | | (8,699,607 | ) | | | | | | | 126,491,652 | |
NET ASSETS: | | | | | | | | | | | | | | | | | | | | | | | | | | | | | | | | | | | | | | | | |
Net Assets at the Beginning of period | | | | | | | 1,133,057,989 | | | | | | | | 814,767,579 | | | | 85,759,908 | | | | | | | | 81,713,912 | | | | 359,957,705 | | | | | | | | 233,466,053 | |
Net Assets at the End of period | | | | | | $ | 1,382,517,081 | | | | | | | $ | 1,133,057,989 | | | $ | 76,091,194 | | | | | | | $ | 85,759,908 | | | $ | 351,258,098 | | | | | | | $ | 359,957,705 | |
Undistributed (Distributions in Excess of) Net Investment Income (Loss) | | | | | | $ | 18,327,417 | | | | | | | $ | 18,201,510 | | | $ | 1,582,473 | | | | | | | $ | 704,088 | | | $ | (148,649 | ) | | | | | | $ | (351,604 | ) |
See accompanying notes to the financial statements.
19
| | | | | | | | | | | | | | | | | | | | | | | | | | | | | | | | | | | | | | | | | | | | | | | | | | | | | | | | | | | | | | | | | | | | | | | | | | |
| | | | Ashmore Emerging Markets Short Duration Fund | | | | | | | | | Ashmore Emerging Markets Active Equity Fund | | | | | | | | | Ashmore Emerging Markets Small-Cap Equity Fund | | | | | | | | | Ashmore Emerging Markets Frontier Equity Fund | |
| | | | 2018 | | | | | | 2017 | | | | | | | | | 2018 | | | | | | 2017 | | | | | | | | | 2018 | | | | | | 2017 | | | | | | | | | 2018 | | | | | | 2017 | |
| | | | | | | | | | | | | | | | | | | | | | | | | | | | | | | | | | | | | | | | | | | | | | | | | | | | | | | | | | | | | | | | | | | | | | | | | | |
| | | | $ | 6,998,233 | | | | | | | $ | 13,045,797 | | | | | | | | | | | $ | (6,232 | ) | | | | | | $ | 69,514 | | | | | | | | | | | $ | (78,562 | ) | | | | | | $ | 234,294 | | | | | | | | | | | $ | 694,805 | | | | | | | $ | 800,353 | |
| | | | | 489,653 | | | | | | | | 2,742,227 | | | | | | | | | | | | 1,738,549 | | | | | | | | 1,511,507 | | | | | | | | | | | | 2,051,427 | | | | | | | | 4,779,455 | | | | | | | | | | | | 4,267,340 | | | | | | | | 10,710,659 | |
| | | | | | (7,878,339 | ) | | | | | | | 1,549,066 | | | | | | | | | | | | (824,197 | ) | | | | | | | 1,685,259 | | | | | | | | | | | | 611,480 | | | | | | | | 1,956,429 | | | | | | | | | | | | 747,696 | | | | | | | | 5,110,923 | |
| | | | | | | | | | | | | | | | | | | | | | | | | | | | | | | | | | | | | | | | | | | | | | | | | | | | | | | | | | | | | | | | | | | | | | | | | | |
| | | | | | (390,453 | ) | | | | | | | 17,337,090 | | | | | | | | | | | | 908,120 | | | | | | | | 3,266,280 | | | | | | | | | | | | 2,584,345 | | | | | | | | 6,970,178 | | | | | | | | | | | | 5,709,841 | | | | | | | | 16,621,935 | |
| | | | | | | | | | | | | | | | | | |
| | | | | | | | | | | | | | | | | | | | | | | | | | | | | | | | | | | | | | | | | | | | | | | | | | | | | | | | | | | | | | | | | | | | | | | | | | |
| | | | | (414,787 | ) | | | | | | | (1,352,634 | ) | | | | | | | | | | | (73 | ) | | | | | | | (49 | ) | | | | | | | | | | | (14,415 | ) | | | | | | | (12,062 | ) | | | | | | | | | | | — | | | | | | | | (119,379 | ) |
| | | | | (247,082 | ) | | | | | | | (179,607 | ) | | | | | | | | | | | (1,023 | ) | | | | | | | — | | | | | | | | | | | | — | | | | | | | | — | | | | | | | | | | | | (630,248 | ) | | | | | | | — | |
| | | | | — | | | | | | | | — | | | | | | | | | | | | — | | | | | | | | — | | | | | | | | | | | | — | | | | | | | | — | | | | | | | | | | | | — | | | | | | | | — | |
| | | | | | | | | | | | | | | | | | | | | | | | | | | | | | | | | | | | | | | | | | | | | | | | | | | | | | | | | | | | | | | | | | | | | | | | | | |
| | | | | (661,869 | ) | | | | | | | (1,532,241 | ) | | | | | | | | | | | (1,096 | ) | | | | | | | (49 | ) | | | | | | | | | | | (14,415 | ) | | | | | | | (12,062 | ) | | | | | | | | | | | (630,248 | ) | | | | | | | (119,379 | ) |
| | | | | | | | | | | | | | | | | | |
| | | | | | | | | | | | | | | | | | | | | | | | | | | | | | | | | | | | | | | | | | | | | | | | | | | | | | | | | | | | | | | | | | | | | | | | | | |
| | | | | | | | | | | | | | | | | | | | | | | | | | | | | | | | | | | | | | | | | | | | | | | | | | | | | | | | | | | | | | | | | | | | | | | | | | |
| | | | | (14,368 | ) | | | | | | | (2,912 | ) | | | | | | | | | | | (51 | ) | | | | | | | (44 | ) | | | | | | | | | | | (3,608 | ) | | | | | | | (3,320 | ) | | | | | | | | | | | — | | | | | | | | (3,210 | ) |
| | | | | (10,509 | ) | | | | | | | — | | | | | | | | | | | | (1,022 | ) | | | | | | | — | | | | | | | | | | | | — | | | | | | | | — | | | | | | | | | | | | (41,081 | ) | | | | | | | — | |
| | | | | — | | | | | | | | — | | | | | | | | | | | | — | | | | | | | | — | | | | | | | | | | | | — | | | | | | | | — | | | | | | | | | | | | — | | | | | | | | — | |
| | | | | | | | | | | | | | | | | | | | | | | | | | | | | | | | | | | | | | | | | | | | | | | | | | | | | | | | | | | | | | | | | | | | | | | | | | |
| | | | | (24,877 | ) | | | | | | | (2,912 | ) | | | | | | | | | | | (1,073 | ) | | | | | | | (44 | ) | | | | | | | | | | | (3,608 | ) | | | | | | | (3,320 | ) | | | | | | | | | | | (41,081 | ) | | | | | | | (3,210 | ) |
| | | | | | | | | | | | | | | | | | |
| | | | | | | | | | | | | | | | | | | | | | | | | | | | | | | | | | | | | | | | | | | | | | | | | | | | | | | | | | | | | | | | | | | | | | | | | | |
| | | | | (6,365,685 | ) | | | | | | | (10,516,157 | ) | | | | | | | | | | | (112,476 | ) | | | | | | | (60,318 | ) | | | | | | | | | | | (519,186 | ) | | | | | | | (536,583 | ) | | | | | | | | | | | — | | | | | | | | (1,033,910 | ) |
| | | | | (4,098,312 | ) | | | | | | | (1,820,393 | ) | | | | | | | | | | | (1,445,467 | ) | | | | | | | — | | | | | | | | | | | | — | | | | | | | | — | | | | | | | | | | | | (5,634,401 | ) | | | | | | | — | |
| | | | | — | | | | | | | | — | | | | | | | | | | | | — | | | | | | | | — | | | | | | | | | | | | — | | | | | | | | — | | | | | | | | | | | | — | | | | | | | | — | |
| | | | | | | | | | | | | | | | | | | | | | | | | | | | | | | | | | | | | | | | | | | | | | | | | | | | | | | | | | | | | | | | | | | | | | | | | | |
| | | | | | | | | | | | | | | | | | |
| | | | | (10,463,997 | ) | | | | | | | (12,336,550 | ) | | | | | | | | | | | (1,557,943 | ) | | | | | | | (60,318 | ) | | | | | | | | | | | (519,186 | ) | | | | | | | (536,583 | ) | | | | | | | | | | | (5,634,401 | ) | | | | | | | (1,033,910 | ) |
| | | | | | | | | | | | | | | | | | | | | | | | | | | | | | | | | | | | | | | | | | | | | | | | | | | | | | | | | | | | | | | | | | | | | | | | | | |
| | | | | | | | | | | | | | | | | | |
| | | | | 8,228,675 | | | | | | | | (584,049 | ) | | | | | | | | | | | 931 | | | | | | | | 10,055 | | | | | | | | | | | | 297,328 | | | | | | | | 217,352 | | | | | | | | | | | | 1,405,119 | | | | | | | | 4,057,056 | |
| | | | | | | | | | | | | | | | | | | | | | | | | | | | | | | | | | | | | | | | | | | | | | | | | | | | | | | | | | | | | | | | | | | | | | | | | | |
| | | | | 615,841 | | | | | | | | 184,019 | | | | | | | | | | | | 913 | | | | | | | | 10,069 | | | | | | | | | | | | 28,106 | | | | | | | | 37,565 | | | | | | | | | | | | 115,309 | | | | | | | | 348,890 | |
| | | | | | | | | | | | | | | | | | |
| | | | | 77,550,334 | | | | | | | | 55,004,360 | | | | | | | | | | | | 1,360,756 | | | | | | | | 14,829,953 | | | | | | | | | | | | 1,558,023 | | | | | | | | (1,482,267 | ) | | | | | | | | | | | 11,886,046 | | | | | | | | 14,695,771 | |
| | | | | | | | | | | | | | | | | | | | | | | | | | | | | | | | | | | | | | | | | | | | | | | | | | | | | | | | | | | | | | | | | | | | | | | | | | |
| | | | | | | | | | | | | | | | | | | | | | | | | | | | | | | | | | | | | | | | | | | | | | | | | | | | | | | | | | | | | | | | | | | | | | | | | | |
| | | | | | 86,394,850 | | | | | | | | 54,604,330 | | | | | | | | | | | | 1,362,600 | | | | | | | | 14,850,077 | | | | | | | | | | | | 1,883,457 | | | | | | | | (1,227,350 | ) | | | | | | | | | | | 13,406,474 | | | | | | | | 19,101,717 | |
| | | | | | 74,853,654 | | | | | | | | 58,069,717 | | | | | | | | | | | | 710,608 | | | | | | | | 18,055,946 | | | | | | | | | | | | 3,930,593 | | | | | | | | 5,190,863 | | | | | | | | | | | | 12,810,585 | | | | | | | | 34,567,153 | |
| | | | | | | | | | | | | | | | | | | | | | | | | | | | | | | | | | | | | | | | | | | | | | | | | | | | | | | | | | | | | | | | | | | | | | | | | | |
| | | | | | 188,545,394 | | | | | | | | 130,475,677 | | | | | | | | | | | | 18,055,946 | | | | | | | | — | | | | | | | | | | | | 39,516,777 | | | | | | | | 34,325,914 | | | | | | | | | | | | 89,494,047 | | | | | | | | 54,926,894 | |
| | | | | $ | 263,399,048 | | | | | | | $ | 188,545,394 | | | | | | | | | | | $ | 18,766,554 | | | | | | | $ | 18,055,946 | | | | | | | | | | | $ | 43,447,370 | | | | | | | $ | 39,516,777 | | | | | | | | | | | $ | 102,304,632 | | | | | | | $ | 89,494,047 | |
| | | | | | | | | | | | | | | | | | |
| | | | | $ | 655,081 | | | | | | | $ | 451,688 | | | | | | | | | | | $ | (14,156 | ) | | | | | | $ | 104,676 | | | | | | | | | | | $ | (205,081 | ) | | | | | | $ | 410,690 | | | | | | | | | | | $ | 689,204 | | | | | | | $ | (5,601 | ) |
See accompanying notes to the financial statements.
20
ASHMORE FUNDS
STATEMENTS OF CHANGES IN NET ASSETS
For the Six Month Period Ended April 30, 2018 (Unaudited) and the Fiscal Year Ended October 31, 2017
| | | | | | | | | | | | |
| | | Ashmore Emerging Markets Equity Fund | |
| | | 2018 | | | | | | 2017 | |
OPERATIONS: | | | | | | | | | | | | |
Net investment income (loss) | | $ | 28,173 | | | | | | | $ | 93,777 | |
Net realized gain (loss) | | | 1,237,630 | | | | | | | | 3,025,338 | |
Net change in unrealized appreciation (depreciation) | | | (1,710,436 | ) | | | | | | | 315,782 | |
Net Increase (Decrease) in Net Assets Resulting from Operations | | | (444,633 | ) | | | | | | | 3,434,897 | |
| | | |
DISTRIBUTIONS TO CLASS A SHAREHOLDERS: | | | | | | | | | | | | |
From net investment income | | | (1,968 | ) | | | | | | | (947 | ) |
| | | | | | | | | | | | |
Total Distributions to Class A Shareholders | | | (1,968 | ) | | | | | | | (947 | ) |
| | | |
DISTRIBUTIONS TO CLASS C SHAREHOLDERS: | | | | | | | | | | | | |
From net investment income | | | (33 | ) | | | | | | | (13 | ) |
| | | | | | | | | | | | |
Total Distributions to Class C Shareholders | | | (33 | ) | | | | | | | (13 | ) |
| | | |
DISTRIBUTIONS TO INSTITUTIONAL CLASS SHAREHOLDERS: | | | | | | | | | | | | |
From net investment income | | | (161,526 | ) | | | | | | | (183,406 | ) |
| | | | | | | | | | | | |
Total Distributions to Institutional Class Shareholders | | | (161,526 | ) | | | | | | | (183,406 | ) |
FUND SHARE TRANSACTIONS: | | | | | | | | | | | | |
Net increase (decrease) in net assets resulting from Class A share transactions | | | 1,671 | | | | | | | | 82,543 | |
Net increase (decrease) in net assets resulting from Class C share transactions | | | (1,294 | ) | | | | | | | 2,155 | |
Net increase (decrease) in net assets resulting from Institutional Class share transactions | | | 22,309,472 | | | | | | | | (4,203,558 | ) |
| | | | | | | | | | | | |
| | | |
Net Increase (Decrease) in Net Assets Resulting from Fund Share Transactions | | | 22,309,849 | | | | | | | | (4,118,860 | ) |
Total Increase (Decrease) in Net Assets | | | 21,701,689 | | | | | | | | (868,329 | ) |
NET ASSETS: | | | | | | | | | | | | |
Net Assets at the Beginning of period | | | 8,241,763 | | | | | | | | 9,110,092 | |
Net Assets at the End of period | | $ | 29,943,452 | | | | | | | $ | 8,241,763 | |
Undistributed (Distributions in Excess of) Net Investment Income (Loss) | | $ | (6,844 | ) | | | | | | $ | 128,510 | |
See accompanying notes to the financial statements.
21
ASHMORE FUNDS
FINANCIAL HIGHLIGHTS
Ashmore Emerging Markets Total Return Fund
| | | | | | | | | | | | | | | | | | | | | | | | |
| | | Class A | |
| | | Six Months
Ended
April 30, 2018
(Unaudited) | | | Year Ended
October 31,
2017 | | | Year Ended
October 31,
2016 | | | Year Ended
October 31,
2015 | | | Year Ended
October 31,
2014 | | | Year Ended
October 31,
2013 | |
| | | | |
Net asset value at beginning of period | | | $ 8.22 | | | | $ 8.01 | | | | $ 7.49 | | | | $ 8.75 | | | | $ 9.30 | | | | $ 10.05 | |
| | | | | | |
Income (loss) from investment operations: | | | | | | | | | | | | | | | | | | | | | | | | |
Net investment income | | | 0.17 | 1 | | | 0.56 | 1 | | | 0.58 | 1 | | | 0.48 | 1 | | | 0.44 | | | | 0.41 | |
Net realized and unrealized gain (loss) | | | (0.19 | ) | | | 0.15 | | | | 0.49 | | | | (1.24 | ) | | | (0.42 | ) | | | (0.57 | ) |
| | | | |
Total from investment operations | | | (0.02 | ) | | | 0.71 | | | | 1.07 | | | | (0.76 | ) | | | 0.02 | | | | (0.16 | ) |
| | | | | | |
Less distributions: | | | | | | | | | | | | | | | | | | | | | | | | |
| | | | | | |
From net investment income | | | (0.16 | ) | | | (0.50 | ) | | | (0.33 | ) | | | — | | | | (0.33 | ) | | | (0.43 | ) |
From net realized gain | | | (0.11 | ) | | | — | | | | — | | | | — | | | | (0.12 | ) | | | (0.16 | ) |
Tax return of capital | | | — | | | | — | | | | (0.22 | ) | | | (0.50 | ) | | | (0.12 | ) | | | — | |
| | | | |
| | | | | | |
Total distributions | | | (0.27 | ) | | | (0.50 | ) | | | (0.55 | ) | | | (0.50 | ) | | | (0.57 | ) | | | (0.59 | ) |
| | | | |
Net asset value at end of period | | | $ 7.93 | | | | $ 8.22 | | | | $ 8.01 | | | | $ 7.49 | | | | $ 8.75 | | | | $ 9.30 | |
| | | | |
| | | | | | |
Total return2 | | | (0.09 | )% | | | 9.12 | % | | | 15.15 | % | | | (8.78 | )% | | | 0.17 | % | | | (1.70 | )% |
| | | | | | |
Portfolio turnover rate3 | | | 28 | % | | | 65 | % | | | 91 | % | | | 101 | % | | | 80 | % | | | 85 | % |
| | | | | | |
Net assets, end of period (in thousands) | | | $19,495 | | | | $18,231 | | | | $3,445 | | | | $2,951 | | | | $8,351 | | | | $10,344 | |
| | | | | | |
Ratios to average net assets:4 | | | | | | | | | | | | | | | | | | | | | | | | |
Total expenses to average net assets: | | | | | | | | | | | | | | | | | | | | | | | | |
Total expenses before reimbursements | | | 1.37 | % | | | 1.37 | % | | | 1.41 | % | | | 1.37 | % | | | 1.38 | % | | | 1.38 | % |
Total expenses after reimbursements | | | 1.27 | % | | | 1.27 | % | | | 1.27 | % | | | 1.29 | % | | | 1.30 | % | | | 1.30 | % |
| | | | | | |
Net investment income to average net assets: | | | | | | | | | | | | | | | | | | | | | | | | |
Net investment income before reimbursements | | | 4.15 | % | | | 6.81 | % | | | 7.48 | % | | | 5.91 | % | | | 4.79 | % | | | 4.55 | % |
Net investment income after reimbursements | | | 4.25 | % | | | 6.91 | % | | | 7.62 | % | | | 5.99 | % | | | 4.87 | % | | | 4.63 | % |
See accompanying notes to the financial statements.
22
ASHMORE FUNDS
FINANCIAL HIGHLIGHTS
Ashmore Emerging Markets Total Return Fund
| | | | | | | | | | | | | | | | | | | | | | | | |
| | | Class C | |
| | | Six Months
Ended
April 30, 2018
(Unaudited) | | | Year Ended
October 31,
2017 | | | Year Ended
October 31,
2016 | | | Year Ended
October 31,
2015 | | | Year Ended
October 31,
2014 | | | Year Ended
October 31,
2013 | |
| | | | |
Net asset value at beginning of period | | | $ 8.21 | | | | $ 8.00 | | | | $ 7.48 | | | | $ 8.74 | | | | $ 9.29 | | | | $10.05 | |
| | | | | | |
Income (loss) from investment operations: | | | | | | | | | | | | | | | | | | | | | | | | |
Net investment income | | | 0.14 | 1 | | | 0.46 | 1 | | | 0.53 | 1 | | | 0.44 | 1 | | | 0.37 | | | | 0.33 | |
Net realized and unrealized gain (loss) | | | (0.19 | ) | | | 0.19 | | | | 0.49 | | | | (1.26 | ) | | | (0.42 | ) | | | (0.57 | ) |
| | | | |
Total from investment operations | | | (0.05 | ) | | | 0.65 | | | | 1.02 | | | | (0.82 | ) | | | (0.05 | ) | | | (0.24 | ) |
| | | | | | |
Less distributions: | | | | | | | | | | | | | | | | | | | | | | | | |
| | | | | | |
From net investment income | | | (0.14 | ) | | | (0.44 | ) | | | (0.30 | ) | | | — | | | | (0.28 | ) | | | (0.36 | ) |
From net realized gain | | | (0.11 | ) | | | — | | | | — | | | | — | | | | (0.12 | ) | | | (0.16 | ) |
Tax return of capital | | | — | | | | — | | | | (0.20 | ) | | | (0.44 | ) | | | (0.10 | ) | | | — | |
| | | | |
| | | | | | |
Total distributions | | | (0.25 | ) | | | (0.44 | ) | | | (0.50 | ) | | | (0.44 | ) | | | (0.50 | ) | | | (0.52 | ) |
| | | | |
Net asset value at end of period | | | $ 7.91 | | | | $ 8.21 | | | | $ 8.00 | | | | $ 7.48 | | | | $ 8.74 | | | | $ 9.29 | |
| | | | |
| | | | | | |
Total return2 | | | (0.52 | )% | | | 8.31 | % | | | 14.32 | % | | | (9.58 | )% | | | (0.45 | )% | | | (2.44 | )% |
| | | | | | |
Portfolio turnover rate3 | | | 28 | % | | | 65 | % | | | 91 | % | | | 101 | % | | | 80 | % | | | 85 | % |
| | | | | | |
Net assets, end of period (in thousands) | | | $5,746 | | | | $3,926 | | | | $2,451 | | | | $ 443 | | | | $1,028 | | | | $ 969 | |
| | | | | | |
Ratios to average net assets:4 | | | | | | | | | | | | | | | | | | | | | | | | |
Total expenses to average net assets: | | | | | | | | | | | | | | | | | | | | | | | | |
Total expenses before reimbursements | | | 2.12 | % | | | 2.12 | % | | | 2.15 | % | | | 2.12 | % | | | 2.13 | % | | | 2.13 | % |
Total expenses after reimbursements | | | 2.02 | % | | | 2.02 | % | | | 2.02 | % | | | 2.03 | % | | | 2.05 | % | | | 2.05 | % |
| | | | | | |
Net investment income to average net assets: | | | | | | | | | | | | | | | | | | | | | | | | |
Net investment income before reimbursements | | | 3.47 | % | | | 5.59 | % | | | 6.79 | % | | | 5.35 | % | | | 4.04 | % | | | 3.83 | % |
Net investment income after reimbursements | | | 3.57 | % | | | 5.69 | % | | | 6.92 | % | | | 5.44 | % | | | 4.12 | % | | | 3.91 | % |
See accompanying notes to the financial statements.
23
ASHMORE FUNDS
FINANCIAL HIGHLIGHTS
| | | | | | | | | | | | | | | | | | | | | | | | |
Ashmore Emerging Markets Total Return Fund | | | | | | | | | | | | | |
| | | Institutional Class | |
| | | Six Months
Ended
April 30, 2018 (Unaudited) | | | Year Ended
October 31,
2017 | | | Year Ended
October 31,
2016 | | | Year Ended
October 31,
2015 | | | Year Ended
October 31,
2014 | | | Year Ended
October 31,
2013 | |
| | | | |
Net asset value at beginning of period | | | $ 8.34 | | | | $ 8.13 | | | | $ 7.60 | | | | $ 8.88 | | | | $ 9.43 | | | | $ 10.20 | |
| | | | | | |
Income (loss) from investment operations: | | | | | | | | | | | | | | | | | | | | | | | | |
Net investment income | | | 0.19 | 1 | | | 0.55 | 1 | | | 0.61 | 1 | | | 0.53 | 1 | | | 0.46 | | | | 0.45 | |
Net realized and unrealized gain (loss) | | | (0.19 | ) | | | 0.19 | | | | 0.50 | | | | (1.28 | ) | | | (0.41 | ) | | | (0.60 | ) |
| | | | |
Total from investment operations | | | — | | | | 0.74 | | | | 1.11 | | | | (0.75 | ) | | | 0.05 | | | | (0.15 | ) |
| | | | | | |
Less distributions: | | | | | | | | | | | | | | | | | | | | | | | | |
| | | | | | |
From net investment income | | | (0.18 | ) | | | (0.53 | ) | | | (0.35 | ) | | | — | | | | (0.35 | ) | | | (0.46 | ) |
From net realized gain | | | (0.11 | ) | | | — | | | | — | | | | — | | | | (0.12 | ) | | | (0.16 | ) |
Tax return of capital | | | — | | | | — | | | | (0.23 | ) | | | (0.53 | ) | | | (0.13 | ) | | | — | |
| | | | |
| | | | | | |
Total distributions | | | (0.29 | ) | | | (0.53 | ) | | | (0.58 | ) | | | (0.53 | ) | | | (0.60 | ) | | | (0.62 | ) |
| | | | |
Net asset value at end of period | | | $ 8.05 | | | | $ 8.34 | | | | $ 8.13 | | | | $ 7.60 | | | | $ 8.88 | | | | $ 9.43 | |
| | | | |
| | | | | | |
Total return2 | | | 0.05 | % | | | 9.36 | % | | | 15.49 | % | | | (8.58 | )% | | | 0.51 | % | | | (1.48 | )% |
| | | | | | |
Portfolio turnover rate3 | | | 28 | % | | | 65 | % | | | 91 | % | | | 101 | % | | | 80 | % | | | 85 | % |
| | | | | | |
Net assets, end of period (in thousands) | | | $1,357,276 | | | | $1,110,901 | | | | $808,872 | | | | $533,742 | | | | $979,949 | | | | $662,412 | |
| | | | | | |
Ratios to average net assets:4 | | | | | | | | | | | | | | | | | | | | | | | | |
Total expenses to average net assets: | | | | | | | | | | | | | | | | | | | | | | | | |
Total expenses before reimbursements | | | 1.12 | % | | | 1.12 | % | | | 1.16 | % | | | 1.12 | % | | | 1.13 | % | | | 1.13 | % |
Total expenses after reimbursements | | | 1.02 | % | | | 1.02 | % | | | 1.02 | % | | | 1.02 | % | | | 1.02 | % | | | 1.02 | % |
| | | | | | |
Net investment income to average net assets: | | | | | | | | | | | | | | | | | | | | | | | | |
Net investment income before reimbursements | | | 4.45 | % | | | 6.60 | % | | | 7.77 | % | | | 6.40 | % | | | 5.04 | % | | | 4.81 | % |
Net investment income after reimbursements | | | 4.55 | % | | | 6.70 | % | | | 7.91 | % | | | 6.50 | % | | | 5.15 | % | | | 4.92 | % |
| 1 | Per share amounts are based on average number of shares outstanding during the period. |
| 2 | Assumes investment at net asset value at the beginning of the period, reinvestment of all distributions at net asset value on distribution date, and a complete redemption of the investment at net asset value at the end of the period excluding the impact of sales charges. Total return is not annualized for periods less than one year. |
| 3 | The portfolio turnover rate is calculated by dividing the lesser of cost of purchases or proceeds from sales of long term portfolio securities, including fully funded total return swaps, by the monthly average of the value of the long term portfolio securities. Portfolio turnover is not annualized for periods less than one year. |
| 4 | Annualized for periods less than one year. |
See accompanying notes to the financial statements.
24
ASHMORE FUNDS
FINANCIAL HIGHLIGHTS
| | | | | | | | | | | | | | | | | | | | | | | | |
Ashmore Emerging Markets Local Currency Bond Fund | |
| | | Class A | |
| | | Six Months
Ended
April 30, 2018
(Unaudited) | | | Year Ended
October 31,
2017 | | | Year Ended
October 31,
2016 | | | Year Ended
October 31,
2015 | | | Year Ended
October 31,
2014 | | | Year Ended
October 31,
2013 | |
| | | | |
Net asset value at beginning of period | | | $ 7.22 | | | | $ 7.06 | | | | $ 6.57 | | | | $ 8.44 | | | | $ 9.13 | | | | $ 9.83 | |
| | | | | | |
Income (loss) from investment operations: | | | | | | | | | | | | | | | | | | | | | | | | |
Net investment income | | | 0.19 | | | | 0.34 | 1 | | | 0.30 | 1 | | | 0.29 | | | | 0.37 | 1 | | | 0.44 | 1 |
Net realized and unrealized gain (loss) | | | 0.20 | | | | 0.14 | | | | 0.49 | | | | (1.88 | ) | | | (0.66 | ) | | | (0.74 | ) |
| | | | |
Total from investment operations | | | 0.39 | | | | 0.48 | | | | 0.79 | | | | (1.59 | ) | | | (0.29 | ) | | | (0.30 | ) |
| | | | | | |
Less distributions: | | | | | | | | | | | | | | | | | | | | | | | | |
| | | | | | |
From net investment income | | | (0.11 | ) | | | (0.09 | ) | | | — | | | | — | | | | — | | | | (0.22 | ) |
From net realized gain | | | — | | | | — | | | | — | | | | — | | | | — | | | | (0.01 | ) |
Tax return of capital | | | — | | | | (0.23 | ) | | | (0.30 | ) | | | (0.28 | ) | | | (0.40 | ) | | | (0.17 | ) |
| | | | |
| | | | | | |
Total distributions | | | (0.11 | ) | | | (0.32 | ) | | | (0.30 | ) | | | (0.28 | ) | | | (0.40 | ) | | | (0.40 | ) |
| | | | |
Net asset value at end of period | | | $ 7.50 | | | | $ 7.22 | | | | $ 7.06 | | | | $ 6.57 | | | | $ 8.44 | | | | $ 9.13 | |
| | | | |
| | | | | | |
Total return2 | | | 5.30 | % | | | 6.83 | % | | | 12.37 | % | | | (19.17 | )% | | | (3.25 | )% | | | (3.21 | )% |
| | | | | | |
Portfolio turnover rate3 | | | 23 | % | | | 68 | % | | | 83 | % | | | 83 | % | | | 112 | % | | | 112 | % |
| | | | | | |
Net assets, end of period (in thousands) | | | $1,402 | | | | $ 915 | | | | $ 841 | | | | $ 712 | | | | $ 897 | | | | $2,096 | |
| | | | | | |
Ratios to average net assets:4 | | | | | | | | | | | | | | | | | | | | | | | | |
Total expenses to average net assets: | | | | | | | | | | | | | | | | | | | | | | | | |
Total expenses before reimbursements | | | 1.54 | % | | | 1.51 | % | | | 1.55 | % | | | 1.51 | % | | | 1.55 | % | | | 1.47 | % |
Total expenses after reimbursements | | | 1.22 | % | | | 1.22 | % | | | 1.22 | % | | | 1.23 | % | | | 1.25 | % | | | 1.25 | % |
| | | | | | |
Net investment income to average net assets: | | | | | | | | | | | | | | | | | | | | | | | | |
Net investment income before reimbursements | | | 4.59 | % | | | 4.37 | % | | | 4.10 | % | | | 3.53 | % | | | 4.29 | % | | | 4.38 | % |
Net investment income after reimbursements | | | 4.91 | % | | | 4.66 | % | | | 4.43 | % | | | 3.81 | % | | | 4.59 | % | | | 4.60 | % |
See accompanying notes to the financial statements.
25
ASHMORE FUNDS
FINANCIAL HIGHLIGHTS
| | | | | | | | | | | | | | | | | | | | | | | | |
Ashmore Emerging Markets Local Currency Bond Fund | | | | | | | | | | | | | | | | |
| | | Class C | |
| | | Six Months Ended April 30, 2018 (Unaudited) | | | Year Ended
October 31,
2017 | | | Year Ended
October 31,
2016 | | | Year Ended
October 31,
2015 | | | Year Ended
October 31,
2014 | | | Year Ended
October 31,
2013 | |
| | | | |
Net asset value at beginning of period | | | $ 7.18 | | | | $ 7.05 | | | | $ 6.56 | | | | $ 8.42 | | | | $ 9.13 | | | | $ 9.83 | |
| | | | | | |
Income (loss) from investment operations: | | | | | | | | | | | | | | | | | | | | | | | | |
Net investment income | | | 0.11 | | | | 0.28 | 1 | | | 0.25 | 1 | | | 0.18 | | | | 0.29 | 1 | | | 0.38 | 1 |
Net realized and unrealized gain (loss) | | | 0.24 | | | | 0.15 | | | | 0.49 | | | | (1.82 | ) | | | (0.67 | ) | | | (0.75 | ) |
| | | | |
Total from investment operations | | | 0.35 | | | | 0.43 | | | | 0.74 | | | | (1.64 | ) | | | (0.38 | ) | | | (0.37 | ) |
| | | | | | |
Less distributions: | | | | | | | | | | | | | | | | | | | | | | | | |
| | | | | | |
From net investment income | | | (0.09 | ) | | | (0.09 | ) | | | — | | | | — | | | | — | | | | (0.18 | ) |
From net realized gain | | | — | | | | — | | | | — | | | | — | | | | — | | | | (0.01 | ) |
Tax return of capital | | | — | | | | (0.21 | ) | | | (0.25 | ) | | | (0.22 | ) | | | (0.33 | ) | | | (0.14 | ) |
| | | | |
| | | | | | |
Total distributions | | | (0.09 | ) | | | (0.30 | ) | | | (0.25 | ) | | | (0.22 | ) | | | (0.33 | ) | | | (0.33 | ) |
| | | | |
Net asset value at end of period | | | $ 7.44 | | | | $ 7.18 | | | | $ 7.05 | | | | $ 6.56 | | | | $ 8.42 | | | | $ 9.13 | |
| | | | |
| | | | | | |
Total return2 | | | 4.84 | % | | | 6.05 | % | | | 11.75 | % | | | (19.83 | )% | | | (4.18 | )% | | | (3.92 | )% |
| | | | | | |
Portfolio turnover rate3 | | | 23 | % | | | 68 | % | | | 83 | % | | | 83 | % | | | 112 | % | | | 112 | % |
| | | | | | |
Net assets, end of period (in thousands) | | | $ 130 | | | | $ 98 | | | | $ 70 | | | | $ 40 | | | | $ 147 | | | | $ 124 | |
| | | | | | |
Ratios to average net assets:4 | | | | | | | | | | | | | | | | | | | | | | | | |
Total expenses to average net assets: | | | | | | | | | | | | | | | | | | | | | | | | |
Total expenses before reimbursements | | | 2.29 | % | | | 2.26 | % | | | 2.30 | % | | | 2.26 | % | | | 2.31 | % | | | 2.22 | % |
Total expenses after reimbursements | | | 1.97 | % | | | 1.97 | % | | | 1.97 | % | | | 1.99 | % | | | 2.00 | % | | | 2.00 | % |
| | | | | | |
Net investment income to average net assets: | | | | | | | | | | | | | | | | | | | | | | | | |
Net investment income before reimbursements | | | 3.84 | % | | | 3.62 | % | | | 3.35 | % | | | 2.71 | % | | | 3.41 | % | | | 3.77 | % |
Net investment income after reimbursements | | | 4.16 | % | | | 3.91 | % | | | 3.68 | % | | | 2.98 | % | | | 3.72 | % | | | 3.99 | % |
See accompanying notes to the financial statements.
26
ASHMORE FUNDS
FINANCIAL HIGHLIGHTS
| | | | | | | | | | | | | | | | | | | | | | | | |
Ashmore Emerging Markets Local Currency Bond Fund | | | | | | | | | | | | | | | | |
| | | Institutional Class | |
| | | Six Months
Ended
April 30, 2018
(Unaudited) | | | Year Ended
October 31,
2017 | | | Year Ended
October 31,
2016 | | | Year Ended
October 31,
2015 | | | Year Ended
October 31,
2014 | | | Year Ended
October 31,
2013 | |
| | | | |
Net asset value at beginning of period | | | $ 7.50 | | | | $ 7.31 | | | | $ 6.80 | | | | $ 8.73 | | | | $ 9.45 | | | | $ 10.18 | |
| | | | | | |
Income (loss) from investment operations: | | | | | | | | | | | | | | | | | | | | | | | | |
Net investment income | | | 0.21 | | | | 0.37 | 1 | | | 0.33 | 1 | | | 0.31 | | | | 0.43 | 1 | | | 0.49 | 1 |
Net realized and unrealized gain (loss) | | | 0.19 | | | | 0.15 | | | | 0.51 | | | | (1.93 | ) | | | (0.71 | ) | | | (0.78 | ) |
| | | | |
Total from investment operations | | | 0.40 | | | | 0.52 | | | | 0.84 | | | | (1.62 | ) | | | (0.28 | ) | | | (0.29 | ) |
| | | | | | |
Less distributions: | | | | | | | | | | | | | | | | | | | | | | | | |
| | | | | | |
From net investment income | | | (0.11 | ) | | | (0.09 | ) | | | — | | | | — | | | | — | | | | (0.24 | ) |
From net realized gain | | | — | | | | — | | | | — | | | | �� | | | | — | | | | (0.01 | ) |
Tax return of capital | | | — | | | | (0.24 | ) | | | (0.33 | ) | | | (0.31 | ) | | | (0.44 | ) | | | (0.19 | ) |
| | | | |
| | | | | | |
Total distributions | | | (0.11 | ) | | | (0.33 | ) | | | (0.33 | ) | | | (0.31 | ) | | | (0.44 | ) | | | (0.44 | ) |
| | | | |
Net asset value at end of period | | | $ 7.79 | | | | $ 7.50 | | | | $ 7.31 | | | | $ 6.80 | | | | $ 8.73 | | | | $ 9.45 | |
| | | | |
| | | | | | |
Total return2 | | | 5.31 | % | | | 7.12 | % | | | 12.69 | % | | | (18.91 | )% | | | (3.04 | )% | | | (3.02 | )% |
| | | | | | |
Portfolio turnover rate3 | | | 23 | % | | | 68 | % | | | 83 | % | | | 83 | % | | | 112 | % | | | 112 | % |
| | | | | | |
Net assets, end of period (in thousands) | | | $74,559 | | | | $84,747 | | | | $80,803 | | | | $79,492 | | | | $101,363 | | | | $82,543 | |
| | | | | | |
Ratios to average net assets:4 | | | | | | | | | | | | | | | | | | | | | | | | |
Total expenses to average net assets: | | | | | | | | | | | | | | | | | | | | | | | | |
Total expenses before reimbursements | | | 1.28 | % | | | 1.26 | % | | | 1.30 | % | | | 1.26 | % | | | 1.32 | % | | | 1.22 | % |
Total expenses after reimbursements | | | 0.97 | % | | | 0.97 | % | | | 0.97 | % | | | 0.97 | % | | | 0.97 | % | | | 0.97 | % |
| | | | | | |
Net investment income to average net assets: | | | | | | | | | | | | | | | | | | | | | | | | |
Net investment income before reimbursements | | | 4.83 | % | | | 4.62 | % | | | 4.35 | % | | | 3.78 | % | | | 4.34 | % | | | 4.64 | % |
Net investment income after reimbursements | | | 5.14 | % | | | 4.91 | % | | | 4.68 | % | | | 4.07 | % | | | 4.69 | % | | | 4.89 | % |
| 1 | Per share amounts are based on average number of shares outstanding during the period. |
| 2 | Assumes investment at net asset value at the beginning of the period, reinvestment of all distributions at net asset value on distribution date, and a complete redemption of the investment at net asset value at the end of the period excluding the impact of sales charges. Total return is not annualized for periods less than one year. |
| 3 | The portfolio turnover rate is calculated by dividing the lesser of cost of purchases or proceeds from sales of long term portfolio securities, including fully funded total return swaps, by the monthly average of the value of the long term portfolio securities. Portfolio turnover is not annualized for periods less than one year. |
| 4 | Annualized for periods less than one year. |
See accompanying notes to the financial statements.
27
ASHMORE FUNDS
FINANCIAL HIGHLIGHTS
| | | | | | | | | | | | | | | | | | | | | | | | |
Ashmore Emerging Markets Corporate Debt Fund | | | | | | | | | | | | | | | | |
| | | Class A | |
| | | Six Months
Ended
April 30, 2018
(Unaudited) | | | Year Ended
October 31,
2017 | | | Year Ended
October 31,
2016 | | | Year Ended
October 31,
2015 | | | Year Ended
October 31,
2014 | | | Year Ended
October 31,
2013 | |
| | | | |
Net asset value at beginning of period | | | $ 8.56 | | | | $ 7.92 | | | | $ 7.66 | | | | $ 8.94 | | | | $ 9.25 | | | | $ 9.69 | |
| | | | | | |
Income (loss) from investment operations: | | | | | | | | | | | | | | | | | | | | | | | | |
Net investment income | | | 0.23 | | | | 0.57 | | | | 0.70 | | | | 0.74 | | | | 0.55 | 1 | | | 0.51 | 1 |
Net realized and unrealized gain (loss) | | | (0.35 | ) | | | 0.65 | | | | 0.21 | | | | (1.21 | ) | | | (0.31 | ) | | | (0.35 | ) |
| | | | |
Total from investment operations | | | (0.12 | ) | | | 1.22 | | | | 0.91 | | | | (0.47 | ) | | | 0.24 | | | | 0.16 | |
| | | | | | |
Less distributions: | | | | | | | | | | | | | | | | | | | | | | | | |
| | | | | | |
From net investment income | | | (0.23 | ) | | | (0.56 | ) | | | (0.65 | ) | | | (0.67 | ) | | | (0.55 | ) | | | (0.52 | ) |
From net realized gain | | | — | | | | — | | | | — | | | | (0.06 | ) | | | — | | | | (0.07 | ) |
Tax return of capital | | | — | | | | (0.02 | ) | | | — | | | | (0.08 | ) | | | — | | | | (0.01 | ) |
| | | | |
| | | | | | |
Total distributions | | | (0.23 | ) | | | (0.58 | ) | | | (0.65 | ) | | | (0.81 | ) | | | (0.55 | ) | | | (0.60 | ) |
| | | | |
Net asset value at end of period | | | $ 8.21 | | | | $ 8.56 | | | | $ 7.92 | | | | $ 7.66 | | | | $ 8.94 | | | | $ 9.25 | |
| | | | |
| | | | | | |
Total return2 | | | (1.32 | )% | | | 15.99 | % | | | 12.92 | % | | | (5.27 | )% | | | 2.53 | % | | | 1.63 | % |
| | | | | | |
Portfolio turnover rate3 | | | 53 | % | | | 87 | % | | | 81 | % | | | 90 | % | | | 82 | % | | | 49 | % |
| | | | | | |
Net assets, end of period (in thousands) | | | $9,924 | | | | $11,995 | | | | $11,466 | | | | $7,280 | | | | $1,704 | | | | $2,852 | |
| | | | | | |
Ratios to average net assets:4 | | | | | | | | | | | | | | | | | | | | | | | | |
Total expenses to average net assets: | | | | | | | | | | | | | | | | | | | | | | | | |
Total expenses before reimbursements | | | 1.52 | % | | | 1.52 | % | | | 1.57 | % | | | 1.55 | % | | | 1.53 | % | | | 1.71 | % |
Total expenses after reimbursements | | | 1.42 | % | | | 1.42 | % | | | 1.42 | % | | | 1.42 | % | | | 1.45 | % | | | 1.45 | % |
| | | | | | |
Net investment income to average net assets: | | | | | | | | | | | | | | | | | | | | | | | | |
Net investment income before reimbursements | | | 5.69 | % | | | 7.11 | % | | | 8.88 | % | | | 8.77 | % | | | 5.79 | % | | | 5.15 | % |
Net investment income after reimbursements | | | 5.79 | % | | | 7.21 | % | | | 9.03 | % | | | 8.90 | % | | | 5.87 | % | | | 5.41 | % |
See accompanying notes to the financial statements.
28
ASHMORE FUNDS
FINANCIAL HIGHLIGHTS
| | | | | | | | | | | | | | | | | | | | | | | | |
Ashmore Emerging Markets Corporate Debt Fund | | | | | | | | | | | | | | | | |
| | | Class C | |
| | | Six Months
Ended
April 30, 2018
(Unaudited) | | | Year Ended
October 31,
2017 | | | Year Ended
October 31,
2016 | | | Year Ended
October 31,
2015 | | | Year Ended
October 31,
2014 | | | Year Ended
October 31,
2013 | |
| | | | |
Net asset value at beginning of period | | | $ 8.55 | | | | $ 7.91 | | | | $ 7.66 | | | | $ 8.95 | | | | $ 9.25 | | | | $ 9.70 | |
| | | | | | |
Income (loss) from investment operations: | | | | | | | | | | | | | | | | | | | | | | | | |
Net investment income | | | 0.21 | | | | 0.52 | | | | 0.63 | | | | 0.64 | | | | 0.48 | 1 | | | 0.44 | 1 |
Net realized and unrealized gain (loss) | | | (0.36 | ) | | | 0.63 | | | | 0.22 | | | | (1.18 | ) | | | (0.30 | ) | | | (0.36 | ) |
| | | | |
Total from investment operations | | | (0.15 | ) | | | 1.15 | | | | 0.85 | | | | (0.54 | ) | | | 0.18 | | | | 0.08 | |
| | | | | | |
Less distributions: | | | | | | | | | | | | | | | | | | | | | | | | |
| | | | | | |
From net investment income | | | (0.20 | ) | | | (0.50 | ) | | | (0.60 | ) | | | (0.62 | ) | | | (0.48 | ) | | | (0.45 | ) |
From net realized gain | | | — | | | | — | | | | — | | | | (0.06 | ) | | | — | | | | (0.07 | ) |
Tax return of capital | | | — | | | | (0.01 | ) | | | — | | | | (0.07 | ) | | | — | | | | (0.01 | ) |
| | | | |
| | | | | | |
Total distributions | | | (0.20 | ) | | | (0.51 | ) | | | (0.60 | ) | | | (0.75 | ) | | | (0.48 | ) | | | (0.53 | ) |
| | | | |
Net asset value at end of period | | | $ 8.20 | | | | $ 8.55 | | | | $ 7.91 | | | | $ 7.66 | | | | $ 8.95 | | | | $ 9.25 | |
| | | | |
| | | | | | |
Total return2 | | | (1.68 | )% | | | 15.16 | % | | | 11.99 | % | | | (6.04 | )% | | | 1.87 | % | | | 0.80 | % |
| | | | | | |
Portfolio turnover rate3 | | | 53 | % | | | 87 | % | | | 81 | % | | | 90 | % | | | 82 | % | | | 49 | % |
| | | | | | |
Net assets, end of period (in thousands) | | | $9,327 | | | | $9,530 | | | | $6,010 | | | | $3,226 | | | | $ 421 | | | | $ 150 | |
| | | | | | |
Ratios to average net assets:4 | | | | | | | | | | | | | | | | | | | | | | | | |
Total expenses to average net assets: | | | | | | | | | | | | | | | | | | | | | | | | |
Total expenses before reimbursements | | | 2.27 | % | | | 2.27 | % | | | 2.32 | % | | | 2.30 | % | | | 2.28 | % | | | 2.46 | % |
Total expenses after reimbursements | | | 2.17 | % | | | 2.17 | % | | | 2.17 | % | | | 2.17 | % | | �� | 2.20 | % | | | 2.20 | % |
| | | | | | |
Net investment income to average net assets: | | | | | | | | | | | | | | | | | | | | | | | | |
Net investment income before reimbursements | | | 5.00 | % | | | 6.40 | % | | | 8.16 | % | | | 8.13 | % | | | 5.15 | % | | | 4.42 | % |
Net investment income after reimbursements | | | 5.10 | % | | | 6.50 | % | | | 8.31 | % | | | 8.26 | % | | | 5.23 | % | | | 4.68 | % |
See accompanying notes to the financial statements.
29
ASHMORE FUNDS
FINANCIAL HIGHLIGHTS
| | | | | | | | | | | | | | | | | | | | | | | | |
Ashmore Emerging Markets Corporate Debt Fund | | | | | | | | | | | | | | | | |
| | | Institutional Class | |
| | | Six Months
Ended
April 30, 2018
(Unaudited) | | | Year Ended
October 31,
2017 | | | Year Ended
October 31,
2016 | | | Year Ended
October 31,
2015 | | | Year Ended
October 31,
2014 | | | Year Ended
October 31,
2013 | |
| | | | |
Net asset value at beginning of period | | | $ 8.92 | | | | $ 8.24 | | | | $ 7.98 | | | | $ 9.30 | | | | $ 9.61 | | | | $ 10.07 | |
| | | | | | |
Income (loss) from investment operations: | | | | | | | | | | | | | | | | | | | | | | | | |
Net investment income | | | 0.26 | | | | 0.62 | | | | 0.72 | | | | 0.75 | | | | 0.59 | 1 | | | 0.55 | 1 |
Net realized and unrealized gain (loss) | | | (0.38 | ) | | | 0.68 | | | | 0.24 | | | | (1.22 | ) | | | (0.31 | ) | | | (0.36 | ) |
| | | | |
Total from investment operations | | | (0.12 | ) | | | 1.30 | | | | 0.96 | | | | (0.47 | ) | | | 0.28 | | | | 0.19 | |
| | | | | | |
Less distributions: | | | | | | | | | | | | | | | | | | | | | | | | |
| | | | | | |
From net investment income | | | (0.25 | ) | | | (0.60 | ) | | | (0.70 | ) | | | (0.71 | ) | | | (0.59 | ) | | | (0.57 | ) |
From net realized gain | | | — | | | | — | | | | — | | | | (0.06 | ) | | | — | | | | (0.07 | ) |
Tax return of capital | | | — | | | | (0.02 | ) | | | — | | | | (0.08 | ) | | | — | | | | (0.01 | ) |
| | | | |
| | | | | | |
Total distributions | | | (0.25 | ) | | | (0.62 | ) | | | (0.70 | ) | | | (0.85 | ) | | | (0.59 | ) | | | (0.65 | ) |
| | | | |
Net asset value at end of period | | | $ 8.55 | | | | $ 8.92 | | | | $ 8.24 | | | | $ 7.98 | | | | $ 9.30 | | | | $ 9.61 | |
| | | | |
| | | | | | |
Total return2 | | | (1.26 | )% | | | 16.45 | % | | | 13.02 | % | | | (5.08 | )% | | | 2.91 | % | | | 1.91 | % |
| | | | | | |
Portfolio turnover rate3 | | | 53 | % | | | 87 | % | | | 81 | % | | | 90 | % | | | 82 | % | | | 49 | % |
| | | | | | |
Net assets, end of period (in thousands) | | | $332,007 | | | | $338,434 | | | | $215,990 | | | | $237,044 | | | | $364,775 | | | | $183,567 | |
| | | | | | |
Ratios to average net assets:4 | | | | | | | | | | | | | | | | | | | | | | | | |
Total expenses to average net assets: | | | | | | | | | | | | | | | | | | | | | | | | |
Total expenses before reimbursements | | | 1.27 | % | | | 1.27 | % | | | 1.32 | % | | | 1.30 | % | | | 1.28 | % | | | 1.46 | % |
Total expenses after reimbursements | | | 1.17 | % | | | 1.17 | % | | | 1.17 | % | | | 1.17 | % | | | 1.17 | % | | | 1.17 | % |
| | | | | | |
Net investment income to average net assets: | | | | | | | | | | | | | | | | | | | | | | | | |
Net investment income before reimbursements | | | 6.00 | % | | | 7.34 | % | | | 9.20 | % | | | 8.63 | % | | | 6.14 | % | | | 5.37 | % |
Net investment income after reimbursements | | | 6.10 | % | | | 7.44 | % | | | 9.35 | % | | | 8.76 | % | | | 6.25 | % | | | 5.66 | % |
| 1 | Per share amounts are based on average number of shares outstanding during the period. |
| 2 | Assumes investment at net asset value at the beginning of the period, reinvestment of all distributions at net asset value on distribution date, and a complete redemption of the investment at net asset value at the end of the period excluding the impact of sales charges. Total return is not annualized for periods less than one year. |
| 3 | The portfolio turnover rate is calculated by dividing the lesser of cost of purchases or proceeds from sales of long term portfolio securities by the monthly average of the value of the long term portfolio securities. Portfolio turnover is not annualized for periods less than one year. |
| 4 | Annualized for periods less than one year. |
See accompanying notes to the financial statements.
30
ASHMORE FUNDS
FINANCIAL HIGHLIGHTS
Ashmore Emerging Markets Short Duration Fund
| | | | | | | | | | | | | | | | | | | | |
| | | Class A | |
| | | | | |
| | | Six Months | | | | | | | | | | | | | |
| | | Ended | | | | | | | | | | | | | |
| | | April 30, | | | Year Ended | | | Year Ended | | | Year Ended | | | Period Ended | |
| | | 2018 | | | October 31, | | | October 31, | | | October 31, | | | October 31, | |
| | | (Unaudited) | | | 2017 | | | 2016 | | | 2015 | | | 20141 | |
| | | | |
Net asset value at beginning of period | | | $ 10.60 | | | | $ 10.37 | | | | $ 9.57 | | | | $ 9.99 | | | | $ 10.00 | |
| | | | | |
Income (loss) from investment operations: | | | | | | | | | | | | | | | | | | | | |
Net investment income | | | 0.26 | | | | 0.83 | 2 | | | 1.02 | | | | 0.67 | | | | 0.05 | |
Net realized and unrealized gain (loss) | | | (0.29 | ) | | | 0.34 | | | | 0.78 | | | | (0.41 | ) | | | (0.01 | ) |
| | | | |
Total from investment operations | | | (0.03 | ) | | | 1.17 | | | | 1.80 | | | | 0.26 | | | | 0.04 | |
| | | | | |
Less distributions: | | | | | | | | | | | | | | | | | | | | |
| | | | | |
From net investment income | | | (0.28 | ) | | | (0.80 | ) | | | (1.00 | ) | | | (0.67 | ) | | | (0.05 | ) |
From net realized gain | | | (0.22 | ) | | | (0.14 | ) | | | — | | | | — | | | | — | |
Tax return of capital | | | — | | | | — | | | | — | | | | (0.01 | ) | | | — | |
| | | | |
| | | | | |
Total distributions | | | (0.50 | ) | | | (0.94 | ) | | | (1.00 | ) | | | (0.68 | ) | | | (0.05 | ) |
| | | | |
Net asset value at end of period | | | $ 10.07 | | | | $ 10.60 | | | | $ 10.37 | | | | $ 9.57 | | | | $ 9.99 | |
| | | | |
| | | | | |
Total return3 | | | (0.12 | )% | | | 12.04 | % | | | 19.82 | % | | | 2.98 | % | | | 0.45 | % |
| | | | | |
Portfolio turnover rate4 | | | 30 | % | | | 59 | % | | | 73 | % | | | 38 | % | | | 19 | % |
| | | | | |
Net assets, end of period (in thousands) | | | $17,676 | | | | $10,178 | | | | $10,395 | | | | $ 425 | | | | $ 201 | |
| | | | | |
Ratios to average net assets:5 | | | | | | | | | | | | | | | | | | | | |
Total expenses to average net assets: | | | | | | | | | | | | | | | | | | | | |
Total expenses before reimbursements | | | 1.03 | % | | | 1.05 | % | | | 1.11 | % | | | 1.65 | % | | | 2.93 | % |
Total expenses after reimbursements | | | 0.92 | % | | | 0.92 | % | | | 0.92 | % | | | 0.93 | % | | | 0.95 | % |
| | | | | |
Net investment income to average net assets: | | | | | | | | | | | | | | | | | | | | |
Net investment income before reimbursements | | | 5.96 | % | | | 7.83 | % | | | 10.63 | % | | | 6.50 | % | | | 3.35 | % |
Net investment income after reimbursements | | | 6.07 | % | | | 7.96 | % | | | 10.82 | % | | | 7.22 | % | | | 5.33 | % |
See accompanying notes to the financial statements.
31
ASHMORE FUNDS
FINANCIAL HIGHLIGHTS
Ashmore Emerging Markets Short Duration Fund
| | | | | | | | |
| | | Class C | |
| | |
| | | Six Months | | | | |
| | | Ended | | | | |
| | | April 30, | | | Period Ended | |
| | | 2018 | | | October 31, | |
| | | (Unaudited) | | | 20176 | |
| | | | |
Net asset value at beginning of period | | | $10.22 | | | | $10.00 | |
| | |
Income (loss) from investment operations: | | | | | | | | |
Net investment income | | | 0.25 | | | | 0.38 | 2 |
Net realized and unrealized gain (loss) | | | (0.32 | ) | | | 0.08 | |
| | | | |
Total from investment operations | | | (0.07 | ) | | | 0.46 | |
| | |
Less distributions: | | | | | | | | |
| | |
From net investment income | | | (0.23 | ) | | | (0.24 | ) |
From net realized gain | | | (0.22 | ) | | | — | |
Tax return of capital | | | — | | | | — | |
| | | | |
| | |
Total distributions | | | (0.45 | ) | | | (0.24 | ) |
| | | | |
Net asset value at end of period | | | $ 9.70 | | | | $10.22 | |
| | | | |
| | |
Total return3 | | | (0.48 | )% | | | 4.74 | % |
| | |
Portfolio turnover rate4 | | | 30 | % | | | 59 | % |
| | |
Net assets, end of period (in thousands) | | | $ 776 | | | | $ 188 | |
| | |
Ratios to average net assets:5 | | | | | | | | |
Total expenses to average net assets: | | | | | | | | |
Total expenses before reimbursements | | | 1.78 | % | | | 1.79 | % |
Total expenses after reimbursements | | | 1.67 | % | | | 1.67 | % |
| | |
Net investment income to average net assets: | | | | | | | | |
Net investment income before reimbursements | | | 5.31 | % | | | 9.66 | % |
Net investment income after reimbursements | | | 5.42 | % | | | 9.78 | % |
See accompanying notes to the financial statements.
32
ASHMORE FUNDS
FINANCIAL HIGHLIGHTS
Ashmore Emerging Markets Short Duration Fund
| | | | | | | | | | | | | | | | | | | | |
| | | Institutional Class | |
| | | | | |
| | | Six Months | | | | | | | | | | | | | |
| | | Ended | | | | | | | | | | | | | |
| | | April 30, | | | Year Ended | | | Year Ended | | | Year Ended | | | Period Ended | |
| | | 2018 | | | October 31, | | | October 31, | | | October 31, | | | October 31, | |
| | | (Unaudited) | | | 2017 | | | 2016 | | | 2015 | | | 20147 | |
| | | | |
Net asset value at beginning of period | | | $ 10.41 | | | | $ 10.19 | | | | $ 9.40 | | | | $ 9.81 | | | | $ 10.00 | |
| | | | | |
Income (loss) from investment operations: | | | | | | | | | | | | | | | | | | | | |
Net investment income | | | 0.29 | | | | 0.90 | 2 | | | 1.07 | | | | 0.68 | | | | 0.16 | |
Net realized and unrealized gain (loss) | | | (0.30 | ) | | | 0.27 | | | | 0.72 | | | | (0.39 | ) | | | (0.19 | ) |
| | | | |
Total from investment operations | | | (0.01 | ) | | | 1.17 | | | | 1.79 | | | | 0.29 | | | | (0.03 | ) |
| | | | | |
Less distributions: | | | | | | | | | | | | | | | | | | | | |
| | | | | |
From net investment income | | | (0.29 | ) | | | (0.81 | ) | | | (1.00 | ) | | | (0.69 | ) | | | (0.16 | ) |
From net realized gain | | | (0.22 | ) | | | (0.14 | ) | | | — | | | | — | | | | — | |
Tax return of capital | | | — | | | | — | | | | — | | | | (0.01 | ) | | | — | |
| | | | |
| | | | | |
Total distributions | | | (0.51 | ) | | | (0.95 | ) | | | (1.00 | ) | | | (0.70 | ) | | | (0.16 | ) |
| | | | |
Net asset value at end of period | | | $ 9.89 | | | | $ 10.41 | | | | $ 10.19 | | | | $ 9.40 | | | | $ 9.81 | |
| | | | |
| | | | | |
Total return3 | | | 0.05 | % | | | 12.28 | % | | | 20.18 | % | | | 3.28 | % | | | (0.25 | )% |
| | | | | |
Portfolio turnover rate4 | | | 30 | % | | | 59 | % | | | 73 | % | | | 38 | % | | | 19 | % |
| | | | | |
Net assets, end of period (in thousands) | | | $244,947 | | | | $178,180 | | | | $120,081 | | | | $26,918 | | | | $21,275 | |
| | | | | |
Ratios to average net assets:5 | | | | | | | | | | | | | | | | | | | | |
Total expenses to average net assets: | | | | | | | | | | | | | | | | | | | | |
Total expenses before reimbursements | | | 0.78 | % | | | 0.80 | % | | | 0.89 | % | | | 1.41 | % | | | 2.94 | % |
Total expenses after reimbursements | | | 0.67 | % | | | 0.67 | % | | | 0.67 | % | | | 0.67 | % | | | 0.67 | % |
| | | | | |
Net investment income to average net assets: | | | | | | | | | | | | | | | | | | | | |
Net investment income before reimbursements | | | 6.26 | % | | | 8.64 | % | | | 11.66 | % | | | 6.61 | % | | | 2.58 | % |
Net investment income after reimbursements | | | 6.37 | % | | | 8.77 | % | | | 11.88 | % | | | 7.35 | % | | | 4.85 | % |
| 1 | Class A commenced investment operations on September 23, 2014. |
| 2 | Per share amounts are based on average number of shares outstanding during the period. |
| 3 | Assumes investment at net asset value at the beginning of the period, reinvestment of all distributions at net asset value on distribution date, and a complete redemption of the investment at net asset value at the end of the period excluding the impact of sales charges. Total return is not annualized for periods less than one year. |
| 4 | The portfolio turnover rate is calculated by dividing the lesser of cost of purchases or proceeds from sales of long term portfolio securities by the monthly average of the value of the long term portfolio securities. Portfolio turnover is not annualized for periods less than one year. |
| 5 | Annualized for periods less than one year. |
| 6 | Class C commenced investment operations on June 13, 2017. |
| 7 | Institutional Class commenced investment operations on June 24, 2014. |
See accompanying notes to the financial statements.
33
ASHMORE FUNDS
FINANCIAL HIGHLIGHTS
Ashmore Emerging Markets Active Equity Fund
| | | | | | | | |
| | | Class A | |
| | |
| | | Six Months | | | | |
| | | Ended | | | | |
| | | April 30, | | | Period Ended | |
| | | 2018 | | | October 31, | |
| | | (Unaudited) | | | 20171 | |
| | | | |
Net asset value at beginning of period | | | $12.72 | | | | $10.00 | |
| | |
Income (loss) from investment operations: | | | | | | | | |
Net investment income (loss) | | | (0.02 | ) | | | 0.03 | |
Net realized and unrealized gain | | | 0.61 | | | | 2.74 | |
| | | | |
Total from investment operations | | | 0.59 | | | | 2.77 | |
| | |
Less distributions: | | | | | | | | |
| | |
From net investment income | | | (0.07 | ) | | | (0.05 | ) |
From net realized gain | | | (1.02 | ) | | | — | |
| | | | |
| | |
Total distributions | | | (1.09 | ) | | | (0.05 | ) |
| | | | |
Net asset value at end of period | | | $12.22 | | | | $12.72 | |
| | | | |
| | |
Total return2 | | | 4.95 | % | | | 27.73 | % |
| | |
Portfolio turnover rate3 | | | 76 | % | | | 196 | % |
| | |
Net assets, end of period (in thousands) | | | $ 13 | | | | $ 13 | |
| | |
Ratios to average net assets:4 | | | | | | | | |
Total expenses to average net assets: | | | | | | | | |
Total expenses before reimbursements | | | 1.86 | % | | | 3.11 | % |
Total expenses after reimbursements | | | 1.27 | % | | | 1.27 | % |
| | |
Net investment income (loss) to average net assets: | | | | | | | | |
Net investment loss before reimbursements | | | (0.91 | )% | | | (1.56 | )% |
Net investment income (loss) after reimbursements | | | (0.32 | )% | | | 0.28 | % |
See accompanying notes to the financial statements.
34
ASHMORE FUNDS
FINANCIAL HIGHLIGHTS
Ashmore Emerging Markets Active Equity Fund
| | | | | | | | |
| | | Class C | |
| | |
| | | Six Months | | | | |
| | | Ended | | | | |
| | | April 30, | | | Period Ended | |
| | | 2018 | | | October 31, | |
| | | (Unaudited) | | | 20171 | |
| | | | |
Net asset value at beginning of period | | | $12.65 | | | | $10.00 | |
| | |
Income (loss) from investment operations: | | | | | | | | |
Net investment loss | | | (0.06 | ) | | | (0.05 | ) |
Net realized and unrealized gain | | | 0.59 | | | | 2.74 | |
| | | | |
Total from investment operations | | | 0.53 | | | | 2.69 | |
| | |
Less distributions: | | | | | | | | |
| | |
From net investment income | | | (0.05 | ) | | | (0.04 | ) |
From net realized gain | | | (1.02 | ) | | | — | |
| | | | |
| | |
Total distributions | | | (1.07 | ) | | | (0.04 | ) |
| | | | |
Net asset value at end of period | | | $12.11 | | | | $12.65 | |
| | | | |
| | |
Total return2 | | | 4.54 | % | | | 26.96 | % |
| | |
Portfolio turnover rate3 | | | 76 | % | | | 196 | % |
| | |
Net assets, end of period (in thousands) | | | $ 13 | | | | $ 13 | |
| | |
Ratios to average net assets:4 | | | | | | | | |
Total expenses to average net assets: | | | | | | | | |
Total expenses before reimbursements | | | 2.61 | % | | | 3.86 | % |
Total expenses after reimbursements | | | 2.02 | % | | | 2.02 | % |
| | |
Net investment loss to average net assets: | | | | | | | | |
Net investment loss before reimbursements | | | (1.66 | )% | | | (2.31 | )% |
Net investment loss after reimbursements | | | (1.07 | )% | | | (0.47 | )% |
See accompanying notes to the financial statements.
35
ASHMORE FUNDS
FINANCIAL HIGHLIGHTS
Ashmore Emerging Markets Active Equity Fund
| | | | | | | | |
| | | Institutional Class | |
| | |
| | | Six Months | | | | |
| | | Ended | | | | |
| | | April 30, | | | Period Ended | |
| | | 2018 | | | October 31, | |
| | | (Unaudited) | | | 20171 | |
| | | | |
Net asset value at beginning of period | | | $ 12.74 | | | | $ 10.00 | |
| | |
Income from investment operations: | | | | | | | | |
Net investment income | | | — | 5 | | | 0.06 | |
Net realized and unrealized gain | | | 0.61 | | | | 2.73 | |
| | | | |
Total from investment operations | | | 0.61 | | | | 2.79 | |
| | |
Less distributions: | | | | | | | | |
| | |
From net investment income | | | (0.08 | ) | | | (0.05 | ) |
From net realized gain | | | (1.02 | ) | | | — | |
| | | | |
| | |
Total distributions | | | (1.10 | ) | | | (0.05 | ) |
| | | | |
Net asset value at end of period | | | $ 12.25 | | | | $ 12.74 | |
| | | | |
| | |
Total return2 | | | 5.08 | % | | | 27.94 | % |
| | |
Portfolio turnover rate3 | | | 76 | % | | | 196 | % |
| | |
Net assets, end of period (in thousands) | | | $18,740 | | | | $18,030 | |
| | |
Ratios to average net assets:4 | | | | | | | | |
Total expenses to average net assets: | | | | | | | | |
Total expenses before reimbursements | | | 1.61 | % | | | 2.87 | % |
Total expenses after reimbursements | | | 1.02 | % | | | 1.02 | % |
| | |
Net investment income (loss) to average net assets: | | | | | | | | |
Net investment loss before reimbursements | | | (0.66 | )% | | | (1.28 | )% |
Net investment income (loss) after reimbursements | | | (0.07 | )% | | | 0.57 | % |
| 1 | Class A, Class C and the Institutional Class commenced investment operations on November 1, 2016. |
| 2 | Assumes investment at net asset value at the beginning of the period, reinvestment of all distributions at net asset value on distribution date, and a complete redemption of the investment at net asset value at the end of the period excluding the impact of sales charges. Total return is not annualized for periods less than one year. |
| 3 | The portfolio turnover rate is calculated by dividing the lesser of cost of purchases or proceeds from sales of long term portfolio securities by the monthly average of the value of the long term portfolio securities. Portfolio turnover is not annualized for periods less than one year. |
| 4 | Annualized for periods less than one year. |
| 5 | Amount is less than $0.005 per share. |
See accompanying notes to the financial statements.
36
ASHMORE FUNDS
FINANCIAL HIGHLIGHTS
Ashmore Emerging Markets Small-Cap Equity Fund
| | | | | | | | | | | | | | | | | | | | | | | | |
| | | Class A | |
| | | Six Months | | | | | | | | | | | | | | | | |
| | | Ended | | | | | | | | | | | | | | | | |
| | | April 30, | | | Year Ended | | | Year Ended | | | Year Ended | | | Year Ended | | | Year Ended | |
| | | 2018 | | | October 31, | | | October 31, | | | October 31, | | | October 31, | | | October 31, | |
| | | (Unaudited) | | | 2017 | | | 2016 | | | 2015 | | | 2014 | | | 2013 | |
| | | | |
Net asset value at beginning of period | | | $10.33 | | | | $ 8.60 | | | | $ 7.92 | | | | $ 9.35 | | | | $10.61 | | | | $ 9.77 | |
| | | | | | |
Income (loss) from investment operations: | | | | | | | | | | | | | | | | | | | | | | | | |
Net investment income (loss) | | | (0.03 | )1 | | | 0.06 | | | | (0.01 | ) | | | 0.16 | | | | 0.01 | 1 | | | 0.08 | 1 |
Net realized and unrealized gain (loss) | | | 0.71 | | | | 1.86 | | | | 0.85 | | | | (1.12 | ) | | | (0.42 | ) | | | 1.31 | |
| | | | |
Total from investment operations | | | 0.68 | | | | 1.92 | | | | 0.84 | | | | (0.96 | ) | | | (0.41 | ) | | | 1.39 | |
| | | | | | |
Less distributions: | | | | | | | | | | | | | | | | | | | | | | | | |
| | | | | | |
From net investment income | | | (0.17 | ) | | | (0.19 | ) | | | (0.16 | ) | | | (0.08 | ) | | | (0.01 | ) | | | (0.03 | ) |
From net realized gain | | | — | | | | — | | | | — | | | | (0.39 | ) | | | (0.84 | ) | | | (0.52 | ) |
| | | | |
| | | | | | |
Total distributions | | | (0.17 | ) | | | (0.19 | ) | | | (0.16 | ) | | | (0.47 | ) | | | (0.85 | ) | | | (0.55 | ) |
| | | | |
Net asset value at end of period | | | $10.84 | | | | $10.33 | | | | $ 8.60 | | | | $ 7.92 | | | | $ 9.35 | | | | $10.61 | |
| | | | |
| | | | | | |
Total return2 | | | 6.74 | % | | | 22.73 | % | | | 10.84 | % | | | (10.32 | )% | | | (3.93 | )% | | | 14.65 | % |
| | | | | | |
Portfolio turnover rate3 | | | 58 | % | | | 126 | % | | | 104 | % | | | 105 | % | | | 104 | % | | | 113 | % |
| | | | | | |
Net assets, end of period (in thousands) | | | $1,184 | | | | $ 847 | | | | $ 524 | | | | $ 259 | | | | $ 332 | | | | $ 265 | |
| | | | | | |
Ratios to average net assets:4 | | | | | | | | | | | | | | | | | | | | | | | | |
Total expenses to average net assets: | | | | | | | | | | | | | | | | | | | | | | | | |
Total expenses before reimbursements | | | 2.20 | % | | | 2.26 | % | | | 2.39 | % | | | 2.33 | % | | | 2.53 | % | | | 2.35 | % |
Total expenses after reimbursements | | | 1.77 | % | | | 1.77 | % | | | 1.77 | % | | | 1.78 | % | | | 1.80 | % | | | 1.80 | % |
| | | | | | |
Net investment income (loss) to average net assets: | | | | | | | | | | | | | | | | | | | | | | | | |
Net investment income (loss) before reimbursements | | | (1.00 | )% | | | 0.01 | % | | | (0.09 | )% | | | 0.96 | % | | | (0.65 | )% | | | 0.25 | % |
Net investment income (loss) after reimbursements | | | (0.57 | )% | | | 0.50 | % | | | 0.53 | % | | | 1.51 | % | | | 0.08 | % | | | 0.80 | % |
See accompanying notes to the financial statements.
37
ASHMORE FUNDS
FINANCIAL HIGHLIGHTS
Ashmore Emerging Markets Small-Cap Equity Fund
| | | | | | | | | | | | | | | | | | | | | | | | |
| | | Class C | |
| | | Six Months | | | | | | | | | | | | | | | | |
| | | Ended | | | | | | | | | | | | | | | | |
| | | April 30, | | | Year Ended | | | Year Ended | | | Year Ended | | | Year Ended | | | Year Ended | |
| | | 2018 | | | October 31, | | | October 31, | | | October 31, | | | October 31, | | | October 31, | |
| | | (Unaudited) | | | 2017 | | | 2016 | | | 2015 | | | 2014 | | | 2013 | |
| | | | |
Net asset value at beginning of period | | | $10.90 | | | | $ 9.11 | | | | $ 8.40 | | | | $ 9.96 | | | | $11.33 | | | | $10.48 | |
| | | | | | |
Income (loss) from investment operations: | | | | | | | | | | | | | | | | | | | | | | | | |
Net investment income (loss) | | | (0.08 | )1 | | | 0.02 | | | | (0.12 | ) | | | 0.10 | | | | (0.05 | )1 | | | (0.06 | )1 |
Net realized and unrealized gain (loss) | | | 0.76 | | | | 1.93 | | | | 0.95 | | | | (1.19 | ) | | | (0.47 | ) | | | 1.46 | |
| | | | |
Total from investment operations | | | 0.68 | | | | 1.95 | | | | 0.83 | | | | (1.09 | ) | | | (0.52 | ) | | | 1.40 | |
| | | | | | |
Less distributions: | | | | | | | | | | | | | | | | | | | | | | | | |
| | | | | | |
From net investment income | | | (0.15 | ) | | | (0.16 | ) | | | (0.12 | ) | | | (0.08 | ) | | | (0.01 | ) | | | (0.03 | ) |
From net realized gain | | | — | | | | — | | | | — | | | | (0.39 | ) | | | (0.84 | ) | | | (0.52 | ) |
| | | | |
| | | | | | |
Total distributions | | | (0.15 | ) | | | (0.16 | ) | | | (0.12 | ) | | | (0.47 | ) | | | (0.85 | ) | | | (0.55 | ) |
| | | | |
Net asset value at end of period | | | $11.43 | | | | $10.90 | | | | $ 9.11 | | | | $ 8.40 | | | | $ 9.96 | | | | $11.33 | |
| | | | |
| | | | | | |
Total return2 | | | 6.36 | % | | | 21.78 | % | | | 10.01 | % | | | (11.02 | )% | | | (4.71 | )% | | | 13.93 | % |
| | | | | | |
Portfolio turnover rate3 | | | 58 | % | | | 126 | % | | | 104 | % | | | 105 | % | | | 104 | % | | | 113 | % |
| | | | | | |
Net assets, end of period (in thousands) | | | $ 292 | | | | $ 251 | | | | $ 176 | | | | $ 311 | | | | $ 77 | | | | $ 12 | |
| | | | | | |
Ratios to average net assets:4 | | | | | | | | | | | | | | | | | | | | | | | | |
Total expenses to average net assets: | | | | | | | | | | | | | | | | | | | | | | | | |
Total expenses before reimbursements | | | 2.94 | % | | | 3.01 | % | | | 3.13 | % | | | 3.09 | % | | | 3.60 | % | | | 3.10 | % |
Total expenses after reimbursements | | | 2.52 | % | | | 2.52 | % | | | 2.52 | % | | | 2.52 | % | | | 2.55 | % | | | 2.55 | % |
| | | | | | |
Net investment income (loss) to average net assets: | | | | | | | | | | | | | | | | | | | | | | | | |
Net investment income (loss) before reimbursements | | | (1.77 | )% | | | (0.76 | )% | | | (0.89 | )% | | | 1.81 | % | | | (1.53 | )% | | | (1.13 | )% |
Net investment income (loss) after reimbursements | | | (1.35 | )% | | | (0.27 | )% | | | (0.28 | )% | | | 2.38 | % | | | (0.48 | )% | | | (0.58 | )% |
See accompanying notes to the financial statements.
38
ASHMORE FUNDS
FINANCIAL HIGHLIGHTS
Ashmore Emerging Markets Small-Cap Equity Fund
| | | | | | | | | | | | | | | | | | | | | | | | |
| | | Institutional Class | |
| | | Six Months | | | | | | | | | | | | | | | | |
| | | Ended | | | | | | | | | | | | | | | | |
| | | April 30, | | | Year Ended | | | Year Ended | | | Year Ended | | | Year Ended | | | Year Ended | |
| | | 2018 | | | October 31, | | | October 31, | | | October 31, | | | October 31, | | | October 31, | |
| | | (Unaudited) | | | 2017 | | | 2016 | | | 2015 | | | 2014 | | | 2013 | |
| | | | |
Net asset value at beginning of period | | | $ 13.19 | | | | $ 10.94 | | | | $ 10.01 | | | | $ 11.63 | | | | $ 12.96 | | | | $ 11.79 | |
| | | | | | |
Income (loss) from investment operations: | | | | | | | | | | | | | | | | | | | | | | | | |
Net investment income (loss) | | | (0.03 | )1 | | | 0.09 | | | | 0.04 | | | | 0.20 | | | | 0.02 | 1 | | | 0.02 | 1 |
Net realized and unrealized gain (loss) | | | 0.93 | | | | 2.36 | | | | 1.07 | | | | (1.35 | ) | | | (0.50 | ) | | | 1.70 | |
| | | | |
Total from investment operations | | | 0.90 | | | | 2.45 | | | | 1.11 | | | | (1.15 | ) | | | (0.48 | ) | | | 1.72 | |
| | | | | | |
Less distributions: | | | | | | | | | | | | | | | | | | | | | | | | |
| | | | | | |
From net investment income | | | (0.18 | ) | | | (0.20 | ) | | | (0.18 | ) | | | (0.08 | ) | | | (0.01 | ) | | | (0.03 | ) |
From net realized gain | | | — | | | | — | | | | — | | | | (0.39 | ) | | | (0.84 | ) | | | (0.52 | ) |
| | | | |
| | | | | | |
Total distributions | | | (0.18 | ) | | | (0.20 | ) | | | (0.18 | ) | | | (0.47 | ) | | | (0.85 | ) | | | (0.55 | ) |
| | | | |
Net asset value at end of period | | | $ 13.91 | | | | $ 13.19 | | | | $ 10.94 | | | | $ 10.01 | | | | $ 11.63 | | | | $ 12.96 | |
| | | | |
| | | | | | |
Total return2 | | | 6.92 | % | | | 22.70 | % | | | 11.21 | % | | | (9.91 | )% | | | (3.74 | )% | | | 15.04 | % |
| | | | | | |
Portfolio turnover rate3 | | | 58 | % | | | 126 | % | | | 104 | % | | | 105 | % | | | 104 | % | | | 113 | % |
| | | | | | |
Net assets, end of period (in thousands) | | | $41,971 | | | | $38,419 | | | | $33,626 | | | | $42,486 | | | | $48,909 | | | | $30,370 | |
| | | | | | |
Ratios to average net assets:4 | | | | | | | | | | | | | | | | | | | | | | | | |
Total expenses to average net assets: | | | | | | | | | | | | | | | | | | | | | | | | |
Total expenses before reimbursements | | | 1.94 | % | | | 2.01 | % | | | 2.10 | % | | | 2.08 | % | | | 2.39 | % | | | 2.11 | % |
Total expenses after reimbursements | | | 1.52 | % | | | 1.52 | % | | | 1.52 | % | | | 1.52 | % | | | 1.52 | % | | | 1.52 | % |
| | | | | | |
Net investment income (loss) to average net assets: | | | | | | | | | | | | | | | | | | | | | | | | |
Net investment income (loss) before reimbursements | | | (0.79 | )% | | | 0.18 | % | | | (0.22 | )% | | | 1.24 | % | | | (0.70 | )% | | | (0.42 | )% |
Net investment income (loss) after reimbursements | | | (0.37 | )% | | | 0.67 | % | | | 0.36 | % | | | 1.80 | % | | | 0.17 | % | | | 0.17 | % |
| 1 | Per share amounts are based on average number of shares outstanding during the period. |
| 2 | Assumes investment at net asset value at the beginning of the period, reinvestment of all distributions at net asset value on distribution date, and a complete redemption of the investment at net asset value at the end of the period excluding the impact of sales charges. Total return is not annualized for periods less than one year. |
| 3 | The portfolio turnover rate is calculated by dividing the lesser of cost of purchases or proceeds from sales of long term portfolio securities by the monthly average of the value of the long term portfolio securities. Portfolio turnover is not annualized for periods less than one year. |
| 4 | Annualized for periods less than one year. |
See accompanying notes to the financial statements.
39
ASHMORE FUNDS
FINANCIAL HIGHLIGHTS
Ashmore Emerging Markets Frontier Equity Fund
| | | | | | | | | | | | | | | | | | | | |
| | | Class A | |
| | | | | |
| | | Six Months | | | | | | | | | | | | | |
| | | Ended | | | | | | | | | | | | | |
| | | April 30, | | | Year Ended | | | Year Ended | | | Year Ended | | | Period Ended | |
| | | 2018 | | | October 31, | | | October 31, | | | October 31, | | | October 31, | |
| | | (Unaudited) | | | 2017 | | | 2016 | | | 2015 | | | 20141 | |
| | | | |
Net asset value at beginning of period | | | $ 9.99 | | | | $ 7.98 | | | | $ 7.83 | | | | $ 10.19 | | | | $10.00 | |
| | | | | |
Income (loss) from investment operations: | | | | | | | | | | | | | | | | | | | | |
Net investment income (loss) | | | 0.05 | | | | 0.10 | | | | 0.36 | | | | 0.10 | 2 | | | (0.03 | ) |
Net realized and unrealized gain (loss) | | | 0.57 | | | | 2.08 | | | | (0.09 | ) | | | (1.45 | ) | | | 0.27 | |
| | | | |
Total from investment operations | | | 0.62 | | | | 2.18 | | | | 0.27 | | | | (1.35 | ) | | | 0.24 | |
| | | | | |
Less distributions: | | | | | | | | | | | | | | | | | | | | |
| | | | | |
From net investment income | | | — | | | | (0.17 | ) | | | (0.12 | ) | | | (0.15 | ) | | | (0.05 | ) |
From net realized gain | | | (0.82 | ) | | | — | | | | — | | | | (0.86 | ) | | | — | |
| | | | |
| | | | | |
Total distributions | | | (0.82 | ) | | | (0.17 | ) | | | (0.12 | ) | | | (1.01 | ) | | | (0.05 | ) |
| | | | |
Net asset value at end of period | | | $ 9.79 | | | | $ 9.99 | | | | $ 7.98 | | | | $ 7.83 | | | | $10.19 | |
| | | | |
| | | | | |
Total return3 | | | 6.62 | % | | | 27.53 | % | | | 3.36 | % | | | (13.68 | )% | | | 2.43 | % |
| | | | | |
Portfolio turnover rate4 | | | 46 | % | | | 107 | % | | | 76 | % | | | 91 | % | | | 157 | % |
| | | | | |
Net assets, end of period (in thousands) | | | $8,973 | | | | $7,710 | | | | $2,154 | | | | $ 45 | | | | $ 9 | |
| | | | | |
Ratios to average net assets:5 | | | | | | | | | | | | | | | | | | | | |
Total expenses to average net assets: | | | | | | | | | | | | | | | | | | | | |
Total expenses before reimbursements | | | 2.13 | % | | | 2.21 | % | | | 2.45 | % | | | 2.73 | % | | | 6.90 | % |
Total expenses after reimbursements | | | 1.77 | % | | | 1.77 | % | | | 1.77 | % | | | 1.79 | % | | | 1.80 | % |
| | | | | |
Net investment income (loss) to average net assets: | | | | | | | | | | | | | | | | | | | | |
Net investment income (loss) before reimbursements | | | 0.81 | % | | | 1.05 | % | | | 4.34 | % | | | 0.25 | % | | | (5.89 | )% |
Net investment income (loss) after reimbursements | | | 1.17 | % | | | 1.49 | % | | | 5.02 | % | | | 1.19 | % | | | (0.79 | )% |
See accompanying notes to the financial statements.
40
ASHMORE FUNDS
FINANCIAL HIGHLIGHTS
Ashmore Emerging Markets Frontier Equity Fund
| | | | | | | | | | | | | | | | | | | | |
| | | Class C | |
| | | | | |
| | | Six Months | | | | | | | | | | | | | |
| | | Ended | | | | | | | | | | | | | |
| | | April 30, | | | Year Ended | | | Year Ended | | | Year Ended | | | Period Ended | |
| | | 2018 | | | October 31, | | | October 31, | | | October 31, | | | October 31, | |
| | | (Unaudited) | | | 2017 | | | 2016 | | | 2015 | | | 20141 | |
| | | | |
Net asset value at beginning of period | | | $ 9.82 | | | | $ 7.86 | | | | $ 7.73 | | | | $ 10.15 | | | | $10.00 | |
| | | | | |
Income (loss) from investment operations: | | | | | | | | | | | | | | | | | | | | |
Net investment income (loss) | | | 0.03 | | | | 0.08 | | | | 0.08 | | | | (0.05 | )2 | | | (0.83 | ) |
Net realized and unrealized gain (loss) | | | 0.54 | | | | 2.00 | | | | 0.12 | | | | (1.36 | ) | | | 1.03 | |
| | | | |
Total from investment operations | | | 0.57 | | | | 2.08 | | | | 0.20 | | | | (1.41 | ) | | | 0.20 | |
| | | | | |
Less distributions: | | | | | | | | | | | | | | | | | | | | |
| | | | | |
From net investment income | | | — | | | | (0.12 | ) | | | (0.07 | ) | | | (0.15 | ) | | | (0.05 | ) |
From net realized gain | | | (0.82 | ) | | | — | | | | — | | | | (0.86 | ) | | | — | |
| | | | |
| | | | | |
Total distributions | | | (0.82 | ) | | | (0.12 | ) | | | (0.07 | ) | | | (1.01 | ) | | | (0.05 | ) |
| | | | |
Net asset value at end of period | | | $ 9.57 | | | | $ 9.82 | | | | $ 7.86 | | | | $ 7.73 | | | | $10.15 | |
| | | | |
| | | | | |
Total return3 | | | 6.20 | % | | | 26.57 | % | | | 2.61 | % | | | (14.51 | )% | | | 2.02 | % |
| | | | | |
Portfolio turnover rate4 | | | 46 | % | | | 107 | % | | | 76 | % | | | 91 | % | | | 157 | % |
| | | | | |
Net assets, end of period (in thousands) | | | $ 563 | | | | $ 459 | | | | $ 62 | | | | $ 53 | | | | $ 1 | |
| | | | | |
Ratios to average net assets:5 | | | | | | | | | | | | | | | | | | | | |
Total expenses to average net assets: | | | | | | | | | | | | | | | | | | | | |
Total expenses before reimbursements | | | 2.88 | % | | | 2.99 | % | | | 3.05 | % | | | 3.45 | % | | | 7.71 | % |
Total expenses after reimbursements | | | 2.52 | % | | | 2.52 | % | | | 2.52 | % | | | 2.52 | % | | | 2.55 | % |
| | | | | |
Net investment income (loss) to average net assets: | | | | | | | | | | | | | | | | | | | | |
Net investment income (loss) before reimbursements | | | 0.07 | % | | | (0.21 | )% | | | 0.39 | % | | | (1.53 | )% | | | (6.42 | )% |
Net investment income (loss) after reimbursements | | | 0.43 | % | | | 0.26 | % | | | 0.92 | % | | | (0.60 | )% | | | (1.26 | )% |
See accompanying notes to the financial statements.
41
ASHMORE FUNDS
FINANCIAL HIGHLIGHTS
Ashmore Emerging Markets Frontier Equity Fund
| | | | | | | | | | | | | | | | | | | | |
| | | Institutional Class | |
| | | | | |
| | | Six Months | | | | | | | | | | | | | |
| | | Ended | | | | | | | | | | | | | |
| | | April 30, | | | Year Ended | | | Year Ended | | | Year Ended | | | Period Ended | |
| | | 2018 | | | October 31, | | | October 31, | | | October 31, | | | October 31, | |
| | | (Unaudited) | | | 2017 | | | 2016 | | | 2015 | | | 20146 | |
| | | | |
Net asset value at beginning of period | | | $ 11.38 | | | | $ 9.06 | | | | $ 8.88 | | | | $ 11.35 | | | | $10.00 | |
| | | | | |
Income (loss) from investment operations: | | | | | | | | | | | | | | | | | | | | |
Net investment income | | | 0.08 | | | | 0.13 | | | | 0.18 | | | | 0.12 | 2 | | | 0.14 | |
Net realized and unrealized gain (loss) | | | 0.63 | | | | 2.37 | | | | 0.13 | | | | (1.58 | ) | | | 1.32 | |
| | | | |
Total from investment operations | | | 0.71 | | | | 2.50 | | | | 0.31 | | | | (1.46 | ) | | | 1.46 | |
| | | | | |
Less distributions: | | | | | | | | | | | | | | | | | | | | |
| | | | | |
From net investment income | | | — | | | | (0.18 | ) | | | (0.13 | ) | | | (0.15 | ) | | | (0.11 | ) |
From net realized gain | | | (0.82 | ) | | | — | | | | — | | | | (0.86 | ) | | | — | |
| | | | |
| | | | | |
Total distributions | | | (0.82 | ) | | | (0.18 | ) | | | (0.13 | ) | | | (1.01 | ) | | | (0.11 | ) |
| | | | |
Net asset value at end of period | | | $ 11.27 | | | | $ 11.38 | | | | $ 9.06 | | | | $ 8.88 | | | | $11.35 | |
| | | | |
| | | | | |
Total return3 | | | 6.60 | % | | | 27.87 | % | | | 3.58 | % | | | (13.29 | )% | | | 14.69 | % |
| | | | | |
Portfolio turnover rate4 | | | 46 | % | | | 107 | % | | | 76 | % | | | 91 | % | | | 157 | % |
| | | | | |
Net assets, end of period (in thousands) | | | $92,769 | | | | $81,324 | | | | $52,711 | | | | $49,952 | | | | $7,280 | |
| | | | | |
Ratios to average net assets:5 | | | | | | | | | | | | | | | | | | | | |
Total expenses to average net assets: | | | | | | | | | | | | | | | | | | | | |
Total expenses before reimbursements | | | 1.88 | % | | | 1.96 | % | | | 2.05 | % | | | 2.46 | % | | | 6.09 | % |
Total expenses after reimbursements | | | 1.52 | % | | | 1.52 | % | | | 1.52 | % | | | 1.52 | % | | | 1.52 | % |
| | | | | |
Net investment income (loss) to average net assets: | | | | | | | | | | | | | | | | | | | | |
Net investment income (loss) before reimbursements | | | 1.15 | % | | | 0.73 | % | | | 1.48 | % | | | 0.34 | % | | | (3.68 | )% |
Net investment income after reimbursements | | | 1.51 | % | | | 1.17 | % | | | 2.01 | % | | | 1.28 | % | | | 0.89 | % |
| 1 | Class A and Class C commenced investment operations on May 7, 2014. |
| 2 | Per share amounts are based on average number of shares outstanding during the period. |
| 3 | Assumes investment at net asset value at the beginning of the period, reinvestment of all distributions at net asset value on distribution date, and a complete redemption of the investment at net asset value at the end of the period excluding the impact of sales charges. Total return is not annualized for periods less than one year. |
| 4 | The portfolio turnover rate is calculated by dividing the lesser of cost of purchases or proceeds from sales of long term portfolio securities by the monthly average of the value of the long term portfolio securities. Portfolio turnover is not annualized for periods less than one year. |
| 5 | Annualized for periods less than one year. |
| 6 | Institutional Class commenced investment operations on November 5, 2013. |
See accompanying notes to the financial statements.
42
ASHMORE FUNDS
FINANCIAL HIGHLIGHTS
Ashmore Emerging Markets Equity Fund
| | | | | | | | | | | | | | | | | | | | | | | | |
| | | Class A | |
| | | | | | |
| | | Six Months | | | | | | | | | | | | | | | | |
| | | Ended | | | | | | | | | | | | | | | | |
| | | April 30, | | | Year Ended | | | Year Ended | | | Year Ended | | | Year Ended | | | Year Ended | |
| | | 2018 | | | October 31, | | | October 31, | | | October 31, | | | October 31, | | | October 31, | |
| | | (Unaudited) | | | 2017 | | | 2016 | | | 2015 | | | 2014 | | | 2013 | |
| | | | |
Net asset value at beginning of period | | | $11.16 | | | | $ 8.34 | | | | $ 7.29 | | | | $ 9.24 | | | | $ 9.66 | | | | $ 9.01 | |
| | | | | | |
Income (loss) from investment operations: | | | | | | | | | | | | | | | | | | | | | | | | |
Net investment income (loss) | | | (0.01 | ) | | | 0.06 | 1 | | | 0.06 | | | | 0.03 | | | | 0.06 | | | | 0.08 | 1 |
Net realized and unrealized gain (loss) | | | 0.51 | | | | 2.90 | | | | 1.05 | | | | (1.92 | ) | | | (0.40 | ) | | | 0.64 | |
| | | | |
Total from investment operations | | | 0.50 | | | | 2.96 | | | | 1.11 | | | | (1.89 | ) | | | (0.34 | ) | | | 0.72 | |
| | | | | | |
Less distributions: | | | | | | | | | | | | | | | | | | | | | | | | |
| | | | | | |
From net investment income | | | (0.16 | ) | | | (0.14 | ) | | | (0.06 | ) | | | (0.06 | ) | | | (0.08 | ) | | | (0.06 | ) |
From net realized gain | | | — | | | | — | | | | — | | | | — | | | | — | | | | — | |
Tax return of capital | | | — | | | | — | | | | — | | | | — | 2 | | | — | | | | (0.01 | ) |
| | | | |
| | | | | | |
Total distributions | | | (0.16 | ) | | | (0.14 | ) | | | (0.06 | ) | | | (0.06 | ) | | | (0.08 | ) | | | (0.07 | ) |
| | | | |
Net asset value at end of period | | | $11.50 | | | | $11.16 | | | | $ 8.34 | | | | $ 7.29 | | | | $ 9.24 | | | | $ 9.66 | |
| | | | |
| | | | | | |
Total return3 | | | 4.54 | % | | | 35.90 | % | | | 15.36 | % | | | (20.52 | )% | | | (3.58 | )% | | | 8.11 | % |
| | | | | | |
Portfolio turnover rate4 | | | 67 | % | | | 140 | % | | | 119 | % | | | 106 | % | | | 130 | % | | | 92 | % |
| | | | | | |
Net assets, end of period (in thousands) | | | $ 139 | | | | $ 134 | | | | $ 36 | | | | $ 24 | | | | $ 30 | | | | $ 28 | |
| | | | | | |
Ratios to average net assets:5 | | | | | | | | | | | | | | | | | | | | | | | | |
Total expenses to average net assets: | | | | | | | | | | | | | | | | | | | | | | | | |
Total expenses before reimbursements | | | 2.12 | % | | | 2.65 | % | | | 2.96 | % | | | 3.56 | % | | | 3.62 | % | | | 3.01 | % |
Total expenses after reimbursements | | | 1.42 | % | | | 1.42 | % | | | 1.42 | % | | | 1.43 | % | | | 1.45 | % | | | 1.45 | % |
| | | | | | |
Net investment income (loss) to average net assets: | | | | | | | | | | | | | | | | | | | | | | | | |
Net investment loss before reimbursements | | | (0.79 | )% | | | (0.64 | )% | | | (0.74 | )% | | | (1.82 | )% | | | (1.45 | )% | | | (0.70 | )% |
Net investment income (loss) after reimbursements | | | (0.09 | )% | | | 0.59 | % | | | 0.80 | % | | | 0.31 | % | | | 0.72 | % | | | 0.86 | % |
See accompanying notes to the financial statements.
43
ASHMORE FUNDS
FINANCIAL HIGHLIGHTS
Ashmore Emerging Markets Equity Fund
| | | | | | | | | | | | | | | | | | | | | | | | |
| | | Class C | |
| | | | | | |
| | | Six Months | | | | | | | | | | | | | | | | |
| | | Ended | | | | | | | | | | | | | | | | |
| | | April 30, | | | Period Ended | | | Period Ended | | | Year Ended | | | Year Ended | | | Year Ended | |
| | | 2018 | | | October 31, | | | August 9, | | | October 31, | | | October 31, | | | October 31, | |
| | | (Unaudited) | | | 2017 | | | 2016 | | | 2015 | | | 2014 | | | 2013 | |
| | | | |
Net asset value at beginning of period | | | $10.73 | | | | $ 8.86 | 6 | | | $ 8.17 | | | | $ 10.46 | | | | $11.00 | | | | $10.32 | |
| | | | | | |
Income (loss) from investment operations: | | | | | | | | | | | | | | | | | | | | | | | | |
Net investment income (loss) | | | (0.15 | ) | | | — | 1,2 | | | 0.01 | | | | (0.04 | ) | | | (0.01 | ) | | | (0.03 | )1 |
Net realized and unrealized gain (loss) | | | 0.60 | | | | 1.93 | | | | 0.81 | | | | (2.19 | ) | | | (0.45 | ) | | | 0.78 | |
| | | | |
Total from investment operations | | | 0.45 | | | | 1.93 | | | | 0.82 | | | | (2.23 | ) | | | (0.46 | ) | | | 0.75 | |
| | | | | | |
Less distributions: | | | | | | | | | | | | | | | | | | | | | | | | |
| | | | | | |
From net investment income | | | (0.14 | ) | | | (0.06 | ) | | | (0.03 | ) | | | (0.06 | ) | | | (0.08 | ) | | | (0.06 | ) |
From net realized gain | | | — | | | | — | | | | — | | | | — | | | | — | | | | — | |
Tax return of capital | | | — | | | | — | | | | — | | | | — | 2 | | | — | | | | (0.01 | ) |
| | | | |
| | | | | | |
Total distributions | | | (0.14 | ) | | | (0.06 | ) | | | (0.03 | ) | | | (0.06 | ) | | | (0.08 | ) | | | (0.07 | ) |
| | | | |
Net asset value at end of period | | | $11.04 | | | | $10.73 | | | | $ 8.96 | 7 | | | $ 8.17 | | | | $10.46 | | | | $11.00 | |
| | | | |
| | | | | | |
Total return3 | | | 4.24 | % | | | 10.81 | % | | | 10.02 | % | | | (21.38 | )% | | | (4.24 | )% | | | 7.58 | % |
| | | | | | |
Portfolio turnover rate4 | | | 67 | % | | | 140 | % | | | 119 | % | | | 106 | % | | | 130 | % | | | 92 | % |
| | | | | | |
Net assets, end of period (in thousands) | | | $ 1 | | | | $ 2 | | | | $ 1 | | | | $ 1 | | | | $ 1 | | | | $ 1 | |
| | | | | | |
Ratios to average net assets:5 | | | | | | | | | | | | | | | | | | | | | | | | |
Total expenses to average net assets: | | | | | | | | | | | | | | | | | | | | | | | | |
Total expenses before reimbursements | | | 2.90 | % | | | 3.38 | % | | | 3.86 | % | | | 4.31 | % | | | 4.34 | % | | | 3.77 | % |
Total expenses after reimbursements | | | 2.17 | % | | | 2.17 | % | | | 2.22 | % | | | 2.18 | % | | | 2.20 | % | | | 2.20 | % |
| | | | | | |
Net investment income (loss) to average net assets: | | | | | | | | | | | | | | | | | | | | | | | | |
Net investment loss before reimbursements | | | (1.58 | )% | | | (1.20 | )% | | | (1.39 | )% | | | (2.57 | )% | | | (2.25 | )% | | | (1.81 | )% |
Net investment income (loss) after reimbursements | | | (0.85 | )% | | | 0.01 | % | | | 0.25 | % | | | (0.44 | )% | | | (0.11 | )% | | | (0.24 | )% |
See accompanying notes to the financial statements.
44
ASHMORE FUNDS
FINANCIAL HIGHLIGHTS
Ashmore Emerging Markets Equity Fund
| | | | | | | | | | | | | | | | | | | | | | | | |
| | | Institutional Class | |
| | | | | | |
| | | Six Months | | | | | | | | | | | | | | | | |
| | | Ended | | | | | | | | | | | | | | | | |
| | | April 30, | | | Year Ended | | | Year Ended | | | Year Ended | | | Year Ended | | | Year Ended | |
| | | 2018 | | | October 31, | | | October 31, | | | October 31, | | | October 31, | | | October 31, | |
| | | (Unaudited) | | | 2017 | | | 2016 | | | 2015 | | | 2014 | | | 2013 | |
| | | | |
Net asset value at beginning of period | | | $ 10.78 | | | | $ 8.05 | | | | $ 7.02 | | | | $ 8.88 | | | | $ 9.27 | | | | $ 8.62 | |
| | | | | | |
Income (loss) from investment operations: | | | | | | | | | | | | | | | | | | | | | | | | |
Net investment income | | | — | 2 | | | 0.08 | 1 | | | 0.08 | | | | 0.05 | | | | 0.08 | | | | 0.07 | 1 |
Net realized and unrealized gain (loss) | | | 0.50 | | | | 2.80 | | | | 1.02 | | | | (1.85 | ) | | | (0.39 | ) | | | 0.65 | |
| | | | |
Total from investment operations | | | 0.50 | | | | 2.88 | | | | 1.10 | | | | (1.80 | ) | | | (0.31 | ) | | | 0.72 | |
| | | | | | |
Less distributions: | | | | | | | | | | | | | | | | | | | | | | | | |
| | | | | | |
From net investment income | | | (0.17 | ) | | | (0.15 | ) | | | (0.07 | ) | | | (0.06 | ) | | | (0.08 | ) | | | (0.06 | ) |
From net realized gain | | | — | | | | — | | | | — | | | | — | | | | — | | | | — | |
Tax return of capital | | | — | | | | — | | | | — | | | | — | 2 | | | — | | | | (0.01 | ) |
| | | | |
| | | | | | |
Total distributions | | | (0.17 | ) | | | (0.15 | ) | | | (0.07 | ) | | | (0.06 | ) | | | (0.08 | ) | | | (0.07 | ) |
| | | | |
Net asset value at end of period | | | $ 11.11 | | | | $10.78 | | | | $ 8.05 | | | | $ 7.02 | | | | $ 8.88 | | | | $ 9.27 | |
| | | | |
| | | | | | |
Total return3 | | | 4.67 | % | | | 36.21 | % | | | 15.80 | % | | | (20.34 | )% | | | (3.40 | )% | | | 8.48 | % |
| | | | | | |
Portfolio turnover rate4 | | | 67 | % | | | 140 | % | | | 119 | % | | | 106 | % | | | 130 | % | | | 92 | % |
| | | | | | |
Net assets, end of period (in thousands) | | | $29,803 | | | | $8,106 | | | | $9,074 | | | | $ 7,601 | | | | $10,304 | | | | $9,825 | |
| | | | | | |
Ratios to average net assets:5 | | | | | | | | | | | | | | | | | | | | | | | | |
Total expenses to average net assets: | | | | | | | | | | | | | | | | | | | | | | | | |
Total expenses before reimbursements | | | 1.77 | % | | | 2.35 | % | | | 2.71 | % | | | 3.31 | % | | | 3.37 | % | | | 2.76 | % |
Total expenses after reimbursements | | | 1.17 | % | | | 1.17 | % | | | 1.17 | % | | | 1.17 | % | | | 1.17 | % | | | 1.17 | % |
| | | | | | |
Net investment income (loss) to average net assets: | | | | | | | | | | | | | | | | | | | | | | | | |
Net investment loss before reimbursements | | | (0.32 | )% | | | (0.33 | )% | | | (0.46 | )% | | | (1.59 | )% | | | (1.28 | )% | | | (0.79 | )% |
Net investment income after reimbursements | | | 0.28 | % | | | 0.85 | % | | | 1.08 | % | | | 0.55 | % | | | 0.92 | % | | | 0.80 | % |
| 1 | Per share amounts are based on average number of shares outstanding during the period. |
| 2 | Amount is less than $0.005 per share. |
| 3 | Assumes investment at net asset value at the beginning of the period, reinvestment of all distributions at net asset value on distribution date, and a complete redemption of the investment at net asset value at the end of the period excluding the impact of sales charges. Total return is not annualized for periods less than one year. |
| 4 | The portfolio turnover rate is calculated by dividing the lesser of cost of purchases or proceeds from sales of long term portfolio securities by the monthly average of the value of the long term portfolio securities. Portfolio turnover is not annualized for periods less than one year. |
| 5 | Annualized for periods less than one year. |
| 6 | Initial investment in Class C occurred on March 3, 2017. The beginning NAV for Class C is the end of day NAV for the Institutional Class on March 3, 2017. |
| 7 | There were no investors in Ashmore Emerging Markets Equity Fund Class C at the year ended October 31, 2016. Net asset value shown represents net asset value prior to the final redemption. |
See accompanying notes to the financial statements.
45
ASHMORE EMERGING MARKETS TOTAL RETURN FUND
SCHEDULE OF INVESTMENTS
As of April 30, 2018 (Unaudited)
| | | | | | | | | | | | | | | | |
| | | Currency(1) | | | Par | | | Value | | | % of Net
Assets | |
Debt Securities | | | | | | | | | | | | | | | | |
| | | | |
Angola (Cost $2,317,453) | | | | | | | | | | | | | | | | |
Angola (Rep of), 9.500%, 11/12/2025 | | | | | | | 2,314,000 | | | $ | 2,597,928 | | | | 0.19 | |
| | | | | | | | | | | 2,597,928 | | | | 0.19 | |
Argentina (Cost $54,567,648) | | | | | | | | | | | | | | | | |
Argentina (Rep of), 6.875%, 04/22/2021 | | | | | | | 3,389,000 | | | | 3,556,756 | | | | 0.26 | |
Argentina (Rep of), 7.500%, 04/22/2026 | | | | | | | 4,604,000 | | | | 4,824,992 | | | | 0.35 | |
Argentina (Rep of), 5.875%, 01/11/2028 | | | | | | | 3,803,000 | | | | 3,483,548 | | | | 0.25 | |
Argentina (Rep of), 8.280%, 12/31/2033 | | | | | | | 2,890,802 | | | | 3,078,483 | | | | 0.22 | |
Argentina (Rep of), (Step to 3.750% on 03/31/19) 2.500%, 12/31/2038(2) | | | | | | | 7,453,446 | | | | 4,863,374 | | | | 0.35 | |
Argentina (Rep of), 6.875%, 01/11/2048 | | | | | | | 6,081,000 | | | | 5,402,969 | | | | 0.39 | |
Argentina Bonar Bonds, (Floating, Argentina Deposit Rates Badlar Private Banks 30-35 Days + 2.500%) 25.331%, 03/11/2019 | | | ARS | | | | 8,343,000 | | | | 404,451 | | | | 0.03 | |
Argentina Bonar Bonds, (Floating, Argentina Deposit Rates Badlar Private Banks 30-35 Days + 3.250%) 26.088%, 03/01/2020 | | | ARS | | | | 8,070,000 | | | | 405,694 | | | | 0.03 | |
Argentina Bonar Bonds, (Floating, Argentina Deposit Rates Badlar Private Banks 30-35 Days + 2.000%) 24.839%, 04/03/2022 | | | ARS | | | | 62,946,600 | | | | 3,055,678 | | | | 0.22 | |
Argentina POM Politica Monetaria, (Floating, Argentina Central Bank 7D Repo Rate + 0.000%) 28.875%, 06/21/2020 | | | ARS | | | | 149,556,712 | | | | 7,607,165 | | | | 0.55 | |
Letras del Banco Central de la Republica Argentina, 23.434%,
06/21/2018(3) | | | ARS | | | | 162,669,435 | | | | 7,601,337 | | | | 0.55 | |
Letras del Banco Central de la Republica Argentina, 24.098%,
08/15/2018(3) | | | ARS | | | | 28,456,791 | | | | 1,275,624 | | | | 0.09 | |
Provincia de Buenos Aires, (Floating, Argentina Deposit Rates Badlar Private Banks 30-35 Days + 3.750%) 0.000%, 04/12/2025(4) | | | ARS | | | | 53,295,000 | | | | 2,620,586 | | | | 0.19 | |
YPF S.A., 7.000%, 12/15/2047 | | | | | | | 2,070,000 | | | | 1,845,819 | | | | 0.14 | |
| | | | | | | | | | | 50,026,476 | | | | 3.62 | |
Azerbaijan (Cost $8,605,189) | | | | | | | | | | | | | | | | |
Southern Gas Corridor CJSC, 6.875%, 03/24/2026 | | | | | | | 4,610,000 | | | | 5,036,425 | | | | 0.36 | |
State Oil Co. of the Azerbaijan Republic, 4.750%, 03/13/2023 | | | | | | | 1,050,000 | | | | 1,046,325 | | | | 0.08 | |
State Oil Co. of the Azerbaijan Republic, 6.950%, 03/18/2030 | | | | | | | 2,270,000 | | | | 2,438,843 | | | | 0.18 | |
| | | | | | | | | | | 8,521,593 | | | | 0.62 | |
Belarus (Cost $14,918,726) | | | | | | | | | | | | | | | | |
Belarus (Rep of), 6.875%, 02/28/2023 | | | | | | | 7,436,000 | | | | 7,781,923 | | | | 0.56 | |
Belarus (Rep of), 7.625%, 06/29/2027 | | | | | | | 4,272,000 | | | | 4,594,109 | | | | 0.33 | |
Belarus (Rep of), 6.200%, 02/28/2030(4) | | | | | | | 2,120,000 | | | | 2,045,630 | | | | 0.15 | |
| | | | | | | | | | | 14,421,662 | | | | 1.04 | |
Brazil (Cost $134,001,115) | | | | | | | | | | | | | | | | |
Banco do Brasil S.A., (Variable, U.S. Treasury Yield Curve Rate CMT 10Y + 4.398%) 6.250%, 04/15/2024(5) | | | | | | | 1,105,000 | | | | 980,356 | | | | 0.07 | |
Banco do Brasil S.A., (Variable, U.S. Treasury Yield Curve Rate CMT 10Y + 6.362%) 9.000%, 06/18/2024(5) | | | | | | | 775,000 | | | | 820,260 | | | | 0.06 | |
Banco Nacional de Desenvolvimento Economico e Social, 6.500%, 06/10/2019 | | | | | | | 2,700,000 | | | | 2,789,748 | | | | 0.20 | |
See accompanying notes to the financial statements.
46
ASHMORE EMERGING MARKETS TOTAL RETURN FUND
SCHEDULE OF INVESTMENTS (CONTINUED)
As of April 30, 2018 (Unaudited)
| | | | | | | | | | | | | | | | |
| | | Currency(1) | | | Par | | | Value | | | % of Net
Assets | |
Brazil (continued) | | | | | | | | | | | | | | | | |
Banco Nacional de Desenvolvimento Economico e Social, 4.750%, 05/09/2024 | | | | | | | 1,367,000 | | | $ | 1,346,495 | | | | 0.10 | |
Brazil (Rep of), 2.625%, 01/05/2023 | | | | | | | 1,650,000 | | | | 1,553,475 | | | | 0.11 | |
Brazil (Rep of), 4.250%, 01/07/2025 | | | | | | | 3,264,000 | | | | 3,211,776 | | | | 0.23 | |
Brazil (Rep of), 6.000%, 04/07/2026 | | | | | | | 1,486,000 | | | | 1,607,109 | | | | 0.12 | |
Brazil (Rep of), 4.625%, 01/13/2028 | | | | | | | 2,562,000 | | | | 2,467,206 | | | | 0.18 | |
Brazil (Rep of), 8.250%, 01/20/2034 | | | | | | | 1,016,000 | | | | 1,258,834 | | | | 0.09 | |
Brazil (Rep of), 7.125%, 01/20/2037 | | | | | | | 2,191,000 | | | | 2,497,740 | | | | 0.18 | |
Brazil (Rep of), 5.625%, 01/07/2041 | | | | | | | 988,000 | | | | 939,104 | | | | 0.07 | |
Brazil (Rep of), 5.000%, 01/27/2045 | | | | | | | 2,174,000 | | | | 1,880,510 | | | | 0.14 | |
Brazil (Rep of), 5.625%, 02/21/2047 | | | | | | | 1,809,000 | | | | 1,702,269 | | | | 0.12 | |
Brazil Letras do Tesouro Nacional, 6.412%, 01/01/2020(3) | | | BRL | | | | 79,540,000 | | | | 20,294,121 | | | | 1.47 | |
Brazil Notas do Tesouro Nacional Serie B, 6.000%, 08/15/2022(6) | | | BRL | | | | 25,246,000 | | | | 23,729,326 | | | | 1.72 | |
Brazil Notas do Tesouro Nacional Serie F, 10.000%, 01/01/2023 | | | BRL | | | | 56,348,000 | | | | 16,709,984 | | | | 1.21 | |
Brazil Notas do Tesouro Nacional Serie F, 10.000%, 01/01/2025 | | | BRL | | | | 41,415,000 | | | | 12,151,955 | | | | 0.88 | |
Brazil Notas do Tesouro Nacional Serie F, 10.000%, 01/01/2027 | | | BRL | | | | 38,664,000 | | | | 11,241,485 | | | | 0.81 | |
CSN Islands XI Corp., 6.875%, 09/21/2019 | | | | | | | 1,430,000 | | | | 1,433,575 | | | | 0.10 | |
CSN Resources S.A., 6.500%, 07/21/2020 | | | | | | | 1,460,000 | | | | 1,419,850 | | | | 0.10 | |
Petrobras Global Finance B.V., 7.375%, 01/17/2027 | | | | | | | 1,750,000 | | | | 1,876,875 | | | | 0.14 | |
Petrobras Global Finance B.V., 6.875%, 01/20/2040 | | | | | | | 6,200,000 | | | | 5,959,750 | | | | 0.43 | |
Petrobras Global Finance B.V., 6.850%, 06/05/2115 | | | | | | | 3,765,000 | | | | 3,478,860 | | | | 0.25 | |
QGOG Atlantic/Alaskan Rigs Ltd., 5.250%, 07/30/2018 | | | | | | | 868,500 | | | | 842,445 | | | | 0.06 | |
QGOG Constellation S.A., 9.500%, (5% PIK), 11/09/2024(7) | | | | | | | 1,412,327 | | | | 692,040 | | | | 0.05 | |
Samarco Mineracao S.A., 4.125%, 11/01/2022(8) | | | | | | | 2,295,000 | | | | 1,669,613 | | | | 0.12 | |
Samarco Mineracao S.A., 5.750%, 10/24/2023(8) | | | | | | | 3,468,000 | | | | 2,522,970 | | | | 0.18 | |
Samarco Mineracao S.A., 5.375%, 09/26/2024(8) | | | | | | | 1,790,000 | | | | 1,302,225 | | | | 0.10 | |
| | | | | | | | | | | 128,379,956 | | | | 9.29 | |
Cameroon (Cost $373,234) | | | | | | | | | | | | | | | | |
Cameroon (Rep of), 9.500%, 11/19/2025 | | | | | | | 320,000 | | | | 367,251 | | | | 0.03 | |
| | | | | | | | | | | 367,251 | | | | 0.03 | |
Chile (Cost $57,704,788) | | | | | | | | | | | | | | | | |
Banco del Estado de Chile, 3.875%, 02/08/2022 | | | | | | | 960,000 | | | | 964,222 | | | | 0.07 | |
Bonos de la Tesoreria de la Republica en pesos, 4.500%, 03/01/2021 | | | CLP | | | | 20,495,000,000 | | | | 34,299,101 | | | | 2.48 | |
Bonos de la Tesoreria de la Republica en pesos, 5.000%, 03/01/2035 | | | CLP | | | | 4,205,000,000 | | | | 6,936,878 | | | | 0.50 | |
Chile (Rep of), 3.240%, 02/06/2028 | | | | | | | 643,000 | | | | 614,708 | | | | 0.04 | |
Corp. Nacional del Cobre de Chile, 4.250%, 07/17/2042 | | | | | | | 1,461,000 | | | | 1,386,971 | | | | 0.10 | |
Corp. Nacional del Cobre de Chile, 5.625%, 10/18/2043 | | | | | | | 2,422,000 | | | | 2,756,890 | | | | 0.20 | |
Corp. Nacional del Cobre de Chile, 4.875%, 11/04/2044 | | | | | | | 4,541,000 | | | | 4,698,346 | | | | 0.34 | |
Corp. Nacional del Cobre de Chile, 4.500%, 08/01/2047 | | | | | | | 2,440,000 | | | | 2,392,054 | | | | 0.17 | |
Empresa Nacional del Petroleo, 3.750%, 08/05/2026 | | | | | | | 1,260,000 | | | | 1,195,929 | | | | 0.09 | |
Empresa Nacional del Petroleo, 4.500%, 09/14/2047 | | | | | | | 1,602,000 | | | | 1,461,825 | | | | 0.11 | |
| | | | | | | | | | | 56,706,924 | | | | 4.10 | |
China (Cost $17,332,210) | | | | | | | | | | | | | | | | |
Amber Circle Funding Ltd., 3.250%, 12/04/2022 | | | | | | | 3,246,000 | | | | 3,177,237 | | | | 0.23 | |
China Railway Resources Huitung Ltd., 3.850%, 02/05/2023 | | | | | | | 1,705,000 | | | | 1,693,425 | | | | 0.12 | |
See accompanying notes to the financial statements.
47
ASHMORE EMERGING MARKETS TOTAL RETURN FUND
SCHEDULE OF INVESTMENTS (CONTINUED)
As of April 30, 2018 (Unaudited)
| | | | | | | | | | | | | | | | |
| | | Currency(1) | | | Par | | | Value | | | % of Net
Assets | |
China (continued) | | | | | | | | | | | | | | | | |
Far East Energy Bermuda Ltd., 13.000%, 01/15/2016(4)(8)(9)(10)(11) | | | | | | | 1,975,424 | | | $ | — | | | | — | |
Franshion Development Ltd., 6.750%, 04/15/2021 | | | | | | | 2,170,000 | | | | 2,316,887 | | | | 0.17 | |
Industrial & Commercial Bank of China Asia Ltd., 5.125%, 11/30/2020 | | | | | | | 1,519,000 | | | | 1,566,964 | | | | 0.11 | |
Sinochem Overseas Capital Co. Ltd., 4.500%, 11/12/2020 | | | | | | | 2,612,000 | | | | 2,660,816 | | | | 0.19 | |
Sinochem Overseas Capital Co. Ltd., 6.300%, 11/12/2040 | | | | | | | 1,170,000 | | | | 1,427,980 | | | | 0.10 | |
Sinopec Group Overseas Development 2012 Ltd., 4.875%, 05/17/2042 | | | | | | | 1,030,000 | | | | 1,073,397 | | | | 0.08 | |
Sunac China Holdings Ltd., 7.950%, 08/08/2022 | | | | | | | 1,100,000 | | | | 1,076,448 | | | | 0.08 | |
| | | | | | | | | | | 14,993,154 | | | | 1.08 | |
Colombia (Cost $24,604,945) | | | | | | | | | | | | | | | | |
Colombia (Rep of), 7.375%, 03/18/2019 | | | | | | | 1,943,000 | | | | 2,014,891 | | | | 0.15 | |
Colombia (Rep of), 11.750%, 02/25/2020 | | | | | | | 765,000 | | | | 876,307 | | | | 0.06 | |
Colombia (Rep of), 4.000%, 02/26/2024 | | | | | | | 1,150,000 | | | | 1,147,125 | | | | 0.08 | |
Colombia (Rep of), 8.125%, 05/21/2024 | | | | | | | 1,808,000 | | | | 2,193,104 | | | | 0.16 | |
Colombia (Rep of), 3.875%, 04/25/2027 | | | | | | | 1,956,000 | | | | 1,887,540 | | | | 0.14 | |
Colombia (Rep of), 7.375%, 09/18/2037 | | | | | | | 3,398,000 | | | | 4,306,965 | | | | 0.31 | |
Colombia (Rep of), 6.125%, 01/18/2041 | | | | | | | 3,772,000 | | | | 4,262,360 | | | | 0.31 | |
Colombia (Rep of), 5.625%, 02/26/2044 | | | | | | | 2,813,000 | | | | 3,015,536 | | | | 0.22 | |
Colombia (Rep of), 5.000%, 06/15/2045 | | | | | | | 1,677,000 | | | | 1,660,230 | | | | 0.12 | |
Empresas Publicas de Medellin ESP, 8.375%, 11/08/2027 | | | COP | | | | 8,747,000,000 | | | | 3,239,525 | | | | 0.23 | |
| | | | | | | | | | | 24,603,583 | | | | 1.78 | |
Costa Rica (Cost $6,008,861) | | | | | | | | | | | | | | | | |
Banco Nacional de Costa Rica, 6.250%, 11/01/2023 | | | | | | | 860,000 | | | | 891,175 | | | | 0.06 | |
Costa Rica (Rep of), 4.250%, 01/26/2023 | | | | | | | 4,006,000 | | | | 3,837,748 | | | | 0.28 | |
Costa Rica (Rep of), 5.625%, 04/30/2043 | | | | | | | 900,000 | | | | 776,061 | | | | 0.06 | |
Instituto Costarricense de Electricidad, 6.950%, 11/10/2021 | | | | | | | 400,000 | | | | 425,400 | | | | 0.03 | |
| | | | | | | | | | | 5,930,384 | | | | 0.43 | |
Croatia (Cost $12,492,936) | | | | | | | | | | | | | | | | |
Croatia (Rep of), 6.625%, 07/14/2020 | | | | | | | 4,050,000 | | | | 4,317,300 | | | | 0.31 | |
Croatia (Rep of), 6.375%, 03/24/2021 | | | | | | | 3,299,000 | | | | 3,539,827 | | | | 0.26 | |
Croatia (Rep of), 6.000%, 01/26/2024 | | | | | | | 4,310,000 | | | | 4,696,935 | | | | 0.34 | |
| | | | | | | | | | | 12,554,062 | | | | 0.91 | |
Czech Republic (Cost $2,189,403) | | | | | | | | | | | | | | | | |
New World Resources N.V., 8.000%, 04/07/2020(8)(10) | | | EUR | | | | 1,938,518 | | | | — | | | | — | |
New World Resources N.V., 4.000%, 10/07/2020(8)(10) | | | EUR | | | | 669,526 | | | | — | | | | — | |
| | | | | | | | | | | — | | | | — | |
Dominican Republic (Cost $26,188,543) | | | | | | | | | | | | | | | | |
Dominican (Rep of), 7.500%, 05/06/2021 | | | | | | | 3,017,000 | | | | 3,187,461 | | | | 0.23 | |
Dominican (Rep of), 6.600%, 01/28/2024 | | | | | | | 1,400,000 | | | | 1,491,000 | | | | 0.11 | |
Dominican (Rep of), 5.875%, 04/18/2024 | | | | | | | 5,059,000 | | | | 5,223,417 | | | | 0.38 | |
Dominican (Rep of), 5.500%, 01/27/2025 | | | | | | | 4,820,000 | | | | 4,836,870 | | | | 0.35 | |
Dominican (Rep of), 6.875%, 01/29/2026 | | | | | | | 4,260,000 | | | | 4,615,710 | | | | 0.33 | |
Dominican (Rep of), 7.450%, 04/30/2044 | | | | | | | 1,920,000 | | | | 2,102,400 | | | | 0.15 | |
See accompanying notes to the financial statements.
48
ASHMORE EMERGING MARKETS TOTAL RETURN FUND
SCHEDULE OF INVESTMENTS (CONTINUED)
As of April 30, 2018 (Unaudited)
| | | | | | | | | | | | | | | | |
| | | Currency(1) | | | Par | | | Value | | | % of Net
Assets | |
Dominican Republic (continued) | | | | | | | | | | | | | | | | |
Dominican (Rep of), 6.850%, 01/27/2045 | | | | | | | 4,277,000 | | | $ | 4,416,002 | | | | 0.32 | |
| | | | | | | | | | | 25,872,860 | | | | 1.87 | |
Ecuador (Cost $87,838,385) | | | | | | | | | | | | | | | | |
Ecuador (Rep of), 10.500%, 03/24/2020 | | | | | | | 19,691,000 | | | | 20,281,730 | | | | 1.47 | |
Ecuador (Rep of), 10.750%, 03/28/2022 | | | | | | | 18,330,000 | | | | 19,338,150 | | | | 1.40 | |
Ecuador (Rep of), 8.750%, 06/02/2023 | | | | | | | 7,303,000 | | | | 7,156,940 | | | | 0.52 | |
Ecuador (Rep of), 7.950%, 06/20/2024 | | | | | | | 7,332,000 | | | | 6,892,080 | | | | 0.50 | |
Ecuador (Rep of), 9.650%, 12/13/2026 | | | | | | | 7,185,000 | | | | 7,077,225 | | | | 0.51 | |
Ecuador (Rep of), 9.625%, 06/02/2027 | | | | | | | 4,130,000 | | | | 4,047,400 | | | | 0.29 | |
Ecuador (Rep of), 8.875%, 10/23/2027 | | | | | | | 8,124,000 | | | | 7,656,870 | | | | 0.55 | |
Ecuador (Rep of), 7.875%, 01/23/2028 | | | | | | | 9,096,000 | | | | 8,049,960 | | | | 0.58 | |
EP PetroEcuador via Noble Sovereign Funding I Ltd., (Floating,
ICE LIBOR USD 3M + 5.630%) 7.925%, 09/24/2019 | | | | | | | 3,751,579 | | | | 3,750,829 | | | | 0.27 | |
| | | | | | | | | | | 84,251,184 | | | | 6.09 | |
Egypt (Cost $30,475,544) | | | | | | | | | | | | | | | | |
Egypt (Rep of), 6.125%, 01/31/2022 | | | | | | | 1,660,000 | | | | 1,703,492 | | | | 0.12 | |
Egypt (Rep of), 7.500%, 01/31/2027 | | | | | | | 6,419,000 | | | | 6,773,971 | | | | 0.49 | |
Egypt (Rep of), 6.588%, 02/21/2028(4) | | | | | | | 4,148,000 | | | | 4,090,840 | | | | 0.30 | |
Egypt (Rep of), 6.875%, 04/30/2040 | | | | | | | 590,000 | | | | 560,568 | | | | 0.04 | |
Egypt (Rep of), 8.500%, 01/31/2047 | | | | | | | 3,740,000 | | | | 4,006,871 | | | | 0.29 | |
Egypt (Rep of), 7.903%, 02/21/2048(4) | | | | | | | 1,900,000 | | | | 1,925,616 | | | | 0.14 | |
Egypt Treasury Bill, 15.759%, 05/22/2018(3) | | | EGP | | | | 18,500,000 | | | | 1,039,147 | | | | 0.07 | |
Egypt Treasury Bill, 16.559%, 06/26/2018(3) | | | EGP | | | | 9,000,000 | | | | 497,330 | | | | 0.04 | |
Egypt Treasury Bill, 16.008%, 07/03/2018(3) | | | EGP | | | | 4,450,000 | | | | 245,095 | | | | 0.02 | |
Egypt Treasury Bill, 15.650%, 07/10/2018(3) | | | EGP | | | | 89,875,000 | | | | 4,933,794 | | | | 0.36 | |
Egypt Treasury Bill, 16.676%, 07/17/2018(3) | | | EGP | | | | 76,875,000 | | | | 4,206,240 | | | | 0.30 | |
Egypt Treasury Bill, 16.586%, 07/24/2018(3) | | | EGP | | | | 5,650,000 | | | | 308,121 | | | | 0.02 | |
| | | | | | | | | | | 30,291,085 | | | | 2.19 | |
El Salvador (Cost $10,031,122) | | | | | | | | | | | | | | | | |
El Salvador (Rep of), 7.375%, 12/01/2019 | | | | | | | 1,000,000 | | | | 1,031,630 | | | | 0.07 | |
El Salvador (Rep of), 5.875%, 01/30/2025 | | | | | | | 1,626,000 | | | | 1,593,480 | | | | 0.12 | |
El Salvador (Rep of), 6.375%, 01/18/2027 | | | | | | | 930,000 | | | | 918,375 | | | | 0.07 | |
El Salvador (Rep of), 8.625%, 02/28/2029 | | | | | | | 1,570,000 | | | | 1,793,725 | | | | 0.13 | |
El Salvador (Rep of), 8.250%, 04/10/2032 | | | | | | | 775,000 | | | | 854,066 | | | | 0.06 | |
El Salvador (Rep of), 7.650%, 06/15/2035 | | | | | | | 860,000 | | | | 894,400 | | | | 0.06 | |
El Salvador (Rep of), 7.625%, 02/01/2041 | | | | | | | 3,190,000 | | | | 3,318,206 | | | | 0.24 | |
| | | | | | | | | | | 10,403,882 | | | | 0.75 | |
Ethiopia (Cost $5,935,700) | | | | | | | | | | | | | | | | |
Ethiopia (Rep of), 6.625%, 12/11/2024 | | | | | | | 6,060,000 | | | | 6,124,357 | | | | 0.44 | |
| | | | | | | | | | | 6,124,357 | | | | 0.44 | |
Gabon (Cost $5,396,447) | | | | | | | | | | | | | | | | |
Gabon (Rep of), 6.375%, 12/12/2024 | | | | | | | 5,119,700 | | | | 4,989,619 | | | | 0.36 | |
Gabon (Rep of), 6.950%, 06/16/2025 | | | | | | | 400,000 | | | | 398,646 | | | | 0.03 | |
| | | | | | | | | | | 5,388,265 | | | | 0.39 | |
See accompanying notes to the financial statements.
49
ASHMORE EMERGING MARKETS TOTAL RETURN FUND
SCHEDULE OF INVESTMENTS (CONTINUED)
As of April 30, 2018 (Unaudited)
| | | | | | | | | | | | | | | | |
| | | Currency(1) | | | Par | | | Value | | | % of Net
Assets | |
Georgia (Cost $4,201,678) | | | | | | | | | | | | | | | | |
Georgia (Rep of), 6.875%, 04/12/2021 | | | | | | | 2,850,000 | | | $ | 3,067,996 | | | | 0.22 | |
Georgian Railway JSC, 7.750%, 07/11/2022 | | | | | | | 1,040,000 | | | | 1,115,367 | | | | 0.08 | |
| | | | | | | | | | | 4,183,363 | | | | 0.30 | |
Ghana (Cost $2,737,059) | | | | | | | | | | | | | | | | |
Ghana (Rep of), 9.250%, 09/15/2022 | | | | | | | 1,370,000 | | | | 1,558,375 | | | | 0.11 | |
Ghana (Rep of), 8.125%, 01/18/2026 | | | | | | | 930,000 | | | | 994,010 | | | | 0.07 | |
Ghana (Rep of), 10.750%, 10/14/2030 | | | | | | | 200,000 | | | | 258,540 | | | | 0.02 | |
| | | | | | | | | | | 2,810,925 | | | | 0.20 | |
Hungary (Cost $17,538,358) | | | | | | | | | | | | | | | | |
Hungary (Rep of), 5.375%, 02/21/2023 | | | | | | | 5,412,000 | | | | 5,793,546 | | | | 0.42 | |
Hungary (Rep of), 5.750%, 11/22/2023 | | | | | | | 5,326,000 | | | | 5,810,666 | | | | 0.42 | |
Hungary (Rep of), 5.375%, 03/25/2024 | | | | | | | 2,610,000 | | | | 2,805,750 | | | | 0.20 | |
Hungary (Rep of), 5.500%, 06/24/2025 | | | HUF | | | | 511,880,000 | | | | 2,419,030 | | | | 0.18 | |
Hungary (Rep of), 7.625%, 03/29/2041 | | | | | | | 604,000 | | | | 850,058 | | | | 0.06 | |
| | | | | | | | | | | 17,679,050 | | | | 1.28 | |
India (Cost $34,269,914) | | | | | | | | | | | | | | | | |
Export-Import Bank of India, 4.000%, 01/14/2023 | | | | | | | 1,949,000 | | | | 1,938,959 | | | | 0.14 | |
Export-Import Bank of India, 3.375%, 08/05/2026 | | | | | | | 1,090,000 | | | | 1,009,593 | | | | 0.07 | |
India (Rep of), 7.350%, 06/22/2024 | | | INR | | | | 420,000,000 | | | | 6,145,190 | | | | 0.44 | |
India (Rep of), 7.720%, 05/25/2025 | | | INR | | | | 823,510,000 | | | | 12,265,042 | | | | 0.89 | |
India (Rep of), 7.590%, 01/11/2026 | | | INR | | | | 730,000,000 | | | | 10,708,271 | | | | 0.78 | |
| | | | | | | | | | | 32,067,055 | | | | 2.32 | |
Indonesia (Cost $76,106,142) | | | | | | | | | | | | | | | | |
Indonesia (Rep of), 4.875%, 05/05/2021 | | | | | | | 1,098,000 | | | | 1,138,957 | | | | 0.08 | |
Indonesia (Rep of), 5.625%, 05/15/2023 | | | IDR | | | | 9,076,000,000 | | | | 632,135 | | | | 0.05 | |
Indonesia (Rep of), 8.375%, 03/15/2024 | | | IDR | | | | 54,394,000,000 | | | | 4,221,146 | | | | 0.31 | |
Indonesia (Rep of), 4.125%, 01/15/2025 | | | | | | | 1,385,000 | | | | 1,383,899 | | | | 0.10 | |
Indonesia (Rep of), 8.375%, 09/15/2026 | | | IDR | | | | 112,000,000,000 | | | | 8,707,711 | | | | 0.63 | |
Indonesia (Rep of), 7.000%, 05/15/2027 | | | IDR | | | | 42,812,000,000 | | | | 3,104,158 | | | | 0.22 | |
Indonesia (Rep of), 6.125%, 05/15/2028 | | | IDR | | | | 62,398,000,000 | | | | 4,260,098 | | | | 0.31 | |
Indonesia (Rep of), 8.750%, 05/15/2031 | | | IDR | | | | 27,075,000,000 | | | | 2,163,906 | | | | 0.16 | |
Indonesia (Rep of), 7.500%, 08/15/2032 | | | IDR | | | | 114,464,000,000 | | | | 8,416,652 | | | | 0.61 | |
Indonesia (Rep of), 6.625%, 05/15/2033 | | | IDR | | | | 22,278,000,000 | | | | 1,525,966 | | | | 0.11 | |
Indonesia (Rep of), 8.375%, 03/15/2034 | | | IDR | | | | 28,422,000,000 | | | | 2,234,783 | | | | 0.16 | |
Indonesia (Rep of), 8.500%, 10/12/2035 | | | | | | | 1,145,000 | | | | 1,605,505 | | | | 0.12 | |
Indonesia (Rep of), 8.250%, 05/15/2036 | | | IDR | | | | 40,119,000,000 | | | | 3,097,057 | | | | 0.22 | |
Indonesia (Rep of), 6.625%, 02/17/2037 | | | | | | | 1,524,000 | | | | 1,816,696 | | | | 0.13 | |
Indonesia (Rep of), 7.750%, 01/17/2038 | | | | | | | 2,058,000 | | | | 2,747,072 | | | | 0.20 | |
Indonesia (Rep of), 7.500%, 05/15/2038 | | | IDR | | | | 18,107,000,000 | | | | 1,312,777 | | | | 0.09 | |
Indonesia (Rep of), 5.250%, 01/17/2042 | | | | | | | 1,603,000 | | | | 1,662,348 | | | | 0.12 | |
Indonesia (Rep of), 5.125%, 01/15/2045 | | | | | | | 3,751,000 | | | | 3,815,630 | | | | 0.28 | |
Indonesia (Rep of), 5.950%, 01/08/2046 | | | | | | | 3,119,000 | | | | 3,539,276 | | | | 0.26 | |
Indonesia (Rep of), 5.250%, 01/08/2047 | | | | | | | 2,147,000 | | | | 2,222,476 | | | | 0.16 | |
Indonesia (Rep of), 4.750%, 07/18/2047 | | | | | | | 1,280,000 | | | | 1,243,188 | | | | 0.09 | |
See accompanying notes to the financial statements.
50
ASHMORE EMERGING MARKETS TOTAL RETURN FUND
SCHEDULE OF INVESTMENTS (CONTINUED)
As of April 30, 2018 (Unaudited)
| | | | | | | | | | | | | | | | |
| | | Currency(1) | | | Par | | | Value | | | % of Net
Assets | |
Indonesia (continued) | | | | | | | | | | | | | | | | |
Majapahit Holding B.V., 8.000%, 08/07/2019 | | | | | | | 1,400,000 | | | $ | 1,487,500 | | | | 0.11 | |
Majapahit Holding B.V., 7.750%, 01/20/2020 | | | | | | | 1,280,000 | | | | 1,368,064 | | | | 0.10 | |
Pertamina Persero PT, 6.000%, 05/03/2042 | | | | | | | 1,699,000 | | | | 1,773,982 | | | | 0.13 | |
Perusahaan Listrik Negara PT, 5.500%, 11/22/2021 | | | | | | | 4,030,000 | | | | 4,216,388 | | | | 0.30 | |
Perusahaan Listrik Negara PT, 5.250%, 05/15/2047 | | | | | | | 988,000 | | | | 946,022 | | | | 0.07 | |
Perusahaan Penerbit SBSN Indonesia III, 4.325%, 05/28/2025 | | | | | | | 1,448,000 | | | | 1,447,686 | | | | 0.10 | |
Perusahaan Penerbit SBSN Indonesia III, 4.550%, 03/29/2026 | | | | | | | 2,080,000 | | | | 2,094,416 | | | | 0.15 | |
| | | | | | | | | | | 74,185,494 | | | | 5.37 | |
Ivory Coast (Cost $11,751,238) | | | | | | | | | | | | | | | | |
Ivory Coast (Rep of), 6.375%, 03/03/2028 | | | | | | | 1,276,000 | | | | 1,284,230 | | | | 0.09 | |
Ivory Coast (Rep of), 5.750%, 12/31/2032 | | | | | | | 10,865,610 | | | | 10,394,043 | | | | 0.75 | |
| | | | | | | | | | | 11,678,273 | | | | 0.84 | |
Jamaica (Cost $21,589,489) | | | | | | | | | | | | | | | | |
Digicel Group Ltd., 8.250%, 09/30/2020 | | | | | | | 14,315,000 | | | | 12,794,031 | | | | 0.93 | |
Digicel Group Ltd., 7.125%, 04/01/2022 | | | | | | | 5,580,000 | | | | 4,537,768 | | | | 0.33 | |
Jamaica (Rep of), 6.750%, 04/28/2028 | | | | | | | 920,000 | | | | 1,015,220 | | | | 0.07 | |
Jamaica (Rep of), 7.875%, 07/28/2045 | | | | | | | 1,560,000 | | | | 1,833,000 | | | | 0.13 | |
| | | | | | | | | | | 20,180,019 | | | | 1.46 | |
Jordan (Cost $1,376,589) | | | | | | | | | | | | | | | | |
Jordan (Rep of), 5.750%, 01/31/2027 | | | | | | | 1,430,000 | | | | 1,357,899 | | | | 0.10 | |
| | | | | | | | | | | 1,357,899 | | | | 0.10 | |
Kazakhstan (Cost $27,647,062) | | | | | | | | | | | | | | | | |
Development Bank of Kazakhstan JSC, 4.125%, 12/10/2022 | | | | | | | 3,463,000 | | | | 3,454,343 | | | | 0.25 | |
KazAgro National Management Holding JSC, 4.625%, 05/24/2023 | | | | | | | 2,290,000 | | | | 2,238,475 | | | | 0.16 | |
Kazakhstan (Rep of), 5.125%, 07/21/2025 | | | | | | | 4,850,000 | | | | 5,167,617 | | | | 0.37 | |
Kazakhstan (Rep of), 4.875%, 10/14/2044 | | | | | | | 1,199,000 | | | | 1,176,938 | | | | 0.09 | |
Kazakhstan (Rep of), 6.500%, 07/21/2045 | | | | | | | 2,213,000 | | | | 2,637,232 | | | | 0.19 | |
Kazakhstan Temir Zholy Finance B.V., 6.950%, 07/10/2042 | | | | | | | 3,651,000 | | | | 3,987,922 | | | | 0.29 | |
Kazakhstan Temir Zholy National Co. JSC, 4.850%, 11/17/2027 | | | | | | | 901,000 | | | | 891,990 | | | | 0.06 | |
KazMunayGas National Co. JSC, 9.125%, 07/02/2018 | | | | | | | 1,341,000 | | | | 1,352,921 | | | | 0.10 | |
KazMunayGas National Co. JSC, 7.000%, 05/05/2020 | | | | | | | 1,744,000 | | | | 1,861,057 | | | | 0.13 | |
KazMunayGas National Co. JSC, 6.375%, 04/09/2021 | | | | | | | 1,030,000 | | | | 1,102,306 | | | | 0.08 | |
KazMunayGas National Co. JSC, 5.375%, 04/24/2030(4)(11) | | | | | | | 2,151,000 | | | | 2,150,355 | | | | 0.16 | |
KazMunayGas National Co. JSC, 5.750%, 04/30/2043 | | | | | | | 1,376,000 | | | | 1,459,936 | | | | 0.11 | |
KazMunayGas National Co. JSC, 6.375%, 10/24/2048(4)(11) | | | | | | | 1,131,000 | | | | 1,155,056 | | | | 0.08 | |
| | | | | | | | | | | 28,636,148 | | | | 2.07 | |
Kenya (Cost $3,520,511) | | | | | | | | | | | | | | | | |
Kenya (Rep of), 6.875%, 06/24/2024 | | | | | | | 1,480,000 | | | | 1,533,457 | | | | 0.11 | |
Kenya (Rep of), 7.250%, 02/28/2028(4) | | | | | | | 840,000 | | | | 867,028 | | | | 0.06 | |
Kenya (Rep of), 8.250%, 02/28/2048(4) | | | | | | | 1,160,000 | | | | 1,195,902 | | | | 0.09 | |
| | | | | | | | | | | 3,596,387 | | | | 0.26 | |
Lebanon (Cost $23,235,834) | | | | | | | | | | | | | | | | |
Lebanon (Rep of), 5.150%, 11/12/2018 | | | | | | | 280,000 | | | | 279,048 | | | | 0.02 | |
See accompanying notes to the financial statements.
51
ASHMORE EMERGING MARKETS TOTAL RETURN FUND
SCHEDULE OF INVESTMENTS (CONTINUED)
As of April 30, 2018 (Unaudited)
| | | | | | | | | | | | | | | | |
| | | Currency(1) | | | Par | | | Value | | | % of Net
Assets | |
Lebanon (continued) | | | | | | | | | | | | | | | | |
Lebanon (Rep of), 5.450%, 11/28/2019 | | | | | | | 2,330,000 | | | $ | 2,294,178 | | | | 0.17 | |
Lebanon (Rep of), 6.375%, 03/09/2020 | | | | | | | 2,164,000 | | | | 2,156,223 | | | | 0.16 | |
Lebanon (Rep of), 8.250%, 04/12/2021 | | | | | | | 4,945,000 | | | | 5,056,490 | | | | 0.37 | |
Lebanon (Rep of), 6.100%, 10/04/2022 | | | | | | | 7,454,000 | | | | 7,091,512 | | | | 0.51 | |
Lebanon (Rep of), 6.000%, 01/27/2023 | | | | | | | 3,350,000 | | | | 3,157,040 | | | | 0.23 | |
Lebanon (Rep of), 6.600%, 11/27/2026 | | | | | | | 1,926,000 | | | | 1,736,347 | | | | 0.12 | |
Lebanon (Rep of), 6.750%, 11/29/2027 | | | | | | | 546,000 | | | | 492,474 | | | | 0.03 | |
| | | | | | | | | | | 22,263,312 | | | | 1.61 | |
Malaysia (Cost $25,894,532) | | | | | | | | | | | | | | | | |
Axiata SPV1 Labuan Ltd., 5.375%, 04/28/2020 | | | | | | | 500,000 | | | | 517,786 | | | | 0.04 | |
Malaysia (Rep of), 3.759%, 03/15/2019 | | | MYR | | | | 1,609,000 | | | | 411,001 | | | | 0.03 | |
Malaysia (Rep of), 3.654%, 10/31/2019 | | | MYR | | | | 4,888,000 | | | | 1,246,378 | | | | 0.09 | |
Malaysia (Rep of), 3.659%, 10/15/2020 | | | MYR | | | | 48,440,000 | | | | 12,345,206 | | | | 0.89 | |
Malaysia (Rep of), 3.882%, 03/10/2022 | | | MYR | | | | 2,246,000 | | | | 574,805 | | | | 0.04 | |
Malaysia (Rep of), 3.418%, 08/15/2022 | | | MYR | | | | 6,439,000 | | | | 1,611,906 | | | | 0.12 | |
Malaysia (Rep of), 3.480%, 03/15/2023 | | | MYR | | | | 146,000 | | | | 36,340 | | | | — | |
Malaysia (Rep of), 4.181%, 07/15/2024 | | | MYR | | | | 2,150,000 | | | | 550,422 | | | | 0.04 | |
Malaysia (Rep of), 3.955%, 09/15/2025 | | | MYR | | | | 50,000 | | | | 12,560 | | | | — | |
Malaysia (Rep of), 4.392%, 04/15/2026 | | | MYR | | | | 125,000 | | | | 32,393 | | | | — | |
Malaysia (Rep of), 3.900%, 11/30/2026 | | | MYR | | | | 114,000 | | | | 28,511 | | | | — | |
Malaysia (Rep of), 4.498%, 04/15/2030 | | | MYR | | | | 6,297,000 | | | | 1,599,783 | | | | 0.12 | |
Malaysia (Rep of), 4.232%, 06/30/2031 | | | MYR | | | | 2,488,000 | | | | 614,952 | | | | 0.04 | |
Malaysia (Rep of), 3.844%, 04/15/2033 | | | MYR | | | | 7,162,000 | | | | 1,667,166 | | | | 0.12 | |
Malaysia (Rep of), 4.254%, 05/31/2035 | | | MYR | | | | 468,000 | | | | 110,949 | | | | 0.01 | |
Petronas Capital Ltd., 5.250%, 08/12/2019 | | | | | | | 1,672,000 | | | | 1,715,989 | | | | 0.12 | |
Petronas Capital Ltd., 7.875%, 05/22/2022 | | | | | | | 1,760,000 | | | | 2,033,712 | | | | 0.15 | |
Wakala Global Sukuk Bhd., 4.646%, 07/06/2021 | | | | | | | 1,421,000 | | | | 1,485,798 | | | | 0.11 | |
| | | | | | | | | | | 26,595,657 | | | | 1.92 | |
Mexico (Cost $86,922,289) | | | | | | | | | | | | | | | | |
Comision Federal de Electricidad, 4.875%, 01/15/2024 | | | | | | | 1,963,000 | | | | 2,009,621 | | | | 0.15 | |
Comision Federal de Electricidad, 8.180%, 12/23/2027 | | | MXN | | | | 24,850,000 | | | | 1,272,293 | | | | 0.09 | |
Comision Federal de Electricidad, 5.750%, 02/14/2042 | | | | | | | 2,150,000 | | | | 2,201,063 | | | | 0.16 | |
Mexican Bonos, 6.500%, 06/10/2021 | | | MXN | | | | 322,560,000 | | | | 16,828,715 | | | | 1.22 | |
Mexican Bonos, 6.500%, 06/09/2022 | | | MXN | | | | 141,110,000 | | | | 7,308,772 | | | | 0.53 | |
Mexican Bonos, 8.000%, 12/07/2023 | | | MXN | | | | 55,600,000 | | | | 3,058,705 | | | | 0.22 | |
Mexican Bonos, 10.000%, 12/05/2024 | | | MXN | | | | 251,050,000 | | | | 15,272,503 | | | | 1.10 | |
Mexican Bonos, 5.750%, 03/05/2026 | | | MXN | | | | 254,120,000 | | | | 12,230,528 | | | | 0.88 | |
Mexico (Rep of), 6.050%, 01/11/2040 | | | | | | | 672,000 | | | | 738,528 | | | | 0.05 | |
Mexico (Rep of), 4.750%, 03/08/2044 | | | | | | | 1,546,000 | | | | 1,453,240 | | | | 0.11 | |
Mexico (Rep of), 5.550%, 01/21/2045 | | | | | | | 1,437,000 | | | | 1,527,244 | | | | 0.11 | |
Mexico (Rep of), 4.600%, 01/23/2046 | | | | | | | 4,393,000 | | | | 4,026,185 | | | | 0.29 | |
Mexico (Rep of), 4.350%, 01/15/2047 | | | | | | | 1,207,000 | | | | 1,066,988 | | | | 0.08 | |
Mexico (Rep of), 5.750%, 10/12/2110 | | | | | | | 1,508,000 | | | | 1,485,380 | | | | 0.11 | |
Petroleos Mexicanos, 6.000%, 03/05/2020 | | | | | | | 624,000 | | | | 647,400 | | | | 0.05 | |
Petroleos Mexicanos, 7.190%, 09/12/2024 | | | MXN | | | | 44,460,000 | | | | 2,139,240 | | | | 0.15 | |
See accompanying notes to the financial statements.
52
ASHMORE EMERGING MARKETS TOTAL RETURN FUND
SCHEDULE OF INVESTMENTS (CONTINUED)
As of April 30, 2018 (Unaudited)
| | | | | | | | | | | | | | | | |
| | | Currency(1) | | | Par | | | Value | | | % of Net
Assets | |
Mexico (continued) | | | | | | | | | | | | | | | | |
Petroleos Mexicanos, 6.875%, 08/04/2026 | | | | | | | 3,095,000 | | | $ | 3,314,745 | | | | 0.24 | |
Petroleos Mexicanos, 6.500%, 06/02/2041 | | | | | | | 1,910,000 | | | | 1,828,825 | | | | 0.13 | |
Petroleos Mexicanos, 5.500%, 06/27/2044 | | | | | | | 548,000 | | | | 462,068 | | | | 0.03 | |
Petroleos Mexicanos, 5.625%, 01/23/2046 | | | | | | | 2,630,000 | | | | 2,221,693 | | | | 0.16 | |
Petroleos Mexicanos, 6.750%, 09/21/2047 | | | | | | | 3,521,000 | | | | 3,399,173 | | | | 0.25 | |
| | | | | | | | | | | 84,492,909 | | | | 6.11 | |
Mongolia (Cost $3,037,618) | | | | | | | | | | | | | | | | |
Energy Resources LLC, 2.961%, 09/30/2022(12) | | | | | | | 2,430,113 | | | | 2,454,414 | | | | 0.18 | |
Mongolia (Rep of), 5.625%, 05/01/2023 | | | | | | | 920,000 | | | | 892,336 | | | | 0.07 | |
Mongolian Mining Corp., 1.822%, 10/01/2018(7) | | | | | | | 992,986 | | | | 605,721 | | | | 0.04 | |
| | | | | | | | | | | 3,952,471 | | | | 0.29 | |
Morocco (Cost $7,904,736) | | | | | | | | | | | | | | | | |
Morocco (Rep of), 4.250%, 12/11/2022 | | | | | | | 5,172,000 | | | | 5,197,860 | | | | 0.38 | |
Morocco (Rep of), 5.500%, 12/11/2042 | | | | | | | 2,378,000 | | | | 2,473,120 | | | | 0.18 | |
| | | | | | | | | | | 7,670,980 | | | | 0.56 | |
Nigeria (Cost $6,700,498) | | | | | | | | | | | | | | | | |
Nigeria (Rep of), 6.500%, 11/28/2027 | | | | | | | 3,000,000 | | | | 3,019,992 | | | | 0.22 | |
Nigeria (Rep of), 7.696%, 02/23/2038(4) | | | | | | | 1,933,000 | | | | 1,986,157 | | | | 0.14 | |
Nigeria (Rep of), 7.625%, 11/28/2047 | | | | | | | 1,710,000 | | | | 1,722,825 | | | | 0.13 | |
| | | | | | | | | | | 6,728,974 | | | | 0.49 | |
Oman (Cost $7,105,395) | | | | | | | | | | | | | | | | |
Oman (Rep of), 4.750%, 06/15/2026 | | | | | | | 404,000 | | | | 376,245 | | | | 0.03 | |
Oman (Rep of), 6.500%, 03/08/2047 | | | | | | | 2,700,000 | | | | 2,489,670 | | | | 0.18 | |
Oman (Rep of), 6.750%, 01/17/2048 | | | | | | | 4,120,000 | | | | 3,878,560 | | | | 0.28 | |
| | | | | | | | | | | 6,744,475 | | | | 0.49 | |
Pakistan (Cost $23,280,873) | | | | | | | | | | | | | | | | |
Pakistan (Rep of), 7.250%, 04/15/2019 | | | | | | | 4,678,000 | | | | 4,766,742 | | | | 0.35 | |
Pakistan (Rep of), 8.250%, 04/15/2024 | | | | | | | 3,718,000 | | | | 3,863,582 | | | | 0.28 | |
Pakistan (Rep of), 8.250%, 09/30/2025 | | | | | | | 2,590,000 | | | | 2,685,633 | | | | 0.20 | |
Pakistan (Rep of), 6.875%, 12/05/2027 | | | | | | | 4,632,000 | | | | 4,332,291 | | | | 0.31 | |
Second Pakistan International Sukuk (The) Co. Ltd., 6.750%, 12/03/2019 | | | | | | | 2,890,000 | | | | 2,949,771 | | | | 0.21 | |
Third Pakistan International Sukuk (The) Co. Ltd., 5.500%, 10/13/2021 | | | | | | | 2,283,000 | | | | 2,243,221 | | | | 0.16 | |
Third Pakistan International Sukuk (The) Co. Ltd., 5.625%, 12/05/2022 | | | | | | | 1,986,000 | | | | 1,913,934 | | | | 0.14 | |
| | | | | | | | | | | 22,755,174 | | | | 1.65 | |
Panama (Cost $11,415,187) | | | | | | | | | | | | | | | | |
Panama (Rep of), 4.000%, 09/22/2024 | | | | | | | 670,000 | | | | 678,375 | | | | 0.05 | |
Panama (Rep of), 7.125%, 01/29/2026 | | | | | | | 1,889,000 | | | | 2,257,355 | | | | 0.16 | |
Panama (Rep of), 8.875%, 09/30/2027 | | | | | | | 777,000 | | | | 1,058,663 | | | | 0.08 | |
Panama (Rep of), 9.375%, 04/01/2029 | | | | | | | 781,000 | | | | 1,110,972 | | | | 0.08 | |
Panama (Rep of), 6.700%, 01/26/2036 | | | | | | | 1,872,000 | | | | 2,311,920 | | | | 0.17 | |
Panama (Rep of), 4.500%, 05/15/2047 | | | | | | | 1,320,000 | | | | 1,287,000 | | | | 0.09 | |
See accompanying notes to the financial statements.
53
ASHMORE EMERGING MARKETS TOTAL RETURN FUND
SCHEDULE OF INVESTMENTS (CONTINUED)
As of April 30, 2018 (Unaudited)
| | | | | | | | | | | | | | | | |
| | | Currency(1) | | | Par | | | Value | | | % of Net
Assets | |
Panama (continued) | | | | | | | | | | | | | | | | |
Panama (Rep of), 4.300%, 04/29/2053 | | | | | | | 2,540,000 | | | $ | 2,381,250 | | | | 0.17 | |
| | | | | | | | | | | 11,085,535 | | | | 0.80 | |
Paraguay (Cost $2,613,371) | | | | | | | | | | | | | | | | |
Paraguay (Rep of), 4.625%, 01/25/2023 | | | | | | | 1,570,000 | | | | 1,601,400 | | | | 0.11 | |
Paraguay (Rep of), 4.700%, 03/27/2027 | | | | | | | 956,000 | | | | 951,220 | | | | 0.07 | |
| | | | | | | | | | | 2,552,620 | | | | 0.18 | |
Peru (Cost $24,835,711) | | | | | | | | | | | | | | | | |
Banco de Credito del Peru, 4.850%, 10/30/2020 | | | PEN | | | | 9,670,000 | | | | 2,983,788 | | | | 0.22 | |
Fondo MIVIVIENDA S.A., 7.000%, 02/14/2024 | | | PEN | | | | 5,140,000 | | | | 1,734,138 | | | | 0.12 | |
Peru (Rep of), 7.350%, 07/21/2025 | | | | | | | 4,359,000 | | | | 5,350,673 | | | | 0.39 | |
Peru (Rep of), 8.750%, 11/21/2033 | | | | | | | 4,056,000 | | | | 5,972,460 | | | | 0.43 | |
Peru (Rep of), 5.625%, 11/18/2050 | | | | | | | 5,523,000 | | | | 6,470,194 | | | | 0.47 | |
Petroleos del Peru S.A., 5.625%, 06/19/2047 | | | | | | | 1,708,000 | | | | 1,661,457 | | | | 0.12 | |
| | | | | | | | | | | 24,172,710 | | | | 1.75 | |
Philippines (Cost $20,700,593) | | | | | | | | | | | | | | | | |
Development Bank of the Philippines, 5.500%, 03/25/2021 | | | | | | | 1,490,000 | | | | 1,577,287 | | | | 0.11 | |
Philippines (Rep of), 4.950%, 01/15/2021 | | | PHP | | | | 11,000,000 | | | | 214,210 | | | | 0.01 | |
Philippines (Rep of), 3.900%, 11/26/2022 | | | PHP | | | | 35,000,000 | | | | 648,267 | | | | 0.05 | |
Philippines (Rep of), 10.625%, 03/16/2025 | | | | | | | 1,157,000 | | | | 1,646,852 | | | | 0.12 | |
Philippines (Rep of), 5.500%, 03/30/2026 | | | | | | | 500,000 | | | | 557,856 | | | | 0.04 | |
Philippines (Rep of), 9.500%, 02/02/2030 | | | | | | | 3,137,000 | | | | 4,643,604 | | | | 0.34 | |
Philippines (Rep of), 7.750%, 01/14/2031 | | | | | | | 2,738,000 | | | | 3,681,047 | | | | 0.27 | |
Philippines (Rep of), 6.375%, 10/23/2034 | | | | | | | 1,899,000 | | | | 2,382,303 | | | | 0.17 | |
Philippines (Rep of), 6.250%, 01/14/2036 | | | PHP | | | | 15,000,000 | | | | 316,960 | | | | 0.02 | |
Power Sector Assets & Liabilities Management Corp., 7.390%, 12/02/2024 | | | | | | | 3,236,000 | | | | 3,879,394 | | | | 0.28 | |
| | | | | | | | | | | 19,547,780 | | | | 1.41 | |
Poland (Cost $4,978,936) | | | | | | | | | | | | | | | | |
Poland (Rep of), 5.000%, 03/23/2022 | | | | | | | 1,633,000 | | | | 1,732,678 | | | | 0.12 | |
Poland (Rep of), 3.000%, 03/17/2023 | | | | | | | 715,000 | | | | 703,203 | | | | 0.05 | |
Poland (Rep of), 3.250%, 07/25/2025 | | | PLN | | | | 838,000 | | | | 244,917 | | | | 0.02 | |
Poland (Rep of), 2.500%, 07/25/2026 | | | PLN | | | | 8,834,000 | | | | 2,431,593 | | | | 0.18 | |
| | | | | | | | | | | 5,112,391 | | | | 0.37 | |
Qatar (Cost $2,370,000) | | | | | | | | | | | | | | | | |
Qatar (Rep of), 5.103%, 04/23/2048(4)(11) | | | | | | | 2,370,000 | | | | 2,349,026 | | | | 0.17 | |
| | | | | | | | | | | 2,349,026 | | | | 0.17 | |
Romania (Cost $9,015,324) | | | | | | | | | | | | | | | | |
Romania (Rep of), 4.375%, 08/22/2023 | | | | | | | 6,386,000 | | | | 6,481,790 | | | | 0.47 | |
Romania (Rep of), 5.800%, 07/26/2027 | | | RON | | | | 6,150,000 | | | | 1,732,027 | | | | 0.13 | |
Romania (Rep of), 6.125%, 01/22/2044 | | | | | | | 530,000 | | | | 614,800 | | | | 0.04 | |
| | | | | | | | | | | 8,828,617 | | | | 0.64 | |
Russian Federation (Cost $51,129,516) | | | | | | | | | | | | | | | | |
CEDC Finance Corp International, Inc., 10.000%, 12/31/2022(4) | | | | | | | 1,071,532 | | | | 874,638 | | | | 0.06 | |
See accompanying notes to the financial statements.
54
ASHMORE EMERGING MARKETS TOTAL RETURN FUND
SCHEDULE OF INVESTMENTS (CONTINUED)
As of April 30, 2018 (Unaudited)
| | | | | | | | | | | | | | | | |
| | | Currency(1) | | | Par | | | Value | | | % of Net
Assets | |
Russian Federation (continued) | | | | | | | | | | | | | | | | |
Gazprom Neft OAO Via GPN Capital S.A., 4.375%, 09/19/2022 | | | | | | | 4,152,000 | | | $ | 4,071,850 | | | | 0.30 | |
Gazprom OAO Via Gaz Capital S.A., 9.250%, 04/23/2019 | | | | | | | 640,000 | | | | 670,400 | | | | 0.05 | |
Gazprom OAO Via Gaz Capital S.A., 8.625%, 04/28/2034 | | | | | | | 1,040,000 | | | | 1,318,762 | | | | 0.10 | |
Russian Federal Bond - OFZ, 7.500%, 08/18/2021 | | | RUB | | | | 585,143,000 | | | | 9,533,726 | | | | 0.69 | |
Russian Federal Bond - OFZ, 7.400%, 12/07/2022 | | | RUB | | | | 74,448,000 | | | | 1,210,651 | | | | 0.09 | |
Russian Federal Bond - OFZ, 7.750%, 09/16/2026 | | | RUB | | | | 324,001,000 | | | | 5,340,685 | | | | 0.39 | |
Russian Federal Bond - OFZ, 8.500%, 09/17/2031 | | | RUB | | | | 316,795,000 | | | | 5,549,603 | | | | 0.40 | |
Russian Federal Bond - OFZ, 7.700%, 03/23/2033 | | | RUB | | | | 35,390,000 | | | | 576,322 | | | | 0.04 | |
Russian Foreign Bond - Eurobond, 4.375%, 03/21/2029(4) | | | | | | | 3,200,000 | | | | 3,099,251 | | | | 0.22 | |
Russian Foreign Bond - Eurobond, 5.250%, 06/23/2047 | | | | | | | 3,600,000 | | | | 3,488,126 | | | | 0.25 | |
Sberbank of Russia Via SB Capital S.A., 5.125%, 10/29/2022 | | | | | | | 1,420,000 | | | | 1,405,800 | | | | 0.10 | |
Sberbank of Russia Via SB Capital S.A., 5.250%, 05/23/2023 | | | | | | | 3,620,000 | | | | 3,592,850 | | | | 0.26 | |
SCF Capital Designated Activity Co., 5.375%, 06/16/2023 | | | | | | | 2,580,000 | | | | 2,541,610 | | | | 0.18 | |
Vnesheconombank Via VEB Finance PLC, 6.902%, 07/09/2020 | | | | | | | 880,000 | | | | 913,572 | | | | 0.07 | |
Vnesheconombank Via VEB Finance PLC, 6.025%, 07/05/2022 | | | | | | | 1,520,000 | | | | 1,573,504 | | | | 0.11 | |
Vnesheconombank Via VEB Finance PLC, 5.942%, 11/21/2023 | | | | | | | 3,264,000 | | | | 3,389,958 | | | | 0.25 | |
| | | | | | | | | | | 49,151,308 | | | | 3.56 | |
Saudi Arabia (Cost $1,076,098) | | | | | | | | | | | | | | | | |
Saudi (Rep of), 5.000%, 04/17/2049(4)(11) | | | | | | | 1,100,000 | | | | 1,054,889 | | | | 0.08 | |
| | | | | | | | | | | 1,054,889 | | | | 0.08 | |
Senegal (Cost $4,591,727) | | | | | | | | | | | | | | | | |
Senegal (Rep of), 6.250%, 05/23/2033 | | | | | | | 2,369,000 | | | | 2,283,313 | | | | 0.16 | |
Senegal (Rep of), 6.750%, 03/13/2048(4) | | | | | | | 2,157,000 | | | | 2,032,973 | | | | 0.15 | |
| | | | | | | | | | | 4,316,286 | | | | 0.31 | |
Serbia (Cost $3,429,700) | | | | | | | | | | | | | | | | |
Serbia (Rep of), 4.875%, 02/25/2020 | | | | | | | 2,524,000 | | | | 2,570,613 | | | | 0.19 | |
Serbia (Rep of), 7.250%, 09/28/2021 | | | | | | | 780,000 | | | | 861,498 | | | | 0.06 | |
| | | | | | | | | | | 3,432,111 | | | | 0.25 | |
South Africa (Cost $75,840,871) | | | | | | | | | | | | | | | | |
Eskom Holdings SOC Ltd., 5.750%, 01/26/2021 | | | | | | | 450,000 | | | | 448,713 | | | | 0.03 | |
Eskom Holdings SOC Ltd., 6.750%, 08/06/2023 | | | | | | | 2,487,000 | | | | 2,518,088 | | | | 0.18 | |
Eskom Holdings SOC Ltd., 7.125%, 02/11/2025 | | | | | | | 5,008,000 | | | | 5,116,674 | | | | 0.37 | |
South Africa (Rep of), 5.875%, 05/30/2022 | | | | | | | 1,782,000 | | | | 1,898,963 | | | | 0.14 | |
South Africa (Rep of), 4.875%, 04/14/2026 | | | | | | | 2,690,000 | | | | 2,642,021 | | | | 0.19 | |
South Africa (Rep of), 10.500%, 12/21/2026 | | | ZAR | | | | 111,902,000 | | | | 10,240,402 | | | | 0.74 | |
South Africa (Rep of), 4.300%, 10/12/2028 | | | | | | | 5,969,000 | | | | 5,479,805 | | | | 0.40 | |
South Africa (Rep of), 8.000%, 01/31/2030 | | | ZAR | | | | 55,284,000 | | | | 4,245,758 | | | | 0.31 | |
South Africa (Rep of), 7.000%, 02/28/2031 | | | ZAR | | | | 142,050,346 | | | | 9,937,256 | | | | 0.72 | |
South Africa (Rep of), 8.250%, 03/31/2032 | | | ZAR | | | | 56,129,000 | | | | 4,320,019 | | | | 0.31 | |
South Africa (Rep of), 8.500%, 01/31/2037 | | | ZAR | | | | 17,781,660 | | | | 1,369,301 | | | | 0.10 | |
South Africa (Rep of), 9.000%, 01/31/2040 | | | ZAR | | | | 64,175,480 | | | | 5,138,883 | | | | 0.37 | |
South Africa (Rep of), 6.500%, 02/28/2041 | | | ZAR | | | | 22,931,000 | | | | 1,394,624 | | | | 0.10 | |
South Africa (Rep of), 8.750%, 01/31/2044 | | | ZAR | | | | 90,550,000 | | | | 7,033,283 | | | | 0.51 | |
South Africa (Rep of), 5.000%, 10/12/2046 | | | | | | | 4,565,000 | | | | 4,028,613 | | | | 0.29 | |
See accompanying notes to the financial statements.
55
ASHMORE EMERGING MARKETS TOTAL RETURN FUND
SCHEDULE OF INVESTMENTS (CONTINUED)
As of April 30, 2018 (Unaudited)
| | | | | | | | | | | | | | | | |
| | | Currency(1) | | | Par | | | Value | | | % of Net
Assets | |
South Africa (continued) | | | | | | | | | | | | | | | | |
South Africa (Rep of), 5.650%, 09/27/2047 | | | | | | | 3,600,000 | | | $ | 3,449,520 | | | | 0.25 | |
South Africa (Rep of), 8.750%, 02/28/2048 | | | ZAR | | | | 126,444,690 | | | | 9,837,427 | | | | 0.71 | |
| | | | | | | | | | | 79,099,350 | | | | 5.72 | |
Sri Lanka (Cost $2,209,759) | | | | | | | | | | | | | | | | |
Sri Lanka (Rep of), 6.825%, 07/18/2026 | | | | | | | 1,051,000 | | | | 1,065,502 | | | | 0.08 | |
Sri Lanka (Rep of), 6.200%, 05/11/2027 | | | | | | | 1,071,000 | | | | 1,033,324 | | | | 0.07 | |
| | | | | | | | | | | 2,098,826 | | | | 0.15 | |
Suriname (Cost $2,100,446) | | | | | | | | | | | | | | | | |
Suriname (Rep of), 9.250%, 10/26/2026 | | | | | | | 2,077,000 | | | | 2,139,310 | | | | 0.16 | |
| | | | | | | | | | | 2,139,310 | | | | 0.16 | |
Thailand (Cost $6,430,355) | | | | | | | | | | | | | | | | |
Thailand (Rep of), 2.000%, 12/17/2022 | | | THB | | | | 29,304,000 | | | | 932,371 | | | | 0.07 | |
Thailand (Rep of), 1.250%, 03/12/2028(6) | | | THB | | | | 22,210,000 | | | | 695,874 | | | | 0.05 | |
Thailand (Rep of), 3.775%, 06/25/2032 | | | THB | | | | 86,450,000 | | | | 2,988,099 | | | | 0.21 | |
Thailand (Rep of), 3.400%, 06/17/2036 | | | THB | | | | 58,033,000 | | | | 1,904,599 | | | | 0.14 | |
| | | | | | | | | | | 6,520,943 | | | | 0.47 | |
Turkey (Cost $31,772,381) | | | | | | | | | | | | | | | | |
Turkey (Rep of), 7.000%, 03/11/2019 | | | | | | | 1,410,000 | | | | 1,450,636 | | | | 0.10 | |
Turkey (Rep of), 7.500%, 11/07/2019 | | | | | | | 1,620,000 | | | | 1,707,367 | | | | 0.12 | |
Turkey (Rep of), 7.000%, 06/05/2020 | | | | | | | 360,000 | | | | 380,161 | | | | 0.03 | |
Turkey (Rep of), 5.625%, 03/30/2021 | | | | | | | 1,730,000 | | | | 1,784,135 | | | | 0.13 | |
Turkey (Rep of), 3.000%, 02/23/2022(6) | | | TRY | | | | 5,042,000 | | | | 2,047,990 | | | | 0.15 | |
Turkey (Rep of), 10.700%, 08/17/2022 | | | TRY | | | | 14,380,000 | | | | 3,267,458 | | | | 0.24 | |
Turkey (Rep of), 6.250%, 09/26/2022 | | | | | | | 820,000 | | | | 862,035 | | | | 0.06 | |
Turkey (Rep of), 3.250%, 03/23/2023 | | | | | | | 850,000 | | | | 784,159 | | | | 0.06 | |
Turkey (Rep of), 5.750%, 03/22/2024 | | | | | | | 1,770,000 | | | | 1,794,373 | | | | 0.13 | |
Turkey (Rep of), 7.375%, 02/05/2025 | | | | | | | 1,657,000 | | | | 1,815,959 | | | | 0.13 | |
Turkey (Rep of), 11.000%, 02/24/2027 | | | TRY | | | | 15,021,000 | | | | 3,453,784 | | | | 0.25 | |
Turkey (Rep of), 6.000%, 03/25/2027 | | | | | | | 1,090,000 | | | | 1,093,989 | | | | 0.08 | |
Turkey (Rep of), 6.125%, 10/24/2028 | | | | | | | 1,940,000 | | | | 1,935,150 | | | | 0.14 | |
Turkey (Rep of), 6.750%, 05/30/2040 | | | | | | | 1,927,000 | | | | 1,936,307 | | | | 0.14 | |
Turkey (Rep of), 6.000%, 01/14/2041 | | | | | | | 850,000 | | | | 782,245 | | | | 0.06 | |
Turkey (Rep of), 4.875%, 04/16/2043 | | | | | | | 2,860,000 | | | | 2,274,415 | | | | 0.16 | |
Turkey (Rep of), 5.750%, 05/11/2047 | | | | | | | 1,722,000 | | | | 1,503,723 | | | | 0.11 | |
| | | | | | | | | | | 28,873,886 | | | | 2.09 | |
Ukraine (Cost $23,901,136) | | | | | | | | | | | | | | | | |
DTEK Finance PLC, 10.750%, (13% PIK), 12/31/2024(7) | | | | | | | 4,423,861 | | | | 4,687,081 | | | | 0.34 | |
Metinvest B.V., 7.750%, 04/23/2023(4) | | | | | | | 3,500,000 | | | | 3,402,700 | | | | 0.25 | |
Ukraine (Rep of), 7.750%, 09/01/2021 | | | | | | | 329,000 | | | | 339,758 | | | | 0.02 | |
Ukraine (Rep of), 7.750%, 09/01/2022 | | | | | | | 642,000 | | | | 654,686 | | | | 0.05 | |
Ukraine (Rep of), 7.750%, 09/01/2023 | | | | | | | 2,522,000 | | | | 2,542,277 | | | | 0.18 | |
Ukraine (Rep of), 7.750%, 09/01/2024 | | | | | | | 858,000 | | | | 855,855 | | | | 0.06 | |
Ukraine (Rep of), 7.750%, 09/01/2025 | | | | | | | 2,073,000 | | | | 2,057,453 | | | | 0.15 | |
Ukraine (Rep of), 7.750%, 09/01/2026 | | | | | | | 1,654,000 | | | | 1,630,447 | | | | 0.12 | |
See accompanying notes to the financial statements.
56
ASHMORE EMERGING MARKETS TOTAL RETURN FUND
SCHEDULE OF INVESTMENTS (CONTINUED)
As of April 30, 2018 (Unaudited)
| | | | | | | | | | | | | | | | |
| | | Currency(1) | | | Par | | | Value | | | % of Net
Assets | |
Ukraine (continued) | | | | | | | | | | | | | | | | |
Ukraine (Rep of), 7.375%, 09/25/2032 | | | | | | | 4,832,000 | | | $ | 4,458,486 | | | | 0.32 | |
Ukraine Railways Via Shortline PLC, 9.875%, 09/15/2021 | | | | | | | 890,000 | | | | 927,953 | | | | 0.07 | |
Ukreximbank Via Biz Finance PLC, 9.750%, 01/22/2025 | | | | | | | 2,150,000 | | | | 2,249,437 | | | | 0.16 | |
| | | | | | | | | | | 23,806,133 | | | | 1.72 | |
United Arab Emirates (Cost $1,064,534) | | | | | | | | | | | | | | | | |
Abu Dhabi (Rep of), 3.125%, 05/03/2026 | | | | | | | 1,090,000 | | | | 1,027,626 | | | | 0.07 | |
| | | | | | | | | | | 1,027,626 | | | | 0.07 | |
Uruguay (Cost $12,916,642) | | | | | | | | | | | | | | | | |
Uruguay (Rep of), 7.875%, 01/15/2033 | | | | | | | 2,456,000 | | | | 3,220,676 | | | | 0.23 | |
Uruguay (Rep of), 7.625%, 03/21/2036 | | | | | | | 1,804,000 | | | | 2,347,996 | | | | 0.17 | |
Uruguay (Rep of), 4.125%, 11/20/2045 | | | | | | | 1,634,235 | | | | 1,450,383 | | | | 0.11 | |
Uruguay (Rep of), 5.100%, 06/18/2050 | | | | | | | 1,386,000 | | | | 1,361,745 | | | | 0.10 | |
Uruguay (Rep of), 4.975%, 04/20/2055 | | | | | | | 4,345,974 | | | | 4,183,000 | | | | 0.30 | |
| | | | | | | | | | | 12,563,800 | | | | 0.91 | |
Venezuela (Cost $65,367,002) | | | | | | | | | | | | | | | | |
Petroleos de Venezuela S.A., 8.500%, 10/27/2020 | | | | | | | 39,687,750 | | | | 34,369,591 | | | | 2.49 | |
Petroleos de Venezuela S.A., 9.000%, 11/17/2021(8) | | | | | | | 3,789,076 | | | | 1,136,723 | | | | 0.08 | |
Petroleos de Venezuela S.A., 12.750%, 02/17/2022(8) | | | | | | | 1,695,000 | | | | 529,688 | | | | 0.04 | |
Petroleos de Venezuela S.A., 5.375%, 04/12/2027(8) | | | | | | | 1,590,000 | | | | 415,785 | | | | 0.03 | |
Petroleos de Venezuela S.A., 9.750%, 05/17/2035(8) | | | | | | | 4,123,147 | | | | 1,164,377 | | | | 0.08 | |
Venezuela (Rep of), 7.750%, 10/13/2019(8) | | | | | | | 2,600,000 | | | | 767,000 | | | | 0.06 | |
Venezuela (Rep of), 12.750%, 08/23/2022(8) | | | | | | | 3,246,000 | | | | 1,022,490 | | | | 0.07 | |
Venezuela (Rep of), 9.000%, 05/07/2023(8) | | | | | | | 3,000,000 | | | | 855,000 | | | | 0.06 | |
Venezuela (Rep of), 8.250%, 10/13/2024(8) | | | | | | | 6,920,000 | | | | 1,972,200 | | | | 0.14 | |
Venezuela (Rep of), 7.650%, 04/21/2025(8) | | | | | | | 1,442,000 | | | | 407,365 | | | | 0.03 | |
Venezuela (Rep of), 11.750%, 10/21/2026(8) | | | | | | | 12,847,200 | | | | 3,950,514 | | | | 0.29 | |
Venezuela (Rep of), 9.250%, 09/15/2027(8) | | | | | | | 3,247,000 | | | | 1,006,570 | | | | 0.07 | |
Venezuela (Rep of), 9.250%, 05/07/2028(8) | | | | | | | 4,253,000 | | | | 1,201,472 | | | | 0.09 | |
Venezuela (Rep of), 11.950%, 08/05/2031(8) | | | | | | | 21,629,200 | | | | 6,650,979 | | | | 0.48 | |
| | | | | | | | | | | 55,449,754 | | | | 4.01 | |
Vietnam (Cost $6,398,097) | | | | | | | | | | | | | | | | |
Vietnam (Rep of), 6.750%, 01/29/2020 | | | | | | | 4,110,000 | | | | 4,321,299 | | | | 0.31 | |
Vietnam (Rep of), 4.800%, 11/19/2024 | | | | | | | 1,982,000 | | | | 2,014,222 | | | | 0.15 | |
| | | | | | | | | | | 6,335,521 | | | | 0.46 | |
Zambia (Cost $5,090,030) | | | | | | | | | | | | | | | | |
Zambia (Rep of), 5.375%, 09/20/2022 | | | | | | | 250,000 | | | | 228,762 | | | | 0.01 | |
Zambia (Rep of), 8.500%, 04/14/2024 | | | | | | | 1,090,000 | | | | 1,100,736 | | | | 0.08 | |
See accompanying notes to the financial statements.
57
ASHMORE EMERGING MARKETS TOTAL RETURN FUND
SCHEDULE OF INVESTMENTS (CONTINUED)
As of April 30, 2018 (Unaudited)
| | | | | | | | | | | | | | | | |
| | | Currency(1) | | | Par | | | Value | | | % of Net
Assets | |
Zambia (continued) | | | | | | | | | | | | | | | | |
Zambia (Rep of), 8.970%, 07/30/2027 | | | | | | | 3,809,000 | | | $ | 3,828,045 | | | | 0.28 | |
| | | | | | | | | | | 5,157,543 | | | | 0.37 | |
| | | | |
Total Debt Securities (Cost $1,255,049,480) | | | | | | | | | | | 1,213,689,136 | | | | 87.79 | |
| | | | |
Bank Loans | | | | | | | | | | | | | | | | |
| | | | |
United Arab Emirates (Cost $16,512,159) | | | | | | | | | | | | | | | | |
DP World Ltd., 3.750%, 09/30/2022(13) | | | | | | | 6,863,615 | | | | 6,520,435 | | | | 0.47 | |
DP World Ltd., 4.750%, 09/30/2022(13) | | | | | | | 5,344,401 | | | | 5,077,181 | | | | 0.37 | |
Dubai Drydocks World LLC, 4.302%, 11/20/2020(13) | | | | | | | 6,470,000 | | | | 6,146,500 | | | | 0.44 | |
| | | | | | | | | | | 17,744,116 | | | | 1.28 | |
| | | | |
Total Bank Loans (Cost $16,512,159) | | | | | | | | | | | 17,744,116 | | | | 1.28 | |
| | | | |
| | | Currency(1) | | | Shares | | | Value | | | % of Net
Assets | |
Equity Securities | | | | | | | | | | | | | | | | |
| | | | |
Mongolia (Cost $1,170,643) | | | | | | | | | | | | | | | | |
Mongolian Mining Corp. * | | | HKD | | | | 6,813,061 | | | $ | 128,832 | | | | 0.01 | |
| | | | | | | | | | | 128,832 | | | | 0.01 | |
| | | | |
Niger (Cost $265,038) | | | | | | | | | | | | | | | | |
Savannah Petroleum PLC * | | | GBP | | | | 682,262 | | | | 285,501 | | | | 0.02 | |
| | | | | | | | | | | 285,501 | | | | 0.02 | |
| | | | |
Russian Federation (Cost $130,309) | | | | | | | | | | | | | | | | |
Roust Corp. *(13) | | | | | | | 8,407 | | | | 42,035 | | | | — | |
| | | | | | | | | | | 42,035 | | | | — | |
| | | | |
Total Equity Securities (Cost $1,565,990) | | | | | | | | | | | 456,368 | | | | 0.03 | |
| | | | |
| | | Currency(1) | | | Number
of Warrants | | | Value | | | % of Net
Assets | |
Warrants | | | | | | | | | | | | | | | | |
| | | | |
Mexico (Cost $—) | | | | | | | | | | | | | | | | |
Corp. GEO S.A.B. de C.V., Exp. 07/31/2022, Strike Price $9.75 *(10) | | | MXN | | | | 63,823 | | | $ | — | | | | — | |
| | | | | | | | | | | — | | | | — | |
Total Warrants (Cost $—) | | | | | | | | | | | — | | | | — | |
| | | | |
Total Investments in Securities (Cost $1,273,127,629) | | | | | | | | | | | 1,231,889,620 | | | | 89.10 | |
| | | | |
| | | Currency(1) | | | Par | | | Value | | | % of Net
Assets | |
Fully Funded Total Return Swaps | | | | | | | | | | | | | | | | |
| | | | |
Indonesia (Cost $4,248,029) | | | | | | | | | | | | | | | | |
Indonesia (Rep of), Issued by ANZ Banking Corp., 8.375%, 03/15/2024 | | | IDR | | | | 5,702,000,000 | | | $ | 442,493 | | | | 0.03 | |
See accompanying notes to the financial statements.
58
ASHMORE EMERGING MARKETS TOTAL RETURN FUND
SCHEDULE OF INVESTMENTS (CONTINUED)
As of April 30, 2018 (Unaudited)
| | | | | | | | | | | | | | | | |
| | | Currency(1) | | | Par | | | Value | | | % of Net
Assets | |
Indonesia (continued) | | | | | | | | | | | | | | | | |
Indonesia (Rep of), Issued by ANZ Banking Corp., 8.375%, 03/15/2034 | | | IDR | | | | 262,000,000 | | | $ | 20,601 | | | | — | |
Indonesia (Rep of), Issued by Standard Chartered, 12.800%, 06/15/2021 | | | IDR | | | | 1,840,000,000 | | | | 155,773 | | | | 0.01 | |
Indonesia (Rep of), Issued by Standard Chartered, 8.375%, 03/15/2024 | | | IDR | | | | 6,958,000,000 | | | | 539,963 | | | | 0.04 | |
Indonesia (Rep of), Issued by Standard Chartered, 11.000%, 09/15/2025 | | | IDR | | | | 3,602,000,000 | | | | 318,870 | | | | 0.02 | |
Indonesia (Rep of), Issued by Standard Chartered, 7.000%, 05/15/2027 | | | IDR | | | | 2,613,000,000 | | | | 189,460 | | | | 0.01 | |
Indonesia (Rep of), Issued by Standard Chartered, 9.000%, 03/15/2029 | | | IDR | | | | 11,300,000,000 | | | | 921,826 | | | | 0.07 | |
Indonesia (Rep of), Issued by Standard Chartered, 10.500%, 08/15/2030 | | | IDR | | | | 8,356,000,000 | | | | 750,815 | | | | 0.06 | |
Indonesia (Rep of), Issued by Standard Chartered, 8.375%, 03/15/2034 | | | IDR | | | | 2,727,000,000 | | | | 214,420 | | | | 0.02 | |
| | | | | | | | | | | 3,554,221 | | | | 0.26 | |
| | | | |
Total Fully Funded Total Return Swaps (Cost $4,248,029) | | | | | | | | | | | 3,554,221 | | | | 0.26 | |
| | | | |
Total Investments (Total Cost $1,277,375,658) | | | | | | | | | | | 1,235,443,841 | | | | 89.36 | |
Other Assets Less Liabilities (See Statements of Assets and Liabilities for further detail) | | | | | | | | | | | 147,073,240 | | | | 10.64 | |
| | | | |
Net Assets | | | | | | | | | | $ | 1,382,517,081 | | | | 100.00 | |
| * | Non-income producing security. |
| (1) | Par values are stated in United States Dollars unless otherwise noted below. |
| (2) | Step coupon bond. Rate as of April 30, 2018 is disclosed. |
| (3) | Zero coupon bond – interest rate reflects effective yield on the date of purchase. |
| (4) | Securities exempt from registration under Rule 144A of the Securities Act of 1933. These securities may not be publicly traded without registration under the Securities Act of 1933. |
| (5) | Variable rate security. Security issued at a fixed coupon rate, which converts to a variable rate at a specified date. Rate shown is the rate in effect as of period end. |
| (6) | Inflation-indexed bonds are shown at original par and stated coupon rate. |
| (7) | Security is a payment-in-kind bond, and unless otherwise noted in the description of the security, pays its entire coupon on an in-kind basis. |
| (8) | Issuer has defaulted on terms of debt obligation. |
| (9) | Maturity has been extended under the terms of a plan of reorganization. |
| (10) | Security has been deemed worthless and is a Level 3 investment. |
| (11) | Restricted security that has been deemed illiquid. At April 30, 2018 the value of these restricted illiquid securities amount to $6,709,326 or 0.5% of net assets. Additional information on each restricted illiquid security is as follows: |
| | | | | | |
| SECURITY | | ACQUISITION DATE | | ACQUISITION COST | |
| | |
Far East Energy Bermuda Ltd., 13.000%, 01/15/2016 | | 01/14/2013-07/20/2015 | | | $1,953,742 | |
KazMunayGas National Co. JSC, 5.375%, 04/24/2030 | | 04/17/2018 | | | 2,151,000 | |
KazMunayGas National Co. JSC, 6.375%, 10/24/2048 | | 04/17/2018 | | | 1,119,747 | |
Qatar (Rep of), 5.103%, 04/23/2048 | | 04/12/2018 | | | 2,370,000 | |
Saudi (Rep of), 5.000%, 04/17/2049 | | 04/10/2018 | | | 1,076,086 | |
See accompanying notes to the financial statements.
59
ASHMORE EMERGING MARKETS TOTAL RETURN FUND
SCHEDULE OF INVESTMENTS (CONTINUED)
As of April 30, 2018 (Unaudited)
| (12) | The coupon rate is subject to the performance of the TSIPPCAE Commodity Index. |
| (13) | Security is a Level 3 investment. |
Percentages shown are based on net assets.
At April 30, 2018, the Ashmore Emerging Markets Total Return Fund had outstanding forward foreign currency exchange contracts as follows:
| | | | | | | | | | | | | | | | | | |
Settlement Date | | Counterparty | | Currency Buy | | Currency Buy Amount
(Local
Currency) | | | Currency Sell | | Currency Sell Amount
(Local Currency) | | | Unrealized
Gain/(Loss) | |
05/03/2018 | | Goldman Sachs | | United States Dollar | | | 23,293,224 | | | Brazilian Real | | | 77,038,845 | | | $ | 1,308,866 | |
05/03/2018 | | JP Morgan | | United States Dollar | | | 6,140,876 | | | Brazilian Real | | | 20,461,399 | | | | 301,864 | |
05/29/2018 | | Deutsche Bank | | United States Dollar | | | 7,305,000 | | | Chilean Peso | | | 4,401,993,000 | | | | 128,770 | |
05/31/2018 | | Morgan Stanley | | Indian Rupee | | | 32,206,459 | | | United States Dollar | | | 481,340 | | | | 1,171 | |
05/31/2018 | | HSBC Bank | | United States Dollar | | | 4,067,934 | | | Argentine Peso | | | 84,613,023 | | | | 72,564 | |
05/31/2018 | | Barclays | | United States Dollar | | | 1,289,666 | | | South African Rand | | | 15,370,494 | | | | 62,041 | |
05/31/2018 | | Merrill Lynch | | United States Dollar | | | 1,231,437 | | | South African Rand | | | 15,249,068 | | | | 13,510 | |
06/04/2018 | | Merrill Lynch | | United States Dollar | | | 15,148,229 | | | Brazilian Real | | | 52,212,159 | | | | 296,295 | |
06/29/2018 | | Goldman Sachs | | Indonesian Rupiah | | | 8,419,200,000 | | | United States Dollar | | | 600,000 | | | | 663 | |
06/29/2018 | | ANZ | | Philippine Peso | | | 260,766,960 | | | United States Dollar | | | 4,981,031 | | | | 49,195 | |
06/29/2018 | | Barclays | | Philippine Peso | | | 37,703,058 | | | United States Dollar | | | 717,880 | | | | 9,417 | |
07/31/2018 | | Credit Suisse | | Colombian Peso | | | 4,036,890,000 | | | United States Dollar | | | 1,430,000 | | | | 4,303 | |
07/31/2018 | | Citibank | | Mexican Peso | | | 64,211,192 | | | United States Dollar | | | 3,353,500 | | | | 29,951 | |
07/31/2018 | | BNP Paribas | | Turkish Lira | | | 80,697,803 | | | United States Dollar | | | 19,298,769 | | | | 2,072 | |
07/31/2018 | | Citibank | | Turkish Lira | | | 2,321,424 | | | United States Dollar | | | 551,050 | | | | 4,175 | |
07/31/2018 | | BNP Paribas | | United States Dollar | | | 1,219,106 | | | South African Rand | | | 15,249,068 | | | | 10,521 | |
03/29/2019 | | JP Morgan | | United States Dollar | | | 20,720,535 | | | Chilean Peso | | | 12,491,374,800 | | | | 367,389 | |
03/29/2019 | | JP Morgan | | United States Dollar | | | 14,448,964 | | | Chilean Peso | | | 8,688,161,916 | | | | 292,681 | |
04/02/2019 | | Standard Chartered | | United States Dollar | | | 20,132,953 | | | Brazilian Real | | | 70,723,036 | | | | 459,158 | |
| | | | | | | | | | | | | | | | | | |
Subtotal Appreciation | | | | | | | | | | | | | | | | | 3,414,606 | |
| | | | | | | | | | | | | | | | | | |
05/03/2018 | | Goldman Sachs | | Brazilian Real | | | 10,014,270 | | | United States Dollar | | | 3,010,000 | | | $ | (152,256 | ) |
05/03/2018 | | HSBC Bank | | Brazilian Real | | | 5,728,958 | | | United States Dollar | | | 1,715,000 | | | | (80,143 | ) |
05/03/2018 | | JP Morgan | | Brazilian Real | | | 29,544,858 | | | United States Dollar | | | 8,793,767 | | | | (362,634 | ) |
05/03/2018 | | Merrill Lynch | | Brazilian Real | | | 52,212,159 | | | United States Dollar | | | 15,186,783 | | | | (287,146 | ) |
05/30/2018 | | Barclays | | Polish Zloty | | | 6,512,166 | | | United States Dollar | | | 1,963,655 | | | | (107,660 | ) |
05/30/2018 | | BNP Paribas | | Polish Zloty | | | 7,379,539 | | | United States Dollar | | | 2,183,780 | | | | (80,580 | ) |
05/30/2018 | | Citibank | | Polish Zloty | | | 8,595,208 | | | United States Dollar | | | 2,498,310 | | | | (48,639 | ) |
05/30/2018 | | Merrill Lynch | | Polish Zloty | | | 13,383,216 | | | United States Dollar | | | 3,907,052 | | | | (92,779 | ) |
05/30/2018 | | Standard Chartered | | Polish Zloty | | | 6,256,787 | | | United States Dollar | | | 1,866,965 | | | | (83,754 | ) |
05/30/2018 | | Citibank | | South African Rand | | | 6,530,697 | | | United States Dollar | | | 545,996 | | | | (24,332 | ) |
05/31/2018 | | BNP Paribas | | Argentine Peso | | | 21,045,000 | | | United States Dollar | | | 1,000,000 | | | | (6,269 | ) |
05/31/2018 | | BNP Paribas | | Argentine Peso | | | 60,936,293 | | | United States Dollar | | | 2,898,967 | | | | (21,597 | ) |
05/31/2018 | | Deutsche Bank | | Czech Koruna | | | 39,068,742 | | | United States Dollar | | | 1,879,740 | | | | (33,328 | ) |
05/31/2018 | | Deutsche Bank | | Czech Koruna | | | 36,991,645 | | | United States Dollar | | | 1,819,940 | | | | (71,692 | ) |
05/31/2018 | | JP Morgan | | Czech Koruna | | | 189,760,814 | | | United States Dollar | | | 9,344,601 | | | | (376,390 | ) |
05/31/2018 | | BNP Paribas | | Hungarian Forint | | | 2,273,912,972 | | | United States Dollar | | | 9,015,236 | | | $ | (245,383 | ) |
See accompanying notes to the financial statements.
60
ASHMORE EMERGING MARKETS TOTAL RETURN FUND
SCHEDULE OF INVESTMENTS (CONTINUED)
As of April 30, 2018 (Unaudited)
| | | | | | | | | | | | | | | | | | |
Settlement Date | | Counterparty | | Currency Buy | | Currency Buy Amount
(Local
Currency) | | | Currency Sell | | Currency Sell Amount
(Local Currency) | | | Unrealized
Gain/(Loss) | |
| | | | | | |
05/31/2018 | | Credit Suisse | | Hungarian Forint | | | 398,266,032 | | | United States Dollar | | | 1,574,100 | | | | (38,098 | ) |
05/31/2018 | | Deutsche Bank | | Hungarian Forint | | | 784,901,494 | | | United States Dollar | | | 3,106,552 | | | | (79,405 | ) |
05/31/2018 | | BNP Paribas | | Indian Rupee | | | 51,734,730 | | | United States Dollar | | | 789,000 | | | | (13,920 | ) |
05/31/2018 | | BNP Paribas | | Indian Rupee | | | 290,814,177 | | | United States Dollar | | | 4,430,475 | | | | (73,554 | ) |
05/31/2018 | | Goldman Sachs | | Indian Rupee | | | 131,869,738 | | | United States Dollar | | | 2,002,000 | | | | (26,354 | ) |
05/31/2018 | | Merrill Lynch | | Indian Rupee | | | 103,068,000 | | | United States Dollar | | | 1,575,000 | | | | (30,856 | ) |
05/31/2018 | | Deutsche Bank | | Malaysian Ringgit | | | 14,579,377 | | | United States Dollar | | | 3,721,317 | | | | (9,569 | ) |
05/31/2018 | | Deutsche Bank | | Malaysian Ringgit | | | 3,656,583 | | | United States Dollar | | | 945,000 | | | | (14,074 | ) |
05/31/2018 | | BNP Paribas | | Romanian Leu | | | 3,589,484 | | | United States Dollar | | | 951,430 | | | | (21,526 | ) |
05/31/2018 | | BNP Paribas | | Romanian Leu | | | 3,857,598 | | | United States Dollar | | | 1,025,642 | | | | (26,280 | ) |
05/31/2018 | | Deutsche Bank | | Romanian Leu | | | 5,001,696 | | | United States Dollar | | | 1,322,700 | | | | (26,944 | ) |
05/31/2018 | | HSBC Bank | | Romanian Leu | | | 16,157,932 | | | United States Dollar | | | 4,287,971 | | | | (102,044 | ) |
05/31/2018 | | Goldman Sachs | | Russian Ruble | | | 21,904,345 | | | United States Dollar | | | 354,290 | | | | (7,826 | ) |
05/31/2018 | | HSBC Bank | | Russian Ruble | | | 927,264,576 | | | United States Dollar | | | 14,996,395 | | | | (329,707 | ) |
05/31/2018 | | JP Morgan | | South African Rand | | | 45,251,957 | | | United States Dollar | | | 3,620,620 | | | | (6,394 | ) |
05/31/2018 | | ANZ | | Taiwan Dollar | | | 587,871,044 | | | United States Dollar | | | 20,229,561 | | | | (330,528 | ) |
05/31/2018 | | HSBC Bank | | Taiwan Dollar | | | 23,610,550 | | | United States Dollar | | | 815,000 | | | | (15,799 | ) |
05/31/2018 | | Standard Chartered | | Taiwan Dollar | | | 48,819,307 | | | United States Dollar | | | 1,683,889 | | | | (31,389 | ) |
05/31/2018 | | BNP Paribas | | Thai Baht | | | 32,411,069 | | | United States Dollar | | | 1,037,387 | | | | (9,496 | ) |
05/31/2018 | | BNP Paribas | | Thai Baht | | | 26,452,000 | | | United States Dollar | | | 850,000 | | | | (11,096 | ) |
05/31/2018 | | Citibank | | Thai Baht | | | 115,540,986 | | | United States Dollar | | | 3,707,991 | | | | (43,701 | ) |
05/31/2018 | | Deutsche Bank | | Thai Baht | | | 33,389,190 | | | United States Dollar | | | 1,067,600 | | | | (8,689 | ) |
05/31/2018 | | UBS | | Thai Baht | | | 59,515,105 | | | United States Dollar | | | 1,906,313 | | | | (18,840 | ) |
06/04/2018 | | BNP Paribas | | Brazilian Real | | | 6,623,996 | | | United States Dollar | | | 1,901,420 | | | | (17,201 | ) |
06/29/2018 | | BNP Paribas | | Argentine Peso | | | 58,074,315 | | | United States Dollar | | | 2,712,106 | | | | (17,867 | ) |
06/29/2018 | | Barclays | | Czech Koruna | | | 8,628,885 | | | United States Dollar | | | 421,785 | | | | (13,270 | ) |
06/29/2018 | | BNP Paribas | | Indonesian Rupiah | | | 140,047,387,793 | | | United States Dollar | | | 10,079,703 | | | | (88,094 | ) |
06/29/2018 | | HSBC Bank | | Korean Won | | | 19,103,747,938 | | | United States Dollar | | | 17,910,044 | | | | (44,386 | ) |
06/29/2018 | | Merrill Lynch | | Korean Won | | | 20,241,281,926 | | | United States Dollar | | | 18,984,864 | | | | (55,394 | ) |
06/29/2018 | | Deutsche Bank | | Polish Zloty | | | 34,701,910 | | | United States Dollar | | | 10,298,647 | | | | (401,631 | ) |
06/29/2018 | | Merrill Lynch | | Polish Zloty | | | 22,525,857 | | | United States Dollar | | | 6,665,293 | | | | (240,898 | ) |
06/29/2018 | | Standard Chartered | | Polish Zloty | | | 4,158,527 | | | United States Dollar | | | 1,225,901 | | | | (39,885 | ) |
06/29/2018 | | Merrill Lynch | | Romanian Leu | | | 7,900,174 | | | United States Dollar | | | 2,099,714 | | | | (52,766 | ) |
06/29/2018 | | Goldman Sachs | | Thai Baht | | | 250,581,000 | | | United States Dollar | | | 8,052,736 | | | | (99,361 | ) |
06/29/2018 | | JP Morgan | | Thai Baht | | | 256,046,000 | | | United States Dollar | | | 8,229,021 | | | | (102,189 | ) |
06/29/2018 | | Standard Chartered | | Thai Baht | | | 11,002,950 | | | United States Dollar | | | 350,000 | | | | (769 | ) |
06/29/2018 | | UBS | | Thai Baht | | | 486,501,273 | | | United States Dollar | | | 15,605,594 | | | | (164,173 | ) |
07/31/2018 | | HSBC Bank | | Argentine Peso | | | 57,192,024 | | | United States Dollar | | | 2,681,295 | | | | (85,117 | ) |
07/31/2018 | | BNP Paribas | | Chinese Yuan Renminbi | | | 86,850,049 | | | United States Dollar | | | 13,743,756 | | | | (80,636 | ) |
07/31/2018 | | Goldman Sachs | | Chinese Yuan Renminbi | | | 5,160,453 | | | United States Dollar | | | 814,080 | | | | (2,245 | ) |
07/31/2018 | | HSBC Bank | | Chinese Yuan Renminbi | | | 145,666,384 | | | United States Dollar | | | 23,047,979 | | | | (131,961 | ) |
07/31/2018 | | Credit Suisse | | Colombian Peso | | | 74,972,924,820 | | | United States Dollar | | | 27,591,471 | | | | (953,666 | ) |
07/31/2018 | | JP Morgan | | Colombian Peso | | | 1,617,206,513 | | | United States Dollar | | | 579,430 | | | $ | (4,838 | ) |
See accompanying notes to the financial statements.
61
ASHMORE EMERGING MARKETS TOTAL RETURN FUND
SCHEDULE OF INVESTMENTS (CONTINUED)
As of April 30, 2018 (Unaudited)
| | | | | | | | | | | | | | | | | | |
Settlement Date | | Counterparty | | Currency Buy | | Currency Buy Amount
(Local
Currency) | | | Currency Sell | | Currency Sell Amount
(Local Currency) | | | Unrealized
Gain/(Loss) | |
| | | | | | |
07/31/2018 | | BNP Paribas | | Czech Koruna | | | 181,764,040 | | | United States Dollar | | | 8,763,810 | | | | (141,147 | ) |
07/31/2018 | | JP Morgan | | Czech Koruna | | | 189,182,980 | | | United States Dollar | | | 9,164,510 | | | | (189,902 | ) |
07/31/2018 | | Merrill Lynch | | Israeli Shekel | | | 18,307,639 | | | United States Dollar | | | 5,200,148 | | | | (84,525 | ) |
07/31/2018 | | HSBC Bank | | Mexican Peso | | | 243,313,586 | | | United States Dollar | | | 13,129,092 | | | | (308,279 | ) |
07/31/2018 | | Merrill Lynch | | Mexican Peso | | | 164,243,163 | | | United States Dollar | | | 8,999,872 | | | | (345,481 | ) |
07/31/2018 | | BNP Paribas | | Peruvian Nuevo Sol | | | 25,088,231 | | | United States Dollar | | | 7,782,434 | | | | (90,070 | ) |
07/31/2018 | | Citibank | | Peruvian Nuevo Sol | | | 2,228,094 | | | United States Dollar | | | 687,450 | | | | (4,289 | ) |
07/31/2018 | | Barclays | | Polish Zloty | | | 37,279,894 | | | United States Dollar | | | 10,853,437 | | | | (212,667 | ) |
07/31/2018 | | Merrill Lynch | | Polish Zloty | | | 38,801,522 | | | United States Dollar | | | 11,308,194 | | | | (233,107 | ) |
07/31/2018 | | BNP Paribas | | Romanian Leu | | | 7,832,092 | | | United States Dollar | | | 2,054,697 | | | | (25,749 | ) |
07/31/2018 | | Barclays | | Singapore Dollar | | | 22,362,810 | | | United States Dollar | | | 17,096,034 | | | | (194,323 | ) |
07/31/2018 | | HSBC Bank | | Singapore Dollar | | | 14,731,825 | | | United States Dollar | | | 11,264,723 | | | | (130,476 | ) |
07/31/2018 | | Citibank | | South African Rand | | | 20,975,127 | | | United States Dollar | | | 1,676,810 | | | | (14,398 | ) |
08/31/2018 | | Barclays | | Czech Koruna | | | 75,977,100 | | | United States Dollar | | | 3,672,453 | | | | (61,977 | ) |
08/31/2018 | | Deutsche Bank | | Czech Koruna | | | 221,383,646 | | | United States Dollar | | | 10,841,033 | | | | (320,753 | ) |
08/31/2018 | | HSBC Bank | | Hungarian Forint | | | 100,006,391 | | | United States Dollar | | | 394,400 | | | | (6,174 | ) |
08/31/2018 | | JP Morgan | | Hungarian Forint | | | 2,354,704,482 | | | United States Dollar | | | 9,377,183 | | | | (236,187 | ) |
08/31/2018 | | HSBC Bank | | Polish Zloty | | | 37,439,357 | | | United States Dollar | | | 10,891,133 | | | | (197,100 | ) |
08/31/2018 | | JP Morgan | | Polish Zloty | | | 35,971,147 | | | United States Dollar | | | 10,536,210 | | | | (261,551 | ) |
08/31/2018 | | Barclays | | Russian Ruble | | | 890,901,260 | | | United States Dollar | | | 14,129,089 | | | | (187,708 | ) |
| | | | | | | | | | | | | | | | | | |
| | | | | | |
Subtotal Depreciation | | | | | | | | | | | | | | | | | (9,192,881 | ) |
| | | | | | | | | | | | | | | | | | |
| | | | | | |
Total | | | | | | | | | | | | | | | | $ | (5,778,275 | ) |
| | | | | | | | | | | | | | | | | | |
At April 30, 2018, the Ashmore Emerging Markets Total Return Fund had the following centrally cleared swap contracts outstanding:
| | | | | | | | | | | | | | | | | | | | | | | | | | | | | | | | |
Pay Rate Index/ Pay Rate | | Receive Rate/
Receive Rate
Index | | | | | | Notional
Amount | | | Expiration
Date | | | Fair Value/
Unrealized
Appreciation
(Depreciation)** | | | Premiums
Paid/
(Received) | | | Variation
Margin
Receivable (Payable) | | | Counterparty | |
MXN-TIIE-BANXICO 28 Day Rate (Pay Lunar) | |
| 7.349% (Receive
Lunar) |
| | | MXN | | | | 439,000,000 | | | | 06/14/2023 | | | | $(136,349) | | | | — | | | | $(39,834) | | | | Merrill Lynch | |
MXN-TIIE-BANXICO 28 Day Rate (Pay Lunar) | |
| 7.375% (Receive
Lunar) |
| | | MXN | | | | 417,400,000 | | | | 06/14/2023 | | | | (105,665) | | | | — | | | | (37,994) | | | | Santander | |
WIBOR Poland 6 Month Rate (Pay Semiannually) | |
| 2.400% (Receive
Annually) |
| | | PLN | | | | 13,970,000 | | | | 03/26/2023 | | | | 9,482 | | | | — | | | | 187 | | | | Merrill Lynch | |
Johannesburg Interbank Agreed Rate 3 Month (Pay Quarterly) | |
| 7.705% (Receive
Quarterly) |
| | | ZAR | | | | 82,611,000 | | | | 03/15/2028 | | | | (958) | | | | — | | | | 7,182 | | | | Deutsche Bank | |
Johannesburg Interbank Agreed Rate 3 Month (Pay Quarterly) | |
| 7.551% (Receive
Quarterly) |
| | | ZAR | | | | 28,269,000 | | | | 03/15/2028 | | | | (25,039) | | | | — | | | | 2,736 | | | | HSBC Bank | |
Johannesburg Interbank Agreed Rate 3 Month (Pay Quarterly) | |
| 7.693% (Receive
Quarterly) |
| | | ZAR | | | | 98,600,000 | | | | 06/20/2028 | | | | (29,891) | | | | — | | | | 9,071 | | | | Goldman Sachs | |
Johannesburg Interbank Agreed Rate 3 Month (Pay Quarterly) | |
| 7.670% (Receive
Quarterly) |
| | | ZAR | | | | 15,400,000 | | | | 06/20/2028 | | | | (6,598) | | | | — | | | | 1,438 | | | | HSBC Bank | |
| | | | | | | | | | | | | | | | | | | | | | | | | | | | | | | | |
| | | | | | | | | | | | | | | | | | | $(295,018) | | | | | | | | $(57,214) | | | | | |
| | | | | | | | | | | | | | | | | | | | | | | | | | | | | | | | |
See accompanying notes to the financial statements.
62
ASHMORE EMERGING MARKETS TOTAL RETURN FUND
SCHEDULE OF INVESTMENTS (CONTINUED)
As of April 30, 2018 (Unaudited)
**Includes cumulative appreciation/depreciation on centrally cleared swap agreements. Only the current day’s variation margin is reported within the Statements of Assets and Liabilities.
The inputs or methodologies used for valuing securities are not necessarily an indication of the risks associated with investing in those securities and other financial instruments, if any. See note 4 in the Notes to the Financial Statements for more information regarding pricing inputs and valuation techniques. The following is a summary of the inputs used in valuing the Ashmore Emerging Markets Total Return Fund’s investments and other financial instruments, which are carried at fair value, as of April 30, 2018:
| | | | | | | | | | | | | | | | |
| | | Level 1 | | | Level 2 | | | Level 3 | | | Total | |
Investments | | | | | | | | | | | | | | | | |
Assets: | | | | | | | | | | | | | | | | |
Debt Securities | | | | | | | | | | | | | | | | |
Corporate Bonds | | | $— | | | $ | 207,529,999 | | | $ | — | | | $ | 207,529,999 | |
Financial Certificates | | | — | | | | 12,134,826 | | | | — | | | | 12,134,826 | |
Government Agencies | | | — | | | | 34,950,387 | | | | — | | | | 34,950,387 | |
Government Bonds | | | — | | | | 929,980,149 | | | | — | | | | 929,980,149 | |
Index Linked Government Bonds | | | — | | | | 26,473,189 | | | | — | | | | 26,473,189 | |
Municipal Bonds | | | — | | | | 2,620,586 | | | | — | | | | 2,620,586 | |
| | | | | | | | | | | | | | | | |
Total Debt Securities | | | — | | | | 1,213,689,136 | | | | — | | | | 1,213,689,136 | |
Bank Loans | | | — | | | | — | | | | 17,744,116 | | | | 17,744,116 | |
Common Stock | | | | | | | | | | | | | | | | |
Mongolia | | | — | | | | 128,832 | | | | — | | | | 128,832 | |
Niger | | | — | | | | 285,501 | | | | — | | | | 285,501 | |
Russian Federation | | | — | | | | — | | | | 42,035 | | | | 42,035 | |
| | | | | | | | | | | | | | | | |
Total Common Stock | | | — | | | | 414,333 | | | | 42,035 | | | | 456,368 | |
Warrants | | | — | | | | — | | | | — | | | | — | |
Fully Funded Total Return Swaps | | | — | | | | 3,554,221 | | | | — | | | | 3,554,221 | |
Total Investments | | | $— | | | $ | 1,217,657,690 | | | $ | 17,786,151 | | | $ | 1,235,443,841 | |
| | | | |
Other Financial Instruments | | | | | | | | | | | | | | | | |
Assets: | | | | | | | | | | | | | | | | |
Forward Foreign Currency Exchange Contracts | | | $— | | | $ | 3,414,606 | | | $ | — | | | $ | 3,414,606 | |
Centrally Cleared Swap Contracts | | | — | | | | 9,482 | | | | — | | | | 9,482 | |
Liabilities: | | | | | | | | | | | | | | | | |
Forward Foreign Currency Exchange Contracts | | | — | | | | (9,192,881 | ) | | | — | | | | (9,192,881 | ) |
Centrally Cleared Swap Contracts | | | — | | | | (304,500 | ) | | | — | | | | (304,500 | ) |
Total Other Financial Instruments | | | $— | | | $ | (6,073,293 | ) | | $ | — | | | $ | (6,073,293 | ) |
See accompanying notes to the financial statements.
63
ASHMORE EMERGING MARKETS TOTAL RETURN FUND
SCHEDULE OF INVESTMENTS (CONTINUED)
As of April 30, 2018 (Unaudited)
The Fund discloses all transfers between levels based on valuations at the end of each reporting period. At April 30, 2018, there were no transfers between Level 1, Level 2 and Level 3 based on levels assigned to the securities on October 31, 2017.
The following is a reconciliation of investments in which significant unobservable inputs (Level 3) were used for the Fund during the period ending April 30, 2018:
| | | | | | | | | | | | | | | | | | | | | | | | | | | | | | | | | | | | | | | | | | | | | | | | | | |
Category and Subcategory | | Beginning
Balance
at 10/31/2017 | | Accrued Discounts (Premiums) | | Purchases | | Sales | | Realized Gains (Losses) | | Change in Unrealized Appreciation (Depreciation) | | Transfer into Level 3 | | Transfer out of Level 3 | | Ending Balance at 04/30/2018 | | Change in
Unrealized
Appreciation
(Depreciation) from Investments still held
04/30/2018 |
Investments, at value | | | | | | | | | | | | | | | | | | | | | | | | | | | | | | | | | | | | | | | | | | | | | | | | | | |
Corporate Bonds | | | | | | | | | | | | | | | | | | | | | | | | | | | | | | | | | | | | | | | | | | | | | | | | | | |
China | | | $ | — | | | | $ | — | | | | $ | — | | | | $ | — | | | | $ | — | | | | $ | — | | | | | $— | | | | | $— | | | | $ | — | | | | $ | — | |
Czech Republic | | | | — | | | | | — | | | | | — | | | | | — | | | | | — | | | | | — | | | | | — | | | | | — | | | | | — | | | | | — | |
Bank Loans | | | | | | | | | | | | | | | | | | | | | | | | | | | | | | | | | | | | | | | | | | | | | | | | | | |
China | | | | — | | | | | — | | | | | — | | | | | — | | | | | (281,761 | ) | | | | 281,761 | | | | | — | | | | | — | | | | | — | | | | | — | |
United Arab | | | | | | | | | | | | | | | | | | | | | | | | | | | | | | | | | | | | | | | | | | | | | | | | | | |
Emirates | | | | 11,080,864 | | | | | 185,653 | | | | | 6,338,437 | | | | | (245,287 | ) | | | | 47,329 | | | | | 337,120 | | | | | — | | | | | — | | | | | 17,744,116 | | | | | 337,120 | |
Common Stock | | | | | | | | | | | | | | | | | | | | | | | | | | | | | | | | | | | | | | | | | | | | | | | | | | |
Russian Federation | | | | 113,494 | | | | | — | | | | | — | | | | | — | | | | | — | | | | | (71,459 | ) | | | | — | | | | | — | | | | | 42,035 | | | | | (71,459 | ) |
Warrants | | | | | | | | | | | | | | | | | | | | | | | | | | | | | | | | | | | | | | | | | | | | | | | | | | |
China | | | | — | | | | | — | | | | | — | | | | | — | | | | | (27,482 | ) | | | | 27,482 | | | | | — | | | | | — | | | | | — | | | | | — | |
Mexico | | | | — | | | | | — | | | | | — | | | | | — | | | | | — | | | | | — | | | | | — | | | | | — | | | | | — | | | | | — | |
Total | | | $ | 11,194,358 | | | | $ | 185,653 | | | | $ | 6,338,437 | | | | $ | (245,287 | ) | | | $ | (261,914 | ) | | | $ | 574,904 | | | | | $— | | | | | $— | | | | $ | 17,786,151 | | | | $ | 265,661 | |
The following table on “Quantitative information about Fair Value measurements” provides information on the valuation techniques and inputs used to value Level 3 securities at April 30, 2018:
| | | | | | | | | | | | |
Quantitative Information about Level 3 Fair Value Measurements | |
| | | |
| | | Fair Value at
04/30/2018 | | | Valuation Technique | | | Unobservable Input | |
Bank Loans | | | $17,744,116 | | | | Broker quote | | | | Inputs to broker model | |
Common Stock | | | 42,035 | | | | Broker quote | | | | Inputs to broker model | |
Total | | | $17,786,151 | | | | | | | | | |
The following is a summary of the fair values of the Fund’s derivative instruments*:
Fair Values of Financial Derivative Instruments on the Statements of Assets and Liabilities as of April 30, 2018:
| | | | | | | | |
| | | Derivatives Not Accounted for as
Hedging Instruments | |
| | |
| | | Foreign
Exchange | | | Interest
Rate | |
| | |
Assets: | | | | | | | | |
Unrealized Appreciation on Centrally Cleared Swap Contracts | | | $ — | | | | $9,482 | † |
Unrealized Appreciation on Forward Foreign Currency Exchange Contracts | | | 3,414,606 | | | | — | |
| | | | |
| | | $3,414,606 | | | | $9,482 | |
| | | | |
See accompanying notes to the financial statements.
64
ASHMORE EMERGING MARKETS TOTAL RETURN FUND
SCHEDULE OF INVESTMENTS (CONTINUED)
As of April 30, 2018 (Unaudited)
| | | | | | | | |
| | | Derivatives Not Accounted for as
Hedging Instruments | |
| | |
| | | Foreign
Exchange | | | Interest
Rate | |
Liabilities: | | | | | | | | |
Unrealized Depreciation on Centrally Cleared Swap Contracts | | $ | — | | | $ | (304,500 | )† |
Unrealized Depreciation on Forward Foreign Currency Exchange Contracts | | | (9,192,881 | ) | | | — | |
| | | | |
| | $ | (9,192,881 | ) | | $ | (304,500 | ) |
| | | | |
† Includes cumulative appreciation/depreciation on centrally cleared swap agreements. Only the current day’s variation margin is reported within the Statements of Assets and Liabilities.
The Effect of Financial Derivative Instruments on the Statements of Operations for the Six Months Ended April 30, 2018:
| | | | | | | | |
| | | Derivatives Not Accounted for as
Hedging Instruments | |
| | |
| | | Foreign
Exchange | | | Interest Rate | |
Realized Gain (Loss) on Derivatives Recognized resulting from Operations: | | | | | | | | |
Net Realized Gain on Forward Foreign Currency Exchange Contracts | | $ | 6,580,312 | | | $ | — | |
Net Realized Gain on Interest Rate Swap Contracts | | | — | | | | 1,646,925 | |
| | | | |
| | $ | 6,580,312 | | | $ | 1,646,925 | |
| | | | |
Net Change in Unrealized Appreciation (Depreciation) on Derivatives Recognized resulting from Operations: | | | | | | | | |
Net Change in Unrealized Appreciation on Forward Foreign Currency Exchange Contracts | | $ | (2,249,528 | ) | | $ | — | |
Net Change in Unrealized Depreciation on Interest Rate Swap Contracts | | | — | | | | (1,090,424 | ) |
| | | | |
| | $ | (2,249,528 | ) | | $ | (1,090,424 | ) |
| | | | |
* See note 10 in the Notes to the Financial Statements for additional information.
See accompanying notes to the financial statements.
65
ASHMORE EMERGING MARKETS LOCAL CURRENCY BOND FUND
SCHEDULE OF INVESTMENTS
As of April 30, 2018 (Unaudited)
| | | | | | | | | | | | | | | | |
| | | Currency(1) | | | Par | | | Value | | | % of Net
Assets | |
Debt Securities | | | | | | | | | | | | | | | | |
| | | | |
Argentina (Cost $3,129,843) | | | | | | | | | | | | | | | | |
Argentina Bonar Bonds, (Floating, Argentina Deposit Rates Badlar Private Banks 30-35 Days + 2.500%) 25.331%, 03/11/2019 | | | ARS | | | | 1,731,496 | | | $ | 83,939 | | | | 0.11 | |
Argentina Bonar Bonds, (Floating, Argentina Deposit Rates Badlar Private Banks 30-35 Days + 3.250%) 26.088%, 03/01/2020 | | | ARS | | | | 1,747,700 | | | | 87,860 | | | | 0.12 | |
Argentina Bonar Bonds, (Floating, Argentina Deposit Rates Badlar Private Banks 30-35 Days + 2.000%) 24.839%, 04/03/2022 | | | ARS | | | | 6,974,400 | | | | 338,565 | | | | 0.45 | |
Argentina POM Politica Monetaria, (Floating, Argentina Central Bank 7D Repo Rate + 0.000%) 28.875%, 06/21/2020 | | | ARS | | | | 9,796,376 | | | | 498,290 | | | | 0.65 | |
Letras del Banco Central de la Republica Argentina, 23.434%, 06/21/2018(2) | | | ARS | | | | 27,081,967 | | | | 1,265,506 | | | | 1.66 | |
Letras del Banco Central de la Republica Argentina, 24.098%, 08/15/2018(2) | | | ARS | | | | 1,822,451 | | | | 81,695 | | | | 0.11 | |
Provincia de Buenos Aires, (Floating, Argentina Deposit Rates Badlar Private Banks 30-35 Days + 3.750%) 0.000%, 04/12/2025(3) | | | ARS | | | | 5,801,000 | | | | 285,243 | | | | 0.37 | |
| | | | | | | | | | | 2,641,098 | | | | 3.47 | |
Brazil (Cost $8,560,117) | | | | | | | | | | | | | | | | |
Brazil Notas do Tesouro Nacional Serie B, 6.000%, 08/15/2022(4) | | | BRL | | | | 2,423,000 | | | | 2,277,436 | | | | 2.99 | |
Brazil Notas do Tesouro Nacional Serie F, 10.000%, 01/01/2023 | | | BRL | | | | 3,229,000 | | | | 957,431 | | | | 1.26 | |
Brazil Notas do Tesouro Nacional Serie F, 10.000%, 01/01/2025 | | | BRL | | | | 8,032,000 | | | | 2,356,843 | | | | 3.10 | |
Brazil Notas do Tesouro Nacional Serie F, 10.000%, 01/01/2027 | | | BRL | | | | 7,996,000 | | | | 2,324,822 | | | | 3.05 | |
| | | | | | | | | | | 7,916,532 | | | | 10.40 | |
Chile (Cost $3,535,560) | | | | | | | | | | | | | | | | |
Bonos de la Tesoreria de la Republica en pesos, 4.500%, 03/01/2021 | | | CLP | | | | 1,265,000,000 | | | | 2,117,022 | | | | 2.78 | |
Bonos de la Tesoreria de la Republica en pesos, 5.000%, 03/01/2035 | | | CLP | | | | 825,000,000 | | | | 1,360,981 | | | | 1.79 | |
| | | | | | | | | | | 3,478,003 | | | | 4.57 | |
Colombia (Cost $2,815,155) | | | | | | | | | | | | | | | | |
Colombian TES, 11.000%, 07/24/2020 | | | COP | | | | 265,000,000 | | | | 106,195 | | | | 0.14 | |
Colombian TES, 7.000%, 05/04/2022 | | | COP | | | | 6,506,400,000 | | | | 2,443,481 | | | | 3.21 | |
Colombian TES, 7.750%, 09/18/2030 | | | COP | | | | 445,500,000 | | | | 173,731 | | | | 0.23 | |
Colombian TES, 7.000%, 06/30/2032 | | | COP | | | | 997,800,000 | | | | 360,754 | | | | 0.47 | |
Empresas Publicas de Medellin ESP, 8.375%, 11/08/2027 | | | COP | | | | 60,000,000 | | | | 22,221 | | | | 0.03 | |
| | | | | | | | | | | 3,106,382 | | | | 4.08 | |
Egypt (Cost $1,140,657) | | | | | | | | | | | | | | | | |
Egypt Treasury Bill, 16.559%, 06/26/2018(2) | | | EGP | | | | 1,775,000 | | | | 98,085 | | | | 0.13 | |
Egypt Treasury Bill, 15.650%, 07/10/2018(2) | | | EGP | | | | 7,225,000 | | | | 396,625 | | | | 0.52 | |
Egypt Treasury Bill, 16.676%, 07/17/2018(2) | | | EGP | | | | 11,875,000 | | | | 649,744 | | | | 0.86 | |
| | | | | | | | | | | 1,144,454 | | | | 1.51 | |
Hungary (Cost $1,551,231) | | | | | | | | | | | | | | | | |
Hungary (Rep of), 7.500%, 11/12/2020 | | | HUF | | | | 27,590,000 | | | | 124,729 | | | | 0.16 | |
Hungary (Rep of), 7.000%, 06/24/2022 | | | HUF | | | | 85,960,000 | | | | 409,901 | | | | 0.54 | |
Hungary (Rep of), 1.750%, 10/26/2022 | | | HUF | | | | 36,590,000 | | | | 143,554 | | | | 0.19 | |
Hungary (Rep of), 3.000%, 06/26/2024 | | | HUF | | | | 123,890,000 | | | | 511,080 | | | | 0.67 | |
See accompanying notes to the financial statements.
66
ASHMORE EMERGING MARKETS LOCAL CURRENCY BOND FUND
SCHEDULE OF INVESTMENTS (CONTINUED)
As of April 30, 2018 (Unaudited)
| | | | | | | | | | | | | | | | |
| | | Currency(1) | | | Par | | | Value | | | % of Net
Assets | |
Hungary (continued) | | | | | | | | | | | | | | | | |
Hungary (Rep of), 5.500%, 06/24/2025 | | | HUF | | | | 118,670,000 | | | $ | 560,808 | | | | 0.74 | |
| | | | | | | | | | | 1,750,072 | | | | 2.30 | |
India (Cost $3,739,351) | | | | | | | | | | | | | | | | |
India (Rep of), 7.350%, 06/22/2024 | | | INR | | | | 10,000,000 | | | | 146,314 | | | | 0.19 | |
India (Rep of), 7.720%, 05/25/2025 | | | INR | | | | 174,220,000 | | | | 2,594,766 | | | | 3.41 | |
India (Rep of), 7.590%, 01/11/2026 | | | INR | | | | 55,000,000 | | | | 806,788 | | | | 1.06 | |
| | | | | | | | | | | 3,547,868 | | | | 4.66 | |
Indonesia (Cost $5,947,363) | | | | | | | | | | | | | | | | |
Indonesia (Rep of), 8.250%, 07/15/2021 | | | IDR | | | | 10,539,000,000 | | | | 796,849 | | | | 1.05 | |
Indonesia (Rep of), 5.625%, 05/15/2023 | | | IDR | | | | 1,723,000,000 | | | | 120,005 | | | | 0.16 | |
Indonesia (Rep of), 8.375%, 03/15/2024 | | | IDR | | | | 1,930,000,000 | | | | 149,774 | | | | 0.20 | |
Indonesia (Rep of), 8.375%, 09/15/2026 | | | IDR | | | | 8,335,000,000 | | | | 648,025 | | | | 0.85 | |
Indonesia (Rep of), 7.000%, 05/15/2027 | | | IDR | | | | 4,542,000,000 | | | | 329,326 | | | | 0.43 | |
Indonesia (Rep of), 6.125%, 05/15/2028 | | | IDR | | | | 12,888,000,000 | | | | 879,902 | | | | 1.16 | |
Indonesia (Rep of), 9.000%, 03/15/2029 | | | IDR | | | | 12,761,000,000 | | | | 1,041,011 | | | | 1.37 | |
Indonesia (Rep of), 8.750%, 05/15/2031 | | | IDR | | | | 4,227,000,000 | | | | 337,833 | | | | 0.44 | |
Indonesia (Rep of), 8.250%, 06/15/2032 | | | IDR | | | | 1,145,000,000 | | | | 88,161 | | | | 0.12 | |
Indonesia (Rep of), 7.500%, 08/15/2032 | | | IDR | | | | 1,243,000,000 | | | | 91,399 | | | | 0.12 | |
Indonesia (Rep of), 6.625%, 05/15/2033 | | | IDR | | | | 4,820,000,000 | | | | 330,153 | | | | 0.43 | |
Indonesia (Rep of), 8.375%, 03/15/2034 | | | IDR | | | | 5,957,000,000 | | | | 468,391 | | | | 0.61 | |
Indonesia (Rep of), 8.250%, 05/15/2036 | | | IDR | | | | 4,313,000,000 | | | | 332,950 | | | | 0.44 | |
Indonesia (Rep of), 7.500%, 05/15/2038 | | | IDR | | | | 3,500,000,000 | | | | 253,754 | | | | 0.33 | |
| | | | | | | | | | | 5,867,533 | | | | 7.71 | |
Malaysia (Cost $3,271,361) | | | | | | | | | | | | | | | | |
Malaysia (Rep of), 3.580%, 09/28/2018 | | | MYR | | | | 1,388,000 | | | | 353,964 | | | | 0.47 | |
Malaysia (Rep of), 3.759%, 03/15/2019 | | | MYR | | | | 904,000 | | | | 230,917 | | | | 0.30 | |
Malaysia (Rep of), 3.654%, 10/31/2019 | | | MYR | | | | 1,605,000 | | | | 409,255 | | | | 0.54 | |
Malaysia (Rep of), 3.620%, 11/30/2021 | | | MYR | | | | 1,775,000 | | | | 451,791 | | | | 0.59 | |
Malaysia (Rep of), 3.882%, 03/10/2022 | | | MYR | | | | 1,390,000 | | | | 355,734 | | | | 0.47 | |
Malaysia (Rep of), 3.418%, 08/15/2022 | | | MYR | | | | 1,704,000 | | | | 426,571 | | | | 0.56 | |
Malaysia (Rep of), 3.795%, 09/30/2022 | | | MYR | | | | 372,000 | | | | 94,235 | | | | 0.13 | |
Malaysia (Rep of), 3.480%, 03/15/2023 | | | MYR | | | | 1,432,000 | | | | 356,428 | | | | 0.47 | |
Malaysia (Rep of), 4.181%, 07/15/2024 | | | MYR | | | | 1,259,000 | | | | 322,317 | | | | 0.42 | |
Malaysia (Rep of), 3.955%, 09/15/2025 | | | MYR | | | | 390,000 | | | | 97,968 | | | | 0.13 | |
Malaysia (Rep of), 4.392%, 04/15/2026 | | | MYR | | | | 365,000 | | | | 94,587 | | | | 0.13 | |
Malaysia (Rep of), 4.498%, 04/15/2030 | | | MYR | | | | 310,000 | | | | 78,757 | | | | 0.10 | |
Malaysia (Rep of), 4.232%, 06/30/2031 | | | MYR | | | | 227,000 | | | | 56,107 | | | | 0.07 | |
Malaysia (Rep of), 3.844%, 04/15/2033 | | | MYR | | | | 654,000 | | | | 152,238 | | | | 0.20 | |
| | | | | | | | | | | 3,480,869 | | | | 4.58 | |
Mexico (Cost $3,681,610) | | | | | | | | | | | | | | | | |
Comision Federal de Electricidad, 8.180%, 12/23/2027 | | | MXN | | | | 3,620,000 | | | | 185,340 | | | | 0.24 | |
Mexican Bonos, 8.000%, 12/07/2023 | | | MXN | | | | 6,700,000 | | | | 368,585 | | | | 0.48 | |
Mexican Bonos, 10.000%, 12/05/2024 | | | MXN | | | | 14,320,000 | | | | 871,150 | | | | 1.15 | |
Mexican Bonos, 5.750%, 03/05/2026 | | | MXN | | | | 38,050,000 | | | | 1,831,306 | | | | 2.41 | |
See accompanying notes to the financial statements.
67
ASHMORE EMERGING MARKETS LOCAL CURRENCY BOND FUND
SCHEDULE OF INVESTMENTS (CONTINUED)
As of April 30, 2018 (Unaudited)
| | | | | | | | | | | | | | | | |
| | | Currency(1) | | | Par | | | Value | | | % of Net
Assets | |
Mexico (continued) | | | | | | | | | | | | | | | | |
Petroleos Mexicanos, 7.190%, 09/12/2024 | | | MXN | | | | 6,270,000 | | | $ | 301,688 | | | | 0.40 | |
| | | | | | | | | | | 3,558,069 | | | | 4.68 | |
Peru (Cost $1,059,507) | | | | | | | | | | | | | | | | |
Fondo MIVIVIENDA S.A., 7.000%, 02/14/2024 | | | PEN | | | | 990,000 | | | | 334,007 | | | | 0.44 | |
Peru (Rep of), 6.950%, 08/12/2031 | | | PEN | | | | 1,404,000 | | | | 487,582 | | | | 0.64 | |
Peru (Rep of), 6.150%, 08/12/2032(3) | | | PEN | | | | 386,000 | | | | 124,241 | | | | 0.16 | |
Peru (Rep of), 6.900%, 08/12/2037 | | | PEN | | | | 509,000 | | | | 172,899 | | | | 0.23 | |
| | | | | | | | | | | 1,118,729 | | | | 1.47 | |
Philippines (Cost $457,943) | | | | | | | | | | | | | | | | |
Philippines (Rep of), 4.950%, 01/15/2021 | | | PHP | | | | 10,000,000 | | | | 194,736 | | | �� | 0.26 | |
Philippines (Rep of), 3.900%, 11/26/2022 | | | PHP | | | | 10,000,000 | | | | 185,219 | | | | 0.24 | |
| | | | | | | | | 379,955 | | | 0.50 | |
Poland (Cost $1,216,741) | | | | | | | | | | | | | | | | |
Poland (Rep of), 2.750%, 08/25/2023(4) | | | PLN | | | | 324,000 | | | | 121,667 | | | | 0.16 | |
Poland (Rep of), 3.250%, 07/25/2025 | | | PLN | | | | 3,543,000 | | | | 1,035,489 | | | | 1.36 | |
Poland (Rep of), 2.500%, 07/25/2026 | | | PLN | | | | 560,000 | | | | 154,142 | | | | 0.20 | |
| | | | | | | | | | | 1,311,298 | | | | 1.72 | |
Romania (Cost $218,954) | | | | | | | | | | | | | | | | |
Romania (Rep of), 5.800%, 07/26/2027 | | | RON | | | | 790,000 | | | | 222,488 | | | | 0.29 | |
| | | | | | | | | | | 222,488 | | | | 0.29 | |
Russian Federation (Cost $4,367,997) | | | | | | | | | | | | | | | | |
Russian Federal Bond - OFZ, 6.400%, 05/27/2020 | | | RUB | | | | 8,007,000 | | | | 126,848 | | | | 0.17 | |
Russian Federal Bond - OFZ, 7.600%, 04/14/2021 | | | RUB | | | | 10,529,000 | | | | 171,755 | | | | 0.23 | |
Russian Federal Bond - OFZ, 7.500%, 08/18/2021 | | | RUB | | | | 53,780,000 | | | | 876,237 | | | | 1.15 | |
Russian Federal Bond - OFZ, 7.400%, 12/07/2022 | | | RUB | | | | 10,223,000 | | | | 166,243 | | | | 0.22 | |
Russian Federal Bond - OFZ, 7.000%, 01/25/2023 | | | RUB | | | | 9,706,000 | | | | 155,906 | | | | 0.20 | |
Russian Federal Bond - OFZ, 7.100%, 10/16/2024 | | | RUB | | | | 25,893,000 | | | | 414,066 | | | | 0.54 | |
Russian Federal Bond - OFZ, 7.750%, 09/16/2026 | | | RUB | | | | 61,177,000 | | | | 1,008,414 | | | | 1.32 | |
Russian Federal Bond - OFZ, 8.500%, 09/17/2031 | | | RUB | | | | 52,809,000 | | | | 925,106 | | | | 1.22 | |
Russian Federal Bond - OFZ, 7.700%, 03/23/2033 | | | RUB | | | | 20,963,000 | | | | 341,380 | | | | 0.45 | |
| | | | | | | | | | | 4,185,955 | | | | 5.50 | |
South Africa (Cost $9,562,122) | | | | | | | | | | | | | | | | |
South Africa (Rep of), 7.750%, 02/28/2023 | | | ZAR | | | | 14,171,810 | | | | 1,141,703 | | | | 1.50 | |
South Africa (Rep of), 10.500%, 12/21/2026 | | | ZAR | | | | 27,067,770 | | | | 2,477,032 | | | | 3.26 | |
South Africa (Rep of), 8.000%, 01/31/2030 | | | ZAR | | | | 16,159,000 | | | | 1,240,996 | | | | 1.63 | |
South Africa (Rep of), 7.000%, 02/28/2031 | | | ZAR | | | | 20,743,590 | | | | 1,451,136 | | | | 1.91 | |
South Africa (Rep of), 8.250%, 03/31/2032 | | | ZAR | | | | 6,796,000 | | | | 523,060 | | | | 0.69 | |
South Africa (Rep of), 8.500%, 01/31/2037 | | | ZAR | | | | 8,784,000 | | | | 676,424 | | | | 0.89 | |
South Africa (Rep of), 9.000%, 01/31/2040 | | | ZAR | | | | 8,207,750 | | | | 657,240 | | | | 0.86 | |
South Africa (Rep of), 6.500%, 02/28/2041 | | | ZAR | | | | 3,646,000 | | | | 221,743 | | | | 0.29 | |
South Africa (Rep of), 8.750%, 01/31/2044 | | | ZAR | | | | 7,043,000 | | | | 547,050 | | | | 0.72 | |
South Africa (Rep of), 8.750%, 02/28/2048 | | | ZAR | | | | 15,585,760 | | | | 1,212,576 | | | | 1.59 | |
| | | | | | | | | | | 10,148,960 | | | | 13.34 | |
See accompanying notes to the financial statements.
68
ASHMORE EMERGING MARKETS LOCAL CURRENCY BOND FUND
SCHEDULE OF INVESTMENTS (CONTINUED)
As of April 30, 2018 (Unaudited)
| | | | | | | | | | | | | | | | |
| | | Currency(1) | | | Par | | | Value | | | % of Net
Assets | |
Thailand (Cost $3,303,882) | | | | | | | | | | | | | | | | |
Thailand (Rep of), 2.550%, 06/26/2020 | | | THB | | | | 4,258,000 | | | $ | 137,779 | | | | 0.18 | |
Thailand (Rep of), 2.000%, 12/17/2022 | | | THB | | | | 26,923,000 | | | | 856,615 | | | | 1.13 | |
Thailand (Rep of), 3.625%, 06/16/2023 | | | THB | | | | 12,189,000 | | | | 417,127 | | | | 0.55 | |
Thailand (Rep of), 3.850%, 12/12/2025 | | | THB | | | | 3,589,000 | | | | 125,469 | | | | 0.16 | |
Thailand (Rep of), 2.125%, 12/17/2026 | | | THB | | | | 8,289,000 | | | | 255,796 | | | | 0.34 | |
Thailand (Rep of), 1.250%, 03/12/2028(4) | | | THB | | | | 3,352,000 | | | | 105,023 | | | | 0.14 | |
Thailand (Rep of), 3.650%, 06/20/2031 | | | THB | | | | 2,833,000 | | | | 96,900 | | | | 0.13 | |
Thailand (Rep of), 3.775%, 06/25/2032 | | | THB | | | | 18,098,000 | | | | 625,548 | | | | 0.82 | |
Thailand (Rep of), 3.400%, 06/17/2036 | | | THB | | | | 16,964,000 | | | | 556,745 | | | | 0.73 | |
Thailand (Rep of), 2.875%, 06/17/2046 | | | THB | | | | 5,961,000 | | | | 170,522 | | | | 0.22 | |
| | | | | | | | | | | 3,347,524 | | | | 4.40 | |
Turkey (Cost $3,317,005) | | | | | | | | | | | | | | | | |
Turkey (Rep of), 3.000%, 02/23/2022(4) | | | TRY | | | | 1,097,810 | | | | 445,915 | | | | 0.59 | |
Turkey (Rep of), 10.700%, 08/17/2022 | | | TRY | | | | 1,650,000 | | | | 374,917 | | | | 0.49 | |
Turkey (Rep of), 10.600%, 02/11/2026 | | | TRY | | | | 3,995,479 | | | | 899,994 | | | | 1.18 | |
Turkey (Rep of), 11.000%, 02/24/2027 | | | TRY | | | | 505,000 | | | | 116,115 | | | | 0.15 | |
Turkey (Rep of), 10.500%, 08/11/2027 | | | TRY | | | | 3,280,000 | | | | 734,792 | | | | 0.97 | |
| | | | | | | | | | | 2,571,733 | | | | 3.38 | |
Total Debt Securities (Cost $60,876,399) | | | | | | | | | | | 59,777,522 | | | | 78.56 | |
| | | | |
Total Investments in Securities (Cost $60,876,399) | | | | | | | | | | | 59,777,522 | | | | 78.56 | |
| | | | |
Fully Funded Total Return Swaps | | | | | | | | | | | | | | | | |
| | | | |
Indonesia (Cost $2,336,949) | | | | | | | | | | | | | | | | |
Indonesia (Rep of), Issued by ANZ Banking Corp., 7.875%, 04/15/2019 | | | IDR | | | | 1,456,000,000 | | | | 106,646 | | | | 0.14 | |
Indonesia (Rep of), Issued by ANZ Banking Corp., 8.375%, 03/15/2024 | | | IDR | | | | 9,817,000,000 | | | | 761,830 | | | | 1.00 | |
Indonesia (Rep of), Issued by ANZ Banking Corp., 7.000%, 05/15/2027 | | | IDR | | | | 941,000,000 | | | | 68,229 | | | | 0.09 | |
Indonesia (Rep of), Issued by ANZ Banking Corp., 10.500%, 08/15/2030 | | | IDR | | | | 600,000,000 | | | | 53,912 | | | | 0.07 | |
Indonesia (Rep of), Issued by ANZ Banking Corp., 8.375%, 03/15/2034 | | | IDR | | | | 2,751,000,000 | | | | 216,307 | | | | 0.28 | |
Indonesia (Rep of), Issued by HSBC Bank, 8.250%, 06/15/2032 | | | IDR | | | | 30,000,000 | | | | 2,310 | | | | — | |
Indonesia (Rep of), Issued by Standard Chartered, 8.375%, 03/15/2024 | | | IDR | | | | 2,600,000,000 | | | | 201,768 | | | | 0.27 | |
Indonesia (Rep of), Issued by Standard Chartered, 7.000%, 05/15/2027 | | | IDR | | | | 6,009,000,000 | | | | 435,693 | | | | 0.57 | |
Indonesia (Rep of), Issued by Standard Chartered, 10.500%, 08/15/2030 | | | IDR | | | | 1,064,000,000 | | | | 95,604 | | | | 0.13 | |
See accompanying notes to the financial statements.
69
ASHMORE EMERGING MARKETS LOCAL CURRENCY BOND FUND
SCHEDULE OF INVESTMENTS (CONTINUED)
As of April 30, 2018 (Unaudited)
| | | | | | | | | | | | | | | | |
| | | Currency(1) | | | Par | | | Value | | | % of Net
Assets | |
Indonesia (continued) | | | | | | | | | | | | | | | | |
Indonesia (Rep of), Issued by Standard Chartered,, 8.250%, 05/15/2036 | | | IDR | | | | 2,022,000,000 | | | $ | 156,092 | | | | 0.21 | |
| | | | | | | | | | | 2,098,391 | | | | 2.76 | |
| | | | |
Total Fully Funded Total Return Swaps (Cost $2,336,949) | | | | | | | | | | | 2,098,391 | | | | 2.76 | |
| | | | |
Total Investments (Total Cost $63,213,348) | | | | | | | | | | | 61,875,913 | | | | 81.32 | |
| | | | |
Other Assets Less Liabilities (See Statements of Assets and Liabilities for further detail) | | | | | | | | | | | 14,215,281 | | | | 18.68 | |
| | | | |
Net Assets | | | | | | | | | | $ | 76,091,194 | | | | 100.00 | |
| (1) | Par values are stated in United States Dollars unless otherwise noted below. |
| (2) | Zero coupon bond – interest rate reflects effective yield on the date of purchase. |
| (3) | Securities exempt from registration under Rule 144A of the Securities Act of 1933. These securities may not be publicly traded without registration under the Securities Act of 1933. |
| (4) | Inflation-indexed bonds are shown at original par and stated coupon rate. |
Percentages shown are based on net assets.
At April 30, 2018, the Ashmore Emerging Markets Local Currency Bond Fund had outstanding forward foreign currency exchange contracts as follows:
| | | | | | | | | | | | | | | | | | |
Settlement Date | | Counterparty | | Currency Buy | | Currency Buy Amount
(Local
Currency) | | | Currency Sell | | Currency Sell Amount
(Local
Currency) | | | Unrealized
Gain/(Loss) | |
| | | | | | |
05/03/2018 | | Goldman Sachs | | United States Dollar | | | 1,146,689 | | | Brazilian Real | | | 3,792,503 | | | $ | 64,433 | |
05/29/2018 | | Deutsche Bank | | United States Dollar | | | 740,000 | | | Chilean Peso | | | 445,924,000 | | | | 13,044 | |
05/31/2018 | | Barclays | | United States Dollar | | | 1,096,001 | | | Indian Rupee | | | 71,936,000 | | | | 18,270 | |
05/31/2018 | | BNP Paribas | | United States Dollar | | | 1,120,514 | | | Indian Rupee | | | 73,550,000 | | | | 18,603 | |
05/31/2018 | | JP Morgan | | United States Dollar | | | 773,211 | | | Indian Rupee | | | 50,753,571 | | | | 12,831 | |
05/31/2018 | | Barclays | | United States Dollar | | | 489,132 | | | South African Rand | | | 5,829,568 | | | | 23,530 | |
05/31/2018 | | Merrill Lynch | | United States Dollar | | | 819,843 | | | South African Rand | | | 10,152,233 | | | | 8,994 | |
05/31/2018 | | BNP Paribas | | United States Dollar | | | 77,534 | | | Thai Baht | | | 2,416,338 | | | | 902 | |
06/04/2018 | | Merrill Lynch | | United States Dollar | | | 748,592 | | | Brazilian Real | | | 2,580,209 | | | | 14,642 | |
06/29/2018 | | BNP Paribas | | United States Dollar | | | 290,050 | | | Indonesian Rupiah | | | 4,029,959,819 | | | | 2,535 | |
07/31/2018 | | Credit Suisse | | Colombian Peso | | | 903,360,000 | | | United States Dollar | | | 320,000 | | | | 963 | |
07/31/2018 | | HSBC Bank | | Mexican Peso | | | 4,795,737 | | | United States Dollar | | | 250,000 | | | | 2,700 | |
07/31/2018 | | BNP Paribas | | Turkish Lira | | | 6,115,939 | | | United States Dollar | | | 1,462,618 | | | | 157 | |
07/31/2018 | | HSBC Bank | | United States Dollar | | | 164,672 | | | Argentine Peso | | | 3,512,456 | | | | 5,227 | |
07/31/2018 | | Credit Suisse | | United States Dollar | | | 333,883 | | | Chilean Peso | | | 198,620,367 | | | | 10,129 | |
07/31/2018 | | Barclays | | United States Dollar | | | 617,215 | | | South African Rand | | | 7,750,920 | | | | 2,905 | |
07/31/2018 | | BNP Paribas | | United States Dollar | | | 811,633 | | | South African Rand | | | 10,152,233 | | | | 7,005 | |
03/29/2019 | | JP Morgan | | United States Dollar | | | 1,276,296 | | | Chilean Peso | | | 769,414,984 | | | | 22,630 | |
03/29/2019 | | JP Morgan | | United States Dollar | | | 894,460 | | | Chilean Peso | | | 537,838,595 | | | | 18,118 | |
| | | | | | | | | | | | | | | | | | |
| | | | | | |
Subtotal Appreciation | | | | | | | | | | | | | | | | | 247,618 | |
| | | | | | | | | | | | | | | | | | |
See accompanying notes to the financial statements.
70
ASHMORE EMERGING MARKETS LOCAL CURRENCY BOND FUND
SCHEDULE OF INVESTMENTS (CONTINUED)
As of April 30, 2018 (Unaudited)
| | | | | | | | | | | | | | | | | | |
Settlement Date | | Counterparty | | Currency Buy | | Currency Buy Amount
(Local
Currency) | | | Currency Sell | | Currency
Sell Amount
(Local
Currency) | | | Unrealized
Gain/(Loss) | |
| | | | | | |
05/03/2018 | | BNP Paribas | | Brazilian Real | | | 513,624 | | | United States Dollar | | | 150,000 | | | $ | (3,429 | ) |
05/03/2018 | | Goldman Sachs | | Brazilian Real | | | 698,670 | | | United States Dollar | | | 210,000 | | | | (10,622 | ) |
05/03/2018 | | Merrill Lynch | | Brazilian Real | | | 2,580,209 | | | United States Dollar | | | 750,497 | | | | (14,190 | ) |
05/30/2018 | | Barclays | | Polish Zloty | | | 444,849 | | | United States Dollar | | | 134,138 | | | | (7,354 | ) |
05/30/2018 | | Merrill Lynch | | Polish Zloty | | | 4,234,328 | | | United States Dollar | | | 1,236,156 | | | | (29,354 | ) |
05/30/2018 | | Standard Chartered | | Polish Zloty | | | 427,404 | | | United States Dollar | | | 127,533 | | | | (5,721 | ) |
05/31/2018 | | BNP Paribas | | Argentine Peso | | | 2,299,239 | | | United States Dollar | | | 109,383 | | | | (815 | ) |
05/31/2018 | | Deutsche Bank | | Czech Koruna | | | 4,910,904 | | | United States Dollar | | | 241,610 | | | | (9,518 | ) |
05/31/2018 | | BNP Paribas | | Hungarian Forint | | | 47,302,414 | | | United States Dollar | | | 187,537 | | | | (5,105 | ) |
05/31/2018 | | Deutsche Bank | | Hungarian Forint | | | 89,529,815 | | | United States Dollar | | | 354,349 | | | | (9,057 | ) |
05/31/2018 | | Deutsche Bank | | Malaysian Ringgit | | | 1,812,181 | | | United States Dollar | | | 462,551 | | | | (1,189 | ) |
05/31/2018 | | Deutsche Bank | | Malaysian Ringgit | | | 580,430 | | | United States Dollar | | | 149,000 | | | | (1,229 | ) |
05/31/2018 | | Deutsche Bank | | Malaysian Ringgit | | | 423,805 | | | United States Dollar | | | 109,200 | | | | (1,304 | ) |
05/31/2018 | | BNP Paribas | | Romanian Leu | | | 512,882 | | | United States Dollar | | | 136,363 | | | | (3,494 | ) |
05/31/2018 | | HSBC Bank | | Romanian Leu | | | 4,478,619 | | | United States Dollar | | | 1,188,530 | | | | (28,284 | ) |
05/31/2018 | | HSBC Bank | | Russian Ruble | | | 41,745,257 | | | United States Dollar | | | 675,135 | | | | (14,843 | ) |
05/31/2018 | | JP Morgan | | South African Rand | | | 4,887,124 | | | United States Dollar | | | 391,020 | | | | (691 | ) |
05/31/2018 | | BNP Paribas | | Thai Baht | | | 5,154,127 | | | United States Dollar | | | 164,969 | | | | (1,510 | ) |
05/31/2018 | | Deutsche Bank | | Thai Baht | | | 5,310,495 | | | United States Dollar | | | 169,800 | | | | (1,382 | ) |
05/31/2018 | | Goldman Sachs | | Thai Baht | | | 2,301,084 | | | United States Dollar | | | 73,800 | | | | (823 | ) |
05/31/2018 | | UBS | | Thai Baht | | | 9,463,749 | | | United States Dollar | | | 303,131 | | | | (2,996 | ) |
06/04/2018 | | HSBC Bank | | Brazilian Real | | | 558,320 | | | United States Dollar | | | 160,000 | | | | (1,184 | ) |
06/29/2018 | | BNP Paribas | | Argentine Peso | | | 6,538,626 | | | United States Dollar | | | 305,358 | | | | (2,012 | ) |
06/29/2018 | | Barclays | | Czech Koruna | | | 36,180,347 | | | United States Dollar | | | 1,768,518 | | | | (55,640 | ) |
06/29/2018 | | Deutsche Bank | | Indonesian Rupiah | | | 3,700,060,000 | | | United States Dollar | | | 266,000 | | | | (2,021 | ) |
06/29/2018 | | Deutsche Bank | | Polish Zloty | | | 110,487 | | | United States Dollar | | | 32,747 | | | | (1,236 | ) |
06/29/2018 | | Standard Chartered | | Polish Zloty | | | 292,669 | | | United States Dollar | | | 85,000 | | | | (1,531 | ) |
06/29/2018 | | Merrill Lynch | | Romanian Leu | | | 1,521,212 | | | United States Dollar | | | 404,309 | | | | (10,160 | ) |
06/29/2018 | | Goldman Sachs | | Thai Baht | | | 15,971,000 | | | United States Dollar | | | 513,248 | | | | (6,333 | ) |
06/29/2018 | | JP Morgan | | Thai Baht | | | 16,320,000 | | | United States Dollar | | | 524,506 | | | | (6,513 | ) |
06/29/2018 | | Morgan Stanley | | Thai Baht | | | 3,900,750 | | | United States Dollar | | | 125,000 | | | | (1,191 | ) |
06/29/2018 | | UBS | | Thai Baht | | | 31,007,892 | | | United States Dollar | | | 994,646 | | | | (10,464 | ) |
06/29/2018 | | HSBC Bank | | United States Dollar | | | 113,259 | | | Indonesian Rupiah | | | 1,602,613,086 | | | | (1,079 | ) |
06/29/2018 | | JP Morgan | | United States Dollar | | | 113,318 | | | Indonesian Rupiah | | | 1,600,619,328 | | | | (877 | ) |
06/29/2018 | | ANZ | | United States Dollar | | | 176,230 | | | Philippine Peso | | | 9,225,970 | | | | (1,741 | ) |
07/31/2018 | | Credit Suisse | | Colombian Peso | | | 5,102,921,375 | | | United States Dollar | | | 1,877,973 | | | | (64,910 | ) |
07/31/2018 | | BNP Paribas | | Czech Koruna | | | 8,914,542 | | | United States Dollar | | | 429,817 | | | | (6,922 | ) |
07/31/2018 | | JP Morgan | | Czech Koruna | | | 9,278,401 | | | United States Dollar | | | 449,470 | | | | (9,314 | ) |
07/31/2018 | | HSBC Bank | | Mexican Peso | | | 52,989,147 | | | United States Dollar | | | 2,859,271 | | | | (67,137 | ) |
07/31/2018 | | Merrill Lynch | | Mexican Peso | | | 47,155,319 | | | United States Dollar | | | 2,583,924 | | | | (99,190 | ) |
07/31/2018 | | BNP Paribas | | Peruvian Nuevo Sol | | | 2,855,932 | | | United States Dollar | | | 885,917 | | | | (10,253 | ) |
07/31/2018 | | Barclays | | Polish Zloty | | | 4,802,304 | | | United States Dollar | | | 1,398,113 | | | | (27,395 | ) |
07/31/2018 | | Merrill Lynch | | Polish Zloty | | | 4,998,317 | | | United States Dollar | | | 1,456,694 | | | | (30,028 | ) |
See accompanying notes to the financial statements.
71
ASHMORE EMERGING MARKETS LOCAL CURRENCY BOND FUND
SCHEDULE OF INVESTMENTS (CONTINUED)
As of April 30, 2018 (Unaudited)
| | | | | | | | | | | | | | | | | | |
Settlement Date | | Counterparty | | Currency Buy | | Currency
Buy Amount
(Local
Currency) | | | Currency Sell | | Currency
Sell Amount
(Local
Currency) | | | Unrealized
Gain/(Loss) | |
| | | | | | |
07/31/2018 | | BNP Paribas | | Romanian Leu | | | 1,041,306 | | | United States Dollar | | | 273,180 | | | $ | (3,423 | ) |
08/31/2018 | | Barclays | | Czech Koruna | | | 3,726,266 | | | United States Dollar | | | 180,114 | | | | (3,040 | ) |
08/31/2018 | | Deutsche Bank | | Czech Koruna | | | 30,999,230 | | | United States Dollar | | | 1,518,015 | | | | (44,913 | ) |
08/31/2018 | | JP Morgan | | Hungarian Forint | | | 268,589,444 | | | United States Dollar | | | 1,069,609 | | | | (26,941 | ) |
08/31/2018 | | HSBC Bank | | Polish Zloty | | | 6,119,518 | | | United States Dollar | | | 1,780,172 | | | | (32,216 | ) |
08/31/2018 | | JP Morgan | | Polish Zloty | | | 5,879,537 | | | United States Dollar | | | 1,722,159 | | | | (42,751 | ) |
08/31/2018 | | Barclays | | Russian Ruble | | | 40,108,188 | | | United States Dollar | | | 636,089 | | | | (8,451 | ) |
| | | | | | | | | | | | | | | | | | |
| | | | | | |
Subtotal Depreciation | | | | | | | | | | | | | | | | | (731,776 | ) |
| | | | | | | | | | | | | | | | | | |
| | | | | | |
Total | | | | | | | | | | | | | | | | $ | (484,158 | ) |
| | | | | | | | | | | | | | | | | | |
At April 30, 2018, the Ashmore Emerging Markets Local Currency Bond Fund had the following interest rate swap contracts outstanding:
| | | | | | | | | | | | | | | | | | | | | | | | | | | | | | | | |
Pay Rate Index/ Pay Rate | | Receive Rate/
Receive Rate
Index | | | Notional
Amount | | | Expiration
Date | | | Fair
Value | | | Premiums
Paid/
(Received) | | | Unrealized
Appreciation
(Depreciation) | | | Counterparty | |
| | | | | | | | |
MYR-KLIBOR-BNM 3 Month Rate (Pay Quarterly) | |
| 3.600% (Receive
Quarterly) |
| | | MYR | | | | 750,000 | | | | 08/18/2026 | | | $ | (8,066) | | | | — | | | | $(8,066) | | | | HSBC Bank | |
MYR-KLIBOR-BNM 3 Month Rate (Pay Quarterly) | |
| 4.055% (Receive
Quarterly) |
| | | MYR | | | | 1,300,000 | | | | 04/27/2026 | | | | (2,942) | | | | — | | | | (2,942) | | | | HSBC Bank | |
WIBOR Poland 6 Month Rate (Pay Semiannually) | |
| 1.955% (Receive
Annually) |
| | | PLN | | | | 6,400,000 | | | | 09/24/2020 | | | | 19,115 | | | | — | | | | 19,115 | | | | BNP Paribas | |
| | | | | | | | | | | | | | | | | | | | | | | | | | | | | | | | |
| | | | | | | | | | | | | | | | | | | | | | | | | | | $8,107 | | | | | |
| | | | | | | | | | | | | | | | | | | | | | | | | | | | | | | | |
At April 30, 2018, the Ashmore Emerging Markets Local Currency Bond Fund had the following centrally cleared swap contracts outstanding:
| | | | | | | | | | | | | | | | | | | | | | | | | | | | |
Pay Rate Index/ Pay Rate | | Receive Rate/
Receive Rate Index | | Notional
Amount | | | | | | Expiration
Date | | | Fair Value/
Unrealized
Appreciation
(Depreciation)** | | | Premiums
Paid/ (Received) | | | Variation
Margin
Receivable
(Payable) | | | Counterparty |
| | | | | | | | |
Brazil CETIP Interbank Deposit Rate (Pay at Maturity) | | 8.708% (Receive at Maturity) | | | BRL | | | | 6,351,437 | | | | 01/04/2021 | | | | $48,549 | | | | — | | | $ | (2,839) | | | Merrill Lynch |
Budapest Interbank 6 Month Rate (Pay Semiannually) | | 1.820% (Receive Annually) | | | HUF | | | | 91,600,000 | | | | 10/07/2020 | | | | 16,013 | | | | — | | | | (113) | | | HSBC Bank |
Budapest Interbank 6 Month Rate (Pay Semiannually) | | 1.795% (Receive Annually) | | | HUF | | | | 93,000,000 | | | | 10/09/2020 | | | | 15,955 | | | | — | | | | (113) | | | HSBC Bank |
MXN-TIIE-BANXICO 28 Day Rate (Pay Lunar) | | 7.711% (Receive Lunar) | | | MXN | | | | 137,000,000 | | | | 03/15/2023 | | | | 64,998 | | | | — | | | | (12,408) | | | Merrill Lynch |
MXN-TIIE-BANXICO 28 Day Rate (Pay Lunar) | | 7.349% (Receive Lunar) | | | MXN | | | | 33,500,000 | | | | 06/14/2023 | | | | (10,405) | | | | — | | | | (3,040) | | | Merrill Lynch |
MXN-TIIE-BANXICO 28 Day Rate (Pay Lunar) | | 7.475% (Receive Lunar) | | | MXN | | | | 33,000,000 | | | | 06/14/2023 | | | | (1,035) | | | | — | | | | (3,040) | | | Goldman Sachs |
WIBOR Poland 6 Month Rate (Pay Semiannually) | | 2.400% (Receive Annually) | | | PLN | | | | 3,770,000 | | | | 03/26/2023 | | | | 2,559 | | | | — | | | | 51 | | | Merrill Lynch |
| | | | | | | | | | | | | | | | | | | | | | | | | | | | |
| | | | | | | | | | | | | | | | | $136,634 | | | | | | | $ | (21,502) | | | |
| | | | | | | | | | | | | | | | | | | | | | | | | | | | |
**Includes cumulative appreciation/depreciation on centrally cleared swap agreements. Only the current day’s variation margin is reported within the Statements of Assets and Liabilities.
See accompanying notes to the financial statements.
72
ASHMORE EMERGING MARKETS LOCAL CURRENCY BOND FUND
SCHEDULE OF INVESTMENTS (CONTINUED)
As of April 30, 2018 (Unaudited)
The inputs or methodologies used for valuing securities are not necessarily an indication of the risks associated with investing in those securities and other financial instruments, if any. See note 4 in the Notes to the Financial Statements for more information regarding pricing inputs and valuation techniques. The following is a summary of the inputs used in valuing the Ashmore Emerging Markets Local Currency Bond Fund’s investments and other financial instruments, which are carried at fair value, as of April 30, 2018:
| | | | | | | | | | | | | | | | |
| | | Level 1 | | | Level 2 | | | Level 3 | | | Total | |
Investments | | | | | | | | | | | | | | | | |
Assets: | | | | | | | | | | | | | | | | |
Debt Securities | | | | | | | | | | | | | | | | |
Corporate Bonds | | | $— | | | $ | 509,249 | | | | $— | | | $ | 509,249 | |
Government Agencies | | | — | | | | 334,007 | | | | — | | | | 334,007 | |
Government Bonds | | | — | | | | 55,984,225 | | | | — | | | | 55,984,225 | |
Index Linked Government Bonds | | | — | | | | 2,950,041 | | | | — | | | | 2,950,041 | |
| | | | | | | | | | | | | | | | |
Total Debt Securities | | | — | | | | 59,777,522 | | | | — | | | | 59,777,522 | |
Fully Funded Total Return Swaps | | | — | | | | 2,098,391 | | | | — | | | | 2,098,391 | |
Total Investments | | | $— | | | $ | 61,875,913 | | | | $— | | | $ | 61,875,913 | |
| | | | |
Other Financial Instruments | | | | | | | | | | | | | | | | |
Assets: | | | | | | | | | | | | | | | | |
Forward Foreign Currency Exchange Contracts | | | $— | | | $ | 247,618 | | | | $— | | | $ | 247,618 | |
Interest Rate Swap Contracts | | | — | | | | 19,115 | | | | — | | | | 19,115 | |
Centrally Cleared Swap Contracts | | | — | | | | 148,074 | | | | — | | | | 148,074 | |
Liabilities: | | | | | | | | | | | | | | | | |
Forward Foreign Currency Exchange Contracts | | | — | | | | (731,776 | ) | | | — | | | | (731,776 | ) |
Interest Rate Swap Contracts | | | — | | | | (11,008 | ) | | | — | | | | (11,008 | ) |
Centrally Cleared Swap Contracts | | | — | | | | (11,440 | ) | | | — | | | | (11,440 | ) |
Total Other Financial Instruments | | | $— | | | $ | (339,417 | ) | | | $— | | | $ | (339,417 | ) |
The Fund discloses all transfers between levels based on valuations at the end of each reporting period. At April 30, 2018, there were no transfers between Level 1, Level 2 and Level 3 based on levels assigned to the securities on October 31, 2017.
See accompanying notes to the financial statements.
73
ASHMORE EMERGING MARKETS LOCAL CURRENCY BOND FUND
SCHEDULE OF INVESTMENTS (CONTINUED)
As of April 30, 2018 (Unaudited)
The following is a summary of the fair values of the Fund’s derivative instruments*:
Fair Values of Financial Derivative Instruments on the Statements of Assets and Liabilities as of April 30, 2018:
| | | | | | | | |
| | | Derivatives Not Accounted for as
Hedging Instruments | |
| | |
| | | Foreign Exchange | | | Interest Rate | |
Assets: | | | | | | | | |
Unrealized Appreciation on Interest Rate Swap Contracts | | | $ — | | | | $ 19,115 | |
Unrealized Appreciation on Centrally Cleared Swap Contracts | | | — | | | | 148,074 | † |
Unrealized Appreciation on Forward Foreign Currency Exchange Contracts | | | 247,618 | | | | — | |
| | | | |
| | | $ 247,618 | | | | $ 167,189 | |
| | | | |
Liabilities: | | | | | | | | |
Unrealized Depreciation on Interest Rate Swap Contracts | | | $ — | | | | $ (11,008) | |
Unrealized Depreciation on Centrally Cleared Swap Contracts | | | — | | | | (11,440) | † |
Unrealized Depreciation on Forward Foreign Currency Exchange Contracts | | | (731,776 | ) | | | — | |
| | | | |
| | | $(731,776 | ) | | | $ (22,448) | |
| | | | |
† Includes cumulative appreciation/depreciation on centrally cleared swap agreements. Only the current day’s variation margin is reported within the Statements of Assets and Liabilities.
The Effect of Financial Derivative Instruments on the Statements of Operations for the Six Months Ended April 30, 2018:
| | | | | | | | |
| | | Derivatives Not Accounted for as
Hedging Instruments | |
| | |
| | | Foreign
Exchange | | | Interest Rate | |
Realized Gain (Loss) on Derivatives Recognized resulting from Operations: | | | | | | | | |
Net Realized Gain on Forward Foreign Currency Exchange Contracts | | | $679,545 | | | | $ — | |
Net Realized Gain on Interest Rate Swap Contracts | | | — | | | | 140,713 | |
| | | | |
| | | $679,545 | | | | $140,713 | |
| | | | |
Net Change in Unrealized Appreciation (Depreciation) on Derivatives Recognized resulting from Operations: | | | | | | | | |
Net Change in Unrealized Depreciation on Forward Foreign Currency Exchange Contracts | | | $282,355 | | | | $ — | |
Net Change in Unrealized Depreciation on Interest Rate Swap Contracts | | | — | | | | (42,453 | ) |
| | | | |
| | | $282,355 | | | | $(42,453 | ) |
| | | | |
* See note 10 in the Notes to the Financial Statements for additional information.
See accompanying notes to the financial statements.
74
ASHMORE EMERGING MARKETS CORPORATE DEBT FUND
SCHEDULE OF INVESTMENTS
As of April 30, 2018 (Unaudited)
| | | | | | | | | | | | | | | | |
| | | Currency(1)
| | | Par | | | Value | | | % of Net
Assets | |
Debt Securities | | | | | | | | | | | | | | | | |
| | | | |
Argentina (Cost $13,456,233) | | | | | | | | | | | | | | | | |
Pampa Energia S.A., 7.500%, 01/24/2027 | | | | | | | 1,390,000 | | | $ | 1,414,325 | | | | 0.40 | |
Rio Energy S.A./UGEN S.A./UENSA S.A., 6.875%, 02/01/2025 | | | | | | | 1,455,000 | | | | 1,418,625 | | | | 0.41 | |
YPF S.A., 8.500%, 07/28/2025 | | | | | | | 3,450,000 | | | | 3,767,400 | | | | 1.07 | |
YPF S.A., 6.950%, 07/21/2027 | | | | | | | 5,275,000 | | | | 5,189,281 | | | | 1.48 | |
YPF S.A., 7.000%, 12/15/2047 | | | | | | | 1,500,000 | | | | 1,337,550 | | | | 0.38 | |
| | | | | | | | | | | 13,127,181 | | | | 3.74 | |
Belarus (Cost $2,891,841) | | | | | | | | | | | | | | | | |
Eurotorg LLC Via Bonitron DAC, 8.750%, 10/30/2022 | | | | | | | 2,835,000 | | | | 2,866,412 | | | | 0.82 | |
| | | | | | | | | | | 2,866,412 | | | | 0.82 | |
Brazil (Cost $72,510,114) | | | | | | | | | | | | | | | | |
Andrade Gutierrez International S.A., 4.000%, 05/03/2018 | | | | | | | 3,975,000 | | | | 3,776,250 | | | | 1.07 | |
Banco do Brasil S.A., (Variable, U.S. Treasury Yield Curve Rate CMT 10Y + 4.398%) 6.250%, 04/15/2024(2) | | | | | | | 4,415,000 | | | | 3,916,988 | | | | 1.11 | |
Banco do Brasil S.A., (Variable, U.S. Treasury Yield Curve Rate CMT 10Y + 6.362%) 9.000%, 06/18/2024(2) | | | | | | | 665,000 | | | | 703,836 | | | | 0.20 | |
Braskem Finance Ltd., 5.750%, 04/15/2021 | | | | | | | 795,000 | | | | 822,746 | | | | 0.23 | |
Braskem Finance Ltd., 6.450%, 02/03/2024 | | | | | | | 1,180,000 | | | | 1,266,152 | | | | 0.36 | |
CSN Islands XI Corp., 6.875%, 09/21/2019 | | | | | | | 2,175,000 | | | | 2,180,437 | | | | 0.62 | |
CSN Resources S.A., 6.500%, 07/21/2020 | | | | | | | 2,225,000 | | | | 2,163,812 | | | | 0.62 | |
GOL Finance S.A., 8.875%, 01/24/2022 | | | | | | | 1,923,000 | | | | 2,007,150 | | | | 0.57 | |
Gol Finance, Inc., 7.000%, 01/31/2025 | | | | | | | 1,500,000 | | | | 1,440,960 | | | | 0.41 | |
GTL Trade Finance, Inc., 7.250%, 04/16/2044 | | | | | | | 665,000 | | | | 720,694 | | | | 0.21 | |
GTL Trade Finance, Inc./Gerdau Holdings, Inc., 5.893%,
04/29/2024 | | | | | | | 1,035,000 | | | | 1,090,062 | | | | 0.31 | |
Marfrig Holdings Europe B.V., 8.000%, 06/08/2023 | | | | | | | 1,695,000 | | | | 1,714,069 | | | | 0.49 | |
Minerva Luxembourg S.A., 5.875%, 01/19/2028 | | | | | | | 2,990,000 | | | | 2,667,678 | | | | 0.76 | |
Petrobras Global Finance B.V., 8.750%, 05/23/2026 | | | | | | | 5,815,000 | | | | 6,810,819 | | | | 1.94 | |
Petrobras Global Finance B.V., 6.875%, 01/20/2040 | | | | | | | 14,355,000 | | | | 13,798,744 | | | | 3.93 | |
Petrobras Global Finance B.V., 6.850%, 06/05/2115 | | | | | | | 7,405,000 | | | | 6,842,220 | | | | 1.95 | |
QGOG Atlantic/Alaskan Rigs Ltd., 5.250%, 07/30/2018 | | | | | | | 840,250 | | | | 815,043 | | | | 0.23 | |
QGOG Constellation S.A., 9.500%, 11/09/2024(3) | | | | | | | 2,940,936 | | | | 1,441,059 | | | | 0.41 | |
Raizen Fuels Finance S.A., 5.300%, 01/20/2027 | | | | | | | 910,000 | | | | 914,550 | | | | 0.26 | |
Samarco Mineracao S.A., 4.125%, 11/01/2022(4) | | | | | | | 6,403,000 | | | | 4,658,182 | | | | 1.33 | |
Samarco Mineracao S.A., 5.750%, 10/24/2023(4) | | | | | | | 5,108,000 | | | | 3,716,070 | | | | 1.06 | |
Samarco Mineracao S.A., 5.375%, 09/26/2024(4) | | | | | | | 1,030,000 | | | | 749,325 | | | | 0.21 | |
St Marys Cement, Inc., 5.750%, 01/28/2027 | | | | | | | 990,000 | | | | 1,008,958 | | | | 0.29 | |
Suzano Austria GmbH, 7.000%, 03/16/2047 | | | | | | | 325,000 | | | | 362,375 | | | | 0.10 | |
Vale Overseas Ltd., 6.250%, 08/10/2026 | | | | | | | 2,433,000 | | | | 2,683,356 | | | | 0.76 | |
Votorantim Cimentos S.A., 7.250%, 04/05/2041 | | | | | | | 1,130,000 | | | | 1,231,135 | | | | 0.35 | |
Vrio Finco 1 LLC/Vrio Finco 2, Inc., 6.250%, 04/04/2023(5) | | | | | | | 1,800,000 | | | | 1,813,500 | | | | 0.52 | |
Vrio Finco 1 LLC/Vrio Finco 2, Inc., 6.875%, 04/04/2028(5) | | | | | | | 1,800,000 | | | | 1,793,250 | | | | 0.51 | |
| | | | | | | | | | | 73,109,420 | | | | 20.81 | |
Chile (Cost $2,018,413) | | | | | | | | | | | | | | | | |
Cencosud S.A., 4.375%, 07/17/2027 | | | | | | | 1,515,000 | | | | 1,435,462 | | | | 0.41 | |
See accompanying notes to the financial statements.
75
ASHMORE EMERGING MARKETS CORPORATE DEBT FUND
SCHEDULE OF INVESTMENTS (CONTINUED)
As of April 30, 2018 (Unaudited)
| | | | | | | | | | | | | | | | |
| | | Currency(1)
| | | Par | | | Value | | | % of Net
Assets | |
Chile (continued) | | | | | | | | | | | | | | | | |
Itau CorpBanca, 3.875%, 09/22/2019 | | | | | | | 500,000 | | | $ | 505,760 | | | | 0.14 | |
| | | | | | | | | | | 1,941,222 | | | | 0.55 | |
China (Cost $24,965,789) | | | | | | | | | | | | | | | | |
Bank of China Ltd., (Floating, ICE LIBOR USD 3M + 0.850%)
2.897%, 03/08/2023 | | | | | | | 1,157,000 | | | | 1,158,689 | | | | 0.33 | |
Bank of China Ltd., 5.000%, 11/13/2024 | | | | | | | 950,000 | | | | 969,295 | | | | 0.28 | |
Central China Real Estate Ltd., 6.500%, 03/05/2021 | | | | | | | 1,445,000 | | | | 1,407,758 | | | | 0.40 | |
Chalco Hong Kong Investment Co. Ltd., (Variable, U.S. Treasury Yield Curve Rate CMT 5Y + 7.931%) 4.250%, 11/07/2021(2) | | | | | | | 835,000 | | | | 811,914 | | | | 0.23 | |
China Evergrande Group, 7.500%, 06/28/2023 | | | | | | | 2,265,000 | | | | 2,130,344 | | | | 0.61 | |
China Forestry Holdings Co. Ltd., 10.250%, 11/17/2015(4)(6)(7) | | | | | | | 60,000 | | | | — | | | | — | |
China Minmetals Corp., (Variable, U.S. Treasury Yield Curve Rate CMT 5Y + 4.717%) 3.750%, 11/13/2022(2) | | | | | | | 820,000 | | | | 770,811 | | | | 0.22 | |
Far East Energy Bermuda Ltd., 13.000%, 01/15/2016(4)(5)(6)(7)(8) | | | | | | | 282,201 | | | | — | | | | — | |
Franshion Brilliant Ltd., 5.750%, 03/19/2019 | | | | | | | 1,225,000 | | | | 1,243,610 | | | | 0.35 | |
Hontop Energy Singapore via China Wanda International Funding,
7.950%, 12/14/2020 | | | | | | | 1,355,000 | | | | 1,305,082 | | | | 0.37 | |
ICBC Standard Bank PLC, 8.125%, 12/02/2019 | | | | | | | 2,260,000 | | | | 2,397,521 | | | | 0.68 | |
Kaisa Group Holdings Ltd., 8.500%, 06/30/2022 | | | | | | | 1,800,000 | | | | 1,567,337 | | | | 0.45 | |
Leader Goal International Ltd., (Variable, U.S. Treasury Yield Curve Rate CMT 5Y + 6.919%) 4.250%, 01/19/2023(2) | | | | | | | 865,000 | | | | 840,084 | | | | 0.24 | |
Longfor Properties Co. Ltd., 4.500%, 01/16/2028 | | | | | | | 890,000 | | | | 822,238 | | | | 0.23 | |
Reward International Investment Ltd., 7.250%, 01/25/2020 | | | | | | | 2,995,000 | | | | 2,217,130 | | | | 0.63 | |
Shenzhen International Holdings Ltd., (Variable, U.S. Treasury Yield Curve Rate CMT 5Y + 6.850%) 3.950%, 11/29/2022(2) | | | | | | | 820,000 | | | | 783,102 | | | | 0.22 | |
Sunac China Holdings Ltd., 7.950%, 08/08/2022 | | | | | | | 2,895,000 | | | | 2,833,015 | | | | 0.81 | |
Sunny Optical Technology Group Co. Ltd., 3.750%, 01/23/2023 | | | | | | | 435,000 | | | | 421,043 | | | | 0.12 | |
Tunghsu Venus Holdings Ltd., 7.000%, 06/12/2020 | | | | | | | 1,550,000 | | | | 1,248,114 | | | | 0.36 | |
| | | | | | | | | | | 22,927,087 | | | | 6.53 | |
Colombia (Cost $6,313,681) | | | | | | | | | | | | | | | | |
Banco Bilbao Vizcaya Argentaria Colombia S.A., 4.875%,
04/21/2025 | | | | | | | 424,000 | | | | 428,240 | | | | 0.12 | |
Banco de Bogota S.A., 4.375%, 08/03/2027 | | | | | | | 1,045,000 | | | | 994,067 | | | | 0.28 | |
Bancolombia S.A., 5.950%, 06/03/2021 | | | | | | | 380,000 | | | | 400,425 | | | | 0.12 | |
Ecopetrol S.A., 7.375%, 09/18/2043 | | | | | | | 1,380,000 | | | | 1,581,135 | | | | 0.45 | |
Ecopetrol S.A., 5.875%, 05/28/2045 | | | | | | | 625,000 | | | | 602,656 | | | | 0.17 | |
Empresa de Telecomunicaciones de Bogota, 7.000%, 01/17/2023 | | | COP | | | | 3,260,000,000 | | | | 959,447 | | | | 0.27 | |
GrupoSura Finance S.A., 5.500%, 04/29/2026 | | | | | | | 745,000 | | | | 775,731 | | | | 0.22 | |
| | | | | | | | | | | 5,741,701 | | | | 1.63 | |
Czech Republic (Cost $1,965,282) | | | | | | | | | | | | | | | | |
New World Resources N.V., 8.000%, 04/07/2020(4)(7) | | | EUR | | | | 1,685,299 | | | | — | | | | — | |
New World Resources N.V., 4.000%, 10/07/2020(4)(7) | | | EUR | | | | 700,590 | | | | — | | | | — | |
New World Resources N.V., 16.651%, 10/07/2020(4)(5)(7)(8)(9) | | | EUR | | | | 101,612 | | | | — | | | | — | |
| | | | | | | | | | | — | | | | — | |
See accompanying notes to the financial statements.
76
ASHMORE EMERGING MARKETS CORPORATE DEBT FUND
SCHEDULE OF INVESTMENTS (CONTINUED)
As of April 30, 2018 (Unaudited)
| | | | | | | | | | | | | | | | |
| | | Currency(1)
| | | Par | | | Value | | | % of Net
Assets | |
Ecuador (Cost $12,308,796) | | | | | | | | | | | | | | | | |
EP PetroEcuador via Noble Sovereign Funding I Ltd., (Floating, ICE LIBOR USD 3M + 5.630%) 7.925%, 09/24/2019 | | | | | | | 7,171,264 | | | $ | 7,169,829 | | | | 2.04 | |
Petroamazonas EP, 4.625%, 02/16/2020 | | | | | | | 3,760,000 | | | | 3,581,400 | | | | 1.02 | |
Petroamazonas EP, 4.625%, 11/06/2020 | | | | | | | 1,800,000 | | | | 1,674,000 | | | | 0.48 | |
| | | | | | | | | | | 12,425,229 | | | | 3.54 | |
Hong Kong (Cost $656,330) | | | | | | | | | | | | | | | | |
Bank of East Asia (The) Ltd., 6.125%, 07/16/2020 | | | | | | | 620,000 | | | | 649,570 | | | | 0.18 | |
| | | | | | | | | | | 649,570 | | | | 0.18 | |
India (Cost $2,521,149) | | | | | | | | | | | | | | | | |
Bharat Petroleum Corp. Ltd., 4.000%, 05/08/2025 | | | | | | | 414,000 | | | | 399,143 | | | | 0.11 | |
Bharti Airtel International Netherlands B.V., 5.125%, 03/11/2023 | | | | | | | 910,000 | | | | 915,980 | | | | 0.26 | |
Oil India International Pte. Ltd., 4.000%, 04/21/2027 | | | | | | | 1,145,000 | | | | 1,075,506 | | | | 0.31 | |
| | | | | | | | | | | 2,390,629 | | | | 0.68 | |
Indonesia (Cost $4,366,572) | | | | | | | | | | | | | | | | |
Golden Legacy Pte. Ltd., 8.250%, 06/07/2021 | | | | | | | 1,825,000 | | | | 1,912,107 | | | | 0.55 | |
Minejesa Capital B.V., 4.625%, 08/10/2030 | | | | | | | 2,110,000 | | | | 1,998,611 | | | | 0.57 | |
Pertamina Persero PT, 6.000%, 05/03/2042 | | | | | | | 310,000 | | | | 323,681 | | | | 0.09 | |
| | | | | | | | | | | 4,234,399 | | | | 1.21 | |
Iraq (Cost $3,533,039) | | | | | | | | | | | | | | | | |
Oilflow SPV 1 DAC, 12.000%, 01/13/2022 | | | | | | | 3,415,000 | | | | 3,553,953 | | | | 1.01 | |
| | | | | | | | | | | 3,553,953 | | | | 1.01 | |
Israel (Cost $23,557,743) | | | | | | | | | | | | | | | | |
Altice Financing S.A., 7.500%, 05/15/2026 | | | | | | | 10,100,000 | | | | 9,948,500 | | | | 2.83 | |
Altice Finco S.A., 7.625%, 02/15/2025 | | | | | | | 1,515,000 | | | | 1,443,038 | | | | 0.41 | |
Teva Pharmaceutical Finance Netherlands Co. LLC, 6.150%,
02/01/2036 | | | | | | | 2,945,000 | | | | 2,767,045 | | | | 0.79 | |
Teva Pharmaceutical Finance Netherlands II B.V., 4.500%,
03/01/2025(5) | | | EUR | | | | 1,220,000 | | | | 1,493,957 | | | | 0.42 | |
Teva Pharmaceutical Finance Netherlands III B.V., 2.800%,
07/21/2023 | | | | | | | 1,760,000 | | | | 1,476,492 | | | | 0.42 | |
Teva Pharmaceutical Finance Netherlands III B.V., 6.750%,
03/01/2028(5) | | | | | | | 700,000 | | | | 691,438 | | | | 0.20 | |
Teva Pharmaceutical Finance Netherlands III B.V., 4.100%,
10/01/2046 | | | | | | | 6,410,000 | | | | 4,742,214 | | | | 1.35 | |
| | | | | | | | | | | 22,562,684 | | | | 6.42 | |
Jamaica (Cost $21,983,861) | | | | | | | | | | | | | | | | |
Digicel Group Ltd., 8.250%, 09/30/2020 | | | | | | | 11,484,000 | | | | 10,263,825 | | | | 2.92 | |
Digicel Group Ltd., 7.125%, 04/01/2022 | | | | | | | 12,405,000 | | | | 10,087,994 | | | | 2.87 | |
| | | | | | | | | | | 20,351,819 | | | | 5.79 | |
Kazakhstan (Cost $13,758,765) | | | | | | | | | | | | | | | | |
Kazakhstan Temir Zholy Finance B.V., 6.950%, 07/10/2042 | | | | | | | 1,200,000 | | | | 1,310,738 | | | | 0.37 | |
Kazakhstan Temir Zholy National Co. JSC, 4.850%, 11/17/2027 | | | | | | | 2,285,000 | | | | 2,262,150 | | | | 0.65 | |
Kazkommertsbank JSC, 5.500%, 12/21/2022 | | | | | | | 6,268,255 | | | | 6,247,444 | | | | 1.78 | |
KazMunayGas National Co. JSC, 7.000%, 05/05/2020 | | | | | | | 790,000 | | | | 843,025 | | | | 0.24 | |
See accompanying notes to the financial statements.
77
ASHMORE EMERGING MARKETS CORPORATE DEBT FUND
SCHEDULE OF INVESTMENTS (CONTINUED)
As of April 30, 2018 (Unaudited)
| | | | | | | | | | | | | | | | |
| | | Currency(1)
| | | Par | | | Value | | | % of Net
Assets | |
Kazakhstan (continued) | | | | | | | | | | | | | | | | |
KazMunayGas National Co. JSC, 6.375%, 04/09/2021 | | | | | | | 1,170,000 | | | $ | 1,252,134 | | | | 0.36 | |
KazMunayGas National Co. JSC, 5.375%, 04/24/2030(5)(8) | | | | | | | 465,000 | | | | 464,861 | | | | 0.13 | |
KazMunayGas National Co. JSC, 6.375%, 10/24/2048(5)(8) | | | | | | | 800,000 | | | | 817,016 | | | | 0.23 | |
Nostrum Oil & Gas Finance B.V., 8.000%, 07/25/2022 | | | | | | | 900,000 | | | | 915,883 | | | | 0.26 | |
| | | | | | | | | | | 14,113,251 | | | | 4.02 | |
Kuwait (Cost $1,571,266) | | | | | | | | | | | | | | | | |
Kuwait Projects Co. SPC Ltd., 4.500%, 02/23/2027 | | | | | | | 445,000 | | | | 428,267 | | | | 0.12 | |
NBK Tier 1 Financing Ltd., (Variable, USD Swap 6Y + 4.119%)
5.750%, 04/09/2021(2) | | | | | | | 1,080,000 | | | | 1,094,170 | | | | 0.31 | |
| | | | | | | | | | | 1,522,437 | | | | 0.43 | |
Mexico (Cost $7,422,909) | | | | | | | | | | | | | | | | |
BBVA Bancomer S.A., (Variable, U.S. Treasury Yield Curve Rate CMT 5Y + 2.650%) 5.125%, 01/18/2033(2) | | | | | | | 1,400,000 | | | | 1,321,250 | | | | 0.38 | |
Cemex S.A.B. de C.V., 5.700%, 01/11/2025 | | | | | | | 585,000 | | | | 591,070 | | | | 0.17 | |
Cometa Energia S.A. de C.V., 6.375%, 04/24/2035(5) | | | | | | | 1,312,000 | | | | 1,285,760 | | | | 0.37 | |
Mexichem S.A.B. de C.V., 6.750%, 09/19/2042 | | | | | | | 335,000 | | | | 368,500 | | | | 0.10 | |
Mexico Generadora de Energia S. de rl, 5.500%, 12/06/2032 | | | | | | | 638,091 | | | | 653,246 | | | | 0.18 | |
Petroleos Mexicanos, (Floating, ICE LIBOR USD 3M + 3.650%)
5.721%, 03/11/2022 | | | | | | | 1,215,000 | | | | 1,326,172 | | | | 0.38 | |
Petroleos Mexicanos, 4.875%, 01/18/2024 | | | | | | | 325,000 | | | | 322,400 | | | | 0.09 | |
Petroleos Mexicanos, 5.350%, 02/12/2028 | | | | | | | 790,000 | | | | 751,606 | | | | 0.21 | |
Trust F/1401, 6.950%, 01/30/2044 | | | | | | | 610,000 | | | | 620,675 | | | | 0.18 | |
| | | | | | | | | | | 7,240,679 | | | | 2.06 | |
Mongolia (Cost $7,763,421) | | | | | | | | | | | | | | | | |
Energy Resources LLC, 2.961%, 09/30/2022(2)(9)(10) | | | | | | | 7,652,415 | | | | 7,728,939 | | | | 2.20 | |
Mongolian Mining Corp., 1.822%, 10/01/2018(3)(9) | | | | | | | 3,390,888 | | | | 2,068,442 | | | | 0.59 | |
| | | | | | | | | | | 9,797,381 | | | | 2.79 | |
Morocco (Cost $1,576,093) | | | | | | | | | | | | | | | | |
OCP S.A., 5.625%, 04/25/2024 | | | | | | | 870,000 | | | | 895,012 | | | | 0.25 | |
OCP S.A., 6.875%, 04/25/2044 | | | | | | | 570,000 | | | | 614,660 | | | | 0.18 | |
| | | | | | | | | | | 1,509,672 | | | | 0.43 | |
Nigeria (Cost $5,251,640) | | | | | | | | | | | | | | | | |
First Bank of Nigeria Ltd. Via FBN Finance Co. B.V., (Variable, USD Swap 2Y + 6.875%) 8.250%, 08/07/2020(2) | | | | | | | 2,210,000 | | | | 2,198,950 | | | | 0.63 | |
First Bank of Nigeria Ltd. Via FBN Finance Co. B.V., (Variable, USD Swap 2Y + 6.488%) 8.000%, 07/23/2021(2) | | | | | | | 3,596,000 | | | | 3,546,555 | | | | 1.01 | |
| | | | | | | | | | | 5,745,505 | | | | 1.64 | |
Oman (Cost $294,646) | | | | | | | | | | | | | | | | |
Oztel Holdings SPC Ltd., 6.625%, 04/24/2028(5) | | | | | | | 300,000 | | | | 291,564 | | | | 0.08 | |
| | | | | | | | | | | 291,564 | | | | 0.08 | |
Panama (Cost $4,806,504) | | | | | | | | | | | | | | | | |
Banistmo S.A., 3.650%, 09/19/2022 | | | | | | | 900,000 | | | | 859,725 | | | | 0.25 | |
Multibank, Inc., 4.375%, 11/09/2022 | | | | | | | 395,000 | | | | 390,669 | | | | 0.11 | |
See accompanying notes to the financial statements.
78
ASHMORE EMERGING MARKETS CORPORATE DEBT FUND
SCHEDULE OF INVESTMENTS (CONTINUED)
As of April 30, 2018 (Unaudited)
| | | | | | | | | | | | | | | | |
| | | Currency(1)
| | | Par | | | Value | | | % of Net
Assets | |
Panama (continued) | | | | | | | | | | | | | | | | |
Sable International Finance Ltd., 6.875%, 08/01/2022 | | | | | | | 3,440,000 | | | $ | 3,616,300 | | | | 1.03 | |
| | | | | | | | | | | 4,866,694 | | | | 1.39 | |
Peru (Cost $7,686,798) | | | | | | | | | | | | | | | | |
Ajecorp B.V., 6.500%, 05/14/2022 | | | | | | | 4,285,000 | | | | 3,856,500 | | | | 1.10 | |
Intercorp Financial Services, Inc., 4.125%, 10/19/2027 | | | | | | | 405,000 | | | | 376,144 | | | | 0.11 | |
Minsur S.A., 6.250%, 02/07/2024 | | | | | | | 1,005,000 | | | | 1,061,531 | | | | 0.30 | |
Nexa Resources S.A., 5.375%, 05/04/2027 | | | | | | | 1,295,000 | | | | 1,298,237 | | | | 0.37 | |
Volcan Cia Minera S.A.A., 5.375%, 02/02/2022 | | | | | | | 820,000 | | | | 845,010 | | | | 0.24 | |
| | | | | | | | | | | 7,437,422 | | | | 2.12 | |
Qatar (Cost $1,925,320) | | | | | | | | | | | | | | | | |
CBQ Finance Ltd., 2.875%, 06/24/2019 | | | | | | | 800,000 | | | | 791,261 | | | | 0.23 | |
Ezdan Sukuk Co. Ltd., 4.375%, 05/18/2021 | | | | | | | 1,215,000 | | | | 1,030,320 | | | | 0.29 | |
| | | | | | | | | | | 1,821,581 | | | | 0.52 | |
Russian Federation (Cost $19,389,535) | | | | | | | | | | | | | | | | |
CEDC Finance Corp International, Inc., 10.000%, 12/31/2022(5) | | | | | | | 5,052,696 | | | | 4,124,263 | | | | 1.17 | |
Gazprom OAO Via Gaz Capital S.A., 8.625%, 04/28/2034 | | | | | | | 4,664,000 | | | | 5,914,139 | | | | 1.68 | |
GTH Finance B.V., 7.250%, 04/26/2023 | | | | | | | 3,485,000 | | | | 3,663,084 | | | | 1.04 | |
Koks OAO Via Koks Finance DAC, 7.500%, 05/04/2022 | | | | | | | 870,000 | | | | 881,167 | | | | 0.25 | |
MMC Norilsk Nickel OJSC Via MMC Finance DAC, 4.100%,
04/11/2023 | | | | | | | 465,000 | | | | 446,944 | | | | 0.13 | |
Novolipetsk Steel Via Steel Funding DAC, 4.000%, 09/21/2024 | | | | | | | 290,000 | | | | 269,642 | | | | 0.08 | |
Tinkoff Credit Systems Via TCS Finance Ltd., (Variable, U.S. Treasury Yield Curve Rate CMT 5Y + 7.592%) 9.250%,
09/15/2022(2) | | | | | | | 2,560,000 | | | | 2,617,600 | | | | 0.75 | |
| | | | | | | | | | | 17,916,839 | | | | 5.10 | |
Saudi Arabia (Cost $468,536) | | | | | | | | | | | | | | | | |
Acwa Power Management And Investments One Ltd., 5.950%,
12/15/2039 | | | | | | | 450,000 | | | | 455,850 | | | | 0.13 | |
| | | | | | | | | | | 455,850 | | | | 0.13 | |
Singapore (Cost $497,212) | | | | | | | | | | | | | | | | |
DBS Group Holdings Ltd., 2.246%, 07/16/2019 | | | | | | | 500,000 | | | | 494,825 | | | | 0.14 | |
| | | | | | | | | 494,825 | | | 0.14 | |
South Africa (Cost $5,151,841) | | | | | | | | | | | | | | | | |
Eskom Holdings SOC Ltd., 7.125%, 02/11/2025 | | | | | | | 3,020,000 | | | | 3,085,534 | | | | 0.88 | |
Growthpoint Properties International Pty. Ltd., 05/02/2023(5)(11) | | | | | | | 700,000 | | | | 709,474 | | | | 0.20 | |
Liquid Telecommunications Financing PLC, 8.500%, 07/13/2022 | | | | | | | 1,320,000 | | | | 1,389,218 | | | | 0.40 | |
| | | | | | | | | | | 5,184,226 | | | | 1.48 | |
Tanzania (Cost $2,177,316) | | | | | | | | | | | | | | | | |
HTA Group Ltd., 9.125%, 03/08/2022 | | | | | | | 2,130,000 | | | | 2,231,601 | | | | 0.64 | |
| | | | | | | | | | | 2,231,601 | | | | 0.64 | |
Turkey (Cost $937,148) | | | | | | | | | | | | | | | | |
KOC Holding A.S., 5.250%, 03/15/2023 | | | | | | | 375,000 | | | | 377,661 | | | | 0.11 | |
See accompanying notes to the financial statements.
79
ASHMORE EMERGING MARKETS CORPORATE DEBT FUND
SCHEDULE OF INVESTMENTS (CONTINUED)
As of April 30, 2018 (Unaudited)
| | | | | | | | | | | | | | | | |
| | | Currency(1)
| | | Par | | | Value | | | % of Net
Assets | |
Turkey (continued) | | | | | | | | | | | | | | | | |
Yuksel Insaat A.S., 9.500%, 11/10/2015(4)(6)(12) | | | | | | | 535,000 | | | $ | 1 | | | | — | |
| | | | | | | | | | | 377,662 | | | | 0.11 | |
Ukraine (Cost $16,869,427) | | | | | | | | | | | | | | | | |
DTEK Finance PLC, 10.750%, (49% PIK), 12/31/2024(3) | | | | | | | 11,449,698 | | | | 12,130,955 | | | | 3.46 | |
Ferrexpo Finance PLC, 10.375%, 04/07/2019 | | | | | | | 789,000 | | | | 812,485 | | | | 0.23 | |
Metinvest B.V., 7.750%, 04/23/2023(5) | | | | | | | 2,929,000 | | | | 2,847,574 | | | | 0.81 | |
Metinvest B.V., 8.500%, 04/23/2026(5) | | | | | | | 3,287,000 | | | | 3,162,751 | | | | 0.90 | |
MHP S.E., 7.750%, 05/10/2024 | | | | | | | 550,000 | | | | 567,919 | | | | 0.16 | |
| | | | | | | | | | | 19,521,684 | | | | 5.56 | |
United Arab Emirates (Cost $5,239,665) | | | | | | | | | | | | | | | | |
Abu Dhabi National Energy Co. PJSC, 4.375%, 04/23/2025(5) | | | | | | | 700,000 | | | | 692,874 | | | | 0.20 | |
Abu Dhabi National Energy Co. PJSC, 4.875%, 04/23/2030(5) | | | | | | | 400,000 | | | | 396,467 | | | | 0.11 | |
ADCB Finance Cayman Ltd., 4.000%, 03/29/2023(5) | | | | | | | 600,000 | | | | 591,000 | | | | 0.17 | |
BOS Funding Ltd., 3.374%, 06/08/2020 | | | | | | | 515,000 | | | | 507,790 | | | | 0.14 | |
EMG Sukuk Ltd., 4.564%, 06/18/2024 | | | | | | | 775,000 | | | | 782,750 | | | | 0.22 | |
Fab Sukuk Co. Ltd., 3.625%, 03/05/2023 | | | | | | | 460,000 | | | | 453,597 | | | | 0.13 | |
First Abu Dhabi Bank PJSC, 3.000%, 08/13/2019 | | | | | | | 380,000 | | | | 379,726 | | | | 0.11 | |
First Abu Dhabi Bank PJSC, (Variable, USD Swap 5Y + 3.350%)
5.250%, 06/17/2020(2) | | | | | | | 905,000 | | | | 909,978 | | | | 0.26 | |
Union National Bank PJSC, 4.000%, 03/13/2023 | | | | | | | 465,000 | | | | 458,025 | | | | 0.13 | |
| | | | | | | | | | | 5,172,207 | | | | 1.47 | |
Venezuela (Cost $8,763,022) | | | | | | | | | | | | | | | | |
Petroleos de Venezuela S.A., 8.500%, 10/27/2020 | | | | | | | 8,490,750 | | | | 7,352,989 | | | | 2.09 | |
Petroleos de Venezuela S.A., 9.750%, 05/17/2035(4) | | | | | | | 5,104,093 | | | | 1,441,396 | | | | 0.41 | |
| | | | | | | | | | | 8,794,385 | | | | 2.50 | |
Total Debt Securities (Cost $304,599,907) | | | | | | | | | | | 300,376,771 | | | | 85.52 | |
| | | | |
Bank Loans | | | | | | | | | | | | | | | | |
| | | | |
Brazil (Cost $2,100,000) | | | | | | | | | | | | | | | | |
Samarco Mineracao S.A., (Floating, ICE LIBOR USD + 0.000%)
3.387%, 09/09/2018(12) | | | | | | | 3,000,000 | | | | 2,010,000 | | | | 0.57 | |
| | | | | | | | | | | 2,010,000 | | | | 0.57 | |
Czech Republic (Cost $362,933) | | | | | | | | | | | | | | | | |
New World Resources N.V., 8.500%, 10/07/2016(6)(7) | | | EUR | | | | 394,768 | | | | — | | | | — | |
| | | | | | | | | | | — | | | | — | |
Malaysia (Cost $2,134,306) | | | | | | | | | | | | | | | | |
DRB-Hicom Bhd., 3.995%, 01/22/2021(12) | | | | | | | 2,317,584 | | | | 2,213,293 | | | | 0.63 | |
| | | | | | | | | | | 2,213,293 | | | | 0.63 | |
Nigeria (Cost $1,035,598) | | | | | | | | | | | | | | | | |
Seven Energy Ltd., 11.750%, 06/30/2020(12) | | | | | | | 1,085,453 | | | | 646,496 | | | | 0.18 | |
| | | | | | | | | | | 646,496 | | | | 0.18 | |
See accompanying notes to the financial statements.
80
ASHMORE EMERGING MARKETS CORPORATE DEBT FUND
SCHEDULE OF INVESTMENTS (CONTINUED)
As of April 30, 2018 (Unaudited)
| | | | | | | | | | | | | | | | |
| | | Currency(1)
| | | Par | | | Value | | | % of Net
Assets | |
Ukraine (Cost $80,325) | | | | | | | | | | | | | | | | |
Metinvest B.V., 5.394%, 06/30/2021(12) | | | | | | | 508 | | | $ | 506 | | | | — | |
| | | | | | | | | | | 506 | | | | — | |
United Arab Emirates (Cost $19,545,377) | | | | | | | | | | | | | | | | |
DP World Ltd., 3.750%, 09/30/2022(12) | | | | | | | 9,695,964 | | | | 9,211,166 | | | | 2.62 | |
DP World Ltd., 4.750%, 09/30/2022(12) | | | | | | | 421,378 | | | | 400,309 | | | | 0.12 | |
Dubai Drydocks World LLC, 4.630%, 11/20/2020(12) | | | | | | | 11,170,000 | | | | 10,611,500 | | | | 3.02 | |
| | | | | | | | | | | 20,222,975 | | | | 5.76 | |
| | | | |
Total Bank Loans (Cost $25,258,539) | | | | | | | | | | | 25,093,270 | | | | 7.14 | |
| | | | |
| | | Currency(1)
| | | Shares | | | Value | | | % of Net
Assets | |
Equity Securities | | | | | | | | | | | | | | | | |
| | | | |
Czech Republic (Cost $1,093,253) | | | | | | | | | | | | | | | | |
New World Resources PLC, Class A *(7) | | | GBP | | | | 36,580,138 | | | $ | — | | | | — | |
| | | | | | | | | | | — | | | | — | |
Mongolia (Cost $2,417,612) | | | | | | | | | | | | | | | | |
Mongolian Mining Corp. * | | | HKD | | | | 14,731,698 | | | | 278,571 | | | | 0.08 | |
| | | | | | | | | | | 278,571 | | | | 0.08 | |
Niger (Cost $1,308,571) | | | | | | | | | | | | | | | | |
Savannah Petroleum PLC * | | | GBP | | | | 3,368,524 | | | | 1,409,599 | | | | 0.40 | |
| | | | | | | | | | | 1,409,599 | | | | 0.40 | |
Russian Federation (Cost $655,355) | | | | | | | | | | | | | | | | |
Roust Corp. *(12) | | | | | | | 13,359 | | | | 66,795 | | | | 0.02 | |
Roust Corp., Class C *(12) | | | | | | | 28,922 | | | | 144,610 | | | | 0.04 | |
| | | | | | | | | | | 211,405 | | | | 0.06 | |
Total Equity Securities (Cost $5,474,791) | | | | | | | | | | | 1,899,575 | | | | 0.54 | |
| | | | |
| | | Currency(1)
| | | Number of Warrants | | | Value | | | % of Net
Assets | |
Warrants | | | | | | | | | | | | | | | | |
| | | | |
Mexico (Cost $—) | | | | | | | | | | | | | | | | |
Corp. GEO S.A.B. de C.V., Exp. 07/31/2022, Strike Price
$9.75 *(7) | | | MXN | | | | 13,777 | | | $ | — | | | | — | |
| | | | | | | | | | | — | | | | — | |
| | | | |
Total Warrants (Cost $—) | | | | | | | | | | | — | | | | — | |
| | | | |
Total Investments (Total Cost $335,333,237) | | | | | | | | | | | 327,369,616 | | | | 93.20 | |
Other Assets Less Liabilities (See Statements of Assets and | | | | | | | | | | | | | | | | |
Liabilities for further detail) | | | | | | | | | | | 23,888,482 | | | | 6.80 | |
| | | | |
Net Assets | | | | | | | | | | $ | 351,258,098 | | | | 100.00 | |
See accompanying notes to the financial statements.
81
ASHMORE EMERGING MARKETS CORPORATE DEBT FUND
SCHEDULE OF INVESTMENTS (CONTINUED)
As of April 30, 2018 (Unaudited)
| * | Non-income producing security. |
| (1) | Par values are stated in United States Dollars unless otherwise noted below. |
| (2) | Variable rate security. Security issued at a fixed coupon rate, which converts to a variable rate at a specified date. Rate shown is the rate in effect as of period end. |
| (3) | Security is a payment-in-kind bond, and unless otherwise noted in the description of the security, pays its entire coupon on an in-kind basis. |
| (4) | Issuer has defaulted on terms of debt obligation. |
| (5) | Securities exempt from registration under Rule 144A of the Securities Act of 1933. These securities may not be publicly traded without registration under the Securities Act of 1933. |
| (6) | Maturity has been extended under the terms of a plan of reorganization. |
| (7) | Security has been deemed worthless and is a Level 3 investment. |
| (8) | Restricted security that has been deemed illiquid. At April 30, 2018 the value of these restricted illiquid securities amount to $1,281,877 or 0.4% of net assets. Additional information on each restricted illiquid security is as follows: |
| | | | | | | | | | |
| SECURITY | | ACQUISITION DATE | | ACQUISITION COST |
Far East Energy Bermuda Ltd., 13.000%, 01/15/2016 | | 01/14/2013-07/24/2015 | | | $ | 279,057 | |
KazMunayGas National Co. JSC, 5.375%, 04/24/2030 | | 04/18/2018 | | | | 466,056 | |
KazMunayGas National Co. JSC, 6.375%, 10/24/2048 | | 04/17/2018 | | | | 792,040 | |
New World Resources N.V., 16.651%, 10/07/2020 | | 10/07/2014 | | | | — | |
| (9) | Zero coupon bond – interest rate reflects effective yield on the date of purchase. |
| (10) | The coupon rate is subject to the performance of the TSIPPCAE Commodity Index. |
| (11) | When issued security. |
| (12) | Security is a Level 3 investment. |
Percentages shown are based on net assets.
At April 30, 2018, the Ashmore Emerging Markets Corporate Debt Fund had outstanding forward foreign currency exchange contracts as follows:
| | | | | | | | | | | | | | | | | | | | |
Settlement
Date | | Counterparty | | Currency Buy | | Currency
Buy Amount
(Local
Currency) | | | | | Currency
Sell | | Currency
Sell Amount
(Local
Currency) | | | Unrealized
Gain/(Loss) | |
05/24/2018 | | Barclays | | United States Dollar | | | 1,543,858 | | | Euro | | | | | 1,248,975 | | | | $32,838 | |
| | | | | | | | | | | | | | | | | | | | |
| | | | | | | |
Total | | | | | | | | | | | | | | | | | | | $32,838 | |
| | | | | | | | | | | | | | | | | | | | |
See accompanying notes to the financial statements.
82
ASHMORE EMERGING MARKETS CORPORATE DEBT FUND
SCHEDULE OF INVESTMENTS (CONTINUED)
As of April 30, 2018 (Unaudited)
The inputs or methodologies used for valuing securities are not necessarily an indication of the risks associated with investing in those securities and other financial instruments, if any. See note 4 in the Notes to the Financial Statements for more information regarding pricing inputs and valuation techniques. The following is a summary of the inputs used in valuing the Ashmore Emerging Markets Corporate Debt Fund’s investments and other financial instruments, which are carried at fair value, as of April 30, 2018:
| | | | | | | | | | | | | | | | |
| | | Level 1 | | | Level 2 | | | Level 3 | | | Total | |
Investments | | | | | | | | | | | | | | | | |
Assets: | | | | | | | | | | | | | | | | |
Debt Securities | | | | | | | | | | | | | | | | |
Corporate Bonds | | | $— | | | $ | 291,187,917 | | | $ | 1 | | | $ | 291,187,918 | |
Corporate Convertible Bonds | | | — | | | | 1,321,250 | | | | — | | | | 1,321,250 | |
Financial Certificates | | | — | | | | 2,266,667 | | | | — | | | | 2,266,667 | |
Government Agencies | | | — | | | | 5,600,936 | | | | — | | | | 5,600,936 | |
| | | | | | | | | | | | | | | | |
Total Debt Securities | | | — | | | | 300,376,770 | | | | 1 | | | | 300,376,771 | |
Bank Loans | | | | | | | | | | | | | | | | |
Brazil | | | — | | | | — | | | | 2,010,000 | | | | 2,010,000 | |
Malaysia | | | — | | | | — | | | | 2,213,293 | | | | 2,213,293 | |
Nigeria | | | — | | | | — | | | | 646,496 | | | | 646,496 | |
Ukraine | | | — | | | | — | | | | 506 | | | | 506 | |
United Arab Emirates | | | — | | | | — | | | | 20,222,975 | | | | 20,222,975 | |
| | | | | | | | | | | | | | | | |
Total Bank Loans | | | — | | | | — | | | | 25,093,270 | | | | 25,093,270 | |
Common Stock | | | | | | | | | | | | | | | | |
Mongolia | | | — | | | | 278,571 | | | | — | | | | 278,571 | |
Niger | | | — | | | | 1,409,599 | | | | — | | | | 1,409,599 | |
Russian Federation | | | — | | | | — | | | | 211,405 | | | | 211,405 | |
| | | | | | | | | | | | | | | | |
Total Common Stock | | | — | | | | 1,688,170 | | | | 211,405 | | | | 1,899,575 | |
Warrants | | | — | | | | — | | | | — | | | | — | |
Total Investments | | | $— | | | $ | 302,064,940 | | | $ | 25,304,676 | | | $ | 327,369,616 | |
| | | | |
Other Financial Instruments | | | | | | | | | | | | | | | | |
Assets: | | | | | | | | | | | | | | | | |
Forward Foreign Currency Exchange Contracts | | | $— | | | $ | 32,838 | | | $ | — | | | $ | 32,838 | |
The Fund discloses all transfers between levels based on valuations at the end of each reporting period. At April 30, 2018, there were no transfers between Level 1, Level 2 and Level 3 based on levels assigned to the securities on October 31, 2017.
See accompanying notes to the financial statements.
83
ASHMORE EMERGING MARKETS CORPORATE DEBT FUND
SCHEDULE OF INVESTMENTS (CONTINUED)
As of April 30, 2018 (Unaudited)
The following is a reconciliation of investments in which significant unobservable inputs (Level 3) were used for the Fund during the period ending April 30, 2018:
| | | | | | | | | | | | | | | | | | | | | | | | | | | | | | | | | | | | | | | | |
Category and
Subcategory | | Beginning
Balance at 10/31/2017 | | | Accrued
Discounts
(Premiums) | | | Purchases | | | Sales | | | Realized
Gains
(Losses) | | | Change in
Unrealized
Appreciation
(Depreciation) | | | Transfer
into
Level 3 | | | Transfer
out of
Level 3 | | | Ending
Balance at 04/30/2018 | | | Change in
Unrealized
Appreciation
(Depreciation)
from Investments
still held
04/30/2018 | |
Investments, at value | | | | | | | | | | | | | | | | | | | | | | | | | | | | | | | | | | | | | | | | |
Corporate Bonds | | | | | | | | | | | | | | | | | | | | | | | | | | | | | | | | | | | | | | | | |
China | | $ | — | | | $ | — | | | $ | — | | | $ | — | | | $ | (279,057 | ) | | $ | 279,057 | | | $ | — | | | $ | — | | | $ | — | | | $ | — | |
Czech Republic | | | — | | | | — | | | | — | | | | — | | | | — | | | | — | | | | — | | | | — | | | | — | | | | — | |
Turkey | | | — | | | | — | | | | — | | | | — | | | | — | | | | 1 | | | | — | | | | — | | | | 1 | | | | 1 | |
Bank Loans | | | | | | | | | | | | | | | | | | | | | | | | | | | | | | | | | | | | | | | | |
Brazil | | | — | | | | — | | | | 2,100,000 | | | | — | | | | — | | | | (90,000 | ) | | | — | | | | — | | | | 2,010,000 | | | | (90,000 | ) |
China | | | — | | | | — | | | | — | | | | — | | | | (39,677 | ) | | | 39,677 | | | | — | | | | — | | | | — | | | | — | |
Czech Republic | | | — | | | | — | | | | — | | | | — | | | | — | | | | — | | | | — | | | | — | | | | — | | | | — | |
Malaysia | | | 2,079,189 | | | | 30,382 | | | | 472,850 | | | | (386,203 | ) | | | 38,152 | | | | (21,077 | ) | | | — | | | | — | | | | 2,213,293 | | | | (21,077 | ) |
Nigeria | | | 646,496 | | | | — | | | | — | | | | — | | | | — | �� | | | — | | | | — | | | | — | | | | 646,496 | | | | — | |
Ukraine | | | 3,100,309 | | | | 612,686 | | | | — | | | | (3,595,808 | ) | | | 22,203 | | | | (138,884 | ) | | | — | | | | — | | | | 506 | | | | (138,884 | ) |
United Arab Emirates | | | 13,466,581 | | | | (209,552 | ) | | | 10,802,328 | | | | (3,989,812 | ) | | | (256,461 | ) | | | 409,891 | | | | — | | | | — | | | | 20,222,975 | | | | 141,760 | |
Common Stock | | | | | | | | | | | | | | | | | | | | | | | | | | | | | | | | | | | | | | | | |
Czech Republic | | | — | | | | — | | | | — | | | | — | | | | — | | | | — | | | | — | | | | — | | | | — | | | | — | |
Russian Federation | | | 556,333 | | | | — | | | | — | | | | — | | | | — | | | | (344,928 | ) | | | — | | | | — | | | | 211,405 | | | | (344,928 | ) |
Warrants | | | | | | | | | | | | | | | | | | | | | | | | | | | | | | | | | | | | | | | | |
China | | | — | | | | — | | | | — | | | | — | | | | (3,926 | ) | | | 3,926 | | | | — | | | | — | | | | — | | | | — | |
Mexico | | | — | | | | — | | | | — | | | | — | | | | — | | | | — | | | | — | | | | — | | | | — | | | | — | |
Total | | $ | 19,848,908 | | | $ | 433,516 | | | $ | 13,375,178 | | | $ | (7,971,823 | ) | | $ | (518,766 | ) | | $ | 137,663 | | | $ | — | | | $ | — | | | $ | 25,304,676 | | | $ | (453,128 | ) |
The following table on “Quantitative information about Fair Value measurements” provides information on the valuation techniques and inputs used to value Level 3 securities at April 30, 2018:
| | | | | | | | | | | | |
| Quantitative Information about Level 3 Fair Value Measurements | |
| | | Fair Value at
04/30/2018 | | | Valuation
Technique | | | Unobservable Input | |
Bank Loans | | | $24,446,774 | | | | Broker quote | | | | Inputs to broker model | |
Bank Loans | | | 646,496 | | | | Indicative Bid | | | | Bid Source | |
Common Stock | | | 211,405 | | | | Broker quote | | | | Inputs to broker model | |
Total | | | $25,304,675 | | | | | | | | | |
See accompanying notes to the financial statements.
84
ASHMORE EMERGING MARKETS CORPORATE DEBT FUND
SCHEDULE OF INVESTMENTS (CONTINUED)
As of April 30, 2018 (Unaudited)
The following is a summary of the fair values of the Fund’s derivative instruments*:
Fair Values of Financial Derivative Instruments on the Statements of Assets and Liabilities as of April 30, 2018:
| | | | |
| | | Derivatives Not Accounted for as
Hedging Instruments | |
| | | Foreign Exchange | |
Assets: | | | | |
Unrealized Appreciation on Forward Foreign Currency Exchange Contracts | | | $32,838 | |
|
The Effect of Financial Derivative Instruments on the Statements of Operations for the Six Months Ended April 30, 2018: | |
| | | Derivatives Not Accounted for as
Hedging Instruments | |
| | | Foreign Exchange | |
Realized Gain (Loss) on Derivatives Recognized resulting from Operations: | | | | |
Net Realized Gain on Forward Foreign Currency Exchange Contracts | | | $5,512 | |
| |
Net Change in Unrealized Appreciation (Depreciation) on Derivatives Recognized resulting from Operations: | | | | |
Net Change in Unrealized Appreciation on Forward Foreign Currency Exchange Contracts | | | $13,245 | |
* See note 10 in the Notes to the Financial Statements for additional information.
See accompanying notes to the financial statements.
85
ASHMORE EMERGING MARKETS SHORT DURATION FUND
SCHEDULE OF INVESTMENTS
As of April 30, 2018 (Unaudited)
| | | | | | | | | | | | | | | | |
| | | Currency(1)
| | | Par | | | Value | | | % of Net
Assets | |
Debt Securities | | | | | | | | | | | | | | | | |
| | | | |
Angola (Cost $2,167,400) | | | | | | | | | | | | | | | | |
Angola (Rep of) Via Northern Lights III B.V., 7.000%, 08/17/2019 | | | | | | | 2,171,250 | | | $ | 2,200,562 | | | | 0.83 | |
| | | | | | | | | 2,200,562 | | | 0.83 | |
Argentina (Cost $4,874,446) | | | | | | | | | | | | | | | | |
Empresa Distribuidora Y Comercializadora Norte, 9.750%, 10/25/2022 | | | | | | | 650,000 | | | | 688,902 | | | | 0.26 | |
Mastellone Hermanos S.A., 12.625%, 07/03/2021 | | | | | | | 510,000 | | | | 545,578 | | | | 0.21 | |
Transportadora de Gas del Sur S.A., 9.625%, 05/14/2020 | | | | | | | 461,250 | | | | 476,610 | | | | 0.18 | |
YPF S.A., 8.500%, 03/23/2021 | | | | | | | 2,800,000 | | | | 3,041,500 | | | | 1.15 | |
| | | | | | | | | | | 4,752,590 | | | | 1.80 | |
Bahrain (Cost $1,495,487) | | | | | | | | | | | | | | | | |
Batelco International Finance No. 1 Ltd., 4.250%, 05/01/2020 | | | | | | | 1,510,000 | | | | 1,470,362 | | | | 0.56 | |
| | | | | | | | | | | 1,470,362 | | | | 0.56 | |
Brazil (Cost $46,468,356) | | | | | | | | | | | | | | | | |
Andrade Gutierrez International S.A., 4.000%, 04/30/2018 | | | | | | | 415,000 | | | | 392,175 | | | | 0.15 | |
Banco BTG Pactual S.A., 4.000%, 01/16/2020 | | | | | | | 660,000 | | | | 643,500 | | | | 0.24 | |
Banco do Brasil S.A., 5.875%, 01/26/2022 | | | | | | | 3,815,000 | | | | 3,905,606 | | | | 1.48 | |
Banco Votorantim S.A., 7.375%, 01/21/2020 | | | | | | | 1,830,000 | | | | 1,918,664 | | | | 0.73 | |
Braskem Finance Ltd., 7.000%, 05/07/2020 | | | | | | | 1,050,000 | | | | 1,110,690 | | | | 0.42 | |
Braskem Finance Ltd., 5.750%, 04/15/2021 | | | | | | | 2,190,000 | | | | 2,266,431 | | | | 0.86 | |
Cia Brasileira de Aluminio, 6.750%, 04/05/2021 | | | | | | | 1,160,000 | | | | 1,233,950 | | | | 0.47 | |
CSN Islands XI Corp., 6.875%, 09/21/2019 | | | | | | | 2,005,000 | | | | 2,010,012 | | | | 0.76 | |
CSN Resources S.A., 6.500%, 07/21/2020 | | | | | | | 1,920,000 | | | | 1,867,200 | | | | 0.71 | |
GOL Finance S.A., 8.875%, 01/24/2022 | | | | | | | 900,000 | | | | 939,384 | | | | 0.36 | |
Itau Unibanco Holding S.A., 5.750%, 01/22/2021 | | | | | | | 1,640,000 | | | | 1,694,120 | | | | 0.64 | |
Marfrig Holdings Europe B.V., 6.875%, 06/24/2019 | | | | | | | 1,660,000 | | | | 1,684,900 | | | | 0.64 | |
Marfrig Holdings Europe B.V., 11.250%, 09/20/2021 | | | | | | | 500,000 | | | | 513,750 | | | | 0.20 | |
Petrobras Global Finance B.V., 5.375%, 01/27/2021 | | | | | | | 2,000,000 | | | | 2,072,000 | | | | 0.79 | |
Petrobras Global Finance B.V., 8.375%, 05/23/2021 | | | | | | | 9,405,000 | | | | 10,597,554 | | | | 4.02 | |
Petrobras Global Finance B.V., 6.125%, 01/17/2022 | | | | | | | 11,920,000 | | | | 12,585,136 | | | | 4.78 | |
QGOG Atlantic/Alaskan Rigs Ltd., 5.250%, 07/30/2018 | | | | | | | 1,028,625 | | | | 997,766 | | | | 0.38 | |
| | | | | | | | | | | 46,432,838 | | | | 17.63 | |
China (Cost $17,408,650) | | | | | | | | | | | | | | | | |
361 Degrees International Ltd., 7.250%, 06/03/2021 | | | | | | | 690,000 | | | | 699,824 | | | | 0.26 | |
Agile Group Holdings Ltd., 9.000%, 05/21/2020 | | | | | | | 600,000 | | | | 626,857 | | | | 0.24 | |
Central China Real Estate Ltd., 6.500%, 06/04/2018 | | | | | | | 200,000 | | | | 199,747 | | | | 0.08 | |
Central China Real Estate Ltd., 8.750%, 01/23/2021 | | | | | | | 1,205,000 | | | | 1,253,002 | | | | 0.48 | |
Central China Real Estate Ltd., 6.500%, 03/05/2021 | | | | | | | 1,735,000 | | | | 1,690,284 | | | | 0.64 | |
China Evergrande Group, 7.000%, 03/23/2020 | | | | | | | 500,000 | | | | 500,784 | | | | 0.19 | |
China Evergrande Group, 8.250%, 03/23/2022 | | | | | | | 2,000,000 | | | | 1,983,396 | | | | 0.75 | |
CIFI Holdings Group Co. Ltd., 7.750%, 06/05/2020 | | | | | | | 300,000 | | | | 307,428 | | | | 0.12 | |
ICBC Standard Bank PLC, 8.125%, 12/02/2019 | | | | | | | 2,355,000 | | | | 2,498,302 | | | | 0.95 | |
Kaisa Group Holdings Ltd., 7.250%, 06/30/2020 | | | | | | | 1,499,000 | | | | 1,418,751 | | | | 0.54 | |
Kaisa Group Holdings Ltd., 8.500%, 06/30/2022 | | | | | | | 1,625,000 | | | | 1,414,957 | | | | 0.54 | |
See accompanying notes to the financial statements.
86
ASHMORE EMERGING MARKETS SHORT DURATION FUND
SCHEDULE OF INVESTMENTS (CONTINUED)
As of April 30, 2018 (Unaudited)
| | | | | | | | | | | | | | | | |
| | | Currency(1)
| | | Par | | | Value | | | % of Net
Assets | |
China (continued) | | | | | | | | | | | | | | | | |
Logan Property Holdings Co. Ltd., 6.375%, 03/07/2021 | | | | | | | 400,000 | | | $ | 391,800 | | | | 0.15 | |
Logan Property Holdings Co. Ltd., 5.250%, 02/23/2023 | | | | | | | 425,000 | | | | 379,672 | | | | 0.14 | |
Sunac China Holdings Ltd., 8.750%, 12/05/2019 | | | | | | | 485,000 | | | | 503,180 | | | | 0.19 | |
Times China Holdings Ltd., 6.250%, 01/23/2020 | | | | | | | 635,000 | | | | 636,087 | | | | 0.24 | |
Times China Holdings Ltd., 6.250%, 01/17/2021 | | | | | | | 395,000 | | | | 384,730 | | | | 0.15 | |
Tunghsu Venus Holdings Ltd., 7.000%, 06/12/2020 | | | | | | | 325,000 | | | | 261,701 | | | | 0.10 | |
Yuzhou Properties Co. Ltd., 6.375%, 03/06/2021 | | | | | | | 1,735,000 | | | | 1,697,826 | | | | 0.64 | |
| | | | | | | | | | | 16,848,328 | | | | 6.40 | |
Colombia (Cost $1,748,068) | | | | | | | | | | | | | | | | |
Bancolombia S.A., 5.125%, 09/11/2022 | | | | | | | 1,670,000 | | | | 1,717,595 | | | | 0.65 | |
| | | | | | | | | | | 1,717,595 | | | | 0.65 | |
Costa Rica (Cost $423,602) | | | | | | | | | | | | | | | | |
Banco Nacional de Costa Rica, 5.875%, 04/25/2021 | | | | | | | 200,000 | | | | 205,444 | | | | 0.08 | |
Instituto Costarricense de Electricidad, 6.950%, 11/10/2021 | | | | | | | 200,000 | | | | 212,700 | | | | 0.08 | |
| | | | | | | | | | | 418,144 | | | | 0.16 | |
Ecuador (Cost $41,818,573) | | | | | | | | | | | | | | | | |
Ecuador (Rep of), 10.500%, 03/24/2020 | | | | | | | 12,572,000 | | | | 12,949,160 | | | | 4.92 | |
Ecuador (Rep of), 10.750%, 03/28/2022 | | | | | | | 18,048,000 | | | | 19,040,640 | | | | 7.23 | |
EP PetroEcuador via Noble Sovereign Funding I Ltd., (Floating,
ICE LIBOR USD 3M + 5.630%) 7.925%, 09/24/2019 | | | | | | | 4,362,632 | | | | 4,361,759 | | | | 1.66 | |
Petroamazonas EP, 4.625%, 02/16/2020 | | | | | | | 3,250,000 | | | | 3,095,625 | | | | 1.17 | |
Petroamazonas EP, 4.625%, 11/06/2020 | | | | | | | 2,023,878 | | | | 1,882,207 | | | | 0.71 | |
| | | | | | | | | | | 41,329,391 | | | | 15.69 | |
Iraq (Cost $414,757) | | | | | | | | | | | | | | | | |
Oilflow SPV 1 DAC, 12.000%, 01/13/2022 | | | | | | | 400,000 | | | | 416,276 | | | | 0.16 | |
| | | | | | | | | | | 416,276 | | | | 0.16 | |
Jamaica (Cost $15,062,407) | | | | | | | | | | | | | | | | |
Digicel Group Ltd., 8.250%, 09/30/2020 | | | | | | | 13,655,000 | | | | 12,204,156 | | | | 4.63 | |
Digicel Group Ltd., 7.125%, 04/01/2022 | | | | | | | 1,708,000 | | | | 1,388,980 | | | | 0.53 | |
Digicel Ltd., 6.000%, 04/15/2021 | | | | | | | 750,000 | | | | 713,438 | | | | 0.27 | |
| | | | | | | | | | | 14,306,574 | | | | 5.43 | |
Kazakhstan (Cost $8,964,166) | | | | | | | | | | | | | | | | |
Kazkommertsbank JSC, 8.500%, 05/11/2018 | | | | | | | 2,485,000 | | | | 2,484,195 | | | | 0.94 | |
Kazkommertsbank JSC, 5.500%, 12/21/2022 | | | | | | | 6,500,000 | | | | 6,478,420 | | | | 2.46 | |
| | | | | | | | | | | 8,962,615 | | | | 3.40 | |
Kuwait (Cost $1,159,332) | | | | | | | | | | | | | | | | |
Kuwait Projects Co. SPC Ltd., 4.800%, 02/05/2019 | | | | | | | 1,145,000 | | | | 1,156,668 | | | | 0.44 | |
| | | | | | | | | | | 1,156,668 | | | | 0.44 | |
Lebanon (Cost $9,481,605) | | | | | | | | | | | | | | | | |
Lebanon (Rep of), 5.150%, 11/12/2018 | | | | | | | 1,249,000 | | | | 1,244,754 | | | | 0.47 | |
Lebanon (Rep of), 5.450%, 11/28/2019 | | | | | | | 3,261,000 | | | | 3,210,865 | | | | 1.22 | |
Lebanon (Rep of), 6.375%, 03/09/2020 | | | | | | | 3,270,000 | | | | 3,258,248 | | | | 1.24 | |
See accompanying notes to the financial statements.
87
ASHMORE EMERGING MARKETS SHORT DURATION FUND
SCHEDULE OF INVESTMENTS (CONTINUED)
As of April 30, 2018 (Unaudited)
| | | | | | | | | | | | | | | | |
| | | Currency(1) | | | Par | | | Value | | | % of Net
Assets | |
Lebanon (continued) | | | | | | | | | | | | | | | | |
Lebanon (Rep of), 8.250%, 04/12/2021 | | | | | | | 1,570,000 | | | $ | 1,605,397 | | | | 0.61 | |
| | | | | | | | | | | 9,319,264 | | | | 3.54 | |
Mexico (Cost $5,505,424) | | | | | | | | | | | | | | | | |
BBVA Bancomer S.A., 6.500%, 03/10/2021 | | | | | | | 1,600,000 | | | | 1,688,400 | | | | 0.64 | |
Mexichem S.A.B. de C.V., 4.875%, 09/19/2022 | | | | | | | 1,660,000 | | | | 1,679,920 | | | | 0.64 | |
Petroleos Mexicanos, (Floating, ICE LIBOR USD 3M + 3.650%)
5.721%, 03/11/2022 | | | | | | | 1,924,000 | | | | 2,100,046 | | | | 0.80 | |
| | | | | | | | | | | 5,468,366 | | | | 2.08 | |
Mongolia (Cost $704,456) | | | | | | | | | | | | | | | | |
Trade & Development Bank of Mongolia LLC, 9.375%, 05/19/2020 | | | | | | | 650,000 | | | | 692,260 | | | | 0.26 | |
| | | | | | | | | | | 692,260 | | | | 0.26 | |
Nigeria (Cost $497,160) | | | | | | | | | | | | | | | | |
First Bank of Nigeria Ltd. Via FBN Finance Co. B.V., (Variable,
USD Swap 2Y + 6.875%) 8.250%, 08/07/2020(2) | | | | | | | 500,000 | | | | 497,500 | | | | 0.19 | |
| | | | | | | | | | | 497,500 | | | | 0.19 | |
Pakistan (Cost $11,357,817) | | | | | | | | | | | | | | | | |
Third Pakistan International Sukuk (The) Co. Ltd., 5.500%,
10/13/2021 | | | | | | | 5,752,000 | | | | 5,651,777 | | | | 2.15 | |
Third Pakistan International Sukuk (The) Co. Ltd., 5.625%,
12/05/2022 | | | | | | | 5,666,000 | | | | 5,460,398 | | | | 2.07 | |
| | | | | | | | | | | 11,112,175 | | | | 4.22 | |
Panama (Cost $2,713,484) | | | | | | | | | | | | | | | | |
Banistmo S.A., 3.650%, 09/19/2022 | | | | | | | 1,560,000 | | | | 1,490,190 | | | | 0.56 | |
Sable International Finance Ltd., 6.875%, 08/01/2022 | | | | | | | 1,100,000 | | | | 1,156,375 | | | | 0.44 | |
| | | | | | | | | | | 2,646,565 | | | | 1.00 | |
Peru (Cost $3,760,487) | | | | | | | | | | | | | | | | |
Ajecorp B.V., 6.500%, 05/14/2022 | | | | | | | 1,940,000 | | | | 1,746,000 | | | | 0.66 | |
Volcan Cia Minera S.A.A., 5.375%, 02/02/2022 | | | | | | | 1,905,000 | | | | 1,963,102 | | | | 0.75 | |
| | | | | | | | | | | 3,709,102 | | | | 1.41 | |
Qatar (Cost $1,037,282) | | | | | | | | | | | | | | | | |
CBQ Finance Ltd., 3.250%, 06/13/2021 | | | | | | | 650,000 | | | | 631,995 | | | | 0.24 | |
Ezdan Sukuk Co. Ltd., 4.375%, 05/18/2021 | | | | | | | 410,000 | | | | 347,680 | | | | 0.13 | |
| | | | | | | | | | | 979,675 | | | | 0.37 | |
Russian Federation (Cost $12,048,904) | | | | | | | | | | | | | | | | |
Credit Bank of Moscow Via CBOM Finance PLC, 5.875%,
11/07/2021 | | | | | | | 5,385,000 | | | | 5,227,327 | | | | 1.99 | |
GTH Finance B.V., 6.250%, 04/26/2020 | | | | | | | 375,000 | | | | 380,467 | | | | 0.14 | |
Koks OAO Via Koks Finance DAC, 7.500%, 05/04/2022 | | | | | | | 2,300,000 | | | | 2,329,523 | | | | 0.88 | |
Promsvyazbank OJSC Via PSB Finance S.A., 5.250%, 10/19/2019 | | | | | | | 1,200,000 | | | | 1,020,000 | | | | 0.39 | |
TMK OAO Via TMK Capital S.A., 6.750%, 04/03/2020 | | | | | | | 2,390,000 | | | | 2,354,150 | | | | 0.89 | |
| | | | | | | | | | | 11,311,467 | | | | 4.29 | |
South Africa (Cost $11,674,838) | | | | | | | | | | | | | | | | |
Eskom Holdings SOC Ltd., 5.750%, 01/26/2021 | | | | | | | 10,901,000 | | | | 10,869,823 | | | | 4.13 | |
See accompanying notes to the financial statements.
88
ASHMORE EMERGING MARKETS SHORT DURATION FUND
SCHEDULE OF INVESTMENTS (CONTINUED)
As of April 30, 2018 (Unaudited)
| | | | | | | | | | | | | | | | |
| | | Currency(1)
| | | Par | | | Value | | | % of Net
Assets | |
South Africa (continued) | | | | | | | | | | | | | | | | |
MTN Mauritius Investment Ltd., 5.373%, 02/13/2022 | | | | | | | 835,000 | | | $ | 845,438 | | | | 0.32 | |
| | | | | | | | | | | 11,715,261 | | | | 4.45 | |
Tanzania (Cost $918,652) | | | | | | | | | | | | | | | | |
HTA Group Ltd., 9.125%, 03/08/2022 | | | | | | | 855,000 | | | | 895,784 | | | | 0.34 | |
| | | | | | | | | | | 895,784 | | | | 0.34 | |
Turkey (Cost $3,003,831) | | | | | | | | | | | | | | | | |
Export Credit Bank of Turkey, 5.375%, 02/08/2021 | | | | | | | 200,000 | | | | 200,421 | | | | 0.08 | |
KOC Holding A.S., 3.500%, 04/24/2020 | | | | | | | 1,500,000 | | | | 1,479,846 | | | | 0.56 | |
Turkiye Is Bankasi A.S., 5.375%, 10/06/2021 | | | | | | | 1,305,000 | | | | 1,285,190 | | | | 0.49 | |
| | | | | | | | | | | 2,965,457 | | | | 1.13 | |
Ukraine (Cost $6,652,472) | | | | | | | | | | | | | | | | |
Ferrexpo Finance PLC, 10.375%, 04/07/2019 | | | | | | | 1,368,000 | | | | 1,408,719 | | | | 0.53 | |
Metinvest B.V., 7.500%, 12/31/2021 | | | | | | | 5,175,682 | | | | 5,136,139 | | | | 1.95 | |
| | | | | | | | | | | 6,544,858 | | | | 2.48 | |
United Arab Emirates (Cost $2,166,281) | | | | | | | | | | | | | | | | |
BOS Funding Ltd., 3.374%, 06/08/2020 | | | | | | | 665,000 | | | | 655,690 | | | | 0.25 | |
First Abu Dhabi Bank PJSC, 3.000%, 08/13/2019 | | | | | | | 1,500,000 | | | | 1,498,920 | | | | 0.57 | |
| | | | | | | | | | | 2,154,610 | | | | 0.82 | |
Venezuela (Cost $14,369,588) | | | | | | | | | | | | | | | | |
Petroleos de Venezuela S.A., 8.500%, 10/27/2020 | | | | | | | 17,520,750 | | | | 15,172,969 | | | | 5.76 | |
| | | | | | | | | | | 15,172,969 | | | | 5.76 | |
| | | | |
Total Debt Securities (Cost $227,897,525) | | | | | | | | | | | 225,197,256 | | | | 85.49 | |
| | | | |
Bank Loans | | | | | | | | | | | | | | | | |
| | | | |
Malaysia (Cost $610,842) | | | | | | | | | | | | | | | | |
DRB-Hicom Bhd., 3.995%, 01/22/2021(3) | | | | | | | 646,177 | | | | 617,099 | | | | 0.24 | |
| | | | | | | | | | | 617,099 | | | | 0.24 | |
United Arab Emirates (Cost $20,302,562) | | | | | | | | | | | | | | | | |
DP World Ltd., 3.750%, 09/30/2022(3) | | | | | | | 16,721,000 | | | | 15,884,950 | | | | 6.03 | |
Dubai Drydocks World LLC, 4.302%, 11/20/2020(3) | | | | | | | 5,134,110 | | | | 4,877,405 | | | | 1.85 | |
| | | | | | | | | | | 20,762,355 | | | | 7.88 | |
| | | | |
Total Bank Loans (Cost $20,913,404) | | | | | | | | | | | 21,379,454 | | | | 8.12 | |
| | | | |
Total Investments (Total Cost $248,810,929) | | | | | | | | | | | 246,576,710 | | | | 93.61 | |
Other Assets Less Liabilities (See Statements of Assets and
Liabilities for further detail) | | | | | | | | | | | 16,822,338 | | | | 6.39 | |
| | | | |
Net Assets | | | | | | | | | | $ | 263,399,048 | | | | 100.00 | |
| (1) | Par values are stated in United States Dollars unless otherwise noted below. |
| (2) | Variable rate security. Security issued at a fixed coupon rate, which converts to a variable rate at a specified date. Rate shown is the rate in effect as of period end. |
| (3) | Security is a Level 3 investment. |
See accompanying notes to the financial statements.
89
ASHMORE EMERGING MARKETS SHORT DURATION FUND
SCHEDULE OF INVESTMENTS (CONTINUED)
As of April 30, 2018 (Unaudited)
Percentages shown are based on net assets.
The inputs or methodologies used for valuing securities are not necessarily an indication of the risks associated with investing in those securities and other financial instruments, if any. See note 4 in the Notes to the Financial Statements for more information regarding pricing inputs and valuation techniques. The following is a summary of the inputs used in valuing the Ashmore Emerging Markets Short Duration Fund’s investments and other financial instruments, which are carried at fair value, as of April 30, 2018:
| | | | | | | | | | | | | | | | |
| | | Level 1 | | | Level 2 | | | Level 3 | | | Total | |
Investments | | | | | | | | | | | | | | | | |
Assets: | | | | | | | | | | | | | | | | |
Debt Securities | | | | | | | | | | | | | | | | |
Corporate Bonds | | | $— | | | $ | 170,027,354 | | | $ | — | | | $ | 170,027,354 | |
Financial Certificates | | | — | | | | 11,459,855 | | | | — | | | | 11,459,855 | |
Government Agencies | | | — | | | | 200,421 | | | | — | | | | 200,421 | |
Government Bonds | | | — | | | | 43,509,626 | | | | — | | | | 43,509,626 | |
| | | | | | | | | | | | | | | | |
Total Debt Securities | | | — | | | | 225,197,256 | | | | — | | | | 225,197,256 | |
Bank Loans | | | — | | | | — | | | | 21,379,454 | | | | 21,379,454 | |
Total Investments | | $ | — | | | $ | 225,197,256 | | | $ | 21,379,454 | | | $ | 246,576,710 | |
The Fund discloses all transfers between levels based on valuations at the end of each reporting period. At April 30, 2018, there were no transfers between Level 1, Level 2 and Level 3 based on levels assigned to the securities on October 31, 2017.
The following is a reconciliation of investments in which significant unobservable inputs (Level 3) were used for the Fund during the period ending April 30, 2018:
| | | | | | | | | | | | | | | | | | | | | | | | | | | | | | | | | | | | | | | | |
Category and Subcategory | | Beginning
Balance at 10/31/2017 | | | Accrued
Discounts (Premiums) | | | Purchases | | | Sales | | | Realized
Gains
(Losses) | | | Change in
Unrealized
Appreciation (Depreciation) | | | Transfer
into
Level 3 | | | Transfer out of
Level 3 | | | Ending
Balance at 04/30/2018 | | | Change in
Unrealized
Appreciation
(Depreciation)
from Investments
still held
04/30/2018 | |
Investments, at value | | | | | | | | | | | | | | | | | | | | | | | | | | | | | | | | | | | | | | | | |
Bank Loans | | | | | | | | | | | | | | | | | | | | | | | | | | | | | | | | | | | | | | | | |
Malaysia | | | $ — | | | | $ 3,436 | | | $ | 607,406 | | | $ | — | | | | $ — | | | | $ 6,257 | | | | $— | | | | $— | | | | $ 617,099 | | | | $ 6,257 | |
United Arab Emirates | | | 5,759,709 | | | | 117,216 | | | | 15,942,960 | | | | (1,347,091 | ) | | | 41,044 | | | | 248,517 | | | | — | | | | — | | | | 20,762,355 | | | | 239,557 | |
Total | | | $5,759,709 | | | | $120,652 | | | $ | 16,550,366 | | | $ | (1,347,091 | ) | | | $41,044 | | | | $254,774 | | | | $— | | | | $— | | | | $21,379,454 | | | | $245,814 | |
The following table on “Quantitative information about Fair Value measurements” provides information on the valuation techniques and inputs used to value Level 3 securities at April 30, 2018:
| | | | | | | | |
Quantitative Information about Level 3 Fair Value Measurements |
| | | Fair Value at | | | Valuation | | Unobservable |
| | | 04/30/2018 | | | Technique | | Input |
Bank Loans | | $ | 21,379,454 | | | Broker Quote | | Inputs to broker model |
See accompanying notes to the financial statements.
90
ASHMORE EMERGING MARKETS SHORT DURATION FUND
SCHEDULE OF INVESTMENTS (CONTINUED)
As of April 30, 2018 (Unaudited)
The following is a summary of the fair values of the Fund’s derivative instruments*:
The Effect of Financial Derivative Instruments on the Statements of Operations for the Six Months Ended April 30, 2018:
| | | | |
| | | Derivatives Not Accounted for as | |
| | | Hedging Instruments | |
| | | Foreign Exchange | |
Realized Gain (Loss) on Derivatives Recognized resulting from Operations: | | | | |
Net Realized Loss on Forward Foreign Currency Exchange Contracts | | | $(53,367) | |
| | | | |
* See note 10 in the Notes to the Financial Statements for additional information.
See accompanying notes to the financial statements.
91
ASHMORE EMERGING MARKETS ACTIVE EQUITY FUND
SCHEDULE OF INVESTMENTS
As of April 30, 2018 (Unaudited)
| | | | | | | | | | | | | | | | |
| | | Currency(1) | | | Shares | | | Value | | | % of Net
Assets | |
Common Stocks | | | | | | | | | | | | | | | | |
| | | | |
Brazil (Cost $1,755,272) | | | | | | | | | | | | | | | | |
BR Malls Participacoes S.A. | | | BRL | | | | 55,000 | | | $ | 171,443 | | | | 0.91 | |
Kroton Educacional S.A. | | | BRL | | | | 152,900 | | | | 611,478 | | | | 3.26 | |
Lojas Renner S.A. | | | BRL | | | | 36,800 | | | | 342,558 | | | | 1.83 | |
Vale S.A. ADR * | | | | | | | 37,271 | | | | 515,830 | | | | 2.75 | |
| | | | | | | | | | | 1,641,309 | | | | 8.75 | |
China (Cost $4,515,787) | | | | | | | | | | | | | | | | |
Alibaba Group Holding Ltd. ADR * | | | | | | | 6,030 | | | | 1,076,596 | | | | 5.74 | |
Baidu, Inc. ADR * | | | | | | | 2,326 | | | | 583,593 | | | | 3.11 | |
Bank of China Ltd., Class H | | | HKD | | | | 1,560,000 | | | | 845,656 | | | | 4.50 | |
China Construction Bank Corp., Class H | | | HKD | | | | 884,000 | | | | 926,985 | | | | 4.94 | |
CNOOC Ltd. | | | HKD | | | | 487,000 | | | | 821,672 | | | | 4.38 | |
CNOOC Ltd. ADR | | | | | | | 640 | | | | 108,166 | | | | 0.58 | |
Ping An Insurance Group Co. of China Ltd., Class H | | | HKD | | | | 39,500 | | | | 385,770 | | | | 2.05 | |
Yum China Holdings, Inc. | | | | | | | 4,700 | | | | 200,972 | | | | 1.07 | |
| | | | | | | | | | | 4,949,410 | | | | 26.37 | |
Hong Kong (Cost $801,804) | | | | | | | | | | | | | | | | |
AIA Group Ltd. | | | HKD | | | | 98,400 | | | | 878,532 | | | | 4.68 | |
| | | | | | | | | | | 878,532 | | | | 4.68 | |
India (Cost $874,047) | | | | | | | | | | | | | | | | |
HDFC Bank Ltd. ADR | | | | | | | 2,991 | | | | 286,568 | | | | 1.53 | |
ICICI Bank Ltd. ADR | | | | | | | 65,173 | | | | 554,622 | | | | 2.95 | |
| | | | | | | | | | | 841,190 | | | | 4.48 | |
Indonesia (Cost $437,500) | | | | | | | | | | | | | | | | |
Bank Mandiri Persero Tbk PT | | | IDR | | | | 831,800 | | | | 423,143 | | | | 2.25 | |
| | | | | | | | | | | 423,143 | | | | 2.25 | |
Mexico (Cost $463,654) | | | | | | | | | | | | | | | | |
Cemex S.A.B. de C.V. ADR (Participation Certificate) * | | | | | | | 12,375 | | | | 76,849 | | | | 0.41 | |
Fibra Uno Administracion S.A. de C.V. | | | MXN | | | | 171,200 | | | | 283,502 | | | | 1.51 | |
Fomento Economico Mexicano S.A.B. de C.V. ADR | | | | | | | 973 | | | | 94,050 | | | | 0.50 | |
| | | | | | | | | | | 454,401 | | | | 2.42 | |
Russian Federation (Cost $795,773) | | | | | | | | | | | | | | | | |
Sberbank of Russia PJSC ADR | | | | | | | 44,784 | | | | 662,050 | | | | 3.53 | |
| | | | | | | | | | | 662,050 | | | | 3.53 | |
South Africa (Cost $410,238) | | | | | | | | | | | | | | | | |
Naspers Ltd., Class N | | | ZAR | | | | 1,484 | | | | 362,103 | | | | 1.93 | |
| | | | | | | | | | | 362,103 | | | | 1.93 | |
South Korea (Cost $3,220,464) | | | | | | | | | | | | | | | | |
Hana Financial Group, Inc. | | | KRW | | | | 16,826 | | | | 747,886 | | | | 3.99 | |
Lotte Chemical Corp. | | | KRW | | | | 711 | | | | 274,297 | | | | 1.46 | |
Samsung Electronics Co. Ltd. (2) | | | KRW | | | | 384 | | | | 942,026 | | | | 5.02 | |
Samsung Electronics Co. Ltd. GDR (3) | | | | | | | 256 | | | | 316,151 | | | | 1.68 | |
See accompanying notes to the financial statements.
92
ASHMORE EMERGING MARKETS ACTIVE EQUITY FUND
SCHEDULE OF INVESTMENTS (CONTINUED)
As of April 30, 2018 (Unaudited)
| | | | | | | | | | | | | | | | |
| | | Currency(1)
| | | Shares | | | Value | | | % of Net
Assets | |
South Korea (continued) | | | | | | | | | | | | | | | | |
Samsung SDI Co. Ltd. | | | KRW | | | | 2,363 | | | $ | 402,605 | | | | 2.15 | |
SK Hynix, Inc. | | | KRW | | | | 11,180 | | | | 875,392 | | | | 4.66 | |
| | | | | | | | | | | 3,558,357 | | | | 18.96 | |
Taiwan (Cost $2,773,158) | | | | | | | | | | | | | | | | |
Catcher Technology Co. Ltd. | | | TWD | | | | 43,853 | | | | 486,319 | | | | 2.59 | |
Cathay Financial Holding Co. Ltd. | | | TWD | | | | 161,097 | | | | 289,029 | | | | 1.54 | |
Globalwafers Co. Ltd. | | | TWD | | | | 28,074 | | | | 451,803 | | | | 2.41 | |
Taiwan Semiconductor Manufacturing Co. Ltd. | | | TWD | | | | 161,256 | | | | 1,222,397 | | | | 6.51 | |
Taiwan Semiconductor Manufacturing Co. Ltd. ADR | | | | | | | 12,564 | | | | 483,086 | | | | 2.58 | |
| | | | | | | | | | | 2,932,634 | | | | 15.63 | |
| | | | |
Total Common Stocks (Cost $16,047,697) | | | | | | | | | | | 16,703,129 | | | | 89.00 | |
| | | | |
Preferred Stocks | | | | | | | | | | | | | | | | |
| | | | |
Brazil (Cost $423,158) | | | | | | | | | | | | | | | | |
Petroleo Brasileiro S.A. ADR * | | | | | | | 38,284 | | | | 503,435 | | | | 2.68 | |
| | | | | | | | | | | 503,435 | | | | 2.68 | |
South Korea (Cost $577,516) | | | | | | | | | | | | | | | | |
Samsung Electronics Co. Ltd., 2.506% (2)(4) | | | KRW | | | | 357 | | | | 703,050 | | | | 3.75 | |
| | | | | | | | | 703,050 | | | 3.75 | |
| | | | |
Total Preferred Stocks (Cost $1,000,674) | | | | | | | | | | | 1,206,485 | | | | 6.43 | |
| | | | |
Total Investments (Total Cost $17,048,371) | | | | | | | | | | | 17,909,614 | | | | 95.43 | |
| | | | |
Other Assets Less Liabilities (See Statements of Assets and
Liabilities for further detail) | | | | | | | | | | | 856,940 | | | | 4.57 | |
| | | | |
Net Assets | | | | | | | | | | $ | 18,766,554 | | | | 100.00 | |
| * | Non-income producing security. |
| (1) | Par values are stated in United States Dollars unless otherwise noted below. |
| (2) | Security is a Level 3 investment. |
| (3) | Securities exempt from registration under Rule 144A of the Securities Act of 1933. These securities may not be publicly traded without registration under the Securities Act of 1933. |
| (4) | Current yield is disclosed. Dividends are calculated based on a percentage of the issuer’s net income. |
Percentages shown are based on net assets.
See accompanying notes to the financial statements.
93
ASHMORE EMERGING MARKETS ACTIVE EQUITY FUND
SCHEDULE OF INVESTMENTS (CONTINUED)
As of April 30, 2018 (Unaudited)
At April 30, 2018, the industry sectors for the Ashmore Emerging Markets Active Equity Fund were:
| | | | |
| Sector | | Percentage of
Net Assets | |
Consumer Discretionary | | | 8.1 | % |
Consumer Staples | | | 0.5 | |
Energy | | | 7.6 | |
Financials | | | 32.0 | |
Information Technology | | | 40.2 | |
Materials | | | 4.6 | |
Real Estate | | | 2.4 | |
Total Investments | | | 95.4 | |
Other Assets Less Liabilities | | | 4.6 | |
Net Assets | | | 100.0 | % |
The inputs or methodologies used for valuing securities are not necessarily an indication of the risks associated with investing in those securities and other financial instruments, if any. See note 4 in the Notes to the Financial Statements for more information regarding pricing inputs and valuation techniques. The following is a summary of the inputs used in valuing the Ashmore Emerging Markets Active Equity Fund’s investments and other financial instruments, which are carried at fair value, as of April 30, 2018:
| | | | | | | | | | | | | | | | |
| | | Level 1 | | | Level 2 | | | Level 3 | | | Total | |
Investments | | | | | | | | | | | | | | | | |
Assets: | | | | | | | | | | | | | | | | |
Common Stock | | | | | | | | | | | | | | | | |
Brazil | | $ | 1,641,309 | | | $ | — | | | $ | — | | | $ | 1,641,309 | |
China | | | 1,969,327 | | | | 2,980,083 | | | | — | | | | 4,949,410 | |
Hong Kong | | | — | | | | 878,532 | | | | — | | | | 878,532 | |
India | | | 841,190 | | | | — | | | | — | | | | 841,190 | |
Indonesia | | | — | | | | 423,143 | | | | — | | | | 423,143 | |
Mexico | | | 454,401 | | | | — | | | | — | | | | 454,401 | |
Russian Federation | | | — | | | | 662,050 | | | | — | | | | 662,050 | |
South Africa | | | — | | | | 362,103 | | | | — | | | | 362,103 | �� |
South Korea | | | — | | | | 2,616,331 | | | | 942,026 | | | | 3,558,357 | |
Taiwan | | | 483,086 | | | | 2,449,548 | | | | — | | | | 2,932,634 | |
| | | | | | | | | | | | | | | | |
Total Common Stock | | | 5,389,313 | | | | 10,371,790 | | | | 942,026 | | | | 16,703,129 | |
Preferred Stock | | | | | | | | | | | | | | | | |
Brazil | | | 503,435 | | | | — | | | | — | | | | 503,435 | |
South Korea | | | — | | | | — | | | | 703,050 | | | | 703,050 | |
| | | | | | | | | | | | | | | | |
Total Preferred Stock | | | 503,435 | | | | — | | | | 703,050 | | | | 1,206,485 | |
Total Investments | | $ | 5,892,748 | | | $ | 10,371,790 | | | $ | 1,645,076 | | | $ | 17,909,614 | |
See accompanying notes to the financial statements.
94
ASHMORE EMERGING MARKETS ACTIVE EQUITY FUND
SCHEDULE OF INVESTMENTS (CONTINUED)
As of April 30, 2018 (Unaudited)
The Fund discloses all transfers between levels based on valuations at the end of each reporting period. At April 30, 2018, the Fund had transfers as disclosed below.
| | | | | | |
Transfers from Level 1 to Level 2 |
| Country | | Value | | | Reason |
| | |
Common Stocks | | | | | | |
China | | $ | 2,980,083 | | | Fair Value ITG Factor other than 1 applied. |
Hong Kong | | | 878,532 | | | Fair Value ITG Factor other than 1 applied. |
Indonesia | | | 423,143 | | | Fair Value ITG Factor other than 1 applied. |
Russian Federation | | | 662,050 | | | Fair Value ITG Factor other than 1 applied. |
South Africa | | | 362,103 | | | Fair Value ITG Factor other than 1 applied. |
South Korea | | | 2,616,331 | | | Fair Value ITG Factor other than 1 applied. |
Taiwan | | | 1,511,426 | | | Fair Value ITG Factor other than 1 applied. |
Total | | $ | 9,433,668 | | | |
| | |
| Transfers from Level 1 to Level 3 | | | | | |
Country | | | Value | | | Reason |
Preferred Stocks | | | | | | |
South Korea | | $ | 703,050 | | | Asset suspended during the current period. |
See accompanying notes to the financial statements.
95
ASHMORE EMERGING MARKETS ACTIVE EQUITY FUND
SCHEDULE OF INVESTMENTS (CONTINUED)
As of April 30, 2018 (Unaudited)
The following is a reconciliation of investments in which significant unobservable inputs (Level 3) were used for the Fund during the period ending April 30, 2018:
| | | | | | | | | | | | | | | | | | | | | | | | | | | | | | | | | | | | | | | | |
Category and
Subcategory | | Beginning
Balance at 10/31/2017 | | | Accrued
Discounts (Premiums) | | | Purchases | | | Sales | | | Realized
Gains
(Losses) | | | Change in
Unrealized
Appreciation (Depreciation) | | | Transfer
into
Level 3 | | | Transfer out of
Level 3 | | | Ending
Balance at 04/30/2018 | | | Change in
Unrealized
Appreciation
(Depreciation)
from Investments
still held
04/30/2018 | |
Investments, at value | | | | | | | | | | | | | | | | | | | | | | | | | | | | | | | | | | | | | | | | |
Common Stock | | | | | | | | | | | | | | | | | | | | | | | | | | | | | | | | | | | | | | | | |
South Korea | | | $— | | | | $— | | | | $880,934 | | | | $— | | | | $— | | | | $61,092 | | | $ | — | | | | $— | | | | $ 942,026 | | | | $61,092 | |
Preferred Stock | | | | | | | | | | | | | | | | | | | | | | | | | | | | | | | | | | | | | | | | |
South Korea | | | — | | | | — | | | | — | | | | — | | | | — | | | | — | | | | 703,050 | | | | — | | | | 703,050 | | | | (2,615) | |
Total | | | $— | | | | $— | | | | $880,934 | | | | $— | | | | $— | | | | $61,092 | | | $ | 703,050 | | | | $— | | | | $1,645,076 | | | | $58,477 | |
The following table on “Quantitative information about Fair Value measurements” provides information on the valuation techniques and inputs used to value Level 3 securities at April 30, 2018:
| | | | | | | | |
| Quantitative Information about Level 3 Fair Value Measurements |
| | | Fair Value at
04/30/2018 | | | Valuation Technique | | Unobservable Input |
Common Stock | | $ | 942,026 | | | Last available close | | Temporary halt in trading due to share split |
Preferred Stock | | | 703,050 | | | Last available close | | Temporary halt in trading due to share split |
Total | | $ | 1,645,076 | | | | | |
See accompanying notes to the financial statements.
96
ASHMORE EMERGING MARKETS SMALL-CAP EQUITY FUND
SCHEDULE OF INVESTMENTS
As of April 30, 2018 (Unaudited)
| | | | | | | | | | | | | | | | |
| | | Currency(1) | | | Shares | | | Value | | | % of Net
Assets | |
Common Stocks | | | | | | | | | | | | | | | | |
| | | | |
Argentina (Cost $1,366,495) | | | | | | | | | | | | | | | | |
Globant S.A. * | | | EUR | | | | 18,400 | | | $ | 828,184 | | | | 1.90 | |
Grupo Supervielle S.A. ADR | | | | | | | 30,900 | | | | 863,346 | | | | 1.99 | |
| | | | | | | | | | | 1,691,530 | | | | 3.89 | |
Brazil (Cost $1,608,405) | | | | | | | | | | | | | | | | |
Iochpe-Maxion S.A. | | | BRL | | | | 176,746 | | | | 1,417,722 | | | | 3.27 | |
Smiles Fidelidade S.A. * | | | BRL | | | | 29,400 | | | | 604,247 | | | | 1.39 | |
| | | | | | | | | | | 2,021,969 | | | | 4.66 | |
China (Cost $9,611,971) | | | | | | | | | | | | | | | | |
AviChina Industry & Technology Co. Ltd., Class H | | | HKD | | | | 888,000 | | | | 560,247 | | | | 1.29 | |
China Yongda Automobiles Services Holdings Ltd. | | | HKD | | | | 1,012,000 | | | | 1,156,936 | | | | 2.66 | |
Goodbaby International Holdings Ltd. | | | HKD | | | | 854,000 | | | | 541,662 | | | | 1.25 | |
Haitian International Holdings Ltd. | | | HKD | | | | 297,000 | | | | 789,628 | | | | 1.82 | |
JNBY Design Ltd. | | | HKD | | | | 971,500 | | | | 1,970,023 | | | | 4.53 | |
Li Ning Co. Ltd. * | | | HKD | | | | 1,485,000 | | | | 1,668,993 | | | | 3.84 | |
Noah Holdings Ltd. ADR * | | | | | | | 18,300 | | | | 945,561 | | | | 2.18 | |
SINA Corp. * | | | | | | | 7,800 | | | | 745,212 | | | | 1.72 | |
Tarena International, Inc. ADR | | | | | | | 58,738 | | | | 593,841 | | | | 1.37 | |
Xiabuxiabu Catering Management China Holdings Co. Ltd. (2) | | | HKD | | | | 864,500 | | | | 1,483,359 | | | | 3.41 | |
YY, Inc. ADR * | | | | | | | 9,526 | | | | 918,211 | | | | 2.11 | |
| | | | | | | | | | | 11,373,673 | | | | 26.18 | |
India (Cost $5,296,261) | | | | | | | | | | | | | | | | |
Multi Commodity Exchange of India Ltd. | | | INR | | | | 57,165 | | | | 663,811 | | | | 1.53 | |
Persistent Systems Ltd. | | | INR | | | | 83,173 | | | | 1,001,548 | | | | 2.30 | |
Quess Corp. Ltd. *(2) | | | INR | | | | 67,871 | | | | 1,179,759 | | | | 2.72 | |
Sanghi Industries Ltd. * | | | INR | | | | 460,517 | | | | 772,320 | | | | 1.78 | |
South Indian Bank (The) Ltd. | | | INR | | | | 1,744,293 | | | | 687,736 | | | | 1.58 | |
V-Mart Retail Ltd. | | | INR | | | | 39,528 | | | | 1,234,474 | | | | 2.84 | |
| | | | | | | | | | | 5,539,648 | | | | 12.75 | |
Indonesia (Cost $92,441) | | | | | | | | | | | | | | | | |
Berlian Laju Tanker Tbk PT *(3) | | | IDR | | | | 4,428,000 | | | | — | | | | — | |
| | | | | | | | | | | — | | | | — | |
Malaysia (Cost $1,379,674) | | | | | | | | | | | | | | | | |
My EG Services Bhd. | | | MYR | | | | 2,671,200 | | | | 1,743,821 | | | | 4.01 | |
| | | | | | | | | | | 1,743,821 | | | | 4.01 | |
Mexico (Cost $858,295) | | | | | | | | | | | | | | | | |
Grupo Aeroportuario del Centro Norte S.A.B. de C.V. ADR | | | | | | | 21,400 | | | | 901,582 | | | | 2.08 | |
| | | | | | | | | | | 901,582 | | | | 2.08 | |
Poland (Cost $859,415) | | | | | | | | | | | | | | | | |
CCC S.A. | | | PLN | | | | 10,224 | | | | 750,154 | | | | 1.73 | |
| | | | | | | | | | | 750,154 | | | | 1.73 | |
See accompanying notes to the financial statements.
97
ASHMORE EMERGING MARKETS SMALL-CAP EQUITY FUND
SCHEDULE OF INVESTMENTS (CONTINUED)
As of April 30, 2018 (Unaudited)
| | | | | | | | | | | | | | | | |
| | | Currency(1) | | | Shares | | | Value | | | % of Net
Assets | |
South Africa (Cost $1,732,192) | | | | | | | | | | | | | | | | |
JSE Ltd. | | | ZAR | | | | 62,546 | | | $ | 979,258 | | | | 2.25 | |
Truworths International Ltd. | | | ZAR | | | | 115,073 | | | | 937,128 | | | | 2.16 | |
| | | | | | | | | | | 1,916,386 | | | | 4.41 | |
South Korea (Cost $6,741,923) | | | | | | | | | | | | | | | | |
Com2uS Corp. | | | KRW | | | | 11,637 | | | | 1,732,892 | | | | 3.99 | |
Cosmax, Inc. | | | KRW | | | | 10,581 | | | | 1,543,074 | | | | 3.55 | |
Dentium Co. Ltd. | | | KRW | | | | 22,154 | | | | 1,627,655 | | | | 3.75 | |
Eugene Technology Co. Ltd. | | | KRW | | | | 64,037 | | | | 1,079,474 | | | | 2.48 | |
Modetour Network, Inc. | | | KRW | | | | 52,702 | | | | 1,828,821 | | | | 4.21 | |
| | | | | | | | | | | 7,811,916 | | | | 17.98 | |
Taiwan (Cost $9,226,068) | | | | | | | | | | | | | | | | |
Accton Technology Corp. | | | TWD | | | | 305,000 | | | | 702,195 | | | | 1.62 | |
Hota Industrial Manufacturing Co. Ltd. | | | TWD | | | | 243,000 | | | | 1,076,175 | | | | 2.48 | |
Lite-On Technology Corp. | | | TWD | | | | 582,000 | | | | 766,319 | | | | 1.76 | |
Parade Technologies Ltd. | | | TWD | | | | 70,000 | | | | 1,079,623 | | | | 2.48 | |
Silergy Corp. | | | TWD | | | | 44,000 | | | | 920,122 | | | | 2.12 | |
Silicon Motion Technology Corp. ADR | | | | | | | 19,254 | | | | 870,473 | | | | 2.00 | |
Sunonwealth Electric Machine Industry Co. Ltd. | | | TWD | | | | 583,000 | | | | 709,514 | | | | 1.63 | |
Taiwan Paiho Ltd. | | | TWD | | | | 383,000 | | | | 1,024,234 | | | | 2.36 | |
TCI Co. Ltd. | | | TWD | | | | 74,157 | | | | 1,085,541 | | | | 2.50 | |
| | | | | | | | | | | 8,234,196 | | | | 18.95 | |
Thailand (Cost $744,553) | | | | | | | | | | | | | | | | |
Supalai PCL (Registered) * | | | THB | | | | 1,349,350 | | | | 991,918 | | | | 2.28 | |
| | | | | | | | | | | 991,918 | | | | 2.28 | |
| | | | |
Total Common Stocks (Cost $39,517,693) | | | | | | | | | | | 42,976,793 | | | | 98.92 | |
| | | | |
Preferred Stocks | | | | | | | | | | | | | | | | |
| | | | |
Brazil (Cost $666,652) | | | | | | | | | | | | | | | | |
Banco ABC Brasil S.A. * | | | BRL | | | | 158,252 | | | | 847,456 | | | | 1.95 | |
| | | | | | | | | | | 847,456 | | | | 1.95 | |
| | | | |
Total Preferred Stocks (Cost $666,652) | | | | | | | | | | | 847,456 | | | | 1.95 | |
See accompanying notes to the financial statements.
98
ASHMORE EMERGING MARKETS SMALL-CAP EQUITY FUND
SCHEDULE OF INVESTMENTS (CONTINUED)
As of April 30, 2018 (Unaudited)
| | | | | | | | | | | | | | | | |
| | | Currency(1) | | | Number of Warrants | | | Value | | | % of Net Assets | |
Warrants | | | | | | | | | | | | | | | | |
| | | | |
Brazil (Cost $—) | | | | | | | | | | | | | | | | |
Iochpe-Maxion S.A., Exp. 06/03/2019, Strike Price $12.70 * | | | BRL | | | | 2,184 | | | $ | 9,289 | | | | 0.02 | |
| | | | |
| | | | | | | | | | | 9,289 | | | | 0.02 | |
| | | | |
Total Warrants (Cost $—) | | | | | | | | | | | 9,289 | | | | 0.02 | |
| | | | |
Total Investments (Total Cost $40,184,345) | | | | | | | | | | | 43,833,538 | | | | 100.89 | |
| | | | |
Liabilities Less Other Assets (See Statements of Assets and
Liabilities for further detail) | | | | | | | | | | | (386,168 | ) | | | (0.89 | ) |
| | | | |
Net Assets | | | | | | | | | | $ | 43,447,370 | | | | 100.00 | |
| * | Non-income producing security. |
| (1) | Par values are stated in United States Dollars unless otherwise noted below. |
| (2) | Securities exempt from registration under Rule 144A of the Securities Act of 1933. These securities may not be publicly traded without registration under the Securities Act of 1933. |
| (3) | Security has been deemed worthless and is a Level 3 investment. |
Percentages shown are based on net assets.
At April 30, 2018, the industry sectors for the Ashmore Emerging Markets Small-Cap Equity Fund were:
| | | | | |
| Sector | | Percentage of
Net Assets |
Consumer Discretionary | | | | 34.2 | % |
Consumer Staples | | | | 6.1 | |
Financials | | | | 11.5 | |
Health Care | | | | 3.7 | |
Industrials | | | | 12.8 | |
Information Technology | | | | 28.5 | |
Materials | | | | 1.8 | |
Real Estate | | | | 2.3 | |
Total Investments | | | | 100.9 | |
Liabilities Less Other Assets | | | | (0.9 | ) |
Net Assets | | | | 100.0 | % |
See accompanying notes to the financial statements.
99
ASHMORE EMERGING MARKETS SMALL-CAP EQUITY FUND
SCHEDULE OF INVESTMENTS (CONTINUED)
As of April 30, 2018 (Unaudited)
The inputs or methodologies used for valuing securities are not necessarily an indication of the risks associated with investing in those securities and other financial instruments, if any. See note 4 in the Notes to the Financial Statements for more information regarding pricing inputs and valuation techniques. The following is a summary of the inputs used in valuing the Ashmore Emerging Markets Small-Cap Equity Fund’s investments and other financial instruments, which are carried at fair value, as of April 30, 2018:
| | | | | | | | | | | | | | | | | | | | |
| | | Level 1 | | Level 2 | | Level 3 | | Total |
Investments | | | | | | | | | | | | | | | | | | | | |
Assets: | | | | | | | | | | | | | | | | | | | | |
Common Stock | | | | | | | | | | | | | | | | | | | | |
Argentina | | | $ | 1,691,530 | | | | $ | — | | | | $ | — | | | | $ | 1,691,530 | |
Brazil | | | | 2,021,969 | | | | | — | | | | | — | | | | | 2,021,969 | |
China | | | | 3,202,825 | | | | | 8,170,848 | | | | | — | | | | | 11,373,673 | |
India | | | | — | | | | | 5,539,648 | | | | | — | | | | | 5,539,648 | |
Malaysia | | | | — | | | | | 1,743,821 | | | | | — | | | | | 1,743,821 | |
Mexico | | | | 901,582 | | | | | — | | | | | — | | | | | 901,582 | |
| | | | | | | | | | | | | | | | | | | | |
Poland | | | | — | | | | | 750,154 | | | | | — | | | | | 750,154 | |
South Africa | | | | — | | | | | 1,916,386 | | | | | — | | | | | 1,916,386 | |
South Korea | | | | — | | | | | 7,811,916 | | | | | — | | | | | 7,811,916 | |
Taiwan | | | | 870,473 | | | | | 7,363,723 | | | | | — | | | | | 8,234,196 | |
Thailand | | | | 991,918 | | | | | — | | | | | — | | | | | 991,918 | |
Total Common Stock | | | | 9,680,297 | | | | | 33,296,496 | | | | | — | | | | | 42,976,793 | |
Preferred Stock | | | | | | | | | | | | | | | | | | | | |
Brazil | | | | 847,456 | | | | | — | | | | | — | | | | | 847,456 | |
Warrants | | | | | | | | | | | | | | | | | | | | |
Brazil | | | | — | | | | | 9,289 | | | | | — | | | | | 9,289 | |
Total Investments | | | $ | 10,527,753 | | | | $ | 33,305,785 | | | | $ | — | | | | $ | 43,833,538 | |
The Fund discloses all transfers between levels based on valuations at the end of each reporting period. At April 30, 2018, the Fund had transfers as disclosed below.
| | | | | | |
| Transfers from Level 1 to Level 2 | | | | | |
| Country | | Value | | | Reason |
| | |
Common Stocks | | | | | | |
China | | $ | 6,820,973 | | | Fair Value ITG Factor other than 1 applied |
Malaysia | | | 1,743,821 | | | Fair Value ITG Factor other than 1 applied |
South Korea | | | 6,184,261 | | | Fair Value ITG Factor other than 1 applied |
Taiwan | | | 4,339,744 | | | Fair Value ITG Factor other than 1 applied |
| | |
Total | | $ | 19,088,799 | | | |
The following is a summary of the fair values of the Fund’s derivative instruments*:
The Effect of Financial Derivative Instruments on the Statements of Operations for the Six Months Ended April 30, 2018:
| | | | |
| | | Derivatives Not Accounted for as
Hedging Instruments | |
| | | Foreign Exchange | |
Realized Gain (Loss) on Derivatives Recognized resulting from Operations: | | | | |
Net Realized Loss on Forward Foreign Currency Exchange Contracts | | | $(627 | ) |
| | | | |
* See note 10 in the Notes to the Financial Statements for additional information.
See accompanying notes to the financial statements.
100
ASHMORE EMERGING MARKETS FRONTIER EQUITY FUND
SCHEDULE OF INVESTMENTS
As of April 30, 2018 (Unaudited)
| | | | | | | | | | | | | | | | |
| | | Currency(1) | | | Shares | | | Value | | | % of Net
Assets | |
Common Stocks | | | | | | | | | | | | | | | | |
| | | | |
Argentina (Cost $19,091,703) | | | | | | | | | | | | | | | | |
Banco Macro S.A. ADR | | | | | | | 18,300 | | | $ | 1,773,636 | | | | 1.73 | |
BBVA Banco Frances S.A. ADR | | | | | | | 81,550 | | | | 1,814,488 | | | | 1.77 | |
Globant S.A. * | | | EUR | | | | 34,600 | | | | 1,557,346 | | | | 1.52 | |
Grupo Financiero Galicia S.A. ADR | | | | | | | 58,394 | | | | 3,732,544 | | | | 3.65 | |
Grupo Supervielle S.A. ADR | | | | | | | 131,300 | | | | 3,668,522 | | | | 3.59 | |
Loma Negra Cia Industrial Argentina S.A. ADR * | | | | | | | 112,406 | | | | 2,331,300 | | | | 2.28 | |
Pampa Energia S.A. ADR * | | | | | | | 44,169 | | | | 2,519,400 | | | | 2.46 | |
YPF S.A. ADR | | | | | | | 54,457 | | | | 1,192,064 | | | | 1.17 | |
| | | | | | | | | | | 18,589,300 | | | | 18.17 | |
Bangladesh (Cost $1,709,604) | | | | | | | | | | | | | | | | |
BRAC Bank Ltd. * | | | BDT | | | | 104,754 | | | | 110,656 | | | | 0.11 | |
Square Pharmaceuticals Ltd. | | | BDT | | | | 464,306 | | | | 1,716,772 | | | | 1.68 | |
| | | | | | | | | | | 1,827,428 | | | | 1.79 | |
Egypt (Cost $7,440,697) | | | | | | | | | | | | | | | | |
ADES International Holding Ltd. *(2) | | | | | | | 171,843 | | | | 2,787,852 | | | | 2.72 | |
Arabian Food Industries Co. DOMTY * | | | EGP | | | | 1,550,000 | | | | 1,085,132 | | | | 1.06 | |
Centamin PLC | | | GBP | | | | 1,051,086 | | | | 2,266,229 | | | | 2.22 | |
Commercial International Bank Egypt S.A.E. | | | EGP | | | | 531,065 | | | | 2,822,262 | | | | 2.76 | |
| | | | | | | | | | | 8,961,475 | | | | 8.76 | |
Georgia (Cost $4,647,174) | | | | | | | | | | | | | | | | |
BGEO Group PLC | | | GBP | | | | 40,751 | | | | 1,943,577 | | | | 1.90 | |
Georgia Healthcare Group PLC *(2) | | | GBP | | | | 390,132 | | | | 1,491,195 | | | | 1.45 | |
TBC Bank Group PLC | | | GBP | | | | 40,311 | | | | 1,020,680 | | | | 1.00 | |
| | | | | | | | | | | 4,455,452 | | | | 4.35 | |
Ivory Coast (Cost $2,021,628) | | | | | | | | | | | | | | | | |
Sonatel S.A. | | | XOF | | | | 49,766 | | | | 2,154,854 | | | | 2.11 | |
| | | | | | | | | | | 2,154,854 | | | | 2.11 | |
Kazakhstan (Cost $663,063) | | | | | | | | | | | | | | | | |
Halyk Savings Bank of Kazakhstan JSC GDR (Registered) | | | | | | | 89,830 | | | | 1,121,246 | | | | 1.10 | |
| | | | | | | | | | | 1,121,246 | | | | 1.10 | |
Kenya (Cost $3,474,417) | | | | | | | | | | | | | | | | |
KCB Group Ltd. | | | KES | | | | 4,354,908 | | | | 2,171,488 | | | | 2.12 | |
Safaricom PLC | | | KES | | | | 7,715,600 | | | | 2,171,462 | | | | 2.12 | |
| | | | | | | | | | | 4,342,950 | | | | 4.24 | |
Kuwait (Cost $9,730,391) | | | | | | | | | | | | | | | | |
Human Soft Holding Co. K.S.C. | | | KWD | | | | 265,042 | | | | 3,367,520 | | | | 3.29 | |
Mabanee Co. S.A.K. | | | KWD | | | | 187,051 | | | | 395,509 | | | | 0.39 | |
National Bank of Kuwait S.A.K.P. | | | KWD | | | | 2,579,620 | | | | 6,391,733 | | | | 6.25 | |
| | | | | | | | | | | 10,154,762 | | | | 9.93 | |
See accompanying notes to the financial statements.
101
ASHMORE EMERGING MARKETS FRONTIER EQUITY FUND
SCHEDULE OF INVESTMENTS (CONTINUED)
As of April 30, 2018 (Unaudited)
| | | | | | | | | | | | | | |
| | | Currency(1) | | Shares | | | Value | | | % of Net
Assets | |
Mauritius (Cost $2,503,607) | | | | | | | | | | | | | | |
MCB Group Ltd. | | MUR | | | 341,100 | | | $ | 2,797,037 | | | | 2.73 | |
| | | | | | | | | 2,797,037 | | | | 2.73 | |
Nigeria (Cost $9,909,204) | | | | | | | | | | | | | | |
Dangote Cement PLC | | NGN | | | 2,250,660 | | | | 1,538,522 | | | | 1.50 | |
Guaranty Trust Bank PLC | | NGN | | | 36,127,630 | | | | 4,516,351 | | | | 4.42 | |
Lekoil Ltd. * | | GBP | | | 1,924,884 | | | | 467,927 | | | | 0.46 | |
Nestle Nigeria PLC | | NGN | | | 710,641 | | | | 3,153,037 | | | | 3.08 | |
United Bank for Africa PLC | | NGN | | | 68,876,302 | | | | 2,210,305 | | | | 2.16 | |
| | | | | | | | | 11,886,142 | | | | 11.62 | |
Pakistan (Cost $3,847,663) | | | | | | | | | | | | | | |
Maple Leaf Cement Factory Ltd. | | PKR | | | 2,971,300 | | | | 1,777,413 | | | | 1.74 | |
United Bank Ltd. | | PKR | | | 827,000 | | | | 1,437,530 | | | | 1.40 | |
| | | | | | | | | 3,214,943 | | | | 3.14 | |
Peru (Cost $2,496,270) | | | | | | | | | | | | | | |
Alicorp S.A.A. | | PEN | | | 877,638 | | | | 3,224,031 | | | | 3.15 | |
| | | | | | | | | 3,224,031 | | | | 3.15 | |
Philippines (Cost $2,975,571) | | | | | | | | | | | | | | |
Cosco Capital, Inc. | | PHP | | | 5,441,900 | | | | 704,716 | | | | 0.69 | |
International Container Terminal Services, Inc. | | PHP | | | 1,004,900 | | | | 1,636,773 | | | | 1.60 | |
| | | | | | | | | 2,341,489 | | | | 2.29 | |
Romania (Cost $1,671,028) | | | | | | | | | | | | | | |
Banca Transilvania S.A. | | RON | | | 2,342,042 | | | | 1,553,295 | | | | 1.52 | |
Sphera Franchise Group S.A. * | | RON | | | 43,490 | | | | 349,584 | | | | 0.34 | |
| | | | | | | | | 1,902,879 | | | | 1.86 | |
Saudi Arabia (Cost $4,107,901) | | | | | | | | | | | | | | |
Bupa Arabia for Cooperative Insurance Co. | | SAR | | | 36,460 | | | | 1,019,304 | | | | 1.00 | |
National Commercial Bank | | SAR | | | 97,396 | | | | 1,741,733 | | | | 1.70 | |
Saudi Co. For Hardware CJSC | | SAR | | | 14,500 | | | | 506,143 | | | | 0.49 | |
United Electronics Co. | | SAR | | | 49,102 | | | | 1,008,632 | | | | 0.99 | |
| | | | | | | | | 4,275,812 | | | | 4.18 | |
Sri Lanka (Cost $2,756,894) | | | | | | | | | | | | | | |
John Keells Holdings PLC | | LKR | | | 1,242,445 | | | | 1,296,103 | | | | 1.27 | |
Sampath Bank PLC * | | LKR | | | 819,634 | | | | 1,569,057 | | | | 1.53 | |
| | | | | | | | | 2,865,160 | | | | 2.80 | |
United Arab Emirates (Cost $8,261,268) | | | | | | | | | | | | | | |
Aramex PJSC | | AED | | | 734,757 | | | | 809,664 | | | | 0.79 | |
DP World Ltd. | | | | | 141,389 | | | | 3,139,101 | | | | 3.07 | |
Emaar Development PJSC * | | AED | | | 626,057 | | | | 943,886 | | | | 0.92 | |
Emaar Malls PJSC | | AED | | | 1,281,534 | | | | 773,354 | | | | 0.75 | |
Emirates NBD PJSC | | AED | | | 493,357 | | | | 1,449,338 | | | | 1.42 | |
NMC Health PLC | | GBP | | | 39,635 | | | | 1,941,417 | | | | 1.90 | |
| | | | | | | | | 9,056,760 | | | | 8.85 | |
See accompanying notes to the financial statements.
102
ASHMORE EMERGING MARKETS FRONTIER EQUITY FUND
SCHEDULE OF INVESTMENTS (CONTINUED)
As of April 30, 2018 (Unaudited)
| | | | | | | | | | | | | | | | |
| | | Currency(1) | | | Shares | | | Value | | | % of Net
Assets | |
Vietnam (Cost $3,449,146) | | | | | | | | | | | | | | | | |
Military Commercial Joint Stock Bank | | | VND | | | | 1,944,217 | | | $ | 2,536,110 | | | | 2.48 | |
Mobile World Investment Corp. | | | VND | | | | 87,850 | | | | 393,198 | | | | 0.38 | |
Vietnam Dairy Products JSC | | | VND | | | | 244,920 | | | | 1,990,393 | | | | 1.95 | |
| | | | | | | | | | | 4,919,701 | | | | 4.81 | |
| | | | |
Total Common Stocks (Cost $90,757,229) | | | | | | | | | | | 98,091,421 | | | | 95.88 | |
| | | | |
Preferred Stocks | | | | | | | | | | | | | | | | |
| | | | |
Colombia (Cost $1,577,997) | | | | | | | | | | | | | | | | |
Banco Davivienda S.A., 2.365% (3) | | | COP | | | | 147,286 | | | | 1,770,187 | | | | 1.73 | |
| | | | | | | | | | | 1,770,187 | | | | 1.73 | |
| | | | |
Total Preferred Stocks (Cost $1,577,997) | | | | | | | | | | | 1,770,187 | | | | 1.73 | |
| | | | |
Total Investments (Total Cost $92,335,226) | | | | | | | | | | | 99,861,608 | | | | 97.61 | |
| | | | |
Other Assets Less Liabilities (See Statements of Assets and
Liabilities for further detail) | | | | | | | | | | | 2,443,024 | | | | 2.39 | |
| | | | |
Net Assets | | | | | | | | | | $ | 102,304,632 | | | | 100.00 | |
| * | Non-income producing security. |
| (1) | Par values are stated in United States Dollars unless otherwise noted below. |
| (2) | Securities exempt from registration under Rule 144A of the Securities Act of 1933. These securities may not be publicly traded without registration under the Securities Act of 1933. |
| (3) | Current yield is disclosed. Dividends are calculated based on a percentage of the issuer’s net income. |
Percentages shown are based on net assets.
See accompanying notes to the financial statements.
103
ASHMORE EMERGING MARKETS FRONTIER EQUITY FUND
SCHEDULE OF INVESTMENTS (CONTINUED)
As of April 30, 2018 (Unaudited)
At April 30, 2018, the industry sectors for the Ashmore Emerging Markets Frontier Equity Fund were:
| | | | | |
| Sector | | Percentage of
Net Assets |
Consumer Discretionary | | | | 5.5 | % |
Consumer Staples | | | | 9.9 | |
Energy | | | | 4.4 | |
Financials | | | | 48.1 | |
Health Care | | | | 5.0 | |
Industrials | | | | 6.7 | |
Information Technology | | | | 1.5 | |
Materials | | | | 7.7 | |
Real Estate | | | | 2.1 | |
Telecommunication Services | | | | 4.2 | |
Utilities | | | | 2.5 | |
Total Investments | | | | 97.6 | |
Other Assets Less Liabilities | | | | 2.4 | |
Net Assets | | | | 100.0 | % |
See accompanying notes to the financial statements.
104
ASHMORE EMERGING MARKETS FRONTIER EQUITY FUND
SCHEDULE OF INVESTMENTS (CONTINUED)
As of April 30, 2018 (Unaudited)
The inputs or methodologies used for valuing securities are not necessarily an indication of the risks associated with investing in those securities and other financial instruments, if any. See note 4 in the Notes to the Financial Statements for more information regarding pricing inputs and valuation techniques. The following is a summary of the inputs used in valuing the Ashmore Emerging Markets Frontier Equity Fund’s investments and other financial instruments, which are carried at fair value, as of April 30, 2018:
| | | | | | | | | | | | | | | | | | | | |
| | | Level 1 | | Level 2 | | Level 3 | | Total |
Investments | | | | | | | | | | | | | | | | | | | | |
Assets: | | | | | | | | | | | | | | | | | | | | |
Common Stock | | | | | | | | | | | | | | | | | | | | |
Argentina | | | $ | 18,589,300 | | | | $ | — | | | | $ | — | | | | $ | 18,589,300 | |
Bangladesh | | | | — | | | | | 1,827,428 | | | | | — | | | | | 1,827,428 | |
Egypt | | | | 1,085,132 | | | | | 7,876,343 | | | | | — | | | | | 8,961,475 | |
Georgia | | | | — | | | | | 4,455,452 | | | | | — | | | | | 4,455,452 | |
Ivory Coast | | | | — | | | | | 2,154,854 | | | | | — | | | | | 2,154,854 | |
Kazakhstan | | | | — | | | | | 1,121,246 | | | | | — | | | | | 1,121,246 | |
Kenya | | | | — | | | | | 4,342,950 | | | | | — | | | | | 4,342,950 | |
Kuwait | | | | — | | | | | 10,154,762 | | | | | — | | | | | 10,154,762 | |
Mauritius | | | | — | | | | | 2,797,037 | | | | | — | | | | | 2,797,037 | |
Nigeria | | | | — | | | | | 11,886,142 | | | | | — | | | | | 11,886,142 | |
Pakistan | | | | — | | | | | 3,214,943 | | | | | — | | | | | 3,214,943 | |
Peru | | | | 3,224,031 | | | | | — | | | | | — | | | | | 3,224,031 | |
Philippines | | | | — | | | | | 2,341,489 | | | | | — | | | | | 2,341,489 | |
Romania | | | | — | | | | | 1,902,879 | | | | | — | | | | | 1,902,879 | |
Saudi Arabia | | | | — | | | | | 4,275,812 | | | | | — | | | | | 4,275,812 | |
Sri Lanka | | | | — | | | | | 2,865,160 | | | | | — | | | | | 2,865,160 | |
United Arab Emirates | | | | — | | | | | 9,056,760 | | | | | — | | | | | 9,056,760 | |
Vietnam | | | | — | | | | | 4,919,701 | | | | | — | | | | | 4,919,701 | |
| | | | | | | | | | | | | | | | | | | | |
Total Common Stock | | | | 22,898,463 | | | | | 75,192,958 | | | | | — | | | | | 98,091,421 | |
Preferred Stock | | | | | | | | | | | | | | | | | | | | |
Colombia | | | | 1,770,187 | | | | | — | | | | | — | | | | | 1,770,187 | |
Total Investments | | | $ | 24,668,650 | | | | $ | 75,192,958 | | | | $ | — | | | | $ | 99,861,608 | |
The Fund discloses all transfers between levels based on valuations at the end of each reporting period. At April 30, 2018, the Fund had transfers as disclosed below.
| | | | | | |
| Transfers from Level 1 to Level 2 | | | | | |
| Country | | Value | | | Reason |
| | |
Common Stocks | | | | | | |
Bangladesh | | $ | 1,827,428 | | | Fair Value ITG Factor other than 1 applied |
Egypt | | | 5,610,114 | | | Fair Value ITG Factor other than 1 applied |
Georgia | | | 3,434,772 | | | Fair Value ITG Factor other than 1 applied |
Ivory Coast | | | 2,154,854 | | | Volume-based policy implemented in the current period. |
Kazakhstan | | | 1,121,246 | | | Fair Value ITG Factor other than 1 applied |
Kenya | | | 4,342,950 | | | Fair Value ITG Factor other than 1 applied |
Kuwait | | | 10,154,762 | | | Fair Value ITG Factor other than 1 applied |
Mauritius | | | 2,797,037 | | | Fair Value ITG Factor other than 1 applied |
Nigeria | | | 11,418,215 | | | Fair Value ITG Factor other than 1 applied |
Pakistan | | | 3,214,943 | | | Fair Value ITG Factor other than 1 applied |
Philippines | | | 2,341,489 | | | Fair Value ITG Factor other than 1 applied |
Saudi Arabia | | | 1,019,304 | | | Fair Value ITG Factor other than 1 applied |
See accompanying notes to the financial statements.
105
ASHMORE EMERGING MARKETS FRONTIER EQUITY FUND
SCHEDULE OF INVESTMENTS (CONTINUED)
As of April 30, 2018 (Unaudited)
| | | | | | |
| Transfers from Level 1 to Level 2 | | | | | |
| Country | | Value | | | Reason |
Sri Lanka | | $ | 2,865,160 | | | Fair Value ITG Factor other than 1 applied |
United Arab Emirates | | | 8,112,874 | | | Fair Value ITG Factor other than 1 applied |
Vietnam | | | 4,526,503 | | | Fair Value ITG Factor other than 1 applied |
| | |
Total | | $ | 64,941,651 | | | |
See accompanying notes to the financial statements.
106
ASHMORE EMERGING MARKETS EQUITY FUND
SCHEDULE OF INVESTMENTS
As of April 30, 2018 (Unaudited)
| | | | | | | | | | | | | | | | |
| | | Currency(1) | | | Shares | | | Value | | | % of Net
Assets | |
Common Stocks | | | | | | | | | | | | | | | | |
| | | | |
Argentina (Cost $850,860) | | | | | | | | | | | | | | | | |
Globant S.A. * | | | | | | | 8,900 | | | $ | 400,589 | | | | 1.34 | |
Grupo Supervielle S.A. ADR | | | | | | | 14,756 | | | | 412,283 | | | | 1.38 | |
| | | | | | | | | | | 812,872 | | | | 2.72 | |
Brazil (Cost $2,333,166) | | | | | | | | | | | | | | | | |
Hypera S.A. * | | | BRL | | | | 63,600 | | | | 571,877 | | | | 1.91 | |
Localiza Rent a Car S.A. * | | | BRL | | | | 42,200 | | | | 335,967 | | | | 1.12 | |
Rumo S.A. * | | | BRL | | | | 73,200 | | | | 310,293 | | | | 1.04 | |
Smiles Fidelidade S.A. * | | | BRL | | | | 18,800 | | | | 386,390 | | | | 1.29 | |
Suzano Papel e Celulose S.A. | | | BRL | | | | 34,000 | | | | 398,504 | | | | 1.33 | |
Vale S.A. ADR * | | | | | | | 27,532 | | | | 381,043 | | | | 1.27 | |
| | | | | | | | | | | 2,384,074 | | | | 7.96 | |
China (Cost $7,914,846) | | | | | | | | | | | | | | | | |
58.com, Inc. ADR * | | | | | | | 3,939 | | | | 344,229 | | | | 1.15 | |
Alibaba Group Holding Ltd. ADR * | | | | | | | 2,540 | | | | 453,492 | | | | 1.52 | |
Anhui Conch Cement Co. Ltd., Class H | | | HKD | | | | 70,000 | | | | 435,883 | | | | 1.46 | |
ANTA Sports Products Ltd. | | | HKD | | | | 127,000 | | | | 725,164 | | | | 2.42 | |
AviChina Industry & Technology Co. Ltd., Class H | | | HKD | | | | 641,000 | | | | 404,412 | | | | 1.35 | |
Baoshan Iron & Steel Co. Ltd., Class A | | | CNH | | | | 226,100 | | | | 331,865 | | | | 1.11 | |
China Construction Bank Corp., Class H | | | HKD | | | | 897,000 | | | | 940,617 | | | | 3.14 | |
CSPC Pharmaceutical Group Ltd. | | | HKD | | | | 112,000 | | | | 284,273 | | | | 0.95 | |
Haitian International Holdings Ltd. | | | HKD | | | | 153,000 | | | | 406,778 | | | | 1.36 | |
New Oriental Education & Technology Group, Inc. ADR | | | | | | | 3,891 | | | | 349,567 | | | | 1.17 | |
Ping An Insurance Group Co. of China Ltd., Class H | | | HKD | | | | 90,500 | | | | 883,852 | | | | 2.95 | |
Qingdao Haier Co. Ltd., Class A | | | CNH | | | | 154,382 | | | | 420,060 | | | | 1.40 | |
Shanghai Fosun Pharmaceutical Group Co. Ltd., Class H | | | HKD | | | | 70,000 | | | | 381,554 | | | | 1.27 | |
SINA Corp. * | | | | | | | 4,300 | | | | 410,822 | | | | 1.37 | |
Tencent Holdings Ltd. | | | HKD | | | | 7,800 | | | | 382,953 | | | | 1.28 | |
Xiabuxiabu Catering Management China Holdings Co. Ltd. (2) | | | HKD | | | | 230,500 | | | | 395,505 | | | | 1.32 | |
YY, Inc. ADR * | | | | | | | 4,829 | | | | 465,467 | | | | 1.55 | |
| | | | | | | | | | | 8,016,493 | | | | 26.77 | |
Czech Republic (Cost $354,892) | | | | | | | | | | | | | | | | |
Erste Group Bank A.G. | | | EUR | | | | 7,362 | | | | 359,665 | | | | 1.20 | |
| | | | | | | | | | | 359,665 | | | | 1.20 | |
Hong Kong (Cost $357,557) | | | | | | | | | | | | | | | | |
AIA Group Ltd. | | | HKD | | | | 42,600 | | | | 380,340 | | | | 1.27 | |
| | | | | | | | | | | 380,340 | | | | 1.27 | |
Hungary (Cost $459,801) | | | | | | | | | | | | | | | | |
OTP Bank PLC | | | HUF | | | | 10,061 | | | | 440,620 | | | | 1.47 | |
| | | | | | | | | | | 440,620 | | | | 1.47 | |
India (Cost $2,852,919) | | | | | | | | | | | | | | | | |
Adani Ports & Special Economic Zone Ltd. | | | INR | | | | 32,845 | | | | 199,451 | | | | 0.67 | |
Axis Bank Ltd. | | | INR | | | | 39,574 | | | | 304,923 | | | | 1.02 | |
See accompanying notes to the financial statements.
107
ASHMORE EMERGING MARKETS EQUITY FUND
SCHEDULE OF INVESTMENTS (CONTINUED)
As of April 30, 2018 (Unaudited)
| | | | | | | | | | | | | | | | |
| | | Currency(1) | | | Shares | | | Value | | | % of Net
Assets | |
India (continued) | | | | | | | | | | | | | | | | |
Housing Development Finance Corp. Ltd. | | | INR | | | | 18,536 | | | $ | 520,792 | | | | 1.74 | |
ICICI Bank Ltd. ADR | | | | | | | 104,956 | | | | 893,176 | | | | 2.98 | |
Mahindra & Mahindra Ltd. | | | INR | | | | 47,423 | | | | 618,806 | | | | 2.07 | |
Mahindra & Mahindra Ltd. GDR | | | | | | | 13,854 | | | | 180,997 | | | | 0.60 | |
| | | | | | | | | | | 2,718,145 | | | | 9.08 | |
Mexico (Cost $1,047,488) | | | | | | | | | | | | | | | | |
Grupo Aeroportuario del Sureste S.A.B. de C.V. ADR | | | | | | | 2,356 | | | | 423,609 | | | | 1.41 | |
Grupo Financiero Banorte S.A.B. de C.V., Series O | | | MXN | | | | 50,900 | | | | 318,485 | | | | 1.06 | |
Ternium S.A. ADR | | | | | | | 8,802 | | | | 349,175 | | | | 1.17 | |
| | | | | | | | | | | 1,091,269 | | | | 3.64 | |
Peru (Cost $294,952) | | | | | | | | | | | | | | | | |
Credicorp Ltd. | | | | | | | 1,400 | | | | 325,486 | | | | 1.09 | |
| | | | | | | | | | | 325,486 | | | | 1.09 | |
Russian Federation (Cost $1,758,249) | | | | | | | | | | | | | | | | |
LUKOIL PJSC ADR | | | | | | | 10,544 | | | | 702,643 | | | | 2.35 | |
Mail.Ru Group Ltd. GDR (Registered) * | | | | | | | 14,311 | | | | 450,011 | | | | 1.50 | |
Sberbank of Russia PJSC | | | RUB | | | | 158,540 | | | | 569,189 | | | | 1.90 | |
| | | | | | | | | | | 1,721,843 | | | | 5.75 | |
Saudi Arabia (Cost $391,952) | | | | | | | | | | | | | | | | |
Samba Financial Group | | | SAR | | | | 49,793 | | | | 385,500 | | | | 1.29 | |
| | | | | | | | | | | 385,500 | | | | 1.29 | |
South Africa (Cost $3,297,643) | | | | | | | | | | | | | | | | |
Barclays Africa Group Ltd. | | | ZAR | | | | 34,703 | | | | 506,121 | | | | 1.69 | |
Naspers Ltd., Class N | | | ZAR | | | | 5,555 | | | | 1,355,447 | | | | 4.53 | |
Sanlam Ltd. | | | ZAR | | | | 68,124 | | | | 429,862 | | | | 1.43 | |
Shoprite Holdings Ltd. | | | ZAR | | | | 20,086 | | | | 399,430 | | | | 1.33 | |
Truworths International Ltd. | | | ZAR | | | | 45,843 | | | | 373,335 | | | | 1.25 | |
| | | | | | | | | | | 3,064,195 | | | | 10.23 | |
South Korea (Cost $2,580,088) | | | | | | | | | | | | | | | | |
Com2uS Corp. | | | KRW | | | | 2,814 | | | | 419,039 | | | | 1.40 | |
Dentium Co. Ltd. | | | KRW | | | | 3,951 | | | | 290,280 | | | | 0.97 | |
KB Financial Group, Inc. | | | KRW | | | | 10,503 | | | | 598,938 | | | | 2.00 | |
LG Corp. | | | KRW | | | | 3,650 | | | | 275,706 | | | | 0.92 | |
NCSoft Corp. | | | KRW | | | | 860 | | | | 288,463 | | | | 0.96 | |
SK Hynix, Inc. | | | KRW | | | | 10,591 | | | | 829,273 | | | | 2.77 | |
| | | | | | | | | | | 2,701,699 | | | | 9.02 | |
Taiwan (Cost $4,108,808) | | | | | | | | | | | | | | | | |
Airtac International Group | | | TWD | | | | 21,000 | | | | 363,059 | | | | 1.21 | |
Hota Industrial Manufacturing Co. Ltd. | | | TWD | | | | 89,000 | | | | 394,154 | | | | 1.32 | |
Lite-On Technology Corp. | | | TWD | | | | 408,000 | | | | 537,213 | | | | 1.79 | |
Parade Technologies Ltd. | | | TWD | | | | 20,000 | | | | 308,464 | | | | 1.03 | |
Silergy Corp. | | | TWD | | | | 16,000 | | | | 334,590 | | | | 1.12 | |
Silicon Motion Technology Corp. ADR | | | | | | | 8,807 | | | | 398,164 | | | | 1.33 | |
See accompanying notes to the financial statements.
108
ASHMORE EMERGING MARKETS EQUITY FUND
SCHEDULE OF INVESTMENTS (CONTINUED)
As of April 30, 2018 (Unaudited)
| | | | | | | | | | | | | | | | |
| | | Currency(1) | | | Shares | | | Value | | | % of Net
Assets | |
Taiwan (continued) | | | | | | | | | | | | | | | | |
Taiwan Paiho Ltd. | | | TWD | | | | 105,000 | | | $ | 280,795 | | | | 0.94 | |
Taiwan Semiconductor Manufacturing Co. Ltd. | | | TWD | | | | 78,000 | | | | 591,277 | | | | 1.97 | |
Taiwan Semiconductor Manufacturing Co. Ltd. ADR | | | | | | | 18,159 | | | | 698,214 | | | | 2.33 | |
| | | | | | | | | | | 3,905,930 | | | | 13.04 | |
Thailand (Cost $736,064) | | | | | | | | | | | | | | | | |
PTT PCL NVDR | | | THB | | | | 227,000 | | | | 403,903 | | | | 1.35 | |
Siam Commercial Bank (The) PCL NVDR | | | THB | | | | 86,300 | | | | 357,184 | | | | 1.19 | |
| | | | | | | | | | | 761,087 | | | | 2.54 | |
United Arab Emirates (Cost $360,884) | | | | | | | | | | | | | | | | |
DP World Ltd. | | | | | | | 13,829 | | | | 307,030 | | | | 1.03 | |
| | | | | | | | | | | 307,030 | | | | 1.03 | |
| | | | |
Total Common Stocks (Cost $29,700,169) | | | | | | | | | | | 29,376,248 | | | | 98.10 | |
| | | | |
Preferred Stocks | | | | | | | | | | | | | | | | |
| | | | |
South Korea (Cost $282,547) | | | | | | | | | | | | | | | | |
Samsung Electronics Co. Ltd., 2.506% (3)(4) | | | KRW | | | | 161 | | | | 317,062 | | | | 1.06 | |
| | | | | | | | | | | 317,062 | | | | 1.06 | |
| | | | |
Total Preferred Stocks (Cost $282,547) | | | | | | | | | | | 317,062 | | | | 1.06 | |
| | | | |
Equity-Linked Securities | | | | | | | | | | | | | | | | |
| | | | |
India (Cost $135,520) | | | | | | | | | | | | | | | | |
Adani Ports & Special Economic Zone Ltd., Class A, Issued by JP Morgan Structured Products B.V. | | | | | | | 33,479 | | | | 203,301 | | | | 0.68 | |
| | | | | | | | | | | 203,301 | | | | 0.68 | |
| | | | |
Total Equity-Linked Securities (Cost $135,520) | | | | | | | | | | | 203,301 | | | | 0.68 | |
| | | | |
Total Investments (Total Cost $30,118,236) | | | | | | | | | | | 29,896,611 | | | | 99.84 | |
| | | | |
Other Assets Less Liabilities (See Statements of Assets and
Liabilities for further detail) | | | | | | | | | | | 46,841 | | | | 0.16 | |
| | | | |
Net Assets | | | | | | | | | | $ | 29,943,452 | | | | 100.00 | |
| * | Non-income producing security. |
| (1) | Par values are stated in United States Dollars unless otherwise noted below. |
| (2) | Securities exempt from registration under Rule 144A of the Securities Act of 1933. These securities may not be publicly traded without registration under the Securities Act of 1933. |
| (3) | Security is a Level 3 investment. |
| (4) | Current yield is disclosed. Dividends are calculated based on a percentage of the issuer’s net income. |
Percentages shown are based on net assets.
See accompanying notes to the financial statements.
109
ASHMORE EMERGING MARKETS EQUITY FUND
SCHEDULE OF INVESTMENTS (CONTINUED)
As of April 30, 2018 (Unaudited)
At April 30, 2018, the industry sectors for the Ashmore Emerging Markets Equity Fund were:
| | | | |
| Sector | | Percentage of
Net Assets | |
Consumer Discretionary | | | 18.3 | % |
Consumer Staples | | | 1.3 | |
Energy | | | 3.7 | |
Financials | | | 28.8 | |
Health Care | | | 5.1 | |
Industrials | | | 10.8 | |
Information Technology | | | 25.5 | |
Materials | | | 6.3 | |
Total Investments | | | 99.8 | |
Other Assets Less Liabilities | | | 0.2 | |
Net Assets | | | 100.0 | % |
At April 30, 2018, the Ashmore Emerging Markets Equity Fund had outstanding forward foreign currency exchange contracts as follows:
| | | | | | | | | | | | | | | | |
Settlement
Date | | Counterparty | | Currency Buy | | Currency
Buy Amount
(Local
Currency) | | | Currency Sell | | Currency
Sell Amount
(Local
Currency) | | | Unrealized
Gain/(Loss) |
| | | | | | |
05/03/2018 | | Brown Brothers Harriman | | United States Dollar | | | 879,710 | | | South African Rand | | | 70,838 | | | $(294) |
| | | | | | | | | | | | | | | | |
| | | | | | |
Total | | | | | | | | | | | | | | | | $(294) |
| | | | | | | | | | | | | | | | |
See accompanying notes to the financial statements.
110
ASHMORE EMERGING MARKETS EQUITY FUND
SCHEDULE OF INVESTMENTS (CONTINUED)
As of April 30, 2018 (Unaudited)
The inputs or methodologies used for valuing securities are not necessarily an indication of the risks associated with investing in those securities and other financial instruments, if any. See note 4 in the Notes to the Financial Statements for more information regarding pricing inputs and valuation techniques. The following is a summary of the inputs used in valuing the Ashmore Emerging Markets Equity Fund’s investments and other financial instruments, which are carried at fair value, as of April 30, 2018:
| | | | | | | | | | | | | | | | | | | | |
| | | Level 1 | | Level 2 | | Level 3 | | Total |
Investments | | | | | | | | | | | | | | | | | | | | |
Assets: | | | | | | | | | | | | | | | | | | | | |
Common Stock | | | | | | | | | | | | | | | | | | | | |
Argentina | | | $ | 812,872 | | | | $ | — | | | | $ | — | | | | $ | 812,872 | |
Brazil | | | | 2,384,074 | | | | | — | | | | | — | | | | | 2,384,074 | |
China | | | | 2,023,577 | | | | | 5,992,916 | | | | | — | | | | | 8,016,493 | |
Czech Republic | | | | — | | | | | 359,665 | | | | | — | | | | | 359,665 | |
Hong Kong | | | | — | | | | | 380,340 | | | | | — | | | | | 380,340 | |
Hungary | | | | — | | | | | 440,620 | | | | | — | | | | | 440,620 | |
India | | | | 893,176 | | | | | 1,824,969 | | | | | — | | | | | 2,718,145 | |
Mexico | | | | 1,091,269 | | | | | — | | | | | — | | | | | 1,091,269 | |
Peru | | | | 325,486 | | | | | — | | | | | — | | | | | 325,486 | |
Russian Federation | | | | — | | | | | 1,721,843 | | | | | — | | | | | 1,721,843 | |
Saudi Arabia | | | | — | | | | | 385,500 | | | | | — | | | | | 385,500 | |
South Africa | | | | — | | | | | 3,064,195 | | | | | — | | | | | 3,064,195 | |
South Korea | | | | — | | | | | 2,701,699 | | | | | — | | | | | 2,701,699 | |
Taiwan | | | | 1,096,378 | | | | | 2,809,552 | | | | | — | | | | | 3,905,930 | |
Thailand | | | | — | | | | | 761,087 | | | | | — | | | | | 761,087 | |
United Arab Emirates | | | | — | | | | | 307,030 | | | | | — | | | | | 307,030 | |
| | | | | | | | | | | | | | | | | | | | |
Total Common Stock | | | | 8,626,832 | | | | | 20,749,416 | | | | | — | | | | | 29,376,248 | |
Preferred Stock | | | | | | | | | | | | | | | | | | | | |
South Korea | | | | — | | | | | — | | | | | 317,062 | | | | | 317,062 | |
Equity-Linked Securities | | | | | | | | | | | | | | | | | | | | |
India | | | | — | | | | | 203,301 | | | | | — | | | | | 203,301 | |
Total Investments | | | $ | 8,626,832 | | | | $ | 20,952,717 | | | | $ | 317,062 | | | | $ | 29,896,611 | |
| | | | |
Other Financial Instruments | | | | | | | | | | | | | | | | | | | | |
Liabilities: | | | | | | | | | | | | | | | | | | | | |
Forward Foreign Currency Exchange Contracts | | | $ | — | | | | $ | (294 | ) | | | $ | — | | | | $ | (294 | ) |
See accompanying notes to the financial statements.
111
ASHMORE EMERGING MARKETS EQUITY FUND
SCHEDULE OF INVESTMENTS (CONTINUED)
As of April 30, 2018 (Unaudited)
The Fund discloses all transfers between levels based on valuations at the end of each reporting period. At April 30, 2018, the Fund had transfers as disclosed below.
| | | | | | |
| Transfers from Level 1 to Level 2 | | | | | |
| Country | | Value | | | Reason |
Common Stock | | | | | | |
China | | $ | 2,602,927 | | | Fair Value ITG Factor other than 1 applied. |
Hong Kong | | | 380,340 | | | Fair Value ITG Factor other than 1 applied. |
Russian Federation | | | 569,189 | | | Fair Value ITG Factor other than 1 applied. |
South Africa | | | 1,355,447 | | | Fair Value ITG Factor other than 1 applied. |
South Korea | | | 1,248,312 | | | Fair Value ITG Factor other than 1 applied. |
Taiwan | | | 1,522,645 | | | Fair Value ITG Factor other than 1 applied. |
United Arab Emirates | | | 307,030 | | | Fair Value ITG Factor other than 1 applied. |
| | |
Total | | $ | 7,985,890 | | | |
| | |
| Transfers from Level 1 to Level 3 | | | | | |
| Country | | Value | | | Reason |
Preferred Stock | | | | | | |
South Korea | | $ | 317,062 | | | Asset suspended during the current period. |
The following is a reconciliation of investments in which significant unobservable inputs (Level 3) were used for the Fund during the period ending April 30, 2018:
| | | | | | | | | | | | | | | | | | | | | | | | | | | | | | | | | | | | | | | | | | | | | | | | | | |
Category and
Subcategory | | Beginning
Balance
at 10/31/2017 | | Accrued
Discounts
(Premiums) | | Purchases | | Sales | | Realized
Gains
(Losses) | | Change in
Unrealized
Appreciation
(Depreciation) | | Transfer
into
Level 3 | | Transfer
out of
Level 3 | | Ending
Balance
at 04/30/2018 | | Change in
Unrealized
Appreciation
(Depreciation)
from Investments
still held
04/30/2018 |
Investments, at value | | | | | | | | | | | | | | | | | | | | | | | | | | | | | | | | | | | | | | | | | | | | | | | | | | |
Preferred Stock | | | | | | | | | | | | | | | | | | | | | | | | | | | | | | | | | | | | | | | | | | | | | | | | | | |
South Korea | | | | $— | | | | | $— | | | | | $— | | | | | $— | | | | | $— | | | | | $— | | | | | $317,062 | | | | | $— | | | | | $317,062 | | | | | $(24,540) | |
The following table on “Quantitative information about Fair Value measurements” provides information on the valuation techniques and inputs used to value Level 3 securities at April 30, 2018:
| | | | | | | | | | |
Quantitative Information about Level 3 Fair Value Measurements | |
| | | Fair Value at
04/30/2018 | | Valuation Technique | | | Unobservable Input | |
Preferred Stock | | $317,062 | | | Last available close | | | | Temporary halt in trading due to share split | |
See accompanying notes to the financial statements.
112
ASHMORE EMERGING MARKETS EQUITY FUND
SCHEDULE OF INVESTMENTS (CONTINUED)
As of April 30, 2018 (Unaudited)
The following is a summary of the fair values of the Fund’s derivative instruments*:
Fair Values of Financial Derivative Instruments on the Statements of Assets and Liabilities as of April 30, 2018:
| | | | |
| | | Derivatives Not Accounted for as
Hedging Instruments | |
| | | Foreign Exchange | |
Liabilities: | | | | |
Unrealized Depreciation on Forward Foreign Currency Exchange Contracts | | | $(294 | ) |
| | | | |
The Effect of Financial Derivative Instruments on the Statements of Operations for the Six Months Ended April 30, 2018:
| | | | |
| | | Derivatives Not Accounted for as
Hedging Instruments | |
| | | Foreign Exchange | |
Realized Gain (Loss) on Derivatives Recognized resulting from Operations: | | | | |
Net Realized Gain on Forward Foreign Currency Exchange Contracts | | | $2,808 | |
| | | | |
| |
Net Change in Unrealized Appreciation (Depreciation) on Derivatives Recognized resulting from Operations: | | | | |
Net Change in Unrealized Depreciation on Forward Foreign Currency Exchange Contracts | | | $ (294 | ) |
| | | | |
* See note 10 in the Notes to the Financial Statements for additional information.
See accompanying notes to the financial statements.
113
ASHMORE FUNDS
NOTES TO FINANCIAL STATEMENTS
As of April 30, 2018 (Unaudited)
1. Organization
Ashmore Funds (the “Trust”) is a Massachusetts business trust organized under the laws of the Commonwealth of Massachusetts on August 6, 2010 (inception date) and is registered under the Investment Company Act of 1940, as amended (the “Investment Company Act” or “1940 Act”), as an open-end investment management company. The Trust follows accounting and reporting guidance under Financial Accounting Standards Codification Topic 946, “Financial Services – Investment Companies.” The Trust includes eight funds as of April 30, 2018, each with its own investment objective. The Ashmore Emerging Markets Total Return Fund, Ashmore Emerging Markets Local Currency Bond Fund, Ashmore Emerging Markets Corporate Debt Fund, Ashmore Emerging Markets Short Duration Fund, Ashmore Emerging Markets Active Equity Fund, Ashmore Emerging Markets Small-Cap Equity Fund, Ashmore Emerging Markets Frontier Equity Fund and Ashmore Emerging Markets Equity Fund (each a “Fund” and collectively, the “Funds”) are separate series of the Trust. The Ashmore Emerging Markets Local Currency Bond Fund and the Ashmore Emerging Markets Short Duration Fund are each non-diversified funds. Non-diversified funds may invest a relatively large portion of their net assets in a single issuer or a small number of issuers. Each of the Funds’ financial statements are presented herein. The Ashmore Emerging Markets Hard Currency Debt Fund liquidated on November 20, 2017 and the Ashmore Emerging Markets Equity Opportunities Fund liquidated on January 5, 2018.
Ashmore Investment Advisors Limited (“AIAL” or the “Investment Manager”) serves as investment manager to the Funds. AIAL is a wholly owned subsidiary of Ashmore Investments (UK) Limited, which is a wholly owned subsidiary of Ashmore Group plc (“Ashmore Group”). Ashmore Investment Management (US) Corporation (“AIMUS”) is the principal underwriter of shares of the Funds. AIMUS is an affiliate of the Investment Manager. The Northern Trust Company (“Northern Trust”) serves as the administrator, custodian and transfer agent of the Funds.
Related parties or personnel of the Investment Manager may invest in the Funds. The Investment Manager could face a conflict if a related party is invested in a Fund and that party’s interests diverge from those of the Fund, but equally this co-investment may serve to better align the interests of the Funds and the personnel of the Investment Manager. When a related party provides capital for a Fund, it may do so with the intention of redeeming all or part of its interest in the Fund at a future point in time.
The Funds have assessed the impact of the Alternative Investment Fund Managers Directive (AIFMD) (the “Directive”) on the financial statements of the Trust and have concluded that the Trust is exempt from following Chapter V. Section 1. Articles 103-111 of the European Commission’s Level 2 Delegated Regulation on the basis of the operations of the Trust being (i) Non-EEA AIFs (“European Economic Area Alternative Investment Funds”), and (ii) not being marketed in the European Union, as defined by the Directive.
2. Significant accounting policies
The significant accounting policies adopted and consistently followed in the preparation of the Funds’ financial statements are set out below:
(a) Basis of preparation
The financial statements have been prepared in accordance with accounting principles generally accepted in the United States of America (“U.S. GAAP”).
(b) Use of estimates
The preparation of financial statements in accordance with U.S. GAAP requires estimates and assumptions that affect the reported amounts of assets and liabilities and the disclosure of contingent assets and liabilities at the date of the financial statements, as well as the reported amounts of revenues generated and expenses incurred during the reporting period. Actual results could differ from these estimates. These financial statements contain all adjustments which are, in the opinion of the Trust, necessary to portray a fair statement of the period presented. Such adjustments are normal and recurring in nature. Valuation models used to determine the fair value of unlisted derivative instruments require the use of a number of market based assumptions.
114
ASHMORE FUNDS
NOTES TO FINANCIAL STATEMENTS (CONTINUED)
As of April 30, 2018 (Unaudited)
(c) Determination of the Net Asset Value
The net asset value (“NAV”) of a Fund’s shares is calculated at the close of regular trading (normally 4:00 p.m. Eastern time) (the “NYSE Close”) on each day that the New York Stock Exchange (“NYSE”) is open for regular trading.
(d) Investment valuation
For the purposes of calculating NAV, portfolio securities and other assets for which market quotations are readily available are valued at market value. Market values for securities and other instruments are generally determined on the basis of closing prices or the last reported sales prices on an exchange or other market, or if no closing prices or sales are reported, based on quotes or other market information obtained from a quotation reporting system, established market makers, or pricing services. Domestic and foreign debt securities where the close of trading does not coincide with the NYSE close and non-exchange traded derivatives are normally valued on the basis of quotes obtained from brokers and dealers or pricing services using data reflecting the earlier closing of the principal markets for those securities (e.g., certain foreign securities). Prices obtained from independent pricing services are based on information provided by market makers or estimates of market values obtained from yield data relating to investments or securities with similar characteristics. Certain debt securities purchased on a delayed delivery basis are marked-to-market daily until settlement. Exchange traded options, futures and options on futures are generally valued at the settlement price determined by the exchange on which the instrument is primarily traded. With respect to any portion of a Fund’s assets that are invested in one or more open-ended investment management companies, a Fund’s NAV will be calculated based upon the NAVs of such investments. The prospectuses for these open-end investment management companies explain the circumstances under which those companies will use fair value pricing and the effects of using fair value pricing.
If a Fund believes a non-U.S. (foreign) security’s value has materially changed after the close of the security’s primary exchange or principal market but before the time as of which the Funds calculate their NAVs, the security will be valued at fair value based on procedures approved by the Board. A Fund may determine the fair value of investments based on information provided by pricing services and other third-party vendors, which may recommend fair value prices or adjustments with reference to other securities, indices or assets. The Funds may use fair value pricing more frequently for foreign securities or assets because, amongst other things, many foreign markets close well before the NAV of the Funds’ shares is next calculated. In considering whether fair value pricing is required and in determining fair values, the Fund may, amongst other things, consider significant events (which may be considered to include changes in the value of U.S. securities or securities indices) that occur after the close of the relevant market and before the time as of which the Funds calculate their NAVs. A Fund may utilize modeling tools provided by third-party vendors to determine the fair values of non-U.S. securities. Foreign exchanges may permit trading in foreign securities on days when the Trust is not open for business, which may result in the values of a Fund’s portfolio investments being affected when investors are unable to buy, sell or exchange shares of the Fund.
Investments initially valued in currencies other than the United States Dollar are converted to the United States Dollar using exchange rates obtained from pricing services. Foreign exchange rates are calculated as of 4:00 p.m. Eastern time on each day that the NYSE opens for regular trading. As a result, the NAV of a Fund’s shares may be affected by changes in the value of currencies in relation to the United States Dollar. The value of securities traded in markets outside the United States or denominated in currencies other than the United States Dollar may be affected significantly on a day that the NYSE is closed and an investor is not able to purchase, redeem or exchange shares of the Funds.
In the event that market quotes are not readily available, and the security or asset cannot be valued pursuant to one of the Board’s approved valuation methods, the fair value of the security or asset will be determined in good faith by the Board, generally based upon recommendations provided by the Investment Manager. Market quotes are considered not readily available in circumstances where there is an absence of current or reliable market-based data (e.g., trade information, bid/asked information, broker quotes), including where events occur after the close of the relevant market, but prior to a Fund’s NAV calculation time, that materially affect the values of a Fund’s securities or assets. In addition, market quotes are considered not readily available when, due to extraordinary circumstances, the exchanges or markets on which the securities trade do not open for trading for the entire day and no other market prices are available. A Fund may also determine that market quotations are not readily available due to events relating to a single issuer (e.g., corporate actions or announcements) or events relating to multiple issuers (e.g., governmental actions or natural disasters). The Board has delegated to the Investment Manager the responsibility for monitoring significant events that may materially affect the values of a Fund’s securities or assets and for determining whether the value of the applicable securities or assets should be re-evaluated in light of such significant events.
115
ASHMORE FUNDS
NOTES TO FINANCIAL STATEMENTS (CONTINUED)
As of April 30, 2018 (Unaudited)
The Investment Manager primarily employs a market-based approach which may use related or comparable assets or liabilities, recent transactions, market multiples, book values, and other relevant information to determine the fair value of the investment. The Investment Manager may also apply a discount to the last traded price in situations where the last traded price may not represent the fair value of the security, such as if a security’s trading has been suspended on its primary trading market, a security has been de-listed from its primary trading market, a security has not traded for an extended period of time, or a security’s primary trading market is temporarily closed at a time when under normal conditions it would be open. Any such discount is based on a number of factors including but not limited to the circumstances surrounding any potential suspension or de-listing, market and industry conditions, competitor information, and the period of time since the last trading took place.
When a Fund uses fair value pricing to determine the NAV of its shares, securities may not be priced on the basis of quotes from the primary market in which they are traded, but rather may be priced by another method that the Board or persons acting at its direction believe accurately reflects fair value. Fair value pricing may require subjective determinations about the value of a security or asset. While the Funds’ policies are intended to result in a calculation of a Fund’s NAV that fairly reflects security and asset values as of the time of pricing, the Funds cannot ensure that fair values determined by the Board or persons acting at their direction accurately reflects the price that a Fund could obtain for a security or asset if it were to dispose of that security or asset at the time of pricing (for instance, in a forced or distressed sale). The prices used by a Fund may differ from the value that would be realized if the securities were sold. Also, the use of fair value pricing may not always result in adjustments to the prices of securities or other assets held by the Fund for the purpose of calculating the NAV of the Fund’s shares.
(e) Investment transactions, income and expenses
Investment transactions are recorded at the trade date. The Funds determine the gain or loss realized from investment transactions using an identified cost basis method. Interest income is recognized on an accrual basis and includes the amortization of premiums and the accretion of discounts using the effective yield method.
Dividend income is recognized on the ex-dividend date. Dividends from foreign securities are recorded on the ex-dividend date, or as soon as such information is available, net of any applicable tax withholding. Expenses are recorded on an accrual basis. Each Fund is charged for those expenses that are directly attributable to that Fund. Certain expenses arising in connection with a class of shares are charged to that class of shares. Expenses incurred which do not specifically relate to an individual Fund are allocated amongst all the Funds in the Trust in proportion to each Fund’s relative net assets.
(f) Fully funded total return swaps
Each Fund is subject to market risk in the normal course of pursuing its investment objectives. Certain Funds enter into fully funded total return swaps (“TRS”) to manage their exposure to the market, certain sectors of the market or a particular security or reference asset, or to create exposure to certain investments to which they would otherwise not be exposed. TRS contracts involve the exchange by a Fund and a counterparty of their respective commitments to pay or receive a net amount based, in part, on the change in the value of a notional amount of a particular security, index or reference asset.
Where a Fund enters into a TRS transaction with a swap counterparty, pursuant to which the Fund makes an initial payment equal to the estimated value of an emerging market debt or equity security, loan or other financial instrument, the TRS is considered an investment for financial statement purposes and is accounted for using the same policies as would apply to the underlying assets it represents. In addition to the market risk of the underlying security, index or reference asset, there is a risk of default by the counterparty to the transaction.
(g) Equity-Linked Securities
Certain Funds may purchase equity-linked securities, also known as participation notes. Equity-linked securities are primarily used by the Funds as an alternate means to access what is generally an emerging securities market. A Fund deposits cash with its custodian (or broker) in an amount near or equal to the value of the underlying security in exchange for an equity linked security. Upon sale, the Fund receives cash from the broker or custodian, equal to the value of the underlying security. In addition to the market risk and credit risk of the underlying securities, there is a risk of default by the counterparty to the transaction. In the event of insolvency of the counterparty, a Fund might be unable to obtain its expected benefit. In addition, while the Funds will seek to enter into such
116
ASHMORE FUNDS
NOTES TO FINANCIAL STATEMENTS (CONTINUED)
As of April 30, 2018 (Unaudited)
transactions only with parties that are capable of entering into closing transactions with a Fund, there can be no assurance that a Fund will be able to close out such a transaction with the counterparty or obtain an offsetting position with any counterparty at a time prior to the end of the term of the underlying agreement.
(h) Inflation Index Securities
Certain Funds may invest in inflation-indexed bonds which are fixed income securities whose principal value is periodically adjusted based on a measure of rate of inflation. The interest rate on these bonds is generally fixed at issuance at a rate lower than typical bonds. Over the life of an inflation-indexed bond interest will be paid based on a principal value which is adjusted for inflation. Any increase or decrease in the principal amount of an inflation-indexed bond will be included as interest income on the Statements of Operations, even though investors do not receive their principal until maturity. At April 30, 2018, all inflation-indexed bonds were shown on the Statement of Investments with their original par and stated coupon rate.
3. Principal Risks
In the normal course of business, the Funds trade financial instruments and enter into financial transactions where a risk of potential loss exists due to, amongst other things, changes in the market (market risk), or the failure or inability of the other party to a transaction to perform (credit and counterparty risk). See below for a summary description of select principal risks, some of which may not apply to a particular Fund. A discussion of the principal risks of investing in each Fund is included in that Fund’s prospectus.
Counterparty and Third Party Risk
Transactions involving a counterparty to a derivative or other instrument, or a third party responsible for servicing the instrument, are subject to the credit risk of the counterparty or third party, and to the counterparty’s or third party’s ability to perform in accordance with the terms of the transaction.
Credit Risk
The Funds could lose money if the issuer or guarantor of a debt security or other instrument is unable or unwilling to meet its financial obligations, and the lack of ability, or perceived lack of ability, of the issuer to make timely payments of interest and/or principal will negatively affect the value of the security or instrument.
Market Risk
The value of securities and instruments owned by the Funds may rise and fall, sometimes rapidly or unpredictably, due to factors affecting securities markets generally or particular industries or geographic areas. Recent instability in the financial markets has led governments around the world to take a number of unprecedented actions designed to support certain financial institutions and segments of the financial markets that have experienced extreme volatility, and in some cases a lack of liquidity. The withdrawal of this support, failure of these efforts, or investor perception that these efforts are not succeeding could negatively affect financial markets generally as well as the values and liquidity of a Fund’s portfolio securities and other assets.
Derivative financial instruments may result in off-balance sheet market and credit risk. If the markets should move against one or more positions that the Funds hold, the Funds could incur losses greater than the unrealized amounts recorded in the Statements of Assets and Liabilities. Derivative risk exposures are discussed in note 10.
Foreign/Emerging Markets Risks
Investments in foreign securities entail risks in addition to those customarily associated with investing in U.S. securities. Economic, political and social instability could disrupt financial markets in which the Fund invests and adversely affect the value of the Fund’s assets. In addition, national policies may restrict investment opportunities. In foreign markets there may be a lower degree of market volume and liquidity than in U.S. markets, and this may result in greater price volatility. The securities markets in many Emerging-Market countries are substantially smaller, less developed, less liquid and more volatile than the securities markets of developed countries. Furthermore, since the composition of each Fund will differ from that of market indexes, its performance generally will not mirror the returns provided by a specific market index.
117
ASHMORE FUNDS
NOTES TO FINANCIAL STATEMENTS (CONTINUED)
As of April 30, 2018 (Unaudited)
4. Fair value measurements
U.S. GAAP includes a topic which defines fair value as the price that the Fund would receive upon selling an investment in an orderly and timely transaction to a market participant in the principal or most advantageous market of the investment. This topic establishes a three-tier hierarchy to maximize the use of observable market data, minimize the use of unobservable inputs and establish classification of fair value measurements for disclosure purposes. Inputs may be observable or unobservable and refer broadly to the assumptions that market participants would use in pricing the asset or liability including assumptions about risk. Such risks include the inherent risk in a particular valuation technique which is used to measure fair value. Observable inputs are inputs that reflect the assumptions market participants would use in pricing the asset or liability developed based on market data obtained from sources independent of the reporting entity. Unobservable inputs are inputs that reflect the reporting entity’s own assumptions about the assumptions market participants would use in pricing the asset or liability, developed based on the best information available in the circumstances. The three-tier hierarchy of inputs is summarized in the three broad levels listed below.
| | • | | Level 1 – Inputs using unadjusted quoted prices in active markets or exchanges for identical assets and liabilities. |
| | • | | Level 2 – Significant observable inputs other than those used in Level 1, which may include, but are not limited to, quoted prices for similar assets or liabilities in markets that are active, quoted prices for identical or similar assets or liabilities in markets that are not active, inputs other than quoted prices that are observable for the assets or liabilities (such as interest rates, yield curves, volatilities, prepayment rates, loss severities, credit risks and default rates) or other market corroborated inputs. |
| | • | | Level 3 – Significant unobservable inputs based on the best information available in the circumstances, to the extent observable inputs are not available, which may include assumptions made by the Board or persons acting at their discretion that are used in determining the fair market value of investments. |
Fixed income securities including corporate, convertible and municipal bonds and notes, U.S. government agency securities, U.S. treasury obligations, sovereign issues, bank loans, convertible preferred securities and non-U.S. bonds are normally priced using data reflecting the earlier closing of the principal markets for those securities, subject to possible fair value adjustments. Information that becomes known to a Fund or its agents after NAV has been calculated on a particular day will not generally be used to retroactively adjust the price of a security or NAV determined earlier that day.
Portfolio securities and other assets for which market quotations are readily available are typically categorized as Level 1 of the fair value hierarchy. Domestic and foreign debt securities where the close of trading does not coincide with the NYSE close and non-exchange traded derivatives are normally valued on the basis of quotes obtained from brokers and dealers or pricing services using data reflecting the earlier closing of the principal markets for those securities. Prices obtained from independent pricing services are based on information provided by market makers or estimates of market values obtained from yield data relating to investments or securities with similar characteristics. Securities using these valuation adjustments are typically categorized as Level 2 of the fair value hierarchy. Preferred securities, equity linked notes and other equities traded on inactive markets or valued by reference to similar instruments are also typically categorized as Level 2 of the fair value hierarchy.
With respect to any portion of a Fund’s assets that are invested in one or more open-ended investment management companies, a Fund’s NAV will be calculated based upon the NAVs of such investments. The prospectuses for these open-end investment management companies explain the circumstances under which those companies will use fair value pricing and the effects of using fair value pricing. Investments in privately held investment funds will be valued based upon the NAVs of such investments and are categorized as Level 2 of the fair value hierarchy. Investments in public open-end investment funds are categorized as Level 2.
Investments and derivatives classified within Level 3 have significant unobservable inputs, as they trade infrequently or not at all. Level 3 instruments may include bank loan agreements and less-liquid corporate debt securities (including distressed debt instruments). Also included in this category are certain bonds and loans for which independent broker prices are used and information relating to the inputs of the price models is not available.
118
ASHMORE FUNDS
NOTES TO FINANCIAL STATEMENTS (CONTINUED)
As of April 30, 2018 (Unaudited)
5. Reverse repurchase agreements
Certain Funds may enter into reverse repurchase agreements. In a reverse repurchase agreement, a Fund delivers a security in exchange for cash to a financial institution, the counterparty, with a simultaneous agreement to repurchase the same or substantially the same security at an agreed upon price and date. The Fund is entitled to receive principal and interest payments, if any, made on the security delivered to the counterparty during the term of the agreement. Cash received in exchange for securities delivered plus accrued interest payments to be made by the Fund to counterparties are reflected as a liability on the Statements of Assets and Liabilities. Interest payments made by the Fund to counterparties are recorded as a component of interest expense on the Statements of Operations. In periods of increased demand for the security, the Fund may receive a fee for use of the security by the counterparty, which may result in interest income to the Fund.
As of April 30, 2018, the Funds did not hold any reverse repurchase agreements.
6. Capital share transactions
Transactions in Class A shares for the period ended April 30, 2018, were as follows:
| | | | | | | | | | | | | | | | | | | | | | | | | | | | | | | | |
| Fund | | Shares Sold | | Proceeds from
Shares Sold | | Shares from
Reinvested
Distributions | | Proceeds from
Reinvestment
of Distributions | | Shares
Redeemed | | Payments for
Shares
Redeemed | | Net Increase/
(Decrease)
in Shares | | Net Increase/
(Decrease) in
Net Assets | |
| Ashmore Emerging Markets Total Return Fund | | | 482,200 | | | | $ 3,942,208 | | | | 70,946 | | | | $577,385 | | | | (312,496 | ) | | $ | (2,540,615 | ) | | | 240,650 | | | $ | 1,978,978 | |
| Ashmore Emerging Markets Local Currency Bond Fund | | | 59,936 | | | | 464,880 | | | | 751 | | | | 5,845 | | | | (416 | ) | | | (3,239 | ) | | | 60,271 | | | | 467,486 | |
| Ashmore Emerging Markets Corporate Debt Fund | | | 481,517 | | | | 4,073,335 | | | | 28,324 | | | | 238,622 | | | | (701,917 | ) | | | (5,914,175 | ) | | | (192,076 | ) | | | (1,602,218 | ) |
| Ashmore Emerging Markets Short Duration Fund | | | 1,088,189 | | | | 11,256,748 | | | | 55,519 | | | | 573,455 | | | | (349,555 | ) | | | (3,601,528 | ) | | | 794,153 | | | | 8,228,675 | |
| Ashmore Emerging Markets Active Equity Fund | | | — | | | | — | | | | 79 | | | | 931 | | | | — | | | | — | | | | 79 | | | | 931 | |
| Ashmore Emerging Markets Small-Cap Equity Fund | | | 28,055 | | | | 306,248 | | | | 1,204 | | | | 12,214 | | | | (1,998 | ) | | | (21,134 | ) | | | 27,261 | | | | 297,328 | |
| Ashmore Emerging Markets Frontier Equity Fund | | | 152,471 | | | | 1,511,956 | | | | 67,240 | | | | 626,672 | | | | (74,850 | ) | | | (733,509 | ) | | | 144,861 | | | | 1,405,119 | |
| Ashmore Emerging Markets Equity Fund | | | 5 | | | | 52 | | | | 145 | | | | 1,653 | | | | (3 | ) | | | (34 | ) | | | 147 | | | | 1,671 | |
|
Transactions in Class C shares for the period ended April 30, 2018, were as follows: | |
| Fund | | Shares Sold | | Proceeds from
Shares Sold | | Shares from
Reinvested
Distributions | | Proceeds from
Reinvestment
of Distributions | | Shares
Redeemed | | Payments for
Shares
Redeemed | | Net Increase/
(Decrease)
in Shares | | Net Increase/
(Decrease) in
Net Assets | |
| Ashmore Emerging Markets Total Return Fund | | | 318,066 | | | | $2,588,660 | | | | 6,563 | | | | $ 53,275 | | | | (76,881 | ) | | $ | (623,735 | ) | | | 247,748 | | | | $2,018,200 | |
| Ashmore Emerging Markets Local Currency Bond Fund | | | 6,521 | | | | 50,345 | | | | 45 | | | | 349 | | | | (2,773 | ) | | | (21,127 | ) | | | 3,793 | | | | 29,567 | |
| Ashmore Emerging Markets Corporate Debt Fund | | | 264,980 | | | | 2,238,660 | | | | 18,822 | | | | 158,281 | | | | (260,682 | ) | | | (2,186,308 | ) | | | 23,120 | | | | 210,633 | |
119
ASHMORE FUNDS
NOTES TO FINANCIAL STATEMENTS (CONTINUED)
As of April 30, 2018 (Unaudited)
| | | | | | | | | | | | | | | | | | | | | | | | | | | | | | | | |
| Fund | | Shares Sold | | Proceeds from
Shares Sold | | Shares from
Reinvested
Distributions | | Proceeds from
Reinvestment
of Distributions | | Shares
Redeemed | | Payments for
Shares
Redeemed | | Net Increase/
(Decrease)
in Shares | | Net Increase/
(Decrease) in
Net Assets | |
| Ashmore Emerging Markets Short Duration Fund | | | 62,910 | | | | $628,685 | | | | 2,229 | | | | $22,185 | | | | (3,546 | ) | | $ | (35,029 | ) | | | 61,593 | | | | $615,841 | |
| Ashmore Emerging Markets Active Equity Fund | | | — | | | | — | | | | 78 | | | | 913 | | | | — | | | | — | | | | 78 | | | | 913 | |
| Ashmore Emerging Markets Small-Cap Equity Fund | | | 2,279 | | | | 25,677 | | | | 336 | | | | 3,608 | | | | (110 | ) | | | (1,179 | ) | | | 2,505 | | | | 28,106 | |
| Ashmore Emerging Markets Frontier Equity Fund | | | 8,215 | | | | 80,651 | | | | 4,495 | | | | 41,081 | | | | (703 | ) | | | (6,423 | ) | | | 12,007 | | | | 115,309 | |
| Ashmore Emerging Markets Equity Fund | | | — | | | | — | | | | 3 | | | | 30 | | | | (118 | ) | | | (1,324 | ) | | | (115 | ) | | | (1,294 | ) |
|
Transactions in Institutional Class shares for the period ended April 30, 2018, were as follows: | |
| Fund | | Shares Sold | | Proceeds from
Shares Sold | | Shares from
Reinvested
Distributions | | Proceeds from
Reinvestment
of Distributions | | Shares
Redeemed | | Payments for Shares
Redeemed | | Net Increase/
(Decrease)
in Shares | | Net Increase/
(Decrease) in
Net Assets | |
| Ashmore Emerging Markets Total Return Fund | | | 41,288,233 | | | $ | 343,357,588 | | | | 4,467,985 | | | | $36,905,140 | | | | (10,307,840 | ) | | | $(85,358,370) | | | | 35,448,378 | | | $ | 294,904,358 | |
| Ashmore Emerging Markets Local Currency Bond Fund | | | 1,269,676 | | | | 10,119,228 | | | | 124,918 | | | | 1,010,583 | | | | (3,129,504 | ) | | | (24,060,538 | ) | | | (1,734,910 | ) | | | (12,930,727 | ) |
| Ashmore Emerging Markets Corporate Debt Fund | | | 11,740,198 | | | | 103,306,186 | | | | 293,193 | | | | 2,574,978 | | | | (11,159,469 | ) | | | (97,821,681 | ) | | | 873,922 | | | | 8,059,483 | |
| Ashmore Emerging Markets Short Duration Fund | | | 10,774,946 | | | | 109,012,907 | | | | 599,783 | | | | 6,091,577 | | | | (3,726,103 | ) | | | (37,554,150 | ) | | | 7,648,626 | | | | 77,550,334 | |
| Ashmore Emerging Markets Active Equity Fund | | | 457,101 | | | | 5,698,277 | | | | 117,745 | | | | 1,392,927 | | | | (460,036 | ) | | | (5,730,448 | ) | | | 114,810 | | | | 1,360,756 | |
| Ashmore Emerging Markets Small-Cap Equity Fund | | | 606,661 | | | | 8,488,071 | | | | 30,683 | | | | 398,874 | | | | (531,669 | ) | | | (7,328,922 | ) | | | 105,675 | | | | 1,558,023 | |
| Ashmore Emerging Markets Frontier Equity Fund | | | 1,975,318 | | | | 22,247,889 | | | | 503,193 | | | | 5,399,261 | | | | (1,394,069 | ) | | | (15,761,104 | ) | | | 1,084,442 | | | | 11,886,046 | |
| Ashmore Emerging Markets Equity Fund | | | 1,927,119 | | | | 22,277,444 | | | | 12,622 | | | | 138,458 | | | | (9,211 | ) | | | (106,430 | ) | | | 1,930,530 | | | | 22,309,472 | |
|
Transactions in Class A shares for the year ended October 31, 2017, were as follows: | |
| Fund | | Shares Sold | | Proceeds from
Shares Sold | | Shares from
Reinvested
Distributions | | Proceeds from
Reinvestment
of Distributions | | Shares
Redeemed | | Payments for Shares Redeemed | | Net Increase/
(Decrease) in Shares | | Net Increase/
(Decrease) in
Net Assets | |
| Ashmore Emerging Markets Total Return Fund | | | 1,980,157 | | | | $16,397,952 | | | | 28,756 | | | | $233,104 | | | | (221,478 | ) | | | $ (1,787,334 | ) | | | 1,787,435 | | | | $14,843,722 | |
| Ashmore Emerging Markets Local Currency Bond Fund | | | 34,089 | | | | 248,304 | | | | 662 | | | | 4,863 | | | | (27,145 | ) | | | (201,371 | ) | | | 7,606 | | | | 51,796 | |
120
ASHMORE FUNDS
NOTES TO FINANCIAL STATEMENTS (CONTINUED)
As of April 30, 2018 (Unaudited)
| | | | | | | | | | | | | | | | | | | | | | | | | | | | | | | | |
| Fund | | Shares Sold | | | Proceeds from
Shares Sold | | | Shares from
Reinvested
Distributions | | | Proceeds from
Reinvestment
of Distributions | | | Shares
Redeemed | | | Payments for Shares Redeemed | | | Net Increase/
(Decrease) in Shares | | | Net Increase/
(Decrease) in
Net Assets | |
| Ashmore Emerging Markets Corporate Debt Fund | | | 768,834 | | | | $ 6,402,707 | | | | 41,912 | | | | $ 347,318 | | | | (858,519 | ) | | $ | (6,905,390 | ) | | | (47,773 | ) | | $ | (155,365 | ) |
| Ashmore Emerging Markets Short Duration Fund | | | 1,460,585 | | | | 15,179,610 | | | | 138,171 | | | | 1,434,189 | | | | (1,640,977 | ) | | | (17,197,848 | ) | | | (42,221 | ) | | | (584,049 | ) |
| Ashmore Emerging Markets Active Equity Fund | | | 1,000 | | | | 10,007 | | | | 4 | | | | 48 | | | | — | | | | — | | | | 1,004 | | | | 10,055 | |
| Ashmore Emerging Markets Small-Cap Equity Fund | | | 43,903 | | | | 428,915 | | | | 1,258 | | | | 11,008 | | | | (23,994 | ) | | | (222,571 | ) | | | 21,167 | | | | 217,352 | |
| Ashmore Emerging Markets Frontier Equity Fund | | | 701,976 | | | | 5,903,145 | | | | 13,146 | | | | 119,018 | | | | (213,455 | ) | | | (1,965,107 | ) | | | 501,667 | | | | 4,057,056 | |
| Ashmore Emerging Markets Equity Fund | | | 10,915 | | | | 117,848 | | | | 75 | | | | 737 | | | | (3,389 | ) | | | (36,042 | ) | | | 7,601 | | | | 82,543 | |
|
Transactions in Class C shares for the year ended October 31, 2017, were as follows: | |
| Fund | | Shares Sold | | | Proceeds from
Shares Sold | | | Shares from
Reinvested
Distributions | | | Proceeds from
Reinvestment
of Distributions | | | Shares
Redeemed | | | Payments for Shares
Redeemed | | | Net Increase/
(Decrease)
in Shares | | | Net Increase/
(Decrease) in
Net Assets | |
| Ashmore Emerging Markets Total Return Fund | | | 227,228 | | | | $1,839,471 | | | | 6,660 | | | | $ 53,679 | | | | (61,950 | ) | | $ | (505,852 | ) | | | 171,938 | | | $ | 1,387,298 | |
| Ashmore Emerging Markets Local Currency Bond Fund | | | 4,333 | | | | 29,619 | | | | 346 | | | | 2,516 | | | | (818 | ) | | | (5,877 | ) | | | 3,861 | | | | 26,258 | |
| Ashmore Emerging Markets Corporate Debt Fund | | | 504,064 | | | | 4,216,948 | | | | 21,238 | | | | 176,391 | | | | (171,353 | ) | | | (1,407,980 | ) | | | 353,949 | | | | 2,985,359 | |
| Ashmore Emerging Markets Short Duration Fund | | | 18,401 | | | | 184,019 | | | | 263 | | | | 2,668 | | | | (263 | ) | | | (2,668 | ) | | | 18,401 | | | | 184,019 | |
| Ashmore Emerging Markets Active Equity Fund | | | 1,000 | | | | 10,025 | | | | 4 | | | | 44 | | | | — | | | | — | | | | 1,004 | | | | 10,069 | |
| Ashmore Emerging Markets Small-Cap Equity Fund | | | 6,631 | | | | 65,887 | | | | 364 | | | | 3,319 | | | | (3,318 | ) | | | (31,641 | ) | | | 3,677 | | | | 37,565 | |
| Ashmore Emerging Markets Frontier Equity Fund | | | 47,984 | | | | 434,418 | | | | 349 | | | | 3,187 | | | | (9,424 | ) | | | (88,715 | ) | | | 38,909 | | | | 348,890 | |
| Ashmore Emerging Markets Equity Fund | | | 772 | | | | 7,103 | | | | 1 | | | | 13 | | | | (543 | ) | | | (4,961 | ) | | | 230 | | | | 2,155 | |
121
ASHMORE FUNDS
NOTES TO FINANCIAL STATEMENTS (CONTINUED)
As of April 30, 2018 (Unaudited)
Transactions in Institutional Class shares for the year ended October 31, 2017, were as follows:
| | | | | | | | | | | | | | | | | | | | | | | | | | | | | | |
| Fund | | Shares Sold | | | Proceeds from
Shares Sold | | | Shares from
Reinvested
Distributions | | | Proceeds from
Reinvestment
of Distributions | | | Shares
Redeemed | | | Payments for
Shares
Redeemed | | | Net Increase/
(Decrease)
in Shares | | | Net Increase/
(Decrease) in
Net Assets |
| Ashmore Emerging Markets Total Return Fund | | | 46,716,460 | | | $ | 381,357,339 | | | | 6,584,095 | | | $ | 53,825,213 | | | | (19,589,180 | ) | | | $(155,535,775 | ) | | | 33,711,375 | | | $ 279,646,777 |
| Ashmore Emerging Markets Local Currency Bond Fund | | | 1,963,607 | | | | 14,603,382 | | | | 382,096 | | | | 2,893,384 | | | | (2,093,667 | ) | | | (15,529,899 | ) | | | 252,036 | | | 1,966,867 |
| Ashmore Emerging Markets Corporate Debt Fund | | | 19,178,672 | | | | 165,170,528 | | | | 532,265 | | | | 4,580,648 | | | | (7,969,360 | ) | | | (68,139,079 | ) | | | 11,741,577 | | | 101,612,097 |
| Ashmore Emerging Markets Short Duration Fund | | | 12,816,423 | | | | 131,396,629 | | | | 547,915 | | | | 5,569,501 | | | | (8,034,314 | ) | | | (81,961,770 | ) | | | 5,330,024 | | | 55,004,360 |
| Ashmore Emerging Markets Active Equity Fund | | | 1,410,020 | | | | 14,770,766 | | | | 4,989 | | | | 59,219 | | | | —* | | | | (32 | ) | | | 1,415,009 | | | 14,829,953 |
| Ashmore Emerging Markets Small-Cap Equity Fund | | | 1,466,176 | | | | 17,791,675 | | | | 37,277 | | | | 416,792 | | | | (1,666,373 | ) | | | (19,690,734 | ) | | | (162,920 | ) | | (1,482,267) |
| Ashmore Emerging Markets Frontier Equity Fund | | | 6,671,423 | | | | 69,085,145 | | | | 94,974 | | | | 966,444 | | | | (5,432,605 | ) | | | (55,355,818 | ) | | | 1,333,792 | | | 14,695,771 |
| Ashmore Emerging Markets Equity Fund | | | 663,438 | | | | 5,711,246 | | | | 11,603 | | | | 103,627 | | | | (1,050,301 | ) | | | (10,018,431 | ) | | | (375,260 | ) | | (4,203,558) |
* Amount rounds to less than 0.5 shares.
Capital shares
Class A shares are issued at the Fund’s relevant NAV per share plus any applicable sales charge. Institutional Class and Class C shares are issued at the Fund’s relevant NAV per share without a sales charge. Shares confer upon the holders the right to receive notice of and attend, speak and vote at shareholder meetings of the Funds. The shares confer upon the holders the right to any or all dividends or distributions which the Trustees in their sole discretion may from time to time resolve to make or declare.
7. Investment transactions
For the period ended April 30, 2018 the aggregate costs of purchases and proceeds from sales of investments (including fully funded TRS and excluding short-term investments) for the Funds were as follows:
| | | | | | | | |
Fund | | | Purchases | | | | Sales | |
Ashmore Emerging Markets Total Return Fund | | $ | 531,105,395 | | | $ | 304,854,934 | |
Ashmore Emerging Markets Local Currency Bond Fund | | | 13,923,947 | | | | 22,280,642 | |
Ashmore Emerging Markets Corporate Debt Fund | | | 186,223,746 | | | | 180,425,331 | |
Ashmore Emerging Markets Short Duration Fund | | | 151,510,541 | | | | 61,693,422 | |
Ashmore Emerging Markets Active Equity Fund | | | 13,505,012 | | | | 14,036,939 | |
Ashmore Emerging Markets Small-Cap Equity Fund | | | 27,279,954 | | | | 23,793,858 | |
Ashmore Emerging Markets Frontier Equity Fund | | | 51,115,815 | | | | 41,769,910 | |
Ashmore Emerging Markets Equity Fund | | | 35,875,015 | | | | 13,516,062 | |
The difference between book basis and tax basis net unrealized appreciation (depreciation) is attributable primarily to the tax deferral of losses on wash sales, deferral of post October currency and capital losses for tax purposes, and the recharacterization of income recognition on investments in PFICs. At April 30, 2018, for federal income tax purposes, gross unrealized appreciation, gross unrealized depreciation, net unrealized appreciation (depreciation) on investments (including the effects of foreign currency translation and derivative instruments, if any) and the cost basis of investments (including derivative instruments, if any) were as follows:
122
ASHMORE FUNDS
NOTES TO FINANCIAL STATEMENTS (CONTINUED)
As of April 30, 2018 (Unaudited)
| | | | | | | | | | | | | | | | |
| Fund | | Unrealized
Appreciation | | | Unrealized
Depreciation | | | Net Appreciation
(Depreciation) | | | Cost Basis of
Investments | |
Ashmore Emerging Markets Total Return Fund | | $ | 18,248,401 | | | $ | (70,759,897 | ) | | $ | (52,511,496 | ) | | $ | 1,282,177,062 | |
Ashmore Emerging Markets Local Currency Bond Fund | | | 1,944,673 | | | | (3,877,491 | ) | | | (1,932,818 | ) | | | 63,324,573 | |
Ashmore Emerging Markets Corporate Debt Fund | | | 9,837,530 | | | | (18,033,797 | ) | | | (8,196,267 | ) | | | 335,598,721 | |
Ashmore Emerging Markets Short Duration Fund | | | 2,063,656 | | | | (4,299,356 | ) | | | (2,235,700 | ) | | | 248,812,410 | |
Ashmore Emerging Markets Active Equity Fund | | | 1,402,818 | | | | (618,285 | ) | | | 784,533 | | | | 17,125,081 | |
Ashmore Emerging Markets Small-Cap Equity Fund | | | 6,005,680 | | | | (2,455,364 | ) | | | 3,550,316 | | | | 40,283,222 | |
Ashmore Emerging Markets Frontier Equity Fund | | | 10,291,824 | | | | (3,138,716 | ) | | | 7,153,108 | | | | 92,708,500 | |
Ashmore Emerging Markets Equity Fund | | | 1,374,234 | | | | (1,636,099 | ) | | | (261,865 | ) | | | 30,158,476 | |
8. Federal income taxes
No provision for U.S. federal income taxes has been made since each Fund’s policy is to comply with the requirements of Subchapter M of the Internal Revenue Code of 1986, as amended, applicable to regulated investment companies, and to distribute, each year, substantially all of its taxable income and capital gains to its shareholders.
The Regulated Investment Company Modernization Act of 2010 (the “Act”) was enacted on December 22, 2010. The Act made changes to several tax rules affecting the Funds. Although the Act provides several benefits, including the unlimited carryover of future capital losses, there may be a greater likelihood that all, or a portion of a Fund’s pre-enactment capital loss carryovers may expire without being utilized, due to the fact that post-enactment capital losses are utilized before pre-enactment capital loss carryovers.
The following Funds have available capital loss carryforwards for which there is no expiration date:
| | | | |
| Fund | | Short-Term Capital Loss
Carryforward at October
31, 2017 | | Long-Term Capital Loss
Carryforward at October 31,
2017 |
Ashmore Emerging Markets Total Return Fund | | $ — | | $ (51,968,031) |
Ashmore Emerging Markets Local Currency Bond Fund | | (223,877) | | (1,412,869) |
Ashmore Emerging Markets Corporate Debt Fund | | (3,913,767) | | (27,644,843) |
Ashmore Emerging Markets Short Duration Fund | | — | | — |
Ashmore Emerging Markets Active Equity Fund | | — | | — |
Ashmore Emerging Markets Small-Cap Equity Fund | | (464,777) | | (1,988,233) |
Ashmore Emerging Markets Frontier Equity Fund | | — | | — |
Ashmore Emerging Markets Equity Fund | | (353,067) | | — |
The Funds in the above table may offset future capital gains with these capital loss carryforwards. There were no post-enactment losses for the fiscal year ended October 31, 2017.
The Funds are subject to the provisions of the Financial Accounting Standards Board (“FASB”) Accounting Standards Codification (“ASC”) Topic 740-10, Income Taxes. This standard provides guidance as to how uncertain tax positions should be recognized, measured, presented and disclosed in the Funds’ financial statements. The Funds recognize the tax benefits of uncertain tax positions only where the position is more-likely-than-not (i.e. greater than 50-percent) to be sustained assuming examination by a tax authority based on the technical merits of the position. In evaluating whether a tax position has met the recognition threshold, the Funds must presume that the position will be examined by the appropriate taxing authority that has full knowledge of all relevant information. A tax position that meets the more-likely-than-not recognition threshold is measured to determine the amount of benefit to recognize in the Funds’ financial statements. Income tax and related interest and penalties would be recognized by the Funds as tax expense in the Statement of Operations if the tax positions were deemed not to meet the more-likely-than-not threshold. The Funds analyze all open tax years for all major taxing jurisdictions. Open tax years are those that are open to examination by
123
ASHMORE FUNDS
NOTES TO FINANCIAL STATEMENTS (CONTINUED)
As of April 30, 2018 (Unaudited)
taxing authorities, as defined by the Statute of Limitations in each jurisdiction. The Funds have no examinations by tax authorities in progress. The Trust has analyzed the Funds’ tax positions, and has concluded that no liability for unrecognized tax benefits should be recorded related to uncertain tax positions. Further, the Trust is not aware of any tax positions for which it is reasonably possible that the total amounts of unrecognized tax benefits will significantly change in the next twelve months.
As of October 31, 2017, the components of distributable taxable earnings, including temporary differences were as follows:
| | | | | | | | | | | | | | | | | | | | | | | | | |
| Fund | | Undistributed
Ordinary
Income | | Undistributed
Long Term
Capital Gain | | Accumulated
Capital Losses
and Other | | Undistributed
Appreciation
(Depreciation) on
Investments and
Foreign Currencies | | Total
Accumulated
Earnings (Deficit) |
| Ashmore Emerging Markets Total Return Fund | | | $ | 16,104,084 | | | | $ | — | | | | $ | (52,893,560 | ) | | | $ | (6,158,943 | ) | | | $ | (42,948,419) | |
| Ashmore Emerging Markets Local Currency Bond Fund | | | | — | | | | | — | | | | | (1,658,519 | ) | | | | (2,818,346 | ) | | | | (4,476,865 | ) |
| Ashmore Emerging Markets Corporate Debt Fund | | | | — | | | | | — | | | | | (31,890,621 | ) | | | | 3,922,639 | | | | | (27,967,982 | ) |
| Ashmore Emerging Markets Short Duration Fund | | | | 2,239,145 | | | | | 2,116,768 | | | | | (266,223 | ) | | | | 5,645,448 | | | | | 9,735,138 | |
| Ashmore Emerging Markets Active Equity Fund | | | | 1,555,928 | | | | | — | | | | | — | | | | | 1,650,246 | | | | | 3,206,174 | |
| Ashmore Emerging Markets Small-Cap Equity Fund | | | | 505,482 | | | | | — | | | | | (2,453,010 | ) | | | | 2,763,101 | | | | | 815,573 | |
| Ashmore Emerging Markets Frontier Equity Fund | | | | 528,209 | | | | | 5,777,521 | | | | | (5,601 | ) | | | | 6,558,560 | | | | | 12,858,689 | |
| Ashmore Emerging Markets Equity Fund | | | | 160,762 | | | | | — | | | | | (353,327 | ) | | | | 1,414,112 | | | | | 1,221,547 | |
The taxable character of distributions paid during the fiscal year ended October 31, 2017, were as follows:
| | | | | | | | | | | | | | | | | | | | |
| | | |
| | | Distributions From | | | | |
| Fund | | Ordinary Income | | | Short-Term
Capital Gains | | | Long-Term
Capital Gains | | | Return of
Capital | | | Total Distributions
Paid | |
| Ashmore Emerging Markets Total Return Fund | | $ | 58,479,792 | | | $ | — | | | $ | — | | | $ | — | | | $ | 58,479,792 | |
| Ashmore Emerging Markets Local Currency Bond Fund | | | 1,107,475 | | | | — | | | | — | | | | 2,667,206 | | | | 3,774,681 | |
| Ashmore Emerging Markets Corporate Debt Fund | | | 19,702,427 | | | | — | | | | — | | | | 649,976 | | | | 20,352,403 | |
| Ashmore Emerging Markets Short Duration Fund | | | 11,795,594 | | | | 2,000,000 | | | | — | | | | — | | | | 13,795,594 | |
| Ashmore Emerging Markets Active Equity Fund | | | 60,411 | | | | — | | | | — | | | | — | | | | 60,411 | |
| Ashmore Emerging Markets Small-Cap Equity Fund | | | 551,965 | | | | — | | | | — | | | | — | | | | 551,965 | |
| Ashmore Emerging Markets Frontier Equity Fund | | | 542,424 | | | | 614,075 | | | | — | | | | — | | | | 1,156,499 | |
| Ashmore Emerging Markets Equity Fund | | | 184,366 | | | | — | | | | — | | | | — | | | | 184,366 | |
124
ASHMORE FUNDS
NOTES TO FINANCIAL STATEMENTS (CONTINUED)
As of April 30, 2018 (Unaudited)
9. Distributions to shareholders
The Ashmore Emerging Markets Total Return Fund, Ashmore Emerging Markets Local Currency Bond Fund, Ashmore Emerging Markets Corporate Debt Fund and Ashmore Emerging Markets Short Duration Fund declare distributions of their net investment income daily and pay such distributions monthly. The Ashmore Emerging Markets Active Equity Fund, Ashmore Emerging Markets Small-Cap Equity Fund, Ashmore Emerging Markets Frontier Equity Fund and Ashmore Emerging Markets Equity Fund declare and pay distributions of their net investment income at least quarterly.
Distributions of net realized capital gains, if any, are declared and paid at least annually. The Funds may also make a special distribution to comply with federal tax requirements. Income dividends and capital gains distributions determined in accordance with federal income tax regulations may differ from U.S. GAAP. Differences between tax regulations and U.S. GAAP may change the fiscal period in which income and capital items are recognized for tax and U.S. GAAP purposes. Examples of events that give rise to timing differences include wash sales, straddles and capital loss carryforwards. Further, the character of investment income and capital gains may be different for certain transactions under the two methods of accounting. Examples of characterization differences include the treatment of foreign currency transactions and swap transactions. As a result, income dividends and capital gain distributions declared during a fiscal period for federal tax purposes may differ significantly from the net investment income and realized capital gain reported on each Fund’s financial statements presented under U.S. GAAP. In general, to the extent that any differences which are permanent in nature result in over distributions to shareholders, the amount of the over distribution may be reported as return of capital. Temporary differences do not require reclassification. See note 8 for further details.
10. Derivative instruments and hedging activities
FASB ASC Topic 815-10 (“Topic 815-10”), Disclosures about Derivative Instruments and Hedging Activities, improves financial reporting about derivative instruments by requiring enhanced disclosures to enable investors to better understand how and why the Funds use derivative instruments, how these derivative instruments are accounted for and their effects on the Funds’ financial position and results of operations.
None of the derivatives held in the Funds have been designated as hedging instruments under Topic 815-10. A discussion of the strategies for these derivatives and their counterparty credit risk can be found below.
In accordance with Topic 815-10, the Funds record their trading-related derivative activities on a fair value basis (as described in note 4). Fair values represent the amount at which the instrument could be exchanged in a current transaction between willing parties, other than in a forced or liquidation sale.
The following disclosures contain information on how and why the Funds used derivative financial instruments; the credit-risk-related contingent features in certain derivative financial instruments; and how derivative financial instruments affected the Funds’ financial position, results of operations and cash flows. The location and fair value of these instruments on the Statements of Assets and Liabilities and the realized, and changes in unrealized, gains and losses on the Statements of Operations, are included in tables following each Fund’s Schedule of Investments and are categorized by type of financial derivative contract.
(a) Options
Each Fund is subject to market risk in the normal course of pursuing its investment objectives. The Funds may enter into options to speculate on the price movements of the financial instrument underlying the option, for use as an economic hedge against certain equity positions held in a Fund’s portfolio holdings or for other investment purposes. Purchased option contracts give a Fund the right, but not the obligation, to buy or sell within a limited time, a financial instrument, commodity or currency at a contracted price that may also be settled in cash, based on differentials between specified indices or prices.
Options written obligate a Fund, in return for a premium, to buy or sell within a limited time, a financial instrument, commodity or currency at a contracted price that may also be settled in cash, based on differentials between specified indices or prices. Options written by a Fund may expose a Fund to the market risk of an unfavorable change in the financial instrument underlying the written option.
125
ASHMORE FUNDS
NOTES TO FINANCIAL STATEMENTS (CONTINUED)
As of April 30, 2018 (Unaudited)
A Fund is exposed to counterparty risk from the potential that a seller or buyer of an option contract does not sell or purchase the underlying asset as agreed under the terms of the option contract. The maximum risk of loss from counterparty risk to a Fund holding a put or call option is generally the fair value of the contracts and the premiums paid to purchase its open option contracts. The risk of loss on call options sold by the Funds is potentially unlimited. A Fund considers the credit risk of the intermediary counterparties to its option transactions in evaluating potential credit risk.
Gains and losses associated with the valuation of options are recognized at fair value as the net change in unrealized appreciation/(depreciation) on investments in securities in the Statements of Operations. The premium on purchased put options exercised is subtracted from the proceeds of the sale of the underlying security or foreign currency in determining the realized gain or loss. The premium on purchased call options exercised is added to the cost of the securities or foreign currency purchased. Premiums paid on the purchase of options that expire unexercised are recorded as realized losses and are reflected in net realized gain/(loss) on investments in securities in the Statements of Operations.
During the period ended April 30, 2018 the Funds did not hold options contracts.
(b) Forward foreign currency exchange contracts
A forward foreign exchange contract involves an obligation to purchase or sell a specific currency at a future date at a price set at the time the contract is made. The Funds may enter into forward foreign currency exchange contracts in connection with settling planned purchases or sales of securities, as part of an investment strategy to protect against uncertainty in the level of future foreign exchange rates in the purchase and sale of securities, or to gain or limit exposure to foreign currencies. All forward foreign currency exchange contracts are valued daily at the applicable exchange rates. Any resulting unrealized gains or losses are recorded in net change in unrealized appreciation/(depreciation) on forward foreign currency exchange contracts in the Statements of Operations. A Fund records realized gains or losses at the time the forward foreign exchange contract is offset by entering into a closing transaction with the same counterparty or is extinguished by delivery of the currency. Realized gains or losses, if any, are included in net realized gain/(loss) on forward foreign exchange contracts in the Statements of Operations.
Risks arise upon entering into these contracts from the potential inability of counterparties to meet the terms of their contracts and from unanticipated movements in the value of a foreign currency relative to the United States Dollar. The contractual amounts of forward foreign currency exchange contracts do not necessarily represent the amounts potentially subject to risk. The measurement of the risks associated with these instruments should be considered in light of all related and offsetting transactions. The Funds bear market risk from changes in foreign currency exchange rates and credit risk if the counterparty fails to perform. Further information on the impact of these positions on the Funds’ financial statements can be found in the notes to the Schedules of Investments.
During the period ended April 30, 2018, the Ashmore Emerging Markets Total Return Fund, Ashmore Emerging Markets Local Currency Bond Fund, Ashmore Emerging Markets Corporate Debt Fund, Ashmore Emerging Markets Short Duration Fund and Ashmore Emerging Markets Equity Fund had average quarterly contract notional exposures of $581,300,921, $43,533,698, $771,929, $626,045 and $35,419, respectively, related to forward foreign currency exchange contracts.
(c) Futures contracts
Futures contracts obligate the buyer to take and the seller to make delivery at a future date of a specified quantity of a financial instrument or an amount of cash based on the value of securities indices, commodities or the fair value in United States Dollars of a foreign currency.
The Funds’ participation in the futures markets involves certain risks, including the imperfect correlation between movements in the price of the futures contracts and movements in the price of the underlying securities. Risks may arise from the potential inability of a counterparty to meet the terms of the contract.
Credit risk is mitigated to the extent that the exchange on which a particular futures contract is traded assumes the risk of a counterparty defaulting on its obligations under the contract.
At the time the Funds enter into a futures contract, the Funds deposit and maintain as collateral initial margin with the broker, as required by the exchange on which the transaction is effected. Pursuant to the contract, the Funds agree to receive from or pay to the broker an amount of cash equal to the fluctuation in the value of the contract. Such receipts or payments are determined by the rules
126
ASHMORE FUNDS
NOTES TO FINANCIAL STATEMENTS (CONTINUED)
As of April 30, 2018 (Unaudited)
of the futures exchange and are known as variation margin. When the contract is closed, the Funds record a realized gain or loss equal to the difference between the value of the contract at the time it was opened and the time it was closed. This amount is included in net realized gain or loss on futures contracts in the Statement of Operations. Any unrealized gains or losses on open futures contracts are included in net change in unrealized appreciation/(depreciation) on futures contracts in the Statement of Operations.
During the period ended April 30, 2018 the Funds did not hold futures contracts.
(d) Swap Agreements
During the reporting period, certain Funds entered into swap agreements, which are arrangements between two parties to exchange cash flows based on a notional principal amount. Swap agreements are either privately negotiated in the over-the-counter market (“OTC swaps”) or may be executed in a multilateral or other trade facility platform, such as a registered exchange (“centrally cleared swaps”). Swap agreements are recorded at their fair value. The fair value is based on quoted market prices or prices obtained from a third party provider at the date of the Statements of Assets and Liabilities without any deduction for estimated future selling costs. Swap agreements are marked to market daily and the change in fair value, if any, is recorded as unrealized gain or loss. Payments made or received are recorded as part of realized gains and losses. Daily changes in valuation of centrally cleared swaps, if any, are recorded as a receivable or payable for the change in value as appropriate (“variation margin”) on the Statement of Assets and Liabilities.
The periodic payments on the swap agreements entered into by the Funds are reflected in the Statement of Operations within net realized gain/(loss) on interest rate swap contracts. Unrealized gains are reported as an asset and unrealized losses are reported as a liability in the Statements of Assets and Liabilities for OTC swaps. Changes in the fair value are reflected in the Statements of Operations within net change in unrealized appreciation/(depreciation) on interest rate and centrally cleared swap contracts in the period in which they occur. Certain Funds could be exposed to credit or market risk due to unfavorable changes in the fluctuation of interest rates or if the counterparty defaults on its obligations to perform.
During the period ended April 30, 2018, the Ashmore Emerging Markets Total Return Fund and Ashmore Emerging Markets Local Currency Bond Fund had average quarterly notional exposures of $65,272,404 and $22,900,983, respectively, related to swap agreements.
The Funds may enter into transactions subject to enforceable netting agreements or other similar arrangements (“netting agreements”). Generally, netting agreements allow the Funds to offset any exposure to a specific counterparty with any collateral received or delivered to that counterparty based on the terms of the agreements. Generally, the Funds manage their cash collateral and securities collateral on a counterparty basis.
Offsetting of Financial Assets and Derivative Assets as of April 30, 2018:
(a) Exchange-Traded:
Centrally Cleared Swaps
| | | | | | | | | | | | | | | | | | | | | | | | |
| Ashmore Emerging Markets Total Return Fund | |
| Counterparty | | Gross Amounts of Derivatives Assets Presented in the Statement of Assets and Liabilities | | | Gross Amounts of Derivatives Liabilities
Presented in the Statement of Assets and Liabilities | | | | | | Net Amounts | | | Collateral
(Received) Paid | | | Net Exposure | |
Deutsche Bank | | $ | — | | | $ | (958 | ) | | | | | | $ | (958 | ) | | $ | — | | | $ | (958 | ) |
Goldman Sachs | | | — | | | | (29,891 | ) | | | | | | | (29,891 | ) | | | — | | | | (29,891 | ) |
HSBC Bank | | | — | | | | (31,637 | ) | | | | | | | (31,637 | ) | | | — | | | | (31,637 | ) |
Merrill Lynch | | | 9,482 | | | | (136,349 | ) | | | | | | | (126,867 | ) | | | — | | | | (126,867 | ) |
Santander | | | — | | | | (105,665 | ) | | | | | | | (105,665 | ) | | | — | | | | (105,665 | ) |
| | | | | | | | | | | | | | | | | | | | | | | | |
Total | | $ | 9,482 | | | $ | (304,500 | ) | | | | | | $ | (295,018 | ) | | $ | — | | | $ | (295,018 | ) |
| | | | | | | | | | | | | | | | | | | | | | | | |
127
ASHMORE FUNDS
NOTES TO FINANCIAL STATEMENTS (CONTINUED)
As of April 30, 2018 (Unaudited)
| | | | | | | | | | | | | | | | | | | | | | | | |
| Ashmore Emerging Markets Local Currency Bond Fund | |
| Counterparty | | Gross Amounts of
Derivatives Assets
Presented in the Statement of Assets and Liabilities | | | Gross Amounts of Derivatives Liabilities
Presented in the Statement of Assets and Liabilities | | | | | | Net Amounts | | | Collateral
(Received) Paid | | | Net Exposure | |
Goldman Sachs | | $ | — | | | $ | (1,035 | ) | | | | | | $ | (1,035 | ) | | $ | — | | | $ | (1,035 | ) |
HSBC Bank | | | 31,968 | | | | — | | | | | | | | 31,968 | | | | — | | | | 31,968 | |
Merrill Lynch | | | 116,106 | | | | (10,405 | ) | | | | | | | 105,701 | | | | — | | | | 105,701 | |
| | | | | | | | | | | | | | | | | | | | | | | | |
Total | | $ | 148,074 | | | $ | (11,440 | ) | | | | | | $ | 136,634 | | | $ | — | | | $ | 136,634 | |
| | | | | | | | | | | | | | | | | | | | | | | | |
(b) Over-the-Counter Financial Derivative Instruments:
Forward Currency Contracts and Interest Rate Swap Contracts
| | | | | | | | | | | | | | | | |
| Ashmore Emerging Markets Total Return Fund | |
| Counterparty | | Gross Amounts of
Derivatives Assets
Presented in the Statement of
Assets and Liabilities | | | Derivatives
available for offset | | | Collateral
Received | | | Net Amount Due
From Counterparty | |
ANZ | | $ | 49,195 | | | $ | (49,195 | ) | | $ | — | | | $ | — | |
Barclays | | | 71,458 | | | | (71,458 | ) | | | — | | | | — | |
BNP Paribas | | | 12,593 | | | | (12,593 | ) | | | — | | | | — | |
Citibank | | | 34,126 | | | | (34,126 | ) | | | — | | | | — | |
Credit Suisse | | | 4,303 | | | | (4,303 | ) | | | — | | | | — | |
Deutsche Bank | | | 128,770 | | | | (128,770 | ) | | | — | | | | — | |
Goldman Sachs | | | 1,309,529 | | | | (288,042 | ) | | | — | | | | 1,021,487 | |
HSBC Bank | | | 72,564 | | | | (72,564 | ) | | | — | | | | — | |
JP Morgan | | | 961,934 | | | | (961,934 | ) | | | — | | | | — | |
Merrill Lynch | | | 309,805 | | | | (309,805 | ) | | | — | | | | — | |
Morgan Stanley | | | 1,171 | | | | — | | | | — | | | | 1,171 | |
Standard Chartered | | | 459,158 | | | | (155,797 | ) | | | — | | | | 303,361 | |
| | | | | | | | | | | | | | | | |
Total | | $ | 3,414,606 | | | $ | (2,088,587 | ) | | $ | — | | | $ | 1,326,019 | |
| | | | | | | | | | | | | | | | |
128
ASHMORE FUNDS
NOTES TO FINANCIAL STATEMENTS (CONTINUED)
As of April 30, 2018 (Unaudited)
| | | | | | | | | | | | | | | | |
| Ashmore Emerging Markets Total Return Fund | |
| Counterparty | | Gross Amounts of
Derivatives Liabilities
Presented in the Statement of
Assets and Liabilities | | | Derivatives
available for offset | | | Collateral
Pledged | | | Net Amount Due
From Counterparty | |
ANZ | | $ | 330,528 | | | $ | (49,195 | ) | | $ | — | | | $ | 281,333 | |
Barclays | | | 777,605 | | | | (71,458 | ) | | | — | | | | 706,147 | |
BNP Paribas | | | 970,465 | | | | (12,593 | ) | | | — | | | | 957,872 | |
Citibank | | | 135,359 | | | | (34,126 | ) | | | — | | | | 101,233 | |
Credit Suisse | | | 991,764 | | | | (4,303 | ) | | | — | | | | 987,461 | |
Deutsche Bank | | | 966,085 | | | | (128,770 | ) | | | — | | | | 837,315 | |
Goldman Sachs | | | 288,042 | | | | (288,042 | ) | | | — | | | | — | |
HSBC Bank | | | 1,431,186 | | | | (72,564 | ) | | | — | | | | 1,358,622 | |
JP Morgan | | | 1,540,085 | | | | (961,934 | ) | | | — | | | | 578,151 | |
Merrill Lynch | | | 1,422,952 | | | | (309,805 | ) | | | — | | | | 1,113,147 | |
Standard Chartered | | | 155,797 | | | | (155,797 | ) | | | — | | | | — | |
UBS | | | 183,013 | | | | — | | | | — | | | | 183,013 | |
| | | | | | | | | | | | | | | | |
Total | | $ | 9,192,881 | | | $ | (2,088,587 | ) | | $ | — | | | $ | 7,104,294 | |
| | | | | | | | | | | | | | | | |
| | | | | | | | | | | | | | | | |
| Ashmore Emerging Markets Local Currency Bond Fund | |
| Counterparty | | Gross Amounts of
Derivatives Assets
Presented in the Statement of
Assets and Liabilities | | | Derivatives
available for offset | | | Collateral
Received | | | Net Amount Due
From Counterparty | |
Barclays | | $ | 44,705 | | | $ | (44,705 | ) | | $ | — | | | $ | — | |
BNP Paribas | | | 48,317 | | | | (36,963 | ) | | | — | | | | 11,354 | |
Credit Suisse | | | 11,092 | | | | (11,092 | ) | | | — | | | | — | |
Deutsche Bank | | | 13,044 | | | | (13,044 | ) | | | — | | | | — | |
Goldman Sachs | | | 64,433 | | | | (17,778 | ) | | | — | | | | 46,655 | |
HSBC Bank | | | 7,927 | | | | (7,927 | ) | | | — | | | | — | |
JP Morgan | | | 53,579 | | | | (53,579 | ) | | | — | | | | — | |
Merrill Lynch | | | 23,636 | | | | (23,636 | ) | | | — | | | | — | |
| | | | | | | | | | | | | | | | |
Total | | $ | 266,733 | | | $ | (208,724 | ) | | $ | — | | | $ | 58,009 | |
| | | | | | | | | | | | | | | | |
| | | | | | | | | | | | | | | | |
| Ashmore Emerging Markets Local Currency Bond Fund | |
| Counterparty | | Gross Amounts of
Derivatives Liabilities
Presented in the Statement of
Assets and Liabilities | | | Derivatives
available for offset | | | Collateral
Pledged | | | Net Amount Due
From Counterparty | |
ANZ | | $ | 1,741 | | | $ | — | | | $ | — | | | $ | 1,741 | |
Barclays | | | 101,880 | | | | (44,705 | ) | | | — | | | | 57,175 | |
BNP Paribas | | | 36,963 | | | | (36,963 | ) | | | — | | | | — | |
Credit Suisse | | | 64,910 | | | | (11,092 | ) | | | — | | | | 53,818 | |
Deutsche Bank | | | 71,849 | | | | (13,044 | ) | | | — | | | | 58,805 | |
Goldman Sachs | | | 17,778 | | | | (17,778 | ) | | | — | | | | — | |
HSBC Bank | | | 155,751 | | | | (7,927 | ) | | | — | | | | 147,824 | |
JP Morgan | | | 87,087 | | | | (53,579 | ) | | | — | | | | 33,508 | |
Merrill Lynch | | | 182,922 | | | | (23,636 | ) | | | — | | | | 159,286 | |
Morgan Stanley | | | 1,191 | | | | — | | | | — | | | | 1,191 | |
129
ASHMORE FUNDS
NOTES TO FINANCIAL STATEMENTS (CONTINUED)
As of April 30, 2018 (Unaudited)
| | | | | | | | | | | | | | | | |
| Ashmore Emerging Markets Local Currency Bond Fund | |
| Counterparty | | Gross Amounts of
Derivatives Liabilities
Presented in the Statement of
Assets and Liabilities | | | Derivatives available for offset | | | Collateral Pledged | | | Net Amount Due From Counterparty | |
Standard Chartered | | $ | 7,252 | | | $ | — | | | $ | — | | | $ | 7,252 | |
UBS | | | 13,460 | | | | — | | | | — | | | | 13,460 | |
| | | | | | | | | | | | | | | | |
Total | | $ | 742,784 | | | $ | (208,724 | ) | | $ | — | | | $ | 534,060 | |
| | | | | | | | | | | | | | | | |
| | | | |
| | | | | | | | | | | | | |
| Ashmore Emerging Markets Corporate Debt Fund | |
| Counterparty | | Gross Amounts of
Derivatives Assets
Presented in the Statement of
Assets and Liabilities | | | Derivatives available for offset | | | Collateral Received | | | Net Amount Due From Counterparty | |
Barclays | | $ | 32,838 | | | $ | — | | | $ | — | | | $ | 32,838 | |
| | | | | | | | | | | | | | | | |
Total | | $ | 32,838 | | | $ | — | | | $ | — | | | $ | 32,838 | |
| | | | | | | | | | | | | | | | |
| | | | |
| | | | | | | | | | | | | |
| Ashmore Emerging Markets Equity Fund | |
| Counterparty | | Gross Amounts of
Derivatives Liabilities
Presented in the Statement of
Assets and Liabilities | | | Derivatives available for offset | | | Collateral Received | | | Net Amount Due From Counterparty | |
Brown Brothers | | | | | | | | | | | | | | | | |
Harriman | | $ | 294 | | | $ | — | | | $ | — | | | $ | 294 | |
| | | | | | | | | | | | | | | | |
Total | | $ | 294 | | | $ | — | | | $ | — | | | $ | 294 | |
| | | | | | | | | | | | | | | | |
11. Related parties
Investment management fees
The Trust has an Investment Management Agreement (the “Agreement”) with the Investment Manager, with whom certain officers and directors of the Trust are affiliated, to furnish investment management services to the Funds. Under the terms of the Agreement, the Trust, on behalf of the Funds, compensates the Investment Manager for its investment management services at the following rates, based on each Fund’s average daily net assets:
| | | | |
| Fund | | Rate | |
Ashmore Emerging Markets Total Return Fund | | | 1.00 | % |
Ashmore Emerging Markets Local Currency Bond Fund | | | 0.95 | % |
Ashmore Emerging Markets Corporate Debt Fund | | | 1.15 | % |
Ashmore Emerging Markets Short Duration Fund | | | 0.65 | % |
Ashmore Emerging Markets Active Equity Fund | | | 1.00 | % |
Ashmore Emerging Markets Small-Cap Equity Fund | | | 1.50 | % |
Ashmore Emerging Markets Frontier Equity Fund | | | 1.50 | % |
Ashmore Emerging Markets Equity Fund | | | 1.15 | % |
130
ASHMORE FUNDS
NOTES TO FINANCIAL STATEMENTS (CONTINUED)
As of April 30, 2018 (Unaudited)
The Investment Manager has contractually agreed to waive its fees or reimburse each Fund for other expenses until February 28, 2019 to the extent that total operating expenses (other than acquired fund fees and expenses, interest expenses, taxes, extraordinary expenses and certain credits and offset arrangements) for each class of shares of each Fund exceed the rates in the table below, based on each Fund’s average daily net assets. The expense limitation arrangement may be terminated by the Board at any time.
| | | | | | |
| Fund | | Class A | | Class C | | Institutional Class |
Ashmore Emerging Markets Total Return Fund | | 1.27% | | 2.02% | | 1.02% |
Ashmore Emerging Markets Local Currency Bond Fund | | 1.22% | | 1.97% | | 0.97% |
Ashmore Emerging Markets Corporate Debt Fund | | 1.42% | | 2.17% | | 1.17% |
Ashmore Emerging Markets Short Duration Fund | | 0.92% | | 1.67% | | 0.67% |
Ashmore Emerging Markets Active Equity Fund | | 1.27% | | 2.02% | | 1.02% |
Ashmore Emerging Markets Small-Cap Equity Fund | | 1.77% | | 2.52% | | 1.52% |
Ashmore Emerging Markets Frontier Equity Fund | | 1.77% | | 2.52% | | 1.52% |
Ashmore Emerging Markets Equity Fund | | 1.42% | | 2.17% | | 1.17% |
Any such waiver or reimbursement is subject to the Investment Manager’s right to recover amounts waived or reimbursed to the extent actual fees and expenses for a future fiscal period are less than each Fund’s expense limitation cap, provided, however, that the Investment Manager shall only be entitled to recover such amounts waived or reimbursed during the previous three fiscal years. The amounts recaptured pursuant to the expense limitation agreement will be limited to the lesser of (1) the expense limitation amount that was in effect at the time of the waiver or reimbursement or (2) the expense limitation amount that is in effect at the time of recapture. The total amounts subject to recovery in fiscal years are shown below:
| | | | | | | | | | |
| Fund | | 2018 | | 2019 | | 2020 | | 2021 | | Total |
| Ashmore Emerging Markets Total Return Fund | | $ 768,326 | | $ 833,414 | | $ 947,660 | | $ 606,348 | | $ 3,155,748 |
| Ashmore Emerging Markets Local Currency Bond Fund | | 255,183 | | 250,550 | | 242,748 | | 116,574 | | 865,055 |
| Ashmore Emerging Markets Corporate Debt Fund | | 353,990 | | 335,299 | | 295,848 | | 185,143 | | 1,170,280 |
| Ashmore Emerging Markets Short Duration Fund | | 192,324 | | 150,467 | | 201,321 | | 121,759 | | 665,871 |
| Ashmore Emerging Markets Active Equity Fund | | — | | — | | 226,921 | | 55,589 | | 282,510 |
| Ashmore Emerging Markets Small-Cap Equity Fund | | 268,940 | | 216,973 | | 172,952 | | 87,268 | | 746,133 |
| Ashmore Emerging Markets Frontier Equity Fund | | 243,042 | | 266,211 | | 293,467 | | 169,097 | | 971,817 |
| Ashmore Emerging Markets Equity Fund | | 187,166 | | 131,748 | | 129,266 | | 62,021 | | 510,201 |
Distribution and Servicing fees
The Funds have adopted Amended Plans of Distribution and Servicing Fees pursuant to Rule 12b-1 under the 1940 Act (“Distribution and Servicing Fee Plans”). Under the Distribution and Servicing Fee Plans, each of the Funds may pay fees to the distributor on an ongoing basis as compensation for the services the distributor renders and the expenses it bears in connection with the sale and distribution of Fund shares (“distribution fees”) and/or in connection with personal services rendered to Fund shareholders and the maintenance of shareholder accounts (“servicing fees”). Class A and C shares each have a separate 12b-1 Plan.
131
ASHMORE FUNDS
NOTES TO FINANCIAL STATEMENTS (CONTINUED)
As of April 30, 2018 (Unaudited)
Class A shares pay only servicing fees. Class C shares pay both distribution and servicing fees. The following table lists the maximum annual rates at which the distribution and/or servicing fees may be paid under each 12b-1 Plan (calculated as a percentage of a Fund’s average daily net assets attributable to the particular class of shares):
| | | | |
| | | Servicing Fee | | Distribution Fee |
Class A shares | | 0.25% | | None |
Class C shares | | 0.25% | | 0.75% |
Cross Trades The 1940 Act prohibits the Funds and their affiliates from knowingly selling any security or other property to the Funds (other than securities of which the buyer is the issuer), or buying any security (other than securities of which the seller is the issuer) or other property from the Funds. Rule 17a-7 under the 1940 Act provides relief from these prohibitions for various types of “cross trades” and similar transactions that may benefit shareholders by allowing the participating funds or accounts to avoid brokerage commissions and other transaction costs of trades. During the period ended April 30, 2018, the following Funds bought and/or sold securities from an account or accounts that were also advised by the Trust’s investment adviser or its affiliates: |
| Fund | | Purchases | | Sales |
Ashmore Emerging Markets Total Return Fund | | $ — | | $ 1,164,801,600 |
Ashmore Emerging Markets Corporate Debt Fund | | 2,101,074 | | 2,666,562 |
Ashmore Emerging Markets Short Duration Fund | | 5,860,499 | | 198,875 |
As of April 30, 2018, Ashmore Investments UK Limited owned the following percentages of the outstanding shares of each Fund: |
| Fund | | Class A | | Class C |
Ashmore Emerging Markets Local Currency Bond Fund | | 33.35% | | —% |
Ashmore Emerging Markets Active Equity Fund | | 100.00% | | 100.00% |
Ashmore Emerging Markets Equity Fund | | 12.13% | | 100.00% |
| | | | |
| Fund | | | | Institutional Class |
Ashmore Emerging Markets Total Return Fund | | | | 20.21% |
Ashmore Emerging Markets Local Currency Bond Fund | | | | 45.05% |
Ashmore Emerging Markets Active Equity Fund | | | | 98.55% |
Ashmore Emerging Markets Small-Cap Equity Fund | | | | 5.44% |
Ashmore Emerging Markets Frontier Equity Fund | | | | 21.88% |
Ashmore Emerging Markets Equity Fund | | | | 98.28% |
In addition to the Ashmore Investments UK Limited ownership, shown in the table above, the following Funds had other investors owning of record or known by the Funds to own beneficially greater than 5% of the outstanding shares of such Funds:
| | | | | | |
| Fund | | Class | | # of Investors
Owning > 5% of outstanding Shares | | % of Ownership by Investor |
Ashmore Emerging Markets Total Return Fund | | Class A | | 4 | | 52.08%, 28.46%, 11.62%, 5.06% |
| | | Class C | | 3 | | 40.35%, 34.01%, 25.32% |
| | | Class I | | 6 | | 17.77%, 15.46%, 13.51%, 8.69%, 6.03%, 5.21% |
132
ASHMORE FUNDS
NOTES TO FINANCIAL STATEMENTS (CONTINUED)
As of April 30, 2018 (Unaudited)
| | | | | | |
| Fund | | Class | | # of Investors
Owning > 5% of outstanding Shares | | % of Ownership by Investor |
Ashmore Emerging Markets Local Currency Bond Fund | | Class A | | 3 | | 40.45%, 16.20%, 9.38% |
| | | Class C | | 2 | | 65.86%, 31.78% |
| | | Class I | | 1 | | 50.10% |
Ashmore Emerging Markets Corporate Debt Fund | | Class A | | 5 | | 33.31%, 21.56%, 14.93%, 13.62%, 9.75% |
| | | Class C | | 3 | | 50.84%, 30.44%, 13.24% |
| | | Class I | | 3 | | 62.48%, 11.69%, 7.75% |
Ashmore Emerging Markets Short Duration Fund | | Class A | | 5 | | 36.26%, 31.42%, 9.96%, 9.02%, 5.96% |
| | | Class C | | 1 | | 92.37% |
| | | Class I | | 5 | | 44.86%, 15.96%, 9.15%, 8.32%, 5.46% |
Ashmore Emerging Markets Small-Cap Equity Fund | | Class A | | 4 | | 48.99%, 28.59%, 11.30%, 7.51% |
| | | Class C | | 2 | | 70.61%, 29.37% |
| | | Class I | | 4 | | 26.87%, 26.83%, 22.49%, 11.96% |
Ashmore Emerging Markets Frontier Equity Fund | | Class A | | 2 | | 79.96%, 9.68% |
| | | Class C | | 2 | | 61.65%, 38.32% |
| | | Class I | | 4 | | 31.33%, 31.13%, 7.47%, 5.12% |
Ashmore Emerging Markets Equity Fund | | Class A | | 4 | | 41.85%, 25.05%, 11.77%, 9.19% |
12. Commitments
In relation to its investments, some of the Funds of the Trust may from time to time agree to indemnify and/or pre-fund trustees or other agents, either solely or alongside other creditors on a several basis. Generally, such agreements do not have a termination date. The Trustees are not aware of and do not currently expect any claims to be made against the Funds under any such indemnity or pre-funding agreements.
13. New accounting pronouncements
On March 30, 2017, the FASB issued Accounting Standards Update (ASU) 2017-08 “Premium Amortization on Purchased Callable Debt Securities”, which amends the amortization period for certain purchased callable debt securities held at premium shortening such period to the earliest call date. The new guidance requires an entity to amortize the premium on a callable debt security within its scope to the earliest call date, unless the guidance for considering estimated prepayments as described above is applied. If the call option is not exercised at the earliest call date, the yield is reset to the effective yield using the payment terms of the security. If the security has more than one call date and the premium was amortized to a call price greater than the next call price, any excess of the amortized cost basis over the amount repayable at the next call date will be amortized to that date. If there are no other call dates, any excess of the amortized cost basis over the par amount will be amortized to maturity. Discounts on purchased callable debt securities will continue to be amortized to the security’s maturity date. The ASU 2017-08 is effective for public business entities for fiscal years, and interim periods within those fiscal years, beginning after December 15, 2018. For all other entities, the ASU 2017-08 is effective for fiscal years beginning after December 15, 2019, and interim periods within fiscal years beginning after December 15,
133
ASHMORE FUNDS
NOTES TO FINANCIAL STATEMENTS (CONTINUED)
As of April 30, 2018 (Unaudited)
2020. Earlier application is permitted for all entities, including adoption in an interim period. If an entity early adopts the ASU in an interim period, any adjustments must be reflected as of the beginning of the fiscal year that includes that interim period. Management is still assessing the impact of the adoption of ASU 2017-08 on the financial statements but does not expect it to have a material impact.
14. Subsequent events
The Trust has evaluated subsequent events for the Funds through the date the financial statements were issued, and has concluded that there are no identified subsequent events relevant for financial statement adjustment or disclosure, other than the items mentioned above.
134
ASHMORE FUNDS
ADVISORY AGREEMENT APPROVAL
As of April 30, 2018 (Unaudited)
ADVISORY AGREEMENT APPROVAL
At an in-person meeting of the Board of Trustees (the “Board”) of Ashmore Funds (the “Trust”) held on March 21, 2018, the Board, including a majority of the Trustees who are not “interested persons” of the Trust within the meaning of the Investment Company Act of 1940, as amended (the “1940 Act”) (the “Independent Trustees”), voting separately, considered and unanimously approved the continuation of the Investment Management Agreement between Ashmore Investment Advisors Limited (“AIAL”) and the Trust (the “Agreement”), on behalf of each of Ashmore Emerging Markets Corporate Debt Fund, Ashmore Emerging Markets Frontier Equity Fund, Ashmore Emerging Markets Local Currency Bond Fund, Ashmore Emerging Markets Short Duration Fund, Ashmore Emerging Markets Small-Cap Equity Fund, Ashmore Emerging Markets Total Return Fund, Ashmore Emerging Markets Active Equity Fund and Ashmore Emerging Markets Equity Fund (formerly, Ashmore Emerging Markets Value Fund) (each series, a “Fund,” and collectively, the “Funds”).
In determining to approve the continuation of the Agreement for a one-year period, the Board considered all factors that it believed, in light of the legal advice furnished to them and their own business judgment, to be relevant to the interests of shareholders, including those listed below. In evaluating the terms of the Agreement, the Board did not identify any single factor as controlling, and individual members of the Board did not necessarily attribute the same weight or importance to each factor, nor are the items described herein all encompassing of the matters considered by the Board. Throughout their review of the Agreement, the Independent Trustees were assisted by their own Independent Trustee legal counsel. The Independent Trustees had formally requested through their legal counsel, and AIAL had provided, certain information the Independent Trustees considered relevant to their evaluation. The Contracts Review Committee, which is comprised of all of the Independent Trustees, discussed the information over the course of several different occasions, without representatives of AIAL present.
Among the information and factors considered by the Board in evaluating the Agreements were the following:
NATURE, QUALITY AND EXTENT OF INVESTMENT MANAGEMENT SERVICES
The Board examined the nature, quality and extent of the services provided by AIAL to the Funds.
AIAL’s Services to All Funds
The Board considered information regarding the overall organization and resources of AIAL, including information regarding senior management, portfolio managers and other personnel providing investment management, administrative and other services to the Funds. The Board reviewed AIAL’s key personnel who provide investment management services to the Funds, as well as the fact that, under the Agreement, AIAL has the authority and responsibility, subject to the Board’s oversight, to make and execute investment decisions for the Funds within the framework of the Funds’ investment policies and restrictions.
The Board considered that AIAL’s duties include: (i) investment research and selection, (ii) adherence to the Funds’ investment policies and restrictions, the 1940 Act and other relevant laws; and (iii) furnishing office space and equipment, providing bookkeeping and clerical services (excluding determination of net asset value and shareholder accounting services) and paying all salaries, fees and expenses of officers and Trustees of the Trust who are affiliated with AIAL (except to the extent such salaries, fees and expenses are paid by another AIAL affiliate other than the Trust or a Fund). The Board also considered that AIAL terminated the Sub-Advisory Agreement by and between AIAL and Ashmore Equities Investment Management (US) LLC with respect to Ashmore Emerging Markets Small-Cap Equity Fund, Ashmore Emerging Markets Frontier Equity Fund and Ashmore Emerging Markets Equity Fund, effective November 1, 2017. The Board also evaluated the significant compliance resources available to, and utilized by, AIAL.
Investment Performance
In considering each Fund’s performance, the Board requested and received from AIAL data compiled by Broadridge Financial Solutions, Inc. (“Broadridge”). The Trustees also received information explaining the methodology for compilation of certain of this information and what it was intended to demonstrate. The Board considered the performance of each Fund in light of its investment objectives on a comparable basis relative to the Fund’s peers. The Board received performance information for Institutional Shares for the one-, three- and five-year periods ended December 31, 2017 for Ashmore Emerging Markets Corporate Debt Fund, Ashmore Emerging Markets Local Currency Bond Fund, Ashmore Emerging Markets Total Return Fund, Ashmore Emerging Markets Equity Fund and Ashmore Emerging
135
ASHMORE FUNDS
ADVISORY AGREEMENT APPROVAL (CONTINUED)
As of April 30, 2018 (Unaudited)
Markets Small-Cap Equity Fund. The Board received performance information for Institutional Shares for the one- and three-year periods ended December 31, 2017 for Ashmore Emerging Markets Frontier Equity Fund and Ashmore Emerging Markets Short Duration Fund. The Board also received performance information for Institutional Shares for the one-year period ended December 31, 2017 for Ashmore Emerging Markets Active Equity Fund. In considering such comparative data, the Trustees noted the specialized nature and focus of many of the Funds, and for certain Funds the limited number of peer group funds, particularly for the longer performance periods. In their review, the Trustees also sought to identify Funds for which the performance, fees and total expenses appeared to be outliers within their respective peer groups or other comparative metrics, and sought to understand the reasons for such comparative positions.
Ashmore Emerging Markets Corporate Debt Fund. The Board noted that the Ashmore Emerging Markets Corporate Debt Fund’s performance ranked first out of seven, first out of seven and first out of three in its peer group for the one-, three- and five-year periods ended December 31, 2017, respectively, while ranking in the first quintile (first being the best) in its larger performance universe for the same three periods.
Ashmore Emerging Markets Short Duration Fund. The Board noted that the Ashmore Emerging Markets Short Duration Fund’s performance ranked first out of four in its peer group for the one- and three-year periods ended December 31, 2017, while ranking in the second and first quintiles (first being the best), respectively, in its larger performance universe for the same two periods.
Ashmore Emerging Markets Equity Fund. The Board observed that Ashmore Emerging Markets Equity Fund’s performance ranked third out of thirteen, fifth out of eleven and third out of eight in its peer group for the one-, three- and five-year periods ended December 31, 2017, respectively, while ranking in the first, first and second quintiles (first being the best), respectively, in its larger performance universe for the same three periods.
Ashmore Emerging Markets Frontier Equity Fund. The Board noted that the Ashmore Emerging Markets Frontier Equity Fund’s performance ranked fourth out of nine and third out of eight in its peer group for the one- and three-year periods ended December 31, 2017, respectively, while ranking in the fourth and third quintiles (first being the best), respectively, in its larger performance universe for the same two periods.
Ashmore Emerging Markets Local Currency Bond Fund. The Board observed that the Ashmore Emerging Markets Local Currency Bond Fund’s performance ranked second out of eight, fourth out of eight and fourth out of six in its peer group for the one-, three- and five-year periods ended December 31, 2017, respectively, while ranking in the first, first and third quintiles (first being the best), respectively, in its larger performance universe for the same three periods.
Ashmore Emerging Markets Small-Cap Equity Fund. The Board noted that the Ashmore Emerging Markets Small-Cap Equity Fund’s performance ranked ninth out of eleven, fifth out of nine and second out of four in its peer group for the one-, three- and five-year periods ended December 31, 2017, respectively, while ranking in the fourth, first and second quintiles (first being the best), respectively, in its larger performance universe for the same three periods.
Ashmore Emerging Markets Active Equity Fund. The Board noted that the Ashmore Emerging Markets Active Equity Fund’s performance ranked fourth out of eleven in its peer group for the one-year period ended December 31, 2017, while ranking in the second quintile (first being the best) in its larger performance universe for the same period.
Ashmore Emerging Markets Total Return Fund. The Board observed that the Ashmore Emerging Markets Total Return Fund’s performance ranked third out of nine, second out of eight and fourth out of eight in its peer group for the one-, three- and five-year periods ended December 31, 2017, respectively, while ranking in the first, first and fourth quintiles (first being the best), respectively, in its larger performance universe for the same three periods.
The Board noted AIAL’s expressed long-term approach to investment management and its favorable longer-term track record in managing accounts having similar strategies to the Funds.
The Board concluded that it was satisfied with the nature, extent and quality of services provided by AIAL to each Fund and that there was a reasonable basis on which to conclude that each Fund would continue to benefit from the services provided by AIAL.
136
ASHMORE FUNDS
ADVISORY AGREEMENT APPROVAL (CONTINUED)
As of April 30, 2018 (Unaudited)
INVESTMENT MANAGEMENT FEES AND COST OF SERVICES
The Board also considered the contractual and actual investment management fees paid by each Fund to AIAL. In doing so, the Board compared the contractual and actual investment management fees and overall gross and net expense ratios (represented by the Funds’ Institutional Shares) to those of the Funds’ peers as determined by Broadridge. The Board noted that several of the Funds were quite small in size relative to their peers. As with the performance comparisons, the Board also noted that, with respect to several of the Funds, there were only a limited number of peer funds with similar investment strategies. Where contractual or actual management fees or total expense ratios of a Fund were meaningfully above those of the Broadridge peers, the Board also considered and took into account the extent to which AIAL had undertaken to waive a portion of its fees and/or reimburse expenses so as to otherwise limit these Funds’ ordinary operating expenses until at least February 28, 2019.
The Board reviewed AIAL’s costs and profitability as presented by it in serving as investment adviser. The Board noted that AIAL was operating at a loss with respect to Ashmore Emerging Markets Active Equity Fund and Ashmore Emerging Markets Equity Fund. With respect to the remaining Funds, the Board concluded that AIAL’s profitability was not excessive.
In evaluating the terms of the Agreement, the Board also considered the other benefits that may inure to AIAL as a result of its relationship with the Funds, such as the reputational benefit derived from serving as investment adviser to the Funds.
In light of the information provided and the quality of the services rendered and anticipated to be rendered, the Board concluded that the investment management fees to be charged to the Funds were appropriate.
ECONOMIES OF SCALE
The Board noted that the contractual investment management fees for the Funds do not contain breakpoints that would reduce the fee rate on assets above specified levels. The Board observed that many of the Funds remained quite small in size, and that the collective assets of all of the Funds were only approximately $2.15 billion. The Board also observed that AIAL was subsidizing all of the Funds through fee waivers and expense reimbursements. In evaluating the Funds’ contractual investment management fees, the Board considered AIAL’s representation that the contractual investment management fees were intended to reflect achievable economies of scale and also AIAL’s continuing agreement to limit certain expenses of each Fund. The Board received and evaluated information concerning whether AIAL would realize economies of scale as the assets of individual Funds grow beyond current levels. The Board noted they intend to monitor each Fund’s asset growth in connection with future reviews of the Funds’ Agreement to determine whether breakpoints may be appropriate at such time. In light of the Funds’ current sizes and expense structures, the Board concluded that breakpoints in the Funds’ contractual investment management fees were not warranted at this time.
* * *
The Board concluded that the fees to be paid to AIAL by each Fund were appropriate in light of the services to be provided by AIAL, the costs to AIAL of operating the Funds and the Funds’ current and reasonably foreseeable asset levels, and determined that the Agreement should, therefore, be approved.
* * *
137
ASHMORE FUNDS
SUPPLEMENTARY INFORMATION
As of April 30, 2018 (Unaudited)
REMUNERATION DISCLOSURE
Ashmore Investment Advisors Limited (“AIAL”) is a full-scope UK Alternative Investment Fund Manager (“AIFM”) that manages many alternative investment funds (“AIFs”). These AIFs implement a number of investment strategies including; equity, fixed income and alternatives; and invest in many different regions and industry sectors. AIAL manages both open-ended and closed-ended AIFs, several of its AIFs are leveraged and some are listed on regulated markets. Its assets under management was approximately $5.2 billion at June 30, 2017. AIAL’s parent company (“Ashmore”) is listed on a regulated market, counts ten offices worldwide and has a number of subsidiaries both in the UK and abroad. Taking into account guidance from the UK Financial Conduct Authority (“FCA”), AIAL has complied with the full AIFM Remuneration Code.
AIAL does not have any direct employees, and as such the amount of remuneration paid to staff by AIAL is zero. All AIAL AIFM Remuneration Code Staff are employed and paid by Ashmore. Ashmore’s remuneration principles have remained unchanged since it was listed, and are designed to align all employees with the long-term success of the business. These include significant levels of deferral, a clear link between performance and levels of remuneration and strong alignment of executive directors and employees with shareholders and clients through significant employee share ownership. The culture is therefore a collaborative one, with clients’ interests and the creation of shareholder value, including for employee shareholders, the overarching factors for success.
Executive directors, members of the investment team, and indeed all other employees, participate in a single capped incentive pool and are paid under a similar structure, with an annual cash bonus and share award, meaning that all employees are long-term shareholders in the business.
The policy includes:
–– A capped basic salary to contain the fixed cost base;
–– A cap on the total variable compensation including any awards made under Ashmore’s share plan, available for all employees at 25% of profits, which to date has not been fully utilized; and
–– A deferral for five years of a substantial portion of variable compensation into Ashmore shares (or equivalent), which, in the case of executive directors in lieu of a separate long term investing plan, is also partly subject to additional performance conditions measured over five years.
AIAL’s board of directors reviews the general principles of the remuneration policy and is responsible for its implementation with regard to AIAL’s AIFM Remuneration Code Staff. Ashmore’s Remuneration Committee periodically reviews the ongoing appropriateness and relevance of the remuneration policy, including in connection with the provision of services to AIAL. Ashmore employs the services of; McLagan to provide advice on remuneration benchmarking; Deloitte to provide advice on tax compliance, share plan design and administration; and the Remuneration Committee’s advisors are Hewitt New Bridge Street. The Remuneration Committee’s terms of reference can be found here:
http://www.ashmoregroup.com/investor-relations/corporate-governance.
Performance assessment for AIAL’s AIFM Remuneration Code Staff for their work relating to AIAL is based on a combination of quantitative and qualitative criteria related to the performance of AIAL, the performance of relevant AIF(s) or business units and the performance of the individual. Qualitative criteria include adherence to Ashmore Group plc’s risk and compliance policies. This performance assessment is adjusted for relevant current and future risks related to the AIFs managed by AIAL.
The compensation of control function staff is based on function specific objectives and is independent from the performance of AIAL and/or the AIFs managed by AIAL. The remuneration of the senior officers in AIAL’s control functions is directly overseen by the Remuneration Committee.
Variable remuneration awarded to AIAL’s Remuneration Code Staff in respect of AIFMD work is subject to performance adjustment which allows Ashmore to reduce the deferred amount, including to nil, in light of the ongoing financial situation and/or performance of Ashmore, AIAL, the AIFs that AIAL manages and the individual concerned.
138
ASHMORE FUNDS
SUPPLEMENTARY INFORMATION (CONTINUED)
As of April 30, 2018 (Unaudited)
The total contribution of AIAL’s AIFM Remuneration Code Staff to the business of Ashmore is apportioned between work carried out for AIAL and work carried out for the other businesses and subsidiaries of Ashmore. Their remuneration is similarly apportioned between AIAL and the other businesses and subsidiaries where required.
The remuneration attributable to AIAL for its AIFMD identified staff for the financial year ended June 30, 2017 was as follows:
| | | | | | | | | | | | | | |
| | | Number of | | Variable | | | Fixed | | | Total | |
| Fund | | Beneficiaries | | Remuneration | | | Remuneration | | | Remuneration | |
Ashmore Emerging Markets Total Return Fund | | 20 | | | £409,320 | | | | £34,859 | | | | £444,179 | |
Ashmore Emerging Markets Local Currency Bond Fund | | 20 | | | 16,569 | | | | 2,129 | | | | 18,698 | |
Ashmore Emerging Markets Corporate Debt Fund | | 20 | | | 104,918 | | | | 9,435 | | | | 114,353 | |
Ashmore Emerging Markets Short Duration Fund | | 20 | | | 51,926 | | | | 4,669 | | | | 56,595 | |
Ashmore Emerging Markets Active Equity Fund | | 20 | | | 7,419 | | | | 843 | | | | 8,262 | |
Ashmore Emerging Markets Small-Cap Equity Fund | | 20 | | | 21,539 | | | | 2,447 | | | | 23,986 | |
Ashmore Emerging Markets Frontier Equity Fund | | 20 | | | 35,260 | | | | 4,006 | | | | 39,266 | |
Ashmore Emerging Markets Equity Fund | | 20 | | | 6,240 | | | | 709 | | | | 6,949 | |
Total AIAL | | 20 | | | £2,010,863 | | | | £179,762 | | | | £2,190,625 | |
All of the remuneration above was attributable to senior management who have a material impact on the Funds’ risk profile. The Funds’ allocation of the AIAL remuneration has been made on the basis of NAV.
139
ASHMORE FUNDS
FOR MORE INFORMATION
As of April 30, 2018 (Unaudited)
PORTFOLIO HOLDINGS
The Ashmore Funds file their complete schedule of portfolio holdings with the Securities and Exchange Commission (“SEC”) for the first and third quarters of each fiscal year on Form N-Q. The Funds’ Forms N-Q are available on the SEC’s Web site at www.sec.gov. You may also review and obtain copies at the SEC’s Public Reference Room in Washington D.C. Information about the Public Reference Room may be obtained by calling 800-SEC-0330. In addition, no later than thirty calendar days after the end of each calendar quarter, a list of all portfolio holdings in each Fund as of the end of such calendar quarter is made available at www.ashmoregroup.com.
PROXY VOTING
Ashmore Funds’ Proxy Voting Policies and Procedures and each Fund’s portfolio securities voting record for the most recent 12-month period ended June 30 are available upon request and without charge by visiting the Ashmore Funds’ Web site at www.ashmoregroup.com or the SEC’s Web site at www.sec.gov or by calling 866-876-8294.
140
ASHMORE FUNDS
PRIVACY POLICY
We consider customer privacy to be a fundamental aspect of our relationships with shareholders and are committed to maintaining the confidentiality, integrity and security of our current, prospective and former shareholders’ personal information. To ensure our shareholders’ privacy, we have developed policies that are designed to protect this confidentiality, while allowing shareholders’ needs to be served.
Obtaining Personal Information In the course of providing shareholders with products and services, we may obtain non-public personal information about shareholders, which may come from sources such as account applications and other forms, from other written, electronic or verbal correspondence, from shareholder transactions, from a shareholder’s brokerage or financial advisory firm, financial adviser or consultant, and/or from information captured on our internet web sites.
Respecting Your Privacy As a matter of policy, we do not disclose any personal or account information provided by shareholders or gathered by us to non-affiliated third parties, except as required for our everyday business purposes, such as to process transactions or service a shareholder’s account, or as otherwise permitted by law. As is common in the industry, non-affiliated companies may from time to time be used to provide certain services, such as preparing and mailing prospectuses, reports, account statements and other information, and gathering shareholder proxies. We may also retain non-affiliated financial services providers to market our shares or products and we may enter into joint-marketing arrangements with them and other financial companies. We may also retain marketing and research service firms to conduct research on shareholder satisfaction. These companies may have access to a shareholder’s personal and account information, but are permitted to use this information solely to provide the specific service or as otherwise permitted by law. We may also provide a shareholder’s personal and account information to their respective brokerage or financial advisory firm, Custodian, and/or to their financial advisor or consultant.
Sharing Information with Third Parties We reserve the right to disclose or report personal information to non-affiliated third parties where we believe in good faith that disclosure is required under law to cooperate with regulators or law enforcement authorities, to protect our rights or property or upon reasonable request by any investee entity in which a shareholder has chosen to invest. Of course, we may also share your information with your consent.
Sharing Information with Affiliates We may share shareholder information with our affiliates in connection with our affiliates’ everyday business purposes, such as servicing a shareholder’s account, but our affiliates may not use this information to market products and services to you except in conformance with applicable laws or regulations. The information we share includes information about our experiences and transactions with a shareholder and may include, for example, a shareholder’s participation in one of the Funds or in other investment programs, a shareholder’s ownership of certain types of accounts, or other data about a shareholder’s transactions or accounts. Our affiliates, in turn, are not permitted to share shareholder information with non-affiliated entities, except as required or permitted by law.
Procedures to Safeguard Private Information We take seriously the obligation to safeguard shareholder non-public personal information. In addition to this policy, we have also implemented procedures that are designed to restrict access to a shareholder’s non-public personal information only to internal personnel who need to know that information in order to provide products or services to such shareholders. In addition, we have physical, electronic, and procedural safeguards in place to guard a shareholder’s non-public personal information.
Disposal of Confidential Records We will dispose of records, if any, that are knowingly derived from data received from a consumer reporting agency regarding a shareholder that is an individual in a manner that ensures the confidentiality of the data is maintained. Such records include, among other things, copies of consumer reports and notes of conversations with individuals at consumer reporting agencies.
141
ASHMORE FUNDS
OTHER INFORMATION
Administrator, Custodian and Transfer Agent
The Northern Trust Company
50 South LaSalle Street
Chicago, Illinois 60603
312-630-6000
Investment Manager
Ashmore Investment Advisors Limited
61 Aldwych
London WC2B 4AE
United Kingdom
44-20-3077-6000
Independent Registered Public Accounting Firm
KPMG LLP
Aon Center
Suite 5500
200 East Randolph Drive
Chicago, Illinois 60601-6436
Distributor
Ashmore Investment Management (US) Corporation
475 Fifth Avenue
15th Floor
New York, New York 10017
212-661-0061
Legal Counsel
Ropes & Gray LLP
Prudential Tower
800 Boylston Street
Boston, Massachusetts 02199
617-951-7000
Independent Trustees’ Counsel
Dechert LLP
One International Place
40th Floor
100 Oliver Street
Boston, Massachusetts 02110
617-728-7100
142
Item 2. Code of Ethics.
Not applicable for this reporting period.
Item 3. Audit Committee Financial Expert.
Not applicable for this reporting period.
Item 4. Principal Accountant Fees and Services.
Not applicable for this reporting period.
Item 5. Audit Committee of Listed Registrants.
Not applicable.
Item 6. Investments.
| (a) | The registrant has elected to include the schedule of investments in securities of unaffiliated issuers as part of the report to shareholders filed under Item 1 of this report on Form N-CSR. |
Item 7. Disclosure of Proxy Voting Policies and Procedures for Closed-End Management Investment Companies.
Not applicable.
Item 8. Portfolio Managers of Closed-End Management Investment Companies.
Not applicable.
Item 9. Purchases of Equity Securities by Closed-End Management Investment Company and Affiliated Purchasers.
Not applicable.
Item 10. Submission of Matters to a Vote of Security Holders.
There have been no material changes to the procedures by which shareholders may recommend nominees to the registrant’s Board of Trustees.
Item 11. Controls and Procedures.
| (a) | The registrant’s principal executive and principal financial officers, or persons performing similar functions, have concluded that the registrant’s disclosure controls and |
3
| | procedures (as defined in Rule 30a-3(c) under the Investment Company Act of 1940 (the “1940 Act”)) are effective, based on the evaluation of these controls and procedures required by Rule 30a-3(b) under the 1940 Act and Rules 13a-15(b) or 15d-15(b) under the Securities Exchange Act of 1934 as of a date within 90 days of the filing date of this report. |
| (b) | There were no changes in the registrant’s internal control over financial reporting (as defined in Rule 30a-3(d) under the 1940 Act) that occurred during the second fiscal quarter of the period covered by this report that have materially affected, or are reasonably likely to materially affect, the registrant’s internal control over financial reporting. |
Item 12. Exhibits.
| (a)(1) | Not applicable for this reporting period. |
| (a)(2) | Exhibit 99.CERT: Certifications pursuant to Section 302 of the Sarbanes-Oxley Act of 2002. |
| (b) | Exhibit 99.906 CERT: Certifications pursuant to Section 906 of the Sarbanes-Oxley Act of 2002. |
4
SIGNATURES
Pursuant to the requirements of the Securities Exchange Act of 1934 and the Investment Company Act of 1940, the registrant has duly caused this report to be signed on its behalf by the undersigned, thereunto duly authorized.
| | |
| Ashmore Funds |
| |
| By | | /s/ George Grunebaum |
| | George Grunebaum, President and Chief Executive Officer |
| | (Principal Executive Officer) |
Date: June 28, 2018
Pursuant to the requirements of the Securities Exchange Act of 1934 and the Investment Company Act of 1940, this report has been signed below by the following persons on behalf of the registrant and in the capacities and on the dates indicated.
| | |
| By | | /s/ George Grunebaum |
| | George Grunebaum, President and Chief Executive Officer |
| | (Principal Executive Officer) |
Date: June 28, 2018
| | |
| By | | /s/ Chris Tsutsui |
| | Chris Tsutsui, Treasurer |
| | (Principal Financial and Accounting Officer) |
Date: June 28, 2018
5