UNITED STATES
SECURITIES AND EXCHANGE COMMISSION
Washington, D.C. 20549
FORMN-CSR
CERTIFIED SHAREHOLDER REPORT OF REGISTERED MANAGEMENT
INVESTMENT COMPANIES
Investment Company Act file number 811-22468
Ashmore Funds
(Exact name of registrant as specified in charter)
c/o Ashmore Investment Advisors Limited
61 Aldwych
London WC2B 4AE
England
(Address of principal executive offices) (Zip code)
Corporation Service Company
84 State Street
Boston, MA 20109
(Name and address of agent for service)
Registrant’s telephone number, including area code:011-44-20-3077-6000
Date of fiscal year end:October 31
Date of reporting period:April 30, 2020
Item 1. Reports to Stockholders.
2
ASHMORE FUNDS
SEMI ANNUAL FINANCIAL STATEMENTS
April 30, 2020
Beginning on January 1, 2021, as permitted by regulations adopted by the Securities and Exchange Commission, paper copies of the Funds’ annual and semi-annual shareholder reports will no longer be sent by mail, unless you specifically request paper copies of the reports from the Funds or your financial intermediary. Instead, the reports will be made available on the Funds’ website (www.ashmoregroup.com), and you will be notified by mail each time a report is posted and provided with a website link to access the report.
If you already elected to receive shareholder reports electronically, you will not be affected by this change and you need not take any action. You may elect to receive shareholder reports and other communications from the Funds electronically anytime by contacting your financial intermediary (such as a broker-dealer or bank) or, if you are a direct investor, by calling866-8768294.
You may elect to receive all future reports in paper free of charge. If you invest through a financial intermediary, you can contact your financial intermediary to request that you continue to receive paper copies of your shareholder reports. If you invest directly with the Funds, you can contact the Funds to let the Funds know you wish to continue receiving paper copies of your shareholder reports. Your election to receive reports in paper will apply to all funds held in your account if you invest through your financial intermediary or all funds held with the Trust if you invest directly with the Funds.

(THIS PAGE INTENTIONALLY LEFT BLANK)
ASHMORE FUNDS
TABLE OF CONTENTS
Ashmore Investment Management (US) Corporation is the Distributor for Ashmore Funds.
This material is authorized for use only when preceded or accompanied by the current Ashmore Funds’ prospectus. Investors should consider the investment objectives, principal risks, charges and expenses of these Funds carefully before investing. This and other information is contained in the Funds’ prospectus. Please read the prospectus carefully before you invest or send money.
A Fund’s past performance is not necessarily an indication of how the Fund will perform in the future.
The performance data quoted in this report represents past performance. Investment return and principal value will fluctuate, so an investor’s shares, when redeemed, may be worth more or less than the original cost. Current performance may be lower or higher than the performance data quoted in this report. For performance information current to the most recentmonth-end, please call (866)876-8294.
An investment in a Fund is not a bank deposit and is not guaranteed or insured by the Federal Deposit Insurance Corporation or any other government agency. It is possible to lose money on investments in the Funds.
IMPORTANT INFORMATION ABOUT THE FUNDS
Ashmore Investment Advisors Limited
The following disclosure provides important information regarding each Fund’s Average Annual Total Return table and Cumulative Returns chart, which appear on each Fund’s individual page in this report (the “Shareholder Report” or the “Report”). Please refer to this information when reviewing the table and chart for a Fund.
On each individual Fund Summary page in this Report, the Average Annual Total Return table and Cumulative Returns chart measure performance assuming that all dividend and capital gain distributions were reinvested. Returns do not reflect the deduction of taxes that a shareholder would pay on (i) Fund distributions or (ii) the redemption of Fund shares. The Cumulative Returns Chart reflects only Institutional Class performance. Performance for Class A and Class C shares is typically lower than Institutional Class performance due to the lower expenses paid by Institutional Class shares. Except for the load-waived performance for the Class A and C shares of each Fund (as applicable), performance shown is net of fees and expenses. The load-waived performance for Class A and Class C shares does not reflect the sales charges shareholders of those classes may pay in connection with a purchase or redemption of Class A and Class C shares. The load-waived performance of those share classes is relevant only to shareholders who purchased Class A or Class C shares on a load-waived basis. The figures in the line graph are calculated at net asset value and assume the investment of $1,000,000 at the beginning of the first full month following the inception of the Institutional Class. Each Fund measures its performance against a broad-based securities market index (“benchmark index”). Each benchmark index does not take into account fees, expenses or taxes.
For periods prior to the inception date of the Class A and Class C shares (if applicable), performance information shown is based on the performance of the Fund’s Institutional Class shares, adjusted to reflect the distribution and/or service fees and other expenses paid by the Class A and Class C shares, respectively.
A Fund’s past performance, before and after taxes, is not necessarily an indication of how the Fund will perform in the future.
1
IMPORTANT INFORMATION ABOUT THE FUNDS (CONTINUED)
The following disclosure provides important information regarding each Fund’s Expense Example, which appears on each Fund’s individual page in this Shareholder Report. Please refer to this information when reviewing the Expense Example for a Fund.
EXPENSE EXAMPLE
Fund Expenses
As a shareholder of the Funds, you incur two types of costs: (1) transaction costs, including sales charges (loads) on purchase payments; redemption fees; and exchange fees; and (2) ongoing costs, including management fees; distribution(12b-1) fees; and other Fund expenses. This Example is intended to help you understand your ongoing costs (in Dollars) of investing in the Funds and to compare these costs with the ongoing costs of investing in other mutual funds. The Example is based on an investment of $1,000 invested at the beginning of the period and held for the entire period, from November 1, 2019 or the inception date (if later), through April 30, 2020.
Actual Expenses
The information in the table under the heading “Actual Performance” provides information based on actual performance and actual expenses. You may use the information in these columns, together with the amount you invested, to estimate the expenses that you paid over the period. Simply divide your account value by $1,000 (for example, an $8,600 account value divided by $1,000 = $8.60), then multiply the result by the number in the appropriate column for your share class, in the row titled “Expenses Paid” to estimate the expenses you paid on your account during this period.
Hypothetical Example for Comparison Purposes
The information in the table under the heading “Hypothetical Performance” provides information about hypothetical account values and hypothetical expenses based on the Fund’s actual expense ratio and an assumed rate of return of 5% per year before expenses, which is not the Fund’s actual return. The hypothetical account values and expenses may not be used to estimate the actual ending account balance or expenses you paid for the period. You may use this information to compare the ongoing costs of investing in the Fund and other funds. To do so, compare this 5% hypothetical example with the 5% hypothetical examples that appear in the shareholder reports of the other funds.
Please note that the expenses shown in the table are meant to highlight your ongoing costs only and do not reflect any transactional costs, such as sales charges (loads), redemption fees, or exchange fees. Therefore, the information under the heading “Hypothetical Performance” is useful in comparing ongoing costs only, and will not help you determine the relative total costs of owning different funds. In addition, if these transactional costs were included, your costs would have been higher.
2
UNAUDITED
FUND SUMMARY
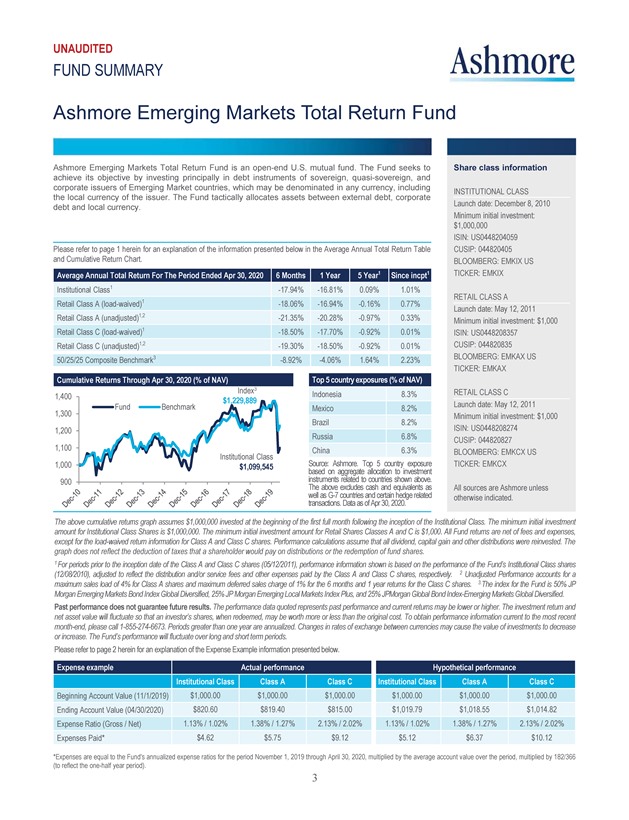
Ashmore Emerging Markets Total Return Fund
Ashmore Emerging Markets Total Return Fund is an open-end U.S. mutual fund. The Fund seeks to achieve its objective by investing principally in debt instruments of sovereign, quasi-sovereign, and corporate issuers of Emerging Market countries, which may be denominated in any currency, including the local currency of the issuer. The Fund tactically allocates assets between external debt, corporate debt and local currency. Please refer to page 1 herein for an explanation of the information presented below in the Average Annual Total Return Table and Cumulative Return Chart. Average Annual Total Return For The Period Ended Apr 30, 2020 6 Months 1 Year 5 Year1 Since incept1 Institutional Class1-17.94%-16.81% 0.09% 1.01% Retail Class A (load-waived)1-18.06%-16.94%-0.16% 0.77% Retail Class A (unadjusted)1,2-21.35%-20.28%-0.97% 0.33% Retail Class C (load-waived)1-18.50%-17.70%-0.92% 0.01% Retail Class C (unadjusted)1,2-19.30%-18.50%-0.92% 0.01% 50/25/25 Composite Benchmark3-8.92%-4.06% 1.64% 2.23% Cumulative Returns Through Apr 30, 2020 (% of NAV) Index3 1,400 $1,229,889 Fund Benchmark 1,300 1,200 1,100 1,000 Institutional Class $1,099,545 900 Top 5 country exposures (% of NAV) Indonesia 8.3% Mexico 8.2% Brazil 8.2% Russia 6.8% China 6.3% Source: Ashmore. Top 5 country exposure based on aggregate allocation to investment instruments related to countries shown above. The above excludes cash and equivalents as well as G-7 countries and certain hedge related transactions. Data as of Apr 30, 2020. Dec-10 Dec-11 Dec-12 Dec-13 Dec-14 Dec-15 Dec-16 Dec-17 Dec-18 Dec-19 Share class information INSTITUTIONAL CLASS Launch date: December 8, 2010 Minimum initial investment: $1,000,000 ISIN: US0448204059 CUSIP: 044820405 BLOOMBERG: EMKIX US TICKER: EMKIX RETAIL CLASS A Launch date: May 12, 2011 Minimum initial investment: $1,000 ISIN: US0448208357 CUSIP: 044820835 BLOOMBERG: EMKAX US TICKER: EMKAX RETAIL CLASS C Launch date: May 12, 2011 Minimum initial investment: $1,000 ISIN: US0448208274 CUSIP: 044820827 BLOOMBERG: EMKCX US TICKER: EMKCX All sources are Ashmore unless otherwise indicated. The above cumulative returns graph assumes $1,000,000 invested at the beginning of the first full month following the inception of the Institutional Class. The minimum initial investment amount for Institutional Class Shares is $1,000,000. The minimum initial investment amount for Retail Shares Classes A and C is $1,000. All Fund returns are net of fees and expenses, except for the load-waived return information for Class A and Class C shares. Performance calculations assume that all dividend, capital gain and other distributions were reinvested. The graph does not reflect the deduction of taxes that a shareholder would pay on distributions or the redemption of fund shares. 1 For periods prior to the inception date of the Class A and Class C shares (05/12/2011), performance information shown is based on the performance of the Fund’s Institutional Class shares (12/08/2010), adjusted to reflect the distribution and/or service fees and other expenses paid by the Class A and Class C shares, respectively. 2 Unadjusted Performance accounts for a maximum sales load of 4% for Class A shares and maximum deferred sales charge of 1% for the 6 months and 1 year returns for the Class C shares. 3. The index for the Fund is 50% JP Morgan Emerging Markets Bond Index Global Diversified, 25% JP Morgan Emerging Local Markets Index Plus, and 25% JPMorgan Global Bond Index-Emerging Markets Global Diversified. Past performance does not guarantee future results. The performance data quoted represents past performance and current returns may be lower or higher. The investment return and net asset value will fluctuate so that an investor’s shares, when redeemed, may be worth more or less than the original cost. To obtain performance information current to the most recentmonth-end, please call1-855-274-6673. Periods greater than one year are annualized. Changes in rates of exchange between currencies may cause the value of investments to decrease or increase. The Fund’s performance will fluctuate over long and short term periods. Please refer to page 2 herein for an explanation of the Expense Example information presented below. Expense example Actual performance Hypothetical performance Institutional Class Class A Class C Institutional Class Class A Class C Beginning Account Value (11/1/2019) $1,000.00 $1,000.00 $1,000.00 $1,000.00 $1,000.00 $1,000.00 Ending Account Value (04/30/2020) $820.60 $819.40 $815.00 $1,019.79 $1,018.55 $1,014.82 Expense Ratio (Gross / Net) 1.13% / 1.02% 1.38% / 1.27% 2.13% / 2.02% 1.13% / 1.02% 1.38% / 1.27% 2.13% / 2.02% Expenses Paid* $4.62 $5.75 $9.12 $5.12 $6.37 $10.12 *Expenses are equal to the Fund’s annualized expense ratios for the period November 1, 2019 through April 30, 2020, multiplied by the average account value over the period, multiplied by 182/366 (to reflect theone-half year period). 3
UNAUDITED
FUND SUMMARY
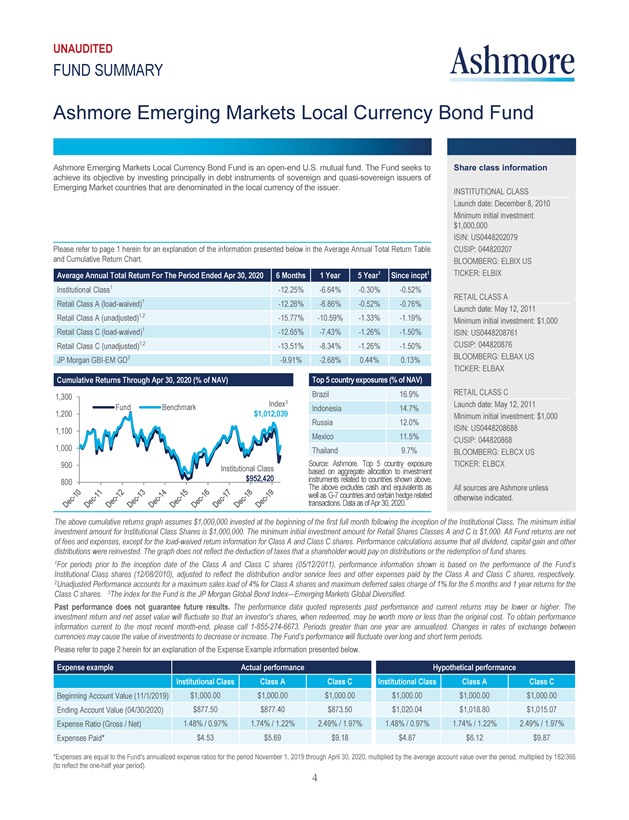
Ashmore Emerging Markets Local Currency Bond Fund
Ashmore Emerging Markets Local Currency Bond Fund is an open-end U.S. mutual fund. The Fund seeks to achieve its objective by investing principally in debt instruments of sovereign and quasi-sovereign issuers of Emerging Market countries that are denominated in the local currency of the issuer. Please refer to page 1 herein for an explanation of the information presented below in the Average Annual Total Return Table and Cumulative Return Chart. Average Annual Total Return For The Period Ended Apr 30, 2020 6 Months 1 Year 5 Year1 Since incpt1 Institutional Class1-12.25%-6.64%-0.30%-0.52% Retail Class A (load-waived)1-12.26%-6.86%-0.52%-0.76% Retail Class A (unadjusted)1,2-15.77%-10.59%-1.33%-1.19% Retail Class C (load-waived)1-12.65%-7.43%-1.26%-1.50% Retail Class C (unadjusted)1,2-13.51%-8.34%-1.26%-1.50% JP MorganGBI-EM GD3-9.91%-2.68% 0.44% 0.13% Cumulative Returns Through Apr 30, 2020 (% of NAV) Top 5 country exposures (% of NAV) 1,300 Brazil 16.9% Index3 Fund Benchmark Indonesia 14.7% 1,200 $1,012,039 Russia 12.0% 1,100 Mexico 11.5% 1,000 Thailand 9.7% 900 Source: Ashmore. Top 5 country exposure Institutional Class based on aggregate allocation to investment 800 $952,420 instruments related to countries shown above. The well as aboveG-7 countries excludes and cash certain and equivalents hedge related as transactions. Data as of Apr 30, 2020. Share class information INSTITUTIONAL CLASS Launch date: December 8, 2010 Minimum initial investment: $1,000,000 ISIN: US0448202079 CUSIP: 044820207 BLOOMBERG: ELBIX US TICKER: ELBIX RETAIL CLASS A Launch date: May 12, 2011 Minimum initial investment: $1,000 ISIN: US0448208761 CUSIP: 044820876 BLOOMBERG: ELBAX US TICKER: ELBAX RETAIL CLASS C Launch date: May 12, 2011 Minimum initial investment: $1,000 ISIN: US0448208688 CUSIP: 044820868 BLOOMBERG: ELBCX US TICKER: ELBCX All sources are Ashmore unless otherwise indicated. The above cumulative returns graph assumes $1,000,000 invested at the beginning of the first full month following the inception of the Institutional Class. The minimum initial investment amount for Institutional Class Shares is $1,000,000. The minimum initial investment amount for Retail Shares Classes A and C is $1,000. All Fund returns are net of fees and expenses, except for the load-waived return information for Class A and Class C shares. Performance calculations assume that all dividend, capital gain and other distributions were reinvested. The graph does not reflect the deduction of taxes that a shareholder would pay on distributions or the redemption of fund shares. 1For periods prior to the inception date of the Class A and Class C shares (05/12/2011), performance information shown is based on the performance of the Fund’s Institutional Class shares (12/08/2010), adjusted to reflect the distribution and/or service fees and other expenses paid by the Class A and Class C shares, respectively. 2Unadjusted Performance accounts for a maximum sales load of 4% for Class A shares and maximum deferred sales charge of 1% for the 6 months and 1 year returns for the Class C shares. 3The index for the Fund is the JP Morgan Global Bond Index—Emerging Markets Global Diversified. Past performance does not guarantee future results. The performance data quoted represents past performance and current returns may be lower or higher. The investment return and net asset value will fluctuate so that an investor’s shares, when redeemed, may be worth more or less than the original cost. To obtain performance information current to the most recentmonth-end, please call1-855-274-6673. Periods greater than one year are annualized. Changes in rates of exchange between currencies may cause the value of investments to decrease or increase. The Fund’s performance will fluctuate over long and short term periods. Please refer to page 2 herein for an explanation of the Expense Example information presented below. Expense example Actual performance Hypothetical performance Institutional Class Class A Class C Institutional Class Class A Class C Beginning Account Value (11/1/2019) $1,000.00 $1,000.00 $1,000.00 $1,000.00 $1,000.00 $1,000.00 Ending Account Value (04/30/2020) $877.50 $877.40 $873.50 $1,020.04 $1,018.80 $1,015.07 Expense Ratio (Gross / Net) 1.48% / 0.97% 1.74% / 1.22% 2.49% / 1.97% 1.48% / 0.97% 1.74% / 1.22% 2.49% / 1.97% Expenses Paid* $4.53 $5.69 $9.18 $4.87 $6.12 $9.87 *Expenses are equal to the Fund’s annualized expense ratios for the period November 1, 2019 through April 30, 2020, multiplied by the average account value over the period, multiplied by 182/366 (to reflect theone-half year period).
UNAUDITED
FUND SUMMARY
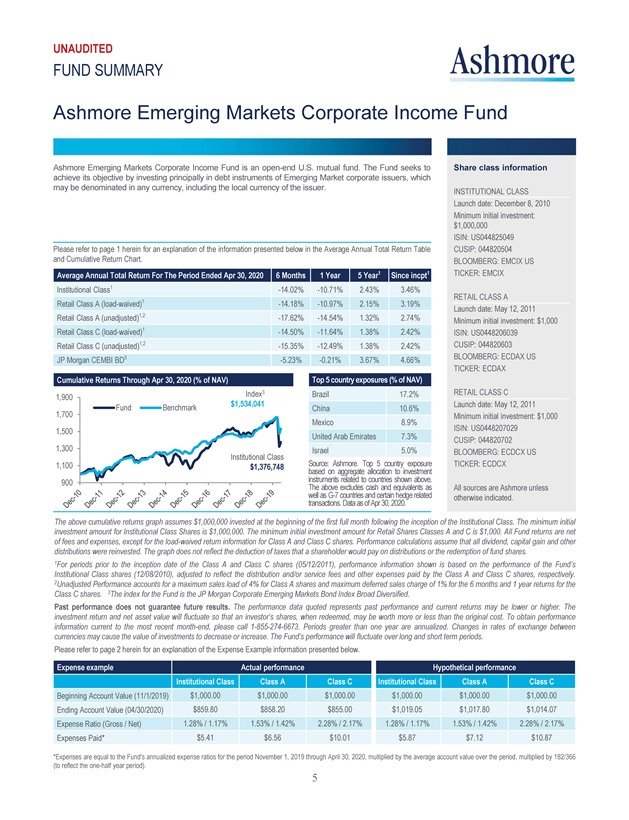
Ashmore Emerging Markets Corporate Income Fund
Ashmore Emerging Markets Corporate Income Fund is an open-end U.S. mutual fund. The Fund seeks to achieve its objective by investing principally in debt instruments of Emerging Market corporate issuers, which may be denominated in any currency, including the local currency of the issuer. Please refer to page 1 herein for an explanation of the information presented below in the Average Annual Total Return Table and Cumulative Return Chart. Average Annual Total Return For The Period Ended Apr 30, 2020 6 Months 1 Year 5 Year1 Since incpt1 Institutional Class1-14.02%-10.71% 2.43% 3.46% Retail Class A (load-waived)1-14.18%-10.97% 2.15% 3.19% Retail Class A (unadjusted)1,2-17.62%-14.54% 1.32% 2.74% Retail Class C (load-waived)1-14.50%-11.64% 1.38% 2.42% Retail Class C (unadjusted)1,2-15.35%-12.49% 1.38% 2.42% JP Morgan CEMBI BD3-5.23%-0.21% 3.67% 4.66% Cumulative Returns Through Apr 30, 2020 (% of NAV) Top 5 country exposures (% of NAV) Index3 Brazil 17.2% 1,900 Fund Benchmark $1,534,041 China 10.6% 1,700 Mexico 8.9% 1,500 United Arab Emirates 7.3% 1,300 Israel 5.0% Institutional Class 1,100 $1,376,748 Source: Ashmore. Top 5 country exposure based on aggregate allocation to investment instruments related to countries shown above. The above excludes cash and equivalents as well as G-7 countries and certain hedge related transactions. Data as of Apr 30, 2020. Dec-10 Dec-11 Dec-12 Dec-13 Dec-14 Dec-15 Dec-16 Dec-17 Dec-18 Dec-19 Share class information INSTITUTIONAL CLASS Launch date: December 8, 2010 Minimum initial investment: $1,000,000 ISIN: US044825049 CUSIP: 044820504 BLOOMBERG: EMCIX US TICKER: EMCIX RETAIL CLASS A Launch date: May 12, 2011 Minimum initial investment: $1,000 ISIN: US0448206039 CUSIP: 044820603 BLOOMBERG: ECDAX US TICKER: ECDAX RETAIL CLASS C Launch date: May 12, 2011 Minimum initial investment: $1,000 ISIN: US0448207029 CUSIP: 044820702 BLOOMBERG: ECDCX US TICKER: ECDCX All sources are Ashmore unless otherwise indicated. The above cumulative returns graph assumes $1,000,000 invested at the beginning of the first full month following the inception of the Institutional Class. The minimum initial investment amount for Institutional Class Shares is $1,000,000. The minimum initial investment amount for Retail Shares Classes A and C is $1,000. All Fund returns are net of fees and expenses, except for the load-waived return information for Class A and Class C shares. Performance calculations assume that all dividend, capital gain and other distributions were reinvested. The graph does not reflect the deduction of taxes that a shareholder would pay on distributions or the redemption of fund shares. 1For periods prior to the inception date of the Class A and Class C shares (05/12/2011), performance information shown is based on the performance of the Fund’s Institutional Class shares (12/08/2010), adjusted to reflect the distribution and/or service fees and other expenses paid by the Class A and Class C shares, respectively. 2Unadjusted Performance accounts for a maximum sales load of 4% for Class A shares and maximum deferred sales charge of 1% for the 6 months and 1 year returns for the Class C shares. 3The index for the Fund is the JP Morgan Corporate Emerging Markets Bond Index Broad Diversified. Past performance does not guarantee future results. The performance data quoted represents past performance and current returns may be lower or higher. The investment return and net asset value will fluctuate so that an investor’s shares, when redeemed, may be worth more or less than the original cost. To obtain performance information current to the most recentmonth-end, please call1-855-274-6673. Periods greater than one year are annualized. Changes in rates of exchange between currencies may cause the value of investments to decrease or increase. The Fund’s performance will fluctuate over long and short term periods. Please refer to page 2 herein for an explanation of the Expense Example information presented below. Expense example Actual performance Hypothetical performance Institutional Class Class A Class C Institutional Class Class A Class C Beginning Account Value (11/1/2019) $1,000.00 $1,000.00 $1,000.00 $1,000.00 $1,000.00 $1,000.00 Ending Account Value (04/30/2020) $859.80 $858.20 $855.00 $1,019.05 $1,017.80 $1,014.07 Expense Ratio (Gross / Net) 1.28% / 1.17% 1.53% / 1.42% 2.28% / 2.17% 1.28% / 1.17% 1.53% / 1.42% 2.28% / 2.17% Expenses Paid* $5.41 $6.56 $10.01 $5.87 $7.12 $10.87 *Expenses are equal to the Fund’s annualized expense ratios for the period November 1, 2019 through April 30, 2020, multiplied by the average account value over the period, multiplied by 182/366 (to reflect theone-half year period). 5
UNAUDITED
FUND SUMMARY
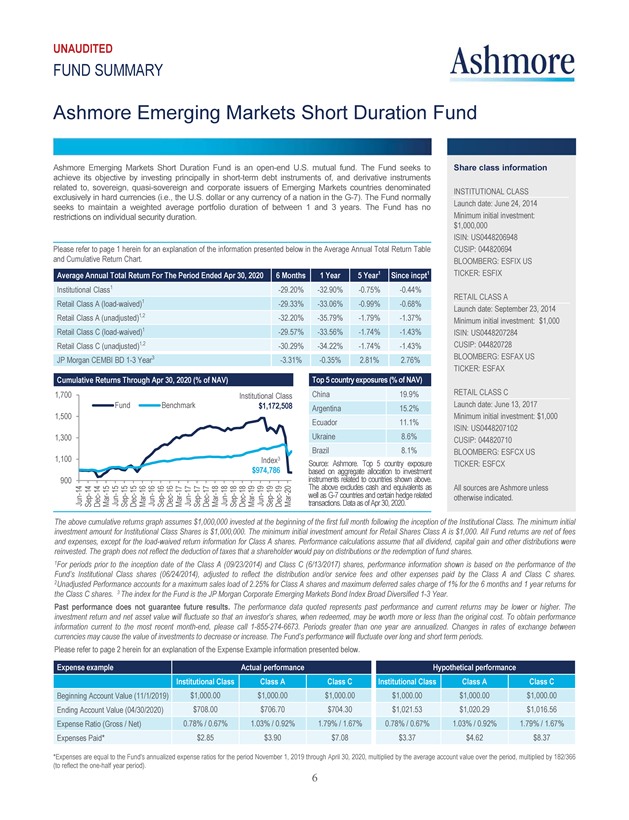
Ashmore Emerging Markets Short Duration Fund
Ashmore Emerging Markets Short Duration Fund is an open-end U.S. mutual fund. The Fund seeks to achieve its objective by investing principally in short-term debt instruments of, and derivative instruments related to, sovereign, quasi-sovereign and corporate issuers of Emerging Markets countries denominated exclusively in hard currencies (i.e., the U.S. dollar or any currency of a nation in the G-7). The Fund normally seeks to maintain a weighted average portfolio duration of between 1 and 3 years. The Fund has no restrictions on individual security duration. Please refer to page 1 herein for an explanation of the information presented below in the Average Annual Total Return Table and Cumulative Return Chart. Average Annual Total Return For The Period Ended Apr 30, 2020 6 Months 1 Year 5 Year1 Since incpt1 Institutional Class1-29.20%-32.90%-0.75%-0.44% Retail Class A (load-waived)1-29.33%-33.06%-0.99%-0.68% Retail Class A (unadjusted)1,2-32.20%-35.79%-1.79%-1.37% Retail Class C (load-waived)1-29.57%-33.56%-1.74%-1.43% Retail Class C (unadjusted)1,2-30.29%-34.22%-1.74%-1.43% JP Morgan CEMBI BD1-3 Year3-3.31%-0.35% 2.81% 2.76% Cumulative Returns Through Apr 30, 2020 (% of NAV) Top 5 country exposures (% of NAV) 1,700 Institutional $1,172,508 Class China 19.9% Fund Benchmark Argentina 15.2% 1,500 Ecuador 11.1% 1,300 Ukraine 8.6% Brazil 8.1% 1,100 Index3 $974,786 Source: Ashmore. Top 5 country exposure based on aggregate allocation to investment instruments realated to countries shown above. The above excludes cash and equivalents as well as G-7 Countries and certain hedge related transactions. Data as of Apr 30, 2020. June-14 Sep-14 Dec-14 Mar-15 Jun-15 Sep-15 Dec-15 Mar-16 Jun-16 Sep-16 Dec-16 Mar-17 Jun-17 Sep-17 Dec-17 Mar-18 Jun-18 Sep-18 Dec-18 Mar-19 Jun-19 Sep-19 Dec-19 Mar-20 Share class information INSTITUTIONAL CLASS Launch date: June 24, 2014 Minimum initial investment: $1,000,000 ISIN: US0448206948 CUSIP: 044820694 BLOOMBERG: ESFIX US TICKER: ESFIX RETAIL CLASS A Launch date: September 23, 2014 Minimum initial investment: $1,000 ISIN: US0448207284 CUSIP: 044820728 BLOOMBERG: ESFAX US TICKER: ESFAX RETAIL CLASS C Launch date: June 13, 2017 Minimum initial investment: $1,000 ISIN: US0448207102 CUSIP: 044820710 BLOOMBERG: ESFCX US TICKER: ESFCX All sources are Ashmore unless otherwise indicated. The above cumulative returns graph assumes $1,000,000 invested at the beginning of the first full month following the inception of the Institutional Class. The minimum initial investment amount for Institutional Class Shares is $1,000,000. The minimum initial investment amount for Retail Shares Class A is $1,000. All Fund returns are net of fees and expenses, except for the load-waived return information for Class A shares. Performance calculations assume that all dividend, capital gain and other distributions were reinvested. The graph does not reflect the deduction of taxes that a shareholder would pay on distributions or the redemption of fund shares. 1For periods prior to the inception date of the Class A (09/23/2014) and Class C (6/13/2017) shares, performance information shown is based on the performance of the Fund’s Institutional Class shares (06/24/2014), adjusted to reflect the distribution and/or service fees and other expenses paid by the Class A and Class C shares. 2Unadjusted Performance accounts for a maximum sales load of 2.25% for Class A shares and maximum deferred sales charge of 1% for the 6 months and 1 year returns for the Class C shares. 3 The index for the Fund is the JP Morgan Corporate Emerging Markets Bond Index Broad Diversified1-3 Year. Past performance does not guarantee future results. The performance data quoted represents past performance and current returns may be lower or higher. The investment return and net asset value will fluctuate so that an investor’s shares, when redeemed, may be worth more or less than the original cost. To obtain performance information current to the most recentmonth-end, please call1-855-274-6673. Periods greater than one year are annualized. Changes in rates of exchange between currencies may cause the value of investments to decrease or increase. The Fund’s performance will fluctuate over long and short term periods. Please refer to page 2 herein for an explanation of the Expense Example information presented below. Expense example Actual performance Hypothetical performance Institutional Class Class A Class C Institutional Class Class A Class C Beginning Account Value (11/1/2019) $1,000.00 $1,000.00 $1,000.00 $1,000.00 $1,000.00 $1,000.00 Ending Account Value (04/30/2020) $708.00 $706.70 $704.30 $1,021.53 $1,020.29 $1,016.56 Expense Ratio (Gross / Net) 0.78% / 0.67% 1.03% / 0.92% 1.79% / 1.67% 0.78% / 0.67% 1.03% / 0.92% 1.79% / 1.67% Expenses Paid* $2.85 $3.90 $7.08 $3.37 $4.62 $8.37 *Expenses are equal to the Fund’s annualized expense ratios for the period November 1, 2019 through April 30, 2020, multiplied by the average account value over the period, multiplied by 182/366 (to reflect theone-half year period).
UNAUDITED
FUND SUMMARY
Ashmore Emerging Markets Active Equity Fund
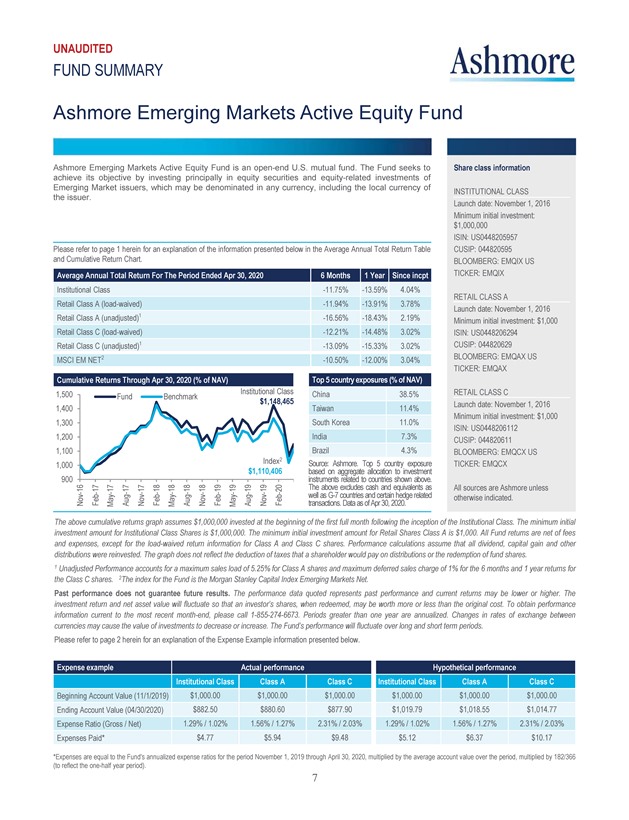
Ashmore Emerging Markets Active Equity Fund is an open-end U.S. mutual fund. The Fund seeks to achieve its objective by investing principally in equity securities and equity-related investments of Emerging Market issuers, which may be denominated in any currency, including the local currency of the issuer.
Please refer to page 1 herein for an explanation of the information presented below in the Average Annual Total Return Table and Cumulative Return Chart. Average Annual Total Return For The Period Ended Apr 30, 2020 6 Months 1 Year Since incpt Institutional Class-11.75%-13.59% 4.04% Retail Class A (load-waived)-11.94%-13.91% 3.78% Retail Class A (unadjusted)1-16.56%-18.43% 2.19% Retail Class C (load-waived)-12.21%-14.48% 3.02% Retail Class C (unadjusted)1-13.09%-15.33% 3.02% MSCI EM NET2-10.50%-12.00% 3.04% Cumulative Returns Through Apr 30, 2020 (% of NAV) Top 5 country exposures (% of NAV) 1,500 Institutional Class China 38.5% Fund Benchmark $1,148,465 1,400 Taiwan 11.4% 1,300 South Korea 11.0% 1,200 India 7.3% 1,100 Brazil 4.3% Index2 Source: Ashmore. Top 5 country exposure based on aggregate allocation to investment instrumentsrelated to countries shown above. The above excludes cash and equivalents as well as G-7 countries and certain hedge related transactions. Data as of Apr 30, 2020. 1,000 900 Nov-16 Feb-17 May-17 Aug-17 Nov-17 Feb-18 May-19 Aug-19 Nov-19 Feb-19 May-19 Aug-19 Nov-19 Feb-20 Share class information INSTITUTIONAL CLASS Launch date: November 1, 2016 Minimum initial investment: $1,000,000 ISIN: US0448205957 CUSIP: 044820595 BLOOMBERG: EMQIX US TICKER: EMQIX RETAIL CLASS A Launch date: November 1, 2016 Minimum initial investment: $1,000 ISIN: US0448206294 CUSIP: 044820629 BLOOMBERG: EMQAX US TICKER: EMQAX RETAIL CLASS C Launch date: November 1, 2016 Minimum initial investment: $1,000 ISIN: US0448206112 CUSIP: 044820611 BLOOMBERG: EMQCX US TICKER: EMQCX All sources are Ashmore unless otherwise indicated. The above cumulative returns graph assumes $1,000,000 invested at the beginning of the first full month following the inception of the Institutional Class. The minimum initial investment amount for Institutional Class Shares is $1,000,000. The minimum initial investment amount for Retail Shares Class A is $1,000. All Fund returns are net of fees and expenses, except for the load-waived return information for Class A and Class C shares. Performance calculations assume that all dividend, capital gain and other distributions were reinvested. The graph does not reflect the deduction of taxes that a shareholder would pay on distributions or the redemption of fund shares. 1 Unadjusted Performance accounts for a maximum sales load of 5.25% for Class A shares and maximum deferred sales charge of 1% for the 6 months and 1 year returns for the Class C shares. 2The index for the Fund is the Morgan Stanley Capital Index Emerging Markets Net. Past performance does not guarantee future results. The performance data quoted represents past performance and current returns may be lower or higher. The investment return and net asset value will fluctuate so that an investor’s shares, when redeemed, may be worth more or less than the original cost. To obtain performance information current to the most recentmonth-end, please call1-855-274-6673. Periods greater than one year are annualized. Changes in rates of exchange between currencies may cause the value of investments to decrease or increase. The Fund’s performance will fluctuate over long and short term periods. Please refer to page 2 herein for an explanation of the Expense Example information presented below. Expense example Actual performance Hypothetical performance Institutional Class Class A Class C Institutional Class Class A Class C Beginning Account Value (11/1/2019) $1,000.00 $1,000.00 $1,000.00 $1,000.00 $1,000.00 $1,000.00 Ending Account Value (04/30/2020) $882.50 $880.60 $877.90 $1,019.79 $1,018.55 $1,014.77 Expense Ratio (Gross / Net) 1.29% / 1.02% 1.56% / 1.27% 2.31% / 2.03% 1.29% / 1.02% 1.56% / 1.27% 2.31% / 2.03% Expenses Paid* $4.77 $5.94 $9.48 $5.12 $6.37 $10.17 *Expenses are equal to the Fund’s annualized expense ratios for the period November 1, 2019 through April 30, 2020, multiplied by the average account value over the period, multiplied by 182/366 (to reflect theone-half year period).
UNAUDITED
FUND SUMMARY
Ashmore Emerging Markets Small-Cap Equity Fund
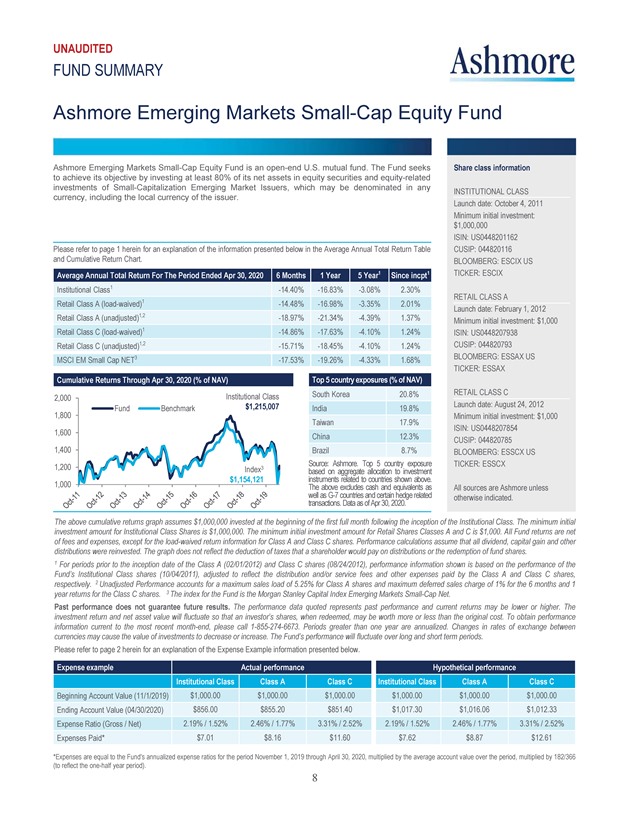
Ashmore Emerging Markets Small-Cap Equity Fund is an open-end U.S. mutual fund. The Fund seeks to achieve its objective by investing at least 80% of its net assets in equity securities and equity-related investments of Small-Capitalization Emerging Market Issuers, which may be denominated in any currency, including the local currency of the issuer.
Please refer to page 1 herein for an explanation of the information presented below in the Average Annual Total Return Table and Cumulative Return Chart. Average Annual Total Return For The Period Ended Apr 30, 2020 6 Months 1 Year 5 Year1 Since incpt1 Institutional Class1-14.40%-16.83%-3.08% 2.30% Retail Class A (load-waived)1-14.48%-16.98%-3.35% 2.01% Retail Class A (unadjusted)1,2-18.97%-21.34%-4.39% 1.37% Retail Class C (load-waived)1-14.86%-17.63%-4.10% 1.24% Retail Class C (unadjusted)1,2-15.71%-18.45%-4.10% 1.24% MSCI EM Small Cap NET3-17.53%-19.26%-4.33% 1.68% Cumulative Returns Through Apr 30, 2020 (% of NAV) Top 5 country exposures (% of NAV) 2,000 Institutional Class South Korea 20.8% Fund Benchmark $1,215,007 India 19.8% 1,800 Taiwan 17.9% 1,600 China 12.3% 1,400 Brazil 8.7% Source: Ashmore. Top 5 country exposure based on aggregate allocation to investment instruments related to countries shown above. The above excludes cash and equivalents as well as G-7 countries and certain hedge related transactions. Data as of Apr 30, 2020. Oct-11 OCt-12 Oct-13 Oct-14 Oct-15 Oct-16 Oct-17 Oct-18 Oct-19 Index3 $1,154,121 1,200 1,000 Share class information INSTITUTIONAL CLASS Launch date: October 4, 2011 Minimum initial investment: $1,000,000 ISIN: US0448201162 CUSIP: 044820116 BLOOMBERG: ESCIX US TICKER: ESCIX RETAIL CLASS A Launch date: February 1, 2012 Minimum initial investment: $1,000 ISIN: US0448207938 CUSIP: 044820793 BLOOMBERG: ESSAX US TICKER: ESSAX RETAIL CLASS C Launch date: August 24, 2012 Minimum initial investment: $1,000 ISIN: US0448207854 CUSIP: 044820785 BLOOMBERG: ESSCX US TICKER: ESSCX All sources are Ashmore unless otherwise indicated. The above cumulative returns graph assumes $1,000,000 invested at the beginning of the first full month following the inception of the Institutional Class. The minimum initial investment amount for Institutional Class Shares is $1,000,000. The minimum initial investment amount for Retail Shares Classes A and C is $1,000. All Fund returns are net of fees and expenses, except for the load-waived return information for Class A and Class C shares. Performance calculations assume that all dividend, capital gain and other distributions were reinvested. The graph does not reflect the deduction of taxes that a shareholder would pay on distributions or the redemption of fund shares. 1 For periods prior to the inception date of the Class A (02/01/2012) and Class C shares (08/24/2012), performance information shown is based on the performance of the Fund’s Institutional Class shares (10/04/2011), adjusted to reflect the distribution and/or service fees and other expenses paid by the Class A and Class C shares, respectively. 2 Unadjusted Performance accounts for a maximum sales load of 5.25% for Class A shares and maximum deferred sales charge of 1% for the 6 months and 1 year returns for the Class C shares. 3 The index for the Fund is the Morgan Stanley Capital Index Emerging MarketsSmall-Cap Net. Past performance does not guarantee future results. The performance data quoted represents past performance and current returns may be lower or higher. The investment return and net asset value will fluctuate so that an investor’s shares, when redeemed, may be worth more or less than the original cost. To obtain performance information current to the most recentmonth-end, please call1-855-274-6673. Periods greater than one year are annualized. Changes in rates of exchange between currencies may cause the value of investments to decrease or increase. The Fund’s performance will fluctuate over long and short term periods. Please refer to page 2 herein for an explanation of the Expense Example information presented below. Expense example Actual performance Hypothetical performance Institutional Class Class A Class C Institutional Class Class A Class C Beginning Account Value (11/1/2019) $1,000.00 $1,000.00 $1,000.00 $1,000.00 $1,000.00 $1,000.00 Ending Account Value (04/30/2020) $856.00 $855.20 $851.40 $1,017.30 $1,016.06 $1,012.33 Expense Ratio (Gross / Net) 2.19% / 1.52% 2.46% / 1.77% 3.31% / 2.52% 2.19% / 1.52% 2.46% / 1.77% 3.31% / 2.52% Expenses Paid* $7.01 $8.16 $11.60 $7.62 $8.87 $12.61 *Expenses are equal to the Fund’s annualized expense ratios for the period November 1, 2019 through April 30, 2020, multiplied by the average account value over the period, multiplied by 182/366 (to reflect theone-half year period). 8
UNAUDITED
FUND SUMMARY
Ashmore Emerging Markets Frontier Equity Fund
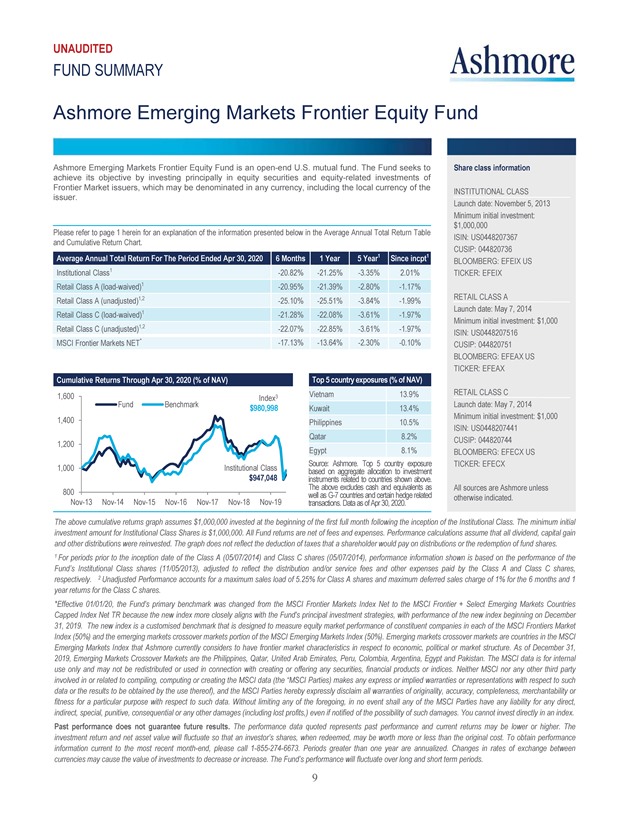
Ashmore Emerging Markets Frontier Equity Fund is an open-end U.S. mutual fund. The Fund seeks to achieve its objective by investing principally in equity securities and equity-related investments of Frontier Market issuers, which may be denominated in any currency, including the local currency of the issuer.
Please refer to page 1 herein for an explanation of the information presented below in the Average Annual Total Return Table and Cumulative Return Chart. Average Annual Total Return For The Period Ended Apr 30, 2020 6 Months 1 Year 5 Year1 Since incpt1 Institutional Class1-20.82%-21.25%-3.35% 2.01% Retail Class A (load-waived)1-20.95%-21.39%-2.80%-1.17% Retail Class A (unadjusted)1,2-25.10%-25.51%-3.84%-1.99% Retail Class C (load-waived)1-21.28%-22.08%-3.61%-1.97% Retail Class C (unadjusted)1,2-22.07%-22.85%-3.61%-1.97% MSCI Frontier Markets NET*-17.13%-13.64%-2.30%-0.10% Cumulative Returns Through Apr 30, 2020 (% of NAV) Top 5 country exposures (% of NAV) 1,600 Index3 Vietnam 13.9% Fund Benchmark $980,998 Kuwait 13.4% 1,400 Philippines 10.5% 1,200 Qatar 8.2% Egypt 8.1% Source: Ashmore. Top 5 country exposure based on aggregate allocation to investment instruments related to countries shown above. The above excludes cash and equivalents as well as G-7 countries and certain hedge related transactions. Data as of Apr 30, 2020. 1,000 800Nov-13Nov-14Nov-15Nov-16Nov-17Nov-18Nov-19 Share class information INSTITUTIONAL CLASS Launch date: November 5, 2013 Minimum initial investment: $1,000,000 ISIN: US0448207367 CUSIP: 044820736 BLOOMBERG: EFEIX US TICKER: EFEIX RETAIL CLASS A Launch date: May 7, 2014 Minimum initial investment: $1,000 ISIN: US0448207516 CUSIP: 044820751 BLOOMBERG: EFEAX US TICKER: EFEAX RETAIL CLASS C Launch date: May 7, 2014 Minimum initial investment: $1,000 ISIN: US0448207441 CUSIP: 044820744 BLOOMBERG: EFECX US TICKER: EFECX All sources are Ashmore unless otherwise indicated. The above cumulative returns graph assumes $1,000,000 invested at the beginning of the first full month following the inception of the Institutional Class. The minimum initial investment amount for Institutional Class Shares is $1,000,000. All Fund returns are net of fees and expenses. Performance calculations assume that all dividend, capital gain and other distributions were reinvested. The graph does not reflect the deduction of taxes that a shareholder would pay on distributions or the redemption of fund shares. 1 For periods prior to the inception date of the Class A (05/07/2014) and Class C shares (05/07/2014), performance information shown is based on the performance of the Fund’s Institutional Class shares (11/05/2013), adjusted to reflect the distribution and/or service fees and other expenses paid by the Class A and Class C shares, respectively. 2 Unadjusted Performance accounts for a maximum sales load of 5.25% for Class A shares and maximum deferred sales charge of 1% for the 6 months and 1 year returns for the Class C shares. *Effective 01/01/20, the Fund’s primary benchmark was changed from the MSCI Frontier Markets Index Net to the MSCI Frontier + Select Emerging Markets Countries Capped Index Net TR because the new index more closely aligns with the Fund’s principal investment strategies, with performance of the new index beginning on December 31, 2019. The new index is a customised benchmark that is designed to measure equity market performance of constituent companies in each of the MSCI Frontiers Market Index (50%) and the emerging markets crossover markets portion of the MSCI Emerging Markets Index (50%). Emerging markets crossover markets are countries in the MSCI Emerging Markets Index that Ashmore currently considers to have frontier market characteristics in respect to economic, political or market structure. As of December 31, 2019, Emerging Markets Crossover Markets are the Philippines, Qatar, United Arab Emirates, Peru, Colombia, Argentina, Egypt and Pakistan. The MSCI data is for internal use only and may not be redistributed or used in connection with creating or offering any securities, financial products or indices. Neither MSCI nor any other third party involved in or related to compiling, computing or creating the MSCI data (the “MSCI Parties) makes any express or implied warranties or representations with respect to such data or the results to be obtained by the use thereof), and the MSCI Parties hereby expressly disclaim all warranties of originality, accuracy, completeness, merchantability or fitness for a particular purpose with respect to such data. Without limiting any of the foregoing, in no event shall any of the MSCI Parties have any liability for any direct, indirect, special, punitive, consequential or any other damages (including lost profits,) even if notified of the possibility of such damages. You cannot invest directly in an index. Past performance does not guarantee future results. The performance data quoted represents past performance and current returns may be lower or higher. The investment return and net asset value will fluctuate so that an investor’s shares, when redeemed, may be worth more or less than the original cost. To obtain performance information current to the most recentmonth-end, please call1-855-274-6673. Periods greater than one year are annualized. Changes in rates of exchange between currencies may cause the value of investments to decrease or increase. The Fund’s performance will fluctuate over long and short term periods. 9
UNAUDITED
FUND SUMMARY
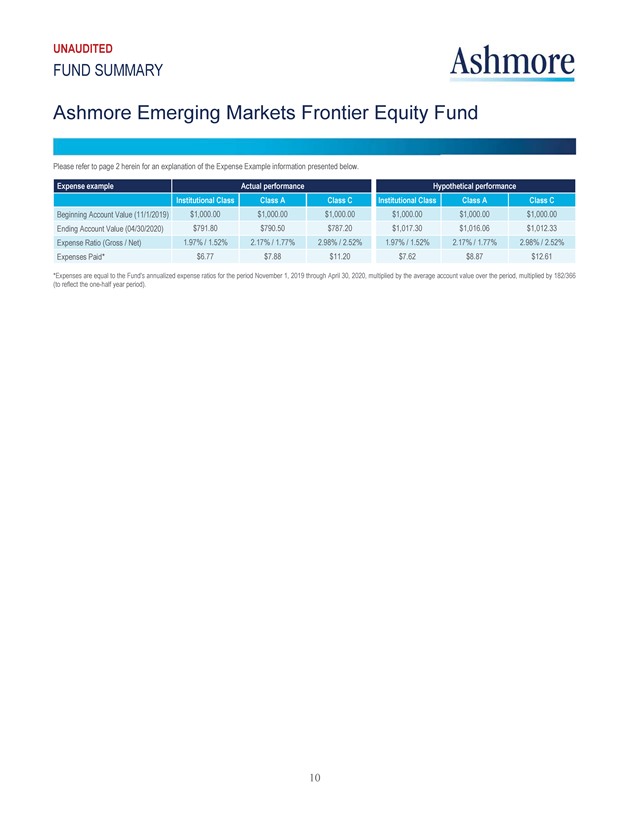
Ashmore Emerging Markets Frontier Equity Fund
Please refer to page 2 herein for an explanation of the Expense Example information presented below. Expense example Actual performance Hypothetical performance Institutional Class Class A Class C Institutional Class Class A Class C Beginning Account Value (11/1/2019) $1,000.00 $1,000.00 $1,000.00 $1,000.00 $1,000.00 $1,000.00 Ending Account Value (04/30/2020) $791.80 $790.50 $787.20 $1,017.30 $1,016.06 $1,012.33 Expense Ratio (Gross / Net) 1.97% / 1.52% 2.17% / 1.77% 2.98% / 2.52% 1.97% / 1.52% 2.17% / 1.77% 2.98% / 2.52% Expenses Paid* $6.77 $7.88 $11.20 $7.62 $8.87 $12.61 *Expenses are equal to the Fund’s annualized expense ratios for the period November 1, 2019 through April 30, 2020, multiplied by the average account value over the period, multiplied by 182/366 (to reflect theone-half year period).
UNAUDITED
FUND SUMMARY
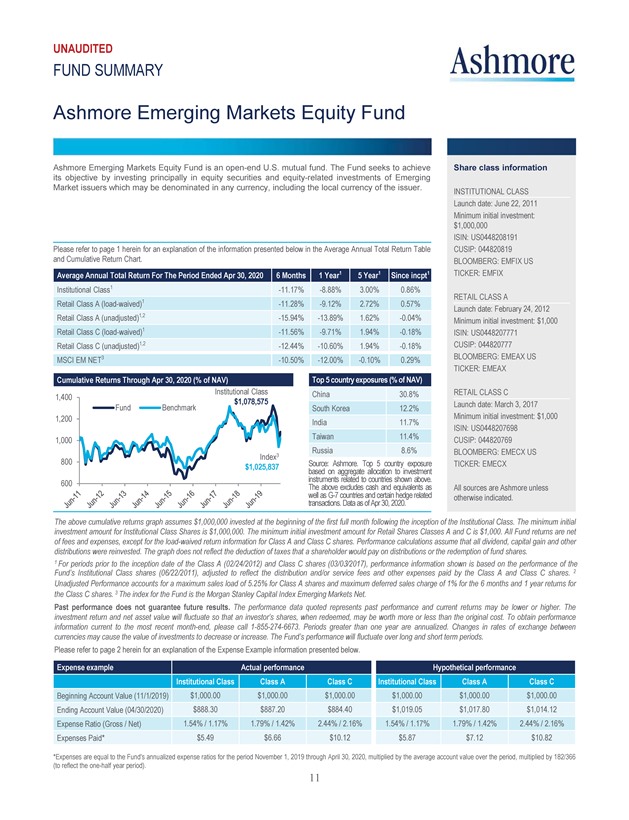
Ashmore Emerging Markets Equity Fund
Ashmore Emerging Markets Equity Fund is an open-end U.S. mutual fund. The Fund seeks to achieve its objective by investing principally in equity securities and equity-related investments of Emerging Market issuers which may be denominated in any currency, including the local currency of the issuer.
Please refer to page 1 herein for an explanation of the information presented below in the Average Annual Total Return Table and Cumulative Return Chart. Average Annual Total Return For The Period Ended Apr 30, 2020 6 Months 1 Year1 5 Year1 Since incpt1 Institutional Class1-11.17%-8.88% 3.00% 0.86% Retail Class A (load-waived)1-11.28%-9.12% 2.72% 0.57% Retail Class A (unadjusted)1,2-15.94%-13.89% 1.62%-0.04% Retail Class C (load-waived)1-11.56%-9.71% 1.94%-0.18% Retail Class C (unadjusted)1,2-12.44%-10.60% 1.94%-0.18% MSCI EM NET3-10.50%-12.00%-0.10% 0.29% Cumulative Returns Through Apr 30, 2020 (% of NAV) Top 5 country exposures (% of NAV) Institutional Class China 30.8% 1,400 $1,078,575 Fund Benchmark South Korea 12.2% 1,200 India 11.7% 1,000 Taiwan 11.4% Russia 8.6% 800 Index3 $1,025,837 Source: Ashmore. Top 5 country exposure based on aggregate allocation to investment instruments related to countries shown above. The above excludes cash and equivalents as well as G-7 countries and certain hedge related transactions. Data as of Apr 30, 2020. Jun-11 Jun-12 Jun-13 Jun-14 Jun-15 Jun-16 Jun-17 Jun-18 Jun-19 Share class information INSTITUTIONAL CLASS Launch date: June 22, 2011 Minimum initial investment: $1,000,000 ISIN: US0448208191 CUSIP: 044820819 BLOOMBERG: EMFIX US TICKER: EMFIX RETAIL CLASS A Launch date: February 24, 2012 Minimum initial investment: $1,000 ISIN: US0448207771 CUSIP: 044820777 BLOOMBERG: EMEAX US TICKER: EMEAX RETAIL CLASS C Launch date: March 3, 2017 Minimum initial investment: $1,000 ISIN: US0448207698 CUSIP: 044820769 BLOOMBERG: EMECX US TICKER: EMECX All sources are Ashmore unless otherwise indicated. The above cumulative returns graph assumes $1,000,000 invested at the beginning of the first full month following the inception of the Institutional Class. The minimum initial investment amount for Institutional Class Shares is $1,000,000. The minimum initial investment amount for Retail Shares Classes A and C is $1,000. All Fund returns are net of fees and expenses, except for the load-waived return information for Class A and Class C shares. Performance calculations assume that all dividend, capital gain and other distributions were reinvested. The graph does not reflect the deduction of taxes that a shareholder would pay on distributions or the redemption of fund shares. 1 For periods prior to the inception date of the Class A (02/24/2012) and Class C shares (03/03/2017), performance information shown is based on the performance of the Fund’s Institutional Class shares (06/22/2011), adjusted to reflect the distribution and/or service fees and other expenses paid by the Class A and Class C shares. 2 Unadjusted Performance accounts for a maximum sales load of 5.25% for Class A shares and maximum deferred sales charge of 1% for the 6 months and 1 year returns for the Class C shares. 3 The index for the Fund is the Morgan Stanley Capital Index Emerging Markets Net. Past performance does not guarantee future results. The performance data quoted represents past performance and current returns may be lower or higher. The investment return and net asset value will fluctuate so that an investor’s shares, when redeemed, may be worth more or less than the original cost. To obtain performance information current to the most recentmonth-end, please call1-855-274-6673. Periods greater than one year are annualized. Changes in rates of exchange between currencies may cause the value of investments to decrease or increase. The Fund’s performance will fluctuate over long and short term periods. Please refer to page 2 herein for an explanation of the Expense Example information presented below. Expense example Actual performance Hypothetical performance Institutional Class Class A Class C Institutional Class Class A Class C Beginning Account Value (11/1/2019) $1,000.00 $1,000.00 $1,000.00 $1,000.00 $1,000.00 $1,000.00 Ending Account Value (04/30/2020) $888.30 $887.20 $884.40 $1,019.05 $1,017.80 $1,014.12 Expense Ratio (Gross / Net) 1.54% / 1.17% 1.79% / 1.42% 2.44% / 2.16% 1.54% / 1.17% 1.79% / 1.42% 2.44% / 2.16% Expenses Paid* $5.49 $6.66 $10.12 $5.87 $7.12 $10.82 *Expenses are equal to the Fund’s annualized expense ratios for the period November 1, 2019 through April 30, 2020, multiplied by the average account value over the period, multiplied by 182/366 (to reflect theone-half year period). 11
UNAUDITED
FUND SUMMARY
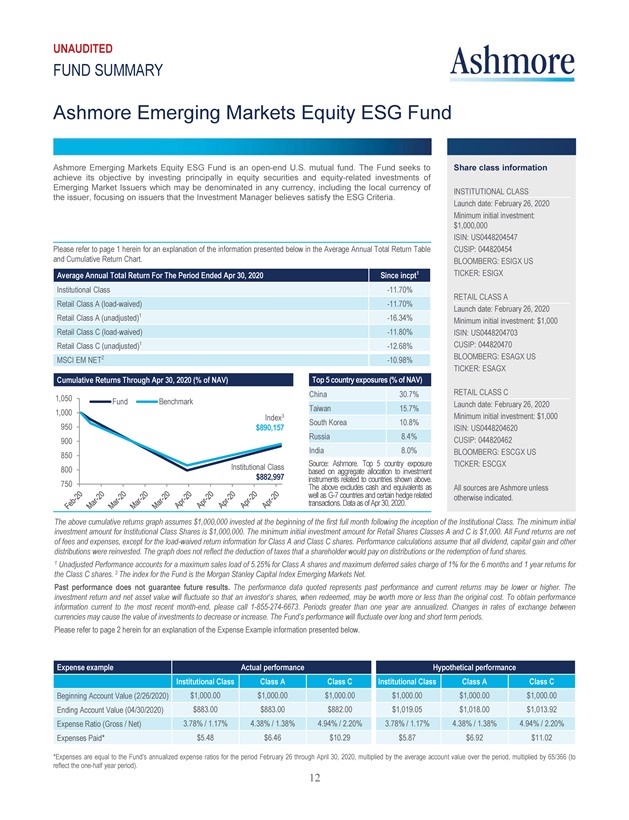
Ashmore Emerging Markets Equity ESG Fund
Ashmore Emerging Markets Equity ESG Fund is an open-end U.S. mutual fund. The Fund seeks to achieve its objective by investing principally in equity securities and equity-related investments of Emerging Market Issuers which may be denominated in any currency, including the local currency of the issuer, focusing on issuers that the Investment Manager believes satisfy the ESG Criteria.
Please refer to page 1 herein for an explanation of the information presented below in the Average Annual Total Return Table and Cumulative Return Chart. Average Annual Total Return For The Period Ended Apr 30, 2020 Since incept1 Institutional Class-11.70% Retail Class A (load-waived)-11.70% Retail Class A (unadjusted)1-16.34% Retail Class C (load-waived)-11.80% Retail Class C (unadjusted)1-12.68% MSCI EM NET2-10.98% Cumulative Returns Through Apr 30, 2020 (% of NAV) Top 5 country exposures (% of NAV) China 30.7% 1,050 Fund Benchmark Taiwan 15.7% 1,000 Index3 South Korea 10.8% 950
$890,157 Russia 8.4% 900 India 8.0% 850 Source: Ashmore. Top 5 country exposure based on aggregate allocation to investment instruments related to countries shown above. The above excludes cash and equivalents as well as G-7 countries and certain hedge related transactions. Data as of Apr 30, 2020. Institutional Class $882,997 Feb-20 Mar-20 Mar-20 Mar-20 Mar-20 Apr-20 Apr-20 Apr-20 Apr-20 Apr-20 Share class information INSTITUTIONAL CLASS Launch date: February 26, 2020 Minimum initial investment: $1,000,000 ISIN: US0448204547 CUSIP: 044820454 BLOOMBERG: ESIGX US TICKER: ESIGX RETAIL CLASS A Launch date: February 26, 2020 Minimum initial investment: $1,000 ISIN: US0448204703 CUSIP: 044820470 BLOOMBERG: ESAGX US TICKER: ESAGX RETAIL CLASS C Launch date: February 26, 2020 Minimum initial investment: $1,000 ISIN: US0448204620 CUSIP: 044820462 BLOOMBERG: ESCGX US TICKER: ESCGX All sources are Ashmore unless otherwise indicated. The above cumulative returns graph assumes $1,000,000 invested at the beginning of the first full month following the inception of the Institutional Class. The minimum initial investment amount for Institutional Class Shares is $1,000,000. The minimum initial investment amount for Retail Shares Classes A and C is $1,000. All Fund returns are net of fees and expenses, except for the load-waived return information for Class A and Class C shares. Performance calculations assume that all dividend, capital gain and other distributions were reinvested. The graph does not reflect the deduction of taxes that a shareholder would pay on distributions or the redemption of fund shares. 1 Unadjusted Performance accounts for a maximum sales load of 5.25% for Class A shares and maximum deferred sales charge of 1% for the 6 months and 1 year returns for the Class C shares. 2 The index for the Fund is the Morgan Stanley Capital Index Emerging Markets Net. Past performance does not guarantee future results. The performance data quoted represents past performance and current returns may be lower or higher. The investment return and net asset value will fluctuate so that an investor’s shares, when redeemed, may be worth more or less than the original cost. To obtain performance information current to the most recentmonth-end, please call1-855-274-6673. Periods greater than one year are annualized. Changes in rates of exchange between currencies may cause the value of investments to decrease or increase. The Fund’s performance will fluctuate over long and short term periods. Please refer to page 2 herein for an explanation of the Expense Example information presented below. Expense example Actual performance Hypothetical performance Institutional Class Class A Class C Institutional Class Class A Class C Beginning Account Value (2/26/2020) $1,000.00 $1,000.00 $1,000.00 $1,000.00 $1,000.00 $1,000.00 Ending Account Value (04/30/2020) $883.00 $883.00 $882.00 $1,019.05 $1,018.00 $1,013.92 Expense Ratio (Gross / Net) 3.78% / 1.17% 4.38% / 1.38% 4.94% / 2.20% 3.78% / 1.17% 4.38% / 1.38% 4.94% / 2.20% Expenses Paid* $5.48 $6.46 $10.29 $5.87 $6.92 $11.02 *Expenses are equal to the Fund’s annualized expense ratios for the period February 26 through April 30, 2020, multiplied by the average account value over the period, multiplied by 65/366 (to reflect theone-half year period). 12
ASHMORE FUNDS
STATEMENTS OF ASSETS AND LIABILITIES
As of April 30, 2020 (Unaudited)
| | | | | | | | | | | | |
| | | Ashmore Emerging Markets Total Return Fund | | | Ashmore Emerging Markets Local Currency Bond Fund | | | Ashmore Emerging Markets Corporate Income Fund |
ASSETS: | | | | | | | | | | | | |
Investments in securities, at value | | $ | 1,119,458,870 | | | | $31,352,167 | | | | $280,863,972 | |
Deposit held at broker | | | 1,826,659 | | | | 270,396 | | | | — | |
Cash | | | 125,084,156 | | | | 3,252,348 | | | | 22,429,498 | |
Foreign currency, at value | | | 3,678,394 | | | | 473,167 | | | | 62 | |
Unrealized appreciation on forward foreign currency exchange contracts | | | 3,290,861 | | | | 256,713 | | | | 6,561 | |
Variation margin receivable on centrally cleared swap contracts | | | — | | | | 51 | | | | — | |
Unrealized appreciation on interest rate swap contracts | | | — | | | | 52,237 | | | | — | |
Due from broker | | | 749,954 | | | | 170,211 | | | | — | |
Receivable for securities and currencies sold | | | 2,212,837 | | | | 15,752 | | | | 5,743,313 | |
Receivable for fund shares sold | | | 3,052,566 | | | | — | | | | 434,348 | |
Receivable from Investment Manager | | | 158,670 | | | | 17,211 | | | | 43,192 | |
Interest and dividends receivable | | | 20,565,703 | | | | 613,625 | | | | 5,069,024 | |
Other assets | | | 108,488 | | | | 14,849 | | | | 42,917 | |
Total Assets | | | 1,280,187,158 | | | | 36,488,727 | | | | 314,632,887 | |
LIABILITIES: | | | | | | | | | | | | |
Reverse repurchase agreements | | | — | | | | — | | | | 1,477,104 | |
Unrealized depreciation on forward foreign currency exchange contracts | | | 5,633,973 | | | | 226,340 | | | | 12,913 | |
Variation margin payable on centrally cleared swap contracts | | | 25,302 | | | | 3,581 | | | | — | |
Payable for securities and currencies purchased | | | 39,902,291 | | | | 15,910 | | | | 12,462,076 | |
Payable for when-issued securities | | | 1,191,000 | | | | 347,979 | | | | — | |
Payable for fund shares redeemed | | | 5,791,485 | | | | 146,563 | | | | 771,192 | |
Distributions payable | | | — | | | | — | | | | 243,365 | |
Due to broker | | | 1,969,740 | | | | 1,080 | | | | — | |
Investment Manager fee payable | | | 974,934 | | | | 27,168 | | | | 296,510 | |
Trustees’ fees payable | | | 30,228 | | | | 1,278 | | | | 8,660 | |
Other liabilities | | | 276,049 | | | | 50,679 | | | | 84,933 | |
Total Liabilities | | | 55,795,002 | | | | 820,578 | | | | 15,356,753 | |
Net Assets | | $ | 1,224,392,156 | | | | $35,668,149 | | | | $299,276,134 | |
NET ASSETS: | | | | | | | | | | | | |
Paid in capital | | $ | 1,657,867,080 | | | | $43,631,777 | | | | $433,999,611 | |
Distributable earnings/(Accumulated loss) | | | (433,474,924 | ) | | | (7,963,628 | ) | | | (134,723,477 | ) |
Net Assets | | $ | 1,224,392,156 | | | | $35,668,149 | | | | $299,276,134 | |
| | | |
Net Assets: | | | | | | | | | | | | |
Class A | | $ | 9,622,682 | | | | $ 1,630,420 | | | | $ 12,263,153 | |
Class C | | | 4,072,796 | | | | 47,892 | | | | 8,019,291 | |
Institutional Class | | | 1,210,696,678 | | | | 33,989,837 | | | | 278,993,690 | |
| | | |
Shares Issued and Outstanding (no par value, unlimited shares authorized): | | | | | | | | | | | | |
Class A | | | 1,600,638 | | | | 255,875 | | | | 1,856,833 | |
Class C | | | 679,368 | | | | 7,623 | | | | 1,215,991 | |
Institutional Class | | | 198,492,533 | | | | 5,114,377 | | | | 40,538,100 | |
| | | |
Net Asset Value and Redemption Price Per Share (Net Asset Per Share Outstanding): | | | | | | | | | | | | |
Class A | | $ | 6.01 | | | | $ 6.37 | | | | $ 6.60 | |
Class C | | | 5.99 | | | | 6.28 | | | | 6.59 | |
Institutional Class | | | 6.10 | | | | 6.65 | | | | 6.88 | |
| | | | |
Cost of Investments in securities | | $ | 1,448,315,996 | | | | $37,078,005 | | | | $358,064,751 | |
Cost of foreign currency held | | $ | 3,558,352 | | | | $ 466,077 | | | | $ 71 | |
See accompanying notes to the financial statements.
13
| | | | | | | | | | | | | | | | | | | | | | | | | | | | |
Ashmore Emerging Markets Short Duration Fund | | Ashmore Emerging Markets
Active Equity Fund | | Ashmore Emerging Markets Small-Cap Equity Fund | | Ashmore Emerging Markets Frontier Equity Fund | | Ashmore Emerging Markets Equity Fund | | Ashmore Emerging Markets
Equity ESG Fund |
| | | | | |
| | | $ 466,443,028 | | | | $ | 50,324,098 | | | | $ | 7,314,357 | | | | $ | 50,840,559 | | | | | $54,056,667 | | | | $ | 8,518,756 | |
| | | — | | | | | — | | | | | — | | | | | — | | | | | — | | | | | — | |
| | | 40,140,557 | | | | | 7,359,871 | | | | | 121,712 | | | | | 1,592,409 | | | | | 1,643,257 | | | | | 247,440 | |
| | | 22,306 | | | | | 291,817 | | | | | 2,501 | | | | | 1,035,976 | | | | | 275,168 | | | | | — | |
| | | — | | | | | — | | | | | — | | | | | — | | | | | — | | | | | — | |
| | | — | | | | | — | | | | | — | | | | | — | | | | | — | | | | | — | |
| | | — | | | | | — | | | | | — | | | | | — | | | | | — | | | | | — | |
| | | — | | | | | — | | | | | — | | | | | — | | | | | — | | | | | — | |
| | | 3,446,632 | | | | | 705,740 | | | | | 97,232 | | | | | 981,208 | | | | | 145,638 | | | | | 72,801 | |
| | | 785,402 | | | | | 1,385,643 | | | | | — | | | | | 1,541 | | | | | 469,378 | | | | | — | |
| | | 112,183 | | | | | 13,054 | | | | | 10,511 | | | | | 28,345 | | | | | 13,551 | | | | | 19,729 | |
| | | 11,602,940 | | | | | 62,468 | | | | | 30,072 | | | | | 263,506 | | | | | 72,891 | | | | | 15,468 | |
| | | 261,538 | | | | | — | | | | | 47 | | | | | 1,632 | | | | | 3,188 | | | | | 16,787 | |
| | | 522,814,586 | | | | | 60,142,691 | | | | | 7,576,432 | | | | | 54,745,176 | | | | | 56,679,738 | | | | | 8,890,981 | |
| | | | | |
| | | — | | | | | — | | | | | — | | | | | — | | | | | — | | | | | — | |
| | | — | | | | | 9,422 | | | | | — | | | | | — | | | | | 172 | | | | | — | |
| | | — | | | | | — | | | | | — | | | | | — | | | | | — | | | | | — | |
| | | — | | | | | 1,344,737 | | | | | 70,945 | | | | | 136,179 | | | | | 757,614 | | | | | 23,522 | |
| | | — | | | | | — | | | | | — | | | | | — | | | | | — | | | | | — | |
| | | 3,373,500 | | | | | 4,970 | | | | | 29,525 | | | | | 12,280 | | | | | 2,992 | | | | | — | |
| | | — | | | | | — | | | | | — | | | | | — | | | | | — | | | | | — | |
| | | — | | | | | — | | | | | — | | | | | 65,611 | | | | | — | | | | | — | |
| | | 293,851 | | | | | 43,195 | | | | | 10,372 | | | | | 66,216 | | | | | 47,031 | | | | | 7,851 | |
| | | 17,027 | | | | | 915 | | | | | 573 | | | | | 1,724 | | | | | 807 | | | | | 188 | |
| | | 152,390 | | | | | 35,261 | | | | | 35,636 | | | | | 61,525 | | | | | 28,926 | | | | | 26,031 | |
| | | 3,836,768 | | | | | 1,438,500 | | | | | 147,051 | | | | | 343,535 | | | | | 837,542 | | | | | 57,592 | |
| | | $ 518,977,818 | | | | $ | 58,704,191 | | | | $ | 7,429,381 | | | | $ | 54,401,641 | | | | $ | 55,842,196 | | | | $ | 8,833,389 | |
| | | | | |
| | | $ 1,009,454,951 | | | | $ | 67,741,846 | | | | $ | 15,366,889 | | | | $ | 77,095,988 | | | | $ | 58,089,849 | | | | $ | 10,000,000 | |
| | | (490,477,133) | | | | | (9,037,655 | ) | | | | (7,937,508 | ) | | | | (22,694,347 | ) | | | | (2,247,653 | ) | | | | (1,166,611 | ) |
| | | $ 518,977,818 | | | | $ | 58,704,191 | | | | $ | 7,429,381 | | | | $ | 54,401,641 | | | | $ | 55,842,196 | | | | $ | 8,833,389 | |
| | | | | |
| | | $ 32,181,729 | | | | $ | 577,333 | | | | $ | 306,532 | | | | $ | 730,982 | | | | $ | 439,997 | | | | $ | 883 | |
| | | 1,514,333 | | | | | 1,221 | | | | | 92,648 | | | | | 300,703 | | | | | 1,102 | | | | | 882 | |
| | | 485,281,756 | | | | | 58,125,637 | | | | | 7,030,201 | | | | | 53,369,956 | | | | | 55,401,097 | | | | | 8,831,624 | |
| | | | | |
| | | 5,307,846 | | | | | 62,723 | | | | | 40,565 | | | | | 115,232 | | | | | 44,409 | | | | | 100 | |
| | | 259,737 | | | | | 135 | | | | | 11,806 | | | | | 48,950 | | | | | 117 | | | | | 100 | |
| | | 81,503,062 | | | | | 6,278,527 | | | | | 721,083 | | | | | 7,227,543 | | | | | 5,779,834 | | | | | 999,800 | |
| | | | | |
| | $ | 6.06 | | | | $ | 9.20 | | | | $ | 7.56 | | | | $ | 6.34 | | | | $ | 9.91 | | | | $ | 8.83 | |
| | | 5.83 | | | | | 9.06 | | | | | 7.85 | | �� | | | 6.14 | | | | | 9.41 | | | | | 8.82 | |
| | | 5.95 | | | | | 9.26 | | | | | 9.75 | | | | | 7.38 | | | | | 9.59 | | | | | 8.83 | |
| | | | | | | | | | | | | | | | | | | | | | | | | | | | | |
| | $ | 906,057,437 | | | | $ | 51,831,760 | | | | $ | 7,458,247 | | | | $ | 61,426,445 | | | | $ | 50,993,060 | | | | $ | 9,204,882 | |
| | $ | 22,030 | | | | $ | 291,271 | | | | $ | 2,473 | | | | $ | 1,037,686 | | | | $ | 275,152 | | | | $ | — | |
See accompanying notes to the financial statements.
14
ASHMORE FUNDS
STATEMENTS OF OPERATIONS
For the Six Month Period Ended April 30, 2020 (Unaudited)
| | | | | | | | | | | | |
| | | Ashmore Emerging Markets Total Return Fund | | | Ashmore Emerging Markets Local Currency Bond Fund | | | Ashmore Emerging Markets Corporate Income Fund | |
| | | |
INVESTMENT INCOME: | | | | | | | | | | | | |
Interest, net of foreign tax withholdings* | | | $ 48,181,025 | | | | $ 1,359,996 | | | | $ 16,089,553 | |
Dividends, net of foreign tax withholdings* | | | — | | | | — | | | | — | |
Total Income | | | 48,181,025 | | | | 1,359,996 | | | | 16,089,553 | |
EXPENSES: | | | | | | | | | | | | |
Investment Manager fees | | | 7,307,363 | | | | 195,512 | | | | 2,557,552 | |
Administration fees | | | 146,135 | | | | 4,116 | | | | 44,475 | |
Custody fees | | | 283,448 | | | | 39,338 | | | | 53,044 | |
Professional fees | | | 255,997 | | | | 22,394 | | | | 88,741 | |
Trustees’ fees | | | 55,796 | | | | 1,348 | | | | 17,294 | |
Offering expenses and registration fees | | | 88,636 | | | | 27,817 | | | | 34,189 | |
Insurance fees | | | 26,463 | | | | 1,255 | | | | 6,875 | |
Printing fees | | | 45,260 | | | | 7,243 | | | | 21,446 | |
Distribution and servicing fees - Class A | | | 13,492 | | | | 2,288 | | | | 18,809 | |
Distribution and servicing fees - Class C | | | 24,691 | | | | 263 | | | | 51,140 | |
Regulatory fees | | | 17,626 | | | | 5,984 | | | | 10,523 | |
Interest expense | | | — | | | | — | | | | 5,196 | |
Total Expenses | | | 8,264,907 | | | | 307,558 | | | | 2,909,284 | |
Less expenses reimbursed by the Investment Manager | | | (773,217 | ) | | | (105,379 | ) | | | (232,109 | ) |
Net Expenses | | | 7,491,690 | | | | 202,179 | | | | 2,677,175 | |
Net Investment Income (Loss) | | | 40,689,335 | | | | 1,157,817 | | | | 13,412,378 | |
NET REALIZED AND UNREALIZED GAINS (LOSSES): | | | | | | | | | | | | |
NET REALIZED GAIN (LOSS) ON: | | | | | | | | | | | | |
Investments in securities | | | (13,575,432 | ) | | | (537,458 | ) | | | (19,103,355 | ) |
Forward foreign currency exchange contracts | | | (28,365,375 | ) | | | (679,647 | ) | | | 60,304 | |
Interest rate swap contracts | | | (1,115,189 | ) | | | (54,038 | ) | | | — | |
Foreign exchange transactions | | | (1,388,491 | ) | | | (149,609 | ) | | | (30,685 | ) |
Net Realized Gain (Loss) | | | (44,444,487 | ) | | | (1,420,752 | ) | | | (19,073,736 | ) |
NET CHANGE IN UNREALIZED APPRECIATION (DEPRECIATION) ON: | | | | | | | | | | | | |
Investments in securities (net of increase (decrease) in deferred foreign taxes of $-, $-, $-, $-, $-, $-, $(539), $-, and $-, respectively) | | | (276,765,079 | ) | | | (4,816,744 | ) | | | (61,079,704 | ) |
Forward foreign currency exchange contracts | | | (3,477,555 | ) | | | (251,428 | ) | | | (6,352 | ) |
Interest rate swap contracts | | | 1,908,987 | | | | 228,879 | | | | — | |
Foreign exchange translations | | | (242,871 | ) | | | (30,472 | ) | | | 1,873 | |
Change in Net Unrealized Appreciation (Depreciation) | | | (278,576,518 | ) | | | (4,869,765 | ) | | | (61,084,183 | ) |
Net Realized and Unrealized Losses | | | (323,021,005 | ) | | | (6,290,517 | ) | | | (80,157,919 | ) |
Net Decrease in Net Assets Resulting from Operations | | | $(282,331,670 | ) | | | $(5,132,700 | ) | | | $(66,745,541 | ) |
* Foreign Tax Withholdings | | | $ 442,045 | | | | $ 50,535 | | | | $ — | |
See accompanying notes to the financial statements.
15
| | | | | | | | | | | | | | | | | | | | | | | | | | | | |
Ashmore Emerging Markets Short Duration Fund | | Ashmore Emerging Markets Active Equity Fund | | Ashmore Emerging Markets Small-Cap Equity Fund | | Ashmore Emerging Markets Frontier Equity Fund | | Ashmore Emerging Markets Equity Fund | | Ashmore Emerging Markets Equity ESG Fund1 |
| | | | | |
| | $ | 46,976,932 | | | | $ | 14,973 | | | | $ | — | | | | $ | — | | | | $ | 948 | | | | $ | 427 | |
| | | — | | | | | 398,007 | | | | | 91,918 | | | | | 1,157,007 | | | | | 200,090 | | | | | 19,883 | |
| | | 46,976,932 | | | | | 412,980 | | | | | 91,918 | | | | | 1,157,007 | | | | | 201,038 | | | | | 20,310 | |
| | | | | |
| | | 3,217,792 | | | | | 286,187 | | | | | 156,909 | | | | | 586,364 | | | | | 228,629 | | | | | 17,094 | |
| | | 99,001 | | | | | 5,723 | | | | | 2,092 | | | | | 7,818 | | | | | 3,976 | | | | | 297 | |
| | | 131,155 | | | | | 19,068 | | | | | 17,997 | | | | | 102,195 | | | | | 18,010 | | | | | 4,020 | |
| | | 204,890 | | | | | 18,005 | | | | | 11,914 | | | | | 20,169 | | | | | 13,930 | | | | | 5,008 | |
| | | 42,795 | | | | | 2,305 | | | | | 807 | | | | | 2,930 | | | | | 1,452 | | | | | 193 | |
| | | 71,846 | | | | | 26,086 | | | | | 27,051 | | | | | 31,072 | | | | | 27,498 | | | | | 24,749 | |
| | | 14,003 | | | | | 358 | | | | | 653 | | | | | 1,479 | | | | | 468 | | | | | 53 | |
| | | 67,910 | | | | | 7,311 | | | | | 7,372 | | | | | 10,509 | | | | | 7,669 | | | | | 4,241 | |
| | | 90,689 | | | | | 376 | | | | | 1,455 | | | | | 5,329 | | | | | 709 | | | | | 1 | |
| | | 8,896 | | | | | 33 | | | | | 686 | | | | | 1,592 | | | | | 6 | | | | | 1 | |
| | | 16,506 | | | | | 4,401 | | | | | 4,456 | | | | | 4,870 | | | | | 4,501 | | | | | 465 | |
| | | 2,810 | | | | | — | | | | | — | | | | | — | | | | | — | | | | | — | |
| | | 3,968,293 | | | | | 369,853 | | | | | 231,392 | | | | | 774,327 | | | | | 306,848 | | | | | 56,122 | |
| | | (549,105 | ) | | | | (77,533 | ) | | | | (70,249 | ) | | | | (173,223 | ) | | | | (73,527 | ) | | | | (38,729 | ) |
| | | 3,419,188 | | | | | 292,320 | | | | | 161,143 | | | | | 601,104 | | | | | 233,321 | | | | | 17,393 | |
| | | 43,557,744 | | | | | 120,660 | | | | | (69,225 | ) | | | | 555,903 | | | | | (32,283 | ) | | | | 2,917 | |
| | | | | |
| | | (44,168,892 | ) | | | | (6,955,531 | ) | | | | (3,504,244 | ) | | | | (7,149,713 | ) | | | | (2,510,053 | ) | | | | (468,320 | ) |
| | | — | | | | | (3,208 | ) | | | | — | | | | | (3,504 | ) | | | | (989 | ) | | | | — | |
| | | — | | | | | — | | | | | — | | | | | — | | | | | — | | | | | — | |
| | | 187 | | | | | (11,690 | ) | | | | (14,558 | ) | | | | (121,558 | ) | | | | 14,888 | | | | | (15,330 | ) |
| | | (44,168,705 | ) | | | | (6,970,429 | ) | | | | (3,518,802 | ) | | | | (7,274,775 | ) | | | | (2,496,154 | ) | | | | (483,650 | ) |
| | | | | |
| | | (304,085,595 | ) | | | | (2,112,014 | ) | | | | 1,095,542 | | | | | (9,763,946 | ) | | | | (33,376 | ) | | | | (686,126 | ) |
| | | — | | | | | (4,746 | ) | | | | — | | | | | — | | | | | (172 | ) | | | | — | |
| | | — | | | | | — | | | | | — | | | | | — | | | | | — | | | | | — | |
| | | (718 | ) | | | | (5,004 | ) | | | | 444 | | | | | (1,916 | ) | | | | 409 | | | | | 248 | |
| | | (304,086,313 | ) | | | | (2,121,764 | ) | | | | 1,095,986 | | | | | (9,765,862 | ) | | | | (33,139 | ) | | | | (685,878 | ) |
| | | (348,255,018 | ) | | | | (9,092,193 | ) | | | | (2,422,816 | ) | | | | (17,040,637 | ) | | | | (2,529,293 | ) | | | | (1,169,528 | ) |
| | $ | (304,697,274 | ) | | | $ | (8,971,533 | ) | | | $ | (2,492,041 | ) | | | $ | (16,484,734 | ) | | | $ | (2,561,576 | ) | | | $ | (1,166,611 | ) |
| | $ | — | | | | $ | 64,298 | | | | $ | 17,722 | | | | $ | 62,232 | | | | $ | 31,097 | | | | $ | 2,304 | |
1 The Fund commenced investment operations on February 26, 2020.
See accompanying notes to the financial statements.
16
ASHMORE FUNDS
STATEMENTS OF CHANGES IN NET ASSETS
For the Six Month Period Ended April 30, 2020 (Unaudited) and the Fiscal Year Ended October 31, 2019
| | | | | | | | | | | | | | | | | | | | | | | | |
| | | Ashmore Emerging Markets Total Return Fund | | | Ashmore Emerging Markets Local Currency Bond Fund | | | Ashmore Emerging Markets
Corporate Income Fund | |
| | | 2020 | | | 2019 | | | 2020 | | | 2019 | | | 2020 | | | 2019 | |
OPERATIONS: | | | | | | | | | | | | | | | | | | | | | | | | |
Net investment income (loss) | | $ | 40,689,335 | | | $ | 79,838,451 | | | $ | 1,157,817 | | | $ | 3,793,360 | | | $ | 13,412,378 | | | $ | 28,325,215 | |
Net realized gain (loss) | | | (44,444,487 | ) | | | (10,064,694 | ) | | | (1,420,752 | ) | | | (4,065,973 | ) | | | (19,073,736 | ) | | | (2,822,143 | ) |
Net change in unrealized appreciation (depreciation) | | | (278,576,518 | ) | | | 51,117,249 | | | | (4,869,765 | ) | | | 8,031,065 | | | | (61,084,183 | ) | | | 6,042,603 | |
Net Increase (Decrease) in Net Assets Resulting from Operations | | | (282,331,670 | ) | | | 120,891,006 | | | | (5,132,700 | ) | | | 7,758,452 | | | | (66,745,541 | ) | | | 31,545,675 | |
| | | | | | | |
DISTRIBUTIONS TO SHAREHOLDERS: | | | | | | | | | | | | | | | | | | | | | | | | |
Class A | | | (295,373 | ) | | | (416,984 | ) | | | (24,315 | ) | | | — | | | | (435,971 | ) | | | (764,139 | ) |
Class C | | | (118,645 | ) | | | (186,063 | ) | | | (627 | ) | | | — | | | | (260,706 | ) | | | (578,625 | ) |
Institutional Class | | | (41,217,700 | ) | | | (61,911,176 | ) | | | (512,379 | ) | | | — | | | | (12,673,822 | ) | | | (27,024,138 | ) |
| | | | | | | | | | | | | | | | | | | | | | | | | |
Total Distributions to Shareholders | | | (41,631,718 | ) | | | (62,514,223 | ) | | | (537,321 | ) | | | — | | | | (13,370,499 | ) | | | (28,366,902 | ) |
TAX RETURN OF CAPITAL DISTRIBUTIONS TO SHAREHOLDERS: | | | | | | | | | | | | | | | | | | | | | | | | |
Class A | | | — | | | | (117,667 | ) | | | — | | | | (14,685 | ) | | | — | | | | — | |
Class C | | | — | | | | (52,499 | ) | | | — | | | | (81 | ) | | | — | | | | — | |
Institutional Class | | | — | | | | (17,060,547 | ) | | | — | | | | (471,758 | ) | | | — | | | | — | |
| | | | | | | | | | | | | | | | | | | | | | | | | |
Total Tax Return of Capital Distributions to Shareholders | | | — | | | | (17,230,713 | ) | | | — | | | | (486,524 | ) | | | — | | | | — | |
FUND SHARE TRANSACTIONS: | | | | | | | | | | | | | | | | | | | | | | | | |
Net increase (decrease) in net assets resulting from Class A share transactions | | | 931,798 | | | | 2,497,025 | | | | (41,118 | ) | | | 432,898 | | | | 1,668,664 | | | | 4,700,433 | |
Net increase (decrease) in net assets resulting from Class C share transactions | | | (379,819 | ) | | | 1,094,917 | | | | 93 | | | | (29,036 | ) | | | (932,258 | ) | | | 1,877,655 | |
Net increase (decrease) in net assets resulting from Institutional Class share transactions | | | 2,993,744 | | | | 173,786,229 | | | | (3,153,982 | ) | | | (27,487,997 | ) | | | (89,352,013 | ) | | | 121,430,883 | |
| | | | | | | | | | | | | | | | | | | | | | | | | |
| | | | | | | |
Net Increase (Decrease) in Net Assets Resulting from Fund Share Transactions | | | 3,545,723 | | | | 177,378,171 | | | | (3,195,007 | ) | | | (27,084,135 | ) | | | (88,615,607 | ) | | | 128,008,971 | |
Total Increase (Decrease) in Net Assets | | | (320,417,665 | ) | | | 218,524,241 | | | | (8,865,028 | ) | | | (19,812,207 | ) | | | (168,731,647 | ) | | | 131,187,744 | |
NET ASSETS: | | | | | | | | | | | | | | | | | | | | | | | | |
Net Assets at the Beginning of period | | | 1,544,809,821 | | | | 1,326,285,580 | | | | 44,533,177 | | | | 64,345,384 | | | | 468,007,781 | | | | 336,820,037 | |
Net Assets at the End of period | | $ | 1,224,392,156 | | | $ | 1,544,809,821 | | | $ | 35,668,149 | | | $ | 44,533,177 | | | $ | 299,276,134 | | | $ | 468,007,781 | |
See accompanying notes to the financial statements.
17
| | | | | | | | | | | | | | | | | | | | | | | | | | | | | | |
Ashmore Emerging Markets Short Duration Fund | | | Ashmore Emerging Markets Active Equity Fund | | | Ashmore Emerging Markets Small-Cap Equity Fund | | | Ashmore Emerging Markets Frontier Equity Fund | |
| 2020 | | | 2019 | | | 2020 | | | 2019 | | | 2020 | | | 2019 | | | 2020 | | | 2019 | |
| | | | | | | |
| | $ 43,557,744 | | | $ | 84,642,186 | | | $ | 120,660 | | | $ | 197,622 | | | $ | (69,225 | ) | | $ | 40,443 | | | $ | 555,903 | | | $ | 1,541,496 | |
| | (44,168,705) | | | | (2,284,467 | ) | | | (6,970,429 | ) | | | (381,475 | ) | | | (3,518,802 | ) | | | (3,392,452 | ) | | | (7,274,775 | ) | | | 579,116 | |
| | (304,086,313) | | | | (120,383,491 | ) | | | (2,121,764 | ) | | | 2,108,933 | | | | 1,095,986 | | | | 6,915,634 | | | | (9,765,862 | ) | | | 3,356,846 | |
| | | | | | | | |
| | (304,697,274) | | | | (38,025,772 | ) | | | (8,971,533 | ) | | | 1,925,080 | | | | (2,492,041 | ) | | | 3,563,625 | | | | (16,484,734 | ) | | | 5,477,458 | |
| | | | | | | |
| | (3,510,083) | | | | (8,284,202 | ) | | | (287 | ) | | | (21,413 | ) | | | — | | | | (298 | ) | | | — | | | | (127,832 | ) |
| | (78,429) | | | | (166,264 | ) | | | — | | | | (1,074 | ) | | | — | | | | — | | | | — | | | | (4,994 | ) |
| | (45,090,623) | | | | (78,738,421 | ) | | | (106,465 | ) | | | (1,732,228 | ) | | | — | | | | (27,129 | ) | | | — | | | | (1,394,737 | ) |
| | | | | | | | | | | | | | | | | | | | | | | | | | | | | | |
| | (48,679,135) | | | | (87,188,887 | ) | | | (106,752 | ) | | | (1,754,715 | ) | | | — | | | | (27,427 | ) | | | — | | | | (1,527,563 | ) |
| | | | | | | |
| | — | | | | — | | | | — | | | | (466 | ) | | | — | | | | (265 | ) | | | — | | | | — | |
| | — | | | | — | | | | — | | | | (21 | ) | | | — | | | | — | | | | — | | | | — | |
| | — | | | | — | | | | — | | | | (48,790 | ) | | | — | | | | (9,711 | ) | | | — | | | | — | |
| | | | | | | | | | | | | | | | | | | | | | | | | | | | | | |
| | | | | | | |
| | — | | | | — | | | | — | | | | (49,277 | ) | | | — | | | | (9,976 | ) | | | — | | | | — | |
| | | | | | | |
| | (55,971,123) | | | | 39,331,061 | | | | 375,571 | | | | (9,080 | ) | | | (753,123 | ) | | | (250,635 | ) | | | (6,151,922 | ) | | | (770,518 | ) |
| | | | | | | |
| | (134,698) | | | | 578,876 | | | | (12,000 | ) | | | 966 | | | | (29,650 | ) | | | (148,936 | ) | | | 69,252 | | | | (117,171 | ) |
| | | | | | | |
| | (380,144,259) | | | | 615,030,356 | | | | 46,695,003 | | | | 2,939,947 | | | | (17,090,762 | ) | | | (9,506,974 | ) | | | (11,367,300 | ) | | | (567,809 | ) |
| | | | | | | | | | | | | | | | | | | | | | | | | | | | | | |
| | | | | | | |
| | (436,250,080) | | | | 654,940,293 | | | | 47,058,574 | | | | 2,931,833 | | | | (17,873,535 | ) | | | (9,906,545 | ) | | | (17,449,970 | ) | | | (1,455,498 | ) |
| | | | | | | | |
| | (789,626,489) | | | | 529,725,634 | | | | 37,980,289 | | | | 3,052,921 | | | | (20,365,576 | ) | | | (6,380,323 | ) | | | (33,934,704 | ) | | | 2,494,397 | |
| | | | | | | |
| | 1,308,604,307 | | | | 778,878,673 | | | | 20,723,902 | | | | 17,670,981 | | | | 27,794,957 | | | | 34,175,280 | | | | 88,336,345 | | | | 85,841,948 | |
| | $ 518,977,818 | | | | $1,308,604,307 | | | | $58,704,191 | | | | $20,723,902 | | | $ | 7,429,381 | | | | $27,794,957 | | | $ | 54,401,641 | | | | $88,336,345 | |
See accompanying notes to the financial statements.
18
ASHMORE FUNDS
STATEMENTS OF CHANGES IN NET ASSETS
For the Six Month Period Ended April 30, 2020 (Unaudited) and the Fiscal Year Ended October 31, 2019
| | | | | | | | | | | | |
| | | Ashmore Emerging Markets Equity Fund | | | Ashmore
Emerging Markets
Equity ESG Fund1 |
| | | 2020 | | | 2019 | | | 2020 |
OPERATIONS: | | | | | | | | | | | | |
| | | | |
Net investment income (loss) | | $ | (32,283 | ) | | $ | 187,250 | | | $ | 2,917 | |
| | | | |
Net realized gain (loss) | | | (2,496,154 | ) | | | (1,282,131 | ) | | | (483,650 | ) |
| | | | |
Net change in unrealized appreciation (depreciation) | | | (33,139 | ) | | | 7,114,444 | | | | (685,878 | ) |
| | | | |
Net Increase (Decrease) in Net Assets Resulting from Operations | | | (2,561,576 | ) | | | 6,019,563 | | | | (1,166,611 | ) |
| | | | |
DISTRIBUTIONS TO SHAREHOLDERS: | | | | | | | | | | | | |
| | | | |
Class A | | | (610 | ) | | | (12,365 | ) | | | — | |
| | | | |
Class C | | | — | | | | (21 | ) | | | — | |
| | | | |
Institutional Class | | | (50,822 | ) | | | (760,397 | ) | | | — | |
| | | | | | | | | | | | | |
| | | | |
Total Distributions to Shareholders | | | (51,432 | ) | | | (772,783 | ) | | | — | |
| | | | |
FUND SHARE TRANSACTIONS: | | | | | | | | | | | | |
| | | | |
Net increase (decrease) in net assets resulting from Class A share transactions | | | (145,818 | ) | | | 264,418 | | | | 1,000 | |
| | | | |
Net increase (decrease) in net assets resulting from Class C share transactions | | | — | | | | 19 | | | | 1,000 | |
| | | | |
Net increase (decrease) in net assets resulting from Institutional Class share transactions | | | 22,948,173 | | | | 5,675,604 | | | | 9,998,000 | |
| | | | | | | | | | | | | |
| | | | |
Net Increase (Decrease) in Net Assets Resulting from Fund Share Transactions | | | 22,802,355 | | | | 5,940,041 | | | | 10,000,000 | |
| | | | |
Total Increase (Decrease) in Net Assets | | | 20,189,347 | | | | 11,186,821 | | | | 8,833,389 | |
| | | | |
NET ASSETS: | | | | | | | | | | | | |
| | | | |
Net Assets at the Beginning of period | | | 35,652,849 | | | | 24,466,028 | | | | — | |
| | | | |
Net Assets at the End of period | | $ | 55,842,196 | | | $ | 35,652,849 | | | $ | 8,833,389 | |
1 The Fund commenced investment operations on February 26, 2020.
See accompanying notes to the financial statements.
19
ASHMORE FUNDS
FINANCIAL HIGHLIGHTS
Ashmore Emerging Markets Total Return Fund
| | | | | | | | | | | | | | | | | | | | | | | | |
| | | | | | | | | Class A | | | | | | | | | | |
| | | | | | |
| | | Six Months Ended April 30, 2020 (Unaudited) | | | Year Ended October 31, 2019 | | | Year Ended October 31, 2018 | | | Year Ended October 31, 2017 | | | Year Ended October 31, 2016 | | | Year Ended October 31, 2015 | |
| | | | |
Net asset value at beginning of period | | | $ 7.54 | | | | $ 7.31 | | | | $ 8.22 | | | | $ 8.01 | | | | $ 7.49 | | | | $ 8.75 | |
| | | | | | |
Income (loss) from investment operations: | | | | | | | | | | | | | | | | | | | | | | | | |
Net investment income | | | 0.19 | | | | 0.40 | | | | 0.36 | 1 | | | 0.56 | 1 | | | 0.58 | 1 | | | 0.48 | 1 |
Net realized and unrealized gain (loss) | | | (1.52 | ) | | | 0.24 | | | | (0.82 | ) | | | 0.15 | | | | 0.49 | | | | (1.24 | ) |
| | | | |
Total from investment operations | | | (1.33 | ) | | | 0.64 | | | | (0.46 | ) | | | 0.71 | | | | 1.07 | | | | (0.76 | ) |
| | | | | | |
Less distributions: | | | | | | | | | | | | | | | | | | | | | | | | |
| | | | | | |
From net investment income | | | (0.20 | ) | | | (0.33 | ) | | | (0.16 | ) | | | (0.50 | ) | | | (0.33 | ) | | | — | |
From net realized gain | | | — | | | | — | | | | (0.11 | ) | | | — | | | | — | | | | — | |
Tax return of capital | | | — | | | | (0.08 | ) | | | (0.18 | ) | | | — | | | | (0.22 | ) | | | (0.50 | ) |
| | | | |
| | | | | | |
Total distributions | | | (0.20 | ) | | | (0.41 | ) | | | (0.45 | ) | | | (0.50 | ) | | | (0.55 | ) | | | (0.50 | ) |
| | | | |
Net asset value at end of period | | | $ 6.01 | | | | $ 7.54 | | | | $ 7.31 | | | | $ 8.22 | | | | $ 8.01 | | | | $ 7.49 | |
| | | | |
| | | | | | |
Total return2 | | | (18.06 | )% | | | 8.68 | % | | | (5.65 | )% | | | 9.12 | % | | | 15.15 | % | | | (8.78 | )% |
| | | | | | |
Portfolio turnover rate3 | | | 33 | % | | | 49 | % | | | 66 | % | | | 65 | % | | | 91 | % | | | 101 | % |
| | | | | | |
Net assets, end of period (in thousands) | | | $ 9,623 | | | | $11,108 | | | | $8,347 | | | | $18,231 | | | | $3,445 | | | | $2,951 | |
| | | | | | |
Ratios to average net assets:4 | | | | | | | | | | | | | | | | | | | | | | | | |
Total expenses to average net assets: | | | | | | | | | | | | | | | | | | | | | | | | |
Total expenses before reimbursements | | | 1.38 | % | | | 1.36 | % | | | 1.36 | % | | | 1.37 | % | | | 1.41 | % | | | 1.37 | % |
Total expenses after reimbursements | | | 1.27 | % | | | 1.27 | % | | | 1.27 | % | | | 1.27 | % | | | 1.27 | % | | | 1.29 | % |
| | | | | | |
Net investment income to average net assets: | | | | | | | | | | | | | | | | | | | | | | | | |
Net investment income before reimbursements | | | 5.21 | % | | | 5.16 | % | | | 4.42 | % | | | 6.81 | % | | | 7.48 | % | | | 5.91 | % |
Net investment income after reimbursements | | | 5.32 | % | | | 5.25 | % | | | 4.51 | % | | | 6.91 | % | | | 7.62 | % | | | 5.99 | % |
See accompanying notes to the financial statements.
20
ASHMORE FUNDS
FINANCIAL HIGHLIGHTS
Ashmore Emerging Markets Total Return Fund
| | | | | | | | | | | | | | | | | | | | | | | | |
| | | | | | | | | Class C | | | | | | | |
| | | | | | |
| | | Six Months Ended April 30, 2020 (Unaudited) | | | Year Ended October 31, 2019 | | | Year Ended October 31, 2018 | | | Year Ended October 31, 2017 | | | Year Ended October 31, 2016 | | | Year Ended October 31, 2015 | |
| | | | |
Net asset value at beginning of period | | | $ 7.53 | | | | $ 7.29 | | | | $ 8.21 | | | | $ 8.00 | | | | $ 7.48 | | | | $ 8.74 | |
| | | | | | |
Income (loss) from investment operations: | | | | | | | | | | | | | | | | | | | | | | | | |
Net investment income | | | 0.17 | | | | 0.34 | | | | 0.31 | 1 | | | 0.46 | 1 | | | 0.53 | 1 | | | 0.44 | 1 |
Net realized and unrealized gain (loss) | | | (1.54 | ) | | | 0.25 | | | | (0.83 | ) | | | 0.19 | | | | 0.49 | | | | (1.26 | ) |
| | | | |
Total from investment operations | | | (1.37 | ) | | | 0.59 | | | | (0.52 | ) | | | 0.65 | | | | 1.02 | | | | (0.82 | ) |
| | | | | | |
Less distributions: | | | | | | | | | | | | | | | | | | | | | | | | |
| | | | | | |
From net investment income | | | (0.17 | ) | | | (0.28 | ) | | | (0.14 | ) | | | (0.44 | ) | | | (0.30 | ) | | | — | |
From net realized gain | | | — | | | | — | | | | (0.11 | ) | | | — | | | | — | | | | — | |
Tax return of capital | | | — | | | | (0.07 | ) | | | (0.15 | ) | | | — | | | | (0.20 | ) | | | (0.44 | ) |
| | | | |
| | | | | | |
Total distributions | | | (0.17 | ) | | | (0.35 | ) | | | (0.40 | ) | | | (0.44 | ) | | | (0.50 | ) | | | (0.44 | ) |
| | | | |
Net asset value at end of period | | | $ 5.99 | | | | $ 7.53 | | | | $ 7.29 | | | | $ 8.21 | | | | $ 8.00 | | | | $ 7.48 | |
| | | | |
| | | | | | |
Total return2 | | | (18.50 | )% | | | 8.02 | % | | | (6.43 | )% | | | 8.31 | % | | | 14.32 | % | | | (9.58 | )% |
| | | | | | |
Portfolio turnover rate3 | | | 33 | % | | | 49 | % | | | 66 | % | | | 65 | % | | | 91 | % | | | 101 | % |
| | | | | | |
Net assets, end of period (in thousands) | | | $ 4,073 | | | | $5,506 | | | | $4,278 | | | | $3,926 | | | | $2,451 | | | | $ 443 | |
| | | | | | |
Ratios to average net assets:4 | | | | | | | | | | | | | | | | | | | | | | | | |
Total expenses to average net assets: | | | | | | | | | | | | | | | | | | | | | | | | |
Total expenses before reimbursements | | | 2.13 | % | | | 2.11 | % | | | 2.12 | % | | | 2.12 | % | | | 2.15 | % | | | 2.12 | % |
Total expenses after reimbursements | | | 2.02 | % | | | 2.02 | % | | | 2.02 | % | | | 2.02 | % | | | 2.02 | % | | | 2.03 | % |
| | | | | | |
Net investment income to average net assets: | | | | | | | | | | | | | | | | | | | | | | | | |
Net investment income before reimbursements | | | 4.47 | % | | | 4.41 | % | | | 3.92 | % | | | 5.59 | % | | | 6.79 | % | | | 5.35 | % |
Net investment income after reimbursements | | | 4.58 | % | | | 4.50 | % | | | 4.02 | % | | | 5.69 | % | | | 6.92 | % | | | 5.44 | % |
See accompanying notes to the financial statements.
21
ASHMORE FUNDS
FINANCIAL HIGHLIGHTS
Ashmore Emerging Markets Total Return Fund
| | | | | | | | | | | | | | | | | | | | | | | | |
| | | | | | | | | Institutional Class | | | | | | | |
| | | | | | |
| | | Six Months Ended April 30, 2020 (Unaudited) | | | Year Ended October 31, 2019 | | | Year Ended October 31, 2018 | | | Year Ended October 31, 2017 | | | Year Ended October 31, 2016 | | | Year Ended October 31, 2015 | |
| | | | |
Net asset value at beginning of period | | | $ 7.65 | | | | $ 7.41 | | | | $ 8.34 | | | | $ 8.13 | | | | $ 7.60 | | | | $ 8.88 | |
Income (loss) from investment operations: | | | | | | | | | | | | | | | | | | | | | | | | |
Net investment income | | | 0.21 | | | | 0.44 | | | | 0.40 | 1 | | | 0.55 | 1 | | | 0.61 | 1 | | | 0.53 | 1 |
Net realized and unrealized gain (loss) | | | (1.55 | ) | | | 0.24 | | | | (0.85 | ) | | | 0.19 | | | | 0.50 | | | | (1.28 | ) |
| | | | |
Total from investment operations | | | (1.34 | ) | | | 0.68 | | | | (0.45 | ) | | | 0.74 | | | | 1.11 | | | | (0.75 | ) |
| | | | | | |
Less distributions: | | | | | | | | | | | | | | | | | | | | | | | | |
| | | | | | |
From net investment income | | | (0.21 | ) | | | (0.35 | ) | | | (0.17 | ) | | | (0.53 | ) | | | (0.35 | ) | | | — | |
From net realized gain | | | — | | | | — | | | | (0.11 | ) | | | — | | | | — | | | | — | |
Tax return of capital | | | — | | | | (0.09 | ) | | | (0.20 | ) | | | — | | | | (0.23 | ) | | | (0.53 | ) |
| | | | |
| | | | | | |
Total distributions | | | (0.21 | ) | | | (0.44 | ) | | | (0.48 | ) | | | (0.53 | ) | | | (0.58 | ) | | | (0.53 | ) |
| | | | |
Net asset value at end of period | | | $ 6.10 | | | | $ 7.65 | | | | $ 7.41 | | | | $ 8.34 | | | | $ 8.13 | | | | $ 7.60 | |
| | | | |
| | | | | | |
Total return2 | | | (17.94 | )% | | | 9.04 | % | | | (5.53 | )% | | | 9.36 | % | | | 15.49 | % | | | (8.58 | )% |
| | | | | | |
Portfolio turnover rate3 | | | 33 | % | | | 49 | % | | | 66 | % | | | 65 | % | | | 91 | % | | | 101 | % |
| | | | | | |
Net assets, end of period (in thousands) | | | $1,210,697 | | | | $1,528,196 | | | | $1,313,660 | | | | $1,110,901 | | | | $808,872 | | | | $533,742 | |
| | | | | | |
Ratios to average net assets:4 | | | | | | | | | | | | | | | | | | | | | | | | |
Total expenses to average net assets: | | | | | | | | | | | | | | | | | | | | | | | | |
Total expenses before reimbursements | | | 1.13 | % | | | 1.11 | % | | | 1.12 | % | | | 1.12 | % | | | 1.16 | % | | | 1.12 | % |
Total expenses after reimbursements | | | 1.02 | % | | | 1.02 | % | | | 1.02 | % | | | 1.02 | % | | | 1.02 | % | | | 1.02 | % |
| | | | | | |
Net investment income to average net assets: | | | | | | | | | | | | | | | | | | | | | | | | |
Net investment income before reimbursements | | | 5.47 | % | | | 5.40 | % | | | 4.97 | % | | | 6.60 | % | | | 7.77 | % | | | 6.40 | % |
Net investment income after reimbursements | | | 5.58 | % | | | 5.49 | % | | | 5.07 | % | | | 6.70 | % | | | 7.91 | % | | | 6.50 | % |
| 1 | Per share amounts are based on average number of shares outstanding during the period. |
| 2 | Assumes investment at net asset value at the beginning of the period, reinvestment of distributions at net asset value on distribution date, and a complete redemption of the investment at net asset value at the end of the period, excluding the impact of sales charges. Total return is not annualized for periods less than one year. |
| 3 | The portfolio turnover rate is calculated by dividing the lesser of cost of purchases or proceeds from sales of long term portfolio securities, including fully funded total return swaps, by the monthly average of the value of the long term portfolio securities. Portfolio turnover is not annualized for periods less than one year. |
| 4 | Annualized for periods less than one year. |
See accompanying notes to the financial statements.
22
ASHMORE FUNDS
FINANCIAL HIGHLIGHTS
Ashmore Emerging Markets Local Currency Bond Fund
| | | | | | | | | | | | | | | | | | | | | | | | |
| | | | | | | | | Class A | | | | | | | | | | |
| | | | | | |
| | | Six Months Ended April 30, 2020 (Unaudited) | | | Year Ended
October 31,
2019 | | | Year Ended
October 31,
2018 | | | Year Ended
October 31,
2017 | | | Year Ended
October 31,
2016 | | | Year Ended
October 31,
2015 | |
| | | | |
Net asset value at beginning of period | | | $ 7.35 | | | | $ 6.53 | | | | $ 7.22 | | | | $ 7.06 | | | | $ 6.57 | | | | $ 8.44 | |
| | | | | | |
Income (loss) from investment operations: | | | | | | | | | | | | | | | | | | | | | | | | |
Net investment income | | | 0.11 | | | | 0.59 | | | | 0.36 | | | | 0.34 | 1 | | | 0.30 | 1 | | | 0.29 | |
Net realized and unrealized gain (loss) | | | (1.00 | ) | | | 0.27 | | | | (0.88 | ) | | | 0.14 | | | | 0.49 | | | | (1.88 | ) |
| | | | |
Total from investment operations | | | (0.89 | ) | | | 0.86 | | | | (0.52 | ) | | | 0.48 | | | | 0.79 | | | | (1.59 | ) |
| | | | | | |
Less distributions: | | | | | | | | | | | | | | | | | | | | | | | | |
| | | | | | |
From net investment income | | | (0.09 | ) | | | — | | | | (0.08 | ) | | | (0.09 | ) | | | — | | | | — | |
From net realized gain | | | — | | | | — | | | | — | | | | — | | | | — | | | | — | |
Tax return of capital | | | — | | | | (0.04 | ) | | | (0.09 | ) | | | (0.23 | ) | | | (0.30 | ) | | | (0.28 | ) |
| | | | |
| | | | | | |
Total distributions | | | (0.09 | ) | | | (0.04 | ) | | | (0.17 | ) | | | (0.32 | ) | | | (0.30 | ) | | | (0.28 | ) |
| | | | |
Net asset value at end of period | | | $ 6.37 | | | | $ 7.35 | | | | $ 6.53 | | | | $ 7.22 | | | | $ 7.06 | | | | $ 6.57 | |
| | | | |
| | | | | | |
Total return2 | | | (12.26 | )% | | | 13.24 | % | | | (7.47 | )% | | | 6.83 | % | | | 12.37 | % | | | (19.17 | )% |
| | | | | | |
Portfolio turnover rate3 | | | 28 | % | | | 56 | % | | | 75 | % | | | 68 | % | | | 83 | % | | | 83 | % |
| | | | | | |
Net assets, end of period (in thousands) | | | $ 1,630 | | | | $1,933 | | | | $1,259 | | | | $ 915 | | | | $ 841 | | | | $ 712 | |
| | | | | | |
Ratios to average net assets:4 | | | | | | | | | | | | | | | | | | | | | | | | |
Total expenses to average net assets: | | | | | | | | | | | | | | | | | | | | | | | | |
Total expenses before reimbursements | | | 1.74 | % | | | 1.55 | % | | | 1.57 | % | | | 1.51 | % | | | 1.55 | % | | | 1.51 | % |
Total expenses after reimbursements | | | 1.22 | % | | | 1.22 | % | | | 1.22 | % | | | 1.22 | % | | | 1.22 | % | | | 1.23 | % |
| | | | | | |
Net investment income to average net assets: | | | | | | | | | | | | | | | | | | | | | | | | |
Net investment income before reimbursements | | | 4.88 | % | | | 5.08 | % | | | 4.63 | % | | | 4.37 | % | | | 4.10 | % | | | 3.53 | % |
Net investment income after reimbursements | | | 5.40 | % | | | 5.41 | % | | | 4.98 | % | | | 4.66 | % | | | 4.43 | % | | | 3.81 | % |
See accompanying notes to the financial statements.
23
ASHMORE FUNDS
FINANCIAL HIGHLIGHTS
Ashmore Emerging Markets Local Currency Bond Fund
| | | | | | | | | | | | | | | | | | | | | | | | |
| | | | | | | | | Class C | | | | | | | |
| | | | | | |
| | | Six Months Ended April 30, 2020 (Unaudited) | | | Year Ended October 31, 2019 | | | Year Ended October 31, 2018 | | | Year Ended October 31, 2017 | | | Year Ended October 31,
2016 | | | Year Ended
October 31, 2015 | |
| | | | |
Net asset value at beginning of period | | | $ 7.27 | | | | $ 6.47 | | | | $ 7.18 | | | | $ 7.05 | | | | $ 6.56 | | | | $ 8.42 | |
| | | | | | |
Income (loss) from investment operations: | | | | | | | | | | | | | | | | | | | | | | | | |
Net investment income | | | 0.08 | | | | 0.34 | | | | 0.30 | | | | 0.28 | 1 | | | 0.25 | 1 | | | 0.18 | |
Net realized and unrealized gain (loss) | | | (0.99 | ) | | | 0.47 | | | | (0.88 | ) | | | 0.15 | | | | 0.49 | | | | (1.82 | ) |
| | | | |
Total from investment operations | | | (0.91 | ) | | | 0.81 | | | | (0.58 | ) | | | 0.43 | | | | 0.74 | | | | (1.64 | ) |
| | | | | | |
Less distributions: | | | | | | | | | | | | | | | | | | | | | | | | |
| | | | | | |
From net investment income | | | (0.08 | ) | | | — | | | | (0.07 | ) | | | (0.09 | ) | | | — | | | | — | |
From net realized gain | | | — | | | | — | | | | — | | | | — | | | | — | | | | — | |
Tax return of capital | | | — | | | | (0.01 | ) | | | (0.06 | ) | | | (0.21 | ) | | | (0.25 | ) | | | (0.22 | ) |
| | | | |
| | | | | | |
Total distributions | | | (0.08 | ) | | | (0.01 | ) | | | (0.13 | ) | | | (0.30 | ) | | | (0.25 | ) | | | (0.22 | ) |
| | | | |
Net asset value at end of period | | | $ 6.28 | | | | $ 7.27 | | | | $ 6.47 | | | | $ 7.18 | | | | $ 7.05 | | | | $ 6.56 | |
| | | | |
| | | | | | |
Total return2 | | | (12.65 | )% | | | 12.54 | % | | | (8.24 | )% | | | 6.05 | % | | | 11.75 | % | | | (19.83 | )% |
| | | | | | |
Portfolio turnover rate3 | | | 28 | % | | | 56 | % | | | 75 | % | | | 68 | % | | | 83 | % | | | 83 | % |
| | | | | | |
Net assets, end of period (in thousands) | | | $ 48 | | | | $ 55 | | | | $ 77 | | | | $ 98 | | | | $ 70 | | | | $ 40 | |
| | | | | | |
Ratios to average net assets:4 | | | | | | | | | | | | | | | | | | | | | | | | |
Total expenses to average net assets: | | | | | | | | | | | | | | | | | | | | | | | | |
Total expenses before reimbursements | | | 2.49 | % | | | 2.29 | % | | | 2.31 | % | | | 2.26 | % | | | 2.30 | % | | | 2.26 | % |
Total expenses after reimbursements | | | 1.97 | % | | | 1.97 | % | | | 1.97 | % | | | 1.97 | % | | | 1.97 | % | | | 1.99 | % |
| | | | | | |
Net investment income to average net assets: | | | | | | | | | | | | | | | | | | | | | | | | |
Net investment income before reimbursements | | | 4.13 | % | | | 4.33 | % | | | 3.85 | % | | | 3.62 | % | | | 3.35 | % | | | 2.71 | % |
Net investment income after reimbursements | | | 4.65 | % | | | 4.65 | % | | | 4.19 | % | | | 3.91 | % | | | 3.68 | % | | | 2.98 | % |
See accompanying notes to the financial statements.
24
ASHMORE FUNDS
FINANCIAL HIGHLIGHTS
Ashmore Emerging Markets Local Currency Bond Fund
| | | | | | | | | | | | | | | | | | | | | | | | |
| | | | | | | | | Institutional Class | | | | | | | |
| | | | | | |
| | | Six Months Ended April 30, 2020
(Unaudited) | | | Year Ended October 31,
2019 | | | Year Ended October 31, 2018 | | | Year Ended October 31, 2017 | | | Year Ended October 31, 2016 | | | Year Ended
October 31,
2015 | |
| | | | |
Net asset value at beginning of period | | | $ 7.66 | | | | $ 6.79 | | | | $ 7.50 | | | | $ 7.31 | | | | $ 6.80 | | | | $ 8.73 | |
Income (loss) from investment operations: | | | | | | | | | | | | | | | | | | | | | | | | |
Net investment income | | | 0.17 | | | | 0.65 | | | | 0.41 | | | | 0.37 | 1 | | | 0.33 | 1 | | | 0.31 | |
Net realized and unrealized gain (loss) | | | (1.09 | ) | | | 0.27 | | | | (0.94 | ) | | | 0.15 | | | | 0.51 | | | | (1.93 | ) |
| | | | |
Total from investment operations | | | (0.92 | ) | | | 0.92 | | | | (0.53 | ) | | | 0.52 | | | | 0.84 | | | | (1.62 | ) |
| | | | | | |
Less distributions: | | | | | | | | | | | | | | | | | | | | | | | | |
| | | | | | |
From net investment income | | | (0.09 | ) | | | — | | | | (0.09 | ) | | | (0.09 | ) | | | — | | | | — | |
From net realized gain | | | — | | | | — | | | | — | | | | — | | | | — | | | | — | |
Tax return of capital | | | — | | | | (0.05 | ) | | | (0.09 | ) | | | (0.24 | ) | | | (0.33 | ) | | | (0.31 | ) |
| | | | |
| | | | | | |
Total distributions | | | (0.09 | ) | | | (0.05 | ) | | | (0.18 | ) | | | (0.33 | ) | | | (0.33 | ) | | | (0.31 | ) |
| | | | |
Net asset value at end of period | | | $ 6.65 | | | | $ 7.66 | | | | $ 6.79 | | | | $ 7.50 | | | | $ 7.31 | | | | $ 6.80 | |
| | | | |
| | | | | | |
Total return2 | | | (12.25 | )% | | | 13.59 | % | | | (7.33 | )% | | | 7.12 | % | | | 12.69 | % | | | (18.91 | )% |
| | | | | | |
Portfolio turnover rate3 | | | 28 | % | | | 56 | % | | | 75 | % | | | 68 | % | | | 83 | % | | | 83 | % |
| | | | | | |
Net assets, end of period (in thousands) | | | $33,990 | | | | $42,545 | | | | $63,009 | | | | $84,747 | | | | $80,803 | | | | $79,492 | |
| | | | | | |
Ratios to average net assets:4 | | | | | | | | | | | | | | | | | | | | | | | | |
Total expenses to average net assets: | | | | | | | | | | | | | | | | | | | | | | | | |
Total expenses before reimbursements | | | 1.48 | % | | | 1.28 | % | | | 1.32 | % | | | 1.26 | % | | | 1.30 | % | | | 1.26 | % |
Total expenses after reimbursements | | | 0.97 | % | | | 0.97 | % | | | 0.97 | % | | | 0.97 | % | | | 0.97 | % | | | 0.97 | % |
| | | | | | |
Net investment income to average net assets: | | | | | | | | | | | | | | | | | | | | | | | | |
Net investment income before reimbursements | | | 5.13 | % | | | 5.31 | % | | | 4.87 | % | | | 4.62 | % | | | 4.35 | % | | | 3.78 | % |
Net investment income after reimbursements | | | 5.64 | % | | | 5.62 | % | | | 5.22 | % | | | 4.91 | % | | | 4.68 | % | | | 4.07 | % |
| 1 | Per share amounts are based on average number of shares outstanding during the period. |
| 2 | Assumes investment at net asset value at the beginning of the period, reinvestment of distributions at net asset value on distribution date, and a complete redemption of the investment at net asset value at the end of the period, excluding the impact of sales charges. Total return is not annualized for periods less than one year. |
| 3 | The portfolio turnover rate is calculated by dividing the lesser of cost of purchases or proceeds from sales of long term portfolio securities, including fully funded total return swaps, by the monthly average of the value of the long term portfolio securities. Portfolio turnover is not annualized for periods less than one year. |
| 4 | Annualized for periods less than one year. |
See accompanying notes to the financial statements.
25
ASHMORE FUNDS
FINANCIAL HIGHLIGHTS
Ashmore Emerging Markets Corporate Income Fund
| | | | | | | | | | | | | | | | | | | | | | | | |
| | | | | | | | | Class A | | | | | | | |
| | | | | | |
| | | Six Months Ended April 30, 2020 (Unaudited) | | | Year Ended October 31, 2019 | | | Year Ended October 31, 2018 | | | Year Ended October 31, 2017 | | | Year Ended October 31, 2016 | | | Year Ended October 31, 2015 | |
| | | | |
Net asset value at beginning of period | | | $ 7.92 | | | | $ 7.87 | | | | $ 8.56 | | | | $ 7.92 | | | | $ 7.66 | | | | $ 8.94 | |
| | | | | | |
Income (loss) from investment operations: | | | | | | | | | | | | | | | | | | | | | | | | |
Net investment income | | | 0.23 | | | | 0.52 | | | | 0.51 | | | | 0.57 | | | | 0.70 | | | | 0.74 | |
Net realized and unrealized gain (loss) | | | (1.33 | ) | | | 0.03 | | | | (0.71 | ) | | | 0.65 | | | | 0.21 | | | | (1.21 | ) |
| | | | |
Total from investment operations | | | (1.10 | ) | | | 0.55 | | | | (0.20 | ) | | | 1.22 | | | | 0.91 | | | | (0.47 | ) |
| | | | | | |
Less distributions: | | | | | | | | | | | | | | | | | | | | | | | | |
| | | | | | |
From net investment income | | | (0.22 | ) | | | (0.50 | ) | | | (0.49 | ) | | | (0.56 | ) | | | (0.65 | ) | | | (0.67 | ) |
From net realized gain | | | — | | | | (— | )1 | | | — | | | | — | | | | — | | | | (0.06 | ) |
Tax return of capital | | | — | | | | — | | | | — | | | | (0.02 | ) | | | — | | | | (0.08 | ) |
| | | | |
| | | | | | |
Total distributions | | | (0.22 | ) | | | (0.50 | ) | | | (0.49 | ) | | | (0.58 | ) | | | (0.65 | ) | | | (0.81 | ) |
| | | | |
Net asset value at end of period | | | $ 6.60 | | | | $ 7.92 | | | | $ 7.87 | | | | $ 8.56 | | | | $ 7.92 | | | | $ 7.66 | |
| | | | |
| | | | | | |
Total return2 | | | (14.18 | )% | | | 7.37 | % | | | (2.58 | )% | | | 15.99 | % | | | 12.92 | % | | | (5.27 | )% |
| | | | | | |
Portfolio turnover rate3 | | | 61 | % | | | 96 | % | | | 88 | % | | | 87 | % | | | 81 | % | | | 90 | % |
| | | | | | |
Net assets, end of period (in thousands) | | | $12,263 | | | | $13,383 | | | | $ 8,616 | | | | $11,995 | | | | $11,466 | | | | $7,280 | |
| | | | | | |
Ratios to average net assets:4 | | | | | | | | | | | | | | | | | | | | | | | | |
Total expenses to average net assets: | | | | | | | | | | | | | | | | | | | | | | | | |
Total expenses before reimbursements | | | 1.53 | % | | | 1.51 | % | | | 1.53 | % | | | 1.52 | % | | | 1.57 | % | | | 1.55 | % |
Total expenses after reimbursements | | | 1.42 | % | | | 1.42 | % | | | 1.42 | % | | | 1.42 | % | | | 1.42 | % | | | 1.42 | % |
| | | | | | |
Net investment income to average net assets: | | | | | | | | | | | | | | | | | | | | | | | | |
Net investment income before reimbursements | | | 5.71 | % | | | 6.39 | % | | | 6.09 | % | | | 7.11 | % | | | 8.88 | % | | | 8.77 | % |
Net investment income after reimbursements | | | 5.82 | % | | | 6.48 | % | | | 6.20 | % | | | 7.21 | % | | | 9.03 | % | | | 8.90 | % |
See accompanying notes to the financial statements.
26
ASHMORE FUNDS
FINANCIAL HIGHLIGHTS
Ashmore Emerging Markets Corporate Income Fund
| | | | | | | | | | | | | | | | | | | | | | | | |
| | | | | | | | | Class C | | | | | | | |
| | | | | | |
| | | Six Months Ended April 30, 2020 (Unaudited) | | | Year Ended October 31, 2019 | | | Year Ended October 31, 2018 | | | Year Ended October 31, 2017 | | | Year Ended October 31, 2016 | | | Year Ended October 31, 2015 | |
| | | | |
Net asset value at beginning of period | | | $ 7.91 | | | | $ 7.86 | | | | $ 8.55 | | | | $ 7.91 | | | | $ 7.66 | | | | $ 8.95 | |
| | | | | | |
Income (loss) from investment operations: | | | | | | | | | | | | | | | | | | | | | | | | |
Net investment income | | | 0.19 | | | | 0.45 | | | | 0.46 | | | | 0.52 | | | | 0.63 | | | | 0.64 | |
Net realized and unrealized gain (loss) | | | (1.31 | ) | | | 0.04 | | | | (0.72 | ) | | | 0.63 | | | | 0.22 | | | | (1.18 | ) |
| | | | |
Total from investment operations | | | (1.12 | ) | | | 0.49 | | | | (0.26 | ) | | | 1.15 | | | | 0.85 | | | | (0.54 | ) |
| | | | | | |
Less distributions: | | | | | | | | | | | | | | | | | | | | | | | | |
| | | | | | |
From net investment income | | | (0.20 | ) | | | (0.44 | ) | | | (0.43 | ) | | | (0.50 | ) | | | (0.60 | ) | | | (0.62 | ) |
From net realized gain | | | — | | | | (— | )1 | | | — | | | | — | | | | — | | | | (0.06 | ) |
Tax return of capital | | | — | | | | — | | | | — | | | | (0.01 | ) | | | — | | | | (0.07 | ) |
| | | | |
| | | | | | |
Total distributions | | | (0.20 | ) | | | (0.44 | ) | | | (0.43 | ) | | | (0.51 | ) | | | (0.60 | ) | | | (0.75 | ) |
| | | | |
Net asset value at end of period | | | $ 6.59 | | | | $ 7.91 | | | | $ 7.86 | | | | $ 8.55 | | | | $ 7.91 | | | | $ 7.66 | |
| | | | |
| | | | | | |
Total return2 | | | (14.50 | )% | | | 6.58 | % | | | (3.30 | )% | | | 15.16 | % | | | 11.99 | % | | | (6.04 | )% |
| | | | | | |
Portfolio turnover rate3 | | | 61 | % | | | 96 | % | | | 88 | % | | | 87 | % | | | 81 | % | | | 90 | % |
| | | | | | |
Net assets, end of period (in thousands) | | | $ 8,019 | | | | $10,745 | | | | $8,785 | | | | $9,530 | | | | $6,010 | | | | $3,226 | |
| | | | | | |
Ratios to average net assets:4 | | | | | | | | | | | | | | | | | | | | | | | | |
Total expenses to average net assets: | | | | | | | | | | | | | | | | | | | | | | | | |
Total expenses before reimbursements | | | 2.28 | % | | | 2.26 | % | | | 2.29 | % | | | 2.27 | % | | | 2.32 | % | | | 2.30 | % |
Total expenses after reimbursements | | | 2.17 | % | | | 2.17 | % | | | 2.17 | % | | | 2.17 | % | | | 2.17 | % | | | 2.17 | % |
| | | | | | |
Net investment income to average net assets: | | | | | | | | | | | | | | | | | | | | | | | | |
Net investment income before reimbursements | | | 4.96 | % | | | 5.65 | % | | | 5.38 | % | | | 6.40 | % | | | 8.16 | % | | | 8.13 | % |
Net investment income after reimbursements | | | 5.07 | % | | | 5.74 | % | | | 5.50 | % | | | 6.50 | % | | | 8.31 | % | | | 8.26 | % |
See accompanying notes to the financial statements.
27
ASHMORE FUNDS
FINANCIAL HIGHLIGHTS
Ashmore Emerging Markets Corporate Income Fund
| | | | | | | | | | | | | | | | | | | | | | | | | | | | |
| | | | | | Institutional Class | |
| | | | | | | |
| | | | | | Six Months
Ended
April 30,
2020
(Unaudited) | | | Year Ended
October 31,
2019 | | | Year Ended
October 31,
2018 | | | Year Ended
October 31,
2017 | | | Year Ended
October 31,
2016 | | | Year Ended
October 31,
2015 | |
| | | | |
Net asset value at beginning of period | | | | | | | $ 8.25 | | | | $ 8.20 | | | | $ 8.92 | | | | $ 8.24 | | | | $ 7.98 | | | | $ 9.30 | |
Income (loss) from investment operations: | | | | | | | | | | | | | | | | | | | | | | | | | | | | |
Net investment income | | | | | | | 0.24 | | | | 0.55 | | | | 0.56 | | | | 0.62 | | | | 0.72 | | | | 0.75 | |
Net realized and unrealized gain (loss) | | | | | | | (1.37 | ) | | | 0.04 | | | | (0.75 | ) | | | 0.68 | | | | 0.24 | | | | (1.22 | ) |
| | | | |
Total from investment operations | | | | | | | (1.13 | ) | | | 0.59 | | | | (0.19 | ) | | | 1.30 | | | | 0.96 | | | | (0.47 | ) |
| | | | | | | |
Less distributions: | | | | | | | | | | | | | | | | | | | | | | | | | | | | |
| | | | | | | |
From net investment income | | | | | | | (0.24 | ) | | | (0.54 | ) | | | (0.53 | ) | | | (0.60 | ) | | | (0.70 | ) | | | (0.71 | ) |
From net realized gain | | | | | | | — | | | | (— | )1 | | | — | | | | — | | | | — | | | | (0.06 | ) |
Tax return of capital | | | | | | | — | | | | — | | | | — | | | | (0.02 | ) | | | — | | | | (0.08 | ) |
| | | | |
| | | | | | | |
Total distributions | | | | | | | (0.24 | ) | | | (0.54 | ) | | | (0.53 | ) | | | (0.62 | ) | | | (0.70 | ) | | | (0.85 | ) |
| | | | |
Net asset value at end of period | | | | | | | $ 6.88 | | | | $ 8.25 | | | | $ 8.20 | | | | $ 8.92 | | | | $ 8.24 | | | | $ 7.98 | |
| | | | |
| | | | | | | |
Total return2 | | | | | | | (14.02 | )% | | | 7.61 | % | | | (2.34 | )% | | | 16.45 | % | | | 13.02 | % | | | (5.08 | )% |
| | | | | | | |
Portfolio turnover rate3 | | | | | | | 61 | % | | | 96 | % | | | 88 | % | | | 87 | % | | | 81 | % | | | 90 | % |
| | | | | | | |
Net assets, end of period (in thousands) | | | | | | | $278,994 | | | | $443,880 | | | | $319,419 | | | | $338,434 | | | | $215,990 | | | | $237,044 | |
| | | | | | | |
Ratios to average net assets:4 | | | | | | | | | | | | | | | | | | | | | | | | | | | | |
Total expenses to average net assets: | | | | | | | | | | | | | | | | | | | | | | | | | | | | |
Total expenses before reimbursements | | | | | | | 1.28 | % | | | 1.26 | % | | | 1.29 | % | | | 1.27 | % | | | 1.32 | % | | | 1.30 | % |
Total expenses after reimbursements | | | | | | | 1.17 | % | | | 1.17 | % | | | 1.17 | % | | | 1.17 | % | | | 1.17 | % | | | 1.17 | % |
| | | | | | | |
Net investment income to average net assets: | | | | | | | | | | | | | | | | | | | | | | | | | | | | |
Net investment income before reimbursements | | | | | | | 5.96 | % | | | 6.66 | % | | | 6.40 | % | | | 7.34 | % | | | 9.20 | % | | | 8.63 | % |
Net investment income after reimbursements | | | | | | | 6.07 | % | | | 6.75 | % | | | 6.52 | % | | | 7.44 | % | | | 9.35 | % | | | 8.76 | % |
| 1 | Amount is less than $0.005 per share. |
| 2 | Assumes investment at net asset value at the beginning of the period, reinvestment of distributions at net asset value on distribution date, and a complete redemption of the investment at net asset value at the end of the period, excluding the impact of sales charges. Total return is not annualized for periods less than one year. |
| 3 | The portfolio turnover rate is calculated by dividing the lesser of cost of purchases or proceeds from sales of long term portfolio securities by the monthly average of the value of the long term portfolio securities. Portfolio turnover is not annualized for periods less than one year. |
| 4 | Annualized for periods less than one year. |
See accompanying notes to the financial statements.
28
ASHMORE FUNDS
FINANCIAL HIGHLIGHTS
Ashmore Emerging Markets Short Duration Fund
| | | | | | | | | | | | | | | | | | | | | | | | | | | | |
| | | | | | Class A | |
| | | | | | | |
| | | | | | Six Months
Ended
April 30,
2020
(Unaudited) | | | Year Ended
October 31,
2019 | | | Year Ended
October 31,
2018 | | | Year Ended
October 31,
2017 | | | Year Ended
October 31,
2016 | | | Year Ended
October 31,
2015 | |
| | | | |
Net asset value at beginning of period | | | | | | | $ 9.00 | | | | $ 9.78 | | | | $ 10.60 | | | | $ 10.37 | | | | $ 9.57 | | | | $ 9.99 | |
| | | | | | | |
Income (loss) from investment operations: | | | | | | | | | | | | | | | | | | | | | | | | | | | | |
Net investment income | | | | | | | 0.34 | | | | 0.68 | | | | 0.55 | | | | 0.83 | 1 | | | 1.02 | | | | 0.67 | |
Net realized and unrealized gain (loss) | | | | | | | (2.88 | ) | | | (0.75 | ) | | | (0.58 | ) | | | 0.34 | | | | 0.78 | | | | (0.41 | ) |
| | | | |
Total from investment operations | | | | | | | (2.54 | ) | | | (0.07 | ) | | | (0.03 | ) | | | 1.17 | | | | 1.80 | | | | 0.26 | |
| | | | | | | |
Less distributions: | | | | | | | | | | | | | | | | | | | | | | | | | | | | |
| | | | | | | |
From net investment income | | | | | | | (0.40 | ) | | | (0.68 | ) | | | (0.57 | ) | | | (0.80 | ) | | | (1.00 | ) | | | (0.67 | ) |
From net realized gain | | | | | | | — | | | | (0.03 | ) | | | (0.22 | ) | | | (0.14 | ) | | | — | | | | — | |
Tax return of capital | | | | | | | — | | | | — | | | | — | | | | — | | | | — | | | | (0.01 | ) |
| | | | |
| | | | | | | |
Total distributions | | | | | | | (0.40 | ) | | | (0.71 | ) | | | (0.79 | ) | | | (0.94 | ) | | | (1.00 | ) | | | (0.68 | ) |
| | | | |
Net asset value at end of period | | | | | | | $ 6.06 | | | | $ 9.00 | | | | $ 9.78 | | | | $ 10.60 | | | | $ 10.37 | | | | $ 9.57 | |
| | | | |
| | | | | | | |
Total return2 | | | | | | | (29.33 | )% | | | (1.22 | )% | | | (0.12 | )% | | | 12.04 | % | | | 19.82 | % | | | 2.98 | % |
| | | | | | | |
Portfolio turnover rate3 | | | | | | | 22 | % | | | 53 | % | | | 37 | % | | | 59 | % | | | 73 | % | | | 38 | % |
| | | | | | | |
Net assets, end of period (in thousands) | | | | | | | $32,182 | | | | $110,771 | | | | $83,290 | | | | $10,178 | | | | $10,395 | | | | $ 425 | |
| | | | | | | |
Ratios to average net assets:4 | | | | | | | | | | | | | | | | | | | | | | | | | | | | |
Total expenses to average net assets: | | | | | | | | | | | | | | | | | | | | | | | | | | | | |
Total expenses before reimbursements | | | | | | | 1.03 | % | | | 1.00 | % | | | 1.05 | % | | | 1.05 | % | | | 1.11 | % | | | 1.65 | % |
Total expenses after reimbursements | | | | | | | 0.92 | % | | | 0.92 | % | | | 0.92 | % | | | 0.92 | % | | | 0.92 | % | | | 0.93 | % |
| | | | | | | |
Net investment income to average net assets: | | | | | | | | | | | | | | | | | | | | | | | | | | | | |
Net investment income before reimbursements | | | | | | | 8.58 | % | | | 6.74 | % | | | 7.00 | % | | | 7.83 | % | | | 10.63 | % | | | 6.50 | % |
Net investment income after reimbursements | | | | | | | 8.69 | % | | | 6.82 | % | | | 7.13 | % | | | 7.96 | % | | | 10.82 | % | | | 7.22 | % |
See accompanying notes to the financial statements.
29
ASHMORE FUNDS
FINANCIAL HIGHLIGHTS
Ashmore Emerging Markets Short Duration Fund
| | | | | | | | | | | | | | | | | | | | |
| | | | | | Class C | |
| | | | | |
| | | | | | Six Months
Ended
April 30,
2020
(Unaudited) | | | Year Ended
October 31,
2019 | | | Year Ended
October 31,
2018 | | | Period Ended
October 31,
20175 | |
| | | | |
Net asset value at beginning of period | | | | | | | $ 8.66 | | | | $ 9.41 | | | | $10.22 | | | | $10.00 | |
| | | | | |
Income (loss) from investment operations: | | | | | | | | | | | | | | | | | | | | |
Net investment income | | | | | | | 0.31 | | | | 0.58 | | | | 0.52 | | | | 0.38 | 1 |
Net realized and unrealized gain (loss) | | | | | | | (2.78 | ) | | | (0.72 | ) | | | (0.64 | ) | | | 0.08 | |
| | | | |
Total from investment operations | | | | | | | (2.47 | ) | | | (0.14 | ) | | | (0.12 | ) | | | 0.46 | |
| | | | | |
Less distributions: | | | | | | | | | | | | | | | | | | | | |
| | | | | |
From net investment income | | | | | | | (0.36 | ) | | | (0.58 | ) | | | (0.47 | ) | | | (0.24 | ) |
From net realized gain | | | | | | | — | | | | (0.03 | ) | | | (0.22 | ) | | | — | |
Tax return of capital | | | | | | | — | | | | — | | | | — | | | | — | |
| | | | |
| | | | | |
Total distributions | | | | | | | (0.36 | ) | | | (0.61 | ) | | | (0.69 | ) | | | (0.24 | ) |
| | | | |
Net asset value at end of period | | | | | | | $ 5.83 | | | | $ 8.66 | | | | $ 9.41 | | | | $10.22 | |
| | | | |
| | | | | |
Total return2 | | | | | | | (29.57 | )% | | | (1.94 | )% | | | (0.98 | )% | | | 4.74 | % |
| | | | | |
Portfolio turnover rate3 | | | | | | | 22 | % | | | 53 | % | | | 37 | % | | | 59 | % |
| | | | | |
Net assets, end of period (in thousands) | | | | | | | $1,514 | | | | $2,342 | | | | $2,012 | | | | $ 188 | |
| | | | | |
Ratios to average net assets:4 | | | | | | | | | | | | | | | | | | | | |
Total expenses to average net assets: | | | | | | | | | | | | | | | | | | | | |
Total expenses before reimbursements | | | | | | | 1.79 | % | | | 1.75 | % | | | 1.79 | % | | | 1.79 | % |
Total expenses after reimbursements | | | | | | | 1.67 | % | | | 1.67 | % | | | 1.67 | % | | | 1.67 | % |
| | | | | |
Net investment income to average net assets: | | | | | | | | | | | | | | | | | | | | |
Net investment income before reimbursements | | | | | | | 7.32 | % | | | 5.96 | % | | | 5.93 | % | | | 9.66 | % |
Net investment income after reimbursements | | | | | | | 7.44 | % | | | 6.04 | % | | | 6.05 | % | | | 9.78 | % |
See accompanying notes to the financial statements.
30
ASHMORE FUNDS
FINANCIAL HIGHLIGHTS
Ashmore Emerging Markets Short Duration Fund
| | | | | | | | | | | | | | | | | | | | | | | | | | | | |
| | | | | | Institutional Class | |
| | | | | | | |
| | | | | | Six Months
Ended April 30,
2020
(Unaudited) | | | Year Ended
October 31,
2019 | | | Year Ended
October 31,
2018 | | | Year Ended
October 31,
2017 | | | Year Ended
October 31,
2016 | | | Year Ended
October 31,
2015 | |
| | | | |
Net asset value at beginning of period | | | | | | | $ 8.83 | | | | $ 9.60 | | | | $ 10.41 | | | | $ 10.19 | | | | $ 9.40 | | | | $ 9.81 | |
Income (loss) from investment operations: | | | | | | | | | | | | | | | | | | | | | | | | | | | | |
Net investment income | | | | | | | 0.35 | | | | 0.69 | | | | 0.60 | | | | 0.90 | 1 | | | 1.07 | | | | 0.68 | |
Net realized and unrealized gain (loss) | | | | | | | (2.83 | ) | | | (0.74 | ) | | | (0.61 | ) | | | 0.27 | | | | 0.72 | | | | (0.39 | ) |
| | | | |
Total from investment operations | | | | | | | (2.48 | ) | | | (0.05 | ) | | | (0.01 | ) | | | 1.17 | | | | 1.79 | | | | 0.29 | |
| | | | | | | |
Less distributions: | | | | | | | | | | | | | | | | | | | | | | | | | | | | |
| | | | | | | |
From net investment income | | | | | | | (0.40 | ) | | | (0.69 | ) | | | (0.58 | ) | | | (0.81 | ) | | | (1.00 | ) | | | (0.69 | ) |
From net realized gain | | | | | | | — | | | | (0.03 | ) | | | (0.22 | ) | | | (0.14 | ) | | | — | | | | — | |
Tax return of capital | | | | | | | — | | | | — | | | | — | | | | — | | | | — | | | | (0.01 | ) |
| | | | |
| | | | | | | |
Total distributions | | | | | | | (0.40 | ) | | | (0.72 | ) | | | (0.80 | ) | | | (0.95 | ) | | | (1.00 | ) | | | (0.70 | ) |
| | | | |
Net asset value at end of period | | | | | | | $ 5.95 | | | | $ 8.83 | | | | $ 9.60 | | | | $ 10.41 | | | | $ 10.19 | | | | $ 9.40 | |
| | | | |
| | | | | | | |
Total return2 | | | | | | | (29.20 | )% | | | (1.01 | )% | | | 0.11 | % | | | 12.28 | % | | | 20.18 | % | | | 3.28 | % |
| | | | | | | |
Portfolio turnover rate3 | | | | | | | 22 | % | | | 53 | % | | | 37 | % | | | 59 | % | | | 73 | % | | | 38 | % |
| | | | | | | |
Net assets, end of period (in thousands) | | | | | | | $485,282 | | | | $1,195,492 | | | | $693,577 | | | | $178,180 | | | | $120,081 | | | | $26,918 | |
| | | | | | | |
Ratios to average net assets:4 | | | | | | | | | | | | | | | | | | | | | | | | | | | | |
Total expenses to average net assets: | | | | | | | | | | | | | | | | | | | | | | | | | | | | |
Total expenses before reimbursements | | | | | | | 0.78 | % | | | 0.75 | % | | | 0.79 | % | | | 0.80 | % | | | 0.89 | % | | | 1.41 | % |
Total expenses after reimbursements | | | | | | | 0.67 | % | | | 0.67 | % | | | 0.67 | % | | | 0.67 | % | | | 0.67 | % | | | 0.67 | % |
| | | | | | | |
Net investment income to average net assets: | | | | | | | | | | | | | | | | | | | | | | | | | | | | |
Net investment income before reimbursements | | | | | | | 8.71 | % | | | 7.04 | % | | | 7.30 | % | | | 8.64 | % | | | 11.66 | % | | | 6.61 | % |
Net investment income after reimbursements | | | | | | | 8.82 | % | | | 7.12 | % | | | 7.42 | % | | | 8.77 | % | | | 11.88 | % | | | 7.35 | % |
| 1 | Per share amounts are based on average number of shares outstanding during the period. |
| 2 | Assumes investment at net asset value at the beginning of the period, reinvestment of distributions at net asset value on distribution date, and a complete redemption of the investment at net asset value at the end of the period, excluding the impact of sales charges. Total return is not annualized for periods less than one year. |
| 3 | The portfolio turnover rate is calculated by dividing the lesser of cost of purchases or proceeds from sales of long term portfolio securities by the monthly average of the value of the long term portfolio securities. Portfolio turnover is not annualized for periods less than one year. |
| 4 | Annualized for periods less than one year. |
| 5 | Class C commenced investment operations on June 13, 2017. |
See accompanying notes to the financial statements.
31
ASHMORE FUNDS
FINANCIAL HIGHLIGHTS
Ashmore Emerging Markets Active Equity Fund
| | | | | | | | | | | | | | | | |
| | | Class A | |
| | | | |
| | | Six Months Ended April 30, 2020 (Unaudited) | | | Year Ended October 31, 2019 | | | Year Ended October 31, 2018 | | | Period Ended October 31, 20171 | |
| | | | |
Net asset value at beginning of period | | | $ 10.46 | | | | $10.53 | | | | $12.72 | | | | $10.00 | |
| | | | |
Income (loss) from investment operations: | | | | | | | | | | | | | | | | |
Net investment income (loss) | | | (0.01 | )2 | | | 0.13 | | | | 0.08 | | | | 0.03 | |
Net realized and unrealized gain (loss) | | | (1.24 | ) | | | 0.85 | | | | (1.05 | ) | | | 2.74 | |
| | | | |
Total from investment operations | | | (1.25 | ) | | | 0.98 | | | | (0.97 | ) | | | 2.77 | |
| | | | |
Less distributions: | | | | | | | | | | | | | | | | |
| | | | |
From net investment income | | | — | | | | (0.09 | ) | | | (0.20 | ) | | | (0.05 | ) |
| | | | |
From net realized gain | | | (0.01 | ) | | | (0.94 | ) | | | (1.02 | ) | | | — | |
| | | | |
Tax return of capital | | | — | | | | (0.02 | ) | | | — | | | | — | |
| | | | |
| | | | |
Total distributions | | | (0.01 | ) | | | (1.05 | ) | | | (1.22 | ) | | | (0.05 | ) |
| | | | |
Net asset value at end of period | | | $ 9.20 | | | | $10.46 | | | | $10.53 | | | | $12.72 | |
| | | | |
| | | | |
Total return3 | | | (11.94 | )% | | | 10.73 | % | | | (8.59 | )% | | | 27.73 | % |
| | | | |
Portfolio turnover rate4 | | | 122 | % | | | 153 | % | | | 164 | % | | | 196 | % |
| | | | |
Net assets, end of period (in thousands) | | | $ 577 | | | | $ 209 | | | | $ 223 | | | | $ 13 | |
| | | | |
Ratios to average net assets:5 | | | | | | | | | | | | | | | | |
Total expenses to average net assets: | | | | | | | | | | | | | | | | |
Total expenses before reimbursements | | | 1.56 | % | | | 1.96 | % | | | 2.20 | % | | | 3.11 | % |
Total expenses after reimbursements | | | 1.27 | % | | | 1.27 | % | | | 1.27 | % | | | 1.27 | % |
| | | | |
Net investment income (loss) to average net assets: | | | | | | | | | | | | | | | | |
Net investment income (loss) before reimbursements | | | (0.43 | )% | | | 0.55 | % | | | 0.56 | % | | | (1.56 | )% |
Net investment income (loss) after reimbursements | | | (0.14 | )% | | | 1.24 | % | | | 1.49 | % | | | 0.28 | % |
See accompanying notes to the financial statements.
32
ASHMORE FUNDS
FINANCIAL HIGHLIGHTS
Ashmore Emerging Markets Active Equity Fund
| | | | | | | | | | | | | | | | |
| | | Class C | |
| | | | |
| | | Six Months Ended April 30, 2020
(Unaudited) | | | Year Ended
October 31,
2019 | | | Year Ended
October 31,
2018 | | | Period Ended
October 31,
20171 | |
| | | | |
Net asset value at beginning of period | | | $ 10.32 | | | | $10.43 | | | | $12.65 | | | | $10.00 | |
| | | | |
Income (loss) from investment operations: | | | | | | | | | | | | | | | | |
Net investment income (loss) | | | (0.01 | )2 | | | 0.07 | | | | 0.03 | | | | (0.05 | ) |
Net realized and unrealized gain (loss) | | | (1.25 | ) | | | 0.83 | | | | (1.10 | ) | | | 2.74 | |
| | | | |
Total from investment operations | | | (1.26 | ) | | | 0.90 | | | | (1.07 | ) | | | 2.69 | |
| | | | |
Less distributions: | | | | | | | | | | | | | | | | |
| | | | |
From net investment income | | | — | | | | (0.05 | ) | | | (0.13 | ) | | | (0.04 | ) |
| | | | |
From net realized gain | | | — | | | | (0.94 | ) | | | (1.02 | ) | | | — | |
| | | | |
Tax return of capital | | | — | | | | (0.02 | ) | | | — | | | | — | |
| | | | |
| | | | |
Total distributions | | | — | | | | (1.01 | ) | | | (1.15 | ) | | | (0.04 | ) |
| | | | |
Net asset value at end of period | | | $ 9.06 | | | | $10.32 | | | | $10.43 | | | | $12.65 | |
| | | | |
| | | | |
Total return3 | | | (12.21 | )% | | | 9.88 | % | | | (9.40 | )% | | | 26.96 | % |
| | | | |
Portfolio turnover rate4 | | | 122 | % | | | 153 | % | | | 164 | % | | | 196 | % |
| | | | |
Net assets, end of period (in thousands) | | | $ 1 | | | | $ 12 | | | | $ 11 | | | | $ 13 | |
| | | | |
Ratios to average net assets:5 | | | | | | | | | | | | | | | | |
Total expenses to average net assets: | | | | | | | | | | | | | | | | |
Total expenses before reimbursements | | | 2.31 | % | | | 2.71 | % | | | 2.73 | % | | | 3.86 | % |
Total expenses after reimbursements | | | 2.03 | % | | | 2.02 | % | | | 2.02 | % | | | 2.02 | % |
| | | | |
Net investment income (loss) to average net assets: | | | | | | | | | | | | | | | | |
Net investment loss before reimbursements | | | (0.38 | )% | | | (0.17 | )% | | | (0.51 | )% | | | (2.31 | )% |
Net investment income (loss) after reimbursements | | | (0.10 | )% | | | 0.52 | % | | | 0.20 | % | | | (0.47 | )% |
See accompanying notes to the financial statements.
33
ASHMORE FUNDS
FINANCIAL HIGHLIGHTS
Ashmore Emerging Markets Active Equity Fund
| | | | | | | | | | | | | | | | |
| | | Institutional Class | |
| | | | |
| | | Six Months Ended April 30, 2020
(Unaudited) | | | Year Ended October 31,
2019 | | | Year Ended October 31,
2018 | | | Period Ended October 31,
20171 | |
| | | | |
Net asset value at beginning of period | | | $ 10.51 | | | | $ 10.56 | | | | $ 12.74 | | | | $ 10.00 | |
Income (loss) from investment operations: | | | | | | | | | | | | | | | | |
Net investment income | | | 0.02 | 2 | | | 0.16 | | | | 0.14 | | | | 0.06 | |
Net realized and unrealized gain (loss) | | | (1.25 | ) | | | 0.86 | | | | (1.09 | ) | | | 2.73 | |
| | | | |
Total from investment operations | | | (1.23 | ) | | | 1.02 | | | | (0.95 | ) | | | 2.79 | |
| | | | |
Less distributions: | | | | | | | | | | | | | | | | |
| | | | |
From net investment income | | | — | | | | (0.10 | ) | | | (0.21 | ) | | | (0.05 | ) |
| | | | |
From net realized gain | | | (0.02 | ) | | | (0.94 | ) | | | (1.02 | ) | | | — | |
| | | | |
Tax return of capital | | | — | | | | (0.03 | ) | | | — | | | | — | |
| | | | |
| | | | |
Total distributions | | | (0.02 | ) | | | (1.07 | ) | | | (1.23 | ) | | | (0.05 | ) |
| | | | |
Net asset value at end of period | | | $ 9.26 | | | | $ 10.51 | | | | $ 10.56 | | | | $ 12.74 | |
| | | | |
| | | | |
Total return3 | | | (11.75 | )% | | | 11.05 | % | | | (8.41 | )% | | | 27.94 | % |
| | | | |
Portfolio turnover rate4 | | | 122 | % | | | 153 | % | | | 164 | % | | | 196 | % |
| | | | |
Net assets, end of period (in thousands) | | | $58,126 | | | | $20,502 | | | | $17,436 | | | | $18,030 | |
| | | | |
Ratios to average net assets:5 | | | | | | | | | | | | | | | | |
Total expenses to average net assets: | | | | | | | | | | | | | | | | |
Total expenses before reimbursements | | | 1.29 | % | | | 1.72 | % | | | 1.73 | % | | | 2.87 | % |
Total expenses after reimbursements | | | 1.02 | % | | | 1.02 | % | | | 1.02 | % | | | 1.02 | % |
| | | | |
Net investment income (loss) to average net assets: | | | | | | | | | | | | | | | | |
Net investment income (loss) before reimbursements | | | 0.15 | % | | | 0.83 | % | | | 0.47 | % | | | (1.28 | )% |
Net investment income after reimbursements | | | 0.42 | % | | | 1.53 | % | | | 1.18 | % | | | 0.57 | % |
| 1 | Class A, Class C and the Institutional Class commenced investment operations on November 1, 2016. |
| 2 | Per share amounts are based on average number of shares outstanding during the period. |
| 3 | Assumes investment at net asset value at the beginning of the period, reinvestment of distributions at net asset value on distribution date, and a complete redemption of the investment at net asset value at the end of the period, excluding the impact of sales charges. Total return is not annualized for periods less than one year. |
| 4 | The portfolio turnover rate is calculated by dividing the lesser of cost of purchases or proceeds from sales of long term portfolio securities by the monthly average of the value of the long term portfolio securities. Portfolio turnover is not annualized for periods less than one year. |
| 5 | Annualized for periods less than one year. |
See accompanying notes to the financial statements.
34
ASHMORE FUNDS
FINANCIAL HIGHLIGHTS
Ashmore Emerging Markets Small-Cap Equity Fund
| | | | | | | | | | | | | | | | | | | | | | | | |
| | | | | | Class A | | | | | | | | | | |
| | | | | | |
| | | Six Months Ended April 30, 2020 (Unaudited) | | | Year Ended
October 31,
2019 | | | Year Ended October 31, 2018 | | | Year Ended October 31,
2017 | | | Year Ended October 31, 2016 | | | Year Ended October 31, 2015 | |
| | | | |
Net asset value at beginning of period | | | $ 8.84 | | | | $ 8.02 | | | | $ 10.33 | | | | $ 8.60 | | | | $ 7.92 | | | | $ 9.35 | |
| | | | | | |
Income (loss) from investment operations: | | | | | | | | | | | | | | | | | | | | | | | | |
Net investment income (loss) | | | (0.16 | ) | | | (0.01 | ) | | | 0.04 | | | | 0.06 | | | | (0.01 | ) | | | 0.16 | |
Net realized and unrealized gain (loss) | | | (1.12 | ) | | | 0.83 | | | | (2.17 | ) | | | 1.86 | | | | 0.85 | | | | (1.12 | ) |
| | | | |
Total from investment operations | | | (1.28 | ) | | | 0.82 | | | | (2.13 | ) | | | 1.92 | | | | 0.84 | | | | (0.96 | ) |
| | | | | | |
Less distributions: | | | | | | | | | | | | | | | | | | | | | | | | |
| | | | | | |
From net investment income | | | — | | | | (— | )1 | | | (0.17 | ) | | | (0.19 | ) | | | (0.16 | ) | | | (0.08 | ) |
From net realized gain | | | — | | | | — | | | | — | | | | — | | | | — | | | | (0.39 | ) |
Tax return of capital | | | — | | | | (— | )1 | | | (0.01 | ) | | | — | | | | — | | | | — | |
| | | | |
| | | | | | |
Total distributions | | | — | | | | — | | | | (0.18 | ) | | | (0.19 | ) | | | (0.16 | ) | | | (0.47 | ) |
| | | | |
Net asset value at end of period | | | $ 7.56 | | | | $ 8.84 | | | | $ 8.02 | | | | $10.33 | | | | $ 8.60 | | | | $ 7.92 | |
| | | | |
| | | | | | |
Total return2 | | | (14.48 | )% | | | 10.27 | % | | | (20.96 | )% | | | 22.73 | % | | | 10.84 | % | | | (10.32 | )% |
| | | | | | |
Portfolio turnover rate3 | | | 33 | % | | | 60 | % | | | 112 | % | | | 126 | % | | | 104 | % | | | 105 | % |
| | | | | | |
Net assets, end of period (in thousands) | | | $ 307 | | | | $1,356 | | | | $ 1,447 | | | | $ 847 | | | | $ 524 | | | | $ 259 | |
| | | | | | |
Ratios to average net assets:4 | | | | | | | | | | | | | | | | | | | | | | | | |
Total expenses to average net assets: | | | | | | | | | | | | | | | | | | | | | | | | |
Total expenses before reimbursements | | | 2.46 | % | | | 2.30 | % | | | 2.37 | % | | | 2.26 | % | | | 2.39 | % | | | 2.33 | % |
| | | | | | |
Total expenses after reimbursements | | | 1.77 | % | | | 1.77 | % | | | 1.77 | % | | | 1.77 | % | | | 1.77 | % | | | 1.78 | % |
| | | | | | |
Net investment income (loss) to average net assets: | | | | | | | | | | | | | | | | | | | | | | | | |
Net investment income (loss) before reimbursements | | | (1.57 | )% | | | (0.62 | )% | | | (0.31 | )% | | | 0.01 | % | | | (0.09 | )% | | | 0.96 | % |
Net investment income (loss) after reimbursements | | | (0.88 | )% | | | (0.09 | )% | | | 0.29 | % | | | 0.50 | % | | | 0.53 | % | | | 1.51 | % |
See accompanying notes to the financial statements.
35
ASHMORE FUNDS
FINANCIAL HIGHLIGHTS
Ashmore Emerging Markets Small-Cap Equity Fund
| | | | | | | | | | | | | | | | | | | | | | | | |
| | | | | | | | | Class C | | | | | | | |
| | | | | | |
| | | Six Months Ended April 30, 2020
(Unaudited) | | | Year Ended
October 31,
2019 | | | Year Ended
October 31,
2018 | | | Year Ended
October 31,
2017 | | | Year Ended
October 31,
2016 | | | Year Ended
October 31,
2015 | |
| | | | |
Net asset value at beginning of period | | | $ 9.22 | | | | $ 8.42 | | | | $ 10.90 | | | | $ 9.11 | | | | $ 8.40 | | | | $ 9.96 | |
| | | | | | |
Income (loss) from investment operations: | | | | | | | | | | | | | | | | | | | | | | | | |
Net investment income (loss) | | | (0.29 | ) | | | (0.38 | ) | | | 0.01 | | | | 0.02 | | | | (0.12 | ) | | | 0.10 | |
Net realized and unrealized gain (loss) | | | (1.08 | ) | | | 1.18 | | | | (2.33 | ) | | | 1.93 | | | | 0.95 | | | | (1.19 | ) |
| | | | |
Total from investment operations | | | (1.37 | ) | | | 0.80 | | | | (2.32 | ) | | | 1.95 | | | | 0.83 | | | | (1.09 | ) |
| | | | | | |
Less distributions: | | | | | | | | | | | | | | | | | | | | | | | | |
| | | | | | |
From net investment income | | | — | | | | — | | | | (0.16 | ) | | | (0.16 | ) | | | (0.12 | ) | | | (0.08 | ) |
From net realized gain | | | — | | | | — | | | | — | | | | — | | | | — | | | | (0.39 | ) |
Tax return of capital | | | — | | | | — | | | | — | 1 | | | — | | | | — | | | | — | |
| | | | |
| | | | | | |
Total distributions | | | — | | | | — | | | | (0.16 | ) | | | (0.16 | ) | | | (0.12 | ) | | | (0.47 | ) |
| | | | |
Net asset value at end of period | | | $ 7.85 | | | | $ 9.22 | | | | $ 8.42 | | | | $ 10.90 | | | | $ 9.11 | | | | $ 8.40 | |
| | | | |
| | | | | | |
Total return2 | | | (14.86 | )% | | | 9.50 | % | | | (21.62 | )% | | | 21.78 | % | | | 10.01 | % | | | (11.02 | )% |
| | | | | | |
Portfolio turnover rate3 | | | 33 | % | | | 60 | % | | | 112 | % | | | 126 | % | | | 104 | % | | | 105 | % |
| | | | | | |
Net assets, end of period (in thousands) | | | $ 93 | | | | $ 144 | | | | $ 272 | | | | $ 251 | | | | $ 176 | | | | $ 311 | |
| | | | | | |
Ratios to average net assets:4 | | | | | | | | | | | | | | | | | | | | | | | | |
Total expenses to average net assets: | | | | | | | | | | | | | | | | | | | | | | | | |
Total expenses before reimbursements | | | 3.31 | % | | | 3.05 | % | | | 3.09 | % | | | 3.01 | % | | | 3.13 | % | | | 3.09 | % |
Total expenses after reimbursements | | | 2.52 | % | | | 2.52 | % | | | 2.52 | % | | | 2.52 | % | | | 2.52 | % | | | 2.52 | % |
| | | | | | |
Net investment income (loss) to average net assets: | | | | | | | | | | | | | | | | | | | | | | | | |
Net investment income (loss) before reimbursements | | | (2.40 | )% | | | (1.48 | )% | | | (1.30 | )% | | | (0.76 | )% | | | (0.89 | )% | | | 1.81 | % |
Net investment income (loss) after reimbursements | | | (1.61 | )% | | | (0.95 | )% | | | (0.73 | )% | | | (0.27 | )% | | | (0.28 | )% | | | 2.38 | % |
See accompanying notes to the financial statements.
36
ASHMORE FUNDS
FINANCIAL HIGHLIGHTS
Ashmore Emerging Markets Small-Cap Equity Fund
| | | | | | | | | | | | | | | | | | | | | | | | |
| | | | | | | | | Institutional Class | | | | | | | |
| | | | | | |
| | | Six Months Ended April 30, 2020
(Unaudited) | | | Year Ended
October 31,
2019 | | | Year Ended
October 31,
2018 | | | Year Ended
October 31,
2017 | | | Year Ended
October 31,
2016 | | | Year Ended
October 31,
2015 | |
| | | | |
Net asset value at beginning of period | | | $ 11.39 | | | | $ 10.32 | | | | $ 13.19 | | | | $ 10.94 | | | | $ 10.01 | | | | $ 11.63 | |
Income (loss) from investment operations: | | | | | | | | | | | | | | | | | | | | | | | | |
Net investment income (loss) | | | (0.07 | ) | | | 0.02 | | | | 0.05 | | | | 0.09 | | | | 0.04 | | | | 0.20 | |
Net realized and unrealized gain (loss) | | | (1.57 | ) | | | 1.06 | | | | (2.73 | ) | | | 2.36 | | | | 1.07 | | | | (1.35 | ) |
| | | | |
Total from investment operations | | | (1.64 | ) | | | 1.08 | | | | (2.68 | ) | | | 2.45 | | | | 1.11 | | | | (1.15 | ) |
| | | | | | |
Less distributions: | | | | | | | | | | | | | | | | | | | | | | | | |
| | | | | | |
From net investment income | | | — | | | | (0.01 | ) | | | (0.18 | ) | | | (0.20 | ) | | | (0.18 | ) | | | (0.08 | ) |
From net realized gain | | | — | | | | — | | | | — | | | | — | | | | — | | | | (0.39 | ) |
Tax return of capital | | | — | | | | (— | )1 | | | (0.01 | ) | | | — | | | | — | | | | — | |
| | | | |
| | | | | | |
Total distributions | | | — | | | | (0.01 | ) | | | (0.19 | ) | | | (0.20 | ) | | | (0.18 | ) | | | (0.47 | ) |
| | | | |
Net asset value at end of period | | | $ 9.75 | | | | $ 11.39 | | | | $ 10.32 | | | | $ 13.19 | | | | $ 10.94 | | | | $ 10.01 | |
| | | | |
| | | | | | |
Total return2 | | | (14.40 | )% | | | 10.52 | % | | | (20.60 | )% | | | 22.70 | % | | | 11.21 | % | | | (9.91 | )% |
| | | | | | |
Portfolio turnover rate3 | | | 33 | % | | | 60 | % | | | 112 | % | | | 126 | % | | | 104 | % | | | 105 | % |
| | | | | | |
Net assets, end of period (in thousands) | | | $ 7,030 | | | | $26,296 | | | | $32,456 | | | | $38,419 | | | | $33,626 | | | | $42,486 | |
| | | | | | |
Ratios to average net assets:4 | | | | | | | | | | | | | | | | | | | | | | | | |
Total expenses to average net assets: | | | | | | | | | | | | | | | | | | | | | | | | |
Total expenses before reimbursements | | | 2.19 | % | | | 2.05 | % | | | 2.06 | % | | | 2.01 | % | | | 2.10 | % | | | 2.08 | % |
Total expenses after reimbursements | | | 1.52 | % | | | 1.52 | % | | | 1.52 | % | | | 1.52 | % | | | 1.52 | % | | | 1.52 | % |
| | | | | | |
Net investment income (loss) to average net assets: | | | | | | | | | | | | | | | | | | | | | | | | |
Net investment income (loss) before reimbursements | | | (1.31 | )% | | | (0.38 | )% | | | (0.16 | )% | | | 0.18 | % | | | (0.22 | )% | | | 1.24 | % |
Net investment income (loss) after reimbursements | | | (0.64 | )% | | | 0.15 | % | | | 0.38 | % | | | 0.67 | % | | | 0.36 | % | | | 1.80 | % |
| 1 | Amount is less than $0.005 per share. |
| 2 | Assumes investment at net asset value at the beginning of the period, reinvestment of distributions at net asset value on distribution date, and a complete redemption of the investment at net asset value at the end of the period, excluding the impact of sales charges. Total return is not annualized for periods less than one year. |
| 3 | The portfolio turnover rate is calculated by dividing the lesser of cost of purchases or proceeds from sales of long term portfolio securities by the monthly average of the value of the long term portfolio securities. Portfolio turnover is not annualized for periods less than one year. |
| 4 | Annualized for periods less than one year. |
See accompanying notes to the financial statements.
37
ASHMORE FUNDS
FINANCIAL HIGHLIGHTS
Ashmore Emerging Markets Frontier Equity Fund
| | | | | | | | | | | | | | | | | | | | | | | | |
| | | | | | | | | Class A | | | | | | | |
| | | | | | |
| | | Six Months Ended April 30, 2020 (Unaudited) | | | Year Ended
October 31,
2019 | | | Year Ended
October 31,
2018 | | | Year Ended
October 31,
2017 | | | Year Ended
October 31,
2016 | | | Year Ended
October 31,
2015 | |
| | | | |
Net asset value at beginning of period | | | $ 8.02 | | | | $ 7.66 | | | | $ 9.99 | | | | $ 7.98 | | | | $ 7.83 | | | | $ 10.19 | |
| | | | | | |
Income (loss) from investment operations: | | | | | | | | | | | | | | | | | | | | | | | | |
Net investment income (loss) | | | (0.01 | )1 | | | 0.14 | | | | 0.08 | | | | 0.10 | | | | 0.36 | | | | 0.10 | 1 |
Net realized and unrealized gain (loss) | | | (1.67 | ) | | | 0.37 | | | | (1.47 | ) | | | 2.08 | | | | (0.09 | ) | | | (1.45 | ) |
| | | | |
Total from investment operations | | | (1.68 | ) | | | 0.51 | | | | (1.39 | ) | | | 2.18 | | | | 0.27 | | | | (1.35 | ) |
| | | | | | |
Less distributions: | | | | | | | | | | | | | | | | | | | | | | | | |
| | | | | | |
From net investment income | | | — | | | | (0.15 | ) | | | (0.08 | ) | | | (0.17 | ) | | | (0.12 | ) | | | (0.15 | ) |
From net realized gain | | | — | | | | — | | | | (0.82 | ) | | | — | | | | — | | | | (0.86 | ) |
Tax return of capital | | | — | | | | — | | | | (0.04 | ) | | | — | | | | — | | | | — | |
| | | | |
| | | | | | |
Total distributions | | | — | | | | (0.15 | ) | | | (0.94 | ) | | | (0.17 | ) | | | (0.12 | ) | | | (1.01 | ) |
| | | | |
Net asset value at end of period | | | $ 6.34 | | | | $ 8.02 | | | | $ 7.66 | | | | $ 9.99 | | | | $ 7.98 | | | | $ 7.83 | |
| | | | |
| | | | | | |
Total return2 | | | (20.95 | )% | | | 6.58 | % | | | (15.44 | )% | | | 27.53 | % | | | 3.36 | % | | | (13.68 | )% |
| | | | | | |
Portfolio turnover rate3 | | | 65 | % | | | 93 | % | | | 80 | % | | | 107 | % | | | 76 | % | | | 91 | % |
| | | | | | |
Net assets, end of period (in thousands) | | | $ 731 | | | | $ 6,985 | | | | $ 7,645 | | | | $ 7,710 | | | | $ 2,154 | | | | $ 45 | |
| | | | | | |
Ratios to average net assets:4 | | | | | | | | | | | | | | | | | | | | | | | | |
Total expenses to average net assets: | | | | | | | | | | | | | | | | | | | | | | | | |
Total expenses before reimbursements | | | 2.17 | % | | | 2.12 | % | | | 2.20 | % | | | 2.21 | % | | | 2.45 | % | | | 2.73 | % |
Total expenses after reimbursements | | | 1.77 | % | | | 1.77 | % | | | 1.77 | % | | | 1.77 | % | | | 1.77 | % | | | 1.79 | % |
| | | | | | |
Net investment income (loss) to average net assets: | | | | | | | | | | | | | | | | | | | | | | | | |
Net investment income (loss) before reimbursements | | | (0.63 | )% | | | 1.61 | % | | | 0.46 | % | | | 1.05 | % | | | 4.34 | % | | | 0.25 | % |
Net investment income (loss) after reimbursements | | | (0.23 | )% | | | 1.96 | % | | | 0.89 | % | | | 1.49 | % | | | 5.02 | % | | | 1.19 | % |
See accompanying notes to the financial statements.
38
ASHMORE FUNDS
FINANCIAL HIGHLIGHTS
Ashmore Emerging Markets Frontier Equity Fund
| | | | | | | | | | | | | | | | | | | | | | | | |
| | | | | | | | | Class C | | | | | | | |
| | | | | | |
| | | Six Months Ended April 30, 2020 (Unaudited) | | | Year Ended
October 31,
2019 | | | Year Ended
October 31,
2018 | | | Year Ended
October 31,
2017 | | | Year Ended
October 31,
2016 | | | Year Ended
October 31,
2015 | |
| | | | |
Net asset value at beginning of period | | | $ 7.80 | | | | $ 7.47 | | | | $ 9.82 | | | | $ 7.86 | | | | $ 7.73 | | | | $ 10.15 | |
| | | | | | |
Income (loss) from investment operations: | | | | | | | | | | | | | | | | | | | | | | | | |
Net investment income (loss) | | | 0.03 | 1 | | | 0.02 | | | | 0.03 | | | | 0.08 | | | | 0.08 | | | | (0.05 | )1 |
Net realized and unrealized gain (loss) | | | (1.69 | ) | | | 0.42 | | | | (1.48 | ) | | | 2.00 | | | | 0.12 | | | | (1.36 | ) |
| | | | |
Total from investment operations | | | (1.66 | ) | | | 0.44 | | | | (1.45 | ) | | | 2.08 | | | | 0.20 | | | | (1.41 | ) |
| | | | | | |
Less distributions: | | | | | | | | | | | | | | | | | | | | | | | | |
| | | | | | |
From net investment income | | | — | | | | (0.11 | ) | | | (0.05 | ) | | | (0.12 | ) | | | (0.07 | ) | | | (0.15 | ) |
From net realized gain | | | — | | | | — | | | | (0.82 | ) | | | — | | | | — | | | | (0.86 | ) |
Tax return of capital | | | — | | | | — | | | | (0.03 | ) | | | — | | | | — | | | | — | |
| | | | |
| | | | | | |
Total distributions | | | — | | | | (0.11 | ) | | | (0.90 | ) | | | (0.12 | ) | | | (0.07 | ) | | | (1.01 | ) |
| | | | |
Net asset value at end of period | | | $ 6.14 | | | | $ 7.80 | | | | $ 7.47 | | | | $ 9.82 | | | | $ 7.86 | | | | $ 7.73 | |
| | | | |
| | | | | | |
Total return2 | | | (21.28 | )% | | | 5.87 | % | | | (16.30 | )% | | | 26.57 | % | | | 2.61 | % | | | (14.51 | )% |
| | | | | | |
Portfolio turnover rate3 | | | 65 | % | | | 93 | % | | | 80 | % | | | 107 | % | | | 76 | % | | | 91 | % |
| | | | | | |
Net assets, end of period (in thousands) | | | $ 301 | | | | $ 305 | | | | $ 408 | | | | $ 459 | | | | $ 62 | | | | $ 53 | |
| | | | | | |
Ratios to average net assets:4 | | | | | | | | | | | | | | | | | | | | | | | | |
Total expenses to average net assets: | | | | | | | | | | | | | | | | | | | | | | | | |
Total expenses before reimbursements | | | 2.98 | % | | | 2.88 | % | | | 2.94 | % | | | 2.99 | % | | | 3.05 | % | | | 3.45 | % |
Total expenses after reimbursements | | | 2.52 | % | | | 2.52 | % | | | 2.52 | % | | | 2.52 | % | | | 2.52 | % | | | 2.52 | % |
| | | | | | |
Net investment income (loss) to average net assets: | | | | | | | | | | | | | | | | | | | | | | | | |
Net investment income (loss) before reimbursements | | | 0.26 | % | | | 0.48 | % | | | (0.18 | )% | | | (0.21 | )% | | | 0.39 | % | | | (1.53 | )% |
Net investment income (loss) after reimbursements | | | 0.72 | % | | | 0.84 | % | | | 0.24 | % | | | 0.26 | % | | | 0.92 | % | | | (0.60 | )% |
See accompanying notes to the financial statements.
39
ASHMORE FUNDS
FINANCIAL HIGHLIGHTS
Ashmore Emerging Markets Frontier Equity Fund
| | | | | | | | | | | | | | | | | | | | | | | | | | | | |
| | | | | | Institutional Class | |
| | | | | | | |
| | | | | | Six Months
Ended
April 30,
2020
(Unaudited) | | | Year Ended
October 31,
2019 | | | Year Ended
October 31,
2018 | | | Year Ended
October 31, 2017 | | | Year Ended
October 31,
2016 | | | Year Ended
October 31,
2015 | |
| | | | |
Net asset value at beginning of period | | | | | | | $ 9.32 | | | | $ 8.86 | | | | $ 11.38 | | | | $ 9.06 | | | | $ 8.88 | | | | $ 11.35 | |
Income (loss) from investment operations: | | | | | | | | | | | | | | | | | | | | | | | | | | | | |
Net investment income | | | | | | | 0.07 | 1 | | | 0.16 | | | | 0.12 | | | | 0.13 | | | | 0.18 | | | | 0.12 | 1 |
Net realized and unrealized gain (loss) | | | | | | | (2.01 | ) | | | 0.46 | | | | (1.69 | ) | | | 2.37 | | | | 0.13 | | | | (1.58 | ) |
| | | | |
Total from investment operations | | | | | | | (1.94 | ) | | | 0.62 | | | | (1.57 | ) | | | 2.50 | | | | 0.31 | | | | (1.46 | ) |
| | | | | | | |
Less distributions: | | | | | | | | | | | | | | | | | | | | | | | | | | | | |
| | | | | | | |
From net investment income | | | | | | | — | | | | (0.16 | ) | | | (0.08 | ) | | | (0.18 | ) | | | (0.13 | ) | | | (0.15 | ) |
From net realized gain | | | | | | | — | | | | — | | | | (0.82 | ) | | | — | | | | — | | | | (0.86 | ) |
Tax return of capital | | | | | | | — | | | | — | | | | (0.05 | ) | | | — | | | | — | | | | — | |
| | | | |
| | | | | | | |
Total distributions | | | | | | | — | | | | (0.16 | ) | | | (0.95 | ) | | | (0.18 | ) | | | (0.13 | ) | | | (1.01 | ) |
| | | | |
Net asset value at end of period | | | | | | | $ 7.38 | | | | $ 9.32 | | | | $ 8.86 | | | | $ 11.38 | | | | $ 9.06 | | | | $ 8.88 | |
| | | | |
| | | | | | | |
Total return2 | | | | | | | (20.82 | )% | | | 6.97 | % | | | (15.11 | )% | | | 27.87 | % | | | 3.58 | % | | | (13.29 | )% |
| | | | | | | |
Portfolio turnover rate3 | | | | | | | 65 | % | | | 93 | % | | | 80 | % | | | 107 | % | | | 76 | % | | | 91 | % |
| | | | | | | |
Net assets, end of period (in thousands) | | | | | | | $53,370 | | | | $81,047 | | | | $77,788 | | | | $81,324 | | | | $52,711 | | | | $49,952 | |
| | | | | | | |
Ratios to average net assets:4 | | | | | | | | | | | | | | | | | | | | | | | | | | | | |
Total expenses to average net assets: | | | | | | | | | | | | | | | | | | | | | | | | | | | | |
Total expenses before reimbursements | | | | | | | 1.97 | % | | | 1.88 | % | | | 1.95 | % | | | 1.96 | % | | | 2.05 | % | | | 2.46 | % |
Total expenses after reimbursements | | | | | | | 1.52 | % | | | 1.52 | % | | | 1.52 | % | | | 1.52 | % | | | 1.52 | % | | | 1.52 | % |
| | | | | | | |
Net investment income to average net assets: | | | | | | | | | | | | | | | | | | | | | | | | | | | | |
Net investment income before reimbursements | | | | | | | 1.07 | % | | | 1.39 | % | | | 0.78 | % | | | 0.73 | % | | | 1.48 | % | | | 0.34 | % |
Net investment income after reimbursements | | | | | | | 1.52 | % | | | 1.75 | % | | | 1.21 | % | | | 1.17 | % | | | 2.01 | % | | | 1.28 | % |
| 1 | Per share amounts are based on average number of shares outstanding during the period. |
| 2 | Assumes investment at net asset value at the beginning of the period, reinvestment of distributions at net asset value on distribution date, and a complete redemption of the investment at net asset value at the end of the period, excluding the impact of sales charges. Total return is not annualized for periods less than one year. |
| 3 | The portfolio turnover rate is calculated by dividing the lesser of cost of purchases or proceeds from sales of long term portfolio securities by the monthly average of the value of the long term portfolio securities. Portfolio turnover is not annualized for periods less than one year. |
| 4 | Annualized for periods less than one year. |
See accompanying notes to the financial statements.
40
ASHMORE FUNDS
FINANCIAL HIGHLIGHTS
Ashmore Emerging Markets Equity Fund
| | | | | | | | | | | | | | | | | | | | | | | | | | | | |
| | | | | | Class A | |
| | | | | | | |
| | | | | | Six Months
Ended April 30, 2020
(Unaudited) | | | Year Ended
October 31,
2019 | | | Year Ended
October 31,
2018 | | | Year Ended
October 31,
2017 | | | Year Ended
October 31,
2016 | | | Year Ended
October 31,
2015 | |
| | | | |
Net asset value at beginning of period | | | | | | | $ 11.18 | | | | $ 9.38 | | | | $ 11.16 | | | | $ 8.34 | | | | $ 7.29 | | | | $ 9.24 | |
| | | | | | | |
Income (loss) from investment operations: | | | | | | | | | | | | | | | | | | | | | | | | | | | | |
Net investment income (loss) | | | | | | | (0.02 | )1 | | | 0.05 | | | | 0.01 | | | | 0.06 | 1 | | | 0.06 | | | | 0.03 | |
Net realized and unrealized gain (loss) | | | | | | | (1.24 | ) | | | 1.97 | | | | (1.55 | ) | | | 2.90 | | | | 1.05 | | | | (1.92 | ) |
| | | | |
Total from investment operations | | | | | | | (1.26 | ) | | | 2.02 | | | | (1.54 | ) | | | 2.96 | | | | 1.11 | | | | (1.89 | ) |
| | | | | | | |
Less distributions: | | | | | | | | | | | | | | | | | | | | | | | | | | | | |
| | | | | | | |
From net investment income | | | | | | | (0.01 | ) | | | (0.22 | ) | | | (0.23 | ) | | | (0.14 | ) | | | (0.06 | ) | | | (0.06 | ) |
From net realized gain | | | | | | | — | | | | — | | | | — | | | | — | | | | — | | | | — | |
Tax return of capital | | | | | | | — | | | | — | | | | (0.01 | ) | | | — | | | | — | | | | — | 2 |
| | | | |
| | | | | | | |
Total distributions | | | | | | | (0.01 | ) | | | (0.22 | ) | | | (0.24 | ) | | | (0.14 | ) | | | (0.06 | ) | | | (0.06 | ) |
| | | | |
Net asset value at end of period | | | | | | | $ 9.91 | | | | $11.18 | | | | $ 9.38 | | | | $11.16 | | | | $ 8.34 | | | | $ 7.29 | |
| | | | |
| | | | | | | |
Total return3 | | | | | | | (11.28 | )% | | | 21.66 | % | | | (14.16 | )% | | | 35.90 | % | | | 15.36 | % | | | (20.52 | )% |
| | | | | | | |
Portfolio turnover rate4 | | | | | | | 44 | % | | | 76 | % | | | 113 | % | | | 140 | % | | | 119 | % | | | 106 | % |
| | | | | | | |
Net assets, end of period (in thousands) | | | | | | | $ 440 | | | | $ 641 | | | | $ 303 | | | | $ 134 | | | | $ 36 | | | | $ 24 | |
| | | | | | | |
Ratios to average net assets:5 | | | | | | | | | | | | | | | | | | | | | | | | | | | | |
Total expenses to average net assets: | | | | | | | | | | | | | | | | | | | | | | | | | | | | |
Total expenses before reimbursements | | | | | | | 1.79 | % | | | 1.91 | % | | | 2.19 | % | | | 2.65 | % | | | 2.96 | % | | | 3.56 | % |
Total expenses after reimbursements | | | | | | | 1.42 | % | | | 1.42 | % | | | 1.42 | % | | | 1.42 | % | | | 1.42 | % | | | 1.43 | % |
| | | | | | | |
Net investment income (loss) to average net assets: | | | | | | | | | | | | | | | | | | | | | | | | | | | | |
Net investment loss before reimbursements | | | | | | | (0.76 | )% | | | (0.01 | )% | | | (0.06 | )% | | | (0.64 | )% | | | (0.74 | )% | | | (1.82 | )% |
Net investment income (loss) after reimbursements | | | | | | | (0.39 | )% | | | 0.48 | % | | | 0.71 | % | | | 0.59 | % | | | 0.80 | % | | | 0.31 | % |
See accompanying notes to the financial statements.
41
ASHMORE FUNDS
FINANCIAL HIGHLIGHTS
Ashmore Emerging Markets Equity Fund
| | | | | | | | | | | | | | | | | | | | | | | | | | | | |
| | | Class C | |
| | | Six Months
Ended
April 30, 2020
(Unaudited) | | | Year Ended
October 31,
2019 | | | Year Ended
October 31,
2018 | | | Period Ended
October 31,
2017 | | | Period Ended
August 9,
2016 | | | Year Ended
October 31,
2015 | | | Year Ended
October 31,
2014 | |
| | | | |
Net asset value at beginning of period | | | $ 10.64 | | | | $ 8.96 | | | | $ 10.73 | | | | $ 8.86 | 6 | | | $ 8.17 | | | | $ 10.46 | | | | $11.00 | |
| | | | | | | |
Income (loss) from investment operations: | | | | | | | | | | | | | | | | | | | | | | | | | | | | |
Net investment income (loss) | | | (0.06 | )1 | | | (0.04 | ) | | | (0.13 | ) | | | — | 1,2 | | | 0.01 | | | | (0.04 | ) | | | (0.01 | ) |
Net realized and unrealized gain (loss) | | | (1.17 | ) | | | 1.91 | | | | (1.44 | ) | | | 1.93 | | | | 0.81 | | | | (2.19 | ) | | | (0.45 | ) |
| | | | |
Total from investment operations | | | (1.23 | ) | | | 1.87 | | | | (1.57 | ) | | | 1.93 | | | | 0.82 | | | | (2.23 | ) | | | (0.46 | ) |
| | | | | | | |
Less distributions: | | | | | | | | | | | | | | | | | | | | | | | | | | | | |
| | | | | | | |
From net investment income | | | — | | | | (0.19 | ) | | | (0.19 | ) | | | (0.06 | ) | | | (0.03 | ) | | | (0.06 | ) | | | (0.08 | ) |
From net realized gain | | | — | | | | — | | | | — | | | | — | | | | — | | | | — | | | | — | |
Tax return of capital | | | — | | | | — | | | | (0.01 | ) | | | — | | | | — | | | | — | 2 | | | — | |
| | | | |
| | | | | | | |
Total distributions | | | — | | | | (0.19 | ) | | | (0.20 | ) | | | (0.06 | ) | | | (0.03 | ) | | | (0.06 | ) | | | (0.08 | ) |
| | | | |
Net asset value at end of period | | | $ 9.41 | | | | $10.64 | | | | $ 8.96 | | | | $10.73 | | | | $ 8.96 | 7 | | | $ 8.17 | | | | $10.46 | |
| | | | |
| | | | | | | |
Total return3 | | | (11.56 | )% | | | 20.89 | % | | | (14.92 | )% | | | 10.81 | % | | | 10.02 | % | | | (21.38 | )% | | | (4.24 | )% |
| | | | | | | |
Portfolio turnover rate4 | | | 44 | % | | | 76 | % | | | 113 | % | | | 140 | % | | | 119 | % | | | 106 | % | | | 130 | % |
| | | | | | | |
Net assets, end of period (in thousands) | | | $ 1 | | | | $ 1 | | | | $ 1 | | | | $ 2 | | | | $ 1 | | | | $ 1 | | | | $ 1 | |
| | | | | | | |
Ratios to average net assets:5 | | | | | | | | | | | | | | | | | | | | | | | | | | | | |
Total expenses to average net assets: | | | | | | | | | | | | | | | | | | | | | | | | | | | | |
Total expenses before reimbursements | | | 2.44 | % | | | 2.66 | % | | | 2.96 | % | | | 3.38 | % | | | 3.86 | % | | | 4.31 | % | | | 4.34 | % |
Total expenses after reimbursements | | | 2.16 | % | | | 2.17 | % | | | 2.17 | % | | | 2.17 | % | | | 2.22 | % | | | 2.18 | % | | | 2.20 | % |
| | | | | | | |
Net investment income (loss) to average net assets: | | | | | | | | | | | | | | | | | | | | | | | | | | | | |
Net investment loss before reimbursements | | | (1.46 | )% | | | (0.95 | )% | | | (1.25 | )% | | | (1.20 | )% | | | (1.39 | )% | | | (2.57 | )% | | | (2.25 | )% |
Net investment income (loss) after reimbursements | | | (1.18 | )% | | | (0.46 | )% | | | (0.46 | )% | | | 0.01 | % | | | 0.25 | % | | | (0.44 | )% | | | (0.11 | )% |
See accompanying notes to the financial statements.
42
ASHMORE FUNDS
FINANCIAL HIGHLIGHTS
Ashmore Emerging Markets Equity Fund
| | | | | | | | | | | | | | | | | | | | | | | | | | | | |
| | | | | | Institutional Class | |
| | | | | | | |
| | | | | | Six Months
Ended
April 30,
2020
(Unaudited) | | | Year Ended
October 31,
2019 | | | Year Ended
October 31,
2018 | | | Year Ended
October 31,
2017 | | | Year Ended
October 31,
2016 | | | Year Ended
October 31,
2015 | |
| | | | |
Net asset value at beginning of period | | | | | | | $ 10.81 | | | | $ 9.06 | | | | $ 10.78 | | | | $ 8.05 | | | | $ 7.02 | | | | $ 8.88 | |
Income (loss) from investment operations: | | | | | | | | | | | | | | | | | | | | | | | | | | | | |
Net investment income (loss) | | | | | | | (0.01 | )1 | | | 0.06 | | | | 0.07 | | | | 0.08 | 1 | | | 0.08 | | | | 0.05 | |
Net realized and unrealized gain (loss) | | | | | | | (1.19 | ) | | | 1.93 | | | | (1.54 | ) | | | 2.80 | | | | 1.02 | | | | (1.85 | ) |
| | | | |
Total from investment operations | | | | | | | (1.20 | ) | | | 1.99 | | | | (1.47 | ) | | | 2.88 | | | | 1.10 | | | | (1.80 | ) |
| | | | | | | |
Less distributions: | | | | | | | | | | | | | | | | | | | | | | | | | | | | |
| | | | | | | |
From net investment income | | | | | | | (0.02 | ) | | | (0.24 | ) | | | (0.24 | ) | | | (0.15 | ) | | | (0.07 | ) | | | (0.06 | ) |
From net realized gain | | | | | | | — | | | | — | | | | — | | | | — | | | | — | | | | — | |
Tax return of capital | | | | | | | — | | | | — | | | | (0.01 | ) | | | — | | | | — | | | | — | 2 |
| | | | |
| | | | | | | |
Total distributions | | | | | | | (0.02 | ) | | | (0.24 | ) | | | (0.25 | ) | | | (0.15 | ) | | | (0.07 | ) | | | (0.06 | ) |
| | | | |
Net asset value at end of period | | | | | | | $ 9.59 | | | | $ 10.81 | | | | $ 9.06 | | | | $10.78 | | | | $ 8.05 | | | | $ 7.02 | |
| | | | |
| | | | | | | |
Total return3 | | | | | | | (11.17 | )% | | | 22.05 | % | | | (14.01 | )% | | | 36.21 | % | | | 15.80 | % | | | (20.34 | )% |
| | | | | | | |
Portfolio turnover rate4 | | | | | | | 44 | % | | | 76 | % | | | 113 | % | | | 140 | % | | | 119 | % | | | 106 | % |
| | | | | | | |
Net assets, end of period (in thousands) | | | | | | | $55,401 | | | | $35,011 | | | | $24,162 | | | | $8,106 | | | | $9,074 | | | | $7,601 | |
| | | | | | | |
Ratios to average net assets:5 | | | | | | | | | | | | | | | | | | | | | | | | | | | | |
Total expenses to average net assets: | | | | | | | | | | | | | | | | | | | | | | | | | | | | |
Total expenses before reimbursements | | | | | | | 1.54 | % | | | 1.66 | % | | | 1.95 | % | | | 2.35 | % | | | 2.71 | % | | | 3.31 | % |
Total expenses after reimbursements | | | | | | | 1.17 | % | | | 1.17 | % | | | 1.17 | % | | | 1.17 | % | | | 1.17 | % | | | 1.17 | % |
| | | | | | | |
Net investment income (loss) to average net assets: | | | | | | | | | | | | | | | | | | | | | | | | | | | | |
Net investment income (loss) before reimbursements | | | | | | | (0.53 | )% | | | 0.09 | % | | | 0.10 | % | | | (0.33 | )% | | | (0.46 | )% | | | (1.59 | )% |
Net investment income (loss) after reimbursements | | | | | | | (0.16 | )% | | | 0.58 | % | | | 0.88 | % | | | 0.85 | % | | | 1.08 | % | | | 0.55 | % |
| 1 | Per share amounts are based on average number of shares outstanding during the period. |
| 2 | Amount is less than $0.005 per share. |
| 3 | Assumes investment at net asset value at the beginning of the period, reinvestment of distributions at net asset value on distribution date, and a complete redemption of the investment at net asset value at the end of the period, excluding the impact of sales charges. Total return is not annualized for periods less than one year. |
| 4 | The portfolio turnover rate is calculated by dividing the lesser of cost of purchases or proceeds from sales of long term portfolio securities by the monthly average of the value of the long term portfolio securities. Portfolio turnover is not annualized for periods less than one year. |
| 5 | Annualized for periods less than one year. |
| 6 | Initial investment in Class C occurred on March 3, 2017. The beginning NAV for Class C is the end of day NAV for the Institutional Class on March 3, 2017. |
| 7 | There were no investors in Ashmore Emerging Markets Equity Fund Class C at the year ended October 31, 2016. Net asset value shown represents net asset value prior to the final redemption. |
See accompanying notes to the financial statements.
43
ASHMORE FUNDS
FINANCIAL HIGHLIGHTS
Ashmore Emerging Markets Equity ESG Fund
| | | | |
| | | Class A | |
| |
| | | Period Ended
April 30, 20201
(Unaudited) | |
| | | | |
Net asset value at beginning of period | | | $ 10.00 | |
| |
Loss from investment operations: | | | | |
Net investment income | | | — | |
Net realized and unrealized loss | | | (1.17 | ) |
| | | | |
Total from investment operations | | | (1.17 | ) |
| |
Less distributions: | | | | |
| |
From net investment income | | | — | |
From net realized gain | | | — | |
Tax return of capital | | | — | |
| | | | |
| |
Total distributions | | | — | |
| | | | |
Net asset value at end of period | | | $ 8.83 | |
| | | | |
| |
Total return2 | | | (11.70 | )% |
| |
Portfolio turnover rate3 | | | 16 | % |
| |
Net assets, end of period (in thousands) | | | $ 1 | |
| |
Ratios to average net assets:4 | | | | |
Total expenses to average net assets: | | | | |
Total expenses before reimbursements | | | 4.38 | % |
Total expenses after reimbursements | | | 1.38 | % |
| |
Net investment loss to average net assets: | | | | |
Net investment loss before reimbursements | | | (3.00 | )% |
Net investment income after reimbursements | | | — | % |
See accompanying notes to the financial statements.
44
ASHMORE FUNDS
FINANCIAL HIGHLIGHTS
Ashmore Emerging Markets Equity ESG Fund
| | | | |
| | | Class C | |
| |
| | | Period Ended
April 30, 20201
(Unaudited) | |
| | | | |
Net asset value at beginning of period | | | $ 10.00 | |
| |
Loss from investment operations: | | | | |
Net investment loss | | | (0.01 | ) |
Net realized and unrealized loss | | | (1.17 | ) |
| | | | |
Total from investment operations | | | (1.18 | ) |
| |
Less distributions: | | | | |
| |
From net investment income | | | — | |
From net realized gain | | | — | |
Tax return of capital | | | — | |
| | | | |
| |
Total distributions | | | — | |
| | | | |
Net asset value at end of period | | | $ 8.82 | |
| | | | |
| |
Total return2 | | | (11.80 | )% |
| |
Portfolio turnover rate3 | | | 16 | % |
| |
Net assets, end of period (in thousands) | | | $ 1 | |
| |
Ratios to average net assets:4 | | | | |
Total expenses to average net assets: | | | | |
Total expenses before reimbursements | | | 4.94 | % |
Total expenses after reimbursements | | | 2.20 | % |
| |
Net investment loss to average net assets: | | | | |
Net investment loss before reimbursements | | | (3.56 | )% |
Net investment loss after reimbursements | | | (0.82 | )% |
See accompanying notes to the financial statements.
45
ASHMORE FUNDS
FINANCIAL HIGHLIGHTS
Ashmore Emerging Markets Equity ESG Fund
| | | | |
| | | Institutional
Class Period Ended April 30,
20201
(Unaudited) | |
Net asset value at beginning of period | | | $ 10.00 | |
| |
Loss from investment operations: | | | | |
Net investment income | | | — | 5 |
Net realized and unrealized loss | | | (1.17 | ) |
| | | | |
Total from investment operations | | | (1.17 | ) |
| |
Less distributions: | | | | |
| |
From net investment income | | | — | |
From net realized gain | | | — | |
Tax return of capital | | | — | |
| | | | |
| |
Total distributions | | | — | |
| | | | |
Net asset value at end of period | | | $ 8.83 | |
| | | | |
| |
Total return2 | | | (11.70 | )% |
| |
Portfolio turnover rate3 | | | 16 | % |
| |
Net assets, end of period (in thousands) | | | $ 8,832 | |
| |
Ratios to average net assets:4 | | | | |
Total expenses to average net assets: | | | | |
Total expenses before reimbursements | | | 3.78 | % |
Total expenses after reimbursements | | | 1.17 | % |
| |
Net investment income (loss) to average net assets: | | | | |
Net investment loss before reimbursements | | | (2.41 | )% |
Net investment income after reimbursements | | | 0.20 | % |
| 1 | Class A, Class C and the Institutional Class commenced investment operations on February 26, 2020. |
| 2 | Assumes investment at net asset value at the beginning of the period, reinvestment of distributions at net asset value on distribution date, and a complete redemption of the investment at net asset value at the end of the period, excluding the impact of sales charges. Total return is not annualized for periods less than one year. |
| 3 | The portfolio turnover rate is calculated by dividing the lesser of cost of purchases or proceeds from sales of long term portfolio securities by the monthly average of the value of the long term portfolio securities. Portfolio turnover is not annualized for periods less than one year. |
| 4 | Annualized for periods less than one year. |
| 5 | Amount is less than $0.005 per share. |
See accompanying notes to the financial statements.
46
ASHMORE EMERGING MARKETS TOTAL RETURN FUND
SCHEDULE OF INVESTMENTS
As of April 30, 2020 (Unaudited)
| | | | | | | | | | | | | | | | |
| | | Currency1 | | Par | | | Value | | | % of Net Assets | |
Debt Securities | | | | | | | | | | | | | | | | |
| | | | |
Angola (Cost $21,654,743) | | | | | | | | | | | | | | | | |
Angola (Rep of), 9.500%, 11/12/2025 | | | | | | | 4,507,000 | | | $ | 2,098,414 | | | | 0.17 | |
Angola (Rep of), 8.250%, 05/09/2028 | | | | | | | 2,695,000 | | | | 1,172,427 | | | | 0.09 | |
Angola (Rep of), 8.000%, 11/26/2029 | | | | | | | 3,920,000 | | | | 1,705,200 | | | | 0.14 | |
Angola (Rep of), 9.375%, 05/08/2048 | | | | | | | 6,562,000 | | | | 2,796,948 | | | | 0.23 | |
Angola (Rep of), 9.125%, 11/26/2049 | | | | | | | 5,990,000 | | | | 2,540,095 | | | | 0.21 | |
| | | | | | | | | | | 10,313,084 | | | | 0.84 | |
| | | | |
Argentina (Cost $90,008,494) | | | | | | | | | | | | | | | | |
Argentina (Rep of), 6.875%, 04/22/2021 | | | | | | | 17,885,000 | | | | 5,106,168 | | | | 0.42 | |
Argentina (Rep of), 5.625%, 01/26/2022 | | | | | | | 8,131,000 | | | | 2,256,353 | | | | 0.18 | |
Argentina (Rep of), 4.625%, 01/11/2023 | | | | | | | 10,149,000 | | | | 2,841,822 | | | | 0.23 | |
Argentina (Rep of), 7.500%, 04/22/2026 | | | | | | | 6,431,000 | | | | 1,707,431 | | | | 0.14 | |
Argentina (Rep of), 5.875%, 01/11/2028 | | | | | | | 5,773,000 | | | | 1,451,967 | | | | 0.12 | |
Argentina (Rep of), 8.280%, 12/31/2033 | | | | | | | 5,889,761 | | | | 2,019,200 | | | | 0.17 | |
Argentina (Rep of), (Step to 5.250% on 03/31/2029), 3.750%, 12/31/20382 | | | | | | | 10,105,926 | | | | 3,132,837 | | | | 0.26 | |
Argentina (Rep of), 7.625%, 04/22/2046 | | | | | | | 7,656,000 | | | | 1,875,797 | | | | 0.15 | |
Argentina (Rep of), 6.875%, 01/11/2048 | | | | | | | 18,120,000 | | | | 4,213,081 | | | | 0.34 | |
Argentina POM Politica Monetaria, (Floating, Argentina Blended Historical Policy Rate + 0.000%), 38.038%, 06/21/2020 | | | ARS | | | | 359,119,619 | | | | 2,909,728 | | | | 0.24 | |
Argentina Treasury Bills, 0.000%, 05/13/20203 | | | ARS | | | | 52,475,012 | | | | 214,765 | | | | 0.02 | |
Argentina Treasury Bills, 0.000%, 07/29/20203 | | | ARS | | | | 21,930,360 | | | | 247,258 | | | | 0.02 | |
Argentina Treasury Bills, 0.000%, 08/27/20203 | | | ARS | | | | 40,787,398 | | | | 485,943 | | | | 0.04 | |
Argentina Treasury Bills, 0.000%, 10/29/20203 | | | ARS | | | | 101,103,019 | | | | 1,257,852 | | | | 0.10 | |
Bonos del Tesoro Nacional en Pesos Badlar, (Floating, Argentina Deposit Rates Badlar Private Banks30-35 Days + 2.000%), 22.741%, 04/03/2022 | | | ARS | | | | 77,137,255 | | | | 495,337 | | | | 0.04 | |
Ciudad Autonoma De Buenos Aires, (Floating, Argentina Deposit Rates Badlar Private Banks30-35 Days + 3.250%), 24.157%, 03/29/2024 | | | ARS | | | | 50,819,611 | | | | 291,937 | | | | 0.02 | |
Pampa Energia S.A., 7.375%, 07/21/2023 | | | | | | | 4,120,000 | | | | 2,688,300 | | | | 0.22 | |
Provincia de Buenos Aires, (Floating, Argentina Deposit Rates Badlar Private Banks30-35 Days + 3.750%), 23.621%, 04/12/20254 | | | ARS | | | | 62,075,000 | | | | 310,910 | | | | 0.03 | |
Telecom Argentina S.A., 6.500%, 06/15/2021 | | | | | | | 2,034,000 | | | | 1,840,790 | | | | 0.15 | |
YPF S.A., 8.750%, 04/04/2024 | | | | | | | 9,948,000 | | | | 5,309,745 | | | | 0.43 | |
| | | | | | | | | | | 40,657,221 | | | | 3.32 | |
| | | | |
Azerbaijan (Cost $11,042,192) | | | | | | | | | | | | | | | | |
Southern Gas Corridor CJSC, 6.875%, 03/24/2026 | | | | | | | 5,939,000 | | | | 6,194,614 | | | | 0.51 | |
State Oil Co. of the Azerbaijan Republic, 4.750%, 03/13/2023 | | | | | | | 710,000 | | | | 710,000 | | | | 0.06 | |
State Oil Co. of the Azerbaijan Republic, 6.950%, 03/18/2030 | | | | | | | 3,424,000 | | | | 3,585,887 | | | | 0.29 | |
| | | | | | | | | | | 10,490,501 | | | | 0.86 | |
See accompanying notes to the financial statements.
47
ASHMORE EMERGING MARKETS TOTAL RETURN FUND
SCHEDULE OF INVESTMENTS (CONTINUED)
As of April 30, 2020 (Unaudited)
| | | | | | | | | | | | | | | | |
| | | Currency1 | | Par | | | Value | | | % of Net Assets | |
Bahrain (Cost $10,972,415) | | | | | | | | | | | | | | | | |
Bahrain (Rep of), 7.000%, 10/12/2028 | | | | | | | 1,046,000 | | | $ | 1,039,737 | | | | 0.08 | |
Bahrain (Rep of), 7.500%, 09/20/2047 | | | | | | | 5,589,000 | | | | 5,275,457 | | | | 0.43 | |
Oil and Gas Holding (The) Co. BSCC, 7.625%, 11/07/2024 | | | | | | | 1,717,000 | | | | 1,673,972 | | | | 0.14 | |
Oil and Gas Holding (The) Co. BSCC, 8.375%, 11/07/2028 | | | | | | | 2,200,000 | | | | 2,145,466 | | | | 0.18 | |
| | | | | | | | | | | 10,134,632 | | | | 0.83 | |
| | | | |
Belarus (Cost $10,462,587) | | | | | | | | | | | | | | | | |
Belarus (Rep of), 6.875%, 02/28/2023 | | | | | | | 5,664,000 | | | | 5,531,802 | | | | 0.45 | |
Belarus (Rep of), 7.625%, 06/29/2027 | | | | | | | 2,746,000 | | | | 2,706,183 | | | | 0.22 | |
Belarus (Rep of), 6.200%, 02/28/2030 | | | | | | | 1,622,000 | | | | 1,457,692 | | | | 0.12 | |
| | | | | | | | | | | 9,695,677 | | | | 0.79 | |
| | | | |
Brazil (Cost $129,319,782) | | | | | | | | | | | | | | | | |
Banco do Brasil S.A., (Variable, U.S. Treasury Yield Curve Rate CMT 10Y + 4.398%), 6.250%, 04/15/20245 | | | | | | | 3,570,000 | | | | 2,918,475 | | | | 0.24 | |
Banco do Brasil S.A., (Variable, U.S. Treasury Yield Curve Rate CMT 10Y + 6.362%), 9.000%, 06/18/20245 | | | | | | | 3,470,000 | | | | 3,317,320 | | | | 0.27 | |
Brazil (Rep of), 4.625%, 01/13/2028 | | | | | | | 1,910,000 | | | | 1,974,004 | | | | 0.16 | |
Brazil (Rep of), 7.125%, 01/20/2037 | | | | | | | 1,080,000 | | | | 1,220,411 | | | | 0.10 | |
Brazil (Rep of), 5.625%, 01/07/2041 | | | | | | | 1,270,000 | | | | 1,266,825 | | | | 0.10 | |
Brazil (Rep of), 5.000%, 01/27/2045 | | | | | | | 2,060,000 | | | | 1,915,800 | | | | 0.16 | |
Brazil (Rep of), 5.625%, 02/21/2047 | | | | | | | 1,949,000 | | | | 1,953,872 | | | | 0.16 | |
Brazil Letras do Tesouro Nacional, 0.000%, 07/01/20233 | | | BRL | | | | 139,404,000 | | | | 21,683,617 | | | | 1.77 | |
Brazil Notas do Tesouro Nacional Serie F, 10.000%, 01/01/2027 | | | BRL | | | | 93,048,000 | | | | 19,535,053 | | | | 1.60 | |
Brazil Notas do Tesouro Nacional Serie F, 10.000%, 01/01/2029 | | | BRL | | | | 33,132,000 | | | | 6,983,659 | | | | 0.57 | |
Brazil Notas do Tesouro Nacional Serie F, 10.000%, 01/01/2031 | | | BRL | | | | 34,355,000 | | | | 7,196,224 | | | | 0.59 | |
CSN Resources S.A., 7.625%, 02/13/2023 | | | | | | | 3,515,000 | | | | 2,759,275 | | | | 0.23 | |
Oi S.A., 10.000%, (100% Cash), 07/27/20256 | | | | | | | 19,625,000 | | | | 14,620,625 | | | | 1.19 | |
Samarco Mineracao S.A., 4.125%, 11/01/20227 | | | | | | | 7,907,000 | | | | 3,083,730 | | | | 0.25 | |
Samarco Mineracao S.A., 5.750%, 10/24/20237 | | | | | | | 11,258,000 | | | | 4,503,200 | | | | 0.37 | |
Samarco Mineracao S.A., 5.375%, 09/26/20247 | | | | | | | 7,745,000 | | | | 3,098,000 | | | | 0.25 | |
| | | | | | | | | | | 98,030,090 | | | | 8.01 | |
| | | | |
Chile (Cost $32,356,204) | | | | | | | | | | | | | | | | |
Banco del Estado de Chile, 3.875%, 02/08/2022 | | | | | | | 1,560,000 | | | | 1,591,255 | | | | 0.13 | |
Bonos de la Tesoreria de la Republica, 1.500%, 03/01/2026 | | | CLP | | | | 134,500 | | | | 5,068,330 | | | | 0.41 | |
Bonos de la Tesoreria de la Republica, 1.900%, 09/01/2030 | | | CLP | | | | 14,500 | | | | 586,254 | | | | 0.05 | |
Bonos de la Tesoreria de la Republica, 2.000%, 03/01/2035 | | | CLP | | | | 13,000 | | | | 546,231 | | | | 0.05 | |
Bonos de la Tesoreria de la Republica en pesos, 4.700%, 09/01/20304 | | | CLP | | | | 1,780,000,000 | | | | 2,521,363 | | | | 0.21 | |
Chile (Rep of), 3.240%, 02/06/2028 | | | | | | | 1,133,000 | | | | 1,213,738 | | | | 0.10 | |
Corp. Nacional del Cobre de Chile, 4.250%, 07/17/2042 | | | | | | | 1,661,000 | | | | 1,608,153 | | | | 0.13 | |
Corp. Nacional del Cobre de Chile, 5.625%, 10/18/2043 | | | | | | | 3,379,000 | | | | 3,965,402 | | | | 0.32 | |
Corp. Nacional del Cobre de Chile, 4.875%, 11/04/2044 | | | | | | | 4,516,000 | | | | 4,809,747 | | | | 0.39 | |
See accompanying notes to the financial statements.
48
ASHMORE EMERGING MARKETS TOTAL RETURN FUND
SCHEDULE OF INVESTMENTS (CONTINUED)
As of April 30, 2020 (Unaudited)
| | | | | | | | | | | | | | | | |
| | | Currency1 | | Par | | | Value | | | % of Net Assets | |
Chile (continued) | | | | | | | | | | | | | | | | |
Corp. Nacional del Cobre de Chile, 4.500%, 08/01/2047 | | | | | | | 1,867,000 | | | $ | 1,938,679 | | | | 0.16 | |
Corp. Nacional del Cobre de Chile, 4.375%, 02/05/2049 | | | | | | | 2,741,000 | | | | 2,807,362 | | | | 0.23 | |
Empresa Nacional del Petroleo, 3.750%, 08/05/2026 | | | | | | | 1,730,000 | | | | 1,664,613 | | | | 0.14 | |
Empresa Nacional del Petroleo, 4.500%, 09/14/2047 | | | | | | | 3,035,000 | | | | 2,740,515 | | | | 0.22 | |
| | | | | | | | | | | 31,061,642 | | | | 2.54 | |
| | | | |
China (Cost $38,293,658) | | | | | | | | | | | | | | | | |
Amber Circle Funding Ltd., 3.250%, 12/04/2022 | | | | | | | 2,130,000 | | | | 2,186,381 | | | | 0.18 | |
China Evergrande Group, 11.500%, 01/22/2023 | | | | | | | 2,361,000 | | | | 2,107,405 | | | | 0.17 | |
China Evergrande Group, 7.500%, 06/28/2023 | | | | | | | 6,546,000 | | | | 5,075,569 | | | | 0.41 | |
China Evergrande Group, 10.500%, 04/11/2024 | | | | | | | 5,393,000 | | | | 4,478,066 | | | | 0.37 | |
China Evergrande Group, 8.750%, 06/28/2025 | | | | | | | 2,865,000 | | | | 2,260,941 | | | | 0.18 | |
Far East Energy Bermuda Ltd., 13.000%, 01/15/20164,7,8,9 | | | | | | | 1,975,424 | | | | — | | | | — | |
Kaisa Group Holdings Ltd., 8.500%, 06/30/2022 | | | | | | | 3,463,000 | | | | 3,207,965 | | | | 0.26 | |
Kaisa Group Holdings Ltd., 11.500%, 01/30/2023 | | | | | | | 770,000 | | | | 735,460 | | | | 0.06 | |
Kaisa Group Holdings Ltd., 10.875%, 07/23/2023 | | | | | | | 3,025,000 | | | | 2,824,602 | | | | 0.23 | |
Kaisa Group Holdings Ltd., 9.375%, 06/30/2024 | | | | | | | 5,290,000 | | | | 4,511,559 | | | | 0.37 | |
Scenery Journey Ltd., 12.000%, 10/24/2023 | | | | | | | 1,240,000 | | | | 1,080,540 | | | | 0.09 | |
Scenery Journey Ltd., 13.750%, 11/06/2023 | | | | | | | 400,000 | | | | 366,002 | | | | 0.03 | |
Sinochem Overseas Capital Co. Ltd., 4.500%, 11/12/2020 | | | | | | | 1,665,000 | | | | 1,682,204 | | | | 0.14 | |
Sinochem Overseas Capital Co. Ltd., 6.300%, 11/12/2040 | | | | | | | 1,170,000 | | | | 1,652,361 | | | | 0.14 | |
Sinopec Group Overseas Development 2012 Ltd., 4.875%, 05/17/2042 | | | | | | | 1,790,000 | | | | 2,230,963 | | | | 0.18 | |
| | | | | | | | | | | 34,400,018 | | | | 2.81 | |
| | | | |
Colombia (Cost $49,131,053) | | | | | | | | | | | | | | | | |
Colombia (Rep of), 4.000%, 02/26/2024 | | | | | | | 2,878,000 | | | | 2,922,062 | | | | 0.24 | |
Colombia (Rep of), 8.125%, 05/21/2024 | | | | | | | 3,276,000 | | | | 3,779,718 | | | | 0.31 | |
Colombia (Rep of), 3.875%, 04/25/2027 | | | | | | | 3,023,000 | | | | 2,985,213 | | | | 0.24 | |
Colombia (Rep of), 7.375%, 09/18/2037 | | | | | | | 2,551,000 | | | | 3,163,240 | | | | 0.26 | |
Colombia (Rep of), 6.125%, 01/18/2041 | | | | | | | 3,414,000 | | | | 3,806,610 | | | | 0.31 | |
Colombia (Rep of), 5.625%, 02/26/2044 | | | | | | | 2,901,000 | | | | 3,111,322 | | | | 0.25 | |
Colombia (Rep of), 5.000%, 06/15/2045 | | | | | | | 744,000 | | | | 743,263 | | | | 0.06 | |
Colombian TES, 7.000%, 05/04/2022 | | | COP | | | | 22,555,900,000 | | | | 5,991,827 | | | | 0.49 | |
Colombian TES, 4.750%, 02/23/2023 | | | COP | | | | 61,670,000 | | | | 4,564,194 | | | | 0.37 | |
Colombian TES, 10.000%, 07/24/2024 | | | COP | | | | 9,497,500,000 | | | | 2,819,599 | | | | 0.23 | |
Colombian TES, 6.250%, 11/26/2025 | | | COP | | | | 2,582,700,000 | | | | 662,033 | | | | 0.05 | |
Colombian TES, 7.500%, 08/26/2026 | | | COP | | | | 15,931,700,000 | | | | 4,295,228 | | | | 0.35 | |
Colombian TES, 5.750%, 11/03/2027 | | | COP | | | | 2,679,600,000 | | | | 641,397 | | | | 0.05 | |
Colombian TES, 6.000%, 04/28/2028 | | | COP | | | | 3,349,400,000 | | | | 805,329 | | | | 0.07 | |
Colombian TES, 7.000%, 06/30/2032 | | | COP | | | | 851,800,000 | | | | 212,522 | | | | 0.02 | |
Colombian TES, 7.250%, 10/18/2034 | | | COP | | | | 6,799,200,000 | | | | 1,723,890 | | | | 0.14 | |
Empresas Publicas de Medellin ESP, 8.375%, 11/08/2027 | | | COP | | | | 8,747,000,000 | | | | 2,165,249 | | | | 0.18 | |
| | | | | | | | | | | 44,392,696 | | | | 3.62 | |
See accompanying notes to the financial statements.
49
ASHMORE EMERGING MARKETS TOTAL RETURN FUND
SCHEDULE OF INVESTMENTS (CONTINUED)
As of April 30, 2020 (Unaudited)
| | | | | | | | | | | | | | | | |
| | | Currency1 | | Par | | | Value | | | % of Net Assets | |
Costa Rica (Cost $5,371,003) | | | | | | | | | | | | | | | | |
Banco Nacional de Costa Rica, 6.250%, 11/01/2023 | | | | | | | 2,390,000 | | | $ | 2,198,800 | | | | 0.18 | |
Costa Rica (Rep of), 6.125%, 02/19/2031 | | | | | | | 1,399,000 | | | | 1,129,692 | | | | 0.09 | |
Costa Rica (Rep of), 5.625%, 04/30/2043 | | | | | | | 1,460,000 | | | | 1,022,015 | | | | 0.08 | |
Costa Rica (Rep of), 7.000%, 04/04/2044 | | | | | | | 273,000 | | | | 207,480 | | | | 0.02 | |
| | | | | | | | | | | 4,557,987 | | | | 0.37 | |
| | | | |
Croatia (Cost $11,832,104) | | | | | | | | | | | | | | | | |
Croatia (Rep of), 6.625%, 07/14/2020 | | | | | | | 4,031,000 | | | | 4,052,203 | | | | 0.33 | |
Croatia (Rep of), 6.375%, 03/24/2021 | | | | | | | 3,381,000 | | | | 3,482,430 | | | | 0.28 | |
Croatia (Rep of), 6.000%, 01/26/2024 | | | | | | | 3,830,000 | | | | 4,263,234 | | | | 0.35 | |
| | | | | | | | | | | 11,797,867 | | | | 0.96 | |
| | | | |
Czech Republic (Cost $9,440,703) | | | | | | | | | | | | | | | | |
Czech (Rep of), 1.000%, 06/26/2026 | | | CZK | | | | 3,310,000 | | | | 133,007 | | | | 0.01 | |
Czech (Rep of), 0.950%, 05/15/2030 | | | CZK | | | | 38,960,000 | | | | 1,523,334 | | | | 0.12 | |
Czech (Rep of), 2.000%, 10/13/2033 | | | CZK | | | | 112,070,000 | | | | 4,869,549 | | | | 0.40 | |
Czech (Rep of), 4.200%, 12/04/2036 | | | CZK | | | | 6,350,000 | | | | 355,244 | | | | 0.03 | |
New World Resources N.V., 8.000%, 04/07/20207,8,9 | | | EUR | | | | 1,938,518 | | | | — | | | | — | |
New World Resources N.V., 4.000%, 10/07/20207,9 | | | EUR | | | | 669,526 | | | | — | | | | — | |
| | | | | | | | | | | 6,881,134 | | | | 0.56 | |
| | | | |
Dominican Republic (Cost $29,343,323) | | | | | | | | | | | | | | | | |
Dominican (Rep of), 7.500%, 05/06/2021 | | | | | | | 1,518,667 | | | | 1,511,089 | | | | 0.12 | |
Dominican (Rep of), 6.600%, 01/28/2024 | | | | | | | 2,519,000 | | | | 2,456,025 | | | | 0.20 | |
Dominican (Rep of), 5.875%, 04/18/2024 | | | | | | | 3,920,000 | | | | 3,782,800 | | | | 0.31 | |
Dominican (Rep of), 5.500%, 01/27/2025 | | | | | | | 1,804,000 | | | | 1,686,740 | | | | 0.14 | |
Dominican (Rep of), 6.875%, 01/29/2026 | | | | | | | 6,166,000 | | | | 5,919,360 | | | | 0.48 | |
Dominican (Rep of), 9.750%, 06/05/2026 | | | DOP | | | | 29,150,000 | | | | 427,924 | | | | 0.03 | |
Dominican (Rep of), 6.000%, 07/19/2028 | | | | | | | 1,450,000 | | | | 1,308,625 | | | | 0.11 | |
Dominican (Rep of), 7.450%, 04/30/2044 | | | | | | | 2,935,000 | | | | 2,663,512 | | | | 0.22 | |
Dominican (Rep of), 6.850%, 01/27/2045 | | | | | | | 5,858,000 | | | | 5,081,815 | | | | 0.42 | |
Dominican (Rep of), 6.500%, 02/15/2048 | | | | | | | 1,319,000 | | | | 1,091,473 | | | | 0.09 | |
| | | | | | | | | | | 25,929,363 | | | | 2.12 | |
| | | | |
Ecuador (Cost $90,646,790) | | | | | | | | | | | | | | | | |
Ecuador (Rep of), 10.750%, 03/28/2022 | | | | | | | 12,215,000 | | | | 3,863,116 | | | | 0.32 | |
Ecuador (Rep of), 8.750%, 06/02/2023 | | | | | | | 5,119,000 | | | | 1,586,890 | | | | 0.13 | |
Ecuador (Rep of), 7.950%, 06/20/2024 | | | | | | | 9,170,000 | | | | 2,854,254 | | | | 0.23 | |
Ecuador (Rep of), 9.650%, 12/13/2026 | | | | | | | 19,487,000 | | | | 5,553,990 | | | | 0.45 | |
Ecuador (Rep of), 9.625%, 06/02/2027 | | | | | | | 7,056,000 | | | | 2,002,210 | | | | 0.16 | |
Ecuador (Rep of), 8.875%, 10/23/2027 | | | | | | | 14,268,000 | | | | 4,066,523 | | | | 0.33 | |
Ecuador (Rep of), 7.875%, 01/23/2028 | | | | | | | 8,464,000 | | | | 2,401,745 | | | | 0.20 | |
Ecuador (Rep of), 10.750%, 01/31/2029 | | | | | | | 16,851,000 | | | | 4,802,703 | | | | 0.39 | |
Ecuador (Rep of), 9.500%, 03/27/2030 | | | | | | | 11,044,000 | | | | 3,147,540 | | | | 0.26 | |
| | | | | | | | | | | 30,278,971 | | | | 2.47 | |
See accompanying notes to the financial statements.
50
ASHMORE EMERGING MARKETS TOTAL RETURN FUND
SCHEDULE OF INVESTMENTS (CONTINUED)
As of April 30, 2020 (Unaudited)
| | | | | | | | | | | | | | | | |
| | | Currency1 | | Par | | | Value | | | % of Net Assets | |
Egypt (Cost $23,441,824) | | | | | | | | | | | | | | | | |
Egypt (Rep of), 7.500%, 01/31/2027 | | | | | | | 2,212,000 | | | $ | 2,149,077 | | | | 0.18 | |
Egypt (Rep of), 6.588%, 02/21/2028 | | | | | | | 4,821,000 | | | | 4,425,678 | | | | 0.36 | |
Egypt (Rep of), 7.600%, 03/01/2029 | | | | | | | 2,205,000 | | | | 2,090,146 | | | | 0.17 | |
Egypt (Rep of), 8.500%, 01/31/2047 | | | | | | | 6,314,000 | | | | 5,635,245 | | | | 0.46 | |
Egypt (Rep of), 7.903%, 02/21/2048 | | | | | | | 6,319,000 | | | | 5,442,239 | | | | 0.44 | |
Egypt (Rep of), 8.700%, 03/01/2049 | | | | | | | 1,019,000 | | | | 913,222 | | | | 0.07 | |
Egypt (Rep of), 8.150%, 11/20/2059 | | | | | | | 369,000 | | | | 321,030 | | | | 0.03 | |
| | | | | | | | | | | 20,976,637 | | | | 1.71 | |
| | | | |
El Salvador (Cost $19,639,113) | | | | | | | | | | | | | | | | |
El Salvador (Rep of), 5.875%, 01/30/2025 | | | | | | | 2,086,000 | | | | 1,663,585 | | | | 0.14 | |
El Salvador (Rep of), 6.375%, 01/18/2027 | | | | | | | 4,823,000 | | | | 3,822,227 | | | | 0.31 | |
El Salvador (Rep of), 8.625%, 02/28/2029 | | | | | | | 3,175,000 | | | | 2,682,875 | | | | 0.22 | |
El Salvador (Rep of), 8.250%, 04/10/2032 | | | | | | | 1,932,000 | | | | 1,574,580 | | | | 0.13 | |
El Salvador (Rep of), 7.650%, 06/15/2035 | | | | | | | 1,924,000 | | | | 1,519,960 | | | | 0.12 | |
El Salvador (Rep of), 7.625%, 02/01/2041 | | | | | | | 3,623,000 | | | | 2,789,710 | | | | 0.23 | |
El Salvador (Rep of), 7.125%, 01/20/2050 | | | | | | | 2,114,000 | | | | 1,596,070 | | | | 0.13 | |
| | | | | | | | | | | 15,649,007 | | | | 1.28 | |
| | | | |
Gabon (Cost $5,434,836) | | | | | | | | | | | | | | | | |
Gabon (Rep of), 6.375%, 12/12/2024 | | | | | | | 2,765,771 | | | | 1,977,195 | | | | 0.16 | |
Gabon (Rep of), 6.625%, 02/06/2031 | | | | | | | 4,063,000 | | | | 2,877,760 | | | | 0.24 | |
| | | | | | | | | | | 4,854,955 | | | | 0.40 | |
| | | | |
Georgia (Cost $4,834,590) | | | | | | | | | | | | | | | | |
Georgia (Rep of), 6.875%, 04/12/2021 | | | | | | | 2,723,000 | | | | 2,732,013 | | | | 0.22 | |
Georgian Railway JSC, 7.750%, 07/11/2022 | | | | | | | 1,950,000 | | | | 1,891,890 | | | | 0.16 | |
| | | | | | | | | | | 4,623,903 | | | | 0.38 | |
| | | | |
Ghana (Cost $13,116,086) | | | | | | | | | | | | | | | | |
Ghana (Rep of), 8.125%, 01/18/2026 | | | | | | | 1,590,000 | | | | 1,310,239 | | | | 0.11 | |
Ghana (Rep of), 7.875%, 03/26/2027 | | | | | | | 1,090,000 | | | | 862,626 | | | | 0.07 | |
Ghana (Rep of), 7.625%, 05/16/2029 | | | | | | | 1,943,000 | | | | 1,486,239 | | | | 0.12 | |
Ghana (Rep of), 8.125%, 03/26/2032 | | | | | | | 2,300,000 | | | | 1,748,000 | | | | 0.14 | |
Ghana (Rep of), 7.875%, 02/11/20354 | | | | | | | 1,118,000 | | | | 840,177 | | | | 0.07 | |
Ghana (Rep of), 8.627%, 06/16/2049 | | | | | | | 2,711,000 | | | | 2,033,928 | | | | 0.16 | |
Ghana (Rep of), 8.950%, 03/26/2051 | | | | | | | 1,400,000 | | | | 1,056,667 | | | | 0.09 | |
Ghana (Rep of), 8.750%, 03/11/20614 | | | | | | | 826,000 | | | | 622,061 | | | | 0.05 | |
| | | | | | | | | | | 9,959,937 | | | | 0.81 | |
| | | | |
Hungary (Cost $16,254,117) | | | | | | | | | | | | | | | | |
Hungary (Rep of), 5.375%, 02/21/2023 | | | | | | | 2,060,000 | | | | 2,226,345 | | | | 0.18 | |
Hungary (Rep of), 5.750%, 11/22/2023 | | | | | | | 2,110,000 | | | | 2,346,130 | | | | 0.19 | |
Hungary (Rep of), 5.375%, 03/25/2024 | | | | | | | 3,784,000 | | | | 4,211,365 | | | | 0.34 | |
Hungary (Rep of), 3.000%, 10/27/2027 | | | HUF | | | | 344,460,000 | | | | 1,163,149 | | | | 0.10 | |
Hungary (Rep of), 6.750%, 10/22/2028 | | | HUF | | | | 430,020,000 | | | | 1,848,745 | | | | 0.15 | |
Hungary (Rep of), 3.000%, 08/21/2030 | | | HUF | | | | 838,700,000 | | | | 2,860,845 | | | | 0.23 | |
See accompanying notes to the financial statements.
51
ASHMORE EMERGING MARKETS TOTAL RETURN FUND
SCHEDULE OF INVESTMENTS (CONTINUED)
As of April 30, 2020 (Unaudited)
| | | | | | | | | | | | | | | | |
| | | Currency1 | | Par | | | Value | | | % of Net Assets | |
Hungary (continued) | | | | | | | | | | | | | | | | |
Hungary (Rep of), 7.625%, 03/29/2041 | | | | | | | 884,000 | | | $ | 1,414,400 | | | | 0.12 | |
| | | | | | | | | | | 16,070,979 | | | | 1.31 | |
| | | | |
India (Cost $2,462,599) | | | | | | | | | | | | | | | | |
Export-Import Bank of India, 4.000%, 01/14/2023 | | | | | | | 2,419,000 | | | | 2,475,871 | | | | 0.20 | |
| | | | | | | | | | | 2,475,871 | | | | 0.20 | |
| | | | |
Indonesia (Cost $98,278,438) | | | | | | | | | | | | | | | | |
Indonesia (Rep of), 8.375%, 03/15/2024 | | | IDR | | | | 79,014,000,000 | | | | 5,517,690 | | | | 0.45 | |
Indonesia (Rep of), 4.125%, 01/15/2025 | | | | | | | 1,456,000 | | | | 1,526,144 | | | | 0.12 | |
Indonesia (Rep of), 8.375%, 09/15/2026 | | | IDR | | | | 135,662,000,000 | | | | 9,473,540 | | | | 0.77 | |
Indonesia (Rep of), 7.000%, 05/15/2027 | | | IDR | | | | 47,273,000,000 | | | | 3,053,346 | | | | 0.25 | |
Indonesia (Rep of), 6.125%, 05/15/2028 | | | IDR | | | | 48,446,000,000 | | | | 2,913,316 | | | | 0.24 | |
Indonesia (Rep of), 8.250%, 05/15/2029 | | | IDR | | | | 78,724,000,000 | | | | 5,378,657 | | | | 0.44 | |
Indonesia (Rep of), 7.000%, 09/15/2030 | | | IDR | | | | 55,576,000,000 | | | | 3,521,422 | | | | 0.29 | |
Indonesia (Rep of), 8.750%, 05/15/2031 | | | IDR | | | | 27,075,000,000 | | | | 1,907,303 | | | | 0.16 | |
Indonesia (Rep of), 7.500%, 08/15/2032 | | | IDR | | | | 52,371,000,000 | | | | 3,351,237 | | | | 0.27 | |
Indonesia (Rep of), 6.625%, 05/15/2033 | | | IDR | | | | 87,846,000,000 | | | | 5,193,432 | | | | 0.42 | |
Indonesia (Rep of), 8.375%, 03/15/2034 | | | IDR | | | | 9,455,000,000 | | | | 646,783 | | | | 0.05 | |
Indonesia (Rep of), 7.500%, 06/15/2035 | | | IDR | | | | 30,328,000,000 | | | | 1,950,467 | | | | 0.16 | |
Indonesia (Rep of), 8.500%, 10/12/2035 | | | | | | | 1,677,000 | | | | 2,424,560 | | | | 0.20 | |
Indonesia (Rep of), 8.250%, 05/15/2036 | | | IDR | | | | 38,990,000,000 | | | | 2,650,400 | | | | 0.22 | |
Indonesia (Rep of), 6.625%, 02/17/2037 | | | | | | | 1,795,000 | | | | 2,282,707 | | | | 0.19 | |
Indonesia (Rep of), 7.750%, 01/17/2038 | | | | | | | 2,492,000 | | | | 3,513,162 | | | | 0.29 | |
Indonesia (Rep of), 7.500%, 05/15/2038 | | | IDR | | | | 8,539,000,000 | | | | 543,555 | | | | 0.04 | |
Indonesia (Rep of), 8.375%, 04/15/2039 | | | IDR | | | | 37,239,000,000 | | | | 2,550,319 | | | | 0.21 | |
Indonesia (Rep of), 5.250%, 01/17/2042 | | | | | | | 2,203,000 | | | | 2,516,723 | | | | 0.21 | |
Indonesia (Rep of), 5.125%, 01/15/2045 | | | | | | | 4,665,000 | | | | 5,254,628 | | | | 0.43 | |
Indonesia (Rep of), 5.950%, 01/08/2046 | | | | | | | 2,286,000 | | | | 2,845,791 | | | | 0.23 | |
Indonesia (Rep of), 5.250%, 01/08/2047 | | | | | | | 3,090,000 | | | | 3,547,737 | | | | 0.29 | |
Indonesia (Rep of), 4.750%, 07/18/2047 | | | | | | | 1,950,000 | | | | 2,102,353 | | | | 0.17 | |
Indonesia Asahan Aluminium Persero PT, 5.710%, 11/15/2023 | | | | | | | 2,261,000 | | | | 2,311,872 | | | | 0.19 | |
Indonesia Asahan Aluminium Persero PT, 6.757%, 11/15/2048 | | | | | | | 1,747,000 | | | | 1,868,533 | | | | 0.15 | |
Pertamina Persero PT, 6.000%, 05/03/2042 | | | | | | | 1,289,000 | | | | 1,359,433 | | | | 0.11 | |
Pertamina Persero PT, 6.500%, 11/07/2048 | | | | | | | 1,467,000 | | | | 1,642,378 | | | | 0.13 | |
Pertamina Persero PT, 4.175%, 01/21/2050 | | | | | | | 1,622,000 | | | | 1,350,880 | | | | 0.11 | |
Perusahaan Listrik Negara PT, 5.500%, 11/22/2021 | | | | | | | 3,080,000 | | | | 3,141,600 | | | | 0.26 | |
Perusahaan Listrik Negara PT, 5.250%, 05/15/2047 | | | | | | | 1,388,000 | | | | 1,408,820 | | | | 0.12 | |
Perusahaan Listrik Negara PT, 6.150%, 05/21/2048 | | | | | | | 2,781,000 | | | | 3,031,290 | | | | 0.25 | |
Perusahaan Penerbit SBSN Indonesia III, 4.325%, 05/28/2025 | | | | | | | 1,438,000 | | | | 1,503,570 | | | | 0.12 | |
Perusahaan Penerbit SBSN Indonesia III, 4.550%, 03/29/2026 | | | | | | | 2,789,000 | | | | 2,966,199 | | | | 0.24 | |
| | | | | | | | | | | 95,249,847 | | | | 7.78 | |
| | | | |
Iraq (Cost $1,539,220) | | | | | | | | | | | | | | | | |
Iraq (Rep of), 5.800%, 01/15/2028 | | | | | | | 1,624,000 | | | | 1,177,725 | | | | 0.10 | |
| | | | | | | | | | | 1,177,725 | | | | 0.10 | |
See accompanying notes to the financial statements.
52
ASHMORE EMERGING MARKETS TOTAL RETURN FUND
SCHEDULE OF INVESTMENTS (CONTINUED)
As of April 30, 2020 (Unaudited)
| | | | | | | | | | | | | | | | |
| | | Currency1 | | Par | | | Value | | | % of Net Assets | |
Ivory Coast (Cost $9,611,256) | | | | | | | | | | | | | | | | |
Ivory Coast (Rep of), 6.375%, 03/03/2028 | | | | | | | 1,676,000 | | | $ | 1,502,115 | | | | 0.12 | |
Ivory Coast (Rep of), 5.875%, 10/17/2031 | | | EUR | | | | 3,183,000 | | | | 2,829,595 | | | | 0.23 | |
Ivory Coast (Rep of), 6.125%, 06/15/2033 | | | | | | | 200,000 | | | | 171,824 | | | | 0.02 | |
Ivory Coast (Rep of), 6.875%, 10/17/2040 | | | EUR | | | | 3,288,000 | | | | 2,937,292 | | | | 0.24 | |
| | | | | | | | | | | 7,440,826 | | | | 0.61 | |
| | | | |
Jamaica (Cost $22,797,205) | | | | | | | | | | | | | | | | |
Digicel Group One Ltd., 8.250%, 12/30/2022 | | | | | | | 11,390,000 | | | | 6,720,100 | | | | 0.55 | |
Digicel Group Two Ltd., 8.250%, 09/30/2022 | | | | | | | 10,693,000 | | | | 320,790 | | | | 0.02 | |
Digicel Group Two Ltd., 9.125%, 04/01/20246 | | | | | | | 3,563,908 | | | | 106,917 | | | | 0.01 | |
Digicel Ltd., 6.000%, 04/15/2021 | | | | | | | 3,670,000 | | | | 2,202,037 | | | | 0.18 | |
Jamaica (Rep of), 7.875%, 07/28/2045 | | | | | | | 2,190,000 | | | | 2,304,975 | | | | 0.19 | |
| | | | | | | | | | | 11,654,819 | | | | 0.95 | |
| | | | |
Jordan (Cost $1,715,367) | | | | | | | | | | | | | | | | |
Jordan (Rep of), 5.750%, 01/31/2027 | | | | | | | 1,760,000 | | | | 1,684,366 | | | | 0.14 | |
| | | | | | | | | | | 1,684,366 | | | | 0.14 | |
| | | | |
Kazakhstan (Cost $16,871,740) | | | | | | | | | | | | | | | | |
Development Bank of Kazakhstan JSC, 4.125%, 12/10/2022 | | | | | | | 4,780,000 | | | | 4,695,012 | | | | 0.38 | |
Kazakhstan (Rep of), 6.500%, 07/21/2045 | | | | | | | 3,227,000 | | | | 4,267,707 | | | | 0.35 | |
Kazakhstan Temir Zholy Finance B.V., 6.950%, 07/10/2042 | | | | | | | 2,691,000 | | | | 3,089,806 | | | | 0.25 | |
KazMunayGas National Co. JSC, 5.375%, 04/24/2030 | | | | | | | 2,985,000 | | | | 2,955,848 | | | | 0.24 | |
KazMunayGas National Co. JSC, 6.375%, 10/24/2048 | | | | | | | 1,741,000 | | | | 1,802,207 | | | | 0.15 | |
| | | | | | | | | | | 16,810,580 | | | | 1.37 | |
| | | | |
Kenya (Cost $7,422,934) | | | | | | | | | | | | | | | | |
Kenya (Rep of), 7.000%, 05/22/2027 | | | | | | | 1,070,000 | | | | 971,025 | | | | 0.08 | |
Kenya (Rep of), 8.000%, 05/22/2032 | | | | | | | 2,810,000 | | | | 2,543,050 | | | | 0.21 | |
Kenya (Rep of), 8.250%, 02/28/2048 | | | | | | | 3,316,000 | | | | 2,956,347 | | | | 0.24 | |
| | | | | | | | | | | 6,470,422 | | | | 0.53 | |
| | | | |
Lebanon (Cost $50,259,740) | | | | | | | | | | | | | | | | |
Lebanon (Rep of), 6.375%, 03/09/20207,8 | | | | | | | 6,305,000 | | | | 993,037 | | | | 0.08 | |
Lebanon (Rep of), 5.800%, 04/14/20207,8 | | | | | | | 4,399,000 | | | | 692,843 | | | | 0.05 | |
Lebanon (Rep of), 6.150%, 06/19/20207 | | | | | | | 7,757,000 | | | | 1,221,727 | | | | 0.10 | |
Lebanon (Rep of), 8.250%, 04/12/20217 | | | | | | | 12,325,000 | | | | 1,941,187 | | | | 0.16 | |
Lebanon (Rep of), 6.100%, 10/04/20227 | | | | | | | 14,555,000 | | | | 2,292,412 | | | | 0.19 | |
Lebanon (Rep of), 6.000%, 01/27/20237 | | | | | | | 1,421,000 | | | | 223,808 | | | | 0.02 | |
Lebanon (Rep of), 6.600%, 11/27/20267 | | | | | | | 2,059,000 | | | | 324,293 | | | | 0.02 | |
Lebanon (Rep of), 6.850%, 03/23/20277 | | | | | | | 5,314,000 | | | | 836,955 | | | | 0.07 | |
Lebanon (Rep of), 7.000%, 03/23/20327 | | | | | | | 3,635,000 | | | | 572,513 | | | | 0.05 | |
Lebanon (Rep of), 7.050%, 11/02/20357 | | | | | | | 244,000 | | | | 38,430 | | | | — | |
Lebanon (Rep of), 7.250%, 03/23/20377 | | | | | | | 2,067,000 | | | | 325,553 | | | | 0.03 | |
| | | | | | | | | | | 9,462,758 | | | | 0.77 | |
| | | | |
Malaysia (Cost $13,401,322) | | | | | | | | | | | | | | | | |
Malaysia (Rep of), 4.181%, 07/15/2024 | | | MYR | | | | 2,150,000 | | | | 532,439 | | | | 0.05 | |
See accompanying notes to the financial statements.
53
ASHMORE EMERGING MARKETS TOTAL RETURN FUND
SCHEDULE OF INVESTMENTS (CONTINUED)
As of April 30, 2020 (Unaudited)
| | | | | | | | | | | | | | | | |
| | | Currency1 | | Par | | | Value | | | % of Net Assets | |
Malaysia (continued) | | | | | | | | | | | | | | | | |
Malaysia (Rep of), 3.899%, 11/16/2027 | | | MYR | | | | 1,099,000 | | | $ | 274,710 | | | | 0.02 | |
Malaysia (Rep of), 3.733%, 06/15/2028 | | | MYR | | | | 6,370,000 | | | | 1,569,992 | | | | 0.13 | |
Malaysia (Rep of), 3.885%, 08/15/2029 | | | MYR | | | | 4,029,000 | | | | 1,013,565 | | | | 0.08 | |
Malaysia (Rep of), 4.498%, 04/15/2030 | | | MYR | | | | 6,297,000 | | | | 1,649,141 | | | | 0.14 | |
Malaysia (Rep of), 4.232%, 06/30/2031 | | | MYR | | | | 2,488,000 | | | | 641,680 | | | | 0.05 | |
Malaysia (Rep of), 4.642%, 11/07/2033 | | | MYR | | | | 1,728,000 | | | | 461,193 | | | | 0.04 | |
Malaysia (Rep of), 3.828%, 07/05/2034 | | | MYR | | | | 5,407,000 | | | | 1,357,987 | | | | 0.11 | |
Malaysia (Rep of), 4.935%, 09/30/2043 | | | MYR | | | | 747,000 | | | | 207,104 | | | | 0.02 | |
Malaysia (Rep of), 4.921%, 07/06/2048 | | | MYR | | | | 1,743,000 | | | | 491,879 | | | | 0.04 | |
Petronas Capital Ltd., 7.875%, 05/22/2022 | | | | | | | 1,250,000 | | | | 1,388,913 | | | | 0.11 | |
Petronas Capital Ltd., 4.550%, 04/21/20504 | | | | | | | 1,223,000 | | | | 1,325,087 | | | | 0.11 | |
Petronas Capital Ltd., 4.800%, 04/21/20604 | | | | | | | 774,000 | | | | 894,626 | | | | 0.07 | |
Wakala Global Sukuk Bhd., 4.646%, 07/06/2021 | | | | | | | 1,921,000 | | | | 1,984,604 | | | | 0.16 | |
| | | | | | | | | | | 13,792,920 | | | | 1.13 | |
| | | | |
Mexico (Cost $75,049,168) | | | | | | | | | | | | | | | | |
Banco Mercantil del Norte S.A., (Variable, U.S. Treasury Yield Curve Rate CMT 5Y + 4.967%), 6.750%, 09/27/20245 | | | | | | | 1,270,000 | | | | 1,007,237 | | | | 0.08 | |
Banco Mercantil del Norte S.A., (Variable, U.S. Treasury Yield Curve Rate CMT 10Y + 5.353%), 7.625%, 01/10/20285 | | | | | | | 200,000 | | | | 161,000 | | | | 0.01 | |
Banco Mercantil del Norte S.A., (Variable, U.S. Treasury Yield Curve Rate CMT 10Y + 5.470%), 7.500%, 06/27/20295 | | | | | | | 1,290,000 | | | | 1,058,058 | | | | 0.09 | |
Comision Federal de Electricidad, 4.875%, 01/15/2024 | | | | | | | 2,553,000 | | | | 2,540,235 | | | | 0.21 | |
Comision Federal de Electricidad, 8.180%, 12/23/2027 | | | MXN | | | | 24,850,000 | | | | 969,703 | | | | 0.08 | |
Comision Federal de Electricidad, 5.750%, 02/14/2042 | | | | | | | 3,217,000 | | | | 3,080,310 | | | | 0.25 | |
Mexican Bonos, 10.000%, 12/05/2024 | | | MXN | | | | 24,500,000 | | | | 1,198,163 | | | | 0.10 | |
Mexican Bonos, 7.500%, 06/03/2027 | | | MXN | | | | 42,080,000 | | | | 1,873,914 | | | | 0.15 | |
Mexican Bonos, 8.500%, 05/31/2029 | | | MXN | | | | 92,650,000 | | | | 4,339,761 | | | | 0.36 | |
Mexican Bonos, 7.750%, 11/23/2034 | | | MXN | | | | 95,840,000 | | | | 4,214,359 | | | | 0.34 | |
Mexican Bonos, 8.500%, 11/18/2038 | | | MXN | | | | 108,370,000 | | | | 4,906,439 | | | | 0.40 | |
Mexican Bonos, 8.000%, 11/07/2047 | | | MXN | | | | 69,070,000 | | | | 2,952,319 | | | | 0.24 | |
Mexico (Rep of), 6.050%, 01/11/2040 | | | | | | | 1,268,000 | | | | 1,377,758 | | | | 0.11 | |
Mexico (Rep of), 4.750%, 03/08/2044 | | | | | | | 1,788,000 | | | | 1,656,600 | | | | 0.14 | |
Mexico (Rep of), 5.550%, 01/21/2045 | | | | | | | 2,114,000 | | | | 2,184,840 | | | | 0.18 | |
Mexico (Rep of), 4.350%, 01/15/2047 | | | | | | | 1,732,000 | | | | 1,519,830 | | | | 0.12 | |
Mexico (Rep of), 5.750%, 10/12/2110 | | | | | | | 2,288,000 | | | | 2,170,763 | | | | 0.18 | |
Petroleos Mexicanos, 7.190%, 09/12/2024 | | | MXN | | | | 79,460,000 | | | | 2,540,239 | | | | 0.21 | |
Petroleos Mexicanos, 6.750%, 09/21/2047 | | | | | | | 11,922,000 | | | | 8,196,375 | | | | 0.67 | |
Petroleos Mexicanos, 6.350%, 02/12/2048 | | | | | | | 3,050,000 | | | | 2,039,687 | | | | 0.17 | |
Petroleos Mexicanos, 7.690%, 01/23/2050 | | | | | | | 6,563,000 | | | | 4,823,805 | | | | 0.39 | |
Petroleos Mexicanos, 6.950%, 01/28/2060 | | | | | | | 13,357,000 | | | | 9,350,034 | | | | 0.76 | |
| | | | | | | | | | | 64,161,429 | | | | 5.24 | |
| | | | |
Mongolia (Cost $2,931,399) | | | | | | | | | | | | | | | | |
Development Bank of Mongolia LLC, 7.250%, 10/23/2023 | | | | | | | 1,300,000 | | | | 1,121,257 | | | | 0.09 | |
Mongolia (Rep of), 5.625%, 05/01/2023 | | | | | | | 1,320,000 | | | | 1,174,800 | | | | 0.10 | |
See accompanying notes to the financial statements.
54
ASHMORE EMERGING MARKETS TOTAL RETURN FUND
SCHEDULE OF INVESTMENTS (CONTINUED)
As of April 30, 2020 (Unaudited)
| | | | | | | | | | | | | | | | |
| | | Currency1 | | Par | | | Value | | | % of Net Assets | |
Mongolia (continued) | | | | | | | | | | | | | | | | |
Mongolian Mining Corp., 2.119%, 10/01/20206,10 | | | | | | | 992,986 | | | $ | 486,563 | | | | 0.04 | |
| | | | | | | | | | | 2,782,620 | | | | 0.23 | |
| | | | |
Morocco (Cost $5,273,756) | | | | | | | | | | | | | | | | |
Morocco (Rep of), 4.250%, 12/11/2022 | | | | | | | 3,685,000 | | | | 3,830,543 | | | | 0.31 | |
Morocco (Rep of), 5.500%, 12/11/2042 | | | | | | | 1,333,000 | | | | 1,509,622 | | | | 0.13 | |
| | | | | | | | | | | 5,340,165 | | | | 0.44 | |
| | | | |
Nigeria (Cost $9,708,458) | | | | | | | | | | | | | | | | |
Nigeria (Rep of), 6.500%, 11/28/2027 | | | | | | | 3,566,000 | | | | 2,692,330 | | | | 0.22 | |
Nigeria (Rep of), 7.696%, 02/23/2038 | | | | | | | 2,303,000 | | | | 1,692,779 | | | | 0.14 | |
Nigeria (Rep of), 7.625%, 11/28/2047 | | | | | | | 2,280,000 | | | | 1,664,400 | | | | 0.14 | |
Nigeria (Rep of), 9.248%, 01/21/2049 | | | | | | | 1,550,000 | | | | 1,262,903 | | | | 0.10 | |
| | | | | | | | | | | 7,312,412 | | | | 0.60 | |
| | | | |
Oman (Cost $12,840,871) | | | | | | | | | | | | | | | | |
Oman (Rep of), 4.750%, 06/15/2026 | | | | | | | 1,296,000 | | | | 986,059 | | | | 0.08 | |
Oman (Rep of), 6.500%, 03/08/2047 | | | | | | | 7,843,000 | | | | 5,481,865 | | | | 0.45 | |
Oman (Rep of), 6.750%, 01/17/2048 | | | | | | | 4,765,000 | | | | 3,345,411 | | | | 0.27 | |
| | | | | | | | | | | 9,813,335 | | | | 0.80 | |
| | | | |
Pakistan (Cost $19,591,545) | | | | | | | | | | | | | | | | |
Pakistan (Rep of), 8.250%, 04/15/2024 | | | | | | | 6,510,000 | | | | 6,119,400 | | | | 0.50 | |
Pakistan (Rep of), 8.250%, 09/30/2025 | | | | | | | 1,594,000 | | | | 1,466,799 | | | | 0.12 | |
Pakistan (Rep of), 6.875%, 12/05/2027 | | | | | | | 7,947,000 | | | | 6,872,565 | | | | 0.56 | |
Third Pakistan International Sukuk (The) Co. Ltd., 5.500%, 10/13/2021 | | | | | | | 1,057,000 | | | | 997,005 | | | | 0.08 | |
Third Pakistan International Sukuk (The) Co. Ltd., 5.625%, 12/05/2022 | | | | | | | 2,386,000 | | | | 2,197,344 | | | | 0.18 | |
| | | | | | | | | | | 17,653,113 | | | | 1.44 | |
| | | | |
Panama (Cost $15,640,029) | | | | | | | | | | | | | | | | |
Panama (Rep of), 4.000%, 09/22/2024 | | | | | | | 1,530,000 | | | | 1,616,460 | | | | 0.13 | |
Panama (Rep of), 7.125%, 01/29/2026 | | | | | | | 869,000 | | | | 1,044,112 | | | | 0.09 | |
Panama (Rep of), 8.875%, 09/30/2027 | | | | | | | 1,637,000 | | | | 2,209,966 | | | | 0.18 | |
Panama (Rep of), 9.375%, 04/01/2029 | | | | | | | 1,592,000 | | | | 2,230,806 | | | | 0.18 | |
Panama (Rep of), 6.700%, 01/26/2036 | | | | | | | 2,969,000 | | | | 3,904,265 | | | | 0.32 | |
Panama (Rep of), 4.500%, 05/15/2047 | | | | | | | 1,520,000 | | | | 1,691,015 | | | | 0.14 | |
Panama (Rep of), 4.300%, 04/29/2053 | | | | | | | 3,191,000 | | | | 3,470,245 | | | | 0.28 | |
| | | | | | | | | | | 16,166,869 | | | | 1.32 | |
| | | | |
Paraguay (Cost $1,303,166) | | | | | | | | | | | | | | | | |
Paraguay (Rep of), 4.700%, 03/27/2027 | | | | | | | 1,246,000 | | | | 1,292,725 | | | | 0.10 | |
| | | | | | | | | | | 1,292,725 | | | | 0.10 | |
| | | | |
Peru (Cost $38,012,941) | | | | | | | | | | | | | | | | |
Banco de Credito del Peru, 4.850%, 10/30/2020 | | | PEN | | | | 990,000 | | | | 294,463 | | | | 0.02 | |
Fondo MIVIVIENDA S.A., 7.000%, 02/14/2024 | | | PEN | | | | 5,140,000 | | | | 1,655,977 | | | | 0.14 | |
Peru (Rep of), 7.350%, 07/21/2025 | | | | | | | 4,044,000 | | | | 5,055,040 | | | | 0.41 | |
See accompanying notes to the financial statements.
55
ASHMORE EMERGING MARKETS TOTAL RETURN FUND
SCHEDULE OF INVESTMENTS (CONTINUED)
As of April 30, 2020 (Unaudited)
| | | | | | | | | | | | | | | | |
| | | Currency1 | | Par | | | Value | | | % of Net Assets | |
Peru (continued) | | | | | | | | | | | | | | | | |
Peru (Rep of), 6.950%, 08/12/2031 | | | PEN | | | | 21,535,000 | | | $ | 7,562,378 | | | | 0.62 | |
Peru (Rep of), 8.750%, 11/21/2033 | | | | | | | 5,550,000 | | | | 8,769,056 | | | | 0.72 | |
Peru (Rep of), 5.400%, 08/12/20344 | | | PEN | | | | 10,341,000 | | | | 3,152,521 | | | | 0.26 | |
Peru (Rep of), 5.350%, 08/12/20404 | | | PEN | | | | 6,968,000 | | | | 1,963,312 | | | | 0.16 | |
Peru (Rep of), 5.625%, 11/18/2050 | | | | | | | 6,083,000 | | | | 9,109,292 | | | | 0.74 | |
Petroleos del Peru S.A., 5.625%, 06/19/2047 | | | | | | | 1,918,000 | | | | 1,870,069 | | | | 0.15 | |
| | | | | | | | | | | 39,432,108 | | | | 3.22 | |
| | | | |
Philippines (Cost $23,250,539) | | | | | | | | | | | | | | | | |
Philippines (Rep of), 4.950%, 01/15/2021 | | | PHP | | | | 11,000,000 | | | | 217,333 | | | | 0.02 | |
Philippines (Rep of), 3.900%, 11/26/2022 | | | PHP | | | | 35,000,000 | | | | 671,083 | | | | 0.05 | |
Philippines (Rep of), 10.625%, 03/16/2025 | | | | | | | 1,730,000 | | | | 2,368,872 | | | | 0.19 | |
Philippines (Rep of), 9.500%, 02/02/2030 | | | | | | | 3,152,000 | | | | 5,009,910 | | | | 0.41 | |
Philippines (Rep of), 7.750%, 01/14/2031 | | | | | | | 3,360,000 | | | | 4,925,995 | | | | 0.40 | |
Philippines (Rep of), 6.375%, 10/23/2034 | | | | | | | 2,828,000 | | | | 4,016,938 | | | | 0.33 | |
Philippines (Rep of), 6.250%, 01/14/2036 | | | PHP | | | | 15,000,000 | | | | 334,219 | | | | 0.03 | |
Philippines (Rep of), 05/05/204511 | | | | | | | 1,191,000 | | | | 1,220,119 | | | | 0.10 | |
Power Sector Assets & Liabilities Management Corp., 7.390%, 12/02/2024 | | | | | | | 4,346,000 | | | | 5,093,770 | | | | 0.42 | |
| | | | | | | | | | | 23,858,239 | | | | 1.95 | |
| | | | |
Poland (Cost $9,418,186) | | | | | | | | | | | | | | | | |
Poland (Rep of), 2.750%, 04/25/2028 | | | PLN | | | | 15,011,000 | | | | 3,989,012 | | | | 0.32 | |
Poland (Rep of), 2.750%, 10/25/2029 | | | PLN | | | | 19,564,000 | | | | 5,249,143 | | | | 0.43 | |
| | | | | | | | | | | 9,238,155 | | | | 0.75 | |
| | | | |
Qatar (Cost $19,816,389) | | | | | | | | | | | | | | | | |
Qatar (Rep of), 3.250%, 06/02/2026 | | | | | | | 4,637,000 | | | | 4,897,831 | | | | 0.40 | |
Qatar (Rep of), 5.103%, 04/23/2048 | | | | | | | 5,090,000 | | | | 6,337,050 | | | | 0.52 | |
Qatar (Rep of), 4.817%, 03/14/2049 | | | | | | | 8,340,000 | | | | 10,031,219 | | | | 0.82 | |
| | | | | | | | | | | 21,266,100 | | | | 1.74 | |
| | | | |
Romania (Cost $7,043,188) | | | | | | | | | | | | | | | | |
Romania (Rep of), 6.750%, 02/07/2022 | | | | | | | 1,550,000 | | | | 1,651,091 | | | | 0.14 | |
Romania (Rep of), 4.375%, 08/22/2023 | | | | | | | 3,302,000 | | | | 3,427,113 | | | | 0.28 | |
Romania (Rep of), 6.125%, 01/22/2044 | | | | | | | 658,000 | | | | 780,041 | | | | 0.06 | |
Romania (Rep of), 3.375%, 01/28/2050 | | | EUR | | | | 1,290,000 | | | | 1,197,949 | | | | 0.10 | |
| | | | | | | | | | | 7,056,194 | | | | 0.58 | |
| | | | |
Russian Federation (Cost $43,256,051) | | | | | | | | | | | | | | | | |
CEDC Finance Corp. International, Inc., 10.000%, 12/31/20224 | | | | | | | 1,071,532 | | | | 835,795 | | | | 0.07 | |
Russian Federal Bond - OFZ, 7.400%, 12/07/2022 | | | RUB | | | | 74,448,000 | | | | 1,054,284 | | | | 0.08 | |
Russian Federal Bond - OFZ, 7.400%, 07/17/2024 | | | RUB | | | | 162,465,000 | | | | 2,341,396 | | | | 0.19 | |
Russian Federal Bond - OFZ, 7.750%, 09/16/2026 | | | RUB | | | | 324,001,000 | | | | 4,833,243 | | | | 0.39 | |
Russian Federal Bond - OFZ, 7.950%, 10/07/2026 | | | RUB | | | | 81,233,000 | | | | 1,224,884 | | | | 0.10 | |
Russian Federal Bond - OFZ, 7.050%, 01/19/2028 | | | RUB | | | | 259,680,000 | | | | 3,762,233 | | | | 0.31 | |
Russian Federal Bond - OFZ, 6.900%, 05/23/2029 | | | RUB | | | | 164,990,000 | | | | 2,376,785 | | | | 0.19 | |
See accompanying notes to the financial statements.
56
ASHMORE EMERGING MARKETS TOTAL RETURN FUND
SCHEDULE OF INVESTMENTS (CONTINUED)
As of April 30, 2020 (Unaudited)
| | | | | | | | | | | | | | | | |
| | | Currency1 | | Par | | | Value | | | % of Net Assets | |
Russian Federation (continued) | | | | | | | | | | | | | | | | |
Russian Federal Bond - OFZ, 8.500%, 09/17/2031 | | | RUB | | | | 280,759,000 | | | $ | 4,527,515 | | | | 0.37 | |
Russian Federal Bond - OFZ, 7.700%, 03/23/2033 | | | RUB | | | | 300,544,000 | | | | 4,609,185 | | | | 0.38 | |
Russian Federal Bond - OFZ, 7.250%, 05/10/2034 | | | RUB | | | | 44,033,000 | | | | 654,418 | | | | 0.05 | |
Russian Foreign Bond - Eurobond, 4.250%, 06/23/2027 | | | | | | | 1,800,000 | | | | 1,948,767 | | | | 0.16 | |
Russian Foreign Bond - Eurobond, 4.375%, 03/21/2029 | | | | | | | 3,400,000 | | | | 3,752,920 | | | | 0.31 | |
Russian Foreign Bond - Eurobond, 5.250%, 06/23/2047 | | | | | | | 6,200,000 | | | | 7,674,422 | | | | 0.63 | |
SCF Capital Designated Activity Co., 5.375%, 06/16/2023 | | | | | | | 3,453,000 | | | | 3,557,481 | | | | 0.29 | |
| | | | | | | | | | | 43,153,328 | | | | 3.52 | |
| | | | |
Saudi Arabia (Cost $15,917,649) | | | | | | | | | | | | | | | | |
Saudi (Rep of), 5.000%, 04/17/2049 | | | | | | | 5,217,000 | | | | 5,757,053 | | | | 0.47 | |
Saudi (Rep of), 5.250%, 01/16/2050 | | | | | | | 5,100,000 | | | | 5,783,247 | | | | 0.47 | |
Saudi (Rep of), 3.750%, 01/21/2055 | | | | | | | 3,417,000 | | | | 3,134,831 | | | | 0.26 | |
Saudi (Rep of), 4.500%, 04/22/20604 | | | | | | | 1,592,000 | | | | 1,585,075 | | | | 0.13 | |
| | | | | | | | | | | 16,260,206 | | | | 1.33 | |
| | | | |
Senegal (Cost $1,656,567) | | | | | | | | | | | | | | | | |
Senegal (Rep of), 6.750%, 03/13/2048 | | | | | | | 1,807,000 | | | | 1,499,810 | | | | 0.12 | |
| | | | | | | | | | | 1,499,810 | | | | 0.12 | |
| | | | |
South Africa (Cost $46,002,596) | | | | | | | | | | | | | | | | |
Eskom Holdings SOC Ltd., 7.125%, 02/11/2025 | | | | | | | 3,551,000 | | | | 2,592,230 | | | | 0.21 | |
Eskom Holdings SOC Ltd., 8.450%, 08/10/2028 | | | | | | | 1,360,000 | | | | 965,600 | | | | 0.08 | |
South Africa (Rep of), 5.875%, 05/30/2022 | | | | | | | 1,442,000 | | | | 1,480,213 | | | | 0.12 | |
South Africa (Rep of), 10.500%, 12/21/2026 | | | ZAR | | | | 28,969,000 | | | | 1,716,369 | | | | 0.14 | |
South Africa (Rep of), 4.300%, 10/12/2028 | | | | | | | 5,531,000 | | | | 4,646,151 | | | | 0.38 | |
South Africa (Rep of), 8.000%, 01/31/2030 | | | ZAR | | | | 75,734,000 | | | | 3,507,569 | | | | 0.29 | |
South Africa (Rep of), 5.875%, 06/22/2030 | | | | | | | 1,157,000 | | | | 1,061,547 | | | | 0.09 | |
South Africa (Rep of), 7.000%, 02/28/2031 | | | ZAR | | | | 2,950,000 | | | | 122,978 | | | | 0.01 | |
South Africa (Rep of), 8.250%, 03/31/2032 | | | ZAR | | | | 73,029,000 | | | | 3,276,315 | | | | 0.27 | |
South Africa (Rep of), 8.875%, 02/28/2035 | | | ZAR | | | | 31,743,140 | | | | 1,412,319 | | | | 0.11 | |
South Africa (Rep of), 9.000%, 01/31/2040 | | | ZAR | | | | 38,094,480 | | | | 1,625,210 | | | | 0.13 | |
South Africa (Rep of), 8.750%, 01/31/2044 | | | ZAR | | | | 33,638,980 | | | | 1,372,637 | | | | 0.11 | |
South Africa (Rep of), 5.000%, 10/12/2046 | | | | | | | 1,267,000 | | | | 944,521 | | | | 0.08 | |
South Africa (Rep of), 5.650%, 09/27/2047 | | | | | | | 3,788,000 | | | | 2,926,230 | | | | 0.24 | |
South Africa (Rep of), 8.750%, 02/28/2048 | | | ZAR | | | | 91,472,690 | | | | 3,704,211 | | | | 0.30 | |
South Africa (Rep of), 5.750%, 09/30/2049 | | | | | | | 2,180,000 | | | | 1,700,574 | | | | 0.14 | |
| | | | | | | | | | | 33,054,674 | | | | 2.70 | |
| | | | |
Sri Lanka (Cost $10,723,000) | | | | | | | | | | | | | | | | |
Sri Lanka (Rep of), 6.825%, 07/18/2026 | | | | | | | 1,451,000 | | | | 827,069 | | | | 0.07 | |
Sri Lanka (Rep of), 6.200%, 05/11/2027 | | | | | | | 2,550,000 | | | | 1,427,960 | | | | 0.12 | |
Sri Lanka (Rep of), 6.750%, 04/18/2028 | | | | | | | 600,000 | | | | 338,998 | | | | 0.03 | |
Sri Lanka (Rep of), 7.850%, 03/14/2029 | | | | | | | 3,328,000 | | | | 1,880,353 | | | | 0.15 | |
Sri Lanka (Rep of), 7.550%, 03/28/2030 | | | | | | | 3,038,000 | | | | 1,731,391 | | | | 0.14 | |
| | | | | | | | | | | 6,205,771 | | | | 0.51 | |
See accompanying notes to the financial statements.
57
ASHMORE EMERGING MARKETS TOTAL RETURN FUND
SCHEDULE OF INVESTMENTS (CONTINUED)
As of April 30, 2020 (Unaudited)
| | | | | | | | | | | | | | | | |
| | | Currency1 | | Par | | | Value | | | % of Net Assets | |
Suriname (Cost $2,681,386) | | | | | | | | | | | | | | | | |
Suriname (Rep of), 9.250%, 10/26/2026 | | | | | | | 2,751,000 | | | $ | 997,238 | | | | 0.08 | |
| | | | | | | | | | | 997,238 | | | | 0.08 | |
| | | | |
Thailand (Cost $5,765,749) | | | | | | | | | | | | | | | | |
Thailand (Rep of), 3.400%, 06/17/2036 | | | THB | | | | 58,477,000 | | | | 2,281,203 | | | | 0.19 | |
Thailand (Rep of), 3.300%, 06/17/2038 | | | THB | | | | 79,504,000 | | | | 3,127,590 | | | | 0.26 | |
Thailand (Rep of), 2.875%, 06/17/2046 | | | THB | | | | 4,854,000 | | | | 172,614 | | | | 0.01 | |
Thailand (Rep of), 3.600%, 06/17/2067 | | | THB | | | | 42,050,000 | | | | 1,724,461 | | | | 0.14 | |
| | | | | | | | | | | 7,305,868 | | | | 0.60 | |
| | | | |
Turkey (Cost $50,925,246) | | | | | | | | | | | | | | | | |
Turkey (Rep of), 7.000%, 06/05/2020 | | | | | | | 1,147,000 | | | | 1,148,661 | | | | 0.09 | |
Turkey (Rep of), 5.625%, 03/30/2021 | | | | | | | 770,000 | | | | 773,850 | | | | 0.06 | |
Turkey (Rep of), 3.000%, 02/23/2022 | | | TRY | | | | 2,379,300 | | | | 773,277 | | | | 0.06 | |
Turkey (Rep of), 10.700%, 08/17/2022 | | | TRY | | | | 14,170,000 | | | | 2,084,092 | | | | 0.17 | |
Turkey (Rep of), 6.250%, 09/26/2022 | | | | | | | 1,780,000 | | | | 1,783,749 | | | | 0.15 | |
Turkey (Rep of), 3.250%, 03/23/2023 | | | | | | | 1,500,000 | | | | 1,383,120 | | | | 0.11 | |
Turkey (Rep of), 7.250%, 12/23/2023 | | | | | | | 1,238,000 | | | | 1,252,873 | | | | 0.10 | |
Turkey (Rep of), 5.750%, 03/22/2024 | | | | | | | 2,370,000 | | | | 2,283,860 | | | | 0.19 | |
Turkey (Rep of), 6.350%, 08/10/2024 | | | | | | | 3,510,000 | | | | 3,442,102 | | | | 0.28 | |
Turkey (Rep of), 5.600%, 11/14/2024 | | | | | | | 5,926,000 | | | | 5,644,515 | | | | 0.46 | |
Turkey (Rep of), 7.375%, 02/05/2025 | | | | | | | 2,614,000 | | | | 2,655,688 | | | | 0.22 | |
Turkey (Rep of), 8.000%, 03/12/2025 | | | TRY | | | | 1,610,000 | | | | 204,201 | | | | 0.02 | |
Turkey (Rep of), 4.250%, 03/13/2025 | | | | | | | 5,795,000 | | | | 5,157,550 | | | | 0.42 | |
Turkey (Rep of), 10.600%, 02/11/2026 | | | TRY | | | | 9,170,000 | | | | 1,277,857 | | | | 0.11 | |
Turkey (Rep of), 11.000%, 02/24/2027 | | | TRY | | | | 1,994,000 | | | | 279,579 | | | | 0.02 | |
Turkey (Rep of), 6.000%, 03/25/2027 | | | | | | | 2,608,000 | | | | 2,392,058 | | | | 0.20 | |
Turkey (Rep of), 10.500%, 08/11/2027 | | | TRY | | | | 5,956,000 | | | | 816,346 | | | | 0.07 | |
Turkey (Rep of), 6.125%, 10/24/2028 | | | | | | | 2,340,000 | | | | 2,123,784 | | | | 0.17 | |
Turkey (Rep of), 7.625%, 04/26/2029 | | | | | | | 1,396,000 | | | | 1,376,037 | | | | 0.11 | |
Turkey (Rep of), 6.875%, 03/17/2036 | | | | | | | 840,000 | | | | 758,100 | | | | 0.06 | |
Turkey (Rep of), 6.750%, 05/30/2040 | | | | | | | 1,385,000 | | | | 1,192,862 | | | | 0.10 | |
Turkey (Rep of), 6.000%, 01/14/2041 | | | | | | | 965,000 | | | | 772,000 | | | | 0.06 | |
Turkey (Rep of), 4.875%, 04/16/2043 | | | | | | | 4,412,000 | | | | 3,193,626 | | | | 0.26 | |
Turkey (Rep of), 5.750%, 05/11/2047 | | | | | | | 4,535,000 | | | | 3,445,403 | | | | 0.28 | |
| | | | | | | | | | | 46,215,190 | | | | 3.77 | |
| | | | |
Ukraine (Cost $47,076,183) | | | | | | | | | | | | | | | | |
DTEK Finance PLC, 10.750%, (100% Cash), 12/31/20246 | | | | | | | 5,040,000 | | | | 2,343,600 | | | | 0.19 | |
Metinvest B.V., 7.750%, 04/23/2023 | | | | | | | 3,555,000 | | | | 2,484,945 | | | | 0.20 | |
Ukraine (Rep of), 16.000%, 08/11/20214 | | | UAH | | | | 9,165,000 | | | | 341,391 | | | | 0.03 | |
Ukraine (Rep of), 17.250%, 01/05/20224 | | | UAH | | | | 9,276,000 | | | | 347,239 | | | | 0.03 | |
Ukraine (Rep of), 17.000%, 05/11/20224 | | | UAH | | | | 8,814,000 | | | | 334,927 | | | | 0.03 | |
Ukraine (Rep of), 7.750%, 09/01/2022 | | | | | | | 1,202,000 | | | | 1,144,905 | | | | 0.09 | |
Ukraine (Rep of), 7.750%, 09/01/2023 | | | | | | | 3,290,000 | | | | 3,117,275 | | | | 0.25 | |
Ukraine (Rep of), 8.994%, 02/01/2024 | | | | | | | 2,121,000 | | | | 2,065,277 | | | | 0.17 | |
See accompanying notes to the financial statements.
58
ASHMORE EMERGING MARKETS TOTAL RETURN FUND
SCHEDULE OF INVESTMENTS (CONTINUED)
As of April 30, 2020 (Unaudited)
| | | | | | | | | | | | | | | | |
| | | Currency1 | | Par | | | Value | | | % of Net Assets | |
Ukraine (continued) | | | | | | | | | | | | | | | | |
Ukraine (Rep of), 7.750%, 09/01/2024 | | | | | | | 1,450,000 | | | $ | 1,366,590 | | | | 0.11 | |
Ukraine (Rep of), 15.840%, 02/26/20254 | | | UAH | | | | 35,105,000 | | | | 1,294,460 | | | | 0.11 | |
Ukraine (Rep of), 7.750%, 09/01/2025 | | | | | | | 6,033,000 | | | | 5,625,772 | | | | 0.46 | |
Ukraine (Rep of), 7.750%, 09/01/2026 | | | | | | | 3,955,000 | | | | 3,648,361 | | | | 0.30 | |
Ukraine (Rep of), 7.750%, 09/01/2027 | | | | | | | 2,375,000 | | | | 2,171,553 | | | | 0.18 | |
Ukraine (Rep of), 9.750%, 11/01/2028 | | | | | | | 2,871,000 | | | | 2,805,024 | | | | 0.23 | |
Ukraine (Rep of), 7.375%, 09/25/2032 | | | | | | | 12,201,000 | | | | 10,797,885 | | | | 0.88 | |
Ukraine Railways Via Shortline PLC, 9.875%, 09/15/2021 | | | | | | | 471,000 | | | | 447,978 | | | | 0.04 | |
Ukreximbank Via Biz Finance PLC, 9.750%, 01/22/2025 | | | | | | | 2,050,000 | | | | 1,982,596 | | | | 0.16 | |
| | | | | | | | | | | 42,319,778 | | | | 3.46 | |
| | | | |
United Arab Emirates (Cost $4,720,577) | | | | | | | | | | | | | | | | |
Abu Dhabi (Gov’t of), 3.125%, 09/30/2049 | | | | | | | 3,500,000 | | | | 3,353,000 | | | | 0.27 | |
Abu Dhabi (Gov’t of), 3.875%, 04/16/20504 | | | | | | | 1,050,000 | | | | 1,118,460 | | | | 0.09 | |
| | | | | | | | | | | 4,471,460 | | | | 0.36 | |
| | | | |
Uruguay (Cost $23,614,514) | | | | | | | | | | | | | | | | |
Uruguay (Rep of), 9.875%, 06/20/2022 | | | UYU | | | | 20,413,000 | | | | 453,783 | | | | 0.04 | |
Uruguay (Rep of), 8.500%, 03/15/2028 | | | UYU | | | | 46,011,000 | | | | 906,789 | | | | 0.07 | |
Uruguay (Rep of), 4.375%, 12/15/2028 | | | UYU | | | | 8,870,757 | | | | 411,394 | | | | 0.03 | |
Uruguay (Rep of), 7.875%, 01/15/2033 | | | | | | | 3,056,000 | | | | 4,274,611 | | | | 0.35 | |
Uruguay (Rep of), 7.625%, 03/21/2036 | | | | | | | 2,454,000 | | | | 3,401,882 | | | | 0.28 | |
Uruguay (Rep of), 4.125%, 11/20/2045 | | | | | | | 2,064,235 | | | | 2,121,022 | | | | 0.17 | |
Uruguay (Rep of), 5.100%, 06/18/2050 | | | | | | | 1,766,000 | | | | 2,004,428 | | | | 0.16 | |
Uruguay (Rep of), 4.975%, 04/20/2055 | | | | | | | 5,490,974 | | | | 6,191,128 | | | | 0.51 | |
Uruguay Monetary Regulation Bill, 0.000%, 06/10/20203 | | | UYU | | | | 28,920,000 | | | | 675,592 | | | | 0.06 | |
Uruguay Monetary Regulation Bill, 0.000%, 07/03/20203 | | | UYU | | | | 57,711,000 | | | | 1,340,097 | | | | 0.11 | |
Uruguay Monetary Regulation Bill, 0.000%, 12/18/20203 | | | UYU | | | | 1,910,000 | | | | 41,762 | | | | — | |
Uruguay Monetary Regulation Bill, 0.000%, 02/05/20213 | | | UYU | | | | 4,775,000 | | | | 102,426 | | | | 0.01 | |
Uruguay Monetary Regulation Bill, 0.000%, 02/19/20213,12 | | | UYU | | | | 11,867,000 | | | | 254,434 | | | | 0.02 | |
Uruguay Monetary Regulation Bill, 0.000%, 03/10/20213 | | | UYU | | | | 25,359,000 | | | | 537,404 | | | | 0.04 | |
Uruguay Monetary Regulation Bill, 0.000%, 06/09/20213 | | | UYU | | | | 26,553,000 | | | | 545,118 | | | | 0.04 | |
Uruguay Monetary Regulation Bill, 0.000%, 12/08/20213 | | | UYU | | | | 22,722,000 | | | | 439,266 | | | | 0.04 | |
| | | | | | | | | | | 23,701,136 | | | | 1.93 | |
| | | | |
Venezuela (Cost $49,980,027) | | | | | | | | | | | | | | | | |
Petroleos de Venezuela S.A., 8.500%, 10/27/2020 | | | | | | | 28,100,000 | | | | 3,582,750 | | | | 0.29 | |
Petroleos de Venezuela S.A., 9.000%, 11/17/20217 | | | | | | | 3,789,076 | | | | 142,090 | | | | 0.01 | |
Petroleos de Venezuela S.A., 12.750%, 02/17/20227 | | | | | | | 1,695,000 | | | | 63,563 | | | | 0.01 | |
Petroleos de Venezuela S.A., 5.375%, 04/12/20277 | | | | | | | 1,590,000 | | | | 59,625 | | | | 0.01 | |
Petroleos de Venezuela S.A., 9.750%, 05/17/20357 | | | | | | | 5,253,147 | | | | 196,993 | | | | 0.02 | |
Venezuela (Rep of), 7.750%, 10/13/20197,8 | | | | | | | 1,638,000 | | | | 131,040 | | | | 0.01 | |
Venezuela (Rep of), 12.750%, 08/23/20227 | | | | | | | 3,246,000 | | | | 259,680 | | | | 0.02 | |
Venezuela (Rep of), 9.000%, 05/07/20237 | | | | | | | 1,407,000 | | | | 112,560 | | | | 0.01 | |
Venezuela (Rep of), 8.250%, 10/13/20247 | | | | | | | 3,213,200 | | | | 257,056 | | | | 0.02 | |
Venezuela (Rep of), 11.750%, 10/21/20267 | | | | | | | 12,976,000 | | | | 1,038,080 | | | | 0.08 | |
See accompanying notes to the financial statements.
59
ASHMORE EMERGING MARKETS TOTAL RETURN FUND
SCHEDULE OF INVESTMENTS (CONTINUED)
As of April 30, 2020 (Unaudited)
| | | | | | | | | | | | | | | | |
| | | Currency1 | | Par | | | Value | | | % of Net Assets | |
Venezuela (continued) | | | | | | | | | | | | | | | | |
Venezuela (Rep of), 9.250%, 09/15/20277 | | | | | | | 3,647,000 | | | $ | 291,760 | | | | 0.02 | |
Venezuela (Rep of), 9.250%, 05/07/20287 | | | | | | | 2,317,000 | | | | 185,360 | | | | 0.02 | |
Venezuela (Rep of), 11.950%, 08/05/20317 | | | | | | | 21,478,800 | | | | 1,718,304 | | | | 0.14 | |
| | | | | | | | | | | 8,038,861 | | | | 0.66 | |
| | | | |
Vietnam (Cost $3,633,503) | | | | | | | | | | | | | | | | |
Vietnam (Rep of), 4.800%, 11/19/2024 | | | | | | | 3,511,000 | | | | 3,660,040 | | | | 0.30 | |
| | | | | | | | | | | 3,660,040 | | | | 0.30 | |
| | | | |
Zambia (Cost $13,833,151) | | | | | | | | | | | | | | | | |
First Quantum Minerals Ltd., 7.250%, 04/01/2023 | | | | | | | 3,710,000 | | | | 3,367,196 | | | | 0.27 | |
First Quantum Minerals Ltd., 6.500%, 03/01/2024 | | | | | | | 3,980,000 | | | | 3,507,176 | | | | 0.29 | |
Zambia (Rep of), 5.375%, 09/20/2022 | | | | | | | 1,421,000 | | | | 464,838 | | | | 0.04 | |
Zambia (Rep of), 8.500%, 04/14/2024 | | | | | | | 1,490,000 | | | | 484,250 | | | | 0.04 | |
Zambia (Rep of), 8.970%, 07/30/2027 | | | | | | | 5,170,000 | | | | 1,681,284 | | | | 0.14 | |
| | | | | | | | | | | 9,504,744 | | | | 0.78 | |
| | | | |
Total Debt Securities (Cost $1,406,621,272) | | | | | | | | | | | 1,078,738,003 | | | | 88.10 | |
| | | | |
Bank Loans | | | | | | | | | | | | | | | | |
| | | | |
United Arab Emirates (Cost $36,830,663) | | | | | | | | | | | | | | | | |
DP World Ltd., 4.250%, 09/30/202212 | | | | | | | 39,900,000 | | | | 36,309,000 | | | | 2.97 | |
| | | | | | | | | | | 36,309,000 | | | | 2.97 | |
| | | | |
Total Bank Loans (Cost $36,830,663) | | | | | | | | | | | 36,309,000 | | | | 2.97 | |
| | | | |
Credit Linked Notes | | | | | | | | | | | | | | | | |
| | | | |
Indonesia (Cost $4,468,714) | | | | | | | | | | | | | | | | |
Indonesia (Rep of), Issued by Standard Chartered, 12.800%, 06/17/20214 | | | IDR | | | | 1,840,000,000 | | | | 133,294 | | | | 0.01 | |
Indonesia (Rep of), Issued by Standard Chartered, 8.375%, 03/19/20244 | | | IDR | | | | 6,958,000,000 | | | | 485,890 | | | | 0.04 | |
Indonesia (Rep of), Issued by Standard Chartered, 8.125%, 05/17/20244 | | | IDR | | | | 5,702,000,000 | | | | 396,409 | | | | 0.03 | |
Indonesia (Rep of), Issued by Standard Chartered, 11.000%, 09/17/20254 | | | IDR | | | | 3,602,000,000 | | | | 278,028 | | | | 0.02 | |
Indonesia (Rep of), Issued by Standard Chartered, 7.000%, 05/24/20274 | | | IDR | | | | 10,298,000,000 | | | | 665,144 | | | | 0.06 | |
Indonesia (Rep of), Issued by Standard Chartered, 9.000%, 03/20/20294 | | | IDR | | | | 11,300,000,000 | | | | 808,049 | | | | 0.07 | |
Indonesia (Rep of), Issued by Standard Chartered, 10.500%, 08/19/20304 | | | IDR | | | | 8,356,000,000 | | | | 656,440 | | | | 0.05 | |
Indonesia (Rep of), Issued by Standard Chartered, 8.375%, 03/17/20344 | | | IDR | | | | 13,035,000,000 | | | | 891,678 | | | | 0.07 | |
| | | | | | | | | | | 4,314,932 | | | | 0.35 | |
| | | | |
Total Credit Linked Notes (Cost $4,468,714) | | | | | | | | | | | 4,314,932 | | | | 0.35 | |
See accompanying notes to the financial statements.
60
ASHMORE EMERGING MARKETS TOTAL RETURN FUND
SCHEDULE OF INVESTMENTS (CONTINUED)
As of April 30, 2020 (Unaudited)
| | | | | | | | | | | | | | | | |
| | | Currency1 | | Shares | | | Value | | | % of Net Assets | |
Equity Securities | | | | | | | | | | | | | | | | |
| | | | |
Niger (Cost $265,038) | | | | | | | | | | | | | | | | |
Savannah Energy PLC * | | | GBP | | | | 682,262 | | | $ | 66,670 | | | | 0.01 | |
| | | | | | | | | | | 66,670 | | | | 0.01 | |
| | | | |
Russian Federation (Cost $130,309) | | | | | | | | | | | | | | | | |
Roust Corp. *,12 | | | | | | | 8,407 | | | | 30,265 | | | | — | |
| | | | | | | | | | | 30,265 | | | | — | |
| | | | |
Total Equity Securities (Cost $395,347) | | | | | | | | | | | 96,935 | | | | 0.01 | |
| | | | |
Total Investments in Securities (Cost $1,448,315,996) | | | | | | | | | | | 1,119,458,870 | | | | 91.43 | |
| | | | |
Total Investments (Total Cost $1,448,315,996) | | | | | | | | | | | 1,119,458,870 | | | | 91.43 | |
| | | | |
Other Assets Less Liabilities (See Statements of Assets and Liabilities for further detail) | | | | | | | | | | | 104,933,286 | | | | 8.57 | |
| | | | |
Net Assets | | | | | | | | | | $ | 1,224,392,156 | | | | 100.00 | |
| * | Non-income producing security. |
| 1 | Local currency is United States Dollars unless otherwise noted below. |
| 2 | Step coupon bond. Rate as of April 30, 2020 is disclosed. |
| 4 | Securities exempt from registration under Rule 144A of the Securities Act of 1933. These securities may not be publicly traded without registration under the Securities Act of 1933. |
| 5 | Variable rate security. Security issued at a fixed coupon rate, which converts to a variable rate at a specified date. Rate shown is the rate in effect as of period end. |
| 6 | Security is apayment-in-kind bond, and unless otherwise noted in the description of the security, pays its entire coupon on anin-kind basis. |
| 7 | Issuer has defaulted on terms of debt obligation. |
| 8 | Maturity has been extended under the terms of a plan of reorganization. |
| 9 | Security has been deemed worthless and is a Level 3 investment. |
| 10 | Zero coupon bond – interest rate reflects effective yield on the date of purchase. |
| 11 | When issued security. Coupon rate was not in effect at April 30, 2020. |
| 12 | Security is a Level 3 investment. |
Percentages shown are based on net assets.
At April 30, 2020, the Ashmore Emerging Markets Total Return Fund had outstanding forward foreign currency exchange contracts
as follows:
| | | | | | | | | | | | | | | | | | |
Settlement Date | | Counterparty | | Currency Buy | | Currency Buy Amount (Local Currency) | | | Currency Sell | | Currency Sell Amount (Local Currency) | | | Unrealized
Gain/(Loss) | |
| | | | | | |
| 05/05/2020 | | JP Morgan | | United States Dollar | | | 800,390 | | | Brazilian Real | | | 4,036,351 | | | $ | 58,460 | |
| 05/06/2020 | | Merrill Lynch | | Ukraine Hryvnia | | | 21,519,352 | | | United States Dollar | | | 728,400 | | | | 67,184 | |
| 05/06/2020 | | Merrill Lynch | | United States Dollar | | | 857,894 | | | Ukraine Hryvnia | | | 21,519,352 | | | | 62,309 | |
See accompanying notes to the financial statements.
61
ASHMORE EMERGING MARKETS TOTAL RETURN FUND
SCHEDULE OF INVESTMENTS (CONTINUED)
As of April 30, 2020 (Unaudited)
| | | | | | | | | | | | | | | | | | |
Settlement Date | | Counterparty | | Currency Buy | | Currency Buy Amount (Local Currency) | | | Currency Sell | | Currency Sell Amount (Local Currency) | | | Unrealized Gain/(Loss) | |
| | | | | | |
| 05/14/2020 | | HSBC Bank | | Romanian Leu | | | 13,554,312 | | | United States Dollar | | | 3,013,007 | | | $ | 50,391 | |
| 05/14/2020 | | Barclays | | Ukraine Hryvnia | | | 21,363,980 | | | United States Dollar | | | 722,000 | | | | 64,971 | |
| 05/14/2020 | | Citibank | | United States Dollar | | | 849,985 | | | Ukraine Hryvnia | | | 21,363,980 | | | | 63,014 | |
| 05/20/2020 | | Deutsche Bank | | Indonesian Rupiah | | | 33,203,094,384 | | | United States Dollar | | | 2,003,321 | | | | 196,816 | |
| 05/20/2020 | | Barclays | | Ukraine Hryvnia | | | 10,660,330 | | | United States Dollar | | | 361,000 | | | | 30,614 | |
| 05/20/2020 | | Standard Chartered | | United States Dollar | | | 740,000 | | | Indonesian Rupiah | | | 11,114,800,000 | | | | 3,500 | |
| 05/22/2020 | | Goldman Sachs | | Ukraine Hryvnia | | | 26,014,256 | | | United States Dollar | | | 878,860 | | | | 75,916 | |
| 05/22/2020 | | Citibank | | United States Dollar | | | 244,920 | | | Ukraine Hryvnia | | | 6,164,625 | | | | 18,665 | |
| 05/22/2020 | | JP Morgan | | United States Dollar | | | 173,349 | | | Ukraine Hryvnia | | | 4,439,480 | | | | 10,412 | |
| 05/22/2020 | | Merrill Lynch | | United States Dollar | | | 604,028 | | | Ukraine Hryvnia | | | 15,410,151 | | | | 38,444 | |
| 05/29/2020 | | BNP Paribas | | Chinese Offshore Yuan | | | 40,552,901 | | | United States Dollar | | | 5,711,990 | | | | 12,984 | |
| 05/29/2020 | | Morgan Stanley | | Chinese Offshore Yuan | | | 47,737,000 | | | United States Dollar | | | 6,720,965 | | | | 18,210 | |
| 05/29/2020 | | Standard Chartered | | Chinese Offshore Yuan | | | 45,808,000 | | | United States Dollar | | | 6,452,831 | | | | 14,021 | |
| 05/29/2020 | | Barclays | | Czech Koruna | | | 247,800,657 | | | United States Dollar | | | 9,723,011 | | | | 301,250 | |
| 05/29/2020 | | Merrill Lynch | | Hungarian Forint | | | 3,106,570,085 | | | United States Dollar | | | 9,468,580 | | | | 184,698 | |
| 05/29/2020 | | Barclays | | Indian Rupee | | | 629,085,600 | | | United States Dollar | | | 8,071,668 | | | | 239,219 | |
| 05/29/2020 | | BNP Paribas | | Polish Zloty | | | 1,053,653 | | | United States Dollar | | | 250,822 | | | | 3,071 | |
| 05/29/2020 | | Deutsche Bank | | Polish Zloty | | | 39,905,469 | | | United States Dollar | | | 9,565,212 | | | | 50,590 | |
| 05/29/2020 | | Merrill Lynch | | Polish Zloty | | | 25,118,289 | | | United States Dollar | | | 6,014,772 | | | | 37,844 | |
| 05/29/2020 | | Merrill Lynch | | Romanian Leu | | | 20,237,430 | | | United States Dollar | | | 4,545,184 | | | | 18,837 | |
| 05/29/2020 | | JP Morgan | | South African Rand | | | 3,017,588 | | | United States Dollar | | | 161,050 | | | | 1,224 | |
| 05/29/2020 | | BNP Paribas | | Thai Baht | | | 32,836,178 | | | United States Dollar | | | 998,971 | | | | 15,901 | |
| 05/29/2020 | | HSBC Bank | | Thai Baht | | | 27,000,000 | | | United States Dollar | | | 819,697 | | | | 14,795 | |
| 05/29/2020 | | Citibank | | United States Dollar | | | 4,248,000 | | | Chinese Offshore Yuan | | | 30,004,474 | | | | 12,179 | |
| 05/29/2020 | | JP Morgan | | United States Dollar | | | 1,415,970 | | | Russian Ruble | | | 104,555,225 | | | | 18,674 | |
| 06/30/2020 | | Barclays | | Czech Koruna | | | 26,584,012 | | | United States Dollar | | | 1,044,965 | | | | 30,855 | |
| 06/30/2020 | | JP Morgan | | Czech Koruna | | | 26,584,000 | | | United States Dollar | | | 1,039,697 | | | | 36,123 | |
| 06/30/2020 | | Merrill Lynch | | Israeli Shekel | | | 14,211,061 | | | United States Dollar | | | 4,014,596 | | | | 69,907 | |
| 06/30/2020 | | BNP Paribas | | Korean Won | | | 29,211,087,926 | | | United States Dollar | | | 23,927,824 | | | | 143,514 | |
| 06/30/2020 | | Deutsche Bank | | Malaysian Ringgit | | | 3,303,105 | | | United States Dollar | | | 757,801 | | | | 8,382 | |
| 06/30/2020 | | Barclays | | Philippine Peso | | | 194,782,909 | | | United States Dollar | | | 3,814,710 | | | | 30,702 | |
| 06/30/2020 | | BNP Paribas | | Polish Zloty | | | 19,952,469 | | | United States Dollar | | | 4,736,682 | | | | 71,131 | |
| 06/30/2020 | | Merrill Lynch | | Polish Zloty | | | 19,953,000 | | | United States Dollar | | | 4,783,802 | | | | 24,139 | |
| 06/30/2020 | | Barclays | | Russian Ruble | | | 678,523,073 | | | United States Dollar | | | 9,026,995 | | | | 1,274 | |
| 06/30/2020 | | ANZ | | Singapore Dollar | | | 25,494,895 | | | United States Dollar | | | 17,856,444 | | | | 228,077 | |
| 06/30/2020 | | JP Morgan | | Taiwan Dollar | | | 458,880,796 | | | United States Dollar | | | 15,407,991 | | | | 197,469 | |
| 06/30/2020 | | HSBC Bank | | Thai Baht | | | 170,770,000 | | | United States Dollar | | | 5,225,392 | | | | 52,870 | |
| 06/30/2020 | | Morgan Stanley | | Thai Baht | | | 242,524,540 | | | United States Dollar | | | 7,422,782 | | | | 73,314 | |
| 06/30/2020 | | Barclays | | Turkish Lira | | | 51,284,858 | | | United States Dollar | | | 7,159,090 | | | | 53,604 | |
| 06/30/2020 | | Deutsche Bank | | United States Dollar | | | 468,000 | | | Indonesian Rupiah | | | 7,066,425,600 | | | | 8,308 | |
| 06/30/2020 | | JP Morgan | | United States Dollar | | | 3,345,000 | | | Indonesian Rupiah | | | 50,717,391,750 | | | | 45,682 | |
| 07/31/2020 | | Merrill Lynch | | Chilean Peso | | | 1,221,968,386 | | | United States Dollar | | | 1,433,394 | | | | 34,076 | |
See accompanying notes to the financial statements.
62
ASHMORE EMERGING MARKETS TOTAL RETURN FUND
SCHEDULE OF INVESTMENTS (CONTINUED)
As of April 30, 2020 (Unaudited)
| | | | | | | | | | | | | | | | | | |
Settlement Date | | Counterparty | | Currency Buy | | Currency Buy Amount (Local Currency) | | | Currency Sell | | Currency Sell Amount (Local Currency) | | | Unrealized Gain/(Loss) | |
| |
| | | | | | |
| 07/31/2020 | | HSBC Bank | | Mexican Peso | | | 626,233,174 | | | United States Dollar | | | 25,245,230 | | | $ | 374,195 | |
| 07/31/2020 | | Merrill Lynch | | Mexican Peso | | | 200,445,386 | | | United States Dollar | | | 8,088,933 | | | | 111,360 | |
| 07/31/2020 | | HSBC Bank | | United States Dollar | | | 2,020,264 | | | Peruvian Nuevo Sol | | | 6,813,341 | | | | 11,686 | |
| | | | | | | | | | | | | | | | | | |
Subtotal Appreciation | | | | | | | | | | | | | | | 3,290,861 | |
| | | | | | | | | | | | | | | | | | |
| | | | | | |
| 05/05/2020 | | HSBC Bank | | Brazilian Real | | | 27,904,801 | | | United States Dollar | | | 5,492,152 | | | | (362,910 | ) |
| 05/05/2020 | | Barclays | | United States Dollar | | | 5,835,000 | | | Brazilian Real | | | 32,492,781 | | | | (137,568 | ) |
| 05/05/2020 | | Deutsche Bank | | United States Dollar | | | 7,505,000 | | | Brazilian Real | | | 42,248,458 | | | | (260,781 | ) |
| 05/20/2020 | | BNP Paribas | | United States Dollar | | | 1,202,674 | | | Euro | | | 1,106,094 | | | | (9,917 | ) |
| 05/20/2020 | | HSBC Bank | | United States Dollar | | | 9,741,594 | | | Euro | | | 8,952,231 | | | | (72,588 | ) |
| 05/20/2020 | | JP Morgan | | United States Dollar | | | 454,000 | | | Indonesian Rupiah | | | 7,170,930,000 | | | | (21,167 | ) |
| 05/20/2020 | | Morgan Stanley | | United States Dollar | | | 442,000 | | | Indonesian Rupiah | | | 6,972,550,000 | | | | (20,022 | ) |
| 05/29/2020 | | HSBC Bank | | Chinese Offshore Yuan | | | 189,421,973 | | | United States Dollar | | | 27,172,855 | | | | (431,590 | ) |
| 05/29/2020 | | ANZ | | Indian Rupee | | | 961,268,638 | | | United States Dollar | | | 12,787,079 | | | | (87,703 | ) |
| 05/29/2020 | | BNP Paribas | | Russian Ruble | | | 39,176,872 | | | United States Dollar | | | 527,664 | | | | (4,097 | ) |
| 05/29/2020 | | Merrill Lynch | | Russian Ruble | | | 1,654,983,600 | | | United States Dollar | | | 25,398,532 | | | | (3,281,012 | ) |
| 05/29/2020 | | Barclays | | Thai Baht | | | 160,000,000 | | | United States Dollar | | | 5,071,621 | | | | (126,481 | ) |
| 05/29/2020 | | Deutsche Bank | | Thai Baht | | | 83,000,000 | | | United States Dollar | | | 2,633,265 | | | | (67,974 | ) |
| 05/29/2020 | | BNP Paribas | | United States Dollar | | | 1,365,000 | | | Czech Koruna | | | 34,487,339 | | | | (30,114 | ) |
| 05/29/2020 | | BNP Paribas | | United States Dollar | | | 775,000 | | | Hungarian Forint | | | 254,898,120 | | | | (17,064 | ) |
| 05/29/2020 | | Barclays | | United States Dollar | | | 714,270 | | | Indian Rupee | | | 54,927,363 | | | | (11,379 | ) |
| 05/29/2020 | | HSBC Bank | | United States Dollar | | | 1,555,000 | | | Indian Rupee | | | 121,694,300 | | | | (52,710 | ) |
| 05/29/2020 | | Morgan Stanley | | United States Dollar | | | 4,490,000 | | | Indian Rupee | | | 344,383,000 | | | | (59,664 | ) |
| 05/29/2020 | | BNP Paribas | | United States Dollar | | | 1,215,000 | | | Polish Zloty | | | 5,094,313 | | | | (12,548 | ) |
| 05/29/2020 | | UBS | | United States Dollar | | | 659,220 | | | Polish Zloty | | | 2,762,489 | | | | (6,442 | ) |
| 05/29/2020 | | Barclays | | United States Dollar | | | 2,939,820 | | | South African Rand | | | 56,110,000 | | | | (77,549 | ) |
| 05/29/2020 | | BNP Paribas | | United States Dollar | | | 1,230,000 | | | South African Rand | | | 23,038,472 | | | | (8,916 | ) |
| 05/29/2020 | | Merrill Lynch | | United States Dollar | | | 835,000 | | | Thai Baht | | | 27,150,025 | | | | (4,129 | ) |
| 06/02/2020 | | JP Morgan | | Brazilian Real | | | 35,563,256 | | | United States Dollar | | | 6,597,395 | | | | (76,141 | ) |
| 06/02/2020 | | Deutsche Bank | | United States Dollar | | | 9,294,550 | | | Brazilian Real | | | 50,872,788 | | | | (34,021 | ) |
| 06/30/2020 | | JP Morgan | | Romanian Leu | | | 12,696,637 | | | United States Dollar | | | 2,856,708 | | | | (5,573 | ) |
| 06/30/2020 | | HSBC Bank | | Russian Ruble | | | 678,523,000 | | | United States Dollar | | | 9,058,689 | | | | (30,422 | ) |
| 06/30/2020 | | Barclays | | United States Dollar | | | 154,180 | | | Indonesian Rupiah | | | 2,440,668,904 | | | | (4,593 | ) |
| 06/30/2020 | | BNP Paribas | | United States Dollar | | | 134,579 | | | Indonesian Rupiah | | | 2,135,760,990 | | | | (4,359 | ) |
| 06/30/2020 | | Citibank | | United States Dollar | | | 318,774 | | | Indonesian Rupiah | | | 5,052,566,097 | | | | (9,911 | ) |
| 06/30/2020 | | Deutsche Bank | | United States Dollar | | | 673,958 | | | Indonesian Rupiah | | | 10,688,979,950 | | | | (21,392 | ) |
| 06/30/2020 | | HSBC Bank | | United States Dollar | | | 258,582 | | | Indonesian Rupiah | | | 4,102,404,698 | | | | (8,292 | ) |
| 06/30/2020 | | JP Morgan | | United States Dollar | | | 510,000 | | | Indonesian Rupiah | | | 8,065,650,000 | | | | (14,695 | ) |
| 06/30/2020 | | Morgan Stanley | | United States Dollar | | | 905,000 | | | Korean Won | | | 1,106,272,000 | | | | (6,621 | ) |
| 06/30/2020 | | Merrill Lynch | | United States Dollar | | | 2,955,761 | | | South African Rand | | | 56,109,213 | | | | (52,494 | ) |
| 06/30/2020 | | Barclays | | United States Dollar | | | 1,110,000 | | | Taiwan Dollar | | | 32,964,780 | | | | (11,055 | ) |
| 07/31/2020 | | JP Morgan | | United States Dollar | | | 575,000 | | | Chilean Peso | | | 490,446,250 | | | | (13,980 | ) |
| 07/31/2020 | | Credit Suisse | | United States Dollar | | | 7,718,386 | | | Colombian Peso | | | 31,359,031,606 | | | | (141,943 | ) |
See accompanying notes to the financial statements.
63
ASHMORE EMERGING MARKETS TOTAL RETURN FUND
SCHEDULE OF INVESTMENTS (CONTINUED)
As of April 30, 2020 (Unaudited)
| | | | | | | | | | | | | | | | | | |
Settlement Date | | Counterparty | | Currency Buy | | Currency Buy Amount (Local Currency) | | | Currency Sell | | Currency Sell Amount (Local Currency) | | | Unrealized Gain/(Loss) | |
| |
| | | | | | |
| 07/31/2020 | | JP Morgan | | United States Dollar | | | 1,255,000 | | | Colombian Peso | | | 5,102,830,000 | | | $ | (24,055 | ) |
| 07/31/2020 | | Merrill Lynch | | United States Dollar | | | 1,435,000 | | | Peruvian Nuevo Sol | | | 4,901,960 | | | | (10,101 | ) |
| | | | | | | | | | | | | | | | | | |
Subtotal Depreciation | | | | | | | | | | | | | | | (5,633,973 | ) |
| | | | | | | | | | | | | | | | |
| Total | | | | | | | | | | | | | | | | $ | (2,343,112 | ) |
| | | | | | | | | | | | | | | | | | |
At April 30, 2020, the Ashmore Emerging Markets Total Return Fund had the following centrally cleared swap contracts outstanding:
| | | | | | | | | | | | | | | | | | | | | | |
Pay Rate Index/ Pay Rate | | Receive Rate/ Receive Rate Index | | Notional Amount | | | Expiration Date | | | Fair Value/ Unrealized Appreciation (Depreciation)** | | Variation Margin Receivable (Payable) | | Counterparty | |
| |
| | | | | | | |
CFETS China Fixing Repo Rates 7 Day (Pay Quarterly) | | 2.575% (Receive Quarterly) | | | CNY | | | | 41,598,000 | | | | 3/18/2025 | | | $222,674 | | $(8,514) | | | JP Morgan | |
CFETS China Fixing Repo Rates 7 Day (Pay Quarterly) | | 2.580% (Receive Quarterly) | | | CNY | | | | 39,814,000 | | | | 3/18/2025 | | | 214,479 | | (8,146) | | | JP Morgan | |
CFETS China Fixing Repo Rates 7 Day (Pay Quarterly) | | 2.582% (Receive Quarterly) | | | CNY | | | | 20,884,000 | | | | 3/18/2025 | | | 112,730 | | (4,272) | | | HSBC Bank | |
MXN-TIIE-BANXICO 28 Day Rate (Pay Lunar) | | 5.503% (Receive Lunar) | | | MXN | | | | 206,660,000 | | | | 6/11/2025 | | | 7,973 | | (4,332) | | | Merrill Lynch | |
WIBOR Poland 6 Month Rate (Pay Semiannually) | | 2.400% (Receive Annually) | | | PLN | | | | 13,970,000 | | | | 3/26/2023 | | | 192,098 | | (38) | | | Merrill Lynch | |
| | | | | | | | | | | | | | | | | | | | | | |
| | | | | | | | | | | | | | | | $749,954 | | $(25,302) | | | | |
| | | | | | | | | | | | | | | | | | | | | | |
**Includes cumulative appreciation/depreciation on centrally cleared swap agreements. Only the current day’s variation margin is reported within the Statements of Assets and Liabilities.
See accompanying notes to the financial statements.
64
ASHMORE EMERGING MARKETS TOTAL RETURN FUND
SCHEDULE OF INVESTMENTS (CONTINUED)
As of April 30, 2020 (Unaudited)
The inputs or methodologies used for valuing securities are not necessarily an indication of the risks associated with investing in those securities and other financial instruments, if any. See note 4 in the Notes to the Financial Statements for more information regarding pricing inputs and valuation techniques. The following is a summary of the inputs used in valuing the Ashmore Emerging Markets Total Return Fund’s investments and other financial instruments, which are carried at fair value, as of April 30, 2020:
| | | | | | | | | | | | | | | | |
| | | Level 1 | | | Level 2 | | | Level 3 | | | Total | |
| | | | | | | | | | | | | | | | |
Investments | | | | | | | | | | | | | | | | |
Assets: | | | | | | | | | | | | | | | | |
Debt Securities | | | | | | | | | | | | | | | | |
Corporate Bonds | | | $— | | | | $ 208,349,809 | | | | $ — | | | | $ 208,349,809 | |
Corporate Convertible Bonds | | | — | | | | 2,226,295 | | | | — | | | | 2,226,295 | |
Government Agencies | | | — | | | | 26,165,398 | | | | — | | | | 26,165,398 | |
Government Bonds | | | — | | | | 826,692,382 | | | | — | | | | 826,692,382 | |
Index Linked Government Bonds | | | — | | | | 11,949,680 | | | | — | | | | 11,949,680 | |
Municipal Bonds | | | — | | | | 602,847 | | | | — | | | | 602,847 | |
Short Term Bills and Notes | | | — | | | | 2,497,158 | | | | 254,434 | | | | 2,751,592 | |
| | | | | | | | | | | | | | | | |
Total Debt Securities | | | — | | | | 1,078,483,569 | | | | 254,434 | | | | 1,078,738,003 | |
Bank Loans | | | | | | | | | | | | | | | | |
United Arab Emirates | | | — | | | | — | | | | 36,309,000 | | | | 36,309,000 | |
Credit Linked Notes | | | | | | | | | | | | | | | | |
Indonesia | | | — | | | | 4,314,932 | | | | — | | | | 4,314,932 | |
Equity Securities | | | | | | | | | | | | | | | | |
Common Stock | | | | | | | | | | | | | | | | |
Niger | | | — | | | | 66,670 | | | | — | | | | 66,670 | |
Russian Federation | | | — | | | | — | | | | 30,265 | | | | 30,265 | |
| | | | | | | | | | | | | | | | |
Total Common Stock | | | — | | | | 66,670 | | | | 30,265 | | | | 96,935 | |
| |
Total Investments | | | $— | | | | $1,082,865,171 | | | | $36,593,699 | | | | $1,119,458,870 | |
| |
| | | | |
Other Financial Instruments | | | | | | | | | | | | | | | | |
Assets: | | | | | | | | | | | | | | | | |
Forward Foreign Currency Exchange Contracts | | | $— | | | | $ 3,290,861 | | | | $— | | | | $ 3,290,861 | |
Centrally Cleared Swap Contracts† | | | — | | | | 749,954 | | | | — | | | | 749,954 | |
Liabilities: | | | | | | | | | | | | | | | | |
Forward Foreign Currency Exchange Contracts | | | — | | | | (5,633,973 | ) | | | — | | | | (5,633,973 | ) |
| |
Total Other Financial Instruments | | | $— | | | | $(1,593,158 | ) | | | $— | | | | $(1,593,158 | ) |
| |
† Includes cumulative appreciation/depreciation on centrally cleared swap agreements. Only the current day’s variation margin is reported within the Statements of Assets and Liabilities.
See accompanying notes to the financial statements.
65
ASHMORE EMERGING MARKETS TOTAL RETURN FUND
SCHEDULE OF INVESTMENTS (CONTINUED)
As of April 30, 2020 (Unaudited)
The following is a reconciliation of investments in which significant unobservable inputs (Level 3) were used for the Fund during the period ending April 30, 2020:
| | | | | | | | | | | | | | | | | | | | | | | | | | | | | | | | | | | | | | | | | | | | |
Category and
Subcategory | | Beginning
Balance at 10/31/2019 | | | Accrued
Discounts
(Premiums) | | | Purchases | | | Sales | | | Realized
Gains
(Losses) | | | Change in
Unrealized
Appreciation
(Depreciation) | | | Transfer
into
Level 3 | | | Transfer
out of
Level 3 | | | Ending
Balance at 04/30/2020 | | | Change in
Unrealized
Appreciation
(Depreciation)
from Investments
still held
04/30/2020 | |
| |
| | | | | | | | | | | |
Investments, at value | | | | | | | | | | | | | | | | | | | | | | | | | | | | | | | | | | | | | | | | | | | | |
Bank Loans | | | | | | | | | | | | | | | | | | | | | | | | | | | | | | | | | | | | | | | | | | | | |
United Arab Emirates | | | $19,279,489 | | | | $197,818 | | | | $36,814,732 | | | | $(19,459,184 | ) | | | $39,696 | | | | $(563,551 | ) | | | $— | | | | $— | | | | $36,309,000 | | | | $(424,311 | ) | | | | |
Common Stock | | | | | | | | | | | | | | | | | | | | | | | | | | | | | | | | | | | | | | | | | | | | |
Russian Federation | | | 25,221 | | | | — | | | | — | | | | — | | | | — | | | | 5,044 | | | | — | | | | — | | | | 30,265 | | | | 5,044 | | | | | |
Short Term Bills and Notes | | | | | | | | | | | | | | | | | | | | | | | | | | | | | | | | | | | | | | | | | | | | |
Uruguay | | | — | | | | 3,762 | | | | 269,336 | | | | — | | | | — | | | | (18,664 | ) | | | — | | | | — | | | | 254,434 | | | | (18,664 | ) | | | | |
| |
| | | | | | | | | | | |
Total | | | $19,304,710 | | | | $201,580 | | | | $37,084,068 | | | | $(19,459,184 | ) | | | $39,696 | | | | $(577,171 | ) | | | $— | | | | $— | | | | $36,593,699 | | | | $(437,931 | ) | | | | |
| |
The following table on “Quantitative information about Level 3 Fair Value measurements” provides information on the valuation techniques and inputs used to value Level 3 securities at April 30, 2020:
| | | | | | | | |
| Quantitative Information about Level 3 Fair Value Measurements |
|
| | | |
| | | Fair Value at 04/30/2020 | | | Valuation Technique | | Unobservable Input |
|
| | | |
Bank Loans | | $ | 36,309,000 | | | Broker Quote | | Inputs to broker model |
Common Stock | | | 30,265 | | | Broker Quote | | Inputs to broker model |
Short Term Bills and Notes | | | 254,434 | | | Broker Quote | | Inputs to broker model |
|
| | | |
Total | | $ | 36,593,699 | | | | | |
|
See accompanying notes to the financial statements.
66
ASHMORE EMERGING MARKETS TOTAL RETURN FUND
SCHEDULE OF INVESTMENTS (CONTINUED)
As of April 30, 2020 (Unaudited)
The following is a summary of the fair values of the Fund’s derivative instruments*:
Fair Values of Financial Derivative Instruments on the Statements of Assets and Liabilities as of April 30, 2020:
| | | | | | | | |
| | | Derivatives Not Accounted for as
Hedging Instruments | |
| | | Foreign Exchange Risk | | | Interest Rate Risk | |
| |
| | |
Assets: | | | | | | | | |
Unrealized Appreciation on Centrally Cleared Swap Contracts | | $ | — | | | $ | 749,954 | † |
Unrealized Appreciation on Forward Foreign Currency Exchange Contracts | | | 3,290,861 | | | | — | |
| | | | |
| | $ | 3,290,861 | | | $ | 749,954 | |
| | | | |
Liabilities: | | | | | | | | |
Unrealized Depreciation on Forward Foreign Currency Exchange Contracts | | $ | (5,633,973 | ) | | $ | — | |
| | | | |
| | $ | (5,633,973 | ) | | $ | — | |
| | | | |
† Includes cumulative appreciation/depreciation on centrally cleared swap agreements. Only the current day’s variation margin is reported within the Statements of Assets and Liabilities.
The Effect of Financial Derivative Instruments on the Statements of Operations for the Six Months Ended April 30, 2020:
| | | | | | | | |
| | | Derivatives Not Accounted for as
Hedging Instruments | |
| | | Foreign
Exchange Risk | | | Interest Rate Risk | |
| |
Realized Gain (Loss) on Derivatives Recognized resulting from Operations: | | | | | | | | |
Net Realized Loss on Forward Foreign Currency Exchange Contracts | | $ | (28,365,375 | ) | | $ | — | |
Net Realized Loss on Interest Rate Swap Contracts | | | — | | | | (1,115,189 | ) |
| | | | |
| | $ | (28,365,375 | ) | | $ | (1,115,189 | ) |
| | | | |
Net Change in Unrealized Appreciation (Depreciation) on Derivatives Recognized resulting from Operations: | | | | | | | | |
Net Change in Unrealized Depreciation on Forward Foreign Currency Exchange Contracts | | $ | (3,477,555 | ) | | $ | — | |
Net Change in Unrealized Appreciation on Interest Rate Swap Contracts | | | — | | | | 1,908,987 | |
| | | | |
| | $ | (3,477,555 | ) | | $ | 1,908,987 | |
| | | | |
* See note 10 in the Notes to the Financial Statements for additional information.
See accompanying notes to the financial statements.
67
ASHMORE EMERGING MARKETS LOCAL CURRENCY BOND FUND
SCHEDULE OF INVESTMENTS
As of April 30, 2020 (Unaudited)
| | | | | | | | | | | | | | | | |
| | | Currency1 | | Par | | | Value | | | % of Net
Assets | |
Debt Securities | | | | | | | | | | | | | �� | | | |
| | | | |
Argentina (Cost $1,070,326) | | | | | | | | | | | | | | | | |
Argentina POM Politica Monetaria, (Floating, Argentina Blended Historical Policy Rate + 0.000%), 38.038%, 06/21/2020 | | | ARS | | | | 10,908,735 | | | $ | 88,387 | | | | 0.25 | |
Argentina Treasury Bills, 0.000%, 05/13/20202 | | | ARS | | | | 4,723,115 | | | | 19,330 | | | | 0.05 | |
Argentina Treasury Bills, 0.000%, 07/29/20202 | | | ARS | | | | 1,715,999 | | | | 19,347 | | | | 0.05 | |
Argentina Treasury Bills, 0.000%, 08/27/20202 | | | ARS | | | | 2,636,418 | | | | 31,411 | | | | 0.09 | |
Argentina Treasury Bills, 0.000%, 10/29/20202 | | | ARS | | | | 8,506,833 | | | | 105,836 | | | | 0.30 | |
Bonos del Tesoro Nacional en Pesos Badlar, (Floating, Argentina Deposit Rates Badlar Private Banks30-35 Days + 2.000%), 22.741%, 04/03/2022 | | | ARS | | | | 3,021,979 | | | | 19,406 | | | | 0.05 | |
Ciudad Autonoma De Buenos Aires, (Floating, Argentina Deposit Rates Badlar Private Banks30-35 Days + 3.250%), 24.157%, 03/29/2024 | | | ARS | | | | 5,013,699 | | | | 28,802 | | | | 0.08 | |
Provincia de Buenos Aires, (Floating, Argentina Deposit Rates Badlar Private Banks30-35 Days + 3.750%), 23.621%, 04/12/20253 | | | ARS | | | | 6,760,000 | | | | 33,858 | | | | 0.10 | |
| | | | | | | | | | | 346,377 | | | | 0.97 | |
| | | | |
Brazil (Cost $7,828,554) | | | | | | | | | | | | | | | | |
Brazil Letras do Tesouro Nacional, 0.000%, 07/01/20212 | | | BRL | | | | 3,562,000 | | | | 631,970 | | | | 1.77 | |
Brazil Letras do Tesouro Nacional, 0.000%, 01/01/20222 | | | BRL | | | | 2,004,000 | | | | 346,912 | | | | 0.97 | |
Brazil Letras do Tesouro Nacional, 0.000%, 07/01/20222 | | | BRL | | | | 2,479,000 | | | | 416,453 | | | | 1.17 | |
Brazil Letras do Tesouro Nacional, 0.000%, 07/01/20232 | | | BRL | | | | 2,670,000 | | | | 415,305 | | | | 1.16 | |
Brazil Notas do Tesouro Nacional Serie F, 10.000%, 01/01/2023 | | | BRL | | | | 6,736,000 | | | | 1,389,680 | | | | 3.90 | |
Brazil Notas do Tesouro Nacional Serie F, 10.000%, 01/01/2025 | | | BRL | | | | 4,816,000 | | | | 1,008,922 | | | | 2.83 | |
Brazil Notas do Tesouro Nacional Serie F, 10.000%, 01/01/2027 | | | BRL | | | | 4,929,000 | | | | 1,034,824 | | | | 2.90 | |
Brazil Notas do Tesouro Nacional Serie F, 10.000%, 01/01/2029 | | | BRL | | | | 2,617,000 | | | | 551,619 | | | | 1.55 | |
Brazil Notas do Tesouro Nacional Serie F, 10.000%, 01/01/2031 | | | BRL | | | | 440,000 | | | | 92,165 | | | | 0.26 | |
| | | | | | | | | | | 5,887,850 | | | | 16.51 | |
| | | | |
Chile (Cost $1,797,099) | | | | | | | | | | | | | | | | |
Bonos de la Tesoreria de la Republica, 1.500%, 03/01/2026 | | | CLP | | | | 7,500 | | | | 282,621 | | | | 0.79 | |
Bonos de la Tesoreria de la Republica, 1.900%, 09/01/2030 | | | CLP | | | | 1,000 | | | | 40,432 | | | | 0.11 | |
Bonos de la Tesoreria de la Republica, 2.000%, 03/01/2035 | | | CLP | | | | 3,500 | | | | 147,062 | | | | 0.41 | |
Bonos de la Tesoreria de la Republica en pesos, 4.500%, 03/01/2021 | | | CLP | | | | 495,000,000 | | | | 613,038 | | | | 1.72 | |
Bonos de la Tesoreria de la Republica en pesos, 4.700%, 09/01/20303 | | | CLP | | | | 85,000,000 | | | | 120,402 | | | | 0.34 | |
Bonos de la Tesoreria de la Republica en pesos, 5.000%, 03/01/2035 | | | CLP | | | | 270,000,000 | | | | 405,580 | | | | 1.14 | |
| | | | | | | | | | | 1,609,135 | | | | 4.51 | |
See accompanying notes to the financial statements.
68
ASHMORE EMERGING MARKETS LOCAL CURRENCY BOND FUND
SCHEDULE OF INVESTMENTS (CONTINUED)
As of April 30, 2020 (Unaudited)
| | | | | | | | | | | | | | | | |
| | | Currency1 | | Par | | | Value | | | % of Net
Assets | |
China (Cost $343,708) | | | | | | | | | | | | | | | | |
China (Rep of), 12/05/20264 | | | CNY | | | | 2,320,000 | | | $ | 345,409 | | | | 0.97 | |
| | | | | | | | | | | 345,409 | | | | 0.97 | |
| | | | |
Colombia (Cost $2,061,114) | | | | | | | | | | | | | | | | |
Colombian TES, 4.750%, 02/23/2023 | | | COP | | | | 4,197,000 | | | | 310,620 | | | | 0.87 | |
Colombian TES, 7.500%, 08/26/2026 | | | COP | | | | 2,001,600,000 | | | | 539,636 | | | | 1.51 | |
Colombian TES, 3.300%, 03/17/2027 | | | COP | | | | 3,771,000 | | | | 267,829 | | | | 0.75 | |
Colombian TES, 5.750%, 11/03/2027 | | | COP | | | | 128,900,000 | | | | 30,854 | | | | 0.09 | |
Colombian TES, 6.000%, 04/28/2028 | | | COP | | | | 135,800,000 | | | | 32,652 | | | | 0.09 | |
Colombian TES, 7.750%, 09/18/2030 | | | COP | | | | 926,200,000 | | | | 246,447 | | | | 0.69 | |
Colombian TES, 7.000%, 06/30/2032 | | | COP | | | | 351,900,000 | | | | 87,798 | | | | 0.25 | |
Colombian TES, 3.000%, 03/25/2033 | | | COP | | | | 735,000 | | | | 48,983 | | | | 0.14 | |
Colombian TES, 7.250%, 10/18/2034 | | | COP | | | | 570,600,000 | | | | 144,672 | | | | 0.40 | |
| | | | | | | | | | | 1,709,491 | | | | 4.79 | |
| | | | |
Czech Republic (Cost $413,003) | | | | | | | | | | | | | | | | |
Czech (Rep of), 0.950%, 05/15/2030 | | | CZK | | | | 1,440,000 | | | | 56,304 | | | | 0.16 | |
Czech (Rep of), 2.000%, 10/13/2033 | | | CZK | | | | 6,960,000 | | | | 302,419 | | | | 0.85 | |
Czech (Rep of), 4.200%, 12/04/2036 | | | CZK | | | | 620,000 | | | | 34,685 | | | | 0.09 | |
| | | | | | | | | | | 393,408 | | | | 1.10 | |
| | | | |
Dominican Republic (Cost $159,333) | | | | | | | | | | | | | | | | |
Dominican (Rep of), 9.750%, 06/05/2026 | | | DOP | | | | 8,050,000 | | | | 118,175 | | | | 0.33 | |
| | | | | | | | | | | 118,175 | | | | 0.33 | |
| | | | |
Hungary (Cost $1,191,799) | | | | | | | | | | | | | | | | |
Hungary (Rep of), 3.000%, 06/26/2024 | | | HUF | | | | 70,740,000 | | | | 232,938 | | | | 0.65 | |
Hungary (Rep of), 5.500%, 06/24/2025 | | | HUF | | | | 143,170,000 | | | | 532,090 | | | | 1.49 | |
Hungary (Rep of), 3.000%, 10/27/2027 | | | HUF | | | | 24,500,000 | | | | 82,730 | | | | 0.23 | |
Hungary (Rep of), 6.750%, 10/22/2028 | | | HUF | | | | 22,820,000 | | | | 98,108 | | | | 0.28 | |
Hungary (Rep of), 3.000%, 08/21/2030 | | | HUF | | | | 49,840,000 | | | | 170,007 | | | | 0.48 | |
| | | | | | | | | | | 1,115,873 | | | | 3.13 | |
| | | | |
Indonesia (Cost $3,450,079) | | | | | | | | | | | | | | | | |
Indonesia (Rep of), 8.250%, 07/15/2021 | | | IDR | | | | 3,298,000,000 | | | | 228,310 | | | | 0.64 | |
Indonesia (Rep of), 6.500%, 06/15/2025 | | | IDR | | | | 3,610,000,000 | | | | 235,894 | | | | 0.66 | |
Indonesia (Rep of), 8.375%, 09/15/2026 | | | IDR | | | | 5,527,000,000 | | | | 385,961 | | | | 1.08 | |
Indonesia (Rep of), 7.000%, 05/15/2027 | | | IDR | | | | 661,000,000 | | | | 42,694 | | | | 0.12 | |
Indonesia (Rep of), 6.125%, 05/15/2028 | | | IDR | | | | 8,628,000,000 | | | | 518,848 | | | | 1.46 | |
Indonesia (Rep of), 9.000%, 03/15/2029 | | | IDR | | | | 300,000,000 | | | | 21,453 | | | | 0.06 | |
Indonesia (Rep of), 8.250%, 05/15/2029 | | | IDR | | | | 1,935,000,000 | | | | 132,205 | | | | 0.37 | |
Indonesia (Rep of), 7.000%, 09/15/2030 | | | IDR | | | | 6,786,000,000 | | | | 429,976 | | | | 1.21 | |
Indonesia (Rep of), 8.750%, 05/15/2031 | | | IDR | | | | 2,679,000,000 | | | | 188,723 | | | | 0.53 | |
Indonesia (Rep of), 7.500%, 08/15/2032 | | | IDR | | | | 2,690,000,000 | | | | 172,134 | | | | 0.48 | |
Indonesia (Rep of), 6.625%, 05/15/2033 | | | IDR | | | | 5,855,000,000 | | | | 346,146 | | | | 0.97 | |
Indonesia (Rep of), 8.375%, 03/15/2034 | | | IDR | | | | 542,000,000 | | | | 37,076 | | | | 0.10 | |
Indonesia (Rep of), 7.500%, 06/15/2035 | | | IDR | | | | 2,155,000,000 | | | | 138,593 | | | | 0.39 | |
See accompanying notes to the financial statements.
69
ASHMORE EMERGING MARKETS LOCAL CURRENCY BOND FUND
SCHEDULE OF INVESTMENTS (CONTINUED)
As of April 30, 2020 (Unaudited)
| | | | | | | | | | | | | | | | |
| | | Currency1 | | Par | | | Value | | | % of Net
Assets | |
Indonesia (continued) | | | | | | | | | | | | | | | | |
Indonesia (Rep of), 8.250%, 05/15/2036 | | | IDR | | | | 3,114,000,000 | | | $ | 211,678 | | | | 0.59 | |
Indonesia (Rep of), 8.375%, 04/15/2039 | | | IDR | | | | 2,598,000,000 | | | | 177,924 | | | | 0.50 | |
| | | | | | | | | | | 3,267,615 | | | | 9.16 | |
| | | | |
Malaysia (Cost $1,685,780) | | | | | | | | | | | | | | | | |
Malaysia (Rep of), 3.882%, 03/10/2022 | | | MYR | | | | 57,000 | | | | 13,613 | | | | 0.04 | |
Malaysia (Rep of), 3.478%, 06/14/2024 | | | MYR | | | | 1,176,000 | | | | 283,223 | | | | 0.80 | |
Malaysia (Rep of), 4.181%, 07/15/2024 | | | MYR | | | | 309,000 | | | | 76,523 | | | | 0.22 | |
Malaysia (Rep of), 3.955%, 09/15/2025 | | | MYR | | | | 1,164,000 | | | | 290,207 | | | | 0.81 | |
Malaysia (Rep of), 3.906%, 07/15/2026 | | | MYR | | | | 492,000 | | | | 121,902 | | | | 0.34 | |
Malaysia (Rep of), 3.900%, 11/30/2026 | | | MYR | | | | 321,000 | | | | 79,868 | | | | 0.22 | |
Malaysia (Rep of), 3.899%, 11/16/2027 | | | MYR | | | | 238,000 | | | | 59,491 | | | | 0.17 | |
Malaysia (Rep of), 3.733%, 06/15/2028 | | | MYR | | | | 382,000 | | | | 94,150 | | | | 0.26 | |
Malaysia (Rep of), 3.885%, 08/15/2029 | | | MYR | | | | 466,000 | | | | 117,230 | | | | 0.33 | |
Malaysia (Rep of), 4.498%, 04/15/2030 | | | MYR | | | | 195,000 | | | | 51,069 | | | | 0.14 | |
Malaysia (Rep of), 4.232%, 06/30/2031 | | | MYR | | | | 210,000 | | | | 54,161 | | | | 0.15 | |
Malaysia (Rep of), 3.844%, 04/15/2033 | | | MYR | | | | 350,000 | | | | 86,565 | | | | 0.24 | |
Malaysia (Rep of), 4.642%, 11/07/2033 | | | MYR | | | | 447,000 | | | | 119,302 | | | | 0.34 | |
Malaysia (Rep of), 3.828%, 07/05/2034 | | | MYR | | | | 883,000 | | | | 221,768 | | | | 0.62 | |
Malaysia (Rep of), 4.935%, 09/30/2043 | | | MYR | | | | 52,000 | | | | 14,417 | | | | 0.04 | |
Malaysia (Rep of), 4.921%, 07/06/2048 | | | MYR | | | | 123,000 | | | | 34,711 | | | | 0.10 | |
| | | | | | | | | | | 1,718,200 | | | | 4.82 | |
| | | | |
Mexico (Cost $1,960,508) | | | | | | | | | | | | | | | | |
Comision Federal de Electricidad, 8.180%, 12/23/2027 | | | MXN | | | | 2,120,000 | | | | 82,727 | | | | 0.23 | |
Mexican Bonos, 8.500%, 05/31/2029 | | | MXN | | | | 9,660,000 | | | | 452,478 | | | | 1.27 | |
Mexican Bonos, 7.750%, 11/23/2034 | | | MXN | | | | 2,910,000 | | | | 127,961 | | | | 0.36 | |
Mexican Bonos, 8.500%, 11/18/2038 | | | MXN | | | | 4,160,000 | | | | 188,344 | | | | 0.53 | |
Mexican Bonos, 7.750%, 11/13/2042 | | | MXN | | | | 14,500,000 | | | | 598,344 | | | | 1.68 | |
Petroleos Mexicanos, 7.190%, 09/12/2024 | | | MXN | | | | 4,600,000 | | | | 147,056 | | | | 0.41 | |
Petroleos Mexicanos, 7.470%, 11/12/2026 | | | MXN | | | | 210,000 | | | | 6,187 | | | | 0.01 | |
| | | | | | | | | | | 1,603,097 | | | | 4.49 | |
| | | | |
Peru (Cost $1,429,390) | | | | | | | | | | | | | | | | |
Fondo MIVIVIENDA S.A., 7.000%, 02/14/2024 | | | PEN | | | | 625,000 | | | | 201,359 | | | | 0.57 | |
Peru (Rep of), 5.940%, 02/12/20293 | | | PEN | | | | 281,000 | | | | 93,840 | | | | 0.26 | |
Peru (Rep of), 6.950%, 08/12/2031 | | | PEN | | | | 1,466,000 | | | | 514,810 | | | | 1.44 | |
Peru (Rep of), 6.150%, 08/12/20323 | | | PEN | | | | 447,000 | | | | 146,896 | | | | 0.41 | |
Peru (Rep of), 5.400%, 08/12/20343 | | | PEN | | | | 467,000 | | | | 142,368 | | | | 0.40 | |
Peru (Rep of), 6.900%, 08/12/2037 | | | PEN | | | | 809,000 | | | | 274,130 | | | | 0.77 | |
Peru (Rep of), 5.350%, 08/12/20403 | | | PEN | | | | 315,000 | | | | 88,755 | | | | 0.25 | |
| | | | | | | | | | | 1,462,158 | | | | 4.10 | |
| | | | |
Philippines (Cost $337,921) | | | | | | | | | | | | | | | | |
Philippines (Rep of), 4.950%, 01/15/2021 | | | PHP | | | | 5,000,000 | | | | 98,788 | | | | 0.27 | |
Philippines (Rep of), 3.900%, 11/26/2022 | | | PHP | | | | 10,000,000 | | | | 191,738 | | | | 0.54 | |
| | | | | | | | | | | 290,526 | | | | 0.81 | |
See accompanying notes to the financial statements.
70
ASHMORE EMERGING MARKETS LOCAL CURRENCY BOND FUND
SCHEDULE OF INVESTMENTS (CONTINUED)
As of April 30, 2020 (Unaudited)
| | | | | | | | | | | | | | | | |
| | | Currency1 | | Par | | | Value | | | % of Net
Assets | |
Poland (Cost $1,503,202) | | | | | | | | | | | | | | | | |
Poland (Rep of), 3.250%, 07/25/2025 | | | PLN | | | | 1,693,000 | | | $ | 454,837 | | | | 1.27 | |
Poland (Rep of), 2.500%, 07/25/2026 | | | PLN | | | | 560,000 | | | | 145,711 | | | | 0.41 | |
Poland (Rep of), 2.500%, 07/25/2027 | | | PLN | | | | 244,000 | | | | 63,549 | | | | 0.18 | |
Poland (Rep of), 2.750%, 04/25/2028 | | | PLN | | | | 976,000 | | | | 259,361 | | | | 0.73 | |
Poland (Rep of), 2.750%, 10/25/2029 | | | PLN | | | | 2,136,000 | | | | 573,102 | | | | 1.61 | |
| | | | | | | | | | | 1,496,560 | | | | 4.20 | |
Romania (Cost $87,797) | | | | | | | | | | | | | | | | |
Romania (Rep of), 5.800%, 07/26/2027 | | | RON | | | | 320,000 | | | | 78,477 | | | | 0.22 | |
| | | | | | | | | | | 78,477 | | | | 0.22 | |
| | | | |
Russian Federation (Cost $3,088,113) | | | | | | | | | | | | | | | | |
Russian Federal Bond - OFZ, 7.000%, 08/16/2023 | | | RUB | | | | 10,745,000 | | | | 151,750 | | | | 0.43 | |
Russian Federal Bond - OFZ, 7.400%, 07/17/2024 | | | RUB | | | | 8,931,000 | | | | 128,711 | | | | 0.36 | |
Russian Federal Bond - OFZ, 7.100%, 10/16/2024 | | | RUB | | | | 11,281,000 | | | | 161,119 | | | | 0.45 | |
Russian Federal Bond - OFZ, 7.750%, 09/16/2026 | | | RUB | | | | 42,899,000 | | | | 639,940 | | | | 1.79 | |
Russian Federal Bond - OFZ, 7.950%, 10/07/2026 | | | RUB | | | | 4,465,000 | | | | 67,326 | | | | 0.19 | |
Russian Federal Bond - OFZ, 8.150%, 02/03/2027 | | | RUB | | | | 7,433,000 | | | | 113,782 | | | | 0.32 | |
Russian Federal Bond - OFZ, 7.050%, 01/19/2028 | | | RUB | | | | 7,267,000 | | | | 105,284 | | | | 0.30 | |
Russian Federal Bond - OFZ, 6.900%, 05/23/2029 | | | RUB | | | | 5,015,000 | | | | 72,244 | | | | 0.20 | |
Russian Federal Bond - OFZ, 7.650%, 04/10/2030 | | | RUB | | | | 3,173,000 | | | | 47,883 | | | | 0.13 | |
Russian Federal Bond - OFZ, 8.500%, 09/17/2031 | | | RUB | | | | 27,642,000 | | | | 445,755 | | | | 1.25 | |
Russian Federal Bond - OFZ, 7.700%, 03/23/2033 | | | RUB | | | | 40,389,000 | | | | 619,412 | | | | 1.74 | |
Russian Federal Bond - OFZ, 7.250%, 05/10/2034 | | | RUB | | | | 24,476,000 | | | | 363,762 | | | | 1.02 | |
| | | | | | | | | | | 2,916,968 | | | | 8.18 | |
| | | | |
South Africa (Cost $3,791,819) | | | | | | | | | | | | | | | | |
South Africa (Rep of), 10.500%, 12/21/2026 | | | ZAR | | | | 5,968,000 | | | | 353,595 | | | | 0.99 | |
South Africa (Rep of), 8.000%, 01/31/2030 | | | ZAR | | | | 10,085,000 | | | | 467,080 | | | | 1.31 | |
South Africa (Rep of), 7.000%, 02/28/2031 | | | ZAR | | | | 6,941,000 | | | | 289,354 | | | | 0.81 | |
South Africa (Rep of), 8.250%, 03/31/2032 | | | ZAR | | | | 3,316,000 | | | | 148,766 | | | | 0.42 | |
South Africa (Rep of), 8.875%, 02/28/2035 | | | ZAR | | | | 2,123,000 | | | | 94,457 | | | | 0.26 | |
South Africa (Rep of), 6.250%, 03/31/2036 | | | ZAR | | | | 959,000 | | | | 32,510 | | | | 0.09 | |
South Africa (Rep of), 8.500%, 01/31/2037 | | | ZAR | | | | 3,300,000 | | | | 138,154 | | | | 0.39 | |
South Africa (Rep of), 9.000%, 01/31/2040 | | | ZAR | | | | 2,142,000 | | | | 91,383 | | | | 0.26 | |
South Africa (Rep of), 6.500%, 02/28/2041 | | | ZAR | | | | 2,786,000 | | | | 90,188 | | | | 0.25 | |
South Africa (Rep of), 8.750%, 01/31/2044 | | | ZAR | | | | 7,858,000 | | | | 320,645 | | | | 0.90 | |
South Africa (Rep of), 8.750%, 02/28/2048 | | | ZAR | | | | 11,189,000 | | | | 453,102 | | | | 1.27 | |
| | | | | | | | | | | 2,479,234 | | | | 6.95 | |
| | | | |
Thailand (Cost $1,258,056) | | | | | | | | | | | | | | | | |
Thailand (Rep of), 4.875%, 06/22/2029 | | | THB | | | | 2,771,000 | | | | 112,833 | | | | 0.31 | |
Thailand (Rep of), 3.775%, 06/25/2032 | | | THB | | | | 4,556,000 | | | | 178,082 | | | | 0.50 | |
Thailand (Rep of), 1.600%, 06/17/2035 | | | THB | | | | 2,827,000 | | | | 90,095 | | | | 0.25 | |
Thailand (Rep of), 3.400%, 06/17/2036 | | | THB | | | | 9,402,000 | | | | 366,775 | | | | 1.03 | |
Thailand (Rep of), 3.300%, 06/17/2038 | | | THB | | | | 5,142,000 | | | | 202,280 | | | | 0.57 | |
Thailand (Rep of), 2.875%, 06/17/2046 | | | THB | | | | 7,888,000 | | | | 280,507 | | | | 0.79 | |
See accompanying notes to the financial statements.
71
ASHMORE EMERGING MARKETS LOCAL CURRENCY BOND FUND
SCHEDULE OF INVESTMENTS (CONTINUED)
As of April 30, 2020 (Unaudited)
| | | | | | | | | | | | | | | | |
| | | Currency1 | | Par | | | Value | | | % of Net
Assets | |
Thailand (continued) | | | | | | | | | | | | | | | | |
Thailand (Rep of), 3.600%, 06/17/2067 | | | THB | | | | 4,625,000 | | | $ | 189,670 | | | | 0.53 | |
| | | | | | | | | | | 1,420,242 | | | | 3.98 | |
| | | | |
Turkey (Cost $1,125,191) | | | | | | | | | | | | | | | | |
Turkey (Rep of), 3.000%, 02/23/2022 | | | TRY | | | | 245,000 | | | | 79,625 | | | | 0.22 | |
Turkey (Rep of), 11.000%, 03/02/2022 | | | TRY | | | | 632,000 | | | | 93,134 | | | | 0.26 | |
Turkey (Rep of), 8.000%, 03/12/2025 | | | TRY | | | | 584,000 | | | | 74,071 | | | | 0.21 | |
Turkey (Rep of), 10.600%, 02/11/2026 | | | TRY | | | | 1,485,065 | | | | 206,947 | | | | 0.58 | |
Turkey (Rep of), 11.000%, 02/24/2027 | | | TRY | | | | 534,000 | | | | 74,872 | | | | 0.21 | |
Turkey (Rep of), 10.500%, 08/11/2027 | | | TRY | | | | 1,425,000 | | | | 195,314 | | | | 0.55 | |
Turkey (Rep of), 12.400%, 03/08/2028 | | | TRY | | | | 130,000 | | | | 19,576 | | | | 0.06 | |
| | | | | | | | | | | 743,539 | | | | 2.09 | |
| | | | |
Ukraine (Cost $171,536) | | | | | | | | | | | | | | | | |
Ukraine (Rep of), 17.000%, 05/11/20223 | | | UAH | | | | 662,000 | | | | 25,156 | | | | 0.07 | |
Ukraine (Rep of), 15.840%, 02/26/20253 | | | UAH | | | | 3,490,000 | | | | 128,690 | | | | 0.36 | |
| | | | | | | | | | | 153,846 | | | | 0.43 | |
| | | | |
Uruguay (Cost $410,974) | | | | | | | | | | | | | | | | |
Uruguay (Rep of), 9.875%, 06/20/2022 | | | UYU | | | | 1,106,000 | | | | 24,587 | | | | 0.07 | |
Uruguay (Rep of), 8.500%, 03/15/2028 | | | UYU | | | | 1,805,000 | | | | 35,573 | | | | 0.10 | |
Uruguay (Rep of), 4.375%, 12/15/2028 | | | UYU | | | | 343,754 | | | | 15,942 | | | | 0.04 | |
Uruguay Monetary Regulation Bill, 0.000%, 06/10/20202 | | | UYU | | | | 2,872,000 | | | | 67,092 | | | | 0.19 | |
Uruguay Monetary Regulation Bill, 0.000%, 07/03/20202 | | | UYU | | | | 5,776,000 | | | | 134,124 | | | | 0.38 | |
Uruguay Monetary Regulation Bill, 0.000%, 12/18/20202 | | | UYU | | | | 102,000 | | | | 2,230 | | | | 0.01 | |
Uruguay Monetary Regulation Bill, 0.000%, 02/05/20212 | | | UYU | | | | 255,000 | | | | 5,470 | | | | 0.01 | |
Uruguay Monetary Regulation Bill, 0.000%, 02/19/20212,5 | | | UYU | | | | 268,000 | | | | 5,746 | | | | 0.02 | |
Uruguay Monetary Regulation Bill, 0.000%, 03/10/20212 | | | UYU | | | | 1,321,000 | | | | 27,994 | | | | 0.08 | |
Uruguay Monetary Regulation Bill, 0.000%, 06/09/20212 | | | UYU | | | | 599,000 | | | | 12,297 | | | | 0.03 | |
Uruguay Monetary Regulation Bill, 0.000%, 12/08/20212 | | | UYU | | | | 513,000 | | | | 9,917 | | | | 0.03 | |
| | | | | | | | | | | 340,972 | | | | 0.96 | |
| | | | |
Total Debt Securities (Cost $35,165,302) | | | | | | | | | | | 29,497,152 | | | | 82.70 | |
| | | | |
Credit Linked Notes | | | | | | | | | | | | | | | | |
| | | | |
Indonesia (Cost $1,912,703) | | | | | | | | | | | | | | | | |
Indonesia (Rep of), Issued by Standard Chartered, 8.375%, 03/19/20243 | | | IDR | | | | 2,600,000,000 | | | | 181,563 | | | | 0.51 | |
Indonesia (Rep of), Issued by Standard Chartered, 8.125%, 05/17/20243 | | | IDR | | | | 9,817,000,000 | | | | 682,488 | | | | 1.91 | |
Indonesia (Rep of), Issued by Standard Chartered, 7.000%, 05/24/20273 | | | IDR | | | | 6,950,000,000 | | | | 448,898 | | | | 1.26 | |
Indonesia (Rep of), Issued by Standard Chartered, 10.500%, 08/19/20303 | | | IDR | | | | 1,064,000,000 | | | | 83,587 | | | | 0.23 | |
Indonesia (Rep of), Issued by Standard Chartered, 8.375%, 03/17/20343 | | | IDR | | | | 4,693,000,000 | | | | 321,031 | | | | 0.90 | |
See accompanying notes to the financial statements.
72
ASHMORE EMERGING MARKETS LOCAL CURRENCY BOND FUND
SCHEDULE OF INVESTMENTS (CONTINUED)
As of April 30, 2020 (Unaudited)
| | | | | | | | | | | | | | | | |
| | | Currency1 | | Par | | | Value | | | % of Net Assets | |
Indonesia (continued) | | | | | | | | | | | | | | | | |
Indonesia (Rep of), Issued by Standard Chartered, 8.250%, 05/19/20363 | | | IDR | | | | 2,022,000,000 | | | $ | 137,448 | | | | 0.39 | |
| | | | | | | | | | | 1,855,015 | | | | 5.20 | |
| | | | |
Total Credit Linked Notes (Cost $1,912,703) | | | | | | | | | | | 1,855,015 | | | | 5.20 | |
| | | | |
Total Investments in Securities (Cost $37,078,005) | | | | | | | | | | | 31,352,167 | | | | 87.90 | |
| | | | |
Total Investments (Total Cost $37,078,005) | | | | | | | | | | | 31,352,167 | | | | 87.90 | |
| | | | |
Other Assets Less Liabilities (See Statements of Assets and Liabilities for further detail) | | | | | | | | | | | 4,315,982 | | | | 12.10 | |
| | | | |
Net Assets | | | | | | | | | | $ | 35,668,149 | | | | 100.00 | |
| 1 | Local currency is United States Dollars unless otherwise noted below. |
| 3 | Securities exempt from registration under Rule 144A of the Securities Act of 1933. These securities may not be publicly traded without registration under the Securities Act of 1933. |
| 4 | When issued security. Coupon rate was not in effect at April 30, 2020. |
| 5 | Security is a Level 3 investment. |
Percentages shown are based on net assets.
At April 30, 2020, the Ashmore Emerging Markets Local Currency Bond Fund had outstanding forward foreign currency exchange contracts as follows:
| | | | | | | | | | | | | | | | | | |
Settlement Date | | Counterparty | | Currency Buy | | Currency
Buy Amount (Local Currency) | | | Currency Sell | | Currency Sell Amount (Local Currency) | | | Unrealized
Gain/(Loss) | |
| | | | | | |
05/05/2020 | | Deutsche Bank | | United States Dollar | | | 95,000 | | | Brazilian Real | | | 494,808 | | | $ | 4,048 | |
05/05/2020 | | HSBC Bank | | United States Dollar | | | 1,138,662 | | | Brazilian Real | | | 5,785,372 | | | | 75,241 | |
05/06/2020 | | Merrill Lynch | | United States Dollar | | | 2,144,387 | | | Ukraine Hryvnia | | | 2,131,975 | | | | 12,413 | |
05/14/2020 | | Barclays | | Ukraine Hryvnia | | | 2,071,300 | | | United States Dollar | | | 70,000 | | | | 6,299 | |
05/14/2020 | | Barclays | | United States Dollar | | | 72,950 | | | Ukraine Hryvnia | | | 1,951,413 | | | | 1,067 | |
05/14/2020 | | Citibank | | United States Dollar | | | 4,770 | | | Ukraine Hryvnia | | | 119,888 | | | | 354 | |
05/20/2020 | | Barclays | | Ukraine Hryvnia | | | 1,033,550 | | | United States Dollar | | | 35,000 | | | | 2,968 | |
05/20/2020 | | Merrill Lynch | | United States Dollar | | | 40,138 | | | Ukraine Hryvnia | | | 1,033,550 | | | | 2,170 | |
05/22/2020 | | Goldman Sachs | | Ukraine Hryvnia | | | 2,539,680 | | | United States Dollar | | | 85,800 | | | | 7,412 | |
05/22/2020 | | Citibank | | United States Dollar | | | 6,968 | | | Ukraine Hryvnia | | | 175,379 | | | | 531 | |
05/22/2020 | | JP Morgan | | United States Dollar | | | 76,302 | | | Ukraine Hryvnia | | | 1,925,895 | | | | 5,617 | |
05/22/2020 | | Merrill Lynch | | United States Dollar | | | 17,184 | | | Ukraine Hryvnia | | | 438,406 | | | | 1,094 | |
05/29/2020 | | BNP Paribas | | Chinese Offshore Yuan | | | 1,800,098 | | | United States Dollar | | | 253,549 | | | | 576 | |
05/29/2020 | | Morgan Stanley | | Chinese Offshore Yuan | | | 2,119,000 | | | United States Dollar | | | 298,337 | | | | 808 | |
05/29/2020 | | Standard Chartered | | Chinese Offshore Yuan | | | 2,033,000 | | | United States Dollar | | | 286,382 | | | | 622 | |
05/29/2020 | | Barclays | | Czech Koruna | | | 27,944,425 | | | United States Dollar | | | 1,096,462 | | | | 33,972 | |
See accompanying notes to the financial statements.
73
ASHMORE EMERGING MARKETS LOCAL CURRENCY BOND FUND
SCHEDULE OF INVESTMENTS (CONTINUED)
As of April 30, 2020 (Unaudited)
| | | | | | | | | | | | | | | | | | |
Settlement Date | | Counterparty | | Currency Buy | | Currency Buy Amount (Local Currency) | | | Currency Sell | | Currency Sell Amount
(Local Currency) | | | Unrealized
Gain/(Loss) | |
| | | | | | |
05/29/2020 | | UBS | | Czech Koruna | | | 814,584 | | | United States Dollar | | | 32,560 | | | $ | 392 | |
05/29/2020 | | Merrill Lynch | | Hungarian Forint | | | 76,776,270 | | | United States Dollar | | | 234,008 | | | | 4,565 | |
05/29/2020 | | BNP Paribas | | Polish Zloty | | | 1,369,064 | | | United States Dollar | | | 322,477 | | | | 7,419 | |
05/29/2020 | | BNP Paribas | | Romanian Leu | | | 302,046 | | | United States Dollar | | | 67,380 | | | | 739 | |
05/29/2020 | | Merrill Lynch | | Romanian Leu | | | 2,282,433 | | | United States Dollar | | | 512,618 | | | | 2,125 | |
05/29/2020 | | JP Morgan | | South African Rand | | | 168,473 | | | United States Dollar | | | 8,991 | | | | 68 | |
05/29/2020 | | BNP Paribas | | Thai Baht | | | 15,925,366 | | | United States Dollar | | | 484,495 | | | | 7,712 | |
05/29/2020 | | HSBC Bank | | Thai Baht | | | 12,000,000 | | | United States Dollar | | | 364,310 | | | | 6,576 | |
05/29/2020 | | Citibank | | United States Dollar | | | 142,000 | | | Chinese Offshore Yuan | | | 1,002,974 | | | | 407 | |
05/29/2020 | | JP Morgan | | United States Dollar | | | 259,780 | | | Russian Ruble | | | 19,182,155 | | | | 3,426 | |
06/30/2020 | | Barclays | | Czech Koruna | | | 1,093,881 | | | United States Dollar | | | 42,998 | | | | 1,270 | |
06/30/2020 | | JP Morgan | | Czech Koruna | | | 1,093,800 | | | United States Dollar | | | 42,778 | | | | 1,486 | |
06/30/2020 | | Deutsche Bank | | Malaysian Ringgit | | | 2,880,663 | | | United States Dollar | | | 660,884 | | | | 7,310 | |
06/30/2020 | | BNP Paribas | | Polish Zloty | | | 2,943,487 | | | United States Dollar | | | 698,779 | | | | 10,494 | |
06/30/2020 | | Merrill Lynch | | Polish Zloty | | | 2,943,000 | | | United States Dollar | | | 705,595 | | | | 3,560 | |
06/30/2020 | | Barclays | | Russian Ruble | | | 39,044,135 | | | United States Dollar | | | 519,439 | | | | 73 | |
06/30/2020 | | Barclays | | Turkish Lira | | | 639,008 | | | United States Dollar | | | 89,202 | | | | 668 | |
06/30/2020 | | Deutsche Bank | | United States Dollar | | | 64,000 | | | Indonesian Rupiah | | | 969,305,000 | | | | 944 | |
06/30/2020 | | JP Morgan | | United States Dollar | | | 177,000 | | | Indonesian Rupiah | | | 2,683,700,550 | | | | 2,417 | |
07/31/2020 | | Credit Suisse | | Colombian Peso | | | 1,679,361,235 | | | United States Dollar | | | 413,341 | | | | 7,601 | |
07/31/2020 | | HSBC Bank | | Mexican Peso | | | 53,460,250 | | | United States Dollar | | | 2,155,134 | | | | 31,944 | |
07/31/2020 | | UBS | | United States Dollar | | | 57,883 | | | Mexican Peso | | | 1,407,676 | | | | 295 | |
07/31/2020 | | Deutsche Bank | | United States Dollar | | | 67,611 | | | Peruvian Nuevo Sol | | | 229,241 | | | | 30 | |
| | | | | | | | | | | | | | | | | | |
Subtotal Appreciation | | | | | | | | | | | | | | | 256,713 | |
| | | | | | | | | | | | | | | | | | |
| | | | | | |
05/05/2020 | | Standard Chartered | | Brazilian Real | | | 1,077,583 | | | United States Dollar | | | 205,000 | | | | (6,927 | ) |
05/05/2020 | | Barclays | | United States Dollar | | | 350,000 | | | Brazilian Real | | | 1,949,010 | | | | (8,252 | ) |
05/05/2020 | | Deutsche Bank | | United States Dollar | | | 370,000 | | | Brazilian Real | | | 2,075,515 | | | | (11,505 | ) |
05/14/2020 | | HSBC Bank | | United States Dollar | | | 36,870 | | | Romanian Leu | | | 165,863 | | | | (617 | ) |
05/20/2020 | | Deutsche Bank | | United States Dollar | | | 357,446 | | | Indonesian Rupiah | | | 5,706,782,254 | | | | (20,703 | ) |
05/20/2020 | | JP Morgan | | United States Dollar | | | 36,000 | | | Indonesian Rupiah | | | 568,620,000 | | | | (1,678 | ) |
05/20/2020 | | Morgan Stanley | | United States Dollar | | | 117,000 | | | Indonesian Rupiah | | | 1,845,265,000 | | | | (5,273 | ) |
05/29/2020 | | BNP Paribas | | Russian Ruble | | | 4,983,978 | | | United States Dollar | | | 67,118 | | | | (511 | ) |
05/29/2020 | | Merrill Lynch | | Russian Ruble | | | 35,998,745 | | | United States Dollar | | | 552,462 | | | | (71,368 | ) |
05/29/2020 | | Barclays | | Thai Baht | | | 29,000,000 | | | United States Dollar | | | 919,231 | | | | (22,925 | ) |
05/29/2020 | | Deutsche Bank | | Thai Baht | | | 15,000,000 | | | United States Dollar | | | 475,891 | | | | (12,284 | ) |
05/29/2020 | | JP Morgan | | Thai Baht | | | 2,569,242 | | | United States Dollar | | | 80,551 | | | | (1,143 | ) |
05/29/2020 | | HSBC Bank | | United States Dollar | | | 347,925 | | | Chinese Offshore Yuan | | | 2,465,398 | | | | (122 | ) |
05/29/2020 | | UBS | | United States Dollar | | | 133,760 | | | Polish Zloty | | | 560,504 | | | | (1,302 | ) |
05/29/2020 | | Barclays | | United States Dollar | | | 357,850 | | | South African Rand | | | 6,830,000 | | | | (9,440 | ) |
05/29/2020 | | Barclays | | United States Dollar | | | 197,891 | | | Thai Baht | | | 6,463,256 | | | | (1,870 | ) |
05/29/2020 | | HSBC Bank | | United States Dollar | | | 69,000 | | | Thai Baht | | | 2,240,637 | | | | (252 | ) |
06/02/2020 | | Deutsche Bank | | United States Dollar | | | 1,685,812 | | | Brazilian Real | | | 9,227,122 | | | | (6,171 | ) |
See accompanying notes to the financial statements.
74
ASHMORE EMERGING MARKETS LOCAL CURRENCY BOND FUND
SCHEDULE OF INVESTMENTS (CONTINUED)
As of April 30, 2020 (Unaudited)
| | | | | | | | | | | | | | | | | | |
Settlement Date | | Counterparty | | Currency Buy | | Currency Buy Amount (Local Currency) | | | Currency Sell | | Currency Sell Amount (Local Currency) | | | Unrealized
Gain/(Loss) | |
| | | | | | |
06/30/2020 | | JP Morgan | | Romanian Leu | | | 1,959,127 | | | United States Dollar | | | 440,798 | | | $ | (860 | ) |
06/30/2020 | | HSBC Bank | | Russian Ruble | | | 39,044,000 | | | United States Dollar | | | 521,261 | | | | (1,750 | ) |
06/30/2020 | | Barclays | | United States Dollar | | | 10,722 | | | Indonesian Rupiah | | | 169,722,283 | | | | (319 | ) |
06/30/2020 | | BNP Paribas | | United States Dollar | | | 234,426 | | | Indonesian Rupiah | | | 3,692,200,863 | | | | (5,763 | ) |
06/30/2020 | | Citibank | | United States Dollar | | | 22,183 | | | Indonesian Rupiah | | | 351,603,774 | | | | (690 | ) |
06/30/2020 | | Deutsche Bank | | United States Dollar | | | 46,829 | | | Indonesian Rupiah | | | 742,713,398 | | | | (1,486 | ) |
06/30/2020 | | HSBC Bank | | United States Dollar | | | 18,002 | | | Indonesian Rupiah | | | 285,603,808 | | | | (577 | ) |
06/30/2020 | | JP Morgan | | United States Dollar | | | 270,000 | | | Indonesian Rupiah | | | 4,270,050,000 | | | | (7,779 | ) |
06/30/2020 | | Barclays | | United States Dollar | | | 228,867 | | | Philippine Peso | | | 11,686,164 | | | | (1,842 | ) |
06/30/2020 | | Merrill Lynch | | United States Dollar | | | 359,765 | | | South African Rand | | | 6,829,414 | | | | (6,389 | ) |
07/31/2020 | | UBS | | Mexican Peso | | | 4,503,331 | | | United States Dollar | | | 185,000 | | | | (767 | ) |
07/31/2020 | | Merrill Lynch | | United States Dollar | | | 663,553 | | | Chilean Peso | | | 565,679,030 | | | | (15,775 | ) |
| | | | | | | | | | | | | | | | | | |
| | | | | |
Subtotal Depreciation | | | | | | | | | | | | | | | (226,340 | ) |
| | | | | | | | | | | | | | | | | | |
| | | | | | |
Total | | | | | | | | | | | | | | | | $ | 30,373 | |
| | | | | | | | | | | | | | | | | | |
At April 30, 2020, the Ashmore Emerging Markets Local Currency Bond Fund had the following interest rate swap contracts outstanding:
| | | | | | | | | | | | | | | | | | | | | | | | | | |
Pay Rate Index/ Pay Rate | | Receive Rate/
Receive Rate
Index | | | Notional Amount | | | Expiration
Date | | | Fair
Value | | | Premiums
Paid/
(Received) | | | Unrealized
Appreciation
(Depreciation) | | Counterparty | |
MYR-KLIBOR-BNM 3 Month Rate (Pay Quarterly) | |
| 4.055% (Receive
Quarterly) |
| | | MYR 1,300,000 | | | | 4/27/2026 | | | | $31,378 | | | | — | | | $31,378 | | | HSBC Bank | |
WIBOR Poland 6 Month Rate (Pay Semiannually) | |
| 1.955% (Receive
Annually) |
| | | PLN 6,400,000 | | | | 9/24/2020 | | | | 20,859 | | | | — | | | 20,859 | | | BNP Paribas | |
| | | | | | | | | | | | | | | | | | | | | | $52,237 | | | | |
At April 30, 2020, the Ashmore Emerging Markets Local Currency Bond Fund had the following centrally cleared swap contracts outstanding:
| | | | | | | | | | | | | | | | | | |
Pay Rate Index/ Pay Rate | | Receive Rate/
Receive Rate
Index | | Notional Amount | | | Expiration Date | | | Fair Value/
Unrealized
Appreciation
(Depreciation)** | | | Variation
Margin
Receivable
(Payable) | | Counterparty |
Budapest Interbank 6 Month Rate (Pay Semiannually) | | 1.795% (Receive
Annually) | | | HUF 93,000,000 | | | | 10/9/2020 | | | | $ 3,807 | | | $51 | | HSBC Bank |
CFETS China Fixing Repo Rates 7 Day (Pay Quarterly) | | 2.535% (Receive
Quarterly) | | | CNY 2,499,000 | | | | 3/18/2025 | | | | 12,696 | | | (513) | | JP Morgan |
CFETS China Fixing Repo Rates 7 Day (Pay Quarterly) | | 2.582% (Receive
Quarterly) | | | CNY 917,000 | | | | 3/18/2025 | | | | 4,950 | | | (188) | | HSBC Bank |
CFETS China Fixing Repo Rates 7 Day (Pay Quarterly) | | 2.580% (Receive
Quarterly) | | | CNY 1,748,000 | | | | 3/18/2025 | | | | 9,416 | | | (358) | | JP Morgan |
See accompanying notes to the financial statements.
75
ASHMORE EMERGING MARKETS LOCAL CURRENCY BOND FUND
SCHEDULE OF INVESTMENTS (CONTINUED)
As of April 30, 2020 (Unaudited)
| | | | | | | | | | | | | | | | | | | | | | |
Pay Rate Index/ Pay Rate | | Receive Rate/ Receive Rate Index | | | Notional Amount | | | Expiration
Date | | | Fair Value/
Unrealized
Appreciation
(Depreciation)** | | Variation
Margin
Receivable
(Payable) | | Counterparty | |
CFETS China Fixing Repo Rates 7 Day (Pay Quarterly) | |
| 2.575% (Receive
Quarterly) |
| | | CNY 1,826,000 | | | | 3/18/2025 | | | | $ 9,775 | | | $(374) | | | JP Morgan | |
MXN-TIIE-BANXICO 28 Day Rate (Pay Lunar) | |
| 6.563% (Receive
Lunar) |
| | | MXN 30,000,000 | | | | 12/31/2024 | | | | 61,761 | | | (1,242) | | | Merrill Lynch | |
MXN-TIIE-BANXICO 28 Day Rate (Pay Lunar) | |
| 7.900% (Receive
Lunar) |
| | | MXN 3,200,000 | | | | 6/5/2030 | | | | 16,464 | | | (306) | | | HSBC Bank | |
MXN-TIIE-BANXICO 28 Day Rate (Pay Lunar) | |
| 7.055% (Receive
Lunar) |
| | | MXN 5,100,000 | | | | 6/5/2030 | | | | 12,163 | | | (321) | | | Merrill Lynch | |
MXN-TIIE-BANXICO 28 Day Rate (Pay Lunar) | |
| 5.503% (Receive
Lunar) |
| | | MXN 13,000,000 | | | | 6/11/2025 | | | | 502 | | | (272) | | | Merrill Lynch | |
WIBOR Poland 6 Month Rate (Pay Semiannually) | |
| 2.400% (Receive
Annually) |
| | | PLN 2,556,000 | | | | 3/26/2023 | | | | 35,147 | | | (7) | | | Merrill Lynch | |
| | | | | | | | | | | | | | | | | | | | | | |
| | | | | | |
| | | | | | | | | | | | | | | $166,681 | | | $(3,530) | | | | |
| | | | | | | | | | | | | | | | | | | | | | |
** Includes cumulative appreciation/depreciation on centrally cleared swap agreements. Only the current day’s variation margin is reported within the Statements of Assets and Liabilities.
See accompanying notes to the financial statements.
76
ASHMORE EMERGING MARKETS LOCAL CURRENCY BOND FUND
SCHEDULE OF INVESTMENTS (CONTINUED)
As of April 30, 2020 (Unaudited)
The inputs or methodologies used for valuing securities are not necessarily an indication of the risks associated with investing in those securities and other financial instruments, if any. See note 4 in the Notes to the Financial Statements for more information regarding pricing inputs and valuation techniques. The following is a summary of the inputs used in valuing the Ashmore Emerging Markets Local Currency Bond Fund’s investments and other financial instruments, which are carried at fair value, as of April 30, 2020:
| | | | | | | | | | | | | | | | |
| | | Level 1 | | | Level 2 | | | Level 3 | | | Total | |
Investments | | | | | | | | | | | | | | | | |
Assets: | | | | | | | | | | | | | | | | |
Debt Securities | | | | | | | | | | | | | | | | |
Corporate Bonds | | | $— | | | | $ 235,970 | | | | $ — | | | | $ 235,970 | |
Government Agencies | | | — | | | | 201,359 | | | | — | | | | 201,359 | |
Government Bonds | | | — | | | | 27,634,859 | | | | — | | | | 27,634,859 | |
Index Linked Government Bonds | | | — | | | | 1,193,114 | | | | — | | | | 1,193,114 | |
Municipal Bonds | | | — | | | | 62,660 | | | | — | | | | 62,660 | |
Short Term Bills and Notes | | | — | | | | 163,444 | | | | 5,746 | | | | 169,190 | |
| | | | | | | | | | | | | | | | |
Total Debt Securities | | | — | | | | 29,491,406 | | | | 5,746 | | | | 29,497,152 | |
Credit Linked Notes | | | | | | | | | | | | | | | | |
Indonesia | | | — | | | | 1,855,015 | | | | — | | | | 1,855,015 | |
| |
Total Investments | | | $— | | | | $31,346,421 | | | | $5,746 | | | | $31,352,167 | |
| |
| | | | |
Other Financial Instruments | | | | | | | | | | | | | | | | |
Assets: | | | | | | | | | | | | | | | | |
Forward Foreign Currency Exchange Contracts | | | $— | | | | $ 256,713 | | | | $— | | | | $ 256,713 | |
Interest Rate Swap Contracts | | | — | | | | 52,237 | | | | — | | | | 52,237 | |
Centrally Cleared Swap Contracts† | | | — | | | | 166,681 | | | | — | | | | 166,681 | |
Liabilities: | | | | | | | | | | | | | | | | |
Forward Foreign Currency Exchange Contracts | | | — | | | | (226,340 | ) | | | — | | | | (226,340 | ) |
| |
Total Other Financial Instruments | | | $— | | | | $ 249,291 | | | | $— | | | | $ 249,291 | |
| |
† Includes cumulative appreciation/depreciation on centrally cleared swap agreements. Only the current day’s variation margin is reported within the Statements of Assets and Liabilities.
The following is a reconciliation of investments in which significant unobservable inputs (Level 3) were used for the Fund during the period ending April 30, 2020:
| | | | | | | | | | | | | | | | | | | | |
Category and Subcategory | | Beginning Balance at 04/30/2020 | | Accrued Discounts (Premiums) | | Purchases | | Sales | | Realized Gains (Losses) | | Change in Unrealized Appreciation (Depreciation) | | Transfer into Level 3 | | Transfer out of Level 3 | | Ending Balance at 04/30/2020 | | Change in Unrealized Appreciation (Depreciation) from Investments still held 04/30/2020 |
| | | | | | | | | | |
Investments, at value | | | | | | | | | | | | | | | | | | | | |
Short Term Bills and Notes | | | | | | | | | | | | | | | | | | | | |
Uruguay | | $— | | $85 | | $6,083 | | $— | | $— | | $(422) | | $— | | $— | | $5,746 | | $(422) |
| | | | | | | | | | |
Total | | $— | | $85 | | $6,083 | | $— | | $— | | $(422) | | $— | | $— | | $5,746 | | $(422) |
See accompanying notes to the financial statements.
77
ASHMORE EMERGING MARKETS LOCAL CURRENCY BOND FUND
SCHEDULE OF INVESTMENTS (CONTINUED)
As of April 30, 2020 (Unaudited)
The following table on “Quantitative information about Level 3 Fair Value measurements” provides information on the valuation techniques and inputs used to value Level 3 securities at April 30, 2020:
| | | | | | | | | | | | |
| Quantitative Information about Level 3 Fair Value Measurements | |
| | | Fair Value at 04/30/2020 | | | Valuation Technique | | | Unobservable Input | |
Short Term Bills and Notes | | | $5,746 | | | | Broker Quote | | | | Inputs to broker model | |
Total | | | $5,746 | | | | | | | | | |
The following is a summary of the fair values of the Fund’s derivative instruments*:
Fair Values of Financial Derivative Instruments on the Statements of Assets and Liabilities as of April 30, 2020:
| | | | | | | | | | | | |
| | | Derivatives Not Accounted for as
Hedging Instruments | |
| | | Foreign Exchange Risk | | | Interest Rate Risk | |
| |
Assets: | | | | | | | | | | | | |
Unrealized Appreciation on Centrally Cleared Swap Contracts | | | | | | $ | — | | | $ | 166,681 | † |
Unrealized Appreciation on Interest Rate Swap Contracts | | | | | | | — | | | | 52,237 | |
Unrealized Appreciation on Forward Foreign Currency Exchange Contracts | | | | | | | 256,713 | | | | — | |
| | | | |
| | | | | | $ | 256,713 | | | $ | 218,918 | |
| | | | |
Liabilities: | | | | | | | | | | | | |
Unrealized Depreciation on Forward Foreign Currency Exchange Contracts | | | | | | $ | (226,340 | ) | | $ | — | |
| | | | |
| | | | | | $ | (226,340 | ) | | $ | — | |
| | | | |
† Includes cumulative appreciation/depreciation on centrally cleared swap agreements. Only the current day’s variation margin is reported within the Statements of Assets and Liabilities.
The Effect of Financial Derivative Instruments on the Statements of Operations for the Six Months Ended April 30, 2020:
| | | | | | | | | | | | |
| | | Derivatives Not Accounted for as
Hedging Instruments | |
| | | Foreign Exchange Risk | | | Interest Rate Risk | |
| |
Realized Gain (Loss) on Derivatives Recognized resulting from Operations: | | | | | | | | | | | | |
Net Realized Loss on Forward Foreign Currency Exchange Contracts | | | | | | $ | (679,647 | ) | | $ | — | |
Net Realized Loss on Interest Rate Swap Contracts | | | | | | | — | | | | (54,038 | ) |
| | | | |
| | | | | | $ | (679,647 | ) | | $ | (54,038 | ) |
| | | | |
Net Change in Unrealized Appreciation (Depreciation) on Derivatives Recognized resulting from Operations: | | | | | | | | | | | | |
Net Change in Unrealized Depreciation on Forward Foreign Currency Exchange Contracts | | | | | | $ | (251,428 | ) | | $ | — | |
Net Change in Unrealized Appreciation on Interest Rate Swap Contracts | | | | | | | — | | | | 228,879 | |
| | | | |
| | | | | | $ | (251,428 | ) | | $ | 228,879 | |
| | | | |
* See note 10 in the Notes to the Financial Statements for additional information.
See accompanying notes to the financial statements.
78
ASHMORE EMERGING MARKETS CORPORATE INCOME FUND
SCHEDULE OF INVESTMENTS
As of April 30, 2020 (Unaudited)
| | | | | | | | | | | | | | | | |
| | | Currency1 | | Par | | | Value | | | % of Net Assets | |
Debt Securities | | | | | | | | | | | | | | | | |
| | | | |
Argentina (Cost $17,360,261) | | | | | | | | | | | | | | | | |
Genneia S.A., 8.750%, 01/20/2022 | | | | | | | 970,000 | | | $ | 533,500 | | | | 0.18 | |
IRSA Propiedades Comerciales S.A., 8.750%, 03/23/2023 | | | | | | | 1,565,000 | | | | 790,341 | | | | 0.26 | |
Pampa Energia S.A., 7.375%, 07/21/2023 | | | | | | | 4,370,000 | | | | 2,851,425 | | | | 0.95 | |
Pampa Energia S.A., 7.500%, 01/24/2027 | | | | | | | 1,550,000 | | | | 939,300 | | | | 0.31 | |
Telecom Argentina S.A., 6.500%, 06/15/20212 | | | | | | | 645,000 | | | | 583,731 | | | | 0.20 | |
YPF S.A., 8.500%, 03/23/2021 | | | | | | | 2,465,000 | | | | 1,546,812 | | | | 0.52 | |
YPF S.A., 8.750%, 04/04/2024 | | | | | | | 5,645,000 | | | | 3,013,019 | | | | 1.01 | |
YPF S.A., 8.500%, 07/28/2025 | | | | | | | 1,615,000 | | | | 783,275 | | | | 0.26 | |
| | | | | | | | | | | 11,041,403 | | | | 3.69 | |
| | | | |
Brazil (Cost $60,313,966) | | | | | | | | | | | | | | | | |
Banco do Brasil S.A., (Variable, U.S. Treasury Yield Curve Rate CMT 10Y + 7.327%), 9.250%, 04/15/20233 | | | | | | | 1,015,000 | | | | 1,002,313 | | | | 0.34 | |
Banco do Brasil S.A., (Variable, U.S. Treasury Yield Curve Rate CMT 10Y + 4.398%), 6.250%, 04/15/20243 | | | | | | | 1,258,000 | | | | 1,028,415 | | | | 0.34 | |
Banco do Brasil S.A., (Variable, U.S. Treasury Yield Curve Rate CMT 10Y + 6.362%), 9.000%, 06/18/20243 | | | | | | | 1,020,000 | | | | 975,120 | | | | 0.33 | |
Braskem Netherlands Finance B.V., 5.875%, 01/31/2050 | | | | | | | 1,185,000 | | | | 909,488 | | | | 0.30 | |
CSN Islands XI Corp., 6.750%, 01/28/2028 | | | | | | | 4,225,000 | | | | 2,756,812 | | | | 0.92 | |
CSN Resources S.A., 7.625%, 04/17/2026 | | | | | | | 2,185,000 | | | | 1,551,350 | | | | 0.52 | |
Gerdau Trade, Inc., 4.875%, 10/24/2027 | | | | | | | 1,250,000 | | | | 1,201,000 | | | | 0.40 | |
GTL Trade Finance, Inc., 7.250%, 04/16/2044 | | | | | | | 525,000 | | | | 573,563 | | | | 0.19 | |
GTL Trade Finance, Inc./Gerdau Holdings, Inc., 5.893%, 04/29/2024 | | | | | | | 409,000 | | | | 411,045 | | | | 0.14 | |
InterCement Financial Operations B.V., 5.750%, 07/17/2024 | | | | | | | 5,550,000 | | | | 2,333,220 | | | | 0.78 | |
Itau Unibanco Holding S.A., (Variable, U.S. Treasury Yield Curve Rate CMT 5Y + 3.981%), 6.125%, 12/12/20223 | | | | | | | 1,075,000 | | | | 997,063 | | | | 0.33 | |
JBS Investments GmbH, 6.250%, 02/05/2023 | | | | | | | 1,298,000 | | | | 1,286,655 | | | | 0.43 | |
JBS Investments II GmbH, 5.750%, 01/15/2028 | | | | | | | 1,640,000 | | | | 1,599,000 | | | | 0.53 | |
MARB BondCo PLC, 7.000%, 03/15/2024 | | | | | | | 1,005,000 | | | | 982,388 | | | | 0.33 | |
NBM US Holdings, Inc., 7.000%, 05/14/2026 | | | | | | | 2,070,000 | | | | 1,992,375 | | | | 0.67 | |
NBM US Holdings, Inc., 6.625%, 08/06/2029 | | | | | | | 2,690,000 | | | | 2,504,255 | | | | 0.84 | |
Oi S.A., 10.000%, 07/27/2025 | | | | | | | 6,100,000 | | | | 4,544,500 | | | | 1.52 | |
Petrobras Global Finance B.V., 6.850%, 06/05/2115 | | | | | | | 10,460,000 | | | | 9,780,100 | | | | 3.27 | |
Rede D’or Finance S.a.r.l., 4.500%, 01/22/2030 | | | | | | | 2,205,000 | | | | 1,866,091 | | | | 0.62 | |
Samarco Mineracao S.A., 4.125%, 11/01/20224 | | | | | | | 7,173,000 | | | | 2,797,470 | | | | 0.93 | |
Samarco Mineracao S.A., 5.750%, 10/24/20234 | | | | | | | 4,823,000 | | | | 1,929,200 | | | | 0.64 | |
Samarco Mineracao S.A., 5.375%, 09/26/20244 | | | | | | | 1,195,000 | | | | 478,000 | | | | 0.16 | |
St Marys Cement, Inc., 5.750%, 01/28/2027 | | | | | | | 1,515,000 | | | | 1,528,271 | | | | 0.51 | |
Suzano Austria GmbH, 5.000%, 01/15/2030 | | | | | | | 365,000 | | | | 345,969 | | | | 0.12 | |
Unigel Luxembourg S.A., 8.750%, 10/01/2026 | | | | | | | 1,640,000 | | | | 977,456 | | | | 0.33 | |
Vale Overseas Ltd., 6.250%, 08/10/2026 | | | | | | | 915,000 | | | | 1,002,840 | | | | 0.34 | |
Vale Overseas Ltd., 8.250%, 01/17/2034 | | | | | | | 590,000 | | | | 751,666 | | | | 0.25 | |
See accompanying notes to the financial statements.
79
ASHMORE EMERGING MARKETS CORPORATE INCOME FUND
SCHEDULE OF INVESTMENTS (CONTINUED)
As of April 30, 2020 (Unaudited)
| | | | | | | | | | | | | | | | |
| | | Currency1 | | Par | | | Value | | | % of Net Assets | |
Brazil (continued) | | | | | | | | | | | | | | | | |
Votorantim Cimentos International S.A., 7.250%, 04/05/2041 | | | | | | | 1,290,000 | | | $ | 1,412,550 | | | | 0.47 | |
| | | | | | | | | | | 49,518,175 | | | | 16.55 | |
| | | | |
Chile (Cost $4,909,657) | | | | | | | | | | | | | | | | |
Colbun S.A., 3.150%, 03/06/2030 | | | | | | | 400,000 | | | | 381,000 | | | | 0.13 | |
Corp Nacional del Cobre de Chile, 3.750%, 01/15/20315 | | | | | | | 810,000 | | | | 820,716 | | | | 0.27 | |
Empresa Nacional del Petroleo, 5.250%, 11/06/2029 | | | | | | | 460,000 | | | | 480,901 | | | | 0.16 | |
Enel Chile S.A., 4.875%, 06/12/2028 | | | | | | | 485,000 | | | | 531,075 | | | | 0.18 | |
GNL Quintero S.A., 4.634%, 07/31/2029 | | | | | | | 1,170,000 | | | | 1,212,412 | | | | 0.40 | |
Inversiones CMPC S.A., 4.750%, 09/15/2024 | | | | | | | 890,000 | | | | 928,807 | | | | 0.31 | |
Sociedad Quimica y Minera de Chile S.A., 4.250%, 01/22/2050 | | | | | | | 530,000 | | | | 474,350 | | | | 0.16 | |
| | | | | | | | | | | 4,829,261 | | | | 1.61 | |
| | | | |
China (Cost $36,549,827) | | | | | | | | | | | | | | | | |
CFLD Cayman Investment Ltd., 8.600%, 04/08/2024 | | | | | | | 3,285,000 | | | | 2,940,075 | | | | 0.98 | |
China Evergrande Group, 11.500%, 01/22/2023 | | | | | | | 1,069,000 | | | | 954,179 | | | | 0.32 | |
China Evergrande Group, 9.500%, 03/29/2024 | | | | | | | 1,225,000 | | | | 986,125 | | | | 0.33 | |
China Evergrande Group, 8.750%, 06/28/2025 | | | | | | | 2,545,000 | | | | 2,008,410 | | | | 0.67 | |
China Hongqiao Group Ltd., 7.125%, 07/22/2022 | | | | | | | 1,295,000 | | | | 1,074,850 | | | | 0.36 | |
Country Garden Holdings Co. Ltd., 7.125%, 04/25/2022 | | | | | | | 650,000 | | | | 667,875 | | | | 0.22 | |
Fantasia Holdings Group Co. Ltd., 12.250%, 10/18/2022 | | | | | | | 970,000 | | | | 950,807 | | | | 0.32 | |
Fantasia Holdings Group Co. Ltd., 10.875%, 01/09/2023 | | | | | | | 1,125,000 | | | | 1,073,131 | | | | 0.36 | |
Far East Energy Bermuda Ltd., 13.000%, 01/15/20164,5,6,7 | | | | | | | 282,201 | | | | — | | | | — | |
Kaisa Group Holdings Ltd., 8.500%, 06/30/2022 | | | | | | | 1,953,000 | | | | 1,809,170 | | | | 0.60 | |
Kaisa Group Holdings Ltd., 10.875%, 07/23/2023 | | | | | | | 1,010,000 | | | | 943,090 | | | | 0.32 | |
Kaisa Group Holdings Ltd., 9.375%, 06/30/2024 | | | | | | | 2,735,000 | | | | 2,332,536 | | | | 0.78 | |
KWG Group Holdings Ltd., 5.875%, 11/10/2024 | | | | | | | 2,185,000 | | | | 1,979,533 | | | | 0.66 | |
Prime Bloom Holdings Ltd., 6.950%, 07/05/2022 | | | | | | | 2,545,000 | | | | 1,068,900 | | | | 0.36 | |
Ronshine China Holdings Ltd., 8.750%, 10/25/2022 | | | | | | | 1,055,000 | | | | 1,051,044 | | | | 0.35 | |
Scenery Journey Ltd., 12.000%, 10/24/2023 | | | | | | | 3,335,000 | | | | 2,906,130 | | | | 0.97 | |
Sunac China Holdings Ltd., 7.500%, 02/01/2024 | | | | | | | 1,035,000 | | | | 996,483 | | | | 0.33 | |
Sunac China Holdings Ltd., 6.500%, 01/10/2025 | | | | | | | 1,090,000 | | | | 1,008,665 | | | | 0.34 | |
Tunghsu Venus Holdings Ltd., 7.000%, 06/12/2020 | | | | | | | 2,785,000 | | | | 979,986 | | | | 0.33 | |
Xiaomi Best Time International Ltd., 3.375%, 04/29/20305 | | | | | | | 700,000 | | | | 687,697 | | | | 0.23 | |
Zhenro Properties Group Ltd., 9.800%, 08/20/2021 | | | | | | | 1,015,000 | | | | 1,025,396 | | | | 0.34 | |
Zhenro Properties Group Ltd., 8.650%, 01/21/2023 | | | | | | | 748,000 | | | | 728,686 | | | | 0.24 | |
Zhenro Properties Group Ltd., 9.150%, 05/06/2023 | | | | | | | 985,000 | | | | 968,419 | | | | 0.32 | |
Zhenro Properties Group Ltd., 7.875%, 04/14/2024 | | | | | | | 1,120,000 | | | | 1,006,154 | | | | 0.34 | |
Zhongrong International Resources Co. Ltd., 7.250%, 10/26/2020 | | | | | | | 2,570,000 | | | | 647,617 | | | | 0.22 | |
| | | | | | | | | | | 30,794,958 | | | | 10.29 | |
| | | | |
Colombia (Cost $13,767,050) | | | | | | | | | | | | | | | | |
Banco Bilbao Vizcaya Argentaria Colombia S.A., 4.875%, 04/21/2025 | | | | | | | 150,000 | | | | 149,625 | | | | 0.05 | |
Bancolombia S.A., 3.000%, 01/29/2025 | | | | | | | 445,000 | | | | 411,905 | | | | 0.14 | |
See accompanying notes to the financial statements.
80
ASHMORE EMERGING MARKETS CORPORATE INCOME FUND
SCHEDULE OF INVESTMENTS (CONTINUED)
As of April 30, 2020 (Unaudited)
| | | | | | | | | | | | | | | | |
| | | Currency1 | | Par | | | Value | | | % of Net Assets | |
Colombia (continued) | | | | | | | | | | | | | | | | |
Bancolombia S.A., (Variable, U.S. Treasury Yield Curve Rate CMT 5Y + 2.944%), 4.625%, 12/18/20293 | | | | | | | 1,240,000 | | | $ | 1,069,500 | | | | 0.36 | |
Ecopetrol S.A., 7.375%, 09/18/2043 | | | | | | | 790,000 | | | | 815,912 | | | | 0.27 | |
Ecopetrol S.A., 5.875%, 05/28/2045 | | | | | | | 545,000 | | | | 478,020 | | | | 0.16 | |
Frontera Energy Corp., 9.700%, 06/25/2023 | | | | | | | 5,150,000 | | | | 3,527,750 | | | | 1.18 | |
Grupo Aval Ltd., 4.375%, 02/04/2030 | | | | | | | 1,800,000 | | | | 1,512,000 | | | | 0.51 | |
Grupo de Inversiones Suramericana S.A., 5.500%, 04/29/2026 | | | | | | | 240,000 | | | | 240,002 | | | | 0.08 | |
Millicom International Cellular S.A., 6.250%, 03/25/2029 | | | | | | | 1,540,000 | | | | 1,509,200 | | | | 0.50 | |
Promigas S.A. ESP/Gases del Pacifico S.A.C., 3.750%, 10/16/2029 | | | | | | | 1,100,000 | | | | 991,100 | | | | 0.33 | |
SURA Asset Management S.A., 4.375%, 04/11/20272 | | | | | | | 300,000 | | | | 292,503 | | | | 0.10 | |
| | | | | | | | | | | 10,997,517 | | | | 3.68 | |
| | | | |
Czech Republic (Cost $1,965,282) | | | | | | | | | | | | | | | | |
New World Resources N.V., 8.000%, 04/07/20204,6,7 | | | EUR | | | | 1,685,299 | | | | — | | | | — | |
New World Resources N.V., 4.000%, 10/07/20204,7 | | | EUR | | | | 700,590 | | | | — | | | | — | |
New World Resources N.V., 16.423%, 10/07/20204,5,7,8,9 | | | EUR | | | | 101,612 | | | | — | | | | — | |
| | | | | | | | | | | — | | | | — | |
| | | | |
Ecuador (Cost $8,534,793) | | | | | | | | | | | | | | | | |
International Airport Finance S.A., 12.000%, 03/15/2033 | | | | | | | 6,610,000 | | | | 4,098,200 | | | | 1.37 | |
Petroamazonas EP, 4.625%, 11/06/2020 | | | | | | | 1,598,334 | | | | 719,250 | | | | 0.24 | |
| | | | | | | | | | | 4,817,450 | | | | 1.61 | |
| | | | |
Egypt (Cost $3,113,522) | | | | | | | | | | | | | | | | |
ADES International Holding PLC, 8.625%, 04/24/2024 | | | | | | | 3,090,000 | | | | 2,349,018 | | | | 0.79 | |
| | | | | | | | | | | 2,349,018 | | | | 0.79 | |
| | | | |
Guatemala (Cost $1,266,894) | | | | | | | | | | | | | | | | |
Comunicaciones Celulares S.A. Via Comcel Trust, 6.875%, 02/06/2024 | | | | | | | 1,266,000 | | | | 1,266,000 | | | | 0.42 | |
| | | | | | | | | | | 1,266,000 | | | | 0.42 | |
| | | | |
India (Cost $1,498,134) | | | | | | | | | | | | | | | | |
Adani Transmission Ltd., 4.250%, 05/21/2036 | | | | | | | 400,000 | | | | 349,002 | | | | 0.12 | |
Greenko Solar Mauritius Ltd., 5.950%, 07/29/2026 | | | | | | | 373,000 | | | | 324,700 | | | | 0.11 | |
Power Finance Corp. Ltd., 4.500%, 06/18/2029 | | | | | | | 675,000 | | | | 618,010 | | | | 0.20 | |
| | | | | | | | | | | 1,291,712 | | | | 0.43 | |
| | | | |
Indonesia (Cost $9,733,919) | | | | | | | | | | | | | | | | |
Adaro Indonesia PT, 4.250%, 10/31/2024 | | | | | | | 905,000 | | | | 803,188 | | | | 0.27 | |
Eterna Capital Pte. Ltd., 8.000%, 12/11/202210 | | | | | | | 4,894,525 | | | | 2,358,438 | | | | 0.79 | |
Indonesia Asahan Aluminium Persero PT, 6.530%, 11/15/2028 | | | | | | | 710,000 | | | | 768,575 | | | | 0.26 | |
Minejesa Capital B.V., 4.625%, 08/10/2030 | | | | | | | 1,660,000 | | | | 1,584,802 | | | | 0.53 | |
Pertamina Persero PT, 6.000%, 05/03/2042 | | | | | | | 930,000 | | | | 980,817 | | | | 0.33 | |
Perusahaan Listrik Negara PT, 4.125%, 05/15/2027 | | | | | | | 714,000 | | | | 708,645 | | | | 0.23 | |
| | | | | | | | | | | 7,204,465 | | | | 2.41 | |
See accompanying notes to the financial statements.
81
ASHMORE EMERGING MARKETS CORPORATE INCOME FUND
SCHEDULE OF INVESTMENTS (CONTINUED)
As of April 30, 2020 (Unaudited)
| | | | | | | | | | | | | | | | |
| | | Currency1 | | Par | | | Value | | | % of Net Assets | |
Iraq (Cost $11,423,226) | | | | | | | | | | | | | | | | |
DNO A.S.A., 8.750%, 05/31/20235 | | | | | | | 4,400,000 | | | $ | 2,816,000 | | | | 0.94 | |
DNO A.S.A., 8.375%, 05/29/20245 | | | | | | | 3,130,000 | | | | 1,971,900 | | | | 0.66 | |
Oilflow SPV 1 DAC, 12.000%, 01/13/2022 | | | | | | | 4,081,875 | | | | 2,938,795 | | | | 0.98 | |
| | | | | | | | | | | 7,726,695 | | | | 2.58 | |
| | | | |
Israel (Cost $14,577,198) | | | | | | | | | | | | | | | | |
Altice Financing S.A., 7.500%, 05/15/2026 | | | | | | | 2,625,000 | | | | 2,736,563 | | | | 0.92 | |
ICL Ltd., 6.375%, 05/31/20385 | | | | | | | 821,000 | | | | 903,853 | | | | 0.30 | |
Teva Pharmaceutical Finance Co. LLC, 6.150%, 02/01/2036 | | | | | | | 2,220,000 | | | | 2,075,700 | | | | 0.69 | |
Teva Pharmaceutical Finance Netherlands III B.V., 7.125%, 01/31/2025 | | | | | | | 1,860,000 | | | | 1,926,588 | | | | 0.64 | |
Teva Pharmaceutical Finance Netherlands III B.V., 6.750%, 03/01/2028 | | | | | | | 6,840,000 | | | | 7,034,940 | | | | 2.35 | |
| | | | | | | | | | | 14,677,644 | | | | 4.90 | |
| | | | |
Jamaica (Cost $13,318,364) | | | | | | | | | | | | | | | | |
Digicel Group One Ltd., 8.250%, 12/30/2022 | | | | | | | 5,892,000 | | | | 3,476,280 | | | | 1.16 | |
Digicel Group Two Ltd., 8.250%, 09/30/2022 | | | | | | | 5,533,000 | | | | 165,990 | | | | 0.06 | |
Digicel Group Two Ltd., 9.125%, 04/01/2024 | | | | | | | 8,850,410 | | | | 265,513 | | | | 0.09 | |
Digicel Ltd., 6.000%, 04/15/2021 | | | | | | | 1,320,000 | | | | 792,013 | | | | 0.26 | |
| | | | | | | | | | | 4,699,796 | | | | 1.57 | |
| | | | |
Kazakhstan (Cost $1,395,369) | | | | | | | | | | | | | | | | |
Kazakhstan Temir Zholy Finance B.V., 6.950%, 07/10/2042 | | | | | | | 780,000 | | | | 895,596 | | | | 0.30 | |
Tengizchevroil Finance Co. International Ltd., 4.000%, 08/15/2026 | | | | | | | 425,000 | | | | 404,855 | | | | 0.14 | |
| | | | | | | | | | | 1,300,451 | | | | 0.44 | |
| | | | |
Kuwait (Cost $2,846,910) | | | | | | | | | | | | | | | | |
NBK Tier 1 Financing Ltd., (Variable, USD Swap 6Y + 4.119%), 5.750%, 04/09/20213 | | | | | | | 2,755,000 | | | | 2,619,454 | | | | 0.88 | |
| | | | | | | | | | | 2,619,454 | | | | 0.88 | |
| | | | |
Malaysia (Cost $1,191,172) | | | | | | | | | | | | | | | | |
Petronas Capital Ltd., 3.500%, 04/21/20305 | | | | | | | 700,000 | | | | 733,074 | | | | 0.25 | |
Petronas Capital Ltd., 4.550%, 04/21/20505 | | | | | | | 500,000 | | | | 541,736 | | | | 0.18 | |
| | | | | | | | | | | 1,274,810 | | | | 0.43 | |
| | | | |
Mexico (Cost $32,392,685) | | | | | | | | | | | | | | | | |
Alfa S.A.B. de C.V., 6.875%, 03/25/2044 | | | | | | | 1,735,000 | | | | 1,694,748 | | | | 0.57 | |
Axtel S.A.B. de C.V., 6.375%, 11/14/2024 | | | | | | | 1,170,000 | | | | 1,091,025 | | | | 0.36 | |
Banco Mercantil del Norte S.A., (Variable, U.S. Treasury Yield Curve Rate CMT 5Y + 5.035%), 6.875%, 07/06/20223 | | | | | | | 1,810,000 | | | | 1,420,868 | | | | 0.47 | |
Banco Mercantil del Norte S.A., (Variable, U.S. Treasury Yield Curve Rate CMT 10Y + 5.353%), 7.625%, 01/10/20283 | | | | | | | 1,635,000 | | | | 1,316,175 | | | | 0.44 | |
Banco Santander Mexico S.A. Institucion de Banca Multiple Grupo Financiero Santander, 5.375%, 04/17/20255 | | | | | | | 930,000 | | | | 954,412 | | | | 0.32 | |
BBVA Bancomer S.A., (Variable, U.S. Treasury Yield Curve Rate CMT 5Y + 2.650%), 5.125%, 01/18/20333 | | | | | | | 2,305,000 | | | | 1,993,825 | | | | 0.67 | |
See accompanying notes to the financial statements.
82
ASHMORE EMERGING MARKETS CORPORATE INCOME FUND
SCHEDULE OF INVESTMENTS (CONTINUED)
As of April 30, 2020 (Unaudited)
| | | | | | | | | | | | | | | | |
| | | Currency1 | | Par | | | Value | | | % of Net Assets | |
Mexico (continued) | | | | | | | | | | | | | | | | |
Cemex S.A.B. de C.V., 5.450%, 11/19/2029 | | | | | | | 2,285,000 | | | $ | 1,885,125 | | | | 0.63 | |
Cometa Energia S.A. de C.V., 6.375%, 04/24/2035 | | | | | | | 1,458,250 | | | | 1,305,134 | | | | 0.44 | |
Grupo Posadas S.A.B. de C.V., 7.875%, 06/30/2022 | | | | | | | 1,035,000 | | | | 405,203 | | | | 0.14 | |
Industrias Penoles S.A.B. de C.V., 4.150%, 09/12/20292 | | | | | | | 800,000 | | | | 756,240 | | | | 0.25 | |
Minera Mexico S.A. de C.V., 4.500%, 01/26/2050 | | | | | | | 540,000 | | | | 464,670 | | | | 0.15 | |
Orbia Advance Corp. S.A.B. de C.V., 5.875%, 09/17/2044 | | | | | | | 680,000 | | | | 651,957 | | | | 0.22 | |
Orbia Advance Corp. S.A.B. de C.V., 5.500%, 01/15/2048 | | | | | | | 565,000 | | | | 524,749 | | | | 0.17 | |
Petroleos Mexicanos, 6.500%, 03/13/2027 | | | | | | | 1,755,000 | | | | 1,430,325 | | | | 0.48 | |
Petroleos Mexicanos, 6.750%, 09/21/2047 | | | | | | | 4,230,000 | | | | 2,908,125 | | | | 0.97 | |
Petroleos Mexicanos, 7.690%, 01/23/2050 | | | | | | | 3,525,000 | | | | 2,590,875 | | | | 0.87 | |
Petroleos Mexicanos, 6.950%, 01/28/2060 | | | | | | | 2,700,000 | | | | 1,890,027 | | | | 0.63 | |
Trust Fibra Uno, 5.250%, 12/15/2024 | | | | | | | 1,020,000 | | | | 962,625 | | | | 0.32 | |
Trust Fibra Uno, 6.390%, 01/15/2050 | | | | | | | 2,088,000 | | | | 1,860,951 | | | | 0.62 | |
| | | | | | | | | | | 26,107,059 | | | | 8.72 | |
| | | | |
Mongolia (Cost $3,708,808) | | | | | | | | | | | | | | | | |
Mongolian Mining Corp., 1.797%, 10/01/20208 | | | | | | | 3,390,888 | | | | 1,661,535 | | | | 0.55 | |
Mongolian Mining Corp./Energy Resources LLC, 9.250%, 04/15/2024 | | | | | | | 2,295,000 | | | | 1,366,549 | | | | 0.46 | |
| | | | | | | | | | | 3,028,084 | | | | 1.01 | |
| | | | |
Morocco (Cost $2,568,820) | | | | | | | | | | | | | | | | |
OCP S.A., 5.625%, 04/25/2024 | | | | | | | 625,000 | | | | 668,510 | | | | 0.22 | |
OCP S.A., 4.500%, 10/22/2025 | | | | | | | 1,180,000 | | | | 1,217,453 | | | | 0.41 | |
OCP S.A., 6.875%, 04/25/2044 | | | | | | | 510,000 | | | | 603,075 | | | | 0.20 | |
| | | | | | | | | | | 2,489,038 | | | | 0.83 | |
| | | | |
Niger (Cost $—) | | | | | | | | | | | | | | | | |
Savannah Petroleum PLC, 65.040%, 05/30/20217 | | | | | | | 348,642 | | | | — | | | | — | |
| | | | | | | | | | | — | | | | — | |
| | | | |
Panama (Cost $4,440,840) | | | | | | | | | | | | | | | | |
Banco General S.A., 4.125%, 08/07/2027 | | | | | | | 465,000 | | | | 458,030 | | | | 0.15 | |
Banistmo S.A., 3.650%, 09/19/2022 | | | | | | | 1,445,000 | | | | 1,398,052 | | | | 0.47 | |
C&W Senior Financing DAC, 6.875%, 09/15/2027 | | | | | | | 1,040,000 | | | | 1,027,000 | | | | 0.34 | |
Cable Onda S.A., 4.500%, 01/30/2030 | | | | | | | 1,315,000 | | | | 1,249,250 | | | | 0.42 | |
| | | | | | | | | | | 4,132,332 | | | | 1.38 | |
| | | | |
Peru (Cost $3,432,360) | | | | | | | | | | | | | | | | |
Banco Internacional del Peru S.A.A. Interbank, 3.250%, 10/04/2026 | | | | | | | 205,000 | | | | 195,777 | | | | 0.06 | |
Intercorp Financial Services, Inc., 4.125%, 10/19/2027 | | | | | | | 790,000 | | | | 742,600 | | | | 0.25 | |
Intercorp Peru Ltd., 3.875%, 08/15/2029 | | | | | | | 620,000 | | | | 555,272 | | | | 0.19 | |
Kallpa Generacion S.A., 4.875%, 05/24/2026 | | | | | | | 550,000 | | | | 559,625 | | | | 0.19 | |
Kallpa Generacion S.A., 4.125%, 08/16/2027 | | | | | | | 1,205,000 | | | | 1,180,912 | | | | 0.39 | |
| | | | | | | | | | | 3,234,186 | | | | 1.08 | |
See accompanying notes to the financial statements.
83
ASHMORE EMERGING MARKETS CORPORATE INCOME FUND
SCHEDULE OF INVESTMENTS (CONTINUED)
As of April 30, 2020 (Unaudited)
| | | | | | | | | | | | | | | | |
| | | Currency1 | | Par | | | Value | | | % of Net Assets | |
Poland (Cost $2,008,080) | | | | | | | | | | | | | | | | |
Walnut Bidco PLC, 9.125%, 08/01/2024 | | | | | | | 1,940,000 | | | $ | 1,628,591 | | | | 0.54 | |
| | | | | | | | | | | 1,628,591 | | | | 0.54 | |
| | | | |
Qatar (Cost $1,336,092) | | | | | | | | | | | | | | | | |
QNB Finance Ltd., (Floating, ICE LIBOR USD 3M + 1.350%), 2.988%, 05/31/2021 | | | | | | | 1,328,000 | | | | 1,321,453 | | | | 0.44 | |
| | | | | | | | | | | 1,321,453 | | | | 0.44 | |
| | | | |
Romania (Cost $1,378,663) | | | | | | | | | | | | | | | | |
NE Property B.V., 1.875%, 10/09/2026 | | | EUR | | | | 1,245,000 | | | | 1,118,671 | | | | 0.37 | |
| | | | | | | | | | | 1,118,671 | | | | 0.37 | |
| | | | |
Russian Federation (Cost $15,371,315) | | | | | | | | | | | | | | | | |
CEDC Finance Corp. International, Inc., 10.000%, 12/31/20225 | | | | | | | 5,052,696 | | | | 3,941,103 | | | | 1.32 | |
Credit Bank of Moscow Via CBOM Finance PLC, (Variable, USD Swap 5Y + 5.416%), 7.500%, 10/05/20273 | | | | | | | 6,225,000 | | | | 5,446,875 | | | | 1.82 | |
Severstal OAO Via Steel Capital S.A., 5.900%, 10/17/2022 | | | | | | | 380,000 | | | | 404,692 | | | | 0.13 | |
Sovcombank Via SovCom Capital DAC, (Variable, U.S. Treasury Yield Curve Rate CMT 5Y + 6.427%), 8.000%, 04/07/20303 | | | | | | | 3,290,000 | | | | 3,191,958 | | | | 1.07 | |
VEON Holdings B.V., 4.000%, 04/09/2025 | | | | | | | 890,000 | | | | 920,189 | | | | 0.31 | |
| | | | | | | | | | | 13,904,817 | | | | 4.65 | |
| | | | |
Saudi Arabia (Cost $6,177,827) | | | | | | | | | | | | | | | | |
Acwa Power Management And Investments One Ltd., 5.950%, 12/15/20392 | | | | | | | 1,710,000 | | | | 1,650,492 | | | | 0.55 | |
Samba Funding Ltd., 2.750%, 10/02/2024 | | | | | | | 1,185,000 | | | | 1,167,225 | | | | 0.39 | |
Saudi Arabian Oil Co., 4.250%, 04/16/2039 | | | | | | | 530,000 | | | | 546,135 | | | | 0.18 | |
Saudi Arabian Oil Co., 4.375%, 04/16/2049 | | | | | | | 1,170,000 | | | | 1,192,583 | | | | 0.40 | |
Saudi Electricity Global Sukuk Co. 2, 5.060%, 04/08/2043 | | | | | | | 203,000 | | | | 214,798 | | | | 0.07 | |
Saudi Electricity Global Sukuk Co. 3, 5.500%, 04/08/2044 | | | | | | | 910,000 | | | | 1,018,013 | | | | 0.34 | |
| | | | | | | | | | | 5,789,246 | | | | 1.93 | |
| | | | |
Singapore (Cost $2,334,989) | | | | | | | | | | | | | | | | |
DBS Group Holdings Ltd., (Variable, U.S. Treasury Yield Curve Rate CMT 5Y + 1.915%), 3.300%, 02/27/20253 | | | | | | | 1,000,000 | | | | 925,250 | | | | 0.31 | |
GLP Pte. Ltd., 3.875%, 06/04/2025 | | | | | | | 405,000 | | | | 375,360 | | | | 0.12 | |
Puma International Financing S.A., 5.000%, 01/24/2026 | | | | | | | 949,000 | | | | 598,965 | | | | 0.20 | |
United Overseas Bank Ltd., (Variable, USD Swap 5Y + 1.794%), 3.875%, 10/19/20233 | | | | | | | 465,000 | | | | 448,147 | | | | 0.15 | |
| | | | | | | | | | | 2,347,722 | | | | 0.78 | |
| | | | |
South Africa (Cost $4,733,656) | | | | | | | | | | | | | | | | |
Gold Fields Orogen Holdings BVI Ltd., 5.125%, 05/15/2024 | | | | | | | 695,000 | | | | 709,804 | | | | 0.24 | |
Gold Fields Orogen Holdings BVI Ltd., 6.125%, 05/15/2029 | | | | | | | 1,355,000 | | | | 1,429,864 | | | | 0.48 | |
Liquid Telecommunications Financing PLC, 8.500%, 07/13/2022 | | | | | | | 2,175,000 | | | | 1,845,487 | | | | 0.61 | |
Prosus N.V., 3.680%, 01/21/2030 | | | | | | | 300,000 | | | | 300,255 | | | | 0.10 | |
| | | | | | | | | | | 4,285,410 | | | | 1.43 | |
See accompanying notes to the financial statements.
84
ASHMORE EMERGING MARKETS CORPORATE INCOME FUND
SCHEDULE OF INVESTMENTS (CONTINUED)
As of April 30, 2020 (Unaudited)
| | | | | | | | | | | | | | | | |
| | | Currency1 | | Par | | | Value | | | % of Net Assets | |
South Korea (Cost $405,032) | | | | | | | | | | | | | | | | |
Shinhan Financial Group Co. Ltd., 3.340%, 02/05/2030 | | | | | | | 400,000 | | | $ | 403,506 | | | | 0.14 | |
| | | | | | | | | | | 403,506 | | | | 0.14 | |
| | | | |
Tanzania (Cost $1,108,069) | | | | | | | | | | | | | | | | |
HTA Group Ltd., 9.125%, 03/08/2022 | | | | | | | 1,095,000 | | | | 1,077,480 | | | | 0.36 | |
| | | | | | | | | | | 1,077,480 | | | | 0.36 | |
| | | | |
Thailand (Cost $2,569,663) | | | | | | | | | | | | | | | | |
Bangkok Bank PCL, 9.025%, 03/15/2029 | | | | | | | 605,000 | | | | 766,496 | | | | 0.26 | |
Bangkok Bank PCL, (Variable, U.S. Treasury Yield Curve Rate CMT 5Y + 1.900%), 3.733%, 09/25/20343 | | | | | | | 745,000 | | | | 664,019 | | | | 0.22 | |
Thaioil Treasury Center Co. Ltd., 3.500%, 10/17/2049 | | | | | | | 1,050,000 | | | | 883,512 | | | | 0.29 | |
| | | | | | | | | | | 2,314,027 | | | | 0.77 | |
| | | | |
Turkey (Cost $6,941,710) | | | | | | | | | | | | | | | | |
Akbank T.A.S., (Variable, USD Swap 5Y + 5.026%), 7.200%, 03/16/20273 | | | | | | | 695,000 | | | | 632,450 | | | | 0.21 | |
Akbank T.A.S., (Variable, USD Swap 5Y + 4.029%), 6.797%, 04/27/20283 | | | | | | | 1,980,000 | | | | 1,676,268 | | | | 0.56 | |
Turkiye Garanti Bankasi A.S., (Variable, USD Swap 5Y + 4.220%), 6.125%, 05/24/20273 | | | | | | | 2,400,000 | | | | 2,039,376 | | | | 0.68 | |
Turkiye Is Bankasi A.S., (Variable, USD Swap 5Y + 5.117%), 7.000%, 06/29/20283 | | | | | | | 2,415,000 | | | | 2,076,900 | | | | 0.70 | |
| | | | | | | | | | | 6,424,994 | | | | 2.15 | |
| | | | |
Ukraine (Cost $16,952,457) | | | | | | | | | | | | | | | | |
DTEK Finance PLC, 10.750%, (100% Cash), 12/31/202410 | | | | | | | 6,384,568 | | | | 2,968,824 | | | | 0.99 | |
Metinvest B.V., 8.500%, 04/23/2026 | | | | | | | 3,482,000 | | | | 2,315,530 | | | | 0.78 | |
Metinvest B.V., 7.750%, 10/17/2029 | | | | | | | 3,000,000 | | | | 1,922,160 | | | | 0.64 | |
MHP Lux S.A., 6.250%, 09/19/2029 | | | | | | | 1,815,000 | | | | 1,524,891 | | | | 0.51 | |
VF Ukraine PAT via VFU Funding PLC, 6.200%, 02/11/2025 | | | | | | | 2,465,000 | | | | 2,268,293 | | | | 0.76 | |
| | | | | | | | | | | 10,999,698 | | | | 3.68 | |
| | | | |
United Arab Emirates (Cost $10,418,504) | | | | | | | | | | | | | | | | |
Abu Dhabi National Energy Co. PJSC, 6.500%, 10/27/2036 | | | | | | | 380,000 | | | | 460,750 | | | | 0.15 | |
Abu Dhabi National Energy Co. PJSC, 4.000%, 10/03/2049 | | | | | | | 870,000 | | | | 870,174 | | | | 0.29 | |
Aldar Sukuk No. 2 Ltd., 3.875%, 10/22/2029 | | | | | | | 660,000 | | | | 647,757 | | | | 0.22 | |
DP World Crescent Ltd., 3.750%, 01/30/2030 | | | | | | | 1,055,000 | | | | 929,012 | | | | 0.31 | |
DP World PLC, 6.850%, 07/02/2037 | | | | | | | 1,040,000 | | | | 1,124,500 | | | | 0.38 | |
EMG Sukuk Ltd., 4.564%, 06/18/2024 | | | | | | | 1,140,000 | | | | 1,108,764 | | | | 0.37 | |
First Abu Dhabi Bank PJSC, (Variable, USD Swap 5Y + 3.350%), 5.250%, 06/17/20203 | | | | | | | 2,775,000 | | | | 2,559,938 | | | | 0.85 | |
MAF Global Securities Ltd., 4.750%, 05/07/2024 | | | | | | | 700,000 | | | | 681,100 | | | | 0.23 | |
Tabreed Sukuk SPC Ltd., 5.500%, 10/31/2025 | | | | | | | 1,095,000 | | | | 1,148,370 | | | | 0.38 | |
| | | | | | | | | | | 9,530,365 | | | | 3.18 | |
| | | | |
Venezuela (Cost $8,318,882) | | | | | | | | | | | | | | | | |
Petroleos de Venezuela S.A., 8.500%, 10/27/2020 | | | | | | | 7,112,500 | | | | 906,844 | | | | 0.30 | |
See accompanying notes to the financial statements.
85
ASHMORE EMERGING MARKETS CORPORATE INCOME FUND
SCHEDULE OF INVESTMENTS (CONTINUED)
As of April 30, 2020 (Unaudited)
| | | | | | | | | | | | | | | | |
| | | Currency1 | | Par | | | Value | | | % of Net Assets | |
Venezuela (continued) | | | | | | | | | | | | | | | | |
Petroleos de Venezuela S.A., 9.750%, 05/17/20354 | | | | | | | 6,744,093 | | | $ | 252,903 | | | | 0.09 | |
| | | | | | | | | | | 1,159,747 | | | | 0.39 | |
| | | | |
Zambia (Cost $7,552,795) | | | | | | | | | | | | | | | | |
First Quantum Minerals Ltd., 7.250%, 04/01/2023 | | | | | | | 4,420,000 | | | | 4,011,592 | | | | 1.34 | |
First Quantum Minerals Ltd., 6.875%, 03/01/2026 | | | | | | | 3,505,000 | | | | 3,073,885 | | | | 1.03 | |
| | | | | | | | | | | 7,085,477 | | | | 2.37 | |
| | | | |
Total Debt Securities (Cost $337,916,791) | | | | | | | | | | | 264,790,712 | | | | 88.48 | |
| | | | |
Bank Loans | | | | | | | | | | | | | | | | |
| | | | |
Brazil (Cost $2,100,000) | | | | | | | | | | | | | | | | |
Samarco Mineracao S.A., 3.887%, 12/31/204911 | | | | | | | 3,000,000 | | | | 990,000 | | | | 0.33 | |
| | | | | | | | | | | 990,000 | | | | 0.33 | |
| | | | |
Czech Republic (Cost $362,933) | | | | | | | | | | | | | | | | |
New World Resources N.V., 8.500%, 10/07/20166,7 | | | EUR | | | | 549,096 | | | | — | | | | — | |
| | | | | | | | | | | — | | | | — | |
| | | | |
Ghana (Cost $3,000,000) | | | | | | | | | | | | | | | | |
Karpower International B.V., 10.380%, 11/16/202311 | | | | | | | 3,000,000 | | | | 2,940,000 | | | | 0.98 | |
| | | | | | | | | | | 2,940,000 | | | | 0.98 | |
| | | | |
United Arab Emirates (Cost $12,058,922) | | | | | | | | | | | | | | | | |
DP World Ltd., 4.250%, 09/30/202211 | | | | | | | 12,516,226 | | | | 11,389,766 | | | | 3.81 | |
DP World Ltd., 5.750%, 09/30/202211 | | | | | | | 422,832 | | | | 380,549 | | | | 0.13 | |
| | | | | | | | | | | 11,770,315 | | | | 3.94 | |
| | | | |
Total Bank Loans (Cost $17,521,855) | | | | | | | | | | | 15,700,315 | | | | 5.25 | |
| | | | |
| | | Currency1 | | Shares | | | Value | | | % of Net Assets | |
Equity Securities | | | | | | | | | | | | | | | | |
| | | | |
Czech Republic (Cost $1,093,253) | | | | | | | | | | | | | | | | |
New World Resources PLC, Class A*,7 | | | GBP | | | | 36,580,138 | | | $ | — | | | | — | |
| | | | | | | | — | | | — | |
| | | | |
Niger (Cost $877,496) | | | | | | | | | | | | | | | | |
Savannah Energy PLC* | | | GBP | | | | 2,258,852 | | | | 220,733 | | | | 0.07 | |
| | | | | | | | | | | 220,733 | | | | 0.07 | |
| | | | |
Russian Federation (Cost $655,356) | | | | | | | | | | | | | | | | |
Roust Corp.*,11 | | | | | | | 13,359 | | | | 48,093 | | | | 0.02 | |
See accompanying notes to the financial statements.
86
ASHMORE EMERGING MARKETS CORPORATE INCOME FUND
SCHEDULE OF INVESTMENTS (CONTINUED)
As of April 30, 2020 (Unaudited)
| | | | | | | | | | | | | | | | |
| | | Currency1 | | | Shares | | | Value | | | % of Net Assets | |
Russian Federation (continued) | | | | | | | | | | | | | | | | |
Roust Corp., Class C*,11 | | | | | | | 28,922 | | | $ | 104,119 | | | | 0.03 | |
| | | | | | | | | | | 152,212 | | | | 0.05 | |
| | | | |
Total Equity Securities (Cost $2,626,105) | | | | | | | | | | | 372,945 | | | | 0.12 | |
| | | | |
Total Investments (Total Cost $358,064,751) | | | | | | | | | | | 280,863,972 | | | | 93.85 | |
| | | | |
Other Assets Less Liabilities (See Statements of Assets and Liabilities for further detail) | | | | | | | | | | | 18,412,162 | | | | 6.15 | |
| | | | |
Net Assets | | | | | | | | | | $ | 299,276,134 | | | | 100.00 | |
| * | Non-income producing security. |
| 1 | Local currency is United States Dollars unless otherwise noted below. |
| 2 | All or a portion of security is held as collateral for reverse repurchase agreements. |
| 3 | Variable rate security. Security issued at a fixed coupon rate, which converts to a variable rate at a specified date. Rate shown is the rate in effect as of period end. |
| 4 | Issuer has defaulted on terms of debt obligation. |
| 5 | Securities exempt from registration under Rule 144A of the Securities Act of 1933. These securities may not be publicly traded without registration under the Securities Act of 1933. |
| 6 | Maturity has been extended under the terms of a plan of reorganization. |
| 7 | Security has been deemed worthless and is a Level 3 investment. |
| 8 | Zero coupon bond – interest rate reflects effective yield on the date of purchase. |
| 9 | Restricted security that has been deemed illiquid. At April 30, 2020 the value of these restricted illiquid securities amount to $0 or 0% of net assets. Additional information on each restricted illiquid security is as follows: |
| | | | |
| SECURITY | | ACQUISITION DATE | | ACQUISITION COST |
| | |
New World Resources N.V., 16.423%, 10/07/2020 | | 10/07/2014 | | $- |
| 10 | Security is apayment-in-kind bond, and unless otherwise noted in the description of the security, pays its entire coupon on anin-kind basis. |
| 11 | Security is a Level 3 investment. |
Percentages shown are based on net assets.
At April 30, 2020, the Ashmore Emerging Markets Corporate Income Fund had outstanding forward foreign currency exchange contracts as follows:
| | | | | | | | | | | | | | | | | | |
Settlement Date | | Counterparty | | Currency Buy | | Currency Buy Amount (Local
Currency) | | Currency Sell | | Currency Sell Amount (Local
Currency) | | | Unrealized
Gain/(Loss) |
| | | | | | |
05/20/2020 | | Merrill Lynch | | Euro | | | 581,828 | | | United States Dollar | | | 631,287 | | | $ | 6,561 | |
| | | | | | | | | | | | | | | | | | |
| | | | | | |
Subtotal Appreciation | | | | | | | | | | | | | | | | | 6,561 | |
| | | | | | | | | | | | | | | | | | |
| | | | | | |
05/20/2020 | | HSBC Bank | | United States Dollar | | | 1,732,975 | | | Euro | | | 1,592,552 | | | | (12,913 | ) |
| | | | | | | | | | | | | | | | | | |
| | | | | | |
Subtotal Depreciation | | | | | | | | | | | | | | | | | (12,913 | ) |
| | | | | | | | | | | | | | | | | | |
| | | | | | |
Total | | | | | | | | | | | | | | | | $ | (6,352 | ) |
| | | | | | | | | | | | | | | | | | |
See accompanying notes to the financial statements.
87
ASHMORE EMERGING MARKETS CORPORATE INCOME FUND
SCHEDULE OF INVESTMENTS (CONTINUED)
As of April 30, 2020 (Unaudited)
The inputs or methodologies used for valuing securities are not necessarily an indication of the risks associated with investing in those securities and other financial instruments, if any. See note 4 in the Notes to the Financial Statements for more information regarding pricing inputs and valuation techniques. The following is a summary of the inputs used in valuing the Ashmore Emerging Markets Corporate Income Fund’s investments and other financial instruments, which are carried at fair value, as of April 30, 2020:
| | | | | | | | | | | | | | | | |
| | | Level 1 | | | Level 2 | | | Level 3 | | | Total | |
Investments | | | | | | | | | | | | | | | | |
Assets: | | | | | | | | | | | | | | | | |
Debt Securities | | | | | | | | | | | | | | | | |
Corporate Bonds | | | $— | | | | $245,899,854 | | | | $ — | | | | $245,899,854 | |
| | | | | | | | | | | | | | | | |
Corporate Convertible Bonds | | | — | | | | 6,797,431 | | | | — | | | | 6,797,431 | |
Financial Certificates | | | — | | | | 5,066,714 | | | | — | | | | 5,066,714 | |
Government Agencies | | | — | | | | 7,026,713 | | | | — | | | | 7,026,713 | |
| | | | | | | | | | | | | | | | |
Total Debt Securities | | | — | | | | 264,790,712 | | | | — | | | | 264,790,712 | |
Bank Loans | | | | | | | | | | | | | | | | |
Brazil | | | — | | | | — | | | | 990,000 | | | | 990,000 | |
Ghana | | | — | | | | — | | | | 2,940,000 | | | | 2,940,000 | |
United Arab Emirates | | | — | | | | — | | | | 11,770,315 | | | | 11,770,315 | |
| | | | | | | | | | | | | | | | |
Total Bank Loans | | | — | | | | — | | | | 15,700,315 | | | | 15,700,315 | |
Equity Securities | | | | | | | | | | | | | | | | |
Common Stock | | | | | | | | | | | | | | | | |
Niger | | | — | | | | 220,733 | | | | — | | | | 220,733 | |
Russian Federation | | | — | | | | — | | | | 152,212 | | | | 152,212 | |
| | | | | | | | | | | | | | | | |
Total Common Stock | | | — | | | | 220,733 | | | | 152,212 | | | | 372,945 | |
| |
Total Investments | | | $— | | | | $265,011,445 | | | | $15,852,527 | | | | $280,863,972 | |
| |
| | | | |
Other Financial Instruments | | | | | | | | | | | | | | | | |
Assets: | | | | | | | | | | | | | | | | |
Forward Foreign Currency Exchange Contracts | | | $— | | | | $ 6,561 | | | | $— | | | | $ 6,561 | |
Liabilities: | | | | | | | | | | | | | | | | |
Forward Foreign Currency Exchange Contracts | | | — | | | | (12,913 | ) | | | — | | | | (12,913 | ) |
| |
Total Other Financial Instruments | | | $— | | | | $ (6,352 | ) | | | $— | | | | $ (6,352 | ) |
| |
See accompanying notes to the financial statements.
88
ASHMORE EMERGING MARKETS CORPORATE INCOME FUND
SCHEDULE OF INVESTMENTS (CONTINUED)
As of April 30, 2020 (Unaudited)
The following is a reconciliation of investments in which significant unobservable inputs (Level 3) were used for the Fund during the period ending April 30, 2020:
| | | | | | | | | | | | | | | | | | | | | | | | | | | | | | | | | | | | | | | | | | | | | | | | | | |
Category and
Subcategory | | Beginning
Balance at 10/31/2019 | | Accrued Discounts
(Premiums) | | Purchases | | Sales | | Realized
Gains
(Losses) | | Change in Unrealized
Appreciation (Depreciation) | | Transfer into
Level 3 | | Transfer out of
Level 3 | | Ending
Balance at 04/30/2020 | | Change in
Unrealized
Appreciation
(Depreciation)
from Investments
still held
04/30/2020 |
| | | | | | | | | | |
Investments, at value | | | | | | | | | | | | | | | | | | | | | | | | | | | | | | | | | | | | | | | | | | | | | | | | | | |
Bank Loans | | | | | | | | | | | | | | | | | | | | | | | | | | | | | | | | | | | | | | | | | | | | | | | | | | |
Brazil | | | $ | 1,980,000 | | | | $ | — | | | | $ | — | | | | $ | — | | | | $ | — | | | | $ | (990,000 | ) | | | $ | — | | | | $ | — | | | | $ | 990,000 | | | | $ | (990,000 | ) |
Ghana | | | | 3,007,500 | | | | | — | | | | | — | | | | | — | | | | | — | | | | | (67,500 | ) | | | | — | | | | | — | | | | | 2,940,000 | | | | | (67,500 | ) |
Malaysia | | | | 1,118,410 | | | | | 2,179 | | | | | — | | | | | (1,158,973 | ) | | | | 38,817 | | | | | (433 | ) | | | | — | | | | | — | | | | | — | | | | | — | |
Nigeria | | | | 542,727 | | | | | (23,413 | ) | | | | — | | | | | (988,772 | ) | | | | (23,413 | ) | | | | 492,871 | | | | | — | | | | | — | | | | | — | | | | | — | |
United Arab Emirates | | | | 11,820,491 | | | | | 150,926 | | | | | 119,299 | | | | | (28,600 | ) | | | | 2,275 | | | | | (294,076 | ) | | | | — | | | | | — | | | | | 11,770,315 | | | | | (294,076 | ) |
Common stock | | | | | | | | | | | | | | | | | | | | | | | | | | | | | | | | | | | | | | | | | | | | | | | | | | |
Russian Federation | | | | 126,843 | | | | | — | | | | | — | | | | | — | | | | | — | | | | | 25,369 | | | | | — | | | | | — | | | | | 152,212 | | | | | 25,369 | |
| | | | | | | | | | | |
Total | | | $ | 18,595,971 | | | | $ | 129,692 | | | | $ | 119,299 | | | | $ | (2,176,345 | ) | | | $ | 17,679 | | | | $ | (833,769 | ) | | | $ | — | | | | $ | — | | | | $ | 15,852,527 | | | | $ | (1,326,207 | ) |
The following table on “Quantitative information about Level 3 Fair Value measurements” provides information on the valuation techniques and inputs used to value Level 3 securities at April 30, 2020:
| | | | | | | | | | | | |
| Quantitative Information about Level 3 Fair Value Measurements | |
| | | |
| | | Fair Value at
04/30/2020 | | | Valuation
Technique | | | Unobservable Input | |
| | | |
Bank Loans | | $ | 15,700,315 | | | | Broker Quote | | | | Inputs to broker model | |
| | | |
Common Stock | | | 152,212 | | | | Broker Quote | | | | Inputs to broker model | |
| | | |
Total | | $ | 15,852,527 | | | | | | | | | |
See accompanying notes to the financial statements.
89
ASHMORE EMERGING MARKETS CORPORATE INCOME FUND
SCHEDULE OF INVESTMENTS (CONTINUED)
As of April 30, 2020 (Unaudited)
The following is a summary of the fair values of the Fund’s derivative instruments*:
Fair Values of Financial Derivative Instruments on the Statements of Assets and Liabilities as of April 30, 2020:
| | | | |
| | | Derivatives Not Accounted for as
Hedging Instruments | |
| | | Foreign Exchange Risk | |
| |
Assets: | | | | |
Unrealized Appreciation on Forward Foreign Currency Exchange Contracts | | | $ 6,561 | |
| | | | |
| |
Liabilities: | | | | |
Unrealized Depreciation on Forward Foreign Currency Exchange Contracts | | | $(12,913 | ) |
| | | | |
The Effect of Financial Derivative Instruments on the Statements of Operations for the Six Months Ended April 30, 2020:
| | | | |
| | | Derivatives Not Accounted for as
Hedging Instruments | |
| | | Foreign Exchange Risk | |
| |
Realized Gain (Loss) on Derivatives Recognized resulting from Operations: | | | | |
Net Realized Gain on Forward Foreign Currency Exchange Contracts | | | $60,304 | |
| | | | |
| |
Net Change in Unrealized Appreciation (Depreciation) on Derivatives Recognized resulting from Operations: | | | | |
Net Change in Unrealized Depreciation on Forward Foreign Currency Exchange Contracts | | | $(6,352 | ) |
| | | | |
* See note 10 in the Notes to the Financial Statements for additional information.
See accompanying notes to the financial statements.
90
ASHMORE EMERGING MARKETS SHORT DURATION FUND
SCHEDULE OF INVESTMENTS
As of April 30, 2020 (Unaudited)
| | | | | | | | | | | | | | | | |
| | | Currency1 | | | Par | | | Value | | | % of Net
Assets | |
Debt Securities | | | | | | | | | | | | | | | | |
| | | | |
Argentina (Cost $176,329,067) | | | | | | | | | | | | | | | | |
Argentina (Rep of), 6.875%, 04/22/2021 | | | | | | | 126,557,000 | | | $ | 36,132,023 | | | | 6.96 | |
Argentina (Rep of), 5.625%, 01/26/2022 | | | | | | | 44,404,000 | | | | 12,322,110 | | | | 2.37 | |
Empresa Distribuidora Y Comercializadora Norte, 9.750%, 10/25/2022 | | | | | | | 650,000 | | | | 371,319 | | | | 0.07 | |
Genneia S.A., 8.750%, 01/20/2022 | | | | | | | 3,855,000 | | | | 2,120,250 | | | | 0.41 | |
IRSA Propiedades Comerciales S.A., 8.750%, 03/23/2023 | | | | | | | 8,490,000 | | | | 4,287,535 | | | | 0.83 | |
Mastellone Hermanos S.A., 12.625%, 07/03/2021 | | | | | | | 1,720,000 | | | | 1,272,800 | | | | 0.25 | |
Pampa Energia S.A., 7.375%, 07/21/2023 | | | | | | | 4,250,000 | | | | 2,773,125 | | | | 0.53 | |
Pan American Energy LLC, 7.875%, 05/07/2021 | | | | | | | 1,586,667 | | | | 1,479,567 | | | | 0.29 | |
Telecom Argentina S.A., 6.500%, 06/15/2021 | | | | | | | 4,689,000 | | | | 4,243,592 | | | | 0.82 | |
YPF S.A., 8.500%, 03/23/2021 | | | | | | | 19,550,000 | | | | 12,267,820 | | | | 2.36 | |
YPF S.A., 8.750%, 04/04/2024 | | | | | | | 655,000 | | | | 349,606 | | | | 0.07 | |
| | | | | | | | | | | 77,619,747 | | | | 14.96 | |
| | | | |
Brazil (Cost $49,894,141) | | | | | | | | | | | | | | | | |
Banco do Brasil S.A., 5.875%, 01/26/2022 | | | | | | | 5,520,000 | | | | 5,595,955 | | | | 1.08 | |
CSN Resources S.A., 7.625%, 02/13/2023 | | | | | | | 19,000,000 | | | | 14,915,000 | | | | 2.88 | |
InterCement Financial Operations B.V., 5.750%, 07/17/2024 | | | | | | | 5,940,000 | | | | 2,497,176 | | | | 0.48 | |
JBS Investments GmbH, 6.250%, 02/05/2023 | | | | | | | 3,630,000 | | | | 3,598,274 | | | | 0.69 | |
MARB BondCo PLC, 7.000%, 03/15/2024 | | | | | | | 9,575,000 | | | | 9,359,562 | | | | 1.80 | |
Petrobras Global Finance B.V., 4.375%, 05/20/2023 | | | | | | | 655,000 | | | | 635,350 | | | | 0.12 | |
Petrobras Global Finance B.V., 6.250%, 03/17/2024 | | | | | | | 4,680,000 | | | | 4,744,584 | | | | 0.92 | |
| | | | | | | | | | | 41,345,901 | | | | 7.97 | |
| | | | |
China (Cost $106,239,683) | | | | | | | | | | | | | | | | |
Central China Real Estate Ltd., 7.250%, 04/24/2023 | | | | | | | 9,130,000 | | | | 8,563,272 | | | | 1.65 | |
Central China Real Estate Ltd., 7.900%, 11/07/2023 | | | | | | | 2,615,000 | | | | 2,459,071 | | | | 0.47 | |
China Evergrande Group, 8.250%, 03/23/2022 | | | | | | | 14,475,000 | | | | 12,738,897 | | | | 2.45 | |
China Evergrande Group, 9.500%, 04/11/2022 | | | | | | | 1,120,000 | | | | 1,003,799 | | | | 0.19 | |
China Evergrande Group, 11.500%, 01/22/2023 | | | | | | | 1,853,000 | | | | 1,653,969 | | | | 0.32 | |
China Evergrande Group, 10.000%, 04/11/2023 | | | | | | | 10,205,000 | | | | 8,725,275 | | | | 1.68 | |
China Hongqiao Group Ltd., 7.125%, 07/22/2022 | | | | | | | 1,600,000 | | | | 1,328,000 | | | | 0.26 | |
Fantasia Holdings Group Co. Ltd., 12.250%, 10/18/2022 | | | | | | | 1,900,000 | | | | 1,862,406 | | | | 0.36 | |
GCL New Energy Holdings Ltd., 7.100%, 01/30/2021 | | | | | | | 12,500,000 | | | | 4,676,405 | | | | 0.90 | |
Kaisa Group Holdings Ltd., 11.250%, 04/09/2022 | | | | | | | 2,660,000 | | | | 2,620,100 | | | | 0.51 | |
Kaisa Group Holdings Ltd., 8.500%, 06/30/2022 | | | | | | | 7,678,000 | | | | 7,112,549 | | | | 1.37 | |
Kaisa Group Holdings Ltd., 11.950%, 10/22/2022 | | | | | | | 4,360,000 | | | | 4,245,550 | | | | 0.82 | |
Kaisa Group Holdings Ltd., 11.500%, 01/30/2023 | | | | | | | 9,590,000 | | | | 9,159,815 | | | | 1.77 | |
Kaisa Group Holdings Ltd., 10.875%, 07/23/2023 | | | | | | | 3,930,000 | | | | 3,669,647 | | | | 0.71 | |
Prime Bloom Holdings Ltd., 6.950%, 07/05/2022 | | | | | | | 6,470,000 | | | | 2,717,400 | | | | 0.52 | |
Ronshine China Holdings Ltd., 8.750%, 10/25/2022 | | | | | | | 3,075,000 | | | | 3,063,469 | | | | 0.59 | |
Scenery Journey Ltd., 11.000%, 11/06/2020 | | | | | | | 4,172,000 | | | | 4,173,007 | | | | 0.80 | |
Tunghsu Venus Holdings Ltd., 7.000%, 06/12/2020 | | | | | | | 2,640,000 | | | | 928,963 | | | | 0.18 | |
Yuzhou Properties Co. Ltd., 6.000%, 10/25/2023 | | | | | | | 4,735,000 | | | | 4,172,719 | | | | 0.80 | |
See accompanying notes to the financial statements.
91
ASHMORE EMERGING MARKETS SHORT DURATION FUND
SCHEDULE OF INVESTMENTS (CONTINUED)
As of April 30, 2020 (Unaudited)
| | | | | | | | | | | | | | | | |
| | | Currency1 | | Par | | | Value | | | % of Net Assets | |
China (continued) | | | | | | | | | | | | | | | | |
Zhenro Properties Group Ltd., 8.700%, 08/03/2022 | | | | | | | 4,000,000 | | | $ | 3,932,590 | | | | 0.76 | |
Zhenro Properties Group Ltd., 9.150%, 05/06/2023 | | | | | | | 2,385,000 | | | | 2,344,853 | | | | 0.45 | |
| | | | | | | | | | | 91,151,756 | | | | 17.56 | |
| | | | |
Colombia (Cost $4,935,247) | | | | | | | | | | | | | | | | |
Frontera Energy Corp., 9.700%, 06/25/2023 | | | | | | | 4,680,000 | | | | 3,205,800 | | | | 0.62 | |
| | | | | | | | | | | 3,205,800 | | | | 0.62 | |
| | | | |
Ecuador (Cost $182,069,691) | | | | | | | | | | | | | | | | |
Ecuador (Rep of), 10.750%, 03/28/2022 | | | | | | | 88,667,000 | | | | 28,041,826 | | | | 5.40 | |
Ecuador (Rep of), 8.750%, 06/02/2023 | | | | | | | 40,585,000 | | | | 12,581,350 | | | | 2.42 | |
Ecuador (Rep of), 7.950%, 06/20/2024 | | | | | | | 32,467,000 | | | | 10,105,678 | | | | 1.95 | |
Petroamazonas EP, 4.625%, 11/06/2020 | | | | | | | 15,052,243 | | | | 6,773,510 | | | | 1.31 | |
| | | | | | | | | | | 57,502,364 | | | | 11.08 | |
| | | | |
Egypt (Cost $3,122,423) | | | | | | | | | | | | | | | | |
ADES International Holding PLC, 8.625%, 04/24/2024 | | | | | | | 3,005,000 | | | | 2,284,401 | | | | 0.44 | |
| | | | | | | | | | | 2,284,401 | | | | 0.44 | |
| | | | |
India (Cost $1,068,219) | | | | | | | | | | | | | | | | |
Greenko Dutch B.V., 4.875%, 07/24/2022 | | | | | | | 1,100,000 | | | | 1,011,582 | | | | 0.19 | |
| | | | | | | | | | | 1,011,582 | | | | 0.19 | |
| | | | |
Indonesia (Cost $118,998) | | | | | | | | | | | | | | | | |
Eterna Capital Pte. Ltd., 7.500%, (100% Cash), 12/11/20222 | | | | | | | 148,310 | | | | 115,216 | | | | 0.02 | |
| | | | | | | | | | | 115,216 | | | | 0.02 | |
| | | | |
Iraq (Cost $17,635,434) | | | | | | | | | | | | | | | | |
DNO A.S.A., 8.750%, 05/31/20233 | | | | | | | 11,600,000 | | | | 7,424,000 | | | | 1.43 | |
DNO A.S.A., 8.375%, 05/29/20243 | | | | | | | 2,995,000 | | | | 1,886,850 | | | | 0.37 | |
Oilflow SPV 1 DAC, 12.000%, 01/13/2022 | | | | | | | 2,686,250 | | | | 1,933,998 | | | | 0.37 | |
| | | | | | | | | | | 11,244,848 | | | | 2.17 | |
| | | | |
Jamaica (Cost $18,831,338) | | | | | | | | | | | | | | | | |
Digicel Group One Ltd., 8.250%, 12/30/2022 | | | | | | | 7,000,000 | | | | 4,130,000 | | | | 0.80 | |
Digicel Group Two Ltd., 8.250%, 09/30/2022 | | | | | | | 1,991,000 | | | | 59,730 | | | | 0.01 | |
Digicel Ltd., 6.000%, 04/15/2021 | | | | | | | 12,990,000 | | | | 7,794,130 | | | | 1.50 | |
| | | | | | | | | | | 11,983,860 | | | | 2.31 | |
| | | | |
Kazakhstan (Cost $6,297,886) | | | | | | | | | | | | | | | | |
Halyk Savings Bank of Kazakhstan JSC, 5.500%, 12/21/2022 | | | | | | | 6,286,524 | | | | 6,128,041 | | | | 1.18 | |
| | | | | | | | | | | 6,128,041 | | | | 1.18 | |
| | | | |
Lebanon (Cost $152,417,841) | | | | | | | | | | | | | | | | |
Lebanon (Rep of), 6.375%, 03/09/20204,5 | | | | | | | 43,712,000 | | | | 6,884,640 | | | | 1.33 | |
Lebanon (Rep of), 5.800%, 04/14/20204,5 | | | | | | | 29,248,000 | | | | 4,606,560 | | | | 0.89 | |
Lebanon (Rep of), 6.150%, 06/19/20204 | | | | | | | 19,996,000 | | | | 3,149,370 | | | | 0.61 | |
Lebanon (Rep of), 8.250%, 04/12/20214 | | | | | | | 59,195,000 | | | | 9,323,213 | | | | 1.79 | |
See accompanying notes to the financial statements.
92
ASHMORE EMERGING MARKETS SHORT DURATION FUND
SCHEDULE OF INVESTMENTS (CONTINUED)
As of April 30, 2020 (Unaudited)
| | | | | | | | | | | | | | | | |
| | | Currency1 | | Par | | | Value | | | % of Net Assets | |
Lebanon (continued) | | | | | | | | | | | | | | | | |
Lebanon (Rep of), 6.100%, 10/04/20224 | | | | | | | 12,566,000 | | | $ | 1,979,145 | | | | 0.38 | |
| | | | | | | | | | | 25,942,928 | | | | 5.00 | |
| | | | |
Mexico (Cost $3,576,826) | | | | | | | | | | | | | | | | |
BBVA Bancomer S.A., 6.500%, 03/10/2021 | | | | | | | 841,000 | | | | 855,726 | | | | 0.17 | |
Grupo Posadas S.A.B. de C.V., 7.875%, 06/30/2022 | | | | | | | 2,805,000 | | | | 1,098,157 | | | | 0.21 | |
| | | | | | | | | | | 1,953,883 | | | | 0.38 | |
| | | | |
Oman (Cost $2,034,742) | | | | | | | | | | | | | | | | |
Bank Muscat SAOG, 4.875%, 03/14/2023 | | | | | | | 1,200,000 | | | | 1,047,048 | | | | 0.20 | |
National Bank of Oman SAOG, 5.625%, 09/25/2023 | | | | | | | 750,000 | | | | 673,500 | | | | 0.13 | |
| | | | | | | | | | | 1,720,548 | | | | 0.33 | |
| | | | |
Peru (Cost $1,228,514) | | | | | | | | | | | | | | | | |
Ajecorp B.V., 6.500%, 05/14/2022 | | | | | | | 1,435,000 | | | | 1,252,038 | | | | 0.24 | |
| | | | | | | | | | | 1,252,038 | | | | 0.24 | |
| | | | |
Poland (Cost $3,037,001) | | | | | | | | | | | | | | | | |
Walnut Bidco PLC, 9.125%, 08/01/2024 | | | | | | | 2,945,000 | | | | 2,472,269 | | | | 0.48 | |
| | | | | | | | | | | 2,472,269 | | | | 0.48 | |
| | | | |
Russian Federation (Cost $1,551,598) | | | | | | | | | | | | | | | | |
Koks OAO Via Koks Finance DAC, 7.500%, 05/04/2022 | | | | | | | 1,500,000 | | | | 1,401,240 | | | | 0.27 | |
| | | | | | | | | | | 1,401,240 | | | | 0.27 | |
| | | | |
South Africa (Cost $12,537,283) | | | | | | | | | | | | | | | | |
Liquid Telecommunications Financing PLC, 8.500%, 07/13/2022 | | | | | | | 12,500,000 | | | | 10,606,250 | | | | 2.04 | |
| | | | | | | | | | | 10,606,250 | | | | 2.04 | |
| | | | |
Tanzania (Cost $844,222) | | | | | | | | | | | | | | | | |
HTA Group Ltd., 9.125%, 03/08/2022 | | | | | | | 830,000 | | | | 816,720 | | | | 0.16 | |
| | | | | | | | | | | 816,720 | | | | 0.16 | |
| | | | |
Turkey (Cost $11,348,319) | | | | | | | | | | | | | | | | |
Turkiye Is Bankasi A.S., 6.000%, 10/24/2022 | | | | | | | 6,140,000 | | | | 5,725,550 | | | | 1.10 | |
Yapi ve Kredi Bankasi A.S., 5.500%, 12/06/2022 | | | | | | | 5,610,000 | | | | 5,105,100 | | | | 0.99 | |
| | | | | | | | | | | 10,830,650 | | | | 2.09 | |
| | | | |
Ukraine (Cost $52,243,467) | | | | | | | | | | | | | | | | |
DTEK Finance PLC, 10.750%, (100% Cash), 12/31/20242 | | | | | | | 10,296,000 | | | | 4,787,640 | | | | 0.92 | |
Metinvest B.V., 7.500%, 12/31/2021 | | | | | | | 5,017,278 | | | | 4,560,947 | | | | 0.88 | |
Metinvest B.V., 7.500%, (100% Cash), 12/31/20212 | | | | | | | 158,403 | | | | 143,996 | | | | 0.03 | |
Metinvest B.V., 7.750%, 04/23/2023 | | | | | | | 15,752,000 | | | | 11,010,648 | | | | 2.12 | |
MHP SE, 7.750%, 05/10/2024 | | | | | | | 3,770,000 | | | | 3,659,765 | | | | 0.70 | |
Ukraine (Rep of), 7.750%, 09/01/2022 | | | | | | | 15,884,000 | | | | 15,129,510 | | | | 2.92 | |
| | | | | | | | | | | 39,292,506 | | | | 7.57 | |
See accompanying notes to the financial statements.
93
ASHMORE EMERGING MARKETS SHORT DURATION FUND
SCHEDULE OF INVESTMENTS (CONTINUED)
As of April 30, 2020 (Unaudited)
| | | | | | | | | | | | | | | | |
| | | Currency1 | | Par | | | Value | | | % of Net Assets | |
Venezuela (Cost $32,680,072) | | | | | | | | | | | | | | | | |
Petroleos de Venezuela S.A., 8.500%, 10/27/2020 | | | | | | | 37,855,500 | | | $ | 4,826,576 | | | | 0.93 | |
| | | | | | | | | | | 4,826,576 | | | | 0.93 | |
| | | | |
Zambia (Cost $20,230,665) | | | | | | | | | | | | | | | | |
First Quantum Minerals Ltd., 7.250%, 04/01/20233 | | | | | | | 1,700,000 | | | | 1,542,920 | | | | 0.30 | |
First Quantum Minerals Ltd., 7.250%, 04/01/2023 | | | | | | | 9,045,000 | | | | 8,209,242 | | | | 1.58 | |
First Quantum Minerals Ltd., 6.500%, 03/01/2024 | | | | | | | 9,265,000 | | | | 8,164,318 | | | | 1.57 | |
| | | | | | | | | | | 17,916,480 | | | | 3.45 | |
| | | | |
Total Debt Securities (Cost $860,272,677) | | | | | | | | | | | 422,625,604 | | | | 81.44 | |
| | | | |
Bank Loans | | | | | | | | | | | | | | | | |
| | | | |
China (Cost $10,232,344) | | | | | | | | | | | | | | | | |
KWG Group Holdings Ltd., 4.649%, 05/06/20226 | | | | | | | 3,000,000 | | | | 2,760,000 | | | | 0.53 | |
Sunac China Holdings Ltd., 9.617%, 01/25/20216 | | | | | | | 3,600,000 | | | | 3,492,000 | | | | 0.67 | |
Sunac China Holdings Ltd., 8.394%, 04/30/20216 | | | | | | | 3,800,000 | | | | 3,610,000 | | | | 0.70 | |
| | | | | | | | | | | 9,862,000 | | | | 1.90 | |
| | | | |
Ukraine (Cost $5,225,628) | | | | | | | | | | | | | | | | |
Metinvest B.V., 5.361%, 10/24/20226 | | | | | | | 5,431,031 | | | | 4,887,928 | | | | 0.94 | |
| | | | | | | | | | | 4,887,928 | | | | 0.94 | |
| | | | |
United Arab Emirates (Cost $30,326,788) | | | | | | | | | | | | | | | | |
DP World Ltd., 4.750%, 09/30/20226 | | | | | | | 29,848,734 | | | | 27,162,348 | | | | 5.23 | |
DP World Ltd., 5.750%, 09/30/20226 | | | | | | | 2,116,831 | | | | 1,905,148 | | | | 0.37 | |
| | | | | | | | | | | 29,067,496 | | | | 5.60 | |
| | | | |
Total Bank Loans (Cost $45,784,760) | | | | | | | | | | | 43,817,424 | | | | 8.44 | |
| | | | |
Total Investments (Total Cost $906,057,437) | | | | | | | | | | | 466,443,028 | | | | 89.88 | |
Other Assets Less Liabilities (See Statements of Assets and Liabilities for further detail) | | | | | | | | | | | 52,534,790 | | | | 10.12 | |
| | | | |
Net Assets | | | | | | | | | | $ | 518,977,818 | | | | 100.00 | |
| 1 | Local currency is United States Dollars unless otherwise noted below. |
| 2 | Security is apayment-in-kind bond, and unless otherwise noted in the description of the security, pays its entire coupon on anin-kind basis. |
| 3 | Securities exempt from registration under Rule 144A of the Securities Act of 1933. These securities may not be publicly traded without registration under the Securities Act of 1933. |
| 4 | Issuer has defaulted on terms of debt obligation. |
| 5 | Maturity has been extended under the terms of a plan of reorganization. |
| 6 | Security is a Level 3 investment. |
Percentages shown are based on net assets.
See accompanying notes to the financial statements.
94
ASHMORE EMERGING MARKETS SHORT DURATION FUND
SCHEDULE OF INVESTMENTS (CONTINUED)
As of April 30, 2020 (Unaudited)
The inputs or methodologies used for valuing securities are not necessarily an indication of the risks associated with investing in those securities and other financial instruments, if any. See note 4 in the Notes to the Financial Statements for more information regarding pricing inputs and valuation techniques. The following is a summary of the inputs used in valuing the Ashmore Emerging Markets Short Duration Fund’s investments and other financial instruments, which are carried at fair value, as of April 30, 2020:
| | | | | | | | | | | | | | | | |
| | | Level 1 | | | Level 2 | | | Level 3 | | | Total | |
| | | | | | | | | | | | | | | | |
Investments | | | | | | | | | | | | | | | | |
Assets: | | | | | | | | | | | | | | | | |
Debt Securities | | | | | | | | | | | | | | | | |
Corporate Bonds | | | $— | | | | $282,370,179 | | | | $ — | | | | $282,370,179 | |
Government Bonds | | | — | | | | 140,255,425 | | | | — | | | | 140,255,425 | |
| | | | | | | | | | | | | | | | |
Total Debt Securities | | | — | | | | 422,625,604 | | | | — | | | | 422,625,604 | |
Bank Loans | | | | | | | | | | | | | | | | |
China | | | — | | | | — | | | | 9,862,000 | | | | 9,862,000 | |
Ukraine | | | — | | | | — | | | | 4,887,928 | | | | 4,887,928 | |
United Arab Emirates | | | — | | | | — | | | | 29,067,496 | | | | 29,067,496 | |
| | | | | | | | | | | | | | | | |
Total Bank Loans | | | — | | | | — | | | | 43,817,424 | | | | 43,817,424 | |
| |
Total Investments | | | $— | | | | $422,625,604 | | | | $43,817,424 | | | | $466,443,028 | |
| |
The following is a reconciliation of investments in which significant unobservable inputs (Level 3) were used for the Fund during the period ending April 30, 2020:
| | | | | | | | | | | | | | | | | | | | | | | | | | | | | | | | | | | | | | | | | | | | |
Category and Subcategory | | Beginning Balance at 10/31/2019 | | | Accrued Discounts (Premiums) | | | Purchases | | | Sales | | | Realized Gains (Losses) | | | Change in Unrealized Appreciation (Depreciation) | | | Transfer into Level 3 | | | Transfer out of Level 3 | | | Ending Balance at 04/30/2020 | | | Change in Unrealized Appreciation (Depreciation) from Investments still held 04/30/2020 | |
| |
| | | | | | | | |
Investments, at
value | | | | | | | | | | | | | | | | | | | | | | | | | | | | | | | | | |
Bank Loans | | | | | | | | | | | | | | | | | | | | | | | | | | | | | | | | | |
China | | | $10,105,730 | | | $ | 58,922 | | | | $ — | | | | $ — | | | $ | — | | | | $(302,652 | ) | | | $— | | | | $— | | | | $ 9,862,000 | | | | $(302,652 | ) | | | | |
Malaysia | | | 311,827 | | | | 439 | | | | — | | | | (323,137 | ) | | | 7,762 | | | | 3,109 | | | | — | | | | — | | | | — | | | | — | | | | | |
Ukraine | | | 5,563,835 | | | | 37,898 | | | | — | | | | (195,824 | ) | | | 7,496 | | | | (525,477 | ) | | | — | | | | — | | | | 4,887,928 | | | | (525,477 | ) | | | | |
United Arab Emirates | | | 43,709,541 | | | | 415,695 | | | | 9,015,762 | | | | (23,197,756 | ) | | | (841,538 | ) | | | (34,208 | ) | | | — | | | | — | | | | 29,067,496 | | | | (34,208 | ) | | | | |
| |
| | | | | | | | | | | |
Total | | | $59,690,933 | | | $ | 512,954 | | | | $9,015,762 | | | | $(23,716,717 | ) | | $ | (826,280 | ) | | | $(859,228 | ) | | | $— | | | | $— | | | | $43,817,424 | | | | $(862,337 | ) | | | | |
| |
The following table on “Quantitative information about Level 3 Fair Value measurements” provides information on the valuation techniques and inputs used to value Level 3 securities at April 30, 2020:
| | | | | | | | | | | | |
| Quantitative Information about Level 3 Fair Value Measurements | |
| | | |
| | | Fair Value at 04/30/2020 | | | Valuation Technique | | | Unobservable Input | |
Bank Loans | | $ | 43,817,424 | | | | Broker quote | | | | Inputs to broker model | |
Total | | $ | 43,817,424 | | | | | | | | | |
See accompanying notes to the financial statements.
95
ASHMORE EMERGING MARKETS ACTIVE EQUITY FUND
SCHEDULE OF INVESTMENTS
As of April 30, 2020 (Unaudited)
| | | | | | | | | | | | | | | | |
| | | Currency1 | | Shares | | | Value | | | % of Net
Assets | |
Common Stocks | | | | | | | | | | | | | | | | |
| | | | |
Brazil (Cost $2,533,452) | | | | | | | | | | | | | | | | |
CVC Brasil Operadora e Agencia de Viagens S.A.* | | | BRL | | | | 128,000 | | | $ | 324,831 | | | | 0.55 | |
Vale S.A. ADR* | | | | | | | 232,446 | | | | 1,917,680 | | | | 3.27 | |
| | | | | | | | | | | 2,242,511 | | | | 3.82 | |
| | | | |
China (Cost $21,345,314) | | | | | | | | | | | | | | | | |
Alibaba Group Holding Ltd.* | | | HKD | | | | 132,900 | | | | 3,367,829 | | | | 5.74 | |
Alibaba Group Holding Ltd. ADR* | | | | | | | 8,267 | | | | 1,675,473 | | | | 2.85 | |
Anhui Conch Cement Co. Ltd., Class H | | | HKD | | | | 277,500 | | | | 2,148,540 | | | | 3.66 | |
Baidu, Inc. ADR* | | | | | | | 12,776 | | | | 1,289,482 | | | | 2.20 | |
China Overseas Land & Investment Ltd. | | | HKD | | | | 606,363 | | | | 2,185,597 | | | | 3.72 | |
China Vanke Co. Ltd., Class H | | | HKD | | | | 429,700 | | | | 1,400,479 | | | | 2.38 | |
CITIC Securities Co. Ltd., Class H | | | HKD | | | | 750,500 | | | | 1,438,884 | | | | 2.45 | |
Huatai Securities Co. Ltd., Class H2 | | | HKD | | | | 356,400 | | | | 591,508 | | | | 1.01 | |
NetEase, Inc. ADR | | | | | | | 7,534 | | | | 2,598,929 | | | | 4.43 | |
Ping An Insurance Group Co. of China Ltd., Class H | | | HKD | | | | 85,500 | | | | 866,949 | | | | 1.48 | |
Prosus N.V.* | | | EUR | | | | 7,537 | | | | 572,103 | | | | 0.97 | |
Tencent Holdings Ltd. | | | HKD | | | | 83,300 | | | | 4,419,323 | | | | 7.53 | |
| | | | | | | | | | | 22,555,096 | | | | 38.42 | |
| | | | |
Hong Kong (Cost $2,112,757) | | | | | | | | | | | | | | | | |
AIA Group Ltd. | | | HKD | | | | 222,000 | | | | 2,020,744 | | | | 3.44 | |
| | | | | | | | | | | 2,020,744 | | | | 3.44 | |
| | | | |
India (Cost $4,943,433) | | | | | | | | | | | | | | | | |
HDFC Bank Ltd. ADR | | | | | | | 54,129 | | | | 2,346,492 | | | | 4.00 | |
ICICI Bank Ltd. ADR | | | | | | | 171,241 | | | | 1,671,313 | | | | 2.84 | |
Reliance Industries Ltd. | | | INR | | | | 14,767 | | | | 286,525 | | | | 0.49 | |
| | | | | | | | | | | 4,304,330 | | | | 7.33 | |
| | | | |
Indonesia (Cost $345,802) | | | | | | | | | | | | | | | | |
Bank Central Asia Tbk PT | | | IDR | | | | 153,800 | | | | 267,048 | | | | 0.45 | |
| | | | | | | | | | | 267,048 | | | | 0.45 | |
| | | | |
Mexico (Cost $3,076,497) | | | | | | | | | | | | | | | | |
Fomento Economico Mexicano S.A.B. de C.V. ADR | | | | | | | 4,778 | | | | 307,369 | | | | 0.52 | |
Grupo Financiero Banorte S.A.B. de C.V., Series O | | | MXN | | | | 224,400 | | | | 613,676 | | | | 1.05 | |
Grupo Mexico S.A.B. de C.V., Series B | | | MXN | | | | 673,300 | | | | 1,435,941 | | | | 2.45 | |
| | | | | | | | | | | 2,356,986 | | | | 4.02 | |
| | | | |
Peru (Cost $1,369,184) | | | | | | | | | | | | | | | | |
Southern Copper Corp. | | | | | | | 39,300 | | | | 1,274,892 | | | | 2.17 | |
| | | | | | | | | | | 1,274,892 | | | | 2.17 | |
| | | | |
Russian Federation (Cost $1,011,798) | | | | | | | | | | | | | | | | |
Sberbank of Russia PJSC ADR | | | | | | | 71,622 | | | | 764,264 | | | | 1.30 | |
| | | | | | | | | | | 764,264 | | | | 1.30 | |
See accompanying notes to the financial statements.
96
ASHMORE EMERGING MARKETS ACTIVE EQUITY FUND
SCHEDULE OF INVESTMENTS (CONTINUED)
As of April 30, 2020 (Unaudited)
| | | | | | | | | | | | | | | | |
| | | Currency1 | | Shares | | | Value | | | % of Net
Assets | |
South Korea (Cost $5,013,173) | | | | | | | | | | | | | | | | |
NCSoft Corp. | | | KRW | | | | 1,014 | | | $ | 531,612 | | | | 0.91 | |
Samsung Electronics Co. Ltd. | | | KRW | | | | 8,734 | | | | 359,903 | | | | 0.61 | |
Samsung Electronics Co. Ltd. GDR (Registered) | | | | | | | 1,419 | | | | 1,482,154 | | | | 2.53 | |
SK Hynix, Inc. | | | KRW | | | | 33,328 | | | | 2,267,930 | | | | 3.86 | |
| | | | | | | | | | | 4,641,599 | | | | 7.91 | |
| | | | |
Taiwan (Cost $6,779,338) | | | | | | | | | | | | | | | | |
Largan Precision Co. Ltd. | | | TWD | | | | 15,197 | | | | 2,076,039 | | | | 3.54 | |
MediaTek, Inc. | | | TWD | | | | 198,000 | | | | 2,707,121 | | | | 4.61 | |
Taiwan Semiconductor Manufacturing Co. Ltd. | | | TWD | | | | 183,021 | | | | 1,839,264 | | | | 3.13 | |
| | | | | | | | | | | 6,622,424 | | | | 11.28 | |
| | | | |
Total Common Stocks (Cost $48,530,748) | | | | | | | | | | | 47,049,894 | | | | 80.14 | |
| | | | |
Preferred Stocks | | | | | | | | | | | | | | | | |
| | | | |
Brazil (Cost $477,467) | | | | | | | | | | | | | | | | |
Petroleo Brasileiro S.A. ADR* | | | | | | | 47,557 | | | | 317,205 | | | | 0.54 | |
| | | | | | | | | | | 317,205 | | | | 0.54 | |
| | | | |
Colombia (Cost $857,447) | | | | | | | | | | | | | | | | |
Bancolombia S.A. ADR, 4.016%3 | | | | | | | 43,340 | | | | 1,131,174 | | | | 1.93 | |
| | | | | | | | | | | 1,131,174 | | | | 1.93 | |
| | | | |
South Korea (Cost $1,966,098) | | | | | | | | | | | | | | | | |
Samsung Electronics Co. Ltd., 3.439%3 | | | KRW | | | | 52,426 | | | | 1,825,825 | | | | 3.11 | |
| | | | | | | | | | | 1,825,825 | | | | 3.11 | |
| | | | |
Total Preferred Stocks (Cost $3,301,012) | | | | | | | | | | | 3,274,204 | | | | 5.58 | |
| | | | |
Total Investments (Total Cost $51,831,760) | | | | | | | | | | | 50,324,098 | | | | 85.72 | |
| | | | |
Other Assets Less Liabilities (See Statements of Assets and Liabilities for further detail) | | | | | | | | | | | 8,380,093 | | | | 14.28 | |
| | | | |
Net Assets | | | | | | | | | | $ | 58,704,191 | | | | 100.00 | |
| * | Non-income producing security. |
| 1 | Local currency is United States Dollars unless otherwise noted below. |
| 2 | Securities exempt from registration under Rule 144A of the Securities Act of 1933. These securities may not be publicly traded without registration under the Securities Act of 1933. |
| 3 | Current yield is disclosed. Dividends are calculated based on a percentage of the issuer’s net income. |
Percentages shown are based on net assets.
See accompanying notes to the financial statements.
97
ASHMORE EMERGING MARKETS ACTIVE EQUITY FUND
SCHEDULE OF INVESTMENTS (CONTINUED)
As of April 30, 2020 (Unaudited)
At April 30, 2020, the industry sectors for the Ashmore Emerging Markets Active Equity Fund were:
| | | | |
| Sector | | Percentage of Net Assets | |
Communication Services | | | 15.1% | |
Consumer Discretionary | | | 10.1 | |
Consumer Staples | | | 0.5 | |
Energy | | | 1.0 | |
Financials | | | 20.0 | |
Information Technology | | | 21.4 | |
Materials | | | 11.5 | |
Real Estate | | | 6.1 | |
Total Investments | | | 85.7 | |
Other Assets Less Liabilities | | | 14.3 | |
Net Assets | | | 100.0% | |
At April 30, 2020, the Ashmore Emerging Markets Active Equity Fund had outstanding forward foreign currency exchange contracts as follows:
| | | | | | | | | | | | | | | | | | | | | | | | | | | | |
Settlement Date | | Counterparty | | | Currency Buy | | | Currency Buy Amount (Local
Currency) | | | | | | Currency Sell | | | Currency Sell Amount (Local
Currency) | | | Unrealized Gain/(Loss) | |
| | | | | | | |
05/20/2020 | | | Credit Suisse | | | | United States Dollar | | | | 527,350 | | | | Euro | | | | | | | | 489,629 | | | | $(9,422) | |
| | | | | | | |
Total | | | | | | | | | | | | | | | | | | | | | | | | | | | $(9,422) | |
| | | | | | | | | | | | | | | | | | | | | | | | | | | | |
See accompanying notes to the financial statements.
98
ASHMORE EMERGING MARKETS ACTIVE EQUITY FUND
SCHEDULE OF INVESTMENTS (CONTINUED)
As of April 30, 2020 (Unaudited)
The inputs or methodologies used for valuing securities are not necessarily an indication of the risks associated with investing in those securities and other financial instruments, if any. See note 4 in the Notes to the Financial Statements for more information regarding pricing inputs and valuation techniques. The following is a summary of the inputs used in valuing the Ashmore Emerging Markets Active Equity Fund’s investments and other financial instruments, which are carried at fair value, as of April 30, 2020:
| | | | | | | | | | | | | | | | |
| | | Level 1 | | | Level 2 | | | Level 3 | | | Total | |
| | | | | | | | | | | | | | | | |
| | | | |
Investments | | | | | | | | | | | | | | | | |
Assets: | | | | | | | | | | | | | | | | |
Common Stocks | | | | | | | | | | | | | | | | |
Brazil | | | $ 2,242,511 | | | | $ — | | | | $— | | | | $ 2,242,511 | |
China | | | 5,563,884 | | | | 16,991,212 | | | | — | | | | 22,555,096 | |
Hong Kong | | | — | | | | 2,020,744 | | | | — | | | | 2,020,744 | |
India | | | 4,017,805 | | | | 286,525 | | | | — | | | | 4,304,330 | |
Indonesia | | | — | | | | 267,048 | | | | — | | | | 267,048 | |
Mexico | | | 2,356,986 | | | | — | | | | — | | | | 2,356,986 | |
Peru | | | 1,274,892 | | | | — | | | | — | | | | 1,274,892 | |
Russian Federation | | | — | | | | 764,264 | | | | — | | | | 764,264 | |
South Korea | | | — | | | | 4,641,599 | | | | — | | | | 4,641,599 | |
Taiwan | | | — | | | | 6,622,424 | | | | — | | | | 6,622,424 | |
| | | | | | | | | | | | | | | | |
Total Common Stocks | | | 15,456,078 | | | | 31,593,816 | | | | — | | | | 47,049,894 | |
Preferred Stocks | | | | | | | | | | | | | | | | |
Brazil | | | 317,205 | | | | — | | | | — | | | | 317,205 | |
Colombia | | | 1,131,174 | | | | — | | | | — | | | | 1,131,174 | |
South Korea | | | — | | | | 1,825,825 | | | | — | | | | 1,825,825 | |
| | | | | | | | | | | | | | | | |
Total Preferred Stocks | | | 1,448,379 | | | | 1,825,825 | | | | — | | | | 3,274,204 | |
| |
Total Investments | | | $16,904,457 | | | | $33,419,641 | | | | $— | | | | $50,324,098 | |
| |
| | | | |
Other Financial Instruments | | | | | | | | | | | | | | | | |
Liabilities: | | | | | | | | | | | | | | | | |
Forward Foreign Currency Exchange Contracts | | | $— | | | | $(9,422 | ) | | | $— | | | | $(9,422 | ) |
| |
Total Other Financial Instruments | | | $— | | | | $(9,422 | ) | | | $— | | | | $(9,422 | ) |
| |
See accompanying notes to the financial statements.
99
ASHMORE EMERGING MARKETS ACTIVE EQUITY FUND
SCHEDULE OF INVESTMENTS (CONTINUED)
As of April 30, 2020 (Unaudited)
The following is a summary of the fair values of the Fund’s derivative instruments*:
Fair Values of Financial Derivative Instruments on the Statements of Assets and Liabilities as of April 30, 2020:
| | | | |
| | | Derivatives Not Accounted for as
Hedging Instruments | |
| | | Foreign Exchange Risk | |
| |
Liabilities: | | | | |
Unrealized Depreciation on Forward Foreign Currency Exchange Contracts | | | $(9,422 | ) |
| | | | |
The Effect of Financial Derivative Instruments on the Statements of Operations for the Six Months Ended April 30, 2020:
| | | | |
| | | Derivatives Not Accounted for as
Hedging Instruments | |
| | | Foreign Exchange Risk | |
| |
Realized Gain (Loss) on Derivatives Recognized resulting from Operations: | | | | |
Net Realized Loss on Forward Foreign Currency Exchange Contracts | | | $(3,208 | ) |
| | | | |
| |
Net Change in Unrealized Appreciation (Depreciation) on Derivatives Recognized resulting from Operations: | | | | |
Net Change in Unrealized Depreciation on Forward Foreign Currency Exchange Contracts | | | $(4,746 | ) |
| | | | |
* See note 10 in the Notes to the Financial Statements for additional information.
See accompanying notes to the financial statements.
100
ASHMORE EMERGING MARKETS SMALL-CAP EQUITY FUND
SCHEDULE OF INVESTMENTS
As of April 30, 2020 (Unaudited)
| | | | | | | | | | | | | | | | |
| | | Currency1 | | Shares | | | Value | | | % of Net
Assets | |
Common Stocks | | | | | | | | | | | | | | | | |
| | | | |
Brazil (Cost $595,358) | | | | | | | | | | | | | | | | |
Arezzo Industria e Comercio S.A. | | | BRL | | | | 15,800 | | | $ | 123,485 | | | | 1.66 | |
Locaweb Servicos de Internet S.A.*,2 | | | BRL | | | | 46,300 | | | | 193,786 | | | | 2.61 | |
Sinqia S.A.* | | | BRL | | | | 54,400 | | | | 217,784 | | | | 2.93 | |
TOTVS S.A. | | | BRL | | | | 10,300 | | | | 112,037 | | | | 1.51 | |
| | | | | | | | | | | 647,092 | | | | 8.71 | |
| | | | |
China (Cost $1,004,253) | | | | | | | | | | | | | | | | |
58.com, Inc. ADR* | | | | | | | 2,323 | | | | 120,680 | | | | 1.62 | |
Fu Shou Yuan International Group Ltd. | | | HKD | | | | 104,000 | | | | 93,966 | | | | 1.26 | |
JNBY Design Ltd. | | | HKD | | | | 222,000 | | | | 215,083 | | | | 2.90 | |
Li Ning Co. Ltd. | | | HKD | | | | 67,000 | | | | 209,752 | | | | 2.82 | |
Xiabuxiabu Catering Management China Holdings Co. Ltd.*,2 | | | HKD | | | | 174,000 | | | | 159,440 | | | | 2.15 | |
Xinyi Solar Holdings Ltd. | | | HKD | | | | 186,000 | | | | 118,693 | | | | 1.60 | |
| | | | | | | | | | | 917,614 | | | | 12.35 | |
| | | | |
Hungary (Cost $76,160) | | | | | | | | | | | | | | | | |
Wizz Air Holdings PLC*,2 | | | GBP | | | | 2,793 | | | | 101,228 | | | | 1.36 | |
| | | | | | | | | | | 101,228 | | | | 1.36 | |
| | | | |
India (Cost $1,657,490) | | | | | | | | | | | | | | | | |
Bajaj Consumer Care Ltd.* | | | INR | | | | 105,453 | | | | 202,661 | | | | 2.73 | |
Eicher Motors Ltd. | | | INR | | | | 511 | | | | 99,705 | | | | 1.34 | |
Granules India Ltd. | | | INR | | | | 94,432 | | | | 200,785 | | | | 2.70 | |
IndiaMart InterMesh Ltd.2 | | | INR | | | | 5,351 | | | | 158,018 | | | | 2.13 | |
Info Edge India Ltd. | | | INR | | | | 3,377 | | | | 113,776 | | | | 1.53 | |
Larsen & Toubro Infotech Ltd.2 | | | INR | | | | 3,783 | | | | 79,004 | | | | 1.06 | |
Multi Commodity Exchange of India Ltd. | | | INR | | | | 22,529 | | | | 314,542 | | | | 4.24 | |
Quess Corp. Ltd.*,2 | | | INR | | | | 62,630 | | | | 171,832 | | | | 2.31 | |
V-Mart Retail Ltd. | | | INR | | | | 5,348 | | | | 121,787 | | | | 1.64 | |
| | | | | | | | | | | 1,462,110 | | | | 19.68 | |
| | | | |
Malaysia (Cost $443,252) | | | | | | | | | | | | | | | | |
My EG Services Bhd. | | | MYR | | | | 1,525,900 | | | | 447,310 | | | | 6.02 | |
| | | | | | | | | | | 447,310 | | | | 6.02 | |
| | | | |
Mexico (Cost $215,885) | | | | | | | | | | | | | | | | |
Grupo Aeroportuario del Centro Norte S.A.B. de C.V. ADR | | | | | | | 5,900 | | | | 171,336 | | | | 2.31 | |
| | | | | | | | | | | 171,336 | | | | 2.31 | |
| | | | |
Peru (Cost $237,097) | | | | | | | | | | | | | | | | |
Alicorp S.A.A. | | | PEN | | | | 70,886 | | | | 144,061 | | | | 1.94 | |
| | | | | | | | | | | 144,061 | | | | 1.94 | |
| | | | |
Russian Federation (Cost $562,031) | | | | | | | | | | | | | | | | |
HeadHunter Group PLC ADR | | | | | | | 18,682 | | | | 308,253 | | | | 4.15 | |
TCS Group Holding PLC (Registered) | | | | | | | 17,311 | | | | 240,912 | | | | 3.24 | |
| | | | | | | | | | | 549,165 | | | | 7.39 | |
See accompanying notes to the financial statements.
101
ASHMORE EMERGING MARKETS SMALL-CAP EQUITY FUND
SCHEDULE OF INVESTMENTS (CONTINUED)
As of April 30, 2020 (Unaudited)
| | | | | | | | | | | | | | | | |
| | | Currency1 | | Shares | | | Value | | | % of Net
Assets | |
South Korea (Cost $1,604,795) | | | | | | | | | | | | | | | | |
Dentium Co. Ltd.* | | | KRW | | | | 8,182 | | | $ | 249,403 | | | | 3.36 | |
Douzone Bizon Co. Ltd. | | | KRW | | | | 2,444 | | | | 179,676 | | | | 2.42 | |
Hansol Chemical Co. Ltd. | | | KRW | | | | 3,556 | | | | 248,389 | | | | 3.34 | |
Hugel, Inc.* | | | KRW | | | | 700 | | | | 221,332 | | | | 2.98 | |
KoMiCo Ltd. | | | KRW | | | | 15,204 | | | | 317,694 | | | | 4.27 | |
NICE Information Service Co. Ltd. | | | KRW | | | | 10,945 | | | | 156,879 | | | | 2.11 | |
SK Materials Co. Ltd. | | | KRW | | | | 645 | | | | 83,701 | | | | 1.13 | |
WONIK IPS Co. Ltd.* | | | KRW | | | | 4,323 | | | | 99,321 | | | | 1.34 | |
| | | | | | | | | | | 1,556,395 | | | | 20.95 | |
| | | | |
Taiwan (Cost $1,061,926) | | | | | | | | | | | | | | | | |
ASPEED Technology, Inc. | | | TWD | | | | 3,000 | | | | 118,623 | | | | 1.60 | |
Nien Made Enterprise Co. Ltd. | | | TWD | | | | 19,000 | | | | 143,627 | | | | 1.93 | |
Parade Technologies Ltd. | | | TWD | | | | 11,000 | | | | 270,360 | | | | 3.64 | |
Poya International Co. Ltd. | | | TWD | | | | 13,000 | | | | 217,388 | | | | 2.93 | |
Silergy Corp. | | | TWD | | | | 2,714 | | | | 107,887 | | | | 1.45 | |
Sinbon Electronics Co. Ltd. | | | TWD | | | | 32,000 | | | | 154,413 | | | | 2.08 | |
Sunonwealth Electric Machine Industry Co. Ltd. | | | TWD | | | | 131,000 | | | | 170,153 | | | | 2.29 | |
Taiwan Union Technology Corp. | | | TWD | | | | 30,000 | | | | 135,595 | | | | 1.82 | |
| | | | | | | | | | | 1,318,046 | | | | 17.74 | |
| | | | |
Total Common Stocks (Cost $7,458,247) | | | | | | | | | | | 7,314,357 | | | | 98.45 | |
| | | | |
Total Investments (Total Cost $7,458,247) | | | | | | | | | | | 7,314,357 | | | | 98.45 | |
| | | | |
Other Assets Less Liabilities (See Statements of Assets and Liabilities for further detail) | | | | | | | | | | | 115,024 | | | | 1.55 | |
| | | | |
Net Assets | | | | | | | | | | $ | 7,429,381 | | | | 100.00 | |
| * | Non-income producing security. |
| 1 | Local currency is United States Dollars unless otherwise noted below. |
| 2 | Securities exempt from registration under Rule 144A of the Securities Act of 1933. These securities may not be publicly traded without registration under the Securities Act of 1933. |
Percentages shown are based on net assets.
At April 30, 2020, the industry sectors for the Ashmore Emerging MarketsSmall-Cap Equity Fund were:
| | | | |
| Sector | | Percentage of Net Assets | |
| |
Communication Services | | | 3.2% | |
Consumer Discretionary | | | 18.6 | |
Consumer Staples | | | 4.7 | |
Financials | | | 7.5 | |
Health Care | | | 9.0 | |
Industrials | | | 16.7 | |
Information Technology | | | 34.3 | |
| |
See accompanying notes to the financial statements.
102
ASHMORE EMERGING MARKETS SMALL-CAP EQUITY FUND
SCHEDULE OF INVESTMENTS (CONTINUED)
As of April 30, 2020 (Unaudited)
| | | | |
Sector | | Percentage of Net Assets | |
| |
Materials | | | 4.5% | |
| |
Total Investments | | | 98.5 | |
Other Assets Less Liabilities | | | 1.5 | |
Net Assets | | | 100.0% | |
| |
The inputs or methodologies used for valuing securities are not necessarily an indication of the risks associated with investing in those securities and other financial instruments, if any. See note 4 in the Notes to the Financial Statements for more information regarding pricing inputs and valuation techniques. The following is a summary of the inputs used in valuing the Ashmore Emerging MarketsSmall-Cap Equity Fund’s investments and other financial instruments, which are carried at fair value, as of April 30, 2020:
| | | | | | | | | | | | | | | | |
| | | Level 1 | | | Level 2 | | | Level 3 | | | Total | |
Investments | | | | | | | | | | | | | | | | |
Assets: | | | | | | | | | | | | | | | | |
Common Stocks | | | | | | | | | | | | | | | | |
Brazil | | $ | 647,092 | | | $ | — | | | | $— | | | $ | 647,092 | |
China | | | 120,680 | | | | 796,934 | | | | — | | | | 917,614 | |
Hungary | | | — | | | | 101,228 | | | | — | | | | 101,228 | |
India | | | — | | | | 1,462,110 | | | | — | | | | 1,462,110 | |
Malaysia | | | — | | | | 447,310 | | | | — | | | | 447,310 | |
Mexico | | | 171,336 | | | | — | | | | — | | | | 171,336 | |
Peru | | | 144,061 | | | | — | | | | — | | | | 144,061 | |
Russian Federation | | | 308,253 | | | | 240,912 | | | | — | | | | 549,165 | |
South Korea | | | — | | | | 1,556,395 | | | | — | | | | 1,556,395 | |
Taiwan | | | — | | | | 1,318,046 | | | | — | | | | 1,318,046 | |
| | | | | | | | | | | | | | | | |
Total Common Stocks | | | 1,391,422 | | | | 5,922,935 | | | | — | | | | 7,314,357 | |
| |
Total Investments | | $ | 1,391,422 | | | $ | 5,922,935 | | | | $— | | | $ | 7,314,357 | |
| |
See accompanying notes to the financial statements.
103
ASHMORE EMERGING MARKETS FRONTIER EQUITY FUND
SCHEDULE OF INVESTMENTS
As of April 30, 2020 (Unaudited)
| | | | | | | | | | | | | | | | |
| | | Currency1 | | Shares | | | Value | | | % of Net
Assets | |
Common Stocks | | | | | | | | | | | | | | | | |
| | | | |
Argentina (Cost $1,077,763) | | | | | | | | | | | | | | | | |
Globant S.A.* | | | | | | | 10,200 | | | $ | 1,179,834 | | | | 2.17 | |
| | | | | | | | | | | 1,179,834 | | | | 2.17 | |
| | | | |
Bahrain (Cost $696,417) | | | | | | | | | | | | | | | | |
Ahli United Bank BSC | | | KWD | | | | 836,631 | | | | 530,262 | | | | 0.97 | |
| | | | | | | | | | | 530,262 | | | | 0.97 | |
| | | | |
Bangladesh (Cost $1,646,543) | | | | | | | | | | | | | | | | |
Square Pharmaceuticals Ltd. | | | BDT | | | | 540,239 | | | | 1,092,283 | | | | 2.01 | |
| | | | | | | | | | | 1,092,283 | | | | 2.01 | |
| | | | |
Egypt (Cost $5,625,231) | | | | | | | | | | | | | | | | |
ADES International Holding PLC*,2 | | | | | | | 92,323 | | | | 807,994 | | | | 1.49 | |
Arabian Food Industries Co. S.A.E. Domty | | | EGP | | | | 1,472,262 | | | | 551,514 | | | | 1.01 | |
Cleopatra Hospital* | | | EGP | | | | 3,844,637 | | | | 1,047,206 | | | | 1.92 | |
Commercial International Bank Egypt S.A.E. | | | EGP | | | | 494,068 | | | | 2,005,869 | | | | 3.69 | |
| | | | | | | | | | | 4,412,583 | | | | 8.11 | |
| | | | |
Georgia (Cost $792,807) | | | | | | | | | | | | | | | | |
Georgia Capital PLC* | | | GBP | | | | 45,810 | | | | 242,453 | | | | 0.45 | |
| | | | | | | | | | | 242,453 | | | | 0.45 | |
| | | | |
Kazakhstan (Cost $596,483) | | | | | | | | | | | | | | | | |
Halyk Savings Bank of Kazakhstan JSC GDR*,2 | | | | | | | 46,590 | | | | 419,310 | | | | 0.77 | |
Halyk Savings Bank of Kazakhstan JSC GDR (Registered) | | | | | | | 5,842 | | | | 52,632 | | | | 0.10 | |
| | | | | | | | | | | 471,942 | | | | 0.87 | |
| | | | |
Kenya (Cost $3,377,673) | | | | | | | | | | | | | | | | |
Equity Group Holdings PLC | | | KES | | | | 3,256,800 | | | | 1,143,346 | | | | 2.10 | |
Safaricom PLC | | | KES | | | | 8,548,400 | | | | 2,269,820 | | | | 4.17 | |
| | | | | | | | | | | 3,413,166 | | | | 6.27 | |
| | | | |
Kuwait (Cost $7,990,107) | | | | | | | | | | | | | | | | |
Humansoft Holding Co. K.S.C.* | | | KWD | | | | 72,929 | | | | 670,730 | | | | 1.23 | |
Mobile Telecommunications Co. K.S.C. | | | KWD | | | | 939,926 | | | | 1,608,666 | | | | 2.96 | |
National Bank of Kuwait S.A.K.P. | | | KWD | | | | 2,108,635 | | | | 5,040,495 | | | | 9.27 | |
| | | | | | | | | | | 7,319,891 | | | | 13.46 | |
| | | | |
Mauritius (Cost $1,266,740) | | | | | | | | | | | | | | | | |
MCB Group Ltd. | | | MUR | | | | 154,085 | | | | 782,750 | | | | 1.44 | |
| | | | | | | | | | | 782,750 | | | | 1.44 | |
| | | | |
Morocco (Cost $3,411,380) | | | | | | | | | | | | | | | | |
Attijariwafa Bank | | | MAD | | | | 15,902 | | | | 576,761 | | | | 1.06 | |
Maroc Telecom | | | MAD | | | | 105,158 | | | | 1,377,994 | | | | 2.53 | |
Vivo Energy PLC2 | | | GBP | | | | 789,644 | | | | 777,179 | | | | 1.43 | |
| | | | | | | | | | | 2,731,934 | | | | 5.02 | |
See accompanying notes to the financial statements.
104
ASHMORE EMERGING MARKETS FRONTIER EQUITY FUND
SCHEDULE OF INVESTMENTS (CONTINUED)
As of April 30, 2020 (Unaudited)
| | | | | | | | | | | | | | | | |
| | | Currency1 | | Shares | | | Value | | | % of Net
Assets | |
Nigeria (Cost $1,382,771) | | | | | | | | | | | | | | | | |
Guaranty Trust Bank PLC | | | NGN | | | | 11,516,345 | | | $ | 539,252 | | | | 0.99 | |
| | | | | | | | | | | 539,252 | | | | 0.99 | |
| | | | |
Pakistan (Cost $869,169) | | | | | | | | | | | | | | | | |
Honda Atlas Cars Pakistan Ltd. | | | PKR | | | | 422,100 | | | | 452,732 | | | | 0.83 | |
MCB Bank Ltd. | | | PKR | | | | 297,800 | | | | 303,552 | | | | 0.56 | |
| | | | | | | | | | | 756,284 | | | | 1.39 | |
| | | | |
Peru (Cost $4,829,592) | | | | | | | | | | | | | | | | |
Alicorp S.A.A. | | | PEN | | | | 151,478 | | | | 307,847 | | | | 0.57 | |
Credicorp Ltd. | | | | | | | 11,350 | | | | 1,691,377 | | | | 3.11 | |
Intercorp Financial Services, Inc. | | | | | | | 21,800 | | | | 548,052 | | | | 1.01 | |
Southern Copper Corp. | | | | | | | 39,300 | | | | 1,274,892 | | | | 2.34 | |
| | | | | | | | | | | 3,822,168 | | | | 7.03 | |
| | | | |
Philippines (Cost $7,010,611) | | | | | | | | | | | | | | | | |
BDO Unibank, Inc. | | | PHP | | | | 667,410 | | | | 1,325,504 | | | | 2.44 | |
International Container Terminal Services, Inc. | | | PHP | | | | 1,096,820 | | | | 1,936,908 | | | | 3.56 | |
SM Investments Corp. | | | PHP | | | | 45,540 | | | | 741,834 | | | | 1.36 | |
SM Prime Holdings, Inc. | | | PHP | | | | 2,692,400 | | | | 1,606,646 | | | | 2.95 | |
| | | | | | | | | | | 5,610,892 | | | | 10.31 | |
| | | | |
Qatar (Cost $4,614,746) | | | | | | | | | | | | | | | | |
Qatar Gas Transport Co. Ltd. | | | QAR | | | | 2,191,548 | | | | 1,498,921 | | | | 2.75 | |
Qatar National Bank QPSC | | | QAR | | | | 625,776 | | | | 2,953,741 | | | | 5.43 | |
| | | | | | | | | | | 4,452,662 | | | | 8.18 | |
| | | | |
Romania (Cost $1,144,573) | | | | | | | | | | | | | | | | |
Banca Transilvania S.A. | | | RON | | | | 1,156,572 | | | | 498,602 | | | | 0.92 | |
OMV Petrom S.A. | | | RON | | | | 5,864,703 | | | | 425,248 | | | | 0.78 | |
| | | | | | | | | | | 923,850 | | | | 1.70 | |
| | | | |
Saudi Arabia (Cost $884,767) | | | | | | | | | | | | | | | | |
Bupa Arabia for Cooperative Insurance Co. | | | SAR | | | | 38,534 | | | | 1,099,393 | | | | 2.02 | |
| | | | | | | | | | | 1,099,393 | | | | 2.02 | |
| | | | |
Senegal (Cost $690,069) | | | | | | | | | | | | | | | | |
Sonatel S.A. | | | XOF | | | | 17,670 | | | | 410,324 | | | | 0.75 | |
| | | | | | | | | | | 410,324 | | | | 0.75 | |
| | | | |
Slovenia (Cost $582,894) | | | | | | | | | | | | | | | | |
Nova Ljubljanska Banka dd GDR (Registered) | | | EUR | | | | 47,012 | | | | 376,010 | | | | 0.69 | |
| | | | | | | | | | | 376,010 | | | | 0.69 | |
| | | | |
United Arab Emirates (Cost $2,176,707) | | | | | | | | | | | | | | | | |
Emaar Properties PJSC* | | | AED | | | | 1,406,397 | | | | 1,033,946 | | | | 1.90 | |
Emirates NBD Bank PJSC | | | AED | | | | 178,457 | | | | 414,112 | | | | 0.76 | |
First Abu Dhabi Bank PJSC | | | AED | | | | 241,466 | | | | 754,482 | | | | 1.39 | |
| | | | | | | | | | | 2,202,540 | | | | 4.05 | |
See accompanying notes to the financial statements.
105
ASHMORE EMERGING MARKETS FRONTIER EQUITY FUND
SCHEDULE OF INVESTMENTS (CONTINUED)
As of April 30, 2020 (Unaudited)
| | | | | | | | | | | | | | | | |
| | | Currency1 | | | Shares | | | Value | | | % of Net
Assets | |
Vietnam (Cost $7,289,015) | | | | | | | | | | | | | | | | |
FPT Corp. | | | VND | | | | 201,700 | | | $ | 435,008 | | | | 0.80 | |
Hoa Phat Group JSC* | | | VND | | | | 1,181,330 | | | | 1,084,335 | | | | 1.99 | |
Military Commercial Joint Stock Bank* | | | VND | | | | 718,226 | | | | 489,116 | | | | 0.90 | |
Mobile World Investment Corp. | | | VND | | | | 612,133 | | | | 2,135,194 | | | | 3.93 | |
Saigon Beer Alcohol Beverage Corp. | | | VND | | | | 68,100 | | | | 473,886 | | | | 0.87 | |
Vietnam Dairy Products JSC | | | VND | | | | 256,120 | | | | 1,082,528 | | | | 1.99 | |
| | | | | | | | | | | 5,700,067 | | | | 10.48 | |
| | | | |
Total Common Stocks (Cost $57,956,058) | | | | | | | | | | | 48,070,540 | | | | 88.36 | |
| | | | |
Preferred Stocks | | | | | | | | | | | | | | | | |
| | | | |
Colombia (Cost $1,214,833) | | | | | | | | | | | | | | | | |
Banco Davivienda S.A., 3.353%3 | | | COP | | | | 58,700 | | | | 425,831 | | | | 0.78 | |
Bancolombia S.A. ADR, 4.016%3 | | | | | | | 18,769 | | | | 489,871 | | | | 0.90 | |
| | | | | | | | | | | 915,702 | | | | 1.68 | |
| | | | |
Total Preferred Stocks (Cost $1,214,833) | | | | | | | | | | | 915,702 | | | | 1.68 | |
| | | | |
Investment Companies | | | | | | | | | | | | | | | | |
| | | | |
Vietnam Enterprise Investments Ltd., Class C * | | | GBP | | | | 377,286 | | | | 1,854,317 | | | | 3.41 | |
Total Investment Companies (Cost $2,255,554) | | | | | | | | | | | 1,854,317 | | | | 3.41 | |
| | | | |
Total Investments (Total Cost $61,426,445) | | | | | | | | | | | 50,840,559 | | | | 93.45 | |
| | | | |
Other Assets Less Liabilities (See Statements of Assets and Liabilities for further detail) | | | | | | | | | | | 3,561,082 | | | | 6.55 | |
| | | | |
Net Assets | | | | | | | | | | $ | 54,401,641 | | | | 100.00 | |
| * | Non-income producing security. |
| 1 | Local currency is United States Dollars unless otherwise noted below. |
| 2 | Securities exempt from registration under Rule 144A of the Securities Act of 1933. These securities may not be publicly traded without registration under the Securities Act of 1933. |
| 3 | Current yield is disclosed. Dividends are calculated based on a percentage of the issuer’s net income. |
Percentages shown are based on net assets.
At April 30, 2020, the industry sectors for the Ashmore Emerging Markets Frontier Equity Fund were:
| | | | |
| Sector | | Percentage of Net Assets |
Communication Services | | | 10.4 | % |
Consumer Discretionary | | | 7.4 | |
Consumer Staples | | | 4.5 | |
Energy | | | 5.0 | |
Financials | | | 45.2 | |
Health Care | | | 3.9 | |
Industrials | | | 4.9 | |
See accompanying notes to the financial statements.
106
ASHMORE EMERGING MARKETS FRONTIER EQUITY FUND
SCHEDULE OF INVESTMENTS (CONTINUED)
As of April 30, 2020 (Unaudited)
| | | | |
| Sector | | Percentage of Net Assets |
Information Technology | | | 3.0 | % |
Materials | | | 4.3 | |
Real Estate | | | 4.9 | |
Total Investments | | | 93.5 | |
Other Assets Less Liabilities | | | 6.5 | |
Net Assets | | | 100.0 | % |
The inputs or methodologies used for valuing securities are not necessarily an indication of the risks associated with investing in those securities and other financial instruments, if any. See note 4 in the Notes to the Financial Statements for more information regarding pricing inputs and valuation techniques. The following is a summary of the inputs used in valuing the Ashmore Emerging Markets Frontier Equity Fund’s investments and other financial instruments, which are carried at fair value, as of April 30, 2020:
| | | | | | | | | | | | | | | | |
| | | Level 1 | | | Level 2 | | | Level 3 | | | Total | |
Investments | | | | | | | | | | | | | | | | |
Assets: | | | | | | | | | | | | | | | | |
Common Stocks | | | | | | | | | | | | | | | | |
Argentina | | | $1,179,834 | | | | $ — | | | | $— | | | | $ 1,179,834 | |
Bahrain | | | — | | | | 530,262 | | | | — | | | | 530,262 | |
Bangladesh | | | — | | | | 1,092,283 | | | | — | | | | 1,092,283 | |
Egypt | | | 1,598,720 | | | | 2,813,863 | | | | — | | | | 4,412,583 | |
Georgia | | | — | | | | 242,453 | | | | — | | | | 242,453 | |
Kazakhstan | | | — | | | | 471,942 | | | | — | | | | 471,942 | |
Kenya | | | — | | | | 3,413,166 | | | | — | | | | 3,413,166 | |
Kuwait | | | — | | | | 7,319,891 | | | | — | | | | 7,319,891 | |
Mauritius | | | — | | | | 782,750 | | | | — | | | | 782,750 | |
Morocco | | | — | | | | 2,731,934 | | | | — | | | | 2,731,934 | |
Nigeria | | | — | | | | 539,252 | | | | — | | | | 539,252 | |
Pakistan | | | — | | | | 756,284 | | | | — | | | | 756,284 | |
Peru | | | 3,822,168 | | | | — | | | | — | | | | 3,822,168 | |
Philippines | | | — | | | | 5,610,892 | | | | — | | | | 5,610,892 | |
Qatar | | | — | | | | 4,452,662 | | | | — | | | | 4,452,662 | |
Romania | | | — | | | | 923,850 | | | | — | | | | 923,850 | |
Saudi Arabia | | | — | | | | 1,099,393 | | | | — | | | | 1,099,393 | |
Senegal | | | 410,324 | | | | — | | | | — | | | | 410,324 | |
Slovenia | | | — | | | | 376,010 | | | | — | | | | 376,010 | |
United Arab Emirates | | | — | | | | 2,202,540 | | | | — | | | | 2,202,540 | |
Vietnam | | | — | | | | 5,700,067 | | | | — | | | | 5,700,067 | |
| | | | | | | | | | | | | | | | |
Total Common Stocks | | | 7,011,046 | | | | 41,059,494 | | | | — | | | | 48,070,540 | |
Preferred Stocks | | | | | | | | | | | | | | | | |
Colombia | | | 915,702 | | | | — | | | | — | | | | 915,702 | |
Investment Companies | | | | | | | | | | | | | | | | |
Vietnam | | | — | | | | 1,854,317 | | | | — | | | | 1,854,317 | |
| |
Total Investments | | | $7,926,748 | | | | $42,913,811 | | | | $— | | | | $50,840,559 | |
| |
See accompanying notes to the financial statements.
107
ASHMORE EMERGING MARKETS FRONTIER EQUITY FUND
SCHEDULE OF INVESTMENTS (CONTINUED)
As of April 30, 2020 (Unaudited)
The following is a summary of the fair values of the Fund’s derivative instruments*:
The Effect of Financial Derivative Instruments on the Statements of Operations for the Six Months Ended April 30, 2020:
| | | | |
| | | Derivatives Not Accounted for as
Hedging Instruments | |
| | | Foreign Exchange Risk | |
| |
Realized Gain (Loss) on Derivatives Recognized resulting from Operations: | | | | |
Net Realized Loss on Forward Foreign Currency Exchange Contracts | | | $(3,504 | ) |
| | | | |
| * | See note 10 in the Notes to the Financial Statements for additional information. |
See accompanying notes to the financial statements.
108
ASHMORE EMERGING MARKETS EQUITY FUND
SCHEDULE OF INVESTMENTS
As of April 30, 2020 (Unaudited)
| | | | | | | | | | | | | | |
| | | Currency1 | | Shares | | | Value | | | % of Net Assets | |
Common Stocks | | | | | | | | | | | | | | |
| | | | |
Brazil (Cost $2,945,338) | | | | | | | | | | | | | | |
Arezzo Industria e Comercio S.A. | | BRL | | | 73,700 | | | $ | 576,004 | | | | 1.03 | |
Lojas Renner S.A. | | BRL | | | 128,280 | | | | 905,620 | | | | 1.62 | |
Notre Dame Intermedica Participacoes S.A. | | BRL | | | 58,600 | | | | 590,644 | | | | 1.06 | |
TOTVS S.A. | | BRL | | | 55,100 | | | | 599,342 | | | | 1.07 | |
| | | | | | | | | 2,671,610 | | | | 4.78 | |
| | | | |
China (Cost $15,124,021) | | | | | | | | | | | | | | |
58.com, Inc. ADR* | | | | | 19,579 | | | | 1,017,129 | | | | 1.82 | |
Alibaba Group Holding Ltd. ADR* | | | | | 23,264 | | | | 4,714,915 | | | | 8.44 | |
Angel Yeast Co. Ltd., Class A | | CNY | | | 94,500 | | | | 490,005 | | | | 0.88 | |
Anhui Conch Cement Co. Ltd., Class H | | HKD | | | 88,500 | | | | 685,210 | | | | 1.23 | |
ANTA Sports Products Ltd. | | HKD | | | 129,000 | | | | 1,102,189 | | | | 1.97 | |
China International Travel Service Corp. Ltd., Class A | | CNY | | | 65,440 | | | | 827,086 | | | | 1.48 | |
China Mengniu Dairy Co. Ltd.* | | HKD | | | 224,000 | | | | 788,717 | | | | 1.41 | |
Kweichow Moutai Co. Ltd., Class A | | CNY | | | 1,800 | | | | 317,352 | | | | 0.57 | |
New Oriental Education & Technology Group, Inc. ADR* | | | | | 13,051 | | | | 1,666,091 | | | | 2.98 | |
Prosus N.V.* | | EUR | | | 7,847 | | | | 595,634 | | | | 1.07 | |
Tencent Holdings Ltd. | | HKD | | | 49,400 | | | | 2,620,823 | | | | 4.69 | |
Times China Holdings Ltd. | | HKD | | | 294,000 | | | | 479,949 | | | | 0.86 | |
Weichai Power Co. Ltd., Class H | | HKD | | | 298,000 | | | | 510,986 | | | | 0.92 | |
Wuxi Biologics Cayman, Inc.*,2 | | HKD | | | 52,000 | | | | 806,420 | | �� | | 1.44 | |
Xinyi Solar Holdings Ltd. | | HKD | | | 872,000 | | | | 556,453 | | | | 1.00 | |
| | | | | | | | | 17,178,959 | | | | 30.76 | |
| | | | |
Hong Kong (Cost $2,283,329) | | | | | | | | | | | | | | |
AIA Group Ltd. | | HKD | | | 163,400 | | | | 1,487,341 | | | | 2.67 | |
Xinyi Glass Holdings Ltd. | | HKD | | | 698,000 | | | | 799,559 | | | | 1.43 | |
| | | | | | | | | 2,286,900 | | | | 4.10 | |
| | | | |
Hungary (Cost $1,101,933) | | | | | | | | | | | | | | |
OTP Bank Nyrt. | | HUF | | | 15,575 | | | | 462,938 | | | | 0.83 | |
Wizz Air Holdings PLC*,2 | | GBP | | | 16,976 | | | | 615,267 | | | | 1.10 | |
| | | | | | | | | 1,078,205 | | | | 1.93 | |
| | | | |
India (Cost $6,568,333) | | | | | | | | | | | | | | |
Eicher Motors Ltd. | | INR | | | 2,962 | | | | 577,937 | | | | 1.03 | |
HDFC Bank Ltd. ADR | | | | | 43,128 | | | | 1,869,599 | | | | 3.35 | |
ICICI Bank Ltd. ADR | | | | | 162,251 | | | | 1,583,570 | | | | 2.84 | |
Larsen & Toubro Infotech Ltd.2 | | INR | | | 21,001 | | | | 438,586 | | | | 0.79 | |
Larsen & Toubro Ltd. | | INR | | | 61,180 | | | | 727,625 | | | | 1.30 | |
Multi Commodity Exchange of India Ltd. | | INR | | | 27,683 | | | | 386,500 | | | | 0.69 | |
Reliance Industries Ltd. | | INR | | | 49,166 | | | | 953,971 | | | | 1.71 | |
| | | | | | | | | 6,537,788 | | | | 11.71 | |
See accompanying notes to the financial statements.
109
ASHMORE EMERGING MARKETS EQUITY FUND
SCHEDULE OF INVESTMENTS (CONTINUED)
As of April 30, 2020 (Unaudited)
| | | | | | | | | | | | | | | | |
| | | Currency1 | | Shares | | | Value | | | % of Net
Assets | |
Indonesia (Cost $532,226) | | | | | | | | | | | | | | | | |
Bank Central Asia Tbk PT | | | IDR | | | | 281,700 | | | $ | 489,126 | | | | 0.88 | |
| | | | | | | | | | | 489,126 | | | | 0.88 | |
| | | | |
Malaysia (Cost $444,807) | | | | | | | | | | | | | | | | |
My EG Services Bhd. | | | MYR | | | | 1,795,800 | | | | 526,430 | | | | 0.94 | |
| | | | | | | | | | | 526,430 | | | | 0.94 | |
| | | | |
Mexico (Cost $1,804,964) | | | | | | | | | | | | | | | | |
Fomento Economico Mexicano S.A.B. de C.V. ADR | | | | | | | 15,642 | | | | 1,006,250 | | | | 1.80 | |
Grupo Aeroportuario del Pacifico S.A.B. de C.V., Series B | | | MXN | | | | 97,600 | | | | 609,873 | | | | 1.09 | |
| | | | | | | | | | | 1,616,123 | | | | 2.89 | |
| | | | |
Peru (Cost $638,518) | | | | | | | | | | | | | | | | |
Credicorp Ltd. | | | | | | | 3,997 | | | | 595,633 | | | | 1.07 | |
| | | | | | | | | | | 595,633 | | | | 1.07 | |
| | | | |
Russian Federation (Cost $4,716,271) | | | | | | | | | | | | | | | | |
HeadHunter Group PLC ADR | | | | | | | 36,214 | | | | 597,531 | | | | 1.07 | |
LUKOIL PJSC ADR | | | | | | | 8,382 | | | | 549,929 | | | | 0.98 | |
Sberbank of Russia PJSC | | | RUB | | | | 126,770 | | | | 337,522 | | | | 0.60 | |
TCS Group Holding PLC (Registered) | | | | | | | 47,591 | | | | 662,310 | | | | 1.19 | |
X5 Retail Group N.V. GDR (Registered) | | | | | | | 38,464 | | | | 1,136,983 | | | | 2.04 | |
Yandex N.V., Class A* | | | | | | | 40,400 | | | | 1,526,312 | | | | 2.73 | |
| | | | | | | | | | | 4,810,587 | | | | 8.61 | |
| | | | |
South Africa (Cost $2,437,543) | | | | | | | | | | | | | | | | |
Naspers Ltd., Class N | | | ZAR | | | | 16,511 | | | | 2,582,494 | | | | 4.63 | |
| | | | | | | | | | | 2,582,494 | | | | 4.63 | |
| | | | |
South Korea (Cost $6,448,366) | | | | | | | | | | | | | | | | |
Douzone Bizon Co. Ltd. | | | KRW | | | | 7,127 | | | | 523,958 | | | | 0.94 | |
Hansol Chemical Co. Ltd. | | | KRW | | | | 13,375 | | | | 934,253 | | | | 1.67 | |
Hugel, Inc.* | | | KRW | | | | 3,368 | | | | 1,064,923 | | | | 1.91 | |
LG Household & Health Care Ltd. | | | KRW | | | | 516 | | | | 583,635 | | | | 1.04 | |
NCSoft Corp. | | | KRW | | | | 1,179 | | | | 618,117 | | | | 1.11 | |
Samsung Electronics Co. Ltd. GDR (Registered) | | | | | | | 1,437 | | | | 1,500,955 | | | | 2.69 | |
SK Hynix, Inc. | | | KRW | | | | 16,135 | | | | 1,097,967 | | | | 1.96 | |
WONIK IPS Co. Ltd.* | | | KRW | | | | 22,550 | | | | 518,085 | | | | 0.93 | |
| | | | | | | | | | | 6,841,893 | | | | 12.25 | |
| | | | |
Taiwan (Cost $5,239,465) | | | | | | | | | | | | | | | | |
ASPEED Technology, Inc. | | | TWD | | | | 13,000 | | | | 514,034 | | | | 0.92 | |
Largan Precision Co. Ltd. | | | TWD | | | | 5,000 | | | | 683,042 | | | | 1.22 | |
Parade Technologies Ltd. | | | TWD | | | | 22,000 | | | | 540,720 | | | | 0.97 | |
Silergy Corp. | | | TWD | | | | 17,857 | | | | 709,852 | | | | 1.27 | |
Sinbon Electronics Co. Ltd. | | | TWD | | | | 186,000 | | | | 897,529 | | | | 1.61 | |
Taiwan Semiconductor Manufacturing Co. Ltd. | | | TWD | | | | 137,000 | | | | 1,376,777 | | | | 2.46 | |
Taiwan Semiconductor Manufacturing Co. Ltd. ADR | | | | | | | 20,074 | | | | 1,066,532 | | | | 1.91 | |
See accompanying notes to the financial statements.
110
ASHMORE EMERGING MARKETS EQUITY FUND
SCHEDULE OF INVESTMENTS (CONTINUED)
As of April 30, 2020 (Unaudited)
| | | | | | | | | | | | | | | | |
| | | Currency1 | | | Shares | | | Value | | | % of Net
Assets | |
Taiwan (continued) | | | | | | | | | | | | | | | | |
Taiwan Union Technology Corp. | | | TWD | | | | 112,000 | | | $ | 506,221 | | | | 0.91 | |
| | | | | | | | | | | 6,294,707 | | | | 11.27 | |
| | | | |
Total Common Stocks (Cost $50,285,114) | | | | | | | | | | | 53,510,455 | | | | 95.82 | |
| | | | |
Preferred Stocks | | | | | | | | | | | | | | | | |
| | | | |
Brazil (Cost $707,946) | | | | | | | | | | | | | | | | |
Banco Bradesco S.A. ADR, 13.894%3 | | | | | | | 155,174 | | | | 546,212 | | | | 0.98 | |
| | | | | | | | | | | 546,212 | | | | 0.98 | |
| | | | |
Total Preferred Stocks (Cost $707,946) | | | | | | | | | | | 546,212 | | | | 0.98 | |
| | | | |
Total Investments (Total Cost $50,993,060) | | | | | | | | | | | 54,056,667 | | | | 96.80 | |
| | | | |
Other Assets Less Liabilities (See Statements of Assets and Liabilities for further detail) | | | | | | | | | | | 1,785,529 | | | | 3.20 | |
| | | | |
Net Assets | | | | | | | | | | $ | 55,842,196 | | | | 100.00 | |
| * | Non-income producing security. |
| 1 | Local currency is United States Dollars unless otherwise noted below. |
| 2 | Securities exempt from registration under Rule 144A of the Securities Act of 1933. These securities may not be publicly traded without registration under the Securities Act of 1933. |
| 3 | Current yield is disclosed. Dividends are calculated based on a percentage of the issuer’s net income. |
Percentages shown are based on net assets.
At April 30, 2020, the industry sectors for the Ashmore Emerging Markets Equity Fund were:
| | |
| Sector | | Percentage of Net Assets |
Communication Services | | 10.3% |
Consumer Discretionary | | 25.7 |
Consumer Staples | | 7.7 |
Energy | | 2.7 |
Financials | | 15.1 |
Health Care | | 4.4 |
Industrials | | 5.5 |
Information Technology | | 21.6 |
Materials | | 2.9 |
Real Estate | | 0.9 |
Total Investments | | 96.8 |
Other Assets Less Liabilities | | 3.2 |
Net Assets | | 100.0% |
See accompanying notes to the financial statements.
111
ASHMORE EMERGING MARKETS EQUITY FUND
SCHEDULE OF INVESTMENTS (CONTINUED)
As of April 30, 2020 (Unaudited)
At April 30, 2020, the Ashmore Emerging Markets Equity Fund had outstanding forward foreign currency exchange contracts as follows:
| | | | | | | | | | | | | | |
Settlement Date | | Counterparty | | Currency Buy | | Currency Buy Amount (Local Currency) | | Currency Sell | | Currency Sell Amount (Local
Currency) | | | Unrealized
Gain/(Loss) |
| | | | | | |
05/06/2020 | | Brown Brothers Harriman | | South African Rand | | 641,400 | | United States Dollar | | | 34,752 | | | $(172) |
| | | | | | | | | | | | | | |
| | | | | |
Subtotal Depreciation | | | | | | | | | | | | (172) |
| | | | | | | | | | | | | | |
| | | | | | |
Total | | | | | | | | | | | | | | $(172) |
| | | | | | | | | | | | | | |
The inputs or methodologies used for valuing securities are not necessarily an indication of the risks associated with investing in those securities and other financial instruments, if any. See note 4 in the Notes to the Financial Statements for more information regarding pricing inputs and valuation techniques. The following is a summary of the inputs used in valuing the Ashmore Emerging Markets Equity Fund’s investments and other financial instruments, which are carried at fair value, as of April 30, 2020:
| | | | | | | | | | | | | | | | |
| | | Level 1 | | | Level 2 | | | Level 3 | | | Total | |
Investments | | | | | | | | | | | | | | | | |
Assets: | | | | | | | | | | | | | | | | |
Common Stocks | | | | | | | | | | | | | | | | |
Brazil | | | $ 2,671,610 | | | | $ — | | | | $— | | | | $ 2,671,610 | |
China | | | 7,398,135 | | | | 9,780,824 | | | | — | | | | 17,178,959 | |
Hong Kong | | | — | | | | 2,286,900 | | | | — | | | | 2,286,900 | |
Hungary | | | — | | | | 1,078,205 | | | | — | | | | 1,078,205 | |
India | | | 3,453,169 | | | | 3,084,619 | | | | — | | | | 6,537,788 | |
Indonesia | | | — | | | | 489,126 | | | | — | | | | 489,126 | |
Malaysia | | | — | | | | 526,430 | | | | — | | | | 526,430 | |
Mexico | | | 1,616,123 | | | | — | | | | — | | | | 1,616,123 | |
Peru | | | 595,633 | | | | — | | | | — | | | | 595,633 | |
Russian Federation | | | 2,123,843 | | | | 2,686,744 | | | | — | | | | 4,810,587 | |
South Africa | | | — | | | | 2,582,494 | | | | — | | | | 2,582,494 | |
South Korea | | | — | | | | 6,841,893 | | | | — | | | | 6,841,893 | |
Taiwan | | | 1,066,532 | | | | 5,228,175 | | | | — | | | | 6,294,707 | |
| | | | | | | | | | | | | | | | |
Total Common Stocks | | | 18,925,045 | | | | 34,585,410 | | | | — | | | | 53,510,455 | |
Preferred Stocks | | | | | | | | | | | | | | | | |
Brazil | | | 546,212 | | | | — | | | | — | | | | 546,212 | |
| |
Total Investments | | | $19,471,257 | | | | $34,585,410 | | | | $— | | | | $54,056,667 | |
| |
| | | | |
Other Financial Instruments | | | | | | | | | | | | | | | | |
Liabilities: | | | | | | | | | | | | | | | | |
Forward Foreign Currency Exchange Contracts | | | $— | | | | $(172 | ) | | | $— | | | | $(172 | ) |
| |
Total Other Financial Instruments | | | $— | | | | $(172 | ) | | | $— | | | | $(172 | ) |
| |
See accompanying notes to the financial statements.
112
ASHMORE EMERGING MARKETS EQUITY FUND
SCHEDULE OF INVESTMENTS (CONTINUED)
As of April 30, 2020 (Unaudited)
The following is a summary of the fair values of the Fund’s derivative instruments*:
Fair Values of Financial Derivative Instruments on the Statements of Assets and Liabilities as of April 30, 2020:
| | | | |
| | | Derivatives Not Accounted for as
Hedging Instruments | |
| | | Foreign Exchange Risk | |
| |
| |
Liabilities: | | | | |
Unrealized Depreciation on Forward Foreign Currency Exchange Contracts | | | $(172 | ) |
| | | | |
The Effect of Financial Derivative Instruments on the Statements of Operations for the Six Months Ended April 30, 2020:
| | | | |
| | | Derivatives Not Accounted for as
Hedging Instruments | |
| | | Foreign Exchange Risk | |
| |
Realized Gain (Loss) on Derivatives Recognized resulting from Operations: | | | | |
Net Realized Loss on Forward Foreign Currency Exchange Contracts | | | $(989 | ) |
| | | | |
| |
Net Change in Unrealized Appreciation (Depreciation) on Derivatives Recognized resulting from Operations: | | | | |
Net Change in Unrealized Depreciation on Forward Foreign Currency Exchange Contracts | | | $(172 | ) |
| | | | |
| * | See note 10 in the Notes to the Financial Statements for additional information. |
See accompanying notes to the financial statements.
113
ASHMORE EMERGING MARKETS EQUITY ESG FUND
SCHEDULE OF INVESTMENTS
As of April 30, 2020 (Unaudited)
| | | | | | | | | | | | | | | | |
| | | Currency1 | | | Shares | | | Value | | | % of Net
Assets | |
Common Stocks | | | | | | | | | | | | | | | | |
| | | | |
Argentina (Cost $95,828) | | | | | | | | | | | | | | | | |
Globant S.A.* | | | | | | | 900 | | | $ | 104,103 | | | | 1.18 | |
| | | | | | | | | | | 104,103 | | | | 1.18 | |
| | | | |
Brazil (Cost $644,537) | | | | | | | | | | | | | | | | |
Arezzo Industria e Comercio S.A. | | | BRL | | | | 11,800 | | | | 92,223 | | | | 1.05 | |
Lojas Renner S.A. | | | BRL | | | | 27,800 | | | | 196,260 | | | | 2.22 | |
Notre Dame Intermedica Participacoes S.A. | | | BRL | | | | 10,200 | | | | 102,808 | | | | 1.16 | |
TOTVS S.A. | | | BRL | | | | 8,800 | | | | 95,721 | | | | 1.08 | |
| | | | | | | | | | | 487,012 | | | | 5.51 | |
| | | | |
China (Cost $2,678,452) | | | | | | | | | | | | | | | | |
58.com, Inc. ADR* | | | | | | | 3,042 | | | | 158,032 | | | | 1.79 | |
Alibaba Group Holding Ltd. ADR* | | | | | | | 3,621 | | | | 733,868 | | | | 8.31 | |
Angel Yeast Co. Ltd., Class A | | | CNH | | | | 17,000 | | | | 88,149 | | | | 1.00 | |
ANTA Sports Products Ltd. | | | HKD | | | | 29,000 | | | | 247,779 | | | | 2.80 | |
China International Travel Service Corp. Ltd., Class A | | | CNH | | | | 12,900 | | | | 163,041 | | | | 1.85 | |
China Mengniu Dairy Co. Ltd.* | | | HKD | | | | 40,000 | | | | 140,842 | | | | 1.59 | |
Kweichow Moutai Co. Ltd., Class A | | | CNH | | | | 500 | | | | 88,153 | | | | 1.00 | |
New Oriental Education & Technology Group, Inc. ADR* | | | | | | | 2,547 | | | | 325,150 | | | | 3.68 | |
Tencent Holdings Ltd. | | | HKD | | | | 9,700 | | | | 514,615 | | | | 5.83 | |
Wuxi Biologics Cayman, Inc.*,2 | | | HKD | | | | 10,000 | | | | 155,081 | | | | 1.76 | |
Xinyi Solar Holdings Ltd. | | | HKD | | | | 146,000 | | | | 93,168 | | | | 1.05 | |
| | | | | | | | | | | 2,707,878 | | | | 30.66 | |
| | | | |
Hong Kong (Cost $396,694) | | | | | | | | | | | | | | | | |
AIA Group Ltd. | | | HKD | | | | 40,200 | | | | 365,919 | | | | 4.14 | |
| | | | | | | | | | | 365,919 | | | | 4.14 | |
| | | | |
Hungary (Cost $151,741) | | | | | | | | | | | | | | | | |
OTP Bank Nyrt. | | | HUF | | | | 3,222 | | | | 95,768 | | | | 1.08 | |
| | | | | | | | | | | 95,768 | | | | 1.08 | |
| | | | |
India (Cost $903,401) | | | | | | | | | | | | | | | | |
HDFC Bank Ltd. ADR | | | | | | | 10,692 | | | | 463,498 | | | | 5.25 | |
ICICI Bank Ltd. ADR | | | | | | | 24,700 | | | | 241,072 | | | | 2.73 | |
| | | | | | | | | | | 704,570 | | | | 7.98 | |
| | | | |
Indonesia (Cost $98,185) | | | | | | | | | | | | | | | | |
Bank Central Asia Tbk PT | | | IDR | | | | 44,400 | | | | 77,093 | | | | 0.87 | |
| | | | | | | | | | | 77,093 | | | | 0.87 | |
| | | | |
Malaysia (Cost $105,373) | | | | | | | | | | | | | | | | |
My EG Services Bhd. | | | MYR | | | | 372,600 | | | | 109,226 | | | | 1.24 | |
| | | | | | | | | | | 109,226 | | | | 1.24 | |
| | | | |
Mexico (Cost $326,285) | | | | | | | | | | | | | | | | |
Fomento Economico Mexicano S.A.B. de C.V. ADR | | | | | | | 2,482 | | | | 159,667 | | | | 1.81 | |
See accompanying notes to the financial statements.
114
ASHMORE EMERGING MARKETS EQUITY ESG FUND
SCHEDULE OF INVESTMENTS (CONTINUED)
As of April 30, 2020 (Unaudited)
| | | | | | | | | | | | | | | | |
| | | Currency1 | | | Shares | | | Value | | | % of Net
Assets | |
Mexico (continued) | | | | | | | | | | | | | | | | |
Grupo Aeroportuario del Pacifico S.A.B. de C.V., Series B | | | MXN | | | | 17,200 | | | $ | 107,478 | | | | 1.21 | |
| | | | | | | | | | | 267,145 | | | | 3.02 | |
| | | | |
Peru (Cost $133,284) | | | | | | | | | | | | | | | | |
Credicorp Ltd. | | | | | | | 800 | | | | 119,216 | | | | 1.35 | |
| | | | | | | | | | | 119,216 | | | | 1.35 | |
| | | | |
Russian Federation (Cost $865,877) | | | | | | | | | | | | | | | | |
HeadHunter Group PLC ADR | | | | | | | 7,429 | | | | 122,579 | | | | 1.39 | |
TCS Group Holding PLC (Registered) | | | | | | | 9,179 | | | | 127,741 | | | | 1.45 | |
X5 Retail Group N.V. GDR (Registered) | | | | | | | 7,130 | | | | 210,760 | | | | 2.38 | |
Yandex N.V., Class A* | | | | | | | 7,500 | | | | 283,350 | | | | 3.21 | |
| | | | | | | | | | | 744,430 | | | | 8.43 | |
| | | | |
South Africa (Cost $415,243) | | | | | | | | | | | | | | | | |
Naspers Ltd., Class N | | | ZAR | | | | 2,567 | | | | 401,506 | | | | 4.55 | |
| | | | | | | | | | | 401,506 | | | | 4.55 | |
| | | | |
South Korea (Cost $1,039,783) | | | | | | | | | | | | | | | | |
Hansol Chemical Co. Ltd. | | | KRW | | | | 3,145 | | | | 219,680 | | | | 2.49 | |
Hugel, Inc.* | | | KRW | | | | 683 | | | | 215,957 | | | | 2.44 | |
NCSoft Corp. | | | KRW | | | | 226 | | | | 118,486 | | | | 1.34 | |
Samsung Electronics Co. Ltd. GDR (Registered) | | | | | | | 300 | | | | 313,352 | | | | 3.55 | |
WONIK IPS Co. Ltd.* | | | KRW | | | | 3,957 | | | | 90,912 | | | | 1.03 | |
| | | | | | | | | | | 958,387 | | | | 10.85 | |
| | | | |
Taiwan (Cost $1,350,199) | | | | | | | | | | | | | | | | |
ASPEED Technology, Inc. | | | TWD | | | | 3,000 | | | | 118,623 | | | | 1.34 | |
Delta Electronics, Inc. | | | TWD | | | | 22,000 | | | | 102,045 | | | | 1.15 | |
Largan Precision Co. Ltd. | | | TWD | | | | 1,000 | | | | 136,609 | | | | 1.55 | |
Parade Technologies Ltd. | | | TWD | | | | 5,000 | | | | 122,891 | | | | 1.39 | |
Silergy Corp. | | | TWD | | | | 3,429 | | | | 136,310 | | | | 1.54 | |
Sinbon Electronics Co. Ltd. | | | TWD | | | | 36,000 | | | | 173,715 | | | | 1.97 | |
Taiwan Semiconductor Manufacturing Co. Ltd. | | | TWD | | | | 19,000 | | | | 190,940 | | | | 2.16 | |
Taiwan Semiconductor Manufacturing Co. Ltd. ADR | | | | | | | 5,570 | | | | 295,934 | | | | 3.35 | |
Taiwan Union Technology Corp. | | | TWD | | | | 22,000 | | | | 99,436 | | | | 1.13 | |
| | | | | | | | | | | 1,376,503 | | | | 15.58 | |
| | | | |
Total Common Stocks (Cost $9,204,882) | | | | | | | | | | | 8,518,756 | | | | 96.44 | |
| | | | |
Total Investments (Total Cost $9,204,882) | | | | | | | | | | | 8,518,756 | | | | 96.44 | |
| | | | |
Other Assets Less Liabilities (See Statements of Assets and Liabilities for further detail) | | | | | | | | | | | 314,633 | | | | 3.56 | |
| | | | |
Net Assets | | | | | | | | | | $ | 8,833,389 | | | | 100.00 | |
| * | Non-income producing security. |
| 1 | Local currency is United States Dollars unless otherwise noted below. |
See accompanying notes to the financial statements.
115
ASHMORE EMERGING MARKETS EQUITY ESG FUND
SCHEDULE OF INVESTMENTS (CONTINUED)
As of April 30, 2020 (Unaudited)
| 2 | Securities exempt from registration under Rule 144A of the Securities Act of 1933. These securities may not be publicly traded without registration under the Securities Act of 1933. |
Percentages shown are based on net assets.
At April 30, 2020, the industry sectors for the Ashmore Emerging Markets Equity ESG Fund were:
| | |
| Sector | | Percentage of Net Assets |
Communication Services | | 12.1% |
Consumer Discretionary | | 24.4 |
Consumer Staples | | 7.8 |
Financials | | 16.9 |
Health Care | | 5.4 |
Industrials | | 2.6 |
Information Technology | | 24.7 |
Materials | | 2.5 |
Total Investments | | 96.4 |
Other Assets Less Liabilities | | 3.6 |
Net Assets | | 100.0% |
The inputs or methodologies used for valuing securities are not necessarily an indication of the risks associated with investing in those securities and other financial instruments, if any. See note 4 in the Notes to the Financial Statements for more information regarding pricing inputs and valuation techniques. The following is a summary of the inputs used in valuing the Ashmore Emerging Markets Equity ESG Fund’s investments and other financial instruments, which are carried at fair value, as of April 30, 2020:
| | | | | | | | | | | | | | | | |
| | | Level 1 | | | Level 2 | | | Level 3 | | | Total | |
Investments | | | | | | | | | | | | | | | | |
Assets: | | | | | | | | | | | | | | | | |
Common Stocks | | | | | | | | | | | | | | | | |
Argentina | | | $ 104,103 | | | | $ — | | | | $— | | | | $ 104,103 | |
Brazil | | | 487,012 | | | | — | | | | — | | | | 487,012 | |
China | | | 1,217,050 | | | | 1,490,828 | | | | — | | | | 2,707,878 | |
Hong Kong | | | — | | | | 365,919 | | | | — | | | | 365,919 | |
Hungary | | | — | | | | 95,768 | | | | — | | | | 95,768 | |
India | | | 704,570 | | | | — | | | | — | | | | 704,570 | |
Indonesia | | | — | | | | 77,093 | | | | — | | | | 77,093 | |
Malaysia | | | — | | | | 109,226 | | | | — | | | | 109,226 | |
Mexico | | | 267,145 | | | | — | | | | — | | | | 267,145 | |
Peru | | | 119,216 | | | | — | | | | — | | | | 119,216 | |
Russian Federation | | | 405,929 | | | | 338,501 | | | | — | | | | 744,430 | |
South Africa | | | — | | | | 401,506 | | | | — | | | | 401,506 | |
South Korea | | | — | | | | 958,387 | | | | — | | | | 958,387 | |
Taiwan | | | 295,934 | | | | 1,080,569 | | | | — | | | | 1,376,503 | |
| | | | | | | | | | | | | | | | |
Total Common Stocks | | | 3,600,959 | | | | 4,917,797 | | | | — | | | | 8,518,756 | |
| |
Total Investments | | | $3,600,959 | | | | $4,917,797 | | | | $— | | | | $8,518,756 | |
| |
See accompanying notes to the financial statements.
116
ASHMORE FUNDS
NOTES TO FINANCIAL STATEMENTS
As of April 30, 2020 (Unaudited)
Ashmore Funds (the “Trust”) is a Massachusetts business trust organized under the laws of the Commonwealth of Massachu-setts on August 6, 2010 (inception date) and is registered under the Investment Company Act of 1940, as amended (the “Investment Company Act” or “1940 Act”), as anopen-end management investment company. The Trust follows accounting and reporting guidance under Financial Accounting Standards Codification Topic 946, “Financial Services – Investment Companies.” The Trust includes nine funds as of April 30, 2020, each with its own investment objective. The Ashmore Emerging Markets Total Return Fund, Ashmore Emerging Markets Local Currency Bond Fund, Ashmore Emerging Markets Corporate Income Fund, Ashmore Emerging Markets Short Duration Fund, Ashmore Emerging Markets Active Equity Fund, Ashmore Emerging MarketsSmall-Cap Equity Fund, Ashmore Emerging Markets Frontier Equity Fund, Ashmore Emerging Markets Equity Fund and Ashmore Emerging Markets Equity ESG Fund (each a “Fund” and collectively, the “Funds”) are separate series of the Trust. The Ashmore Emerging Markets Local Currency Bond Fund and the Ashmore Emerging Markets Short Duration Fund are eachnon-diversified funds.Non-diversified funds may invest a relatively large portion of their net assets in a single issuer or a small number of issuers. Each of the Funds’ financial statements are presented herein. On February 26, 2020, the Trust launched the Ashmore Emerging Markets Equity ESG Fund by offering Class A, Class C and Institutional Class shares of the Fund.
Ashmore Investment Advisors Limited (“AIAL” or the “Investment Manager”) serves as investment manager to the Funds. AIAL is a wholly owned subsidiary of Ashmore Investments (UK) Limited, which is a wholly owned subsidiary of Ashmore Group plc (“Ashmore Group”). Ashmore Investment Management (US) Corporation (“AIMUS”) is the principal underwriter of shares of the Funds. AIMUS is an affiliate of the Investment Manager. The Northern Trust Company (“Northern Trust”) serves as the administrator, custodian and transfer agent of the Funds.
Related parties or personnel of the Investment Manager may invest in the Funds. The Investment Manager could face a conflict of interest if a related party is invested in a Fund and that party’s interests diverge from those of the Fund, but equally thisco-investment may serve to better align the interests of the Funds and the personnel of the Investment Manager. When a related party provides capital for a Fund, it may do so with the intention of redeeming all or part of its interest in the Fund at a future point in time.
The Funds have assessed the impact of the Alternative Investment Fund Managers Directive (AIFMD) (the “Directive”) on the financial statements of the Trust and have concluded that the Trust is exempt from following Chapter V. Section 1. Articles103-111 of the European Commission’s Level 2 Delegated Regulation on the basis of the operations of the Trust (i) beingNon-EEA AIFs (“European Economic Area Alternative Investment Funds”), and (ii) not being marketed in the European Union, as defined by the Directive.
| 2. | Significant accounting policies |
The significant accounting policies adopted and consistently followed in the preparation of the Funds’ financial statements are set out below:
(a) Basis of preparation
The financial statements have been prepared in accordance with accounting principles generally accepted in the United States of America (“U.S. GAAP”).
(b) Use of estimates
The preparation of financial statements in accordance with U.S. GAAP requires estimates and assumptions that affect the reported amounts of assets and liabilities and the disclosure of contingent assets and liabilities at the date of the financial statements, as well as the reported amounts of revenues generated and expenses incurred during the reporting period. Actual
117
ASHMORE FUNDS
NOTES TO FINANCIAL STATEMENTS (CONTINUED)
As of April 30, 2020 (Unaudited)
results could differ from these estimates. These financial statements contain all adjustments which are, in the opinion of the Trust, necessary to portray a fair statement of the period presented. Such adjustments are normal and recurring in nature. Valuation models used to determine the fair value of hard to value investments require the use of a number of market based assumptions.
(c) Determination of the Net Asset Value
The net asset value (“NAV”) of a Fund’s shares is calculated at the close of regular trading (normally 4:00 p.m. Eastern time) (the “NYSE Close”) on each day that the New York Stock Exchange (“NYSE”) is open for regular trading.
(d) Investment valuation
For the purposes of calculating NAV, portfolio securities and other assets for which market quotations are readily available are valued at market value. Market values for securities and other instruments are generally determined on the basis of closing prices or the last reported sales prices on an exchange or other market, or if no closing prices or sales are reported, based on quotes or other market information obtained from a quotation reporting system, established market makers, or pricing services. Domestic and foreign debt securities for which the close of trading does not coincide with the NYSE close andnon-exchange traded derivatives are normally valued on the basis of quotes obtained from brokers and dealers or pricing services using data reflecting the earlier closing of the principal markets for those securities (e.g., certain foreign securities). Prices obtained from independent pricing services are based on information provided by market makers or estimates of market values obtained from yield data relating to investments or securities with similar characteristics. Certain debt securities purchased on a delayed delivery basis aremarked-to-market daily until settlement. Exchange traded options, futures and options on futures are generally valued at the settlement price determined by the exchange on which the instrument is primarily traded. With respect to any portion of a Fund’s assets that are invested in one or more open-ended investment management companies, a Fund’s NAV will be calculated based upon the NAVs of such investments. The prospectuses for theseopen-end management investment companies explain the circumstances under which those companies will use fair value pricing and the effects of using fair value pricing.
If a Fund’snon-U.S. (foreign) security’s value has materially changed after the close of the security’s primary exchange or principal market but before the time as of which the Funds calculate their NAVs, the security will be valued at fair value based on procedures approved by the Board. A Fund may determine the fair value of investments based on information provided by pricing services and other third-party vendors, which may recommend fair value prices or adjustments with reference to other securities, indices or assets. The Funds may use fair value pricing more frequently for foreign securities or assets because, amongst other things, many foreign markets close well before the NAV of the Funds’ shares is next calculated. In considering whether fair value pricing is required and in determining fair values, the Fund may, amongst other things, consider significant events (which may be considered to include changes in the value of U.S. securities or securities indices) that occur after the close of the relevant market and before the time as of which the Funds calculate their NAVs. A Fund may utilize modeling tools provided by third-party vendors to determine the fair values ofnon-U.S. securities. Foreign exchanges may permit trading in foreign securities on days when the Trust is not open for business, which may result in the values of a Fund’s portfolio investments being affected when investors are unable to buy, sell or exchange shares of the Fund.
Investments initially valued in currencies other than the United States Dollar are converted to the United States Dollar using exchange rates obtained from pricing services. Foreign exchange rates are calculated as of 4:00 p.m. Eastern time on each day that the NYSE opens for regular trading. As a result, the NAV of a Fund’s shares may be affected by changes in the value of currencies in relation to the United States Dollar. The value of securities traded in markets outside the United States or denominated in currencies other than the United States Dollar may be affected significantly on a day that the NYSE is closed and an investor is not able to purchase, redeem or exchange shares of the Funds.
In the event that market quotes are not readily available, and the security or asset cannot be valued pursuant to one of the Board’s approved valuation methods, the fair value of the security or asset will be determined in good faith by the Board, generally based upon recommendations provided by the Investment Manager. Market quotes are considered not readily available in circumstances where there is an absence of current or reliable market-based data (e.g., trade information, bid/asked information,
118
ASHMORE FUNDS
NOTES TO FINANCIAL STATEMENTS (CONTINUED)
As of April 30, 2020 (Unaudited)
broker quotes), including where events occur after the close of the relevant market, but prior to a Fund’s NAV calculation time, that materially affect the values of a Fund’s securities or assets. In addition, market quotes are considered not readily available when, due to extraordinary circumstances, the exchanges or markets on which the securities trade do not open for trading for the entire day and no other market prices are available. A Fund may also determine that market quotations are not readily available due to events relating to a single issuer (e.g., corporate actions or announcements) or events relating tomultiple issuers (e.g., governmental actions or natural disasters). The Board has delegated to the Investment Manager the responsibility for monitoring significant events that may materially affect the values of a Fund’s securities or assets and for determining whether the value of the applicable securities or assets should bere-evaluated in light of such significant events.
The Investment Manager primarily employs a market-based approach which may use related or comparable assets or liabilities, recent transactions, market multiples, book values, and other relevant information to determine the fair value of the investment. The Investment Manager may also apply a discount to the last traded price in situations where the last traded price may not represent the fair value of the security, such as if a security’s trading has been suspended on its primary trading market, a security has beende-listed from its primary trading market, a security has not traded for an extended period of time, or a security’s primary trading market is temporarily closed at a time when under normal conditions it would be open. Any such discount is based on a number of factors including but not limited to the circumstances surrounding any potential suspension orde-listing, market and industry conditions, competitor information, and the period of time since the last trading took place.
For Funds that use fair value pricing to determine the NAV of its shares, securities may not be priced on the basis of quotes from the primary market in which they are traded, but rather may be priced by another method that the Board or persons acting at its direction believe accurately reflects fair value. Fair value pricing may require subjective determinations about the value of a security or asset. While the Funds’ policies are intended to result in a calculation of a Fund’s NAV that fairly reflects security and asset values as of the time of pricing, the Funds cannot ensure that fair values determined by the Board or persons acting at their direction accurately reflects the price that a Fund could obtain for a security or asset if it were to dispose of that security or asset at the time of pricing (for instance, in a forced or distressed sale). The prices used by a Fund may differ from the value that would be realized if the securities were sold. Also, the use of fair value pricing may not always result in adjustments to the prices of securities or other assets held by the Fund for the purpose of calculating the NAV of the Fund’s shares.
(e) Investment transactions, income and expenses
Investment transactions are recorded at the trade date. The Funds determine the gain or loss realized from investment transactions using an identified cost basis method. Interest income is recognized on an accrual basis and includes the amortization of premiums and the accretion of discounts using the effective yield method. Dividend income is recognized on theex-dividend date. Dividends from foreign securities are recorded on theex-dividend date, or as soon as such information is available, net of any applicable tax withholding.
Expenses are recorded on an accrual basis. Each Fund is charged for those expenses that are directly attributable to that Fund. Certain expenses arising in connection with a class of shares are charged to that class of shares. Expenses incurred which do not specifically relate to an individual Fund are allocated amongst all the Funds in the Trust in proportion to each Fund’s relative net assets.
(f) Fully funded total return swaps
Each Fund is subject to market risk in the normal course of pursuing its investment objectives. Certain Funds may enter into fully funded total return swaps (“TRS”) to manage their exposure to the market, certain sectors of the market or a particular security or reference asset, or to create exposure to certain investments to which they would otherwise not be exposed. TRS contracts involve the exchange by a Fund and a counterparty of their respective commitments to pay or receive a net amount based, in part, on the change in the value of a notional amount of a particular security, index or reference asset.
119
ASHMORE FUNDS
NOTES TO FINANCIAL STATEMENTS (CONTINUED)
As of April 30, 2020 (Unaudited)
Where a Fund enters into a TRS transaction with a swap counterparty, pursuant to which the Fund makes an initial payment equal to the estimated value of an emerging market debt or equity security, loan or other financial instrument, the TRS is considered an investment for financial statement purposes and is accounted for using the same policies as would apply to the underlying assets it represents. In addition to the market risk of the underlying security, index or reference asset, there is a risk of default by the counterparty to the transaction.
(g) Equity-Linked Securities
Certain Funds may purchase equity-linked securities, also known as participation notes. Equity-linked securities are primarily used by the Funds as an alternate means to access what is generally an emerging securities market. A Fund deposits cash with its custodian (or broker) in an amount near or equal to the value of the underlying security in exchange for an equity linked security. Upon sale, the Fund receives cash from the broker or custodian, equal to the value of the underlying security. In addition to the market risk and credit risk of the underlying securities, there is a risk of default by the counterparty to the transaction. In the event of insolvency of the counterparty, a Fund might be unable to obtain its expected benefit. In addition, while the Funds will seek to enter into such transactions only with parties that are capable of entering into closing transactions with a Fund, there can be no assurance that a Fund will be able to close out such a transaction with the counterparty or obtain an offsetting position with any counterparty at a time prior to the end of the term of the underlying agreement.
(h) Inflation Index Securities
Certain Funds may invest in inflation-indexed bonds which are fixed income securities whose principal value is periodically adjusted based on a measure of rate of inflation. The interest rate on these bonds is generally fixed at issuance at a rate lower than typical bonds. Over the life of an inflation-indexed bond interest will be paid based on a principal value which is adjusted for inflation. Any increase or decrease in the principal amount of an inflation-indexed bond will be included as interest income on the Statements of Operations, even though investors do not receive their principal until maturity. At April 30, 2020, all inflation-indexed bonds were shown on the Statement of Investments with their original par and stated coupon rate.
(i) Credit-Linked Notes
Certain Funds may invest in credit-linked notes to provide exposure to the high yield or another fixed income market. The value of a credit-linked note is based on the price movements of a particular credit, known as a reference credit. Credit-linked notes that a Fund invests in are typically listed instruments that typically provide the same return as the underlying reference credit. A Fund generally will receive a fixed or floating coupon and the note’s par value upon maturity. If a specified credit event occurs, such as default or bankruptcy, the Fund may experience a delay in payment or forego interest. The maximum potential risk of loss is limited to the par amount of the credit linked note plus any accrued interest.
In the normal course of business, the Funds trade financial instruments and enter into financial transactions where a risk of potential loss exists due to, amongst other things, changes in the market (market risk), or the failure or inability of the other party to a transaction to perform (credit and counterparty risk). See below for a summary description of select principal risks, some of which may not apply to a particular Fund. A discussion of the principal risks of investing in each Fund is included in that Fund’s prospectus.
Counterparty and Third Party Risk
Transactions involving a counterparty to a derivative or other instrument, or a third party responsible for servicing the instrument, are subject to the credit risk of the counterparty or third party, and to the counterparty’s or third party’s ability to perform in accordance with the terms of the transaction.
120
ASHMORE FUNDS
NOTES TO FINANCIAL STATEMENTS (CONTINUED)
As of April 30, 2020 (Unaudited)
Credit Risk
The Funds could lose money if the issuer or guarantor of a debt security or other instrument is unable or unwilling to meet its financial obligations, and the lack of ability, or perceived lack of ability, of the issuer to make timely payments of interest and/or principal will negatively affect the value of the security or instrument.
Market Risk
The value of securities and instruments owned by the Funds may rise and fall, sometimes rapidly or unpredictably, due to factors affecting securities markets generally or particular industries or geographic areas. Recent instability in the financial markets has led governments around the world to take a number of unprecedented actions designed to support certain financial institutions and segments of the financial markets that have experienced extreme volatility, and in some cases a lack of liquidity. The withdrawal of this support, failure of these efforts, or investor perception that these efforts are not succeeding could negatively affect financial markets generally as well as the values and liquidity of a Fund’s portfolio securities and other assets.
Derivative financial instruments may result inoff-balance sheet market and credit risk. If the markets should move against one or more positions that the Funds hold, the Funds could incur losses greater than the unrealized amounts recorded in the Statements of Assets and Liabilities. Derivative risk exposures are discussed in note 10.
Foreign/Emerging Markets Risks
Investments in foreign securities entail risks in addition to those customarily associated with investing in U.S. securities. Economic, political and social instability could disrupt financial markets in which the Fund invests and adversely affect the value of the Fund’s assets. In addition, national policies may restrict investment opportunities. In foreign markets there may be a lower degree of market volume and liquidity than in U.S. markets, and this may result in greater price volatility. The securities markets in many Emerging-Market countries are substantially smaller, less developed, less liquid and more volatile than the securities markets of developed countries. Furthermore, since the composition of each Fund will differ from that of market indexes, its performance generally will not mirror the returns provided by a specific market index.
| 4. | Fair value measurements |
U.S. GAAP includes a topic which defines fair value as the price that the Fund would receive upon selling an investment in an orderly and timely transaction to a market participant in the principal or most advantageous market of the investment. This topic establishes a three-tier hierarchy to maximize the use of observable market data, minimize the use of unobservable inputs and establish classification of fair value measurements for disclosure purposes. Inputs may be observable or unobservable and refer broadly to the assumptions that market participants would use in pricing the asset or liability including assumptions about risk. Such risks include the inherent risk in a particular valuation technique which is used to measure fair value. Observable inputs are inputs that reflect the assumptions market participants would use in pricing the asset or liability developed based on market data obtained from sources independent of the reporting entity. Unobservable inputs are inputs that reflect the reporting entity’s own assumptions about the assumptions market participants would use in pricing the asset or liability, developed based on the best information available in the circumstances. The three-tier hierarchy of inputs is summarized in the three broad levels listed below.
| | • | | Level 1 – Inputs using unadjusted quoted prices in active markets or exchanges for identical assets and liabilities. |
| | • | | Level 2 – Significant observable inputs other than those used in Level 1, which may include, but are not limited to, quoted prices for similar assets or liabilities in markets that are active, quoted prices for identical or similar assets or liabilities in markets that are not active, inputs other than quoted prices that are observable for the assets or liabilities (such as interest rates, yield curves, volatilities, prepayment rates, loss severities, credit risks and default rates) or other market corroborated inputs. |
121
ASHMORE FUNDS
NOTES TO FINANCIAL STATEMENTS (CONTINUED)
As of April 30, 2020 (Unaudited)
| | • | | Level 3 – Significant unobservable inputs based on the best information available in the circumstances, to the extent observable inputs are not available, which may include assumptions made by the Board or persons acting at their discretion that are used in determining the fair market value of investments. |
Fixed income securities including corporate, convertible and municipal bonds and notes, U.S. government agency securities, U.S. treasury obligations, sovereign issues, bank loans, convertible preferred securities andnon-U.S. bonds are normally priced using data reflecting the earlier closing of the principal markets for those securities, subject to possible fair value adjustments. Information that becomes known to a Fund or its agents after NAV has been calculated on a particular day will not generally be used to retroactively adjust the price of a security or NAV determined earlier that day.
Portfolio securities and other assets for which market quotations are readily available are typically categorized as Level 1 of the fair value hierarchy. Domestic and foreign debt securities where the close of trading does not coincide with the NYSE close andnon-exchange traded derivatives are normally valued on the basis of quotes obtained from brokers and dealers or pricing services using data reflecting the earlier closing of the principal markets for those securities. Prices obtained from independent pricing services are based on information provided by market makers or estimates of market values obtained from yield data relating to investments or securities with similar characteristics. Securities using these valuation adjustments are typically categorized as Level 2 of the fair value hierarchy. Preferred securities, equity linked notes and other equities traded on inactive markets or valued by reference to similar instruments are also typically categorized as Level 2 of the fair value hierarchy.
Investments and derivatives classified within Level 3 have significant unobservable inputs, as they trade infrequently or not at all. Level 3 instruments may include bank loan agreements and less-liquid corporate debt securities (including distressed debt instruments). Also included in this category are certain bonds and loans for which independent broker prices are used and information relating to the inputs of the price models is not available.
| 5. | Reverse repurchase agreements |
Certain Funds may enter into reverse repurchase agreements. In a reverse repurchase agreement, a Fund delivers a security in exchange for cash to a financial institution, the counterparty, with a simultaneous agreement to repurchase the same or substantially the same security at an agreed upon price and date. The Fund is entitled to receive principal and interest payments, if any, made on the security delivered to the counterparty during the term of the agreement. Cash received in exchange for securities delivered plus accrued interest payments to be made by the Fund to counterparties are reflected as a liability on the Statements of Assets and Liabilities. Interest payments made by the Fund to counterparties are recorded as a component of interest expense on the Statements of Operations. In periods of increased demand for the security, the Fund may receive a fee for use of the security by the counterparty, which may result in interest income to the Fund.
The following is a summary by counterparty of the market value of reverse repurchase agreements and collateral pledged as of April 30, 2020:
| | | | | | | | |
| |
| Ashmore Emerging Markets Corporate Income Fund | |
| |
| | |
| Counterparty | | Payable for Reverse Repurchase Agreements | | | Collateral Pledged | |
| |
JP Morgan | | $ | 1,477,104 | | | $ | 2,770,052 | |
| | | | | | | | |
Total | | $ | 1,477,104 | | | $ | 2,770,052 | |
| | | | | | | | |
Securities with an aggregate market value of $2,770,052 have been pledged as collateral in respect of reverse repurchase agreements as of April 30, 2020. The actual collateral exceeds the market values of the reverse repurchase agreements.
The average amount of reverse repurchase agreements outstanding during the period ended April 30, 2020, was $369,276 at a weighted average interest rate of 1.75%.
122
ASHMORE FUNDS
NOTES TO FINANCIAL STATEMENTS (CONTINUED)
As of April 30, 2020 (Unaudited)
| 6. | Capital share transactions |
Transactions in Class A shares for the period ended April 30, 2020, were as follows:
| | | | | | | | | | | | | | | | | | | | | | | | | | | | | | | | |
| | | | | | | | | |
| Fund | | Shares Sold | | | Proceeds from Shares Sold | | | Shares from Reinvested Distributions | | | Proceeds from Reinvestment of Distributions | | | Shares Redeemed | | | Payments for Shares Redeemed | | | Net Increase/ (Decrease) in Shares | | | Net Increase/ (Decrease) in Net Assets | |
| Ashmore Emerging Markets Total Return Fund | | | 606,860 | | | $ | 4,366,442 | | | | 34,998 | | | $ | 243,729 | | | | (514,081 | ) | | $ | (3,678,373 | ) | | | 127,777 | | | $ | 931,798 | |
| Ashmore Emerging Markets Local Currency Bond Fund | | | — | | | | — | | | | 136 | | | | 1,011 | | | | (7,189 | ) | | | (42,129 | ) | | | (7,053 | ) | | | (41,118 | ) |
| Ashmore Emerging Markets Corporate Income Fund | | | 810,754 | | | | 6,269,063 | | | | 34,141 | | | | 256,580 | | | | (678,024 | ) | | | (4,856,979 | ) | | | 166,871 | | | | 1,668,664 | |
| Ashmore Emerging Markets Short Duration Fund | | | 1,338,064 | | | | 11,066,375 | | | | 437,274 | | | | 3,561,550 | | | | (8,778,165 | ) | | | (70,599,048 | ) | | | (7,002,827 | ) | | | (55,971,123 | ) |
| Ashmore Emerging Markets Active Equity Fund | | | 47,056 | | | | 417,867 | | | | 19 | | | | 214 | | | | (4,356 | ) | | | (42,510 | ) | | | 42,719 | | | | 375,571 | |
| Ashmore Emerging MarketsSmall-Cap Equity Fund | | | 5,140 | | | | 45,018 | | | | — | | | | — | | | | (117,932 | ) | | | (798,141 | ) | | | (112,792 | ) | | | (753,123 | ) |
| Ashmore Emerging Markets Frontier Equity Fund | | | 101,921 | | | | 849,838 | | | | — | | | | — | | | | (857,534 | ) | | | (7,001,760 | ) | | | (755,613 | ) | | | (6,151,922 | ) |
| Ashmore Emerging Markets Equity Fund | | | 10,409 | | | | 123,108 | | | | 50 | | | | 605 | | | | (23,397 | ) | | | (269,531 | ) | | | (12,938 | ) | | | (145,818 | ) |
123
ASHMORE FUNDS
NOTES TO FINANCIAL STATEMENTS (CONTINUED)
As of April 30, 2020 (Unaudited)
| | | | | | | | | | | | | | | | | | | | | | | | | | | | | | | | |
| | | | | | | | | |
| Fund | | Shares Sold | | | Proceeds from Shares Sold | | | Shares from Reinvested Distributions | | | Proceeds from Reinvestment of Distributions | | | Shares Redeemed | | | Payments for Shares Redeemed | | | Net Increase/ (Decrease) in Shares | | | Net Increase/ (Decrease) in Net Assets | |
| Ashmore Emerging Markets Equity ESG Fund | | | 100 | | | $ | 1,000 | | | | — | | | $ | — | | | | — | | | $ | — | | | | 100 | | | $ | 1,000 | |
|
Transactions in Class C shares for the period ended April 30, 2020, were as follows: | |
| | | | | | | | | |
| Fund | | Shares Sold | | | Proceeds from Shares Sold | | | Shares from Reinvested Distributions | | | Proceeds from Reinvestment of Distributions | | | Shares Redeemed | | | Payments for Shares Redeemed | | | Net Increase/ (Decrease) in Shares | | | Net Increase/ (Decrease) in Net Assets | |
| Ashmore Emerging Markets Total Return Fund | | | 52,523 | | | $ | 362,823 | | | | 12,307 | | | $ | 85,718 | | | | (117,146 | ) | | $ | (828,360 | ) | | | (52,316 | ) | | | $(379,819 | ) |
| Ashmore Emerging Markets Local Currency Bond Fund | | | — | | | | — | | | | 13 | | | | 93 | | | | — | | | | — | | | | 13 | | | | 93 | |
| Ashmore Emerging Markets Corporate Income Fund | | | 127,476 | | | | 1,015,754 | | | | 27,826 | | | | 207,720 | | | | (297,718 | ) | | | (2,155,732 | ) | | | (142,416 | ) | | | (932,258 | ) |
| Ashmore Emerging Markets Short Duration Fund | | | 113,968 | | | | 793,221 | | | | 10,287 | | | | 78,536 | | | | (134,897 | ) | | | (1,006,455 | ) | | | (10,642 | ) | | | (134,698 | ) |
| Ashmore Emerging Markets Active Equity Fund | | | — | | | | 1 | | | | — | | | | — | | | | (1,059 | ) | | | (12,001 | ) | | | (1,059 | ) | | | (12,000 | ) |
| Ashmore Emerging MarketsSmall-Cap Equity Fund | | | — | | | | — | | | | — | | | | — | | | | (3,762 | ) | | | (29,650 | ) | | | (3,762 | ) | | | (29,650 | ) |
| Ashmore Emerging Markets Frontier Equity Fund | | | 14,397 | | | | 103,122 | | | | — | | | | — | | | | (4,518 | ) | | | (33,870 | ) | | | 9,879 | | | | 69,252 | |
| Ashmore Emerging Markets Equity Fund | | | — | | | | — | | | | — | | | | — | | | | — | | | | — | | | | — | | | | — | |
124
ASHMORE FUNDS
NOTES TO FINANCIAL STATEMENTS (CONTINUED)
As of April 30, 2020 (Unaudited)
| | | | | | | | | | | | | | | | | | | | | | | | | | | | | | | | |
| | | | | | | | | |
| Fund | | Shares Sold | | | Proceeds from Shares Sold | | | Shares from Reinvested Distributions | | | Proceeds from Reinvestment of Distributions | | | Shares Redeemed | | | Payments for Shares Redeemed | | | Net Increase/ (Decrease) in Shares | | | Net Increase/ (Decrease) in Net Assets | |
| Ashmore Emerging Markets Equity ESG Fund | | | 100 | | | $ | 1,000 | | | | — | | | $ | — | | | | — | | | $ | — | | | | 100 | | | $ | 1,000 | |
|
Transactions in Institutional Class shares for the period ended April 30, 2020, were as follows: | |
| | | | | | | | | |
| Fund | | Shares Sold | | | Proceeds from Shares Sold | | | Shares from Reinvested Distributions | | | Proceeds from Reinvestment of Distributions | | | Shares Redeemed | | | Payments for Shares Redeemed | | | Net Increase/ (Decrease) in Shares | | | Net Increase/ (Decrease) in Net Assets | |
| Ashmore Emerging Markets Total Return Fund | | | 36,581,199 | | | $ | 253,793,526 | | | | 5,408,818 | | | $ | 38,369,028 | | | | (43,199,471 | ) | | | $(289,168,810 | ) | | | (1,209,454 | ) | | $ | 2,993,744 | |
| Ashmore Emerging Markets Local Currency Bond Fund | | | 457,274 | | | | 3,209,156 | | | | 64,929 | | | | 503,201 | | | | (965,100 | ) | | | (6,866,339 | ) | | | (442,897 | ) | | | (3,153,982 | ) |
| Ashmore Emerging Markets Corporate Income Fund | | | 11,619,484 | | | | 93,072,691 | | | | 679,603 | | | | 5,311,349 | | | | (25,558,025 | ) | | | (187,736,053 | ) | | | (13,258,938 | ) | | | (89,352,013 | ) |
| Ashmore Emerging Markets Short Duration Fund | | | 25,627,050 | | | | 216,350,991 | | | | 3,462,275 | | | | 27,628,061 | | | | (82,904,252 | ) | | | (624,123,311 | ) | | | (53,814,927 | ) | | | (380,144,259 | ) |
| Ashmore Emerging Markets Active Equity Fund | | | 7,825,435 | | | | 81,474,498 | | | | 5,263 | | | | 60,039 | | | | (3,502,012 | ) | | | (34,839,534 | ) | | | 4,328,686 | | | | 46,695,003 | |
| Ashmore Emerging MarketsSmall-Cap Equity Fund | | | 50,865 | | | | 494,093 | | | | — | | | | — | | | | (1,637,863 | ) | | | (17,584,855 | ) | | | (1,586,998 | ) | | | (17,090,762 | ) |
| Ashmore Emerging Markets Frontier Equity Fund | | | 871,257 | | | | 7,086,110 | | | | — | | | | — | | | | (2,335,261 | ) | | | (18,453,410 | ) | | | (1,464,004 | ) | | | (11,367,300 | ) |
| Ashmore Emerging Markets Equity Fund | | | 3,290,874 | | | | 29,434,353 | | | | 3,807 | | | | 44,204 | | | | (754,693 | ) | | | (6,530,384 | ) | | | 2,539,988 | | | | 22,948,173 | |
125
ASHMORE FUNDS
NOTES TO FINANCIAL STATEMENTS (CONTINUED)
As of April 30, 2020 (Unaudited)
| | | | | | | | | | | | | | | | | | | | | | | | | | | | | | | | |
| Fund | | Shares Sold | | | Proceeds from Shares Sold | | | Shares from
Reinvested
Distributions | | | Proceeds from Reinvestment of Distributions | | | Shares Redeemed | | | Payments for Shares Redeemed | | | Net Increase/ (Decrease) in Shares | | | Net Increase/ (Decrease) in Net Assets | |
| Ashmore Emerging Markets Equity ESG Fund | | | 999,800 | | | $ | 9,998,000 | | | | — | | | $ | — | | | | — | | | $ | — | | | | 999,800 | | | $ | 9,998,000 | |
|
Transactions in Class A shares for the year ended October 31, 2019, were as follows: | |
| Fund | | Shares Sold | | | Proceeds from
Shares Sold | | | Shares from
Reinvested
Distributions | | | Proceeds from
Reinvestment
of Distributions | | | Shares Redeemed | | | Payments for Shares Redeemed | | | Net Increase/
(Decrease) in
Shares | | | Net Increase/
(Decrease) in
Net Assets | |
| Ashmore Emerging Markets Total Return Fund | | | 998,414 | | | $ | 7,558,502 | | | | 56,834 | | | $ | 431,702 | | | | (724,545 | ) | | $ | (5,493,179 | ) | | | 330,703 | | | $ | 2,497,025 | |
| Ashmore Emerging Markets Local Currency Bond Fund | | | 430,000 | | | | 3,040,320 | | | | 70 | | | | 501 | | | | (359,880 | ) | | | (2,607,923 | ) | | | 70,190 | | | | 432,898 | |
| Ashmore Emerging Markets Corporate Income Fund | | | 999,040 | | | | 7,863,450 | | | | 49,282 | | | | 387,562 | | | | (453,387 | ) | | | (3,550,579 | ) | | | 594,935 | | | | 4,700,433 | |
| Ashmore Emerging Markets Short Duration Fund | | | 10,317,532 | | | | 100,991,640 | | | | 847,612 | | | | 8,168,410 | | | | (7,372,572 | ) | | | (69,828,989 | ) | | | 3,792,572 | | | | 39,331,061 | |
| Ashmore Emerging Markets Active Equity Fund | | | 4,664 | | | | 48,101 | | | | 1,773 | | | | 16,423 | | | | (7,662 | ) | | | (73,604 | ) | | | (1,225 | ) | | | (9,080 | ) |
| Ashmore Emerging MarketsSmall-Cap Equity Fund | | | 68,320 | | | | 562,609 | | | | 65 | | | | 554 | | | | (95,554 | ) | | | (813,798 | ) | | | (27,169 | ) | | | (250,635 | ) |
| Ashmore Emerging Markets Frontier Equity Fund | | | 909,538 | | | | 7,323,256 | | | | 15,381 | | | | 125,753 | | | | (1,052,776 | ) | | | (8,219,527 | ) | | | (127,857 | ) | | | (770,518 | ) |
126
ASHMORE FUNDS
NOTES TO FINANCIAL STATEMENTS (CONTINUED)
As of April 30, 2020 (Unaudited)
| | | | | | | | | | | | | | | | | | | | | | | | | | | | | | | | |
| Fund | | Shares Sold | | | Proceeds from Shares Sold | | | Shares from Reinvested Distributions | | | Proceeds from Reinvestment of Distributions | | | Shares
Redeemed | | | Payments for
Shares
Redeemed | | | Net Increase/ (Decrease) in Shares | | | Net Increase/ (Decrease) in Net Assets | |
| Ashmore Emerging Markets Equity Fund | | | 33,615 | | | | $ 357,561 | | | | 1,139 | | | | $ 12,320 | | | | (9,683 | ) | | | $ (105,463 | ) | | | 25,071 | | | | $ 264,418 | |
|
Transactions in Class C shares for the year ended October 31, 2019, were as follows: | |
| Fund | | Shares Sold | | | Proceeds from Shares Sold | | | Shares from Reinvested Distributions | | | Proceeds from Reinvestment of Distributions | | | Shares Redeemed | | | Payments for Shares Redeemed | | | Net Increase/ (Decrease) in Shares | | | Net Increase/ (Decrease) in Net Assets | |
| Ashmore Emerging Markets Total Return Fund | | | 245,064 | | | | $1,842,320 | | | | 22,284 | | | | $169,070 | | | | (122,489 | ) | | | $ (916,473 | ) | | | 144,859 | | | | $1,094,917 | |
| Ashmore Emerging Markets Local Currency Bond Fund | | | — | * | | | 71 | | | | 2 | | | | 12 | | | | (4,353 | ) | | | (29,119 | ) | | | (4,351 | ) | | | (29,036 | ) |
| Ashmore Emerging Markets Corporate Income Fund | | | 416,995 | | | | 3,263,986 | | | | 54,827 | | | | 430,774 | | | | (231,298 | ) | | | (1,817,105 | ) | | | 240,524 | | | | 1,877,655 | |
| Ashmore Emerging Markets Short Duration Fund | | | 171,138 | | | | 1,615,295 | | | | 17,953 | | | | 166,721 | | | | (132,461 | ) | | | (1,203,140 | ) | | | 56,630 | | | | 578,876 | |
| Ashmore Emerging Markets Active Equity Fund | | | — | | | | — | | | | 106 | | | | 966 | | | | — | | | | — | | | | 106 | | | | 966 | |
| Ashmore Emerging MarketsSmall-Cap Equity Fund | | | — | * | | | 120 | | | | — | | | | — | | | | (16,783 | ) | | | (149,056 | ) | | | (16,783 | ) | | | (148,936 | ) |
| Ashmore Emerging Markets Frontier Equity Fund | | | 4,957 | | | | 39,294 | | | | 600 | | | | 4,792 | | | | (21,152 | ) | | | (161,257 | ) | | | (15,595 | ) | | | (117,171 | ) |
127
ASHMORE FUNDS
NOTES TO FINANCIAL STATEMENTS (CONTINUED)
As of April 30, 2020 (Unaudited)
| | | | | | | | | | | | | | | | | | | | | | | | | | | | | | | | |
| Fund | | Shares Sold | | | Proceeds from Shares Sold | | | Shares from Reinvested Distributions | | | Proceeds from Reinvestment of Distributions | | | Shares Redeemed | | | Payments for Shares Redeemed | | | Net Increase/ (Decrease) in Shares | | | Net Increase/ (Decrease) in Net Assets | |
| Ashmore Emerging Markets Equity Fund | | | — | * | | | $ 1 | | | | 2 | | | | $ 18 | | | | — | | | | $ — | | | | 2 | | | | $ 19 | |
|
* Amount rounds to less than 0.5 shares. | |
|
Transactions in Institutional Class shares for the year ended October 31, 2019, were as follows: | |
| Fund | | Shares Sold | | | Proceeds
from Shares Sold | | | Shares from Reinvested Distributions | | | Proceeds from Reinvestment of Distributions | | | Shares Redeemed | | | Payments for Shares Redeemed | | | Net Increase/ (Decrease) in Shares | | | Net Increase/ (Decrease) in Net Assets | |
| Ashmore Emerging Markets Total Return Fund | | | 63,315,636 | | | | $484,755,522 | | | | 9,227,589 | | | | $71,101,652 | | | | (50,003,874 | ) | | | $(382,070,945 | ) | | | 22,539,351 | | | | $173,786,229 | |
| Ashmore Emerging Markets Local Currency Bond Fund | | | 2,306,010 | | | | 17,074,036 | | | | 61,710 | | | | 458,625 | | | | (6,085,333 | ) | | | (45,020,658 | ) | | | (3,717,613 | ) | | | (27,487,997 | ) |
| Ashmore Emerging Markets Corporate Income Fund | | | 33,012,593 | | | | 269,571,723 | | | | 1,064,643 | | | | 8,733,027 | | | | (19,248,890 | ) | | | (156,873,867 | ) | | | 14,828,346 | | | | 121,430,883 | |
| Ashmore Emerging Markets Short Duration Fund | | | 95,094,279 | | | | 912,174,812 | | | | 5,098,443 | | | | 48,170,866 | | | | (37,113,670 | ) | | | (345,315,322 | ) | | | 63,079,052 | | | | 615,030,356 | |
| Ashmore Emerging Markets Active Equity Fund | | | 197,160 | | | | 1,997,157 | | | | 158,249 | | | | 1,477,964 | | | | (55,954 | ) | | | (535,174 | ) | | | 299,455 | | | | 2,939,947 | |
| Ashmore Emerging MarketsSmall-Cap Equity Fund | | | 294,289 | | | | 3,236,180 | | | | 2,181 | | | | 24,310 | | | | (1,134,847 | ) | | | (12,767,464 | ) | | | (838,377 | ) | | | (9,506,974 | ) |
| Ashmore Emerging Markets Frontier Equity Fund | | | 1,649,957 | | | | 15,407,880 | | | | 140,716 | | | | 1,336,562 | | | | (1,874,076 | ) | | | (17,312,251 | ) | | | (83,403 | ) | | | (567,809 | ) |
| Ashmore Emerging Markets Equity Fund | | | 763,669 | | | | 7,751,075 | | | | 63,214 | | | | 661,482 | | | | (253,265 | ) | | | (2,736,953 | ) | | | 573,618 | | | | 5,675,604 | |
128
ASHMORE FUNDS
NOTES TO FINANCIAL STATEMENTS (CONTINUED)
As of April 30, 2020 (Unaudited)
Capital shares
Class A shares are issued at the Fund’s relevant NAV per share plus any applicable sales charge. Institutional Class and Class C shares are issued at the Fund’s relevant NAV per share without a sales charge. Shares confer upon the holders the right to receive notice of and attend, speak and vote at shareholder meetings of the Funds. The shares confer upon the holders the right to any or all dividends or distributions which the Trustees in their sole discretion may from time to time resolve to make or declare.
| 7. | Investment transactions |
For the period ended April 30, 2020, the aggregate cost of purchases and proceeds from sales of investments (including fully funded TRS and excluding short-term investments) for the Funds were as follows:
| | | | | | | | |
| Fund | | Purchases | | | Sales | |
| Ashmore Emerging Markets Total Return Fund | | $ | 440,507,300 | | | $ | 470,805,619 | |
| Ashmore Emerging Markets Local Currency Bond Fund | | | 10,069,044 | | | | 12,724,607 | |
| Ashmore Emerging Markets Corporate Income Fund | | | 250,121,061 | | | | 334,360,164 | |
| Ashmore Emerging Markets Short Duration Fund | | | 187,948,426 | | | | 588,112,021 | |
| Ashmore Emerging Markets Active Equity Fund | | | 100,463,357 | | | | 61,458,182 | |
| Ashmore Emerging MarketsSmall-Cap Equity Fund | | | 6,803,604 | | | | 24,755,422 | |
| Ashmore Emerging Markets Frontier Equity Fund | | | 48,661,381 | | | | 68,542,582 | |
| Ashmore Emerging Markets Equity Fund | | | 39,164,064 | | | | 17,774,423 | |
| Ashmore Emerging Markets Equity ESG Fund | | | 10,844,671 | | | | 1,171,470 | |
The difference between book basis and tax basis net unrealized appreciation (depreciation) is attributable primarily to the tax deferral of losses on wash sales, deferral of post October currency and capital losses for tax purposes, and the recharacterization of income recognition on investments in PFICs. At April 30, 2020, for federal income tax purposes, gross unrealized appreciation, gross unrealized depreciation, net unrealized appreciation (depreciation) on investments (including the effects of foreign currency translation and derivative instruments, if any) and the cost basis of investments (including derivative instruments, if any) were as follows:
| | | | | | | | | | | | | | | | |
| Amounts in Thousands | | Unrealized Appreciation | | Unrealized Depreciation | | Net Appreciation (Depreciation) | | Cost Basis of Investments | |
| Ashmore Emerging Markets Total Return Fund | | | $ 19,542,320 | | | | $ (360,792,882) | | | | $ (341,250,562) | | | | $ 1,459,116,274 | |
| Ashmore Emerging Markets Local Currency Bond Fund | | | 836,166 | | | | (6,411,507) | | | | (5,575,341) | | | | 37,176,799 | |
| Ashmore Emerging Markets Corporate Income Fund | | | 1,563,739 | | | | (79,777,271) | | | | (78,213,532) | | | | 359,071,152 | |
| Ashmore Emerging Markets Short Duration Fund | | | 99,076 | | | | (441,105,133) | | | | (441,006,057) | | | | 907,449,085 | |
| Ashmore Emerging Markets Active Equity Fund | | | 2,276,611 | | | | (6,805,192) | | | | (4,528,581) | | | | 54,843,257 | |
| Ashmore Emerging MarketsSmall-Cap Equity Fund | | | 880,222 | | | | (1,848,305) | | | | (968,083) | | | | 8,282,440 | |
| Ashmore Emerging Markets Frontier Equity Fund | | | 997,880 | | | | (13,503,115) | | | | (12,505,235) | | | | 63,345,794 | |
| Ashmore Emerging Markets Equity Fund | | | 2,361,590 | | | | (1,921,754) | | | | 439,836 | | | | 53,616,659 | |
| Ashmore Emerging Markets Equity ESG Fund | | | 147,621 | | | | (919,032) | | | | (771,411) | | | | 9,290,167 | |
129
ASHMORE FUNDS
NOTES TO FINANCIAL STATEMENTS (CONTINUED)
As of April 30, 2020 (Unaudited)
No provision for U.S. federal income taxes has been made since each Fund’s policy is to comply with the requirements of Subchapter M of the Internal Revenue Code of 1986, as amended, applicable to regulated investment companies, and to distribute, each year, substantially all of its taxable income and capital gains to its shareholders.
The Regulated Investment Company Modernization Act of 2010 (the “Act”) was enacted on December 22, 2010. The Act made changes to several tax rules affecting the Funds. Although the Act provides several benefits, including the unlimited carryover of future capital losses, there may be a greater likelihood that all, or a portion of a Fund’spre-enactment capital loss carryovers may expire without being utilized, due to the fact that post-enactment capital losses are utilized beforepre-enactment capital loss carryovers.
The following Funds have available capital loss carryforwards for which there is no expiration date:
| | | | | | | | |
| Fund | | Short-Term Capital Loss Carryforward at October 31, 2019 | | | Long-Term Capital Loss Carryforward at October 31, 2019 | |
| Ashmore Emerging Markets Total Return Fund | | $ | — | | | $ | (49,479,478) | |
| Ashmore Emerging Markets Local Currency Bond Fund | | | — | | | | (1,349,482) | |
| Ashmore Emerging Markets Corporate Income Fund | | | (4,188,503) | | | | (34,100,550) | |
| Ashmore Emerging Markets Short Duration Fund | | | (39,125) | | | | (1,476,678) | |
| Ashmore Emerging Markets Active Equity Fund | | | — | | | | (278,654) | |
| Ashmore Emerging MarketsSmall-Cap Equity Fund | | | (991,096) | | | | (2,407,262) | |
| Ashmore Emerging Markets Frontier Equity Fund | | | (4,079,920) | | | | (517,961) | |
| Ashmore Emerging Markets Equity Fund | | | (1,597,891) | | | | (470,857) | |
The Funds are subject to the provisions of the Financial Accounting Standards Board (“FASB”) Accounting Standards Codification (“ASC”) Topic740-10,Income Taxes. This standard provides guidance as to how uncertain tax positions should be recognized, measured, presented and disclosed in the Funds’ financial statements. The Funds recognize the tax benefits of uncertain tax positions only where the position ismore-likely-than-not (i.e. greater than50-percent) to be sustained assuming examination by a tax authority based on the technical merits of the position. In evaluating whether a tax position has met the recognition threshold, the Funds must presume that the position will be examined by the appropriate taxing authority that has full knowledge of all relevant information. A tax position that meets themore-likely-than-not recognition threshold is measured to determine the amount of benefit to recognize in the Funds’ financial statements. Income tax and related interest and penalties would be recognized by the Funds as tax expense in the Statement of Operations if the tax positions were deemed not to meet themore-likely-than-not threshold. The Funds analyze all open tax years for all major taxing jurisdictions. Open tax years are those that are open to examination by taxing authorities, as defined by the Statute of Limitations in each jurisdiction. The Funds have no examinations by tax authorities in progress. The Trust has analyzed the Funds’ tax positions, and has concluded that no liability for unrecognized tax benefits should be recorded related to uncertain tax positions. Further, the Trust is not aware of any tax positions for which it is reasonably possible that the total amounts of unrecognized tax benefits will significantly change in the next twelve months.
As of October 31, 2019, the components of distributable taxable earnings, including temporary differences were as follows:
| | | | | | | | | | | | | | | | | | | | |
| Fund | | Undistributed Ordinary Income | | | Undistributed Long Term Capital Gain | | | Accumulated Capital Losses and Other | | | Undistributed Appreciation (Depreciation) on Investments and Foreign Currencies | | | Total Accumulated Earnings (Deficit) | |
| Ashmore Emerging Markets Total Return Fund | | $ | — | | | $ | — | | | $ | (50,993,436) | | | $ | (58,518,100 | ) | | $ | (109,511,536 | ) |
130
ASHMORE FUNDS
NOTES TO FINANCIAL STATEMENTS (CONTINUED)
As of April 30, 2020 (Unaudited)
| | | | | | | | | | | | | | | | | | | | |
| Fund | | Undistributed Ordinary Income | | | Undistributed Long Term Capital Gain | | | Accumulated Capital Losses and Other | | | Undistributed Appreciation (Depreciation) on Investments and Foreign Currencies | | | Total Accumulated Earnings (Deficit) | |
| Ashmore Emerging Markets Local Currency Bond Fund | | | — | | | | — | | | | (1,365,870) | | | | (927,737) | | | | (2,293,607) | |
| Ashmore Emerging Markets Corporate Income Fund | | | 581,196 | | | | — | | | | (38,876,711) | | | | (16,311,922) | | | | (54,607,437) | |
| Ashmore Emerging Markets Short Duration Fund | | | 2,834,060 | | | | — | | | | (3,834,638) | | | | (136,100,146) | | | | (137,100,724) | |
| Ashmore Emerging Markets Active Equity Fund | | | — | | | | — | | | | (278,654) | | | | 319,284 | | | | 40,630 | |
| Ashmore Emerging MarketsSmall-Cap Equity Fund | | | — | | | | — | | | | (3,398,359) | | | | (2,047,108) | | | | (5,445,467) | |
| Ashmore Emerging Markets Frontier Equity Fund | | | 37,985 | | | | — | | | | (4,602,470) | | | | (1,645,128) | | | | (6,209,613) | |
| Ashmore Emerging Markets Equity Fund | | | 47,341 | | | | — | | | | (2,068,935) | | | | 2,386,949 | | | | 365,355 | |
The taxable character of distributions paid during the fiscal year ended October 31, 2019, were as follows: | |
| | | Distributions From | | | | | | | |
| Fund | | Ordinary Income | | | Short-Term Capital Gains | | | Long-Term Capital Gains | | | Return of Capital | | | Total Distributions Paid | |
| Ashmore Emerging Markets Total Return Fund | | $ | 64,237,212 | | | $ | — | | | $ | — | | | $ | 17,230,713 | | | $ | 81,467,925 | |
| Ashmore Emerging Markets Local Currency Bond Fund | | | — | | | | — | | | | — | | | | 486,524 | | | | 486,524 | |
| Ashmore Emerging Markets Corporate Income Fund | | | 27,943,249 | | | | — | | | | — | | | | — | | | | 27,943,249 | |
| Ashmore Emerging Markets Short Duration Fund | | | 84,955,579 | | | | 184,507 | | | | 2,758,398 | | | | — | | | | 87,898,484 | |
| Ashmore Emerging Markets Active Equity Fund | | | 243,975 | | | | 1,144,895 | | | | 365,845 | | | | 49,277 | | | | 1,803,992 | |
| Ashmore Emerging MarketsSmall-Cap Equity Fund | | | 27,427 | | | | — | | | | — | | | | 9,976 | | | | 37,403 | |
131
ASHMORE FUNDS
NOTES TO FINANCIAL STATEMENTS (CONTINUED)
As of April 30, 2020 (Unaudited)
| | | | | | | | | | | | | | | | | | | | |
| | | Distributions From | | | | | | | |
| Fund | | Ordinary Income | | | Short-Term Capital Gains | | | Long-Term Capital Gains | | | Return of
Capital | | | Total Distributions Paid | |
| Ashmore Emerging Markets Frontier Equity Fund | | | 1,527,563 | | | | — | | | | — | | | | — | | | | 1,527,563 | |
| Ashmore Emerging Markets Equity Fund | | | 772,783 | | | | — | | | | — | | | | — | | | | 772,783 | |
| 9. | Distributions to shareholders |
The Ashmore Emerging Markets Total Return Fund, Ashmore Emerging Markets Corporate Income Fund and Ashmore Emerging Markets Short Duration Fund declare distributions of their net investment income daily and pay such distributions monthly. The Ashmore Emerging Markets Local Currency Bond Fund, Ashmore Emerging Markets Active Equity Fund, Ashmore Emerging MarketsSmall-Cap Equity Fund, Ashmore Emerging Markets Frontier Equity Fund, Ashmore Emerging Markets Equity Fund and Ashmore Emerging Markets Equity ESG Fund declare and pay distributions of their net investment income at least quarterly.
Distributions of net realized capital gains, if any, are declared and paid at least annually. The Funds may also make a special distribution to comply with federal tax requirements. Income dividends and capital gains distributions determined in accordance with federal income tax regulations may differ from U.S. GAAP. Differences between tax regulations and U.S. GAAP may change the fiscal period in which income and capital items are recognized for tax and U.S. GAAP purposes. Examples of events that give rise to timing differences include wash sales, straddles and capital loss carryforwards. Further, the character of investment income and capital gains may be different for certain transactions under the two methods of accounting. Examples of characterization differences include the treatment of foreign currency transactions and swap transactions. As a result, income dividends and capital gain distributions declared during a fiscal period for federal tax purposes may differ significantly from the net investment income and realized capital gain reported on each Fund’s financial statements presented under U.S. GAAP. In general, to the extent that any differences which are permanent in nature result in over distributions to shareholders, the amount of the over distribution may be reported as return of capital. Temporary differences do not require reclassification. See note 8 for further details.
| 10. | Derivative instruments and hedging activities |
FASB ASC Topic815-10 (“Topic815-10”),Disclosures about Derivative Instruments and Hedging Activities, improves financial reporting about derivative instruments by requiring enhanced disclosures to enable investors to better understand how and why the Funds use derivative instruments, how these derivative instruments are accounted for and their effects on the Funds’ financial position and results of operations.
None of the derivatives held in the Funds have been designated as hedging instruments under Topic815-10. A discussion of the strategies for these derivatives and their counterparty credit risk can be found below.
In accordance with Topic815-10, the Funds record their trading-related derivative activities on a fair value basis (as described in note 4). Fair values represent the amount at which the instrument could be exchanged in a current transaction between willing parties, other than in a forced or liquidation sale.
The following disclosures contain information on how and why the Funds used derivative financial instruments; the credit-risk-related contingent features in certain derivative financial instruments; and how derivative financial instruments affected the Funds’ financial position, results of operations and cash flows. The location and fair value of these instruments on the Statements of Assets and Liabilities and the realized, and changes in unrealized, gains and losses on the Statements of Operations, are included in tables following each Fund’s Schedule of Investments and are categorized by type of financial derivative contract.
132
ASHMORE FUNDS
NOTES TO FINANCIAL STATEMENTS (CONTINUED)
As of April 30, 2020 (Unaudited)
(a) Options
Each Fund is subject to market risk in the normal course of pursuing its investment objectives. The Funds may enter into options to speculate on the price movements of the financial instrument underlying the option, for use as an economic hedge against certain equity positions held in a Fund’s portfolio holdings or for other investment purposes. Purchased option contracts give a Fund the right, but not the obligation, to buy or sell within a limited time, a financial instrument, commodity or currency at a contracted price that may also be settled in cash, based on differentials between specified indices or prices.
Options written obligate a Fund, in return for a premium, to buy or sell within a limited time, a financial instrument, commodity or currency at a contracted price that may also be settled in cash, based on differentials between specified indices or prices. Options written by a Fund may expose a Fund to the market risk of an unfavorable change in the financial instrument underlying the written option.
A Fund is exposed to counterparty risk from the potential that a seller or buyer of an option contract does not sell or purchase the underlying asset as agreed under the terms of the option contract. The maximum risk of loss from counterparty risk to a Fund holding a put or call option is generally the fair value of the contracts and the premiums paid to purchase its open option contracts. The risk of loss on call options sold by the Funds is potentially unlimited. A Fund considers the credit risk of the intermediary counterparties to its option transactions in evaluating potential credit risk.
Gains and losses associated with the valuation of options are recognized at fair value as the net change in unrealized appreciation/(depreciation) on investments in securities in the Statements of Operations. The premium on purchased put options exercised is subtracted from the proceeds of the sale of the underlying security or foreign currency in determining the realized gain or loss. The premium on purchased call options exercised is added to the cost of the securities or foreign currency purchased. Premiums paid on the purchase of options that expire unexercised are recorded as realized losses and are reflected in net realized gain/(loss) on investments in securities in the Statements of Operations.
During the period ended April 30, 2020, the Funds did not hold options contracts.
(b) Forward foreign currency exchange contracts
A forward foreign exchange contract involves an obligation to purchase or sell a specific currency at a future date at a price set at the time the contract is made. The Funds may enter into forward foreign currency exchange contracts in connection with settling planned purchases or sales of securities, as part of an investment strategy to protect against uncertainty in the level of future foreign exchange rates in the purchase and sale of securities, or to gain or limit exposure to foreign currencies. All forward foreign currency exchange contracts are valued daily at the applicable exchange rates. Any resulting unrealized gains or losses are recorded in net change in unrealized appreciation/(depreciation) on forward foreign currency exchange contracts in the Statements of Operations. A Fund records realized gains or losses at the time the forward foreign exchange contract is offset by entering into a closing transaction with the same counterparty or is extinguished by delivery of the currency. Realized gains or losses, if any, are included in net realized gain/(loss) on forward foreign exchange contracts in the Statements of Operations.
Risks arise upon entering into these contracts from the potential inability of counterparties to meet the terms of their contracts and from unanticipated movements in the value of a foreign currency relative to the United States Dollar. The contractual amounts of forward foreign currency exchange contracts do not necessarily represent the amounts potentially subject to risk. The measurement of the risks associated with these instruments should be considered in light of all related and offsetting transactions. The Funds bear market risk from changes in foreign currency exchange rates and credit risk if the counterparty fails to perform. Further information on the impact of these positions on the Funds’ financial statements can be found in the notes to the Schedules of Investments.
During the period ended April 30, 2020, the Ashmore Emerging Markets Total Return Fund, Ashmore Emerging Markets Local Currency Bond Fund, Ashmore Emerging Markets Corporate Income Fund, Ashmore Emerging Markets Active Equity Fund and Ashmore Emerging Markets Equity Fund had average quarterly contract notional exposures of $480,593,066, $26,982,687, $2,191,650, $263,675 and $17,376, respectively, related to forward foreign currency exchange contracts.
133
ASHMORE FUNDS
NOTES TO FINANCIAL STATEMENTS (CONTINUED)
As of April 30, 2020 (Unaudited)
(c) Swap Agreements
During the reporting period, certain Funds entered into swap agreements, which are arrangements between two parties to exchange cash flows based on a notional principal amount. Swap agreements are either privately negotiated in theover-the-counter market (“OTC swaps”) or may be executed in a multilateral or other trade facility platform, such as a registered exchange (“centrally cleared swaps”). Swap agreements are recorded at their fair value. The fair value is based on quoted market prices or prices obtained from a third party provider at the date of the Statements of Assets and Liabilities without any deduction for estimated future selling costs. Swap agreements are marked to market daily and the change in fair value, if any, is recorded as unrealized gain or loss. Payments made or received are recorded as part of realized gains and losses. Daily changes in valuation of centrally cleared swaps, if any, are recorded as a receivable or payable for the change in value as appropriate (“variation margin”) on the Statement of Assets and Liabilities.
The periodic payments on the swap agreements entered into by the Funds are reflected in the Statement of Operations within net realized gain/(loss) on interest rate swap contracts. Unrealized gains are reported as an asset and unrealized losses are reported as a liability in the Statements of Assets and Liabilities for OTC swaps. Changes in the fair value are reflected in the Statements of Operations within net change in unrealized appreciation/(depreciation) on interest rate and centrally cleared swap contracts in the period in which they occur. Certain Funds could be exposed to credit or market risk due to unfavorable changes in the fluctuation of interest rates or if the counterparty defaults on its obligations to perform.
During the period ended April 30, 2020, the Ashmore Emerging Markets Total Return Fund and Ashmore Emerging Markets Local Currency Bond Fund had average quarterly notional exposures of $36,089,874 and $5,196,000, respectively, related to interest rate swap agreements.
The Funds may enter into transactions subject to enforceable netting agreements or other similar arrangements (“netting agreements”). Generally, netting agreements allow the Funds to offset any exposure to a specific counterparty with any collateral received or delivered to that counterparty based on the terms of the agreements. Generally, the Funds manage their cash collateral and securities collateral on a counterparty basis. No amounts have been offset in the Statements of Assets and Liabilities.
Offsetting of Financial Assets and Derivative Assets as of April 30, 2020:
(a) Exchange-Traded:
Centrally Cleared Swaps
| | | | | | | | | | | | | | | | | | | | |
| |
| | | Ashmore Emerging Markets Total Return Fund | | | | | | | |
| |
| Counterparty | | Gross Amounts of Derivatives Assets Presented in the Statement of Assets and Liabilities | | | Gross Amounts of
Derivatives
Liabilities Presented in the Statement of Assets and Liabilities | | | Net Amounts | | | Collateral
(Received) Paid | | | Net Exposure | |
| |
HSBC Bank | | $ | — | | | $ | (4,272) | | | $ | (4,272) | | | $ | — | | | $ | (4,272) | |
JP Morgan | | | — | | | | (16,660) | | | | (16,660) | | | | — | | | | (16,660) | |
Merrill Lynch | | | — | | | | (4,370) | | | | (4,370) | | | | — | | | | (4,370) | |
| | | | | | | | | | | | | | | | | | | | |
| Total | | $ | — | | | $ | (25,302) | | | $ | (25,302) | | | $ | — | | | $ | (25,302) | |
| | | | | | | | | | | | | | | | | | | | |
134
ASHMORE FUNDS
NOTES TO FINANCIAL STATEMENTS (CONTINUED)
As of April 30, 2020 (Unaudited)
| | | | | | | | | | | | | | | | | | | | |
| |
| Ashmore Emerging Markets Local Currency Bond Fund | |
| |
| Counterparty | | Gross Amounts of
Derivatives Assets
Presented in the
Statement of
Assets and
Liabilities | | | Gross Amounts of Derivatives Liabilities Presented in the Statement of Assets and Liabilities | | | Net Amounts | | | Collateral
(Received) Paid | | | Net Exposure | |
| |
HSBC Bank | | $ | 51 | | | $ | (494) | | | $ | (443) | | | $ | — | | | $ | (443) | |
JP Morgan | | | — | | | | (1,245) | | | | (1,245) | | | | — | | | | (1,245) | |
Merrill Lynch | | | — | | | | (1,842) | | | | (1,842) | | | | — | | | | (1,842) | |
| | | | | | | | | | | | | | | | | | | | |
| Total | | $ | 51 | | | $ | (3,581) | | | $ | (3,530) | | | $ | — | | | $ | (3,530) | |
| | | | | | | | | | | | | | | | | | | | |
(b)Over-the-Counter Financial Derivative Instruments:
Forward Currency Contracts and Interest Rate Swap Contracts
| | | | | | | | | | | | | | | | |
| |
| Ashmore Emerging Markets Total Return Fund | |
| |
| Counterparty | | Gross Amounts of Derivatives Assets Presented in the Statement of Assets and Liabilities | | | Derivatives available for offset | | | Collateral Received | | | Net Amount Due From Counterparty | |
| |
ANZ | | $ | 228,077 | | | $ | (87,703) | | | $ | — | | | $ | 140,374 | |
Barclays | | | 752,489 | | | | (368,625) | | | | — | | | | 383,864 | |
BNP Paribas | | | 246,601 | | | | (87,015) | | | | — | | | | 159,586 | |
Citibank | | | 93,858 | | | | (9,911) | | | | — | | | | 83,947 | |
Deutsche Bank | | | 264,096 | | | | (264,096) | | | | — | | | | — | |
Goldman Sachs | | | 75,916 | | | | — | | | | — | | | | 75,916 | |
HSBC Bank | | | 503,937 | | | | (503,937) | | | | — | | | | — | |
JP Morgan | | | 368,044 | | | | (155,611) | | | | — | | | | 212,433 | |
Merrill Lynch | | | 648,798 | | | | (648,798) | | | | — | | | | — | |
Morgan Stanley | | | 91,524 | | | | (86,307) | | | | — | | | | 5,217 | |
Standard | | | | | | | | | | | | | | | | |
Chartered | | | 17,521 | | | | — | | | | — | | | | 17,521 | |
| | | | | | | | | | | | | | | | |
Total | | $ | 3,290,861 | | | $ | (2,212,003) | | | $ | — | | | $ | 1,078,858 | |
| | | | | | | | | | | | | | | | |
| | | | | | | | | | | | | | | | |
| |
| Ashmore Emerging Markets Total Return Fund | |
| |
| Counterparty | | Gross Amounts of Derivatives Liabilities Presented in the Statement of Assets and Liabilities | | | Derivatives available for offset | | | Collateral Pledged | | | Net Amount Due From Counterparty | |
| |
ANZ | | $ | 87,703 | | | $ | (87,703) | | | $ | — | | | $ | — | |
Barclays | | | 368,625 | | | | (368,625) | | | | — | | | | — | |
BNP Paribas | | | 87,015 | | | | (87,015) | | | | — | | | | — | |
Citibank | | | 9,911 | | | | (9,911) | | | | — | | | | — | |
Credit Suisse | | | 141,943 | | | | — | | | | — | | | | 141,943 | |
Deutsche Bank | | | 384,168 | | | | (264,096) | | | | — | | | | 120,072 | |
HSBC Bank | | | 958,512 | | | | (503,937) | | | | — | | | | 454,575 | |
JP Morgan | | | 155,611 | | | | (155,611) | | | | — | | | | — | |
135
ASHMORE FUNDS
NOTES TO FINANCIAL STATEMENTS (CONTINUED)
As of April 30, 2020 (Unaudited)
| | | | | | | | | | | | | | | | |
| Ashmore Emerging Markets Total Return Fund | |
| Counterparty | | Gross Amounts of Derivatives Liabilities Presented in the Statement of Assets and Liabilities | | | Derivatives available for offset | | | Collateral Pledged | | | Net Amount Due From Counterparty | |
Merrill Lynch | | $ | 3,347,736 | | | $ | (648,798) | | | $ | — | | | $ | 2,698,938 | |
Morgan Stanley | | | 86,307 | | | | (86,307) | | | | — | | | | — | |
UBS | | | 6,442 | | | | — | | | | — | | | | 6,442 | |
| | | | | | | | | | | | | | | | |
Total | | $ | 5,633,973 | | | $ | (2,212,003) | | | $ | — | | | $ | 3,421,970 | |
| | | | | | | | | | | | | | | | |
| | | | |
| | | | | | | | | | | | | | | | |
| Ashmore Emerging Markets Local Currency Bond Fund | |
| Counterparty | | Gross Amounts of Derivatives Assets Presented in the Statement of Assets and Liabilities | | | Derivatives available for offset | | | Collateral Received | | | Net Amount Due From Counterparty | |
Barclays | | $ | 46,317 | | | $ | (44,648) | | | $ | — | | | $ | 1,669 | |
BNP Paribas | | | 47,799 | | | | (6,274) | | | | — | | | | 41,525 | |
Citibank | | | 1,292 | | | | (690) | | | | — | | | | 602 | |
Credit Suisse | | | 7,601 | | | | — | | | | — | | | | 7,601 | |
Deutsche Bank | | | 12,332 | | | | (12,332) | | | | — | | | | — | |
Goldman Sachs | | | 7,412 | | | | — | | | | — | | | | 7,412 | |
HSBC Bank | | | 145,139 | | | | (3,318) | | | | — | | | | 141,821 | |
JP Morgan | | | 13,014 | | | | (11,460) | | | | — | | | | 1,554 | |
Merrill Lynch | | | 25,927 | | | | (25,927) | | | | — | | | | — | |
Morgan Stanley | | | 808 | | | | (808) | | | | — | | | | — | |
Standard | |
Chartered | | | 622 | | | | (622) | | | | — | | | | — | |
UBS | | | 687 | | | | (687) | | | | — | | | | — | |
| | | | | | | | | | | | | | | | |
Total | | $ | 308,950 | | | $ | (106,766) | | | $ | — | | | $ | 202,184 | |
| | | | | | | | | | | | | | | | |
| | | | |
| | | | | | | | | | | | | | | | |
| Ashmore Emerging Markets Local Currency Bond Fund | |
| Counterparty | | Gross Amounts of Derivatives Liabilities Presented in the Statement of Assets and Liabilities | | | Derivatives available for offset | | | Collateral Pledged | | | Net Amount Due From Counterparty | |
Barclays | | $ | 44,648 | | | $ | (44,648) | | | $ | — | | | $ | — | |
BNP Paribas | | | 6,274 | | | | (6,274) | | | | — | | | | — | |
Citibank | | | 690 | | | | (690) | | | | — | | | | — | |
Deutsche Bank | | | 52,149 | | | | (12,332) | | | | — | | | | 39,817 | |
HSBC Bank | | | 3,318 | | | | (3,318) | | | | — | | | | — | |
JP Morgan | | | 11,460 | | | | (11,460) | | | | — | | | | — | |
Merrill Lynch | | | 93,532 | | | | (25,927) | | | | — | | | | 67,605 | |
Morgan Stanley | | | 5,273 | | | | (808) | | | | — | | | | 4,465 | |
Standard | | | | | | | | |
Chartered | | | 6,927 | | | | (622) | | | | — | | | | 6,305 | |
UBS | | | 2,069 | | | | (687) | | | | — | | | | 1,382 | |
| | | | | | | | | | | | | | | | |
Total | | $ | 226,340 | | | $ | (106,766) | | | $ | — | | | $ | 119,574 | |
| | | | | | | | | | | | | | | | |
136
ASHMORE FUNDS
NOTES TO FINANCIAL STATEMENTS (CONTINUED)
As of April 30, 2020 (Unaudited)
| | | | | | | | | | | | | | | | |
| Ashmore Emerging Markets Corporate Income Fund | |
| Counterparty | | Gross Amounts of Derivatives Assets Presented in the Statement of Assets and Liabilities | | | Derivatives available for offset | | | Collateral Received | | | Net Amount Due From Counterparty | |
Merrill Lynch | | $ | 6,561 | | | $ | — | | | $ | — | | | $ | 6,561 | |
| | | | | | | | | | | | | | | | |
Total | | $ | 6,561 | | | $ | — | | | $ | — | | | $ | 6,561 | |
| | | | | | | | | | | | | | | | |
| | | | |
| | | | | | | | | | | | | | | | |
| Ashmore Emerging Markets Corporate Income Fund | |
| Counterparty | | Gross Amounts of Derivatives Liabilities Presented in the Statement of Assets and Liabilities | | | Derivatives available for offset | | | Collateral Pledged | | | Net Amount Due From Counterparty | |
HSBC Bank | | $ | 12,913 | | | $ | — | | | $ | — | | | $ | 12,913 | |
| | | | | | | | | | | | | | | | |
Total | | $ | 12,913 | | | $ | — | | | $ | — | | | $ | 12,913 | |
| | | | | | | | | | | | | | | | |
| | | | |
| | | | | | | | | | | | | | | | |
| Ashmore Emerging Markets Active Equity Fund | |
| Counterparty | | Gross Amounts of Derivatives Liabilities Presented in the Statement of Assets and Liabilities | | | Derivatives available for offset | | | Collateral Pledged | | | Net Amount Due From Counterparty | |
Credit Suisse | | $ | 9,422 | | | $ | — | | | $ | — | | | $ | 9,422 | |
| | | | | | | | | | | | | | | | |
Total | | $ | 9,422 | | | $ | — | | | $ | — | | | $ | 9,422 | |
| | | | | | | | | | | | | | | | |
| | | | |
| | | | | | | | | | | | | | | | |
| Ashmore Emerging Markets Equity Fund | |
| Counterparty | | Gross Amounts of Derivatives Liabilities Presented in the Statement of Assets and Liabilities | | | Derivatives available for offset | | | Collateral Pledged | | | Net Amount Due From Counterparty | |
Brown Brothers | | | | | | | | | | | | | | | | |
Harriman | | $ | 172 | | | $ | — | | | $ | — | | | $ | 172 | |
| | | | | | | | | | | | | | | | |
Total | | $ | 172 | | | $ | — | | | $ | — | | | $ | 172 | |
| | | | | | | | | | | | | | | | |
Investment management fees
The Trust has an Investment Management Agreement (the “Agreement”) with the Investment Manager, with whom certain Trustees and Officers of the Trust are affiliated, to furnish investment management services to the Funds. Under the terms of the Agreement, the Trust, on behalf of the Funds, compensates the Investment Manager for its investment management services at the following rates, based on each Fund’s average daily net assets:
| | | | |
| | |
| Fund | | Rate | |
Ashmore Emerging Markets Total Return Fund | | | 1.00 | % |
Ashmore Emerging Markets Local Currency Bond Fund | | | 0.95 | % |
Ashmore Emerging Markets Corporate Income Fund | | | 1.15 | % |
Ashmore Emerging Markets Short Duration Fund | | | 0.65 | % |
Ashmore Emerging Markets Active Equity Fund | | | 1.00 | % |
Ashmore Emerging MarketsSmall-Cap Equity Fund | | | 1.50 | % |
137
ASHMORE FUNDS
NOTES TO FINANCIAL STATEMENTS (CONTINUED)
As of April 30, 2020 (Unaudited)
| | | | |
| | |
| Fund | | Rate | |
Ashmore Emerging Markets Frontier Equity Fund | | | 1.50 | % |
Ashmore Emerging Markets Equity Fund | | | 1.15 | % |
Ashmore Emerging Markets Equity ESG Fund | | | 1.15 | % |
The Investment Manager has contractually agreed to waive its fees or reimburse each Fund for other expenses until February 28, 2021 to the extent that total operating expenses (other than acquired fund fees and expenses, interest expenses, taxes, extraordinary expenses and certain credits and offset arrangements) for each class of shares of each Fund exceed the rates in the table below, based on each Fund’s average daily net assets. The expense limitation arrangement may be terminated by the Board at any time.
| | | | | | |
| | | | |
| Fund | | Class A | | Class C | | Institutional Class |
Ashmore Emerging Markets Total Return Fund | | 1.27% | | 2.02% | | 1.02% |
Ashmore Emerging Markets Local Currency Bond Fund | | 1.22% | | 1.97% | | 0.97% |
Ashmore Emerging Markets Corporate Income Fund | | 1.42% | | 2.17% | | 1.17% |
Ashmore Emerging Markets Short Duration Fund | | 0.92% | | 1.67% | | 0.67% |
Ashmore Emerging Markets Active Equity Fund | | 1.27% | | 2.02% | | 1.02% |
Ashmore Emerging MarketsSmall-Cap Equity Fund | | 1.77% | | 2.52% | | 1.52% |
Ashmore Emerging Markets Frontier Equity Fund | | 1.77% | | 2.52% | | 1.52% |
Ashmore Emerging Markets Equity Fund | | 1.42% | | 2.17% | | 1.17% |
Ashmore Emerging Markets Equity ESG Fund | | 1.42% | | 2.17% | | 1.17% |
Any such waiver or reimbursement is subject to the Investment Manager’s right to recover amounts waived or reimbursed to the extent actual fees and expenses for a future fiscal period are less than each Fund’s expense limitation cap, provided, however, that the Investment Manager shall only be entitled to recover such amounts waived or reimbursed during the previous three fiscal years. The amounts recaptured pursuant to the expense limitation agreement will be limited to the lesser of (1) the expense limitation amount that was in effect at the time of the waiver or reimbursement or (2) the expense limitation amount that is in effect at the time of recapture. The total amounts subject to recovery in fiscal years are shown below:
| | | | | | | | | | | | | | | | | | | | |
| | | | | | |
| Fund | | 2020 | | | 2021 | | | 2022 | | | 2023 | | | Total | |
| Ashmore Emerging Markets Total Return Fund | | $ | 947,660 | | | $ | 1,258,875 | | | $ | 1,264,520 | | | $ | 773,217 | | | $ | 4,244,272 | |
| Ashmore Emerging Markets Local Currency Bond Fund | | | 242,748 | | | | 247,985 | | | | 209,246 | | | | 105,379 | | | | 805,358 | |
| Ashmore Emerging Markets Corporate Income Fund | | | 295,848 | | | | 411,298 | | | | 398,019 | | | | 232,109 | | | | 1,337,274 | |
| Ashmore Emerging Markets Short Duration Fund | | | 201,321 | | | | 387,123 | | | | 1,013,327 | | | | 549,105 | | | | 2,150,876 | |
138
ASHMORE FUNDS
NOTES TO FINANCIAL STATEMENTS (CONTINUED)
As of April 30, 2020 (Unaudited)
| | | | | | | | | | | | | | | | | | | | |
| | | | | | |
| Fund | | 2020 | | | 2021 | | | 2022 | | | 2023 | | | Total | |
| Ashmore Emerging Markets Active Equity Fund | | | 226,921 | | | | 131,123 | | | | 133,595 | | | | 77,533 | | | | 569,172 | |
| Ashmore Emerging MarketsSmall-Cap Equity Fund | | | 172,952 | | | | 227,807 | | | | 161,504 | | | | 70,249 | | | | 632,512 | |
| Ashmore Emerging Markets Frontier Equity Fund | | | 293,467 | | | | 399,730 | | | | 314,851 | | | | 173,223 | | | | 1,181,271 | |
| Ashmore Emerging Markets Equity Fund | | | 129,266 | | | | 190,079 | | | | 157,757 | | | | 73,527 | | | | 550,629 | |
| Ashmore Emerging Markets Equity ESG Fund | | | — | | | | — | | | | — | | | | 38,729 | | | | 38,729 | |
Distribution and Servicing fees
The Funds have adopted Amended Plans of Distribution and Servicing Fees pursuant to Rule12b-1 under the 1940 Act (“Distribution and Servicing Fee Plans”). Under the Distribution and Servicing Fee Plans, each of the Funds may pay fees to the distributor on an ongoing basis as compensation for the services the distributor renders and the expenses it bears in connection with the sale and distribution of Fund shares (“distribution fees”) and/or in connection with personal services rendered to Fund shareholders and the maintenance of shareholder accounts (“servicing fees”). Class A and C shares each have a separate12b-1 Plan. Class A shares pay only servicing fees. Class C shares pay both distribution and servicing fees. The following table lists the maximum annual rates at which the distribution and/or servicing fees may be paid under each12b-1 Plan (calculated as a percentage of a Fund’s average daily net assets attributable to the particular class of shares):
| | | | |
| | | |
| | | Servicing Fee | | Distribution Fee |
Class A shares | | 0.25% | | None |
Class C shares | | 0.25% | | 0.75% |
Cross Trades
The 1940 Act prohibits the Funds and their affiliates from knowingly selling any security or other property to the Funds (other than securities of which the buyer is the issuer), or buying any security (other than securities of which the seller is the issuer) or other property from the Funds. Rule17a-7 under the 1940 Act provides relief from these prohibitions for various types of “cross trades” and similar transactions that may benefit shareholders by allowing the participating funds or accounts to avoid brokerage commissions and other transaction costs of trades.
During the period ended April 30, 2020, the following Funds bought and/or sold securities from an account or accounts that were also advised by the Trust’s investment adviser or its affiliates:
| | | | | | | | |
| | | |
| Fund | | Purchases | | | Sales | |
Ashmore Emerging Markets Total Return Fund | | $ | 51,636,579 | | | $ | 12,012,070 | |
Ashmore Emerging Markets Corporate Income Fund | | | 4,380,695 | | | | 26,478,864 | |
Ashmore Emerging Markets Short Duration Fund | | | 10,992,849 | | | | 175,937,709 | |
As of April 30, 2020, Ashmore Investments UK Limited owned the following percentages of the outstanding shares of each Fund:
| | | | | | | | |
| | | |
| Fund | | Class A | | | Class C | |
Ashmore Emerging Markets Active Equity Fund | | | — | | | | 100.00 | % |
139
ASHMORE FUNDS
NOTES TO FINANCIAL STATEMENTS (CONTINUED)
As of April 30, 2020 (Unaudited)
| | | | | | | | |
| | | |
| Fund | | Class A | | | Class C | |
Ashmore Emerging Markets Equity Fund | | | — | | | | 100.00 | % |
Ashmore Emerging Markets Equity ESG Fund | | | 100.00 | % | | | 100.00 | % |
| | | | | | | | |
| Fund | | | | | Institutional Class | |
Ashmore Emerging Markets Frontier Equity Fund | | | | | | | 5.54 | % |
Ashmore Emerging Markets Equity Fund | | | | | | | 46.99 | % |
Ashmore Emerging Markets Equity ESG Fund | | | | | | | 100.00 | % |
In addition to the Ashmore Investments UK Limited ownership, shown in the table above, the following Funds had other investors owning of record or known by the Funds to own beneficially greater than 5% of the outstanding shares of such Funds:
| | | | | | |
Fund | | Class | | # of Investors Owning > 5% of outstanding Shares | | % of Ownership by Investor |
| Ashmore Emerging Markets Total Return Fund | | Class A | | 10 | | 9.42%, 9.08%, 8.87%, 8.34%, 8.34%, 7.83%, 6.97%, 6.06%, 5.65%, 5.58% |
| | | Class C | | 3 | | 22.27%, 20.34%, 6.10% |
| | | Class I | | 4 | | 28.17%, 11.28%, 8.68%, 5.02% |
| Ashmore Emerging Markets Local Currency Bond Fund | | Class A | | 3 | | 64.67%, 16.36%, 11.80% |
| | | Class C | | 4 | | 42.48%, 42.48%, 9.40%, 5.64% |
| | | Class I | | 3 | | 64.25%, 27.28%, 6.99% |
| Ashmore Emerging Markets Corporate Income Fund | | Class A | | 5 | | 20.49%, 17.19%, 16.40%, 14.92%, 14.89% |
| | | Class C | | 3 | | 33.45%, 23.35%, 19.63% |
| | | Class I | | 2 | | 18.72%, 6.13% |
| Ashmore Emerging Markets Short Duration Fund | | Class A | | 3 | | 73.00%, 11.18%, 7.78% |
| | | Class C | | 2 | | 83.95%, 5.65% |
| | | Class I | | 6 | | 24.35%, 21.33%, 15.08%, 12.87%, 8.34%, 5.42% |
| Ashmore Emerging Markets Active Equity Fund | | Class A | | 1 | | 87.16% |
| | | Class I | | 3 | | 41.15%, 39.99%, 6.48% |
140
ASHMORE FUNDS
NOTES TO FINANCIAL STATEMENTS (CONTINUED)
As of April 30, 2020 (Unaudited)
| | | | | | |
| | | | |
Fund | | Class | | # of Investors Owning > 5% of outstanding
Shares | | % of Ownership by Investor |
| Ashmore Emerging MarketsSmall-Cap Equity Fund | | Class A | | 6 | | 53.85%, 10.47%, 9.10%, 8.11%, 6.16%, 5.13% |
| | | Class C | | 4 | | 57.67%, 24.16%, 6.40%, 5.38% |
| | | Class I | | 6 | | 35.86%, 11.49%, 10.15%, 8.61%, 7.42%, 6.25% |
| | | | |
| Ashmore Emerging Markets Frontier Equity Fund | | Class A | | 3 | | 45.37%, 25.47%, 15.73% |
| | | | |
| | | Class C | | 3 | | 70.44%, 14.33%, 12.49% |
| | | | |
| | | Class I | | 2 | | 43.95%, 30.90% |
| Ashmore Emerging Markets Equity Fund | | Class A | | 4 | | 72.40%, 8.18%, 6.10%, 5.64% |
| | | Class I | | 2 | | 33.42%, 7.71% |
In relation to its investments, some of the Funds of the Trust may from time to time agree to indemnify and/orpre-fund trustees or other agents, either solely or alongside other creditors on a several basis. Generally, such agreements do not have a termination date. The Trustees are not aware of and do not currently expect any claims to be made against the Funds under any such indemnity orpre-funding agreements.
The Funds have submitted a proof of claim in connection with the settlement of a securities class action lawsuit brought by certain investors against Petróleo Brasileiro S.A. and certain of its affiliates, underwriters, external auditors, and current and former directors and officers. A gain will not be recorded with regard to this matter until it is settled, and is expected to be immaterial.
The Funds have submitted a claim in connection with the settlement of a securities class action lawsuit preliminarily approved by the U.S. District Court for the Southern District of New York captioned in re Foreign Exchange Benchmark Rates Antitrust Litigation. A gain will not be recorded with regard to this matter until it is settled.
| 14. | New accounting pronouncements |
On March 30, 2017, the FASB issued Accounting Standards Update (ASU)2017-08 “Premium Amortization on Purchased Callable Debt Securities”, which amends the amortization period for certain purchased callable debt securities held at a premium by shortening such period to the earliest call date. The new guidance requires an entity to amortize the premium on a callable debt security within its scope to the earliest call date. If the call option is not exercised at the earliest call date, the yield is reset to the effective yield using the payment terms of the security. If there are no other call dates, any excess of the amortized cost basis over the par amount will be amortized to maturity. Discounts on purchased callable debt securities will continue to be amortized to the security’s maturity date. The ASU2017-08 is effective for public business entities for fiscal years, and
141
ASHMORE FUNDS
NOTES TO FINANCIAL STATEMENTS (CONTINUED)
As of April 30, 2020 (Unaudited)
interim periods within those fiscal years, beginning after December 15, 2018. If an entity early adopts the ASU in an interim period, any adjustments must be reflected as of the beginning of the fiscal year that includes that interim period. The Funds have adopted the ASU. The adoption of the ASU did not have a material impact on the Funds’ financial statements.
On August 28, 2018, the FASB issued Accounting Standards Update (“ASU”)2018-13, “Disclosure Framework —Changes to the Disclosure Requirements for Fair Value Measurement,” which amends the fair value measurement disclosure requirements of ASC 820. The amendments of ASU2018-13 include new, eliminated, and modified disclosure requirements of ASC 820. In addition, the amendments clarify that materiality is an appropriate consideration of entities when evaluating disclosure requirements. The ASU is effective for all entities for fiscal years beginning after December 15, 2019, including interim periods therein. Early adoption is permitted for any eliminated or modified disclosures upon issuance of this ASU. The Funds have early adopted certain provisions of ASU2018-13 for these financial statements.
Certain of the Funds’ investments, payment obligations, and financing terms may be based on floating rates such as LIBOR, Euro Interbank Offered Rate, and other similar types of reference rates (each, a “Reference Rate”). On July 27, 2017, the Chief Executive of the UK Financial Conduct Authority (“FCA”), which regulates LIBOR, announced that the FCA will no longer persuade nor compel banks to submit rates for the calculation of LIBOR and certain other Reference Rates after 2021. Such announcement indicates that the continuation of LIBOR and other Reference Rates on the current basis cannot and will not be guaranteed after 2021. The transition away from Reference Rates may lead to increased volatility and illiquidity in markets that are tied to such Reference Rates and reduced values of Reference Rate-related instruments. This announcement and any additional regulatory or market changes that occur as a result of the transition away from Reference Rates may have an adverse impact on a Fund’s investments, performance, or financial condition.
COVID-19, the novel respiratory disease also known as “coronavirus”, which was first detected in China in December 2019, has now been declared a pandemic by the World Health Organization. The coronavirus has resulted in closing borders, enhanced health screenings, healthcare service shortages, quarantines, cancelations, disruptions to supply chains and vendor and customer activity, as well as general concern and uncertainty. The impact of infectious diseases across the world, but especially in developing or emerging market countries, may be more pronounced where less established health care systems exists or where health care systems are unprepared to handle the outbreak of a disease like the coronavirus. Health crises caused by the recent coronavirus outbreak may exacerbate otherpre-existing political, social and economic risks in certain countries. The duration of theCOVID-19 pandemic and its effects cannot be determined with certainty, and could prevent a Fund from executing advantageous investment decisions in a timely manner and negatively impact a Fund’s ability to achieve its investment objective.
On June 15, 2020, the Trust launched the Ashmore Emerging Markets Short Duration Select Fund.
The Trust has evaluated subsequent events for the Funds through the date the financial statements were issued, and has concluded that there are no identified subsequent events relevant for financial statement adjustment or disclosure, other than the item mentioned above.
142
ASHMORE FUNDS
LIQUIDITY RISK MANAGEMENT PROGRAM
As of April 30, 2020 (Unaudited)
LIQUIDITY RISK MANAGEMENT PROGRAM
The Funds have adopted a liquidity risk management program pursuant to Rule22e-4 under the Investment Company Act of 1940, as amended. The program’s principal objectives are to support each Fund’s compliance with limits on investments in illiquid assets and to mitigate the risk that a Fund is unable to meet its redemption obligations in a timely manner. From December 1, 2018 through December 31, 2019, the period covered by the annual liquidity risk management report to the Board of Trustees regarding the operation and effectiveness of the program, the program supported each Fund’s ability to meet redemption requests in a timely manner and the program administrator’s management of each Fund’s liquidity risk, including during any periods of market volatility and net redemptions. The program includes a number of elements that support the management or assessment of liquidity risk, including an annual assessment of factors that may impact a Fund’s liquidity and the periodic classification (orre-classification, as determined necessary) of a Fund’s investments into liquidity buckets that reflect the program administrator’s assessment of their relative liquidity under current market conditions. There can be no assurance that the program will achieve its objectives under all circumstances in the future. Please refer to your Fund’s prospectus for more information regarding each Fund’s exposure to liquidity risk and other risks to which each Fund may be subject.
143
ASHMORE FUNDS
ADVISORY AGREEMENT APPROVAL
As of April 30, 2020 (Unaudited)
ADVISORY AGREEMENT APPROVAL FOR ASHMORE EMERGING MARKETS EQUITY ESG FUND
At anin-person meeting of the Board of Trustees of Ashmore Funds (the “Trust”) held on December 11, 2019, the Board, including a majority of the Trustees who are not “interested persons” of the Trust within the meaning of the Investment Company Act of 1940, as amended (the “1940 Act”) (the “Independent Trustees”), voting separately, considered and unanimously approved the Investment Management Agreement (the “Agreement”) between Ashmore Investment Advisors Limited (“AIAL”) and the Trust, on behalf of Ashmore Emerging Markets Equity ESG Fund (the “Fund”). In determining to approve the Agreement for an initial term, the Trustees considered all factors that they believed, in light of the legal advice furnished to them and their own business judgment, to be relevant to the interests of shareholders, including those listed below.
In evaluating the terms of the Agreement, the Board did not identify any single factor as controlling, and individual members of the Board did not necessarily attribute the same weight or importance to each factor, nor are the items described hereinall-encompassing of the matters considered by the Board. Throughout their review of the Agreement, the Independent Trustees were assisted by their own Independent Trustee legal counsel. The Independent Trustees had formally requested through their legal counsel, and AIAL had provided, certain information the Independent Trustees considered relevant to their evaluation. The Independent Trustees discussed the information on different occasions, without representatives of AIAL present.
Among the information and factors considered by the Board in evaluating the Agreement were the following:
NATURE, QUALITY AND EXTENT OF INVESTMENT MANAGEMENT SERVICES
The Board examined the nature, quality and extent of the services expected to be provided to the Fund by AIAL.
AIAL’s Services
The Board considered information regarding the overall organization and resources of AIAL, including information regarding senior management, portfolio managers and other personnel expected to provide investment management, administrative and other services to the Fund. The Board reviewed AIAL’s key personnel who would provide investment management services to the Fund, as well as the fact that, under the Agreement, AIAL would have the authority and responsibility, subject to the Board’s oversight, to make and execute investment decisions for the Fund within the framework of the Fund’s investment policies and restrictions.
The Board considered that AIAL’s duties would include: (i) investment research and selection, (ii) adherence to (and monitoring compliance with) the Fund’s investment policies and restrictions, the 1940 Act and other relevant laws; and (iii) furnishing office space and equipment, providing bookkeeping and clerical services (excluding determination of net asset value and shareholder accounting services) and paying all salaries, fees and expenses of officers and Trustees of the Trust who are affiliated with AIAL (except to the extent such salaries, fees and expenses are paid by another AIAL affiliate other than the Trust or the Fund). The Board also evaluated the significant compliance resources available to and expected to be utilized by AIAL.
The Board concluded that it was satisfied with the nature, extent and quality of services expected to be provided by to the Fund by AIAL, and that there was a reasonable basis on which to conclude that the Fund would benefit from the services provided by AIAL.
INVESTMENT MANAGEMENT FEES AND COST OF SERVICES
The Board also considered the contractual and actual investment management fees to be paid by the Fund to AIAL. In doing so, the Board compared the proposed contractual and actual investment management fees to those of the Fund’s peers. The Board considered that the proposed contractual investment management fee for the Fund was the same as that for the Ashmore Emerging Market Equity Fund. The Board also considered and took into account AIAL’s undertaking to waive fees and/or reimburse expenses so as to otherwise limit the Fund’s ordinary operating expenses until at least February 28, 2021.
The Board reviewed AIAL’s projected costs and profitability as presented by it in serving as investment adviser to the Fund. The Board noted that the Fund was not expected to be profitable to AIAL initially.
144
ASHMORE FUNDS
ADVISORY AGREEMENT APPROVAL (CONTINUED)
As of April 30, 2020 (Unaudited)
In evaluating the terms of the Agreement, the Board also considered the other benefits that may inure to AIAL as a result of their relationship with the Fund, such as the reputational benefit derived from serving as investment adviser to the Fund.
In light of the information provided and the quality of the services rendered and anticipated to be rendered, the Board concluded that the investment management fees to be charged the Fund were reasonable.
ECONOMIES OF SCALE
The Board noted that the proposed contractual investment management fees for the Fund do not contain breakpoints that would reduce the fee rate on assets above specified levels. In evaluating the Fund’s contractual investment management fees, the Board considered AIAL’s representation that the contractual investment management fees were intended to reflect achievable economies of scale and also considered AIAL’s agreement to limit certain expenses of the Fund. In light of the Trust’s current size and expense structure, the Board concluded that breakpoints in the Fund’s contractual investment management fees were not warranted at this time. The Board noted, however, that it intends to monitor the Fund’s asset growth in connection with future reviews of the Fund’s advisory arrangements to determine whether breakpoints may be appropriate at such time.
* * *
145
ASHMORE FUNDS
ADVISORY AGREEMENT APPROVAL (CONTINUED)
As of April 30, 2020 (Unaudited)
ADVISORY AGREEMENT APPROVAL FOR ASHMORE EMERGING MARKETS SHORT DURATION SELECT FUND
At a meeting of the Board of Trustees of Ashmore Funds (the “Trust”) held on March 18, 2020, the Board, including a majority of the Trustees who are not “interested persons” of the Trust within the meaning of the Investment Company Act of 1940, as amended (the “1940 Act”) (the “Independent Trustees”), voting separately, considered and unanimously approved the Investment Management Agreement (the “Agreement”) between Ashmore Investment Advisors Limited (“AIAL”) and the Trust, on behalf of Ashmore Emerging Markets Short Duration Select Fund (the “Fund”). In determining to approve the Agreement for an initial term, the Trustees considered all factors that they believed, in light of the legal advice furnished to them and their own business judgment, to be relevant to the interests of shareholders, including those listed below.
In evaluating the terms of the Agreement, the Board did not identify any single factor as controlling, and individual members of the Board did not necessarily attribute the same weight or importance to each factor, nor are the items described hereinall-encompassing of the matters considered by the Board. Throughout their review of the Agreement, the Independent Trustees were assisted by their own Independent Trustee legal counsel. The Independent Trustees had formally requested through their legal counsel, and AIAL had provided, certain information the Independent Trustees considered relevant to their evaluation. The Independent Trustees discussed the information on different occasions, without representatives of AIAL present.
Among the information and factors considered by the Board in evaluating the Agreement were the following:
NATURE, QUALITY AND EXTENT OF INVESTMENT MANAGEMENT SERVICES
The Board examined the nature, quality and extent of the services expected to be provided to the Fund by AIAL.
AIAL’s Services
The Board considered information regarding the overall organization and resources of AIAL, including information regarding senior management, portfolio managers and other personnel expected to provide investment management, administrative and other services to the Fund. The Board reviewed AIAL’s key personnel who would provide investment management services to the Fund, as well as the fact that, under the Agreement, AIAL would have the authority and responsibility, subject to the Board’s oversight, to make and execute investment decisions for the Fund within the framework of the Fund’s investment policies and restrictions.
The Board considered that AIAL’s duties would include: (i) investment research and selection; (ii) adherence to (and monitoring compliance with) the Fund’s investment policies and restrictions, the 1940 Act and other relevant laws; and (iii) furnishing office space and equipment, providing bookkeeping and clerical services (excluding determination of net asset value and shareholder accounting services) and paying all salaries, fees and expenses of officers and Trustees of the Trust who are affiliated with AIAL (except to the extent such salaries, fees and expenses are paid by another AIAL affiliate other than the Trust or the Fund). The Board also evaluated the significant compliance resources available to and expected to be utilized by AIAL. The Board considered that AIAL would support the Fund’s compliance control structure, and, in particular, the resources that would be devoted by AIAL in support of the Fund’s obligations pursuant to Rule38a-1 under the 1940 Act and the Fund’s liquidity risk management program. The Board also considered AIAL’s investments in business continuity planning designed to benefit the Fund, and the implementation of AIAL’s business continuity planning due to the Coronavirus Disease 2019 pandemic.
The Board concluded that it was satisfied with the nature, extent and quality of services expected to be provided to the Fund by AIAL, and that there was a reasonable basis on which to conclude that the Fund would benefit from the services provided by AIAL.
146
ASHMORE FUNDS
ADVISORY AGREEMENT APPROVAL (CONTINUED)
As of April 30, 2020 (Unaudited)
INVESTMENT MANAGEMENT FEES AND COST OF SERVICES
The Board also considered the contractual and actual investment management fees to be paid by the Fund to AIAL. In doing so, the Board compared the proposed contractual and actual investment management fees to those of the Fund’s peers. The Board considered that the proposed contractual investment management fee for the Fund was the same as that for the Ashmore Emerging Markets Short Duration Select Fund. The Board also considered and took into account AIAL’s undertaking to waive fees and/or reimburse expenses so as to otherwise limit the Fund’s ordinary operating expenses until at least June 30, 2021.
The Board reviewed AIAL’s projected costs and profitability as presented by it in serving as investment adviser to the Fund. The Board noted that the Fund was not expected to be profitable to AIAL initially.
In evaluating the terms of the Agreement, the Board also considered the other benefits that may inure to AIAL as a result of their relationship with the Fund, such as the reputational benefit derived from serving as investment adviser to the Fund.
In light of the information provided and the quality of the services rendered and anticipated to be rendered, the Board concluded that the investment management fees to be charged to the Fund were reasonable.
ECONOMIES OF SCALE
The Board noted that the proposed contractual investment management fees for the Fund do not contain breakpoints that would reduce the fee rate on assets above specified levels. In evaluating the Fund’s contractual investment management fees, the Board considered AIAL’s representation that the contractual investment management fees were intended to reflect achievable economies of scale and also considered AIAL’s agreement to limit certain expenses of the Fund. In light of the Trust’s current size and expense structure, the Board concluded that breakpoints in the Fund’s contractual investment management fees were not warranted at this time. The Board noted, however, that it intends to monitor the Fund’s asset growth in connection with future reviews of the Fund’s advisory arrangements to determine whether breakpoints may be appropriate at such time.
* * *
147
ASHMORE FUNDS
ADVISORY AGREEMENT APPROVAL (CONTINUED)
As of April 30, 2020 (Unaudited)
ADVISORY AGREEMENT APPROVAL
At a meeting of the Board of Trustees (the “Board”) of Ashmore Funds (the “Trust”) held on March 18, 2020, the Board, including a majority of the Trustees who are not “interested persons” of the Trust within the meaning of the Investment Company Act of 1940, as amended (the “1940 Act”) (the “Independent Trustees”), voting separately, considered and unanimously approved the continuation of the Investment Management Agreement between Ashmore Investment Advisors Limited (“AIAL”) and the Trust (the “Agreement”), on behalf of each of Ashmore Emerging Markets Corporate Income Fund, Ashmore Emerging Markets Frontier Equity Fund, Ashmore Emerging Markets Local Currency Bond Fund, Ashmore Emerging Markets Short Duration Fund, Ashmore Emerging MarketsSmall-Cap Equity Fund, Ashmore Emerging Markets Total Return Fund, Ashmore Emerging Markets Active Equity Fund and Ashmore Emerging Markets Equity Fund (each series, a “Fund,” and collectively, the “Funds”).
In determining to approve the continuation of the Agreement for aone-year period, the Board considered all factors that it believed, in light of the legal advice furnished to them and their own business judgment, to be relevant to the interests of shareholders, including those listed below. In evaluating the terms of the Agreement, the Board did not identify any single factor as controlling, and individual members of the Board did not necessarily attribute the same weight or importance to each factor, nor are the items described herein all encompassing of the matters considered by the Board. Throughout their review of the Agreement, the Independent Trustees were assisted by their own Independent Trustee legal counsel. The Independent Trustees had formally requested through their legal counsel, and AIAL had provided, certain information the Independent Trustees considered relevant to their evaluation. The Contracts Review Committee, which is comprised of all of the Independent Trustees, discussed the information on different occasions, without representatives of AIAL present.
Among the information and factors considered by the Board in evaluating the Agreement were the following:
NATURE, QUALITY AND EXTENT OF INVESTMENT MANAGEMENT SERVICES
The Board examined the nature, quality and extent of the services provided by AIAL to the Funds.
AIAL’s Services to All Funds
The Board considered information regarding the overall organization and resources of AIAL, including information regarding senior management, portfolio managers and other personnel providing investment management, administrative and other services to the Funds. The Board reviewed AIAL’s key personnel who provide investment management services to the Funds, as well as the fact that, under the Agreement, AIAL has the authority and responsibility, subject to the Board’s oversight, to make and execute investment decisions for the Funds within the framework of the Funds’ investment policies and restrictions.
The Board considered that AIAL’s duties include: (i) investment research and selection; (ii) adherence to (and monitoring compliance with) the Funds’ investment policies and restrictions, the 1940 Act and other relevant laws; and (iii) furnishing office space and equipment, providing bookkeeping and clerical services (excluding determination of net asset value and shareholder accounting services) and paying all salaries, fees and expenses of officers and Trustees of the Trust who are affiliated with AIAL (except to the extent such salaries, fees and expenses are paid by another AIAL affiliate other than the Trust or a Fund). The Board also evaluated the significant compliance resources available to, and utilized by, AIAL. The Board also considered that AIAL supports the Funds’ compliance control structure, and, in particular, the resources that are devoted by AIAL in support of the Funds’ obligations pursuant to Rule38a-1 under the 1940 Act and the Funds’ liquidity risk management program. The Board also considered AIAL’s investments in business continuity planning designed to benefit the Funds, and the implementation of AIAL’s business continuity planning due to the Coronavirus Disease 2019 pandemic.
Investment Performance
In considering each Fund’s performance, the Board requested and received from AIAL data compiled by FUSE Research Network, LLC (“Fuse”). The Trustees also received information explaining the methodology for compilation of certain of this information and what it was intended to demonstrate. The Board considered the performance of each Fund in light of its investment objective on a
148
ASHMORE FUNDS
ADVISORY AGREEMENT APPROVAL (CONTINUED)
As of April 30, 2020 (Unaudited)
comparable basis relative to the Fund’s peers. The Board received performance information for Institutional Shares for theone-, three- and five-year periods ended December 31, 2019 for Ashmore Emerging Markets Corporate Income Fund, Ashmore Emerging Markets Local Currency Bond Fund, Ashmore Emerging Markets Total Return Fund, Ashmore Emerging Markets Short Duration Fund, Ashmore Emerging Markets Equity Fund, Ashmore Emerging MarketsSmall-Cap Equity Fund and Ashmore Emerging Markets Frontier Equity Fund. The Board received performance information for Institutional Shares for theone- and three-year periods ended December 31, 2019 for Ashmore Emerging Markets Active Equity Fund. In considering such comparative data, the Trustees noted the specialized nature and focus of many of the Funds, and for certain Funds the limited number of peer group funds, particularly for the longer performance periods. In their review, the Trustees also sought to identify Funds for which the performance, fees and total expenses appeared to be outliers within their respective peer groups or other comparative metrics, and sought to understand the reasons for such comparative positions.
Ashmore Emerging Markets Corporate Income Fund.The Board noted that the Ashmore Emerging Markets Corporate Income Fund’s performance ranked tenth out of ten, second out of nine and first out of eight in its peer group for theone-, three- and five-year periods ended December 31, 2019, respectively, while ranking in the fourth, first and first quartiles (first being the best) in its larger performance universe for the same three periods.
Ashmore Emerging Markets Short Duration Fund.The Board noted that the Ashmore Emerging Markets Short Duration Fund’s performance ranked sixth out of six, fourth out of five, and first out of four in its peer group for theone-, three- and five-year periods ended December 31, 2019, respectively, while ranking in the fourth, fourth and first quartiles (first being the best) in its larger performance universe for the same three periods.
Ashmore Emerging Markets Equity Fund.The Board observed that Ashmore Emerging Markets Equity Fund’s performance ranked second out of fifteen, second out of thirteen and second out of eleven in its peer group for theone-, three- and five-year periods ended December 31, 2019, respectively, while ranking in the first quartile (first being the best) in its larger performance universe for the same three periods.
Ashmore Emerging Markets Frontier Equity Fund.The Board noted that the Ashmore Emerging Markets Frontier Equity Fund’s performance ranked fourth out of nine, third out of eight and first out of six in its peer group for theone-, three- and five-year periods ended December 31, 2019, respectively, while ranking in the second, second and first quartiles (first being the best) in its performance universe for the same three periods.
Ashmore Emerging Markets Local Currency Bond Fund.The Board observed that the Ashmore Emerging Markets Local Currency Bond Fund’s performance ranked eleventh out of twelve, eighth out of twelve and seventh out of eleven in its peer group for theone-, three-and five-year periods ended December 31, 2019, respectively, while ranking in the fourth, third and third quartiles (first being the best) in its performance universe for the same three periods.
Ashmore Emerging Markets Small-Cap Equity Fund. The Board noted that the Ashmore Emerging Markets Small-Cap Equity Fund’s performance ranked eleventh out of sixteen, fourteenth out of fifteen and seventh out of eleven in its peer group for theone-,three-and five-year periods ended December 31, 2019, respectively, while ranking in the third, fourth and third quartiles (first being the best) in its performance universe for the same three periods.
Ashmore Emerging Markets Active Equity Fund.The Board noted that the Ashmore Emerging Markets Active Equity Fund’s performance ranked seventh out of fifteen and fifth out of eleven in its peer group for theone- and three-year periods ended December 31, 2019, respectively, while ranking in the second and first quartiles (first being the best) in its larger performance universe for the same two periods.
Ashmore Emerging Markets Total Return Fund.The Board observed that the Ashmore Emerging Markets Total Return Fund’s performance ranked thirteenth out of thirteen, eleventh out of thirteen and third out of nine in its peer group for theone-, three- and five-year periods ended December 31, 2019, respectively, while ranking in the fourth, third and second quartiles (first being the best) in its larger performance universe for the same three periods.
149
ASHMORE FUNDS
ADVISORY AGREEMENT APPROVAL (CONTINUED)
As of April 30, 2020 (Unaudited)
The Board noted AIAL’s expressed long-term approach to investment management and its favorable longer-term track record in managing accounts having similar strategies as the Funds.
The Board concluded that it was satisfied with the nature, extent and quality of services provided by AIAL to each Fund and that there was a reasonable basis on which to conclude that each Fund would continue to benefit from the services provided by AIAL.
INVESTMENT MANAGEMENT FEES AND COST OF SERVICES
The Board also considered the contractual and actual investment management fees paid by each Fund to AIAL. In doing so, the Board compared the contractual and actual investment management fees and overall net expense ratios (represented by the Funds’ Institutional Shares) to those of the Funds’ peers as determined by Fuse. The Board noted that several of the Funds were quite small in size relative to their peers. As with the performance comparisons, the Board also noted that, with respect to several of the Funds, there were only a limited number of peer funds with similar investment strategies. Where contractual or actual management fees or total expense ratios of a Fund were meaningfully above those of the Fuse peers, the Board also considered and took into account the extent to which AIAL had undertaken to waive a portion of its fees and/or reimburse expenses so as to otherwise limit these Funds’ ordinary operating expenses until at least February 28, 2021.
The Board reviewed AIAL’s costs and profitability as presented by it in serving as investment adviser. The Board noted that AIAL was operating at a loss with respect to Ashmore Emerging Markets Active Equity Fund and Ashmore Emerging Markets Equity Fund. With respect to the remaining Funds, the Board concluded that AIAL’s profitability was not excessive.
In evaluating the terms of the Agreement, the Board also considered the other benefits that may inure to AIAL as a result of its relationship with the Funds, such as the reputational benefit derived from serving as investment adviser to the Funds.
In light of the information provided and the quality of the services rendered and anticipated to be rendered, the Board concluded that the investment management fees to be charged to the Funds were appropriate.
ECONOMIES OF SCALE
The Board noted that the contractual investment management fees for the Funds do not contain breakpoints that would reduce the fee rate on assets above specified levels. The Board observed that many of the Funds remained quite small in size, and that the collective assets of all of the Funds were only approximately $3.426 billion as of December 31, 2019. The Board also observed that AIAL was subsidizing all of the Funds through fee waivers and expense reimbursements. In evaluating the Funds’ contractual investment management fees, the Board considered AIAL’s representation that the contractual investment management fees were intended to reflect achievable economies of scale and also AIAL’s continuing agreement to limit certain expenses of each Fund. The Board received and evaluated information concerning whether AIAL would realize economies of scale as the assets of individual Funds grow beyond current levels. The Board noted they intend to monitor each Fund’s asset growth in connection with future reviews of the Funds’ Agreement to determine whether breakpoints may be appropriate at such time. In light of the Funds’ current sizes and expense structures, the Board concluded that breakpoints in the Funds’ contractual investment management fees were not warranted at this time.
* * *
The Board concluded that the fees to be paid to AIAL by each Fund were appropriate in light of the services to be provided by AIAL, the costs to AIAL of operating the Funds and the Funds’ current and reasonably foreseeable asset levels, and determined that the Agreement should, therefore, be approved.
* * *
150
ASHMORE FUNDS
SUPPLEMENTARY INFORMATION
As of April 30, 2020 (Unaudited)
REMUNERATION DISCLOSURE
Ashmore Investment Advisors Limited (“AIAL”) is a full-scope UK Alternative Investment Fund Manager (“AIFM”) that manages many alternative investment funds (“AIFs”). These AIFs implement a number of investment strategies including; equity, fixed income and alternatives; and invest in many different regions and industry sectors. AIAL manages both open-ended and closed-ended AIFs, several of its AIFs are leveraged and some are listed on regulated markets. Its assets under management was approximately US$7.6 billion at 30 June 2019. AIAL’s parent company (“Ashmore”) is listed on a regulated market, counts ten offices worldwide and has a number of subsidiaries both in the UK and abroad. Taking into account guidance from the UK Financial Conduct Authority (“FCA”), AIAL has complied with the full AIFM Remuneration Code.
AIAL does not have any direct employees, and as such the amount of remuneration paid to staff by AIAL is zero. All AIAL AIFM Remuneration Code Staff are employed and paid by Ashmore. Ashmore’s remuneration principles have remained unchanged since it was listed, and are designed to align all employees with the long-term success of the business. These include significant levels of deferral, a clear link between performance and levels of remuneration and strong alignment of executive directors and employees with shareholders and clients through significant employee share ownership. The culture is therefore a collaborative one, with clients’ interests and the creation of shareholder value, including for employee shareholders, the overarching factors for success.
Executive directors, members of the investment team, and indeed all other employees, participate in a single capped incentive pool and are paid under a similar structure, with an annual cash bonus and share award, meaning that all employees are long-term shareholders in the business.
The policy includes:
–– A capped basic salary to contain the fixed cost base;
–– A cap on the total variable compensation including any awards made under Ashmore’s share plan, available for all employees at 25% of profits, which to date has not been fully utilized; and
–– A deferral for five years of a substantial portion of variable compensation into Ashmore shares (or equivalent), which, in the case of executive directors in lieu of a separate long-term investing plan, is also partly subject to additional performance conditions measured over five years.
AIAL’s board of directors reviews the general principles of the remuneration policy and is responsible for its implementation with regard to AIAL’s AIFM Remuneration Code Staff. Ashmore’s Remuneration Committee periodically reviews the ongoing appropriateness and relevance of the remuneration policy, including in connection with the provision of services to AIAL. Ashmore employs the services of; McLagan to provide advice on remuneration benchmarking; Deloitte to provide advice on tax compliance, share plan design and administration; and the Remuneration Committee’s advisors are Aon. The Remuneration Committee’s terms of reference can be found here:
http://www.ashmoregroup.com/investor-relations/corporate-governance.
Performance assessment for AIAL’s AIFM Remuneration Code Staff for their work relating to AIAL is based on a combination of quantitative and qualitative criteria related to the performance of AIAL, the performance of relevant AIF(s) or business units and the performance of the individual. Qualitative criteria include adherence to Ashmore Group plc’s risk and compliance policies. This performance assessment is adjusted for relevant current and future risks related to the AIFs managed by AIAL.
The compensation of control function staff is based on function specific objectives and is independent from the performance of AIAL and/or the AIFs managed by AIAL. The remuneration of the senior officers in AIAL’s control functions is directly overseen by the Remuneration Committee.
151
ASHMORE FUNDS
SUPPLEMENTARY INFORMATION (CONTINUED)
As of April 30, 2020 (Unaudited)
Variable remuneration awarded to AIAL’s Remuneration Code Staff in respect of AIFMD work is subject to performance adjustment which allows Ashmore to reduce the deferred amount, including to nil, in light of the ongoing financial situation and/or performance of Ashmore, AIAL, the AIFs that AIAL manages and the individual concerned.
The total contribution of AIAL’s AIFM Remuneration Code Staff to the business of Ashmore is apportioned between work carried out for AIAL and work carried out for the other businesses and subsidiaries of Ashmore. Their remuneration is similarly apportioned between AIAL and the other businesses and subsidiaries where required.
The remuneration attributable to AIAL for its AIFMD identified staff for the financial year ended June 30, 2019 was as follows:
| | | | | | | | | | | | | | |
| Fund | | Number of Beneficiaries | | Variable Remuneration | | | Fixed Remuneration | | | Total Remuneration | |
| Ashmore Emerging Markets Total Return Fund | | 17 | | | £315,690 | | | | £27,111 | | | | £342,801 | |
| Ashmore Emerging Markets Local Currency Bond Fund | | 16 | | | 12,236 | | | | 1,121 | | | | 13,357 | |
| Ashmore Emerging Markets Corporate Income Fund | | 17 | | | 115,187 | | | | 9,662 | | | | 124,849 | |
| Ashmore Emerging Markets Short Duration Fund | | 17 | | | 370,424 | | | | 31,074 | | | | 401,498 | |
| Ashmore Emerging Markets Active Equity Fund | | 16 | | | 15,762 | | | | 1,331 | | | | 17,093 | |
| Ashmore Emerging MarketsSmall-Cap Equity Fund | | 16 | | | 148,712 | | | | 7,689 | | | | 156,401 | |
| Ashmore Emerging Markets Frontier Equity Fund | | 16 | | | 25,185 | | | | 5,647 | | | | 30,832 | |
| Ashmore Emerging Markets Equity Fund | | 16 | | | 177,976 | | | | 9,202 | | | | 187,178 | |
Total AIAL | | 21 | | | £2,348,230 | | | | £202,102 | | | | £2,550,332 | |
All of the remuneration above was attributable to senior management who have a material impact on the Funds’ risk profile. The Funds’ allocation of the AIAL remuneration has been made on the basis of NAV.
152
ASHMORE FUNDS
FOR MORE INFORMATION
As of April 30, 2020 (Unaudited)
PORTFOLIO HOLDINGS
The Ashmore Funds file their complete schedule of portfolio holdings with the Securities and Exchange Commission (“SEC”) for the first and third quarters of each fiscal year on FormN-PORT. The Funds’ FormN-PORT is available on the SEC’s Web site at www.sec.gov within sixty days after the Funds’ first and third fiscal quarters. In addition, no later than thirty calendar days after the end of each calendar quarter, a list of all portfolio holdings in each Fund as of the end of such calendar quarter is made available at www.ashmoregroup.com.
PROXY VOTING
Ashmore Funds’ Proxy Voting Policies and Procedures and each Fund’s portfolio securities voting record for the most recent
12-month period ended June 30 are available upon request and without charge by visiting the Ashmore Funds’ Web site at www.ashmoregroup.com or the SEC’s Web site at www.sec.gov or by calling866-876-8294.
153
ASHMORE FUNDS
PRIVACY POLICY
We consider customer privacy to be a fundamental aspect of our relationships with shareholders and are committed to maintaining the confidentiality, integrity and security of our current, prospective and former shareholders’ personal information. To ensure our shareholders’ privacy, we have developed policies that are designed to protect this confidentiality, while allowing shareholders’ needs to be served.
Obtaining Personal InformationIn the course of providing shareholders with products and services, we may obtainnon-public personal information about shareholders, which may come from sources such as account applications and other forms, from other written, electronic or verbal correspondence, from shareholder transactions, from a shareholder’s brokerage or financial advisory firm, financial adviser or consultant, and/or from information captured on our internet web sites.
Respecting Your PrivacyAs a matter of policy, we do not disclose any personal or account information provided by shareholders or gathered by us tonon-affiliated third parties, except as required for our everyday business purposes, such as to process transactions or service a shareholder’s account, or as otherwise permitted by law. As is common in the industry,non-affiliated companies may from time to time be used to provide certain services, such as preparing and mailing prospectuses, reports, account statements and other information, and gathering shareholder proxies. We may also retainnon-affiliated financial services providers to market our shares or products and we may enter into joint-marketing arrangements with them and other financial companies. We may also retain marketing and research service firms to conduct research on shareholder satisfaction. These companies may have access to a shareholder’s personal and account information, but are permitted to use this information solely to provide the specific service or as otherwise permitted by law. We may also provide a shareholder’s personal and account information to their respective brokerage or financial advisory firm, Custodian, and/or to their financial advisor or consultant.
Sharing Information with Third PartiesWe reserve the right to disclose or report personal information tonon-affiliated third parties where we believe in good faith that disclosure is required under law to cooperate with regulators or law enforcement authorities, to protect our rights or property or upon reasonable request by any investee entity in which a shareholder has chosen to invest. Of course, we may also share your information with your consent.
Sharing Information with AffiliatesWe may share shareholder information with our affiliates in connection with our affiliates’ everyday business purposes, such as servicing a shareholder’s account, but our affiliates may not use this information to market products and services to you except in conformance with applicable laws or regulations. The information we share includes information about our experiences and transactions with a shareholder and may include, for example, a shareholder’s participation in one of the Funds or in other investment programs, a shareholder’s ownership of certain types of accounts, or other data about a shareholder’s transactions or accounts. Our affiliates, in turn, are not permitted to share shareholder information withnon-affiliated entities, except as required or permitted by law.
Procedures to Safeguard Private InformationWe take seriously the obligation to safeguard shareholdernon-public personal information. In addition to this policy, we have also implemented procedures that are designed to restrict access to a shareholder’snon-public personal information only to internal personnel who need to know that information in order to provide products or services to such shareholders. In addition, we have physical, electronic, and procedural safeguards in place to guard a shareholder’snon-public personal information.
Disposal of Confidential RecordsWe will dispose of records, if any, that are knowingly derived from data received from a consumer reporting agency regarding a shareholder that is an individual in a manner that ensures the confidentiality of the data is maintained. Such records include, among other things, copies of consumer reports and notes of conversations with individuals at consumer reporting agencies.
154
ASHMORE FUNDS
OTHER INFORMATION
Administrator, Custodian and Transfer Agent
The Northern Trust Company
333 South Wabash Avenue
Chicago, Illinois 60604
312-630-6000
Investment Manager
Ashmore Investment Advisors Limited
61 Aldwych
London WC2B 4AE
United Kingdom
44-20-3077-6000
Independent Registered Public Accounting Firm
KPMG LLP
Aon Center
Suite 5500
200 East Randolph Drive
Chicago, Illinois 60601-6436
Distributor
Ashmore Investment Management (US) Corporation
475 Fifth Avenue
15th Floor
New York, New York 10017
212-661-0061
Legal Counsel
Ropes & Gray LLP
Prudential Tower
800 Boylston Street
Boston, Massachusetts 02199
617-951-7000
Independent Trustees’ Counsel
Dechert LLP
One International Place
40th Floor
100 Oliver Street
Boston, Massachusetts 02110
617-728-7100
155
Item 2. Code of Ethics.
Not applicable for this reporting period.
Item 3. Audit Committee Financial Expert.
Not applicable for this reporting period.
Item 4. Principal Accountant Fees and Services.
Not applicable for this reporting period.
Item 5. Audit Committee of Listed Registrants.
Not applicable.
Item 6. Investments.
| (a) | The registrant has elected to include the schedule of investments in securities of unaffiliated issuers as part of the report to shareholders filed under Item 1 of this report on FormN-CSR. |
Item 7. Disclosure of Proxy Voting Policies and Procedures forClosed-End Management Investment Companies.
Not applicable.
Item 8. Portfolio Managers ofClosed-End Management Investment Companies.
Not applicable.
Item 9. Purchases of Equity Securities byClosed-End Management Investment Company and Affiliated Purchasers.
Not applicable.
Item 10. Submission of Matters to a Vote of Security Holders.
There have been no material changes to the procedures by which shareholders may recommend nominees to the registrant’s Board of Trustees.
Item 11. Controls and Procedures.
| (a) | The registrant’s principal executive and principal financial officers, or persons performing similar functions, have concluded that the registrant’s disclosure controls and procedures (as defined in Rule30a-3(c) under the Investment Company Act of 1940 (the “1940 Act”)) are effective, based on the evaluation of these controls and procedures |
3
| | required by Rule30a-3(b) under the 1940 Act and Rules13a-15(b) or15d-15(b) under the Securities Exchange Act of 1934 as of a date within 90 days of the filing date of this report. |
| (b) | There were no changes in the registrant’s internal control over financial reporting (as defined in Rule30a-3(d) under the 1940 Act) that occurred during the period covered by this report that have materially affected, or are reasonably likely to materially affect, the registrant’s internal control over financial reporting. |
Item 12. Disclosure of Securities Lending Activities forClosed-End Management Investment Companies.
Not applicable.
Item 13. Exhibits.
4
SIGNATURES
Pursuant to the requirements of the Securities Exchange Act of 1934 and the Investment Company Act of 1940, the registrant has duly caused this report to be signed on its behalf by the undersigned, thereunto duly authorized.
| | |
| Ashmore Funds |
| |
| By | | /s/ George Grunebaum |
| | George Grunebaum, President and Chief Executive Officer |
| | (Principal Executive Officer) |
|
| Date: June 26, 2020 |
Pursuant to the requirements of the Securities Exchange Act of 1934 and the Investment Company Act of 1940, this report has been signed below by the following persons on behalf of the registrant and in the capacities and on the dates indicated.
| | |
| By | | /s/ George Grunebaum |
| | George Grunebaum, President and Chief Executive Officer |
| | (Principal Executive Officer) |
|
| Date: June 26, 2020 |
| |
| By | | /s/ Jonathan Kim |
| | Jonathan Kim, Treasurer |
| | (Principal Financial and Accounting Officer) |
|
| Date: June 26, 2020 |
5