UNITED STATES
SECURITIES AND EXCHANGE COMMISSION
Washington, D.C. 20549
FORM N-CSR
CERTIFIED SHAREHOLDER REPORT OF REGISTERED MANAGEMENT
INVESTMENT COMPANIES
Investment Company Act file number 811-22468
Ashmore Funds
(Exact name of registrant as specified in charter)
c/o Ashmore Investment Advisors Limited
61 Aldwych
London WC2B 4AE
England
(Address of principal executive offices) (Zip code)
Corporation Service Company
84 State Street
Boston, MA 20109
(Name and address of agent for service)
Registrant’s telephone number, including area code: 011-44-20-3077-6000
Date of fiscal year end: October 31
Date of reporting period: October 31, 2018
Item 1. Reports to Stockholders.
ASHMORE FUNDS
ANNUAL FINANCIAL STATEMENTS
October 31, 2018
Beginning on January 1, 2021, as permitted by regulations adopted by the Securities and Exchange Commission, paper copies of the Fund’s annual and semi-annual shareholder reports will no longer be sent by mail, unless you specifically request paper copies of the reports from the Fund or your financial intermediary. Instead, the reports will be made available on the Fund’s website (www.ashmoregroup.com), and you will be notified by mail each time a report is posted and provided with a website link to access the report.
If you already elected to receive shareholder reports electronically, you will not be affected by this change and you need not take any action. You may elect to receive shareholder reports and other communications from the Fund electronically anytime by contacting your financial intermediary (such as a broker-dealer or bank) or, if you are a direct investor, by calling 866-876-8294.
Beginning on January 1, 2019, you may elect to receive all future reports in paper free of charge. If you invest through a financial intermediary, you can contact your financial intermediary to request that you continue to receive paper copies of your shareholder reports. If you invest directly with the Fund, you can contact the Fund to let the Fund know you wish to continue receiving paper copies of your shareholder reports. Your election to receive reports in paper will apply to all funds held in your account if you invest through your financial intermediary or all funds held with the Trust if you invest directly with the Fund.

(THIS PAGE INTENTIONALLY LEFT BLANK)
ASHMORE FUNDS
TABLE OF CONTENTS
*Effective January 1, 2019, the Ashmore Emerging Markets Corporate Debt Fund changed its name to the Ashmore Emerging Markets Income Fund.
Ashmore Investment Management (US) Corporation is the Distributor for Ashmore Funds.
This material is authorized for use only when preceded or accompanied by the current Ashmore Funds’ prospectus. Investors should consider the investment objectives, principal risks, charges and expenses of these Funds carefully before investing. This and other information is contained in the Funds’ prospectus. Please read the prospectus carefully before you invest or send money.
A Fund’s past performance is not necessarily an indication of how the Fund will perform in the future.
The performance data quoted in this report represents past performance. Investment return and principal value will fluctuate, so an investor’s shares, when redeemed, may be worth more or less than the original cost. Current performance may be lower or higher than the performance data quoted in this report. For performance information current to the most recent month-end, please call (866) 876-8294.
An investment in a Fund is not a bank deposit and is not guaranteed or insured by the Federal Deposit Insurance Corporation or any other government agency. It is possible to lose money on investments in the Funds.
ASHMORE FUNDS
INVESTMENT MANAGER’S REPORT
For the period November 1, 2017 to October 31, 2018
Overview
The last quarter of 2017 capped a year of strong performance for global macro-economic performance and asset prices, and offered promises of further strength going into the new year. Global economic data was strong across all regions, both in developed and emerging markets, and global growth expectations were revised upwards. While this economic backdrop was very supportive for financial markets in 2017 Q4, it came with associated policy risks. The first one was the swift approval of a significant package of tax cuts in the US, first proposed in the middle of September, and signed by President Trump before Christmas. This lifted US growth forecasts, but also increased the risk of higher inflation. The second risk was the potential change in the Fed’s policy stance as leadership transferred to governor-elect Jay Powell at the March 2018 meeting. Political developments across emerging markets were broadly supportive during Q4, notably the narrow election victory by Cyril Ramaphosa in South Africa’s ANC Elective Conference, which paved the way for much welcome political and policy changes, and the convincing victory by center-right candidate Sebastian Pinera in Chile’s presidential election.
Towards the end of the first quarter of 2018, newly-installed Fed chair Jay Powell delivered a 25 basis points (bps) hike in the Fed Funds rate to 1.75%. The February sell-off in global equities continued in March as fears of a “trade war” dominated market developments. The White House first announced new tariffs on steel and aluminum imports to the US, which rattled global markets and led to the resignation of President Trump’s economic advisor Gary Cohn. Although these tariffs were eventually watered down by exemptions negotiated with a number of trading partners, they were followed by specific actions against China on “national security” grounds for breach of intellectual property, targeting around $50 billion worth of export to the US. The risk of escalation increased when China responded with tariffs of similar magnitude and President Trump vowed to broaden tariffs on a wider array of Chinese goods.
The second quarter of 2018 was characterized by a global risk-off sentiment as markets incorporated revisions to the prior belief in global synchronous economic growth. The realignment of the USDEUR exchange rate had a knock-on impact on Emerging Markets (EM) that led to significant credit spread widening, a tightening of liquidity conditions and outflows from the asset class. The risk-off environment was sustained by concerns about trade wars, the potential impact of domestic defaults in China, and friction between the US and its G7 and NATO partners. With the release of the March Federal Open Market Committee (FOMC) minutes, the Fed confirmed the view that it was the sole hawk in the central bank world. Argentina faced a classic balance of payments crisis in May. The central bank was forced to raise benchmark interest rates by 12.75% in three emergency meetings, to 40%. Ultimately, Argentina was forced to approach the IMF for a support package, requesting $30 billion in support but ultimately receiving $50 billion in a strong show of support by the multilateral institution. Turkey was also under the microscope due to its large current account deficit of 5.5% of GDP, high inflation, and its reliance on portfolio flows to finance its deficit. The market responded poorly to President Erdogan’s proposal to curb the central bank’s independence, in the lead-up to June’s presidential and parliamentary elections. As in Argentina, the central bank was forced to raise interest rates by 300 bps. The risk aversion trade continued into June, as defensive assets outperformed and EM remained under pressure.
Although most investors will remember the summer of 2018 for the difficult financial markets of August, it was actually book-ended by relatively good months in July and September. The dominant theme was the extreme divergence in stock market performance and momentum between the US the rest of the world, from Europe to China and Emerging Markets, which culminated in August. Although US economic data printed some impressive numbers, such as a strong 4.2% Q2 GDP growth, a few indicators such as housing suggested that the US economy had already peaked. The Fed hiked its target rate by 25 bps at its September meeting, as expected, and guided the market towards another rate hike at its December meeting. However, by the middle of September, with a “new NAFTA” in the works, Fed rate hikes telegraphed and priced-in, and adequate policy measures announced in Turkey (rate hikes) and Argentina (expanded IMF package), market worries focused on two main items: US-China trade relations and the presidential election in Brazil, where the expected election of right-wing candidate Jair Bolsonaro was well-received by investors due to his fiscal pledges. As the quarter ended, attention shifted to the early-November mid-term elections in the US.
The net result for the EM fixed income indices over the period was negative. The JP Morgan Emerging Markets Bond Index Global Diversified (JPM EMBI GD) index was down 4.4%. The broad corporate bond index, the JP Morgan Corporate Emerging Markets Bond Index Broad Diversified (JPM CEMBI BD), was down 1.9%. The reference local currency bond index, the JP Morgan Government Bond Index – Emerging Markets Global Diversified (JPM GBI-EM GD), was down 6.6%, while the reference local currency FX index, the JP Morgan Emerging Markets Local Markets Index Plus (JPM ELMI+), was down 3.1%.
1
ASHMORE FUNDS
INVESTMENT MANAGER’S REPORT (CONTINUED)
Portfolio Overview
Ashmore Emerging Markets Total Return Fund
The Ashmore Emerging Markets Total Return Fund (the “Fund”) seeks to achieve its objective by investing principally in the debt instruments of sovereign, quasi-sovereign, and corporate issuers, which may be denominated in any currency, including the local currency of the issuer. The Fund tactically allocates assets between external debt, corporate debt and local currency.
Over the period, the Fund’s institutional class underperformed its benchmark, returning -5.53% (net of fees) versus -4.57% for the composite 50% JP Morgan Emerging Markets Bond Index Global Diversified (“JP Morgan EMBI GD”), 25% JP Morgan Government Bond Index - Emerging Markets Global Diversified (“JP Morgan GBI-EM GD”), and 25% JP Morgan Emerging Local Markets Index Plus (“JP Morgan ELMI+”). Local currency, external debt and corporate debt detracted from performance. Brazil, South Africa, and United Arab Emirates were the main contributors to Fund performance. Argentina, Indonesia, and Venezuela were the main detractors from Fund performance.
Argentina was a detractor during the period, and its poor performance emanated from a classic balance of payments crisis. Following the initial relaxation of inflation targets and rate cuts earlier this year, the central bank initially sought to stem the ARS depreciation via USD sales (using its reserves). When this faltered (after having spent more than $6 billion in the markets), it raised benchmark rates by 12.75% to 40% in three emergency meetings. When this still proved insufficient, it approached the International Monetary Fund (IMF). The IMF stand-by agreement, with its $50 billion loan facility, was signed off in late June and obviates the government’s need to approach the market to finance its fiscal deficit. However, the central bank continued to send mixed messages and the market hopes that the recent replacement of its President with ex-Finance Minister Luis Caputo will provide more clarity and coordination with the Finance Ministry.
Ashmore Emerging Markets Local Currency Bond Fund
The Ashmore Emerging Markets Local Currency Bond Fund (the “Fund”) seeks to achieve its objective by investing principally in the debt instruments of sovereign and quasi-sovereign EM issuers, denominated in the local currency of the issuer. The Fund’s returns are driven by EM currency appreciation, interest rate positioning and credit worthiness.
Over the period, the Fund’s institutional class underperformed its benchmark, returning -7.33% (net of fees) versus -6.58% for the JP Morgan GBI-EM GD. Allocations to the South African Rand, Brazilian Real, and Malaysian Ringgit were the main contributors to Fund performance. Allocations to the Turkish Lira, Indonesian Rupiah, and Argentine Peso were the main detractors from Fund performance.
Argentina was a detractor during the period, and its poor performance emanated from a classic balance of payments crisis. Following the initial relaxation of inflation targets and rate cuts earlier this year, the central bank initially sought to stem the ARS depreciation via USD sales (using its reserves). When this faltered (after having spent more than $6 billion in the markets), it raised benchmark rates by 12.75% to 40% in three ‘emergency’ meetings. When this still proved insufficient, it approached the International Monetary Fund (IMF). The IMF stand-by agreement, with its $50 billion loan facility, was signed off in late June and obviates the government’s need to approach the market to finance its fiscal deficit. However, the central bank continued to send mixed messages and the market hopes that the recent replacement of its President with ex-Finance Minister Luis Caputo will provide more clarity and coordination with the Finance Ministry.
Ashmore Emerging Markets Corporate Debt Fund
The Ashmore Emerging Markets Corporate Debt Fund (the “Fund”) seeks to achieve its objective by investing principally in the debt instruments of EM corporate issuers, which may be denominated in any currency, including the local currency of the issuer.
Over the period, the Fund’s institutional class underperformed its benchmark, returning -2.34% (net of fees) versus -1.86% for the JP Morgan Corporate Emerging Markets Bond Index Broad Diversified (“JP Morgan CEMBI BD”). Ukraine, United Arab Emirates, and Nigeria were the main contributors to Fund performance. Jamaica, Russia, and China were the main detractors from Fund performance.
2
ASHMORE FUNDS
INVESTMENT MANAGER’S REPORT (CONTINUED)
China was a detractor during the period. Increased trade sanctions by the US and further threats of escalation between China and the US put pressure on credit spreads of USD denominated Chinese bonds.
Ashmore Emerging Markets Short Duration Fund
The Ashmore Emerging Markets Short Duration Fund (the “Fund”) seeks to achieve its objective by investing principally in short-term debt instruments of, and derivative instruments related to, Sovereign, Quasi-Sovereign and Corporate issuers of emerging markets countries denominated exclusively in Hard Currencies (i.e., the U.S. dollar or any currency of a nation in the G-7). The Fund normally seeks to maintain weighted average portfolio duration of between 1 and 3 years. The Fund has no restrictions on individual security duration.
Over the period, the Fund’s institutional class underperformed its benchmark, returning +0.11% (net of fees) versus +1.32% for the JP Morgan CEMBI BD 1-3 Year. Venezuela, Brazil, and United Arab Emirates were the main contributors to Fund performance. Jamaica, China, and Russia were the main detractors from Fund performance.
Venezuela, an off-benchmark allocation, was a noteworthy contributor during the period. The decision to focus the portfolio’s Venezuelan exposure entirely in the collateralized bond issued by the state-owned oil company PDVSA continued to benefit the portfolio, as this bond is the only one in Venezuela that continues to be current, with the latest coupon arriving on time and in full during the quarter.
Ashmore Emerging Markets Active Equity Fund
The Ashmore Emerging Markets Active Equity Fund (the “Fund”) seeks to achieve its objective by investing principally in equity securities and equity-related investments of emerging markets issuers, which may be denominated in any currency, including the local currency of the issuer.
Over the period, the Fund’s institutional class outperformed its benchmark, returning -8.41% (net of fees) versus -12.52% for the MSCI Emerging Markets Index. Positions in Chinese energy, Indian banks and South Korea semiconductors were the main contributors to Fund relative performance. Positions in certain Russian banks were the main detractor from Fund relative performance.
Favorable demand and supply dynamics led to energy price strength. This supported the Fund’s position in a Chinese exploration and production energy company. The normalization of non-performing loans and increased visibility over retail lending was a positive for the Fund’s position in an Indian bank, although the default of an Indian leasing company weighed on performance towards the end of the period. Semiconductors performed well on strong demand from data centers. The Fund’s position in a Russian bank performed poorly on increased sanction risk.
Ashmore Emerging Markets Small-Cap Equity Fund
The Ashmore Emerging Markets Small-Cap Equity Fund (the “Fund”) seeks to achieve its objective by investing principally in equity securities and equity-related investments of small-capitalization EM issuers, which may be denominated in any currency, including the local currency of the issuer.
Over the period, the Fund’s institutional class underperformed its benchmark, returning -20.60% (net of fees) versus -17.21% for the MSCI Emerging Markets Small Cap Index. Positions in Taiwanese and Indian consumer discretionary stocks were the primary drivers of Fund relative returns. Positions in certain Indian banks were the primary detractors to relative Fund performance.
The Fund’s position in a Taiwanese food and cosmetics manufacturer performed well on strong results. The Fund’s position in an Indian fashion retailer performed well on significant structural growth in organized retail.
The Fund’s positions in an Indian bank and an Indian diversified financial company both performed poorly in part due to liquidity pressure in the Indian financial sector following the default of a leasing company. Higher energy prices and pressure on the rupee further weighed on market sentiment in India.
3
ASHMORE FUNDS
INVESTMENT MANAGER’S REPORT (CONTINUED)
Ashmore Emerging Markets Frontier Equity Fund
The Ashmore Emerging Markets Frontier Equity Fund (the “Fund”) seeks to achieve its objective by investing principally in equity securities and equity-related investments of Frontier Market issuers, which may be denominated in any currency, including the local currency of the issuer.
Over the period, the Fund’s institutional class underperformed its benchmark, returning -15.11% (net of fees) versus -12.07% for the MSCI Frontier Markets Index. Positions in Saudi Arabia and an underweight position in Argentina were the main contributors to Fund relative performance. Underweight positions in Kuwait and Vietnam were the main detractors from Fund relative performance.
The Saudi Arabian market performed well driven higher primarily by energy price strength and news from index provider MSCI that the Kingdom will be reclassified to the MSCI Emerging Markets index. The Argentinian market fell sharply on peso weakness compared to the dollar due to a balance of payment crisis.
Kuwait performed well on increased infrastructure spending. Sentiment was also boosted by news from FTSE that the market will be included in their Emerging Markets index. Vietnam performed well as the economy enjoyed strong growth.
Ashmore Emerging Markets Equity Fund
The Ashmore Emerging Markets Equity Fund (the “Fund”) seeks to achieve its objective by investing principally in equity securities and equity-related investments of EM issuers, which may be denominated in any currency, including the local currency of the issuer.
Over the period, the Fund’s institutional class underperformed its benchmark, returning -14.01% (net of fees) versus -12.52% for the MSCI Emerging Markets Index. Positions in South Korea were the primary contributor to relative Fund performance. Positions in Taiwan and India were the primary detractors to Fund relative performance.
The Fund’s position in a South Korean dental company performed strongly. The company continues to take market share from its competitors due to its superior sales network and marketing strategy. It is also expanding successfully in India, an underpenetrated high growth market.
The Fund’s position in an Asian bakery chain performed poorly as it got embroiled in politics between Taiwan and China. The Fund’s position in an Indian diversified financial company performed poorly in part due to liquidity pressure in the Indian financial sector following the default of a leasing company.
4
IMPORTANT INFORMATION ABOUT THE FUNDS
Ashmore Investment Advisors Limited
This commentary may include statements that constitute “forward-looking statements” under the U.S. securities laws. Forward-looking statements include, among other things, projections, estimates, and information about possible or future results related to the Funds and market or regulatory developments. The views expressed above are not guarantees of future performance or economic results and involve certain risks, uncertainties and assumptions that could cause actual outcomes and results to differ materially from the views expressed herein. The views expressed above are those of Ashmore Investment Advisors Limited as of the date indicated and are subject to change at any time based upon economic, market, or other conditions and Ashmore Investment Advisors Limited undertakes no obligation to update the views expressed herein. Any discussions of specific securities or markets should not be considered a recommendation to buy or sell or invest in those securities or markets. The views expressed above may not be relied upon as investment advice or as an indication of the Funds’ trading intent. Information about the Funds’ holdings, asset allocation or country diversification is historical and is not an indication of future portfolio composition, which may vary. Direct investment in any index is not possible. The performance of any index mentioned in this commentary has not been adjusted for ongoing management, distribution and operating expenses applicable to mutual fund investments. In addition, the returns do not reflect certain charges that an investor in the Funds may pay. If these additional fees were reflected, the performance shown would have been lower.
The following disclosure provides important information regarding each Fund’s Average Annual Total Return table and Cumulative Returns chart, which appear on each Fund’s individual page in this report (the “Shareholder Report” or the “Report”). Please refer to this information when reviewing the table and chart for a Fund.
On each individual Fund Summary page in this Report, the Average Annual Total Return table and Cumulative Returns chart measure performance assuming that all dividend and capital gain distributions were reinvested. Returns do not reflect the deduction of taxes that a shareholder would pay on (i) Fund distributions or (ii) the redemption of Fund shares. The Cumulative Returns Chart reflects only Institutional Class performance. Performance for Class A and Class C shares is typically lower than Institutional Class performance due to the lower expenses paid by Institutional Class shares. Except for the load-waived performance for the Class A and C shares of each Fund (as applicable), performance shown is net of fees and expenses. The load-waived performance for Class A and Class C shares does not reflect the sales charges shareholders of those classes may pay in connection with a purchase or redemption of Class A and Class C shares. The load-waived performance of those share classes is relevant only to shareholders who purchased Class A or Class C shares on a load-waived basis. The figures in the line graph are calculated at net asset value and assume the investment of $1,000,000 at the beginning of the first full month following the inception of the Institutional Class. Each Fund measures its performance against a broad-based securities market index (“benchmark index”). Each benchmark index does not take into account fees, expenses or taxes.
For periods prior to the inception date of the Class A and Class C shares (if applicable), performance information shown is based on the performance of the Fund’s Institutional Class shares, adjusted to reflect the distribution and/or service fees and other expenses paid by the Class A and Class C shares, respectively.
A Fund’s past performance, before and after taxes, is not necessarily an indication of how the Fund will perform in the future.
An investment in a Fund is not a bank deposit and is not guaranteed or insured by the Federal Deposit Insurance Corporation or any other government agency. It is possible to lose money on investments in the Funds.
5
IMPORTANT INFORMATION ABOUT THE FUNDS (CONTINUED)
The following disclosure provides important information regarding each Fund’s Expense Example, which appears on each Fund’s individual page in this Shareholder Report. Please refer to this information when reviewing the Expense Example for a Fund.
EXPENSE EXAMPLE
Fund Expenses
As a shareholder of the Funds, you incur two types of costs: (1) transaction costs, including sales charges (loads) on purchase payments; redemption fees; and exchange fees; and (2) ongoing costs, including management fees; distribution (12b-1) fees; and other Fund expenses. This Example is intended to help you understand your ongoing costs (in Dollars) of investing in the Funds and to compare these costs with the ongoing costs of investing in other mutual funds. The Example is based on an investment of $1,000 invested at the beginning of the period and held for the entire period, from May 1, 2018 or the inception date (if later), through October 31, 2018.
Actual Expenses
The information in the table under the heading “Actual Performance” provides information based on actual performance and actual expenses. You may use the information in these columns, together with the amount you invested, to estimate the expenses that you paid over the period. Simply divide your account value by $1,000 (for example, an $8,600 account value divided by $1,000 = $8.60), then multiply the result by the number in the appropriate column for your share class, in the row titled “Expenses Paid” to estimate the expenses you paid on your account during this period.
Hypothetical Example for Comparison Purposes
The information in the table under the heading “Hypothetical Performance” provides information about hypothetical account values and hypothetical expenses based on the Fund’s actual expense ratio and an assumed rate of return of 5% per year before expenses, which is not the Fund’s actual return. The hypothetical account values and expenses may not be used to estimate the actual ending account balance or expenses you paid for the period. You may use this information to compare the ongoing costs of investing in the Fund and other funds. To do so, compare this 5% hypothetical example with the 5% hypothetical examples that appear in the shareholder reports of the other funds.
Please note that the expenses shown in the table are meant to highlight your ongoing costs only and do not reflect any transactional costs, such as sales charges (loads), redemption fees, or exchange fees. Therefore, the information under the heading “Hypothetical Performance” is useful in comparing ongoing costs only, and will not help you determine the relative total costs of owning different funds. In addition, if these transactional costs were included, your costs would have been higher.
6
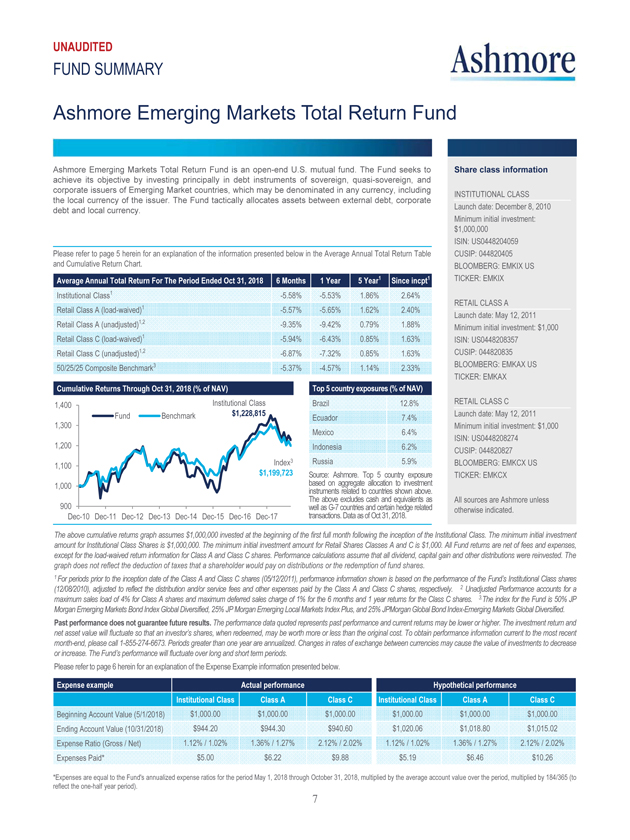
UNAUDITED FUND SUMMARY Ashmore Emerging Markets Total Return Fund Ashmore Emerging Markets Total Return Fund is an open-end U.S. mutual fund. The Fund seeks to achieve its objective by investing principally in debt instruments of sovereign, quasi-sovereign, and corporate issuers of Emerging Market countries, which may be denominated in any currency, including the local currency of the issuer. The Fund tactically allocates assets between external debt, corporate debt and local currency. Please refer to page 5 herein for an explanation of the information presented below in the Average Annual Total Return Table and Cumulative Return Chart. Institutional Class1 -5.58% -5.53% 1.86% 2.64% Retail Class A (load-waived)1 -5.57% -5.65% 1.62% 2.40% Retail Class A (unadjusted)1,2 -9.35% -9.42% 0.79% 1.88% Retail Class C (load-waived)1 -5.94% -6.43% 0.85% 1.63% Retail Class C unadjusted)1,2 -6.87% -7.32% 0.85% 1.63% 50/25/25 Composite Benchmark3 -5.37% -4.57% 1.14% 2.33 Brazil 12.8% Ecuador 7.4% Mexico 6.4% Indonesia 6.2% Russia 5.9% based Source:on Ashmore aggregate . Top allocation 5 country to investment exposure instruments The above excludes related tocash countries and equivalents shown above as. well transactions as G-7 countries . Data as of and Oct certain 31, 2018 hedge . related Share class information INSTITUTIONAL CLASS Launch date: December 8, 2010 Minimum initial investment: $1,000,000 ISIN: US0448204059 CUSIP: 044820405 BLOOMBERG: EMKIX US TICKER: EMKIX RETAIL CLASS A Launch date: May 12, 2011 Minimum initial investment: $1,000 ISIN: US0448208357 CUSIP: 044820835 BLOOMBERG: EMKAX US TICKER: EMKAX RETAIL CLASS C Launch date: May 12, 2011 Minimum initial investment: $1,000 ISIN: US0448208274 CUSIP: 044820827 BLOOMBERG: EMKCX US TICKER: EMKCX All sources are Ashmore unless otherwise indicated. The above cumulative returns graph assumes $1,000,000 invested at the beginning of the first full month following the inception of the Institutional Class. The minimum initial investment amount for Institutional Class Shares is $1,000,000. The minimum initial investment amount for Retail Shares Classes A and C is $1,000. All Fund returns are net of fees and expenses, except for the load-waived return information for Class A and Class C shares. Performance calculations assume that all dividend, capital gain and other distributions were reinvested. The graph does not reflect the deduction of taxes that a shareholder would pay on distributions or the redemption of fund shares. 1 For periods prior to the inception date of the Class A and Class C shares (05/12/2011), performance information shown is based on the performance of the Fund’s Institutional Class shares (12/08/2010), adjusted to reflect the distribution and/or service fees and other expenses paid by the Class A and Class C shares, respectively. 2 Unadjusted Performance accounts for a maximum sales load of 4% for Class A shares and maximum deferred sales charge of 1% for the 6 months and 1 year returns for the Class C shares. 3.The index for the Fund is 50% JP Morgan Emerging Markets Bond Index Global Diversified, 25% JP Morgan Emerging Local Markets Index Plus, and 25% JPMorgan Global Bond Index-Emerging Markets Global Diversified. Past performance does not guarantee future results. The performance data quoted represents past performance and current returns may be lower or higher. The investment return and net asset value will fluctuate so that an investor’s shares, when redeemed, may be worth more or less than the original cost. To obtain performance information current to the most recent month-end, please call 1-855-274-6673. Periods greater than one year are annualized. Changes in rates of exchange between currencies may cause the value of investments to decrease or increase. The Fund’s performance will fluctuate over long and short term periods. Please refer to page 6 herein for an explanation of the Expense Example information presented below. Beginning Account Value (5/1/2018) $1,000.00 $1,000.00 $1,000.00 $1,000.00 $1,000.00 $1,000.00 Ending Account Value (10/31/2018) $944.20 $944.30 $940.60 $1,020.06 $1,018.80 $1,015.02 Expense Ratio (Gross / Net) 1.12% / 1.02% 1.36% / 1.27% 2.12% / 2.02% 1.12% / 1.02% 1.36% / 1.27% 2.12% / 2.02% Expenses Paid* $5.00 $6.22 $9.88 $5.19 $6.46 $10.26 *Expenses are equal to the Fund’s annualized expense ratios for the period May 1, 2018 through October 31, 2018, multiplied by the average account value over the period, multiplied by 184/365 (to reflect the one-half year period). 7
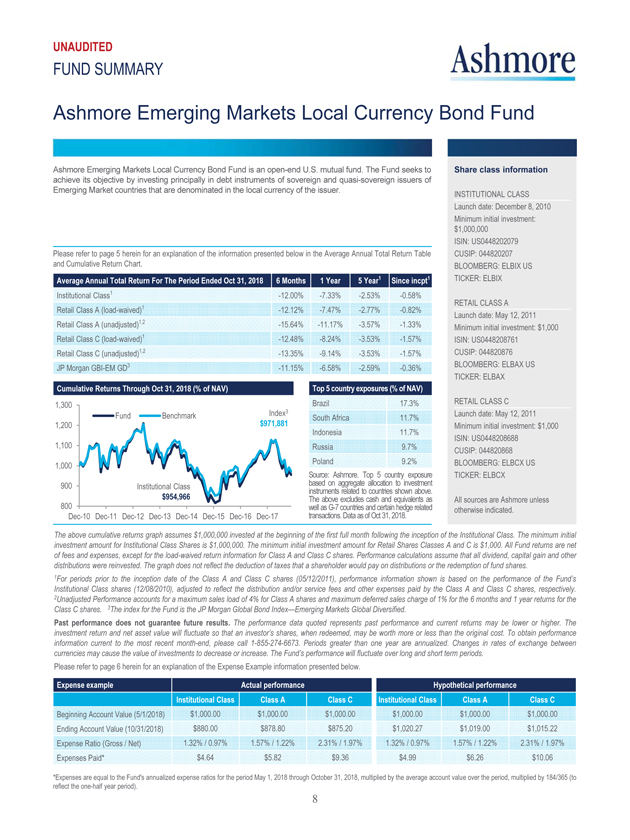
UNAUDITED FUND SUMMARY Ashmore Emerging Markets Local Currency Bond Fund Ashmore Emerging Markets Local Currency Bond Fund is an open-end U.S. mutual fund. The Fund seeks to achieve its objective by investing principally in debt instruments of sovereign and quasi-sovereign issuers of Emerging Market countries that are denominated in the local currency of the issuer. Please refer to page 5 herein for an explanation of the information presented below in the Average Annual Total Return Table and Cumulative Return Chart. Institutional Class1 -12.00% -7.33% -2.53% -0.58% Retail Class A (load-waived)1 -12.12% -7.47% 2.77% -0.82% Retail Class A (unadjusted)1,2 -15.64% -11.17% -3.57% -1.33% Retail Class C (load-waived)1 -12.48% -8.24% -3.53% -1.57% Retail Class C (unadjusted)1,2 -13.35% -9.14% -3.53% -1.57% JP Morgan GBI-EM GD3 -11.15% -6.58% -2.59% -0.36% Brazil 17.3% South Africa 11.7% Indonesia 11.7% Russia 9.7% Poland 9.2% based Source:on Ashmore aggregate . Top allocation 5 country to investment exposure instruments The above excludes related tocash countries and equivalents shown above as. well transactions as G-7 countries . Data as of and Oct certain 31, 2018 hedge . related Share class information INSTITUTIONAL CLASS Launch date: December 8, 2010 Minimum initial investment: $1,000,000 ISIN: US0448202079 CUSIP: 044820207 BLOOMBERG: ELBIX US TICKER: ELBIX RETAIL CLASS A Launch date: May 12, 2011 Minimum initial investment: $1,000 ISIN: US0448208761 CUSIP: 044820876 BLOOMBERG: ELBAX US TICKER: ELBAX RETAIL CLASS C Launch date: May 12, 2011 Minimum initial investment: $1,000 ISIN: US0448208688 CUSIP: 044820868 BLOOMBERG: ELBCX US TICKER: ELBCX All sources are Ashmore unless otherwise indicated. The above cumulative returns graph assumes $1,000,000 invested at the beginning of the first full month following the inception of the Institutional Class. The minimum initial investment amount for Institutional Class Shares is $1,000,000. The minimum initial investment amount for Retail Shares Classes A and C is $1,000. All Fund returns are net of fees and expenses, except for the load-waived return information for Class A and Class C shares. Performance calculations assume that all dividend, capital gain and other distributions were reinvested. The graph does not reflect the deduction of taxes that a shareholder would pay on distributions or the redemption of fund shares. 1For periods prior to the inception date of the Class A and Class C shares (05/12/2011), performance information shown is based on the performance of the Fund’s Institutional Class shares (12/08/2010), adjusted to reflect the distribution and/or service fees and other expenses paid by the Class A and Class C shares, respectively. 2Unadjusted Performance accounts for a maximum sales load of 4% for Class A shares and maximum deferred sales charge of 1% for the 6 months and 1 year returns for the Class C shares. 3The index for the Fund is the JP Morgan Global Bond Index—Emerging Markets Global Diversified. Past performance does not guarantee future results. The performance data quoted represents past performance and current returns may be lower or higher. The investment return and net asset value will fluctuate so that an investor’s shares, when redeemed, may be worth more or less than the original cost. To obtain performance information current to the most recent month-end, please call 1-855-274-6673. Periods greater than one year are annualized. Changes in rates of exchange between currencies may cause the value of investments to decrease or increase. The Fund’s performance will fluctuate over long and short term periods. Please refer to page 6 herein for an explanation of the Expense Example information presented below. Beginning Account Value (5/1/2018) $1,000.00 $1,000.00 $1,000.00 $1,000.00 $1,000.00 $1,000.00 Ending Account Value (10/31/2018) $880.00 $878.80 $875.20 $1,020.27 $1,019.00 $1,015.22 Expense Ratio (Gross / Net) 1.32% / 0.97% 1.57% / 1.22% 2.31% / 1.97% 1.32% / 0.97% 1.57% / 1.22% 2.31% / 1.97% Expenses Paid* $4.64 $5.82 $9.36 $4.99 $6.26 $10.06 *Expenses are equal to the Fund’s annualized expense ratios for the period May 1, 2018 through October 31, 2018, multiplied by the average account value over the period, multiplied by 184/365 (to reflect the one-half year period). 8
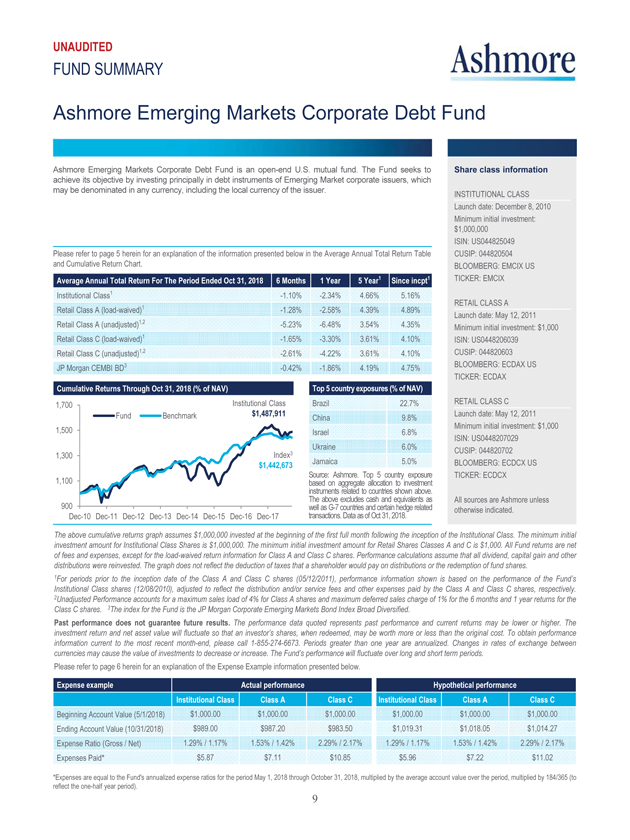
UNAUDITED FUND SUMMARY Ashmore Emerging Markets Corporate Debt Fund Ashmore Emerging Markets Corporate Debt Fund is an open-end U.S. mutual fund. The Fund seeks to achieve its objective by investing principally in debt instruments of Emerging Market corporate issuers, which may be denominated in any currency, including the local currency of the issuer. Please refer to page 5 herein for an explanation of the information presented below in the Average Annual Total Return Table and Cumulative Return Chart. Institutional Class1 -1.10% -2.34% 4.66% 5.16% Retail Class A (load-waived)1 -1.28% -2.58% 4.39%4.89% Retail Class A (unadjusted)1,2 -5.23% -6.48% 3.54% 4.35% Retail Class C (load-waived)1 -1.65% -3.30% 3.61% 4.10% Retail Class C (unadjusted)1,2 -2.61% -4.22% 3.61% 4.10% JP Morgan CEMBI BD3 -0.42% -1.86% 4.19% 4.75% Brazil 22.7% China9.8% Israel 6.8% Ukraine 6.0% Jamaica 5.0% based Source:on Ashmore aggregate . Top allocation 5 country to investment exposure instruments The above excludes related tocash countries and equivalents shown above as. well transactions as G-7 countries .Data as of and Oct certain 31, 2018 hedge . related Share class information INSTITUTIONAL CLASS Launch date: December 8, 2010 Minimum initial investment: $1,000,000 ISIN: US044825049 CUSIP: 044820504 BLOOMBERG: EMCIX US TICKER: EMCIX RETAIL CLASS A Launch date: May 12, 2011 Minimum initial investment: $1,000 ISIN: US0448206039 CUSIP: 044820603 BLOOMBERG: ECDAX US TICKER: ECDAX RETAIL CLASS C Launch date: May 12, 2011 Minimum initial investment: $1,000 ISIN: US0448207029 CUSIP: 044820702 BLOOMBERG: ECDCX US TICKER: ECDCX All sources are Ashmore unless otherwise indicated. The above cumulative returns graph assumes $1,000,000 invested at the beginning of the first full month following the inception of the Institutional Class. The minimum initial investment amount for Institutional Class Shares is $1,000,000. The minimum initial investment amount for Retail Shares Classes A and C is $1,000. All Fund returns are net of fees and expenses, except for the load-waived return information for Class A and Class C shares. Performance calculations assume that all dividend, capital gain and other distributions were reinvested. The graph does not reflect the deduction of taxes that a shareholder would pay on distributions or the redemption of fund shares. 1For periods prior to the inception date of the Class A and Class C shares (05/12/2011), performance information shown is based on the performance of the Fund’s Institutional Class shares (12/08/2010), adjusted to reflect the distribution and/or service fees and other expenses paid by the Class A and Class C shares, respectively. 2Unadjusted Performance accounts for a maximum sales load of 4% for Class A shares and maximum deferred sales charge of 1% for the 6 months and 1 year returns for the Class C shares. 3The index for the Fund is the JP Morgan Corporate Emerging Markets Bond Index Broad Diversified. Past performance does not guarantee future results. The performance data quoted represents past performance and current returns may be lower or higher. The investment return and net asset value will fluctuate so that an investor’s shares, when redeemed, may be worth more or less than the original cost. To obtain performance information current to the most recent month-end, please call 1-855-274-6673. Periods greater than one year are annualized. Changes in rates of exchange between currencies may cause the value of investments to decrease or increase. The Fund’s performance will fluctuate over long and short term periods. Please refer to page 6 herein for an explanation of the Expense Example information presented below. Beginning Account Value (5/1/2018) $1,000.00 $1,000.00 $1,000.00 $1,000.00 $1,000.00 $1,000.00 Ending Account Value (10/31/2018) $989.00 $987.20 $983.50 $1,019.31 $1,018.05 $1,014.27 Expense Ratio (Gross / Net) 1.29% / 1.17% 1.53% / 1.42% 2.29% / 2.17% 1.29% / 1.17% 1.53% / 1.42% 2.29% / 2.17% Expenses Paid* $5.87 $7.11 $10.85 $5.96 $7.22 $11.02 *Expenses are equal to the Fund’s annualized expense ratios for the period May 1, 2018 through October 31, 2018, multiplied by the average account value over the period, multiplied by 184/365 (to reflect the one-half year period). 9
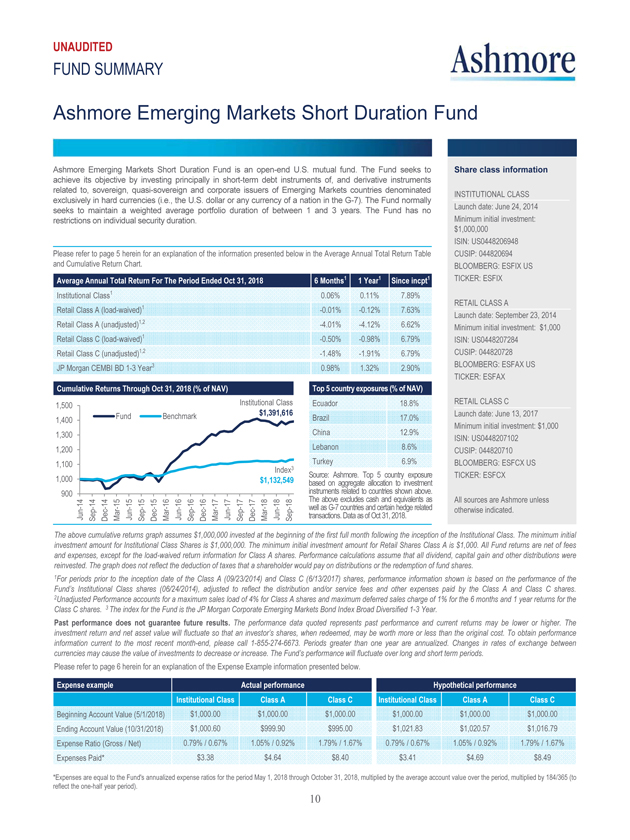
UNAUDITED FUND SUMMARY Ashmore Emerging Markets Short Duration Fund Ashmore Emerging Markets Short Duration Fund is an open-end U.S. mutual fund. The Fund seeks to achieve its objective by investing principally in short-term debt instruments of, and derivative instruments related to, sovereign, quasi-sovereign and corporate issuers of Emerging Markets countries denominated exclusively in hard currencies (i.e., the U.S. dollar or any currency of a nation in the G-7). The Fund normally seeks to maintain a weighted average portfolio duration of between 1 and 3 years. The Fund has no restrictions on individual security duration. Please refer to page 5 herein for an explanation of the information presented below in the Average Annual Total Return Table and Cumulative Return Chart. Institutional Class1 0.06% 0.11% 7.89% Retail Class A (load-waived)1 -0.01% -0.12% 7.63% Retail Class A (unadjusted)1,2 -4.01% -4.12% 6.62% Retail Class C (load-waived)1 -0.50% -0.98% 6.79% Retail Class C (unadjusted)1,2 -1.48% 1.91% 6.79% JP Morgan CEMBI BD 1-3 Year3 0.98% 1.32% 2.90% Ecuador 18.8% Brazil 17.0% China 12.9% Lebanon 8.6% Turkey 6.9% based Source:on Ashmore aggregate . Top allocation 5 country to investment exposure instruments The above excludes related tocash countries and equivalents shown above as. well transactions as G-7 countries . Data as of and Oct certain 31, 2018 hedge . related Share class information INSTITUTIONAL CLASS Launch date: June 24, 2014 Minimum initial investment: $1,000,000 ISIN: US0448206948 CUSIP: 044820694 BLOOMBERG: ESFIX US TICKER: ESFIX RETAIL CLASS A Launch date: September 23, 2014 Minimum initial investment: $1,000 ISIN: US0448207284 CUSIP: 044820728 BLOOMBERG: ESFAX US TICKER: ESFAX RETAIL CLASS C Launch date: June 13, 2017 Minimum initial investment: $1,000 ISIN: US0448207102 CUSIP: 044820710 BLOOMBERG: ESFCX US TICKER: ESFCX All sources are Ashmore unless otherwise indicated. The above cumulative returns graph assumes $1,000,000 invested at the beginning of the first full month following the inception of the Institutional Class. The minimum initial investment amount for Institutional Class Shares is $1,000,000. The minimum initial investment amount for Retail Shares Class A is $1,000. All Fund returns are net of fees and expenses, except for the load-waived return information for Class A shares. Performance calculations assume that all dividend, capital gain and other distributions were reinvested. The graph does not reflect the deduction of taxes that a shareholder would pay on distributions or the redemption of fund shares. 1For periods prior to the inception date of the Class A (09/23/2014) and Class C (6/13/2017) shares, performance information shown is based on the performance of the Fund’s Institutional Class shares (06/24/2014), adjusted to reflect the distribution and/or service fees and other expenses paid by the Class A and Class C shares. 2Unadjusted Performance accounts for a maximum sales load of 4% for Class A shares and maximum deferred sales charge of 1% for the 6 months and 1 year returns for the Class C shares. 3 The index for the Fund is the JP Morgan Corporate Emerging Markets Bond Index Broad Diversified 1-3 Year. Past performance does not guarantee future results. The performance data quoted represents past performance and current returns may be lower or higher. The investment return and net asset value will fluctuate so that an investor’s shares, when redeemed, may be worth more or less than the original cost. To obtain performance information current to the most recent month-end, please call 1-855-274-6673. Periods greater than one year are annualized. Changes in rates of exchange between currencies may cause the value of investments to decrease or increase. The Fund’s performance will fluctuate over long and short term periods. Please refer to page 6 herein for an explanation of the Expense Example information presented below.Beginning Account Value (5/1/2018) $1,000.00 $1,000.00 $1,000.00 $1,000.00 $1,000.00 $1,000.00 Ending Account Value (10/31/2018) $1,000.60 $999.90 $995.00 $1,021.83 $1,020.57$1,016.79 Expense Ratio (Gross / Net) 0.79% / 0.67% 1.05% / 0.92% 1.79% / 1.67% 0.79% / 0.67% 1.05% / 0.92% 1.79% /1.67% Expenses Paid* $3.38 $4.64 $8.40 $3.41 $4.69 $8.49 *Expenses are equal to the Fund’s annualized expense ratios for the period May 1, 2018 through October 31, 2018, multiplied by the average account value over the period, multiplied by 184/365 (to reflect the one-half year period). 10
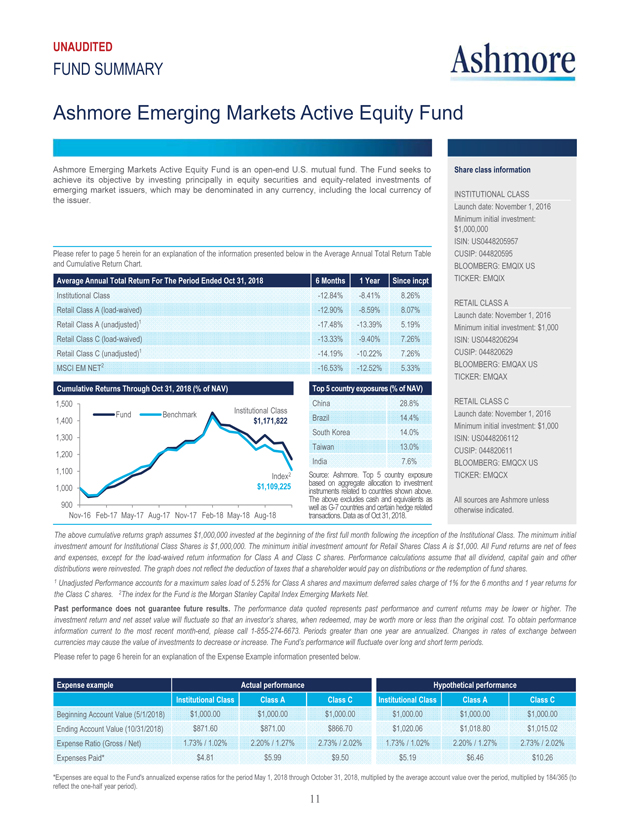
UNAUDITED FUND SUMMARY Ashmore Emerging Markets Active Equity Fund Ashmore Emerging Markets Active Equity Fund is an open-end U.S. mutual fund. The Fund seeks to achieve its objective by investing principally in equity securities and equity-related investments of emerging market issuers, which may be denominated in any currency, including the local currency of the issuer. Please refer to page 5 herein for an explanation of the information presented below in the Average Annual Total Return Table and Cumulative Return Chart. Institutional Class -12.84% -8.41% 8.26% Retail Class A (load-waived) -12.90% -8.59% 8.07% Retail Class A (unadjusted)1 -17.48% -13.39% 5.19% Retail Class C (load-waived) -13.33% -9.40% 7.26% Retail Class C (unadjusted)1 14.19% -10.22% 7.26% MSCI EM NET2 -16.53% -12.52% 5.33% China 28.8% Brazil 14.4% South Korea 14.0% Taiwan 13.0% India 7.6% based Source:on Ashmore aggregate . Top allocation 5 country to investment exposure instruments The above excludes related tocash countries and equivalents shown above as. well transactions as G-7 countries . Data as of and Oct certain 31, 2018 hedge . related Share class information INSTITUTIONAL CLASS Launch date: November 1, 2016 Minimum initial investment: $1,000,000 ISIN: US0448205957 CUSIP: 044820595 BLOOMBERG: EMQIX US TICKER: EMQIX RETAIL CLASS A Launch date: November 1, 2016 Minimum initial investment: $1,000 ISIN: US0448206294 CUSIP: 044820629 BLOOMBERG: EMQAX US TICKER: EMQAX RETAIL CLASS C Launch date: November 1, 2016 Minimum initial investment: $1,000 ISIN: US0448206112 CUSIP: 044820611 BLOOMBERG: EMQCX US TICKER: EMQCX All sources are Ashmore unless otherwise indicated. The above cumulative returns graph assumes $1,000,000 invested at the beginning of the first full month following the inception of the Institutional Class. The minimum initial investment amount for Institutional Class Shares is $1,000,000. The minimum initial investment amount for Retail Shares Class A is $1,000. All Fund returns are net of fees and expenses, except for the load-waived return information for Class A and Class C shares. Performance calculations assume that all dividend, capital gain and other distributions were reinvested. The graph does not reflect the deduction of taxes that a shareholder would pay on distributions or the redemption of fund shares. 1 Unadjusted Performance accounts for a maximum sales load of 5.25% for Class A shares and maximum deferred sales charge of 1% for the 6 months and 1 year returns for the Class C shares. 2The index for the Fund is the Morgan Stanley Capital Index Emerging Markets Net. Past performance does not guarantee future results. The performance data quoted represents past performance and current returns may be lower or higher. The investment return and net asset value will fluctuate so that an investor’s shares, when redeemed, may be worth more or less than the original cost. To obtain performance information current to the most recent month-end, please call 1-855-274-6673. Periods greater than one year are annualized. Changes in rates of exchange between currencies may cause the value of investments to decrease or increase. The Fund’s performance will fluctuate over long and short term periods. Please refer to page 6 herein for an explanation of the Expense Example information presented below. Beginning Account Value (5/1/2018) $1,000.00 $1,000.00 $1,000.00 $1,000.00 $1,000.00 $1,000.00 Ending Account Value (10/31/2018) $871.60 $871.00 $866.70 $1,020.06 $1,018.80 $1,015.02 Expense Ratio (Gross / Net) 1.73% / 1.02% 2.20% / 1.27% 2.73% / 2.02% 1.73% / 1.02% 2.20% / 1.27% 2.73% / 2.02% Expenses Paid* $4.81$5.99 $9.50 $5.19 $6.46 $10.26 *Expenses are equal to the Fund’s annualized expense ratios for the period May 1, 2018 through October 31, 2018, multiplied by the average account value over the period, multiplied by 184/365 (to reflect the one-half year period). 11
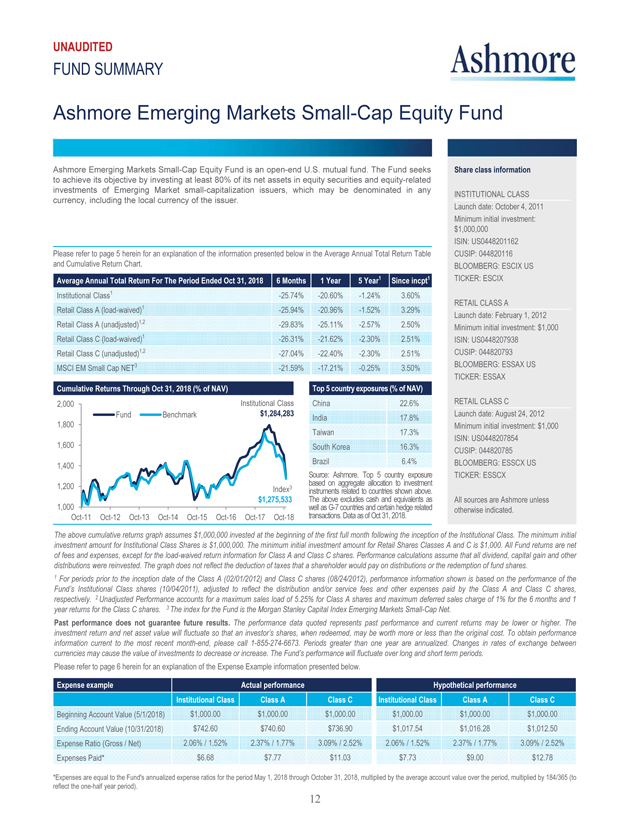
UNAUDITED FUND SUMMARY Ashmore Emerging Markets Small-Cap Equity Fund Ashmore Emerging Markets Small-Cap Equity Fund is an open-end U.S. mutual fund. The Fund seeks to achieve its objective by investing at least 80% of its net assets in equity securities and equity-related investments of Emerging Market small-capitalization issuers, which may be denominated in any currency, including the local currency of the issuer. Please refer to page 5 herein for an explanation of the information presented below in the Average Annual Total Return Table and Cumulative Return Chart. Institutional Class1 -25.74% -20.60%-1.24% 3.60% Retail Class A (load-waived)1 -25.94% -20.96% -1.52% 3.29% Retail Class A (unadjusted)1,2 -29.83% -25.11% -2.57% 2.50% Retail Class C (load-waived)1 -26.31% -21.62% -2.30% 2.51% Retail Class C (unadjusted)1,2 -27.04% -22.40% -2.30% 2.51% MSCI EM Small Cap NET3 -21.59% -17.21% -0.25% 3.50% China 22.6% India 17.8% Taiwan 17.3% South Korea 16.3% Brazil 6.4% based Source:on Ashmore aggregate . Top allocation 5 country to investment exposure instruments The above excludes related tocash countries and equivalents shown above as. well transactions as G-7 countries . Data as of and Oct certain 31, 2018 hedge . related Share class information INSTITUTIONAL CLASS Launch date: October 4, 2011 Minimum initial investment: $1,000,000 ISIN: US0448201162 CUSIP: 044820116 BLOOMBERG: ESCIX US TICKER: ESCIX RETAIL CLASS A Launch date: February 1, 2012 Minimum initial investment: $1,000 ISIN: US0448207938 CUSIP: 044820793 BLOOMBERG: ESSAX US TICKER: ESSAX RETAIL CLASS C Launch date: August 24, 2012 Minimum initial investment: $1,000 ISIN: US0448207854 CUSIP: 044820785 BLOOMBERG: ESSCX US TICKER: ESSCX All sources are Ashmore unless otherwise indicated. The above cumulative returns graph assumes $1,000,000 invested at the beginning of the first full month following the inception of the Institutional Class. The minimum initial investment amount for Institutional Class Shares is $1,000,000. The minimum initial investment amount for Retail Shares Classes A and C is $1,000. All Fund returns are net of fees and expenses, except for the load-waived return information for Class A and Class C shares. Performance calculations assume that all dividend, capital gain and other distributions were reinvested. The graph does not reflect the deduction of taxes that a shareholder would pay on distributions or the redemption of fund shares. 1 For periods prior to the inception date of the Class A (02/01/2012) and Class C shares (08/24/2012), performance information shown is based on the performance of the Fund’s Institutional Class shares (10/04/2011), adjusted to reflect the distribution and/or service fees and other expenses paid by the Class A and Class C shares, respectively. 2 Unadjusted Performance accounts for a maximum sales load of 5.25% for Class A shares and maximum deferred sales charge of 1% for the 6 months and 1 year returns for the Class C shares. 3 The index for the Fund is the Morgan Stanley Capital Index Emerging Markets Small-Cap Net. Past performance does not guarantee future results. The performance data quoted represents past performance and current returns may be lower or higher. The investment return and net asset value will fluctuate so that an investor’s shares, when redeemed, may be worth more or less than the original cost. To obtain performance information current to the most recent month-end, please call 1-855-274-6673. Periods greater than one year are annualized. Changes in rates of exchange between currencies may cause the value of investments to decrease or increase. The Fund’s performance will fluctuate over long and short term periods. Please refer to page 6 herein for an explanation of the Expense Example information presented below. Beginning Account Value (5/1/2018) $1,000.00 $1,000.00 $1,000.00 $1,000.00 $1,000.00 $1,000.00 Ending Account Value (10/31/2018) $742.60 $740.60 $736.90 $1,017.54 $1,016.28 $1,012.50 Expense Ratio (Gross / Net) 2.06% / 1.52% 2.37% / 1.77% 3.09% / 2.52% 2.06% / 1.52% 2.37% / 1.77% 3.09% / 2.52% Expenses Paid* $6.68 $7.77 $11.03 $7.73 $9.00 $12.78 *Expenses are equal to the Fund’s annualized expense ratios for the period May 1, 2018 through October 31, 2018, multiplied by the average account value over the period, multiplied by 184/365 (to reflect the one-half year period).

UNAUDITED FUND SUMMARY Ashmore Emerging Markets Frontier Equity Fund Ashmore Emerging Markets Frontier Equity Fund is an open-end U.S. mutual fund. The Fund seeks to achieve its objective by investing principally in equity securities and equity-related investments of Frontier Market issuers, which may be denominated in any currency, including the local currency of the issuer. Please refer to page 5 herein for an explanation of the information presented below in the Average Annual Total Return Table and Cumulative Return Chart. Institutional Class -20.37% -15.11% 2.26% Retail Class A (load-waived)1 -20.69% -15.44% 1.92% Retail Class A (unadjusted)1,2 -24.85% -19.88% 0.83% Retail Class C (load-waived)1 -21.19% -16.30% 1.07% Retail Class C (unadjusted)1,2 -21.97% -17.07% 1.07% MSCI Frontier Markets NET3 -17.20% -12.07% 1.62% Nigeria 12.1% Kuwait 11.2% Vietnam 11.0% Argentina 9.2% United Arab Emirates 8.5% based Source:on Ashmore aggregate . Top allocation 5 country to investment exposure instruments The above excludes related tocash countries and equivalents shown above as. well transactions as G-7 countries . Data as of and Oct certain 31, 2018 hedge . related Share class information INSTITUTIONAL CLASS Launch date: November 5, 2013 Minimum initial investment: $1,000,000 ISIN: US0448207367 CUSIP: 044820736 BLOOMBERG: EFEIX US TICKER: EFEIX RETAIL CLASS A Launch date: May 7, 2014 Minimum initial investment: $1,000 ISIN: US0448207516 CUSIP: 044820751BLOOMBERG: EFEAX US TICKER: EFEAX RETAIL CLASS C Launch date: May 7, 2014 Minimum initial investment: $1,000 ISIN: US0448207441 CUSIP: 044820744 BLOOMBERG: EFECX US TICKER: EFECX All sources are Ashmore unless otherwise indicated. The above cumulative returns graph assumes $1,000,000 invested at the beginning of the first full month following the inception of the Institutional Class. The minimum initial investment amount for Institutional Class Shares is $1,000,000. All Fund returns are net of fees and expenses. Performance calculations assume that all dividend, capital gain and other distributions were reinvested. The graph does not reflect the deduction of taxes that a shareholder would pay on distributions or the redemption of fund shares. 1 For periods prior to the inception date of the Class A (05/07/2014) and Class C shares (05/07/2014), performance information shown is based on the performance of the Fund’s Institutional Class shares (11/05/2013), adjusted to reflect the distribution and/or service fees and other expenses paid by the Class A and Class C shares, respectively. 2 Unadjusted Performance accounts for a maximum sales load of 5.25% for Class A shares and maximum deferred sales charge of 1% for the 6 months and 1 year returns for the Class C shares. 3The index for the Fund is the Morgan Stanley Capital Index Frontier Markets Net. Past performance does not guarantee future results. The performance data quoted represents past performance and current returns may be lower or higher. The investment return and net asset value will fluctuate so that an investor’s shares, when redeemed, may be worth more or less than the original cost. To obtain performance information current to the most recent month-end, please call 1-855-274-6673. Periods greater than one year are annualized. Changes in rates of exchange between currencies may cause the value of investments to decrease or increase. The Fund’s performance will fluctuate over long and short term periods. Please refer to page 6 herein for an explanation of the Expense Example information presented belowBeginning Account Value (5/1/2018) $1,000.00 $1,000.00 $1,000.00 $1,000.00 $1,000.00 $1,000.00 Ending Account Value (10/31/2018) $796.30 $793.10 $788.10 $1,017.54 $1,016.28 $1,012.50 Expense Ratio (Gross / Net) 1.95% / 1.52% 2.20% / 1.77% 2.94% / 2.52% 1.95% / 1.52% 2.20% / 1.77% 2.94% / 2.52% Expenses Paid* $6.88 $8.00 $11.36 $7.73 $9.00 $12.78 *Expenses are equal to the Fund’s annualized expense ratios for the period May 1, 2018 through October 31, 2018, multiplied by the average account value over the period, multiplied by 184/365 (to reflect the one-half year period). 13

UNAUDITED FUND SUMMARY Ashmore Emerging Markets Equity Fund* Ashmore Emerging Markets Equity Fund is an open-end U.S. mutual fund. The Fund seeks to achieve its objective by investing principally in equity securities and equity-related investments of Emerging Market issuers which may be denominated in any currency, including the local currency of the issuer. *Effective November 1, 2017 the Fund’s name changed from Ashmore Emerging Markets Value Fund to Ashmore Emerging Markets Equity Fund. Please refer to page 5 herein for an explanation of the information presented below in the Average Annual Total Return Table and Cumulative Return Chart. Institutional Class1 -17.85% -14.01% 0.86% -0.07% Retail Class A (load-waived)1 -17.88% 14.16% 0.62% -0.35% Retail Class A (unadjusted)1,2 -22.20% -18.66% -0.47% -1.08% Retail Class C (load-waived)1 -18.38% 14.92% -0.19% -1.12% Retail Class C (unadjusted)1,2 -19.19% -15.75% -0.19% -1.12% MSCI EM NET3 -16.53% -12.52% 0.78% 0.33% China 27.8% India 12.0% Brazil 9.8% Taiwan 9.8% Russia 7.8% based Source:on Ashmore aggregate . Top allocation 5 country to investment exposure instruments The above excludes related tocash countries and equivalents shown above as. well transactions as G-7 countries . Data as of and Oct certain 31, 2018 hedge . related Share class information INSTITUTIONAL CLASS Launch date: June 22, 2011 Minimum initial investment: $1,000,000 ISIN: US0448208191 CUSIP: 044820819 BLOOMBERG: EMFIX US TICKER: EMFIX RETAIL CLASS A Launch date: February 27, 2012 Minimum initial investment: $1,000 ISIN: US0448207771 CUSIP: 044820777 BLOOMBERG: EMEAX US TICKER: EMEAX RETAIL CLASS C Launch date: March 7, 2017 Minimum initial investment: $1,000 ISIN: US0448207698 CUSIP: 044820769 BLOOMBERG: EMECX US TICKER: EMECX All sources are Ashmore unless otherwise indicated. The above cumulative returns graph assumes $1,000,000 invested at the beginning of the first full month following the inception of the Institutional Class. The minimum initial investment amount for Institutional Class Shares is $1,000,000. The minimum initial investment amount for Retail Shares Classes A and C is $1,000. All Fund returns are net of fees and expenses, except for the load-waived return information for Class A and Class C shares. Performance calculations assume that all dividend, capital gain and other distributions were reinvested. The graph does not reflect the deduction of taxes that a shareholder would pay on distributions or the redemption of fund shares. 1 For periods prior to the inception date of the Class A (02/27/2012) and Class C shares (03/07/2017), performance information shown is based on the performance of the Fund’s Institutional Class shares (06/22/2011), adjusted to reflect the distribution and/or service fees and other expenses paid by the Class A and Class C shares. 2 Unadjusted Performance accounts for a maximum sales load of 5.25% for Class A shares and maximum deferred sales charge of 1% for the 6 months and 1 year returns for the Class C shares. 3 The index for the Fund is the Morgan Stanley Capital Index Emerging Markets Net. Past performance does not guarantee future results. The performance data quoted represents past performance and current returns may be lower or higher. The investment return and net asset value will fluctuate so that an investor’s shares, when redeemed, may be worth more or less than the original cost. To obtain performance information current to the most recent month-end, please call 1-855-274-6673. Periods greater than one year are annualized. Changes in rates of exchange between currencies may cause the value of investments to decrease or increase. The Fund’s performance will fluctuate over long and short term periods. Please refer to page 6 herein for an explanation of the Expense Example information presented below. Beginning Account Value (5/1/2018) $1,000.00 $1,000.00 $1,000.00 $1,000.00 $1,000.00 $1,000.00 Ending Account Value (10/31/2018) $821.50 $821.20 $816.20 $1,019.31 $1,018.05 $1,014.32 Expense Ratio (Gross / Net) 1.95% / 1.17% 2.19% / 1.42% 2.96% / 2.17% 1.95% / 1.17% 2.19% / 1.42% 2.96% / 2.17% Expenses Paid* $5.37 $6.52 $9.89 $5.96 $7.22 $10.97 *Expenses are equal to the Fund’s annualized expense ratios for the period May 1, 2018 through October 31, 2018, multiplied by the average account value over the period, multiplied by 184/365 (to reflect the one-half year period). 14
Report of Independent Registered Public Accounting Firm
To the Shareholders and Board of Trustees
Ashmore Funds:
Opinion on the Financial Statements
We have audited the accompanying statements of assets and liabilities of Ashmore Emerging Markets Total Return Fund, Ashmore Emerging Markets Local Currency Bond Fund, Ashmore Emerging Markets Corporate Debt Fund, Ashmore Emerging Markets Short Duration Fund, Ashmore Emerging Markets Active Equity Fund, Ashmore Emerging Markets Small-Cap Equity Fund, Ashmore Emerging Markets Frontier Equity Fund, and Ashmore Emerging Markets Equity Fund (funds within Ashmore Funds)(the Funds), including the schedules of investments, as of October 31, 2018, the related statements of operations for the year then ended, the statements of changes in net assets for each of the years in the two-year period then ended, and the related notes (collectively, the financial statements) and the financial highlights for each of the years or periods in the five-year period then ended. In our opinion, the financial statements and financial highlights present fairly, in all material respects, the financial position of the Funds as of October 31, 2018, the results of their operations for the year then ended, the changes in their net assets for each of the years in the two-year period then ended, and the financial highlights for each of the years or periods in the five-year period then ended, in conformity with U.S. generally accepted accounting principles.
Basis for Opinion
These financial statements and financial highlights are the responsibility of the Funds’ management. Our responsibility is to express an opinion on these financial statements and financial highlights based on our audits. We are a public accounting firm registered with the Public Company Accounting Oversight Board (United States) (PCAOB) and are required to be independent with respect to the Funds in accordance with the U.S. federal securities laws and the applicable rules and regulations of the Securities and Exchange Commission and the PCAOB.
We conducted our audits in accordance with the standards of the PCAOB. Those standards require that we plan and perform the audit to obtain reasonable assurance about whether the financial statements and financial highlights are free of material misstatement, whether due to error or fraud. Our audits included performing procedures to assess the risks of material misstatement of the financial statements and financial highlights, whether due to error or fraud, and performing procedures that respond to those risks. Such procedures included examining, on a test basis, evidence regarding the amounts and disclosures in the financial statements and financial highlights. Such procedures also included confirmation of securities owned as of October 31, 2018, by correspondence with custodians and brokers. Our audits also included evaluating the accounting principles used and significant estimates made by management, as well as evaluating the overall presentation of the financial statements and financial highlights. We believe that our audits provide a reasonable basis for our opinion.
/s/ KPMG LLP
We have served as the auditor of Ashmore Funds since 2010.
Chicago, IL
December 21, 2018
(THIS PAGE INTENTIONALLY LEFT BLANK)
16
ASHMORE FUNDS
STATEMENTS OF ASSETS AND LIABILITIES
As of October 31, 2018
| | | | | | | | | | | | | | | | | | | | | | | | | |
| | | Ashmore
Emerging Markets Total Return
Fund | | | | Ashmore
Emerging Markets
Local Currency
Bond Fund | | | | Ashmore
Emerging Markets
Corporate Debt
Fund |
ASSETS: | | | | | | | | | | | | | | | | | | | | | | | | | |
Investments in securities, at value | | | $ | 1,223,200,326 | | | | | | | | | $ | 50,149,642 | | | | | | | | | $ | 319,130,781 | |
Investments in fully funded total return swaps, at value | | | | 3,402,985 | | | | | | | | | | 1,745,774 | | | | | | | | | | — | |
Deposit held at broker | | | | 5,371,689 | | | | | | | | | | 642,318 | | | | | | | | | | — | |
Cash | | | | 84,415,223 | | | | | | | | | | 11,130,889 | | | | | | | | | | 14,335,592 | |
Foreign currency, at value | | | | 3,698,914 | | | | | | | | | | 183,167 | | | | | | | | | | 71,309 | |
Unrealized appreciation on forward foreign currency exchange contracts | | | | 10,500,287 | | | | | | | | | | 846,608 | | | | | | | | | | 56,998 | |
Variation margin receivable on centrally cleared swap contracts | | | | 202,398 | | | | | | | | | | 23,761 | | | | | | | | | | — | |
Due from broker | | | | 1,020,167 | | | | | | | | | | 112,693 | | | | | | | | | | — | |
Receivable for securities and currencies sold | | | | 993,677 | | | | | | | | | | 8,364 | | | | | | | | | | — | |
Receivable for fund shares sold | | | | 391,041 | | | | | | | | | | 14,619 | | | | | | | | | | 2,225,540 | |
Receivable from Investment Manager | | | | 106,087 | | | | | | | | | | 18,449 | | | | | | | | | | 37,839 | |
Interest and dividends receivable | | | | 18,586,049 | | | | | | | | | | 1,012,104 | | | | | | | | | | 4,740,752 | |
Other assets | | | | 18,109 | | | | | | | | | | 8,760 | | | | | | | | | | 13,738 | |
Total Assets | | | | 1,351,906,952 | | | | | | | | | | 65,897,148 | | | | | | | | | | 340,612,549 | |
LIABILITIES: | | | | | | | | | | | | | | | | | | | | | | | | | |
Reverse repurchase agreements | | | | — | | | | | | | | | | — | | | | | | | | | | 294,298 | |
Cash overdraft | | | | — | | | | | | | | | | — | | | | | | | | | | — | |
Unrealized depreciation on forward foreign currency exchange contracts | | | | 8,175,124 | | | | | | | | | | 1,006,476 | | | | | | | | | | — | |
Variation margin payable on centrally cleared swap contracts | | | | 369,347 | | | | | | | | | | 78,547 | | | | | | | | | | — | |
Unrealized depreciation on interest rate swap contracts | | | | — | | | | | | | | | | 8,434 | | | | | | | | | | — | |
Payable for securities and currencies purchased | | | | 7,837,057 | | | | | | | | | | 26,750 | | | | | | | | | | 1,674,968 | |
Payable for when-issued securities | | | | — | | | | | | | | | | — | | | | | | | | | | 450,000 | |
Payable for fund shares redeemed | | | | 563,228 | | | | | | | | | | 40,701 | | | | | | | | | | 777,843 | |
Distributions payable | | | | 3,218,338 | | | | | | | | | | — | | | | | | | | | | 157,302 | |
Due to broker | | | | 3,910,032 | | | | | | | | | | 274,258 | | | | | | | | | | — | |
Investment Manager fee payable | | | | 1,142,528 | | | | | | | | | | 53,382 | | | | | | | | | | 322,746 | |
Trustees’ fees payable | | | | 31,740 | | | | | | | | | | 1,347 | | | | | | | | | | 7,195 | |
Other liabilities | | | | 373,978 | | | | | | | | | | 61,869 | | | | | | | | | | 108,160 | |
Total Liabilities | | | | 25,621,372 | | | | | | | | | | 1,551,764 | | | | | | | | | | 3,792,512 | |
Net Assets | | | $ | 1,326,285,580 | | | | | | | | | $ | 64,345,384 | | | | | | | | | $ | 336,820,037 | |
NET ASSETS: | | | | | | | | | | | | | | | | | | | | | | | | | |
Paid in capital | | | $ | 1,494,173,899 | | | | | | | | | $ | 74,915,827 | | | | | | | | | $ | 394,606,247 | |
Distributable earnings/(Accumulated loss) | | | | (167,888,319 | ) | | | | | | | | | (10,570,443 | ) | | | | | | | | | (57,786,210 | ) |
Net Assets | | | $ | 1,326,285,580 | | | | | | | | | $ | 64,345,384 | | | | | | | | | $ | 336,820,037 | |
| | | | | |
Net Assets: | | | | | | | | | | | | | | | | | | | | | | | | | |
Class A | | | $ | 8,347,036 | | | | | | | | | $ | 1,258,707 | | | | | | | | | $ | 8,616,288 | |
Class C | | | | 4,278,426 | | | | | | | | | | 77,392 | | | | | | | | | | 8,785,014 | |
Institutional Class | | | | 1,313,660,118 | | | | | | | | | | 63,009,285 | | | | | | | | | | 319,418,735 | |
| | | | | |
Shares Issued and Outstanding (no par value, unlimited shares authorized): | | | | | | | | | | | | | | | | | | | | | | | | | |
Class A | | | | 1,142,158 | | | | | | | | | | 192,738 | | | | | | | | | | 1,095,027 | |
Class C | | | | 586,825 | | | | | | | | | | 11,961 | | | | | | | | | | 1,117,883 | |
Institutional Class | | | | 177,162,636 | | | | | | | | | | 9,274,887 | | | | | | | | | | 38,968,692 | |
| | | | | |
Net Asset Value and Redemption Price Per Share (Net Asset Per Share Outstanding): | | | | | | | | | | | | | | | | | | | | | | | | | |
Class A | | | $ | 7.31 | | | | | | | | | $ | 6.53 | | | | | | | | | $ | 7.87 | |
Class C | | | | 7.29 | | | | | | | | | | 6.47 | | | | | | | | | | 7.86 | |
Institutional Class | | | | 7.41 | | | | | | | | | | 6.79 | | | | | | | | | | 8.20 | |
| | | | | |
Cost of Investments in securities | | | $ | 1,326,802,997 | | | | | | | | | $ | 57,828,947 | | | | | | | | | $ | 341,345,374 | |
Cost of Investments in fully funded total return swaps | | | $ | 4,793,918 | | | | | | | | | $ | 2,335,577 | | | | | | | | | $ | — | |
Cost of foreign currency held | | | $ | 3,693,644 | | | | | | | | | $ | 181,843 | | | | | | | | | $ | 72,988 | |
See accompanying notes to the financial statements.
17
| | | | | | | | | | | | | | | | | | | | | | | | | | | | | | | | | | | | |
| | | | | | | | | |
| | | Ashmore
Emerging Markets
Short Duration
Fund | | | | | | Ashmore
Emerging Markets
Active Equity Fund | | | | | | Ashmore
Emerging Markets
Small-Cap
Equity Fund | | | | | | Ashmore
Emerging Markets
Frontier Equity
Fund | | | | | | Ashmore
Emerging Markets
Equity Fund | |
| | | | | | | | | | | | | | | | | | | | | | | | | | | | | | | | | | | | |
| | | $747,541,804 | | | | | | | | $17,147,582 | | | | | | | | $33,710,611 | | | | | | | | $ 84,230,416 | | | | | | | | $23,973,403 | |
| | | — | | | | | | | | — | | | | | | | | — | | | | | | | | — | | | | | | | | — | |
| | | — | | | | | | | | — | | | | | | | | — | | | | | | | | — | | | | | | | | — | |
| | | 68,083,179 | | | | | | | | 966,510 | | | | | | | | — | | | | | | | | 695,022 | | | | | | | | 510,431 | |
| | | 39,948 | | | | | | | | 95,242 | | | | | | | | 171,881 | | | | | | | | 458,060 | | | | | | | | 3,413 | |
| | | — | | | | | | | | 4,241 | | | | | | | | — | | | | | | | | — | | | | | | | | — | |
| | | — | | | | | | | | — | | | | | | | | — | | | | | | | | — | | | | | | | | — | |
| | | — | | | | | | | | — | | | | | | | | — | | | | | | | | — | | | | | | | | — | |
| | | — | | | | | | | | 549,157 | | | | | | | | 504,408 | | | | | | | | 519,144 | | | | | | | | 59,975 | |
| | | 2,806,872 | | | | | | | | — | | | | | | | | 231,492 | | | | | | | | 19,576 | | | | | | | | — | |
| | | 98,670 | | | | | | | | 18,240 | | | | | | | | 34,459 | | | | | | | | 46,857 | | | | | | | | 5,057 | |
| | | 10,156,014 | | | | | | | | 13,447 | | | | | | | | 68,532 | | | | | | | | 67,648 | | | | | | | | 15,924 | |
| | | | 51,453 | | | | | | | | 11,527 | | | | | | | | 9,530 | | | | | | | | — | | | | | | | | 8,512 | |
| | | | 828,777,940 | | | | | | | | 18,805,946 | | | | | | | | 34,730,913 | | | | | | | | 86,036,723 | | | | | | | | 24,576,715 | |
| | | — | | | | | | | | — | | | | | | | | — | | | | | | | | — | | | | | | | | — | |
| | | — | | | | | | | | — | | | | | | | | 238,210 | | | | | | | | — | | | | | | | | — | |
| | | — | | | | | | | | — | | | | | | | | — | | | | | | | | — | | | | | | | | — | |
| | | — | | | | | | | | — | | | | | | | | — | | | | | | | | — | | | | | | | | — | |
| | | — | | | | | | | | — | | | | | | | | — | | | | | | | | — | | | | | | | | — | |
| | | 45,733,266 | | | | | | | | 1,090,152 | | | | | | | | 205,831 | | | | | | | | — | | | | | | | | 50,973 | |
| | | — | | | | | | | | — | | | | | | | | — | | | | | | | | — | | | | | | | | — | |
| | | 545,400 | | | | | | | | — | | | | | | | | 13,337 | | | | | | | | 3,138 | | | | | | | | 4,109 | |
| | | 3,028,432 | | | | | | | | — | | | | | | | | — | | | | | | | | — | | | | | | | | — | |
| | | — | | | | | | | | — | | | | | | | | — | | | | | | | | — | | | | | | | | — | |
| | | 413,505 | | | | | | | | 15,190 | | | | | | | | 46,605 | | | | | | | | 111,507 | | | | | | | | 24,705 | |
| | | 12,757 | | | | | | | | 371 | | | | | | | | 782 | | | | | | | | 1,877 | | | | | | | | 550 | |
| | | | 165,907 | | | | | | | | 29,252 | | | | | | | | 50,868 | | | | | | | | 78,253 | | | | | | | | 30,350 | |
| | | | 49,899,267 | | | | | | | | 1,134,965 | | | | | | | | 555,633 | | | | | | | | 194,775 | | | | | | | | 110,687 | |
| | | | $778,878,673 | | | | | | | | $17,670,981 | | | | | | | | $34,175,280 | | | | | | | | $ 85,841,948 | | | | | | | | $24,466,028 | |
| | | | | | | | | | | | | | | | | | | | | | | | | | | | | | | | | | | | |
| | | $790,764,739 | | | | | | | | $17,800,716 | | | | | | | | $43,156,945 | | | | | | | | $ 96,001,456 | | | | | | | | $29,347,453 | |
| | | | (11,886,066 | ) | | | | | | | (129,735 | ) | | | | | | | (8,981,665 | ) | | | | | | | (10,159,508 | ) | | | | | | | (4,881,425) | |
| | | | $778,878,673 | | | | | | | | $17,670,981 | | | | | | | | $34,175,280 | | | | | | | | $ 85,841,948 | | | | | | | | $24,466,028 | |
| | | | | | | | | |
| | | | | | | | | | | | | | | | | | | | | | | | | | | | | | | | | | | | |
| | | $ 83,289,658 | | | | | | | | $ 223,469 | | | | | | | | $ 1,447,012 | | | | | | | | $ 7,645,159 | | | | | | | | $ 302,629 | |
| | | 2,011,993 | | | | | | | | 11,344 | | | | | | | | 272,299 | | | | | | | | 408,345 | | | | | | | | 1,033 | |
| | | 693,577,022 | | | | | | | | 17,436,168 | | | | | | | | 32,455,969 | | | | | | | | 77,788,444 | | | | | | | | 24,162,366 | |
| | | | | | | | | |
| | | | | | | | | | | | | | | | | | | | | | | | | | | | | | | | | | | | |
| | | 8,518,101 | | | | | | | | 21,229 | | | | | | | | 180,526 | | | | | | | | 998,702 | | | | | | | | 32,276 | |
| | | 213,749 | | | | | | | | 1,088 | | | | | | | | 32,351 | | | | | | | | 54,666 | | | | | | | | 115 | |
| | | 72,238,937 | | | | | | | | 1,650,386 | | | | | | | | 3,146,458 | | | | | | | | 8,774,950 | | | | | | | | 2,666,228 | |
| | | | | | | | | |
| | | | | | | | | | | | | | | | | | | | | | | | | | | | | | | | | | | | |
| | | $ 9.78 | | | | | | | | $ 10.53 | | | | | | | | $ 8.02 | | | | | | | | $ 7.66 | | | | | | | | $ 9.38 | |
| | | 9.41 | | | | | | | | 10.43 | | | | | | | | 8.42 | | | | | | | | 7.47 | | | | | | | | 8.96 | |
| | | | 9.60 | | | | | | | | 10.56 | | | | | | | | 10.32 | | | | | | | | 8.86 | | | | | | | | 9.06 | |
| | | | | | | | | |
| | | $762,684,702 | | | | | | | | $18,687,243 | | | | | | | | $41,868,903 | | | | | | | | $ 88,408,731 | | | | | | | | $27,991,566 | |
| | | $ — | | | | | | | | $ — | | | | | | | | $ — | | | | | | | | $ — | | | | | | | | $ — | |
| | | | $ 41,379 | | | | | | | | $ 95,242 | | | | | | | | $ 171,916 | | | | | | | | $ 458,017 | | | | | | | | $ 3,417 | |
See accompanying notes to the financial statements.
18
ASHMORE FUNDS
STATEMENTS OF OPERATIONS
For the Year Ended October 31, 2018
| | | | | | | | | | | | | | | | | | | | | | | | | |
| | | Ashmore
Emerging Markets Total Return
Fund | | | | Ashmore
Emerging Markets
Local Currency
Bond Fund | | | | Ashmore
Emerging Markets
Corporate Debt
Fund |
INVESTMENT INCOME: | | | | | | | | | | | | | | | | | | | | | | | | | |
Interest, net of foreign tax withholdings* | | | $ | 78,074,252 | | | | | | | | | $ | 4,469,128 | | | | | | | | | $ | 24,637,298 | |
Payment-in-kind interest | | | | — | | | | | | | | | | — | | | | | | | | | | 2,080,465 | |
Dividends, net of foreign tax withholdings* | | | | — | | | | | | | | | | — | | | | | | | | | | — | |
Total Income | | | | 78,074,252 | | | | | | | | | | 4,469,128 | | | | | | | | | | 26,717,763 | |
EXPENSES: | | | | | | | | | | | | | | | | | | | | | | | | | |
Investment Manager fees | | | | 12,822,198 | | | | | | | | | | 686,177 | | | | | | | | | | 3,998,250 | |
Administration fees | | | | 256,423 | | | | | | | | | | 14,445 | | | | | | | | | | 69,529 | |
Custody fees | | | | 471,870 | | | | | | | | | | 79,707 | | | | | | | | | | 77,041 | |
Professional fees | | | | 311,422 | | | | | | | | | | 56,069 | | | | | | | | | | 109,280 | |
Trustees’ fees | | | | 126,535 | | | | | | | | | | 6,686 | | | | | | | | | | 33,162 | |
Offering expenses and registration fees | | | | 168,389 | | | | | | | | | | 51,252 | | | | | | | | | | 117,927 | |
Insurance fees | | | | 42,073 | | | | | | | | | | 3,427 | | | | | | | | | | 11,962 | |
Printing fees | | | | 44,565 | | | | | | | | | | 13,544 | | | | | | | | | | 20,234 | |
Distribution and servicing fees - Class A | | | | 41,920 | | | | | | | | | | 2,931 | | | | | | | | | | 26,639 | |
Distribution and servicing fees - Class C | | | | 45,819 | | | | | | | | | | 1,008 | | | | | | | | | | 94,301 | |
Other | | | | 91,542 | | | | | | | | | | 40,278 | | | | | | | | | | 41,704 | |
Total Expenses | | | | 14,422,756 | | | | | | | | | | 955,524 | | | | | | | | | | 4,600,029 | |
Less expenses reimbursed by the Investment Manager | | | | (1,258,875 | ) | | | | | | | | | (247,985 | ) | | | | | | | | | (411,298 | ) |
Net Expenses | | | | 13,163,881 | | | | | | | | | | 707,539 | | | | | | | | | | 4,188,731 | |
Net Investment Income | | | | 64,910,371 | | | | | | | | | | 3,761,589 | | | | | | | | | | 22,529,032 | |
NET REALIZED AND UNREALIZED GAINS (LOSSES): | | | | | | | | | | | | | | | | | | | | | | | | | |
NET REALIZED GAIN (LOSS) ON: | | | | | | | | | | | | | | | | | | | | | | | | | |
Investments in securities | | | | (22,365,042 | ) | | | | | | | | | (2,910,936 | ) | | | | | | | | | (3,566,567 | ) |
Forward foreign currency exchange contracts | | | | (22,728,693 | ) | | | | | | | | | (775,333 | ) | | | | | | | | | 132,068 | |
Interest rate swap contracts | | | | (23,462 | ) | | | | | | | | | (69,210 | ) | | | | | | | | | — | |
Foreign exchange transactions | | | | (2,415,270 | ) | | | | | | | | | 22,107 | | | | | | | | | | 28,510 | |
Net Realized Gain (Loss) | | | | (47,532,467 | ) | | | | | | | | | (3,733,372 | ) | | | | | | | | | (3,405,989 | ) |
NET CHANGE IN UNREALIZED APPRECIATION (DEPRECIATION) ON: | | | | | | | | | | | | | | | | | | | | | | | | | |
Investments in securities (net of increase (decrease) in deferred foreign taxes of $-, $-, $-, $-, $-, $-, $(57,149), and $-, respectively) | | | | (103,159,696 | ) | | | | | | | | | (5,157,195 | ) | | | | | | | | | (27,788,014 | ) |
Forward foreign currency exchange contracts | | | | 5,853,910 | | | | | | | | | | 606,645 | | | | | | | | | | 37,405 | |
Investments in fully funded total return swaps | | | | (792,251 | ) | | | | | | | | | (352,500 | ) | | | | | | | | | — | |
Interest rate swap contracts | | | | (1,344,051 | ) | | | | | | | | | (411,212 | ) | | | | | | | | | — | |
Foreign exchange translations | | | | 168,018 | | | | | | | | | | 12,064 | | | | | | | | | | (5,713 | ) |
Change in Net Unrealized Appreciation (Depreciation) | | | | (99,274,070 | ) | | | | | | | | | (5,302,198 | ) | | | | | | | | | (27,756,322 | ) |
Net Realized and Unrealized Losses | | | | (146,806,537 | ) | | | | | | | | | (9,035,570 | ) | | | | | | | | | (31,162,311 | ) |
Net Increase (Decrease) in Net Assets Resulting from Operations | | | $ | (81,896,166 | ) | | | | | | | | $ | (5,273,981 | ) | | | | | | | | $ | (8,633,279 | ) |
* Foreign Tax Withholdings | | | $ | 1,128,116 | | | | | | | | | $ | 227,779 | | | | | | | | | $ | 2,629 | |
See accompanying notes to the financial statements.
19
| | | | | | | | | | | | | | | | | | | | | | | | | | | | | | | | | | | | |
| | | Ashmore
Emerging Markets
Short Duration
Fund | | | | | | Ashmore
Emerging Markets
Active Equity Fund | | | | | | Ashmore
Emerging Markets
Small-Cap
Equity Fund | | | | | | Ashmore
Emerging Markets
Frontier Equity
Fund | | | | | | Ashmore
Emerging Markets
Equity Fund | |
| | | | | | | | | | | | | | | | | | | | | | | | | | | | | | | | | | | | |
| | | $ 25,284,729 | | | | | | | | $ 4,133 | | | | | | | | $ 1,378 | | | | | | | | $ 10,341 | | | | | | | | $ 907 | |
| | | — | | | | | | | | — | | | | | | | | — | | | | | | | | — | | | | | | | | — | |
| | | | — | | | | | | | | 402,222 | | | | | | | | 791,383 | | | | | | | | 2,542,434 | | | | | | | | 497,759 | |
| | | | 25,284,729 | | | | | | | | 406,355 | | | | | | | | 792,761 | | | | | | | | 2,552,775 | | | | | | | | 498,666 | |
| | | | | | | | | | | | | | | | | | | | | | | | | | | | | | | | | | | | |
| | | 2,033,400 | | | | | | | | 184,320 | | | | | | | | 625,177 | | | | | | | | 1,407,739 | | | | | | | | 279,745 | |
| | | 62,561 | | | | | | | | 3,686 | | | | | | | | 8,335 | | | | | | | | 18,768 | | | | | | | | 4,865 | |
| | | 58,455 | | | | | | | | 20,787 | | | | | | | | 86,015 | | | | | | | | 230,761 | | | | | | | | 70,215 | |
| | | 99,498 | | | | | | | | 29,194 | | | | | | | | 34,849 | | | | | | | | 46,765 | | | | | | | | 27,823 | |
| | | 33,322 | | | | | | | | 1,750 | | | | | | | | 4,031 | | | | | | | | 9,508 | | | | | | | | 2,653 | |
| | | 124,368 | | | | | | | | 46,499 | | | | | | | | 53,485 | | | | | | | | 66,351 | | | | | | | | 53,220 | |
| | | 9,698 | | | | | | | | 575 | | | | | | | | 1,468 | | | | | | | | 3,052 | | | | | | | | 653 | |
| | | 28,462 | | | | | | | | 13,480 | | | | | | | | 19,126 | | | | | | | | 16,854 | | | | | | | | 13,537 | |
| | | 80,750 | | | | | | | | 178 | | | | | | | | 3,190 | | | | | | | | 20,775 | | | | | | | | 536 | |
| | | 9,860 | | | | | | | | 128 | | | | | | | | 2,611 | | | | | | | | 4,916 | | | | | | | | 18 | |
| | | | 33,328 | | | | | | | | 18,529 | | | | | | | | 28,848 | | | | | | | | 26,441 | | | | | | | | 22,020 | |
| | | | 2,573,702 | | | | | | | | 319,126 | | | | | | | | 867,135 | | | | | | | | 1,851,930 | | | | | | | | 475,285 | |
| | | | (387,123 | ) | | | | | | | (131,123 | ) | | | | | | | (227,807 | ) | | | | | | | (399,730 | ) | | | | | | | (190,079 | ) |
| | | | 2,186,579 | | | | | | | | 188,003 | | | | | | | | 639,328 | | | | | | | | 1,452,200 | | | | | | | | 285,206 | |
| | | | 23,098,150 | | | | | | | | 218,352 | | | | | | | | 153,433 | | | | | | | | 1,100,575 | | | | | | | | 213,460 | |
| | | | | | | | | | | | | | | | | | | | | | | | | | | | | | | | | | | | |
| | | | | | | | | | | | | | | | | | | | | | | | | | | | | | | | | | | | |
| | | 668,866 | | | | | | | | 1,440,910 | | | | | | | | 1,788,525 | | | | | | | | (5,676,702 | ) | | | | | | | (442,336 | ) |
| | | (53,367 | ) | | | | | | | — | | | | | | | | (626 | ) | | | | | | | — | | | | | | | | 1,788 | |
| | | — | | | | | | | | — | | | | | | | | — | | | | | | | | — | | | | | | | | — | |
| | | | (6,432 | ) | | | | | | | (16,605 | ) | | | | | | | (97,057 | ) | | | | | | | (175,348 | ) | | | | | | | (24,095 | ) |
| | | | 609,067 | | | | | | | | 1,424,305 | | | | | | | | 1,690,842 | | | | | | | | (5,852,050 | ) | | | | | | | (464,643 | ) |
| | | | | | | | | | | | | | | | | | | | | | | | | | | | | | | | | | | | |
| | | | | | | | | |
| | | (20,781,937 | ) | | | | | | | (3,225,140 | ) | | | | | | | (11,118,684 | ) | | | | | | | (11,182,743 | ) | | | | | | | (5,506,914 | ) |
| | | — | | | | | | | | 4,241 | | | | | | | | — | | | | | | | | — | | | | | | | | — | |
| | | — | | | | | | | | — | | | | | | | | — | | | | | | | | — | | | | | | | | — | |
| | | — | | | | | | | | — | | | | | | | | — | | | | | | | | — | | | | | | | | — | |
| | | | (7,841 | ) | | | | | | | (3,109 | ) | | | | | | | 13,796 | | | | | | | | 76 | | | | | | | | 73 | |
| | | | (20,789,778 | ) | | | | | | | (3,224,008 | ) | | | | | | | (11,104,888 | ) | | | | | | | (11,182,667 | ) | | | | | | | (5,506,841 | ) |
| | | | (20,180,711 | ) | | | | | | | (1,799,703 | ) | | | | | | | (9,414,046 | ) | | | | | | | (17,034,717 | ) | | | | | | | (5,971,484 | ) |
| | | | $ 2,917,439 | | | | | | | | $(1,581,351) | | | | | | | | $ (9,260,613) | | | | | | | | $(15,934,142) | | | | | | | | $(5,758,024) | |
| | | | $ 112,386 | | | | | | | | $ 72,510 | | | | | | | | $ 79,288 | | | | | | | | $ 162,689 | | | | | | | | $ 56,612 | |
See accompanying notes to the financial statements.
20
ASHMORE FUNDS
STATEMENTS OF CHANGES IN NET ASSETS
For the Fiscal Years Ended October 31,
| | | | | | | | | | | | | | | | | | | | | | | | |
| | | Ashmore Emerging Markets Total Return Fund | | | Ashmore Emerging Markets Local Currency Bond Fund | | | Ashmore Emerging Markets Corporate Debt Fund | |
| | | | | | |
| | | 2018 | | | 20172 | | | 2018 | | | 20172 | | | 2018 | | | 20172 | |
OPERATIONS: | | | | | | | | | | | | | | | | | | | | | | | | |
Net investment income (loss) | | $ | 64,910,371 | | | $ | 61,296,167 | | | $ | 3,761,589 | | | $ | 4,122,082 | | | $ | 22,529,032 | | | $ | 21,082,493 | |
Net realized gain (loss) | | | (47,532,467 | ) | | | 30,056,490 | | | | (3,733,372 | ) | | | 2,665,136 | | | | (3,405,989 | ) | | | 4,232,565 | |
Net change in unrealized appreciation (depreciation) | | | (99,274,070 | ) | | | (10,655,233 | ) | | | (5,302,198 | ) | | | (1,063,110 | ) | | | (27,756,322 | ) | | | 17,153,785 | |
Net Increase (Decrease) in Net Assets Resulting from Operations | | | (81,896,166 | ) | | | 80,697,424 | | | | (5,273,981 | ) | | | 5,724,108 | | | | (8,633,279 | ) | | | 42,468,843 | |
| | | | | | |
DISTRIBUTIONS TO SHAREHOLDERS:1 | | | | | | | | | | | | | | | | | | | | | | | | |
Class A | | | (635,538 | ) | | | (348,466 | ) | | | (14,591 | ) | | | (11,983 | ) | | | (624,678 | ) | | | (661,364 | ) |
Class C | | | (137,585 | ) | | | (168,371 | ) | | | (1,436 | ) | | | (1,194 | ) | | | (486,143 | ) | | | (407,649 | ) |
Institutional Class | | | (42,270,613 | ) | | | (57,767,974 | ) | | | (803,570 | ) | | | (1,042,650 | ) | | | (20,147,242 | ) | | | (18,700,293 | ) |
| | | | | | | | | | | | | | | | | | | | | | | | |
Total Distributions to Shareholders | | | (43,043,736 | ) | | | (58,284,811 | ) | | | (819,597 | ) | | | (1,055,827 | ) | | | (21,258,063 | ) | | | (19,769,306 | ) |
TAX RETURN OF CAPITAL DISTRIBUTIONS TO SHAREHOLDERS: | | | | | | | | | | | | | | | | | | | | | | | | |
Class A | | | (353,284 | ) | | | — | | | | (15,852 | ) | | | (32,535 | ) | | | — | | | | (21,620 | ) |
Class C | | | (95,003 | ) | | | — | | | | (914 | ) | | | (2,916 | ) | | | — | | | | (15,724 | ) |
Institutional Class | | | (33,281,020 | ) | | | — | | | | (876,502 | ) | | | (2,631,755 | ) | | | — | | | | (612,632 | ) |
| | | | | | | | | | | | | | | | | | | | | | | | |
Total Tax Return of Capital Distributions to Shareholders | | | (33,729,307 | ) | | | — | | | | (893,268 | ) | | | (2,667,206 | ) | | | — | | | | (649,976 | ) |
FUND SHARE TRANSACTIONS: | | | | | | | | | | | | | | | | | | | | | | | | |
Net increase (decrease) in net assets resulting from Class A share transactions | | | (7,766,049 | ) | | | 14,843,722 | | | | 511,457 | | | | 51,796 | | | | (2,510,631 | ) | | | (155,365 | ) |
Net increase (decrease) in net assets resulting from Class C share transactions | | | 958,535 | | | | 1,387,298 | | | | (9,681 | ) | | | 26,258 | | | | 56,412 | | | | 2,985,359 | |
Net increase (decrease) in net assets resulting from Institutional Class share transactions | | | 358,704,314 | | | | 279,646,777 | | | | (14,929,454 | ) | | | 1,966,867 | | | | 9,207,893 | | | | 101,612,097 | |
| | | | | | | | | | | | | | | | | | | | | | | | |
| | | | | | |
Net Increase (Decrease) in Net Assets Resulting from Fund Share Transactions | | | 351,896,800 | | | | 295,877,797 | | | | (14,427,678 | ) | | | 2,044,921 | | | | 6,753,674 | | | | 104,442,091 | |
Total Increase (Decrease) in Net Assets | | | 193,227,591 | | | | 318,290,410 | | | | (21,414,524 | ) | | | 4,045,996 | | | | (23,137,668 | ) | | | 126,491,652 | |
NET ASSETS: | | | | | | | | | | | | | | | | | | | | | | | | |
Net Assets at the Beginning of year | | | 1,133,057,989 | | | | 814,767,579 | | | | 85,759,908 | | | | 81,713,912 | | | | 359,957,705 | | | | 233,466,053 | |
Net Assets at the End of year | | $ | 1,326,285,580 | | | $ | 1,133,057,989 | | | $ | 64,345,384 | | | $ | 85,759,908 | | | $ | 336,820,037 | | | $ | 359,957,705 | |
1 As described in Note 15, Recent Pronouncements, the Funds adopted the U.S. Securities and Exchange Commission (“SEC”) Disclosure Update and Simplification. In the Funds’ annual report to shareholders for the year ended October 31, 2017, Distributions to shareholders for each Fund were shown on a GAAP basis as follows:
| | | | | | | | | | | | |
From net investment income | | | | | | | | | | | | |
Class A | | | (348,466) | | | | (11,983) | | | | (661,364) | |
Class C | | | (168,371) | | | | (1,194) | | | | (407,649) | |
Institutional Class | | | (57,767,974) | | | | (1,042,650) | | | | (18,700,293) | |
From net realized gains | | | | | | | | | | | | |
Class A | | | — | | | | — | | | | — | |
Class C | | | — | | | | — | | | | — | |
Institutional Class | | | — | | | | — | | | | — | |
2 As described in Note 15, Recent Pronouncements, the Funds are no longer required to show Undistributed (Distributions in Excess of) Net Investment Income (Loss). In the Funds’ annual report to shareholders for the year ended October 31, 2017, Undistributed (Distributions in Excess of) Net Investment Income (Loss) was as follows:
| | | | | | | | | | | | |
| | | 18,201,510 | | | | 704,088 | | | | (351,604) | |
See accompanying notes to the financial statements.
21
| | | | | | | | | | | | | | | | | | | | | | | | | | | | | | |
Ashmore Emerging Markets Short Duration Fund | | | Ashmore Emerging Markets Active Equity Fund | | | Ashmore Emerging Markets Small-Cap Equity Fund | | | Ashmore Emerging Markets Frontier Equity Fund | |
| | | | | | | |
2018 | | | 20172 | | | 2018 | | | 20172 | | | 2018 | | | 20172 | | | 2018 | | | 20172 | |
| | | | | | | | | | | | | | | | | | | | | | | | | | | | | | |
| | $ 23,098,150 | | | | $ 13,045,797 | | | | $ 218,352 | | | | $ 69,514 | | | | $ 153,433 | | | | $ 234,294 | | | | $ 1,100,575 | | | | $ 800,353 | |
| | 609,067 | | | | 2,742,227 | | | | 1,424,305 | | | | 1,511,507 | | | | 1,690,842 | | | | 4,779,455 | | | | (5,852,050 | ) | | | 10,710,659 | |
| | (20,789,778 | ) | | | 1,549,066 | | | | (3,224,008 | ) | | | 1,685,259 | | | | (11,104,888 | ) | | | 1,956,429 | | | | (11,182,667 | ) | | | 5,110,923 | |
| | 2,917,439 | | | | 17,337,090 | | | | (1,581,351 | ) | | | 3,266,280 | | | | (9,260,613 | ) | | | 6,970,178 | | | | (15,934,142 | ) | | | 16,621,935 | |
| | | | | | | |
| | | | | | | | | | | | | | | | | | | | | | | | | | | | | | |
| | (2,244,061 | ) | | | (1,532,241 | ) | | | (3,550 | ) | | | (49 | ) | | | (14,399 | ) | | | (12,062 | ) | | | (701,887 | ) | | | (119,379 | ) |
| | (62,434 | ) | | | (2,912 | ) | | | (1,160 | ) | | | (44 | ) | | | (3,604 | ) | | | (3,320 | ) | | | (43,893 | ) | | | (3,210 | ) |
| | (22,232,148 | ) | | | (12,336,550 | ) | | | (1,749,848 | ) | | | (60,318 | ) | | | (518,621 | ) | | | (536,583 | ) | | | (6,338,275 | ) | | | (1,033,910 | ) |
| | | | | | | | | | | | | | | | | | | | | | | | | | | | | | |
| | (24,538,643 | ) | | | (13,871,703 | ) | | | (1,754,558 | ) | | | (60,411 | ) | | | (536,624 | ) | | | (551,965 | ) | | | (7,084,055 | ) | | | (1,156,499 | ) |
| | | | | | | |
| | | | | | | | | | | | | | | | | | | | | | | | | | | | | | |
| | — | | | | — | | | | — | | | | — | | | | (1,628 | ) | | | — | | | | (40,555 | ) | | | — | |
| | — | | | | — | | | | — | | | | — | | | | (128 | ) | | | — | | | | (1,592 | ) | | | — | |
| | — | | | | — | | | | — | | | | — | | | | (35,361 | ) | | | — | | | | (398,465 | ) | | | — | |
| | | | | | | | | | | | | | | | | | | | | | | | | | | | | | |
| | — | | | | — | | | | — | | | | — | | | | (37,117 | ) | | | — | | | | (440,612 | ) | | | — | |
| | | | | | | | | | | | | | | | | | | | | | | | | | | | | | |
| | | | | | | |
| | 74,725,009 | | | | (584,049 | ) | | | 234,009 | | | | 10,055 | | | | 1,035,060 | | | | 217,352 | | | | 2,119,049 | | | | 4,057,056 | |
| | | | | | | |
| | 1,879,245 | | | | 184,019 | | | | 970 | | | | 10,069 | | | | 88,860 | | | | 37,565 | | | | 79,841 | | | | 348,890 | |
| | | | | | | |
| | 535,350,229 | | | | 55,004,360 | | | | 2,715,965 | | | | 14,829,953 | | | | 3,368,937 | | | | (1,482,267 | ) | | | 17,607,820 | | | | 14,695,771 | |
| | | | | | | | | | | | | | | | | | | | | | | | | | | | | | |
| | | | | | | |
| | 611,954,483 | | | | 54,604,330 | | | | 2,950,944 | | | | 14,850,077 | | | | 4,492,857 | | | | (1,227,350 | ) | | | 19,806,710 | | | | 19,101,717 | |
| | 590,333,279 | | | | 58,069,717 | | | | (384,965 | ) | | | 18,055,946 | | | | (5,341,497 | ) | | | 5,190,863 | | | | (3,652,099 | ) | | | 34,567,153 | |
| | | | | | | | | | | | | | | | | | | | | | | | | | | | | | |
| | 188,545,394 | | | | 130,475,677 | | | | 18,055,946 | | | | — | | | | 39,516,777 | | | | 34,325,914 | | | | 89,494,047 | | | | 54,926,894 | |
| | $778,878,673 | | | | $188,545,394 | | | | $17,670,981 | | | | $18,055,946 | | | | $34,175,280 | | | | $39,516,777 | | | | $ 85,841,948 | | | | $89,494,047 | |
| | | | | | | | | | | | | | | | | | | | | | | | | | | | | | |
| | | | | | | | | | | | | | | | | | | | | | | | | | | | | | |
| | | | | | | |
| | | | | | | | | | | | | | | | | | | | | | | | | | | | | | |
| | | | | (1,352,634 | ) | | | | | | | (49 | ) | | | | | | | (12,062 | ) | | | | | | | (119,379 | ) |
| | | | | (2,912 | ) | | | | | | | (44 | ) | | | | | | | (3,320 | ) | | | | | | | (3,210 | ) |
| | | | | (10,516,157 | ) | | | | | | | (60,318 | ) | | | | | | | (536,583 | ) | | | | | | | (1,033,910 | ) |
| | | | | | | | | | | | | | | | | | | | | | | | | | | | | | |
| | | | | (179,607 | ) | | | | | | | — | | | | | | | | — | | | | | | | | — | |
| | | | | — | | | | | | | | — | | | | | | | | — | | | | | | | | — | |
| | | | | (1,820,393 | ) | | | | | | | — | | | | | | | | — | | | | | | | | — | |
| | | | | | | | | | | | | | | | | | | | | | | | | | | | | | |
| | | | | | | | | | | | | | | | | | | | | | | | | | | | | | |
| | | | | | | |
| | | | | 451,688 | | | | | | | | 104,676 | | | | | | | | 410,690 | | | | | | | | (5,601 | ) |
See accompanying notes to the financial statements.
22
ASHMORE FUNDS
STATEMENTS OF CHANGES IN NET ASSETS
For the Fiscal Years Ended October 31,
| | | | | | | | | | | | | | | | |
| | | | | | Ashmore Emerging Markets Equity Fund | |
| | | | | | 2018 | | | | | | 20172 | |
| | | | |
OPERATIONS: | | | | | | | | | | | | | | | | |
Net investment income (loss) | | | | | | | $ 213,460 | | | | | | | | $ 93,777 | |
Net realized gain (loss) | | | | | | | (464,643 | ) | | | | | | | 3,025,338 | |
Net change in unrealized appreciation (depreciation) | | | | | | | (5,506,841 | ) | | | | | | | 315,782 | |
Net Increase (Decrease) in Net Assets Resulting from Operations | | | | | | | (5,758,024 | ) | | | | | | | 3,434,897 | |
| | | | |
DISTRIBUTIONS TO SHAREHOLDERS:1 | | | | | | | | | | | | | | | | |
Class A | | | | | | | (3,870 | ) | | | | | | | (947 | ) |
Class C | | | | | | | (39 | ) | | | | | | | (13 | ) |
Institutional Class | | | | | | | (341,038 | ) | | | | | | | (183,406 | ) |
| | | | | | | | | | | | | | | | |
Total Distributions to Shareholders | | | | | | | (344,947 | ) | | | | | | | (184,366 | ) |
TAX RETURN OF CAPITAL DISTRIBUTIONS TO SHAREHOLDERS: | | | | | | | | | | | | | | | | |
Class A | | | | | | | (228 | ) | | | | | | | — | |
Class C | | | | | | | (1 | ) | | | | | | | — | |
Institutional Class | | | | | | | (21,392 | ) | | | | | | | — | |
| | | | | | | | | | | | | | | | |
Total Tax Return of Capital Distributions to Shareholders | | | | | | | (21,621 | ) | | | | | | | — | |
FUND SHARE TRANSACTIONS: | | | | | | | | | | | | | | | | |
Net increase (decrease) in net assets resulting from Class A share transactions | | | | | | | 230,744 | | | | | | | | 82,543 | |
Net increase (decrease) in net assets resulting from Class C share transactions | | | | | | | (1,289 | ) | | | | | | | 2,155 | |
Net increase (decrease) in net assets resulting from Institutional Class share transactions | | | | | | | 22,119,402 | | | | | | | | (4,203,558 | ) |
| | | | | | | | | | | | | | | | |
| | | | |
Net Increase (Decrease) in Net Assets Resulting from Fund Share Transactions | | | | | | | 22,348,857 | | | | | | | | (4,118,860 | ) |
Total Increase (Decrease) in Net Assets | | | | | | | 16,224,265 | | | | | | | | (868,329 | ) |
NET ASSETS: | | | | | | | | | | | | | | | | |
Net Assets at the Beginning of year | | | | | | | 8,241,763 | | | | | | | | 9,110,092 | |
Net Assets at the End of year | | | | | | | $24,466,028 | | | | | | | | $ 8,241,763 | |
1 As described in Note 15, Recent Pronouncements, the Funds adopted the U.S. Securities and Exchange Commission (“SEC”) Disclosure Update and Simplification. In the Funds’ annual report to shareholders for the year ended October 31, 2017, Distributions to shareholders for each Fund were shown on a GAAP basis as follows:
| | | | | | | | |
From net investment income | | | | | | | | |
Class A | | | | | | | (947 | ) |
Class C | | | | | | | (13 | ) |
Institutional Class | | | | | | | (183,406 | ) |
From net realized gains | | | | | | | | |
Class A | | | | | | | — | |
Class C | | | | | | | — | |
Institutional Class | | | | | | | — | |
2 As described in Note 15, Recent Pronouncements, the Funds are no longer required to show Undistributed (Distributions in Excess of) Net Investment Income (Loss). In the Funds’ annual report to shareholders for the year ended October 31, 2017, Undistributed (Distributions in Excess of) Net Investment Income (Loss) was as follows:
See accompanying notes to the financial statements.
23
ASHMORE FUNDS
FINANCIAL HIGHLIGHTS
| | | | | | | | | | | | | | | | | | | | |
| Ashmore Emerging Markets Total Return Fund | | | | | | | |
| |
| | | Class A | |
| | | | | |
| | | Year Ended October 31, 2018 | | | Year Ended
October 31,
2017 | | | Year Ended
October 31,
2016 | | | Year Ended
October 31,
2015 | | | Year Ended October 31, 2014 | |
| | | | |
Net asset value at beginning of year | | | $ 8.22 | | | | $ 8.01 | | | | $ 7.49 | | | | $ 8.75 | | | | $ 9.30 | |
| | | | | |
Income (loss) from investment operations: | | | | | | | | | | | | | | | | | | | | |
Net investment income | | | 0.36 | 1 | | | 0.56 | 1 | | | 0.58 | 1 | | | 0.48 | 1 | | | 0.44 | |
Net realized and unrealized gain (loss) | | | (0.82 | ) | | | 0.15 | | | | 0.49 | | | | (1.24 | ) | | | (0.42 | ) |
| | | | |
Total from investment operations | | | (0.46 | ) | | | 0.71 | | | | 1.07 | | | | (0.76 | ) | | | 0.02 | |
| | | | | |
Less distributions: | | | | | | | | | | | | | | | | | | | | |
| | | | | |
From net investment income | | | (0.16 | ) | | | (0.50 | ) | | | (0.33 | ) | | | — | | | | (0.33 | ) |
From net realized gain | | | (0.11 | ) | | | — | | | | — | | | | — | | | | (0.12 | ) |
Tax return of capital | | | (0.18 | ) | | | — | | | | (0.22 | ) | | | (0.50 | ) | | | (0.12 | ) |
| | | | |
| | | | | |
Total distributions | | | (0.45 | ) | | | (0.50 | ) | | | (0.55 | ) | | | (0.50 | ) | | | (0.57 | ) |
| | | | |
Net asset value at end of year | | | $ 7.31 | | | | $ 8.22 | | | | $ 8.01 | | | | $ 7.49 | | | | $ 8.75 | |
| | | | |
| | | | | |
Total return2 | | | (5.65 | )% | | | 9.12 | % | | | 15.15 | % | | | (8.78 | )% | | | 0.17 | % |
| | | | | |
Portfolio turnover rate3 | | | 66 | % | | | 65 | % | | | 91 | % | | | 101 | % | | | 80 | % |
| | | | | |
Net assets, end of year (in thousands) | | | $8,347 | | | | $18,231 | | | | $3,445 | | | | $2,951 | | | | $8,351 | |
| | | | | |
Ratios to average net assets: | | | | | | | | | | | | | | | | | | | | |
Total expenses to average net assets: | | | | | | | | | | | | | | | | | | | | |
Total expenses before reimbursements | | | 1.36 | % | | | 1.37 | % | | | 1.41 | % | | | 1.37 | % | | | 1.38 | % |
Total expenses after reimbursements | | | 1.27 | % | | | 1.27 | % | | | 1.27 | % | | | 1.29 | % | | | 1.30 | % |
| | | | | |
Net investment income to average net assets: | | | | | | | | | | | | | | | | | | | | |
Net investment income before reimbursements | | | 4.42 | % | | | 6.81 | % | | | 7.48 | % | | | 5.91 | % | | | 4.79 | % |
Net investment income after reimbursements | | | 4.51 | % | | | 6.91 | % | | | 7.62 | % | | | 5.99 | % | | | 4.87 | % |
See accompanying notes to the financial statements.
24
ASHMORE FUNDS
FINANCIAL HIGHLIGHTS
| | | | | | | | | | | | | | | | | | | | |
| Ashmore Emerging Markets Total Return Fund | | | | | | | |
| |
| | | Class C | |
| | | | | |
| | | Year Ended October 31, 2018 | | | Year Ended
October 31,
2017 | | | Year Ended
October 31,
2016 | | | Year Ended
October 31,
2015 | | | Year Ended
October 31,
2014 | |
| | | | |
Net asset value at beginning of year | | | $ 8.21 | | | | $ 8.00 | | | | $ 7.48 | | | | $ 8.74 | | | | $ 9.29 | |
| | | | | |
Income (loss) from investment operations: | | | | | | | | | | | | | | | | | | | | |
Net investment income | | | 0.31 | 1 | | | 0.46 | 1 | | | 0.53 | 1 | | | 0.44 | 1 | | | 0.37 | |
Net realized and unrealized gain (loss) | | | (0.83 | ) | | | 0.19 | | | | 0.49 | | | | (1.26 | ) | | | (0.42 | ) |
| | | | |
Total from investment operations | | | (0.52 | ) | | | 0.65 | | | | 1.02 | | | | (0.82 | ) | | | (0.05 | ) |
| | | | | |
Less distributions: | | | | | | | | | | | | | | | | | | | | |
| | | | | |
From net investment income | | | (0.14 | ) | | | (0.44 | ) | | | (0.30 | ) | | | — | | | | (0.28 | ) |
From net realized gain | | | (0.11 | ) | | | — | | | | — | | | | — | | | | (0.12 | ) |
Tax return of capital | | | (0.15 | ) | | | — | | | | (0.20 | ) | | | (0.44 | ) | | | (0.10 | ) |
| | | | |
| | | | | |
Total distributions | | | (0.40 | ) | | | (0.44 | ) | | | (0.50 | ) | | | (0.44 | ) | | | (0.50 | ) |
| | | | |
Net asset value at end of year | | | $ 7.29 | | | | $ 8.21 | | | | $ 8.00 | | | | $ 7.48 | | | | $ 8.74 | |
| | | | |
| | | | | |
Total return2 | | | (6.43 | )% | | | 8.31 | % | | | 14.32 | % | | | (9.58 | )% | | | (0.45 | )% |
| | | | | |
Portfolio turnover rate3 | | | 66 | % | | | 65 | % | | | 91 | % | | | 101 | % | | | 80 | % |
| | | | | |
Net assets, end of year (in thousands) | | | $4,278 | | | | $3,926 | | | | $2,451 | | | | $ 443 | | | | $1,028 | |
| | | | | |
Ratios to average net assets: | | | | | | | | | | | | | | | | | | | | |
Total expenses to average net assets: | | | | | | | | | | | | | | | | | | | | |
Total expenses before reimbursements | | | 2.12 | % | | | 2.12 | % | | | 2.15 | % | | | 2.12 | % | | | 2.13 | % |
Total expenses after reimbursements | | | 2.02 | % | | | 2.02 | % | | | 2.02 | % | | | 2.03 | % | | | 2.05 | % |
| | | | | |
Net investment income to average net assets: | | | | | | | | | | | | | | | | | | | | |
Net investment income before reimbursements | | | 3.92 | % | | | 5.59 | % | | | 6.79 | % | | | 5.35 | % | | | 4.04 | % |
Net investment income after reimbursements | | | 4.02 | % | | | 5.69 | % | | | 6.92 | % | | | 5.44 | % | | | 4.12 | % |
See accompanying notes to the financial statements.
25
ASHMORE FUNDS
FINANCIAL HIGHLIGHTS
| | | | | | | | | | | | | | | | | | | | |
| Ashmore Emerging Markets Total Return Fund | | | | | | | |
| |
| | | Institutional Class | |
| | | | | |
| | | Year Ended October 31, 2018 | | | Year Ended
October 31,
2017 | | | Year Ended
October 31,
2016 | | | Year Ended
October 31,
2015 | | | Year Ended October 31, 2014 | |
| | | | |
Net asset value at beginning of year | | | $ 8.34 | | | | $ 8.13 | | | | $ 7.60 | | | | $ 8.88 | | | | $ 9.43 | |
| | | | | |
Income (loss) from investment operations: | | | | | | | | | | | | | | | | | | | | |
Net investment income | | | 0.40 | 1 | | | 0.55 | 1 | | | 0.61 | 1 | | | 0.53 | 1 | | | 0.46 | |
Net realized and unrealized gain (loss) | | | (0.85 | ) | | | 0.19 | | | | 0.50 | | | | (1.28 | ) | | | (0.41 | ) |
| | | | |
Total from investment operations | | | (0.45 | ) | | | 0.74 | | | | 1.11 | | | | (0.75 | ) | | | 0.05 | |
| | | | | |
Less distributions: | | | | | | | | | | | | | | | | | | | | |
| | | | | |
From net investment income | | | (0.17 | ) | | | (0.53 | ) | | | (0.35 | ) | | | — | | | | (0.35 | ) |
From net realized gain | | | (0.11 | ) | | | — | | | | — | | | | — | | | | (0.12 | ) |
Tax return of capital | | | (0.20 | ) | | | — | | | | (0.23 | ) | | | (0.53 | ) | | | (0.13 | ) |
| | | | |
| | | | | |
Total distributions | | | (0.48 | ) | | | (0.53 | ) | | | (0.58 | ) | | | (0.53 | ) | | | (0.60 | ) |
| | | | |
Net asset value at end of year | | | $ 7.41 | | | | $ 8.34 | | | | $ 8.13 | | | | $ 7.60 | | | | $ 8.88 | |
| | | | |
| | | | | |
Total return2 | | | (5.53 | )% | | | 9.36 | % | | | 15.49 | % | | | (8.58 | )% | | | 0.51 | % |
| | | | | |
Portfolio turnover rate3 | | | 66 | % | | | 65 | % | | | 91 | % | | | 101 | % | | | 80 | % |
| | | | | |
Net assets, end of year (in thousands) | | | $1,313,660 | | | | $1,110,901 | | | | $808,872 | | | | $533,742 | | | | $979,949 | |
| | | | | |
Ratios to average net assets: | | | | | | | | | | | | | | | | | | | | |
Total expenses to average net assets: | | | | | | | | | | | | | | | | | | | | |
Total expenses before reimbursements | | | 1.12 | % | | | 1.12 | % | | | 1.16 | % | | | 1.12 | % | | | 1.13 | % |
Total expenses after reimbursements | | | 1.02 | % | | | 1.02 | % | | | 1.02 | % | | | 1.02 | % | | | 1.02 | % |
| | | | | |
Net investment income to average net assets: | | | | | | | | | | | | | | | | | | | | |
Net investment income before reimbursements | | | 4.97 | % | | | 6.60 | % | | | 7.77 | % | | | 6.40 | % | | | 5.04 | % |
Net investment income after reimbursements | | | 5.07 | % | | | 6.70 | % | | | 7.91 | % | | | 6.50 | % | | | 5.15 | % |
| 1 | Per share amounts are based on average number of shares outstanding during the period. |
| 2 | Assumes investment at net asset value at the beginning of the year, reinvestment of all distributions at net asset value on distribution date, and a complete redemption of the investment at net asset value at the end of the year, excluding the impact of sales charges. |
| 3 | The portfolio turnover rate is calculated by dividing the lesser of cost of purchases or proceeds from sales of long term portfolio securities, including fully funded total return swaps, by the monthly average of the value of the long term portfolio securities. |
See accompanying notes to the financial statements.
26
ASHMORE FUNDS
FINANCIAL HIGHLIGHTS
| | | | | | | | | | | | | | | | | | | | |
| Ashmore Emerging Markets Local Currency Bond Fund | | | | | | | |
| |
| | | Class A | |
| | | | | |
| | | Year Ended October 31, 2018 | | | Year Ended
October 31,
2017 | | | Year Ended
October 31,
2016 | | | Year Ended
October 31,
2015 | | | Year Ended
October 31,
2014 | |
| | | | |
Net asset value at beginning of year | | | $ 7.22 | | | | $ 7.06 | | | | $ 6.57 | | | | $ 8.44 | | | | $ 9.13 | |
| | | | | |
Income (loss) from investment operations: | | | | | | | | | | | | | | | | | | | | |
Net investment income | | | 0.36 | | | | 0.34 | 1 | | | 0.30 | 1 | | | 0.29 | | | | 0.37 | 1 |
Net realized and unrealized gain (loss) | | | (0.88 | ) | | | 0.14 | | | | 0.49 | | | | (1.88 | ) | | | (0.66 | ) |
| | | | |
Total from investment operations | | | (0.52 | ) | | | 0.48 | | | | 0.79 | | | | (1.59 | ) | | | (0.29 | ) |
| | | | | |
Less distributions: | | | | | | | | | | | | | | | | | | | | |
| | | | | |
From net investment income | | | (0.08 | ) | | | (0.09 | ) | | | — | | | | — | | | | — | |
From net realized gain | | | — | | | | — | | | | — | | | | — | | | | — | |
Tax return of capital | | | (0.09 | ) | | | (0.23 | ) | | | (0.30 | ) | | | (0.28 | ) | | | (0.40 | ) |
| | | | |
| | | | | |
Total distributions | | | (0.17 | ) | | | (0.32 | ) | | | (0.30 | ) | | | (0.28 | ) | | | (0.40 | ) |
| | | | |
Net asset value at end of year | | | $ 6.53 | | | | $ 7.22 | | | | $ 7.06 | | | | $ 6.57 | | | | $ 8.44 | |
| | | | |
| | | | | |
Total return2 | | | (7.47 | )% | | | 6.83 | % | | | 12.37 | % | | | (19.17 | )% | | | (3.25 | )% |
| | | | | |
Portfolio turnover rate3 | | | 75 | % | | | 68 | % | | | 83 | % | | | 83 | % | | | 112 | % |
| | | | | |
Net assets, end of year (in thousands) | | | $1,259 | | | | $ 915 | | | | $ 841 | | | | $ 712 | | | | $ 897 | |
| | | | | |
Ratios to avera ge net assets: | | | | | | | | | | | | | | | | | | | | |
Total expenses to average net assets: | | | | | | | | | | | | | | | | | | | | |
Total expenses before reimbursements | | | 1.57 | % | | | 1.51 | % | | | 1.55 | % | | | 1.51 | % | | | 1.55 | % |
Total expenses after reimbursements | | | 1.22 | % | | | 1.22 | % | | | 1.22 | % | | | 1.23 | % | | | 1.25 | % |
| | | | | |
Net investment income to average net assets: | | | | | | | | | | | | | | | | | | | | |
Net investment income before reimbursements | | | 4.63 | % | | | 4.37 | % | | | 4.10 | % | | | 3.53 | % | | | 4.29 | % |
Net investment income after reimbursements | | | 4.98 | % | | | 4.66 | % | | | 4.43 | % | | | 3.81 | % | | | 4.59 | % |
See accompanying notes to the financial statements.
27
ASHMORE FUNDS
FINANCIAL HIGHLIGHTS
| | | | | | | | | | | | | | | | | | | | |
| Ashmore Emerging Markets Local Currency Bond Fund | | | | | | | |
| |
| | | Class C | |
| | | | | |
| | | Year Ended
October 31,
2018 | | | Year Ended
October 31,
2017 | | | Year Ended
October 31,
2016 | | | Year Ended
October 31,
2015 | | | Year Ended
October 31,
2014 | |
| | | | |
Net asset value at beginning of year | | | $ 7.18 | | | | $ 7.05 | | | | $ 6.56 | | | | $ 8.42 | | | | $ 9.13 | |
| | | | | |
Income (loss) from investment operations: | | | | | | | | | | | | | | | | | | | | |
Net investment income | | | 0.30 | | | | 0.28 | 1 | | | 0.25 | 1 | | | 0.18 | | | | 0.29 | 1 |
Net realized and unrealized gain (loss) | | | (0.88 | ) | | | 0.15 | | | | 0.49 | | | | (1.82 | ) | | | (0.67 | ) |
| | | | |
Total from investment operations | | | (0.58 | ) | | | 0.43 | | | | 0.74 | | | | (1.64 | ) | | | (0.38 | ) |
| | | | | |
Less distributions: | | | | | | | | | | | | | | | | | | | | |
| | | | | |
From net investment income | | | (0.07 | ) | | | (0.09 | ) | | | — | | | | — | | | | — | |
From net realized gain | | | — | | | | — | | | | — | | | | — | | | | — | |
Tax return of capital | | | (0.06 | ) | | | (0.21 | ) | | | (0.25 | ) | | | (0.22 | ) | | | (0.33 | ) |
| | | | |
| | | | | |
Total distributions | | | (0.13 | ) | | | (0.30 | ) | | | (0.25 | ) | | | (0.22 | ) | | | (0.33 | ) |
| | | | |
Net asset value at end of year | | | $ 6.47 | | | | $ 7.18 | | | | $ 7.05 | | | | $ 6.56 | | | | $ 8.42 | |
| | | | |
| | | | | |
Total return2 | | | (8.24 | )% | | | 6.05 | % | | | 11.75 | % | | | (19.83 | )% | | | (4.18 | )% |
| | | | | |
Portfolio turnover rate3 | | | 75 | % | | | 68 | % | | | 83 | % | | | 83 | % | | | 112 | % |
| | | | | |
Net assets, end of year (in thousands) | | | $ 77 | | | | $ 98 | | | | $ 70 | | | | $ 40 | | | | $ 147 | |
| | | | | |
Ratios to average net assets: | | | | | | | | | | | | | | | | | | | | |
Total expenses to average net assets: | | | | | | | | | | | | | | | | | | | | |
Total expenses before reimbursements | | | 2.31 | % | | | 2.26 | % | | | 2.30 | % | | | 2.26 | % | | | 2.31 | % |
Total expenses after reimbursements | | | 1.97 | % | | | 1.97 | % | | | 1.97 | % | | | 1.99 | % | | | 2.00 | % |
| | | | | |
Net investment income to average net assets: | | | | | | | | | | | | | | | | | | | | |
Net investment income before reimbursements | | | 3.85 | % | | | 3.62 | % | | | 3.35 | % | | | 2.71 | % | | | 3.41 | % |
Net investment income after reimbursements | | | 4.19 | % | | | 3.91 | % | | | 3.68 | % | | | 2.98 | % | | | 3.72 | % |
See accompanying notes to the financial statements.
28
ASHMORE FUNDS
FINANCIAL HIGHLIGHTS
| | | | | | | | | | | | | | | | | | | | |
| Ashmore Emerging Markets Local Currency Bond Fund | | | | | | | |
| |
| | | Institutional Class | |
| | | | | |
| | | Year Ended
October 31,
2018 | | | Year Ended
October 31,
2017 | | | Year Ended
October 31,
2016 | | | Year Ended
October 31,
2015 | | | Year Ended
October 31,
2014 | |
| | | | |
Net asset value at beginning of year | | | $ 7.50 | | | | $ 7.31 | | | | $ 6.80 | | | | $ 8.73 | | | | $ 9.45 | |
| | | | | |
Income (loss) from investment operations: | | | | | | | | | | | | | | | | | | | | |
Net investment income | | | 0.41 | | | | 0.37 | 1 | | | 0.33 | 1 | | | 0.31 | | | | 0.43 | 1 |
Net realized and unrealized gain (loss) | | | (0.94 | ) | | | 0.15 | | | | 0.51 | | | | (1.93 | ) | | | (0.71 | ) |
| | | | |
Total from investment operations | | | (0.53 | ) | | | 0.52 | | | | 0.84 | | | | (1.62 | ) | | | (0.28 | ) |
| | | | | |
Less distributions: | | | | | | | | | | | | | | | | | | | | |
| | | | | |
From net investment income | | | (0.09 | ) | | | (0.09 | ) | | | — | | | | — | | | | — | |
From net realized gain | | | — | | | | — | | | | — | | | | — | | | | — | |
Tax return of capital | | | (0.09 | ) | | | (0.24 | ) | | | (0.33 | ) | | | (0.31 | ) | | | (0.44 | ) |
| | | | |
| | | | | |
Total distributions | | | (0.18 | ) | | | (0.33 | ) | | | (0.33 | ) | | | (0.31 | ) | | | (0.44 | ) |
| | | | |
Net asset value at end of year | | | $ 6.79 | | | | $ 7.50 | | | | $ 7.31 | | | | $ 6.80 | | | | $ 8.73 | |
| | | | |
| | | | | |
Total return2 | | | (7.33 | )% | | | 7.12 | % | | | 12.69 | % | | | (18.91 | )% | | | (3.04 | )% |
| | | | | |
Portfolio turnover rate3 | | | 75 | % | | | 68 | % | | | 83 | % | | | 83 | % | | | 112 | % |
| | | | | |
Net assets, end of year (in thousands) | | | $63,009 | | | | $84,747 | | | | $80,803 | | | | $79,492 | | | | $101,363 | |
| | | | | |
Ratios to average net assets: | | | | | | | | | | | | | | | | | | | | |
Total expenses to average net assets: | | | | | | | | | | | | | | | | | | | | |
Total expenses before reimbursements | | | 1.32 | % | | | 1.26 | % | | | 1.30 | % | | | 1.26 | % | | | 1.32 | % |
Total expenses after reimbursements | | | 0.97 | % | | | 0.97 | % | | | 0.97 | % | | | 0.97 | % | | | 0.97 | % |
| | | | | |
Net investment income to average net assets: | | | | | | | | | | | | | | | | | | | | |
Net investment income before reimbursements | | | 4.87 | % | | | 4.62 | % | | | 4.35 | % | | | 3.78 | % | | | 4.34 | % |
Net investment income after reimbursements | | | 5.22 | % | | | 4.91 | % | | | 4.68 | % | | | 4.07 | % | | | 4.69 | % |
| 1 | Per share amounts are based on average number of shares outstanding during the period. |
| 2 | Assumes investment at net asset value at the beginning of the year, reinvestment of all distributions at net asset value on distribution date, and a complete redemption of the investment at net asset value at the end of the year, excluding the impact of sales charges. |
| 3 | The portfolio turnover rate is calculated by dividing the lesser of cost of purchases or proceeds from sales of long term portfolio securities, including fully funded total return swaps, by the monthly average of the value of the long term portfolio securities. |
See accompanying notes to the financial statements.
29
ASHMORE FUNDS
FINANCIAL HIGHLIGHTS
| | | | | | | | | | | | | | | | | | | | |
| Ashmore Emerging Markets Corporate Debt Fund | | | | | | | |
| |
| | | Class A | |
| | | | | |
| | | Year Ended
October 31,
2018 | | | Year Ended
October 31,
2017 | | | Year Ended
October 31,
2016 | | | Year Ended
October 31,
2015 | | | Year Ended
October 31,
2014 | |
| | | | |
Net asset value at beginning of year | | | $ 8.56 | | | | $ 7.92 | | | | $ 7.66 | | | | $ 8.94 | | | | $ 9.25 | |
| | | | | |
Income (loss) from investment operations: | | | | | | | | | | | | | | | | | | | | |
Net investment income | | | 0.51 | | | | 0.57 | | | | 0.70 | | | | 0.74 | | | | 0.55 | 1 |
Net realized and unrealized gain (loss) | | | (0.71 | ) | | | 0.65 | | | | 0.21 | | | | (1.21 | ) | | | (0.31 | ) |
| | | | |
Total from investment operations | | | (0.20 | ) | | | 1.22 | | | | 0.91 | | | | (0.47 | ) | | | 0.24 | |
| | | | | |
Less distributions: | | | | | | | | | | | | | | | | | | | | |
| | | | | |
From net investment income | | | (0.49 | ) | | | (0.56 | ) | | | (0.65 | ) | | | (0.67 | ) | | | (0.55 | ) |
From net realized gain | | | — | | | | — | | | | — | | | | (0.06 | ) | | | — | |
Tax return of capital | | | — | | | | (0.02 | ) | | | — | | | | (0.08 | ) | | | — | |
| | | | |
| | | | | |
Total distributions | | | (0.49 | ) | | | (0.58 | ) | | | (0.65 | ) | | | (0.81 | ) | | | (0.55 | ) |
| | | | |
Net asset value at end of year | | | $ 7.87 | | | | $ 8.56 | | | | $ 7.92 | | | | $ 7.66 | | | | $ 8.94 | |
| | | | |
| | | | | |
Total return2 | | | (2.58 | )% | | | 15.99 | % | | | 12.92 | % | | | (5.27 | )% | | | 2.53 | % |
| | | | | |
Portfolio turnover rate3 | | | 88 | % | | | 87 | % | | | 81 | % | | | 90 | % | | | 82 | % |
| | | | | |
Net assets, end of year (in thousands) | | | $8,616 | | | | $11,995 | | | | $11,466 | | | | $7,280 | | | | $1,704 | |
| | | | | |
Ratios to average net assets: | | | | | | | | | | | | | | | | | | | | |
Total expenses to average net assets: | | | | | | | | | | | | | | | | | | | | |
Total expenses before reimbursements | | | 1.53 | % | | | 1.52 | % | | | 1.57 | % | | | 1.55 | % | | | 1.53 | % |
Total expenses after reimbursements | | | 1.42 | % | | | 1.42 | % | | | 1.42 | % | | | 1.42 | % | | | 1.45 | % |
| | | | | |
Net investment income to average net assets: | | | | | | | | | | | | | | | | | | | | |
Net investment income before reimbursements | | | 6.09 | % | | | 7.11 | % | | | 8.88 | % | | | 8.77 | % | | | 5.79 | % |
Net investment income after reimbursements | | | 6.20 | % | | | 7.21 | % | | | 9.03 | % | | | 8.90 | % | | | 5.87 | % |
See accompanying notes to the financial statements.
30
ASHMORE FUNDS
FINANCIAL HIGHLIGHTS
| | | | | | | | | | | | | | | | | | | | |
| Ashmore Emerging Markets Corporate Debt Fund | | | | | | | |
| |
| | | Class C | |
| | | | | |
| | | Year Ended
October 31,
2018 | | | Year Ended
October 31,
2017 | | | Year Ended
October 31,
2016 | | | Year Ended
October 31,
2015 | | | Year Ended
October 31,
2014 | |
| | | | |
Net asset value at beginning of year | | | $ 8.55 | | | | $ 7.91 | | | | $ 7.66 | | | | $ 8.95 | | | | $ 9.25 | |
| | | | | |
Income (loss) from investment operations: | | | | | | | | | | | | | | | | | | | | |
Net investment income | | | 0.46 | | | | 0.52 | | | | 0.63 | | | | 0.64 | | | | 0.48 | 1 |
Net realized and unrealized gain (loss) | | | (0.72 | ) | | | 0.63 | | | | 0.22 | | | | (1.18 | ) | | | (0.30 | ) |
| | | | |
Total from investment operations | | | (0.26 | ) | | | 1.15 | | | | 0.85 | | | | (0.54 | ) | | | 0.18 | |
| | | | | |
Less distributions: | | | | | | | | | | | | | | | | | | | | |
| | | | | |
From net investment income | | | (0.43 | ) | | | (0.50 | ) | | | (0.60 | ) | | | (0.62 | ) | | | (0.48 | ) |
From net realized gain | | | — | | | | — | | | | — | | | | (0.06 | ) | | | — | |
Tax return of capital | | | — | | | | (0.01 | ) | | | — | | | | (0.07 | ) | | | — | |
| | | | |
| | | | | |
Total distributions | | | (0.43 | ) | | | (0.51 | ) | | | (0.60 | ) | | | (0.75 | ) | | | (0.48 | ) |
| | | | |
Net asset value at end of year | | | $ 7.86 | | | | $ 8.55 | | | | $ 7.91 | | | | $ 7.66 | | | | $ 8.95 | |
| | | | |
| | | | | |
Total return2 | | | (3.30 | )% | | | 15.16 | % | | | 11.99 | % | | | (6.04 | )% | | | 1.87 | % |
| | | | | |
Portfolio turnover rate3 | | | 88 | % | | | 87 | % | | | 81 | % | | | 90 | % | | | 82 | % |
| | | | | |
Net assets, end of year (in thousands) | | | $8,785 | | | | $9,530 | | | | $6,010 | | | | $3,226 | | | | $ 421 | |
| | | | | |
Ratios to average net assets: | | | | | | | | | | | | | | | | | | | | |
Total expenses to average net assets: | | | | | | | | | | | | | | | | | | | | |
Total expenses before reimbursements | | | 2.29 | % | | | 2.27 | % | | | 2.32 | % | | | 2.30 | % | | | 2.28 | % |
Total expenses after reimbursements | | | 2.17 | % | | | 2.17 | % | | | 2.17 | % | | | 2.17 | % | | | 2.20 | % |
| | | | | |
Net investment income to average net assets: | | | | | | | | | | | | | | | | | | | | |
Net investment income before reimbursements | | | 5.38 | % | | | 6.40 | % | | | 8.16 | % | | | 8.13 | % | | | 5.15 | % |
Net investment income after reimbursements | | | 5.50 | % | | | 6.50 | % | | | 8.31 | % | | | 8.26 | % | | | 5.23 | % |
See accompanying notes to the financial statements.
31
ASHMORE FUNDS
FINANCIAL HIGHLIGHTS
| | | | | | | | | | | | | | | | | | | | |
| Ashmore Emerging Markets Corporate Debt Fund | | | | | | | |
| |
| | | Institutional Class | |
| | | | | |
| | | Year Ended
October 31,
2018 | | | Year Ended
October 31,
2017 | | | Year Ended
October 31,
2016 | | | Year Ended
October 31,
2015 | | | Year Ended
October 31,
2014 | |
| | | | |
Net asset value at beginning of year | | | $ 8.92 | | | | $ 8.24 | | | | $ 7.98 | | | | $ 9.30 | | | | $ 9.61 | |
| | | | | |
Income (loss) from investment operations: | | | | | | | | | | | | | | | | | | | | |
Net investment income | | | 0.56 | | | | 0.62 | | | | 0.72 | | | | 0.75 | | | | 0.59 | 1 |
Net realized and unrealized gain (loss) | | | (0.75 | ) | | | 0.68 | | | | 0.24 | | | | (1.22 | ) | | | (0.31 | ) |
| | | | |
Total from investment operations | | | (0.19 | ) | | | 1.30 | | | | 0.96 | | | | (0.47 | ) | | | 0.28 | |
| | | | | |
Less distributions: | | | | | | | | | | | | | | | | | | | | |
| | | | | |
From net investment income | | | (0.53 | ) | | | (0.60 | ) | | | (0.70 | ) | | | (0.71 | ) | | | (0.59 | ) |
From net realized gain | | | — | | | | — | | | | — | | | | (0.06 | ) | | | — | |
Tax return of capital | | | — | | | | (0.02 | ) | | | — | | | | (0.08 | ) | | | — | |
| | | | |
| | | | | |
Total distributions | | | (0.53 | ) | | | (0.62 | ) | | | (0.70 | ) | | | (0.85 | ) | | | (0.59 | ) |
| | | | |
Net asset value at end of year | | | $ 8.20 | | | | $ 8.92 | | | | $ 8.24 | | | | $ 7.98 | | | | $ 9.30 | |
| | | | |
| | | | | |
Total return2 | | | (2.34 | )% | | | 16.45 | % | | | 13.02 | % | | | (5.08 | )% | | | 2.91 | % |
| | | | | |
Portfolio turnover rate3 | | | 88 | % | | | 87 | % | | | 81 | % | | | 90 | % | | | 82 | % |
| | | | | |
Net assets, end of year (in thousands) | | | $319,419 | | | | $338,434 | | | | $215,990 | | | | $237,044 | | | | $364,775 | |
| | | | | |
Ratios to average net assets: | | | | | | | | | | | | | | | | | | | | |
Total expenses to average net assets: | | | | | | | | | | | | | | | | | | | | |
Total expenses before reimbursements | | | 1.29 | % | | | 1.27 | % | | | 1.32 | % | | | 1.30 | % | | | 1.28 | % |
Total expenses after reimbursements | | | 1.17 | % | | | 1.17 | % | | | 1.17 | % | | | 1.17 | % | | | 1.17 | % |
| | | | | |
Net investment income to average net assets: | | | | | | | | | | | | | | | | | | | | |
Net investment income before reimbursements | | | 6.40 | % | | | 7.34 | % | | | 9.20 | % | | | 8.63 | % | | | 6.14 | % |
Net investment income after reimbursements | | | 6.52 | % | | | 7.44 | % | | | 9.35 | % | | | 8.76 | % | | | 6.25 | % |
| 1 | Per share amounts are based on average number of shares outstanding during the period. |
| 2 | Assumes investment at net asset value at the beginning of the year, reinvestment of all distributions at net asset value on distribution date, and a complete redemption of the investment at net asset value at the end of the year, excluding the impact of sales charges. |
| 3 | The portfolio turnover rate is calculated by dividing the lesser of cost of purchases or proceeds from sales of long term portfolio securities by the monthly average of the value of the long term portfolio securities. |
See accompanying notes to the financial statements.
32
ASHMORE FUNDS
FINANCIAL HIGHLIGHTS
| | | | | | | | | | | | | | | | | | | | |
| Ashmore Emerging Markets Short Duration Fund | | | | | | | |
| |
| | | Class A | |
| | | | | |
| | | Year Ended
October 31,
2018 | | | Year Ended
October 31,
2017 | | | Year Ended
October 31,
2016 | | | Year Ended
October 31,
2015 | | | Period Ended
October 31,
20141 | |
| | | | |
Net asset value at beginning of period | | | $ 10.60 | | | | $ 10.37 | | | | $ 9.57 | | | | $ 9.99 | | | | $10.00 | |
| | | | | |
Income (loss) from investment operations: | | | | | | | | | | | | | | | | | | | | |
Net investment income | | | 0.55 | | | | 0.83 | 2 | | | 1.02 | | | | 0.67 | | | | 0.05 | |
Net realized and unrealized gain (loss) | | | (0.58 | ) | | | 0.34 | | | | 0.78 | | | | (0.41 | ) | | | (0.01 | ) |
| | | | |
Total from investment operations | | | (0.03 | ) | | | 1.17 | | | | 1.80 | | | | 0.26 | | | | 0.04 | |
| | | | | |
Less distributions: | | | | | | | | | | | | | | | | | | | | |
| | | | | |
From net investment income | | | (0.57 | ) | | | (0.80 | ) | | | (1.00 | ) | | | (0.67 | ) | | | (0.05 | ) |
From net realized gain | | | (0.22 | ) | | | (0.14 | ) | | | — | | | | — | | | | — | |
Tax return of capital | | | — | | | | — | | | | — | | | | (0.01 | ) | | | — | |
| | | | |
| | | | | |
Total distributions | | | (0.79 | ) | | | (0.94 | ) | | | (1.00 | ) | | | (0.68 | ) | | | (0.05 | ) |
| | | | |
Net asset value at end of period | | | $ 9.78 | | | | $ 10.60 | | | | $ 10.37 | | | | $ 9.57 | | | | $ 9.99 | |
| | | | |
| | | | | |
Total return3 | | | (0.12 | )% | | | 12.04 | % | | | 19.82 | % | | | 2.98 | % | | | 0.45 | % |
| | | | | |
Portfolio turnover rate4 | | | 37 | % | | | 59 | % | | | 73 | % | | | 38 | % | | | 19 | % |
| | | | | |
Net assets, end of period (in thousands) | | | $83,290 | | | | $10,178 | | | | $10,395 | | | | $ 425 | | | | $ 201 | |
| | | | | |
Ratios to average net assets:5 | | | | | | | | | | | | | | | | | | | | |
Total expenses to average net assets: | | | | | | | | | | | | | | | | | | | | |
Total expenses before reimbursements | | | 1.05 | % | | | 1.05 | % | | | 1.11 | % | | | 1.65 | % | | | 2.93 | % |
Total expenses after reimbursements | | | 0.92 | % | | | 0.92 | % | | | 0.92 | % | | | 0.93 | % | | | 0.95 | % |
| | | | | |
Net investment income to average net assets: | | | | | | | | | | | | | | | | | | | | |
Net investment income before reimbursements | | | 7.00 | % | | | 7.83 | % | | | 10.63 | % | | | 6.50 | % | | | 3.35 | % |
Net investment income after reimbursements | | | 7.13 | % | | | 7.96 | % | | | 10.82 | % | | | 7.22 | % | | | 5.33 | % |
See accompanying notes to the financial statements.
33
ASHMORE FUNDS
FINANCIAL HIGHLIGHTS
Ashmore Emerging Markets Short Duration Fund
| | | | | | | | |
| |
| | | Class C | |
| | |
| | | Year Ended
October 31,
2018 | | | Period Ended
October 31,
20176 | |
| | | | |
Net asset value at beginning of period | | | $10.22 | | | | $10.00 | |
| | |
Income (loss) from investment operations: | | | | | | | | |
Net investment income | | | 0.52 | | | | 0.38 | 2 |
Net realized and unrealized gain (loss) | | | (0.64 | ) | | | 0.08 | |
| | | | |
Total from investment operations | | | (0.12 | ) | | | 0.46 | |
| | |
Less distributions: | | | | | | | | |
| | |
From net investment income | | | (0.47 | ) | | | (0.24 | ) |
From net realized gain | | | (0.22 | ) | | | — | |
Tax return of capital | | | — | | | | — | |
| | | | |
| | |
Total distributions | | | (0.69 | ) | | | (0.24 | ) |
| | | | |
Net asset value at end of period | | | $ 9.41 | | | | $10.22 | |
| | | | |
| | |
Total return3 | | | (0.98 | )% | | | 4.74 | % |
| | |
Portfolio turnover rate4 | | | 37 | % | | | 59 | % |
| | |
Net assets, end of period (in thousands) | | | $2,012 | | | | $ 188 | |
| | |
Ratios to average net assets:5 | | | | | | | | |
Total expenses to average net assets: | | | | | | | | |
Total expenses before reimbursements | | | 1.79 | % | | | 1.79 | % |
Total expenses after reimbursements | | | 1.67 | % | | | 1.67 | % |
| | |
Net investment income to average net assets: | | | | | | | | |
Net investment income before reimbursements | | | 5.93 | % | | | 9.66 | % |
Net investment income after reimbursements | | | 6.05 | % | | | 9.78 | % |
See accompanying notes to the financial statements.
34
ASHMORE FUNDS
FINANCIAL HIGHLIGHTS
| | | | | | | | | | | | | | | | | | | | |
| Ashmore Emerging Markets Short Duration Fund | | | | | | | |
| |
| | | Institutional Class | |
| | | | | |
| | | Year Ended
October 31,
2018 | | | Year Ended
October 31,
2017 | | | Year Ended
October 31,
2016 | | | Year Ended
October 31,
2015 | | | Period Ended
October 31,
20147 | |
| | | | |
Net asset value at beginning of period | | | $ 10.41 | | | | $ 10.19 | | | | $ 9.40 | | | | $ 9.81 | | | | $ 10.00 | |
| | | | | |
Income (loss) from investment operations: | | | | | | | | | | | | | | | | | | | | |
Net investment income | | | 0.60 | | | | 0.90 | 2 | | | 1.07 | | | | 0.68 | | | | 0.16 | |
Net realized and unrealized gain (loss) | | | (0.61 | ) | | | 0.27 | | | | 0.72 | | | | (0.39 | ) | | | (0.19 | ) |
| | | | |
Total from investment operations | | | (0.01 | ) | | | 1.17 | | | | 1.79 | | | | 0.29 | | | | (0.03 | ) |
| | | | | |
Less distributions: | | | | | | | | | | | | | | | | | | | | |
| | | | | |
From net investment income | | | (0.58 | ) | | | (0.81 | ) | | | (1.00 | ) | | | (0.69 | ) | | | (0.16 | ) |
From net realized gain | | | (0.22 | ) | | | (0.14 | ) | | | — | | | | — | | | | — | |
Tax return of capital | | | — | | | | — | | | | — | | | | (0.01 | ) | | | — | |
| | | | |
| | | | | |
Total distributions | | | (0.80 | ) | | | (0.95 | ) | | | (1.00 | ) | | | (0.70 | ) | | | (0.16 | ) |
| | | | |
Net asset value at end of period | | | $ 9.60 | | | | $ 10.41 | | | | $ 10.19 | | | | $ 9.40 | | | | $ 9.81 | |
| | | | |
| | | | | |
Total return3 | | | 0.11 | % | | | 12.28 | % | | | 20.18 | % | | | 3.28 | % | | | (0.25 | )% |
| | | | | |
Portfolio turnover rate4 | | | 37 | % | | | 59 | % | | | 73 | % | | | 38 | % | | | 19 | % |
| | | | | |
Net assets, end of period (in thousands) | | | $693,577 | | | | $178,180 | | | | $120,081 | | | | $26,918 | | | | $21,275 | |
| | | | | |
Ratios to average net assets:5 | | | | | | | | | | | | | | | | | | | | |
Total expenses to average net assets: | | | | | | | | | | | | | | | | | | | | |
Total expenses before reimbursements | | | 0.79 | % | | | 0.80 | % | | | 0.89 | % | | | 1.41 | % | | | 2.94 | % |
Total expenses after reimbursements | | | 0.67 | % | | | 0.67 | % | | | 0.67 | % | | | 0.67 | % | | | 0.67 | % |
| | | | | |
Net investment income to average net assets: | | | | | | | | | | | | | | | | | | | | |
Net investment income before reimbursements | | | 7.30 | % | | | 8.64 | % | | | 11.66 | % | | | 6.61 | % | | | 2.58 | % |
Net investment income after reimbursements | | | 7.42 | % | | | 8.77 | % | | | 11.88 | % | | | 7.35 | % | | | 4.85 | % |
| 1 | Class A commenced investment operations on September 23, 2014. |
| 2 | Per share amounts are based on average number of shares outstanding during the period. |
| 3 | Assumes investment at net asset value at the beginning of the period, reinvestment of distributions at net asset value on distribution date, and a complete redemption of the investment at net asset value at the end of the period, excluding the impact of sales charges. Total return is not annualized for periods less than one year. |
| 4 | The portfolio turnover rate is calculated by dividing the lesser of cost of purchases or proceeds from sales of long term portfolio securities by the monthly average of the value of the long term portfolio securities. Portfolio turnover is not annualized for periods less than one year. |
| 5 | Annualized for periods less than one year. |
| 6 | Class C commenced investment operations on June 13, 2017. |
| 7 | Institutional Class commenced investment operations on June 24, 2014. |
See accompanying notes to the financial statements.
35
ASHMORE FUNDS
FINANCIAL HIGHLIGHTS
Ashmore Emerging Markets Active Equity Fund
| | | | | | | | |
| |
| | | Class A | |
| | |
| | | Year Ended
October 31,
2018 | | | Period Ended
October 31,
20171 | |
| | | | |
Net asset value at beginning of period | | | $12.72 | | | | $10.00 | |
| | |
Income (loss) from investment operations: | | | | | | | | |
Net investment income | | | 0.08 | | | | 0.03 | |
Net realized and unrealized gain (loss) | | | (1.05 | ) | | | 2.74 | |
| | | | |
Total from investment operations | | | (0.97 | ) | | | 2.77 | |
| | |
Less distributions: | | | | | | | | |
| | |
From net investment income | | | (0.20 | ) | | | (0.05 | ) |
From net realized gain | | | (1.02 | ) | | | — | |
| | | | |
| | |
Total distributions | | | (1.22 | ) | | | (0.05 | ) |
| | | | |
Net asset value at end of period | | | $10.53 | | | | $12.72 | |
| | | | |
| | |
Total return2 | | | (8.59 | )% | | | 27.73 | % |
| | |
Portfolio turnover rate3 | | | 164 | % | | | 196 | % |
| | |
Net assets, end of period (in thousands) | | | $ 223 | | | | $ 13 | |
| | |
Ratios to average net assets: | | | | | | | | |
Total expenses to average net assets: | | | | | | | | |
Total expenses before reimbursements | | | 2.20 | % | | | 3.11 | % |
Total expenses after reimbursements | | | 1.27 | % | | | 1.27 | % |
| | |
Net investment income (loss) to average net assets: | | | | | | | | |
Net investment income (loss) before reimbursements | | | 0.56 | % | | | (1.56 | )% |
Net investment income after reimbursements | | | 1.49 | % | | | 0.28 | % |
See accompanying notes to the financial statements.
36
ASHMORE FUNDS
FINANCIAL HIGHLIGHTS
Ashmore Emerging Markets Active Equity Fund
| | | | | | | | |
| |
| | | Class C | |
| | |
| | | Year Ended
October 31,
2018 | | | Period Ended
October 31,
20171 | |
| | | | |
Net asset value at beginning of period | | | $12.65 | | | | $10.00 | |
| | |
Income (loss) from investment operations: | | | | | | | | |
Net investment income (loss) | | | 0.03 | | | | (0.05 | ) |
Net realized and unrealized gain (loss) | | | (1.10 | ) | | | 2.74 | |
| | | | |
Total from investment operations | | | (1.07 | ) | | | 2.69 | |
| | |
Less distributions: | | | | | | | | |
| | |
From net investment income | | | (0.13 | ) | | | (0.04 | ) |
From net realized gain | | | (1.02 | ) | | | — | |
| | | | |
| | |
Total distributions | | | (1.15 | ) | | | (0.04 | ) |
| | | | |
Net asset value at end of period | | | $10.43 | | | | $12.65 | |
| | | | |
| | |
Total return2 | | | (9.40 | )% | | | 26.96 | % |
| | |
Portfolio turnover rate3 | | | 164 | % | | | 196 | % |
| | |
Net assets, end of period (in thousands) | | | $ 11 | | | | $ 13 | |
| | |
Ratios to average net assets: | | | | | | | | |
Total expenses to average net assets: | | | | | | | | |
Total expenses before reimbursements | | | 2.73 | % | | | 3.86 | % |
Total expenses after reimbursements | | | 2.02 | % | | | 2.02 | % |
| | |
Net investment income (loss) to average net assets: | | | | | | | | |
Net investment loss before reimbursements | | | (0.51 | )% | | | (2.31 | )% |
Net investment income (loss) after reimbursements | | | 0.20 | % | | | (0.47 | )% |
See accompanying notes to the financial statements.
37
ASHMORE FUNDS
FINANCIAL HIGHLIGHTS
Ashmore Emerging Markets Active Equity Fund
| | | | | | | | |
| |
| | | Institutional Class | |
| | |
| | | Year Ended
October 31,
2018 | | | Period Ended
October 31,
20171 | |
| | | | |
Net asset value at beginning of period | | | $ 12.74 | | | | $ 10.00 | |
| | |
Income (loss) from investment operations: | | | | | | | | |
Net investment income | | | 0.14 | | | | 0.06 | |
Net realized and unrealized gain (loss) | | | (1.09 | ) | | | 2.73 | |
| | | | |
Total from investment operations | | | (0.95 | ) | | | 2.79 | |
| | |
Less distributions: | | | | | | | | |
| | |
From net investment income | | | (0.21 | ) | | | (0.05 | ) |
From net realized gain | | | (1.02 | ) | | | — | |
| | | | |
| | |
Total distributions | | | (1.23 | ) | | | (0.05 | ) |
| | | | |
Net asset value at end of period | | | $ 10.56 | | | | $ 12.74 | |
| | | | |
| | |
Total return2 | | | (8.41 | )% | | | 27.94 | % |
| | |
Portfolio turnover rate3 | | | 164 | % | | | 196 | % |
| | |
Net assets, end of period (in thousands) | | | $17,436 | | | | $18,030 | |
| | |
Ratios to average net assets: | | | | | | | | |
Total expenses to average net assets: | | | | | | | | |
Total expenses before reimbursements | | | 1.73 | % | | | 2.87 | % |
Total expenses after reimbursements | | | 1.02 | % | | | 1.02 | % |
| | |
Net investment income (loss) to average net assets: | | | | | | | | |
Net investment income (loss) before reimbursements | | | 0.47 | % | | | (1.28 | )% |
Net investment income after reimbursements | | | 1.18 | % | | | 0.57 | % |
| 1 | Class A, Class C and the Institutional Class commenced investment operations on November 1, 2016. |
| 2 | Assumes investment at net asset value at the beginning of the period, reinvestment of distributions at net asset value on distribution date, and a complete redemption of the investment at net asset value at the end of the period, excluding the impact of sales charges. Total return is not annualized for periods less than one year. |
| 3 | The portfolio turnover rate is calculated by dividing the lesser of cost of purchases or proceeds from sales of long term portfolio securities by the monthly average of the value of the long term portfolio securities. Portfolio turnover is not annualized for periods less than one year. |
See accompanying notes to the financial statements.
38
ASHMORE FUNDS
FINANCIAL HIGHLIGHTS
| | | | | | | | | | | | | | | | | | | | |
| Ashmore Emerging Markets Small-Cap Equity Fund | | | | | | | |
| |
| | | Class A | |
| | | | | |
| | | Year Ended
October 31,
2018 | | | Year Ended
October 31,
2017 | | | Year Ended
October 31,
2016 | | | Year Ended
October 31,
2015 | | | Year Ended
October 31,
2014 | |
| | | | |
Net asset value at beginning of year | | | $ 10.33 | | | | $ 8.60 | | | | $ 7.92 | | | | $ 9.35 | | | | $ 10.61 | |
| | | | | |
Income (loss) from investment operations: | | | | | | | | | | | | | | | | | | | | |
Net investment income (loss) | | | 0.04 | | | | 0.06 | | | | (0.01 | ) | | | 0.16 | | | | 0.01 | 1 |
Net realized and unrealized gain (loss) | | | (2.17 | ) | | | 1.86 | | | | 0.85 | | | | (1.12 | ) | | | (0.42 | ) |
| | | | |
Total from investment operations | | | (2.13 | ) | | | 1.92 | | | | 0.84 | | | | (0.96 | ) | | | (0.41 | ) |
| | | | | |
Less distributions: | | | | | | | | | | | | | | | | | | | | |
| | | | | |
From net investment income | | | (0.17 | ) | | | (0.19 | ) | | | (0.16 | ) | | | (0.08 | ) | | | (0.01 | ) |
From net realized gain | | | — | | | | — | | | | — | | | | (0.39 | ) | | | (0.84 | ) |
Tax return of capital | | | (0.01 | ) | | | — | | | | — | | | | — | | | | — | |
| | | | |
| | | | | |
Total distributions | | | (0.18 | ) | | | (0.19 | ) | | | (0.16 | ) | | | (0.47 | ) | | | (0.85 | ) |
| | | | |
Net asset value at end of year | | | $ 8.02 | | | | $ 10.33 | | | | $ 8.60 | | | | $ 7.92 | | | | $ 9.35 | |
| | | | |
| | | | | |
Total return2 | | | (20.96 | )% | | | 22.73 | % | | | 10.84 | % | | | (10.32 | )% | | | (3.93 | )% |
| | | | | |
Portfolio turnover rate3 | | | 112 | % | | | 126 | % | | | 104 | % | | | 105 | % | | | 104 | % |
| | | | | |
Net assets, end of year (in thousands) | | | $ 1,447 | | | | $ 847 | | | | $ 524 | | | | $ 259 | | | | $ 332 | |
| | | | | |
Ratios to average net assets: | | | | | | | | | | | | | | | | | | | | |
Total expenses to average net assets: | | | | | | | | | | | | | | | | | | | | |
Total expenses before reimbursements | | | 2.37 | % | | | 2.26 | % | | | 2.39 | % | | | 2.33 | % | | | 2.53 | % |
Total expenses after reimbursements | | | 1.77 | % | | | 1.77 | % | | | 1.77 | % | | | 1.78 | % | | | 1.80 | % |
| | | | | |
Net investment income (loss) to average net assets: | | | | | | | | | | | | | | | | | | | | |
Net investment income (loss) before reimbursements | | | (0.31 | )% | | | 0.01 | % | | | (0.09 | )% | | | 0.96 | % | | | (0.65 | )% |
Net investment income after reimbursements | | | 0.29 | % | | | 0.50 | % | | | 0.53 | % | | | 1.51 | % | | | 0.08 | % |
See accompanying notes to the financial statements.
39
ASHMORE FUNDS
FINANCIAL HIGHLIGHTS
| | | | | | | | | | | | | | | | | | | | |
| Ashmore Emerging Markets Small-Cap Equity Fund | | | | | | | |
| |
| | | Class C | |
| | | | | |
| | | Year Ended
October 31,
2018 | | | Year Ended
October 31,
2017 | | | Year Ended
October 31,
2016 | | | Year Ended
October 31,
2015 | | | Year Ended
October 31,
2014 | |
| | | | |
Net asset value at beginning of year | | | $ 10.90 | | | | $ 9.11 | | | | $ 8.40 | | | | $ 9.96 | | | | $11.33 | |
| | | | | |
Income (loss) from investment operations: | | | | | | | | | | | | | | | | | | | | |
Net investment income (loss) | | | 0.01 | | | | 0.02 | | | | (0.12 | ) | | | 0.10 | | | | (0.05 | )1 |
Net realized and unrealized gain (loss) | | | (2.33 | ) | | | 1.93 | | | | 0.95 | | | | (1.19 | ) | | | (0.47 | ) |
| | | | |
Total from investment operations | | | (2.32 | ) | | | 1.95 | | | | 0.83 | | | | (1.09 | ) | | | (0.52 | ) |
| | | | | |
Less distributions: | | | | | | | | | | | | | | | | | | | | |
| | | | | |
From net investment income | | | (0.16 | ) | | | (0.16 | ) | | | (0.12 | ) | | | (0.08 | ) | | | (0.01 | ) |
From net realized gain | | | — | | | | — | | | | — | | | | (0.39 | ) | | | (0.84 | ) |
Tax return of capital | | | — | 4 | | | — | | | | — | | | | — | | | | — | |
| | | | |
| | | | | |
Total distributions | | | (0.16 | ) | | | (0.16 | ) | | | (0.12 | ) | | | (0.47 | ) | | | (0.85 | ) |
| | | | |
Net asset value at end of year | | | $ 8.42 | | | | $10.90 | | | | $ 9.11 | | | | $ 8.40 | | | | $ 9.96 | |
| | | | |
| | | | | |
Total return2 | | | (21.62 | )% | | | 21.78 | % | | | 10.01 | % | | | (11.02 | )% | | | (4.71 | )% |
| | | | | |
Portfolio turnover rate3 | | | 112 | % | | | 126 | % | | | 104 | % | | | 105 | % | | | 104 | % |
| | | | | |
Net assets, end of year (in thousands) | | | $ 272 | | | | $ 251 | | | | $ 176 | | | | $ 311 | | | | $ 77 | |
| | | | | |
Ratios to average net assets: | | | | | | | | | | | | | | | | | | | | |
Total expenses to average net assets: | | | | | | | | | | | | | | | | | | | | |
Total expenses before reimbursements | | | 3.09 | % | | | 3.01 | % | | | 3.13 | % | | | 3.09 | % | | | 3.60 | % |
Total expenses after reimbursements | | | 2.52 | % | | | 2.52 | % | | | 2.52 | % | | | 2.52 | % | | | 2.55 | % |
| | | | | |
Net investment income (loss) to average net assets: | | | | | | | | | | | | | | | | | | | | |
Net investment income (loss) before reimbursements | | | (1.30 | )% | | | (0.76 | )% | | | (0.89 | )% | | | 1.81 | % | | | (1.53 | )% |
Net investment income (loss) after reimbursements | | | (0.73 | )% | | | (0.27 | )% | | | (0.28 | )% | | | 2.38 | % | | | (0.48 | )% |
See accompanying notes to the financial statements.
40
ASHMORE FUNDS
FINANCIAL HIGHLIGHTS
| | | | | | | | | | | | | | | | | | | | |
| Ashmore Emerging Markets Small-Cap Equity Fund | | | | | | | |
| |
| | | Institutional Class | |
| | | | | |
| | | Year Ended
October 31,
2018 | | | Year Ended
October 31,
2017 | | | Year Ended
October 31,
2016 | | | Year Ended
October 31,
2015 | | | Year Ended
October 31,
2014 | |
| | | | |
Net asset value at beginning of year | | | $ 13.19 | | | | $ 10.94 | | | | $ 10.01 | | | | $ 11.63 | | | | $ 12.96 | |
| | | | | |
Income (loss) from investment operations: | | | | | | | | | | | | | | | | | | | | |
Net investment income | | | 0.05 | | | | 0.09 | | | | 0.04 | | | | 0.20 | | | | 0.02 | 1 |
Net realized and unrealized gain (loss) | | | (2.73 | ) | | | 2.36 | | | | 1.07 | | | | (1.35 | ) | | | (0.50 | ) |
| | | | |
Total from investment operations | | | (2.68 | ) | | | 2.45 | | | | 1.11 | | | | (1.15 | ) | | | (0.48 | ) |
| | | | | |
Less distributions: | | | | | | | | | | | | | | | | | | | | |
| | | | | |
From net investment income | | | (0.18 | ) | | | (0.20 | ) | | | (0.18 | ) | | | (0.08 | ) | | | (0.01 | ) |
From net realized gain | | | — | | | | — | | | | — | | | | (0.39 | ) | | | (0.84 | ) |
Tax return of capital | | | (0.01 | ) | | | — | | | | — | | | | — | | | | — | |
| | | | |
| | | | | |
Total distributions | | | (0.19 | ) | | | (0.20 | ) | | | (0.18 | ) | | | (0.47 | ) | | | (0.85 | ) |
| | | | |
Net asset value at end of year | | | $ 10.32 | | | | $ 13.19 | | | | $ 10.94 | | | | $ 10.01 | | | | $ 11.63 | |
| | | | |
| | | | | |
Total return2 | | | (20.60 | )% | | | 22.70 | % | | | 11.21 | % | | | (9.91 | )% | | | (3.74 | )% |
| | | | | |
Portfolio turnover rate3 | | | 112 | % | | | 126 | % | | | 104 | % | | | 105 | % | | | 104 | % |
| | | | | |
Net assets, end of year (in thousands) | | | $32,456 | | | | $38,419 | | | | $33,626 | | | | $42,486 | | | | $48,909 | |
| | | | | |
Ratios to average net assets: | | | | | | | | | | | | | | | | | | | | |
Total expenses to average net assets: | | | | | | | | | | | | | | | | | | | | |
Total expenses before reimbursements | | | 2.06 | % | | | 2.01 | % | | | 2.10 | % | | | 2.08 | % | | | 2.39 | % |
Total expenses after reimbursements | | | 1.52 | % | | | 1.52 | % | | | 1.52 | % | | | 1.52 | % | | | 1.52 | % |
| | | | | |
Net investment income (loss) to average net assets: | | | | | | | | | | | | | | | | | | | | |
Net investment income (loss) before reimbursements | | | (0.16 | )% | | | 0.18 | % | | | (0.22 | )% | | | 1.24 | % | | | (0.70 | )% |
Net investment income after reimbursements | | | 0.38 | % | | | 0.67 | % | | | 0.36 | % | | | 1.80 | % | | | 0.17 | % |
| 1 | Per share amounts are based on average number of shares outstanding during the period. |
| 2 | Assumes investment at net asset value at the beginning of the year, reinvestment of all distributions at net asset value on distribution date, and a complete redemption of the investment at net asset value at the end of the year, excluding the impact of sales charges. |
| 3 | The portfolio turnover rate is calculated by dividing the lesser of cost of purchases or proceeds from sales of long term portfolio securities by the monthly average of the value of the long term portfolio securities. |
| 4 | Amount is less than $0.005 per share. |
See accompanying notes to the financial statements.
41
ASHMORE FUNDS
FINANCIAL HIGHLIGHTS
| | | | | | | | | | | | | | | | | | | | |
| Ashmore Emerging Markets Frontier Equity Fund | | | | | | | |
| |
| | | Class A | |
| | | | | |
| | | Year Ended
October 31,
2018 | | | Year Ended
October 31,
2017 | | | Year Ended
October 31,
2016 | | | Year Ended
October 31,
2015 | | | Period Ended
October 31,
20141 | |
| | | | |
Net asset value at beginning of period | | | $ 9.99 | | | | $ 7.98 | | | | $ 7.83 | | | | $ 10.19 | | | | $10.00 | |
| | | | | |
Income (loss) from investment operations: | | | | | | | | | | | | | | | | | | | | |
Net investment income (loss) | | | 0.08 | | | | 0.10 | | | | 0.36 | | | | 0.10 | 2 | | | (0.03 | ) |
Net realized and unrealized gain (loss) | | | (1.47 | ) | | | 2.08 | | | | (0.09 | ) | | | (1.45 | ) | | | 0.27 | |
| | | | |
Total from investment operations | | | (1.39 | ) | | | 2.18 | | | | 0.27 | | | | (1.35 | ) | | | 0.24 | |
| | | | | |
Less distributions: | | | | | | | | | | | | | | | | | | | | |
| | | | | |
From net investment income | | | (0.08 | ) | | | (0.17 | ) | | | (0.12 | ) | | | (0.15 | ) | | | (0.05 | ) |
From net realized gain | | | (0.82 | ) | | | — | | | | — | | | | (0.86 | ) | | | — | |
Tax return of capital | | | (0.04 | ) | | | — | | | | — | | | | — | | | | — | |
| | | | |
| | | | | |
Total distributions | | | (0.94 | ) | | | (0.17 | ) | | | (0.12 | ) | | | (1.01 | ) | | | (0.05 | ) |
| | | | |
Net asset value at end of period | | | $ 7.66 | | | | $ 9.99 | | | | $ 7.98 | | | | $ 7.83 | | | | $10.19 | |
| | | | |
| | | | | |
Total return3 | | | (15.44 | )% | | | 27.53 | % | | | 3.36 | % | | | (13.68 | )% | | | 2.43 | % |
| | | | | |
Portfolio turnover rate4 | | | 80 | % | | | 107 | % | | | 76 | % | | | 91 | % | | | 157 | % |
| | | | | |
Net assets, end of period (in thousands) | | | $ 7,645 | | | | $7,710 | | | | $2,154 | | | | $ 45 | | | | $ 9 | |
| | | | | |
Ratios to average net assets:5 | | | | | | | | | | | | | | | | | | | | |
Total expenses to average net assets: | | | | | | | | | | | | | | | | | | | | |
Total expenses before reimbursements | | | 2.20 | % | | | 2.21 | % | | | 2.45 | % | | | 2.73 | % | | | 6.90 | % |
Total expenses after reimbursements | | | 1.77 | % | | | 1.77 | % | | | 1.77 | % | | | 1.79 | % | | | 1.80 | % |
| | | | | |
Net investment income (loss) to average net assets: | | | | | | | | | | | | | | | | | | | | |
Net investment income (loss) before reimbursements | | | 0.46 | % | | | 1.05 | % | | | 4.34 | % | | | 0.25 | % | | | (5.89 | )% |
Net investment income (loss) after reimbursements | | | 0.89 | % | | | 1.49 | % | | | 5.02 | % | | | 1.19 | % | | | (0.79 | )% |
See accompanying notes to the financial statements.
42
ASHMORE FUNDS
FINANCIAL HIGHLIGHTS
| | | | | | | | | | | | | | | | | | | | |
| Ashmore Emerging Markets Frontier Equity Fund | | | | | | | |
| |
| | | Class C | |
| | | | | |
| | | Year Ended
October 31,
2018 | | | Year Ended
October 31,
2017 | | | Year Ended
October 31,
2016 | | | Year Ended
October 31,
2015 | | | Period Ended
October 31,
20141 | |
| | | | |
Net asset value at beginning of period | | | $ 9.82 | | | | $ 7.86 | | | | $ 7.73 | | | | $ 10.15 | | | | $10.00 | |
| | | | | |
Income (loss) from investment operations: | | | | | | | | | | | | | | | | | | | | |
Net investment income (loss) | | | 0.03 | | | | 0.08 | | | | 0.08 | | | | (0.05 | )2 | | | (0.83 | ) |
Net realized and unrealized gain (loss) | | | (1.48 | ) | | | 2.00 | | | | 0.12 | | | | (1.36 | ) | | | 1.03 | |
| | | | |
Total from investment operations | | | (1.45 | ) | | | 2.08 | | | | 0.20 | | | | (1.41 | ) | | | 0.20 | |
| | | | | |
Less distributions: | | | | | | | | | | | | | | | | | | | | |
| | | | | |
From net investment income | | | (0.05 | ) | | | (0.12 | ) | | | (0.07 | ) | | | (0.15 | ) | | | (0.05 | ) |
From net realized gain | | | (0.82 | ) | | | — | | | | — | | | | (0.86 | ) | | | — | |
Tax return of capital | | | (0.03 | ) | | | — | | | | — | | | | — | | | | — | |
| | | | |
| | | | | |
Total distributions | | | (0.90 | ) | | | (0.12 | ) | | | (0.07 | ) | | | (1.01 | ) | | | (0.05 | ) |
| | | | |
Net asset value at end of period | | | $ 7.47 | | | | $ 9.82 | | | | $ 7.86 | | | | $ 7.73 | | | | $10.15 | |
| | | | |
| | | | | |
Total return3 | | | (16.30 | )% | | | 26.57 | % | | | 2.61 | % | | | (14.51 | )% | | | 2.02 | % |
| | | | | |
Portfolio turnover rate4 | | | 80 | % | | | 107 | % | | | 76 | % | | | 91 | % | | | 157 | % |
| | | | | |
Net assets, end of period (in thousands) | | | $ 408 | | | | $ 459 | | | | $ 62 | | | | $ 53 | | | | $ 1 | |
| | | | | |
Ratios to average net assets:5 | | | | | | | | | | | | | | | | | | | | |
Total expenses to average net assets: | | | | | | | | | | | | | | | | | | | | |
Total expenses before reimbursements | | | 2.94 | % | | | 2.99 | % | | | 3.05 | % | | | 3.45 | % | | | 7.71 | % |
Total expenses after reimbursements | | | 2.52 | % | | | 2.52 | % | | | 2.52 | % | | | 2.52 | % | | | 2.55 | % |
| | | | | |
Net investment income (loss) to average net assets: | | | | | | | | | | | | | | | | | | | | |
Net investment income (loss) before reimbursements | | | (0.18 | )% | | | (0.21 | )% | | | 0.39 | % | | | (1.53 | )% | | | (6.42 | )% |
Net investment income (loss) after reimbursements | | | 0.24 | % | | | 0.26 | % | | | 0.92 | % | | | (0.60 | )% | | | (1.26 | )% |
See accompanying notes to the financial statements.
43
ASHMORE FUNDS
FINANCIAL HIGHLIGHTS
| | | | | | | | | | | | | | | | | | | | |
| Ashmore Emerging Markets Frontier Equity Fund | | | | | | | |
| |
| | | Institutional Class | |
| | | | | |
| | | Year Ended
October 31,
2018 | | | Year Ended
October 31,
2017 | | | Year Ended
October 31,
2016 | | | Year Ended
October 31,
2015 | | | Period Ended
October 31,
20146 | |
| | | | |
Net asset value at beginning of period | | | $ 11.38 | | | | $ 9.06 | | | | $ 8.88 | | | | $ 11.35 | | | | $10.00 | |
| | | | | |
Income (loss) from investment operations: | | | | | | | | | | | | | | | | | | | | |
Net investment income | | | 0.12 | | | | 0.13 | | | | 0.18 | | | | 0.12 | 2 | | | 0.14 | |
Net realized and unrealized gain (loss) | | | (1.69 | ) | | | 2.37 | | | | 0.13 | | | | (1.58 | ) | | | 1.32 | |
| | | | |
Total from investment operations | | | (1.57 | ) | | | 2.50 | | | | 0.31 | | | | (1.46 | ) | | | 1.46 | |
| | | | | |
Less distributions: | | | | | | | | | | | | | | | | | | | | |
| | | | | |
From net investment income | | | (0.08 | ) | | | (0.18 | ) | | | (0.13 | ) | | | (0.15 | ) | | | (0.11 | ) |
From net realized gain | | | (0.82 | ) | | | — | | | | — | | | | (0.86 | ) | | | — | |
Tax return of capital | | | (0.05 | ) | | | — | | | | — | | | | — | | | | — | |
| | | | |
| | | | | |
Total distributions | | | (0.95 | ) | | | (0.18 | ) | | | (0.13 | ) | | | (1.01 | ) | | | (0.11 | ) |
| | | | |
Net asset value at end of period | | | $ 8.86 | | | | $ 11.38 | | | | $ 9.06 | | | | $ 8.88 | | | | $11.35 | |
| | | | |
| | | | | |
Total return3 | | | (15.11 | )% | | | 27.87 | % | | | 3.58 | % | | | (13.29 | )% | | | 14.69 | % |
| | | | | |
Portfolio turnover rate4 | | | 80 | % | | | 107 | % | | | 76 | % | | | 91 | % | | | 157 | % |
| | | | | |
Net assets, end of period (in thousands) | | | $77,788 | | | | $81,324 | | | | $52,711 | | | | $49,952 | | | | $7,280 | |
| | | | | |
Ratios to average net assets:5 | | | | | | | | | | | | | | | | | | | | |
Total expenses to average net assets: | | | | | | | | | | | | | | | | | | | | |
Total expenses before reimbursements | | | 1.95 | % | | | 1.96 | % | | | 2.05 | % | | | 2.46 | % | | | 6.09 | % |
Total expenses after reimbursements | | | 1.52 | % | | | 1.52 | % | | | 1.52 | % | | | 1.52 | % | | | 1.52 | % |
| | | | | |
Net investment income (loss) to average net assets: | | | | | | | | | | | | | | | | | | | | |
Net investment income (loss) before reimbursements | | | 0.78 | % | | | 0.73 | % | | | 1.48 | % | | | 0.34 | % | | | (3.68 | )% |
Net investment income after reimbursements | | | 1.21 | % | | | 1.17 | % | | | 2.01 | % | | | 1.28 | % | | | 0.89 | % |
| 1 | Class A and Class C commenced investment operations on May 7, 2014. |
| 2 | Per share amounts are based on average number of shares outstanding during the period. |
| 3 | Assumes investment at net asset value at the beginning of the period, reinvestment of distributions at net asset value on distribution date, and a complete redemption of the investment at net asset value at the end of the period, excluding the impact of sales charges. Total return is not annualized for periods less than one year. |
| 4 | The portfolio turnover rate is calculated by dividing the lesser of cost of purchases or proceeds from sales of long term portfolio securities by the monthly average of the value of the long term portfolio securities. Portfolio turnover is not annualized for periods less than one year. |
| 5 | Annualized for periods less than one year. |
| 6 | Institutional Class commenced investment operations on November 5, 2013. |
See accompanying notes to the financial statements.
44
ASHMORE FUNDS
FINANCIAL HIGHLIGHTS
| | | | | | | | | | | | | | | | | | | | |
| Ashmore Emerging Markets Equity Fund | | | | | | | |
| |
| | | Class A | |
| | | | | |
| | | Year Ended
October 31,
2018 | | | Year Ended
October 31,
2017 | | | Year Ended
October 31,
2016 | | | Year Ended
October 31,
2015 | | | Year Ended
October 31,
2014 | |
| | | | |
Net asset value at beginning of year | | | $ 11.16 | | | | $ 8.34 | | | | $ 7.29 | | | | $ 9.24 | | | | $ 9.66 | |
| | | | | |
Income (loss) from investment operations: | | | | | | | | | | | | | | | | | | | | |
Net investment income | | | 0.01 | | | | 0.06 | 1 | | | 0.06 | | | | 0.03 | | | | 0.06 | |
Net realized and unrealized gain (loss) | | | (1.55 | ) | | | 2.90 | | | | 1.05 | | | | (1.92 | ) | | | (0.40 | ) |
| | | | |
Total from investment operations | | | (1.54 | ) | | | 2.96 | | | | 1.11 | | | | (1.89 | ) | | | (0.34 | ) |
| | | | | |
Less distributions: | | | | | | | | | | | | | | | | | | | | |
| | | | | |
From net investment income | | | (0.23 | ) | | | (0.14 | ) | | | (0.06 | ) | | | (0.06 | ) | | | (0.08 | ) |
From net realized gain | | | — | | | | — | | | | — | | | | — | | | | — | |
Tax return of capital | | | (0.01 | ) | | | — | | | | — | | | | — | 2 | | | — | |
| | | | |
| | | | | |
Total distributions | | | (0.24 | ) | | | (0.14 | ) | | | (0.06 | ) | | | (0.06 | ) | | | (0.08 | ) |
| | | | |
Net asset value at end of year | | | $ 9.38 | | | | $11.16 | | | | $ 8.34 | | | | $ 7.29 | | | | $ 9.24 | |
| | | | |
| | | | | |
Total return3 | | | (14.16 | )% | | | 35.90 | % | | | 15.36 | % | | | (20.52 | )% | | | (3.58 | )% |
| | | | | |
Portfolio turnover rate4 | | | 113 | % | | | 140 | % | | | 119 | % | | | 106 | % | | | 130 | % |
| | | | | |
Net assets, end of year (in thousands) | | | $ 303 | | | | $ 134 | | | | $ 36 | | | | $ 24 | | | | $ 30 | |
| | | | | |
Ratios to average net assets: | | | | | | | | | | | | | | | | | | | | |
Total expenses to average net assets: | | | | | | | | | | | | | | | | | | | | |
Total expenses before reimbursements | | | 2.19 | % | | | 2.65 | % | | | 2.96 | % | | | 3.56 | % | | | 3.62 | % |
Total expenses after reimbursements | | | 1.42 | % | | | 1.42 | % | | | 1.42 | % | | | 1.43 | % | | | 1.45 | % |
| | | | | |
Net investment income (loss) to average net assets: | | | | | | | | | | | | | | | | | | | | |
Net investment loss before reimbursements | | | (0.06 | )% | | | (0.64 | )% | | | (0.74 | )% | | | (1.82 | )% | | | (1.45 | )% |
Net investment income after reimbursements | | | 0.71 | % | | | 0.59 | % | | | 0.80 | % | | | 0.31 | % | | | 0.72 | % |
See accompanying notes to the financial statements.
45
ASHMORE FUNDS
FINANCIAL HIGHLIGHTS
| | | | | | | | | | | | | | | | | | | | | | | | |
| Ashmore Emerging Markets Equity Fund | | | | | | | | | | |
| |
| | | Class C | |
| | | | | | |
| | | Year Ended
October 31,
2018 | | | Period Ended
October 31,
2017 | | | Period Ended
August 9,
2016 | | | Year Ended
October 31,
2015 | | | Year Ended
October 31,
2014 | | | Year Ended
October 31,
2013 | |
| | | | |
Net asset value at beginning of period | | | $ 10.73 | | | | $ 8.86 | 5 | | | $ 8.17 | | | | $ 10.46 | | | | $ 11.00 | | | | $ 10.32 | |
| | | | | | |
Income (loss) from investment operations: | | | | | | | | | | | | | | | | | | | | | | | | |
Net investment income (loss) | | | (0.13 | ) | | | — | 1,2 | | | 0.01 | | | | (0.04 | ) | | | (0.01 | ) | | | (0.03 | )1 |
Net realized and unrealized gain (loss) | | | (1.44 | ) | | | 1.93 | | | | 0.81 | | | | (2.19 | ) | | | (0.45 | ) | | | 0.78 | |
| | | | |
Total from investment operations | | | (1.57 | ) | | | 1.93 | | | | 0.82 | | | | (2.23 | ) | | | (0.46 | ) | | | 0.75 | |
| | | | | | |
Less distributions: | | | | | | | | | | | | | | | | | | | | | | | | |
| | | | | | |
From net investment income | | | (0.19 | ) | | | (0.06 | ) | | | (0.03 | ) | | | (0.06 | ) | | | (0.08 | ) | | | (0.06 | ) |
From net realized gain | | | — | | | | — | | | | — | | | | — | | | | — | | | | — | |
Tax return of capital | | | (0.01 | ) | | | — | | | | — | | | | — | 2 | | | — | | | | (0.01 | ) |
| | | | |
| | | | | | |
Total distributions | | | (0.20 | ) | | | (0.06 | ) | | | (0.03 | ) | | | (0.06 | ) | | | (0.08 | ) | | | (0.07 | ) |
| | | | |
Net asset value at end of period | | | $ 8.96 | | | | $ 10.73 | | | | $ 8.96 | 6 | | | $ 8.17 | | | | $ 10.46 | | | | $ 11.00 | |
| | | | |
| | | | | | |
Total return3 | | | (14.92 | )% | | | 10.81 | % | | | 10.02 | % | | | (21.38 | )% | | | (4.24 | )% | | | 7.58 | % |
| | | | | | |
Portfolio turnover rate4 | | | 113 | % | | | 140 | % | | | 119 | % | | | 106 | % | | | 130 | % | | | 92 | % |
| | | | | | |
Net assets, end of period (in thousands) | | | $ 1 | | | | $ 2 | | | | $ 1 | | | | $ 1 | | | | $ 1 | | | | $ 1 | |
| | | | | | |
Ratios to average net assets:7 | | | | | | | | | | | | | | | | | | | | | | | | |
Total expenses to average net assets: | | | | | | | | | | | | | | | | | | | | | | | | |
Total expenses before reimbursements | | | 2.96 | % | | | 3.38 | % | | | 3.86 | % | | | 4.31 | % | | | 4.34 | % | | | 3.77 | % |
Total expenses after reimbursements | | | 2.17 | % | | | 2.17 | % | | | 2.22 | % | | | 2.18 | % | | | 2.20 | % | | | 2.20 | % |
| | | | | | |
Net investment income (loss) to average net assets: | | | | | | | | | | | | | | | | | | | | | | | | |
Net investment loss before reimbursements | | | (1.25 | )% | | | (1.20 | )% | | | (1.39 | )% | | | (2.57 | )% | | | (2.25 | )% | | | (1.81 | )% |
Net investment income (loss) after reimbursements | | | (0.46 | )% | | | 0.01 | % | | | 0.25 | % | | | (0.44 | )% | | | (0.11 | )% | | | (0.24 | )% |
See accompanying notes to the financial statements.
46
ASHMORE FUNDS
FINANCIAL HIGHLIGHTS
| | | | | | | | | | | | | | | | | | | | |
| Ashmore Emerging Markets Equity Fund | | | | | | | |
| |
| | | Institutional Class | |
| | | | | |
| | | Year Ended
October 31,
2018 | | | Year Ended
October 31,
2017 | | | Year Ended
October 31, 2016 | | | Year Ended
October 31,
2015 | | | Year Ended
October 31,
2014 | |
| | | | |
Net asset value at beginning of year | | | $ 10.78 | | | | $ 8.05 | | | | $ 7.02 | | | | $ 8.88 | | | | $ 9.27 | |
| | | | | |
Income (loss) from investment operations: | | | | | | | | | | | | | | | | | | | | |
Net investment income | | | 0.07 | | | | 0.08 | 1 | | | 0.08 | | | | 0.05 | | | | 0.08 | |
Net realized and unrealized gain (loss) | | | (1.54 | ) | | | 2.80 | | | | 1.02 | | | | (1.85 | ) | | | (0.39 | ) |
| | | | |
Total from investment operations | | | (1.47 | ) | | | 2.88 | | | | 1.10 | | | | (1.80 | ) | | | (0.31 | ) |
| | | | | |
Less distributions: | | | | | | | | | | | | | | | | | | | | |
| | | | | |
From net investment income | | | (0.24 | ) | | | (0.15 | ) | | | (0.07 | ) | | | (0.06 | ) | | | (0.08 | ) |
From net realized gain | | | — | | | | — | | | | — | | | | — | | | | — | |
Tax return of capital | | | (0.01 | ) | | | — | | | | — | | | | — | 2 | | | — | |
| | | | |
| | | | | |
Total distributions | | | (0.25 | ) | | | (0.15 | ) | | | (0.07 | ) | | | (0.06 | ) | | | (0.08 | ) |
| | | | |
Net asset value at end of year | | | $ 9.06 | | | | $10.78 | | | | $ 8.05 | | | | $ 7.02 | | | | $ 8.88 | |
| | | | |
| | | | | |
Total return3 | | | (14.01 | )% | | | 36.21 | % | | | 15.80 | % | | | (20.34 | )% | | | (3.40 | )% |
| | | | | |
Portfolio turnover rate4 | | | 113 | % | | | 140 | % | | | 119 | % | | | 106 | % | | | 130 | % |
| | | | | |
Net assets, end of year (in thousands) | | | $24,162 | | | | $8,106 | | | | $9,074 | | | | $ 7,601 | | | | $10,304 | |
| | | | | |
Ratios to average net assets: | | | | | | | | | | | | | | | | | | | | |
Total expenses to average net assets: | | | | | | | | | | | | | | | | | | | | |
Total expenses before reimbursements | | | 1.95 | % | | | 2.35 | % | | | 2.71 | % | | | 3.31 | % | | | 3.37 | % |
Total expenses after reimbursements | | | 1.17 | % | | | 1.17 | % | | | 1.17 | % | | | 1.17 | % | | | 1.17 | % |
| | | | | |
Net investment income (loss) to average net assets: | | | | | | | | | | | | | | | | | | | | |
Net investment income (loss) before reimbursements | | | 0.10 | % | | | (0.33 | )% | | | (0.46 | )% | | | (1.59 | )% | | | (1.28 | )% |
Net investment income after reimbursements | | | 0.88 | % | | | 0.85 | % | | | 1.08 | % | | | 0.55 | % | | | 0.92 | % |
| 1 | Per share amounts are based on average number of shares outstanding during the period. |
| 2 | Amount is less than $0.005 per share. |
| 3 | Assumes investment at net asset value at the beginning of the period, reinvestment of distributions at net asset value on distribution date, and a complete redemption of the investment at net asset value at the end of the period, excluding the impact of sales charges. Total return is not annualized for periods less than one year. |
| 4 | The portfolio turnover rate is calculated by dividing the lesser of cost of purchases or proceeds from sales of long term portfolio securities by the monthly average of the value of the long term portfolio securities. Portfolio turnover is not annualized for periods less than one year. |
| 5 | Initial investment in Class C occurred on March 3, 2017. The beginning NAV for Class C is the end of day NAV for the Institutional Class on March 3, 2017. |
| 6 | There were no investors in Ashmore Emerging Markets Equity Fund Class C at the year ended October 31, 2016. Net asset value shown represents net asset value prior to the final redemption. |
| 7 | Annualized for periods less than one year. |
See accompanying notes to the financial statements.
47
ASHMORE EMERGING MARKETS TOTAL RETURN FUND
SCHEDULE OF INVESTMENTS
As of October 31, 2018
| | | | | | | | | | | | | | | | |
| | | Currency(1) | | | Par | | | Value | | | % of Net
Assets | |
Debt Securities | | | | | | | | | | | | | | | | |
| | | | |
Angola (Cost $7,932,258) | | | | | | | | | | | | | | | | |
Angola (Rep of), 9.500%, 11/12/2025 | | | | | | | 2,554,000 | | | $ | 2,812,209 | | | | 0.21 | |
Angola (Rep of), 8.250%, 05/09/2028 | | | | | | | 2,915,000 | | | | 2,912,056 | | | | 0.22 | |
Angola (Rep of), 9.375%, 05/08/2048 | | | | | | | 2,410,000 | | | | 2,422,243 | | | | 0.18 | |
| | | | | | | | | | | 8,146,508 | | | | 0.61 | |
| | | | |
Argentina (Cost $44,198,943) | | | | | | | | | | | | | | | | |
Argentina (Rep of), 6.875%, 04/22/2021 | | | | | | | 3,479,000 | | | | 3,327,664 | | | | 0.25 | |
Argentina (Rep of), 7.500%, 04/22/2026 | | | | | | | 4,794,000 | | | | 4,182,765 | | | | 0.32 | |
Argentina (Rep of), 5.875%, 01/11/2028 | | | | | | | 4,063,000 | | | | 3,128,510 | | | | 0.24 | |
Argentina (Rep of), 8.280%, 12/31/2033 | | | | | | | 3,157,189 | | | | 2,694,937 | | | | 0.20 | |
Argentina (Rep of), (Step to 3.750% on 03/31/2019) 2.500%, 12/31/2038(2) | | | | | | | 7,933,446 | | | | 4,418,929 | | | | 0.33 | |
Argentina (Rep of), 6.875%, 01/11/2048 | | | | | | | 6,521,000 | | | | 4,776,632 | | | | 0.36 | |
Argentina Bonar Bonds, (Floating, Argentina Deposit Rates Badlar Private Banks 30-35 Days + 2.500%) 50.516%, 03/11/2019 | | | ARS | | | | 8,343,000 | | | | 232,125 | | | | 0.02 | |
Argentina Bonar Bonds, (Floating, Argentina Deposit Rates Badlar Private Banks 30-35 Days + 3.250%) 49.840%, 03/01/2020 | | | ARS | | | | 8,070,000 | | | | 225,702 | | | | 0.02 | |
Argentina Bonar Bonds, (Floating, Argentina Deposit Rates Badlar Private Banks 30-35 Days + 2.000%) 52.789%, 04/03/2022 | | | ARS | | | | 77,137,255 | | | | 2,123,067 | | | | 0.16 | |
Argentina POM Politica Monetaria, (Floating, Argentina Blended Historical Policy Rate + 0.000%) 67.467%, 06/21/2020 | | | ARS | | | | 130,884,781 | | | | 4,125,061 | | | | 0.31 | |
Provincia de Buenos Aires, (Floating, Argentina Deposit Rates Badlar Private Banks 30-35 Days + 3.750%) 55.307%, 04/12/2025(3) | | | ARS | | | | 53,295,000 | | | | 1,325,305 | | | | 0.10 | |
YPF S.A., 8.750%, 04/04/2024 | | | | | | | 2,310,000 | | | | 2,275,350 | | | | 0.17 | |
| | | | | | | | | | | 32,836,047 | | | | 2.48 | |
| | | | |
Azerbaijan (Cost $8,834,409) | | | | | | | | | | | | | | | | |
Southern Gas Corridor CJSC, 6.875%, 03/24/2026 | | | | | | | 5,050,000 | | | | 5,417,024 | | | | 0.41 | |
State Oil Co. of the Azerbaijan Republic, 4.750%, 03/13/2023 | | | | | | | 490,000 | | | | 483,674 | | | | 0.04 | |
State Oil Co. of the Azerbaijan Republic, 6.950%, 03/18/2030 | | | | | | | 2,570,000 | | | | 2,725,393 | | | | 0.20 | |
| | | | | | | | | | | 8,626,091 | | | | 0.65 | |
| | | | |
Bahrain (Cost $6,330,093) | | | | | | | | | | | | | | | | |
Bahrain (Rep of), 7.000%, 10/12/2028 | | | | | | | 3,640,000 | | | | 3,553,150 | | | | 0.27 | |
Bahrain (Rep of), 7.500%, 09/20/2047 | | | | | | | 1,230,000 | | | | 1,133,747 | | | | 0.08 | |
Oil and Gas Holding (The) Co. B.S.C. (Closed), 8.375%, 11/07/2028 | | | | | | | 1,800,000 | | | | 1,800,000 | | | | 0.14 | |
| | | | | | | | | | | 6,486,897 | | | | 0.49 | |
| | | | |
Belarus (Cost $16,743,901) | | | | | | | | | | | | | | | | |
Belarus (Rep of), 6.875%, 02/28/2023 | | | | | | | 7,606,000 | | | | 7,836,158 | | | | 0.59 | |
Belarus (Rep of), 7.625%, 06/29/2027 | | | | | | | 4,532,000 | | | | 4,792,590 | | | | 0.36 | |
Belarus (Rep of), 6.200%, 02/28/2030 | | | | | | | 3,810,000 | | | | 3,607,460 | | | | 0.27 | |
| | | | | | | | | | | 16,236,208 | | | | 1.22 | |
See accompanying notes to the financial statements.
48
ASHMORE EMERGING MARKETS TOTAL RETURN FUND
SCHEDULE OF INVESTMENTS (CONTINUED)
As of October 31, 2018
| | | | | | | | | | | | | | | | |
| | | Currency(1) | | | Par | | | Value | | | % of Net
Assets | |
Brazil (Cost $161,889,480) | | | | | | | | | | | | | | | | |
Banco do Brasil S.A., (Variable, U.S. Treasury Yield Curve Rate CMT 10Y + 7.327%) 9.250%, 04/15/2023(4) | | | | | | | 1,150,000 | | | $ | 1,236,250 | | | | 0.09 | |
Banco do Brasil S.A., (Variable, U.S. Treasury Yield Curve Rate CMT 10Y + 4.398%) 6.250%, 04/15/2024(4) | | | | | | | 5,680,000 | | | | 4,898,574 | | | | 0.37 | |
Banco do Brasil S.A., (Variable, U.S. Treasury Yield Curve Rate CMT 10Y + 6.362%) 9.000%, 06/18/2024(4) | | | | | | | 4,585,000 | | | | 4,745,475 | | | | 0.36 | |
Banco Nacional de Desenvolvimento Economico e Social,
6.500%, 06/10/2019 | | | | | | | 1,770,000 | | | | 1,798,904 | | | | 0.14 | |
Brazil (Rep of), 2.625%, 01/05/2023 | | | | | | | 2,500,000 | | | | 2,315,025 | | | | 0.17 | |
Brazil (Rep of), 4.250%, 01/07/2025 | | | | | | | 3,264,000 | | | | 3,150,935 | | | | 0.24 | |
Brazil (Rep of), 6.000%, 04/07/2026 | | | | | | | 1,796,000 | | | | 1,876,964 | | | | 0.14 | |
Brazil (Rep of), 4.625%, 01/13/2028 | | | | | | | 3,112,000 | | | | 2,919,087 | | | | 0.22 | |
Brazil (Rep of), 8.250%, 01/20/2034 | | | | | | | 1,236,000 | | | | 1,480,110 | | | | 0.11 | |
Brazil (Rep of), 7.125%, 01/20/2037 | | | | | | | 1,751,000 | | | | 1,926,100 | | | | 0.14 | |
Brazil (Rep of), 5.625%, 01/07/2041 | | | | | | | 988,000 | | | | 909,454 | | | | 0.07 | |
Brazil (Rep of), 5.000%, 01/27/2045 | | | | | | | 2,754,000 | | | | 2,299,590 | | | | 0.17 | |
Brazil (Rep of), 5.625%, 02/21/2047 | | | | | | | 1,809,000 | | | | 1,623,578 | | | | 0.12 | |
Brazil Letras do Tesouro Nacional, 0.000%, 01/01/2020(5) | | | BRL | | | | 127,898 | | | | 31,576,562 | | | | 2.38 | |
Brazil Letras do Tesouro Nacional, 0.000%, 07/01/2021(5) | | | BRL | | | | 185,189 | | | | 40,101,392 | | | | 3.02 | |
Brazil Letras do Tesouro Nacional, 0.000%, 01/01/2022(5) | | | BRL | | | | 10,160 | | | | 2,090,910 | | | | 0.16 | |
Brazil Notas do Tesouro Nacional Serie F, 10.000%, 01/01/2027 | | | BRL | | | | 118,985 | | | | 31,910,218 | | | | 2.41 | |
CSN Resources S.A., 6.500%, 07/21/2020 | | | | | | | 1,810,000 | | | | 1,759,664 | | | | 0.13 | |
MARB BondCo PLC, 7.000%, 03/15/2024 | | | | | | | 2,380,000 | | | | 2,281,111 | | | | 0.17 | |
Petrobras Global Finance B.V., 7.375%, 01/17/2027 | | | | | | | 2,300,000 | | | | 2,383,605 | | | | 0.18 | |
Petrobras Global Finance B.V., 6.875%, 01/20/2040 | | | | | | | 10,003,000 | | | | 9,490,346 | | | | 0.72 | |
Petrobras Global Finance B.V., 6.850%, 06/05/2115 | | | | | | | 4,700,000 | | | | 4,165,375 | | | | 0.31 | |
Samarco Mineracao S.A., 4.125%, 11/01/2022(6) | | | | | | | 5,810,000 | | | | 4,328,508 | | | | 0.33 | |
Samarco Mineracao S.A., 5.750%, 10/24/2023(6) | | | | | | | 6,503,000 | | | | 5,007,310 | | | | 0.38 | |
Samarco Mineracao S.A., 5.375%, 09/26/2024(6) | | | | | | | 2,345,000 | | | | 1,808,581 | | | | 0.14 | |
| | | | | | | | | | | 168,083,628 | | | | 12.67 | |
| | | | |
Cameroon (Cost $347,769) | | | | | | | | | | | | | | | | |
Cameroon (Rep of), 9.500%, 11/19/2025 | | | | | | | 320,000 | | | | 333,081 | | | | 0.03 | |
| | | | | | | | | | | 333,081 | | | | 0.03 | |
| | | | |
Chile (Cost $59,857,219) | | | | | | | | | | | | | | | | |
Banco del Estado de Chile, 3.875%, 02/08/2022 | | | | | | | 960,000 | | | | 953,960 | | | | 0.07 | |
Bonos de la Tesoreria de la Republica en pesos, 4.500%, 03/01/2021 | | | CLP | | | | 21,795,000,000 | | | | 31,711,480 | | | | 2.39 | |
Bonos de la Tesoreria de la Republica en pesos, 5.000%, 03/01/2035 | | | CLP | | | | 4,205,000,000 | | | | 6,073,305 | | | | 0.46 | |
Chile (Rep of), 3.240%, 02/06/2028 | | | | | | | 933,000 | | | | 873,755 | | | | 0.07 | |
See accompanying notes to the financial statements.
49
ASHMORE EMERGING MARKETS TOTAL RETURN FUND
SCHEDULE OF INVESTMENTS (CONTINUED)
As of October 31, 2018
| | | | | | | | | | | | | | | | |
| | | Currency(1) | | | Par | | | Value | | | % of Net
Assets | |
Chile (continued) | | | | | | | | | | | | | | | | |
Corp. Nacional del Cobre de Chile, 4.250%, 07/17/2042 | | | | | | | 1,261,000 | | | $ | 1,115,612 | | | | 0.08 | |
Corp. Nacional del Cobre de Chile, 5.625%, 10/18/2043 | | | | | | | 2,712,000 | | | | 2,908,625 | | | | 0.22 | |
Corp. Nacional del Cobre de Chile, 4.875%, 11/04/2044 | | | | | | | 3,651,000 | | | | 3,555,117 | | | | 0.27 | |
Corp. Nacional del Cobre de Chile, 4.500%, 08/01/2047 | | | | | | | 2,720,000 | | | | 2,513,987 | | | | 0.19 | |
Empresa Nacional del Petroleo, 3.750%, 08/05/2026 | | | | | | | 1,530,000 | | | | 1,409,130 | | | | 0.11 | |
Empresa Nacional del Petroleo, 4.500%, 09/14/2047 | | | | | | | 1,892,000 | | | | 1,605,362 | | | | 0.12 | |
| | | | | | | | | | | 52,720,333 | | | | 3.98 | |
| | | | |
China (Cost $27,431,697) | | | | | | | | | | | | | | | | |
Amber Circle Funding Ltd., 3.250%, 12/04/2022 | | | | | | | 3,246,000 | | | | 3,151,275 | | | | 0.24 | |
China Evergrande Group, 7.500%, 06/28/2023 | | | | | | | 6,600,000 | | | | 5,300,935 | | | | 0.40 | |
China Railway Resources Huitung Ltd., 3.850%, 02/05/2023 | | | | | | | 1,505,000 | | | | 1,480,767 | | | | 0.11 | |
Far East Energy Bermuda Ltd., 13.000%, 01/15/2016(3)(6)(7)(8)(9) | | | | | | | 1,975,424 | | | | — | | | | — | |
Franshion Development Ltd., 6.750%, 04/15/2021 | | | | | | | 2,390,000 | | | | 2,493,953 | | | | 0.19 | |
Industrial & Commercial Bank of China Asia Ltd., 5.125%, 11/30/2020 | | | | | | | 1,779,000 | | | | 1,820,856 | | | | 0.14 | |
Kaisa Group Holdings Ltd., 8.500%, 06/30/2022 | | | | | | | 3,775,000 | | | | 2,661,194 | | | | 0.20 | |
Sinochem Overseas Capital Co. Ltd., 4.500%, 11/12/2020 | | | | | | | 2,672,000 | | | | 2,702,554 | | | | 0.20 | |
Sinochem Overseas Capital Co. Ltd., 6.300%, 11/12/2040 | | | | | | | 1,170,000 | | | | 1,364,065 | | | | 0.10 | |
Sinopec Group Overseas Development 2012 Ltd., 4.875%, 05/17/2042 | | | | | | | 1,280,000 | | | | 1,287,192 | | | | 0.10 | |
Sunac China Holdings Ltd., 7.950%, 08/08/2022 | | | | | | | 1,380,000 | | | | 1,233,343 | | | | 0.09 | |
| | | | | | | | | | | 23,496,134 | | | | 1.77 | |
| | | | |
Colombia (Cost $22,181,536) | | | | | | | | | | | | | | | | |
Colombia (Rep of), 11.750%, 02/25/2020 | | | | | | | 45,000 | | | | 49,748 | | | | — | |
Colombia (Rep of), 4.000%, 02/26/2024 | | | | | | | 2,090,000 | | | | 2,063,875 | | | | 0.16 | |
Colombia (Rep of), 8.125%, 05/21/2024 | | | | | | | 2,138,000 | | | | 2,516,426 | | | | 0.19 | |
Colombia (Rep of), 3.875%, 04/25/2027 | | | | | | | 1,956,000 | | | | 1,862,112 | | | | 0.14 | |
Colombia (Rep of), 7.375%, 09/18/2037 | | | | | | | 2,868,000 | | | | 3,463,110 | | | | 0.26 | |
Colombia (Rep of), 6.125%, 01/18/2041 | | | | | | | 2,984,000 | | | | 3,225,734 | | | | 0.24 | |
Colombia (Rep of), 5.625%, 02/26/2044 | | | | | | | 2,813,000 | | | | 2,880,512 | | | | 0.22 | |
Colombia (Rep of), 5.000%, 06/15/2045 | | | | | | | 2,497,000 | | | | 2,363,435 | | | | 0.18 | |
Empresas Publicas de Medellin ESP, 8.375%, 11/08/2027 | | | COP | | | | 8,747,000,000 | | | | 2,574,241 | | | | 0.19 | |
| | | | | | | | | | | 20,999,193 | | | | 1.58 | |
| | | | |
Costa Rica (Cost $4,545,589) | | | | | | | | | | | | | | | | |
Banco Nacional de Costa Rica, 6.250%, 11/01/2023 | | | | | | | 1,120,000 | | | | 1,054,816 | | | | 0.08 | |
Costa Rica (Rep of), 4.250%, 01/26/2023 | | | | | | | 2,196,000 | | | | 1,916,010 | | | | 0.14 | |
Costa Rica (Rep of), 5.625%, 04/30/2043 | | | | | | | 900,000 | | | | 655,227 | | | | 0.05 | |
Instituto Costarricense de Electricidad, 6.950%, 11/10/2021 | | | | | | | 400,000 | | | | 382,004 | | | | 0.03 | |
| | | | | | | | | | | 4,008,057 | | | | 0.30 | |
| | | | |
Croatia (Cost $12,862,312) | | | | | | | | | | | | | | | | |
Croatia (Rep of), 6.625%, 07/14/2020 | | | | | | | 3,690,000 | | | | 3,851,201 | | | | 0.29 | |
Croatia (Rep of), 6.375%, 03/24/2021 | | | | | | | 3,549,000 | | | | 3,724,761 | | | | 0.28 | |
Croatia (Rep of), 6.000%, 01/26/2024 | | | | | | | 4,850,000 | | | | 5,224,013 | | | | 0.40 | |
| | | | | | | | | | | 12,799,975 | | | | 0.97 | |
See accompanying notes to the financial statements.
50
ASHMORE EMERGING MARKETS TOTAL RETURN FUND
SCHEDULE OF INVESTMENTS (CONTINUED)
As of October 31, 2018
| | | | | | | | | | | | | | | | |
| | | Currency(1) | | | Par | | | Value | | | % of Net
Assets | |
Czech Republic (Cost $2,189,403) | | | | | | | | | | | | | | | | |
New World Resources N.V., 8.000%, 04/07/2020(6)(8) | | | EUR | | | | 1,938,518 | | | $ | — | | | | — | |
New World Resources N.V., 4.000%, 10/07/2020(6)(8) | | | EUR | | | | 669,526 | | | | — | | | | — | |
| | | | | | | | | | | — | | | | — | |
| | | | |
Dominican Republic (Cost $26,852,109) | | | | | | | | | | | | | | | | |
Dominican (Rep of), 7.500%, 05/06/2021 | | | | | | | 2,855,000 | | | | 2,954,925 | | | | 0.22 | |
Dominican (Rep of), 6.600%, 01/28/2024 | | | | | | | 1,950,000 | | | | 2,032,875 | | | | 0.15 | |
Dominican (Rep of), 5.875%, 04/18/2024 | | | | | | | 3,074,000 | | | | 3,116,114 | | | | 0.23 | |
Dominican (Rep of), 5.500%, 01/27/2025 | | | | | | | 4,950,000 | | | | 4,883,175 | | | | 0.37 | |
Dominican (Rep of), 6.875%, 01/29/2026 | | | | | | | 4,900,000 | | | | 5,145,000 | | | | 0.39 | |
Dominican (Rep of), 6.000%, 07/19/2028(3) | | | | | | | 910,000 | | | | 902,037 | | | | 0.07 | |
Dominican (Rep of), 7.450%, 04/30/2044 | | | | | | | 2,160,000 | | | | 2,257,200 | | | | 0.17 | |
Dominican (Rep of), 6.850%, 01/27/2045 | | | | | | | 4,677,000 | | | | 4,606,845 | | | | 0.35 | |
| | | | | | | | | | | 25,898,171 | | | | 1.95 | |
| | | | |
Ecuador (Cost $102,574,985) | | | | | | | | | | | | | | | | |
Ecuador (Rep of), 10.500%, 03/24/2020 | | | | | | | 23,966,000 | | | | 24,565,150 | | | | 1.85 | |
Ecuador (Rep of), 10.750%, 03/28/2022 | | | | | | | 22,430,000 | | | | 23,102,900 | | | | 1.74 | |
Ecuador (Rep of), 8.750%, 06/02/2023 | | | | | | | 7,563,000 | | | | 7,222,665 | | | | 0.54 | |
Ecuador (Rep of), 7.950%, 06/20/2024 | | | | | | | 7,562,000 | | | | 6,764,209 | | | | 0.51 | |
Ecuador (Rep of), 9.650%, 12/13/2026 | | | | | | | 12,064,000 | | | | 11,219,520 | | | | 0.85 | |
Ecuador (Rep of), 9.625%, 06/02/2027 | | | | | | | 5,633,000 | | | | 5,175,319 | | | | 0.39 | |
Ecuador (Rep of), 8.875%, 10/23/2027 | | | | | | | 8,284,000 | | | | 7,281,636 | | | | 0.55 | |
Ecuador (Rep of), 7.875%, 01/23/2028 | | | | | | | 10,758,000 | | | | 8,990,460 | | | | 0.68 | |
EP PetroEcuador via Noble Sovereign Funding I Ltd., (Floating, ICE LIBOR USD 3M + 5.630%) 8.016%, 09/24/2019 | | | | | | | 2,080,000 | | | | 2,074,800 | | | | 0.16 | |
| | | | | | | | | | | 96,396,659 | | | | 7.27 | |
| | | | |
Egypt (Cost $18,090,991) | | | | | | | | | | | | | | | | |
Egypt (Rep of), 7.500%, 01/31/2027 | | | | | | | 6,569,000 | | | | 6,423,300 | | | | 0.48 | |
Egypt (Rep of), 6.588%, 02/21/2028 | | | | | | | 4,148,000 | | | | 3,799,029 | | | | 0.29 | |
Egypt (Rep of), 6.875%, 04/30/2040 | | | | | | | 590,000 | | | | 493,547 | | | | 0.04 | |
Egypt (Rep of), 8.500%, 01/31/2047 | | | | | | | 4,010,000 | | | | 3,784,036 | | | | 0.28 | |
Egypt (Rep of), 7.903%, 02/21/2048 | | | | | | | 2,190,000 | | | | 1,958,587 | | | | 0.15 | |
| | | | | | | | | | | 16,458,499 | | | | 1.24 | |
| | | | |
El Salvador (Cost $12,864,889) | | | | | | | | | | | | | | | | |
El Salvador (Rep of), 7.375%, 12/01/2019 | | | | | | | 900,000 | | | | 898,650 | | | | 0.07 | |
El Salvador (Rep of), 5.875%, 01/30/2025 | | | | | | | 1,696,000 | | | | 1,517,920 | | | | 0.12 | |
El Salvador (Rep of), 6.375%, 01/18/2027 | | | | | | | 1,833,000 | | | | 1,638,244 | | | | 0.12 | |
El Salvador (Rep of), 8.625%, 02/28/2029 | | | | | | | 2,739,000 | | | | 2,786,932 | | | | 0.21 | |
El Salvador (Rep of), 8.250%, 04/10/2032 | | | | | | | 1,809,000 | | | | 1,772,928 | | | | 0.13 | |
El Salvador (Rep of), 7.650%, 06/15/2035 | | | | | | | 860,000 | | | | 787,975 | | | | 0.06 | |
El Salvador (Rep of), 7.625%, 02/01/2041 | | | | | | | 2,980,000 | | | | 2,703,218 | | | | 0.20 | |
| | | | | | | | | | | 12,105,867 | | | | 0.91 | |
See accompanying notes to the financial statements.
51
ASHMORE EMERGING MARKETS TOTAL RETURN FUND
SCHEDULE OF INVESTMENTS (CONTINUED)
As of October 31, 2018
| | | | | | | | | | | | | | | | |
| | | Currency(1) | | | Par | | | Value | | | % of Net
Assets | |
Ethiopia (Cost $5,014,857) | | | | | | | | | | | | | | | | |
Ethiopia (Rep of), 6.625%, 12/11/2024 | | | | | | | 5,073,000 | | | $ | 4,922,231 | | | | 0.37 | |
| | | | | | | | | | | 4,922,231 | | | | 0.37 | |
| | | | |
Gabon (Cost $5,443,426) | | | | | | | | | | | | | | | | |
Gabon (Rep of), 6.375%, 12/12/2024 | | | | | | | 5,179,700 | | | | 4,705,965 | | | | 0.35 | |
Gabon (Rep of), 6.950%, 06/16/2025 | | | | | | | 400,000 | | | | 367,993 | | | | 0.03 | |
| | | | | | | | | | | 5,073,958 | | | | 0.38 | |
| | | | |
Georgia (Cost $4,212,124) | | | | | | | | | | | | | | | | |
Georgia (Rep of), 6.875%, 04/12/2021 | | | | | | | 2,650,000 | | | | 2,773,437 | | | | 0.21 | |
Georgian Railway JSC, 7.750%, 07/11/2022 | | | | | | | 1,290,000 | | | | 1,361,724 | | | | 0.10 | |
| | | | | | | | | | | 4,135,161 | | | | 0.31 | |
| | | | |
Ghana (Cost $6,493,165) | | | | | | | | | | | | | | | | |
Ghana (Rep of), 8.125%, 01/18/2026 | | | | | | | 1,190,000 | | | | 1,195,538 | | | | 0.09 | |
Ghana (Rep of), 7.625%, 05/16/2029 | | | | | | | 1,853,000 | | | | 1,768,329 | | | | 0.13 | |
Ghana (Rep of), 10.750%, 10/14/2030 | | | | | | | 200,000 | | | | 239,756 | | | | 0.02 | |
Ghana (Rep of), 8.627%, 06/16/2049 | | | | | | | 3,136,000 | | | | 2,941,731 | | | | 0.22 | |
| | | | | | | | | | | 6,145,354 | | | | 0.46 | |
| | | | |
Hungary (Cost $15,933,118) | | | | | | | | | | | | | | | | |
Hungary (Rep of), 5.375%, 02/21/2023 | | | | | | | 5,532,000 | | | | 5,811,797 | | | | 0.44 | |
Hungary (Rep of), 5.750%, 11/22/2023 | | | | | | | 5,166,000 | | | | 5,534,088 | | | | 0.42 | |
Hungary (Rep of), 5.375%, 03/25/2024 | | | | | | | 3,120,000 | | | | 3,307,824 | | | | 0.25 | |
Hungary (Rep of), 7.625%, 03/29/2041 | | | | | | | 654,000 | | | | 887,805 | | | | 0.06 | |
| | | | | | | | | | | 15,541,514 | | | | 1.17 | |
| | | | |
India (Cost $22,572,565) | | | | | | | | | | | | | | | | |
Export-Import Bank of India, 4.000%, 01/14/2023 | | | | | | | 2,019,000 | | | | 1,991,099 | | | | 0.15 | |
Export-Import Bank of India, 3.375%, 08/05/2026 | | | | | | | 1,100,000 | | | | 995,375 | | | | 0.07 | |
India (Rep of), 7.350%, 06/22/2024 | | | INR | | | | 110,000,000 | | | | 1,454,865 | | | | 0.11 | |
India (Rep of), 7.720%, 05/25/2025 | | | INR | | | | 403,510,000 | | | | 5,421,424 | | | | 0.41 | |
India (Rep of), 7.590%, 01/11/2026 | | | INR | | | | 290,000,000 | | | | 3,855,555 | | | | 0.29 | |
India (Rep of), 7.170%, 01/08/2028 | | | INR | | | | 510,000,000 | | | | 6,591,480 | | | | 0.50 | |
| | | | | | | | | | | 20,309,798 | | | | 1.53 | |
| | | | |
Indonesia (Cost $87,668,059) | | | | | | | | | | | | | | | | |
Indonesia (Rep of), 8.250%, 07/15/2021 | | | IDR | | | | 69,190,000,000 | | | | 4,584,067 | | | | 0.35 | |
Indonesia (Rep of), 5.625%, 05/15/2023 | | | IDR | | | | 87,009,000,000 | | | | 5,146,096 | | | | 0.39 | |
Indonesia (Rep of), 8.375%, 03/15/2024 | | | IDR | | | | 79,014,000,000 | | | | 5,169,992 | | | | 0.39 | |
Indonesia (Rep of), 4.125%, 01/15/2025 | | | | | | | 1,655,000 | | | | 1,592,259 | | | | 0.12 | |
Indonesia (Rep of), 8.375%, 09/15/2026 | | | IDR | | | | 117,201,000,000 | | | | 7,599,235 | | | | 0.57 | |
Indonesia (Rep of), 7.000%, 05/15/2027 | | | IDR | | | | 40,329,000,000 | | | | 2,401,603 | | | | 0.18 | |
Indonesia (Rep of), 6.125%, 05/15/2028 | | | IDR | | | | 93,553,000,000 | | | | 5,196,851 | | | | 0.39 | |
See accompanying notes to the financial statements.
52
ASHMORE EMERGING MARKETS TOTAL RETURN FUND
SCHEDULE OF INVESTMENTS (CONTINUED)
As of October 31, 2018
| | | | | | | | | | | | | | | | |
| | | Currency(1) | | | Par | | | Value | | | % of Net
Assets | |
Indonesia (continued) | | | | | | | | | | | | | | | | |
Indonesia (Rep of), 8.250%, 05/15/2029 | | | IDR | | | | 59,326,000,000 | | | $ | 3,833,843 | | | | 0.29 | |
Indonesia (Rep of), 8.750%, 05/15/2031 | | | IDR | | | | 27,075,000,000 | | | | 1,771,151 | | | | 0.13 | |
Indonesia (Rep of), 7.500%, 08/15/2032 | | | IDR | | | | 37,148,000,000 | | | | 2,179,669 | | | | 0.16 | |
Indonesia (Rep of), 6.625%, 05/15/2033 | | | IDR | | | | 81,627,000,000 | | | | 4,425,110 | | | | 0.33 | |
Indonesia (Rep of), 8.375%, 03/15/2034 | | | IDR | | | | 9,455,000,000 | | | | 593,166 | | | | 0.04 | |
Indonesia (Rep of), 8.500%, 10/12/2035 | | | | | | | 1,335,000 | | | | 1,753,521 | | | | 0.13 | |
Indonesia (Rep of), 8.250%, 05/15/2036 | | | IDR | | | | 24,710,000,000 | | | | 1,535,848 | | | | 0.12 | |
Indonesia (Rep of), 6.625%, 02/17/2037 | | | | | | | 1,404,000 | | | | 1,578,280 | | | | 0.12 | |
Indonesia (Rep of), 7.750%, 01/17/2038 | | | | | | | 2,058,000 | | | | 2,570,926 | | | | 0.19 | |
Indonesia (Rep of), 7.500%, 05/15/2038 | | | IDR | | | | 18,107,000,000 | | | | 1,033,239 | | | | 0.08 | |
Indonesia (Rep of), 5.250%, 01/17/2042 | | | | | | | 1,603,000 | | | | 1,548,270 | | | | 0.12 | |
Indonesia (Rep of), 5.125%, 01/15/2045 | | | | | | | 3,941,000 | | | | 3,720,663 | | | | 0.28 | |
Indonesia (Rep of), 5.950%, 01/08/2046 | | | | | | | 3,349,000 | | | | 3,522,502 | | | | 0.27 | |
Indonesia (Rep of), 5.250%, 01/08/2047 | | | | | | | 2,447,000 | | | | 2,354,927 | | | | 0.18 | |
Indonesia (Rep of), 4.750%, 07/18/2047 | | | | | | | 1,550,000 | | | | 1,396,896 | | | | 0.11 | |
Pertamina Persero PT, 6.000%, 05/03/2042 | | | | | | | 1,109,000 | | | | 1,051,737 | | | | 0.08 | |
Pertamina Persero PT, 6.500%, 11/07/2048 | | | | | | | 1,117,000 | | | | 1,095,341 | | | | 0.08 | |
Perusahaan Listrik Negara PT, 5.500%, 11/22/2021 | | | | | | | 3,830,000 | | | | 3,954,475 | | | | 0.30 | |
Perusahaan Listrik Negara PT, 5.250%, 05/15/2047 | | | | | | | 988,000 | | | | 868,388 | | | | 0.07 | |
Perusahaan Listrik Negara PT, 6.150%, 05/21/2048 | | | | | | | 2,434,000 | | | | 2,368,267 | | | | 0.18 | |
Perusahaan Penerbit SBSN Indonesia III, 4.325%, 05/28/2025 | | | | | | | 1,248,000 | | | | 1,214,530 | | | | 0.09 | |
Perusahaan Penerbit SBSN Indonesia III, 4.550%, 03/29/2026 | | | | | | | 2,350,000 | | | | 2,288,486 | | | | 0.17 | |
| | | | | | | | | | | 78,349,338 | | | | 5.91 | |
| | | | |
Iraq (Cost $689,823) | | | | | | | | | | | | | | | | |
Iraq (Rep of), 5.800%, 01/15/2028 | | | | | | | 750,000 | | | | 686,991 | | | | 0.05 | |
| | | | | | | | | | | 686,991 | | | | 0.05 | |
| | | | |
Ivory Coast (Cost $11,113,024) | | | | | | | | | | | | | | | | |
Ivory Coast (Rep of), 6.375%, 03/03/2028 | | | | | | | 1,276,000 | | | | 1,182,673 | | | | 0.09 | |
Ivory Coast (Rep of), 5.750%, 12/31/2032 | | | | | | | 10,244,375 | | | | 9,273,864 | | | | 0.70 | |
| | | | | | | | | | | 10,456,537 | | | | 0.79 | |
| | | | |
Jamaica (Cost $31,377,969) | | | | | | | | | | | | | | | | |
Digicel Group Ltd., 8.250%, 09/30/2020 | | | | | | | 22,130,000 | | | | 15,823,171 | | | | 1.19 | |
Digicel Group Ltd., 7.125%, 04/01/2022 | | | | | | | 5,580,000 | | | | 3,480,581 | | | | 0.26 | |
Digicel Ltd., 6.000%, 04/15/2021 | | | | | | | 3,670,000 | | | | 3,330,525 | | | | 0.25 | |
Jamaica (Rep of), 6.750%, 04/28/2028 | | | | | | | 920,000 | | | | 998,200 | | | | 0.08 | |
Jamaica (Rep of), 7.875%, 07/28/2045 | | | | | | | 1,790,000 | | | | 2,085,350 | | | | 0.16 | |
| | | | | | | | | | | 25,717,827 | | | | 1.94 | |
| | | | |
Jordan (Cost $1,309,664) | | | | | | | | | | | | | | | | |
Jordan (Rep of), 5.750%, 01/31/2027 | | | | | | | 1,360,000 | | | | 1,248,126 | | | | 0.09 | |
| | | | | | | | | | | 1,248,126 | | | | 0.09 | |
See accompanying notes to the financial statements.
53
ASHMORE EMERGING MARKETS TOTAL RETURN FUND
SCHEDULE OF INVESTMENTS (CONTINUED)
As of October 31, 2018
| | | | | | | | | | | | | | | | |
| | | | Currenc | y(1) | | | Par | | | | Value | | |
| % of Net
Assets |
|
Kazakhstan (Cost $21,844,581) | | | | | | | | | | | | | | | | |
Development Bank of Kazakhstan JSC, 4.125%, 12/10/2022 | | | | | | | 3,863,000 | | | $ | 3,787,594 | | | | 0.28 | |
KazAgro National Management Holding JSC, 4.625%, 05/24/2023 | | | | | | | 2,980,000 | | | | 2,940,813 | | | | 0.22 | |
Kazakhstan (Rep of), 5.125%, 07/21/2025 | | | | | | | 1,410,000 | | | | 1,486,473 | | | | 0.11 | |
Kazakhstan (Rep of), 4.875%, 10/14/2044 | | | | | | | 1,469,000 | | | | 1,441,383 | | | | 0.11 | |
Kazakhstan (Rep of), 6.500%, 07/21/2045 | | | | | | | 3,203,000 | | | | 3,813,652 | | | | 0.29 | |
Kazakhstan Temir Zholy Finance B.V., 6.950%, 07/10/2042 | | | | | | | 3,411,000 | | | | 3,693,247 | | | | 0.28 | |
Kazakhstan Temir Zholy National Co. JSC, 4.850%, 11/17/2027 | | | | | | | 901,000 | | | | 885,115 | | | | 0.07 | |
KazMunayGas National Co. JSC, 5.375%, 04/24/2030(3) | | | | | | | 2,151,000 | | | | 2,134,867 | | | | 0.16 | |
KazMunayGas National Co. JSC, 6.375%, 10/24/2048(3) | | | | | | | 1,131,000 | | | | 1,147,506 | | | | 0.09 | |
Nostrum Oil & Gas Finance B.V., 8.000%, 07/25/2022 | | | | | | | 1,150,000 | | | | 986,424 | | | | 0.07 | |
| | | | | | | | | | | 22,317,074 | | | | 1.68 | |
| | | | |
Kenya (Cost $4,287,211) | | | | | | | | | | | | | | | | |
Kenya (Rep of), 6.875%, 06/24/2024 | | | | | | | 1,480,000 | | | | 1,439,904 | | | | 0.11 | |
Kenya (Rep of), 7.250%, 02/28/2028 | | | | | | | 498,000 | | | | 469,664 | | | | 0.04 | |
Kenya (Rep of), 8.250%, 02/28/2048 | | | | | | | 2,260,000 | | | | 2,060,306 | | | | 0.15 | |
| | | | | | | | | | | 3,969,874 | | | | 0.30 | |
| | | | |
Lebanon (Cost $23,528,868) | | | | | | | | | | | | | | | | |
Lebanon (Rep of), 5.150%, 11/12/2018 | | | | | | | 550,000 | | | | 549,131 | | | | 0.04 | |
Lebanon (Rep of), 5.450%, 11/28/2019 | | | | | | | 3,176,000 | | | | 3,060,203 | | | | 0.23 | |
Lebanon (Rep of), 6.375%, 03/09/2020 | | | | | | | 2,304,000 | | | | 2,216,208 | | | | 0.16 | |
Lebanon (Rep of), 8.250%, 04/12/2021 | | | | | | | 5,515,000 | | | | 5,278,076 | | | | 0.40 | |
Lebanon (Rep of), 6.100%, 10/04/2022 | | | | | | | 8,514,000 | | | | 7,420,973 | | | | 0.56 | |
Lebanon (Rep of), 6.000%, 01/27/2023 | | | | | | | 1,520,000 | | | | 1,308,200 | | | | 0.10 | |
Lebanon (Rep of), 6.600%, 11/27/2026 | | | | | | | 1,926,000 | | | | 1,554,840 | | | | 0.12 | |
| | | | | | | | | | | 21,387,631 | | | | 1.61 | |
| | | | |
Malaysia (Cost $21,316,077) | | | | | | | | | | | | | | | | |
Axiata SPV1 Labuan Ltd., 5.375%, 04/28/2020 | | | | | | | 500,000 | | | | 510,378 | | | | 0.04 | |
Malaysia (Rep of), 3.759%, 03/15/2019 | | | MYR | | | | 1,609,000 | | | | 385,086 | | | | 0.03 | |
Malaysia (Rep of), 3.659%, 10/15/2020 | | | MYR | | | | 48,440,000 | | | | 11,606,465 | | | | 0.88 | |
Malaysia (Rep of), 3.882%, 03/10/2022 | | | MYR | | | | 2,246,000 | | | | 539,318 | | | | 0.04 | |
Malaysia (Rep of), 3.418%, 08/15/2022 | | | MYR | | | | 9,000 | | | | 2,123 | | | | — | |
Malaysia (Rep of), 3.757%, 04/20/2023 | | | MYR | | | | 146,000 | | | | 34,801 | | | | — | |
Malaysia (Rep of), 4.181%, 07/15/2024 | | | MYR | | | | 2,150,000 | | | | 518,511 | | | | 0.04 | |
Malaysia (Rep of), 3.955%, 09/15/2025 | | | MYR | | | | 50,000 | | | | 11,853 | | | | — | |
Malaysia (Rep of), 4.392%, 04/15/2026 | | | MYR | | | | 125,000 | | | | 30,235 | | | | — | |
Malaysia (Rep of), 3.900%, 11/30/2026 | | | MYR | | | | 114,000 | | | | 26,825 | | | | — | |
Malaysia (Rep of), 4.498%, 04/15/2030 | | | MYR | | | | 6,297,000 | | | | 1,504,538 | | | | 0.11 | |
Malaysia (Rep of), 4.232%, 06/30/2031 | | | MYR | | | | 2,488,000 | | | | 578,784 | | | | 0.05 | |
Malaysia (Rep of), 3.844%, 04/15/2033 | | | MYR | | | | 1,712,000 | | | | 376,253 | | | | 0.03 | |
Malaysia (Rep of), 4.642%, 11/07/2033 | | | MYR | | | | 5,024,000 | | | | 1,204,739 | | | | 0.09 | |
Malaysia (Rep of), 4.254%, 05/31/2035 | | | MYR | | | | 468,000 | | | | 105,747 | | | | 0.01 | |
Petronas Capital Ltd., 7.875%, 05/22/2022 | | | | | | | 1,540,000 | | | | 1,741,250 | | | | 0.13 | |
Wakala Global Sukuk Bhd., 4.646%, 07/06/2021 | | | | | | | 1,671,000 | | | | 1,723,319 | | | | 0.13 | |
| | | | | | | | | | | 20,900,225 | | | | 1.58 | |
See accompanying notes to the financial statements.
54
ASHMORE EMERGING MARKETS TOTAL RETURN FUND
SCHEDULE OF INVESTMENTS (CONTINUED)
As of October 31, 2018
| | | | | | | | | | | | | | | | |
| | | Currency(1) | | | Par | | | Value | | | % of Net Assets | |
Mexico (Cost $67,026,123) | | | | | | | | | | | | | | | | |
Comision Federal de Electricidad, 4.875%, 01/15/2024 | | | | | | | 2,353,000 | | | $ | 2,318,905 | | | | 0.18 | |
Comision Federal de Electricidad, 8.180%, 12/23/2027 | | | MXN | | | | 248,500 | | | | 1,101,101 | | | | 0.08 | |
Comision Federal de Electricidad, 5.750%, 02/14/2042 | | | | | | | 2,150,000 | | | | 1,998,984 | | | | 0.15 | |
Mexican Bonos, 6.500%, 06/10/2021 | | | MXN | | | | 4,295,200 | | | | 20,097,728 | | | | 1.52 | |
Mexican Bonos, 6.500%, 06/09/2022 | | | MXN | | | | 1,561,100 | | | | 7,174,839 | | | | 0.54 | |
Mexican Bonos, 8.000%, 12/07/2023 | | | MXN | | | | 656,000 | | | | 3,138,899 | | | | 0.24 | |
Mexico (Rep of), 6.050%, 01/11/2040 | | | | | | | 1,162,000 | | | | 1,205,575 | | | | 0.09 | |
Mexico (Rep of), 4.750%, 03/08/2044 | | | | | | | 1,546,000 | | | | 1,370,545 | | | | 0.10 | |
Mexico (Rep of), 5.550%, 01/21/2045 | | | | | | | 1,437,000 | | | | 1,419,770 | | | | 0.11 | |
Mexico (Rep of), 4.600%, 01/23/2046 | | | | | | | 3,093,000 | | | | 2,670,836 | | | | 0.20 | |
Mexico (Rep of), 4.350%, 01/15/2047 | | | | | | | 1,207,000 | | | | 1,005,419 | | | | 0.08 | |
Mexico (Rep of), 5.750%, 10/12/2110 | | | | | | | 1,788,000 | | | | 1,640,490 | | | | 0.12 | |
Petroleos Mexicanos, 6.000%, 03/05/2020 | | | | | | | 874,000 | | | | 886,009 | | | | 0.07 | |
Petroleos Mexicanos, 7.190%, 09/12/2024 | | | MXN | | | | 444,600 | | | | 1,838,898 | | | | 0.14 | |
Petroleos Mexicanos, 6.875%, 08/04/2026 | | | | | | | 3,355,000 | | | | 3,341,580 | | | | 0.25 | |
Petroleos Mexicanos, 6.500%, 06/02/2041 | | | | | | | 1,910,000 | | | | 1,635,533 | | | | 0.12 | |
Petroleos Mexicanos, 5.500%, 06/27/2044 | | | | | | | 548,000 | | | | 424,700 | | | | 0.03 | |
Petroleos Mexicanos, 5.625%, 01/23/2046 | | | | | | | 2,630,000 | | | | 2,037,724 | | | | 0.15 | |
Petroleos Mexicanos, 6.750%, 09/21/2047 | | | | | | | 4,331,000 | | | | 3,717,297 | | | | 0.28 | |
| | | | | | | | | | | 59,024,832 | | | | 4.45 | |
| | | | |
Mongolia (Cost $3,678,254) | | | | | | | | | | | | | | | | |
Development Bank of Mongolia LLC, 7.250%, 10/23/2023(3)(9) | | | | | | | 920,000 | | | | 898,150 | | | | 0.07 | |
Energy Resources LLC, 8.000%, 09/30/2022(10) | | | | | | | 2,030,113 | | | | 1,931,652 | | | | 0.14 | |
Mongolia (Rep of), 5.625%, 05/01/2023 | | | | | | | 920,000 | | | | 875,850 | | | | 0.07 | |
Mongolian Mining Corp., 8.000%, 04/01/2019(11) | | | | | | | 992,986 | | | | 488,053 | | | | 0.04 | |
| | | | | | | | | | | 4,193,705 | | | | 0.32 | |
| | | | |
Morocco (Cost $8,216,034) | | | | | | | | | | | | | | | | |
Morocco (Rep of), 4.250%, 12/11/2022 | | | | | | | 5,232,000 | | | | 5,203,956 | | | | 0.39 | |
Morocco (Rep of), 5.500%, 12/11/2042 | | | | | | | 2,628,000 | | | | 2,667,499 | | | | 0.20 | |
| | | | | | | | | | | 7,871,455 | | | | 0.59 | |
| | | | |
Nigeria (Cost $6,459,273) | | | | | | | | | | | | | | | | |
Nigeria (Rep of), 6.500%, 11/28/2027 | | | | | | | 2,760,000 | | | | 2,532,410 | | | | 0.19 | |
Nigeria (Rep of), 7.696%, 02/23/2038 | | | | | | | 1,693,000 | | | | 1,523,714 | | | | 0.12 | |
Nigeria (Rep of), 7.625%, 11/28/2047 | | | | | | | 1,990,000 | | | | 1,754,464 | | | | 0.13 | |
| | | | | | | | | | | 5,810,588 | | | | 0.44 | |
| | | | |
Oman (Cost $7,423,684) | | | | | | | | | | | | | | | | |
Oman (Rep of), 4.750%, 06/15/2026 | | | | | | | 404,000 | | | | 371,680 | | | | 0.03 | |
Oman (Rep of), 6.500%, 03/08/2047 | | | | | | | 2,950,000 | | | | 2,632,875 | | | | 0.20 | |
Oman (Rep of), 6.750%, 01/17/2048 | | | | | | | 4,210,000 | | | | 3,841,625 | | | | 0.29 | |
| | | | | | | | | | | 6,846,180 | | | | 0.52 | |
See accompanying notes to the financial statements.
55
ASHMORE EMERGING MARKETS TOTAL RETURN FUND
SCHEDULE OF INVESTMENTS (CONTINUED)
As of October 31, 2018
| | | | | | | | | | | | | | | | |
| | | | Currency(1) | | | | Par | | | | Value | | |
| % of Net
Assets |
|
Pakistan (Cost $23,498,528) | | | | | | | | | | | | | | | | |
Pakistan (Rep of), 7.250%, 04/15/2019 | | | | | | | 3,818,000 | | | $ | 3,820,902 | | | | 0.29 | |
Pakistan (Rep of), 8.250%, 04/15/2024 | | | | | | | 4,954,000 | | | | 5,059,322 | | | | 0.38 | |
Pakistan (Rep of), 8.250%, 09/30/2025 | | | | | | | 2,840,000 | | | | 2,896,800 | | | | 0.22 | |
Pakistan (Rep of), 6.875%, 12/05/2027 | | | | | | | 5,259,000 | | | | 4,855,130 | | | | 0.37 | |
Second Pakistan International Sukuk (The) Co. Ltd., 6.750%, 12/03/2019 | | | | | | | 3,290,000 | | | | 3,295,231 | | | | 0.25 | |
Third Pakistan International Sukuk (The) Co. Ltd., 5.500%, 10/13/2021 | | | | | | | 1,157,000 | | | | 1,120,196 | | | | 0.08 | |
Third Pakistan International Sukuk (The) Co. Ltd., 5.625%, 12/05/2022 | | | | | | | 1,986,000 | | | | 1,894,493 | | | | 0.14 | |
| | | | | | | | | | | 22,942,074 | | | | 1.73 | |
| | | | |
Panama (Cost $12,026,461) | | | | | | | | | | | | | | | | |
Panama (Rep of), 4.000%, 09/22/2024 | | | | | | | 1,060,000 | | | | 1,054,700 | | | | 0.08 | |
Panama (Rep of), 7.125%, 01/29/2026 | | | | | | | 1,889,000 | | | | 2,211,037 | | | | 0.17 | |
Panama (Rep of), 8.875%, 09/30/2027 | | | | | | | 777,000 | | | | 1,023,698 | | | | 0.08 | |
Panama (Rep of), 9.375%, 04/01/2029 | | | | | | | 781,000 | | | | 1,081,685 | | | | 0.08 | |
Panama (Rep of), 6.700%, 01/26/2036 | | | | | | | 2,092,000 | | | | 2,505,170 | | | | 0.19 | |
Panama (Rep of), 4.500%, 05/15/2047 | | | | | | | 1,320,000 | | | | 1,236,193 | | | | 0.09 | |
Panama (Rep of), 4.300%, 04/29/2053 | | | | | | | 2,540,000 | | | | 2,270,785 | | | | 0.17 | |
| | | | | | | | | | | 11,383,268 | | | | 0.86 | |
| | | | |
Paraguay (Cost $2,606,572) | | | | | | | | | | | | | | | | |
Paraguay (Rep of), 4.625%, 01/25/2023 | | | | | | | 1,570,000 | | | | 1,566,075 | | | | 0.12 | |
Paraguay (Rep of), 4.700%, 03/27/2027 | | | | | | | 956,000 | | | | 933,295 | | | | 0.07 | |
| | | | | | | | | | | 2,499,370 | | | | 0.19 | |
| | | | |
Peru (Cost $25,104,514) | | | | | | | | | | | | | | | | |
Banco de Credito del Peru, 4.850%, 10/30/2020 | | | PEN | | | | 9,670,000 | | | | 2,875,330 | | | | 0.22 | |
Fondo MIVIVIENDA S.A., 7.000%, 02/14/2024 | | | PEN | | | | 5,140 | | | | 1,635,836 | | | | 0.12 | |
Peru (Rep of), 7.350%, 07/21/2025 | | | | | | | 4,469,000 | | | | 5,385,145 | | | | 0.41 | |
Peru (Rep of), 8.750%, 11/21/2033 | | | | | | | 4,146,000 | | | | 5,928,780 | | | | 0.45 | |
Peru (Rep of), 5.625%, 11/18/2050 | | | | | | | 5,633,000 | | | | 6,308,960 | | | | 0.47 | |
Petroleos del Peru S.A., 5.625%, 06/19/2047 | | | | | | | 1,718,000 | | | | 1,637,700 | | | | 0.12 | |
| | | | | | | | | | | 23,771,751 | | | | 1.79 | |
| | | | |
Philippines (Cost $20,928,519) | | | | | | | | | | | | | | | | |
Development Bank of the Philippines, 5.500%, 03/25/2021 | | | | | | | 1,760,000 | | | | 1,826,495 | | | | 0.14 | |
Philippines (Rep of), 4.950%, 01/15/2021 | | | PHP | | | | 11,000,000 | | | | 202,211 | | | | 0.01 | |
Philippines (Rep of), 3.900%, 11/26/2022 | | | PHP | | | | 35,000,000 | | | | 607,489 | | | | 0.05 | |
Philippines (Rep of), 10.625%, 03/16/2025 | | | | | | | 1,357,000 | | | | 1,838,466 | | | | 0.14 | |
Philippines (Rep of), 9.500%, 02/02/2030 | | | | | | | 3,197,000 | | | | 4,601,752 | | | | 0.35 | |
Philippines (Rep of), 7.750%, 01/14/2031 | | | | | | | 2,738,000 | | | | 3,588,713 | | | | 0.27 | |
Philippines (Rep of), 6.375%, 10/23/2034 | | | | | | | 2,209,000 | | | | 2,684,308 | | | | 0.20 | |
See accompanying notes to the financial statements.
56
ASHMORE EMERGING MARKETS TOTAL RETURN FUND
SCHEDULE OF INVESTMENTS (CONTINUED)
As of October 31, 2018
| | | | | | | | | | | | | | | | |
| | | | Currency(1) | | | | Par | | | | Value | | |
| % of Net
Assets |
|
Philippines (continued) | | | | | | | | | | | | | | | | |
Philippines (Rep of), 6.250%, 01/14/2036 | | | PHP | | | | 15,000,000 | | | $ | 262,662 | | | | 0.02 | |
Power Sector Assets & Liabilities Management Corp., 7.390%, 12/02/2024 | | | | | | | 3,236,000 | | | | 3,761,514 | | | | 0.28 | |
| | | | | | | | | | | 19,373,610 | | | | 1.46 | |
| | | | |
Qatar (Cost $2,370,000) | | | | | | | | | | | | | | | | |
Qatar (Rep of), 5.103%, 04/23/2048 | | | | | | | 2,370,000 | | | | 2,405,550 | | | | 0.18 | |
| | | | | | | | | | | 2,405,550 | | | | 0.18 | |
| | | | |
Romania (Cost $7,494,920) | | | | | | | | | | | | | | | | |
Romania (Rep of), 4.375%, 08/22/2023 | | | | | | | 6,596,000 | | | | 6,581,555 | | | | 0.50 | |
Romania (Rep of), 6.125%, 01/22/2044 | | | | | | | 530,000 | | | | 570,683 | | | | 0.04 | |
| | | | | | | | | | | 7,152,238 | | | | 0.54 | |
| | | | |
Russian Federation (Cost $46,265,048) | | | | | | | | | | | | | | | | |
CEDC Finance Corp International, Inc., 10.000%, 12/31/2022(3) | | | | | | | 1,071,532 | | | | 771,503 | | | | 0.06 | |
Gazprom OAO Via Gaz Capital S.A., 9.250%, 04/23/2019 | | | | | | | 890,000 | | | | 910,773 | | | | 0.07 | |
Gazprom OAO Via Gaz Capital S.A., 8.625%, 04/28/2034 | | | | | | | 1,063,000 | | | | 1,299,199 | | | | 0.10 | |
Russian Federal Bond - OFZ, 7.500%, 08/18/2021 | | | RUB | | | | 585,143,000 | | | | 8,759,324 | | | | 0.66 | |
Russian Federal Bond - OFZ, 7.400%, 12/07/2022 | | | RUB | | | | 74,448,000 | | | | 1,101,919 | | | | 0.08 | |
Russian Federal Bond - OFZ, 7.750%, 09/16/2026 | | | RUB | | | | 324,001,000 | | | | 4,729,004 | | | | 0.36 | |
Russian Federal Bond - OFZ, 7.050%, 01/19/2028 | | | RUB | | | | 259,680,000 | | | | 3,600,583 | | | | 0.27 | |
Russian Federal Bond - OFZ, 8.500%, 09/17/2031 | | | RUB | | | | 316,795,000 | | | | 4,809,316 | | | | 0.36 | |
Russian Federal Bond - OFZ, 7.700%, 03/23/2033 | | | RUB | | | | 35,390,000 | | | | 503,130 | | | | 0.04 | |
Russian Foreign Bond - Eurobond, 4.375%, 03/21/2029 | | | | | | | 3,400,000 | | | | 3,215,482 | | | | 0.24 | |
Russian Foreign Bond - Eurobond, 5.250%, 06/23/2047 | | | | | | | 3,600,000 | | | | 3,332,160 | | | | 0.25 | |
Sberbank of Russia Via SB Capital S.A., 5.125%, 10/29/2022 | | | | | | | 1,960,000 | | | | 1,926,837 | | | | 0.14 | |
Sberbank of Russia Via SB Capital S.A., 5.250%, 05/23/2023 | | | | | | | 3,620,000 | | | | 3,559,908 | | | | 0.27 | |
SCF Capital Designated Activity Co., 5.375%, 06/16/2023 | | | | | | | 2,580,000 | | | | 2,483,766 | | | | 0.19 | |
Vnesheconombank Via VEB Finance PLC, 6.025%, 07/05/2022 | | | | | | | 761,000 | | | | 738,322 | | | | 0.06 | |
Vnesheconombank Via VEB Finance PLC, 5.942%, 11/21/2023 | | | | | | | 262,000 | | | | 250,123 | | | | 0.02 | |
| | | | | | | | | | | 41,991,349 | | | | 3.17 | |
| | | | |
Saudi Arabia (Cost $1,076,260) | | | | | | | | | | | | | | | | |
Saudi (Rep of), 5.000%, 04/17/2049 | | | | | | | 1,100,000 | | | | 1,054,935 | | | | 0.08 | |
| | | | | | | | | | | 1,054,935 | | | | 0.08 | |
| | | | |
Senegal (Cost $4,510,843) | | | | | | | | | | | | | | | | |
Senegal (Rep of), 6.250%, 05/23/2033 | | | | | | | 2,369,000 | | | | 2,048,280 | | | | 0.15 | |
Senegal (Rep of), 6.750%, 03/13/2048 | | | | | | | 2,257,000 | | | | 1,854,577 | | | | 0.14 | |
| | | | | | | | | | | 3,902,857 | | | | 0.29 | |
| | | | |
Serbia (Cost $3,361,323) | | | | | | | | | | | | | | | | |
Serbia (Rep of), 4.875%, 02/25/2020 | | | | | | | 2,264,000 | | | | 2,282,112 | | | | 0.17 | |
Serbia (Rep of), 7.250%, 09/28/2021 | | | | | | | 980,000 | | | | 1,057,136 | | | | 0.08 | |
| | | | | | | | | | | 3,339,248 | | | | 0.25 | |
| | | | |
South Africa (Cost $79,096,837) | | | | | | | | | | | | | | | | |
Eskom Holdings SOC Ltd., 5.750%, 01/26/2021 | | | | | | | 450,000 | | | | 430,875 | | | | 0.03 | |
See accompanying notes to the financial statements.
57
ASHMORE EMERGING MARKETS TOTAL RETURN FUND
SCHEDULE OF INVESTMENTS (CONTINUED)
As of October 31, 2018
| | | | | | | | | | | | | | | | |
| | | | Currency(1) | | | | Par | | | | Value | | |
| % of Net
Assets |
|
South Africa (continued) | | | | | | | | | | | | | | | | |
Eskom Holdings SOC Ltd., 6.750%, 08/06/2023 | | | | | | | 2,687,000 | | | $ | 2,512,345 | | | | 0.19 | |
Eskom Holdings SOC Ltd., 7.125%, 02/11/2025 | | | | | | | 5,128,000 | | | | 4,794,680 | | | | 0.36 | |
Eskom Holdings SOC Ltd., 8.450%, 08/10/2028(3) | | | | | | | 900,000 | | | | 868,590 | | | | 0.06 | |
South Africa (Rep of), 5.875%, 05/30/2022 | | | | | | | 1,782,000 | | | | 1,818,175 | | | | 0.14 | |
South Africa (Rep of), 4.875%, 04/14/2026 | | | | | | | 2,960,000 | | | | 2,738,000 | | | | 0.21 | |
South Africa (Rep of), 10.500%, 12/21/2026 | | | ZAR | | | | 36,626,000 | | | | 2,632,653 | | | | 0.20 | |
South Africa (Rep of), 4.300%, 10/12/2028 | | | | | | | 6,209,000 | | | | 5,293,172 | | | | 0.40 | |
South Africa (Rep of), 8.000%, 01/31/2030 | | | ZAR | | | | 55,284,000 | | | | 3,287,203 | | | | 0.25 | |
South Africa (Rep of), 5.875%, 06/22/2030 | | | | | | | 2,497,000 | | | | 2,350,301 | | | | 0.18 | |
South Africa (Rep of), 7.000%, 02/28/2031 | | | ZAR | | | | 154,657,346 | | | | 8,327,647 | | | | 0.63 | |
South Africa (Rep of), 8.250%, 03/31/2032 | | | ZAR | | | | 56,129,000 | | | | 3,309,041 | | | | 0.25 | |
South Africa (Rep of), 8.875%, 02/28/2035 | | | ZAR | | | | 110,450,000 | | | | 6,746,401 | | | | 0.51 | |
South Africa (Rep of), 8.500%, 01/31/2037 | | | ZAR | | | | 4,560,660 | | | | 266,241 | | | | 0.02 | |
South Africa (Rep of), 9.000%, 01/31/2040 | | | ZAR | | | | 38,094,480 | | | | 2,294,952 | | | | 0.17 | |
South Africa (Rep of), 6.500%, 02/28/2041 | | | ZAR | | | | 97,091,000 | | | | 4,430,153 | | | | 0.33 | |
South Africa (Rep of), 8.750%, 01/31/2044 | | | ZAR | | | | 71,957,000 | | | | 4,207,796 | | | | 0.32 | |
South Africa (Rep of), 5.000%, 10/12/2046 | | | | | | | 4,745,000 | | | | 3,786,510 | | | | 0.28 | |
South Africa (Rep of), 5.650%, 09/27/2047 | | | | | | | 3,870,000 | | | | 3,260,475 | | | | 0.25 | |
South Africa (Rep of), 8.750%, 02/28/2048 | | | ZAR | | | | 91,472,690 | | | | 5,336,759 | | | | 0.40 | |
| | | | | | | | | | | 68,691,969 | | | | 5.18 | |
| | | | |
Sri Lanka (Cost $2,939,832) | | | | | | | | | | | | | | | | |
Sri Lanka (Rep of), 6.825%, 07/18/2026 | | | | | | | 1,251,000 | | | | 1,119,681 | | | | 0.08 | |
Sri Lanka (Rep of), 6.200%, 05/11/2027 | | | | | | | 1,703,000 | | | | 1,455,653 | | | | 0.11 | |
| | | | | | | | | | | 2,575,334 | | | | 0.19 | |
| | | | |
Suriname (Cost $2,099,436) | | | | | | | | | | | | | | | | |
Suriname (Rep of), 9.250%, 10/26/2026 | | | | | | | 2,077,000 | | | | 2,040,653 | | | | 0.15 | |
| | | | | | | | | | | 2,040,653 | | | | 0.15 | |
| | | | |
Thailand (Cost $33,407,819) | | | | | | | | | | | | | | | | |
Thailand (Rep of), 1.875%, 06/17/2022 | | | THB | | | | 357,785,000 | | | | 10,634,342 | | | | 0.80 | |
Thailand (Rep of), 2.000%, 12/17/2022 | | | THB | | | | 359,328,000 | | | | 10,690,274 | | | | 0.81 | |
Thailand (Rep of), 2.400%, 12/17/2023 | | | THB | | | | 87,140,000 | | | | 2,622,783 | | | | 0.20 | |
Thailand (Rep of), 2.125%, 12/17/2026 | | | THB | | | | 40,383,000 | | | | 1,162,040 | | | | 0.09 | |
Thailand (Rep of), 2.875%, 12/17/2028 | | | THB | | | | 37,940,000 | | | | 1,145,726 | | | | 0.09 | |
Thailand (Rep of), 4.875%, 06/22/2029 | | | THB | | | | 18,680,000 | | | | 660,016 | | | | 0.05 | |
Thailand (Rep of), 3.775%, 06/25/2032 | | | THB | | | | 101,419,000 | | | | 3,233,452 | | | | 0.24 | |
Thailand (Rep of), 3.400%, 06/17/2036 | | | THB | | | | 75,197,000 | | | | 2,308,387 | | | | 0.17 | |
Thailand (Rep of), 2.875%, 06/17/2046 | | | THB | | | | 4,854,000 | | | | 131,838 | | | | 0.01 | |
| | | | | | | | | | | 32,588,858 | | | | 2.46 | |
| | | | |
Turkey (Cost $23,733,241) | | | | | | | | | | | | | | | | |
Turkey (Rep of), 7.000%, 06/05/2020 | | | | | | | 1,047,000 | | | | 1,053,768 | | | | 0.08 | |
Turkey (Rep of), 5.625%, 03/30/2021 | | | | | | | 670,000 | | | | 653,212 | | | | 0.05 | |
Turkey (Rep of), 3.000%, 02/23/2022 | | | TRY | | | | 2,939,300 | | | | 947,387 | | | | 0.07 | |
Turkey (Rep of), 10.700%, 08/17/2022 | | | TRY | | | | 16,340,000 | | | | 2,236,314 | | | | 0.17 | |
See accompanying notes to the financial statements.
58
ASHMORE EMERGING MARKETS TOTAL RETURN FUND
SCHEDULE OF INVESTMENTS (CONTINUED)
As of October 31, 2018
| | | | | | | | | | | | | | | | |
| | | | Currency(1) | | | | Par | | | | Value | | |
| % of Net
Assets |
|
Turkey (continued) | | | | | | | | | | | | | | | | |
Turkey (Rep of), 6.250%, 09/26/2022 | | | | | | | 1,100,000 | | | $ | 1,065,596 | | | | 0.08 | |
Turkey (Rep of), 3.250%, 03/23/2023 | | | | | | | 1,300,000 | | | | 1,114,750 | | | | 0.09 | |
Turkey (Rep of), 5.750%, 03/22/2024 | | | | | | | 1,770,000 | | | | 1,648,741 | | | | 0.13 | |
Turkey (Rep of), 7.375%, 02/05/2025 | | | | | | | 2,264,000 | | | | 2,243,977 | | | | 0.17 | |
Turkey (Rep of), 8.000%, 03/12/2025 | | | TRY | | | | 1,610,000 | | | | 181,462 | | | | 0.01 | |
Turkey (Rep of), 6.000%, 03/25/2027 | | | | | | | 1,090,000 | | | | 981,859 | | | | 0.07 | |
Turkey (Rep of), 6.125%, 10/24/2028 | | | | | | | 1,940,000 | | | | 1,728,474 | | | | 0.13 | |
Turkey (Rep of), 6.750%, 05/30/2040 | | | | | | | 1,177,000 | | | | 1,021,048 | | | | 0.08 | |
Turkey (Rep of), 6.000%, 01/14/2041 | | | | | | | 565,000 | | | | 449,478 | | | | 0.03 | |
Turkey (Rep of), 4.875%, 04/16/2043 | | | | | | | 3,060,000 | | | | 2,170,091 | | | | 0.16 | |
Turkey (Rep of), 5.750%, 05/11/2047 | | | | | | | 2,736,000 | | | | 2,072,520 | | | | 0.16 | |
| | | | | | | | | | | 19,568,677 | | | | 1.48 | |
| | | | |
Ukraine (Cost $46,160,611) | | | | | | | | | | | | | | | | |
DTEK Finance PLC, 10.750%, (4% PIK), 12/31/2024(11) | | | | | | | 5,847,000 | | | | 5,970,255 | | | | 0.45 | |
Metinvest B.V., 7.750%, 04/23/2023 | | | | | | | 11,035,000 | | | | 10,593,600 | | | | 0.80 | |
Metinvest B.V., 8.500%, 04/23/2026 | | | | | | | 2,770,000 | | | | 2,638,425 | | | | 0.20 | |
Ukraine (Rep of), 7.750%, 09/01/2022 | | | | | | | 902,000 | | | | 874,363 | | | | 0.07 | |
Ukraine (Rep of), 7.750%, 09/01/2023 | | | | | | | 2,522,000 | | | | 2,398,921 | | | | 0.18 | |
Ukraine (Rep of), 7.750%, 09/01/2024 | | | | | | | 1,108,000 | | | | 1,038,750 | | | | 0.08 | |
Ukraine (Rep of), 7.750%, 09/01/2025 | | | | | | | 4,910,000 | | | | 4,511,347 | | | | 0.34 | |
Ukraine (Rep of), 7.750%, 09/01/2026 | | | | | | | 1,654,000 | | | | 1,494,918 | | | | 0.11 | |
Ukraine (Rep of), 7.750%, 09/01/2027 | | | | | | | 2,057,000 | | | | 1,839,411 | | | | 0.14 | |
Ukraine (Rep of), 9.750%, 11/01/2028(3)(9) | | | | | | | 2,900,000 | | | | 2,863,170 | | | | 0.21 | |
Ukraine (Rep of), 7.375%, 09/25/2032 | | | | | | | 8,609,000 | | | | 7,175,257 | | | | 0.54 | |
Ukraine Railways Via Shortline PLC, 9.875%, 09/15/2021 | | | | | | | 1,150,000 | | | | 1,150,455 | | | | 0.09 | |
Ukreximbank Via Biz Finance PLC, 9.750%, 01/22/2025 | | | | | | | 1,650,000 | | | | 1,641,777 | | | | 0.12 | |
| | | | | | | | | | | 44,190,649 | | | | 3.33 | |
| | | | |
Uruguay (Cost $14,381,181) | | | | | | | | | | | | | | | | |
Uruguay (Rep of), 9.875%, 06/20/2022 | | | UYU | | | | 11,881,000 | | | | 356,267 | | | | 0.03 | |
Uruguay (Rep of), 8.500%, 03/15/2028 | | | UYU | | | | 19,801,000 | | | | 515,918 | | | | 0.04 | |
Uruguay (Rep of), 7.875%, 01/15/2033 | | | | | | | 2,556,000 | | | | 3,322,800 | | | | 0.25 | |
Uruguay (Rep of), 7.625%, 03/21/2036 | | | | | | | 1,924,000 | | | | 2,476,188 | | | | 0.19 | |
Uruguay (Rep of), 4.125%, 11/20/2045 | | | | | | | 1,714,235 | | | | 1,487,099 | | | | 0.11 | |
Uruguay (Rep of), 5.100%, 06/18/2050 | | | | | | | 1,666,000 | | | | 1,578,535 | | | | 0.12 | |
Uruguay (Rep of), 4.975%, 04/20/2055 | | | | | | | 4,295,974 | | | | 3,984,516 | | | | 0.30 | |
| | | | | | | | | | | 13,721,323 | | | | 1.04 | |
| | | | |
Venezuela (Cost $59,082,478) | | | | | | | | | | | | | | | | |
Petroleos de Venezuela S.A., 8.500%, 10/27/2020 | | | | | | | 29,328,500 | | | | 27,348,826 | | | | 2.06 | |
Petroleos de Venezuela S.A., 9.000%, 11/17/2021(6) | | | | | | | 3,789,076 | | | | 795,327 | | | | 0.06 | |
Petroleos de Venezuela S.A., 12.750%, 02/17/2022(6) | | | | | | | 1,695,000 | | | | 360,188 | | | | 0.03 | |
Petroleos de Venezuela S.A., 5.375%, 04/12/2027(6) | | | | | | | 1,590,000 | | | | 282,225 | | | | 0.02 | |
Petroleos de Venezuela S.A., 9.750%, 05/17/2035(6) | | | | | | | 5,253,147 | | | | 1,116,294 | | | | 0.08 | |
Venezuela (Rep of), 7.750%, 10/13/2019(6) | | | | | | | 2,600,000 | | | | 640,900 | | | | 0.05 | |
See accompanying notes to the financial statements.
59
ASHMORE EMERGING MARKETS TOTAL RETURN FUND
SCHEDULE OF INVESTMENTS (CONTINUED)
As of October 31, 2018
| | | | | | | | | | | | | | | | |
| | | | Currency(1) | | | | Par | | | | Value | | |
| % of Net
Assets |
|
Venezuela (continued) | | | | | | | | | | | | | | | | |
Venezuela (Rep of), 12.750%, 08/23/2022(6) | | | | | | | 3,246,000 | | | $ | 827,730 | | | | 0.06 | |
Venezuela (Rep of), 9.000%, 05/07/2023(6) | | | | | | | 2,660,000 | | | | 671,650 | | | | 0.05 | |
Venezuela (Rep of), 8.250%, 10/13/2024(6) | | | | | | | 7,990,000 | | | | 1,997,500 | | | | 0.15 | |
Venezuela (Rep of), 7.650%, 04/21/2025(6) | | | | | | | 1,442,000 | | | | 362,303 | | | | 0.03 | |
Venezuela (Rep of), 11.750%, 10/21/2026(6) | | | | | | | 13,837,200 | | | | 3,528,486 | | | | 0.27 | |
Venezuela (Rep of), 9.250%, 09/15/2027(6) | | | | | | | 3,647,000 | | | | 920,867 | | | | 0.07 | |
Venezuela (Rep of), 9.250%, 05/07/2028(6) | | | | | | | 5,363,000 | | | | 1,340,750 | | | | 0.10 | |
Venezuela (Rep of), 11.950%, 08/05/2031(6) | | | | | | | 23,689,200 | | | | 6,040,746 | | | | 0.46 | |
| | | | | | | | | | | 46,233,792 | | | | 3.49 | |
| | | | |
Vietnam (Cost $6,602,984) | | | | | | | | | | | | | | | | |
Vietnam (Rep of), 6.750%, 01/29/2020 | | | | | | | 3,860,000 | | | | 3,971,893 | | | | 0.30 | |
Vietnam (Rep of), 4.800%, 11/19/2024 | | | | | | | 2,502,000 | | | | 2,516,079 | | | | 0.19 | |
| | | | | | | | | | | 6,487,972 | | | | 0.49 | |
| | | | |
Zambia (Cost $5,879,476) | | | | | | | | | | | | | | | | |
Zambia (Rep of), 5.375%, 09/20/2022 | | | | | | | 250,000 | | | | 168,308 | | | | 0.01 | |
Zambia (Rep of), 8.500%, 04/14/2024 | | | | | | | 1,090,000 | | | | 741,954 | | | | 0.06 | |
Zambia (Rep of), 8.970%, 07/30/2027 | | | | | | | 4,875,000 | | | | 3,310,125 | | | | 0.25 | |
| | | | | | | | | | | 4,220,387 | | | | 0.32 | |
| | | | |
Total Debt Securities (Cost $1,313,962,365) | | | | | | | | | | | 1,210,675,611 | | | | 91.28 | |
| | | | |
Bank Loans | | | | | | | | | | | | | | | | |
| | | | |
United Arab Emirates (Cost $11,274,642) | | | | | | | | | | | | | | | | |
DP World Ltd., 3.750%, 09/30/2022(12) | | | | | | | 7,734,111 | | | | 7,192,723 | | | | 0.54 | |
DP World Ltd., 4.750%, 09/30/2022(12) | | | | | | | 5,275,871 | | | | 4,906,560 | | | | 0.37 | |
| | | | | | | | | | | 12,099,283 | | | | 0.91 | |
| | | | |
Total Bank Loans (Cost $11,274,642) | | | | | | | | | | | 12,099,283 | | | | 0.91 | |
| | | | |
| | | | Currency(1) | | | | Shares | | | | Value | | |
| % of Net
Assets |
|
Equity Securities | | | | | | | | | | | | | | | | |
| | | | |
Mongolia (Cost $1,170,643) | | | | | | | | | | | | | | | | |
Mongolian Mining Corp. * | | | HKD | | | | 6,813,061 | | | $ | 142,828 | | | | 0.01 | |
| | | | | | | | | | | 142,828 | | | | 0.01 | |
| | | | |
Niger (Cost $265,038) | | | | | | | | | | | | | | | | |
Savannah Petroleum PLC * | | | GBP | | | | 682,262 | | | | 265,790 | | | | 0.02 | |
| | | | | | | | | | | 265,790 | | | | 0.02 | |
| | | | |
Russian Federation (Cost $130,309) | | | | | | | | | | | | | | | | |
Roust Corp. *(12) | | | | | | | 8,407 | | | | 16,814 | | | | — | |
| | | | | | | | | | | 16,814 | | | | — | |
| | | | |
Total Equity Securities (Cost $1,565,990) | | | | | | | | | | | 425,432 | | | | 0.03 | |
See accompanying notes to the financial statements.
60
ASHMORE EMERGING MARKETS TOTAL RETURN FUND
SCHEDULE OF INVESTMENTS (CONTINUED)
As of October 31, 2018
| | | | | | | | | | | | | | | | |
| | | Currency(1) | | | Number of Warrants | | | Value | | | % of Net
Assets | |
Warrants | | | | | | | | | | | | | | | | |
| | | | |
Mexico (Cost $—) | | | | | | | | | | | | | | | | |
Corp. GEO S.A.B. de C.V., Exp. 07/31/2022, Strike Price $9.75 *(8) | | | MXN | | | | 63,823 | | | $ | — | | | | — | |
| | | | | | | | | | | — | | | | — | |
Total Warrants (Cost $—) | | | | | | | | | | | — | | | | — | |
| | | | |
Total Investments in Securities (Cost $1,326,802,997) | | | | | | | | | | | 1,223,200,326 | | | | 92.22 | |
| | | | |
| | | Currency(1) | | | Par | | | Value | | | % of Net Assets | |
Fully Funded Total Return Swaps | | | | | | | | | | | | | | | | |
| | | | |
Indonesia (Cost $4,793,918) | | | | | | | | | | | | | | | | |
Indonesia (Rep of), Issued by ANZ Banking Corp., 8.375%, 03/15/2024 | | | IDR | | | | 5,702,000,000 | | | $ | 373,090 | | | | 0.03 | |
Indonesia (Rep of), Issued by ANZ Banking Corp., 8.375%, 03/15/2034 | | | IDR | | | | 262,000,000 | | | | 16,437 | | | | — | |
Indonesia (Rep of), Issued by Standard Chartered, 12.800%, 06/15/2021 | | | IDR | | | | 1,840,000,000 | | | | 134,781 | | | | 0.01 | |
Indonesia (Rep of), Issued by Standard Chartered, 8.375%, 03/15/2024 | | | IDR | | | | 6,958,000,000 | | | | 455,271 | | | | 0.03 | |
Indonesia (Rep of), Issued by Standard Chartered, 11.000%, 09/15/2025 | | | IDR | | | | 3,602,000,000 | | | | 265,804 | | | | 0.02 | |
Indonesia (Rep of), Issued by Standard Chartered, 7.000%, 05/15/2027 | | | IDR | | | | 10,298,000,000 | | | | 613,249 | | | | 0.05 | |
Indonesia (Rep of), Issued by Standard Chartered, 9.000%, 03/15/2029 | | | IDR | | | | 11,300,000,000 | | | | 755,858 | | | | 0.06 | |
Indonesia (Rep of), Issued by Standard Chartered, 10.500%, 08/15/2030 | | | IDR | | | | 8,356,000,000 | | | | 617,415 | | | | 0.05 | |
Indonesia (Rep of), Issued by Standard Chartered, 8.375%, 03/15/2034 | | | IDR | | | | 2,727,000,000 | | | | 171,080 | | | | 0.01 | |
| | | | | | | | | | | 3,402,985 | | | | 0.26 | |
| | | | |
Total Fully Funded Total Return Swaps (Cost $4,793,918) | | | | | | | | | | | 3,402,985 | | | | 0.26 | |
| | | | |
Total Investments (Total Cost $1,331,596,915) | | | | | | | | | | | 1,226,603,311 | | | | 92.48 | |
| | | | |
Other Assets Less Liabilities (See Statements of Assets and Liabilities for further detail) | | | | | | | | | | | 99,682,269 | | | | 7.52 | |
| | | | |
Net Assets | | | | | | | | | | $ | 1,326,285,580 | | | | 100.00 | |
See accompanying notes to the financial statements.
61
ASHMORE EMERGING MARKETS TOTAL RETURN FUND
SCHEDULE OF INVESTMENTS (CONTINUED)
As of October 31, 2018
| * | Non-income producing security. |
| (1) | Par values are stated in United States Dollars unless otherwise noted below. |
| (2) | Step coupon bond. Rate as of October 31, 2018 is disclosed. |
| (3) | Securities exempt from registration under Rule 144A of the Securities Act of 1933. These securities may not be publicly traded without registration under the Securities Act of 1933. |
| (4) | Variable rate security. Security issued at a fixed coupon rate, which converts to a variable rate at a specified date. Rate shown is the rate in effect as of period end. |
| (6) | Issuer has defaulted on terms of debt obligation. |
| (7) | Maturity has been extended under the terms of a plan of reorganization. |
| (8) | Security has been deemed worthless and is a Level 3 investment. |
| (9) | Restricted security that has been deemed illiquid. At October 31, 2018, the value of these restricted illiquid securities amount to $3,761,320 or 0.3% of net assets. Additional information on each restricted illiquid security is as follows: |
| | | | |
| SECURITY | | ACQUISITION DATE | | ACQUISITION COST |
| | |
Development Bank of Mongolia LLC, 7.250%, 10/23/2023 | | 10/16/2018 | | $910,552 |
Far East Energy Bermuda Ltd., 13.000%, 01/15/2016 | | 01/14/2013-07/20/2015 | | 1,953,742 |
Ukraine (Rep of), 9.750%, 11/01/2028 | | 10/25/2018 | | 2,900,000 |
| (10) | The interest rate is subject to the performance of the TSIPPCAE Commodity Index. |
| (11) | Security is a payment-in-kind bond, and unless otherwise noted in the description of the security, pays its entire coupon on an in-kind basis. |
| (12) | Security is a Level 3 investment. |
Percentages shown are based on net assets.
At October 31, 2018, the Ashmore Emerging Markets Total Return Fund had outstanding forward foreign currency exchange contracts as follows:
| | | | | | | | | | | | | | | | | | |
Settlement Date | | Counterparty | | Currency Buy | | Currency Buy Amount
(Local Currency) | | | Currency Sell | | Currency Sell Amount (Local
Currency) | | | Unrealized
Gain/(Loss) | |
| | | | | | |
11/02/2018 | | HSBC Bank | | Indonesian Rupiah | | | 2,424,982,527 | | | United States Dollar | | | 159,444 | | | $ | 68 | |
11/05/2018 | | BNP Paribas | | Brazilian Real | | | 39,298,910 | | | United States Dollar | | | 9,677,008 | | | | 877,700 | |
11/05/2018 | | Deutsche Bank | | Brazilian Real | | | 37,848,009 | | | United States Dollar | | | 9,285,000 | | | | 880,032 | |
11/05/2018 | | Deutsche Bank | | Brazilian Real | | | 12,316,710 | | | United States Dollar | | | 3,295,000 | | | | 12,961 | |
11/05/2018 | | Goldman Sachs | | Brazilian Real | | | 30,340,160 | | | United States Dollar | | | 8,035,000 | | | | 113,611 | |
11/05/2018 | | Santander | | United States Dollar | | | 7,715,000 | | | Brazilian Real | | | 28,684,370 | | | | 11,093 | |
11/09/2018 | | JP Morgan | | Argentine Peso | | | 36,997,509 | | | United States Dollar | | | 947,197 | | | | 71,770 | |
11/30/2018 | | BNP Paribas | | Turkish Lira | | | 79,783,083 | | | United States Dollar | | | 13,694,551 | | | | 308,009 | |
11/30/2018 | | HSBC Bank | | Turkish Lira | | | 15,564,461 | | | United States Dollar | | | 2,420,977 | | | | 310,708 | |
11/30/2018 | | HSBC Bank | | Turkish Lira | | | 3,774,373 | | | United States Dollar | | | 634,743 | | | | 27,689 | |
11/30/2018 | | Standard Chartered | | Turkish Lira | | | 33,664,828 | | | United States Dollar | | | 5,106,000 | | | | 802,442 | |
11/30/2018 | | HSBC Bank | | United States Dollar | | | 173,879 | | | Indonesian Rupiah | | | 2,657,743,704 | | | | 23 | |
11/30/2018 | | Deutsche Bank | | United States Dollar | | | 6,945,000 | | | Malaysian Ringgit | | | 28,787,025 | | | | 70,569 | |
11/30/2018 | | Merrill Lynch | | United States Dollar | | | 978,959 | | | South African Rand | | | 13,166,503 | | | | 89,833 | |
11/30/2018 | | Merrill Lynch | | United States Dollar | | | 1,735,778 | | | South African Rand | | | 25,195,159 | | | | 34,365 | |
11/30/2018 | | JP Morgan | | United States Dollar | | | 1,425,000 | | | Turkish Lira | | | 8,115,161 | | | | 725 | |
See accompanying notes to the financial statements.
62
ASHMORE EMERGING MARKETS TOTAL RETURN FUND
SCHEDULE OF INVESTMENTS (CONTINUED)
As of October 31, 2018
| | | | | | | | | | | | | | | | | | |
Settlement Date | | Counterparty | | Currency Buy | | Currency Buy Amount
(Local
Currency) | | | Currency Sell | | Currency Sell Amount
(Local
Currency) | | | Unrealized
Gain/(Loss) | |
| | | | | | |
12/04/2018 | | HSBC Bank | | United States Dollar | | | 16,405,445 | | | Brazilian Real | | | 59,371,306 | | | $ | 504,296 | |
12/04/2018 | | Morgan Stanley | | United States Dollar | | | 6,365,000 | | | Brazilian Real | | | 23,649,158 | | | | 31,153 | |
01/31/2019 | | BNP Paribas | | Philippine Peso | | | 81,837,385 | | | United States Dollar | | | 1,505,000 | | | | 18,458 | |
01/31/2019 | | HSBC Bank | | Philippine Peso | | | 222,475,207 | | | United States Dollar | | | 4,058,285 | | | | 83,241 | |
01/31/2019 | | ANZ | | Singapore Dollar | | | 33,732,324 | | | United States Dollar | | | 24,400,835 | | | | 5,706 | |
01/31/2019 | | ANZ | | Taiwan Dollar | | | 587,247,413 | | | United States Dollar | | | 19,075,145 | | | | 41,472 | |
01/31/2019 | | JP Morgan | | United States Dollar | | | 313,636 | | | Indonesian Rupiah | | | 4,848,976,674 | | | | 281 | |
01/31/2019 | | Merrill Lynch | | United States Dollar | | | 335,283 | | | Indonesian Rupiah | | | 5,180,117,985 | | | | 528 | |
01/31/2019 | | Goldman Sachs | | United States Dollar | | | 475,990 | | | Korean Won | | | 540,105,125 | | | | 1,192 | |
01/31/2019 | | Morgan Stanley | | United States Dollar | | | 985,000 | | | Korean Won | | | 1,106,844,500 | | | | 11,990 | |
01/31/2019 | | Deutsche Bank | | United States Dollar | | | 5,609,962 | | | Malaysian Ringgit | | | 23,312,198 | | | | 44,763 | |
01/31/2019 | | BNP Paribas | | United States Dollar | | | 1,393,456 | | | Peruvian Nuevo Sol | | | 4,664,315 | | | | 15,096 | |
01/31/2019 | | Deutsche Bank | | United States Dollar | | | 5,976,288 | | | South African Rand | | | 88,101,833 | | | | 76,103 | |
03/29/2019 | | JP Morgan | | United States Dollar | | | 20,720,535 | | | Chilean Peso | | | 12,491,374,800 | | | | 2,740,725 | |
03/29/2019 | | JP Morgan | | United States Dollar | | | 14,448,964 | | | Chilean Peso | | | 8,688,161,916 | | | | 1,943,415 | |
04/02/2019 | | Standard Chartered | | United States Dollar | | | 20,132,953 | | | Brazilian Real | | | 70,723,036 | | | | 1,370,270 | |
| | | | | | | | | | | | | | | | | | |
| | | | | | |
Subtotal Appreciation | | | | | | | | | | | | | | | | | 10,500,287 | |
| | | | | | | | | | | | | | | | | | |
| | | | | | |
11/05/2018 | | HSBC Bank | | Brazilian Real | | | 59,371,306 | | | United States Dollar | | | 16,446,345 | | | $ | (500,692 | ) |
11/05/2018 | | BNP Paribas | | United States Dollar | | | 2,287,000 | | | Brazilian Real | | | 8,868,025 | | | | (94,731 | ) |
11/05/2018 | | Morgan Stanley | | United States Dollar | | | 37,323,152 | | | Brazilian Real | | | 141,622,700 | | | | (713,175 | ) |
11/09/2018 | | HSBC Bank | | United States Dollar | | | 1,238,941 | | | Argentine Peso | | | 46,398,332 | | | | (38,939 | ) |
11/29/2018 | | BNP Paribas | | Israeli Shekel | | | 18,315,365 | | | United States Dollar | | | 4,985,929 | | | | (50,573 | ) |
11/29/2018 | | Merrill Lynch | | Romanian Leu | | | 11,340,840 | | | United States Dollar | | | 2,800,000 | | | | (48,090 | ) |
11/29/2018 | | Merrill Lynch | | Romanian Leu | | | 6,853,656 | | | United States Dollar | | | 1,723,106 | | | | (60,034 | ) |
11/30/2018 | | Credit Suisse | | Colombian Peso | | | 4,891,360,000 | | | United States Dollar | | | 1,520,000 | | | | (2,899 | ) |
11/30/2018 | | Credit Suisse | | Colombian Peso | | | 37,521,840,658 | | | United States Dollar | | | 12,559,822 | | | | (922,076 | ) |
11/30/2018 | | Deutsche Bank | | Czech Koruna | | | 140,225,403 | | | United States Dollar | | | 6,404,806 | | | | (277,158 | ) |
11/30/2018 | | HSBC Bank | | Indian Rupee | | | 587,324,340 | | | United States Dollar | | | 7,904,652 | | | | (3,073 | ) |
11/30/2018 | | Deutsche Bank | | Malaysian Ringgit | | | 19,466,460 | | | United States Dollar | | | 4,680,000 | | | | (31,349 | ) |
11/30/2018 | | BNP Paribas | | Polish Zloty | | | 34,158,485 | | | United States Dollar | | | 9,390,370 | | | | (482,846 | ) |
11/30/2018 | | HSBC Bank | | Polish Zloty | | | 17,842,928 | | | United States Dollar | | | 4,865,000 | | | | (212,091 | ) |
11/30/2018 | | JP Morgan | | Polish Zloty | | | 34,158,485 | | | United States Dollar | | | 9,332,919 | | | | (425,395 | ) |
11/30/2018 | | HSBC Bank | | Russian Ruble | | | 27,303,000 | | | United States Dollar | | | 415,128 | | | | (2,310 | ) |
11/30/2018 | | HSBC Bank | | Russian Ruble | | | 198,476,390 | | | United States Dollar | | | 3,010,000 | | | | (9,057 | ) |
11/30/2018 | | UBS | | Russian Ruble | | | 463,486,370 | | | United States Dollar | | | 7,032,110 | | | | (24,242 | ) |
11/30/2018 | | JP Morgan | | Thai Baht | | | 153,458,833 | | | United States Dollar | | | 4,661,214 | | | | (28,705 | ) |
11/30/2018 | | Standard Chartered | | Thai Baht | | | 223,091,316 | | | United States Dollar | | | 6,860,000 | | | | (125,473 | ) |
11/30/2018 | | BNP Paribas | | United States Dollar | | | 759,636 | | | Indonesian Rupiah | | | 11,647,249,688 | | | | (2,269 | ) |
11/30/2018 | | Citibank | | United States Dollar | | | 3,115,515 | | | Indonesian Rupiah | | | 47,954,000,000 | | | | (21,399 | ) |
11/30/2018 | | HSBC Bank | | United States Dollar | | | 2,766,278 | | | Indonesian Rupiah | | | 42,656,000,000 | | | | (24,067 | ) |
11/30/2018 | | Goldman Sachs | | United States Dollar | | | 1,702,000 | | | Turkish Lira | | | 10,117,879 | | | | (73,767 | ) |
11/30/2018 | | Goldman Sachs | | United States Dollar | | | 1,614,000 | | | Turkish Lira | | | 9,620,731 | | | | (74,514 | ) |
See accompanying notes to the financial statements.
63
ASHMORE EMERGING MARKETS TOTAL RETURN FUND
SCHEDULE OF INVESTMENTS (CONTINUED)
As of October 31, 2018
| | | | | | | | | | | | | | | | | | |
Settlement Date | | Counterparty | | Currency Buy | | Currency Buy Amount
(Local Currency) | | | Currency Sell | | Currency Sell Amount (Local
Currency) | | | Unrealized
Gain/(Loss) | |
11/30/2018 | | JP Morgan | | United States Dollar | | | 484,000 | | | Turkish Lira | | | 2,763,156 | | | $ | (956 | ) |
01/31/2019 | | Credit Suisse | | Chilean Peso | | | 3,237,263,597 | | | United States Dollar | | | 4,725,449 | | | | (68,753 | ) |
01/31/2019 | | HSBC Bank | | Chinese Yuan Renminbi | | | 5,943,960 | | | United States Dollar | | | 855,000 | | | | (6,806 | ) |
01/31/2019 | | HSBC Bank | | Chinese Yuan Renminbi | | | 107,638,147 | | | United States Dollar | | | 15,414,313 | | | | (54,521 | ) |
01/31/2019 | | HSBC Bank | | Chinese Yuan Renminbi | | | 123,068,875 | | | United States Dollar | | | 17,638,141 | | | | (76,408 | ) |
01/31/2019 | | Credit Suisse | | Colombian Peso | | | 38,845,469,056 | | | United States Dollar | | | 12,439,905 | | | | (416,960 | ) |
01/31/2019 | | BNP Paribas | | Czech Koruna | | | 244,214,667 | | | United States Dollar | | | 11,230,186 | | | | (477,287 | ) |
01/31/2019 | | BNP Paribas | | Hungarian Forint | | | 926,066,770 | | | United States Dollar | | | 3,340,000 | | | | (83,348 | ) |
01/31/2019 | | Goldman Sachs | | Hungarian Forint | | | 2,856,787,843 | | | United States Dollar | | | 10,146,465 | | | | (100,144 | ) |
01/31/2019 | | ANZ | | Korean Won | | | 19,809,497,874 | | | United States Dollar | | | 17,497,238 | | | | (83,005 | ) |
01/31/2019 | | JP Morgan | | Korean Won | | | 19,126,400,868 | | | United States Dollar | | | 16,894,621 | | | | (80,889 | ) |
01/31/2019 | | Merrill Lynch | | Mexican Peso | | | 518,872,411 | | | United States Dollar | | | 26,346,725 | | | | (1,195,420 | ) |
01/31/2019 | | HSBC Bank | | Polish Zloty | | | 13,694,810 | | | United States Dollar | | | 3,700,000 | | | | (121,090 | ) |
01/31/2019 | | HSBC Bank | | Romanian Leu | | | 24,017,818 | | | United States Dollar | | | 6,045,879 | | | | (220,957 | ) |
01/31/2019 | | HSBC Bank | | Singapore Dollar | | | 1,118,565 | | | United States Dollar | | | 815,000 | | | | (5,679 | ) |
01/31/2019 | | Merrill Lynch | | Taiwan Dollar | | | 25,016,425 | | | United States Dollar | | | 815,000 | | | | (642 | ) |
01/31/2019 | | Merrill Lynch | | United States Dollar | | | 1,062,058 | | | Indonesian Rupiah | | | 16,448,085,192 | | | | (867 | ) |
01/31/2019 | | UBS | | United States Dollar | | | 1,155,583 | | | Indonesian Rupiah | | | 17,894,205,984 | | | | (794 | ) |
02/28/2019 | | Merrill Lynch | | Hungarian Forint | | | 2,856,787,842 | | | United States Dollar | | | 10,228,385 | | | | (162,727 | ) |
02/28/2019 | | JP Morgan | | Polish Zloty | | | 78,107,736 | | | United States Dollar | | | 20,979,784 | | | | (549,793 | ) |
02/28/2019 | | BNP Paribas | | Romanian Leu | | | 21,603,038 | | | United States Dollar | | | 5,268,391 | | | | (32,408 | ) |
02/28/2019 | | Morgan Stanley | | Russian Ruble | | | 1,688,198,863 | | | United States Dollar | | | 25,377,863 | | | | (104,844 | ) |
03/29/2019 | | BNP Paribas | | Czech Koruna | | | 201,614,755 | | | United States Dollar | | | 8,976,734 | | | | (81,902 | ) |
| | | | | | | | | | | | | | | | | | |
| | | | | | |
Subtotal Depreciation | | | | | | | | | | | | | | | | | (8,175,124 | ) |
| | | | | | | | | | | | | | | | | | |
| | | | | | |
Total | | | | | | | | | | | | | | | | $ | 2,325,163 | |
| | | | | | | | | | | | | | | | | | |
At October 31, 2018, the Ashmore Emerging Markets Total Return Fund had the following centrally cleared swap contracts outstanding:
| | | | | | | | | | | | | | | | | | | | |
Pay Rate Index/ Pay Rate | | Receive Rate/ Receive Rate Index | | | | Notional
Amount | | Expiration
Date | | Fair Value/
Unrealized
Appreciation
(Depreciation)** | | | Premiums
Paid/
(Received) | | Variation
Margin
Receivable
(Payable) | | | Counterparty |
MXN-TIIE-BANXICO 28 Day Rate (Pay Lunar) | | 7.935% (Receive
Lunar) | | MXN | | 717,000,000 | | 12/16/2020 | | | $ (591,662) | | | — | | | $ (94,527) | | | Banco Bilbao Vizcaya
Argentaria SA |
8.255% (Pay Lunar) | | MXN-TIIE-BANXICO
28 Day Rate (Receive
Lunar) | | MXN | | 189,000,000 | | 12/06/2028 | | | 506,359 | | | — | | | 90,550 | | | Banco Bilbao Vizcaya
Argentaria SA |
See accompanying notes to the financial statements.
64
ASHMORE EMERGING MARKETS TOTAL RETURN FUND
SCHEDULE OF INVESTMENTS (CONTINUED)
As of October 31, 2018
| | | | | | | | | | | | | | | | | | | | | | | | | | | | | | | | |
Pay Rate
Index/
Pay Rate | | Receive Rate/
Receive Rate
Index | | | Notional
Amount | | | Expiration
Date | | | Fair Value/
Unrealized
Appreciation
(Depreciation)** | | | Premiums
Paid/
(Received) | | | Variation
Margin
Receivable
(Payable) | | | Counterparty | |
MXN-TIIE-BANXICO
28 Day Rate (Pay Lunar) | |
| 8.156% (Receive
Lunar) |
| | | MXN | | | | 854,000,000 | | | | 12/13/2023 | | | | $(1,179,548) | | | | — | | | | $(268,870 | ) | | | Merrill Lynch | |
8.410% (Pay Lunar) | |
| MXN-TIIE-BANXICO
28 Day Rate (Receive
Lunar) |
| | | MXN | | | | 184,000,000 | | | | 12/06/2028 | | | | 400,831 | | | | — | | | | 90,099 | | | | Merrill Lynch | |
2.069% (Pay Annually) | |
| PRIBOR Czech
Republic 6 Month Rate
(Receive Semiannually) |
| | | CZK | | | | 292,400,000 | | | | 09/19/2023 | | | | 277,327 | | | | — | | | | 21,749 | | | | ING Capital Markets | |
WIBOR Poland
6 Month Rate (Pay Semiannually) | |
| 2.400% (Receive
Annually) |
| | | PLN | | | | 13,970,000 | | | | 03/26/2023 | | | | 38,048 | | | | — | | | | (5,950 | ) | | | Merrill Lynch | |
| | | | | | | | | | | | | | | | | | | | | | | | | | | | | | | | |
| | | | | | | | |
| | | | | | | | | | | | | | | | | | | $ (548,645) | | | | | | | | $(166,949 | ) | | | | |
| | | | | | | | | | | | | | | | | | | | | | | | | | | | | | | | |
**Includes cumulative appreciation/depreciation on centrally cleared swap agreements. Only the current day’s variation margin is reported within the Statements of Assets and Liabilities.
See accompanying notes to the financial statements.
65
ASHMORE EMERGING MARKETS TOTAL RETURN FUND
SCHEDULE OF INVESTMENTS (CONTINUED)
As of October 31, 2018
The inputs or methodologies used for valuing securities are not necessarily an indication of the risks associated with investing in those securities and other financial instruments, if any. See note 4 in the Notes to the Financial Statements for more information regarding pricing inputs and valuation techniques. The following is a summary of the inputs used in valuing the Ashmore Emerging Markets Total Return Fund’s investments and other financial instruments, which are carried at fair value, as of October 31, 2018:
| | | | | | | | | | | | | | | | |
| | | Level 1 | | | Level 2 | | | Level 3 | | | Total | |
Investments | | | | | | | | | | | | | | | | |
Assets: | | | | | | | | | | | | | | | | |
Debt Securities | | | | | | | | | | | | | | | | |
Corporate Bonds | | | $— | | | | $ 235,068,362 | | | | $ — | | | | $ 235,068,362 | |
Financial Certificates | | | — | | | | 11,536,255 | | | | — | | | | 11,536,255 | |
Government Agencies | | | — | | | | 26,128,201 | | | | — | | | | 26,128,201 | |
Government Bonds | | | — | | | | 935,670,101 | | | | — | | | | 935,670,101 | |
Index Linked Government Bonds | | | — | | | | 947,387 | | | | — | | | | 947,387 | |
Municipal Bonds | | | — | | | | 1,325,305 | | | | — | | | | 1,325,305 | |
| | | | | | | | | | | | | | | | |
Total Debt Securities | | | — | | | | 1,210,675,611 | | | | — | | | | 1,210,675,611 | |
Bank Loans | | | | | | | | | | | | | | | | |
United Arab Emirates | | | — | | | | — | | | | 12,099,283 | | | | 12,099,283 | |
Equity Securities | | | | | | | | | | | | | | | | |
Common Stock | | | | | | | | | | | | | | | | |
Mongolia | | | — | | | | 142,828 | | | | — | | | | 142,828 | |
Niger | | | — | | | | 265,790 | | | | — | | | | 265,790 | |
Russian Federation | | | — | | | | — | | | | 16,814 | | | | 16,814 | |
| | | | | | | | | | | | | | | | |
Total Common Stock | | | — | | | | 408,618 | | | | 16,814 | | | | 425,432 | |
Fully Funded Total Return Swaps | | | — | | | | 3,402,985 | | | | — | | | | 3,402,985 | |
| |
Total Investments | | | $— | | | | $1,214,487,214 | | | | $12,116,097 | | | | $1,226,603,311 | |
| |
| | | | |
Other Financial Instruments | | | | | | | | | | | | | | | | |
Assets: | | | | | | | | | | | | | | | | |
Forward Foreign Currency Exchange Contracts | | | $— | | | | $10,500,287 | | | | $— | | | | $10,500,287 | |
Centrally Cleared Swap Contracts | | | — | | | | 1,222,565 | | | | — | | | | 1,222,565 | |
Liabilities: | | | | | | | | | | | | | | | | |
Forward Foreign Currency Exchange Contracts | | | — | | | | (8,175,124 | ) | | | — | | | | (8,175,124 | ) |
Centrally Cleared Swap Contracts | | | — | | | | (1,771,210 | ) | | | — | | | | (1,771,210 | ) |
| |
Total Other Financial Instruments | | | $— | | | | $ 1,776,518 | | | | $— | | | | $ 1,776,518 | |
| |
See accompanying notes to the financial statements.
66
ASHMORE EMERGING MARKETS TOTAL RETURN FUND
SCHEDULE OF INVESTMENTS (CONTINUED)
As of October 31, 2018
The following is a reconciliation of investments in which significant unobservable inputs (Level 3) were used for the Fund during the period ending October 31, 2018:
| | | | | | | | | | | | | | | | | | | | | | | | | | | | | | | | | | | | | | | | |
Category and
Subcategory | | Beginning
Balance
at 10/31/2017 | | | Accrued
Discounts
(Premiums) | | | Purchases | | | Sales | | | Realized
Gains
(Losses) | | | Change in
Unrealized
Appreciation
(Depreciation) | | | Transfer
into
Level 3 | | | Transfer
out of
Level 3 | | | Ending
Balance at
10/31/2018 | | | Change in
Unrealized
Appreciation
(Depreciation)
from
Investments
still held
10/31/2018 | |
| | | | | | | | | | |
Investments, at value | | | | | | | | | | | | | | | | | | | | | | | | | | | | | | | | | | | | | | | | |
Bank Loans | | | | | | | | | | | | | | | | | | | | | | | | | | | | | | | | | | | | | | | | |
China | | $ | — | | | $ | — | | | $ | — | | | $ | — | | | $ | (281,761 | ) | | | $281,761 | | | | $— | | | | $— | | | $ | — | | | | $ — | |
United Arab Emirates | | | 11,080,864 | | | | 353,807 | | | | 1,208,586 | | | | (578,171 | ) | | | 104,393 | | | | (70,196 | ) | | | — | | | | — | | | | 12,099,283 | | | | (70,196 | ) |
Common Stock | | | | | | | | | | | | | | | | | | | | | | | | | | | | | | | | | | | | | | | | |
Russian Federation | | | 113,494 | | | | — | | | | — | | | | — | | | | — | | | | (96,680 | ) | | | — | | | | — | | | | 16,814 | | | | (96,680 | ) |
Warrants | | | | | | | | | | | | | | | | | | | | | | | | | | | | | | | | | | | | | | | | |
China | | | — | | | | — | | | | — | | | | — | | | | (27,482 | ) | | | 27,482 | | | | — | | | | — | | | | — | | | | — | |
Total | | $ | 11,194,358 | | | $ | 353,807 | | | $ | 1,208,586 | | | $ | (578,171 | ) | | $ | (204,850 | ) | | | $142,367 | | | | $— | | | | $— | | | $ | 12,116,097 | | | $ | (166,876 | ) |
The following table on “Quantitative information about Fair Value measurements” provides information on the valuation techniques and inputs used to value Level 3 securities at October 31, 2018:
| | | | | | | | | | | | |
| Quantitative Information about Level 3 Fair Value Measurements | |
| | | Fair Value at
10/31/2018 | | | Valuation
Technique | | | Unobservable
Input | |
Bank Loans | | | $12,099,283 | | | | Broker Quote | | | | Inputs to broker model | |
Common Stock | | | 16,814 | | | | Broker Quote | | | | Inputs to broker model | |
Total | | | $12,116,097 | | | | | | | | | |
See accompanying notes to the financial statements.
67
ASHMORE EMERGING MARKETS TOTAL RETURN FUND
SCHEDULE OF INVESTMENTS (CONTINUED)
As of October 31, 2018
The following is a summary of the fair values of the Fund’s derivative instruments*:
Fair Values of Financial Derivative Instruments on the Statements of Assets and Liabilities as of October 31, 2018:
| | | | | | | | |
| | | Derivatives Not Accounted for as
Hedging Instruments | |
| | | Foreign
Exchange Risk | | | Interest
Rate Risk | |
| |
Assets: | | | | | | | | |
Unrealized Appreciation on Centrally Cleared Swap Contracts | | $ | — | | | $ | 1,222,565 | † |
Unrealized Appreciation on Forward Foreign Currency Exchange Contracts | | | 10,500,287 | | | | — | |
| | | | |
| | $ | 10,500,287 | | | $ | 1,222,565 | |
| | | | |
| | |
Liabilities: | | | | | | | | |
Unrealized Depreciation on Centrally Cleared Swap Contracts | | $ | — | | | $ | (1,771,210 | )† |
Unrealized Depreciation on Forward Foreign Currency Exchange Contracts | | | (8,175,124 | ) | | | — | |
| | | | |
| | $ | (8,175,124 | ) | | $ | (1,771,210 | ) |
| | | | |
† Includes cumulative appreciation/depreciation on centrally cleared swap agreements. Only the current day’s variation margin is reported within the Statements of Assets and Liabilities.
The Effect of Financial Derivative Instruments on the Statements of Operations for the Year Ended October 31, 2018:
| | | | | | | | |
| | | Derivatives Not Accounted for as
Hedging Instruments | |
| | | Foreign
Exchange Risk | | | Interest
Rate Risk | |
| |
Realized Gain (Loss) on Derivatives Recognized resulting from Operations: | | | | | | | | |
Net Realized Loss on Forward Foreign Currency Exchange Contracts | | | $(22,728,693 | ) | | | $ — | |
Net Realized Loss on Interest Rate Swap Contracts | | | — | | | | (23,462 | ) |
| | | | |
| | | $(22,728,693 | ) | | | $ (23,462 | ) |
| | | | |
| | |
Net Change in Unrealized Appreciation (Depreciation) on Derivatives Recognized resulting from Operations: | | | | | | | | |
Net Change in Unrealized Appreciation on Forward Foreign Currency Exchange Contracts | | | $ 5,853,910 | | | | $ — | |
Net Change in Unrealized Depreciation on Interest Rate Swap Contracts | | | — | | | | (1,344,051 | ) |
| | | | |
| | | $ 5,853,910 | | | | $(1,344,051 | ) |
| | | | |
* See note 10 in the Notes to the Financial Statements for additional information.
See accompanying notes to the financial statements.
68
ASHMORE EMERGING MARKETS LOCAL CURRENCY BOND FUND
SCHEDULE OF INVESTMENTS
As of October 31, 2018
| | | | | | | | | | | | | | | | |
| | | Currency(1) | | | Par | | | Value | | | % of Net
Assets | |
Debt Securities | | | | | | | | | | | | | | | | |
| | | | |
Argentina (Cost $1,640,212) | | | | | | | | | | | | | | | | |
Argentina Bonar Bonds, (Floating, Argentina Deposit Rates Badlar Private Banks 30-35 Days + 2.500%) 50.516%, 03/11/2019 | | | ARS | | | | 1,731,496 | | | $ | 48,175 | | | | 0.07 | |
Argentina Bonar Bonds, (Floating, Argentina Deposit Rates Badlar Private Banks 30-35 Days + 3.250%) 49.840%, 03/01/2020 | | | ARS | | | | 1,747,700 | | | | 48,880 | | | | 0.08 | |
Argentina Bonar Bonds, (Floating, Argentina Deposit Rates Badlar Private Banks 30-35 Days + 2.000%) 52.789%, 04/03/2022 | | | ARS | | | | 8,475,703 | | | | 233,279 | | | | 0.36 | |
Argentina POM Politica Monetaria, (Floating, Argentina Blended Historical Policy Rate + 0.000%) 67.467%, 06/21/2020 | | | ARS | | | | 11,361,091 | | | | 358,064 | | | | 0.56 | |
Provincia de Buenos Aires, (Floating, Argentina Deposit Rates Badlar Private Banks 30-35 Days + 3.750%) 55.307%, 04/12/2025(2) | | | ARS | | | | 5,801,000 | | | | 144,255 | | | | 0.22 | |
| | | | | | | | | | | 832,653 | | | | 1.29 | |
| | | | |
Brazil (Cost $11,405,846) | | | | | | | | | | | | | | | | |
Brazil Letras do Tesouro Nacional, 0.000%, 01/01/2020(3) | | | BRL | | | | 4,670 | | | | 1,152,970 | | | | 1.79 | |
Brazil Letras do Tesouro Nacional, 0.000%, 07/01/2021(3) | | | BRL | | | | 10,864 | | | | 2,352,524 | | | | 3.66 | |
Brazil Letras do Tesouro Nacional, 0.000%, 01/01/2022(3) | | | BRL | | | | 1,670 | | | | 343,683 | | | | 0.54 | |
Brazil Notas do Tesouro Nacional Serie F, 10.000%, 01/01/2023 | | | BRL | | | | 8,559 | | | | 2,356,735 | | | | 3.66 | |
Brazil Notas do Tesouro Nacional Serie F, 10.000%, 01/01/2025 | | | BRL | | | | 7,782 | | | | 2,116,721 | | | | 3.29 | |
Brazil Notas do Tesouro Nacional Serie F, 10.000%, 01/01/2027 | | | BRL | | | | 9,700 | | | | 2,601,360 | | | | 4.04 | |
| | | | | | | | | | | 10,923,993 | | | | 16.98 | |
| | | | |
Chile (Cost $3,526,272) | | | | | | | | | | | | | | | | |
Bonos de la Tesoreria de la Republica en pesos, 4.500%, 03/01/2021 | | | CLP | | | | 1,265,000,000 | | | | 1,840,561 | | | | 2.86 | |
Bonos de la Tesoreria de la Republica en pesos, 5.000%, 03/01/2035 | | | CLP | | | | 825,000,000 | | | | 1,191,552 | | | | 1.85 | |
| | | | | | | | | | | 3,032,113 | | | | 4.71 | |
| | | | |
Colombia (Cost $2,670,422) | | | | | | | | | | | | | | | | |
Colombian TES, 11.000%, 07/24/2020 | | | COP | | | | 305,000,000 | | | | 103,388 | | | | 0.16 | |
Colombian TES, 7.000%, 05/04/2022 | | | COP | | | | 5,660,700,000 | | | | 1,817,097 | | | | 2.82 | |
Colombian TES, 7.750%, 09/18/2030 | | | COP | | | | 628,700,000 | | | | 201,133 | | | | 0.31 | |
Colombian TES, 7.000%, 06/30/2032 | | | COP | | | | 1,207,200,000 | | | | 357,768 | | | | 0.56 | |
| | | | | | | | | | | 2,479,386 | | | | 3.85 | |
| | | | |
Hungary (Cost $1,044,166) | | | | | | | | | | | | | | | | |
Hungary (Rep of), 1.750%, 10/26/2022 | | | HUF | | | | 36,590,000 | | | | 125,311 | | | | 0.19 | |
Hungary (Rep of), 3.000%, 06/26/2024 | | | HUF | | | | 123,890,000 | | | | 434,499 | | | | 0.68 | |
Hungary (Rep of), 5.500%, 06/24/2025 | | | HUF | | | | 118,670,000 | | | | 472,091 | | | | 0.73 | |
| | | | | | | | | | | 1,031,901 | | | | 1.60 | |
See accompanying notes to the financial statements.
69
ASHMORE EMERGING MARKETS LOCAL CURRENCY BOND FUND
SCHEDULE OF INVESTMENTS (CONTINUED)
As of October 31, 2018
| | | | | | | | | | | | | | | | |
| | | Currency(1) | | | Par | | | Value | | | % of Net
Assets | |
India (Cost $3,580,328) | | | | | | | | | | | | | | | | |
India (Rep of), 7.350%, 06/22/2024 | | | INR | | | | 10,000,000 | | | $ | 132,261 | | | | 0.20 | |
India (Rep of), 7.720%, 05/25/2025 | | | INR | | | | 164,220,000 | | | | 2,206,404 | | | | 3.43 | |
India (Rep of), 7.590%, 01/11/2026 | | | INR | | | | 55,000,000 | | | | 731,226 | | | | 1.14 | |
| | | | | | | | | | | 3,069,891 | | | | 4.77 | |
| | | | |
Indonesia (Cost $6,725,773) | | | | | | | | | | | | | | | | |
Indonesia (Rep of), 8.250%, 07/15/2021 | | | IDR | | | | 10,905,000,000 | | | | 722,492 | | | | 1.12 | |
Indonesia (Rep of), 5.625%, 05/15/2023 | | | IDR | | | | 4,423,000,000 | | | | 261,596 | | | | 0.41 | |
Indonesia (Rep of), 8.375%, 03/15/2024 | | | IDR | | | | 1,502,000,000 | | | | 98,278 | | | | 0.15 | |
Indonesia (Rep of), 8.375%, 09/15/2026 | | | IDR | | | | 8,969,000,000 | | | | 581,544 | | | | 0.90 | |
Indonesia (Rep of), 7.000%, 05/15/2027 | | | IDR | | | | 4,076,000,000 | | | | 242,727 | | | | 0.38 | |
Indonesia (Rep of), 6.125%, 05/15/2028 | | | IDR | | | | 13,735,000,000 | | | | 762,977 | | | | 1.19 | |
Indonesia (Rep of), 9.000%, 03/15/2029 | | | IDR | | | | 12,761,000,000 | | | | 853,584 | | | | 1.33 | |
Indonesia (Rep of), 8.250%, 05/15/2029 | | | IDR | | | | 5,635,000,000 | | | | 364,152 | | | | 0.57 | |
Indonesia (Rep of), 8.750%, 05/15/2031 | | | IDR | | | | 4,227,000,000 | | | | 276,516 | | | | 0.43 | |
Indonesia (Rep of), 7.500%, 08/15/2032 | | | IDR | | | | 1,243,000,000 | | | | 72,933 | | | | 0.11 | |
Indonesia (Rep of), 6.625%, 05/15/2033 | | | IDR | | | | 9,756,000,000 | | | | 528,886 | | | | 0.82 | |
Indonesia (Rep of), 8.375%, 03/15/2034 | | | IDR | | | | 5,957,000,000 | | | | 373,716 | | | | 0.58 | |
Indonesia (Rep of), 8.250%, 05/15/2036 | | | IDR | | | | 4,313,000,000 | | | | 268,074 | | | | 0.42 | |
Indonesia (Rep of), 7.500%, 05/15/2038 | | | IDR | | | | 3,500,000,000 | | | | 199,720 | | | | 0.31 | |
| | | | | | | | | | | 5,607,195 | | | | 8.72 | |
| | | | |
Malaysia (Cost $2,572,657) | | | | | | | | | | | | | | | | |
Malaysia (Rep of), 3.759%, 03/15/2019 | | | MYR | | | | 4,000 | | | | 957 | | | | — | |
Malaysia (Rep of), 3.654%, 10/31/2019 | | | MYR | | | | 1,605,000 | | | | 384,354 | | | | 0.60 | |
Malaysia (Rep of), 3.620%, 11/30/2021 | | | MYR | | | | 1,500,000 | | | | 357,839 | | | | 0.56 | |
Malaysia (Rep of), 3.882%, 03/10/2022 | | | MYR | | | | 1,390,000 | | | | 333,772 | | | | 0.52 | |
Malaysia (Rep of), 3.418%, 08/15/2022 | | | MYR | | | | 4,000 | | | | 943 | | | | — | |
Malaysia (Rep of), 3.795%, 09/30/2022 | | | MYR | | | | 2,000 | | | | 478 | | | | — | |
Malaysia (Rep of), 3.757%, 04/20/2023 | | | MYR | | | | 1,432,000 | | | | 341,332 | | | | 0.53 | |
Malaysia (Rep of), 4.181%, 07/15/2024 | | | MYR | | | | 1,259,000 | | | | 303,630 | | | | 0.47 | |
Malaysia (Rep of), 3.955%, 09/15/2025 | | | MYR | | | | 1,800,000 | | | | 426,696 | | | | 0.66 | |
Malaysia (Rep of), 4.392%, 04/15/2026 | | | MYR | | | | 365,000 | | | | 88,287 | | | | 0.14 | |
Malaysia (Rep of), 4.498%, 04/15/2030 | | | MYR | | | | 310,000 | | | | 74,068 | | | | 0.12 | |
Malaysia (Rep of), 4.232%, 06/30/2031 | | | MYR | | | | 227,000 | | | | 52,807 | | | | 0.08 | |
Malaysia (Rep of), 3.844%, 04/15/2033 | | | MYR | | | | 156,000 | | | | 34,285 | | | | 0.05 | |
Malaysia (Rep of), 4.642%, 11/07/2033 | | | MYR | | | | 458,000 | | | | 109,827 | | | | 0.17 | |
| | | | | | | | | | | 2,509,275 | | | | 3.90 | |
| | | | |
Mexico (Cost $1,583,524) | | | | | | | | | | | | | | | | |
Comision Federal de Electricidad, 8.180%, 12/23/2027 | | | MXN | | | | 36,200 | | | | 160,402 | | | | 0.25 | |
Mexican Bonos, 6.500%, 06/10/2021 | | | MXN | | | | 102,400 | | | | 479,141 | | | | 0.74 | |
Mexican Bonos, 10.000%, 12/05/2024 | | | MXN | | | | 82,300 | | | | 429,273 | | | | 0.67 | |
Petroleos Mexicanos, 7.190%, 09/12/2024 | | | MXN | | | | 62,700 | | | | 259,332 | | | | 0.40 | |
| | | | | | | | | | | 1,328,148 | | | | 2.06 | |
See accompanying notes to the financial statements.
70
ASHMORE EMERGING MARKETS LOCAL CURRENCY BOND FUND
SCHEDULE OF INVESTMENTS (CONTINUED)
As of October 31, 2018
| | | | | | | | | | | | | | | | |
| | | Currency(1) | | | Par | | | Value | | | % of Net
Assets | |
Peru (Cost $1,058,190) | | | | | | | | | | | | | | | | |
Fondo MIVIVIENDA S.A., 7.000%, 02/14/2024 | | | PEN | | | | 990 | | | $ | 315,073 | | | | 0.49 | |
Peru (Rep of), 6.950%, 08/12/2031 | | | PEN | | | | 1,404 | | | | 444,541 | | | | 0.69 | |
Peru (Rep of), 6.150%, 08/12/2032(2) | | | PEN | | | | 386,000 | | | | 113,826 | | | | 0.18 | |
Peru (Rep of), 6.900%, 08/12/2037 | | | PEN | | | | 509 | | | | 157,387 | | | | 0.24 | |
| | | | | | | | | | | 1,030,827 | | | | 1.60 | |
| | | | |
Philippines (Cost $456,932) | | | | | | | | | | | | | | | | |
Philippines (Rep of), 4.950%, 01/15/2021 | | | PHP | | | | 10,000,000 | | | | 183,828 | | | | 0.29 | |
Philippines (Rep of), 3.900%, 11/26/2022 | | | PHP | | | | 10,000,000 | | | | 173,568 | | | | 0.27 | |
| | | | | | | | | 357,396 | | | 0.56 | |
| | | | |
Poland (Cost $1,215,897) | | | | | | | | | | | | | | | | |
Poland (Rep of), 2.750%, 08/25/2023 | | | PLN | | | | 324,000 | | | | 111,926 | | | | 0.17 | |
Poland (Rep of), 3.250%, 07/25/2025 | | | PLN | | | | 3,543,000 | | | | 943,378 | | | | 1.47 | |
Poland (Rep of), 2.500%, 07/25/2026 | | | PLN | | | | 560,000 | | | | 140,542 | | | | 0.22 | |
| | | | | | | | | | | 1,195,846 | | | | 1.86 | |
| | | | |
Romania (Cost $218,167) | | | | | | | | | | | | | | | | |
Romania (Rep of), 5.800%, 07/26/2027 | | | RON | | | | 790,000 | | | | 202,314 | | | | 0.32 | |
| | | | | | | | | | | 202,314 | | | | 0.32 | |
| | | | |
Russian Federation (Cost $5,069,499) | | | | | | | | | | | | | | | | |
Russian Federal Bond - OFZ, 6.400%, 05/27/2020 | | | RUB | | | | 8,007,000 | | | | 119,232 | | | | 0.19 | |
Russian Federal Bond - OFZ, 7.600%, 04/14/2021 | | | RUB | | | | 10,529,000 | | | | 158,717 | | | | 0.25 | |
Russian Federal Bond - OFZ, 7.500%, 08/18/2021 | | | RUB | | | | 51,210,000 | | | | 766,590 | | | | 1.19 | |
Russian Federal Bond - OFZ, 7.400%, 12/07/2022 | | | RUB | | | | 10,223,000 | | | | 151,313 | | | | 0.23 | |
Russian Federal Bond - OFZ, 7.000%, 08/16/2023 | | | RUB | | | | 10,745,000 | | | | 155,579 | | | | 0.24 | |
Russian Federal Bond - OFZ, 6.500%, 02/28/2024 | | | RUB | | | | 18,782,000 | | | | 262,696 | | | | 0.41 | |
Russian Federal Bond - OFZ, 7.100%, 10/16/2024 | | | RUB | | | | 32,222,000 | | | | 460,689 | | | | 0.72 | |
Russian Federal Bond - OFZ, 7.750%, 09/16/2026 | | | RUB | | | | 58,967,000 | | | | 860,662 | | | | 1.34 | |
Russian Federal Bond - OFZ, 7.050%, 01/19/2028 | | | RUB | | | | 12,985,000 | | | | 180,043 | | | | 0.28 | |
Russian Federal Bond - OFZ, 8.500%, 09/17/2031 | | | RUB | | | | 60,408,000 | | | | 917,064 | | | | 1.42 | |
Russian Federal Bond - OFZ, 7.700%, 03/23/2033 | | | RUB | | | | 25,945,000 | | | | 368,853 | | | | 0.57 | |
| | | | | | | | | | | 4,401,438 | | | | 6.84 | |
| | | | |
South Africa (Cost $8,995,462) | | | | | | | | | | | | | | | | |
South Africa (Rep of), 7.750%, 02/28/2023 | | | ZAR | | | | 12,374,810 | | | | 811,734 | | | | 1.26 | |
South Africa (Rep of), 10.500%, 12/21/2026 | | | ZAR | | | | 22,343,000 | | | | 1,606,000 | | | | 2.50 | |
South Africa (Rep of), 8.000%, 01/31/2030 | | | ZAR | | | | 15,679,000 | | | | 932,278 | | | | 1.45 | |
South Africa (Rep of), 7.000%, 02/28/2031 | | | ZAR | | | | 17,972,000 | | | | 967,717 | | | | 1.50 | |
South Africa (Rep of), 8.250%, 03/31/2032 | | | ZAR | | | | 6,796,000 | | | | 400,653 | | | | 0.62 | |
South Africa (Rep of), 8.500%, 01/31/2037 | | | ZAR | | | | 8,364,000 | | | | 488,272 | | | | 0.76 | |
South Africa (Rep of), 9.000%, 01/31/2040 | | | ZAR | | | | 7,937,750 | | | | 478,199 | | | | 0.74 | |
South Africa (Rep of), 6.500%, 02/28/2041 | | | ZAR | | | | 5,624,000 | | | | 256,617 | | | | 0.40 | |
South Africa (Rep of), 8.750%, 01/31/2044 | | | ZAR | | | | 12,174,000 | | | | 711,893 | | | | 1.11 | |
South Africa (Rep of), 8.750%, 02/28/2048 | | | ZAR | | | | 12,895,760 | | | | 752,373 | | | | 1.17 | |
| | | | | | | | | | | 7,405,736 | | | | 11.51 | |
See accompanying notes to the financial statements.
71
ASHMORE EMERGING MARKETS LOCAL CURRENCY BOND FUND
SCHEDULE OF INVESTMENTS (CONTINUED)
As of October 31, 2018
| | | | | | | | | | | | | | | | |
| | | Currency(1) | | | Par | | | Value | | | % of Net
Assets | |
Thailand (Cost $3,234,904) | | | | | | | | | | | | | | | | |
Thailand (Rep of), 3.625%, 06/16/2023 | | | THB | | | | 12,189,000 | | | $ | 387,362 | | | | 0.60 | |
Thailand (Rep of), 2.400%, 12/17/2023 | | | THB | | | | 8,950,000 | | | | 269,382 | | | | 0.42 | |
Thailand (Rep of), 3.850%, 12/12/2025 | | | THB | | | | 3,589,000 | | | | 116,652 | | | | 0.18 | |
Thailand (Rep of), 2.125%, 12/17/2026 | | | THB | | | | 8,587,000 | | | | 247,095 | | | | 0.38 | |
Thailand (Rep of), 1.250%, 03/12/2028 | | | THB | | | | 3,352,000 | | | | 99,235 | | | | 0.16 | |
Thailand (Rep of), 2.875%, 12/17/2028 | | | THB | | | | 8,068,000 | | | | 243,641 | | | | 0.38 | |
Thailand (Rep of), 4.875%, 06/22/2029 | | | THB | | | | 5,788,000 | | | | 204,506 | | | | 0.32 | |
Thailand (Rep of), 3.650%, 06/20/2031 | | | THB | | | | 2,833,000 | | | | 89,933 | | | | 0.14 | |
Thailand (Rep of), 3.775%, 06/25/2032 | | | THB | | | | 22,069,000 | | | | 703,606 | | | | 1.09 | |
Thailand (Rep of), 3.400%, 06/17/2036 | | | THB | | | | 19,238,000 | | | | 590,566 | | | | 0.92 | |
Thailand (Rep of), 2.875%, 06/17/2046 | | | THB | | | | 5,853,000 | | | | 158,972 | | | | 0.25 | |
| | | | | | | | | | | 3,110,950 | | | | 4.84 | |
| | | | |
Turkey (Cost $2,659,212) | | | | | | | | | | | | | | | | |
Turkey (Rep of), 3.000%, 02/23/2022 | | | TRY | | | | 644,810 | | | | 207,834 | | | | 0.32 | |
Turkey (Rep of), 11.000%, 03/02/2022 | | | TRY | | | | 1,390,000 | | | | 193,221 | | | | 0.30 | |
Turkey (Rep of), 10.700%, 08/17/2022 | | | TRY | | | | 1,650,000 | | | | 225,821 | | | | 0.35 | |
Turkey (Rep of), 8.000%, 03/12/2025 | | | TRY | | | | 740,000 | | | | 83,405 | | | | 0.13 | |
Turkey (Rep of), 10.600%, 02/11/2026 | | | TRY | | | | 3,432,519 | | | | 437,232 | | | | 0.68 | |
Turkey (Rep of), 11.000%, 02/24/2027 | | | TRY | | | | 465,000 | | | | 58,599 | | | | 0.09 | |
Turkey (Rep of), 10.500%, 08/11/2027 | | | TRY | | | | 2,090,000 | | | | 255,193 | | | | 0.40 | |
| | | | | | | | | | | 1,461,305 | | | | 2.27 | |
| | | | |
Uruguay (Cost $171,484) | | | | | | | | | | | | | | | | |
Uruguay (Rep of), 9.875%, 06/20/2022 | | | UYU | | | | 3,856,000 | | | | 115,627 | | | | 0.18 | |
Uruguay (Rep of), 8.500%, 03/15/2028 | | | UYU | | | | 2,059,000 | | | | 53,648 | | | | 0.08 | |
| | | | | | | | | | | 169,275 | | | | 0.26 | |
| | | | |
Total Debt Securities (Cost $57,828,947) | | | | | | | | | | | 50,149,642 | | | | 77.94 | |
| | | | |
Total Investments in Securities (Cost $57,828,947) | | | | | | | | | | | 50,149,642 | | | | 77.94 | |
| | | | |
Fully Funded Total Return Swaps | | | | | | | | | | | | | | | | |
| | | | |
Indonesia (Cost $2,335,577) | | | | | | | | | | | | | | | | |
Indonesia (Rep of), Issued by ANZ Banking Corp., 7.875%, 04/15/2019 | | | IDR | | | | 1,456,000,000 | | | | 96,346 | | | | 0.15 | |
Indonesia (Rep of), Issued by ANZ Banking Corp., 8.375%, 03/15/2024 | | | IDR | | | | 9,817,000,000 | | | | 642,340 | | | | 1.00 | |
Indonesia (Rep of), Issued by ANZ Banking Corp., 7.000%, 05/15/2027 | | | IDR | | | | 941,000,000 | | | | 56,037 | | | | 0.09 | |
Indonesia (Rep of), Issued by ANZ Banking Corp., 10.500%, 08/15/2030 | | | IDR | | | | 600,000,000 | | | | 44,333 | | | | 0.07 | |
Indonesia (Rep of), Issued by ANZ Banking Corp., 8.375%, 03/15/2034 | | | IDR | | | | 2,751,000,000 | | | | 172,586 | | | | 0.27 | |
Indonesia (Rep of), Issued by HSBC Bank, 8.250%, 06/15/2032 | | | IDR | | | | 30,000,000 | | | | 1,878 | | | | — | |
Indonesia (Rep of), Issued by Standard Chartered, 8.375%, 03/15/2024 | | | IDR | | | | 2,600,000,000 | | | | 170,121 | | | | 0.26 | |
See accompanying notes to the financial statements.
72
ASHMORE EMERGING MARKETS LOCAL CURRENCY BOND FUND
SCHEDULE OF INVESTMENTS (CONTINUED)
As of October 31, 2018
| | | | | | | | | | | | | | | | |
| | | Currency(1) | | | Par | | | Value | | | % of Net
Assets | |
Indonesia (continued) | | | | | | | | | | | | | | | | |
Indonesia (Rep of), Issued by Standard Chartered, 7.000%, 05/15/2027 | | | IDR | | | | 6,009,000,000 | | | $ | 357,838 | | | | 0.56 | |
Indonesia (Rep of), Issued by Standard Chartered, 10.500%, 08/15/2030 | | | IDR | | | | 1,064,000,000 | | | | 78,618 | | | | 0.12 | |
Indonesia (Rep of), Issued by Standard Chartered, 8.250%, 05/15/2036 | | | IDR | | | | 2,022,000,000 | | | | 125,677 | | | | 0.19 | |
| | | | |
| | | | | | | | | 1,745,774 | | | 2.71 | |
| | | | |
Total Fully Funded Total Return Swaps (Cost $2,335,577) | | | | | | | | | | | 1,745,774 | | | | 2.71 | |
| | | | |
Total Investments (Total Cost $60,164,524) | | | | | | | | | | | 51,895,416 | | | | 80.65 | |
| | | | |
Other Assets Less Liabilities (See Statements of Assets and Liabilities for further detail) | | | | | | | | | | | 12,449,968 | | | | 19.35 | |
| | | | |
Net Assets | | | | | | | | | | $ | 64,345,384 | | | | 100.00 | |
| (1) | Par values are stated in United States Dollars unless otherwise noted below. |
| (2) | Securities exempt from registration under Rule 144A of the Securities Act of 1933. These securities may not be publicly traded without registration under the Securities Act of 1933. |
Percentages shown are based on net assets.
At October 31, 2018, the Ashmore Emerging Markets Local Currency Bond Fund had outstanding forward foreign currency exchange contracts as follows:
| | | | | | | | | | | | | | | | | | |
Settlement
Date | | Counterparty | | Currency
Buy | | Currency
Buy Amount
(Local
Currency) | | | Currency
Sell | | Currency
Sell Amount
(Local
Currency) | | | Unrealized
Gain/(Loss) | |
11/02/2018 | | HSBC Bank | | Indonesian Rupiah | | | 295,547,659 | | | United States Dollar | | | 19,432 | | | $ | 8 | |
11/05/2018 | | BNP Paribas | | Brazilian Real | | | 7,395,589 | | | United States Dollar | | | 1,821,098 | | | | 165,173 | |
11/05/2018 | | Deutsche Bank | | Brazilian Real | | | 3,505,578 | | | United States Dollar | | | 860,000 | | | | 81,511 | |
11/05/2018 | | Goldman Sachs | | Brazilian Real | | | 2,265,600 | | | United States Dollar | | | 600,000 | | | | 8,484 | |
11/05/2018 | | Santander | | Brazilian Real | | | 950,000 | | | United States Dollar | | | 255,143 | | | | 3 | |
11/05/2018 | | Goldman Sachs | | United States Dollar | | | 130,000 | | | Brazilian Real | | | 481,195 | | | | 763 | |
11/05/2018 | | Santander | | United States Dollar | | | 950,000 | | | Brazilian Real | | | 3,532,100 | | | | 1,366 | |
11/30/2018 | | Barclays | | Thai Baht | | | 3,994,800 | | | United States Dollar | | | 120,000 | | | | 592 | |
11/30/2018 | | BNP Paribas | | Turkish Lira | | | 1,802,546 | | | United States Dollar | | | 309,402 | | | | 6,959 | |
11/30/2018 | | HSBC Bank | | Turkish Lira | | | 863,948 | | | United States Dollar | | | 134,383 | | | | 17,247 | |
11/30/2018 | | HSBC Bank | | Turkish Lira | | | 1,666,518 | | | United States Dollar | | | 280,261 | | | | 12,226 | |
11/30/2018 | | Standard Chartered | | Turkish Lira | | | 2,505,412 | | | United States Dollar | | | 380,000 | | | | 59,720 | |
11/30/2018 | | HSBC Bank | | United States Dollar | | | 861,449 | | | Indian Rupee | | | 64,006,611 | | | | 335 | |
11/30/2018 | | HSBC Bank | | United States Dollar | | | 21,173 | | | Indonesian Rupiah | | | 323,621,760 | | | | 3 | |
11/30/2018 | | Deutsche Bank | | United States Dollar | | | 714,000 | | | Malaysian Ringgit | | | 2,959,530 | | | | 7,255 | |
11/30/2018 | | BNP Paribas | | United States Dollar | | | 86,330 | | | Polish Zloty | | | 322,653 | | | | 2,192 | |
See accompanying notes to the financial statements.
73
ASHMORE EMERGING MARKETS LOCAL CURRENCY BOND FUND
SCHEDULE OF INVESTMENTS (CONTINUED)
As of October 31, 2018
| | | | | | | | | | | | | | | | | | |
Settlement
Date | | Counterparty | | Currency
Buy | | Currency
Buy Amount
(Local
Currency) | | | Currency
Sell | | Currency
Sell Amount
(Local
Currency) | | | Unrealized
Gain/(Loss) | |
| | | | | | |
11/30/2018 | | BNP Paribas | | United States Dollar | | | 134,640 | | | Russian Ruble | | | 8,887,807 | | | $ | 257 | |
11/30/2018 | | Barclays | | United States Dollar | | | 190,310 | | | South African Rand | | | 2,734,706 | | | | 5,637 | |
11/30/2018 | | Merrill Lynch | | United States Dollar | | | 1,039,609 | | | South African Rand | | | 13,982,219 | | | | 95,399 | |
11/30/2018 | | Merrill Lynch | | United States Dollar | | | 236,891 | | | South African Rand | | | 3,438,521 | | | | 4,690 | |
11/30/2018 | | Morgan Stanley | | United States Dollar | | | 49,080 | | | Thai Baht | | | 1,608,543 | | | | 522 | |
11/30/2018 | | JP Morgan | | United States Dollar | | | 142,000 | | | Turkish Lira | | | 808,669 | | | | 72 | |
12/04/2018 | | HSBC Bank | | United States Dollar | | | 2,019,981 | | | Brazilian Real | | | 7,310,311 | | | | 62,093 | |
12/04/2018 | | Morgan Stanley | | United States Dollar | | | 995,000 | | | Brazilian Real | | | 3,696,923 | | | | 4,870 | |
01/31/2019 | | Standard Chartered | | Chilean Peso | | | 112,000,000 | | | United States Dollar | | | 160,000 | | | | 1,108 | |
01/31/2019 | | BNP Paribas | | United States Dollar | | | 83,480 | | | Colombian Peso | | | 261,499,472 | | | | 2,544 | |
01/31/2019 | | Goldman Sachs | | United States Dollar | | | 119,720 | | | Indonesian Rupiah | | | 1,848,835,960 | | | | 243 | |
01/31/2019 | | JP Morgan | | United States Dollar | | | 38,225 | | | Indonesian Rupiah | | | 590,974,858 | | | | 34 | |
01/31/2019 | | Merrill Lynch | | United States Dollar | | | 40,871 | | | Indonesian Rupiah | | | 631,454,490 | | | | 64 | |
01/31/2019 | | BNP Paribas | | United States Dollar | | | 73,800 | | | Peruvian Nuevo Sol | | | 247,030 | | | | 799 | |
01/31/2019 | | Deutsche Bank | | United States Dollar | | | 1,202,635 | | | South African Rand | | | 17,729,125 | | | | 15,315 | |
03/29/2019 | | JP Morgan | | United States Dollar | | | 1,276,296 | | | Chilean Peso | | | 769,414,984 | | | | 168,817 | |
03/29/2019 | | JP Morgan | | United States Dollar | | | 894,460 | | | Chilean Peso | | | 537,838,595 | | | | 120,307 | |
| | | | | | | | | | | | | | | | | | |
| | | | | |
Subtotal Appreciation | | | | | | | | | | | | | | | 846,608 | |
| | | | | | | | | | | | | | | | | | |
| | | | | | |
11/05/2018 | | HSBC Bank | | Brazilian Real | | | 7,310,311 | | | United States Dollar | | | 2,025,017 | | | $
|
(61,650 |
) |
11/05/2018 | | Morgan Stanley | | United States Dollar | | | 4,589,217 | | | Brazilian Real | | | 17,413,783 | | | | (87,691 | ) |
11/09/2018 | | HSBC Bank | | United States Dollar | | | 175,830 | | | Argentine Peso | | | 6,584,844 | | | | (5,526 | ) |
11/09/2018 | | JP Morgan | | United States Dollar | | | 165,704 | | | Argentine Peso | | | 6,472,382 | | | | (12,556 | ) |
11/29/2018 | | Merrill Lynch | | Romanian Leu | | | 759,139 | | | United States Dollar | | | 190,858 | | | | (6,650 | ) |
11/30/2018 | | Credit Suisse | | Colombian Peso | | | 691,870,000 | | | United States Dollar | | | 215,000 | | | | (410 | ) |
11/30/2018 | | Credit Suisse | | Colombian Peso | | | 5,480,041,271 | | | United States Dollar | | | 1,834,354 | | | | (134,669 | ) |
11/30/2018 | | Deutsche Bank | | Czech Koruna | | | 9,761,904 | | | United States Dollar | | | 445,876 | | | | (19,295 | ) |
11/30/2018 | | Deutsche Bank | | Malaysian Ringgit | | | 431,062 | | | United States Dollar | | | 103,693 | | | | (754 | ) |
11/30/2018 | | BNP Paribas | | Polish Zloty | | | 6,064,078 | | | United States Dollar | | | 1,667,051 | | | | (85,717 | ) |
11/30/2018 | | JP Morgan | | Polish Zloty | | | 6,064,078 | | | United States Dollar | | | 1,656,852 | | | | (75,519 | ) |
11/30/2018 | | Credit Suisse | | Russian Ruble | | | 4,718,407 | | | United States Dollar | | | 71,515 | | | | (174 | ) |
11/30/2018 | | HSBC Bank | | Russian Ruble | | | 2,138,804 | | | United States Dollar | | | 32,419 | | | | (80 | ) |
11/30/2018 | | HSBC Bank | | Russian Ruble | | | 6,009,000 | | | United States Dollar | | | 91,364 | | | | (508 | ) |
11/30/2018 | | UBS | | Russian Ruble | | | 43,749,081 | | | United States Dollar | | | 663,770 | | | | (2,288 | ) |
11/30/2018 | | Deutsche Bank | | South African Rand | | | 3,428,336 | | | United States Dollar | | | 240,646 | | | | (9,133 | ) |
11/30/2018 | | JP Morgan | | Thai Baht | | | 78,622,056 | | | United States Dollar | | | 2,388,095 | | | | (14,706 | ) |
11/30/2018 | | Goldman Sachs | | United States Dollar | | | 669,790 | | | Indian Rupee | | | 50,174,000 | | | | (5,226 | ) |
11/30/2018 | | HSBC Bank | | United States Dollar | | | 669,053 | | | Indian Rupee | | | 50,174,000 | | | | (5,964 | ) |
11/30/2018 | | Morgan Stanley | | United States Dollar | | | 925,802 | | | Indian Rupee | | | 68,912,091 | | | | (1,308 | ) |
11/30/2018 | | BNP Paribas | | United States Dollar | | | 100,295 | | | Indonesian Rupiah | | | 1,537,795,347 | | | | (300 | ) |
11/30/2018 | | Citibank | | United States Dollar | | | 411,448 | | | Indonesian Rupiah | | | 6,333,000,000 | | | | (2,826 | ) |
11/30/2018 | | HSBC Bank | | United States Dollar | | | 365,370 | | | Indonesian Rupiah | | | 5,634,000,000 | | | | (3,179 | ) |
11/30/2018 | | Goldman Sachs | | United States Dollar | | | 190,000 | | | Turkish Lira | | | 1,129,493 | | | | (8,235 | ) |
See accompanying notes to the financial statements.
74
ASHMORE EMERGING MARKETS LOCAL CURRENCY BOND FUND
SCHEDULE OF INVESTMENTS (CONTINUED)
As of October 31, 2018
| | | | | | | | | | | | | | | | | | |
Settlement Date | | Counterparty | | Currency
Buy | | Currency
Buy Amount
(Local
Currency) | | | Currency
Sell | | Currency
Sell Amount
(Local
Currency) | | | Unrealized
Gain/(Loss) | |
| | | | | | |
11/30/2018 | | Goldman Sachs | | United States Dollar | | | 180,000 | | | Turkish Lira | | | 1,072,944 | | | $ | (8,310 | ) |
11/30/2018 | | JP Morgan | | United States Dollar | | | 48,000 | | | Turkish Lira | | | 274,032 | | | | (95 | ) |
01/31/2019 | | Credit Suisse | | Chilean Peso | | | 299,973,233 | | | United States Dollar | | | 437,872 | | | | (6,371 | ) |
01/31/2019 | | Credit Suisse | | Colombian Peso | | | 1,641,750,980 | | | United States Dollar | | | 525,756 | | | | (17,622 | ) |
01/31/2019 | | BNP Paribas | | Czech Koruna | | | 28,928,926 | | | United States Dollar | | | 1,330,294 | | | | (56,538 | ) |
01/31/2019 | | Goldman Sachs | | Hungarian Forint | | | 279,542,908 | | | United States Dollar | | | 992,854 | | | | (9,799 | ) |
01/31/2019 | | Merrill Lynch | | Mexican Peso | | | 95,701,862 | | | United States Dollar | | | 4,859,443 | | | | (220,486 | ) |
01/31/2019 | | BNP Paribas | | Polish Zloty | | | 2,077,308 | | | United States Dollar | | | 569,422 | | | | (26,552 | ) |
01/31/2019 | | HSBC Bank | | Romanian Leu | | | 4,991,501 | | | United States Dollar | | | 1,256,484 | | | | (45,920 | ) |
01/31/2019 | | Merrill Lynch | | United States Dollar | | | 129,394 | | | Indonesian Rupiah | | | 2,003,925,447 | | | | (106 | ) |
01/31/2019 | | UBS | | United States Dollar | | | 140,789 | | | Indonesian Rupiah | | | 2,180,111,199 | | | | (97 | ) |
01/31/2019 | | HSBC Bank | | United States Dollar | | | 168,296 | | | Philippine Peso | | | 9,225,970 | | | | (3,452 | ) |
02/28/2019 | | JP Morgan | | Czech Koruna | | | 2,297,206 | | | United States Dollar | | | 106,634 | | | | (5,388 | ) |
02/28/2019 | | BNP Paribas | | Hungarian Forint | | | 44,161,228 | | | United States Dollar | | | 155,810 | | | | (212 | ) |
02/28/2019 | | Merrill Lynch | | Hungarian Forint | | | 279,542,908 | | | United States Dollar | | | 1,000,870 | | | | (15,923 | ) |
02/28/2019 | | JP Morgan | | Polish Zloty | | | 4,198,517 | | | United States Dollar | | | 1,127,724 | | | | (29,553 | ) |
02/28/2019 | | BNP Paribas | | Romanian Leu | | | 1,565,442 | | | United States Dollar | | | 381,769 | | | | (2,348 | ) |
02/28/2019 | | Morgan Stanley | | Russian Ruble | | | 72,685,452 | | | United States Dollar | | | 1,092,645 | | | | (4,514 | ) |
03/29/2019 | | BNP Paribas | | Czech Koruna | | | 21,726,130 | | | United States Dollar | | | 967,338 | | | | (8,826 | ) |
| | | | | | | | | | | | | | | | | | |
| | | | | | |
Subtotal Depreciation | | | | | | | | | | | | | | | | | (1,006,476 | ) |
| | | | | | | | | | | | | | | | | | |
| | | | | |
Total | | | | | | | | | | | | | | $ | (159,868 | ) |
| | | | | | | | | | | | | | | | | | |
At October 31, 2018, the Ashmore Emerging Markets Local Currency Bond Fund had the following interest rate swap contracts outstanding:
| | | | | | | | | | | | | | | | | | | | |
Pay Rate Index/
Pay Rate | | Receive Rate/
Receive Rate
Index | | Notional
Amount | | | Expiration
Date | | Fair
Value | | Premiums
Paid/
(Received) | | Unrealized
Appreciation
(Depreciation) | | | Counterparty |
| | | | | | | | |
MYR-KLIBOR-BNM 3 Month Rate
(Pay Quarterly) | | 3.600% (Receive
Quarterly) | | MYR | | | 750,000 | | | 08/18/2026 | | $(6,335) | | — | | | $(6,335) | | | HSBC Bank |
MYR-KLIBOR-BNM 3 Month Rate
(Pay Quarterly) | | 4.055% (Receive
Quarterly) | | MYR | | | 1,300,000 | | | 04/27/2026 | | (1,067) | | — | | | (1,067) | | | HSBC Bank |
WIBOR Poland 6 Month Rate
(Pay Semiannually) | | 1.955% (Receive
Annually) | | PLN | | | 6,400,000 | | | 09/24/2020 | | (1,032) | | — | | | (1,032) | | | BNP Paribas |
| | | | | | | | | | | | | | | | | | | | |
| | | | | | | | |
| | | | | | | | | | | | | | | | | $(8,434) | | | |
| | | | | | | | | | | | | | | | | | | | |
See accompanying notes to the financial statements.
75
ASHMORE EMERGING MARKETS LOCAL CURRENCY BOND FUND
SCHEDULE OF INVESTMENTS (CONTINUED)
As of October 31, 2018
At October 31, 2018, the Ashmore Emerging Markets Local Currency Bond Fund had the following centrally cleared swap contracts outstanding:
| | | | | | | | | | | | | | | | | | | | | | | | | | | | |
Pay Rate
Index/
Pay Rate | | Receive Rate/
Receive Rate
Index | | Notional
Amount | | | Expiration
Date | | | Fair Value/
Unrealized
Appreciation
(Depreciation)** | | | Premiums
Paid/
(Received) | | | Variation
Margin
Receivable
(Payable) | | | Counterparty |
| | | | | | | | |
Budapest Interbank 6 Month Rate (Pay Semiannually) | | 1.820% (Receive
Annually) | | | HUF | | | | 91,600,000 | | | | 10/07/2020 | | | | $ 4,290 | | | | — | | | | $ (232 | ) | | HSBC Bank |
Budapest Interbank 6 Month Rate (Pay Semiannually) | | 1.795% (Receive
Annually) | | | HUF | | | | 93,000,000 | | | | 10/09/2020 | | | | 4,138 | | | | — | | | | (238 | ) | | HSBC Bank |
MXN-TIIE-BANXICO 28 Day Rate (Pay Lunar) | | 7.935% (Receive
Lunar) | | | MXN | | | | 69,000,000 | | | | 12/16/2020 | | | | (56,938) | | | | — | | | | (9,096 | ) | | Banco Bilbao Vizcaya Argentaria SA |
8.255% (Pay Lunar) | | MXN-TIIE-BANXICO
28 Day Rate (Receive
Lunar) | | | MXN | | | | 22,000,000 | | | | 12/06/2028 | | | | 58,941 | | | | — | | | | 10,540 | | | Banco Bilbao Vizcaya Argentaria SA |
MXN-TIIE-BANXICO 28 Day Rate (Pay Lunar) | | 8.156% (Receive
Lunar) | | | MXN | | | | 214,000,000 | | | | 12/13/2023 | | | | (295,578) | | | | — | | | | (67,375 | ) | | Merrill Lynch |
8.410% (Pay Lunar) | | MXN-TIIE-BANXICO
28 Day Rate (Receive
Lunar) | | | MXN | | | | 27,000,000 | | | | 12/06/2028 | | | | 58,817 | | | | — | | | | 13,221 | | | Merrill Lynch |
WIBOR Poland 6 Month Rate (Pay Semiannually) | | 2.400% (Receive
Annually) | | | PLN | | | | 3,770,000 | | | | 03/26/2023 | | | | 10,268 | | | | — | | | | (1,606 | ) | | Merrill Lynch |
| | | | | | | | | | | | | | | | | | | | | | | | | | | | |
| | | | | | | | |
| | | | | | | | | | | | | | | | | $(216,062) | | | | | | | | $(54,786 | ) | | |
| | | | | | | | | | | | | | | | | | | | | | | | | | | | |
**Includes cumulative appreciation/depreciation on centrally cleared swap agreements. Only the current day’s variation margin is reported within the Statements of Assets and Liabilities.
See accompanying notes to the financial statements.
76
ASHMORE EMERGING MARKETS LOCAL CURRENCY BOND FUND
SCHEDULE OF INVESTMENTS (CONTINUED)
As of October 31, 2018
The inputs or methodologies used for valuing securities are not necessarily an indication of the risks associated with investing in those securities and other financial instruments, if any. See note 4 in the Notes to the Financial Statements for more information regarding pricing inputs and valuation techniques. The following is a summary of the inputs used in valuing the Ashmore Emerging Markets Local Currency Bond Fund’s investments and other financial instruments, which are carried at fair value, as of October 31, 2018:
| | | | | | | | | | | | | | | | |
| | | Level 1 | | | Level 2 | | | Level 3 | | | Total | |
Investments | | | | | | | | | | | | | | | | |
Assets: | | | | | | | | | | | | | | | | |
Debt Securities | | | | | | | | | | | | | | | | |
Corporate Bonds | | | $— | | | | $ 419,734 | | | | $— | | | | $ 419,734 | |
Government Agencies | | | — | | | | 315,073 | | | | — | | | | 315,073 | |
Government Bonds | | | — | | | | 48,851,585 | | | | — | | | | 48,851,585 | |
Index Linked Government Bonds | | | — | | | | 418,995 | | | | — | | | | 418,995 | |
Municipal Bonds | | | — | | | | 144,255 | | | | — | | | | 144,255 | |
| | | | | | | | | | | | | | | | |
Total Debt Securities | | | — | | | | 50,149,642 | | | | — | | | | 50,149,642 | |
Fully Funded Total Return Swaps | | | — | | | | 1,745,774 | | | | — | | | | 1,745,774 | |
Total Investments | | | $— | | | | $51,895,416 | | | | $— | | | | $51,895,416 | |
| | | | |
Other Financial Instruments | | | | | | | | | | | | | | | | |
Assets: | | | | | | | | | | | | | | | | |
Forward Foreign Currency Exchange Contracts | | | $— | | | | $ 846,608 | | | | $— | | | | $ 846,608 | |
Centrally Cleared Swap Contracts | | | — | | | | 136,454 | | | | — | | | | 136,454 | |
Liabilities: | | | | | | | | | | | | | | | | |
Forward Foreign Currency Exchange Contracts | | | — | | | | (1,006,476 | ) | | | — | | | | (1,006,476 | ) |
Interest Rate Swap Contracts | | | — | | | | (8,434 | ) | | | — | | | | (8,434 | ) |
Centrally Cleared Swap Contracts | | | — | | | | (352,516 | ) | | | — | | | | (352,516 | ) |
Total Other Financial Instruments | | | $— | | | | $ (384,364 | ) | | | $— | | | | $ (384,364 | ) |
See accompanying notes to the financial statements.
77
ASHMORE EMERGING MARKETS LOCAL CURRENCY BOND FUND
SCHEDULE OF INVESTMENTS (CONTINUED)
As of October 31, 2018
The following is a summary of the fair values of the Fund’s derivative instruments*:
Fair Values of Financial Derivative Instruments on the Statements of Assets and Liabilities as of October 31, 2018:
| | | | | | | | |
| | | Derivatives Not Accounted for as Hedging Instruments | |
| | | | |
| | | Foreign
Exchange Risk | | | Interest
Rate Risk | |
Assets: | | | | | | | | |
Unrealized Appreciation on Centrally Cleared Swap Contracts | | | $ — | | | $ | 136,454 | † |
Unrealized Appreciation on Forward Foreign Currency Exchange Contracts | | | 846,608 | | | | — | |
| | | | |
| | | $ 846,608 | | | $ | 23,761 | |
| | | | |
| | |
Liabilities: | | | | | | | | |
Unrealized Depreciation on Interest Rate Swap Contracts | | | $ — | | | $ | (8,434 | ) |
Unrealized Depreciation on Centrally Cleared Swap Contracts | | | — | | | | (352,516 | )† |
Unrealized Depreciation on Forward Foreign Currency Exchange Contracts | | | (1,006,476 | ) | | | — | |
| | | | |
| | | $(1,006,476 | ) | | $ | (86,981 | ) |
| | | | |
† Includes cumulative appreciation/depreciation on centrally cleared swap agreements. Only the current day’s variation margin is reported within the Statements of Assets and Liabilities.
The Effect of Financial Derivative Instruments on the Statements of Operations for the Year Ended October 31, 2018:
| | | | | | | | |
| | | Derivatives Not Accounted for as Hedging Instruments | |
| | | | |
| | | Foreign
Exchange Risk | | | Interest
Rate Risk | |
Realized Gain (Loss) on Derivatives Recognized resulting from Operations: | | | | | | | | |
Net Realized Loss on Forward Foreign Currency Exchange Contracts | | | $(775,333 | ) | | | $ — | |
Net Realized Loss on Interest Rate Swap Contracts | | | — | | | | (69,210 | ) |
| | | | |
| | | $(775,333 | ) | | | $ (69,210 | ) |
| | | | |
Net Change in Unrealized Appreciation (Depreciation) on Derivatives Recognized resulting from Operations: | | | | | | | | |
Net Change in Unrealized Appreciation on Forward Foreign Currency Exchange Contracts | | | $ 606,645 | | | | $ — | |
Net Change in Unrealized Depreciation on Interest Rate Swap Contracts | | | — | | | | (411,212 | ) |
| | | | |
| | | $ 606,645 | | | | $(411,212 | ) |
| | | | |
* See note 10 in the Notes to the Financial Statements for additional information.
See accompanying notes to the financial statements.
78
ASHMORE EMERGING MARKETS CORPORATE DEBT FUND
SCHEDULE OF INVESTMENTS
As of October 31, 2018
| | | | | | | | | | | | | | | | |
| | | Currency(1) | | | Par | | | Value | | | % of Net
Assets | |
Debt Securities | | | | | | | | | | | | | | | | |
| | | | |
Argentina (Cost $12,743,639) | | | | | | | | | | | | | | | | |
Cablevision S.A., 6.500%, 06/15/2021 | | | | | | | 720,000 | | | $ | 703,800 | | | | 0.21 | |
IRSA Propiedades Comerciales S.A., 8.750%, 03/23/2023 | | | | | | | 695,000 | | | | 694,138 | | | | 0.21 | |
Pampa Energia S.A., 7.375%, 07/21/2023 | | | | | | | 790,000 | | | | 729,723 | | | | 0.22 | |
Pampa Energia S.A., 7.500%, 01/24/2027 | | | | | | | 1,390,000 | | | | 1,216,250 | | | | 0.36 | |
Rio Energy S.A./UGEN S.A./UENSA S.A., 6.875%, 02/01/2025 | | | | | | | 1,455,000 | | | | 1,145,813 | | | | 0.34 | |
YPF S.A., 8.750%, 04/04/2024 | | | | | | | 2,940,000 | | | | 2,895,900 | | | | 0.86 | |
YPF S.A., 8.500%, 07/28/2025 | | | | | | | 2,200,000 | | | | 2,083,950 | | | | 0.62 | |
YPF S.A., 6.950%, 07/21/2027 | | | | | | | 2,455,000 | | | | 2,074,966 | | | | 0.61 | |
| | | | | | | | | | | 11,544,540 | | | | 3.43 | |
| | | | |
Belarus (Cost $2,886,457) | | | | | | | | | | | | | | | | |
Eurotorg LLC Via Bonitron DAC, 8.750%, 10/30/2022 | | | | | | | 2,835,000 | | | | 2,851,454 | | | | 0.85 | |
| | | | | | | | | | | 2,851,454 | | | | 0.85 | |
| | | | |
Brazil (Cost $74,197,327) | | | | | | | | | | | | | | | | |
Andrade Gutierrez International S.A., 11.000%, 08/20/2021(2)(3) | | | | | | | 4,812,000 | | | | 3,849,648 | | | | 1.14 | |
Banco do Brasil S.A., (Variable, U.S. Treasury Yield Curve Rate CMT 10Y + 4.398%) 6.250%, 04/15/2024(4) | | | | | | | 5,405,000 | | | | 4,661,407 | | | | 1.38 | |
Banco do Brasil S.A., (Variable, U.S. Treasury Yield Curve Rate CMT 10Y + 6.362%) 9.000%, 06/18/2024(4) | | | | | | | 1,470,000 | | | | 1,521,450 | | | | 0.45 | |
Braskem Finance Ltd., 6.450%, 02/03/2024 | | | | | | | 1,180,000 | | | | 1,238,115 | | | | 0.37 | |
CSN Islands XI Corp., 6.875%, 09/21/2019 | | | | | | | 2,700,000 | | | | 2,689,875 | | | | 0.80 | |
CSN Resources S.A., 6.500%, 07/21/2020 | | | | | | | 3,575,000 | | | | 3,475,579 | | | | 1.03 | |
Gol Finance S.A., 8.875%, 01/24/2022 | | | | | | | 1,923,000 | | | | 1,876,386 | | | | 0.56 | |
Gol Finance, Inc., 7.000%, 01/31/2025 | | | | | | | 2,355,000 | | | | 2,063,392 | | | | 0.61 | |
GTL Trade Finance, Inc., 7.250%, 04/16/2044 | | | | | | | 665,000 | | | | 691,607 | | | | 0.20 | |
GTL Trade Finance, Inc./Gerdau Holdings, Inc., 5.893%, 04/29/2024 | | | | | | | 1,035,000 | | | | 1,055,700 | | | | 0.31 | |
MARB BondCo PLC, 7.000%, 03/15/2024 | | | | | | | 1,460,000 | | | | 1,399,337 | | | | 0.42 | |
Marfrig Holdings Europe B.V., 8.000%, 06/08/2023 | | | | | | | 3,085,000 | | | | 3,127,419 | | | | 0.93 | |
Minerva Luxembourg S.A., (Variable, U.S. Treasury Yield Curve Rate CMT 5Y + 7.046%) 8.750%, 04/03/2019(4) | | | | | | | 1,410,000 | | | | 1,424,100 | | | | 0.42 | |
Minerva Luxembourg S.A., 5.875%, 01/19/2028 | | | | | | | 2,990,000 | | | | 2,585,453 | | | | 0.77 | |
Petrobras Global Finance B.V., 8.750%, 05/23/2026 | | | | | | | 5,815,000 | | | | 6,494,483 | | | | 1.93 | |
Petrobras Global Finance B.V., 7.375%, 01/17/2027 | | | | | | | 2,710,000 | | | | 2,808,508 | | | | 0.83 | |
Petrobras Global Finance B.V., 6.875%, 01/20/2040 | | | | | | | 6,040,000 | | | | 5,730,450 | | | | 1.70 | |
Petrobras Global Finance B.V., 6.850%, 06/05/2115 | | | | | | | 7,405,000 | | | | 6,562,681 | | | | 1.95 | |
Samarco Mineracao S.A., 4.125%, 11/01/2022(5) | | | | | | | 6,403,000 | | | | 4,770,299 | | | | 1.42 | |
Samarco Mineracao S.A., 5.750%, 10/24/2023(5) | | | | | | | 5,108,000 | | | | 3,933,160 | | | | 1.17 | |
Samarco Mineracao S.A., 5.375%, 09/26/2024(5) | | | | | | | 1,030,000 | | | | 794,388 | | | | 0.24 | |
St Marys Cement, Inc., 5.750%, 01/28/2027 | | | | | | | 990,000 | | | | 980,100 | | | | 0.29 | |
Suzano Austria GmbH, 5.750%, 07/14/2026 | | | | | | | 695,000 | | | | 708,205 | | | | 0.21 | |
Suzano Austria GmbH, 7.000%, 03/16/2047 | | | | | | | 320,000 | | | | 333,760 | | | | 0.10 | |
Unigel Luxembourg S.A., 10.500%, 01/22/2024 | | | | | | | 2,100,000 | | | | 2,152,500 | | | | 0.64 | |
See accompanying notes to the financial statements.
79
ASHMORE EMERGING MARKETS CORPORATE DEBT FUND
SCHEDULE OF INVESTMENTS (CONTINUED)
As of October 31, 2018
| | | | | | | | | | | | | | | | |
| | | Currency(1) | | | Par | | | Value | | | % of Net
Assets | |
Brazil (continued) | | | | | | | | | | | | | | | | |
Vale Overseas Ltd., 6.250%, 08/10/2026 | | | | | | | 1,503,000 | | | $ | 1,606,361 | | | | 0.48 | |
Vale Overseas Ltd., 6.875%, 11/21/2036 | | | | | | | 295,000 | | | | 327,536 | | | | 0.10 | |
Votorantim Cimentos S.A., 7.250%, 04/05/2041 | | | | | | | 3,975,000 | | | | 4,078,350 | | | | 1.21 | |
| | | | | | | | | | | 72,940,249 | | | | 21.66 | |
| | | | |
Chile (Cost $1,636,539) | | | | | | | | | | | | | | | | |
Empresa Nacional del Petroleo, 5.250%, 11/06/2029(2)(6) | | | | | | | 400,000 | | | | 399,660 | | | | 0.12 | |
GNL Quintero S.A., 4.634%, 07/31/2029 | | | | | | | 735,000 | | | | 710,194 | | | | 0.21 | |
Itau CorpBanca, 3.875%, 09/22/2019 | | | | | | | 500,000 | | | | 500,639 | | | | 0.15 | |
| | | | | | | | | | | 1,610,493 | | | | 0.48 | |
| | | | |
China (Cost $36,634,447) | | | | | | | | | | | | | | | | |
Bank of China Ltd., (Floating, ICE LIBOR USD 3M + 0.850%)
3.177%, 03/08/2023 | | | | | | | 1,590,000 | | | | 1,590,636 | | | | 0.47 | |
Bank of China Ltd., 5.000%, 11/13/2024 | | | | | | | 950,000 | | | | 967,191 | | | | 0.29 | |
Central China Real Estate Ltd., 6.500%, 03/05/2021 | | | | | | | 1,445,000 | | | | 1,353,810 | | | | 0.40 | |
CFLD Cayman Investment Ltd., 6.500%, 12/21/2020 | | | | | | | 995,000 | | | | 905,413 | | | | 0.27 | |
Chalco Hong Kong Investment Co. Ltd., (Variable, 7.931% - U.S. Treasury Yield Curve Rate CMT 5Y) 4.250%, 11/07/2021(4) | | | | | | | 1,360,000 | | | | 1,294,570 | | | | 0.38 | |
China Evergrande Group, 7.500%, 06/28/2023 | | | | | | | 2,910,000 | | | | 2,337,231 | | | | 0.69 | |
China Forestry Holdings Co. Ltd., 10.250%, 11/17/2015(5)(7)(8) | | | | | | | 60,000 | | | | — | | | | — | |
China Hongqiao Group Ltd., 6.850%, 04/22/2019 | | | | | | | 700,000 | | | | 695,800 | | | | 0.21 | |
China Minmetals Corp., (Variable, 4.717% - U.S. Treasury Yield Curve Rate CMT 5Y) 3.750%, 11/13/2022(4) | | | | | | | 820,000 | | | | 755,585 | | | | 0.22 | |
Far East Energy Bermuda Ltd., 13.000%, 01/15/2016(2)(5)(6)(7)(8) | | | | | | | 282,201 | | | | — | | | | — | |
Franshion Brilliant Ltd., 5.750%, 03/19/2019 | | | | | | | 1,225,000 | | | | 1,233,411 | | | | 0.37 | |
Fufeng Group Ltd., 5.875%, 08/28/2021 | | | | | | | 670,000 | | | | 670,142 | | | | 0.20 | |
Hontop Energy Singapore via China Wanda International Funding, 7.950%, 12/14/2020 | | | | | | | 1,555,000 | | | | 1,467,625 | | | | 0.44 | |
ICBC Standard Bank PLC, 8.125%, 12/02/2019 | | | | | | | 2,105,000 | | | | 2,183,685 | | | | 0.65 | |
Kaisa Group Holdings Ltd., 7.250%, 06/30/2020 | | | | | | | 730,000 | | | | 607,711 | | | | 0.18 | |
Kaisa Group Holdings Ltd., 8.500%, 06/30/2022 | | | | | | | 1,800,000 | | | | 1,268,914 | | | | 0.38 | |
KWG Group Holdings Ltd., 7.875%, 08/09/2021 | | | | | | | 1,355,000 | | | | 1,300,059 | | | | 0.39 | |
Leader Goal International Ltd., (Variable, 6.919% - U.S. Treasury Yield Curve Rate CMT 5Y) 4.250%, 01/19/2023(4) | | | | | | | 865,000 | | | | 813,411 | | | | 0.24 | |
Longfor Group Holdings Ltd., 4.500%, 01/16/2028 | | | | | | | 1,715,000 | | | | 1,447,678 | | | | 0.43 | |
New Metro Global Ltd., 5.000%, 08/08/2022 | | | | | | | 760,000 | | | | 647,868 | | | | 0.19 | |
Prime Bloom Holdings Ltd., 7.500%, 12/19/2019 | | | | | | | 1,090,000 | | | | 1,010,966 | | | | 0.30 | |
Reward International Investment Ltd., 7.250%, 01/25/2020 | | | | | | | 2,995,000 | | | | 1,847,205 | | | | 0.55 | |
Shenzhen International Holdings Ltd., (Variable, 6.850% - U.S. Treasury Yield Curve Rate CMT 5Y) 3.950%, 11/29/2022(4) | | | | | | | 820,000 | | | | 761,645 | | | | 0.23 | |
Sunac China Holdings Ltd., 7.950%, 08/08/2022 | | | | | | | 2,895,000 | | | | 2,587,340 | | | | 0.77 | |
Sunny Optical Technology Group Co. Ltd., 3.750%, 01/23/2023 | | | | | | | 750,000 | | | | 716,303 | | | | 0.21 | |
Tunghsu Venus Holdings Ltd., 7.000%, 06/12/2020 | | | | | | | 2,785,000 | | | | 2,236,171 | | | | 0.66 | |
See accompanying notes to the financial statements.
80
ASHMORE EMERGING MARKETS CORPORATE DEBT FUND
SCHEDULE OF INVESTMENTS (CONTINUED)
As of October 31, 2018
| | | | | | | | | | | | | | | | |
| | | | Currency(1) | | | | Par | | | | Value | | |
| % of Net
Assets |
|
China (continued) | | | | | | | | | | | | | | | | |
Zhongrong International Resources Co. Ltd., 7.250%, 10/26/2020 | | | | | | | 2,625,000 | | | $ | 1,732,077 | | | | 0.51 | |
| | | | | | | | | | | 32,432,447 | | | | 9.63 | |
| | | | |
Colombia (Cost $8,452,314) | | | | | | | | | | | | | | | | |
Ecopetrol S.A., 7.375%, 09/18/2043 | | | | | | | 1,900,000 | | | | 2,125,625 | | | | 0.63 | |
Ecopetrol S.A., 5.875%, 05/28/2045 | | | | | | | 625,000 | | | | 595,625 | | | | 0.18 | |
Empresa de Telecomunicaciones de Bogota, 7.000%, 01/17/2023 | | | COP | | | | 3,260,000,000 | | | | 861,888 | | | | 0.26 | |
Frontera Energy Corp., 9.700%, 06/25/2023 | | | | | | | 3,440,000 | | | | 3,639,520 | | | | 1.08 | |
Transportadora de Gas Internacional S.A. ESP, 5.700%, 03/20/2022 | | | | | | | 200,000 | | | | 203,800 | | | | 0.06 | |
Transportadora de Gas Internacional S.A. ESP, 11/01/2028(2)(6)(9) | | | | | | | 450,000 | | | | 452,295 | | | | 0.13 | |
| | | | | | | | | | | 7,878,753 | | | | 2.34 | |
| | | | |
Czech Republic (Cost $1,965,282) | | | | | | | | | | | | | | | | |
New World Resources N.V., 8.000%, 04/07/2020(5)(8) | | | EUR | | | | 1,685,299 | | | | — | | | | — | |
New World Resources N.V., 4.000%, 10/07/2020(5)(8) | | | EUR | | | | 700,590 | | | | — | | | | — | |
New World Resources N.V., 16.651%, 10/07/2020(2)(5)(6)(8)(10) | | | EUR | | | | 101,612 | | | | — | | | | — | |
| | | | | | | | | — | | | — | |
| | | | |
Ecuador (Cost $10,087,431) | | | | | | | | | | | | | | | | |
EP PetroEcuador via Noble Sovereign Funding I Ltd., (Floating, ICE LIBOR USD 3M + 5.630%) 8.016%, 09/24/2019 | | | | | | | 4,780,842 | | | | 4,768,890 | | | | 1.42 | |
Petroamazonas EP, 4.625%, 02/16/2020 | | | | | | | 3,760,000 | | | | 3,656,600 | | | | 1.08 | |
Petroamazonas EP, 4.625%, 11/06/2020 | | | | | | | 1,800,000 | | | | 1,696,077 | | | | 0.50 | |
| | | | | | | | | | | 10,121,567 | | | | 3.00 | |
| | | | |
Hong Kong (Cost $648,287) | | | | | | | | | | | | | | | | |
Bank of East Asia (The) Ltd., 6.125%, 07/16/2020 | | | | | | | 620,000 | | | | 638,382 | | | | 0.19 | |
| | | | | | | | | 638,382 | | | 0.19 | |
| | | | |
India (Cost $1,446,010) | | | | | | | | | | | | | | | | |
Bharti Airtel International Netherlands B.V., 5.125%, 03/11/2023 | | | | | | | 1,400,000 | | | | 1,357,978 | | | | 0.40 | |
| | | | | | | | | | | 1,357,978 | | | | 0.40 | |
| | | | |
Indonesia (Cost $7,608,279) | | | | | | | | | | | | | | | | |
Golden Legacy Pte. Ltd., 8.250%, 06/07/2021 | | | | | | | 1,825,000 | | | | 1,873,302 | | | | 0.56 | |
Jababeka International B.V., 6.500%, 10/05/2023 | | | | | | | 800,000 | | | | 640,419 | | | | 0.19 | |
Minejesa Capital B.V., 4.625%, 08/10/2030 | | | | | | | 2,110,000 | | | | 1,856,673 | | | | 0.55 | |
Pertamina Persero PT, 5.250%, 05/23/2021 | | | | | | | 655,000 | | | | 671,230 | | | | 0.20 | |
Pertamina Persero PT, 6.000%, 05/03/2042 | | | | | | | 1,105,000 | | | | 1,047,943 | | | | 0.31 | |
Pertamina Persero PT, 6.500%, 11/07/2048 | | | | | | | 450,000 | | | | 441,275 | | | | 0.13 | |
TBLA International Pte. Ltd., 7.000%, 01/24/2023 | | | | | | | 775,000 | | | | 657,116 | | | | 0.19 | |
| | | | | | | | | | | 7,187,958 | | | | 2.13 | |
See accompanying notes to the financial statements.
81
ASHMORE EMERGING MARKETS CORPORATE DEBT FUND
SCHEDULE OF INVESTMENTS (CONTINUED)
As of October 31, 2018
| | | | | | | | | | | | | | | | |
| | | | Currency(1) | | | | Par | | | | Value | | |
| % of Net
Assets |
|
Iraq (Cost $6,352,597) | | | | | | | | | | | | | | | | |
DNO A.S.A., 8.750%, 05/31/2023(2) | | | | | | | 2,800,000 | | | $ | 2,849,000 | | | | 0.84 | |
Oilflow SPV 1 DAC, 12.000%, 01/13/2022 | | | | | | | 3,415,000 | | | | 3,490,973 | | | | 1.04 | |
| | | | | | | | | 6,339,973 | | | 1.88 | |
Israel (Cost $24,147,318) | | | | | | | | | | | | | | | | |
Altice Financing S.A., 7.500%, 05/15/2026 | | | | | | | 8,975,000 | | | | 8,436,500 | | | | 2.50 | |
Israel Chemicals Ltd., 6.375%, 05/31/2038(2) | | | | | | | 1,075,000 | | | | 1,066,508 | | | | 0.32 | |
Teva Pharmaceutical Finance Co. LLC, 6.150%, 02/01/2036 | | | | | | | 2,945,000 | | | | 2,792,537 | | | | 0.83 | |
Teva Pharmaceutical Finance Netherlands II B.V., 4.500%, 03/01/2025 | | | EUR | | | | 1,715,000 | | | | 2,039,996 | | | | 0.61 | |
Teva Pharmaceutical Finance Netherlands III B.V., 2.800%, 07/21/2023 | | | | | | | 1,760,000 | | | | 1,553,790 | | | | 0.46 | |
Teva Pharmaceutical Finance Netherlands III B.V., 6.000%, 04/15/2024 | | | | | | | 2,080,000 | | | | 2,065,124 | | | | 0.61 | |
Teva Pharmaceutical Finance Netherlands III B.V., 6.750%, 03/01/2028 | | | | | | | 700,000 | | | | 715,727 | | | | 0.21 | |
Teva Pharmaceutical Finance Netherlands III B.V., 4.100%, 10/01/2046 | | | | | | | 5,755,000 | | | | 3,965,730 | | | | 1.18 | |
| | | | | | | | | 22,635,912 | | | 6.72 | |
Jamaica (Cost $22,918,829) | | | | | | | | | | | | | | | | |
Digicel Group Ltd., 8.250%, 09/30/2020 | | | | | | | 11,449,000 | | | | 8,186,149 | | | | 2.43 | |
Digicel Group Ltd., 7.125%, 04/01/2022 | | | | | | | 13,855,000 | | | | 8,642,195 | | | | 2.57 | |
| | | | | | | | | 16,828,344 | | | 5.00 | |
Kazakhstan (Cost $8,302,841) | | | | | | | | | | | | | | | | |
Halyk Savings Bank of Kazakhstan JSC, 5.500%, 12/21/2022 | | | | | | | 5,658,255 | | | | 5,646,938 | | | | 1.68 | |
Kazakhstan Temir Zholy Finance B.V., 6.950%, 07/10/2042 | | | | | | | 975,000 | | | | 1,055,677 | | | | 0.31 | |
KazMunayGas National Co. JSC, 5.375%, 04/24/2030 | | | | | | | 465,000 | | | | 461,513 | | | | 0.14 | |
Nostrum Oil & Gas Finance B.V., 8.000%, 07/25/2022 | | | | | | | 760,000 | | | | 651,898 | | | | 0.19 | |
Nostrum Oil & Gas Finance B.V., 7.000%, 02/16/2025 | | | | | | | 790,000 | | | | 635,950 | | | | 0.19 | |
| | | | | | | | | | | 8,451,976 | | | | 2.51 | |
Kuwait (Cost $1,572,747) | | | | | | | | | | | | | | | | |
NBK Tier 1 Financing Ltd., (Variable, USD Swap 6Y + 4.119%) 5.750%, 04/09/2021(4) | | | | | | | 1,520,000 | | | | 1,523,800 | | | | 0.45 | |
| | | | | | | | | | | 1,523,800 | | | | 0.45 | |
Mexico (Cost $8,548,511) | | | | | | | | | | | | | | | | |
Alfa S.A.B. de C.V., 6.875%, 03/25/2044 | | | | | | | 495,000 | | | | 494,139 | | | | 0.15 | |
BBVA Bancomer S.A., (Variable, U.S. Treasury Yield Curve Rate CMT 5Y + 2.650%) 5.125%, 01/18/2033(4) | | | | | | | 2,240,000 | | | | 1,976,262 | | | | 0.59 | |
Cemex S.A.B. de C.V., 7.750%, 04/16/2026 | | | | | | | 680,000 | | | | 717,400 | | | | 0.21 | |
Cometa Energia S.A. de C.V., 6.375%, 04/24/2035 | | | | | | | 1,613,745 | | | | 1,558,958 | | | | 0.46 | |
Mexico Generadora de Energia S. de rl, 5.500%, 12/06/2032 | | | | | | | 624,594 | | | | 606,019 | | | | 0.18 | |
Petroleos Mexicanos, 6.875%, 08/04/2026 | | | | | | | 1,160,000 | | | | 1,155,360 | | | | 0.34 | |
Petroleos Mexicanos, 5.350%, 02/12/2028 | | | | | | | 790,000 | | | | 703,811 | | | | 0.21 | |
Southern Copper Corp., 7.500%, 07/27/2035 | | | | | | | 270,000 | | | | 324,337 | | | | 0.10 | |
Trust F/1401, 6.950%, 01/30/2044 | | | | | | | 610,000 | | | | 606,499 | | | | 0.18 | |
| | | | | | | | | 8,142,785 | | | 2.42 | |
See accompanying notes to the financial statements.
82
ASHMORE EMERGING MARKETS CORPORATE DEBT FUND
SCHEDULE OF INVESTMENTS (CONTINUED)
As of October 31, 2018
| | | | | | | | | | | | | | | | |
| | | Currency(1) | | | Par | | | Value | | | % of Net
Assets | |
Mongolia (Cost $6,203,480) | | | | | | | | | | | | | | | | |
Energy Resources LLC, 8.000%, 09/30/2022(11) | | | | | | | 5,595,567 | | | $ | 5,324,182 | | | | 1.58 | |
Mongolian Mining Corp., 1.822%, 04/01/2019(3)(10) | | | | | | | 3,390,888 | | | | 1,666,621 | | | | 0.50 | |
| | | | | | | | | | | 6,990,803 | | | | 2.08 | |
Morocco (Cost $1,570,683) | | | | | | | | | | | | | | | | |
OCP S.A., 5.625%, 04/25/2024 | | | | | | | 870,000 | | | | 886,774 | | | | 0.26 | |
OCP S.A., 6.875%, 04/25/2044 | | | | | | | 570,000 | | | | 594,795 | | | | 0.18 | |
| | | | | | | | | | | 1,481,569 | | | | 0.44 | |
Nigeria (Cost $4,934,702) | | | | | | | | | | | | | | | | |
First Bank of Nigeria Ltd. Via FBN Finance Co. B.V., (Variable, USD Swap 2Y + 6.488%) 8.000%, 07/23/2021(4) | | | | | | | 5,306,000 | | | | 5,292,735 | | | | 1.57 | |
| | | | | | | | | | | 5,292,735 | | | | 1.57 | |
Oman (Cost $401,241) | | | | | | | | | | | | | | | | |
Oztel Holdings SPC Ltd., 6.625%, 04/24/2028 | | | | | | | 410,000 | | | | 401,718 | | | | 0.12 | |
| | | | | | | | | | | 401,718 | | | | 0.12 | |
Panama (Cost $4,094,266) | | | | | | | | | | | | | | | | |
Banistmo S.A., 3.650%, 09/19/2022 | | | | | | | 900,000 | | | | 852,750 | | | | 0.25 | |
Sable International Finance Ltd., 6.875%, 08/01/2022 | | | | | | | 3,135,000 | | | | 3,272,156 | | | | 0.97 | |
| | | | | | | | | | | 4,124,906 | | | | 1.22 | |
Peru (Cost $5,814,421) | | | | | | | | | | | | | | | | |
Ajecorp B.V., 6.500%, 05/14/2022 | | | | | | | 4,175,000 | | | | 3,162,563 | | | | 0.94 | |
Intercorp Financial Services, Inc., 4.125%, 10/19/2027 | | | | | | | 205,000 | | | | 184,756 | | | | 0.06 | |
Minsur S.A., 6.250%, 02/07/2024 | | | | | | | 280,000 | | | | 284,483 | | | | 0.08 | |
Nexa Resources S.A., 5.375%, 05/04/2027 | | | | | | | 1,100,000 | | | | 1,069,761 | | | | 0.32 | |
Peru LNG Srl, 5.375%, 03/22/2030 | | | | | | | 375,000 | | | | 370,875 | | | | 0.11 | |
| | | | | | | | | | | 5,072,438 | | | | 1.51 | |
Qatar (Cost $3,851,905) | | | | | | | | | | | | | | | | |
CBQ Finance Ltd., 2.875%, 06/24/2019 | | | | | | | 1,545,000 | | | | 1,535,235 | | | | 0.46 | |
Ezdan Sukuk Co. Ltd., 4.375%, 05/18/2021 | | | | | | | 1,615,000 | | | | 1,363,480 | | | | 0.40 | |
Ezdan Sukuk Co. Ltd., 4.875%, 04/05/2022 | | | | | | | 1,000,000 | | | | 834,660 | | | | 0.25 | |
| | | | | | | | | | | 3,733,375 | | | | 1.11 | |
Russian Federation (Cost $13,748,206) | | | | | | | | | | | | | | | | |
CEDC Finance Corp International, Inc., 10.000%, 12/31/2022(2) | | | | | | | 5,052,696 | | | | 3,637,941 | | | | 1.08 | |
Credit Bank of Moscow Via CBOM Finance PLC, (Variable, USD Swap 5Y + 5.416%) 7.500%, 10/05/2027(4) | | | | | | | 1,670,000 | | | | 1,262,273 | | | | 0.37 | |
GTH Finance B.V., 7.250%, 04/26/2023 | | | | | | | 3,485,000 | | | | 3,606,975 | | | | 1.07 | |
Koks OAO Via Koks Finance DAC, 7.500%, 05/04/2022 | | | | | | | 870,000 | | | | 869,652 | | | | 0.26 | |
Tinkoff Bank JSC Via TCS Finance Ltd., (Variable, U.S. Treasury Yield Curve Rate CMT 5Y + 7.592%) 9.250%, 09/15/2022(4) | | | | | | | 2,560,000 | | | | 2,521,600 | | | | 0.75 | |
| | | | | | | | | | | 11,898,441 | | | | 3.53 | |
See accompanying notes to the financial statements.
83
ASHMORE EMERGING MARKETS CORPORATE DEBT FUND
SCHEDULE OF INVESTMENTS (CONTINUED)
As of October 31, 2018
| | | | | | | | | | | | | | | | |
| | | Currency(1) | | | Par | | | Value | | | % of Net
Assets | |
Russian Federation (continued) | | | | | | | | | | | | | | | | |
Saudi Arabia (Cost $1,452,857) | | | | | | | | | | | | | | | | |
Acwa Power Management And Investments One Ltd., 5.950%, 12/15/2039 | | | | | | | 1,045,000 | | | $ | 987,402 | | | | 0.29 | |
SABIC Capital II B.V., 4.000%, 10/10/2023(2)(6) | | | | | | | 400,000 | | | | 395,080 | | | | 0.12 | |
| | | | | | | | | | | 1,382,482 | | | | 0.41 | |
Singapore (Cost $498,361) | | | | | | | | | | | | | | | | |
DBS Group Holdings Ltd., 2.246%, 07/16/2019 | | | | | | | 500,000 | | | | 496,850 | | | | 0.15 | |
| | | | | | | | | | | 496,850 | | | | 0.15 | |
South Africa (Cost $1,577,995) | | | | | | | | | | | | | | | | |
Liquid Telecommunications Financing PLC, 8.500%, 07/13/2022 | | | | | | | 1,320,000 | | | | 1,346,234 | | | | 0.40 | |
SASOL Financing USA LLC, 5.875%, 03/27/2024 | | | | | | | 200,000 | | | | 201,476 | | | | 0.06 | |
| | | | | | | | | | | 1,547,710 | | | | 0.46 | |
South Korea (Cost $723,365) | | | | | | | | | | | | | | | | |
Woori Bank, 4.750%, 04/30/2024 | | | | | | | 715,000 | | | | 715,000 | | | | 0.21 | |
| | | | | | | | | 715,000 | | | 0.21 | |
Tanzania (Cost $1,656,621) | | | | | | | | | | | | | | | | |
HTA Group Ltd., 9.125%, 03/08/2022 | | | | | | | 1,625,000 | | | | 1,655,469 | | | | 0.49 | |
| | | | | | | | | | | 1,655,469 | | | | 0.49 | |
Turkey (Cost $14,216,719) | | | | | | | | | | | | | | | | |
Akbank T.A.S., 4.000%, 01/24/2020 | | | | | | | 760,000 | | | | 733,257 | | | | 0.22 | |
Akbank T.A.S., 5.000%, 10/24/2022 | | | | | | | 1,201,000 | | | | 1,093,189 | | | | 0.32 | |
Akbank T.A.S., 5.125%, 03/31/2025 | | | | | | | 780,000 | | | | 667,388 | | | | 0.20 | |
KOC Holding A.S., 5.250%, 03/15/2023 | | | | | | | 1,570,000 | | | | 1,474,670 | | | | 0.44 | |
QNB Finansbank A.S., 4.875%, 05/19/2022 | | | | | | | 830,000 | | | | 766,553 | | | | 0.23 | |
Tupras Turkiye Petrol Rafinerileri A.S., 4.500%, 10/18/2024 | | | | | | | 880,000 | | | | 780,007 | | | | 0.23 | |
Turkiye Garanti Bankasi A.S., 5.250%, 09/13/2022(12) | | | | | | | 1,230,000 | | | | 1,133,150 | | | | 0.34 | |
Turkiye Garanti Bankasi A.S., 5.875%, 03/16/2023 | | | | | | | 870,000 | | | | 804,924 | | | | 0.24 | |
Turkiye Is Bankasi A.S., 5.000%, 06/25/2021 | | | | | | | 1,534,000 | | | | 1,354,657 | | | | 0.40 | |
Turkiye Is Bankasi A.S., 5.375%, 10/06/2021 | | | | | | | 1,559,000 | | | | 1,374,302 | | | | 0.41 | |
Turkiye Is Bankasi A.S., 5.500%, 04/21/2022 | | | | | | | 1,545,000 | | | | 1,334,843 | | | | 0.40 | |
Yapi ve Kredi Bankasi A.S., 5.750%, 02/24/2022 | | | | | | | 1,735,000 | | | | 1,570,175 | | | | 0.46 | |
Yapi ve Kredi Bankasi A.S., 5.850%, 06/21/2024 | | | | | | | 1,530,000 | | | | 1,297,991 | | | | 0.38 | |
Yuksel Insaat A.S., 9.500%, 11/10/2015(5)(7)(8) | | | | | | | 435,000 | | | | — | | | | — | |
| | | | | | | | | | | 14,385,106 | | | | 4.27 | |
Ukraine (Cost $18,339,893) | | | | | | | | | | | | | | | | |
DTEK Finance PLC, 10.750%, (14% PIK), 12/31/2024(3) | | | | | | | 11,449,698 | | | | 11,691,058 | | | | 3.47 | |
Ferrexpo Finance PLC, 10.375%, 04/07/2019 | | | | | | | 789,000 | | | | 804,938 | | | | 0.24 | |
See accompanying notes to the financial statements.
84
ASHMORE EMERGING MARKETS CORPORATE DEBT FUND
SCHEDULE OF INVESTMENTS (CONTINUED)
As of October 31, 2018
| | | | | | | | | | | | | | | | |
| | | | Currency(1) | | | | Par | | | | Value | | |
| % of Net
Assets |
|
Ukraine (continued) | | | | | | | | | | | | | | | | |
Metinvest B.V., 7.750%, 04/23/2023 | | | | | | | 4,379,000 | | | $ | 4,203,840 | | | | 1.25 | |
Metinvest B.V., 8.500%, 04/23/2026 | | | | | | | 2,822,000 | | | | 2,687,955 | | | | 0.80 | |
MHP S.E., 7.750%, 05/10/2024 | | | | | | | 550,000 | | | | 542,239 | | | | 0.16 | |
| | | | | | | | | | | 19,930,030 | | | | 5.92 | |
United Arab Emirates (Cost $5,151,413) | | | | | | | | | | | | | | | | |
BOS Funding Ltd., 3.374%, 06/08/2020 | | | | | | | 1,075,000 | | | | 1,053,672 | | | | 0.31 | |
DIB Sukuk Ltd., 3.625%, 02/06/2023 | | | | | | | 685,000 | | | | 659,998 | | | | 0.20 | |
DP World Ltd., 6.850%, 07/02/2037 | | | | | | | 290,000 | | | | 322,872 | | | | 0.10 | |
EMG Sukuk Ltd., 4.564%, 06/18/2024 | | | | | | | 775,000 | | | | 764,336 | | | | 0.23 | |
Emirates Semb Corp Water & Power Co. PJSC, 4.450%, 08/01/2035 | | | | | | | 375,000 | | | | 352,856 | | | | 0.10 | |
First Abu Dhabi Bank PJSC, 3.000%, 08/13/2019 | | | | | | | 380,000 | | | | 379,245 | | | | 0.11 | |
First Abu Dhabi Bank PJSC, (Variable, USD Swap 5Y + 3.350%) 5.250%, 06/17/2020(4) | | | | | | | 1,505,000 | | | | 1,495,398 | | | | 0.44 | |
| | | | | | | | | | | 5,028,377 | | | | 1.49 | |
Venezuela (Cost $7,385,856) | | | | | | | | | | | | | | | | |
Petroleos de Venezuela S.A., 8.500%, 10/27/2020 | | | | | | | 6,512,500 | | | | 6,072,906 | | | | 1.80 | |
Petroleos de Venezuela S.A., 9.750%, 05/17/2035(5) | | | | | | | 5,104,093 | | | | 1,084,620 | | | | 0.32 | |
| | | | | | | | | | | 7,157,526 | | | | 2.12 | |
| | | | |
Total Debt Securities (Cost $321,770,839) | | | | | | | | | | | 303,781,146 | | | | 90.19 | |
| | | | |
Bank Loans | | | | | | | | | | | | | | | | |
| | | | |
Brazil (Cost $2,100,000) | | | | | | | | | | | | | | | | |
Samarco Mineracao S.A., 3.387%, 09/09/2018(7)(13) | | | | | | | 3,000,000 | | | | 1,890,000 | | | | 0.56 | |
| | | | | | | | | | | 1,890,000 | | | | 0.56 | |
| | | | |
Czech Republic (Cost $362,933) | | | | | | | | | | | | | | | | |
New World Resources N.V., 8.500%, 10/07/2016(7)(8) | | | EUR | | | | 428,574 | | | | — | | | | — | |
| | | | | | | | | | | — | | | | — | |
Malaysia (Cost $1,812,026) | | | | | | | | | | | | | | | | |
DRB-Hicom Bhd., 4.719%, 01/22/2021(13) | | | | | | | 1,931,381 | | | | 1,863,783 | | | | 0.55 | |
| | | | | | | | | | | 1,863,783 | | | | 0.55 | |
Nigeria (Cost $1,035,598) | | | | | | | | | | | | | | | | |
Seven Energy Ltd., 12.250%, 06/30/2020(13) | | | | | | | 1,085,453 | | | | 646,496 | | | | 0.19 | |
| | | | | | | | | | | 646,496 | | | | 0.19 | |
United Arab Emirates (Cost $8,789,186) | | | | | | | | | | | | | | | | |
DP World Ltd., 3.750%, 09/30/2022(13) | | | | | | | 9,523,465 | | | | 8,856,822 | | | | 2.63 | |
DP World Ltd., 4.750%, 09/30/2022(13) | | | | | | | 415,974 | | | | 386,856 | | | | 0.12 | |
| | | | | | | | | | | 9,243,678 | | | | 2.75 | |
| | | | |
Total Bank Loans (Cost $14,099,743) | | | | | | | | | | | 13,643,957 | | | | 4.05 | |
See accompanying notes to the financial statements.
85
ASHMORE EMERGING MARKETS CORPORATE DEBT FUND
SCHEDULE OF INVESTMENTS (CONTINUED)
As of October 31, 2018
| | | | | | | | | | | | | | | | |
| | | Currency(1) | | | Shares | | | Value | | | % of Net
Assets | |
Equity Securities | | | | | | | | | | | | | | | | |
| | | | |
Czech Republic (Cost $1,093,253) | | | | | | | | | | | | | | | | |
New World Resources PLC, Class A *(8) | | | GBP | | | | 36,580,138 | | | $ | — | | | | — | |
| | | | | | | | | | | — | | | | — | |
Mongolia (Cost $2,417,612) | | | | | | | | | | | | | | | | |
Mongolian Mining Corp. * | | | HKD | | | | 14,731,698 | | | | 308,832 | | | | 0.09 | |
| | | | | | | | | | | 308,832 | | | | 0.09 | |
Niger (Cost $1,308,571) | | | | | | | | | | | | | | | | |
Savannah Petroleum PLC * | | | GBP | | | | 3,368,524 | | | | 1,312,284 | | | | 0.39 | |
| | | | | | | | | | | 1,312,284 | | | | 0.39 | |
Russian Federation (Cost $655,356) | | | | | | | | | | | | | | | | |
Roust Corp. *(13) | | | | | | | 13,359 | | | | 26,718 | | | | 0.01 | |
Roust Corp., Class C *(13) | | | | | | | 28,922 | | | | 57,844 | | | | 0.02 | |
| | | | | | | | | | | 84,562 | | | | 0.03 | |
| | | | |
Total Equity Securities (Cost $5,474,792) | | | | | | | | | | | 1,705,678 | | | | 0.51 | |
| | | Currency(1) | | | Number
of
Warrants | | | Value | | | % of Net
Assets | |
Warrants | | | | | | | | | | | | | | | | |
| | | | |
Mexico (Cost $—) | | | | | | | | | | | | | | | | |
Corp. GEO S.A.B. de C.V., Exp. 07/31/2022, Strike Price $9.75 *(8) | | | MXN | | | | 13,777 | | | $ | — | | | | — | |
| | | | | | | | | | | — | | | | — | |
Total Warrants (Cost $—) | | | | | | | | | | | — | | | | — | |
| | | | |
Total Investments (Total Cost $341,345,374) | | | | | | | | | | | 319,130,781 | | | | 94.75 | |
| | | | |
Other Assets Less Liabilities (See Statements of Assets and Liabilities for further detail) | | | | | | | | | | | 17,689,256 | | | | 5.25 | |
| | | | |
Net Assets | | | | | | | | | | $ | 336,820,037 | | | | 100.00 | |
| * | Non-income producing security. |
| (1) | Par values are stated in United States Dollars unless otherwise noted below. |
| (2) | Securities exempt from registration under Rule 144A of the Securities Act of 1933. These securities may not be publicly traded without registration under the Securities Act of 1933. |
| (3) | Security is a payment-in-kind bond, and unless otherwise noted in the description of the security, pays its entire coupon on an in-kind basis. |
| (4) | Variable rate security. Security issued at a fixed coupon rate, which converts to a variable rate at a specified date. Rate shown is the rate in effect as of period end. |
| (5) | Issuer has defaulted on terms of debt obligation. |
| (6) | Restricted security that has been deemed illiquid. At October 31, 2018, the value of these restricted illiquid securities amount to $1,247,035 or 0.4% of net assets. Additional information on each restricted illiquid security is as follows: |
See accompanying notes to the financial statements.
86
ASHMORE EMERGING MARKETS CORPORATE DEBT FUND
SCHEDULE OF INVESTMENTS (CONTINUED)
As of October 31, 2018
| | | | |
| SECURITY | | ACQUISITION DATE | | ACQUISITION COST |
| | |
Empresa Nacional del Petroleo, 5.250%, 11/06/2029 | | 10/30/2018 | | $399,660 |
Far East Energy Bermuda Ltd., 13.000%, 01/15/2016 | | 01/14/2013-07/24/2015 | | 279,057 |
New World Resources N.V., 16.651%, 10/07/2020 | | 10/07/2014 | | — |
SABIC Capital II B.V., 4.000%, 10/10/2023 | | 10/02/2018 | | 398,386 |
Transportadora de Gas Internacional S.A. ESP, 11/01/2028 | | 10/17/2018 | | 450,000 |
| (7) | Maturity has been extended under the terms of a plan of reorganization. |
| (8) | Security has been deemed worthless and is a Level 3 investment. |
| (9) | When issued security. Coupon rate was not in effect at October 31, 2018. |
| (10) | Zero coupon bond – interest rate reflects effective yield on the date of purchase. |
| (11) | The interest rate is subject to the performance of the TSIPPCAE Commodity Index. |
| (12) | All or a portion of security is held as collateral for reverse repurchase agreements. |
| (13) | Security is a Level 3 investment. |
Percentages shown are based on net assets.
At October 31, 2018, the Ashmore Emerging Markets Corporate Debt Fund had outstanding forward foreign currency exchange contracts as follows:
| | | | | | | | | | | | | | | | | | |
Settlement Date | | Counterparty | | Currency
Buy | | Currency
Buy Amount
(Local
Currency) | | | | | Currency
Sell | | Currency
Sell Amount
(Local
Currency) | | | Unrealized
Gain/(Loss) |
| | | | | | | |
11/21/2018 | | Morgan Stanley | | United States Dollar | | | 2,372,489 | | | Euro | | | | | 2,040,895 | | | $56,998 |
| | | | | | | | | | | | | | | | | | |
| | | | | | | |
Total | | | | | | | | | | | | | | | | | | $56,998 |
| | | | | | | | | | | | | | | | | | |
See accompanying notes to the financial statements.
87
ASHMORE EMERGING MARKETS CORPORATE DEBT FUND
SCHEDULE OF INVESTMENTS (CONTINUED)
As of October 31, 2018
The inputs or methodologies used for valuing securities are not necessarily an indication of the risks associated with investing in those securities and other financial instruments, if any. See note 4 in the Notes to the Financial Statements for more information regarding pricing inputs and valuation techniques. The following is a summary of the inputs used in valuing the Ashmore Emerging Markets Corporate Debt Fund’s investments and other financial instruments, which are carried at fair value, as of October 31, 2018:
| | | | | | | | | | | | | | | | |
| | | Level 1 | | | Level 2 | | | Level 3 | | | Total | |
Investments | | | | | | | | | | | | | | | | |
Assets: | | | | | | | | | | | | | | | | |
Debt Securities | | | | | | | | | | | | | | | | |
Corporate Bonds | | | $— | | | | $296,393,979 | | | | $ — | | | | $296,393,979 | |
Corporate Convertible Bonds | | | — | | | | 1,976,262 | | | | — | | | | 1,976,262 | |
Financial Certificates | | | — | | | | 3,622,474 | | | | — | | | | 3,622,474 | |
Government Agencies | | | — | | | | 1,788,431 | | | | — | | | | 1,788,431 | |
| | | | | | | | | | | | | | | | |
Total Debt Securities | | | — | | | | 303,781,146 | | | | — | | | | 303,781,146 | |
Bank Loans | | | | | | | | | | | | | | | | |
Brazil | | | — | | | | — | | | | 1,890,000 | | | | 1,890,000 | |
Malaysia | | | — | | | | — | | | | 1,863,783 | | | | 1,863,783 | |
Nigeria | | | — | | | | — | | | | 646,496 | | | | 646,496 | |
United Arab Emirates | | | — | | | | — | | | | 9,243,678 | | | | 9,243,678 | |
| | | | | | | | | | | | | | | | |
Total Bank Loans | | | — | | | | — | | | | 13,643,957 | | | | 13,643,957 | |
Equity Securities | | | | | | | | | | | | | | | | |
Common Stock | | | | | | | | | | | | | | | | |
Mongolia | | | — | | | | 308,832 | | | | — | | | | 308,832 | |
Niger | | | — | | | | 1,312,284 | | | | — | | | | 1,312,284 | |
Russian Federation | | | — | | | | — | | | | 84,562 | | | | 84,562 | |
| | | | | | | | | | | | | | | | |
Total Common Stock | | | — | | | | 1,621,116 | | | | 84,562 | | | | 1,705,678 | |
Total Investments | | | $— | | | | $305,402,262 | | | | $13,728,519 | | | | $319,130,781 | |
| | | | |
Other Financial Instruments | | | | | | | | | | | | | | | | |
Assets: | | | | | | | | | | | | | | | | |
Forward Foreign Currency Exchange Contracts | | | $— | | | | $56,998 | | | | $— | | | | $56,998 | |
Total Other Financial Instruments | | | $— | | | | $56,998 | | | | $— | | | | $56,998 | |
See accompanying notes to the financial statements.
88
ASHMORE EMERGING MARKETS CORPORATE DEBT FUND
SCHEDULE OF INVESTMENTS (CONTINUED)
As of October 31, 2018
The following is a reconciliation of investments in which significant unobservable inputs (Level 3) were used for the Fund during the period ending October 31, 2018:
| | | | | | | | | | | | | | | | | | | | | | | | | | | | | | | | | | | | | | | | | | | | | | | | | | |
Category and
Subcategory | | Beginning
Balance
at 10/31/2017 | | Accrued
Discounts
(Premiums) | | Purchases | | Sales | | Realized
Gains
(Losses) | | Change in
Unrealized
Appreciation
(Depreciation) | | Transfer
into
Level 3 | | Transfer
out of
Level 3 | | Ending
Balance
at 10/31/2018 | | Change in
Unrealized
Appreciation
(Depreciation)
from Investments
still held
10/31/2018 |
Investments, at value | | | | | | | | | | | | | | | | | | | | | | | | | | | | | | | | | | | | | | | | | | | | | | | | | | |
Corporate Bonds Turkey | | | $ | — | | | | $ | — | | | | $ | — | | | | $ | (5,000 | ) | | | $ | (70,000 | ) | | | $ | 75,000 | | | | $ | — | | | | $ | — | | | | $ | — | | | | $ | 75,000 | |
Bank Loans | | | | | | | | | | | | | | | | | | | | | | | | | | | | | | | | | | | | | | | | | | | | | | | | | | |
Brazil | | | | — | | | | | — | | | | | 2,100,000 | | | | | — | | | | | — | | | | | (210,000 | ) | | | | — | | | | | — | | | | | 1,890,000 | | | | | (210,000 | ) |
China | | | | — | | | | | — | | | | | — | | | | | — | | | | | (39,677 | ) | | | | 39,677 | | | | | — | | | | | — | | | | | — | | | | | — | |
Malaysia | | | | 2,079,189 | | | | | 61,417 | | | | | 472,850 | | | | | (772,406 | ) | | | | 71,041 | | | | | (48,308 | ) | | | | — | | | | | — | | | | | 1,863,783 | | | | | (48,308 | ) |
Nigeria | | | | 646,496 | | | | | — | | | | | — | | | | | — | | | | | — | | | | | — | | | | | — | | | | | — | | | | | 646,496 | | | | | — | |
Ukraine | | | | 3,100,309 | | | | | 59,202 | | | | | — | | | | | (3,122,649 | ) | | | | 22,203 | | | | | (59,065 | ) | | | | — | | | | | — | | | | | — | | | | | — | |
United Arab Emirates | | | | 13,466,581 | | | | | (113,139 | ) | | | | 184,224 | | | | | (4,258,507 | ) | | | | (222,267 | ) | | | | 186,786 | | | | | — | | | | | — | | | | | 9,243,678 | | | | | (81,345 | ) |
Common Stock | | | | | | | | | | | | | | | | | | | | | | | | | | | | | | | | | | | | | | | | | | | | | | | | | | |
Russian Federation | | | | 556,333 | | | | | — | | | | | — | | | | | — | | | | | — | | | | | (471,771 | ) | | | | — | | | | | — | | | | | 84,562 | | | | | (471,771 | ) |
Warrants | | | | | | | | | | | | | | | | | | | | | | | | | | | | | | | | | | | | | | | | | | | | | | | | | | |
China | | | | — | | | | | — | | | | | — | | | | | — | | | | | (3,926 | ) | | | | 3,926 | | | | | — | | | | | — | | | | | — | | | | | — | |
| | | | | | | | | | |
Total | | | $ | 19,848,908 | | | | $ | 7,480 | | | | $ | 2,757,074 | | | | $ | (8,158,562 | ) | | | $ | (242,626 | ) | | | $ | (483,755 | ) | | | $ | — | | | | $ | — | | | | $ | 13,728,519 | | | | $ | (736,424 | ) |
The following table on “Quantitative information about Fair Value measurements” provides information on the valuation techniques and inputs used to value Level 3 securities at October 31, 2018:
| | | | | | | | |
Quantitative Information about Level 3 Fair Value Measurements |
| | | |
| | | Fair Value at
10/31/2018 | | | Valuation
Technique | | Unobservable
Input |
| | | |
Banks Loans | | $ | 12,997,461 | | | Broker quote | | Inputs to broker model |
Banks Loans | | | 646,496 | | | Indicative Bid | | Bid Source |
Common Stock | | | 84,562 | | | Broker quote | | Inputs to broker model |
| | | | |
Total | | $ | 13,728,519 | | | | | |
See accompanying notes to the financial statements.
89
ASHMORE EMERGING MARKETS CORPORATE DEBT FUND
SCHEDULE OF INVESTMENTS (CONTINUED)
As of October 31, 2018
The following is a summary of the fair values of the Fund’s derivative instruments*:
Fair Values of Financial Derivative Instruments on the Statements of Assets and Liabilities as of October 31, 2018:
| | | | |
| | | Derivatives Not Accounted for as
Hedging Instruments | |
| | | Foreign
Exchange Risk | |
Assets: | | | | |
Unrealized Appreciation on Forward Foreign Currency Exchange Contracts | | | $56,998 | |
| | | | |
The Effect of Financial Derivative Instruments on the Statements of Operations for the Year Ended October 31, 2018:
| | | | | | | | | | |
| | | Derivatives Not Accounted for as
Hedging Instruments |
| | | Foreign
Exchange Risk |
Realized Gain (Loss) on Derivatives Recognized resulting from Operations: | | | | | |
Net Realized Gain on Forward Foreign Currency Exchange Contracts | | | | | | | | | $132,068 | |
| | | | | |
| | |
Net Change in Unrealized Appreciation (Depreciation) on Derivatives Recognized resulting from Operations: | | | | | | | | | | |
Net Change in Unrealized Appreciation on Forward Foreign Currency Exchange Contracts | | | | | | | | | $37,405 | |
| | | | | |
* See note 10 in the Notes to the Financial Statements for additional information.
See accompanying notes to the financial statements.
90
ASHMORE EMERGING MARKETS SHORT DURATION FUND
SCHEDULE OF INVESTMENTS
As of October 31, 2018
| | | | | | | | | | | | | | | | |
| | | Currency(1) | | | Par | | | Value | | | % of Net
Assets | |
Debt Securities | | | | | | | | | | | | | | | | |
| | | | |
Angola (Cost $1,445,889) | | | | | | | | | | | | | | | | |
Angola (Rep of) Via Northern Lights III B.V., 7.000%, 08/17/2019 | | | | | | | 1,447,500 | | | $ | 1,452,841 | | | | 0.19 | |
| | | | | | | | | | | 1,452,841 | | | | 0.19 | |
| | | | |
Argentina (Cost $10,698,230) | | | | | | | | | | | | | | | | |
Cablevision S.A., 6.500%, 06/15/2021 | | | | | | | 1,590,000 | | | | 1,554,225 | | | | 0.20 | |
Empresa Distribuidora Y Comercializadora Norte, 9.750%, 10/25/2022 | | | | | | | 650,000 | | | | 626,243 | | | | 0.08 | |
Mastellone Hermanos S.A., 12.625%, 07/03/2021 | | | | | | | 510,000 | | | | 518,685 | | | | 0.07 | |
Pan American Energy LLC, 7.875%, 05/07/2021 | | | | | | | 2,380,000 | | | | 2,424,744 | | | | 0.31 | |
YPF S.A., 8.500%, 03/23/2021 | | | | | | | 5,370,000 | | | | 5,421,015 | | | | 0.69 | |
| | | | | | | | | | | 10,544,912 | | | | 1.35 | |
| | | | |
Bahrain (Cost $4,901,195) | | | | | | | | | | | | | | | | |
Batelco International Finance No. 1 Ltd., 4.250%, 05/01/2020 | | | | | | | 4,960,000 | | | | 4,846,912 | | | | 0.62 | |
| | | | | | | | | | | 4,846,912 | | | | 0.62 | |
| | | | |
Brazil (Cost $130,351,813) | | | | | | | | | | | | | | | | |
Andrade Gutierrez International S.A., 11.000%, 08/20/2021(2)(3) | | | | | | | 560,000 | | | | 448,006 | | | | 0.06 | |
Banco BTG Pactual S.A., 4.000%, 01/16/2020 | | | | | | | 4,900,000 | | | | 4,826,549 | | | | 0.62 | |
Banco do Brasil S.A., 5.875%, 01/26/2022 | | | | | | | 13,490,000 | | | | 13,692,350 | | | | 1.76 | |
Banco Votorantim S.A., 7.375%, 01/21/2020 | | | | | | | 1,830,000 | | | | 1,897,527 | | | | 0.24 | |
Braskem Finance Ltd., 7.000%, 05/07/2020 | | | | | | | 2,000,000 | | | | 2,070,000 | | | | 0.27 | |
Braskem Finance Ltd., 5.750%, 04/15/2021 | | | | | | | 2,190,000 | | | | 2,242,035 | | | | 0.29 | |
Cia Brasileira de Aluminio, 6.750%, 04/05/2021 | | | | | | | 3,850,000 | | | | 4,000,150 | | | | 0.51 | |
CSN Islands XI Corp., 6.875%, 09/21/2019 | | | | | | | 9,645,000 | | | | 9,608,831 | | | | 1.23 | |
CSN Resources S.A., 6.500%, 07/21/2020 | | | | | | | 19,165,000 | | | | 18,632,021 | | | | 2.39 | |
Gol Finance S.A., 8.875%, 01/24/2022 | | | | | | | 900,000 | | | | 878,184 | | | | 0.11 | |
Itau Unibanco Holding S.A., 5.750%, 01/22/2021 | | | | | | | 1,640,000 | | | | 1,676,916 | | | | 0.22 | |
Itau Unibanco Holding S.A., 6.200%, 12/21/2021 | | | | | | | 6,490,000 | | | | 6,713,970 | | | | 0.86 | |
Marfrig Holdings Europe B.V., 6.875%, 06/24/2019 | | | | | | | 1,660,000 | | | | 1,680,750 | | | | 0.22 | |
Marfrig Holdings Europe B.V., 11.250%, 09/20/2021 | | | | | | | 500,000 | | | | 511,250 | | | | 0.07 | |
Petrobras Global Finance B.V., 5.375%, 01/27/2021 | | | | | | | 1,000,000 | | | | 1,017,500 | | | | 0.13 | |
Petrobras Global Finance B.V., 8.375%, 05/23/2021 | | | | | | | 25,725,000 | | | | 27,995,231 | | | | 3.59 | |
Petrobras Global Finance B.V., 6.125%, 01/17/2022 | | | | | | | 14,120,000 | | | | 14,631,850 | | | | 1.88 | |
Petrobras Global Finance B.V., 4.375%, 05/20/2023 | | | | | | | 18,040,000 | | | | 17,399,580 | | | | 2.23 | |
| | | | | | | | | | | 129,922,700 | | | | 16.68 | |
| | | | |
China (Cost $105,646,555) | | | | | | | | | | | | | | | | |
361 Degrees International Ltd., 7.250%, 06/03/2021 | | | | | | | 1,125,000 | | | | 1,068,649 | | | | 0.14 | |
Agile Group Holdings Ltd., 9.000%, 05/21/2020 | | | | | | | 600,000 | | | | 617,365 | | | | 0.08 | |
Central China Real Estate Ltd., 8.750%, 01/23/2021 | | | | | | | 4,083,000 | | | | 4,034,576 | | | | 0.52 | |
Central China Real Estate Ltd., 6.500%, 03/05/2021 | | | | | | | 3,735,000 | | | | 3,499,295 | | | | 0.45 | |
CFLD Cayman Investment Ltd., 6.500%, 12/21/2020 | | | | | | | 5,200,000 | | | | 4,731,808 | | | | 0.61 | |
China Evergrande Group, 7.000%, 03/23/2020 | | | | | | | 500,000 | | | | 486,132 | | | | 0.06 | |
China Evergrande Group, 8.250%, 03/23/2022 | | | | | | | 13,590,000 | | | | 11,959,635 | | | | 1.54 | |
See accompanying notes to the financial statements.
91
ASHMORE EMERGING MARKETS SHORT DURATION FUND
SCHEDULE OF INVESTMENTS (CONTINUED)
As of October 31, 2018
| | | | | | | | | | | | | | | | |
| | | Currency(1) | | | Par | | | Value | | | % of Net
Assets | |
China (continued) | | | | | | | | | | | | | | | | |
China Hongqiao Group Ltd., 6.850%, 04/22/2019 | | | | | | | 7,869,000 | | | $ | 7,821,786 | | | | 1.00 | |
China SCE Group Holdings Ltd., 7.450%, 04/17/2021 | | | | | | | 3,435,000 | | | | 3,216,386 | | | | 0.41 | |
CIFI Holdings Group Co. Ltd., 7.750%, 06/05/2020 | | | | | | | 300,000 | | | | 296,759 | | | | 0.04 | |
CIFI Holdings Group Co. Ltd., 6.875%, 04/23/2021 | | | | | | | 3,105,000 | | | | 2,917,275 | | | | 0.38 | |
GCL New Energy Holdings Ltd., 7.100%, 01/30/2021 | | | | | | | 3,435,000 | | | | 2,979,753 | | | | 0.38 | |
ICBC Standard Bank PLC, 8.125%, 12/02/2019 | | | | | | | 1,355,000 | | | | 1,405,650 | | | | 0.18 | |
Kaisa Group Holdings Ltd., 7.250%, 06/30/2020 | | | | | | | 7,524,000 | | | | 6,263,587 | | | | 0.80 | |
Kaisa Group Holdings Ltd., 8.500%, 06/30/2022 | | | | | | | 6,655,000 | | | | 4,691,455 | | | | 0.60 | |
KWG Group Holdings Ltd., 7.875%, 08/09/2021 | | | | | | | 4,985,000 | | | | 4,782,873 | | | | 0.61 | |
Logan Property Holdings Co. Ltd., 6.375%, 03/07/2021 | | | | | | | 400,000 | | | | 374,627 | | | | 0.05 | |
Logan Property Holdings Co. Ltd., 5.250%, 02/23/2023 | | | | | | | 3,915,000 | | | | 3,145,284 | | | | 0.40 | |
New Metro Global Ltd., 5.000%, 08/08/2022 | | | | | | | 3,880,000 | | | | 3,307,537 | | | | 0.43 | |
Prime Bloom Holdings Ltd., 7.500%, 12/19/2019 | | | | | | | 3,925,000 | | | | 3,640,406 | | | | 0.47 | |
Sunac China Holdings Ltd., 8.750%, 12/05/2019 | | | | | | | 4,590,000 | | | | 4,622,750 | | | | 0.59 | |
Sunac China Holdings Ltd., 7.350%, 07/19/2021 | | | | | | | 7,710,000 | | | | 6,996,570 | | | | 0.90 | |
Times China Holdings Ltd., 6.250%, 01/23/2020 | | | | | | | 635,000 | | | | 619,843 | | | | 0.08 | |
Times China Holdings Ltd., 6.250%, 01/17/2021 | | | | | | | 5,155,000 | | | | 4,726,604 | | | | 0.61 | |
Tunghsu Venus Holdings Ltd., 7.000%, 06/12/2020 | | | | | | | 2,640,000 | | | | 2,119,746 | | | | 0.27 | |
Yuzhou Properties Co. Ltd., 6.375%, 03/06/2021 | | | | | | | 6,895,000 | | | | 6,459,877 | | | | 0.83 | |
Zhongrong International Resources Co. Ltd., 7.250%, 10/26/2020 | | | | | | | 3,233,000 | | | | 2,133,259 | | | | 0.27 | |
| | | | | | | | | | | 98,919,487 | | | | 12.70 | |
| | | | |
Colombia (Cost $3,627,556) | | | | | | | | | | | | | | | | |
Bancolombia S.A., 5.125%, 09/11/2022 | | | | | | | 3,505,000 | | | | 3,522,525 | | | | 0.45 | |
| | | | | | | | | | | 3,522,525 | | | | 0.45 | |
| | | | |
Costa Rica (Cost $214,623) | | | | | | | | | | | | | | | | |
Instituto Costarricense de Electricidad, 6.950%, 11/10/2021 | | | | | | | 200,000 | | | | 191,002 | | | | 0.02 | |
| | | | | | | | | | | 191,002 | | | | 0.02 | |
| | | | |
Ecuador (Cost $149,205,141) | | | | | | | | | | | | | | | | |
Ecuador (Rep of), 10.500%, 03/24/2020 | | | | | | | 35,272,000 | | | | 36,153,800 | | | | 4.64 | |
Ecuador (Rep of), 10.750%, 03/28/2022 | | | | | | | 77,547,000 | | | | 79,873,410 | | | | 10.25 | |
EP PetroEcuador via Noble Sovereign Funding I Ltd., (Floating, ICE LIBOR USD 3M + 5.630%) 8.016%, 09/24/2019 | | | | | | | 4,904,211 | | | | 4,891,950 | | | | 0.63 | |
Petroamazonas EP, 4.625%, 02/16/2020 | | | | | | | 3,750,000 | | | | 3,646,875 | | | | 0.47 | |
Petroamazonas EP, 4.625%, 11/06/2020 | | | | | | | 22,805,846 | | | | 21,537,724 | | | | 2.77 | |
| | | | | | | | | | | 146,103,759 | | | | 18.76 | |
| | | | |
India (Cost $2,484,848) | | | | | | | | | | | | | | | | |
Greenko Dutch B.V., 4.875%, 07/24/2022 | | | | | | | 2,610,000 | | | | 2,454,183 | | | | 0.32 | |
| | | | | | | | | | | 2,454,183 | | | | 0.32 | |
| | | | |
Iraq (Cost $5,706,334) | | | | | | | | | | | | | | | | |
DNO A.S.A., 8.750%, 06/18/2020(2) | | | | | | | 300,000 | | | | 308,250 | | | | 0.04 | |
DNO A.S.A., 8.750%, 05/31/2023(2) | | | | | | | 4,900,000 | | | | 4,985,750 | | | | 0.64 | |
See accompanying notes to the financial statements.
92
ASHMORE EMERGING MARKETS SHORT DURATION FUND
SCHEDULE OF INVESTMENTS (CONTINUED)
As of October 31, 2018
| | | | | | | | | | | | | | | | |
| | | Currency(1) | | | Par | | | Value | | | % of Net
Assets | |
Iraq (continued) | | | | | | | | | | | | | | | | |
Oilflow SPV 1 DAC, 12.000%, 01/13/2022 | | | | | | | 400,000 | | | $ | 408,899 | | | | 0.05 | |
| | | | | | | | | | | 5,702,899 | | | | 0.73 | |
| | | | |
Jamaica (Cost $29,431,097) | | | | | | | | | | | | | | | | |
Digicel Group Ltd., 8.250%, 09/30/2020 | | | | | | | 15,035,000 | | | | 10,750,175 | | | | 1.38 | |
Digicel Group Ltd., 7.125%, 04/01/2022 | | | | | | | 1,708,000 | | | | 1,065,382 | | | | 0.14 | |
Digicel Ltd., 6.000%, 04/15/2021 | | | | | | | 14,820,000 | | | | 13,449,150 | | | | 1.72 | |
| | | | | | | | | | | 25,264,707 | | | | 3.24 | |
| | | | |
Kazakhstan (Cost $8,817,944) | | | | | | | | | | | | | | | | |
Halyk Savings Bank of Kazakhstan JSC, 5.500%, 12/21/2022 | | | | | | | 8,838,000 | | | | 8,820,324 | | | | 1.13 | |
| | | | | | | | | | | 8,820,324 | | | | 1.13 | |
| | | | |
Kuwait (Cost $1,149,924) | | | | | | | | | | | | | | | | |
Kuwait Projects Co. SPC Ltd., 4.800%, 02/05/2019 | | | | | | | 1,145,000 | | | | 1,147,322 | | | | 0.15 | |
| | | | | | | | | | | 1,147,322 | | | | 0.15 | |
Lebanon (Cost $66,205,097) | | | | | | | | | | | | | | | | |
Lebanon (Rep of), 5.150%, 11/12/2018 | | | | | | | 2,249,000 | | | | 2,245,447 | | | | 0.29 | |
Lebanon (Rep of), 5.450%, 11/28/2019 | | | | | | | 30,621,000 | | | | 29,504,558 | | | | 3.79 | |
Lebanon (Rep of), 6.375%, 03/09/2020 | | | | | | | 31,284,000 | | | | 30,091,955 | | | | 3.86 | |
Lebanon (Rep of), 5.800%, 04/14/2020 | | | | | | | 1,228,000 | | | | 1,164,316 | | | | 0.15 | |
Lebanon (Rep of), 6.150%, 06/19/2020 | | | | | | | 758,000 | | | | 717,068 | | | | 0.09 | |
Lebanon (Rep of), 8.250%, 04/12/2021 | | | | | | | 2,210,000 | | | | 2,115,058 | | | | 0.27 | |
| | | | | | | | | | | 65,838,402 | | | | 8.45 | |
| | | | |
Mexico (Cost $6,992,352) | | | | | | | | | | | | | | | | |
BBVA Bancomer S.A., 7.250%, 04/22/2020 | | | | | | | 1,500,000 | | | | 1,545,390 | | | | 0.20 | |
BBVA Bancomer S.A., 6.500%, 03/10/2021 | | | | | | | 2,600,000 | | | | 2,678,000 | | | | 0.35 | |
Petroleos Mexicanos, (Floating, ICE LIBOR USD 3M + 3.650%) 5.981%, 03/11/2022 | | | | | | | 2,500,000 | | | | 2,593,750 | | | | 0.33 | |
| | | | | | | | | | | 6,817,140 | | | | 0.88 | |
| | | | |
Mongolia (Cost $1,756,854) | | | | | | | | | | | | | | | | |
Trade & Development Bank of Mongolia LLC, 9.375%, 05/19/2020 | | | | | | | 1,660,000 | | | | 1,739,818 | | | | 0.22 | |
| | | | | | | | | | | 1,739,818 | | | | 0.22 | |
| | | | |
Nigeria (Cost $3,933,414) | | | | | | | | | | | | | | | | |
First Bank of Nigeria Ltd. Via FBN Finance Co. B.V., (Variable, USD Swap 2Y + 6.488%) 8.000%, 07/23/2021(4) | | | | | | | 3,920,000 | | | | 3,910,200 | | | | 0.50 | |
| | | | | | | | | | | 3,910,200 | | | | 0.50 | |
| | | | |
Pakistan (Cost $13,962,886) | | | | | | | | | | | | | | | | |
Third Pakistan International Sukuk (The) Co. Ltd., 5.500%, 10/13/2021 | | | | | | | 6,842,000 | | | | 6,624,356 | | | | 0.85 | |
Third Pakistan International Sukuk (The) Co. Ltd., 5.625%, 12/05/2022 | | | | | | | 7,244,000 | | | | 6,910,226 | | | | 0.89 | |
| | | | | | | | | | | 13,534,582 | | | | 1.74 | |
See accompanying notes to the financial statements.
93
ASHMORE EMERGING MARKETS SHORT DURATION FUND
SCHEDULE OF INVESTMENTS (CONTINUED)
As of October 31, 2018
| | | | | | | | | | | | | | | | |
| | | Currency(1) | | | Par | | | Value | | | % of Net
Assets | |
Panama (Cost $6,055,199) | | | | | | | | | | | | | | | | |
Banistmo S.A., 3.650%, 09/19/2022 | | | | | | | 1,560,000 | | | $ | 1,478,100 | | | | 0.19 | |
Sable International Finance Ltd., 6.875%, 08/01/2022 | | | | | | | 4,300,000 | | | | 4,488,125 | | | | 0.58 | |
| | | | | | | | | | | 5,966,225 | | | | 0.77 | |
Peru (Cost $7,835,398) | | | | | | | | | | | | | | | | |
Ajecorp B.V., 6.500%, 05/14/2022 | | | | | | | 6,210,000 | | | | 4,704,075 | | | | 0.60 | |
Union Andina de Cementos S.A.A., 5.875%, 10/30/2021 | | | | | | | 605,000 | | | | 618,770 | | | | 0.08 | |
Volcan Cia Minera S.A.A., 5.375%, 02/02/2022 | | | | | | | 1,905,000 | | | | 1,918,335 | | | | 0.25 | |
| | | | | | | | | | | 7,241,180 | | | | 0.93 | |
| | | | |
Qatar (Cost $9,065,954) | | | | | | | | | | | | | | | | |
Ezdan Sukuk Co. Ltd., 4.375%, 05/18/2021 | | | | | | | 1,210,000 | | | | 1,021,554 | | | | 0.13 | |
Ezdan Sukuk Co. Ltd., 4.875%, 04/05/2022 | | | | | | | 600,000 | | | | 500,796 | | | | 0.06 | |
QNB Finance Ltd., (Floating, ICE LIBOR USD 3M + 1.350%) 3.663%, 05/31/2021 | | | | | | | 7,410,000 | | | | 7,437,573 | | | | 0.96 | |
| | | | | | | | | | | 8,959,923 | | | | 1.15 | |
| | | | |
Russian Federation (Cost $19,295,995) | | | | | | | | | | | | | | | | |
Credit Bank of Moscow Via CBOM Finance PLC, 5.875%, 11/07/2021 | | | | | | | 12,235,000 | | | | 11,911,996 | | | | 1.53 | |
Koks OAO Via Koks Finance DAC, 7.500%, 05/04/2022 | | | | | | | 2,300,000 | | | | 2,299,080 | | | | 0.29 | |
TMK OAO Via TMK Capital S.A., 6.750%, 04/03/2020 | | | | | | | 2,390,000 | | | | 2,403,384 | | | | 0.31 | |
Vnesheconombank Via VEB Finance PLC, 4.224%, 11/21/2018 | | | | | | | 1,300,000 | | | | 1,295,320 | | | | 0.17 | |
Vnesheconombank Via VEB Finance PLC, 6.902%, 07/09/2020 | | | | | | | 961,000 | | | | 969,572 | | | | 0.12 | |
| | | | | | | | | | | 18,879,352 | | | | 2.42 | |
| | | | |
South Africa (Cost $20,469,043) | | | | | | | | | | | | | | | | |
Eskom Holdings SOC Ltd., 5.750%, 01/26/2021 | | | | | | | 12,465,000 | | | | 11,935,237 | | | | 1.53 | |
Liquid Telecommunications Financing PLC, 8.500%, 07/13/2022 | | | | | | | 3,255,000 | | | | 3,319,690 | | | | 0.43 | |
MTN Mauritius Investments Ltd., 5.373%, 02/13/2022 | | | | | | | 4,775,000 | | | | 4,585,910 | | | | 0.59 | |
| | | | | | | | | | | 19,840,837 | | | | 2.55 | |
| | | | |
Tanzania (Cost $5,067,802) | | | | | | | | | | | | | | | | |
HTA Group Ltd., 9.125%, 03/08/2022 | | | | | | | 4,900,000 | | | | 4,991,875 | | | | 0.64 | |
| | | | | | | | | | | 4,991,875 | | | | 0.64 | |
| | | | |
Turkey (Cost $51,648,961) | | | | | | | | | | | | | | | | |
Akbank T.A.S., 4.000%, 01/24/2020 | | | | | | | 1,370,000 | | | | 1,321,792 | | | | 0.17 | |
Akbank T.A.S., 5.000%, 10/24/2022 | | | | | | | 4,825,000 | | | | 4,391,869 | | | | 0.56 | |
Export Credit Bank of Turkey, 5.375%, 02/08/2021 | | | | | | | 1,570,000 | | | | 1,486,806 | | | | 0.19 | |
Export Credit Bank of Turkey, 5.000%, 09/23/2021 | | | | | | | 2,150,000 | | | | 1,980,821 | | | | 0.25 | |
Export Credit Bank of Turkey, 4.250%, 09/18/2022 | | | | | | | 2,273,000 | | | | 1,979,401 | | | | 0.25 | |
KOC Holding A.S., 3.500%, 04/24/2020 | | | | | | | 4,015,000 | | | | 3,858,720 | | | | 0.50 | |
QNB Finansbank A.S., 6.250%, 04/30/2019 | | | | | | | 2,435,000 | | | | 2,430,130 | | | | 0.31 | |
Turkey (Rep of), 5.125%, 03/25/2022 | | | | | | | 3,783,000 | | | | 3,557,193 | | | | 0.46 | |
Turkey (Rep of), 3.250%, 03/23/2023 | | | | | | | 2,090,000 | | | | 1,792,175 | | | | 0.23 | |
Turkiye Garanti Bankasi A.S., 4.750%, 10/17/2019 | | | | | | | 410,000 | | | | 402,098 | | | | 0.05 | |
See accompanying notes to the financial statements.
94
ASHMORE EMERGING MARKETS SHORT DURATION FUND
SCHEDULE OF INVESTMENTS (CONTINUED)
As of October 31, 2018
| | | | | | | | | | | | | | | | |
| | | Currency(1) | | | Par | | | Value | | | % of Net
Assets | |
Turkey (continued) | | | | | | | | | | | | | | | | |
Turkiye Garanti Bankasi A.S., 6.250%, 04/20/2021 | | | | | | | 1,510,000 | | | $ | 1,468,475 | | | | 0.19 | |
Turkiye Garanti Bankasi A.S., 5.250%, 09/13/2022 | | | | | | | 5,285,000 | | | | 4,868,859 | | | | 0.63 | |
Turkiye Is Bankasi A.S., 5.000%, 04/30/2020 | | | | | | | 6,105,000 | | | | 5,778,871 | | | | 0.74 | |
Turkiye Is Bankasi A.S., 5.375%, 10/06/2021 | | | | | | | 9,250,000 | | | | 8,154,134 | | | | 1.05 | |
Yapi ve Kredi Bankasi A.S., 5.250%, 12/03/2018 | | | | | | | 3,495,000 | | | | 3,486,263 | | | | 0.45 | |
Yapi ve Kredi Bankasi A.S., 5.125%, 10/22/2019 | | | | | | | 1,240,000 | | | | 1,202,718 | | | | 0.15 | |
Yapi ve Kredi Bankasi A.S., 4.000%, 01/22/2020 | | | | | | | 1,810,000 | | | | 1,719,381 | | | | 0.22 | |
Yapi ve Kredi Bankasi A.S., 5.750%, 02/24/2022 | | | | | | | 2,375,000 | | | | 2,149,375 | | | | 0.28 | |
| | | | | | | | | | | 52,029,081 | | | | 6.68 | |
| | | | |
Ukraine (Cost $23,313,338) | | | | | | | | | | | | | | | | |
Ferrexpo Finance PLC, 10.375%, 04/07/2019 | | | | | | | 1,368,000 | | | | 1,395,634 | | | | 0.18 | |
Metinvest B.V., 7.500%, 12/31/2021(3) | | | | | | | 5,175,681 | | | | 5,023,475 | | | | 0.65 | |
Metinvest B.V., 7.750%, 04/23/2023 | | | | | | | 10,380,000 | | | | 9,964,800 | | | | 1.28 | |
Ukraine (Rep of), 7.750%, 09/01/2021 | | | | | | | 4,525,000 | | | | 4,451,288 | | | | 0.57 | |
Ukraine (Rep of), 7.750%, 09/01/2022 | | | | | | | 2,100,000 | | | | 2,035,656 | | | | 0.26 | |
| | | | | | | | | | | 22,870,853 | | | | 2.94 | |
| | | | |
United Arab Emirates (Cost $1,296,319) | | | | | | | | | | | | | | | | |
First Abu Dhabi Bank PJSC, 3.000%, 08/13/2019 | | | | | | | 1,295,000 | | | | 1,292,428 | | | | 0.17 | |
| | | | | | | | | | | 1,292,428 | | | | 0.17 | |
| | | | |
Venezuela (Cost $28,703,554) | | | | | | | | | | | | | | | | |
Petroleos de Venezuela S.A., 8.500%, 10/27/2020 | | | | | | | 33,625,000 | | | | 31,355,313 | | | | 4.03 | |
| | | | | | | | | | | 31,355,313 | | | | 4.03 | |
| | | | |
Total Debt Securities (Cost $719,283,315) | | | | | | | | | | | 704,160,782 | | | | 90.41 | |
| | | | |
Bank Loans | | | | | | | | | | | | | | | | |
| | | | |
Malaysia (Cost $514,479) | | | | | | | | | | | | | | | | |
DRB-Hicom Bhd., 4.719%, 01/22/2021(5) | | | | | | | 538,497 | | | | 519,649 | | | | 0.07 | |
| | | | | | | | | | | 519,649 | | | | 0.07 | |
| | | | |
Turkey (Cost $1,274,000) | | | | | | | | | | | | | | | | |
Akbank T.A.S., 1.900%, 03/25/2019(5) | | | | | | | 1,300,000 | | | | 1,267,500 | | | | 0.16 | |
| | | | | | | | | | | 1,267,500 | | | | 0.16 | |
| | | | |
United Arab Emirates (Cost $19,012,908) | | | | | | | | | | | | | | | | |
DP World Ltd., 3.750%, 09/30/2022(5) | | | | | | | 20,423,519 | | | | 18,993,873 | | | | 2.44 | |
| | | | | | | | | | | 18,993,873 | | | | 2.44 | |
| | | | |
Total Bank Loans (Cost $20,801,387) | | | | | | | | | | | 20,781,022 | | | | 2.67 | |
| | | | |
Short-Term Investments | | | | | | | | | | | | | | | | |
| | | | |
Canada (Cost $18,000,000) | | | | | | | | | | | | | | | | |
Canadian Imperial Bank of Commerce, Time Deposit, 2.200%, | | | | | | | 18,000,000 | | | | 18,000,000 | | | | 2.31 | |
| | | | | | | | | | | 18,000,000 | | | | 2.31 | |
See accompanying notes to the financial statements.
95
ASHMORE EMERGING MARKETS SHORT DURATION FUND
SCHEDULE OF INVESTMENTS (CONTINUED)
As of October 31, 2018
| | | | | | | | | | | | | | | | |
| | | Currency(1) | | | Par | | | Value | | | % of Net
Assets | |
United States (Cost $4,600,000) | | | | | | | | | | | | | | | | |
Oversea-Chinese Banking Co. Ltd., Time Deposit, 2.200%, | | | | | | | 4,600,000 | | | $ | 4,600,000 | | | | 0.59 | |
| | | | | | | | | | | 4,600,000 | | | | 0.59 | |
| | | | |
Total Short-Term Investments (Cost $22,600,000) | | | | | | | | | | | 22,600,000 | | | | 2.90 | |
| | | | |
Total Investments (Total Cost $762,684,702) | | | | | | | | | | | 747,541,804 | | | | 95.98 | |
| | | | |
Other Assets Less Liabilities (See Statements of Assets and
Liabilities for further detail) | | | | | | | | | | | 31,336,869 | | | | 4.02 | |
| | | | |
Net Assets | | | | | | | | | | $ | 778,878,673 | | | | 100.00 | |
| (1) | Par values are stated in United States Dollars unless otherwise noted below. |
| (2) | Securities exempt from registration under Rule 144A of the Securities Act of 1933. These securities may not be publicly traded without registration under the Securities Act of 1933. |
| (3) | Security is a payment-in-kind bond, and unless otherwise noted in the description of the security, pays its entire coupon on an in-kind basis. |
| (4) | Variable rate security. Security issued at a fixed coupon rate, which converts to a variable rate at a specified date. Rate shown is the rate in effect as of period end. |
| (5) | Security is a Level 3 investment. |
Percentages shown are based on net assets.
The inputs or methodologies used for valuing securities are not necessarily an indication of the risks associated with investing in those securities and other financial instruments, if any. See note 4 in the Notes to the Financial Statements for more information regarding pricing inputs and valuation techniques. The following is a summary of the inputs used in valuing the Ashmore Emerging Markets Short Duration Fund’s investments and other financial instruments, which are carried at fair value, as of October 31, 2018:
| | | | | | | | | | | | | | | | |
| | | Level 1 | | | Level 2 | | | Level 3 | | | Total | |
Investments | | | | | | | | | | | | | | | | |
Assets: | | | | | | | | | | | | | | | | |
Debt Securities | | | | | | | | | | | | | | | | |
Corporate Bonds | | | $— | | | | $487,206,737 | | | | $ — | | | | $487,206,737 | |
Financial Certificates | | | — | | | | 15,056,932 | | | | — | | | | 15,056,932 | |
Government Agencies | | | — | | | | 6,742,348 | | | | — | | | | 6,742,348 | |
Government Bonds | | | — | | | | 195,154,765 | | | | — | | | | 195,154,765 | |
| | | | | | | | | | | | | | | | |
Total Debt Securities | | | — | | | | 704,160,782 | | | | — | | | | 704,160,782 | |
Bank Loans | | | | | | | | | | | | | | | | |
Malaysia | | | — | | | | — | | | | 519,649 | | | | 519,649 | |
Turkey | | | — | | | | — | | | | 1,267,500 | | | | 1,267,500 | |
United Arab Emirates | | | — | | | | — | | | | 18,993,873 | | | | 18,993,873 | |
| | | | | | | | | | | | | | | | |
Total Bank Loans | | | — | | | | — | | | | 20,781,022 | | | | 20,781,022 | |
Short-Term Investments | | | — | | | | 22,600,000 | | | | — | | | | 22,600,000 | |
Total Investments | | | $— | | | | $726,760,782 | | | | $20,781,022 | | | | $747,541,804 | |
See accompanying notes to the financial statements.
96
ASHMORE EMERGING MARKETS SHORT DURATION FUND
SCHEDULE OF INVESTMENTS (CONTINUED)
As of October 31, 2018
The following is a reconciliation of investments in which significant unobservable inputs (Level 3) were used for the Fund during the period ending October 31, 2018:
| | | | | | | | | | | | | | | | | | | | | | | | | | | | | | | | | | | | | | | | |
Category and
Subcategory | | Beginning
Balance
at 10/31/2017 | | | Accrued
Discounts
(Premiums) | | | Purchases | | | Sales | | | Realized
Gains
(Losses) | | | Change in
Unrealized
Appreciation
(Depreciation) | | | Transfer
into
Level 3 | | | Transfer
out of
Level 3 | | | Ending Balance at 10/31/2018 | | | Change in
Unrealized
Appreciation
(Depreciation)
from Investments
still held
10/31/2018 | |
| | | | | | | | | | |
Investments, at value | | | | | | | | | | | | | | | | | | | | | | | | | | | | | | | | | | | | | | | | |
Bank Loans | | | | | | | | | | | | | | | | | | | | | | | | | | | | | | | | | | | | | | | | |
Malaysia | | $ | — | | | $ | 9,319 | | | $ | 607,406 | | | | $ (107,680 | ) | | $ | 5,433 | | | | $ 5,171 | | | | $— | | | | $— | | | | $ 519,649 | | | $ | 5,171 | |
Turkey | | | — | | | | — | | | | 1,274,000 | | | | — | | | | — | | | | (6,500) | | | | — | | | | — | | | | 1,267,500 | | | | (6,500) | |
United | | | | | | | | | | | | | | | | | | | | | | | | | | | | | | | | | | | | | | | | |
Arab | | | | | | | | | | | | | | | | | | | | | | | | | | | | | | | | | | | | | | | | |
Emirates | | | 5,759,709 | | | | 226,951 | | | | 14,947,790 | | | | (1,792,314 | ) | | | 82,049 | | | | (230,312) | | | | — | | | | — | | | | 18,993,873 | | | | (239,272) | |
Total | | $ | 5,759,709 | | | | $236,270 | | | $ | 16,829,196 | | | $ | (1,899,994 | ) | | $ | 87,482 | | | | $(231,641) | | | | $— | | | | $— | | | | $20,781,022 | | | | $(240,601) | |
| | | | | | | | | | | | |
| Quantitative Information about Level 3 Fair Value Measurements | |
| | | Fair Value at
10/31/2018 | | | Valuation
Technique | | | Unobservable Input | |
| | | |
Bank Loans | | | $20,781,022 | | | | Broker quote | | | | Inputs to broker model | |
The following is a summary of the fair values of the Fund’s derivative instruments*:
The Effect of Financial Derivative Instruments on the Statements of Operations for the Year Ended October 31, 2018:
| | | | |
| | | Derivatives Not Accounted for as
Hedging Instruments | |
| | | Foreign Exchange Risk | |
Realized Gain (Loss) on Derivatives Recognized resulting from Operations: | | | | |
Net Realized Gain on Forward Foreign Currency Exchange Contracts | | | $(53,367) | |
| | | | |
*See note 10 in the Notes to the Financial Statements for additional information.
See accompanying notes to the financial statements.
97
ASHMORE EMERGING MARKETS ACTIVE EQUITY FUND
SCHEDULE OF INVESTMENTS
As of October 31, 2018
| | | | | | | | | | | | | | | | |
| | | Currency(1) | | | Shares | | | Value | | | % of Net
Assets | |
Common Stocks | | | | | | | | | | | | | | | | |
| | | | |
Brazil (Cost $1,890,570) | | | | | | | | | | | | | | | | |
Banco do Brasil S.A. * | | | BRL | | | | 42,500 | | | $ | 488,211 | | | | 2.76 | |
Kroton Educacional S.A. | | | BRL | | | | 72,000 | | | | 220,943 | | | | 1.25 | |
Lojas Renner S.A. | | | BRL | | | | 42,800 | | | | 432,428 | | | | 2.45 | |
Petroleo Brasileiro S.A. ADR (New York Exchange) * | | | | | | | 14,225 | | | | 231,156 | | | | 1.31 | |
Vale S.A. ADR | | | | | | | 37,950 | | | | 573,045 | | | | 3.24 | |
| | | | | | | | | 1,945,783 | | | 11.01 | |
| | | | |
China (Cost $5,820,197) | | | | | | | | | | | | | | | | |
Alibaba Group Holding Ltd. ADR * | | | | | | | 10,409 | | | | 1,480,993 | | | | 8.38 | |
Angang Steel Co. Ltd., Class H | | | HKD | | | | 216,000 | | | | 183,411 | | | | 1.04 | |
Anhui Conch Cement Co. Ltd., Class H | | | HKD | | | | 54,000 | | | | 277,655 | | | | 1.57 | |
Baidu, Inc. ADR * | | | | | | | 1,377 | | | | 261,713 | | | | 1.48 | |
Bank of China Ltd., Class H | | | HKD | | | | 211,000 | | | | 89,683 | | | | 0.51 | |
Baoshan Iron & Steel Co. Ltd., Class A | | | CNY | | | | 223,775 | | | | 245,127 | | | | 1.39 | |
China Construction Bank Corp., Class H | | | HKD | | | | 107,000 | | | | 84,618 | | | | 0.48 | |
China Overseas Land & Investment Ltd. | | | HKD | | | | 92,000 | | | | 287,464 | | | | 1.62 | |
CNOOC Ltd. | | | HKD | | | | 343,000 | | | | 581,067 | | | | 3.29 | |
Ping An Insurance Group Co. of China Ltd., Class H | | | HKD | | | | 85,000 | | | | 804,437 | | | | 4.55 | |
Tencent Holdings Ltd. | | | HKD | | | | 23,100 | | | | 782,976 | | | | 4.43 | |
| | | | | | | | | | | 5,079,144 | | | | 28.74 | |
| | | | |
Hong Kong (Cost $887,654) | | | | | | | | | | | | | | | | |
AIA Group Ltd. | | | HKD | | | | 101,800 | | | | 774,293 | | | | 4.38 | |
| | | | | | | | | 774,293 | | | 4.38 | |
| | | | |
India (Cost $1,254,652) | | | | | | | | | | | | | | | | |
HDFC Bank Ltd. ADR | | | | | | | 7,027 | | | | 624,771 | | | | 3.54 | |
ICICI Bank Ltd. ADR | | | | | | | 75,259 | | | | 714,208 | | | | 4.04 | |
| | | | | | | | | 1,338,979 | | | 7.58 | |
| | | | |
Indonesia (Cost $525,496) | | | | | | | | | | | | | | | | |
Bank Mandiri Persero Tbk PT | �� | | IDR | | | | 1,053,300 | | | | 475,564 | | | | 2.69 | |
| | | | | | | | | | | 475,564 | | | | 2.69 | |
| | | | |
Mexico (Cost $474,225) | | | | | | | | | | | | | | | | |
Cemex S.A.B. de C.V. ADR (Participation Certificate) * | | | | | | | 28,528 | | | | 143,781 | | | | 0.81 | |
Fibra Uno Administracion S.A. de C.V. | | | MXN | | | | 77,200 | | | | 82,964 | | | | 0.47 | |
Grupo Financiero Banorte S.A.B. de C.V., Series O | | | MXN | | | | 31,400 | | | | 172,758 | | | | 0.98 | |
| | | | | | | | | 399,503 | | | 2.26 | |
| | | | |
Peru (Cost $574,096) | | | | | | | | | | | | | | | | |
Credicorp Ltd. | | | | | | | 2,610 | | | | 589,103 | | | | 3.33 | |
| | | | | | | | | | | 589,103 | | | | 3.33 | |
| | | | |
Russian Federation (Cost $533,458) | | | | | | | | | | | | | | | | |
Sberbank of Russia PJSC ADR | | | | | | | 41,038 | | | | 482,374 | | | | 2.73 | |
| | | | | | | | | | | 482,374 | | | | 2.73 | |
See accompanying notes to the financial statements.
98
ASHMORE EMERGING MARKETS ACTIVE EQUITY FUND
SCHEDULE OF INVESTMENTS (CONTINUED)
As of October 31, 2018
| | | | | | | | | | | | | | | | |
| | | Currency(1) | | | Shares | | | Value | | | % of Net
Assets | |
South Africa (Cost $1,198,229) | | | | | | | | | | | | | | | | |
Absa Group Ltd. | | | ZAR | | | | 18,980 | | | $ | 191,370 | | | | 1.08 | |
FirstRand Ltd. | | | ZAR | | | | 66,265 | | | | 288,060 | | | | 1.63 | |
Naspers Ltd., Class N | | | ZAR | | | | 3,040 | | | | 532,472 | | | | 3.02 | |
| | | | | | | | | | | 1,011,902 | | | | 5.73 | |
| | | | |
South Korea (Cost $2,102,941) | | | | | | | | | | | | | | | | |
Lotte Chemical Corp. | | | KRW | | | | 756 | | | | 174,619 | | | | 0.99 | |
Samsung Electronics Co. Ltd. (Korean Exchange) | | | KRW | | | | 18,629 | | | | 696,718 | | | | 3.94 | |
Samsung Electronics Co. Ltd. GDR (2) | | | | | | | 325 | | | | 302,525 | | | | 1.71 | |
SK Hynix, Inc. | | | KRW | | | | 10,556 | | | | 635,658 | | | | 3.60 | |
| | | | | | | | | | | 1,809,520 | | | | 10.24 | |
| | | | |
Taiwan (Cost $2,490,135) | | | | | | | | | | | | | | | | |
Catcher Technology Co. Ltd. | | | TWD | | | | 50,853 | | | | 517,223 | | | | 2.93 | |
Globalwafers Co. Ltd. | | | TWD | | | | 21,074 | | | | 165,376 | | | | 0.94 | |
LandMark Optoelectronics Corp. | | | TWD | | | | 21,000 | | | | 138,553 | | | | 0.78 | |
Taiwan Semiconductor Manufacturing Co. Ltd. | | | TWD | | | | 87,256 | | | | 648,280 | | | | 3.67 | |
Taiwan Semiconductor Manufacturing Co. Ltd. ADR | | | | | | | 19,627 | | | | 747,789 | | | | 4.23 | |
| | | | | | | | | 2,217,221 | | | 12.55 | |
| | | | |
Total Common Stocks (Cost $17,751,653) | | | | | | | | | | | 16,123,386 | | | | 91.24 | |
| | | | |
Preferred Stocks | | | | | | | | | | | | | | | | |
| | | | |
Brazil (Cost $461,018) | | | | | | | | | | | | | | | | |
Petroleo Brasileiro S.A. ADR * | | | | | | | 38,909 | | | | 576,631 | | | | 3.27 | |
| | | | | | | | | | | 576,631 | | | | 3.27 | |
| | | | |
South Korea (Cost $474,572) | | | | | | | | | | | | | | | | |
Samsung Electronics Co. Ltd., 4.124% (3) | | | KRW | | | | 14,203 | | | | 447,565 | | | | 2.53 | |
| | | | | | | | | | | 447,565 | | | | 2.53 | |
| | | | |
Total Preferred Stocks (Cost $935,590) | | | | | | | | | | | 1,024,196 | | | | 5.80 | |
| | | | |
Total Investments (Total Cost $18,687,243) | | | | | | | | | | | 17,147,582 | | | | 97.04 | |
| | | | |
Other Assets Less Liabilities (See Statements of Assets and
Liabilities for further detail) | | | | | | | | | | | 523,399 | | | | 2.96 | |
| | | | |
Net Assets | | | | | | | | | | $ | 17,670,981 | | | | 100.00 | |
| * | Non-income producing security. |
| (1) | Par values are stated in United States Dollars unless otherwise noted below. |
| (2) | Securities exempt from registration under Rule 144A of the Securities Act of 1933. These securities may not be publicly traded without registration under the Securities Act of 1933. |
| (3) | Current yield is disclosed. Dividends are calculated based on a percentage of the issuer’s net income. |
Percentages shown are based on net assets.
See accompanying notes to the financial statements.
99
ASHMORE EMERGING MARKETS ACTIVE EQUITY FUND
SCHEDULE OF INVESTMENTS (CONTINUED)
As of October 31, 2018
At October 31, 2018, the industry sectors for the Ashmore Emerging Markets Active Equity Fund were:
| | | | |
| Sector | | Percentage of
Net Assets | |
Communication Services | | | 8.9 | % |
Consumer Discretionary | | | 12.1 | |
Energy | | | 7.9 | |
Financials | | | 32.7 | |
Information Technology | | | 24.3 | |
Materials | | | 9.0 | |
Real Estate | | | 2.1 | |
Total Investments | | | 97.0 | |
Other Assets Less Liabilities | | | 3.0 | |
Net Assets | | | 100.0 | % |
At October 31, 2018, the Ashmore Emerging Markets Active Equity Fund had outstanding forward foreign currency exchange contracts as follows:
| | | | | | | | | | | | | | | | |
Settlement
Date | | Counterparty | | Currency
Buy | | Currency
Buy Amount
(Local
Currency) | | | Currency
Sell | | Currency
Sell Amount
(Local
Currency) | | | Unrealized
Gain/(Loss) |
| | | | | | |
11/06/2018 | | JP Morgan | | United States Dollar | | | 262,502 | | | Mexican Peso | | | 5,251,354 | | | $4,241 |
| | | | | | | | | | | | | | | | |
Total | | | | | | | | | | | | | | | | $4,241 |
| | | | | | | | | | | | | | | | |
See accompanying notes to the financial statements.
100
ASHMORE EMERGING MARKETS ACTIVE EQUITY FUND
SCHEDULE OF INVESTMENTS (CONTINUED)
As of October 31, 2018
The inputs or methodologies used for valuing securities are not necessarily an indication of the risks associated with investing in those securities and other financial instruments, if any. See note 4 in the Notes to the Financial Statements for more information regarding pricing inputs and valuation techniques. The following is a summary of the inputs used in valuing the Ashmore Emerging Markets Active Equity Fund’s investments and other financial instruments, which are carried at fair value, as of October 31, 2018:
| | | | | | | | | | | | | | | | |
| | | Level 1 | | | Level 2 | | | Level 3 �� | | | Total | |
Investments | | | | | | | | | | | | | | | | |
Assets: | | | | | | | | | | | | | | | | |
Common Stocks | | | | | | | | | | | | | | | | |
Brazil | | | $1,945,783 | | | | $ — | | | | $— | | | | $ 1,945,783 | |
China | | | 1,742,706 | | | | 3,336,438 | | | | — | | | | 5,079,144 | |
Hong Kong | | | — | | | | 774,293 | | | | — | | | | 774,293 | |
India | | | 1,338,979 | | | | — | | | | — | | | | 1,338,979 | |
Indonesia | | | — | | | | 475,564 | | | | — | | | | 475,564 | |
Mexico | | | 399,503 | | | | — | | | | — | | | | 399,503 | |
Peru | | | 589,103 | | | | — | | | | — | | | | 589,103 | |
Russian Federation | | | — | | | | 482,374 | | | | — | | | | 482,374 | |
South Africa | | | — | | | | 1,011,902 | | | | — | | | | 1,011,902 | |
South Korea | | | — | | | | 1,809,520 | | | | — | | | | 1,809,520 | |
Taiwan | | | 747,789 | | | | 1,469,432 | | | | — | | | | 2,217,221 | |
| | | | | | | | | | | | | | | | |
Total Common Stocks | | | 6,763,863 | | | | 9,359,523 | | | | — | | | | 16,123,386 | |
Preferred Stocks | | | | | | | | | | | | | | | | |
Brazil | | | 576,631 | | | | — | | | | — | | | | 576,631 | |
South Korea | | | — | | | | 447,565 | | | | — | | | | 447,565 | |
| | | | | | | | | | | | | | | | |
Total Preferred Stocks | | | 576,631 | | | | 447,565 | | | | — | | | | 1,024,196 | |
Total Investments | | | $7,340,494 | | | | $9,807,088 | | | | $— | | | | $17,147,582 | |
| | | | |
Other Financial Instruments | | | | | | | | | | | | | | | | |
Assets: | | | | | | | | | | | | | | | | |
Forward Foreign Currency Exchange Contracts | | | $— | | | | $4,241 | | | | $— | | | | $4,241 | |
Total Other Financial Instruments | | | $— | | | | $4,241 | | | | $— | | | | $4,241 | |
See accompanying notes to the financial statements.
101
ASHMORE EMERGING MARKETS ACTIVE EQUITY FUND
SCHEDULE OF INVESTMENTS (CONTINUED)
As of October 31, 2018
The following is a summary of the fair values of the Fund’s derivative instruments*:
Fair Values of Financial Derivative Instruments on the Statements of Assets and Liabilities as of October 31, 2018:
| | | | |
| | | Derivatives Not Accounted for as
Hedging Instruments | |
| | | Foreign
Exchange Risk | |
Assets: | | | | |
Unrealized Appreciation on Forward Foreign Currency Exchange Contracts | | | $4,241 | |
The Effect of Financial Derivative Instruments on the Statements of Operations for the Year Ended October 31, 2018:
| | |
| | | Derivatives Not Accounted for as
Hedging Instruments |
| | | Foreign Exchange Risk |
Net Change in Unrealized Appreciation (Depreciation) on Derivatives Recognized resulting from Operations: | | |
Net Change in Unrealized Appreciation on Forward Foreign Currency Exchange Contracts | | $4,241 |
* See note 10 in the Notes to the Financial Statements for additional information.
See accompanying notes to the financial statements.
102
ASHMORE EMERGING MARKETS SMALL-CAP EQUITY FUND
SCHEDULE OF INVESTMENTS
As of October 31, 2018
| | | | | | | | | | | | | | | | |
| | | Currency(1) | | | Shares | | | Value | | | % of Net
Assets | |
Common Stocks | | | | | | | | | | | | | | | | |
| | | | |
Argentina (Cost $766,597) | | | | | | | | | | | | | | | | |
Globant S.A. * | | | | | | | 13,690 | | | $ | 704,761 | | | | 2.06 | |
Grupo Financiero Galicia S.A. ADR | | | | | | | 7,353 | | | | 169,560 | | | | 0.50 | |
| | | | | | | | | | | 874,321 | | | | 2.56 | |
| | | | |
Brazil (Cost $1,994,471) | | | | | | | | | | | | | | | | |
Fleury S.A. | | | BRL | | | | 103,400 | | | | 579,307 | | | | 1.69 | |
Hypera S.A. * | | | BRL | | | | 99,300 | | | | 794,614 | | | | 2.33 | |
Iguatemi Empresa de Shopping Centers S.A. | | | BRL | | | | 78,700 | | | | 821,787 | | | | 2.40 | |
| | | | | | | | | | | 2,195,708 | | | | 6.42 | |
| | | | |
China (Cost $9,505,161) | | | | | | | | | | | | | | | | |
AviChina Industry & Technology Co. Ltd., Class H | | | HKD | | | | 689,000 | | | | 460,069 | | | | 1.35 | |
China Yongda Automobiles Services Holdings Ltd. | | | HKD | | | | 575,500 | | | | 307,166 | | | | 0.90 | |
Goodbaby International Holdings Ltd. | | | HKD | | | | 2,043,000 | | | | 635,549 | | | | 1.86 | |
Haitian International Holdings Ltd. | | | HKD | | | | 381,000 | | | | 752,247 | | | | 2.20 | |
JNBY Design Ltd. | | | HKD | | | | 890,000 | | | | 1,357,378 | | | | 3.97 | |
Li Ning Co. Ltd. * | | | HKD | | | | 1,251,500 | | | | 1,177,251 | | | | 3.44 | |
Noah Holdings Ltd. ADR * | | | | | | | 10,600 | | | | 399,726 | | | | 1.17 | |
SINA Corp. * | | | | | | | 12,500 | | | | 791,375 | | | | 2.32 | |
Xiabuxiabu Catering Management China Holdings Co. Ltd. *(2) | | | HKD | | | | 1,039,000 | | | | 1,293,807 | | | | 3.79 | |
YY, Inc. ADR * | | | | | | | 8,691 | | | | 555,355 | | | | 1.62 | |
| | | | | | | | | | | 7,729,923 | | | | 22.62 | |
| | | | |
India (Cost $8,878,990) | | | | | | | | | | | | | | | | |
Edelweiss Financial Services Ltd. | | | INR | | | | 339,153 | | | | 746,076 | | | | 2.18 | |
Multi Commodity Exchange of India Ltd. | | | INR | | | | 89,707 | | | | 852,279 | | | | 2.50 | |
Parag Milk Foods Ltd. (2) | | | INR | | | | 369,866 | | | | 1,298,407 | | | | 3.80 | |
Persistent Systems Ltd. | | | INR | | | | 88,835 | | | | 680,469 | | | | 1.99 | |
Quess Corp. Ltd. *(2) | | | INR | | | | 72,747 | | | | 720,407 | | | | 2.11 | |
Sanghi Industries Ltd. * | | | INR | | | | 774,845 | | | | 640,382 | | | | 1.87 | |
South Indian Bank (The) Ltd. | | | INR | | | | 1,878,707 | | | | 376,025 | | | | 1.10 | |
V-Mart Retail Ltd. | | | INR | | | | 23,045 | | | | 754,931 | | | | 2.21 | |
| | | | | | | | | | | 6,068,976 | | | | 17.76 | |
| | | | |
Indonesia (Cost $92,441) | | | | | | | | | | | | | | | | |
Berlian Laju Tanker Tbk PT *(3) | | | IDR | | | | 4,428,000 | | | | — | | | | — | |
| | | | | | | | | | | — | | | | — | |
| | | | |
Malaysia (Cost $1,751,568) | | | | | | | | | | | | | | | | |
My EG Services Bhd. | | | MYR | | | | 5,894,900 | | | | 1,686,977 | | | | 4.94 | |
| | | | | | | | | | | 1,686,977 | | | | 4.94 | |
| | | | |
Mexico (Cost $600,564) | | | | | | | | | | | | | | | | |
Grupo Aeroportuario del Centro Norte S.A.B. de C.V. ADR | | | | | | | 14,100 | | | | 588,957 | | | | 1.72 | |
| | | | | | | | | | | 588,957 | | | | 1.72 | |
See accompanying notes to the financial statements.
103
ASHMORE EMERGING MARKETS SMALL-CAP EQUITY FUND
SCHEDULE OF INVESTMENTS (CONTINUED)
As of October 31, 2018
| | | | | | | | | | | | | | | | |
| | | Currency(1) | | | Shares | | | Value | | | % of Net
Assets | |
Poland (Cost $1,116,794) | | | | | | | | | | | | | | | | |
CCC S.A. | | | PLN | | | | 14,684 | | | $ | 638,815 | | | | 1.87 | |
| | | | | | | | | | | 638,815 | | | | 1.87 | |
| | | | |
South Africa (Cost $931,965) | | | | | | | | | | | | | | | | |
JSE Ltd. | | | ZAR | | | | 74,366 | | | | 826,780 | | | | 2.42 | |
| | | | | | | | | | | 826,780 | | | | 2.42 | |
| | | | |
South Korea (Cost $6,695,060) | | | | | | | | | | | | | | | | |
Com2uS Corp. | | | KRW | | | | 13,526 | | | | 1,527,308 | | | | 4.47 | |
Dentium Co. Ltd. | | | KRW | | | | 17,667 | | | | 1,125,071 | | | | 3.29 | |
Eugene Technology Co. Ltd. | | | KRW | | | | 67,414 | | | | 764,854 | | | | 2.24 | |
KoMiCo Ltd. | | | KRW | | | | 48,106 | | | | 1,022,403 | | | | 2.99 | |
Modetour Network, Inc. | | | KRW | | | | 54,778 | | | | 1,136,120 | | | | 3.33 | |
| | | | | | | | | | | 5,575,756 | | | | 16.32 | |
| | | | |
Taiwan (Cost $7,768,964) | | | | | | | | | | | | | | | | |
ASPEED Technology, Inc. | | | TWD | | | | 66,000 | | | | 964,452 | | | | 2.82 | |
Gourmet Master Co. Ltd. | | | TWD | | | | 166,528 | | | | 1,005,792 | | | | 2.94 | |
Hota Industrial Manufacturing Co. Ltd. | | | TWD | | | | 280,000 | | | | 1,180,475 | | | | 3.45 | |
Parade Technologies Ltd. | | | TWD | | | | 80,000 | | | | 1,052,625 | | | | 3.08 | |
Silergy Corp. | | | TWD | | | | 45,000 | | | | 569,637 | | | | 1.67 | |
Silicon Motion Technology Corp. ADR | | | | | | | 7,374 | | | | 277,189 | | | | 0.81 | |
Sunonwealth Electric Machine Industry Co. Ltd. | | | TWD | | | | 762,000 | | | | 818,655 | | | | 2.40 | |
| | | | | | | | | | | 5,868,825 | | | | 17.17 | |
| | | | |
Thailand (Cost $1,766,328) | | | | | | | | | | | | | | | | |
Supalai PCL (Registered) | | | THB | | | | 1,201,750 | | | | 793,916 | | | | 2.32 | |
Taokaenoi Food & Marketing PCL (Registered) | | | THB | | | | 2,203,400 | | | | 857,432 | | | | 2.51 | |
| | | | | | | | | | | 1,651,348 | | | | 4.83 | |
| | | | |
Total Common Stocks (Cost $41,868,903) | | | | | | | | | | | 33,706,386 | | | | 98.63 | |
| | | | |
| | | Currency(1)
| | | Number
of
Warrants | | | Value | | | % of Net
Assets | |
Warrants | | | | | | | | | | | | | | | | |
| | | | |
Brazil (Cost $—) | | | | | | | | | | | | | | | | |
Iochpe-Maxion S.A., Exp. 06/03/2019, Strike Price $12.70 * | | | BRL | | | | 2,184 | | | $ | 4,225 | | | | 0.01 | |
| | | | | | | | | 4,225 | | | 0.01 | |
| | | | |
Total Warrants (Cost $—) | | | | | | | | | | | 4,225 | | | | 0.01 | |
| | | | |
Total Investments (Total Cost $41,868,903) | | | | | | | | | | | 33,710,611 | | | | 98.64 | |
| | | | |
Other Assets Less Liabilities (See Statements of Assets and
Liabilities for further detail) | | | | | | | | | | | 464,669 | | | | 1.36 | |
| | | | |
Net Assets | | | | | | | | | | $ | 34,175,280 | | | | 100.00 | |
See accompanying notes to the financial statements.
104
ASHMORE EMERGING MARKETS SMALL-CAP EQUITY FUND
SCHEDULE OF INVESTMENTS (CONTINUED)
As of October 31, 2018
| * | Non-income producing security. |
| (1) | Par values are stated in United States Dollars unless otherwise noted below. |
| (2) | Securities exempt from registration under Rule 144A of the Securities Act of 1933. These securities may not be publicly traded without registration under the Securities Act of 1933. |
| (3) | Security has been deemed worthless and is a Level 3 investment. |
Percentages shown are based on net assets.
At October 31, 2018, the industry sectors for the Ashmore Emerging Markets Small-Cap Equity Fund were:
| | | | |
| Sector | | Percentage of
Net Assets | |
Communication Services | | | 8.4% | |
Consumer Discretionary | | | 27.7 | |
Consumer Staples | | | 6.3 | |
Financials | | | 9.9 | |
Health Care | | | 7.3 | |
Industrials | | | 9.8 | |
Information Technology | | | 22.6 | |
Materials | | | 1.9 | |
Real Estate | | | 4.7 | |
Total Investments | | | 98.6 | |
Other Assets Less Liabilities | | | 1.4 | |
Net Assets | | | 100.0% | |
| |
The inputs or methodologies used for valuing securities are not necessarily an indication of the risks associated with investing in those securities and other financial instruments, if any. See note 4 in the Notes to the Financial Statements for more information regarding pricing inputs and valuation techniques. The following is a summary of the inputs used in valuing the Ashmore Emerging Markets Small-Cap Equity Fund’s investments and other financial instruments, which are carried at fair value, as of October 31, 2018:
| | | | | | | | | | | | | | | | |
| | | Level 1 | | | Level 2 | | | Level 3 | | | Total | |
Investments | | | | | | | | | | | | | | | | |
Assets: | | | | | | | | | | | | | | | | |
Common Stocks | | | | | | | | | | | | | | | | |
Argentina | | $ | 874,321 | | | $ | — | | | | $— | | | $ | 874,321 | |
Brazil | | | 2,195,708 | | | | — | | | | — | | | | 2,195,708 | |
China | | | 1,746,456 | | | | 5,983,467 | | | | — | | | | 7,729,923 | |
India | | | — | | | | 6,068,976 | | | | — | | | | 6,068,976 | |
Malaysia | | | — | | | | 1,686,977 | | | | — | | | | 1,686,977 | |
Mexico | | | 588,957 | | | | — | | | | — | | | | 588,957 | |
Poland | | | — | | | | 638,815 | | | | — | | | | 638,815 | |
South Africa | | | — | | | | 826,780 | | | | — | | | | 826,780 | |
South Korea | | | — | | | | 5,575,756 | | | | — | | | | 5,575,756 | |
Taiwan | | | 277,189 | | | | 5,591,636 | | | | — | | | | 5,868,825 | |
Thailand | | | 1,651,348 | | | | — | | | | — | | | | 1,651,348 | |
| | | | | | | | | | | | | | | | |
Total Common Stocks | | | 7,333,979 | | | | 26,372,407 | | | | — | | | | 33,706,386 | |
Warrants | | | | | | | | | | | | | | | | |
Brazil | | | — | | | | 4,225 | | | | — | | | | 4,225 | |
Total Investments | | $ | 7,333,979 | | | $ | 26,376,632 | | | | $— | | | $ | 33,710,611 | |
See accompanying notes to the financial statements.
105
ASHMORE EMERGING MARKETS SMALL-CAP EQUITY FUND
SCHEDULE OF INVESTMENTS (CONTINUED)
As of October 31, 2018
The following is a summary of the fair values of the Fund’s derivative instruments*:
The Effect of Financial Derivative Instruments on the Statements of Operations for the Year Ended October 31, 2018:
| | | | |
| | | Derivatives Not Accounted for as
Hedging Instruments | |
| | | Foreign Exchange Risk | |
Realized Gain (Loss) on Derivatives Recognized resulting from Operations: | |
Net Realized Loss on Forward Foreign Currency Exchange Contracts | | | $(626) | |
| | | | |
*See note 10 in the Notes to the Financial Statements for additional information.
See accompanying notes to the financial statements.
106
ASHMORE EMERGING MARKETS FRONTIER EQUITY FUND
SCHEDULE OF INVESTMENTS
As of October 31, 2018
| | | | | | | | | | | | | | | | |
| | | Currency(1) | | | Shares | | | Value | | | % of Net
Assets | |
Common Stocks | | | | | | | | | | | | | | | | |
| | | | |
Argentina (Cost $8,531,462) | | | | | | | | | | | | | | | | |
BBVA Banco Frances S.A. ADR | | | | | | | 74,000 | | | $ | 811,780 | | | | 0.95 | |
Globant S.A. * | | | | | | | 35,200 | | | | 1,812,096 | | | | 2.11 | |
Grupo Financiero Galicia S.A. ADR | | | | | | | 140,541 | | | | 3,240,876 | | | | 3.77 | |
YPF S.A. ADR * | | | | | | | 132,859 | | | | 1,992,885 | | | | 2.32 | |
| | | | | | | | | | | 7,857,637 | | | | 9.15 | |
Bangladesh (Cost $1,815,593) | | | | | | | | | | | | | | | | |
Square Pharmaceuticals Ltd. | | | BDT | | | | 523,838 | | | | 1,669,084 | | | | 1.95 | |
| | | | | | | | | | | 1,669,084 | | | | 1.95 | |
Egypt (Cost $6,274,129) | | | | | | | | | | | | | | | | |
ADES International Holding Ltd. *(2) | | | | | | | 171,843 | | | | 2,321,123 | | | | 2.71 | |
Arabian Food Industries Co. S.A.E. Domty * | | | EGP | | | | 1,550,000 | | | | 807,003 | | | | 0.94 | |
Commercial International Bank Egypt S.A.E. | | | EGP | | | | 709,104 | | | | 3,177,118 | | | | 3.70 | |
| | | | | | | | | | | 6,305,244 | | | | 7.35 | |
Georgia (Cost $3,844,829) | | | | | | | | | | | | | | | | |
Bank of Georgia Group PLC | | | GBP | | | | 51,800 | | | | 1,032,443 | | | | 1.20 | |
Georgia Healthcare Group PLC *(2) | | | GBP | | | | 331,091 | | | | 1,019,347 | | | | 1.19 | |
TBC Bank Group PLC | | | GBP | | | | 53,070 | | | | 1,145,844 | | | | 1.34 | |
| | | | | | | | | | | 3,197,634 | | | | 3.73 | |
Ivory Coast (Cost $1,483,823) | | | | | | | | | | | | | | | | |
Sonatel S.A. | | | XOF | | | | 36,204 | | | | 1,187,765 | | | | 1.38 | |
| | | | | | | | | | | 1,187,765 | | | | 1.38 | |
Kazakhstan (Cost $1,019,505) | | | | | | | | | | | | | | | | |
Halyk Savings Bank of Kazakhstan JSC GDR (Registered) | | | | | | | 119,426 | | | | 1,357,433 | | | | 1.58 | |
| | | | | | | | | | | 1,357,433 | | | | 1.58 | |
Kenya (Cost $3,062,807) | | | | | | | | | | | | | | | | |
KCB Group Ltd. | | | KES | | | | 2,993,108 | | | | 1,118,851 | | | | 1.30 | |
Safaricom PLC | | | KES | | | | 7,947,700 | | | | 1,809,056 | | | | 2.11 | |
| | | | | | | | | | | 2,927,907 | | | | 3.41 | |
Kuwait (Cost $9,277,340) | | | | | | | | | | | | | | | | |
Humansoft Holding Co. K.S.C. | | | KWD | | | | 234,290 | | | | 2,351,923 | | | | 2.74 | |
National Bank of Kuwait S.A.K.P. | | | KWD | | | | 2,682,409 | | | | 7,259,089 | | | | 8.46 | |
| | | | | | | | | | | 9,611,012 | | | | 11.20 | |
Mauritius (Cost $2,618,343) | | | | | | | | | | | | | | | | |
MCB Group Ltd. | | | MUR | | | | 347,100 | | | | 2,758,964 | | | | 3.21 | |
| | | | | | | | | | | 2,758,964 | | | | 3.21 | |
Morocco (Cost $2,111,487) | | | | | | | | | | | | | | | | |
Attijariwafa Bank | | | MAD | | | | 42,270 | | | | 1,840,685 | | | | 2.15 | |
| | | | | | | | | | | 1,840,685 | | | | 2.15 | |
See accompanying notes to the financial statements.
107
ASHMORE EMERGING MARKETS FRONTIER EQUITY FUND
SCHEDULE OF INVESTMENTS (CONTINUED)
As of October 31, 2018
| | | | | | | | | | | | | | | | |
| | | Currency(1) | | | Shares | | | Value | | | % of Net
Assets | |
Nigeria (Cost $11,155,389) | | | | | | | | | | | | | | | | |
Dangote Cement PLC | | | NGN | | | | 3,802,397 | | | $ | 2,188,983 | | | | 2.55 | |
Guaranty Trust Bank PLC | | | NGN | | | | 39,448,713 | | | | 4,075,190 | | | | 4.75 | |
Lekoil Ltd. * | | | GBP | | | | 1,924,884 | | | | 326,486 | | | | 0.38 | |
Nestle Nigeria PLC | | | NGN | | | | 723,363 | | | | 2,749,978 | | | | 3.20 | |
United Bank for Africa PLC | | | NGN | �� | | | 48,514,717 | | | | 1,055,847 | | | | 1.23 | |
| | | | | | | | | | | 10,396,484 | | | | 12.11 | |
Pakistan (Cost $1,218,985) | | | | | | | | | | | | | | | | |
United Bank Ltd. | | | PKR | | | | 661,000 | | | | 749,165 | | | | 0.87 | |
| | | | | | | | | | | 749,165 | | | | 0.87 | |
Peru (Cost $4,027,138) | | | | | | | | | | | | | | | | |
Alicorp S.A.A. | | | PEN | | | | 722,179 | | | | 2,088,461 | | | | 2.43 | |
Credicorp Ltd. | | | | | | | 8,600 | | | | 1,941,106 | | | | 2.26 | |
| | | | | | | | | | | 4,029,567 | | | | 4.69 | |
Philippines (Cost $2,429,941) | | | | | | | | | | | | | | | | |
International Container Terminal Services, Inc. | | | PHP | | | | 1,254,170 | | | | 2,121,883 | | | | 2.47 | |
| | | | | | | | | | | 2,121,883 | | | | 2.47 | |
Romania (Cost $1,911,168) | | | | | | | | | | | | | | | | |
Banca Transilvania S.A. | | | RON | | | | 2,971,056 | | | | 1,673,974 | | | | 1.95 | |
Sphera Franchise Group S.A. * | | | RON | | | | 43,490 | | | | 237,641 | | | | 0.28 | |
| | | | | | | | | | | 1,911,615 | | | | 2.23 | |
Saudi Arabia (Cost $6,188,150) | | | | | | | | | | | | | | | | |
Bupa Arabia for Cooperative Insurance Co. | | | SAR | | | | 113,824 | | | | 3,131,467 | | | | 3.65 | |
Samba Financial Group | | | SAR | | | | 107,773 | | | | 892,293 | | | | 1.04 | |
Saudi Co. For Hardware CJSC | | | SAR | | | | 19,339 | | | | 443,354 | | | | 0.52 | |
United Electronics Co. | | | SAR | | | | 108,616 | | | | 1,764,603 | | | | 2.05 | |
| | | | | | | | | | | 6,231,717 | | | | 7.26 | |
Sri Lanka (Cost $1,405,366) | | | | | | | | | | | | | | | | |
Sampath Bank PLC * | | | LKR | | | | 819,634 | | | | 1,073,550 | | | | 1.25 | |
| | | | | | | | | | | 1,073,550 | | | | 1.25 | |
United Arab Emirates (Cost $7,668,288) | | | | | | | | | | | | | | | | |
Aramex PJSC | | | AED | | | | 603,221 | | | | 649,435 | | | | 0.76 | |
DP World Ltd. | | | | | | | 143,685 | | | | 2,586,811 | | | | 3.01 | |
Emaar Development PJSC | | | AED | | | | 469,961 | | | | 633,752 | | | | 0.74 | |
Emaar Malls PJSC | | | AED | | | | 1,121,534 | | | | 559,556 | | | | 0.65 | |
Emirates NBD PJSC | | | AED | | | | 233,357 | | | | 589,638 | | | | 0.69 | |
NMC Health PLC | | | GBP | | | | 50,743 | | | | 2,288,211 | | | | 2.66 | |
| | | | | | | | | | | 7,307,403 | | | | 8.51 | |
Vietnam (Cost $9,692,116) | | | | | | | | | | | | | | | | |
Masan Group Corp. * | | | VND | | | | 754,730 | | | | 2,694,894 | | | | 3.14 | |
Military Commercial Joint Stock Bank | | | VND | | | | 2,475,636 | | | | 2,319,364 | | | | 2.70 | |
Mobile World Investment Corp. | | | VND | | | | 87,850 | | | | 424,483 | | | | 0.50 | |
See accompanying notes to the financial statements.
108
ASHMORE EMERGING MARKETS FRONTIER EQUITY FUND
SCHEDULE OF INVESTMENTS (CONTINUED)
As of October 31, 2018
| | | | | | | | | | | | | | | | |
| | | Currency(1) | | | Shares | | | Value | | | % of Net
Assets | |
Vietnam (continued) | | | | | | | | | | | | | | | | |
Vietnam Dairy Products JSC | | | VND | | | | 423,720 | | | $ | 2,115,330 | | | | 2.46 | |
Vietnam Technological & Commercial Joint Stock Bank * | | | VND | | | | 1,616,250 | | | | 1,871,325 | | | | 2.18 | |
| | | | | | | | | | | 9,425,396 | | | | 10.98 | |
| | | | |
Total Common Stocks (Cost $85,735,859) | | | | | | | | | | | 81,960,145 | | | | 95.48 | |
| | | | |
Preferred Stocks | | | | | | | | | | | | | | | | |
| | | | |
Colombia (Cost $2,672,872) | | | | | | | | | | | | | | | | |
Banco Davivienda S.A., 2.462% (3) | | | COP | | | | 235,779 | | | | 2,270,271 | | | | 2.64 | |
| | | | | | | | | | | 2,270,271 | | | | 2.64 | |
| | | | |
Total Preferred Stocks (Cost $2,672,872) | | | | | | | | | | | 2,270,271 | | | | 2.64 | |
| | | | |
Total Investments (Total Cost $88,408,731) | | | | | | | | | | | 84,230,416 | | | | 98.12 | |
| | | | |
Other Assets Less Liabilities (See Statements of Assets and Liabilities for further detail) | | | | | | | | | | | 1,611,532 | | | | 1.88 | |
| | | | |
Net Assets | | | | | | | | | | $ | 85,841,948 | | | | 100.00 | |
| * | Non-income producing security. |
| (1) | Par values are stated in United States Dollars unless otherwise noted below. |
| (2) | Securities exempt from registration under Rule 144A of the Securities Act of 1933. These securities may not be publicly traded without registration under the Securities Act of 1933. |
| (3) | Current yield is disclosed. Dividends are calculated based on a percentage of the issuer’s net income. |
Percentages shown are based on net assets.
At October 31, 2018, the industry sectors for the Ashmore Emerging Markets Frontier Equity Fund were:
| | | | |
| Sector | | Percentage of
Net Assets | |
Communication Services | | | 3.5% | |
Consumer Discretionary | | | 6.1 | |
Consumer Staples | | | 12.2 | |
Energy | | | 5.4 | |
Financials | | | 52.9 | |
Health Care | | | 5.8 | |
Industrials | | | 6.2 | |
Information Technology | | | 2.1 | |
Materials | | | 2.5 | |
Real Estate | | | 1.4 | |
Total Investments | | | 98.1 | |
Other Assets Less Liabilities | | | 1.9 | |
Net Assets | | | 100.0% | |
See accompanying notes to the financial statements.
109
ASHMORE EMERGING MARKETS FRONTIER EQUITY FUND
SCHEDULE OF INVESTMENTS (CONTINUED)
As of October 31, 2018
The inputs or methodologies used for valuing securities are not necessarily an indication of the risks associated with investing in those securities and other financial instruments, if any. See note 4 in the Notes to the Financial Statements for more information regarding pricing inputs and valuation techniques. The following is a summary of the inputs used in valuing the Ashmore Emerging Markets Frontier Equity Fund’s investments and other financial instruments, which are carried at fair value, as of October 31, 2018:
| | | | | | | | | | | | | | | | |
| | | Level 1 | | | Level 2 | | | Level 3 | | | Total | |
Investments | | | | | | | | | | | | | | | | |
Assets: | | | | | | | | | | | | | | | | |
Common Stocks | | | | | | | | | | | | | | | | |
Argentina | | $ | 7,857,637 | | | $ | — | | | | $— | | | $ | 7,857,637 | |
Bangladesh | | | — | | | | 1,669,084 | | | | — | | | | 1,669,084 | |
Egypt | | | 3,984,121 | | | | 2,321,123 | | | | — | | | | 6,305,244 | |
Georgia | | | — | | | | 3,197,634 | | | | — | | | | 3,197,634 | |
Ivory Coast | | | — | | | | 1,187,765 | | | | — | | | | 1,187,765 | |
Kazakhstan | | | — | | | | 1,357,433 | | | | — | | | | 1,357,433 | |
Kenya | | | — | | | | 2,927,907 | | | | — | | | | 2,927,907 | |
Kuwait | | | — | | | | 9,611,012 | | | | — | | | | 9,611,012 | |
Mauritius | | | — | | | | 2,758,964 | | | | — | | | | 2,758,964 | |
Morocco | | | — | | | | 1,840,685 | | | | — | | | | 1,840,685 | |
Nigeria | | | — | | | | 10,396,484 | | | | — | | | | 10,396,484 | |
Pakistan | | | — | | | | 749,165 | | | | — | | | | 749,165 | |
Peru | | | 4,029,567 | | | | — | | | | — | | | | 4,029,567 | |
Philippines | | | — | | | | 2,121,883 | | | | — | | | | 2,121,883 | |
Romania | | | — | | | | 1,911,615 | | | | — | | | | 1,911,615 | |
Saudi Arabia | | | — | | | | 6,231,717 | | | | — | | | | 6,231,717 | |
Sri Lanka | | | — | | | | 1,073,550 | | | | — | | | | 1,073,550 | |
United Arab Emirates | | | — | | | | 7,307,403 | | | | — | | | | 7,307,403 | |
Vietnam | | | — | | | | 9,425,396 | | | | — | | | | 9,425,396 | |
| | | | | | | | | | | | | | | | |
Total Common Stocks | | | 15,871,325 | | | | 66,088,820 | | | | — | | | | 81,960,145 | |
Preferred Stocks | | | | | | | | | | | | | | | | |
Colombia | | | 2,270,271 | | | | — | | | | — | | | | 2,270,271 | |
Total Investments | | $ | 18,141,596 | | | $ | 66,088,820 | | | | $— | | | $ | 84,230,416 | |
See accompanying notes to the financial statements.
110
ASHMORE EMERGING MARKETS EQUITY FUND
SCHEDULE OF INVESTMENTS
As of October 31, 2018
| | | | | | | | | | | | | | |
| | | Currency(1) | | Shares | | | Value | | | % of Net
Assets | |
Common Stocks | | | | | | | | | | | | | | |
| | | | |
Argentina (Cost $437,740) | | | | | | | | | | | | | | |
Globant S.A. * | | | | | 6,864 | | | $ | 353,359 | | | | 1.44 | |
Grupo Financiero Galicia S.A. ADR | | | | | 5,077 | | | | 117,075 | | | | 0.48 | |
| | | | | | | | | 470,434 | | | | 1.92 | |
| | | | |
Brazil (Cost $1,896,458) | | | | | | | | | | | | | | |
Fleury S.A. | | BRL | | | 44,900 | | | | 251,556 | | | | 1.03 | |
Hypera S.A. * | | BRL | | | 70,500 | | | | 564,152 | | | | 2.30 | |
Rumo S.A. * | | BRL | | | 86,000 | | | | 384,764 | | | | 1.57 | |
Smiles Fidelidade S.A. | | BRL | | | 21,700 | | | | 217,204 | | | | 0.89 | |
Suzano Papel e Celulose S.A. | | BRL | | | 25,400 | | | | 258,334 | | | | 1.06 | |
| | | | | | | | | 1,676,010 | | | | 6.85 | |
| | | | |
China (Cost $8,431,485) | | | | | | | | | | | | | | |
58.com, Inc. ADR * | | | | | 7,929 | | | | 520,063 | | | | 2.13 | |
Alibaba Group Holding Ltd. ADR * | | | | | 1,863 | | | | 265,068 | | | | 1.08 | |
Anhui Conch Cement Co. Ltd., Class H | | HKD | | | 48,500 | | | | 249,376 | | | | 1.02 | |
ANTA Sports Products Ltd. | | HKD | | | 159,000 | | | | 651,671 | | | | 2.66 | |
AviChina Industry & Technology Co. Ltd., Class H | | HKD | | | 447,000 | | | | 298,477 | | | | 1.22 | |
China Construction Bank Corp., Class H | | HKD | | | 399,000 | | | | 315,539 | | | | 1.29 | |
CSPC Pharmaceutical Group Ltd. | | HKD | | | 104,000 | | | | 218,676 | | | | 0.89 | |
Haitian International Holdings Ltd. | | HKD | | | 187,000 | | | | 369,213 | | | | 1.51 | |
Jiangsu Yanghe Brewery Joint-Stock Co. Ltd., Class A | | CNY | | | 29,400 | | | | 374,354 | | | | 1.53 | |
New Oriental Education & Technology Group, Inc. ADR * | | | | | 7,083 | | | | 414,426 | | | | 1.69 | |
Ping An Insurance Group Co. of China Ltd., Class H | | HKD | | | 103,000 | | | | 974,788 | | | | 3.98 | |
SINA Corp. * | | | | | 4,300 | | | | 272,233 | | | | 1.11 | |
Tencent Holdings Ltd. | | HKD | | | 25,800 | | | | 874,492 | | | | 3.58 | |
Weibo Corp. ADR * | | | | | 6,284 | | | | 370,819 | | | | 1.52 | |
Xiabuxiabu Catering Management China Holdings Co. Ltd. *(2) | | HKD | | | 325,500 | | | | 405,327 | | | | 1.66 | |
YY, Inc. ADR * | | | | | 3,440 | | | | 219,816 | | | | 0.90 | |
| | | | | | | | | 6,794,338 | | | | 27.77 | |
| | | | |
Hong Kong (Cost $422,395) | | | | | | | | | | | | | | |
AIA Group Ltd. | | HKD | | | 49,600 | | | | 377,259 | | | | 1.54 | |
| | | | | | | | | 377,259 | | | | 1.54 | |
| | | | |
Hungary (Cost $403,902) | | | | | | | | | | | | | | |
OTP Bank Nyrt. | | HUF | | | 9,146 | | | | 328,175 | | | | 1.34 | |
| | | | | | | | | 328,175 | | | | 1.34 | |
| | | | |
India (Cost $3,345,047) | | | | | | | | | | | | | | |
Edelweiss Financial Services Ltd. | | INR | | | 115,197 | | | | 253,413 | | | | 1.04 | |
HDFC Bank Ltd. ADR | | | | | 4,775 | | | | 424,545 | | | | 1.73 | |
ICICI Bank Ltd. ADR | | | | | 92,625 | | | | 879,011 | | | | 3.59 | |
Larsen & Toubro Infotech Ltd. (2) | | INR | | | 16,366 | | | | 393,532 | | | | 1.61 | |
Mahindra & Mahindra Ltd. | | INR | | | 42,736 | | | | 446,606 | | | | 1.82 | |
Mahindra & Mahindra Ltd. GDR | | | | | 11,117 | | | | 115,008 | | | | 0.47 | |
See accompanying notes to the financial statements.
111
ASHMORE EMERGING MARKETS EQUITY FUND
SCHEDULE OF INVESTMENTS (CONTINUED)
As of October 31, 2018
| | | | | | | | | | | | | | |
| | | Currency(1) | | Shares | | | Value | | | % of Net
Assets | |
India (continued) | | | | | | | | | | | | | | |
Reliance Industries Ltd. | | INR | | | 30,587 | | | $ | 434,603 | | | | 1.78 | |
| | | | | | | | | 2,946,718 | | | | 12.04 | |
| | | | |
Malaysia (Cost $247,991) | | | | | | | | | | | | | | |
My EG Services Bhd. | | MYR | | | 649,500 | | | | 185,871 | | | | 0.76 | |
| | | | | | | | | 185,871 | | | | 0.76 | |
| | | | |
Mexico (Cost $1,716,274) | | | | | | | | | | | | | | |
Fomento Economico Mexicano S.A.B. de C.V. ADR | | | | | 4,051 | | | | 344,619 | | | | 1.41 | |
Grupo Aeroportuario del Pacifico S.A.B. de C.V., Series B | | MXN | | | 28,300 | | | | 234,124 | | | | 0.96 | |
Grupo Aeroportuario del Sureste S.A.B. de C.V. ADR | | | | | 2,688 | | | | 443,574 | | | | 1.81 | |
Grupo Financiero Banorte S.A.B. de C.V., Series O | | MXN | | | 46,800 | | | | 257,485 | | | | 1.05 | |
Ternium S.A. ADR | | | | | 8,453 | | | | 269,143 | | | | 1.10 | |
| | | | | | | | | 1,548,945 | | | | 6.33 | |
| | | | |
Peru (Cost $294,952) | | | | | | | | | | | | | | |
Credicorp Ltd. | | | | | 1,400 | | | | 315,994 | | | | 1.29 | |
| | | | | | | | | 315,994 | | | | 1.29 | |
| | | | |
Russian Federation (Cost $2,017,593) | | | | | | | | | | | | | | |
LUKOIL PJSC ADR | | | | | 11,493 | | | | 858,177 | | | | 3.51 | |
Mail.Ru Group Ltd. GDR (Registered) * | | | | | 12,551 | | | | 333,739 | | | | 1.36 | |
Sberbank of Russia PJSC | | RUB | | | 158,320 | | | | 455,968 | | | | 1.86 | |
Yandex N.V., Class A * | | | | | 8,900 | | | | 268,157 | | | | 1.10 | |
| | | | | | | | | 1,916,041 | | | | 7.83 | |
| | | | |
South Africa (Cost $2,100,575) | | | | | | | | | | | | | | |
Naspers Ltd., Class N | | ZAR | | | 4,192 | | | | 734,251 | | | | 3.00 | |
Sanlam Ltd. | | ZAR | | | 85,386 | | | | 428,643 | | | | 1.76 | |
Shoprite Holdings Ltd. | | ZAR | | | 20,086 | | | | 245,079 | | | | 1.00 | |
| | | | | | | | | 1,407,973 | | | | 5.76 | |
| | | | |
South Korea (Cost $1,303,487) | | | | | | | | | | | | | | |
Com2uS Corp. | | KRW | | | 3,281 | | | | 370,479 | | | | 1.51 | |
Dentium Co. Ltd. | | KRW | | | 3,745 | | | | 238,489 | | | | 0.98 | |
NCSoft Corp. | | KRW | | | 1,346 | | | | 509,010 | | | | 2.08 | |
Samsung Electronics Co. Ltd. (Korean Exchange) | | KRW | | | 3,184 | | | | 119,081 | | | | 0.49 | |
| | | | | | | | | 1,237,059 | | | | 5.06 | |
| | | | |
Taiwan (Cost $2,916,314) | | | | | | | | | | | | | | |
Gourmet Master Co. Ltd. | | TWD | | | 44,536 | | | | 268,987 | | | | 1.10 | |
Hota Industrial Manufacturing Co. Ltd. | | TWD | | | 89,000 | | | | 375,223 | | | | 1.53 | |
Parade Technologies Ltd. | | TWD | | | 20,000 | | | | 263,156 | | | | 1.08 | |
Silergy Corp. | | TWD | | | 20,000 | | | | 253,172 | | | | 1.04 | |
Silicon Motion Technology Corp. ADR | | | | | 3,111 | | | | 116,943 | | | | 0.48 | |
Taiwan Semiconductor Manufacturing Co. Ltd. | | TWD | | | 78,000 | | | | 579,511 | | | | 2.37 | |
Taiwan Semiconductor Manufacturing Co. Ltd. ADR | | | | | 13,835 | | | | 527,114 | | | | 2.15 | |
| | | | | | | | | 2,384,106 | | | | 9.75 | |
See accompanying notes to the financial statements.
112
ASHMORE EMERGING MARKETS EQUITY FUND
SCHEDULE OF INVESTMENTS (CONTINUED)
As of October 31, 2018
| | | | | | | | | | | | | | | | |
| | | Currency(1) | | | Shares | | | Value | | | % of Net
Assets | |
Thailand (Cost $1,593,552) | | | | | | | | | | | | | | | | |
CP ALL PCL (Registered) | | | THB | | | | 259,100 | | | $ | 525,625 | | | | 2.15 | |
PTT PCL NVDR | | | THB | | | | 165,900 | | | | 256,352 | | | | 1.05 | |
Siam Commercial Bank (The) PCL NVDR | | | THB | | | | 110,000 | | | | 457,299 | | | | 1.87 | |
Supalai PCL (Registered) | | | THB | | | | 353,500 | | | | 233,534 | | | | 0.95 | |
| | | | | | | | | 1,472,810 | | | 6.02 | |
| | | | |
Total Common Stocks (Cost $27,127,765) | | | | | | | | | | | 23,061,733 | | | | 94.26 | |
| | | | |
Preferred Stocks | | | | | | | | | | | | | | | | |
| | | | |
Brazil (Cost $651,398) | | | | | | | | | | | | | | | | |
Banco Bradesco S.A. ADR * | | | | | | | 46,981 | | | | 430,816 | | | | 1.76 | |
Lojas Americanas S.A. * | | | BRL | | | | 59,100 | | | | 298,557 | | | | 1.22 | |
| | | | | | | | | 729,373 | | | 2.98 | |
| | | | |
South Korea (Cost $212,403) | | | | | | | | | | | | | | | | |
Samsung Electronics Co. Ltd., 4.124% (3) | | | KRW | | | | 5,785 | | | | 182,297 | | | | 0.75 | |
| | | | | | | | | | | 182,297 | | | | 0.75 | |
Total Preferred Stocks (Cost $863,801) | | | | | | | | | | | 911,670 | | | | 3.73 | |
| | | | |
Total Investments (Total Cost $27,991,566) | | | | | | | | | | | 23,973,403 | | | | 97.99 | |
| | | | |
Other Assets Less Liabilities (See Statements of Assets and Liabilities for further detail) | | | | | | | | | | | 492,625 | | | | 2.01 | |
| | | | |
Net Assets | | | | | | | | | | $ | 24,466,028 | | | | 100.00 | |
| * | Non-income producing security. |
| (1) | Par values are stated in United States Dollars unless otherwise noted below. |
| (2) | Securities exempt from registration under Rule 144A of the Securities Act of 1933. These securities may not be publicly traded without registration under the Securities Act of 1933. |
| (3) | Current yield is disclosed. Dividends are calculated based on a percentage of the issuer’s net income. |
Percentages shown are based on net assets.
See accompanying notes to the financial statements.
113
ASHMORE EMERGING MARKETS EQUITY FUND
SCHEDULE OF INVESTMENTS (CONTINUED)
As of October 31, 2018
At October 31, 2018, the industry sectors for the Ashmore Emerging Markets Equity Fund were:
| | | | |
| Sector | | Percentage of
Net Assets | |
Communication Services | | | 19.2% | |
Consumer Discretionary | | | 13.2 | |
Consumer Staples | | | 6.1 | |
Energy | | | 6.3 | |
Financials | | | 24.6 | |
Health Care | | | 5.2 | |
Industrials | | | 7.1 | |
Information Technology | | | 12.2 | |
Materials | | | 3.2 | |
Real Estate | | | 0.9 | |
Total Investments | | | 98.0 | |
Other Assets Less Liabilities | | | 2.0 | |
Net Assets | | | 100.0% | |
The inputs or methodologies used for valuing securities are not necessarily an indication of the risks associated with investing in those securities and other financial instruments, if any. See note 4 in the Notes to the Financial Statements for more information regarding pricing inputs and valuation techniques. The following is a summary of the inputs used in valuing the Ashmore Emerging Markets Equity Fund’s investments and other financial instruments, which are carried at fair value, as of October 31, 2018:
| | | | | | | | | | | | | | | | |
| | | Level 1 | | | Level 2 | | | Level 3 | | | Total | |
Investments | | | | | | | | | | | | | | | | |
Assets: | | | | | | | | | | | | | | | | |
Common Stocks | | | | | | | | | | | | | | | | |
Argentina | | | $ 470,434 | | | | $ — | | | | $— | | | | $ 470,434 | |
Brazil | | | 1,676,010 | | | | — | | | | — | | | | 1,676,010 | |
China | | | 2,062,425 | | | | 4,731,913 | | | | — | | | | 6,794,338 | |
Hong Kong | | | — | | | | 377,259 | | | | — | | | | 377,259 | |
Hungary | | | — | | | | 328,175 | | | | — | | | | 328,175 | |
India | | | 1,303,556 | | | | 1,643,162 | | | | — | | | | 2,946,718 | |
Malaysia | | | — | | | | 185,871 | | | | — | | | | 185,871 | |
Mexico | | | 1,548,945 | | | | — | | | | — | | | | 1,548,945 | |
Peru | | | 315,994 | | | | — | | | | — | | | | 315,994 | |
Russian Federation | | | 268,157 | | | | 1,647,884 | | | | — | | | | 1,916,041 | |
South Africa | | | — | | | | 1,407,973 | | | | — | | | | 1,407,973 | |
South Korea | | | — | | | | 1,237,059 | | | | — | | | | 1,237,059 | |
Taiwan | | | 644,057 | | | | 1,740,049 | | | | — | | | | 2,384,106 | |
Thailand | | | 759,159 | | | | 713,651 | | | | — | | | | 1,472,810 | |
| | | | | | | | | | | | | | | | |
Total Common Stocks | | | 9,048,737 | | | | 14,012,996 | | | | — | | | | 23,061,733 | |
Preferred Stocks | | | | | | | | | | | | | | | | |
Brazil | | | 729,373 | | | | — | | | | — | | | | 729,373 | |
South Korea | | | — | | | | 182,297 | | | | — | | | | 182,297 | |
| | | | | | | | | | | | | | | | |
Total Preferred Stocks | | | 729,373 | | | | 182,297 | | | | — | | | | 911,670 | |
Total Investments | | | $9,778,110 | | | | $14,195,293 | | | | $— | | | | $23,973,403 | |
See accompanying notes to the financial statements.
114
ASHMORE EMERGING MARKETS EQUITY FUND
SCHEDULE OF INVESTMENTS (CONTINUED)
As of October 31, 2018
The following is a summary of the fair values of the Fund’s derivative instruments*:
The Effect of Financial Derivative Instruments on the Statements of Operations for the Year Ended October 31, 2018:
| | | | |
| | | Derivatives Not Accounted for as
Hedging Instruments | |
| | | Foreign
Exchange Risk | |
Realized Gain (Loss) on Derivatives Recognized resulting from Operations: | | | | |
Net Realized Gain on Forward Foreign Currency Exchange Contracts | | | $1,788 | |
| | | | |
* See note 10 in the Notes to the Financial Statements for additional information.
See accompanying notes to the financial statements.
115
ASHMORE FUNDS
NOTES TO FINANCIAL STATEMENTS
As of October 31, 2018
Ashmore Funds (the “Trust”) is a Massachusetts business trust organized under the laws of the Commonwealth of Massachusetts on August 6, 2010 (inception date) and is registered under the Investment Company Act of 1940, as amended (the “Investment Company Act” or “1940 Act”), as an open-end management investment company. The Trust follows accounting and reporting guidance under Financial Accounting Standards Codification Topic 946, “Financial Services – Investment Companies.” The Trust includes eight funds as of October 31, 2018, each with its own investment objective. The Ashmore Emerging Markets Total Return Fund, Ashmore Emerging Markets Local Currency Bond Fund, Ashmore Emerging Markets Corporate Debt Fund, Ashmore Emerging Markets Short Duration Fund, Ashmore Emerging Markets Active Equity Fund, Ashmore Emerging Markets Small-Cap Equity Fund, Ashmore Emerging Markets Frontier Equity Fund and Ashmore Emerging Markets Equity Fund (each a “Fund” and collectively, the “Funds”) are separate series of the Trust. The Ashmore Emerging Markets Local Currency Bond Fund and the Ashmore Emerging Markets Short Duration Fund are each non-diversified funds. Non-diversified funds may invest a relatively large portion of their net assets in a single issuer or a small number of issuers. Each of the Funds’ financial statements are presented herein. Effective November 1, 2017, the Ashmore Emerging Markets Value Fund changed its name to the Ashmore Emerging Markets Equity Fund. The Ashmore Emerging Markets Hard Currency Debt Fund liquidated on November 20, 2017 and the Ashmore Emerging Markets Equity Opportunities Fund liquidated on January 5, 2018.
Ashmore Investment Advisors Limited (“AIAL” or the “Investment Manager”) serves as investment manager to the Funds. AIAL is a wholly owned subsidiary of Ashmore Investments (UK) Limited, which is a wholly owned subsidiary of Ashmore Group plc (“Ashmore Group”). Ashmore Investment Management (US) Corporation (“AIMUS”) is the principal underwriter of shares of the Funds. AIMUS is an affiliate of the Investment Manager. The Northern Trust Company (“Northern Trust”) serves as the administrator, custodian and transfer agent of the Funds.
Related parties or personnel of the Investment Manager may invest in the Funds. The Investment Manager could face a conflict of interest if a related party is invested in a Fund and that party’s interests diverge from those of the Fund, but equally this co-investment may serve to better align the interests of the Funds and the personnel of the Investment Manager. When a related party provides capital for a Fund, it may do so with the intention of redeeming all or part of its interest in the Fund at a future point in time.
The Funds have assessed the impact of the Alternative Investment Fund Managers Directive (AIFMD) (the “Directive”) on the financial statements of the Trust and have concluded that the Trust is exempt from following Chapter V. Section 1. Articles 103-111 of the European Commission’s Level 2 Delegated Regulation on the basis of the operations of the Trust being (i) Non-EEA AIFs (“European Economic Area Alternative Investment Funds”), and (ii) not being marketed in the European Union, as defined by the Directive.
| 2. | Significant accounting policies |
The significant accounting policies adopted and consistently followed in the preparation of the Funds’ financial statements are set out below:
(a) Basis of preparation
The financial statements have been prepared in accordance with accounting principles generally accepted in the United States of America (“U.S. GAAP”).
(b) Use of estimates
The preparation of financial statements in accordance with U.S. GAAP requires estimates and assumptions that affect the reported amounts of assets and liabilities and the disclosure of contingent assets and liabilities at the date of the financial statements, as well as the reported amounts of revenues generated and expenses incurred during the reporting period. Actual
116
ASHMORE FUNDS
NOTES TO FINANCIAL STATEMENTS (CONTINUED)
As of October 31, 2018
results could differ from these estimates. These financial statements contain all adjustments which are, in the opinion of the Trust, necessary to portray a fair statement of the period presented. Such adjustments are normal and recurring in nature. Valuation models used to determine the fair value of hard to value investments require the use of a number of market based assumptions.
(c) Determination of the Net Asset Value
The net asset value (“NAV”) of a Fund’s shares is calculated at the close of regular trading (normally 4:00 p.m. Eastern time) (the “NYSE Close”) on each day that the New York Stock Exchange (“NYSE”) is open for regular trading.
(d) Investment valuation
For the purposes of calculating NAV, portfolio securities and other assets for which market quotations are readily available are valued at market value. Market values for securities and other instruments are generally determined on the basis of closing prices or the last reported sales prices on an exchange or other market, or if no closing prices or sales are reported, based on quotes or other market information obtained from a quotation reporting system, established market makers, or pricing services. Domestic and foreign debt securities for which the close of trading does not coincide with the NYSE close and non-exchange traded derivatives are normally valued on the basis of quotes obtained from brokers and dealers or pricing services using data reflecting the earlier closing of the principal markets for those securities (e.g., certain foreign securities). Prices obtained from independent pricing services are based on information provided by market makers or estimates of market values obtained from yield data relating to investments or securities with similar characteristics. Certain debt securities purchased on a delayed delivery basis are marked-to-market daily until settlement. Exchange traded options, futures and options on futures are generally valued at the settlement price determined by the exchange on which the instrument is primarily traded. With respect to any portion of a Fund’s assets that are invested in one or more open-ended investment management companies, a Fund’s NAV will be calculated based upon the NAVs of such investments. The prospectuses for these open-end management investment companies explain the circumstances under which those companies will use fair value pricing and the effects of using fair value pricing.
If a Fund believes a non-U.S. (foreign) security’s value has materially changed after the close of the security’s primary exchange or principal market but before the time as of which the Funds calculate their NAVs, the security will be valued at fair value based on procedures approved by the Board. A Fund may determine the fair value of investments based on information provided by pricing services and other third-party vendors, which may recommend fair value prices or adjustments with reference to other securities, indices or assets. The Funds may use fair value pricing more frequently for foreign securities or assets because, amongst other things, many foreign markets close well before the NAV of the Funds’ shares is next calculated. In considering whether fair value pricing is required and in determining fair values, the Fund may, amongst other things, consider significant events (which may be considered to include changes in the value of U.S. securities or securities indices) that occur after the close of the relevant market and before the time as of which the Funds calculate their NAVs. A Fund may utilize modeling tools provided by third-party vendors to determine the fair values of non-U.S. securities. Foreign exchanges may permit trading in foreign securities on days when the Trust is not open for business, which may result in the values of a Fund’s portfolio investments being affected when investors are unable to buy, sell or exchange shares of the Fund.
Investments initially valued in currencies other than the United States Dollar are converted to the United States Dollar using exchange rates obtained from pricing services. Foreign exchange rates are calculated as of 4:00 p.m. Eastern time on each day that the NYSE opens for regular trading. As a result, the NAV of a Fund’s shares may be affected by changes in the value of currencies in relation to the United States Dollar. The value of securities traded in markets outside the United States or denominated in currencies other than the United States Dollar may be affected significantly on a day that the NYSE is closed and an investor is not able to purchase, redeem or exchange shares of the Funds.
In the event that market quotes are not readily available, and the security or asset cannot be valued pursuant to one of the Board’s approved valuation methods, the fair value of the security or asset will be determined in good faith by the Board, generally based upon recommendations provided by the Investment Manager. Market quotes are considered not readily available in circumstances where there is an absence of current or reliable market-based data (e.g., trade information, bid/asked information,
117
ASHMORE FUNDS
NOTES TO FINANCIAL STATEMENTS (CONTINUED)
As of October 31, 2018
broker quotes), including where events occur after the close of the relevant market, but prior to a Fund’s NAV calculation time, that materially affect the values of a Fund’s securities or assets. In addition, market quotes are considered not readily available when, due to extraordinary circumstances, the exchanges or markets on which the securities trade do not open for trading for the entire day and no other market prices are available. A Fund may also determine that market quotations are not readily available due to events relating to a single issuer (e.g., corporate actions or announcements) or events relating to multiple issuers (e.g., governmental actions or natural disasters). The Board has delegated to the Investment Manager the responsibility for monitoring significant events that may materially affect the values of a Fund’s securities or assets and for determining whether the value of the applicable securities or assets should be re-evaluated in light of such significant events.
The Investment Manager primarily employs a market-based approach which may use related or comparable assets or liabilities, recent transactions, market multiples, book values, and other relevant information to determine the fair value of the investment. The Investment Manager may also apply a discount to the last traded price in situations where the last traded price may not represent the fair value of the security, such as if a security’s trading has been suspended on its primary trading market, a security has been de-listed from its primary trading market, a security has not traded for an extended period of time, or a security’s primary trading market is temporarily closed at a time when under normal conditions it would be open. Any such discount is based on a number of factors including but not limited to the circumstances surrounding any potential suspension or de-listing, market and industry conditions, competitor information, and the period of time since the last trading took place.
When a Fund uses fair value pricing to determine the NAV of its shares, securities may not be priced on the basis of quotes from the primary market in which they are traded, but rather may be priced by another method that the Board or persons acting at its direction believe accurately reflects fair value. Fair value pricing may require subjective determinations about the value of a security or asset. While the Funds’ policies are intended to result in a calculation of a Fund’s NAV that fairly reflects security and asset values as of the time of pricing, the Funds cannot ensure that fair values determined by the Board or persons acting at their direction accurately reflects the price that a Fund could obtain for a security or asset if it were to dispose of that security or asset at the time of pricing (for instance, in a forced or distressed sale). The prices used by a Fund may differ from the value that would be realized if the securities were sold. Also, the use of fair value pricing may not always result in adjustments to the prices of securities or other assets held by the Fund for the purpose of calculating the NAV of the Fund’s shares.
(e) Investment transactions, income and expenses
Investment transactions are recorded at the trade date. The Funds determine the gain or loss realized from investment transactions using an identified cost basis method. Interest income is recognized on an accrual basis and includes the amortization of premiums and the accretion of discounts using the effective yield method.
Dividend income is recognized on the ex-dividend date. Dividends from foreign securities are recorded on the ex-dividend date, or as soon as such information is available, net of any applicable tax withholding. Expenses are recorded on an accrual basis. Each Fund is charged for those expenses that are directly attributable to that Fund. Certain expenses arising in connection with a class of shares are charged to that class of shares. Expenses incurred which do not specifically relate to an individual Fund are allocated amongst all the Funds in the Trust in proportion to each Fund’s relative net assets.
(f) Fully funded total return swaps
Each Fund is subject to market risk in the normal course of pursuing its investment objectives. Certain Funds enter into fully funded total return swaps (“TRS”) to manage their exposure to the market, certain sectors of the market or a particular security or reference asset, or to create exposure to certain investments to which they would otherwise not be exposed. TRS contracts involve the exchange by a Fund and a counterparty of their respective commitments to pay or receive a net amount based, in part, on the change in the value of a notional amount of a particular security, index or reference asset.
118
ASHMORE FUNDS
NOTES TO FINANCIAL STATEMENTS (CONTINUED)
As of October 31, 2018
Where a Fund enters into a TRS transaction with a swap counterparty, pursuant to which the Fund makes an initial payment equal to the estimated value of an emerging market debt or equity security, loan or other financial instrument, the TRS is considered an investment for financial statement purposes and is accounted for using the same policies as would apply to the underlying assets it represents. In addition to the market risk of the underlying security, index or reference asset, there is a risk of default by the counterparty to the transaction.
(g) Equity-Linked Securities
Certain Funds may purchase equity-linked securities, also known as participation notes. Equity-linked securities are primarily used by the Funds as an alternate means to access what is generally an emerging securities market. A Fund deposits cash with its custodian (or broker) in an amount near or equal to the value of the underlying security in exchange for an equity linked security. Upon sale, the Fund receives cash from the broker or custodian, equal to the value of the underlying security. In addition to the market risk and credit risk of the underlying securities, there is a risk of default by the counterparty to the transaction. In the event of insolvency of the counterparty, a Fund might be unable to obtain its expected benefit. In addition, while the Funds will seek to enter into such transactions only with parties that are capable of entering into closing transactions with a Fund, there can be no assurance that a Fund will be able to close out such a transaction with the counterparty or obtain an offsetting position with any counterparty at a time prior to the end of the term of the underlying agreement.
(h) Inflation Index Securities
Certain Funds may invest in inflation-indexed bonds which are fixed income securities whose principal value is periodically adjusted based on a measure of rate of inflation. The interest rate on these bonds is generally fixed at issuance at a rate lower than typical bonds. Over the life of an inflation-indexed bond interest will be paid based on a principal value which is adjusted for inflation. Any increase or decrease in the principal amount of an inflation-indexed bond will be included as interest income on the Statements of Operations, even though investors do not receive their principal until maturity. At October 31, 2018, all inflation-indexed bonds were shown on the Statement of Investments with their original par and stated coupon rate.
In the normal course of business, the Funds trade financial instruments and enter into financial transactions where a risk of potential loss exists due to, amongst other things, changes in the market (market risk), or the failure or inability of the other party to a transaction to perform (credit and counterparty risk). See below for a summary description of select principal risks, some of which may not apply to a particular Fund. A discussion of the principal risks of investing in each Fund is included in that Fund’s prospectus.
Counterparty and Third Party Risk
Transactions involving a counterparty to a derivative or other instrument, or a third party responsible for servicing the instrument, are subject to the credit risk of the counterparty or third party, and to the counterparty’s or third party’s ability to perform in accordance with the terms of the transaction.
Credit Risk
The Funds could lose money if the issuer or guarantor of a debt security or other instrument is unable or unwilling to meet its financial obligations, and the lack of ability, or perceived lack of ability, of the issuer to make timely payments of interest and/or principal will negatively affect the value of the security or instrument.
Market Risk
The value of securities and instruments owned by the Funds may rise and fall, sometimes rapidly or unpredictably, due to factors affecting securities markets generally or particular industries or geographic areas. Recent instability in the financial markets has led governments around the world to take a number of unprecedented actions designed to support certain financial
119
ASHMORE FUNDS
NOTES TO FINANCIAL STATEMENTS (CONTINUED)
As of October 31, 2018
institutions and segments of the financial markets that have experienced extreme volatility, and in some cases a lack of liquidity. The withdrawal of this support, failure of these efforts, or investor perception that these efforts are not succeeding could negatively affect financial markets generally as well as the values and liquidity of a Fund’s portfolio securities and other assets.
Derivative financial instruments may result in off-balance sheet market and credit risk. If the markets should move against one or more positions that the Funds hold, the Funds could incur losses greater than the unrealized amounts recorded in the Statements of Assets and Liabilities. Derivative risk exposures are discussed in note 10.
Foreign/Emerging Markets Risks
Investments in foreign securities entail risks in addition to those customarily associated with investing in U.S. securities. Economic, political and social instability could disrupt financial markets in which the Fund invests and adversely affect the value of the Fund’s assets. In addition, national policies may restrict investment opportunities. In foreign markets there may be a lower degree of market volume and liquidity than in U.S. markets, and this may result in greater price volatility. The securities markets in many Emerging-Market countries are substantially smaller, less developed, less liquid and more volatile than the securities markets of developed countries. Furthermore, since the composition of each Fund will differ from that of market indexes, its performance generally will not mirror the returns provided by a specific market index.
| 4. | Fair value measurements |
U.S. GAAP includes a topic which defines fair value as the price that the Fund would receive upon selling an investment in an orderly and timely transaction to a market participant in the principal or most advantageous market of the investment. This topic establishes a three-tier hierarchy to maximize the use of observable market data, minimize the use of unobservable inputs and establish classification of fair value measurements for disclosure purposes. Inputs may be observable or unobservable and refer broadly to the assumptions that market participants would use in pricing the asset or liability including assumptions about risk. Such risks include the inherent risk in a particular valuation technique which is used to measure fair value. Observable inputs are inputs that reflect the assumptions market participants would use in pricing the asset or liability developed based on market data obtained from sources independent of the reporting entity. Unobservable inputs are inputs that reflect the reporting entity’s own assumptions about the assumptions market participants would use in pricing the asset or liability, developed based on the best information available in the circumstances. The three-tier hierarchy of inputs is summarized in the three broad levels listed below.
| | • | | Level 1 – Inputs using unadjusted quoted prices in active markets or exchanges for identical assets and liabilities. |
| | • | | Level 2 – Significant observable inputs other than those used in Level 1, which may include, but are not limited to, quoted prices for similar assets or liabilities in markets that are active, quoted prices for identical or similar assets or liabilities in markets that are not active, inputs other than quoted prices that are observable for the assets or liabilities (such as interest rates, yield curves, volatilities, prepayment rates, loss severities, credit risks and default rates) or other market corroborated inputs. |
| | • | | Level 3 – Significant unobservable inputs based on the best information available in the circumstances, to the extent observable inputs are not available, which may include assumptions made by the Board or persons acting at their discretion that are used in determining the fair market value of investments. |
Fixed income securities including corporate, convertible and municipal bonds and notes, U.S. government agency securities, U.S. treasury obligations, sovereign issues, bank loans, convertible preferred securities and non-U.S. bonds are normally priced using data reflecting the earlier closing of the principal markets for those securities, subject to possible fair value adjustments. Information that becomes known to a Fund or its agents after NAV has been calculated on a particular day will not generally be used to retroactively adjust the price of a security or NAV determined earlier that day.
120
ASHMORE FUNDS
NOTES TO FINANCIAL STATEMENTS (CONTINUED)
As of October 31, 2018
Portfolio securities and other assets for which market quotations are readily available are typically categorized as Level 1 of the fair value hierarchy. Domestic and foreign debt securities where the close of trading does not coincide with the NYSE close and non-exchange traded derivatives are normally valued on the basis of quotes obtained from brokers and dealers or pricing services using data reflecting the earlier closing of the principal markets for those securities. Prices obtained from independent pricing services are based on information provided by market makers or estimates of market values obtained from yield data relating to investments or securities with similar characteristics. Securities using these valuation adjustments are typically categorized as Level 2 of the fair value hierarchy. Preferred securities, equity linked notes and other equities traded on inactive markets or valued by reference to similar instruments are also typically categorized as Level 2 of the fair value hierarchy.
Investments and derivatives classified within Level 3 have significant unobservable inputs, as they trade infrequently or not at all. Level 3 instruments may include bank loan agreements and less-liquid corporate debt securities (including distressed debt instruments). Also included in this category are certain bonds and loans for which independent broker prices are used and information relating to the inputs of the price models is not available.
| 5. | Reverse repurchase agreements |
Certain Funds may enter into reverse repurchase agreements. In a reverse repurchase agreement, a Fund delivers a security in exchange for cash to a financial institution, the counterparty, with a simultaneous agreement to repurchase the same or substantially the same security at an agreed upon price and date. The Fund is entitled to receive principal and interest payments, if any, made on the security delivered to the counterparty during the term of the agreement. Cash received in exchange for securities delivered plus accrued interest payments to be made by the Fund to counterparties are reflected as a liability on the Statements of Assets and Liabilities. Interest payments made by the Fund to counterparties are recorded as a component of interest expense on the Statements of Operations. For the year ended October 31, 2018, there were no interest payments made by the Fund. In periods of increased demand for the security, the Fund may receive a fee for use of the security by the counterparty, which may result in interest income to the Fund.
The following is a summary by counterparty of the market value of reverse repurchase agreements and collateral pledged as of October 31, 2018:
| | | | | | | | | | | | | | | | |
| Ashmore Emerging Markets Corporate Debt Fund | |
| | | | |
| Counterparty | | Maturity Date | | | Payable for
Reverse
Repurchase
Agreements | | | | | | Collateral Pledged | |
JP Morgan | | | 11/23/2018 | | | | $ 294,298 | | | | | | | | $ 368,504 | |
Total | | | | | | | $ 294,298 | | | | | | | | $ 368,504 | |
Securities with an aggregate market value of $368,504 have been pledged as collateral in respect of reverse repurchase agreements as of October 31, 2018. The actual collateral exceeds the market values of the reverse repurchase agreements.
For the five days reverse repurchase agreements were outstanding during the year ended October 31, 2018, the average amount outstanding was $294,298.
121
ASHMORE FUNDS
NOTES TO FINANCIAL STATEMENTS (CONTINUED)
As of October 31, 2018
| 6. | Capital share transactions |
Transactions in Class A shares for the year ended October 31, 2018, were as follows:
| | | | | | | | | | | | | | | | | | | | | | | | | | | | | | | | |
| Fund | | Shares Sold | | | Proceeds from
Shares Sold | | | Shares from
Reinvested
Distributions | | | Proceeds from
Reinvestment
of
Distributions | | | Shares
Redeemed | | | Payments for
Shares
Redeemed | | | Net Increase/
(Decrease) in
Shares | | | Net Increase/
(Decrease) in
Net Assets | |
| Ashmore Emerging Markets Total Return Fund | | | 1,055,989 | | | $ | 8,221,599 | | | | 110,782 | | | $ | 877,055 | | | | (2,242,015 | ) | | $ | (16,864,703 | ) | | | (1,075,244 | ) | | $ | (7,766,049 | ) |
| Ashmore Emerging Markets Local Currency Bond Fund | | | 106,755 | | | | 780,126 | | | | 1,344 | | | | 9,855 | | | | (42,011 | ) | | | (278,524 | ) | | | 66,088 | | | | 511,457 | |
| Ashmore Emerging Markets Corporate Debt Fund | | | 759,237 | | | | 6,255,649 | | | | 55,860 | | | | 456,211 | | | | (1,120,665 | ) | | | (9,222,491 | ) | | | (305,568 | ) | | | (2,510,631 | ) |
| Ashmore Emerging Markets Short Duration Fund | | | 8,860,239 | | | | 87,639,937 | | | | 185,591 | | | | 1,852,710 | | | | (1,488,119 | ) | | | (14,767,638 | ) | | | 7,557,711 | | | | 74,725,009 | |
| Ashmore Emerging Markets Active Equity Fund | | | 19,978 | | | | 231,200 | | | | 247 | | | | 2,845 | | | | — | * | | | (36 | ) | | | 20,225 | | | | 234,009 | |
| Ashmore Emerging Markets Small-Cap Equity Fund | | | 108,988 | | | | 1,143,260 | | | | 1,360 | | | | 13,678 | | | | (11,826 | ) | | | (121,878 | ) | | | 98,522 | | | | 1,035,060 | |
| Ashmore Emerging Markets Frontier Equity Fund | | | 329,033 | | | | 3,037,758 | | | | 80,331 | | | | 737,298 | | | | (182,267 | ) | | | (1,656,007 | ) | | | 227,097 | | | | 2,119,049 | |
| Ashmore Emerging Markets Equity Fund | | | 23,582 | | | | 265,628 | | | | 334 | | | | 3,646 | | | | (3,609 | ) | | | (38,530 | ) | | | 20,307 | | | | 230,744 | |
* Amount rounds to less than 0.5 shares.
122
ASHMORE FUNDS
NOTES TO FINANCIAL STATEMENTS (CONTINUED)
As of October 31, 2018
Transactions in Class C shares for the year ended October 31, 2018, were as follows:
| | | | | | | | | | | | | | | | | | | | | | | | | | | | | | | | |
| Fund | | Shares Sold | | | Proceeds from
Shares Sold | | | Shares from
Reinvested
Distributions | | | Proceeds from
Reinvestment
of
Distributions | | | Shares
Redeemed | | | Payments for
Shares
Redeemed | | | Net Increase/
(Decrease) in
Shares | | | Net Increase/
(Decrease) in
Net Assets | |
| Ashmore Emerging Markets Total Return Fund | | | 385,578 | | | | $3,091,800 | | | | 13,062 | | | | $101,928 | | | | (290,040 | ) | | | $(2,235,193 | ) | | | 108,600 | | | | $958,535 | |
| Ashmore Emerging Markets Local Currency Bond Fund | | | 6,521 | | | | 50,345 | | | | 52 | | | | 398 | | | | (8,337 | ) | | | (60,424 | ) | | | (1,764 | ) | | | (9,681 | ) |
| Ashmore Emerging Markets Corporate Debt Fund | | | 353,871 | | | | 2,937,727 | | | | 39,067 | | | | 318,001 | | | | (389,109 | ) | | | (3,199,316 | ) | | | 3,829 | | | | 56,412 | |
| Ashmore Emerging Markets Short Duration Fund | | | 200,692 | | | | 1,930,493 | | | | 5,614 | | | | 54,255 | | | | (10,958 | ) | | | (105,503 | ) | | | 195,348 | | | | 1,879,245 | |
| Ashmore Emerging Markets Active Equity Fund | | | — | | | | — | | | | 84 | | | | 987 | | | | —* | | | | (17 | ) | | | 84 | | | | 970 | |
| Ashmore Emerging Markets Small-Cap Equity Fund | | | 18,471 | | | | 192,158 | | | | 349 | | | | 3,732 | | | | (9,495 | ) | | | (107,030 | ) | | | 9,325 | | | | 88,860 | |
| Ashmore Emerging Markets Frontier Equity Fund | | | 21,025 | | | | 191,968 | | | | 4,987 | | | | 45,155 | | | | (18,127 | ) | | | (157,282 | ) | | | 7,885 | | | | 79,841 | |
| Ashmore Emerging Markets Equity Fund | | | — | | | | — | | | | 3 | | | | 36 | | | | (118 | ) | | | (1,325 | ) | | | (115 | ) | | | (1,289 | ) |
* Amount rounds to less than 0.5 shares.
123
ASHMORE FUNDS
NOTES TO FINANCIAL STATEMENTS (CONTINUED)
As of October 31, 2018
Transactions in Institutional Class shares for the year ended October 31, 2018, were as follows:
| | | | | | | | | | | | | | | | | | | | | | | | | | | | | | | | |
| Fund | | Shares Sold | | | Proceeds from
Shares Sold | | | Shares from
Reinvested
Distributions | | | Proceeds from
Reinvestment
of
Distributions | | | Shares
Redeemed | | | Payments for
Shares
Redeemed | | | Net Increase/
(Decrease) in
Shares | | | Net Increase/
(Decrease) in
Net Assets | |
| Ashmore Emerging Markets Total Return Fund | | | 80,980,163 | | | | $645,888,234 | | | | 8,049,834 | | | | $64,119,416 | | | | (45,042,488) | | | | $(351,303,336) | | | | 43,987,509 | | | | $358,704,314 | |
| Ashmore Emerging Markets Local Currency Bond Fund | | | 1,832,437 | | | | 14,168,560 | | | | 213,743 | | | | 1,635,027 | | | | (4,074,426) | | | | (30,733,041) | | | | (2,028,246) | | | | (14,929,454) | |
| Ashmore Emerging Markets Corporate Debt Fund | | | 22,054,844 | | | | 188,292,483 | | | | 561,941 | | | | 4,786,559 | | | | (21,587,215) | | | | (183,871,149) | | | | 1,029,570 | | | | 9,207,893 | |
| Ashmore Emerging Markets Short Duration Fund | | | 64,698,851 | | | | 629,289,427 | | | | 1,107,118 | | | | 10,992,403 | | | | (10,685,503) | | | | (104,931,601) | | | | 55,120,466 | | | | 535,350,229 | |
| Ashmore Emerging Markets Active Equity Fund | | | 587,045 | | | | 7,173,072 | | | | 132,045 | | | | 1,556,099 | | | | (483,713) | | | | (6,013,206) | | | | 235,377 | | | | 2,715,965 | |
| Ashmore Emerging Markets Small-Cap Equity Fund | | | 1,273,008 | | | | 16,924,177 | | | | 32,565 | | | | 421,619 | | | | (1,071,107) | | | | (13,976,859) | | | | 234,466 | | | | 3,368,937 | |
| Ashmore Emerging Markets Frontier Equity Fund | | | 3,666,847 | | | | 39,118,499 | | | | 610,749 | | | | 6,449,009 | | | | (2,651,644) | | | | (27,959,688) | | | | 1,625,952 | | | | 17,607,820 | |
| Ashmore Emerging Markets Equity Fund | | | 1,934,642 | | | | 22,357,646 | | | | 29,362 | | | | 309,493 | | | | (49,692) | | | | (547,737) | | | | 1,914,312 | | | | 22,119,402 | |
124
ASHMORE FUNDS
NOTES TO FINANCIAL STATEMENTS (CONTINUED)
As of October 31, 2018
Transactions in Class A shares for the year ended October 31, 2017, were as follows:
| | | | | | | | | | | | | | | | | | | | | | | | | | | | | | | | |
| Fund | | Shares Sold | | | Proceeds from
Shares Sold | | | Shares from
Reinvested
Distributions | | | Proceeds from
Reinvestment
of
Distributions | | | Shares
Redeemed | | | Payments for
Shares
Redeemed | | | Net Increase/
(Decrease) in
Shares | | | Net Increase/
(Decrease) in
Net Assets | |
| Ashmore Emerging Markets Total Return Fund | | | 1,980,157 | | | | $16,397,952 | | | | 28,756 | | | | $ 233,104 | | | | (221,478) | | | | $(1,787,334) | | | | 1,787,435 | | | | $14,843,722 | |
| Ashmore Emerging Markets Local Currency Bond Fund | | | 34,089 | | | | 248,304 | | | | 662 | | | | 4,863 | | | | (27,145) | | | | (201,371) | | | | 7,606 | | | | 51,796 | |
| Ashmore Emerging Markets Corporate Debt Fund | | | 768,834 | | | | 6,402,707 | | | | 41,912 | | | | 347,318 | | | | (858,519) | | | | (6,905,390) | | | | (47,773) | | | | (155,365) | |
| Ashmore Emerging Markets Short Duration Fund | | | 1,460,585 | | | | 15,179,610 | | | | 138,171 | | | | 1,434,189 | | | | (1,640,977) | | | | (17,197,848) | | | | (42,221) | | | | (584,049) | |
| Ashmore Emerging Markets Active Equity Fund | | | 1,000 | | | | 10,007 | | | | 4 | | | | 48 | | | | — | | | | — | | | | 1,004 | | | | 10,055 | |
| Ashmore Emerging Markets Small-Cap Equity Fund | | | 43,903 | | | | 428,915 | | | | 1,258 | | | | 11,008 | | | | (23,994) | | | | (222,571) | | | | 21,167 | | | | 217,352 | |
| Ashmore Emerging Markets Frontier Equity Fund | | | 701,976 | | | | 5,903,145 | | | | 13,146 | | | | 119,018 | | | | (213,455) | | | | (1,965,107) | | | | 501,667 | | | | 4,057,056 | |
| Ashmore Emerging Markets Equity Fund | | | 10,915 | | | | 117,848 | | | | 75 | | | | 737 | | | | (3,389) | | | | (36,042) | | | | 7,601 | | | | 82,543 | |
125
ASHMORE FUNDS
NOTES TO FINANCIAL STATEMENTS (CONTINUED)
As of October 31, 2018
Transactions in Class C shares for the year ended October 31, 2017, were as follows:
| | | | | | | | | | | | | | | | | | | | | | | | | | | | | | | | |
| Fund | | Shares Sold | | | Proceeds from
Shares Sold | | | Shares from
Reinvested
Distributions | | | Proceeds from
Reinvestment
of
Distributions | | | Shares
Redeemed | | | Payments for
Shares
Redeemed | | | Net Increase/
(Decrease) in
Shares | | | Net Increase/
(Decrease) in
Net Assets | |
| Ashmore Emerging Markets Total Return Fund | | | 227,228 | | | | $1,839,471 | | | | 6,660 | | | | $ 53,679 | | | | (61,950) | | | | $(505,852) | | | | 171,938 | | | | $1,387,298 | |
| Ashmore Emerging Markets Local Currency Bond Fund | | | 4,333 | | | | 29,619 | | | | 346 | | | | 2,516 | | | | (818) | | | | (5,877) | | | | 3,861 | | | | 26,258 | |
| Ashmore Emerging Markets Corporate Debt Fund | | | 504,064 | | | | 4,216,948 | | | | 21,238 | | | | 176,391 | | | | (171,353) | | | | (1,407,980) | | | | 353,949 | | | | 2,985,359 | |
| Ashmore Emerging Markets Short Duration Fund | | | 18,401 | | | | 184,019 | | | | 263 | | | | 2,668 | | | | (263) | | | | (2,668) | | | | 18,401 | | | | 184,019 | |
| Ashmore Emerging Markets Active Equity Fund | | | 1,000 | | | | 10,025 | | | | 4 | | | | 44 | | | | — | | | | — | | | | 1,004 | | | | 10,069 | |
| Ashmore Emerging Markets Small-Cap Equity Fund | | | 6,631 | | | | 65,887 | | | | 364 | | | | 3,319 | | | | (3,318) | | | | (31,641) | | | | 3,677 | | | | 37,565 | |
| Ashmore Emerging Markets Frontier Equity Fund | | | 47,984 | | | | 434,418 | | | | 349 | | | | 3,187 | | | | (9,424) | | | | (88,715) | | | | 38,909 | | | | 348,890 | |
| Ashmore Emerging Markets Equity Fund | | | 772 | | | | 7,103 | | | | 1 | | | | 13 | | | | (543) | | | | (4,961) | | | | 230 | | | | 2,155 | |
126
ASHMORE FUNDS
NOTES TO FINANCIAL STATEMENTS (CONTINUED)
As of October 31, 2018
Transactions in Institutional Class shares for the year ended October 31, 2017, were as follows:
| | | | | | | | | | | | | | | | | | | | | | | | | | | | | | | | |
| Fund | | Shares Sold | | | Proceeds from
Shares Sold | | | Shares from
Reinvested
Distributions | | | Proceeds from
Reinvestment of Distributions | | | Shares
Redeemed | | | Payments for
Shares
Redeemed | | | Net Increase/
(Decrease) in
Shares | | | Net Increase/
(Decrease) in
Net Assets | |
| Ashmore Emerging Markets Total Return Fund | | | 46,716,460 | | | | $381,357,339 | | | | 6,584,095 | | | | $53,825,213 | | | | (19,589,180) | | | | $(155,535,775) | | | | 33,711,375 | | | | $279,646,777 | |
| Ashmore Emerging Markets Local Currency Bond Fund | | | 1,963,607 | | | | 14,603,382 | | | | 382,096 | | | | 2,893,384 | | | | (2,093,667) | | | | (15,529,899) | | | | 252,036 | | | | 1,966,867 | |
| Ashmore Emerging Markets Corporate Debt Fund | | | 19,178,672 | | | | 165,170,528 | | | | 532,265 | | | | 4,580,648 | | | | (7,969,360) | | | | (68,139,079) | | | | 11,741,577 | | | | 101,612,097 | |
| Ashmore Emerging Markets Short Duration Fund | | | 12,816,423 | | | | 131,396,629 | | | | 547,915 | | | | 5,569,501 | | | | (8,034,314) | | | | (81,961,770) | | | | 5,330,024 | | | | 55,004,360 | |
| Ashmore Emerging Markets Active Equity Fund | | | 1,410,020 | | | | 14,770,766 | | | | 4,989 | | | | 59,219 | | | | —* | | | | (32) | | | | 1,415,009 | | | | 14,829,953 | |
| Ashmore Emerging Markets Small-Cap Equity Fund | | | 1,466,176 | | | | 17,791,675 | | | | 37,277 | | | | 416,792 | | | | (1,666,373) | | | | (19,690,734) | | | | (162,920) | | | | (1,482,267) | |
| Ashmore Emerging Markets Frontier Equity Fund | | | 6,671,423 | | | | 69,085,145 | | | | 94,974 | | | | 966,444 | | | | (5,432,605) | | | | (55,355,818) | | | | 1,333,792 | | | | 14,695,771 | |
| Ashmore Emerging Markets Equity Fund | | | 663,438 | | | | 5,711,246 | | | | 11,603 | | | | 103,627 | | | | (1,050,301) | | | | (10,018,431) | | | | (375,260) | | | | (4,203,558) | |
* Amount rounds to less than 0.5 shares.
127
ASHMORE FUNDS
NOTES TO FINANCIAL STATEMENTS (CONTINUED)
As of October 31, 2018
Capital shares
Class A shares are issued at the Fund’s relevant NAV per share plus any applicable sales charge. Institutional Class and Class C shares are issued at the Fund’s relevant NAV per share without a sales charge. Shares confer upon the holders the right to receive notice of and attend, speak and vote at shareholder meetings of the Funds. The shares confer upon the holders the right to any or all dividends or distributions which the Trustees in their sole discretion may from time to time resolve to make or declare.
| 7. | Investment transactions |
For the year ended October 31, 2018, the aggregate cost of purchases and proceeds from sales of investments (including fully funded TRS and excluding short-term investments) for the Funds were as follows:
| | | | | | | | |
| | | |
| Fund | | Purchases | | | Sales | |
Ashmore Emerging Markets Total Return Fund | | $ | 1,056,320,546 | | | $ | 741,472,538 | |
Ashmore Emerging Markets Local Currency Bond Fund | | | 43,002,179 | | | | 50,160,498 | |
Ashmore Emerging Markets Corporate Debt Fund | | | 302,248,083 | | | | 292,074,992 | |
Ashmore Emerging Markets Short Duration Fund | | | 665,321,024 | | | | 109,982,127 | |
Ashmore Emerging Markets Active Equity Fund | | | 29,995,906 | | | | 28,578,236 | |
Ashmore Emerging Markets Small-Cap Equity Fund | | | 50,491,732 | | | | 45,072,500 | |
Ashmore Emerging Markets Frontier Equity Fund | | | 87,213,650 | | | | 71,640,209 | |
Ashmore Emerging Markets Equity Fund | | | 48,279,492 | | | | 26,360,557 | |
The difference between book basis and tax basis net unrealized appreciation (depreciation) is attributable primarily to the tax deferral of losses on wash sales, deferral of post October currency and capital losses for tax purposes, and the recharacterization of income recognition on investments in PFICs. At October 31, 2018, for federal income tax purposes, gross unrealized appreciation, gross unrealized depreciation, net unrealized appreciation (depreciation) on investments (including the effects of foreign currency translation and derivative instruments, if any) and the cost basis of investments (including derivative instruments, if any) were as follows:
| | | | | | | | | | | | | | | | |
| Amounts in Thousands | | Unrealized
Appreciation | | | Unrealized
Depreciation | | | Net
Appreciation
(Depreciation) | | | Cost Basis of
Investments | |
| Ashmore Emerging Markets Total Return Fund | | $ | 24,440,989 | | | $ | (135,533,056 | ) | | $ | (111,092,067 | ) | | $ | 1,336,845,321 | |
| Ashmore Emerging Markets Local Currency Bond Fund | | | 1,303,622 | | | | (9,992,968 | ) | | | (8,689,346 | ) | | | 60,288,702 | |
| Ashmore Emerging Markets Corporate Debt Fund | | | 6,577,908 | | | | (29,211,358 | ) | | | (22,633,450 | ) | | | 341,764,231 | |
| Ashmore Emerging Markets Short Duration Fund | | | 3,720,887 | | | | (18,869,782 | ) | | | (15,148,895 | ) | | | 762,690,699 | |
| Ashmore Emerging Markets Active Equity Fund | | | 575,651 | | | | (2,260,465 | ) | | | (1,684,814 | ) | | | 18,832,227 | |
| Ashmore Emerging Markets Small-Cap Equity Fund | | | 1,006,901 | | | | (9,948,860 | ) | | | (8,941,959 | ) | | | 42,652,570 | |
| Ashmore Emerging Markets Frontier Equity Fund | | | 3,812,348 | | | | (8,331,666 | ) | | | (4,519,318 | ) | | | 88,749,734 | |
| Ashmore Emerging Markets Equity Fund | | | 501,122 | | | | (4,612,324 | ) | | | (4,111,202 | ) | | | 28,084,605 | |
128
ASHMORE FUNDS
NOTES TO FINANCIAL STATEMENTS (CONTINUED)
As of October 31, 2018
No provision for U.S. federal income taxes has been made since each Fund’s policy is to comply with the requirements of Subchapter M of the Internal Revenue Code of 1986, as amended, applicable to regulated investment companies, and to distribute, each year, substantially all of its taxable income and capital gains to its shareholders.
For financial reporting purposes the Funds may periodically make reclassifications among components of capital accounts to reflect permanent differences between U.S. GAAP and taxable income. The reclassifications have no impact on the net assets of the Funds.
The Regulated Investment Company Modernization Act of 2010 (the “Act”) was enacted on December 22, 2010. The Act made changes to several tax rules affecting the Funds. Although the Act provides several benefits, including the unlimited carryover of future capital losses, there may be a greater likelihood that all, or a portion of a Fund’s pre-enactment capital loss carryovers may expire without being utilized, due to the fact that post-enactment capital losses are utilized before pre-enactment capital loss carryovers.
During the fiscal year ended October 31, 2018, the Ashmore Emerging Markets Small-Cap Equity Fund utilized $2,410,421 in capital loss carryforwards.
The following Funds have available capital loss carryforwards for which there is no expiration date:
| | | | | | | | |
| Fund | | Short-Term Capital Loss
Carryforward at October
31, 2018 | | | Long-Term Capital Loss
Carryforward at October 31,
2018 | |
Ashmore Emerging Markets Total Return Fund | | | $ (2,828,974) | | | $ | (50,666,938) | |
Ashmore Emerging Markets Local Currency Bond Fund | | | (155,388) | | | | (1,661,406) | |
Ashmore Emerging Markets Corporate Debt Fund | | | (8,239,543) | | | | (26,519,610) | |
Ashmore Emerging Markets Short Duration Fund | | | — | | | | — | |
Ashmore Emerging Markets Active Equity Fund | | | — | | | | — | |
Ashmore Emerging Markets Small-Cap Equity Fund | | | — | | | | (42,589) | |
Ashmore Emerging Markets Frontier Equity Fund | | | (5,116,144) | | | | (345,592) | |
Ashmore Emerging Markets Equity Fund | | | (769,954) | | | | — | |
The Funds in the above table may offset future capital gains with these capital loss carryforwards. There were no post-enactment losses for the fiscal year ended October 31, 2018.
The Funds are subject to the provisions of the Financial Accounting Standards Board (“FASB”) Accounting Standards Codification (“ASC”) Topic 740-10, Income Taxes. This standard provides guidance as to how uncertain tax positions should be recognized, measured, presented and disclosed in the Funds’ financial statements. The Funds recognize the tax benefits of uncertain tax positions only where the position is more-likely-than-not (i.e. greater than 50-percent) to be sustained assuming examination by a tax authority based on the technical merits of the position. In evaluating whether a tax position has met the recognition threshold, the Funds must presume that the position will be examined by the appropriate taxing authority that has full knowledge of all relevant information. A tax position that meets the more-likely-than-not recognition threshold is measured to determine the amount of benefit to recognize in the Funds’ financial statements. Income tax and related interest and penalties would be recognized by the Funds as tax expense in the Statement of Operations if the tax positions were deemed not to meet the more-likely-than-not threshold. The Funds analyze all open tax years for all major taxing jurisdictions. Open tax years are those that are open to examination by taxing authorities, as defined by the Statute of Limitations in each jurisdiction. The Funds have no examinations by tax authorities in progress. The Trust has analyzed the Funds’ tax positions, and has concluded that
129
ASHMORE FUNDS
NOTES TO FINANCIAL STATEMENTS (CONTINUED)
As of October 31, 2018
no liability for unrecognized tax benefits should be recorded related to uncertain tax positions. Further, the Trust is not aware of any tax positions for which it is reasonably possible that the total amounts of unrecognized tax benefits will significantly change in the next twelve months.
As of October 31, 2018, the components of distributable taxable earnings, including temporary differences were as follows:
| | | | | | | | | | | | | | | | | | | | |
| Fund | | Undistributed
Ordinary
Income | | | Undistributed
Long Term
Capital Gain | | | Accumulated
Capital Losses and
Other | | | Undistributed
Appreciation
(Depreciation) on
Investments and
Foreign Currencies | | | Total
Accumulated
Earnings (Deficit) | |
| Ashmore Emerging Markets Total Return Fund | | $ | — | | | $ | — | | | $ | (56,735,918) | | | $ | (111,152,401) | | | $ | (167,888,319) | |
| Ashmore Emerging Markets Local Currency Bond Fund | | | — | | | | — | | | | (1,835,874) | | | | (8,734,569) | | | | (10,570,443) | |
| Ashmore Emerging Markets Corporate Debt Fund | | | 306,019 | | | | — | | | | (34,924,256) | | | | (23,167,973) | | | | (57,786,210) | |
| Ashmore Emerging Markets Short Duration Fund | | | 3,534,295 | | | | 2,758,398 | | | | (3,028,432) | | | | (15,150,327) | �� | | | (11,886,066) | |
| Ashmore Emerging Markets Active Equity Fund | | | 1,192,564 | | | | 365,845 | | | | — | | | | (1,688,144) | | | | (129,735) | |
| Ashmore Emerging Markets Small-Cap Equity Fund | | | — | | | | — | | | | (42,590) | | | | (8,939,075) | | | | (8,981,665) | |
| Ashmore Emerging Markets Frontier Equity Fund | | | — | | | | — | | | | (5,466,831) | | | | (4,692,677) | | | | (10,159,508) | |
| Ashmore Emerging Markets Equity Fund | | | — | | | | — | | | | (770,178) | | | | (4,111,247) | | | | (4,881,425) | |
|
The taxable character of distributions paid during the fiscal year ended October 31, 2018, were as follows: | |
| | | Distributions From | | | | | | | |
| Fund | | Ordinary
Income | | | Short-
Term
Capital
Gains | | | Long-Term
Capital Gains | | | Return of Capital | | | Total Distributions
Paid | |
| Ashmore Emerging Markets Total Return Fund | | $ | 25,262,830 | | | $ | 15,463,369 | | | $ | — | | | $ | 33,729,307 | | | $ | 74,455,506 | |
| Ashmore Emerging Markets Local Currency Bond Fund | | | 819,597 | | | | — | | | | — | | | | 893,268 | | | | 1,712,865 | |
| Ashmore Emerging Markets Corporate Debt Fund | | | 21,423,872 | | | | — | | | | — | | | | — | | | | 21,423,872 | |
| Ashmore Emerging Markets Short Duration Fund | | | 17,420,532 | | | | 2,239,134 | | | | 2,116,768 | | | | — | | | | 21,776,434 | |
130
ASHMORE FUNDS
NOTES TO FINANCIAL STATEMENTS (CONTINUED)
As of October 31, 2018
| | | | | | | | | | | | | | | | | | | | |
| | | Distributions From | | | | | | | |
| Fund | | Ordinary
Income | | | Short-Term
Capital
Gains | | | Long-Term
Capital
Gains | | | Return of
Capital | | | Total
Distributions
Paid | |
| Ashmore Emerging Markets Active Equity Fund | | | 307,046 | | | | 1,447,512 | | | | — | | | | — | | | | 1,754,558 | |
| Ashmore Emerging Markets Small-Cap Equity Fund | | | 536,624 | | | | — | | | | — | | | | 37,117 | | | | 573,741 | |
| Ashmore Emerging Markets Frontier Equity Fund | | | 778,325 | | | | 528,209 | | | | 5,777,521 | | | | 440,612 | | | | 7,524,667 | |
| Ashmore Emerging Markets Equity Fund | | | 344,947 | | | | — | | | | — | | | | 21,621 | | | | 366,568 | |
|
The taxable character of distributions paid during the fiscal year ended October 31, 2017, were as follows: | |
| | | Distributions From | | | | | | | |
| Fund | | Ordinary
Income | | | Short-
Term
Capital
Gains | | | Long-
Term
Capital
Gains | | | Return of
Capital | | | Total
Distributions
Paid | |
| Ashmore Emerging Markets Total Return Fund | | $ | 58,479,792 | | | $ | — | | | $ | — | | | $ | — | | | $ | 58,479,792 | |
| Ashmore Emerging Markets Local Currency Bond Fund | | | 1,107,475 | | | | — | | | | — | | | | 2,667,206 | | | | 3,774,681 | |
| Ashmore Emerging Markets Corporate Debt Fund | | | 19,702,427 | | | | — | | | | — | | | | 649,976 | | | | 20,352,403 | |
| Ashmore Emerging Markets Short Duration Fund | | | 11,795,594 | | | | 2,000,000 | | | | — | | | | — | | | | 13,795,594 | |
| Ashmore Emerging Active Equity Fund | | | 60,411 | | | | — | | | | — | | | | — | | | | 60,411 | |
| Ashmore Emerging Markets Small-Cap Equity Fund | | | 551,965 | | | | — | | | | — | | | | — | | | | 551,965 | |
| Ashmore Emerging Markets Frontier Equity Fund | | | 542,424 | | | | 614,075 | | | | — | | | | — | | | | 1,156,499 | |
| Ashmore Emerging Markets Equity Fund | | | 184,366 | | | | — | | | | — | | | | — | | | | 184,366 | |
| 9. | Distributions to shareholders |
The Ashmore Emerging Markets Total Return Fund, Ashmore Emerging Markets Corporate Debt Fund and Ashmore Emerging Markets Short Duration Fund declare distributions of their net investment income daily and pay such distributions monthly. The Ashmore Emerging Markets Local Currency Bond Fund, Ashmore Emerging Markets Active Equity Fund, Ashmore Emerging Markets Small-Cap Equity Fund, Ashmore Emerging Markets Frontier Equity Fund and Ashmore Emerging Markets Equity Fund declare and pay distributions of their net investment income at least quarterly.
131
ASHMORE FUNDS
NOTES TO FINANCIAL STATEMENTS (CONTINUED)
As of October 31, 2018
Dividends paid in the months of May through September 2018 by Ashmore Emerging Markets Corporate Debt Fund included approximately $900,000 in amounts that should not at the time have been characterized as net investment income, but were fully offset by reduced dividends paid by the Fund and net income realized from other sources during the balance of its fiscal year ended October 31, 2018, such that no portion of such amounts represented a return of capital for the fiscal year.
Distributions of net realized capital gains, if any, are declared and paid at least annually. The Funds may also make a special distribution to comply with federal tax requirements. Income dividends and capital gains distributions determined in accordance with federal income tax regulations may differ from U.S. GAAP. Differences between tax regulations and U.S. GAAP may change the fiscal period in which income and capital items are recognized for tax and U.S. GAAP purposes. Examples of events that give rise to timing differences include wash sales, straddles and capital loss carryforwards. Further, the character of investment income and capital gains may be different for certain transactions under the two methods of accounting. Examples of characterization differences include the treatment of foreign currency transactions and swap transactions. As a result, income dividends and capital gain distributions declared during a fiscal period for federal tax purposes may differ significantly from the net investment income and realized capital gain reported on each Fund’s financial statements presented under U.S. GAAP. In general, to the extent that any differences which are permanent in nature result in over distributions to shareholders, the amount of the over distribution may be reported as return of capital. Temporary differences do not require reclassification. See note 8 for further details.
| 10. | Derivative instruments and hedging activities |
FASB ASC Topic 815-10 (“Topic 815-10”), Disclosures about Derivative Instruments and Hedging Activities, improves financial reporting about derivative instruments by requiring enhanced disclosures to enable investors to better understand how and why the Funds use derivative instruments, how these derivative instruments are accounted for and their effects on the Funds’ financial position and results of operations.
None of the derivatives held in the Funds have been designated as hedging instruments under Topic 815-10. A discussion of the strategies for these derivatives and their counterparty credit risk can be found below.
In accordance with Topic 815-10, the Funds record their trading-related derivative activities on a fair value basis (as described in note 4). Fair values represent the amount at which the instrument could be exchanged in a current transaction between willing parties, other than in a forced or liquidation sale.
The following disclosures contain information on how and why the Funds used derivative financial instruments; the credit-risk-related contingent features in certain derivative financial instruments; and how derivative financial instruments affected the Funds’ financial position, results of operations and cash flows. The location and fair value of these instruments on the Statements of Assets and Liabilities and the realized, and changes in unrealized, gains and losses on the Statements of Operations, are included in tables following each Fund’s Schedule of Investments and are categorized by type of financial derivative contract.
(a) Options
Each Fund is subject to market risk in the normal course of pursuing its investment objectives. The Funds may enter into options to speculate on the price movements of the financial instrument underlying the option, for use as an economic hedge against certain equity positions held in a Fund’s portfolio holdings or for other investment purposes. Purchased option contracts give a Fund the right, but not the obligation, to buy or sell within a limited time, a financial instrument, commodity or currency at a contracted price that may also be settled in cash, based on differentials between specified indices or prices.
Options written obligate a Fund, in return for a premium, to buy or sell within a limited time, a financial instrument, commodity or currency at a contracted price that may also be settled in cash, based on differentials between specified indices or prices. Options written by a Fund may expose a Fund to the market risk of an unfavorable change in the financial instrument underlying the written option.
132
ASHMORE FUNDS
NOTES TO FINANCIAL STATEMENTS (CONTINUED)
As of October 31, 2018
A Fund is exposed to counterparty risk from the potential that a seller or buyer of an option contract does not sell or purchase the underlying asset as agreed under the terms of the option contract. The maximum risk of loss from counterparty risk to a Fund holding a put or call option is generally the fair value of the contracts and the premiums paid to purchase its open option contracts. The risk of loss on call options sold by the Funds is potentially unlimited. A Fund considers the credit risk of the intermediary counterparties to its option transactions in evaluating potential credit risk.
Gains and losses associated with the valuation of options are recognized at fair value as the net change in unrealized appreciation/(depreciation) on investments in securities in the Statements of Operations. The premium on purchased put options exercised is subtracted from the proceeds of the sale of the underlying security or foreign currency in determining the realized gain or loss. The premium on purchased call options exercised is added to the cost of the securities or foreign currency purchased. Premiums paid on the purchase of options that expire unexercised are recorded as realized losses and are reflected in net realized gain/(loss) on investments in securities in the Statements of Operations.
During the year ended October 31, 2018, the Funds did not hold options contracts.
(b) Forward foreign currency exchange contracts
A forward foreign exchange contract involves an obligation to purchase or sell a specific currency at a future date at a price set at the time the contract is made. The Funds may enter into forward foreign currency exchange contracts in connection with settling planned purchases or sales of securities, as part of an investment strategy to protect against uncertainty in the level of future foreign exchange rates in the purchase and sale of securities, or to gain or limit exposure to foreign currencies. All forward foreign currency exchange contracts are valued daily at the applicable exchange rates. Any resulting unrealized gains or losses are recorded in net change in unrealized appreciation/(depreciation) on forward foreign currency exchange contracts in the Statements of Operations. A Fund records realized gains or losses at the time the forward foreign exchange contract is offset by entering into a closing transaction with the same counterparty or is extinguished by delivery of the currency. Realized gains or losses, if any, are included in net realized gain/(loss) on forward foreign exchange contracts in the Statements of Operations.
Risks arise upon entering into these contracts from the potential inability of counterparties to meet the terms of their contracts and from unanticipated movements in the value of a foreign currency relative to the United States Dollar. The contractual amounts of forward foreign currency exchange contracts do not necessarily represent the amounts potentially subject to risk. The measurement of the risks associated with these instruments should be considered in light of all related and offsetting transactions. The Funds bear market risk from changes in foreign currency exchange rates and credit risk if the counterparty fails to perform. Further information on the impact of these positions on the Funds’ financial statements can be found in the notes to the Schedules of Investments.
During the year ended October 31, 2018, the Ashmore Emerging Markets Total Return Fund, Ashmore Emerging Markets Local Currency Bond Fund, Ashmore Emerging Markets Corporate Debt Fund, Ashmore Emerging Markets Short Duration Fund, Ashmore Emerging Markets Active Equity Fund and Ashmore Emerging Markets Equity Fund had average quarterly contract notional exposures of $590,508,065, $50,732,769, $1,573,815, $313,022, $65,626 and $17,710, respectively, related to forward foreign currency exchange contracts.
(c) Swap Agreements
During the reporting period, certain Funds entered into swap agreements, which are arrangements between two parties to exchange cash flows based on a notional principal amount. Swap agreements are either privately negotiated in the over-the-counter market (“OTC swaps”) or may be executed in a multilateral or other trade facility platform, such as a registered exchange (“centrally cleared swaps”). Swap agreements are recorded at their fair value. The fair value is based on quoted market prices or prices obtained from a third party provider at the date of the Statements of Assets and Liabilities without any deduction for estimated future selling costs. Swap agreements are marked to market daily and the change in fair value, if any, is recorded as unrealized gain or loss. Payments made or received are recorded as part of realized gains and losses. Daily changes in valuation of centrally cleared swaps, if any, are recorded as a receivable or payable for the change in value as appropriate (“variation margin”) on the Statement of Assets and Liabilities.
133
ASHMORE FUNDS
NOTES TO FINANCIAL STATEMENTS (CONTINUED)
As of October 31, 2018
The periodic payments on the swap agreements entered into by the Funds are reflected in the Statement of Operations within net realized gain/(loss) on interest rate swap contracts. Unrealized gains are reported as an asset and unrealized losses are reported as a liability in the Statements of Assets and Liabilities for OTC swaps. Changes in the fair value are reflected in the Statements of Operations within net change in unrealized appreciation/(depreciation) on interest rate and centrally cleared swap contracts in the period in which they occur. Certain Funds could be exposed to credit or market risk due to unfavorable changes in the fluctuation of interest rates or if the counterparty defaults on its obligations to perform.
During the year ended October 31, 2018, the Ashmore Emerging Markets Total Return Fund and Ashmore Emerging Markets Local Currency Bond Fund had average quarterly notional exposures of $81,052,983 and $22,388,459, respectively, related to interest rate swap agreements.
The Funds may enter into transactions subject to enforceable netting agreements or other similar arrangements (“netting agreements”). Generally, netting agreements allow the Funds to offset any exposure to a specific counterparty with any collateral received or delivered to that counterparty based on the terms of the agreements. Generally, the Funds manage their cash collateral and securities collateral on a counterparty basis. No amounts have been offset in the Statements of Assets and Liabilities.
Offsetting of Financial Assets and Derivative Assets as of October 31, 2018:
(a) Exchange-Traded:
Centrally Cleared Swaps
| | | | | | | | | | | | | | | | | | | | |
| | | Ashmore Emerging Markets Total Return Fund | | | | | | | |
| Counterparty | | Gross Amounts of
Derivatives Assets
Presented in the
Statement of
Assets and
Liabilities | | | Gross Amounts of
Derivatives
Liabilities
Presented in the
Statement of
Assets and
Liabilities | | | Net
Amounts | | | Collateral
(Received) Paid | | | Net
Exposure | |
| Banco Bilbao Vizcaya Argentaria SA | | $ | 506,359 | | | $ | (591,662) | | | $ | (85,303) | | | $ | — | | | $ | (85,303) | |
ING Capital Markets | | | 277,327 | | | | — | | | | 277,327 | | | | — | | | | 277,327 | |
Merrill Lynch | | | 438,879 | | | | (1,179,548) | | | | (740,669) | | | | — | | | | (740,669) | |
| | | | | | | | | | | | | | | | | | | | |
Total | | $ | 1,222,565 | | | $ | (1,771,210) | | | $ | (548,645) | | | $ | — | | | $ | (548,645) | |
| | | | | | | | | | | | | | | | | | | | |
| | | | | | | | | | | | | | | | | | | | |
| | | Ashmore Emerging Markets Local Currency Bond Fund | | | | | | | |
| Counterparty | | Gross Amounts of
Derivatives Assets
Presented in the
Statement of
Assets and
Liabilities | | | Gross Amounts of
Derivatives
Liabilities
Presented in the
Statement of
Assets and
Liabilities | | | Net
Amounts | | | Collateral
(Received) Paid | | | Net
Exposure | |
| Banco Bilbao Vizcaya Argentaria SA | | $ | 58,941 | | | $ | (56,938) | | | $ | 2,003 | | | $ | — | | | $ | 2,003 | |
HSBC Bank | | | 8,428 | | | | — | | | | 8,428 | | | | — | | | | 8,428 | |
Merrill Lynch | | | 69,085 | | | | (295,578) | | | | (226,493) | | | | — | | | | (226,493) | |
| | | | | | | | | | | | | | | | | | | | |
Total | | $ | 136,454 | | | $ | (352,516) | | | $ | (216,062) | | | $ | — | | | $ | (216,062) | |
| | | | | | | | | | | | | | | | | | | | |
(b) Over-the-Counter Financial Derivative Instruments:
134
ASHMORE FUNDS
NOTES TO FINANCIAL STATEMENTS (CONTINUED)
As of October 31, 2018
Forward Currency Contracts and Interest Rate Swap Contracts
| | | | | | | | | | | | | | | | |
| | | Ashmore Emerging Markets Total Return Fund | | | | |
| Counterparty | | Gross Amounts of
Derivatives Assets
Presented in the Statement of
Assets and Liabilities | | | Derivatives available for offset | | | Collateral
Received | | | Net Amount Due
From Counterparty | |
ANZ | | $ | 47,178 | | | $ | (47,178) | | | $ | — | | | $ | — | |
BNP Paribas | | | 1,219,263 | | | | (1,219,263) | | | | — | | | | — | |
Deutsche Bank | | | 1,084,428 | | | | (308,507) | | | | — | | | | 775,921 | |
Goldman Sachs | | | 114,803 | | | | (114,803) | | | | — | | | | — | |
HSBC Bank | | | 926,025 | | | | (926,025) | | | | — | | | | — | |
JP Morgan | | | 4,756,916 | | | | (1,085,738) | | | | — | | | | 3,671,178 | |
Merrill Lynch | | | 124,726 | | | | (124,726) | | | | — | | | | — | |
Morgan Stanley | | | 43,143 | | | | (43,143) | | | | — | | | | — | |
Santander | | | 11,093 | | | | — | | | | — | | | | 11,093 | |
Standard | | | | | | | | | | | | | | | | |
Chartered | | | 2,172,712 | | | | (125,473) | | | | — | | | | 2,047,239 | |
| | | | | | | | | | | | | | | | |
Total | | $ | 10,500,287 | | | $ | (3,994,856) | | | $ | — | | | $ | 6,505,431 | |
| | | | | | | | | | | | | | | | |
| | | | | | | | | | | | | | | | |
| | | Ashmore Emerging Markets Total Return Fund | | | | |
| Counterparty | | Gross Amounts of
Derivatives Liabilities
Presented in the Statement of
Assets and Liabilities | | | Derivatives
available
for offset | | | Collateral
Pledged | | | Net Amount Due
From Counterparty | |
ANZ | | $ | 83,005 | | | $ | (47,178) | | | $ | — | | | $ | 35,827 | |
BNP Paribas | | | 1,305,364 | | | | (1,219,263) | | | | — | | | | 86,101 | |
Citibank | | | 21,399 | | | | — | | | | — | | | | 21,399 | |
Credit Suisse | | | 1,410,688 | | | | — | | | | — | | | | 1,410,688 | |
Deutsche Bank | | | 308,507 | | | | (308,507) | | | | — | | | | — | |
Goldman Sachs | | | 248,425 | | | | (114,803) | | | | — | | | | 133,622 | |
HSBC Bank | | | 1,275,690 | | | | (926,025) | | | | — | | | | 349,665 | |
JP Morgan | | | 1,085,738 | | | | (1,085,738) | | | | — | | | | — | |
Merrill Lynch | | | 1,467,780 | | | | (124,726) | | | | — | | | | 1,343,054 | |
Morgan Stanley | | | 818,019 | | | | (43,143) | | | | — | | | | 774,876 | |
Standard | | | | | | | | | | | | | | | | |
Chartered | | | 125,473 | | | | (125,473) | | | | — | | | | — | |
UBS | | | 25,036 | | | | — | | | | — | | | | 25,036 | |
| | | | | | | | | | | | | | | | |
Total | | $ | 8,175,124 | | | $ | (3,994,856) | | | $ | — | | | $ | 4,180,268 | |
| | | | | | | | | | | | | | | | |
| | | | |
| | | | | | | | | | | | | | | | |
| | | Ashmore Emerging Markets Local Currency Bond Fund | | | | |
| Counterparty | | Gross Amounts of
Derivatives Assets
Presented in the Statement of
Assets and Liabilities | | | Derivatives
available
for offset | | | Collateral
Received | | | Net Amount Due
From Counterparty | |
Barclays | | $ | 6,229 | | | $ | — | | | $ | — | | | $ | 6,229 | |
BNP Paribas | | | 177,924 | | | | (177,924) | | | | — | | | | — | |
Deutsche Bank | | | 104,081 | | | | (29,182) | | | | — | | | | 74,899 | |
135
ASHMORE FUNDS
NOTES TO FINANCIAL STATEMENTS (CONTINUED)
As of October 31, 2018
| | | | | | | | | | | | | | | | |
| | | Ashmore Emerging Markets Local Currency Bond Fund | | | | |
| Counterparty | | Gross Amounts of
Derivatives Assets
Presented in the Statement of
Assets and Liabilities | | | Derivatives
available
for offset | | | Collateral
Received | | | Net Amount Due
From Counterparty | |
Goldman Sachs | | $ | 9,490 | | | $ | (9,490) | | | $ | — | | | $ | — | |
HSBC Bank | | | 91,912 | | | | (91,912) | | | | — | | | | — | |
JP Morgan | | | 289,230 | | | | (137,817) | | | | — | | | | 151,413 | |
Merrill Lynch | | | 100,153 | | | | (100,153) | | | | — | | | | — | |
Morgan Stanley | | | 5,392 | | | | (5,392) | | | | — | | | | — | |
Santander | | | 1,369 | | | | — | | | | — | | | | 1,369 | |
Standard | | | | | | | | | | | | | | | | |
Chartered | | | 60,828 | | | | — | | | | — | | | | 60,828 | |
| | | | | | | | | | | | | | | | |
Total | | $ | 846,608 | | | $ | (551,870) | | | $ | — | | | $ | 294,738 | |
| | | | | | | | | | | | | | | | |
| | | | | | | | | | | | | | | | |
| | | Ashmore Emerging Markets Local Currency Bond Fund | | | | |
| Counterparty | | Gross Amounts of
Derivatives Liabilities
Presented in the Statement of
Assets and Liabilities | | | Derivatives
available
for offset | | | Collateral
Pledged | | | Net Amount Due
From Counterparty | |
BNP Paribas | | $ | 181,525 | | | $ | (177,924) | | | $ | — | | | $ | 3,602 | |
Citibank | | | 2,826 | | | | — | | | | — | | | | 2,826 | |
Credit Suisse | | | 159,246 | | | | — | | | | — | | | | 159,246 | |
Deutsche Bank | | | 29,182 | | | | (29,182) | | | | — | | | | — | |
Goldman Sachs | | | 31,570 | | | | (9,490) | | | | — | | | | 22,080 | |
HSBC Bank | | | 133,681 | | | | (91,912) | | | | — | | | | 41,769 | |
JP Morgan | | | 137,817 | | | | (137,817) | | | | — | | | | — | |
Merrill Lynch | | | 243,165 | | | | (100,153) | | | | — | | | | 143,012 | |
Morgan Stanley | | | 93,513 | | | | (5,392) | | | | — | | | | 88,121 | |
UBS | | | 2,385 | | | | — | | | | — | | | | 2,384 | |
| | | | | | | | | | | | | | | | |
Total | | $ | 1,014,910 | | | $ | (551,870) | | | $ | — | | | $ | 463,040 | |
| | | | | | | | | | | | | | | | |
| | | | | | | | | | | | | | | | |
| | | Ashmore Emerging Markets Corporate Debt Fund | | | | |
| Counterparty | | Gross Amounts of
Derivatives Assets
Presented in the Statement of
Assets and Liabilities | | | Derivatives
available
for offset | | | Collateral
Received | | | Net Amount Due
From Counterparty | |
Morgan Stanley | | $ | 56,998 | | | $ | — | | | $ | — | | | $ | 56,998 | |
| | | | | | | | | | | | | | | | |
Total | | $ | 56,998 | | | $ | — | | | $ | — | | | $ | 56,998 | |
| | | | | | | | | | | | | | | | |
| | | | | | | | | | | | | | | | |
| | �� | Ashmore Emerging Markets Active Equity Fund | | | | |
| Counterparty | | Gross Amounts of
Derivatives Assets
Presented in the Statement of
Assets and Liabilities | | | Derivatives
available
for offset | | | Collateral
Received | | | Net Amount Due
From Counterparty | |
JP Morgan | | $ | 4,241 | | | $ | — | | | $ | — | | | $ | 4,241 | |
| | | | | | | | | | | | | | | | |
Total | | $ | 4,241 | | | $ | — | | | $ | — | | | $ | 4,241 | |
| | | | | | | | | | | | | | | | |
136
ASHMORE FUNDS
NOTES TO FINANCIAL STATEMENTS (CONTINUED)
As of October 31, 2018
Investment management fees
The Trust has an Investment Management Agreement (the “Agreement”) with the Investment Manager, with whom certain Trustees and Officers of the Trust are affiliated, to furnish investment management services to the Funds. Under the terms of the Agreement, the Trust, on behalf of the Funds, compensates the Investment Manager for its investment management services at the following rates, based on each Fund’s average daily net assets:
| | | | |
| Fund | | Rate | |
Ashmore Emerging Markets Total Return Fund | | | 1.00 | % |
Ashmore Emerging Markets Local Currency Bond Fund | | | 0.95 | % |
Ashmore Emerging Markets Corporate Debt Fund | | | 1.15 | % |
Ashmore Emerging Markets Short Duration Fund | | | 0.65 | % |
Ashmore Emerging Markets Active Equity | | | 1.00 | % |
Ashmore Emerging Markets Small-Cap Equity Fund | | | 1.50 | % |
Ashmore Emerging Markets Frontier Equity Fund | | | 1.50 | % |
Ashmore Emerging Markets Equity Fund | | | 1.15 | % |
The Investment Manager has contractually agreed to waive its fees or reimburse each Fund for other expenses until February 28, 2019 to the extent that total operating expenses (other than acquired fund fees and expenses, interest expenses, taxes, extraordinary expenses and certain credits and offset arrangements) for each class of shares of each Fund exceed the rates in the table below, based on each Fund’s average daily net assets. The expense limitation arrangement may be terminated by the Board at any time.
| | | | | | |
| Fund | | Class A | | Class C | | Institutional
Class |
Ashmore Emerging Markets Total Return Fund | | 1.27% | | 2.02% | | 1.02% |
Ashmore Emerging Markets Local Currency Bond Fund | | 1.22% | | 1.97% | | 0.97% |
Ashmore Emerging Markets Corporate Debt Fund | | 1.42% | | 2.17% | | 1.17% |
Ashmore Emerging Markets Short Duration Fund | | 0.92% | | 1.67% | | 0.67% |
Ashmore Emerging Markets Active Equity Fund | | 1.27% | | 2.02% | | 1.02% |
Ashmore Emerging Markets Small-Cap Equity Fund | | 1.77% | | 2.52% | | 1.52% |
Ashmore Emerging Markets Frontier Equity Fund | | 1.77% | | 2.52% | | 1.52% |
Ashmore Emerging Markets Equity Fund | | 1.42% | | 2.17% | | 1.17% |
Any such waiver or reimbursement is subject to the Investment Manager’s right to recover amounts waived or reimbursed to the extent actual fees and expenses for a future fiscal period are less than each Fund’s expense limitation cap, provided, however, that the Investment Manager shall only be entitled to recover such amounts waived or reimbursed during the previous
137
ASHMORE FUNDS
NOTES TO FINANCIAL STATEMENTS (CONTINUED)
As of October 31, 2018
three fiscal years. The amounts recaptured pursuant to the expense limitation agreement will be limited to the lesser of (1) the expense limitation amount that was in effect at the time of the waiver or reimbursement or (2) the expense limitation amount that is in effect at the time of recapture. The total amounts subject to recovery in fiscal years are shown below:
| | | | | | | | | | | | | | | | |
| Fund | | 2019 | | | 2020 | | | 2021 | | | Total | |
Ashmore Emerging Markets Total Return Fund | | | $ 833,414 | | | | $ 947,660 | | | | $ 1,258,875 | | | | $ 3,039,949 | |
Ashmore Emerging Markets Local Currency Bond Fund | | | 250,550 | | | | 242,748 | | | | 247,985 | | | | 741,283 | |
Ashmore Emerging Markets Corporate Debt Fund | | | 335,299 | | | | 295,848 | | | | 411,298 | | | | 1,042,445 | |
Ashmore Emerging Markets Short Duration Fund | | | 150,467 | | | | 201,321 | | | | 387,123 | | | | 738,911 | |
Ashmore Emerging Markets Active Equity Fund | | | — | | | | 226,921 | | | | 131,123 | | | | 358,044 | |
Ashmore Emerging Markets Small-Cap Equity Fund | | | 216,973 | | | | 172,952 | | | | 227,807 | | | | 617,732 | |
Ashmore Emerging Markets Frontier Equity Fund | | | 266,211 | | | | 293,467 | | | | 399,730 | | | | 959,408 | |
Ashmore Emerging Markets Equity Fund | | | 131,748 | | | | 129,266 | | | | 190,079 | | | | 451,093 | |
Distribution and Servicing fees
The Funds have adopted Amended Plans of Distribution and Servicing Fees pursuant to Rule 12b-1 under the 1940 Act (“Distribution and Servicing Fee Plans”). Under the Distribution and Servicing Fee Plans, each of the Funds may pay fees to the distributor on an ongoing basis as compensation for the services the distributor renders and the expenses it bears in connection with the sale and distribution of Fund shares (“distribution fees”) and/or in connection with personal services rendered to Fund shareholders and the maintenance of shareholder accounts (“servicing fees”). Class A and C shares each have a separate 12b-1 Plan. Class A shares pay only servicing fees. Class C shares pay both distribution and servicing fees. The following table lists the maximum annual rates at which the distribution and/or servicing fees may be paid under each 12b-1 Plan (calculated as a percentage of a Fund’s average daily net assets attributable to the particular class of shares):
| | | | |
| | | Servicing Fee | | Distribution Fee |
Class A shares | | 0.25% | | None |
Class C shares | | 0.25% | | 0.75% |
Cross Trades
The 1940 Act prohibits the Funds and their affiliates from knowingly selling any security or other property to the Funds (other than securities of which the buyer is the issuer), or buying any security (other than securities of which the seller is the issuer) or other property from the Funds. Rule 17a-7 under the 1940 Act provides relief from these prohibitions for various types of “cross trades” and similar transactions that may benefit shareholders by allowing the participating funds or accounts to avoid brokerage commissions and other transaction costs of trades.
During the year ended October 31, 2018, the following Funds bought and/or sold securities from an account or accounts that were also advised by the Trust’s investment adviser or its affiliates:
| | | | | | | | |
| Fund | | Purchases | | | Sales | |
Ashmore Emerging Markets Total Return Fund | | $ | — | | | $ | 384,665 | |
Ashmore Emerging Markets Corporate Debt Fund | | | 2,101,074 | | | | 3,327,482 | |
Ashmore Emerging Markets Short Duration Fund | | | 18,584,576 | | | | 1,407,035 | |
138
ASHMORE FUNDS
NOTES TO FINANCIAL STATEMENTS (CONTINUED)
As of October 31, 2018
As of October 31, 2018, Ashmore Investments UK Limited owned the following percentages of the outstanding shares of each Fund:
| | | | | | | | |
Fund | | Class A | | | Class C | |
Ashmore Emerging Markets Active Equity Fund | | | 5.15 | % | | | 100.00 | % |
Ashmore Emerging Markets Equity Fund | | | — | % | | | 100.00 | % |
| | | | |
| | |
| Fund | | Institutional
Class | |
Ashmore Emerging Markets Active Equity Fund | | | 92.21 | % |
Ashmore Emerging Markets Frontier Equity Fund | | | 4.68 | % |
Ashmore Emerging Markets Equity Fund | | | 99.18 | % |
In addition to the Ashmore Investments UK Limited ownership, shown in the table above, the following Funds had other investors owning of record or known by the Funds to own beneficially greater than 5% of the outstanding shares of such Funds:
| | | | | | |
| Fund | | Class | | # of Investors
Owning > 5%
of outstanding
Shares | | % of Ownership by
Investor |
| Ashmore Emerging Markets Total Return Fund | | Class A | | 6 | | 21.75%, 14.05%, 12.16%, 11.72%, 10.89%, 7.90% |
| | | Class C | | 3 | | 34.56%, 21.08%, 6.62% |
| | | Class I | | 3 | | 19.15%, 9.64%, 9.27% |
| Ashmore Emerging Markets Local Currency Bond Fund | | Class A | | 6 | | 30.79%, 29.07%, 15.84%, 9.94%, 9.21%, 5.02% |
| | | Class C | | 3 | | 54.15%, 36.39%, 5.92% |
| | | Class I | | 2 | | 52.11%, 40.28% |
| Ashmore Emerging Markets Active Equity Fund | | Class A | | 4 | | 34.49%, 17.84%, 11.97%, 5.41% |
| | | Class I | | 1 | | 7.62% |
| Ashmore Emerging Markets Corporate Debt Fund | | Class A | | 6 | | 27.38%, 16.20%, 12.54%, 12.29%, 7.76%, 5.50% |
| | | Class C | | 2 | | 48.66%, 22.59% |
| | | Class I | | 1 | | 7.76% |
| Ashmore Emerging Markets Short Duration Fund | | Class A | | 2 | | 83.07%, 7.03% |
| | | Class C | | 1 | | 89.63% |
| | | Class I | | 5 | | 37.71%, 23.58%, 18.21%, 5.84%, 5.44% |
| Ashmore Emerging Markets Small-Cap Equity Fund | | Class A | | 6 | | 27.42%, 17.39%, 8.20%, 7.58%, 6.39%, 5.84% |
| | | Class C | | 3 | | 45.37%, 36.58%, 11.63% |
| | | Class I | | 3 | | 36.50%, 12.53%, 11.78% |
139
ASHMORE FUNDS
NOTES TO FINANCIAL STATEMENTS (CONTINUED)
As of October 31, 2018
| | | | | | |
| Fund | | Class | | # of Investors
Owning > 5%
of outstanding
Shares | | % of Ownership by
Investor |
| Ashmore Emerging Markets Frontier Equity Fund | | Class A | | 3 | | 71.14%, 8.83%, 5.96% |
| | | Class C | | 3 | | 78.92%, 15.07%, 6.00% |
| | | Class I | | 4 | | 33.18%, 29.28%, 9.27%, 8.57% |
Ashmore Emerging Markets Equity Fund | | Class A | | 4 | | 52.82%, 13.63%, 11.01%, 9.60% |
In relation to its investments, some of the Funds of the Trust may from time to time agree to indemnify and/or pre-fund trustees or other agents, either solely or alongside other creditors on a several basis. Generally, such agreements do not have a termination date. The Trustees are not aware of and do not currently expect any claims to be made against the Funds under any such indemnity or pre-funding agreements.
The Funds have submitted a proof of claim in connection with the settlement of a securities class action lawsuit brought by certain investors against Petróleo Brasileiro S.A. and certain of its affiliates, underwriters, external auditors, and current and former directors and officers. The inflow of economic benefits from the settlement fund is deemed to be probable, but not virtually certain.
The Funds have submitted a claim in connection with the settlement of a securities class action lawsuit preliminary approved by the U.S. District Court for the Southern District of New York captioned in re Foreign Exchange Benchmark Rates Antitrust Litigation. The inflow of economic benefits from the settlement fund is deemed to be probable, but not virtually certain.
| 14. | New accounting pronouncements |
On March 30, 2017, the FASB issued Accounting Standards Update (ASU) 2017-08 “Premium Amortization on Purchased Callable Debt Securities”, which amends the amortization period for certain purchased callable debt securities held at a premium by shortening such period to the earliest call date. The new guidance requires an entity to amortize the premium on a callable debt security within its scope to the earliest call date. If the call option is not exercised at the earliest call date, the yield is reset to the effective yield using the payment terms of the security. If there are no other call dates, any excess of the amortized cost basis over the par amount will be amortized to maturity. Discounts on purchased callable debt securities will continue to be amortized to the security’s maturity date. The ASU 2017-08 is effective for public business entities for fiscal years, and interim periods within those fiscal years, beginning after December 15, 2018. If an entity early adopts the ASU in an interim period, any adjustments must be reflected as of the beginning of the fiscal year that includes that interim period. Management is still assessing the impact of the adoption of ASU 2017-08 on the financial statements but does not expect it to have a material impact.
On August 28, 2018, the FASB issued Accounting Standards Update (“ASU”) 2018-13, “Disclosure Framework —Changes to the Disclosure Requirements for Fair Value Measurement,” which amends the fair value measurement disclosure requirements of ASC 820. The amendments of ASU 2018-13 include new, eliminated, and modified disclosure requirements of ASC 820. In addition, the amendments clarify that materiality is an appropriate consideration of entities when evaluating disclosure requirements. The ASU is effective for all entities for fiscal years beginning after December 15, 2019, including interim periods therein. Early adoption is permitted for any eliminated or modified disclosures upon issuance of this ASU. The Funds have early adopted certain provisions of ASU 2018-13 for these financial statements.
140
ASHMORE FUNDS
NOTES TO FINANCIAL STATEMENTS (CONTINUED)
As of October 31, 2018
| 15. | New and Amended Financial Reporting Rules and Forms |
In August 2018, the U.S. Securities and Exchange Commission (“SEC”) issued a final rule which amends certain disclosure requirements that have become redundant, duplicative, overlapping, outdated, or superseded, in light of other SEC disclosure requirements, U.S. GAAP, International Financial Reporting Standards, or changes in the information environment. The rule became effective on November 5, 2018. The Funds have complied with the amended rules for the year ended October 31, 2018.
Effective January 1, 2019, Ashmore Emerging Markets Corporate Debt Fund changed its name to Ashmore Emerging Markets Income Fund.
The Trust has evaluated subsequent events for the Funds through the date the financial statements were issued, and has concluded that there are no identified subsequent events relevant for financial statement adjustment or disclosure, other than the item mentioned above.
141
ASHMORE FUNDS
SUPPLEMENTARY INFORMATION
As of October 31, 2018 (Unaudited)
REMUNERATION DISCLOSURE
Ashmore Investment Advisors Limited (“AIAL”) is a full-scope UK Alternative Investment Fund Manager (“AIFM”) that manages many alternative investment funds (“AIFs”). These AIFs implement a number of investment strategies, including equity, fixed income and alternatives, and invest in many different regions and industry sectors. AIAL manages both open-ended and closed-ended AIFs, several of its AIFs are leveraged and some are listed on regulated markets. Its assets under management was approximately $5.6 billion at June 30, 2018. AIAL’s parent company (“Ashmore”) is listed on a regulated market, counts ten offices worldwide and has a number of subsidiaries both in the UK and abroad. Taking into account guidance from the UK Financial Conduct Authority (“FCA”), AIAL has complied with the full AIFM Remuneration Code.
AIAL does not have any direct employees, and as such the amount of remuneration paid to staff by AIAL is zero. All AIAL AIFM Remuneration Code Staff are employed and paid by Ashmore. Ashmore’s remuneration principles have remained unchanged since it was listed, and are designed to align all employees with the long-term success of the business. These include significant levels of deferral, a clear link between performance and levels of remuneration and strong alignment of executive directors and employees with shareholders and clients through significant employee share ownership. The culture is therefore a collaborative one, with clients’ interests and the creation of shareholder value, including for employee shareholders, the overarching factors for success.
Executive directors, members of the investment team, and indeed all other employees, participate in a single capped incentive pool and are paid under a similar structure, with an annual cash bonus and share award, meaning that all employees are long-term shareholders in the business.
The policy includes:
–– A capped basic salary to contain the fixed cost base;
–– A cap on the total variable compensation including any awards made under Ashmore’s share plan, available for all employees at 25% of profits, which to date has not been fully utilized; and
–– A deferral for five years of a substantial portion of variable compensation into Ashmore shares (or equivalent), which, in the case of executive directors in lieu of a separate long term investing plan, is also partly subject to additional performance conditions measured over five years.
AIAL’s board of directors reviews the general principles of the remuneration policy and is responsible for its implementation with regard to AIAL’s AIFM Remuneration Code Staff. Ashmore’s Remuneration Committee periodically reviews the ongoing appropriateness and relevance of the remuneration policy, including in connection with the provision of services to AIAL. Ashmore employs the services of; McLagan to provide advice on remuneration benchmarking; Deloitte to provide advice on tax compliance, share plan design and administration; and the Remuneration Committee’s advisors are Aon. The Remuneration Committee’s terms of reference can be found here:
http://www.ashmoregroup.com/investor-relations/corporate-governance.
Performance assessment for AIAL’s AIFM Remuneration Code Staff for their work relating to AIAL is based on a combination of quantitative and qualitative criteria related to the performance of AIAL, the performance of relevant AIF(s) or business units and the performance of the individual. Qualitative criteria include adherence to Ashmore Group plc’s risk and compliance policies. This performance assessment is adjusted for relevant current and future risks related to the AIFs managed by AIAL.
The compensation of control function staff is based on function specific objectives and is independent from the performance of AIAL and/or the AIFs managed by AIAL. The remuneration of the senior officers in AIAL’s control functions is directly overseen by the Remuneration Committee.
142
ASHMORE FUNDS
SUPPLEMENTARY INFORMATION (CONTINUED)
As of October 31, 2018 (Unaudited)
Variable remuneration awarded to AIAL’s Remuneration Code Staff in respect of AIFMD work is subject to performance adjustment which allows Ashmore to reduce the deferred amount, including to nil, in light of the ongoing financial situation and/or performance of Ashmore, AIAL, the AIFs that AIAL manages and the individual concerned.
The total contribution of AIAL’s AIFM Remuneration Code Staff to the business of Ashmore is apportioned between work carried out for AIAL and work carried out for the other businesses and subsidiaries of Ashmore. Their remuneration is similarly apportioned between AIAL and the other businesses and subsidiaries where required.
The remuneration attributable to AIAL for its AIFMD identified staff for the financial year ended June 30, 2018 was as follows:
| | | | | | | | | | | | | | |
| Fund | | Number of
Beneficiaries | | Variable
Remuneration | | | Fixed
Remuneration | | | Total
Remuneration | |
Ashmore Emerging Markets Total Return Fund | | 18 | | | £370,706 | | | | £36,985 | | | | £407,691 | |
Ashmore Emerging Markets Local Currency Bond Fund | | 16 | | | 13,943 | | | | 1,534 | | | | 15,477 | |
Ashmore Emerging Markets Corporate Debt Fund | | 17 | | | 80,211 | | | | 8,292 | | | | 88,503 | |
Ashmore Emerging Markets Short Duration Fund | | 17 | | | 69,092 | | | | 7,143 | | | | 76,235 | |
Ashmore Emerging Markets Active Equity Fund | | 18 | | | 13,540 | | | | 1,667 | | | | 15,207 | |
Ashmore Emerging Markets Small-Cap Equity Fund | | 18 | | | 31,717 | | | | 3,906 | | | | 35,623 | |
Ashmore Emerging Markets Frontier Equity Fund | | 18 | | | 70,935 | | | | 8,736 | | | | 79,671 | |
Ashmore Emerging Markets Equity Fund | | 18 | | | 21,717 | | | | 2,675 | | | | 24,392 | |
Total AIAL | | 21 | | | £1,794,805 | | | | £193,918 | | | | £1,988,723 | |
All of the remuneration above was attributable to senior management who have a material impact on the Funds’ risk profile. The Funds’ allocation of the AIAL remuneration has been made on the basis of NAV.
143
ASHMORE FUNDS
FOR MORE INFORMATION
As of October 31, 2018
PORTFOLIO HOLDINGS
The Ashmore Funds file their complete schedule of portfolio holdings with the Securities and Exchange Commission (“SEC”) for the first and third quarters of each fiscal year on Form N-Q. The Funds’ Forms N-Q are available on the SEC’s Web site at www.sec.gov. You may also review and obtain copies at the SEC’s Public Reference Room in Washington D.C. Information about the Public Reference Room may be obtained by calling 800-SEC-0330. In addition, no later than thirty calendar days after the end of each calendar quarter, a list of all portfolio holdings in each Fund as of the end of such calendar quarter is made available at www.ashmoregroup.com.
PROXY VOTING
Ashmore Funds’ Proxy Voting Policies and Procedures and each Fund’s portfolio securities voting record for the most recent 12-month period ended June 30 are available upon request and without charge by visiting the Ashmore Funds’ Web site at www.ashmoregroup.com or the SEC’s Web site at www.sec.gov or by calling 866-876-8294.
144
ASHMORE FUNDS
PRIVACY POLICY
We consider customer privacy to be a fundamental aspect of our relationships with shareholders and are committed to maintaining the confidentiality, integrity and security of our current, prospective and former shareholders’ personal information. To ensure our shareholders’ privacy, we have developed policies that are designed to protect this confidentiality, while allowing shareholders’ needs to be served.
Obtaining Personal Information In the course of providing shareholders with products and services, we may obtain non-public personal information about shareholders, which may come from sources such as account applications and other forms, from other written, electronic or verbal correspondence, from shareholder transactions, from a shareholder’s brokerage or financial advisory firm, financial adviser or consultant, and/or from information captured on our internet web sites.
Respecting Your Privacy As a matter of policy, we do not disclose any personal or account information provided by shareholders or gathered by us to non-affiliated third parties, except as required for our everyday business purposes, such as to process transactions or service a shareholder’s account, or as otherwise permitted by law. As is common in the industry, non-affiliated companies may from time to time be used to provide certain services, such as preparing and mailing prospectuses, reports, account statements and other information, and gathering shareholder proxies. We may also retain non-affiliated financial services providers to market our shares or products and we may enter into joint-marketing arrangements with them and other financial companies. We may also retain marketing and research service firms to conduct research on shareholder satisfaction. These companies may have access to a shareholder’s personal and account information, but are permitted to use this information solely to provide the specific service or as otherwise permitted by law. We may also provide a shareholder’s personal and account information to their respective brokerage or financial advisory firm, Custodian, and/or to their financial advisor or consultant.
Sharing Information with Third Parties We reserve the right to disclose or report personal information to non-affiliated third parties where we believe in good faith that disclosure is required under law to cooperate with regulators or law enforcement authorities, to protect our rights or property or upon reasonable request by any investee entity in which a shareholder has chosen to invest. Of course, we may also share your information with your consent.
Sharing Information with Affiliates We may share shareholder information with our affiliates in connection with our affiliates’ everyday business purposes, such as servicing a shareholder’s account, but our affiliates may not use this information to market products and services to you except in conformance with applicable laws or regulations. The information we share includes information about our experiences and transactions with a shareholder and may include, for example, a shareholder’s participation in one of the Funds or in other investment programs, a shareholder’s ownership of certain types of accounts, or other data about a shareholder’s transactions or accounts. Our affiliates, in turn, are not permitted to share shareholder information with non-affiliated entities, except as required or permitted by law.
Procedures to Safeguard Private Information We take seriously the obligation to safeguard shareholder non-public personal information. In addition to this policy, we have also implemented procedures that are designed to restrict access to a shareholder’s non-public personal information only to internal personnel who need to know that information in order to provide products or services to such shareholders. In addition, we have physical, electronic, and procedural safeguards in place to guard a shareholder’s non-public personal information.
Disposal of Confidential Records We will dispose of records, if any, that are knowingly derived from data received from a consumer reporting agency regarding a shareholder that is an individual in a manner that ensures the confidentiality of the data is maintained. Such records include, among other things, copies of consumer reports and notes of conversations with individuals at consumer reporting agencies.
145
ASHMORE FUNDS
OTHER INFORMATION
Administrator, Custodian and Transfer Agent
The Northern Trust Company
50 South LaSalle Street
Chicago, Illinois 60603
312-630-6000
Investment Manager
Ashmore Investment Advisors Limited
61 Aldwych
London WC2B 4AE
United Kingdom
44-20-3077-6000
Independent Registered Public Accounting Firm
KPMG LLP
Aon Center
Suite 5500
200 East Randolph Drive
Chicago, Illinois 60601-6436
Distributor
Ashmore Investment Management (US) Corporation
475 Fifth Avenue
15th Floor
New York, New York 10017
212-661-0061
Legal Counsel
Ropes & Gray LLP
Prudential Tower
800 Boylston Street
Boston, Massachusetts 02199
617-951-7000
Independent Trustees’ Counsel
Dechert LLP
One International Place
40th Floor
100 Oliver Street
Boston, Massachusetts 02110
617-728-7100
146
ASHMORE FUNDS
TRUSTEES AND OFFICERS
Set forth below is information about the Trustees and Officers of the Ashmore Funds. Each Trustee has served in that capacity since he or she was originally elected or appointed to the Board of Trustees. Each Trustee oversees a total of eight portfolios in the Ashmore Funds. The Ashmore Funds’ Statement of Additional Information contains additional information about the Trustees and is available upon request and without charge by calling 866-876-8294.
INDEPENDENT TRUSTEES
| | | | | | | | | | |
Name, Address* and Age of Independent Trustee | | Positions(s)
Held with Trust | | Term of Office
and Length of
Time Served | | Principal
Occupation(s) During Past
5 Years | | Number of
Portfolios in
Fund Complex
Overseen by
Trustee | | Other
Directorships
Held by Trustee
During the Past
5 Years |
Yeelong Balladon (Age 60) | | Trustee;
Lead
Independent
Trustee | | Indefinite term;
Trustee since
inception in
2010 | | Freshfields Bruckhaus
Deringer (a law firm)
from 1982 to 2009
(Partner from 1999). | | 8 | | Non-executive
director August
2010 – October
2015,
Jasper Investments
Limited(1) . |
Michael Chamberlin (Age 69) | | Trustee | | Indefinite term;
Trustee since
2012 | | Executive Director,
Emerging Markets
Traders Association(2) . | | 8 | | None |
Joseph Grainger (Age 64) | | Trustee | | Indefinite
term; Trustee
since 2014 | | Ernst & Young LLP
from 1988 to December
2013 (Partner from
October 1990). | | 8 | | None |
| * | Each Trustee may be contacted at 61 Aldwych, London WC2B 4AE, United Kingdom. |
| (1) | Affiliates of the Investment Manager may be deemed to have controlled Jasper Investments Limited through September 2015 and Pacnet Limited through April 2015. Employees and officers of affiliates of the Investment Manager have served on the Boards of Jasper Investments Limited and Pacnet Limited. |
| (2) | Mr. Chamberlin has served as the Executive Director of the Emerging Markets Traders Association (“EMTA”) since 1994. Mark Coombs is Co-Chair of EMTA’s Board of Directors, and the Investment Manager’s ultimate parent company, Ashmore Group plc, is a member of the EMTA. Mr. Coombs is the Investment Manager’s Chief Executive Officer. |
147
ASHMORE FUNDS
NOTES TO FINANCIAL STATEMENTS
| | | | | | | | | | |
Name, Address* and Age of Interested Trustee | | Positions(s) Held with Trust | | Term of Office and Length of Time Served | | Principal
Occupation(s)
During Past
5 Years | | Number of
Portfolios in
Fund Complex
Overseen by
Trustee | | Other Directorships Held by Trustee During the Past 5 Years |
George Grunebaum(3) (Age 55) | | Trustee; Chairman of the Trustees; President and Chief Executive Officer | | Indefinite term; Trustee since inception | | Chief Executive Officer since November 2008, Ashmore Investment Management (US) Corporation. | | 8 | | None |
Stephen Hicks(4) (Age 58) | | Trustee | | Indefinite term; Trustee since 2014 | | CCO of Trinity Street Asset Management LLP, a UK private asset manager, since 2014; Group Head of Compliance from June 2010 to January 2014, Ashmore Group plc; Chief Compliance Officer from inception to December 2013, Ashmore Funds. | | 8 | | None |
| * | Each Trustee may be contacted at 61 Aldwych, London WC2B 4AE, United Kingdom. |
| (3) | Mr. Grunebaum is an “interested person” of the Trust, as defined in Section 2(a)(19) of the 1940 Act, due to, among other things, his positions with the Distributor and its affiliates. Mr. Grunebaum serves or has served as a trustee or director of other pooled investment vehicles sponsored by Ashmore Group plc (“Ashmore Group”) and its affiliates, including Ashmore Global Emerging Markets Funds, LTD and Ashmore Global Opportunities Limited. |
| (4) | Mr. Hicks is an “interested person” of the Trust, as defined in Section 2(a)(19) of the 1940 Act, due to his former position with Ashmore Group, the parent company of Ashmore Investment Advisors Limited. Ashmore Group indirectly compensates Mr. Hicks, through a separate private company, for his service as a Trustee of the Trust and as a trustee or director of other pooled investment vehicles sponsored by Ashmore Group and its affiliates. |
148
ASHMORE FUNDS
TRUSTEES AND OFFICERS (CONTINUED)
OFFICERS
| | | | | | |
| | | | |
Name, Address** and Age of Officer | | Positions(s) Held
with Trust | | Term of Office and
Length of Time Served | | Principal Occupation(s) During Past 5 Years |
George Grunebaum (Age 55) | | Trustee, President and Chief Executive Officer | | Indefinite term; since inception | | Chief Executive Officer since November 2008, Ashmore Investment Management (US) Corporation. |
Alexandra Autrey (Age 42) | | Chief Legal Officer | | Indefinite term; since inception | | Global Head of Legal and Transaction Management, Ashmore Group plc, since January 2012. |
Christopher Tsutsui (Age 54) | | Treasurer and Principal Financial and Accounting Officer | | Indefinite term; since inception | | Chief Financial Officer, Ashmore Investment Management (US) Corporation, from July 2014 to June 2015. Head of Finance, Ashmore Group plc, from July 2012 - June 2014. |
Kevin Hourihan (Age 40) | | Secretary and Chief Compliance Officer | | Indefinite term; since September 2017 | | Chief Compliance Officer since October 2015, Ashmore Equities Investment Management (US) LLC; Chief Compliance Officer since November 2014, Ashmore Investment Management (US) Corp; Senior Compliance Manager February 2014 - November 2015, Ashmore Equities Investment Management (US) LLC; Senior Compliance Manager February 2014 - November 2014, Ashmore Investment Management (US) Corp; Compliance Manager from January 2012 to January 2014, ProShare Advisors LLC. |
Owen Meacham (Age 47) | | Assistant Secretary | | Indefinite term; since inception | | Assistant General Counsel since August 2015, Managing Attorney from May 2012 to August 2015. |
Paul Robinson (Age 45) | | Assistant Chief Legal Officer | | Indefinite term; since June 2011 | | Group Deputy Head of Legal and Transaction Management since August 2012, Ashmore Group plc. |
| ** | Each Officer may be contacted at 61 Aldwych, London WC2B 4AE, United Kingdom. |
149
(THIS PAGE INTENTIONALLY LEFT BLANK)
150
(THIS PAGE INTENTIONALLY LEFT BLANK)
151
Item 2. Code of Ethics.
| (a) | As of October 31, 2018, the registrant has adopted a code of ethics that applies to its principal executive officer, principal financial officer, principal accounting officer or controller, or persons performing similar functions, regardless of whether these individuals are employed by the registrant or a third party (the “Code of Ethics”). |
| (c) | The registrant has not amended its Code of Ethics during the period covered by this report. |
| (d) | The registrant has not granted any waivers, including an implicit waiver, from any provisions of its Code of Ethics during the period covered by this report. |
Item 3. Audit Committee Financial Expert.
The registrant’s Board of Trustees has determined that the registrant has at least one “audit committee financial expert” (as defined in Item 3 of Form N-CSR), serving on its audit committee. Joseph Grainger is the “audit committee financial expert” and is “independent” (as each term is defined in Item 3 of Form N-CSR).
Under applicable securities laws and regulations, a person who is determined to be an audit committee financial expert will not be deemed an “expert” for any purpose, including without limitation for purposes of Section 11 of the Securities Act of 1933, as amended, as a result of being designated or identified as an audit committee financial expert. The designation or identification of a person as an audit committee financial expert does not impose on such person any duties, obligations, or liability that are greater than the duties, obligations, and liability imposed on such person as a member of the registrant’s Audit Committee and Board of Trustees in the absence of such designation or identification. The designation or identification of a person as an audit committee financial expert does not affect the duties, obligations or liability of any other member of the registrant’s Audit Committee or Board of Trustees.
3
Item 4. Principal Accountant Fees and Services.
Item 4(a): Audit Fees
The aggregate fees billed for each of the last two fiscal years for professional services rendered by KPMG LLP (“KPMG”), independent registered public accounting firm, for the audit of the registrant’s annual financial statements or services that are normally provided by the accountant in connection with statutory and regulatory filings or engagements for those fiscal years are $192,697 in 2018 and $225,433 in 2017.
Item 4(b): Audit-Related Fees
The aggregate fees billed in each of the last two fiscal years for assurance and related services by KPMG that are reasonably related to the performance of the audit of the registrant’s financial statements and are not reported under paragraph (a) of this Item are NONE.
Item 4(c): Tax Fees
The aggregate fees billed in each of the last two fiscal years for professional services rendered by KPMG for RIC tax compliance and diversification review and tax return review are $44,100 in 2018 and $44,100 in 2017.
Item 4(d): All Other Fees
The aggregate fees billed in each of the last two fiscal years for products and services provided by KPMG, other than the services reported in paragraphs (a) through (c) of this Item are NONE.
Item 4(e)(1): Pre-Approval Policies and Procedures
Pursuant to the registrant’s Audit Committee Charter adopted on November 17, 2010, as revised on December 13, 2017, the Audit Committee shall, to the extent required by applicable regulations, pre-approve (i) all audit and permitted non-audit services rendered by the independent auditors to a Fund and (ii) all non-audit services rendered by the independent auditors to a Fund’s investment adviser(s) (including any sub-advisers) and to certain of the investment adviser’s affiliates, as applicable. The Audit Committee may implement policies and procedures by which such services are pre-approved other than by the full Committee (for example, by the Committee chair).
Item 4(e)(2): Percentage of Fees Pre-Approved Pursuant to Waiver Provision of Paragraph (c)(7)(i)(C) of Rule 2-01 of Regulation S-X
No percentage of the principal accountant’s fees or services were approved pursuant to the waiver provision of paragraph (c)(7)(i)(C) of Rule 2-01 of Regulation S-X.
Item 4(f): Work Performed by Persons Other than the Principal Accountant
Not applicable.
Item 4(g): Aggregate Non-Audit Fees Disclosure
The aggregate non-audit fees and services billed by KPMG for services rendered to the registrant and service affiliates for the last two fiscal years were $44,100 for 2018 and $44,100 for 2017.
4
Item 4(h): Non-Audit Services and Independent Accountant’s Independence
The registrant’s Audit Committee has considered whether the provision of non-audit services to service affiliates, not pre-approved pursuant to paragraph (c)(7)(ii) of Rule 2-01 of Regulation S-X, is compatible with maintaining the registered public accountant’s independence in performing audit services.
Item 5. Audit Committee of Listed Registrants.
Not applicable.
Item 6. Investments.
| (a) | The registrant has elected to include the schedule of investments in securities of unaffiliated issuers as part of the report to shareholders filed under Item 1 of this report on Form N-CSR. |
Item 7. Disclosure of Proxy Voting Policies and Procedures for Closed-End Management Investment Companies.
Not applicable.
Item 8. Portfolio Managers of Closed-End Management Investment Companies.
Not applicable.
Item 9. Purchases of Equity Securities by Closed-End Management Investment Company and Affiliated Purchasers.
Not applicable.
Item 10. Submission of Matters to a Vote of Security Holders.
There have been no material changes to the procedures by which shareholders may recommend nominees to the registrant’s Board of Trustees.
Item 11. Controls and Procedures.
| (a) | The registrant’s principal executive and principal financial officers, or persons performing similar functions, have concluded that the registrant’s disclosure controls and procedures (as defined in Rule 30a-3(c) under the Investment Company Act of 1940 (the “1940 Act”)) are effective, based on the evaluation of these controls and procedures required by Rule 30a-3(b) under the 1940 Act and Rules 13a-15(b) or 15d-15(b) under the Securities Exchange Act of 1934 as of a date within 90 days of the filing date of this report. |
| (b) | There were no changes in the registrant’s internal control over financial reporting (as defined in Rule 30a-3(d) under the 1940 Act) that occurred during the second fiscal quarter of the period covered by this report that have materially affected, or are reasonably likely to materially affect, the registrant’s internal control over financial reporting. |
5
Item 12. Disclosure of Securities Lending Activities for Closed-End Management Investment Companies.
Not applicable.
Item 13. Exhibits.
| (a)(1) | Exhibit 99.CODE: Code of Ethics pursuant to Item 2 of Form N-CSR. |
| (a)(2) | Exhibit 99.CERT: Certifications pursuant to Section 302 of the Sarbanes-Oxley Act of 2002. |
| (b) | Exhibit 99.906 CERT: Certifications pursuant to Section 906 of the Sarbanes-Oxley Act of 2002. |
6
SIGNATURES
Pursuant to the requirements of the Securities Exchange Act of 1934 and the Investment Company Act of 1940, the registrant has duly caused this report to be signed on its behalf by the undersigned, thereunto duly authorized.
Ashmore Funds
| | |
| By | | /s/ George Grunebaum |
| | George Grunebaum, President and
Chief Executive Officer |
| | (Principal Executive Officer) |
Pursuant to the requirements of the Securities Exchange Act of 1934 and the Investment Company Act of 1940, this report has been signed below by the following persons on behalf of the registrant and in the capacities and on the dates indicated.
| | |
| By | | /s/ George Grunebaum |
| | George Grunebaum, President and
Chief Executive Officer |
| | (Principal Executive Officer) |
| | |
| By | | /s/ Jonathan Kim |
| | Jonathan Kim, Treasurer |
| | (Principal Financial and Accounting Officer) |
7