UNITED STATES
SECURITIES AND EXCHANGE COMMISSION
Washington, D.C. 20549
FORM N-CSR
CERTIFIED SHAREHOLDER REPORT OF REGISTERED MANAGEMENT
INVESTMENT COMPANIES
Investment Company Act file number 811-22468
Ashmore Funds
(Exact name of registrant as specified in charter)
c/o Ashmore Investment Advisors Limited
61 Aldwych
London WC2B 4AE
England
(Address of principal executive offices) (Zip code)
Corporation Service Company
84 State Street
Boston, MA 20109
(Name and address of agent for service)
Registrant’s telephone number, including area code: 011-44-20-3077-6000
Date of fiscal year end: October 31
Date of reporting period: October 31, 2020
Item 1. Reports to Stockholders.
ASHMORE FUNDS
ANNUAL FINANCIAL STATEMENTS
October 31, 2020
Beginning on January 1, 2021, as permitted by regulations adopted by the Securities and Exchange Commission, paper copies of the Fund’s annual and semi-annual shareholder reports will no longer be sent by mail, unless you specifically request paper copies of the reports from the Fund or your financial intermediary. Instead, the reports will be made available on the Fund’s website (www.ashmoregroup.com), and you will be notified by mail each time a report is posted and provided with a website link to access the report.
If you already elected to receive shareholder reports electronically, you will not be affected by this change and you need not take any action. You may elect to receive shareholder reports and other communications from the Fund electronically anytime by contacting your financial intermediary (such as a broker-dealer or bank) or, if you are a direct investor, by calling 866-876-8294.
You may elect to receive all future reports in paper free of charge. If you invest through a financial intermediary, you can contact your financial intermediary to request that you continue to receive paper copies of your shareholder reports. If you invest directly with the Fund, you can contact the Fund to let the Fund know you wish to continue receiving paper copies of your shareholder reports. Your election to receive reports in paper will apply to all funds held in your account if you invest through your financial intermediary or all funds held with the Trust if you invest directly with the Fund.

(THIS PAGE INTENTIONALLY LEFT BLANK)
ASHMORE FUNDS
TABLE OF CONTENTS
Ashmore Investment Management (US) Corporation is the Distributor for Ashmore Funds.
This material is authorized for use only when preceded or accompanied by the current Ashmore Funds’ prospectus. Investors should consider the investment objectives, principal risks, charges and expenses of these Funds carefully before investing. This and other information is contained in the Funds’ prospectus. Please read the prospectus carefully before you invest or send money.
A Fund’s past performance is not necessarily an indication of how the Fund will perform in the future.
The performance data quoted in this report represents past performance. Investment return and principal value will fluctuate, so an investor’s shares, when redeemed, may be worth more or less than the original cost. Current performance may be lower or higher than the performance data quoted in this report. For performance information current to the most recent month-end, please call (866) 876-8294.
An investment in a Fund is not a bank deposit and is not guaranteed or insured by the Federal Deposit Insurance Corporation or any other government agency. It is possible to lose money on investments in the Funds.
ASHMORE FUNDS
INVESTMENT MANAGER’S REPORT
For the period November 1, 2019 to October 31, 2020
Overview
The third quarter of 2019 offered more of the familiar themes that characterized global economic and global market indicators in previous quarters: uncertainty about global trade flows, ongoing weakness in manufacturing data, and dovish policy makers. As a result, lower global bond yields papered over the cracks in credit and equity markets, and net returns for investors were not so bad: the main global equity index was unchanged over the quarter, global government bond yields tightened and credit spreads remained in their recent range. On the trade wars front, the main battle started on August 1, 2019 when the US confirmed the imposition of 10% tariffs on USD 300 billion (bn) of mainly consumer goods imports from China, starting September 1, 2019. China’s retaliation against USD 75bn in US imports was countered by President Donald Trump with an increase in the US headline tariffs level to 15% from 10%, and threats that the current 25% tariff on USD 250bn of Chinese goods would increase to 30% starting October 1, 2019. Tensions subsided in September when the October tariff increase was pushed out, but the damage from the tariffs was apparent in the economic data.
As the last quarter of 2019 progressed, economic data and news flow confirmed that macro-economic risks were on the wane: firstly, trade frictions were no longer worsening and if anything were subsiding; secondly, global economic activity was no longer decelerating - indeed some of the more cyclical area indicators (Global IP) rebounded from their late-summer troughs. In the US, survey-based data was generally better, despite some residual weakness in the manufacturing sector, and payroll and housing data was strong. Headline Consumer Price Index (CPI) and average hourly earnings both fell by one tenth over the quarter to 2.3% and 2.9%, respectively. In Europe, survey data was inching up slowly from a low base, but expectations surveys such as the ZEW growth expectations survey, for instance, were much improved in comparison to their August lows (10.7% in November versus -43.9% in August, for the German gauge). Average Euro (currency) area inflation ticked up to 1.3% in December from 0.8% in September, partly due to base effects. In China, the December data confirmed a slow improvement in domestic activity that started in the previous summer, with the official Purchasing Managers Index (PMI) manufacturing data flat at 50.2%. Industrial production, industrial profit, fixed investment, and retail sales all beat expectations. Meanwhile, the world’s central banks continued to see no risk of inflation and maintained a dovish bias. In the US, the Federal Reserve cut rates in October 2019 and left rates unchanged at its December 2019 meeting, while indicating that the hurdle for a rate hike is high indeed. Importantly, last September, a spike in the Repo rates highlighted the shortage of US dollar ‘reserves’ available in the US banking system. This technical issue notably arose from the tighter liquidity ration regulation put in place in recent years, but was not helped by the Treasury’s heavy issuance needs. To fix the issue, the Federal Reserve announced that it would start buying USD 60 billion in treasury bills per month, starting October 15, 2019. This led to a sharp increase in the Federal Reserve’s balance sheet, which had increased by USD 400bn by year-end, in a striking reversal of the quantitative tightening that had started in early 2018.
The emergency lockdowns announced around the world in an attempt to contain the coronavirus (“COVID-19”) pandemic, combined with a surprise oil price war triggered by Saudi Arabia and Russia, led to one of the greatest financial markets corrections on record during the month of March. As the impact on real economic activity was assessed, the pandemic was set to be responsible for the deepest global economic contraction since World War II. The Q1 financial markets scorecard showed large drawdowns across all asset classes except for core bonds and gold. The VIX index of implied volatility in US stocks soared to a record-breaking 82, higher than the level experienced during the Global Financial Crisis in 2008. As the global economic prognosis turned bleaker, one pressure point was commodity prices and notably oil markets after Saudi Arabia called Russia’s bluff in early March and increased production. The dual demand and supply shock in oil markets led to a historic 66% fall in oil prices to USD 22 per barrel during Q1 2020. This had widespread implications for sovereign oil exporters and corporate high yield energy names. As markets fell and the economy faltered, the policy response was swift and unprecedented in terms of size and number of instruments used to restore stability to global markets and to prevent a seizure of credit markets. The Federal Reserve cut its target Fed Funds rate to zero in two emergency rate cuts in March, and 25 other central banks around the world announced rate cuts totaling over 3,000 basis points of easing.
Financial markets rebounded sharply in Q2 2020, after large drawdowns across all asset classes in Q1 2020, in response to marginal improvements in the pace of COVID-19 infections, and the impact of record amounts of liquidity and security purchases by the world’s major central banks. Meanwhile, the confinement measures adopted around the world depressed economic activity, and economic data for March and April provided some early indications of the magnitude of the incipient contraction.
1
ASHMORE FUNDS
INVESTMENT MANAGER’S REPORT (CONTINUED)
Q2 2020 recorded the best quarter for oil prices (Brent futures 81%) since Q3 1990 and the best quarter for each of the S&P 500 index (20%) since Q4 1998, for Nasdaq (31%) since Q4 1999, for US Investment Grade (IG) credit (9%) since Q2 2009, and for US High Yield (HY) bonds (9.5%) since Q3 2009. Global equities also rebounded strongly, with European stocks (Eurostoxx50), MSCI World and Emerging Markets (EM) stocks (MSCI EM) posting returns of 16%, 19% and 18%, respectively. In their June World Economic Outlook publication, the International Monetary Fund (IMF) downgraded their 2020 global real Gross Domestic Product (GDP) growth forecast to -4.9% from -3.0% in its April forecast, and projected a more gradual recovery than previously anticipated. The IMF’s growth forecast for EM was downgraded to -3.0 from -1.0%, and the growth forecast for Advanced Economies was downgraded to -8.0% from -6.1%. In 2021, global growth is projected at 5.4%, which would leave 2021 GDP some 6.5 percentage points lower than in the pre-COVID-19 projections of January 2020. With this challenging outlook in mind, the Fed committed to keeping the policy rate unchanged until at least the end of 2022 and Federal Reserve Chair Jerome Powell pledged to “do whatever we can for as long as it takes”. He said that the Fed was considering the adoption of yield curve controls, but questioned the effectiveness of the policy.
In July and August 2020, global markets surprised positively with unexpected positive performance. Core government bond yields declined gradually, a reflection of low growth expectations, setting the stage for a similarly gradual fall in volatility and in credit spreads. Meanwhile, a decent corporate earnings season for Q2 2020 (versus low expectations) supported good performance from global equity markets. This strong market performance contrasted with poor economic data releases, and growing reminders of the difficulty of containing COVID-19 in large patches of the globe. In EM, data also surprised on the upside, particularly in Brazil, where industrial production was up another 8% month over month in July, and in India. Both Ecuador and Argentina announced the results of successful debt exchange offers, achieved in record time and with overwhelming investor participation. In Ecuador, the IMF agreed on a new USD 6.5bn Extended Funding Facility program, of which USD 4.0bn will be disbursed in 2020. Ecuador’s new bonds received a B- rating from both S&P and Fitch.
Heading into September and October 2020, the market increasingly focused on a number of key risk factors: the beginning of a feared “second wave” of the coronavirus, the US presidential election, and a less bullish narrative around the US economic outlook. The improvement in economic data started to lose momentum as the market’s expectations of strong forward guidance from the September Federal Open Market Committee meeting was disappointed when various Federal Reserve officials varied in their interpretation of the new flexible policy framework. After a strong summer, markets performed relatively poorly, giving back recent gains. Global credit markets reversed about one-third of the tightening that had taken place since June. As the US election neared, concerns about the impact of a disputed election outcome assumed greater importance than concerns about the eventual winner of the contest. In October, the IMF again revised its growth outlook, forecasting a slightly better picture than had been announced at the end of Q2 2020. The expected growth for EM was downgraded to -3.3% from -3.0%, while the growth forecast for Advanced Economies was upgraded to -5.8% from -8.0%, leading to a contraction of -4.4% for the global economy.
Portfolio Overview
Ashmore Emerging Markets Total Return Fund
The Ashmore Emerging Markets Total Return Fund (the “Fund”) seeks to achieve its objective by investing principally in the debt instruments of sovereign, quasi-sovereign, and corporate issuers, which may be denominated in any currency, including the local currency of the issuer. The Fund tactically allocates assets between external debt, corporate debt and local currency.
Over the period, the Fund’s institutional class underperformed its benchmark, returning -5.09% (net of fees) versus -0.85% for the composite 50% JP Morgan Emerging Markets Bond Index Global Diversified (“JP Morgan EMBI GD”), 25% JP Morgan Emerging Local Markets Index Plus (“JP Morgan ELMI+”), 25% JP Morgan Government Bond Index - Emerging Markets Global Diversified (“JP Morgan GBI-EM GD”). Local currency and external debt detracted from performance while corporate debt contributed to performance. Indonesia, Brazil, and Mexico were the main contributors to Fund performance. Venezuela, Argentina, and Jamaica were the main detractors from Fund performance.
Venezuela was a detractor during the period. JP Morgan re-weighted the country in the index to a zero weighting in light of US sanctions and the resulting difficulty in trading Venezuelan debt. This was completed at the end of November 2019. State-owned oil company PDVSA missed the coupon and amortization payment due on its 2020 bond maturity in late October 2019, leading to legal challenges with regard to the collateral backing the bond. Bond prices for Venezuela continue to languish as the US looks to tighten
2
ASHMORE FUNDS
INVESTMENT MANAGER’S REPORT (CONTINUED)
sanctions further and as the domestic political environment remains extremely tense between Nicolas Maduro and Juan Guaido and their supporters. Maduro lost a significant court battle in the UK over ownership of the country’s gold held in reserve, and with no active oil rigs in the country, oil production has largely ceased.
Ashmore Emerging Markets Local Currency Bond Fund
The Ashmore Emerging Markets Local Currency Bond Fund (the “Fund”) seeks to achieve its objective by investing principally in the debt instruments of sovereign and quasi-sovereign EM issuers, denominated in the local currency of the issuer. The Fund’s returns are driven by EM currency appreciation, interest rate positioning and credit worthiness.
Over the period, the Fund’s institutional class underperformed its benchmark, returning -5.38% (net of fees) versus -3.81% for the JP Morgan GBI-EM GD. Allocations to the Mexican Peso, Argentine Peso, and Malaysian Ringgit were the main contributors to Fund performance. Allocations to the Brazilian Real, Russian Ruble, and Turkish Lira were the main detractors from Fund performance.
In the Adviser’s view, the Brazilian Real was collateral damage from concerns about Chinese growth due to the coronavirus. China is Brazil’s biggest export market with a share of just under 22% of all exports. As a result, more and more Brazilian companies operated with partial factory shutdowns and scheduling stoppages due to problems in sourcing parts from China related to the coronavirus. Earlier in 2020, financial outflows prompted the Brazilian Central Bank to sell USD 5 bn in FX swaps to contain depreciation of the Brazilian Real. In direct response to the anticipated fall-out from the coronavirus crisis, the central bank cut the Selic rate by 75 bps to 3.75% over the quarter and signaled more rate cuts to alleviate the impact of coronavirus on the economy. The Brazilian government, however, adopted a less stringent and less coordinated response to the coronavirus outbreak than some other Latin American countries.
Ashmore Emerging Markets Corporate Income Fund
The Ashmore Emerging Markets Corporate Income Fund (the “Fund”) seeks to achieve its objective by investing principally in the debt instruments of EM corporate issuers, which may be denominated in any currency, including the local currency of the issuer.
Over the period, the Fund’s institutional class underperformed its benchmark, returning +1.04% (net of fees) versus +4.24% for the JP Morgan Corporate Emerging Markets Bond Index Broad Diversified (“JP Morgan CEMBI BD”). Brazil, Turkey, and Ukraine were the main contributors to Fund performance. Jamaica, Venezuela, and Argentina were the main detractors from Fund performance.
Venezuela was a detractor during the period. JP Morgan re-weighted the country in the index to a zero weighting in light of US sanctions and the resulting difficulty in trading Venezuelan debt. This was completed at the end of November 2019. State-owned oil company PDVSA missed the coupon and amortization payment due on its 2020 bond maturity in late October 2019, leading to legal challenges with regard to the collateral backing the bond. Bond prices for Venezuela continue to languish as the US looks to tighten sanctions further and as the domestic political environment remains extremely tense between Nicolas Maduro and Juan Guaido and their supporters. Maduro lost a significant court battle in the UK over ownership of the country’s gold held in reserve, and with no active oil rigs in the country, oil production has largely ceased.
Ashmore Emerging Markets Short Duration Fund
The Ashmore Emerging Markets Short Duration Fund (the “Fund”) seeks to achieve its objective by investing principally in short-term debt instruments of, and derivative instruments related to, Sovereign, Quasi-Sovereign and Corporate issuers of EM countries denominated exclusively in Hard Currencies (i.e., the U.S. dollar or any currency of a nation in the G-7). The Fund normally seeks to maintain weighted average portfolio duration of between 1 and 3 years. The Fund has no restrictions on individual security duration.
Over the period, the Fund’s institutional class underperformed its benchmark, returning -10.94% (net of fees) versus +2.97% for the JP Morgan CEMBI BD 1-3 Year. China, Ecuador, and Brazil were the main contributors to Fund performance. Argentina, Venezuela, and Lebanon were the main detractors from Fund performance.
3
ASHMORE FUNDS
INVESTMENT MANAGER’S REPORT (CONTINUED)
Venezuela was a detractor during the period. JP Morgan re-weighted the country in the index to a zero weighting in light of US sanctions and the resulting difficulty in trading Venezuelan debt. This was completed at the end of November 2019. State-owned oil company PDVSA missed the coupon and amortization payment due on its 2020 bond maturity in late October 2019, leading to legal challenges with regard to the collateral backing the bond. Bond prices for Venezuela continue to languish as the US looks to tighten sanctions further and as the domestic political environment remains extremely tense between Nicolas Maduro and Juan Guaido and their supporters. Maduro lost a significant court battle in the UK over ownership of the country’s gold held in reserve, and with no active oil rigs in the country, oil production has largely ceased.
Ashmore Emerging Markets Active Equity Fund
The Ashmore Emerging Markets Active Equity Fund (the “Fund”) seeks to achieve its objective by investing principally in equity securities and equity-related investments of EM issuers, which may be denominated in any currency, including the local currency of the issuer.
Over the period, the Fund’s institutional class underperformed its benchmark, returning +6.79% (net of fees) versus +8.25% for the MSCI Emerging Markets Index.
Our top-down driven strategy struggled in the abrupt market collapse caused by the COVID-19 pandemic. An overarching headwind to performance was the disproportionate sell-off seen in highly liquid stocks, which is where our portfolio is focused. A perceived liquidity shortfall led investors to sell what they could rather than necessarily what they wanted. While we have participated in the recovery, the narrow nature of that recovery has prolonged our ability to recoup and return to outperformance.
Our exposure to Brazil was the most significant detractor from performance, specifically banks, domestic consumption and energy names. The unwillingness and inability to tackle COVID-19 surprised us negatively and was exacerbated by uncoordinated policy. The principal detractor was Brazilian travel service provider, CVC. The stock suffered from a “perfect storm” of headwinds, including disappointing Q3 2019 results and a pandemic that significantly extinguished travel demand in 2020.
Taiwanese Semiconductor companies were the largest source of relative value over the period. This was largely driven by TSMC and MediaTek. We initiated our position in Mediatek, a fabless semiconductor company, in Q1 given, in our view, a strong product pipeline for 2020 that was expected to drive operating leverage. We added to the position through market volatility and it was one of the few companies to maintain constructive guidance over the summer. It is expected to be a key beneficiary of the 5g rollout in China and continued Sino-US tech tensions. TSMC was also a source of relative value driven by excellent capex discipline and high barriers to entry. The result is a resilient company notably well placed in the current global backdrop. The company delivered strongly positive Q2 2020 results, as both revenues and earnings were ahead of market expectations and guided positively for Q3 2020. Investor sentiment was also buoyed by news that Intel may cease to be a competitor for the manufacturing of high end chips.
Peruvian material names also added value, most notably Southern Copper. As “First in, First out” (“FIFO”) economies reopened, the demand supply dynamics for copper and iron ore improved significantly.
Ashmore Emerging Markets Small-Cap Equity Fund
The Ashmore Emerging Markets Small-Cap Equity Fund (the “Fund”) seeks to achieve its objective by investing at least 80% of its net assets in equity securities and equity-related investments of small-capitalization EM issuers, which may be denominated in any currency, including the local currency of the issuer.
Over the period, the Fund’s institutional class outperformed its benchmark, returning +24.58% (net of fees) versus +2.36%. Performance was driven largely by stock selection, in-line with our investment process.
Over the period, the Fund focused on companies that were characterized by resilient balance sheets, strong industry positions and robust cash flow generation that we believed would allow them to make further market share gains in a difficult global environment.
4
ASHMORE FUNDS
INVESTMENT MANAGER’S REPORT (CONTINUED)
Several of our holdings in India were among the strongest performers. IndiaMart, India’s largest online business-to-business classified advertiser, benefitted from accelerated digitalisation of SMEs business. The resilience of their business model was reflected in strong results and margin expansion. Granules, a pharmaceutical company, produced strong results with double digit earnings growth year-on-year. We believe the company’s product pipeline is strong, suggesting a bright outlook.
Other strong performers include securities that benefit from the acceleration of digitalization trends including Hansol Chemical, a South Korean chemical producer used in the semiconductor manufacturing process. Hansol’s various divisions have been resilient amidst the challenges of the pandemic, and we believe the company should see sustainable growth across a range of high margin products where they are a leading supplier, such as for binding material for EV batteries.
The largest detractor from relative performance was Dentium, a South Korean dental company that has reported modestly weak results and lagged.
Ashmore Emerging Markets Frontier Equity Fund
The Ashmore Emerging Markets Frontier Equity Fund (the “Fund”) seeks to achieve its objective by investing principally in equity securities and equity-related investments of Frontier Market issuers, which may be denominated in any currency, including the local currency of the issuer.
Over the period, the Fund’s institutional class underperformed its benchmark, returning -11.17% (net of fees) versus -6.85% for the MSCI Frontier Markets + Select EM Countries Capped Index. Our strategy targets long term absolute USD returns and we believe assessing performance over short term periods is somewhat counterintuitive. With that said, in 2020, Frontier Markets were disproportionately sold off during the global drawdown and have lagged in recovery given their less entwined nature with global capital flows.
The standout performer over the period was Fawry, a leading electronic payment platform in Egypt. Revenue growth continued to beat market expectations driven by the rising penetration of electronic payments, more services available on the platform and a growing point-of-sale network and user base. The better-than-expected recovery in domestic activity bodes well for credit growth and asset quality growth into 2021. Other notable exposures that added to relative performance included our exposure to Vietnam. While South East Asia was the first region to experience the COVID-19 pandemic, it was also the first out which was a tailwind to performance. Specific names that added value were Military Commercial Bank, which we believe is a well-run corporation that tightened asset quality despite the challenging domestic backdrop, and Hoa Phat, a Steel producer that posted strong results driven by revenue growth and stringent control of operation expenses.
Two of the largest detractors from performance where NMC Health and Network International. NMC, a London listed company, had attractive underlying assets with hospitals across the Middle East which were well placed to benefit from structural demand growth drivers. This said, we had significantly reduced our exposure from summer 2019 onwards as our concerns grew over poor transparency and disclosure relating to historic acquisitions. In Q1 2020, the stock suffered a corporate governance scandal, after it was revealed the CEO raised personal debt liabilities off balance sheet, and the stock collapsed. Network International, a Middle East payment solution company also weighed on returns. The company’s travel exposure to Dubai continued to be a negative, as expected, although accelerating trends of card adoption away from cash is a positive.
Ashmore Emerging Markets Equity Fund
The Ashmore Emerging Markets Equity Fund (the “Fund”) seeks to achieve its objective by investing principally in equity securities and equity-related investments of EM issuers, which may be denominated in any currency, including the local currency of the issuer.
Over the period, the Fund’s institutional class outperformed its benchmark, returning +17.41% (net of fees) versus +8.25% for the MSCI Emerging Markets Index. Performance was driven largely by stock selection, in-line with our investment process.
Over the period, the Fund focused on companies that were characterized by resilient balance sheets, strong industry positions and robust cash flow generation that we believed would allow them to make further market share gains in a difficult global environment.
5
ASHMORE FUNDS
INVESTMENT MANAGER’S REPORT (CONTINUED)
Chinese stocks Xinyi Glass and Xinyi Solar were the two strongest performers. The former is a major glass producer in the automobile and construction industries. Tight supply and improved demand dynamics helped drive the stock price. Margins also recovered strongly helped by lower input costs, such as natural gas. Xinyi Solar, a global leader in solar glass, benefited from demand recovery which supported product prices, as well as expectations of a greater emphasis on renewable energy within China’s soon-to-be-announced five year economic plan.
Other strong performers include securities that benefited from the acceleration of digitalization trends including Hansol Chemical, a South Korean chemical producer used in the semiconductor manufacturing process. Hansol’s various divisions have been resilient amidst the challenges of the pandemic, and we believe the company should see sustainable growth across a range of high margin products where they are a leading supplier, such as for binding material for EV batteries).
Larsen & Toubro was one of the largest detractors to performance. The company announced weak results as COVID-19 containment measures weighed heavily on infrastructure project execution and labor shortages in India.
Ashmore Emerging Markets Equity ESG Fund
The Ashmore Emerging Markets Equity ESG Fund (the “Fund”) seeks to achieve its objective by investing principally in equity securities and equity-related investments of Emerging Market Issuers, which may be denominated in any currency, including the local currency of the issuer, focusing on issuers that the Investment Manager believes satisfy the ESG Criteria.
Over the period, the Fund’s institutional class outperformed its benchmark, returning +20.60% (net of fees) versus +7.67% for the MSCI Emerging Markets Index. Performance was driven largely by stock selection, in-line with our investment process.
Over the period, the Fund focused on companies that were characterized by resilient balance sheets, strong industry positions and robust cash flow generation that we believed would allow them to make further market share gains in a difficult global environment.
Chinese stock Xinyi Solar was the strongest performer. The company is a global leader in solar glass and benefited from demand recovery which supported product prices, as well as expectations of a greater emphasis on renewable energy within China’s soon-to-be-announced five year economic plan. Other strong performers include securities that benefit from the acceleration of digitalization trends including Hansol Chemical, a South Korean chemical producer used in the semiconductor manufacturing process. Hansol’s various divisions have been resilient, and we believe the company should see sustainable growth across a range of high margin products where they are a leading supplier, such as for binding material for EV batteries).
Ashmore Emerging Markets Short Duration Select Fund
The Ashmore Emerging Markets Short Duration Select Fund (the “Fund”) seeks to achieve its objective by investing principally in in short-term debt instruments of, and derivative instruments related to, Sovereign, Quasi-Sovereign and Corporate issuers of Emerging Market Countries denominated exclusively in Hard Currencies (i.e., the U.S. dollar or any currency of a nation in the G-7). The Fund normally seeks to maintain a weighted average portfolio duration of between 1 and 3 years and an Investment Grade weighted average credit rating.
Over the period, the Fund’s institutional class outperformed its benchmark, returning +3.43% (net of fees) versus +1.94% for the JP Morgan CEMBI BD IG (1-3 Year). China, South Africa, and Brazil were the main contributors to Fund performance. Ecuador, Oman, and Chile were the main detractors from Fund performance.
Brazilian natural resource companies were able to target exports to East Asia markets such as China, Taiwan and South Korea, as those economies returned to positive growth in the aftermath of the COVID-19 pandemic. CSN Resources, the country’s largest steel maker and a major player in mining and cement, was a top performer.
In Chile, a plebiscite was held that resulted in 78% of voters supporting a new constitution, to be prepared by a constituent assembly with a targeted completion date of June 2022. The uncertainty about the constitutional reform, and the likelihood of new measures that could pressure fiscal accounts, weighed on Chilean asset prices.
6
ASHMORE FUNDS
INVESTMENT MANAGER’S REPORT (CONTINUED)
Ashmore Emerging Markets Investment Grade Income Fund
The Ashmore Emerging Markets Investment Grade Income (the “Fund”) seeks to achieve its objective by investing principally in debt instruments of, and derivative instruments related to, Sovereigns, Quasi-Sovereigns, EM Supra-Nationals and Corporate issuers of EM Countries denominated exclusively in Hard Currencies (i.e., the U.S. dollar or any currency of a nation in the G-7). The Fund observes a policy to normally invest at least 80% of its net assets in Investment Grade bonds.
Over the period, the Fund’s institutional class underperformed its benchmark, returning -1.16% (net of fees) versus -0.18% for the JP Morgan CEMBI IG Broad. Panama, South Africa, and India were the main contributors to Fund performance. China, Chile, and Ukraine were the main detractors from Fund performance.
Investments in a portfolio of Chinese property sector names underperformed after a strong run-up earlier in the year. One property name was particularly volatile due to concerns about leverage, but the market stabilized as the government’s “Three Red Line” policy looked to curb excessive leverage in the sector.
7
IMPORTANT INFORMATION ABOUT THE FUNDS
Ashmore Investment Advisors Limited
This commentary may include statements that constitute “forward-looking statements” under the U.S. securities laws. Forward-looking statements include, among other things, projections, estimates, and information about possible or future results related to the Funds and market or regulatory developments. The views expressed above are not guarantees of future performance or economic results and involve certain risks, uncertainties and assumptions that could cause actual outcomes and results to differ materially from the views expressed herein. The views expressed above are those of Ashmore Investment Advisors Limited as of the date indicated and are subject to change at any time based upon economic, market, or other conditions and Ashmore Investment Advisors Limited undertakes no obligation to update the views expressed herein. Any discussions of specific securities or markets should not be considered a recommendation to buy or sell or invest in those securities or markets. The views expressed above may not be relied upon as investment advice or as an indication of the Funds’ trading intent. Information about the Funds’ holdings, asset allocation or country diversification is historical and is not an indication of future portfolio composition, which may vary. Direct investment in any index is not possible. The performance of any index mentioned in this commentary has not been adjusted for ongoing management, distribution and operating expenses applicable to mutual fund investments. In addition, the returns do not reflect certain charges that an investor in the Funds may pay. If these additional fees were reflected, the performance shown would have been lower.
The following disclosure provides important information regarding each Fund’s Average Annual Total Return table and Cumulative Returns chart, which appear on each Fund’s individual page in this report (the “Shareholder Report” or the “Report”). Please refer to this information when reviewing the table and chart for a Fund.
On each individual Fund Summary page in this Report, the Average Annual Total Return table and Cumulative Returns chart measure performance assuming that all dividend and capital gain distributions were reinvested. Returns do not reflect the deduction of taxes that a shareholder would pay on (i) Fund distributions or (ii) the redemption of Fund shares. The Cumulative Returns Chart reflects only Institutional Class performance. Performance for Class A and Class C shares is typically lower than Institutional Class performance due to the lower expenses paid by Institutional Class shares. Except for the load-waived performance for the Class A and C shares of each Fund (as applicable), performance shown is net of fees and expenses. The load-waived performance for Class A and Class C shares does not reflect the sales charges shareholders of those classes may pay in connection with a purchase or redemption of Class A and Class C shares. The load-waived performance of those share classes is relevant only to shareholders who purchased Class A or Class C shares on a load-waived basis. The figures in the line graph are calculated at net asset value and assume the investment of $1,000,000 at the beginning of the first full month following the inception of the Institutional Class. Each Fund measures its performance against a broad-based securities market index (“benchmark index”). Each benchmark index does not take into account fees, expenses or taxes.
For periods prior to the inception date of the Class A and Class C shares (if applicable), performance information shown is based on the performance of the Fund’s Institutional Class shares, adjusted to reflect the distribution and/or service fees and other expenses paid by the Class A and Class C shares, respectively.
A Fund’s past performance, before and after taxes, is not necessarily an indication of how the Fund will perform in the future.
8
IMPORTANT INFORMATION ABOUT THE FUNDS (CONTINUED)
The following disclosure provides important information regarding each Fund’s Expense Example, which appears on each Fund’s individual page in this Shareholder Report. Please refer to this information when reviewing the Expense Example for a Fund.
EXPENSE EXAMPLE
Fund Expenses
As a shareholder of the Funds, you incur two types of costs: (1) transaction costs, including sales charges (loads) on purchase payments; redemption fees; and exchange fees; and (2) ongoing costs, including management fees; distribution (12b-1) fees; and other Fund expenses. This Example is intended to help you understand your ongoing costs (in Dollars) of investing in the Funds and to compare these costs with the ongoing costs of investing in other mutual funds. The Example is based on an investment of $1,000 invested at the beginning of the period and held for the entire period, from May 1, 2020 or the inception date (if later), through October 31, 2020.
Actual Expenses
The information in the table under the heading “Actual Performance” provides information based on actual performance and actual expenses. You may use the information in these columns, together with the amount you invested, to estimate the expenses that you paid over the period. Simply divide your account value by $1,000 (for example, an $8,600 account value divided by $1,000 = $8.60), then multiply the result by the number in the appropriate column for your share class, in the row titled “Expenses Paid” to estimate the expenses you paid on your account during this period.
Hypothetical Example for Comparison Purposes
The information in the table under the heading “Hypothetical Performance” provides information about hypothetical account values and hypothetical expenses based on the Fund’s actual expense ratio and an assumed rate of return of 5% per year before expenses, which is not the Fund’s actual return. The hypothetical account values and expenses may not be used to estimate the actual ending account balance or expenses you paid for the period. You may use this information to compare the ongoing costs of investing in the Fund and other funds. To do so, compare this 5% hypothetical example with the 5% hypothetical examples that appear in the shareholder reports of the other funds.
Please note that the expenses shown in the table are meant to highlight your ongoing costs only and do not reflect any transactional costs, such as sales charges (loads), redemption fees, or exchange fees. Therefore, the information under the heading “Hypothetical Performance” is useful in comparing ongoing costs only, and will not help you determine the relative total costs of owning different funds. In addition, if these transactional costs were included, your costs would have been higher.
9
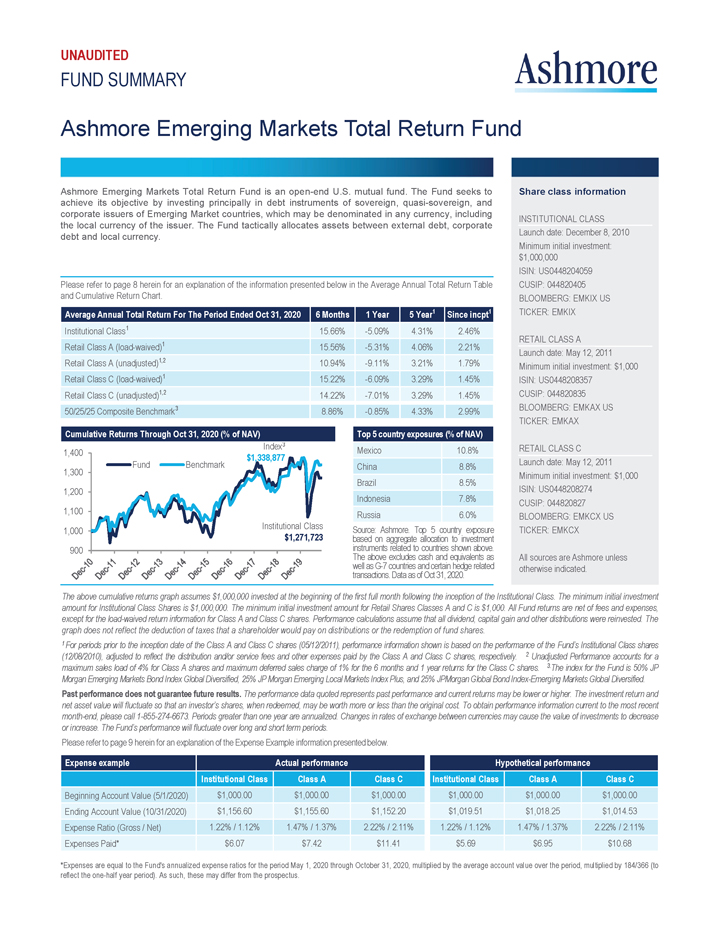
UNAUDITED FUND SUMMARY Ashmore Ashmore Emerging Markets Total Return Fund Ashmore Emerging Markets Total Return Fund is an open-end U.S. mutual fund. The Fund seeks to achieve its objective by investing principally in debt instruments of sovereign, quasi-sovereign, and corporate issuers of Emerging Market countries, which may be denominated in any currency, including the local currency of the issuer. The Fund tactically allocates assets between external debt, corporate debt and local currency. Please refer to page 8 herein for an explanation of the information presented below in the Average Annual Total Return Table and Cumulative Return Chart. Average Annual Total Return For The Period Ended Oct 31, 2020 6 Months 1 Year 5 Year1 Since incpt1 Institutional Class1 15.66% -5.09% 4.31% 2.46% Retail Class A (load-waived)1 15.56% -5.31% 4.06% 2.21% Retail Class A (unadjusted)1,2 10.94% -9.11% 3.21% 1.79% Retail Class C (load-waived)1 15.22% -6.09% 3.29% 1.45% Retail Class C (unadjusted)1,2 14.22% -7.01% 3.29% 1.45% 50/25/25 Composite Benchmark3 8.86% -0.85% 4.33% 2.99% Cumulative Returns Through Oct 31, 2020 (% of NAV) Top 5 country exposures (% of NAV) 1,400 1,300 1,200 1,100 1,000, 900 Dec-10 Dec-11 Dec-12 Dec-13 Dec-14 Dec-15 Dec-16 Dec-17 Dec-18 Dec-19 Fund Benchmark Index3 $1,338,877 Institutional Class $1,271,723 Mexico 10.8% China 8.8% Brazil 8.5% Indonesia 7.8% Russia 6.0% Source: Ashmore. Top 5 country exposure based on aggregate allocation to investment instruments related to countries shown above. The above excludes cash and equivalents as well as G-7 countries and certain hedge related transactions. Data as of Oct 31, 2020. Share class information INSTITUTIONAL CLASS Launch date: December 8, 2010 Minimum initial investment: $1,000,000 ISIN: US0448204059 CUSIP: 044820405 BLOOMBERG: EMKIX US TICKER: EMKIX RETAIL CLASS A Launch date: May 12, 2011 Minimum initial investment: $1,000 ISIN: US0448208357 CUSIP: 044820835 BLOOMBERG: EMKAX US TICKER: EMKAX RETAIL CLASS C Launch date: May 12, 2011 Minimum initial investment: $1,000 ISIN: US0448208274 CUSIP: 044820827 BLOOMBERG: EMKCX US TICKER: EMKCX All sources are Ashmore unless otherwise indicated. The above cumulative returns graph assumes $1,000,000 invested at the beginning of the first full month following the inception of the Institutional Class. The minimum initial investment amount for Institutional Class Shares is $1,000,000. The minimum initial investment amount for Retail Shares Classes A and C is $1,000. All Fund returns are net of fees and expenses, except for the load-waived return information for Class A and Class C shares. Performance calculations assume that all dividend, capital gain and other distributions were reinvested. The graph does not reflect the deduction of taxes that a shareholder would pay on distributions or the redemption of fund shares. 1 For periods prior to the inception date of the Class A and Class C shares (05/12/2011), performance information shown is based on the performance of the Fund’s Institutional Class shares (12/08/2010), adjusted to reflect the distribution and/or service fees and other expenses paid by the Class A and Class C shares, respectively. 2 Unadjusted Performance accounts for a maximum sales load of 4% for Class A shares and maximum deferred sales charge of 1% for the 6 months and 1 year returns for the Class C shares. 3.The index for the Fund is 50% JP Morgan Emerging Markets Bond Index Global Diversified, 25% JP Morgan Emerging Local Markets Index Plus, and 25% JPMorgan Global Bond Index-Emerging Markets Global Diversified. Past performance does not guarantee future results. The performance data quoted represents past performance and current returns may be lower or higher. The investment return and net asset value will fluctuate so that an investor’s shares, when redeemed, may be worth more or less than the original cost. To obtain performance information current to the most recent month-end, please call 1-855-274-6673. Periods greater than one year are annualized. Changes in rates of exchange between currencies may cause the value of investments to decrease or increase. The Fund’s performance will fluctuate over long and short term periods. Please refer to page 9 herein for an explanation of the Expense Example information presented below. Expense example Actual performance Hypothetical performance Institutional Class Class A Class C Institutional Class Class A Class C Beginning Account Value (5/1/2020) $1,000.00 $1,000.00 $1,000.00 $1,000.00 $1,000.00 $1,000.00 Ending Account Value (10/31/2020) $1,156.60 $1,155.60 $1,152.20 $1,019.51 $1,018.25 $1,014.53 Expense Ratio (Gross / Net) 1.22% / 1.12% 1.47% / 1.37% 2.22% / 2.11% 1.22% / 1.12% 1.47% / 1.37% 2.22% / 2.11% Expenses Paid* $6.07 $7.42 $11.41 $5.69 $6.95 $10.68 *Expenses are equal to the Fund’s annualized expense ratios for the period May 1, 2020 through October 31, 2020, multiplied by the average account value over the period, multiplied by 184/366 (to reflect the one-half year period). As such, these may differ from the prospectus. 10
10
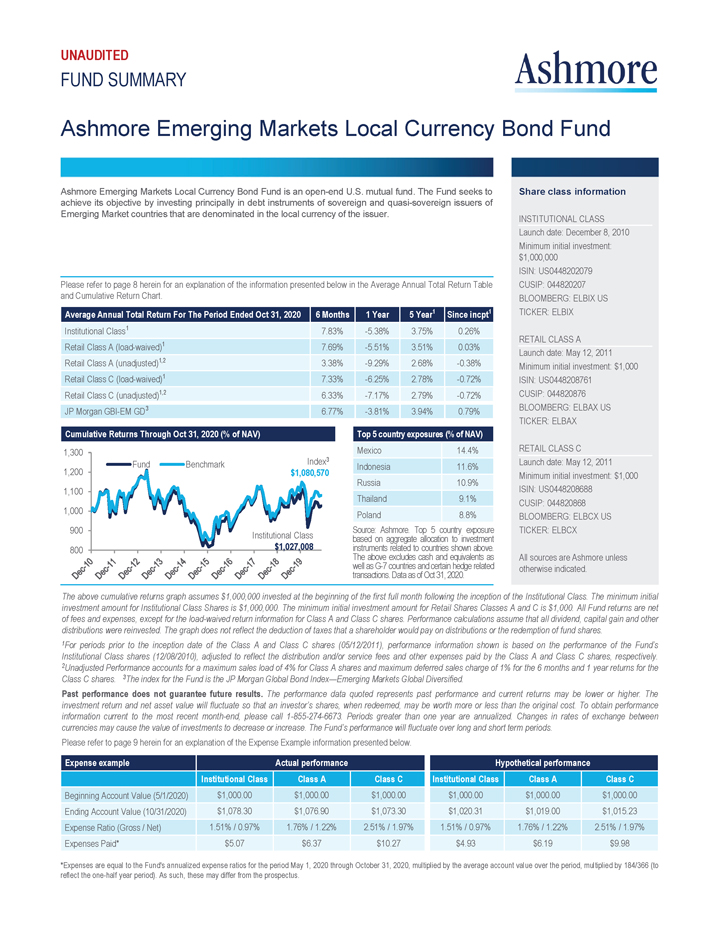
UNAUDITED FUND SUMMARY Ashmore Ashmore Emerging Markets Local Currency Bond Fund Ashmore Emerging Markets Local Currency Bond Fund is an open-end U.S. mutual fund. The Fund seeks to achieve its objective by investing principally in debt instruments of sovereign and quasi-sovereign issuers of Emerging Market countries that are denominated in the local currency of the issuer. Please refer to page 8 herein for an explanation of the information presented below in the Average Annual Total Return Table and Cumulative Return Chart. Average Annual Total Return For The Period Ended Oct 31, 2020 6 Months 1 Year 5 Year1 Since incpt1 Institutional Class1 7.83% -5.38% 3.75% 0.26% Retail Class A (load-waived)1 7.69% -5.51% 3.51% 0.03% Retail Class A (unadjusted)1,2 3.38% -9.29% 2.68% -0.38% Retail Class C (load-waived)1 7.33% -6.25% 2.78% -0.72% Retail Class C (unadjusted)1,2 6.33% -7.17% 2.79% -0.72% JP Morgan GBI-EM GD3 6.77% -3.81% 3.94% 0.79% Cumulative Returns Through Oct 31, 2020 (% of NAV) Top 5 country exposures (% of NAV) 1,300 1,200 1,100 900 800 Dec-10 Dec-11 Dec-12 Dec-13 Dec-14 Dec-15 Dec-16 Dec-17 Dec-18 De-19 Fund Benchmark Index3 $1,080,570 Institutional Class $1,027,008 Mexico 14.4% Indonesia 11.6% Russia 10.9% Thailand 9.1% Poland 8.8% Source: Ashmore. Top 5 country exposure based on aggregate allocation to investment instruments related to countries shown above. The above excludes cash and equivalents as well as G-7 countries and certain hedge related transactions. Data as of Oct 31, 2020. Share class information INSTITUTIONAL CLASS Launch date: December 8, 2010 Minimum initial investment: $1,000,000 ISIN: US0448202079 CUSIP: 044820207 BLOOMBERG: ELBIX US TICKER: ELBIX RETAIL CLASS A Launch date: May 12, 2011 Minimum initial investment: $1,000 ISIN: US0448208761 CUSIP: 044820876 BLOOMBERG: ELBAX US TICKER: ELBAX RETAIL CLASS C Launch date: May 12, 2011 Minimum initial investment: $1,000 ISIN: US0448208688 CUSIP: 044820868 BLOOMBERG: ELBCX US TICKER: ELBCX All sources are Ashmore unless otherwise indicated. The above cumulative returns graph assumes $1,000,000 invested at the beginning of the first full month following the inception of the Institutional Class. The minimum initial investment amount for Institutional Class Shares is $1,000,000. The minimum initial investment amount for Retail Shares Classes A and C is $1,000. All Fund returns are net of fees and expenses, except for the load-waived return information for Class A and Class C shares. Performance calculations assume that all dividend, capital gain and other distributions were reinvested. The graph does not reflect the deduction of taxes that a shareholder would pay on distributions or the redemption of fund shares. 1For periods prior to the inception date of the Class A and Class C shares (05/12/2011), performance information shown is based on the performance of the Fund’s Institutional Class shares (12/08/2010), adjusted to reflect the distribution and/or service fees and other expenses paid by the Class A and Class C shares, respectively. 2Unadjusted Performance accounts for a maximum sales load of 4% for Class A shares and maximum deferred sales charge of 1% for the 6 months and 1 year returns for the Class C shares. 3The index for the Fund is the JP Morgan Global Bond Index—Emerging Markets Global Diversified. Past performance does not guarantee future results. The performance data quoted represents past performance and current returns may be lower or higher. The investment return and net asset value will fluctuate so that an investor’s shares, when redeemed, may be worth more or less than the original cost. To obtain performance information current to the most recent month-end, please call 1-855-274-6673. Periods greater than one year are annualized. Changes in rates of exchange between currencies may cause the value of investments to decrease or increase. The Fund’s performance will fluctuate over long and short term periods. Please refer to page 9 herein for an explanation of the Expense Example information presented below. Expense example Actual performance Hypothetical performance Institutional Class Class A Class C Institutional Class Class A Class C Beginning Account Value (5/1/2020) $1,000.00 $1,000.00 $1,000.00 $1,000.00 $1,000.00 $1,000.00 Ending Account Value (10/31/2020) $1,078.30 $1,076.90 $1,073.30 $1,020.31 $1,019.00 $1,015.23 Expense Ratio (Gross / Net) 1.51% / 0.97% 1.76% / 1.22% 2.51% / 1.97% 1.51% / 0.97% 1.76% / 1.22% 2.51% / 1.97% Expenses Paid* $5.07 $6.37 $10.27 $4.93 $6.19 $9.98 *Expenses are equal to the Fund’s annualized expense ratios for the period May 1, 2020 through October 31, 2020, multiplied by the average account value over the period, multiplied by 184/366 (to reflect the one-half year period). As such, these may differ from the prospectus. 11
11
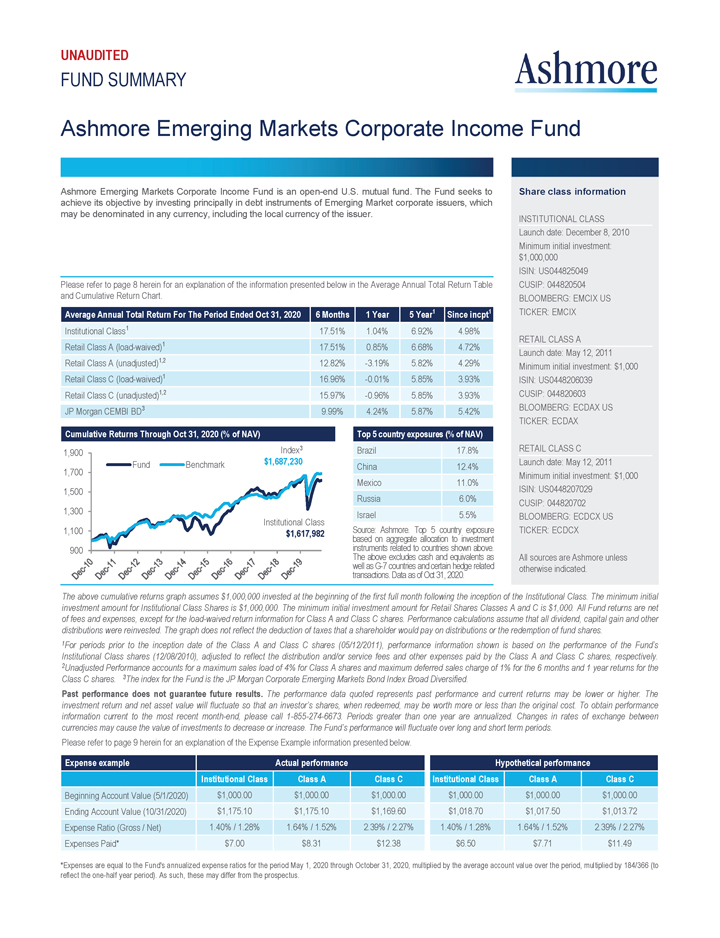
UNAUDITED FUND SUMMARY Ashmore Ashmore Emerging Markets Corporate Income Fund Ashmore Emerging Markets Corporate Income Fund is an open-end U.S. mutual fund. The Fund seeks to achieve its objective by investing principally in debt instruments of Emerging Market corporate issuers, which may be denominated in any currency, including the local currency of the issuer. Please refer to page 8 herein for an explanation of the information presented below in the Average Annual Total Return Table and Cumulative Return Chart. Average Annual Total Return For The Period Ended Oct 31, 2020 6 Months 1 Year 5 Year1 Since incpt1 Institutional Class1 17.51% 1.04% 6.92% 4.98% Retail Class A (load-waived)1 17.51% 0.85% 6.68% 4.72% Retail Class A (unadjusted)1,2 12.82% -3.19% 5.82% 4.29% Retail Class C (load-waived)1 16.96% -0.01% 5.85% 3.93% Retail Class C (unadjusted)1,2 15.97% -0.96% 5.85% 3.93% JP Morgan CEMBI BD3 9.99% 4.24% 5.87% 5.42% Cumulative Returns Through Oct 31, 2020 (% of NAV) Top 5 country exposures (% of NAV) 1,900 1,700 1,500 1,300 1,100 900 Dec-10 Dec-11 Dec-12 Dec-13 Dec-14 Dec-15 Dec-16 Dec-17 Dec-18 Dec-19 Fund Benchmark Index3 $1,687,230 Institutional Class $1,617,982 Brazil 17.8% China 12.4% Mexico 11.0% Russia 6.0% Israel 5.5% Source: Ashmore. Top 5 country exposure based on aggregate allocation to investment instruments related to countries shown above. The above excludes cash and equivalents as well as G-7 countries and certain hedge related transactions Data as of Oct 31, 2020. Share class information INSTITUTIONAL CLASS Launch date: December 8, 2010 Minimum initial investment: $1,000,000 ISIN: US044825049 CUSIP: 044820504 BLOOMBERG: EMCIX US TICKER: EMCIX RETAIL CLASS A Launch date: May 12, 2011 Minimum initial investment: $1,000 ISIN: US0448206039 CUSIP: 044820603 BLOOMBERG: ECDAX US TICKER: ECDAX RETAIL CLASS C Launch date: May 12, 2011 Minimum initial investment: $1,000 ISIN: US0448207029 CUSIP: 044820702 BLOOMBERG: ECDCX US TICKER: ECDCX All sources are Ashmore unless otherwise indicated. The above cumulative returns graph assumes $1,000,000 invested at the beginning of the first full month following the inception of the Institutional Class. The minimum initial investment amount for Institutional Class Shares is $1,000,000. The minimum initial investment amount for Retail Shares Classes A and C is $1,000. All Fund returns are net of fees and expenses, except for the load-waived return information for Class A and Class C shares. Performance calculations assume that all dividend, capital gain and other distributions were reinvested. The graph does not reflect the deduction of taxes that a shareholder would pay on distributions or the redemption of fund shares. 1For periods prior to the inception date of the Class A and Class C shares (05/12/2011), performance information shown is based on the performance of the Fund’s Institutional Class shares (12/08/2010), adjusted to reflect the distribution and/or service fees and other expenses paid by the Class A and Class C shares, respectively. 2Unadjusted Performance accounts for a maximum sales load of 4% for Class A shares and maximum deferred sales charge of 1% for the 6 months and 1 year returns for the Class C shares. 3The index for the Fund is the JP Morgan Corporate Emerging Markets Bond Index Broad Diversified. Past performance does not guarantee future results. The performance data quoted represents past performance and current returns may be lower or higher. The investment return and net asset value will fluctuate so that an investor’s shares, when redeemed, may be worth more or less than the original cost. To obtain performance information current to the most recent month-end, please call 1-855-274-6673. Periods greater than one year are annualized. Changes in rates of exchange between currencies may cause the value of investments to decrease or increase. The Fund’s performance will fluctuate over long and short term periods. Please refer to page 9 herein for an explanation of the Expense Example information presented below. Expense example Actual performance Hypothetical performance Institutional Class Class A Class C Institutional Class Class A Class C Beginning Account Value (5/1/2020) $1,000.00 $1,000.00 $1,000.00 $1,000.00 $1,000.00 $1,000.00 Ending Account Value (10/31/2020) $1,175.10 $1,175.10 $1,169.60 $1,018.70 $1,017.50 $1,013.72 Expense Ratio (Gross / Net) 1.40% / 1.28% 1.64% / 1.52% 2.39% / 2.27% 1.40% / 1.28% 1.64% / 1.52% 2.39% / 2.27% Expenses Paid* $7.00 $8.31 $12.38 $6.50 $7.71 $11.49 *Expenses are equal to the Fund’s annualized expense ratios for the period May 1, 2020 through October 31, 2020, multiplied by the average account value over the period, multiplied by 184/366 (to reflect the one-half year period). As such, these may differ from the prospectus. 12
12
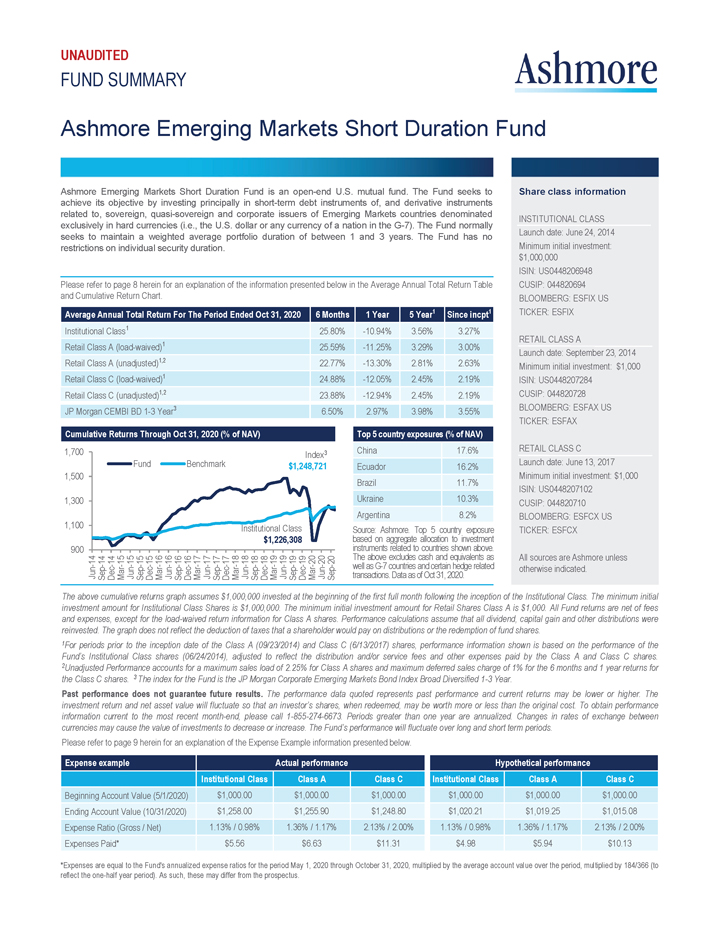
UNAUDITED FUND SUMMARY Ashmore Ashmore Emerging Markets Short Duration Fund Ashmore Emerging Markets Short Duration Fund is an open-end U.S. mutual fund. The Fund seeks to achieve its objective by investing principally in short-term debt instruments of, and derivative instruments related to, sovereign, quasi-sovereign and corporate issuers of Emerging Markets countries denominated exclusively in hard currencies (i.e., the U.S. dollar or any currency of a nation in the G-7). The Fund normally seeks to maintain a weighted average portfolio duration of between 1 and 3 years. The Fund has no restrictions on individual security duration. Please refer to page 8 herein for an explanation of the information presented below in the Average Annual Total Return Table and Cumulative Return Chart. Average Annual Total Return For The Period Ended Oct 31, 2020 6 Months 1 Year 5 Year1 Since incpt1 Institutional Class1 25.80% -10.94% 3.56% 3.27% Retail Class A (load-waived)1 25.59% -11.25% 3.29% 3.00% Retail Class A (unadjusted)1,2 22.77% -13.30% 2.81% 2.63% Retail Class C (load-waived)1 24.88% -12.05% 2.45% 2.19% Retail Class C (unadjusted)1,2 23.88% -12.94% 2.45% 2.19% JP Morgan CEMBI BD 1-3 Year3 6.50% 2.97% 3.98% 3.55% Cumulative Returns Through Oct 31, 2020 (% of NAV) Top 5 country exposures (% of NAV) 1,700 1,500 1,300 1,100 900 June-14 Sep-14 Dec-14 Mar-15 Jun-15 Sep-15 Dec-15 Mar-16 Jun-16 Sep-16 Dec-16 Mar-17 Jun-17 Sep-17 Dec-17 Mar-18 Jun-18 Sep-18 Dec-18 Mar-19 Jun-19 Sep-19 Dec-19 Mar-20 Jun-20 Sep-20 Fund Benchmark Index3 $1,248,721 Institutional Class $1,226,308 China 17.6% Ecuador 16.2% Brazil 11.7% Ukraine 10.3% Argentina 8.2% Source: Ashmore. Top 5 country exposure based on aggregate allocation to investment instruments related to countries shown above. The above excludes cash and equivalents as well as G-7 countries and certain hedge related transactions. Data as of Oct 31, 2020. Share class information INSTITUTIONAL CLASS Launch date: June 24, 2014 Minimum initial investment: $1,000,000 ISIN: US0448206948 CUSIP: 044820694 BLOOMBERG: ESFIX US TICKER: ESFIX RETAIL CLASS A Launch date: September 23, 2014 Minimum initial investment: $1,000 ISIN: US0448207284 CUSIP: 044820728 BLOOMBERG: ESFAX US TICKER: ESFAX RETAIL CLASS C Launch date: June 13, 2017 Minimum initial investment: $1,000 ISIN: US0448207102 CUSIP: 044820710 BLOOMBERG: ESFCX US TICKER: ESFCX All sources are Ashmore unless otherwise indicated. The above cumulative returns graph assumes $1,000,000 invested at the beginning of the first full month following the inception of the Institutional Class. The minimum initial investment amount for Institutional Class Shares is $1,000,000. The minimum initial investment amount for Retail Shares Class A is $1,000. All Fund returns are net of fees and expenses, except for the load-waived return information for Class A shares. Performance calculations assume that all dividend, capital gain and other distributions were reinvested. The graph does not reflect the deduction of taxes that a shareholder would pay on distributions or the redemption of fund shares. 1 For periods prior to the inception date of the Class A (09/23/2014) and Class C (6/13/2017) shares, performance information shown is based on the performance of the Fund’s Institutional Class shares (06/24/2014), adjusted to reflect the distribution and/or service fees and other expenses paid by the Class A and Class C shares. 2 Unadjusted Performance accounts for a maximum sales load of 2.25% for Class A shares and maximum deferred sales charge of 1% for the 6 months and 1 year returns for the Class C shares. 3 The index for the Fund is the JP Morgan Corporate Emerging Markets Bond Index Broad Diversified 1-3 Year. Past performance does not guarantee future results. The performance data quoted represents past performance and current returns may be lower or higher. The investment return and net asset value will fluctuate so that an investor’s shares, when redeemed, may be worth more or less than the original cost. To obtain performance information current to the most recent month-end, please call 1-855-274-6673. Periods greater than one year are annualized. Changes in rates of exchange between currencies may cause the value of investments to decrease or increase. The Fund’s performance will fluctuate over long and short term periods. Please refer to page 9 herein for an explanation of the Expense Example information presented below. Expense example Actual performance Hypothetical performance Institutional Class Class A Class C Institutional Class Class A Class C Beginning Account Value (5/1/2020) $1,000.00 $1,000.00 $1,000.00 $1,000.00 $1,000.00 $1,000.00 Ending Account Value (10/31/2020) $1,258.00 $1,255.90 $1,248.80 $1,020.21 $1,019.25 $1,015.08 Expense Ratio (Gross / Net) 1.13% / 0.98% 1.36% / 1.17% 2.13% / 2.00% 1.13% / 0.98% 1.36% / 1.17% 2.13% / 2.00% Expenses Paid* $5.56 $6.63 $11.31 $4.98 $5.94 $10.13 *Expenses are equal to the Fund’s annualized expense ratios for the period May 1, 2020 through October 31, 2020, multiplied by the average account value over the period, multiplied by 184/366 (to reflect the one-half year period). As such, these may differ from the prospectus. 13
13
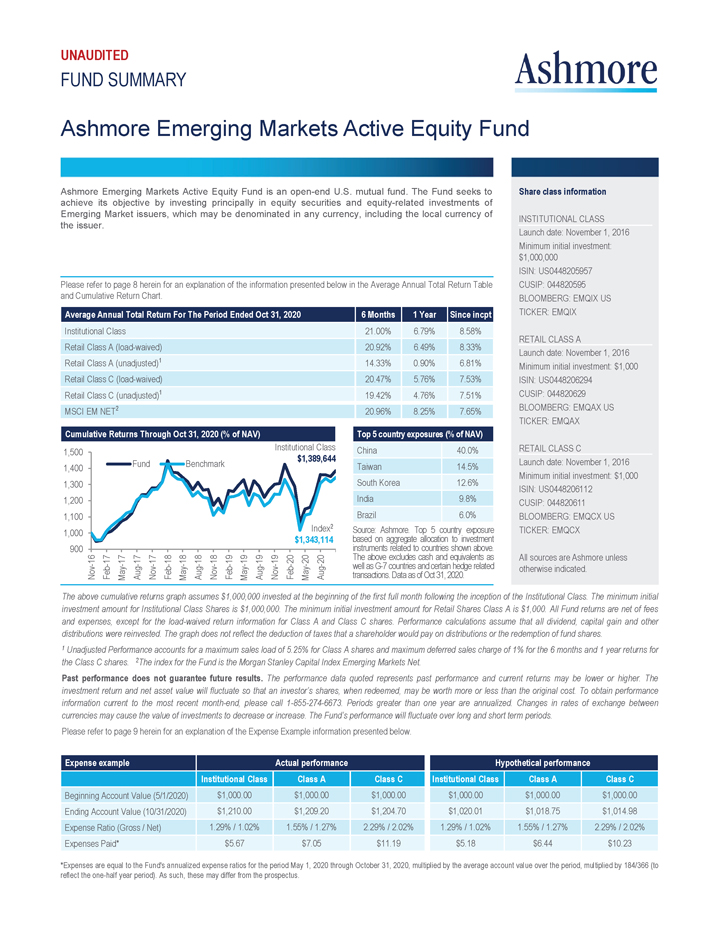
UNAUDITED FUND SUMMARY Ashmore Ashmore Emerging Markets Active Equity Fund Ashmore Emerging Markets Active Equity Fund is an open-end U.S. mutual fund. The Fund seeks to achieve its objective by investing principally in equity securities and equity-related investments of Emerging Market issuers, which may be denominated in any currency, including the local currency of the issuer. Please refer to page 8 herein for an explanation of the information presented below in the Average Annual Total Return Table and Cumulative Return Chart. Average Annual Total Return For The Period Ended Oct 31, 2020 6 Months 1 Year Since incpt Institutional Class 21.00% 6.79% 8.58% Retail Class A (load-waived) 20.92% 6.49% 8.33% Retail Class A (unadjusted)1 14.33% 0.90% 6.81% Retail Class C (load-waived) 20.47% 5.76% 7.53% Retail Class C (unadjusted)1 19.42% 4.76% 7.51% MSCI EM NET2 20.96% 8.25% 7.65% Cumulative Returns Through Oct 31, 2020 (% of NAV) Top 5 country exposures (% of NAV) 1,500 1,400 1,300 1,200 1,100 1,000 900 Nov-16 Frb-17 May-17 Aug-17 Nov-17 Feb-18 May-18 Aug-18 Nov-18 Feb-19 May-19 Aug-19 Nov-19 Frb-20 May-20 Aug-20 Fund Benchmark Institutional Class $1,389,644 Index2 $1,343,114 China 40.0% Taiwan 14.5% South Korea 12.6% India 9.8% Brazil 6.0% Source: Ashmore. Top 5 country exposure based on aggregate allocation to investment instruments related to countries shown above. The above excludes cash and equivalents as well as G-7 countries and certain hedge related transactions. Data as of Oct 31, 2020. Share class information INSTITUTIONAL CLASS Launch date: November 1, 2016 Minimum initial investment: $1,000,000 ISIN: US0448205957 CUSIP: 044820595 BLOOMBERG: EMQIX US TICKER: EMQIX RETAIL CLASS A Launch date: November 1, 2016 Minimum initial investment: $1,000 ISIN: US0448206294 CUSIP: 044820629 BLOOMBERG: EMQAX US TICKER: EMQAX RETAIL CLASS C Launch date: November 1, 2016 Minimum initial investment: $1,000 ISIN: US0448206112 CUSIP: 044820611 BLOOMBERG: EMQCX US TICKER: EMQCX All sources are Ashmore unless otherwise indicated. The above cumulative returns graph assumes $1,000,000 invested at the beginning of the first full month following the inception of the Institutional Class. The minimum initial investment amount for Institutional Class Shares is $1,000,000. The minimum initial investment amount for Retail Shares Class A is $1,000. All Fund returns are net of fees and expenses, except for the load-waived return information for Class A and Class C shares. Performance calculations assume that all dividend, capital gain and other distributions were reinvested. The graph does not reflect the deduction of taxes that a shareholder would pay on distributions or the redemption of fund shares. 1 Unadjusted Performance accounts for a maximum sales load of 5.25% for Class A shares and maximum deferred sales charge of 1% for the 6 months and 1 year returns for the Class C shares. 2The index for the Fund is the Morgan Stanley Capital Index Emerging Markets Net. Past performance does not guarantee future results. The performance data quoted represents past performance and current returns may be lower or higher. The investment return and net asset value will fluctuate so that an investor’s shares, when redeemed, may be worth more or less than the original cost. To obtain performance information current to the most recent month-end, please call 1-855-274-6673. Periods greater than one year are annualized. Changes in rates of exchange between currencies may cause the value of investments to decrease or increase. The Fund’s performance will fluctuate over long and short term periods. Please refer to page 9 herein for an explanation of the Expense Example information presented below. Expense example Actual performance Hypothetical performance Institutional Class Class A Class C Institutional Class Class A Class C Beginning Account Value (5/1/2020) $1,000.00 $1,000.00 $1,000.00 $1,000.00 $1,000.00 $1,000.00 Ending Account Value (10/31/2020) $1,210.00 $1,209.20 $1,204.70 $1,020.01 $1,018.75 $1,014.98 Expense Ratio (Gross / Net) 1.29% / 1.02% 1.55% / 1.27% 2.29% / 2.02% 1.29% / 1.02% 1.55% / 1.27% 2.29% / 2.02% Expenses Paid* $5.67 $7.05 $11.19 $5.18 $6.44 $10.23 *Expenses are equal to the Fund’s annualized expense ratios for the period May 1, 2020 through October 31, 2020, multiplied by the average account value over the period, multiplied by 184/366 (to reflect the one-half year period). As such, these may differ from the prospectus. 14
14
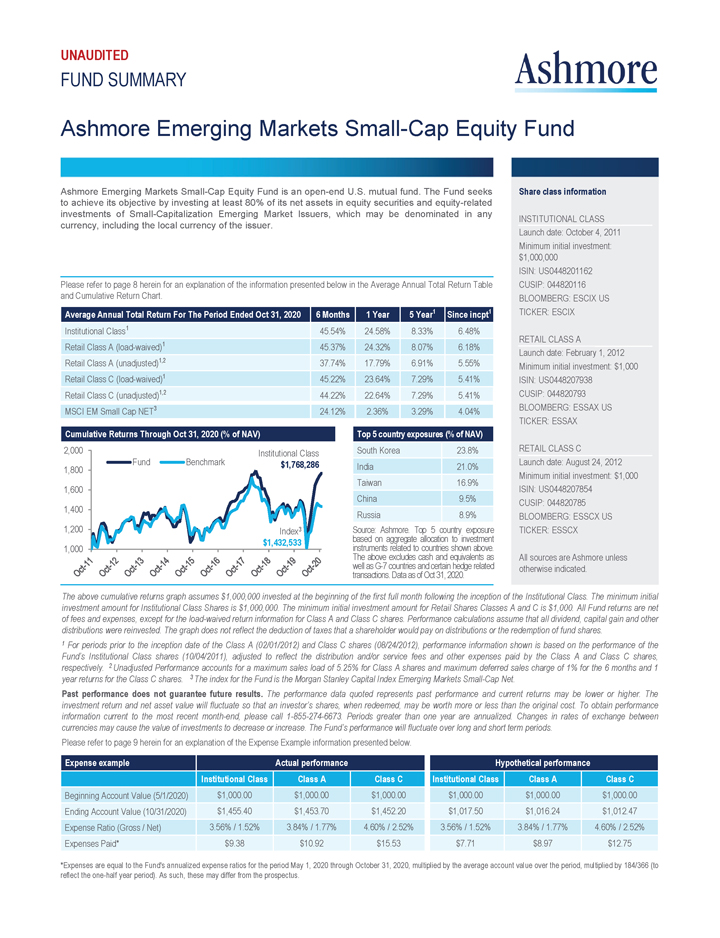
UNAUDITED FUND SUMMARY Ashmore Ashmore Emerging Markets Small-Cap Equity Fund Ashmore Emerging Markets Small-Cap Equity Fund is an open-end U.S. mutual fund. The Fund seeks to achieve its objective by investing at least 80% of its net assets in equity securities and equity-related investments of Small-Capitalization Emerging Market Issuers, which may be denominated in any currency, including the local currency of the issuer. Please refer to page 8 herein for an explanation of the information presented below in the Average Annual Total Return Table and Cumulative Return Chart. Average Annual Total Return For The Period Ended Oct 31, 2020 6 Months 1 Year 5 Year1 Since incpt1 Institutional Class1 45.54% 24.58% 8.33% 6.48% Retail Class A (load-waived)1 45.37% 24.32% 8.07% 6.18% Retail Class A (unadjusted)1,2 37.74% 17.79% 6.91% 5.55% Retail Class C (load-waived)1 45.22% 23.64% 7.29% 5.41% Retail Class C (unadjusted)1,2 44.22% 22.64% 7.29% 5.41% MSCI EM Small Cap NET3 24.12% 2.36% 3.29% 4.04% Cumulative Returns Through Oct 31, 2020 (% of NAV) Top 5 country exposures (% of NAV) 2,000 1,800 1,600 1,400 1,200 1,000 Oct-11 Oct-12 Oct-13 Oct-14 Oct-15 Oct-16 Oct-17 Oct-18 Oct-19 Oct-20 Fund Benchmark Institutional Class $1,768,286 Index3 $1,432,533 South Korea 23.8% India 21.0% Taiwan 16.9% China 9.5% Russia 8.9% Source: Ashmore. Top 5 country exposure based on aggregate allocation to investment instruments related to countries shown above. The above excludes cash and equivalents as well as G-7 countries and certain hedge related transactions. Data as of Oct 31, 2020. Share class information INSTITUTIONAL CLASS Launch date: October 4, 2011 Minimum initial investment: $1,000,000 ISIN: US0448201162 CUSIP: 044820116 BLOOMBERG: ESCIX US TICKER: ESCIX RETAIL CLASS A Launch date: February 1, 2012 Minimum initial investment: $1,000 ISIN: US0448207938 CUSIP: 044820793 BLOOMBERG: ESSAX US TICKER: ESSAX RETAIL CLASS C Launch date: August 24, 2012 Minimum initial investment: $1,000 ISIN: US0448207854 CUSIP: 044820785 BLOOMBERG: ESSCX US TICKER: ESSCX All sources are Ashmore unless otherwise indicated. The above cumulative returns graph assumes $1,000,000 invested at the beginning of the first full month following the inception of the Institutional Class. The minimum initial investment amount for Institutional Class Shares is $1,000,000. The minimum initial investment amount for Retail Shares Classes A and C is $1,000. All Fund returns are net of fees and expenses, except for the load-waived return information for Class A and Class C shares. Performance calculations assume that all dividend, capital gain and other distributions were reinvested. The graph does not reflect the deduction of taxes that a shareholder would pay on distributions or the redemption of fund shares. 1 For periods prior to the inception date of the Class A (02/01/2012) and Class C shares (08/24/2012), performance information shown is based on the performance of the Fund’s Institutional Class shares (10/04/2011), adjusted to reflect the distribution and/or service fees and other expenses paid by the Class A and Class C shares, respectively. 2 Unadjusted Performance accounts for a maximum sales load of 5.25% for Class A shares and maximum deferred sales charge of 1% for the 6 months and 1 year returns for the Class C shares. 3 The index for the Fund is the Morgan Stanley Capital Index Emerging Markets Small-Cap Net. Past performance does not guarantee future results. The performance data quoted represents past performance and current returns may be lower or higher. The investment return and net asset value will fluctuate so that an investor’s shares, when redeemed, may be worth more or less than the original cost. To obtain performance information current to the most recent month-end, please call 1-855-274-6673. Periods greater than one year are annualized. Changes in rates of exchange between currencies may cause the value of investments to decrease or increase. The Fund’s performance will fluctuate over long and short term periods. Please refer to page 9 herein for an explanation of the Expense Example information presented below. Expense example Actual performance Hypothetical performance Institutional Class Class A Class C Institutional Class Class A Class C Beginning Account Value (5/1/2020) $1,000.00 $1,000.00 $1,000.00 $1,000.00 $1,000.00 $1,000.00 Ending Account Value (10/31/2020) $1,455.40 $1,453.70 $1,452.20 $1,017.50 $1,016.24 $1,012.47 Expense Ratio (Gross / Net) 3.56% / 1.52% 3.84% / 1.77% 4.60% / 2.52% 3.56% / 1.52% 3.84% / 1.77% 4.60% / 2.52% Expenses Paid* $9.38 $10.92 $15.53 $7.71 $8.97 $12.75 *Expenses are equal to the Fund’s annualized expense ratios for the period May 1, 2020 through October 31, 2020, multiplied by the average account value over the period, multiplied by 184/366 (to reflect the one-half year period). As such, these may differ from the prospectus. 15
15
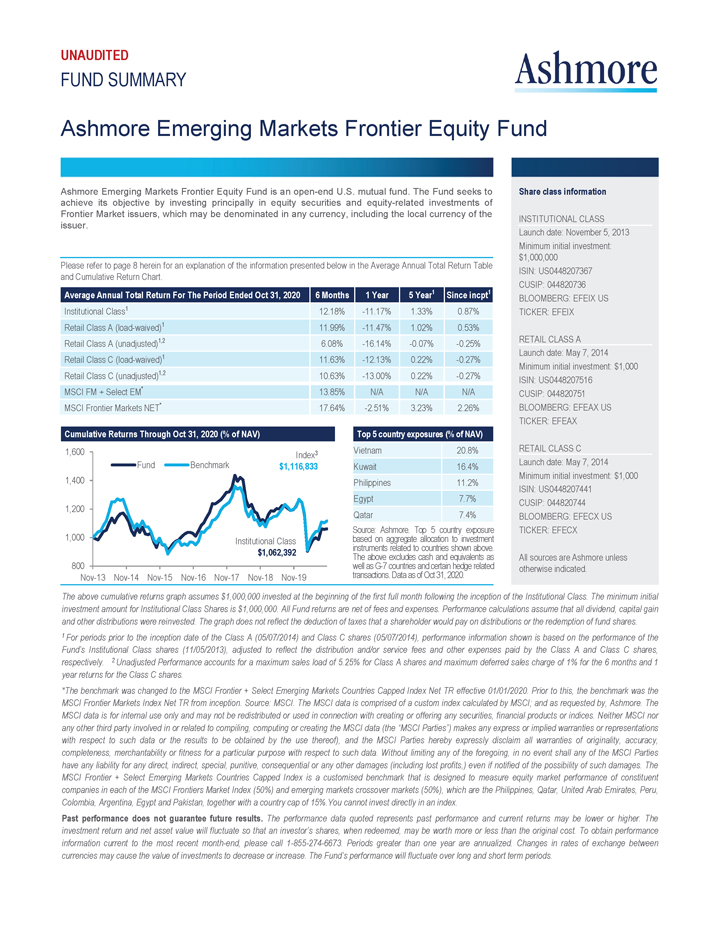
UNAUDITED FUND SUMMARY Ashmore Ashmore Emerging Markets Frontier Equity Fund Ashmore Emerging Markets Frontier Equity Fund is an open-end U.S. mutual fund. The Fund seeks to achieve its objective by investing principally in equity securities and equity-related investments of Frontier Market issuers, which may be denominated in any currency, including the local currency of the issuer. Please refer to page 8 herein for an explanation of the information presented below in the Average Annual Total Return Table and Cumulative Return Chart. Average Annual Total Return For The Period Ended Oct 31, 2020 6 Months 1 Year 5 Year1 Since incpt1 Institutional Class1 12.18% -11.17% 1.33% 0.87% Retail Class A (load-waived)1 11.99% -11.47% 1.02% 0.53% Retail Class A (unadjusted)1,2 6.08% -16.14% -0.07% -0.25% Retail Class C (load-waived)1 11.63% -12.13% 0.22% -0.27% Retail Class C (unadjusted)1,2 10.63% -13.00% 0.22% -0.27% MSCI FM + Select EM* 13.85% N/A N/A N/A MSCI Frontier Markets NET* 17.64% -2.51% 3.23% 2.26% Cumulative Returns Through Oct 31, 2020 (% of NAV) Top 5 country exposures (% of NAV) 1,600 1,400 1,200 1,000 800 Nov-13 Nov-14 Nov-15 Nov-16 Nov-17 Nov-18 Nov-19 Fund Benchmark Index3 $1,116,833 Institutional Class $1,062,392 Vietnam 20.8% Kuwait 16.4% Philippines 11.2% Egypt 7.7% Qatar 7.4% Source: Ashmore. Top 5 country exposure based on aggregate allocation to investment instruments related to countries shown above. The above excludes cash and equivalents as well as G-7 countries and certain hedge related transactions. Data as of Oct 31, 2020. Share class information INSTITUTIONAL CLASS Launch date: November 5, 2013 Minimum initial investment: $1,000,000 ISIN: US0448207367 CUSIP: 044820736 BLOOMBERG: EFEIX US TICKER: EFEIX RETAIL CLASS A Launch date: May 7, 2014 Minimum initial investment: $1,000 ISIN: US0448207516 CUSIP: 044820751 BLOOMBERG: EFEAX US TICKER: EFEAX RETAIL CLASS C Launch date: May 7, 2014 Minimum initial investment: $1,000 ISIN: US0448207441 CUSIP: 044820744 BLOOMBERG: EFECX US TICKER: EFECX All sources are Ashmore unless otherwise indicated. The above cumulative returns graph assumes $1,000,000 invested at the beginning of the first full month following the inception of the Institutional Class. The minimum initial investment amount for Institutional Class Shares is $1,000,000. All Fund returns are net of fees and expenses. Performance calculations assume that all dividend, capital gain and other distributions were reinvested. The graph does not reflect the deduction of taxes that a shareholder would pay on distributions or the redemption of fund shares. 1 For periods prior to the inception date of the Class A (05/07/2014) and Class C shares (05/07/2014), performance information shown is based on the performance of the Fund’s Institutional Class shares (11/05/2013), adjusted to reflect the distribution and/or service fees and other expenses paid by the Class A and Class C shares, respectively. 2 Unadjusted Performance accounts for a maximum sales load of 5.25% for Class A shares and maximum deferred sales charge of 1% for the 6 months and 1 year returns for the Class C shares. *The benchmark was changed to the MSCI Frontier + Select Emerging Markets Countries Capped Index Net TR effective 01/01/2020. Prior to this, the benchmark was the MSCI Frontier Markets Index Net TR from inception. Source: MSCI. The MSCI data is comprised of a custom index calculated by MSCI; and as requested by, Ashmore. The MSCI data is for internal use only and may not be redistributed or used in connection with creating or offering any securities, financial products or indices. Neither MSCI nor any other third party involved in or related to compiling, computing or creating the MSCI data (the “MSCI Parties”) makes any express or implied warranties or representations with respect to such data or the results to be obtained by the use thereof), and the MSCI Parties hereby expressly disclaim all warranties of originality, accuracy, completeness, merchantability or fitness for a particular purpose with respect to such data. Without limiting any of the foregoing, in no event shall any of the MSCI Parties have any liability for any direct, indirect, special, punitive, consequential or any other damages (including lost profits,) even if notified of the possibility of such damages. The MSCI Frontier + Select Emerging Markets Countries Capped Index is a customised benchmark that is designed to measure equity market performance of constituent companies in each of the MSCI Frontiers Market Index (50%) and emerging markets crossover markets (50%), which are the Philippines, Qatar, United Arab Emirates, Peru, Colombia, Argentina, Egypt and Pakistan, together with a country cap of 15%.You cannot invest directly in an index. Past performance does not guarantee future results. The performance data quoted represents past performance and current returns may be lower or higher. The investment return and net asset value will fluctuate so that an investor’s shares, when redeemed, may be worth more or less than the original cost. To obtain performance information current to the most recent month-end, please call 1-855-274-6673. Periods greater than one year are annualized. Changes in rates of exchange between currencies may cause the value of investments to decrease or increase. The Fund’s performance will fluctuate over long and short term periods. 16
16
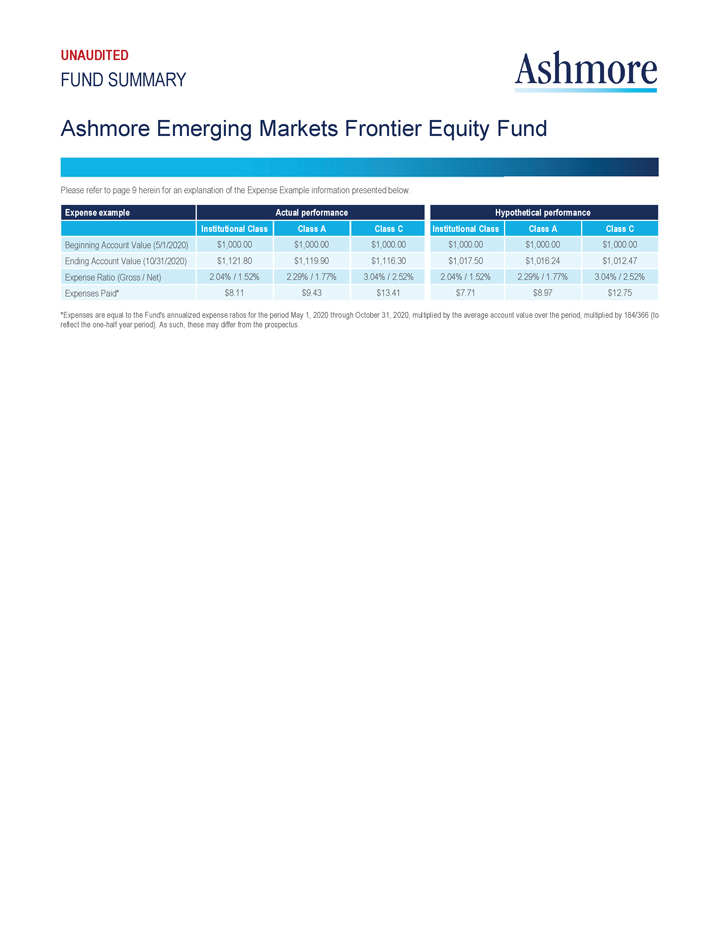
UNAUDITED FUND SUMMARY Ashmore Ashmore Emerging Markets Frontier Equity Fund Please refer to page 9 herein for an explanation of the Expense Example information presented below. Expense example Actual performance Hypothetical performance Institutional Class Class A Class C Institutional Class Class A Class C Beginning Account Value (5/1/2020) $1,000.00 $1,000.00 $1,000.00 $1,000.00 $1,000.00 $1,000.00 Ending Account Value (10/31/2020) $1,121.80 $1,119.90 $1,116.30 $1,017.50 $1,016.24 $1,012.47 Expense Ratio (Gross / Net) 2.04% / 1.52% 2.29% / 1.77% 3.04% / 2.52% 2.04% / 1.52% 2.29% / 1.77% 3.04% / 2.52% Expenses Paid* $8.11 $9.43 $13.41 $7.71 $8.97 $12.75 *Expenses are equal to the Fund’s annualized expense ratios for the period May 1, 2020 through October 31, 2020, multiplied by the average account value over the period, multiplied by 184/366 (to reflect the one-half year period). As such, these may differ from the prospectus. 17
17
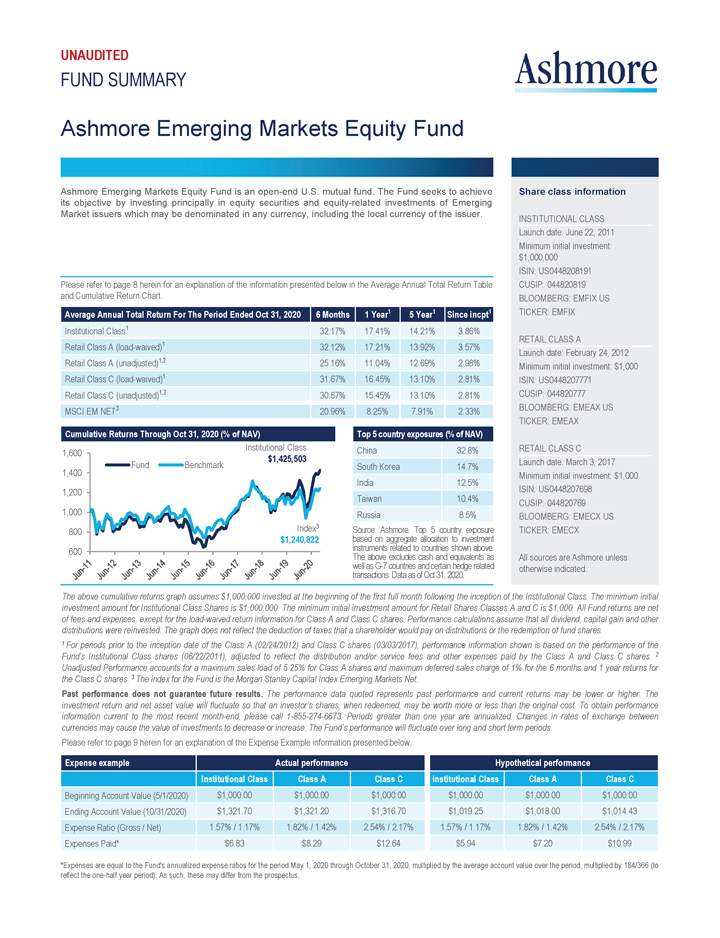
UNAUDITED FUND SUMMARY Ashmore Ashmore Emerging Markets Equity Fund Ashmore Emerging Markets Equity Fund is an open-end U.S. mutual fund. The Fund seeks to achieve its objective by investing principally in equity securities and equity-related investments of Emerging Market issuers which may be denominated in any currency, including the local currency of the issuer. Please refer to page 8 herein for an explanation of the information presented below in the Average Annual Total Return Table and Cumulative Return Chart. Average Annual Total Return For The Period Ended Oct 31, 2020 6 Months 1 Year1 5 Year1 Since incpt1 Institutional Class1 32.17% 17.41% 14.21% 3.86% Retail Class A (load-waived)1 32.12% 17.21% 13.92% 3.57% Retail Class A (unadjusted)1,2 25.16% 11.04% 12.69% 2.98% Retail Class C (load-waived)1 31.67% 16.45% 13.10% 2.81% Retail Class C (unadjusted)1,2 30.67% 15.45% 13.10% 2.81% MSCI EM NET3 20.96% 8.25% 7.91% 2.33% Cumulative Returns Through Oct 31, 2020 (% of NAV) Top 5 country exposures (% of NAV) 1,600 1,400 1,200 1,000 800 600 Jun-11 Jun-12 Jun-13 Jun-14 Jun-15 Jun-16 Jun-17 Jun-18 Jun-19 Jun-20 Fund Benchmark Institutional Class $1,425,503 Index3 $1,240,822 China 32.8% South Korea 14.7% India 12.5% Taiwan 10.4% Russia 8.5% Source: Ashmore. Top 5 country exposure based on aggregate allocation to investment instruments related to countries shown above. The above excludes cash and equivalents as well as G-7 countries and certain hedge related transactions. Data as of Oct 31, 2020. Share class information INSTITUTIONAL CLASS Launch date: June 22, 2011 Minimum initial investment: $1,000,000 ISIN: US0448208191 CUSIP: 044820819 BLOOMBERG: EMFIX US TICKER: EMFIX RETAIL CLASS A Launch date: February 24, 2012 Minimum initial investment: $1,000 ISIN: US0448207771 CUSIP: 044820777 BLOOMBERG: EMEAX US TICKER: EMEAX RETAIL CLASS C Launch date: March 3, 2017 Minimum initial investment: $1,000 ISIN: US0448207698 CUSIP: 044820769 BLOOMBERG: EMECX US TICKER: EMECX All sources are Ashmore unless otherwise indicated. The above cumulative returns graph assumes $1,000,000 invested at the beginning of the first full month following the inception of the Institutional Class. The minimum initial investment amount for Institutional Class Shares is $1,000,000. The minimum initial investment amount for Retail Shares Classes A and C is $1,000. All Fund returns are net of fees and expenses, except for the load-waived return information for Class A and Class C shares. Performance calculations assume that all dividend, capital gain and other distributions were reinvested. The graph does not reflect the deduction of taxes that a shareholder would pay on distributions or the redemption of fund shares. 1 For periods prior to the inception date of the Class A (02/24/2012) and Class C shares (03/03/2017), performance information shown is based on the performance of the Fund’s Institutional Class shares (06/22/2011), adjusted to reflect the distribution and/or service fees and other expenses paid by the Class A and Class C shares. 2 Unadjusted Performance accounts for a maximum sales load of 5.25% for Class A shares and maximum deferred sales charge of 1% for the 6 months and 1 year returns for the Class C shares. 3 The index for the Fund is the Morgan Stanley Capital Index Emerging Markets Net. Past performance does not guarantee future results. The performance data quoted represents past performance and current returns may be lower or higher. The investment return and net asset value will fluctuate so that an investor’s shares, when redeemed, may be worth more or less than the original cost. To obtain performance information current to the most recent month-end, please call 1-855-274-6673. Periods greater than one year are annualized. Changes in rates of exchange between currencies may cause the value of investments to decrease or increase. The Fund’s performance will fluctuate over long and short term periods. Please refer to page 9 herein for an explanation of the Expense Example information presented below. Expense example Actual performance Hypothetical performance Institutional Class Class A Class C Institutional Class Class A Class C Beginning Account Value (5/1/2020) $1,000.00 $1,000.00 $1,000.00 $1,000.00 $1,000.00 $1,000.00 Ending Account Value (10/31/2020) $1,321.70 $1,321.20 $1,316.70 $1,019.25 $1,018.00 $1,014.43 Expenses Ratio (Gross / Net) 1.57% / 1.17% 1.82% / 1.42% 2.54% / 2.17% 1.57% / 1.17% 1.82% / 1.42% 2.54% / 2.17% Expenses Paid* $6.83 $8.29 $12.64 $5.94 $7.20 $10.99 *Expenses are equal to the Fund’s annualized expense ratios for the period May 1, 2020 through October 31, 2020, multiplied by the average account value over the period, multiplied by 184/366 (to reflect the one-half year period). As such, these may differ from the prospectus. 18
18
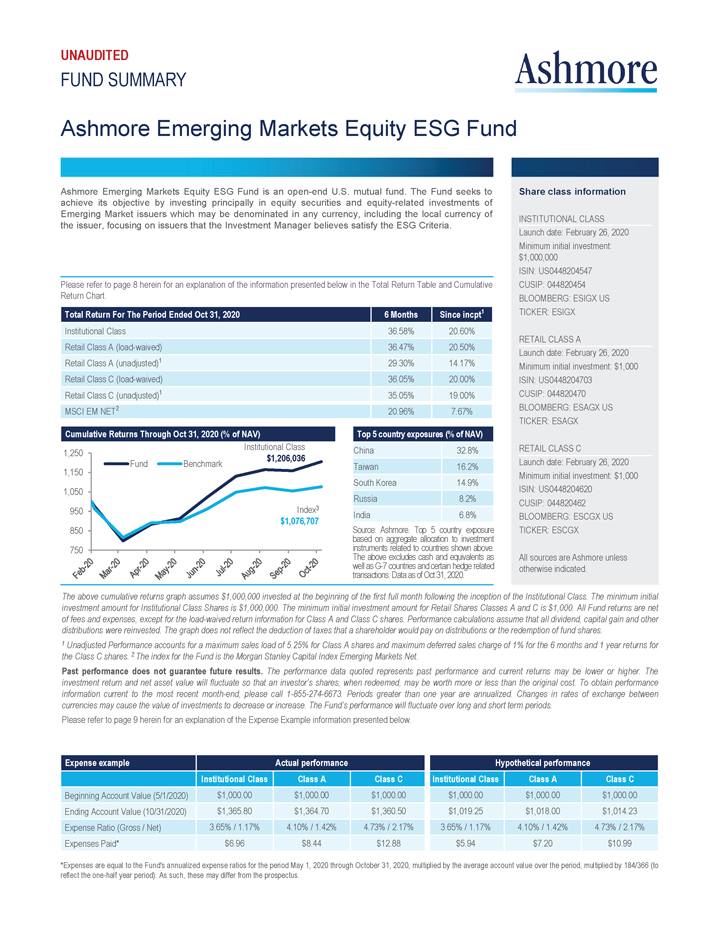
UNAUDITED FUND SUMMARY Ashmore Ashmore Emerging Markets Equity ESG Fund Ashmore Emerging Markets Equity ESG Fund is an open-end U.S. mutual fund. The Fund seeks to achieve its objective by investing principally in equity securities and equity-related investments of Emerging Market issuers which may be denominated in any currency, including the local currency of the issuer, focusing on issuers that the Investment Manager believes satisfy the ESG Criteria. Please refer to page 8 herein for an explanation of the information presented below in the Total Return Table and Cumulative Return Chart. Total Return For The Period Ended Oct 31, 2020 6 Months Since incpt1 Institutional Class 36.58% 20.60% Retail Class A (load-waived) 36.47% 20.50% Retail Class A (unadjusted)1 29.30% 14.17% Retail Class C (load-waived) 36.05% 20.00% Retail Class C (unadjusted)1 35.05% 19.00% MSCI EM NET2 20.96% 7.67% Cumulative Returns Through Oct 31, 2020 (% of NAV) Top 5 country exposures (% of NAV) 1,250 1,150 1,050 950 850 750 Feb-20 Mar-20 Apr-20 May-20 Jun-20 Jul-20 Aug-20 Sep-20 Oct-20 Fund Benchmark Institutional Class $1,206,036 Index $1,076,707 China 32.8% Taiwan 16.2% South Korea 14.9% Russia 8.2% India 6.8% Source: Ashmore. Top 5 country exposure based on aggregate allocation to investment instruments related to countries shown above. The above excludes cash and equivalents as well as G-7 countries and certain hedge related transactions. Data as of Oct 31, 2020. Share class information INSTITUTIONAL CLASS Launch date: February 26, 2020 Minimum initial investment: $1,000,000 ISIN: US0448204547 CUSIP: 044820454 BLOOMBERG: ESIGX US TICKER: ESIGX RETAIL CLASS A Launch date: February 26, 2020 Minimum initial investment: $1,000 ISIN: US0448204703 CUSIP: 044820470 BLOOMBERG: ESAGX US TICKER: ESAGX RETAIL CLASS C Launch date: February 26, 2020 Minimum initial investment: $1,000 ISIN: US0448204620 CUSIP: 044820462 BLOOMBERG: ESCGX US TICKER: ESCGX All sources are Ashmore unless otherwise indicated. The above cumulative returns graph assumes $1,000,000 invested at the beginning of the first full month following the inception of the Institutional Class. The minimum initial investment amount for Institutional Class Shares is $1,000,000. The minimum initial investment amount for Retail Shares Classes A and C is $1,000. All Fund returns are net of fees and expenses, except for the load-waived return information for Class A and Class C shares. Performance calculations assume that all dividend, capital gain and other distributions were reinvested. The graph does not reflect the deduction of taxes that a shareholder would pay on distributions or the redemption of fund shares. 1 Unadjusted Performance accounts for a maximum sales load of 5.25% for Class A shares and maximum deferred sales charge of 1% for the 6 months and 1 year returns for the Class C shares. 2 The index for the Fund is the Morgan Stanley Capital Index Emerging Markets Net. Past performance does not guarantee future results. The performance data quoted represents past performance and current returns may be lower or higher. The investment return and net asset value will fluctuate so that an investor’s shares, when redeemed, may be worth more or less than the original cost. To obtain performance information current to the most recent month-end, please call 1-855-274-6673. Periods greater than one year are annualized. Changes in rates of exchange between currencies may cause the value of investments to decrease or increase. The Fund’s performance will fluctuate over long and short term periods. Please refer to page 9 herein for an explanation of the Expense Example information presented below. Expense example Actual performance Hypothetical performance Institutional Class Class A Class C Institutional Class Class A Class C Beginning Account Value (5/1/2020) $1,000.00 $1,000.00 $1,000.00 $1,000.00 $1,000.00 $1,000.00 Ending Account Value (10/31/2020) $1,365.80 $1,364.70 $1,360.50 $1,019.25 $1,018.00 $1,014.23 Expense Ratio (Gross / Net) 3.65% / 1.17% 4.10% / 1.42% 4.73% / 2.17% 3.65% / 1.17% 4.10% / 1.42% 4.73% / 2.17% Expenses Paid* $6.96 $8.44 $12.88 $5.94 $7.20 $10.99 *Expenses are equal to the Fund’s annualized expense ratios for the period May 1, 2020 through October 31, 2020, multiplied by the average account value over the period, multiplied by 184/366 (to reflect the one-half year period). As such, these may differ from the prospectus. 19
19
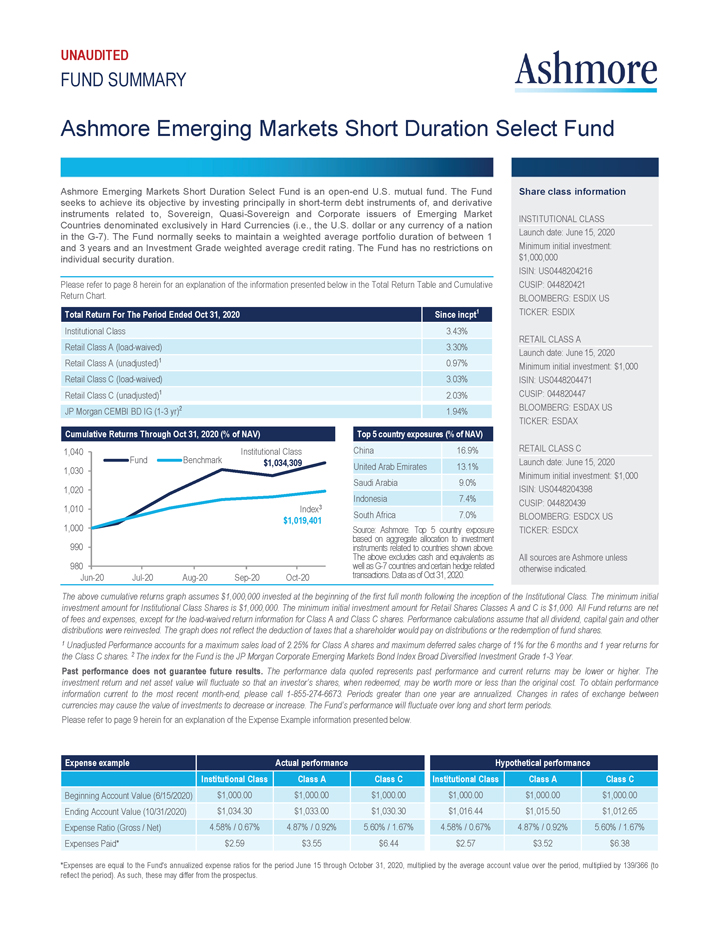
UNAUDITED FUND SUMMARY Ashmore Ashmore Emerging Markets Short Duration Select Fund Ashmore Emerging Markets Short Duration Select Fund is an open-end U.S. mutual fund. The Fund seeks to achieve its objective by investing principally in short-term debt instruments of, and derivative instruments related to, Sovereign, Quasi-Sovereign and Corporate issuers of Emerging Market Countries denominated exclusively in Hard Currencies (i.e., the U.S. dollar or any currency of a nation in the G-7). The Fund normally seeks to maintain a weighted average portfolio duration of between 1 and 3 years and an Investment Grade weighted average credit rating. The Fund has no restrictions on individual security duration. Please refer to page 8 herein for an explanation of the information presented below in the Total Return Table and Cumulative Return Chart. Total Return For The Period Ended Oct 31, 2020 Since incpt1 Institutional Class 3.43% Retail Class A (load-waived) 3.30% Retail Class A (unadjusted)1 0.97% Retail Class C (load-waived) 3.03% Retail Class C (unadjusted)1 2.03% JP Morgan CEMBI BD IG (1-3 yr)2 1.94% Cumulative Returns Through Oct 31, 2020 (% of NAV) Top 5 country exposures (% of NAV) 1,040 1,030 1,020 1,010 1,000 990 980 Jun-20 Jul-20 Aug-20 Sep-20 Oct-20 Fund Benchmark Institutional Class $1,034,309 Index3 $1,019,401 China 16.9% United Arab Emirates 13.1% Saudi Arabia 9.0% Indonesia 7.4% South Africa 7.0% Source: Ashmore. Top 5 country exposure based on aggregate allocation to investment instruments related to countries shown above. The above excludes cash and equivalents as well as G-7 countries and certain hedge related transactions. Data as of Oct 31, 2020. Share class information INSTITUTIONAL CLASS Launch date: June 15, 2020 Minimum initial investment: $1,000,000 ISIN: US0448204216 CUSIP: 044820421 BLOOMBERG: ESDIX US TICKER: ESDIX RETAIL CLASS A Launch date: June 15, 2020 Minimum initial investment: $1,000 ISIN: US0448204471 CUSIP: 044820447 BLOOMBERG: ESDAX US TICKER: ESDAX RETAIL CLASS C Launch date: June 15, 2020 Minimum initial investment: $1,000 ISIN: US0448204398 CUSIP: 044820439 BLOOMBERG: ESDCX US TICKER: ESDCX All sources are Ashmore unless otherwise indicated. The above cumulative returns graph assumes $1,000,000 invested at the beginning of the first full month following the inception of the Institutional Class. The minimum initial investment amount for Institutional Class Shares is $1,000,000. The minimum initial investment amount for Retail Shares Classes A and C is $1,000. All Fund returns are net of fees and expenses, except for the load-waived return information for Class A and Class C shares. Performance calculations assume that all dividend, capital gain and other distributions were reinvested. The graph does not reflect the deduction of taxes that a shareholder would pay on distributions or the redemption of fund shares. 1 Unadjusted Performance accounts for a maximum sales load of 2.25% for Class A shares and maximum deferred sales charge of 1% for the 6 months and 1 year returns for the Class C shares. 2 The index for the Fund is the JP Morgan Corporate Emerging Markets Bond Index Broad Diversified Investment Grade 1-3 Year. Past performance does not guarantee future results. The performance data quoted represents past performance and current returns may be lower or higher. The investment return and net asset value will fluctuate so that an investor’s shares, when redeemed, may be worth more or less than the original cost. To obtain performance information current to the most recent month-end, please call 1-855-274-6673. Periods greater than one year are annualized. Changes in rates of exchange between currencies may cause the value of investments to decrease or increase. The Fund’s performance will fluctuate over long and short term periods. Please refer to page 9 herein for an explanation of the Expense Example information presented below. Expense example Actual performance Hypothetical performance Institutional Class Class A Class C Institutional Class Class A Class C Beginning Account Value (6/15/2020) $1,000.00 $1,000.00 $1,000.00 $1,000.00 $1,000.00 $1,000.00 Ending Account Value (10/31/2020) $1,034.30 $1,033.00 $1,030.30 $1,016.44 $1,015.50 $1,012.65 Expense Ratio (Gross / Net) 4.58% / 0.67% 4.87% / 0.92% 5.60% / 1.67% 4.58% / 0.67% 4.87% / 0.92% 5.60% / 1.67% Expenses Paid* $2.59 $3.55 $6.44 $2.57 $3.52 $6.38 *Expenses are equal to the Fund’s annualized expense ratios for the period June 15 through October 31, 2020, multiplied by the average account value over the period, multiplied by 139/366 (to reflect the period). As such, these may differ from the prospectus. 20
20
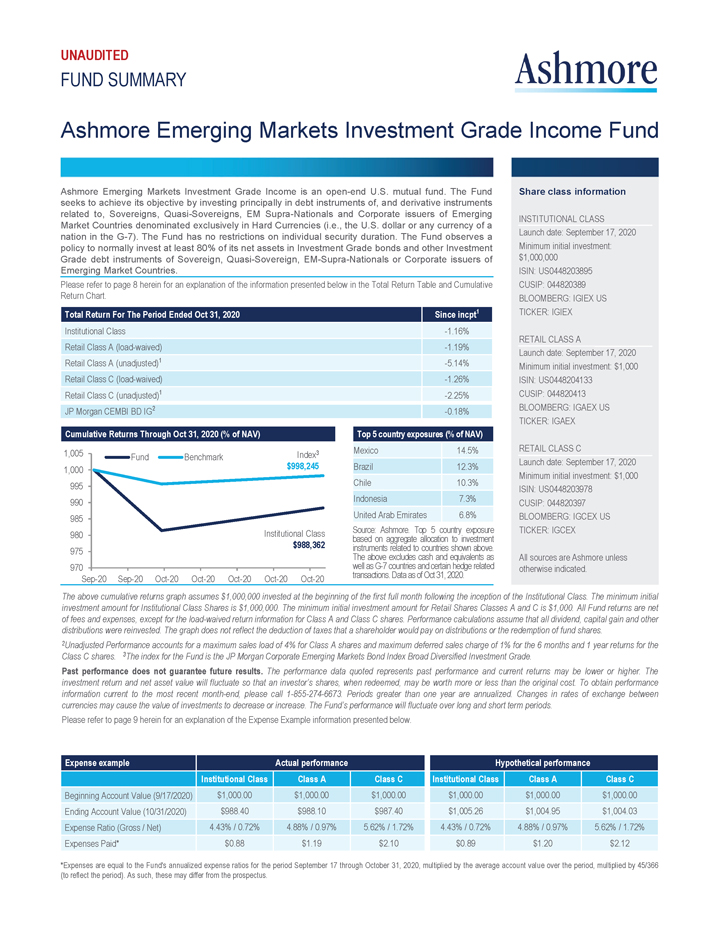
UNAUDITED FUND SUMMARY Ashmore Ashmore Emerging Markets Investment Grade Income Fund Ashmore Emerging Markets Investment Grade Income is an open-end U.S. mutual fund. The Fund seeks to achieve its objective by investing principally in debt instruments of, and derivative instruments related to, Sovereigns, Quasi-Sovereigns, EM Supra-Nationals and Corporate issuers of Emerging Market Countries denominated exclusively in Hard Currencies (i.e., the U.S. dollar or any currency of a nation in the G-7). The Fund has no restrictions on individual security duration. The Fund observes a policy to normally invest at least 80% of its net assets in Investment Grade bonds and other Investment Grade debt instruments of Sovereign, Quasi-Sovereign, EM-Supra-Nationals or Corporate issuers of Emerging Market Countries. Please refer to page 8 herein for an explanation of the information presented below in the Total Return Table and Cumulative Return Chart. Total Return For The Period Ended Oct 31, 2020 Since incpt1 Institutional Class -1.16% Retail Class A (load-waived) -1.19% Retail Class A (unadjusted)1 -5.14% Retail Class C (load-waived) -1.26% Retail Class C (unadjusted)1 -2.25% JP Morgan CEMBI BD IG2 -0.18% Cumulative Returns Through Oct 31, 2020 (% of NAV) Top 5 country exposures (% of NAV) 1,005 1,000 995 990 985 980 975 970 Sep-20 Sep-20 Oct-20 Oct-20 Oct-20 Oct-20 Oct-20 Fund Benchmark Index5 $998,245 Institutional Class $988,362 Mexico 14.5% Brazil 12.3% Chile 10.3% Indonesia 7.3% United Arab Emirates 6.8% Source: Ashmore. Top 5 country exposure based on aggregate allocation to investment instruments related to countries shown above. The above excludes cash and equivalents as well as G-7 countries and certain hedge related transactions. Data as of Oct 31, 2020. Share class information INSTITUTIONAL CLASS Launch date: September 17, 2020 Minimum initial investment: $1,000,000 ISIN: US0448203895 CUSIP: 044820389 BLOOMBERG: IGIEX US TICKER: IGIEX RETAIL CLASS A Launch date: September 17, 2020 Minimum initial investment: $1,000 ISIN: US0448204133 CUSIP: 044820413 BLOOMBERG: IGAEX US TICKER: IGAEX RETAIL CLASS C Launch date: September 17, 2020 Minimum initial investment: $1,000 ISIN: US0448203978 CUSIP: 044820397 BLOOMBERG: IGCEX US TICKER: IGCEX All sources are Ashmore unless otherwise indicated. The above cumulative returns graph assumes $1,000,000 invested at the beginning of the first full month following the inception of the Institutional Class. The minimum initial investment amount for Institutional Class Shares is $1,000,000. The minimum initial investment amount for Retail Shares Classes A and C is $1,000. All Fund returns are net of fees and expenses, except for the load-waived return information for Class A and Class C shares. Performance calculations assume that all dividend, capital gain and other distributions were reinvested. The graph does not reflect the deduction of taxes that a shareholder would pay on distributions or the redemption of fund shares. 2Unadjusted Performance accounts for a maximum sales load of 4% for Class A shares and maximum deferred sales charge of 1% for the 6 months and 1 year returns for the Class C shares. 3The index for the Fund is the JP Morgan Corporate Emerging Markets Bond Index Broad Diversified Investment Grade. Past performance does not guarantee future results. The performance data quoted represents past performance and current returns may be lower or higher. The investment return and net asset value will fluctuate so that an investor’s shares, when redeemed, may be worth more or less than the original cost. To obtain performance information current to the most recent month-end, please call 1-855-274-6673. Periods greater than one year are annualized. Changes in rates of exchange between currencies may cause the value of investments to decrease or increase. The Fund’s performance will fluctuate over long and short term periods. Please refer to page 9 herein for an explanation of the Expense Example information presented below. Expense example Actual performance Hypothetical performance Institutional Class Class A Class C Institutional Class Class A Class C Beginning Account Value (9/17/2020) $1,000.00 $1,000.00 $1,000.00 $1,000.00 $1,000.00 $1,000.00 Ending Account Value (10/31/2020) $988.40 $988.10 $987.40 $1,005.26 $1,004.95 $1,004.03 Expense Ratio (Gross / Net) 4.43% / 0.72% 4.88% / 0.97% 5.62% / 1.72% 4.43% / 0.72% 4.88% / 0.97% 5.62% / 1.72% Expenses Paid* $0.88 $1.19 $2.10 $0.89 $1.20 $2.12 *Expenses are equal to the Fund’s annualized expense ratios for the period September 17 through October 31, 2020, multiplied by the average account value over the period, multiplied by 45/366 (to reflect the period). As such, these may differ from the prospectus. 21
21
| | | | |
 | | | | KPMG LLP |
| | | | Aon Center |
| | | | Suite 5500 |
| | | | 200 E. Randolph Street |
| | | | Chicago, IL 60601-6436 |
Report of Independent Registered Public Accounting Firm
To the Shareholders and Board of Trustees
Ashmore Funds:
Opinion on the Financial Statements
We have audited the accompanying statements of assets and liabilities of Ashmore Emerging Markets Total Return Fund, Ashmore Emerging Markets Local Currency Bond Fund, Ashmore Emerging Markets Corporate Income Fund, Ashmore Emerging Markets Short Duration Fund, Ashmore Emerging Markets Active Equity Fund, Ashmore Emerging Markets Small-Cap Equity Fund, Ashmore Emerging Markets Frontier Equity Fund, Ashmore Emerging Markets Equity Fund, Ashmore Emerging Markets Equity ESG Fund, Ashmore Emerging Markets Short Duration Select Fund, and Ashmore Emerging Markets Investment Grade Income Fund (collectively, the Funds), including the schedules of investments, as of October 31, 2020, the related statements of operations for the year or period then ended (periods from February 26, 2020, June 15, 2020, and September 17, 2020, (commencement of operations) to October 31, 2020 for Ashmore Emerging Markets Equity ESG Fund, Ashmore Emerging Markets Short Duration Select Fund, and Ashmore Emerging Markets Investment Grade Income Fund, respectively), the statements of changes in net assets for each of the years or periods in the two-year period then ended (periods from February 26, 2020, June 15, 2020, and September 17, 2020 to October 31, 2020 for Ashmore Emerging Markets Equity ESG Fund, Ashmore Emerging Markets Short Duration Select Fund, and Ashmore Emerging Markets Investment Grade Income Fund, respectively), and the related notes (collectively, the financial statements) and the financial highlights for each of the years or periods in the five-year period then ended (periods from February 26, 2020, June 15, 2020, and September, 17, 2020 to October 31, 2020 for Ashmore Emerging Markets Equity ESG Fund, Ashmore Emerging Markets Short Duration Select Fund, and Ashmore Emerging Markets Investment Grade Income Fund, respectively). In our opinion, the financial statements and financial highlights present fairly, in all material respects, the financial position of each Fund as of October 31, 2020, the results of its operations for the year or period then ended (periods from February 26, 2020, June 15, 2020, and September 17, 2020 to October 31, 2020 for Ashmore Emerging Markets Equity ESG Fund, Ashmore Emerging Markets Short Duration Select Fund, and Ashmore Emerging Markets Investment Grade Income Fund, respectively), the changes in its net assets for each of the years or periods in the two-year period then ended (periods from February 26, 2020, June 15, 2020, and September 17, 2020 to October 31, 2020 for Ashmore Emerging Markets Equity ESG Fund, Ashmore Emerging Markets Short Duration Select Fund, and Ashmore Emerging Markets Investment Grade Income Fund, respectively), and the financial highlights for each of the years or periods in the five-year period then ended (period from February 26, 2020, June 15, 2020, and September 17, 2020 to October 31, 2020 for Ashmore Emerging Markets Equity ESG Fund, Ashmore Emerging Markets Short Duration Select Fund, and Ashmore Emerging Markets Investment Grade Income Fund, respectively), in conformity with U.S. generally accepted accounting principles.
Basis for Opinion
These financial statements and financial highlights are the responsibility of the Funds’ management. Our responsibility is to express an opinion on these financial statements and financial highlights based on our audits. We are a public accounting firm registered with the Public Company Accounting Oversight Board (United States) (PCAOB) and are required to be independent with respect to the Funds in accordance with the U.S. federal securities laws and the applicable rules and regulations of the Securities and Exchange Commission and the PCAOB.
KPMG LLP, a Delaware limited liability partnership and a member firm of
the KPMG global organization of independent member firms affiliated with
KPMG International Limited, a private English company limited by guarantee.

We conducted our audits in accordance with the standards of the PCAOB. Those standards require that we plan and perform the audit to obtain reasonable assurance about whether the financial statements and financial highlights are free of material misstatement, whether due to error or fraud. Our audits included performing procedures to assess the risks of material misstatement of the financial statements and financial highlights, whether due to error or fraud, and performing procedures that respond to those risks. Such procedures included examining, on a test basis, evidence regarding the amounts and disclosures in the financial statements and financial highlights. Such procedures also included confirmation of securities owned as of October 31, 2020, by correspondence with custodians and brokers. Our audits also included evaluating the accounting principles used and significant estimates made by management, as well as evaluating the overall presentation of the financial statements and financial highlights. We believe that our audits provide a reasonable basis for our opinion.

We have served as the auditor of one or more Ashmore Funds investment companies since 2010.
Chicago, Illinois
December 21, 2020
(THIS PAGE INTENTIONALLY LEFT BLANK)
24
ASHMORE FUNDS
STATEMENTS OF ASSETS AND LIABILITIES
As of October 31, 2020
| | | | | | | | | | | | | | | | | | | | | | | | | | | | |
| | | Ashmore Emerging Markets Total Return Fund | | | | | | | Ashmore Emerging Markets Local Currency Bond Fund | | | | | | Ashmore Emerging Markets Corporate Income Fund |
ASSETS: | | | | | | | | | | | | | | | | | | | | | | | | | | | | |
Investments in securities, at value | | $ | 1,198,297,281 | | | | | | | | | | | $ | 27,313,961 | | | | | | | | | | | $ | 277,881,389 | |
Deposit held at broker | | | 2,519,277 | | | | | | | | | | | | 254,776 | | | | | | | | | | | | — | |
Cash | | | 18,021,836 | | | | | | | | | | | | 2,141,579 | | | | | | | | | | | | 1,930,391 | |
Foreign currency, at value | | | 8,217,197 | | | | | | | | | | | | 232,039 | | | | | | | | | | | | 475 | |
Unrealized appreciation on forward foreign currency exchange contracts | | | 3,902,936 | | | | | | | | | | | | 221,676 | | | | | | | | | | | | 10,966 | |
Variation margin receivable on centrally cleared swap contracts | | | 207 | | | | | | | | | | | | 115 | | | | | | | | | | | | — | |
Due from broker | | | 259,075 | | | | | | | | | | | | 130,609 | | | | | | | | | | | | — | |
Receivable for securities and currencies sold | | | 2,861,177 | | | | | | | | | | | | 215,166 | | | | | | | | | | | | 1,365,326 | |
Receivable for fund shares sold | | | 5,375,473 | | | | | | | | | | | | — | | | | | | | | | | | | 241,618 | |
Receivable from Investment Manager | | | — | | | | | | | | | | | | 12,889 | | | | | | | | | | | | — | |
Interest and dividends receivable | | | 17,521,339 | | | | | | | | | | | | 441,547 | | | | | | | | | | | | 4,223,924 | |
Other assets | | | 39,080 | | | | | | | | | | | | 1,374 | | | | | | | | | | | | 11,443 | |
Total Assets | | | 1,257,014,878 | | | | | | | | | | | | 30,965,731 | | | | | | | | | | | | 285,665,532 | |
LIABILITIES: | | | | | | | | | | | | | | | | | | | | | | | | | | | | |
Unrealized depreciation on forward foreign currency exchange contracts | | | 4,284,422 | | | | | | | | | | | | 241,972 | | | | | | | | | | | | — | |
Payable for securities and currencies purchased | | | 3,750,265 | | | | | | | | | | | | — | | | | | | | | | | | | 614,066 | |
Payable for when-issued securities | | | — | | | | | | | | | | | | — | | | | | | | | | | | | 3,639,305 | |
Payable for fund shares redeemed | | | 640,948 | | | | | | | | | | | | 580,224 | | | | | | | | | | | | 806,183 | |
Distributions payable | | | 644,285 | | | | | | | | | | | | — | | | | | | | | | | | | 165,009 | |
Due to broker | | | 2,274,420 | | | | | | | | | | | | 30,851 | | | | | | | | | | | | — | |
Investment Manager fee payable | | | 1,343,316 | | | | | | | | | | | | 25,774 | | | | | | | | | | | | 327,936 | |
Trustees’ fees payable | | | 30,142 | | | | | | | | | | | | 731 | | | | | | | | | | | | 6,478 | |
Deferred foreign capital gains taxes payable | | | — | | | | | | | | | | | | — | | | | | | | | | | | | — | |
Other liabilities | | | 584,365 | | | | | | | | | | | | 43,775 | | | | | | | | | | | | 135,417 | |
Total Liabilities | | | 13,552,163 | | | | | | | | | | | | 923,327 | | | | | | | | | | | | 5,694,394 | |
Net Assets | | $ | 1,243,462,715 | | | | | | | | | | | $ | 30,042,404 | | | | | | | | | | | $ | 279,971,138 | |
NET ASSETS: | | | | | | | | | | | | | | | | | | | | | | | | | | | | |
Paid in capital | | $ | 1,470,149,536 | | | | | | | | | | | $ | 34,189,858 | | | | | | | | | | | $ | 375,542,221 | |
Distributable earnings/(Accumulated loss) | | | (226,686,821 | ) | | | | | | | | | | | (4,147,454 | ) | | | | | | | | | | | (95,571,083 | ) |
Net Assets | | $ | 1,243,462,715 | | | | | | | | | | | $ | 30,042,404 | | | | | | | | | | | $ | 279,971,138 | |
| | | | | | | |
Net Assets: | | | | | | | | | | | | | | | | | | | | | | | | | | | | |
Class A | | $ | 10,377,173 | | | | | | | | | | | $ | 1,755,477 | | | | | | | | | | | $ | 11,198,049 | |
Class C | | | 3,905,043 | | | | | | | | | | | | 29,540 | | | | | | | | | | | | 7,466,102 | |
Institutional Class | | | 1,229,180,499 | | | | | | | | | | | | 28,257,387 | | | | | | | | | | | | 261,306,987 | |
| | | | | | | |
Shares Issued and Outstanding (no par value, unlimited shares authorized): | | | | | | | | | | | | | | | | | | | | | | | | | | | | |
Class A | | | 1,525,597 | | | | | | | | | | | | 255,875 | | | | | | | | | | | | 1,487,892 | |
Class C | | | 575,958 | | | | | | | | | | | | 4,384 | | | | | | | | | | | | 993,718 | |
Institutional Class | | | 178,076,956 | | | | | | | | | | | | 3,943,958 | | | | | | | | | | | | 33,320,767 | |
| | | | | | | |
Net Asset Value and Redemption Price Per Share (Net Asset Per Share Outstanding): | | | | | | | | | | | | | | | | | | | | | | | | | | | | |
Class A | | $ | 6.80 | | | | | | | | | | | $ | 6.86 | | | | | | | | | | | $ | 7.53 | |
Class C | | | 6.78 | | | | | | | | | | | | 6.74 | | | | | | | | | | | | 7.51 | |
Institutional Class | | | 6.90 | | | | | | | | | | | | 7.16 | | | | | | | | | | | | 7.84 | |
| | | | | | | |
Cost of Investments in securities | | $ | 1,317,706,730 | | | | | | | | | | | $ | 30,507,245 | | | | | | | | | | | $ | 302,630,160 | |
Cost of foreign currency held | | $ | 8,205,476 | | | | | | | | | | | $ | 232,428 | | | | | | | | | | | $ | 482 | |
See accompanying notes to the financial statements.
25
| | | | | | | | | | | | | | | | | | | | | | | | | | | | | | |
Ashmore Emerging Markets Short Duration Fund | | Ashmore Emerging Markets Active Equity Fund | | Ashmore Emerging Markets Small-Cap Equity Fund | | Ashmore Emerging Markets Frontier Equity Fund | | Ashmore Emerging Markets Equity Fund | | Ashmore Emerging Markets Equity ESG Fund | | Ashmore Emerging Markets Short Duration
Select Fund | | Ashmore Emerging Markets Investment Grade Income Fund |
| | | | | | | | |
| $ | 442,965,467 | | | $ | 77,993,698 | | | $ | 7,909,763 | | | $ | 53,515,578 | | | $ | 82,610,210 | | | $ | 11,874,661 | | | $ | 9,542,809 | | | $ | 19,317,253 | |
| | — | | | | — | | | | — | | | | — | | | | — | | | | — | | | | — | | | | — | |
| | 13,408,560 | | | | 5,036,959 | | | | 35,830 | | | | 1,044,273 | | | | 1,760,199 | | | | 53,977 | | | | 378,088 | | | | 212,140 | |
| | 23,259 | | | | 29,267 | | | | 14,438 | | | | 348,386 | | | | 36,564 | | | | — | | | | — | | | | 6,195 | |
| | — | | | | 9,607 | | | | — | | | | — | | | | — | | | | — | | | | — | | | | 4,788 | |
| | — | | | | — | | | | — | | | | — | | | | — | | | | — | | | | — | | | | — | |
| | — | | | | — | | | | — | | | | — | | | | — | | | | — | | | | — | | | | — | |
| | 3,365,291 | | | | 743,611 | | | | 83,617 | | | | 101,668 | | | | 953,339 | | | | 134,975 | | | | 305,870 | | | | — | |
| | 56,023 | | | | 50,009 | | | | — | | | | 41,330 | | | | 70,027 | | | | — | | | | — | | | | — | |
| | — | | | | 18,181 | | | | 16,805 | | | | 8,921 | | | | 39,792 | | | | 23,901 | | | | 38,498 | | | | 66,599 | |
| | 5,698,324 | | | | 138,538 | | | | 8,159 | | | | — | | | | 43,345 | | | | 6,503 | | | | 122,156 | | | | 236,032 | |
| | 15,952 | | | | 7,568 | | | | 582 | | | | 5,459 | | | | 2,047 | | | | 59,933 | | | | 6 | | | | — | |
| | 465,532,876 | | | | 84,027,438 | | | | 8,069,194 | | | | 55,065,615 | | | | 85,515,523 | | | | 12,153,950 | | | | 10,387,427 | | | | 19,843,007 | |
| | | | | | | | |
| | — | | | | — | | | | — | | | | — | | | | — | | | | — | | | | — | | | | — | |
| | — | | | | 1,782,908 | | | | 77,643 | | | | 432,831 | | | | 1,446,469 | | | | 48,347 | | | | — | | | | — | |
| | — | | | | — | | | | — | | | | — | | | | — | | | | — | | | | — | | | | — | |
| | 1,136,591 | | | | 12,998 | | | | 5,000 | | | | 431,411 | | | | 11,986 | | | | — | | | | — | | | | — | |
| | 297,736 | | | | — | | | | — | | | | — | | | | — | | | | — | | | | 4,137 | | | | 6,246 | |
| | — | | | | — | | | | — | | | | 65,611 | | | | — | | | | — | | | | — | | | | — | |
| | 657,984 | | | | 67,784 | | | | 10,166 | | | | 69,986 | | | | 81,991 | | | | 11,779 | | | | 5,669 | | | | 11,758 | |
| | 10,831 | | | | 1,891 | | | | 186 | | | | 1,265 | | | | 1,956 | | | | 279 | | | | 239 | | | | 2,068 | |
| | — | | | | 34,617 | | | | — | | | | 15,511 | | | | 129,503 | | | | — | | | | — | | | | — | |
| | 525,715 | | | | 35,657 | | | | 34,342 | | | | 52,845 | | | | 63,066 | | | | 29,192 | | | | 58,730 | | | | 63,633 | |
| | 2,628,857 | | | | 1,935,855 | | | | 127,337 | | | | 1,069,460 | | | | 1,734,971 | | | | 89,597 | | | | 68,775 | | | | 83,705 | |
| $ | 462,904,019 | | | $ | 82,091,583 | | | $ | 7,941,857 | | | $ | 53,996,155 | | | $ | 83,780,552 | | | $ | 12,064,353 | | | $ | 10,318,652 | | | $ | 19,759,302 | |
| | | | | | | | |
| $ | 830,256,974 | | | $ | 78,445,483 | | | $ | 13,039,265 | | | $ | 70,905,659 | | | $ | 66,521,016 | | | $ | 10,000,296 | | | $ | 10,134,385 | | | $ | 20,052,102 | |
| | (367,352,955 | ) | | | 3,646,100 | | | | (5,097,408 | ) | | | (16,909,504 | ) | | | 17,259,536 | | | | 2,064,057 | | | | 184,267 | | | | (292,800 | ) |
| $ | 462,904,019 | | | $ | 82,091,583 | | | $ | 7,941,857 | | | $ | 53,996,155 | | | $ | 83,780,552 | | | $ | 12,064,353 | | | $ | 10,318,652 | | | $ | 19,759,302 | |
| | | | | | | | |
| $ | 19,865,268 | | | $ | 1,615,728 | | | $ | 388,526 | | | $ | 656,430 | | | $ | 1,394,169 | | | $ | 1,205 | | | $ | 1,031 | | | $ | 987 | |
| | 1,572,151 | | | | 1,470 | | | | 134,567 | | | | 286,395 | | | | 1,451 | | | | 1,200 | | | | 1,028 | | | | 987 | |
| | 441,466,600 | | | | 80,474,385 | | | | 7,418,764 | | | | 53,053,330 | | | | 82,384,932 | | | | 12,061,948 | | | | 10,316,593 | | | | 19,757,328 | |
| | | | | | | | |
| | 2,639,928 | | | | 145,789 | | | | 35,351 | | | | 92,839 | | | | 106,605 | | | | 100 | | | | 101 | | | | 100 | |
| | 217,644 | | | | 135 | | | | 11,806 | | | | 42,022 | | | | 117 | | | | 100 | | | | 101 | | | | 100 | |
| | 59,684,840 | | | | 7,215,878 | | | | 522,762 | | | | 6,470,550 | | | | 6,512,161 | | | | 999,829 | | | | 1,013,020 | | | | 2,005,050 | |
| | | | | | | | |
| $ | 7.52 | | | $ | 11.08 | | | $ | 10.99 | | | $ | 7.07 | | | $ | 13.08 | | | $ | 12.05 | | | $ | 10.18 | | | $ | 9.85 | |
| | 7.22 | | | | 10.90 | | | | 11.40 | | | | 6.82 | | | | 12.39 | | | | 12.00 | | | | 10.18 | | | | 9.85 | |
| | 7.40 | | | | 11.15 | | | | 14.19 | | | | 8.20 | | | | 12.65 | | | | 12.06 | | | | 10.18 | | | | 9.85 | |
| | | | | | | | |
| $ | 640,175,076 | | | $ | 71,267,654 | | | $ | 6,249,175 | | | $ | 55,321,157 | | | $ | 64,653,895 | | | $ | 9,649,681 | | | $ | 9,390,734 | | | $ | 19,609,165 | |
| $ | 21,988 | | | $ | 29,162 | | | $ | 14,418 | | | $ | 348,566 | | | $ | 36,505 | | | $ | — | | | $ | — | | | $ | 6,252 | |
See accompanying notes to the financial statements.
26
ASHMORE FUNDS
STATEMENTS OF OPERATIONS
For the Year Ended October 31, 2020
| | | | | | | | | | | | | | | | | | | | |
| | | Ashmore Emerging Markets Total Return
Fund | | | | | | Ashmore Emerging Markets Local Currency Bond Fund | | | | | | Ashmore Emerging Markets
Corporate Income
Fund |
INVESTMENT INCOME: | | | | | | | | | | | | | | | | | | | | |
Interest, net of foreign tax withholdings* | | $ | 83,539,401 | | | | | | | $ | 2,354,758 | | | | | | | $ | 25,084,060 | |
Payment-in-kind interest | | | 2,767,658 | | | | | | | | — | | | | | | | | 2,070,170 | |
Dividends, net of foreign tax withholdings* | | | — | | | | | | | | — | | | | | | | | — | |
Total Income | | | 86,307,059 | | | | | | | | 2,354,758 | | | | | | | | 27,154,230 | |
EXPENSES: | | | | | | | | | | | | | | | | | | | | |
Investment Manager fees | | | 14,008,498 | | | | | | | | 358,160 | | | | | | | | 4,262,544 | |
Administration fees | | | 280,146 | | | | | | | | 7,539 | | | | | | | | 74,125 | |
Custody fees | | | 529,141 | | | | | | | | 71,624 | | | | | | | | 92,460 | |
Professional fees | | | 1,120,577 | | | | | | | | 46,147 | | | | | | | | 309,461 | |
Trustees’ fees | | | 113,021 | | | | | | | | 2,340 | | | | | | | | 29,103 | |
Offering expenses and registration fees | | | 175,451 | | | | | | | | 55,517 | | | | | | | | 67,049 | |
Insurance fees | | | 55,265 | | | | | | | | 2,109 | | | | | | | | 13,913 | |
Printing fees | | | 66,848 | | | | | | | | 9,642 | | | | | | | | 35,103 | |
Distribution and servicing fees - Class A | | | 26,699 | | | | | | | | 4,489 | | | | | | | | 34,742 | |
Distribution and servicing fees - Class C | | | 45,995 | | | | | | | | 498 | | | | | | | | 92,546 | |
Regulatory fees | | | 41,101 | | | | | | | | 10,887 | | | | | | | | 21,552 | |
Interest expense | | | — | | | | | | | | — | | | | | | | | 6,559 | |
Total Expenses | | | 16,462,742 | | | | | | | | 568,952 | | | | | | | | 5,039,157 | |
Less expenses reimbursed by the Investment Manager | | | (1,453,580 | ) | | | | | | | (198,265 | ) | | | | | | | (404,041 | ) |
Net Expenses | | | 15,009,162 | | | | | | | | 370,687 | | | | | | | | 4,635,116 | |
Net Investment Income (Loss) | | | 71,297,897 | | | | | | | | 1,984,071 | | | | | | | | 22,519,114 | |
NET REALIZED AND UNREALIZED GAINS (LOSSES): | | | | | | | | | | | | | | | | | | | | |
NET REALIZED GAIN (LOSS) ON: | | | | | | | | | | | | | | | | | | | | |
Investments in securities | | | (76,326,742 | ) | | | | | | | (1,740,231 | ) | | | | | | | (32,505,337 | ) |
Forward foreign currency exchange contracts | | | (17,437,848 | ) | | | | | | | 55,913 | | | | | | | | (28,832 | ) |
Interest rate swap contracts | | | (859,183 | ) | | | | | | | 71,964 | | | | | | | | — | |
Foreign exchange transactions | | | (167,408 | ) | | | | | | | (204,243 | ) | | | | | | | (7,869 | ) |
Net Realized Gain (Loss) | | | (94,791,181 | ) | | | | | | | (1,816,597 | ) | | | | | | | (32,542,038 | ) |
NET CHANGE IN UNREALIZED APPRECIATION (DEPRECIATION) ON: | | | | | | | | | | | | | | | | | | | | |
Investments in securities (net of increase (decrease) in deferred foreign taxes of $-, $-, $-, $-, $6,568, $-, $14,971, $129,503, $-, $-, and $-, respectively) | | | (67,317,402 | ) | | | | | | | (2,284,190 | ) | | | | | | | (8,627,696 | ) |
Forward foreign currency exchange contracts | | | (1,515,929 | ) | | | | | | | (302,098 | ) | | | | | | | 10,966 | |
Interest rate swap contracts | | | 1,141,114 | | | | | | | | 115,571 | | | | | | | | — | |
Foreign exchange translations | | | (44,255 | ) | | | | | | | (2,551 | ) | | | | | | | 1,937 | |
Change in Net Unrealized Appreciation (Depreciation) | | | (67,736,472 | ) | | | | | | | (2,473,268 | ) | | | | | | | (8,614,793 | ) |
Net Realized and Unrealized Gains (Losses) | | | (162,527,653 | ) | | | | | | | (4,289,865 | ) | | | | | | | (41,156,831 | ) |
Net Increase (Decrease) in Net Assets Resulting from Operations | | $ | (91,229,756 | ) | | | | | | $ | (2,305,794 | ) | | | | | | $ | (18,637,717 | ) |
* Foreign Tax Withholdings | | $ | 929,832 | | | | | | | $ | 59,059 | | | | | | | $ | — | |
See accompanying notes to the financial statements.
27
| | | | | | | | | | | | | | | | | | | | | | | | | | | | | | |
Ashmore Emerging Markets Short Duration Fund | | Ashmore Emerging Markets Active Equity Fund | | Ashmore Emerging Markets Small-Cap Equity Fund | | Ashmore Emerging Markets Frontier Equity Fund | | Ashmore Emerging Markets Equity Fund | | Ashmore Emerging Markets Equity ESG Fund1 | | Ashmore Emerging Markets Short Duration Select Fund2 | | Ashmore Emerging Markets Investment Grade Income Fund3 |
| | | | | | | | |
| | $ 60,755,129 | | | $ | 14,731 | | | $ | — | | | $ | — | | | $ | 800 | | | $ | 772 | | | $ | 187,265 | | | $ | 83,572 | |
| | 657,362 | | | | — | | | | — | | | | — | | | | — | | | | — | | | | — | | | | — | |
| | — | | | | 1,222,835 | | | | 149,747 | | | | 1,687,836 | | | | 767,906 | | | | 87,097 | | | | — | | | | — | |
| | 61,412,491 | | | | 1,237,566 | | | | 149,747 | | | | 1,687,836 | | | | 768,706 | | | | 87,869 | | | | 187,265 | | | | 83,572 | |
| | | | | | | | |
| | 5,049,652 | | | | 627,840 | | | | 213,648 | | | | 996,996 | | | | 658,202 | | | | 79,565 | | | | 24,994 | | | | 16,674 | |
| | 155,360 | | | | 12,556 | | | | 2,848 | | | | 13,292 | | | | 11,446 | | | | 1,384 | | | | 769 | | | | 476 | |
| | 196,448 | | | | 50,334 | | | | 40,692 | | | | 182,279 | | | | 95,979 | | | | 8,664 | | | | 2,326 | | | | 5,163 | |
| | 1,296,434 | | | | 42,673 | | | | 33,933 | | | | 37,884 | | | | 45,109 | | | | 26,502 | | | | 25,083 | | | | 19,692 | |
| | 63,069 | | | | 5,976 | | | | 792 | | | | 4,917 | | | | 5,270 | | | | 705 | | | | 423 | | | | 2,068 | |
| | 138,224 | | | | 52,006 | | | | 54,298 | | | | 61,871 | | | | 55,117 | | | | 107,120 | | | | 94,073 | | | | 36,910 | |
| | 26,079 | | | | 1,644 | | | | 843 | | | | 2,743 | | | | 1,727 | | | | 227 | | | | 28 | | | | 868 | |
| | 96,073 | | | | 10,952 | | | | 9,190 | | | | 16,533 | | | | 10,910 | | | | 23,282 | | | | 24,960 | | | | 19,376 | |
| | 129,054 | | | | 2,216 | | | | 1,903 | | | | 6,255 | | | | 2,230 | | | | 2 | | | | 1 | | | | — | |
| | 17,570 | | | | 40 | | | | 1,293 | | | | 3,178 | | | | 13 | | | | 7 | | | | 4 | | | | 1 | |
| | 33,338 | | | | 7,597 | | | | 7,947 | | | | 9,039 | | | | 8,487 | | | | 7,255 | | | | 3,518 | | | | 4,332 | |
| | — | | | | — | | | | — | | | | — | | | | — | | | | — | | | | — | | | | — | |
| | 7,201,301 | | | | 813,834 | | | | 367,387 | | | | 1,334,987 | | | | 894,490 | | | | 254,713 | | | | 176,179 | | | | 105,560 | |
| | (973,684) | | | | (171,181 | ) | | | (147,694 | ) | | | (315,267 | ) | | | (222,597 | ) | | | (173,755 | ) | | | (150,410 | ) | | | (88,408 | ) |
| | 6,227,617 | | | | 642,653 | | | | 219,693 | | | | 1,019,720 | | | | 671,893 | | | | 80,958 | | | | 25,769 | | | | 17,152 | |
| | 55,184,874 | | | | 594,913 | | | | (69,946 | ) | | | 668,116 | | | | 96,813 | | | | 6,911 | | | | 161,496 | | | | 66,420 | |
| | | | | | | | |
| | (168,910,698) | | | | (2,591,108 | ) | | | (2,552,089 | ) | | | (9,690,969 | ) | | | 2,262,183 | | | | (151,447 | ) | | | 32,938 | | | | (4,232 | ) |
| | — | | | | (127,572 | ) | | | — | | | | (3,504 | ) | | | (970 | ) | | | — | | | | — | | | | (564 | ) |
| | — | | | | — | | | | — | | | | — | | | | — | | | | — | | | | — | | | | — | |
| | 189 | | | | (23,712 | ) | | | (15,604 | ) | | | (168,779 | ) | | | 4,516 | | | | (16,008 | ) | | | — | | | | 305 | |
| | (168,910,509) | | | | (2,742,392 | ) | | | (2,567,693 | ) | | | (9,863,252 | ) | | | 2,265,729 | | | | (167,455 | ) | | | 32,938 | | | | (4,491 | ) |
| | | | | | | | |
| | (61,680,795) | | | | 6,115,124 | | | | 2,900,020 | | | | (999,149 | ) | | | 14,729,829 | | | | 2,224,980 | | | | 152,075 | | | | (291,912 | ) |
| | — | | | | 14,283 | | | | — | | | | — | | | | — | | | | — | | | | — | | | | 4,788 | |
| | — | | | | — | | | | — | | | | — | | | | — | | | | — | | | | — | | | | — | |
| | 279 | | | | (2,575 | ) | | | 298 | | | | (502 | ) | | | (2,926 | ) | | | (30 | ) | | | — | | | | (62 | ) |
| | (61,680,516) | | | | 6,126,832 | | | | 2,900,318 | | | | (999,651 | ) | | | 14,726,903 | | | | 2,224,950 | | | | 152,075 | | | | (287,186 | ) |
| | (230,591,025) | | | | 3,384,440 | | | | 332,625 | | | | (10,862,903 | ) | | | 16,992,632 | | | | 2,057,495 | | | | 185,013 | | | | (291,677 | ) |
| | $(175,406,151) | | | $ | 3,979,353 | | | $ | 262,679 | | | $ | (10,194,787 | ) | | $ | 17,089,445 | | | $ | 2,064,406 | | | $ | 346,509 | | | $ | (225,257 | ) |
| | $ — | | | $ | 146,409 | | | $ | 25,834 | | | $ | 94,014 | | | $ | 91,292 | | | $ | 11,020 | | | $ | 3,077 | | | $ | 8,250 | |
| 1 | The Fund commenced investment operations on February, 26, 2020. |
| 2 | The Fund commenced investment operations on June 15, 2020. |
| 3 | The Fund commenced investment operations on September 17, 2020. |
See accompanying notes to the financial statements.
28
ASHMORE FUNDS
STATEMENTS OF CHANGES IN NET ASSETS
For the Fiscal Years Ended October 31,
| | | | | | | | | | | | | | | | | | | | | | | | |
| | | Ashmore Emerging Markets Total Return Fund | | | Ashmore Emerging Markets Local Currency Bond Fund | | | Ashmore Emerging Markets Corporate Income Fund | |
| | | 2020 | | | 2019 | | 2020 | | | 2019 | | 2020 | | | 2019 |
OPERATIONS: | | | | | | | | | | | | | | | | | | | | | | | | |
| | | | | | |
Net investment income (loss) | | | $ 71,297,897 | | | | $ 79,838,451 | | | | $ 1,984,071 | | | | $ 3,793,360 | | | | $ 22,519,114 | | | | $ 28,325,215 | |
| | | | | | |
Net realized gain (loss) | | | (94,791,181 | ) | | | (10,064,694 | ) | | | (1,816,597 | ) | | | (4,065,973 | ) | | | (32,542,038 | ) | | | (2,822,143 | ) |
| | | | | | |
Net change in unrealized appreciation (depreciation) | | | (67,736,472 | ) | | | 51,117,249 | | | | (2,473,268 | ) | | | 8,031,065 | | | | (8,614,793 | ) | | | 6,042,603 | |
| | | | | | | |
Net Increase (Decrease) in Net Assets Resulting from Operations | | | (91,229,756 | ) | | | 120,891,006 | | | | (2,305,794 | ) | | | 7,758,452 | | | | (18,637,717 | ) | | | 31,545,675 | |
| | | | | | |
DISTRIBUTIONS TO SHAREHOLDERS: | | | | | | | | | | | | | | | | | | | | | | | | |
Class A | | | (179,927 | ) | | | (416,984 | ) | | | — | | | | — | | | | (809,491 | ) | | | (764,139 | ) |
| | | | | | |
Class C | | | (73,753 | ) | | | (186,063 | ) | | | — | | | | — | | | | (473,514 | ) | | | (578,625 | ) |
| | | | | | |
Institutional Class | | | (25,691,849 | ) | | | (61,911,176 | ) | | | — | | | | — | | | | (21,042,924 | ) | | | (27,024,138 | ) |
| | | | | | | | | | | | | | | | | | | | | | | | |
Total Distributions to Shareholders | | | (25,945,529 | ) | | | (62,514,223 | ) | | | — | | | | — | | | | (22,325,929 | ) | | | (28,366,902 | ) |
| | | | | | |
TAX RETURN OF CAPITAL DISTRIBUTIONS TO SHAREHOLDERS: | | | | | | | | | | | | | | | | | | | | | | | | |
| | | | | | |
Class A | | | (338,304 | ) | | | (117,667 | ) | | | (24,315 | ) | | | (14,685 | ) | | | (5,937 | ) | | | — | |
| | | | | | |
Class C | | | (120,353 | ) | | | (52,499 | ) | | | (627 | ) | | | (81 | ) | | | (3,534 | ) | | | — | |
| | | | | | |
Institutional Class | | | (45,002,937 | ) | | | (17,060,547 | ) | | | (512,379 | ) | | | (471,758 | ) | | | (146,369 | ) | | | — | |
| | | | | | | | | | | | | | | | | | | | | | | | |
Total Tax Return of Capital Distributions to Shareholders | | | (45,461,594 | ) | | | (17,230,713 | ) | | | (537,321 | ) | | | (486,524 | ) | | | (155,840 | ) | | | — | |
| | | | | | |
FUND SHARE TRANSACTIONS: | | | | | | | | | | | | | | | | | | | | | | | | |
| | | | | | |
Net increase (decrease) in net assets resulting from Class A share transactions | | | 400,217 | | | | 2,497,025 | | | | (41,118 | ) | | | 432,898 | | | | (1,139,647 | ) | | | 4,700,433 | |
| | | | | | |
Net increase (decrease) in net assets resulting from Class C share transactions | | | (1,081,246 | ) | | | 1,094,917 | | | | (22,027 | ) | | | (29,036 | ) | | | (2,571,648 | ) | | | 1,877,655 | |
| | | | | | |
Net increase (decrease) in net assets resulting from Institutional Class share transactions | | | (138,029,198 | ) | | | 173,786,229 | | | | (11,584,513 | ) | | | (27,487,997) | | | | (143,205,862 | ) | | | 121,430,883 | |
| | | | | | | | | | | | | | | | | | | | | | | | |
| | | | | | |
Net Increase (Decrease) in Net Assets Resulting from Fund Share Transactions | | | (138,710,227 | ) | | | 177,378,171 | | | | (11,647,658 | ) | | | (27,084,135 | ) | | | (146,917,157 | ) | | | 128,008,971 | |
| | | | | | | |
Total Increase (Decrease) in Net Assets | | | (301,347,106 | ) | | | 218,524,241 | | | | (14,490,773 | ) | | | (19,812,207 | ) | | | (188,036,643 | ) | | | 131,187,744 | |
NET ASSETS: | | | | | | | | | | | | | | | | | | | | | | | | |
| | | | | | |
Net Assets at the Beginning of year | | | 1,544,809,821 | | | | 1,326,285,580 | | | | 44,533,177 | | | | 64,345,384 | | | | 468,007,781 | | | | 336,820,037 | |
| | | | | | | |
Net Assets at the End of year | | | $1,243,462,715 | | | | $1,544,809,821 | | | | $ 30,042,404 | | | | $ 44,533,177 | | | | $ 279,971,138 | | | | $468,007,781 | |
See accompanying notes to the financial statements.
29
| | | | | | | | | | | | | | | | | | | | | | | | | | | | | | |
Ashmore Emerging Markets Short Duration Fund | | | Ashmore Emerging Markets Active Equity Fund | | | Ashmore Emerging Markets Small-Cap Equity Fund | | | Ashmore Emerging Markets Frontier Equity Fund | |
| 2020 | | | 2019 | | 2020 | | | 2019 | | 2020 | | | 2019 | | 2020 | | | 2019 |
| | | | | | | |
| | $ 55,184,874 | | | $ | 84,642,186 | | | $ | 594,913 | | | $ | 197,622 | | | $ | (69,946 | ) | | $ | 40,443 | | | $ | 668,116 | | | $ | 1,541,496 | |
| | (168,910,509) | | | | (2,284,467 | ) | | | (2,742,392 | ) | | | (381,475 | ) | | | (2,567,693 | ) | | | (3,392,452 | ) | | | (9,863,252 | ) | | | 579,116 | |
| | | | | | | |
| | (61,680,516) | | | | (120,383,491 | ) | | | 6,126,832 | | | | 2,108,933 | | | | 2,900,318 | | | | 6,915,634 | | | | (999,651 | ) | | | 3,356,846 | |
| | | | | | | | |
| | (175,406,151) | | | | (38,025,772 | ) | | | 3,979,353 | | | | 1,925,080 | | | | 262,679 | | | | 3,563,625 | | | | (10,194,787 | ) | | | 5,477,458 | |
| | | | | | | |
| | (3,798,269) | | | | (8,284,202 | ) | | | (5,074 | ) | | | (21,413 | ) | | | — | | | | (298 | ) | | | (3,282 | ) | | | (127,832 | ) |
| | (92,251) | | | | (166,264 | ) | | | (1 | ) | | | (1,074 | ) | | | — | | | | — | | | | (1,619 | ) | | | (4,994 | ) |
| | (50,955,560) | | | | (78,738,421 | ) | | | (371,295 | ) | | | (1,732,228 | ) | | | — | | | | (27,129 | ) | | | (500,203 | ) | | | (1,394,737 | ) |
| | | | | | | | | | | | | | | | | | | | | | | | | | | | | | |
| | (54,846,080) | | | | (87,188,887 | ) | | | (376,370 | ) | | | (1,754,715 | ) | | | — | | | | (27,427 | ) | | | (505,104 | ) | | | (1,527,563 | ) |
| | | | | | | |
| | — | | | | — | | | | — | | | | (466 | ) | | | — | | | | (265 | ) | | | — | | | | — | |
| | — | | | | — | | | | — | | | | (21 | ) | | | — | | | | — | | | | — | | | | — | |
| | — | | | | — | | | | — | | | | (48,790) | | | | — | | | | (9,711 | ) | | | — | | | | — | |
| | | | | | | | | | | | | | | | | | | | | | | | | | | | | | |
| | | | | | | |
| | — | | | | — | | | | — | | | | (49,277 | ) | | | — | | | | (9,976 | ) | | | — | | | | — | |
| | | | | | | |
| | (75,756,615) | | | | 39,331,061 | | | | 1,134,178 | | | | (9,080 | ) | | | (796,542 | ) | | | (250,635 | ) | | | (6,309,348 | ) | | | (770,518 | ) |
| | | | | | | |
| | (447,021) | | | | 578,876 | | | | (11,998 | ) | | | 966 | | | | (29,307 | ) | | | (148,936 | ) | | | 21,190 | | | | (117,171 | ) |
| | | | | | | |
| | (539,244,421) | | | | 615,030,356 | | | | 56,642,518 | | | | 2,939,947 | | | | (19,289,930 | ) | | | (9,506,974 | ) | | | (17,352,141 | ) | | | (567,809 | ) |
| | | | | | | | | | | | | | | | | | | | | | | | | | | | | | |
| | | | | | | |
| | (615,448,057) | | | | 654,940,293 | | | | 57,764,698 | | | | 2,931,833 | | | | (20,115,779 | ) | | | (9,906,545 | ) | | | (23,640,299 | ) | | | (1,455,498 | ) |
| | | | | | | | |
| | (845,700,288) | | | | 529,725,634 | | | | 61,367,681 | | | | 3,052,921 | | | | (19,853,100 | ) | | | (6,380,323 | ) | | | (34,340,190 | ) | | | 2,494,397 | |
| | | | | | | | |
| | 1,308,604,307 | | | | 778,878,673 | | | | 20,723,902 | | | | 17,670,981 | | | | 27,794,957 | | | | 34,175,280 | | | | 88,336,345 | | | | 85,841,948 | |
| | $ 462,904,019 | | | | $1,308,604,307 | | | | $82,091,583 | | | | $20,723,902 | | | | $ 7,941,857 | | | | $27,794,957 | | | | $ 53,996,155 | | | | $88,336,345 | |
See accompanying notes to the financial statements.
30
ASHMORE FUNDS
STATEMENTS OF CHANGES IN NET ASSETS
For the Fiscal Years Ended October 31,
| | | | | | | | | | | | | | | | | | | | |
| | | Ashmore Emerging Markets Equity Fund | | | Ashmore Emerging Markets Equity ESG Fund1 | | Ashmore Emerging Markets Short Duration
Select Fund2 | | Ashmore Emerging Markets Investment Grade Income Fund3 |
| | | 2020 | | | 2019 | | 2020 | | 2020 | | 2020 |
OPERATIONS: | | | | | | | | | | | | | | | | | | | | |
| | | | | |
Net investment income (loss) | | | $ 96,813 | | | | $ 187,250 | | | | $ 6,911 | | | | $ 161,496 | | | | $ 66,420 | |
| | | | | |
Net realized gain (loss) | | | 2,265,729 | | | | (1,282,131 | ) | | | (167,455 | ) | | | 32,938 | | | | (4,491 | ) |
| | | | | |
Net change in unrealized appreciation (depreciation) | | | 14,726,903 | | | | 7,114,444 | | | | 2,224,950 | | | | 152,075 | | | | (287,186 | ) |
Net Increase (Decrease) in Net Assets Resulting from Operations | | | 17,089,445 | | | | 6,019,563 | | | | 2,064,406 | | | | 346,509 | | | | (225,257 | ) |
| | | | | |
DISTRIBUTIONS TO SHAREHOLDERS: | | | | | | | | | | | | | | | | | | | | |
| | | | | |
Class A | | | (1,806 | ) | | | (12,365 | ) | | | — | | | | (15 | ) | | | (3 | ) |
| | | | | |
Class C | | | — | | | | (21 | ) | | | — | | | | (12 | ) | | | (3 | ) |
| | | | | |
Institutional Class | | | (193,458) | | | | (760,397 | ) | | | (351 | ) | | | (162,219 | ) | | | (67,537 | ) |
Total Distributions to Shareholders | | | (195,264 | ) | | | (772,783 | ) | | | (351 | ) | | | (162,246 | ) | | | (67,543 | ) |
| | | | | |
FUND SHARE TRANSACTIONS: | | | | | | | | | | | | | | | | | | | | |
| | | | | |
Net increase (decrease) in net assets resulting from Class A share transactions | | | 470,474 | | | | 264,418 | | | | 1,000 | | | | 1,012 | | | | 1,002 | |
| | | | | |
Net increase (decrease) in net assets resulting from Class C share transactions | | | 2 | | | | 19 | | | | 1,002 | | | | 1,010 | | | | 1,002 | |
| | | | | |
Net increase (decrease) in net assets resulting from Institutional Class share transactions | | | 30,763,046 | | | | 5,675,604 | | | | 9,998,296 | | | | 10,132,367 | | | | 20,050,098 | |
| | | | | |
Net Increase (Decrease) in Net Assets Resulting from Fund Share Transactions | | | 31,233,522 | | | | 5,940,041 | | | | 10,000,298 | | | | 10,134,389 | | | | 20,052,102 | |
Total Increase (Decrease) in Net Assets | | | 48,127,703 | | | | 11,186,821 | | | | 12,064,353 | | | | 10,318,652 | | | | 19,759,302 | |
NET ASSETS: | | | | | | | | | | | | | | | | | | | | |
| | | | | |
Net Assets at the Beginning of year | | | 35,652,849 | | | | 24,466,028 | | | | — | | | | — | | | | — | |
Net Assets at the End of year | | | $83,780,552 | | | | $35,652,849 | | | | $12,064,353 | | | | $10,318,652 | | | | $19,759,302 | |
| 1 | The Fund commenced investment operations on February, 26, 2020. |
| 2 | The Fund commenced investment operations on June 15, 2020. |
| 3 | The Fund commenced investment operations on September 17, 2020. |
See accompanying notes to the financial statements.
31
ASHMORE FUNDS
FINANCIAL HIGHLIGHTS
Ashmore Emerging Markets Total Return Fund
| | | | | | | | | | | | | | | | | | | | |
| | | | | | | | | Class A | | | | | | | |
| | | | | |
| | | Year Ended
October 31,
2020 | | | Year Ended
October 31,
2019 | | | Year Ended
October 31,
2018 | | | Year Ended
October 31,
2017 | | | Year Ended
October 31,
2016 | |
| | | | |
Net asset value at beginning of year | | $ | 7.54 | | | $ | 7.31 | | | $ | 8.22 | | | $ | 8.01 | | | $ | 7.49 | |
| | | | | |
Income (loss) from investment operations: | | | | | | | | | | | | | | | | | | | | |
| | | | | |
Net investment income | | | 0.34 | | | | 0.40 | | | | 0.36 | 1 | | | 0.56 | 1 | | | 0.58 | 1 |
| | | | | |
Net realized and unrealized gain (loss) | | | (0.74 | ) | | | 0.24 | | | | (0.82 | ) | | | 0.15 | | | | 0.49 | |
| |
| | | | |
| | | | | |
Total from investment operations | | | (0.40 | ) | | | 0.64 | | | | (0.46 | ) | | | 0.71 | | | | 1.07 | |
| | | | | |
Less distributions: | | | | | | | | | | | | | | | | | | | | |
| | | | | |
From net investment income | | | (0.12 | ) | | | (0.33 | ) | | | (0.16 | ) | | | (0.50 | ) | | | (0.33 | ) |
| | | | | |
From net realized gain | | | — | | | | — | | | | (0.11 | ) | | | — | | | | — | |
| | | | | |
Tax return of capital | | | (0.22 | ) | | | (0.08 | ) | | | (0.18 | ) | | | — | | | | (0.22 | ) |
| | | | |
| | | | | |
Total distributions | | | (0.34 | ) | | | (0.41 | ) | | | (0.45 | ) | | | (0.50 | ) | | | (0.55 | ) |
| | | | |
| | | | | |
Net asset value at end of year | | $ | 6.80 | | | $ | 7.54 | | | $ | 7.31 | | | $ | 8.22 | | | $ | 8.01 | |
| | | | |
| | | | | |
Total return2 | | | (5.31 | )% | | | 8.68 | % | | | (5.65 | )% | | | 9.12 | % | | | 15.15 | % |
| | | | | |
Portfolio turnover rate3 | | | 67 | % | | | 49 | % | | | 66 | % | | | 65 | % | | | 91 | % |
| | | | | |
Net assets, end of year (in thousands) | | $ | 10,377 | | | $ | 11,108 | | | $ | 8,347 | | | $ | 18,231 | | | $ | 3,445 | |
| | | | | |
Ratios to average net assets: | | | | | | | | | | | | | | | | | | | | |
| | | | | |
Total expenses to average net assets: | | | | | | | | | | | | | | | | | | | | |
| | | | | |
Total expenses before reimbursements | | | 1.42 | %4 | | | 1.36 | % | | | 1.36 | % | | | 1.37 | % | | | 1.41 | % |
| | | | | |
Total expenses after reimbursements | | | 1.32 | %4 | | | 1.27 | % | | | 1.27 | % | | | 1.27 | % | | | 1.27 | % |
| | | | | |
Net investment income to average net assets: | | | | | | | | | | | | | | | | | | | | |
| | | | | |
Net investment income before reimbursements | | | 4.72 | %4 | | | 5.16 | % | | | 4.42 | % | | | 6.81 | % | | | 7.48 | % |
| | | | | |
Net investment income after reimbursements | | | 4.82 | %4 | | | 5.25 | % | | | 4.51 | % | | | 6.91 | % | | | 7.62 | % |
See accompanying notes to the financial statements.
32
ASHMORE FUNDS
FINANCIAL HIGHLIGHTS
Ashmore Emerging Markets Total Return Fund
| | | | | | | | | | | | | | | | | | | | |
| | | | | | | | | Class C | | | | | | | |
| | | | | |
| | | Year Ended
October 31,
2020 | | | Year Ended
October 31,
2019 | | | Year Ended
October 31,
2018 | | | Year Ended
October 31,
2017 | | | Year Ended
October 31,
2016 | |
| | | | |
Net asset value at beginning of year | | $ | 7.53 | | | $ | 7.29 | | | $ | 8.21 | | | $ | 8.00 | | | $ | 7.48 | |
| | | | | |
Income (loss) from investment operations: | | | | | | | | | | | | | | | | | | | | |
| | | | | |
Net investment income | | | 0.30 | | | | 0.34 | | | | 0.31 | 1 | | | 0.46 | 1 | | | 0.53 | 1 |
| | | | | |
Net realized and unrealized gain (loss) | | | (0.76 | ) | | | 0.25 | | | | (0.83 | ) | | | 0.19 | | | | 0.49 | |
| |
| | | | |
| | | | | |
Total from investment operations | | | (0.46 | ) | | | 0.59 | | | | (0.52 | ) | | | 0.65 | | | | 1.02 | |
| | | | | |
Less distributions: | | | | | | | | | | | | | | | | | | | | |
| | | | | |
From net investment income | | | (0.11 | ) | | | (0.28 | ) | | | (0.14 | ) | | | (0.44 | ) | | | (0.30 | ) |
| | | | | |
From net realized gain | | | — | | | | — | | | | (0.11 | ) | | | — | | | | — | |
| | | | | |
Tax return of capital | | | (0.18 | ) | | | (0.07 | ) | | | (0.15 | ) | | | — | | | | (0.20 | ) |
| | | | |
| | | | | |
Total distributions | | | (0.29 | ) | | | (0.35 | ) | | | (0.40 | ) | | | (0.44 | ) | | | (0.50 | ) |
| | | | |
Net asset value at end of year | | $ | 6.78 | | | $ | 7.53 | | | $ | 7.29 | | | $ | 8.21 | | | $ | 8.00 | |
| | | | |
| | | | | |
Total return2 | | | (6.09 | )% | | | 8.02 | % | | | (6.43 | )% | | | 8.31 | % | | | 14.32 | % |
| | | | | |
Portfolio turnover rate3 | | | 67 | % | | | 49 | % | | | 66 | % | | | 65 | % | | | 91 | % |
| | | | | |
Net assets, end of year (in thousands) | | $ | 3,905 | | | $ | 5,506 | | | $ | 4,278 | | | $ | 3,926 | | | $ | 2,451 | |
| | | | | |
Ratios to average net assets: | | | | | | | | | | | | | | | | | | | | |
| | | | | |
Total expenses to average net assets: | | | | | | | | | | | | | | | | | | | | |
| | | | | |
Total expenses before reimbursements | | | 2.17 | %5 | | | 2.11 | % | | | 2.12 | % | | | 2.12 | % | | | 2.15 | % |
| | | | | |
Total expenses after reimbursements | | | 2.06 | %5 | | | 2.02 | % | | | 2.02 | % | | | 2.02 | % | | | 2.02 | % |
| | | | | |
Net investment income to average net assets: | | | | | | | | | | | | | | | | | | | | |
| | | | | |
Net investment income before reimbursements | | | 4.01 | %5 | | | 4.41 | % | | | 3.92 | % | | | 5.59 | % | | | 6.79 | % |
| | | | | |
Net investment income after reimbursements | | | 4.12 | %5 | | | 4.50 | % | | | 4.02 | % | | | 5.69 | % | | | 6.92 | % |
See accompanying notes to the financial statements.
33
ASHMORE FUNDS
FINANCIAL HIGHLIGHTS
Ashmore Emerging Markets Total Return Fund
| | | | | | | | | | | | | | | | | | | | |
| | | | | | | | | Institutional Class | | | | | | | |
| | | | | |
| | | Year Ended
October 31, 2020 | | | Year Ended
October 31, 2019 | | | Year Ended
October 31, 2018 | | | Year Ended
October 31, 2017 | | | Year Ended
October 31, 2016 | |
| | | | |
Net asset value at beginning of year | | $ | 7.65 | | | $ | 7.41 | | | $ | 8.34 | | | $ | 8.13 | | | $ | 7.60 | |
| | | | | |
Income (loss) from investment operations: | | | | | | | | | | | | | | | | | | | | |
| | | | | |
Net investment income | | | 0.36 | | | | 0.44 | | | | 0.40 | 1 | | | 0.55 | 1 | | | 0.61 | 1 |
| | | | | |
Net realized and unrealized gain (loss) | | | (0.75 | ) | | | 0.24 | | | | (0.85 | ) | | | 0.19 | | | | 0.50 | |
| |
| | | | |
| | | | | |
Total from investment operations | | | (0.39 | ) | | | 0.68 | | | �� | (0.45 | ) | | | 0.74 | | | | 1.11 | |
| | | | | |
Less distributions: | | | | | | | | | | | | | | | | | | | | |
| | | | | |
From net investment income | | | (0.13 | ) | | | (0.35 | ) | | | (0.17 | ) | | | (0.53 | ) | | | (0.35 | ) |
| | | | | |
From net realized gain | | | — | | | | — | | | | (0.11 | ) | | | — | | | | — | |
| | | | | |
Tax return of capital | | | (0.23 | ) | | | (0.09 | ) | | | (0.20 | ) | | | — | | | | (0.23 | ) |
| | | | |
| | | | | |
Total distributions | | | (0.36 | ) | | | (0.44 | ) | | | (0.48 | ) | | | (0.53 | ) | | | (0.58 | ) |
| | | | |
Net asset value at end of year | | $ | 6.90 | | | $ | 7.65 | | | $ | 7.41 | | | $ | 8.34 | | | $ | 8.13 | |
| | | | |
| | | | | |
Total return2 | | | (5.09 | )% | | | 9.04 | % | | | (5.53 | )% | | | 9.36 | % | | | 15.49 | % |
| | | | | |
Portfolio turnover rate3 | | | 67 | % | | | 49 | % | | | 66 | % | | | 65 | % | | | 91 | % |
| | | | | |
Net assets, end of year (in thousands) | | $ | 1,229,181 | | | $ | 1,528,196 | | | $ | 1,313,660 | | | $ | 1,110,901 | | | $ | 808,872 | |
| | | | | |
Ratios to average net assets: | | | | | | | | | | | | | | | | | | | | |
| | | | | |
Total expenses to average net assets: | | | | | | | | | | | | | | | | | | | | |
| | | | | |
Total expenses before reimbursements | | | 1.17 | %6 | | | 1.11 | % | | | 1.12 | % | | | 1.12 | % | | | 1.16 | % |
| | | | | |
Total expenses after reimbursements | | | 1.07 | %6 | | | 1.02 | % | | | 1.02 | % | | | 1.02 | % | | | 1.02 | % |
| | | | | |
Net investment income to average net assets: | | | | | | | | | | | | | | | | | | | | |
| | | | | |
Net investment income before reimbursements | | | 4.99 | %6 | | | 5.40 | % | | | 4.97 | % | | | 6.60 | % | | | 7.77 | % |
| | | | | |
Net investment income after reimbursements | | | 5.09 | %6 | | | 5.49 | % | | | 5.07 | % | | | 6.70 | % | | | 7.91 | % |
| 1 | Per share amounts are based on average number of shares outstanding during the period. |
| 2 | Assumes investment at net asset value at the beginning of the year, reinvestment of all distributions at net asset value on distribution date, and a complete redemption of the investment at net asset value at the end of the year, excluding the impact of sales charges. |
| 3 | The portfolio turnover rate is calculated by dividing the lesser of cost of purchases or proceeds from sales of long term portfolio securities, including fully funded total return swaps, by the monthly average of the value of the long term portfolio securities. |
| 4 | Ratios include legal expenses of $5,146 that are outside of the expense cap under the expense limitation agreement. Expense ratios would have been lower by 0.05% and Net investment income ratios would have been higher by 0.05% excluding these expenses. |
| 5 | Ratios include legal expenses of $1,990 that are outside of the expense cap under the expense limitation agreement. Expense ratios would have been lower by 0.04% and Net investment income ratios would have been higher by 0.04% excluding these expenses. |
| 6 | Ratios include legal expenses of $640,665 that are outside of the expense cap under the expense limitation agreement. Expense ratios would have been lower by 0.05% and Net investment income ratios would have been higher by 0.05% excluding these expenses. |
See accompanying notes to the financial statements.
34
ASHMORE FUNDS
FINANCIAL HIGHLIGHTS
Ashmore Emerging Markets Local Currency Bond Fund
| | | | | | | | | | | | | | | | | | | | |
| | | | | | | | | Class A | | | | | | | |
| | | | | |
| | | Year Ended
October 31,
2020 | | | Year Ended
October 31,
2019 | | | Year Ended
October 31,
2018 | | | Year Ended
October 31,
2017 | | | Year Ended
October 31,
2016 | |
| | | | |
Net asset value at beginning of year | | $ | 7.35 | | | $ | 6.53 | | | $ | 7.22 | | | $ | 7.06 | | | $ | 6.57 | |
| | | | | |
Income (loss) from investment operations: | | | | | | | | | | | | | | | | | | | | |
| | | | | |
Net investment income | | | 0.35 | 1 | | | 0.59 | | | | 0.36 | | | | 0.34 | 1 | | | 0.30 | 1 |
| | | | | |
Net realized and unrealized gain (loss) | | | (0.75 | ) | | | 0.27 | | | | (0.88 | ) | | | 0.14 | | | | 0.49 | |
| | | | |
| | | | | |
Total from investment operations | | | (0.40 | ) | | | 0.86 | | | | (0.52 | ) | | | 0.48 | | | | 0.79 | |
| | | | | |
Less distributions: | | | | | | | | | | | | | | | | | | | | |
| | | | | |
From net investment income | | | — | | | | — | | | | (0.08 | ) | | | (0.09 | ) | | | — | |
| | | | | |
From net realized gain | | | — | | | | — | | | | — | | | | — | | | | — | |
| | | | | |
Tax return of capital | | | (0.09 | ) | | | (0.04 | ) | | | (0.09 | ) | | | (0.23 | ) | | | (0.30 | ) |
| | | | |
| | | | | |
Total distributions | | | (0.09 | ) | | | (0.04 | ) | | | (0.17 | ) | | | (0.32 | ) | | | (0.30 | ) |
| | | | |
Net asset value at end of year | | $ | 6.86 | | | $ | 7.35 | | | $ | 6.53 | | | $ | 7.22 | | | $ | 7.06 | |
| | | | |
| | | | | |
Total return2 | | | (5.51 | )% | | | 13.24 | % | | | (7.47 | )% | | | 6.83 | % | | | 12.37 | % |
| | | | | |
Portfolio turnover rate3 | | | 47 | % | | | 56 | % | | | 75 | % | | | 68 | % | | | 83 | % |
| | | | | |
Net assets, end of year (in thousands) | | $ | 1,755 | | | $ | 1,933 | | | $ | 1,259 | | | $ | 915 | | | $ | 841 | |
| | | | | |
Ratios to average net assets: | | | | | | | | | | | | | | | | | | | | |
| | | | | |
Total expenses to average net assets: | | | | | | | | | | | | | | | | | | | | |
| | | | | |
Total expenses before reimbursements | | | 1.75 | % | | | 1.55 | % | | | 1.57 | % | | | 1.51 | % | | | 1.55 | % |
| | | | | |
Total expenses after reimbursements | | | 1.22 | % | | | 1.22 | % | | | 1.22 | % | | | 1.22 | % | | | 1.22 | % |
| | | | | |
Net investment income to average net assets: | | | | | | | | | | | | | | | | | | | | |
| | | | | |
Net investment income before reimbursements | | | 4.45 | % | | | 5.08 | % | | | 4.63 | % | | | 4.37 | % | | | 4.10 | % |
| | | | | |
Net investment income after reimbursements | | | 4.98 | % | | | 5.41 | % | | | 4.98 | % | | | 4.66 | % | | | 4.43 | % |
See accompanying notes to the financial statements.
35
ASHMORE FUNDS
FINANCIAL HIGHLIGHTS
Ashmore Emerging Markets Local Currency Bond Fund
| | | | | | | | | | | | | | | | | | | | |
| | | | | | | | | Class C | | | | | | | |
| | | | | |
| | | Year Ended
October 31,
2020 | | | Year Ended
October 31,
2019 | | | Year Ended
October 31,
2018 | | | Year Ended
October 31,
2017 | | | Year Ended
October 31,
2016 | |
| | | | |
Net asset value at beginning of year | | $ | 7.27 | | | $ | 6.47 | | | $ | 7.18 | | | $ | 7.05 | | | $ | 6.56 | |
| | | | | |
Income (loss) from investment operations: | | | | | | | | | | | | | | | | | | | | |
| | | | | |
Net investment income | | | 0.29 | 1 | | | 0.34 | | | | 0.30 | | | | 0.28 | 1 | | | 0.25 | 1 |
| | | | | |
Net realized and unrealized gain (loss) | | | (0.74 | ) | | | 0.47 | | | | (0.88 | ) | | | 0.15 | | | | 0.49 | |
| | | | |
| | | | | |
Total from investment operations | | | (0.45 | ) | | | 0.81 | | | | (0.58 | ) | | | 0.43 | | | | 0.74 | |
| | | | | |
Less distributions: | | | | | | | | | | | | | | | | | | | | |
| | | | | |
From net investment income | | | — | | | | — | | | | (0.07 | ) | | | (0.09 | ) | | | — | |
| | | | | |
From net realized gain | | | — | | | | — | | | | — | | | | — | | | | — | |
| | | | | |
Tax return of capital | | | (0.08 | ) | | | (0.01 | ) | | | (0.06 | ) | | | (0.21 | ) | | | (0.25 | ) |
| | | | |
| | | | | |
Total distributions | | | (0.08 | ) | | | (0.01 | ) | | | (0.13 | ) | | | (0.30 | ) | | | (0.25 | ) |
| | | | |
Net asset value at end of year | | $ | 6.74 | | | $ | 7.27 | | | $ | 6.47 | | | $ | 7.18 | | | $ | 7.05 | |
| | | | |
| | | | | |
Total return2 | | | (6.25 | )% | | | 12.54 | % | | | (8.24 | )% | | | 6.05 | % | | | 11.75 | % |
| | | | | |
Portfolio turnover rate3 | | | 47 | % | | | 56 | % | | | 75 | % | | | 68 | % | | | 83 | % |
| | | | | |
Net assets, end of year (in thousands) | | $ | 30 | | | $ | 55 | | | $ | 77 | | | $ | 98 | | | $ | 70 | |
| | | | | |
Ratios to average net assets: | | | | | | | | | | | | | | | | | | | | |
| | | | | |
Total expenses to average net assets: | | | | | | | | | | | | | | | | | | | | |
| | | | | |
Total expenses before reimbursements | | | 2.50 | % | | | 2.29 | % | | | 2.31 | % | | | 2.26 | % | | | 2.30 | % |
| | | | | |
Total expenses after reimbursements | | | 1.97 | % | | | 1.97 | % | | | 1.97 | % | | | 1.97 | % | | | 1.97 | % |
| | | | | |
Net investment income to average net assets: | | | | | | | | | | | | | | | | | | | | |
| | | | | |
Net investment income before reimbursements | | | 3.77 | % | | | 4.33 | % | | | 3.85 | % | | | 3.62 | % | | | 3.35 | % |
| | | | | |
Net investment income after reimbursements | | | 4.30 | % | | | 4.65 | % | | | 4.19 | % | | | 3.91 | % | | | 3.68 | % |
See accompanying notes to the financial statements.
36
ASHMORE FUNDS
FINANCIAL HIGHLIGHTS
Ashmore Emerging Markets Local Currency Bond Fund
| | | | | | | | | | | | | | | | | | | | |
| | | | | | | | | Institutional Class | | | | | | | |
| | | | | |
| | | Year Ended
October 31,
2020 | | | Year Ended
October 31,
2019 | | | Year Ended
October 31, 2018 | | | Year Ended
October 31,
2017 | | | Year Ended
October 31,
2016 | |
| | | | |
Net asset value at beginning of year | | $ | 7.66 | | | $ | 6.79 | | | $ | 7.50 | | | $ | 7.31 | | | $ | 6.80 | |
| | | | | |
Income (loss) from investment operations: | | | | | | | | | | | | | | | | | | | | |
| | | | | |
Net investment income | | | 0.38 | 1 | | | 0.65 | | | | 0.41 | | | | 0.37 | 1 | | | 0.33 | 1 |
| | | | | |
Net realized and unrealized gain (loss) | | | (0.78 | ) | | | 0.27 | | | | (0.94 | ) | | | 0.15 | | | | 0.51 | |
| | | | |
| | | | | |
Total from investment operations | | | (0.40 | ) | | | 0.92 | | | | (0.53 | ) | | | 0.52 | | | | 0.84 | |
| | | | | |
Less distributions: | | | | | | | | | | | | | | | | | | | | |
| | | | | |
From net investment income | | | — | | | | — | | | | (0.09 | ) | | | (0.09 | ) | | | — | |
| | | | | |
From net realized gain | | | — | | | | — | | | | — | | | | — | | | | — | |
| | | | | |
Tax return of capital | | | (0.10 | ) | | | (0.05 | ) | | | (0.09 | ) | | | (0.24 | ) | | | (0.33 | ) |
| | | | |
| | | | | |
Total distributions | | | (0.10 | ) | | | (0.05 | ) | | | (0.18 | ) | | | (0.33 | ) | | | (0.33 | ) |
| | | | |
Net asset value at end of year | | $ | 7.16 | | | $ | 7.66 | | | $ | 6.79 | | | $ | 7.50 | | | $ | 7.31 | |
| | | | |
| | | | | |
Total return2 | | | (5.38 | )% | | | 13.59 | % | | | (7.33 | )% | | | 7.12 | % | | | 12.69 | % |
| | | | | |
Portfolio turnover rate3 | | | 47 | % | | | 56 | % | | | 75 | % | | | 68 | % | | | 83 | % |
| | | | | |
Net assets, end of year (in thousands) | | $ | 28,257 | | | $ | 42,545 | | | $ | 63,009 | | | $ | 84,747 | | | $ | 80,803 | |
| | | | | |
Ratios to average net assets: | | | | | | | | | | | | | | | | | | | | |
| | | | | |
Total expenses to average net assets: | | | | | | | | | | | | | | | | | | | | |
| | | | | |
Total expenses before reimbursements | | | 1.50 | % | | | 1.28 | % | | | 1.32 | % | | | 1.26 | % | | | 1.30 | % |
| | | | | |
Total expenses after reimbursements | | | 0.97 | % | | | 0.97 | % | | | 0.97 | % | | | 0.97 | % | | | 0.97 | % |
| | | | | |
Net investment income to average net assets: | | | | | | | | | | | | | | | | | | | | |
| | | | | |
Net investment income before reimbursements | | | 4.75 | % | | | 5.31 | % | | | 4.87 | % | | | 4.62 | % | | | 4.35 | % |
| | | | | |
Net investment income after reimbursements | | | 5.28 | % | | | 5.62 | % | | | 5.22 | % | | | 4.91 | % | | | 4.68 | % |
| 1 | Per share amounts are based on average number of shares outstanding during the period. |
| 2 | Assumes investment at net asset value at the beginning of the year, reinvestment of all distributions at net asset value on distribution date, and a complete redemption of the investment at net asset value at the end of the year, excluding the impact of sales charges. |
| 3 | The portfolio turnover rate is calculated by dividing the lesser of cost of purchases or proceeds from sales of long term portfolio securities, including fully funded total return swaps, by the monthly average of the value of the long term portfolio securities. |
See accompanying notes to the financial statements.
37
ASHMORE FUNDS
FINANCIAL HIGHLIGHTS
Ashmore Emerging Markets Corporate Income Fund
| | | | | | | | | | | | | | | | | | | | |
| | | | | | | | | Class A | | | | | | | |
| | | | | |
| | | Year Ended
October 31,
2020 | | | Year Ended
October 31,
2019 | | | Year Ended
October 31,
2018 | | | Year Ended
October 31,
2017 | | | Year Ended October 31, 2016 | |
| | | | |
Net asset value at beginning of year | | $ | 7.92 | | | $ | 7.87 | | | $ | 8.56 | | | $ | 7.92 | | | $ | 7.66 | |
| | | | | |
Income (loss) from investment operations: | | | | | | | | | | | | | | | | | | | | |
| | | | | |
Net investment income | | | 0.44 | | | | 0.52 | | | | 0.51 | | | | 0.57 | | | | 0.70 | |
| | | | | |
Net realized and unrealized gain (loss) | | | (0.39 | ) | | | 0.03 | | | | (0.71 | ) | | | 0.65 | | | | 0.21 | |
| | | | |
| | | | | |
Total from investment operations | | | 0.05 | | | | 0.55 | | | | (0.20 | ) | | | 1.22 | | | | 0.91 | |
| | | | | |
Less distributions: | | | | | | | | | | | | | | | | | | | | |
| | | | | |
From net investment income | | | (0.44 | ) | | | (0.50 | ) | | | (0.49 | ) | | | (0.56 | ) | | | (0.65 | ) |
| | | | | |
From net realized gain | | | — | | | | (— | )1 | | | — | | | | — | | | | — | |
| | | | | |
Tax return of capital | | | (— | )1 | | | — | | | | — | | | | (0.02 | ) | | | — | |
| | | | |
| | | | | |
Total distributions | | | (0.44 | ) | | | (0.50 | ) | | | (0.49 | ) | | | (0.58 | ) | | | (0.65 | ) |
| | | | |
Net asset value at end of year | | $ | 7.53 | | | $ | 7.92 | | | $ | 7.87 | | | $ | 8.56 | | | $ | 7.92 | |
| | | | |
| | | | | |
Total return2 | | | 0.85 | % | | | 7.37 | % | | | (2.58 | )% | | | 15.99 | % | | | 12.92 | % |
| | | | | |
Portfolio turnover rate3 | | | 117 | % | | | 96 | % | | | 88 | % | | | 87 | % | | | 81 | % |
| | | | | |
Net assets, end of year (in thousands) | | $ | 11,198 | | | $ | 13,383 | | | $ | 8,616 | | | $ | 11,995 | | | $ | 11,466 | |
| | | | | |
Ratios to average net assets: | | | | | | | | | | | | | | | | | | | | |
| | | | | |
Total expenses to average net assets: | | | | | | | | | | | | | | | | | | | | |
| | | | | |
Total expenses before reimbursements | | | 1.58 | %4 | | | 1.51 | % | | | 1.53 | % | | | 1.52 | % | | | 1.57 | % |
| | | | | |
Total expenses after reimbursements | | | 1.47 | %4 | | | 1.42 | % | | | 1.42 | % | | | 1.42 | % | | | 1.42 | % |
| | | | | |
Net investment income to average net assets: | | | | | | | | | | | | | | | | | | | | |
| | | | | |
Net investment income before reimbursements | | | 5.76 | %4 | | | 6.39 | % | | | 6.09 | % | | | 7.11 | % | | | 8.88 | % |
| | | | | |
Net investment income after reimbursements | | | 5.87 | %4 | | | 6.48 | % | | | 6.20 | % | | | 7.21 | % | | | 9.03 | % |
See accompanying notes to the financial statements.
38
ASHMORE FUNDS
FINANCIAL HIGHLIGHTS
Ashmore Emerging Markets Corporate Income Fund
| | | | | | | | | | | | | | | | | | | | |
| | | | | | | | | Class C | | | | | | | |
| | | | | |
| | | Year Ended
October 31,
2020 | | | Year Ended
October 31,
2019 | | | Year Ended
October 31,
2018 | | | Year Ended
October 31,
2017 | | | Year Ended
October 31,
2016 | |
| | | | |
Net asset value at beginning of year | | $ | 7.91 | | | $ | 7.86 | | | $ | 8.55 | | | $ | 7.91 | | | $ | 7.66 | |
| | | | | |
Income (loss) from investment operations: | | | | | | | | | | | | | | | | | | | | |
| | | | | |
Net investment income | | | 0.39 | | | | 0.45 | | | | 0.46 | | | | 0.52 | | | | 0.63 | |
| | | | | |
Net realized and unrealized gain (loss) | | | (0.40 | ) | | | 0.04 | | | | (0.72 | ) | | | 0.63 | | | | 0.22 | |
| | | | |
| | | | | |
Total from investment operations | | | (0.01 | ) | | | 0.49 | | | | (0.26 | ) | | | 1.15 | | | | 0.85 | |
| | | | | |
Less distributions: | | | | | | | | | | | | | | | | | | | | |
| | | | | |
From net investment income | | | (0.39 | ) | | | (0.44 | ) | | | (0.43 | ) | | | (0.50 | ) | | | (0.60 | ) |
| | | | | |
From net realized gain | | | — | | | | (— | )1 | | | — | | | | — | | | | — | |
| | | | | |
Tax return of capital | | | (— | )1 | | | — | | | | — | | | | (0.01 | ) | | | — | |
| | | | |
| | | | | |
Total distributions | | | (0.39 | ) | | | (0.44 | ) | | | (0.43 | ) | | | (0.51 | ) | | | (0.60 | ) |
| | | | |
Net asset value at end of year | | $ | 7.51 | | | $ | 7.91 | | | $ | 7.86 | | | $ | 8.55 | | | $ | 7.91 | |
| | | | |
| | | | | |
Total return2 | | | (0.01 | )% | | | 6.58 | % | | | (3.30 | )% | | | 15.16 | % | | | 11.99 | % |
| | | | | |
Portfolio turnover rate3 | | | 117 | % | | | 96 | % | | | 88 | % | | | 87 | % | | | 81 | % |
| | | | | |
Net assets, end of year (in thousands) | | $ | 7,466 | | | $ | 10,745 | | | $ | 8,785 | | | $ | 9,530 | | | $ | 6,010 | |
| | | | | |
Ratios to average net assets: | | | | | | | | | | | | | | | | | | | | |
| | | | | |
Total expenses to average net assets: | | | | | | | | | | | | | | | | | | | | |
| | | | | |
Total expenses before reimbursements | | | 2.33 | %5 | | | 2.26 | % | | | 2.29 | % | | | 2.27 | % | | | 2.32 | % |
| | | | | |
Total expenses after reimbursements | | | 2.22 | %5 | | | 2.17 | % | | | 2.17 | % | | | 2.17 | % | | | 2.17 | % |
| | | | | |
Net investment income to average net assets: | | | | | | | | | | | | | | | | | | | | |
| | | | | |
Net investment income before reimbursements | | | 5.01 | %5 | | | 5.65 | % | | | 5.38 | % | | | 6.40 | % | | | 8.16 | % |
| | | | | |
Net investment income after reimbursements | | | 5.12 | %5 | | | 5.74 | % | | | 5.50 | % | | | 6.50 | % | | | 8.31 | % |
See accompanying notes to the financial statements.
39
ASHMORE FUNDS
FINANCIAL HIGHLIGHTS
Ashmore Emerging Markets Corporate Income Fund
| | | | | | | | | | | | | | | | | | | | |
| | | | | | | | | Institutional Class | | | | | | | |
| | | | | |
| | | Year Ended
October 31,
2020 | | | Year Ended
October 31,
2019 | | | Year Ended
October 31, 2018 | | | Year Ended
October 31,
2017 | | | Year Ended
October 31, 2016 | |
| | | | |
Net asset value at beginning of year | | $ | 8.25 | | | $ | 8.20 | | | $ | 8.92 | | | $ | 8.24 | | | $ | 7.98 | |
| | | | | |
Income (loss) from investment operations: | | | | | | | | | | | | | | | | | | | | |
| | | | | |
Net investment income | | | 0.48 | | | | 0.55 | | | | 0.56 | | | | 0.62 | | | | 0.72 | |
| | | | | |
Net realized and unrealized gain (loss) | | | (0.41 | ) | | | 0.04 | | | | (0.75 | ) | | | 0.68 | | | | 0.24 | |
| | | | |
| | | | | |
Total from investment operations | | | 0.07 | | | | 0.59 | | | | (0.19 | ) | | | 1.30 | | | | 0.96 | |
| | | | | |
Less distributions: | | | | | | | | | | | | | | | | | | | | |
| | | | | |
From net investment income | | | (0.48 | ) | | | (0.54 | ) | | | (0.53 | ) | | | (0.60 | ) | | | (0.70 | ) |
| | | | | |
From net realized gain | | | — | | | | (— | )1 | | | — | | | | — | | | | — | |
| | | | | |
Tax return of capital | | | (— | )1 | | | — | | | | — | | | | (0.02 | ) | | | — | |
| | | | |
| | | | | |
Total distributions | | | (0.48 | ) | | | (0.54 | ) | | | (0.53 | ) | | | (0.62 | ) | | | (0.70 | ) |
| | | | |
Net asset value at end of year | | $ | 7.84 | | | $ | 8.25 | | | $ | 8.20 | | | $ | 8.92 | | | $ | 8.24 | |
| | | | |
| | | | | |
Total return2 | | | 1.04 | % | | | 7.61 | % | | | (2.34 | )% | | | 16.45 | % | | | 13.02 | % |
| | | | | |
Portfolio turnover rate3 | | | 117 | % | | | 96 | % | | | 88 | % | | | 87 | % | | | 81 | % |
| | | | | |
Net assets, end of year (in thousands) | | $ | 261,307 | | | $ | 443,880 | | | $ | 319,419 | | | $ | 338,434 | | | $ | 215,990 | |
| | | | | |
Ratios to average net assets: | | | | | | | | | | | | | | | | | | | | |
| | | | | |
Total expenses to average net assets: | | | | | | | | | | | | | | | | | | | | |
| | | | | |
Total expenses before reimbursements | | | 1.32 | %6 | | | 1.26 | % | | | 1.29 | % | | | 1.27 | % | | | 1.32 | % |
| | | | | |
Total expenses after reimbursements | | | 1.21 | %6 | | | 1.17 | % | | | 1.17 | % | | | 1.17 | % | | | 1.17 | % |
| | | | | |
Net investment income to average net assets: | | | | | | | | | | | | | | | | | | | | |
| | | | | |
Net investment income before reimbursements | | | 6.00 | %6 | | | 6.66 | % | | | 6.40 | % | | | 7.34 | % | | | 9.20 | % |
| | | | | |
Net investment income after reimbursements | | | 6.11 | %6 | | | 6.75 | % | | | 6.52 | % | | | 7.44 | % | | | 9.35 | % |
| 1 | Amount is less than $0.005 per share. |
| 2 | Assumes investment at net asset value at the beginning of the year, reinvestment of all distributions at net asset value on distribution date, and a complete redemption of the investment at net asset value at the end of the year, excluding the impact of sales charges. |
| 3 | The portfolio turnover rate is calculated by dividing the lesser of cost of purchases or proceeds from sales of long term portfolio securities by the monthly average of the value of the long term portfolio securities. |
| 4 | Ratios include legal expenses of $6,538 that are outside of the expense cap under the expense limitation agreement. Expense ratios would have been lower by 0.05% and Net investment income ratios would have been higher by 0.05% excluding these expenses. |
| 5 | Ratios include legal expenses of $4,394 that are outside of the expense cap under the expense limitation agreement. Expense ratios would have been lower by 0.05% and Net investment income ratios would have been higher by 0.05% excluding these expenses. |
| 6 | Ratios include legal expenses of $153,663 that are outside of the expense cap under the expense limitation agreement. Expense ratios would have been lower by 0.04% and Net investment income ratios would have been higher by 0.04% excluding these expenses. |
See accompanying notes to the financial statements.
40
ASHMORE FUNDS
FINANCIAL HIGHLIGHTS
Ashmore Emerging Markets Short Duration Fund
| | | | | | | | | | | | | | | | | | | | |
| | | | | | | | | Class A | | | | | | | |
| | | | | |
| | | Year Ended October 31, 2020 | | | Year Ended October 31, 2019 | | | Year Ended October 31, 2018 | | | Year Ended October 31, 2017 | | | Year Ended October 31, 2016 | |
| | | | |
Net asset value at beginning of year | | $ | 9.00 | | | $ | 9.78 | | | $ | 10.60 | | | $ | 10.37 | | | $ | 9.57 | |
| | | | | |
Income (loss) from investment operations: | | | | | | | | | | | | | | | | | | | | |
| | | | | |
Net investment income | | | 0.46 | | | | 0.68 | | | | 0.55 | | | | 0.83 | 1 | | | 1.02 | |
| | | | | |
Net realized and unrealized gain (loss) | | | (1.46 | ) | | | (0.75 | ) | | | (0.58 | ) | | | 0.34 | | | | 0.78 | |
| | | | |
| | | | | |
Total from investment operations | | | (1.00 | ) | | | (0.07 | ) | | | (0.03 | ) | | | 1.17 | | | | 1.80 | |
| | | | | |
Less distributions: | | | | | | | | | | | | | | | | | | | | |
| | | | | |
From net investment income | | | (0.48 | ) | | | (0.68 | ) | | | (0.57 | ) | | | (0.80 | ) | | | (1.00 | ) |
| | | | | |
From net realized gain | | | — | | | | (0.03 | ) | | | (0.22 | ) | | | (0.14 | ) | | | — | |
| | | | | |
Tax return of capital | | | — | | | | — | | | | — | | | | — | | | | — | |
| | | | |
| | | | | |
Total distributions | | | (0.48 | ) | | | (0.71 | ) | | | (0.79 | ) | | | (0.94 | ) | | | (1.00 | ) |
| | | | |
| | | | | |
Net asset value at end of year | | $ | 7.52 | | | $ | 9.00 | | | $ | 9.78 | | | $ | 10.60 | | | $ | 10.37 | |
| | | | |
| | | | | |
Total return2 | | | (11.25 | )% | | | (1.22 | )% | | | (0.12 | )% | | | 12.04 | % | | | 19.82 | % |
| | | | | |
Portfolio turnover rate3 | | | 80 | % | | | 53 | % | | | 37 | % | | | 59 | % | | | 73 | % |
| | | | | |
Net assets, end of year (in thousands) | | $ | 19,865 | | | $ | 110,771 | | | $ | 83,290 | | | $ | 10,178 | | | $ | 10,395 | |
| | | | | |
Ratios to average net assets:4 | | | | | | | | | | | | | | | | | | | | |
Total expenses to average net assets: | | | | | | | | | | | | | | | | | | | | |
| | | | | |
Total expenses before reimbursements | | | 1.13 | %5 | | | 1.00 | % | | | 1.05 | % | | | 1.05 | % | | | 1.11 | % |
| | | | | |
Total expenses after reimbursements | | | 0.99 | %5 | | | 0.92 | % | | | 0.92 | % | | | 0.92 | % | | | 0.92 | % |
| | | | | |
Net investment income to average net assets: | | | | | | | | | | | | | | | | | | | | |
| | | | | |
Net investment income before reimbursements | | | 7.07 | %5 | | | 6.74 | % | | | 7.00 | % | | | 7.83 | % | | | 10.63 | % |
| | | | | |
Net investment income after reimbursements | | | 7.21 | %5 | | | 6.82 | % | | | 7.13 | % | | | 7.96 | % | | | 10.82 | % |
See accompanying notes to the financial statements.
41
ASHMORE FUNDS
FINANCIAL HIGHLIGHTS
Ashmore Emerging Markets Short Duration Fund
| | | | | | | | | | | | | | | | |
| | | | | | Class C | | | | |
| | | | |
| | | Year Ended October 31, 2020 | | | Year Ended October 31, 2019 | | | Year Ended October 31, 2018 | | | Period Ended October 31, 20176 | |
| | | | |
Net asset value at beginning of period | | $ | 8.66 | | | $ | 9.41 | | | $ | 10.22 | | | $ | 10.00 | |
| | | | |
Income (loss) from investment operations: | | | | | | | | | | | | | | | | |
| | | | |
Net investment income | | | 0.42 | | | | 0.58 | | | | 0.52 | | | | 0.38 | 1 |
| | | | |
Net realized and unrealized gain (loss) | | | (1.45 | ) | | | (0.72 | ) | | | (0.64 | ) | | | 0.08 | |
| | | | |
| | | | |
Total from investment operations | | | (1.03 | ) | | | (0.14 | ) | | | (0.12 | ) | | | 0.46 | |
| | | | |
Less distributions: | | | | | | | | | | | | | | | | |
| | | | |
From net investment income | | | (0.41 | ) | | | (0.58 | ) | | | (0.47 | ) | | | (0.24 | ) |
| | | | |
From net realized gain | | | — | | | | (0.03 | ) | | | (0.22 | ) | | | — | |
| | | | |
Tax return of capital | | | — | | | | — | | | | — | | | | — | |
| | | | |
| | | | |
Total distributions | | | (0.41 | ) | | | (0.61 | ) | | | (0.69 | ) | | | (0.24 | ) |
| | | | |
| | | | |
Net asset value at end of period | | $ | 7.22 | | | $ | 8.66 | | | $ | 9.41 | | | $ | 10.22 | |
| | | | |
| | | | |
Total return2 | | | (12.05 | )% | | | (1.94 | )% | | | (0.98 | )% | | | 4.74 | % |
| | | | |
Portfolio turnover rate3 | | | 80 | % | | | 53 | % | | | 37 | % | | | 59 | % |
| | | | |
Net assets, end of period (in thousands) | | $ | 1,572 | | | $ | 2,342 | | | $ | 2,012 | | | $ | 188 | |
| | | | |
Ratios to average net assets:4 | | | | | | | | | | | | | | | | |
| | | | |
Total expenses to average net assets: | | | | | | | | | | | | | | | | |
| | | | |
Total expenses before reimbursements | | | 1.96 | %7 | | | 1.75 | % | | | 1.79 | % | | | 1.79 | % |
| | | | |
Total expenses after reimbursements | | | 1.83 | %7 | | | 1.67 | % | | | 1.67 | % | | | 1.67 | % |
| | | | |
Net investment income to average net assets: | | | | | | | | | | | | | | | | |
| | | | |
Net investment income before reimbursements | | | 5.20 | %7 | | | 5.96 | % | | | 5.93 | % | | | 9.66 | % |
| | | | |
Net investment income after reimbursements | | | 5.33 | %7 | | | 6.04 | % | | | 6.05 | % | | | 9.78 | % |
See accompanying notes to the financial statements.
42
ASHMORE FUNDS
FINANCIAL HIGHLIGHTS
Ashmore Emerging Markets Short Duration Fund
| | | | | | | | | | | | | | | | | | | | |
| | | | | | Institutional Class | | | | |
| | | | | |
| | | Year Ended
October 31, 2020 | | | Year Ended October 31, 2019 | | | Year Ended October 31, 2018 | | | Year Ended October 31, 2017 | | | Year Ended October 31, 2016 | |
| | | | |
Net asset value at beginning of year | | $ | 8.83 | | | $ | 9.60 | | | $ | 10.41 | | | $ | 10.19 | | | $ | 9.40 | |
| | | | | |
Income (loss) from investment operations: | | | | | | | | | | | | | | | | | | | | |
| | | | | |
Net investment income | | | 0.49 | | | | 0.69 | | | | 0.60 | | | | 0.90 | 1 | | | 1.07 | |
| | | | | |
Net realized and unrealized gain (loss) | | | (1.44 | ) | | | (0.74 | ) | | | (0.61 | ) | | | 0.27 | | | | 0.72 | |
| | | | |
| | | | | |
Total from investment operations | | | (0.95 | ) | | | (0.05 | ) | | | (0.01 | ) | | | 1.17 | | | | 1.79 | |
| | | | | |
Less distributions: | | | | | | | | | | | | | | | | | | | | |
| | | | | |
From net investment income | | | (0.48 | ) | | | (0.69 | ) | | | (0.58 | ) | | | (0.81 | ) | | | (1.00 | ) |
| | | | | |
From net realized gain | | | — | | | | (0.03 | ) | | | (0.22 | ) | | | (0.14 | ) | | | — | |
| | | | | |
Tax return of capital | | | — | | | | — | | | | — | | | | — | | | | — | |
| | | | |
| | | | | |
Total distributions | | | (0.48 | ) | | | (0.72 | ) | | | (0.80 | ) | | | (0.95 | ) | | | (1.00 | ) |
| | | | |
Net asset value at end of year | | $ | 7.40 | | | $ | 8.83 | | | $ | 9.60 | | | $ | 10.41 | | | $ | 10.19 | |
| | | | |
| | | | | |
Total return2 | | | (10.94 | )% | | | (1.01 | )% | | | 0.11 | % | | | 12.28 | % | | | 20.18 | % |
| | | | | |
Portfolio turnover rate3 | | | 80 | % | | | 53 | % | | | 37 | % | | | 59 | % | | | 73 | % |
| | | | | |
Net assets, end of year (in thousands) | | $ | 441,467 | | | $ | 1,195,492 | | | $ | 693,577 | | | $ | 178,180 | | | $ | 120,081 | |
| | | | | |
Ratios to average net assets:4 | | | | | | | | | | | | | | | | | | | | |
| | | | | |
Total expenses to average net assets: | | | | | | | | | | | | | | | | | | | | |
| | | | | |
Total expenses before reimbursements | | | 0.91 | %8 | | | 0.75 | % | | | 0.79 | % | | | 0.80 | % | | | 0.89 | % |
| | | | | |
Total expenses after reimbursements | | | 0.79 | %8 | | | 0.67 | % | | | 0.67 | % | | | 0.67 | % | | | 0.67 | % |
| | | | | |
Net investment income to average net assets: | | | | | | | | | | | | | | | | | | | | |
| | | | | |
Net investment income before reimbursements | | | 6.98 | %8 | | | 7.04 | % | | | 7.30 | % | | | 8.64 | % | | | 11.66 | % |
| | | | | |
Net investment income after reimbursements | | | 7.10 | %8 | | | 7.12 | % | | | 7.42 | % | | | 8.77 | % | | | 11.88 | % |
| 1 | Per share amounts are based on average number of shares outstanding during the period. |
| 2 | Assumes investment at net asset value at the beginning of the period, reinvestment of distributions at net asset value on distribution date, and a complete redemption of the investment at net asset value at the end of the period, excluding the impact of sales charges. Total return is not annualized for periods less than one year. |
| 3 | The portfolio turnover rate is calculated by dividing the lesser of cost of purchases or proceeds from sales of long term portfolio securities by the monthly average of the value of the long term portfolio securities. Portfolio turnover is not annualized for periods less than one year. |
| 4 | Annualized for periods less than one year. |
| 5 | Ratios include legal expenses of $37,676 that are outside of the expense cap under the expense limitation agreement. Expense ratios would have been lower by 0.07% and Net investment income ratios would have been higher by 0.07% excluding these expenses. |
| 6 | Class C commenced investment operations on June 13, 2017. |
| 7 | Ratios include legal expenses of $2,841 that are outside of the expense cap under the expense limitation agreement. Expense ratios would have been lower by 0.16% and Net investment income ratios would have been higher by 0.16% excluding these expenses. |
| 8 | Ratios include legal expenses of $835,457 that are outside of the expense cap under the expense limitation agreement. Expense ratios would have been lower by 0.12% and Net investment income ratios would have been higher by 0.12% excluding these expenses. |
See accompanying notes to the financial statements.
43
ASHMORE FUNDS
FINANCIAL HIGHLIGHTS
Ashmore Emerging Markets Active Equity Fund
| | | | | | | | | | | | | | | | |
| | | Class A | |
| | | | |
| | | Year Ended October 31, 2020 | | | Year Ended October 31,
2019 | | | Year Ended October 31, 2018 | | | Period Ended October 31, 20171 | |
| | | | |
Net asset value at beginning of period | | $ | 10.46 | | | $ | 10.53 | | | $ | 12.72 | | | $ | 10.00 | |
| | | | |
Income (loss) from investment operations: | | | | | | | | | | | | | | | | |
| | | | |
Net investment income | | | 0.11 | 2 | | | 0.13 | | | | 0.08 | | | | 0.03 | |
| | | | |
Net realized and unrealized gain (loss) | | | 0.56 | | | | 0.85 | | | | (1.05 | ) | | | 2.74 | |
| | | | |
| | | | |
Total from investment operations | | | 0.67 | | | | 0.98 | | | | (0.97 | ) | | | 2.77 | |
| | | | |
Less distributions: | | | | | | | | | | | | | | | | |
| | | | |
From net investment income | | | (0.05 | ) | | | (0.09 | ) | | | (0.20 | ) | | | (0.05 | ) |
| | | | |
From net realized gain | | | — | | | | (0.94 | ) | | | (1.02 | ) | | | — | |
| | | | |
Tax return of capital | | | — | | | | (0.02 | ) | | | — | | | | — | |
| | | | |
| | | | |
Total distributions | | | (0.05 | ) | | | (1.05 | ) | | | (1.22 | ) | | | (0.05 | ) |
| | | | |
Net asset value at end of period | | $ | 11.08 | | | $ | 10.46 | | | $ | 10.53 | | | $ | 12.72 | |
| | | | |
| | | | |
Total return3 | | | 6.49 | % | | | 10.73 | % | | | (8.59 | )% | | | 27.73 | % |
| | | | |
Portfolio turnover rate4 | | | 228 | % | | | 153 | % | | | 164 | % | | | 196 | % |
| | | | |
Net assets, end of period (in thousands) | | $ | 1,616 | | | $ | 209 | | | $ | 223 | | | $ | 13 | |
| | | | |
Ratios to average net assets: | | | | | | | | | | | | | | | | |
| | | | |
Total expenses to average net assets: | | | | | | | | | | | | | | | | |
| | | | |
Total expenses before reimbursements | | | 1.55 | % | | | 1.96 | % | | | 2.20 | % | | | 3.11 | % |
| | | | |
Total expenses after reimbursements | | | 1.27 | % | | | 1.27 | % | | | 1.27 | % | | | 1.27 | % |
| | | | |
Net investment income (loss) to average net assets: | | | | | | | | | | | | | | | | |
| | | | |
Net investment income (loss) before reimbursements | | | 0.73 | % | | | 0.55 | % | | | 0.56 | % | | | (1.56 | )% |
| | | | |
Net investment income after reimbursements | | | 1.01 | % | | | 1.24 | % | | | 1.49 | % | | | 0.28 | % |
See accompanying notes to the financial statements.
44
ASHMORE FUNDS
FINANCIAL HIGHLIGHTS
Ashmore Emerging Markets Active Equity Fund
| | | | | | | | | | | | | | | | |
| | | Class C | |
| | | | |
| | | Year Ended October 31, 2020 | | | Year Ended October 31, 2019 | | | Year Ended October 31, 2018 | | | Period Ended October 31, 20171 | |
| | | | |
Net asset value at beginning of period | | $ | 10.32 | | | $ | 10.43 | | | $ | 12.65 | | | $ | 10.00 | |
| | | | |
Income (loss) from investment operations: | | | | | | | | | | | | | | | | |
| | | | |
Net investment income (loss) | | | — | 2,5 | | | 0.07 | | | | 0.03 | | | | (0.05 | ) |
| | | | |
Net realized and unrealized gain (loss) | | | 0.58 | | | | 0.83 | | | | (1.10 | ) | | | 2.74 | |
| | | | |
| | | | |
Total from investment operations | | | 0.58 | | | | 0.90 | | | | (1.07 | ) | | | 2.69 | |
| | | | |
Less distributions: | | | | | | | | | | | | | | | | |
| | | | |
From net investment income | | | (— | )5 | | | (0.05 | ) | | | (0.13 | ) | | | (0.04 | ) |
| | | | |
From net realized gain | | | — | | | | (0.94 | ) | | | (1.02 | ) | | | — | |
| | | | |
Tax return of capital | | | — | | | | (0.02 | ) | | | — | | | | — | |
| | | | |
| | | | |
Total distributions | | | — | | | | (1.01 | ) | | | (1.15 | ) | | | (0.04 | ) |
| | | | |
| | | | |
Net asset value at end of period | | $ | 10.90 | | | $ | 10.32 | | | $ | 10.43 | | | $ | 12.65 | |
| | | | |
| | | | |
Total return3 | | | 5.76 | % | | | 9.88 | % | | | (9.40 | )% | | | 26.96 | % |
| | | | |
Portfolio turnover rate4 | | | 228 | % | | | 153 | % | | | 164 | % | | | 196 | % |
| | | | |
Net assets, end of period (in thousands) | | $ | 2 | | | $ | 12 | | | $ | 11 | | | $ | 13 | |
| | | | |
Ratios to average net assets: | | | | | | | | | | | | | | | | |
| | | | |
Total expenses to average net assets: | | | | | | | | | | | | | | | | |
| | | | |
Total expenses before reimbursements | | | 2.31 | % | | | 2.71 | % | | | 2.73 | % | | | 3.86 | % |
| | | | |
Total expenses after reimbursements | | | 2.02 | % | | | 2.02 | % | | | 2.02 | % | | | 2.02 | % |
| | | | |
Net investment income (loss) to average net assets: | | | | | | | | | | | | | | | | |
| | | | |
Net investment loss before reimbursements | | | (0.30 | )% | | | (0.17 | )% | | | (0.51 | )% | | | (2.31 | )% |
| | | | |
Net investment income (loss) after reimbursements | | | (0.01 | )% | | | 0.52 | % | | | 0.20 | % | | | (0.47 | )% |
See accompanying notes to the financial statements.
45
ASHMORE FUNDS
FINANCIAL HIGHLIGHTS
Ashmore Emerging Markets Active Equity Fund
| | | | | | | | | | | | | | | | |
| | | Institutional Class | |
| | | | |
| | | Year Ended October 31, 2020 | | | Year Ended October 31, 2019 | | | Year Ended October 31, 2018 | | | Period Ended October 31, 20171 | |
| | | | |
Net asset value at beginning of period | | $ | 10.51 | | | $ | 10.56 | | | $ | 12.74 | | | $ | 10.00 | |
| | | | |
Income (loss) from investment operations: | | | | | | | | | | | | | | | | |
| | | | |
Net investment income | | | 0.10 | 2 | | | 0.16 | | | | 0.14 | | | | 0.06 | |
| | | | |
Net realized and unrealized gain (loss) | | | 0.60 | | | | 0.86 | | | | (1.09 | ) | | | 2.73 | |
| | | | |
| | | | |
Total from investment operations | | | 0.70 | | | | 1.02 | | | | (0.95 | ) | | | 2.79 | |
| | | | |
Less distributions: | | | | | | | | | | | | | | | | |
| | | | |
From net investment income | | | (0.06 | ) | | | (0.10 | ) | | | (0.21 | ) | | | (0.05 | ) |
| | | | |
From net realized gain | | | — | | | | (0.94 | ) | | | (1.02 | ) | | | — | |
| | | | |
Tax return of capital | | | — | | | | (0.03 | ) | | | — | | | | — | |
| | | | |
| | | | |
Total distributions | | | (0.06 | ) | | | (1.07 | ) | | | (1.23 | ) | | | (0.05 | ) |
| | | | |
| | | | |
Net asset value at end of period | | $ | 11.15 | | | $ | 10.51 | | | $ | 10.56 | | | $ | 12.74 | |
| | | | |
| | | | |
Total return3 | | | 6.79 | % | | | 11.05 | % | | | (8.41 | )% | | | 27.94 | % |
| | | | |
Portfolio turnover rate4 | | | 228 | % | | | 153 | % | | | 164 | % | | | 196 | % |
| | | | |
Net assets, end of period (in thousands) | | $ | 80,474 | | | $ | 20,502 | | | $ | 17,436 | | | $ | 18,030 | |
| | | | |
Ratios to average net assets: | | | | | | | | | | | | | | | | |
| | | | |
Total expenses to average net assets: | | | | | | | | | | | | | | | | |
| | | | |
Total expenses before reimbursements | | | 1.29 | % | | | 1.72 | % | | | 1.73 | % | | | 2.87 | % |
| | | | |
Total expenses after reimbursements | | | 1.02 | % | | | 1.02 | % | | | 1.02 | % | | | 1.02 | % |
| | | | |
Net investment income (loss) to average net assets: | | | | | | | | | | | | | | | | |
| | | | |
Net investment income (loss) before reimbursements | | | 0.67 | % | | | 0.83 | % | | | 0.47 | % | | | (1.28 | )% |
| | | | |
Net investment income after reimbursements | | | 0.94 | % | | | 1.53 | % | | | 1.18 | % | | | 0.57 | % |
| 1 | Class A, Class C and the Institutional Class commenced investment operations on November 1, 2016. |
| 2 | Per share amounts are based on average number of shares outstanding during the period. |
| 3 | Assumes investment at net asset value at the beginning of the period, reinvestment of distributions at net asset value on distribution date, and a complete redemption of the investment at net asset value at the end of the period, excluding the impact of sales charges. Total return is not annualized for periods less than one year. |
| 4 | The portfolio turnover rate is calculated by dividing the lesser of cost of purchases or proceeds from sales of long term portfolio securities by the monthly average of the value of the long term portfolio securities. Portfolio turnover is not annualized for periods less than one year. |
| 5 | Amount is less than $0.005 per share. |
See accompanying notes to the financial statements.
46
ASHMORE FUNDS
FINANCIAL HIGHLIGHTS
Ashmore Emerging Markets Small-Cap Equity Fund
| | | | | | | | | | | | | | | | | | | | |
| | | Class A | |
| | | | | |
| | | Year Ended October 31, 2020 | | | Year Ended October 31, 2019 | | | Year Ended October 31, 2018 | | | Year Ended October 31, 2017 | | | Year Ended October 31, 2016 | |
| | | | |
Net asset value at beginning of year | | | $ 8.84 | | | | $ 8.02 | | | | $ 10.33 | | | | $ 8.60 | | | | $ 7.92 | |
| | | | | |
Income (loss) from investment operations: | | | | | | | | | | | | | | | | | | | | |
| | | | | |
Net investment income (loss) | | | (0.20 | ) | | | (0.01 | ) | | | 0.04 | | | | 0.06 | | | | (0.01 | ) |
| | | | | |
Net realized and unrealized gain (loss) | | | 2.35 | | | | 0.83 | | | | (2.17 | ) | | | 1.86 | | | | 0.85 | |
| | | | |
| | | | | |
Total from investment operations | | | 2.15 | | | | 0.82 | | | | (2.13 | ) | | | 1.92 | | | | 0.84 | |
| | | | | |
Less distributions: | | | | | | | | | | | | | | | | | | | | |
| | | | | |
From net investment income | | | — | | | | (— | )1 | | | (0.17 | ) | | | (0.19 | ) | | | (0.16 | ) |
| | | | | |
From net realized gain | | | — | | | | — | | | | — | | | | — | | | | — | |
| | | | | |
Tax return of capital | | | — | | | | (— | )1 | | | (0.01 | ) | | | — | | | | — | |
| | | | |
| | | | | |
Total distributions | | | — | | | | — | | | | (0.18 | ) | | | (0.19 | ) | | | (0.16 | ) |
| | | | |
Net asset value at end of year | | | $10.99 | | | | $ 8.84 | | | | $ 8.02 | | | | $ 10.33 | | | | $ 8.60 | |
| | | | |
| | | | | |
Total return2 | | | 24.32 | % | | | 10.27 | % | | | (20.96 | )% | | | 22.73 | % | | | 10.84 | % |
| | | | | |
Portfolio turnover rate3 | | | 62 | % | | | 60 | % | | | 112 | % | | | 126 | % | | | 104 | % |
| | | | | |
Net assets, end of year (in thousands) | | | $ 388 | | | | $1,356 | | | | $ 1,447 | | | | $ 847 | | | | $ 524 | |
| | | | | |
Ratios to average net assets: | | | | | | | | | | | | | | | | | | | | |
| | | | | |
Total expenses to average net assets: | | | | | | | | | | | | | | | | | | | | |
| | | | | |
Total expenses before reimbursements | | | 2.78 | % | | | 2.30 | % | | | 2.37 | % | | | 2.26 | % | | | 2.39 | % |
| | | | | |
Total expenses after reimbursements | | | 1.77 | % | | | 1.77 | % | | | 1.77 | % | | | 1.77 | % | | | 1.77 | % |
| | | | | |
Net investment income (loss) to average net assets: | | | | | | | | | | | | | | | | | | | | |
| | | | | |
Net investment income (loss) before reimbursements | | | (1.74 | )% | | | (0.62 | )% | | | (0.31 | )% | | | 0.01 | % | | | (0.09 | )% |
| | | | | |
Net investment income (loss) after reimbursements | | | (0.73 | )% | | | (0.09 | )% | | | 0.29 | % | | | 0.50 | % | | | 0.53 | % |
See accompanying notes to the financial statements.
47
ASHMORE FUNDS
FINANCIAL HIGHLIGHTS
Ashmore Emerging Markets Small-Cap Equity Fund
| | | | | | | | | | | | | | | | | | | | |
| | | Class C | |
| | | | | |
| | | Year Ended October 31, 2020 | | | Year Ended October 31, 2019 | | | Year Ended October 31, 2018 | | | Year Ended October 31, 2017 | | | Year Ended October 31, 2016 | |
| | | | |
Net asset value at beginning of year | | | $ 9.22 | | | | $ 8.42 | | | | $ 10.90 | | | | $ 9.11 | | | | $ 8.40 | |
| | | | | |
Income (loss) from investment operations: | | | | | | | | | | | | | | | | | | | | |
| | | | | |
Net investment income (loss) | | | (0.34 | ) | | | (0.38 | ) | | | 0.01 | | | | 0.02 | | | | (0.12 | ) |
| | | | | |
Net realized and unrealized gain (loss) | | | 2.52 | | | | 1.18 | | | | (2.33 | ) | | | 1.93 | | | | 0.95 | |
| | | | |
| | | | | |
Total from investment operations | | | 2.18 | | | | 0.80 | | | | (2.32 | ) | | | 1.95 | | | | 0.83 | |
| | | | | |
Less distributions: | | | | | | | | | | | | | | | | | | | | |
| | | | | |
From net investment income | | | — | | | | — | | | | (0.16 | ) | | | (0.16 | ) | | | (0.12 | ) |
| | | | | |
From net realized gain | | | — | | | | — | | | | — | | | | — | | | | — | |
| | | | | |
Tax return of capital | | | — | | | | — | | | | — | 1 | | | — | | | | — | |
| | | | |
| | | | | |
Total distributions | | | — | | | | — | | | | (0.16 | ) | | | (0.16 | ) | | | (0.12 | ) |
| | | | |
| | | | | |
Net asset value at end of year | | | $11.40 | | | | $ 9.22 | | | | $ 8.42 | | | | $10.90 | | | | $ 9.11 | |
| | | | |
| | | | | |
Total return2 | | | 23.64 | % | | | 9.50 | % | | | (21.62 | )% | | | 21.78 | % | | | 10.01 | % |
| | | | | |
Portfolio turnover rate3 | | | 62 | % | | | 60 | % | | | 112 | % | | | 126 | % | | | 104 | % |
| | | | | |
Net assets, end of year (in thousands) | | | $ 135 | | | | $ 144 | | | | $ 272 | | | | $ 251 | | | | $ 176 | |
| | | | | |
Ratios to average net assets: | | | | | | | | | | | | | | | | | | | | |
| | | | | |
Total expenses to average net assets: | | | | | | | | | | | | | | | | | | | | |
| | | | | |
Total expenses before reimbursements | | | 3.91 | % | | | 3.05 | % | | | 3.09 | % | | | 3.01 | % | | | 3.13 | % |
| | | | | |
Total expenses after reimbursements | | | 2.52 | % | | | 2.52 | % | | | 2.52 | % | | | 2.52 | % | | | 2.52 | % |
| | | | | |
Net investment loss to average net assets: | | | | | | | | | | | | | | | | | | | | |
| | | | | |
Net investment loss before reimbursements | | | (2.70 | )% | | | (1.48 | )% | | | (1.30 | )% | | | (0.76 | )% | | | (0.89 | )% |
| | | | | |
Net investment loss after reimbursements | | | (1.31 | )% | | | (0.95 | )% | | | (0.73 | )% | | | (0.27 | )% | | | (0.28 | )% |
See accompanying notes to the financial statements.
48
ASHMORE FUNDS
FINANCIAL HIGHLIGHTS
Ashmore Emerging Markets Small-Cap Equity Fund
| | | | | | | | | | | | | | | | | | | | |
| | | Institutional Class | |
| | | | | |
| | | Year Ended October 31, 2020 | | | Year Ended October 31, 2019 | | | Year Ended October 31, 2018 | | | Year Ended October 31, 2017 | | | Year Ended October 31, 2016 | |
| | | | |
Net asset value at beginning of year | | | $11.39 | | | | $ 10.32 | | | | $ 13.19 | | | | $ 10.94 | | | | $ 10.01 | |
| | | | | |
Income (loss) from investment operations: | | | | | | | | | | | | | | | | | | | | |
| | | | | |
Net investment income (loss) | | | (0.10 | ) | | | 0.02 | | | | 0.05 | | | | 0.09 | | | | 0.04 | |
| | | | | |
Net realized and unrealized gain (loss) | | | 2.90 | | | | 1.06 | | | | (2.73 | ) | | | 2.36 | | | | 1.07 | |
| | | | |
| | | | | |
Total from investment operations | | | 2.80 | | | | 1.08 | | | | (2.68 | ) | | | 2.45 | | | | 1.11 | |
| | | | | |
Less distributions: | | | | | | | | | | | | | | | | | | | | |
| | | | | |
From net investment income | | | — | | | | (0.01 | ) | | | (0.18 | ) | | | (0.20 | ) | | | (0.18 | ) |
| | | | | |
From net realized gain | | | — | | | | — | | | | — | | | | — | | | | — | |
| | | | | |
Tax return of capital | | | — | | | | (— | )1 | | | (0.01 | ) | | | — | | | | — | |
| | | | |
| | | | | |
Total distributions | | | — | | | | (0.01 | ) | | | (0.19 | ) | | | (0.20 | ) | | | (0.18 | ) |
| | | | |
| | | | | |
Net asset value at end of year | | | $14.19 | | | | $ 11.39 | | | | $ 10.32 | | | | $ 13.19 | | | | $ 10.94 | |
| | | | |
| | | | | |
Total return2 | | | 24.58 | % | | | 10.52 | % | | | (20.60 | )% | | | 22.70 | % | | | 11.21 | % |
| | | | | |
Portfolio turnover rate3 | | | 62 | % | | | 60 | % | | | 112 | % | | | 126 | % | | | 104 | % |
| | | | | |
Net assets, end of year (in thousands) | | | $7,419 | | | | $26,296 | | | | $32,456 | | | | $38,419 | | | | $33,626 | |
| | | | | |
Ratios to average net assets: | | | | | | | | | | | | | | | | | | | | |
| | | | | |
Total expenses to average net assets: | | | | | | | | | | | | | | | | | | | | |
| | | | | |
Total expenses before reimbursements | | | 2.56 | % | | | 2.05 | % | | | 2.06 | % | | | 2.01 | % | | | 2.10 | % |
| | | | | |
Total expenses after reimbursements | | | 1.52 | % | | | 1.52 | % | | | 1.52 | % | | | 1.52 | % | | | 1.52 | % |
| | | | | |
Net investment income (loss) to average net assets: | | | | | | | | | | | | | | | | | | | | |
| | | | | |
Net investment income (loss) before reimbursements | | | (1.51 | )% | | | (0.38 | )% | | | (0.16 | )% | | | 0.18 | % | | | (0.22 | )% |
| | | | | |
Net investment income (loss) after reimbursements | | | (0.47 | )% | | | 0.15 | % | | | 0.38 | % | | | 0.67 | % | | | 0.36 | % |
| 1 | Amount is less than $0.005 per share. |
| 2 | Assumes investment at net asset value at the beginning of the year, reinvestment of all distributions at net asset value on distribution date, and a complete redemption of the investment at net asset value at the end of the year, excluding the impact of sales charges. |
| 3 | The portfolio turnover rate is calculated by dividing the lesser of cost of purchases or proceeds from sales of long term portfolio securities by the monthly average of the value of the long term portfolio securities. |
See accompanying notes to the financial statements.
49
ASHMORE FUNDS
FINANCIAL HIGHLIGHTS
Ashmore Emerging Markets Frontier Equity Fund
| | | | | | | | | | | | | | | | | | | | |
| | | Class A | |
| | | | | |
| | | Year Ended October 31, 2020 | | | Year Ended October 31, 2019 | | | Year Ended October 31, 2018 | | | Year Ended October 31, 2017 | | | Year Ended October 31, 2016 | |
| | | | |
Net asset value at beginning of year | | | $ 8.02 | | | | $ 7.66 | | | | $ 9.99 | | | | $ 7.98 | | | | $ 7.83 | |
| | | | | |
Income (loss) from investment operations: | | | | | | | | | | | | | | | | | | | | |
| | | | | |
Net investment income (loss) | | | (0.01 | )1 | | | 0.14 | | | | 0.08 | | | | 0.10 | | | | 0.36 | |
| | | | | |
Net realized and unrealized gain (loss) | | | (0.91 | ) | | | 0.37 | | | | (1.47 | ) | | | 2.08 | | | | (0.09 | ) |
| | | | |
| | | | | |
Total from investment operations | | | (0.92 | ) | | | 0.51 | | | | (1.39 | ) | | | 2.18 | | | | 0.27 | |
| | | | | |
Less distributions: | | | | | | | | | | | | | | | | | | | | |
| | | | | |
From net investment income | | | (0.03 | ) | | | (0.15 | ) | | | (0.08 | ) | | | (0.17 | ) | | | (0.12 | ) |
| | | | | |
From net realized gain | | | — | | | | — | | | | (0.82 | ) | | | — | | | | — | |
| | | | | |
Tax return of capital | | | — | | | | — | | | | (0.04 | ) | | | — | | | | — | |
| | | | |
| | | | | |
Total distributions | | | (0.03 | ) | | | (0.15 | ) | | | (0.94 | ) | | | (0.17 | ) | | | (0.12 | ) |
| | | | |
| | | | | |
Net asset value at end of year | | | $ 7.07 | | | | $ 8.02 | | | | $ 7.66 | | | | $ 9.99 | | | | $ 7.98 | |
| | | | |
| | | | | |
Total return2 | | | (11.47 | )% | | | 6.58 | % | | | (15.44 | )% | | | 27.53 | % | | | 3.36 | % |
| | | | | |
Portfolio turnover rate3 | | | 108 | % | | | 93 | % | | | 80 | % | | | 107 | % | | | 76 | % |
| | | | | |
Net assets, end of year (in thousands) | | | $ 656 | | | | $6,985 | | | | $ 7,645 | | | | $7,710 | | | | $2,154 | |
| | | | | |
Ratios to average net assets: | | | | | | | | | | | | | | | | | | | | |
| | | | | |
Total expenses to average net assets: | | | | | | | | | | | | | | | | | | | | |
| | | | | |
Total expenses before reimbursements | | | 2.18 | % | | | 2.12 | % | | | 2.20 | % | | | 2.21 | % | | | 2.45 | % |
| | | | | |
Total expenses after reimbursements | | | 1.77 | % | | | 1.77 | % | | | 1.77 | % | | | 1.77 | % | | | 1.77 | % |
| | | | | |
Net investment income (loss) to average net assets: | | | | | | | | | | | | | | | | | | | | |
| | | | | |
Net investment income (loss) before reimbursements | | | (0.59 | )% | | | 1.61 | % | | | 0.46 | % | | | 1.05 | % | | | 4.34 | % |
| | | | | |
Net investment income (loss) after reimbursements | | | (0.18 | )% | | | 1.96 | % | | | 0.89 | % | | | 1.49 | % | | | 5.02 | % |
See accompanying notes to the financial statements.
50
ASHMORE FUNDS
FINANCIAL HIGHLIGHTS
Ashmore Emerging Markets Frontier Equity Fund
| | | | | | | | | | | | | | | | | | | | |
| | | Class C | |
| | | | | |
| | | Year Ended October 31, 2020 | | | Year Ended October 31, 2019 | | | Year Ended October 31, 2018 | | | Year Ended October 31, 2017 | | | Year Ended October 31, 2016 | |
| | | | |
Net asset value at beginning of year | | | $ 7.80 | | | | $ 7.47 | | | | $ 9.82 | | | | $ 7.86 | | | | $ 7.73 | |
| | | | | |
Income (loss) from investment operations: | | | | | | | | | | | | | | | | | | | | |
| | | | | |
Net investment income | | | 0.01 | 1 | | | 0.02 | | | | 0.03 | | | | 0.08 | | | | 0.08 | |
| | | | | |
Net realized and unrealized gain (loss) | | | (0.96 | ) | | | 0.42 | | | | (1.48 | ) | | | 2.00 | | | | 0.12 | |
| |
| | | | |
| | | | | |
Total from investment operations | | | (0.95 | ) | | | 0.44 | | | | (1.45 | ) | | | 2.08 | | | | 0.20 | |
| | | | | |
Less distributions: | | | | | | | | | | | | | | | | | | | | |
| | | | | |
From net investment income | | | (0.03 | ) | | | (0.11 | ) | | | (0.05 | ) | | | (0.12 | ) | | | (0.07 | ) |
| | | | | |
From net realized gain | | | — | | | | — | | | | (0.82 | ) | | | — | | | | — | |
| | | | | |
Tax return of capital | | | — | | | | — | | | | (0.03 | ) | | | — | | | | — | |
| | | | |
| | | | | |
Total distributions | | | (0.03 | ) | | | (0.11 | ) | | | (0.90 | ) | | | (0.12 | ) | | | (0.07 | ) |
| | | | |
Net asset value at end of year | | | $ 6.82 | | | | $ 7.80 | | | | $ 7.47 | | | | $ 9.82 | | | | $ 7.86 | |
| | | | |
| | | | | |
Total return2 | | | (12.13 | )% | | | 5.87 | % | | | (16.30 | )% | | | 26.57 | % | | | 2.61 | % |
| | | | | |
Portfolio turnover rate3 | | | 108 | % | | | 93 | % | | | 80 | % | | | 107 | % | | | 76 | % |
| | | | | |
Net assets, end of year (in thousands) | | | $ 286 | | | | $ 305 | | | | $ 408 | | | | $ 459 | | | | $ 62 | |
| | | | | |
Ratios to average net assets: | | | | | | | | | | | | | | | | | | | | |
| | | | | |
Total expenses to average net assets: | | | | | | | | | | | | | | | | | | | | |
| | | | | |
Total expenses before reimbursements | | | 3.01 | % | | | 2.88 | % | | | 2.94 | % | | | 2.99 | % | | | 3.05 | % |
| | | | | |
Total expenses after reimbursements | | | 2.52 | % | | | 2.52 | % | | | 2.52 | % | | | 2.52 | % | | | 2.52 | % |
| | | | | |
Net investment income (loss) to average net assets: | | | | | | | | | | | | | | | | | | | | |
| | | | | |
Net investment income (loss) before reimbursements | | | (0.41 | )% | | | 0.48 | % | | | (0.18 | )% | | | (0.21 | )% | | | 0.39 | % |
| | | | | |
Net investment income after reimbursements | | | 0.08 | % | | | 0.84 | % | | | 0.24 | % | | | 0.26 | % | | | 0.92 | % |
See accompanying notes to the financial statements.
51
ASHMORE FUNDS
FINANCIAL HIGHLIGHTS
Ashmore Emerging Markets Frontier Equity Fund
| | | | | | | | | | | | | | | | | | | | |
| | | Institutional Class | |
| | | | | |
| | | Year Ended
October 31, 2020 | | | Year Ended
October 31,
2019 | | | Year Ended
October 31, 2018 | | | Year Ended
October 31,
2017 | | | Year Ended
October 31, 2016 | |
| | | | |
Net asset value at beginning of year | | | $ 9.32 | | | | $ 8.86 | | | | $ 11.38 | | | | $ 9.06 | | | | $ 8.88 | |
| | | | | |
Income (loss) from investment operations: | | | | | | | | | | | | | | | | | | | | |
| | | | | |
Net investment income | | | 0.09 | 1 | | | 0.16 | | | | 0.12 | | | | 0.13 | | | | 0.18 | |
| | | | | |
Net realized and unrealized gain (loss) | | | (1.13 | ) | | | 0.46 | | | | (1.69 | ) | | | 2.37 | | | | 0.13 | |
| | | | |
Total from investment operations | | | (1.04 | ) | | | 0.62 | | | | (1.57 | ) | | | 2.50 | | | | 0.31 | |
| | | | | |
Less distributions: | | | | | | | | | | | | | | | | | | | | |
| | | | | |
From net investment income | | | (0.08 | ) | | | (0.16 | ) | | | (0.08 | ) | | | (0.18 | ) | | | (0.13 | ) |
| | | | | |
From net realized gain | | | — | | | | — | | | | (0.82 | ) | | | — | | | | — | |
| | | | | |
Tax return of capital | | | — | | | | — | | | | (0.05 | ) | | | — | | | | — | |
| | | | |
| | | | | |
Total distributions | | | (0.08 | ) | | | (0.16 | ) | | | (0.95 | ) | | | (0.18 | ) | | | (0.13 | ) |
| | | | |
| | | | | |
Net asset value at end of year | | | $ 8.20 | | | | $ 9.32 | | | | $ 8.86 | | | | $ 11.38 | | | | $ 9.06 | |
| | | | |
| | | | | |
Total return2 | | | (11.17 | )% | | | 6.97 | % | | | (15.11 | )% | | | 27.87 | % | | | 3.58 | % |
| | | | | |
Portfolio turnover rate3 | | | 108 | % | | | 93 | % | | | 80 | % | | | 107 | % | | | 76 | % |
| | | | | |
Net assets, end of year (in thousands) | | | $53,053 | | | | $81,047 | | | | $77,788 | | | | $81,324 | | | | $52,711 | |
| | | | | |
Ratios to average net assets: | | | | | | | | | | | | | | | | | | | | |
Total expenses to average net assets: | | | | | | | | | | | | | | | | | | | | |
| | | | | |
Total expenses before reimbursements | | | 2.00 | % | | | 1.88 | % | | | 1.95 | % | | | 1.96 | % | | | 2.05 | % |
| | | | | |
Total expenses after reimbursements | | | 1.52 | % | | | 1.52 | % | | | 1.52 | % | | | 1.52 | % | | | 1.52 | % |
| | | | | |
Net investment income to average net assets: | | | | | | | | | | | | | | | | | | | | |
| | | | | |
Net investment income before reimbursements | | | 0.58 | % | | | 1.39 | % | | | 0.78 | % | | | 0.73 | % | | | 1.48 | % |
| | | | | |
Net investment income after reimbursements | | | 1.06 | % | | | 1.75 | % | | | 1.21 | % | | | 1.17 | % | | | 2.01 | % |
| 1 | Per share amounts are based on average number of shares outstanding during the period. |
| 2 | Assumes investment at net asset value at the beginning of the year, reinvestment of all distributions at net asset value on distribution date, and a complete redemption of the investment at net asset value at the end of the year, excluding the impact of sales charges. |
| 3 | The portfolio turnover rate is calculated by dividing the lesser of cost of purchases or proceeds from sales of long term portfolio securities by the monthly average of the value of the long term portfolio securities. |
See accompanying notes to the financial statements.
52
ASHMORE FUNDS
FINANCIAL HIGHLIGHTS
Ashmore Emerging Markets Equity Fund
| | | | | | | | | | | | | | | | | | | | |
| | | Class A | |
| | | | | |
| | | Year Ended October 31, 2020 | | | Year Ended October 31, 2019 | | | Year Ended October 31, 2018 | | | Year Ended October 31, 2017 | | | Year Ended October 31, 2016 | |
| | | | |
Net asset value at beginning of year | | | $11.18 | | | | $ 9.38 | | | | $ 11.16 | | | | $ 8.34 | | | | $ 7.29 | |
| | | | | |
Income (loss) from investment operations: | | | | | | | | | | | | | | | | | | | | |
| | | | | |
Net investment income | | | 0.08 | | | | 0.05 | | | | 0.01 | | | | 0.06 | 1 | | | 0.06 | |
| | | | | |
Net realized and unrealized gain (loss) | | | 1.84 | | | | 1.97 | | | | (1.55 | ) | | | 2.90 | | | | 1.05 | |
| | | | |
Total from investment operations | | | 1.92 | | | | 2.02 | | | | (1.54 | ) | | | 2.96 | | | | 1.11 | |
| | | | | |
Less distributions: | | | | | | | | | | | | | | | | | | | | |
| | | | | |
From net investment income | | | (0.02 | ) | | | (0.22 | ) | | | (0.23 | ) | | | (0.14 | ) | | | (0.06 | ) |
| | | | | |
From net realized gain | | | — | | | | — | | | | — | | | | — | | | | — | |
| | | | | |
Tax return of capital | | | — | | | | — | | | | (0.01 | ) | | | — | | | | — | |
| | | | |
| | | | | |
Total distributions | | | (0.02 | ) | | | (0.22 | ) | | | (0.24 | ) | | | (0.14 | ) | | | (0.06 | ) |
| | | | |
Net asset value at end of year | | | $13.08 | | | | $11.18 | | | | $ 9.38 | | | | $11.16 | | | | $ 8.34 | |
| | | | |
| | | | | |
Total return2 | | | 17.21 | % | | | 21.66 | % | | | (14.16 | )% | | | 35.90 | % | | | 15.36 | % |
| | | | | |
Portfolio turnover rate3 | | | 76 | % | | | 76 | % | | | 113 | % | | | 140 | % | | | 119 | % |
| | | | | |
Net assets, end of year (in thousands) | | | $1,394 | | | | $ 641 | | | | $ 303 | | | | $ 134 | | | | $ 36 | |
| | | | | |
Ratios to average net assets: | | | | | | | | | | | | | | | | | | | | |
| | | | | |
Total expenses to average net assets: | | | | | | | | | | | | | | | | | | | | |
| | | | | |
Total expenses before reimbursements | | | 1.81 | % | | | 1.91 | % | | | 2.19 | % | | | 2.65 | % | | | 2.96 | % |
| | | | | |
Total expenses after reimbursements | | | 1.42 | % | | | 1.42 | % | | | 1.42 | % | | | 1.42 | % | | | 1.42 | % |
| | | | | |
Net investment income (loss) to average net assets: | | | | | | | | | | | | | | | | | | | | |
| | | | | |
Net investment loss before reimbursements | | | (0.42 | )% | | | (0.01 | )% | | | (0.06 | )% | | | (0.64 | )% | | | (0.74 | )% |
| | | | | |
Net investment income (loss) after reimbursements | | | (0.03 | )% | | | 0.48 | % | | | 0.71 | % | | | 0.59 | % | | | 0.80 | % |
See accompanying notes to the financial statements.
53
ASHMORE FUNDS
FINANCIAL HIGHLIGHTS
Ashmore Emerging Markets Equity Fund
| | | | | | | | | | | | | | | | | | | | | | | | |
| | | | | | | | | Class C | | | | | | | |
| | | | | | |
| | | Year Ended
October 31, 2020 | | | Year Ended October 31, 2019 | | | Year Ended October 31, 2018 | | | Period Ended October 31, 2017 | | | Period Ended August 9, 2016 | | | Year Ended October 31, 2015 | |
| | | | |
Net asset value at beginning of period | | | $10.64 | | | | $ 8.96 | | | | $ 10.73 | | | | $ 8.86 | 4 | | | $ 8.17 | | | | $ 10.46 | |
| | | | | | |
Income (loss) from investment operations: | | | | | | | | | | | | | | | | | | | | | | | | |
| | | | | | |
Net investment income (loss) | | | (0.10 | ) | | | (0.04 | ) | | | (0.13 | ) | | | — | 1,5 | | | 0.01 | | | | (0.04 | ) |
| | | | | | |
Net realized and unrealized gain (loss) | | | 1.85 | | | | 1.91 | | | | (1.44 | ) | | | 1.93 | | | | 0.81 | | | | (2.19 | ) |
| | | | |
| | | | | | |
Total from investment operations | | | 1.75 | | | | 1.87 | | | | (1.57 | ) | | | 1.93 | | | | 0.82 | | | | (2.23 | ) |
| | | | | | |
Less distributions: | | | | | | | | | | | | | | | | | | | | | | | | |
| | | | | | |
From net investment income | | | — | | | | (0.19 | ) | | | (0.19 | ) | | | (0.06 | ) | | | (0.03 | ) | | | (0.06 | ) |
| | | | | | |
From net realized gain | | | — | | | | — | | | | — | | | | — | | | | — | | | | — | |
| | | | | | |
Tax return of capital | | | — | | | | — | | | | (0.01 | ) | | | — | | | | — | | | | — | 5 |
| | | | |
| | | | | | |
Total distributions | | | — | | | | (0.19 | ) | | | (0.20 | ) | | | (0.06 | ) | | | (0.03 | ) | | | (0.06 | ) |
| | | | |
Net asset value at end of period | | | $12.39 | | | | $10.64 | | | | $ 8.96 | | | | $10.73 | | | | $ 8.96 | 6 | | | $ 8.17 | |
| | | | |
| | | | | | |
Total return2 | | | 16.45 | % | | | 20.89 | % | | | (14.92 | )% | | | 10.81 | % | | | 10.02 | % | | | (21.38 | )% |
| | | | | | |
Portfolio turnover rate3 | | | 76 | % | | | 76 | % | | | 113 | % | | | 140 | % | | | 119 | % | | | 106 | % |
| | | | | | |
Net assets, end of period (in thousands) | | | $ 2 | | | | $ 1 | | | | $ 1 | | | | $ 2 | | | | $ 1 | | | | $ 1 | |
| | | | | | |
Ratios to average net assets:7 | | | | | | | | | | | | | | | | | | | | | | | | |
| | | | | | |
Total expenses to average net assets: | | | | | | | | | | | | | | | | | | | | | | | | |
| | | | | | |
Total expenses before reimbursements | | | 2.49 | % | | | 2.66 | % | | | 2.96 | % | | | 3.38 | % | | | 3.86 | % | | | 4.31 | % |
| | | | | | |
Total expenses after reimbursements | | | 2.17 | % | | | 2.17 | % | | | 2.17 | % | | | 2.17 | % | | | 2.22 | % | | | 2.18 | % |
| | | | | | |
Net investment income (loss) to average net assets: | | | | | | | | | | | | | | | | | | | | | | | | |
| | | | | | |
Net investment loss before reimbursements | | | (1.22 | )% | | | (0.95 | )% | | | (1.25 | )% | | | (1.20 | )% | | | (1.39 | )% | | | (2.57 | )% |
| | | | | | |
Net investment income (loss) after reimbursements | | | (0.90 | )% | | | (0.46 | )% | | | (0.46 | )% | | | 0.01 | % | | | 0.25 | % | | | (0.44 | )% |
See accompanying notes to the financial statements.
54
ASHMORE FUNDS
FINANCIAL HIGHLIGHTS
Ashmore Emerging Markets Equity Fund
| | | | | | | | | | | | | | | | | | | | |
| | | Institutional Class | |
| | | | | |
| | | Year Ended
October 31, 2020 | | | Year Ended October 31, 2019 | | | Year Ended October 31, 2018 | | | Year Ended October 31, 2017 | | | Year Ended October 31, 2016 | |
| | | | |
Net asset value at beginning of year | | | $ 10.81 | | | | $ 9.06 | | | | $ 10.78 | | | | $ 8.05 | | | | $ 7.02 | |
Income (loss) from investment operations: | | | | | | | | | | | | | | | | | | | | |
Net investment income | | | 0.11 | | | | 0.06 | | | | 0.07 | | | | 0.08 | 1 | | | 0.08 | |
Net realized and unrealized gain (loss) | | | 1.77 | | | | 1.93 | | | | (1.54 | ) | | | 2.80 | | | | 1.02 | |
| | | | |
Total from investment operations | | | 1.88 | | | | 1.99 | | | | (1.47 | ) | | | 2.88 | | | | 1.10 | |
| | | | | |
Less distributions: | | | | | | | | | | | | | | | | | | | | |
| | | | | |
From net investment income | | | (0.04 | ) | | | (0.24 | ) | | | (0.24 | ) | | | (0.15 | ) | | | (0.07 | ) |
From net realized gain | | | — | | | | — | | | | — | | | | — | | | | — | |
Tax return of capital | | | — | | | | — | | | | (0.01 | ) | | | — | | | | — | |
| | | | |
| | | | | |
Total distributions | | | (0.04 | ) | | | (0.24 | ) | | | (0.25 | ) | | | (0.15 | ) | | | (0.07 | ) |
| | | | |
Net asset value at end of year | | | $ 12.65 | | | | $ 10.81 | | | | $ 9.06 | | | | $10.78 | | | | $ 8.05 | |
| | | | |
| | | | | |
Total return2 | | | 17.41 | % | | | 22.05 | % | | | (14.01 | )% | | | 36.21 | % | | | 15.80 | % |
| | | | | |
Portfolio turnover rate3 | | | 76 | % | | | 76 | % | | | 113 | % | | | 140 | % | | | 119 | % |
| | | | | |
Net assets, end of year (in thousands) | | | $82,385 | | | | $35,011 | | | | $24,162 | | | | $8,106 | | | | $9,074 | |
| | | | | |
Ratios to average net assets: | | | | | | | | | | | | | | | | | | | | |
Total expenses to average net assets: | | | | | | | | | | | | | | | | | | | | |
Total expenses before reimbursements | | | 1.56 | % | | | 1.66 | % | | | 1.95 | % | | | 2.35 | % | | | 2.71 | % |
Total expenses after reimbursements | | | 1.17 | % | | | 1.17 | % | | | 1.17 | % | | | 1.17 | % | | | 1.17 | % |
| | | | | |
Net investment income (loss) to average net assets: | | | | | | | | | | | | | | | | | | | | |
Net investment income (loss) before reimbursements | | | (0.22 | )% | | | 0.09 | % | | | 0.10 | % | | | (0.33 | )% | | | (0.46 | )% |
Net investment income after reimbursements | | | 0.17 | % | | | 0.58 | % | | | 0.88 | % | | | 0.85 | % | | | 1.08 | % |
| 1 | Per share amounts are based on average number of shares outstanding during the period. |
| 2 | Assumes investment at net asset value at the beginning of the period, reinvestment of distributions at net asset value on distribution date, and a complete redemption of the investment at net asset value at the end of the period, excluding the impact of sales charges. Total return is not annualized for periods less than one year. |
| 3 | The portfolio turnover rate is calculated by dividing the lesser of cost of purchases or proceeds from sales of long term portfolio securities by the monthly average of the value of the long term portfolio securities. Portfolio turnover is not annualized for periods less than one year. |
| 4 | Initial investment in Class C occurred on March 3, 2017. The beginning NAV for Class C is the end of day NAV for the Institutional Class on March 3, 2017. |
| 5 | Amount is less than $0.005 per share. |
| 6 | There were no investors in Ashmore Emerging Markets Equity Fund Class C at the year ended October 31, 2016. Net asset value shown represents net asset value prior to the final redemption. |
| 7 | Annualized for periods less than one year. |
See accompanying notes to the financial statements.
55
ASHMORE FUNDS
FINANCIAL HIGHLIGHTS
Ashmore Emerging Markets Equity ESG Fund
| | | | |
| | | Class A Period Ended October 31,
20201 | |
Net asset value at beginning of period | | | $10.00 | |
| |
Income (loss) from investment operations: | | | | |
| |
Net investment loss | | | (0.01 | ) |
| |
Net realized and unrealized gain | | | 2.06 | |
| | | | |
| |
Total from investment operations | | | 2.05 | |
| |
Less distributions: | | | | |
| |
From net investment income | | | — | |
| |
From net realized gain | | | — | |
| |
Tax return of capital | | | — | |
| | | | |
| |
Total distributions | | | — | |
| | | | |
Net asset value at end of period | | | $12.05 | |
| | | | |
| |
Total return2 | | | 20.50 | % |
| |
Portfolio turnover rate3 | | | 45 | % |
| |
Net assets, end of period (in thousands) | | | $ 1 | |
| |
Ratios to average net assets:4 | | | | |
| |
Total expenses to average net assets: | | | | |
| |
Total expenses before reimbursements | | | 4.16 | % |
| |
Total expenses after reimbursements | | | 1.42 | % |
| |
Net investment loss to average net assets: | | | | |
| |
Net investment loss before reimbursements | | | (2.89 | )% |
| |
Net investment loss after reimbursements | | | (0.15 | )% |
See accompanying notes to the financial statements.
56
ASHMORE FUNDS
FINANCIAL HIGHLIGHTS
Ashmore Emerging Markets Equity ESG Fund
| | | | |
| | | Class C Period Ended October 31,
20201 | |
Net asset value at beginning of period | | | $10.00 | |
| |
Income (loss) from investment operations: | | | | |
| |
Net investment loss | | | (0.06 | ) |
| |
Net realized and unrealized gain | | | 2.06 | |
| | | | |
Total from investment operations | | | 2.00 | |
| |
Less distributions: | | | | |
| |
From net investment income | | | — | |
| |
From net realized gain | | | — | |
| |
Tax return of capital | | | — | |
| | | | |
| |
Total distributions | | | — | |
| | | | |
Net asset value at end of period | | | $12.00 | |
| | | | |
| |
Total return2 | | | 20.00 | % |
| |
Portfolio turnover rate3 | | | 45 | % |
| |
Net assets, end of period (in thousands) | | | $ 1 | |
| |
Ratios to average net assets:4 | | | | |
Total expenses to average net assets: | | | | |
| |
Total expenses before reimbursements | | | 4.77 | % |
| |
Total expenses after reimbursements | | | 2.17 | % |
| |
Net investment loss to average net assets: | | | | |
| |
Net investment loss before reimbursements | | | (3.50 | )% |
| |
Net investment loss after reimbursements | | | (0.90 | )% |
See accompanying notes to the financial statements.
57
ASHMORE FUNDS
FINANCIAL HIGHLIGHTS
Ashmore Emerging Markets Equity ESG Fund
| | | | |
| | | Institutional
Class Period Ended October 31,
20201 | |
Net asset value at beginning of period | | | $ 10.00 | |
| |
Income from investment operations: | | | | |
| |
Net investment income | | | 0.01 | |
| |
Net realized and unrealized gain | | | 2.05 | |
| | | | |
Total from investment operations | | | 2.06 | |
| |
Less distributions: | | | | |
| |
From net investment income | | | (— | )5 |
| |
From net realized gain | | | — | |
| |
Tax return of capital | | | — | |
| | | | |
| |
Total distributions | | | — | |
| | | | |
Net asset value at end of period | | | $ 12.06 | |
| | | | |
| |
Total return2 | | | 20.60 | % |
| |
Portfolio turnover rate3 | | | 45 | % |
| |
Net assets, end of period (in thousands) | | | $12,062 | |
| |
Ratios to average net assets:4 | | | | |
Total expenses to average net assets: | | | | |
| |
Total expenses before reimbursements | | | 3.68 | % |
| |
Total expenses after reimbursements | | | 1.17 | % |
| |
Net investment income (loss) to average net assets: | | | | |
| |
Net investment loss before reimbursements | | | (2.41 | )% |
| |
Net investment income after reimbursements | | | 0.10 | % |
| 1 | Class A, Class C and the Institutional Class commenced investment operations on February 26, 2020. |
| 2 | Assumes investment at net asset value at the beginning of the period, reinvestment of distributions at net asset value on distribution date, and a complete redemption of the investment at net asset value at the end of the period, excluding the impact of sales charges. Total return is not annualized for periods less than one year. |
| 3 | The portfolio turnover rate is calculated by dividing the lesser of cost of purchases or proceeds from sales of long term portfolio securities by the monthly average of the value of the long term portfolio securities. Portfolio turnover is not annualized for periods less than one year. |
| 4 | Annualized for periods less than one year. |
| 5 | Amount is less than $0.005 per share. |
See accompanying notes to the financial statements.
58
ASHMORE FUNDS
FINANCIAL HIGHLIGHTS
Ashmore Emerging Markets Short Duration Select Fund
| | | | |
| | | Class A Period Ended October 31,
20201 | |
Net asset value at beginning of period | | | $10.00 | |
| |
Income from investment operations: | | | | |
| |
Net investment income | | | 0.14 | |
| |
Net realized and unrealized gain | | | 0.19 | |
| | | | |
| |
Total from investment operations | | | 0.33 | |
| |
Less distributions: | | | | |
| |
From net investment income | | | (0.15 | ) |
| |
From net realized gain | | | — | |
| |
Tax return of capital | | | — | |
| | | | |
| |
Total distributions | | | (0.15 | ) |
| | | | |
Net asset value at end of period | | | $10.18 | |
| | | | |
| |
Total return2 | | | 3.30 | % |
| |
Portfolio turnover rate3 | | | 12 | % |
| |
Net assets, end of period (in thousands) | | | $ 1 | |
| |
Ratios to average net assets:4 | | | | |
Total expenses to average net assets: | | | | |
| |
Total expenses before reimbursements | | | 4.87 | % |
| |
Total expenses after reimbursements | | | 0.92 | % |
| |
Net investment income to average net assets: | | | | |
| |
Net investment income before reimbursements | | | 0.05 | % |
| |
Net investment income after reimbursements | | | 4.00 | % |
See accompanying notes to the financial statements.
59
ASHMORE FUNDS
FINANCIAL HIGHLIGHTS
Ashmore Emerging Markets Short Duration Select Fund
| | | | |
| | | Class C Period Ended
October 31, 20201 | |
Net asset value at beginning of period | | | $10.00 | |
| |
Income from investment operations: | | | | |
| |
Net investment income | | | 0.12 | |
| |
Net realized and unrealized gain | | | 0.18 | |
| | | | |
Total from investment operations | | | 0.30 | |
| |
Less distributions: | | | | |
| |
From net investment income | | | (0.12 | ) |
| |
From net realized gain | | | — | |
| |
Tax return of capital | | | — | |
| | | | |
| |
Total distributions | | | (0.12 | ) |
| | | | |
| |
Net asset value at end of period | | | $10.18 | |
| | | | |
| |
Total return2 | | | 3.03 | % |
| |
Portfolio turnover rate3 | | | 12 | % |
| |
Net assets, end of period (in thousands) | | | $ 1 | |
| |
Ratios to average net assets:4 | | | | |
Total expenses to average net assets: | | | | |
| |
Total expenses before reimbursements | | | 5.60 | % |
| |
Total expenses after reimbursements | | | 1.67 | % |
| |
Net investment income (loss) to average net assets: | | | | |
| |
Net investment loss before reimbursements | | | (0.68 | )% |
| |
Net investment income after reimbursements | | | 3.25 | % |
See accompanying notes to the financial statements.
60
ASHMORE FUNDS
FINANCIAL HIGHLIGHTS
Ashmore Emerging Markets Short Duration Select Fund
| | | | |
| | | Institutional
Class Period Ended October 31,
20201 | |
Net asset value at beginning of period | | | $ 10.00 | |
| |
Income from investment operations: | | | | |
| |
Net investment income | | | 0.16 | |
| |
Net realized and unrealized gain | | | 0.18 | |
| | | | |
| |
Total from investment operations | | | 0.34 | |
| |
Less distributions: | | | | |
| |
From net investment income | | | (0.16 | ) |
| |
From net realized gain | | | — | |
| |
Tax return of capital | | | — | |
| | | | |
| |
Total distributions | | | (0.16 | ) |
| | | | |
Net asset value at end of period | | | $ 10.18 | |
| | | | |
| |
Total return2 | | | 3.43 | % |
| |
Portfolio turnover rate3 | | | 12 | % |
| |
Net assets, end of period (in thousands) | | | $10,317 | |
| |
Ratios to average net assets:4 | | | | |
| |
Total expenses to average net assets: | | | | |
| |
Total expenses before reimbursements | | | 4.58 | % |
| |
Total expenses after reimbursements | | | 0.67 | % |
| |
Net investment income to average net assets: | | | | |
| |
Net investment income before reimbursements | | | 0.29 | % |
| |
Net investment income after reimbursements | | | 4.20 | % |
| 1 | Class A, Class C and the Institutional Class commenced investment operations on June 15, 2020. |
| 2 | Assumes investment at net asset value at the beginning of the period, reinvestment of distributions at net asset value on distribution date, and a complete redemption of the investment at net asset value at the end of the period, excluding the impact of sales charges. Total return is not annualized for periods less than one year. |
| 3 | The portfolio turnover rate is calculated by dividing the lesser of cost of purchases or proceeds from sales of long term portfolio securities by the monthly average of the value of the long term portfolio securities. Portfolio turnover is not annualized for periods less than one year. |
| 4 | Annualized for periods less than one year. |
See accompanying notes to the financial statements.
61
ASHMORE FUNDS
FINANCIAL HIGHLIGHTS
Ashmore Emerging Markets Investment Grade Income Fund
| | | | |
| | | Class A Period Ended October 31,
20201 | |
Net asset value at beginning of period | | | $10.00 | |
| |
Income (loss) from investment operations: | | | | |
| |
Net investment income | | | 0.03 | |
| |
Net realized and unrealized loss | | | (0.15 | ) |
| | | | |
| |
Total from investment operations | | | (0.12 | ) |
| |
Less distributions: | | | | |
| |
From net investment income | | | (0.03 | ) |
| |
From net realized gain | | | — | |
| |
Tax return of capital | | | — | |
| | | | |
| |
Total distributions | | | (0.03 | ) |
| | | | |
Net asset value at end of period | | | $ 9.85 | |
| | | | |
| |
Total return2 | | | (1.19 | )% |
| |
Portfolio turnover rate3 | | | 3 | % |
| |
Net assets, end of period (in thousands) | | | $ 1 | |
| |
Ratios to average net assets:4 | | | | |
| |
Total expenses to average net assets: | | | | |
| |
Total expenses before reimbursements | | | 4.88 | % |
| |
Total expenses after reimbursements | | | 0.97 | % |
| |
Net investment income (loss) to average net assets: | | | | |
| |
Net investment loss before reimbursements | | | (1.27 | )% |
| |
Net investment income after reimbursements | | | 2.64 | % |
See accompanying notes to the financial statements.
62
ASHMORE FUNDS
FINANCIAL HIGHLIGHTS
Ashmore Emerging Markets Investment Grade Income Fund
| | | | |
| | | Class C Period Ended October 31,
20201 | |
Net asset value at beginning of period | | | $10.00 | |
| |
Income (loss) from investment operations: | | | | |
| |
Net investment income | | | 0.02 | |
| |
Net realized and unrealized loss | | | (0.15 | ) |
| | | | |
| |
Total from investment operations | | | (0.13 | ) |
| |
Less distributions: | | | | |
| |
From net investment income | | | (0.02 | ) |
| |
From net realized gain | | | — | |
| |
Tax return of capital | | | — | |
| | | | |
| |
Total distributions | | | (0.02 | ) |
| | | | |
Net asset value at end of period | | | $ 9.85 | |
| | | | |
| |
Total return2 | | | (1.26 | )% |
| |
Portfolio turnover rate3 | | | 3 | % |
| |
Net assets, end of period (in thousands) | | | $ 1 | |
| |
Ratios to average net assets:4 | | | | |
| |
Total expenses to average net assets: | | | | |
| |
Total expenses before reimbursements | | | 5.62 | % |
| |
Total expenses after reimbursements | | | 1.72 | % |
| |
Net investment income (loss) to average net assets: | | | | |
| |
Net investment loss before reimbursements | | | (2.02 | )% |
| |
Net investment income after reimbursements | | | 1.88 | % |
See accompanying notes to the financial statements.
63
ASHMORE FUNDS
FINANCIAL HIGHLIGHTS
Ashmore Emerging Markets Investment Grade Income Fund
| | | | |
| | | Institutional
Class Period Ended October 31,
20201 | |
Net asset value at beginning of period | | | $ 10.00 | |
| |
Income (loss) from investment operations: | | | | |
| |
Net investment income | | | 0.03 | |
| |
Net realized and unrealized loss | | | (0.15 | ) |
| | | | |
| |
Total from investment operations | | | (0.12 | ) |
| |
Less distributions: | | | | |
| |
From net investment income | | | (0.03 | ) |
| |
From net realized gain | | | — | |
| |
Tax return of capital | | | — | |
| | | | |
| |
Total distributions | | | (0.03 | ) |
| | | | |
Net asset value at end of period | | | $ 9.85 | |
| | | | |
| |
Total return2 | | | (1.16 | )% |
| |
Portfolio turnover rate3 | | | 3 | % |
| |
Net assets, end of period (in thousands) | | | $19,757 | |
| |
Ratios to average net assets:4 | | | | |
| |
Total expenses to average net assets: | | | | |
| |
Total expenses before reimbursements | | | 4.43 | % |
| |
Total expenses after reimbursements | | | 0.72 | % |
| |
Net investment income (loss) to average net assets: | | | | |
| |
Net investment loss before reimbursements | | | (0.92 | )% |
| |
Net investment income after reimbursements | | | 2.79 | % |
| 1 | Class A, Class C and the Institutional Class commenced investment operations on September 17, 2020. |
| 2 | Assumes investment at net asset value at the beginning of the period, reinvestment of distributions at net asset value on distribution date, and a complete redemption of the investment at net asset value at the end of the period, excluding the impact of sales charges. Total return is not annualized for periods less than one year. |
| 3 | The portfolio turnover rate is calculated by dividing the lesser of cost of purchases or proceeds from sales of long term portfolio securities by the monthly average of the value of the long term portfolio securities. Portfolio turnover is not annualized for periods less than one year. |
| 4 | Annualized for periods less than one year. |
See accompanying notes to the financial statements.
64
ASHMORE EMERGING MARKETS TOTAL RETURN FUND
SCHEDULE OF INVESTMENTS
As of October 31, 2020
| | | | | | | | | | | | | | |
| | | Currency1 | | Par | | | Value | | | % of Net Assets | |
| |
Debt Securities | | | | | | | | | | | | | | |
| | | | |
Angola (Cost $19,108,049) | | | | | | | | | | | | | | |
Angola (Rep of), 9.500%, 11/12/2025 | | | | | 4,217,000 | | | $ | 3,605,974 | | | | 0.29 | |
Angola (Rep of), 8.250%, 05/09/2028 | | | | | 2,435,000 | | | | 1,913,666 | | | | 0.16 | |
Angola (Rep of), 8.000%, 11/26/2029 | | | | | 3,530,000 | | | | 2,713,659 | | | | 0.22 | |
Angola (Rep of), 9.375%, 05/08/2048 | | | | | 5,682,000 | | | | 4,339,912 | | | | 0.35 | |
Angola (Rep of), 9.125%, 11/26/2049 | | | | | 5,620,000 | | | | 4,267,873 | | | | 0.34 | |
| | | | | | | | | 16,841,084 | | | | 1.36 | |
| | | | |
Argentina (Cost $59,287,437) | | | | | | | | | | | | | | |
Argentina (Rep of), 1.000%, 07/09/2029 | | | | | 3,975,200 | | | | 1,629,832 | | | | 0.13 | |
Argentina (Rep of), (Step to 0.500% on 07/09/2021), 0.125%, 07/09/20302 | | | | | 34,487,451 | | | | 12,656,894 | | | | 1.02 | |
Argentina (Rep of), (Step to 1.125% on 07/09/2021), 0.125%, 07/09/20352 | | | | | 28,708,317 | | | | 9,387,620 | | | | 0.76 | |
Argentina (Rep of), (Step to 2.000% on 07/09/2021), 0.125%, 01/09/20382 | | | | | 5,581,313 | | | | 2,081,885 | | | | 0.17 | |
Argentina (Rep of), (Step to 2.500% on 07/09/2021), 0.125%, 07/09/20412 | | | | | 9,665,926 | | | | 3,267,180 | | | | 0.26 | |
Bonos del Tesoro Nacional en Pesos Badlar, (Floating, Argentina Deposit Rates Badlar Private Banks 30-35 Days + 2.000%), 33.016%, 04/03/2022 | | ARS | | | 68,512,050 | | | | 384,836 | | | | 0.03 | |
Ciudad Autonoma De Buenos Aires, (Floating, Argentina Deposit Rates Badlar Private Banks 30-35 Days + 3.250%), 34.214%, 03/29/2024 | | ARS | | | 22,430,417 | | | | 123,770 | | | | 0.01 | |
Pampa Energia S.A., 7.375%, 07/21/2023 | | | | | 2,021,000 | | | | 1,677,390 | | | | 0.13 | |
Provincia de Buenos Aires, 34.958%, 04/12/20253 | | ARS | | | 62,075,000 | | | | 273,515 | | | | 0.02 | |
YPF S.A., 8.750%, 04/04/2024 | | | | | 11,558,000 | | | | 7,606,898 | | | | 0.61 | |
| | | | | | | | | 39,089,820 | | | | 3.14 | |
| | | | |
Azerbaijan (Cost $9,818,783) | | | | | | | | | | | | | | |
Southern Gas Corridor CJSC, 6.875%, 03/24/2026 | | | | | 5,289,000 | | | | 6,021,135 | | | | 0.49 | |
State Oil Co. of the Azerbaijan Republic, 4.750%, 03/13/2023 | | | | | 710,000 | | | | 739,728 | | | | 0.06 | |
State Oil Co. of the Azerbaijan Republic, 6.950%, 03/18/2030 | | | | | 2,984,000 | | | | 3,534,130 | | | | 0.28 | |
| | | | | | | | | 10,294,993 | | | | 0.83 | |
| | | | |
Bahrain (Cost $7,922,655) | | | | | | | | | | | | | | |
Bahrain (Rep of), 7.500%, 09/20/2047 | | | | | 3,922,000 | | | | 4,138,302 | | | | 0.33 | |
Oil and Gas Holding (The) Co. BSCC, 7.625%, 11/07/2024 | | | | | 1,517,000 | | | | 1,619,325 | | | | 0.13 | |
Oil and Gas Holding (The) Co. BSCC, 8.375%, 11/07/2028 | | | | | 2,000,000 | | | | 2,195,500 | | | | 0.18 | |
| | | | | | | | | 7,953,127 | | | | 0.64 | |
| | | | |
Belarus (Cost $2,914,806) | | | | | | | | | | | | | | |
Belarus (Rep of), 7.625%, 06/29/2027 | | | | | 1,595,000 | | | | 1,580,167 | | | | 0.13 | |
Belarus (Rep of), 6.200%, 02/28/2030 | | | | | 1,162,000 | | | | 1,094,599 | | | | 0.09 | |
| | | | | | | | | 2,674,766 | | | | 0.22 | |
See accompanying notes to the financial statements.
65
ASHMORE EMERGING MARKETS TOTAL RETURN FUND
SCHEDULE OF INVESTMENTS (CONTINUED)
As of October 31, 2020
| | | | | | | | | | | | | | | | |
| | | Currency1 | | | Par | | | Value | | | % of Net
Assets | |
| |
Brazil (Cost $130,062,025) | | | | | | | | | | | | | | | | |
Banco do Brasil S.A., (Variable, U.S. Treasury Yield Curve Rate CMT 10Y + 4.398%), 6.250%, 04/15/20244 | | | | | | | 8,605,000 | | | $ | 8,260,800 | | | | 0.66 | |
Banco do Brasil S.A., (Variable, U.S. Treasury Yield Curve Rate CMT 10Y + 6.362%), 9.000%, 06/18/20244 | | | | | | | 4,290,000 | | | | 4,667,520 | | | | 0.38 | |
Brazil (Rep of), 6.000%, 04/07/2026 | | | | | | | 1,540,000 | | | | 1,794,100 | | | | 0.14 | |
Brazil (Rep of), 4.625%, 01/13/2028 | | | | | | | 1,710,000 | | | | 1,857,915 | | | | 0.15 | |
Brazil (Rep of), 8.250%, 01/20/2034 | | | | | | | 1,360,000 | | | | 1,846,214 | | | | 0.15 | |
Brazil (Rep of), 7.125%, 01/20/2037 | | | | | | | 1,930,000 | | | | 2,424,582 | | | | 0.20 | |
Brazil (Rep of), 5.625%, 01/07/2041 | | | | | | | 1,170,000 | | | | 1,278,225 | | | | 0.10 | |
Brazil (Rep of), 5.000%, 01/27/2045 | | | | | | | 2,800,000 | | | | 2,856,000 | | | | 0.23 | |
Brazil (Rep of), 5.625%, 02/21/2047 | | | | | | | 1,749,000 | | | | 1,919,528 | | | | 0.16 | |
Brazil Letras do Tesouro Nacional, 0.000%, 07/01/20235 | | | BRL | | | | 124,404,000 | | | | 18,616,641 | | | | 1.50 | |
Brazil Notas do Tesouro Nacional Serie F, 10.000%, 01/01/2027 | | | BRL | | | | 82,548,000 | | | | 16,209,171 | | | | 1.30 | |
Brazil Notas do Tesouro Nacional Serie F, 10.000%, 01/01/2029 | | | BRL | | | | 36,089,000 | | | | 7,133,005 | | | | 0.57 | |
Brazil Notas do Tesouro Nacional Serie F, 10.000%, 01/01/2031 | | | BRL | | | | 31,355,000 | | | | 6,229,230 | | | | 0.50 | |
CSN Islands XI Corp., 6.750%, 01/28/2028 | | | | | | | 2,825,000 | | | | 2,778,387 | | | | 0.22 | |
CSN Resources S.A., 7.625%, 02/13/2023 | | | | | | | 3,720,000 | | | | 3,859,500 | | | | 0.31 | |
Oi S.A., 10.000%, 07/27/20256 | | | | | | | 25,950,000 | | | | 25,366,384 | | | | 2.04 | |
Samarco Mineracao S.A., 4.125%, 11/01/20227 | | | | | | | 3,607,000 | | | | 1,736,771 | | | | 0.14 | |
Samarco Mineracao S.A., 5.750%, 10/24/20237 | | | | | | | 3,978,000 | | | | 1,955,187 | | | | 0.16 | |
Samarco Mineracao S.A., 5.375%, 09/26/20247 | | | | | | | 3,545,000 | | | | 1,742,368 | | | | 0.14 | |
| | | | | | | | | | | 112,531,528 | | | | 9.05 | |
| | | | |
Chile (Cost $30,041,272) | | | | | | | | | | | | | | | | |
Banco del Estado de Chile, 3.875%, 02/08/2022 | | | | | | | 1,220,000 | | | | 1,259,466 | | | | 0.10 | |
Bonos de la Tesoreria de la Republica, 1.500%, 03/01/2026 | | | CLP | | | | 132,000 | | | | 5,583,905 | | | | 0.45 | |
Bonos de la Tesoreria de la Republica, 1.900%, 09/01/2030 | | | CLP | | | | 14,500 | | | | 650,293 | | | | 0.05 | |
Bonos de la Tesoreria de la Republica, 2.000%, 03/01/2035 | | | CLP | | | | 13,000 | | | | 597,538 | | | | 0.05 | |
Chile (Rep of), 3.240%, 02/06/2028 | | | | | | | 1,133,000 | | | | 1,259,341 | | | | 0.10 | |
Corp. Nacional del Cobre de Chile, 4.250%, 07/17/2042 | | | | | | | 1,461,000 | | | | 1,629,636 | | | | 0.13 | |
Corp. Nacional del Cobre de Chile, 5.625%, 10/18/2043 | | | | | | | 2,979,000 | | | | 3,962,113 | | | | 0.32 | |
Corp. Nacional del Cobre de Chile, 4.875%, 11/04/2044 | | | | | | | 4,006,000 | | | | 4,900,343 | | | | 0.39 | |
Corp. Nacional del Cobre de Chile, 4.500%, 08/01/2047 | | | | | | | 1,867,000 | | | | 2,201,502 | | | | 0.18 | |
Corp. Nacional del Cobre de Chile, 4.375%, 02/05/2049 | | | | | | | 2,541,000 | | | | 2,950,632 | | | | 0.24 | |
Empresa de Transporte de Pasajeros Metro S.A., 4.700%, 05/07/2050 | | | | | | | 2,471,000 | | | | 2,987,439 | | | | 0.24 | |
Empresa Nacional del Petroleo, 3.750%, 08/05/2026 | | | | | | | 1,530,000 | | | | 1,615,122 | | | | 0.13 | |
Empresa Nacional del Petroleo, 4.500%, 09/14/2047 | | | | | | | 2,495,000 | | | | 2,654,423 | | | | 0.21 | |
| | | | | | | | | | | 32,251,753 | | | | 2.59 | |
| | | | |
China (Cost $64,551,621) | | | | | | | | | | | | | | | | |
China (Rep of), 2.680%, 05/21/2030 | | | CNY | | | | 32,640,000 | | | | 4,672,158 | | | | 0.38 | |
China Evergrande Group, 11.500%, 01/22/2023 | | | | | | | 4,240,000 | | | | 3,534,925 | | | | 0.28 | |
China Evergrande Group, 7.500%, 06/28/2023 | | | | | | | 7,041,000 | | | | 5,319,395 | | | | 0.43 | |
See accompanying notes to the financial statements.
66
ASHMORE EMERGING MARKETS TOTAL RETURN FUND
SCHEDULE OF INVESTMENTS (CONTINUED)
As of October 31, 2020
| | | | | | | | | | | | | | | | |
| | | Currency1 | | | Par | | | Value | | | % of Net
Assets | |
| |
China (continued) | | | | | | | | | | | | | | | | |
China Evergrande Group, 10.500%, 04/11/2024 | | | | | | | 6,628,000 | | | $ | 5,206,015 | | | | 0.42 | |
China Evergrande Group, 8.750%, 06/28/2025 | | | | | | | 6,885,000 | | | | 5,081,130 | | | | 0.41 | |
Fantasia Holdings Group Co. Ltd., 12.250%, 10/18/2022 | | | | | | | 1,189,000 | | | | 1,249,004 | | | | 0.10 | |
Fantasia Holdings Group Co. Ltd., 10.875%, 01/09/2023 | | | | | | | 2,175,000 | | | | 2,230,373 | | | | 0.18 | |
Far East Energy Bermuda Ltd., 13.000%, 01/15/20163,7,8,9 | | | | | | | 1,975,424 | | | | — | | | | — | |
Kaisa Group Holdings Ltd., 8.500%, 06/30/2022 | | | | | | | 4,843,000 | | | | 4,724,253 | | | | 0.38 | |
Kaisa Group Holdings Ltd., 11.500%, 01/30/2023 | | | | | | | 1,655,000 | | | | 1,669,376 | | | | 0.13 | |
Kaisa Group Holdings Ltd., 10.875%, 07/23/2023 | | | | | | | 3,395,000 | | | | 3,371,192 | | | | 0.27 | |
Kaisa Group Holdings Ltd., 9.375%, 06/30/2024 | | | | | | | 7,135,000 | | | | 6,464,773 | | | | 0.52 | |
Scenery Journey Ltd., 11.500%, 10/24/2022 | | | | | | | 5,345,000 | | | | 4,517,465 | | | | 0.36 | |
Scenery Journey Ltd., 12.000%, 10/24/2023 | | | | | | | 3,235,000 | | | | 2,638,139 | | | | 0.21 | |
Scenery Journey Ltd., 13.750%, 11/06/2023 | | | | | | | 800,000 | | | | 688,359 | | | | 0.06 | |
Sinochem Overseas Capital Co. Ltd., 4.500%, 11/12/2020 | | | | | | | 3,066,000 | | | | 3,068,482 | | | | 0.25 | |
Sinopec Group Overseas Development 2012 Ltd., 4.875%, 05/17/2042 | | | | | | | 1,310,000 | | | | 1,692,801 | | | | 0.14 | |
Sinopec Group Overseas Development 2018 Ltd., 2.700%, 05/13/2030 | | | | | | | 1,900,000 | | | | 1,977,217 | | | | 0.16 | |
Sinopec Group Overseas Development 2018 Ltd., 3.350%, 05/13/2050 | | | | | | | 631,000 | | | | 675,030 | | | | 0.05 | |
| | | | | | | | | | | 58,780,087 | | | | 4.73 | |
| | | | |
Colombia (Cost $48,222,809) | | | | | | | | | | | | | | | | |
Colombia (Rep of), 4.000%, 02/26/2024 | | | | | | | 2,398,000 | | | | 2,554,829 | | | | 0.21 | |
Colombia (Rep of), 8.125%, 05/21/2024 | | | | | | | 2,986,000 | | | | 3,598,130 | | | | 0.29 | |
Colombia (Rep of), 3.875%, 04/25/2027 | | | | | | | 2,623,000 | | | | 2,836,774 | | | | 0.23 | |
Colombia (Rep of), 7.375%, 09/18/2037 | | | | | | | 2,191,000 | | | | 3,081,116 | | | | 0.25 | |
Colombia (Rep of), 6.125%, 01/18/2041 | | | | | | | 3,584,000 | | | | 4,625,152 | | | | 0.37 | |
Colombia (Rep of), 5.625%, 02/26/2044 | | | | | | | 3,021,000 | | | | 3,743,019 | | | | 0.30 | |
Colombia (Rep of), 5.000%, 06/15/2045 | | | | | | | 544,000 | | | | 635,392 | | | | 0.05 | |
Colombia (Rep of), 4.125%, 05/15/2051 | | | | | | | 1,643,000 | | | | 1,719,400 | | | | 0.14 | |
Colombian TES, 4.750%, 02/23/2023 | | | COP | | | | 41,783,000 | | | | 3,244,193 | | | | 0.26 | |
Colombian TES, 10.000%, 07/24/2024 | | | COP | | | | 9,497,500,000 | | | | 2,987,773 | | | | 0.24 | |
Colombian TES, 6.250%, 11/26/2025 | | | COP | | | | 2,582,700,000 | | | | 726,559 | | | | 0.06 | |
Colombian TES, 7.500%, 08/26/2026 | | | COP | | | | 15,931,700,000 | | | | 4,707,461 | | | | 0.38 | |
Colombian TES, 5.750%, 11/03/2027 | | | COP | | | | 25,255,200,000 | | | | 6,753,884 | | | | 0.54 | |
Colombian TES, 6.000%, 04/28/2028 | | | COP | | | | 4,902,100,000 | | | | 1,322,069 | | | | 0.11 | |
Colombian TES, 7.000%, 06/30/2032 | | | COP | | | | 2,774,500,000 | | | | 763,216 | | | | 0.06 | |
Colombian TES, 7.250%, 10/18/2034 | | | COP | | | | 2,799,200,000 | | | | 776,788 | | | | 0.06 | |
Colombian TES, 7.250%, 10/26/2050 | | | COP | | | | 4,859,600,000 | | | | 1,286,542 | | | | 0.10 | |
Empresas Publicas de Medellin ESP, 8.375%, 11/08/2027 | | | COP | | | | 8,747,000,000 | | | | 2,332,987 | | | | 0.19 | |
| | | | | | | | | | | 47,695,284 | | | | 3.84 | |
| | | | |
Costa Rica (Cost $2,610,541) | | | | | | | | | | | | | | | | |
Costa Rica (Rep of), 6.125%, 02/19/2031 | | | | | | | 1,049,000 | | | | 873,303 | | | | 0.07 | |
Costa Rica (Rep of), 5.625%, 04/30/2043 | | | | | | | 1,460,000 | | | | 1,062,150 | | | | 0.08 | |
See accompanying notes to the financial statements.
67
ASHMORE EMERGING MARKETS TOTAL RETURN FUND
SCHEDULE OF INVESTMENTS (CONTINUED)
As of October 31, 2020
| | | | | | | | | | | | | | | | |
| | | Currency1 | | | Par | | | Value | | | % of Net
Assets | |
| |
Costa Rica (continued) | | | | | | | | | | | | | | | | |
Costa Rica (Rep of), 7.000%, 04/04/2044 | | | | | | | 273,000 | | | $ | 213,622 | | | | 0.02 | |
| | | | | | | | | | | 2,149,075 | | | | 0.17 | |
| | | | |
Croatia (Cost $8,372,601) | | | | | | | | | | | | | | | | |
Croatia (Rep of), 6.375%, 03/24/2021 | | | | | | | 3,781,000 | | | | 3,861,346 | | | | 0.31 | |
Croatia (Rep of), 6.000%, 01/26/2024 | | | | | | | 4,090,000 | | | | 4,712,130 | | | | 0.38 | |
| | | | | | | | | | | 8,573,476 | | | | 0.69 | |
| | | | |
Czech Republic (Cost $8,364,736) | | | | | | | | | | | | | | | | |
Czech (Rep of), 0.950%, 05/15/2030 | | | CZK | | | | 31,190,000 | | | | 1,325,755 | | | | 0.11 | |
Czech (Rep of), 2.000%, 10/13/2033 | | | CZK | | | | 98,850,000 | | | | 4,665,968 | | | | 0.37 | |
Czech (Rep of), 4.200%, 12/04/2036 | | | CZK | | | | 6,350,000 | | | | 390,808 | | | | 0.03 | |
New World Resources N.V., 8.000%, 04/07/20207,8,9 | | | EUR | | | | 1,938,518 | | | | — | | | | — | |
New World Resources N.V., 4.000%, 10/07/20207,8,9 | | | EUR | | | | 669,526 | | | | — | | | | — | |
| | | | | | | | | | | 6,382,531 | | | | 0.51 | |
| | | | |
Dominican Republic (Cost $35,234,006) | | | | | | | | | | | | | | | | |
Dominican (Rep of), 7.500%, 05/06/2021 | | | | | | | 682,667 | | | | 699,740 | | | | 0.06 | |
Dominican (Rep of), 6.600%, 01/28/2024 | | | | | | | 2,259,000 | | | | 2,470,239 | | | | 0.20 | |
Dominican (Rep of), 5.875%, 04/18/2024 | | | | | | | 3,470,000 | | | | 3,660,885 | | | | 0.29 | |
Dominican (Rep of), 5.500%, 01/27/2025 | | | | | | | 1,594,000 | | | | 1,703,189 | | | | 0.14 | |
Dominican (Rep of), 6.875%, 01/29/2026 | | | | | | | 5,456,000 | | | | 6,158,460 | | | | 0.49 | |
Dominican (Rep of), 9.750%, 06/05/2026 | | | DOP | | | | 94,650,000 | | | | 1,662,068 | | | | 0.13 | |
Dominican (Rep of), 6.000%, 07/19/2028 | | | | | | | 1,070,000 | | | | 1,177,011 | | | | 0.09 | |
Dominican (Rep of), 4.875%, 09/23/20323 | | | | | | | 4,980,000 | | | | 5,054,750 | | | | 0.41 | |
Dominican (Rep of), 7.450%, 04/30/2044 | | | | | | | 2,535,000 | | | | 2,893,702 | | | | 0.23 | |
Dominican (Rep of), 6.850%, 01/27/2045 | | | | | | | 3,235,000 | | | | 3,465,655 | | | | 0.28 | |
Dominican (Rep of), 6.500%, 02/15/2048 | | | | | | | 1,319,000 | | | | 1,355,286 | | | | 0.11 | |
Dominican (Rep of), 5.875%, 01/30/20603 | | | | | | | 6,335,000 | | | | 6,049,925 | | | | 0.49 | |
| | | | | | | | | | | 36,350,910 | | | | 2.92 | |
| | | | |
Ecuador (Cost $63,147,710) | | | | | | | | | | | | | | | | |
Ecuador (Rep of), 0.000%, 07/31/20303,5 | | | | | | | 3,931,820 | | | | 1,789,017 | | | | 0.14 | |
Ecuador (Rep of), (Step to 5.000% on 07/31/2021), 0.500%, 07/31/20302,3 | | | | | | | 22,798,952 | | | | 15,161,531 | | | | 1.22 | |
Ecuador (Rep of), (Step to 1.000% on 07/31/2021), 0.500%, 07/31/20352,3 | | | | | | | 53,875,012 | | | | 29,429,225 | | | | 2.37 | |
Ecuador (Rep of), (Step to 0.500% on 07/31/2021), 0.500%, 07/31/20402,3 | | | | | | | 15,462,012 | | | | 7,653,851 | | | | 0.62 | |
| | | | | | | | | | | 54,033,624 | | | | 4.35 | |
| | | | |
Egypt (Cost $24,553,386) | | | | | | | | | | | | | | | | |
Egypt (Rep of), 6.588%, 02/21/2028 | | | | | | | 2,277,000 | | | | 2,288,840 | | | | 0.18 | |
Egypt (Rep of), 7.600%, 03/01/2029 | | | | | | | 2,005,000 | | | | 2,083,797 | | | | 0.17 | |
Egypt (Rep of), 7.625%, 05/29/20323 | | | | | | | 2,224,000 | | | | 2,249,798 | | | | 0.18 | |
Egypt (Rep of), 8.500%, 01/31/2047 | | | | | | | 5,484,000 | | | | 5,445,162 | | | | 0.44 | |
Egypt (Rep of), 7.903%, 02/21/2048 | | | | | | | 5,519,000 | | | | 5,223,458 | | | | 0.42 | |
Egypt (Rep of), 8.700%, 03/01/2049 | | | | | | | 2,376,000 | | | | 2,391,444 | | | | 0.19 | |
See accompanying notes to the financial statements.
68
ASHMORE EMERGING MARKETS TOTAL RETURN FUND
SCHEDULE OF INVESTMENTS (CONTINUED)
As of October 31, 2020
| | | | | | | | | | | | | | | | |
| | | Currency1 | | | Par | | | Value | | | % of Net
Assets | |
| |
Egypt (continued) | | | | | | | | | | | | | | | | |
Egypt (Rep of), 8.875%, 05/29/20503 | | | | | | | 4,290,000 | | | $ | 4,329,897 | | | | 0.35 | |
Egypt (Rep of), 8.150%, 11/20/2059 | | | | | | | 369,000 | | | | 348,714 | | | | 0.03 | |
| | | | | | | | | | | 24,361,110 | | | | 1.96 | |
| | | | |
El Salvador (Cost $17,041,930) | | | | | | | | | | | | | | | | |
El Salvador (Rep of), 5.875%, 01/30/2025 | | | | | | | 1,363,000 | | | | 1,119,718 | | | | 0.09 | |
El Salvador (Rep of), 6.375%, 01/18/2027 | | | | | | | 2,530,000 | | | | 2,053,120 | | | | 0.16 | |
El Salvador (Rep of), 8.625%, 02/28/2029 | | | | | | | 2,705,000 | | | | 2,343,910 | | | | 0.19 | |
El Salvador (Rep of), 8.250%, 04/10/2032 | | | | | | | 1,732,000 | | | | 1,422,855 | | | | 0.11 | |
El Salvador (Rep of), 7.650%, 06/15/2035 | | | | | | | 1,814,000 | | | | 1,434,892 | | | | 0.12 | |
El Salvador (Rep of), 7.625%, 02/01/2041 | | | | | | | 3,043,000 | | | | 2,323,361 | | | | 0.19 | |
El Salvador (Rep of), 7.125%, 01/20/2050 | | | | | | | 2,556,000 | | | | 1,897,830 | | | | 0.15 | |
El Salvador (Rep of), 9.500%, 07/15/20523 | | | | | | | 1,601,000 | | | | 1,382,480 | | | | 0.11 | |
| | | | | | | | | | | 13,978,166 | | | | 1.12 | |
| | | | |
Gabon (Cost $4,713,438) | | | | | | | | | | | | | | | | |
Gabon (Rep of), 6.375%, 12/12/2024 | | | | | | | 2,365,771 | | | | 2,250,913 | | | | 0.18 | |
Gabon (Rep of), 6.625%, 02/06/2031 | | | | | | | 3,503,000 | | | | 3,123,110 | | | | 0.25 | |
| | | | | | | | | | | 5,374,023 | | | | 0.43 | |
| | | | |
Georgia (Cost $2,756,913) | | | | | | | | | | | | | | | | |
Georgia (Rep of), 6.875%, 04/12/2021 | | | | | | | 2,723,000 | | | | 2,763,317 | | | | 0.22 | |
| | | | | | | | | | | 2,763,317 | | | | 0.22 | |
| | | | |
Ghana (Cost $6,392,341) | | | | | | | | | | | | | | | | |
Ghana (Rep of), 7.625%, 05/16/2029 | | | | | | | 1,743,000 | | | | 1,612,275 | | | | 0.13 | |
Ghana (Rep of), 8.125%, 03/26/2032 | | | | | | | 2,050,000 | | | | 1,883,187 | | | | 0.15 | |
Ghana (Rep of), 7.875%, 02/11/2035 | | | | | | | 838,000 | | | | 742,678 | | | | 0.06 | |
Ghana (Rep of), 8.950%, 03/26/2051 | | | | | | | 1,200,000 | | | | 1,075,920 | | | | 0.09 | |
Ghana (Rep of), 8.750%, 03/11/2061 | | | | | | | 626,000 | | | | 550,135 | | | | 0.04 | |
| | | | | | | | | | | 5,864,195 | | | | 0.47 | |
| | | | |
Guatemala (Cost $386,638) | | | | | | | | | | | | | | | | |
Guatemala (Rep of), 6.125%, 06/01/2050 | | | | | | | 323,000 | | | | 397,939 | | | | 0.03 | |
| | | | | | | | | | | 397,939 | | | | 0.03 | |
| | | | |
Hungary (Cost $11,847,364) | | | | | | | | | | | | | | | | |
Hungary (Rep of), 5.750%, 11/22/2023 | | | | | | | 1,830,000 | | | | 2,097,656 | | | | 0.17 | |
Hungary (Rep of), 5.375%, 03/25/2024 | | | | | | | 3,314,000 | | | | 3,798,805 | | | | 0.30 | |
Hungary (Rep of), 6.750%, 10/22/2028 | | | HUF | | | | 430,020,000 | | | | 1,851,531 | | | | 0.15 | |
Hungary (Rep of), 3.000%, 08/21/2030 | | | HUF | | | | 838,700,000 | | | | 2,848,374 | | | | 0.23 | |
Hungary (Rep of), 7.625%, 03/29/2041 | | | | | | | 884,000 | | | | 1,574,492 | | | | 0.13 | |
| | | | | | | | | | | 12,170,858 | | | | 0.98 | |
| | | | |
India (Cost $3,196,226) | | | | | | | | | | | | | | | | |
Export-Import Bank of India, 4.000%, 01/14/2023 | | | | | | | 2,189,000 | | | | 2,303,793 | | | | 0.18 | |
Export-Import Bank of India, 3.375%, 08/05/2026 | | | | | | | 920,000 | | | | 969,993 | | | | 0.08 | |
| | | | | | | | | | | 3,273,786 | | | | 0.26 | |
See accompanying notes to the financial statements.
69
ASHMORE EMERGING MARKETS TOTAL RETURN FUND
SCHEDULE OF INVESTMENTS (CONTINUED)
As of October 31, 2020
| | | | | | | | | | | | | | | | |
| | | Currency1 | | | Par | | | Value | | | % of Net
Assets | |
| |
Indonesia (Cost $82,283,605) | | | | | | | | | | | | | | | | |
Indonesia (Rep of), 8.375%, 03/15/2024 | | | IDR | | | | 79,014,000,000 | | | $ | 5,940,140 | | | | 0.48 | |
Indonesia (Rep of), 8.375%, 09/15/2026 | | | IDR | | | | 105,269,000,000 | | | | 8,067,924 | | | | 0.65 | |
Indonesia (Rep of), 7.000%, 05/15/2027 | | | IDR | | | | 47,273,000,000 | | | | 3,369,274 | | | | 0.27 | |
Indonesia (Rep of), 6.125%, 05/15/2028 | | | IDR | | | | 27,701,000,000 | | | | 1,859,035 | | | | 0.15 | |
Indonesia (Rep of), 8.250%, 05/15/2029 | | | IDR | | | | 60,562,000,000 | | | | 4,591,341 | | | | 0.37 | |
Indonesia (Rep of), 7.000%, 09/15/2030 | | | IDR | | | | 45,861,000,000 | | | | 3,230,496 | | | | 0.26 | |
Indonesia (Rep of), 7.750%, 04/15/2031 | | | IDR | | | | 8,998,000,000 | | | | 657,669 | | | | 0.05 | |
Indonesia (Rep of), 8.750%, 05/15/2031 | | | IDR | | | | 27,075,000,000 | | | | 2,098,260 | | | | 0.17 | |
Indonesia (Rep of), 6.625%, 05/15/2033 | | | IDR | | | | 46,487,000,000 | | | | 3,087,465 | | | | 0.25 | |
Indonesia (Rep of), 8.375%, 03/15/2034 | | | IDR | | | | 9,455,000,000 | | | | 709,545 | | | | 0.06 | |
Indonesia (Rep of), 7.500%, 06/15/2035 | | | IDR | | | | 30,328,000,000 | | | | 2,137,994 | | | | 0.17 | |
Indonesia (Rep of), 8.500%, 10/12/2035 | | | | | | | 1,467,000 | | | | 2,368,670 | | | | 0.19 | |
Indonesia (Rep of), 8.250%, 05/15/2036 | | | IDR | | | | 38,990,000,000 | | | | 2,885,471 | | | | 0.23 | |
Indonesia (Rep of), 6.625%, 02/17/2037 | | | | | | | 1,755,000 | | | | 2,476,200 | | | | 0.20 | |
Indonesia (Rep of), 7.750%, 01/17/2038 | | | | | | | 2,222,000 | | | | 3,463,376 | | | | 0.28 | |
Indonesia (Rep of), 7.500%, 05/15/2038 | | | IDR | | | | 8,539,000,000 | | | | 595,151 | | | | 0.05 | |
Indonesia (Rep of), 8.375%, 04/15/2039 | | | IDR | | | | 37,239,000,000 | | | | 2,780,329 | | | | 0.22 | |
Indonesia (Rep of), 5.250%, 01/17/2042 | | | | | | | 1,633,000 | | | | 2,074,931 | | | | 0.17 | |
Indonesia (Rep of), 5.125%, 01/15/2045 | | | | | | | 4,135,000 | | | | 5,243,697 | | | | 0.42 | |
Indonesia (Rep of), 5.950%, 01/08/2046 | | | | | | | 1,886,000 | | | | 2,680,691 | | | | 0.22 | |
Indonesia (Rep of), 5.250%, 01/08/2047 | | | | | | | 2,690,000 | | | | 3,526,221 | | | | 0.28 | |
Indonesia (Rep of), 4.750%, 07/18/2047 | | | | | | | 1,750,000 | | | | 2,162,499 | | | | 0.17 | |
Indonesia Asahan Aluminium Persero PT, 5.710%, 11/15/2023 | | | | | | | 2,061,000 | | | | 2,267,100 | | | | 0.18 | |
Indonesia Asahan Aluminium Persero PT, 4.750%, 05/15/20253 | | | | | | | 776,000 | | | | 840,020 | | | | 0.07 | |
Indonesia Asahan Aluminium Persero PT, 5.450%, 05/15/20303 | | | | | | | 1,094,000 | | | | 1,246,310 | | | | 0.10 | |
Indonesia Asahan Aluminium Persero PT, 6.757%, 11/15/2048 | | | | | | | 1,747,000 | | | | 2,237,139 | | | | 0.18 | |
Indonesia Asahan Aluminium Persero PT, 5.800%, 05/15/20503 | | | | | | | 573,000 | | | | 663,974 | | | | 0.05 | |
Pertamina Persero PT, 6.000%, 05/03/2042 | | | | | | | 1,079,000 | | | | 1,316,380 | | | | 0.11 | |
Pertamina Persero PT, 6.500%, 11/07/2048 | | | | | | | 947,000 | | | | 1,268,980 | | | | 0.10 | |
Pertamina Persero PT, 4.175%, 01/21/2050 | | | | | | | 1,422,000 | | | | 1,419,533 | | | | 0.11 | |
Perusahaan Penerbit SBSN Indonesia III, 4.325%, 05/28/2025 | | | | | | | 617,000 | | | | 698,731 | | | | 0.06 | |
Perusahaan Penerbit SBSN Indonesia III, 4.550%, 03/29/2026 | | | | | | | 2,589,000 | | | | 2,982,062 | | | | 0.24 | |
Perusahaan Penerbit SBSN Indonesia III, 3.800%, 06/23/2050 | | | | | | | 698,000 | | | | 740,215 | | | | 0.06 | |
Perusahaan Perseroan Persero PT Perusahaan Listrik Negara, 5.500%, 11/22/2021 | | | | | | | 2,680,000 | | | | 2,801,672 | | | | 0.23 | |
Perusahaan Perseroan Persero PT Perusahaan Listrik Negara, 5.250%, 05/15/2047 | | | | | | | 1,188,000 | | | | 1,357,290 | | | | 0.11 | |
Perusahaan Perseroan Persero PT Perusahaan Listrik Negara, 6.150%, 05/21/2048 | | | | | | | 2,381,000 | | | | 3,029,822 | | | | 0.24 | |
| | | | | | | | | | | 88,875,607 | | | | 7.15 | |
| | | | |
Iraq (Cost $955,144) | | | | | | | | | | | | | | | | |
Iraq (Rep of), 5.800%, 01/15/2028 | | | | | | | 997,500 | | | | 857,798 | | | | 0.07 | |
| | | | | | | | | | | 857,798 | | | | 0.07 | |
See accompanying notes to the financial statements.
70
ASHMORE EMERGING MARKETS TOTAL RETURN FUND
SCHEDULE OF INVESTMENTS (CONTINUED)
As of October 31, 2020
| | | | | | | | | | | | | | |
| | | Currency1 | | Par | | | Value | | | % of Net
Assets | |
| |
Ivory Coast (Cost $10,741,380) | | | | | | | | | | | | | | |
Ivory Coast (Rep of), 6.375%, 03/03/2028 | | | | | 2,588,000 | | | $ | 2,713,285 | | | | 0.22 | |
Ivory Coast (Rep of), 5.875%, 10/17/2031 | | EUR | | | 2,813,000 | | | | 3,203,135 | | | | 0.26 | |
Ivory Coast (Rep of), 6.125%, 06/15/2033 | | | | | 200,000 | | | | 201,691 | | | | 0.02 | |
Ivory Coast (Rep of), 6.875%, 10/17/2040 | | EUR | | | 4,100,000 | | | | 4,649,959 | | | | 0.37 | |
| | | | | | | | | 10,768,070 | | | | 0.87 | |
| | | | |
Jamaica (Cost $12,358,992) | | | | | | | | | | | | | | |
Digicel Group 0.5 Ltd., 7.000%, 11/23/20203,6 | | | | | 1,125,933 | | | | 152,001 | | | | 0.01 | |
Digicel Group 0.5 Ltd., 10.000%, 04/01/20246 | | | | | 8,039,811 | | | | 6,110,256 | | | | 0.49 | |
Digicel Group 0.5 Ltd., 8.000%, 04/01/20253,6 | | | | | 3,864,071 | | | | 1,304,124 | | | | 0.11 | |
Digicel International Finance Ltd./Digicel Holdings Bermuda Ltd., 8.750%, 05/25/2024 | | | | | 2,447,503 | | | | 2,444,444 | | | | 0.20 | |
Digicel International Finance Ltd./Digicel Holdings Bermuda Ltd., 8.000%, 12/31/2026 | | | | | 1,014,589 | | | | 755,869 | | | | 0.06 | |
Jamaica (Rep of), 7.875%, 07/28/2045 | | | | | 1,750,000 | | | | 2,279,375 | | | | 0.18 | |
| | | | | | | | | 13,046,069 | | | | 1.05 | |
| | | | |
Kazakhstan (Cost $15,001,443) | | | | | | | | | | | | | | |
Development Bank of Kazakhstan JSC, 4.125%, 12/10/2022 | | | | | 4,180,000 | | | | 4,374,370 | | | | 0.35 | |
Kazakhstan (Rep of), 6.500%, 07/21/2045 | | | | | 2,827,000 | | | | 4,458,530 | | | | 0.36 | |
Kazakhstan Temir Zholy Finance B.V., 6.950%, 07/10/2042 | | | | | 2,491,000 | | | | 3,412,371 | | | | 0.27 | |
KazMunayGas National Co. JSC, 5.375%, 04/24/2030 | | | | | 2,585,000 | | | | 3,083,543 | | | | 0.25 | |
KazMunayGas National Co. JSC, 6.375%, 10/24/2048 | | | | | 1,541,000 | | | | 2,047,305 | | | | 0.17 | |
| | | | | | | | | 17,376,119 | | | | 1.40 | |
| | | | |
Kenya (Cost $3,501,270) | | | | | | | | | | | | | | |
Kenya (Rep of), 7.000%, 05/22/2027 | | | | | 1,070,000 | | | | 1,111,613 | | | | 0.09 | |
Kenya (Rep of), 8.000%, 05/22/2032 | | | | | 2,260,000 | | | | 2,371,011 | | | | 0.19 | |
| | | | | | | | | 3,482,624 | | | | 0.28 | |
| | | | |
Lebanon (Cost $40,510,468) | | | | | | | | | | | | | | |
Lebanon (Rep of), 6.375%, 03/09/20207,8 | | | | | 5,105,000 | | | | 840,385 | | | | 0.07 | |
Lebanon (Rep of), 5.800%, 04/14/20207,8 | | | | | 3,619,000 | | | | 596,628 | | | | 0.05 | |
Lebanon (Rep of), 6.150%, 06/19/20207,8 | | | | | 6,977,000 | | | | 1,123,018 | | | | 0.09 | |
Lebanon (Rep of), 8.250%, 04/12/20217 | | | | | 11,125,000 | | | | 1,680,765 | | | | 0.14 | |
Lebanon (Rep of), 6.100%, 10/04/20227 | | | | | 12,335,000 | | | | 1,769,086 | | | | 0.14 | |
Lebanon (Rep of), 6.000%, 01/27/20237 | | | | | 1,421,000 | | | | 196,325 | | | | 0.02 | |
Lebanon (Rep of), 6.600%, 11/27/20267 | | | | | 2,059,000 | | | | 293,819 | | | | 0.02 | |
Lebanon (Rep of), 6.850%, 03/23/20277 | | | | | 4,544,000 | | | | 641,577 | | | | 0.05 | |
Lebanon (Rep of), 7.000%, 03/23/20327 | | | | | 3,055,000 | | | | 427,560 | | | | 0.04 | |
Lebanon (Rep of), 7.050%, 11/02/20357 | | | | | 244,000 | | | | 34,643 | | | | — | |
Lebanon (Rep of), 7.250%, 03/23/20377 | | | | | 2,067,000 | | | | 294,217 | | | | 0.02 | |
| | | | | | | | | 7,898,023 | | | | 0.64 | |
| | | | |
Malaysia (Cost $18,923,064) | | | | | | | | | | | | | | |
Malaysia (Rep of), 4.181%, 07/15/2024 | | MYR | | | 2,150,000 | | | | 558,770 | | | | 0.05 | |
Malaysia (Rep of), 3.899%, 11/16/2027 | | MYR | | | 1,099,000 | | | | 289,128 | | | | 0.02 | |
Malaysia (Rep of), 3.733%, 06/15/2028 | | MYR | | | 6,370,000 | | | | 1,661,180 | | | | 0.13 | |
See accompanying notes to the financial statements.
71
ASHMORE EMERGING MARKETS TOTAL RETURN FUND
SCHEDULE OF INVESTMENTS (CONTINUED)
As of October 31, 2020
| | | | | | | | | | | | | | |
| | | Currency1 | | Par | | | Value | | | % of Net
Assets | |
| |
Malaysia (continued) | | | | | | | | | | | | | | |
Malaysia (Rep of), 3.885%, 08/15/2029 | | MYR | | | 4,029,000 | | | $ | 1,062,930 | | | | 0.09 | |
Malaysia (Rep of), 2.632%, 04/15/2031 | | MYR | | | 15,443,000 | | | | 3,717,359 | | | | 0.30 | |
Malaysia (Rep of), 4.232%, 06/30/2031 | | MYR | | | 2,488,000 | | | | 676,729 | | | | 0.05 | |
Malaysia (Rep of), 4.642%, 11/07/2033 | | MYR | | | 1,728,000 | | | | 484,603 | | | | 0.04 | |
Malaysia (Rep of), 3.828%, 07/05/2034 | | MYR | | | 5,407,000 | | | | 1,403,204 | | | | 0.11 | |
Malaysia (Rep of), 4.893%, 06/08/2038 | | MYR | | | 1,707,000 | | | | 482,560 | | | | 0.04 | |
Malaysia (Rep of), 3.757%, 05/22/2040 | | MYR | | | 2,004,000 | | | | 501,140 | | | | 0.04 | |
Malaysia (Rep of), 4.935%, 09/30/2043 | | MYR | | | 747,000 | | | | 208,390 | | | | 0.02 | |
Malaysia (Rep of), 4.921%, 07/06/2048 | | MYR | | | 1,743,000 | | | | 482,158 | | | | 0.04 | |
Malaysia (Rep of), 4.065%, 06/15/2050 | | MYR | | | 4,456,000 | | | | 1,103,329 | | | | 0.09 | |
Petronas Capital Ltd., 4.550%, 04/21/2050 | | | | | 4,288,000 | | | | 5,396,529 | | | | 0.43 | |
Petronas Capital Ltd., 4.800%, 04/21/2060 | | | | | 574,000 | | | | 780,081 | | | | 0.06 | |
| | | | | | | | | 18,808,090 | | | | 1.51 | |
| | | | |
Mexico (Cost $69,091,132) | | | | | | | | | | | | | | |
Banco Mercantil del Norte S.A., (Variable, U.S. Treasury Yield Curve Rate CMT 5Y + 4.967%), 6.750%, 09/27/20244 | | | | | 1,670,000 | | | | 1,678,350 | | | | 0.14 | |
Banco Mercantil del Norte S.A., (Variable, U.S. Treasury Yield Curve Rate CMT 10Y + 5.353%), 7.625%, 01/10/20284 | | | | | 550,000 | | | | 548,625 | | | | 0.04 | |
Banco Mercantil del Norte S.A., (Variable, U.S. Treasury Yield Curve Rate CMT 10Y + 5.470%), 7.500%, 06/27/20294 | | | | | 1,575,000 | | | | 1,556,100 | | | | 0.13 | |
Banco Mercantil del Norte S.A., (Variable, U.S. Treasury Yield Curve Rate CMT 10Y + 7.760%), 8.375%, 10/14/20304 | | | | | 3,600,000 | | | | 3,820,536 | | | | 0.31 | |
Braskem Idesa S.A.P.I., 7.450%, 11/15/2029 | | | | | 3,835,000 | | | | 3,626,069 | | | | 0.29 | |
Comision Federal de Electricidad, 4.875%, 01/15/2024 | | | | | 2,353,000 | | | | 2,558,911 | | | | 0.21 | |
Comision Federal de Electricidad, 8.180%, 12/23/2027 | | MXN | | | 24,850,000 | | | | 1,133,212 | | | | 0.09 | |
Comision Federal de Electricidad, 5.750%, 02/14/2042 | | | | | 2,767,000 | | | | 3,043,700 | | | | 0.24 | |
Mexican Bonos, 10.000%, 12/05/2024 | | MXN | | | 24,500,000 | | | | 1,366,151 | | | | 0.11 | |
Mexican Bonos, 7.500%, 06/03/2027 | | MXN | | | 15,080,000 | | | | 781,865 | | | | 0.06 | |
Mexican Bonos, 8.500%, 05/31/2029 | | MXN | | | 23,130,000 | | | | 1,272,115 | | | | 0.10 | |
Mexican Bonos, 8.500%, 11/18/2038 | | MXN | | | 146,090,000 | | | | 7,995,262 | | | | 0.64 | |
Mexico (Rep of), 3.600%, 01/30/2025 | | | | | 1,236,000 | | | | 1,330,814 | | | | 0.11 | |
Mexico (Rep of), 6.050%, 01/11/2040 | | | | | 1,068,000 | | | | 1,341,814 | | | | 0.11 | |
Mexico (Rep of), 4.750%, 03/08/2044 | | | | | 1,388,000 | | | | 1,533,754 | | | | 0.12 | |
Mexico (Rep of), 5.550%, 01/21/2045 | | | | | 1,734,000 | | | | 2,115,497 | | | | 0.17 | |
Mexico (Rep of), 4.350%, 01/15/2047 | | | | | 1,292,000 | | | | 1,356,613 | | | | 0.11 | |
Mexico (Rep of), 5.750%, 10/12/2110 | | | | | 2,038,000 | | | | 2,369,195 | | | | 0.19 | |
Petroleos Mexicanos, 7.190%, 09/12/2024 | | MXN | | | 79,460,000 | | | | 3,257,217 | | | | 0.26 | |
Petroleos Mexicanos, 6.750%, 09/21/2047 | | | | | 10,322,000 | | | | 8,012,865 | | | | 0.64 | |
Petroleos Mexicanos, 6.350%, 02/12/2048 | | | | | 2,700,000 | | | | 2,062,125 | | | | 0.17 | |
Petroleos Mexicanos, 7.690%, 01/23/2050 | | | | | 8,214,000 | | | | 6,825,259 | | | | 0.55 | |
Petroleos Mexicanos, 6.950%, 01/28/2060 | | | | | 13,357,000 | | | | 10,445,174 | | | | 0.84 | |
| | | | | | | | | 70,031,223 | | | | 5.63 | |
| | | | |
Mongolia (Cost $3,238,894) | | | | | | | | | | | | | | |
Development Bank of Mongolia LLC, 7.250%, 10/23/2023 | | | | | 1,100,000 | | | | 1,149,500 | | | | 0.09 | |
See accompanying notes to the financial statements.
72
ASHMORE EMERGING MARKETS TOTAL RETURN FUND
SCHEDULE OF INVESTMENTS (CONTINUED)
As of October 31, 2020
| | | | | | | | | | | | | | | | |
| | | Currency1 | | | Par | | | Value | | | % of Net
Assets | |
| |
Mongolia (continued) | | | | | | | | | | | | | | | | |
Mongolia (Rep of), 5.625%, 05/01/2023 | | | | | | | 1,120,000 | | | $ | 1,163,400 | | | | 0.10 | |
Mongolia (Rep of), 5.125%, 04/07/20263 | | | | | | | 711,000 | | | | 732,228 | | | | 0.06 | |
Mongolian Mining Corp., 2.155%, 04/01/20216 | | | | | | | 992,986 | | | | 397,415 | | | | 0.03 | |
| | | | | | | | | | | 3,442,543 | | | | 0.28 | |
| | | | |
Morocco (Cost $3,830,465) | | | | | | | | | | | | | | | | |
Morocco (Rep of), 4.250%, 12/11/2022 | | | | | | | 2,485,000 | | | | 2,599,494 | | | | 0.21 | |
Morocco (Rep of), 5.500%, 12/11/2042 | | | | | | | 1,133,000 | | | | 1,361,739 | | | | 0.11 | |
| | | | | | | | | | | 3,961,233 | | | | 0.32 | |
| | | | |
Nigeria (Cost $6,850,907) | | | | | | | | | | | | | | | | |
Nigeria (Rep of), 6.500%, 11/28/2027 | | | | | | | 1,576,000 | | | | 1,528,424 | | | | 0.12 | |
Nigeria (Rep of), 7.696%, 02/23/2038 | | | | | | | 1,903,000 | | | | 1,748,666 | | | | 0.14 | |
Nigeria (Rep of), 7.625%, 11/28/2047 | | | | | | | 2,280,000 | | | | 2,074,937 | | | | 0.17 | |
Nigeria (Rep of), 9.248%, 01/21/2049 | | | | | | | 1,110,000 | | | | 1,126,650 | | | | 0.09 | |
| | | | | | | | | | | 6,478,677 | | | | 0.52 | |
| | | | |
Oman (Cost $9,681,932) | | | | | | | | | | | | | | | | |
Oman (Rep of), 4.750%, 06/15/2026 | | | | | | | 1,096,000 | | | | 1,001,810 | | | | 0.08 | |
Oman (Rep of), 6.500%, 03/08/2047 | | | | | | | 6,122,000 | | | | 4,939,597 | | | | 0.40 | |
Oman (Rep of), 6.750%, 01/17/2048 | | | | | | | 3,454,000 | | | | 2,820,840 | | | | 0.23 | |
| | | | | | | | | | | 8,762,247 | | | | 0.71 | |
| | | | |
Pakistan (Cost $17,842,029) | | | | | | | | | | | | | | | | |
Pakistan (Rep of), 8.250%, 04/15/2024 | | | | | | | 5,650,000 | | | | 5,874,644 | | | | 0.47 | |
Pakistan (Rep of), 8.250%, 09/30/2025 | | | | | | | 1,394,000 | | | | 1,458,821 | | | | 0.12 | |
Pakistan (Rep of), 6.875%, 12/05/2027 | | | | | | | 7,737,000 | | | | 7,564,434 | | | | 0.61 | |
Third Pakistan International Sukuk (The) Co. Ltd., 5.500%, 10/13/2021 | | | | | | | 837,000 | | | | 833,861 | | | | 0.07 | |
Third Pakistan International Sukuk (The) Co. Ltd., 5.625%, 12/05/2022 | | | | | | | 2,186,000 | | | | 2,181,978 | | | | 0.17 | |
| | | | | | | | | | | 17,913,738 | | | | 1.44 | |
| | | | |
Panama (Cost $13,495,896) | | | | | | | | | | | | | | | | |
Panama (Rep of), 4.000%, 09/22/2024 | | | | | | | 1,050,000 | | | | 1,151,073 | | | | 0.09 | |
Panama (Rep of), 7.125%, 01/29/2026 | | | | | | | 769,000 | | | | 971,832 | | | | 0.08 | |
Panama (Rep of), 8.875%, 09/30/2027 | | | | | | | 1,427,000 | | | | 2,045,976 | | | | 0.17 | |
Panama (Rep of), 9.375%, 04/01/2029 | | | | | | | 1,482,000 | | | | 2,278,590 | | | | 0.18 | |
Panama (Rep of), 6.700%, 01/26/2036 | | | | | | | 2,529,000 | | | | 3,654,430 | | | | 0.29 | |
Panama (Rep of), 4.500%, 05/15/2047 | | | | | | | 1,320,000 | | | | 1,626,913 | | | | 0.13 | |
Panama (Rep of), 4.300%, 04/29/2053 | | | | | | | 2,781,000 | | | | 3,358,085 | | | | 0.27 | |
| | | | | | | | | | | 15,086,899 | | | | 1.21 | |
| | | | |
Paraguay (Cost $3,095,480) | | | | | | | | | | | | | | | | |
Paraguay (Rep of), 4.625%, 01/25/2023 | | | | | | | 1,680,000 | | | | 1,775,760 | | | | 0.14 | |
Paraguay (Rep of), 4.700%, 03/27/2027 | | | | | | | 1,246,000 | | | | 1,406,746 | | | | 0.12 | |
| | | | | | | | | | | 3,182,506 | | | | 0.26 | |
See accompanying notes to the financial statements.
73
ASHMORE EMERGING MARKETS TOTAL RETURN FUND
SCHEDULE OF INVESTMENTS (CONTINUED)
As of October 31, 2020
| | | | | | | | | | | | | | |
| | | Currency1 | | Par | | | Value | | | % of Net
Assets | |
| |
Peru (Cost $35,488,023) | | | | | | | | | | | | | | |
Fondo MIVIVIENDA S.A., 7.000%, 02/14/2024 | | PEN | | | 5,140,000 | | | $ | 1,593,677 | | | | 0.13 | |
Peru (Rep of), 7.350%, 07/21/2025 | | | | | 3,484,000 | | | | 4,450,845 | | | | 0.36 | |
Peru (Rep of), 6.950%, 08/12/2031 | | PEN | | | 21,748,000 | | | | 7,418,841 | | | | 0.59 | |
Peru (Rep of), 8.750%, 11/21/2033 | | | | | 4,920,000 | | | | 8,302,549 | | | | 0.67 | |
Peru (Rep of), 5.400%, 08/12/2034 | | PEN | | | 10,341,000 | | | | 3,010,797 | | | | 0.24 | |
Peru (Rep of), 5.350%, 08/12/2040 | | PEN | | | 6,968,000 | | | | 1,881,157 | | | | 0.15 | |
Peru (Rep of), 5.625%, 11/18/2050 | | | | | 5,843,000 | | | | 9,334,193 | | | | 0.75 | |
Petroleos del Peru S.A., 5.625%, 06/19/2047 | | | | | 1,718,000 | | | | 1,972,350 | | | | 0.16 | |
| | | | | | | | | 37,964,409 | | | | 3.05 | |
| | | | |
Philippines (Cost $20,859,843) | | | | | | | | | | | | | | |
Philippines (Rep of), 4.950%, 01/15/2021 | | PHP | | | 11,000,000 | | | | 227,273 | | | | 0.02 | |
Philippines (Rep of), 3.900%, 11/26/2022 | | PHP | | | 35,000,000 | | | | 736,690 | | | | 0.06 | |
Philippines (Rep of), 10.625%, 03/16/2025 | | | | | 1,530,000 | | | | 2,168,285 | | | | 0.17 | |
Philippines (Rep of), 9.500%, 02/02/2030 | | | | | 2,862,000 | | | | 4,683,577 | | | | 0.38 | |
Philippines (Rep of), 7.750%, 01/14/2031 | | | | | 3,160,000 | | | | 4,784,909 | | | | 0.38 | |
Philippines (Rep of), 6.375%, 10/23/2034 | | | | | 2,418,000 | | | | 3,501,146 | | | | 0.28 | |
Philippines (Rep of), 6.250%, 01/14/2036 | | PHP | | | 15,000,000 | | | | 397,563 | | | | 0.03 | |
Philippines (Rep of), 2.950%, 05/05/2045 | | | | | 1,191,000 | | | | 1,250,947 | | | | 0.10 | |
Power Sector Assets & Liabilities Management Corp., 7.390%, 12/02/2024 | | | | | 3,826,000 | | | | 4,793,060 | | | | 0.39 | |
| | | | | | | | | 22,543,450 | | | | 1.81 | |
| | | | |
Poland (Cost $1,645,710) | | | | | | | | | | | | | | |
Poland (Rep of), 2.750%, 10/25/2029 | | PLN | | | 6,102,000 | | | | 1,757,258 | | | | 0.14 | |
| | | | | | | | | 1,757,258 | | | | 0.14 | |
| | | | |
Qatar (Cost $19,490,710) | | | | | | | | | | | | | | |
Qatar (Rep of), 3.250%, 06/02/2026 | | | | | 4,217,000 | | | | 4,654,725 | | | | 0.37 | |
Qatar (Rep of), 5.103%, 04/23/2048 | | | | | 4,300,000 | | | | 5,928,152 | | | | 0.48 | |
Qatar (Rep of), 4.817%, 03/14/2049 | | | | | 7,480,000 | | | | 9,960,742 | | | | 0.80 | |
Qatar (Rep of), 4.400%, 04/16/2050 | | | | | 1,330,000 | | | | 1,693,010 | | | | 0.14 | |
| | | | | | | | | 22,236,629 | | | | 1.79 | |
| | | | |
Romania (Cost $21,294,429) | | | | | | | | | | | | | | |
Romania (Rep of), 6.750%, 02/07/2022 | | | | | 2,420,000 | | | | 2,597,628 | | | | 0.21 | |
Romania (Rep of), 4.375%, 08/22/2023 | | | | | 4,192,000 | | | | 4,563,411 | | | | 0.37 | |
Romania (Rep of), 5.800%, 07/26/2027 | | RON | | | 16,130,000 | | | | 4,437,678 | | | | 0.36 | |
Romania (Rep of), 3.624%, 05/26/2030 | | EUR | | | 1,050,000 | | | | 1,401,913 | | | | 0.11 | |
Romania (Rep of), 3.000%, 02/14/20313 | | | | | 800,000 | | | | 828,410 | | | | 0.07 | |
Romania (Rep of), 6.125%, 01/22/2044 | | | | | 658,000 | | | | 885,161 | | | | 0.07 | |
Romania (Rep of), 3.375%, 01/28/2050 | | EUR | | | 3,351,000 | | | | 4,053,021 | | | | 0.32 | |
Romania (Rep of), 4.000%, 02/14/2051 | | | | | 3,720,000 | | | | 3,789,802 | | | | 0.30 | |
| | | | | | | | | 22,557,024 | | | | 1.81 | |
| | | | |
Russian Federation (Cost $41,844,741) | | | | | | | | | | | | | | |
CEDC Finance Corp. International, Inc., 10.000%, 12/31/20223 | | | | | 1,071,532 | | | | 725,963 | | | | 0.06 | |
See accompanying notes to the financial statements.
74
ASHMORE EMERGING MARKETS TOTAL RETURN FUND
SCHEDULE OF INVESTMENTS (CONTINUED)
As of October 31, 2020
| | | | | | | | | | | | | | | | |
| | | Currency1 | | | Par | | | Value | | | % of Net
Assets | |
| |
Russian Federation (continued) | | | | | | | | | | | | | | | | |
Russian Federal Bond - OFZ, 7.400%, 07/17/2024 | | | RUB | | | | 162,465,000 | | | $ | 2,198,857 | | | | 0.18 | |
Russian Federal Bond - OFZ, 7.150%, 11/12/2025 | | | RUB | | | | 174,924,000 | | | | 2,365,555 | | | | 0.19 | |
Russian Federal Bond - OFZ, 7.750%, 09/16/2026 | | | RUB | | | | 372,068,000 | | | | 5,203,320 | | | | 0.42 | |
Russian Federal Bond - OFZ, 7.050%, 01/19/2028 | | | RUB | | | | 259,680,000 | | | | 3,510,679 | | | | 0.28 | |
Russian Federal Bond - OFZ, 6.900%, 05/23/2029 | | | RUB | | | | 164,990,000 | | | | 2,206,658 | | | | 0.18 | |
Russian Federal Bond - OFZ, 8.500%, 09/17/2031 | | | RUB | | | | 280,759,000 | | | | 4,149,312 | | | | 0.33 | |
Russian Federal Bond - OFZ, 7.700%, 03/23/2033 | | | RUB | | | | 300,544,000 | | | | 4,218,199 | | | | 0.34 | |
Russian Federal Bond - OFZ, 7.250%, 05/10/2034 | | | RUB | | | | 44,033,000 | | | | 598,370 | | | | 0.05 | |
Russian Foreign Bond - Eurobond, 4.250%, 06/23/2027 | | | | | | | 1,600,000 | | | | 1,796,621 | | | | 0.14 | |
Russian Foreign Bond - Eurobond, 4.375%, 03/21/2029 | | | | | | | 3,000,000 | | | | 3,425,442 | | | | 0.27 | |
Russian Foreign Bond - Eurobond, 5.250%, 06/23/2047 | | | | | | | 5,400,000 | | | | 7,084,519 | | | | 0.57 | |
SCF Capital Designated Activity Co., 5.375%, 06/16/2023 | | | | | | | 2,653,000 | | | | 2,832,078 | | | | 0.23 | |
| | | | | | | | | | | 40,315,573 | | | | 3.24 | |
| | | | |
Saudi Arabia (Cost $16,456,722) | | | | | | | | | | | | | | | | |
Saudi (Rep of), 4.625%, 10/04/2047 | | | | | | | 1,426,000 | | | | 1,723,806 | | | | 0.14 | |
Saudi (Rep of), 5.000%, 04/17/2049 | | | | | | | 4,076,000 | | | | 5,201,604 | | | | 0.42 | |
Saudi (Rep of), 5.250%, 01/16/2050 | | | | | | | 5,110,000 | | | | 6,757,014 | | | | 0.54 | |
Saudi (Rep of), 3.750%, 01/21/2055 | | | | | | | 3,047,000 | | | | 3,252,989 | | | | 0.26 | |
Saudi (Rep of), 4.500%, 04/22/20603 | | | | | | | 1,592,000 | | | | 1,935,821 | | | | 0.16 | |
| | | | | | | | | | | 18,871,234 | | | | 1.52 | |
| | | | |
Singapore (Cost $548,983) | | | | | | | | | | | | | | | | |
Puma International Financing S.A., 5.000%, 01/24/2026 | | | | | | | 655,000 | | | | 538,737 | | | | 0.04 | |
| | | | | | | | | | | 538,737 | | | | 0.04 | |
| | | | |
South Africa (Cost $43,268,774) | | | | | | | | | | | | | | | | |
Eskom Holdings SOC Ltd., 7.125%, 02/11/2025 | | | | | | | 1,019,000 | | | | 952,349 | | | | 0.08 | |
South Africa (Rep of), 5.875%, 05/30/2022 | | | | | | | 1,292,000 | | | | 1,367,623 | | | | 0.11 | |
South Africa (Rep of), 10.500%, 12/21/2026 | | | ZAR | | | | 25,971,000 | | | | 1,855,374 | | | | 0.15 | |
South Africa (Rep of), 4.300%, 10/12/2028 | | | | | | | 4,849,000 | | | | 4,709,349 | | | | 0.38 | |
South Africa (Rep of), 8.000%, 01/31/2030 | | | ZAR | | | | 77,558,000 | | | | 4,382,527 | | | | 0.35 | |
South Africa (Rep of), 5.875%, 06/22/2030 | | | | | | | 1,157,000 | | | | 1,221,954 | | | | 0.10 | |
South Africa (Rep of), 8.250%, 03/31/2032 | | | ZAR | | | | 202,082,000 | | | | 10,663,166 | | | | 0.86 | |
South Africa (Rep of), 8.875%, 02/28/2035 | | | ZAR | | | | 22,480,000 | | | | 1,154,785 | | | | 0.09 | |
South Africa (Rep of), 9.000%, 01/31/2040 | | | ZAR | | | | 29,264,000 | | | | 1,435,916 | | | | 0.12 | |
South Africa (Rep of), 8.750%, 01/31/2044 | | | ZAR | | | | 25,991,000 | | | | 1,216,498 | | | | 0.10 | |
South Africa (Rep of), 5.000%, 10/12/2046 | | | | | | | 1,067,000 | | | | 899,737 | | | | 0.07 | |
South Africa (Rep of), 5.650%, 09/27/2047 | | | | | | | 3,168,000 | | | | 2,858,360 | | | | 0.23 | |
South Africa (Rep of), 8.750%, 02/28/2048 | | | ZAR | | | | 77,870,000 | | | | 3,631,342 | | | | 0.29 | |
South Africa (Rep of), 5.750%, 09/30/2049 | | | | | | | 1,980,000 | | | | 1,783,148 | | | | 0.14 | |
| | | | | | | | | | | 38,132,128 | | | | 3.07 | |
| | | | |
Sri Lanka (Cost $9,830,423) | | | | | | | | | | | | | | | | |
Sri Lanka (Rep of), 6.825%, 07/18/2026 | | | | | | | 1,251,000 | | | | 662,954 | | | | 0.05 | |
Sri Lanka (Rep of), 6.200%, 05/11/2027 | | | | | | | 2,250,000 | | | | 1,181,250 | | | | 0.10 | |
Sri Lanka (Rep of), 6.750%, 04/18/2028 | | | | | | | 910,000 | | | | 477,750 | | | | 0.04 | |
See accompanying notes to the financial statements.
75
ASHMORE EMERGING MARKETS TOTAL RETURN FUND
SCHEDULE OF INVESTMENTS (CONTINUED)
As of October 31, 2020
| | | | | | | | | | | | | | |
| | | Currency1 | | Par | | | Value | | | % of Net Assets | |
| |
Sri Lanka (continued) | | | | | | | | | | | | | | |
Sri Lanka (Rep of), 7.850%, 03/14/2029 | | | | | 3,128,000 | | | $ | 1,673,480 | | | | 0.13 | |
Sri Lanka (Rep of), 7.550%, 03/28/2030 | | | | | 2,648,000 | | | | 1,403,205 | | | | 0.11 | |
| | | | | | | | | 5,398,639 | | | | 0.43 | |
| | | | |
Suriname (Cost $2,083,101) | | | | | | | | | | | | | | |
Suriname (Rep of), 9.250%, 10/26/2026 | | | | | 2,141,000 | | | | 1,113,320 | | | | 0.09 | |
| | | | | | | | | 1,113,320 | | | | 0.09 | |
| | | | |
Thailand (Cost $5,524,817) | | | | | | | | | | | | | | |
Thailand (Rep of), 3.400%, 06/17/2036 | | THB | | | 26,902,000 | | | | 1,066,131 | | | | 0.09 | |
Thailand (Rep of), 3.300%, 06/17/2038 | | THB | | | 79,504,000 | | | | 3,085,200 | | | | 0.25 | |
Thailand (Rep of), 2.000%, 06/17/2042 | | THB | | | 44,923,000 | | | | 1,442,562 | | | | 0.12 | |
Thailand (Rep of), 2.875%, 06/17/2046 | | THB | | | 4,854,000 | | | | 179,615 | | | | 0.01 | |
Thailand (Rep of), 3.600%, 06/17/2067 | | THB | | | 18,378,000 | | | | 766,031 | | | | 0.06 | |
| | | | | | | | | 6,539,539 | | | | 0.53 | |
| | | | |
Turkey (Cost $26,927,624) | | | | | | | | | | | | | | |
Turkey (Rep of), 10.700%, 08/17/2022 | | TRY | | | 14,170,000 | | | | 1,591,261 | | | | 0.13 | |
Turkey (Rep of), 3.250%, 03/23/2023 | | | | | 1,300,000 | | | | 1,226,623 | | | | 0.10 | |
Turkey (Rep of), 7.250%, 12/23/2023 | | | | | 686,000 | | | | 700,056 | | | | 0.06 | |
Turkey (Rep of), 5.750%, 03/22/2024 | | | | | 1,930,000 | | | | 1,876,385 | | | | 0.15 | |
Turkey (Rep of), 6.350%, 08/10/2024 | | | | | 965,000 | | | | 950,322 | | | | 0.08 | |
Turkey (Rep of), 5.600%, 11/14/2024 | | | | | 1,158,000 | | | | 1,111,587 | | | | 0.09 | |
Turkey (Rep of), 7.375%, 02/05/2025 | | | | | 1,338,000 | | | | 1,365,563 | | | | 0.11 | |
Turkey (Rep of), 4.250%, 03/13/2025 | | | | | 698,000 | | | | 636,052 | | | | 0.05 | |
Turkey (Rep of), 10.600%, 02/11/2026 | | TRY | | | 6,075,000 | | | | 637,986 | | | | 0.05 | |
Turkey (Rep of), 6.000%, 03/25/2027 | | | | | 2,408,000 | | | | 2,271,587 | | | | 0.18 | |
Turkey (Rep of), 10.500%, 08/11/2027 | | TRY | | | 5,956,000 | | | | 604,165 | | | | 0.05 | |
Turkey (Rep of), 6.125%, 10/24/2028 | | | | | 2,140,000 | | | | 1,995,550 | | | | 0.16 | |
Turkey (Rep of), 6.875%, 03/17/2036 | | | | | 780,000 | | | | 715,650 | | | | 0.06 | |
Turkey (Rep of), 6.750%, 05/30/2040 | | | | | 1,385,000 | | | | 1,223,994 | | | | 0.10 | |
Turkey (Rep of), 6.000%, 01/14/2041 | | | | | 965,000 | | | | 781,650 | | | | 0.06 | |
Turkey (Rep of), 4.875%, 04/16/2043 | | | | | 4,012,000 | | | | 2,923,745 | | | | 0.23 | |
Turkey (Rep of), 5.750%, 05/11/2047 | | | | | 3,895,000 | | | | 3,014,418 | | | | 0.24 | |
| | | | | | | | | 23,626,594 | | | | 1.90 | |
| | | | |
Ukraine (Cost $55,586,636) | | | | | | | | | | | | | | |
DTEK Finance PLC, 10.750%, (100% Cash), 12/31/20246,7 | | | | | 5,015,000 | | | | 3,259,750 | | | | 0.26 | |
Metinvest B.V., 8.500%, 04/23/2026 | | | | | 3,055,000 | | | | 3,078,523 | | | | 0.25 | |
Metinvest B.V., 7.650%, 10/01/20273 | | | | | 4,600,000 | | | | 4,469,268 | | | | 0.36 | |
Metinvest B.V., 7.750%, 10/17/2029 | | | | | 1,610,000 | | | | 1,539,160 | | | | 0.12 | |
Ukraine (Rep of), 16.000%, 08/11/20213 | | UAH | | | 9,165,000 | | | | 333,878 | | | | 0.03 | |
Ukraine (Rep of), 7.750%, 09/01/2021 | | | | | 1,135,000 | | | | 1,168,487 | | | | 0.09 | |
Ukraine (Rep of), 17.250%, 01/05/20223 | | UAH | | | 5,208,000 | | | | 195,117 | | | | 0.02 | |
Ukraine (Rep of), 17.000%, 05/11/20223 | | UAH | | | 8,814,000 | | | | 333,039 | | | | 0.03 | |
Ukraine (Rep of), 7.750%, 09/01/2023 | | | | | 2,990,000 | | | | 3,109,600 | | | | 0.25 | |
Ukraine (Rep of), 8.994%, 02/01/2024 | | | | | 1,921,000 | | | | 2,042,400 | | | | 0.16 | |
See accompanying notes to the financial statements.
76
ASHMORE EMERGING MARKETS TOTAL RETURN FUND
SCHEDULE OF INVESTMENTS (CONTINUED)
As of October 31, 2020
| | | | | | | | | | | | | | |
| | | Currency1 | | Par | | | Value | | | % of Net
Assets | |
| |
Ukraine (continued) | | | | | | | | | | | | | | |
Ukraine (Rep of), 7.750%, 09/01/2024 | | | | | 1,210,000 | | | $ | 1,250,838 | | | | 0.10 | |
Ukraine (Rep of), 15.840%, 02/26/20253 | | UAH | | | 35,105,000 | | | | 1,362,159 | | | | 0.11 | |
Ukraine (Rep of), 7.750%, 09/01/2025 | | | | | 5,323,000 | | | | 5,443,300 | | | | 0.44 | |
Ukraine (Rep of), 7.750%, 09/01/2026 | | | | | 4,991,000 | | | | 5,043,405 | | | | 0.40 | |
Ukraine (Rep of), 7.750%, 09/01/2027 | | | | | 2,871,000 | | | | 2,888,944 | | | | 0.23 | |
Ukraine (Rep of), 9.750%, 11/01/2028 | | | | | 2,485,000 | | | | 2,706,165 | | | | 0.22 | |
Ukraine (Rep of), 7.375%, 09/25/2032 | | | | | 10,851,000 | | | | 10,393,522 | | | | 0.84 | |
Ukraine (Rep of), 7.253%, 03/15/20333 | | | | | 4,613,000 | | | | 4,330,481 | | | | 0.35 | |
Ukreximbank Via Biz Finance PLC, 9.750%, 01/22/2025 | | | | | 1,850,000 | | | | 1,899,950 | | | | 0.15 | |
| | | | | | | | | 54,847,986 | | | | 4.41 | |
| | | | |
United Arab Emirates (Cost $11,443,593) | | | | | | | | | | | | | | |
Abu Dhabi (Gov’t of), 3.125%, 09/30/2049 | | | | | 3,060,000 | | | | 3,223,710 | | | | 0.26 | |
Abu Dhabi (Gov’t of), 3.875%, 04/16/2050 | | | | | 3,753,000 | | | | 4,455,186 | | | | 0.36 | |
DP World Crescent Ltd., 3.875%, 07/18/2029 | | | | | 1,771,000 | | | | 1,852,413 | | | | 0.15 | |
DP World Crescent Ltd., 3.750%, 01/30/2030 | | | | | 1,524,000 | | | | 1,573,856 | | | | 0.12 | |
| | | | | | | | | 11,105,165 | | | | 0.89 | |
| | | | |
Uruguay (Cost $28,815,969) | | | | | | | | | | | | | | |
Uruguay (Rep of), 9.875%, 06/20/2022 | | UYU | | | 20,413,000 | | | | 489,333 | | | | 0.04 | |
Uruguay (Rep of), 8.500%, 03/15/2028 | | UYU | | | 46,011,000 | | | | 1,121,137 | | | | 0.09 | |
Uruguay (Rep of), 4.375%, 12/15/2028 | | UYU | | | 8,870,757 | | | | 475,687 | | | | 0.04 | |
Uruguay (Rep of), 7.875%, 01/15/2033 | | | | | 2,756,000 | | | | 4,261,493 | | | | 0.34 | |
Uruguay (Rep of), 7.625%, 03/21/2036 | | | | | 2,174,000 | | | | 3,386,027 | | | | 0.27 | |
Uruguay (Rep of), 3.875%, 07/02/2040 | | UYU | | | 136,436,000 | | | | 3,700,229 | | | | 0.30 | |
Uruguay (Rep of), 4.125%, 11/20/2045 | | | | | 1,834,235 | | | | 2,182,758 | | | | 0.17 | |
Uruguay (Rep of), 5.100%, 06/18/2050 | | | | | 2,125,674 | | | | 2,839,922 | | | | 0.23 | |
Uruguay (Rep of), 4.975%, 04/20/2055 | | | | | 6,008,300 | | | | 7,930,956 | | | | 0.64 | |
Uruguay Monetary Regulation Bill, 0.000%, 12/18/20205 | | UYU | | | 1,910,000 | | | | 44,073 | | | | — | |
Uruguay Monetary Regulation Bill, 0.000%, 02/05/20215 | | UYU | | | 4,775,000 | | | | 109,137 | | | | 0.01 | |
Uruguay Monetary Regulation Bill, 0.000%, 02/19/20215 | | UYU | | | 11,867,000 | | | | 270,444 | | | | 0.02 | |
Uruguay Monetary Regulation Bill, 0.000%, 03/10/20215 | | UYU | | | 25,359,000 | | | | 575,542 | | | | 0.05 | |
Uruguay Monetary Regulation Bill, 0.000%, 03/19/20215 | | UYU | | | 13,540,000 | | | | 306,565 | | | | 0.02 | |
Uruguay Monetary Regulation Bill, 0.000%, 05/07/20215 | | UYU | | | 31,903,000 | | | | 714,274 | | | | 0.06 | |
Uruguay Monetary Regulation Bill, 0.000%, 06/09/20215 | | UYU | | | 26,553,000 | | | | 590,132 | | | | 0.05 | |
Uruguay Monetary Regulation Bill, 0.000%, 06/18/20215 | | UYU | | | 55,877,000 | | | | 1,239,952 | | | | 0.10 | |
Uruguay Monetary Regulation Bill, 0.000%, 07/21/20215 | | UYU | | | 10,516,000 | | | | 231,461 | | | | 0.02 | |
Uruguay Monetary Regulation Bill, 0.000%, 08/06/20215 | | UYU | | | 46,006,000 | | | | 1,009,188 | | | | 0.08 | |
Uruguay Monetary Regulation Bill, 0.000%, 12/08/20215 | | UYU | | | 22,722,000 | | | | 485,675 | | | | 0.04 | |
| | | | | | | | | 31,963,985 | | | | 2.57 | |
| | | | |
Venezuela (Cost $49,980,026) | | | | | | | | | | | | | | |
Petroleos de Venezuela S.A., 8.500%, 10/27/20207,8 | | | | | 28,100,000 | | | | 7,025,000 | | | | 0.57 | |
Petroleos de Venezuela S.A., 9.000%, 11/17/20217 | | | | | 3,789,076 | | | | 128,829 | | | | 0.01 | |
Petroleos de Venezuela S.A., 12.750%, 02/17/20227 | | | | | 1,695,000 | | | | 57,630 | | | | 0.01 | |
Petroleos de Venezuela S.A., 5.375%, 04/12/20277 | | | | | 1,590,000 | | | | 54,060 | | | | — | |
See accompanying notes to the financial statements.
77
ASHMORE EMERGING MARKETS TOTAL RETURN FUND
SCHEDULE OF INVESTMENTS (CONTINUED)
As of October 31, 2020
| | | | | | | | | | | | | | | | |
| | | Currency1 | | | Par | | | Value | | | % of Net Assets | |
| |
Venezuela (continued) | | | | | | | | | | | | | | | | |
Petroleos de Venezuela S.A., 9.750%, 05/17/20357 | | | | | | | 5,253,147 | | | $ | 178,607 | | | | 0.01 | |
Venezuela (Rep of), 7.750%, 10/13/20197,8 | | | | | | | 1,638,000 | | | | 149,877 | | | | 0.01 | |
Venezuela (Rep of), 12.750%, 08/23/20227 | | | | | | | 3,246,000 | | | | 297,009 | | | | 0.02 | |
Venezuela (Rep of), 9.000%, 05/07/20237 | | | | | | | 1,407,000 | | | | 128,741 | | | | 0.01 | |
Venezuela (Rep of), 8.250%, 10/13/20247 | | | | | | | 3,213,200 | | | | 294,008 | | | | 0.02 | |
Venezuela (Rep of), 11.750%, 10/21/20267 | | | | | | | 12,976,000 | | | | 1,187,304 | | | | 0.10 | |
Venezuela (Rep of), 9.250%, 09/15/20277 | | | | | | | 3,647,000 | | | | 333,700 | | | | 0.03 | |
Venezuela (Rep of), 9.250%, 05/07/20287 | | | | | | | 2,317,000 | | | | 212,005 | | | | 0.02 | |
Venezuela (Rep of), 11.950%, 08/05/20317 | | | | | | | 21,478,800 | | | | 1,965,310 | | | | 0.16 | |
| | | | | | | | | | | 12,012,080 | | | | 0.97 | |
| | | | |
Vietnam (Cost $3,212,156) | | | | | | | | | | | | | | | | |
Vietnam (Rep of), 4.800%, 11/19/2024 | | | | | | | 3,111,000 | | | | 3,468,497 | | | | 0.28 | |
| | | | | | | | | | | 3,468,497 | | | | 0.28 | |
| | | | |
Zambia (Cost $24,826,842) | | | | | | | | | | | | | | | | |
First Quantum Minerals Ltd., 7.250%, 04/01/2023 | | | | | | | 3,825,000 | | | | 3,844,125 | | | | 0.31 | |
First Quantum Minerals Ltd., 6.500%, 03/01/2024 | | | | | | | 4,670,000 | | | | 4,634,975 | | | | 0.37 | |
First Quantum Minerals Ltd., 7.500%, 04/01/2025 | | | | | | | 4,600,000 | | | | 4,623,000 | | | | 0.37 | |
First Quantum Minerals Ltd., 6.875%, 03/01/2026 | | | | | | | 4,590,000 | | | | 4,555,575 | | | | 0.37 | |
First Quantum Minerals Ltd., 6.875%, 10/15/20273 | | | | | | | 3,300,000 | | | | 3,291,717 | | | | 0.26 | |
Zambia (Rep of), 8.500%, 04/14/2024 | | | | | | | 1,230,000 | | | | 531,195 | | | | 0.04 | |
Zambia (Rep of), 8.970%, 07/30/2027 | | | | | | | 4,320,000 | | | | 1,825,407 | | | | 0.15 | |
| | | | | | | | | | | 23,305,994 | | | | 1.87 | |
| | | | |
Total Debt Securities (Cost $1,291,078,510) | | | | | | | | | | | 1,172,055,159 | | | | 94.26 | |
| | | | |
Bank Loans | | | | | | | | | | | | | | | | |
| | | | |
Brazil (Cost $6,459,375) | | | | | | | | | | | | | | | | |
Samarco Mineracao S.A., 0.930%, 09/09/201810 | | | | | | | 13,250,000 | | | | 5,962,500 | | | | 0.48 | |
| | | | | | | | | | | 5,962,500 | | | | 0.48 | |
| | | | |
Ukraine (Cost $11,836,374) | | | | | | | | | | | | | | | | |
Metinvest B.V., 4.900%, 10/24/202210 | | | | | | | 12,072,973 | | | | 11,952,243 | | | | 0.96 | |
| | | | | | | | | | | 11,952,243 | | | | 0.96 | |
| | | | |
Total Bank Loans (Cost $18,295,749) | | | | | | | | | | | 17,914,743 | | | | 1.44 | |
| | | | |
Credit Linked Notes | | | | | | | | | | | | | | | | |
| | | | |
Indonesia (Cost $8,066,767) | | | | | | | | | | | | | | | | |
Indonesia (Rep of), Issued by JPMorgan Chase Bank N.A., 7.500%, 08/17/20323 | | | IDR | | | | 52,371,000,000 | | | | 3,697,121 | | | | 0.30 | |
Indonesia (Rep of), Issued by Standard Chartered, 8.375%, 03/19/20243 | | | IDR | | | | 6,958,000,000 | | | | 523,091 | | | | 0.04 | |
Indonesia (Rep of), Issued by Standard Chartered, 8.125%, 05/17/20243 | | | IDR | | | | 5,702,000,000 | | | | 426,336 | | | | 0.04 | |
Indonesia (Rep of), Issued by Standard Chartered, 11.000%, 09/17/20253 | | | IDR | | | | 3,602,000,000 | | | | 301,042 | | | | 0.02 | |
See accompanying notes to the financial statements.
78
ASHMORE EMERGING MARKETS TOTAL RETURN FUND
SCHEDULE OF INVESTMENTS (CONTINUED)
As of October 31, 2020
| | | | | | | | | | | | | | |
| | | Currency1 | | Par | | | Value | | | % of Net Assets | |
| |
Indonesia (continued) | | | | | | | | | | | | | | |
Indonesia (Rep of), Issued by Standard Chartered, 7.000%, 05/24/20273 | | IDR | | | 10,298,000,000 | | | $ | 733,966 | | | | 0.06 | |
Indonesia (Rep of), Issued by Standard Chartered, 9.000%, 03/20/20293 | | IDR | | | 11,300,000,000 | | | | 890,214 | | | | 0.07 | |
Indonesia (Rep of), Issued by Standard Chartered, 10.500%, 08/19/20303 | | IDR | | | 8,356,000,000 | | | | 718,729 | | | | 0.06 | |
Indonesia (Rep of), Issued by Standard Chartered, 8.375%, 03/17/20343 | | IDR | | | 13,035,000,000 | | | | 978,204 | | | | 0.08 | |
| | | | | | | | | 8,268,703 | | | | 0.67 | |
| | | | |
Total Credit Linked Notes (Cost $8,066,767) | | | | | | | | | 8,268,703 | | | | 0.67 | |
| | | | |
| | | Currency1 | | Shares | | | Value | | | % of Net Assets | |
| |
Equity Securities | | | | | | | | | | | | | | |
| | | | |
Niger (Cost $135,395) | | | | | | | | | | | | | | |
Savannah Energy PLC * | | GBP | | | 348,535 | | | $ | 35,557 | | | | — | |
| | | | | | | | | 35,557 | | | | — | |
| | | | |
Russian Federation (Cost $130,309) | | | | | | | | | | | | | | |
Roust Corp. *,10 | | | | | 8,407 | | | | 23,119 | | | | — | |
| | | | | | | | | 23,119 | | | | — | |
| | | | |
Total Equity Securities (Cost $265,704) | | | | | | | | | 58,676 | | | | — | |
| | | | |
Total Investments in Securities (Cost $1,317,706,730) | | | | | | | | | 1,198,297,281 | | | | 96.37 | |
| | | | |
Total Investments (Total Cost $1,317,706,730) | | | | | | | | | 1,198,297,281 | | | | 96.37 | |
| | | | |
Other Assets Less Liabilities (See Statements of Assets and Liabilities for further detail) | | | | | | | | | 45,165,434 | | | | 3.63 | |
| | | | |
Net Assets | | | | | | | | $ | 1,243,462,715 | | | | 100.00 | |
| * | Non-income producing security. |
| 1 | Local currency is United States Dollars unless otherwise noted below. |
| 2 | Step coupon bond. Rate as of October 31, 2020 is disclosed. |
| 3 | Securities exempt from registration under Rule 144A of the Securities Act of 1933. These securities may not be publicly traded without registration under the Securities Act of 1933. |
| 4 | Variable rate security. Security issued at a fixed coupon rate, which converts to a variable rate at a specified date. Rate shown is the rate in effect as of period end. |
| 6 | Security is a payment-in-kind bond, and unless otherwise noted in the description of the security, pays its entire coupon on an in-kind basis. |
| 7 | Issuer has defaulted on terms of debt obligation. |
| 8 | Maturity has been extended under the terms of a plan of reorganization. |
| 9 | Security has been deemed worthless and is a Level 3 investment. |
| 10 | Security is a Level 3 investment. |
Percentages shown are based on net assets.
See accompanying notes to the financial statements.
79
ASHMORE EMERGING MARKETS TOTAL RETURN FUND
SCHEDULE OF INVESTMENTS (CONTINUED)
As of October 31, 2020
At October 31, 2020, the Ashmore Emerging Markets Total Return Fund had outstanding forward foreign currency exchange contracts as follows:
| | | | | | | | | | | | | | | | | | |
Settlement Date | | Counterparty | | Currency Buy | | Currency Buy Amount (Local Currency) | | | Currency Sell | | Currency Sell Amount (Local Currency) | | | Unrealized Gain/(Loss) | |
| |
| 11/04/2020 | | Standard Chartered | | Indonesian Rupiah | | | 47,639,460,000 | | | United States Dollar | | | 3,190,000 | | | $ | 24,094 | |
| 11/04/2020 | | HSBC Bank | | United States Dollar | | | 202,881 | | | Turkish Lira | | | 1,627,312 | | | | 15,443 | |
| 11/06/2020 | | BNP Paribas | | Korean Won | | | 15,976,000,000 | | | United States Dollar | | | 13,741,495 | | | | 312,606 | |
| 11/06/2020 | | Standard Chartered | | Thai Baht | | | 160,900,000 | | | United States Dollar | | | 5,138,408 | | | | 22,903 | |
| 11/18/2020 | | Merrill Lynch | | Korean Won | | | 8,030,000,000 | | | United States Dollar | | | 6,966,253 | | | | 97,745 | |
| 11/27/2020 | | Barclays | | Chinese Offshore Yuan | | | 22,607,370 | | | United States Dollar | | | 3,285,000 | | | | 83,829 | |
| 11/27/2020 | | HSBC Bank | | Chinese Offshore Yuan | | | 21,684,315 | | | United States Dollar | | | 3,155,000 | | | | 76,280 | |
| 11/27/2020 | | UBS | | Russian Ruble | | | 71,948,030 | | | United States Dollar | | | 902,000 | | | | 617 | |
| 11/27/2020 | | Morgan Stanley | | Singapore Dollar | | | 26,394,671 | | | United States Dollar | | | 19,283,496 | | | | 40,094 | |
| 11/27/2020 | | HSBC Bank | | Thai Baht | | | 73,700,000 | | | United States Dollar | | | 2,352,941 | | | | 11,189 | |
| 11/30/2020 | | JP Morgan | | Brazilian Real | | | 32,688,280 | | | United States Dollar | | | 5,664,330 | | | | 23,791 | |
| 11/30/2020 | | Standard Chartered | | Chinese Offshore Yuan | | | 21,373,503 | | | United States Dollar | | | 3,111,000 | | | | 73,965 | |
| 11/30/2020 | | Merrill Lynch | | Israeli Shekel | | | 11,604,428 | | | United States Dollar | | | 3,363,359 | | | | 38,521 | |
| 11/30/2020 | | BNP Paribas | | Romanian Leu | | | 31,030,439 | | | United States Dollar | | | 7,404,949 | | | | 15,493 | |
| 11/30/2020 | | HSBC Bank | | Thai Baht | | | 48,210,203 | | | United States Dollar | | | 1,534,379 | | | | 12,096 | |
| 11/30/2020 | | Morgan Stanley | | Thai Baht | | | 399,146,618 | | | United States Dollar | | | 12,736,215 | | | | 65,767 | |
| 11/30/2020 | | Deutsche Bank | | United States Dollar | | | 20,471,803 | | | Brazilian Real | | | 115,462,043 | | | | 380,138 | |
| 11/30/2020 | | HSBC Bank | | United States Dollar | | | 18,806,018 | | | Brazilian Real | | | 104,888,683 | | | | 529,826 | |
| 11/30/2020 | | State Street | | United States Dollar | | | 441,100 | | | Brazilian Real | | | 2,462,882 | | | | 11,958 | |
| 11/30/2020 | | Credit Suisse | | United States Dollar | | | 440,900 | | | Colombian Peso | | | 1,701,494,826 | | | | 3,149 | |
| 11/30/2020 | | Deutsche Bank | | United States Dollar | | | 3,180,000 | | | Colombian Peso | | | 12,322,500,000 | | | | 9,736 | |
| 11/30/2020 | | HSBC Bank | | United States Dollar | | | 1,491,100 | | | Czech Koruna | | | 34,705,800 | | | | 5,104 | |
| 11/30/2020 | | JP Morgan | | United States Dollar | | | 14,490,641 | | | Euro | | | 12,336,261 | | | | 117,514 | |
| 11/30/2020 | | BNP Paribas | | United States Dollar | | | 933,900 | | | Hungarian Forint | | | 292,079,373 | | | | 7,616 | |
| 11/30/2020 | | State Street | | United States Dollar | | | 559,200 | | | Indian Rupee | | | 41,508,018 | | | | 3,401 | |
| 11/30/2020 | | HSBC Bank | | United States Dollar | | | 4,397,710 | | | Peruvian Nuevo Sol | | | 15,859,463 | | | | 11,858 | |
| 11/30/2020 | | Deutsche Bank | | United States Dollar | | | 2,109,100 | | | Polish Zloty | | | 8,281,151 | | | | 16,658 | |
| 11/30/2020 | | Deutsche Bank | | United States Dollar | | | 1,022,900 | | | Romanian Leu | | | 4,254,630 | | | | 5,472 | |
| 11/30/2020 | | Barclays | | United States Dollar | | | 622,209 | | | Turkish Lira | | | 4,860,015 | | | | 51,038 | |
| 11/30/2020 | | HSBC Bank | | United States Dollar | | | 1,101,202 | | | Turkish Lira | | | 8,116,936 | | | | 135,481 | |
| 11/30/2020 | | Merrill Lynch | | United States Dollar | | | 400,409 | | | Ukraine Hryvnia | | | 11,627,865 | | | | 1,566 | |
| 12/02/2020 | | Barclays | | Chilean Peso | | | 3,136,714,740 | | | United States Dollar | | | 4,030,472 | | | | 26,088 | |
| 12/02/2020 | | BNP Paribas | | United States Dollar | | | 753,200 | | | Indian Rupee | | | 55,766,928 | | | | 6,471 | |
| 12/02/2020 | | Citibank | | United States Dollar | | | 6,766,910 | | | Indonesian Rupiah | | | 99,784,854,860 | | | | 34,720 | |
| 01/06/2021 | | Citibank | | United States Dollar | | | 967,000 | | | Singapore Dollar | | | 1,316,377 | | | | 3,278 | |
| 01/08/2021 | | HSBC Bank | | Chinese Offshore Yuan | | | 295,116,439 | | | United States Dollar | | | 43,005,470 | | | | 971,200 | |
| 01/29/2021 | | Deutsche Bank | | Chinese Offshore Yuan | | | 22,423,680 | | | United States Dollar | | | 3,264,000 | | | | 77,457 | |
| 01/29/2021 | | Merrill Lynch | | Chinese Offshore Yuan | | | 18,673,759 | | | United States Dollar | | | 2,731,000 | | | | 51,663 | |
| 01/29/2021 | | Standard Chartered | | Indonesian Rupiah | | | 79,928,682,395 | | | United States Dollar | | | 5,350,695 | | | | 41,857 | |
| | | | | | |
| 01/29/2021 | | Barclays | | Korean Won | | | 25,685,848,510 | | | United States Dollar | | | 22,268,330 | | | | 327,534 | |
See accompanying notes to the financial statements.
80
ASHMORE EMERGING MARKETS TOTAL RETURN FUND
SCHEDULE OF INVESTMENTS (CONTINUED)
As of October 31, 2020
| | | | | | | | | | | | | | | | | | |
Settlement Date | | Counterparty | | Currency Buy | | Currency Buy Amount (Local Currency) | | | Currency Sell | | Currency Sell Amount (Local Currency) | | | Unrealized Gain/(Loss) | |
| |
| | | | | | |
| 01/29/2021 | | Deutsche Bank | | Philippine Peso | | | 194,782,909 | | | United States Dollar | | | 3,995,793 | | | $ | 16,714 | |
| | | | | | |
| 01/29/2021 | | BNP Paribas | | Polish Zloty | | | 10,690,735 | | | United States Dollar | | | 2,669,480 | | | | 31,353 | |
| | | | | | |
| 01/29/2021 | | HSBC Bank | | Russian Ruble | | | 25,732,275 | | | United States Dollar | | | 322,500 | | | | 322 | |
| | | | | | |
| 01/29/2021 | | Standard Chartered | | South African Rand | | | 104,109,643 | | | United States Dollar | | | 6,314,163 | | | | 15,537 | |
| | | | | | |
| 01/29/2021 | | Standard Chartered | | Taiwan Dollar | | | 430,973,941 | | | United States Dollar | | | 15,128,794 | | | | 70,429 | |
| | | | | | |
| 01/29/2021 | | Deutsche Bank | | Thai Baht | | | 89,934,000 | | | United States Dollar | | | 2,884,765 | | | | 116 | |
| | | | | | |
| 01/29/2021 | | ANZ | | United States Dollar | | | 2,611,300 | | | Indonesian Rupiah | | | 38,443,558,600 | | | | 17,626 | |
| | | | | | |
| 01/29/2021 | | Barclays | | United States Dollar | | | 2,248,400 | | | Korean Won | | | 2,549,910,440 | | | | 5,241 | |
| | | | | | |
| 01/29/2021 | | Deutsche Bank | | United States Dollar | | | 445,297 | | | Thai Baht | | | 13,869,883 | | | | 382 | |
| | | | | | | | | | | | | | | | | | |
| | | | |
| Subtotal Appreciation | | | | | | | | | | | | | 3,902,936 | |
| | | | | | | | | | | | | | | | | | |
| | | | | | |
| 11/04/2020 | | HSBC Bank | | United States Dollar | | | 827,600 | | | Taiwan Dollar | | | 23,499,702 | | | | (1,166 | ) |
| | | | | | |
| 11/27/2020 | | ANZ | | Indian Rupee | | | 94,464,750 | | | United States Dollar | | | 1,275,000 | | | | (10,101 | ) |
| | | | | | |
| 11/27/2020 | | Citibank | | Mexican Peso | | | 900,381,701 | | | United States Dollar | | | 42,620,610 | | | | (602,657 | ) |
| | | | | | |
| 11/27/2020 | | HSBC Bank | | Russian Ruble | | | 988,795,000 | | | United States Dollar | | | 12,862,541 | | | | (532,581 | ) |
| | | | | | |
| 11/27/2020 | | Morgan Stanley | | United States Dollar | | | 3,912,900 | | | Chinese Offshore Yuan | | | 26,345,556 | | | | (12,974 | ) |
| | | | | | |
| 11/30/2020 | | Deutsche Bank | | Brazilian Real | | | 107,351,564 | | | United States Dollar | | | 19,074,549 | | | | (369,216 | ) |
| | | | | | |
| 11/30/2020 | | JP Morgan | | Colombian Peso | | | 4,303,000,000 | | | United States Dollar | | | 1,111,599 | | | | (4,547 | ) |
| | | | | | |
| 11/30/2020 | | JP Morgan | | Czech Koruna | | | 191,949,000 | | | United States Dollar | | | 8,323,894 | | | | (105,228 | ) |
| | | | | | |
| 11/30/2020 | | Merrill Lynch | | Czech Koruna | | | 226,940,890 | | | United States Dollar | | | 9,780,754 | | | | (79,835 | ) |
| | | | | | |
| 11/30/2020 | | Morgan Stanley | | Czech Koruna | | | 25,834,708 | | | United States Dollar | | | 1,106,518 | | | | (355 | ) |
| | | | | | |
| 11/30/2020 | | Barclays | | Hungarian Forint | | | 3,351,798,027 | | | United States Dollar | | | 10,723,523 | | | | (86,366 | ) |
| | | | | | |
| 11/30/2020 | | Standard Chartered | | Hungarian Forint | | | 1,222,592,427 | | | United States Dollar | | | 3,948,813 | | | | (71,552 | ) |
| | | | | | |
| 11/30/2020 | | HSBC Bank | | Indian Rupee | | | 1,330,029,575 | | | United States Dollar | | | 17,954,181 | | | | (144,860 | ) |
| | | | | | |
| 11/30/2020 | | Morgan Stanley | | Indonesian Rupiah | | | 2,040,490,080 | | | United States Dollar | | | 138,724 | | | | (1,058 | ) |
| | | | | | |
| 11/30/2020 | | Deutsche Bank | | Malaysian Ringgit | | | 4,545,175 | | | United States Dollar | | | 1,094,247 | | | | (1,697 | ) |
| | | | | | |
| 11/30/2020 | | Barclays | | Polish Zloty | | | 54,542,262 | | | United States Dollar | | | 14,074,369 | | | | (292,927 | ) |
| | | | | | |
| 11/30/2020 | | BNP Paribas | | Polish Zloty | | | 49,336,051 | | | United States Dollar | | | 12,719,739 | | | | (253,742 | ) |
| | | | | | |
| 11/30/2020 | | Deutsche Bank | | Polish Zloty | | | 27,805,954 | | | United States Dollar | | | 7,138,867 | | | | (114,164 | ) |
| | | | | | |
| 11/30/2020 | | Merrill Lynch | | Polish Zloty | | | 15,567,269 | | | United States Dollar | | | 3,932,966 | | | | (159 | ) |
| | | | | | |
| 11/30/2020 | | JP Morgan | | Romanian Leu | | | 1,937,862 | | | United States Dollar | | | 465,878 | | | | (2,469 | ) |
| | | | | | |
| 11/30/2020 | | JP Morgan | | Russian Ruble | | | 136,964,526 | | | United States Dollar | | | 1,727,300 | | | | (9,025 | ) |
| | | | | | |
| 11/30/2020 | | ANZ | | Singapore Dollar | | | 1,506,215 | | | United States Dollar | | | 1,110,000 | | | | (7,297 | ) |
| | | | | | |
| 11/30/2020 | | BNP Paribas | | Turkish Lira | | | 14,144,835 | | | United States Dollar | | | 1,757,000 | | | | (94,634 | ) |
| | | | | | |
| 11/30/2020 | | HSBC Bank | | Turkish Lira | | | 8,733,872 | | | United States Dollar | | | 1,084,201 | | | | (57,757 | ) |
| | | | | | |
| 11/30/2020 | | Merrill Lynch | | Turkish Lira | | | 4,605,326 | | | United States Dollar | | | 573,000 | | | | (31,761 | ) |
| | | | | | |
| 11/30/2020 | | Standard Chartered | | Turkish Lira | | | 11,589,538 | | | United States Dollar | | | 1,338,362 | | | | (16,568 | ) |
| | | | | | |
| 11/30/2020 | | State Street | | United States Dollar | | | 3,332,200 | | | Mexican Peso | | | 71,581,861 | | | | (8,298 | ) |
| | | | | | |
| 11/30/2020 | | State Street | | United States Dollar | | | 478,800 | | | Singapore Dollar | | | 660,220 | | | | (4,548 | ) |
| | | | | | |
| 12/16/2020 | | Barclays | | Turkish Lira | | | 2,881,005 | | | United States Dollar | | | 358,000 | | | | (19,411 | ) |
| | | | | | |
| 01/28/2021 | | Deutsche Bank | | United States Dollar | | | 2,207,578 | | | Malaysian Ringgit | | | 9,187,276 | | | | (823 | ) |
| | | | | | |
| 01/29/2021 | | Barclays | | Colombian Peso | | | 19,507,799,328 | | | United States Dollar | | | 5,145,887 | | | | (127,029 | ) |
| | | | | | |
| 01/29/2021 | | BNP Paribas | | Czech Koruna | | | 151,120,284 | | | United States Dollar | | | 6,543,420 | | | | (78,829 | ) |
See accompanying notes to the financial statements.
81
ASHMORE EMERGING MARKETS TOTAL RETURN FUND
SCHEDULE OF INVESTMENTS (CONTINUED)
As of October 31, 2020
| | | | | | | | | | | | | | | | | | |
Settlement Date | | Counterparty | | Currency Buy | | Currency Buy Amount (Local Currency) | | | Currency Sell | | Currency Sell Amount (Local Currency) | | | Unrealized Gain/(Loss) | |
| |
| | | | | | |
| 01/29/2021 | | HSBC Bank | | Mexican Peso | | | 535,142,125 | | | United States Dollar | | | 25,202,372 | | | $ | (228,990 | ) |
| | | | | | |
| 01/29/2021 | | BNP Paribas | | Polish Zloty | | | 9,231,461 | | | United States Dollar | | | 2,383,660 | | | | (51,098 | ) |
| | | | | | |
| 01/29/2021 | | HSBC Bank | | Russian Ruble | | | 491,808,000 | | | United States Dollar | | | 6,370,735 | | | | (238,045 | ) |
| | | | | | |
| 01/29/2021 | | Merrill Lynch | | Russian Ruble | | | 1,025,269,830 | | | United States Dollar | | | 13,205,005 | | | | (342,586 | ) |
| | | | | | |
| 01/29/2021 | | JP Morgan | | Turkish Lira | | | 17,108,709 | | | United States Dollar | | | 2,126,000 | | | | (115,307 | ) |
| | | | | | |
| 01/29/2021 | | JP Morgan | | United States Dollar | | | 889,400 | | | Chilean Peso | | | 689,489,562 | | | | (2,283 | ) |
| | | | | | |
| 01/29/2021 | | Barclays | | United States Dollar | | | 4,668,124 | | | Chinese Offshore Yuan | | | 31,866,951 | | | | (80,518 | ) |
| | | | | | |
| 01/29/2021 | | State Street | | United States Dollar | | | 1,792,400 | | | Chinese Offshore Yuan | | | 12,317,277 | | | | (43,055 | ) |
| | | | | | |
| 01/29/2021 | | BNP Paribas | | United States Dollar | | | 460,200 | | | Indonesian Rupiah | | | 6,828,309,540 | | | | (486 | ) |
| | | | | | |
| 01/29/2021 | | Merrill Lynch | | United States Dollar | | | 971,500 | | | Indonesian Rupiah | | | 14,689,274,300 | | | | (19,542 | ) |
| | | | | | |
| 01/29/2021 | | State Street | | United States Dollar | | | 721,700 | | | Philippine Peso | | | 35,096,271 | | | | (1,279 | ) |
| | | | | | |
| 01/29/2021 | | Deutsche Bank | | United States Dollar | | | 1,674,300 | | | South African Rand | | | 27,643,959 | | | | (6,409 | ) |
| | | | | | |
| 01/29/2021 | | HSBC Bank | | United States Dollar | | | 158,250 | | | South African Rand | | | 2,629,181 | | | | (1,600 | ) |
| | | | | | |
| 01/29/2021 | | UBS | | United States Dollar | | | 818,400 | | | South African Rand | | | 13,609,174 | | | | (9,016 | ) |
| | | | | | |
| 01/29/2021 | | HSBC Bank | | United States Dollar | | | 1,136,100 | | | Thai Baht | | | 35,434,959 | | | | (574 | ) |
| | | | | | | | | | | | | | | | | | |
| | | | |
| Subtotal Depreciation | | | | | | | | | | | | | (4,284,422 | ) |
| | | | | | | | | | | | | | | | | | |
| | | | | | | | | | | | | | | | | | |
| Total | | | | | | | | | | | | | | | | $ | (381,486 | ) |
| | | | | | | | | | | | | | | | | | |
See accompanying notes to the financial statements.
82
ASHMORE EMERGING MARKETS TOTAL RETURN FUND
SCHEDULE OF INVESTMENTS (CONTINUED)
As of October 31, 2020
At October 31, 2020, the Ashmore Emerging Markets Total Return Fund had the following centrally cleared swap contracts outstanding:
| | | | | | | | | | | | | | | | | | |
Pay Rate Index/ Pay Rate | | Receive Rate/ Receive Rate Index | | Notional Amount | | Expiration Date | | | Fair Value/ Unrealized Appreciation (Depreciation)** | | Variation Margin Receivable (Payable) | | Counterparty |
|
| | | | | | | |
Brazil CETIP Interbank Deposit Rate (Pay at Maturity) | | 6.570% (Receive at Maturity) | | BRL | | (54,876,948) | | | 1/2/2025 | | | $ | 18,847 | | | $— | | JP Morgan |
| | | | | | | |
Brazil CETIP Interbank Deposit Rate (Pay at Maturity) | | 4.575% (Receive at Maturity) | | BRL | | 85,210,356 | | | 1/2/2023 | | | | (94,371 | ) | | — | | BNP Paribas |
| | | | | | | |
CFETS China Fixing Repo Rates 7 Day (Pay Quarterly) | | 2.580% (Receive Quarterly) | | CNY | | 39,814,000 | | | 3/18/2025 | | | | 2,336 | | | — | | JP Morgan |
| | | | | | | |
CFETS China Fixing Repo Rates 7 Day (Pay Quarterly) | | 2.582% (Receive Quarterly) | | CNY | | 20,884,000 | | | 3/18/2025 | | | | 1,440 | | | — | | HSBC Bank |
| | | | | | | |
CFETS China Fixing Repo Rates 7 Day (Pay Quarterly) | | 2.575% (Receive Quarterly) | | CNY | | 41,598,000 | | | 3/18/2025 | | | | 1,105 | | | — | | JP Morgan |
| | | | | | | |
CFETS China Fixing Repo Rates 7 Day (Pay Quarterly) | | 2.325% (Receive Quarterly) | | CNY | | 93,220,000 | | | 9/16/2025 | | | | (175,529 | ) | | — | | Merrill Lynch |
| | | | | | | |
CFETS China Fixing Repo Rates 7 Day (Pay Quarterly) | | 2.535% Receive Quarterly) | | CNY | | 19,040,000 | | | 9/16/2025 | | | | (7,302 | ) | | — | | Merrill Lynch |
| | | | | | | |
WIBOR Poland 6 Month Rate (Pay Semiannually) | | 2.400% (Receive Annually) | | PLN | | 13,970,000 | | | 3/26/2023 | | | | 235,555 | | | 207 | | Merrill Lynch |
| | | | | | | | | | | | | | | | | | |
| | | | | | | |
| | | | | | | | | | | | $ | (17,919 | ) | | $207 | | |
| | | | | | | | | | | | | | | | | | |
**Includes cumulative appreciation/depreciation on centrally cleared swap agreements. Only the current day’s variation margin is reported within the Statements of Assets and Liabilities.
See accompanying notes to the financial statements.
83
ASHMORE EMERGING MARKETS TOTAL RETURN FUND
SCHEDULE OF INVESTMENTS (CONTINUED)
As of October 31, 2020
The inputs or methodologies used for valuing securities are not necessarily an indication of the risks associated with investing in those securities and other financial instruments, if any. See note 4 in the Notes to the Financial Statements for more information regarding pricing inputs and valuation techniques. The following is a summary of the inputs used in valuing the Ashmore Emerging Markets Total Return Fund’s investments and other financial instruments, which are carried at fair value, as of October 31, 2020:
| | | | | | | | | | | | | | | | |
| | | Level 1 | | | Level 2 | | | Level 3 | | | Total | |
Investments | | | | | | | | | | | | | | | | |
Assets: | | | | | | | | | | | | | | | | |
Debt Securities | | | | | | | | | | | | | | | | |
Corporate Bonds | | | $— | | | | $ 257,387,100 | | | | $ — | | | | $ 257,387,100 | |
Corporate Convertible Bonds | | | — | | | | 7,755,612 | | | | — | | | | 7,755,612 | |
Government Agencies | | | — | | | | 47,698,471 | | | | — | | | | 47,698,471 | |
Government Bonds | | | — | | | | 840,819,184 | | | | — | | | | 840,819,184 | |
Index Linked Government Bonds | | | — | | | | 14,251,845 | | | | — | | | | 14,251,845 | |
Municipal Bonds | | | — | | | | 397,285 | | | | — | | | | 397,285 | |
Short Term Bills and Notes | | | — | | | | 3,745,662 | | | | — | | | | 3,745,662 | |
| | | | | | | | | | | | | | | | |
Total Debt Securities | | | — | | | | 1,172,055,159 | | | | — | | | | 1,172,055,159 | |
Bank Loans | | | | | | | | | | | | | | | | |
Brazil | | | — | | | | — | | | | 5,962,500 | | | | 5,962,500 | |
Ukraine | | | — | | | | — | | | | 11,952,243 | | | | 11,952,243 | |
| | | | | | | | | | | | | | | | |
Total Bank Loans | | | — | | | | — | | | | 17,914,743 | | | | 17,914,743 | |
Credit Linked Notes | | | | | | | | | | | | | | | | |
Indonesia | | | — | | | | 8,268,703 | | | | — | | | | 8,268,703 | |
Equity Securities | | | | | | | | | | | | | | | | |
Common Stock | | | | | | | | | | | | | | | | |
Niger | | | — | | | | 35,557 | | | | — | | | | 35,557 | |
Russian Federation | | | — | | | | — | | | | 23,119 | | | | 23,119 | |
| | | | | | | | | | | | | | | | |
Total Common Stock | | | — | | | | 35,557 | | | | 23,119 | | | | 58,676 | |
| |
Total Investments | | | $— | | | | $1,180,359,419 | | | | $17,937,862 | | | | $1,198,297,281 | |
| |
| | | | |
Other Financial Instruments | | | | | | | | | | | | | | | | |
Assets: | | | | | | | | | | | | | | | | |
Forward Foreign Currency Exchange Contracts | | | $— | | | | $ 3,902,936 | | | | $— | | | | $ 3,902,936 | |
Centrally Cleared Swap Contracts† | | | — | | | | 259,283 | | | | — | | | | 259,283 | |
Liabilities: | | | | | | | | | | | | | | | | |
Forward Foreign Currency Exchange Contracts | | | — | | | | (4,284,422 | ) | | | — | | | | (4,284,422 | ) |
Centrally Cleared Swap Contracts† | | | — | | | | (277,202 | ) | | | — | | | | (277,202 | ) |
| |
Total Other Financial Instruments | | | $— | | | | $ (399,405 | ) | | | $— | | | | $ (399,405 | ) |
| |
† Includes cumulative appreciation/depreciation on centrally cleared swap agreements. Only the current day’s variation margin is reported within the Statements of Assets and Liabilities.
See accompanying notes to the financial statements.
84
ASHMORE EMERGING MARKETS TOTAL RETURN FUND
SCHEDULE OF INVESTMENTS (CONTINUED)
As of October 31, 2020
The following is a reconciliation of investments in which significant unobservable inputs (Level 3) were used for the Fund during the period ended October 31, 2020:
| | | | | | | | | | | | | | | | | | | | | | | | | | | | | | | | | | | | | | | | |
| | | | | | | | | | | | | | | | | | | | | | | | | | | | | | Change in |
| | | | | | | | | | | | | | | | | | | | | | | | | | | | | | Unrealized |
| | | | | | | | | | | | | | | | | | | | | | | | | | | | | | Appreciation |
| | | | | | | | | | | | | | | | | | Change in | | | | | | | | | | | | (Depreciation) |
| | | Beginning | | | Accrued | | | | | | | | | Realized | | | Unrealized | | | Transfers | | | Transfers | | | Ending | | | from Investments |
| Category and | | Balance | | | Discounts | | | | | | | | | Gains | | | Appreciation | | | into | | | out of | | | Balance | | | still held |
| Subcategory | | at 10/31/2019 | | | (Premiums) | | | Purchases | | | Sales | | | (Losses) | | | (Depreciation) | | | Level 3 | | | Level 3 | | | at 10/31/2020 | | | 10/31/2020 |
| Investments, at value | | | | | | | | | | | | | | | | | | | | | | | | | | | | | | | | | | | | | | | | |
Bank Loans | | | | | | | | | | | | | | | | | | | | | | | | | | | | | | | | | | | | | | | | |
Brazil | | | $ — | | | | $ — | | | | $6,459,375 | | | | $ — | | | | $ — | | | | $(496,875 | ) | | | $— | | | | $— | | | | $ 5,962,500 | | | | $(496,875 | ) |
Ukraine | | | — | | | | 5,055 | | | | 12,411,986 | | | | (592,319 | ) | | | 11,652 | | | | 115,869 | | | | — | | | | — | | | | 11,952,243 | | | | 115,869 | |
United Arab Emirates | | | 19,279,489 | | | | 388,637 | | | | 37,167,736 | | | | (59,712,188 | ) | | | 2,918,214 | | | | (41,888 | ) | | | — | | | | — | | | | — | | | | — | |
| Common Stock | | | | | | | | | | | | | | | | | | | | | | | | | | | | | | | | | | | | | | | | |
Russian Federation | | | 25,221 | | | | — | | | | — | | | | — | | | | — | | | | (2,102 | ) | | | — | | | | — | | | | 23,119 | | | | (2,102 | ) |
| | | | | | | | | | | |
| Total | | | $19,304,710 | | | | $393,692 | | | | $56,039,097 | | | | $(60,304,507) | | | | $2,929,866 | | | | $(424,996 | ) | | | $— | | | | $— | | | | $17,937,862 | | | | $(383,108 | ) |
The following table on “Quantitative information about Level 3 Fair Value measurements” provides information on the valuation techniques and inputs used to value Level 3 securities at October 31, 2020:
| | | | | | | | | | | | |
| Quantitative Information about Level 3 Fair Value Measurements | |
| |
| | | |
| | | Fair Value at | | | Valuation | | | Unobservable | |
| | | 10/31/2020 | | | Technique | | | Input | |
| |
Bank Loans | | | $17,914,743 | | | | Broker Quote | | | | Inputs to broker model | |
Common Stock | | | 23,119 | | | | Broker Quote | | | | Inputs to broker model | |
| |
| | | |
Total | | | $17,937,862 | | | | | | | | | |
| |
The following is a summary of the fair values of the Fund’s derivative instruments*:
Fair Values of Financial Derivative Instruments on the Statements of Assets and Liabilities as of October 31, 2020:
| | | | | | | | |
| | | Derivatives Not Accounted for as
Hedging Instruments | |
| | | Foreign | | | Interest | |
| | | Exchange Risk | | | Rate Risk | |
| |
Assets: | | | | | | | | |
Unrealized Appreciation on Centrally Cleared Swap Contracts | | $ | — | | | $ | 259,283 | † |
Unrealized Appreciation on Forward Foreign Currency Exchange Contracts | | | 3,902,936 | | | | — | |
| | | | |
| | $ | 3,902,936 | | | $ | 259,283 | |
| | | | |
Liabilities: | | | | | | | | |
Unrealized Depreciation on Centrally Cleared Swap Contracts | | $ | — | | | $ | (277,202 | )† |
Unrealized Depreciation on Forward Foreign Currency Exchange Contracts | | | (4,284,422 | ) | | | — | |
| | | | |
| | $ | (4,284,422 | ) | | $ | (277,202 | ) |
| | | | |
See accompanying notes to the financial statements.
85
ASHMORE EMERGING MARKETS TOTAL RETURN FUND
SCHEDULE OF INVESTMENTS (CONTINUED)
As of October 31, 2020
| † | Includes cumulative appreciation/depreciation on centrally cleared swap agreements. Only the current day’s variation margin is reported within the Statements of Assets and Liabilities. |
The Effect of Financial Derivative Instruments on the Statements of Operations for the Year Ended October 31, 2020:
| | | | | | | | |
| | | Derivatives Not Accounted for as | |
| | | Hedging Instruments | |
| | | Foreign | | | Interest | |
| | | Exchange Risk | | | Rate Risk | |
| |
Realized Gain (Loss) on Derivatives Recognized resulting from Operations: | | | | | | | | |
Net Realized Loss on Forward Foreign Currency Exchange Contracts | | $ | (17,437,848 | ) | | $ | — | |
Net Realized Loss on Interest Rate Swap Contracts | | | — | | | | (859,183 | ) |
| | | | |
| | $ | (17,437,848 | ) | | $ | (859,183 | ) |
| | | | |
Net Change in Unrealized Appreciation (Depreciation) on Derivatives Recognized resulting from Operations: | | | | | | | | |
Net Change in Unrealized Depreciation on Forward Foreign Currency Exchange Contracts | | $ | (1,515,929 | ) | | $ | — | |
Net Change in Unrealized Appreciation on Interest Rate Swap Contracts | | | — | | | | 1,141,114 | |
| | | | |
| | $ | (1,515,929 | ) | | $ | 1,141,114 | |
| | | | |
*See note 10 in the Notes to the Financial Statements for the additional information.
See accompanying notes to the financial statements.
86
ASHMORE EMERGING MARKETS LOCAL CURRENCY BOND FUND
SCHEDULE OF INVESTMENTS
As of October 31, 2020
| | | | | | | | | | | | | | |
| | | Currency1 | | Par | | | Value | | | % of Net Assets | |
| |
Debt Securities | | | | | | | | | | | | | | |
| | | | |
Argentina (Cost $160,167) | | | | | | | | | | | | | | |
Bonos del Tesoro Nacional en Pesos Badlar, (Floating, Argentina Deposit Rates Badlar Private Banks 30-35 Days + 2.000%), 33.016%, 04/03/2022 | | ARS | | | 2,684,072 | | | $ | 15,076 | | | | 0.05 | |
Ciudad Autonoma De Buenos Aires, (Floating, Argentina Deposit Rates Badlar Private Banks 30-35 Days + 3.250%), 34.214%, 03/29/2024 | | ARS | | | 2,212,913 | | | | 12,211 | | | | 0.04 | |
| | | | | | | | | 27,287 | | | | 0.09 | |
| | | | |
Brazil (Cost $6,674,528) | | | | | | | | | | | | | | |
Brazil Letras do Tesouro Nacional, 0.000%, 07/01/20212 | | BRL | | | 932,000 | | | | 159,739 | | | | 0.53 | |
Brazil Letras do Tesouro Nacional, 0.000%, 01/01/20222 | | BRL | | | 2,174,000 | | | | 363,927 | | | | 1.21 | |
Brazil Letras do Tesouro Nacional, 0.000%, 07/01/20222 | | BRL | | | 2,379,000 | | | | 385,512 | | | | 1.28 | |
Brazil Letras do Tesouro Nacional, 0.000%, 07/01/20232 | | BRL | | | 2,570,000 | | | | 384,592 | | | | 1.28 | |
Brazil Notas do Tesouro Nacional Serie F, 10.000%, 01/01/2023 | | BRL | | | 4,956,000 | | | | 945,392 | | | | 3.15 | |
Brazil Notas do Tesouro Nacional Serie F, 10.000%, 01/01/2025 | | BRL | | | 4,266,000 | | | | 832,073 | | | | 2.77 | |
Brazil Notas do Tesouro Nacional Serie F, 10.000%, 01/01/2027 | | BRL | | | 5,059,000 | | | | 993,388 | | | | 3.31 | |
Brazil Notas do Tesouro Nacional Serie F, 10.000%, 01/01/2029 | | BRL | | | 3,290,000 | | | | 650,270 | | | | 2.17 | |
Brazil Notas do Tesouro Nacional Serie F, 10.000%, 01/01/2031 | | BRL | | | 440,000 | | | | 87,414 | | | | 0.29 | |
| | | | | | | | | 4,802,307 | | | | 15.99 | |
| | | | |
Chile (Cost $1,386,660) | | | | | | | | | | | | | | |
Bonos de la Tesoreria de la Republica, 1.500%, 03/01/2026 | | CLP | | | 7,500 | | | | 317,267 | | | | 1.06 | |
Bonos de la Tesoreria de la Republica, 1.900%, 09/01/2030 | | CLP | | | 1,000 | | | | 44,848 | | | | 0.15 | |
Bonos de la Tesoreria de la Republica en pesos, 4.500%, 03/01/2021 | | CLP | | | 510,000,000 | | | | 669,192 | | | | 2.23 | |
Bonos de la Tesoreria de la Republica en pesos, 4.700%, 09/01/20303 | | CLP | | | 85,000,000 | | | | 129,874 | | | | 0.43 | |
Bonos de la Tesoreria de la Republica en pesos, 5.000%, 03/01/2035 | | CLP | | | 95,000,000 | | | | 147,843 | | | | 0.49 | |
| | | | | | | | | 1,309,024 | | | | 4.36 | |
| | | | |
China (Cost $1,463,229) | | | | | | | | | | | | | | |
China (Rep of), 1.990%, 04/09/2025 | | CNY | | | 4,620,000 | | | | 659,875 | | | | 2.19 | |
China (Rep of), 2.850%, 06/04/2027 | | CNY | | | 2,200,000 | | | | 320,540 | | | | 1.07 | |
China (Rep of), 2.680%, 05/21/2030 | | CNY | | | 2,030,000 | | | | 290,578 | | | | 0.97 | |
China (Rep of), 3.810%, 09/14/2050 | | CNY | | | 1,540,000 | | | | 227,709 | | | | 0.76 | |
| | | | | | | | | 1,498,702 | | | | 4.99 | |
| | | | |
Colombia (Cost $1,542,893) | | | | | | | | | | | | | | |
Colombian TES, 3.300%, 03/17/2027 | | COP | | | 2,956,000 | | | | 230,266 | | | | 0.77 | |
Colombian TES, 5.750%, 11/03/2027 | | COP | | | 198,300,000 | | | | 53,031 | | | | 0.18 | |
Colombian TES, 6.000%, 04/28/2028 | | COP | | | 247,700,000 | | | | 66,803 | | | | 0.22 | |
See accompanying notes to the financial statements.
87
ASHMORE EMERGING MARKETS LOCAL CURRENCY BOND FUND
SCHEDULE OF INVESTMENTS (CONTINUED)
As of October 31, 2020
| | | | | | | | | | | | | | |
| | | Currency1 | | Par | | | Value | | | % of Net Assets | |
| |
Colombia (continued) | | | | | | | | | | | | | | |
Colombian TES, 7.750%, 09/18/2030 | | COP | | | 716,200,000 | | | $ | 211,500 | | | | 0.70 | |
Colombian TES, 7.000%, 06/30/2032 | | COP | | | 401,200,000 | | | | 110,363 | | | | 0.37 | |
Colombian TES, 3.000%, 03/25/2033 | | COP | | | 735,000 | | | | 52,414 | | | | 0.18 | |
Colombian TES, 7.250%, 10/18/2034 | | COP | | | 2,404,800,000 | | | | 667,341 | | | | 2.22 | |
Colombian TES, 7.250%, 10/26/2050 | | COP | | | 219,100,000 | | | | 58,005 | | | | 0.19 | |
| | | | | | | | | 1,449,723 | | | | 4.83 | |
| | | | |
Czech Republic (Cost $384,877) | | | | | | | | | | | | | | |
Czech (Rep of), 0.950%, 05/15/2030 | | CZK | | | 1,440,000 | | | | 61,209 | | | | 0.20 | |
Czech (Rep of), 2.000%, 10/13/2033 | | CZK | | | 6,470,000 | | | | 305,400 | | | | 1.02 | |
Czech (Rep of), 4.200%, 12/04/2036 | | CZK | | | 520,000 | | | | 32,003 | | | | 0.11 | |
| | | | | | | | | 398,612 | | | | 1.33 | |
| | | | |
Dominican Republic (Cost $159,333) | | | | | | | | | | | | | | |
Dominican (Rep of), 9.750%, 06/05/2026 | | DOP | | | 8,050,000 | | | | 141,359 | | | | 0.47 | |
| | | | | | | | | 141,359 | | | | 0.47 | |
| | | | |
Hungary (Cost $1,038,441) | | | | | | | | | | | | | | |
Hungary (Rep of), 3.000%, 06/26/2024 | | HUF | | | 58,110,000 | | | | 195,300 | | | | 0.65 | |
Hungary (Rep of), 5.500%, 06/24/2025 | | HUF | | | 119,650,000 | | | | 448,726 | | | | 1.49 | |
Hungary (Rep of), 3.000%, 10/27/2027 | | HUF | | | 24,500,000 | | | | 83,846 | | | | 0.28 | |
Hungary (Rep of), 6.750%, 10/22/2028 | | HUF | | | 22,820,000 | | | | 98,256 | | | | 0.33 | |
Hungary (Rep of), 3.000%, 08/21/2030 | | HUF | | | 47,120,000 | | | | 160,028 | | | | 0.53 | |
| | | | | | | | | 986,156 | | | | 3.28 | |
| | | | |
Indonesia (Cost $1,665,839) | | | | | | | | | | | | | | |
Indonesia (Rep of), 6.500%, 06/15/2025 | | IDR | | | 2,534,000,000 | | | | 180,426 | | | | 0.60 | |
Indonesia (Rep of), 7.000%, 05/15/2027 | | IDR | | | 292,000,000 | | | | 20,812 | | | | 0.07 | |
Indonesia (Rep of), 6.125%, 05/15/2028 | | IDR | | | 3,541,000,000 | | | | 237,639 | | | | 0.79 | |
Indonesia (Rep of), 9.000%, 03/15/2029 | | IDR | | | 300,000,000 | | | | 23,634 | | | | 0.08 | |
Indonesia (Rep of), 8.250%, 05/15/2029 | | IDR | | | 815,000,000 | | | | 61,787 | | | | 0.21 | |
Indonesia (Rep of), 7.000%, 09/15/2030 | | IDR | | | 2,146,000,000 | | | | 151,167 | | | | 0.50 | |
Indonesia (Rep of), 6.500%, 02/15/2031 | | IDR | | | 893,000,000 | | | | 60,663 | | | | 0.20 | |
Indonesia (Rep of), 7.750%, 04/15/2031 | | IDR | | | 698,000,000 | | | | 51,017 | | | | 0.17 | |
Indonesia (Rep of), 8.750%, 05/15/2031 | | IDR | | | 2,679,000,000 | | | | 207,617 | | | | 0.69 | |
Indonesia (Rep of), 6.625%, 05/15/2033 | | IDR | | | 4,572,000,000 | | | | 303,653 | | | | 1.01 | |
Indonesia (Rep of), 7.500%, 06/15/2035 | | IDR | | | 1,683,000,000 | | | | 118,644 | | | | 0.39 | |
Indonesia (Rep of), 8.250%, 05/15/2036 | | IDR | | | 2,647,000,000 | | | | 195,892 | | | | 0.65 | |
Indonesia (Rep of), 8.375%, 04/15/2039 | | IDR | | | 1,834,000,000 | | | | 136,930 | | | | 0.46 | |
| | | | | | | | | 1,749,881 | | | | 5.82 | |
| | | | |
Malaysia (Cost $1,413,508) | | | | | | | | | | | | | | |
Malaysia (Rep of), 3.955%, 09/15/2025 | | MYR | | | 919,000 | | | | 240,493 | | | | 0.80 | |
Malaysia (Rep of), 3.906%, 07/15/2026 | | MYR | | | 430,000 | | | | 112,720 | | | | 0.38 | |
Malaysia (Rep of), 3.900%, 11/30/2026 | | MYR | | | 321,000 | | | | 84,362 | | | | 0.28 | |
Malaysia (Rep of), 3.899%, 11/16/2027 | | MYR | | | 238,000 | | | | 62,614 | | | | 0.21 | |
Malaysia (Rep of), 3.733%, 06/15/2028 | | MYR | | | 382,000 | | | | 99,619 | | | | 0.33 | |
See accompanying notes to the financial statements.
88
ASHMORE EMERGING MARKETS LOCAL CURRENCY BOND FUND
SCHEDULE OF INVESTMENTS (CONTINUED)
As of October 31, 2020
| | | | | | | | | | | | | | |
| | | Currency1 | | Par | | | Value | | | % of Net Assets | |
| |
Malaysia (continued) | | | | | | | | | | | | | | |
Malaysia (Rep of), 3.885%, 08/15/2029 | | MYR | | | 466,000 | | | $ | 122,940 | | | | 0.41 | |
Malaysia (Rep of), 2.632%, 04/15/2031 | | MYR | | | 149,000 | | | | 35,867 | | | | 0.12 | |
Malaysia (Rep of), 4.232%, 06/30/2031 | | MYR | | | 210,000 | | | | 57,119 | | | | 0.19 | |
Malaysia (Rep of), 3.844%, 04/15/2033 | | MYR | | | 350,000 | | | | 91,321 | | | | 0.30 | |
Malaysia (Rep of), 4.642%, 11/07/2033 | | MYR | | | 505,000 | | | | 141,623 | | | | 0.47 | |
Malaysia (Rep of), 3.828%, 07/05/2034 | | MYR | | | 821,000 | | | | 213,063 | | | | 0.71 | |
Malaysia (Rep of), 4.893%, 06/08/2038 | | MYR | | | 112,000 | | | | 31,662 | | | | 0.11 | |
Malaysia (Rep of), 3.757%, 05/22/2040 | | MYR | | | 296,000 | | | | 74,021 | | | | 0.25 | |
Malaysia (Rep of), 4.935%, 09/30/2043 | | MYR | | | 52,000 | | | | 14,506 | | | | 0.05 | |
Malaysia (Rep of), 4.921%, 07/06/2048 | | MYR | | | 123,000 | | | | 34,025 | | | | 0.11 | |
Malaysia (Rep of), 4.065%, 06/15/2050 | | MYR | | �� | 321,000 | | | | 79,481 | | | | 0.26 | |
| | | | | | | | | 1,495,436 | | | | 4.98 | |
| | | | |
Mexico (Cost $911,718) | | | | | | | | | | | | | | |
Comision Federal de Electricidad, 8.180%, 12/23/2027 | | MXN | | | 2,120,000 | | | | 96,676 | | | | 0.32 | |
Mexican Bonos, 8.500%, 05/31/2029 | | MXN | | | 1,160,000 | | | | 63,798 | | | | 0.21 | |
Mexican Bonos, 7.750%, 11/23/2034 | | MXN | | | 1,850,000 | | | | 96,191 | | | | 0.32 | |
Mexican Bonos, 8.500%, 11/18/2038 | | MXN | | | 4,160,000 | | | | 227,670 | | | | 0.76 | |
Mexican Bonos, 7.750%, 11/13/2042 | | MXN | | | 4,250,000 | | | | 214,659 | | | | 0.71 | |
Petroleos Mexicanos, 7.190%, 09/12/2024 | | MXN | | | 4,600,000 | | | | 188,563 | | | | 0.63 | |
Petroleos Mexicanos, 7.470%, 11/12/2026 | | MXN | | | 210,000 | | | | 7,815 | | | | 0.03 | |
| | | | | | | | | 895,372 | | | | 2.98 | |
| | | | |
Peru (Cost $1,323,609) | | | | | | | | | | | | | | |
Fondo MIVIVIENDA S.A., 7.000%, 02/14/2024 | | PEN | | | 625,000 | | | | 193,784 | | | | 0.65 | |
Peru (Rep of), 5.940%, 02/12/2029 | | PEN | | | 281,000 | | | | 92,717 | | | | 0.31 | |
Peru (Rep of), 6.950%, 08/12/2031 | | PEN | | | 1,276,000 | | | | 435,279 | | | | 1.45 | |
Peru (Rep of), 6.150%, 08/12/2032 | | PEN | | | 447,000 | | | | 142,480 | | | | 0.47 | |
Peru (Rep of), 5.400%, 08/12/2034 | | PEN | | | 467,000 | | | | 135,968 | | | | 0.45 | |
Peru (Rep of), 6.900%, 08/12/2037 | | PEN | | | 666,000 | | | | 217,809 | | | | 0.73 | |
Peru (Rep of), 5.350%, 08/12/2040 | | PEN | | | 315,000 | | | | 85,041 | | | | 0.28 | |
| | | | | | | | | 1,303,078 | | | | 4.34 | |
| | | | |
Philippines (Cost $337,328) | | | | | | | | | | | | | | |
Philippines (Rep of), 4.950%, 01/15/2021 | | PHP | | | 5,000,000 | | | | 103,306 | | | | 0.34 | |
Philippines (Rep of), 3.900%, 11/26/2022 | | PHP | | | 10,000,000 | | | | 210,483 | | | | 0.70 | |
| | | | | | | | | 313,789 | | | | 1.04 | |
| | | | |
Poland (Cost $527,870) | | | | | | | | | | | | | | |
Poland (Rep of), 3.250%, 07/25/2025 | | PLN | | | 812,000 | | | | 232,549 | | | | 0.78 | |
Poland (Rep of), 2.750%, 10/25/2029 | | PLN | | | 1,151,000 | | | | 331,466 | | | | 1.10 | |
| | | | | | | | | 564,015 | | | | 1.88 | |
| | | | |
Romania (Cost $496,090) | | | | | | | | | | | | | | |
Romania (Rep of), 5.800%, 07/26/2027 | | RON | | | 1,110,000 | | | | 305,383 | | | | 1.01 | |
Romania (Rep of), 4.150%, 01/26/2028 | | RON | | | 865,000 | | | | 218,294 | | | | 0.73 | |
| | | | | | | | | 523,677 | | | | 1.74 | |
See accompanying notes to the financial statements.
89
ASHMORE EMERGING MARKETS LOCAL CURRENCY BOND FUND
SCHEDULE OF INVESTMENTS (CONTINUED)
As of October 31, 2020
| | | | | | | | | | | | | | |
| | | Currency1 | | Par | | | Value | | | % of Net Assets | |
| |
Russian Federation (Cost $2,558,959) | | | | | | | | | | | | | | |
Russian Federal Bond - OFZ, 7.100%, 10/16/2024 | | RUB | | | 10,511,000 | | | $ | 141,244 | | | | 0.47 | |
Russian Federal Bond - OFZ, 7.150%, 11/12/2025 | | RUB | | | 8,481,000 | | | | 114,691 | | | | 0.38 | |
Russian Federal Bond - OFZ, 7.750%, 09/16/2026 | | RUB | | | 36,786,000 | | | | 514,447 | | | | 1.71 | |
Russian Federal Bond - OFZ, 7.950%, 10/07/2026 | | RUB | | | 5,246,000 | | | | 74,074 | | | | 0.25 | |
Russian Federal Bond - OFZ, 8.150%, 02/03/2027 | | RUB | | | 7,433,000 | | | | 105,977 | | | | 0.35 | |
Russian Federal Bond - OFZ, 7.050%, 01/19/2028 | | RUB | | | 6,841,000 | | | | 92,485 | | | | 0.31 | |
Russian Federal Bond - OFZ, 6.900%, 05/23/2029 | | RUB | | | 5,015,000 | | | | 67,073 | | | | 0.22 | |
Russian Federal Bond - OFZ, 7.650%, 04/10/2030 | | RUB | | | 3,173,000 | | | | 44,386 | | | | 0.15 | |
Russian Federal Bond - OFZ, 8.500%, 09/17/2031 | | RUB | | | 23,294,000 | | | | 344,260 | | | | 1.15 | |
Russian Federal Bond - OFZ, 7.700%, 03/23/2033 | | RUB | | | 33,898,000 | | | | 475,766 | | | | 1.58 | |
Russian Federal Bond - OFZ, 7.250%, 05/10/2034 | | RUB | | | 21,440,000 | | | | 291,351 | | | | 0.97 | |
| | | | | | | | | 2,265,754 | | | | 7.54 | |
| | | | |
South Africa (Cost $3,278,148) | | | | | | | | | | | | | | |
South Africa (Rep of), 10.500%, 12/21/2026 | | ZAR | | | 3,737,000 | | | | 266,972 | | | | 0.89 | |
South Africa (Rep of), 8.000%, 01/31/2030 | | ZAR | | | 8,589,000 | | | | 485,334 | | | | 1.61 | |
South Africa (Rep of), 7.000%, 02/28/2031 | | ZAR | | | 6,743,000 | | | | 339,103 | | | | 1.13 | |
South Africa (Rep of), 8.250%, 03/31/2032 | | ZAR | | | 7,159,000 | | | | 377,755 | | | | 1.26 | |
South Africa (Rep of), 8.875%, 02/28/2035 | | ZAR | | | 2,304,000 | | | | 118,355 | | | | 0.39 | |
South Africa (Rep of), 6.250%, 03/31/2036 | | ZAR | | | 647,000 | | | | 26,068 | | | | 0.09 | |
South Africa (Rep of), 8.500%, 01/31/2037 | | ZAR | | | 2,779,000 | | | | 133,744 | | | | 0.44 | |
South Africa (Rep of), 9.000%, 01/31/2040 | | ZAR | | | 1,529,000 | | | | 75,024 | | | | 0.25 | |
South Africa (Rep of), 6.500%, 02/28/2041 | | ZAR | | | 2,581,000 | | | | 97,126 | | | | 0.32 | |
South Africa (Rep of), 8.750%, 01/31/2044 | | ZAR | | | 7,102,000 | | | | 332,406 | | | | 1.11 | |
South Africa (Rep of), 8.750%, 02/28/2048 | | ZAR | | | 9,575,000 | | | | 446,515 | | | | 1.49 | |
| | | | | | | | | 2,698,402 | | | | 8.98 | |
| | | | |
Thailand (Cost $1,280,811) | | | | | | | | | | | | | | |
Thailand (Rep of), 4.875%, 06/22/2029 | | THB | | | 1,357,000 | | | | 55,789 | | | | 0.18 | |
Thailand (Rep of), 3.775%, 06/25/2032 | | THB | | | 4,006,000 | | | | 159,298 | | | | 0.53 | |
Thailand (Rep of), 1.600%, 06/17/2035 | | THB | | | 2,756,000 | | | | 88,134 | | | | 0.29 | |
Thailand (Rep of), 3.400%, 06/17/2036 | | THB | | | 7,552,000 | | | | 299,287 | | | | 1.00 | |
Thailand (Rep of), 3.300%, 06/17/2038 | | THB | | | 10,197,000 | | | | 395,701 | | | | 1.32 | |
Thailand (Rep of), 2.000%, 06/17/2042 | | THB | | | 4,113,000 | | | | 132,076 | | | | 0.44 | |
Thailand (Rep of), 2.875%, 06/17/2046 | | THB | | | 5,826,000 | | | | 215,582 | | | | 0.72 | |
Thailand (Rep of), 3.600%, 06/17/2067 | | THB | | | 1,682,000 | | | | 70,109 | | | | 0.23 | |
| | | | | | | | | 1,415,976 | | | | 4.71 | |
| | | | |
Turkey (Cost $1,022,464) | | | | | | | | | | | | | | |
Turkey (Rep of), 3.000%, 02/23/2022 | | TRY | | | 245,000 | | | | 70,032 | | | | 0.23 | |
Turkey (Rep of), 11.000%, 03/02/2022 | | TRY | | | 632,000 | | | | 72,481 | | | | 0.24 | |
Turkey (Rep of), 8.000%, 03/12/2025 | | TRY | | | 584,000 | | | | 55,755 | | | | 0.19 | |
Turkey (Rep of), 10.600%, 02/11/2026 | | TRY | | | 994,000 | | | | 104,388 | | | | 0.35 | |
Turkey (Rep of), 11.000%, 02/24/2027 | | TRY | | | 534,000 | | | | 55,697 | | | | 0.18 | |
Turkey (Rep of), 10.500%, 08/11/2027 | | TRY | | | 1,235,016 | | | | 125,278 | | | | 0.42 | |
See accompanying notes to the financial statements.
90
ASHMORE EMERGING MARKETS LOCAL CURRENCY BOND FUND
SCHEDULE OF INVESTMENTS (CONTINUED)
As of October 31, 2020
| | | | | | | | | | | | | | |
| | | Currency1 | | Par | | | Value | | | % of Net
Assets | |
| |
Turkey (continued) | | | | | | | | | | | | | | |
Turkey (Rep of), 12.400%, 03/08/2028 | | TRY | | | 130,000 | | | $ | 14,296 | | | | 0.05 | |
| | | | | | | | | 497,927 | | | | 1.66 | |
| | | | |
Ukraine (Cost $171,247) | | | | | | | | | | | | | | |
Ukraine (Rep of), 17.000%, 05/11/20223 | | UAH | | | 662,000 | | | | 25,014 | | | | 0.08 | |
Ukraine (Rep of), 15.840%, 02/26/20253 | | UAH | | | 3,490,000 | | | | 135,420 | | | | 0.45 | |
| | | | | | | | | 160,434 | | | | 0.53 | |
| | | | |
Uruguay (Cost $604,234) | | | | | | | | | | | | | | |
Uruguay (Rep of), 9.875%, 06/20/2022 | | UYU | | | 1,106,000 | | | | 26,513 | | | | 0.09 | |
Uruguay (Rep of), 8.500%, 03/15/2028 | | UYU | | | 1,805,000 | | | | 43,982 | | | | 0.15 | |
Uruguay (Rep of), 4.375%, 12/15/2028 | | UYU | | | 343,754 | | | | 18,434 | | | | 0.06 | |
Uruguay (Rep of), 3.875%, 07/02/2040 | | UYU | | | 5,971,000 | | | | 161,937 | | | | 0.54 | |
Uruguay Monetary Regulation Bill, 0.000%, 12/18/20202 | | UYU | | | 102,000 | | | | 2,354 | | | | 0.01 | |
Uruguay Monetary Regulation Bill, 0.000%, 02/05/20212 | | UYU | | | 255,000 | | | | 5,828 | | | | 0.02 | |
Uruguay Monetary Regulation Bill, 0.000%, 02/19/20212 | | UYU | | | 268,000 | | | | 6,108 | | | | 0.02 | |
Uruguay Monetary Regulation Bill, 0.000%, 03/10/20212 | | UYU | | | 1,321,000 | | | | 29,981 | | | | 0.10 | |
Uruguay Monetary Regulation Bill, 0.000%, 03/19/20212 | | UYU | | | 1,355,000 | | | | 30,679 | | | | 0.10 | |
Uruguay Monetary Regulation Bill, 0.000%, 05/07/20212 | | UYU | | | 3,168,000 | | | | 70,928 | | | | 0.24 | |
Uruguay Monetary Regulation Bill, 0.000%, 06/09/20212 | | UYU | | | 599,000 | | | | 13,313 | | | | 0.04 | |
Uruguay Monetary Regulation Bill, 0.000%, 06/18/20212 | | UYU | | | 5,328,000 | | | | 118,232 | | | | 0.39 | |
Uruguay Monetary Regulation Bill, 0.000%, 07/21/20212 | | UYU | | | 591,000 | | | | 13,008 | | | | 0.04 | |
Uruguay Monetary Regulation Bill, 0.000%, 08/06/20212 | | UYU | | | 2,586,000 | | | | 56,726 | | | | 0.19 | |
Uruguay Monetary Regulation Bill, 0.000%, 12/08/20212 | | UYU | | | 513,000 | | | | 10,965 | | | | 0.04 | |
| | | | | | | | | 608,988 | | | | 2.03 | |
| | | | |
Total Debt Securities (Cost $28,401,953) | | | | | | | | | 25,105,899 | | | | 83.57 | |
| | | | |
Credit Linked Notes | | | | | | | | | | | | | | |
| | | | |
Indonesia (Cost $2,105,292) | | | | | | | | | | | | | | |
Indonesia (Rep of), Issued by JPMorgan Chase Bank N.A., 7.500%, 08/17/20323 | | IDR | | | 2,690,000,000 | | | | 189,900 | | | | 0.63 | |
Indonesia (Rep of), Issued by Standard Chartered, 8.375%, 03/19/20243 | | IDR | | | 2,600,000,000 | | | | 195,464 | | | | 0.65 | |
Indonesia (Rep of), Issued by Standard Chartered, 8.125%, 05/17/20243 | | IDR | | | 9,817,000,000 | | | | 734,012 | | | | 2.44 | |
Indonesia (Rep of), Issued by Standard Chartered, 7.000%, 05/24/20273 | | IDR | | | 6,950,000,000 | | | | 495,345 | | | | 1.65 | |
Indonesia (Rep of), Issued by Standard Chartered, 10.500%, 08/19/20303 | | IDR | | | 1,064,000,000 | | | | 91,518 | | | | 0.31 | |
Indonesia (Rep of), Issued by Standard Chartered, 8.375%, 03/17/20343 | | IDR | | | 4,693,000,000 | | | | 352,184 | | | | 1.17 | |
See accompanying notes to the financial statements.
91
ASHMORE EMERGING MARKETS LOCAL CURRENCY BOND FUND
SCHEDULE OF INVESTMENTS (CONTINUED)
As of October 31, 2020
| | | | | | | | | | | | | | | | |
| | | Currency1 | | | Par | | | Value | | | % of Net
Assets | |
| |
Indonesia (continued) | | | | | | | | | | | | | | | | |
Indonesia (Rep of), Issued by Standard Chartered, 8.250%, 05/19/20363 | | | IDR | | | | 2,022,000,000 | | | $ | 149,639 | | | | 0.50 | |
| | | | | | | | | | | 2,208,062 | | | | 7.35 | |
| | | | |
Total Credit Linked Notes (Cost $2,105,292) | | | | | | | | | | | 2,208,062 | | | | 7.35 | |
| | | | |
Total Investments in Securities (Cost $30,507,245) | | | | | | | | | | | 27,313,961 | | | | 90.92 | |
| | | | |
Total Investments (Total Cost $30,507,245) | | | | | | | | | | | 27,313,961 | | | | 90.92 | |
| | | | |
Other Assets Less Liabilities (See Statements of Assets and Liabilities for further detail) | | | | | | | | | | | 2,728,443 | | | | 9.08 | |
| | | | |
Net Assets | | | | | | | | | | $ | 30,042,404 | | | | 100.00 | |
| 1 | Local currency is United States Dollars unless otherwise noted below. |
| 3 | Securities exempt from registration under Rule 144A of the Securities Act of 1933. These securities may not be publicly traded without registration under the Securities Act of 1933. |
Percentages shown are based on net assets.
At October 31, 2020, the Ashmore Emerging Markets Local Currency Bond Fund had outstanding forward foreign currency exchange contracts as follows:
| | | | | | | | | | | | | | | | | | |
Settlement Date | | Counterparty | | Currency Buy | | Currency Buy Amount (Local Currency) | | | Currency Sell | | Currency Sell Amount (Local Currency) | | | Unrealized Gain/(Loss) |
| 11/04/2020 | | Deutsche Bank | | United States Dollar | | | 80,000 | | | Brazilian Real | | | 451,840 | | | | $ 1,270 | |
| 11/04/2020 | | HSBC Bank | | United States Dollar | | | 2,484,667 | | | Brazilian Real | | | 13,857,979 | | | | 70,001 | |
| 11/04/2020 | | JP Morgan | | United States Dollar | | | 184,400 | | | Brazilian Real | | | 1,028,449 | | | | 5,199 | |
| 11/06/2020 | | HSBC Bank | | United States Dollar | | | 86,883 | | | Turkish Lira | | | 642,129 | | | | 10,486 | |
| 11/27/2020 | | BNP Paribas | | Romanian Leu | | | 1,179,811 | | | United States Dollar | | | 281,544 | | | | 589 | |
| 11/30/2020 | | Barclays | | Chinese Offshore Yuan | | | 1,245,642 | | | United States Dollar | | | 181,000 | | | | 4,619 | |
| 11/30/2020 | | Deutsche Bank | | Chinese Offshore Yuan | | | 1,236,600 | | | United States Dollar | | | 180,000 | | | | 4,271 | |
| 11/30/2020 | | HSBC Bank | | Chinese Offshore Yuan | | | 3,527,142 | | | United States Dollar | | | 514,204 | | | | 11,392 | |
| 11/30/2020 | | JP Morgan | | Chinese Offshore Yuan | | | 2,105,927 | | | United States Dollar | | | 313,000 | | | | 814 | |
| 11/30/2020 | | Merrill Lynch | | Chinese Offshore Yuan | | | 1,176,084 | | | United States Dollar | | | 172,000 | | | | 3,254 | |
| 11/30/2020 | | Standard Chartered | | Chinese Offshore Yuan | | | 1,174,821 | | | United States Dollar | | | 171,000 | | | | 4,066 | |
| 11/30/2020 | | BNP Paribas | | Polish Zloty | | | 586,127 | | | United States Dollar | | | 146,356 | | | | 1,719 | |
| 11/30/2020 | | HSBC Bank | | Russian Ruble | | | 1,157,753 | | | United States Dollar | | | 14,510 | | | | 14 | |
| 11/30/2020 | | UBS | | Russian Ruble | | | 3,190,600 | | | United States Dollar | | | 40,000 | | | | 27 | |
| 11/30/2020 | | Deutsche Bank | | Thai Baht | | | 11,726,000 | | | United States Dollar | | | 376,129 | | | | 15 | |
| 11/30/2020 | | HSBC Bank | | Thai Baht | | | 15,777,149 | | | United States Dollar | | | 503,148 | | | | 2,948 | |
| 11/30/2020 | | Standard Chartered | | Thai Baht | | | 22,400,000 | | | United States Dollar | | | 715,353 | | | | 3,188 | |
| 11/30/2020 | | Citibank | | United States Dollar | | | 81,500 | | | Chinese Offshore Yuan | | | 544,176 | | | | 410 | |
See accompanying notes to the financial statements.
92
ASHMORE EMERGING MARKETS LOCAL CURRENCY BOND FUND
SCHEDULE OF INVESTMENTS (CONTINUED)
As of October 31, 2020
| | | | | | | | | | | | | | | | | | |
Settlement Date | | Counterparty | | Currency Buy | | Currency Buy Amount (Local Currency) | | | Currency Sell | | Currency Sell Amount (Local
Currency) | | | Unrealized
Gain/(Loss) |
| 11/30/2020 | | HSBC Bank | | United States Dollar | | | 32,327 | | | Chinese Offshore Yuan | | | 215,539 | | | | $ 208 | |
| 11/30/2020 | | BNP Paribas | | United States Dollar | | | 97,000 | | | Indonesian Rupiah | | | 1,434,300,200 | | | | 232 | |
| 11/30/2020 | | HSBC Bank | | United States Dollar | | | 161,190 | | | Indonesian Rupiah | | | 2,382,480,010 | | | | 451 | |
| 11/30/2020 | | Deutsche Bank | | United States Dollar | | | 40,742 | | | Thai Baht | | | 1,269,000 | | | | 35 | |
| 11/30/2020 | | Barclays | | United States Dollar | | | 268,850 | | | Turkish Lira | | | 2,096,083 | | | | 22,509 | |
| 12/02/2020 | | Deutsche Bank | | United States Dollar | | | 2,352,880 | | | Brazilian Real | | | 13,252,949 | | | | 46,721 | |
| 12/09/2020 | | Barclays | | United States Dollar | | | 52,477 | | | Turkish Lira | | | 401,000 | | | | 5,573 | |
| 01/06/2021 | | Merrill Lynch | | United States Dollar | | | 35,716 | | | Ukraine Hryvnia | | | 1,037,190 | | | | 140 | |
| 01/08/2021 | | HSBC Bank | | United States Dollar | | | 63,315 | | | Turkish Lira | | | 507,848 | | | | 4,820 | |
| 01/29/2021 | | Barclays | | Korean Won | | | 477,220,474 | | | United States Dollar | | | 413,570 | | | | 6,242 | |
| 01/29/2021 | | BNP Paribas | | Korean Won | | | 319,000,000 | | | United States Dollar | | | 274,383 | | | | 6,242 | |
| 01/29/2021 | | Deutsche Bank | | Korean Won | | | 37,964,850 | | | United States Dollar | | | 33,000 | | | | 398 | |
| 01/29/2021 | | Merrill Lynch | | Korean Won | | | 160,000,000 | | | United States Dollar | | | 138,805 | | | | 1,948 | |
| 01/29/2021 | | Deutsche Bank | | United States Dollar | | | 170,000 | | | Colombian Peso | | | 658,750,000 | | | | 520 | |
| 01/29/2021 | | Morgan Stanley | | United States Dollar | | | 12,500 | | | Czech Koruna | | | 291,140 | | | | 34 | |
| 01/29/2021 | | Deutsche Bank | | United States Dollar | | | 17,700 | | | Hungarian Forint | | | 5,556,632 | | | | 78 | |
| 01/29/2021 | | HSBC Bank | | United States Dollar | | | 20,800 | | | Korean Won | | | 23,583,040 | | | | 54 | |
| 01/29/2021 | | Deutsche Bank | | United States Dollar | | | 18,200 | | | Peruvian Nuevo Sol | | | 65,755 | | | | 16 | |
| 01/29/2021 | | HSBC Bank | | United States Dollar | | | 338,408 | | | Peruvian Nuevo Sol | | | 1,220,402 | | | | 912 | |
| 01/29/2021 | | Deutsche Bank | | United States Dollar | | | 39,900 | | | Polish Zloty | | | 156,876 | | | | 261 | |
| | | | | | | | | | | | | | | | | | |
| | | | |
| Subtotal Appreciation | | | | | | | | | | | | | 221,676 | |
| | | | | | | | | | | | | | | | | | |
| 11/02/2020 | | JP Morgan | | United States Dollar | | | 133,061 | | | Indonesian Rupiah | | | 1,954,000,000 | | | | (546 | ) |
| 11/04/2020 | | Banco Santander | | Brazilian Real | | | 854,458 | | | United States Dollar | | | 152,871 | | | | (3,987 | ) |
| 11/04/2020 | | BNP Paribas | | Brazilian Real | | | 534,861 | | | United States Dollar | | | 95,000 | | | | (1,804 | ) |
| 11/04/2020 | | Deutsche Bank | | Brazilian Real | | | 13,252,949 | | | United States Dollar | | | 2,354,824 | | | | (45,581 | ) |
| 11/04/2020 | | JP Morgan | | Brazilian Real | | | 696,000 | | | United States Dollar | | | 123,479 | | | | (2,205 | ) |
| 11/27/2020 | | Deutsche Bank | | United States Dollar | | | 239,731 | | | Philippine Peso | | | 11,686,164 | | | | (1,003 | ) |
| 11/27/2020 | | Morgan Stanley | | United States Dollar | | | 17,600 | | | Philippine Peso | | | 855,536 | | | | (24 | ) |
| 11/30/2020 | | Merrill Lynch | | Czech Koruna | | | 25,187,141 | | | United States Dollar | | | 1,085,522 | | | | (8,861 | ) |
| 11/30/2020 | | Barclays | | Hungarian Forint | | | 41,534,845 | | | United States Dollar | | | 132,884 | | | | (1,070 | ) |
| 11/30/2020 | | ANZ | | Indonesian Rupiah | | | 3,500,000,000 | | | United States Dollar | | | 236,550 | | | | (416 | ) |
| 11/30/2020 | | BNP Paribas | | Indonesian Rupiah | | | 1,954,000,000 | | | United States Dollar | | | 132,880 | | | | (1,049 | ) |
| 11/30/2020 | | HSBC Bank | | Indonesian Rupiah | | | 2,492,000,000 | | | United States Dollar | | | 169,454 | | | | (1,327 | ) |
| 11/30/2020 | | Deutsche Bank | | Malaysian Ringgit | | | 2,576,499 | | | United States Dollar | | | 622,418 | | | | (3,090 | ) |
| 11/30/2020 | | Deutsche Bank | | Polish Zloty | | | 738,366 | | | United States Dollar | | | 190,185 | | | | (3,650 | ) |
| 11/30/2020 | | Merrill Lynch | | Polish Zloty | | | 884,635 | | | United States Dollar | | | 223,497 | | | | (9 | ) |
| 11/30/2020 | | JP Morgan | | Russian Ruble | | | 6,161,144 | | | United States Dollar | | | 77,700 | | | | (406 | ) |
| 11/30/2020 | | Merrill Lynch | | Russian Ruble | | | 32,872,525 | | | United States Dollar | | | 421,300 | | | | (8,901 | ) |
| 11/30/2020 | | Barclays | | Turkish Lira | | | 104,618 | | | United States Dollar | | | 13,000 | | | | (705 | ) |
| 11/30/2020 | | BNP Paribas | | Turkish Lira | | | 531,341 | | | United States Dollar | | | 66,000 | | | | (3,554 | ) |
| 11/30/2020 | | HSBC Bank | | Turkish Lira | | | 617,609 | | | United States Dollar | | | 75,929 | | | | (3,345 | ) |
| 11/30/2020 | | JP Morgan | | Turkish Lira | | | 635,742 | | | United States Dollar | | | 79,000 | | | | (4,285 | ) |
See accompanying notes to the financial statements.
93
ASHMORE EMERGING MARKETS LOCAL CURRENCY BOND FUND
SCHEDULE OF INVESTMENTS (CONTINUED)
As of October 31, 2020
| | | | | | | | | | | | | | | | | | |
Settlement Date | | Counterparty | | Currency Buy | | Currency Buy Amount (Local Currency) | | | Currency Sell | | Currency Sell Amount (Local Currency) | | | Unrealized Gain/(Loss) |
| 11/30/2020 | | Merrill Lynch | | Turkish Lira | | | 168,782 | | | United States Dollar | | | 21,000 | | | $ | (1,164 | ) |
| 11/30/2020 | | UBS | | Turkish Lira | | | 239,370 | | | United States Dollar | | | 29,765 | | | | (1,633 | ) |
| 11/30/2020 | | Barclays | | United States Dollar | | | 290,328 | | | Chinese Offshore Yuan | | | 1,981,921 | | | | (5,008 | ) |
| 11/30/2020 | | BNP Paribas | | United States Dollar | | | 82,000 | | | Chinese Offshore Yuan | | | 558,705 | | | | (1,255 | ) |
| 11/30/2020 | | Citibank | | United States Dollar | | | 55,300 | | | Chinese Offshore Yuan | | | 371,975 | | | | (130 | ) |
| 11/30/2020 | | HSBC Bank | | United States Dollar | | | 84,414 | | | Chinese Offshore Yuan | | | 573,269 | | | | (1,012 | ) |
| 11/30/2020 | | Morgan Stanley | | United States Dollar | | | 190,044 | | | Indonesian Rupiah | | | 2,848,000,000 | | | | (2,102 | ) |
| 11/30/2020 | | Standard Chartered | | United States Dollar | | | 644,531 | | | Indonesian Rupiah | | | 9,628,000,000 | | | | (5,042 | ) |
| 11/30/2020 | | BNP Paribas | | United States Dollar | | | 45,000 | | | Thai Baht | | | 1,425,645 | | | | (731 | ) |
| 11/30/2020 | | Deutsche Bank | | United States Dollar | | | 63,688 | | | Thai Baht | | | 1,991,256 | | | | (187 | ) |
| 11/30/2020 | | HSBC Bank | | United States Dollar | | | 115,056 | | | Thai Baht | | | 3,597,065 | | | | (330 | ) |
| 11/30/2020 | | Morgan Stanley | | United States Dollar | | | 35,200 | | | Thai Baht | | | 1,100,352 | | | | (97 | ) |
| 12/16/2020 | | BNP Paribas | | Czech Koruna | | | 3,129,537 | | | United States Dollar | | | 135,507 | | | | (1,632 | ) |
| 01/28/2021 | | Barclays | | Polish Zloty | | | 4,835,587 | | | United States Dollar | | | 1,247,800 | | | | (25,970 | ) |
| 01/29/2021 | | Credit Suisse | | Chilean Peso | | | 24,337,347 | | | United States Dollar | | | 31,491 | | | | (17 | ) |
| 01/29/2021 | | Barclays | | Colombian Peso | | | 3,489,794,217 | | | United States Dollar | | | 920,559 | | | | (22,724 | ) |
| 01/29/2021 | | JP Morgan | | Colombian Peso | | | 82,000,000 | | | United States Dollar | | | 21,604 | | | | (507 | ) |
| 01/29/2021 | | JP Morgan | | Czech Koruna | | | 3,975,000 | | | United States Dollar | | | 172,376 | | | | (2,179 | ) |
| 01/29/2021 | | Standard Chartered | | Hungarian Forint | | | 35,433,961 | | | United States Dollar | | | 114,987 | | | | (2,613 | ) |
| 01/29/2021 | | Citibank | | Mexican Peso | | | 45,288,473 | | | United States Dollar | | | 2,143,782 | | | | (30,313 | ) |
| 01/29/2021 | | HSBC Bank | | Mexican Peso | | | 26,917,217 | | | United States Dollar | | | 1,267,659 | | | | (11,518 | ) |
| 01/29/2021 | | BNP Paribas | | Polish Zloty | | | 1,163,155 | | | United States Dollar | | | 300,204 | | | | (6,303 | ) |
| 01/29/2021 | | Deutsche Bank | | Romanian Leu | | | 435,281 | | | United States Dollar | | | 104,971 | | | | (1,287 | ) |
| 01/29/2021 | | HSBC Bank | | Russian Ruble | | | 35,452,000 | | | United States Dollar | | | 460,527 | | | | (18,452 | ) |
| 01/29/2021 | | Barclays | | United States Dollar | | | 478,810 | | | Chilean Peso | | | 372,633,893 | | | | (3,099 | ) |
| 01/29/2021 | | State Street | | United States Dollar | | | 14,700 | | | Chilean Peso | | | 11,378,535 | | | | (15 | ) |
| 01/29/2021 | | Merrill Lynch | | United States Dollar | | | 46,200 | | | Mexican Peso | | | 990,135 | | | | (6 | ) |
| 01/29/2021 | | HSBC Bank | | United States Dollar | | | 7,220 | | | South African Rand | | | 119,954 | | | | (73 | ) |
| 01/29/2021 | | Morgan Stanley | | United States Dollar | | | 48,800 | | | South African Rand | | | 806,249 | | | | (219 | ) |
| 01/29/2021 | | Standard Chartered | | United States Dollar | | | 303,473 | | | South African Rand | | | 4,993,497 | | | | (124 | ) |
| 01/29/2021 | | UBS | | United States Dollar | | | 37,350 | | | South African Rand | | | 621,093 | | | | (412 | ) |
| | | | | | | | | | | | | | | | | | |
| | | | |
| Subtotal Depreciation | | | | | | | | | | | | | (241,972 | ) |
| | | | | | | | | | | | | | | | | | |
| | | | | | |
| Total | | | | | | | | | | | | | | | | $ | (20,296 | ) |
| | | | | | | | | | | | | | | | | | |
See accompanying notes to the financial statements.
94
ASHMORE EMERGING MARKETS LOCAL CURRENCY BOND FUND
SCHEDULE OF INVESTMENTS (CONTINUED)
As of October 31, 2020
At October 31, 2020, the Ashmore Emerging Markets Local Currency Bond Fund had the following centrally cleared swap contracts outstanding:
| | | | | | | | | | | | | | | | | | | | |
Pay Rate Index/ Pay Rate | | Receive Rate/ Receive Rate
Index | | Notional Amount | | Expiration Date | | Fair Value/ Unrealized Appreciation (Depreciation)** | | Variation Margin Receivable (Payable) | | Counterparty |
Brazil CETIP Interbank Deposit Rate (Pay at Maturity) | | 6.570% (Receive at Maturity) | | | BRL | | | 2,442,368 | | 1/2/2025 | | $ | 839 | | | | $— | | | JP Morgan |
Brazil CETIP Interbank Deposit Rate (Pay at Maturity) | | 4.575% (Receive at Maturity) | | | BRL | | | 4,161,015 | | 1/2/2023 | | | (4,608 | ) | | | — | | | BNP Paribas |
CFETS China Fixing Repo Rates 7 Day (Pay Quarterly) | | 2.535% Receive Quarterly) | | | CNY | | | 2,499,000 | | 3/18/2025 | | | (576 | ) | | | — | | | JP Morgan |
CFETS China Fixing Repo Rates 7 Day (Pay Quarterly) | | 2.580% (Receive Quarterly) | | | CNY | | | 1,748,000 | | 3/18/2025 | | | 102 | | | | — | | | JP Morgan |
CFETS China Fixing Repo Rates 7 Day (Pay Quarterly) | | 2.010% (Receive Quarterly) | | | CNY | | | 3,550,000 | | 9/16/2025 | | | (14,669 | ) | | | — | | | BNP Paribas |
CFETS China Fixing Repo Rates 7 Day (Pay Quarterly) | | 2.325% (Receive Quarterly) | | | CNY | | | 3,130,000 | | 9/16/2025 | | | (5,894 | ) | | | — | | | Merrill Lynch |
MXN-TIIE-BANXICO 28 Day Rate (Pay Lunar) | | 6.563% (Receive Lunar) | | | MXN | | | 30,000,000 | | 12/31/2024 | | | 86,684 | | | | 77 | | | Merrill Lynch |
WIBOR Poland 6 Month Rate (Pay Semiannually) | | 2.400% (Receive Annually) | | | PLN | | | 2,556,000 | | 3/26/2023 | | | 43,098 | | | | 38 | | | Merrill Lynch |
| | | | | | | | | | | | | | | | | | | | |
| | | | | | | |
| | | | | | | | | | | | $ | 104,976 | | | | $115 | | | |
| | | | | | | | | | | | | | | | | | | | |
**Includes cumulative appreciation/depreciation on centrally cleared swap agreements. Only the current day’s variation margin is reported within the Statements of Assets and Liabilities.
See accompanying notes to the financial statements.
95
ASHMORE EMERGING MARKETS LOCAL CURRENCY BOND FUND
SCHEDULE OF INVESTMENTS (CONTINUED)
As of October 31, 2020
The inputs or methodologies used for valuing securities are not necessarily an indication of the risks associated with investing in those securities and other financial instruments, if any. See note 4 in the Notes to the Financial Statements for more information regarding pricing inputs and valuation techniques. The following is a summary of the inputs used in valuing the Ashmore Emerging Markets Local Currency Bond Fund’s investments and other financial instruments, which are carried at fair value, as of October 31, 2020:
| | | | | | | | | | | | | | | | |
| | | Level 1 | | | Level 2 | | | Level 3 | | | Total | |
Investments | | | | | | | | | | | | | | | | |
Assets: | | | | | | | | | | | | | | | | |
Debt Securities | | | | | | | | | | | | | | | | |
Corporate Bonds | | | $— | | | | $ 293,054 | | | | $— | | | | $ 293,054 | |
Government Agencies | | | — | | | | 193,784 | | | | — | | | | 193,784 | |
Government Bonds | | | — | | | | 23,436,577 | | | | — | | | | 23,436,577 | |
Index Linked Government Bonds | | | — | | | | 895,198 | | | | — | | | | 895,198 | |
Municipal Bonds | | | — | | | | 12,211 | | | | — | | | | 12,211 | |
Short Term Bills and Notes | | | — | | | | 275,075 | | | | — | | | | 275,075 | |
| | | | | | | | | | | | | | | | |
Total Debt Securities | | | — | | | | 25,105,899 | | | | — | | | | 25,105,899 | |
Credit Linked Notes | | | | | | | | | | | | | | | | |
Indonesia | | | — | | | | 2,208,062 | | | | — | | | | 2,208,062 | |
| |
Total Investments | | | $— | | | | $27,313,961 | | | | $— | | | | $27,313,961 | |
| |
| | | | |
Other Financial Instruments | | | | | | | | | | | | | | | | |
Assets: | | | | | | | | | | | | | | | | |
Forward Foreign Currency Exchange Contracts | | | $— | | | | $ 221,676 | | | | $— | | | | $ 221,676 | |
Centrally Cleared Swap Contracts† | | | — | | | | 130,723 | | | | — | | | | 130,723 | |
Liabilities: | | | | | | | | | | | | | | | | |
Forward Foreign Currency Exchange Contracts | | | — | | | | (241,972 | ) | | | — | | | | (241,972 | ) |
Centrally Cleared Swap Contracts† | | | — | | | | (25,747 | ) | | | — | | | | (25,747 | ) |
| |
Total Other Financial Instruments | | | $— | | | | $ 84,680 | | | | $— | | | | $ 84,680 | |
| |
† Includes cumulative appreciation/depreciation on centrally cleared swap agreements. Only the current day’s variation margin is reported within the Statements of Assets and Liabilities.
See accompanying notes to the financial statements.
96
ASHMORE EMERGING MARKETS LOCAL CURRENCY BOND FUND
SCHEDULE OF INVESTMENTS (CONTINUED)
As of October 31, 2020
The following is a summary of the fair values of the Fund’s derivative instruments*:
Fair Values of Financial Derivative Instruments on the Statements of Assets and Liabilities as of October 31, 2020:
| | | | | | | | |
| | | Derivatives Not Accounted for as
Hedging Instruments | |
| | | Foreign
Exchange Risk | | | Interest
Rate Risk | |
| |
Assets: | | | | | | | | |
Unrealized Appreciation on Centrally Cleared Swap Contracts | | | $ — | | | | $130,723 | † |
Unrealized Appreciation on Forward Foreign Currency Exchange Contracts | | | 221,676 | | | | — | |
| | | | |
| | | $ 221,676 | | | | $130,723 | |
| | | | |
Liabilities: | | | | | | | | |
Unrealized Depreciation on Centrally Cleared Swap Contracts | | | $ — | | | | $(25,747 | )† |
Unrealized Depreciation on Forward Foreign Currency Exchange Contracts | | | (241,972 | ) | | | — | |
| | | | |
| | | $(241,972 | ) | | | $(25,747 | ) |
| | | | |
| † | Includes cumulative appreciation/depreciation on centrally cleared swap agreements. Only the current day’s variation margin is reported within the Statements of Assets and Liabilities. |
The Effect of Financial Derivative Instruments on the Statements of Operations for the Year Ended October 31, 2020:
| | | | | | | | |
| | | Derivatives Not Accounted for as
Hedging Instruments | |
| | | Foreign
Exchange Risk | | | Interest
Rate Risk | |
| |
Realized Gain (Loss) on Derivatives Recognized resulting from Operations: | | | | | | | | |
Net Realized Gain on Forward Foreign Currency Exchange Contracts | | | $ 55,913 | | | | $ — | |
Net Realized Gain on Interest Rate Swap Contracts | | | — | | | | 71,964 | |
| | | | |
| | | $ 55,913 | | | | $ 71,964 | |
| | | | |
Net Change in Unrealized Appreciation (Depreciation) on Derivatives Recognized resulting from Operations: | | | | | | | | |
Net Change in Unrealized Depreciation on Forward Foreign Currency Exchange Contracts | | | $(302,098 | ) | | | $ — | |
Net Change in Unrealized Appreciation on Interest Rate Swap Contracts | | | — | | | | 115,571 | |
| | | | |
| | | $(302,098 | ) | | | $115,571 | |
| | | | |
* See note 10 in the Notes to the Financial Statements for additional information.
See accompanying notes to the financial statements.
97
ASHMORE EMERGING MARKETS CORPORATE INCOME FUND
SCHEDULE OF INVESTMENTS
As of October 31, 2020
| | | | | | | | | | | | | | | | |
| | | Currency1 | | | Par | | | Value | | | % of Net Assets | |
Debt Securities | | | | | | | | | | | | | | | | |
| | | | |
Argentina (Cost $6,445,591) | | | | | | | | | | | | | | | | |
Genneia S.A., 8.750%, 01/20/2022 | | | | | | | 560,000 | | | $ | 427,513 | | | | 0.15 | |
IRSA Propiedades Comerciales S.A., 8.750%, 03/23/2023 | | | | | | | 293,000 | | | | 220,929 | | | | 0.08 | |
Pampa Energia S.A., 7.375%, 07/21/2023 | | | | | | | 1,095,000 | | | | 908,828 | | | | 0.33 | |
Telecom Argentina S.A., 8.500%, 08/06/20252 | | | | | | | 3,180,000 | | | | 2,608,554 | | | | 0.93 | |
YPF S.A., 8.750%, 04/04/2024 | | | | | | | 546,000 | | | | 359,350 | | | | 0.13 | |
| | | | | | | | | | | 4,525,174 | | | | 1.62 | |
| | | | |
Belarus (Cost $700,000) | | | | | | | | | | | | | | | | |
Eurotorg LLC Via Bonitron DAC, 9.000%, 10/22/20252 | | | | | | | 700,000 | | | | 707,140 | | | | 0.25 | |
| | | | | | | | | | | 707,140 | | | | 0.25 | |
| | | | |
Brazil (Cost $48,153,506) | | | | | | | | | | | | | | | | |
Banco do Brasil S.A., (Variable, U.S. Treasury Yield Curve Rate CMT 10Y + 4.398%), 6.250%, 04/15/20243 | | | | | | | 2,763,000 | | | | 2,652,480 | | | | 0.95 | |
Braskem Netherlands Finance B.V., 5.875%, 01/31/2050 | | | | | | | 985,000 | | | | 914,829 | | | | 0.33 | |
Braskem Netherlands Finance B.V., (Variable, U.S. Treasury Yield Curve Rate CMT 5Y + 8.220%), 8.500%, 01/23/20813 | | | | | | | 1,665,000 | | | | 1,691,240 | | | | 0.60 | |
BRF S.A., 5.750%, 09/21/20502 | | | | | | | 1,420,000 | | | | 1,350,597 | | | | 0.48 | |
CSN Islands XI Corp., 6.750%, 01/28/2028 | | | | | | | 2,685,000 | | | | 2,640,697 | | | | 0.94 | |
CSN Resources S.A., 7.625%, 04/17/2026 | | | | | | | 1,735,000 | | | | 1,781,845 | | | | 0.64 | |
Gerdau Trade, Inc., 4.875%, 10/24/2027 | | | | | | | 765,000 | | | | 841,936 | | | | 0.30 | |
GTL Trade Finance, Inc., 7.250%, 04/16/2044 | | | | | | | 305,000 | | | | 396,808 | | | | 0.14 | |
InterCement Financial Operations B.V., 5.750%, 07/17/2024 | | | | | | | 3,105,000 | | | | 2,138,569 | | | | 0.76 | |
Itau Unibanco Holding S.A., (Variable, U.S. Treasury Yield Curve Rate CMT 5Y + 3.981%), 6.125%, 12/12/20223 | | | | | | | 1,780,000 | | | | 1,712,360 | | | | 0.61 | |
JSM Global S.a.r.l., 4.750%, 10/20/20302 | | | | | | | 1,925,000 | | | | 1,941,362 | | | | 0.69 | |
Klabin Austria GmbH, 7.000%, 04/03/2049 | | | | | | | 775,000 | | | | 885,438 | | | | 0.32 | |
MARB BondCo PLC, 7.000%, 03/15/2024 | | | | | | | 805,000 | | | | 825,737 | | | | 0.29 | |
NBM U.S. Holdings, Inc., 7.000%, 05/14/2026 | | | | | | | 1,670,000 | | | | 1,771,870 | | | | 0.63 | |
NBM U.S. Holdings, Inc., 6.625%, 08/06/2029 | | | | | | | 720,000 | | | | 776,700 | | | | 0.28 | |
Oi S.A., 10.000%, (100% Cash), 07/27/20254 | | | | | | | 3,745,000 | | | | 3,660,775 | | | | 1.31 | |
Petrobras Global Finance B.V., 6.875%, 01/20/2040 | | | | | | | 3,095,000 | | | | 3,486,548 | | | | 1.25 | |
Petrobras Global Finance B.V., 6.850%, 06/05/2115 | | | | | | | 6,340,000 | | | | 6,823,045 | | | | 2.44 | |
Rede D’or Finance S.a.r.l., 4.500%, 01/22/2030 | | | | | | | 985,000 | | | | 968,994 | | | | 0.35 | |
Samarco Mineracao S.A., 4.125%, 11/01/20225 | | | | | | | 4,158,000 | | | | 2,002,077 | | | | 0.71 | |
Samarco Mineracao S.A., 5.750%, 10/24/20235 | | | | | | | 2,893,000 | | | | 1,421,909 | | | | 0.51 | |
Samarco Mineracao S.A., 5.375%, 09/26/20245 | | | | | | | 880,000 | | | | 432,520 | | | | 0.15 | |
St Marys Cement, Inc., 5.750%, 01/28/2027 | | | | | | | 685,000 | | | | 768,913 | | | | 0.27 | |
Suzano Austria GmbH, 7.000%, 03/16/2047 | | | | | | | 1,885,000 | | | | 2,285,110 | | | | 0.82 | |
Unigel Luxembourg S.A., 8.750%, 10/01/2026 | | | | | | | 1,825,000 | | | | 1,763,406 | | | | 0.63 | |
Vale Overseas Ltd., 6.250%, 08/10/2026 | | | | | | | 695,000 | | | | 829,274 | | | | 0.30 | |
Vale Overseas Ltd., 8.250%, 01/17/2034 | | | | | | | 460,000 | | | | 661,250 | | | | 0.24 | |
Votorantim Cimentos International S.A., 7.250%, 04/05/2041 | | | | | | | 425,000 | | | | 543,384 | | | | 0.19 | |
| | | | | | | | | | | 47,969,673 | | | | 17.13 | |
See accompanying notes to the financial statements.
98
ASHMORE EMERGING MARKETS CORPORATE INCOME FUND
SCHEDULE OF INVESTMENTS (CONTINUED)
As of October 31, 2020
| | | | | | | | | | | | | | | | |
| | | Currency1 | | | Par | | | Value | | | % of Net Assets | |
Chile (Cost $8,884,219) | | | | | | | | | | | | | | | | |
AES GENER S.A., (Variable, USD Swap 5Y + 4.644%), 7.125%, 03/26/20793 | | | | | | | 2,075,000 | | | $ | 2,149,539 | | | | 0.77 | |
Colbun S.A., 3.150%, 03/06/2030 | | | | | | | 420,000 | | | | 439,173 | | | | 0.16 | |
Corp. Nacional del Cobre de Chile, 3.750%, 01/15/20312 | | | | | | | 810,000 | | | | 893,713 | | | | 0.32 | |
Empresa Nacional del Petroleo, 5.250%, 11/06/2029 | | | | | | | 460,000 | | | | 527,041 | | | | 0.19 | |
Enel Chile S.A., 4.875%, 06/12/2028 | | | | | | | 345,000 | | | | 402,788 | | | | 0.14 | |
GNL Quintero S.A., 4.634%, 07/31/2029 | | | | | | | 1,095,000 | | | | 1,191,907 | | | | 0.42 | |
Inversiones CMPC S.A., 4.750%, 09/15/2024 | | | | | | | 815,000 | | | | 891,203 | | | | 0.32 | |
Inversiones CMPC S.A., 4.375%, 04/04/2027 | | | | | | | 380,000 | | | | 423,229 | | | | 0.15 | |
Sociedad Quimica y Minera de Chile S.A., 4.250%, 05/07/2029 | | | | | | | 355,000 | | | | 403,813 | | | | 0.14 | |
VTR Comunicaciones S.p.A., 5.125%, 01/15/2028 | | | | | | | 550,000 | | | | 581,625 | | | | 0.21 | |
VTR Finance N.V., 6.375%, 07/15/2028 | | | | | | | 1,095,000 | | | | 1,168,912 | | | | 0.42 | |
| | | | | | | | | | | 9,072,943 | | | | 3.24 | |
| | | | |
China (Cost $38,704,342) | | | | | | | | | | | | | | | | |
Baidu, Inc., 3.625%, 07/06/2027 | | | | | | | 505,000 | | | | 551,904 | | | | 0.20 | |
CFLD Cayman Investment Ltd., 8.600%, 04/08/2024 | | | | | | | 2,705,000 | | | | 2,489,952 | | | | 0.89 | |
China Construction Bank Corp., (Variable, U.S. Treasury Yield Curve Rate CMT 5Y + 2.150%), 2.450%, 06/24/20303 | | | | | | | 870,000 | | | | 873,471 | | | | 0.31 | |
China Evergrande Group, 11.500%, 01/22/2023 | | | | | | | 1,069,000 | | | | 891,235 | | | | 0.32 | |
China Evergrande Group, 9.500%, 03/29/2024 | | | | | | | 1,025,000 | | | | 771,783 | | | | 0.28 | |
China Evergrande Group, 8.750%, 06/28/2025 | | | | | | | 2,145,000 | | | | 1,583,010 | | | | 0.57 | |
China Hongqiao Group Ltd., 7.125%, 07/22/2022 | | | | | | | 980,000 | | | | 924,385 | | | | 0.33 | |
Country Garden Holdings Co. Ltd., 7.125%, 01/27/2022 | | | | | | | 480,000 | | | | 497,037 | | | | 0.18 | |
Country Garden Holdings Co. Ltd., 7.125%, 04/25/2022 | | | | | | | 850,000 | | | | 888,663 | | | | 0.32 | |
Country Garden Holdings Co. Ltd., 8.000%, 01/27/2024 | | | | | | | 400,000 | | | | 431,569 | | | | 0.15 | |
ENN Energy Holdings Ltd., 2.625%, 09/17/20302 | | | | | | | 570,000 | | | | 574,061 | | | | 0.20 | |
Fantasia Holdings Group Co. Ltd., 12.250%, 10/18/2022 | | | | | | | 770,000 | | | | 808,859 | | | | 0.29 | |
Fantasia Holdings Group Co. Ltd., 10.875%, 01/09/2023 | | | | | | | 925,000 | | | | 948,550 | | | | 0.34 | |
Fantasia Holdings Group Co. Ltd., 11.875%, 06/01/2023 | | | | | | | 770,000 | | | | 796,876 | | | | 0.28 | |
Far East Energy Bermuda Ltd., 13.000%, 01/15/20162,5,6,7 | | | | | | | 282,201 | | | | — | | | | — | |
Kaisa Group Holdings Ltd., 8.500%, 06/30/2022 | | | | | | | 1,663,000 | | | | 1,622,224 | | | | 0.58 | |
Kaisa Group Holdings Ltd., 10.875%, 07/23/2023 | | | | | | | 810,000 | | | | 804,320 | | | | 0.29 | |
Kaisa Group Holdings Ltd., 9.375%, 06/30/2024 | | | | | | | 2,280,000 | | | | 2,065,828 | | | | 0.74 | |
Kaisa Group Holdings Ltd., 11.250%, 04/16/2025 | | | | | | | 880,000 | | | | 833,624 | | | | 0.30 | |
KWG Group Holdings Ltd., 5.875%, 11/10/2024 | | | | | | | 1,755,000 | | | | 1,755,798 | | | | 0.63 | |
Meituan, 2.125%, 10/28/20252 | | | | | | | 200,000 | | | | 200,196 | | | | 0.07 | |
Meituan Dianping, 3.050%, 10/28/20302 | | | | | | | 330,000 | | | | 330,690 | | | | 0.12 | |
Prime Bloom Holdings Ltd., 6.950%, 07/05/2022 | | | | | | | 2,545,000 | | | | 472,098 | | | | 0.17 | |
Radiance Capital Investments Ltd., 8.800%, 09/17/2023 | | | | | | | 2,540,000 | | | | 2,590,462 | | | | 0.92 | |
Scenery Journey Ltd., 12.000%, 10/24/2023 | | | | | | | 2,815,000 | | | | 2,295,629 | | | | 0.82 | |
Shimao Group Holdings Ltd., 5.600%, 07/15/2026 | | | | | | | 510,000 | | | | 558,670 | | | | 0.20 | |
Sunac China Holdings Ltd., 7.500%, 02/01/2024 | | | | | | | 835,000 | | | | 835,364 | | | | 0.30 | |
Sunac China Holdings Ltd., 6.500%, 01/10/2025 | | | | | | | 890,000 | | | | 854,813 | | | | 0.30 | |
Tencent Holdings Ltd., 3.975%, 04/11/2029 | | | | | | | 715,000 | | | | 805,214 | | | | 0.29 | |
See accompanying notes to the financial statements.
99
ASHMORE EMERGING MARKETS CORPORATE INCOME FUND
SCHEDULE OF INVESTMENTS (CONTINUED)
As of October 31, 2020
| | | | | | | | | | | | | | | | |
| | | Currency1 | | | Par | | | Value | | | % of Net Assets | |
China (continued) | | | | | | | | | | | | | | | | |
Tunghsu Venus Holdings Ltd., 7.000%, 06/12/20205,6 | | | | | | | 2,785,000 | | | $ | 489,659 | | | | 0.17 | |
Xiaomi Best Time International Ltd., 3.375%, 04/29/2030 | | | | | | | 700,000 | | | | 728,649 | | | | 0.26 | |
Zhenro Properties Group Ltd., 8.650%, 01/21/2023 | | | | | | | 548,000 | | | | 560,580 | | | | 0.20 | |
Zhenro Properties Group Ltd., 9.150%, 05/06/2023 | | | | | | | 785,000 | | | | 812,850 | | | | 0.29 | |
Zhenro Properties Group Ltd., 8.350%, 03/10/2024 | | | | | | | 1,260,000 | | | | 1,273,167 | | | | 0.45 | |
Zhenro Properties Group Ltd., 7.875%, 04/14/2024 | | | | | | | 920,000 | | | | 915,805 | | | | 0.33 | |
| | | | | | | | | | | 33,836,995 | | | | 12.09 | |
| | | | |
Colombia (Cost $5,508,814) | | | | | | | | | | | | | | | | |
Ecopetrol S.A., 6.875%, 04/29/2030 | | | | | | | 610,000 | | | | 733,464 | | | | 0.26 | |
Frontera Energy Corp., 9.700%, 06/25/2023 | | | | | | | 2,490,000 | | | | 1,992,025 | | | | 0.71 | |
Grupo de Inversiones Suramericana S.A., 5.500%, 04/29/2026 | | | | | | | 240,000 | | | | 270,122 | | | | 0.10 | |
Millicom International Cellular S.A., 6.250%, 03/25/2029 | | | | | | | 880,000 | | | | 972,840 | | | | 0.35 | |
Oleoducto Central S.A., 4.000%, 07/14/2027 | | | | | | | 640,000 | | | | 670,336 | | | | 0.24 | |
SURA Asset Management S.A., 4.875%, 04/17/2024 | | | | | | | 215,000 | | | | 234,221 | | | | 0.08 | |
SURA Asset Management S.A., 4.375%, 04/11/2027 | | | | | | | 150,000 | | | | 167,175 | | | | 0.06 | |
| | | | | | | | | | | 5,040,183 | | | | 1.80 | |
| | | | |
Czech Republic (Cost $1,965,282) | | | | | | | | | | | | | | | | |
New World Resources N.V., 8.000%, 04/07/20205,6,7 | | | EUR | | | | 1,685,299 | | | | — | | | | — | |
New World Resources N.V., 4.000%, 10/07/20205,6,7 | | | EUR | | | | 700,590 | | | | — | | | | — | |
New World Resources N.V., 16.423%, 10/07/20202,5,6,7,8,9 | | | EUR | | | | 101,612 | | | | — | | | | — | |
| | | | | | | | | | | — | | | | — | |
| | | | |
Ecuador (Cost $6,212,847) | | | | | | | | | | | | | | | | |
International Airport Finance S.A., 12.000%, 03/15/2033 | | | | | | | 4,469,622 | | | | 3,989,137 | | | | 1.42 | |
Petroamazonas EP, 4.625%, 12/06/2021 | | | | | | | 1,598,333 | | | | 1,442,496 | | | | 0.52 | |
| | | | | | | | | | | 5,431,633 | | | | 1.94 | |
| | | | |
Egypt (Cost $2,272,430) | | | | | | | | | | | | | | | | |
ADES International Holding PLC, 8.625%, 04/24/2024 | | | | | | | 2,255,000 | | | | 2,121,955 | | | | 0.76 | |
| | | | | | | | | | | 2,121,955 | | | | 0.76 | |
| | | | |
Guatemala (Cost $1,522,246) | | | | | | | | | | | | | | | | |
Comunicaciones Celulares S.A. Via Comcel Trust, 6.875%, 02/06/2024 | | | | | | | 1,520,000 | | | | 1,554,200 | | | | 0.56 | |
| | | | | | | | | | | 1,554,200 | | | | 0.56 | |
| | | | |
Hong Kong (Cost $1,106,960) | | | | | | | | | | | | | | | | |
Bank of China Hong Kong Ltd., (Variable, U.S. Treasury Yield Curve Rate CMT 5Y + 3.036%), 5.900%, 09/14/20233 | | | | | | | 530,000 | | | | 565,078 | | | | 0.20 | |
CK Hutchison Capital Securities 17 Ltd., (Variable, U.S. Treasury Yield Curve Rate CMT 5Y + 2.070%), 4.000%, 05/12/20223 | | | | | | | 530,000 | | | | 539,929 | | | | 0.19 | |
| | | | | | | | | | | 1,105,007 | | | | 0.39 | |
India (Cost $2,173,481) | | | | | | | | | | | | | | | | |
Adani Transmission Ltd., 4.000%, 08/03/2026 | | | | | | | 295,000 | | | | 308,250 | | | | 0.11 | |
Adani Transmission Ltd., 4.250%, 05/21/2036 | | | | | | | 398,000 | | | | 402,225 | | | | 0.15 | |
See accompanying notes to the financial statements.
100
ASHMORE EMERGING MARKETS CORPORATE INCOME FUND
SCHEDULE OF INVESTMENTS (CONTINUED)
As of October 31, 2020
| | | | | | | | | | | | | | | | |
| | | Currency1 | | | Par | | | Value | | | % of Net Assets | |
India (continued) | | | | | | | | | | | | | | | | |
Greenko Solar Mauritius Ltd., 5.950%, 07/29/2026 | | | | | | | 523,000 | | | $ | 551,554 | | | | 0.20 | |
India Green Energy Holdings, 5.375%, 04/29/20242 | | | | | | | 450,000 | | | | 450,655 | | | | 0.16 | |
Power Finance Corp. Ltd., 4.500%, 06/18/2029 | | | | | | | 475,000 | | | | 485,810 | | | | 0.17 | |
| | | | | | | | | | | 2,198,494 | | | | 0.79 | |
| | | | |
Indonesia (Cost $7,149,880) | | | | | | | | | | | | | | | | |
Eterna Capital Pte. Ltd., 8.000%, 12/11/20224 | | | | | | | 3,317,421 | | | | 663,466 | | | | 0.24 | |
Indonesia Asahan Aluminium Persero PT, 6.530%, 11/15/2028 | | | | | | | 920,000 | | | | 1,120,762 | | | | 0.40 | |
Minejesa Capital B.V., 4.625%, 08/10/2030 | | | | | | | 1,545,000 | | | | 1,587,302 | | | | 0.57 | |
Pertamina Persero PT, 6.000%, 05/03/2042 | | | | | | | 995,000 | | | | 1,213,900 | | | | 0.43 | |
Star Energy Geothermal Darajat II/Star Energy Geothermal Salak, 4.850%, 10/14/20382 | | | | | | | 250,000 | | | | 256,185 | | | | 0.09 | |
| | | | | | | | | | | 4,841,615 | | | | 1.73 | |
| | | | |
Iraq (Cost $7,569,427) | | | | | | | | | | | | | | | | |
DNO A.S.A., 8.750%, 05/31/20232 | | | | | | | 3,000,000 | | | | 2,677,500 | | | | 0.95 | |
DNO A.S.A., 8.375%, 05/29/20242 | | | | | | | 2,115,000 | | | | 1,840,050 | | | | 0.66 | |
Oilflow SPV 1 DAC, 12.000%, 01/13/2022 | | | | | | | 2,681,910 | | | | 2,628,379 | | | | 0.94 | |
| | | | | | | | | | | 7,145,929 | | | | 2.55 | |
| | | | |
Israel (Cost $14,911,875) | | | | | | | | | | | | | | | | |
Altice Financing S.A., 7.500%, 05/15/2026 | | | | | | | 1,525,000 | | | | 1,591,719 | | | | 0.57 | |
Bank Leumi Le-Israel B.M., (Variable, U.S. Treasury Yield Curve Rate CMT 5Y + 1.631%), 3.275%, 01/29/20312,3 | | | | | | | 920,000 | | | | 927,776 | | | | 0.33 | |
ICL Group Ltd., 6.375%, 05/31/20382 | | | | | | | 441,000 | | | | 565,009 | | | | 0.20 | |
Israel Electric Corp. Ltd., 5.000%, 11/12/20242 | | | | | | | 365,000 | | | | 412,450 | | | | 0.15 | |
Israel Electric Corp. Ltd., 4.250%, 08/14/20282 | | | | | | | 450,000 | | | | 515,250 | | | | 0.19 | |
Leviathan Bond Ltd., 5.750%, 06/30/20232 | | | | | | | 390,000 | | | | 398,775 | | | | 0.14 | |
Leviathan Bond Ltd., 6.125%, 06/30/20252 | | | | | | | 930,000 | | | | 961,434 | | | | 0.34 | |
Leviathan Bond Ltd., 6.500%, 06/30/20272 | | | | | | | 948,000 | | | | 976,440 | | | | 0.35 | |
Leviathan Bond Ltd., 6.750%, 06/30/20302 | | | | | | | 220,000 | | | | 225,786 | | | | 0.08 | |
Teva Pharmaceutical Finance Co. LLC, 6.150%, 02/01/2036 | | | | | | | 1,725,000 | | | | 1,725,000 | | | | 0.62 | |
Teva Pharmaceutical Finance Netherlands III B.V., 7.125%, 01/31/2025 | | | | | | | 1,650,000 | | | | 1,709,812 | | | | 0.61 | |
Teva Pharmaceutical Finance Netherlands III B.V., 6.750%, 03/01/2028 | | | | | | | 4,985,000 | | | | 5,236,119 | | | | 1.87 | |
| | | | | | | | | | | 15,245,570 | | | | 5.45 | |
| | | | |
Jamaica (Cost $4,533,442) | | | | | | | | | | | | | | | | |
Digicel Group 0.5 Ltd., 7.000%, 11/23/20202,4 | | | | | | | 2,751,103 | | | | 371,399 | | | | 0.13 | |
Digicel Group 0.5 Ltd., 10.000%, 04/01/20244 | | | | | | | 2,554,236 | | | | 1,941,219 | | | | 0.69 | |
Digicel Group 0.5 Ltd., 8.000%, 04/01/20252,4 | | | | | | | 1,607,476 | | | | 542,523 | | | | 0.20 | |
Digicel International Finance Ltd./Digicel Holdings Bermuda Ltd.,
8.750%, 05/25/2024 | | | | | | | 1,424,320 | | | | 1,422,540 | | | | 0.51 | |
Digicel International Finance Ltd./Digicel Holdings Bermuda Ltd.,
8.000%, 12/31/2026 | | | | | | | 649,879 | | | | 484,160 | | | | 0.17 | |
| | | | | | | | | | | 4,761,841 | | | | 1.70 | |
See accompanying notes to the financial statements.
101
ASHMORE EMERGING MARKETS CORPORATE INCOME FUND
SCHEDULE OF INVESTMENTS (CONTINUED)
As of October 31, 2020
| | | | | | | | | | | | | | | | |
| | | Currency1 | | | Par | | | Value | | | % of Net Assets | |
Jordan (Cost $455,317) | | | | | | | | | | | | | | | | |
Hikma Finance U.S.A. LLC, 3.250%, 07/09/2025 | | | | | | | 445,000 | | | $ | 457,327 | | | | 0.16 | |
| | | | | | | | | | | 457,327 | | | | 0.16 | |
| | | | |
Kazakhstan (Cost $941,519) | | | | | | | | | | | | | | | | |
Kazakhstan Temir Zholy Finance B.V., 6.950%, 07/10/2042 | | | | | | | 380,000 | | | | 520,554 | | | | 0.19 | |
Tengizchevroil Finance Co. International Ltd., 4.000%, 08/15/2026 | | | | | | | 425,000 | | | | 452,073 | | | | 0.16 | |
| | | | | | | | | | | 972,627 | | | | 0.35 | |
| | | | |
Kuwait (Cost $697,938) | | | | | | | | | | | | | | | | |
NBK Tier 1 Financing Ltd., (Variable, USD Swap 6Y + 4.119%), 5.750%, 04/09/20213 | | | | | | | 680,000 | | | | 679,150 | | | | 0.24 | |
| | | | | | | | | | | 679,150 | | | | 0.24 | |
| | | | |
Malaysia (Cost $595,735) | | | | | | | | | | | | | | | | |
Axiata SPV2 Bhd., 2.163%, 08/19/2030 | | | | | | | 285,000 | | | | 283,185 | | | | 0.10 | |
Axiata Spv5 Labuan Ltd., 3.064%, 08/19/2050 | | | | | | | 330,000 | | | | 317,845 | | | | 0.11 | |
| | | | | | | | | | | 601,030 | | | | 0.21 | |
| | | | |
Mexico (Cost $30,936,076) | | | | | | | | | | | | | | | | |
Alfa S.A.B. de C.V., 6.875%, 03/25/2044 | | | | | | | 840,000 | | | | 981,750 | | | | 0.35 | |
Axtel S.A.B. de C.V., 6.375%, 11/14/2024 | | | | | | | 910,000 | | | | 947,265 | | | | 0.34 | |
Banco Mercantil del Norte S.A., (Variable, U.S. Treasury Yield Curve Rate CMT 5Y + 5.035%), 6.875%, 07/06/20223 | | | | | | | 1,495,000 | | | | 1,493,146 | | | | 0.53 | |
Banco Mercantil del Norte S.A., (Variable, U.S. Treasury Yield Curve Rate CMT 10Y + 5.353%), 7.625%, 01/10/20283 | | | | | | | 1,105,000 | | | | 1,102,237 | | | | 0.39 | |
Banco Santander Mexico S.A. Institucion de Banca Multiple Grupo Financiero Santander, 5.375%, 04/17/2025 | | | | | | | 660,000 | | | | 739,207 | | | | 0.27 | |
BBVA Bancomer S.A., (Variable, U.S. Treasury Yield Curve Rate CMT 5Y + 2.650%), 5.125%, 01/18/20333 | | | | | | | 1,705,000 | | | | 1,681,556 | | | | 0.60 | |
Braskem Idesa S.A.P.I., 7.450%, 11/15/2029 | | | | | | | 2,700,000 | | | | 2,552,904 | | | | 0.91 | |
Cemex S.A.B. de C.V., 7.750%, 04/16/2026 | | | | | | | 1,185,000 | | | | 1,253,730 | | | | 0.45 | |
Cemex S.A.B. de C.V., 7.375%, 06/05/2027 | | | | | | | 520,000 | | | | 572,785 | | | | 0.21 | |
Cemex S.A.B. de C.V., 5.450%, 11/19/2029 | | | | | | | 1,195,000 | | | | 1,264,071 | | | | 0.45 | |
Cemex S.A.B. de C.V., 5.200%, 09/17/20302 | | | | | | | 840,000 | | | | 887,368 | | | | 0.32 | |
Cometa Energia S.A. de C.V., 6.375%, 04/24/2035 | | | | | | | 1,100,975 | | | | 1,217,954 | | | | 0.44 | |
Credito Real S.A.B. de C.V. SOFOM ER, 7.250%, 07/20/2023 | | | | | | | 600,000 | | | | 586,626 | | | | 0.21 | |
Fresnillo PLC, 4.250%, 10/02/20502 | | | | | | | 720,000 | | | | 732,780 | | | | 0.26 | |
Grupo Posadas S.A.B. de C.V., 7.875%, 06/30/20225 | | | | | | | 2,200,000 | | | | 792,000 | | | | 0.28 | |
Industrias Penoles S.A.B. de C.V., 4.150%, 09/12/2029 | | | | | | | 460,000 | | | | 503,700 | | | | 0.18 | |
Industrias Penoles S.A.B. de C.V., 4.750%, 08/06/2050 | | | | | | | 220,000 | | | | 231,275 | | | | 0.08 | |
Mexico Generadora de Energia S. de r.l., 5.500%, 12/06/2032 | | | | | | | 699,011 | | | | 794,426 | | | | 0.29 | |
Minera Mexico S.A. de C.V., 4.500%, 01/26/2050 | | | | | | | 280,000 | | | | 303,128 | | | | 0.11 | |
Orbia Advance Corp. S.A.B. de C.V., 4.000%, 10/04/2027 | | | | | | | 475,000 | | | | 513,475 | | | | 0.18 | |
Orbia Advance Corp. S.A.B. de C.V., 5.875%, 09/17/2044 | | | | | | | 410,000 | | | | 477,031 | | | | 0.17 | |
Petroleos Mexicanos, 6.500%, 03/13/2027 | | | | | | | 1,235,000 | | | | 1,147,006 | | | | 0.41 | |
Petroleos Mexicanos, 6.750%, 09/21/2047 | | | | | | | 3,090,000 | | | | 2,398,736 | | | | 0.86 | |
Petroleos Mexicanos, 7.690%, 01/23/2050 | | | | | | | 2,625,000 | | | | 2,181,191 | | | | 0.78 | |
See accompanying notes to the financial statements.
102
ASHMORE EMERGING MARKETS CORPORATE INCOME FUND
SCHEDULE OF INVESTMENTS (CONTINUED)
As of October 31, 2020
| | | | | | | | | | | | | | | | |
| | | Currency1 | | | Par | | | Value | | | % of Net
Assets | |
Mexico (continued) | | | | | | | | | | | | | | | | |
Petroleos Mexicanos, 6.950%, 01/28/2060 | | | | | | | 2,840,000 | | | $ | 2,220,880 | | | | 0.79 | |
Trust Fibra Uno, 4.869%, 01/15/2030 | | | | | | | 625,000 | | | | 650,000 | | | | 0.23 | |
Trust Fibra Uno, 6.390%, 01/15/2050 | | | | | | | 1,273,000 | | | | 1,322,329 | | | | 0.47 | |
Unifin Financiera S.A.B. de C.V., 7.000%, 01/15/2025 | | | | | | | 630,000 | | | | 510,300 | | | | 0.18 | |
Unifin Financiera S.A.B. de C.V., 8.375%, 01/27/2028 | | | | | | | 465,000 | | | | 368,280 | | | | 0.13 | |
| | | | | | | | | | | 30,427,136 | | | | 10.87 | |
| | | | |
Mongolia (Cost $3,007,823) | | | | | | | | | | | | | | | | |
Mongolian Mining Corp., 1.797%, 04/01/20214,8 | | | | | | | 3,390,888 | | | | 1,357,108 | | | | 0.48 | |
Mongolian Mining Corp./Energy Resources LLC, 9.250%, 04/15/2024 | | | | | | | 1,565,000 | | | | 1,259,602 | | | | 0.45 | |
| | | | | | | | | | | 2,616,710 | | | | 0.93 | |
| | | | |
Morocco (Cost $618,509) | | | | | | | | | | | | | | | | |
OCP S.A., 4.500%, 10/22/2025 | | | | | | | 585,000 | | | | 618,564 | | | | 0.22 | |
| | | | | | | | | | | 618,564 | | | | 0.22 | |
| | | | |
Niger (Cost $—) | | | | | | | | | | | | | | | | |
Savannah Petroleum PLC, 67.163%, 05/30/20217,8 | | | | | | | 362,153 | | | | — | | | | — | |
| | | | | | | | | | | — | | | | — | |
| | | | |
Panama (Cost $5,250,092) | | | | | | | | | | | | | | | | |
AES Panama Generation Holdings SRL, 4.375%, 05/31/2030 | | | | | | | 2,070,000 | | | | 2,193,558 | | | | 0.78 | |
Banco General S.A., 4.125%, 08/07/2027 | | | | | | | 465,000 | | | | 517,317 | | | | 0.19 | |
Banistmo S.A., 3.650%, 09/19/2022 | | | | | | | 805,000 | | | | 820,939 | | | | 0.29 | |
C&W Senior Financing DAC, 6.875%, 09/15/2027 | | | | | | | 840,000 | | | | 884,520 | | | | 0.32 | |
Cable Onda S.A., 4.500%, 01/30/2030 | | | | | | | 880,000 | | | | 926,200 | | | | 0.33 | |
| | | | | | | | | | | 5,342,534 | | | | 1.91 | |
| | | | |
Peru (Cost $3,464,771) | | | | | | | | | | | | | | | | |
Ajecorp B.V., 6.500%, 05/14/2022 | | | | | | | 300,000 | | | | 299,400 | | | | 0.11 | |
Banco Internacional del Peru S.A.A. Interbank, 3.250%, 10/04/2026 | | | | | | | 720,000 | | | | 758,700 | | | | 0.27 | |
Consorcio Transmantaro S.A., 4.375%, 05/07/2023 | | | | | | | 310,000 | | | | 328,991 | | | | 0.12 | |
Credicorp Ltd., 2.750%, 06/17/2025 | | | | | | | 270,000 | | | | 277,087 | | | | 0.10 | |
Hunt Oil Co. of Peru LLC Sucursal Del Peru, 6.375%, 06/01/2028 | | | | | | | 1,210,000 | | | | 1,213,025 | | | | 0.43 | |
Intercorp Peru Ltd., 3.875%, 08/15/2029 | | | | | | | 620,000 | | | | 627,986 | | | | 0.22 | |
| | | | | | | | | | | 3,505,189 | | | | 1.25 | |
| | | | |
Philippines (Cost $776,370) | | | | | | | | | | | | | | | | |
BDO Unibank, Inc., 2.125%, 01/13/2026 | | | | | | | 570,000 | | | | 570,246 | | | | 0.21 | |
PLDT, Inc., 2.500%, 01/23/2031 | | | | | | | 200,000 | | | | 205,126 | | | | 0.07 | |
| | | | | | | | | | | 775,372 | | | | 0.28 | |
| | | | |
Poland (Cost $1,733,481) | | | | | | | | | | | | | | | | |
Walnut Bidco PLC, 9.125%, 08/01/2024 | | | | | | | 1,680,000 | | | | 1,718,035 | | | | 0.61 | |
| | | | | | | | | | | 1,718,035 | | | | 0.61 | |
See accompanying notes to the financial statements.
103
ASHMORE EMERGING MARKETS CORPORATE INCOME FUND
SCHEDULE OF INVESTMENTS (CONTINUED)
As of October 31, 2020
| | | | | | | | | | | | | | | | |
| | | Currency1 | | | Par | | | Value | | | % of Net
Assets | |
Qatar (Cost $5,065,278) | | | | | | | | | | | | | | | | |
ABQ Finance Ltd., 3.125%, 09/24/2024 | | | | | | | 1,005,000 | | | $ | 1,047,568 | | | | 0.37 | |
Nakilat, Inc., 6.067%, 12/31/2033 | | | | | | | 240,000 | | | | 302,601 | | | | 0.11 | |
QIB Sukuk Ltd., (Floating, ICE LIBOR USD 3M + 1.350%), 1.575%, 02/07/2025 | | | | | | | 1,325,000 | | | | 1,298,516 | | | | 0.46 | |
QNB Finance Ltd., (Floating, ICE LIBOR USD 3M + 1.350%), 1.606%, 05/31/2021 | | | | | | | 1,028,000 | | | | 1,031,670 | | | | 0.37 | |
QNB Finance Ltd., 2.625%, 05/12/2025 | | | | | | | 580,000 | | | | 602,806 | | | | 0.22 | |
QNB Finance Ltd., 2.750%, 02/12/2027 | | | | | | | 775,000 | | | | 810,077 | | | | 0.29 | |
| | | | | | | | | | | 5,093,238 | | | | 1.82 | |
| | | | |
Romania (Cost $1,259,222) | | | | | | | | | | | | | | | | |
NE Property B.V., 1.875%, 10/09/2026 | | | EUR | | | | 1,140,000 | | | | 1,219,520 | | | | 0.44 | |
| | | | | | | | | | | 1,219,520 | | | | 0.44 | |
| | | | |
Russian Federation (Cost $18,077,584) | | | | | | | | | | | | | | | | |
CEDC Finance Corp. International, Inc., 10.000%, 12/31/20222 | | | | | | | 5,052,696 | | | | 3,423,202 | | | | 1.22 | |
Credit Bank of Moscow Via CBOM Finance PLC, (Variable, USD Swap 5Y + 6.942%), 8.875%, 11/10/20223 | | | | | | | 870,000 | | | | 797,764 | | | | 0.29 | |
Credit Bank of Moscow Via CBOM Finance PLC, (Variable, USD Swap 5Y + 5.416%), 7.500%, 10/05/20273 | | | | | | | 5,239,000 | | | | 4,937,234 | | | | 1.76 | |
Gazprom PJSC via Gaz Finance PLC, 3.000%, 06/29/2027 | | | | | | | 900,000 | | | | 898,290 | | | | 0.32 | |
Novolipetsk Steel Via Steel Funding DAC, 4.700%, 05/30/2026 | | | | | | | 505,000 | | | | 560,712 | | | | 0.20 | |
PJSC Koks via IMH Capital DAC, 5.900%, 09/23/20252 | | | | | | | 875,000 | | | | 896,875 | | | | 0.32 | |
Severstal OAO Via Steel Capital S.A., 5.900%, 10/17/2022 | | | | | | | 380,000 | | | | 407,019 | | | | 0.15 | |
Severstal OAO Via Steel Capital S.A., 3.150%, 09/16/2024 | | | | | | | 365,000 | | | | 375,497 | | | | 0.13 | |
Sovcombank Via SovCom Capital DAC, (Variable, U.S. Treasury Yield Curve Rate CMT 5Y + 6.427%), 8.000%, 04/07/20303 | | | | | | | 2,435,000 | | | | 2,454,012 | | | | 0.88 | |
TMK OAO Via TMK Capital S.A., 4.300%, 02/12/2027 | | | | | | | 865,000 | | | | 846,489 | | | | 0.30 | |
VEON Holdings B.V., 4.000%, 04/09/2025 | | | | | | | 890,000 | �� | | | 928,377 | | | | 0.33 | |
| | | | | | | | | | | 16,525,471 | | | | 5.90 | |
| | | | |
Saudi Arabia (Cost $7,532,742) | | | | | | | | | | | | | | | | |
Acwa Power Management And Investments One Ltd., 5.950%, 12/15/2039 | | | | | | | 1,450,000 | | | | 1,660,250 | | | | 0.59 | |
Dar Al-Arkan Sukuk Co. Ltd., 6.750%, 02/15/2025 | | | | | | | 1,500,000 | | | | 1,430,970 | | | | 0.51 | |
SABIC Capital II B.V., 4.500%, 10/10/2028 | | | | | | | 285,000 | | | | 335,838 | | | | 0.12 | |
Samba Funding Ltd., 2.750%, 10/02/2024 | | | | | | | 1,090,000 | | | | 1,124,793 | | | | 0.40 | |
Saudi Arabian Oil Co., 4.250%, 04/16/2039 | | | | | | | 1,425,000 | | | | 1,625,353 | | | | 0.58 | |
Saudi Electricity Global Sukuk Co. 3, 5.500%, 04/08/2044 | | | | | | | 910,000 | | | | 1,138,684 | | | | 0.41 | |
Saudi Electricity Global Sukuk Co. 4, 4.723%, 09/27/2028 | | | | | | | 310,000 | | | | 365,267 | | | | 0.13 | |
| | | | | | | | | | | 7,681,155 | | | | 2.74 | |
| | | | |
Singapore (Cost $5,167,291) | | | | | | | | | | | | | | | | |
DBS Group Holdings Ltd., (Variable, U.S. Treasury Yield Curve Rate CMT 5Y + 1.915%), 3.300%, 02/27/20253 | | | | | | | 990,000 | | | | 987,525 | | | | 0.35 | |
GLP Pte. Ltd., 3.875%, 06/04/2025 | | | | | | | 905,000 | | | | 932,415 | | | | 0.33 | |
See accompanying notes to the financial statements.
104
ASHMORE EMERGING MARKETS CORPORATE INCOME FUND
SCHEDULE OF INVESTMENTS (CONTINUED)
As of October 31, 2020
| | | | | | | | | | | | | | | | |
| | | Currency1 | | | Par | | | Value | | | % of Net
Assets | |
Singapore (continued) | | | | | | | | | | | | | | | | |
Oversea-Chinese Banking Corp. Ltd., (Variable, U.S. Treasury Yield Curve Rate CMT 5Y + 1.580%), 1.832%, 09/10/20302,3 | | | | | | | 380,000 | | | $ | 378,906 | | | | 0.14 | |
Puma International Financing S.A., 5.000%, 01/24/2026 | | | | | | | 3,135,000 | | | | 2,578,537 | | | | 0.92 | |
United Overseas Bank Ltd., (Variable, USD Swap 5Y + 1.794%), 3.875%, 10/19/20233 | | | | | | | 465,000 | | | | 476,625 | | | | 0.17 | |
| | | | | | | | | | | 5,354,008 | | | | 1.91 | |
| | | | |
South Africa (Cost $8,252,888) | | | | | | | | | | | | | | | | |
AngloGold Ashanti Holdings PLC, 3.750%, 10/01/2030 | | | | | | | 545,000 | | | | 577,643 | | | | 0.21 | |
Gold Fields Orogen Holdings BVI Ltd., 6.125%, 05/15/2029 | | | | | | | 980,000 | | | | 1,166,200 | | | | 0.42 | |
Liquid Telecommunications Financing PLC, 8.500%, 07/13/2022 | | | | | | | 1,775,000 | | | | 1,804,110 | | | | 0.64 | |
MTN Mauritius Investments Ltd., 6.500%, 10/13/2026 | | | | | | | 1,490,000 | | | | 1,661,177 | | | | 0.59 | |
Prosus N.V., 5.500%, 07/21/2025 | | | | | | | 795,000 | | | | 912,113 | | | | 0.33 | |
Prosus N.V., 3.680%, 01/21/2030 | | | | | | | 300,000 | | | | 326,469 | | | | 0.12 | |
Prosus N.V., 4.027%, 08/03/2050 | | | | | | | 205,000 | | | | 209,290 | | | | 0.07 | |
Sasol Financing U.S.A. LLC, 6.500%, 09/27/2028 | | | | | | | 1,815,000 | | | | 1,741,492 | | | | 0.62 | |
| | | | | | | | | | | 8,398,494 | | | | 3.00 | |
| | | | |
South Korea (Cost $1,764,623) | | | | | | | | | | | | | | | | |
Kookmin Bank, 2.500%, 11/04/20302,10 | | | | | | | 440,000 | | | | 439,492 | | | | 0.16 | |
Shinhan Financial Group Co. Ltd., (Variable, U.S. Treasury Yield Curve Rate CMT 5Y + 1.500%), 3.340%, 02/05/20303 | | | | | | | 765,000 | | | | 800,450 | | | | 0.28 | |
Woori Bank, 4.750%, 04/30/2024 | | | | | | | 500,000 | | | | 550,290 | | | | 0.20 | |
| | | | | | | | | | | 1,790,232 | | | | 0.64 | |
| | | | |
Tanzania (Cost $695,249) | | | | | | | | | | | | | | | | |
HTA Group Ltd., 7.000%, 12/18/2025 | | | | | | | 665,000 | | | | 694,792 | | | | 0.25 | |
| | | | | | | | | | | 694,792 | | | | 0.25 | |
| | | | |
Thailand (Cost $1,516,618) | | | | | | | | | | | | | | | | |
Bangkok Bank PCL, 9.025%, 03/15/2029 | | | | | | | 475,000 | | | | 651,880 | | | | 0.23 | |
PTTEP Treasury Center Co. Ltd., 2.587%, 06/10/2027 | | | | | | | 200,000 | | | | 206,254 | | | | 0.08 | |
PTTEP Treasury Center Co. Ltd., 3.903%, 12/06/2059 | | | | | | | 600,000 | | | | 639,990 | | | | 0.23 | |
| | | | | | | | | | | 1,498,124 | | | | 0.54 | |
| | | | |
Turkey (Cost $1,623,070) | | | | | | | | | | | | | | | | |
Akbank T.A.S., (Variable, USD Swap 5Y + 5.026%), 7.200%, 03/16/20273 | | | | | | | 215,000 | | | | 195,113 | | | | 0.07 | |
Akbank T.A.S., (Variable, USD Swap 5Y + 4.029%), 6.797%, 04/27/20283 | | | | | | | 614,000 | | | | 541,248 | | | | 0.19 | |
Turkiye Garanti Bankasi A.S., (Variable, USD Swap 5Y + 4.220%),
6.125%, 05/24/20273 | | | | | | | 535,000 | | | | 477,364 | | | | 0.17 | |
Turkiye Is Bankasi A.S., (Variable, USD Swap 5Y + 5.117%),
7.000%, 06/29/20283 | | | | | | | 356,000 | | | | 320,071 | | | | 0.12 | |
| | | | | | | | | | | 1,533,796 | | | | 0.55 | |
See accompanying notes to the financial statements.
105
ASHMORE EMERGING MARKETS CORPORATE INCOME FUND
SCHEDULE OF INVESTMENTS (CONTINUED)
As of October 31, 2020
| | | | | | | | | | | | | | | | |
| | | Currency1 | | | Par | | | Value | | | % of Net
Assets | |
Ukraine (Cost $11,303,766) | | | | | | | | | | | | | | | | |
DTEK Finance PLC, 10.750%, (100% Cash), 12/31/20244,5 | | | | | | | 2,644,000 | | | $ | 1,718,600 | | | | 0.61 | |
Metinvest B.V., 8.500%, 04/23/2026 | | | | | | | 3,117,000 | | | | 3,141,001 | | | | 1.12 | |
Metinvest B.V., 7.750%, 10/17/2029 | | | | | | | 2,065,000 | | | | 1,974,140 | | | | 0.70 | |
MHP Lux S.A., 6.250%, 09/19/2029 | | | | | | | 1,785,000 | | | | 1,696,643 | | | | 0.61 | |
VF Ukraine PAT via VFU Funding PLC, 6.200%, 02/11/2025 | | | | | | | 1,765,000 | | | | 1,751,762 | | | | 0.63 | |
| | | | | | | | | | | 10,282,146 | | | | 3.67 | |
| | | | |
United Arab Emirates (Cost $10,361,215) | | | | | | | | | | | | | | | | |
Abu Dhabi National Energy Co. PJSC, 4.875%, 04/23/2030 | | | | | | | 310,000 | | | | 382,924 | | | | 0.14 | |
Abu Dhabi National Energy Co. PJSC, 6.500%, 10/27/2036 | | | | | | | 380,000 | | | | 554,198 | | | | 0.20 | |
Aldar Sukuk No. 2 Ltd., 3.875%, 10/22/2029 | | | | | | | 660,000 | | | | 704,491 | | | | 0.25 | |
DIB Sukuk Ltd., 2.950%, 01/16/2026 | | | | | | | 1,330,000 | | | | 1,379,398 | | | | 0.49 | |
DP World Crescent Ltd., 4.848%, 09/26/2028 | | | | | | | 240,000 | | | | 267,864 | | | | 0.10 | |
DP World PLC, 6.850%, 07/02/2037 | | | | | | | 840,000 | | | | 1,053,526 | | | | 0.38 | |
DP World Salaam, (Variable, U.S. Treasury Yield Curve Rate CMT 5Y + 5.750%), 6.000%, 10/01/20253 | | | | | | | 1,635,000 | | | | 1,712,663 | | | | 0.61 | |
Galaxy Pipeline Assets Bidco Ltd., 2.625%, 03/31/20362,10 | | | | | | | 1,400,000 | | | | 1,396,632 | | | | 0.50 | |
Galaxy Pipeline Assets Bidco Ltd., 3.250%, 09/30/20402,10 | | | | | | | 1,800,000 | | | | 1,779,551 | | | | 0.63 | |
MAF Global Securities Ltd., 4.750%, 05/07/2024 | | | | | | | 215,000 | | | | 230,136 | | | | 0.08 | |
Tabreed Sukuk SPC Ltd., 5.500%, 10/31/2025 | | | | | | | 810,000 | | | | 938,879 | | | | 0.33 | |
| | | | | | | | | | | 10,400,262 | | | | 3.71 | |
| | | | |
Venezuela (Cost $8,318,882) | | | | | | | | | | | | | | | | |
Petroleos de Venezuela S.A., 8.500%, 10/27/20205,6 | | | | | | | 7,112,500 | | | | 1,778,125 | | | | 0.64 | |
Petroleos de Venezuela S.A., 9.750%, 05/17/20355 | | | | | | | 6,744,093 | | | | 229,299 | | | | 0.08 | |
| | | | | | | | | | | 2,007,424 | | | | 0.72 | |
| | | | |
Zambia (Cost $7,310,720) | | | | | | | | | | | | | | | | |
First Quantum Minerals Ltd., 7.250%, 04/01/2023 | | | | | | | 3,545,000 | | | | 3,562,725 | | | | 1.27 | |
First Quantum Minerals Ltd., 6.875%, 03/01/2026 | | | | | | | 2,730,000 | | | | 2,709,525 | | | | 0.97 | |
First Quantum Minerals Ltd., 6.875%, 10/15/20272 | | | | | | | 1,300,000 | | | | 1,296,737 | | | | 0.46 | |
| | | | | | | | | | | 7,568,987 | | | | 2.70 | |
| | | | |
Total Debt Securities (Cost $294,541,121) | | | | | | | | | | | 273,319,675 | | | | 97.62 | |
| | | | |
Bank Loans | | | | | | | | | | | | | | | | |
| | | | |
Brazil (Cost $2,100,000) | | | | | | | | | | | | | | | | |
Samarco Mineracao S.A., 0.930%, 09/09/20186,11 | | | | | | | 3,000,000 | | | | 1,350,000 | | | | 0.48 | |
| | | | | | | | | | | 1,350,000 | | | | 0.48 | |
| | | | |
Czech Republic (Cost $362,934) | | | | | | | | | | | | | | | | |
New World Resources N.V., 8.500%, 10/07/20166,7 | | | EUR | | | | 571,997 | | | | — | | | | — | |
| | | | | | | | | | | — | | | | — | |
| | | | |
Ghana (Cost $3,000,000) | | | | | | | | | | | | | | | | |
Karpower International B.V., 8.920%, 11/16/202311 | | | | | | | 3,000,000 | | | | 2,865,000 | | | | 1.03 | |
| | | | | | | | | | | 2,865,000 | | | | 1.03 | |
| | | | |
Total Bank Loans (Cost $5,462,934) | | | | | | | | | | | 4,215,000 | | | | 1.51 | |
��
See accompanying notes to the financial statements.
106
ASHMORE EMERGING MARKETS CORPORATE INCOME FUND
SCHEDULE OF INVESTMENTS (CONTINUED)
As of October 31, 2020
| | | | | | | | | | | | | | | | |
| | | Currency1 | | | Shares | | | Value | | | % of Net
Assets | |
Equity Securities | | | | | | | | | | | | | | | | |
| | | | |
Czech Republic (Cost $1,093,253) | | | | | | | | | | | | | | | | |
New World Resources PLC, Class A*,7 | | | GBP | | | | 36,580,138 | | | $ | — | | | | — | |
| | | | | | | | | | | — | | | | — | |
| | | | |
Niger (Cost $877,496) | | | | | | | | | | | | | | | | |
Savannah Energy PLC* | | | GBP | | | | 2,258,852 | | | | 230,441 | | | | 0.08 | |
| | | | | | | | | | | 230,441 | | | | 0.08 | |
| | | | |
Russian Federation (Cost $655,356) | | | | | | | | | | | | | | | | |
Roust Corp.*,11 | | | | | | | 13,359 | | | | 36,737 | | | | 0.01 | |
Roust Corp., Class C*,11 | | | | | | | 28,922 | | | | 79,536 | | | | 0.03 | |
| | | | | | | | | | | 116,273 | | | | 0.04 | |
| | | | |
Total Equity Securities (Cost $2,626,105) | | | | | | | | | | | 346,714 | | | | 0.12 | |
| | | | |
Total Investments (Total Cost $302,630,160) | | | | | | | | | | | 277,881,389 | | | | 99.25 | |
| | | | |
Other Assets Less Liabilities (See Statements of Assets and Liabilities for further detail) | | | | | | | | | | | 2,089,749 | | | | 0.75 | |
| | | | |
Net Assets | | | | | | | | | | $ | 279,971,138 | | | | 100.00 | |
| * | Non-income producing security. |
| 1 | Local currency is United States Dollars unless otherwise noted below. |
| 2 | Securities exempt from registration under Rule 144A of the Securities Act of 1933. These securities may not be publicly traded without registration under the Securities Act of 1933. |
| 3 | Variable rate security. Security issued at a fixed coupon rate, which converts to a variable rate at a specified date. Rate shown is the rate in effect as of period end. |
| 4 | Security is a payment-in-kind bond, and unless otherwise noted in the description of the security, pays its entire coupon on an in-kind basis. |
| 5 | Issuer has defaulted on terms of debt obligation. |
| 6 | Maturity has been extended under the terms of a plan of reorganization. |
| 7 | Security has been deemed worthless and is a Level 3 investment. |
| 8 | Zero coupon bond – interest rate reflects effective yield on the date of purchase. |
| 9 | Restricted security that has been deemed illiquid. At October 31, 2020 the value of these restricted illiquid securities amount to $0 or 0.00% of net assets. Additional information on each restricted illiquid security is as follows: |
| | | | |
| SECURITY | | ACQUISITION DATE | | ACQUISITION COST |
New World Resources N.V., 16.423%, 10/07/2020 | | 10/7/2014 | | $- |
| 10 | When issued security. Coupon rate was not in effect at October 31, 2020. |
| 11 | Security is a Level 3 investment. |
Percentages shown are based on net assets.
See accompanying notes to the financial statements.
107
ASHMORE EMERGING MARKETS CORPORATE INCOME FUND
SCHEDULE OF INVESTMENTS (CONTINUED)
As of October 31, 2020
At October 31, 2020, the Ashmore Emerging Markets Corporate Income Fund had outstanding forward foreign currency exchange contracts as follows:
| | | | | | | | | | | | | | | | | | | | | | |
Settlement Date | | Counterparty | | Currency Buy | | Currency Buy Amount (Local Currency) | | | | | Currency Sell | | | Currency Sell Amount (Local Currency) | | | Unrealized Gain/(Loss) | |
| |
| 11/18/2020 | | Citibank | | United States Dollar | | 453,155 | | | Euro | | | | | | | | 385,000 | | | | $ 4,587 | |
| 11/18/2020 | | JP Morgan | | United States Dollar | | 786,559 | | | Euro | | | | | | | | 669,618 | | | | 6,379 | |
| | | | | | | | | | | | | | | | | | | | | | |
| | | | | | |
Subtotal Appreciation | | | | | | | | | | | | | | | | | | | 10,966 | |
| | | | | | | | | | | | | | | | | | | | | | |
| | | | | | | |
| Total | | | | | | | | | | | | | | | | | | | | | $10,966 | |
| | | | | | | | | | | | | | | | | | | | | | |
The inputs or methodologies used for valuing securities are not necessarily an indication of the risks associated with investing in those securities and other financial instruments, if any. See note 4 in the Notes to the Financial Statements for more information regarding pricing inputs and valuation techniques. The following is a summary of the inputs used in valuing the Ashmore Emerging Markets Corporate Income Fund’s investments and other financial instruments, which are carried at fair value, as of October 31, 2020:
| | | | | | | | | | | | | | | | |
| | | Level 1 | | | Level 2 | | | Level 3 | | | Total | |
Investments | | | | | | | | | | | | | | | | |
Assets: | | | | | | | | | | | | | | | | |
Debt Securities | | | | | | | | | | | | | | | | |
Corporate Bonds | | | $— | | | | $247,760,425 | | | | $ — | | | | $247,760,425 | |
Corporate Convertible Bonds | | | — | | | | 7,288,474 | | | | — | | | | 7,288,474 | |
Financial Certificates | | | — | | | | 8,886,786 | | | | — | | | | 8,886,786 | |
Government Agencies | | | — | | | | 9,383,990 | | | | — | | | | 9,383,990 | |
| | | | | | | | | | | | | | | | |
Total Debt Securities | | | — | | | | 273,319,675 | | | | — | | | | 273,319,675 | |
Bank Loans | | | | | | | | | | | | | | | | |
Brazil | | | — | | | | — | | | | 1,350,000 | | | | 1,350,000 | |
Ghana | | | — | | | | — | | | | 2,865,000 | | | | 2,865,000 | |
| | | | | | | | | | | | | | | | |
Total Bank Loans | | | — | | | | — | | | | 4,215,000 | | | | 4,215,000 | |
Equity Securities | | | | | | | | | | | | | | | | |
Common Stock | | | | | | | | | | | | | | | | |
Niger | | | — | | | | 230,441 | | | | — | | | | 230,441 | |
Russian Federation | | | — | | | | — | | | | 116,273 | | | | 116,273 | |
| | | | | | | | | | | | | | | | |
Total Common Stock | | | — | | | | 230,441 | | | | 116,273 | | | | 346,714 | |
| |
Total Investments | | | $— | | | | $273,550,116 | | | | $4,331,273 | | | | $277,881,389 | |
| |
| | | | |
Other Financial Instruments | | | | | | | | | | | | | | | | |
Assets: | | | | | | | | | | | | | | | | |
Forward Foreign Currency Exchange Contracts | | | $— | | | | $10,966 | | | | $ — | | | | $10,966 | |
| |
Total Other Financial Instruments | | | $— | | | | $10,966 | | | | $ — | | | | $10,966 | |
| |
See accompanying notes to the financial statements.
108
ASHMORE EMERGING MARKETS CORPORATE INCOME FUND
SCHEDULE OF INVESTMENTS (CONTINUED)
As of October 31, 2020
The following is a reconciliation of investments in which significant unobservable inputs (Level 3) were used for the Fund during the period ended October 31, 2020:
| | | | | | | | | | | | | | | | | | | | | | | | | | | | | | | | | | | | | | | | |
Category and Subcategory | | Beginning Balance at 10/31/2019 | | | Accrued Discounts (Premiums) | | | Purchases | | | Sales | | | Realized Gains (Losses) | | | Change in Unrealized Appreciation (Depreciation) | | | Transfer into Level 3 | | | Transfer out of Level 3 | | | Ending Balance at 10/31/2020 | | | Change in Unrealized Appreciation (Depreciation) from Investments still held 10/31/2020 | |
|
Investments, at value | |
| | | | | | | | | | |
Bank Loans | | | | | | | | | | | | | | | | | | | | | | | | | | | | | | | | | | | | | | | | |
| | | | | | | | | | |
Brazil | | | $ 1,980,000 | | | | $ — | | | | $ — | | | | $ — | | | | $ — | | | | $(630,000 | ) | | | $— | | | | $— | | | | $1,350,000 | | | | $(630,000 | ) |
| | | | | | | | | | |
Ghana | | | 3,007,500 | | | | — | | | | — | | | | — | | | | — | | | | (142,500 | ) | | | — | | | | — | | | | 2,865,000 | | | | (142,500 | ) |
| | | | | | | | | | |
Malaysia | | | 1,118,410 | | | | 2,179 | | | | — | | | | (1,158,974 | ) | | | 38,817 | | | | (432 | ) | | | — | | | | — | | | | — | | | | — | |
| | | | | | | | | | |
Nigeria | | | 542,727 | | | | (23,413 | ) | | | — | | | | (988,772 | ) | | | (23,413 | ) | | | 492,871 | | | | — | | | | — | | | | — | | | | — | |
| | | | | | | | | | |
United Arab Emirates | | | 11,820,491 | | | | 205,534 | | | | 235,911 | | | | (13,084,271 | ) | | | 827,804 | | | | (5,469 | ) | | | — | | | | — | | | | — | | | | — | |
| | | | | | | | | | |
Common Stocks | | | | | | | | | | | | | | | | | | | | | | | | | | | | | | | | | | | | | | | | |
| | | | | | | | | | |
Russian Federation | | | 126,843 | | | | — | | | | — | | | | — | | | | — | | | | (10,570 | ) | | | — | | | | — | | | | 116,273 | | | | (10,570 | ) |
| | | | | | | | | | | |
Total | | | $18,595,971 | | | | $184,300 | | | | $235,911 | | | | $(15,232,017 | ) | | | $843,208 | | | | $(296,100 | ) | | | $— | | | | $— | | | | $4,331,273 | | | | $(783,070 | ) |
The following table on “Quantitative information about Level 3 Fair Value measurements” provides information on the valuation techniques and inputs used to value Level 3 securities at October 31, 2020:
| | | | | | | | | | | | |
| Quantitative Information about Level 3 Fair Value Measurements | |
| |
| | | |
| | | Fair Value at 10/31/2020 | | | Valuation Technique | | | Unobservable Input | |
| |
| | | |
Bank Loans | | | $4,215,000 | | | | Broker Quote | | | | Inputs to broker model | |
Common Stock | | | 116,273 | | | | Broker Quote | | | | Inputs to broker model | |
| |
| | | |
Total | | | $4,331,273 | | | | | | | | | |
| |
See accompanying notes to the financial statements.
109
ASHMORE EMERGING MARKETS CORPORATE INCOME FUND
SCHEDULE OF INVESTMENTS (CONTINUED)
As of October 31, 2020
The following is a summary of the fair values of the Fund’s derivative instruments*:
Fair Values of Financial Derivative Instruments on the Statements of Assets and Liabilities as of October 31, 2020:
| | | | |
| | | Derivatives Not Accounted for as
Hedging Instruments | |
| | | Foreign Exchange Risk | |
| |
Assets: | | | | |
Unrealized Appreciation on Forward Foreign Currency Exchange Contracts | | | $10,966 | |
| | | | |
The Effect of Financial Derivative Instruments on the Statements of Operations for the Year Ended October 31, 2020:
| | | | |
| | | Derivatives Not Accounted for as
Hedging Instruments | |
| | | Foreign Exchange Risk | |
| |
Realized Gain (Loss) on Derivatives Recognized resulting from Operations: | | | | |
Net Realized Loss on Forward Foreign Currency Exchange Contracts | | | $(28,832 | ) |
| | | | |
| |
Net Change in Unrealized Appreciation (Depreciation) on Derivatives Recognized resulting from Operations: | | | | |
Net Change in Unrealized Appreciation on Forward Foreign Currency Exchange Contracts | | | $ 10,966 | |
| | | | |
* See note 10 in the Notes to the Financial Statements for additional information.
See accompanying notes to the financial statements.
110
ASHMORE EMERGING MARKETS SHORT DURATION FUND
SCHEDULE OF INVESTMENTS
As of October 31, 2020
| | | | | | | | | | | | | | | | |
| | | Currency1 | | | Par | | | Value | | | % of Net Assets | |
Debt Securities | | | | | | | | | | | | | | | | |
| | | | |
Argentina (Cost $50,294,139) | | | | | | | | | | | | | | | | |
Argentina (Rep of), (Step to 0.500% on 07/09/2021), 0.125%, 07/09/20302 | | | | | | | 61,266,482 | | | $ | 22,484,799 | | | | 4.86 | |
Genneia S.A., 8.750%, 01/20/2022 | | | | | | | 1,775,000 | | | | 1,355,062 | | | | 0.29 | |
IRSA Propiedades Comerciales S.A., 8.750%, 03/23/2023 | | | | | | | 5,191,000 | | | | 3,914,144 | | | | 0.85 | |
Mastellone Hermanos S.A., 12.625%, 07/03/2021 | | | | | | | 1,720,000 | | | | 1,315,817 | | | | 0.28 | |
Pampa Energia S.A., 7.375%, 07/21/2023 | | | | | | | 2,027,000 | | | | 1,682,369 | | | | 0.36 | |
YPF S.A., 8.500%, 03/23/2021 | | | | | | | 4,305,000 | | | | 3,659,293 | | | | 0.79 | |
YPF S.A., 8.750%, 04/04/2024 | | | | | | | 241,000 | | | | 158,614 | | | | 0.04 | |
YPF S.A., 8.500%, 03/23/2025 | | | | | | | 5,344,000 | | | | 3,420,160 | | | | 0.74 | |
| | | | | | | | | | | 37,990,258 | | | | 8.21 | |
| | | | |
Brazil (Cost $52,582,103) | | | | | | | | | | | | | | | | |
Azul Investments LLP, 5.875%, 10/26/2024 | | | | | | | 2,375,000 | | | | 1,896,485 | | | | 0.41 | |
CSN Resources S.A., 7.625%, 02/13/2023 | | | | | | | 17,935,000 | | | | 18,607,562 | | | | 4.02 | |
Embraer Overseas Ltd., 5.696%, 09/16/2023 | | | | | | | 1,710,000 | | | | 1,738,728 | | | | 0.38 | |
Gol Finance S.A., 7.000%, 01/31/2025 | | | | | | | 2,060,000 | | | | 1,524,441 | | | | 0.33 | |
InterCement Financial Operations B.V., 5.750%, 07/17/2024 | | | | | | | 8,950,000 | | | | 6,164,313 | | | | 1.33 | |
MARB BondCo PLC, 7.000%, 03/15/2024 | | | | | | | 9,575,000 | | | | 9,821,652 | | | | 2.12 | |
MARB BondCo PLC, 6.875%, 01/19/2025 | | | | | | | 1,500,000 | | | | 1,549,950 | | | | 0.33 | |
Oi S.A., 10.000%, (100% Cash), 07/27/20253 | | | | | | | 12,300,000 | | | | 12,023,373 | | | | 2.60 | |
| | | | | | | | | | | 53,326,504 | | | | 11.52 | |
| | | | |
China (Cost $95,517,375) | | | | | | | | | | | | | | | | |
CFLD Cayman Investment Ltd., 8.050%, 01/13/2025 | | | | | | | 2,975,000 | | | | 2,619,401 | | | | 0.56 | |
China Evergrande Group, 8.250%, 03/23/2022 | | | | | | | 14,475,000 | | | | 12,166,238 | | | | 2.63 | |
China Evergrande Group, 9.500%, 04/11/2022 | | | | | | | 1,120,000 | | | | 955,349 | | | | 0.21 | |
China Evergrande Group, 11.500%, 01/22/2023 | | | | | | | 1,853,000 | | | | 1,544,862 | | | | 0.33 | |
China Evergrande Group, 10.000%, 04/11/2023 | | | | | | | 11,205,000 | | | | 9,025,223 | | | | 1.95 | |
China Hongqiao Group Ltd., 7.125%, 07/22/2022 | | | | | | | 1,600,000 | | | | 1,509,200 | | | | 0.33 | |
Fantasia Holdings Group Co. Ltd., 12.250%, 10/18/2022 | | | | | | | 4,000,000 | | | | 4,201,863 | | | | 0.91 | |
Fantasia Holdings Group Co. Ltd., 10.875%, 01/09/2023 | | | | | | | 4,160,000 | | | | 4,265,910 | | | | 0.92 | |
Fantasia Holdings Group Co. Ltd., 11.875%, 06/01/2023 | | | | | | | 2,710,000 | | | | 2,804,588 | | | | 0.60 | |
GCL New Energy Holdings Ltd., 7.100%, 01/30/2021 | | | | | | | 12,500,000 | | | | 6,006,250 | | | | 1.30 | |
Kaisa Group Holdings Ltd., 11.250%, 04/09/2022 | | | | | | | 2,660,000 | | | | 2,714,499 | | | | 0.59 | |
Kaisa Group Holdings Ltd., 8.500%, 06/30/2022 | | | | | | | 7,678,000 | | | | 7,489,741 | | | | 1.62 | |
Kaisa Group Holdings Ltd., 11.500%, 01/30/2023 | | | | | | | 9,590,000 | | | | 9,673,302 | | | | 2.09 | |
Kaisa Group Holdings Ltd., 10.875%, 07/23/2023 | | | | | | | 3,930,000 | | | | 3,902,440 | | | | 0.84 | |
Kaisa Group Holdings Ltd., 11.250%, 04/16/2025 | | | | | | | 4,280,000 | | | | 4,054,442 | | | | 0.88 | |
Prime Bloom Holdings Ltd., 6.950%, 07/05/2022 | | | | | | | 6,470,000 | | | | 1,200,185 | | | | 0.26 | |
Radiance Capital Investments Ltd., 8.800%, 09/17/2023 | | | | | | | 1,400,000 | | | | 1,427,814 | | | | 0.31 | |
Ronshine China Holdings Ltd., 8.750%, 10/25/2022 | | | | | | | 1,146,000 | | | | 1,175,182 | | | | 0.25 | |
Tunghsu Venus Holdings Ltd., 7.000%, 06/12/20204,5 | | | | | | | 2,640,000 | | | | 464,165 | | | | 0.10 | |
Zhenro Properties Group Ltd., 9.150%, 05/06/2023 | | | | | | | 2,385,000 | | | | 2,469,615 | | | | 0.53 | |
| | | | | | | | | | | 79,670,269 | | | | 17.21 | |
See accompanying notes to the financial statements.
111
ASHMORE EMERGING MARKETS SHORT DURATION FUND
SCHEDULE OF INVESTMENTS (CONTINUED)
As of October 31, 2020
| | | | | | | | | | | | | | | | |
| | | Currency1 | | | Par | | | Value | | | % of Net Assets | |
Colombia (Cost $5,503,736) | | | | | | | | | | | | | | | | |
Frontera Energy Corp., 9.700%, 06/25/2023 | | | | | | | 3,600,000 | | | $ | 2,880,036 | | | | 0.62 | |
Geopark Ltd., 6.500%, 09/21/2024 | | | | | | | 1,785,000 | | | | 1,677,900 | | | | 0.37 | |
| | | | | | | | | | | 4,557,936 | | | | 0.99 | |
| | | | |
Ecuador (Cost $86,601,077) | | | | | | | | | | | | | | | | |
Ecuador (Rep of), (Step to 5.000% on 07/31/2021), 0.500%, 07/31/20302,6 | | | | | | | 45,997,165 | | | | 30,588,574 | | | | 6.61 | |
Ecuador (Rep of), (Step to 1.000% on 07/31/2021), 0.500%, 07/31/20352,6 | | | | | | | 56,698,733 | | | | 30,971,683 | | | | 6.69 | |
Petroamazonas EP, 4.625%, 12/06/2021 | | | | | | | 15,052,244 | | | | 13,584,650 | | | | 2.93 | |
| | | | | | | | | | | 75,144,907 | | | | 16.23 | |
| | | | |
Egypt (Cost $5,815,170) | | | | | | | | | | | | | | | | |
ADES International Holding PLC, 8.625%, 04/24/2024 | | | | | | | 5,875,000 | | | | 5,528,375 | | | | 1.20 | |
| | | | | | | | | | | 5,528,375 | | | | 1.20 | |
| | | | |
Indonesia (Cost $125,073) | | | | | | | | | | | | | | | | |
Eterna Capital Pte. Ltd., 7.500%, (13% PIK), 12/11/20223 | | | | | | | 149,691 | | | | 60,460 | | | | 0.01 | |
| | | | | | | | | | | 60,460 | | | | 0.01 | |
| | | | |
Iraq (Cost $17,302,827) | | | | | | | | | | | | | | | | |
DNO A.S.A., 8.750%, 05/31/20236 | | | | | | | 11,600,000 | | | | 10,353,000 | | | | 2.24 | |
DNO A.S.A., 8.375%, 05/29/20246 | | | | | | | 2,995,000 | | | | 2,605,650 | | | | 0.56 | |
Oilflow SPV 1 DAC, 12.000%, 01/13/2022 | | | | | | | 2,421,607 | | | | 2,373,272 | | | | 0.51 | |
| | | | | | | | | | | 15,331,922 | | | | 3.31 | |
| | | | |
Jamaica (Cost $10,864,737) | | | | | | | | | | | | | | | | |
Digicel Group 0.5 Ltd., 7.000%, 11/23/20203,6 | | | | | | | 107,533 | | | | 14,517 | | | | — | |
Digicel Group 0.5 Ltd., 10.000%, 04/01/20243 | | | | | | | 5,744,284 | | | | 4,365,656 | | | | 0.94 | |
Digicel International Finance Ltd./Digicel Holdings Bermuda Ltd.,
8.750%, 05/25/2024 | | | | | | | 5,116,490 | | | | 5,110,095 | | | | 1.11 | |
Digicel International Finance Ltd./Digicel Holdings Bermuda Ltd.,
8.000%, 12/31/2026 | | | | | | | 1,931,136 | | | | 1,438,696 | | | | 0.31 | |
| | | | | | | | | | | 10,928,964 | | | | 2.36 | |
| | | | |
Lebanon (Cost $152,417,841) | | | | | | | | | | | | | | | | |
Lebanon (Rep of), 6.375%, 03/09/20204,5 | | | | | | | 43,712,000 | | | | 7,195,869 | | | | 1.55 | |
Lebanon (Rep of), 5.800%, 04/14/20204,5 | | | | | | | 29,248,000 | | | | 4,821,825 | | | | 1.04 | |
Lebanon (Rep of), 6.150%, 06/19/20204,5 | | | | | | | 19,996,000 | | | | 3,218,556 | | | | 0.70 | |
Lebanon (Rep of), 8.250%, 04/12/20214 | | | | | | | 59,195,000 | | | | 8,943,181 | | | | 1.93 | |
Lebanon (Rep of), 6.100%, 10/04/20224 | | | | | | | 12,566,000 | | | | 1,802,216 | | | | 0.39 | |
| | | | | | | | | | | 25,981,647 | | | | 5.61 | |
| | | | |
Mexico (Cost $12,841,393) | | | | | | | | | | | | | | | | |
Credito Real S.A.B. de C.V. SOFOM ER, 7.250%, 07/20/2023 | | | | | | | 1,720,000 | | | | 1,681,661 | | | | 0.36 | |
Grupo Posadas S.A.B. de C.V., 7.875%, 06/30/20224 | | | | | | | 2,805,000 | | | | 1,009,800 | | | | 0.22 | |
Petroleos Mexicanos, 4.875%, 01/18/2024 | | | | | | | 3,161,000 | | | | 3,101,732 | | | | 0.67 | |
Petroleos Mexicanos, 6.875%, 10/16/20256 | | | | | | | 5,234,000 | | | | 5,173,809 | | | | 1.12 | |
See accompanying notes to the financial statements.
112
ASHMORE EMERGING MARKETS SHORT DURATION FUND
SCHEDULE OF INVESTMENTS (CONTINUED)
As of October 31, 2020
| | | | | | | | | | | | | | | | |
| | | Currency1 | | | Par | | | Value | | | % of Net Assets | |
Mexico (continued) | | | | | | | | | | | | | | | | |
Unifin Financiera S.A.B. de C.V., 7.000%, 01/15/2025 | | | | | | | 200,000 | | | $ | 162,000 | | | | 0.03 | |
| | | | | | | | | | | 11,129,002 | | | | 2.40 | |
| | | | |
Oman (Cost $3,051,107) | | | | | | | | | | | | | | | | |
National Bank of Oman SAOG, 5.625%, 09/25/2023 | | | | | | | 750,000 | | | | 747,000 | | | | 0.16 | |
Oztel Holdings SPC Ltd., 5.625%, 10/24/2023 | | | | | | | 2,240,000 | | | | 2,233,056 | | | | 0.48 | |
| | | | | | | | | | | 2,980,056 | | | | 0.64 | |
| | | | |
Peru (Cost $2,440,112) | | | | | | | | | | | | | | | | |
Ajecorp B.V., 6.500%, 05/14/2022 | | | | | | | 2,615,000 | | | | 2,609,770 | | | | 0.56 | |
| | | | | | | | | | | 2,609,770 | | | | 0.56 | |
| | | | |
Poland (Cost $4,019,811) | | | | | | | | | | | | | | | | |
Walnut Bidco PLC, 9.125%, 08/01/2024 | | | | | | | 3,905,000 | | | | 3,993,409 | | | | 0.86 | |
| | | | | | | | | | | 3,993,409 | | | | 0.86 | |
| | | | |
Russian Federation (Cost $1,000,000) | | | | | | | | | | | | | | | | |
PJSC Koks via IMH Capital DAC, 5.900%, 09/23/20256 | | | | | | | 1,000,000 | | | | 1,025,000 | | | | 0.22 | |
| | | | | | | | | | | 1,025,000 | | | | 0.22 | |
| | | | |
Saudi Arabia (Cost $5,460,791) | | | | | | | | | | | | | | | | |
Arabian Centres Sukuk Ltd., 5.375%, 11/26/2024 | | | | | | | 2,475,000 | | | | 2,300,512 | | | | 0.50 | |
Dar Al-Arkan Sukuk Co. Ltd., 6.875%, 04/10/2022 | | | | | | | 3,145,000 | | | | 3,124,935 | | | | 0.67 | |
| | | | | | | | | | | 5,425,447 | | | | 1.17 | |
| | | | |
Singapore (Cost $5,874,117) | | | | | | | | | | | | | | | | |
Puma International Financing S.A., 5.125%, 10/06/2024 | | | | | | | 6,670,000 | | | | 5,622,810 | | | | 1.22 | |
| | | | | | | | | | | 5,622,810 | | | | 1.22 | |
| | | | |
South Africa (Cost $15,919,326) | | | | | | | | | | | | | | | | |
Liquid Telecommunications Financing PLC, 8.500%, 07/13/2022 | | | | | | | 12,500,000 | | | | 12,705,000 | | | | 2.75 | |
Sasol Financing International Ltd., 4.500%, 11/14/2022 | | | | | | | 1,735,000 | | | | 1,685,383 | | | | 0.36 | |
Sasol Financing U.S.A. LLC, 5.875%, 03/27/2024 | | | | | | | 1,725,000 | | | | 1,666,350 | | | | 0.36 | |
| | | | | | | | | | | 16,056,733 | | | | 3.47 | |
| | | | |
Turkey (Cost $7,085,841) | | | | | | | | | | | | | | | | |
KOC Holding A.S., 6.500%, 03/11/2025 | | | | | | | 1,685,000 | | | | 1,697,806 | | | | 0.37 | |
Turkiye Is Bankasi A.S., 6.000%, 10/24/2022 | | | | | | | 4,220,000 | | | | 4,067,025 | | | | 0.88 | |
Turkiye Vakiflar Bankasi TAO, 5.750%, 01/30/2023 | | | | | | | 1,300,000 | | | | 1,244,750 | | | | 0.27 | |
| | | | | | | | | | | 7,009,581 | | | | 1.52 | |
| | | | |
Ukraine (Cost $42,772,742) | | | | | | | | | | | | | | | | |
DTEK Finance PLC, 10.750%, (100% Cash), 12/31/20243,4 | | | | | | | 10,296,000 | | | | 6,692,400 | | | | 1.44 | |
Metinvest B.V., 7.750%, 04/23/2023 | | | | | | | 8,115,000 | | | | 8,277,300 | | | | 1.79 | |
MHP SE, 7.750%, 05/10/2024 | | | | | | | 7,380,000 | | | | 7,694,388 | | | | 1.66 | |
Ukraine (Rep of), 8.994%, 02/01/2024 | | | | | | | 5,529,000 | | | | 5,878,411 | | | | 1.27 | |
Ukraine (Rep of), 7.750%, 09/01/2024 | | | | | | | 7,822,000 | | | | 8,085,992 | | | | 1.75 | |
VF Ukraine PAT via VFU Funding PLC, 6.200%, 02/11/2025 | | | | | | | 2,270,000 | | | | 2,252,975 | | | | 0.49 | |
| | | | | | | | | | | 38,881,466 | | | | 8.40 | |
See accompanying notes to the financial statements.
113
ASHMORE EMERGING MARKETS SHORT DURATION FUND
SCHEDULE OF INVESTMENTS (CONTINUED)
As of October 31, 2020
| | | | | | | | | | | | | | | | |
| | | Currency1 | | | Par | | | Value | | | % of Net Assets | |
Venezuela (Cost $32,680,072) | | | | | | | | | | | | | | | | |
Petroleos de Venezuela S.A., 8.500%, 10/27/20204,5 | | | | | | | 37,855,500 | | | $ | 9,463,875 | | | | 2.05 | |
| | | | | | | | | | | 9,463,875 | | | | 2.05 | |
| | | | |
Zambia (Cost $21,819,952) | | | | | | | | | | | | | | | | |
First Quantum Minerals Ltd., 7.250%, 04/01/2023 | | | | | | | 11,245,000 | | | | 11,301,225 | | | | 2.44 | |
First Quantum Minerals Ltd., 6.500%, 03/01/2024 | | | | | | | 10,715,000 | | | | 10,634,638 | | | | 2.30 | |
| | | | | | | | | | | 21,935,863 | | | | 4.74 | |
| | | | |
Total Debt Securities (Cost $631,989,342) | | | | | | | | | | | 434,654,254 | | | | 93.90 | |
| | | | |
Bank Loans | | | | | | | | | | | | | | | | |
| | | | |
Ukraine (Cost $8,185,734) | | | | | | | | | | | | | | | | |
Metinvest B.V., 4.944%, 10/24/20227 | | | | | | | 8,395,165 | | | | 8,311,213 | | | | 1.79 | |
| | | | | | | | | | | 8,311,213 | | | | 1.79 | |
| | | | |
Total Bank Loans (Cost $8,185,734) | | | | | | | | | | | 8,311,213 | | | | 1.79 | |
| | | | |
Total Investments (Total Cost $640,175,076) | | | | | | | | | | | 442,965,467 | | | | 95.69 | |
| | | | |
Other Assets Less Liabilities (See Statements of Assets and Liabilities for further detail) | | | | | | | | | | | 19,938,552 | | | | 4.31 | |
| | | | |
Net Assets | | | | | | | | | | $ | 462,904,019 | | | | 100.00 | |
| 1 | Local currency is United States Dollars unless otherwise noted below. |
| 2 | Step coupon bond. Rate as of October 31, 2020 is disclosed. |
| 3 | Security is a payment-in-kind bond, and unless otherwise noted in the description of the security, pays its entire coupon on an in-kind basis. |
| 4 | Issuer has defaulted on terms of debt obligation. |
| 5 | Maturity has been extended under the terms of a plan of reorganization. |
| 6 | Securities exempt from registration under Rule 144A of the Securities Act of 1933. These securities may not be publicly traded without registration under the Securities Act of 1933. |
| 7 | Security is a Level 3 investment. |
Percentages shown are based on net assets.
See accompanying notes to the financial statements.
114
ASHMORE EMERGING MARKETS SHORT DURATION FUND
SCHEDULE OF INVESTMENTS (CONTINUED)
As of October 31, 2020
The inputs or methodologies used for valuing securities are not necessarily an indication of the risks associated with investing in those securities and other financial instruments, if any. See note 4 in the Notes to the Financial Statements for more information regarding pricing inputs and valuation techniques. The following is a summary of the inputs used in valuing the Ashmore Emerging Markets Short Duration Fund’s investments and other financial instruments, which are carried at fair value, as of October 31, 2020:
| | | | | | | | | | | | | | | | |
| | | Level 1 | | | Level 2 | | | Level 3 | | | Total | |
Investments | | | | | | | | | | | | | | | | |
Assets: | | | | | | | | | | | | | | | | |
Debt Securities | | | | | | | | | | | | | | | | |
Corporate Bonds | | | $— | | | $ | 302,121,452 | | | $ | — | | | $ | 302,121,452 | |
Corporate Convertible Bonds | | | — | | | | 14,517 | | | | — | | | | 14,517 | |
Financial Certificates | | | — | | | | 5,425,447 | | | | — | | | | 5,425,447 | |
Government Agencies | | | — | | | | 3,101,732 | | | | — | | | | 3,101,732 | |
Government Bonds | | | — | | | | 123,991,106 | | | | — | | | | 123,991,106 | |
| | | | | | | | | | | | | | | | |
Total Debt Securities | | | — | | | | 434,654,254 | | | | — | | | | 434,654,254 | |
Bank Loans | | | | | | | | | | | | | | | | |
Ukraine | | | — | | | | — | | | | 8,311,213 | | | | 8,311,213 | |
| |
Total Investments | | | $— | | | $ | 434,654,254 | | | $ | 8,311,213 | | | $ | 442,965,467 | |
| |
The following is a reconciliation of investments in which significant unobservable inputs (Level 3) were used for the Fund during the period ended October 31, 2020:
| | | | | | | | | | | | | | | | | | | | | | | | | | | | | | | | | | | | | | | | | | |
Category and Subcategory | | Beginning Balance at 10/31/2019 | | | Accrued Discounts (Premiums) | | | Purchases | | | Sales | | | Realized Gains (Losses) | | | Change in Unrealized Appreciation (Depreciation) | | | Transfers into Level 3 | | | Transfers out of Level 3 | | | Ending Balance at 10/31/2020 | | | Change in Unrealized Appreciation (Depreciation) from Investments still held 10/31/2020 |
Investments, at value | | | | | | | | | | | | | | | | | | | | | | | | | | | | | | | | | | | | | | | | | | |
| | | | | | | | | | | |
Bank Loans | | | | | | | | | | | | | | | | | | | | | | | | | | | | | | | | | | | | | | | | | | |
| | | | | | | | | | | |
China | | | $10,105,730 | | | $ | 76,652 | | | | $ — | | | $ | (10,121,770 | ) | | $ | (128,303 | ) | | $ | 67,691 | | | | $— | | | | $— | | | | $ — | | | | $ — | | | |
| | | | | | | | | | | |
Malaysia | | | 311,827 | | | | 439 | | | | — | | | | (323,137 | ) | | | 7,762 | | | | 3,109 | | | | — | | | | — | | | | — | | | | — | | | |
| | | | | | | | | | | |
Ukraine | | | 5,563,835 | | | | 75,902 | | | | 4,315,027 | | | | (1,634,781 | ) | | | 53,527 | | | | (62,297 | ) | | | — | | | | — | | | | 8,311,213 | | | | (62,297 | ) | | |
| | | | | | | | | | | |
United Arab Emirates | | | 43,709,541 | | | | 518,762 | | | | 9,309,270 | | | | (55,456,828 | ) | | | 694,170 | | | | 1,225,085 | | | | — | | | | — | | | | — | | | | — | | | |
Total | | | $59,690,933 | | | $ | 671,755 | | | $ | 13,624,297 | | | $ | (67,536,516 | ) | | $ | 627,156 | | | $ | 1,233,588 | | | | $— | | | | $— | | | | $ 8,311,213 | | | | $ (62,297 | ) | | |
The following table on “Quantitative information about Level 3 Fair Value measurements” provides information on the valuation techniques and inputs used to value Level 3 securities at October 31, 2020:
| | | | | | | | |
| Quantitative Information about Level 3 Fair Value Measurements |
| | | |
| | | Fair Value at 10/31/2020 | | | Valuation Technique | | Unobservable Input |
Bank Loans | | | $8,311,213 | | | Broker quote | | Inputs to broker model |
See accompanying notes to the financial statements.
115
ASHMORE EMERGING MARKETS ACTIVE EQUITY FUND
SCHEDULE OF INVESTMENTS
As of October 31, 2020
| | | | | | | | | | | | | | | | |
| | | Currency1 | | Shares | | | Value | | | % of Net Assets | |
Common Stocks | | | | | | | | | | | | | | | | |
| | | | |
Brazil (Cost $3,375,109) | | | | | | | | | | | | | | | | |
Lojas Renner S.A. | | | BRL | | | | 116,400 | | | $ | 759,711 | | | | 0.93 | |
Vale S.A. ADR | | | | | | | 226,223 | | | | 2,391,177 | | | | 2.91 | |
| | | | | | | | | | | 3,150,888 | | | | 3.84 | |
| | | | |
China (Cost $29,941,830) | | | | | | | | | | | | | | | | |
Alibaba Group Holding Ltd.* | | | HKD | | | | 194,000 | | | | 7,385,377 | | | | 9.00 | |
Anhui Conch Cement Co. Ltd., Class H | | | HKD | | | | 357,000 | | | | 2,234,296 | | | | 2.72 | |
China Life Insurance Co. Ltd., Class H | | | HKD | | | | 1,083,000 | | | | 2,355,177 | | | | 2.87 | |
China Mengniu Dairy Co. Ltd.* | | | HKD | | | | 169,000 | | | | 795,190 | | | | 0.97 | |
China Overseas Land & Investment Ltd. | | | HKD | | | | 320,695 | | | | 802,963 | | | | 0.98 | |
China Resources Cement Holdings Ltd. | | | HKD | | | | 628,000 | | | | 820,075 | | | | 1.00 | |
China Vanke Co. Ltd., Class H | | | HKD | | | | 273,600 | | | | 849,355 | | | | 1.03 | |
CITIC Securities Co. Ltd., Class H | | | HKD | | | | 469,000 | | | | 1,012,581 | | | | 1.23 | |
East Money Information Co. Ltd., Class A | | | CNY | | | | 239,500 | | | | 841,979 | | | | 1.03 | |
JD.com, Inc. ADR* | | | | | | | 6,200 | | | | 505,424 | | | | 0.62 | |
JD.com, Inc., Class A* | | | HKD | | | | 61,700 | | | | 2,521,115 | | | | 3.07 | |
NetEase, Inc. | | | HKD | | | | 142,500 | | | | 2,491,599 | | | | 3.04 | |
Ping An Insurance Group Co. of China Ltd., Class H | | | HKD | | | | 157,000 | | | | 1,611,742 | | | | 1.96 | |
Prosus N.V.* | | | EUR | | | | 12,232 | | | | 1,222,659 | | | | 1.49 | |
Shandong Gold Mining Co. Ltd., Class H2 | | | HKD | | | | 167,950 | | | | 397,410 | | | | 0.48 | |
Sunny Optical Technology Group Co. Ltd. | | | HKD | | | | 96,300 | | | | 1,601,713 | | | | 1.95 | |
Tencent Holdings Ltd. | | | HKD | | | | 71,200 | | | | 5,461,497 | | | | 6.65 | |
| | | | | | | | | | | 32,910,152 | | | | 40.09 | |
| | | | |
Hong Kong (Cost $348,435) | | | | | | | | | | | | | | | | |
AIA Group Ltd. | | | HKD | | | | 39,800 | | | | 375,366 | | | | 0.46 | |
| | | | | | | | | | | 375,366 | | | | 0.46 | |
| | | | |
India (Cost $6,958,392) | | | | | | | | | | | | | | | | |
HDFC Bank Ltd. ADR* | | | | | | | 33,030 | | | | 1,897,243 | | | | 2.31 | |
ICICI Bank Ltd. ADR* | | | | | | | 245,548 | | | | 2,590,531 | | | | 3.15 | |
Infosys Ltd. ADR | | | | | | | 112,536 | | | | 1,605,889 | | | | 1.96 | |
Tata Consultancy Services Ltd. | | | INR | | | | 54,269 | | | | 1,950,401 | | | | 2.38 | |
| | | | | | | | | | | 8,044,064 | | | | 9.80 | |
| | | | |
Indonesia (Cost $1,283,233) | | | | | | | | | | | | | | | | |
Bank Central Asia Tbk PT | | | IDR | | | | 640,200 | | | | 1,258,652 | | | | 1.53 | |
| | | | | | | | | | | 1,258,652 | | | | 1.53 | |
| | | | |
Mexico (Cost $356,686) | | | | | | | | | | | | | | | | |
Grupo Mexico S.A.B. de C.V., Series B | | | MXN | | | | 151,961 | | | | 431,636 | | | | 0.52 | |
| | | | | | | | | | | 431,636 | | | | 0.52 | |
| | | | |
Peru (Cost $4,714,268) | | | | | | | | | | | | | | | | |
Credicorp Ltd. | | | | | | | 19,978 | | | | 2,291,077 | | | | 2.79 | |
See accompanying notes to the financial statements.
116
ASHMORE EMERGING MARKETS ACTIVE EQUITY FUND
SCHEDULE OF INVESTMENTS (CONTINUED)
As of October 31, 2020
| | | | | | | | | | | | | | | | |
| | | Currency1 | | Shares | | | Value | | | % of Net Assets | |
Peru (continued) | | | | | | | | | | | | | | | | |
Southern Copper Corp. | | | | | | | 49,383 | | | $ | 2,584,706 | | | | 3.15 | |
| | | | | | | | | | | 4,875,783 | | | | 5.94 | |
| | | | |
South Africa (Cost $2,866,417) | | | | | | | | | | | | | | | | |
FirstRand Ltd. | | | ZAR | | | | 526,820 | | | | 1,230,118 | | | | 1.50 | |
Naspers Ltd., Class N* | | | ZAR | | | | 8,797 | | | | 1,720,750 | | | | 2.09 | |
| | | | | | | | | | | 2,950,868 | | | | 3.59 | |
| | | | |
South Korea (Cost $8,762,469) | | | | | | | | | | | | | | | | |
LG Chem Ltd. | | | KRW | | | | 4,139 | | | | 2,250,998 | | | | 2.74 | |
LG Household & Health Care Ltd. | | | KRW | | | | 558 | | | | 732,568 | | | | 0.89 | |
Lotte Chemical Corp. | | | KRW | | | | 3,951 | | | | 816,492 | | | | 1.00 | |
Samsung Electronics Co. Ltd. | | | KRW | | | | 34,454 | | | | 1,727,742 | | | | 2.11 | |
Shinhan Financial Group Co. Ltd. | | | KRW | | | | 68,662 | | | | 1,848,607 | | | | 2.25 | |
SK Hynix, Inc. | | | KRW | | | | 17,997 | | | | 1,274,536 | | | | 1.55 | |
| | | | | | | | | | | 8,650,943 | | | | 10.54 | |
| | | | |
Taiwan (Cost $9,363,218) | | | | | | | | | | | | | | | | |
Largan Precision Co. Ltd. | | | TWD | | | | 13,497 | | | | 1,434,918 | | | | 1.75 | |
MediaTek, Inc. | | | TWD | | | | 133,000 | | | | 3,135,487 | | | | 3.82 | |
Taiwan Semiconductor Manufacturing Co. Ltd. | | | TWD | | | | 484,021 | | | | 7,304,848 | | | | 8.90 | |
| | | | | | | | | | | 11,875,253 | | | | 14.47 | |
| | | | |
Total Common Stocks (Cost $67,970,057) | | | | | | | | | | | 74,523,605 | | | | 90.78 | |
| | | | |
Preferred Stocks | | | | | | | | | | | | | | | | |
| | | | |
Brazil (Cost $1,810,013) | | | | | | | | | | | | | | | | |
Itau Unibanco Holding S.A. ADR, 0.785%3 | | | | | | | 432,644 | | | | 1,769,514 | | | | 2.16 | |
| | | | | | | | | �� | | 1,769,514 | | | | 2.16 | |
| | | | |
South Korea (Cost $1,487,584) | | | | | | | | | | | | | | | | |
Samsung Electronics Co. Ltd., 2.725%3 | | | KRW | | | | 38,327 | | | | 1,700,579 | | | | 2.07 | |
| | | | | | | | | | | 1,700,579 | | | | 2.07 | |
| | | | |
Total Preferred Stocks (Cost $3,297,597) | | | | | | | | | | | 3,470,093 | | | | 4.23 | |
| | | | |
Total Investments (Total Cost $71,267,654) | | | | | | | | | | | 77,993,698 | | | | 95.01 | |
| | | | |
Other Assets Less Liabilities (See Statements of Assets and Liabilities for further detail) | | | | | | | | | | | 4,097,885 | | | | 4.99 | |
| | | | |
Net Assets | | | | | | | | | | $ | 82,091,583 | | | | 100.00 | |
| * | Non-income producing security. |
| 1 | Local currency is United States Dollars unless otherwise noted below. |
| 2 | Securities exempt from registration under Rule 144A of the Securities Act of 1933. These securities may not be publicly traded without registration under the Securities Act of 1933. |
| 3 | Current yield is disclosed. Dividends are calculated based on a percentage of the issuer’s net income. |
See accompanying notes to the financial statements.
117
ASHMORE EMERGING MARKETS ACTIVE EQUITY FUND
SCHEDULE OF INVESTMENTS (CONTINUED)
As of October 31, 2020
Percentages shown are based on net assets.
At October 31, 2020, the industry sectors for the Ashmore Emerging Markets Active Equity Fund were:
| | |
| Sector | | Percentage of
Net Assets |
Communication Services | | 9.7% |
Consumer Discretionary | | 17.2 |
Consumer Staples | | 1.9 |
Financials | | 23.2 |
Information Technology | | 26.5 |
Materials | | 14.5 |
Real Estate | | 2.0 |
Total Investments | | 95.0 |
Other Assets Less Liabilities | | 5.0 |
Net Assets | | 100.0% |
At October 31, 2020, the Ashmore Emerging Markets Active Equity Fund had outstanding forward foreign currency exchange contracts as follows:
| | | | | | | | | | | | | | |
Settlement
Date | | Counterparty | | Currency Buy | | Currency
Buy Amount
(Local
Currency) | | | | Currency
Sell | | Currency
Sell Amount
(Local
Currency) | | Unrealized
Gain/(Loss) |
|
11/18/2020 | | Deutsche Bank | | United States Dollar | | 141,753 | | Euro | | | | 120,657 | | $1,174 |
11/18/2020 | | JP Morgan | | United States Dollar | | 1,039,829 | | Euro | | | | 885,233 | | 8,433 |
| | | | | | | | | | | | | | |
Subtotal Appreciation | | | | | | | | | | | | 9,607 |
| | | | | | | | | | | | | | |
Total | | | | | | | | | | | | | | $9,607 |
| | | | | | | | | | | | | | |
See accompanying notes to the financial statements.
118
ASHMORE EMERGING MARKETS ACTIVE EQUITY FUND
SCHEDULE OF INVESTMENTS (CONTINUED)
As of October 31, 2020
The inputs or methodologies used for valuing securities are not necessarily an indication of the risks associated with investing in those securities and other financial instruments, if any. See note 4 in the Notes to the Financial Statements for more information regarding pricing inputs and valuation techniques. The following is a summary of the inputs used in valuing the Ashmore Emerging Markets Active Equity Fund’s investments and other financial instruments, which are carried at fair value, as of October 31, 2020:
| | | | | | | | | | | | | | |
| | | Level 1 | | | Level 2 | | | Level 3 | | | Total |
Investments | | | | | | | | | | | | | | |
Assets: | | | | | | | | | | | | | | |
Common Stocks | | | | | | | | | | | | | | |
Brazil | | | $ 3,150,888 | | | | $ — | | | | $— | | | $ 3,150,888 |
China | | | 505,424 | | | | 32,404,728 | | | | — | | | 32,910,152 |
Hong Kong | | | — | | | | 375,366 | | | | — | | | 375,366 |
India | | | 6,093,663 | | | | 1,950,401 | | | | — | | | 8,044,064 |
Indonesia | | | — | | | | 1,258,652 | | | | — | | | 1,258,652 |
Mexico | | | 431,636 | | | | — | | | | — | | | 431,636 |
Peru | | | 4,875,783 | | | | — | | | | — | | | 4,875,783 |
South Africa | | | — | | | | 2,950,868 | | | | — | | | 2,950,868 |
South Korea | | | — | | | | 8,650,943 | | | | — | | | 8,650,943 |
Taiwan | | | — | | | | 11,875,253 | | | | — | | | 11,875,253 |
| | | | | | | | | | | | | | |
Total Common Stocks | | | 15,057,394 | | | | 59,466,211 | | | | — | | | 74,523,605 |
Preferred Stocks | | | | | | | | | | | | | | |
Brazil | | | 1,769,514 | | | | — | | | | — | | | 1,769,514 |
South Korea | | | — | | | | 1,700,579 | | | | — | | | 1,700,579 |
| | | | | | | | | | | | | | |
Total Preferred Stocks | | | 1,769,514 | | | | 1,700,579 | | | | — | | | 3,470,093 |
Total Investments | | | $16,826,908 | | | | $61,166,790 | | | | $— | | | $77,993,698 |
| | | | |
Other Financial Instruments | | | | | | | | | | | | | | |
Assets: | | | | | | | | | | | | | | |
Forward Foreign Currency Exchange Contracts | | | $— | | | | $9,607 | | | | $— | | | $9,607 |
Total Other Financial Instruments | | | $— | | | | $9,607 | | | | $— | | | $9,607 |
The following is a summary of the fair values of the Fund’s derivative instruments*:
Fair Values of Financial Derivative Instruments on the Statements of Assets and Liabilities as of October 31, 2020:
| | | | |
| | | Derivatives Not Accounted for as
Hedging Instruments | |
| | | Foreign Exchange Risk | |
Assets: | | | | |
Unrealized Appreciation on Forward Foreign Currency Exchange Contracts | | | $9,607 | |
| | | | |
The Effect of Financial Derivative Instruments on the Statements of Operations for the Year Ended October 31, 2020:
| | | | |
| | | Derivatives Not Accounted for as
Hedging Instruments | |
| | | Foreign Exchange Risk | |
Realized Gain (Loss) on Derivatives Recognized resulting from Operations: | | | | |
Net Realized Loss on Forward Foreign Currency Exchange Contracts | | | $(127,572 | ) |
| | | | |
See accompanying notes to the financial statements.
119
ASHMORE EMERGING MARKETS ACTIVE EQUITY FUND
SCHEDULE OF INVESTMENTS (CONTINUED)
As of October 31, 2020
| | | | |
| | | Derivatives Not Accounted for as
Hedging Instruments | |
| | | Foreign Exchange Risk | |
| |
Net Change in Unrealized Appreciation (Depreciation) on Derivatives Recognized resulting from Operations: | | | | |
Net Change in Unrealized Appreciation on Forward Foreign Currency Exchange Contracts | | | $14,283 | |
| | | | |
* See note 10 in the Notes to the Financial Statements for additional information.
See accompanying notes to the financial statements.
120
ASHMORE EMERGING MARKETS SMALL-CAP EQUITY FUND
SCHEDULE OF INVESTMENTS (CONTINUED)
As of October 31, 2020
| | | | | | | | | | | | | | | | |
| | | Currency1 | | Shares | | | Value | | | % of Net
Assets | |
Common Stocks | | | | | | | | | | | | | | | | |
| | | | |
Brazil (Cost $550,644) | | | | | | | | | | | | | | | | |
Arezzo Industria e Comercio S.A. | | | BRL | | | | 11,500 | | | $ | 120,853 | | | | 1.52 | |
Sinqia S.A.* | | | BRL | | | | 40,000 | | | | 144,651 | | | | 1.82 | |
TOTVS S.A. | | | BRL | | | | 18,800 | | | | 88,464 | | | | 1.12 | |
Vasta Platform Ltd.* | | | | | | | 14,900 | | | | 172,244 | | | | 2.17 | |
| | | | | | | | | | | 526,212 | | | | 6.63 | |
| | | | |
China (Cost $794,556) | | | | | | | | | | | | | | | | |
Fu Shou Yuan International Group Ltd. | | | HKD | | | | 153,000 | | | | 157,881 | | | | 1.99 | |
JNBY Design Ltd. | | | HKD | | | | 163,000 | | | | 177,124 | | | | 2.23 | |
Kangji Medical Holdings Ltd.* | | | HKD | | | | 46,500 | | | | 127,059 | | | | 1.60 | |
Noah Holdings Ltd. ADR* | | | | | | | 3,700 | | | | 97,421 | | | | 1.22 | |
Xiabuxiabu Catering Management China Holdings Co. Ltd.*,2 | | | HKD | | | | 113,000 | | | | 193,572 | | | | 2.44 | |
| | | | | | | | | | | 753,057 | | | | 9.48 | |
| | | | |
Hungary (Cost $40,822) | | | | | | | | | | | | | | | | |
Wizz Air Holdings PLC*,2 | | | GBP | | | | 1,703 | | | | 70,479 | | | | 0.89 | |
| | | | | | | | | | | 70,479 | | | | 0.89 | |
| | | | |
India (Cost $1,154,092) | | | | | | | | | | | | | | | | |
Bajaj Consumer Care Ltd. | | | INR | | | | 77,499 | | | | 194,918 | | | | 2.45 | |
Eicher Motors Ltd. | | | INR | | | | 2,960 | | | | 83,495 | | | | 1.05 | |
Granules India Ltd. | | | INR | | | | 30,661 | | | | 158,637 | | | | 2.00 | |
IndiaMart InterMesh Ltd.2 | | | INR | | | | 2,121 | | | | 138,743 | | | | 1.75 | |
Info Edge India Ltd. | | | INR | | | | 1,654 | | | | 79,307 | | | | 1.00 | |
Just Dial Ltd.* | | | INR | | | | 19,942 | | | | 175,420 | | | | 2.21 | |
Larsen & Toubro Infotech Ltd.2 | | | INR | | | | 1,782 | | | | 70,289 | | | | 0.88 | |
Multi Commodity Exchange of India Ltd. | | | INR | | | | 6,902 | | | | 158,482 | | | | 2.00 | |
Quess Corp. Ltd.*,2 | | | INR | | | | 81,992 | | | | 452,365 | | | | 5.70 | |
V-Mart Retail Ltd.* | | | INR | | | | 5,686 | | | | 147,846 | | | | 1.86 | |
| | | | | | | | | | | 1,659,502 | | | | 20.90 | |
| | | | |
Indonesia (Cost $62,722) | | | | | | | | | | | | | | | | |
Ace Hardware Indonesia Tbk PT | | | IDR | | | | 684,100 | | | | 72,921 | | | | 0.92 | |
| | | | | | | | | | | 72,921 | | | | 0.92 | |
| | | | |
Kazakhstan (Cost $126,027) | | | | | | | | | | | | | | | | |
Kaspi.KZ JSC GDR*,2 | | | | | | | 857 | | | | 35,951 | | | | 0.45 | |
Kaspi.KZ JSC GDR (London Exchange)*,2 | | | | | | | 2,348 | | | | 100,847 | | | | 1.27 | |
| | | | | | | | | | | 136,798 | | | | 1.72 | |
| | | | |
Malaysia (Cost $287,226) | | | | | | | | | | | | | | | | |
My EG Services Bhd. | | | MYR | | | | 1,116,800 | | | | 368,972 | | | | 4.65 | |
| | | | | | | | | | | 368,972 | | | | 4.65 | |
| | | | |
Mexico (Cost $313,912) | | | | | | | | | | | | | | | | |
Genomma Lab Internacional S.A.B. de C.V., Class B* | | | MXN | | | | 153,600 | | | | 136,210 | | | | 1.71 | |
See accompanying notes to the financial statements.
121
ASHMORE EMERGING MARKETS SMALL-CAP EQUITY FUND
SCHEDULE OF INVESTMENTS (CONTINUED)
As of October 31, 2020
| | | | | | | | | | | | | | | | |
| | | Currency1 | | | Shares | | | Value | | | % of Net
Assets | |
Mexico (continued) | | | | | | | | | | | | | | | | |
Grupo Aeroportuario del Centro Norte S.A.B. de C.V. ADR* | | | | | | | 4,300 | | | $ | 155,574 | | | | 1.96 | |
| | | | | | | | | | | 291,784 | | | | 3.67 | |
| | | | |
Peru (Cost $172,955) | | | | | | | | | | | | | | | | |
Alicorp S.A.A. | | | PEN | | | | 52,094 | | | | 100,860 | | | | 1.27 | |
| | | | | | | | | | | 100,860 | | | | 1.27 | |
| | | | |
Russian Federation (Cost $473,446) | | | | | | | | | | | | | | | | |
HeadHunter Group PLC ADR | | | | | | | 15,108 | | | | 346,578 | | | | 4.37 | |
TCS Group Holding PLC GDR (Registered) | | | | | | | 14,822 | | | | 354,481 | | | | 4.46 | |
| | | | | | | | | | | 701,059 | | | | 8.83 | |
| | | | |
South Korea (Cost $1,363,472) | | | | | | | | | | | | | | | | |
Dentium Co. Ltd.* | | | KRW | | | | 7,009 | | | | 231,291 | | | | 2.91 | |
Douzone Bizon Co. Ltd. | | | KRW | | | | 2,013 | | | | 177,049 | | | | 2.23 | |
Hansol Chemical Co. Ltd. | | | KRW | | | | 2,613 | | | | 327,321 | | | | 4.12 | |
Hugel, Inc.* | | | KRW | | | | 1,851 | | | | 343,261 | | | | 4.32 | |
KoMiCo Ltd. | | | KRW | | | | 11,174 | | | | 363,231 | | | | 4.57 | |
NHN KCP Corp. | | | KRW | | | | 1,667 | | | | 98,311 | | | | 1.24 | |
NICE Information Service Co. Ltd. | | | KRW | | | | 8,043 | | | | 138,197 | | | | 1.74 | |
SK Materials Co. Ltd. | | | KRW | | | | 474 | | | | 93,212 | | | | 1.18 | |
WONIK IPS Co. Ltd.* | | | KRW | | | | 4,133 | | | | 117,722 | | | | 1.48 | |
| | | | | | | | | | | 1,889,595 | | | | 23.79 | |
| | | | |
Taiwan (Cost $909,301) | | | | | | | | | | | | | | | | |
ASPEED Technology, Inc. | | | TWD | | | | 2,000 | | | | 96,779 | | | | 1.22 | |
Nien Made Enterprise Co. Ltd. | | | TWD | | | | 13,000 | | | | 146,686 | | | | 1.85 | |
Parade Technologies Ltd. | | | TWD | | | | 5,000 | | | | 191,361 | | | | 2.41 | |
Poya International Co. Ltd. | | | TWD | | | | 10,000 | | | | 215,972 | | | | 2.72 | |
Sensortek Technology Corp. | | | TWD | | | | 3,000 | | | | 76,375 | | | | 0.96 | |
Silergy Corp. | | | TWD | | | | 1,839 | | | | 113,533 | | | | 1.43 | |
Sinbon Electronics Co. Ltd. | | | TWD | | | | 23,000 | | | | 155,086 | | | | 1.95 | |
Sporton International, Inc. | | | TWD | | | | 18,000 | | | | 143,836 | | | | 1.81 | |
Sunonwealth Electric Machine Industry Co. Ltd. | | | TWD | | | | 97,000 | | | | 198,896 | | | | 2.50 | |
| | | | | | | | | | | 1,338,524 | | | | 16.85 | |
| | | | |
Total Common Stocks (Cost $6,249,175) | | | | | | | | | | | 7,909,763 | | | | 99.60 | |
| | | | |
Total Investments (Total Cost $6,249,175) | | | | | | | | | | | 7,909,763 | | | | 99.60 | |
| | | | |
Other Assets Less Liabilities (See Statements of Assets and Liabilities for further detail) | | | | | | | | | | | 32,094 | | | | 0.40 | |
| | | | |
Net Assets | | | | | | | | | | $ | 7,941,857 | | | | 100.00 | |
| * | Non-income producing security. |
| 1 | Local currency is United States Dollars unless otherwise noted below. |
See accompanying notes to the financial statements.
122
ASHMORE EMERGING MARKETS SMALL-CAP EQUITY FUND
SCHEDULE OF INVESTMENTS (CONTINUED)
As of October 31, 2020
| 2 | Securities exempt from registration under Rule 144A of the Securities Act of 1933. These securities may not be publicly traded without registration under the Securities Act of 1933. |
Percentages shown are based on net assets.
At October 31, 2020, the industry sectors for the Ashmore Emerging Markets Small-Cap Equity Fund were:
| | | | |
| Sector | | Percentage of
Net Assets | |
Communication Services | | | 3.2% | |
Consumer Discretionary | | | 18.7 | |
Consumer Staples | | | 3.7 | |
Financials | | | 7.7 | |
Health Care | | | 12.6 | |
Industrials | | | 20.7 | |
Information Technology | | | 27.7 | |
Materials | | | 5.3 | |
Total Investments | | | 99.6 | |
Other Assets Less Liabilities | | | 0.4 | |
Net Assets | | | 100.0% | |
The inputs or methodologies used for valuing securities are not necessarily an indication of the risks associated with investing in those securities and other financial instruments, if any. See note 4 in the Notes to the Financial Statements for more information regarding pricing inputs and valuation techniques. The following is a summary of the inputs used in valuing the Ashmore Emerging Markets Small-Cap Equity Fund’s investments and other financial instruments, which are carried at fair value, as of October 31, 2020:
| | | | | | | | | | | | | | | | |
| | | Level 1 | | | Level 2 | | | Level 3 | | | Total | |
Investments | | | | | | | | | | | | | | | | |
Assets: | | | | | | | | | | | | | | | | |
Common Stocks | | | | | | | | | | | | | | | | |
Brazil | | $ | 526,212 | | | $ | — | | | | $— | | | $ | 526,212 | |
China | | | 97,421 | | | | 655,636 | | | | — | | | | 753,057 | |
Hungary | | | — | | | | 70,479 | | | | — | | | | 70,479 | |
India | | | — | | | | 1,659,502 | | | | — | | | | 1,659,502 | |
Indonesia | | | — | | | | 72,921 | | | | — | | | | 72,921 | |
Kazakhstan | | | 136,798 | | | | — | | | | — | | | | 136,798 | |
Malaysia | | | — | | | | 368,972 | | | | — | | | | 368,972 | |
Mexico | | | 291,784 | | | | — | | | | — | | | | 291,784 | |
Peru | | | 100,860 | | | | — | | | | — | | | | 100,860 | |
Russian Federation | | | 346,578 | | | | 354,481 | | | | — | | | | 701,059 | |
South Korea | | | — | | | | 1,889,595 | | | | — | | | | 1,889,595 | |
Taiwan | | | — | | | | 1,338,524 | | | | — | | | | 1,338,524 | |
| | | | | | | | | | | | | | | | |
Total Common Stocks | | | 1,499,653 | | | | 6,410,110 | | | | — | | | | 7,909,763 | |
| |
Total Investments | | $ | 1,499,653 | | | $ | 6,410,110 | | | | $— | | | $ | 7,909,763 | |
| |
See accompanying notes to the financial statements.
123
ASHMORE EMERGING MARKETS FRONTIER EQUITY FUND
SCHEDULE OF INVESTMENTS
As of October 31, 2020
| | | | | | | | | | | | | | | | |
| | | Currency1 | | Shares | | | Value | | | % of Net Assets | |
Common Stocks | | | | | | | | | | | | | | | | |
| | | | |
Argentina (Cost $722,514) | | | | | | | | | | | | | | | | |
Globant S.A.* | | | | | | | 6,600 | | | $ | 1,192,026 | | | | 2.21 | |
| | | | | | | | | | | 1,192,026 | | | | 2.21 | |
| | | | |
Bahrain (Cost $1,500,488) | | | | | | | | | | | | | | | | |
Ahli United Bank BSC | | | KWD | | | | 1,847,847 | | | | 1,422,057 | | | | 2.63 | |
| | | | | | | | | | | 1,422,057 | | | | 2.63 | |
| | | | |
Cambodia (Cost $929,428) | | | | | | | | | | | | | | | | |
NagaCorp. Ltd. | | | HKD | | | | 730,000 | | | | 755,262 | | | | 1.40 | |
| | | | | | | | | | | 755,262 | | | | 1.40 | |
| | | | |
Egypt (Cost $4,533,399) | | | | | | | | | | | | | | | | |
ADES International Holding PLC*,2 | | | | | | | 45,762 | | | | 439,389 | | | | 0.81 | |
Arabian Food Industries Co. S.A.E. Domty | | | EGP | | | | 1,472,262 | | | | 532,641 | | | | 0.99 | |
Cleopatra Hospital* | | | EGP | | | | 2,444,068 | | | | 741,003 | | | | 1.37 | |
Commercial International Bank Egypt S.A.E. | | | EGP | | | | 387,394 | | | | 1,505,951 | | | | 2.79 | |
Fawry for Banking & Payment Technology Services S.A.E.* | | | EGP | | | | 440,341 | | | | 915,403 | | | | 1.70 | |
| | | | | | | | | | | 4,134,387 | | | | 7.66 | |
| | | | |
Georgia (Cost $846,518) | | | | | | | | | | | | | | | | |
Georgia Capital PLC* | | | GBP | | | | 55,098 | | | | 264,039 | | | | 0.49 | |
| | | | | | | | | | | 264,039 | | | | 0.49 | |
| | | | |
Kazakhstan (Cost $1,049,529) | | | | | | | | | | | | | | | | |
Halyk Savings Bank of Kazakhstan JSC GDR2 | | | | | | | 46,590 | | | | 464,968 | | | | 0.86 | |
Halyk Savings Bank of Kazakhstan JSC GDR (Registered) | | | | | | | 10,851 | | | | 108,300 | | | | 0.20 | |
Kaspi.KZ JSC GDR*,2 | | | | | | | 4,980 | | | | 208,911 | | | | 0.39 | |
Kaspi.KZ JSC GDR (London Exchange)*,2 | | | | | | | 5,000 | | | | 214,750 | | | | 0.40 | |
| | | | | | | | | | | 996,929 | | | | 1.85 | |
| | | | |
Kenya (Cost $2,205,854) | | | | | | | | | | | | | | | | |
Equity Group Holdings PLC* | | | KES | | | | 1,731,000 | | | | 538,484 | | | | 1.00 | |
Safaricom PLC | | | KES | | | | 6,196,700 | | | | 1,756,634 | | | | 3.25 | |
| | | | | | | | | | | 2,295,118 | | | | 4.25 | |
| | | | |
Kuwait (Cost $8,788,624) | | | | | | | | | | | | | | | | |
Humansoft Holding Co. K.S.C.* | | | KWD | | | | 54,488 | | | | 518,959 | | | | 0.96 | |
Mabanee Co. S.A.K. | | | KWD | | | | 341,725 | | | | 724,042 | | | | 1.34 | |
Mobile Telecommunications Co. K.S.C. | | | KWD | | | | 1,303,794 | | | | 2,497,212 | | | | 4.63 | |
National Bank of Kuwait S.A.K.P. | | | KWD | | | | 1,859,350 | | | | 5,134,837 | | | | 9.51 | |
| | | | | | | | | | | 8,875,050 | | | | 16.44 | |
| | | | |
Mauritius (Cost $965,115) | | | | | | | | | | | | | | | | |
MCB Group Ltd. | | | MUR | | | | 120,485 | | | | 616,571 | | | | 1.14 | |
| | | | | | | | | | | 616,571 | | | | 1.14 | |
| | | | |
Morocco (Cost $1,978,899) | | | | | | | | | | | | | | | | |
Attijariwafa Bank* | | | MAD | | | | 13,704 | | | | 561,202 | | | | 1.04 | |
See accompanying notes to the financial statements.
124
ASHMORE EMERGING MARKETS FRONTIER EQUITY FUND
SCHEDULE OF INVESTMENTS (CONTINUED)
As of October 31, 2020
| | | | | | | | | | | | | | | | |
| | | Currency1 | | Shares | | | Value | | | % of Net Assets | |
Morocco (continued) | | | | | | | | | | | | | | | | |
Maroc Telecom | | | MAD | | | | 40,773 | | | $ | 624,845 | | | | 1.16 | |
Vivo Energy PLC*,2 | | | GBP | | | | 550,132 | | | | 539,561 | | | | 1.00 | |
| | | | | | | | | | | 1,725,608 | | | | 3.20 | |
| | | | |
Nigeria (Cost $1,382,771) | | | | | | | | | | | | | | | | |
Guaranty Trust Bank PLC | | | NGN | | | | 11,516,345 | | | | 811,619 | | | | 1.50 | |
| | | | | | | | | | | 811,619 | | | | 1.50 | |
| | | | |
Pakistan (Cost $643,423) | | | | | | | | | | | | | | | | |
Honda Atlas Cars Pakistan Ltd. | | | PKR | | | | 210,400 | | | | 415,128 | | | | 0.77 | |
MCB Bank Ltd. | | | PKR | | | | 297,800 | | | | 309,037 | | | | 0.57 | |
| | | | | | | | | | | 724,165 | | | | 1.34 | |
| | | | |
Peru (Cost $2,071,742) | | | | | | | | | | | | | | | | |
Alicorp S.A.A. | | | PEN | | | | 134,416 | | | | 260,244 | | | | 0.48 | |
Credicorp Ltd. | | | | | | | 6,372 | | | | 730,741 | | | | 1.35 | |
Southern Copper Corp. | | | | | | | 23,214 | | | | 1,215,021 | | | | 2.25 | |
| | | | | | | | | | | 2,206,006 | | | | 4.08 | |
| | | | |
Philippines (Cost $5,804,658) | | | | | | | | | | | | | | | | |
Ayala Corp. | | | PHP | | | | 42,000 | | | | 662,127 | | | | 1.23 | |
GT Capital Holdings, Inc. | | | PHP | | | | 91,290 | | | | 811,282 | | | | 1.50 | |
International Container Terminal Services, Inc. | | | PHP | | | | 314,580 | | | | 747,453 | | | | 1.38 | |
Security Bank Corp. | | | PHP | | | | 318,510 | | | | 634,487 | | | | 1.18 | |
SM Investments Corp. | | | PHP | | | | 62,880 | | | | 1,233,303 | | | | 2.28 | |
SM Prime Holdings, Inc. | | | PHP | | | | 2,033,600 | | | | 1,416,115 | | | | 2.62 | |
Wilcon Depot, Inc. | | | PHP | | | | 1,856,800 | | | | 548,672 | | | | 1.02 | |
| | | | | | | | | | | 6,053,439 | | | | 11.21 | |
| | | | |
Qatar (Cost $3,971,509) | | | | | | | | | | | | | | | | |
Commercial Bank PSQC (The) | | | QAR | | | | 235,000 | | | | 273,658 | | | | 0.51 | |
Qatar Fuel QSC | | | QAR | | | | 81,400 | | | | 384,745 | | | | 0.71 | |
Qatar Gas Transport Co. Ltd. | | | QAR | | | | 1,061,456 | | | | 782,839 | | | | 1.45 | |
Qatar National Bank QPSC | | | QAR | | | | 521,323 | | | | 2,538,361 | | | | 4.70 | |
| | | | | | | | | | | 3,979,603 | | | | 7.37 | |
| | | | |
Romania (Cost $564,228) | | | | | | | | | | | | | | | | |
Banca Transilvania S.A. | | | RON | | | | 586,635 | | | | 265,662 | | | | 0.49 | |
BRD-Groupe Societe Generale S.A.* | | | RON | | | | 90,000 | | | | 245,468 | | | | 0.46 | |
| | | | | | | | | | | 511,130 | | | | 0.95 | |
| | | | |
Saudi Arabia (Cost $1,583,045) | | | | | | | | | | | | | | | | |
Al Hammadi Co. for Development and Investment* | | | SAR | | | | 68,010 | | | | 512,229 | | | | 0.95 | |
Samba Financial Group | | | SAR | | | | 55,784 | | | | 410,441 | | | | 0.76 | |
Saudi Airlines Catering Co. | | | SAR | | | | 20,835 | | | | 432,169 | | | | 0.80 | |
Seera Group Holding* | | | SAR | | | | 53,218 | | | | 236,917 | | | | 0.44 | |
| | | | | | | | | | | 1,591,756 | | | | 2.95 | |
See accompanying notes to the financial statements.
125
ASHMORE EMERGING MARKETS FRONTIER EQUITY FUND
SCHEDULE OF INVESTMENTS (CONTINUED)
As of October 31, 2020
| | | | | | | | | | | | | | | | |
| | | Currency1 | | Shares | | | Value | | | % of Net Assets | |
Senegal (Cost $633,536) | | | | | | | | | | | | | | | | |
Sonatel S.A. | | | XOF | | | | 17,255 | | | $ | 352,316 | | | | 0.65 | |
| | | | | | | | | | | 352,316 | | | | 0.65 | |
| | | | |
Slovenia (Cost $713,324) | | | | | | | | | | | | | | | | |
Nova Ljubljanska Banka dd GDR (Registered)* | | | EUR | | | | 62,534 | | | | 474,879 | | | | 0.88 | |
| | | | | | | | | | | 474,879 | | | | 0.88 | |
| | | | |
Tanzania (Cost $793,615) | | | | | | | | | | | | | | | | |
Helios Towers PLC* | | | GBP | | | | 416,079 | | | | 869,441 | | | | 1.61 | |
| | | | | | | | | | | 869,441 | | | | 1.61 | |
| | | | |
United Arab Emirates (Cost $2,298,369) | | | | | | | | | | | | | | | | |
Emaar Properties PJSC* | | | AED | | | | 1,392,676 | | | | 1,008,803 | | | | 1.87 | |
First Abu Dhabi Bank PJSC | | | AED | | | | 136,611 | | | | 425,165 | | | | 0.78 | |
Network International Holdings PLC*,2 | | | GBP | | | | 209,254 | | | | 604,200 | | | | 1.12 | |
| | | | | | | | | | | 2,038,168 | | | | 3.77 | |
| | | | |
Vietnam (Cost $9,153,427) | | | | | | | | | | | | | | | | |
Digiworld Corp. | | | VND | | | | 246,510 | | | | 568,574 | | | | 1.05 | |
FPT Corp. | | | VND | | | | 441,955 | | | | 982,418 | | | | 1.82 | |
Hoa Phat Group JSC | | | VND | | | | 1,015,632 | | | | 1,338,857 | | | | 2.48 | |
Khang Dien House Trading and Investment JSC | | | VND | | | | 547,268 | | | | 590,730 | | | | 1.09 | |
Military Commercial Joint Stock Bank* | | | VND | | | | 825,959 | | | | 634,420 | | | | 1.18 | |
Mobile World Investment Corp. | | | VND | | | | 612,133 | | | | 2,766,615 | | | | 5.12 | |
Saigon Beer Alcohol Beverage Corp. | | | VND | | | | 69,200 | | | | 550,276 | | | | 1.02 | |
Vietnam Dairy Products JSC | | | VND | | | | 297,806 | | | | 1,390,117 | | | | 2.57 | |
Vinhomes JSC*,2 | | | VND | | | | 201,830 | | | | 661,979 | | | | 1.23 | |
| | | | | | | | | | | 9,483,986 | | | | 17.56 | |
| | | | |
Total Common Stocks (Cost $53,134,015) | | | | | | | | | | | 51,373,555 | | | | 95.14 | |
| | | | |
Preferred Stocks | | | | | | | | | | | | | | | | |
| | | | |
Colombia (Cost $401,779) | | | | | | | | | | | | | | | | |
Bancolombia S.A. ADR, 4.184%3 | | | | | | | 14,614 | | | | 372,511 | | | | 0.69 | |
| | | | | | | | | | | 372,511 | | | | 0.69 | |
| | | | |
Total Preferred Stocks (Cost $401,779) | | | | | | | | | | | 372,511 | | | | 0.69 | |
| | | | |
Investment Companies | | | | | | | | | | | | | | | | |
| | | | |
Vietnam Enterprise Investments Ltd., Class C * | | | GBP | | | | 294,663 | | | | 1,769,512 | | | | 3.28 | |
Total Investment Companies (Cost $1,785,363) | | | | | | | | | | | 1,769,512 | | | | 3.28 | |
| | | | |
Total Investments (Total Cost $55,321,157) | | | | | | | | | | | 53,515,578 | | | | 99.11 | |
| | | | |
Other Assets Less Liabilities (See Statements of Assets and Liabilities for further detail) | | | | | | | | | | | 480,577 | | | | 0.89 | |
| | | | |
Net Assets | | | | | | | | | | $ | 53,996,155 | | | | 100.00 | |
See accompanying notes to the financial statements.
126
ASHMORE EMERGING MARKETS FRONTIER EQUITY FUND
SCHEDULE OF INVESTMENTS (CONTINUED)
As of October 31, 2020
| * | Non-income producing security. |
| 1 | Local currency is United States Dollars unless otherwise noted below. |
| 2 | Securities exempt from registration under Rule 144A of the Securities Act of 1933. These securities may not be publicly traded without registration under the Securities Act of 1933. |
| 3 | Current yield is disclosed. Dividends are calculated based on a percentage of the issuer’s net income. |
Percentages shown are based on net assets.
At October 31, 2020, the industry sectors for the Ashmore Emerging Markets Frontier Equity Fund were:
| | |
| Sector | | Percentage of Net Assets |
Communication Services | | 11.3% |
Consumer Discretionary | | 11.5 |
Consumer Staples | | 5.1 |
Energy | | 3.0 |
Financials | | 38.0 |
Health Care | | 2.3 |
Industrials | | 6.4 |
Information Technology | | 8.7 |
Materials | | 4.7 |
Real Estate | | 8.1 |
Total Investments | | 99.1 |
Other Assets Less Liabilities | | 0.9 |
Net Assets | | 100.0% |
See accompanying notes to the financial statements.
127
ASHMORE EMERGING MARKETS FRONTIER EQUITY FUND
SCHEDULE OF INVESTMENTS (CONTINUED)
As of October 31, 2020
The inputs or methodologies used for valuing securities are not necessarily an indication of the risks associated with investing in those securities and other financial instruments, if any. See note 4 in the Notes to the Financial Statements for more information regarding pricing inputs and valuation techniques. The following is a summary of the inputs used in valuing the Ashmore Emerging Markets Frontier Equity Fund’s investments and other financial instruments, which are carried at fair value, as of October 31, 2020:
| | | | | | | | | | | | | | |
| | | Level 1 | | | Level 2 | | | Level 3 | | | Total |
Investments | | | | | | | | | | | | | | |
Assets: | | | | | | | | | | | | | | |
Common Stocks | | | | | | | | | | | | | | |
Argentina | | | $1,192,026 | | | | $ — | | | | $— | | | $ 1,192,026 |
Bahrain | | | — | | | | 1,422,057 | | | | — | | | 1,422,057 |
Cambodia | | | — | | | | 755,262 | | | | — | | | 755,262 |
Egypt | | | — | | | | 4,134,387 | | | | — | | | 4,134,387 |
Georgia | | | — | | | | 264,039 | | | | — | | | 264,039 |
Kazakhstan | | | 423,661 | | | | 573,268 | | | | — | | | 996,929 |
Kenya | | | — | | | | 2,295,118 | | | | — | | | 2,295,118 |
Kuwait | | | — | | | | 8,875,050 | | | | — | | | 8,875,050 |
Mauritius | | | — | | | | 616,571 | | | | — | | | 616,571 |
Morocco | | | — | | | | 1,725,608 | | | | — | | | 1,725,608 |
Nigeria | | | — | | | | 811,619 | | | | — | | | 811,619 |
Pakistan | | | — | | | | 724,165 | | | | — | | | 724,165 |
Peru | | | 2,206,006 | | | | — | | | | — | | | 2,206,006 |
Philippines | | | — | | | | 6,053,439 | | | | — | | | 6,053,439 |
Qatar | | | — | | | | 3,979,603 | | | | — | | | 3,979,603 |
Romania | | | — | | | | 511,130 | | | | — | | | 511,130 |
Saudi Arabia | | | — | | | | 1,591,756 | | | | — | | | 1,591,756 |
Senegal | | | 352,316 | | | | — | | | | — | | | 352,316 |
Slovenia | | | — | | | | 474,879 | | | | — | | | 474,879 |
Tanzania | | | — | | | | 869,441 | | | | — | | | 869,441 |
United Arab Emirates | | | — | | | | 2,038,168 | | | | — | | | 2,038,168 |
Vietnam | | | — | | | | 9,483,986 | | | | — | | | 9,483,986 |
| | | | | | | | | | | | | | |
Total Common Stocks | | | 4,174,009 | | | | 47,199,546 | | | | — | | | 51,373,555 |
Preferred Stocks | | | | | | | | | | | | | | |
Colombia | | | 372,511 | | | | — | | | | — | | | 372,511 |
Investment Companies | | | | | | | | | | | | | | |
Vietnam | | | — | | | | 1,769,512 | | | | — | | | 1,769,512 |
Total Investments | | | $4,546,520 | | | | $48,969,058 | | | | $— | | | $53,515,578 |
See accompanying notes to the financial statements.
128
ASHMORE EMERGING MARKETS FRONTIER EQUITY FUND
SCHEDULE OF INVESTMENTS (CONTINUED)
As of October 31, 2020
The following is a summary of the fair values of the Fund’s derivative instruments*:
Fair Values of Financial Derivative Instruments on the Statements of Assets and Liabilities as of October 31, 2020:
| | | | |
| | | Derivatives Not Accounted for as
Hedging Instruments | |
| | | | |
| | | Foreign Exchange Risk | |
| |
Realized Gain (Loss) on Derivatives Recognized resulting from Operations: | | | | |
Net Realized Loss on Forward Foreign Currency Exchange Contracts | | | $(3,504 | ) |
| | | | |
* See note 10 in the Notes to the Financial Statements for additional information.
See accompanying notes to the financial statements.
129
ASHMORE EMERGING MARKETS EQUITY FUND
SCHEDULE OF INVESTMENTS
As of October 31, 2020
| | | | | | | | | | | | | | | | |
| | | Currency1 | | Shares | | | Value | | | % of Net
Assets | |
Common Stocks | | | | | | | | | | | | | | | | |
| | | | |
Brazil (Cost $3,686,708) | | | | | | | | | | | | | | | | |
Arezzo Industria e Comercio S.A. | | | BRL | | | | 72,400 | | | $ | 760,850 | | | | 0.91 | |
Lojas Renner S.A. | | | BRL | | | | 125,480 | | | | 818,973 | | | | 0.98 | |
Notre Dame Intermedica Participacoes S.A. | | | BRL | | | | 136,600 | | | | 1,565,272 | | | | 1.87 | |
TOTVS S.A. | | | BRL | | | | 153,800 | | | | 723,708 | | | | 0.86 | |
| | | | | | | | | | | 3,868,803 | | | | 4.62 | |
| | | | |
China (Cost $20,262,451) | | | | | | | | | | | | | | | | |
Alibaba Group Holding Ltd. ADR* | | | | | | | 19,865 | | | | 6,052,667 | | | | 7.22 | |
Angel Yeast Co. Ltd., Class A | | | CNY | | | | 107,700 | | | | 854,728 | | | | 1.02 | |
Anhui Conch Cement Co. Ltd., Class H | | | HKD | | | | 155,500 | | | | 973,202 | | | | 1.16 | |
ANTA Sports Products Ltd. | | | HKD | | | | 93,000 | | | | 1,024,033 | | | | 1.22 | |
China Mengniu Dairy Co. Ltd.* | | | HKD | | | | 406,000 | | | | 1,910,337 | | | | 2.28 | |
ENN Energy Holdings Ltd. | | | HKD | | | | 63,200 | | | | 800,896 | | | | 0.96 | |
Kangji Medical Holdings Ltd.* | | | HKD | | | | 100,000 | | | | 273,246 | | | | 0.33 | |
NetEase, Inc. ADR | | | | | | | 10,492 | | | | 910,601 | | | | 1.09 | |
New Oriental Education & Technology Group, Inc. ADR* | | | | | | | 15,048 | | | | 2,413,398 | | | | 2.88 | |
Ping An Insurance Group Co. of China Ltd., Class H | | | HKD | | | | 78,500 | | | | 805,871 | | | | 0.96 | |
Prosus N.V.* | | | EUR | | | | 7,255 | | | | 725,179 | | | | 0.87 | |
Sunny Optical Technology Group Co. Ltd. | | | HKD | | | | 80,500 | | | | 1,338,919 | | | | 1.60 | |
Tencent Holdings Ltd. | | | HKD | | | | 56,500 | | | | 4,333,913 | | | | 5.17 | |
Venustech Group, Inc., Class A | | | CNY | | | | 150,879 | | | | 696,760 | | | | 0.83 | |
Weichai Power Co. Ltd., Class H | | | HKD | | | | 468,000 | | | | 888,127 | | | | 1.06 | |
WuXi AppTec Co. Ltd., Class H2 | | | HKD | | | | 51,700 | | | | 827,828 | | | | 0.99 | |
Xinyi Solar Holdings Ltd. | | | HKD | | | | 876,000 | | | | 1,604,276 | | | | 1.91 | |
Zhuzhou CRRC Times Electric Co. Ltd., Class H | | | HKD | | | | 308,600 | | | | 948,182 | | | | 1.13 | |
| | | | | | | | | | | 27,382,163 | | | | 32.68 | |
| | | | |
Hong Kong (Cost $2,189,834) | | | | | | | | | | | | | | | | |
AIA Group Ltd. | | | HKD | | | | 186,800 | | | | 1,761,769 | | | | 2.10 | |
Xinyi Glass Holdings Ltd. | | | HKD | | | | 388,000 | | | | 845,975 | | | | 1.01 | |
| | | | | | | | | | | 2,607,744 | | | | 3.11 | |
| | | | |
Hungary (Cost $1,099,421) | | | | | | | | | | | | | | | | |
OTP Bank Nyrt.* | | | HUF | | | | 21,437 | | | | 668,670 | | | | 0.80 | |
Wizz Air Holdings PLC*,2 | | | GBP | | | | 10,394 | | | | 430,159 | | | | 0.51 | |
| | | | | | | | | | | 1,098,829 | | | | 1.31 | |
| | | | |
India (Cost $8,782,751) | | | | | | | | | | | | | | | | |
Eicher Motors Ltd. | | | INR | | | | 29,192 | | | | 823,439 | | | | 0.98 | |
HDFC Bank Ltd. ADR* | | | | | | | 60,127 | | | | 3,453,695 | | | | 4.12 | |
ICICI Bank Ltd. ADR* | | | | | | | 182,548 | | | | 1,925,881 | | | | 2.30 | |
Larsen & Toubro Infotech Ltd.2 | | | INR | | | | 18,772 | | | | 740,445 | | | | 0.88 | |
Larsen & Toubro Ltd. | | | INR | | | | 170,424 | | | | 2,141,312 | | | | 2.56 | |
Mahindra & Mahindra Ltd. | | | INR | | | | 29,737 | | | | 238,194 | | | | 0.28 | |
Mahindra & Mahindra Ltd. GDR | | | | | | | 70,252 | | | | 549,770 | | | | 0.66 | |
See accompanying notes to the financial statements.
130
ASHMORE EMERGING MARKETS EQUITY FUND
SCHEDULE OF INVESTMENTS (CONTINUED)
As of October 31, 2020
| | | | | | | | | | | | | | | | |
| | | Currency1 | | Shares | | | Value | | | % of Net
Assets | |
India (continued) | | | | | | | | | | | | | | | | |
Reliance Industries Ltd. | | | INR | | | | 21,080 | | | $ | 584,066 | | | | 0.70 | |
| | | | | | | | | | | 10,456,802 | | | | 12.48 | |
| | | | |
Kazakhstan (Cost $1,172,632) | | | | | | | | | | | | | | | | |
Kaspi.KZ JSC GDR*,2 | | | | | | | 9,017 | | | | 378,263 | | | | 0.45 | |
Kaspi.KZ JSC GDR (London Exchange)*,2 | | | | | | | 20,996 | | | | 901,778 | | | | 1.08 | |
| | | | | | | | | | | 1,280,041 | | | | 1.53 | |
| | | | |
Malaysia (Cost $798,162) | | | | | | | | | | | | | | | | |
My EG Services Bhd. | | | MYR | | | | 2,827,700 | | | | 934,226 | | | | 1.11 | |
| | | | | | | | | | | 934,226 | | | | 1.11 | |
| | | | |
Mexico (Cost $715,661) | | | | | | | | | | | | | | | | |
Fomento Economico Mexicano S.A.B. de C.V. ADR | | | | | | | 11,863 | | | | 637,874 | | | | 0.76 | |
| | | | | | | | | | | 637,874 | | | | 0.76 | |
| | | | |
Poland (Cost $615,358) | | | | | | | | | | | | | | | | |
Allegro.eu S.A.*,2 | | | PLN | | | | 39,458 | | | | 801,899 | | | | 0.96 | |
| | | | | | | | | | | 801,899 | | | | 0.96 | |
| | | | |
Russian Federation (Cost $5,795,462) | | | | | | | | | | | | | | | | |
HeadHunter Group PLC ADR | | | | | | | 49,759 | | | | 1,141,472 | | | | 1.36 | |
LUKOIL PJSC ADR | | | | | | | 12,324 | | | | 629,949 | | | | 0.75 | |
Polyus PJSC GDR (Registered) | | | | | | | 8,691 | | | | 856,542 | | | | 1.02 | |
TCS Group Holding PLC GDR (Registered) | | | | | | | 81,470 | | | | 1,948,426 | | | | 2.33 | |
X5 Retail Group N.V. GDR (Registered) | | | | | | | 39,128 | | | | 1,375,446 | | | | 1.64 | |
Yandex N.V., Class A* | | | | | | | 20,700 | | | | 1,191,699 | | | | 1.42 | |
| | | | | | | | | | | 7,143,534 | | | | 8.52 | |
| | | | |
South Africa (Cost $3,102,922) | | | | | | | | | | | | | | | | |
Naspers Ltd., Class N* | | | ZAR | | | | 20,162 | | | | 3,943,817 | | | | 4.71 | |
| | | | | | | | | | | 3,943,817 | | | | 4.71 | |
| | | | |
South Korea (Cost $9,517,443) | | | | | | | | | | | | | | | | |
Douzone Bizon Co. Ltd. | | | KRW | | | | 8,126 | | | | 714,704 | | | | 0.85 | |
Hansol Chemical Co. Ltd. | | | KRW | | | | 15,250 | | | | 1,910,313 | | | | 2.28 | |
Hugel, Inc.* | | | KRW | | | | 11,520 | | | | 2,136,339 | | | | 2.55 | |
LG Household & Health Care Ltd. | | | KRW | | | | 899 | | | | 1,180,248 | | | | 1.41 | |
NCSoft Corp. | | | KRW | | | | 1,197 | | | | 821,827 | | | | 0.98 | |
NHN KCP Corp. | | | KRW | | | | 14,201 | | | | 837,500 | | | | 1.00 | |
SK Hynix, Inc. | | | KRW | | | | 42,060 | | | | 2,978,662 | | | | 3.56 | |
SK Materials Co. Ltd. | | | KRW | | | | 3,894 | | | | 765,759 | | | | 0.91 | |
WONIK IPS Co. Ltd.* | | | KRW | | | | 33,422 | | | | 951,976 | | | | 1.14 | |
| | | | | | | | | | | 12,297,328 | | | | 14.68 | |
| | | | |
Taiwan (Cost $5,557,284) | | | | | | | | | | | | | | | | |
ASPEED Technology, Inc. | | | TWD | | | | 15,000 | | | | 725,840 | | | | 0.87 | |
Parade Technologies Ltd. | | | TWD | | | | 22,000 | | | | 841,986 | | | | 1.01 | |
Silergy Corp. | | | TWD | | | | 9,232 | | | | 569,952 | | | | 0.68 | |
See accompanying notes to the financial statements.
131
ASHMORE EMERGING MARKETS EQUITY FUND
SCHEDULE OF INVESTMENTS (CONTINUED)
As of October 31, 2020
| | | | | | | | | | | | | | | | |
| | | Currency1 | | Shares | | | Value | | | % of Net
Assets | |
Taiwan (continued) | | | | | | | | | | | | | | | | |
Sinbon Electronics Co. Ltd. | | | TWD | | | | 124,000 | | | $ | 836,116 | | | | 1.00 | |
Taiwan Semiconductor Manufacturing Co. Ltd. | | | TWD | | | | 215,000 | | | | 3,244,781 | | | | 3.87 | |
Taiwan Semiconductor Manufacturing Co. Ltd. ADR | | | | | | | 29,509 | | | | 2,474,920 | | | | 2.95 | |
| | | | | | | | | | | 8,693,595 | | | | 10.38 | |
| | | | |
Vietnam (Cost $635,695) | | | | | | | | | | | | | | | | |
Vietnam Dairy Products JSC | | | VND | | | | 173,616 | | | | 810,415 | | | | 0.97 | |
| | | | | | | | | | | 810,415 | | | | 0.97 | |
| | | | |
Total Common Stocks (Cost $63,931,784) | | | | | | | | | | | 81,957,070 | | | | 97.82 | |
| | | | |
Preferred Stocks | | | | | | | | | | | | | | | | |
| | | | |
Brazil (Cost $722,111) | | | | | | | | | | | | | | | | |
Itau Unibanco Holding S.A. ADR, 0.785%3 | | | | | | | 159,692 | | | | 653,140 | | | | 0.78 | |
| | | | | | | | | | | 653,140 | | | | 0.78 | |
| | | | |
Total Preferred Stocks (Cost $722,111) | | | | | | | | | | | 653,140 | | | | 0.78 | |
| | | | |
Total Investments (Total Cost $64,653,895) | | | | | | | | | | | 82,610,210 | | | | 98.60 | |
| | | | |
Other Assets Less Liabilities (See Statements of Assets and Liabilities for further detail) | | | | | | | | | | | 1,170,342 | | | | 1.40 | |
| | | | |
Net Assets | | | | | | | | | | $ | 83,780,552 | | | | 100.00 | |
| * | Non-income producing security. |
| 1 | Local currency is United States Dollars unless otherwise noted below. |
| 2 | Securities exempt from registration under Rule 144A of the Securities Act of 1933. These securities may not be publicly traded without registration under the Securities Act of 1933. |
| 3 | Current yield is disclosed. Dividends are calculated based on a percentage of the issuer’s net income. |
Percentages shown are based on net assets.
See accompanying notes to the financial statements.
132
ASHMORE EMERGING MARKETS EQUITY FUND
SCHEDULE OF INVESTMENTS (CONTINUED)
As of October 31, 2020
At October 31, 2020, the industry sectors for the Ashmore Emerging Markets Equity Fund were:
| | | | |
| Sector | | Percentage of Net Assets |
Communication Services | | | 8.7 | % |
Consumer Discretionary | | | 22.7 | |
Consumer Staples | | | 8.1 | |
Energy | | | 1.4 | |
Financials | | | 13.4 | |
Health Care | | | 5.7 | |
Industrials | | | 6.6 | |
Information Technology | | | 25.7 | |
Materials | | | 5.4 | |
Utilities | | | 0.9 | |
Total Investments | | | 98.6 | |
Other Assets Less Liabilities | | | 1.4 | |
Net Assets | | | 100.0 | % |
The inputs or methodologies used for valuing securities are not necessarily an indication of the risks associated with investing in those securities and other financial instruments, if any. See note 4 in the Notes to the Financial Statements for more information regarding pricing inputs and valuation techniques. The following is a summary of the inputs used in valuing the Ashmore Emerging Markets Equity Fund’s investments and other financial instruments, which are carried at fair value, as of October 31, 2020:
| | | | | | | | | | | | | | | | |
| | | Level 1 | | | Level 2 | | | Level 3 | | | Total | |
Investments | | | | | | | | | | | | | | | | |
Assets: | | | | | | | | | | | | | | | | |
Common Stocks | | | | | | | | | | | | | | | | |
Brazil | | $ | 3,868,803 | | | $ | — | | | | $— | | | $ | 3,868,803 | |
China | | | 9,376,666 | | | | 18,005,497 | | | | — | | | | 27,382,163 | |
Hong Kong | | | — | | | | 2,607,744 | | | | — | | | | 2,607,744 | |
Hungary | | | — | | | | 1,098,829 | | | | — | | | | 1,098,829 | |
India | | | 5,379,576 | | | | 5,077,226 | | | | — | | | | 10,456,802 | |
Kazakhstan | | | 1,280,041 | | | | — | | | | — | | | | 1,280,041 | |
Malaysia | | | — | | | | 934,226 | | | | — | | | | 934,226 | |
Mexico | | | 637,874 | | | | — | | | | — | | | | 637,874 | |
Poland | | | 801,899 | | | | — | | | | — | | | | 801,899 | |
Russian Federation | | | 2,333,171 | | | | 4,810,363 | | | | — | | | | 7,143,534 | |
South Africa | | | — | | | | 3,943,817 | | | | — | | | | 3,943,817 | |
South Korea | | | — | | | | 12,297,328 | | | | — | | | | 12,297,328 | |
Taiwan | | | 2,474,920 | | | | 6,218,675 | | | | — | | | | 8,693,595 | |
Vietnam | | | — | | | | 810,415 | | | | — | | | | 810,415 | |
| | | | | | | | | | | | | | | | |
Total Common Stocks | | | 26,152,950 | | | | 55,804,120 | | | | — | | | | 81,957,070 | |
Preferred Stocks | | | | | | | | | | | | | | | | |
Brazil | | | 653,140 | | | | — | | | | — | | | | 653,140 | |
| |
Total Investments | | $ | 26,806,090 | | | $ | 55,804,120 | | | | $— | | | $ | 82,610,210 | |
| |
See accompanying notes to the financial statements.
133
ASHMORE EMERGING MARKETS EQUITY FUND
SCHEDULE OF INVESTMENTS (CONTINUED)
As of October 31, 2020
The following is a summary of the fair values of the Fund’s derivative instruments*:
The Effect of Financial Derivative Instruments on the Statements of Operations for the Year Ended October 31, 2020:
| | | | |
| | | Derivatives Not Accounted for as
Hedging Instruments | |
| | | Foreign Exchange Risk | |
| |
Realized Gain (Loss) on Derivatives Recognized resulting from Operations: | | | | |
Net Realized Loss on Forward Foreign Currency Exchange Contracts | | | $(970 | ) |
| | | | |
* See note 10 in the Notes to the Financial Statements for additional information.
See accompanying notes to the financial statements.
134
ASHMORE EMERGING MARKETS EQUITY ESG FUND
SCHEDULE OF INVESTMENTS
As of October 31, 2020
| | | | | | | | | | | | | | | | |
| | | Currency1 | | Shares | | | Value | | | % of Net Assets | |
Common Stocks | | | | | | | | | | | | | | | | |
| | | | |
Brazil (Cost $825,919) | | | | | | | | | | | | | | | | |
Arezzo Industria e Comercio S.A. | | | BRL | | | | 11,800 | | | $ | 124,006 | | | | 1.03 | |
Lojas Renner S.A. | | | BRL | | | | 23,500 | | | | 153,378 | | | | 1.27 | |
Notre Dame Intermedica Participacoes S.A. | | | BRL | | | | 25,800 | | | | 295,637 | | | | 2.45 | |
StoneCo Ltd., Class A* | | | | | | | 1,900 | | | | 99,826 | | | | 0.83 | |
TOTVS S.A. | | | BRL | | | | 21,800 | | | | 102,580 | | | | 0.85 | |
| | | | | | | | | | | 775,427 | | | | 6.43 | |
| | | | |
China (Cost $2,886,678) | | | | | | | | | | | | | | | | |
Alibaba Group Holding Ltd. ADR* | | | | | | | 2,517 | | | | 766,905 | | | | 6.36 | |
Angel Yeast Co. Ltd., Class A | | | CNY | | | | 17,000 | | | | 134,915 | | | | 1.12 | |
ANTA Sports Products Ltd. | | | HKD | | | | 16,000 | | | | 176,178 | | | | 1.46 | |
China Mengniu Dairy Co. Ltd.* | | | HKD | | | | 62,000 | | | | 291,726 | | | | 2.42 | |
Kweichow Moutai Co. Ltd., Class A | | | CNY | | | | 500 | | | | 125,055 | | | | 1.04 | |
NetEase, Inc. ADR | | | | | | | 2,935 | | | | 254,729 | | | | 2.11 | |
New Oriental Education & Technology Group, Inc. ADR* | | | | | | | 2,908 | | | | 466,385 | | | | 3.87 | |
Ping An Insurance Group Co. of China Ltd., Class H | | | HKD | | | | 22,500 | | | | 230,982 | | | | 1.91 | |
Sunny Optical Technology Group Co. Ltd. | | | HKD | | | | 12,800 | | | | 212,896 | | | | 1.76 | |
Tencent Holdings Ltd. | | | HKD | | | | 9,700 | | | | 744,052 | | | | 6.17 | |
WuXi AppTec Co. Ltd., Class H2 | | | HKD | | | | 11,100 | | | | 177,735 | | | | 1.47 | |
Wuxi Biologics Cayman, Inc.*,2 | | | HKD | | | | 4,500 | | | | 126,436 | | | | 1.05 | |
Xinyi Solar Holdings Ltd. | | | HKD | | | | 126,000 | | | | 230,752 | | | | 1.91 | |
| | | | | | | | | | | 3,938,746 | | | | 32.65 | |
| | | | |
Hong Kong (Cost $396,694) | | | | | | | | | | | | | | | | |
AIA Group Ltd. | | | HKD | | | | 40,200 | | | | 379,139 | | | | 3.14 | |
| | | | | | | | | | | 379,139 | | | | 3.14 | |
| | | | |
Hungary (Cost $184,288) | | | | | | | | | | | | | | | | |
OTP Bank Nyrt.* | | | HUF | | | | 4,270 | | | | 133,191 | | | | 1.10 | |
| | | | | | | | | | | 133,191 | | | | 1.10 | |
| | | | |
India (Cost $828,017) | | | | | | | | | | | | | | | | |
HDFC Bank Ltd. ADR* | | | | | | | 9,668 | | | | 555,330 | | | | 4.60 | |
ICICI Bank Ltd. ADR* | | | | | | | 24,700 | | | | 260,585 | | | | 2.16 | |
| | | | | | | | | | | 815,915 | | | | 6.76 | |
| | | | |
Kazakhstan (Cost $190,978) | | | | | | | | | | | | | | | | |
Kaspi.KZ JSC GDR*,2 | | | | | | | 1,300 | | | | 54,535 | | | | 0.45 | |
Kaspi.KZ JSC GDR (London Exchange)*,2 | | | | | | | 3,557 | | | | 152,773 | | | | 1.27 | |
| | | | | | | | | | | 207,308 | | | | 1.72 | |
| | | | |
Malaysia (Cost $208,810) | | | | | | | | | | | | | | | | |
My EG Services Bhd. | | | MYR | | | | 672,800 | | | | 222,282 | | | | 1.84 | |
| | | | | | | | | | | 222,282 | | | | 1.84 | |
See accompanying notes to the financial statements.
135
ASHMORE EMERGING MARKETS EQUITY ESG FUND
SCHEDULE OF INVESTMENTS (CONTINUED)
As of October 31, 2020
| | | | | | | | | | | | | | | | |
| | | Currency1 | | Shares | | | Value | | | % of Net Assets | |
Poland (Cost $88,955) | | | | | | | | | | | | | | | | |
Allegro.eu S.A.*,2 | | | PLN | | | | 5,674 | | | $ | 115,312 | | | | 0.96 | |
| | | | | | | | | | | 115,312 | | | | 0.96 | |
| | | | |
Russian Federation (Cost $805,518) | | | | | | | | | | | | | | | | |
HeadHunter Group PLC ADR | | | | | | | 8,541 | | | | 195,931 | | | | 1.62 | |
TCS Group Holding PLC GDR (Registered) | | | | | | | 12,618 | | | | 301,770 | | | | 2.50 | |
X5 Retail Group N.V. GDR (Registered) | | | | | | | 7,130 | | | | 250,637 | | | | 2.08 | |
Yandex N.V., Class A* | | | | | | | 4,200 | | | | 241,794 | | | | 2.01 | |
| | | | | | | | | | | 990,132 | | | | 8.21 | |
| | | | |
South Africa (Cost $463,258) | | | | | | | | | | | | | | | | |
Naspers Ltd., Class N* | | | ZAR | | | | 2,818 | | | | 551,219 | | | | 4.57 | |
| | | | | | | | | | | 551,219 | | | | 4.57 | |
| | | | |
South Korea (Cost $1,391,812) | | | | | | | | | | | | | | | | |
Douzone Bizon Co. Ltd. | | | KRW | | | | 1,631 | | | | 143,451 | | | | 1.19 | |
Hansol Chemical Co. Ltd. | | | KRW | | | | 3,145 | | | | 393,963 | | | | 3.27 | |
Hugel, Inc.* | | | KRW | | | | 2,049 | | | | 379,979 | | | | 3.15 | |
NCSoft Corp. | | | KRW | | | | 226 | | | | 155,165 | | | | 1.29 | |
NHN KCP Corp. | | | KRW | | | | 2,883 | | | | 170,024 | | | | 1.41 | |
Samsung Electronics Co. Ltd. GDR (Registered) | | | | | | | 134 | | | | 169,374 | | | | 1.40 | |
SK Hynix, Inc. | | | KRW | | | | 2,799 | | | | 198,224 | | | | 1.64 | |
WONIK IPS Co. Ltd.* | | | KRW | | | | 6,411 | | | | 182,608 | | | | 1.51 | |
| | | | | | | | | | | 1,792,788 | | | | 14.86 | |
| | | | |
Taiwan (Cost $1,378,754) | | | | | | | | | | | | | | | | |
ASPEED Technology, Inc. | | | TWD | | | | 3,000 | | | | 145,168 | | | | 1.20 | |
Delta Electronics, Inc. | | | TWD | | | | 45,000 | | | | 298,652 | | | | 2.48 | |
Parade Technologies Ltd. | | | TWD | | | | 5,000 | | | | 191,361 | | | | 1.59 | |
Silergy Corp. | | | TWD | | | | 2,429 | | | | 149,958 | | | | 1.24 | |
Sinbon Electronics Co. Ltd. | | | TWD | | | | 21,000 | | | | 141,600 | | | | 1.17 | |
Taiwan Semiconductor Manufacturing Co. Ltd. | | | TWD | | | | 23,000 | | | | 347,116 | | | | 2.88 | |
Taiwan Semiconductor Manufacturing Co. Ltd. ADR | | | | | | | 8,100 | | | | 679,347 | | | | 5.63 | |
| | | | | | | | | | | 1,953,202 | | | | 16.19 | |
| | | | |
Total Common Stocks (Cost $9,649,681) | | | | | | | | | | | 11,874,661 | | | | 98.43 | |
| | | | |
Total Investments (Total Cost $9,649,681) | | | | | | | | | | | 11,874,661 | | | | 98.43 | |
| | | | |
Other Assets Less Liabilities (See Statements of Assets and Liabilities for further detail) | | | | | | | | | | | 189,692 | | | | 1.57 | |
| | | | |
Net Assets | | | | | | | | | | $ | 12,064,353 | | | | 100.00 | |
| * | Non-income producing security. |
| 1 | Local currency is United States Dollars unless otherwise noted below. |
| 2 | Securities exempt from registration under Rule 144A of the Securities Act of 1933. These securities may not be publicly traded without registration under the Securities Act of 1933. |
See accompanying notes to the financial statements.
136
ASHMORE EMERGING MARKETS EQUITY ESG FUND
SCHEDULE OF INVESTMENTS (CONTINUED)
As of October 31, 2020
Percentages shown are based on net assets.
At October 31, 2020, the industry sectors for the Ashmore Emerging Markets Equity ESG Fund were:
| | | | |
| Sector | | Percentage of Net Assets |
Communication Services | | | 11.6 | % |
Consumer Discretionary | | | 19.5 | |
Consumer Staples | | | 6.6 | |
Financials | | | 15.4 | |
Health Care | | | 8.1 | |
Industrials | | | 1.6 | |
Information Technology | | | 32.3 | |
Materials | | | 3.3 | |
Total Investments | | | 98.4 | |
Other Assets Less Liabilities | | | 1.6 | |
Net Assets | | | 100.0 | % |
The inputs or methodologies used for valuing securities are not necessarily an indication of the risks associated with investing in those securities and other financial instruments, if any. See note 4 in the Notes to the Financial Statements for more information regarding pricing inputs and valuation techniques. The following is a summary of the inputs used in valuing the Ashmore Emerging Markets Equity ESG Fund’s investments and other financial instruments, which are carried at fair value, as of October 31, 2020:
| | | | | | | | | | | | | | | | |
| | | Level 1 | | | Level 2 | | | Level 3 | | | Total | |
Investments | | | | | | | | | | | | | | | | |
Assets: | | | | | | | | | | | | | | | | |
Common Stocks | | | | | | | | | | | | | | | | |
Brazil | | $ | 775,427 | | | $ | — | | | | $— | | | $ | 775,427 | |
China | | | 1,488,019 | | | | 2,450,727 | | | | — | | | | 3,938,746 | |
Hong Kong | | | — | | | | 379,139 | | | | — | | | | 379,139 | |
Hungary | | | — | | | | 133,191 | | | | — | | | | 133,191 | |
India | | | 815,915 | | | | — | | | | — | | | | 815,915 | |
Kazakhstan | | | 207,308 | | | | — | | | | — | | | | 207,308 | |
Malaysia | | | — | | | | 222,282 | | | | — | | | | 222,282 | |
Poland | | | 115,312 | | | | — | | | | — | | | | 115,312 | |
Russian Federation | | | 437,725 | | | | 552,407 | | | | — | | | | 990,132 | |
South Africa | | | — | | | | 551,219 | | | | — | | | | 551,219 | |
South Korea | | | — | | | | 1,792,788 | | | | — | | | | 1,792,788 | |
Taiwan | | | 679,347 | | | | 1,273,855 | | | | — | | | | 1,953,202 | |
| | | | | | | | | | | | | | | | |
Total Common Stocks | | | 4,519,053 | | | | 7,355,608 | | | | — | | | | 11,874,661 | |
| |
Total Investments | | $ | 4,519,053 | | | $ | 7,355,608 | | | | $— | | | $ | 11,874,661 | |
| |
See accompanying notes to the financial statements.
137
ASHMORE EMERGING MARKETS SHORT DURATION SELECT FUND
SCHEDULE OF INVESTMENTS
As of October 31, 2020
| | | | | | | | | | | | | | | | |
| | | Currency1 | | | Par | | | Value | | | % of Net Assets | |
Debt Securities | | | | | | | | | | | | | | | | |
| | | | |
Brazil (Cost $333,200) | | | | | | | | | | | | | | | | |
CSN Resources S.A., 7.625%, 02/13/2023 | | | | | | | 347,000 | | | $ | 360,012 | | | | 3.49 | |
| | | | | | | | | | | 360,012 | | | | 3.49 | |
| | | | |
China (Cost $1,683,674) | | | | | | | | | | | | | | | | |
Central China Real Estate Ltd., 6.500%, 03/05/2021 | | | | | | | 200,000 | | | | 200,000 | | | | 1.94 | |
CFLD Cayman Investment Ltd., 8.625%, 02/28/2021 | | | | | | | 200,000 | | | | 199,750 | | | | 1.93 | |
China Evergrande Group, 11.500%, 01/22/2023 | | | | | | | 240,000 | | | | 200,090 | | | | 1.94 | |
China Hongqiao Group Ltd., 7.125%, 07/22/2022 | | | | | | | 237,000 | | | | 223,550 | | | | 2.17 | |
Fantasia Holdings Group Co. Ltd., 10.875%, 01/09/2023 | | | | | | | 214,000 | | | | 219,448 | | | | 2.13 | |
Kaisa Group Holdings Ltd., 11.500%, 01/30/2023 | | | | | | | 318,000 | | | | 320,763 | | | | 3.11 | |
Zhenro Properties Group Ltd., 8.700%, 08/03/2022 | | | | | | | 324,000 | | | | 331,444 | | | | 3.21 | |
| | | | | | | | | | | 1,695,045 | | | | 16.43 | |
| | | | |
Colombia (Cost $359,553) | | | | | | | | | | | | | | | | |
Bancolombia S.A., 3.000%, 01/29/2025 | | | | | | | 200,000 | | | | 201,924 | | | | 1.96 | |
Frontera Energy Corp., 9.700%, 06/25/2023 | | | | | | | 200,000 | | | | 160,002 | | | | 1.55 | |
| | | | | | | | | | | 361,926 | | | | 3.51 | |
| | | | |
Ecuador (Cost $112,705) | | | | | | | | | | | | | | | | |
Petroamazonas EP, 4.625%, 12/06/2021 | | | | | | | 116,667 | | | | 105,292 | | | | 1.02 | |
| | | | | | | | | | | 105,292 | | | | 1.02 | |
| | | | |
Egypt (Cost $239,150) | | | | | | | | | | | | | | | | |
ADES International Holding PLC, 8.625%, 04/24/2024 | | | | | | | 252,000 | | | | 237,132 | | | | 2.30 | |
| | | | | | | | | | | 237,132 | | | | 2.30 | |
| | | | |
India (Cost $332,054) | | | | | | | | | | | | | | | | |
Power Finance Corp. Ltd., 3.750%, 06/18/2024 | | | | | | | 331,000 | | | | 341,746 | | | | 3.31 | |
| | | | | | | | | | | 341,746 | | | | 3.31 | |
| | | | |
Indonesia (Cost $737,262) | | | | | | | | | | | | | | | | |
Bank Rakyat Indonesia Persero Tbk PT, 3.950%, 03/28/2024 | | | | | | | 219,000 | | | | 232,234 | | | | 2.25 | |
Indonesia Asahan Aluminium Persero PT, 5.230%, 11/15/2021 | | | | | | | 288,000 | | | | 298,947 | | | | 2.90 | |
Indonesia Asahan Aluminium Persero PT, 5.710%, 11/15/2023 | | | | | | | 200,000 | | | | 220,000 | | | | 2.13 | |
| | | | | | | | | | | 751,181 | | | | 7.28 | |
| | | | |
Kuwait (Cost $335,608) | | | | | | | | | | | | | | | | |
Al Ahli Bank of Kuwait KSCP, 3.500%, 04/05/2022 | | | | | | | 328,000 | | | | 337,942 | | | | 3.27 | |
| | | | | | | | | | | 337,942 | | | | 3.27 | |
| | | | |
Mexico (Cost $696,859) | | | | | | | | | | | | | | | | |
Alfa S.A.B. de C.V., 5.250%, 03/25/2024 | | | | | | | 319,000 | | | | 341,968 | | | | 3.31 | |
Axtel S.A.B. de C.V., 6.375%, 11/14/2024 | | | | | | | 200,000 | | | | 208,190 | | | | 2.02 | |
BBVA Bancomer S.A., 6.500%, 03/10/2021 | | | | | | | 150,000 | | | | 152,475 | | | | 1.48 | |
| | | | | | | | | | | 702,633 | | | | 6.81 | |
See accompanying notes to the financial statements.
138
ASHMORE EMERGING MARKETS SHORT DURATION SELECT FUND
SCHEDULE OF INVESTMENTS (CONTINUED)
As of October 31, 2020
| | | | | | | | | | | | | | | | |
| | | Currency1 | | | Par | | | Value | | | % of Net Assets | |
Morocco (Cost $333,484) | | | | | | | | | | | | | | | | |
OCP S.A., 5.625%, 04/25/2024 | | | | | | | 310,000 | | | $ | 336,514 | | | | 3.26 | |
| | | | | | | | | | | 336,514 | | | | 3.26 | |
| | | | |
Oman (Cost $201,393) | | | | | | | | | | | | | | | | |
Oztel Holdings SPC Ltd., 5.625%, 10/24/2023 | | | | | | | 200,000 | | | | 199,380 | | | | 1.93 | |
| | | | | | | | | | | 199,380 | | | | 1.93 | |
| | | | |
Pakistan (Cost $210,086) | | | | | | | | | | | | | | | | |
Pakistan (Rep of), 8.250%, 04/15/2024 | | | | | | | 200,000 | | | | 207,952 | | | | 2.01 | |
| | | | | | | | | | | 207,952 | | | | 2.01 | |
| | | | |
Panama (Cost $496,068) | | | | | | | | | | | | | | | | |
Banco Latinoamericano de Comercio Exterior S.A., 2.375%, 09/14/20252 | | | | | | | 200,000 | | | | 204,726 | | | | 1.98 | |
Banistmo S.A., 3.650%, 09/19/2022 | | | | | | | 295,000 | | | | 300,841 | | | | 2.92 | |
| | | | | | | | | | | 505,567 | | | | 4.90 | |
| | | | |
Peru (Cost $200,763) | | | | | | | | | | | | | | | | |
Credicorp Ltd., 2.750%, 06/17/2025 | | | | | | | 200,000 | | | | 205,250 | | | | 1.99 | |
| | | | | | | | | | | 205,250 | | | | 1.99 | |
| | | | |
Poland (Cost $227,103) | | | | | | | | | | | | | | | | |
Walnut Bidco PLC, 9.125%, 08/01/2024 | | | | | | | 224,000 | | | | 229,071 | | | | 2.22 | |
| | | | | | | | | | | 229,071 | | | | 2.22 | |
| | | | |
Saudi Arabia (Cost $899,340) | | | | | | | | | | | | | | | | |
Arabian Centres Sukuk Ltd., 5.375%, 11/26/2024 | | | | | | | 256,000 | | | | 237,952 | | | | 2.31 | |
SABIC Capital II B.V., 4.000%, 10/10/2023 | | | | | | | 317,000 | | | | 340,585 | | | | 3.30 | |
Samba Funding Ltd., 2.750%, 10/02/2024 | | | | | | | 333,000 | | | | 343,629 | | | | 3.33 | |
| | | | | | | | | | | 922,166 | | | | 8.94 | |
| | | | |
South Africa (Cost $670,573) | | | | | | | | | | | | | | | | |
Gold Fields Orogen Holdings BVI Ltd., 5.125%, 05/15/2024 | | | | | | | 314,000 | | | | 342,800 | | | | 3.32 | |
Liquid Telecommunications Financing PLC, 8.500%, 07/13/2022 | | | | | | | 352,000 | | | | 357,773 | | | | 3.47 | |
| | | | | | | | | | | 700,573 | | | | 6.79 | |
| | | | |
United Arab Emirates (Cost $1,321,859) | | | | | | | | | | | | | | | | |
Abu Dhabi Commercial Bank PJSC, 4.000%, 03/13/2023 | | | | | | | 213,000 | | | | 225,861 | | | | 2.19 | |
ADCB Finance Cayman Ltd., 4.000%, 03/29/2023 | | | | | | | 214,000 | | | | 226,866 | | | | 2.20 | |
DIB Sukuk Ltd., 3.625%, 02/06/2023 | | | | | | | 200,000 | | | | 208,165 | | | | 2.02 | |
Fab Sukuk Co. Ltd., 3.625%, 03/05/2023 | | | | | | | 321,000 | | | | 338,815 | | | | 3.28 | |
See accompanying notes to the financial statements.
139
ASHMORE EMERGING MARKETS SHORT DURATION SELECT FUND
SCHEDULE OF INVESTMENTS (CONTINUED)
As of October 31, 2020
| | | | | | | | | | | | | | | | |
| | | Currency1 | | | Par | | | Value | | | % of Net Assets | |
United Arab Emirates (continued) | | | | | | | | | | | | | | | | |
Mashreqbank PSC, 4.250%, 02/26/2024 | | | | | | | 322,000 | | | $ | 343,720 | | | | 3.33 | |
| | | | | | | | | | | 1,343,427 | | | | 13.02 | |
| | | | |
Total Debt Securities (Cost $9,390,734) | | | | | | | | | | | 9,542,809 | | | | 92.48 | |
| | | | |
Total Investments (Total Cost $9,390,734) | | | | | | | | | | | 9,542,809 | | | | 92.48 | |
| | | | |
Other Assets Less Liabilities (See Statements of Assets and Liabilities for further detail) | | | | | | | | | | | 775,843 | | | | 7.52 | |
| | | | |
Net Assets | | | | | | | | | | $ | 10,318,652 | | | | 100.00 | |
| 1 | Local currency is United States Dollars unless otherwise noted below. |
| 2 | Securities exempt from registration under Rule 144A of the Securities Act of 1933. These securities may not be publicly traded without registration under the Securities Act of 1933. |
Percentages shown are based on net assets.
The inputs or methodologies used for valuing securities are not necessarily an indication of the risks associated with investing in those securities and other financial instruments, if any. See note 4 in the Notes to the Financial Statements for more information regarding pricing inputs and valuation techniques. The following is a summary of the inputs used in valuing the Ashmore Emerging Markets Short Duration Select Fund’s investments and other financial instruments, which are carried at fair value, as of October 31, 2020:
| | | | | | | | | | | | | | | | |
| | | Level 1 | | | Level 2 | | | Level 3 | | | Total | |
Investments | | | | | | | | | | | | | | | | |
Assets: | | | | | | | | | | | | | | | | |
Debt Securities | | | | | | | | | | | | | | | | |
Corporate Bonds | | | $— | | | $ | 8,345,199 | | | | $— | | | $ | 8,345,199 | |
Financial Certificates | | | — | | | | 784,932 | | | | — | | | | 784,932 | |
Government Agencies | | | — | | | | 204,726 | | | | — | | | | 204,726 | |
Government Bonds | | | — | | | | 207,952 | | | | — | | | | 207,952 | |
| | | | | | | | | | | | | | | | |
Total Debt Securities | | | — | | | | 9,542,809 | | | | — | | | | 9,542,809 | |
| |
Total Investments | | | $— | | | $ | 9,542,809 | | | | $— | | | $ | 9,542,809 | |
| |
See accompanying notes to the financial statements.
140
ASHMORE EMERGING MARKETS INVESTMENT GRADE INCOME FUND
SCHEDULE OF INVESTMENTS
As of October 31, 2020
| | | | | | | | | | | | | | | | |
| | | Currency1 | | | Par | | | Value | | | % of Net Assets | |
Debt Securities | | | | | | | | | | | | | | | | |
| | | | |
Bahrain (Cost $248,062) | | | | | | | | | | | | | | | | |
BBK BSC, 5.500%, 07/09/2024 | | | | | | | 240,000 | | | $ | 242,890 | | | | 1.23 | |
| | | | | | | | | | | 242,890 | | | | 1.23 | |
| | | | |
Brazil (Cost $2,411,879) | | | | | | | | | | | | | | | | |
CSN Resources S.A., 7.625%, 02/13/2023 | | | | | | | 240,000 | | | | 249,000 | | | | 1.26 | |
Gerdau Trade, Inc., 4.875%, 10/24/2027 | | | | | | | 220,000 | | | | 242,125 | | | | 1.23 | |
GTL Trade Finance, Inc., 7.250%, 04/16/2044 | | | | | | | 200,000 | | | | 260,202 | | | | 1.32 | |
NBM U.S. Holdings, Inc., 7.000%, 05/14/2026 | | | | | | | 230,000 | | | | 244,030 | | | | 1.23 | |
Petrobras Global Finance B.V., 6.875%, 01/20/2040 | | | | | | | 215,000 | | | | 242,200 | | | | 1.23 | |
St Marys Cement, Inc., 5.750%, 01/28/2027 | | | | | | | 220,000 | | | | 246,950 | | | | 1.25 | |
Suzano Austria GmbH, 5.000%, 01/15/2030 | | | | | | | 225,000 | | | | 246,600 | | | | 1.25 | |
Vale Overseas Ltd., 8.250%, 01/17/2034 | | | | | | | 275,000 | | | | 395,313 | | | | 2.00 | |
Votorantim Cimentos International S.A., 7.250%, 04/05/2041 | | | | | | | 200,000 | | | | 255,710 | | | | 1.29 | |
| | | | | | | | | | | 2,382,130 | | | | 12.06 | |
| | | | |
Chile (Cost $2,038,036) | | | | | | | | | | | | | | | | |
Colbun S.A., 3.150%, 03/06/2030 | | | | | | | 230,000 | | | | 240,499 | | | | 1.22 | |
Corp. Nacional del Cobre de Chile, 5.625%, 10/18/2043 | | | | | | | 200,000 | | | | 266,003 | | | | 1.35 | |
Empresa Nacional del Petroleo, 5.250%, 11/06/2029 | | | | | | | 268,000 | | | | 307,059 | | | | 1.55 | |
Enel Chile S.A., 4.875%, 06/12/2028 | | | | | | | 205,000 | | | | 239,338 | | | | 1.21 | |
GNL Quintero S.A., 4.634%, 07/31/2029 | | | | | | | 230,000 | | | | 250,355 | | | | 1.27 | |
Inversiones CMPC S.A., 4.375%, 04/04/2027 | | | | | | | 220,000 | | | | 245,027 | | | | 1.24 | |
Sociedad Quimica y Minera de Chile S.A., 4.250%, 01/22/2050 | | | | | | | 225,000 | | | | 247,500 | | | | 1.25 | |
VTR Comunicaciones S.p.A., 5.125%, 01/15/2028 | | | | | | | 200,000 | | | | 211,500 | | | | 1.07 | |
| | | | | | | | | | | 2,007,281 | | | | 10.16 | |
| | | | |
China (Cost $786,016) | | | | | | | | | | | | | | | | |
Country Garden Holdings Co. Ltd., 7.125%, 04/25/2022 | | | | | | | 280,000 | | | | 292,736 | | | | 1.48 | |
Kaisa Group Holdings Ltd., 9.375%, 06/30/2024 | | | | | | | 200,000 | | | | 181,213 | | | | 0.92 | |
Scenery Journey Ltd., 12.000%, 10/24/2023 | | | | | | | 315,000 | | | | 256,882 | | | | 1.30 | |
| | | | | | | | | | | 730,831 | | | | 3.70 | |
| | | | |
Colombia (Cost $489,376) | | | | | | | | | | | | | | | | |
Ecopetrol S.A., 6.875%, 04/29/2030 | | | | | | | 200,000 | | | | 240,480 | | | | 1.22 | |
SURA Asset Management S.A., 4.375%, 04/11/2027 | | | | | | | 220,000 | | | | 245,190 | | | | 1.24 | |
| | | | | | | | | | | 485,670 | | | | 2.46 | |
| | | | |
India (Cost $492,706) | | | | | | | | | | | | | | | | |
Adani Transmission Ltd., 4.250%, 05/21/2036 | | | | | | | 243,775 | | | | 246,363 | | | | 1.25 | |
Power Finance Corp. Ltd., 4.500%, 06/18/2029 | | | | | | | 240,000 | | | | 245,462 | | | | 1.24 | |
| | | | | | | | | | | 491,825 | | | | 2.49 | |
| | | | |
Indonesia (Cost $1,435,130) | | | | | | | | | | | | | | | | |
Indonesia Asahan Aluminium Persero PT, 6.530%, 11/15/2028 | | | | | | | 200,000 | | | | 243,644 | | | | 1.23 | |
Indonesia Asahan Aluminium Persero PT, 6.757%, 11/15/2048 | | | | | | | 200,000 | | | | 256,112 | | | | 1.30 | |
Minejesa Capital B.V., 4.625%, 08/10/2030 | | | | | | | 385,000 | | | | 395,541 | | | | 2.00 | |
See accompanying notes to the financial statements.
141
ASHMORE EMERGING MARKETS INVESTMENT GRADE INCOME FUND
SCHEDULE OF INVESTMENTS (CONTINUED)
As of October 31, 2020
| | | | | | | | | | | | | | | | |
| | | Currency1 | | | Par | | | Value | | | % of Net Assets | |
Indonesia (continued) | | | | | | | | | | | | | | | | |
Pertamina Persero PT, 6.500%, 11/07/2048 | | | | | | | 200,000 | | | $ | 268,000 | | | | 1.36 | |
Perusahaan Perseroan Persero PT Perusahaan Listrik Negara, 6.150%, 05/21/2048 | | | | | | | 200,000 | | | | 254,500 | | | | 1.29 | |
| | | | | | | | | | | 1,417,797 | | | | 7.18 | |
| | | | |
Israel (Cost $965,696) | | | | | | | | | | | | | | | | |
Bank Leumi Le-Israel B.M., (Variable, U.S. Treasury Yield Curve Rate CMT 5Y + 1.631%), 3.275%, 01/29/20312,3 | | | | | | | 245,000 | | | | 247,071 | | | | 1.25 | |
ICL Group Ltd., 6.375%, 05/31/20382 | | | | | | | 235,000 | | | | 301,081 | | | | 1.52 | |
Leviathan Bond Ltd., 6.750%, 06/30/20302 | | | | | | | 190,000 | | | | 194,997 | | | | 0.99 | |
Teva Pharmaceutical Finance Netherlands III B.V., 6.750%, 03/01/2028 | | | | | | | 200,000 | | | | 210,075 | | | | 1.06 | |
| | | | | | | | | | | 953,224 | | | | 4.82 | |
| | | | |
Kazakhstan (Cost $578,843) | | | | | | | | | | | | | | | | |
KazMunayGas National Co. JSC, 6.375%, 10/24/2048 | | | | | | | 429,000 | | | | 569,951 | | | | 2.88 | |
| | | | | | | | | | | 569,951 | | | | 2.88 | |
| | | | |
Kuwait (Cost $201,887) | | | | | | | | | | | | | | | | |
NBK Tier 1 Financing Ltd., (Variable, USD Swap 6Y + 4.119%), 5.750%, 04/09/20213 | | | | | | | 200,000 | | | | 199,750 | | | | 1.01 | |
| | | | | | | | | | | 199,750 | | | | 1.01 | |
| | | | |
Mexico (Cost $2,839,454) | | | | | | | | | | | | | | | | |
Alfa S.A.B. de C.V., 6.875%, 03/25/2044 | | | | | | | 205,000 | | | | 239,594 | | | | 1.21 | |
Axtel S.A.B. de C.V., 6.375%, 11/14/2024 | | | | | | | 200,000 | | | | 208,190 | | | | 1.05 | |
Banco Santander Mexico S.A. Institucion de Banca Multiple Grupo Financiero Santander, 5.375%, 04/17/2025 | | | | | | | 220,000 | | | | 246,402 | | | | 1.25 | |
BBVA Bancomer S.A., (Variable, U.S. Treasury Yield Curve Rate CMT 5Y + 2.650%), 5.125%, 01/18/20333 | | | | | | | 200,000 | | | | 197,250 | | | | 1.00 | |
Cometa Energia S.A. de C.V., 6.375%, 04/24/2035 | | | | | | | 267,045 | | | | 295,419 | | | | 1.50 | |
Mexico Generadora de Energia S. de r.l., 5.500%, 12/06/2032 | | | | | | | 219,689 | | | | 249,677 | | | | 1.26 | |
Minera Mexico S.A. de C.V., 4.500%, 01/26/2050 | | | | | | | 225,000 | | | | 243,585 | | | | 1.23 | |
Orbia Advance Corp. S.A.B. de C.V., 5.875%, 09/17/2044 | | | | | | | 210,000 | | | | 244,333 | | | | 1.24 | |
Petroleos Mexicanos, 7.690%, 01/23/2050 | | | | | | | 450,000 | | | | 373,918 | | | | 1.89 | |
Trust Fibra Uno, 5.250%, 12/15/2024 | | | | | | | 200,000 | | | | 216,000 | | | | 1.09 | |
Trust Fibra Uno, 6.390%, 01/15/2050 | | | | | | | 290,000 | | | | 301,237 | | | | 1.53 | |
| | | | | | | | | | | 2,815,605 | | | | 14.25 | |
| | | | |
Panama (Cost $807,058) | | | | | | | | | | | | | | | | |
AES Panama Generation Holdings SRL, 4.375%, 05/31/2030 | | | | | | | 290,000 | | | | 307,310 | | | | 1.55 | |
C&W Senior Financing DAC, 6.875%, 09/15/2027 | | | | | | | 200,000 | | | | 210,600 | | | | 1.07 | |
Cable Onda S.A., 4.500%, 01/30/2030 | | | | | | | 280,000 | | | | 294,700 | | | | 1.49 | |
| | | | | | | | | | | 812,610 | | | | 4.11 | |
| | | | |
Peru (Cost $490,602) | | | | | | | | | | | | | | | | |
Banco Internacional del Peru S.A.A. Interbank, 3.250%, 10/04/2026 | | | | | | | 190,000 | | | | 200,212 | | | | 1.01 | |
See accompanying notes to the financial statements.
142
ASHMORE EMERGING MARKETS INVESTMENT GRADE INCOME FUND
SCHEDULE OF INVESTMENTS (CONTINUED)
As of October 31, 2020
| | | | | | | | | | | | | | | | |
| | | Currency1 | | | Par | | | Value | | | % of Net
Assets | |
Peru (continued) | | | | | | | | | | | | | | | | |
Southern Copper Corp., 6.750%, 04/16/2040 | | | | | | | 200,000 | | | $ | 287,200 | | | | 1.46 | |
| | | | | | | | | | | 487,412 | | | | 2.47 | |
| | | | |
Qatar (Cost $372,810) | | | | | | | | | | | | | | | | |
Qatar (Rep of), 4.400%, 04/16/2050 | | | | | | | 286,000 | | | | 364,061 | | | | 1.84 | |
| | | | | | | | | | | 364,061 | | | | 1.84 | |
| | | | |
Romania (Cost $306,460) | | | | | | | | | | | | | | | | |
NE Property B.V., 1.875%, 10/09/2026 | | | EUR | | | | 275,000 | | | | 294,182 | | | | 1.49 | |
| | | | | | | | | | | 294,182 | | | | 1.49 | |
| | | | |
Russian Federation (Cost $448,349) | | | | | | | | | | | | | | | | |
Credit Bank of Moscow Via CBOM Finance PLC, (Variable, USD Swap 5Y + 5.416%), 7.500%, 10/05/20273 | | | | | | | 245,000 | | | | 230,888 | | | | 1.17 | |
VEON Holdings B.V., 4.000%, 04/09/2025 | | | | | | | 200,000 | | | | 208,624 | | | | 1.05 | |
| | | | | | | | | | | 439,512 | | | | 2.22 | |
| | | | |
Saudi Arabia (Cost $986,384) | | | | | | | | | | | | | | | | |
Acwa Power Management And Investments One Ltd., 5.950%, 12/15/2039 | | | | | | | 305,000 | | | | 349,225 | | | | 1.77 | |
Saudi Arabian Oil Co., 4.250%, 04/16/2039 | | | | | | | 295,000 | | | | 336,477 | | | | 1.70 | |
Saudi Electricity Global Sukuk Co. 3, 5.500%, 04/08/2044 | | | | | | | 230,000 | | | | 287,799 | | | | 1.46 | |
| | | | | | | | | | | 973,501 | | | | 4.93 | |
| | | | |
Singapore (Cost $457,075) | | | | | | | | | | | | | | | | |
DBS Group Holdings Ltd., (Variable, U.S. Treasury Yield Curve Rate CMT 5Y + 1.915%), 3.300%, 02/27/20253 | | | | | | | 250,000 | | | | 249,375 | | | | 1.26 | |
GLP Pte. Ltd., 3.875%, 06/04/2025 | | | | | | | 200,000 | | | | 206,059 | | | | 1.04 | |
| | | | | | | | | | | 455,434 | | | | 2.30 | |
| | | | |
South Africa (Cost $562,078) | | | | | | | | | | | | | | | | |
Gold Fields Orogen Holdings BVI Ltd., 6.125%, 05/15/2029 | | | | | | | 290,000 | | | | 345,100 | | | | 1.75 | |
Prosus N.V., 3.680%, 01/21/2030 | | | | | | | 200,000 | | | | 217,646 | | | | 1.10 | |
| | | | | | | | | | | 562,746 | | | | 2.85 | |
| | | | |
Thailand (Cost $540,994) | | | | | | | | | | | | | | | | |
Bangkok Bank PCL, 9.025%, 03/15/2029 | | | | | | | 190,000 | | | | 260,752 | | | | 1.32 | |
PTTEP Treasury Center Co. Ltd., 3.903%, 12/06/2059 | | | | | | | 250,000 | | | | 266,662 | | | | 1.35 | |
| | | | | | | | | | | 527,414 | | | | 2.67 | |
| | | | |
Ukraine (Cost $810,868) | | | | | | | | | | | | | | | | |
Metinvest B.V., 8.500%, 04/23/2026 | | | | | | | 200,000 | | | | 201,540 | | | | 1.02 | |
MHP SE, 7.750%, 05/10/2024 | | | | | | | 200,000 | | | | 208,520 | | | | 1.05 | |
Ukraine (Rep of), 9.750%, 11/01/2028 | | | | | | | 339,000 | | | | 369,171 | | | | 1.87 | |
| | | | | | | | | | | 779,231 | | | | 3.94 | |
| | | | |
United Arab Emirates (Cost $1,339,402) | | | | | | | | | | | | | | | | |
Abu Dhabi National Energy Co. PJSC, 6.500%, 10/27/2036 | | | | | | | 170,000 | | | | 247,931 | | | | 1.25 | |
Aldar Sukuk No. 2 Ltd., 3.875%, 10/22/2029 | | | | | | | 225,000 | | | | 240,167 | | | | 1.22 | |
DP World Crescent Ltd., 3.750%, 01/30/2030 | | | | | | | 361,000 | | | | 372,810 | | | | 1.89 | |
See accompanying notes to the financial statements.
143
ASHMORE EMERGING MARKETS INVESTMENT GRADE INCOME FUND
SCHEDULE OF INVESTMENTS (CONTINUED)
As of October 31, 2020
| | | | | | | | | | | | | | | | |
| | | Currency1 | | | Par | | | Value | | | % of Net
Assets | |
United Arab Emirates (continued) | | | | | | | | | | | | | | | | |
MAF Global Securities Ltd., 4.750%, 05/07/2024 | | | | | | | 200,000 | | | $ | 214,080 | | | | 1.08 | |
Tabreed Sukuk SPC Ltd., 5.500%, 10/31/2025 | | | | | | | 215,000 | | | | 249,208 | | | | 1.26 | |
| | | | | | | | | | | 1,324,196 | | | | 6.70 | |
| | | | |
Total Debt Securities (Cost $19,609,165) | | | | | | | | | | | 19,317,253 | | | | 97.76 | |
| | | | |
Total Investments in Securities (Cost $19,609,165) | | | | | | | | | | | 19,317,253 | | | | 97.76 | |
| | | | |
Total Investments (Total Cost $19,609,165) | | | | | | | | | | | 19,317,253 | | | | 97.76 | |
| | | | |
Other Assets Less Liabilities (See Statements of Assets and Liabilities for further detail) | | | | | | | | | | | 442,049 | | | | 2.24 | |
| | | | |
Net Assets | | | | | | | | | | $ | 19,759,302 | | | | 100.00 | |
| 1 | Local currency is United States Dollars unless otherwise noted below. |
| 2 | Securities exempt from registration under Rule 144A of the Securities Act of 1933. These securities may not be publicly traded without registration under the Securities Act of 1933. |
| 3 | Variable rate security. Security issued at a fixed coupon rate, which converts to a variable rate at a specified date. Rate shown is the rate in effect as of period end. |
Percentages shown are based on net assets.
At October 31, 2020, the Ashmore Emerging Markets Investment Grade Income Fund had outstanding forward foreign currency exchange contracts as follows:
| | | | | | | | | | | | | | | | | | | | | | |
Settlement Date | | Counterparty | | Currency Buy | | Currency
Buy Amount
(Local
Currency) | | | | | | Currency
Sell | | | Currency
Sell Amount
(Local
Currency) | | | Unrealized
Gain/(Loss) |
11/18/2020 | | Citibank | | United States Dollar | | | 312,819 | | | | Euro | | | | | | | | 264,379 | | | $4,788 |
| | | | | | | | | | | | | | | | | | | | | | |
Subtotal Appreciation | | | | | | | | | | | | | | | | | | 4,788 |
| | | | | | | | | | | | | | | | | | | | | | |
Total | | | | | | | | | | | | | | | | | | | | | | $4,788 |
| | | | | | | | | | | | | | | | | | | | | | |
See accompanying notes to the financial statements.
144
ASHMORE EMERGING MARKETS INVESTMENT GRADE INCOME FUND
SCHEDULE OF INVESTMENTS (CONTINUED)
As of October 31, 2020
The inputs or methodologies used for valuing securities are not necessarily an indication of the risks associated with investing in those securities and other financial instruments, if any. See note 4 in the Notes to the Financial Statements for more information regarding pricing inputs and valuation techniques. The following is a summary of the inputs used in valuing the Ashmore Emerging Markets Investment Grade Income Fund’s investments and other financial instruments, which are carried at fair value, as of October 31, 2020:
| | | | | | | | | | | | | | |
| | | Level 1 | | | Level 2 | | | Level 3 | | | Total |
Investments | | | | | | | | | | | | | | |
Assets: | | | | | | | | | | | | | | |
Debt Securities | | | | | | | | | | | | | | |
Corporate Bonds | | | $— | | | | $16,615,798 | | | | $— | | | $16,615,798 |
Corporate Convertible Bonds | | | — | | | | 444,321 | | | | — | | | 444,321 |
Financial Certificates | | | — | | | | 777,174 | | | | — | | | 777,174 |
Government Agencies | | | — | | | | 373,918 | | | | — | | | 373,918 |
Government Bonds | | | — | | | | 1,106,042 | | | | — | | | 1,106,042 |
| | | | | | | | | | | | | | |
Total Debt Securities | | | — | | | | 19,317,253 | | | | — | | | 19,317,253 |
Total Investments | | | $— | | | | $19,317,253 | | | | $— | | | $19,317,253 |
| | | | |
Other Financial Instruments | | | | | | | | | | | | | | |
Assets: | | | | | | | | | | | | | | |
Forward Foreign Currency Exchange Contracts | | | $— | | | | $4,788 | | | | $— | | | $4,788 |
Total Other Financial Instruments | | | $— | | | | $4,788 | | | | $— | | | $4,788 |
See accompanying notes to the financial statements.
145
ASHMORE EMERGING MARKETS INVESTMENT GRADE INCOME FUND
SCHEDULE OF INVESTMENTS (CONTINUED)
As of October 31, 2020
The following is a summary of the fair values of the Fund’s derivative instruments*:
Fair Values of Financial Derivative Instruments on the Statements of Assets and Liabilities as of October 31, 2020:
| | | | |
| | | Derivatives Not Accounted for as
Hedging Instruments | |
| | | | |
| | | Foreign Exchange Risk | |
| |
Assets: | | | | |
Unrealized Appreciation on Forward Foreign Currency Exchange Contracts | | | $4,788 | |
| | | | |
The Effect of Financial Derivative Instruments on the Statements of Operations for the Year Ended October 31, 2020:
| | | | |
| | | Derivatives Not Accounted for as
Hedging Instruments | |
| | | | |
| | | Foreign Exchange Risk | |
| |
Realized Gain (Loss) on Derivatives Recognized resulting from Operations: | | | | |
Net Realized Loss on Forward Foreign Currency Exchange Contracts | | | $(564 | ) |
| | | | |
| |
Net Change in Unrealized Appreciation (Depreciation) on Derivatives Recognized resulting from Operations: | | | | |
Net Change in Unrealized Appreciation on Forward Foreign Currency Exchange Contracts | | | $4,788 | |
| | | | |
* See note 10 in the Notes to the Financial Statements for additional information.
See accompanying notes to the financial statements.
146
ASHMORE FUNDS
NOTES TO FINANCIAL STATEMENTS
As of October 31, 2020
Ashmore Funds (the “Trust”) is a Massachusetts business trust organized under the laws of the Commonwealth of Massachu-setts on August 6, 2010 (inception date) and is registered under the Investment Company Act of 1940, as amended (the “Investment Company Act” or “1940 Act”), as an open-end management investment company. The Trust follows accounting and reporting guidance under Financial Accounting Standards Codification Topic 946, “Financial Services – Investment Companies.” The Trust includes eleven funds as of October 31, 2020, each with its own investment objective. The Ashmore Emerging Markets Total Return Fund, Ashmore Emerging Markets Local Currency Bond Fund, Ashmore Emerging Markets Corporate Income Fund, Ashmore Emerging Markets Short Duration Fund, Ashmore Emerging Markets Active Equity Fund, Ashmore Emerging Markets Small-Cap Equity Fund, Ashmore Emerging Markets Frontier Equity Fund, Ashmore Emerging Markets Equity Fund, Ashmore Emerging Markets Equity ESG Fund, Ashmore Emerging Markets Short Duration Select Fund and Ashmore Emerging Markets Investment Grade Income Fund (each a “Fund” and collectively, the “Funds”) are separate series of the Trust. The Ashmore Emerging Markets Local Currency Bond Fund and the Ashmore Emerging Markets Short Duration Fund are each non-diversified funds. Non-diversified funds may invest a relatively large portion of their net assets in a single issuer or a small number of issuers. Each of the Funds’ financial statements are presented herein. On February 26, 2020, June 15, 2020 and September 17, 2020, the Trust launched the Ashmore Emerging Markets Equity ESG Fund, Ashmore Emerging Markets Short Duration Select Fund and Ashmore Emerging Markets Investment Grade Income Fund, respectively, by offering Class A, Class C and Institutional Class shares of the Funds.
Ashmore Investment Advisors Limited (“AIAL” or the “Investment Manager”) serves as investment manager to the Funds. AIAL is a wholly owned subsidiary of Ashmore Investments (UK) Limited, which is a wholly owned subsidiary of Ashmore Group plc (“Ashmore Group”). Ashmore Investment Management (US) Corporation (“AIMUS”) is the principal underwriter of shares of the Funds. AIMUS is an affiliate of the Investment Manager. The Northern Trust Company (“Northern Trust”) serves as the administrator, custodian and transfer agent of the Funds.
Related parties or personnel of the Investment Manager may invest in the Funds. The Investment Manager could face a conflict of interest if a related party is invested in a Fund and that party’s interests diverge from those of the Fund, but equally this co-investment may serve to better align the interests of the Funds and the personnel of the Investment Manager. When a related party provides capital for a Fund, it may do so with the intention of redeeming all or part of its interest in the Fund at a future point in time.
The Funds have assessed the impact of the Alternative Investment Fund Managers Directive (AIFMD) (the “Directive”) on the financial statements of the Trust and have concluded that the Trust is exempt from following Chapter V. Section 1. Articles 103-111 of the European Commission’s Level 2 Delegated Regulation on the basis of the operations of the Trust (i) being Non-EEA AIFs (“European Economic Area Alternative Investment Funds”), and (ii) not being marketed in the European Union, as defined by the Directive.
| 2. | Significant accounting policies |
The significant accounting policies adopted and consistently followed in the preparation of the Funds’ financial statements are set out below:
(a) Basis of preparation
The financial statements have been prepared in accordance with accounting principles generally accepted in the United States of America (“U.S. GAAP”).
(b) Use of estimates
The preparation of financial statements in accordance with U.S. GAAP requires estimates and assumptions that affect the reported amounts of assets and liabilities and the disclosure of contingent assets and liabilities at the date of the financial statements, as well as the reported amounts of revenues generated and expenses incurred during the reporting period. Actual
147
ASHMORE FUNDS
NOTES TO FINANCIAL STATEMENTS (CONTINUED)
As of October 31, 2020
results could differ from these estimates. These financial statements contain all adjustments which are, in the opinion of the Trust, necessary to portray a fair statement of the period presented. Such adjustments are normal and recurring in nature. Valuation models used to determine the fair value of hard to value investments require the use of a number of market based assumptions.
(c) Determination of the Net Asset Value
The net asset value (“NAV”) of a Fund’s shares is calculated at the close of regular trading (normally 4:00 p.m. Eastern time) (the “NYSE Close”) on each day that the New York Stock Exchange (“NYSE”) is open for regular trading.
(d) Investment valuation
For the purposes of calculating NAV, portfolio securities and other assets for which market quotations are readily available are valued at market value. Market values for securities and other instruments are generally determined on the basis of closing prices or the last reported sales prices on an exchange or other market, or if no closing prices or sales are reported, based on quotes or other market information obtained from a quotation reporting system, established market makers, or pricing services. Domestic and foreign debt securities for which the close of trading does not coincide with the NYSE close and non-exchange traded derivatives are normally valued on the basis of quotes obtained from brokers and dealers or pricing services using data reflecting the earlier closing of the principal markets for those securities (e.g., certain foreign securities). Prices obtained from independent pricing services are based on information provided by market makers or estimates of market values obtained from yield data relating to investments or securities with similar characteristics. Certain debt securities purchased on a delayed delivery basis are marked-to-market daily until settlement. Exchange traded options, futures and options on futures are generally valued at the settlement price determined by the exchange on which the instrument is primarily traded. With respect to any portion of a Fund’s assets that are invested in one or more open-ended investment management companies, a Fund’s NAV will be calculated based upon the NAVs of such investments. The prospectuses for these open-end management investment companies explain the circumstances under which those companies will use fair value pricing and the effects of using fair value pricing.
If a Fund’s non-U.S. (foreign) security’s value has materially changed after the close of the security’s primary exchange or principal market but before the time as of which the Funds calculate their NAVs, the security will be valued at fair value based on procedures approved by the Board. A Fund may determine the fair value of investments based on information provided by pricing services and other third-party vendors, which may recommend fair value prices or adjustments with reference to other securities, indices or assets. The Funds may use fair value pricing more frequently for foreign securities or assets because, amongst other things, many foreign markets close well before the NAV of the Funds’ shares is next calculated. In considering whether fair value pricing is required and in determining fair values, the Fund may, amongst other things, consider significant events (which may be considered to include changes in the value of U.S. securities or securities indices) that occur after the close of the relevant market and before the time as of which the Funds calculate their NAVs. A Fund may utilize modeling tools provided by third-party vendors to determine the fair values of non-U.S. securities. Foreign exchanges may permit trading in foreign securities on days when the Trust is not open for business, which may result in the values of a Fund’s portfolio investments being affected when investors are unable to buy, sell or exchange shares of the Fund.
Investments initially valued in currencies other than the United States Dollar are converted to the United States Dollar using exchange rates obtained from pricing services. Foreign exchange rates are calculated as of 4:00 p.m. Eastern time on each day that the NYSE opens for regular trading. As a result, the NAV of a Fund’s shares may be affected by changes in the value of currencies in relation to the United States Dollar. The value of securities traded in markets outside the United States or denominated in currencies other than the United States Dollar may be affected significantly on a day that the NYSE is closed and an investor is not able to purchase, redeem or exchange shares of the Funds.
In the event that market quotes are not readily available, and the security or asset cannot be valued pursuant to one of the Board’s approved valuation methods, the fair value of the security or asset will be determined in good faith by the Board, generally based upon recommendations provided by the Investment Manager. Market quotes are considered not readily available in circumstances where there is an absence of current or reliable market-based data (e.g., trade information, bid/asked information,
148
ASHMORE FUNDS
NOTES TO FINANCIAL STATEMENTS (CONTINUED)
As of October 31, 2020
broker quotes), including where events occur after the close of the relevant market, but prior to a Fund’s NAV calculation time, that materially affect the values of a Fund’s securities or assets. In addition, market quotes are considered not readily available when, due to extraordinary circumstances, the exchanges or markets on which the securities trade do not open for trading for the entire day and no other market prices are available. A Fund may also determine that market quotations are not readily available due to events relating to a single issuer (e.g., corporate actions or announcements) or events relating to multiple issuers (e.g., governmental actions or natural disasters). The Board has delegated to the Investment Manager the responsibility for monitoring significant events that may materially affect the values of a Fund’s securities or assets and for determining whether the value of the applicable securities or assets should be re-evaluated in light of such significant events.
The Investment Manager primarily employs a market-based approach which may use related or comparable assets or liabilities, recent transactions, market multiples, book values, and other relevant information to determine the fair value of the investment. The Investment Manager may also apply a discount to the last traded price in situations where the last traded price may not represent the fair value of the security, such as if a security’s trading has been suspended on its primary trading market, a security has been de-listed from its primary trading market, a security has not traded for an extended period of time, or a security’s primary trading market is temporarily closed at a time when under normal conditions it would be open. Any such discount is based on a number of factors including but not limited to the circumstances surrounding any potential suspension or de-listing, market and industry conditions, competitor information, and the period of time since the last trading took place.
For Funds that use fair value pricing to determine the NAV of its shares, securities may not be priced on the basis of quotes from the primary market in which they are traded, but rather may be priced by another method that the Board or persons acting at its direction believe accurately reflects fair value. Fair value pricing may require subjective determinations about the value of a security or asset. While the Funds’ policies are intended to result in a calculation of a Fund’s NAV that fairly reflects security and asset values as of the time of pricing, the Funds cannot ensure that fair values determined by the Board or persons acting at their direction accurately reflects the price that a Fund could obtain for a security or asset if it were to dispose of that security or asset at the time of pricing (for instance, in a forced or distressed sale). The prices used by a Fund may differ from the value that would be realized if the securities were sold. Also, the use of fair value pricing may not always result in adjustments to the prices of securities or other assets held by the Fund for the purpose of calculating the NAV of the Fund’s shares.
(e) Investment transactions, income and expenses
Investment transactions are recorded at the trade date. The Funds determine the gain or loss realized from investment transactions using an identified cost basis method. Interest income is recognized on an accrual basis and includes the amortization of premiums and the accretion of discounts using the effective yield method, net of any applicable tax withholding. Dividend income is recognized on the ex-dividend date. Dividends from foreign securities are recorded on the ex-dividend date, or as soon as such information is available, net of any applicable tax withholding.
Expenses are recorded on an accrual basis. Each Fund is charged for those expenses that are directly attributable to that Fund. Certain expenses arising in connection with a class of shares are charged to that class of shares. Expenses incurred which do not specifically relate to an individual Fund are allocated amongst all the Funds in the Trust in proportion to each Fund’s relative net assets.
(f) Foreign Currency
Assets and liabilities denominated in foreign currencies are translated into U.S. dollar amounts at the date of valuation. Purchases and sales of investment securities and income and expense items denominated in foreign currencies are translated into U.S. dollar amounts on the respective dates of such transactions.
The Funds do not isolate that portion of the results of operations resulting from changes in foreign exchange rates on investments from the fluctuations arising from changes in market prices of securities held. Such fluctuations are included with the net realized gain or loss and change in unrealized appreciation or depreciation on investments.
149
ASHMORE FUNDS
NOTES TO FINANCIAL STATEMENTS (CONTINUED)
As of October 31, 2020
Reported net realized foreign exchange gains or losses arise from sales of foreign currencies, currency gains or losses realized between the trade and settlement dates on securities transactions, and the difference between the amounts of dividends, interest and foreign withholding taxes recorded on the Funds’ books and the U.S. dollar equivalent of the amounts actually received or paid. Net unrealized foreign exchange gains and losses arise from changes in the fair values of assets and liabilities, other than investments in securities at fiscal year-end, resulting from changes in exchange rates. Such fluctuations are included with the net realized gain or loss and unrealized appreciation or depreciation from foreign currency exchange transactions.
(g) Fully funded total return swaps
Each Fund is subject to market risk in the normal course of pursuing its investment objectives. Certain Funds may enter into fully funded total return swaps (“TRS”) to manage their exposure to the market, certain sectors of the market or a particular security or reference asset, or to create exposure to certain investments to which they would otherwise not be exposed.
Where a Fund enters into a TRS transaction with a swap counterparty, pursuant to which the Fund makes an initial payment equal to the estimated value of an emerging market debt or equity security, loan or other financial instrument, the TRS is considered an investment for financial statement purposes and is accounted for using the same policies as would apply to the underlying assets it represents. In addition to the market risk of the underlying security, index or reference asset, there is a risk of default by the counterparty to the transaction.
(h) Equity-Linked Securities
Certain Funds may purchase equity-linked securities, also known as participation notes. Equity-linked securities are primarily used by the Funds as an alternate means to access what is generally an emerging securities market. A Fund deposits cash with its custodian (or broker) in an amount near or equal to the value of the underlying security in exchange for an equity linked security. Upon sale, the Fund receives cash from the broker or custodian, equal to the value of the underlying security. In addition to the market risk and credit risk of the underlying securities, there is a risk of default by the counterparty to the transaction. In the event of insolvency of the counterparty, a Fund might be unable to obtain its expected benefit. In addition, while the Funds will seek to enter into such transactions only with parties that are capable of entering into closing transactions with a Fund, there can be no assurance that a Fund will be able to close out such a transaction with the counterparty or obtain an offsetting position with any counterparty at a time prior to the end of the term of the underlying agreement.
(i) Inflation Index Securities
Certain Funds may invest in inflation-indexed bonds which are fixed income securities whose principal value is periodically adjusted based on a measure of rate of inflation. The interest rate on these bonds is generally fixed at issuance at a rate lower than typical bonds. Over the life of an inflation-indexed bond interest will be paid based on a principal value which is adjusted for inflation. Any increase or decrease in the principal amount of an inflation-indexed bond will be included as interest income on the Statements of Operations, even though investors do not receive their principal until maturity. At October 31, 2020, all inflation-indexed bonds were shown on the Statement of Investments with their original par and stated coupon rate.
(j) Credit-Linked Notes
Certain Funds may invest in credit-linked notes to provide exposure to the high yield or another fixed income market. The value of a credit-linked note is based on the price movements of a particular credit, known as a reference credit. Credit-linked notes that a Fund invests in are typically listed instruments that typically provide the same return as the underlying reference credit. A Fund generally will receive a fixed or floating coupon and the note’s par value upon maturity. If a specified credit event occurs, such as default or bankruptcy, the Fund may experience a delay in payment or forego interest. The maximum potential risk of loss is limited to the par amount of the credit linked note plus any accrued interest.
150
ASHMORE FUNDS
NOTES TO FINANCIAL STATEMENTS (CONTINUED)
As of October 31, 2020
In the normal course of business, the Funds trade financial instruments and enter into financial transactions where a risk of potential loss exists due to, amongst other things, changes in the market (market risk), or the failure or inability of the other party to a transaction to perform (credit and counterparty risk). See below for a summary description of select principal risks, some of which may not apply to a particular Fund. A discussion of the principal risks of investing in each Fund is included in that Fund’s prospectus.
Counterparty and Third Party Risk
Transactions involving a counterparty to a derivative or other instrument, or a third party responsible for servicing the instrument, are subject to the credit risk of the counterparty or third party, and to the counterparty’s or third party’s ability to perform in accordance with the terms of the transaction.
Credit Risk
The Funds could lose money if the issuer or guarantor of a debt security or other instrument is unable or unwilling to meet its financial obligations, and the lack of ability, or perceived lack of ability, of the issuer to make timely payments of interest and/or principal will negatively affect the value of the security or instrument.
Market Risk
The value of securities and instruments owned by the Funds may rise and fall, sometimes rapidly or unpredictably, due to factors affecting securities markets generally or particular industries or geographic areas. Recent instability in the financial markets has led governments around the world to take a number of unprecedented actions designed to support certain financial institutions and segments of the financial markets that have experienced extreme volatility, and in some cases a lack of liquidity. The withdrawal of this support, failure of these efforts, or investor perception that these efforts are not succeeding could negatively affect financial markets generally as well as the values and liquidity of a Fund’s portfolio securities and other assets.
Derivative financial instruments may result in off-balance sheet market and credit risk. If the markets should move against one or more positions that the Funds hold, the Funds could incur losses greater than the unrealized amounts recorded in the Statements of Assets and Liabilities. Derivative risk exposures are discussed in note 10.
Foreign/Emerging Markets Risks
Investments in foreign securities entail risks in addition to those customarily associated with investing in U.S. securities. Economic, political and social instability could disrupt financial markets in which the Fund invests and adversely affect the value of the Fund’s assets. In addition, national policies may restrict investment opportunities. In foreign markets there may be a lower degree of market volume and liquidity than in U.S. markets, and this may result in greater price volatility. The securities markets in many Emerging-Market countries are substantially smaller, less developed, less liquid and more volatile than the securities markets of developed countries. Furthermore, since the composition of each Fund will differ from that of market indexes, its performance generally will not mirror the returns provided by a specific market index.
| 4. | Fair value measurements |
U.S. GAAP includes a topic which defines fair value as the price that the Fund would receive upon selling an investment in an orderly and timely transaction to a market participant in the principal or most advantageous market of the investment. This topic establishes a three-tier hierarchy to maximize the use of observable market data, minimize the use of unobservable inputs and establish classification of fair value measurements for disclosure purposes. Inputs may be observable or unobservable and refer broadly to the assumptions that market participants would use in pricing the asset or liability including assumptions about risk. Such risks include the inherent risk in a particular valuation technique which is used to measure fair value. Observable inputs are inputs that reflect the assumptions market participants would use in pricing the asset or liability developed based on market
151
ASHMORE FUNDS
NOTES TO FINANCIAL STATEMENTS (CONTINUED)
As of October 31, 2020
data obtained from sources independent of the reporting entity. Unobservable inputs are inputs that reflect the reporting entity’s own assumptions about the assumptions market participants would use in pricing the asset or liability, developed based on the best information available in the circumstances. The three-tier hierarchy of inputs is summarized in the three broad levels listed below.
| | • | | Level 1 – Inputs using unadjusted quoted prices in active markets or exchanges for identical assets and liabilities. |
| | • | | Level 2 – Significant observable inputs other than those used in Level 1, which may include, but are not limited to, quoted prices for similar assets or liabilities in markets that are active, quoted prices for identical or similar assets or liabilities in markets that are not active, inputs other than quoted prices that are observable for the assets or liabilities (such as interest rates, yield curves, volatilities, prepayment rates, loss severities, credit risks and default rates) or other market corroborated inputs. |
| | • | | Level 3 – Significant unobservable inputs based on the best information available in the circumstances, to the extent observable inputs are not available, which may include assumptions made by the Board or persons acting at their discretion that are used in determining the fair market value of investments. |
Fixed income securities including corporate, convertible and municipal bonds and notes, U.S. government agency securities, U.S. treasury obligations, sovereign issues, bank loans, convertible preferred securities and non-U.S. bonds are normally priced using data reflecting the earlier closing of the principal markets for those securities, subject to possible fair value adjustments. Information that becomes known to a Fund or its agents after NAV has been calculated on a particular day will not generally be used to retroactively adjust the price of a security or NAV determined earlier that day.
Portfolio securities and other assets for which market quotations are readily available are typically categorized as Level 1 of the fair value hierarchy. Domestic and foreign debt securities where the close of trading does not coincide with the NYSE close and non-exchange traded derivatives are normally valued on the basis of quotes obtained from brokers and dealers or pricing services using data reflecting the earlier closing of the principal markets for those securities. Prices obtained from independent pricing services are based on information provided by market makers or estimates of market values obtained from yield data relating to investments or securities with similar characteristics. Securities using these valuation adjustments are typically categorized as Level 2 of the fair value hierarchy. Preferred securities, equity linked notes and other equities traded on inactive markets or valued by reference to similar instruments are also typically categorized as Level 2 of the fair value hierarchy.
Investments and derivatives classified within Level 3 have significant unobservable inputs, as they trade infrequently or not at all. Level 3 instruments may include bank loan agreements and less-liquid corporate debt securities (including distressed debt instruments). Also included in this category are certain bonds and loans for which independent broker prices are used and information relating to the inputs of the price models is not available.
| 5. | Reverse repurchase agreements |
Certain Funds may enter into reverse repurchase agreements. In a reverse repurchase agreement, a Fund delivers a security in exchange for cash to a financial institution, the counterparty, with a simultaneous agreement to repurchase the same or substantially the same security at an agreed upon price and date. The Fund is entitled to receive principal and interest payments, if any, made on the security delivered to the counterparty during the term of the agreement. Cash received in exchange for securities delivered plus accrued interest payments to be made by the Fund to counterparties are reflected as a liability on the Statements of Assets and Liabilities. Interest payments made by the Fund to counterparties are recorded as a component of interest expense on the Statements of Operations. In periods of increased demand for the security, the Fund may receive a fee for use of the security by the counterparty, which may result in interest income to the Fund.
As of October 31, 2020, the Funds did not hold any reverse repurchase agreements.
152
ASHMORE FUNDS
NOTES TO FINANCIAL STATEMENTS (CONTINUED)
As of October 31, 2020
| 6. | Capital share transactions |
Transactions in Class A shares for the year ended October 31, 2020, were as follows:
| | | | | | | | | | | | | | | | | | | | | | | | | | | | | | | | |
| Fund | | Shares Sold | | | Proceeds from Shares Sold | | | Shares from Reinvested Distributions | | | Proceeds from Reinvestment of Distributions | | | Shares Redeemed | | | Payments for Shares Redeemed | | | Net Increase/ (Decrease) in Shares | | | Net Increase/ (Decrease) in
Net Assets | |
| Ashmore Emerging Markets Total Return Fund | | | 697,487 | | | $ | 4,987,088 | | | | 62,116 | | | $ | 428,702 | | | | (706,867 | ) | | $ | (5,015,573 | ) | | | 52,736 | | | $ | 400,217 | |
| Ashmore Emerging Markets Local Currency Bond Fund | | | — | | | | — | | | | 136 | | | | 1,011 | | | | (7,189 | ) | | | (42,129 | ) | | | (7,053 | ) | | | (41,118 | ) |
| Ashmore Emerging Markets Corporate Income Fund | | | 973,657 | | | | 7,475,101 | | | | 64,503 | | | | 481,206 | | | | (1,240,230 | ) | | | (9,095,954 | ) | | | (202,070 | ) | | | (1,139,647 | ) |
| Ashmore Emerging Markets Short Duration Fund | | | 2,361,271 | | | | 18,562,319 | | | | 472,177 | | | | 3,827,647 | | | | (12,504,193 | ) | | | (98,146,581 | ) | | | (9,670,745 | ) | | | (75,756,615 | ) |
| Ashmore Emerging Markets Active Equity Fund | | | 158,335 | | | | 1,461,855 | | | | 475 | | | | 4,960 | | | | (33,025 | ) | | | (332,637 | ) | | | 125,785 | | | | 1,134,178 | |
| Ashmore Emerging Markets Small-Cap Equity Fund | | | 5,426 | | | | 48,329 | | | | — | | | | — | | | | (123,432 | ) | | | (844,871 | ) | | | (118,006 | ) | | | (796,542 | ) |
| Ashmore Emerging Markets Frontier Equity Fund | | | 105,675 | | | | 875,409 | | | | 438 | | | | 2,960 | | | | (884,119 | ) | | | (7,187,717 | ) | | | (778,006 | ) | | | (6,309,348 | ) |
| Ashmore Emerging Markets Equity Fund | | | 102,459 | | | | 1,065,643 | | | | 153 | | | | 1,798 | | | | (53,354 | ) | | | (596,967 | ) | | | 49,258 | | | | 470,474 | |
| Ashmore Emerging Markets Equity ESG Fund | | | 100 | | | | 1,000 | | | | — | | | | — | | | | — | | | | — | ** | | | 100 | | | | 1,000 | |
| Ashmore Emerging Markets Short Duration Select Fund | | | 99 | | | | 1,000 | | | | 2 | | | | 12 | | | | — | | | | — | | | | 101 | | | | 1,012 | |
153
ASHMORE FUNDS
NOTES TO FINANCIAL STATEMENTS (CONTINUED)
As of October 31, 2020
| | | | | | | | | | | | | | | | | | | | | | | | | | | | | | | | |
| Fund | | Shares Sold | | | Proceeds from Shares Sold | | | Shares from Reinvested Distributions | | | Proceeds from Reinvestment of Distributions | | | Shares Redeemed | | | Payments for Shares Redeemed | | | Net Increase/ (Decrease) in Shares | | | Net Increase/ (Decrease) in Net Assets | |
| Ashmore Emerging Markets Investment Grade Income Fund | | | 100 | | | $ | 1,000 | | | | — | * | | $ | 2 | | | | — | | | $ | — | | | | 100 | | | $ | 1,002 | |
** Amount rounds to less than $0.5. * Amount rounds to less than 0.5 shares. Transactions in Class C shares for the year ended October 31, 2020, were as follows: | |
| Fund | | Shares Sold | | | Proceeds from
Shares Sold | | | Shares from Reinvested Distributions | | | Proceeds from Reinvestment of Distributions | | | Shares Redeemed | | | Payments for Shares Redeemed | | | Net Increase/ (Decrease) in Shares | | | Net Increase/ (Decrease) in Net Assets | |
| Ashmore Emerging Markets Total Return Fund | | | 56,572 | | | $ | 389,027 | | | | 20,123 | | | $ | 138,773 | | | | (232,421 | ) | | $ | (1,609,046 | ) | | | (155,726 | ) | | $ | (1,081,246 | ) |
| Ashmore Emerging Markets Local Currency Bond Fund | | | — | | | | — | | | | 13 | | | | 93 | | | | (3,239 | ) | | | (22,120 | ) | | | (3,226 | ) | | | (22,027 | ) |
| Ashmore Emerging Markets Corporate Income Fund | | | 139,346 | | | | 1,103,488 | | | | 51,137 | | | | 379,687 | | | | (555,172 | ) | | | (4,054,823 | ) | | | (364,689 | ) | | | (2,571,648 | ) |
| Ashmore Emerging Markets Short Duration Fund | | | 133,326 | | | | 926,449 | | | | 12,008 | | | | 91,118 | | | | (198,069 | ) | | | (1,464,588 | ) | | | (52,735 | ) | | | (447,021 | ) |
| Ashmore Emerging Markets Active Equity Fund | | | — | * | | | 2 | | | | — | * | | | 1 | | | | (1,059 | ) | | | (12,001 | ) | | | (1,059 | ) | | | (11,998 | ) |
| Ashmore Emerging Markets Small-Cap Equity Fund | | | — | * | | | 343 | | | | — | | | | — | | | | (3,762 | ) | | | (29,650 | ) | | | (3,762 | ) | | | (29,307 | ) |
| Ashmore Emerging Markets Frontier Equity Fund | | | 16,040 | | | | 113,582 | | | | 234 | | | | 1,529 | | | | (13,323 | ) | | | (93,921 | ) | | | 2,951 | | | | 21,190 | |
154
ASHMORE FUNDS
NOTES TO FINANCIAL STATEMENTS (CONTINUED)
As of October 31, 2020
| | | | | | | | | | | | | | | | | | | | | | | | | | | | | | | | |
| Fund | | Shares Sold | | | Proceeds from
Shares Sold | | | Shares from Reinvested Distributions | | | Proceeds from Reinvestment of Distributions | | | Shares Redeemed | | | Payments for Shares Redeemed | | | Net Increase/ (Decrease) in Shares | | | Net Increase/ (Decrease) in Net Assets | |
| Ashmore Emerging Markets Equity Fund | | | — | * | | $ | 2 | | | | — | | | $ | — | | | | — | | | $ | — | | | | — | * | | $ | 2 | |
| Ashmore Emerging Markets Equity ESG Fund | | | 100 | | | | 1,002 | | | | — | | | | — | | | | — | | | | — | | | | 100 | | | | 1,002 | |
| Ashmore Emerging Markets Short Duration Select Fund | | | 99 | | | | 1,000 | | | | 2 | | | | 10 | | | | — | | | | — | | | | 101 | | | | 1,010 | |
| Ashmore Emerging Markets Investment Grade Income Fund | | | 100 | | | | 1,000 | | | | — | * | | | 2 | | | | — | | | | — | | | | 100 | | | | 1,002 | |
* Amount rounds to less than 0.5 shares. Transactions in Institutional Class shares for the year ended October 31, 2020, were as follows: | |
| Fund | | Shares Sold | | | Proceeds from Shares Sold | | | Shares from Reinvested Distributions | | | Proceeds from Reinvestment of Distributions | | | Shares Redeemed | | | Payments for Shares Redeemed | | | Net Increase/ (Decrease) in Shares | | | Net Increase/ (Decrease) in Net Assets | |
| Ashmore Emerging Markets Total Return Fund | | | 61,621,367 | | | $ | 425,771,462 | | | | 9,211,953 | | | $ | 64,665,899 | | | | (92,458,351 | ) | | $ | (628,466,559 | ) | �� | | (21,625,031 | ) | | $ | (138,029,198 | ) |
| Ashmore Emerging Markets Local Currency Bond Fund | | | 808,852 | | | | 5,707,063 | | | | 64,929 | | | | 503,201 | | | | (2,487,097 | ) | | | (17,794,777 | ) | | | (1,613,316 | ) | | | (11,584,513 | ) |
| Ashmore Emerging Markets Corporate Income Fund | | | 14,558,538 | | | | 115,713,958 | | | | 1,217,687 | | | | 9,454,112 | | | | (36,252,496 | ) | | | (268,373,932 | ) | | | (20,476,271 | ) | | | (143,205,862 | ) |
| Ashmore Emerging Markets Short Duration Fund | | | 39,487,241 | | | | 314,827,622 | | | | 3,845,955 | | | | 30,504,449 | | | | (118,966,345 | ) | | | (884,576,492 | ) | | | (75,633,149 | ) | | | (539,244,421 | ) |
| Ashmore Emerging Markets Active Equity Fund | | | 9,760,762 | | | | 102,078,960 | | | | 20,206 | | | | 216,279 | | | | (4,514,931 | ) | | | (45,652,721 | ) | | | 5,266,037 | | | | 56,642,518 | |
155
ASHMORE FUNDS
NOTES TO FINANCIAL STATEMENTS (CONTINUED)
As of October 31, 2020
| | | | | | | | | | | | | | | | | | | | | | | | | | | | | | | | |
| Fund | | Shares Sold | | | Proceeds from Shares Sold | | | Shares from Reinvested Distributions | | | Proceeds from Reinvestment of Distributions | | | Shares Redeemed | | | Payments for Shares Redeemed | | | Net Increase/ (Decrease) in Shares | | | Net Increase/ (Decrease) in Net Assets | |
| Ashmore Emerging Markets Small-Cap Equity Fund | | | 50,865 | | | $ | 494,093 | | | | — | | | $ | — | | | | (1,836,184 | ) | | $ | (19,784,023 | ) | | | (1,785,319 | ) | | $ | (19,289,930 | ) |
| Ashmore Emerging Markets Frontier Equity Fund | | | 1,207,464 | | | | 9,749,172 | | | | 60,407 | | | | 473,827 | | | | (3,488,868 | ) | | | (27,575,140 | ) | | | (2,220,997 | ) | | | (17,352,141 | ) |
| Ashmore Emerging Markets Equity Fund | | | 4,250,973 | | | | 39,896,823 | | | | 10,447 | | | | 119,843 | | | | (989,105 | ) | | | (9,253,620 | ) | | | 3,272,315 | | | | 30,763,046 | |
| Ashmore Emerging Markets Equity ESG Fund | | | 999,800 | | | | 9,998,000 | | | | 29 | | | | 298 | | | | — | | | | (2 | ) | | | 999,829 | | | | 9,998,296 | |
| Ashmore Emerging Markets Short Duration Select Fund | | | 999,800 | | | | 9,998,000 | | | | 13,220 | | | | 134,367 | | | | — | | | | — | | | | 1,013,020 | | | | 10,132,367 | |
| Ashmore Emerging Markets Investment Grade Income Fund | | | 1,999,800 | | | | 19,998,000 | | | | 5,250 | | | | 52,098 | | | | — | | | | — | | | | 2,005,050 | | | | 20,050,098 | |
Transactions in Class A shares for the year ended October 31, 2019, were as follows: | |
| Fund | | Shares Sold | | | Proceeds from Shares Sold | | | Shares from Reinvested Distributions | | | Proceeds from Reinvestment of Distributions | | | Shares Redeemed | | | Payments for Shares Redeemed | | | Net Increase/ (Decrease) in Shares | | | Net Increase/ (Decrease) in Net Assets | |
| Ashmore Emerging Markets Total Return Fund | | | 998,414 | | | $ | 7,558,502 | | | | 56,834 | | | $ | 431,702 | | | | (724,545 | ) | | $ | (5,493,179 | ) | | | 330,703 | | | $ | 2,497,025 | |
| Ashmore Emerging Markets Local Currency Bond Fund | | | 430,000 | | | | 3,040,320 | | | | 70 | | | | 501 | | | | (359,880 | ) | | | (2,607,923 | ) | | | 70,190 | | | | 432,898 | |
| Ashmore Emerging Markets Corporate Income Fund | | | 999,040 | | | | 7,863,450 | | | | 49,282 | | | | 387,562 | | | | (453,387 | ) | | | (3,550,579 | ) | | | 594,935 | | | | 4,700,433 | |
156
ASHMORE FUNDS
NOTES TO FINANCIAL STATEMENTS (CONTINUED)
As of October 31, 2020
| | | | | | | | | | | | | | | | | | | | | | | | | | | | | | | | |
| Fund | | Shares Sold | | | Proceeds from Shares Sold | | | Shares from Reinvested Distributions | | | Proceeds from Reinvestment of Distributions | | | Shares Redeemed | | | Payments for Shares Redeemed | | | Net Increase/ (Decrease) in Shares | | | Net Increase/ (Decrease) in Net Assets | |
| Ashmore Emerging Markets Short Duration Fund | | | 10,317,532 | | | $ | 100,991,640 | | | | 847,612 | | | $ | 8,168,410 | | | | (7,372,572 | ) | | $ | (69,828,989 | ) | | | 3,792,572 | | | $ | 39,331,061 | |
| Ashmore Emerging Markets Active Equity Fund | | | 4,664 | | | | 48,101 | | | | 1,773 | | | | 16,423 | | | | (7,662 | ) | | | (73,604 | ) | | | (1,225 | ) | | | (9,080 | ) |
| Ashmore Emerging Markets Small-Cap Equity Fund | | | 68,320 | | | | 562,609 | | | | 65 | | | | 554 | | | | (95,554 | ) | | | (813,798 | ) | | | (27,169 | ) | | | (250,635 | ) |
| Ashmore Emerging Markets Frontier Equity Fund | | | 909,538 | | | | 7,323,256 | | | | 15,381 | | | | 125,753 | | | | (1,052,776 | ) | | | (8,219,527 | ) | | | (127,857 | ) | | | (770,518 | ) |
| Ashmore Emerging Markets Equity Fund | | | 33,615 | | | | 357,561 | | | | 1,139 | | | | 12,320 | | | | (9,683 | ) | | | (105,463 | ) | | | 25,071 | | | | 264,418 | |
Transactions in Class C shares for the year ended October 31, 2019, were as follows: | |
| Fund | | Shares Sold | | | Proceeds from Shares Sold | | | Shares from Reinvested Distributions | | | Proceeds from Reinvestment of Distributions | | | Shares Redeemed | | | Payments for Shares Redeemed | | | Net Increase/ (Decrease) in Shares | | | Net Increase/ (Decrease) in Net Assets | |
| Ashmore Emerging Markets Total Return Fund | | | 245,064 | | | $ | 1,842,320 | | | | 22,284 | | | $ | 169,070 | | | | (122,489 | ) | | $ | (916,473 | ) | | | 144,859 | | | $ | 1,094,917 | |
| Ashmore Emerging Markets Local Currency Bond Fund | | | — | * | | | 71 | | | | 2 | | | | 12 | | | | (4,353 | ) | | | (29,119 | ) | | | (4,351 | ) | | | (29,036 | ) |
| Ashmore Emerging Markets Corporate Income Fund | | | 416,995 | | | | 3,263,986 | | | | 54,827 | | | | 430,774 | | | | (231,298 | ) | | | (1,817,105 | ) | | | 240,524 | | | | 1,877,655 | |
| Ashmore Emerging Markets Short Duration Fund | | | 171,138 | | | | 1,615,295 | | | | 17,953 | | | | 166,721 | | | | (132,461 | ) | | | (1,203,140 | ) | | | 56,630 | | | | 578,876 | |
157
ASHMORE FUNDS
NOTES TO FINANCIAL STATEMENTS (CONTINUED)
As of October 31, 2020
| | | | | | | | | | | | | | | | | | | | | | | | | | | | | | | | |
| Fund | | Shares Sold | | | Proceeds from Shares Sold | | | Shares from Reinvested Distributions | | | Proceeds from Reinvestment of Distributions | | | Shares Redeemed | | | Payments for Shares Redeemed | | | Net Increase/ (Decrease) in Shares | | | Net Increase/ (Decrease) in Net Assets | |
| Ashmore Emerging Markets Active Equity Fund | | | — | | | $ | — | | | | 106 | | | $ | 966 | | | | — | | | $ | — | | | | 106 | | | $ | 966 | |
| Ashmore Emerging Markets Small-Cap Equity Fund | | | — | * | | | 120 | | | | — | | | | — | | | | (16,783 | ) | | | (149,056 | ) | | | (16,783 | ) | | | (148,936 | ) |
| Ashmore Emerging Markets Frontier Equity Fund | | | 4,957 | | | | 39,294 | | | | 600 | | | | 4,792 | | | | (21,152 | ) | | | (161,257 | ) | | | (15,595 | ) | | | (117,171 | ) |
| Ashmore Emerging Markets Equity Fund | | | — | * | | | 1 | | | | 2 | | | | 18 | | | | — | | | | — | | | | 2 | | | | 19 | |
* Amount rounds to less than 0.5 shares. Transactions in Institutional Class shares for the year ended October 31, 2019, were as follows: | |
| Fund | | Shares Sold | | | Proceeds from Shares Sold | | | Shares from Reinvested Distributions | | | Proceeds from Reinvestment of Distributions | | | Shares Redeemed | | | Payments for Shares Redeemed | | | Net Increase/ (Decrease) in Shares | | | Net Increase/ (Decrease) in Net Assets | |
| Ashmore Emerging Markets Total Return Fund | | | 63,315,636 | | | $ | 484,755,522 | | | | 9,227,589 | | | $ | 71,101,652 | | | | (50,003,874 | ) | | $ | (382,070,945 | ) | | | 22,539,351 | | | $ | 173,786,229 | |
| Ashmore Emerging Markets Local Currency Bond Fund | | | 2,306,010 | | | | 17,074,036 | | | | 61,710 | | | | 458,625 | | | | (6,085,333 | ) | | | (45,020,658 | ) | | | (3,717,613 | ) | | | (27,487,997 | ) |
| Ashmore Emerging Markets Corporate Income Fund | | | 33,012,593 | | | | 269,571,723 | | | | 1,064,643 | | | | 8,733,027 | | | | (19,248,890 | ) | | | (156,873,867 | ) | | | 14,828,346 | | | | 121,430,883 | |
| Ashmore Emerging Markets Short Duration Fund | | | 95,094,279 | | | | 912,174,812 | | | | 5,098,443 | | | | 48,170,866 | | | | (37,113,670 | ) | | | (345,315,322 | ) | | | 63,079,052 | | | | 615,030,356 | |
| Ashmore Emerging Markets Active Equity Fund | | | 197,160 | | | | 1,997,157 | | | | 158,249 | | | | 1,477,964 | | | | (55,954 | ) | | | (535,174 | ) | | | 299,455 | | | | 2,939,947 | |
158
ASHMORE FUNDS
NOTES TO FINANCIAL STATEMENTS (CONTINUED)
As of October 31, 2020
| | | | | | | | | | | | | | | | | | | | | | | | | | | | | | | | |
| Fund | | Shares Sold | | | Proceeds from Shares Sold | | | Shares from Reinvested Distributions | | | Proceeds from Reinvestment of Distributions | | | Shares Redeemed | | | Payments for Shares Redeemed | | | Net Increase/ (Decrease) in Shares | | | Net Increase/ (Decrease) in Net Assets | |
| Ashmore Emerging Markets Small-Cap Equity Fund | | | 294,289 | | | $ | 3,236,180 | | | | 2,181 | | | $ | 24,310 | | | | (1,134,847 | ) | | $ | (12,767,464 | ) | | | (838,377 | ) | | $ | (9,506,974 | ) |
| Ashmore Emerging Markets Frontier Equity Fund | | | 1,649,957 | | | | 15,407,880 | | | | 140,716 | | | | 1,336,562 | | | | (1,874,076 | ) | | | (17,312,251 | ) | | | (83,403 | ) | | | (567,809 | ) |
| Ashmore Emerging Markets Equity Fund | | | 763,669 | | | | 7,751,075 | | | | 63,214 | | | | 661,482 | | | | (253,265 | ) | | | (2,736,953 | ) | | | 573,618 | | | | 5,675,604 | |
Capital shares
Class A shares are issued at the Fund’s relevant NAV per share plus any applicable sales charge. Institutional Class and Class C shares are issued at the Fund’s relevant NAV per share without a sales charge. Shares confer upon the holders the right to receive notice of and attend, speak and vote at shareholder meetings of the Funds. The shares confer upon the holders the right to any or all dividends or distributions which the Trustees in their sole discretion may from time to time resolve to make or declare.
| 7. | Investment transactions |
For the year ended October 31, 2020, the aggregate cost of purchases and proceeds from sales of investments (including fully funded TRS and excluding short-term investments) for the Funds were as follows:
| | | | | | | | |
| Fund | | Purchases | | | Sales | |
Ashmore Emerging Markets Total Return Fund | | $ | 867,392,534 | | | $ | 964,417,223 | |
Ashmore Emerging Markets Local Currency Bond Fund | | | 15,715,282 | | | | 23,629,575 | |
Ashmore Emerging Markets Corporate Income Fund | | | 406,413,460 | | | | 530,525,818 | |
Ashmore Emerging Markets Short Duration Fund | | | 558,217,180 | | | | 1,082,768,611 | |
Ashmore Emerging Markets Active Equity Fund | | | 183,997,272 | | | | 129,949,017 | |
Ashmore Emerging Markets Small-Cap Equity Fund | | | 8,948,392 | | | | 29,061,443 | |
Ashmore Emerging Markets Frontier Equity Fund | | | 69,756,267 | | | | 93,368,301 | |
Ashmore Emerging Markets Equity Fund | | | 72,611,597 | | | | 42,377,762 | |
Ashmore Emerging Markets Equity ESG Fund | | | 14,142,773 | | | | 4,341,647 | |
Ashmore Emerging Markets Short Duration Select Fund | | | 9,916,285 | | | | 1,096,089 | |
Ashmore Emerging Markets Investment Grade Income Fund | | | 20,138,441 | | | | 508,180 | |
The difference between book basis and tax basis net unrealized appreciation (depreciation) is attributable primarily to the tax deferral of losses on wash sales, deferral of post October currency and capital losses for tax purposes, and the recharacterization of income recognition on investments in PFICs. At October 31, 2020, for federal income tax purposes, gross unrealized appreciation, gross unrealized depreciation, net unrealized appreciation (depreciation) on investments (including the effects of foreign currency translation and derivative instruments, if any) and the cost basis of investments (including derivative instruments, if any) were as follows:
159
ASHMORE FUNDS
NOTES TO FINANCIAL STATEMENTS (CONTINUED)
As of October 31, 2020
| | | | | | | | | | | | | | | | |
| Amounts in Thousands | | Unrealized Appreciation | | | Unrealized Depreciation | | | Net Appreciation (Depreciation) | | | Cost Basis of Investments | |
| Ashmore Emerging Markets Total Return Fund | | $ | 54,126,535 | | | $ | (177,795,886 | ) | | $ | (123,669,351 | ) | | $ | 1,321,585,146 | |
| Ashmore Emerging Markets Local Currency Bond Fund | | | 792,427 | | | | (3,965,975 | ) | | | (3,173,548 | ) | | | 30,572,190 | |
| Ashmore Emerging Markets Corporate Income Fund | | | 6,131,379 | | | | (32,611,882 | ) | | | (26,480,503 | ) | | | 304,372,858 | |
| Ashmore Emerging Markets Short Duration Fund | | | 3,028,271 | | | | (204,460,074 | ) | | | (201,431,803 | ) | | | 644,397,270 | |
| Ashmore Emerging Markets Active Equity Fund | | | 7,411,517 | | | | (2,241,836 | ) | | | 5,169,681 | | | | 72,833,624 | |
| Ashmore Emerging Markets Small-Cap Equity Fund | | | 1,057,737 | | | | (366,868 | ) | | | 690,869 | | | | 7,218,894 | |
| Ashmore Emerging Markets Frontier Equity Fund | | | 4,077,176 | | | | (7,642,998 | ) | | | (3,565,822 | ) | | | 57,081,400 | |
| Ashmore Emerging Markets Equity Fund | | | 16,498,834 | | | | (1,226,468 | ) | | | 15,272,366 | | | | 67,337,844 | |
| Ashmore Emerging Markets Equity ESG Fund | | | 2,311,354 | | | | (244,353 | ) | | | 2,067,001 | | | | 9,807,660 | |
| Ashmore Emerging Markets Short Duration Select Fund | | | 172,153 | | | | (20,059 | ) | | | 152,094 | | | | 9,390,715 | |
| Ashmore Emerging Markets Investment Grade Income Fund | | | 36,836 | | | | (328,748 | ) | | | (291,912 | ) | | | 19,613,953 | |
No provision for U.S. federal income taxes has been made since each Fund’s policy is to comply with the requirements of Subchapter M of the Internal Revenue Code of 1986, as amended, applicable to regulated investment companies, and to distribute, each year, substantially all of its taxable income and capital gains to its shareholders.
For financial reporting purposes the Funds may periodically make reclassifications among components of capital accounts to reflect permanent differences between U.S. GAAP and taxable income. The reclassifications have no impact on the net assets of the Funds. During the year, revisions were also made to previously determined taxable income amounts. As a result, the following reclassifications were made to the Statements of Assets and Liabilities:
| | | | | | | | |
| Fund | | Paid in Capital | | | Distributable earnings/ (Accumulated loss) | |
Ashmore Emerging Markets Local Currency Bond Fund | | $ | (451,947 | ) | | $ | 451,947 | |
Ashmore Emerging Markets Active Equity Fund | | | (2,487 | ) | | | 2,487 | |
Ashmore Emerging Markets Small-Cap Equity Fund | | | (85,380 | ) | | | 85,380 | |
Ashmore Emerging Markets Equity ESG Fund | | | (2 | ) | | | 2 | |
Ashmore Emerging Markets Short Duration Select Fund | | | (4 | ) | | | 4 | |
During the fiscal year ended October 31, 2020, the Ashmore Emerging Markets Local Currency Bond Fund and Ashmore Emerging Markets Equity Fund utilized $419,710 and $2,068,748, respectively, in capital loss carryforwards.
160
ASHMORE FUNDS
NOTES TO FINANCIAL STATEMENTS (CONTINUED)
As of October 31, 2020
The following Funds have available capital loss carryforwards for which there is no expiration date:
| | | | | | | | |
| Fund | | Short-Term Capital Loss Carryforward at October 31, 2020 | | | Long-Term Capital Loss Carryforward at October 31, 2020 | |
Ashmore Emerging Markets Total Return Fund | | $ | — | | | $ | (102,229,722 | ) |
Ashmore Emerging Markets Local Currency Bond Fund | | | — | | | | (929,772 | ) |
Ashmore Emerging Markets Corporate Income Fund | | | (13,160,419 | ) | | | (55,759,528 | ) |
Ashmore Emerging Markets Short Duration Fund | | | (66,193,273 | ) | | | (100,520,591 | ) |
Ashmore Emerging Markets Active Equity Fund | | | (988,114 | ) | | | (773,550 | ) |
Ashmore Emerging Markets Small-Cap Equity Fund | | | (934,419 | ) | | | (4,853,815 | ) |
Ashmore Emerging Markets Frontier Equity Fund | | | (8,767,006 | ) | | | (4,476,461 | ) |
Ashmore Emerging Markets Equity ESG Fund | | | (81,429 | ) | | | — | |
Ashmore Emerging Markets Investment Grade Income Fund | | | (4,555 | ) | | | — | |
The Funds are subject to the provisions of the Financial Accounting Standards Board (“FASB”) Accounting Standards Codification (“ASC”) Topic 740-10, Income Taxes. This standard provides guidance as to how uncertain tax positions should be recognized, measured, presented and disclosed in the Funds’ financial statements. The Funds recognize the tax benefits of uncertain tax positions only where the position is more-likely-than-not (i.e. greater than 50-percent) to be sustained assuming examination by a tax authority based on the technical merits of the position. In evaluating whether a tax position has met the recognition threshold, the Funds must presume that the position will be examined by the appropriate taxing authority that has full knowledge of all relevant information. A tax position that meets the more-likely-than-not recognition threshold is measured to determine the amount of benefit to recognize in the Funds’ financial statements. Income tax and related interest and penalties would be recognized by the Funds as tax expense in the Statement of Operations if the tax positions were deemed not to meet the more-likely-than-not threshold. The Funds analyze all open tax years for all major taxing jurisdictions. Open tax years are those that are open to examination by taxing authorities, as defined by the Statute of Limitations in each jurisdiction. The Funds have no examinations by tax authorities in progress. The Trust has analyzed the Funds’ tax positions, and has concluded that no liability for unrecognized tax benefits should be recorded related to uncertain tax positions. Further, the Trust is not aware of any tax positions for which it is reasonably possible that the total amounts of unrecognized tax benefits will significantly change in the next twelve months.
As of October 31, 2020, the components of distributable taxable earnings, including temporary differences were as follows:
| | | | | | | | | | | | | | | | | | | | |
| Fund | | Undistributed Ordinary Income | | | Undistributed Long Term Capital Gain | | | Accumulated Capital Losses and Other | | | Undistributed Appreciation (Depreciation) on Investments and Foreign Currencies | | | Total Accumulated Earnings (Deficit) | |
| Ashmore Emerging Markets Total Return Fund | | $ | — | | | $ | — | | | $ | (102,889,555 | ) | | $ | (123,797,266 | ) | | $ | (226,686,821 | ) |
| Ashmore Emerging Markets Local Currency Bond Fund | | | — | | | | — | | | | (943,467 | ) | | | (3,203,987 | ) | | | (4,147,454 | ) |
| Ashmore Emerging Markets Corporate Income Fund | | | — | | | | — | | | | (69,090,559 | ) | | | (26,480,524 | ) | | | (95,571,083 | ) |
| Ashmore Emerging Markets Short Duration Fund | | | 1,089,175 | | | | — | | | | (167,011,599 | ) | | | (201,430,531 | ) | | | (367,352,955 | ) |
161
ASHMORE FUNDS
NOTES TO FINANCIAL STATEMENTS (CONTINUED)
As of October 31, 2020
| | | | | | | | | | | | | | | | | | | | |
| Fund | | Undistributed Ordinary Income | | | Undistributed Long Term Capital Gain | | | Accumulated Capital Losses and Other | | | Undistributed Appreciation (Depreciation) on Investments and Foreign Currencies | | | Total Accumulated Earnings (Deficit) | |
| Ashmore Emerging Markets Active Equity Fund | | $ | 276,718 | | | $ | — | | | $ | (1,761,664 | ) | | $ | 5,131,046 | | | $ | 3,646,100 | |
| Ashmore Emerging Markets Small-Cap Equity Fund | | | — | | | | — | | | | (5,788,235 | ) | | | 690,827 | | | | (5,097,408 | ) |
| Ashmore Emerging Markets Frontier Equity Fund | | | 92,769 | | | | — | | | | (13,247,550 | ) | | | (3,754,723 | ) | | | (16,909,504 | ) |
| Ashmore Emerging Markets Equity Fund | | | 786,065 | | | | 1,333,334 | | | | (151 | ) | | | 15,140,288 | | | | 17,259,536 | |
| Ashmore Emerging Markets Equity ESG Fund | | | 87,867 | | | | — | | | | (90,781 | ) | | | 2,066,971 | | | | 2,064,057 | |
| Ashmore Emerging Markets Short Duration Select Fund | | | 40,692 | | | | — | | | | (8,519 | ) | | | 152,094 | | | | 184,267 | |
| Ashmore Emerging Markets Investment Grade Income Fund | | | 10,961 | | | | — | | | | (11,787 | ) | | | (291,974 | ) | | | (292,800 | ) |
|
The taxable character of distributions paid during the fiscal year ended October 31, 2020, were as follows: | |
| | | Distributions From | | | | | | | |
| Fund | | Ordinary Income | | | Short-Term Capital Gains | | | Long-Term Capital Gains | | | Return of Capital | | | Total Distributions Paid | |
| Ashmore Emerging Markets Total Return Fund | | $ | 26,796,593 | | | $ | — | | | $ | — | | | $ | 45,461,594 | | | $ | 72,258,187 | |
| Ashmore Emerging Markets Local Currency Bond Fund | | | — | | | | — | | | | — | | | | 537,321 | | | | 537,321 | |
| Ashmore Emerging Markets Corporate Income Fund | | | 22,741,875 | | | | — | | | | — | | | | 155,840 | | | | 22,897,715 | |
| Ashmore Emerging Markets Short Duration Fund | | | 56,867,179 | | | | — | | | | — | | | | — | | | | 56,867,179 | |
| Ashmore Emerging Markets Active Equity Fund | | | 376,370 | | | | — | | | | — | | | | — | | | | 376,370 | |
| Ashmore Emerging Markets Small-Cap Equity Fund | | | — | | | | — | | | | — | | | | — | | | | — | |
162
ASHMORE FUNDS
NOTES TO FINANCIAL STATEMENTS (CONTINUED)
As of October 31, 2020
| | | | | | | | | | | | | | | | | | | | |
| | | Distributions From | | | | | | | |
| Fund | | Ordinary Income | | | Short-Term Capital Gains | | | Long-Term Capital Gains | | | Return of Capital | | | Total Distributions Paid | |
| Ashmore Emerging Markets Frontier Equity Fund | | $ | 505,104 | | | $ | — | | | $ | — | | | $ | — | | | $ | 505,104 | |
| Ashmore Emerging Markets Equity Fund | | | 195,264 | | | | — | | | | — | | | | — | | | | 195,264 | |
| Ashmore Emerging Markets Equity ESG Fund | | | 351 | | | | — | | | | — | | | | — | | | | 351 | |
| Ashmore Emerging Markets Short Duration Select Fund | | | 158,109 | | | | — | | | | — | | | | — | | | | 158,109 | |
| Ashmore Emerging Markets Investment Grade Income Fund | | | 61,297 | | | | — | | | | — | | | | — | | | | 61,297 | |
|
The taxable character of distributions paid during the fiscal year ended October 31, 2019, were as follows: | |
| | | Distributions From | | | | | | | |
| Fund | | Ordinary Income | | | Short-Term Capital Gains | | | Long-Term Capital Gains | | | Return of Capital | | | Total Distributions Paid | |
| Ashmore Emerging Markets Total Return Fund | | $ | 64,237,212 | | | $ | — | | | $ | — | | | $ | 17,230,713 | | | $ | 81,467,925 | |
| Ashmore Emerging Markets Local Currency Bond Fund | | | — | | | | — | | | | — | | | | 486,524 | | | | 486,524 | |
| Ashmore Emerging Markets Corporate Income Fund | | | 27,943,249 | | | | — | | | | — | | | | — | | | | 27,943,249 | |
| Ashmore Emerging Markets Short Duration Fund | | | 84,955,579 | | | | 184,507 | | | | 2,758,398 | | | | — | | | | 87,898,484 | |
| Ashmore Emerging Markets Active Equity Fund | | | 243,975 | | | | 1,144,895 | | | | 365,845 | | | | 49,277 | | | | 1,803,992 | |
| Ashmore Emerging Markets Small-Cap Equity Fund | | | 27,427 | | | | — | | | | — | | | | 9,976 | | | | 37,403 | |
| Ashmore Emerging Markets Frontier Equity Fund | | | 1,527,563 | | | | — | | | | — | | | | — | | | | 1,527,563 | |
| Ashmore Emerging Markets Equity Fund | | | 772,783 | | | | — | | | | — | | | | — | | | | 772,783 | |
163
ASHMORE FUNDS
NOTES TO FINANCIAL STATEMENTS (CONTINUED)
As of October 31, 2020
| 9. | Distributions to shareholders |
The Ashmore Emerging Markets Total Return Fund, Ashmore Emerging Markets Corporate Income Fund, Ashmore Emerging Markets Short Duration Fund, Ashmore Emerging Markets Short Duration Select Fund and Ashmore Emerging Markets Investment Grade Income Fund declare distributions of their net investment income daily and pay such distributions monthly. The Ashmore Emerging Markets Local Currency Bond Fund, Ashmore Emerging Markets Active Equity Fund, Ashmore Emerging Markets Small-Cap Equity Fund, Ashmore Emerging Markets Frontier Equity Fund, Ashmore Emerging Markets Equity Fund and Ashmore Emerging Markets Equity ESG Fund declare and pay distributions of their net investment income at least quarterly.
Distributions of net realized capital gains, if any, are declared and paid at least annually. The Funds may also make a special distribution to comply with federal tax requirements. Income dividends and capital gains distributions determined in accordance with federal income tax regulations may differ from U.S. GAAP. Differences between tax regulations and U.S. GAAP may change the fiscal period in which income and capital items are recognized for tax and U.S. GAAP purposes. Examples of events that give rise to timing differences include wash sales, straddles and capital loss carryforwards. Further, the character of investment income and capital gains may be different for certain transactions under the two methods of accounting. Examples of characterization differences include the treatment of foreign currency transactions and swap transactions. As a result, income dividends and capital gain distributions declared during a fiscal period for federal tax purposes may differ significantly from the net investment income and realized capital gain reported on each Fund’s financial statements presented under U.S. GAAP. In general, to the extent that any differences which are permanent in nature result in over distributions to shareholders, the amount of the over distribution may be reported as return of capital. Temporary differences do not require reclassification. See note 8 for further details.
| 10. | Derivative instruments and hedging activities |
FASB ASC Topic 815-10 (“Topic 815-10”), Disclosures about Derivative Instruments and Hedging Activities, required disclosures to enable investors to better understand how and why the Funds use derivative instruments, how these derivative instruments are accounted for and their effects on the Funds’ financial position and results of operations.
None of the derivatives held in the Funds have been designated as hedging instruments under Topic 815-10. A discussion of the strategies for these derivatives and their counterparty credit risk can be found below.
In accordance with Topic 815-10, the Funds record their trading-related derivative activities on a fair value basis (as described in note 4). Fair values represent the amount at which the instrument could be exchanged in a current transaction between willing parties, other than in a forced or liquidation sale.
The following disclosures contain information on how and why the Funds used derivative financial instruments; the credit-risk-related contingent features in certain derivative financial instruments; and how derivative financial instruments affected the Funds’ financial position, results of operations and cash flows. The location and fair value of these instruments on the Statements of Assets and Liabilities and the realized, and changes in unrealized, gains and losses on the Statements of Operations, are included in tables following each Fund’s Schedule of Investments and are categorized by type of financial derivative contract.
(a) Forward foreign currency exchange contracts
A forward foreign exchange contract involves an obligation to purchase or sell a specific currency at a future date at a price set at the time the contract is made. The Funds may enter into forward foreign currency exchange contracts in connection with settling planned purchases or sales of securities, as part of an investment strategy to protect against uncertainty in the level of future foreign exchange rates in the purchase and sale of securities, or to gain or limit exposure to foreign currencies. All forward foreign currency exchange contracts are valued daily at the applicable exchange rates. Any resulting unrealized gains or losses are recorded in net change in unrealized appreciation/(depreciation) on forward foreign currency exchange contracts
164
ASHMORE FUNDS
NOTES TO FINANCIAL STATEMENTS (CONTINUED)
As of October 31, 2020
in the Statements of Operations. A Fund records realized gains or losses at the time the forward foreign exchange contract is offset by entering into a closing transaction with the same counterparty or is extinguished by delivery of the currency. Realized gains or losses, if any, are included in net realized gain/(loss) on forward foreign exchange contracts in the Statements of Operations.
Risks arise upon entering into these contracts from the potential inability of counterparties to meet the terms of their contracts and from unanticipated movements in the value of a foreign currency relative to the United States Dollar. The contractual amounts of forward foreign currency exchange contracts do not necessarily represent the amounts potentially subject to risk. The measurement of the risks associated with these instruments should be considered in light of all related and offsetting transactions. The Funds bear market risk from changes in foreign currency exchange rates and credit risk if the counterparty fails to perform. Further information on the impact of these positions on the Funds’ financial statements can be found in the notes to the Schedules of Investments.
During the year ended October 31, 2020, the Ashmore Emerging Markets Total Return Fund, Ashmore Emerging Markets Local Currency Bond Fund, Ashmore Emerging Markets Corporate Income Fund, Ashmore Emerging Markets Active Equity Fund, Ashmore Emerging Markets Equity Fund, and Ashmore Emerging Markets Investment Grade Income Fund had average quarterly contract notional exposures of $473,648,051, $25,528,408, $1,594,947, $674,078, $8,688, and $312,819, respectively, related to forward foreign currency exchange contracts.
(b) Swap Agreements
During the reporting period, certain Funds entered into swap agreements, which are arrangements between two parties to exchange cash flows based on a notional principal amount. Swap agreements are executed in amultilateral or other trade facility platform such as a registered exchange (“centrally cleared swaps”). Swap agreements are recorded at their fair value. The fair value is based on quoted market prices or prices obtained from a third party provider at the date of the Statements of Assets and Liabilities without any deduction for estimated future selling costs. Swap agreements are marked tomarket daily and the change in fair value, if any, is recorded as unrealized gain or loss. Payments made or received are recorded as part of realized gains and losses. Daily changes in valuation of centrally cleared swaps, if any, are recorded as a receivable or payable for the change in value as appropriate (“variation margin”) on the Statement of Assets and Liabilities.
The periodic payments on the swap agreements entered into by the Funds are reflected in the Statement of Operations within net realized gain/(loss) on interest rate swap contracts. Changes in the fair value are reflected in the Statements of Operations within net change in unrealized appreciation/(depreciation) on interest rate and centrally cleared swap contracts in the period in which they occur. Certain Funds could be exposed to credit or market risk due to unfavorable changes in the fluctuation of interest rates or if the counterparty defaults on its obligations to perform.
During the year ended October 31, 2020, the Ashmore Emerging Markets Total Return Fund and Ashmore Emerging Markets Local Currency Bond Fund had average quarterly notional exposures of $43,975,530 and $5,588,158, respectively, related to interest rate swap agreements.
The Funds may enter into transactions subject to enforceable netting agreements or other similar arrangements (“netting agreements”). Generally, netting agreements allow the Funds to offset any exposure to a specific counterparty with any collateral received or delivered to that counterparty based on the terms of the agreements. Generally, the Funds manage their cash collateral and securities collateral on a counterparty basis. No amounts have been offset in the Statements of Assets and Liabilities.
Offsetting of Financial Assets and Derivative Assets as of October 31, 2020:
(a) Exchange-Traded:
165
ASHMORE FUNDS
NOTES TO FINANCIAL STATEMENTS (CONTINUED)
As of October 31, 2020
Centrally Cleared Swaps
| | | | | | | | | | | | | | | | | | | | |
| |
| Ashmore Emerging Markets Total Return Fund | |
| |
| Counterparty | | Gross Amounts of Derivatives Assets Presented in the Statement of Assets and Liabilities | | | Gross Amounts of Derivatives Liabilities Presented in the Statement of Assets and Liabilities | | | Net Amounts | | | Collateral (Received) Paid | | | Net Exposure | |
| |
Merrill Lynch | | $ | 207 | | | $ | — | | | $ | 207 | | | $ | — | | | $ | 207 | |
| | | | | | | | | | | | | | | | | | | | |
Total | | $ | 207 | | | $ | — | | | $ | 207 | | | $ | — | | | $ | 207 | |
| | | | | | | | | | | | | | | | | | | | |
| | | | | |
| | | | | | | | | | | | | | | | | | | | |
| |
| Ashmore Emerging Markets Local Currency Bond Fund | |
| |
| Counterparty | | Gross Amounts of Derivatives Assets Presented in the Statement of Assets and Liabilities | | | Gross Amounts of Derivatives Liabilities Presented in the Statement of Assets and Liabilities | | | Net Amounts | | | Collateral (Received) Paid | | | Net Exposure | |
| |
Merrill Lynch | | $ | 115 | | | $ | — | | | $ | 115 | | | $ | — | | | $ | 115 | |
| | | | | | | | | | | | | | | | | | | | |
Total | | $ | 115 | | | $ | — | | | $ | 115 | | | $ | — | | | $ | 115 | |
| | | | | | | | | | | | | | | | | | | | |
(b) Over-the-Counter Financial Derivative Instruments:
Forward Currency Contracts and Interest Rate Swap Contracts
| | | | | | | | | | | | | | | | |
| |
| Ashmore Emerging Markets Total Return Fund | |
| |
| Counterparty | | Gross Amounts of Derivatives Assets Presented in the Statement of Assets and Liabilities | | | Derivatives available for offset | | | Collateral Received | | | Net Amount Due From Counterparty | |
| |
ANZ | | $ | 17,626 | | | $ | (17,398 | ) | | $ | — | | | $ | 228 | |
Barclays | | | 493,730 | | | | (493,730 | ) | | | — | | | | — | |
BNP Paribas | | | 373,539 | | | | (373,539 | ) | | | — | | | | — | |
Citibank | | | 37,998 | | | | (37,998 | ) | | | — | | | | — | |
Credit Suisse | | | 3,149 | | | | — | | | | — | | | | 3,149 | |
Deutsche Bank | | | 506,673 | | | | (492,309 | ) | | | — | | | | 14,364 | |
HSBC Bank | | | 1,768,799 | | | | (1,205,573 | ) | | | — | | | | 563,226 | |
JP Morgan | | | 141,305 | | | | (141,305 | ) | | | — | | | | — | |
Merrill Lynch | | | 189,495 | | | | (189,495 | ) | | | — | | | | — | |
Morgan Stanley | | | 105,861 | | | | (14,387 | ) | | | — | | | | 91,474 | |
Standard | | | | | | | | | | | | | | | | |
Chartered | | | 248,785 | | | | (88,120 | ) | | | — | | | | 160,665 | |
State Street | | | 15,359 | | | | (15,359 | ) | | | — | | | | — | |
UBS | | | 617 | | | | (617 | ) | | | — | | | | — | |
| | | | | | | | | | | | | | | | |
Total | | $ | 3,902,936 | | | $ | (3,069,830 | ) | | $ | — | | | $ | 833,106 | |
| | | | | | | | | | | | | | | | |
166
ASHMORE FUNDS
NOTES TO FINANCIAL STATEMENTS (CONTINUED)
As of October 31, 2020
| | | | | | | | | | | | | | | | |
| |
| Ashmore Emerging Markets Total Return Fund | |
| |
| Counterparty | | Gross Amounts of Derivatives Liabilities Presented in the Statement of Assets and Liabilities | | | Derivatives available for offset | | | Collateral Pledged | | | Net Amount Due From Counterparty | |
| |
ANZ | | $ | 17,398 | | | $ | (17,398 | ) | | $ | — | | | $ | — | |
Barclays | | | 606,251 | | | | (493,730 | ) | | | — | | | | 112,521 | |
BNP Paribas | | | 478,789 | | | | (373,539 | ) | | | — | | | | 105,250 | |
Citibank | | | 602,657 | | | | (37,998 | ) | | | — | | | | 564,659 | |
Deutsche Bank | | | 492,309 | | | | (492,309 | ) | | | — | | | | — | |
HSBC Bank | | | 1,205,573 | | | | (1,205,573 | ) | | | — | | | | — | |
JP Morgan | | | 238,859 | | | | (141,305 | ) | | | — | | | | 97,554 | |
Merrill Lynch | | | 473,883 | | | | (189,495 | ) | | | — | | | | 284,388 | |
Morgan Stanley | | | 14,387 | | | | (14,387 | ) | | | — | | | | — | |
Standard | | | | | | | | | | | | | | | | |
Chartered | | | 88,120 | | | | (88,120 | ) | | | — | | | | — | |
State Street | | | 57,180 | | | | (15,359 | ) | | | — | | | | 41,821 | |
UBS | | | 9,016 | | | | (617 | ) | | | — | | | | 8,399 | |
| | | | | | | | | | | | | | | | |
Total | | $ | 4,284,422 | | | $ | (3,069,830 | ) | | $ | — | | | $ | 1,214,592 | |
| | | | | | | | | | | | | | | | |
| | | | |
| | | | | | | | | | | | | | | | |
| |
| Ashmore Emerging Markets Local Currency Bond Fund | |
| |
| Counterparty | | Gross Amounts of Derivatives Assets Presented in the Statement of Assets
and Liabilities | | | Derivatives available for offset | | | Collateral Received | | | Net Amount Due From Counterparty | |
| |
Barclays | | $ | 38,943 | | | $ | (38,943 | ) | | $ | — | | | $ | — | |
BNP Paribas | | | 8,782 | | | | (8,782 | ) | | | — | | | | — | |
Citibank | | | 410 | | | | (410 | ) | | | — | | | | — | |
Deutsche Bank | | | 53,585 | | | | (53,585 | ) | | | — | | | | — | |
HSBC Bank | | | 101,286 | | | | (36,057 | ) | | | — | | | | 65,229 | |
JP Morgan | | | 6,013 | | | | (6,013 | ) | | | — | | | | — | |
Merrill Lynch | | | 5,342 | | | | (5,342 | ) | | | — | | | | — | |
Morgan Stanley | | | 34 | | | | (34 | ) | | | — | | | | — | |
Standard | | | | | | | | | | | | | | | | |
Chartered | | | 7,254 | | | | (7,254 | ) | | | — | | | | — | |
UBS | | | 27 | | | | (27 | ) | | | — | | | | — | |
| | | | | | | | | | | | | | | | |
Total | | $ | 221,676 | | | $ | (156,447 | ) | | $ | — | | | $ | 65,229 | |
| | | | | | | | | | | | | | | | |
| | | | |
| | | | | | | | | | | | | | | | |
| |
| Ashmore Emerging Markets Local Currency Bond Fund | |
| |
| Counterparty | | Gross Amounts of Derivatives Liabilities Presented in the Statement of Assets and Liabilities | | | Derivatives available for offset | | | Collateral Pledged | | | Net Amount Due From Counterparty | |
| |
ANZ | | $ | 416 | | | $ | — | | | $ | — | | | $ | 416 | |
Barclays | | | 58,576 | | | | (38,943 | ) | | | — | | | | 19,633 | |
BNP Paribas | | | 16,329 | | | | (8,782 | ) | | | — | | | | 7,547 | |
Citibank | | | 30,443 | | | | (410 | ) | | | — | | | | 30,033 | |
Credit Suisse | | | 17 | | | | — | | | | — | | | | 17 | |
167
ASHMORE FUNDS
NOTES TO FINANCIAL STATEMENTS (CONTINUED)
As of October 31, 2020
| | | | | | | | | | | | | | | | |
| Ashmore Emerging Markets Local Currency Bond Fund | |
| Counterparty | | Gross Amounts of Derivatives Liabilities Presented in the Statement of Assets and Liabilities | | | Derivatives available for offset | | | Collateral Pledged | | | Net Amount Due From Counterparty | |
Deutsche Bank | | $ | 54,798 | | | $ | (53,585 | ) | | $ | — | | | $ | 1,213 | |
HSBC Bank | | | 36,057 | | | | (36,057 | ) | | | — | | | | — | |
JP Morgan | | | 10,128 | | | | (6,013 | ) | | | — | | | | 4,115 | |
Merrill Lynch | | | 18,941 | | | | (5,342 | ) | | | — | | | | 13,599 | |
Morgan Stanley | | | 2,442 | | | | (34 | ) | | | — | | | | 2,408 | |
Santander | | | 3,987 | | | | — | | | | — | | | | 3,987 | |
Standard | | | | | | | | | | | | | | | | |
Chartered | | | 7,779 | | | | (7,254 | ) | | | — | | | | 525 | |
State Street | | | 15 | | | | — | | | | — | | | | 15 | |
UBS | | | 2,044 | | | | (27 | ) | | | — | | | | 2,017 | |
| | | | | | | | | | | | | | | | |
Total | | $ | 241,972 | | | $ | (156,447 | ) | | $ | — | | | $ | 85,525 | |
| | | | | | | | | | | | | | | | |
| | | | | | | | | | | | | | | | |
| Ashmore Emerging Markets Corporate Income Fund | |
| Counterparty | | Gross Amounts of Derivatives Assets Presented in the Statement of Assets and Liabilities | | | Derivatives available for offset | | | Collateral Received | | | Net Amount Due From Counterparty | |
Citibank | | $ | 4,587 | | | $ | — | | | $ | — | | | $ | 4,587 | |
JP Morgan | | | 6,379 | | | | — | | | | — | | | | 6,379 | |
| | | | | | | | | | | | | | | | |
Total | | $ | 10,966 | | | $ | — | | | $ | — | | | $ | 10,966 | |
| | | | | | | | | | | | | | | | |
| | | | | | | | | | | | | | | | |
| Ashmore Emerging Markets Active Equity Fund | |
| Counterparty | | Gross Amounts of
Derivatives Assets Presented in the Statement of Assets and Liabilities | | | Derivatives available for offset | | | Collateral Received | | | Net Amount Due From Counterparty | |
Deutsche Bank | | $ | 1,174 | | | $ | — | | | $ | — | | | $ | 1,174 | |
JP Morgan | | | 8,433 | | | | — | | | | — | | | | 8,433 | |
| | | | | | | | | | | | | | | | |
Total | | $ | 9,607 | | | $ | — | | | $ | — | | | $ | 9,607 | |
| | | | | | | | | | | | | | | | |
| | | | | | | | | | | | | | | | |
| Ashmore Emerging Markets Investment Grade Income Fund | |
| Counterparty | | Gross Amounts of
Derivatives Assets Presented in the Statement of Assets and Liabilities | | | Derivatives available for offset | | | Collateral
Received | | | Net Amount Due From Counterparty | |
Citibank | | $ | 4,788 | | | $ | — | | | $ | — | | | $ | 4,788 | |
| | | | | | | | | | | | | | | | |
Total | | $ | 4,788 | | | $ | — | | | $ | — | | | $ | 4,788 | |
| | | | | | | | | | | | | | | | |
168
ASHMORE FUNDS
NOTES TO FINANCIAL STATEMENTS (CONTINUED)
As of October 31, 2020
Investment management fees
The Trust has an Investment Management Agreement (the “Agreement”) with the Investment Manager, with whom certain Trustees and Officers of the Trust are affiliated, to furnish investment management services to the Funds. Under the terms of the Agreement, the Trust, on behalf of the Funds, compensates the Investment Manager for its investment management services at the following rates, based on each Fund’s average daily net assets:
| | | | |
Fund | | Rate | |
Ashmore Emerging Markets Total Return Fund | | | 1.00% | |
Ashmore Emerging Markets Local Currency Bond Fund | | | 0.95% | |
Ashmore Emerging Markets Corporate Income Fund | | | 1.15% | |
Ashmore Emerging Markets Short Duration Fund | | | 0.65% | |
Ashmore Emerging Markets Active Equity Fund | | | 1.00% | |
Ashmore Emerging Markets Small-Cap Equity Fund | | | 1.50% | |
Ashmore Emerging Markets Frontier Equity Fund | | | 1.50% | |
Ashmore Emerging Markets Equity Fund | | | 1.15% | |
Ashmore Emerging Markets Equity ESG Fund | | | 1.15% | |
Ashmore Emerging Markets Short Duration Select Fund | | | 0.65% | |
Ashmore Emerging Markets Investment Grade Income Fund | | | 0.70% | |
The Investment Manager has contractually agreed to waive its fees or reimburse each Fund for other expenses until February 28, 2021 (June 30, 2021 with respect to the Ashmore Emerging Markets Short Duration Select Fund and September 30, 2021 with respect to the Ashmore Emerging Markets Investment Grade Income Fund) to the extent that total operating expenses (other than acquired fund fees and expenses, interest expenses, taxes, extraordinary expenses and certain credits and offset arrangements) for each class of shares of each Fund exceed the rates in the table below, based on each Fund’s average daily net assets. The expense limitation arrangement may be terminated by the Board at any time.
| | | | | | |
| Fund | | Class A | | Class C | | Institutional Class |
| Ashmore Emerging Markets Total Return Fund | | 1.27% | | 2.02% | | 1.02% |
| Ashmore Emerging Markets Local Currency Bond Fund | | 1.22% | | 1.97% | | 0.97% |
| Ashmore Emerging Markets Corporate Income Fund | | 1.42% | | 2.17% | | 1.17% |
| Ashmore Emerging Markets Short Duration Fund | | 0.92% | | 1.67% | | 0.67% |
| Ashmore Emerging Markets Active Equity Fund | | 1.27% | | 2.02% | | 1.02% |
| Ashmore Emerging Markets Small-Cap Equity Fund | | 1.77% | | 2.52% | | 1.52% |
| Ashmore Emerging Markets Frontier Equity Fund | | 1.77% | | 2.52% | | 1.52% |
| Ashmore Emerging Markets Equity Fund | | 1.42% | | 2.17% | | 1.17% |
| Ashmore Emerging Markets Equity ESG Fund | | 1.42% | | 2.17% | | 1.17% |
| Ashmore Emerging Markets Short Duration Select Fund | | 0.92% | | 1.67% | | 0.67% |
169
ASHMORE FUNDS
NOTES TO FINANCIAL STATEMENTS (CONTINUED)
As of October 31, 2020
| | | | | | | | |
| Fund | | Class A | | Class C | | Institutional Class |
| Ashmore Emerging Markets Investment Grade Income Fund | | | 0.97% | | | 1.72% | | 0.72% |
Any such waiver or reimbursement is subject to the Investment Manager’s right to recover amounts waived or reimbursed to the extent actual fees and expenses for a future fiscal period are less than each Fund’s expense limitation cap, provided, however, that the Investment Manager shall only be entitled to recover such amounts waived or reimbursed during the previous three fiscal years. The amounts recaptured pursuant to the expense limitation agreement will be limited to the lesser of (1) the expense limitation amount that was in effect at the time of the waiver or reimbursement or (2) the expense limitation amount that is in effect at the time of recapture. The total amounts subject to recovery in fiscal years are shown below:
| | | | | | | | | | | | | | | | |
| Fund | | 2021 | | | 2022 | | | 2023 | | | Total | |
| Ashmore Emerging Markets Total Return Fund | | $ | 1,258,875 | | | $ | 1,264,520 | | | $ | 1,453,580 | | | $ | 3,976,975 | |
| Ashmore Emerging Markets Local Currency Bond Fund | | | 247,985 | | | | 209,246 | | | | 198,265 | | | | 655,496 | |
| Ashmore Emerging Markets Corporate Income Fund | | | 411,298 | | | | 398,019 | | | | 404,041 | | | | 1,213,358 | |
| Ashmore Emerging Markets Short Duration Fund | | | 387,123 | | | | 1,013,327 | | | | 973,684 | | | | 2,374,134 | |
| Ashmore Emerging Markets Active Equity Fund | | | 131,123 | | | | 133,595 | | | | 171,181 | | | | 435,899 | |
| Ashmore Emerging Markets Small-Cap Equity Fund | | | 227,807 | | | | 161,504 | | | | 147,694 | | | | 537,005 | |
| Ashmore Emerging Markets Frontier Equity Fund | | | 399,730 | | | | 314,851 | | | | 315,267 | | | | 1,029,848 | |
| Ashmore Emerging Markets Equity Fund | | | 190,079 | | | | 157,757 | | | | 222,597 | | | | 570,433 | |
| Ashmore Emerging Markets Equity ESG Fund | | | — | | | | — | | | | 173,755 | | | | 173,755 | |
| Ashmore Emerging Markets Short Duration Select Fund | | | — | | | | — | | | | 150,410 | | | | 150,410 | |
| Ashmore Emerging Markets Investment Grade Income Fund | | | — | | | | — | | | | 88,408 | | | | 88,408 | |
Distribution and Servicing fees
The Funds have adopted Amended Plans of Distribution and Servicing Fees pursuant to Rule 12b-1 under the 1940 Act (“Distribution and Servicing Fee Plans”). Under the Distribution and Servicing Fee Plans, each of the Funds may pay fees to the distributor on an ongoing basis as compensation for the services the distributor renders and the expenses it bears in connection with the sale and distribution of Fund shares (“distribution fees”) and/or in connection with personal services rendered to Fund shareholders and the maintenance of shareholder accounts (“servicing fees”). Class A and C shares each have a separate 12b-1 Plan. Class A shares pay only servicing fees. Class C shares pay both distribution and servicing fees. The following table lists the maximum annual rates at which the distribution and/or servicing fees may be paid under each 12b-1 Plan (calculated as a percentage of a Fund’s average daily net assets attributable to the particular class of shares):
| | | | |
| | | Servicing Fee | | Distribution Fee |
Class A shares | | 0.25% | | None |
Class C shares | | 0.25% | | 0.75% |
170
ASHMORE FUNDS
NOTES TO FINANCIAL STATEMENTS (CONTINUED)
As of October 31, 2020
Cross Trades
The 1940 Act prohibits the Funds and their affiliates from knowingly selling any security or other property to the Funds (other than securities of which the buyer is the issuer), or buying any security (other than securities of which the seller is the issuer) or other property from the Funds. Rule 17a-7 under the 1940 Act provides relief from these prohibitions for various types of “cross trades” and similar transactions that may benefit shareholders by allowing the participating funds or accounts to avoid brokerage commissions and other transaction costs of trades.
During the year ended October 31, 2020, the following Funds bought and/or sold securities from an account or accounts that were also advised by the Trust’s investment adviser or its affiliates:
| | | | | | | | |
Fund | | Purchases | | | Sales | |
Ashmore Emerging Markets Total Return Fund | | $ | 64,252,748 | | | $ | 14,419,097 | |
Ashmore Emerging Markets Corporate Income Fund | | | 5,009,570 | | | | 34,385,634 | |
Ashmore Emerging Markets Short Duration Fund | | | 22,107,548 | | | | 177,181,972 | |
Ashmore Emerging Markets Short Duration Select Fund | | | 297,360 | | | | — | |
Ashmore Emerging Markets Investment Grade Income Fund | | | 300,506 | | | | — | |
As of October 31, 2020, Ashmore Investments UK Limited owned the following percentages of the outstanding shares of each Fund:
| | | | | | | | | | | | |
| Fund | | Class A | | | Class C | | | Institutional Class | |
| Ashmore Emerging Markets Active Equity Fund | | | — | % | | | 100.00 | % | | | — | % |
| Ashmore Emerging Markets Frontier Equity Fund | | | — | % | | | — | % | | | 6.19 | % |
| Ashmore Emerging Markets Equity Fund | | | — | % | | | 100.00 | % | | | 41.54 | % |
| Ashmore Emerging Markets Equity ESG Fund | | | 100.00 | % | | | 100.00 | % | | | 100.00 | % |
| Ashmore Emerging Markets Short Duration Select Fund | | | 100.00 | % | | | 100.00 | % | | | 100.00 | % |
| Ashmore Emerging Markets Investment Grade Income Fund | | | 100.00 | % | | | 100.00 | % | | | 100.00 | % |
In addition to the Ashmore Investments UK Limited ownership, shown in the table above, the following Funds had other investors owning of record or known by the Funds to own beneficially greater than 5% of the outstanding shares of such Funds:
| | | | | | | | | | |
Fund | | Class | | | | # of Investors Owning > 5% of outstanding Shares | | | | % of Ownership by Investor |
| Ashmore Emerging Markets Total Return Fund | | Class A | | | | 9 | | | | 10.09%, 9.73%, 9.58%, 9.45%, 8.93%, 8.93%, 8.39%, 6.05%, 5.71% |
| | | | | | |
| | | Class C | | | | 4 | | | | 25.90%, 17.83%, 7.29%, 5.60% |
| | | | | | |
| | | Institutional
Class | | | | 3 | | | | 22.77%, 13.04%, 9.96% |
171
ASHMORE FUNDS
NOTES TO FINANCIAL STATEMENTS (CONTINUED)
As of October 31, 2020
| | | | | | | | | | |
Fund | | Class | | | | # of Investors Owning > 5% of outstanding Shares | | | | % of Ownership by Investor |
| | | | | | |
| Ashmore Emerging Markets Local Currency Bond Fund | | Class A | | | | 4 | | | | 59.44%, 16.36%, 11.80%, 5.24% |
| | | | | | |
| | | Class C | | | | 3 | | | | 73.85%, 16.35%, 9.80% |
| | | | | | |
| | | Institutional
Class | | | | 3 | | | | 73.86%, 15.52%, 8.92% |
| | | | | | |
| Ashmore Emerging Markets Corporate Income Fund | | Class A | | | | 4 | | | | 21.40%, 19.77%, 19.59%, 19.10% |
| | | | | | |
| | | Class C | | | | 3 | | | | 38.52%, 25.08%, 15.21% |
| | | | | | |
| | | Institutional
Class | | | | 3 | | | | 16.11%, 5.58%, 5.12% |
| | | | | | |
| Ashmore Emerging Markets Short Duration Fund | | Class A | | | | 4 | | | | 49.43%, 21.99%, 9.83%, 6.49% |
| | | | | | |
| | | Class C | | | | 2 | | | | 81.90%, 6.79% |
| | | | | | |
| | | Institutional
Class | | | | 6 | | | | 21.06%, 19.31%, 14.61%, 13.20%, 7.62%, 7.48% |
| | | | | | |
| Ashmore Emerging Markets Active Equity Fund | | Class A | | | | 2 | | | | 62.29%, 34.40% |
| | | | | | |
| | | Institutional
Class | | | | 3 | | | | 41.41%, 36.85%, 5.53% |
| | | | | | |
| Ashmore Emerging Markets Small-Cap Equity Fund | | Class A | | | | 5 | | | | 53.01%, 12.01%, 10.45%, 9.30%, 5.88% |
| | | | | | |
| | | Class C | | | | 4 | | | | 76.05%, 8.43%, 7.09%, 6.34% |
| | | | | | |
| | | Institutional
Class | | | | 5 | | | | 24.10%, 15.83%, 13.99%, 11.87%, 10.00% |
| | | | | | |
| Ashmore Emerging Markets Frontier Equity Fund | | Class A | | | | 3 | | | | 56.88%, 18.03%, 14.56% |
| | | | | | |
| | | Class C | | | | 3 | | | | 65.33%, 17.18%, 14.29% |
| | | | | | |
| | | Institutional
Class | | | | 3 | | | | 40.26%, 34.02%, 5.99% |
172
ASHMORE FUNDS
NOTES TO FINANCIAL STATEMENTS (CONTINUED)
As of October 31, 2020
| | | | | | | | | | |
Fund | | Class | | | | # of Investors Owning > 5% of outstanding Shares | | | | % of Ownership by Investor |
| | | | | | |
| Ashmore Emerging Markets Equity Fund | | Class A | | | | 2 | | | | 81.83%, 12.49% |
| | | | | | |
| | | Institutional
Class | | | | 3 | | | | 34.02%, 10.27%, 6.45% |
In relation to its investments, some of the Funds of the Trust may from time to time agree to indemnify and/or pre-fund trustees or other agents, either solely or alongside other creditors on a several basis. Generally, such agreements do not have a termination date. The Trustees are not aware of and do not currently expect any claims to be made against the Funds under any such indemnity or pre-funding agreements.
The Funds have submitted a proof of claim in connection with the settlement of a securities class action lawsuit brought by certain investors against Petróleo Brasileiro S.A. and certain of its affiliates, underwriters, external auditors, and current and former directors and officers. A gain will not be recorded with regard to this matter until it is settled, and is expected to be immaterial.
The Funds have submitted a claim in connection with the settlement of a securities class action lawsuit preliminarily approved by the U.S. District Court for the Southern District of New York captioned in re Foreign Exchange Benchmark Rates Antitrust Litigation. A gain will not be recorded with regard to this matter until it is settled.
| 14. | New accounting pronouncements |
On March 30, 2017, the FASB issued Accounting Standards Update (ASU) 2017-08 “Premium Amortization on Purchased Callable Debt Securities”, which amends the amortization period for certain purchased callable debt securities held at a premium by shortening such period to the earliest call date. The new guidance requires an entity to amortize the premium on a callable debt security within its scope to the earliest call date. If the call option is not exercised at the earliest call date, the yield is reset to the effective yield using the payment terms of the security. If there are no other call dates, any excess of the amortized cost basis over the par amount will be amortized to maturity. Discounts on purchased callable debt securities will continue to be amortized to the security’s maturity date. The ASU 2017-08 is effective for public business entities for fiscal years, and interim periods within those fiscal years, beginning after December 15, 2018. If an entity early adopts the ASU in an interim period, any adjustments must be reflected as of the beginning of the fiscal year that includes that interim period. The Funds have adopted the ASU. The adoption of the ASU did not have a material impact on the Funds’ financial statements.
On August 28, 2018, the FASB issued Accounting Standards Update (“ASU”) 2018-13, “Disclosure Framework —Changes to the Disclosure Requirements for Fair Value Measurement,” which amends the fair value measurement disclosure requirements of ASC 820. The amendments of ASU 2018-13 include new, eliminated, and modified disclosure requirements of ASC 820. In addition, the amendments clarify that materiality is an appropriate consideration of entities when evaluating disclosure requirements. The ASU is effective for all entities for fiscal years beginning after December 15, 2019, including interim periods therein. Early adoption is permitted for any eliminated or modified disclosures upon issuance of this ASU. The Funds have early adopted certain provisions of ASU 2018-13 for these financial statements.
173
ASHMORE FUNDS
NOTES TO FINANCIAL STATEMENTS (CONTINUED)
As of October 31, 2020
Certain of the Funds’ investments, payment obligations, and financing terms may be based on floating rates such as LIBOR, Euro Interbank Offered Rate, and other similar types of reference rates (each, a “Reference Rate”). On July 27, 2017, the Chief Executive of the UK Financial Conduct Authority (“FCA”), which regulates LIBOR, announced that the FCA will no longer persuade nor compel banks to submit rates for the calculation of LIBOR and certain other Reference Rates after 2021. Such announcement indicates that the continuation of LIBOR and other Reference Rates on the current basis cannot and will not be guaranteed after 2021. The transition away from Reference Rates may lead to increased volatility and illiquidity in markets that are tied to such Reference Rates and reduced values of Reference Rate-related instruments. This announcement and any additional regulatory or market changes that occur as a result of the transition away from Reference Rates may have an adverse impact on a Fund’s investments, performance, or financial condition.
COVID-19, the novel respiratory disease also known as “coronavirus”, which was first detected in China in December 2019 and subsequently spread internationally, has resulted in closing borders, enhanced health screenings, healthcare service shortages, quarantines, cancelations, disruptions to supply chains and vendor and customer activity, as well as general concern and uncertainty. The impact of the COVID-19 outbreak could negatively affect the global economy, the economies of individual countries, and the financial performance of individual issuers, sectors, industries, asset classes, and markets in significant and unforseen ways and may continue to do so in the future. Health crises caused by the coronavirus outbreak may exacerbate other pre-existing political, social and economic risks. The effects of the outbreak in developing or emerging market countries may be greater due to less established health care systems. The COVID-19 pandemic and its effects may be short term or may last for an extended period of time, and in either case could result in significant market volatility, exchange trading suspensions and closures, declines in global financial markets, higher default rates, and a substantial economic downturn or recession. The foregoing could impair the Funds’ ability to maintain operational standards (such as with respect to satisfying redemption requests), disrupt the operations of the Funds’ service providers, adversely affect the value and liquidity of the Funds’ investments, and negatively impact the Funds’ performance and your investment in a Fund.
The Trust has evaluated subsequent events for the Funds through the date the financial statements were issued, and has concluded that there are no identified subsequent events relevant for financial statement adjustment or disclosure.
174
ASHMORE FUNDS
ADVISORY AGREEMENT APPROVAL
As of October 31, 2020 (Unaudited)
ADVISORY AGREEMENT APPROVAL FOR ASHMORE EMERGING MARKETS INVESTMENT GRADE INCOME FUND
At a special meeting of the Board of Trustees of Ashmore Funds (the “Trust”) held on August 31, 2020, the Board, including a majority of the Trustees who are not “interested persons” of the Trust within the meaning of the Investment Company Act of 1940, as amended (the “1940 Act”) (the “Independent Trustees”), voting separately, considered and approved the Investment Management Agreement (the “Agreement”) between Ashmore Investment Advisors Limited (“AIAL”) and the Trust, on behalf of Ashmore Emerging Markets Investment Grade Income Fund (the “Fund”). In determining to approve the Agreement for an initial term, the Trustees considered all factors that they believed, in light of the legal advice furnished to them and their own business judgment, to be relevant to the interests of shareholders, including those listed below.
In evaluating the terms of the Agreement, the Board did not identify any single factor as controlling, and individual members of the Board did not necessarily attribute the same weight or importance to each factor, nor are the items described herein all-encompassing of the matters considered by the Board. Throughout their review of the Agreement, the Independent Trustees were assisted by their own Independent Trustee legal counsel. The Independent Trustees had formally requested through their legal counsel, and AIAL had provided, certain information the Independent Trustees considered relevant to their evaluation. The Contracts Review Committee, which is comprised of all of the Independent Trustees, discussed the information on different occasions, with and without representatives of AIAL present.
Among the information and factors considered by the Board in evaluating the Agreement were the following:
NATURE, QUALITY AND EXTENT OF INVESTMENT MANAGEMENT SERVICES
The Board examined the nature, quality and extent of the services expected to be provided to the Fund by AIAL.
AIAL’s Services
The Board considered information regarding the overall organization and resources of AIAL, including information regarding senior management, portfolio managers and other personnel expected to provide investment management, administrative and other services to the Fund. The Board reviewed AIAL’s key personnel who would provide investment management services to the Fund, as well as the fact that, under the Agreement, AIAL would have the authority and responsibility, subject to the Board’s oversight, to make and execute investment decisions for the Fund within the framework of the Fund’s investment policies and restrictions. The Board considered the investment performance of AIAL, its affiliates and its portfolio management team, including, for purposes of considering the investment skill and experience of the Fund’s portfolio managers, performance data showing the portfolio management team’s capabilities in managing other pooled investment vehicles that use investment strategies similar to those proposed for the Fund.
The Board considered that AIAL’s duties would include: (i) investment research and selection; (ii) adherence to (and monitoring compliance with) the Fund’s investment policies and restrictions, the 1940 Act and other relevant laws; and (iii) furnishing office space and equipment, providing bookkeeping and clerical services (excluding determination of net asset value and shareholder accounting services) and paying all salaries, fees and expenses of officers and Trustees of the Trust who are affiliated with AIAL (except to the extent such salaries, fees and expenses are paid by another AIAL affiliate other than the Trust or the Fund). The Board also evaluated the significant compliance resources available to and expected to be utilized by AIAL. The Board considered that AIAL would support the Fund’s compliance control structure, and, in particular, the resources that would be devoted by AIAL in support of the Fund’s obligations pursuant to Rule 38a-1 under the 1940 Act and the Fund’s liquidity risk management program. The Board also considered AIAL’s investments in business continuity planning designed to benefit the Fund, and the implementation of AIAL’s business continuity planning due to the Coronavirus Disease 2019 pandemic.
The Board concluded that it was satisfied with the nature, extent and quality of services expected to be provided to the Fund by AIAL, and that there was a reasonable basis on which to conclude that the Fund would benefit from the services provided by AIAL.
175
ASHMORE FUNDS
ADVISORY AGREEMENT APPROVAL (CONTINUED)
As of October 31, 2020 (Unaudited)
INVESTMENT MANAGEMENT FEES AND COST OF SERVICES
The Board also considered the contractual and actual investment management fees to be paid by the Fund to AIAL. In doing so, the Board compared the proposed contractual and actual investment management fees and overall net expense ratios (represented by the Fund’s Institutional Shares) to those of an appropriate group of peer funds (“Peer Group”) as determined by FUSE Research Network, LLC (“Fuse”). As part of this review, the Board considered the composition of the Peer Group and the methodology used to select the Peer Group. In considering the reasonableness of the Fund’s proposed contractual investment management fees and projected total expense ratios, the Board considered that the Fund’s contractual investment management fees ranked tenth out of twelve and its estimated total net expense ratios ranked second out of twelve in its Peer Group. The Board considered the inherent limitations of such comparisons in light of uncertainty as to how the fees of other funds in the Peer Group are set and potentially material differences between the Fund and the Peer Group. The Board also considered and took into account AIAL’s undertaking to waive fees and/or reimburse expenses so as to otherwise limit the Fund’s ordinary operating expenses until at least September 30, 2021.
The Board reviewed AIAL’s projected costs and profitability as presented by it in serving as investment adviser to the Fund. The Board noted that the Fund was not expected to be profitable to AIAL initially.
In evaluating the terms of the Agreement, the Board also considered the other benefits that may inure to AIAL as a result of their relationship with the Fund, such as the reputational benefit derived from serving as investment adviser to the Fund.
In light of the information provided and the quality of the services rendered and anticipated to be rendered, the Board concluded that the investment management fees to be charged to the Fund were reasonable.
ECONOMIES OF SCALE
The Board noted that the proposed contractual investment management fees for the Fund do not contain breakpoints that would reduce the fee rate on assets above specified levels. In evaluating the Fund’s contractual investment management fees, the Board considered AIAL’s representation that the contractual investment management fees were intended to reflect achievable economies of scale and also considered AIAL’s agreement to limit certain expenses of the Fund. In light of the Trust’s current size and expense structure, the Board concluded that breakpoints in the Fund’s contractual investment management fees were not warranted at this time. The Board noted, however, that it intends to monitor the Fund’s asset growth in connection with future reviews of the Fund’s advisory arrangements to determine whether breakpoints may be appropriate at such time.
* * *
The Board concluded that the fees to be paid to AIAL by the Fund were appropriate in light of the services to be provided by AIAL, the expected costs to AIAL of operating the Fund and the Fund’s reasonably foreseeable asset levels, and determined that the Agreement should, therefore, be approved.
* * *
176
ASHMORE FUNDS
SUPPLEMENTARY INFORMATION
As of October 31, 2020 (Unaudited)
REMUNERATION DISCLOSURE
Ashmore Investment Advisors Limited (“AIAL”) is a full-scope UK Alternative Investment Fund Manager (“AIFM”) that manages many alternative investment funds (“AIFs”). These AIFs implement a number of investment strategies including; equity, fixed income and alternatives; and invest in many different regions and industry sectors. AIAL manages both open-ended and closed-ended AIFs, several of its AIFs are leveraged and some are listed on regulated markets. Its assets under management were approximately US$5.2 billion at 30 June 2020. AIAL’s parent company (“Ashmore”) is listed on a regulated market, counts ten offices worldwide and has a number of subsidiaries both in the UK and abroad. Taking into account guidance from the UK Financial Conduct Authority (“FCA”), AIAL has complied with the full AIFM Remuneration Code.
AIAL does not have any direct employees, and as such the amount of remuneration paid to staff by AIAL is zero. All AIAL AIFM Remuneration Code Staff are employed and paid by Ashmore. Ashmore’s remuneration principles have remained unchanged since it was listed, and are designed to align all employees with the long-term success of the business. These include significant levels of deferral, a clear link between performance and levels of remuneration and strong alignment of executive directors and employeeswith shareholders and clients through significant employee share ownership. The culture is therefore a collaborative one, with clients’ interests and the creation of shareholder value, including for employee shareholders, the overarching factors for success.
Executive directors, members of the investment team, and indeed all other employees, participate in a single capped incentive pool and are paid under a similar structure, with an annual cash bonus and share award, meaning that all employees are long-term shareholders in the business.
The policy includes:
–– A capped basic salary to contain the fixed cost base;
–– A cap on the total variable compensation including any awards made under Ashmore’s share plan, available for all employees at 25% of profits, which to date has not been fully utilised; and
–– A deferral for five years of a substantial portion of variable compensation into Ashmore shares (or equivalent), which, in the case of executive directors in lieu of a separate LTIP, is also partly subject to additional performance conditions measured over five years.
AIAL’s board of directors reviews the general principles of the remuneration policy and is responsible for its implementation with regard to AIAL’s AIFM Remuneration Code Staff. Ashmore’s Remuneration Committee periodically reviews the ongoing appropriateness and relevance of the remuneration policy, including in connection with the provision of services to AIAL. Ashmore employs the services of; McLagan to provide advice on remuneration benchmarking; Deloitte to provide advice on tax compliance, share plan design and administration; and the Remuneration Committee’s advisors are Aon. The Remuneration Committee’s terms of reference can be found here:
http://www.ashmoregroup.com/investor-relations/corporate-governance.
Performance assessment for AIAL’s AIFM Remuneration Code Staff for their work relating to AIAL is based on a combination of quantitative and qualitative criteria related to the performance of AIAL, the performance of relevant AIF(s) or business units and the performance of the individual. Qualitative criteria include adherence to Ashmore Group plc’s risk and compliance policies. This performance assessment is adjusted for relevant current and future risks related to the AIFs managed by AIAL.
The compensation of control function staff is based on function specific objectives and is independent from the performance of AIAL and/or the AIFs managed by AIAL. The remuneration of the senior officers in AIAL’s control functions is directly overseen by the Remuneration Committee.
177
ASHMORE FUNDS
SUPPLEMENTARY INFORMATION (CONTINUED)
As of October 31, 2020 (Unaudited)
Variable remuneration awarded to AIAL’s Remuneration Code Staff in respect of AIFMD work is subject to performance adjustment which allows Ashmore to reduce the deferred amount, including to nil, in light of the ongoing financial situation and/or performance of Ashmore, AIAL, the AIFs that AIAL manages and the individual concerned.
The total contribution of AIAL’s AIFM Remuneration Code Staff to the business of Ashmore is apportioned between work carried out for AIAL and work carried out for the other businesses and subsidiaries of Ashmore. Their remuneration is similarly apportioned between AIAL and the other businesses and subsidiaries where required.
The remuneration attributable to AIAL for its AIFMD identified staff for the financial year ended June 30, 2020 was as follows:
| | | | | | | | | | | | | | |
| Fund | | Number of Beneficiaries | | Variable Remuneration | | | Fixed Remuneration | | | Total Remuneration | |
Ashmore Emerging Markets Total Return Fund | | 17 | | | £305,126 | | | | £39,548 | | | | £344,674 | |
Ashmore Emerging Markets Local Currency Bond Fund | | 15 | | | 5,188 | | | | 783 | | | | 5,971 | |
Ashmore Emerging Markets Corporate Income Fund | | 16 | | | 59,425 | | | | 7,968 | | | | 67,393 | |
Ashmore Emerging Markets Short Duration Fund | | 16 | | | 117,270 | | | | 15,725 | | | | 132,995 | |
Ashmore Emerging Markets Active Equity Fund | | 17 | | | 85,822 | | | | 8,373 | | | | 94,195 | |
Ashmore Emerging Markets Small-Cap Equity Fund | | 17 | | | 8,863 | | | | 865 | | | | 9,728 | |
Ashmore Emerging Markets Frontier Equity Fund | | 17 | | | 67,569 | | | | 6,592 | | | | 74,161 | |
Ashmore Emerging Markets Equity Fund | | 17 | | | 90,264 | | | | 8,806 | | | | 99,070 | |
Ashmore Emerging Markets Equity ESG Fund | | 17 | | | 13,097 | | | | 1,278 | | | | 14,375 | |
Ashmore Emerging Markets Short Duration Select Fund | | 16 | | | 2,009 | | | | 269 | | | | 2,278 | |
Total AIAL | | 20 | | | £1,569,256 | | | | £190,850 | | | | £1,760,106 | |
All of the remuneration above was attributable to senior management who have a material impact on the Funds’ risk profile. The Funds’ allocation of the AIAL remuneration has been made on the basis of NAV.
178
ASHMORE FUNDS
FOR MORE INFORMATION
As of October 31, 2020
PORTFOLIO HOLDINGS
The Ashmore Funds file their complete schedule of portfolio holdings with the Securities and Exchange Commission (“SEC”) for the first and third quarters of each fiscal year on Form N-PORT. The Funds’ Form N-PORT is available on the SEC’s Web site at www.sec.gov within sixty days after the Funds’ first and third fiscal quarters. In addition, no later than thirty calendar days after the end of each calendar quarter, a list of all portfolio holdings in each Fund as of the end of such calendar quarter is made available at www.ashmoregroup.com.
PROXY VOTING
Ashmore Funds’ Proxy Voting Policies and Procedures and each Fund’s portfolio securities voting record for the most recent 12-month period ended June 30 are available upon request and without charge by visiting the Ashmore Funds’ Web site at www.ashmoregroup.com or the SEC’s Web site at www.sec.gov or by calling 866-876-8294.
179
ASHMORE FUNDS
PRIVACY POLICY
We consider customer privacy to be a fundamental aspect of our relationships with shareholders and are committed to maintaining the confidentiality, integrity and security of our current, prospective and former shareholders’ personal information. To ensure our shareholders’ privacy, we have developed policies that are designed to protect this confidentiality, while allowing shareholders’ needs to be served.
Obtaining Personal Information In the course of providing shareholders with products and services, we may obtain non-public personal information about shareholders, which may come from sources such as account applications and other forms, from other written, electronic or verbal correspondence, from shareholder transactions, from a shareholder’s brokerage or financial advisory firm, financial adviser or consultant, and/or from information captured on our internet web sites.
Respecting Your Privacy As a matter of policy, we do not disclose any personal or account information provided by shareholders or gathered by us to non-affiliated third parties, except as required for our everyday business purposes, such as to process transactions or service a shareholder’s account, or as otherwise permitted by law. As is common in the industry, non-affiliated companies may from time to time be used to provide certain services, such as preparing and mailing prospectuses, reports, account statements and other information, and gathering shareholder proxies. We may also retain non-affiliated financial services providers to market our shares or products and we may enter into joint-marketing arrangements with them and other financial companies. We may also retain marketing and research service firms to conduct research on shareholder satisfaction. These companies may have access to a shareholder’s personal and account information, but are permitted to use this information solely to provide the specific service or as otherwise permitted by law. We may also provide a shareholder’s personal and account information to their respective brokerage or financial advisory firm, Custodian, and/or to their financial advisor or consultant.
Sharing Information with Third Parties We reserve the right to disclose or report personal information to non-affiliated third parties where we believe in good faith that disclosure is required under law to cooperate with regulators or law enforcement authorities, to protect our rights or property or upon reasonable request by any investee entity in which a shareholder has chosen to invest. Of course, we may also share your information with your consent.
Sharing Information with Affiliates We may share shareholder information with our affiliates in connection with our affiliates’ everyday business purposes, such as servicing a shareholder’s account, but our affiliates may not use this information to market products and services to you except in conformance with applicable laws or regulations. The information we share includes information about our experiences and transactions with a shareholder and may include, for example, a shareholder’s participation in one of the Funds or in other investment programs, a shareholder’s ownership of certain types of accounts, or other data about a shareholder’s transactions or accounts. Our affiliates, in turn, are not permitted to share shareholder information with non-affiliated entities, except as required or permitted by law.
Procedures to Safeguard Private Information We take seriously the obligation to safeguard shareholder non-public personal information. In addition to this policy, we have also implemented procedures that are designed to restrict access to a shareholder’s non-public personal information only to internal personnel who need to know that information in order to provide products or services to such shareholders. In addition, we have physical, electronic, and procedural safeguards in place to guard a shareholder’s non-public personal information.
Disposal of Confidential Records We will dispose of records, if any, that are knowingly derived from data received from a consumer reporting agency regarding a shareholder that is an individual in a manner that ensures the confidentiality of the data is maintained. Such records include, among other things, copies of consumer reports and notes of conversations with individuals at consumer reporting agencies.
180
ASHMORE FUNDS
OTHER INFORMATION
Administrator, Custodian and Transfer Agent
The Northern Trust Company
333 South Wabash Avenue
Chicago, Illinois 60604
312-630-6000
Investment Manager
Ashmore Investment Advisors Limited
61 Aldwych
London WC2B 4AE
United Kingdom
44-20-3077-6000
Independent Registered Public Accounting Firm
KPMG LLP
Aon Center
Suite 5500
200 East Randolph Drive
Chicago, Illinois 60601-6436
Distributor
Ashmore Investment Management (US) Corporation
475 Fifth Avenue
15th Floor
New York, New York 10017
212-661-0061
Legal Counsel
Ropes & Gray LLP
Prudential Tower
800 Boylston Street
Boston, Massachusetts 02199
617-951-7000
Independent Trustees’ Counsel
Dechert LLP
One International Place
40th Floor
100 Oliver Street
Boston, Massachusetts 02110
617-728-7100
181
(THIS PAGE INTENTIONALLY LEFT BLANK)
182
ASHMORE FUNDS
TRUSTEES AND OFFICERS
Set forth below is information about the Trustees and Officers of the Ashmore Funds. Each Trustee has served in that capacity since he or she was originally elected or appointed to the Board of Trustees. Each Trustee oversees a total of eleven portfolios in the Ashmore Funds. The Ashmore Funds’ Statement of Additional Information contains additional information about the Trustees and is available upon request and without charge by calling 866-876-8294.
INDEPENDENT TRUSTEES
| | | | | | | | | | |
Name, Address* and Age of Independent Trustee | | Positions(s) Held with Trust | | Term of Office and Length of Time Served | | Principal Occupation(s) During Past 5 Years | | Number of Portfolios in Fund Complex Overseen by Trustee | | Other Directorships Held by Trustee During the Past 5 Years |
Yeelong Balladon (Age 62) | | Trustee; Lead Independent Trustee | | Indefinite term; Trustee since inception in 2010 | | Freshfields Bruckhaus Deringer (a law firm) from 1982 to 2009 (Partner from 1999). | | 11 | | None |
Michael Chamberlin (Age 71) | | Trustee | | Indefinite term; Trustee since 2012 | | Executive Director, Emerging Markets Traders Association(1). | | 11 | | None |
Joseph Grainger (Age 66) | | Trustee | | Indefinite term; Trustee since 2014 | | Ernst & Young LLP from 1988 to December 2013 (Partner from October 1990). | | 11 | | None |
| * | Each Trustee may be contacted at 61 Aldwych, London WC2B 4AE, United Kingdom. |
| (1) | Mr. Chamberlin has served as the Executive Director of the Emerging Markets Traders Association (“EMTA”) since 1994. Mark Coombs is Co-Chair of EMTA’s Board of Directors, and the Investment Manager’s ultimate parent company, Ashmore Group plc, is a member of the EMTA. Mr. Coombs is the Investment Manager’s Chief Executive Officer. |
183
ASHMORE FUNDS
TRUSTEES AND OFFICERS (CONTINUED)
| | | | | | | | | | |
Name, Address* and Age of Interested Trustee | | Positions(s) Held with Trust | | Term of Office and Length of Time Served | | Principal Occupation(s) During Past 5 Years | | Number of Portfolios in Fund Complex Overseen by Trustee | | Other Directorships Held by Trustee During the Past 5 Years |
George Grunebaum(2) (Age 57) | | Trustee; Chairman of the Trustees; President and Chief Executive Officer | | Indefinite term; Trustee since inception | | Chief Executive Officer since November 2008, Ashmore Investment Management (US) Corporation. | | 11 | | None |
Stephen Hicks(3) (Age 60) | | Trustee | | Indefinite term; Trustee since 2014 | | CCO of Trinity Street Asset Management LLP, a UK private asset manager, since 2014. | | 11 | | None |
| * | Each Trustee may be contacted at 61 Aldwych, London WC2B 4AE, United Kingdom. |
| (2) | Mr. Grunebaum is an “interested person” of the Trust, as defined in Section 2(a)(19) of the 1940 Act, due to, among other things, his positions with the Distributor and its affiliates. Mr. Grunebaum serves or has served as a trustee or director of other pooled investment vehicles sponsored by Ashmore Group plc (“Ashmore Group”) and its affiliates, including Ashmore Global Emerging Markets Funds, LTD and Ashmore Global Opportunities Limited. |
| (3) | Mr. Hicks is an “interested person” of the Trust, as defined in Section 2(a)(19) of the 1940 Act, due to his former position with Ashmore Group, the parent company of Ashmore Investment Advisors Limited. Ashmore Group indirectly compensates Mr. Hicks, through a separate private company, for his service as a Trustee of the Trust and as a trustee or director of other pooled investment vehicles sponsored by Ashmore Group and its affiliates. |
184
ASHMORE FUNDS
TRUSTEES AND OFFICERS (CONTINUED)
OFFICERS
| | | | | | |
Name, Address** and Age of Officer | | Positions(s) Held with Trust | | Term of Office and Length of Time Served | | Principal Occupation(s) During Past 5 Years |
George Grunebaum (Age 57) | | Trustee, President and Chief Executive Officer | | Indefinite term; since inception | | Chief Executive Officer since November 2008, Ashmore Investment Management (US) Corporation. |
Alexandra Autrey (Age 44) | | Chief Legal Officer | | Indefinite term; since inception | | Global Head of Legal and Transaction Management, Ashmore Group plc, since January 2012. |
Jonathan Kim (Age 34) | | Treasurer and Principal Financial and Accounting Officer | | Indefinite term; since 2018 | | Chief Financial Officer and FinOp, Ashmore Investment Management (US) Corporation, since September 2018; Institutional Account Services, Ashmore Investment Management (US) Corporation, since January 2016; Marketing Associate, Ashmore Investment Management (US) Corporation, from July 2014 - January 2016. |
Kevin Hourihan (Age 42) | | Secretary and Chief Compliance Officer | | Indefinite term; Chief Compliance Officer since September 2017; Secretary since September 2018 | | Director, Ashmore Investment Advisors (US) Corp., from March 2017 to present; Director, Ashmore Investment Management (US) Corp., from March 2017 to present; Chief Compliance Officer, Ashmore Equities Investment Management (US) LLC, from November 2015 to present; Chief Compliance Officer, Ashmore Investment Management (US) Corp., from November 2014 to present; Director, Ashmore Equities Investment Management (US) LLC, from March 2014 to present; Senior Compliance Manager, Ashmore Equities Investment Management (US) LLC, February 2014 - November 2015. |
Michael Jiang (Age 36) | | Assistant Secretary | | Indefinite term; since December 2018 | | Vice President, The Northern Trust Company, October 2018 - present; Second Vice President, The Northern Trust Company, May 2015 - September 2018. |
Paul Robinson (Age 47) | | Assistant Chief Legal Officer | | Indefinite term; since June 2011 | | Group Deputy Head of Legal and Transaction Management since August 2012, Ashmore Group plc. |
| ** | Each Officer may be contacted at 61 Aldwych, London WC2B 4AE, United Kingdom. |
185
(THIS PAGE INTENTIONALLY LEFT BLANK)
186
(THIS PAGE INTENTIONALLY LEFT BLANK)
187
Item 2. Code of Ethics.
| (a) | As of October 31, 2020, the registrant has adopted a code of ethics that applies to its principal executive officer, principal financial officer, principal accounting officer or controller, or persons performing similar functions, regardless of whether these individuals are employed by the registrant or a third party (the “Code of Ethics”). |
| (c) | The registrant has not amended its Code of Ethics during the period covered by this report. |
| (d) | The registrant has not granted any waivers, including an implicit waiver, from any provisions of its Code of Ethics during the period covered by this report. |
Item 3. Audit Committee Financial Expert.
The registrant’s Board of Trustees has determined that the registrant has at least one “audit committee financial expert” (as defined in Item 3 of Form N-CSR), serving on its audit committee. Joseph Grainger is the “audit committee financial expert” and is “independent” (as each term is defined in Item 3 of Form N-CSR).
Under applicable securities laws and regulations, a person who is determined to be an audit committee financial expert will not be deemed an “expert” for any purpose, including without limitation for purposes of Section 11 of the Securities Act of 1933, as amended, as a result of being designated or identified as an audit committee financial expert. The designation or identification of a person as an audit committee financial expert does not impose on such person any duties, obligations, or liability that are greater than the duties, obligations, and liability imposed on such person as a member of the registrant’s Audit Committee and Board of Trustees in the absence of such designation or identification. The designation or identification of a person as an audit committee financial expert does not affect the duties, obligations or liability of any other member of the registrant’s Audit Committee or Board of Trustees.
Item 4. Principal Accountant Fees and Services.
Item 4(a): Audit Fees
The aggregate fees billed for each of the last two fiscal years for professional services rendered by KPMG LLP (“KPMG”), independent registered public accounting firm, for the audit of the registrant’s annual financial statements or services that are normally provided by the accountant
2
in connection with statutory and regulatory filings or engagements for those fiscal years are $287,151 in 2020 and $222,697 in 2019.
Item 4(b): Audit-Related Fees
The aggregate fees billed in each of the last two fiscal years for assurance and related services by KPMG that are reasonably related to the performance of the audit of the registrant’s financial statements and are not reported under paragraph (a) of this Item are NONE.
Item 4(c): Tax Fees
The aggregate fees billed in each of the last two fiscal years for professional services rendered by KPMG for RIC tax compliance and diversification review and tax return review are NONE in 2020 and $44,100 in 2019.
Item 4(d): All Other Fees
The aggregate fees billed in each of the last two fiscal years for products and services provided by KPMG and its affiliates, other than the services reported in paragraphs (a) through (c) of this Item, are GBP 118,750 in 2020 and GBP 94,750 in 2019 for reports on internal controls.
Item 4(e)(1): Pre-Approval Policies and Procedures
Pursuant to the registrant’s Audit Committee Charter adopted on November 17, 2010, as revised on December 13, 2017, the Audit Committee shall, to the extent required by applicable regulations, pre-approve (i) all audit and permitted non-audit services rendered by the independent auditors to a Fund and (ii) all non-audit services rendered by the independent auditors to a Fund’s investment adviser(s) (including any sub-advisers) and to certain of the investment adviser’s affiliates, as applicable. The Audit Committee may implement policies and procedures by which such services are pre-approved other than by the full Committee (for example, by the Committee chair).
Item 4(e)(2): Percentage of Fees Pre-Approved Pursuant to Waiver Provision of Paragraph (c)(7)(i)(C) of Rule 2-01 of Regulation S-X
No percentage of the principal accountant’s fees or services were approved pursuant to the waiver provision of paragraph (c)(7)(i)(C) of Rule 2-01 of Regulation S-X.
Item 4(f): Work Performed by Persons Other than the Principal Accountant
Not applicable.
Item 4(g): Aggregate Non-Audit Fees Disclosure
The aggregate non-audit fees and services billed by KPMG and its affiliates for services rendered to the registrant and service affiliates for the last two fiscal years are GBP 118,750 for 2020 and the total of $44,100 and GBP 94,750 for 2019.
Item 4(h): Non-Audit Services and Independent Accountant’s Independence
The registrant’s Audit Committee has considered whether the provision of non-audit services to service affiliates, not pre-approved pursuant to paragraph (c)(7)(ii) of Rule 2-01 of Regulation S-X, is compatible with maintaining the registered public accountant’s independence in performing audit services.
3
Item 5. Audit Committee of Listed Registrants.
Not applicable.
Item 6. Investments.
| (a) | The registrant has elected to include the schedule of investments in securities of unaffiliated issuers as part of the report to shareholders filed under Item 1 of this report on Form N-CSR. |
Item 7. Disclosure of Proxy Voting Policies and Procedures for Closed-End Management Investment Companies.
Not applicable.
Item 8. Portfolio Managers of Closed-End Management Investment Companies.
Not applicable.
Item 9. Purchases of Equity Securities by Closed-End Management Investment Company and Affiliated Purchasers.
Not applicable.
Item 10. Submission of Matters to a Vote of Security Holders.
There have been no material changes to the procedures by which shareholders may recommend nominees to the registrant’s Board of Trustees.
Item 11. Controls and Procedures.
| (a) | The registrant’s principal executive and principal financial officers, or persons performing similar functions, have concluded that the registrant’s disclosure controls and procedures (as defined in Rule 30a-3(c) under the Investment Company Act of 1940 (the “1940 Act”)) are effective, based on the evaluation of these controls and procedures required by Rule 30a-3(b) under the 1940 Act and Rules 13a-15(b) or 15d-15(b) under the Securities Exchange Act of 1934 as of a date within 90 days of the filing date of this report. |
| (b) | There were no changes in the registrant’s internal control over financial reporting (as defined in Rule 30a-3(d) under the 1940 Act) that occurred during the period covered by this report that have materially affected, or are reasonably likely to materially affect, the registrant’s internal control over financial reporting. |
Item 12. Disclosure of Securities Lending Activities for Closed-End Management Investment Companies.
4
Not applicable.
Item 13. Exhibits.
5
SIGNATURES
Pursuant to the requirements of the Securities Exchange Act of 1934 and the Investment Company Act of 1940, the registrant has duly caused this report to be signed on its behalf by the undersigned, thereunto duly authorized.
| | |
Ashmore Funds |
| |
By | | /s/ George Grunebaum |
| | George Grunebaum, President and |
| | Chief Executive Officer |
| | (Principal Executive Officer) |
Pursuant to the requirements of the Securities Exchange Act of 1934 and the Investment Company Act of 1940, this report has been signed below by the following persons on behalf of the registrant and in the capacities and on the dates indicated.
| | |
By | | /s/ George Grunebaum |
| | George Grunebaum, President and |
| | Chief Executive Officer |
| | (Principal Executive Officer) |
| | |
By | | /s/ Jonathan Kim |
| | Jonathan Kim, Treasurer |
| | (Principal Financial and Accounting Officer) |
6