UNITED STATES
SECURITIES AND EXCHANGE COMMISSION
Washington, D.C. 20549
FORM N-CSR
CERTIFIED SHAREHOLDER REPORT OF REGISTERED MANAGEMENT
INVESTMENT COMPANIES
Investment Company Act file number 811-22468
Ashmore Funds
(Exact name of registrant as specified in charter)
c/o Ashmore Investment Advisors Limited
61 Aldwych
London WC2B 4AE
England
(Address of principal executive offices) (Zip code)
Corporation Service Company
84 State Street
Boston, MA 20109
(Name and address of agent for service)
Registrant’s telephone number, including area code: 011-44-20-3077-6000
Date of fiscal year end: October 31
Date of reporting period: October 31, 2022
Explanatory Note: The Registrant is filing this amendment to its Certified Shareholder Report on Form N-CSR filed with the U.S. Securities and Exchange Commission on December 30, 2022 (the “Report”), to include a revised Initial Investment line graph within the Portfolio Managers’ Report specific to Ashmore Emerging Markets Frontier Equity Fund in response to Item 1 (Reports to Stockholders) that adds an appropriate broad-based securities market index. Except as noted, this amendment does not amend, update or change any other information or disclosures contained in the Report.
Item 1. Reports to Stockholders.
(a) The following is a copy of the report transmitted to shareholders pursuant to Rule 30e-1 under the Investment Company Act of 1940 (17 CFR 270.30e-1)
ASHMORE FUNDS
ANNUAL FINANCIAL STATEMENTS
October 31, 2022

(THIS PAGE INTENTIONALLY LEFT BLANK)
ASHMORE FUNDS
TABLE OF CONTENTS
Ashmore Investment Management (US) Corporation is the Distributor for Ashmore Funds.
This material is authorized for use only when preceded or accompanied by the current Ashmore Funds’ prospectus. Investors should consider the investment objectives, principal risks, charges and expenses of these Funds carefully before investing. This and other information is contained in the Funds’ prospectus. Please read the prospectus carefully before you invest or send money.
A Fund’s past performance is not necessarily an indication of how the Fund will perform in the future.
The performance data quoted in this report represents past performance. Investment return and principal value will fluctuate, so an investor’s shares, when redeemed, may be worth more or less than the original cost. Current performance may be lower or higher than the performance data quoted in this report. For performance information current to the most recent month-end, please call (866) 876-8294.
An investment in a Fund is not a bank deposit and is not guaranteed or insured by the Federal Deposit Insurance Corporation or any other government agency. It is possible to lose money on investments in the Funds.
ASHMORE FUNDS
INVESTMENT MANAGER’S REPORT
For the period November 1, 2021 to October 31, 2022
Overview
In Q4 2021, global markets leapt and fell, and got back on their feet again, as the world went from winning against the (COVID-19) Delta variant to worrying about the Omicron variant in the space of five short weeks. The shadow of rising inflation and a change of heart at the Federal Reserve System (the “Fed”) provided further obstacles. Thus, in our view, it is nothing short of astonishing that global equities managed to clock their best quarterly return of 2021 in Q4, at 7.5% for the MSCI World Index. That said, Fund performance was concentrated in a few winning Russell trades during Q4, and returns were uneven between indices: US growth stocks ended the year on a tear (NASDAQ +11.1% in Q4 2021), but US small cap stocks only managed to return 1.9% for the Russell 2000 Index. European stocks were helped by the year-end rally in financials and energy stocks (Euro Stoxx 50 +6.2%). Emerging Markets (“EM”) underperformed the MSCI Emerging Markets Net, returning -1.7% amid huge disparity in performance between countries: strong returns from Taiwan, Mexico and South Africa contrasted with drawdowns from Russia, Brazil and China.
In Q1 2022, the Russian invasion of Ukraine dramatically altered the economic, political and investment landscapes, not just in terms of the immediate market implications for Q1 2022 returns, but also with regard to the enormous adjustments that central banks had to make to control increased inflation dynamics. The Russia-Ukraine war triggered a sharp sell-off in risk assets, a significant rise in energy prices and other commodities, and a brief move to lower US Treasury yields, before inflationary concerns and market expectations surrounding central bank rate hikes ultimately reasserted their influence and pushed yields higher. A weak start to the year for global equity markets in January and February was further compounded by the Russian war in Ukraine. Global equity markets did, however, try to stage a recovery in the latter half of March 2022. This followed the Fed’s first and widely anticipated rate hike of a new tightening cycle. It came with reassurances from Fed Chair Jerome Powell that the US economy was strong enough to handle higher rates and that the probability of recession was not particularly elevated. In contrast to the difficulties in other markets, the commodities space was the big winner over the period, boosted by frantic hedging against supply risk. In response to the Russian attack on Ukraine, the US and Europe announced the most severe round of economic sanctions ever dealt to a significant commercial partner. This included measures to freeze the part of the Central Bank of Russia’s (“CBR”) FX reserves that are held under their own jurisdiction, which amounts to circa two-thirds of the CBR’s reserves. The impact on financial assets has been severe: Russian onshore debt and equity markets have stopped functioning and payments to offshore investors have been blocked by the CBR, trapping foreign investors’ assets onshore. The asset freeze on CBR assets offshore limits Russia’s ability to defend the ruble. Just as importantly, it is our view that the sanctions make it quasi impossible for Western companies to trade and settle transactions with Russian counter-parties, shutting down the flow of important products out of Russia - at the exclusion of oil and gas products that have remained exempt for the time being. For this reason, the market has been focused on the importance of both Russia and Ukraine in the supply of strategic commodities such as oil, gas, and coal as well as cereals, minerals and fertilisers.
Q2 2022 was another tough quarter for bonds and stocks, which rounded up an equally tough first half (“H1”). Analysts at Deutsche Bank made the point that this was the worst H1 performance for US Treasuries since 1788, and the worst H1 return for the S&P 500 Index since 1962, not far behind the 1932 H1 decline. At the start of the quarter, fears of inflation and higher Fed Funds rates pummelled bond and equity markets as the war in Ukraine sent commodity prices through the roof. The roll-out of harsh COVID-19 lockdown measures in China did not help sentiment. Markets initially bottomed and rebounded in May, but heavy losses returned in June, when 2-year US Treasury yields soared by 80 basis points (“bps”) in the first two weeks, the Fed delivered a greater-than-expected 75 bps hike, and global equities fell by 11%. The combined effect of Fed hikes and lower asset prices amounted to a sharp tightening in financial conditions, with real economic consequences for companies and households.
After a positive start in July, two consecutive monthly declines in stock prices in August and September sent global equity indices down for a third negative consecutive quarter for the first time since the global financial crisis - when equity indices fell for five consecutive quarters. What stands out this year is the concurrent fall in global bond prices, where global indices (e.g., the Bloomberg Barclays Global Aggregate Index) fell for the fifth consecutive quarter in September, against just two back-to-back negative quarters in the middle of 2008. The market correction was driven by a combination of upside surprises in inflation, two consecutive 75 bps rate hikes by the Fed coupled with unrelenting hawkish guidance, and a fall in business confidence indicators across developed markets. A misjudged budget in the UK and a fire sale in UK government bonds (“Gilts”) heaped more pressure on core government bonds towards the end of the quarter.
1
ASHMORE FUNDS
INVESTMENT MANAGER’S REPORT (CONTINUED)
Portfolio Overview
Ashmore Emerging Markets Total Return Fund
The Ashmore Emerging Markets Total Return Fund (the “Fund”) seeks to achieve its objective by investing principally in the debt instruments of sovereign, quasi-sovereign, and corporate issuers, which may be denominated in any currency, including the local currency of the issuer. The Fund tactically allocates assets between external debt, corporate debt and local currency.
Over the period, the Fund’s institutional class underperformed its benchmark, returning -30.74% (net of fees) versus -20.71% for the composite 50% JP Morgan Emerging Markets Bond Index Global Diversified, 25% JP Morgan Government Bond Index - Emerging Markets Global Diversified, 25% JP Morgan Emerging Local Markets Index Plus. Security selection within local currency and external debt detracted from performance. The Fund’s off benchmark allocation to corporate debt was the largest detractor from performance over the period. Russia was the main contributor to the Fund’s relative performance. China and Ukraine were amongst the largest detractors from the Fund’s relative performance.
The Russian invasion of Ukraine, supported by Belarus, created an extremely challenging environment for asset price performance, as both Russia and Belarus were subject to an extreme package of economic sanctions. The sanctions had the immediate impact of restricting trading and settlement of Russian and Belarussian bonds, with both countries ultimately excluded from the entire JP Morgan family of bond indices effective March 31, 2022, with all bond prices being written down to zero. Russia nevertheless continued to make coupon payments on its USD denominated debt obligations, although the US government prevented Russia from making a bond principal payment out of foreign currency reserves held by the Central Bank of Russia at US financial institutions, forcing the Russian government to either pay the maturity out of the diminished pool of liquid and accessible FX reserves or default on the bond.
In our view, the Communist Party congress in China turned out to be a disappointment as President Xi effectively packed the Standing Committee (China’s top leadership body) with a loyal following. He now has absolute power in the country, doing away with previous checks and balances inherited in the system. The President defended the Zero Covid Policy, which remains in place officially, though some actual relaxation was noted in the face of a spiraling number of cases with very low levels of mortality. China risk assets all sold off during October, especially already weak bonds from the property sector, generating significant negative alpha. Evidence of softening industrial activity in China, with manufacturing Purchase Managers Index (“PMI”) surprising to the downside, exacerbated concerns about the stability of the property sector. After many months of relative inaction, the Chinese government announced the establishment of a fund that is aimed at supporting a number of developers with the aim of restoring liquidity to the sector and ensuring the completion of housing units already under development. The Chinese government appears to be backing away from its 5.5% growth target for 2022 following the release of Gross Domestic Product (“GDP”) figures for the first half of the year showing just 2.5% year-on-year (“yoy”) growth.
In Ukraine, the government unsurprisingly launched a consent solicitation to suspend debt repayment on its Eurobonds until August 2024. At the same time, the G7 and the Paris Club announced the suspension of Ukraine’s debt service through 2023. The announcements were the inevitable result of the ongoing war and the impact it has had on the Ukrainian economy.
Ashmore Emerging Markets Local Currency Bond Fund
The Ashmore Emerging Markets Local Currency Bond Fund (the “Fund”) seeks to achieve its objective by investing principally in the debt instruments of sovereign and quasi-sovereign issuers of emerging market countries that are denominated in the local currency of the issuer. The Fund’s returns are driven by emerging market currency appreciation, interest rate positioning and credit worthiness.
Over the period, the Fund’s institutional class outperformed its benchmark, returning -17.49% (net of fees) versus -20.27% for the JP Morgan Government Bond Index - Emerging Markets Global Diversified. Allocations to the Russian Ruble, Polish Zloty and Brazilian Real were the main contributors to the Fund’s relative performance. Allocations to the Ukrainian Hryvnia and Chinese Yuan were the main detractors from the Fund’s relative performance.
Russian local markets remain disrupted by sanctions. The Central Bank of Russia cut policy rates to 7.5% from 9.5% over the quarter as inflation cooled (August yoy print came in at 14.3% against a print of 17.1% for June). The portfolio managed to reduce its off-benchmark holdings over the quarter, generating a mark-to-market gain.
2
ASHMORE FUNDS
INVESTMENT MANAGER’S REPORT (CONTINUED)
A significant concern remains regarding the impact of Poland’s rule of law dispute with the EU, which has held up more than EUR 35bn in COVID-19 recovery grants and loans. Poland’s A- rating with stable outlook was affirmed by Standard and Poor (“S&P”) at the end of third quarter, with the rating agency highlighting the country’s strong external and government balance sheets and its “competitive and diversified” economy.
The Ukrainian Hryvnia was fixed higher over the third quarter (-25.4%) ending at 36.87/USD.
In China, economic indicators presented a mixed bag, with manufacturing Purchase Managing Index (“PMI”) back in expansionary territory but a lagging services sector. As the property sector challenges persist, the government announced additional new initiatives to encourage home purchases and to provide additional funding and support to the sector at the end of Q3, and followed up after the National Party Congress in mid-October with another round of policy support announcements.
Ashmore Emerging Markets Corporate Income Fund
The Ashmore Emerging Markets Corporate Income Fund (the “Fund”) seeks to achieve its objective by investing principally in the debt instruments of corporate issuers, which may be denominated in any currency, including the local currency of the issuer.
Over the period, the Fund’s institutional class underperformed its benchmark, returning -29.15% (net of fees) versus -18.06% for the JP Morgan CEMBI Broad Diversified. Russia was the main contributor to the Fund’s relative performance. China and Ukraine were amongst the largest detractors from the Fund’s relative performance.
The Russian invasion of Ukraine, supported by Belarus, created an extremely challenging environment for asset price performance, as both Russia and Belarus were subject to an extreme package of economic sanctions. The sanctions had the immediate impact of restricting trading and settlement of Russian and Belarussian bonds, with both countries ultimately excluded from the entire JP Morgan family of bond indices effective March 31st 2022, with all bond prices being written down to zero. Russia nevertheless continued to make coupon payments on its USD denominated debt obligations, although the US government prevented Russia from making a bond principal payment out of foreign currency reserves held by the Central Bank of Russia at US financial institutions, forcing the Russian government to either pay the maturity out of the diminished pool of liquid and accessible FX reserves or default on the bond.
Evidence of softening industrial activity in China, with manufacturing Purchase Managers Index (“PMI”) surprising to the downside, exacerbated concerns about the stability of the property sector. After many months of relative inaction, the Chinese government announced the establishment of a fund that is aimed at supporting a number of developers with the aim of restoring liquidity to the sector and ensuring the completion of housing units already under development. The Chinese government appears to be backing away from its 5.5% growth target for 2022 following the release of GDP figures for the first half of the year showing just 2.5% yoy growth.
In Ukraine, the government unsurprisingly launched a consent solicitation to suspend debt repayment on its Eurobonds until August 2024. At the same time, the G7 and the Paris Club announced the suspension of Ukraine’s debt service through 2023. The announcements were the inevitable result of the ongoing war and the impact it has had on the Ukrainian economy.
Ashmore Emerging Markets Short Duration Fund
The Ashmore Emerging Markets Short Duration Fund (the “Fund”) seeks to achieve its objective by investing principally in short-term debt instruments of, and derivative instruments related to, Sovereign, Quasi-Sovereign and Corporate issuers of EM countries denominated exclusively in Hard Currencies (i.e., the U.S. dollar or any currency of a nation in the G-7). The Fund normally seeks to maintain a weighted average portfolio duration of between 1 and 3 years. The Fund has no restrictions on individual security duration.
Over the period, the Fund’s institutional class underperformed its benchmark, returning -31.54% (net of fees) versus -11.56% for the JP Morgan CEMBI Broad Diversified 1-3 Year. Russia was the main contributor to the Fund’s relative performance. Positions in China, Brazil and Ukraine were amongst the largest detractors from the Fund’s relative performance.
3
ASHMORE FUNDS
INVESTMENT MANAGER’S REPORT (CONTINUED)
The Russian invasion of Ukraine, supported by Belarus, created an extremely challenging environment for asset price performance, as both Russia and Belarus were subject to an extreme package of economic sanctions. The sanctions had the immediate impact of restricting trading and settlement of Russian and Belarussian bonds, with both countries ultimately excluded from the entire JP Morgan family of bond indices effective March 31, 2022, with all bond prices being written down to zero. Russia nevertheless continued to make coupon payments on its USD denominated debt obligations, although the US government prevented Russia from making a bond principal payment out of foreign currency reserves held by the Central Bank of Russia at US financial institutions, forcing the Russian government to either pay the maturity out of the diminished pool of liquid and accessible FX reserves or default on the bond.
Evidence of softening industrial activity in China, with manufacturing PMI surprising to the downside, exacerbated concerns about the stability of the property sector. After many months of relative inaction, the Chinese government announced the establishment of a fund that is aimed at supporting a number of developers with the aim of restoring liquidity to the sector and ensuring the completion of housing units already under development. The Chinese government appears to be backing away from its 5.5% growth target for 2022 following the release of GDP figures for the first half of the year showing just 2.5% yoy growth.
Profit taking in Brazil has extended following outperformance in the first quarter. The main negative contributor were security selections with exposure to Telecom, Airlines and Building Materials resulting in negative alpha. Politics took a front seat in the third quarter in the run-up to presidential elections slated for October, with concerns that fiscal stimulus and social spending would be increased to bolster the incumbent. Former President Lula da Silva won the majority of the votes in the election run-off against incumbent Bolsonaro, albeit by the slimmest margin in the recent history of the country. Lula pledged to re-unite the country, but it appears that he will govern with a fragmented Congress and against a sizeable pro-Bolsonaro block. In our view, he will need to form ad-hoc coalitions with Centrist parties in order to achieve his political agenda. He is expected to appoint a market-friendly economic team, and to push for an ambitious social agenda within the confines of limited fiscal space.
In Ukraine, the government unsurprisingly launched a consent solicitation to suspend debt repayment on its Eurobonds until August 2024. At the same time, the G7 and the Paris Club announced the suspension of Ukraine’s debt service through 2023. The announcements were the inevitable result of the ongoing war and the impact it has had on the Ukrainian economy.
Ashmore Emerging Markets Active Equity Fund
The Ashmore Emerging Markets Active Equity Fund (the “Fund”) seeks to achieve its objective by investing principally in equity securities and equity-related investments of emerging market issuers, which may be denominated in any currency, including the local currency of the issuer.
Over the period, the Fund’s institutional class underperformed its benchmark, returning -33.40% (net of fees) versus -31.03% for the MSCI Emerging Markets Net.
Several of our best stock performers were concentrated in Brazil and India, in part reflecting the strong domestic operating environments in both countries. In Brazil, our holding in Hypera, a domestic focused leading pharmaceutical company, performed well. The business continues to take market share, the product pipeline is strong and margin pressure is expected to recede when policy rates ease. High quality apparel retailer, Lojas Renner, which targets middle to upper income consumers less sensitive to higher inflation, also supported performance. Our holding in Banco do Brasil benefitted from strong results, with net income growth up 55% yoy, 20% ahead of market expectations. In India, private banks HDFC and Axis both benefitted from strong loan growth and corporate strategies that focused on expansion in the higher fee retail segment of the market.
However, the above positives were offset by performance detractors primarily in China. This reflected the largely indiscriminate domestic sell off driven by depressed investor sentiment. Our holdings in pan Asia insurer, AIA, diversified financials, China International Capital, and e-commerce giant, Alibaba, all performed poorly.
Our exposure to Xpeng, an EV manufacturer, saw particularly volatile performance given its sensitivity to expectations of domestic economic growth, despite the company reporting revenue up almost 100% over the year, and ahead of market expectations. Meanwhile, our decision to be prudent ahead of the polarized Brazilian Presidential election and not to hold Petrobras was penalized as the company made notably strong dividend payouts.
4
ASHMORE FUNDS
INVESTMENT MANAGER’S REPORT (CONTINUED)
Ashmore Emerging Markets Small-Cap Equity Fund
The Ashmore Emerging Markets Small-Cap Equity Fund (the “Fund”) seeks to achieve its objective by investing at least 80% of its net assets in equity securities and equity-related investments of small-capitalization emerging market issuers, which may be denominated in any currency, including the local currency of the issuer.
Over the period, the Fund’s institutional class underperformed its benchmark, returning -33.21% (net of fees) versus -23.42% for the MSCI Emerging Markets Small Cap Net.
Several of our best stock performers were concentrated in Brazil, including our holding in two leading software companies, Totvs and Sinqia. In the former, the company benefitted from strong revenue growth while the later has seen recent acquisitions and margin expansion from product consolidation push returns higher. Additional performance was generated by Arezzo, a premium footwear retailer that delivered excellent results that were ahead of market expectations.
From a company perspective, Poya International was the top performing stock. The Taiwanese specialty retailer offers a wide variety of products including cosmetics, personal care and household merchandise. The company benefits from economies of scale and management has stated their desire for significant store expansion by 2025.
The primary detractors from performance came from the cyclical segment market and suffered on the broad-based sell down notably in technology stocks. This includes our position in Hansol Chemical and Hana Materials, two South Korean companies in the semiconductor value chain. In Taiwan, Parade Technologies, a fabless supplier of integrated circuits for display and high-speed interfaces, and eCloudvalley, a managed service provider for cloud services, weighed on performance.
Ashmore Emerging Markets Frontier Equity Fund
The Ashmore Emerging Markets Frontier Equity Fund (the “Fund”) seeks to achieve its objective by investing principally in equity securities and equity-related investments of Frontier Market issuers, which may be denominated in any currency, including the local currency of the issuer.
Over the period, the Fund’s institutional class outperformed its benchmark, returning -15.78% (net of fees) versus -16.91% for the MSCI Frontier Markets + Select EM Countries Capped Index Net TR.
A contributor to the Fund’s relative performance was security selection in the UAE. Notably, Abu Dhabi Islamic Bank and Emaar Properties had strong returns. In the former, the company benefitted from high loan growth and fee income in addition to expanding Net Interest Margin (“NIMs”). Management increased guidance, and determined that? Return on Equity (“ROE”) could approach 20%. In the latter, the company benefitted from high real estate demand and increased rents. Staying in the GCC, Al Hammadi Holding, a Saudi Arabian healthcare company, saw a significant increase in profit in the first half of 2022 and contributed to the Fund’s outperformance.
From an issuer perspective, Fertiglobe, an Egyptian based export-focused nitrogen fertilizer platform that has been supported by higher urea and ammonia prices, was the largest contributor to performance.
Kazakhstan was the largest detractor from performance. The year began with political unrest after the government removed energy price caps. The impact was immediate and the country experienced a drastic rise in fuel prices. With a heavy-handed response, the government restored order. However, weak performance continued throughout the period.
In addition, heightened risk aversion was driven by uncertainty surrounding Western economic sanctions relating to the Russia / Ukraine conflict and whether those sanctions would be expanded to include ‘friends of Russia.” The Fund’s holdings in Kaspi, a financial technology services firm, and Halyk Savings Bank, underperformed.
5
ASHMORE FUNDS
INVESTMENT MANAGER’S REPORT (CONTINUED)
Ashmore Emerging Markets Equity Fund
The Ashmore Emerging Markets Equity Fund (the “Fund”) seeks to achieve its objective by investing principally in equity securities and equity-related investments of emerging market issuers, which may be denominated in any currency, including the local currency of the issuer.
Over the period, the Fund’s institutional class underperformed its benchmark, returning -38.85% (net of fees) versus -31.03% for the MSCI Emerging Markets Net.
Several of our best stock performers were concentrated in Brazil and India, in part reflecting the strong domestic operating environments in both countries. In Brazil, our holding in Totvs, a leading software provider benefited from strong revenue growth. Arezzo, a premium footwear retailer, delivered excellent results that were ahead of market expectations, while our holding in energy company Petrobras continued to perform well given notably strong dividend payouts to minority shareholders.
Meanwhile, in India, private banks HDFC and ICICI both benefitted from strong loan growth and corporate strategies that focused on expansion in the higher fee retail segment of the market. Our investment in generics pharmaceutical company Granules performed well on improving margins as well as improving free cash flow generation.
The primary performance detractors were focused in China. Our holding in Beijing Oriental, a high-quality provider of water proofing materials to the real estate sector, struggled given the ongoing challenges in the sector. Depressed investor sentiment towards China in general weighed on our holdings in gaming company Netease, leading pan Asia insurer AIA and e-commerce company JD.Com. In the latter case, this was despite ongoing evidence of market share gains from Alibaba. Indeed, we believe our zero-weight exposure to Alibaba went someway to offset the above negatives.
Ashmore Emerging Markets Equity ESG Fund
The Ashmore Emerging Markets Equity ESG Fund (the “Fund”) seeks to achieve its objective by investing principally in equity securities and equity-related investments of Emerging Market Issuers, which may be denominated in any currency, including the local currency of the issuer, focusing on issuers that the Investment Manager believes satisfy the Environmental, Social, and Governance (“ESG”) Criteria.
Over the period, the Fund’s institutional class underperformed its benchmark, returning -40.10% (net of fees) versus -31.03% for the MSCI Emerging Markets Net.
In Brazil, our holding in Totvs, a leading software provider benefited from strong revenue growth, while Arezzo, a premium footwear retailer, delivered results that were ahead of market expectations. Hapvida, a vertically integrated health care operator, benefitted from growth in the corporate and individual segment of the market which drove revenue higher.
Meanwhile, in India, private banks HDFC and Industrial Credit and Investment Corporation of India (“ICICI”) both benefitted from strong loan growth and corporate strategies that focused on expansion in the higher fee retail segment of the market. Our investment in generics pharmaceutical company Granules performed well on improving margins as well as improving free cash flow generation.
The primary performance detractors were focused in China. Our holding in Beijing Oriental, a high quality provider of water proofing materials to the real estate sector, struggled given the ongoing challenges in the sector. Depressed investor sentiment towards China in general weighed on our holdings in gaming company Tencent, leading pan Asia insurer AIA and e-commerce company JD.Com. In the latter case, this was despite ongoing evidence of market share gains from Alibaba. Indeed, we believe our zero weight exposure to Alibaba went someway to offset the above negatives.
6
ASHMORE FUNDS
INVESTMENT MANAGER’S REPORT (CONTINUED)
Ashmore Emerging Markets Short Duration Select Fund
The Ashmore Emerging Markets Short Duration Select Fund (the “Fund”) seeks to achieve its objective by investing principally in in short-term debt instruments of, and derivative instruments related to, Sovereign, Quasi-Sovereign and Corporate issuers of Emerging Market Countries denominated exclusively in Hard Currencies (i.e., the U.S. dollar or any currency of a nation in the G-7). The Fund normally seeks to maintain a weighted average portfolio duration of between 1 and 3 years and an Investment Grade weighted average credit rating.
Over the period, the Fund’s institutional class underperformed its benchmark, returning -12.16% (net of fees) versus -10.85% for the JP Morgan CEMBI Broad Diversified 1-3 Year. Positions in Russia were amongst the main contributors to the Fund’s relative performance. Positions in China and Poland were amongst the largest detractors from the Fund’s relative performance.
The Russian invasion of Ukraine, supported by Belarus, created an extremely challenging environment for asset price performance, as both Russia and Belarus were subject to an extreme package of economic sanctions. The sanctions had the immediate impact of restricting trading and settlement of Russian and Belarussian bonds, with both countries ultimately excluded from the entire JP Morgan family of bond indices effective March 31, 2022, with all bond prices being written down to zero. Russia nevertheless continued to make coupon payments on its USD denominated debt obligations, although the US government prevented Russia from making a bond principal payment out of foreign currency reserves held by the Central Bank of Russia at US financial institutions, forcing the Russian government to either pay the maturity out of the diminished pool of liquid and accessible FX reserves or default on the bond.
In our view, the Communist Party congress in China turned out to be a disappointment as President Xi effectively packed the Standing Committee (China’s top leadership body) with a loyal following. He now has absolute power in the country, doing away with previous checks and balances inherited in the system. The President defended the Zero Covid Policy, which remains in place officially, though some actual relaxation was noted in the face of a spiraling number of cases with very low levels of mortality. China risk assets all sold off during October, especially already weak bonds from the property sector, generating significant negative alpha. Evidence of softening industrial activity in China, with manufacturing Purchase Managers Index (“PMI”) surprising to the downside, exacerbated concerns about the stability of the property sector. After many months of relative inaction, the Chinese government announced the establishment of a fund that is aimed at supporting a number of developers with the aim of restoring liquidity to the sector and ensuring the completion of housing units already under development. The Chinese government appears to be backing away from its 5.5% growth target for 2022 following the release of GDP figures for the first half of the year showing just 2.5% year-on-year (“yoy”) growth.
Poland has had to cope with high inflation from food and energy prices as well as dealing with an influx of refugees from war torn neighbouring Ukraine. Security selection in the property sector contributed to underperformance in Poland.
Ashmore Emerging Markets Investment Grade Income Fund
The Ashmore Emerging Markets Investment Grade Income (the “Fund”) seeks to achieve its objective by investing principally in debt instruments of, and derivative instruments related to, Sovereigns, Quasi-Sovereigns and Corporate issuers of Emerging Market Countries and EM Supra-Nationals denominated exclusively in Hard Currencies (i.e., the U.S. dollar or any currency of a nation in the G-7). The Fund has no restrictions on individual security duration.
Over the period, the Fund’s institutional class underperformed its benchmark, returning -21.02% (net of fees) versus -18.26% for the JP Morgan CEMBI Investment Grade Broad Diversified. Positions in Russia were amongst the largest country contributors to the Fund’s relative performance. Positions in Ukraine and Mexico detracted from the Fund’s performance.
The Russian invasion of Ukraine, supported by Belarus, created an extremely challenging environment for asset price performance, as both Russia and Belarus were subject to an extreme package of economic sanctions. The sanctions had the immediate impact of restricting trading and settlement of Russian and Belarussian bonds, with both countries ultimately excluded from the entire JP Morgan family of bond indices effective March 31, 2022, with all bond prices being written down to zero. Russia nevertheless
7
ASHMORE FUNDS
INVESTMENT MANAGER’S REPORT (CONTINUED)
continued to make coupon payments on its USD denominated debt obligations, although the US government prevented Russia from making a bond principal payment out of foreign currency reserves held by the Central Bank of Russia at US financial institutions, forcing the Russian government to either pay the maturity out of the diminished pool of liquid and accessible FX reserves or default on the bond.
Economic data was mixed in Mexico, where the government presented an ambitious 2023 Economic Package to Congress, with aggressive revenue forecasts and continued support for Andrés Manuel López Obrador’s (“AMLO’s”) social spending programmes and key infrastructure projects. Longer duration sovereign and Pemex bonds were challenged with moves in US Treasury yields.
In Ukraine, the government unsurprisingly launched a consent solicitation to suspend debt repayment on its Eurobonds until August 2024. At the same time, the G7 and the Paris Club announced the suspension of Ukraine’s debt service through 2023. The announcements were the inevitable result of the ongoing war and the impact it has had on the Ukrainian economy.
Ashmore Emerging Markets Corporate Income ESG Fund
The Ashmore Emerging Markets Corporate Income ESG Fund (the “Fund”) seeks to achieve its objective by investing principally in debt instruments of Corporate issuers, which may be denominated principally in Hard Currencies (i.e., the U.S. dollar or any currency of a nation in the G-7), focusing on issuers that the Investment Manager believes satisfy the ESG Criteria.
The Fund commenced operations on 26 February 2021. Over the period, the Fund’s institutional class underperformed its benchmark, returning -27.56% (net of fees) versus -18.06% for the JP Morgan CEMBI Broad Diversified. Security selection in Jamaica and Qatar contributed to the Fund’s relative performance. China, Mexico and Brazil were the largest detractors from the Fund’s relative performance.
Qatar continued to benefit from increased prices on natural gas and oil exports, and an additional push is expected to come from the upcoming World Cup. Moody’s reported that the current oil price boost will likely lead to a significant improvement in the fiscal and external positions of GCC sovereigns, with Qatar to benefit among the most among its peers in the region.
In our view, the Communist Party congress in China turned out to be a disappointment as President Xi effectively packed the Standing Committee (China’s top leadership body) with a loyal following. He now has absolute power in the country, doing away with previous checks and balances inherited in the system. The President defended the Zero Covid Policy, which remains in place officially, though some actual relaxation was noted in the face of a spiraling number of cases with very low levels of mortality. China risk assets all sold off during October, especially already weak bonds from the property sector, generating significant negative alpha. Evidence of softening industrial activity in China, with manufacturing Purchase Managers Index (“PMI”) surprising to the downside, exacerbated concerns about the stability of the property sector. After many months of relative inaction, the Chinese government announced the establishment of a fund that is aimed at supporting a number of developers with the aim of restoring liquidity to the sector and ensuring the completion of housing units already under development. The Chinese government appears to be backing away from its 5.5% growth target for 2022 following the release of GDP figures for the first half of the year showing just 2.5% year-on-year (“yoy”) growth.
Economic data was mixed in Mexico, where the government presented an ambitious 2023 Economic Package to Congress, with aggressive revenue forecasts and promises to maintain AMLO’s social spending programmes and key infrastructure projects. Longer duration sovereign and Pemex bonds were challenged with moves in US Treasury yields.
Profit taking in Brazil has extended following outperformance in the first quarter. The main negative contributor were security selections with exposure to Telecom, Airlines and Building Materials resulting in negative alpha. Politics took a front seat in the third quarter in the run-up to presidential elections slated for October, with concerns that fiscal stimulus and social spending would be increased to bolster the incumbent. Former President Lula da Silva won the majority of the votes in the election run-off against incumbent Bolsonaro, albeit by the slimmest margin in the recent history of the country. Lula pledged to re-unite the country, but it appears that he will govern with a fragmented Congress and against a sizeable pro-Bolsonaro block. In our view, he will need to form ad-hoc coalitions with Centrist parties in order to achieve his political agenda. He is expected to appoint a market-friendly economic team, and to push for an ambitious social agenda within the confines of limited fiscal space.
8
GLOSSARY OF TERMS
MSCI World Index: A broad global equity index that represents large and mid-cap equity performance across all 23 developed markets countries. It covers approximately 85% of the free float-adjusted market capitalization in each country.
Russell 2000 Index: A stock market index that measures the performance of the 2,000 smaller companies included in the Russell 3000 Index.
MSCI Emerging Markets Net (“MSCI EM Net”): A free float-adjusted market capitalization index that is designed to measure equity market performance in the global Emerging Markets.
S&P 500 Index: Measures the value of the stocks of the 500 largest corporations by market capitalization listed on the New York Stock Exchange or Nasdaq.
Bloomberg Barclays Global Aggregate Index: A flagship measure of global investment grade debt from a multitude local currency markets. This multi-currency benchmark includes treasury, government-related, corporate and securitized fixed-rate bonds from both developed and emerging markets issuers.
JP Morgan Emerging Markets Bond Index Global Diversified: A uniquely weighted USD-denominated Emerging Markets sovereign index. It provides full coverage of the Emerging Markets asset class with representative countries, investable instruments (sovereign and quasi-sovereign), and transparent rules. It limits the weights of those index countries with larger debt stocks by only including specified portions of these countries’ eligible current face amounts of debt outstanding.
JP Morgan Government Bond Index - Emerging Markets Global Diversified (“JP Morgan GBI-EM GD”): A comprehensive global local emerging markets index, and consists of regularly traded, liquid fixed-rate, domestic currency government bonds to which international investors can gain exposure.
JP Morgan Emerging Local Markets Index Plus: Tracks total returns for local currency denominated money market instruments in 23 Emerging Markets.
JP Morgan CEMBI: Tracks the performance of US dollar-denominated bonds issued by emerging market corporate entities.
JP Morgan CEMBI Broad Diversified (“JP Morgan CEMBI BD”): Consists of an investable universe of corporate bonds and tracks total returns of USD-denominated debt instruments issued by corporate entities in Emerging Markets countries.
JP Morgan CEMBI Investment Grade Broad Diversified (“JP Morgan CEMBI IG BD”): A sub index of the JPM CEMBI BD which contains instruments that carry an investment grade rating.
JP Morgan CEMBI Broad Diversified 1-3 Year (“JP Morgan CEMBI BD 1-3 Year”): A sub index of the JPM CEMBI BD which contains instruments that have a maturity greater than 1 year and less than 3 years.
JP Morgan CEMBI Broad Diversified Investment Grade 1-3 Year (“JP Morgan CEMBI BD IG 1-3 Year”): A sub index of the JPM CEMBI BD which contains investment grade instruments that have a maturity greater than 1 year and less than 3 years.
BofA Merrill Lynch 1-3 Year US Treasury Index: A subset of The BofA Merrill Lynch US Treasury Index including all securities with a remaining term to final maturity less than 3 years.
MSCI Emerging Markets Small Cap Net (“MSCI EM Small Cap Net”): A free float-adjusted market capitalization index that is designed to measure small cap equity market performance in the global Emerging Markets.
MSCI Frontier Markets + Select EM Countries Capped Index Net TR (“MSCI FR + Select EM”): A customised benchmark that is designed to measure equity market performance of constituent companies in each of the MSCI Frontiers Market Index (50%) and emerging markets crossover markets (50%), which are the Philippines, Qatar, United Arab Emirates, Peru, Colombia, Argentina, Egypt, Pakistan and Kuwait, together with a country cap of 15%.
9
GLOSSARY OF TERMS (CONTINUED)
Net Interest Margin (“NIMs”): The amount of money that a bank is earning in interest on loans compared to the amount it is paying in interest on deposits.
Basis points (“bps”): A unit of measure used in finance to describe the percentage change in the value of financial instruments or the rate change in an index or other benchmark.
Gross Domestic Product (“GDP”): Measures the monetary value of final goods and services—that is, those that are bought by the final user—produced in a country in a given period of time.
Purchase Managers Index (“PMI”): Is a survey-based indicator of business conditions, which includes individual measures (‘sub-indices’) of business output, new orders, employment, costs, selling prices, exports, purchasing activity, supplier performance, backlogs of orders and inventories of both inputs, etc.
Return on Equity (“ROE”): Is the measure of a company’s net income divided by its shareholders’ equity.
10
IMPORTANT INFORMATION ABOUT THE FUNDS
Ashmore Investment Advisors Limited
This commentary may include statements that constitute “forward-looking statements” under the U.S. securities laws. Forward-looking statements include, among other things, projections, estimates, and information about possible or future results related to the Funds and market or regulatory developments. The views expressed above are not guarantees of future performance or economic results and involve certain risks, uncertainties and assumptions that could cause actual outcomes and results to differ materially from the views expressed herein. The views expressed above are those of Ashmore Investment Advisors Limited as of the date indicated and are subject to change at any time based upon economic, market, or other conditions and Ashmore Investment Advisors Limited undertakes no obligation to update the views expressed herein. Any discussions of specific securities or markets should not be considered a recommendation to buy or sell or invest in those securities or markets. The views expressed above may not be relied upon as investment advice or as an indication of the Funds’ trading intent. Information about the Funds’ holdings, asset allocation or country diversification is historical and is not an indication of future portfolio composition, which may vary. Direct investment in any index is not possible. The performance of any index mentioned in this commentary has not been adjusted for ongoing management, distribution and operating expenses applicable to mutual fund investments. In addition, the returns do not reflect certain charges that an investor in the Funds may pay. If these additional fees were reflected, the performance shown would have been lower.
The following disclosure provides important information regarding each Fund’s Average Annual Total Return table and Cumulative Returns chart, which appear on each Fund’s individual page in this report (the “Shareholder Report” or the “Report”). Please refer to this information when reviewing the table and chart for a Fund.
On each individual Fund Summary page in this Report, the Average Annual Total Return table and Cumulative Returns chart measure performance assuming that all dividend and capital gain distributions were reinvested. Returns do not reflect the deduction of taxes that a shareholder would pay on (i) Fund distributions or (ii) the redemption of Fund shares. The Cumulative Returns Chart reflects only Institutional Class performance. Performance for Class A and Class C shares is typically lower than Institutional Class performance due to the lower expenses paid by Institutional Class shares. Except for the load-waived performance for the Class A and C shares of each Fund (as applicable), performance shown is net of fees and expenses. The load-waived performance for Class A and Class C shares does not reflect the sales charges shareholders of those classes may pay in connection with a purchase or redemption of Class A and Class C shares. The load-waived performance of those share classes is relevant only to shareholders who purchased Class A or Class C shares on a load-waived basis. The figures in the line graph are calculated at net asset value and assume the investment of $1,000,000 at the beginning of the first full month following the inception of the Institutional Class. Each Fund measures its performance against a broad-based securities market index (“benchmark index”). Each benchmark index does not take into account fees, expenses or taxes.
For periods prior to the inception date of the Class A and Class C shares (if applicable), performance information shown is based on the performance of the Fund’s Institutional Class shares, adjusted to reflect the distribution and/or service fees and other expenses paid by the Class A and Class C shares, respectively.
A Fund’s past performance, before and after taxes, is not necessarily an indication of how the Fund will perform in the future.
The expenses shown are for the fiscal year and may differ from the current prospectus.
11
IMPORTANT INFORMATION ABOUT THE FUNDS (CONTINUED)
The following disclosure provides important information regarding each Fund’s Expense Example, which appears on each Fund’s individual page in this Shareholder Report. Please refer to this information when reviewing the Expense Example for a Fund.
EXPENSE EXAMPLE
Fund Expenses
As a shareholder of the Funds, you incur two types of costs: (1) transaction costs, including sales charges (loads) on purchase payments; redemption fees; and exchange fees; and (2) ongoing costs, including management fees; distribution (12b-1) fees; and other Fund expenses. This Example is intended to help you understand your ongoing costs (in Dollars) of investing in the Funds and to compare these costs with the ongoing costs of investing in other mutual funds. The Example is based on an investment of $1,000 invested at the beginning of the period and held for the entire period, from May 1, 2022 or the inception date (if later), through October 31, 2022.
Actual Expenses
The information in the table under the heading “Actual Performance” provides information based on actual performance and actual expenses. You may use the information in these columns, together with the amount you invested, to estimate the expenses that you paid over the period. Simply divide your account value by $1,000 (for example, an $8,600 account value divided by $1,000 = $8.60), then multiply the result by the number in the appropriate column for your share class, in the row titled “Expenses Paid” to estimate the expenses you paid on your account during this period.
Hypothetical Example for Comparison Purposes
The information in the table under the heading “Hypothetical Performance” provides information about hypothetical account values and hypothetical expenses based on the Fund’s actual expense ratio and an assumed rate of return of 5% per year before expenses, which is not the Fund’s actual return. The hypothetical account values and expenses may not be used to estimate the actual ending account balance or expenses you paid for the period. You may use this information to compare the ongoing costs of investing in the Fund and other funds. To do so, compare this 5% hypothetical example with the 5% hypothetical examples that appear in the shareholder reports of the other funds.
Please note that the expenses shown in the table are meant to highlight your ongoing costs only and do not reflect any transactional costs, such as sales charges (loads), redemption fees, or exchange fees. Therefore, the information under the heading “Hypothetical Performance” is useful in comparing ongoing costs only, and will not help you determine the relative total costs of owning different funds. In addition, if these transactional costs were included, your costs would have been higher.
12
Ashmore Emerging Markets Total Return Fund
FUND SUMMARY (UNAUDITED)
| | | | | | | | | | | | | | | | | | | | | | | | | | | | | | | | | | | | | |
Ashmore Emerging Markets Total Return Fund is an open-end U.S. mutual fund. The Fund seeks to achieve its objective by investing principally in debt instruments of sovereign, quasi-sovereign, and corporate issuers of Emerging Market countries, which may be denominated in any currency, including the local currency of the issuer. The Fund tactically allocates assets between external debt, corporate debt and local currency. | | | | | | | | Share class information INSTITUTIONAL CLASS Launch date: December 8, 2010 Minimum initial investment: $1,000,000 ISIN: US0448204059 CUSIP: 044820405 BLOOMBERG: EMKIX US TICKER: EMKIX RETAIL CLASS A Launch date: May 12, 2011 Minimum initial investment: $1,000 ISIN: US0448208357 CUSIP: 044820835 BLOOMBERG: EMKAX US TICKER: EMKAX RETAIL CLASS C Launch date: May 12, 2011 Minimum initial investment: $1,000 ISIN: US0448208274 CUSIP: 044820827 BLOOMBERG: EMKCX US TICKER: EMKCX All sources are Ashmore unless otherwise indicated. |
Please refer to page 1 herein for an explanation of the information presented below in the Average Annual Total Return Table and Cumulative Return Chart. | | | | | | |
Average Annual Total Return For The Period Ended Oct 31, 2022 | | 1 Year | | 5 Year | | 10 Year | | |
Institutional Class | | | | | | | | | | | | | | | | | | | -30.74% | | | | | -7.14% | | | | | -2.34% | | | | | | |
Retail Class A (load-waived) | | | | | | | | | | | | | | | | | | | -30.79% | | | | | -7.33% | | | | | -2.56% | 3 | | | | | |
Retail Class A (unadjusted)1 | | | | | | | | | | | | | | | | | | | -33.60% | | | | | -8.08% | | | | | -2.96% | 3 | | | | | |
Retail Class C (load-waived) | | | | | | | | | | | | | | | | | | | -31.39% | | | | | -8.05% | | | | | -3.15% | 3 | | | | | |
Retail Class C (unadjusted)1 | | | | | | | | | | | | | | | | | | | -32.05% | | | | | -8.05% | | | | | -3.15% | 3 | | | | | |
50/25/25 Composite Benchmark2 | | | | | | | | | | | | | | | | | | | -20.71% | | | | | -2.69% | | | | | -0.47% | | | | | | |
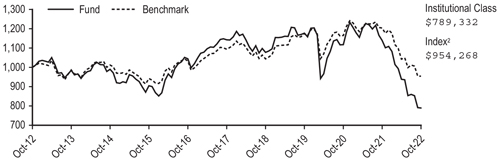
Cumulative Returns Through Oct 31, 2022 (% of NAV) | | | | | | | | | | | | | | | | | | | | | | | | | | | | | | | | | | | |
| |
The above cumulative returns graph assumes $1,000,000 invested at the beginning of the first full month following the inception of the Institutional Class. The minimum initial investment amount for Institutional Class Shares is $1,000,000. The minimum initial investment amount for Retail Shares Classes A and C is $1,000. All Fund returns are net of fees and expenses, except for the load-waived return information for Class A and Class C shares. Performance calculations assume that all dividend, capital gain and other distributions were reinvested. The graph does not reflect the deduction of taxes that a shareholder would pay on distributions or the redemption of fund shares.
1Unadjusted Performance accounts for a maximum sales load of 4% for Class A shares and maximum deferred sales charge of 1% for the 1 year return for the Class C shares. 2The index for the Fund is 50% JP Morgan Emerging Markets Bond Index Global Diversified, 25% JP Morgan Emerging Local Markets Index Plus, and 25% JP Morgan Government Bond Index-Emerging Markets Global Diversified. 3Class C Shares performance reflects conversion to Class A Shares after eight years.
Past performance does not guarantee future results. The performance data quoted represents past performance and current returns may be lower or higher. The investment return and net asset value will fluctuate so that an investor’s shares, when redeemed, may be worth more or less than the original cost. To obtain performance information current to the most recent month-end, please call 1-855-274-6673. Periods greater than one year are annualized. Changes in rates of exchange between currencies may cause the value of investments to decrease or increase. The Fund’s performance will fluctuate over long and short term periods.
Please refer to page 2 herein for an explanation of the Expense Example information presented below.
| | | | | | | | | | | | | | |
| | | | |
Expense example | | Actual performance | | | | Hypothetical performance |
| | | | | | | | |
| | | Institutional Class | | Class A | | Class C | | | | Institutional Class | | Class A | | Class C |
| | | | | | | | |
Beginning Account Value (5/1/2022) | | $1,000.00 | | $1,000.00 | | $1,000.00 | | | | $1,000.00 | | $1,000.00 | | $1,000.00 |
| | | | | | | | |
Ending Account Value (10/31/2022) | | $840.30 | | $840.60 | | $836.80 | | | | $1,020.11 | | $1,018.85 | | $1,015.07 |
| | | | | | | | |
Expense Ratio (Gross / Net) | | 1.19% / 1.01% | | 1.44% / 1.26% | | 2.19% / 2.01% | | | | 1.19% / 1.01% | | 1.44% / 1.26% | | 2.19% / 2.01% |
| | | | | | | | |
Expenses Paid* | | $4.68 | | $5.85 | | $9.31 | | | | $5.14 | | $6.41 | | $10.21 |
*Expenses are equal to the Fund’s annualized expense ratios for the period May 1, 2022 through October 31, 2022, multiplied by the average account value over the period, multiplied by 184/365 (to reflect the one-half year period). As such, these may differ from the prospectus.
13
Ashmore Emerging Markets Local Currency Bond Fund
FUND SUMMARY (UNAUDITED)
| | | | | | | | | | | | | | | | | | | | | | | | | | | | | | | | | | | | | |
Ashmore Emerging Markets Local Currency Bond Fund is an open-end U.S. mutual fund. The Fund seeks to achieve its objective by investing principally in debt instruments of sovereign and quasi-sovereign issuers of Emerging Market countries that are denominated in the local currency of the issuer. | | | | | | | | Share class information INSTITUTIONAL CLASS Launch date: December 8, 2010 Minimum initial investment: $1,000,000 ISIN: US0448202079 CUSIP: 044820207 BLOOMBERG: ELBIX US TICKER: ELBIX RETAIL CLASS A Launch date: May 12, 2011 Minimum initial investment: $1,000 ISIN: US0448208761 CUSIP: 044820876 BLOOMBERG: ELBAX US TICKER: ELBAX RETAIL CLASS C Launch date: May 12, 2011 Minimum initial investment: $1,000 ISIN: US0448208688 CUSIP: 044820868 BLOOMBERG: ELBCX US TICKER: ELBCX All sources are Ashmore unless otherwise indicated. |
Please refer to page 1 herein for an explanation of the information presented below in the Average Annual Total Return Table and Cumulative Return Chart. | | | | | | |
Average Annual Total Return For The Period Ended Oct 31, 2022 | | 1 Year | | 5 Year | | 10 Year | | |
Institutional Class | | | | | | | | | | | | | | | | | | | -17.49% | | | | | -3.64% | | | | | -2.64% | | | | | | |
Retail Class A (load-waived) | | | | | | | | | | | | | | | | | | | -17.75% | | | | | -3.85% | | | | | -2.88% | 3 | | | | | |
Retail Class A (unadjusted)1 | | | | | | | | | | | | | | | | | | | -21.05% | | | | | -4.63% | | | | | -3.27% | 3 | | | | | |
Retail Class C (load-waived) | | | | | | | | | | | | | | | | | | | -18.30% | | | | | -4.58% | | | | | -3.47% | 3 | | | | | |
Retail Class C (unadjusted)1 | | | | | | | | | | | | | | | | | | | -19.11% | | | | | -4.58% | | | | | -3.47% | 3 | | | | | |
JP Morgan GBI-EM GD2 | | | | | | | | | | | | | | | | | | | -20.27% | | | | | -3.54% | | | | | -2.56% | | | | | | |
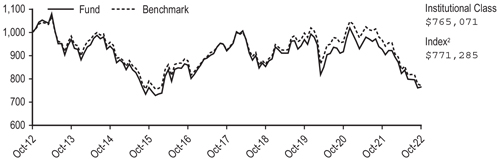
Cumulative Returns Through Oct 31, 2022 (% of NAV) | | | | | | | | | | | | | | | | | | | | | | | | | | | | | | | | | | | |
| |
The above cumulative returns graph assumes $1,000,000 invested at the beginning of the first full month following the inception of the Institutional Class. The minimum initial investment amount for Institutional Class Shares is $1,000,000. The minimum initial investment amount for Retail Shares Classes A and C is $1,000. All Fund returns are net of fees and expenses, except for the load-waived return information for Class A and Class C shares. Performance calculations assume that all dividend, capital gain and other distributions were reinvested. The graph does not reflect the deduction of taxes that a shareholder would pay on distributions or the redemption of fund shares.
1Unadjusted Performance accounts for a maximum sales load of 4% for Class A shares and maximum deferred sales charge of 1% for the 1 year return for the Class C shares. 2The index for the Fund is the JP Morgan Global Bond Index—Emerging Markets Global Diversified. 3Class C Shares performance reflects conversion to Class A Shares after eight years.
Past performance does not guarantee future results. The performance data quoted represents past performance and current returns may be lower or higher. The investment return and net asset value will fluctuate so that an investor’s shares, when redeemed, may be worth more or less than the original cost. To obtain performance information current to the most recent month-end, please call 1-855-274-6673. Periods greater than one year are annualized. Changes in rates of exchange between currencies may cause the value of investments to decrease or increase. The Fund’s performance will fluctuate over long and short term periods.
Please refer to page 2 herein for an explanation of the Expense Example information presented below.
| | | | | | | | | | | | | | |
| | | | |
Expense example | | Actual performance | | | | Hypothetical performance |
| | | | | | | | |
| | | Institutional Class | | Class A | | Class C | | | | Institutional Class | | Class A | | Class C |
| | | | | | | | |
Beginning Account Value (5/1/2022) | | $1,000.00 | | $1,000.00 | | $1,000.00 | | | | $1,000.00 | | $1,000.00 | | $1,000.00 |
| | | | | | | | |
Ending Account Value (10/31/2022) | | $929.10 | | $927.40 | | $925.20 | | | | $1,020.32 | | $1,019.06 | | $1,015.27 |
| | | | | | | | |
Expense Ratio (Gross / Net) | | 3.02% / 0.97% | | 3.27% / 1.22% | | 4.03% / 1.97% | | | | 3.02% / 0.97% | | 3.27% / 1.22% | | 4.03% / 1.97% |
| | | | | | | | |
Expenses Paid* | | $4.72 | | $5.93 | | $9.56 | | | | $4.94 | | $6.21 | | $10.01 |
*Expenses are equal to the Fund’s annualized expense ratios for the period May 1, 2022 through October 31, 2022, multiplied by the average account value over the period, multiplied by 184/365 (to reflect the one-half year period). As such, these may differ from the prospectus.
14
Ashmore Emerging Markets Corporate Income Fund
FUND SUMMARY (UNAUDITED)
| | | | | | | | | | | | | | | | | | | | | | | | | | | | | | | | | | |
Ashmore Emerging Markets Corporate Income Fund is an open-end U.S. mutual fund. The Fund seeks to achieve its objective by investing principally in debt instruments of Emerging Market corporate issuers, which may be denominated in any currency, including the local currency of the issuer. | | | | | | | Share class information INSTITUTIONAL CLASS Launch date: December 8, 2010 Minimum initial investment: $1,000,000 ISIN: US044825049 CUSIP: 044820504 BLOOMBERG: EMCIX US TICKER: EMCIX RETAIL CLASS A Launch date: May 12, 2011 Minimum initial investment: $1,000 ISIN: US0448206039 CUSIP: 044820603 BLOOMBERG: ECDAX US TICKER: ECDAX RETAIL CLASS C Launch date: May 12, 2011 Minimum initial investment: $1,000 ISIN: US0448207029 CUSIP: 044820702 BLOOMBERG: ECDCX US TICKER: ECDCX All sources are Ashmore unless otherwise indicated. |
Please refer to page 1 herein for an explanation of the information presented below in the Average Annual Total Return Table and Cumulative Return Chart. | | | | | |
Average Annual Total Return For The Period Ended Oct 31, 2022 | | | | | | 1 Year | | | 5 Year | | | 10 Year | | | | |
Institutional Class | | | | | | | | | | | | | | | | | | | -29.15% | | | | -4.56% | | | | 0.37% | | | | | |
Retail Class A (load-waived) | | | | | | | | | | | | | | | | | | | -29.30% | | | | -4.80% | | | | 0.11% | 3 | | | | |
Retail Class A (unadjusted)1 | | | | | | | | | | | | | | | | | | | -32.10% | | | | -5.58% | | | | -0.29% | 3 | | | | |
Retail Class C (load-waived) | | | | | | | | | | | | | | | | | | | -29.86% | | | | -5.50% | | | | -0.51% | 3 | | | | |
Retail Class C (unadjusted)1 | | | | | | | | | | | | | | | | | | | -30.52% | | | | -5.50% | | | | -0.51% | 3 | | | | |
JP Morgan CEMBI BD2 | | | | | | | | | | | | | | | | | | | -18.06% | | | | -0.20% | | | | 2.27% | | | | | |
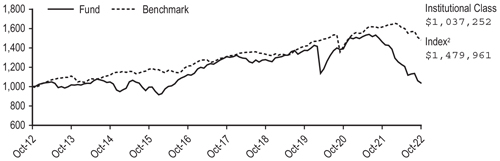
Cumulative Returns Through Oct 31, 2022 (% of NAV) | | | | | | | | | | | | | | | | | | | | | | | | | | | | | | | | |
| | | | | |
The above cumulative returns graph assumes $1,000,000 invested at the beginning of the first full month following the inception of the Institutional Class. The minimum initial investment amount for Institutional Class Shares is $1,000,000. The minimum initial investment amount for Retail Shares Classes A and C is $1,000. All Fund returns are net of fees and expenses, except for the load-waived return information for Class A and Class C shares. Performance calculations assume that all dividend, capital gain and other distributions were reinvested. The graph does not reflect the deduction of taxes that a shareholder would pay on distributions or the redemption of fund shares.
1Unadjusted Performance accounts for a maximum sales load of 4% for Class A shares and maximum deferred sales charge of 1% for the 1 year return for the Class C shares. 2The index for the Fund is the JP Morgan CEMBI Broad Diversified. 3Class C Shares performance reflects conversion to Class A Shares after eight years.
Past performance does not guarantee future results. The performance data quoted represents past performance and current returns may be lower or higher. The investment return and net asset value will fluctuate so that an investor’s shares, when redeemed, may be worth more or less than the original cost. To obtain performance information current to the most recent month-end, please call 1-855-274-6673. Periods greater than one year are annualized. Changes in rates of exchange between currencies may cause the value of investments to decrease or increase. The Fund’s performance will fluctuate over long and short term periods.
Please refer to page 2 herein for an explanation of the Expense Example information presented below.
| | | | | | | | | | | | | | |
| | | | |
Expense example | | Actual performance | | | | Hypothetical performance |
| | | | | | | | |
| | | Institutional Class | | Class A | | Class C | | | | Institutional Class | | Class A | | Class C |
| | | | | | | | |
Beginning Account Value (5/1/2022) | | $1,000.00 | | $1,000.00 | | $1,000.00 | | | | $1,000.00 | | $1,000.00 | | $1,000.00 |
| | | | | | | | |
Ending Account Value (10/31/2022) | | $842.20 | | $841.50 | | $838.10 | | | | $1,020.92 | | $1,019.66 | | $1,015.88 |
| | | | | | | | |
Expense Ratio (Gross / Net) | | 1.10% / 0.85% | | 1.35% / 1.10% | | 2.10% / 1.85% | | | | 1.10% / 0.85% | | 1.35% / 1.10% | | 2.10% / 1.85% |
| | | | | | | | |
Expenses Paid* | | $3.95 | | $5.11 | | $8.57 | | | | $4.33 | | $5.60 | | $9.40 |
*Expenses are equal to the Fund’s annualized expense ratios for the period May 1, 2022 through October 31, 2022, multiplied by the average account value over the period, multiplied by 184/365 (to reflect the one-half year period). As such, these may differ from the prospectus.
15
Ashmore Emerging Markets Short Duration Fund
FUND SUMMARY (UNAUDITED)
| | | | | | | | | | | | | | | | | | | | | | | | | | | | | | | | | | |
Ashmore Emerging Markets Short Duration Fund is an open-end U.S. mutual fund. The Fund seeks to achieve its objective by investing principally in short-term debt instruments of, and derivative instruments related to, sovereign, quasi-sovereign and corporate issuers of Emerging Markets countries denominated exclusively in hard currencies (i.e., the U.S. dollar or any currency of a nation in the G-7). The Fund normally seeks to maintain a weighted average portfolio duration of between 1 and 3 years. The Fund has no restrictions on individual security duration. | | | | | | | Share class information INSTITUTIONAL CLASS Launch date: June 24, 2014 Minimum initial investment: $1,000,000 ISIN: US0448206948 CUSIP: 044820694 BLOOMBERG: ESFIX US TICKER: ESFIX RETAIL CLASS A Launch date: September 23, 2014 Minimum initial investment: $1,000 ISIN: US0448207284 CUSIP: 044820728 BLOOMBERG: ESFAX US TICKER: ESFAX RETAIL CLASS C Launch date: June 13, 2017 Minimum initial investment: $1,000 ISIN: US0448207102 CUSIP: 044820710 BLOOMBERG: ESFCX US TICKER: ESFCX All sources are Ashmore unless otherwise indicated. |
Please refer to page 1 herein for an explanation of the information presented below in the Average Annual Total Return Table and Cumulative Return Chart. | | | | | |
Average Annual Total Return For The Period Ended Oct 31, 2022 | | | | | | 1 Year | | | 5 Year | | | Since incpt1 | | | | |
Institutional Class | | | | | | | | | | | | | | | | | | | -31.54% | | | | -10.27% | | | | -2.51% | | | | | |
Retail Class A (load-waived) | | | | | | | | | | | | | | | | | | | -31.54% | | | | -10.48% | | | | -2.74% | | | | | |
Retail Class A (unadjusted)1 | | | | | | | | | | | | | | | | | | | -33.12% | | | | -11.20% | | | | -3.23% | | | | | |
Retail Class C (load-waived) | | | | | | | | | | | | | | | | | | | -32.29% | | | | -11.21% | | | | -9.68% | | | | | |
Retail Class C (unadjusted)1 | | | | | | | | | | | | | | | | | | | -32.92% | | | | -11.21% | | | | -9.68% | | | | | |
JP Morgan CEMBI BD 1-3 Year2 | | | | | | | | | | | | | | | | | | | -11.56% | | | | 0.78% | | | | 1.81% | | | | | |
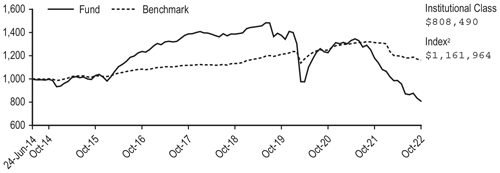
Cumulative Returns Through Oct 31, 2022 (% of NAV) | | | | | | | | | | | | | | | | | | | | | | | | | | | | | | | | |
| | | | | |
The above cumulative returns graph assumes $1,000,000 invested at the beginning of the first full month following the inception of the Institutional Class. The minimum initial investment amount for Institutional Class Shares is $1,000,000. The minimum initial investment amount for Retail Shares Class A is $1,000. All Fund returns are net of fees and expenses, except for the load-waived return information for Class A shares. Performance calculations assume that all dividend, capital gain and other distributions were reinvested. The graph does not reflect the deduction of taxes that a shareholder would pay on distributions or the redemption of fund shares.
1Unadjusted Performance accounts for a maximum sales load of 2.25% for Class A shares and maximum deferred sales charge of 1% for the 1 year return for the Class C shares. 2The index for the Fund is the JP Morgan CEMBI Broad Diversified 1-3 Year. Since inception returns are from the inception of the Institutional Class.
Past performance does not guarantee future results. The performance data quoted represents past performance and current returns may be lower or higher. The investment return and net asset value will fluctuate so that an investor’s shares, when redeemed, may be worth more or less than the original cost. To obtain performance information current to the most recent month-end, please call 1-855-274-6673. Periods greater than one year are annualized. Changes in rates of exchange between currencies may cause the value of investments to decrease or increase. The Fund’s performance will fluctuate over long and short term periods.
Please refer to page 2 herein for an explanation of the Expense Example information presented below.
| | | | | | | | | | | | | | |
| | | | |
Expense example | | Actual performance | | | | Hypothetical performance |
| | | | | | | | |
| | | Institutional Class | | Class A | | Class C | | | | Institutional Class | | Class A | | Class C |
| | | | | | | | |
Beginning Account Value (5/1/2022) | | $1,000.00 | | $1,000.00 | | $1,000.00 | | | | $1,000.00 | | $1,000.00 | | $1,000.00 |
| | | | | | | | |
Ending Account Value (10/31/2022) | | $818.60 | | $819.30 | | $814.60 | | | | $1,023.24 | | $1,021.98 | | $1,018.20 |
| | | | | | | | |
Expense Ratio (Gross / Net) | | 0.69% / 0.39% | | 0.94% / 0.64% | | 1.69% / 1.39% | | | | 0.69% / 0.39% | | 0.94% / 0.64% | | 1.69% / 1.39% |
| | | | | | | | |
Expenses Paid* | | $1.79 | | $2.93 | | $6.36 | | | | $1.99 | | $3.26 | | $7.07 |
*Expenses are equal to the Fund’s annualized expense ratios for the period May 1, 2022 through October 31, 2022, multiplied by the average account value over the period, multiplied by 184/365 (to reflect the one-half year period). As such, these may differ from the prospectus.
16
Ashmore Emerging Markets Active Equity Fund
FUND SUMMARY (UNAUDITED)
| | | | | | | | | | | | | | | | | | | | | | | | | | | | | | | | | | |
Ashmore Emerging Markets Active Equity Fund is an open-end U.S. mutual fund. The Fund seeks to achieve its objective by investing principally in equity securities and equity-related investments of Emerging Market issuers, which may be denominated in any currency, including the local currency of the issuer. | | | | | | | Share class information INSTITUTIONAL CLASS Launch date: November 1, 2016 Minimum initial investment: $1,000,000 ISIN: US0448205957 CUSIP: 044820595 BLOOMBERG: EMQIX US TICKER: EMQIX RETAIL CLASS A Launch date: November 1, 2016 Minimum initial investment: $1,000 ISIN: US0448206294 CUSIP: 044820629 BLOOMBERG: EMQAX US TICKER: EMQAX RETAIL CLASS C Launch date: November 1, 2016 Minimum initial investment: $1,000 ISIN: US0448206112 CUSIP: 044820611 BLOOMBERG: EMQCX US TICKER: EMQCX All sources are Ashmore unless otherwise indicated. |
Please refer to page 1 herein for an explanation of the information presented below in the Average Annual Total Return Table and Cumulative Return Chart. | | | | | |
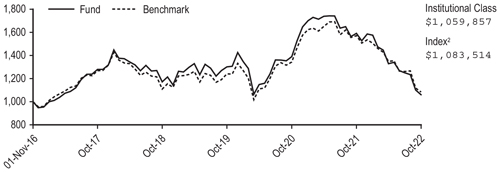
Average Annual Total Return For The Period Ended Oct 31, 2022 | | | | | | 1 Year | | | 5 Year | | | Since incpt1 | | | | |
Institutional Class | | | | | | | | | | | | | | | | | | | -33.40% | | | | -3.70% | | | | 0.97% | | | | | |
Retail Class A (load-waived) | | | | | | | | | | | | | | | | | | | -33.53% | | | | -3.93% | | | | 0.74% | | | | | |
Retail Class A (unadjusted)1 | | | | | | | | | | | | | | | | | | | -37.04% | | | | -4.95% | | | | -0.15% | | | | | |
Retail Class C (load-waived) | | | | | | | | | | | | | | | | | | | -34.05% | | | | -4.67% | | | | 0.00% | | | | | |
Retail Class C (unadjusted)1 | | | | | | | | | | | | | | | | | | | -34.53% | | | | -4.67% | | | | 0.00% | | | | | |
MSCI EM Net2 | | | | | | | | | | | | | | | | | | | -31.03% | | | | -3.09% | | | | 1.35% | | | | | |
Cumulative Returns Through Oct 31, 2022 (% of NAV) | | | | | | | | | | | | | | | | | | | | | | | | | | | | | | | | |
| | | | | |
The above cumulative returns graph assumes $1,000,000 invested at the beginning of the first full month following the inception of the Institutional Class. The minimum initial investment amount for Institutional Class Shares is $1,000,000. The minimum initial investment amount for Retail Shares Classes A and C is $1,000. All Fund returns are net of fees and expenses, except for the load-waived return information for Class A and Class C shares. Performance calculations assume that all dividend, capital gain and other distributions were reinvested. The graph does not reflect the deduction of taxes that a shareholder would pay on distributions or the redemption of fund shares.
1Unadjusted Performance accounts for a maximum sales load of 5.25% for Class A shares and maximum deferred sales charge of 1% for the 1 year return for the Class C shares. 2The index for the Fund is the MSCI Emerging Markets Net.
Past performance does not guarantee future results. The performance data quoted represents past performance and current returns may be lower or higher. The investment return and net asset value will fluctuate so that an investor’s shares, when redeemed, may be worth more or less than the original cost. To obtain performance information current to the most recent month-end, please call 1-855-274-6673. Periods greater than one year are annualized. Changes in rates of exchange between currencies may cause the value of investments to decrease or increase. The Fund’s performance will fluctuate over long and short term periods.
Please refer to page 2 herein for an explanation of the Expense Example information presented below.
| | | | | | | | | | | | | | |
| | | | |
Expense example | | Actual performance | | | | Hypothetical performance |
| | | | | | | | |
| | | Institutional Class | | Class A | | Class C | | | | Institutional Class | | Class A | | Class C |
| | | | | | | | |
Beginning Account Value (5/1/2022) | | $1,000.00 | | $1,000.00 | | $1,000.00 | | | | $1,000.00 | | $1,000.00 | | $1,000.00 |
| | | | | | | | |
Ending Account Value (10/31/2022) | | $797.80 | | $796.60 | | $793.60 | | | | $1,020.06 | | $1,018.80 | | $1,015.02 |
| | | | | | | | |
Expense Ratio (Gross / Net) | | 1.29% / 1.02% | | 1.54% / 1.27% | | 2.32% / 2.02% | | | | 1.29% / 1.02% | | 1.54% / 1.27% | | 2.32% / 2.02% |
| | | | | | | | |
Expenses Paid* | | $4.62 | | $5.75 | | $9.13 | | | | $5.19 | | $6.46 | | $10.26 |
*Expenses are equal to the Fund’s annualized expense ratios for the period May 1, 2022 through October 31, 2022, multiplied by the average account value over the period, multiplied by 184/365 (to reflect the one-half year period). As such, these may differ from the prospectus.
17
Ashmore Emerging Markets Small-Cap Equity Fund
FUND SUMMARY (UNAUDITED)
| | | | | | | | | | | | | | | | | | | | | | | | | | | | | | | | | | |
Ashmore Emerging Markets Small-Cap Equity Fund is an open-end U.S. mutual fund. The Fund seeks to achieve its objective by investing at least 80% of its net assets in equity securities and equity-related investments of Small-Capitalization Emerging Market Issuers, which may be denominated in any currency, including the local currency of the issuer. | | | | | | | Share class information INSTITUTIONAL CLASS Launch date: October 4, 2011 Minimum initial investment: $1,000,000 ISIN: US0448201162 CUSIP: 044820116 BLOOMBERG: ESCIX US TICKER: ESCIX RETAIL CLASS A Launch date: February 1, 2012 Minimum initial investment: $1,000 ISIN: US0448207938 CUSIP: 044820793 BLOOMBERG: ESSAX US TICKER: ESSAX RETAIL CLASS C Launch date: August 23, 2012 Minimum initial investment: $1,000 ISIN: US0448207854 CUSIP: 044820785 BLOOMBERG: ESSCX US TICKER: ESSCX All sources are Ashmore unless otherwise indicated. |
Please refer to page 1 herein for an explanation of the information presented below in the Average Annual Total Return Table and Cumulative Return Chart. | | | | | |
Average Annual Total Return For The Period Ended Oct 31, 2022 | | | | | | 1 Year | | | 5 Year | | | 10 Year | | | | |
Institutional Class | | | | | | | | | | | | | | | | | | | -33.21% | | | | 0.40% | | | | 3.34% | | | | | |
Retail Class A (load-waived) | | | | | | | | | | | | | | | | | | | -33.37% | | | | 0.13% | | | | 3.06% | 3 | | | | |
Retail Class A (unadjusted)1 | | | | | | | | | | | | | | | | | | | -36.87% | | | | -0.94% | | | | 2.51% | 3 | | | | |
Retail Class C (load-waived) | | | | | | | | | | | | | | | | | | | -33.91% | | | | -0.57% | | | | 2.46% | 3 | | | | |
Retail Class C (unadjusted)1 | | | | | | | | | | | | | | | | | | | -34.57% | | | | -0.57% | | | | 2.46% | 3 | | | | |
MSCI EM Small Cap Net2 | | | | | | | | | | | | | | | | | | | -23.42% | | | | 0.54% | | | | 3.06% | | | | | |
Cumulative Returns Through Oct 31, 2022 (% of NAV) | | | | | | | | | | | | | | | | | | | | | | | | | | | | | | | | |
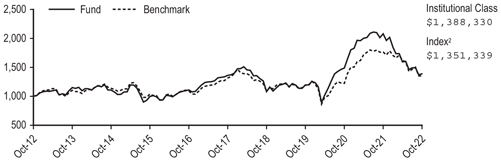
| | | | | |
The above cumulative returns graph assumes $1,000,000 invested at the beginning of the first full month following the inception of the Institutional Class. The minimum initial investment amount for Institutional Class Shares is $1,000,000. The minimum initial investment amount for Retail Shares Classes A and C is $1,000. All Fund returns are net of fees and expenses, except for the load-waived return information for Class A and Class C shares. Performance calculations assume that all dividend, capital gain and other distributions were reinvested. The graph does not reflect the deduction of taxes that a shareholder would pay on distributions or the redemption of fund shares.
1Unadjusted Performance accounts for a maximum sales load of 5.25% for Class A shares and maximum deferred sales charge of 1% for the 1 year return for the Class C shares. 2The index for the Fund is the MSCI Emerging Markets Small Cap Net. 3Class C Shares performance reflects conversion to Class A Shares after eight years.
Past performance does not guarantee future results. The performance data quoted represents past performance and current returns may be lower or higher. The investment return and net asset value will fluctuate so that an investor’s shares, when redeemed, may be worth more or less than the original cost. To obtain performance information current to the most recent month-end, please call 1-855-274-6673. Periods greater than one year are annualized. Changes in rates of exchange between currencies may cause the value of investments to decrease or increase. The Fund’s performance will fluctuate over long and short term periods.
Please refer to page 2 herein for an explanation of the Expense Example information presented below.
| | | | | | | | | | | | | | |
| | | | |
Expense example | | Actual performance | | | | Hypothetical performance |
| | | | | | | | |
| | | Institutional Class | | Class A | | Class C | | | | Institutional Class | | Class A | | Class C |
| | | | | | | | |
Beginning Account Value (5/1/2022) | | $1,000.00 | | $1,000.00 | | $1,000.00 | | | | $1,000.00 | | $1,000.00 | | $1,000.00 |
| | | | | | | | |
Ending Account Value (10/31/2022) | | $870.80 | | $870.00 | | $866.40 | | | | $1,017.54 | | $1,016.28 | | $1,012.50 |
| | | | | | | | |
Expense Ratio (Gross / Net) | | 2.95% / 1.52% | | 3.20% / 1.77% | | 3.96% / 2.52% | | | | 2.95% / 1.52% | | 3.20% / 1.77% | | 3.96% / 2.52% |
| | | | | | | | |
Expenses Paid* | | $7.17 | | $8.34 | | $11.85 | | | | $7.73 | | $9.00 | | $12.78 |
*Expenses are equal to the Fund’s annualized expense ratios for the period May 1, 2022 through October 31, 2022, multiplied by the average account value over the period, multiplied by 184/365 (to reflect the one-half year period). As such, these may differ from the prospectus.
18
Ashmore Emerging Markets Frontier Equity Fund
FUND SUMMARY (UNAUDITED)
| | | | | | | | | | | | | | | | | | | | | | | | | | | | | | | | | | |
Ashmore Emerging Markets Frontier Equity Fund is an open-end U.S. mutual fund. The Fund seeks to achieve its objective by investing principally in equity securities and equity-related investments of Frontier Market issuers, which may be denominated in any currency, including the local currency of the issuer. | | | | | | | Share class information INSTITUTIONAL CLASS Launch date: November 1, 2013 Minimum initial investment: $1,000,000 ISIN: US0448207367 CUSIP: 044820736 BLOOMBERG: EFEIX US TICKER: EFEIX RETAIL CLASS A Launch date: May 7, 2014 Minimum initial investment: $1,000 ISIN: US0448207516 CUSIP: 044820751 BLOOMBERG: EFEAX US TICKER: EFEAX RETAIL CLASS C Launch date: May 7, 2014 Minimum initial investment: $1,000 ISIN: US0448207441 CUSIP: 044820744 BLOOMBERG: EFECX US TICKER: EFECX All sources are Ashmore unless otherwise indicated. |
Please refer to page 1 herein for an explanation of the information presented below in the Average Annual Total Return Table and Cumulative Return Chart. | | | | | |
Average Annual Total Return For The Period Ended Oct 31, 2022 | | | | | | 1 Year | | | 5 Year | | | Since incpt1 | | | | |
Institutional Class | | | | | | | | | | | | | | | | | | | -15.78% | | | | -0.37% | | | | 2.90% | | | | | |
Retail Class A (load-waived) | | | | | | | | | | | | | | | | | | | -15.92% | | | | -0.66% | | | | 1.42%2 | | | | | |
Retail Class A (unadjusted)1 | | | | | | | | | | | | | | | | | | | -20.33% | | | | -1.72% | | | | 0.79%2 | | | | | |
Retail Class C (load-waived) | | | | | | | | | | | | | | | | | | | -16.58% | | | | -1.45% | | | | 0.66%2 | | | | | |
Retail Class C (unadjusted)1 | | | | | | | | | | | | | | | | | | | -17.40% | | | | -1.45% | | | | 0.66%2 | | | | | |
MSCI FM + Select EM* | | | | | | | | | | | | | | | | | | | -16.91% | | | | N/A | | | | N/A | | | | | |
MSCI Frontier Markets Net* | | | | | | | | | | | | | | | | | | | -31.19% | | | | -2.34% | | | | 1.01% | | | | | |
Cumulative Returns Through Oct 31, 2022 (% of NAV) | | | | | | | | | | | | | | | | | | | | | | | | | | | | | | | | |
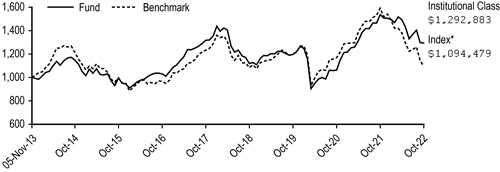
| | | | | |
The above cumulative returns graph assumes $1,000,000 invested at the beginning of the first full month following the inception of the Institutional Class. The minimum initial investment amount for Institutional Class Shares is $1,000,000. All Fund returns are net of fees and expenses. Performance calculations assume that all dividend, capital gain and other distributions were reinvested. The graph does not reflect the deduction of taxes that a shareholder would pay on distributions or the redemption of fund shares.
1Unadjusted Performance accounts for a maximum sales load of 5.25% for Class A shares and maximum deferred sales charge of 1% for the 1 year return for the Class C shares. 2Class C Shares performance reflects conversion to Class A Shares after eight years.
*The index disclosed in the line graph is the MSCI Frontier Markets Index Net TR. Effective December 31, 2019, the Fund started using the MSCI Frontier Markets + Select EM Countries Capped Index Net TR with performance of the index beginning on December 31, 2019. Prior to this Fund’s benchmark was the MSCI Frontier Markets Index Net TR from inception. Source: MSCI. The MSCI data is comprised of a custom index calculated by MSCI for, and as requested by, Ashmore. The MSCI data is for internal use only and may not be redistributed or used in connection with creating or offering any securities, financial products or indices. Neither MSCI nor any other third party involved in or related to compiling, computing or creating the MSCI data (the “MSCI Parties) makes any express or implied warranties or representations with respect to such data or the results to be obtained by the use thereof), and the MSCI Parties hereby expressly disclaim all warranties of originality, accuracy, completeness, merchantability or fitness for a particular purpose with respect to such data. Without limiting any of the foregoing, in no event shall any of the MSCI Parties have any liability for any direct, indirect, special, punitive, consequential or any other damages (including lost profits,) even if notified of the possibility of such damages. The MSCI Frontier + Select Emerging Markets Countries Capped Index is a customised benchmark that is designed to measure equity market performance of constituent companies in each of the MSCI Frontiers Market Index (50%) and emerging markets crossover markets (50%), which are the Philippines, Qatar, United Arab Emirates, Peru, Colombia, Argentina, Egypt and Pakistan, together with a country cap of 15%. You cannot invest directly in an index. Since inception returns are from the inception of the Institutional Class.
Past performance does not guarantee future results. The performance data quoted represents past performance and current returns may be lower or higher. The investment return and net asset value will fluctuate so that an investor’s shares, when redeemed, may be worth more or less than the original cost. To obtain performance information current to the most recent month-end, please call 1-855-274-6673. Periods greater than one year are annualized. Changes in rates of exchange between currencies may cause the value of investments to decrease or increase. The Fund’s performance will fluctuate over long and short term periods.
19
Ashmore Emerging Markets Frontier Equity Fund
FUND SUMMARY (UNAUDITED) (CONTINUED)
Please refer to page 2 herein for an explanation of the Expense Example information presented below.
| | | | | | | | | | | | | | |
| | | | |
Expense example | | Actual performance | | | | Hypothetical performance |
| | | | | | | | |
| | | Institutional Class | | Class A | | Class C | | | | Institutional Class | | Class A | | Class C |
| | | | | | | | |
Beginning Account Value (5/1/2022) | | $1,000.00 | | $1,000.00 | | $1,000.00 | | | | $1,000.00 | | $1,000.00 | | $1,000.00 |
| | | | | | | | |
Ending Account Value (10/31/2022) | | $866.00 | | $865.30 | | $861.40 | | | | $1,017.54 | | $1,016.28 | | $1,012.50 |
| | | | | | | | |
Expense Ratio (Gross / Net) | | 2.05% / 1.52% | | 2.30% / 1.77% | | 3.05% / 2.52% | | | | 2.05% / 1.52% | | 2.30% / 1.77% | | 3.05% / 2.52% |
| | | | | | | | |
Expenses Paid* | | $7.15 | | $8.32 | | $11.82 | | | | $7.73 | | $9.00 | | $12.78 |
*Expenses are equal to the Fund’s annualized expense ratios for the period May 1, 2022 through October 31, 2022, multiplied by the average account value over the period, multiplied by 184/365 (to reflect the one-half year period). As such, these may differ from the prospectus.
20
Ashmore Emerging Markets Equity Fund
FUND SUMMARY (UNAUDITED)
| | | | | | | | | | | | | | | | | | | | | | | | | | | | | | | | | | |
Ashmore Emerging Markets Equity Fund is an open-end U.S. mutual fund. The Fund seeks to achieve its objective by investing principally in equity securities and equity-related investments of Emerging Market issuers, which may be denominated in any currency, including the local currency of the issuer. | | | | | | | Share class information INSTITUTIONAL CLASS Launch date: June 21, 2011 Minimum initial investment: $1,000,000 ISIN: US0448208191 CUSIP: 044820819 BLOOMBERG: EMFIX US TICKER: EMFIX RETAIL CLASS A Launch date: February 24, 2012 Minimum initial investment: $1,000 ISIN: US0448207771 CUSIP: 044820777 BLOOMBERG: EMEAX US TICKER: EMEAX RETAIL CLASS C Launch date: August 23, 2012 Minimum initial investment: $1,000 ISIN: US0448207698 CUSIP: 044820769 BLOOMBERG: EMECX US TICKER: EMECX All sources are Ashmore unless otherwise indicated. |
Please refer to page 1 herein for an explanation of the information presented below in the Average Annual Total Return Table and Cumulative Return Chart. | | | | | |
Average Annual Total Return For The Period Ended Oct 31, 2022 | | | | | | 1 Year | | | 5 Year | | | 10 Year | | | | |
Institutional Class | | | | | | | | | | | | | | | | | | | -38.85% | | | | -0.22% | | | | 2.67% | | | | | |
Retail Class A (load-waived) | | | | | | | | | | | | | | | | | | | -39.01% | | | | -0.46% | | | | 2.41%4 | | | | | |
Retail Class A (unadjusted)1 | | | | | | | | | | | | | | | | | | | -42.22% | | | | -1.53% | | | | 1.86%4 | | | | | |
Retail Class C (load-waived)3 | | | | | | | | | | | | | | | | | | | -39.46% | | | | -1.16% | | | | 1.81%4 | | | | | |
Retail Class C (unadjusted)1,3 | | | | | | | | | | | | | | | | | | | -39.95% | | | | -1.16% | | | | 1.81%4 | | | | | |
MSCI EM Net2 | | | | | | | | | | | | | | | | | | | -31.03% | | | | -3.09% | | | | 0.79% | | | | | |
Cumulative Returns Through Oct 31, 2022 (% of NAV) | | | | | | | | | | | | | | | | | | | | | | | | | | | | | | | | |
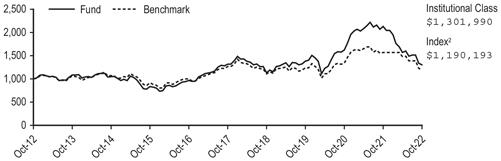
| | | | | |
The above cumulative returns graph assumes $1,000,000 invested at the beginning of the first full month following the inception of the Institutional Class. The minimum initial investment amount for Institutional Class Shares is $1,000,000. The minimum initial investment amount for Retail Shares Classes A and C is $1,000. All Fund returns are net of fees and expenses, except for the load-waived return information for Class A and Class C shares. Performance calculations assume that all dividend, capital gain and other distributions were reinvested. The graph does not reflect the deduction of taxes that a shareholder would pay on distributions or the redemption of fund shares.
1Unadjusted Performance accounts for a maximum sales load of 5.25% for Class A shares and maximum deferred sales charge of 1% for the 1 year return for the Class C shares. 2The index for the Fund is the MSCI Emerging Markets Net. 3The Fund did not have any Class C shares outstanding from August 9, 2016 to March 3, 2017 (the “Gap Period”), but had Class C shares outstanding for all other periods shown. For the Gap Period, performance shown for Class C shares is derived from the historical performance of the Fund’s Class A shares during such period, adjusted to reflect the higher Distribution and/or Service (12b-1) Fees payable by Class C shares. 4Class C Shares performance reflects conversion to Class A Shares after eight years.
Past performance does not guarantee future results. The performance data quoted represents past performance and current returns may be lower or higher. The investment return and net asset value will fluctuate so that an investor’s shares, when redeemed, may be worth more or less than the original cost. To obtain performance information current to the most recent month-end, please call 1-855-274-6673. Periods greater than one year are annualized. Changes in rates of exchange between currencies may cause the value of investments to decrease or increase. The Fund’s performance will fluctuate over long and short term periods.
Please refer to page 2 herein for an explanation of the Expense Example information presented below.
| | | | | | | | | | | | | | |
| | | | |
Expense example | | Actual performance | | | | Hypothetical performance |
| | | | | | | | |
| | | Institutional Class | | Class A | | Class C | | | | Institutional Class | | Class A | | Class C |
| | | | | | | | |
Beginning Account Value (5/1/2022) | | $1,000.00 | | $1,000.00 | | $1,000.00 | | | | $1,000.00 | | $1,000.00 | | $1,000.00 |
| | | | | | | | |
Ending Account Value (10/31/2022) | | $829.50 | | $829.00 | | $825.90 | | | | $1,019.31 | | $1,018.05 | | $1,014.27 |
| | | | | | | | |
Expense Ratio (Gross / Net) | | 1.47% / 1.17% | | 1.71% / 1.42% | | 2.47% / 2.17% | | | | 1.47% / 1.17% | | 1.71% / 1.42% | | 2.47% / 2.17% |
| | | | | | | | |
Expenses Paid* | | $5.40 | | $6.55 | | $9.99 | | | | $5.96 | | $7.22 | | $11.02 |
*Expenses are equal to the Fund’s annualized expense ratios for the period May 1, 2022 through October 31, 2022, multiplied by the average account value over the period, multiplied by 184/365 (to reflect the one-half year period). As such, these may differ from the prospectus.
21
Ashmore Emerging Markets Equity ESG Fund
FUND SUMMARY (UNAUDITED)
| | | | | | | | | | | | | | | | | | | | | | | | | | | | | | | | | | |
Ashmore Emerging Markets Equity ESG Fund is an open-end U.S. mutual fund. The Fund seeks to achieve its objective by investing principally in equity securities and equity-related investments of Emerging Market issuers which may be denominated in any currency, including the local currency of the issuer, focusing on issuers that the Investment Manager believes satisfy the ESG Criteria. | | | | | | | Share class information INSTITUTIONAL CLASS Launch date: February 26, 2020 Minimum initial investment: $1,000,000 ISIN: US0448204547 CUSIP: 044820454 BLOOMBERG: ESIGX US TICKER: ESIGX RETAIL CLASS A Launch date: February 26, 2020 Minimum initial investment: $1,000 ISIN: US0448204703 CUSIP: 044820470 BLOOMBERG: ESAGX US TICKER: ESAGX RETAIL CLASS C Launch date: February 26, 2020 Minimum initial investment: $1,000 ISIN: US0448204620 CUSIP: 044820462 BLOOMBERG: ESCGX US TICKER: ESCGX All sources are Ashmore unless otherwise indicated. |
Please refer to page 1 herein for an explanation of the information presented below in the Average Annual Total Return Table and Cumulative Return Chart. | | | | | |
Average Annual Total Return For The Period Ended Oct 31, 2022 | | | | | | | | | 1 Year | | | Since incpt1 | | | | |
Institutional Class | | | | | | | | | | | | | | | | | | | | | | | -40.10% | | | | -3.78% | | | | | |
Retail Class A (load-waived) | | | | | | | | | | | | | | | | | | | | | | | -40.26% | | | | -4.01% | | | | | |
Retail Class A (unadjusted)1 | | | | | | | | | | | | | | | | | | | | | | | -43.41% | | | | -5.91% | | | | | |
Retail Class C (load-waived) | | | | | | | | | | | | | | | | | | | | | | | -40.76% | | | | -4.65% | | | | | |
Retail Class C (unadjusted)1 | | | | | | | | | | | | | | | | | | | | | | | -41.26% | | | | -4.65% | | | | | |
MSCI EM Net2 | | | | | | | | | | | | | | | | | | | | | | | -31.03% | | | | -5.12% | | | | | |
Cumulative Returns Through Oct 31, 2022 (% of NAV) | | | | | | | | | | | | | | | | | | | | | | | | | | | | | | | | |
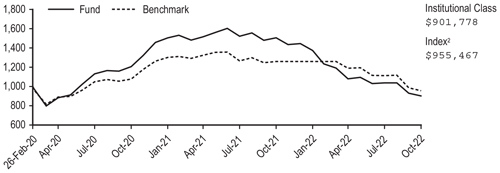
| | | | | |
The above cumulative returns graph assumes $1,000,000 invested at the beginning of the first full month following the inception of the Institutional Class. The minimum initial investment amount for Institutional Class Shares is $1,000,000. The minimum initial investment amount for Retail Shares Class A and C is $1,000. All Fund returns are net of fees and expenses, except for the load-waived return information for Class A and Class C shares. Performance calculations assume that all dividend, capital gain and other distributions were reinvested. The graph does not reflect the deduction of taxes that a shareholder would pay on distributions or the redemption of fund shares.
1Unadjusted Performance accounts for a maximum sales load of 5.25% for Class A shares and maximum deferred sales charge of 1% for the 1 year return for the Class C shares. 2The index for the Fund is the MSCI Emerging Markets Net.
Past performance does not guarantee future results. The performance data quoted represents past performance and current returns may be lower or higher. The investment return and net asset value will fluctuate so that an investor’s shares, when redeemed, may be worth more or less than the original cost. To obtain performance information current to the most recent month-end, please call 1-855-274-6673. Periods greater than one year are annualized. Changes in rates of exchange between currencies may cause the value of investments to decrease or increase. The Fund’s performance will fluctuate over long and short term periods.
Please refer to page 2 herein for an explanation of the Expense Example information presented below.
| | | | | | | | | | | | | | |
| | | | |
Expense example | | Actual performance | | | | Hypothetical performance |
| | | | | | | | |
| | | Institutional Class | | Class A | | Class C | | | | Institutional Class | | Class A | | Class C |
| | | | | | | | |
Beginning Account Value (5/1/2022) | | $1,000.00 | | $1,000.00 | | $1,000.00 | | | | $1,000.00 | | $1,000.00 | | $1,000.00 |
| | | | | | | | |
Ending Account Value (10/31/2022) | | $835.40 | | $834.40 | | $830.90 | | | | $1,019.31 | | $1,018.05 | | $1,014.27 |
| | | | | | | | |
Expense Ratio (Gross / Net) | | 2.36% / 1.17% | | 2.70% / 1.42% | | 3.44% / 2.17% | | | | 2.36% / 1.17% | | 2.70% / 1.42% | | 3.44% / 2.17% |
| | | | | | | | |
Expenses Paid* | | $5.41 | | $6.57 | | $10.01 | | | | $5.96 | | $7.22 | | $11.02 |
*Expenses are equal to the Fund’s annualized expense ratios for the period May 1, 2022 through October 31, 2022, multiplied by the average account value over the period, multiplied by 184/365 (to reflect the one-half year period). As such, these may differ from the prospectus.
22
Ashmore Emerging Markets Short Duration Select Fund
FUND SUMMARY (UNAUDITED)
| | | | | | | | | | | | | | | | | | | | | | | | | | | | | | | | | | |
Ashmore Emerging Markets Short Duration Select Fund is an open-end U.S. mutual fund. The Fund seeks to achieve its objective by investing principally in short-term debt instruments of, and derivative instruments related to, Sovereign, Quasi-Sovereign and Corporate issuers of Emerging Market Countries denominated exclusively in Hard Currencies (i.e., the U.S. dollar or any currency of a nation in the G-7). The Fund normally seeks to maintain a weighted average portfolio duration of between 1 and 3 years and an Investment Grade weighted average credit rating. The Fund has no restrictions on individual security duration. | | | | | | | Share class information INSTITUTIONAL CLASS Launch date: June 15, 2020 Minimum initial investment: $1,000,000 ISIN: US0448204216 CUSIP: 044820421 BLOOMBERG: ESDIX US TICKER: ESDIX RETAIL CLASS A Launch date: June 15, 2020 Minimum initial investment: $1,000 ISIN: US0448204471 CUSIP: 044820447 BLOOMBERG: ESDAX US TICKER: ESDAX RETAIL CLASS C Launch date: June 15, 2020 Minimum initial investment: $1,000 ISIN: US0448204398 CUSIP: 044820439 BLOOMBERG: ESDCX US TICKER: ESDCX All sources are Ashmore unless otherwise indicated. |
Please refer to page 1 herein for an explanation of the information presented below in the Average Annual Total Return Table and Cumulative Return Chart. | | | | | |
Average Annual Total Return For The Period Ended Oct 31, 2022 | | | | | | | | | 1 Year | | | Since incpt1 | | | | |
Institutional Class | | | | | | | | | | | | | | | | | | | | | | | -12.16% | | | | -3.79% | | | | | |
Retail Class A (load-waived) | | | | | | | | | | | | | | | | | | | | | | | -12.27% | | | | -3.97% | | | | | |
Retail Class A (unadjusted)1 | | | | | | | | | | | | | | | | | | | | | | | -14.28% | | | | -4.89% | | | | | |
Retail Class C (load-waived) | | | | | | | | | | | | | | | | | | | | | | | -12.94% | | | | -4.70% | | | | | |
Retail Class C (unadjusted)1 | | | | | | | | | | | | | | | | | | | | | | | -13.79% | | | | -4.70% | | | | | |
JP Morgan CEMBI BD IG 1-3 Year2 | | | | | | | | | | | | | | | | | | | | | | | -10.85% | | | | -3.16% | | | | | |
Cumulative Returns Through Oct 31, 2022 (% of NAV) | | | | | | | | | | | | | | | | | | | | | | | | | | | | | | | | |
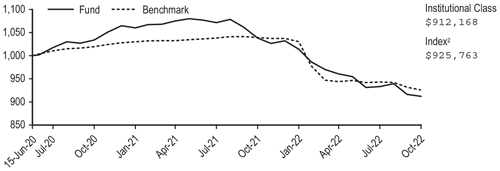
| | | | | |
The above cumulative returns graph assumes $1,000,000 invested at the beginning of the first full month following the inception of the Institutional Class. The minimum initial investment amount for Institutional Class Shares is $1,000,000. The minimum initial investment amount for Retail Shares Classes A and C is $1,000. All Fund returns are net of fees and expenses, except for the load-waived return information for Class A and Class C shares. Performance calculations assume that all dividend, capital gain and other distributions were reinvested. The graph does not reflect the deduction of taxes that a shareholder would pay on distributions or the redemption of fund shares.
1Unadjusted Performance accounts for a maximum sales load of 2.25% for Class A shares and maximum deferred sales charge of 1% for the 1 year return for the Class C shares. 2The index for the Fund is the JP Morgan CEMBI Broad Diversified Investment Grade 1-3 Year.
Past performance does not guarantee future results. The performance data quoted represents past performance and current returns may be lower or higher. The investment return and net asset value will fluctuate so that an investor’s shares, when redeemed, may be worth more or less than the original cost. To obtain performance information current to the most recent month-end, please call 1-855-274-6673. Periods greater than one year are annualized. Changes in rates of exchange between currencies may cause the value of investments to decrease or increase. The Fund’s performance will fluctuate over long and short term periods.
Please refer to page 2 herein for an explanation of the Expense Example information presented below.
| | | | | | | | | | | | | | |
| | | | |
Expense example | | Actual performance | | | | Hypothetical performance |
| | | | | | | | |
| | | Institutional Class | | Class A | | Class C | | | | Institutional Class | | Class A | | Class C |
| | | | | | | | |
Beginning Account Value (5/1/2022) | | $1,000.00 | | $1,000.00 | | $1,000.00 | | | | $1,000.00 | | $1,000.00 | | $1,000.00 |
| | | | | | | | |
Ending Account Value (10/31/2022) | | $949.10 | | $948.60 | | $944.70 | | | | $1,021.83 | | $1,020.57 | | $1,016.79 |
| | | | | | | | |
Expense Ratio (Gross / Net) | | 1.30% / 0.67% | | 1.88% / 0.92% | | 2.46% / 1.67% | | | | 1.30% / 0.67% | | 1.88% / 0.92% | | 2.46% / 1.67% |
| | | | | | | | |
Expenses Paid* | | $3.29 | | $4.52 | | $8.19 | | | | $3.41 | | $4.69 | | $8.49 |
*Expenses are equal to the Fund’s annualized expense ratios for the period May 1, 2022 through October 31, 2022, multiplied by the average account value over the period, multiplied by 184/365 (to reflect the one-half year period). As such, these may differ from the prospectus.
23
Ashmore Emerging Markets Investment Grade Income Fund
FUND SUMMARY (UNAUDITED)
| | | | | | | | | | | | | | | | | | | | | | | | | | | | | | | | | | |
Ashmore Emerging Markets Investment Grade Income Fund is an open-end U.S. mutual fund. The Fund seeks to achieve its objective by investing principally in debt instruments of, and derivative instruments related to, Sovereigns, Quasi-Sovereigns, Corporate issuers of EM Countries and EM Supra-Nationals denominated exclusively in Hard Currencies (i.e., the U.S. dollar or any currency of a nation in the G-7). The Fund has no restrictions on individual security duration. The Fund observes a policy to normally invest at least 80% of its net assets in Investment Grade bonds and other Investment Grade debt instruments of Sovereign, Quasi-Sovereign or Corporate Issuers of Emerging Market Countries and EM Supra-Nationals. | | | | | | | Share class information INSTITUTIONAL CLASS Launch date: September 17, 2020 Minimum initial investment: $1,000,000 ISIN: US0448203895 CUSIP: 044820389 BLOOMBERG: IGIEX US TICKER: IGIEX RETAIL CLASS A Launch date: September 17, 2020 Minimum initial investment: $1,000 ISIN: US0448204133 CUSIP: 044820413 BLOOMBERG: IGAEX US TICKER: IGAEX RETAIL CLASS C Launch date: September 17, 2020 Minimum initial investment: $1,000 ISIN: US0448203978 CUSIP: 044820397 BLOOMBERG: IGCEX US TICKER: IGCEX All sources are Ashmore unless otherwise indicated. |
Please refer to page 1 herein for an explanation of the information presented below in the Average Annual Total Return Table and Cumulative Return Chart. | | | | | |
Average Annual Total Return For The Period Ended Oct 31, 2022 | | | | | | | | | 1 Year | | | Since incpt1 | | | | |
Institutional Class | | | | | | | | | | | | | | | | | | | | | | | -21.02% | | | | -9.35% | | | | | |
Retail Class A (load-waived) | | | | | | | | | | | | | | | | | | | | | | | -21.27% | | | | -9.57% | | | | | |
Retail Class A (unadjusted)1 | | | | | | | | | | | | | | | | | | | | | | | -24.40% | | | | -11.31% | | | | | |
Retail Class C (load-waived) | | | | | | | | | | | | | | | | | | | | | | | -21.84% | | | | -10.23% | | | | | |
Retail Class C (unadjusted)1 | | | | | | | | | | | | | | | | | | | | | | | -22.60% | | | | -10.23% | | | | | |
JP Morgan CEMBI IG BD2 | | | | | | | | | | | | | | | | | | | | | | | -18.26% | | | | -8.14% | | | | | |
Cumulative Returns Through Oct 31, 2022 (% of NAV) | | | | | | | | | | | | | | | | | | | | | | | | | | | | | | | | |
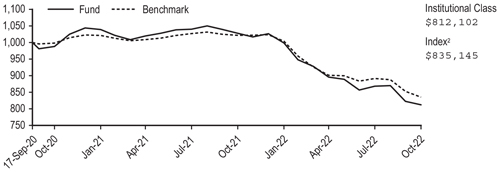
| | | | | |
The above cumulative returns graph assumes $1,000,000 invested at the beginning of the first full month following the inception of the Institutional Class. The minimum initial investment amount for Institutional Class Shares is $1,000,000. The minimum initial investment amount for Retail Shares Classes A and C is $1,000. All Fund returns are net of fees and expenses, except for the load-waived return information for Class A and Class C shares. Performance calculations assume that all dividend, capital gain and other distributions were reinvested. The graph does not reflect the deduction of taxes that a shareholder would pay on distributions or the redemption of fund shares.
1Unadjusted Performance accounts for a maximum sales load of 4% for Class A shares and maximum deferred sales charge of 1% for the 1 year return for the Class C shares. 2The index for the Fund is the JP Morgan CEMBI Investment Grade Broad Diversified.
Past performance does not guarantee future results. The performance data quoted represents past performance and current returns may be lower or higher. The investment return and net asset value will fluctuate so that an investor’s shares, when redeemed, may be worth more or less than the original cost. To obtain performance information current to the most recent month-end, please call 1-855-274-6673. Periods greater than one year are annualized. Changes in rates of exchange between currencies may cause the value of investments to decrease or increase. The Fund’s performance will fluctuate over long and short term periods.
Please refer to page 2 herein for an explanation of the Expense Example information presented below.
| | | | | | | | | | | | | | |
| | | | |
Expense example | | Actual performance | | | | Hypothetical performance |
| | | | | | | | |
| | | Institutional Class | | Class A | | Class C | | | | Institutional Class | | Class A | | Class C |
| | | | | | | | |
Beginning Account Value (5/1/2022) | | $1,000.00 | | $1,000.00 | | $1,000.00 | | | | $1,000.00 | | $1,000.00 | | $1,000.00 |
| | | | | | | | |
Ending Account Value (10/31/2022) | | $906.20 | | $904.40 | | $901.00 | | | | $1,021.58 | | $1,020.32 | | $1,016.53 |
| | | | | | | | |
Expense Ratio (Gross / Net) | | 1.12% / 0.72% | | 1.62% / 0.97% | | 2.08% / 1.72% | | | | 1.12% / 0.72% | | 1.62% / 0.97% | | 2.08% / 1.72% |
| | | | | | | | |
Expenses Paid* | | $3.46 | | $4.66 | | $8.24 | | | | $3.67 | | $4.94 | | $8.74 |
*Expenses are equal to the Fund’s annualized expense ratios for the period May 1, 2022 through October 31, 2022, multiplied by the average account value over the period, multiplied by 184/365 (to reflect the one-half year period). As such, these may differ from the prospectus.
24
Ashmore Emerging Markets Corporate Income ESG Fund
FUND SUMMARY (UNAUDITED)
| | | | | | | | | | | | | | | | | | | | | | | | | | | | | | | | | | |
Ashmore Emerging Markets Corporate Income ESG Fund is an open-end U.S. mutual fund. The Fund seeks to achieve its objective by investing principally in debt instruments of Corporate issuers, which may be denominated principally in Hard Currencies (i.e., the U.S. dollar or any currency of a nation in the G-7), focusing on issuers that the Investment Manager believes satisfy the ESG Criteria. | | | | | | | Share class information INSTITUTIONAL CLASS Launch date: February 26, 2021 Minimum initial investment: $1,000,000 ISIN: US0448203556 CUSIP: 044820355 BLOOMBERG: ECIEX US TICKER: ECIEX RETAIL CLASS A Launch date: February 26, 2021 Minimum initial investment: $1,000 ISIN: US0448203713 CUSIP: 044820371 BLOOMBERG: ECAEX US TICKER: ECAEX RETAIL CLASS C Launch date: February 26, 2021 Minimum initial investment: $1,000 ISIN: US0448203630 CUSIP: 044820363 BLOOMBERG: ECCEX US TICKER: ECCEX All sources are Ashmore unless otherwise indicated. |
Please refer to page 1 herein for an explanation of the information presented below in the Average Annual Total Return Table and Cumulative Return Chart. | | | | | |
Average Annual Total Return For The Period Ended Oct 31, 2022 | | | | | | | | | 1 Year | | | Since incpt1 | | | | |
Institutional Class | | | | | | | | | | | | | | | | | | | | | | | -27.56% | | | | -20.46% | | | | | |
Retail Class A (load-waived) | | | | | | | | | | | | | | | | | | | | | | | -27.67% | | | | -20.61% | | | | | |
Retail Class A (unadjusted)1 | | | | | | | | | | | | | | | | | | | | | | | -30.57% | | | | -22.53% | | | | | |
Retail Class C (load-waived) | | | | | | | | | | | | | | | | | | | | | | | -28.23% | | | | -21.20% | | | | | |
Retail Class C (unadjusted)1 | | | | | | | | | | | | | | | | | | | | | | | -28.91% | | | | -21.20% | | | | | |
JP Morgan CEMBI BD2 | | | | | | | | | | | | | | | | | | | | | | | -18.06% | | | | -10.58% | | | | | |
Cumulative Returns Through Oct 31, 2022 (% of NAV) | | | | | | | | | | | | | | | | | | | | | | | | | | | | | | | | |
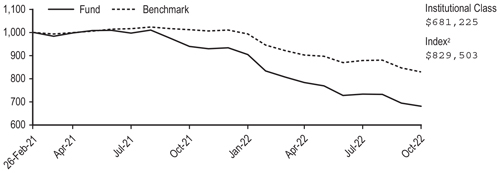
| | | | | |
The above cumulative returns graph assumes $1,000,000 invested at the beginning of the first full month following the inception of the Institutional Class. The minimum initial investment amount for Institutional Class Shares is $1,000,000. The minimum initial investment amount for Retail Shares Classes A and C is $1,000. All Fund returns are net of fees and expenses, except for the load-waived return information for Class A and Class C shares. Performance calculations assume that all dividend, capital gain and other distributions were reinvested. The graph does not reflect the deduction of taxes that a shareholder would pay on distributions or the redemption of fund shares.
1Unadjusted Performance accounts for a maximum sales load of 4% for Class A shares and maximum deferred sales charge of 1% for the 1 year return for the Class C shares. 2The index for the Fund is the JP Morgan CEMBI Broad Diversified.
Past performance does not guarantee future results. The performance data quoted represents past performance and current returns may be lower or higher. The investment return and net asset value will fluctuate so that an investor’s shares, when redeemed, may be worth more or less than the original cost. To obtain performance information current to the most recent month-end, please call 1-855-274-6673. Periods greater than one year are annualized. Changes in rates of exchange between currencies may cause the value of investments to decrease or increase. The Fund’s performance will fluctuate over long and short term periods.
Please refer to page 2 herein for an explanation of the Expense Example information presented below.
| | | | | | | | | | | | | | |
| | | | |
Expense example | | Actual performance | | | | Hypothetical performance |
| | | | | | | | |
| | | Institutional Class | | Class A | | Class C | | | | Institutional Class | | Class A | | Class C |
| | | | | | | | |
Beginning Account Value (5/1/2022) | | $1,000.00 | | $1,000.00 | | $1,000.00 | | | | $1,000.00 | | $1,000.00 | | $1,000.00 |
| | | | | | | | |
Ending Account Value (10/31/2022) | | $869.00 | | $868.40 | | $865.00 | | | | $1,020.82 | | $1,019.56 | | $1,015.78 |
| | | | | | | | |
Expense Ratio (Gross / Net) | | 1.65%/0.87% | | 2.06%/1.12% | | 2.94%/1.87% | | | | 1.65%/0.87% | | 2.06%/1.12% | | 2.94%/1.87% |
| | | | | | | | |
Expenses Paid* | | $4.10 | | $5.27 | | $8.79 | | | | $4.43 | | $5.70 | | $9.50 |
*Expenses are equal to the Fund’s annualized expense ratios for the period May 1, 2022 through October 31, 2022, multiplied by the average account value over the period, multiplied by 184/365 (to reflect the one-half year period). As such, these may differ from the prospectus.
25
| | | | | | |

| | | | | | |
| | KPMG LLP Aon Center Suite 5500 200 E. Randolph Street Chicago, IL 60601-6436 | | | | |
Report of Independent Registered Public Accounting Firm
To the Shareholders of the Funds and Board of Trustees
Ashmore Funds:
Opinion on the Financial Statements
We have audited the accompanying statement of assets and liabilities of Ashmore Emerging Markets Total Return Fund, Ashmore Emerging Markets Local Currency Bond Fund, Ashmore Emerging Markets Corporate Income Fund, Ashmore Emerging Markets Short Duration Fund, Ashmore Emerging Markets Active Equity Fund, Ashmore Emerging Markets Small-Cap Equity Fund, Ashmore Emerging Markets Frontier Equity Fund, Ashmore Emerging Markets Equity Fund, Ashmore Emerging Markets Equity ESG Fund, Ashmore Emerging Markets Short Duration Select Fund, Ashmore Emerging Markets Investment Grade Income Fund, and Ashmore Emerging Markets Corporate Income ESG Fund (collectively, the Funds), including the schedule of investments, as of October 31, 2022, the related statements of operations for the year then ended, the statements of changes in net assets for each of the years or periods in the two-year period then ended (period from February 26, 2021, [commencement of operations] to October 31, 2022 for Ashmore Emerging Markets Corporate Income ESG Fund), and the related notes (collectively, the financial statements) and the financial highlights for each of the years or periods in the five-year period then ended (periods from February 26, 2020, June 15, 2020, September 17, 2020, and February 26, 2021 [commencement of operations] to October 31, 2022 for Ashmore Emerging Markets Equity ESG Fund, Ashmore Emerging Markets Short Duration Select Fund, Ashmore Emerging Markets Investment Grade Income Fund, and Ashmore Emerging Markets Corporate Income ESG Fund, respectively). In our opinion, the financial statements and financial highlights present fairly, in all material respects, the financial position of the Funds as of October 31, 2022, the results of their operations for the year or period then ended (period from February 26, 2021 [commencement of operations] to October 31, 2022 for Ashmore Emerging Markets Corporate Income ESG Fund), the changes in its net assets for each of the years or periods in the two-year period then ended (period from February 26, 2021 [commencement of operations] to October 31, 2022 for Ashmore Emerging Markets Coporate Income ESG Fund) and the financial highlights for each of the years or periods in the five-year period then ended (periods from February 26, 2020, June 15, 2020, September 17, 2020, and February 26, 2021, [commencement of operations] to October 31, 2022 for Ashmore Emerging Markets Equity ESG Fund, Ashmore Emerging Markets Short Duration Select Fund, Ashmore Emerging Markets Investment Grade Income Fund, and Ashmore Emerging Markets Corporate Income ESG Fund, respectively), in conformity with U.S. generally accepted accounting principles.
Basis for Opinion
These financial statements and financial highlights are the responsibility of the Funds’ management. Our responsibility is to express an opinion on these financial statements and financial highlights based on our audits. We are a public accounting firm registered with the Public Company Accounting Oversight Board (United States) (PCAOB) and are required to be independent with respect to the Funds in accordance with the U.S. federal securities laws and the applicable rules and regulations of the Securities and Exchange Commission and the PCAOB.
We conducted our audits in accordance with the standards of the PCAOB. Those standards require that we plan and perform the audit to obtain reasonable assurance about whether the financial statements and financial highlights are free of material misstatement, whether due to error or fraud. Our audits included performing procedures to assess the risks of material misstatement of the financial statements and financial highlights, whether due to error or fraud, and performing procedures that respond to those risks. Such procedures
| | | | |
| | KPMG LLP, a Delaware limited liability partnership and a member firm of the KPMG global organization of independent member firms affiliated with KPMG International Limited, a private English company limited by guarantee. | | |

included examining, on a test basis, evidence regarding the amounts and disclosures in the financial statements and financial highlights. Such procedures also included confirmation of securities owned as of October 31, 2022, by correspondence with custodians and brokers; when replies were not received from brokers, we performed other auditing procedures. Our audits also included evaluating the accounting principles used and significant estimates made by management, as well as evaluating the overall presentation of the financial statements and financial highlights. We believe that our audits provide a reasonable basis for our opinion.
We have served as the auditor of one or more Ashmore Funds investment companies since 2010.
Chicago, Illinois
December 20, 2022
(THIS PAGE INTENTIONALLY LEFT BLANK)
28
ASHMORE FUNDS
STATEMENTS OF ASSETS AND LIABILITIES
As of October 31, 2022
| | | | | | | | | | | | | | | | |
| | | Ashmore Emerging Markets Total Return Fund | | | Ashmore
Emerging
Markets Local Currency
Bond Fund | | | Ashmore
Emerging Markets
Corporate Income
Fund | | | Ashmore
Emerging Markets Short Duration
Fund | |
ASSETS: | | | | | | | | | | | | | | | | |
Investments in securities, at value | | $ | 407,570,575 | | | $ | 4,512,378 | | | $ | 91,013,181 | | | $ | 52,918,705 | |
Deposit held at broker | | | 1,576,977 | | | | 55,484 | | | | — | | | | — | |
Cash | | | 78,704,694 | | | | 828,484 | | | | 808,827 | | | | 1,751,939 | |
Foreign currency, at value | | | 664,899 | | | | 20,483 | | | | 23,808 | | | | 70,129 | |
Unrealized appreciation on forward foreign currency exchange contracts | | | 1,127,443 | | | | 27,957 | | | | 32,751 | | | �� | — | |
Variation margin receivable on centrally cleared swap contracts | | | 4,607 | | | | 199 | | | | — | | | | — | |
Due from broker | | | 104,045 | | | | — | | | | — | | | | — | |
Receivable for securities and currencies sold | | | 3,830,058 | | | | 28,907 | | | | — | | | | — | |
Receivable for fund shares sold | | | 8,475 | | | | — | | | | 470,869 | | | | — | |
Receivable from Investment Manager | | | 30,521 | | | | 9,578 | | | | 14,603 | | | | 11,726 | |
Interest and dividends receivable | | | 8,050,125 | | | | 95,667 | | | | 1,614,960 | | | | 819,763 | |
Other assets | | | 48,328 | | | | 9,035 | | | | 20,213 | | | | 9,226 | |
Total Assets | | | 501,720,747 | | | | 5,588,172 | | | | 93,999,212 | | | | 55,581,488 | |
LIABILITIES: | | | | | | | | | | | | | | | | |
Unrealized depreciation on forward foreign currency exchange contracts | | | 4,688,277 | | | | 82,107 | | | | 9,254 | | | | — | |
Variation margin payable on centrally cleared swap contracts | | | — | | | | 174 | | | | — | | | | — | |
Upfront premiums received from interest rate swap contracts | | | — | | | | 1,166 | | | | — | | | | — | |
Unrealized depreciation on interest rate swap contracts | | | — | | | | 4,216 | | | | — | | | | — | |
Payable for securities and currencies purchased | | | 3,257,853 | | | | 24,061 | | | | 507,904 | | | | — | |
Payable for fund shares redeemed | | | 85,933 | | | | — | | | | 284,736 | | | | 13,852 | |
Distributions payable | | | 454,668 | | | | — | | | | 94,467 | | | | 84,868 | |
Due to broker | | | 311,309 | | | | 33,263 | | | | — | | | | — | |
Investment Manager fee payable | | | 416,590 | | | | 4,322 | | | | 69,328 | | | | 30,741 | |
Trustees’ fees payable | | | 33,264 | | | | 350 | | | | 6,816 | | | | 3,813 | |
Deferred foreign capital gains taxes payable | | | — | | | | — | | | | — | | | | — | |
Administration fees payable | | | 114,221 | | | | 1,048 | | | | 27,309 | | | | 13,643 | |
Custody fees payable | | | 303,410 | | | | 22,260 | | | | 45,342 | | | | 20,969 | |
Professional fees payable | | | 159,804 | | | | 24,896 | | | | 61,629 | | | | 59,551 | |
Regulatory fees payable | | | 28,639 | | | | 8,869 | | | | 15,840 | | | | 13,522 | |
Other liabilities | | | 2,585 | | | | 620 | | | | 5,756 | | | | 1,401 | |
Total Liabilities | | | 9,856,553 | | | | 207,352 | | | | 1,128,381 | | | | 242,360 | |
Net Assets | | $ | 491,864,194 | | | $ | 5,380,820 | | | $ | 92,870,831 | | | $ | 55,339,128 | |
NET ASSETS: | | | | | | | | | | | | | | | | |
Paid in capital | | $ | 1,029,596,572 | | | $ | 7,412,686 | | | $ | 265,301,145 | | | $ | 471,219,744 | |
Distributable earnings/(Accumulated loss) | | | (537,732,378 | ) | | | (2,031,866 | ) | | | (172,430,314 | ) | | | (415,880,616 | ) |
Net Assets | | $ | 491,864,194 | | | $ | 5,380,820 | | | $ | 92,870,831 | | | $ | 55,339,128 | |
| | | | |
Net Assets: | | | | | | | | | | | | | | | | |
Class A | | $ | 1,919,606 | | | $ | 1,247,693 | | | $ | 4,742,019 | | | $ | 2,974,944 | |
Class C | | | 1,080,339 | | | | 2,366 | | | | 1,782,076 | | | | 290,793 | |
Institutional Class | | | 488,864,249 | | | | 4,130,761 | | | | 86,346,736 | | | | 52,073,391 | |
| | | | |
Shares Issued and Outstanding (no par value, unlimited shares authorized): | | | | | | | | | | | | | | | | |
Class A | | | 444,453 | | | | 222,083 | | | | 955,296 | | | | 695,803 | |
Class C | | | 251,090 | | | | 435 | | | | 359,881 | | | | 71,081 | |
Institutional Class | | | 111,548,408 | | | | 700,575 | | | | 16,685,969 | | | | 12,395,494 | |
| | | | |
Net Asset Value and Redemption Price Per Share (Net Asset Per Share Outstanding): | | | | | | | | | | | | | | | | |
Class A | | $ | 4.32 | | | $ | 5.62 | | | $ | 4.96 | | | $ | 4.28 | |
Class C | | | 4.30 | | | | 5.44 | | | | 4.95 | | | | 4.09 | |
Institutional Class | | | 4.38 | | | | 5.90 | | | | 5.17 | | | | 4.20 | |
| | | | | |
Cost of Investments in securities | | $ | 676,163,056 | | | $ | 5,507,312 | | | $ | 159,797,287 | | | $ | 133,418,000 | |
Cost of foreign currency held | | $ | 616,665 | | | $ | 20,612 | | | $ | 24,282 | | | $ | 69,959 | |
See accompanying notes to the financial statements.
29
| | | | | | | | | | | | | | | | | | | | | | | | | | | | | | |
Ashmore Emerging Markets Active Equity Fund | | | Ashmore
Emerging Markets
Small-Cap Equity Fund | | | Ashmore
Emerging Markets Frontier Equity Fund | | | Ashmore
Emerging Markets
Equity Fund | | | Ashmore
Emerging Markets
Equity ESG Fund | | | Ashmore Emerging Markets
Short Duration
Select Fund | | | Ashmore
Emerging Markets
Investment Grade
Income Fund | | | Ashmore
Emerging Markets
Corporate Income ESG Fund | |
| | | | | | | | | | | | | | | | | | | | | | | | | | | | | | | |
| $ | 74,823,778 | | | $ | 6,641,507 | | | $ | 66,191,094 | | | $ | 91,832,167 | | | $ | 8,690,166 | | | $ | 8,740,061 | | | $ | 15,449,136 | | | $ | 5,503,103 | |
| | — | | | | — | | | | — | | | | — | | | | — | | | | — | | | | — | | | | — | |
| | 3,214,319 | | | | 50,374 | | | | 5,929,300 | | | | 2,545,414 | | | | 216,944 | | | | 203,088 | | | | 442,768 | | | | 1,174,446 | |
| | 18,967 | | | | 594 | | | | 843,858 | | | | 11,593 | | | | — | | | | 7,983 | | | | 10,789 | | | | 8,543 | |
| | — | | | | — | | | | — | | | | — | | | | — | | | | — | | | | — | | | | — | |
| | — | | | | — | | | | — | | | | — | | | | — | | | | — | | | | — | | | | — | |
| | — | | | | — | | | | — | | | | — | | | | — | | | | — | | | | — | | | | — | |
| | 1,861,601 | | | | — | | | | — | | | | — | | | | — | | | | — | | | | — | | | | — | |
| | 2,840 | | | | — | | | | 24,087 | | | | 11,118 | | | | — | | | | — | | | | — | | | | — | |
| | 16,105 | | | | 8,198 | | | | 25,287 | | | | 20,593 | | | | 15,706 | | | | — | | | | — | | | | — | |
| | 126,602 | | | | 15,656 | | | | 100,463 | | | | 24,480 | | | | 3,513 | | | | 105,345 | | | | 215,055 | | | | 92,724 | |
| | 10,464 | | | | 5,851 | | | | 9,499 | | | | 13,220 | | | | 3,645 | | | | 1,758 | | | | 2,472 | | | | 1,637 | |
| | 80,074,676 | | | | 6,722,180 | | | | 73,123,588 | | | | 94,458,585 | | | | 8,929,974 | | | | 9,058,235 | | | | 16,120,220 | | | | 6,780,453 | |
| | | | | | | | | | | | | | | | | | | | | | | | | | | | | | |
| | — | | | | — | | | | — | | | | — | | | | — | | | | 1,514 | | | | 4,649 | | | | 1,042 | |
| | — | | | | — | | | | — | | | | — | | | | — | | | | — | | | | — | | | | — | |
| | — | | | | — | | | | — | | | | — | | | | — | | | | — | | | | — | | | | — | |
| | — | | | | — | | | | — | | | | — | | | | — | | | | — | | | | — | | | | — | |
| | 3,537,054 | | | | — | | | | — | | | | — | | | | — | | | | — | | | | — | | | | — | |
| | 244,932 | | | | — | | | | 53,151 | | | | 73,746 | | | | — | | | | — | | | | — | | | | — | |
| | — | | | | — | | | | — | | | | — | | | | — | | | | 3,986 | | | | 7,845 | | | | 4,215 | |
| | — | | | | — | | | | 65,611 | | | | — | | | | — | | | | — | | | | — | | | | — | |
| | 67,633 | | | | 8,519 | | | | 91,970 | | | | 95,298 | | | | 8,914 | | | | 19,795 | | | | 24,381 | | | | 19,644 | |
| | 5,897 | | | | 440 | | | | 4,822 | | | | 6,590 | | | | 608 | | | | 596 | | | | 1,081 | | | | 453 | |
| | 54,384 | | | | 1,437 | | | | 83,911 | | | | 57,689 | | | | 135 | | | | — | | | | — | | | | — | |
| | 14,553 | | | | 1,393 | | | | 12,063 | | | | 19,175 | | | | 1,823 | | | | 1,574 | | | | 2,948 | | | | 1,281 | |
| | 43,775 | | | | 12,837 | | | | 142,539 | | | | 55,140 | | | | 7,093 | | | | 2,364 | | | | 4,088 | | | | 2,096 | |
| | 28,539 | | | | 19,580 | | | | 28,686 | | | | 34,286 | | | | 18,710 | | | | 20,411 | | | | 21,354 | | | | 20,117 | |
| | 7,644 | | | | 6,496 | | | | 7,524 | | | | 7,996 | | | | 6,532 | | | | 9,015 | | | | 9,139 | | | | 8,901 | |
| | 1,050 | | | | 647 | | | | 1,933 | | | | 1,655 | | | | 589 | | | | 589 | | | | 589 | | | | 589 | |
| | 4,005,461 | | | | 51,349 | | | | 492,210 | | | | 351,575 | | | | 44,404 | | | | 59,844 | | | | 76,074 | | | | 58,338 | |
| $ | 76,069,215 | | | $ | 6,670,831 | | | $ | 72,631,378 | | | $ | 94,107,010 | | | $ | 8,885,570 | | | $ | 8,998,391 | | | $ | 16,044,146 | | | $ | 6,722,115 | |
| | | | | | | | | | | | | | | | | | | | | | | | | | | | | | |
| $ | 116,192,962 | | | $ | 12,409,401 | | | $ | 80,782,129 | | | $ | 131,923,616 | | | $ | 11,875,370 | | | $ | 10,797,778 | | | $ | 21,228,531 | | | $ | 10,617,191 | |
| | (40,123,747 | ) | | | (5,738,570 | ) | | | (8,150,751 | ) | | | (37,816,606 | ) | | | (2,989,800 | ) | | | (1,799,387 | ) | | | (5,184,385 | ) | | | (3,895,076 | ) |
| $ | 76,069,215 | | | $ | 6,670,831 | | | $ | 72,631,378 | | | $ | 94,107,010 | | | $ | 8,885,570 | | | $ | 8,998,391 | | | $ | 16,044,146 | | | $ | 6,722,115 | |
| | | | | | | |
| | | | | | | | | | | | | | | | | | | | | | | | | | | | | | |
| $ | 804,390 | | | $ | 392,828 | | | $ | 3,017,822 | | | $ | 3,080,629 | | | $ | 883 | | | $ | 896 | | | $ | 799 | | | $ | 670 | |
| | 1,066 | | | | 41,421 | | | | 293,371 | | | | 104,843 | | | | 868 | | | | 882 | | | | 788 | | | | 663 | |
| | 75,263,759 | | | | 6,236,582 | | | | 69,320,185 | | | | 90,921,538 | | | | 8,883,819 | | | | 8,996,613 | | | | 16,042,559 | | | | 6,720,782 | |
| | | | | | | |
| | | | | | | | | | | | | | | | | | | | | | | | | | | | | | |
| | 131,641 | | | | 39,022 | | | | 361,045 | | | | 371,606 | | | | 116 | | | | 108 | | | | 106 | | | | 107 | |
| | 179 | | | | 3,999 | | | | 36,534 | | | | 13,614 | | | | 116 | | | | 106 | | | | 105 | | | | 106 | |
| | 12,209,172 | | | | 476,499 | | | | 7,122,316 | | | | 11,405,464 | | | | 1,161,618 | | | | 1,080,680 | | | | 2,131,592 | | | | 1,073,739 | |
| | | | | | | |
| | | | | | | | | | | | | | | | | | | | | | | | | | | | | | |
| $ | 6.11 | | | $ | 10.07 | | | $ | 8.36 | | | $ | 8.29 | | | $ | 7.61 | | | $ | 8.32 | | | $ | 7.52 | | | $ | 6.26 | |
| | 5.96 | | | | 10.36 | | | | 8.03 | | | | 7.70 | | | | 7.47 | | | | 8.32 | | | | 7.52 | | | | 6.26 | |
| | 6.16 | | | | 13.09 | | | | 9.73 | | | | 7.97 | | | | 7.65 | | | | 8.32 | | | | 7.53 | | | | 6.26 | |
| $ | 90,974,492 | | | $ | 8,973,811 | | | $ | 69,616,720 | | | $ | 122,926,092 | | | $ | 11,329,934 | | | $ | 9,689,928 | | | $ | 18,885,021 | | | $ | 8,676,057 | |
| $ | 19,243 | | | $ | 596 | | | $ | 843,353 | | | $ | 11,686 | | | $ | — | | | $ | 8,144 | | | $ | 11,006 | | | $ | 8,715 | |
See accompanying notes to the financial statements.
30
ASHMORE FUNDS
STATEMENTS OF OPERATIONS
For the Year Ended October 31, 2022
| | | | | | | | | | | | | | | | |
| | | Ashmore
Emerging
Markets
Total Return
Fund | | | Ashmore
Emerging
Markets
Local Currency
Bond Fund | | | Ashmore
Emerging Markets
Corporate Income
Fund | | | Ashmore
Emerging Markets
Short Duration
Fund | |
INVESTMENT INCOME: | | | | | | | | | | | | | | | | |
Interest, net of foreign tax withholdings* | | $ | 53,447,130 | | | $ | 408,796 | | | $ | 14,164,965 | | | $ | 6,140,672 | |
Payment-in-kind interest | | | — | | | | — | | | | 696,438 | | | | — | |
Dividends, net of foreign tax withholdings* | | | — | | | | — | | | | — | | | | — | |
Non-cash dividends | | | — | | | | — | | | | — | | | | — | |
Total Income | | | 53,447,130 | | | | 408,796 | | | | 14,861,403 | | | | 6,140,672 | |
EXPENSES: | | | | | | | | | | | | | | | | |
Investment Manager fees | | | 7,685,326 | | | | 62,114 | | | | 1,820,663 | | | | 560,989 | |
Administration fees | | | 154,264 | | | | 1,309 | | | | 36,960 | | | | 18,554 | |
Custody fees | | | 382,074 | | | | 16,184 | | | | 61,921 | | | | 24,512 | |
Professional fees | | | 433,966 | | | | 39,890 | | | | 140,482 | | | | 73,795 | |
Trustees’ fees | | | 117,174 | | | | 1,106 | | | | 27,197 | | | | 13,275 | |
Offering expenses and registration fees | | | 53,011 | | | | 44,839 | | | | 51,683 | | | | 50,940 | |
Insurance fees | | | 81,853 | | | | 615 | | | | 20,786 | | | | 11,704 | |
Printing fees | | | 16,630 | | | | 6,528 | | | | 22,429 | | | | 8,020 | |
Distribution and servicing fees - Class A | | | 8,961 | | | | 3,514 | | | | 20,976 | | | | 9,799 | |
Distribution and servicing fees - Class C | | | 17,009 | | | | 91 | | | | 33,433 | | | | 4,932 | |
Regulatory fees | | | 37,752 | | | | 12,670 | | | | 21,748 | | | | 18,488 | |
Interest expense | | | 22,812 | | | | — | | | | — | | | | — | |
Total Expenses | | | 9,010,832 | | | | 188,860 | | | | 2,258,278 | | | | 795,008 | |
Less expenses reimbursed by the Investment Manager | | | (1,119,411 | ) | | | (121,907 | ) | | | (345,989 | ) | | | (216,728 | ) |
Net Expenses | | | 7,891,421 | | | | 66,953 | | | | 1,912,289 | | | | 578,280 | |
Net Investment Income | | | 45,555,709 | | | | 341,843 | | | | 12,949,114 | | | | 5,562,392 | |
NET REALIZED AND UNREALIZED GAINS (LOSSES): | | | | | | | | | | | | | | | | |
NET REALIZED GAIN (LOSS) ON: | | | | | | | | | | | | | | | | |
Investments in securities (net of increase (decrease) in deferred foreign taxes of $-, $-, $-, $-, $(5,176), $(2,207), $20,740, $(3,687), $1, $-, $-, and $-, respectively) | | | (178,351,460 | ) | | | (751,366 | ) | | | (36,637,265 | ) | | | (61,853,315 | ) |
Forward foreign currency exchange contracts | | | (29,961,809 | ) | | | (330,741 | ) | | | 599,723 | | | | 52,514 | |
Interest rate swap contracts | | | (121,222 | ) | | | (3,638 | ) | | | — | | | | — | |
Foreign exchange transactions | | | (688,451 | ) | | | (16,263 | ) | | | 34,085 | | | | 192 | |
Net Realized Gain (Loss) | | | (209,122,942 | ) | | | (1,102,008 | ) | | | (36,003,457 | ) | | | (61,800,609 | ) |
NET CHANGE IN UNREALIZED APPRECIATION (DEPRECIATION) ON: | | | | | | | | | | | | | | | | |
Investments in securities (net of increase (decrease) in deferred foreign taxes of $-, $-, $-, $-, $(65,296), $(66,749), $2,315, $(160,378), $135, $-, $-, and $-, respectively) | | | (105,327,203 | ) | | | (391,423 | ) | | | (39,375,490 | ) | | | 22,923,297 | |
Forward foreign currency exchange contracts | | | (5,414,719 | ) | | | (98,688 | ) | | | 17,247 | | | | (286 | ) |
Interest rate swap contracts | | | 638,780 | | | | (22,384 | ) | | | — | | | | — | |
Foreign exchange translations | | | 66,869 | | | | 497 | | | | (1,170 | ) | | | (710 | ) |
Change in Net Unrealized Appreciation (Depreciation) | | | (110,036,273 | ) | | | (511,998 | ) | | | (39,359,413 | ) | | | 22,922,301 | |
Net Realized and Unrealized Losses | | | (319,159,215 | ) | | | (1,614,006 | ) | | | (75,362,870 | ) | | | (38,878,308 | ) |
Net Decrease in Net Assets Resulting from Operations | | $ | (273,603,506 | ) | | $ | (1,272,163 | ) | | $ | (62,413,756 | ) | | $ | (33,315,916 | ) |
* Foreign Tax Withholdings | | $ | 556,579 | | | $ | 6 | | | $ | — | | | $ | 13,954 | |
See accompanying notes to the financial statements.
31
| | | | | | | | | | | | | | | | | | | | | | | | | | | | | | |
Ashmore Emerging Markets Active Equity Fund | | | Ashmore Emerging Markets Small-Cap Equity Fund | | | Ashmore Emerging Markets Frontier Equity Fund | | | Ashmore Emerging Markets Equity Fund | | | Ashmore Emerging Markets Equity ESG Fund | | | Ashmore Emerging Markets Short Duration Select Fund | | | Ashmore Emerging Markets Investment Grade Income Fund | | | Ashmore Emerging Markets Corporate Income ESG Fund | |
| | | | | | | | | | | | | | | | | | | | | | | | | | | | | | | |
| $ | 31,768 | | | $ | 299 | | | $ | 34,383 | | | $ | 8,452 | | | $ | 1,461 | | | $ | 385,938 | | | $ | 802,303 | | | $ | 460,601 | |
| | — | | | | — | | | | — | | | | — | | | | — | | | | — | | | | — | | | | — | |
| | 1,850,564 | | | | 187,340 | | | | 1,921,935 | | | | 2,901,815 | | | | 141,245 | | | | — | | | | — | | | | — | |
| | — | | | | — | | | | — | | | | — | | | | 16,816 | | | | — | | | | — | | | | — | |
| | 1,882,332 | | | | 187,639 | | | | 1,956,318 | | | | 2,910,267 | | | | 159,522 | | | | 385,938 | | | | 802,303 | | | | 460,601 | |
| | | | | | | | |
| | 877,840 | | | | 133,218 | | | | 1,119,197 | | | | 1,331,083 | | | | 133,131 | | | | 62,439 | | | | 127,610 | | | | 67,726 | |
| | 17,608 | | | | 1,758 | | | | 14,546 | | | | 23,052 | | | | 2,305 | | | | 1,911 | | | | 3,608 | | | | 1,589 | |
| | 54,626 | | | | 16,587 | | | | 191,304 | | | | 87,937 | | | | 9,482 | | | | 3,361 | | | | 5,647 | | | | 2,737 | |
| | 63,900 | | | | 30,067 | | | | 63,944 | | | | 79,633 | | | | 33,211 | | | | 33,731 | | | | 37,952 | | | | 32,829 | |
| | 16,559 | | | | 1,471 | | | | 13,530 | | | | 20,499 | | | | 1,944 | | | | 1,733 | | | | 3,223 | | | | 1,374 | |
| | 50,737 | | | | 45,289 | | | | 45,811 | | | | 51,842 | | | | 44,993 | | | | 18,058 | | | | 18,208 | | | | 41,769 | |
| | 8,065 | | | | 893 | | | | 6,365 | | | | 10,764 | | | | 1,104 | | | | 898 | | | | 1,717 | | | | 705 | |
| | 8,103 | | | | 6,308 | | | | 10,685 | | | | 10,476 | | | | 6,399 | | | | 6,417 | | | | 6,416 | | | | 6,416 | |
| | 2,736 | | | | 896 | | | | 7,464 | | | | 6,280 | | | | 4 | | | | 4 | | | | 4 | | | | 2 | |
| | 14 | | | | 1,035 | | | | 2,881 | | | | 1,167 | | | | 12 | | | | 10 | | | | 9 | | | | 8 | |
| | 19,404 | | | | 10,284 | | | | 11,736 | | | | 21,433 | | | | 13,078 | | | | 13,287 | | | | 13,118 | | | | 14,179 | |
| | — | | | | — | | | | — | | | | — | | | | — | | | | — | | | | — | | | | — | |
| | 1,119,592 | | | | 247,806 | | | | 1,487,463 | | | | 1,644,166 | | | | 245,663 | | | | 141,849 | | | | 217,512 | | | | 169,334 | |
| | (220,507 | ) | | | (110,918 | ) | | | (342,706 | ) | | | (280,776 | ) | | | (110,142 | ) | | | (77,472 | ) | | | (86,233 | ) | | | (99,997 | ) |
| | 899,085 | | | | 136,888 | | | | 1,144,757 | | | | 1,363,390 | | | | 135,521 | | | | 64,377 | | | | 131,279 | | | | 69,337 | |
| | 983,247 | | | | 50,751 | | | | 811,561 | | | | 1,546,877 | | | | 24,001 | | | | 321,561 | | | | 671,024 | | | | 391,264 | |
| | | | | | | | |
| | (21,627,167 | ) | | | (408,480 | ) | | | 3,454,458 | | | | (5,695,471 | ) | | | (289,848 | ) | | | (540,306 | ) | | | (1,666,618 | ) | | | (655,195 | ) |
| | (61,366 | ) | | | — | | | | 25 | | | | (1,482 | ) | | | — | | | | 34,134 | | | | 114,629 | | | | 37,156 | |
| | — | | | | — | | | | — | | | | — | | | | — | | | | — | | | | — | | | | — | |
| | (17,773 | ) | | | (7,358 | ) | | | (255,924 | ) | | | (86,559 | ) | | | (7,594 | ) | | | 5,165 | | | | 15,671 | | | | 2,421 | |
| | (21,706,306 | ) | | | (415,838 | ) | | | 3,198,559 | | | | (5,783,512 | ) | | | (297,442 | ) | | | (501,007 | ) | | | (1,536,318 | ) | | | (615,618 | ) |
| | | | | | | | |
| | (16,849,669 | ) | | | (3,452,851 | ) | | | (17,057,736 | ) | | | (53,868,984 | ) | | | (5,696,026 | ) | | | (1,062,385 | ) | | | (3,427,788 | ) | | | (2,347,998 | ) |
| | — | | | | — | | | | — | | | | — | | | | — | | | | (1,314 | ) | | | (4,908 | ) | | | (1,137 | ) |
| | — | | | | — | | | | — | | | | — | | | | — | | | | — | | | | — | | | | — | |
| | (17,426 | ) | | | (2,174 | ) | | | 21,293 | | | | (3,307 | ) | | | 138 | | | | (148 | ) | | | (421 | ) | | | (174 | ) |
| | (16,867,095 | ) | | | (3,455,025 | ) | | | (17,036,443 | ) | | | (53,872,291 | ) | | | (5,695,888 | ) | | | (1,063,847 | ) | | | (3,433,117 | ) | | | (2,349,309 | ) |
| | (38,573,401 | ) | | | (3,870,863 | ) | | | (13,837,884 | ) | | | (59,655,803 | ) | | | (5,993,330 | ) | | | (1,564,854 | ) | | | (4,969,435 | ) | | | (2,964,927 | ) |
| $ | (37,590,154 | ) | | $ | (3,820,112 | ) | | $ | (13,026,323 | ) | | $ | (58,108,926 | ) | | $ | (5,969,329 | ) | | $ | (1,243,293 | ) | | $ | (4,298,411 | ) | | $ | (2,573,663 | ) |
| $ | 245,301 | | | $ | 21,976 | | | $ | 78,238 | | | $ | 232,277 | | | $ | 15,259 | | | $ | 954 | | | $ | 1,759 | | | $ | 776 | |
See accompanying notes to the financial statements.
32
ASHMORE FUNDS
STATEMENTS OF CHANGES IN NET ASSETS
For the Fiscal Years Ended October 31, 2022
| | | | | | | | | | | | | | | | | | | | | | | | |
| | | Ashmore Emerging Markets Total Return Fund | | | Ashmore Emerging Markets Local Currency Bond Fund | | | Ashmore Emerging Markets Corporate Income Fund | |
| | | 2022 | | | 2021 | | | 2022 | | | 2021 | | | 2022 | | | 2021 | |
OPERATIONS: | | | | | | | | | | | | | | | | | | | | | | | | |
Net investment income (loss) | | $ | 45,555,709 | | | $ | 64,577,741 | | | $ | 341,843 | | | $ | 373,782 | | | $ | 12,949,114 | | | $ | 15,574,393 | |
Net realized gain (loss) | | | (209,122,942 | ) | | | 1,670,365 | | | | (1,102,008 | ) | | | (1,421,218 | ) | | | (36,003,457 | ) | | | 3,663,306 | |
Net change in unrealized appreciation (depreciation) | | | (110,036,273 | ) | | | (42,133,329 | ) | | | (511,998 | ) | | | 2,543,237 | | | | (39,359,413 | ) | | | (4,664,716 | ) |
Net Increase (Decrease) in Net Assets Resulting from Operations | | | (273,603,506 | ) | | | 24,114,777 | | | | (1,272,163 | ) | | | 1,495,801 | | | | (62,413,756 | ) | | | 14,572,983 | |
DISTRIBUTIONS TO SHAREHOLDERS: | | | | | | | | | | | | | | | | | | | | | | | | |
Class A | | | (37,990 | ) | | | (422,026 | ) | | | — | | | | — | | | | (591,756 | ) | | | (593,913 | ) |
Class C | | | (13,646 | ) | | | (124,931 | ) | | | — | | | | — | | | | (213,937 | ) | | | (274,818 | ) |
Institutional Class | | | (8,198,044 | ) | | | (59,387,157 | ) | | | — | | | | — | | | | (12,611,307 | ) | | | (14,732,728 | ) |
| | | | | | | | | | | | | | | | | | | | | | | | |
Total Distributions to Shareholders | | | (8,249,680 | ) | | | (59,934,114 | ) | | | — | | | | — | | | | (13,417,000 | ) | | | (15,601,459 | ) |
TAX RETURN OF CAPITAL DISTRIBUTIONS TO SHAREHOLDERS: | | | | | | | | | | | | | | | | | | | | | | | | |
Class A | | | (156,233 | ) | | | (21,221 | ) | | | (20,107 | ) | | | — | | | | — | | | | — | |
Class C | | | (66,934 | ) | | | (7,549 | ) | | | (298 | ) | | | — | | | | — | | | | — | |
Institutional Class | | | (34,684,669 | ) | | | (4,504,710 | ) | | | (76,188 | ) | | | — | | | | — | | | | — | |
| | | | | | | | | | | | | | | | | | | | | | | | |
Total Tax Return of Capital Distributions to Shareholders | | | (34,907,836 | ) | | | (4,533,480 | ) | | | (96,593 | ) | | | — | | | | — | | | | — | |
FUND SHARE TRANSACTIONS: | | | | | | | | | | | | | | | | | | | | | | | | |
Net increase (decrease) in net assets resulting from Class A share transactions | | | (2,480,460 | ) | | | (4,504,034 | ) | | | (51,180 | ) | | | (190,704 | ) | | | (2,985,423 | ) | | | (12,862 | ) |
Net increase (decrease) in net assets resulting from Class C share transactions | | | (582,173 | ) | | | (1,508,514 | ) | | | (21,775 | ) | | | (5,053 | ) | | | (2,614,851 | ) | | | (1,808,354 | ) |
Net increase (decrease) in net assets resulting from Institutional Class share transactions | | | (413,280,851 | ) | | | 27,871,350 | | | | (1,104,070 | ) | | | (23,415,847 | ) | | | (119,801,222 | ) | | | 16,981,637 | |
| | | | | | | | | | | | | | | | | | | | | | | | |
| | | | | | |
Net Increase (Decrease) in Net Assets Resulting from Fund Share Transactions | | | (416,343,484 | ) | | | 21,858,802 | | | | (1,177,025 | ) | | | (23,611,604 | ) | | | (125,401,496 | ) | | | 15,160,421 | |
Total Increase (Decrease) in Net Assets | | | (733,104,506 | ) | | | (18,494,015 | ) | | | (2,545,781 | ) | | | (22,115,803 | ) | | | (201,232,252 | ) | | | 14,131,945 | |
NET ASSETS: | | | | | | | | | | | | | | | | | | | | | | | | |
Net Assets at the Beginning of year | | | 1,224,968,700 | | | | 1,243,462,715 | | | | 7,926,601 | | | | 30,042,404 | | | | 294,103,083 | | | | 279,971,138 | |
Net Assets at the End of year | | $ | 491,864,194 | | | $ | 1,224,968,700 | | | $ | 5,380,820 | | | $ | 7,926,601 | | | $ | 92,870,831 | | | $ | 294,103,083 | |
See accompanying notes to the financial statements.
33
| | | | | | | | | | | | | | | | | | | | | | |
Ashmore
Emerging Markets
Short Duration Fund | | | Ashmore
Emerging Markets
Active Equity Fund | | | Ashmore
Emerging Markets
Small-Cap
Equity Fund | |
| | | | | | |
| 2022 | | | 2021 | | | 2022 | | | 2021 | | | 2022 | | | 2021 | |
| | | | | | | | | | | | | | | | | | | | | | |
| | $ 5,562,392 | | | $ | 14,791,789 | | | $ | 983,247 | | | $ | 1,303,433 | | | $ | 50,751 | | | $ | (13,215 | ) |
| | (61,800,609) | | | | (101,476,001 | ) | | | (21,706,306 | ) | | | 17,192,177 | | | | (415,838 | ) | | | 3,680,979 | |
| | | | | | | | | | | | | | | | | | | | | | |
| | 22,922,301 | | | | 93,786,911 | | | | (16,867,095 | ) | | | (6,047,071 | ) | | | (3,455,025 | ) | | | (541,465 | ) |
| | | | | | | | | | | | | | | | | | | | | | |
| | | | | | | | | | | | | | | | | | | | | | |
| | (33,315,916) | | | | 7,102,699 | | | | (37,590,154 | ) | | | 12,448,539 | | | | (3,820,112 | ) | | | 3,126,299 | |
| | | | | | | | | | | | | | | | | | | | | | |
| | | | | | | | | | | | | | | | | | | | | | |
| | (336,688) | | | | (810,413 | ) | | | (396,907 | ) | | | (17,346 | ) | | | — | | | | — | |
| | (36,298) | | | | (82,934 | ) | | | (433 | ) | | | (6 | ) | | | — | | | | — | |
| | (7,232,408) | | | | (13,801,736 | ) | | | (17,159,925 | ) | | | (1,053,611 | ) | | | — | | | | — | |
| | | | | | | | | | | | | | | | | | | | | | |
| | (7,605,394) | | | | (14,695,083 | ) | | | (17,557,265 | ) | | | (1,070,963 | ) | | | — | | | | — | |
| | | | | | | | | | | | | | | | | | | | | | |
| | | | | | | | | | | | | | | | | | | | | | |
| | | | | | | | | | | | | | | | | | | | | | |
| | — | | | | — | | | | (1,429 | ) | | | — | | | | (4,734 | ) | | | — | |
| | — | | | | — | | | | (1 | ) | | | — | | | | (704 | ) | | | — | |
| | — | | | | — | | | | (177,587 | ) | | | — | | | | (88,237 | ) | | | — | |
| | | | | | | | | | | | | | | | | | | | | | |
| | | | | | | | | | | | | | | | | | | | | | |
| | — | | | | — | | | | (179,017 | ) | | | — | | | | (93,675 | ) | | | — | |
| | | | | | | | | | | | | | | | | | | | | | |
| | | | | | | | | | | | | | | | | | | | | | |
| | | | | | | | | | | | | | | | | | | | | | |
| | | | | | | | | | | | | | | | | | | | | | |
| | (1,945,708) | | | | (12,717,230 | ) | | | 10,980 | | | | (213,713 | ) | | | 213,811 | | | | (212,657 | ) |
| | | | | | | | | | | | | | | | | | | | | | |
| | | | | | | | | | | | | | | | | | | | | | |
| | (696,358) | | | | (225,817 | ) | | | 383 | | | | 7 | | | | (69,661 | ) | | | (23,421 | ) |
| | | | | | | | | | | | | | | | | | | | | | |
| | | | | | | | | | | | | | | | | | | | | | |
| | | | | | | | | | | | | | | | | | | | | | |
| | (34,104,155) | | | | (309,361,929 | ) | | | 33,353,791 | | | | 4,775,044 | | | | (1,036,778 | ) | | | 645,168 | |
| | | | | | | | | | | | | | | | | | | | | | |
| | | | | | | | | | | | | | | | | | | | | | |
| | | | | | | | | | | | | | | | | | | | | | |
| | (36,746,221) | | | | (322,304,976 | ) | | | 33,365,154 | | | | 4,561,338 | | | | (892,628 | ) | | | 409,090 | |
| | | | | | | | | | | | | | | | | | | | | | |
| | (77,667,531) | | | | (329,897,360 | ) | | | (21,961,282 | ) | | | 15,938,914 | | | | (4,806,415 | ) | | | 3,535,389 | |
| | | | | | | | | | | | | | | | | | | | | | |
| | | | | | | | | | | | | | | | | | | | | | |
| | 133,006,659 | | | | 462,904,019 | | | | 98,030,497 | | | | 82,091,583 | | | | 11,477,246 | | | | 7,941,857 | |
| | $ 55,339,128 | | | $ | 133,006,659 | | | $ | 76,069,215 | | | $ | 98,030,497 | | | $ | 6,670,831 | | | $ | 11,477,246 | |
See accompanying notes to the financial statements.
34
ASHMORE FUNDS
STATEMENTS OF CHANGES IN NET ASSETS
For the Fiscal Years Ended October 31, 2022
| | | | | | | | | | | | | | | | | | | | | | | | |
| | | Ashmore
Emerging Markets
Frontier Equity Fund | | | Ashmore
Emerging Markets
Equity Fund | | | Ashmore
Emerging Markets
Equity ESG Fund | |
| | | | | | | |
| | | 2022 | | | 2021 | | | 2022 | | | 2021 | | | 2022 | | | 2021 | |
OPERATIONS: | | | | | | | | | | | | | | | | | | | | | | | | |
Net investment income (loss) | | $ | 811,561 | | | $ | 381,769 | | | $ | 1,546,877 | | | $ | (137,875 | ) | | $ | 24,001 | | | $ | (52,419 | ) |
Net realized gain (loss) | | | 3,198,559 | | | | 7,845,828 | | | | (5,783,512 | ) | | | 22,014,134 | | | | (297,442 | ) | | | 2,214,008 | |
Net change in unrealized appreciation (depreciation) | | | (17,036,443 | ) | | | 15,377,668 | | | | (53,872,291 | ) | | | 4,897,637 | | | | (5,695,888 | ) | | | 831,053 | |
Net Increase (Decrease) in Net Assets Resulting from Operations | | | (13,026,323 | ) | | | 23,605,265 | | | | (58,108,926 | ) | | | 26,773,896 | | | | (5,969,329 | ) | | | 2,992,642 | |
| | | | | | |
DISTRIBUTIONS TO SHAREHOLDERS: | | | | | | | | | | | | | | | | | | | | | | | | |
Class A | | | (52,312 | ) | | | (4,973 | ) | | | (638,531 | ) | | | (42,189 | ) | | | (204 | ) | | | (9 | ) |
Class C | | | (3,008 | ) | | | (335 | ) | | | (9,143 | ) | | | (34 | ) | | | (204 | ) | | | (8 | ) |
Institutional Class | | | (1,320,948 | ) | | | (438,612 | ) | | | (20,900,163 | ) | | | (2,151,050 | ) | | | (2,040,719 | ) | | | (87,850 | ) |
| | | | | | | | | | | | | | | | | | | | | | | | |
Total Distributions to Shareholders | | | (1,376,268 | ) | | | (443,920 | ) | | | (21,547,837 | ) | | | (2,193,273 | ) | | | (2,041,127 | ) | | | (87,867 | ) |
Class A | | | — | | | | — | | | | (3,640 | ) | | | — | | | | (1 | ) | | | — | |
Class C | | | — | | | | — | | | | (98 | ) | | | — | | | | — | | | | — | |
Institutional Class | | | — | | | | — | | | | (247,762 | ) | | | — | | | | (25,235 | ) | | | — | |
| | | | | | | | | | | | | | | | | | | | | | | | |
Total Tax Return of Capital Distributions to Shareholders | | | — | | | | — | | | | (251,500 | ) | | | — | | | | (25,236 | ) | | | — | |
FUND SHARE TRANSACTIONS: | | | | | | | | | | | | | | | | | | | | | | | | |
Net increase (decrease) in net assets resulting from Class A share transactions | | | 1,042,220 | | | | 1,542,536 | | | | 1,135,776 | | | | 2,015,785 | | | | 186 | | | | 8 | |
Net increase (decrease) in net assets resulting from Class C share transactions | | | 147,108 | | | | (170,063 | ) | | | 67,535 | | | | 108,537 | | | | 186 | | | | 9 | |
Net increase (decrease) in net assets resulting from Institutional Class share transactions | | | 5,534,158 | | | | 1,780,510 | | | | 52,105,586 | | | | 10,220,879 | | | | 1,877,075 | | | | 74,670 | |
| | | | | | | | | | | | | | | | | | | | | | | | |
| | | | | | |
Net Increase (Decrease) in Net Assets Resulting from Fund Share Transactions | | | 6,723,486 | | | | 3,152,983 | | | | 53,308,897 | | | | 12,345,201 | | | | 1,877,447 | | | | 74,687 | |
Total Increase (Decrease) in Net Assets | | | (7,679,105 | ) | | | 26,314,328 | | | | (26,599,366 | ) | | | 36,925,824 | | | | (6,158,245 | ) | | | 2,979,462 | |
NET ASSETS: | | | | | | | | | | | | | | | | | | | | | | | | |
Net Assets at the Beginning of year | | | 80,310,483 | | | | 53,996,155 | | | | 120,706,376 | | | | 83,780,552 | | | | 15,043,815 | | | | 12,064,353 | |
Net Assets at the End of year | | $ | 72,631,378 | | | $ | 80,310,483 | | | $ | 94,107,010 | | | $ | 120,706,376 | | | $ | 8,885,570 | | | $ | 15,043,815 | |
See accompanying notes to the financial statements.
35
| | | | | | | | | | | | | | | | | | | | | | |
Ashmore Emerging Markets Short Duration Select Fund | | | Ashmore Emerging Markets Investment Grade Income Fund | | | Ashmore Emerging Markets Corporate Income ESG Fund | |
| 2022 | | | 2021 | | | 2022 | | | 2021 | | | 2022 | | | 20211 | |
| | | | | | | | | | | | | | | | | | | | | | | |
| | $ 321,561 | | | | $ 415,475 | | | | $ 671,024 | | | | $ 703,270 | | | | $ 391,264 | | | | $ 314,455 | |
| | (501,007 | ) | | | (346,084 | ) | | | (1,536,318 | ) | | | (191,033 | ) | | | (615,618 | ) | | | (80,687 | ) |
|
(1,063,847 |
) | | | (39,815 | ) | | | (3,433,117 | ) | | | 279,281 | | | | (2,349,309 | ) | | | (824,873 | ) |
|
(1,243,293 |
) | | | 29,576 | | | | (4,298,411 | ) | | | 791,518 | | | | (2,573,663 | ) | | | (591,105 | ) |
| | | | | |
|
|
| | | | | | | | | | | | | | | | | | | | |
| | (32 | ) | | | (42 | ) | | | (32 | ) | | | (33 | ) | | | (41 | ) | | | (30 | ) |
| | (23 | ) | | | (34 | ) | | | (25 | ) | | | (26 | ) | | | (34 | ) | | | (25 | ) |
| | (324,438 | ) | | | (445,368 | ) | | | (675,972 | ) | | | (708,604 | ) | | | (415,833 | ) | | | (314,348 | ) |
| | | | | | | | | | | | | | | | | | | | | | |
| | (324,493 | ) | | | (445,444 | ) | | | (676,029 | ) | | | (708,663 | ) | | | (415,908 | ) | | | (314,403 | ) |
| | — | | | | — | | | | — | | | | — | | | | — | | | | — | |
| | — | | | | — | | | | — | | | | — | | | | — | | | | — | |
| | — | | | | — | | | | — | | | | — | | | | — | | | | — | |
| | | | | | | | | | | | | | | | | | | | | | |
| | | | | | | | | | | | | | | | | | | | | | |
| | — | | | | — | | | | — | | | | — | | | | — | | | | — | |
| | | | | | | | | | | | | | | | | | | | | | | |
|
27 |
| | | 37 | | | | 28 | | | | 28 | | | | 34 | | | | 1,025 | |
|
19 |
| | | 30 | | | | 21 | | | | 22 | | | | 29 | | | | 1,021 | |
|
278,378 |
| | | 384,902 | | | | 574,521 | | | | 601,809 | | | | 353,954 | | | | 10,261,131 | |
| | | | | | | | | | | | | | | | | | | | | | |
| | | | | |
|
278,424 |
| | | 384,969 | | | | 574,570 | | | | 601,859 | | | | 354,017 | | | | 10,263,177 | |
|
(1,289,362 |
) | | | (30,899 | ) | | | (4,399,870 | ) | | | 684,714 | | | | (2,635,554 | ) | | | 9,357,669 | |
| | | | | | | | | | | | | | | | | | | | | | | |
| | 10,287,753 | | | | 10,318,652 | | | | 20,444,016 | | | | 19,759,302 | | | | 9,357,669 | | | | — | |
| | $ 8,998,391 | | | | $ 10,287,753 | | | | $ 16,044,146 | | | | $ 20,444,016 | | | | $ 6,722,115 | | | | $ 9,357,669 | |
| 1 | The Fund commenced investment operations on February 26, 2021. |
See accompanying notes to the financial statements.
36
ASHMORE FUNDS
FINANCIAL HIGHLIGHTS
Ashmore Emerging Markets Total Return Fund
| | | | | | | | | | | | | | | | | | | | |
| | | | | | | | | Class A | | | | | | | |
| | | | | |
| | | Year Ended October 31,
2022 | | | Year Ended
October 31,
2021 | | | Year Ended
October 31,
2020 | | | Year Ended
October 31,
2019 | | | Year Ended October 31, 2018 | |
| | | | |
Net asset value at beginning of year | | | $ 6.60 | | | | $ 6.80 | | | | $ 7.54 | | | | $ 7.31 | | | | $ 8.22 | |
| | | | | |
Income (loss) from investment operations: | | | | | | | | | | | | | | | | | | | | |
Net investment income | | | 0.32 | 1 | | | 0.33 | 1 | | | 0.34 | | | | 0.40 | | | | 0.36 | 1 |
Net realized and unrealized gain (loss) | | | (2.30 | ) | | | (0.20 | ) | | | (0.74 | ) | | | 0.24 | | | | (0.82 | ) |
| | | | |
Total from investment operations | | | (1.98 | ) | | | 0.13 | | | | (0.40 | ) | | | 0.64 | | | | (0.46 | ) |
| | | | | |
Less distributions: | | | | | | | | | | | | | | | | | | | | |
| | | | | |
From net investment income | | | (0.05 | ) | | | (0.31 | ) | | | (0.12 | ) | | | (0.33 | ) | | | (0.16 | ) |
From net realized gain | | | — | | | | — | | | | — | | | | — | | | | (0.11 | ) |
Tax return of capital | | | (0.25 | ) | | | (0.02 | ) | | | (0.22 | ) | | | (0.08 | ) | | | (0.18 | ) |
| | | | |
| | | | | |
Total distributions | | | (0.30 | ) | | | (0.33 | ) | | | (0.34 | ) | | | (0.41 | ) | | | (0.45 | ) |
| | | | |
Net asset value at end of year | | | $ 4.32 | | | | $ 6.60 | | | | $ 6.80 | | | | $ 7.54 | | | | $ 7.31 | |
| | | | |
| | | | | |
Total return2 | | | (30.79 | )% | | | 1.68 | % | | | (5.31 | )% | | | 8.68 | % | | | (5.65 | )% |
| | | | | |
Portfolio turnover rate3 | | | 32 | % | | | 54 | % | | | 67 | % | | | 49 | % | | | 66 | % |
| | | | | |
Net assets, end of year (in thousands) | | | $ 1,920 | | | | $5,917 | | | | $10,377 | | | | $11,108 | | | | $8,347 | |
| | | | | |
Ratios to average net assets: | | | | | | | | | | | | | | | | | | | | |
Total expenses to average net assets: | | | | | | | | | | | | | | | | | | | | |
Expenses before reimbursements | | | 1.42 | % | | | 1.37 | %4 | | | 1.42 | %4 | | | 1.36 | % | | | 1.36 | % |
Expenses after reimbursements | | | 1.27 | % | | | 1.28 | %4 | | | 1.32 | %4 | | | 1.27 | % | | | 1.27 | % |
| | | | | |
Net investment income to average net assets: | | | | | | | | | | | | | | | | | | | | |
Net investment income before reimbursements | | | 5.50 | % | | | 4.53 | %4 | | | 4.72 | %4 | | | 5.16 | % | | | 4.42 | % |
Net investment income after reimbursements | | | 5.65 | % | | | 4.62 | %4 | | | 4.82 | %4 | | | 5.25 | % | | | 4.51 | % |
See accompanying notes to the financial statements.
37
ASHMORE FUNDS
FINANCIAL HIGHLIGHTS
Ashmore Emerging Markets Total Return Fund
| | | | | | | | | | | | | | | | | | | | |
| | | | | | | | | Class C | | | | | | | |
| | | | | |
| | | Year Ended
October 31,
2022 | | | Year Ended
October 31,
2021 | | | Year Ended
October 31,
2020 | | | Year Ended
October 31,
2019 | | | Year Ended
October 31,
2018 | |
| | | | |
Net asset value at beginning of year | | | $ 6.58 | | | | $ 6.78 | | | | $ 7.53 | | | | $ 7.29 | | | | $ 8.21 | |
| | | | | |
Income (loss) from investment operations: | | | | | | | | | | | | | | | | | | | | |
| | | | | |
Net investment income | | | 0.27 | 1 | | | 0.27 | 1 | | | 0.30 | | | | 0.34 | | | | 0.31 | 1 |
| | | | | |
Net realized and unrealized gain (loss) | | | (2.29 | ) | | | (0.19 | ) | | | (0.76 | ) | | | 0.25 | | | | (0.83 | ) |
| | | | |
| | | | | |
Total from investment operations | | | (2.02 | ) | | | 0.08 | | | | (0.46 | ) | | | 0.59 | | | | (0.52 | ) |
| | | | | |
Less distributions: | | | | | | | | | | | | | | | | | | | | |
| | | | | |
From net investment income | | | (0.04 | ) | | | (0.26 | ) | | | (0.11 | ) | | | (0.28 | ) | | | (0.14 | ) |
| | | | | |
From net realized gain | | | — | | | | — | | | | — | | | | — | | | | (0.11 | ) |
| | | | | |
Tax return of capital | | | (0.22 | ) | | | (0.02 | ) | | | (0.18 | ) | | | (0.07 | ) | | | (0.15 | ) |
| | | | |
| | | | | |
Total distributions | | | (0.26 | ) | | | (0.28 | ) | | | (0.29 | ) | | | (0.35 | ) | | | (0.40 | ) |
| | | | |
Net asset value at end of year | | | $ 4.30 | | | | $ 6.58 | | | | $ 6.78 | | | | $ 7.53 | | | | $ 7.29 | |
| | | | |
| | | | | |
Total return2 | | | (31.39 | )% | | | 0.93 | % | | | (6.09 | )% | | | 8.02 | % | | | (6.43 | )% |
| | | | | |
Portfolio turnover rate3 | | | 32 | % | | | 54 | % | | | 67 | % | | | 49 | % | | | 66 | % |
| | | | | |
Net assets, end of year (in thousands) | | | $ 1,080 | | | | $2,386 | | | | $3,905 | | | | $5,506 | | | | $4,278 | |
| | | | | |
Ratios to average net assets: | | | | | | | | | | | | | | | | | | | | |
| | | | | |
Total expenses to average net assets: | | | | | | | | | | | | | | | | | | | | |
| | | | | |
Expenses before reimbursements | | | 2.17 | % | | | 2.12 | %5 | | | 2.17 | %5 | | | 2.11 | % | | | 2.12 | % |
| | | | | |
Expenses after reimbursements | | | 2.02 | % | | | 2.03 | %5 | | | 2.06 | %5 | | | 2.02 | % | | | 2.02 | % |
| | | | | |
Net investment income to average net assets: | | | | | | | | | | | | | | | | | | | | |
| | | | | |
Net investment income before reimbursements | | | 4.74 | % | | | 3.76 | %5 | | | 4.01 | %5 | | | 4.41 | % | | | 3.92 | % |
| | | | | |
Net investment income after reimbursements | | | 4.89 | % | | | 3.85 | %5 | | | 4.12 | %5 | | | 4.50 | % | | | 4.02 | % |
See accompanying notes to the financial statements.
38
ASHMORE FUNDS
FINANCIAL HIGHLIGHTS
Ashmore Emerging Markets Total Return Fund
| | | | | | | | | | | | | | | | | | | | |
| | | Institutional Class | |
| | | | | |
| | | Year Ended | | | Year Ended | | | Year Ended | | | Year Ended | | | Year Ended | |
| | | October 31, | | | October 31, | | | October 31, | | | October 31, | | | October 31, | |
| | | 2022 | | | 2021 | | | 2020 | | | 2019 | | | 2018 | |
| | | | |
Net asset value at beginning of year | | $ | 6.70 | | | $ | 6.90 | | | $ | 7.65 | | | $ | 7.41 | | | $ | 8.34 | |
Income (loss) from investment operations: | | | | | | | | | | | | | | | | | | | | |
Net investment income | | | 0.33 | 1 | | | 0.35 | 1 | | | 0.36 | | | | 0.44 | | | | 0.40 | 1 |
Net realized and unrealized gain (loss) | | | (2.34 | ) | | | (0.20 | ) | | | (0.75 | ) | | | 0.24 | | | | (0.85 | ) |
| | | | |
Total from investment operations | | | (2.01 | ) | | | 0.15 | | | | (0.39 | ) | | | 0.68 | | | | (0.45 | ) |
| | | | | |
Less distributions: | | | | | | | | | | | | | | | | | | | | |
| | | | | |
From net investment income | | | (0.05 | ) | | | (0.33 | ) | | | (0.13 | ) | | | (0.35 | ) | | | (0.17 | ) |
From net realized gain | | | — | | | | — | | | | — | | | | — | | | | (0.11 | ) |
Tax return of capital | | | (0.26 | ) | | | (0.02 | ) | | | (0.23 | ) | | | (0.09 | ) | | | (0.20 | ) |
| | | | |
| | | | | |
Total distributions | | | (0.31 | ) | | | (0.35 | ) | | | (0.36 | ) | | | (0.44 | ) | | | (0.48 | ) |
| | | | |
Net asset value at end of year | | $ | 4.38 | | | $ | 6.70 | | | $ | 6.90 | | | $ | 7.65 | | | $ | 7.41 | |
| | | | |
| | | | | |
Total return2 | | | (30.74 | )% | | | 1.94 | % | | | (5.09 | )% | | | 9.04 | % | | | (5.53 | )% |
| | | | | |
Portfolio turnover rate3 | | | 32 | % | | | 54 | % | | | 67 | % | | | 49 | % | | | 66 | % |
| | | | | |
Net assets, end of year (in thousands) | | $ | 488,864 | | | $ | 1,216,666 | | | $ | 1,229,181 | | | $ | 1,528,196 | | | $ | 1,313,660 | |
| | | | | |
Ratios to average net assets: | | | | | | | | | | | | | | | | | | | | |
Total expenses to average net assets: | | | | | | | | | | | | | | | | | | | | |
Expenses before reimbursements | | | 1.17 | % | | | 1.12 | %6 | | | 1.17 | %6 | | | 1.11 | % | | | 1.12 | % |
Expenses after reimbursements | | | 1.02 | % | | | 1.03 | %6 | | | 1.07 | %6 | | | 1.02 | % | | | 1.02 | % |
| | | | | |
Net investment income to average net assets: | | | | | | | | | | | | | | | | | | | | |
Net investment income before reimbursements | | | 5.79 | % | | | 4.78 | %6 | | | 4.99 | %6 | | | 5.40 | % | | | 4.97 | % |
Net investment income after reimbursements | | | 5.94 | % | | | 4.87 | %6 | | | 5.09 | %6 | | | 5.49 | % | | | 5.07 | % |
| 1 | Per share amounts are based on average number of shares outstanding during the period. |
| 2 | Assumes investment at net asset value at the beginning of the year, reinvestment of all distributions at net asset value on distribution date, and a complete redemption of the investment at net asset value at the end of the year, excluding the impact of sales charges. |
| 3 | The portfolio turnover rate is calculated by dividing the lesser of cost of purchases or proceeds from sales of long term portfolio securities, including fully funded total return swaps, by the monthly average of the value of the long term portfolio securities. |
| 4 | Ratios include legal expenses of $3,181 and $5,146 that are outside of the expense cap under the expense limitation agreement for the years ended October 31, 2021 and 2020, respectively. Expense ratios would have been lower by 0.01% and 0.05% and Net investment income ratios would have been higher by 0.01% and 0.05% excluding these expenses. |
| 5 | Ratios include legal expenses of $1,113 and $1,990 that are outside of the expense cap under the expense limitation agreement for the years ended October 31, 2021 and 2020, respectively. Expense ratios would have been lower by 0.01% and 0.04% and Net investment income ratios would have been higher by 0.01% and 0.04% excluding these expenses. |
| 6 | Ratios include legal expenses of $433,533 and $640,665 that are outside of the expense cap under the expense limitation agreement for the years ended October, 2021 and 2020, respectively. Expense ratios would have been lower by 0.01% and 0.05% and Net investment income ratios would have been higher by 0.01% and 0.05% excluding these expenses. |
See accompanying notes to the financial statements.
39
ASHMORE FUNDS
FINANCIAL HIGHLIGHTS
Ashmore Emerging Markets Local Currency Bond Fund
| | | | | | | | | | | | | | | | | | | | |
| | | Class A | |
| | | | | |
| | | Year Ended | | | Year Ended | | | Year Ended | | | Year Ended | | | Year Ended | |
| | | October 31, | | | October 31, | | | October 31, | | | October 31, | | | October 31, | |
| | | 2022 | | | 2021 | | | 2020 | | | 2019 | | | 2018 | |
| | | | |
Net asset value at beginning of year | | $ | 6.92 | | | $ | 6.86 | | | $ | 7.35 | | | $ | 6.53 | | | $ | 7.22 | |
| | | | | |
Income (loss) from investment operations: | | | | | | | | | | | | | | | | | | | | |
Net investment income | | | 0.32 | 1 | | | 0.28 | 1 | | | 0.35 | 1 | | | 0.59 | | | | 0.36 | |
Net realized and unrealized gain (loss) | | | (1.53 | ) | | | (0.22 | ) | | | (0.75 | ) | | | 0.27 | | | | (0.88 | ) |
| | | | |
Total from investment operations | | | (1.21 | ) | | | 0.06 | | | | (0.40 | ) | | | 0.86 | | | | (0.52 | ) |
| | | | | |
Less distributions: | | | | | | | | | | | | | | | | | | | | |
| | | | | |
From net investment income | | | — | | | | — | | | | — | | | | — | | | | (0.08 | ) |
From net realized gain | | | — | | | | — | | | | — | | | | — | | | | — | |
Tax return of capital | | | (0.09 | ) | | | — | | | | (0.09 | ) | | | (0.04 | ) | | | (0.09 | ) |
| | | | |
| | | | | |
Total distributions | | | (0.09 | ) | | | — | | | | (0.09 | ) | | | (0.04 | ) | | | (0.17 | ) |
| | | | |
Net asset value at end of year | | $ | 5.62 | | | $ | 6.92 | | | $ | 6.86 | | | $ | 7.35 | | | $ | 6.53 | |
| | | | |
| | | | | |
Total return2 | | | (17.75 | )% | | | 0.87 | % | | | (5.51 | )% | | | 13.24 | % | | | (7.47 | )% |
| | | | | |
Portfolio turnover rate3 | | | 53 | % | | | 34 | % | | | 47 | % | | | 56 | % | | | 75 | % |
| | | | | |
Net assets, end of year (in thousands) | | $ | 1,248 | | | $ | 1,592 | | | $ | 1,755 | | | $ | 1,933 | | | $ | 1,259 | |
| | | | | |
Ratios to average net assets: | | | | | | | | | | | | | | | | | | | | |
Total expenses to average net assets: | | | | | | | | | | | | | | | | | | | | |
Expenses before reimbursements | | | 3.10 | % | | | 2.97 | % | | | 1.75 | % | | | 1.55 | % | | | 1.57 | % |
Expenses after reimbursements | | | 1.22 | % | | | 1.22 | % | | | 1.22 | % | | | 1.22 | % | | | 1.22 | % |
| | | | | |
Net investment income to average net assets: | | | | | | | | | | | | | | | | | | | | |
Net investment income before reimbursements | | | 3.16 | % | | | 2.11 | % | | | 4.45 | % | | | 5.08 | % | | | 4.63 | % |
Net investment income after reimbursements | | | 5.04 | % | | | 3.86 | % | | | 4.98 | % | | | 5.41 | % | | | 4.98 | % |
See accompanying notes to the financial statements.
40
ASHMORE FUNDS
FINANCIAL HIGHLIGHTS
Ashmore Emerging Markets Local Currency Bond Fund
| | | | | | | | | | | | | | | | | | | | |
| | | Class C | |
| | | | | |
| | | Year Ended | | | Year Ended | | | Year Ended | | | Year Ended | | | Year Ended | |
| | | October 31, | | | October 31, | | | October 31, | | | October 31, | | | October 31, | |
| | | 2022 | | | 2021 | | | 2020 | | | 2019 | | | 2018 | |
| | | | |
Net asset value at beginning of year | | $ | 6.75 | | | $ | 6.74 | | | $ | 7.27 | | | $ | 6.47 | | | $ | 7.18 | |
| | | | | |
Income (loss) from investment operations: | | | | | | | | | | | | | | | | | | | | |
Net investment income | | | 0.30 | 1 | | | 0.22 | 1 | | | 0.29 | 1 | | | 0.34 | | | | 0.30 | |
Net realized and unrealized gain (loss) | | | (1.53 | ) | | | (0.21 | ) | | | (0.74 | ) | | | 0.47 | | | | (0.88 | ) |
| | | | |
Total from investment operations | | | (1.23 | ) | | | 0.01 | | | | (0.45 | ) | | | 0.81 | | | | (0.58 | ) |
| | | | | |
Less distributions: | | | | | | | | | | | | | | | | | | | | |
| | | | | |
From net investment income | | | — | | | | — | | | | — | | | | — | | | | (0.07 | ) |
From net realized gain | | | — | | | | — | | | | — | | | | — | | | | — | |
Tax return of capital | | | (0.08 | ) | | | — | | | | (0.08 | ) | | | (0.01 | ) | | | (0.06 | ) |
| | | | |
| | | | | |
Total distributions | | | (0.08 | ) | | | — | | | | (0.08 | ) | | | (0.01 | ) | | | (0.13 | ) |
| | | | |
Net asset value at end of year | | $ | 5.44 | | | $ | 6.75 | | | $ | 6.74 | | | $ | 7.27 | | | $ | 6.47 | |
| | | | |
| | | | | |
Total return2 | | | (18.30 | )% | | | 0.15 | % | | | (6.25 | )% | | | 12.54 | % | | | (8.24 | )% |
| | | | | |
Portfolio turnover rate3 | | | 53 | % | | | 34 | % | | | 47 | % | | | 56 | % | | | 75 | % |
| | | | | |
Net assets, end of year (in thousands) | | $ | 2 | | | $ | 25 | | | $ | 30 | | | $ | 55 | | | $ | 77 | |
| | | | | |
Ratios to average net assets: | | | | | | | | | | | | | | | | | | | | |
Total expenses to average net assets: | | | | | | | | | | | | | | | | | | | | |
Expenses before reimbursements | | | 3.74 | % | | | 3.75 | % | | | 2.50 | % | | | 2.29 | % | | | 2.31 | % |
Expenses after reimbursements | | | 1.97 | % | | | 1.97 | % | | | 1.97 | % | | | 1.97 | % | | | 1.97 | % |
| | | | | |
Net investment income to average net assets: | | | | | | | | | | | | | | | | | | | | |
Net investment income before reimbursements | | | 2.85 | % | | | 1.35 | % | | | 3.77 | % | | | 4.33 | % | | | 3.85 | % |
Net investment income after reimbursements | | | 4.62 | % | | | 3.13 | % | | | 4.30 | % | | | 4.65 | % | | | 4.19 | % |
See accompanying notes to the financial statements.
41
ASHMORE FUNDS
FINANCIAL HIGHLIGHTS
Ashmore Emerging Markets Local Currency Bond Fund
| | | | | | | | | | | | | | | | | | | | |
| | | Institutional Class | |
| | | | | |
| | | Year Ended | | | Year Ended | | | Year Ended | | | Year Ended | | | Year Ended | |
| | | October 31, | | | October 31, | | | October 31, | | | October 31, | | | October 31, | |
| | | 2022 | | | 2021 | | | 2020 | | | 2019 | | | 2018 | |
| | | | |
Net asset value at beginning of year | | $ | 7.24 | | | $ | 7.16 | | | $ | 7.66 | | | $ | 6.79 | | | $ | 7.50 | |
Income (loss) from investment operations: | | | | | | | | | | | | | | | | | | | | |
Net investment income | | | 0.35 | 1 | | | 0.31 | 1 | | | 0.38 | 1 | | | 0.65 | | | | 0.41 | |
Net realized and unrealized gain (loss) | | | (1.60 | ) | | | (0.23 | ) | | | (0.78 | ) | | | 0.27 | | | | (0.94 | ) |
| | | | |
Total from investment operations | | | (1.25 | ) | | | 0.08 | | | | (0.40 | ) | | | 0.92 | | | | (0.53 | ) |
| | | | | |
Less distributions: | | | | | | | | | | | | | | | | | | | | |
| | | | | |
From net investment income | | | — | | | | — | | | | — | | | | — | | | | (0.09 | ) |
From net realized gain | | | — | | | | — | | | | — | | | | — | | | | — | |
Tax return of capital | | | (0.09 | ) | | | — | | | | (0.10 | ) | | | (0.05 | ) | | | (0.09 | ) |
| | | | |
| | | | | |
Total distributions | | | (0.09 | ) | | | — | | | | (0.10 | ) | | | (0.05 | ) | | | (0.18 | ) |
| | | | |
Net asset value at end of year | | $ | 5.90 | | | $ | 7.24 | | | $ | 7.16 | | | $ | 7.66 | | | $ | 6.79 | |
| | | | |
| | | | | |
Total return2 | | | (17.49 | )% | | | 1.12 | % | | | (5.38 | )% | | | 13.59 | % | | | (7.33 | )% |
| | | | | |
Portfolio turnover rate3 | | | 53 | % | | | 34 | % | | | 47 | % | | | 56 | % | | | 75 | % |
| | | | | |
Net assets, end of year (in thousands) | | $ | 4,131 | | | $ | 6,310 | | | $ | 28,257 | | | $ | 42,545 | | | $ | 63,009 | |
| | | | | |
Ratios to average net assets: | | | | | | | | | | | | | | | | | | | | |
Total expenses to average net assets: | | | | | | | | | | | | | | | | | | | | |
Expenses before reimbursements | | | 2.83 | % | | | 2.61 | % | | | 1.50 | % | | | 1.28 | % | | | 1.32 | % |
Expenses after reimbursements | | | 0.97 | % | | | 0.97 | % | | | 0.97 | % | | | 0.97 | % | | | 0.97 | % |
| | | | | |
Net investment income to average net assets: | | | | | | | | | | | | | | | | | | | | |
Net investment income before reimbursements | | | 3.43 | % | | | 2.46 | % | | | 4.75 | % | | | 5.31 | % | | | 4.87 | % |
Net investment income after reimbursements | | | 5.29 | % | | | 4.10 | % | | | 5.28 | % | | | 5.62 | % | | | 5.22 | % |
| 1 | Per share amounts are based on average number of shares outstanding during the period. |
| 2 | Assumes investment at net asset value at the beginning of the year, reinvestment of all distributions at net asset value on distribution date, and a complete redemption of the investment at net asset value at the end of the year, excluding the impact of sales charges. |
| 3 | The portfolio turnover rate is calculated by dividing the lesser of cost of purchases or proceeds from sales of long term portfolio securities, including fully funded total return swaps, by the monthly average of the value of the long term portfolio securities. |
See accompanying notes to the financial statements.
42
ASHMORE FUNDS
FINANCIAL HIGHLIGHTS
Ashmore Emerging Markets Corporate Income Fund
| | | | | | | | | | | | | | | | | | | | |
| | | Class A | |
| | | | | |
| | | Year Ended | | | Year Ended | | | Year Ended | | | Year Ended | | | Year Ended | |
| | | October 31, | | | October 31, | | | October 31, | | | October 31, | | | October 31, | |
| | | 2022 | | | 2021 | | | 2020 | | | 2019 | | | 2018 | |
| | | | |
Net asset value at beginning of year | | $ | 7.53 | | | $ | 7.53 | | | $ | 7.92 | | | $ | 7.87 | | | $ | 8.56 | |
| | | | | |
Income (loss) from investment operations: | | | | | | | | | | | | | | | | | | | | |
Net investment income | | | 0.40 | | | | 0.37 | | | | 0.44 | | | | 0.52 | | | | 0.51 | |
Net realized and unrealized gain (loss) | | | (2.54 | ) | | | — | | | | (0.39 | ) | | | 0.03 | | | | (0.71 | ) |
| | | | |
Total from investment operations | | | (2.14 | ) | | | 0.37 | | | | 0.05 | | | | 0.55 | | | | (0.20 | ) |
| | | | | |
Less distributions: | | | | | | | | | | | | | | | | | | | | |
| | | | | |
From net investment income | | | (0.42 | ) | | | (0.37 | ) | | | (0.44 | ) | | | (0.50 | ) | | | (0.49 | ) |
From net realized gain | | | (0.01 | ) | | | — | | | | — | | | | (— | )1 | | | — | |
Tax return of capital | | | — | | | | — | | | | (— | )1 | | | — | | | | — | |
| | | | |
| | | | | |
Total distributions | | | (0.43 | ) | | | (0.37 | ) | | | (0.44 | ) | | | (0.50 | ) | | | (0.49 | ) |
| | | | |
Net asset value at end of year | | $ | 4.96 | | | $ | 7.53 | | | $ | 7.53 | | | $ | 7.92 | | | $ | 7.87 | |
| | | | |
| | | | | |
Total return2 | | | (29.30 | )% | | | 4.85 | % | | | 0.85 | % | | | 7.37 | % | | | (2.58 | )% |
| | | | | |
Portfolio turnover rate3 | | | 55 | % | | | 73 | % | | | 117 | % | | | 96 | % | | | 88 | % |
| | | | | |
Net assets, end of year (in thousands) | | $ | 4,742 | | | $ | 11,153 | | | $ | 11,198 | | | $ | 13,383 | | | $ | 8,616 | |
| | | | | |
Ratios to average net assets: | | | | | | | | | | | | | | | | | | | | |
Total expenses to average net assets: | | | | | | | | | | | | | | | | | | | | |
Expenses before reimbursements | | | 1.44 | %4 | | | 1.55 | %4 | | | 1.58 | %4 | | | 1.51 | % | | | 1.53 | % |
Expenses after reimbursements | | | 1.24 | %4 | | | 1.43 | %4 | | | 1.47 | %4 | | | 1.42 | % | | | 1.42 | % |
| | | | | |
Net investment income to average net assets: | | | | | | | | | | | | | | | | | | | | |
Net investment income before reimbursements | | | 6.62 | %4 | | | 4.61 | %4 | | | 5.76 | %4 | | | 6.39 | % | | | 6.09 | % |
Net investment income after reimbursements | | | 6.82 | %4 | | | 4.73 | %4 | | | 5.87 | %4 | | | 6.48 | % | | | 6.20 | % |
See accompanying notes to the financial statements.
43
ASHMORE FUNDS
FINANCIAL HIGHLIGHTS
Ashmore Emerging Markets Corporate Income Fund
| | | | | | | | | | | | | | | | | | | | |
| | | Class C | |
| | | | | |
| | | Year Ended | | | Year Ended | | | Year Ended | | | Year Ended | | | Year Ended | |
| | | October 31, | | | October 31, | | | October 31, | | | October 31, | | | October 31, | |
| | | 2022 | | | 2021 | | | 2020 | | | 2019 | | | 2018 | |
| | | | |
Net asset value at beginning of year | | $ | 7.52 | | | $ | 7.51 | | | $ | 7.91 | | | $ | 7.86 | | | $ | 8.55 | |
| | | | | |
Income (loss) from investment operations: | | | | | | | | | | | | | | | | | | | | |
Net investment income | | | 0.35 | | | | 0.31 | | | | 0.39 | | | | 0.45 | | | | 0.46 | |
Net realized and unrealized gain (loss) | | | (2.53 | ) | | | 0.02 | | | | (0.40 | ) | | | 0.04 | | | | (0.72 | ) |
| | | | |
Total from investment operations | | | (2.18 | ) | | | 0.33 | | | | (0.01 | ) | | | 0.49 | | | | (0.26 | ) |
| | | | | |
Less distributions: | | | | | | | | | | | | | | | | | | | | |
| | | | | |
From net investment income | | | (0.38 | ) | | | (0.32 | ) | | | (0.39 | ) | | | (0.44 | ) | | | (0.43 | ) |
From net realized gain | | | (0.01 | ) | | | — | | | | — | | | | (— | )1 | | | — | |
Tax return of capital | | | — | | | | — | | | | (— | )1 | | | — | | | | — | |
| | | | |
| | | | | |
Total distributions | | | (0.39 | ) | | | (0.32 | ) | | | (0.39 | ) | | | (0.44 | ) | | | (0.43 | ) |
| | | | |
Net asset value at end of year | | $ | 4.95 | | | $ | 7.52 | | | $ | 7.51 | | | $ | 7.91 | | | $ | 7.86 | |
| | | | |
| | | | | |
Total return2 | | | (29.86 | )% | | | 4.25 | % | | | (0.01 | )% | | | 6.58 | % | | | (3.30 | )% |
| | | | | |
Portfolio turnover rate3 | | | 55 | % | | | 73 | % | | | 117 | % | | | 96 | % | | | 88 | % |
| | | | | |
Net assets, end of year (in thousands) | | $ | 1,782 | | | $ | 5,762 | | | $ | 7,466 | | | $ | 10,745 | | | $ | 8,785 | |
| | | | | |
Ratios to average net assets: | | | | | | | | | | | | | | | | | | | | |
Total expenses to average net assets: | | | | | | | | | | | | | | | | | | | | |
Expenses before reimbursements | | | 2.20 | %5 | | | 2.30 | %5 | | | 2.33 | %5 | | | 2.26 | % | | | 2.29 | % |
Expenses after reimbursements | | | 2.01 | %5 | | | 2.18 | %5 | | | 2.22 | %5 | | | 2.17 | % | | | 2.17 | % |
| | | | | |
Net investment income to average net assets: | | | | | | | | | | | | | | | | | | | | |
Net investment income before reimbursements | | | 5.89 | %5 | | | 3.88 | %5 | | | 5.01 | %5 | | | 5.65 | % | | | 5.38 | % |
Net investment income after reimbursements | | | 6.08 | %5 | | | 4.00 | %5 | | | 5.12 | %5 | | | 5.74 | % | | | 5.50 | % |
See accompanying notes to the financial statements.
44
ASHMORE FUNDS
FINANCIAL HIGHLIGHTS
Ashmore Emerging Markets Corporate Income Fund
| | | | | | | | | | | | | | | | | | | | |
| | | Institutional Class | |
| | | | | |
| | | Year Ended | | | Year Ended | | | Year Ended | | | Year Ended | | | Year Ended | |
| | | October 31, | | | October 31, | | | October 31, | | | October 31, | | | October 31, | |
| | | 2022 | | | 2021 | | | 2020 | | | 2019 | | | 2018 | |
| | | | |
Net asset value at beginning of year | | $ | 7.85 | | | $ | 7.84 | | | $ | 8.25 | | | $ | 8.20 | | | $ | 8.92 | |
Income (loss) from investment operations: | | | | | | | | | | | | | | | | | | | | |
Net investment income | | | 0.45 | | | | 0.41 | | | | 0.48 | | | | 0.55 | | | | 0.56 | |
Net realized and unrealized gain (loss) | | | (2.66 | ) | | | 0.01 | | | | (0.41 | ) | | | 0.04 | | | | (0.75 | ) |
| | | | |
Total from investment operations | | | (2.21 | ) | | | 0.42 | | | | 0.07 | | | | 0.59 | | | | (0.19 | ) |
| | | | | |
Less distributions: | | | | | | | | | | | | | | | | | | | | |
| | | | | |
From net investment income | | | (0.46 | ) | | | (0.41 | ) | | | (0.48 | ) | | | (0.54 | ) | | | (0.53 | ) |
From net realized gain | | | (0.01 | ) | | | — | | | | — | | | | (— | )1 | | | — | |
Tax return of capital | | | — | | | | — | | | | (— | )1 | | | — | | | | — | |
| | | | |
| | | | | |
Total distributions | | | (0.47 | ) | | | (0.41 | ) | | | (0.48 | ) | | | (0.54 | ) | | | (0.53 | ) |
| | | | |
Net asset value at end of year | | $ | 5.17 | | | $ | 7.85 | | | $ | 7.84 | | | $ | 8.25 | | | $ | 8.20 | |
| | | | |
| | | | | |
Total return2 | | | (29.15 | )% | | | 5.24 | % | | | 1.04 | % | | | 7.61 | % | | | (2.34 | )% |
| | | | | |
Portfolio turnover rate3 | | | 55 | % | | | 73 | % | | | 117 | % | | | 96 | % | | | 88 | % |
| | | | | |
Net assets, end of year (in thousands) | | $ | 86,347 | | | $ | 277,188 | | | $ | 261,307 | | | $ | 443,880 | | | $ | 319,419 | |
| | | | | |
Ratios to average net assets: | | | | | | | | | | | | | | | | | | | | |
Total expenses to average net assets: | | | | | | | | | | | | | | | | | | | | |
Expenses before reimbursements | | | 1.20 | %6 | | | 1.30 | %6 | | | 1.32 | %6 | | | 1.26 | % | | | 1.29 | % |
Expenses after reimbursements | | | 1.01 | %6 | | | 1.18 | %6 | | | 1.21 | %6 | | | 1.17 | % | | | 1.17 | % |
| | | | | |
Net investment income to average net assets: | | | | | | | | | | | | | | | | | | | | |
Net investment income before reimbursements | | | 6.90 | %6 | | | 4.86 | %6 | | | 6.00 | %6 | | | 6.66 | % | | | 6.40 | % |
Net investment income after reimbursements | | | 7.09 | %6 | | | 4.98 | %6 | | | 6.11 | %6 | | | 6.75 | % | | | 6.52 | % |
| 1 | Amount is less than $0.005 per share. |
| 2 | Assumes investment at net asset value at the beginning of the year, reinvestment of all distributions at net asset value on distribution date, and a complete redemption of the investment at net asset value at the end of the year, excluding the impact of sales charges. |
| 3 | The portfolio turnover rate is calculated by dividing the lesser of cost of purchases or proceeds from sales of long term portfolio securities by the monthly average of the value of the long term portfolio securities. |
| 4 | Ratios include legal expenses of $63, $1,438 and $6,538 that are outside of the expense cap under the expense limitation agreement for the years ended October 31, 2022, 2021 and 2020, respectively. Expense ratios would have been lower by 0.12%, 0.01% and 0.05% and Net investment income ratios would have been higher by 0.07%, 0.01% and 0.05% excluding these expenses. |
| 5 | Ratios include legal expenses of $79, $756 and $4,394 that are outside of the expense cap under the expense limitation agreement for the years ended October 31, 2022, 2021 and 2020, respectively. Expense ratios would have been lower by 0.14%, 0.01% and 0.05% and Net investment income ratios would have been higher by 0.07%, 0.01% and 0.05% excluding these expenses. |
| 6 | Ratios include legal expenses of $3,742, $34,379 and $153,663 that are outside of the expense cap under the expense limitation agreement for the years ended October 31, 2022, 2021 and 2020, respectively. Expense ratios would have been lower by 0.14%, 0.01% and 0.04% and Net investment income ratios would have been higher by 0.07%, 0.01% and 0.04% excluding these expenses. |
See accompanying notes to the financial statements.
45
ASHMORE FUNDS
FINANCIAL HIGHLIGHTS
Ashmore Emerging Markets Short Duration Fund
| | | | | | | | | | | | | | | | | | | | |
| | | Class A | |
| | | | | |
| | | Year Ended | | | Year Ended | | | Year Ended | | | Year Ended | | | Year Ended | |
| | | October 31, | | | October 31, | | | October 31, | | | October 31, | | | October 31, | |
| | | 2022 | | | 2021 | | | 2020 | | | 2019 | | | 2018 | |
| | | | |
Net asset value at beginning of year | | $ | 6.80 | | | $ | 7.52 | | | $ | 9.00 | | | $ | 9.78 | | | $ | 10.60 | |
| | | | | |
Income (loss) from investment operations: | | | | | | | | | | | | | | | | | | | | |
Net investment income | | | 0.32 | | | | 0.44 | | | | 0.46 | | | | 0.68 | | | | 0.55 | |
Net realized and unrealized loss | | | (2.39 | ) | | | (0.69 | ) | | | (1.46 | ) | | | (0.75 | ) | | | (0.58 | ) |
| | | | |
Total from investment operations | | | (2.07 | ) | | | (0.25 | ) | | | (1.00 | ) | | | (0.07 | ) | | | (0.03 | ) |
| | | | | |
Less distributions: | | | | | | | | | | | | | | | | | | | | |
| | | | | |
From net investment income | | | (0.34 | ) | | | (0.47 | ) | | | (0.48 | ) | | | (0.68 | ) | | | (0.57 | ) |
From net realized gain | | | (0.11 | ) | | | — | | | | — | | | | (0.03 | ) | | | (0.22 | ) |
Tax return of capital | | | — | | | | — | | | | — | | | | — | | | | — | |
| | | | |
| | | | | |
Total distributions | | | (0.45 | ) | | | (0.47 | ) | | | (0.48 | ) | | | (0.71 | ) | | | (0.79 | ) |
| | | | |
Net asset value at end of year | | $ | 4.28 | | | $ | 6.80 | | | $ | 7.52 | | | $ | 9.00 | | | $ | 9.78 | |
| | | | |
| | | | | |
Total return1 | | | (31.54 | )% | | | (4.07 | )% | | | (11.25 | )% | | | (1.22 | )% | | | (0.12 | )% |
| | | | | |
Portfolio turnover rate2 | | | 41 | % | | | 32 | % | | | 80 | % | | | 53 | % | | | 37 | % |
| | | | | |
Net assets, end of year (in thousands) | | $ | 2,975 | | | $ | 6,834 | | | $ | 19,865 | | | $ | 110,771 | | | $ | 83,290 | |
| | | | | |
Ratios to average net assets: | | | | | | | | | | | | | | | | | | | | |
Total expenses to average net assets: | | | | | | | | | | | | | | | | | | | | |
Expenses before reimbursements | | | 1.14 | %3 | | | 1.10 | %3 | | | 1.13 | %3 | | | 1.00 | % | | | 1.05 | % |
Expenses after reimbursements | | | 0.89 | %3 | | | 1.00 | %3 | | | 0.99 | %3 | | | 0.92 | % | | | 0.92 | % |
| | | | | |
Net investment income to average net assets: | | | | | | | | | | | | | | | | | | | | |
Net investment income before reimbursements | | | 6.06 | %3 | | | 6.17 | %3 | | | 7.07 | %3 | | | 6.74 | % | | | 7.00 | % |
Net investment income after reimbursements | | | 6.31 | %3 | | | 6.27 | %3 | | | 7.21 | %3 | | | 6.82 | % | | | 7.13 | % |
See accompanying notes to the financial statements.
46
ASHMORE FUNDS
FINANCIAL HIGHLIGHTS
Ashmore Emerging Markets Short Duration Fund
| | | | | | | | | | | | | | | | | | | | |
| | | Class C | |
| | | | | |
| | | Year Ended | | | Year Ended | | | Year Ended | | | Year Ended | | | Year Ended | |
| | | October 31, | | | October 31, | | | October 31, | | | October 31, | | | October 31, | |
| | | 2022 | | | 2021 | | | 2020 | | | 2019 | | | 2018 | |
| | | | |
Net asset value at beginning of year | | $ | 6.53 | | | $ | 7.22 | | | $ | 8.66 | | | $ | 9.41 | | | $ | 10.22 | |
| | | | | |
Income (loss) from investment operations: | | | | | | | | | | | | | | | | | | | | |
Net investment income | | | 0.29 | | | | 0.40 | | | | 0.42 | | | | 0.58 | | | | 0.52 | |
Net realized and unrealized loss | | | (2.33 | ) | | | (0.69 | ) | | | (1.45 | ) | | | (0.72 | ) | | | (0.64 | ) |
| | | | |
Total from investment operations | | | (2.04 | ) | | | (0.29 | ) | | | (1.03 | ) | | | (0.14 | ) | | | (0.12 | ) |
| | | | | |
Less distributions: | | | | | | | | | | | | | | | | | | | | |
| | | | | |
From net investment income | | | (0.29 | ) | | | (0.40 | ) | | | (0.41 | ) | | | (0.58 | ) | | | (0.47 | ) |
From net realized gain | | | (0.11 | ) | | | — | | | | — | | | | (0.03 | ) | | | (0.22 | ) |
Tax return of capital | | | — | | | | — | | | | — | | | | — | | | | — | |
| | | | |
| | | | | |
Total distributions | | | (0.40 | ) | | | (0.40 | ) | | | (0.41 | ) | | | (0.61 | ) | | | (0.69 | ) |
| | | | |
Net asset value at end of year | | $ | 4.09 | | | $ | 6.53 | | | $ | 7.22 | | | $ | 8.66 | | | $ | 9.41 | |
| | | | |
| | | | | |
Total return1 | | | (32.29 | )% | | | (4.56 | )% | | | (12.05 | )% | | | (1.94 | )% | | | (0.98 | )% |
| | | | | |
Portfolio turnover rate2 | | | 41 | % | | | 32 | % | | | 80 | % | | | 53 | % | | | 37 | % |
| | | | | |
Net assets, end of year (in thousands) | | $ | 291 | | | $ | 1,219 | | | $ | 1,572 | | | $ | 2,342 | | | $ | 2,012 | |
| | | | | |
Ratios to average net assets: | | | | | | | | | | | | | | | | | | | | |
Total expenses to average net assets: | | | | | | | | | | | | | | | | | | | | |
Expenses before reimbursements | | | 1.91 | %4 | | | 1.84 | %4 | | | 1.96 | %4 | | | 1.75 | % | | | 1.79 | % |
Expenses after reimbursements | | | 1.66 | %4 | | | 1.76 | %4 | | | 1.83 | %4 | | | 1.67 | % | | | 1.67 | % |
| | | | | |
Net investment income to average net assets: | | | | | | | | | | | | | | | | | | | | |
Net investment income before reimbursements | | | 5.09 | %4 | | | 5.36 | %4 | | | 5.20 | %4 | | | 5.96 | % | | | 5.93 | % |
Net investment income after reimbursements | | | 5.34 | %4 | | | 5.44 | %4 | | | 5.33 | %4 | | | 6.04 | % | | | 6.05 | % |
See accompanying notes to the financial statements.
47
ASHMORE FUNDS
FINANCIAL HIGHLIGHTS
Ashmore Emerging Markets Short Duration Fund
| | | | | | | | | | | | | | | | | | | | |
| | | Institutional Class | |
| | | | | |
| | | Year Ended | | | Year Ended | | | Year Ended | | | Year Ended | | | Year Ended | |
| | | October 31, | | | October 31, | | | October 31, | | | October 31, | | | October 31, | |
| | | 2022 | | | 2021 | | | 2020 | | | 2019 | | | 2018 | |
| | | | |
Net asset value at beginning of year | | $ | 6.69 | | | $ | 7.40 | | | $ | 8.83 | | | $ | 9.60 | | | $ | 10.41 | |
Income (loss) from investment operations: | | | | | | | | | | | | | | | | | | | | |
Net investment income | | | 0.37 | | | | 0.50 | | | | 0.49 | | | | 0.69 | | | | 0.60 | |
Net realized and unrealized loss | | | (2.40 | ) | | | (0.73 | ) | | | (1.44 | ) | | | (0.74 | ) | | | (0.61 | ) |
| | | | |
Total from investment operations | | | (2.03 | ) | | | (0.23 | ) | | | (0.95 | ) | | | (0.05 | ) | | | (0.01 | ) |
| | | | | |
Less distributions: | | | | | | | | | | | | | | | | | | | | |
| | | | | |
From net investment income | | | (0.35 | ) | | | (0.48 | ) | | | (0.48 | ) | | | (0.69 | ) | | | (0.58 | ) |
From net realized gain | | | (0.11 | ) | | | — | | | | — | | | | (0.03 | ) | | | (0.22 | ) |
Tax return of capital | | | — | | | | — | | | | — | | | | — | | | | — | |
| | | | |
| | | | | |
Total distributions | | | (0.46 | ) | | | (0.48 | ) | | | (0.48 | ) | | | (0.72 | ) | | | (0.80 | ) |
| | | | |
Net asset value at end of year | | $ | 4.20 | | | $ | 6.69 | | | $ | 7.40 | | | $ | 8.83 | | | $ | 9.60 | |
| | | | |
| | | | | |
Total return1 | | | (31.54 | )% | | | (3.75 | )% | | | (10.94 | )% | | | (1.01 | )% | | | 0.11 | % |
| | | | | |
Portfolio turnover rate2 | | | 41 | % | | | 32 | % | | | 80 | % | | | 53 | % | | | 37 | % |
| | | | | |
Net assets, end of year (in thousands) | | $ | 52,073 | | | $ | 124,954 | | | $ | 441,467 | | | $ | 1,195,492 | | | $ | 693,577 | |
| | | | | |
Ratios to average net assets: | | | | | | | | | | | | | | | | | | | | |
Total expenses to average net assets: | | | | | | | | | | | | | | | | | | | | |
Expenses before reimbursements | | | 0.90 | %5 | | | 0.84 | %5 | | | 0.91 | %5 | | | 0.75 | % | | | 0.79 | % |
Expenses after reimbursements | | | 0.65 | %5 | | | 0.75 | %5 | | | 0.79 | %5 | | | 0.67 | % | | | 0.67 | % |
| | | | | |
Net investment income to average net assets: | | | | | | | | | | | | | | | | | | | | |
Net investment income before reimbursements | | | 6.22 | %5 | | | 6.38 | %5 | | | 6.98 | %5 | | | 7.04 | % | | | 7.30 | % |
Net investment income after reimbursements | | | 6.47 | %5 | | | 6.47 | %5 | | | 7.10 | %5 | | | 7.12 | % | | | 7.42 | % |
| 1 | Assumes investment at net asset value at the beginning of the year, reinvestment of all distributions at net asset value on distribution date, and a complete redemption of the investment at net asset value at the end of the year, excluding the impact of sales charges. |
| 2 | The portfolio turnover rate is calculated by dividing the lesser of cost of purchases or proceeds from sales of long term portfolio securities by the monthly average of the value of the long term portfolio securities. |
| 3 | Ratios include legal expenses of $(1,101), $10,827 and $37,676 that are outside of the expense cap under the expense limitation agreement for the years ended October 31, 2022, 2021 and 2020, respectively. Expense ratios would have been higher by 0.03% and lower by 0.08% and 0.07% and Net investment income ratios would have been lower by 0.03% and higher by 0.08% and 0.07% excluding these expenses. |
| 4 | Ratios include legal expenses of $(46), $1,388 and $2,841 that are outside of the expense cap under the expense limitation agreement for the years ended October 31, 2022, 2021 and 2020, respectively. Expense ratios would have been higher by 0.01% and lower by 0.09% and 0.16% and Net investment income ratios would have been lower by 0.01% and higher by 0.09% and 0.16% excluding these expenses. |
| 5 | Ratios include legal expenses of $(12,847), $182,441 and $835,457 that are outside of the expense cap under the expense limitation agreement for the years ended October 31, 2022, 2021 and 2020, respectively. Expense ratios would have been higher by 0.02% and lower by 0.08% and 0.12% and Net investment income ratios would have been lower by 0.02% and higher by 0.08% and 0.12% excluding these expenses. |
See accompanying notes to the financial statements.
48
ASHMORE FUNDS
FINANCIAL HIGHLIGHTS
Ashmore Emerging Markets Active Equity Fund
| | | | | | | | | | | | | | | | | | | | |
| | | Class A | |
| | | | | |
| | | Year Ended | | | Year Ended | | | Year Ended | | | Year Ended | | | Year Ended | |
| | | October 31, | | | October 31, | | | October 31, | | | October 31, | | | October 31, | |
| | | 2022 | | | 2021 | | | 2020 | | | 2019 | | | 2018 | |
| | | | |
Net asset value at beginning of year | | $ | 12.55 | | | $ | 11.08 | | | $ | 10.46 | | | $ | 10.53 | | | $ | 12.72 | |
| | | | | |
Income (loss) from investment operations: | | | | | | | | | | | | | | | | | | | | |
Net investment income | | | 0.08 | 1 | | | 0.15 | | | | 0.11 | 1 | | | 0.13 | | | | 0.08 | |
Net realized and unrealized gain (loss) | | | (3.26 | ) | | | 1.44 | | | | 0.56 | | | | 0.85 | | | | (1.05 | ) |
| | | | |
Total from investment operations | | | (3.18 | ) | | | 1.59 | | | | 0.67 | | | | 0.98 | | | | (0.97 | ) |
| | | | | |
Less distributions: | | | | | | | | | | | | | | | | | | | | |
| | | | | |
From net investment income | | | (0.18 | ) | | | (0.12 | ) | | | (0.05 | ) | | | (0.09 | ) | | | (0.20 | ) |
From net realized gain | | | (3.07 | ) | | | — | | | | — | | | | (0.94 | ) | | | (1.02 | ) |
Tax return of capital | | | (0.01 | ) | | | — | | | | — | | | | (0.02 | ) | | | — | |
| | | | |
| | | | | |
Total distributions | | | (3.26 | ) | | | (0.12 | ) | | | (0.05 | ) | | | (1.05 | ) | | | (1.22 | ) |
| | | | |
Net asset value at end of year | | $ | 6.11 | | | $ | 12.55 | | | $ | 11.08 | | | $ | 10.46 | | | $ | 10.53 | |
| | | | |
| | | | | |
Total return2 | | | (33.53 | )% | | | 14.23 | % | | | 6.49 | % | | | 10.73 | % | | | (8.59 | )% |
| | | | | |
Portfolio turnover rate3 | | | 264 | % | | | 206 | % | | | 228 | % | | | 153 | % | | | 164 | % |
| | | | | |
Net assets, end of year (in thousands) | | $ | 804 | | | $ | 1,611 | | | $ | 1,616 | | | $ | 209 | | | $ | 223 | |
| | | | | |
Ratios to average net assets: | | | | | | | | | | | | | | | | | | | | |
| | | | | |
Total expenses to average net assets: | | | | | | | | | | | | | | | | | | | | |
Expenses before reimbursements | | | 1.52 | % | | | 1.49 | % | | | 1.55 | % | | | 1.96 | % | | | 2.20 | % |
Expenses after reimbursements | | | 1.27 | % | | | 1.27 | % | | | 1.27 | % | | | 1.27 | % | | | 1.27 | % |
| | | | | |
Net investment income to average net assets: | | | | | | | | | | | | | | | | | | | | |
Net investment income before reimbursements | | | 0.68 | % | | | 0.91 | % | | | 0.73 | % | | | 0.55 | % | | | 0.56 | % |
Net investment income after reimbursements | | | 0.93 | % | | | 1.13 | % | | | 1.01 | % | | | 1.24 | % | | | 1.49 | % |
See accompanying notes to the financial statements.
49
ASHMORE FUNDS
FINANCIAL HIGHLIGHTS
Ashmore Emerging Markets Active Equity Fund
| | | | | | | | | | | | | | | | | | | | |
| | | Class C | |
| | | | | |
| | | Year Ended | | | Year Ended | | | Year Ended | | | Year Ended | | | Year Ended | |
| | | October 31, | | | October 31, | | | October 31, | | | October 31, | | | October 31, | |
| | | 2022 | | | 2021 | | | 2020 | | | 2019 | | | 2018 | |
| | | | |
Net asset value at beginning of year | | $ | 12.33 | | | $ | 10.90 | | | $ | 10.32 | | | $ | 10.43 | | | $ | 12.65 | |
| | | | | |
Income (loss) from investment operations: | | | | | | | | | | | | | | | | | | | | |
Net investment income | | | 0.01 | 1 | | | 0.05 | | | | — | 1,4 | | | 0.07 | | | | 0.03 | |
Net realized and unrealized gain (loss) | | | (3.18 | ) | | | 1.42 | | | | 0.58 | | | | 0.83 | | | | (1.10 | ) |
| | | | |
Total from investment operations | | | (3.17 | ) | | | 1.47 | | | | 0.58 | | | | 0.90 | | | | (1.07 | ) |
| | | | | |
Less distributions: | | | | | | | | | | | | | | | | | | | | |
| | | | | |
From net investment income | | | (0.13 | ) | | | (0.04 | ) | | | (— | )4 | | | (0.05 | ) | | | (0.13 | ) |
From net realized gain | | | (3.07 | ) | | | — | | | | — | | | | (0.94 | ) | | | (1.02 | ) |
Tax return of capital | | | (— | )4 | | | — | | | | — | | | | (0.02 | ) | | | — | |
| | | | |
| | | | | |
Total distributions | | | (3.20 | ) | | | (0.04 | ) | | | — | | | | (1.01 | ) | | | (1.15 | ) |
| | | | |
Net asset value at end of year | | $ | 5.96 | | | $ | 12.33 | | | $ | 10.90 | | | $ | 10.32 | | | $ | 10.43 | |
| | | | |
| | | | | |
Total return2 | | | (34.05 | )% | | | 13.41 | % | | | 5.76 | % | | | 9.88 | % | | | (9.40 | )% |
| | | | | |
Portfolio turnover rate3 | | | 264 | % | | | 206 | % | | | 228 | % | | | 153 | % | | | 164 | % |
| | | | | |
Net assets, end of year (in thousands) | | $ | 1 | | | $ | 2 | | | $ | 2 | | | $ | 12 | | | $ | 11 | |
| | | | | |
Ratios to average net assets: | | | | | | | | | | | | | | | | | | | | |
Total expenses to average net assets: | | | | | | | | | | | | | | | | | | | | |
Expenses before reimbursements | | | 2.30 | % | | | 2.25 | % | | | 2.31 | % | | | 2.71 | % | | | 2.73 | % |
Expenses after reimbursements | | | 2.02 | % | | | 2.02 | % | | | 2.02 | % | | | 2.02 | % | | | 2.02 | % |
| | | | | |
Net investment income (loss) to average net assets: | | | | | | | | | | | | | | | | | | | | |
Net investment income (loss) before reimbursements | | | (0.10 | )% | | | 0.14 | % | | | (0.30 | )% | | | (0.17 | )% | | | (0.51 | )% |
Net investment income (loss) after reimbursements | | | 0.18 | % | | | 0.37 | % | | | (0.01 | )% | | | 0.52 | % | | | 0.20 | % |
See accompanying notes to the financial statements.
50
ASHMORE FUNDS
FINANCIAL HIGHLIGHTS
Ashmore Emerging Markets Active Equity Fund
| | | | | | | | | | | | | | | | | | | | |
| | | Institutional Class | |
| | | | | |
| | | Year Ended | | | Year Ended | | | Year Ended | | | Year Ended | | | Year Ended | |
| | | October 31, | | | October 31, | | | October 31, | | | October 31, | | | October 31, | |
| | | 2022 | | | 2021 | | | 2020 | | | 2019 | | | 2018 | |
| | | | |
Net asset value at beginning of year | | $ | 12.63 | | | $ | 11.15 | | | $ | 10.51 | | | $ | 10.56 | | | $ | 12.74 | |
Income (loss) from investment operations: | | | | | | | | | | | | | | | | | | | | |
Net investment income | | | 0.09 | 1 | | | 0.18 | | | | 0.10 | 1 | | | 0.16 | | | | 0.14 | |
Net realized and unrealized gain (loss) | | | (3.28 | ) | | | 1.45 | | | | 0.60 | | | | 0.86 | | | | (1.09 | ) |
| | | | |
Total from investment operations | | | (3.19 | ) | | | 1.63 | | | | 0.70 | | | | 1.02 | | | | (0.95 | ) |
| | | | | |
Less distributions: | | | | | | | | | | | | | | | | | | | | |
| | | | | |
From net investment income | | | (0.20 | ) | | | (0.15 | ) | | | (0.06 | ) | | | (0.10 | ) | | | (0.21 | ) |
From net realized gain | | | (3.07 | ) | | | — | | | | — | | | | (0.94 | ) | | | (1.02 | ) |
Tax return of capital | | | (0.01 | ) | | | — | | | | — | | | | (0.03 | ) | | | — | |
| | | | |
| | | | | |
Total distributions | | | (3.28 | ) | | | (0.15 | ) | | | (0.06 | ) | | | (1.07 | ) | | | (1.23 | ) |
| | | | |
Net asset value at end of year | | $ | 6.16 | | | $ | 12.63 | | | $ | 11.15 | | | $ | 10.51 | | | $ | 10.56 | |
| | | | |
| | | | | |
Total return2 | | | (33.40 | )% | | | 14.50 | % | | | 6.79 | % | | | 11.05 | % | | | (8.41 | )% |
| | | | | |
Portfolio turnover rate3 | | | 264 | % | | | 206 | % | | | 228 | % | | | 153 | % | | | 164 | % |
| | | | | |
Net assets, end of year (in thousands) | | $ | 75,264 | | | $ | 96,417 | | | $ | 80,474 | | | $ | 20,502 | | | $ | 17,436 | |
| | | | | |
Ratios to average net assets: | | | | | | | | | | | | | | | | | | | | |
Total expenses to average net assets: | | | | | | | | | | | | | | | | | | | | |
Expenses before reimbursements | | | 1.27 | % | | | 1.24 | % | | | 1.29 | % | | | 1.72 | % | | | 1.73 | % |
Expenses after reimbursements | | | 1.02 | % | | | 1.02 | % | | | 1.02 | % | | | 1.02 | % | | | 1.02 | % |
| | | | | |
Net investment income to average net assets: | | | | | | | | | | | | | | | | | | | | |
Net investment income before reimbursements | | | 0.87 | % | | | 1.15 | % | | | 0.67 | % | | | 0.83 | % | | | 0.47 | % |
Net investment income after reimbursements | | | 1.12 | % | | | 1.37 | % | | | 0.94 | % | | | 1.53 | % | | | 1.18 | % |
| 1 | Per share amounts are based on average number of shares outstanding during the period. |
| 2 | Assumes investment at net asset value at the beginning of the year, reinvestment of all distributions at net asset value on distribution date, and a complete redemption of the investment at net asset value at the end of the year, excluding the impact of sales charges. |
| 3 | The portfolio turnover rate is calculated by dividing the lesser of cost of purchases or proceeds from sales of long term portfolio securities by the monthly average of the value of the long term portfolio securities. |
| 4 | Amount is less than $0.005 per share. |
See accompanying notes to the financial statements.
51
ASHMORE FUNDS
FINANCIAL HIGHLIGHTS
Ashmore Emerging Markets Small-Cap Equity Fund
| | | | | | | | | | | | | | | | | | | | |
| | | Class A | |
| | | | | |
| | | Year Ended | | | Year Ended | | | Year Ended | | | Year Ended | | | Year Ended | |
| | | October 31, | | | October 31, | | | October 31, | | | October 31, | | | October 31, | |
| | | 2022 | | | 2021 | | | 2020 | | | 2019 | | | 2018 | |
| | | | |
Net asset value at beginning of year | | $ | 15.32 | | | $ | 10.99 | | | $ | 8.84 | | | $ | 8.02 | | | $ | 10.33 | |
| | | | | |
Income (loss) from investment operations: | | | | | | | | | | | | | | | | | | | | |
Net investment income (loss) | | | 0.06 | 1 | | | (0.18 | ) | | | (0.20 | ) | | | (0.01 | ) | | | 0.04 | |
Net realized and unrealized gain (loss) | | | (5.15 | ) | | | 4.51 | | | | 2.35 | | | | 0.83 | | | | (2.17 | ) |
| | | | |
Total from investment operations | | | (5.09 | ) | | | 4.33 | | | | 2.15 | | | | 0.82 | | | | (2.13 | ) |
| | | | | |
Less distributions: | | | | | | | | | | | | | | | | | | | | |
| | | | | |
From net investment income | | | — | | | | — | | | | — | | | | (— | )2 | | | (0.17 | ) |
From net realized gain | | | — | | | | — | | | | — | | | | — | | | | — | |
Tax return of capital | | | (0.16 | ) | | | — | | | | — | | | | (— | )2 | | | (0.01 | ) |
| | | | |
| | | | | |
Total distributions | | | (0.16 | ) | | | — | | | | — | | | | — | | | | (0.18 | ) |
| | | | |
Net asset value at end of year | | $ | 10.07 | | | $ | 15.32 | | | $ | 10.99 | | | $ | 8.84 | | | $ | 8.02 | |
| | | | |
| | | | | |
Total return3 | | | (33.37 | )% | | | 39.40 | % | | | 24.32 | % | | | 10.27 | % | | | (20.96 | )% |
| | | | | |
Portfolio turnover rate4 | | | 50 | % | | | 77 | % | | | 62 | % | | | 60 | % | | | 112 | % |
| | | | | |
Net assets, end of year (in thousands) | | $ | 393 | | | $ | 321 | | | $ | 388 | | | $ | 1,356 | | | $ | 1,447 | |
| | | | | |
Ratios to average net assets: | | | | | | | | | | | | | | | | | | | | |
Total expenses to average net assets: | | | | | | | | | | | | | | | | | | | | |
Expenses before reimbursements | | | 3.08 | % | | | 2.75 | % | | | 2.78 | % | | | 2.30 | % | | | 2.37 | % |
Expenses after reimbursements | | | 1.77 | % | | | 1.77 | % | | | 1.77 | % | | | 1.77 | % | | | 1.77 | % |
| | | | | |
Net investment income (loss) to average net assets: | | | | | | | | | | | | | | | | | | | | |
Net investment loss before reimbursements | | | (0.78 | )% | | | (1.48 | )% | | | (1.74 | )% | | | (0.62 | )% | | | (0.31 | )% |
Net investment income (loss) after reimbursements | | | 0.53 | % | | | (0.50 | )% | | | (0.73 | )% | | | (0.09 | )% | | | 0.29 | % |
See accompanying notes to the financial statements.
52
ASHMORE FUNDS
FINANCIAL HIGHLIGHTS
Ashmore Emerging Markets Small-Cap Equity Fund
| | | | | | | | | | | | | | | | | | | | |
| | | Class C | |
| | | | | |
| | | Year Ended | | | Year Ended | | | Year Ended | | | Year Ended | | | Year Ended | |
| | | October 31, | | | October 31, | | | October 31, | | | October 31, | | | October 31, | |
| | | 2022 | | | 2021 | | | 2020 | | | 2019 | | | 2018 | |
| | | | |
Net asset value at beginning of year | | $ | 15.79 | | | $ | 11.40 | | | $ | 9.22 | | | $ | 8.42 | | | $ | 10.90 | |
| | | | | |
Income (loss) from investment operations: | | | | | | | | | | | | | | | | | | | | |
Net investment income (loss) | | | (0.06 | )1 | | | (0.32 | ) | | | (0.34 | ) | | | (0.38 | ) | | | 0.01 | |
Net realized and unrealized gain (loss) | | | (5.28 | ) | | | 4.71 | | | | 2.52 | | | | 1.18 | | | | (2.33 | ) |
| | | | |
Total from investment operations | | | (5.34 | ) | | | 4.39 | | | | 2.18 | | | | 0.80 | | | | (2.32 | ) |
| | | | | |
Less distributions: | | | | | | | | | | | | | | | | | | | | |
| | | | | |
From net investment income | | | — | | | | — | | | | — | | | | — | | | | (0.16 | ) |
From net realized gain | | | — | | | | — | | | | — | | | | — | | | | — | |
Tax return of capital | | | (0.09 | ) | | | — | | | | — | | | | — | | | | — | 2 |
| | | | |
| | | | | |
Total distributions | | | (0.09 | ) | | | — | | | | — | | | | — | | | | (0.16 | ) |
| | | | |
Net asset value at end of year | | $ | 10.36 | | | $ | 15.79 | | | $ | 11.40 | | | $ | 9.22 | | | $ | 8.42 | |
| | | | |
| | | | | |
Total return3 | | | (33.91 | )% | | | 38.51 | % | | | 23.64 | % | | | 9.50 | % | | | (21.62 | )% |
| | | | | |
Portfolio turnover rate4 | | | 50 | % | | | 77 | % | | | 62 | % | | | 60 | % | | | 112 | % |
| | | | | |
Net assets, end of year (in thousands) | | $ | 41 | | | $ | 162 | | | $ | 135 | | | $ | 144 | | | $ | 272 | |
| | | | | |
Ratios to average net assets: | | | | | | | | | | | | | | | | | | | | |
Total expenses to average net assets: | | | | | | | | | | | | | | | | | | | | |
Expenses before reimbursements | | | 3.72 | % | | | 3.47 | % | | | 3.91 | % | | | 3.05 | % | | | 3.09 | % |
Expenses after reimbursements | | | 2.52 | % | | | 2.52 | % | | | 2.52 | % | | | 2.52 | % | | | 2.52 | % |
| | | | | |
Net investment loss to average net assets: | | | | | | | | | | | | | | | | | | | | |
Net investment loss before reimbursements | | | (1.67 | )% | | | (2.09 | )% | | | (2.70 | )% | | | (1.48 | )% | | | (1.30 | )% |
Net investment loss after reimbursements | | | (0.47 | )% | | | (1.14 | )% | | | (1.31 | )% | | | (0.95 | )% | | | (0.73 | )% |
See accompanying notes to the financial statements.
53
ASHMORE FUNDS
FINANCIAL HIGHLIGHTS
Ashmore Emerging Markets Small-Cap Equity Fund
| | | | | | | | | | | | | | | | | | | | |
| | | Institutional Class | |
| | | | | |
| | | Year Ended | | | Year Ended | | | Year Ended | | | Year Ended | | | Year Ended | |
| | | October 31, | | | October 31, | | | October 31, | | | October 31, | | | October 31, | |
| | | 2022 | | | 2021 | | | 2020 | | | 2019 | | | 2018 | |
| | | | |
Net asset value at beginning of year | | $ | 19.82 | | | $ | 14.19 | | | $ | 11.39 | | | $ | 10.32 | | | $ | 13.19 | |
Income (loss) from investment operations: | | | | | | | | | | | | | | | | | | | | |
Net investment income (loss) | | | 0.09 | 1 | | | (0.02 | ) | | | (0.10 | ) | | | 0.02 | | | | 0.05 | |
Net realized and unrealized gain (loss) | | | (6.65 | ) | | | 5.65 | | | | 2.90 | | | | 1.06 | | | | (2.73 | ) |
| | | | |
Total from investment operations | | | (6.56 | ) | | | 5.63 | | | | 2.80 | | | | 1.08 | | | | (2.68 | ) |
| | | | | |
Less distributions: | | | | | | | | | | | | | | | | | | | | |
| | | | | |
From net investment income | | | — | | | | — | | | | — | | | | (0.01 | ) | | | (0.18 | ) |
From net realized gain | | | — | | | | — | | | | — | | | | — | | | | — | |
Tax return of capital | | | (0.17 | ) | | | — | | | | — | | | | (— | )2 | | | (0.01 | ) |
| | | | |
| | | | | |
Total distributions | | | (0.17 | ) | | | — | | | | — | | | | (0.01 | ) | | | (0.19 | ) |
| | | | |
Net asset value at end of year | | $ | 13.09 | | | $ | 19.82 | | | $ | 14.19 | | | $ | 11.39 | | | $ | 10.32 | |
| | | | |
| | | | | |
Total return3 | | | (33.21 | )% | | | 39.68 | % | | | 24.58 | % | | | 10.52 | % | | | (20.60 | )% |
| | | | | |
Portfolio turnover rate4 | | | 50 | % | | | 77 | % | | | 62 | % | | | 60 | % | | | 112 | % |
| | | | | |
Net assets, end of year (in thousands) | | $ | 6,237 | | | $ | 10,994 | | | $ | 7,419 | | | $ | 26,296 | | | $ | 32,456 | |
| | | | | |
Ratios to average net assets: | | | | | | | | | | | | | | | | | | | | |
Total expenses to average net assets: | | | | | | | | | | | | | | | | | | | | |
Expenses before reimbursements | | | 2.77 | % | | | 2.45 | % | | | 2.56 | % | | | 2.05 | % | | | 2.06 | % |
Expenses after reimbursements | | | 1.52 | % | | | 1.52 | % | | | 1.52 | % | | | 1.52 | % | | | 1.52 | % |
| | | | | |
Net investment income (loss) to average net assets: | | | | | | | | | | | | | | | | | | | | |
Net investment loss before reimbursements | | | (0.66 | )% | | | (1.02 | )% | | | (1.51 | )% | | | (0.38 | )% | | | (0.16 | )% |
Net investment income (loss) after reimbursements | | | 0.59 | % | | | (0.09 | )% | | | (0.47 | )% | | | 0.15 | % | | | 0.38 | % |
| 1 | Per share amounts are based on average number of shares outstanding during the period. |
| 2 | Amount is less than $0.005 per share. |
| 3 | Assumes investment at net asset value at the beginning of the year, reinvestment of all distributions at net asset value on distribution date, and a complete redemption of the investment at net asset value at the end of the year, excluding the impact of sales charges. |
| 4 | The portfolio turnover rate is calculated by dividing the lesser of cost of purchases or proceeds from sales of long term portfolio securities by the monthly average of the value of the long term portfolio securities. |
See accompanying notes to the financial statements.
54
ASHMORE FUNDS
FINANCIAL HIGHLIGHTS
Ashmore Emerging Markets Frontier Equity Fund
| | | | | | | | | | | | | | | | | | | | |
| | | Class A | |
| | | | | |
| | | Year Ended | | | Year Ended | | | Year Ended | | | Year Ended | | | Year Ended | |
| | | October 31, | | | October 31, | | | October 31, | | | October 31, | | | October 31, | |
| | | 2022 | | | 2021 | | | 2020 | | | 2019 | | | 2018 | |
| | | | |
Net asset value at beginning of year | | $ | 10.13 | | | $ | 7.07 | | | $ | 8.02 | | | $ | 7.66 | | | $ | 9.99 | |
| | | | | |
Income (loss) from investment operations: | | | | | | | | | | | | | | | | | | | | |
Net investment income (loss) | | | 0.08 | 1 | | | 0.02 | 1 | | | (0.01 | )1 | | | 0.14 | | | | 0.08 | |
Net realized and unrealized gain (loss) | | | (1.67 | ) | | | 3.10 | | | | (0.91 | ) | | | 0.37 | | | | (1.47 | ) |
| | | | |
Total from investment operations | | | (1.59 | ) | | | 3.12 | | | | (0.92 | ) | | | 0.51 | | | | (1.39 | ) |
| | | | | |
Less distributions: | | | | | | | | | | | | | | | | | | | | |
| | | | | |
From net investment income | | | (0.18 | ) | | | (0.06 | ) | | | (0.03 | ) | | | (0.15 | ) | | | (0.08 | ) |
From net realized gain | | | — | | | | — | | | | — | | | | — | | | | (0.82 | ) |
Tax return of capital | | | — | | | | — | | | | — | | | | — | | | | (0.04 | ) |
| | | | |
| | | | | |
Total distributions | | | (0.18 | ) | | | (0.06 | ) | | | (0.03 | ) | | | (0.15 | ) | | | (0.94 | ) |
| | | | |
Net asset value at end of year | | $ | 8.36 | | | $ | 10.13 | | | $ | 7.07 | | | $ | 8.02 | | | $ | 7.66 | |
| | | | |
| | | | | |
Total return2 | | | (15.92 | )% | | | 44.20 | % | | | (11.47 | )% | | | 6.58 | % | | | (15.44 | )% |
| | | | | |
Portfolio turnover rate3 | | | 95 | % | | | 87 | % | | | 108 | % | | | 93 | % | | | 80 | % |
| | | | | |
Net assets, end of year (in thousands) | | $ | 3,018 | | | $ | 2,561 | | | $ | 656 | | | $ | 6,985 | | | $ | 7,645 | |
| | | | | |
Ratios to average net assets: | | | | | | | | | | | | | | | | | | | | |
Total expenses to average net assets: | | | | | | | | | | | | | | | | | | | | |
Expenses before reimbursements | | | 2.24 | % | | | 2.11 | % | | | 2.18 | % | | | 2.12 | % | | | 2.20 | % |
Expenses after reimbursements | | | 1.77 | % | | | 1.77 | % | | | 1.77 | % | | | 1.77 | % | | | 1.77 | % |
| | | | | |
Net investment income (loss) to average net assets: | | | | | | | | | | | | | | | | | | | | |
Net investment income (loss) before reimbursements | | | 0.49 | % | | | (0.09 | )% | | | (0.59 | )% | | | 1.61 | % | | | 0.46 | % |
Net investment income (loss) after reimbursements | | | 0.96 | % | | | 0.25 | % | | | (0.18 | )% | | | 1.96 | % | | | 0.89 | % |
See accompanying notes to the financial statements.
55
ASHMORE FUNDS
FINANCIAL HIGHLIGHTS
Ashmore Emerging Markets Frontier Equity Fund
| | | | | | | | | | | | | | | | | | | | |
| | | Class C | |
| | | | | |
| | | Year Ended | | | Year Ended | | | Year Ended | | | Year Ended | | | Year Ended | |
| | | October 31, | | | October 31, | | | October 31, | | | October 31, | | | October 31, | |
| | | 2022 | | | 2021 | | | 2020 | | | 2019 | | | 2018 | |
| | | | |
Net asset value at beginning of year | | $ | 9.75 | | | $ | 6.82 | | | $ | 7.80 | | | $ | 7.47 | | | $ | 9.82 | |
| | | | | |
Income (loss) from investment operations: | | | | | | | | | | | | | | | | | | | | |
Net investment income (loss) | | | 0.02 | 1 | | | (0.03 | )1 | | | 0.01 | 1 | | | 0.02 | | | | 0.03 | |
Net realized and unrealized gain (loss) | | | (1.62 | ) | | | 2.97 | | | | (0.96 | ) | | | 0.42 | | | | (1.48 | ) |
| | | | |
Total from investment operations | | | (1.60 | ) | | | 2.94 | | | | (0.95 | ) | | | 0.44 | | | | (1.45 | ) |
| | | | | |
Less distributions: | | | | | | | | | | | | | | | | | | | | |
| | | | | |
From net investment income | | | (0.12 | ) | | | (0.01 | ) | | | (0.03 | ) | | | (0.11 | ) | | | (0.05 | ) |
From net realized gain | | | — | | | | — | | | | — | | | | — | | | | (0.82 | ) |
Tax return of capital | | | — | | | | — | | | | — | | | | — | | | | (0.03 | ) |
| | | | |
| | | | | |
Total distributions | | | (0.12 | ) | | | (0.01 | ) | | | (0.03 | ) | | | (0.11 | ) | | | (0.90 | ) |
| | | | |
Net asset value at end of year | | $ | 8.03 | | | $ | 9.75 | | | $ | 6.82 | | | $ | 7.80 | | | $ | 7.47 | |
| | | | |
| | | | | |
Total return2 | | | (16.58 | )% | | | 43.13 | % | | | (12.13 | )% | | | 5.87 | % | | | (16.30 | )% |
| | | | | |
Portfolio turnover rate3 | | | 95 | % | | | 87 | % | | | 108 | % | | | 93 | % | | | 80 | % |
| | | | | |
Net assets, end of year (in thousands) | | $ | 293 | | | $ | 209 | | | $ | 286 | | | $ | 305 | | | $ | 408 | |
| | | | | |
Ratios to average net assets: | | | | | | | | | | | | | | | | | | | | |
Total expenses to average net assets: | | | | | | | | | | | | | | | | | | | | |
Expenses before reimbursements | | | 3.00 | % | | | 2.89 | % | | | 3.01 | % | | | 2.88 | % | | | 2.94 | % |
Expenses after reimbursements | | | 2.52 | % | | | 2.52 | % | | | 2.52 | % | | | 2.52 | % | | | 2.52 | % |
| | | | | |
Net investment income (loss) to average net assets: | | | | | | | | | | | | | | | | | | | | |
Net investment income (loss) before reimbursements | | | (0.21 | )% | | | (0.77 | )% | | | (0.41 | )% | | | 0.48 | % | | | (0.18 | )% |
Net investment income (loss) after reimbursements | | | 0.27 | % | | | (0.40 | )% | | | 0.08 | % | | | 0.84 | % | | | 0.24 | % |
See accompanying notes to the financial statements.
56
ASHMORE FUNDS
FINANCIAL HIGHLIGHTS
Ashmore Emerging Markets Frontier Equity Fund
| | | | | | | | | | | | | | | | | | | | |
| | | Institutional Class | |
| | | | | |
| | | Year Ended | | | Year Ended | | | Year Ended | | | Year Ended | | | Year Ended | |
| | | October 31, | | | October 31, | | | October 31, | | | October 31, | | | October 31, | |
| | | 2022 | | | 2021 | | | 2020 | | | 2019 | | | 2018 | |
| | | | |
Net asset value at beginning of year | | $ | 11.77 | | | $ | 8.20 | | | $ | 9.32 | | | $ | 8.86 | | | $ | 11.38 | |
Income (loss) from investment operations: | | | | | | | | | | | | | | | | | | | | |
Net investment income | | | 0.11 | 1 | | | 0.06 | 1 | | | 0.09 | 1 | | | 0.16 | | | | 0.12 | |
Net realized and unrealized gain (loss) | | | (1.95 | ) | | | 3.58 | | | | (1.13 | ) | | | 0.46 | | | | (1.69 | ) |
| | | | |
Total from investment operations | | | (1.84 | ) | | | 3.64 | | | | (1.04 | ) | | | 0.62 | | | | (1.57 | ) |
| | | | | |
Less distributions: | | | | | | | | | | | | | | | | | | | | |
| | | | | |
From net investment income | | | (0.20 | ) | | | (0.07 | ) | | | (0.08 | ) | | | (0.16 | ) | | | (0.08 | ) |
From net realized gain | | | — | | | | — | | | | — | | | | — | | | | (0.82 | ) |
Tax return of capital | | | — | | | | — | | | | — | | | | — | | | | (0.05 | ) |
| | | | |
| | | | | |
Total distributions | | | (0.20 | ) | | | (0.07 | ) | | | (0.08 | ) | | | (0.16 | ) | | | (0.95 | ) |
| | | | |
Net asset value at end of year | | $ | 9.73 | | | $ | 11.77 | | | $ | 8.20 | | | $ | 9.32 | | | $ | 8.86 | |
| | | | |
| | | | | |
Total return2 | | | (15.78 | )% | | | 44.50 | % | | | (11.17 | )% | | | 6.97 | % | | | (15.11 | )% |
| | | | | |
Portfolio turnover rate3 | | | 95 | % | | | 87 | % | | | 108 | % | | | 93 | % | | | 80 | % |
| | | | | |
Net assets, end of year (in thousands) | | $ | 69,320 | | | $ | 77,540 | | | $ | 53,053 | | | $ | 81,047 | | | $ | 77,788 | |
| | | | | |
Ratios to average net assets: | | | | | | | | | | | | | | | | | | | | |
Total expenses to average net assets: | | | | | | | | | | | | | | | | | | | | |
Expenses before reimbursements | | | 1.98 | % | | | 1.88 | % | | | 2.00 | % | | | 1.88 | % | | | 1.95 | % |
Expenses after reimbursements | | | 1.52 | % | | | 1.52 | % | | | 1.52 | % | | | 1.52 | % | | | 1.52 | % |
| | | | | |
Net investment income to average net assets: | | | | | | | | | | | | | | | | | | | | |
Net investment income before reimbursements | | | 0.64 | % | | | 0.23 | % | | | 0.58 | % | | | 1.39 | % | | | 0.78 | % |
Net investment income after reimbursements | | | 1.10 | % | | | 0.59 | % | | | 1.06 | % | | | 1.75 | % | | | 1.21 | % |
| 1 | Per share amounts are based on average number of shares outstanding during the period. |
| 2 | Assumes investment at net asset value at the beginning of the year, reinvestment of all distributions at net asset value on distribution date, and a complete redemption of the investment at net asset value at the end of the year, excluding the impact of sales charges. |
| 3 | The portfolio turnover rate is calculated by dividing the lesser of cost of purchases or proceeds from sales of long term portfolio securities by the monthly average of the value of the long term portfolio securities. |
See accompanying notes to the financial statements.
57
ASHMORE FUNDS
FINANCIAL HIGHLIGHTS
Ashmore Emerging Markets Equity Fund
| | | | | | | | | | | | | | | | | | | | |
| | | Class A | |
| | | | | |
| | | Year Ended | | | Year Ended | | | Year Ended | | | Year Ended | | | Year Ended | |
| | | October 31, | | | October 31, | | | October 31, | | | October 31, | | | October 31, | |
| | | 2022 | | | 2021 | | | 2020 | | | 2019 | | | 2018 | |
| | | | |
Net asset value at beginning of year | | $ | 16.77 | | | $ | 13.08 | | | $ | 11.18 | | | $ | 9.38 | | | $ | 11.16 | |
| | | | | |
Income (loss) from investment operations: | | | | | | | | | | | | | | | | | | | | |
Net investment income (loss) | | | 0.13 | | | | (0.06 | )1 | | | 0.08 | | | | 0.05 | | | | 0.01 | |
Net realized and unrealized gain (loss) | | | (5.67 | ) | | | 4.07 | | | | 1.84 | | | | 1.97 | | | | (1.55 | ) |
| | | | |
Total from investment operations | | | (5.54 | ) | | | 4.01 | | | | 1.92 | | | | 2.02 | | | | (1.54 | ) |
| | | | | |
Less distributions: | | | | | | | | | | | | | | | | | | | | |
| | | | | |
From net investment income | | | (0.09 | ) | | | (0.10 | ) | | | (0.02 | ) | | | (0.22 | ) | | | (0.23 | ) |
From net realized gain | | | (2.83 | ) | | | (0.22 | ) | | | — | | | | — | | | | — | |
Tax return of capital | | | (0.02 | ) | | | — | | | | — | | | | — | | | | (0.01 | ) |
| | | | |
| | | | | |
Total distributions | | | (2.94 | ) | | | (0.32 | ) | | | (0.02 | ) | | | (0.22 | ) | | | (0.24 | ) |
| | | | |
Net asset value at end of year | | $ | 8.29 | | | $ | 16.77 | | | $ | 13.08 | | | $ | 11.18 | | | $ | 9.38 | |
| | | | |
| | | | | |
Total return2 | | | (39.01 | )% | | | 30.92 | % | | | 17.21 | % | | | 21.66 | % | | | (14.16 | )% |
| | | | | |
Portfolio turnover rate3 | | | 85 | % | | | 77 | % | | | 76 | % | | | 76 | % | | | 113 | % |
| | | | | |
Net assets, end of year (in thousands) | | $ | 3,081 | | | $ | 3,872 | | | $ | 1,394 | | | $ | 641 | | | $ | 303 | |
| | | | | |
Ratios to average net assets: | | | | | | | | | | | | | | | | | | | | |
Total expenses to average net assets: | | | | | | | | | | | | | | | | | | | | |
Expenses before reimbursements | | | 1.65 | % | | | 1.56 | % | | | 1.81 | % | | | 1.91 | % | | | 2.19 | % |
Expenses after reimbursements | | | 1.42 | % | | | 1.42 | % | | | 1.42 | % | | | 1.42 | % | | | 1.42 | % |
| | | | | |
Net investment income (loss) to average net assets: | | | | | | | | | | | | | | | | | | | | |
Net investment income (loss) before reimbursements | | | 0.75 | % | | | (0.48 | )% | | | (0.42 | )% | | | (0.01 | )% | | | (0.06 | )% |
Net investment income (loss) after reimbursements | | | 0.98 | % | | | (0.34 | )% | | | (0.03 | )% | | | 0.48 | % | | | 0.71 | % |
See accompanying notes to the financial statements.
58
ASHMORE FUNDS
FINANCIAL HIGHLIGHTS
Ashmore Emerging Markets Equity Fund
| | | | | | | | | | | | | | | | | | | | |
| | | Class C | |
| | | | | |
| | | Year Ended | | | Year Ended | | | Year Ended | | | Year Ended | | | Year Ended | |
| | | October 31, | | | October 31, | | | October 31, | | | October 31, | | | October 31, | |
| | | 2022 | | | 2021 | | | 2020 | | | 2019 | | | 2018 | |
| | | | |
Net asset value at beginning of year | | $ | 15.80 | | | $ | 12.39 | | | $ | 10.64 | | | $ | 8.96 | | | $ | 10.73 | |
| | | | | |
Income (loss) from investment operations: | | | | | | | | | | | | | | | | | | | | |
Net investment income (loss) | | | 0.02 | | | | (0.16 | )1 | | | (0.10 | ) | | | (0.04 | ) | | | (0.13 | ) |
Net realized and unrealized gain (loss) | | | (5.25 | ) | | | 3.86 | | | | 1.85 | | | | 1.91 | | | | (1.44 | ) |
| | | | |
Total from investment operations | | | (5.23 | ) | | | 3.70 | | | | 1.75 | | | | 1.87 | | | | (1.57 | ) |
| | | | | |
Less distributions: | | | | | | | | | | | | | | | | | | | | |
| | | | | |
From net investment income | | | (0.03 | ) | | | (0.07 | ) | | | — | | | | (0.19 | ) | | | (0.19 | ) |
From net realized gain | | | (2.83 | ) | | | (0.22 | ) | | | — | | | | — | | | | — | |
Tax return of capital | | | (0.01 | ) | | | — | | | | — | | | | — | | | | (0.01 | ) |
| | | | |
| | | | | |
Total distributions | | | (2.87 | ) | | | (0.29 | ) | | | — | | | | (0.19 | ) | | | (0.20 | ) |
| | | | |
Net asset value at end of year | | $ | 7.70 | | | $ | 15.80 | | | $ | 12.39 | | | $ | 10.64 | | | $ | 8.96 | |
| | | | |
| | | | | |
Total return2 | | | (39.46 | )% | | | 30.13 | % | | | 16.45 | % | | | 20.89 | % | | | (14.92 | )% |
| | | | | |
Portfolio turnover rate3 | | | 85 | % | | | 77 | % | | | 76 | % | | | 76 | % | | | 113 | % |
| | | | | |
Net assets, end of year (in thousands) | | $ | 105 | | | $ | 107 | | | $ | 2 | | | $ | 1 | | | $ | 1 | |
| | | | | |
Ratios to average net assets: | | | | | | | | | | | | | | | | | | | | |
Total expenses to average net assets: | | | | | | | | | | | | | | | | | | | | |
Expenses before reimbursements | | | 2.42 | % | | | 2.29 | % | | | 2.49 | % | | | 2.66 | % | | | 2.96 | % |
Expenses after reimbursements | | | 2.17 | % | | | 2.17 | % | | | 2.17 | % | | | 2.17 | % | | | 2.17 | % |
| | | | | |
Net investment income (loss) to average net assets: | | | | | | | | | | | | | | | | | | | | |
Net investment income (loss) before reimbursements | | | 0.12 | % | | | (1.11 | )% | | | (1.22 | )% | | | (0.95 | )% | | | (1.25 | )% |
Net investment income (loss) after reimbursements | | | 0.37 | % | | | (0.99 | )% | | | (0.90 | )% | | | (0.46 | )% | | | (0.46 | )% |
See accompanying notes to the financial statements.
59
ASHMORE FUNDS
FINANCIAL HIGHLIGHTS
Ashmore Emerging Markets Equity Fund
| | | | | | | | | | | | | | | | | | | | |
| | | Institutional Class | |
| | | | | |
| | | Year Ended | | | Year Ended | | | Year Ended | | | Year Ended | | | Year Ended | |
| | | October 31, | | | October 31, | | | October 31, | | | October 31, | | | October 31, | |
| | | 2022 | | | 2021 | | | 2020 | | | 2019 | | | 2018 | |
| | | | |
Net asset value at beginning of year | | $ | 16.23 | | | $ | 12.65 | | | $ | 10.81 | | | $ | 9.06 | | | $ | 10.78 | |
Income (loss) from investment operations: | | | | | | | | | | | | | | | | | | | | |
Net investment income (loss) | | | 0.17 | | | | (0.02 | )1 | | | 0.11 | | | | 0.06 | | | | 0.07 | |
Net realized and unrealized gain (loss) | | | (5.47 | ) | | | 3.92 | | | | 1.77 | | | | 1.93 | | | | (1.54 | ) |
| | | | |
Total from investment operations | | | (5.30 | ) | | | 3.90 | | | | 1.88 | | | | 1.99 | | | | (1.47 | ) |
| | | | | |
Less distributions: | | | | | | | | | | | | | | | | | | | | |
| | | | | |
From net investment income | | | (0.11 | ) | | | (0.10 | ) | | | (0.04 | ) | | | (0.24 | ) | | | (0.24 | ) |
From net realized gain | | | (2.83 | ) | | | (0.22 | ) | | | — | | | | — | | | | — | |
Tax return of capital | | | (0.02 | ) | | | — | | | | — | | | | — | | | | (0.01 | ) |
| | | | |
| | | | | |
Total distributions | | | (2.96 | ) | | | (0.32 | ) | | | (0.04 | ) | | | (0.24 | ) | | | (0.25 | ) |
| | | | |
Net asset value at end of year | | $ | 7.97 | | | $ | 16.23 | | | $ | 12.65 | | | $ | 10.81 | | | $ | 9.06 | |
| | | | |
| | | | | |
Total return2 | | | (38.85 | )% | | | 31.24 | % | | | 17.41 | % | | | 22.05 | % | | | (14.01 | )% |
| | | | | |
Portfolio turnover rate3 | | | 85 | % | | | 77 | % | | | 76 | % | | | 76 | % | | | 113 | % |
| | | | | |
Net assets, end of year (in thousands) | | $ | 90,921 | | | $ | 116,727 | | | $ | 82,385 | | | $ | 35,011 | | | $ | 24,162 | |
| | | | | |
Ratios to average net assets: | | | | | | | | | | | | | | | | | | | | |
Total expenses to average net assets: | | | | | | | | | | | | | | | | | | | | |
Expenses before reimbursements | | | 1.41 | % | | | 1.32 | % | | | 1.56 | % | | | 1.66 | % | | | 1.95 | % |
Expenses after reimbursements | | | 1.17 | % | | | 1.17 | % | | | 1.17 | % | | | 1.17 | % | | | 1.17 | % |
| | | | | |
Net investment income (loss) to average net assets: | | | | | | | | | | | | | | | | | | | | |
Net investment income (loss) before reimbursements | | | 1.10 | % | | | (0.26 | )% | | | (0.22 | )% | | | 0.09 | % | | | 0.10 | % |
Net investment income (loss) after reimbursements | | | 1.34 | % | | | (0.11 | )% | | | 0.17 | % | | | 0.58 | % | | | 0.88 | % |
| 1 | Per share amounts are based on average number of shares outstanding during the period. |
| 2 | Assumes investment at net asset value at the beginning of the year, reinvestment of all distributions at net asset value on distribution date, and a complete redemption of the investment at net asset value at the end of the year, excluding the impact of sales charges. |
| 3 | The portfolio turnover rate is calculated by dividing the lesser of cost of purchases or proceeds from sales of long term portfolio securities by the monthly average of the value of the long term portfolio securities. |
See accompanying notes to the financial statements.
60
ASHMORE FUNDS
FINANCIAL HIGHLIGHTS
Ashmore Emerging Markets Equity ESG Fund
| | | | | | | | | | | | |
| | | Class A | |
| | | |
| | | Year Ended | | | Year Ended | | | Period Ended | |
| | | October 31, | | | October 31, | | | October 31, | |
| | | 2022 | | | 2021 | | | 20201 | |
| | | | |
Net asset value at beginning of period | | $ | 14.91 | | | $ | 12.05 | | | $ | 10.00 | |
| | | |
Income (loss) from investment operations: | | | | | | | | | | | | |
Net investment income (loss) | | | 0.01 | | | | (0.09 | ) | | | (0.01 | ) |
Net realized and unrealized gain (loss) | | | (5.27 | ) | | | 3.04 | | | | 2.06 | |
| | | | |
Total from investment operations | | | (5.26 | ) | | | 2.95 | | | | 2.05 | |
| | | |
Less distributions: | | | | | | | | | | | | |
| | | |
From net investment income | | | — | | | | (0.09 | ) | | | — | |
From net realized gain | | | (2.03 | ) | | | — | | | | — | |
Tax return of capital | | | (0.01 | ) | | | — | | | | — | |
| | | | |
| | | |
Total distributions | | | (2.04 | ) | | | (0.09 | ) | | | — | |
| | | | |
Net asset value at end of period | | $ | 7.61 | | | $ | 14.91 | | | $ | 12.05 | |
| | | | |
| | | |
Total return2 | | | (40.26 | )% | | | 24.50 | % | | | 20.50 | % |
| | | |
Portfolio turnover rate3 | | | 49 | % | | | 55 | % | | | 45 | % |
| | | |
Net assets, end of period (in thousands) | | $ | 1 | | | $ | 2 | | | $ | 1 | |
| | | |
Ratios to average net assets:4 | | | | | | | | | | | | |
Total expenses to average net assets: | | | | | | | | | | | | |
Expenses before reimbursements | | | 2.49 | % | | | 2.39 | % | | | 4.16 | % |
Expenses after reimbursements | | | 1.42 | % | | | 1.42 | % | | | 1.42 | % |
| | | |
Net investment loss to average net assets: | | | | | | | | | | | | |
Net investment loss before reimbursements | | | (1.12 | )% | | | (1.56 | )% | | | (2.89 | )% |
Net investment loss after reimbursements | | | (0.05 | )% | | | (0.59 | )% | | | (0.15 | )% |
See accompanying notes to the financial statements.
61
ASHMORE FUNDS
FINANCIAL HIGHLIGHTS
Ashmore Emerging Markets Equity ESG Fund
| | | | | | | | | | | | |
| | | | | | Class C | | | | |
| | | |
| | | Year Ended | | | Year Ended | | | Period Ended | |
| | | October 31, | | | October 31, | | | October 31, | |
| | | 2022 | | | 2021 | | | 20201 | |
| | | | |
Net asset value at beginning of period | | $ | 14.77 | | | $ | 12.00 | | | $ | 10.00 | |
| | | |
Income (loss) from investment operations: | | | | | | | | | | | | |
Net investment loss | | | (0.04 | ) | | | (0.20 | ) | | | (0.06 | ) |
Net realized and unrealized gain (loss) | | | (5.23 | ) | | | 3.05 | | | | 2.06 | |
| | | | |
Total from investment operations | | | (5.27 | ) | | | 2.85 | | | | 2.00 | |
| | | |
Less distributions: | | | | | | | | | | | | |
| | | |
From net investment income | | | — | | | | (0.08 | ) | | | — | |
From net realized gain | | | (2.03 | ) | | | — | | | | — | |
Tax return of capital | | | — | | | | — | | | | — | |
| | | | |
| | | |
Total distributions | | | (2.03 | ) | | | (0.08 | ) | | | — | |
| | | | |
Net asset value at end of period | | $ | 7.47 | | | $ | 14.77 | | | $ | 12.00 | |
| | | | |
| | | |
Total return2 | | | (40.76 | )% | | | 23.81 | % | | | 20.00 | % |
| | | |
Portfolio turnover rate3 | | | 49 | % | | | 55 | % | | | 45 | % |
| | | |
Net assets, end of period (in thousands) | | $ | 1 | | | $ | 1 | | | $ | 1 | |
| | | |
Ratios to average net assets:4 | | | | | | | | | | | | |
Total expenses to average net assets: | | | | | | | | | | | | |
Expenses before reimbursements | | | 3.22 | % | | | 3.14 | % | | | 4.77 | % |
Expenses after reimbursements | | | 2.17 | % | | | 2.17 | % | | | 2.17 | % |
| | | |
Net investment loss to average net assets: | | | | | | | | | | | | |
Net investment loss before reimbursements | | | (1.85 | )% | | | (2.32 | )% | | | (3.50 | )% |
Net investment loss after reimbursements | | | (0.80 | )% | | | (1.35 | )% | | | (0.90 | )% |
See accompanying notes to the financial statements.
62
ASHMORE FUNDS
FINANCIAL HIGHLIGHTS
Ashmore Emerging Markets Equity ESG Fund
| | | | | | | | | | | | |
| | | Institutional Class | |
| | | |
| | | Year Ended | | | Year Ended | | | Period Ended | |
| | | October 31, | | | October 31, | | | October 31, | |
| | | 2022 | | | 2021 | | | 20201 | |
| | | | |
Net asset value at beginning of period | | $ | 14.96 | | | $ | 12.06 | | | $ | 10.00 | |
| | | |
Income (loss) from investment operations: | | | | | | | | | | | | |
Net investment income (loss) | | | 0.03 | | | | (0.05 | ) | | | 0.01 | |
Net realized and unrealized gain (loss) | | | (5.29 | ) | | | 3.04 | | | | 2.05 | |
| | | | |
Total from investment operations | | | (5.26 | ) | | | 2.99 | | | | 2.06 | |
| | | |
Less distributions: | | | | | | | | | | | | |
| | | |
From net investment income | | | — | | | | (0.09 | ) | | | (— | )5 |
From net realized gain | | | (2.03 | ) | | | — | | | | — | |
Tax return of capital | | | (0.02 | ) | | | — | | | | — | |
| | | | |
| | | |
Total distributions | | | (2.05 | ) | | | (0.09 | ) | | | — | |
| | | | |
Net asset value at end of period | | $ | 7.65 | | | $ | 14.96 | | | $ | 12.06 | |
| | | | |
| | | |
Total return2 | | | (40.10 | )% | | | 24.82 | % | | | 20.60 | % |
| | | |
Portfolio turnover rate3 | | | 49 | % | | | 55 | % | | | 45 | % |
| | | |
Net assets, end of period (in thousands) | | $ | 8,884 | | | $ | 15,041 | | | $ | 12,062 | |
| | | |
Ratios to average net assets:4 | | | | | | | | | | | | |
Total expenses to average net assets: | | | | | | | | | | | | |
Expenses before reimbursements | | | 2.12 | % | | | 2.16 | % | | | 3.68 | % |
Expenses after reimbursements | | | 1.17 | % | | | 1.17 | % | | | 1.17 | % |
| | | |
Net investment income (loss) to average net assets: | | | | | | | | | | | | |
Net investment loss before reimbursements | | | (0.74 | )% | | | (1.34 | )% | | | (2.41 | )% |
Net investment income (loss) after reimbursements | | | 0.21 | % | | | (0.35 | )% | | | 0.10 | % |
| 1 | Class A, Class C and the Institutional Class commenced investment operations on February 26, 2020. |
| 2 | Assumes investment at net asset value at the beginning of the period, reinvestment of distributions at net asset value on distribution date, and a complete redemption of the investment at net asset value at the end of the period, excluding the impact of sales charges. Total return is not annualized for periods less than one year. |
| 3 | The portfolio turnover rate is calculated by dividing the lesser of cost of purchases or proceeds from sales of long term portfolio securities by the monthly average of the value of the long term portfolio securities. Portfolio turnover is not annualized for periods less than one year. |
| 4 | Annualized for periods less than one year. |
| 5 | Amount is less than $0.005 per share. |
See accompanying notes to the financial statements.
63
ASHMORE FUNDS
FINANCIAL HIGHLIGHTS
Ashmore Emerging Markets Short Duration Select Fund
| | | | | | | | | | | | |
| | | | | | Class A | | | | |
| | | |
| | | Year Ended | | | Year Ended | | | Period Ended | |
| | | October 31, | | | October 31, | | | October 31, | |
| | | 2022 | | | 2021 | | | 20201 | |
| | | | |
Net asset value at beginning of period | | $ | 9.80 | | | $ | 10.18 | | | $ | 10.00 | |
| | | |
Income (loss) from investment operations: | | | | | | | | | | | | |
Net investment income | | | 0.29 | | | | 0.38 | | | | 0.14 | |
Net realized and unrealized gain (loss) | | | (1.48 | ) | | | (0.35 | ) | | | 0.19 | |
| | | | |
Total from investment operations | | | (1.19 | ) | | | 0.03 | | | | 0.33 | |
| | | |
Less distributions: | | | | | | | | | | | | |
| | | |
From net investment income | | | (0.29 | ) | | | (0.38 | ) | | | (0.15 | ) |
From net realized gain | | | (— | )2 | | | (0.03 | ) | | | — | |
Tax return of capital | | | — | | | | — | | | | — | |
| | | | |
| | | |
Total distributions | | | (0.29 | ) | | | (0.41 | ) | | | (0.15 | ) |
| | | | |
Net asset value at end of period | | $ | 8.32 | | | $ | 9.80 | | | $ | 10.18 | |
| | | | |
| | | |
Total return3 | | | (12.27 | )% | | | 0.20 | % | | | 3.30 | % |
| | | |
Portfolio turnover rate4 | | | 52 | % | | | 43 | % | | | 12 | % |
| | | |
Net assets, end of period (in thousands) | | $ | 1 | | | $ | 1 | | | $ | 1 | |
| | | |
Ratios to average net assets:5 | | | | | | | | | | | | |
Total expenses to average net assets: | | | | | | | | | | | | |
Expenses before reimbursements | | | 2.05 | % | | | 1.71 | % | | | 4.87 | % |
Expenses after reimbursements | | | 0.92 | % | | | 0.92 | % | | | 0.92 | % |
| | | |
Net investment income to average net assets: | | | | | | | | | | | | |
Net investment income before reimbursements | | | 2.06 | % | | | 2.88 | % | | | 0.05 | % |
Net investment income after reimbursements | | | 3.19 | % | | | 3.67 | % | | | 4.00 | % |
See accompanying notes to the financial statements.
64
ASHMORE FUNDS
FINANCIAL HIGHLIGHTS
Ashmore Emerging Markets Short Duration Select Fund
| | | | | | | | | | | | |
| | | | | | Class C | | | | |
| | | |
| | | Year Ended | | | Year Ended | | | Period Ended | |
| | | October 31, | | | October 31, | | | October 31, | |
| | | 2022 | | | 2021 | | | 20201 | |
| | | | |
Net asset value at beginning of period | | $ | 9.80 | | | $ | 10.18 | | | $ | 10.00 | |
| | | |
Income (loss) from investment operations: | | | | | | | | | | | | |
Net investment income | | | 0.22 | | | | 0.30 | | | | 0.12 | |
Net realized and unrealized gain (loss) | | | (1.48 | ) | | | (0.35 | ) | | | 0.18 | |
| | | | |
Total from investment operations | | | (1.26 | ) | | | (0.05 | ) | | | 0.30 | |
| | | |
Less distributions: | | | | | | | | | | | | |
| | | |
From net investment income | | | (0.22 | ) | | | (0.30 | ) | | | (0.12 | ) |
From net realized gain | | | (— | )2 | | | (0.03 | ) | | | — | |
Tax return of capital | | | — | | | | — | | | | — | |
| | | | |
| | | |
Total distributions | | | (0.22 | ) | | | (0.33 | ) | | | (0.12 | ) |
| | | | |
Net asset value at end of period | | $ | 8.32 | | | $ | 9.80 | | | $ | 10.18 | |
| | | | |
| | | |
Total return3 | | | (12.94 | )% | | | (0.57 | )% | | | 3.03 | % |
| | | |
Portfolio turnover rate4 | | | 52 | % | | | 43 | % | | | 12 | % |
| | | |
Net assets, end of period (in thousands) | | $ | 1 | | | $ | 1 | | | $ | 1 | |
| | | |
Ratios to average net assets:5 | | | | | | | | | | | | |
Total expenses to average net assets: | | | | | | | | | | | | |
Expenses before reimbursements | | | 2.72 | % | | | 2.42 | % | | | 5.60 | % |
Expenses after reimbursements | | | 1.67 | % | | | 1.67 | % | | | 1.67 | % |
| | | |
Net investment income (loss) to average net assets: | | | | | | | | | | | | |
Net investment income (loss) before reimbursements | | | 1.39 | % | | | 2.16 | % | | | (0.68 | )% |
Net investment income after reimbursements | | | 2.44 | % | | | 2.91 | % | | | 3.25 | % |
See accompanying notes to the financial statements.
65
ASHMORE FUNDS
FINANCIAL HIGHLIGHTS
Ashmore Emerging Markets Short Duration Select Fund
| | | | | | | | | | | | |
| | | Institutional Class | |
| | | |
| | | Year Ended | | | Year Ended | | | Period Ended | |
| | | October 31, | | | October 31, | | | October 31, | |
| | | 2022 | | | 2021 | | | 20201 | |
| | | | |
Net asset value at beginning of period | | $ | 9.80 | | | $ | 10.18 | | | $ | 10.00 | |
| | | |
Income (loss) from investment operations: | | | | | | | | | | | | |
Net investment income | | | 0.30 | | | | 0.40 | | | | 0.16 | |
Net realized and unrealized gain (loss) | | | (1.48 | ) | | | (0.35 | ) | | | 0.18 | |
| | | | |
Total from investment operations | | | (1.18 | ) | | | 0.05 | | | | 0.34 | |
| | | |
Less distributions: | | | | | | | | | | | | |
| | | |
From net investment income | | | (0.30 | ) | | | (0.40 | ) | | | (0.16 | ) |
From net realized gain | | | (— | )2 | | | (0.03 | ) | | | — | |
Tax return of capital | | | — | | | | — | | | | — | |
| | | | |
| | | |
Total distributions | | | (0.30 | ) | | | (0.43 | ) | | | (0.16 | ) |
| | | | |
Net asset value at end of period | | $ | 8.32 | | | $ | 9.80 | | | $ | 10.18 | |
| | | | |
| | | |
Total return3 | | | (12.16 | )% | | | 0.40 | % | | | 3.43 | % |
| | | |
Portfolio turnover rate4 | | | 52 | % | | | 43 | % | | | 12 | % |
| | | |
Net assets, end of period (in thousands) | | $ | 8,996 | | | $ | 10,286 | | | $ | 10,317 | |
| | | |
Ratios to average net assets:5 | | | | | | | | | | | | |
Total expenses to average net assets: | | | | | | | | | | | | |
Expenses before reimbursements | | | 1.48 | % | | | 1.38 | % | | | 4.58 | % |
Expenses after reimbursements | | | 0.67 | % | | | 0.67 | % | | | 0.67 | % |
| | | |
Net investment income to average net assets: | | | | | | | | | | | | |
Net investment income before reimbursements | | | 2.54 | % | | | 3.21 | % | | | 0.29 | % |
Net investment income after reimbursements | | | 3.35 | % | | | 3.92 | % | | | 4.20 | % |
| 1 | Class A, Class C and the Institutional Class commenced investment operations on June 15, 2020. |
| 2 | Amount is less than $0.005 per share. |
| 3 | Assumes investment at net asset value at the beginning of the period, reinvestment of distributions at net asset value on distribution date, and a complete redemption of the investment at net asset value at the end of the period, excluding the impact of sales charges. Total return is not annualized for periods less than one year. |
| 4 | The portfolio turnover rate is calculated by dividing the lesser of cost of purchases or proceeds from sales of long term portfolio securities by the monthly average of the value of the long term portfolio securities. Portfolio turnover is not annualized for periods less than one year. |
| 5 | Annualized for periods less than one year. |
See accompanying notes to the financial statements.
66
ASHMORE FUNDS
FINANCIAL HIGHLIGHTS
Ashmore Emerging Markets Investment Grade Income Fund
| | | | | | | | | | | | |
| | | | | | Class A | | | | |
| | | |
| | | Year Ended | | | Year Ended | | | Period Ended | |
| | | October 31, | | | October 31, | | | October 31, | |
| | | 2022 | | | 2021 | | | 20201 | |
| | | | |
Net asset value at beginning of period | | $ | 9.90 | | | $ | 9.85 | | | $ | 10.00 | |
| | | |
Income (loss) from investment operations: | | | | | | | | | | | | |
Net investment income | | | 0.30 | | | | 0.32 | | | | 0.03 | |
Net realized and unrealized gain (loss) | | | (2.37 | ) | | | 0.06 | | | | (0.15 | ) |
| | | | |
Total from investment operations | | | (2.07 | ) | | | 0.38 | | | | (0.12 | ) |
| | | |
Less distributions: | | | | | | | | | | | | |
| | | |
From net investment income | | | (0.31 | ) | | | (0.33 | ) | | | (0.03 | ) |
From net realized gain | | | — | | | | — | | | | — | |
Tax return of capital | | | — | | | | — | | | | — | |
| | | | |
| | | |
Total distributions | | | (0.31 | ) | | | (0.33 | ) | | | (0.03 | ) |
| | | | |
Net asset value at end of period | | $ | 7.52 | | | $ | 9.90 | | | $ | 9.85 | |
| | | | |
| | | |
Total return2 | | | (21.27 | )% | | | 3.85 | % | | | (1.19 | )% |
| | | |
Portfolio turnover rate3 | | | 53 | % | | | 44 | % | | | 3 | % |
| | | |
Net assets, end of period (in thousands) | | $ | 1 | | | $ | 1 | | | $ | 1 | |
| | | |
Ratios to average net assets:4 | | | | | | | | | | | | |
Total expenses to average net assets: | | | | | | | | | | | | |
Expenses before reimbursements | | | 1.56 | % | | | 1.77 | % | | | 4.88 | % |
Expenses after reimbursements | | | 0.97 | % | | | 0.97 | % | | | 0.97 | % |
| | | |
Net investment income (loss) to average net assets: | | | | | | | | | | | | |
Net investment income (loss) before reimbursements | | | 2.87 | % | | | 2.42 | % | | | (1.27 | )% |
Net investment income after reimbursements | | | 3.46 | % | | | 3.22 | % | | | 2.64 | % |
See accompanying notes to the financial statements.
67
ASHMORE FUNDS
FINANCIAL HIGHLIGHTS
Ashmore Emerging Markets Investment Grade Income Fund
| | | | | | | | | | | | |
| | | | | | Class C | | | | |
| | | |
| | | Year Ended | | | Year Ended | | | Period Ended | |
| | | October 31, | | | October 31, | | | October 31, | |
| | | 2022 | | | 2021 | | | 20201 | |
| | | | |
Net asset value at beginning of period | | $ | 9.90 | | | $ | 9.85 | | | $ | 10.00 | |
| | | |
Income (loss) from investment operations: | | | | | | | | | | | | |
Net investment income | | | 0.24 | | | | 0.25 | | | | 0.02 | |
Net realized and unrealized gain (loss) | | | (2.38 | ) | | | 0.05 | | | | (0.15 | ) |
| | | | |
Total from investment operations | | | (2.14 | ) | | | 0.30 | | | | (0.13 | ) |
| | | |
Less distributions: | | | | | | | | | | | | |
| | | |
From net investment income | | | (0.24 | ) | | | (0.25 | ) | | | (0.02 | ) |
From net realized gain | | | — | | | | — | | | | — | |
Tax return of capital | | | — | | | | — | | | | — | |
| | | | |
| | | |
Total distributions | | | (0.24 | ) | | | (0.25 | ) | | | (0.02 | ) |
| | | | |
Net asset value at end of period | | $ | 7.52 | | | $ | 9.90 | | | $ | 9.85 | |
| | | | |
| | | |
Total return2 | | | (21.84 | )% | | | 3.08 | % | | | (1.26 | )% |
| | | |
Portfolio turnover rate3 | | | 53 | % | | | 44 | % | | | 3 | % |
| | | |
Net assets, end of period (in thousands) | | $ | 1 | | | $ | 1 | | | $ | 1 | |
| | | |
Ratios to average net assets:4 | | | | | | | | | | | | |
Total expenses to average net assets: | | | | | | | | | | | | |
Expenses before reimbursements | | | 2.12 | % | | | 2.49 | % | | | 5.62 | % |
Expenses after reimbursements | | | 1.72 | % | | | 1.72 | % | | | 1.72 | % |
| | | |
Net investment income (loss) to average net assets: | | | | | | | | | | | | |
Net investment income (loss) before reimbursements | | | 2.34 | % | | | 1.70 | % | | | (2.02 | )% |
Net investment income after reimbursements | | | 2.74 | % | | | 2.47 | % | | | 1.88 | % |
See accompanying notes to the financial statements.
68
ASHMORE FUNDS
FINANCIAL HIGHLIGHTS
Ashmore Emerging Markets Investment Grade Income Fund
| | | | | | | | | | | | |
| | | Institutional Class | |
| | | |
| | | Year Ended | | | Year Ended | | | Period Ended | |
| | | October 31, | | | October 31, | | | October 31, | |
| | | 2022 | | | 2021 | | | 20201 | |
| | | | |
Net asset value at beginning of period | | $ | 9.90 | | | $ | 9.85 | | | $ | 10.00 | |
| | | |
Income (loss) from investment operations: | | | | | | | | | | | | |
Net investment income | | | 0.32 | | | | 0.35 | | | | 0.03 | |
Net realized and unrealized gain (loss) | | | (2.37 | ) | | | 0.05 | | | | (0.15 | ) |
| | | | |
Total from investment operations | | | (2.05 | ) | | | 0.40 | | | | (0.12 | ) |
| | | |
Less distributions: | | | | | | | | | | | | |
| | | |
From net investment income | | | (0.32 | ) | | | (0.35 | ) | | | (0.03 | ) |
From net realized gain | | | — | | | | — | | | | — | |
Tax return of capital | | | — | | | | — | | | | — | |
| | | | |
| | | |
Total distributions | | | (0.32 | ) | | | (0.35 | ) | | | (0.03 | ) |
| | | | |
Net asset value at end of period | | $ | 7.53 | | | $ | 9.90 | | | $ | 9.85 | |
| | | | |
| | | |
Total return2 | | | (21.02 | )% | | | 4.03 | % | | | (1.16 | )% |
| | | |
Portfolio turnover rate3 | | | 53 | % | | | 44 | % | | | 3 | % |
| | | |
Net assets, end of period (in thousands) | | $ | 16,042 | | | $ | 20,442 | | | $ | 19,757 | |
| | | |
Ratios to average net assets:4 | | | | | | | | | | | | |
Total expenses to average net assets: | | | | | | | | | | | | |
Expenses before reimbursements | | | 1.19 | % | | | 1.48 | % | | | 4.43 | % |
Expenses after reimbursements | | | 0.72 | % | | | 0.72 | % | | | 0.72 | % |
| | | |
Net investment income (loss) to average net assets: | | | | | | | | | | | | |
Net investment income (loss) before reimbursements | | | 3.21 | % | | | 2.66 | % | | | (0.92 | )% |
Net investment income after reimbursements | | | 3.68 | % | | | 3.42 | % | | | 2.79 | % |
| 1 | Class A, Class C and the Institutional Class commenced investment operations on September 17, 2020. |
| 2 | Assumes investment at net asset value at the beginning of the period, reinvestment of distributions at net asset value on distribution date, and a complete redemption of the investment at net asset value at the end of the period, excluding the impact of sales charges. Total return is not annualized for periods less than one year. |
| 3 | The portfolio turnover rate is calculated by dividing the lesser of cost of purchases or proceeds from sales of long term portfolio securities by the monthly average of the value of the long term portfolio securities. Portfolio turnover is not annualized for periods less than one year. |
| 4 | Annualized for periods less than one year. |
See accompanying notes to the financial statements.
69
ASHMORE FUNDS
FINANCIAL HIGHLIGHTS
Ashmore Emerging Markets Corporate Income ESG Fund
| | | | | | | | |
| | | Class A | |
| | |
| | | Year Ended | | | Period Ended | |
| | | October 31, | | | October 31, | |
| | | 2022 | | | 20211 | |
| | | | |
Net asset value at beginning of period | | $ | 9.11 | | | $ | 10.00 | |
| | |
Income (loss) from investment operations: | | | | | | | | |
Net investment income | | | 0.36 | | | | 0.29 | |
Net realized and unrealized loss | | | (2.83 | ) | | | (0.89 | ) |
| | | | |
Total from investment operations | | | (2.47 | ) | | | (0.60 | ) |
| | |
Less distributions: | | | | | | | | |
| | |
From net investment income | | | (0.36 | ) | | | (0.29 | ) |
From net realized gain | | | (0.02 | ) | | | — | |
Tax return of capital | | | — | | | | — | |
| | | | |
| | |
Total distributions | | | (0.38 | ) | | | (0.29 | ) |
| | | | |
Net asset value at end of period | | $ | 6.26 | | | $ | 9.11 | |
| | | | |
| | |
Total return2 | | | (27.67 | )% | | | (6.11 | )% |
| | |
Portfolio turnover rate3 | | | 34 | % | | | 15 | % |
| | |
Net assets, end of period (in thousands) | | $ | 1 | | | $ | 1 | |
| | |
Ratios to average net assets:4 | | | | | | | | |
Total expenses to average net assets: | | | | | | | | |
Expenses before reimbursements | | | 2.59 | % | | | 3.35 | % |
Expenses after reimbursements | | | 1.12 | % | | | 1.12 | % |
| | |
Net investment income to average net assets: | | | | | | | | |
Net investment income before reimbursements | | | 3.26 | % | | | 2.26 | % |
Net investment income after reimbursements | | | 4.73 | % | | | 4.49 | % |
See accompanying notes to the financial statements.
70
ASHMORE FUNDS
FINANCIAL HIGHLIGHTS
Ashmore Emerging Markets Corporate Income ESG Fund
| | | | | | | | |
| | | Class C | |
| | |
| | | Year Ended | | | Period Ended | |
| | | October 31, | | | October 31, | |
| | | 2022 | | | 20211 | |
| | | | |
Net asset value at beginning of period | | $ | 9.11 | | | $ | 10.00 | |
| | |
Income (loss) from investment operations: | | | | | | | | |
Net investment income | | | 0.30 | | | | 0.24 | |
Net realized and unrealized loss | | | (2.82 | ) | | | (0.88 | ) |
| | | | |
Total from investment operations | | | (2.52 | ) | | | (0.64 | ) |
| | |
Less distributions: | | | | | | | | |
| | |
From net investment income | | | (0.31 | ) | | | (0.25 | ) |
From net realized gain | | | (0.02 | ) | | | — | |
Tax return of capital | | | — | | | | — | |
| | | | |
| | |
Total distributions | | | (0.33 | ) | | | (0.25 | ) |
| | | | |
Net asset value at end of period | | $ | 6.26 | | | $ | 9.11 | |
| | | | |
| | |
Total return2 | | | (28.23 | )% | | | (6.55 | )% |
| | |
Portfolio turnover rate3 | | | 34 | % | | | 15 | % |
| | |
Net assets, end of period (in thousands) | | $ | 1 | | | $ | 1 | |
| | |
Ratios to average net assets:4 | | | | | | | | |
Total expenses to average net assets: | | | | | | | | |
Expenses before reimbursements | | | 3.32 | % | | | 4.10 | % |
Expenses after reimbursements | | | 1.87 | % | | | 1.87 | % |
| | |
Net investment income to average net assets: | | | | | | | | |
Net investment income before reimbursements | | | 2.53 | % | | | 1.52 | % |
Net investment income after reimbursements | | | 3.98 | % | | | 3.75 | % |
See accompanying notes to the financial statements.
71
ASHMORE FUNDS
FINANCIAL HIGHLIGHTS
Ashmore Emerging Markets Corporate Income ESG Fund
| | | | | | | | |
| | | Institutional Class | |
| | |
| | | Year Ended | | | Period Ended | |
| | | October 31, | | | October 31, | |
| | | 2022 | | | 20211 | |
| | | | |
Net asset value at beginning of period | | $ | 9.11 | | | $ | 10.00 | |
| | |
Income (loss) from investment operations: | | | | | | | | |
Net investment income | | | 0.37 | | | | 0.31 | |
Net realized and unrealized loss | | | (2.83 | ) | | | (0.89 | ) |
| | | | |
Total from investment operations | | | (2.46 | ) | | | (0.58 | ) |
| | |
Less distributions: | | | | | | | | |
| | |
From net investment income | | | (0.37 | ) | | | (0.31 | ) |
From net realized gain | | | (0.02 | ) | | | — | |
Tax return of capital | | | — | | | | — | |
| | | | |
| | |
Total distributions | | | (0.39 | ) | | | (0.31 | ) |
| | | | |
Net asset value at end of period | | $ | 6.26 | | | $ | 9.11 | |
| | | | |
| | |
Total return2 | | | (27.56 | )% | | | (5.96 | )% |
| | |
Portfolio turnover rate3 | | | 34 | % | | | 15 | % |
| | |
Net assets, end of period (in thousands) | | $ | 6,720 | | | $ | 9,356 | |
| | |
Ratios to average net assets:4 | | | | | | | | |
Total expenses to average net assets: | | | | | | | | |
Expenses before reimbursements | | | 2.12 | % | | | 3.08 | % |
Expenses after reimbursements | | | 0.87 | % | | | 0.87 | % |
| | |
Net investment income to average net assets: | | | | | | | | |
Net investment income before reimbursements | | | 3.66 | % | | | 2.52 | % |
Net investment income after reimbursements | | | 4.91 | % | | | 4.73 | % |
| 1 | Class A, Class C and the Institutional Class commenced investment operations on February 26, 2021. |
| 2 | Assumes investment at net asset value at the beginning of the period, reinvestment of distributions at net asset value on distribution date, and a complete redemption of the investment at net asset value at the end of the period, excluding the impact of sales charges. Total return is not annualized for periods less than one year. |
| 3 | The portfolio turnover rate is calculated by dividing the lesser of cost of purchases or proceeds from sales of long term portfolio securities by the monthly average of the value of the long term portfolio securities. Portfolio turnover is not annualized for periods less than one year. |
| 4 | Annualized for periods less than one year. |
See accompanying notes to the financial statements.
72
ASHMORE EMERGING MARKETS TOTAL RETURN FUND
SCHEDULE OF INVESTMENTS
As of October 31, 2022
| | | | | | | | | | | | | | | | |
| | | Currency1 | | | Par | | | Value | | | % of Net
Assets | |
Debt Securities | | | | | | | | | | | | | | | | |
| | | | |
Angola (Cost $7,751,878) | | | | | | | | | | | | | | | | |
Angola (Rep of), 8.250%, 05/09/2028 | | | | | | | 1,105,000 | | | $ | 929,305 | | | | 0.19 | |
Angola (Rep of), 8.000%, 11/26/2029 | | | | | | | 1,471,000 | | | | 1,194,011 | | | | 0.24 | |
Angola (Rep of), 8.750%, 04/14/2032 | | | | | | | 794,000 | | | | 639,567 | | | | 0.13 | |
Angola (Rep of), 9.375%, 05/08/2048 | | | | | | | 3,507,000 | | | | 2,661,111 | | | | 0.54 | |
Angola (Rep of), 9.125%, 11/26/2049 | | | | | | | 1,480,000 | | | | 1,112,960 | | | | 0.23 | |
| | | | | | | | | | | 6,536,954 | | | | 1.33 | |
| | | | |
Argentina (Cost $20,692,962) | | | | | | | | | | | | | | | | |
Argentina (Rep of), 1.000%, 07/09/2029 | | | | | | | 1,727,840 | | | | 354,278 | | | | 0.07 | |
Argentina (Rep of), (Step to 0.750% on 07/09/2023), 0.500%, 07/09/20302 | | | | | | | 20,083,451 | | | | 4,233,116 | | | | 0.86 | |
Argentina (Rep of), (Step to 3.625% on 07/09/2023), 1.500%, 07/09/20352 | | | | | | | 11,747,271 | | | | 2,331,505 | | | | 0.47 | |
Argentina (Rep of), (Step to 4.250% on 07/09/2023), 3.875%, 01/09/20382 | | | | | | | 2,172,373 | | | | 562,075 | | | | 0.12 | |
Argentina (Rep of), (Step to 4.875% on 07/09/2029), 3.500%, 07/09/20412 | | | | | | | 4,573,926 | | | | 1,089,534 | | | | 0.22 | |
YPF S.A., (Step to 9.000% on 01/01/2023), 4.000%, 02/12/20262 | | | | | | | 770,000 | | | | 675,714 | | | | 0.14 | |
YPF S.A., (Step to 9.000% on 01/01/2023), 2.500%, 06/30/20292 | | | | | | | 3,500,000 | | | | 2,197,440 | | | | 0.45 | |
| | | | | | | | | | | 11,443,662 | | | | 2.33 | |
| | | | |
Azerbaijan (Cost $3,222,746) | | | | | | | | | | | | | | | | |
Southern Gas Corridor CJSC, 6.875%, 03/24/2026 | | | | | | | 1,941,000 | | | | 1,907,071 | | | | 0.39 | |
State Oil Co. of the Azerbaijan Republic, 6.950%, 03/18/2030 | | | | | | | 961,000 | | | | 933,208 | | | | 0.19 | |
| | | | | | | | | | | 2,840,279 | | | | 0.58 | |
| | | | |
Bahrain (Cost $3,401,500) | | | | | | | | | | | | | | | | |
Bahrain (Rep of), 7.500%, 09/20/2047 | | | | | | | 1,598,000 | | | | 1,275,108 | | | | 0.26 | |
Oil and Gas Holding (The) Co. BSCC, 7.625%, 11/07/2024 | | | | | | | 937,000 | | | | 927,817 | | | | 0.19 | |
Oil and Gas Holding (The) Co. BSCC, 8.375%, 11/07/2028 | | | | | | | 750,000 | | | | 734,549 | | | | 0.15 | |
| | | | | | | | | | | 2,937,474 | | | | 0.60 | |
| | | | |
Brazil (Cost $67,209,172) | | | | | | | | | | | | | | | | |
Banco do Brasil S.A., (Variable, U.S. Treasury Yield Curve Rate CMT 10Y + 4.398%), 6.250%, 04/15/20243 | | | | | | | 5,595,000 | | | | 4,916,942 | | | | 1.00 | |
Brazil (Rep of), 4.250%, 01/07/2025 | | | | | | | 2,732,000 | | | | 2,658,955 | | | | 0.54 | |
Brazil (Rep of), 2.875%, 06/06/2025 | | | | | | | 1,475,000 | | | | 1,382,622 | | | | 0.28 | |
Brazil (Rep of), 6.000%, 04/07/2026 | | | | | | | 830,000 | | | | 847,778 | | | | 0.17 | |
Brazil (Rep of), 4.625%, 01/13/2028 | | | | | | | 820,000 | | | | 769,457 | | | | 0.16 | |
Brazil (Rep of), 8.250%, 01/20/2034 | | | | | | | 607,000 | | | | 655,665 | | | | 0.13 | |
Brazil (Rep of), 5.000%, 01/27/2045 | | | | | | | 1,451,000 | | | | 1,041,536 | | | | 0.21 | |
Brazil (Rep of), 5.625%, 02/21/2047 | | | | | | | 739,000 | | | | 560,475 | | | | 0.11 | |
Brazil Letras do Tesouro Nacional, 0.000%, 01/01/20254 | | | BRL | | | | 89,511,000 | | | | 13,618,235 | | | | 2.77 | |
Brazil Letras do Tesouro Nacional, 0.000%, 07/01/20254 | | | BRL | | | | 220,000 | | | | 31,774 | | | | 0.01 | |
See accompanying notes to the financial statements.
73
ASHMORE EMERGING MARKETS TOTAL RETURN FUND
SCHEDULE OF INVESTMENTS (CONTINUED)
As of October 31, 2022
| | | | | | | | | | | | | | |
| | | Currency1 | | Par | | | Value | | | % of Net
Assets | |
Brazil (continued) | | | | | | | | | | | | | | |
Brazil Notas do Tesouro Nacional Serie F, 10.000%, 01/01/2027 | | BRL | | | 78,100,000 | | | $ | 14,331,786 | | | | 2.91 | |
Brazil Notas do Tesouro Nacional Serie F, 10.000%, 01/01/2029 | | BRL | | | 13,380,000 | | | | 2,397,016 | | | | 0.49 | |
Brazil Notas do Tesouro Nacional Serie F, 10.000%, 01/01/2031 | | BRL | | | 3,075,000 | | | | 540,982 | | | | 0.11 | |
MC Brazil Downstream Trading S.A.R.L., 7.250%, 06/30/2031 | | | | | 1,535,000 | | | | 1,172,894 | | | | 0.24 | |
Oi S.A., 10.000%, 07/27/20255 | | | | | 23,583,000 | | | | 6,132,827 | | | | 1.25 | |
| | | | | | | | | 51,058,944 | | | | 10.38 | |
| | | | |
Chile (Cost $18,177,310) | | | | | | | | | | | | | | |
Bonos de la Tesoreria de la Republica en pesos, 5.000%, 10/01/20286 | | CLP | | | 455,000,000 | | | | 441,725 | | | | 0.09 | |
Bonos de la Tesoreria de la Republica en pesos, 7.000%, 05/01/20346 | | CLP | | | 1,535,000,000 | | | | 1,692,918 | | | | 0.34 | |
Chile (Rep of), 2.750%, 01/31/2027 | | | | | 473,000 | | | | 424,219 | | | | 0.09 | |
Chile (Rep of), 3.240%, 02/06/2028 | | | | | 493,000 | | | | 442,381 | | | | 0.09 | |
Chile (Rep of), 2.550%, 07/27/2033 | | | | | 547,000 | | | | 406,737 | | | | 0.08 | |
Chile (Rep of), 3.100%, 05/07/2041 | | | | | 1,950,000 | | | | 1,286,997 | | | | 0.26 | |
Chile (Rep of), 3.500%, 01/25/2050 | | | | | 2,763,000 | | | | 1,814,622 | | | | 0.37 | |
Chile (Rep of), 3.100%, 01/22/2061 | | | | | 1,327,000 | | | | 741,893 | | | | 0.15 | |
Corp. Nacional del Cobre de Chile, 5.625%, 10/18/2043 | | | | | 1,209,000 | | | | 1,072,485 | | | | 0.22 | |
Corp. Nacional del Cobre de Chile, 4.875%, 11/04/2044 | | | | | 390,000 | | | | 319,233 | | | | 0.06 | |
Corp. Nacional del Cobre de Chile, 4.500%, 08/01/2047 | | | | | 368,000 | | | | 277,076 | | | | 0.06 | |
Corp. Nacional del Cobre de Chile, 4.375%, 02/05/2049 | | | | | 779,000 | | | | 573,808 | | | | 0.12 | |
Corp. Nacional del Cobre de Chile, 3.150%, 01/15/2051 | | | | | 446,000 | | | | 270,553 | | | | 0.05 | |
Empresa de Transporte de Pasajeros Metro S.A., 4.700%, 05/07/2050 | | | | | 1,581,000 | | | | 1,175,872 | | | | 0.24 | |
Empresa Nacional del Petroleo, 3.750%, 08/05/2026 | | | | | 730,000 | | | | 647,898 | | | | 0.13 | |
Empresa Nacional del Petroleo, 4.500%, 09/14/2047 | | | | | 1,207,000 | | | | 769,462 | | | | 0.16 | |
Latam Airlines Group S.A., 13.375%, 10/15/20296 | | | | | 1,730,000 | | | | 1,721,350 | | | | 0.35 | |
| | | | | | | | | 14,079,229 | | | | 2.86 | |
| | | | |
China (Cost $83,044,819) | | | | | | | | | | | | | | |
Central China Real Estate Ltd., 7.650%, 08/27/2023 | | | | | 3,520,000 | | | | 533,703 | | | | 0.11 | |
Central China Real Estate Ltd., 7.750%, 05/24/2024 | | | | | 4,550,000 | | | | 622,865 | | | | 0.13 | |
CFLD Cayman Investment Ltd., 9.000%, 07/31/20217,8 | | | | | 6,142,000 | | | | 307,100 | | | | 0.06 | |
CFLD Cayman Investment Ltd., 6.900%, 01/13/20237 | | | | | 5,000,000 | | | | 250,000 | | | | 0.05 | |
China (Rep of), 2.750%, 02/17/2032 | | CNY | | | 16,430,000 | | | | 2,255,661 | | | | 0.46 | |
China (Rep of), 3.720%, 04/12/2051 | | CNY | | | 7,150,000 | | | | 1,082,072 | | | | 0.22 | |
China Evergrande Group, 8.250%, 03/23/20227,8 | | | | | 2,055,000 | | | | 71,846 | | | | 0.01 | |
China Evergrande Group, 11.500%, 01/22/20237 | | | | | 2,800,000 | | | | 98,234 | | | | 0.02 | |
China Evergrande Group, 7.500%, 06/28/20237 | | | | | 10,500,000 | | | | 367,500 | | | | 0.07 | |
China Evergrande Group, 10.500%, 04/11/20247 | | | | | 2,300,000 | | | | 80,441 | | | | 0.02 | |
China Evergrande Group, 8.750%, 06/28/20257 | | | | | 2,745,000 | | | | 99,506 | | | | 0.02 | |
Fantasia Holdings Group Co. Ltd., 15.000%, 12/18/20217,8 | | | | | 4,515,000 | | | | 219,062 | | | | 0.04 | |
Fantasia Holdings Group Co. Ltd., 7.950%, 07/05/20227,8 | | | | | 5,635,000 | | | | 307,681 | | | | 0.06 | |
See accompanying notes to the financial statements.
74
ASHMORE EMERGING MARKETS TOTAL RETURN FUND
SCHEDULE OF INVESTMENTS (CONTINUED)
As of October 31, 2022
| | | | | | | | | | | | | | |
| | | Currency1 | | Par | | | Value | | | % of Net
Assets | |
China (continued) | | | | | | | | | | | | | | |
Fantasia Holdings Group Co. Ltd., 12.250%, 10/18/20227,8 | | | | | 1,189,000 | | | $ | 59,104 | | | | 0.01 | |
Fantasia Holdings Group Co. Ltd., 10.875%, 01/09/20237 | | | | | 2,175,000 | | | | 108,619 | | | | 0.02 | |
Kaisa Group Holdings Ltd., 11.250%, 04/09/20227,8 | | | | | 1,260,000 | | | | 76,958 | | | | 0.02 | |
Kaisa Group Holdings Ltd., 8.500%, 06/30/20227,8 | | | | | 4,150,000 | | | | 276,842 | | | | 0.06 | |
Kaisa Group Holdings Ltd., 11.950%, 10/22/20227,8 | | | | | 1,300,000 | | | | 90,348 | | | | 0.02 | |
Kaisa Group Holdings Ltd., 11.500%, 01/30/20237 | | | | | 2,270,000 | | | | 146,044 | | | | 0.03 | |
Kaisa Group Holdings Ltd., 10.875%, 07/23/20237 | | | | | 2,900,000 | | | | 181,250 | | | | 0.04 | |
Kaisa Group Holdings Ltd., 9.375%, 06/30/20247 | | | | | 3,350,000 | | | | 226,125 | | | | 0.05 | |
Kaisa Group Holdings Ltd., 11.700%, 11/11/20257 | | | | | 2,400,000 | | | | 165,600 | | | | 0.03 | |
Kaisa Group Holdings Ltd., 11.650%, 06/01/20267 | | | | | 1,300,000 | | | | 82,349 | | | | 0.02 | |
Scenery Journey Ltd., 11.500%, 10/24/20227,8 | | | | | 3,140,000 | | | | 70,798 | | | | 0.01 | |
Scenery Journey Ltd., 12.000%, 10/24/20237 | | | | | 1,880,000 | | | | 42,016 | | | | 0.01 | |
Scenery Journey Ltd., 13.750%, 11/06/20237 | | | | | 500,000 | | | | 10,096 | | | | — | |
Shimao Group Holdings Ltd., 4.750%, 07/03/20227,8 | | | | | 200,000 | | | | 9,046 | | | | — | |
Sinopec Group Overseas Development 2012 Ltd., 4.875%, 05/17/2042 | | | | | 710,000 | | | | 625,600 | | | | 0.13 | |
Sinopec Group Overseas Development 2018 Ltd., 2.700%, 05/13/2030 | | | | | 1,180,000 | | | | 993,246 | | | | 0.20 | |
Sinopec Group Overseas Development 2018 Ltd., 3.350%, 05/13/2050 | | | | | 231,000 | | | | 150,706 | | | | 0.03 | |
Sunac China Holdings Ltd., 7.250%, 06/14/20227,8 | | | | | 3,157,000 | | | | 188,589 | | | | 0.04 | |
Sunac China Holdings Ltd., 7.950%, 08/08/20227,8 | | | | | 3,200,000 | | | | 192,779 | | | | 0.04 | |
Sunac China Holdings Ltd., 8.350%, 04/19/20237 | | | | | 2,565,000 | | | | 147,380 | | | | 0.03 | |
Sunac China Holdings Ltd., 7.950%, 10/11/20237 | | | | | 3,700,000 | | | | 210,085 | | | | 0.04 | |
Yuzhou Group Holdings Co. Ltd., 7.813%, 01/21/20237 | | | | | 1,000,000 | | | | 28,561 | | | | 0.01 | |
Yuzhou Group Holdings Co. Ltd., 8.500%, 02/04/20237 | | | | | 2,425,000 | | | | 70,441 | | | | 0.01 | |
Yuzhou Group Holdings Co. Ltd., 9.950%, 06/08/20237 | | | | | 2,595,000 | | | | 76,164 | | | | 0.02 | |
Yuzhou Group Holdings Co. Ltd., 6.000%, 10/25/20237 | | | | | 3,065,000 | | | | 91,730 | | | | 0.02 | |
Yuzhou Group Holdings Co. Ltd., 7.375%, 01/13/20267 | | | | | 2,013,000 | | | | 58,419 | | | | 0.01 | |
Yuzhou Group Holdings Co. Ltd., 6.350%, 01/13/20277 | | | | | 2,440,000 | | | | 70,888 | | | | 0.01 | |
Zhenro Properties Group Ltd., 8.700%, 08/03/20227,8 | | | | | 1,110,000 | | | | 44,400 | | | | 0.01 | |
Zhenro Properties Group Ltd., 8.000%, 03/06/20237 | | | | | 488,000 | | | | 14,640 | | | | — | |
Zhenro Properties Group Ltd., 14.724%, 03/06/20237 | | | | | 1,360,000 | | | | 26,289 | | | | 0.01 | |
Zhenro Properties Group Ltd., 8.300%, 09/15/20237 | | | | | 3,313,000 | | | | 60,770 | | | | 0.01 | |
Zhenro Properties Group Ltd., 7.875%, 04/14/20247 | | | | | 1,269,000 | | | | 24,503 | | | | 0.01 | |
| | | | | | | | | 10,916,056 | | | | 2.22 | |
| | | | |
Colombia (Cost $22,130,747) | | | | | | | | | | | | | | |
Colombia (Rep of), 8.125%, 05/21/2024 | | | | | 1,404,000 | | | | 1,407,422 | | | | 0.29 | |
Colombia (Rep of), 3.875%, 04/25/2027 | | | | | 1,383,000 | | | | 1,152,103 | | | | 0.23 | |
Colombia (Rep of), 7.375%, 09/18/2037 | | | | | 977,000 | | | | 820,836 | | | | 0.17 | |
Colombia (Rep of), 6.125%, 01/18/2041 | | | | | 1,771,000 | | | | 1,259,161 | | | | 0.26 | |
Colombia (Rep of), 5.625%, 02/26/2044 | | | | | 1,730,000 | | | | 1,120,308 | | | | 0.23 | |
Colombia (Rep of), 5.000%, 06/15/2045 | | | | | 344,000 | | | | 208,326 | | | | 0.04 | |
Colombia (Rep of), 4.125%, 05/15/2051 | | | | | 783,000 | | | | 415,227 | | | | 0.08 | |
Colombian TES, 4.750%, 02/23/2023 | | COP | | | 16,910,000 | | | | 1,106,937 | | | | 0.22 | |
See accompanying notes to the financial statements.
75
ASHMORE EMERGING MARKETS TOTAL RETURN FUND
SCHEDULE OF INVESTMENTS (CONTINUED)
As of October 31, 2022
| | | | | | | | | | | | | | |
| | | Currency1 | | Par | | | Value | | | % of Net
Assets | |
Colombia (continued) | | | | | | | | | | | | | | |
Colombian TES, 10.000%, 07/24/2024 | | COP | | | 4,248,800,000 | | | $ | 826,743 | | | | 0.17 | |
Colombian TES, 6.250%, 11/26/2025 | | COP | | | 2,582,700,000 | | | | 434,843 | | | | 0.09 | |
Colombian TES, 6.000%, 04/28/2028 | | COP | | | 5,447,800,000 | | | | 785,455 | | | | 0.16 | |
Colombian TES, 7.000%, 03/26/2031 | | COP | | | 982,900,000 | | | | 133,042 | | | | 0.03 | |
Colombian TES, 7.250%, 10/18/2034 | | COP | | | 5,009,900,000 | | | | 631,206 | | | | 0.13 | |
Colombian TES, 6.250%, 07/09/2036 | | COP | | | 6,516,700,000 | | | | 712,940 | | | | 0.14 | |
Colombian TES, 9.250%, 05/28/2042 | | COP | | | 6,113,000,000 | | | | 853,085 | | | | 0.17 | |
Colombian TES, 7.250%, 10/26/2050 | | COP | | | 2,506,000,000 | | | | 270,784 | | | | 0.05 | |
Empresas Publicas de Medellin ESP, 8.375%, 11/08/2027 | | COP | | | 8,747,000,000 | | | | 1,258,638 | | | | 0.26 | |
| | | | | | | | | 13,397,056 | | | | 2.72 | |
| | | | |
Costa Rica (Cost $1,890,505) | | | | | | | | | | | | | | |
Costa Rica (Rep of), 6.125%, 02/19/2031 | | | | | 1,041,000 | | | | 965,414 | | | | 0.20 | |
Costa Rica (Rep of), 5.625%, 04/30/2043 | | | | | 960,000 | | | | 696,112 | | | | 0.14 | |
| | | | | | | | | 1,661,526 | | | | 0.34 | |
| | | | |
Croatia (Cost $1,996,079) | | | | | | | | | | | | | | |
Croatia (Rep of), 6.000%, 01/26/2024 | | | | | 1,894,000 | | | | 1,906,504 | | | | 0.39 | |
| | | | | | | | | 1,906,504 | | | | 0.39 | |
| | | | |
Czech Republic (Cost $9,093,076) | | | | | | | | | | | | | | |
Czech (Rep of), 2.500%, 08/25/2028 | | CZK | | | 26,480,000 | | | | 885,147 | | | | 0.18 | |
Czech (Rep of), 2.750%, 07/23/2029 | | CZK | | | 78,880,000 | | | | 2,607,779 | | | | 0.53 | |
Czech (Rep of), 0.050%, 11/29/2029 | | CZK | | | 20,170,000 | | | | 537,484 | | | | 0.11 | |
Czech (Rep of), 0.950%, 05/15/2030 | | CZK | | | 1,580,000 | | | | 44,429 | | | | 0.01 | |
Czech (Rep of), 1.750%, 06/23/2032 | | CZK | | | 14,820,000 | | | | 418,249 | | | | 0.08 | |
Czech (Rep of), 2.000%, 10/13/2033 | | CZK | | | 8,260,000 | | | | 229,244 | | | | 0.05 | |
Czech (Rep of), 4.200%, 12/04/2036 | | CZK | | | 6,350,000 | | | | 216,999 | | | | 0.04 | |
New World Resources N.V., 8.000%, 04/07/20207,8,9 | | EUR | | | 1,938,518 | | | | — | | | | — | |
New World Resources N.V., 4.000%, 10/07/20207,8,9 | | EUR | | | 669,526 | | | | — | | | | — | |
| | | | | | | | | 4,939,331 | | | | 1.00 | |
| | | | |
Dominican Republic (Cost $17,260,835) | | | | | | | | | | | | | | |
Dominican (Rep of), 5.500%, 01/27/2025 | | | | | 714,000 | | | | 697,856 | | | | 0.14 | |
Dominican (Rep of), 6.875%, 01/29/2026 | | | | | 1,331,000 | | | | 1,304,571 | | | | 0.26 | |
Dominican (Rep of), 9.750%, 06/05/2026 | | DOP | | | 29,950,000 | | | | 529,394 | | | | 0.11 | |
Dominican (Rep of), 6.000%, 07/19/2028 | | | | | 710,000 | | | | 646,992 | | | | 0.13 | |
Dominican (Rep of), 5.500%, 02/22/2029 | | | | | 483,000 | | | | 421,724 | | | | 0.09 | |
Dominican (Rep of), 4.875%, 09/23/2032 | | | | | 3,740,000 | | | | 2,881,690 | | | | 0.59 | |
Dominican (Rep of), 5.300%, 01/21/2041 | | | | | 1,173,000 | | | | 807,935 | | | | 0.16 | |
Dominican (Rep of), 6.850%, 01/27/2045 | | | | | 363,000 | | | | 279,860 | | | | 0.06 | |
Dominican (Rep of), 6.500%, 02/15/2048 | | | | | 367,000 | | | | 267,816 | | | | 0.05 | |
Dominican (Rep of), 6.400%, 06/05/2049 | | | | | 553,000 | | | | 397,637 | | | | 0.08 | |
Dominican (Rep of), 5.875%, 01/30/2060 | | | | | 7,179,000 | | | | 4,714,867 | | | | 0.96 | |
| | | | | | | | | 12,950,342 | | | | 2.63 | |
See accompanying notes to the financial statements.
76
ASHMORE EMERGING MARKETS TOTAL RETURN FUND
SCHEDULE OF INVESTMENTS (CONTINUED)
As of October 31, 2022
| | | | | | | | | | | | | | |
| | | Currency1 | | Par | | | Value | | | % of Net
Assets | |
Ecuador (Cost $11,919,094) | | | | | | | | | | | | | | |
Ecuador (Rep of), (Step to 3.500% on 07/31/2023), 2.500%, 07/31/20352,6 | | | | | 15,483,434 | | | $ | 5,656,487 | | | | 1.15 | |
Ecuador (Rep of), (Step to 2.500% on 07/31/2023), 1.500%, 07/31/20402 | | | | | 3,544,828 | | | | 1,170,405 | | | | 0.24 | |
| | | | | | | | | 6,826,892 | | | | 1.39 | |
| | | | |
Egypt (Cost $12,755,227) | | | | | | | | | | | | | | |
Egypt (Rep of), 6.588%, 02/21/2028 | | | | | 391,000 | | | | 280,305 | | | | 0.06 | |
Egypt (Rep of), 7.600%, 03/01/2029 | | | | | 995,000 | | | | 712,599 | | | | 0.15 | |
Egypt (Rep of), 5.875%, 02/16/2031 | | | | | 1,310,000 | | | | 805,650 | | | | 0.16 | |
Egypt (Rep of), 7.625%, 05/29/2032 | | | | | 844,000 | | | | 540,604 | | | | 0.11 | |
Egypt (Rep of), 8.500%, 01/31/2047 | | | | | 2,838,000 | | | | 1,673,058 | | | | 0.34 | |
Egypt (Rep of), 7.903%, 02/21/2048 | | | | | 2,194,000 | | | | 1,238,048 | | | | 0.25 | |
Egypt (Rep of), 8.700%, 03/01/2049 | | | | | 2,280,000 | | | | 1,356,600 | | | | 0.28 | |
Egypt (Rep of), 8.875%, 05/29/2050 | | | | | 1,443,000 | | | | 855,087 | | | | 0.17 | |
Egypt (Rep of), 8.750%, 09/30/2051 | | | | | 1,257,000 | | | | 747,161 | | | | 0.15 | |
Egypt (Rep of), 8.150%, 11/20/2059 | | | | | 200,000 | | | | 114,777 | | | | 0.02 | |
| | | | | | | | | 8,323,889 | | | | 1.69 | |
| | | | |
Gabon (Cost $1,113,812) | | | | | | | | | | | | | | |
Gabon (Rep of), 6.625%, 02/06/2031 | | | | | 1,534,000 | | | | 1,073,217 | | | | 0.22 | |
| | | | | | | | | 1,073,217 | | | | 0.22 | |
| | | | |
Ghana (Cost $8,676,381) | | | | | | | | | | | | | | |
Ghana (Rep of), 8.125%, 03/26/2032 | | | | | 433,000 | | | | 124,687 | | | | 0.03 | |
Ghana (Rep of), 8.625%, 04/07/2034 | | | | | 1,441,000 | | | | 414,288 | | | | 0.08 | |
Ghana (Rep of), 7.875%, 02/11/2035 | | | | | 438,000 | | | | 122,675 | | | | 0.02 | |
Ghana (Rep of), 8.875%, 05/07/2042 | | | | | 2,279,000 | | | | 621,027 | | | | 0.13 | |
Ghana (Rep of), 8.950%, 03/26/2051 | | | | | 1,885,000 | | | | 536,848 | | | | 0.11 | |
Ghana (Rep of), 8.750%, 03/11/2061 | | | | | 226,000 | | | | 63,822 | | | | 0.01 | |
Tullow Oil PLC, 7.000%, 03/01/2025 | | | | | 2,170,000 | | | | 1,410,500 | | | | 0.29 | |
Tullow Oil PLC, 10.250%, 05/15/2026 | | | | | 1,697,000 | | | | 1,444,181 | | | | 0.29 | |
| | | | | | | | | 4,738,028 | | | | 0.96 | |
| | | | |
Guatemala (Cost $1,645,419) | | | | | | | | | | | | | | |
Guatemala (Rep of), 5.375%, 04/24/2032 | | | | | 242,000 | | | | 222,882 | | | | 0.05 | |
Guatemala (Rep of), 4.650%, 10/07/2041 | | | | | 408,000 | | | | 299,893 | | | | 0.06 | |
Guatemala (Rep of), 6.125%, 06/01/2050 | | | | | 865,000 | | | | 742,241 | | | | 0.15 | |
| | | | | | | | | 1,265,016 | | | | 0.26 | |
| | | | |
Hungary (Cost $5,348,885) | | | | | | | | | | | | | | |
Hungary (Rep of), 5.375%, 03/25/2024 | | | | | 1,370,000 | | | | 1,356,933 | | | | 0.28 | |
Hungary (Rep of), 6.750%, 10/22/2028 | | HUF | | | 216,810,000 | | | | 425,722 | | | | 0.09 | |
Hungary (Rep of), 3.000%, 08/21/2030 | | HUF | | | 443,460,000 | | | | 665,403 | | | | 0.13 | |
Hungary (Rep of), 2.125%, 09/22/2031 | | | | | 554,000 | | | | 396,101 | | | | 0.08 | |
Hungary (Rep of), 3.000%, 10/27/2038 | | HUF | | | 248,590,000 | | | | 287,314 | | | | 0.06 | |
Hungary (Rep of), 3.125%, 09/21/2051 | | | | | 630,000 | | | | 344,582 | | | | 0.07 | |
| | | | | | | | | 3,476,055 | | | | 0.71 | |
See accompanying notes to the financial statements.
77
ASHMORE EMERGING MARKETS TOTAL RETURN FUND
SCHEDULE OF INVESTMENTS (CONTINUED)
As of October 31, 2022
| | | | | | | | | | | | | | |
| | | Currency1 | | Par | | | Value | | | % of Net
Assets | |
India (Cost $9,649,595) | | | | | | | | | | | | | | |
Export-Import Bank of India, 4.000%, 01/14/2023 | | | | | 1,109,000 | | | $ | 1,106,183 | | | | 0.22 | |
Export-Import Bank of India, 3.375%, 08/05/2026 | | | | | 440,000 | | | | 399,594 | | | | 0.08 | |
Export-Import Bank of India, 2.250%, 01/13/2031 | | | | | 789,000 | | | | 578,140 | | | | 0.12 | |
Greenko Solar Mauritius Ltd., 5.950%, 07/29/2026 | | | | | 1,725,000 | | | | 1,385,175 | | | | 0.28 | |
Vedanta Resources Finance II PLC, 13.875%, 01/21/2024 | | | | | 1,890,000 | | | | 1,579,690 | | | | 0.32 | |
Vedanta Resources Finance II PLC, 8.950%, 03/11/2025 | | | | | 3,120,000 | | | | 1,966,754 | | | | 0.40 | |
Vedanta Resources Ltd., 6.125%, 08/09/2024 | | | | | 900,000 | | | | 532,978 | | | | 0.11 | |
| | | | | | | | | 7,548,514 | | | | 1.53 | |
| | | | |
Indonesia (Cost $35,768,734) | | | | | | | | | | | | | | |
Indonesia (Rep of), 8.375%, 03/15/2024 | | IDR | | | 49,215,000,000 | | | | 3,224,203 | | | | 0.66 | |
Indonesia (Rep of), 8.125%, 05/15/2024 | | IDR | | | 19,857,000,000 | | | | 1,301,221 | | | | 0.27 | |
Indonesia (Rep of), 4.150%, 09/20/2027 | | | | | 420,000 | | | | 397,921 | | | | 0.08 | |
Indonesia (Rep of), 9.000%, 03/15/2029 | | IDR | | | 11,300,000,000 | | | | 781,712 | | | | 0.16 | |
Indonesia (Rep of), 8.250%, 05/15/2029 | | IDR | | | 23,273,000,000 | | | | 1,554,298 | | | | 0.32 | |
Indonesia (Rep of), 10.500%, 08/15/2030 | | IDR | | | 8,356,000,000 | | | | 626,499 | | | | 0.13 | |
Indonesia (Rep of), 7.000%, 09/15/2030 | | IDR | | | 7,151,000,000 | | | | 444,477 | | | | 0.09 | |
Indonesia (Rep of), 7.750%, 04/15/2031 | | IDR | | | 16,825,000,000 | | | | 1,092,345 | | | | 0.22 | |
Indonesia (Rep of), 8.750%, 05/15/2031 | | IDR | | | 16,566,000,000 | | | | 1,141,398 | | | | 0.23 | |
Indonesia (Rep of), 8.375%, 03/15/2034 | | IDR | | | 12,504,000,000 | | | | 840,435 | | | | 0.17 | |
Indonesia (Rep of), 7.500%, 06/15/2035 | | IDR | | | 10,880,000,000 | | | | 689,204 | | | | 0.14 | |
Indonesia (Rep of), 8.500%, 10/12/2035 | | | | | 624,000 | | | | 734,676 | | | | 0.15 | |
Indonesia (Rep of), 8.250%, 05/15/2036 | | IDR | | | 10,391,000,000 | | | | 693,011 | | | | 0.14 | |
Indonesia (Rep of), 6.625%, 02/17/2037 | | | | | 751,000 | | | | 777,206 | | | | 0.16 | |
Indonesia (Rep of), 7.750%, 01/17/2038 | | | | | 1,071,000 | | | | 1,187,746 | | | | 0.24 | |
Indonesia (Rep of), 7.500%, 05/15/2038 | | IDR | | | 8,539,000,000 | | | | 543,879 | | | | 0.11 | |
Indonesia (Rep of), 8.375%, 04/15/2039 | | IDR | | | 12,332,000,000 | | | | 834,716 | | | | 0.17 | |
Indonesia (Rep of), 5.250%, 01/17/2042 | | | | | 833,000 | | | | 757,169 | | | | 0.15 | |
Indonesia (Rep of), 5.125%, 01/15/2045 | | | | | 2,183,000 | | | | 1,923,282 | | | | 0.39 | |
Indonesia (Rep of), 5.950%, 01/08/2046 | | | | | 766,000 | | | | 741,771 | | | | 0.15 | |
Indonesia (Rep of), 5.250%, 01/08/2047 | | | | | 546,000 | | | | 489,599 | | | | 0.10 | |
Indonesia (Rep of), 4.750%, 07/18/2047 | | | | | 750,000 | | | | 625,992 | | | | 0.13 | |
Indonesia (Rep of), 4.200%, 10/15/2050 | | | | | 976,000 | | | | 736,790 | | | | 0.15 | |
Indonesia Asahan Aluminium Persero PT, 4.750%, 05/15/2025 | | | | | 376,000 | | | | 358,152 | | | | 0.07 | |
Indonesia Asahan Aluminium Persero PT, 5.450%, 05/15/2030 | | | | | 1,299,000 | | | | 1,137,517 | | | | 0.23 | |
Indonesia Asahan Aluminium Persero PT, 5.800%, 05/15/2050 | | | | | 200,000 | | | | 144,500 | | | | 0.03 | |
Pertamina Persero PT, 6.000%, 05/03/2042 | | | | | 529,000 | | | | 450,731 | | | | 0.09 | |
Pertamina Persero PT, 6.450%, 05/30/2044 | | | | | 831,000 | | | | 745,771 | | | | 0.15 | |
Pertamina Persero PT, 6.500%, 11/07/2048 | | | | | 567,000 | | | | 508,883 | | | | 0.10 | |
Pertamina Persero PT, 4.175%, 01/21/2050 | | | | | 622,000 | | | | 412,074 | | | | 0.08 | |
Perusahaan Penerbit SBSN Indonesia III, 4.325%, 05/28/2025 | | | | | 217,000 | | | | 213,549 | | | | 0.04 | |
Perusahaan Penerbit SBSN Indonesia III, 4.550%, 03/29/2026 | | | | | 1,329,000 | | | | 1,302,162 | | | | 0.27 | |
Perusahaan Penerbit SBSN Indonesia III, 4.700%, 06/06/2032 | | | | | 453,000 | | | | 423,253 | | | | 0.09 | |
Perusahaan Penerbit SBSN Indonesia III, 3.800%, 06/23/2050 | | | | | 298,000 | | | | 210,191 | | | | 0.04 | |
See accompanying notes to the financial statements.
78
ASHMORE EMERGING MARKETS TOTAL RETURN FUND
SCHEDULE OF INVESTMENTS (CONTINUED)
As of October 31, 2022
| | | | | | | | | | | | | | |
| | | Currency1 | | Par | | | Value | | | % of Net
Assets | |
Indonesia (continued) | | | | | | | | | | | | | | |
Perusahaan Perseroan Persero PT Perusahaan Listrik Negara, 5.250%, 10/24/2042 | | | | | 620,000 | | | $ | 450,706 | | | | 0.09 | |
Perusahaan Perseroan Persero PT Perusahaan Listrik Negara, 5.250%, 05/15/2047 | | | | | 388,000 | | | | 275,965 | | | | 0.06 | |
Perusahaan Perseroan Persero PT Perusahaan Listrik Negara, 6.150%, 05/21/2048 | | | | | 1,672,000 | | | | 1,316,700 | | | | 0.27 | |
| | | | | | | | | 30,089,704 | | | | 6.12 | |
| | | | |
Ivory Coast (Cost $4,637,040) | | | | | | | | | | | | | | |
Ivory Coast (Rep of), 5.875%, 10/17/2031 | | EUR | | | 1,353,000 | | | | 1,012,187 | | | | 0.21 | |
Ivory Coast (Rep of), 4.875%, 01/30/2032 | | EUR | | | 1,170,000 | | | | 809,862 | | | | 0.16 | |
Ivory Coast (Rep of), 6.875%, 10/17/2040 | | EUR | | | 1,015,000 | | | | 669,552 | | | | 0.14 | |
Ivory Coast (Rep of), 6.625%, 03/22/2048 | | EUR | | | 976,000 | | | | 607,655 | | | | 0.12 | |
| | | | | | | | | 3,099,256 | | | | 0.63 | |
| | | | |
Jamaica (Cost $3,509,417) | | | | | | | | | | | | | | |
Digicel Group Holdings Ltd., 7.000%, (49% PIK), 11/16/20225 | | | | | 182,108 | | | | 12,747 | | | | — | |
Digicel Group Holdings Ltd., 8.000%, 04/01/20255 | | | | | 1,751,382 | | | | 525,415 | | | | 0.11 | |
Digicel International Finance Ltd./Digicel International Holdings Ltd., 8.750%, 05/25/2024 | | | | | 720,000 | | | | 614,441 | | | | 0.12 | |
Digicel International Finance Ltd./Digicel International Holdings Ltd., 8.000%, 12/31/2026 | | | | | 400,000 | | | | 200,000 | | | | 0.04 | |
Jamaica (Rep of), 7.875%, 07/28/2045 | | | | | 950,000 | | | | 1,012,535 | | | | 0.21 | |
| | | | | | | | | 2,365,138 | | | | 0.48 | |
| | | | |
Kazakhstan (Cost $6,652,271) | | | | | | | | | | | | | | |
Kazakhstan (Rep of), 6.500%, 07/21/2045 | | | | | 1,217,000 | | | | 1,077,045 | | | | 0.22 | |
Kazakhstan Temir Zholy Finance B.V., 6.950%, 07/10/2042 | | | | | 1,031,000 | | | | 1,015,535 | | | | 0.20 | |
KazMunayGas National Co. JSC, 5.375%, 04/24/2030 | | | | | 1,385,000 | | | | 1,136,154 | | | | 0.23 | |
KazMunayGas National Co. JSC, 3.500%, 04/14/2033 | | | | | 491,000 | | | | 329,304 | | | | 0.07 | |
KazMunayGas National Co. JSC, 6.375%, 10/24/2048 | | | | | 1,088,000 | | | | 780,705 | | | | 0.16 | |
| | | | | | | | | 4,338,743 | | | | 0.88 | |
| | | | |
Lebanon (Cost $12,091,493) | | | | | | | | | | | | | | |
Lebanon (Rep of), 6.375%, 03/09/20207,8 | | | | | 1,855,000 | | | | 106,662 | | | | 0.02 | |
Lebanon (Rep of), 5.800%, 04/14/20207,8 | | | | | 1,719,000 | | | | 100,699 | | | | 0.02 | |
Lebanon (Rep of), 6.150%, 06/19/20207,8 | | | | | 3,148,000 | | | | 184,410 | | | | 0.04 | |
Lebanon (Rep of), 8.250%, 04/12/20217,8 | | | | | 1,610,000 | | | | 96,922 | | | | 0.02 | |
Lebanon (Rep of), 6.100%, 10/04/20227,8 | | | | | 4,808,000 | | | | 289,442 | | | | 0.06 | |
Lebanon (Rep of), 6.000%, 01/27/20237 | | | | | 1,000 | | | | 60 | | | | — | |
Lebanon (Rep of), 6.600%, 11/27/20267 | | | | | 1,089,000 | | | | 64,171 | | | | 0.01 | |
Lebanon (Rep of), 6.850%, 03/23/20277 | | | | | 2,314,000 | | | | 136,526 | | | | 0.03 | |
Lebanon (Rep of), 7.000%, 03/23/20327 | | | | | 1,395,000 | | | | 82,305 | | | | 0.02 | |
Lebanon (Rep of), 7.050%, 11/02/20357 | | | | | 244,000 | | | | 14,396 | | | | — | |
Lebanon (Rep of), 7.250%, 03/23/20377 | | | | | 867,000 | | | | 51,638 | | | | 0.01 | |
| | | | | | | | | 1,127,231 | | | | 0.23 | |
See accompanying notes to the financial statements.
79
ASHMORE EMERGING MARKETS TOTAL RETURN FUND
SCHEDULE OF INVESTMENTS (CONTINUED)
As of October 31, 2022
| | | | | | | | | | | | | | |
| | | Currency1 | | Par | | | Value | | | % of Net
Assets | |
Malaysia (Cost $24,274,443) | | | | | | | | | | | | | | |
Malaysia (Rep of), 3.757%, 04/20/2023 | | MYR | | | 45,306,000 | | | $ | 9,626,761 | | | | 1.96 | |
Malaysia (Rep of), 3.478%, 06/14/2024 | | MYR | | | 6,560,000 | | | | 1,388,264 | | | | 0.28 | |
Malaysia (Rep of), 4.232%, 06/30/2031 | | MYR | | | 2,488,000 | | | | 515,675 | | | | 0.11 | |
Malaysia (Rep of), 3.582%, 07/15/2032 | | MYR | | | 2,208,000 | | | | 438,130 | | | | 0.09 | |
Malaysia (Rep of), 3.828%, 07/05/2034 | | MYR | | | 3,842,000 | | | | 750,835 | | | | 0.15 | |
Malaysia (Rep of), 4.254%, 05/31/2035 | | MYR | | | 2,888,000 | | | | 585,722 | | | | 0.12 | |
Malaysia (Rep of), 4.893%, 06/08/2038 | | MYR | | | 1,707,000 | | | | 363,559 | | | | 0.07 | |
Malaysia (Rep of), 3.757%, 05/22/2040 | | MYR | | | 2,004,000 | | | | 365,892 | | | | 0.07 | |
Malaysia (Rep of), 4.935%, 09/30/2043 | | MYR | | | 747,000 | | | | 157,681 | | | | 0.03 | |
Malaysia (Rep of), 4.921%, 07/06/2048 | | MYR | | | 1,743,000 | | | | 365,341 | | | | 0.07 | |
Malaysia (Rep of), 4.065%, 06/15/2050 | | MYR | | | 2,911,000 | | | | 532,446 | | | | 0.11 | |
Petronas Capital Ltd., 2.480%, 01/28/2032 | | | | | 1,120,000 | | | | 890,042 | | | | 0.18 | |
Petronas Capital Ltd., 4.550%, 04/21/2050 | | | | | 2,081,000 | | | | 1,706,219 | | | | 0.35 | |
Petronas Capital Ltd., 4.800%, 04/21/2060 | | | | | 918,000 | | | | 759,636 | | | | 0.16 | |
Petronas Capital Ltd., 3.404%, 04/28/2061 | | | | | 1,513,000 | | | | 932,909 | | | | 0.19 | |
| | | | | | | | | 19,379,112 | | | | 3.94 | |
| | | | |
Mexico (Cost $55,404,963) | | | | | | | | | | | | | | |
Banco Mercantil del Norte S.A., (Variable, U.S. Treasury Yield Curve Rate CMT 5Y + 4.643%), 5.875%, 01/24/20273 | | | | | 1,004,000 | | | | 765,364 | | | | 0.16 | |
Banco Mercantil del Norte S.A., (Variable, U.S. Treasury Yield Curve Rate CMT 10Y + 5.470%), 7.500%, 06/27/20293 | | | | | 226,000 | | | | 176,408 | | | | 0.04 | |
Banco Mercantil del Norte S.A., (Variable, U.S. Treasury Yield Curve Rate CMT 10Y + 7.760%), 8.375%, 10/14/20303 | | | | | 200,000 | | | | 173,926 | | | | 0.03 | |
Comision Federal de Electricidad, 8.180%, 12/23/2027 | | MXN | | | 24,850,000 | | | | 1,102,083 | | | | 0.22 | |
Comision Federal de Electricidad, 3.875%, 07/26/20336 | | | | | 736,000 | | | | 524,400 | | | | 0.11 | |
Mexican Bonos, 10.000%, 12/05/2024 | | MXN | | | 93,970,000 | | | | 4,720,701 | | | | 0.96 | |
Mexican Bonos, 5.750%, 03/05/2026 | | MXN | | | 108,590,000 | | | | 4,832,233 | | | | 0.98 | |
Mexican Bonos, 5.500%, 03/04/2027 | | MXN | | | 79,490,000 | | | | 3,396,570 | | | | 0.69 | |
Mexican Bonos, 7.750%, 05/29/2031 | | MXN | | | 51,490,000 | | | | 2,287,379 | | | | 0.46 | |
Mexican Bonos, 7.750%, 11/23/2034 | | MXN | | | 32,200,000 | | | | 1,382,333 | | | | 0.28 | |
Mexican Bonos, 10.000%, 11/20/2036 | | MXN | | | 40,020,000 | | | | 2,028,627 | | | | 0.41 | |
Mexican Bonos, 8.500%, 11/18/2038 | | MXN | | | 30,270,000 | | | | 1,345,205 | | | | 0.27 | |
Mexican Bonos, 7.750%, 11/13/2042 | | MXN | | | 29,770,000 | | | | 1,210,821 | | | | 0.25 | |
Mexico (Rep of), 2.659%, 05/24/2031 | | | | | 692,000 | | | | 535,706 | | | | 0.11 | |
Mexico (Rep of), 4.875%, 05/19/2033 | | | | | 711,000 | | | | 625,552 | | | | 0.13 | |
Mexico (Rep of), 6.050%, 01/11/2040 | | | | | 582,000 | | | | 535,255 | | | | 0.11 | |
Mexico (Rep of), 4.280%, 08/14/2041 | | | | | 858,000 | | | | 620,839 | | | | 0.13 | |
Mexico (Rep of), 4.750%, 03/08/2044 | | | | | 450,000 | | | | 341,141 | | | | 0.07 | |
Mexico (Rep of), 5.550%, 01/21/2045 | | | | | 924,000 | | | | 780,003 | | | | 0.16 | |
Mexico (Rep of), 3.771%, 05/24/2061 | | | | | 4,491,000 | | | | 2,606,517 | | | | 0.53 | |
Mexico (Rep of), 3.750%, 04/19/2071 | | | | | 3,424,000 | | | | 1,956,324 | | | | 0.40 | |
Mexico (Rep of), 5.750%, 10/12/2110 | | | | | 1,116,000 | | | | 846,474 | | | | 0.17 | |
Petroleos Mexicanos, 7.190%, 09/12/2024 | | MXN | | | 44,460,000 | | | | 2,032,525 | | | | 0.41 | |
Petroleos Mexicanos, 6.750%, 09/21/2047 | | | | | 4,035,000 | | | | 2,430,203 | | | | 0.49 | |
Petroleos Mexicanos, 6.350%, 02/12/2048 | | | | | 1,400,000 | | | | 803,348 | | | | 0.16 | |
See accompanying notes to the financial statements.
80
ASHMORE EMERGING MARKETS TOTAL RETURN FUND
SCHEDULE OF INVESTMENTS (CONTINUED)
As of October 31, 2022
| | | | | | | | | | | | | | |
| | | Currency1 | | Par | | | Value | | | % of Net
Assets | |
Mexico (continued) | | | | | | | | | | | | | | |
Petroleos Mexicanos, 7.690%, 01/23/2050 | | | | | 5,101,000 | | | $ | 3,323,152 | | | | 0.68 | |
Petroleos Mexicanos, 6.950%, 01/28/2060 | | | | | 6,933,000 | | | | 4,160,685 | | | | 0.85 | |
| | | | | | | | | 45,543,774 | | | | 9.26 | |
| | | | |
Mongolia (Cost $816,249) | | | | | | | | | | | | | | |
Development Bank of Mongolia LLC, 7.250%, 10/23/2023 | | | | | 470,000 | | | | 413,130 | | | | 0.08 | |
Mongolia (Rep of), 5.625%, 05/01/2023 | | | | | 203,000 | | | | 191,327 | | | | 0.04 | |
Mongolian Mining Corp., 2.259%, 04/01/20235,10 | | | | | 471,317 | | | | 158,363 | | | | 0.03 | |
| | | | | | | | | 762,820 | | | | 0.15 | |
| | | | |
Morocco (Cost $1,994,316) | | | | | | | | | | | | | | |
Morocco (Rep of), 4.250%, 12/11/2022 | | | | | 1,015,000 | | | | 1,011,653 | | | | 0.21 | |
Morocco (Rep of), 5.500%, 12/11/2042 | | | | | 533,000 | | | | 399,750 | | | | 0.08 | |
Morocco (Rep of), 4.000%, 12/15/2050 | | | | | 410,000 | | | | 241,934 | | | | 0.05 | |
| | | | | | | | | 1,653,337 | | | | 0.34 | |
| | | | |
Nigeria (Cost $6,630,796) | | | | | | | | | | | | | | |
Nigeria (Rep of), 6.500%, 11/28/2027 | | | | | 736,000 | | | | 520,720 | | | | 0.11 | |
Nigeria (Rep of), 8.375%, 03/24/2029 | | | | | 886,000 | | | | 640,135 | | | | 0.13 | |
Nigeria (Rep of), 7.375%, 09/28/20336 | | | | | 1,379,000 | | | | 830,847 | | | | 0.17 | |
Nigeria (Rep of), 7.696%, 02/23/2038 | | | | | 963,000 | | | | 563,355 | | | | 0.11 | |
Nigeria (Rep of), 7.625%, 11/28/2047 | | | | | 1,280,000 | | | | 724,480 | | | | 0.15 | |
Nigeria (Rep of), 9.248%, 01/21/2049 | | | | | 480,000 | | | | 310,301 | | | | 0.06 | |
Nigeria (Rep of), 8.250%, 09/28/20516 | | | | | 1,017,000 | | | | 587,989 | | | | 0.12 | |
| | | | | | | | | 4,177,827 | | | | 0.85 | |
| | | | |
Oman (Cost $11,423,901) | | | | | | | | | | | | | | |
Oman (Rep of), 4.750%, 06/15/2026 | | | | | 1,545,000 | | | | 1,460,353 | | | | 0.30 | |
Oman (Rep of), 6.750%, 10/28/2027 | | | | | 1,857,000 | | | | 1,860,469 | | | | 0.38 | |
Oman (Rep of), 6.000%, 08/01/2029 | | | | | 1,511,000 | | | | 1,434,187 | | | | 0.29 | |
Oman (Rep of), 6.250%, 01/25/2031 | | | | | 430,000 | | | | 409,575 | | | | 0.08 | |
Oman (Rep of), 6.500%, 03/08/2047 | | | | | 3,384,000 | | | | 2,783,996 | | | | 0.57 | |
Oman (Rep of), 6.750%, 01/17/2048 | | | | | 1,674,000 | | | | 1,404,067 | | | | 0.28 | |
Oman (Rep of), 7.000%, 01/25/2051 | | | | | 1,040,000 | | | | 886,026 | | | | 0.18 | |
| | | | | | | | | 10,238,673 | | | | 2.08 | |
| | | | |
Pakistan (Cost $11,178,024) | | | | | | | | | | | | | | |
Pakistan (Rep of), 8.250%, 04/15/2024 | | | | | 2,690,000 | | | | 1,149,975 | | | | 0.23 | |
Pakistan (Rep of), 8.250%, 09/30/2025 | | | | | 794,000 | | | | 281,870 | | | | 0.06 | |
Pakistan (Rep of), 6.875%, 12/05/2027 | | | | | 1,277,000 | | | | 396,636 | | | | 0.08 | |
Pakistan (Rep of), 7.375%, 04/08/2031 | | | | | 2,662,000 | | | | 825,220 | | | | 0.17 | |
Pakistan (Rep of), 8.875%, 04/08/2051 | | | | | 2,419,000 | | | | 735,981 | | | | 0.15 | |
Pakistan Water & Power Development Authority, 7.500%, 06/04/2031 | | | | | 761,000 | | | | 229,974 | | | | 0.05 | |
Third Pakistan International Sukuk (The) Co. Ltd., 5.625%, 12/05/2022 | | | | | 1,336,000 | | | | 1,203,629 | | | | 0.24 | |
| | | | | | | | | 4,823,285 | | | | 0.98 | |
See accompanying notes to the financial statements.
81
ASHMORE EMERGING MARKETS TOTAL RETURN FUND
SCHEDULE OF INVESTMENTS (CONTINUED)
As of October 31, 2022
| | | | | | | | | | | | | | |
| | | Currency1 | | Par | | | Value | | | % of Net
Assets | |
Panama (Cost $6,328,553) | | | | | | | | | | | | | | |
Panama (Rep of), 4.000%, 09/22/2024 | | | | | 270,000 | | | $ | 261,254 | | | | 0.05 | |
Panama (Rep of), 7.125%, 01/29/2026 | | | | | 309,000 | | | | 323,043 | | | | 0.07 | |
Panama (Rep of), 8.875%, 09/30/2027 | | | | | 663,000 | | | | 750,511 | | | | 0.15 | |
Panama (Rep of), 9.375%, 04/01/2029 | | | | | 737,000 | | | | 850,616 | | | | 0.17 | |
Panama (Rep of), 6.700%, 01/26/2036 | | | | | 1,477,000 | | | | 1,435,006 | | | | 0.29 | |
Panama (Rep of), 4.500%, 05/15/2047 | | | | | 460,000 | | | | 317,896 | | | | 0.07 | |
Panama (Rep of), 4.300%, 04/29/2053 | | | | | 1,281,000 | | | | 830,567 | | | | 0.17 | |
| | | | | | | | | 4,768,893 | | | | 0.97 | |
| | | | |
Paraguay (Cost $1,430,448) | | | | | | | | | | | | | | |
Paraguay (Rep of), 4.700%, 03/27/2027 | | | | | 446,000 | | | | 426,225 | | | | 0.08 | |
Paraguay (Rep of), 5.400%, 03/30/2050 | | | | | 890,000 | | | | 682,380 | | | | 0.14 | |
| | | | | | | | | 1,108,605 | | | | 0.22 | |
| | | | |
Peru (Cost $17,288,441) | | | | | | | | | | | | | | |
Peru (Rep of), 7.350%, 07/21/2025 | | | | | 1,433,000 | | | | 1,491,148 | | | | 0.30 | |
Peru (Rep of), 5.940%, 02/12/2029 | | PEN | | | 5,105,000 | | | | 1,149,178 | | | | 0.23 | |
Peru (Rep of), 6.950%, 08/12/2031 | | PEN | | | 5,476,000 | | | | 1,262,979 | | | | 0.26 | |
Peru (Rep of), 8.750%, 11/21/2033 | | | | | 2,336,000 | | | | 2,760,065 | | | | 0.56 | |
Peru (Rep of), 5.400%, 08/12/2034 | | PEN | | | 7,841,000 | | | | 1,518,620 | | | | 0.31 | |
Peru (Rep of), 3.300%, 03/11/2041 | | | | | 343,000 | | | | 230,673 | | | | 0.05 | |
Peru (Rep of), 5.625%, 11/18/2050 | | | | | 1,268,000 | | | | 1,160,005 | | | | 0.24 | |
Peru (Rep of), 2.780%, 12/01/2060 | | | | | 1,655,000 | | | | 882,021 | | | | 0.18 | |
Peru (Rep of), 3.230%, 07/28/2121 | | | | | 675,000 | | | | 358,809 | | | | 0.07 | |
Petroleos del Peru S.A., 5.625%, 06/19/2047 | | | | | 3,239,000 | | | | 2,077,592 | | | | 0.42 | |
| | | | | | | | | 12,891,090 | | | | 2.62 | |
| | | | |
Philippines (Cost $10,215,067) | | | | | | | | | | | | | | |
Philippines (Rep of), 3.900%, 11/26/2022 | | PHP | | | 35,000,000 | | | | 597,906 | | | | 0.12 | |
Philippines (Rep of), 10.625%, 03/16/2025 | | | | | 647,000 | | | | 722,032 | | | | 0.15 | |
Philippines (Rep of), 9.500%, 02/02/2030 | | | | | 1,380,000 | | | | 1,652,526 | | | | 0.33 | |
Philippines (Rep of), 7.750%, 01/14/2031 | | | | | 1,245,000 | | | | 1,407,966 | | | | 0.29 | |
Philippines (Rep of), 6.375%, 10/23/2034 | | | | | 1,040,000 | | | | 1,073,270 | | | | 0.22 | |
Philippines (Rep of), 6.250%, 01/14/2036 | | PHP | | | 12,000,000 | | | | 187,471 | | | | 0.04 | |
Philippines (Rep of), 3.950%, 01/20/2040 | | | | | 2,155,000 | | | | 1,664,738 | | | | 0.34 | |
Philippines (Rep of), 2.950%, 05/05/2045 | | | | | 784,000 | | | | 510,984 | | | | 0.10 | |
Philippines (Rep of), 4.200%, 03/29/2047 | | | | | 456,000 | | | | 354,188 | | | | 0.07 | |
| | | | | | | | | 8,171,081 | | | | 1.66 | |
| | | | |
Poland (Cost $9,351,913) | | | | | | | | | | | | | | |
Poland (Rep of), 2.500%, 04/25/2024 | | PLN | | | 29,369,000 | | | | 5,659,597 | | | | 1.15 | |
Poland (Rep of), 2.500%, 07/25/2026 | | PLN | | | 1,468,000 | | | | 246,978 | | | | 0.05 | |
Poland (Rep of), 0.250%, 10/25/2026 | | PLN | | | 1,469,000 | | | | 222,068 | | | | 0.05 | |
Poland (Rep of), 3.750%, 05/25/2027 | | PLN | | | 10,579,000 | | | | 1,817,493 | | | | 0.37 | |
Poland (Rep of), 2.500%, 07/25/2027 | | PLN | | | 1,529,000 | | | | 246,864 | | | | 0.05 | |
| | | | | | | | | 8,193,000 | | | | 1.67 | |
See accompanying notes to the financial statements.
82
ASHMORE EMERGING MARKETS TOTAL RETURN FUND
SCHEDULE OF INVESTMENTS (CONTINUED)
As of October 31, 2022
| | | | | | | | | | | | | | |
| | | Currency1 | | Par | | | Value | | | % of Net
Assets | |
Qatar (Cost $9,617,504) | | | | | | | | | | | | | | |
Qatar (Rep of), 3.250%, 06/02/2026 | | | | | 2,037,000 | | | $ | 1,924,794 | | | | 0.39 | |
Qatar (Rep of), 4.817%, 03/14/2049 | | | | | 2,592,000 | | | | 2,307,004 | | | | 0.47 | |
Qatar (Rep of), 4.400%, 04/16/2050 | | | | | 530,000 | | | | 445,200 | | | | 0.09 | |
Qatar Energy, 3.125%, 07/12/2041 | | | | | 3,659,000 | | | | 2,593,499 | | | | 0.53 | |
| | | | | | | | | 7,270,497 | | | | 1.48 | |
| | | | |
Romania (Cost $9,369,767) | | | | | | | | | | | | | | |
Romania (Rep of), 3.000%, 02/27/2027 | | | | | 558,000 | | | | 478,148 | | | | 0.10 | |
Romania (Rep of), 5.800%, 07/26/2027 | | RON | | | 10,340,000 | | | | 1,814,562 | | | | 0.37 | |
Romania (Rep of), 4.150%, 10/24/2030 | | RON | | | 6,725,000 | | | | 976,251 | | | | 0.20 | |
Romania (Rep of), 3.000%, 02/14/2031 | | | | | 400,000 | | | | 295,456 | | | | 0.06 | |
Romania (Rep of), 3.625%, 03/27/2032 | | | | | 1,046,000 | | | | 770,462 | | | | 0.16 | |
Romania (Rep of), 6.125%, 01/22/2044 | | | | | 340,000 | | | | 271,639 | | | | 0.05 | |
Romania (Rep of), 4.000%, 02/14/2051 | | | | | 2,728,000 | | | | 1,593,283 | | | | 0.32 | |
| | | | | | | | | 6,199,801 | | | | 1.26 | |
| | | | |
Russian Federation (Cost $4,860,792) | | | | | | | | | | | | | | |
Russian Federal Bond - OFZ, 6.900%, 05/23/20297,11 | | RUB | | | 177,590,000 | | | | 143,103 | | | | 0.03 | |
Russian Federal Bond - OFZ, 8.500%, 09/17/20317,11 | | RUB | | | 142,679,000 | | | | 114,971 | | | | 0.02 | |
Russian Federal Bond - OFZ, 7.250%, 05/10/20347,11 | | RUB | | | 13,248,000 | | | | 10,675 | | | | — | |
| | | | | | | | | 268,749 | | | | 0.05 | |
| | | | |
Saudi Arabia (Cost $13,492,873) | | | | | | | | | | | | | | |
Saudi (Rep of), 4.375%, 04/16/2029 | | | | | 840,000 | | | | 801,696 | | | | 0.16 | |
Saudi (Rep of), 5.500%, 10/25/20326 | | | | | 895,000 | | | | 906,188 | | | | 0.18 | |
Saudi (Rep of), 4.625%, 10/04/2047 | | | | | 1,008,000 | | | | 810,069 | | | | 0.17 | |
Saudi (Rep of), 5.000%, 04/17/2049 | | | | | 1,903,000 | | | | 1,617,550 | | | | 0.33 | |
Saudi (Rep of), 5.250%, 01/16/2050 | | | | | 1,801,000 | | | | 1,592,048 | | | | 0.32 | |
Saudi (Rep of), 3.750%, 01/21/2055 | | | | | 1,657,000 | | | | 1,153,686 | | | | 0.24 | |
Saudi (Rep of), 4.500%, 04/22/2060 | | | | | 1,128,000 | | | | 884,792 | | | | 0.18 | |
Saudi (Rep of), 3.450%, 02/02/2061 | | | | | 3,142,000 | | | | 2,013,708 | | | | 0.41 | |
| | | | | | | | | 9,779,737 | | | | 1.99 | |
| | | | |
South Africa (Cost $24,471,181) | | | | | | | | | | | | | | |
South Africa (Rep of), 4.300%, 10/12/2028 | | | | | 3,024,000 | | | | 2,579,049 | | | | 0.53 | |
South Africa (Rep of), 8.000%, 01/31/2030 | | ZAR | | | 64,736,360 | | | | 3,021,706 | | | | 0.62 | |
South Africa (Rep of), 5.875%, 06/22/2030 | | | | | 357,000 | | | | 316,266 | | | | 0.06 | |
South Africa (Rep of), 8.250%, 03/31/2032 | | ZAR | | | 78,210,939 | | | | 3,505,894 | | | | 0.71 | |
South Africa (Rep of), 5.875%, 04/20/2032 | | | | | 998,000 | | | | 852,611 | | | | 0.17 | |
South Africa (Rep of), 8.875%, 02/28/2035 | | ZAR | | | 35,859,000 | | | | 1,590,631 | | | | 0.32 | |
South Africa (Rep of), 8.500%, 01/31/2037 | | ZAR | | | 61,447,260 | | | | 2,572,129 | | | | 0.52 | |
South Africa (Rep of), 9.000%, 01/31/2040 | | ZAR | | | 25,913,520 | | | | 1,110,393 | | | | 0.23 | |
South Africa (Rep of), 8.750%, 01/31/2044 | | ZAR | | | 3,000 | | | | 124 | | | | — | |
South Africa (Rep of), 5.000%, 10/12/2046 | | | | | 467,000 | | | | 292,940 | | | | 0.06 | |
South Africa (Rep of), 5.650%, 09/27/2047 | | | | | 1,588,000 | | | | 1,056,020 | | | | 0.22 | |
South Africa (Rep of), 8.750%, 02/28/2048 | | ZAR | | | 7,000 | | | | 287 | | | | — | |
See accompanying notes to the financial statements.
83
ASHMORE EMERGING MARKETS TOTAL RETURN FUND
SCHEDULE OF INVESTMENTS (CONTINUED)
As of October 31, 2022
| | | | | | | | | | | | | | |
| | | Currency1 | | Par | | | Value | | | % of Net
Assets | |
South Africa (continued) | | | | | | | | | | | | | | |
South Africa (Rep of), 5.750%, 09/30/2049 | | | | | 1,648,000 | | | $ | 1,093,118 | | | | 0.22 | |
| | | | | | | | | 17,991,168 | | | | 3.66 | |
| | | | |
Sri Lanka (Cost $2,320,884) | | | | | | | | | | | | | | |
Sri Lanka (Rep of), 6.750%, 04/18/20287 | | | | | 470,000 | | | | 103,548 | | | | 0.02 | |
Sri Lanka (Rep of), 7.850%, 03/14/20297 | | | | | 1,248,000 | | | | 276,209 | | | | 0.06 | |
Sri Lanka (Rep of), 7.550%, 03/28/20307 | | | | | 1,078,000 | | | | 238,098 | | | | 0.05 | |
| | | | | | | | | 617,855 | | | | 0.13 | |
| | | | |
Thailand (Cost $5,537,945) | | | | | | | | | | | | | | |
Thailand (Rep of), 2.000%, 12/17/2031 | | THB | | | 24,345,000 | | | | 581,724 | | | | 0.12 | |
Thailand (Rep of), 1.585%, 12/17/2035 | | THB | | | 44,395,000 | | | | 919,542 | | | | 0.19 | |
Thailand (Rep of), 3.400%, 06/17/2036 | | THB | | | 17,483,000 | | | | 445,676 | | | | 0.09 | |
Thailand (Rep of), 3.300%, 06/17/2038 | | THB | | | 27,502,000 | | | | 675,725 | | | | 0.14 | |
Thailand (Rep of), 2.000%, 06/17/2042 | | THB | | | 44,923,000 | | | | 867,367 | | | | 0.17 | |
Thailand (Rep of), 2.875%, 06/17/2046 | | THB | | | 4,854,000 | | | | 102,319 | | | | 0.02 | |
Thailand (Rep of), 3.600%, 06/17/2067 | | THB | | | 18,378,000 | | | | 382,161 | | | | 0.08 | |
| | | | | | | | | 3,974,514 | | | | 0.81 | |
| | | | |
Turkey (Cost $6,199,787) | | | | | | | | | | | | | | |
Turkey (Rep of), 3.250%, 03/23/2023 | | | | | 890,000 | | | | 884,696 | | | | 0.18 | |
Turkey (Rep of), 6.000%, 01/14/2041 | | | | | 465,000 | | | | 299,497 | | | | 0.06 | |
Turkey (Rep of), 4.875%, 04/16/2043 | | | | | 2,105,000 | | | | 1,229,025 | | | | 0.25 | |
Turkey (Rep of), 5.750%, 05/11/2047 | | | | | 4,410,000 | | | | 2,709,963 | | | | 0.55 | |
| | | | | | | | | 5,123,181 | | | | 1.04 | |
| | | | |
Ukraine (Cost $3,240,353) | | | | | | | | | | | | | | |
Ukraine (Rep of), 9.750%, 11/01/20307 | | | | | 1,055,000 | | | | 189,077 | | | | 0.04 | |
Ukraine (Rep of), 6.876%, 05/21/20317 | | | | | 1,468,000 | | | | 207,722 | | | | 0.04 | |
Ukraine (Rep of), 7.375%, 09/25/20347 | | | | | 621,000 | | | | 96,255 | | | | 0.02 | |
Ukraine (Rep of), 7.253%, 03/15/20357 | | | | | 1,153,000 | | | | 176,354 | | | | 0.04 | |
| | | | | | | | | 669,408 | | | | 0.14 | |
| | | | |
United Arab Emirates (Cost $5,512,140) | | | | | | | | | | | | | | |
Abu Dhabi (Gov’t of), 3.125%, 09/30/2049 | | | | | 1,846,000 | | | | 1,241,509 | | | | 0.25 | |
Abu Dhabi (Gov’t of), 3.875%, 04/16/2050 | | | | | 1,881,000 | | | | 1,455,217 | | | | 0.29 | |
DP World Crescent Ltd., 3.875%, 07/18/2029 | | | | | 641,000 | | | | 570,271 | | | | 0.12 | |
DP World Crescent Ltd., 3.750%, 01/30/2030 | | | | | 604,000 | | | | 529,714 | | | | 0.11 | |
| | | | | | | | | 3,796,711 | | | | 0.77 | |
| | | | |
Uruguay (Cost $13,023,508) | | | | | | | | | | | | | | |
Uruguay (Rep of), 8.500%, 03/15/2028 | | UYU | | | 15,190,000 | | | | 329,955 | | | | 0.07 | |
Uruguay (Rep of), 4.375%, 12/15/2028 | | UYU | | | 8,870,757 | | | | 556,196 | | | | 0.11 | |
Uruguay (Rep of), 8.250%, 05/21/2031 | | UYU | | | 63,603,828 | | | | 1,296,165 | | | | 0.26 | |
Uruguay (Rep of), 7.875%, 01/15/2033 | | | | | 1,417,380 | | | | 1,662,213 | | | | 0.34 | |
Uruguay (Rep of), 5.750%, 10/28/2034 | | | | | 1,045,000 | | | | 1,063,861 | | | | 0.22 | |
Uruguay (Rep of), 7.625%, 03/21/2036 | | | | | 993,660 | | | | 1,173,117 | | | | 0.24 | |
Uruguay (Rep of), 3.875%, 07/02/2040 | | UYU | | | 38,736,000 | | | | 1,145,003 | | | | 0.23 | |
See accompanying notes to the financial statements.
84
ASHMORE EMERGING MARKETS TOTAL RETURN FUND
SCHEDULE OF INVESTMENTS (CONTINUED)
As of October 31, 2022
| | | | | | | | | | | | | | |
| | | Currency1 | | Par | | | Value | | | % of Net
Assets | |
Uruguay (continued) | | | | | | | | | | | | | | |
Uruguay (Rep of), 4.125%, 11/20/2045 | | | | | 890,665 | | | $ | 750,761 | | | | 0.15 | |
Uruguay (Rep of), 5.100%, 06/18/2050 | | | | | 1,034,264 | | | | 923,825 | | | | 0.19 | |
Uruguay (Rep of), 4.975%, 04/20/2055 | | | | | 2,123,300 | | | | 1,839,767 | | | | 0.37 | |
Uruguay Monetary Regulation Bill, 0.000%, 10/26/20234,11 | | UYU | | | 3,921,000 | | | | 86,071 | | | | 0.02 | |
| | | | | | | | | 10,826,934 | | | | 2.20 | |
| | | | |
Venezuela (Cost $49,980,026) | | | | | | | | | | | | | | |
Petroleos de Venezuela S.A., 8.500%, 10/27/20207,8 | | | | | 28,100,000 | | | | 4,917,500 | | | | 1.00 | |
Petroleos de Venezuela S.A., 9.000%, 11/17/20217,8 | | | | | 3,789,076 | | | | 75,782 | | | | 0.01 | |
Petroleos de Venezuela S.A., 12.750%, 02/17/20227,8 | | | | | 1,695,000 | | | | 33,900 | | | | 0.01 | |
Petroleos de Venezuela S.A., 5.375%, 04/12/20277 | | | | | 1,590,000 | | | | 31,800 | | | | 0.01 | |
Petroleos de Venezuela S.A., 9.750%, 05/17/20357 | | | | | 5,253,147 | | | | 105,063 | | | | 0.02 | |
Venezuela (Rep of), 7.750%, 10/13/20197,8 | | | | | 1,638,000 | | | | 94,185 | | | | 0.02 | |
Venezuela (Rep of), 12.750%, 08/23/20227,8 | | | | | 3,246,000 | | | | 227,220 | | | | 0.05 | |
Venezuela (Rep of), 9.000%, 05/07/20237 | | | | | 1,407,000 | | | | 80,903 | | | | 0.02 | |
Venezuela (Rep of), 8.250%, 10/13/20247 | | | | | 3,213,200 | | | | 208,858 | | | | 0.04 | |
Venezuela (Rep of), 11.750%, 10/21/20267 | | | | | 12,976,000 | | | | 875,880 | | | | 0.18 | |
Venezuela (Rep of), 9.250%, 09/15/20277 | | | | | 3,647,000 | | | | 246,172 | | | | 0.05 | |
Venezuela (Rep of), 9.250%, 05/07/20287 | | | | | 2,317,000 | | | | 156,397 | | | | 0.03 | |
Venezuela (Rep of), 11.950%, 08/05/20317 | | | | | 21,478,800 | | | | 1,449,819 | | | | 0.29 | |
| | | | | | | | | 8,503,479 | | | | 1.73 | |
| | | | |
Vietnam (Cost $1,268,287) | | | | | | | | | | | | | | |
Vietnam (Rep of), 4.800%, 11/19/2024 | | | | | 1,241,000 | | | | 1,194,462 | | | | 0.24 | |
| | | | | | | | | 1,194,462 | | | | 0.24 | |
| | | | |
Zambia (Cost $1,291,898) | | | | | | | | | | | | | | |
Zambia (Rep of), 8.970%, 07/30/20277 | | | | | 1,787,000 | | | | 703,542 | | | | 0.14 | |
| | | | | | | | | 703,542 | | | | 0.14 | |
| | | | |
Total Debt Securities (Cost $676,163,056) | | | | | | | | | 407,570,575 | | | | 82.86 | |
| | | | |
Total Investments (Total Cost $676,163,056) | | | | | | | | | 407,570,575 | | | | 82.86 | |
| | | | |
Other Assets Less Liabilities (See Statements of Assets and
Liabilities for further detail) | | | | | | | | | 84,293,619 | | | | 17.14 | |
| | | | |
Net Assets | | | | | | | | $ | 491,864,194 | | | | 100.00 | |
| 1 | Local currency is United States Dollars unless otherwise noted below. |
| 2 | Step coupon bond. Rate as of October 31, 2022 is disclosed. |
| 3 | Variable rate security. Security issued at a fixed coupon rate, which converts to a variable rate at a specified date. Rate shown is the rate in effect as of period end. |
| 5 | Security is a payment-in-kind bond, and unless otherwise noted in the description of the security, pays its entire coupon on an in-kind basis. |
| 6 | Securities exempt from registration under Rule 144A of the Securities Act of 1933. These securities may not be publicly traded without registration under the Securities Act of 1933. |
| 7 | Issuer has defaulted on terms of debt obligation. |
See accompanying notes to the financial statements.
85
ASHMORE EMERGING MARKETS TOTAL RETURN FUND
SCHEDULE OF INVESTMENTS (CONTINUED)
As of October 31, 2022
| 8 | Maturity has been extended under the terms of a plan of reorganization. |
| 9 | Security has been deemed worthless and is a Level 3 investment. |
| 10 | Zero coupon bond – interest rate reflects effective yield on the date of purchase. |
| 11 | Security is a Level 3 investment. |
Percentages shown are based on net assets.
At October 31, 2022, the Ashmore Emerging Markets Total Return Fund had outstanding forward foreign currency exchange contracts as follows:
| | | | | | | | | | | | | | | | | | |
Settlement Date | | Counterparty | | Currency Buy | | Currency Buy Amount (Local Currency) | | | Currency Sell | | Currency Sell Amount (Local Currency) | | | Unrealized
Gain/(Loss) | |
| |
| | | | | | |
| 11/03/2022 | | HSBC Bank | | Brazilian Real | | | 7,475,815 | | | United States Dollar | | | 1,385,000 | | | $ | 61,276 | |
| | | | | | |
| 11/03/2022 | | JP Morgan | | Brazilian Real | | | 1,900,000 | | | United States Dollar | | | 362,229 | | | | 5,346 | |
| | | | | | |
| 11/03/2022 | | Merrill Lynch | | Brazilian Real | | | 26,019,451 | | | United States Dollar | | | 4,863,449 | | | | 170,293 | |
| | | | | | |
| 11/09/2022 | | HSBC Bank | | United States Dollar | | | 865,000 | | | Chinese Offshore Yuan | | | 6,259,378 | | | | 11,416 | |
| | | | | | |
| 11/09/2022 | | Barclays | | United States Dollar | | | 1,571,884 | | | Indonesian Rupiah | | | 23,388,067,690 | | | | 73,504 | |
| | | | | | |
| 11/29/2022 | | Merrill Lynch | | Romanian Leu | | | 14,823,170 | | | United States Dollar | | | 2,971,766 | | | | 3,236 | |
| | | | | | |
| 11/30/2022 | | Citibank | | Czech Koruna | | | 37,734,844 | | | United States Dollar | | | 1,509,829 | | | | 9,944 | |
| | | | | | |
| 11/30/2022 | | HSBC Bank | | Czech Koruna | | | 85,690,556 | | | United States Dollar | | | 3,407,382 | | | | 43,808 | |
| | | | | | |
| 11/30/2022 | | Morgan Stanley | | Czech Koruna | | | 9,051,447 | | | United States Dollar | | | 363,351 | | | | 1,196 | |
| | | | | | |
| 11/30/2022 | | HSBC Bank | | Hungarian Forint | | | 13,492,500 | | | United States Dollar | | | 31,257 | | | | 1,003 | |
| | | | | | |
| 11/30/2022 | | BNP Paribas | | Polish Zloty | | | 27,125,956 | | | United States Dollar | | | 5,601,428 | | | | 59,258 | |
| | | | | | |
| 11/30/2022 | | HSBC Bank | | Polish Zloty | | | 2,049,343 | | | United States Dollar | | | 427,107 | | | | 553 | |
| | | | | | |
| 11/30/2022 | | Citibank | | United States Dollar | | | 2,497,030 | | | South African Rand | | | 44,647,146 | | | | 72,171 | |
| | | | | | |
| 11/30/2022 | | HSBC Bank | | United States Dollar | | | 1,856,045 | | | South African Rand | | | 33,432,918 | | | | 40,248 | |
| | | | | | |
| 12/07/2022 | | BNP Paribas | | Thai Baht | | | 41,736,000 | | | United States Dollar | | | 1,099,126 | | | | 911 | |
| | | | | | |
| 12/09/2022 | | BNP Paribas | | Singapore Dollar | | | 4,658,000 | | | United States Dollar | | | 3,277,175 | | | | 14,088 | |
| | | | | | |
| 12/09/2022 | | Merrill Lynch | | Turkish Lira | | | 65,798,612 | | | United States Dollar | | | 3,299,830 | | | | 131,588 | |
| | | | | | |
| 12/09/2022 | | HSBC Bank | | United States Dollar | | | 530,481 | | | Indonesian Rupiah | | | 7,897,000,000 | | | | 25,673 | |
| | | | | | |
| 12/12/2022 | | Standard Chartered | | United States Dollar | | | 225,000 | | | Taiwan Dollar | | | 7,138,013 | | | | 3,633 | |
| | | | | | |
| 01/12/2023 | | Standard Chartered | | Singapore Dollar | | | 4,659,000 | | | United States Dollar | | | 3,279,231 | | | | 13,830 | |
| | | | | | |
| 01/12/2023 | | Merrill Lynch | | United States Dollar | | | 325,000 | | | Indian Rupee | | | 26,736,418 | | | | 4,855 | |
| | | | | | |
| 01/12/2023 | | Merrill Lynch | | United States Dollar | | | 686,906 | | | Indonesian Rupiah | | | 10,518,597,703 | | | | 15,830 | |
| | | | | | |
| 01/31/2023 | | Morgan Stanley | | Chilean Peso | | | 3,527,931,152 | | | United States Dollar | | | 3,547,085 | | | | 130,451 | |
| | | | | | |
| 01/31/2023 | | HSBC Bank | | Philippine Peso | | | 89,058,071 | | | United States Dollar | | | 1,504,677 | | | | 16,122 | |
| | | | | | |
| 01/31/2023 | | Union Bank of Switzerland | | Polish Zloty | | | 33,606,688 | | | United States Dollar | | | 6,815,943 | | | | 104,587 | |
| | | | | | |
| 01/31/2023 | | ANZ Banking | | Thai Baht | | | 54,706,000 | | | United States Dollar | | | 1,444,383 | | | | 5,634 | |
| | | | | | |
| 01/31/2023 | | HSBC Bank | | Thai Baht | | | 28,518,000 | | | United States Dollar | | | 750,762 | | | | 5,126 | |
| | | | | | |
| 01/31/2023 | | Morgan Stanley | | United States Dollar | | | 2,390,517 | | | Colombian Peso | | | 11,571,299,165 | | | | 88,338 | |
| | | | | | |
| 02/10/2023 | | Citibank | | Singapore Dollar | | | 3,612,650 | | | United States Dollar | | | 2,544,192 | | | | 10,668 | |
| | | | | | |
| 02/10/2023 | | Barclays | | United States Dollar | | | 1,492,443 | | | Indonesian Rupiah | | | 23,388,067,690 | | | | 2,857 | |
| | | | | | | | | | | | | | | | | | |
| | | | |
Subtotal Appreciation | | | | | | | | | | | | | 1,127,443 | |
| | | | | | | | | | | | | | | | | | |
| | | | | | |
| 11/02/2022 | | HSBC Bank | | United States Dollar | | | 1,515,689 | | | Philippine Peso | | | 89,058,071 | | | | (21,120 | ) |
| | | | | | |
| 11/03/2022 | | HSBC Bank | | United States Dollar | | | 5,975,056 | | | Brazilian Real | | | 32,023,613 | | | | (220,254 | ) |
| | | | | | |
| 11/03/2022 | | JP Morgan | | United States Dollar | | | 620,000 | | | Brazilian Real | | | 3,371,653 | | | | (32,282 | ) |
See accompanying notes to the financial statements.
86
ASHMORE EMERGING MARKETS TOTAL RETURN FUND
SCHEDULE OF INVESTMENTS (CONTINUED)
As of October 31, 2022
| | | | | | | | | | | | | | | | | | |
Settlement Date | | Counterparty | | Currency Buy | | Currency Buy Amount (Local Currency) | | | Currency Sell | | Currency Sell Amount (Local Currency) | | | Unrealized
Gain/(Loss) | |
| |
| | | | | | |
| 11/09/2022 | | HSBC Bank | | Chinese Offshore Yuan | | | 156,682,740 | | | United States Dollar | | | 23,266,989 | | | | (1,900,349 | ) |
| | | | | | |
| 11/09/2022 | | Barclays | | Indonesian Rupiah | | | 23,388,067,690 | | | United States Dollar | | | 1,499,812 | | | | (1,432 | ) |
| | | | | | |
| 11/09/2022 | | BNP Paribas | | United States Dollar | | | 3,730,000 | | | Chinese Offshore Yuan | | | 27,453,546 | | | | (13,808 | ) |
| | | | | | |
| 11/23/2022 | | Deutsche Bank | | Thai Baht | | | 5,123,327 | | | United States Dollar | | | 142,121 | | | | (7,268 | ) |
| | | | | | |
| 11/23/2022 | | HSBC Bank | | Thai Baht | | | 2,094,708 | | | United States Dollar | | | 58,581 | | | | (3,445 | ) |
| | | | | | |
| 11/23/2022 | | JP Morgan | | Thai Baht | | | 7,272,747 | | | United States Dollar | | | 203,263 | | | | (11,834 | ) |
| | | | | | |
| 11/25/2022 | | Banco Santander | | United States Dollar | | | 1,646,938 | | | Chilean Peso | | | 1,606,209,310 | | | | (47,533 | ) |
| | | | | | |
| 11/29/2022 | | Morgan Stanley | | Romanian Leu | | | 3,187,213 | | | United States Dollar | | | 650,000 | | | | (10,328 | ) |
| | | | | | |
| 11/30/2022 | | Union Bank of Switzerland | | Czech Koruna | | | 10,246,345 | | | United States Dollar | | | 420,000 | | | | (7,328 | ) |
| | | | | | |
| 11/30/2022 | | HSBC Bank | | Hungarian Forint | | | 628,722,390 | | | United States Dollar | | | 1,525,259 | | | | (21,972 | ) |
| | | | | | |
| 11/30/2022 | | Morgan Stanley | | Hungarian Forint | | | 263,212,834 | | | United States Dollar | | | 636,641 | | | | (7,294 | ) |
| | | | | | |
| 11/30/2022 | | Standard Chartered | | Hungarian Forint | | | 1,226,113,414 | | | United States Dollar | | | 2,935,955 | | | | (4,294 | ) |
| | | | | | |
| 11/30/2022 | | Barclays | | Indonesian Rupiah | | | 12,300,300,000 | | | United States Dollar | | | 790,000 | | | | (3,335 | ) |
| | | | | | |
| 11/30/2022 | | HSBC Bank | | Israeli Shekel | | | 904,478 | | | United States Dollar | | | 270,000 | | | | (13,552 | ) |
| | | | | | |
| 11/30/2022 | | Morgan Stanley | | Israeli Shekel | | | 5,829,616 | | | United States Dollar | | | 1,780,174 | | | | (127,292 | ) |
| | | | | | |
| 11/30/2022 | | BNP Paribas | | Polish Zloty | | | 1,346,816 | | | United States Dollar | | | 286,891 | | | | (5,835 | ) |
| | | | | | |
| 11/30/2022 | | Morgan Stanley | | Polish Zloty | | | 5,595,517 | | | United States Dollar | | | 1,195,000 | | | | (27,319 | ) |
| | | | | | |
| 11/30/2022 | | BNP Paribas | | South African Rand | | | 73,332,627 | | | United States Dollar | | | 4,265,434 | | | | (282,620 | ) |
| | | | | | |
| 11/30/2022 | | HSBC Bank | | South African Rand | | | 7,505,792 | | | United States Dollar | | | 434,783 | | | | (27,131 | ) |
| | | | | | |
| 11/30/2022 | | Morgan Stanley | | South African Rand | | | 23,804,703 | | | United States Dollar | | | 1,372,493 | | | | (79,621 | ) |
| | | | | | |
| 11/30/2022 | | HSBC Bank | | Thai Baht | | | 25,126,000 | | | United States Dollar | | | 711,482 | | | | (49,771 | ) |
| | | | | | |
| 11/30/2022 | | Merrill Lynch | | Thai Baht | | | 52,708,753 | | | United States Dollar | | | 1,428,898 | | | | (40,775 | ) |
| | | | | | |
| 11/30/2022 | | Morgan Stanley | | Thai Baht | | | 9,342,489 | | | United States Dollar | | | 253,627 | | | | (7,586 | ) |
| | | | | | |
| 11/30/2022 | | Deutsche Bank | | United States Dollar | | | 3,182,236 | | | Euro | | | 3,229,783 | | | | (16,393 | ) |
| | | | | | |
| 11/30/2022 | | HSBC Bank | | United States Dollar | | | 250,000 | | | Hungarian Forint | | | 109,595,175 | | | | (12,044 | ) |
| | | | | | |
| 11/30/2022 | | HSBC Bank | | United States Dollar | | | 250,000 | | | Israeli Shekel | | | 884,380 | | | | (750 | ) |
| | | | | | |
| 11/30/2022 | | Morgan Stanley | | United States Dollar | | | 500,000 | | | Polish Zloty | | | 2,510,945 | | | | (23,988 | ) |
| | | | | | |
| 11/30/2022 | | Union Bank of Switzerland | | United States Dollar | | | 6,898,633 | | | Polish Zloty | | | 33,606,688 | | | | (114,463 | ) |
| | | | | | |
| 12/02/2022 | | Merrill Lynch | | United States Dollar | | | 4,833,005 | | | Brazilian Real | | | 26,019,451 | | | | (167,907 | ) |
| | | | | | |
| 12/07/2022 | | BNP Paribas | | Thai Baht | | | 33,389,000 | | | United States Dollar | | | 882,851 | | | | (2,817 | ) |
| | | | | | |
| 12/07/2022 | | Deutsche Bank | | Thai Baht | | | 47,456,000 | | | United States Dollar | | | 1,262,296 | | | | (11,496 | ) |
| | | | | | |
| 12/07/2022 | | HSBC Bank | | Thai Baht | | | 61,505,000 | | | United States Dollar | | | 1,645,889 | | | | (24,800 | ) |
| | | | | | |
| 12/12/2022 | | Barclays | | Taiwan Dollar | | | 262,413,695 | | | United States Dollar | | | 8,682,506 | | | | (544,432 | ) |
| | | | | | |
| 12/13/2022 | | Barclays | | United States Dollar | | | 2,375,000 | | | Turkish Lira | | | 46,348,061 | | | | (33,249 | ) |
| | | | | | |
| 12/19/2022 | | HSBC Bank | | Egyptian Pound | | | 2,547,434 | | | United States Dollar | | | 113,725 | | | | (9,762 | ) |
| | | | | | |
| 12/20/2022 | | HSBC Bank | | Egyptian Pound | | | 3,396,579 | | | United States Dollar | | | 151,633 | | | | (13,060 | ) |
| | | | | | |
| 12/21/2022 | | HSBC Bank | | Egyptian Pound | | | 1,583,148 | | | United States Dollar | | | 72,621 | | | | (8,053 | ) |
| | | | | | |
| 12/21/2022 | | Citibank | | Thai Baht | | | 412,573,318 | | | United States Dollar | | | 11,317,269 | | | | (425,475 | ) |
| | | | | | |
| 01/12/2023 | | Citibank | | Egyptian Pound | | | 4,288,024 | | | United States Dollar | | | 194,292 | | | | (20,611 | ) |
| | | | | | |
| 01/12/2023 | | Morgan Stanley | | Indian Rupee | | | 866,102,235 | | | United States Dollar | | | 10,500,118 | | | | (129,308 | ) |
| | | | | | |
| 01/12/2023 | | Merrill Lynch | | Korean Won | | | 16,362,901,837 | | | United States Dollar | | | 11,489,995 | | | | (3,320 | ) |
| | | | | | |
| 01/12/2023 | | State Street | | United States Dollar | | | 230,000 | | | Korean Won | | | 328,787,875 | | | | (807 | ) |
See accompanying notes to the financial statements.
87
ASHMORE EMERGING MARKETS TOTAL RETURN FUND
SCHEDULE OF INVESTMENTS (CONTINUED)
As of October 31, 2022
| | | | | | | | | | | | | | | | | | |
Settlement Date | | Counterparty | | Currency Buy | | Currency Buy Amount (Local Currency) | | | Currency Sell | | Currency Sell Amount (Local Currency) | | | Unrealized
Gain/(Loss) | |
| |
| | | | | | |
| 01/17/2023 | | Merrill Lynch | | Egyptian Pound | | | 23,153,368 | | | United States Dollar | | | 1,026,757 | | | $ | (90,416 | ) |
| | | | | | |
| 01/18/2023 | | Citibank | | Egyptian Pound | | | 4,317,168 | | | United States Dollar | | | 194,292 | | | | (19,756 | ) |
| | | | | | |
| 01/19/2023 | | Citibank | | Egyptian Pound | | | 1,973,577 | | | United States Dollar | | | 88,620 | | | | (8,857 | ) |
| | | | | | |
| 01/19/2023 | | HSBC Bank | | Egyptian Pound | | | 1,717,243 | | | United States Dollar | | | 75,816 | | | | (6,413 | ) |
| | | | | | |
| 01/31/2023 | | HSBC Bank | | Indonesian Rupiah | | | 29,365,460,658 | | | United States Dollar | | | 1,871,305 | | | | (50 | ) |
| | | | | | |
| 01/31/2023 | | Standard Chartered | | Peruvian Nuevo Sol | | | 4,118,736 | | | United States Dollar | | | 1,024,434 | | | | (260 | ) |
| | | | | | |
| 01/31/2023 | | Barclays | | Thai Baht | | | 29,678,000 | | | United States Dollar | | | 789,834 | | | | (3,199 | ) |
| | | | | | |
| 01/31/2023 | | Citibank | | Thai Baht | | | 32,922,492 | | | United States Dollar | | | 880,869 | | | | (8,238 | ) |
| | | | | | |
| 01/31/2023 | | HSBC Bank | | United States Dollar | | | 466,973 | | | Malaysian Ringgit | | | 2,198,276 | | | | (1,259 | ) |
| | | | | | |
| 01/31/2023 | | Barclays | | United States Dollar | | | 540,514 | | | Mexican Peso | | | 11,094,693 | | | | (9,872 | ) |
| | | | | | |
| 01/31/2023 | | Standard Chartered | | United States Dollar | | | 1,144,458 | | | Peruvian Nuevo Sol | | | 4,609,877 | | | | (1,844 | ) |
| | | | | | | | | | | | | | | | | | |
| | | | | |
Subtotal Depreciation | | | | | | | | | | | | | | | (4,688,277 | ) |
| | | | | | | | | | | | | | | | | | |
| | | | | | |
| Total | | | | | | | | | | | | | | | | $ | (3,560,834 | ) |
| | | | | | | | | | | | | | | | | | |
At October 31, 2022, the Ashmore Emerging Markets Total Return Fund had the following centrally cleared interest rate swap contracts outstanding:
| | | | | | | | | | | | | | | | | | | | | | |
Pay Rate Index/ Pay Rate | | Receive Rate/ Receive Rate Index | | Notional Amount | | | Expiration
Date | | | Fair Value/
Unrealized
Appreciation
(Depreciation)** | | Variation
Margin
Receivable
(Payable) | | Counterparty | |
| |
| | | | | | | |
CFETS China Fixing Repo Rates 7 Day | | 2.580% (Receive
Quarterly) | | | CNY | | | | 39,814,000 | | | | 3/18/2025 | | | $ 63,237 | | $1,650 | | | JP Morgan | |
| | | | | | | |
CFETS China Fixing Repo Rates 7 Day | | 2.325% (Receive
Quarterly) | | | CNY | | | | 28,220,000 | | | | 9/16/2025 | | | 17,695 | | 1,841 | | | Merrill Lynch | |
| | | | | | | |
CFETS China Fixing Repo Rates 7 Day | | 2.535% (Receive
Quarterly) | | | CNY | | | | 19,040,000 | | | | 9/16/2025 | | | 27,720 | | 1,116 | | | Merrill Lynch | |
| | | | | | | | | | | | | | | | | | | | | | |
| | | | | | | |
| | | | | | | | | | | | | | | | $108,652 | | $4,607 | | | | |
| | | | | | | | | | | | | | | | | | | | | | |
**Includes cumulative appreciation/depreciation on centrally cleared interest rate swap agreements. Only the current day’s variation margin is reported within the Statements of Assets and Liabilities.
See accompanying notes to the financial statements.
88
ASHMORE EMERGING MARKETS TOTAL RETURN FUND
SCHEDULE OF INVESTMENTS (CONTINUED)
As of October 31, 2022
The inputs or methodologies used for valuing securities are not necessarily an indication of the risks associated with investing in those securities and other financial instruments, if any. See note 4 in the Notes to the Financial Statements for more information regarding pricing inputs and valuation techniques. The following is a summary of the inputs used in valuing the Ashmore Emerging Markets Total Return Fund’s investments and other financial instruments, which are carried at fair value, as of October 31, 2022:
| | | | | | | | | | | | | | | | |
| | | Level 1 | | | Level 2 | | | Level 3 | | | Total | |
Investments | | | | | | | | | | | | | | | | |
| | | | |
Assets: | | | | | | | | | | | | | | | | |
| | | | |
Debt Securities | | | | | | | | | | | | | | | | |
| | | | |
Corporate Bonds | | $ | — | | | $ | 58,011,413 | | | $ | — | | | $ | 58,011,413 | |
| | | | |
Corporate Convertible Bonds | | | — | | | | 350,334 | | | | — | | | | 350,334 | |
| | | | |
Financial Certificates | | | — | | | | 4,452,769 | | | | — | | | | 4,452,769 | |
| | | | |
Government Agencies | | | — | | | | 28,137,408 | | | | — | | | | 28,137,408 | |
| | | | |
Government Bonds | | | — | | | | 313,455,695 | | | | 268,749 | | | | 313,724,444 | |
| | | | |
Index Linked Government Bonds | | | — | | | | 2,808,136 | | | | — | | | | 2,808,136 | |
| | | | |
Short Term Bills and Notes | | | — | | | | — | | | | 86,071 | | | | 86,071 | |
| | | | | | | | | | | | | | | | |
| | | | |
Total Debt Securities | | | — | | | | 407,215,755 | | | | 354,820 | | | | 407,570,575 | |
| |
| | | | |
Total Investments | | $ | — | | | $ | 407,215,755 | | | $ | 354,820 | | | $ | 407,570,575 | |
| |
| | | | |
Other Financial Instruments | | | | | | | | | | | | | | | | |
| | | | |
Assets: | | | | | | | | | | | | | | | | |
| | | | |
Forward Foreign Currency Exchange Contracts | | $ | — | | | $ | 1,127,443 | | | | $— | | | | $ 1,127,443 | |
| | | | |
Centrally Cleared Interest Rate Swap Contracts† | | | — | | | | 108,652 | | | | — | | | | 108,652 | |
| | | | |
Liabilities: | | | | | | | | | | | | | | | | |
| | | | |
Forward Foreign Currency Exchange Contracts | | | — | | | | (4,688,277 | ) | | | — | | | | (4,688,277 | ) |
| |
| | | | |
Total Other Financial Instruments | | $ | — | | | $ | (3,452,182 | ) | | | $— | | | | $(3,452,182 | ) |
| |
†Includes cumulative appreciation/depreciation on centrally cleared interest rate swap agreements. Only the current day’s variation margin is reported within the Statements of Assets and Liabilities.
The following is a reconciliation of investments in which significant unobservable inputs (Level 3) were used for the Fund during the period ended October 31, 2022:
| | | | | | | | | | | | | | | | | | | | | | | | | | | | | | | | | | | | | | | | | | | | | | | | | | |
| | | | | | | | | | | | | | | | | | | | | Change in |
| | | | | | | | | | | | | | | | | | | | | Unrealized |
| | | | | | | | | | | | | | | | | | | | | Appreciation |
| | | | | | | | | | | | | Change in | | | | | | | | (Depreciation) |
| | | Beginning | | Accrued | | | | | | Realized | | Unrealized | | Transfers | | Transfers | | Ending | | from Investments |
| Category and | | Balance | | Discounts | | | | | | Gains | | Appreciation | | into | | out of | | Balance | | still held |
| Subcategory | | at 10/31/2021 | | (Premiums) | | Purchases | | Sales | | (Losses) | | (Depreciation) | | Level 3 | | Level 3 | | at 10/31/2022 | | 10/31/2022 |
| | | | | | | | | | |
Investments, at value | | | | | | | | | | | | | | | | | | | | | | | | | | | | | | | | | | | | | | | | | | | | | | | | | | |
| | | | | | | | | | |
Bank Loans | | | | | | | | | | | | | | | | | | | | | | | | | | | | | | | | | | | | | | | | | | | | | | | | | | |
| | | | | | | | | | |
Brazil | | | $ | 7,950,000 | | | | $ | — | | | | $ | — | | | | $ | (8,035,425 | ) | | | $ | 1,576,050 | | | | $ | (1,490,625 | ) | | | $ | — | | | | $ | — | | | | $ | — | | | | $ | — | |
| | | | | | | | | | |
Government Bonds | | | | | | | | | | | | | | | | | | | | | | | | | | | | | | | | | | | | | | | | | | | | | | | | | | |
| | | | | | | | | | |
Russian Federation | | | | — | | | | | — | | | | | — | | | | | — | | | | | — | | | | | — | | | | | 268,749 | | | | | — | | | | | 268,749 | | | | | (4,592,044 | ) |
| | | | | | | | | | |
Short Term Bills And Notes | | | | | | | | | | | | | | | | | | | | | | | | | | | | | | | | | | | | | | | | | | | | | | | | | | |
| | | | | | | | | | |
Uruguay | | | | — | | | | | — | | | | | 85,795 | | | | | — | | | | | — | | | | | 276 | | | | | — | | | | | — | | | | | 86,071 | | | | | 276 | |
| | | | | | | | | | |
Total | | | $ | 7,950,000 | | | | $ | — | | | | $ | 85,795 | | | | $ | (8,035,425 | ) | | | $ | 1,576,050 | | | | $ | (1,490,349 | ) | | | $ | 268,749 | | | | $ | — | | | | $ | 354,820 | | | | $ | (4,591,768 | ) |
See accompanying notes to the financial statements.
89
ASHMORE EMERGING MARKETS TOTAL RETURN FUND
SCHEDULE OF INVESTMENTS (CONTINUED)
As of October 31, 2022
The following table on “Quantitative information about Level 3 Fair Value measurements” provides information on the valuation techniques and inputs used to value Level 3 securities at October 31, 2022:
| | | | | | | | | | | | |
| Quantitative Information about Level 3 Fair Value Measurements | |
| | | Fair Value at | | | Valuation | | | Unobservable | |
| | | 10/31/2022 | | | Technique | | | Input | |
| | | |
Bank Loans | | $ | — | | | | Zero priced asset | | | | Inputs to model | |
| | | |
Government Bonds | | | 268,749 | | | | Last observable vendor price | | | | Last observable vendor price | |
| | | |
Short Term Bills and Notes | | | 86,071 | | | | Priced at cost | | | | Cost | |
| | | |
Total | | $ | 354,820 | | | | | | | | | |
| | | | | | | | | | | | |
| | | | | | | | | | | | | |
The following is a summary of the fair values of the Fund’s derivative instruments*:
Fair Values of Financial Derivative Instruments on the Statements of Assets and Liabilities as of October 31, 2022:
| | | | | | | | |
| | | Derivatives Not Accounted for as
Hedging Instruments | |
| | | Foreign | | | Interest | |
| | | Exchange Risk | | | Rate Risk | |
| |
Assets: | | | | | | | | |
Unrealized Appreciation on Centrally Cleared Interest Rate Swap Contracts | | $ | — | | | $ | 108,652 | † |
Unrealized Appreciation on Forward Foreign Currency Exchange Contracts | | | 1,127,443 | | | | — | |
| | | | |
| | $ | 1,127,443 | | | $ | 108,652 | |
| | | | |
| | |
Liabilities: | | | | | | | | |
Unrealized Depreciation on Forward Foreign Currency Exchange Contracts | | $ | (4,688,277 | ) | | $ | — | |
| | | | |
| | $ | (4,688,277 | ) | | $ | — | |
| | | | |
| † | Includes cumulative appreciation/depreciation on centrally cleared interest rate swap agreements. Only the current day’s variation margin is reported within the Statements of Assets and Liabilities. |
The Effect of Financial Derivative Instruments on the Statements of Operations for the Year Ended October 31, 2022:
| | | | | | | | |
| | | Derivatives Not Accounted for as
Hedging Instruments | |
| | | Foreign | | | Interest | |
| | | Exchange Risk | | | Rate Risk | |
| |
Realized Gain (Loss) on Derivatives Recognized resulting from Operations: | | | | | | | | |
Net Realized Loss on Forward Foreign Currency Exchange Contracts | | $ | (29,961,809 | ) | | $ | — | |
Net Realized Loss on Interest Rate Swap Contracts | | | — | | | | (121,222 | ) |
| | | | |
| | $ | (29,961,809 | ) | | $ | (121,222 | ) |
| | | | |
| | |
Net Change in Unrealized Appreciation (Depreciation) on Derivatives Recognized resulting from Operations: | | | | | | | | |
Net Change in Unrealized Depreciation on Forward Foreign Currency Exchange Contracts | | $ | (5,414,719 | ) | | $ | — | |
Net Change in Unrealized Appreciation on Interest Rate Swap Contracts | | | — | | | | 638,780 | |
| | | | |
| | $ | (5,414,719 | ) | | $ | 638,780 | |
| | | | |
* See Note 10 in the Notes to the Financial Statements for additional information.
See accompanying notes to the financial statements.
90
ASHMORE EMERGING MARKETS LOCAL CURRENCY BOND FUND
SCHEDULE OF INVESTMENTS
As of October 31, 2022
| | | | | | | | | | | | | | |
| | | Currency1 | | Par | | | Value | | | % of Net
Assets | |
| |
Debt Securities | | | | | | | | | | | | | | |
| | | | |
Brazil (Cost $1,050,809) | | | | | | | | | | | | | | |
Brazil Letras do Tesouro Nacional, 0.000%, 01/01/20242 | | BRL | | | 1,070,000 | | | $ | 179,914 | | | | 3.34 | |
Brazil Letras do Tesouro Nacional, 0.000%, 07/01/20252 | | BRL | | | 1,000,000 | | | | 144,428 | | | | 2.68 | |
Brazil Notas do Tesouro Nacional Serie F, 10.000%, 01/01/2025 | | BRL | | | 1,026,000 | | | | 191,785 | | | | 3.57 | |
Brazil Notas do Tesouro Nacional Serie F, 10.000%, 01/01/2027 | | BRL | | | 1,539,000 | | | | 282,415 | | | | 5.25 | |
Brazil Notas do Tesouro Nacional Serie F, 10.000%, 01/01/2029 | | BRL | | | 832,000 | | | | 149,052 | | | | 2.77 | |
Brazil Notas do Tesouro Nacional Serie F, 10.000%, 01/01/2031 | | BRL | | | 130,000 | | | | 22,871 | | | | 0.43 | |
| | | | | | | | | 970,465 | | | | 18.04 | |
| | | | |
Chile (Cost $106,540) | | | | | | | | | | | | | | |
Bonos de la Tesoreria de la Republica en pesos, 5.000%, 10/01/20283 | | CLP | | | 30,000,000 | | | | 29,125 | | | | 0.54 | |
Bonos de la Tesoreria de la Republica en pesos, 7.000%, 05/01/20343 | | CLP | | | 60,000,000 | | | | 66,173 | | | | 1.23 | |
| | | | | | | | | 95,298 | | | | 1.77 | |
| | | | |
China (Cost $220,234) | | | | | | | | | | | | | | |
China (Rep of), 1.990%, 04/09/2025 | | CNY | | | 260,000 | | | | 35,441 | | | | 0.66 | |
China (Rep of), 2.850%, 06/04/2027 | | CNY | | | 610,000 | | | | 85,078 | | | | 1.58 | |
China (Rep of), 2.680%, 05/21/2030 | | CNY | | | 290,000 | | | | 39,736 | | | | 0.74 | |
China (Rep of), 3.720%, 04/12/2051 | | CNY | | | 360,000 | | | | 54,482 | | | | 1.01 | |
| | | | | | | | | 214,737 | | | | 3.99 | |
| | | | |
Colombia (Cost $357,269) | | | | | | | | | | | | | | |
Colombian TES, 7.500%, 08/26/2026 | | COP | | | 30,000,000 | | | | 5,020 | | | | 0.09 | |
Colombian TES, 3.300%, 03/17/2027 | | COP | | | 493,000 | | | | 29,156 | | | | 0.54 | |
Colombian TES, 5.750%, 11/03/2027 | | COP | | | 204,300,000 | | | | 29,945 | | | | 0.56 | |
Colombian TES, 6.000%, 04/28/2028 | | COP | | | 151,700,000 | | | | 21,872 | | | | 0.41 | |
Colombian TES, 7.750%, 09/18/2030 | | COP | | | 142,400,000 | | | | 20,613 | | | | 0.38 | |
Colombian TES, 7.000%, 03/26/2031 | | COP | | | 132,400,000 | | | | 17,921 | | | | 0.33 | |
Colombian TES, 7.000%, 06/30/2032 | | COP | | | 143,600,000 | | | | 18,706 | | | | 0.35 | |
Colombian TES, 7.250%, 10/18/2034 | | COP | | | 150,200,000 | | | | 18,924 | | | | 0.35 | |
Colombian TES, 6.250%, 07/09/2036 | | COP | | | 187,000,000 | | | | 20,458 | | | | 0.38 | |
Colombian TES, 9.250%, 05/28/2042 | | COP | | | 138,100,000 | | | | 19,272 | | | | 0.36 | |
Colombian TES, 7.250%, 10/26/2050 | | COP | | | 32,600,000 | | | | 3,523 | | | | 0.07 | |
| | | | | | | | | 205,410 | | | | 3.82 | |
| | | | |
Czech Republic (Cost $203,149) | | | | | | | | | | | | | | |
Czech (Rep of), 2.500%, 08/25/2028 | | CZK | | | 1,060,000 | | | | 35,433 | | | | 0.66 | |
Czech (Rep of), 2.750%, 07/23/2029 | | CZK | | | 1,300,000 | | | | 42,978 | | | | 0.80 | |
Czech (Rep of), 0.050%, 11/29/2029 | | CZK | | | 390,000 | | | | 10,393 | | | | 0.19 | |
Czech (Rep of), 0.950%, 05/15/2030 | | CZK | | | 30,000 | | | | 843 | | | | 0.01 | |
Czech (Rep of), 1.750%, 06/23/2032 | | CZK | | | 870,000 | | | | 24,553 | | | | 0.46 | |
See accompanying notes to the financial statements.
91
ASHMORE EMERGING MARKETS LOCAL CURRENCY BOND FUND
SCHEDULE OF INVESTMENTS (CONTINUED)
As of October 31, 2022
| | | | | | | | | | | | | | | | |
| | | Currency1 | | Par | | | Value | | | % of Net
Assets | |
| |
Czech Republic (continued) | | | | | | | | | | | | | | | | |
Czech (Rep of), 2.000%, 10/13/2033 | | | CZK | | | | 1,090,000 | | | $ | 30,251 | | | | 0.56 | |
| | | | | | | | | | | 144,451 | | | | 2.68 | |
| | | | |
Hungary (Cost $246,575) | | | | | | | | | | | | | | | | |
Hungary (Rep of), 3.000%, 06/26/2024 | | | HUF | | | | 17,910,000 | | | | 36,798 | | | | 0.68 | |
Hungary (Rep of), 5.500%, 06/24/2025 | | | HUF | | | | 25,740,000 | | | | 51,950 | | | | 0.97 | |
Hungary (Rep of), 3.000%, 10/27/2027 | | | HUF | | | | 8,090,000 | | | | 13,432 | | | | 0.25 | |
Hungary (Rep of), 4.500%, 03/23/2028 | | | HUF | | | | 6,800,000 | | | | 11,884 | | | | 0.22 | |
Hungary (Rep of), 6.750%, 10/22/2028 | | | HUF | | | | 1,470,000 | | | | 2,886 | | | | 0.05 | |
Hungary (Rep of), 3.000%, 08/21/2030 | | | HUF | | | | 9,050,000 | | | | 13,579 | | | | 0.25 | |
Hungary (Rep of), 4.750%, 11/24/2032 | | | HUF | | | | 4,740,000 | | | | 7,633 | | | | 0.14 | |
Hungary (Rep of), 3.000%, 10/27/2038 | | | HUF | | | | 3,470,000 | | | | 4,011 | | | | 0.08 | |
| | | | | | | | | | | 142,173 | | | | 2.64 | |
| | | | |
Indonesia (Cost $699,687) | | | | | | | | | | | | | | | | |
Indonesia (Rep of), 5.625%, 05/15/2023 | | | IDR | | | | 806,000,000 | | | | 51,771 | | | | 0.96 | |
Indonesia (Rep of), 8.125%, 05/15/2024 | | | IDR | | | | 2,725,000,000 | | | | 178,568 | | | | 3.32 | |
Indonesia (Rep of), 7.000%, 05/15/2027 | | | IDR | | | | 1,698,000,000 | | | | 107,941 | | | | 2.01 | |
Indonesia (Rep of), 10.500%, 08/15/2030 | | | IDR | | | | 274,000,000 | | | | 20,543 | | | | 0.38 | |
Indonesia (Rep of), 7.000%, 09/15/2030 | | | IDR | | | | 375,000,000 | | | | 23,309 | | | | 0.43 | |
Indonesia (Rep of), 6.500%, 02/15/2031 | | | IDR | | | | 294,000,000 | | | | 17,657 | | | | 0.33 | |
Indonesia (Rep of), 8.750%, 05/15/2031 | | | IDR | | | | 709,000,000 | | | | 48,850 | | | | 0.91 | |
Indonesia (Rep of), 7.500%, 08/15/2032 | | | IDR | | | | 751,000,000 | | | | 47,870 | | | | 0.89 | |
Indonesia (Rep of), 8.375%, 03/15/2034 | | | IDR | | | | 595,000,000 | | | | 39,992 | | | | 0.74 | |
Indonesia (Rep of), 8.250%, 05/15/2036 | | | IDR | | | | 818,000,000 | | | | 54,555 | | | | 1.01 | |
Indonesia (Rep of), 8.375%, 04/15/2039 | | | IDR | | | | 482,000,000 | | | | 32,625 | | | | 0.61 | |
| | | | | | | | | | | 623,681 | | | | 11.59 | |
| | | | |
Malaysia (Cost $304,724) | | | | | | | | | | | | | | | | |
Malaysia (Rep of), 3.955%, 09/15/2025 | | | MYR | | | | 178,000 | | | | 37,707 | | | | 0.70 | |
Malaysia (Rep of), 3.906%, 07/15/2026 | | | MYR | | | | 190,000 | | | | 40,086 | | | | 0.74 | |
Malaysia (Rep of), 3.733%, 06/15/2028 | | | MYR | | | | 74,000 | | | | 15,159 | | | | 0.28 | |
Malaysia (Rep of), 3.885%, 08/15/2029 | | | MYR | | | | 118,000 | | | | 24,181 | | | | 0.45 | |
Malaysia (Rep of), 4.642%, 11/07/2033 | | | MYR | | | | 152,000 | | | | 32,182 | | | | 0.60 | |
Malaysia (Rep of), 3.828%, 07/05/2034 | | | MYR | | | | 247,000 | | | | 48,271 | | | | 0.90 | |
Malaysia (Rep of), 3.757%, 05/22/2040 | | | MYR | | | | 62,000 | | | | 11,320 | | | | 0.21 | |
Malaysia (Rep of), 4.065%, 06/15/2050 | | | MYR | | | | 188,000 | | | | 34,387 | | | | 0.64 | |
Malaysia Government Investment Issue, 3.465%, 10/15/2030 | | | MYR | | | | 34,000 | | | | 6,756 | | | | 0.13 | |
| | | | | | | | | | | 250,049 | | | | 4.65 | |
| | | | |
Mexico (Cost $581,910) | | | | | | | | | | | | | | | | |
Comision Federal de Electricidad, 8.180%, 12/23/2027 | | | MXN | | | | 420,000 | | | | 18,627 | | | | 0.35 | |
Mexican Bonos, 10.000%, 12/05/2024 | | | MXN | | | | 1,620,000 | | | | 81,383 | | | | 1.51 | |
Mexican Bonos, 5.750%, 03/05/2026 | | | MXN | | | | 1,500,000 | | | | 66,750 | | | | 1.24 | |
Mexican Bonos, 5.500%, 03/04/2027 | | | MXN | | | | 1,200,000 | | | | 51,275 | | | | 0.95 | |
Mexican Bonos, 7.500%, 06/03/2027 | | | MXN | | | | 520,000 | | | | 24,013 | | | | 0.45 | |
Mexican Bonos, 7.750%, 05/29/2031 | | | MXN | | | | 1,150,000 | | | | 51,087 | | | | 0.95 | |
See accompanying notes to the financial statements.
92
ASHMORE EMERGING MARKETS LOCAL CURRENCY BOND FUND
SCHEDULE OF INVESTMENTS (CONTINUED)
As of October 31, 2022
| | | | | | | | | | | | | | | | |
| | | Currency1 | | Par | | | Value | | | % of Net
Assets | |
| |
Mexico (continued) | | | | | | | | | | | | | | | | |
Mexican Bonos, 10.000%, 11/20/2036 | | | MXN | | | | 1,540,000 | | | $ | 78,063 | | | | 1.45 | |
Mexican Bonos, 8.500%, 11/18/2038 | | | MXN | | | | 1,260,000 | | | | 55,995 | | | | 1.04 | |
Mexican Bonos, 7.750%, 11/13/2042 | | | MXN | | | | 1,000,000 | | | | 40,673 | | | | 0.76 | |
Mexican Bonos, 8.000%, 11/07/2047 | | | MXN | | | | 520,000 | | | | 21,474 | | | | 0.40 | |
Petroleos Mexicanos, 7.190%, 09/12/2024 | | | MXN | | | | 1,320,000 | | | | 60,345 | | | | 1.12 | |
Petroleos Mexicanos, 7.470%, 11/12/2026 | | | MXN | | | | 210,000 | | | | 8,820 | | | | 0.16 | |
| | | | | | | | | | | 558,505 | | | | 10.38 | |
| | | | |
Peru (Cost $227,269) | | | | | | | | | | | | | | | | |
Fondo MIVIVIENDA S.A., 7.000%, 02/14/2024 | | | PEN | | | | 133,000 | | | | 32,759 | | | | 0.61 | |
Peru (Rep of), 6.350%, 08/12/2028 | | | PEN | | | | 115,000 | | | | 26,826 | | | | 0.50 | |
Peru (Rep of), 5.940%, 02/12/2029 | | | PEN | | | | 93,000 | | | | 20,935 | | | | 0.39 | |
Peru (Rep of), 6.950%, 08/12/2031 | | | PEN | | | | 213,000 | | | | 49,126 | | | | 0.91 | |
Peru (Rep of), 6.150%, 08/12/2032 | | | PEN | | | | 102,000 | | | | 21,800 | | | | 0.40 | |
Peru (Rep of), 5.400%, 08/12/2034 | | | PEN | | | | 134,000 | | | | 25,953 | | | | 0.48 | |
Peru (Rep of), 5.350%, 08/12/2040 | | | PEN | | | | 39,000 | | | | 6,925 | | | | 0.13 | |
| | | | | | | | | | | 184,324 | | | | 3.42 | |
| | | | |
Poland (Cost $300,046) | | | | | | | | | | | | | | | | |
Poland (Rep of), 2.250%, 10/25/2024 | | | PLN | | | | 248,000 | | | | 46,129 | | | | 0.86 | |
Poland (Rep of), 0.750%, 04/25/2025 | | | PLN | | | | 141,000 | | | | 24,460 | | | | 0.45 | |
Poland (Rep of), 3.250%, 07/25/2025 | | | PLN | | | | 56,000 | | | | 10,224 | | | | 0.19 | |
Poland (Rep of), 2.500%, 07/25/2026 | | | PLN | | | | 291,000 | | | | 48,958 | | | | 0.91 | |
Poland (Rep of), 3.750%, 05/25/2027 | | | PLN | | | | 471,000 | | | | 80,919 | | | | 1.50 | |
Poland (Rep of), 2.750%, 10/25/2029 | | | PLN | | | | 166,000 | | | | 24,677 | | | | 0.46 | |
Poland (Rep of), 1.750%, 04/25/2032 | | | PLN | | | | 136,000 | | | | 16,454 | | | | 0.31 | |
| | | | | | | | | | | 251,821 | | | | 4.68 | |
| | | | |
Romania (Cost $147,191) | | | | | | | | | | | | | | | | |
Romania (Rep of), 5.800%, 07/26/2027 | | | RON | | | | 270,000 | | | | 47,382 | | | | 0.88 | |
Romania (Rep of), 4.150%, 01/26/2028 | | | RON | | | | 190,000 | | | | 30,346 | | | | 0.56 | |
Romania (Rep of), 4.850%, 07/25/2029 | | | RON | | | | 85,000 | | | | 13,372 | | | | 0.25 | |
Romania (Rep of), 4.150%, 10/24/2030 | | | RON | | | | 70,000 | | | | 10,162 | | | | 0.19 | |
| | | | | | | | | | | 101,262 | | | | 1.88 | |
| | | | |
Russian Federation (Cost $94,979) | | | | | | | | | | | | | | | | |
Russian Federal Bond - OFZ, 7.250%, 05/10/20344 | | | RUB | | | | 6,038,000 | | | | 4,866 | | | | 0.09 | |
| | | | | | | | | | | 4,866 | | | | 0.09 | |
| | | | |
South Africa (Cost $595,494) | | | | | | | | | | | | | | | | |
South Africa (Rep of), 10.500%, 12/21/2026 | | | ZAR | | | | 552,943 | | | | 31,394 | | | | 0.58 | |
South Africa (Rep of), 8.000%, 01/31/2030 | | | ZAR | | | | 1,413,030 | | | | 65,956 | | | | 1.22 | |
South Africa (Rep of), 7.000%, 02/28/2031 | | | ZAR | | | | 1,030,350 | | | | 43,438 | | | | 0.81 | |
South Africa (Rep of), 8.250%, 03/31/2032 | | | ZAR | | | | 1,639,566 | | | | 73,495 | | | | 1.37 | |
South Africa (Rep of), 8.875%, 02/28/2035 | | | ZAR | | | | 414,885 | | | | 18,404 | | | | 0.34 | |
South Africa (Rep of), 8.500%, 01/31/2037 | | | ZAR | | | | 2,118,020 | | | | 88,659 | | | | 1.65 | |
South Africa (Rep of), 9.000%, 01/31/2040 | | | ZAR | | | | 787,361 | | | | 33,738 | | | | 0.63 | |
See accompanying notes to the financial statements.
93
ASHMORE EMERGING MARKETS LOCAL CURRENCY BOND FUND
SCHEDULE OF INVESTMENTS (CONTINUED)
As of October 31, 2022
| | | | | | | | | | | | | | | | |
| | | Currency1 | | Par | | | Value | | | % of Net
Assets | |
| |
South Africa (continued) | | | | | | | | | | | | | | | | |
South Africa (Rep of), 6.500%, 02/28/2041 | | | ZAR | | | | 580,000 | | | $ | 19,122 | | | | 0.35 | |
South Africa (Rep of), 8.750%, 01/31/2044 | | | ZAR | | | | 1,103,000 | | | | 45,525 | | | | 0.85 | |
South Africa (Rep of), 8.750%, 02/28/2048 | | | ZAR | | | | 1,597,940 | | | | 65,462 | | | | 1.22 | |
| | | | | | | | | | | 485,193 | | | | 9.02 | |
| | | | |
Thailand (Cost $296,942) | | | | | | | | | | | | | | | | |
Thailand (Rep of), 1.000%, 06/17/2027 | | | THB | | | | 929,000 | | | | 22,652 | | | | 0.42 | |
Thailand (Rep of), 3.775%, 06/25/2032 | | | THB | | | | 945,000 | | | | 25,929 | | | | 0.48 | |
Thailand (Rep of), 1.585%, 12/17/2035 | | | THB | | | | 990,000 | | | | 20,506 | | | | 0.38 | |
Thailand (Rep of), 3.400%, 06/17/2036 | | | THB | | | | 1,686,000 | | | | 42,979 | | | | 0.80 | |
Thailand (Rep of), 3.300%, 06/17/2038 | | | THB | | | | 1,217,000 | | | | 29,902 | | | | 0.56 | |
Thailand (Rep of), 2.000%, 06/17/2042 | | | THB | | | | 1,358,000 | | | | 26,220 | | | | 0.49 | |
Thailand (Rep of), 2.875%, 06/17/2046 | | | THB | | | | 1,222,000 | | | | 25,759 | | | | 0.48 | |
Thailand (Rep of), 3.600%, 06/17/2067 | | | THB | | | | 555,000 | | | | 11,541 | | | | 0.21 | |
| | | | | | | | | | | 205,488 | | | | 3.82 | |
| | | | |
Uruguay (Cost $74,494) | | | | | | | | | | | | | | | | |
Uruguay (Rep of), 8.500%, 03/15/2028 | | | UYU | | | | 200,000 | | | | 4,344 | | | | 0.08 | |
Uruguay (Rep of), 4.375%, 12/15/2028 | | | UYU | | | | 113,754 | | | | 7,133 | | | | 0.13 | |
Uruguay (Rep of), 8.250%, 05/21/2031 | | | UYU | | | | 456,361 | | | | 9,300 | | | | 0.17 | |
Uruguay (Rep of), 3.875%, 07/02/2040 | | | UYU | | | | 1,721,000 | | | | 50,871 | | | | 0.95 | |
Uruguay Monetary Regulation Bill, 0.000%, 10/26/20232,4 | | | UYU | | | | 137,000 | | | | 3,007 | | | | 0.06 | |
| | | | | | | | | | | 74,655 | | | | 1.39 | |
| | | | |
Total Debt Securities (Cost $5,507,312) | | | | | | | | | | | 4,512,378 | | | | 83.86 | |
| | | | |
Total Investments in Securities (Cost $5,507,312) | | | | | | | | | | | 4,512,378 | | | | 83.86 | |
| | | | |
Total Investments (Total Cost $5,507,312) | | | | | | | | | | | 4,512,378 | | | | 83.86 | |
| | | | |
Other Assets Less Liabilities (See Statements of Assets and Liabilities for further detail) | | | | | | | | | | | 868,442 | | | | 16.14 | |
| | | | |
Net Assets | | | | | | | | | | $ | 5,380,820 | | | | 100.00 | |
| 1 | Local currency is United States Dollars unless otherwise noted below. |
| 3 | Securities exempt from registration under Rule 144A of the Securities Act of 1933. These securities may not be publicly traded without registration under the Securities Act of 1933. |
| 4 | Security is a Level 3 investment. |
Percentages shown are based on net assets.
See accompanying notes to the financial statements.
94
ASHMORE EMERGING MARKETS LOCAL CURRENCY BOND FUND
SCHEDULE OF INVESTMENTS (CONTINUED)
As of October 31, 2022
At October 31, 2022, the Ashmore Emerging Markets Local Currency Bond Fund had outstanding forward foreign currency exchange contracts as follows:
| | | | | | | | | | | | | | | | | | |
Settlement Date | | Counterparty | | Currency Buy | | Currency Buy Amount (Local Currency) | | | Currency Sell | | Currency Sell Amount (Local Currency) | | | Unrealized Gain/(Loss) |
| | | | | | |
11/03/2022 | | HSBC Bank | | Brazilian Real | | | 134,943 | | | United States Dollar | | | 25,000 | | | $ | 1,106 | |
| | | | | | |
11/03/2022 | | JP Morgan | | Brazilian Real | | | 580,000 | | | United States Dollar | | | 110,753 | | | | 1,454 | |
| | | | | | |
11/03/2022 | | Merrill Lynch | | Brazilian Real | | | 1,244,020 | | | United States Dollar | | | 232,527 | | | | 8,142 | |
| | | | | | |
11/09/2022 | | HSBC Bank | | United States Dollar | | | 20,000 | | | Chinese Offshore Yuan | | | 144,726 | | | | 264 | |
| | | | | | |
11/09/2022 | | Barclays | | United States Dollar | | | 44,870 | | | Indonesian Rupiah | | | 667,626,533 | | | | 2,098 | |
| | | | | | |
11/29/2022 | | Merrill Lynch | | Romanian Leu | | | 322,970 | | | United States Dollar | | | 64,749 | | | | 71 | |
| | | | | | |
11/30/2022 | | Citibank | | Czech Koruna | | | 840,038 | | | United States Dollar | | | 33,611 | | | | 221 | |
| | | | | | |
11/30/2022 | | HSBC Bank | | Czech Koruna | | | 1,886,610 | | | United States Dollar | | | 75,019 | | | | 964 | |
| | | | | | |
11/30/2022 | | Morgan Stanley | | Czech Koruna | | | 450,380 | | | United States Dollar | | | 18,089 | | | | 51 | |
| | | | | | |
11/30/2022 | | HSBC Bank | | Hungarian Forint | | | 3,161,416 | | | United States Dollar | | | 7,324 | | | | 235 | |
| | | | | | |
11/30/2022 | | BNP Paribas | | Polish Zloty | | | 347,343 | | | United States Dollar | | | 71,519 | | | | 965 | |
| | | | | | |
11/30/2022 | | HSBC Bank | | Polish Zloty | | | 43,603 | | | United States Dollar | | | 9,087 | | | | 12 | |
| | | | | | |
11/30/2022 | | Standard Chartered | | United States Dollar | | | 30,132 | | | Hungarian Forint | | | 12,583,585 | | | | 44 | |
| | | | | | |
11/30/2022 | | Citibank | | United States Dollar | | | 56,300 | | | South African Rand | | | 1,006,650 | | | | 1,627 | |
| | | | | | |
11/30/2022 | | HSBC Bank | | United States Dollar | | | 40,305 | | | South African Rand | | | 722,899 | | | | 1,043 | |
| | | | | | |
12/07/2022 | | BNP Paribas | | Thai Baht | | | 945,000 | | | United States Dollar | | | 24,887 | | | | 21 | |
| | | | | | |
12/09/2022 | | HSBC Bank | | United States Dollar | | | 39,297 | | | Indonesian Rupiah | | | 585,000,000 | | | | 1,902 | |
| | | | | | |
01/12/2023 | | HSBC Bank | | United States Dollar | | | 46,776 | | | Indonesian Rupiah | | | 733,076,155 | | | | 7 | |
| | | | | | |
01/12/2023 | | Merrill Lynch | | United States Dollar | | | 50,846 | | | Indonesian Rupiah | | | 778,605,411 | | | | 1,172 | |
| | | | | | |
01/31/2023 | | Merrill Lynch | | Chilean Peso | | | 4,936,200 | | | United States Dollar | | | 5,000 | | | | 145 | |
| | | | | | |
01/31/2023 | | Morgan Stanley | | Chilean Peso | | | 67,060,531 | | | United States Dollar | | | 67,425 | | | | 2,480 | |
| | | | | | |
01/31/2023 | | HSBC Bank | | Malaysian Ringgit | | | 1,299,909 | | | United States Dollar | | | 276,136 | | | | 745 | |
| | | | | | |
01/31/2023 | | HSBC Bank | | Philippine Peso | | | 398,637 | | | United States Dollar | | | 6,735 | | | | 72 | |
| | | | | | |
01/31/2023 | | Union Bank Of Switzerland | | Polish Zloty | | | 541,052 | | | United States Dollar | | | 109,733 | | | | 1,684 | |
| | | | | | |
01/31/2023 | | ANZ Banking | | Thai Baht | | | 1,638,000 | | | United States Dollar | | | 43,248 | | | | 169 | |
| | | | | | |
01/31/2023 | | HSBC Bank | | Thai Baht | | | 854,000 | | | United States Dollar | | | 22,482 | | | | 153 | |
| | | | | | |
01/31/2023 | | Morgan Stanley | | United States Dollar | | | 36,995 | | | Colombian Peso | | | 180,826,364 | | | | 1,018 | |
| | | | | | |
01/31/2023 | | Standard Chartered | | United States Dollar | | | 38,038 | | | Peruvian Nuevo Sol | | | 152,933 | | | | 10 | |
| | | | | | |
02/10/2023 | | Barclays | | United States Dollar | | | 42,603 | | | Indonesian Rupiah | | | 667,626,533 | | | | 82 | |
| | | | | | | | | | | | | | | | | | |
| | | | |
Subtotal Appreciation | | | | | | | | | | | | | 27,957 | |
| | | | | | | | | | | | | | | | | | |
| | | | | | |
11/02/2022 | | HSBC Bank | | United States Dollar | | | 6,784 | | | Philippine Peso | | | 398,637 | | | | (95 | ) |
| | | | | | |
11/03/2022 | | HSBC Bank | | United States Dollar | | | 365,509 | | | Brazilian Real | | | 1,958,963 | | | | (13,474 | ) |
| | | | | | |
11/09/2022 | | HSBC Bank | | Chinese Offshore Yuan | | | 2,237,726 | | | United States Dollar | | | 331,237 | | | | (26,081 | ) |
| | | | | | |
11/09/2022 | | Barclays | | Indonesian Rupiah | | | 667,626,533 | | | United States Dollar | | | 42,813 | | | | (41 | ) |
| | | | | | |
11/09/2022 | | BNP Paribas | | United States Dollar | | | 55,000 | | | Chinese Offshore Yuan | | | 404,811 | | | | (204 | ) |
| | | | | | |
11/23/2022 | | Deutsche Bank | | Thai Baht | | | 304,175 | | | United States Dollar | | | 8,438 | | | | (432 | ) |
| | | | | | |
11/23/2022 | | HSBC Bank | | Thai Baht | | | 1,012,313 | | | United States Dollar | | | 28,485 | | | | (1,840 | ) |
| | | | | | |
11/23/2022 | | JP Morgan | | Thai Baht | | | 312,249 | | | United States Dollar | | | 8,727 | | | | (508 | ) |
| | | | | | |
11/25/2022 | | Banco Santander | | United States Dollar | | | 64,375 | | | Chilean Peso | | | 62,783,426 | | | | (1,858 | ) |
| | | | | | |
11/29/2022 | | Morgan Stanley | | Romanian Leu | | | 110,202 | | | United States Dollar | | | 22,520 | | | | (403 | ) |
See accompanying notes to the financial statements.
95
ASHMORE EMERGING MARKETS LOCAL CURRENCY BOND FUND
SCHEDULE OF INVESTMENTS (CONTINUED)
As of October 31, 2022
| | | | | | | | | | | | | | | | | | |
Settlement Date | | Counterparty | | Currency Buy | | Currency Buy Amount (Local Currency) | | | Currency Sell | | Currency Sell Amount (Local Currency) | | | Unrealized Gain/(Loss) |
| | | | | | |
11/29/2022 | | Morgan Stanley | | United States Dollar | | | 9,000 | | | Romanian Leu | | | 45,918 | | | | $ (216 | ) |
| | | | | | |
11/30/2022 | | HSBC Bank | | Hungarian Forint | | | 13,071,834 | | | United States Dollar | | | 31,489 | | | | (234 | ) |
| | | | | | |
11/30/2022 | | Morgan Stanley | | Hungarian Forint | | | 6,602,930 | | | United States Dollar | | | 15,971 | | | | (183 | ) |
| | | | | | |
11/30/2022 | | Barclays | | Indonesian Rupiah | | | 311,400,000 | | | United States Dollar | | | 20,000 | | | | (84 | ) |
| | | | | | |
11/30/2022 | | BNP Paribas | | Polish Zloty | | | 28,134 | | | United States Dollar | | | 5,993 | | | | (122 | ) |
| | | | | | |
11/30/2022 | | Morgan Stanley | | Polish Zloty | | | 132,020 | | | United States Dollar | | | 27,626 | | | | (76 | ) |
| | | | | | |
11/30/2022 | | BNP Paribas | | South African Rand | | | 869,582 | | | United States Dollar | | | 50,580 | | | | (3,351 | ) |
| | | | | | |
11/30/2022 | | HSBC Bank | | South African Rand | | | 675,238 | | | United States Dollar | | | 38,376 | | | | (1,702 | ) |
| | | | | | |
11/30/2022 | | Morgan Stanley | | South African Rand | | | 802,912 | | | United States Dollar | | | 44,820 | | | | (1,212 | ) |
| | | | | | |
11/30/2022 | | HSBC Bank | | Thai Baht | | | 1,078,000 | | | United States Dollar | | | 30,525 | | | | (2,135 | ) |
| | | | | | |
11/30/2022 | | Merrill Lynch | | Thai Baht | | | 1,448,756 | | | United States Dollar | | | 39,778 | | | | (1,624 | ) |
| | | | | | |
11/30/2022 | | Morgan Stanley | | Thai Baht | | | 197,980 | | | United States Dollar | | | 5,375 | | | | (161 | ) |
| | | | | | |
11/30/2022 | | HSBC Bank | | United States Dollar | | | 6,141 | | | Hungarian Forint | | | 2,628,999 | | | | (145 | ) |
| | | | | | |
11/30/2022 | | Merrill Lynch | | United States Dollar | | | 6,491 | | | Hungarian Forint | | | 2,783,730 | | | | (165 | ) |
| | | | | | |
11/30/2022 | | Morgan Stanley | | United States Dollar | | | 3,281 | | | Hungarian Forint | | | 1,392,289 | | | | (48 | ) |
| | | | | | |
11/30/2022 | | Standard Chartered | | United States Dollar | | | 2,036 | | | Hungarian Forint | | | 864,864 | | | | (32 | ) |
| | | | | | |
11/30/2022 | | BNP Paribas | | United States Dollar | | | 2,063 | | | Polish Zloty | | | 10,049 | | | | (34 | ) |
| | | | | | |
11/30/2022 | | Union Bank Of Switzerland | | United States Dollar | | | 111,065 | | | Polish Zloty | | | 541,052 | | | | (1,843 | ) |
| | | | | | |
12/02/2022 | | Merrill Lynch | | United States Dollar | | | 231,072 | | | Brazilian Real | | | 1,244,020 | | | | (8,028 | ) |
| | | | | | |
12/07/2022 | | BNP Paribas | | Thai Baht | | | 757,000 | | | United States Dollar | | | 20,016 | | | | (64 | ) |
| | | | | | |
12/07/2022 | | Deutsche Bank | | Thai Baht | | | 811,000 | | | United States Dollar | | | 21,572 | | | | (196 | ) |
| | | | | | |
12/07/2022 | | HSBC Bank | | Thai Baht | | | 1,050,000 | | | United States Dollar | | | 28,098 | | | | (423 | ) |
| | | | | | |
12/13/2022 | | Barclays | | United States Dollar | | | 56,000 | | | Turkish Lira | | | 1,092,838 | | | | (784 | ) |
| | | | | | |
12/19/2022 | | HSBC Bank | | Egyptian Pound | | | 151,531 | | | United States Dollar | | | 6,765 | | | | (580 | ) |
| | | | | | |
12/20/2022 | | HSBC Bank | | Egyptian Pound | | | 202,041 | | | United States Dollar | | | 9,020 | | | | (776 | ) |
| | | | | | |
12/21/2022 | | HSBC Bank | | Egyptian Pound | | | 94,172 | | | United States Dollar | | | 4,320 | | | | (479 | ) |
| | | | | | |
12/21/2022 | | Citibank | | Thai Baht | | | 7,059,876 | | | United States Dollar | | | 193,658 | | | | (7,281 | ) |
| | | | | | |
01/12/2023 | | Citibank | | Egyptian Pound | | | 255,068 | | | United States Dollar | | | 11,557 | | | | (1,226 | ) |
| | | | | | |
01/17/2023 | | Merrill Lynch | | Egyptian Pound | | | 277,571 | | | United States Dollar | | | 12,309 | | | | (1,084 | ) |
| | | | | | |
01/18/2023 | | Citibank | | Egyptian Pound | | | 256,801 | | | United States Dollar | | | 11,557 | | | | (1,175 | ) |
| | | | | | |
01/19/2023 | | Citibank | | Egyptian Pound | | | 117,396 | | | United States Dollar | | | 5,271 | | | | (526 | ) |
| | | | | | |
01/19/2023 | | HSBC Bank | | Egyptian Pound | | | 102,148 | | | United States Dollar | | | 4,510 | | | | (381 | ) |
| | | | | | |
01/31/2023 | | HSBC Bank | | Colombian Peso | | | 48,150,800 | | | United States Dollar | | | 10,000 | | | | (420 | ) |
| | | | | | |
01/31/2023 | | Barclays | | Thai Baht | | | 888,000 | | | United States Dollar | | | 23,633 | | | | (96 | ) |
| | | | | | |
01/31/2023 | | Citibank | | Thai Baht | | | 985,567 | | | United States Dollar | | | 26,370 | | | | (247 | ) |
| | | | | | |
01/31/2023 | | State Street | | United States Dollar | | | 10,000 | | | Mexican Peso | | | 201,654 | | | | (4 | ) |
| | | | | | |
01/31/2023 | | Standard Chartered | | United States Dollar | | | 20,849 | | | Peruvian Nuevo Sol | | | 83,980 | | | | (34 | ) |
| | | | | | | | | | | | | | | | | | |
| | | | | |
Subtotal Depreciation | | | | | | | | | | | | | | | (82,107 | ) |
| | | | | | | | | | | | | | | | | | |
| | | | | | |
Total | | | | | | | | | | | | | | | | | $(54,150 | ) |
| | | | | | | | | | | | | | | | | | |
See accompanying notes to the financial statements.
96
ASHMORE EMERGING MARKETS LOCAL CURRENCY BOND FUND
SCHEDULE OF INVESTMENTS (CONTINUED)
As of October 31, 2022
At October 31, 2022, the Ashmore Emerging Markets Local Currency Bond Fund had the following over the counter interest rate swap contracts outstanding:
| | | | | | | | | | | | | | | | | | | | | | | | | | |
Pay Rate Index/ Pay Rate | | Receive Rate/ Receive Rate Index | | Notional Amount | | | Expiration Date | | | Fair Value | | | Premiums Paid/ (Received) | | Unrealized Appreciation (Depreciation) | | Counterparty | |
| | | | | | | | |
MYR-KLIBOR-BNM 3 Month (Pay Quarterly) | | 3.070% (Receive Quarterly) | | | MYR | | | | 453,000 | | | | 3/7/2027 | | | $ | (4,064 | ) | | $— | | $(4,064) | | | HSBC Bank | |
| | | | | | | | |
MYR-KLIBOR-BNM 3 Month (Pay Quarterly) | | 3.070% (Receive Quarterly) | | | MYR | | | | 147,000 | | | | 3/7/2027 | | | | (1,318 | ) | | (1,166) | | (152) | | | HSBC Bank | |
| | | | | | | | | | | | | | | | | | | | | | | | | | |
| | | | | | | | |
| | | | | | | | | | | | | | | | | | | | | | $(4,216) | | | | |
| | | | | | | | | | | | | | | | | | | | | | | | | | |
At October 31, 2022, the Ashmore Emerging Markets Local Currency Bond Fund had the following centrally cleared interest rate swap contracts outstanding:
| | | | | | | | | | | | | | | | | | | | | | | | |
Pay Rate Index/ Pay Rate | | Receive Rate/ Receive Rate Index | | Notional Amount | | | Expiration Date | | Fair Value/ Unrealized Appreciation (Depreciation)** | | Variation Margin Receivable (Payable) | | Counterparty | |
CFETS China Fixing Repo Rates 7 Day (Pay Quarterly) | | 2.010% (Receive Quarterly) | | | CNY | | | | 900,000 | | | 9/16/2025 | | | $ (555) | | | $ | 67 | | | | BNP Paribas | |
CFETS China Fixing Repo Rates 7 Day (Pay Quarterly) | | 2.828% (Receive Quarterly) | | | CNY | | | | 281,000 | | | 6/16/2026 | | | 783 | | | | 18 | | | | Merrill Lynch | |
CFETS China Fixing Repo Rates 7 Day (Pay Quarterly) | | 2.437% (Receive Quarterly) | | | CNY | | | | 1,050,000 | | | 3/16/2027 | | | 680 | | | | 114 | | | | HSBC Bank | |
MXN-TIIE-BANXICO 28 Day Rate (Pay Lunar) | | 6.563% (Pay Lunar) | | | MXN | | | | 8,800,000 | | | 12/31/2024 | | | (30,695) | | | | (174 | ) | | | Merrill Lynch | |
| | | | | | | | | | | | | | | | | | | | | | | | |
| | | | | | | | | | | | | | | $(29,787) | | | $ | 25 | | | | | |
| | | | | | | | | | | | | | | | | | | | | | | | |
**Includes cumulative appreciation/depreciation on centrally cleared interest rate swap agreements. Only the current day’s variation margin is reported within the Statements of Assets and Liabilities.
The inputs or methodologies used for valuing securities are not necessarily an indication of the risks associated with investing in those securities and other financial instruments, if any. See note 4 in the Notes to the Financial Statements for more information regarding pricing inputs and valuation techniques. The following is a summary of the inputs used in valuing the Ashmore Emerging Markets Local Currency Bond Fund’s investments and other financial instruments, which are carried at fair value, as of October 31, 2022:
| | | | | | | | | | | | | | | | |
| | | Level 1 | | | Level 2 | | | Level 3 | | | Total | |
Investments | | | | | | | | | | | | | | | | |
Assets: | | | | | | | | | | | | | | | | |
Debt Securities | | | | | | | | | | | | | | | | |
Corporate Bonds | | | $— | | | | $ 87,792 | | | | $ — | | | | $ 87,792 | |
Government Agencies | | | — | | | | 32,759 | | | | — | | | | 32,759 | |
Government Bonds | | | — | | | | 4,296,795 | | | | 4,866 | | | | 4,301,661 | |
Index Linked Government Bonds | | | — | | | | 87,159 | | | | — | | | | 87,159 | |
Short Term Bills and Notes | | | — | | | | — | | | | 3,007 | | | | 3,007 | |
| | | | | | | | | | | | | | | | |
Total Debt Securities | | | — | | | | 4,504,505 | | | | 7,873 | | | | 4,512,378 | |
Total Investments | | | $— | | | | $4,504,505 | | | | $7,873 | | | | $4,512,378 | |
See accompanying notes to the financial statements.
97
ASHMORE EMERGING MARKETS LOCAL CURRENCY BOND FUND
SCHEDULE OF INVESTMENTS (CONTINUED)
As of October 31, 2022
| | | | | | | | | | | | | | | | |
Other Financial Instruments | | | | | | | | | | | | | | | | |
Assets: | | | | | | | | | | | | | | | | |
Forward Foreign Currency Exchange Contracts | | | $— | | | | $ 27,957 | | | | $— | | | | $ 27,957 | |
Centrally Cleared Interest Rate Swap Contracts† | | | — | | | | 1,463 | | | | — | | | | 1,463 | |
Liabilities: | | | | | | | | | | | | | | | | |
Forward Foreign Currency Exchange Contracts | | | — | | | | (82,107) | | | | — | | | | (82,107 | ) |
Over the Counter Interest Rate Swap Contracts | | | — | | | | (4,216) | | | | — | | | | (4,216 | ) |
Centrally Cleared Interest Rate Swap Contracts† | | | — | | | | (31,250) | | | | — | | | | (31,250 | ) |
Total Other Financial Instruments | | | $— | | | | $(88,153) | | | | $— | | | | $(88,153 | ) |
†Includes cumulative appreciation/depreciation on centrally cleared interest rate swap agreements. Only the current day’s variation margin is reported within the Statements of Assets and Liabilities.
The following is a reconciliation of investments in which significant unobservable inputs (Level 3) were used for the Fund during the period ended October 31, 2022:
| | | | | | | | | | | | | | | | | | | | | | | | | | | | | | | | | | | | | | | | | | | | | | | | | | |
Category and Subcategory | | Beginning Balance at 10/31/2021 | | Accrued Discounts (Premiums) | | Purchases | | Sales | | Realized Gains (Losses)
| | Change in Unrealized Appreciation (Depreciation) | | Transfers into Level 3 | | Transfers out of Level 3 | | Ending Balance at 10/31/2022 | | Change in Unrealized Appreciation (Depreciation) from Investments still held 10/31/2022 |
| | | | | | | | | | |
Investments, at value | | | | | | | | | | | | | | | | | | | | | | | | | | | | | | | | | | | | | | | | | | | | | | | | | | |
| | | | | | | | | | |
Government Bonds Russian Federation | | | $ | — | | | | $ | — | | | | $ | — | | | | $ | — | | | | $ | — | | | | $ | — | | | | $ | 4,866 | | | | $ | — | | | | $ | 4,866 | | | | $ | (90,113 | ) |
| | | | | | | | | | |
Short Term Bills And Notes Uruguay | | | | — | | | | | — | | | | | 2,997 | | | | | — | | | | | — | | | | | 10 | | | | | — | | | | | — | | | | | 3,007 | | | | | 10 | |
| | | | | | | | | | | |
Total | | | $ | — | | | | $ | — | | | | $ | 2,997 | | | | $ | — | | | | $ | — | | | | $ | 10 | | | | $ | 4,866 | | | | $ | — | | | | $ | 7,873 | | | | $ | (90,103 | ) |
The following table on “Quantitative information about Level 3 Fair Value measurements” provides information on the valuation techniques and inputs used to value Level 3 securities at October 31, 2022:
| | | | | | | | |
Quantitative Information about Level 3 Fair Value Measurements |
| | | | | Fair Value at 10/31/2022 | | Valuation Technique | | Unobservable Input |
Government Bonds | | | | $4,866 | | Last observable vendor price | | Last observable vendor price |
Short Term Bills and Notes | | | | 3,007 | | Priced at cost | | Cost |
Total | | | | $7,873 | | | | |
See accompanying notes to the financial statements.
98
ASHMORE EMERGING MARKETS LOCAL CURRENCY BOND FUND
SCHEDULE OF INVESTMENTS (CONTINUED)
As of October 31, 2022
The following is a summary of the fair values of the Fund’s derivative instruments*:
Fair Values of Financial Derivative Instruments on the Statements of Assets and Liabilities as of October 31, 2022:
| | | | | | | | |
| | | Derivatives Not Accounted for as | |
| | | Hedging Instruments | |
| | | | |
| | | Foreign Exchange Risk | | | Interest Rate Risk | |
| |
Assets: | | | | | | | | |
Unrealized Appreciation on Centrally Cleared Interest Rate Swap Contracts | | | $ — | | | | $ 1,463 | † |
Unrealized Appreciation on Forward Foreign Currency Exchange Contracts | | | 27,957 | | | | — | |
| | | | |
| | | $27,957 | | | | $ 1,463 | |
| | | | |
Liabilities: | | | | | | | | |
Unrealized Depreciation on Centrally Cleared Interest Rate Swap Contracts | | | $ — | | | | $(31,250 | )† |
Unrealized Depreciation on Over the Counter Interest Rate Swap Contracts | | | — | | | | (4,216 | ) |
Unrealized Depreciation on Forward Foreign Currency Exchange Contracts | | | (82,107 | ) | | | — | |
| | | | |
| | | $(82,107 | ) | | | $(35,466 | ) |
| | | | |
| † | Includes cumulative appreciation/depreciation on centrally cleared interest rate swap agreements. Only the current day’s variation margin is reported within the Statements of Assets and Liabilities. |
The Effect of Financial Derivative Instruments on the Statements of Operations for the Year Ended October 31, 2022:
| | | | | | | | |
| | | Derivatives Not Accounted for as | |
| | | Hedging Instruments | |
| | | | |
| | | Foreign Exchange Risk | | | Interest Rate Risk | |
| |
Realized Gain (Loss) on Derivatives Recognized resulting from Operations: | | | | | | | | |
Net Realized Loss on Forward Foreign Currency Exchange Contracts | | | $(330,741 | ) | | $ | — | |
Net Realized Loss on Interest Rate Swap Contracts | | | — | | | | (3,638 | ) |
| | | | |
| | | $(330,741 | ) | | $ | (3,638 | ) |
| | | | |
Net Change in Unrealized Appreciation (Depreciation) on Derivatives Recognized resulting from Operations: | | | | | | | | |
Net Change in Unrealized Depreciation on Forward Foreign Currency Exchange Contracts | | | $ (98,688 | ) | | $ | — | |
Net Change in Unrealized Depreciation on Interest Rate Swap Contracts | | | — | | | | (22,384 | ) |
| | | | |
| | | $ (98,688 | ) | | $ | (22,384 | ) |
| | | | |
* See note 10 in the Notes to the Financial Statements for additional information.
See accompanying notes to the financial statements.
99
ASHMORE EMERGING MARKETS CORPORATE INCOME FUND
SCHEDULE OF INVESTMENTS
As of October 31, 2022
| | | | | | | | | | | | | | | | |
| | | | | | | | | | | | % of Net | |
| | | Currency1 | | | Par | | | Value | | | Assets | |
| |
Debt Securities | | | | | | | | | | | | | | | | |
| | | | |
Argentina (Cost $2,229,418) | | | | | | | | | | | | | | | | |
YPF S.A., 8.750%, 04/04/2024 | | | | | | | 630,000 | | | $ | 545,154 | | | | 0.59 | |
YPF S.A., (Step to 9.000% on 01/01/2023), 4.000%, 02/12/20262 | | | | | | | 1,700,000 | | | | 1,491,835 | | | | 1.60 | |
YPF S.A., (Step to 9.000% on 01/01/2023), 2.500%, 06/30/20292 | | | | | | | 279,200 | | | | 175,293 | | | | 0.19 | |
| | | | | | | | | | | 2,212,282 | | | | 2.38 | |
| | | | |
Brazil (Cost $15,142,828) | | | | | | | | | | | | | | | | |
Banco do Brasil S.A., (Variable, U.S. Treasury Yield Curve Rate CMT 10Y + 4.398%), 6.250%, 04/15/20243 | | | | | | | 908,000 | | | | 797,959 | | | | 0.86 | |
Braskem Netherlands Finance B.V., 4.500%, 01/10/2028 | | | | | | | 485,000 | | | | 421,106 | | | | 0.45 | |
Braskem Netherlands Finance B.V., (Variable, U.S. Treasury Yield Curve Rate CMT 5Y + 8.220%), 8.500%, 01/23/20813 | | | | | | | 350,000 | | | | 332,500 | | | | 0.36 | |
BRF S.A., 5.750%, 09/21/2050 | | | | | | | 715,000 | | | | 480,880 | | | | 0.52 | |
CSN Inova Ventures, 6.750%, 01/28/2028 | | | | | | | 1,200,000 | | | | 1,027,889 | | | | 1.11 | |
Globo Comunicacao e Participacoes S.A., 5.500%, 01/14/2032 | | | | | | | 400,000 | | | | 303,625 | | | | 0.33 | |
Gol Finance S.A., 7.000%, 01/31/2025 | | | | | | | 117,000 | | | | 50,895 | | | | 0.06 | |
Gol Finance S.A., 8.000%, 06/30/2026 | | | | | | | 990,000 | | | | 576,957 | | | | 0.62 | |
InterCement Financial Operations B.V., 5.750%, 07/17/2024 | | | | | | | 1,605,000 | | | | 1,113,710 | | | | 1.20 | |
Klabin Austria GmbH, 7.000%, 04/03/2049 | | | | | | | 355,000 | | | | 315,197 | | | | 0.34 | |
MC Brazil Downstream Trading S.A.R.L., 7.250%, 06/30/2031 | | | | | | | 1,615,000 | | | | 1,234,022 | | | | 1.33 | |
Movida Europe S.A., 5.250%, 02/08/2031 | | | | | | | 375,000 | | | | 275,955 | | | | 0.30 | |
Oi S.A., 10.000%, 07/27/20254 | | | | | | | 4,374,000 | | | | 1,137,471 | | | | 1.22 | |
Simpar Europe S.A., 5.200%, 01/26/2031 | | | | | | | 170,000 | | | | 122,754 | | | | 0.13 | |
St Marys Cement, Inc., 5.750%, 01/28/2027 | | | | | | | 245,000 | | | | 241,105 | | | | 0.26 | |
Suzano Austria GmbH, 6.000%, 01/15/2029 | | | | | | | 470,000 | | | | 448,145 | | | | 0.48 | |
Suzano Austria GmbH, 7.000%, 03/16/2047 | | | | | | | 415,000 | | | | 380,763 | | | | 0.41 | |
Unigel Luxembourg S.A., 8.750%, 10/01/2026 | | | | | | | 475,000 | | | | 458,986 | | | | 0.49 | |
Vale Overseas Ltd., 8.250%, 01/17/2034 | | | | | | | 500,000 | | | | 543,073 | | | | 0.58 | |
| | | | | | | | | | | 10,262,992 | | | | 11.05 | |
| | | | |
Chile (Cost $6,198,476) | | | | | | | | | | | | | | | | |
AES Andes S.A., (Variable, USD Swap 5Y + 4.644%), 7.125%, 03/26/20793 | | | | | | | 1,155,000 | | | | 947,945 | | | | 1.02 | |
BPCE S.A., 3.150%, 03/06/2030 | | | | | | | 245,000 | | | | 197,289 | | | | 0.21 | |
Celulosa Arauco y Constitucion S.A., 4.200%, 01/29/2030 | | | | | | | 555,000 | | | | 468,975 | | | | 0.51 | |
Empresa de los Ferrocarriles del Estado, 3.830%, 09/14/20615 | | | | | | | 300,000 | | | | 182,791 | | | | 0.20 | |
GNL Quintero S.A., 4.634%, 07/31/2029 | | | | | | | 564,166 | | | | 523,264 | | | | 0.56 | |
Guacolda Energia S.A., 4.560%, 04/30/2025 | | | | | | | 1,832,000 | | | | 572,386 | | | | 0.62 | |
Inversiones CMPC S.A., 3.850%, 01/13/2030 | | | | | | | 400,000 | | | | 333,500 | | | | 0.36 | |
VTR Comunicaciones S.p.A., 5.125%, 01/15/2028 | | | | | | | 500,000 | | | | 317,962 | | | | 0.34 | |
VTR Finance N.V., 6.375%, 07/15/2028 | | | | | | | 1,000,000 | | | | 524,367 | | | | 0.56 | |
| | | | | | | | | | | 4,068,479 | | | | 4.38 | |
| | | | |
China (Cost $39,127,579) | | | | | | | | | | | | | | | | |
Central China Real Estate Ltd., 7.250%, 04/24/2023 | | | | | | | 465,000 | | | | 137,934 | | | | 0.15 | |
See accompanying notes to the financial statements.
100
ASHMORE EMERGING MARKETS CORPORATE INCOME FUND
SCHEDULE OF INVESTMENTS (CONTINUED)
As of October 31, 2022
| | | | | | | | | | | | | | | | |
| | | | | | | | | | | | % of Net | |
| | | Currency1 | | | Par | | | Value | | | Assets | |
| |
China (continued) | | | | | | | | | | | | | | | | |
Central China Real Estate Ltd., 7.250%, 08/13/2024 | | | | | | | 1,475,000 | | | $ | 187,277 | | | | 0.20 | |
CFLD Cayman Investment Ltd., 8.625%, 02/28/20216,7 | | | | | | | 600,000 | | | | 30,000 | | | | 0.03 | |
CFLD Cayman Investment Ltd., 8.600%, 04/08/20246 | | | | | | | 4,880,000 | | | | 246,928 | | | | 0.27 | |
China Evergrande Group, 8.250%, 03/23/20226,7 | | | | | | | 585,000 | | | | 20,453 | | | | 0.02 | |
China Evergrande Group, 10.000%, 04/11/20236 | | | | | | | 1,035,000 | | | | 36,194 | | | | 0.04 | |
China Evergrande Group, 7.500%, 06/28/20236 | | | | | | | 4,600,000 | | | | 161,000 | | | | 0.17 | |
China Evergrande Group, 8.750%, 06/28/20256 | | | | | | | 765,000 | | | | 27,731 | | | | 0.03 | |
China SCE Group Holdings Ltd., 7.250%, 04/19/2023 | | | | | | | 420,000 | | | | 51,240 | | | | 0.06 | |
Fantasia Holdings Group Co. Ltd., 15.000%, 12/18/20216,7 | | | | | | | 830,000 | | | | 40,271 | | | | 0.04 | |
Fantasia Holdings Group Co. Ltd., 7.950%, 07/05/20226,7 | | | | | | | 3,360,000 | | | | 183,462 | | | | 0.20 | |
Fantasia Holdings Group Co. Ltd., 12.250%, 10/18/20226,7 | | | | | | | 1,840,000 | | | | 91,464 | | | | 0.10 | |
Fantasia Holdings Group Co. Ltd., 10.875%, 01/09/20236 | | | | | | | 925,000 | | | | 46,194 | | | | 0.05 | |
Fantasia Holdings Group Co. Ltd., 11.875%, 06/01/20236 | | | | | | | 770,000 | | | | 38,454 | | | | 0.04 | |
Huarong Finance 2017 Co. Ltd., (Floating, ICE LIBOR USD 3M + 1.150%), 4.013%, 11/07/2022 | | | | | | | 200,000 | | | | 199,500 | | | | 0.21 | |
Huarong Finance 2017 Co. Ltd., (Floating, ICE LIBOR USD 3M + 1.325%), 5.068%, 07/03/2023 | | | | | | | 295,000 | | | | 284,710 | | | | 0.31 | |
Huarong Finance 2019 Co. Ltd., (Floating, ICE LIBOR USD 3M + 1.125%), 4.105%, 02/24/2023 | | | | | | | 265,000 | | | | 260,031 | | | | 0.28 | |
Huarong Finance II Co. Ltd., 5.500%, 01/16/2025 | | | | | | | 595,000 | | | | 502,775 | | | | 0.54 | |
Kaisa Group Holdings Ltd., 8.500%, 06/30/20226,7 | | | | | | | 1,577,000 | | | | 105,200 | | | | 0.11 | |
Kaisa Group Holdings Ltd., 11.500%, 01/30/20236 | | | | | | | 1,850,000 | | | | 119,023 | | | | 0.13 | |
Kaisa Group Holdings Ltd., 10.875%, 07/23/20236 | | | | | | | 690,000 | | | | 43,125 | | | | 0.05 | |
Kaisa Group Holdings Ltd., 9.375%, 06/30/20246 | | | | | | | 1,350,000 | | | | 91,125 | | | | 0.10 | |
Kaisa Group Holdings Ltd., 11.250%, 04/16/20256 | | | | | | | 1,180,000 | | | | 78,175 | | | | 0.08 | |
Kaisa Group Holdings Ltd., 11.700%, 11/11/20256 | | | | | | | 625,000 | | | | 43,125 | | | | 0.05 | |
Prime Bloom Holdings Ltd., 6.950%, 07/05/20226,7 | | | | | | | 960,000 | | | | 124,800 | | | | 0.13 | |
Redco Properties Group Ltd., 9.900%, 02/17/20246 | | | | | | | 980,000 | | | | 140,532 | | | | 0.15 | |
Scenery Journey Ltd., 11.500%, 10/24/20226,7 | | | | | | | 800,000 | | | | 18,038 | | | | 0.02 | |
Scenery Journey Ltd., 12.000%, 10/24/20236 | | | | | | | 2,380,000 | | | | 53,191 | | | | 0.06 | |
Shimao Group Holdings Ltd., 4.750%, 07/03/20226,7 | | | | | | | 860,000 | | | | 38,900 | | | | 0.04 | |
Sunac China Holdings Ltd., 7.250%, 06/14/20226,7 | | | | | | | 1,675,000 | | | | 100,059 | | | | 0.11 | |
Sunac China Holdings Ltd., 7.500%, 02/01/20246 | | | | | | | 1,015,000 | | | | 58,443 | | | | 0.06 | |
Sunac China Holdings Ltd., 6.650%, 08/03/20246 | | | | | | | 200,000 | | | | 11,226 | | | | 0.01 | |
Sunac China Holdings Ltd., 6.500%, 01/10/20256 | | | | | | | 725,000 | | | | 39,930 | | | | 0.04 | |
Tunghsu Venus Holdings Ltd., 7.000%, 06/12/20206,7 | | | | | | | 2,785,000 | | | | 768,660 | | | | 0.83 | |
Xiaomi Best Time International Ltd., 0.000%, 12/17/20278 | | | | | | | 400,000 | | | | 291,000 | | | | 0.31 | |
Yuzhou Group Holdings Co. Ltd., 7.813%, 01/21/20236 | | | | | | | 3,200,550 | | | | 91,412 | | | | 0.10 | |
Yuzhou Group Holdings Co. Ltd., 6.350%, 01/13/20276 | | | | | | | 810,000 | | | | 23,532 | | | | 0.03 | |
Zhenro Properties Group Ltd., 8.700%, 08/03/20226,7 | | | | | | | 1,360,000 | | | | 54,400 | | | | 0.06 | |
Zhenro Properties Group Ltd., 6.500%, 09/01/20226,7 | | | | | | | 2,095,000 | | | | 83,800 | | | | 0.09 | |
Zhenro Properties Group Ltd., 9.150%, 05/06/20236 | | | | | | | 700,000 | | | | 13,265 | | | | 0.01 | |
Zhenro Properties Group Ltd., 7.875%, 04/14/20246 | | | | | | | 2,315,000 | | | | 44,701 | | | | 0.05 | |
| | | | | | | | | | | 4,981,280 | | | | 5.36 | |
See accompanying notes to the financial statements.
101
ASHMORE EMERGING MARKETS CORPORATE INCOME FUND
SCHEDULE OF INVESTMENTS (CONTINUED)
As of October 31, 2022
| | | | | | | | | | | | | | | | |
| | | | | | | | | | | % of Net | |
| | | Currency1 | | Par | | | Value | | | Assets | |
| |
Colombia (Cost $6,031,714) | | | | | | | | | | | | | | | | |
Canacol Energy Ltd., 5.750%, 11/24/2028 | | | | | | | 455,000 | | | $ | 342,101 | | | | 0.37 | |
Ecopetrol S.A., 6.875%, 04/29/2030 | | | | | | | 230,000 | | | | 189,267 | | | | 0.20 | |
Ecopetrol S.A., 5.875%, 05/28/2045 | | | | | | | 660,000 | | | | 401,821 | | | | 0.43 | |
Empresas Publicas de Medellin ESP, 4.375%, 02/15/2031 | | | | | | | 365,000 | | | | 247,375 | | | | 0.27 | |
Frontera Energy Corp., 7.875%, 06/21/2028 | | | | | | | 1,420,000 | | | | 1,061,450 | | | | 1.14 | |
Geopark Ltd., 5.500%, 01/17/2027 | | | | | | | 500,000 | | | | 407,604 | | | | 0.44 | |
Grupo Aval Ltd., 4.375%, 02/04/2030 | | | | | | | 400,000 | | | | 277,376 | | | | 0.30 | |
Millicom International Cellular S.A., 6.250%, 03/25/2029 | | | | | | | 369,000 | | | | 322,875 | | | | 0.35 | |
Millicom International Cellular S.A., 4.500%, 04/27/2031 | | | | | | | 965,000 | | | | 723,431 | | | | 0.78 | |
Oleoducto Central S.A., 4.000%, 07/14/2027 | | | | | | | 440,000 | | | | 358,380 | | | | 0.39 | |
Promigas S.A. ESP/Gases del Pacifico SAC, 3.750%, 10/16/2029 | | | | | | | 200,000 | | | | 148,941 | | | | 0.16 | |
SURA Asset Management S.A., 4.875%, 04/17/2024 | | | | | | | 215,000 | | | | 207,817 | | | | 0.22 | |
| | | | | | | | | | | 4,688,438 | | | | 5.05 | |
| | | | |
Czech Republic (Cost $1,965,282) | | | | | | | | | | | | | | | | |
New World Resources N.V., 8.000%, 04/07/20206,7,9 | | | EUR | | | | 1,685,299 | | | | — | | | | — | |
New World Resources N.V., 0.000%, 10/07/20205,6,7,9,10 | | | EUR | | | | 101,612 | | | | — | | | | — | |
New World Resources N.V., 4.000%, 10/07/20206,7,9 | | | EUR | | | | 700,590 | | | | — | | | | — | |
| | | | | | | | | | | — | | | | — | |
| | | | |
Ecuador (Cost $1,696,470) | | | | | | | | | | | | | | | | |
International Airport Finance S.A., 12.000%, 03/15/2033 | | | | | | | 1,755,444 | | | | 1,518,470 | | | | 1.63 | |
| | | | | | | | | | | 1,518,470 | | | | 1.63 | |
| | | | |
Ghana (Cost $1,567,494) | | | | | | | | | | | | | | | | |
Kosmos Energy Ltd., 7.750%, 05/01/2027 | | | | | | | 1,240,000 | | | | 1,001,300 | | | | 1.08 | |
Tullow Oil PLC, 10.250%, 05/15/2026 | | | | | | | 361,000 | | | | 307,218 | | | | 0.33 | |
| | | | | | | | | | | 1,308,518 | | | | 1.41 | |
| | | | |
Guatemala (Cost $849,527) | | | | | | | | | | | | | | | | |
CT Trust, 5.125%, 02/03/2032 | | | | | | | 930,000 | | | | 742,910 | | | | 0.80 | |
| | | | | | | | | | | 742,910 | | | | 0.80 | |
| | | | |
Hong Kong (Cost $883,757) | | | | | | | | | | | | | | | | |
AIA Group Ltd., (Variable, U.S. Treasury Yield Curve Rate CMT 5Y + 1.758%), 2.700%, 04/07/20263 | | | | | | | 200,000 | | | | 158,098 | | | | 0.17 | |
Airport Authority, (Variable, 4.697% - U.S. Treasury Yield Curve Rate CMT 5Y), 2.100%, 03/08/20263 | | | | | | | 215,000 | | | | 185,545 | | | | 0.20 | |
Phoenix Lead Ltd., 4.850%, 02/23/2023 | | | | | | | 475,000 | | | | 313,595 | | | | 0.34 | |
| | | | | | | | | | | 657,238 | | | | 0.71 | |
| | | | |
India (Cost $6,482,132) | | | | | | | | | | | | | | | | |
Bharti Airtel Ltd., 3.250%, 06/03/2031 | | | | | | | 565,000 | | | | 437,567 | | | | 0.47 | |
Greenko Power II Ltd., 4.300%, 12/13/2028 | | | | | | | 342,125 | | | | 263,436 | | | | 0.28 | |
Greenko Solar Mauritius Ltd., 5.950%, 07/29/2026 | | | | | | | 523,000 | | | | 419,969 | | | | 0.45 | |
India Green Energy Holdings, 5.375%, 04/29/2024 | | | | | | | 250,000 | | | | 233,448 | | | | 0.25 | |
Indian Railway Finance Corp. Ltd., 3.570%, 01/21/2032 | | | | | | | 200,000 | | | | 155,640 | | | | 0.17 | |
See accompanying notes to the financial statements.
102
ASHMORE EMERGING MARKETS CORPORATE INCOME FUND
SCHEDULE OF INVESTMENTS (CONTINUED)
As of October 31, 2022
| | | | | | | | | | | | | | | | |
| | | | | | | | | | | % of Net | |
| | | Currency1 | | Par | | | Value | | | Assets | |
| |
India (continued) | | | | | | | | | | | | | | | | |
Network i2i Ltd., (Variable, U.S. Treasury Yield Curve Rate CMT 5Y + 3.390%), 3.975%, 03/03/20263 | | | | | | | 700,000 | | | $ | 553,917 | | | | 0.60 | |
NTPC Ltd., 4.500%, 03/19/2028 | | | | | | | 210,000 | | | | 192,596 | | | | 0.21 | |
Power Finance Corp. Ltd., 4.500%, 06/18/2029 | | | | | | | 640,000 | | | | 548,355 | | | | 0.59 | |
Reliance Industries Ltd., 2.875%, 01/12/2032 | | | | | | | 250,000 | | | | 188,430 | | | | 0.20 | |
Vedanta Resources Finance II PLC, 8.000%, 04/23/2023 | | | | | | | 960,000 | | | | 896,277 | | | | 0.97 | |
Vedanta Resources Finance II PLC, 8.950%, 03/11/2025 | | | | | | | 1,105,000 | | | | 696,559 | | | | 0.75 | |
Vedanta Resources Ltd., 6.125%, 08/09/2024 | | | | | | | 1,000,000 | | | | 592,197 | | | | 0.64 | |
| | | | | | | | | | | 5,178,391 | | | | 5.58 | |
| | | | |
Indonesia (Cost $2,941,426) | | | | | | | | | | | | | | | | |
Freeport Indonesia PT, 4.763%, 04/14/2027 | | | | | | | 295,000 | | | | 265,058 | | | | 0.29 | |
Freeport Indonesia PT, 6.200%, 04/14/2052 | | | | | | | 400,000 | | | | 301,440 | | | | 0.33 | |
Indonesia Asahan Aluminium Persero PT, 6.530%, 11/15/2028 | | | | | | | 280,000 | | | | 272,303 | | | | 0.29 | |
Medco Bell Pte. Ltd., 6.375%, 01/30/2027 | | | | | | | 535,000 | | | | 427,975 | | | | 0.46 | |
Minejesa Capital B.V., 4.625%, 08/10/2030 | | | | | | | 485,000 | | | | 372,722 | | | | 0.40 | |
Minejesa Capital B.V., 5.625%, 08/10/2037 | | | | | | | 360,000 | | | | 230,400 | | | | 0.25 | |
Star Energy Geothermal Darajat II/Star Energy Geothermal Salak, 4.850%, 10/14/2038 | | | | | | | 705,000 | | | | 523,965 | | | | 0.56 | |
| | | | | | | | | | | 2,393,863 | | | | 2.58 | |
| | | | |
Iraq (Cost $1,180,916) | | | | | | | | | | | | | | | | |
DNO A.S.A., 7.875%, 09/09/20265 | | | | | | | 1,180,000 | | | | 1,067,900 | | | | 1.15 | |
| | | | | | | | | | | 1,067,900 | | | | 1.15 | |
| | | | |
Israel (Cost $8,369,480) | | | | | | | | | | | | | | | | |
Altice Financing S.A., 5.750%, 08/15/2029 | | | | | | | 470,000 | | | | 368,837 | | | | 0.40 | |
Bank Hapoalim B.M., (Variable, U.S. Treasury Yield Curve Rate CMT 5Y + 2.155%), 3.255%, 01/21/20323,5 | | | | | | | 640,000 | | | | 523,200 | | | | 0.56 | |
Bank Leumi Le-Israel B.M., (Variable, U.S. Treasury Yield Curve Rate CMT 5Y + 1.631%), 3.275%, 01/29/20313,5 | | | | | | | 720,000 | | | | 614,700 | | | | 0.66 | |
Leviathan Bond Ltd., 6.125%, 06/30/20255 | | | | | | | 470,000 | | | | 446,181 | | | | 0.48 | |
Leviathan Bond Ltd., 6.500%, 06/30/20275 | | | | | | | 363,000 | | | | 338,498 | | | | 0.37 | |
Leviathan Bond Ltd., 6.750%, 06/30/20305 | | | | | | | 900,000 | | | | 801,918 | | | | 0.87 | |
Mizrahi Tefahot Bank Ltd., (Variable, U.S. Treasury Yield Curve Rate CMT 5Y + 2.250%), 3.077%, 04/07/20313,5 | | | | | | | 700,000 | | | | 588,000 | | | | 0.63 | |
Teva Pharmaceutical Finance Co. LLC, 6.150%, 02/01/2036 | | | | | | | 1,000,000 | | | | 819,510 | | | | 0.88 | |
Teva Pharmaceutical Finance Netherlands II B.V., 4.375%, 05/09/2030 | | | EUR | | | | 900,000 | | | | 714,875 | | | | 0.77 | |
Teva Pharmaceutical Finance Netherlands III B.V., 6.750%, 03/01/2028 | | | | | | | 1,735,000 | | | | 1,635,238 | | | | 1.76 | |
| | | | | | | | | | | 6,850,957 | | | | 7.38 | |
| | | | |
Jamaica (Cost $1,078,437) | | | | | | | | | | | | | | | | |
Digicel Group Holdings Ltd., 7.000%, 11/16/20224 | | | | | | | 1,337,980 | | | | 93,659 | | | | 0.10 | |
Digicel Ltd., 6.750%, 03/01/2023 | | | | | | | 625,000 | | | | 331,250 | | | | 0.36 | |
| | | | | | | | | | | 424,909 | | | | 0.46 | |
See accompanying notes to the financial statements.
103
ASHMORE EMERGING MARKETS CORPORATE INCOME FUND
SCHEDULE OF INVESTMENTS (CONTINUED)
As of October 31, 2022
| | | | | | | | | | | | | | | | |
| | | | | | | | | | | % of Net | |
| | | Currency1 | | Par | | | Value | | | Assets | |
| |
Jordan (Cost $196,510) | | | | | | | | | | | | | | | | |
Hikma Finance U.S.A. LLC, 3.250%, 07/09/2025 | | | | | | | 200,000 | | | $ | 183,997 | | | | 0.20 | |
| | | | | | | | | | | 183,997 | | | | 0.20 | |
| | | | |
Kazakhstan (Cost $713,625) | | | | | | | | | | | | | | | | |
Kazakhstan Temir Zholy Finance B.V., 6.950%, 07/10/2042 | | | | | | | 380,000 | | | | 374,300 | | | | 0.40 | |
Tengizchevroil Finance Co. International Ltd., 4.000%, 08/15/2026 | | | | | | | 210,000 | | | | 170,948 | | | | 0.19 | |
| | | | | | | | | | | 545,248 | | | | 0.59 | |
| | | | |
Kuwait (Cost $1,518,413) | | | | | | | | | | | | | | | | |
MEGlobal Canada ULC, 5.875%, 05/18/2030 | | | | | | | 380,000 | | | | 366,046 | | | | 0.39 | |
NBK Tier 1 Financing 2 Ltd., (Variable, USD CMT 6Y + 2.832%), 4.500%, 08/27/20253 | | | | | | | 465,000 | | | | 409,898 | | | | 0.44 | |
NBK Tier 1 Ltd., (Variable, USD CMT 6Y + 2.875%), 3.625%, 08/24/20263 | | | | | | | 600,000 | | | | 499,260 | | | | 0.54 | |
| | | | | | | | | | | 1,275,204 | | | | 1.37 | |
| | | | |
Malaysia (Cost $299,311) | | | | | | | | | | | | | | | | |
Misc Capital Two Labuan Ltd., 3.750%, 04/06/2027 | | | | | | | 315,000 | | | | 285,972 | | | | 0.31 | |
| | | | | | | | | | | 285,972 | | | | 0.31 | |
| | | | |
Mexico (Cost $15,868,238) | | | | | | | | | | | | | | | | |
Alfa S.A.B. de C.V., 6.875%, 03/25/2044 | | | | | | | 440,000 | | | | 383,882 | | | | 0.41 | |
America Movil S.A.B. de C.V., 5.375%, 04/04/2032 | | | | | | | 475,000 | | | | 402,088 | | | | 0.43 | |
Axtel S.A.B. de C.V., 6.375%, 11/14/2024 | | | | | | | 786,000 | | | | 523,382 | | | | 0.56 | |
Banco Mercantil del Norte S.A., (Variable, U.S. Treasury Yield Curve Rate CMT 10Y + 5.353%), 7.625%, 01/10/20283 | | | | | | | 485,000 | | | | 398,129 | | | | 0.43 | |
Banco Mercantil del Norte S.A., (Variable, U.S. Treasury Yield Curve Rate CMT 10Y + 7.760%), 8.375%, 10/14/20303 | | | | | | | 415,000 | | | | 360,896 | | | | 0.39 | |
Banco Mercantil del Norte S.A., (Variable, U.S. Treasury Yield Curve Rate CMT 10Y + 5.034%), 6.625%, 01/24/20323 | | | | | | | 500,000 | | | | 375,000 | | | | 0.41 | |
BBVA Bancomer S.A., (Variable, U.S. Treasury Yield Curve Rate CMT 5Y + 2.650%), 5.125%, 01/18/20333 | | | | | | | 935,000 | | | | 756,240 | | | | 0.82 | |
Braskem Idesa S.A.P.I., 7.450%, 11/15/2029 | | | | | | | 620,000 | | | | 474,269 | | | | 0.51 | |
Braskem Idesa S.A.P.I., 6.990%, 02/20/2032 | | | | | | | 350,000 | | | | 234,108 | | | | 0.25 | |
Cemex S.A.B. de C.V., (Variable, U.S. Treasury Yield Curve Rate CMT 5Y + 4.534%), 5.125%, 06/08/20263 | | | | | | | 900,000 | | | | 742,995 | | | | 0.80 | |
CIBANCO S.A. Institucion de Banca Multiple Trust CIB/3332, 4.375%, 07/22/2031 | | | | | | | 1,020,000 | | | | 640,050 | | | | 0.69 | |
Cometa Energia S.A. de C.V., 6.375%, 04/24/2035 | | | | | | | 492,775 | | | | 426,250 | | | | 0.46 | |
Comision Federal de Electricidad, 3.348%, 02/09/2031 | | | | | | | 280,000 | | | | 206,858 | | | | 0.22 | |
Comision Federal de Electricidad, 6.264%, 02/15/2052 | | | | | | | 750,000 | | | | 554,576 | | | | 0.60 | |
Corp. Inmobiliaria Vesta S.A.B. de C.V., 3.625%, 05/13/2031 | | | | | | | 200,000 | | | | 145,766 | | | | 0.16 | |
Electricidad Firme de Mexico Holdings S.A. de C.V., 4.900%, 11/20/2026 | | | | | | | 600,000 | | | | 477,018 | | | | 0.51 | |
Grupo Axo S.A.P.I. de C.V., 5.750%, 06/08/2026 | | | | | | | 395,000 | | | | 313,326 | | | | 0.34 | |
Metalsa S.A.P.I de C.V., 3.750%, 05/04/2031 | | | | | | | 500,000 | | | | 345,069 | | | | 0.37 | |
Mexico Generadora de Energia S. de r.l., 5.500%, 12/06/2032 | | | | | | | 470,614 | | | | 428,656 | | | | 0.46 | |
Nemak S.A.B. de C.V., 3.625%, 06/28/2031 | | | | | | | 400,000 | | | | 291,000 | | | | 0.31 | |
See accompanying notes to the financial statements.
104
ASHMORE EMERGING MARKETS CORPORATE INCOME FUND
SCHEDULE OF INVESTMENTS (CONTINUED)
As of October 31, 2022
| | | | | | | | | | | | | | | | |
| | | | | | | | | | | % of Net | |
| | | Currency1 | | Par | | | Value | | | Assets | |
| |
Mexico (continued) | | | | | | | | | | | | | | | | |
Petroleos Mexicanos, 6.700%, 02/16/2032 | | | | | | | 440,000 | | | $ | 332,750 | | | | 0.36 | |
Petroleos Mexicanos, 6.750%, 09/21/2047 | | | | | | | 1,300,000 | | | | 782,965 | | | | 0.84 | |
Petroleos Mexicanos, 7.690%, 01/23/2050 | | | | | | | 1,030,000 | | | | 671,015 | | | | 0.72 | |
Petroleos Mexicanos, 6.950%, 01/28/2060 | | | | | | | 1,360,000 | | | | 816,174 | | | | 0.88 | |
Trust Fibra Uno, 4.869%, 01/15/2030 | | | | | | | 825,000 | | | | 621,435 | | | | 0.67 | |
Trust Fibra Uno, 6.390%, 01/15/2050 | | | | | | | 623,000 | | | | 412,737 | | | | 0.45 | |
| | | | | | | | | | | 12,116,634 | | | | 13.05 | |
| | | | |
Mongolia (Cost $547,234) | | | | | | | | | | | | | | | | |
Mongolian Mining Corp., 1.569%, 04/01/20234,11 | | | | | | | 1,006,671 | | | | 338,241 | | | | 0.36 | |
| | | | | | | | | | | 338,241 | | | | 0.36 | |
| | | | |
Morocco (Cost $584,929) | | | | | | | | | | | | | | | | |
OCP S.A., 5.125%, 06/23/2051 | | | | | | | 600,000 | | | | 367,236 | | | | 0.40 | |
| | | | | | | | | | | 367,236 | | | | 0.40 | |
| | | | |
Nigeria (Cost $881,034) | | | | | | | | | | | | | | | | |
IHS Netherlands Holdco B.V., 8.000%, 09/18/2027 | | | | | | | 900,000 | | | | 694,692 | | | | 0.75 | |
| | | | | | | | | | | 694,692 | | | | 0.75 | |
| | | | |
Oman (Cost $628,150) | | | | | | | | | | | | | | | | |
Oryx Funding Ltd., 5.800%, 02/03/2031 | | | | | | | 300,000 | | | | 262,362 | | | | 0.28 | |
Oztel Holdings SPC Ltd., 5.625%, 10/24/2023 | | | | | | | 335,000 | | | | 331,882 | | | | 0.36 | |
| | | | | | | | | | | 594,244 | | | | 0.64 | |
| | | | |
Panama (Cost $1,811,734) | | | | | | | | | | | | | | | | |
AES Panama Generation Holdings SRL, 4.375%, 05/31/2030 | | | | | | | 575,000 | | | | 452,534 | | | | 0.49 | |
C&W Senior Financing DAC, 6.875%, 09/15/2027 | | | | | | | 1,260,000 | | | | 1,092,649 | | | | 1.17 | |
| | | | | | | | | | | 1,545,183 | | | | 1.66 | |
| | | | |
Peru (Cost $3,835,222) | | | | | | | | | | | | | | | | |
Banco de Credito del Peru S.A., (Variable, U.S. Treasury Yield Curve Rate CMT 5Y + 3.000%), 3.125%, 07/01/20303 | | | | | | | 255,000 | | | | 224,446 | | | | 0.24 | |
Banco de Credito del Peru S.A., (Variable, U.S. Treasury Yield Curve Rate CMT 5Y + 2.450%), 3.250%, 09/30/20313 | | | | | | | 340,000 | | | | 285,090 | | | | 0.31 | |
Banco Internacional del Peru S.A.A. Interbank, (Variable, ICE LIBOR USD 3M + 5.760%), 6.625%, 03/19/20293 | | | | | | | 230,000 | | | | 223,675 | | | | 0.24 | |
Hunt Oil Co. of Peru LLC Sucursal Del Peru, 6.375%, 06/01/2028 | | | | | | | 366,400 | | | | 331,702 | | | | 0.36 | |
InRetail Consumer, 3.250%, 03/22/2028 | | | | | | | 270,000 | | | | 213,502 | | | | 0.23 | |
InRetail Shopping Malls, 5.750%, 04/03/2028 | | | | | | | 245,000 | | | | 217,131 | | | | 0.23 | |
Intercorp Peru Ltd., 3.875%, 08/15/2029 | | | | | | | 420,000 | | | | 325,954 | | | | 0.35 | |
Kallpa Generacion S.A., 4.125%, 08/16/2027 | | | | | | | 310,000 | | | | 272,002 | | | | 0.29 | |
Minsur S.A., 4.500%, 10/28/2031 | | | | | | | 815,000 | | | | 656,792 | | | | 0.71 | |
Peru LNG S.R.L., 5.375%, 03/22/2030 | | | | | | | 225,000 | | | | 176,917 | | | | 0.19 | |
Petroleos del Peru S.A., 5.625%, 06/19/2047 | | | | | | | 590,000 | | | | 378,444 | | | | 0.41 | |
| | | | | | | | | | | 3,305,655 | | | | 3.56 | |
See accompanying notes to the financial statements.
105
ASHMORE EMERGING MARKETS CORPORATE INCOME FUND
SCHEDULE OF INVESTMENTS (CONTINUED)
As of October 31, 2022
| | | | | | | | | | | | | | | | |
| | | | | | | | | | | % of Net | |
| | | Currency1 | | Par | | | Value | | | Assets | |
| |
Poland (Cost $946,877) | | | | | | | | | | | | | | | | |
GTC Aurora Luxembourg S.A., 2.250%, 06/23/2026 | | | EUR | | | | 885,000 | | | $ | 577,377 | | | | 0.62 | |
| | | | | | | | | | | 577,377 | | | | 0.62 | |
| | | | |
Qatar (Cost $556,438) | | | | | | | | | | | | | | | | |
Nakilat, Inc., 6.067%, 12/31/2033 | | | | | | | 128,811 | | | | 126,879 | | | | 0.13 | |
QIB Sukuk Ltd., (Floating, ICE LIBOR USD 3M + 1.350%), 5.858%, 02/07/2025 | | | | | | | 400,000 | | | | 397,998 | | | | 0.43 | |
| | | | | | | | | | | 524,877 | | | | 0.56 | |
| | | | |
Romania (Cost $552,898) | | | | | | | | | | | | | | | | |
NE Property B.V., 1.875%, 10/09/2026 | | | EUR | | | | 285,000 | | | | 223,043 | | | | 0.24 | |
NE Property B.V., 2.000%, 01/20/2030 | | | EUR | | | | 310,000 | | | | 201,941 | | | | 0.22 | |
| | | | | | | | | | | 424,984 | | | | 0.46 | |
| | | | |
Russian Federation (Cost $1,481,647) | | | | | | | | | | | | | | | | |
Sovcombank Via SovCom Capital DAC, 7.600%, 02/17/20276,12 | | | | | | | 1,605,000 | | | | 2 | | | | — | |
| | | | | | | | | | | 2 | | | | — | |
| | | | |
Saudi Arabia (Cost $3,795,140) | | | | | | | | | | | | | | | | |
Acwa Power Management And Investments One Ltd., 5.950%, 12/15/2039 | | | | | | | 958,080 | | | | 834,488 | | | | 0.90 | |
Arabian Centres Sukuk II Ltd., 5.625%, 10/07/2026 | | | | | | | 800,000 | | | | 683,808 | | | | 0.74 | |
Dar Al-Arkan Sukuk Co. Ltd., 6.750%, 02/15/2025 | | | | | | | 600,000 | | | | 572,928 | | | �� | 0.62 | |
EIG Pearl Holdings S.a.r.l., 3.545%, 08/31/2036 | | | | | | | 420,000 | | | | 322,350 | | | | 0.35 | |
EIG Pearl Holdings S.a.r.l., 4.387%, 11/30/2046 | | | | | | | 320,000 | | | | 217,600 | | | | 0.23 | |
SA Global Sukuk Ltd., 2.694%, 06/17/2031 | | | | | | | 240,000 | | | | 196,200 | | | | 0.21 | |
Saudi Arabian Oil Co., 4.250%, 04/16/2039 | | | | | | | 535,000 | | | | 438,967 | | | | 0.47 | |
| | | | | | | | | | | 3,266,341 | | | | 3.52 | |
| | | | |
Singapore (Cost $2,493,550) | | | | | | | | | | | | | | | | |
DBS Group Holdings Ltd., (Variable, U.S. Treasury Yield Curve Rate CMT 5Y + 1.915%), 3.300%, 02/27/20253 | | | | | | | 370,000 | | | | 324,490 | | | | 0.35 | |
Puma International Financing S.A., 5.000%, 01/24/2026 | | | | | | | 2,000,000 | | | | 1,775,000 | | | | 1.91 | |
United Overseas Bank Ltd., (Variable, USD Swap 5Y + 1.794%), 3.875%, 10/19/20233 | | | | | | | 255,000 | | | | 242,888 | | | | 0.26 | |
| | | | | | | | | | | 2,342,378 | | | | 2.52 | |
| | | | |
South Africa (Cost $5,301,821) | | | | | | | | | | | | | | | | |
Absa Group Ltd., (Variable, U.S. Treasury Yield Curve Rate CMT 5Y + 5.411%), 6.375%, 05/27/20263 | | | | | | | 600,000 | | | | 510,000 | | | | 0.55 | |
AngloGold Ashanti Holdings PLC, 3.375%, 11/01/2028 | | | | | | | 270,000 | | | | 218,054 | | | | 0.23 | |
AngloGold Ashanti Holdings PLC, 3.750%, 10/01/2030 | | | | | | | 345,000 | | | | 264,507 | | | | 0.28 | |
Gold Fields Orogen Holdings BVI Ltd., 6.125%, 05/15/2029 | | | | | | | 210,000 | | | | 196,332 | | | | 0.21 | |
Liquid Telecommunications Financing PLC, 5.500%, 09/04/2026 | | | | | | | 800,000 | | | | 552,000 | | | | 0.59 | |
MTN Mauritius Investments Ltd., 6.500%, 10/13/2026 | | | | | | | 775,000 | | | | 738,498 | | | | 0.80 | |
Prosus N.V., 3.680%, 01/21/2030 | | | | | | | 300,000 | | | | 220,778 | | | | 0.24 | |
Prosus N.V., 3.061%, 07/13/2031 | | | | | | | 320,000 | | | | 214,927 | | | | 0.23 | |
See accompanying notes to the financial statements.
106
ASHMORE EMERGING MARKETS CORPORATE INCOME FUND
SCHEDULE OF INVESTMENTS (CONTINUED)
As of October 31, 2022
| | | | | | | | | | | | | | | | |
| | | | | | | | | | | | % of Net | |
| | | Currency1 | | | Par | | | Value | | | Assets | |
| |
South Africa (continued) | | | | | | | | | | | | | | | | |
Sasol Financing U.S.A. LLC, 4.375%, 09/18/2026 | | | | | | | 300,000 | | | $ | 262,500 | | | | 0.28 | |
Sasol Financing U.S.A. LLC, 6.500%, 09/27/2028 | | | | | | | 815,000 | | | | 719,579 | | | | 0.78 | |
Sasol Financing U.S.A. LLC, 5.500%, 03/18/2031 | | | | | | | 445,000 | | | | 333,292 | | | | 0.36 | |
| | | | | | | | | | | 4,230,467 | | | | 4.55 | |
| | | | |
South Korea (Cost $990,807) | | | | | | | | | | | | | | | | |
Kyobo Life Insurance Co. Ltd., (Variable, U.S. Treasury Yield Curve Rate CMT 5Y + 2.887%), 5.900%, 06/15/20523 | | | | | | | 425,000 | | | | 386,750 | | | | 0.42 | |
Shinhan Financial Group Co. Ltd., (Variable, U.S. Treasury Yield Curve Rate CMT 5Y + 3.051%), 5.875%, 08/13/20233 | | | | | | | 235,000 | | | | 228,244 | | | | 0.24 | |
Shinhan Financial Group Co. Ltd., (Variable, U.S. Treasury Yield Curve Rate CMT 5Y + 1.500%), 3.340%, 02/05/20303 | | | | | | | 315,000 | | | | 289,815 | | | | 0.31 | |
| | | | | | | | | | | 904,809 | | | | 0.97 | |
| | | | |
Tanzania (Cost $1,049,233) | | | | | | | | | | | | | | | | |
HTA Group Ltd., 7.000%, 12/18/2025 | | | | | | | 515,000 | | | | 450,625 | | | | 0.49 | |
HTA Group Ltd., 2.875%, 03/18/2027 | | | | | | | 600,000 | | | | 459,000 | | | | 0.49 | |
| | | | | | | | | | | 909,625 | | | | 0.98 | |
| | | | |
Thailand (Cost $1,265,668) | | | | | | | | | | | | | | | | |
Bangkok Bank PCL, 9.025%, 03/15/2029 | | | | | | | 430,000 | | | | 474,074 | | | | 0.51 | |
GC Treasury Center Co. Ltd., 2.980%, 03/18/2031 | | | | | | | 585,000 | | | | 431,537 | | | | 0.47 | |
GC Treasury Center Co. Ltd., 4.400%, 03/30/2032 | | | | | | | 200,000 | | | | 160,620 | | | | 0.17 | |
| | | | | | | | | | | 1,066,231 | | | | 1.15 | |
| | | | |
Turkey (Cost $2,233,402) | | | | | | | | | | | | | | | | |
Akbank T.A.S., (Variable, USD Swap 5Y + 4.029%), 6.797%, 04/27/20283 | | | | | | | 319,000 | | | | 286,274 | | | | 0.31 | |
Turk Telekomunikasyon A.S., 6.875%, 02/28/2025 | | | | | | | 315,000 | | | | 274,050 | | | | 0.29 | |
Turkcell Iletisim Hizmetleri A.S., 5.800%, 04/11/2028 | | | | | | | 140,000 | | | | 111,896 | | | | 0.12 | |
Turkiye Garanti Bankasi A.S., (Variable, USD ICE Swap Rate 5Y + 4.220%), 7.177%, 05/24/20273 | | | | | | | 245,000 | | | | 209,659 | | | | 0.23 | |
Turkiye Is Bankasi A.S., (Variable, USD Swap 5Y + 5.117%), 7.000%, 06/29/20283 | | | | | | | 340,000 | | | | 308,645 | | | | 0.33 | |
Yapi ve Kredi Bankasi A.S., (Variable, U.S. Treasury Yield Curve Rate CMT 5Y + 7.415%), 7.875%, 01/22/20313 | | | | | | | 275,000 | | | | 242,655 | | | | 0.26 | |
Zorlu Yenilenebilir Enerji A.S., 9.000%, 06/01/2026 | | | | | | | 690,000 | | | | 494,247 | | | | 0.53 | |
| | | | | | | | | | | 1,927,426 | | | | 2.07 | |
| | | | |
United Arab Emirates (Cost $3,297,177) | | | | | | | | | | | | | | | | |
DP World Ltd., 6.850%, 07/02/2037 | | | | | | | 660,000 | | | | 632,806 | | | | 0.68 | |
DP World Salaam, (Variable, U.S. Treasury Yield Curve Rate CMT 5Y + 5.750%), 6.000%, 10/01/20253 | | | | | | | 830,000 | | | | 803,878 | | | | 0.87 | |
First Abu Dhabi Bank PJSC, (Variable, U.S. Treasury Yield Curve Rate CMT 5Y + 4.138%), 4.500%, 04/05/20263 | | | | | | | 500,000 | | | | 456,375 | | | | 0.49 | |
Galaxy Pipeline Assets Bidco Ltd., 2.940%, 09/30/2040 | | | | | | | 753,893 | | | | 565,015 | | | | 0.61 | |
MAF Global Securities Ltd., (Variable, U.S. Treasury Yield Curve Rate CMT 5Y + 3.539%), 6.375%, 03/20/20263 | | | | | | | 380,000 | | | | 348,384 | | | | 0.37 | |
| | | | | | | | | | | 2,806,458 | | | | 3.02 | |
See accompanying notes to the financial statements.
107
ASHMORE EMERGING MARKETS CORPORATE INCOME FUND
SCHEDULE OF INVESTMENTS (CONTINUED)
As of October 31, 2022
| | | | | | | | | | | | | | | | |
| | | | | | | | | | | % of Net | |
| | | Currency1 | | Par | | | Value | | | Assets | |
| |
Venezuela (Cost $8,318,882) | | | | | | | | | | | | | | | | |
Petroleos de Venezuela S.A., 8.500%, 10/27/20206,7 | | | | | | | 7,112,500 | | | $ | 1,244,687 | | | | 1.34 | |
Petroleos de Venezuela S.A., 9.750%, 05/17/20356 | | | | | | | 6,744,093 | | | | 134,882 | | | | 0.15 | |
| | | | | | | | | | | 1,379,569 | | | | 1.49 | |
| | | | |
Vietnam (Cost $542,653) | | | | | | | | | | | | | | | | |
Mong Duong Finance Holdings B.V., 5.125%, 05/07/2029 | | | | | | | 635,000 | | | | 439,960 | | | | 0.47 | |
| | | | | | | | | | | 439,960 | | | | 0.47 | |
| | | | |
Zambia (Cost $2,008,075) | | | | | | | | | | | | | | | | |
First Quantum Minerals Ltd., 6.875%, 03/01/2026 | | | | | | | 1,520,000 | | | | 1,426,368 | | | | 1.54 | |
First Quantum Minerals Ltd., 6.875%, 10/15/2027 | | | | | | | 500,000 | | | | 464,914 | | | | 0.50 | |
| | | | | | | | | | | 1,891,282 | | | | 2.04 | |
| | | | |
Total Debt Securities (Cost $157,463,604) | | | | | | | | | | | 90,300,719 | | | | 97.23 | |
| | | | |
Bank Loans | | | | | | | | | | | | | | | | |
| | | | |
Czech Republic (Cost $362,933) | | | | | | | | | | | | | | | | |
New World Resources N.V., 8.500%, 10/07/20167,9 | | | EUR | | | | 827,337 | | | | — | | | | — | |
| | | | | | | | | | | — | | | | — | |
| | | | |
Total Bank Loans (Cost $362,933) | | | | | | | | | | | — | | | | — | |
| | | | |
| | | | | | | | | | | % of Net | |
| | | Currency1 | | Shares | | | Value | | | Assets | |
| |
Equity Securities | | | | | | | | | | | | | | | | |
| | | | |
Czech Republic (Cost $1,093,254) | | | | | | | | | | | | | | | | |
New World Resources PLC, Class A*,9 | | | GBP | | | | 36,580,138 | | | $ | — | | | | — | |
| | | | | | | | | | | — | | | | — | |
| | | | |
Niger (Cost $877,496) | | | | | | | | | | | | | | | | |
Savannah Energy PLC* | | | GBP | | | | 2,258,852 | | | | 712,462 | | | | 0.77 | |
| | | | | | | | | | | 712,462 | | | | 0.77 | |
| | | | |
Total Equity Securities (Cost $1,970,750) | | | | | | | | | | | 712,462 | | | | 0.77 | |
| | | | |
Total Investments (Total Cost $159,797,287) | | | | | | | | | | | 91,013,181 | | | | 98.00 | |
| | | | |
Other Assets Less Liabilities (See Statements of Assets and Liabilities for further detail) | | | | | | | | | | | 1,857,650 | | | | 2.00 | |
| | | | |
Net Assets | | | | | | | | | | $ | 92,870,831 | | | | 100.00 | |
| * | Non-income producing security. |
| 1 | Local currency is United States Dollars unless otherwise noted below. |
| 2 | Step coupon bond. Rate as of October 31, 2022 is disclosed. |
| 3 | Variable rate security. Security issued at a fixed coupon rate, which converts to a variable rate at a specified date. Rate shown is the rate in effect as of period end. |
| 4 | Security is a payment-in-kind bond, and unless otherwise noted in the description of the security, pays its entire coupon on an in-kind basis. |
See accompanying notes to the financial statements.
108
ASHMORE EMERGING MARKETS CORPORATE INCOME FUND
SCHEDULE OF INVESTMENTS (CONTINUED)
As of October 31, 2022
| 5 | Securities exempt from registration under Rule 144A of the Securities Act of 1933. These securities may not be publicly traded without registration under the Securities Act of 1933. |
| 6 | Issuer has defaulted on terms of debt obligation. |
| 7 | Maturity has been extended under the terms of a plan of reorganization. |
| 9 | Security has been deemed worthless and is a Level 3 investment. |
| 10 | Restricted security that has been deemed illiquid. At October 31, 2022 the value of these restricted illiquid securities amount to $0 or 0.00% of net assets. Additional information on each restricted illiquid security is as follows: |
| | | | | | | | |
| SECURITY | | | | ACQUISITION DATE | | | | ACQUISITION COST |
| | | | |
New World Resources N.V., 0.0000%, 10/07/2020 | | | | 10/7/14 | | | | $— |
| 11 | Zero coupon bond – interest rate reflects effective yield on the date of purchase. |
| 12 | Security is a Level 3 investment. |
Percentages shown are based on net assets.
At October 31, 2022, the Ashmore Emerging Markets Corporate Income Fund had outstanding forward foreign currency exchange contracts as follows:
| | | | | | | | | | | | | | | | | | |
| | | | | | | Currency | | | | | Currency | | | | |
| | | | | | | Buy Amount | | | | | Sell Amount | | | | |
| Settlement | | | | Currency | | (Local | | | Currency | | (Local | | | Unrealized | |
| Date | | Counterparty | | Buy | | Currency) | | | Sell | | Currency) | | | Gain/(Loss) | |
| | | | | | |
11/30/2022 | | Deutsche Bank | | British Pound | | | 229,871 | | | United States Dollar | | | 255,572 | | | | $ 8,260 | |
| | | | | | |
11/30/2022 | | State Street | | United States Dollar | | | 942,683 | | | British Pound | | | 800,000 | | | | 24,491 | |
| | | | |
Subtotal Appreciation | | | | | | | | | | | | | 32,751 | |
| | | | | | |
11/30/2022 | | Deutsche Bank | | United States Dollar | | | 1,796,444 | | | Euro | | | 1,823,285 | | | | (9,254) | |
| | | | |
Subtotal Depreciation | | | | | | | | | | | | | (9,254) | |
| | | | | | |
Total | | | | | | | | | | | | | | | | | $23,497 | |
See accompanying notes to the financial statements.
109
ASHMORE EMERGING MARKETS CORPORATE INCOME FUND
SCHEDULE OF INVESTMENTS (CONTINUED)
As of October 31, 2022
The inputs or methodologies used for valuing securities are not necessarily an indication of the risks associated with investing in those securities and other financial instruments, if any. See note 4 in the Notes to the Financial Statements for more information regarding pricing inputs and valuation techniques. The following is a summary of the inputs used in valuing the Ashmore Emerging Markets Corporate Income Fund’s investments and other financial instruments, which are carried at fair value, as of October 31, 2022:
| | | | | | | | | | | | | | | | |
| | | Level 1 | | | Level 2 | | | Level 3 | | | Total | |
Investments | | | | | | | | | | | | | | | | |
Assets: | | | | | | | | | | | | | | | | |
Debt Securities | | | | | | | | | | | | | | | | |
Corporate Bonds | | | $— | | | | $74,055,976 | | | | $ 2 | | | | $74,055,978 | |
Corporate Convertible Bonds | | | — | | | | 4,876,165 | | | | — | | | | 4,876,165 | |
Financial Certificates | | | — | | | | 2,654,813 | | | | — | | | | 2,654,813 | |
Government Agencies | | | — | | | | 8,713,763 | | | | — | | | | 8,713,763 | |
| | | | | | | | | | | | | | | | |
Total Debt Securities | | | — | | | | 90,300,717 | | | | 2 | | | | 90,300,719 | |
Bank Loans | | | | | | | | | | | | | | | | |
Equity Securities | | | | | | | | | | | | | | | | |
Common Stock | | | | | | | | | | | | | | | | |
Niger | | | — | | | | 712,462 | | | | — | | | | 712,462 | |
| | | | | | | | | | | | | | | | |
Total Common Stock | | | — | | | | 712,462 | | | | — | | | | 712,462 | |
| |
Total Investments | | | $— | | | | $91,013,179 | | | | $ 2 | | | | $91,013,181 | |
| |
| | | | |
Other Financial Instruments | | | | | | | | | | | | | | | | |
Assets: | | | | | | | | | | | | | | | | |
Forward Foreign Currency Exchange Contracts | | | $— | | | | $32,751 | | | | $— | | | | $32,751 | |
Liabilities: | | | | | | | | | | | | | | | | |
Forward Foreign Currency Exchange Contracts | | | — | | | | (9,254 | ) | | | — | | | | (9,254 | ) |
| |
Total Other Financial Instruments | | | $— | | | | $23,497 | | | | $— | | | | $23,497 | |
| |
The following is a reconciliation of investments in which significant unobservable inputs (Level 3) were used for the Fund during the period ended October 31, 2022:
| | | | | | | | | | | | | | | | | | | | | | | | | | | | | | | | | | | | | | | | | | | | | | | | | | |
| | | | | | | | | | | | | | | | | | | | | Change in |
| | | | | | | | | | | | | | | | | | | | | Unrealized |
| | | | | | | | | | | | | | | | | | | | | Appreciation |
| | | | | | | | | | | | | Change in | | | | | | | | (Depreciation) |
| | | Beginning | | Accrued | | | | | | Realized | | Unrealized | | Transfers | | Transfers | | Ending | | from Investments |
| Category and | | Balance | | Discounts | | | | | | Gains | | Appreciation | | into | | out of | | Balance | | still held |
| Subcategory | | at 10/31/2021 | | (Premiums) | | Purchases | | Sales | | (Losses) | | (Depreciation) | | Level 3 | | Level 3 | | at 10/31/2022 | | 10/31/2022 |
| | | | | | | | | | |
Investments, at value | | | | | | | | | | | | | | | | | | | | | | | | | | | | | | | | | | | | | | | | | | | | | | | | | | |
| | | | | | | | | | |
Bank Loans | | | | | | | | | | | | | | | | | | | | | | | | | | | | | | | | | | | | | | | | | | | | | | | | | | |
| | | | | | | | | | |
Brazil | | | $ | 1,800,000 | | | | $ | — | | | | $ | — | | | | $ | (1,818,800 | ) | | | $ | (281,200 | ) | | | $ | 300,000 | | | | $ | — | | | | $ | — | | | | $ | — | | | | $ | — | |
| | | | | | | | | | |
Ghana | | | | 2,121,750 | | | | | — | | | | | — | | | | | (2,131,859 | ) | | | | (11,323 | ) | | | | 21,432 | | | | | — | | | | | — | | | | | — | | | | | — | |
| | | | | | | | | | |
Common Stock | | | | | | | | | | | | | | | | | | | | | | | | | | | | | | | | | | | | | | | | | | | | | | | | | | |
| | | | | | | | | | |
Niger | | | | 598,176 | | | | | — | | | | | — | | | | | — | | | | | — | | | | | (598,176 | ) | | | | — | | | | | — | | | | | — | | | | | — | |
| | | | | | | | | | |
Corporate Bonds | | | | | | | | | | | | | | | | | | | | | | | | | | | | | | | | | | | | | | | | | | | | | | | | | | |
| | | | | | | | | | |
Russian Federation | | | | — | | | | | — | | | | | — | | | | | — | | | | | — | | | | | — | | | | | 2 | | | | | — | | | | | 2 | | | | | (1,481,646 | ) |
| | | | | | | | | | |
Total | | | $ | 4,519,926 | | | | $ | — | | | | $ | — | | | | $ | (3,950,659 | ) | | | $ | (292,523 | ) | | | $ | (276,744 | ) | | | $ | 2 | | | | $ | — | | | | $ | 2 | | | | $ | (1,481,646 | ) |
See accompanying notes to the financial statements.
110
ASHMORE EMERGING MARKETS CORPORATE INCOME FUND
SCHEDULE OF INVESTMENTS (CONTINUED)
As of October 31, 2022
The following table on “Quantitative information about Level 3 Fair Value measurements” provides information on the valuation techniques and inputs used to value Level 3 securities at October 31, 2022:
| | | | | | | | |
| Quantitative Information about Level 3 Fair Value Measurements |
|
| | | Fair Value at | | | Valuation | | Unobservable |
| | | 10/31/2022 | | | Technique | | Input |
|
Bank Loans | | | $— | | | Zero priced asset | | Inputs to model |
Common Stock | | | — | | | Zero priced asset | | Inputs to model |
Corporate Bonds | | | 2 | | | Zero priced asset | | Inputs to model |
|
Total | | | $ 2 | | | | | |
|
The following is a summary of the fair values of the Fund’s derivative instruments*:
Fair Values of Financial Derivative Instruments on the Statements of Assets and Liabilities as of October 31, 2022:
| | | | |
| | | Derivatives Not Accounted for as | |
| | | Hedging Instruments | |
| | | Foreign | |
| | | Exchange Risk | |
| |
Assets: | | | | |
| |
Unrealized Appreciation on Forward Foreign Currency Exchange Contracts | | | $32,751 | |
| | | | |
| |
Liabilities: | | | | |
| |
Unrealized Depreciation on Forward Foreign Currency Exchange Contracts | | | $ (9,254 | ) |
| | | | |
The Effect of Financial Derivative Instruments on the Statements of Operations for the Year Ended October 31, 2022:
| | | | |
| | | Derivatives Not Accounted for as | |
| | | Hedging Instruments | |
| | | Foreign | |
| | | Exchange Risk | |
| |
Realized Gain (Loss) on Derivatives Recognized resulting from Operations: | | | | |
| |
Net Realized Gain on Forward Foreign Currency Exchange Contracts | | | $599,723 | |
| | | | |
| |
Net Change in Unrealized Appreciation (Depreciation) on Derivatives Recognized resulting from Operations: | | | | |
| |
Net Change in Unrealized Appreciation on Forward Foreign Currency Exchange Contracts | | | $ 17,247 | |
| | | | |
* See note 10 in the Notes to the Financial Statements for additional information.
See accompanying notes to the financial statements.
111
ASHMORE EMERGING MARKETS SHORT DURATION FUND
SCHEDULE OF INVESTMENTS
As of October 31, 2022
| | | | | | | | | | | | | | | | |
| | | Currency1 | | | Par | | | Value | | | % of Net
Assets | |
| |
Debt Securities | | | | | | | | | | | | | | | | |
| | | | |
Argentina (Cost $1,655,597) | | | | | | | | | | | | | | | | |
YPF S.A., (Step to 9.000% on 01/01/2023), 4.000%, 02/12/20262 | | | | | | | 1,950,000 | | | $ | 1,711,222 | | | | 3.09 | |
| | | | | | | | | | | 1,711,222 | | | | 3.09 | |
| | | | |
Bahrain (Cost $585,285) | | | | | | | | | | | | | | | | |
BBK BSC, 5.500%, 07/09/2024 | | | | | | | 600,000 | | | | 581,651 | | | | 1.05 | |
| | | | | | | | | | | 581,651 | | | | 1.05 | |
| | | | |
Brazil (Cost $17,033,530) | | | | | | | | | | | | | | | | |
Azul Investments LLP, 5.875%, 10/26/2024 | | | | | | | 2,630,000 | | | | 1,981,976 | | | | 3.58 | |
Banco do Brasil S.A., 4.625%, 01/15/2025 | | | | | | | 600,000 | | | | 582,660 | | | | 1.05 | |
Banco Votorantim S.A., 4.500%, 09/24/2024 | | | | | | | 600,000 | | | | 580,738 | | | | 1.05 | |
CSN Resources S.A., 7.625%, 04/17/2026 | | | | | | | 1,150,000 | | | | 1,100,816 | | | | 1.99 | |
Gol Finance S.A., 7.000%, 01/31/2025 | | | | | | | 3,480,000 | | | | 1,513,800 | | | | 2.74 | |
InterCement Financial Operations B.V., 5.750%, 07/17/2024 | | | | | | | 4,350,000 | | | | 3,018,465 | | | | 5.45 | |
Itau Unibanco Holding S.A., 3.250%, 01/24/2025 | | | | | | | 600,000 | | | | 576,954 | | | | 1.04 | |
Oi S.A., 10.000%, 07/27/20253 | | | | | | | 5,400,000 | | | | 1,404,286 | | | | 2.54 | |
| | | | | | | | | | | 10,759,695 | | | | 19.44 | |
| | | | |
Chile (Cost $591,340) | | | | | | | | | | | | | | | | |
Inversiones CMPC S.A., 4.750%, 09/15/2024 | | | | | | | 600,000 | | | | 589,500 | | | | 1.07 | |
| | | | | | | | | | | 589,500 | | | | 1.07 | |
| | | | |
China (Cost $50,317,144) | | | | | | | | | | | | | | | | |
Central China Real Estate Ltd., 7.250%, 04/24/2023 | | | | | | | 875,000 | | | | 259,553 | | | | 0.47 | |
CFLD Cayman Investment Ltd., 8.625%, 02/28/20214,5 | | | | | | | 600,000 | | | | 30,000 | | | | 0.05 | |
CFLD Cayman Investment Ltd., 9.000%, 07/31/20214,5 | | | | | | | 780,000 | | | | 39,000 | | | | 0.07 | |
CFLD Cayman Investment Ltd., 8.600%, 04/08/20244 | | | | | | | 1,035,000 | | | | 52,371 | | | | 0.09 | |
CFLD Cayman Investment Ltd., 8.050%, 01/13/20254 | | | | | | | 2,975,000 | | | | 148,750 | | | | 0.27 | |
China Evergrande Group, 8.250%, 03/23/20224,5 | | | | | | | 4,707,000 | | | | 164,564 | | | | 0.30 | |
China Evergrande Group, 10.000%, 04/11/20234 | | | | | | | 5,150,000 | | | | 180,097 | | | | 0.33 | |
Country Garden Holdings Co. Ltd., 4.750%, 01/17/2023 | | | | | | | 400,000 | | | | 282,302 | | | | 0.51 | |
Country Garden Holdings Co. Ltd., 8.000%, 01/27/2024 | | | | | | | 400,000 | | | | 65,047 | | | | 0.12 | |
Fantasia Holdings Group Co. Ltd., 12.250%, 10/18/20224,5 | | | | | | | 4,000,000 | | | | 198,835 | | | | 0.36 | |
Fantasia Holdings Group Co. Ltd., 10.875%, 01/09/20234 | | | | | | | 4,160,000 | | | | 207,750 | | | | 0.38 | |
Fantasia Holdings Group Co. Ltd., 11.875%, 06/01/20234 | | | | | | | 1,510,000 | | | | 75,409 | | | | 0.14 | |
Kaisa Group Holdings Ltd., 11.500%, 01/30/20234 | | | | | | | 4,875,000 | | | | 313,641 | | | | 0.57 | |
Kaisa Group Holdings Ltd., 10.875%, 07/23/20234 | | | | | | | 3,930,000 | | | | 245,625 | | | | 0.44 | |
Kaisa Group Holdings Ltd., 11.250%, 04/16/20254 | | | | | | | 4,280,000 | | | | 283,550 | | | | 0.51 | |
Prime Bloom Holdings Ltd., 6.950%, 07/05/20224,5 | | | | | | | 6,470,000 | | | | 841,100 | | | | 1.52 | |
Scenery Journey Ltd., 11.500%, 10/24/20224,5 | | | | | | | 1,490,000 | | | | 33,595 | | | | 0.06 | |
Shimao Group Holdings Ltd., 4.750%, 07/03/20224,5 | | | | | | | 200,000 | | | | 9,046 | | | | 0.02 | |
Sunac China Holdings Ltd., 7.250%, 06/14/20224,5 | | | | | | | 690,000 | | | | 41,218 | | | | 0.07 | |
Sunac China Holdings Ltd., 7.950%, 08/08/20224,5 | | | | | | | 730,000 | | | | 43,978 | | | | 0.08 | |
Sunac China Holdings Ltd., 8.350%, 04/19/20234 | | | | | | | 200,000 | | | | 11,492 | | | | 0.02 | |
Sunac China Holdings Ltd., 6.650%, 08/03/20244 | | | | | | | 250,000 | | | | 14,033 | | | | 0.02 | |
See accompanying notes to the financial statements.
112
ASHMORE EMERGING MARKETS SHORT DURATION FUND
SCHEDULE OF INVESTMENTS (CONTINUED)
As of October 31, 2022
| | | | | | | | | | | | | | | | |
| | | Currency1 | | | Par | | | Value | | | % of Net
Assets | |
| |
China (continued) | | | | | | | | | | | | | | | | |
Tunghsu Venus Holdings Ltd., 7.000%, 06/12/20204,5 | | | | | | | 2,640,000 | | | $ | 728,640 | | | | 1.32 | |
Yuzhou Group Holdings Co. Ltd., 7.813%, 01/21/20234 | | | | | | | 670,000 | | | | 19,136 | | | | 0.03 | |
Yuzhou Group Holdings Co. Ltd., 6.000%, 10/25/20234 | | | | | | | 4,940,000 | | | | 147,846 | | | | 0.27 | |
Zhenro Properties Group Ltd., 8.000%, 03/06/20234 | | | | | | | 4,920,000 | | | | 147,600 | | | | 0.27 | |
Zhenro Properties Group Ltd., 9.150%, 05/06/20234 | | | | | | | 813,000 | | | | 15,407 | | | | 0.03 | |
Zhenro Properties Group Ltd., 8.300%, 09/15/20234 | | | | | | | 1,017,000 | | | | 18,655 | | | | 0.03 | |
Zhenro Properties Group Ltd., 7.875%, 04/14/20244 | | | | | | | 575,000 | | | | 11,103 | | | | 0.02 | |
| | | | | | | | | | | 4,629,343 | | | | 8.37 | |
| | | | |
Colombia (Cost $1,348,984) | | | | | | | | | | | | | | | | |
Ecopetrol S.A., 4.125%, 01/16/2025 | | | | | | | 1,350,000 | | | | 1,244,750 | | | | 2.25 | |
| | | | | | | | | | | 1,244,750 | | | | 2.25 | |
| | | | |
Ghana (Cost $1,444,108) | | | | | | | | | | | | | | | | |
Tullow Oil PLC, 10.250%, 05/15/2026 | | | | | | | 1,405,000 | | | | 1,195,683 | | | | 2.16 | |
| | | | | | | | | | | 1,195,683 | | | | 2.16 | |
| | | | |
India (Cost $3,175,240) | | | | | | | | | | | | | | | | |
Bharti Airtel Ltd., 4.375%, 06/10/2025 | | | | | | | 1,195,000 | | | | 1,135,177 | | | | 2.05 | |
Greenko Solar Mauritius Ltd., 5.950%, 07/29/2026 | | | | | | | 1,360,000 | | | | 1,092,080 | | | | 1.98 | |
Vedanta Resources Finance II PLC, 8.000%, 04/23/2023 | | | | | | | 760,000 | | | | 709,553 | | | | 1.28 | |
| | | | | | | | | | | 2,936,810 | | | | 5.31 | |
| | | | |
Jamaica (Cost $3,262,937) | | | | | | | | | | | | | | | | |
Digicel Group Holdings Ltd., 7.000%, 11/16/20223 | | | | | | | 123,394 | | | | 8,638 | | | | 0.02 | |
Digicel International Finance Ltd./Digicel International Holdings Ltd., 8.750%, 05/25/2024 | | | | | | | 3,200,000 | | | | 2,730,848 | | | | 4.93 | |
| | | | | | | | | | | 2,739,486 | | | | 4.95 | |
| | | | |
Jordan (Cost $1,005,817) | | | | | | | | | | | | | | | | |
Hikma Finance U.S.A. LLC, 3.250%, 07/09/2025 | | | | | | | 1,000,000 | | | | 919,986 | | | | 1.66 | |
| | | | | | | | | | | 919,986 | | | | 1.66 | |
| | | | |
Kazakhstan (Cost $830,915) | | | | | | | | | | | | | | | | |
KazMunayGas National Co. JSC, 4.750%, 04/19/2027 | | | | | | | 978,000 | | | | 848,693 | | | | 1.53 | |
| | | | | | | | | | | 848,693 | | | | 1.53 | |
| | | | |
Kuwait (Cost $539,827) | | | | | | | | | | | | | | | | |
MEGlobal Canada ULC, 5.000%, 05/18/2025 | | | | | | | 550,000 | | | | 531,437 | | | | 0.96 | |
| | | | | | | | | | | 531,437 | | | | 0.96 | |
| | | | |
Lebanon (Cost $13,433,289) | | | | | | | | | | | | | | | | |
Lebanon (Rep of), 6.375%, 03/09/20204,5 | | | | | | | 1,527,000 | | | | 87,803 | | | | 0.16 | |
Lebanon (Rep of), 5.800%, 04/14/20204,5 | | | | | | | 7,070,000 | | | | 414,161 | | | | 0.75 | |
Lebanon (Rep of), 6.150%, 06/19/20204,5 | | | | | | | 6,506,000 | | | | 381,121 | | | | 0.69 | |
| | | | | | | | | | | 883,085 | | | | 1.60 | |
| | | | |
Mexico (Cost $9,888,074) | | | | | | | | | | | | | | | | |
Alfa S.A.B. de C.V., 5.250%, 03/25/2024 | | | | | | | 1,080,000 | | | | 1,072,440 | | | | 1.94 | |
Axtel S.A.B. de C.V., 6.375%, 11/14/2024 | | | | | | | 700,000 | | | | 466,116 | | | | 0.84 | |
See accompanying notes to the financial statements.
113
ASHMORE EMERGING MARKETS SHORT DURATION FUND
SCHEDULE OF INVESTMENTS (CONTINUED)
As of October 31, 2022
| | | | | | | | | | | | | | | | |
| | | Currency1 | | | Par | | | Value | | | % of Net
Assets | |
| |
Mexico (continued) | | | | | | | | | | | | | | | | |
Banco Santander Mexico S.A. Institucion de Banca Multiple | | | | | | | | | | | | | | | | |
Grupo Financiero Santander, 5.375%, 04/17/2025 | | | | | | | 1,000,000 | | | $ | 970,000 | | | | 1.75 | |
Grupo Axo S.A.P.I. de C.V., 5.750%, 06/08/2026 | | | | | | | 1,025,000 | | | | 813,061 | | | | 1.47 | |
Petroleos Mexicanos, 6.875%, 10/16/2025 | | | | | | | 5,652,000 | | | | 5,432,985 | | | | 9.82 | |
| | | | | | | | | | | 8,754,602 | | | | 15.82 | |
| | | | |
Morocco (Cost $1,143,333) | | | | | | | | | | | | | | | | |
OCP S.A., 4.500%, 10/22/2025 | | | | | | | 1,100,000 | | | | 1,047,011 | | | | 1.89 | |
| | | | | | | | | | | 1,047,011 | | | | 1.89 | |
| | | | |
Oman (Cost $2,319,540) | | | | | | | | | | | | | | | | |
National Bank of Oman SAOG, 5.625%, 09/25/2023 | | | | | | | 1,200,000 | | | | 1,189,320 | | | | 2.15 | |
Oztel Holdings SPC Ltd., 5.625%, 10/24/2023 | | | | | | | 1,100,000 | | | | 1,089,761 | | | | 1.97 | |
| | | | | | | | | | | 2,279,081 | | | | 4.12 | |
| | | | |
Pakistan (Cost $1,839,100) | | | | | | | | | | | | | | | | |
Third Pakistan International Sukuk (The) Co. Ltd., 5.625%, 12/05/2022 | | | | | | | 1,981,000 | | | | 1,784,723 | | | | 3.23 | |
| | | | | | | | | | | 1,784,723 | | | | 3.23 | |
| | | | |
Saudi Arabia (Cost $1,558,759) | | | | | | | | | | | | | | | | |
Arabian Centres Sukuk Ltd., 5.375%, 11/26/2024 | | | | | | | 1,600,000 | | | | 1,478,976 | | | | 2.67 | |
| | | | | | | | | | | 1,478,976 | | | | 2.67 | |
| | | | |
South Africa (Cost $1,776,890) | | | | | | | | | | | | | | | | |
Liquid Telecommunications Financing PLC, 5.500%, 09/04/2026 | | | | | | | 700,000 | | | | 483,000 | | | | 0.87 | |
Sasol Financing U.S.A. LLC, 5.875%, 03/27/2024 | | | | | | | 1,100,000 | | | | 1,074,150 | | | | 1.94 | |
| | | | | | | | | | | 1,557,150 | | | | 2.81 | |
| | | | |
Tanzania (Cost $1,172,314) | | | | | | | | | | | | | | | | |
HTA Group Ltd., 7.000%, 12/18/2025 | | | | | | | 1,300,000 | | | | 1,137,500 | | | | 2.06 | |
| | | | | | | | | | | 1,137,500 | | | | 2.06 | |
| | | | |
United States (Cost $841,699) | | | | | | | | | | | | | | | | |
U.S. Treasury Bill, 2.360%, 12/29/20226 | | | | | | | 845,000 | | | | 839,799 | | | | 1.52 | |
| | | | | | | | | | | 839,799 | | | | 1.52 | |
| | | | |
Venezuela (Cost $16,453,222) | | | | | | | | | | | | | | | | |
Petroleos de Venezuela S.A., 8.500%, 10/27/20204,5 | | | | | | | 18,697,500 | | | | 3,272,062 | | | | 5.91 | |
| | | | | | | | | | | 3,272,062 | | | | 5.91 | |
See accompanying notes to the financial statements.
114
ASHMORE EMERGING MARKETS SHORT DURATION FUND
SCHEDULE OF INVESTMENTS (CONTINUED)
As of October 31, 2022
| | | | | | | | | | | | | | | | |
| | | Currency1 | | | Par | | | Value | | | % of Net
Assets | |
Zambia (Cost $1,201,056) | | | | | | | | | | | | | | | | |
First Quantum Minerals Ltd., 6.875%, 03/01/2026 | | | | | | | 1,275,000 | | | $ | 1,196,460 | | | | 2.16 | |
| | | | | | | | | | | 1,196,460 | | | | 2.16 | |
| | | | |
Total Debt Securities (Cost $133,418,000) | | | | | | | | | | | 52,918,705 | | | | 95.63 | |
| | | | |
Total Investments (Total Cost $133,418,000) | | | | | | | | | | | 52,918,705 | | | | 95.63 | |
Other Assets Less Liabilities (See Statements of Assets and Liabilities for further detail) | | | | | | | | | | | 2,420,423 | | | | 4.37 | |
| | | | |
Net Assets | | | | | | | | | | $ | 55,339,128 | | | | 100.00 | |
| 1 | Local currency is United States Dollars unless otherwise noted below. |
| 2 | Step coupon bond. Rate as of October 31, 2022 is disclosed. |
| 3 | Security is a payment-in-kind bond, and unless otherwise noted in the description of the security, pays its entire coupon on an in-kind basis. |
| 4 | Issuer has defaulted on terms of debt obligation. |
| 5 | Maturity has been extended under the terms of a plan of reorganization. |
| 6 | Zero coupon bond – interest rate reflects effective yield on the date of purchase. |
Percentages shown are based on net assets.
The inputs ormethodologies used for valuing securities are not necessarily an indication of the risks associated with investing in those securities and other financial instruments, if any. See note 4 in the Notes to the Financial Statements for more information regarding pricing inputs and valuation techniques. The following is a summary of the inputs used in valuing the Ashmore Emerging Markets Short Duration Fund’s investments and other financial instruments, which are carried at fair value, as of October 31, 2022:
| | | | | | | | | | | | | | | | |
| | | Level 1 | | | Level 2 | | | Level 3 | | | Total | |
Investments | | | | | | | | | | | | | | | | |
Assets: | | | | | | | | | | | | | | | | |
Debt Securities | | | | | | | | | | | | | | | | |
Corporate Bonds | | | $— | | | | $39,543,165 | | | | $— | | | $ | 39,543,165 | |
Financial Certificates | | | — | | | | 3,263,699 | | | | — | | | | 3,263,699 | |
Government Agencies | | | — | | | | 8,388,957 | | | | — | | | | 8,388,957 | |
Government Bonds | | | — | | | | 883,085 | | | | — | | | | 883,085 | |
Short Term Bills and Notes | | | — | | | | 839,799 | | | | — | | | | 839,799 | |
| | | | | | | | | | | | | | | | |
Total Debt Securities | | | — | | | | 52,918,705 | | | | — | | | | 52,918,705 | |
| |
Total Investments | | | $— | | | $ | 52,918,705 | | | | $— | | | $ | 52,918,705 | |
| |
See accompanying notes to the financial statements.
115
ASHMOREE MERGING MARKETS SHORT DURATION FUND
SCHEDULE OF INVESTMENTS (CONTINUED)
As of October 31, 2022
The following is a summary of the fair values of the Fund’s derivative instruments*:
The Effect of Financial Derivative Instruments on the Statements of Operations for the Year Ended October 31, 2022:
| | | | |
| | | Derivatives Not Accounted for as
Hedging Instruments | |
| | | Foreign Exchange Risk | |
Realized Gain (Loss) on Derivatives Recognized resulting from Operations: | | | | |
Net Realized Gain on Forward Foreign Currency Exchange Contracts | | | $ 52,514 | |
| | | | |
| |
Net Change in Unrealized Appreciation (Depreciation) on Derivatives Recognized resulting from Operations: | | | | |
Net Change in Unrealized Appreciation on Forward Foreign Currency Exchange Contracts | | | $ (286) | |
| | | | |
* See note 10 in the Notes to the Financial Statements for additional information.
See accompanying notes to the financial statements.
116
ASHMORE EMERGING MARKETS ACTIVE EQUITY FUND
SCHEDULE OF INVESTMENTS
As of October 31, 2022
| | | | | | | | | | | | | | | | |
| | | Currency1 | | | Shares | | | Value | | | % of Net
Assets | |
Common Stocks | | | | | | | | | | | | | | | | |
| | | | |
Argentina (Cost $779,241) | | | | | | | | | | | | | | | | |
Globant S.A.* | | | | | | | 4,560 | | | $ | 860,381 | | | | 1.13 | |
| | | | | | | | | | | 860,381 | | | | 1.13 | |
| | | | |
Brazil (Cost $5,838,035) | | | | | | | | | | | | | | | | |
Banco do Brasil S.A. | | | BRL | | | | 104,300 | | | | 747,495 | | | | 0.98 | |
Hypera S.A.* | | | BRL | | | | 151,100 | | | | 1,486,282 | | | | 1.95 | |
Lojas Renner S.A.* | | | BRL | | | | 156,000 | | | | 933,191 | | | | 1.23 | |
Magazine Luiza S.A.* | | | BRL | | | | 478,200 | | | | 413,814 | | | | 0.54 | |
MercadoLibre, Inc.* | | | | | | | 1,870 | | | | 1,686,030 | | | | 2.22 | |
Rumo S.A. | | | BRL | | | | 194,500 | | | | 833,652 | | | | 1.10 | |
TOTVS S.A.* | | | BRL | | | | 66,200 | | | | 424,972 | | | | 0.56 | |
| | | | | | | | | | | 6,525,436 | | | | 8.58 | |
| | | | |
China (Cost $30,650,681) | | | | | | | | | | | | | | | | |
Alibaba Group Holding Ltd.* | | | HKD | | | | 291,700 | | | | 2,322,362 | | | | 3.05 | |
ANTA Sports Products Ltd. | | | HKD | | | | 195,800 | | | | 1,722,023 | | | | 2.27 | |
Baidu, Inc. ADR* | | | | | | | 23,180 | | | | 1,774,893 | | | | 2.33 | |
China International Capital Corp. Ltd., Class H2 | | | HKD | | | | 841,200 | | | | 1,164,961 | | | | 1.53 | |
China Mengniu Dairy Co. Ltd.* | | | HKD | | | | 521,000 | | | | 1,669,943 | | | | 2.20 | |
China Vanke Co. Ltd., Class H | | | HKD | | | | 960,900 | | | | 1,234,624 | | | | 1.62 | |
JD.com, Inc., Class A | | | HKD | | | | 89,373 | | | | 1,668,852 | | | | 2.20 | |
Meituan, Class B*,2 | | | HKD | | | | 161,300 | | | | 2,565,843 | | | | 3.37 | |
NARI Technology Co. Ltd., Class A | | | CNH | | | | 548,820 | | | | 1,826,131 | | | | 2.40 | |
NetEase, Inc. | | | HKD | | | | 119,200 | | | | 1,326,266 | | | | 1.74 | |
Shenzhen Inovance Technology Co. Ltd., Class A | | | CNH | | | | 197,197 | | | | 1,793,283 | | | | 2.36 | |
Tencent Holdings Ltd. | | | HKD | | | | 62,300 | | | | 1,634,737 | | | | 2.15 | |
Yum China Holdings, Inc. | | | | | | | 27,100 | | | | 1,120,585 | | | | 1.47 | |
| | | | | | | | | | | 21,824,503 | | | | 28.69 | |
| | | | |
Hong Kong (Cost $2,837,531) | | | | | | | | | | | | | | | | |
AIA Group Ltd. | | | HKD | | | | 306,200 | | | | 2,312,330 | | | | 3.04 | |
| | | | | | | | | | | 2,312,330 | | | | 3.04 | |
| | | | |
India (Cost $11,803,386) | | | | | | | | | | | | | | | | |
Axis Bank Ltd. | | | INR | | | | 90,059 | | | | 984,776 | | | | 1.29 | |
HDFC Bank Ltd. ADR | | | | | | | 56,755 | | | | 3,536,404 | | | | 4.65 | |
Infosys Ltd. ADR | | | | | | | 162,400 | | | | 3,041,752 | | | | 4.00 | |
Larsen & Toubro Ltd. | | | INR | | | | 31,675 | | | | 773,679 | | | | 1.02 | |
Reliance Industries Ltd. | | | INR | | | | 91,630 | | | | 2,819,810 | | | | 3.70 | |
Tata Consultancy Services Ltd. | | | INR | | | | 21,265 | | | | 819,620 | | | | 1.08 | |
| | | | | | | | | | | 11,976,041 | | | | 15.74 | |
| | | | |
Indonesia (Cost $948,662) | | | | | | | | | | | | | | | | |
Bank Central Asia Tbk PT | | | IDR | | | | 1,740,100 | | | | 980,525 | | | | 1.29 | |
| | | | | | | | | | | 980,525 | | | | 1.29 | |
| | | | | | | | | | | | | |
See accompanying notes to the financial statements.
117
ASHMORE EMERGING MARKETS ACTIVE EQUITY FUND
SCHEDULE OF INVESTMENTS (CONTINUED)
As of October 31, 2022
| | | | | | | | | | | | | | | | |
| | | Currency1 | | | Shares | | | Value | | | % of Net
Assets | |
Mexico (Cost $2,846,895) | | | | | | | | | | | | | | | | |
Grupo Financiero Banorte S.A.B. de C.V., Class O | | | MXN | | | | 78,900 | | | $ | 641,339 | | | | 0.84 | |
Sitios Latinoamerica S.A.B. de C.V.* | | | MXN | | | | 52,093 | | | | 15,197 | | | | 0.02 | |
Wal-Mart de Mexico S.A.B. de C.V. | | | MXN | | | | 658,750 | | | | 2,544,498 | | | | 3.35 | |
| | | | | | | | | | | 3,201,034 | | | | 4.21 | |
| | | | |
Russian Federation (Cost $2,514,310) | | | | | | | | | | | | | | | | |
Gazprom PJSC3 | | | RUB | | | | 84,440 | | | | — | | | | — | |
LUKOIL PJSC3 | | | RUB | | | | 12,180 | | | | — | | | | — | |
Moscow Exchange MICEX-RTS PJSC*,4 | | | RUB | | | | 528,670 | | | | 1 | | | | — | |
| | | | | | | | | | | 1 | | | | — | |
| | | | |
Saudi Arabia (Cost $5,244,633) | | | | | | | | | | | | | | | | |
Al Rajhi Bank* | | | SAR | | | | 30,842 | | | | 698,782 | | | | 0.92 | |
Saudi Arabian Oil Co.2 | | | SAR | | | | 215,239 | | | | 1,998,439 | | | | 2.63 | |
Saudi National Bank (The) | | | SAR | | | | 124,331 | | | | 1,964,233 | | | | 2.58 | |
| | | | | | | | | | | 4,661,454 | | | | 6.13 | |
| | | | |
South Africa (Cost $2,065,610) | | | | | | | | | | | | | | | | |
Clicks Group Ltd. | | | ZAR | | | | 50,758 | | | | 860,250 | | | | 1.13 | |
FirstRand Ltd. | | | ZAR | | | | 283,446 | | | | 993,764 | | | | 1.30 | |
| | | | | | | | | | | 1,854,014 | | | | 2.43 | |
| | | | |
South Korea (Cost $8,331,007) | | | | | | | | | | | | | | | | |
Korea Shipbuilding & Offshore Engineering Co. Ltd.* | | | KRW | | | | 22,598 | | | | 1,150,279 | | | | 1.51 | |
LG H&H Co. Ltd. | | | KRW | | | | 1,548 | | | | 552,803 | | | | 0.73 | |
Samsung Electronics Co. Ltd. | | | KRW | | | | 77,058 | | | | 3,204,341 | | | | 4.21 | |
SK Telecom Co. Ltd. | | | KRW | | | | 53,396 | | | | 1,876,132 | | | | 2.47 | |
| | | | | | | | | | | 6,783,555 | | | | 8.92 | |
| | | | |
Taiwan (Cost $13,290,465) | | | | | | | | | | | | | | | | |
Chunghwa Telecom Co. Ltd. | | | TWD | | | | 273,000 | | | | 939,535 | | | | 1.24 | |
Delta Electronics, Inc. | | | TWD | | | | 90,000 | | | | 717,264 | | | | 0.94 | |
Hon Hai Precision Industry Co. Ltd. | | | TWD | | | | 534,000 | | | | 1,694,625 | | | | 2.23 | |
MediaTek, Inc. | | | TWD | | | | 21,000 | | | | 382,606 | | | | 0.50 | |
Taiwan Semiconductor Manufacturing Co. Ltd. | | | TWD | | | | 339,021 | | | | 4,079,813 | | | | 5.36 | |
Taiwan Semiconductor Manufacturing Co. Ltd. ADR | | | | | | | 36,947 | | | | 2,274,088 | | | | 2.99 | |
| | | | | | | | | | | 10,087,931 | | | | 13.26 | |
| | | | |
United Arab Emirates (Cost $3,824,036) | | | | | | | | | | | | | | | | |
Dubai Islamic Bank PJSC | | | AED | | | | 815,248 | | | | 1,291,265 | | | | 1.70 | |
Emaar Properties PJSC | | | AED | | | | 779,933 | | | | 1,287,819 | | | | 1.69 | |
See accompanying notes to the financial statements.
118
ASHMORE EMERGING MARKETS ACTIVE EQUITY FUND
SCHEDULE OF INVESTMENTS (CONTINUED)
As of October 31, 2022
| | | | | | | | | | | | | | | | |
| | | Currency1 | | | Shares | | | Value | | | % of Net
Assets | |
United Arab Emirates (continued) | | | | | | | | | | | | | | | | |
First Abu Dhabi Bank PJSC | | | AED | | | | 241,581 | | | $ | 1,177,489 | | | | 1.55 | |
| | | | | | | | | | | 3,756,573 | | | | 4.94 | |
| | | | |
Total Common Stocks (Cost $90,974,492) | | | | | | | | | | | 74,823,778 | | | | 98.36 | |
| | | | |
Total Investments (Total Cost $90,974,492) | | | | | | | | | | | 74,823,778 | | | | 98.36 | |
| | | | |
Other Assets Less Liabilities (See Statements of Assets and Liabilities for further detail) | | | | | | | | | | | 1,245,437 | | | | 1.64 | |
| | | | |
Net Assets | | | | | | | | | | $ | 76,069,215 | | | | 100.00 | |
| * | Non-income producing security. |
| 1 | Local currency is United States Dollars unless otherwise noted below. |
| 2 | Securities exempt from registration under Rule 144A of the Securities Act of 1933. These securities may not be publicly traded without registration under the Securities Act of 1933. |
| 3 | Security has been deemed worthless and is a Level 3 investment. |
| 4 | Security is a Level 3 investment. |
Percentages shown are based on net assets.
At October 31, 2022, the industry sectors for the Ashmore Emerging Markets Active Equity Fund were:
| | | | |
| Sector | | Percentage of Net Assets | |
Communication Services | | | 10.0 | % |
Consumer Discretionary | | | 16.3 | |
Consumer Staples | | | 7.4 | |
Energy | | | 6.3 | |
Financials | | | 21.7 | |
Health Care | | | 2.0 | |
Industrials | | | 8.4 | |
Information Technology | | | 23.0 | |
Real Estate | | | 3.3 | |
Total Investments | | | 98.4 | |
Other Assets Less Liabilities | | | 1.6 | |
Net Assets | | | 100.0 | % |
See accompanying notes to the financial statements.
119
ASHMORE EMERGING MARKETS ACTIVE EQUITY FUND
SCHEDULE OF INVESTMENTS (CONTINUED)
As of October 31, 2022
The inputs or methodologies used for valuing securities are not necessarily an indication of the risks associated with investing in those securities and other financial instruments, if any. See note 4 in the Notes to the Financial Statements for more information regarding pricing inputs and valuation techniques. The following is a summary of the inputs used in valuing the Ashmore Emerging Markets Active Equity Fund’s investments and other financial instruments, which are carried at fair value, as of October 31, 2022:
| | | | | | | | | | | | | | | | |
| | | Level 1 | | | Level 2 | | | Level 3 | | | Total | |
Investments | | | | | | | | | | | | | | | | |
Assets: | | | | | | | | | | | | | | | | |
Common Stocks | | | | | | | | | | | | | | | | |
Argentina | | | $ 860,381 | | | | $ — | | | | $— | | | | $ 860,381 | |
Brazil | | | 6,525,436 | | | | — | | | | — | | | | 6,525,436 | |
China | | | 2,895,478 | | | | 18,929,025 | | | | — | | | | 21,824,503 | |
Hong Kong | | | — | | | | 2,312,330 | | | | — | | | | 2,312,330 | |
India | | | 6,578,156 | | | | 5,397,885 | | | | — | | | | 11,976,041 | |
Indonesia | | | — | | | | 980,525 | | | | — | | | | 980,525 | |
Mexico | | | 3,201,034 | | | | — | | | | — | | | | 3,201,034 | |
Russian Federation | | | — | | | | — | | | | 1 | | | | 1 | |
Saudi Arabia | | | — | | | | 4,661,454 | | | | — | | | | 4,661,454 | |
South Africa | | | — | | | | 1,854,014 | | | | — | | | | 1,854,014 | |
South Korea | | | — | | | | 6,783,555 | | | | — | | | | 6,783,555 | |
Taiwan | | | 2,274,088 | | | | 7,813,843 | | | | — | | | | 10,087,931 | |
United Arab Emirates | | | — | | | | 3,756,573 | | | | — | | | | 3,756,573 | |
| | | | | | | | | | | | | | | | |
Total Common Stocks | | | 22,334,573 | | | | 52,489,204 | | | | 1 | | | | 74,823,778 | |
| |
Total Investments | | | $22,334,573 | | | | $52,489,204 | | | | $ 1 | | | | $74,823,778 | |
| |
The following is a reconciliation of investments in which significant unobservable inputs (Level 3) were used for the Fund during the period ended October 31, 2022:
| | | | | | | | | | | | | | | | | | | | | | | | | | | | | | | | | | | | | | | | |
Category and
Subcategory | | Beginning
Balance
at
10/31/2021 | | | Accrued
Discounts
(Premiums) | | | Purchases | | | Sales | | | Realized
Gains
(Losses) | | | Change in
Unrealized
Appreciation
(Depreciation) | | | Transfers
into
Level 3 | | | Transfers
out of
Level 3 | | | Ending
Balance
at
10/31/2022 | | | Change in
Unrealized
Appreciation
(Depreciation)
from Investments
still held
10/31/2022 | |
| |
Investments, at value | | | | | | | | | | | | | | | | | | | | | | | | | | | | | | | | | | | | | | | | |
| | | | | | | | | | |
Common Stock | | | | | | | | | | | | | | | | | | | | | | | | | | | | | | | | | | | | | | | | |
| | | | | | | | | | |
Russian Federation | | | $— | | | | $— | | | | $2,969,278 | | | | $(1,303,062) | | | | $(228,097) | | | | $(1,438,118) | | | | $— | | | | $— | | | | $1 | | | | $(2,939,896) | |
| |
| | | | | | | | | | |
Total | | | $— | | | | $— | | | | $2,969,278 | | | | $(1,303,062) | | | | $(228,097) | | | | $(1,438,118) | | | | $— | | | | $— | | | | $1 | | | | $(2,939,896) | |
| |
The following table on “Quantitative information about Level 3 Fair Value measurements” provides information on the valuation techniques and inputs used to value Level 3 securities at October 31, 2022:
| | | | | | | | | | | | |
| Quantitative Information about Level 3 Fair Value Measurements | |
| |
| | | Fair Value at | | | Valuation | | | Unobservable | |
| | | 10/31/2022 | | | Technique | | | Input | |
| |
Common Stock | | $ | 1 | | | | Zero priced asset | | | | Inputs to model | |
| |
See accompanying notes to the financial statements.
120
ASHMORE EMERGING MARKETS ACTIVE EQUITY FUND
SCHEDULE OF INVESTMENTS (CONTINUED)
As of October 31, 2022
The following is a summary of the fair values of the Fund’s derivative instruments*:
The Effect of Financial Derivative Instruments on the Statements of Operations for the Year Ended October 31, 2022:
| | | | |
| | | Derivatives Not Accounted for as
Hedging Instruments | |
| | | Foreign
Exchange Risk | |
| |
Realized Gain (Loss) on Derivatives Recognized resulting from Operations: | | | | |
Net Realized Loss on Forward Foreign Currency Exchange Contracts | | | $(61,366) | |
| | | | |
* See Note 10 in the Notes to the Financial Statements for additional information.
See accompanying notes to the financial statements.
121
ASHMORE EMERGING MARKETS SMALL-CAP EQUITY FUND
SCHEDULE OF INVESTMENTS
As of October 31, 2022
| | | | | | | | | | | | | | | | |
| | | Currency1 | | | Shares | | | Value | | | % of Net
Assets | |
Common Stocks | | | | | | | | | | | | | | | | |
| | | | |
Brazil (Cost $757,698) | | | | | | | | | | | | | | | | |
Arezzo Industria e Comercio S.A. | | | BRL | | | | 6,300 | | | $ | 127,451 | | | | 1.91 | |
Sinqia S.A.* | | | BRL | | | | 49,600 | | | | 196,844 | | | | 2.95 | |
TOTVS S.A.* | | | BRL | | | | 32,000 | | | | 205,425 | | | | 3.08 | |
Vasta Platform Ltd.* | | | | | | | 28,125 | | | | 154,125 | | | | 2.31 | |
Zenvia, Inc., Class A* | | | | | | | 16,400 | | | | 29,520 | | | | 0.44 | |
| | | | | | | | | | | 713,365 | | | | 10.69 | |
| | | | |
China (Cost $1,481,711) | | | | | | | | | | | | | | | | |
Baozun, Inc. ADR* | | | | | | | 9,290 | | | | 36,603 | | | | 0.55 | |
CIMC Enric Holdings Ltd. | | | HKD | | | | 70,000 | | | | 68,233 | | | | 1.02 | |
Fu Shou Yuan International Group Ltd. | | | HKD | | | | 242,000 | | | | 120,774 | | | | 1.81 | |
Hongfa Technology Co. Ltd., Class A | | | CNH | | | | 12,400 | | | | 57,903 | | | | 0.87 | |
JNBY Design Ltd. | | | HKD | | | | 186,500 | | | | 146,874 | | | | 2.20 | |
Noah Holdings Ltd. ADR* | | | | | | | 8,400 | | | | 110,208 | | | | 1.65 | |
Xiabuxiabu Catering Management China Holdings Co. Ltd.2 | | | HKD | | | | 247,500 | | | | 127,728 | | | | 1.92 | |
| | | | | | | | | | | 668,323 | | | | 10.02 | |
| | | | |
India (Cost $1,391,962) | | | | | | | | | | | | | | | | |
Granules India Ltd. | | | INR | | | | 60,929 | | | | 274,136 | | | | 4.11 | |
Indian Energy Exchange Ltd.2 | | | INR | | | | 52,025 | | | | 87,848 | | | | 1.32 | |
JB Chemicals & Pharmaceuticals Ltd. | | | INR | | | | 3,456 | | | | 82,459 | | | | 1.24 | |
Multi Commodity Exchange of India Ltd. | | | INR | | | | 8,247 | | | | 153,168 | | | | 2.29 | |
Prince Pipes & Fittings Ltd. | | | INR | | | | 19,853 | | | | 126,552 | | | | 1.90 | |
PVR Ltd.* | | | INR | | | | 6,159 | | | | 132,207 | | | | 1.98 | |
Quess Corp. Ltd.2 | | | INR | | | | 50,850 | | | | 339,757 | | | | 5.09 | |
Radico Khaitan Ltd. | | | INR | | | | 9,599 | | | | 120,701 | | | | 1.81 | |
| | | | | | | | | | | 1,316,828 | | | | 19.74 | |
| | | | |
Indonesia (Cost $110,858) | | | | | | | | | | | | | | | | |
Indofood CBP Sukses Makmur Tbk PT | | | IDR | | | | 190,000 | | | | 118,385 | | | | 1.77 | |
| | | | | | | | | | | 118,385 | | | | 1.77 | |
| | | | |
Kazakhstan (Cost $115,409) | | | | | | | | | | | | | | | | |
NAC Kazatomprom JSC GDR (Registered) | | | | | | | 3,839 | | | | 101,350 | | | | 1.52 | |
| | | | | | | | | | | 101,350 | | | | 1.52 | |
| | | | |
Kuwait (Cost $173,226) | | | | | | | | | | | | | | | | |
Humansoft Holding Co. K.S.C. | | | KWD | | | | 15,601 | | | | 169,202 | | | | 2.54 | |
| | | | | | | | | | | 169,202 | | | | 2.54 | |
| | | | |
Malaysia (Cost $405,544) | | | | | | | | | | | | | | | | |
My EG Services Bhd. | | | MYR | | | | 2,232,824 | | | | 417,733 | | | | 6.26 | |
| | | | | | | | | | | 417,733 | | | | 6.26 | |
| | | | |
Mexico (Cost $414,040) | | | | | | | | | | | | | | | | |
Genomma Lab Internacional S.A.B. de C.V., Class B | | | MXN | | | | 217,600 | | | | 167,706 | | | | 2.52 | |
See accompanying notes to the financial statements.
122
ASHMORE EMERGING MARKETS SMALL-CAP EQUITY FUND
SCHEDULE OF INVESTMENTS (CONTINUED)
As of October 31, 2022
| | | | | | | | | | | | | | | | |
| | | Currency1 | | | Shares | | | Value | | | % of Net
Assets | |
Mexico (continued) | | | | | | | | | | | | | | | | |
Grupo Aeroportuario del Centro Norte S.A.B. de C.V. ADR | | | | | | | 4,500 | | | $ | 286,965 | | | | 4.30 | |
| | | | | | | | | | | 454,671 | | | | 6.82 | |
| | | | |
Peru (Cost $146,883) | | | | | | | | | | | | | | | | |
Alicorp S.A.A. | | | PEN | | | | 95,320 | | | | 150,775 | | | | 2.26 | |
| | | | | | | | | | | 150,775 | | | | 2.26 | |
| | | | |
Poland (Cost $135,261) | | | | | | | | | | | | | | | | |
Dino Polska S.A.*,2 | | | PLN | | | | 2,104 | | | | 137,462 | | | | 2.06 | |
| | | | | | | | | | | 137,462 | | | | 2.06 | |
| | | | |
Russian Federation (Cost $586,207) | | | | | | | | | | | | | | | | |
Detsky Mir PJSC2,3,4 | | | RUB | | | | 131,200 | | | | — | | | | — | |
Fix Price Group Ltd. GDR2,4,5 | | | | | | | 24,412 | | | | 2 | | | | — | |
Fix Price Group Ltd. GDR (Registered)5 | | | | | | | 16,317 | | | | 2 | | | | — | |
| | | | | | | | | | | 4 | | | | — | |
| | | | |
South Africa (Cost $183,184) | | | | | | | | | | | | | | | | |
Karooooo Ltd. | | | | | | | 6,318 | | | | 157,950 | | | | 2.37 | |
| | | | | | | | | | | 157,950 | | | | 2.37 | |
| | | | |
South Korea (Cost $1,565,608) | | | | | | | | | | | | | | | | |
Classys, Inc. | | | KRW | | | | 9,487 | | | | 102,990 | | | | 1.54 | |
Dentium Co. Ltd. | | | KRW | | | | 5,471 | | | | 292,357 | | | | 4.38 | |
Hana Materials, Inc. | | | KRW | | | | 4,181 | | | | 89,591 | | | | 1.34 | |
Hansol Chemical Co. Ltd. | | | KRW | | | | 1,187 | | | | 154,004 | | | | 2.31 | |
Hugel, Inc.* | | | KRW | | | | 1,875 | | | | 146,822 | | | | 2.20 | |
KoMiCo Ltd. | | | KRW | | | | 5,776 | | | | 187,995 | | | | 2.82 | |
Orion Corp. | | | KRW | | | | 1,835 | | | | 130,595 | | | | 1.96 | |
Park Systems Corp. | | | KRW | | | | 1,472 | | | | 113,039 | | | | 1.70 | |
| | | | | | | | | 1,217,393 | | | 18.25 | |
| | | | |
Taiwan (Cost $1,506,220) | | | | | | | | | | | | | | | | |
Andes Technology Corp. | | | TWD | | | | 11,000 | | | | 126,496 | | | | 1.90 | |
E Ink Holdings, Inc. | | | TWD | | | | 27,000 | | | | 171,376 | | | | 2.57 | |
eCloudvalley Digital Technology Co. Ltd. | | | TWD | | | | 16,977 | | | | 44,000 | | | | 0.66 | |
Parade Technologies Ltd. | | | TWD | | | | 4,000 | | | | 75,181 | | | | 1.13 | |
Poya International Co. Ltd. | | | TWD | | | | 23,755 | | | | 301,556 | | | | 4.52 | |
Sensortek Technology Corp. | | | TWD | | | | 12,000 | | | | 73,080 | | | | 1.09 | |
Silergy Corp. | | | TWD | | | | 4,000 | | | | 46,005 | | | | 0.69 | |
Sinbon Electronics Co. Ltd. | | | TWD | | | | 12,000 | | | | 93,091 | | | | 1.39 | |
See accompanying notes to the financial statements.
123
ASHMORE EMERGING MARKETS SMALL-CAP EQUITY FUND
SCHEDULE OF INVESTMENTS (CONTINUED)
As of October 31, 2022
| | | | | | | | | | | | | | | | |
| | | Currency1 | | | Shares | | | Value | | | % of Net
Assets | |
Taiwan (continued) | | | | | | | | | | | | | | | | |
Sporton International, Inc. | | | TWD | | | | 13,900 | | | $ | 87,281 | | | | 1.31 | |
| | | | | | | | | | | 1,018,066 | | | | 15.26 | |
| | | | |
Total Common Stocks (Cost $8,973,811) | | | | | | | | | | | 6,641,507 | | | | 99.56 | |
| | | | |
Total Investments (Total Cost $8,973,811) | | | | | | | | | | | 6,641,507 | | | | 99.56 | |
| | | | |
Other Assets Less Liabilities (See Statements of Assets and Liabilities for further detail) | | | | | | | | | | | 29,324 | | | | 0.44 | |
| | | | |
Net Assets | | | | | | | | | | $ | 6,670,831 | | | | 100.00 | |
| * | Non-income producing security. |
| 1 | Local currency is United States Dollars unless otherwise noted below. |
| 2 | Securities exempt from registration under Rule 144A of the Securities Act of 1933. These securities may not be publicly traded without registration under the Securities Act of 1933. |
| 3 | Security has been deemed worthless and is a Level 3 investment. |
| 4 | Restricted security that has been deemed illiquid. At October 31, 2022 the value of these restricted illiquid securities amount to $0 or 0.00% of net assets. Additional information on each restricted illiquid security is as follows: |
| | | | |
| SECURITY | | ACQUISITION DATE | | ACQUISITION COST |
Detsky Mir PJSC | | 5/7/21-2/2/22 | | $258,305 |
Fix Price Group Ltd. GDR | | 3/5/21-12/17/21 | | 235,528 |
|
| 5 | Security is a Level 3 investment. |
Percentages shown are based on net assets.
At October 31, 2022, the industry sectors for the Ashmore Emerging Markets Small-Cap Equity Fund were:
| | | | | | | | |
Sector | | | | | Percentage of
Net Assets | |
Communication Services | | | | | | | 2.0 | % |
Consumer Discretionary | | | | | | | 17.7 | |
Consumer Staples | | | | | | | 9.9 | |
Energy | | | | | | | 1.5 | |
Financials | | | | | | | 5.3 | |
Health Care | | | | | | | 16.0 | |
Industrials | | | | | | | 14.5 | |
Information Technology | | | | | | | 30.4 | |
Materials | | | | | | | 2.3 | |
Total Investments | | | | | | | 99.6 | |
Other Assets Less Liabilities | | | | | | | 0.4 | |
Net Assets | | | | | | | 100.0 | % |
See accompanying notes to the financial statements.
124
ASHMORE EMERGING MARKETS SMALL-CAP EQUITY FUND
SCHEDULE OF INVESTMENTS (CONTINUED)
As of October 31, 2022
The inputs or methodologies used for valuing securities are not necessarily an indication of the risks associated with investing in those securities and other financial instruments, if any. See note 4 in the Notes to the Financial Statements for more information regarding pricing inputs and valuation techniques. The following is a summary of the inputs used in valuing the Ashmore Emerging Markets Small-Cap Equity Fund’s investments and other financial instruments, which are carried at fair value, as of October 31, 2022:
| | | | | | | | | | | | | | | | |
| | | Level 1 | | | Level 2 | | | Level 3 | | | Total | |
Investments | | | | | | | | | | | | | | | | |
Assets: | | | | | | | | | | | | | | | | |
Common Stocks | | | | | | | | | | | | | | | | |
Brazil | | $ | 713,365 | | | $ | — | | | $ | — | | | $ | 713,365 | |
China | | | 146,811 | | | | 521,512 | | | | — | | | | 668,323 | |
India | | | — | | | | 1,316,828 | | | | — | | | | 1,316,828 | |
Indonesia | | | — | | | | 118,385 | | | | — | | | | 118,385 | |
Kazakhstan | | | 101,350 | | | | — | | | | — | | | | 101,350 | |
Kuwait | | | — | | | | 169,202 | | | | — | | | | 169,202 | |
Malaysia | | | — | | | | 417,733 | | | | — | | | | 417,733 | |
Mexico | | | 454,671 | | | | — | | | | — | | | | 454,671 | |
Peru | | | 150,775 | | | | — | | | | — | | | | 150,775 | |
Poland | | | — | | | | 137,462 | | | | — | | | | 137,462 | |
Russian Federation | | | — | | | | — | | | | 4 | | | | 4 | |
South Africa | | | 157,950 | | | | — | | | | — | | | | 157,950 | |
South Korea | | | — | | | | 1,217,393 | | | | — | | | | 1,217,393 | |
Taiwan | | | — | | | | 1,018,066 | | | | — | | | | 1,018,066 | |
| | | | | | | | | | | | | | | | |
Total Common Stocks | | | 1,724,922 | | | | 4,916,581 | | | | 4 | | | | 6,641,507 | |
Total Investments | | $ | 1,724,922 | | | $ | 4,916,581 | | | $ | 4 | | | $ | 6,641,507 | |
The following is a reconciliation of investments in which significant unobservable inputs (Level 3) were used for the Fund during the period ended October 31, 2022:
| | | | | | | | | | | | | | | | | | | | | | | | | | | | | | | | | | | | | | | | |
Category
and
Subcategory | | Beginning
Balance
at 10/31/2021 | | | Accrued
Discounts
(Premiums) | | | Purchases | | | Sales | | | Realized
Gains
(Losses) | | | Change in
Unrealized
Appreciation (Depreciation) | | | Transfers
into
Level 3 | | | Transfers
out of
Level 3 | | | Ending
Balance at 10/31/2022 | | | Change in
Unrealized
Appreciation
(Depreciation)
from Investments
still held
10/31/2022 | |
| |
Investments, at value | | | | | | | | | | | | | | | | | | | | | | | | | | | | | | | | | | | | | | | | |
Common Stock | | | | | | | | | | | | | | | | | | | | | | | | | | | | | | | | | | | | | | | | |
Russian Federation | | | $— | | | | $— | | | | $93,602 | | | | $(1,271) | | | | $42 | | | | $(92,372) | | | | $3 | | | | $— | | | | $4 | | | | $ | (547,869) |
Total | | | $— | | | | $— | | | | $93,602 | | | | $(1,271) | | | | $42 | | | | $(92,372) | | | | $3 | | | | $— | | | | $4 | | | | $ | (547,869) |
The following table on “Quantitative information about Level 3 Fair Value measurements” provides information on the valuation techniques and inputs used to value Level 3 securities at October 31, 2022:
| | | | | | | | | | | | |
| Quantitative Information about Level 3 Fair Value Measurements | |
| | | Fair Value at
10/31/2022 | | | Valuation Technique | | | Unobservable
Input | |
Common Stock | | | $4 | | | | Zero priced asset | | | | Inputs to model | |
| | | | | | | | | | | | |
See accompanying notes to the financial statements.
125
ASHMORE EMERGING MARKETS FRONTIER EQUITY FUND
SCHEDULE OF INVESTMENTS
As of October 31, 2022
| | | | | | | | | | | | | | | | |
| | | Currency1 | | | Shares | | | Value | | | % of Net
Assets | |
Common Stocks | | | | | | | | | | | | | | | | |
| | | | |
Argentina (Cost $666,653) | | | | | | | | | | | | | | | | |
Globant S.A.* | | | | | | | 3,450 | | | $ | 650,946 | | | | 0.90 | |
| | | | | | | | | | | 650,946 | | | | 0.90 | |
| | | | |
Cambodia (Cost $956,788) | | | | | | | | | | | | | | | | |
NagaCorp. Ltd.* | | | HKD | | | | 1,193,493 | | | | 543,616 | | | | 0.75 | |
| | | | | | | | | | | 543,616 | | | | 0.75 | |
| | | | |
Egypt (Cost $839,331) | | | | | | | | | | | | | | | | |
Fertiglobe PLC | | | AED | | | | 782,134 | | | | 1,084,142 | | | | 1.49 | |
| | | | | | | | | | | 1,084,142 | | | | 1.49 | |
| | | | |
Ghana (Cost $602,568) | | | | | | | | | | | | | | | | |
Kosmos Energy Ltd.* | | | | | | | 97,800 | | | | 634,722 | | | | 0.87 | |
| | | | | | | | | | | 634,722 | | | | 0.87 | |
| | | | |
Iceland (Cost $2,609,179) | | | | | | | | | | | | | | | | |
Arion Banki HF2 | | | ISK | | | | 822,121 | | | | 920,433 | | | | 1.27 | |
Islandsbanki HF | | | ISK | | | | 877,492 | | | | 777,699 | | | | 1.07 | |
Marel HF | | | ISK | | | | 175,231 | | | | 613,712 | | | | 0.84 | |
| | | | | | | | | | | 2,311,844 | | | | 3.18 | |
| | | | |
Kazakhstan (Cost $2,911,789) | | | | | | | | | | | | | | | | |
Halyk Savings Bank of Kazakhstan JSC GDR (Registered) | | | | | | | 78,162 | | | | 788,948 | | | | 1.09 | |
Kaspi.KZ JSC GDR (Registered) | | | | | | | 34,513 | | | | 2,258,755 | | | | 3.11 | |
| | | | | | | | | | | 3,047,703 | | | | 4.20 | |
| | | | |
Kenya (Cost $1,838,710) | | | | | | | | | | | | | | | | |
Equity Group Holdings PLC | | | KES | | | | 1,739,900 | | | | 670,170 | | | | 0.92 | |
Safaricom PLC | | | KES | | | | 4,043,000 | | | | 836,459 | | | | 1.15 | |
| | | | | | | | | | | 1,506,629 | | | | 2.07 | |
| | | | |
Kuwait (Cost $5,911,276) | | | | | | | | | | | | | | | | |
Boubyan Bank K.S.C.P. | | | KWD | | | | 736,597 | | | | 1,959,458 | | | | 2.70 | |
Humansoft Holding Co. K.S.C. | | | KWD | | | | 82,155 | | | | 891,018 | | | | 1.23 | |
National Bank of Kuwait S.A.K.P. | | | KWD | | | | 1,011,378 | | | | 3,517,038 | | | | 4.84 | |
| | | | | | | | | | | 6,367,514 | | | | 8.77 | |
| | | | |
Mauritius (Cost $1,186,646) | | | | | | | | | | | | | | | | |
MCB Group Ltd. | | | MUR | | | | 181,385 | | | | 1,325,200 | | | | 1.82 | |
| | | | | | | | | | | 1,325,200 | | | | 1.82 | |
| | | | |
Morocco (Cost $3,788,207) | | | | | | | | | | | | | | | | |
Attijariwafa Bank | | | MAD | | | | 38,961 | | | | 1,369,091 | | | | 1.88 | |
Itissalat Al-Maghrib | | | MAD | | | | 51,093 | | | | 476,392 | | | | 0.66 | |
Label Vie | | | MAD | | | | 2,516 | | | | 1,033,160 | | | | 1.42 | |
| | | | | | | | | | | 2,878,643 | | | | 3.96 | |
See accompanying notes to the financial statements.
126
ASHMORE EMERGING MARKETS FRONTIER EQUITY FUND
SCHEDULE OF INVESTMENTS (CONTINUED)
As of October 31, 2022
| | | | | | | | | | | | | | | | |
| | | Currency1 | | | Shares | | | Value | | | % of Net
Assets | |
Pakistan (Cost $429,604) | | | | | | | | | | | | | | | | |
Systems Ltd. | | | PKR | | | | 256,180 | | | $ | 515,588 | | | | 0.71 | |
| | | | | | | | | | | 515,588 | | | | 0.71 | |
| | | | |
Peru (Cost $1,328,699) | | | | | | | | | | | | | | | | |
Credicorp Ltd. | | | | | | | 10,993 | | | | 1,608,935 | | | | 2.21 | |
| | | | | | | | | | | 1,608,935 | | | | 2.21 | |
Philippines (Cost $4,888,427) | | | | | | | | | | | | | | | | |
ACEN Corp. | | | PHP | | | | 284,640 | | | | 30,882 | | | | 0.04 | |
Ayala Corp. | | | PHP | | | | 59,430 | | | | 689,936 | | | | 0.95 | |
BDO Unibank, Inc. | | | PHP | | | | 694,460 | | | | 1,534,903 | | | | 2.11 | |
Converge Information and Communications Technology Solutions, Inc.* | | | PHP | | | | 2,126,600 | | | | 454,664 | | | | 0.63 | |
SM Prime Holdings, Inc. | | | PHP | | | | 1,042,200 | | | | 569,561 | | | | 0.79 | |
Wilcon Depot, Inc. | | | PHP | | | | 1,158,300 | | | | 589,454 | | | | 0.81 | |
| | | | | | | | | | | 3,869,400 | | | | 5.33 | |
| | | | |
Qatar (Cost $7,302,469) | | | | | | | | | | | | | | | | |
Commercial Bank PSQC (The) | | | QAR | | | | 842,764 | | | | 1,456,035 | | | | 2.00 | |
Industries Qatar QSC | | | QAR | | | | 216,742 | | | | 938,784 | | | | 1.29 | |
Qatar Electricity & Water Co. QSC | | | QAR | | | | 239,362 | | | | 1,216,569 | | | | 1.68 | |
Qatar Islamic Bank S.A.Q. | | | QAR | | | | 248,858 | | | | 1,665,446 | | | | 2.29 | |
Qatar National Bank QPSC | | | QAR | | | | 429,556 | | | | 2,351,544 | | | | 3.24 | |
| | | | | | | | | | | 7,628,378 | | | | 10.50 | |
| | | | |
Romania (Cost $2,018,986) | | | | | | | | | | | | | | | | |
Banca Transilvania S.A. | | | RON | | | | 188,569 | | | | 644,862 | | | | 0.89 | |
OMV Petrom S.A. | | | RON | | | | 11,116,528 | | | | 1,011,054 | | | | 1.39 | |
| | | | | | | | | | | 1,655,916 | | | | 2.28 | |
| | | | |
Saudi Arabia (Cost $1,881,209) | | | | | | | | | | | | | | | | |
Al Hammadi Holding | | | SAR | | | | 91,991 | | | | 1,101,052 | | | | 1.52 | |
Saudi British Bank (The) | | | SAR | | | | 119,960 | | | | 1,387,944 | | | | 1.91 | |
| | | | | | | | | | | 2,488,996 | | | | 3.43 | |
| | | | |
Slovenia (Cost $481,078) | | | | | | | | | | | | | | | | |
Nova Ljubljanska Banka dd GDR (Registered) | | | EUR | | | | 41,090 | | | | 418,096 | | | | 0.58 | |
| | | | | | | | | | | 418,096 | | | | 0.58 | |
| | | | |
Tanzania (Cost $595,715) | | | | | | | | | | | | | | | | |
Helios Towers PLC* | | | GBP | | | | 286,681 | | | | 412,752 | | | | 0.57 | |
| | | | | | | | | | | 412,752 | | | | 0.57 | |
| | | | |
United Arab Emirates (Cost $13,628,783) | | | | | | | | | | | | | | | | |
Abu Dhabi Islamic Bank PJSC | | | AED | | | | 950,131 | | | | 2,458,264 | | | | 3.38 | |
ADNOC Drilling Co. PJSC | | | AED | | | | 999,437 | | | | 911,404 | | | | 1.26 | |
Dubai Electricity & Water Authority PJSC | | | AED | | | | 2,538,099 | | | | 1,686,198 | | | | 2.32 | |
Dubai Islamic Bank PJSC | | | AED | | | | 1,261,932 | | | | 1,998,764 | | | | 2.75 | |
Emaar Properties PJSC | | | AED | | | | 861,418 | | | | 1,422,367 | | | | 1.96 | |
See accompanying notes to the financial statements.
127
ASHMORE EMERGING MARKETS FRONTIER EQUITY FUND
SCHEDULE OF INVESTMENTS (CONTINUED)
As of October 31, 2022
| | | | | | | | | | | | | | | | |
| | | Currency1 | | | Shares | | | Value | | | % of Net
Assets | |
United Arab Emirates (continued) | | | | | | | | | | | | | | | | |
Emirates Telecommunications Group Co. PJSC | | | AED | | | | 230,269 | | | $ | 1,617,833 | | | | 2.23 | |
First Abu Dhabi Bank PJSC | | | AED | | | | 576,050 | | | | 2,807,723 | | | | 3.87 | |
Network International Holdings PLC*,2 | | | GBP | | | | 210,530 | | | | 785,963 | | | | 1.08 | |
Salik Co. PJSC* | | | AED | | | | 1,026,190 | | | | 639,780 | | | | 0.88 | |
| | | | | | | | | 14,328,296 | | | 19.73 | |
| | | | |
Vietnam (Cost $13,782,293) | | | | | | | | | | | | | | | | |
Bank for Foreign Trade of Vietnam JSC | | | VND | | | | 518,500 | | | | 1,539,327 | | | | 2.12 | |
Digiworld Corp. | | | VND | | | | 467,964 | | | | 1,144,964 | | | | 1.58 | |
FPT Corp. | | | VND | | | | 902,657 | | | | 2,741,484 | | | | 3.77 | |
Hoa Phat Group JSC | | | VND | | | | 711,579 | | | | 447,083 | | | | 0.61 | |
Military Commercial Joint Stock Bank* | | | VND | | | | 1,286,254 | | | | 913,776 | | | | 1.26 | |
Mobile World Investment Corp. | | | VND | | | | 1,358,798 | | | | 2,809,629 | | | | 3.87 | |
Phu Nhuan Jewelry JSC | | | VND | | | | 169,400 | | | | 704,409 | | | | 0.97 | |
Vingroup JSC* | | | VND | | | | 306,449 | | | | 682,320 | | | | 0.94 | |
Vinhomes JSC2 | | | VND | | | | 370,711 | | | | 670,248 | | | | 0.92 | |
| | | | | | | | | | | 11,653,240 | | | | 16.04 | |
| | | | |
Zambia (Cost $646,077) | | | | | | | | | | | | | | | | |
First Quantum Minerals Ltd. | | | CAD | | | | 23,300 | | | | 410,980 | | | | 0.57 | |
| | | | | | | | | 410,980 | | | 0.57 | |
| | | | |
Total Common Stocks (Cost $68,294,487) | | | | | | | | | | | 65,341,536 | | | | 89.96 | |
| | | | |
Investment Companies | | | | | | | | | | | | | | | | |
| | | | |
Vietnam Enterprise Investments Ltd., Class C * | | | GBP | | | | 135,019 | | | | 849,558 | | | | 1.17 | |
Total Investment Companies (Cost $1,322,233) | | | | | | | | | | | 849,558 | | | | 1.17 | |
| | | | |
Total Investments (Total Cost $69,616,720) | | | | | | | | | | | 66,191,094 | | | | 91.13 | |
| | | |
Other Assets Less Liabilities (See Statements of Assets and Liabilities for further detail) | | | | | | | | 6,440,284 | | | | 8.87 | |
| | | | |
Net Assets | | | | | | | | | | $ | 72,631,378 | | | | 100.00 | |
| * | Non-income producing security. |
| 1 | Local currency is United States Dollars unless otherwise noted below. |
| 2 | Securities exempt from registration under Rule 144A of the Securities Act of 1933. These securities may not be publicly traded without registration under the Securities Act of 1933. |
Percentages shown are based on net assets.
See accompanying notes to the financial statements.
128
ASHMORE EMERGING MARKETS FRONTIER EQUITY FUND
SCHEDULE OF INVESTMENTS (CONTINUED)
As of October 31, 2022
At October 31, 2022, the industry sectors for the Ashmore Emerging Markets Frontier Equity Fund were:
| | | | |
| Sector | | Percentage of
Net Assets | |
Communication Services | | | 5.2 | % |
Consumer Discretionary | | | 7.6 | |
Consumer Staples | | | 1.4 | |
Energy | | | 3.5 | |
Financials | | | 48.5 | |
Health Care | | | 1.5 | |
Industrials | | | 4.0 | |
Information Technology | | | 8.1 | |
Materials | | | 2.7 | |
Real Estate | | | 4.6 | |
Utilities | | | 4.0 | |
Total Investments | | | 91.1 | |
Other Assets Less Liabilities | | | 8.9 | |
Net Assets | | | 100.0 | % |
The inputs or methodologies used for valuing securities are not necessarily an indication of the risks associated with investing in those securities and other financial instruments, if any. See note 4 in the Notes to the Financial Statements for more information regarding pricing inputs and valuation techniques. The following is a summary of the inputs used in valuing the Ashmore Emerging Markets Frontier Equity Fund’s investments and other financial instruments, which are carried at fair value, as of October 31, 2022:
| | | | | | | | | | | | | | | | |
| | | Level 1 | | | Level 2 | | | Level 3 | | | Total | |
Investments | | | | | | | | | | | | | | | | |
Assets: | | | | | | | | | | | | | | | | |
Common Stocks | | | | | | | | | | | | | | | | |
Argentina | | $ | 650,946 | | | $ | — | | | | $— | | | $ | 650,946 | |
Cambodia | | | — | | | | 543,616 | | | | — | | | | 543,616 | |
Egypt | | | — | | | | 1,084,142 | | | | — | | | | 1,084,142 | |
Ghana | | | 634,722 | | | | — | | | | — | | | | 634,722 | |
Iceland | | | — | | | | 2,311,844 | | | | — | | | | 2,311,844 | |
Kazakhstan | | | — | | | | 3,047,703 | | | | — | | | | 3,047,703 | |
Kenya | | | — | | | | 1,506,629 | | | | — | | | | 1,506,629 | |
Kuwait | | | — | | | | 6,367,514 | | | | — | | | | 6,367,514 | |
Mauritius | | | — | | | | 1,325,200 | | | | — | | | | 1,325,200 | |
Morocco | | | — | | | | 2,878,643 | | | | — | | | | 2,878,643 | |
Pakistan | | | — | | | | 515,588 | | | | — | | | | 515,588 | |
Peru | | | 1,608,935 | | | | — | | | | — | | | | 1,608,935 | |
Philippines | | | — | | | | 3,869,400 | | | | — | | | | 3,869,400 | |
Qatar | | | — | | | | 7,628,378 | | | | — | | | | 7,628,378 | |
Romania | | | — | | | | 1,655,916 | | | | — | | | | 1,655,916 | |
Saudi Arabia | | | — | | | | 2,488,996 | | | | — | | | | 2,488,996 | |
Slovenia | | | — | | | | 418,096 | | | | — | | | | 418,096 | |
Tanzania | | | — | | | | 412,752 | | | | — | | | | 412,752 | |
United Arab Emirates | | | 639,780 | | | | 13,688,516 | | | | — | | | | 14,328,296 | |
Vietnam | | | — | | | | 11,653,240 | | | | — | | | | 11,653,240 | |
Zambia | | | 410,980 | | | | — | | | | — | | | | 410,980 | |
| | | | | | | | | | | | | | | | |
Total Common Stocks | | | 3,945,363 | | | | 61,396,173 | | | | — | | | | 65,341,536 | |
Investment Companies | | | | | | | | | | | | | | | | |
Vietnam | | | — | | | | 849,558 | | | | — | | | | 849,558 | |
Total Investments | | $ | 3,945,363 | | | $ | 62,245,731 | | | | $— | | | $ | 66,191,094 | |
See accompanying notes to the financial statements.
129
ASHMORE EMERGING MARKETS FRONTIER EQUITY FUND
SCHEDULE OF INVESTMENTS (CONTINUED)
As of October 31, 2022
The following is a summary of the fair values of the Fund’s derivative instruments*:
The Effect of Financial Derivative Instruments on the Statements of Operations for the Year Ended October 31, 2022:
| | | | |
| | | Derivatives Not Accounted for as
Hedging Instruments | |
| | | Foreign Exchange Risk | |
| |
Realized Gain (Loss) on Derivatives Recognized resulting from Operations: | | | | |
Net Realized Gain on Forward Foreign Currency Exchange Contracts | | $ | 25 | |
| | | | |
* See Note 10 in the Notes to the Financial Statements for additional information.
See accompanying notes to the financial statements.
130
ASHMORE EMERGING MARKETS EQUITY FUND
SCHEDULE OF INVESTMENTS
As of October 31, 2022
| | | | | | | | | | | | | | | | |
| | | Currency1 | | | Shares | | | Value | | | % of Net
Assets | |
Common Stocks | | | | | | | | | | | | | | | | |
| | | | |
Brazil (Cost $5,489,984) | | | | | | | | | | | | | | | | |
Arezzo Industria e Comercio S.A. | | | BRL | | | | 66,300 | | | $ | 1,341,274 | | | | 1.43 | |
Hapvida Participacoes e Investimentos S/A*,2 | | | BRL | | | | 973,782 | | | | 1,470,429 | | | | 1.56 | |
MercadoLibre, Inc.* | | | | | | | 630 | | | | 568,020 | | | | 0.60 | |
TOTVS S.A.* | | | BRL | | | | 463,000 | | | | 2,972,235 | | | | 3.16 | |
| | | | | | | | | | | 6,351,958 | | | | 6.75 | |
| | | | |
China (Cost $36,819,680) | | | | | | | | | | | | | | | | |
ANTA Sports Products Ltd. | | | HKD | | | | 122,200 | | | | 1,074,726 | | | | 1.14 | |
Beijing Oriental Yuhong Waterproof Technology Co. Ltd., Class A | | | CNH | | | | 235,870 | | | | 786,834 | | | | 0.84 | |
China Mengniu Dairy Co. Ltd.* | | | HKD | | | | 440,000 | | | | 1,410,317 | | | | 1.50 | |
China Merchants Bank Co. Ltd., Class H | | | HKD | | | | 212,500 | | | | 698,729 | | | | 0.74 | |
CIMC Enric Holdings Ltd. | | | HKD | | | | 958,000 | | | | 933,822 | | | | 0.99 | |
ENN Energy Holdings Ltd. | | | HKD | | | | 86,000 | | | | 853,077 | | | | 0.91 | |
Hongfa Technology Co. Ltd., Class A | | | CNH | | | | 229,100 | | | | 1,069,810 | | | | 1.14 | |
JD.com, Inc. ADR | | | | | | | 59,112 | | | | 2,204,287 | | | | 2.34 | |
JD.com, Inc., Class A | | | HKD | | | | 3,623 | | | | 67,652 | | | | 0.07 | |
Meituan, Class B*,2 | | | HKD | | | | 142,200 | | | | 2,262,014 | | | | 2.40 | |
NetEase, Inc. ADR | | | | | | | 38,460 | | | | 2,139,145 | | | | 2.27 | |
Noah Holdings Ltd. ADR* | | | | | | | 49,900 | | | | 654,688 | | | | 0.70 | |
Prosus N.V.* | | | EUR | | | | 17,422 | | | | 758,250 | | | | 0.81 | |
Tencent Holdings Ltd. | | | HKD | | | | 185,500 | | | | 4,867,476 | | | | 5.17 | |
Wuliangye Yibin Co. Ltd., Class A | | | CNH | | | | 70,400 | | | | 1,282,065 | | | | 1.36 | |
WuXi AppTec Co. Ltd., Class H2 | | | HKD | | | | 98,200 | | | | 787,956 | | | | 0.84 | |
| | | | | | | | | | | 21,850,848 | | | | 23.22 | |
| | | | |
Hong Kong (Cost $2,859,742) | | | | | | | | | | | | | | | | |
AIA Group Ltd. | | | HKD | | | | 282,600 | | | | 2,134,110 | | | | 2.27 | |
| | | | | | | | | | | 2,134,110 | | | | 2.27 | |
| | | | |
India (Cost $16,537,213) | | | | | | | | | | | | | | | | |
Alkem Laboratories Ltd. | | | INR | | | | 26,343 | | | | 1,003,803 | | | | 1.07 | |
Granules India Ltd. | | | INR | | | | 367,677 | | | | 1,654,278 | | | | 1.76 | |
HDFC Bank Ltd. ADR | | | | | | | 50,495 | | | | 3,146,343 | | | | 3.34 | |
Hindalco Industries Ltd. | | | INR | | | | 102,625 | | | | 502,233 | | | | 0.53 | |
ICICI Bank Ltd. ADR | | | | | | | 96,771 | | | | 2,132,833 | | | | 2.27 | |
Indian Energy Exchange Ltd.2 | | | INR | | | | 303,602 | | | | 512,657 | | | | 0.54 | |
Larsen & Toubro Ltd. | | | INR | | | | 42,697 | | | | 1,042,898 | | | | 1.11 | |
Larsen & Toubro Ltd. GDR (Registered) | | | | | | | 24,194 | | | | 582,327 | | | | 0.62 | |
Multi Commodity Exchange of India Ltd. | | | INR | | | | 41,485 | | | | 770,483 | | | | 0.82 | |
PVR Ltd.* | | | INR | | | | 47,943 | | | | 1,029,128 | | | | 1.09 | |
Reliance Industries Ltd. GDR2 | | | | | | | 16,523 | | | | 1,010,135 | | | | 1.07 | |
Sun Pharmaceutical Industries Ltd. | | | INR | | | | 111,786 | | | | 1,374,056 | | | | 1.46 | |
Tata Consultancy Services Ltd. | | | INR | | | | 42,900 | | | | 1,653,501 | | | | 1.76 | |
| | | | | | | | | | | 16,414,675 | | | | 17.44 | |
See accompanying notes to the financial statements.
131
ASHMORE EMERGING MARKETS EQUITY FUND
SCHEDULE OF INVESTMENTS (CONTINUED)
As of October 31, 2022
| | | | | | | | | | | | | | | | |
| | | Currency1 | | | Shares | | | Value | | | % of Net
Assets | |
Indonesia (Cost $1,071,585) | | | | | | | | | | | | | | | | |
Indofood CBP Sukses Makmur Tbk PT | | | IDR | | | | 1,833,000 | | | $ | 1,142,106 | | | | 1.21 | |
| | | | | | | | | | | 1,142,106 | | | | 1.21 | |
| | | | |
Kazakhstan (Cost $2,681,047) | | | | | | | | | | | | | | | | |
Kaspi.KZ JSC GDR (Registered) | | | | | | | 18,298 | | | | 1,197,540 | | | | 1.27 | |
NAC Kazatomprom JSC GDR (Registered) | | | | | | | 34,381 | | | | 907,658 | | | | 0.97 | |
| | | | | | | | | | | 2,105,198 | | | | 2.24 | |
| | | | |
Malaysia (Cost $1,709,819) | | | | | | | | | | | | | | | | |
My EG Services Bhd. | | | MYR | | | | 8,576,754 | | | | 1,604,603 | | | | 1.70 | |
| | | | | | | | | | | 1,604,603 | | | | 1.70 | |
| | | | |
Mexico (Cost $6,462,423) | | | | | | | | | | | | | | | | |
Fomento Economico Mexicano S.A.B. de C.V. ADR | | | | | | | 53,736 | | | | 3,848,572 | | | | 4.09 | |
Grupo Aeroportuario del Pacifico S.A.B. de C.V., Class B | | | MXN | | | | 121,700 | | | | 1,885,112 | | | | 2.00 | |
Grupo Financiero Banorte S.A.B. de C.V., Class O | | | MXN | | | | 160,400 | | | | 1,303,812 | | | | 1.39 | |
| | | | | | | | | | | 7,037,496 | | | | 7.48 | |
| | | | |
Peru (Cost $1,344,522) | | | | | | | | | | | | | | | | |
Credicorp Ltd. | | | | | | | 10,407 | | | | 1,523,169 | | | | 1.62 | |
| | | | | | | | | | | 1,523,169 | | | | 1.62 | |
| | | | |
Philippines (Cost $618,416) | | | | | | | | | | | | | | | | |
BDO Unibank, Inc. | | | PHP | | | | 246,410 | | | | 544,618 | | | | 0.58 | |
| | | | | | | | | | | 544,618 | | | | 0.58 | |
| | | | |
Poland (Cost $2,639,858) | | | | | | | | | | | | | | | | |
Dino Polska S.A.*,2 | | | PLN | | | | 37,737 | | | | 2,465,496 | | | | 2.62 | |
| | | | | | | | | | | 2,465,496 | | | | 2.62 | |
| | | | |
Russian Federation (Cost $6,693,747) | | | | | | | | | | | | | | | | |
Fix Price Group Ltd. GDR2,3,4 | | | | | | | 297,371 | | | | 30 | | | | — | |
Fix Price Group Ltd. GDR (Registered)3 | | | | | | | 124,253 | | | | 12 | | | | — | |
HeadHunter Group PLC ADR3 | | | | | | | 7,572 | | | | 1 | | | | — | |
LUKOIL PJSC3 | | | RUB | | | | 21,299 | | | | — | | | | — | |
Yandex N.V., Class A*,3 | | | | | | | 24,800 | | | | 2 | | | | — | |
| | | | | | | | | | | 45 | | | | — | |
| | | | |
Saudi Arabia (Cost $2,746,892) | | | | | | | | | | | | | | | | |
Saudi British Bank (The) | | | SAR | | | | 103,680 | | | | 1,199,584 | | | | 1.28 | |
Saudi National Bank (The) | | | SAR | | | | 90,051 | | | | 1,422,663 | | | | 1.51 | |
| | | | | | | | | | | 2,622,247 | | | | 2.79 | |
| | | | |
South Korea (Cost $14,462,459) | | | | | | | | | | | | | | | | |
Classys, Inc. | | | KRW | | | | 89,315 | | | | 969,598 | | | | 1.03 | |
Dentium Co. Ltd. | | | KRW | | | | 22,310 | | | | 1,192,191 | | | | 1.27 | |
Hansol Chemical Co. Ltd. | | | KRW | | | | 12,924 | | | | 1,676,785 | | | | 1.78 | |
Hugel, Inc.* | | | KRW | | | | 14,689 | | | | 1,150,219 | | | | 1.22 | |
KoMiCo Ltd. | | | KRW | | | | 24,868 | | | | 809,394 | | | | 0.86 | |
See accompanying notes to the financial statements.
132
ASHMORE EMERGING MARKETS EQUITY FUND
SCHEDULE OF INVESTMENTS (CONTINUED)
As of October 31, 2022
| | | | | | | | | | | | | | | | |
| | | Currency1 | | | Shares | | | Value | | | % of Net
Assets | |
South Korea (continued) | | | | | | | | | | | | | | | | |
LG Chem Ltd. | | | KRW | | | | 1,528 | | | $ | 669,556 | | | | 0.71 | |
Orion Corp. | | | KRW | | | | 20,438 | | | | 1,454,552 | | | | 1.55 | |
SK Hynix, Inc. | | | KRW | | | | 43,587 | | | | 2,522,571 | | | | 2.68 | |
| | | | | | | | | | | 10,444,866 | | | | 11.10 | |
| | | | |
Taiwan (Cost $15,254,106) | | | | | | | | | | | | | | | | |
E Ink Holdings, Inc. | | | TWD | | | | 194,000 | | | | 1,231,369 | | | | 1.31 | |
Parade Technologies Ltd. | | | TWD | | | | 51,000 | | | | 958,559 | | | | 1.02 | |
Silergy Corp. | | | TWD | | | | 52,928 | | | | 608,735 | | | | 0.64 | |
Sinbon Electronics Co. Ltd. | | | TWD | | | | 122,000 | | | | 946,428 | | | | 1.00 | |
Taiwan Semiconductor Manufacturing Co. Ltd. | | | TWD | | | | 333,000 | | | | 4,007,356 | | | | 4.26 | |
Taiwan Semiconductor Manufacturing Co. Ltd. ADR | | | | | | | 46,455 | | | | 2,859,305 | | | | 3.04 | |
| | | | | | | | | | | 10,611,752 | | | | 11.27 | |
| | | | |
United Arab Emirates (Cost $1,935,821) | | | | | | | | | | | | | | | | |
Abu Dhabi Islamic Bank PJSC | | | AED | | | | 381,396 | | | | 986,782 | | | | 1.05 | |
Emaar Properties PJSC | | | AED | | | | 583,079 | | | | 962,775 | | | | 1.02 | |
| | | | | | | | | | | 1,949,557 | | | | 2.07 | |
| | | | |
Total Common Stocks (Cost $119,327,314) | | | | | | | | | | | 88,802,744 | | | | 94.36 | |
| | | | |
Preferred Stocks | | | | | | | | | | | | | | | | |
| | | | |
Brazil (Cost $1,939,437) | | | | | | | | | | | | | | | | |
Petroleo Brasileiro S.A. ADR, 45.157%5 | | | | | | | 156,354 | | | | 1,799,635 | | | | 1.91 | |
| | | | | | | | | | | 1,799,635 | | | | 1.91 | |
| | | | |
South Korea (Cost $1,659,341) | | | | | | | | | | | | | | | | |
LG Chem Ltd., 4.170%5 | | | KRW | | | | 6,075 | | | | 1,229,788 | | | | 1.31 | |
| | | | | | | | | | | 1,229,788 | | | | 1.31 | |
| | | | |
Total Preferred Stocks (Cost $3,598,778) | | | | | | | | | | | 3,029,423 | | | | 3.22 | |
| | | | |
Total Investments (Total Cost $122,926,092) | | | | | | | | | | | 91,832,167 | | | | 97.58 | |
| | | | |
Other Assets Less Liabilities (See Statements of Assets and Liabilities for further detail) | | | | | | | | | | | 2,274,843 | | | | 2.42 | |
| | | | |
Net Assets | | | | | | | | | | $ | 94,107,010 | | | | 100.00 | |
| * | Non-income producing security. |
| 1 | Local currency is United States Dollars unless otherwise noted below. |
| 2 | Securities exempt from registration under Rule 144A of the Securities Act of 1933. These securities may not be publicly traded without registration under the Securities Act of 1933. |
| 3 | Security is a Level 3 investment. |
| 4 | Restricted security that has been deemed illiquid. At October 31, 2022 the value of these restricted illiquid securities amount to $30 or 0.00% of net assets. Additional information on each restricted illiquid security is as follows: |
| | | | | | | | |
| SECURITY | | ACQUISITION DATE | | | ACQUISITION COST | |
Fix Price Group Ltd. GDR | | | 3/10/21 - 4/20/21 | | | $ | 2,917,220 | |
See accompanying notes to the financial statements.
133
ASHMORE EMERGING MARKETS EQUITY FUND
SCHEDULE OF INVESTMENTS (CONTINUED)
As of October 31, 2022
| 5 | Current yield is disclosed. Dividends are calculated based on a percentage of the issuer’s net income. |
Percentages shown are based on net assets.
At October 31, 2022, the industry sectors for the Ashmore Emerging Markets Equity Fund were:
| | | | |
| Sector | | Percentage of
Net Assets | |
Communication Services | | | 8.5 | % |
Consumer Discretionary | | | 8.8 | |
Consumer Staples | | | 12.3 | |
Energy | | | 4.0 | |
Financials | | | 19.4 | |
Health Care | | | 10.2 | |
Industrials | | | 5.9 | |
Information Technology | | | 21.4 | |
Materials | | | 5.2 | |
Real Estate | | | 1.0 | |
Utilities | | | 0.9 | |
| |
Total Investments | | | 97.6 | |
Other Assets Less Liabilities | | | 2.4 | |
Net Assets | | | 100.0 | % |
| |
See accompanying notes to the financial statements.
134
ASHMORE EMERGING MARKETS EQUITY FUND
SCHEDULE OF INVESTMENTS (CONTINUED)
As of October 31, 2022
The inputs or methodologies used for valuing securities are not necessarily an indication of the risks associated with investing in those securities and other financial instruments, if any. See note 4 in the Notes to the Financial Statements for more information regarding pricing inputs and valuation techniques. The following is a summary of the inputs used in valuing the Ashmore Emerging Markets Equity Fund’s investments and other financial instruments, which are carried at fair value, as of October 31, 2022:
| | | | | | | | | | | | | | | | |
| | | Level 1 | | | Level 2 | | | Level 3 | | | Total | |
Investments | | | | | | | | | | | | | | | | |
Assets: | | | | | | | | | | | | | | | | |
Common Stocks | | | | | | | | | | | | | | | | |
Brazil | | $ | 6,351,958 | | | $ | — | | | $ | — | | | $ | 6,351,958 | |
China | | | 5,756,370 | | | | 16,094,478 | | | | — | | | | 21,850,848 | |
Hong Kong | | | — | | | | 2,134,110 | | | | — | | | | 2,134,110 | |
India | | | 5,279,176 | | | | 11,135,499 | | | | — | | | | 16,414,675 | |
Indonesia | | | — | | | | 1,142,106 | | | | — | | | | 1,142,106 | |
Kazakhstan | | | 907,658 | | | | 1,197,540 | | | | — | | | | 2,105,198 | |
Malaysia | | | — | | | | 1,604,603 | | | | — | | | | 1,604,603 | |
Mexico | | | 7,037,496 | | | | — | | | | — | | | | 7,037,496 | |
Peru | | | 1,523,169 | | | | — | | | | — | | | | 1,523,169 | |
Philippines | | | — | | | | 544,618 | | | | — | | | | 544,618 | |
Poland | | | — | | | | 2,465,496 | | | | — | | | | 2,465,496 | |
Russian Federation | | | — | | | | — | | | | 45 | | | | 45 | |
Saudi Arabia | | | — | | | | 2,622,247 | | | | — | | | | 2,622,247 | |
South Korea | | | — | | | | 10,444,866 | | | | — | | | | 10,444,866 | |
Taiwan | | | 2,859,305 | | | | 7,752,447 | | | | — | | | | 10,611,752 | |
United Arab Emirates | | | — | | | | 1,949,557 | | | | — | | | | 1,949,557 | |
| | | | | | | | | | | | | | | | |
Total Common Stocks | | | 29,715,132 | | | | 59,087,567 | | | | 45 | | | | 88,802,744 | |
Preferred Stocks | | | | | | | | | | | | | | | | |
Brazil | | | 1,799,635 | | | | — | | | | — | | | | 1,799,635 | |
South Korea | | | — | | | | 1,229,788 | | | | — | | | | 1,229,788 | |
| | | | | | | | | | | | | | | | |
Total Preferred Stocks | | | 1,799,635 | | | | 1,229,788 | | | | — | | | | 3,029,423 | |
| |
Total Investments | | $ | 31,514,767 | | | $ | 60,317,355 | | | $ | 45 | | | $ | 91,832,167 | |
| |
The following is a reconciliation of investments in which significant unobservable inputs (Level 3) were used for the Fund during the period ended October 31, 2022:
| | | | | | | | | | | | | | | | | | | | | | | | | | | | | | | | | | | | | | | | |
Category and
Subcategory | | Beginning
Balance
at 10/31/2021 | | | Accrued
Discounts (Premiums) | | | Purchases | | | Sales | | | Realized
Gains
(Losses) | | | Change in
Unrealized
Appreciation (Depreciation) | | | Transfers
into
Level 3 | | | Transfers
out of
Level 3 | | | Ending
Balance
at 10/31/2022 | | | Change in
Unrealized
Appreciation
(Depreciation)
from Investments
still held
10/31/2022 | |
| | | | | | | | | | |
Investments, at value | | | | | | | | | | | | | | | | | | | | | | | | | | | | | | | | | | | | | | | | |
| | | | | | | | | | |
Common Stock | | | | | | | | | | | | | | | | | | | | | | | | | | | | | | | | | | | | | | | | |
| | | | | | | | | | |
Russian Federation | | | $— | | | | $— | | | | $— | | | | $— | | | | $— | | | | $— | | | | $45 | | | | $— | | | | $45 | | | | $(7,671,665) | |
| | | | | | | | | | |
Total | | | $— | | | | $— | | | | $— | | | | $— | | | | $— | | | | $— | | | | $45 | | | | $— | | | | $45 | | | | $(7,671,665) | |
See accompanying notes to the financial statements.
135
ASHMORE EMERGING MARKETS EQUITY FUND
SCHEDULE OF INVESTMENTS (CONTINUED)
As of October 31, 2022
The following table on “Quantitative information about Level 3 Fair Value measurements ”provides information on the valuation techniques and inputs used to value Level 3 securities at October 31, 2022:
| | | | | | |
| | | Quantitative Information about Level 3 Fair Value Measurements | | | | |
|
| | | Fair Value at 10/31/2022 | | Valuation
Technique | | Unobservable
Input |
Common Stock | | $45 | | Zero priced asset | | Inputs to model |
The following is a summary of the fair values of the Fund’s derivative instruments*:
The Effect of Financial Derivative Instruments on the Statements of Operations for the Year Ended October 31, 2022:
| | | | |
| | | Derivatives Not Accounted for as
Hedging Instruments | |
| | | Foreign Exchange Risk | |
Realized Gain (Loss) on Derivatives Recognized resulting from Operations: | | | | |
Net Realized Loss on Forward Foreign Currency Exchange Contracts | | | $(1,482) | |
| | | | |
| * | See note 10 in the Notes to the Financial Statements for additional information. |
See accompanying notes to the financial statements.
136
ASHMORE EMERGING MARKETS EQUITY ESG FUND
SCHEDULE OF INVESTMENTS
As of October 31, 2022
| | | | | | | | | | | | | | | | |
| | | Currency1 | | | Shares | | | Value | | | % of Net
Assets | |
Common Stocks | | | | | | | | | | | | | | | | |
| | | | |
Brazil (Cost $808,745) | | | | | | | | | | | | | | | | |
Arezzo Industria e Comercio S.A. | | | BRL | | | | 12,000 | | | $ | 242,764 | | | | 2.73 | |
Hapvida Participacoes e Investimentos S/A*,2 | | | BRL | | | | 126,293 | | | | 190,705 | | | | 2.15 | |
MercadoLibre, Inc.* | | | | | | | 100 | | | | 90,162 | | | | 1.01 | |
TOTVS S.A.* | | | BRL | | | | 50,400 | | | | 323,544 | | | | 3.64 | |
| | | | | | | | | | | 847,175 | | | | 9.53 | |
| | | | |
China (Cost $3,317,461) | | | | | | | | | | | | | | | | |
ANTA Sports Products Ltd. | | | HKD | | | | 14,800 | | | | 130,163 | | | | 1.46 | |
Beijing Oriental Yuhong Waterproof Technology Co. Ltd., | | | | | | | | | | | | | | | | |
Class A | | | CNH | | | | 26,300 | | | | 87,734 | | | | 0.99 | |
China Merchants Bank Co. Ltd., Class H | | | HKD | | | | 30,000 | | | | 98,644 | | | | 1.11 | |
Hongfa Technology Co. Ltd., Class A | | | CNH | | | | 28,300 | | | | 132,150 | | | | 1.49 | |
JD.com, Inc. ADR | | | | | | | 6,854 | | | | 255,586 | | | | 2.87 | |
JD.com, Inc., Class A | | | HKD | | | | 461 | | | | 8,608 | | | | 0.10 | |
NetEase, Inc. ADR | | | | | | | 3,577 | | | | 198,953 | | | | 2.24 | |
Prosus N.V.* | | | EUR | | | | 2,351 | | | | 102,321 | | | | 1.15 | |
Tencent Holdings Ltd. | | | HKD | | | | 19,000 | | | | 498,555 | | | | 5.61 | |
WuXi AppTec Co. Ltd., Class H2 | | | HKD | | | | 22,780 | | | | 182,787 | | | | 2.06 | |
Xiabuxiabu Catering Management China Holdings Co. Ltd.2 | | | HKD | | | | 215,000 | | | | 110,956 | | | | 1.25 | |
| | | | | | | | | | | 1,806,457 | | | | 20.33 | |
| | | | |
Hong Kong (Cost $415,994) | | | | | | | | | | | | | | | | |
AIA Group Ltd. | | | HKD | | | | 41,600 | | | | 314,151 | | | | 3.53 | |
| | | | | | | | | | | 314,151 | | | | 3.53 | |
| | | | |
India (Cost $1,411,745) | | | | | | | | | | | | | | | | |
Alkem Laboratories Ltd. | | | INR | | | | 3,754 | | | | 143,047 | | | | 1.61 | |
Granules India Ltd. | | | INR | | | | 62,526 | | | | 281,321 | | | | 3.17 | |
HDFC Bank Ltd. ADR | | | | | | | 6,391 | | | | 398,223 | | | | 4.48 | |
ICICI Bank Ltd. ADR | | | | | | | 11,751 | | | | 258,992 | | | | 2.91 | |
Quess Corp. Ltd.2 | | | INR | | | | 22,951 | | | | 153,349 | | | | 1.73 | |
Tata Consultancy Services Ltd. | | | INR | | | | 6,928 | | | | 267,027 | | | | 3.00 | |
| | | | | | | | | | | 1,501,959 | | | | 16.90 | |
| | | | |
Malaysia (Cost $241,809) | | | | | | | | | | | | | | | | |
My EG Services Bhd. | | | MYR | | | | 1,518,480 | | | | 284,089 | | | | 3.20 | |
| | | | | | | | | | | 284,089 | | | | 3.20 | |
| | | | |
Mexico (Cost $511,099) | | | | | | | | | | | | | | | | |
Fomento Economico Mexicano S.A.B. de C.V. ADR | | | | | | | 5,703 | | | | 408,449 | | | | 4.60 | |
Grupo Financiero Banorte S.A.B. de C.V., Class O | | | MXN | | | | 22,100 | | | | 179,640 | | | | 2.02 | |
| | | | | | | | | | | 588,089 | | | | 6.62 | |
| | | | |
Peru (Cost $181,505) | | | | | | | | | | | | | | | | |
Credicorp Ltd. | | | | | | | 1,404 | | | | 205,489 | | | | 2.31 | |
| | | | | | | | | | | 205,489 | | | | 2.31 | |
See accompanying notes to the financial statements.
137
ASHMORE EMERGING MARKETS EQUITY ESG FUND
SCHEDULE OF INVESTMENTS (CONTINUED)
As of October 31, 2022
| | | | | | | | | | | | | | | | |
| | | Currency1 | | | Shares | | | Value | | | % of Net
Assets | |
Poland (Cost $349,946) | | | | | | | | | | | | | | | | |
Dino Polska S.A.*,2 | | | PLN | | | | 4,934 | | | $ | 322,356 | | | | 3.63 | |
| | | | | | | | | | | 322,356 | | | | 3.63 | |
| | | | |
Qatar (Cost $101,722) | | | | | | | | | | | | | | | | |
Qatar National Bank QPSC | | | QAR | | | | 16,872 | | | | 92,363 | | | | 1.04 | |
| | | | | | | | | | | 92,363 | | | | 1.04 | |
| | | | |
Russian Federation (Cost $686,783) | | | | | | | | | | | | | | | | |
Fix Price Group Ltd. GDR2,3,4 | | | | | | | 56,671 | | | | 6 | | | | — | |
HeadHunter Group PLC ADR5 | | | | | | | 1,035 | | | | — | | | | — | |
Yandex N.V., Class A*,5 | | | | | | | 2,600 | | | | — | | | | — | |
| | | | | | | | | | | 6 | | | | — | |
| | | | |
Saudi Arabia (Cost $252,335) | | | | | | | | | | | | | | | | |
Saudi National Bank (The) | | | SAR | | | | 12,991 | | | | 205,237 | | | | 2.31 | |
| | | | | | | | | | | 205,237 | | | | 2.31 | |
| | | | |
South Korea (Cost $1,124,523) | | | | | | | | | | | | | | | | |
Dentium Co. Ltd. | | | KRW | | | | 5,423 | | | | 289,792 | | | | 3.26 | |
Hansol Chemical Co. Ltd. | | | KRW | | | | 1,676 | | | | 217,447 | | | | 2.45 | |
Hugel, Inc.* | | | KRW | | | | 1,907 | | | | 149,327 | | | | 1.68 | |
LG Chem Ltd. | | | KRW | | | | 92 | | | | 40,314 | | | | 0.45 | |
SK Hynix, Inc. | | | KRW | | | | 3,646 | | | | 211,010 | | | | 2.38 | |
| | | | | | | | | | | 907,890 | | | | 10.22 | |
| | | | |
Taiwan (Cost $1,501,620) | | | | | | | | | | | | | | | | |
Andes Technology Corp. | | | TWD | | | | 13,000 | | | | 149,494 | | | | 1.68 | |
E Ink Holdings, Inc. | | | TWD | | | | 42,000 | | | | 266,585 | | | | 3.00 | |
Parade Technologies Ltd. | | | TWD | | | | 6,000 | | | | 112,772 | | | | 1.27 | |
Silergy Corp. | | | TWD | | | | 8,000 | | | | 92,009 | | | | 1.04 | |
Taiwan Semiconductor Manufacturing Co. Ltd. | | | TWD | | | | 27,000 | | | | 324,921 | | | | 3.66 | |
Taiwan Semiconductor Manufacturing Co. Ltd. ADR | | | | | | | 5,607 | | | | 345,111 | | | | 3.88 | |
| | | | | | | | | | | 1,290,892 | | | | 14.53 | |
| | | | |
United Arab Emirates (Cost $138,856) | | | | | | | | | | | | | | | | |
Abu Dhabi Islamic Bank PJSC | | | AED | | | | 53,563 | | | | 138,583 | | | | 1.56 | |
| | | | | | | | | | | 138,583 | | | | 1.56 | |
| | | | |
Total Common Stocks (Cost $11,044,143) | | | | | | | | | | | 8,504,736 | | | | 95.71 | |
See accompanying notes to the financial statements.
138
ASHMORE EMERGING MARKETS EQUITY ESG FUND
SCHEDULE OF INVESTMENTS (CONTINUED)
As of October 31, 2022
| | | | | | | | | | | | | | | | |
| | | Currency1 | | | Shares | | | Value | | | % of Net
Assets | |
Preferred Stocks | | | | | | | | | | | | | | | | |
| | | | |
South Korea (Cost $285,791) | | | | | | | | | | | | | | | | |
LG Chem Ltd., 4.170%6 | | | KRW | | | | 916 | | | $ | 185,430 | | | | 2.09 | |
| | | | | | | | | 185,430 | | | 2.09 | |
| | | | |
Total Preferred Stocks (Cost $285,791) | | | | | | | | | | | 185,430 | | | | 2.09 | |
| | | | |
Total Investments (Total Cost $11,329,934) | | | | | | | | | | | 8,690,166 | | | | 97.80 | |
Other Assets Less Liabilities (See Statements of Assets and Liabilities for further detail) | | | | | | | | | | | 195,404 | | | | 2.20 | |
Net Assets | | | | | | | | | | $ | 8,885,570 | | | | 100.00 | |
| * | Non-income producing security. |
| 1 | Local currency is United States Dollars unless otherwise noted below. |
| 2 | Securities exempt from registration under Rule 144A of the Securities Act of 1933. These securities may not be publicly traded without registration under the Securities Act of 1933. |
| 3 | Security is a Level 3 investment. |
| 4 | Restricted security that has been deemed illiquid. At October 31, 2022 the value of these restricted illiquid securities amount to $6 or 0.00% of net assets. Additional information on each restricted illiquid security is as follows: |
| | | | | | | | |
| SECURITY | | ACQUISITION DATE | | | ACQUISITION COST | |
| |
Fix Price Group Ltd. GDR | | | 3/5/21-3/10/21 | | | $ | 556,805 | |
| 5 | Security has been deemed worthless and is a Level 3 investment. |
| 6 | Current yield is disclosed. Dividends are calculated based on a percentage of the issuer’s net income. |
Percentages shown are based on net assets.
At October 31, 2022, the industry sectors for the Ashmore Emerging Markets Equity ESG Fund were:
| | | | |
| Sector | | Percentage of
Net Assets | |
Communication Services | | | 7.9 | % |
Consumer Discretionary | | | 10.6 | |
Consumer Staples | | | 8.2 | |
Financials | | | 21.3 | |
Health Care | | | 13.9 | |
Industrials | | | 3.2 | |
Information Technology | | | 26.7 | |
Materials | | | 6.0 | |
Total Investments | | | 97.8 | |
Other Assets Less Liabilities | | | 2.2 | |
Net Assets | | | 100.0 | % |
See accompanying notes to the financial statements.
139
ASHMORE EMERGING MARKETS EQUITY ESG FUND
SCHEDULE OF INVESTMENTS (CONTINUED)
As of October 31, 2022
The inputs or methodologies used for valuing securities are not necessarily an indication of the risks associated with investing in those securities and other financial instruments, if any. See note 4 in the Notes to the Financial Statements for more information regarding pricing inputs and valuation techniques. The following is a summary of the inputs used invaluing the Ashmore Emerging Markets Equity ESG Fund’s investments and other financial instruments, which are carried at fair value, as of October 31, 2022:
| | | | | | | | | | | | | | | | |
| | | Level 1 | | | Level 2 | | | Level 3 | | | Total | |
Investments | | | | | | | | | | | | | | | | |
Assets: | | | | | | | | | | | | | | | | |
Common Stocks | | | | | | | | | | | | | | | | |
Brazil | | $ | 847,175 | | | $ | — | | | $ | — | | | $ | 847,175 | |
China | | | 556,860 | | | | 1,249,597 | | | | — | | | | 1,806,457 | |
Hong Kong | | | — | | | | 314,151 | | | | — | | | | 314,151 | |
India | | | 657,215 | | | | 844,744 | | | | — | | | | 1,501,959 | |
Malaysia | | | — | | | | 284,089 | | | | — | | | | 284,089 | |
Mexico | | | 588,089 | | | | — | | | | — | | | | 588,089 | |
Peru | | | 205,489 | | | | — | | | | — | | | | 205,489 | |
Poland | | | — | | | | 322,356 | | | | — | | | | 322,356 | |
Qatar | | | — | | | | 92,363 | | | | — | | | | 92,363 | |
Russian Federation | | | — | | | | — | | | | 6 | | | | 6 | |
Saudi Arabia | | | — | | | | 205,237 | | | | — | | | | 205,237 | |
South Korea | | | — | | | | 907,890 | | | | — | | | | 907,890 | |
Taiwan | | | 345,111 | | | | 945,781 | | | | — | | | | 1,290,892 | |
United Arab Emirates | | | — | | | | 138,583 | | | | — | | | | 138,583 | |
| | | | | | | | | | | | | | | | |
Total Common Stocks | | | 3,199,939 | | | | 5,304,791 | | | | 6 | | | | 8,504,736 | |
Preferred Stocks | | | | | | | | | | | | | | | | |
South Korea | | | — | | | | 185,430 | | | | — | | | | 185,430 | |
Total Investments | | $ | 3,199,939 | | | $ | 5,490,221 | | | $ | 6 | | | $ | 8,690,166 | |
The following is a reconciliation of investments in which significant unobservable inputs (Level3)were used for the Fund during the period ended October 31, 2022:
| | | | | | | | | | | | | | | | | | | | | | | | | | | | | | | | | | | | | | | | |
| Category and Subcategory | | Beginning
Balance at 10/31/2021 | | | Accrued
Discounts (Premiums) | | | Purchases | | | Sales | | | Realized
Gains (Losses) | | | Change in
Unrealized
Appreciation (Depreciation) | | | Transfers
into Level 3 | | | Transfers out of Level 3 | | | Ending
Balance at 10/31/2022 | | | Change in
Unrealized
Appreciation (Depreciation)
from Investments
still held
10/31/2022 | |
Investments, at value | | | | | | | | | | | | | | | | | | | | | | | | | | | | | | | | | | | | | | | | |
Common Stock | | | | | | | | | | | | | | | | | | | | | | | | | | | | | | | | | | | | | | | | |
Russian Federation | | | $— | | | | $— | | | | $— | | | | $— | | | | $— | | | | $— | | | | $6 | | | | $— | | | | $6 | | | | $(903,515) | |
Total | | | $— | | | | $— | | | | $— | | | | $— | | | | $— | | | | $— | | | | $6 | | | | $— | | | | $6 | | | | $(903,515) | |
The following table on “Quantitative information about Level 3 Fair Value measurements ”provides information on the valuation techniques and inputs used to value Leve l3 securities at October 31, 2022:
| | | | | | |
| | | Quantitative Information about Level 3 Fair Value Measurements | | | | |
|
| | | Fair Value at 10/31/2022 | | Valuation
Technique | | Unobservable
Input |
|
Common Stock | | $6 | | Zero priced asset | | Inputs to model |
|
See accompanying notes to the financial statements.
140
ASHMORE EMERGING MARKETS SHORT DURATION SELECT FUND
SCHEDULE OF INVESTMENTS
As of October 31, 2022
| | | | | | | | | | | | | | | | |
| | | Currency1 | | | Par | | | Value | | | % of Net
Assets | |
Debt Securities | | | | | | | | | | | | | | | | |
| | | | |
Brazil (Cost $1,205,898) | | | | | | | | | | | | | | | | |
Banco do Brasil S.A., 4.625%, 01/15/2025 | | | | | | | 200,000 | | | $ | 194,220 | | | | 2.16 | |
BRF GmbH, 4.350%, 09/29/2026 | | | | | | | 200,000 | | | | 178,004 | | | | 1.98 | |
Gol Finance S.A., 8.000%, 06/30/2026 | | | | | | | 200,000 | | | | 116,557 | | | | 1.29 | |
MercadoLibre, Inc., 2.375%, 01/14/2026 | | | | | | | 200,000 | | | | 173,315 | | | | 1.92 | |
St Marys Cement, Inc., 5.750%, 01/28/2027 | | | | | | | 200,000 | | | | 196,820 | | | | 2.19 | |
Unigel Luxembourg S.A., 8.750%, 10/01/2026 | | | | | | | 200,000 | | | | 193,257 | | | | 2.15 | |
| | | | | | | | | | | 1,052,173 | | | | 11.69 | |
| | | | |
Chile (Cost $200,242) | | | | | | | | | | | | | | | | |
Inversiones CMPC S.A., 4.750%, 09/15/2024 | | | | | | | 200,000 | | | | 196,500 | | | | 2.18 | |
| | | | | | | | | | | 196,500 | | | | 2.18 | |
| | | | |
China (Cost $577,012) | | | | | | | | | | | | | | | | |
ENN Energy Holdings Ltd., 4.625%, 05/17/2027 | | | | | | | 200,000 | | | | 188,580 | | | | 2.10 | |
Huarong Finance 2017 Co. Ltd., (Floating, ICE LIBOR USD 3M + 1.325%), 5.068%, 07/03/2023 | | | | | | | 210,000 | | | | 202,675 | | | | 2.25 | |
Xiaomi Best Time International Ltd., 0.000%, 12/17/20272 | | | | | | | 200,000 | | | | 145,500 | | | | 1.62 | |
| | | | | | | | | | | 536,755 | | | | 5.97 | |
| | | | |
Colombia (Cost $248,425) | | | | | | | | | | | | | | | | |
Ecopetrol S.A., 4.125%, 01/16/2025 | | | | | | | 140,000 | | | | 129,085 | | | | 1.43 | |
Ecopetrol S.A., 5.375%, 06/26/2026 | | | | | | | 100,000 | | | | 90,860 | | | | 1.01 | |
| | | | | | | | | | | 219,945 | | | | 2.44 | |
| | | | |
Czech Republic (Cost $91,664) | | | | | | | | | | | | | | | | |
CETIN Group N.V., 3.125%, 04/14/2027 | | | EUR | | | | 100,000 | | | | 86,620 | | | | 0.96 | |
| | | | | | | | | | | 86,620 | | | | 0.96 | |
| | | | |
India (Cost $603,930) | | | | | | | | | | | | | | | | |
ABJA Investment Co. Pte. Ltd., 5.950%, 07/31/2024 | | | | | | | 200,000 | | | | 195,874 | | | | 2.18 | |
Greenko Solar Mauritius Ltd., 5.550%, 01/29/2025 | | | | | | | 200,000 | | | | 174,100 | | | | 1.94 | |
Greenko Solar Mauritius Ltd., 5.950%, 07/29/2026 | | | | | | | 200,000 | | | | 160,600 | | | | 1.78 | |
| | | | | | | | | | | 530,574 | | | | 5.90 | |
| | | | |
Indonesia (Cost $421,550) | | | | | | | | | | | | | | | | |
Indonesia Asahan Aluminium Persero PT, 4.750%, 05/15/2025 | | | | | | | 400,000 | | | | 381,013 | | | | 4.23 | |
| | | | | | | | | | | 381,013 | | | | 4.23 | |
| | | | |
Jordan (Cost $204,000) | | | | | | | | | | | | | | | | |
Hikma Finance U.S.A. LLC, 3.250%, 07/09/2025 | | | | | | | 200,000 | | | | 183,997 | | | | 2.04 | |
| | | | | | | | | | | 183,997 | | | | 2.04 | |
| | | | |
Kuwait (Cost $212,433) | | | | | | | | | | | | | | | | |
MEGlobal Canada ULC, 5.000%, 05/18/2025 | | | | | | | 200,000 | | | | 193,250 | | | | 2.15 | |
| | | | | | | | | | | 193,250 | | | | 2.15 | |
See accompanying notes to the financial statements.
141
ASHMORE EMERGING MARKETS SHORT DURATION SELECT FUND
SCHEDULE OF INVESTMENTS (CONTINUED)
As of October 31, 2022
| | | | | | | | | | | | | | | | |
| | | Currency1 | | | Par | | | Value | | | % of Net
Assets | |
Malaysia (Cost $187,896) | | | | | | | | | | | | | | | | |
Misc Capital Two Labuan Ltd., 3.750%, 04/06/2027 | | | | | | | 200,000 | | | $ | 181,569 | | | | 2.02 | |
| | | | | | | | | | | 181,569 | | | | 2.02 | |
| | | | |
Mexico (Cost $1,147,053) | | | | | | | | | | | | | | | | |
Axtel S.A.B. de C.V., 6.375%, 11/14/2024 | | | | | | | 173,000 | | | | 115,197 | | | | 1.28 | |
Electricidad Firme de Mexico Holdings S.A. de C.V., 4.900%, 11/20/2026 | | | | | | | 200,000 | | | | 159,006 | | | | 1.77 | |
Grupo Axo S.A.P.I. de C.V., 5.750%, 06/08/2026 | | | | | | | 200,000 | | | | 158,646 | | | | 1.76 | |
Petroleos Mexicanos, 6.875%, 10/16/2025 | | | | | | | 331,000 | | | | 318,174 | | | | 3.54 | |
Trust Fibra Uno, 5.250%, 01/30/2026 | | | | | | | 200,000 | | | | 181,000 | | | | 2.01 | |
| | | | | | | | | | | 932,023 | | | | 10.36 | |
| | | | |
Oman (Cost $613,605) | | | | | | | | | | | | | | | | |
Bank Muscat SAOG, 4.750%, 03/17/2026 | | | | | | | 200,000 | | | | 188,975 | | | | 2.10 | |
National Bank of Oman SAOG, 5.625%, 09/25/2023 | | | | | | | 200,000 | | | | 198,220 | | | | 2.21 | |
Oztel Holdings SPC Ltd., 5.625%, 10/24/2023 | | | | | | | 200,000 | | | | 198,138 | | | | 2.20 | |
| | | | | | | | | | | 585,333 | | | | 6.51 | |
| | | | |
Panama (Cost $203,352) | | | | | | | | | | | | | | | | |
Banco Latinoamericano de Comercio Exterior S.A., 2.375%, 09/14/2025 | | | | | | | 200,000 | | | | 180,000 | | | | 2.00 | |
| | | | | | | | | | | 180,000 | | | | 2.00 | |
| | | | |
Peru (Cost $200,444) | | | | | | | | | | | | | | | | |
Credicorp Ltd., 2.750%, 06/17/2025 | | | | | | | 200,000 | | | | 184,313 | | | | 2.05 | |
| | | | | | | | | | | 184,313 | | | | 2.05 | |
| | | | |
Poland (Cost $151,564) | | | | | | | | | | | | | | | | |
GTC Aurora Luxembourg S.A., 2.250%, 06/23/2026 | | | EUR | | | | 130,000 | | | | 84,813 | | | | 0.94 | |
| | | | | | | | | | | 84,813 | | | | 0.94 | |
| | | | |
Romania (Cost $138,235) | | | | | | | | | | | | | | | | |
NE Property B.V., 3.375%, 07/14/2027 | | | EUR | | | | 150,000 | | | | 116,057 | | | | 1.29 | |
| | | | | | | | | | | 116,057 | | | | 1.29 | |
| | | | |
Saudi Arabia (Cost $776,823) | | | | | | | | | | | | | | | | |
Arabian Centres Sukuk Ltd., 5.375%, 11/26/2024 | | | | | | | 256,000 | | | | 236,636 | | | | 2.63 | |
Dar Al-Arkan Sukuk Co. Ltd., 6.750%, 02/15/2025 | | | | | | | 200,000 | | | | 190,976 | | | | 2.12 | |
SNB Funding Ltd., 2.750%, 10/02/2024 | | | | | | | 333,000 | | | | 314,352 | | | | 3.50 | |
| | | | | | | | | | | 741,964 | | | | 8.25 | |
| | | | |
Singapore (Cost $227,593) | | | | | | | | | | | | | | | | |
Puma International Financing S.A., 5.125%, 10/06/2024 | | | | | | | 240,000 | | | | 223,800 | | | | 2.49 | |
| | | | | | | | | | | 223,800 | | | | 2.49 | |
| | | | |
South Africa (Cost $592,954) | | | | | | | | | | | | | | | | |
Liquid Telecommunications Financing PLC, 5.500%, 09/04/2026 | | | | | | | 200,000 | | | | 138,000 | | | | 1.53 | |
Prosus N.V., 3.257%, 01/19/2027 | | | | | | | 205,000 | | | | 168,795 | | | | 1.88 | |
See accompanying notes to the financial statements.
142
ASHMORE EMERGING MARKETS SHORT DURATION SELECT FUND
SCHEDULE OF INVESTMENTS (CONTINUED)
As of October 31, 2022
| | | | | | | | | | | | |
| Currency1 | | Par | | | Value | | | % of Net
Assets | |
South Africa (continued) | | | | | | | | | | | | |
Sasol Financing U.S.A. LLC, 5.875%, 03/27/2024 | | | 200,000 | | | $ | 195,300 | | | | 2.17 | |
| | | | | | 502,095 | | | 5.58 | |
| | | |
Tanzania (Cost $207,560) | | | | | | | | | | | | |
HTA Group Ltd., 7.000%, 12/18/2025 | | | 200,000 | | | | 175,000 | | | | 1.94 | |
| | | | | | 175,000 | | | 1.94 | |
| | | |
United Arab Emirates (Cost $1,280,999) | | | | | | | | | | | | |
Abu Dhabi Commercial Bank PJSC, 4.000%, 03/13/2023 | | | 213,000 | | | | 211,730 | | | | 2.35 | |
ADCB Finance Cayman Ltd., 4.000%, 03/29/2023 | | | 214,000 | | | | 212,484 | | | | 2.36 | |
DIB Sukuk Ltd., 3.625%, 02/06/2023 | | | 200,000 | | | | 198,500 | | | | 2.21 | |
Fab Sukuk Co. Ltd., 3.625%, 03/05/2023 | | | 321,000 | | | | 318,582 | | | | 3.54 | |
Mashreqbank PSC, 4.250%, 02/26/2024 | | | 322,000 | | | | 314,835 | | | | 3.50 | |
| | | | | | | 1,256,131 | | | | 13.96 | |
| | | |
Zambia (Cost $196,696) | | | | | | | | | | | | |
First Quantum Minerals Ltd., 6.500%, 03/01/2024 | | | 200,000 | | | | 196,136 | | | | 2.18 | |
| | | | | | | 196,136 | | | | 2.18 | |
| | | |
Total Debt Securities (Cost $9,689,928) | | | | | | | 8,740,061 | | | | 97.13 | |
| | | |
Total Investments (Total Cost $9,689,928) | | | | | | | 8,740,061 | | | | 97.13 | |
| | | |
Other Assets Less Liabilities (See Statements of Assets and Liabilities for further detail) | | | | | | | 258,330 | | | | 2.87 | |
| | | |
Net Assets | | | | | | $ | 8,998,391 | | | | 100.00 | |
| 1 | Local currency is United States Dollars unless otherwise noted below. |
Percentages shown are based on net assets.
At October 31, 2022, the Ashmore Emerging Markets Short Duration Select Fund had outstanding forward foreign currency exchange contracts as follows:
| | | | | | | | | | | | | | | | | | | | | | | | |
Settlement Date | | Counterparty | | Currency Buy | | Currency
Buy
Amount
(Local Currency) | | | | | | Currency Sell | | | Currency
Sell
Amount
(Local Currency) | | | Unrealized Gain/
(Loss) | |
| |
11/30/2022 | | Morgan Stanley | | United States Dollar | | | 326,487 | | | | Euro | | | | | | | | 331,196 | | | $ | (1,514 | ) |
| | | | | | | | | | | | | | | | | | | | | | | | |
Subtotal Depreciation | | | | | | | | | | | | | | | | | | | | | (1,514 | ) |
| | | | | | | | | | | | | | | | | | | | | | | | |
Total | | | | | | | | | | | | | | | | | | | | | | $ | (1,514 | ) |
| | | | | | | | | | | | | | | | | | | | | | | | |
See accompanying notes to the financial statements.
143
ASHMORE EMERGING MARKETS SHORT DURATION SELECT FUND
SCHEDULE OF INVESTMENTS (CONTINUED)
As of October 31, 2022
The inputs or methodologies used for valuing securities are not necessarily an indication of the risks associated with investing in those securities and other financial instruments, if any. See note 4 in the Notes to the Financial Statements for more information regarding pricing inputs and valuation techniques. The following is a summary of the inputs used in valuing the Ashmore Emerging Markets Short Duration Select Fund’s investments and other financial instruments, which are carried at fair value, as of October 31, 2022:
| | | | | | | | | | | | | | | | |
| | | Level 1 | | | Level 2 | | | Level 3 | | | Total | |
Investments | | | | | | | | | | | | | | | | |
Assets: | | | | | | | | | | | | | | | | |
Debt Securities | | | | | | | | | | | | | | | | |
Corporate Bonds | | $ | — | | | $ | 6,460,026 | | | $ | — | | | $ | 6,460,026 | |
Corporate Convertible Bonds | | | — | | | | 145,500 | | | | — | | | | 145,500 | |
Financial Certificates | | | — | | | | 944,694 | | | | — | | | | 944,694 | |
Government Agencies | | | — | | | | 1,009,841 | | | | — | | | | 1,009,841 | |
Municipal Bonds | | | — | | | | 180,000 | | | | — | | | | 180,000 | |
| | | | | | | | | | | | | | | | |
Total Debt Securities | | | — | | | | 8,740,061 | | | | — | | | | 8,740,061 | |
Total Investments | | $ | — | | | $ | 8,740,061 | | | $ | — | | | $ | 8,740,061 | |
| | | | |
Other Financial Instruments | | | | | | | | | | | | | | | | |
Liabilities: | | | | | | | | | | | | | | | | |
Forward Foreign Currency Exchange Contracts | | $ | — | | | $ | (1,514 | ) | | $ | — | | | $ | (1,514 | ) |
Total Other Financial Instruments | | $ | — | | | $ | (1,514 | ) | | $ | — | | | $ | (1,514 | ) |
The following is a summary of the fair values of the Fund’s derivative instruments*:
Fair Values of Financial Derivative Instruments on the Statements of Assets and Liabilities as of October 31, 2022:
| | | | |
| | | Derivatives Not Accounted for as
Hedging Instruments | |
| | | Foreign Exchange Risk | |
| |
Liabilities: | | | | |
Unrealized Depreciation on Forward Foreign Currency Exchange Contracts | | $ | (1,514 | ) |
| | | | |
The Effect of Financial Derivative Instruments on the Statements of Operations for the Year Ended October 31, 2022:
| | | | |
| | | Derivatives Not Accounted for as
Hedging Instruments | |
| | | Foreign Exchange Risk | |
Realized Gain (Loss) on Derivatives Recognized resulting from Operations: | | | | |
Net Realized Gain on Forward Foreign Currency Exchange Contracts | | $ | 34,134 | |
| | | | |
| |
Net Change in Unrealized Appreciation (Depreciation) on Derivatives Recognized resulting from Operations: | | | | |
Net Change in Unrealized Depreciation on Forward Foreign Currency Exchange Contracts | | $ | (1,314 | ) |
| | | | |
* See note 10 in the Notes to the Financial Statements for additional information.
See accompanying notes to the financial statements.
144
ASHMORE EMERGING MARKETS INVESTMENT GRADE INCOME FUND
SCHEDULE OF INVESTMENTS
As of October 31, 2022
| | | | | | | | | | | | | | | | |
| | | Currency1 | | | Par | | | Value | | | % of Net
Assets | |
Debt Securities | | | | | | | | | | | | | | | | |
| | | | |
Brazil (Cost $1,138,778) | | | | | | | | | | | | | | | | |
Braskem Netherlands Finance B.V., (Variable, U.S. Treasury Yield Curve Rate CMT 5Y + 8.220%), 8.500%, 01/23/20812 | | | | | | | 200,000 | | | $ | 190,000 | | | | 1.18 | |
JBS U.S.A. LUX S.A./JBS U.S.A. Food Co./JBS U.S.A. Finance, Inc., 3.625%, 01/15/20323 | | | | | | | 200,000 | | | | 155,000 | | | | 0.97 | |
St Marys Cement, Inc., 5.750%, 01/28/2027 | | | | | | | 220,000 | | | | 216,502 | | | | 1.35 | |
Suzano Austria GmbH, 5.000%, 01/15/2030 | | | | | | | 225,000 | | | | 198,888 | | | | 1.24 | |
Vale Overseas Ltd., 8.250%, 01/17/2034 | | | | | | | 190,000 | | | | 206,368 | | | | 1.29 | |
| | | | | | | | | 966,758 | | | 6.03 | |
| | | | |
Chile (Cost $1,121,123) | | | | | | | | | | | | | | | | |
Celulosa Arauco y Constitucion S.A., 4.200%, 01/29/2030 | | | | | | | 200,000 | | | | 169,000 | | | | 1.05 | |
Cencosud S.A., 6.625%, 02/12/2045 | | | | | | | 200,000 | | | | 191,385 | | | | 1.19 | |
Empresa Nacional del Petroleo, 5.250%, 11/06/2029 | | | | | | | 268,000 | | | | 244,920 | | | | 1.53 | |
GNL Quintero S.A., 4.634%, 07/31/2029 | | | | | | | 189,428 | | | | 175,694 | | | | 1.10 | |
Inversiones CMPC S.A., 3.850%, 01/13/2030 | | | | | | | 200,000 | | | | 166,750 | | | | 1.04 | |
| | | | | | | | | | | 947,749 | | | | 5.91 | |
| | | | |
China (Cost $928,366) | | | | | | | | | | | | | | | | |
Huarong Finance 2017 Co. Ltd., (Floating, ICE LIBOR USD 3M + 1.325%), 5.068%, 07/03/2023 | | | | | | | 210,000 | | | | 202,675 | | | | 1.26 | |
Huarong Finance 2019 Co. Ltd., (Floating, ICE LIBOR USD 3M + 1.125%), 4.105%, 02/24/2023 | | | | | | | 200,000 | | | | 196,250 | | | | 1.22 | |
Tencent Holdings Ltd., 3.975%, 04/11/2029 | | | | | | | 200,000 | | | | 168,484 | | | | 1.05 | |
Xiaomi Best Time International Ltd., 0.000%, 12/17/20274 | | | | | | | 400,000 | | | | 291,000 | | | | 1.82 | |
| | | | | | | | | | | 858,409 | | | | 5.35 | |
| | | | |
Czech Republic (Cost $263,548) | | | | | | | | | | | | | | | | |
CETIN Group N.V., 3.125%, 04/14/2027 | | | EUR | | | | 275,000 | | | | 238,204 | | | | 1.49 | |
| | | | | | | | | | | 238,204 | | | | 1.49 | |
| | | | |
Hong Kong (Cost $201,674) | | | | | | | | | | | | | | | | |
Phoenix Lead Ltd., 4.850%, 02/23/2023 | | | | | | | 200,000 | | | | 132,040 | | | | 0.82 | |
| | | | | | | | | | | 132,040 | | | | 0.82 | |
| | | | |
India (Cost $1,419,448) | | | | | | | | | | | | | | | | |
ABJA Investment Co. Pte. Ltd., 5.450%, 01/24/2028 | | | | | | | 200,000 | | | | 177,083 | | | | 1.10 | |
Bharti Airtel Ltd., 4.375%, 06/10/2025 | | | | | | | 200,000 | | | | 189,988 | | | | 1.18 | |
Bharti Airtel Ltd., 3.250%, 06/03/2031 | | | | | | | 200,000 | | | | 154,891 | | | | 0.97 | |
Indian Railway Finance Corp. Ltd., 3.570%, 01/21/2032 | | | | | | | 200,000 | | | | 155,640 | | | | 0.97 | |
NTPC Ltd., 4.500%, 03/19/2028 | | | | | | | 200,000 | | | | 183,425 | | | | 1.14 | |
Power Finance Corp. Ltd., 4.500%, 06/18/2029 | | | | | | | 240,000 | | | | 205,633 | | | | 1.28 | |
Reliance Industries Ltd., 2.875%, 01/12/2032 | | | | | | | 250,000 | | | | 188,430 | | | | 1.18 | |
| | | | | | | | | | | 1,255,090 | | | | 7.82 | |
| | | | |
Indonesia (Cost $1,306,658) | | | | | | | | | | | | | | | | |
Freeport Indonesia PT, 4.763%, 04/14/2027 | | | | | | | 200,000 | | | | 179,700 | | | | 1.12 | |
Indonesia Asahan Aluminium Persero PT, 4.750%, 05/15/2025 | | | | | | | 200,000 | | | | 190,506 | | | | 1.19 | |
See accompanying notes to the financial statements.
145
ASHMORE EMERGING MARKETS INVESTMENT GRADE INCOME FUND
SCHEDULE OF INVESTMENTS (CONTINUED)
As of October 31, 2022
| | | | | | | | | | | | | | | | |
| | | Currency1 | | | Par | | | Value | | | % of Net
Assets | |
Indonesia (continued) | | | | | | | | | | | | | | | | |
Minejesa Capital B.V., 4.625%, 08/10/2030 | | | | | | | 385,000 | | | $ | 295,873 | | | | 1.84 | |
Pertamina Persero PT, 6.500%, 11/07/2048 | | | | | | | 200,000 | | | | 179,500 | | | | 1.12 | |
Perusahaan Perseroan Persero PT Perusahaan Listrik Negara, 6.150%, 05/21/2048 | | | | | | | 200,000 | | | | 157,500 | | | | 0.98 | |
| | | | | | | | | | | 1,003,079 | | | | 6.25 | |
| | | | |
Israel (Cost $1,348,305) | | | | | | | | | | | | | | | | |
Bank Hapoalim B.M., (Variable, U.S. Treasury Yield Curve | | | | | | | | | | | | | | | | |
Rate CMT 5Y + 2.155%), 3.255%, 01/21/20322,3 | | | | | | | 200,000 | | | | 163,500 | | | | 1.02 | |
Bank Leumi Le-Israel B.M., (Variable, U.S. Treasury Yield | | | | | | | | | | | | | | | | |
Curve Rate CMT 5Y + 1.631%), 3.275%, 01/29/20312,3 | | | | | | | 245,000 | | | | 209,169 | | | | 1.30 | |
Leviathan Bond Ltd., 6.750%, 06/30/20303 | | | | | | | 135,000 | | | | 120,288 | | | | 0.75 | |
Mizrahi Tefahot Bank Ltd., (Variable, U.S. Treasury Yield | | | | | | | | | | | | | | | | |
Curve Rate CMT 5Y + 2.250%), 3.077%, 04/07/20312,3 | | | | | | | 310,000 | | | | 260,400 | | | | 1.62 | |
Teva Pharmaceutical Finance Netherlands II B.V., 4.375%, 05/09/2030 | | | EUR | | | | 200,000 | | | | 158,861 | | | | 0.99 | |
Teva Pharmaceutical Finance Netherlands III B.V., 6.750%, 03/01/2028 | | | | | | | 200,000 | | | | 188,500 | | | | 1.18 | |
| | | | | | | | | | | 1,100,718 | | | | 6.86 | |
| | | | |
Kazakhstan (Cost $281,809) | | | | | | | | | | | | | | | | |
KazMunayGas National Co. JSC, 6.375%, 10/24/2048 | | | | | | | 211,000 | | | | 151,405 | | | | 0.94 | |
| | | | | | | | | | | 151,405 | | | | 0.94 | |
| | | | |
Kuwait (Cost $715,068) | | | | | | | | | | | | | | | | |
MEGlobal Canada ULC, 5.875%, 05/18/2030 | | | | | | | 200,000 | | | | 192,656 | | | | 1.20 | |
NBK Tier 1 Financing 2 Ltd., (Variable, USD CMT 6Y + 2.832%), 4.500%, 08/27/20252 | | | | | | | 490,000 | | | | 431,935 | | | | 2.69 | |
| | | | | | | | | | | 624,591 | | | | 3.89 | |
| | | | |
Malaysia (Cost $189,215) | | | | | | | | | | | | | | | | |
Misc Capital Two Labuan Ltd., 3.750%, 04/06/2027 | | | | | | | 200,000 | | | | 181,569 | | | | 1.13 | |
| | | | | | | | | | | 181,569 | | | | 1.13 | |
| | | | |
Mexico (Cost $2,847,432) | | | | | | | | | | | | | | | | |
Alfa S.A.B. de C.V., 6.875%, 03/25/2044 | | | | | | | 205,000 | | | | 178,854 | | | | 1.11 | |
Axtel S.A.B. de C.V., 6.375%, 11/14/2024 | | | | | | | 173,000 | | | | 115,197 | | | | 0.72 | |
Banco Santander Mexico S.A. Institucion de Banca Multiple | | | | | | | | | | | | | | | | |
Grupo Financiero Santander, 5.375%, 04/17/2025 | | | | | | | 220,000 | | | | 213,400 | | | | 1.33 | |
BBVA Bancomer S.A., (Variable, U.S. Treasury Yield Curve | | | | | | | | | | | | | | | | |
Rate CMT 5Y + 2.650%), 5.125%, 01/18/20332 | | | | | | | 200,000 | | | | 161,762 | | | | 1.01 | |
CIBANCO S.A. Institucion de Banca Multiple Trust CIB/3332, 4.375%, 07/22/2031 | | | | | | | 200,000 | | | | 125,500 | | | | 0.78 | |
Cometa Energia S.A. de C.V., 6.375%, 04/24/2035 | | | | | | | 244,245 | | | | 211,272 | | | | 1.32 | |
Corp. Inmobiliaria Vesta S.A.B. de C.V., 3.625%, 05/13/2031 | | | | | | | 300,000 | | | | 218,648 | | | | 1.36 | |
Infraestructura Energetica Nova S.A.P.I. de C.V., 4.750%, 01/15/2051 | | | | | | | 275,000 | | | | 184,547 | | | | 1.15 | |
Mexico Generadora de Energia S. de r.l., 5.500%, 12/06/2032 | | | | | | | 194,615 | | | | 177,264 | | | | 1.10 | |
Petroleos Mexicanos, 7.690%, 01/23/2050 | | | | | | | 450,000 | | | | 293,162 | | | | 1.83 | |
See accompanying notes to the financial statements.
146
ASHMORE EMERGING MARKETS INVESTMENT GRADE INCOME FUND
SCHEDULE OF INVESTMENTS (CONTINUED)
As of October 31, 2022
| | | | | | | | | | | | | | | | |
| | | Currency1 | | | Par | | | Value | | | %of Net
Assets | |
Mexico (continued) | | | | | | | | | | | | | | | | |
Trust Fibra Uno, 4.869%, 01/15/2030 | | | | | | | 325,000 | | | $ | 244,808 | | | | 1.53 | |
| | | | | | | | | | | 2,124,414 | | | | 13.24 | |
| | | | |
Panama (Cost $799,539) | | | | | | | | | | | | | | | | |
AES Panama Generation Holdings SRL, 4.375%, 05/31/2030 | | | | | | | 290,000 | | | | 228,235 | | | | 1.42 | |
C&W Senior Financing DAC, 6.875%, 09/15/2027 | | | | | | | 200,000 | | | | 173,436 | | | | 1.08 | |
Cable Onda S.A., 4.500%, 01/30/2030 | | | | | | | 280,000 | | | | 229,040 | | | | 1.43 | |
| | | | | | | | | | | 630,711 | | | | 3.93 | |
| | | | |
Peru (Cost $922,230) | | | | | | | | | | | | | | | | |
Banco de Credito del Peru S.A., (Variable, U.S. Treasury Yield | | | | | | | | | | | | | | | | |
Curve Rate CMT 5Y + 2.450%), 3.250%, 09/30/20312 | | | | | | | 300,000 | | | | 251,550 | | | | 1.57 | |
InRetail Consumer, 3.250%, 03/22/2028 | | | | | | | 250,000 | | | | 197,687 | | | | 1.23 | |
Kallpa Generacion S.A., 4.125%, 08/16/2027 | | | | | | | 200,000 | | | | 175,485 | | | | 1.09 | |
Minsur S.A., 4.500%, 10/28/2031 | | | | | | | 200,000 | | | | 161,176 | | | | 1.01 | |
| | | | | | | | | | | 785,898 | | | | 4.90 | |
| | | | |
Poland (Cost $209,344) | | | | | | | | | | | | | | | | |
GTC Aurora Luxembourg S.A., 2.250%, 06/23/2026 | | | EUR | | | | 175,000 | | | | 114,171 | | | | 0.71 | |
| | | | | | | | | | | 114,171 | | | | 0.71 | |
| | | | |
Qatar (Cost $403,889) | | | | | | | | | | | | | | | | |
Doha Finance Ltd., 2.375%, 03/31/2026 | | | | | | | 200,000 | | | | 175,452 | | | | 1.09 | |
QIB Sukuk Ltd., (Floating, ICE LIBOR USD 3M + 1.350%), 5.858%, 02/07/2025 | | | | | | | 200,000 | | | | 198,999 | | | | 1.24 | |
| | | | | | | | | | | 374,451 | | | | 2.33 | |
| | | | |
Romania (Cost $397,906) | | | | | | | | | | | | | | | | |
NE Property B.V., 1.875%, 10/09/2026 | | | EUR | | | | 375,000 | | | | 293,477 | | | | 1.83 | |
| | | | | | | | | | | 293,477 | | | | 1.83 | |
| | | | |
Saudi Arabia (Cost $1,130,008) | | | | | | | | | | | | | | | | |
Acwa Power Management And Investments One Ltd., 5.950%, 12/15/2039 | | | | | | | 304,390 | | | | 265,124 | | | | 1.65 | |
Arabian Centres Sukuk Ltd., 5.375%, 11/26/2024 | | | | | | | 200,000 | | | | 184,872 | | | | 1.15 | |
EIG Pearl Holdings S.a.r.l., 3.545%, 08/31/2036 | | | | | | | 400,000 | | | | 307,000 | | | | 1.92 | |
Saudi Arabian Oil Co., 4.250%, 04/16/2039 | | | | | | | 260,000 | | | | 213,330 | | | | 1.33 | |
| | | | | | | | | | | 970,326 | | | | 6.05 | |
| | | | |
Singapore (Cost $251,075) | | | | | | | | | | | | | | | | |
DBS Group Holdings Ltd., (Variable, U.S. Treasury Yield | | | | | | | | | | | | | | | | |
Curve Rate CMT 5Y + 1.915%), 3.300%, 02/27/20252 | | | | | | | 250,000 | | | | 219,250 | | | | 1.37 | |
| | | | | | | | | | | 219,250 | | | | 1.37 | |
| | | | |
South Africa (Cost $1,150,195) | | | | | | | | | | | | | | | | |
AngloGold Ashanti Holdings PLC, 3.375%, 11/01/2028 | | | | | | | 200,000 | | | | 161,522 | | | | 1.01 | |
Gold Fields Orogen Holdings BVI Ltd., 6.125%, 05/15/2029 | | | | | | | 290,000 | | | | 271,125 | | | | 1.69 | |
Prosus N.V., 3.680%, 01/21/2030 | | | | | | | 400,000 | | | | 294,371 | | | | 1.83 | |
Sasol Financing U.S.A. LLC, 5.875%, 03/27/2024 | | | | | | | 200,000 | | | | 195,300 | | | | 1.22 | |
| | | | | | | | | | | 922,318 | | | | 5.75 | |
See accompanying notes to the financial statements.
147
ASHMORE EMERGING MARKETS INVESTMENT GRADE INCOME FUND
SCHEDULE OF INVESTMENTS (CONTINUED)
As of October 31, 2022
| | | | | | | | | | | | | | |
| | | Currency1 | | Par | | | Value | | | % of Net
Assets | |
South Korea (Cost $393,178) | | | | | | | | | | | | | | |
Kyobo Life Insurance Co. Ltd., (Variable, U.S. Treasury Yield | | | | | | | | | | | | | | |
Curve Rate CMT 5Y + 2.887%), 5.900%, 06/15/20522 | | | | | 200,000 | | | $ | 182,000 | | | | 1.14 | |
Shinhan Bank Co. Ltd., 4.375%, 04/13/2032 | | | | | 200,000 | | | | 170,282 | | | | 1.06 | |
| | | | | | | | 352,282 | | | 2.20 | |
| | | | |
Thailand (Cost $691,152) | | | | | | | | | | | | | | |
Bangkok Bank PCL, 9.025%, 03/15/2029 | | | | | 190,000 | | | | 209,474 | | | | 1.31 | |
GC Treasury Center Co. Ltd., 2.980%, 03/18/2031 | | | | | 255,000 | | | | 188,106 | | | | 1.17 | |
GC Treasury Center Co. Ltd., 4.400%, 03/30/2032 | | | | | 200,000 | | | | 160,620 | | | | 1.00 | |
| | | | | | | | 558,200 | | | 3.48 | |
| | | | |
United Arab Emirates (Cost $775,081) | | | | | | | | | | | | | | |
DP World Crescent Ltd., 3.750%, 01/30/2030 | | | | | 361,000 | | | | 316,601 | | | | 1.97 | |
First Abu Dhabi Bank PJSC, (Variable, U.S. Treasury Yield | | | | | | | | | | | | | | |
Curve Rate CMT 5Y + 4.138%), 4.500%, 04/05/20262 | | | | | 200,000 | | | | 182,550 | | | | 1.14 | |
Galaxy Pipeline Assets Bidco Ltd., 2.940%, 09/30/2040 | | | | | 193,306 | | | | 144,875 | | | | 0.90 | |
| | | | | | | | 644,026 | | | 4.01 | |
| | | | |
Total Debt Securities (Cost $18,885,021) | | | | | | | | | 15,449,136 | | | | 96.29 | |
| | | | |
Total Investments in Securities (Cost $18,885,021) | | | | | | | | | 15,449,136 | | | | 96.29 | |
| | | | |
Total Investments (Total Cost $18,885,021) | | | | | | | | | 15,449,136 | | | | 96.29 | |
| | | | |
Other Assets Less Liabilities (See Statements of Assets and Liabilities for further detail) | | | | | | | | | 595,010 | | | | 3.71 | |
| | | | |
Net Assets | | | | | | | | $ | 16,044,146 | | | | 100.00 | |
| 1 | Local currency is United States Dollars unless otherwise noted below. |
| 2 | Variable rate security. Security issued at a fixed coupon rate, which converts to a variable rate at a specified date. Rate shown is the rate in effect as of period end. |
| 3 | Securities exempt from registration under Rule 144A of the Securities Act of 1933. These securities may not be publicly traded without registration under the Securities Act of 1933. |
Percentages shown are based on net assets.
At October 31, 2022, the Ashmore Emerging Markets Investment Grade Income Fund had outstanding forward foreign currency exchange contracts as follows:
| | | | | | | | | | | | | | | | | | | | | | | | |
Settlement
Date | | Counterparty | | | Currency Buy | | | Currency
Buy Amount
(Local
Currency) | | | Currency Sell | | | Currency
Sell Amount
(Local
Currency) | | | Unrealized
Gain/(Loss) | |
11/30/2022 | | | Citibank | | | | Euro | | | | 43,843 | | | | United States Dollar | | | | 44,000 | | | $ | (579 | ) |
11/30/2022 | | | Morgan Stanley | | | | United States Dollar | | | | 877,356 | | | | Euro | | | | 890,010 | | | | (4,070 | ) |
Subtotal Depreciation | | | | | | | | | | | | | | | | | | | | (4,649 | ) |
Total | | | | | | | | | | | | | | | | | | | | | | $ | (4,649 | ) |
See accompanying notes to the financial statements.
148
ASHMORE EMERGING MARKETS INVESTMENT GRADE INCOME FUND
SCHEDULE OF INVESTMENTS (CONTINUED)
As of October 31, 2022
The inputs or methodologies used for valuing securities are not necessarily an indication of the risks associated with investing in those securities and other financial instruments, if any. See note 4 in the Notes to the Financial Statements for more information regarding pricing inputs and valuation techniques. The following is a summary of the inputs used in valuing the Ashmore Emerging Markets Investment Grade Income Fund’s investments and other financial instruments, which are carried at fair value, as of October 31, 2022:
| | | | | | | | | | | | | | | | |
| | | Level 1 | | | Level 2 | | | Level 3 | | | Total | |
Investments | | | | | | | | | | | | | | | | |
Assets: | | | | | | | | | | | | | | | | |
Debt Securities | | | | | | | | | | | | | | | | |
Corporate Bonds | | $ | — | | | $ | 12,283,455 | | | $ | — | | | $ | 12,283,455 | |
Corporate Convertible Bonds | | | — | | | | 1,085,831 | | | | — | | | | 1,085,831 | |
Financial Certificates | | | — | | | | 700,472 | | | | — | | | | 700,472 | |
Government Agencies | | | — | | | | 1,379,378 | | | | — | | | | 1,379,378 | |
| | | | | | | | | | | | | | | | |
Total Debt Securities | | | — | | | | 15,449,136 | | | | — | | | | 15,449,136 | |
Total Investments | | $ | — | | | $ | 15,449,136 | | | $ | — | | | $ | 15,449,136 | |
| | | | |
Other Financial Instruments | | | | | | | | | | | | | | | | |
Liabilities: | | | | | | | | | | | | | | | | |
Forward Foreign Currency Exchange Contracts | | $ | — | | | $ | (4,649 | ) | | $ | — | | | $ | (4,649 | ) |
Total Other Financial Instruments | | $ | — | | | $ | (4,649 | ) | | $ | — | | | $ | (4,649 | ) |
| | |
The following is a summary of the fair values of the Fund’s derivative instruments*: | | | | | | | | | |
Fair Values of Financial Derivative Instruments on the Statements of Assets and Liabilities as of October 31, 2022:
| | |
| | | Derivatives Not Accounted for as
Hedging Instruments |
| | | Foreign Exchange Risk |
| | | | |
Liabilities: | | | | |
Unrealized Depreciation on Forward Foreign Currency Exchange Contracts | | $ | (4,649 | ) |
| | | | |
The Effect of Financial Derivative Instruments on the Statements of Operations for the Year Ended October31, 2022:
| | | | |
| | | Derivatives Not Accounted for as
Hedging Instruments | |
| | | Foreign Exchange Risk | |
Realized Gain (Loss) on Derivatives Recognized resulting from Operations: | | | | |
Net Realized Gain on Forward Foreign Currency Exchange Contracts | | $ | 114,629 | |
| | | | |
| |
Net Change in Unrealized Appreciation (Depreciation) on Derivatives Recognized resulting from Operations: | | | | |
Net Change in Unrealized Depreciation on Forward Foreign Currency Exchange Contracts | | $ | (4,908 | ) |
| | | | |
* See note 10 in the Notes to the Financial Statements for additional information.
See accompanying notes to the financial statements.
149
ASHMORE EMERGING MARKETS CORPORATE INCOME ESG FUND
SCHEDULE OF INVESTMENTS
As of October 31, 2022
| | | | | | | | | | | | | | | | |
| | | Currency1 | | | Par | | | Value | | | % of Net
Assets | |
Debt Securities | | | | | | | | | | | | | | | | |
Brazil (Cost $1,663,865) | | | | | | | | | | | | | | | | |
Banco do Brasil S.A., (Variable, U.S. Treasury Yield Curve Rate CMT 10Y + 4.398%), 6.250%, 04/15/20242 | | | | | | | 290,000 | | | $ | 254,855 | | | | 3.79 | |
JSM Global S.a.r.l., 4.750%, 10/20/2030 | | | | | | | 230,000 | | | | 159,275 | | | | 2.37 | |
Klabin Austria GmbH, 7.000%, 04/03/2049 | | | | | | | 230,000 | | | | 204,213 | | | | 3.04 | |
MARB BondCo PLC, 3.950%, 01/29/2031 | | | | | | | 300,000 | | | | 222,207 | | | | 3.31 | |
Oi S.A., 10.000%, (100% Cash), 07/27/20253 | | | | | | | 290,000 | | | | 75,415 | | | | 1.12 | |
Suzano Austria GmbH, 7.000%, 03/16/2047 | | | | | | | 200,000 | | | | 183,500 | | | | 2.73 | |
| | | | | | | | | | | 1,099,465 | | | | 16.36 | |
Chile (Cost $194,649) | | | | | | | | | | | | | | | | |
VTR Finance N.V., 6.375%, 07/15/2028 | | | | | | | 200,000 | | | | 104,873 | | | | 1.56 | |
| | | | | | | | | | | 104,873 | | | | 1.56 | |
China (Cost $1,402,050) | | | | | | | | | | | | | | | | |
Central China Real Estate Ltd., 7.250%, 08/13/2024 | | | | | | | 300,000 | | | | 38,090 | | | | 0.57 | |
Fantasia Holdings Group Co. Ltd., 11.875%, 06/01/20234 | | | | | | | 280,000 | | | | 13,983 | | | | 0.21 | |
Kaisa Group Holdings Ltd., 11.250%, 04/16/20254 | | | | | | | 280,000 | | | | 18,550 | | | | 0.28 | |
Sunac China Holdings Ltd., 7.500%, 02/01/20244 | | | | | | | 260,000 | | | | 14,970 | | | | 0.22 | |
Zhenro Properties Group Ltd., 7.875%, 04/14/20244 | | | | | | | 290,000 | | | | 5,600 | | | | 0.08 | |
| | | | | | | | | | | 91,193 | | | | 1.36 | |
Colombia (Cost $175,899) | | | | | | | | | | | | | | | | |
Millicom International Cellular S.A., 5.125%, 01/15/2028 | | | | | | | 180,000 | | | | 153,509 | | | | 2.28 | |
| | | | | | | | | | | 153,509 | | | | 2.28 | |
Ecuador (Cost $278,446) | | | | | | | | | | | | | | | | |
International Airport Finance S.A., 12.000%, 03/15/2033 | | | | | | | 283,611 | | | | 245,324 | | | | 3.65 | |
| | | | | | | | | | | 245,324 | | | | 3.65 | |
India (Cost $188,475) | | | | | | | | | | | | | | | | |
Greenko Power II Ltd., 4.300%, 12/13/2028 | | | | | | | 195,500 | | | | 150,535 | | | | 2.24 | |
| | | | | | | | | | | 150,535 | | | | 2.24 | |
Indonesia (Cost $150,841) | | | | | | | | | | | | | | | | |
Star Energy Geothermal Darajat II/Star Energy Geothermal Salak, 4.850%, 10/14/2038 | | | | | | | 200,000 | | | | 148,643 | | | | 2.21 | |
| | | | | | | | | | | 148,643 | | | | 2.21 | |
Israel (Cost $483,879) | | | | | | | | | | | | | | | | |
Bank Leumi Le-Israel B.M., (Variable, U.S. Treasury Yield Curve Rate CMT 5Y + 1.631%), 3.275%, 01/29/20312,5 | | | | | | | 200,000 | | | | 170,750 | | | | 2.54 | |
Teva Pharmaceutical Finance Co. LLC, 6.150%, 02/01/2036 | | | | | | | 270,000 | | | | 221,268 | | | | 3.29 | |
| | | | | | | | | | | 392,018 | | | | 5.83 | |
Kuwait (Cost $430,766) | | | | | | | | | | | | | | | | |
MEGlobal Canada ULC, 5.875%, 05/18/2030 | | | | | | | 200,000 | | | | 192,656 | | | | 2.87 | |
See accompanying notes to the financial statements.
150
ASHMORE EMERGING MARKETS CORPORATE INCOME ESG FUND
SCHEDULE OF INVESTMENTS (CONTINUED)
As of October 31, 2022
| | | | | | | | | | | | | | | | |
| | | Currency1 | | | Par | | | Value | | | % of Net
Assets | |
Kuwait (continued) | | | | | | | | | | | | | | | | |
NBK Tier 1 Financing 2 Ltd., (Variable, USD CMT 6Y + 2.832%), 4.500%, 08/27/20252 | | | | | | | 200,000 | | | $ | 176,300 | | | | 2.62 | |
| | | | | | | | | | | 368,956 | | | | 5.49 | |
| | | | |
Mexico (Cost $1,216,124) | | | | | | | | | | | | | | | | |
Banco Mercantil del Norte S.A., (Variable, U.S. Treasury Yield Curve Rate CMT 10Y + 7.760%), 8.375%, 10/14/20302 | | | | | | | 260,000 | | | | 226,104 | | | | 3.36 | |
BBVA Bancomer S.A., (Variable, U.S. Treasury Yield Curve Rate CMT 5Y + 2.650%), 5.125%, 01/18/20332 | | | | | | | 240,000 | | | | 194,115 | | | | 2.89 | |
CIBANCO S.A. Institucion de Banca Multiple Trust CIB/3332, 4.375%, 07/22/2031 | | | | | | | 200,000 | | | | 125,500 | | | | 1.87 | |
Orbia Advance Corp. S.A.B. de C.V., 5.875%, 09/17/2044 | | | | | | | 200,000 | | | | 153,958 | | | | 2.29 | |
Trust Fibra Uno, 6.390%, 01/15/2050 | | | | | | | 220,000 | | | | 145,750 | | | | 2.17 | |
| | | | | | | | | | | 845,427 | | | | 12.58 | |
| | | | |
Panama (Cost $198,910) | | | | | | | | | | | | | | | | |
C&W Senior Financing DAC, 6.875%, 09/15/2027 | | | | | | | 200,000 | | | | 173,436 | | | | 2.58 | |
| | | | | | | | | | | 173,436 | | | | 2.58 | |
| | | | |
Peru (Cost $185,233) | | | | | | | | | | | | | | | | |
Intercorp Peru Ltd., 3.875%, 08/15/2029 | | | | | | | 200,000 | | | | 155,216 | | | | 2.31 | |
| | | | | | | | | | | 155,216 | | | | 2.31 | |
| | | | |
Poland (Cost $99,945) | | | | | | | | | | | | | | | | |
GTC Aurora Luxembourg S.A., 2.250%, 06/23/2026 | | | EUR | | | | 100,000 | | | | 65,240 | | | | 0.97 | |
| | | | | | | | | | | 65,240 | | | | 0.97 | |
| | | | |
Qatar (Cost $282,731) | | | | | | | | | | | | | | | | |
QIB Sukuk Ltd., (Floating, ICE LIBOR USD 3M + 1.350%), 5.858%, 02/07/2025 | | | | | | | 280,000 | | | | 278,599 | | | | 4.14 | |
| | | | | | | | | | | 278,599 | | | | 4.14 | |
| | | | |
Romania (Cost $207,470) | | | | | | | | | | | | | | | | |
NE Property B.V., 1.875%, 10/09/2026 | | | EUR | | | | 170,000 | | | | 133,043 | | | | 1.98 | |
| | | | | | | | | | | 133,043 | | | | 1.98 | |
| | | | |
Russian Federation (Cost $184,629) | | | | | | | | | | | | | | | | |
Sovcombank Via SovCom Capital DAC, 7.600%, 02/17/20274,6 | | | | | | | 200,000 | | | | — | | | | — | |
| | | | | | | | | | | — | | | | — | |
| | | | |
South Africa (Cost $408,640) | | | | | | | | | | | | | | | | |
MTN Mauritius Investments Ltd., 6.500%, 10/13/2026 | | | | | | | 210,000 | | | | 200,109 | | | | 2.98 | |
Prosus N.V., 3.680%, 01/21/2030 | | | | | | | 200,000 | | | | 147,185 | | | | 2.19 | |
| | | | | | | | | | | 347,294 | | | | 5.17 | |
| | | | |
Turkey (Cost $198,710) | | | | | | | | | | | | | | | | |
Zorlu Yenilenebilir Enerji A.S., 9.000%, 06/01/2026 | | | | | | | 200,000 | | | | 143,260 | | | | 2.13 | |
| | | | | | | | | | | 143,260 | | | | 2.13 | |
| | | | |
United Arab Emirates (Cost $724,795) | | | | | | | | | | | | | | | | |
DIB Sukuk Ltd., 2.950%, 01/16/2026 | | | | | | | 240,000 | | | | 221,607 | | | | 3.30 | |
See accompanying notes to the financial statements.
151
ASHMORE EMERGING MARKETS CORPORATE INCOME ESG FUND
SCHEDULE OF INVESTMENTS (CONTINUED)
As of October 31, 2022
| | | | | | | | | | | | | | | | |
| | | Currency1 | | | Par | | | Value | | | % of
Net
Assets | |
United Arab Emirates (continued) | | | | | | | | | | | | | | | | |
DP World Ltd., 6.850%, 07/02/2037 | | | | | | | 200,000 | | | $ | 191,759 | | | | 2.85 | |
DP World Salaam, (Variable, U.S. Treasury Yield Curve Rate CMT 5Y + 5.750%), 6.000%, 10/01/20252 | | | | | | | 200,000 | | | | 193,706 | | | | 2.88 | |
| | | | | | | | | | | 607,072 | | | | 9.03 | |
| | | | |
Total Debt Securities (Cost $8,676,057) | | | | | | | | | | | 5,503,103 | | | | 81.87 | |
| | | | |
Total Investments in Securities (Cost $8,676,057) | | | | | | | | | | | 5,503,103 | | | | 81.87 | |
| | | | |
Total Investments (Total Cost $8,676,057) | | | | | | | | | | | 5,503,103 | | | | 81.87 | |
| | | | |
Other Assets Less Liabilities (See Statements of Assets and Liabilities for further detail) | | | | | | | | | | | 1,219,012 | | | | 18.13 | |
Net Assets | | | | | | | | | | $ | 6,722,115 | | | | 100.00 | |
| 1 | Local currency is United States Dollars unless otherwise noted below. |
| 2 | Variable rate security. Security issued at a fixed coupon rate, which converts to a variable rate at a specified date. Rate shown is the rate in effect as of period end. |
| 3 | Security is a payment-in-kind bond, and unless otherwise noted in the description of the security, pays its entire coupon on an in-kind basis. |
| 4 | Issuer has defaulted on terms of debt obligation. |
| 5 | Securities exempt from registration under Rule 144A of the Securities Act of 1933. These securities may not be publicly traded without registration under the Securities Act of 1933. |
| 6 | Security has been deemed worthless and is a Level 3 investment. |
Percentages shown are based on net assets.
At October 31, 2022, the Ashmore Emerging Markets Corporate Income ESG Fund had outstanding forward foreign currency exchange contracts as follows:
| | | | | | | | | | | | | | | | | | | | | | |
Settlement Date | | Counterparty | | Currency Buy | | Currency
Buy Amount
(Local
Currency) | | | | | | Currency
Sell | | Currency
Sell Amount
(Local
Currency) | | | Unrealized
Gain/(Loss) | |
11/30/2022 | | Morgan Stanley | | United States Dollar | | | 224,703 | | | | Euro | | | | | | 227,944 | | | $ | (1,042 | ) |
Subtotal Depreciation | | | | | | | | | | | | | | | | | | | | | (1,042 | ) |
Total | | | | | | | | | | | | | | | | | | | | $ | (1,042 | ) |
See accompanying notes to the financial statements.
152
ASHMORE EMERGING MARKETS CORPORATE INCOME ESG FUND
SCHEDULE OF INVESTMENTS (CONTINUED)
As of October 31, 2022
The inputs or methodologies used for valuing securities are not necessarily an indication of the risks associated with investing in those securities and other financial instruments, if any. See note 4 in the Notes to the Financial Statements for more information regarding pricing inputs and valuation techniques. The following is a summary of the inputs used in valuing the Ashmore Emerging Markets Corporate Income ESG Fund’s investments and other financial instruments, which are carried at fair value, as of October 31, 2022:
| | | | | | | | | | | | | | | | |
| | | Level 1 | | | Level 2 | | | Level 3 | | | Total | |
Investments | | | | | | | | | | | | | | | | |
Assets: | | | | | | | | | | | | | | | | |
Debt Securities | | | | | | | | | | | | | | | | |
Corporate Bonds | | $ | — | | | $ | 4,067,688 | | | $ | — | | | $ | 4,067,688 | |
Corporate Convertible Bonds | | | — | | | | 590,969 | | | | — | | | | 590,969 | |
Financial Certificates | | | — | | | | 693,911 | | | | — | | | | 693,911 | |
Government Agencies | | | — | | | | 150,535 | | | | — | | | | 150,535 | |
| | | | | | | | | | | | | | | | |
Total Debt Securities | | | — | | | | 5,503,103 | | | | — | | | | 5,503,103 | |
Total Investments | | $ | — | | | $ | 5,503,103 | | | $ | — | | | $ | 5,503,103 | |
| | | | |
Other Financial Instruments | | | | | | | | | | | | | | | | |
Liabilities: | | | | | | | | | | | | | | | | |
Forward Foreign Currency Exchange Contracts | | $ | — | | | $ | (1,042 | ) | | $ | — | | | $ | (1,042 | ) |
Total Other Financial Instruments | | $ | — | | | $ | (1,042 | ) | | $ | — | | | $ | (1,042 | ) |
The following is a reconciliation of investments in which significant unobservable inputs (Level 3) were used for the Fund during the
period ended October 31, 2022:
| | | | | | | | | | | | | | | | | | | | | | | | | | | | | | | | | | | | | | | | |
Category and
Subcategory | | Beginning
Balance at
10/31/2021 | | | Accrued
Discounts
(Premiums) | | | Purchases | | | Sales | | | Realized
Gains
(Losses) | | | Change in
Unrealized
Appreciation
(Depreciation) | | | Transfers
into
Level 3 | | | Transfers
out of
Level 3 | | | Ending
Balance at
10/31/2022 | | | Change in
Unrealized
Appreciation
(Depreciation)
from
Investments
still held
10/31/2022 | |
Investments, at value | | | | | | | | | | | | | | | | | | | | | | | | | | | | | | | | | | | | | | | | |
Corporate Bonds | | | | | | | | | | | | | | | | | | | | | | | | | | | | | | | | | | | | | | | | |
Russian Federation | | $ | — | | | $ | 29 | | | $ | 184,600 | | | $ | — | | | $ | — | | | $ | 184,629 | | | $ | — | | | $ | — | | | $ | — | | | $ | (184,629 | ) |
Total | | $ | — | | | $ | 29 | | | $ | 184,600 | | | $ | — | | | $ | — | | | $ | 184,629 | | | $ | — | | | $ | — | | | $ | — | | | $ | (184,629 | ) |
The following table on “Quantitative information about Level 3 Fair Value measurements” provides information on the valuation
techniques and inputs used to value Level 3 securities at October 31, 2022:
| | | | | | | | | | | | |
Quantitative Information about Level 3 Fair Value Measurements | |
| | | Fair Value at
10/31/2022 | | | Valuation
Technique | | | Unobservable
Input | |
Corporate Bonds | | $ | — | | | | Zero priced asset | | | | Inputs to model | |
See accompanying notes to the financial statements.
153
ASHMORE EMERGING MARKETS CORPORATE INCOME ESG FUND
SCHEDULE OF INVESTMENTS (CONTINUED)
As of October 31,2022
The following is a summary of the fair values of the Fund’s derivative instruments*:
Fair Values of Financial Derivative Instruments on the Statements of Assets and Liabilities as of October 31, 2022:
| | |
| | Derivatives
Not
Accounted
forasHedging
Instruments |
| | | Foreign
Exchange
Risk |
| | | | |
Liabilities: | | | | |
Unrealized Depreciation on Forward Foreign Currency Exchange Contracts | | $ | (1,042 | ) |
The Effect of Financial Derivative Instruments on the Statements of Operations for the Year Ended October 31, 2022:
| | | | |
| | | Derivatives Not Accounted for as
Hedging Instruments | |
| | | | |
| | | Foreign Exchange Risk | |
Realized Gain (Loss) on Derivatives Recognized resulting from Operations: | | | | |
Net Realized Gain on Forward Foreign Currency Exchange Contracts | | $ | 37,156 | |
| | | | |
| |
Net Change in Unrealized Appreciation (Depreciation) on Derivatives Recognized resulting from Operations: | | | | |
Net Change in Unrealized Depreciation on Forward Foreign Currency Exchange Contracts | | $ | (1,137 | ) |
| | | | |
* See Note 10 in the Notes to the Financial Statements for additional information.
See accompanying notes to the financial statements.
154
ASHMORE FUNDS
NOTES TO FINANCIAL STATEMENTS
As of October 31, 2022
Ashmore Funds (the “Trust”) is a Massachusetts business trust organized under the laws of the Commonwealth of Massachusetts on August 6, 2010 (inception date) and is registered under the Investment Company Act of 1940, as amended (the “Investment Company Act” or “1940 Act”), as an open-end management investment company. The Trust follows accounting and reporting guidance under Financial Accounting Standards Codification Topic 946, “Financial Services – Investment Companies.” The Trust includes twelve funds as of October 31, 2022, each with its own investment objective. The Ashmore Emerging Markets Total Return Fund, Ashmore Emerging Markets Local Currency Bond Fund, Ashmore Emerging Markets Corporate Income Fund, Ashmore Emerging Markets Short Duration Fund, Ashmore Emerging Markets Active Equity Fund, Ashmore Emerging Markets Small-Cap Equity Fund, Ashmore Emerging Markets Frontier Equity Fund, Ashmore Emerging Markets Equity Fund, Ashmore Emerging Markets Equity ESG Fund, Ashmore Emerging Markets Short Duration Select Fund, Ashmore Emerging Markets Investment Grade Income Fund and Ashmore Emerging Markets Corporate Income ESG Fund (each a “Fund” and collectively, the “Funds”) are separate series of the Trust. The Ashmore Emerging Markets Local Currency Bond Fund and the Ashmore Emerging Markets Short Duration Fund are each non-diversified funds. Non-diversified funds may invest a relatively large portion of their net assets in a single issuer or a small number of issuers. Each of the Funds’ financial statements are presented herein.
Ashmore Investment Advisors Limited (“AIAL” or the “Investment Manager”) serves as investment manager to the Funds. AIAL is a wholly owned subsidiary of Ashmore Investments (UK) Limited, which is a wholly owned subsidiary of Ashmore Group plc (“Ashmore Group”). Ashmore Investment Management (US) Corporation (“AIMUS”) is the principal underwriter of shares of the Funds. AIMUS is an affiliate of the Investment Manager. The Northern Trust Company (“Northern Trust”) serves as the administrator, custodian and transfer agent of the Funds.
Related parties or personnel of the Investment Manager may invest in the Funds. The Investment Manager could face a conflict of interest if a related party is invested in a Fund and that party’s interests diverge from those of the Fund, but equally this co-investment may serve to better align the interests of the Funds and the personnel of the Investment Manager. When a related party provides capital for a Fund, it may do so with the intention of redeeming all or part of its interest in the Fund at a future point in time.
The Funds have assessed the impact of the Alternative Investment Fund Managers Directive (AIFMD) (the “Directive”) on the financial statements of the Trust and have concluded that the Trust is exempt from following Chapter V. Section 1. Articles 103-111 of the European Commission’s Level 2 Delegated Regulation on the basis of the operations of the Trust (i) being Non-EEA AIFs (“European Economic Area Alternative Investment Funds”), and (ii) not being marketed in the European Union, as defined by the Directive.
| 2. | Significant accounting policies |
The significant accounting policies adopted and consistently followed in the preparation of the Funds’ financial statements are set out below:
(a) Basis of preparation
The financial statements have been prepared in accordance with accounting principles generally accepted in the United States of America (“U.S. GAAP”).
(b) Use of estimates
The preparation of financial statements in accordance with U.S. GAAP requires estimates and assumptions that affect the reported amounts of assets and liabilities and the disclosure of contingent assets and liabilities at the date of the financial statements, as well as the reported amounts of revenues generated and expenses incurred during the reporting period. Actual
155
ASHMORE FUNDS
NOTES TO FINANCIAL STATEMENTS (CONTINUED)
As of October 31, 2022
results could differ from these estimates. These financial statements contain all adjustments which are, in the opinion of the Trust, necessary to portray a fair statement of the period presented. Such adjustments are normal and recurring in nature. Valuation models used to determine the fair value of hard to value investments require the use of a number of market based assumptions.
(c) Determination of the Net Asset Value
The net asset value (“NAV”) of a Fund’s shares is calculated at the close of regular trading (normally 4:00 p.m. Eastern time) (the “NYSE Close”) on each day that the New York Stock Exchange (“NYSE”) is open for regular trading.
(d) Investment valuation
For the purposes of calculating NAV, portfolio securities and other assets for which market quotations are readily available are valued at market value. A market quotation is readily available only when that quotation is a quoted price (unadjusted) in active markets for identical investments that the Fund can access at the measurement date, provided that a quotation will not be readily available if it is not reliable. Market value is generally determined on the basis of official closing prices. With respect to any portion of a Fund’s assets that are invested in one or more open-ended investment management companies, a Fund’s NAV will be calculated based upon the NAVs of such investments. The prospectuses for these open-end management investment companies explain the circumstances under which those companies will use fair value pricing and the effects of using fair value pricing.
If a Fund’s non-U.S. (foreign) security’s value has materially changed after the close of the security’s primary exchange or principal market but before the time as of which the Funds calculate their NAVs, the security will be valued at fair value based on procedures approved by the Board. The fair value of investments may be determined based on information provided by pricing services and other third-party vendors, which may recommend fair value prices or adjustments with reference to other securities, indices or assets. The Funds may use fair value pricing more frequently for foreign securities or assets because, amongst other things, many foreign markets close well before the NAV of the Funds’ shares is next calculated. In considering whether fair value pricing is required and in determining fair values, the Valuation Designee (as defined below) may, amongst other things, consider significant events (which may be considered to include changes in the value of U.S. securities or securities indices) that occur after the close of the relevant market and before the time as of which the Funds calculate their NAVs. The Valuation Designee (as defined below) may utilize modeling tools provided by third-party vendors to determine the fair values of non-U.S. securities. Foreign exchanges may permit trading in foreign securities on days when the Trust is not open for business, which may result in the values of a Fund’s portfolio investments being affected when investors are unable to buy, sell or exchange shares of the Fund.
Investments initially valued in currencies other than the United States Dollar are converted to the United States Dollar using exchange rates obtained from pricing services. Foreign exchange rates are calculated as of 4:00 p.m. Eastern time on each day that the NYSE opens for regular trading. As a result, the NAV of a Fund’s shares may be affected by changes in the value of currencies in relation to the United States Dollar. The value of securities traded in markets outside the United States or denominated in currencies other than the United States Dollar may be affected significantly on a day that the NYSE is closed and an investor is not able to purchase, redeem or exchange shares of the Funds.
Investments for which market quotations are not readily available are valued at fair value as determined in good faith pursuant to Rule 2a-5 under the 1940 Act. As a general principle, the fair value of a security or other asset is the price that would be received to sell an asset or paid to transfer a liability in an orderly transaction between market participants at the measurement date. Pursuant to Rule 2a-5, the Board has designated the Investment Manager as the valuation designee (“Valuation Designee”) for the Funds to perform the fair value determination relating to all Fund investments. The Investment Manager may carry out its designated responsibilities as Valuation Designee through various committees. The Valuation Designee’s policies and procedures govern the Valuation Designee’s selection and application of methodologies for determining and calculating the fair value of Fund investments. The Valuation Designee may value Fund portfolio securities for which market quotations are not readily available and other Fund assets utilizing inputs from pricing services, quotation reporting systems, valuation agents and other third-party sources (together, “Pricing Sources”).
156
ASHMORE FUNDS
NOTES TO FINANCIAL STATEMENTS (CONTINUED)
As of October 31, 2022
Domestic and foreign debt securities for which the close of trading does not coincide with the NYSE close and non-exchange traded derivatives are normally valued on the basis of quotes obtained from brokers and dealers or Pricing Sources using data reflecting the earlier closing of the principal markets for those securities. Prices obtained from Pricing Sources may be based on, among other things, information provided by market makers or estimates of market values obtained from yield data relating to investments or securities with similar characteristics. Certain debt securities purchased on a delayed delivery basis are marked-to-market daily until settlement. Exchange traded options, futures and options on futures are generally valued at the settlement price determined by the exchange on which the instrument is primarily traded.
The Valuation Designee primarily employs a market-based approach which may use related or comparable assets or liabilities, recent transactions, market multiples, book values, and other relevant information to determine the fair value of an investment. The Valuation Designee may also apply a discount to the last traded price in situations where the last traded price may not represent the fair value of the security, such as if a security’s trading has been suspended on its primary trading market, a security has been de-listed from its primary trading market, a security has not traded for an extended period of time, or a security’s primary trading market is temporarily closed at a time when under normal conditions it would be open. Any such discount is based on a number of factors including but not limited to the circumstances surrounding any potential suspension or de-listing, market and industry conditions, competitor information, and the period of time since the last trading took place.
Fair valuation may require subjective determinations about the value of a security or asset. While the Funds’ and Valuation Designee’s policies and procedures are intended to result in a calculation of a Fund’s NAV that fairly reflects security and asset values as of the time of pricing, the Funds cannot ensure that fair values accurately reflect the price that a Fund could obtain for a security or asset if it were to dispose of that security or asset at the time of pricing (for instance, in a forced or distressed sale). The prices used by a Fund may differ from the value that would be realized if the securities were sold.
(e) Investment transactions, income and expenses
Investment transactions are recorded at the trade date. The Funds determine the gain or loss realized from investment transactions using an identified cost basis method. Interest income is recognized on an accrual basis and includes the amortization of premiums and the accretion of discounts using the effective yield method, net of any applicable tax withholding. Dividend income is recognized on the ex-dividend date. Dividends from foreign securities are recorded on the ex-dividend date, or as soon as such information is available, net of any applicable tax withholding. Other non-cash dividends are recognized as investment income at the fair value of the property received. Debt obligations may be placed on non-accrual status and related interest income may be reduced by ceasing current accruals and writing off interest receivable when the collection of all or a portion of interest has become doubtful based on consistently applied procedures. A debt obligation is removed from non-accrual status when the issuer resumes interest payments or when collectability of interest is probable.
Expenses are recorded on an accrual basis. Each Fund is charged for those expenses that are directly attributable to that Fund. Certain expenses arising in connection with a class of shares are charged to that class of shares. Expenses incurred which do not specifically relate to an individual Fund are allocated amongst all the Funds in the Trust in proportion to each Fund’s relative net assets.
(f) Foreign Currency
Assets and liabilities denominated in foreign currencies are translated into U.S. dollar amounts at the date of valuation. Purchases and sales of investment securities and income and expense items denominated in foreign currencies are translated into U.S. dollar amounts on the respective dates of such transactions.
The Funds do not isolate that portion of the results of operations resulting from changes in foreign exchange rates on investments from the fluctuations arising from changes in market prices of securities held. Such fluctuations are included with the net realized gain or loss and change in unrealized appreciation or depreciation on investments.
Reported net realized foreign exchange gains or losses arise from sales of foreign currencies, currency gains or losses realized between the trade and settlement dates on securities transactions, and the difference between the amounts of dividends, interest and foreign withholding taxes recorded on the Funds’ books and the U.S. dollar equivalent of the amounts actually received or
157
ASHMORE FUNDS
NOTES TO FINANCIAL STATEMENTS (CONTINUED)
As of October 31, 2022
paid. Net unrealized foreign exchange gains and losses arise from changes in the fair values of assets and liabilities, other than investments in securities at fiscal year-end, resulting from changes in exchange rates. Such fluctuations are included with the net realized gain or loss and unrealized appreciation or depreciation from foreign currency exchange transactions.
(g) Equity-Linked Securities
Certain Funds may purchase equity-linked securities, also known as participation notes. Equity-linked securities are primarily used by the Funds as an alternate means to access what is generally an emerging securities market. A Fund deposits cash with its custodian (or broker) in an amount near or equal to the value of the underlying security in exchange for an equity linked security. Upon sale, the Fund receives cash from the broker or custodian, equal to the value of the underlying security. In addition to the market risk and credit risk of the underlying securities, there is a risk of default by the counterparty to the transaction. In the event of insolvency of the counterparty, a Fund might be unable to obtain its expected benefit. In addition, while the Funds will seek to enter into such transactions only with parties that are capable of entering into closing transactions with a Fund, there can be no assurance that a Fund will be able to close out such a transaction with the counterparty or obtain an offsetting position with any counterparty at a time prior to the end of the term of the underlying agreement.
(h) Inflation Index Securities
Certain Funds may invest in inflation-indexed bonds which are fixed income securities whose principal value is periodically adjusted based on a measure of rate of inflation. The interest rate on these bonds is generally fixed at issuance at a rate lower than typical bonds. Over the life of an inflation-indexed bond interest will be paid based on a principal value which is adjusted for inflation. Any increase or decrease in the principal amount of an inflation-indexed bond will be included as interest income on the Statements of Operations, even though investors do not receive their principal until maturity. At October 31, 2022, all inflation-indexed bonds were shown on the Schedule of Investments with their original par and stated coupon rate.
(i) Credit-Linked Notes
Certain Funds may invest in credit-linked notes to provide exposure to the high yield or another fixed income market. The value of a credit-linked note is based on the price movements of a particular credit, known as a reference credit. Credit-linked notes that a Fund invests in are typically listed instruments that typically provide the same return as the underlying reference credit. A Fund generally will receive a fixed or floating coupon and the note’s par value upon maturity. If a specified credit event occurs, such as default or bankruptcy, the Fund may experience a delay in payment or forego interest. The maximum potential risk of loss is limited to the par amount of the credit linked note plus any accrued interest.
In the normal course of business, the Funds trade financial instruments and enter into financial transactions where a risk of potential loss exists due to, amongst other things, changes in the market (market risk), or the failure or inability of the other party to a transaction to perform (credit and counterparty risk). See below for a summary description of select principal risks, some of which may not apply to a particular Fund. A discussion of the principal risks of investing in each Fund is included in that Fund’s prospectus.
Counterparty and Third Party Risk
Transactions involving a counterparty to a derivative or other instrument, or a third party responsible for servicing the instrument, are subject to the credit risk of the counterparty or third party, and to the counterparty’s or third party’s ability to perform in accordance with the terms of the transaction.
158
ASHMORE FUNDS
NOTES TO FINANCIAL STATEMENTS (CONTINUED)
As of October 31, 2022
Credit Risk
The Funds could lose money if the issuer or guarantor of a debt security or other instrument is unable or unwilling to meet its financial obligations, and the lack of ability, or perceived lack of ability, of the issuer to make timely payments of interest and/or principal will negatively affect the value of the security or instrument.
Market Risk
The value of securities and instruments owned by the Funds may rise and fall, sometimes rapidly or unpredictably, due to factors affecting securities markets generally or particular industries or geographic areas. Recent instability in the financial markets has led governments around the world to take a number of unprecedented actions designed to support certain financial institutions and segments of the financial markets that have experienced extreme volatility, and in some cases a lack of liquidity. The withdrawal of this support, failure of these efforts, or investor perception that these efforts are not succeeding could negatively affect financial markets generally as well as the values and liquidity of a Fund’s portfolio securities and other assets.
Derivative financial instruments may result in off-balance sheet market and credit risk. If the markets should move against one or more positions that the Funds hold, the Funds could incur losses greater than the unrealized amounts recorded in the Statements of Assets and Liabilities. Derivative risk exposures are discussed in note 10.
On February 24, 2022, the Russian government invaded Ukraine. The combination of the Russian invasion and the resultant sanctions imposed by the US and other governments is impacting liquidity and asset values in Russia, Ukraine and Belarus. Consequently, the value and liquidity of the Funds’ investments in these countries, as well as the Funds’ performance, may be impacted.
Foreign/Emerging Markets Risks
Investments in foreign securities entail risks in addition to those customarily associated with investing in U.S. securities. Economic, political and social instability could disrupt financial markets in which the Fund invests and adversely affect the value of the Fund’s assets. In addition, national policies may restrict investment opportunities. In foreign markets there may be a lower degree of market volume and liquidity than in U.S. markets, and this may result in greater price volatility. The securities markets in many Emerging-Market countries are substantially smaller, less developed, less liquid and more volatile than the securities markets of developed countries. Furthermore, since the composition of each Fund will differ from that of market indexes, its performance generally will not mirror the returns provided by a specific market index.
| 4. | Fair value measurements |
U.S. GAAP includes a topic which defines fair value as the price that the Fund would receive upon selling an investment in an orderly and timely transaction to a market participant in the principal or most advantageous market of the investment. This topic establishes a three-tier hierarchy to maximize the use of observable market data, minimize the use of unobservable inputs and establish classification of fair value measurements for disclosure purposes. Inputs may be observable or unobservable and refer broadly to the assumptions that market participants would use in pricing the asset or liability including assumptions about risk. Such risks include the inherent risk in a particular valuation technique which is used to measure fair value. Observable inputs are inputs that reflect the assumptions market participants would use in pricing the asset or liability developed based on market data obtained from sources independent of the reporting entity. Unobservable inputs are inputs that reflect the reporting entity’s own assumptions about the assumptions market participants would use in pricing the asset or liability, developed based on the best information available in the circumstances. The three-tier hierarchy of inputs is summarized in the three broad levels listed below.
| | • | | Level 1 – Inputs using unadjusted quoted prices in active markets or exchanges for identical assets and liabilities. |
159
ASHMORE FUNDS
NOTES TO FINANCIAL STATEMENTS (CONTINUED)
As of October 31, 2022
| | • | | Level 2 – Significant observable inputs other than those used in Level 1, which may include, but are not limited to, quoted prices for similar assets or liabilities in markets that are active, quoted prices for identical or similar assets or liabilities in markets that are not active, inputs other than quoted prices that are observable for the assets or liabilities (such as interest rates, yield curves, volatilities, prepayment rates, loss severities, credit risks and default rates) or other market corroborated inputs. |
| | • | | Level 3 – Significant unobservable inputs based on the best information available in the circumstances, to the extent observable inputs are not available, which may include assumptions made by the Board or persons acting at their discretion that are used in determining the fair market value of investments. |
Fixed income securities including corporate, convertible and municipal bonds and notes, U.S. government agency securities, U.S. treasury obligations, sovereign issues, bank loans, convertible preferred securities and non-U.S. bonds are normally priced using data reflecting the earlier closing of the principal markets for those securities, subject to possible fair value adjustments. Information that becomes known to a Fund or its agents after NAV has been calculated on a particular day will not generally be used to retroactively adjust the price of a security or NAV determined earlier that day.
Portfolio securities and other assets for which market quotations are readily available are typically categorized as Level 1 of the fair value hierarchy. Domestic and foreign debt securities where the close of trading does not coincide with the NYSE close and non-exchange traded derivatives are normally valued on the basis of quotes obtained from brokers and dealers or Pricing Sources using data reflecting the earlier closing of the principal markets for those securities. Prices obtained from Pricing Sources are based on, among other things, information provided by market makers or estimates of market values obtained from yield data relating to investments or securities with similar characteristics. Securities using these valuation adjustments are typically categorized as Level 2 of the fair value hierarchy. Preferred securities, equity linked notes and other equities traded on inactive markets or valued by reference to similar instruments are also typically categorized as Level 2 of the fair value hierarchy.
Investments and derivatives classified within Level 3 have significant unobservable inputs, as they trade infrequently or not at all. Level 3 instruments may include bank loan agreements and less-liquid corporate debt securities (including distressed debt instruments). Also included in this category are certain bonds and loans for which independent broker prices are used and information relating to the inputs of the price models is not available.
In December 2020, the SEC adopted Rule 2a-5, Good Faith Determinations of Fair Value, under the 1940 Act, which addresses valuation practices and the role of the board of directors with respect to the fair value of the investments of a registered investment company, including related oversight and reporting requirements intended to ensure that the Board receives the information it needs to oversee the investment adviser’s fair value determinations. Among other things, Rule 2a-5 permits the Board to designate the Funds’ investment adviser to perform the Funds’ fair value determinations, which are subject to Board oversight. Pursuant to Rule 2a-5, the Board approved changes to the Funds’ valuation policies and procedures and designated the Funds’ investment adviser, Ashmore Investment Advisors Limited, to serve as the “valuation designee” to perform the Funds’ fair value determinations.
| 5. | Reverse repurchase agreements |
Certain Funds may enter into reverse repurchase agreements. In a reverse repurchase agreement, a Fund delivers a security in exchange for cash to a financial institution, the counterparty, with a simultaneous agreement to repurchase the same or substantially the same security at an agreed upon price and date. The Fund is entitled to receive principal and interest payments, if any, made on the security delivered to the counterparty during the term of the agreement. Cash received in exchange for securities delivered plus accrued interest payments to be made by the Fund to counterparties are reflected as a liability on the Statements of Assets and Liabilities. Interest payments made by the Fund to counterparties are recorded as a component of interest expense on the Statements of Operations. In periods of increased demand for the security, a Fund may receive a fee for use of the security by the counterparty, which may result in interest income to the Fund.
As of October 31, 2022, the Funds did not hold any reverse repurchase agreements.
160
ASHMORE FUNDS
NOTES TO FINANCIAL STATEMENTS (CONTINUED)
As of October 31, 2022
| 6. | Capital share transactions |
Transactions in Class A shares for the year ended October 31, 2022, were as follows:
| | | | | | | | | | | | | | | | | | | | | | | | | | | | | | | | |
| | | | | | | | | |
| Fund | | Shares Sold | | | Proceeds from Shares Sold | | | Shares from Reinvested Distributions | | | Proceeds from
Reinvestment of Distributions | | | Shares
Redeemed | | | Payments for Shares Redeemed | | | Net Increase/ (Decrease) in
Shares | | | Net Increase/ (Decrease) in
Net Assets | |
Ashmore Emerging Markets Total Return Fund | | | 135,533 | | | $ | 746,025 | | | | 29,232 | | | $ | 161,915 | | | | (616,950 | ) | | $ | (3,388,400 | ) | | | (452,185 | ) | | $ | (2,480,460 | ) |
Ashmore Emerging Markets Local Currency Bond Fund | | | — | | | | — | | | | 288 | | | | 1,965 | | | | (8,274 | ) | | | (53,145 | ) | | | (7,986 | ) | | | (51,180 | ) |
Ashmore Emerging Markets Corporate Income Fund | | | 463,186 | | | | 2,972,787 | | | | 73,956 | | | | 460,197 | | | | (1,062,469 | ) | | | (6,418,407 | ) | | | (525,327 | ) | | | (2,985,423 | ) |
Ashmore Emerging Markets Short Duration Fund | | | 790,721 | | | | 4,146,328 | | | | 58,372 | | | | 321,960 | | | | (1,157,545 | ) | | | (6,413,996 | ) | | | (308,452 | ) | | | (1,945,708 | ) |
Ashmore Emerging Markets Active Equity Fund | | | 66,229 | | | | 829,209 | | | | 12,344 | | | | 110,600 | | | | (75,330 | ) | | | (928,829 | ) | | | 3,243 | | | | 10,980 | |
Ashmore Emerging Markets Small-Cap Equity Fund | | | 20,187 | | | | 236,302 | | | | 395 | | | | 4,383 | | | | (2,514 | ) | | | (26,874 | ) | | | 18,068 | | | | 213,811 | |
Ashmore Emerging Markets Frontier Equity Fund | | | 121,153 | | | | 1,162,585 | | | | 5,305 | | | | 49,448 | | | | (18,226 | ) | | | (169,813 | ) | | | 108,232 | | | | 1,042,220 | |
Ashmore Emerging Markets Equity Fund | | | 526,316 | | | | 4,873,180 | | | | 30,195 | | | | 385,536 | | | | (415,892 | ) | | | (4,122,940 | ) | | | 140,619 | | | | 1,135,776 | |
Ashmore Emerging Markets Equity ESG Fund | | | — | | | | — | | | | 15 | | | | 186 | | | | — | | | | — | | | | 15 | | | | 186 | |
Ashmore Emerging Markets Short Duration Select Fund | | | — | | | | — | | | | 3 | | | | 27 | | | | — | | | | — | | | | 3 | | | | 27 | |
161
ASHMORE FUNDS
NOTES TO FINANCIAL STATEMENTS (CONTINUED)
As of October 31, 2022
| | | | | | | | | | | | | | | | | | | | | | | | | | | | | | | | |
| | | | | | | | | |
| Fund | | Shares Sold | | | Proceeds from Shares Sold | | | Shares from Reinvested
Distributions | | | Proceeds from Reinvestment of Distributions | | | Shares Redeemed | | | Payments for Shares
Redeemed | | | Net Increase/ (Decrease) in
Shares | | | Net Increase/ (Decrease) in
Net Assets | |
Ashmore Emerging Markets Investment Grade Income Fund | | | — | | | $ | 1 | | | | 3 | | | $ | 27 | | | | — | | | $ | — | | | | 3 | | | $ | 28 | |
Ashmore Emerging Markets Corporate Income ESG Fund | | | — | | | | — | | | | 4 | | | | 34 | | | | — | | | | — | | | | 4 | | | | 34 | |
|
Transactions in Class C shares for the year ended October 31, 2022, were as follows: | |
| | | | | | | | | |
| Fund | | Shares Sold | | | Proceeds from Shares Sold | | | Shares from Reinvested
Distributions | | | Proceeds from Reinvestment of Distributions | | | Shares Redeemed | | | Payments for Shares Redeemed | | | Net Increase/ (Decrease) in
Shares | | | Net Increase/ (Decrease) in
Net Assets | |
Ashmore Emerging Markets Total Return Fund | | | 21,745 | | | $ | 132,090 | | | | 12,015 | | | $ | 64,413 | | | | (145,407 | ) | | $ | (778,676 | ) | | | (111,647 | ) | | $ | (582,173 | ) |
Ashmore Emerging Markets Local Currency Bond Fund | | | — | | | | 14 | | | | 45 | | | | 298 | | | | (3,277 | ) | | | (22,087 | ) | | | (3,232 | ) | | | (21,775 | ) |
Ashmore Emerging Markets Corporate Income Fund | | | 5,577 | | | | 36,731 | | | | 30,372 | | | | 191,362 | | | | (442,674 | ) | | | (2,842,944 | ) | | | (406,725 | ) | | | (2,614,851 | ) |
Ashmore Emerging Markets Short Duration Fund | | | 2,014 | | | | 10,128 | | | | 6,702 | | | | 35,870 | | | | (124,451 | ) | | | (742,356 | ) | | | (115,735 | ) | | | (696,358 | ) |
Ashmore Emerging Markets Active Equity Fund | | | — | | | | — | | | | 44 | | | | 383 | | | | — | | | | — | | | | 44 | | | | 383 | |
Ashmore Emerging Markets Small-Cap Equity Fund | | | 3,716 | | | | 57,747 | | | | 58 | | | | 704 | | | | (10,010 | ) | | | (128,112 | ) | | | (6,236 | ) | | | (69,661 | ) |
Ashmore Emerging Markets Frontier Equity Fund | | | 21,355 | | | | 199,113 | | | | 264 | | | | 2,406 | | | | (6,547 | ) | | | (54,411 | ) | | | 15,072 | | | | 147,108 | |
162
ASHMORE FUNDS
NOTES TO FINANCIAL STATEMENTS (CONTINUED)
As of October 31, 2022
| | | | | | | | | | | | | | | | | | | | | | | | | | | | | | | | |
| | | | | | | | | |
| Fund | | Shares Sold | | | Proceeds from Shares Sold | | | Shares from Reinvested
Distributions | | | Proceeds from Reinvestment of Distributions | | | Shares
Redeemed | | | Payments for Shares
Redeemed | | | Net Increase/ (Decrease) in
Shares | | | Net Increase/ (Decrease) in
Net Assets | |
Ashmore Emerging Markets Equity Fund | | | 9,853 | | | $ | 118,464 | | | | 789 | | | $ | 9,242 | | | | (3,817 | ) | | $ | (60,171 | ) | | | 6,825 | | | $ | 67,535 | |
Ashmore Emerging Markets Equity ESG Fund | | | — | | | | — | | | | 16 | | | | 186 | | | | — | | | | — | | | | 16 | | | | 186 | |
Ashmore Emerging Markets Short Duration Select Fund | | | — | | | | — | | | | 2 | | | | 20 | | | | — | | | | (1 | ) | | | 2 | | | | 19 | |
Ashmore Emerging Markets Investment Grade Income Fund | | | — | | | | 1 | | | | 3 | | | | 21 | | | | — | | | | (1 | ) | | | 3 | | | | 21 | |
Ashmore Emerging Markets Corporate Income ESG Fund | | | — | | | | — | | | | 4 | | | | 29 | | | | — | | | | — | | | | 4 | | | | 29 | |
|
Transactions in Institutional Class shares for the year ended October 31, 2022, were as follows: | |
| | | | | | | | | |
| Fund | | Shares Sold | | | Proceeds from Shares Sold | | | Shares from Reinvested Distributions | | | Proceeds from Reinvestment of Distributions | | | Shares
Redeemed | | | Payments for Shares Redeemed | | | Net Increase/ (Decrease) in Shares | | | Net Increase/ (Decrease) in Net Assets | |
Ashmore Emerging Markets Total Return Fund | | | 35,097,385 | | | $ | 198,826,280 | | | | 7,263,823 | | | $ | 40,206,127 | | | | (112,493,148 | ) | | $ | (652,313,258 | ) | | | (70,131,940 | ) | | $ | (413,280,851 | ) |
Ashmore Emerging Markets Local Currency Bond Fund | | | — | | | | — | | | | 9,772 | | | | 69,775 | | | | (180,201 | ) | | | (1,173,845 | ) | | | (170,429 | ) | | | (1,104,070 | ) |
Ashmore Emerging Markets Corporate Income Fund | | | 6,216,439 | | | | 43,405,532 | | | | 1,216,017 | | | | 7,981,464 | | | | (26,058,215 | ) | | | (171,188,218 | ) | | | (18,625,759 | ) | | | (119,801,222 | ) |
Ashmore Emerging Markets Short Duration Fund | | | 2,592,971 | | | | 14,632,635 | | | | 786,529 | | | | 4,355,127 | | | | (9,665,352 | ) | | | (53,091,917 | ) | | | (6,285,852 | ) | | | (34,104,155 | ) |
163
ASHMORE FUNDS
NOTES TO FINANCIAL STATEMENTS (CONTINUED)
As of October 31, 2022
| | | | | | | | | | | | | | | | | | | | | | | | | | | | | | | | |
| | | | | | | | | |
| Fund | | Shares Sold | | | Proceeds from Shares Sold | | | Shares from Reinvested Distributions | | | Proceeds from Reinvestment of Distributions | | | Shares Redeemed | | | Payments for Shares Redeemed | | | Net Increase/ (Decrease) in Shares | | | Net Increase/ (Decrease) in Net Assets | |
Ashmore Emerging Markets Active Equity Fund | | | 10,481,613 | | | $ | 85,638,558 | | | | 1,843,774 | | | $ | 16,690,212 | | | | (7,752,534 | ) | | $ | (68,974,979 | ) | | | 4,572,853 | | | $ | 33,353,791 | |
Ashmore Emerging Markets Small-Cap Equity Fund | | | 60,566 | | | | 1,072,241 | | | | 5,607 | | | | 83,575 | | | | (144,386 | ) | | | (2,192,594 | ) | | | (78,213 | ) | | | (1,036,778 | ) |
Ashmore Emerging Markets Frontier Equity Fund | | | 2,379,362 | | | | 25,822,772 | | | | 114,240 | | | | 1,241,797 | | | | (1,960,274 | ) | | | (21,530,411 | ) | | | 533,328 | | | | 5,534,158 | |
Ashmore Emerging Markets Equity Fund | | | 9,518,704 | | | | 108,344,606 | | | | 922,024 | | | | 11,164,600 | | | | (6,225,169 | ) | | | (67,403,620 | ) | | | 4,215,559 | | | | 52,105,586 | |
Ashmore Emerging Markets Equity ESG Fund | | | — | | | | — | | | | 156,478 | | | | 1,877,075 | | | | — | | | | — | | | | 156,478 | | | | 1,877,075 | |
Ashmore Emerging Markets Short Duration Select Fund | | | 10,968 | | | | 104,841 | | | | 30,711 | | | | 274,449 | | | | (11,004 | ) | | | (100,912 | ) | | | 30,675 | | | | 278,378 | |
Ashmore Emerging Markets Investment Grade Income Fund | | | — | | | | 801 | | | | 67,001 | | | | 573,721 | | | | — | | | | (1 | ) | | | 67,001 | | | | 574,521 | |
Ashmore Emerging Markets Corporate Income ESG Fund | | | — | | | | — | | | | 47,045 | | | | 353,954 | | | | — | | | | — | | | | 47,045 | | | | 353,954 | |
|
Transactions in Class A shares for the year ended October 31, 2021, were as follows: | |
| | | | | | | | | |
| Fund | | Shares Sold | | | Proceeds from Shares Sold | | | Shares from Reinvested Distributions | | | Proceeds from
Reinvestment of Distributions | | | Shares Redeemed | | | Payments for Shares Redeemed | | | Net Increase/ (Decrease) in Shares | | | Net Increase/ (Decrease) in Net Assets | |
Ashmore Emerging Markets Total Return Fund | | | 384,909 | | | $ | 2,729,205 | | | | 56,093 | | | $ | 399,841 | | | | (1,069,961 | ) | | $ | (7,633,080 | ) | | | (628,959 | ) | | $ | (4,504,034 | ) |
164
ASHMORE FUNDS
NOTES TO FINANCIAL STATEMENTS (CONTINUED)
As of October 31, 2022
| | | | | | | | | | | | | | | | | | | | | | | | | | | | | | | | |
| | | | | | | | | |
| Fund | | Shares Sold | | | Proceeds from Shares Sold | | | Shares from Reinvested Distributions | | | Proceeds from Reinvestment of Distributions | | | Shares Redeemed | | | Payments for Shares Redeemed | | | Net Increase/ (Decrease) in Shares | | | Net Increase/ (Decrease) in Net Assets | |
Ashmore Emerging Markets Local Currency Bond Fund | | | 5,341 | | | $ | 38,643 | | | | — | | | $ | — | | | | (31,147 | ) | | $ | (229,347 | ) | | | (25,806 | ) | | $ | (190,704 | ) |
Ashmore Emerging Markets Corporate Income Fund | | | 596,031 | | | | 4,764,320 | | | | 55,076 | | | | 437,597 | | | | (658,376 | ) | | | (5,214,779 | ) | | | (7,269 | ) | | | (12,862 | ) |
Ashmore Emerging Markets Short Duration Fund | | | 216,716 | | | | 1,655,802 | | | | 99,249 | | | | 771,888 | | | | (1,951,638 | ) | | | (15,144,920 | ) | | | (1,635,673 | ) | | | (12,717,230 | ) |
Ashmore Emerging Markets Active Equity Fund | | | 4,702 | | | | 62,739 | | | | 1,367 | | | | 17,287 | | | | (23,460 | ) | | | (293,739 | ) | | | (17,391 | ) | | | (213,713 | ) |
Ashmore Emerging Markets Small-Cap Equity Fund | | | 2,647 | | | | 38,225 | | | | — | | | | — | | | | (17,044 | ) | | | (250,882 | ) | | | (14,397 | ) | | | (212,657 | ) |
Ashmore Emerging Markets Frontier Equity Fund | | | 179,589 | | | | 1,707,937 | | | | 524 | | | | 4,697 | | | | (20,139 | ) | | | (170,098 | ) | | | 159,974 | | | | 1,542,536 | |
Ashmore Emerging Markets Equity Fund | | | 191,097 | | | | 3,143,529 | | | | 1,562 | | | | 23,482 | | | | (68,277 | ) | | | (1,151,226 | ) | | | 124,382 | | | | 2,015,785 | |
Ashmore Emerging Markets Equity ESG Fund | | | — | | | | 1 | | | | 1 | | | | 7 | | | | — | | | | — | | | | 1 | | | | 8 | |
Ashmore Emerging Markets Short Duration Select Fund | | | — | | | | 1 | | | | 4 | | | | 36 | | | | — | | | | — | | | | 4 | | | | 37 | |
Ashmore Emerging Markets Investment Grade Income Fund | | | — | | | | — | | | | 3 | | | | 28 | | | | — | | | | — | | | | 3 | | | | 28 | |
Ashmore Emerging Markets Corporate Income ESG Fund | | | 100 | | | | 1,000 | | | | 3 | | | | 25 | | | | — | | | | — | | | | 103 | | | | 1,025 | |
165
ASHMORE FUNDS
NOTES TO FINANCIAL STATEMENTS (CONTINUED)
As of October 31, 2022
Transactions in Class C shares for the year ended October 31, 2021, were as follows:
| | | | | | | | | | | | | | | | | | | | | | | | | | | | | | | | |
| | | | | | | | | |
| Fund | | Shares Sold | | | Proceeds from
Shares Sold | | | Shares from
Reinvested Distributions | | | Proceeds from
Reinvestment of Distributions | | | Shares Redeemed | | | Payments for Shares
Redeemed | | | Net Increase/
(Decrease) in
Shares | | | Net Increase/
(Decrease) in
Net Assets | |
| Ashmore Emerging Markets Total Return Fund | | | 43,516 | | | $ | 310,825 | | | | 13,852 | | | $ | 98,283 | | | | (270,589 | ) | | $ | (1,917,622 | ) | | | (213,221 | ) | | $ | (1,508,514 | ) |
| Ashmore Emerging Markets Local Currency Bond Fund | | | — | | | | — | | | | — | | | | — | | | | (717 | ) | | | (5,053 | ) | | | (717 | ) | | | (5,053 | ) |
| Ashmore Emerging Markets Corporate Income Fund | | | 140,265 | | | | 1,112,010 | | | | 27,549 | | | | 218,410 | | | | (394,926 | ) | | | (3,138,774 | ) | | | (227,112 | ) | | | (1,808,354 | ) |
| Ashmore Emerging Markets Short Duration Fund | | | 7,258 | | | | 54,685 | | | | 10,852 | | | | 80,634 | | | | (48,938 | ) | | | (361,136 | ) | | | (30,828 | ) | | | (225,817 | ) |
| Ashmore Emerging Markets Active Equity Fund | | | — | | | | 2 | | | | — | * | | | 5 | | | | — | | | | — | | | | — | | | | 7 | |
| Ashmore Emerging Markets Small-Cap Equity Fund | | | — | | | | 339 | | | | — | | | | — | | | | (1,571 | ) | | | (23,760 | ) | | | (1,571 | ) | | | (23,421 | ) |
Ashmore Emerging Markets Frontier Equity Fund | | | 3,543 | | | | 32,356 | | | | 40 | | | | 312 | | | | (24,143 | ) | | | (202,731 | ) | | | (20,560 | ) | | | (170,063 | ) |
| Ashmore Emerging Markets Equity Fund | | | 6,789 | | | | 110,349 | | | | 2 | | | | 32 | | | | (119 | ) | | | (1,844 | ) | | | 6,672 | | | | 108,537 | |
| Ashmore Emerging Markets Equity ESG Fund | | | — | | | | 2 | | | | — | | | | 7 | | | | — | | | | — | | | | — | | | | 9 | |
| Ashmore Emerging Markets Short Duration Select Fund | | | — | | | | 1 | | | | 3 | | | | 29 | | | | — | | | | — | | | | 3 | | | | 30 | |
| Ashmore Emerging Markets Investment Grade Income Fund | | | — | | | | — | | | | 2 | | | | 22 | | | | — | | | | — | | | | 2 | | | | 22 | |
166
ASHMORE FUNDS
NOTES TO FINANCIAL STATEMENTS (CONTINUED)
As of October 31, 2022
| | | | | | | | | | | | | | | | | | | | | | | | | | | | | | | | |
| | | | | | | | | |
| Fund | | Shares Sold | | | Proceeds from Shares Sold | | | Shares from Reinvested Distributions | | | Proceeds from Reinvestment of Distributions | | | Shares Redeemed | | | Payments for Shares Redeemed | | | Net Increase/ (Decrease) in Shares | | | Net Increase/ (Decrease) in Net Assets | |
Ashmore Emerging Markets Corporate Income ESG Fund | | | 100 | | | $ | 1,000 | | | | 2 | | | $ | 21 | | | | — | | | $ | — | | | | 102 | | | $ | 1,021 | |
| * | Amount rounds to less than 0.5 shares. |
Transactions in Institutional Class shares for the year ended October 31, 2021, were as follows:
| | | | | | | | | | | | | | | | | | | | | | | | | | | | | | | | |
| | | | | | | | | |
| Fund | | Shares Sold | | | Proceeds from Shares Sold | | | Shares from Reinvested Distributions | | | Proceeds from Reinvestment of Distributions | | | Shares Redeemed | | | Payments for Shares Redeemed | | | Net Increase/ (Decrease) in Shares | | | Net Increase/ (Decrease) in Net Assets | |
| Ashmore Emerging Markets Total Return Fund | | | 49,093,162 | | | $ | 354,306,215 | | | | 8,057,330 | | | $ | 58,073,860 | | | | (53,547,100 | ) | | $ | (384,508,725 | ) | | | 3,603,392 | | | $ | 27,871,350 | |
| Ashmore Emerging Markets Local Currency Bond Fund | | | 488,115 | | | | 3,814,234 | | | | — | | | | — | | | | (3,561,069 | ) | | | (27,230,081 | ) | | | (3,072,954 | ) | | | (23,415,847 | ) |
| Ashmore Emerging Markets Corporate Income Fund | | | 11,450,481 | | | | 95,050,634 | | | | 980,096 | | | | 8,110,557 | | | | (10,439,616 | ) | | | (86,179,554 | ) | | | 1,990,961 | | | | 16,981,637 | |
| Ashmore Emerging Markets Short Duration Fund | | | 3,680,994 | | | | 28,141,184 | | | | 1,299,214 | | | | 9,923,146 | | | | (45,983,702 | ) | | | (347,426,259 | ) | | | (41,003,494 | ) | | | (309,361,929 | ) |
| Ashmore Emerging Markets Active Equity Fund | | | 2,580,352 | | | | 34,011,500 | | | | 46,121 | | | | 589,118 | | | | (2,206,032 | ) | | | (29,825,574 | ) | | | 420,441 | | | | 4,775,044 | |
| Ashmore Emerging Markets Small-Cap Equity Fund | | | 82,454 | | | | 1,566,505 | | | | — | | | | — | | | | (50,504 | ) | | | (921,337 | ) | | | 31,950 | | | | 645,168 | |
| Ashmore Emerging Markets Frontier Equity Fund | | | 1,566,026 | | | | 15,957,063 | | | | 40,665 | | | | 423,758 | | | | (1,488,253 | ) | | | (14,600,311 | ) | | | 118,438 | | | | 1,780,510 | |
| Ashmore Emerging Markets Equity Fund | | | 3,070,314 | | | | 48,875,902 | | | | 84,075 | | | | 1,221,605 | | | | (2,476,645 | ) | | | (39,876,628 | ) | | | 677,744 | | | | 10,220,879 | |
167
ASHMORE FUNDS
NOTES TO FINANCIAL STATEMENTS (CONTINUED)
As of October 31, 2022
| | | | | | | | | | | | | | | | | | | | | | | | | | | | | | | | |
| | | | | | | | | |
| Fund | | Shares Sold | | | Proceeds from Shares Sold | | | Shares from Reinvested Distributions | | | Proceeds from Reinvestment of Distributions | | | Shares Redeemed | | | Payments for Shares Redeemed | | | Net Increase/ (Decrease) in Shares | | | Net Increase/ (Decrease) in Net Assets | |
| Ashmore Emerging Markets Equity ESG Fund | | | — | | | $ | — | | | | 5,311 | | | $ | 74,673 | | | | — | | | $ | (3 | ) | | | 5,311 | | | $ | 74,670 | |
| Ashmore Emerging Markets Short Duration Select Fund | | | — | | | | 4,911 | | | | 36,985 | | | | 379,992 | | | | — | | | | (1 | ) | | | 36,985 | | | | 384,902 | |
| Ashmore Emerging Markets Investment Grade Income Fund | | | — | | | | — | | | | 59,541 | | | | 601,809 | | | | — | | | | — | | | | 59,541 | | | | 601,809 | |
Ashmore Emerging Markets Corporate Income ESG Fund | | | 999,800 | | | | 9,998,000 | | | | 26,894 | | | | 263,131 | | | | — | | | | — | | | | 1,026,694 | | | | 10,261,131 | |
Capital shares
Class A shares are issued at the Fund’s relevant NAV per share plus any applicable sales charge. Institutional Class and Class C shares are issued at the Fund’s relevant NAV per share without a sales charge. Shares confer upon the holders the right to receive notice of and attend, speak and vote at shareholder meetings of the Funds. The shares confer upon the holders the right to any or all dividends or distributions which the Trustees in their sole discretion may from time to time resolve to make or declare.
| 7. | Investment transactions |
For the year ended October 31, 2022, the aggregate cost of purchases and proceeds from sales of investments (including fully funded TRS and excluding short-term investments) for the Funds were as follows:
| | | | | | | | |
| | | |
| Fund | | Purchases | | | Sales | |
| Ashmore Emerging Markets Total Return Fund | | $ | 227,197,600 | | | $ | 901,708,307 | |
| Ashmore Emerging Markets Local Currency Bond Fund | | | 2,910,112 | | | | 3,904,580 | |
| Ashmore Emerging Markets Corporate Income Fund | | | 96,078,683 | | | | 228,771,165 | |
| Ashmore Emerging Markets Short Duration Fund | | | 29,186,476 | | | | 68,857,395 | |
| Ashmore Emerging Markets Active Equity Fund | | | 241,245,797 | | | | 221,336,070 | |
| Ashmore Emerging Markets Small-Cap Equity Fund | | | 4,424,254 | | | | 5,149,627 | |
| Ashmore Emerging Markets Frontier Equity Fund | | | 67,430,496 | | | | 66,722,833 | |
| Ashmore Emerging Markets Equity Fund | | | 129,406,903 | | | | 96,954,328 | |
| Ashmore Emerging Markets Equity ESG Fund | | | 5,633,525 | | | | 5,639,752 | |
| Ashmore Emerging Markets Short Duration Select Fund | | | 5,454,956 | | | | 4,835,111 | |
| Ashmore Emerging Markets Investment Grade Income Fund | | | 9,666,689 | | | | 9,332,981 | |
| Ashmore Emerging Markets Corporate Income ESG Fund | | | 2,506,164 | | | | 2,963,602 | |
168
ASHMORE FUNDS
NOTES TO FINANCIAL STATEMENTS (CONTINUED)
As of October 31, 2022
The difference between book basis and tax basis net unrealized appreciation (depreciation) is attributable primarily to the tax deferral of losses on wash sales, deferral of post October currency and capital losses for tax purposes, and the recharacterization of income recognition on investments in PFICs. At October 31, 2022, for federal income tax purposes, gross unrealized appreciation, gross unrealized depreciation, net unrealized appreciation (depreciation) on investments (including the effects of foreign currency translation and derivative instruments, if any) and the cost basis of investments (including derivative instruments, if any) were as follows:
| | | | | | | | | | | | | | | | |
| | | | | |
| Amounts in Thousands | | Unrealized Appreciation | | | Unrealized Depreciation | | | Net Appreciation (Depreciation) | | | Cost Basis of Investments | |
Ashmore Emerging Markets Total Return Fund | | $ | 1,059,736 | | | $ | (280,037,366 | ) | | $ | (278,977,630 | ) | | $ | 683,096,023 | |
Ashmore Emerging Markets Local Currency Bond Fund | | | 50,619 | | | | (1,106,300 | ) | | | (1,055,681 | ) | | | 5,479,906 | |
Ashmore Emerging Markets Corporate Income Fund | | | 50,947 | | | | (71,053,402 | ) | | | (71,002,455 | ) | | | 162,037,787 | |
Ashmore Emerging Markets Short Duration Fund | | | 80,829 | | | | (83,216,794 | ) | | | (83,135,965 | ) | | | 136,054,670 | |
Ashmore Emerging Markets Active Equity Fund | | | 1,662,205 | | | | (25,503,609 | ) | | | (23,841,404 | ) | | | 98,665,182 | |
Ashmore Emerging Markets Small-Cap Equity Fund | | | 473,624 | | | | (3,118,774 | ) | | | (2,645,150 | ) | | | 9,283,017 | |
Ashmore Emerging Markets Frontier Equity Fund | | | 4,366,987 | | | | (8,804,661 | ) | | | (4,437,674 | ) | | | 70,628,768 | |
Ashmore Emerging Markets Equity Fund | | | 3,342,511 | | | | (37,296,726 | ) | | | (33,954,215 | ) | | | 125,786,479 | |
Ashmore Emerging Markets Equity ESG Fund | | | 495,590 | | | | (3,170,145 | ) | | | (2,674,555 | ) | | | 11,364,721 | |
Ashmore Emerging Markets Short Duration Select Fund | | | — | | | | (950,073 | ) | | | (950,073 | ) | | | 9,688,414 | |
Ashmore Emerging Markets Investment Grade Income Fund | | | — | | | | (3,435,885 | ) | | | (3,435,885 | ) | | | 18,880,372 | |
Ashmore Emerging Markets Corporate Income ESG Fund | | | — | | | | (3,232,252 | ) | | | (3,232,252 | ) | | | 8,734,127 | |
No provision for U.S. federal income taxes has been made since each Fund’s policy is to comply with the requirements of Subchapter M of the Internal Revenue Code of 1986, as amended, applicable to regulated investment companies, and to distribute, each year, substantially all of its taxable income and capital gains to its shareholders.
For financial reporting purposes the Funds may periodically make reclassifications among components of capital accounts to reflect permanent differences between U.S. GAAP and taxable income. The reclassifications have no impact on the net assets of the Funds. During the year, revisions were also made to previously determined taxable income amounts. As a result, the following reclassifications were made to the Statements of Assets and Liabilities:
| | | | | | | | |
| | | |
| Fund | | Paid in Capital | | | Distributable earnings/ (Accumulated loss) | |
| Ashmore Emerging Markets Total Return Fund | | $ | (41,534,802) | | | $ | 41,534,802 | |
| Ashmore Emerging Markets Local Currency Bond Fund | | | (515,684) | | | | 515,684 | |
| Ashmore Emerging Markets Short Duration Fund | | | 13,967 | | | | (13,967) | |
| Ashmore Emerging Markets Active Equity Fund | | | (179,013) | | | | 179,013 | |
| Ashmore Emerging Markets Small-Cap Equity Fund | | | (146,326) | | | | 146,326 | |
| Ashmore Emerging Markets Frontier Equity Fund | | | 1 | | | | (1) | |
169
ASHMORE FUNDS
NOTES TO FINANCIAL STATEMENTS (CONTINUED)
As of October 31, 2022
| | | | | | | | |
| | | |
| Fund | | Paid in Capital | | | Distributable earnings/ (Accumulated loss) | |
| Ashmore Emerging Markets Equity Fund | | $ | (251,498) | | | $ | 251,498 | |
| Ashmore Emerging Markets Equity ESG Fund | | | (77,060) | | | | 77,060 | |
During the fiscal year ended October 31, 2022, the Ashmore Emerging Markets Frontier Equity Fund utilized $3,514,520 in capital loss carryforwards.
The following Funds have available capital loss carryforwards for which there is no expiration date:
| | | | | | | | |
| | | |
| Fund | | Short-Term Capital Loss Carryforward at October 31, 2022 | | | Long-Term Capital Loss Carryforward at October 31, 2022 | |
| Ashmore Emerging Markets Total Return Fund | | $ | (35,961,400 | ) | | $ | (222,335,661 | ) |
| Ashmore Emerging Markets Local Currency Bond Fund | | | (76,071 | ) | | | (877,289 | ) |
| Ashmore Emerging Markets Corporate Income Fund | | | (26,232,712 | ) | | | (77,019,670 | ) |
| Ashmore Emerging Markets Short Duration Fund | | | (97,362,829 | ) | | | (236,416,920 | ) |
| Ashmore Emerging Markets Active Equity Fund | | | (14,826,386 | ) | | | (1,389,521 | ) |
| Ashmore Emerging Markets Small-Cap Equity Fund | | | (366,128 | ) | | | (2,727,292 | ) |
| Ashmore Emerging Markets Frontier Equity Fund | | | (3,489,301 | ) | | | — | |
| Ashmore Emerging Markets Equity Fund | | | (3,319,630 | ) | | | — | |
| Ashmore Emerging Markets Equity ESG Fund | | | (307,087 | ) | | | — | |
| Ashmore Emerging Markets Short Duration Select Fund | | | (518,335 | ) | | | (361,280 | ) |
| Ashmore Emerging Markets Investment Grade Income Fund | | | (557,237 | ) | | | (1,327,909 | ) |
| Ashmore Emerging Markets Corporate Income ESG Fund | | | (370,456 | ) | | | (369,044 | ) |
The Funds are subject to the provisions of the Financial Accounting Standards Board (“FASB”) Accounting Standards Codification (“ASC”) Topic 740-10, Income Taxes. This standard provides guidance as to how uncertain tax positions should be recognized, measured, presented and disclosed in the Funds’ financial statements. The Funds recognize the tax benefits of uncertain tax positions only where the position is more-likely-than-not (i.e. greater than 50-percent) to be sustained assuming examination by a tax authority based on the technical merits of the position. In evaluating whether a tax position has met the recognition threshold, the Funds must presume that the position will be examined by the appropriate taxing authority that has full knowledge of all relevant information. A tax position that meets the more-likely-than-not recognition threshold is measured to determine the amount of benefit to recognize in the Funds’ financial statements. Income tax and related interest and penalties would be recognized by the Funds as tax expense in the Statement of Operations if the tax positions were deemed not to meet the more-likely-than-not threshold. The Funds analyze all open tax years for all major taxing jurisdictions. Open tax years are those that are open to examination by taxing authorities, as defined by the Statute of Limitations in each jurisdiction. The Funds have no examinations by tax authorities in progress. The Trust has analyzed the Funds’ tax positions, and has concluded that no liability for unrecognized tax benefits should be recorded related to uncertain tax positions. Further, the Trust is not aware of any tax positions for which it is reasonably possible that the total amounts of unrecognized tax benefits will significantly change in the next twelve months.
170
ASHMORE FUNDS
NOTES TO FINANCIAL STATEMENTS (CONTINUED)
As of October 31, 2022
As of October 31, 2022, the components of distributable taxable earnings, including temporary differences were as follows:
| | | | | | | | | | | | | | | | | | | | |
| | | | | | |
| Fund | | Undistributed Ordinary Income | | | Undistributed Long Term
Capital Gain | | | Accumulated Capital Losses and Other | | | Undistributed Appreciation (Depreciation) on Investments and Foreign Currencies | | | Total Accumulated Earnings (Deficit) | |
Ashmore Emerging Markets Total Return Fund | | $ | — | | | $ | — | | | $ | (258,727,583 | ) | | $ | (279,004,794 | ) | | $ | (537,732,377 | ) |
Ashmore Emerging Markets Local Currency Bond Fund | | | — | | | | — | | | | (961,668 | ) | | | (1,070,198 | ) | | | (2,031,866 | ) |
Ashmore Emerging Markets Corporate Income Fund | | | 1,922,395 | | | | — | | | | (103,350,254 | ) | | | (71,002,455 | ) | | | (172,430,314 | ) |
Ashmore Emerging Markets Short Duration Fund | | | 1,119,796 | | | | — | | | | (333,864,617 | ) | | | (83,135,795 | ) | | | (415,880,616 | ) |
Ashmore Emerging Markets Active Equity Fund | | | — | | | | — | | | | (16,215,907 | ) | | | (23,907,840 | ) | | | (40,123,747 | ) |
Ashmore Emerging Markets Small-Cap Equity Fund | | | — | | | | — | | | | (3,093,420 | ) | | | (2,645,150 | ) | | | (5,738,570 | ) |
Ashmore Emerging Markets Frontier Equity Fund | | | 6,923 | | | | — | | | | (3,492,372 | ) | | | (4,665,302 | ) | | | (8,150,751 | ) |
Ashmore Emerging Markets Equity Fund | | | — | | | | — | | | | (3,319,710 | ) | | | (34,496,895 | ) | | | (37,816,605 | ) |
Ashmore Emerging Markets Equity ESG Fund | | | — | | | | — | | | | (315,127 | ) | | | (2,674,673 | ) | | | (2,989,800 | ) |
Ashmore Emerging Markets Short Duration Select Fund | | | 38,071 | | | | — | | | | (887,385 | ) | | | (950,073 | ) | | | (1,799,387 | ) |
Ashmore Emerging Markets Investment Grade Income Fund | | | 145,833 | | | | — | | | | (1,893,845 | ) | | | (3,436,374 | ) | | | (5,184,386 | ) |
Ashmore Emerging Markets Corporate Income ESG Fund | | | 94,174 | | | | — | | | | (756,998 | ) | | | (3,232,252 | ) | | | (3,895,076 | ) |
|
The taxable character of distributions paid during the fiscal year ended October 31, 2022, were as follows: | |
| | | | |
| | | Distributions From | | | | | | | |
| | | | | | |
| Fund | | Ordinary Income | | | Short-Term
Capital Gains | | | Long-Term
Capital Gains | | | Return of Capital | | | Total Distributions Paid | |
| Ashmore Emerging Markets Total Return Fund | | $ | 8,689,581 | | | $ | — | | | $ | — | | | $ | 34,907,836 | | | $ | 43,597,417 | |
171
ASHMORE FUNDS
NOTES TO FINANCIAL STATEMENTS (CONTINUED)
As of October 31, 2022
| | | | | | | | | | | | | | | | | | | | |
| | | | |
| | | Distributions From | | | | | | | |
| | | | | | |
| Fund | | Ordinary Income | | | Short-Term Capital Gains | | | Long-Term Capital Gains | | | Return of Capital | | | Total Distributions Paid | |
Ashmore Emerging Markets Local Currency Bond Fund | | $ | — | | | $ | — | | | $ | — | | | $ | 96,593 | | | $ | 96,593 | |
Ashmore Emerging Markets Corporate Income Fund | | | 13,585,220 | | | | — | | | | — | | | | — | | | | 13,585,220 | |
Ashmore Emerging Markets Short Duration Fund | | | 7,632,749 | | | | — | | | | — | | | | — | | | | 7,632,749 | |
Ashmore Emerging Markets Active Equity Fund | | | 1,317,312 | | | | 12,469,758 | | | | 3,770,195 | | | | 179,017 | | | | 17,736,282 | |
Ashmore Emerging Markets Small-Cap Equity Fund | | | — | | | | — | | | | — | | | | 93,675 | | | | 93,675 | |
Ashmore Emerging Markets Frontier Equity Fund | | | 1,376,268 | | | | — | | | | — | | | | — | | | | 1,376,268 | |
Ashmore Emerging Markets Equity Fund | | | 1,320,223 | | | | 9,747,840 | | | | 10,479,774 | | | | 251,500 | | | | 21,799,337 | |
Ashmore Emerging Markets Equity ESG Fund | | | — | | | | 1,234,205 | | | | 806,922 | | | | 25,236 | | | | 2,066,363 | |
Ashmore Emerging Markets Short Duration Select Fund | | | 322,963 | | | | — | | | | — | | | | — | | | | 322,963 | |
Ashmore Emerging Markets Investment Grade Income Fund | | | 675,024 | | | | — | | | | — | | | | — | | | | 675,024 | |
Ashmore Emerging Markets Corporate Income ESG Fund | | | 416,491 | | | | — | | | | — | | | | — | | | | 416,491 | |
|
The taxable character of distributions paid during the fiscal year ended October 31, 2021, were as follows: | |
| | | | |
| | | Distributions From | | | | | | | |
| | | | | | |
| Fund | | Ordinary Income | | | Short-Term Capital Gains | | | Long-Term Capital Gains | | | Return of Capital | | | Total Distributions Paid | |
| Ashmore Emerging Markets Total Return Fund | | $ | 59,683,830 | | | $ | — | | | $ | — | | | $ | 4,533,480 | | | $ | 64,217,310 | |
| Ashmore Emerging Markets Local Currency Bond Fund | | | — | | | | — | | | | — | | | | — | | | | — | |
| Ashmore Emerging Markets Corporate Income Fund | | | 15,503,781 | | | | — | | | | — | | | | — | | | | 15,503,781 | |
172
ASHMORE FUNDS
NOTES TO FINANCIAL STATEMENTS (CONTINUED)
As of October 31, 2022
| | | | | | | | | | | | | | | | | | | | |
| | | | |
| | | Distributions From | | | | | | | |
| | | | | | |
| Fund | | Ordinary Income | | | Short-Term Capital Gains | | | Long-Term Capital Gains | | | Return of Capital | | | Total Distributions Paid | |
| Ashmore Emerging Markets Short Duration Fund | | $ | 14,880,589 | | | $ | — | | | $ | — | | | $ | — | | | $ | 14,880,589 | |
| Ashmore Emerging Markets Active Equity Fund | | | 1,070,963 | | | | — | | | | — | | | | — | | | | 1,070,963 | |
| Ashmore Emerging Markets Small-Cap Equity Fund | | | — | | | | — | | | | — | | | | — | | | | — | |
| Ashmore Emerging Markets Frontier Equity Fund | | | 443,920 | | | | — | | | | — | | | | — | | | | 443,920 | |
| Ashmore Emerging Markets Equity Fund | | | 694,077 | | | | 165,861 | | | | 1,333,335 | | | | — | | | | 2,193,273 | |
| Ashmore Emerging Markets Equity ESG Fund | | | 87,867 | | | | — | | | | — | | | | — | | | | 87,867 | |
| Ashmore Emerging Markets Short Duration Select Fund | | | 414,206 | | | | 32,919 | | | | — | | | | — | | | | 447,125 | |
| Ashmore Emerging Markets Investment Grade Income Fund | | | 708,069 | | | | — | | | | — | | | | — | | | | 708,069 | |
| Ashmore Emerging Markets Corporate Income ESG Fund | | | 309,605 | | | | — | | | | — | | | | — | | | | 309,605 | |
| 9. | Distributions to shareholders |
The Ashmore Emerging Markets Total Return Fund, Ashmore Emerging Markets Corporate Income Fund, Ashmore Emerging Markets Short Duration Fund, Ashmore Emerging Markets Short Duration Select Fund, Ashmore Emerging Markets Investment Grade Income Fund and Ashmore Emerging Markets Corporate Income ESG Fund declare distributions of their net investment income daily and pay such distributions monthly. The Ashmore Emerging Markets Local Currency Bond Fund, Ashmore Emerging Markets Active Equity Fund, Ashmore Emerging Markets Small-Cap Equity Fund, Ashmore Emerging Markets Frontier Equity Fund, Ashmore Emerging Markets Equity Fund and Ashmore Emerging Markets Equity ESG Fund declare and pay distributions of their net investment income at least quarterly.
Distributions of net realized capital gains, if any, are declared and paid at least annually. The Funds may also make a special distribution to comply with federal tax requirements. Income dividends and capital gains distributions determined in accordance with federal income tax regulations may differ from U.S. GAAP. Differences between tax regulations and U.S. GAAP may change the fiscal period in which income and capital items are recognized for tax and U.S. GAAP purposes. Examples of events that give rise to timing differences include wash sales, straddles and capital loss carryforwards. Further, the character of investment income and capital gains may be different for certain transactions under the two methods of accounting. Examples of characterization differences include the treatment of foreign currency transactions and swap transactions. As a result, income dividends and capital gain distributions declared during a fiscal period for federal tax purposes may differ significantly from the net investment income and realized capital gain reported on each Fund’s financial statements presented
173
ASHMORE FUNDS
NOTES TO FINANCIAL STATEMENTS (CONTINUED)
As of October 31, 2022
under U.S. GAAP. In general, to the extent that any differences which are permanent in nature result in over distributions to shareholders, the amount of the over distribution may be reported as return of capital. Temporary differences do not require reclassification. See note 8 for further details.
| 10. | Derivative instruments and hedging activities |
FASB ASC Topic 815-10 (“Topic 815-10”), Disclosures about Derivative Instruments and Hedging Activities, required disclosures to enable investors to better understand how and why the Funds use derivative instruments, how these derivative instruments are accounted for and their effects on the Funds’ financial position and results of operations.
None of the derivatives held in the Funds have been designated as hedging instruments under Topic 815-10. A discussion of the strategies for these derivatives and their counterparty credit risk can be found below.
In accordance with Topic 815-10, the Funds record their trading-related derivative activities on a fair value basis (as described in note 4). Fair values represent the amount at which the instrument could be exchanged in a current transaction between willing parties, other than in a forced or liquidation sale.
In October 2020, the SEC adopted Rule 18f-4 under the 1940 Act providing for the regulation of a registered investment company’s use of derivatives and certain related instruments. Among other things, Rule 18f-4 limits a fund’s derivatives exposure through a value-at-risk test and requires the adoption and implementation of a derivatives risk management program for certain derivatives users. Subject to certain conditions, limited derivatives users (as defined in Rule 18f-4), however, would not be subject to the full requirements of Rule 18f-4. In connection with the adoption of Rule 18f-4, the SEC eliminated the asset segregation framework arising from prior SEC guidance for covering derivatives and certain financial instruments. Rule 18f-4 may limit a Fund’s ability to use derivatives as part of its investment strategy, make derivatives more costly or otherwise adversely affect Fund performance.
The following disclosures contain information on how and why the Funds used derivative financial instruments; the credit-risk-related contingent features in certain derivative financial instruments; and how derivative financial instruments affected the Funds’ financial position, results of operations and cash flows. The location and fair value of these instruments on the Statements of Assets and Liabilities and the realized, and changes in unrealized, gains and losses on the Statements of Operations, are included in tables following each Fund’s Schedule of Investments and are categorized by type of financial derivative contract.
(a) Forward foreign currency exchange contracts
A forward foreign exchange contract involves an obligation to purchase or sell a specific currency at a future date at a price set at the time the contract is made. The Funds may enter into forward foreign currency exchange contracts in connection with settling planned purchases or sales of securities, as part of an investment strategy to protect against uncertainty in the level of future foreign exchange rates in the purchase and sale of securities, or to gain or limit exposure to foreign currencies. All forward foreign currency exchange contracts are valued daily at the applicable exchange rates. Any resulting unrealized gains or losses are recorded in net change in unrealized appreciation/(depreciation) on forward foreign currency exchange contracts in the Statements of Operations. A Fund records realized gains or losses at the time the forward foreign exchange contract is offset by entering into a closing transaction with the same counterparty or is extinguished by delivery of the currency. Realized gains or losses, if any, are included in net realized gain/(loss) on forward foreign exchange contracts in the Statements of Operations.
Risks arise upon entering into these contracts from the potential inability of counterparties to meet the terms of their contracts and from unanticipated movements in the value of a foreign currency relative to the United States Dollar. The contractual amounts of forward foreign currency exchange contracts do not necessarily represent the amounts potentially subject to risk. The measurement of the risks associated with these instruments should be considered in light of all related and offsetting transactions. The Funds bear market risk from changes in foreign currency exchange rates and credit risk if the counterparty fails to perform. Further information on the impact of these positions on the Funds’ financial statements can be found in the notes to the Schedules of Investments.
174
ASHMORE FUNDS
NOTES TO FINANCIAL STATEMENTS (CONTINUED)
As of October 31, 2022
During the year ended October 31, 2022, the Ashmore Emerging Markets Total Return Fund, Ashmore Emerging Markets Local Currency Bond Fund, Ashmore Emerging Markets Corporate Income Fund, Ashmore Emerging Markets Short Duration Fund, Ashmore Emerging Markets Active Equity Fund, Ashmore Emerging Markets Frontier Equity Fund, Ashmore Emerging Markets Equity Fund, Ashmore Emerging Markets Short Duration Select Fund, Ashmore Emerging Markets Investment Grade Income Fund and Ashmore Emerging Markets Corporate Income ESG Fund had average quarterly contract notional exposures of $414,379,956, $5,756,783, $3,534,062, $323,866, $341,810, $17,480, $105,009, $247,845, $770,067 and $234,313, respectively, related to forward foreign currency exchange contracts.
(b) Swap Agreements
During the reporting period, certain Funds entered into swap agreements, which are arrangements between two parties to exchange cash flows based on a notional principal amount. Swap agreements are either privately negotiated in the over-the-counter market (“OTC swaps”) or may be executed in a multilateral or other trade facility platform such as a registered exchange (“centrally cleared swaps”). Swap agreements are recorded at their fair value. The fair value is based on quoted market prices or prices obtained from a third party provider at the date of the Statements of Assets and Liabilities without any deduction for estimated future selling costs. Swap agreements are marked to market daily and the change in fair value, if any, is recorded as unrealized gain or loss. Payments made or received are recorded as part of realized gains and losses. Daily changes in valuation of centrally cleared swaps, if any, are recorded as a receivable or payable for the change in value as appropriate (“variation margin”) on the Statements of Assets and Liabilities.
The periodic payments on the swap agreements entered into by the Funds are reflected in the Statements of Operations within net realized gain/(loss) on interest rate swap contracts. Unrealized gains are reported as an asset and unrealized losses are reported as a liability in the Statements of Assets and Liabilities for OTC swaps. Changes in the fair value are reflected in the Statements of Operations within net change in unrealized appreciation/(depreciation) on interest rate and centrally cleared swap contracts in the period in which they occur. Certain Funds could be exposed to credit or market risk due to unfavorable changes in the fluctuation of interest rates or if the counterparty defaults on its obligations to perform.
During the year ended October 31, 2022, the Ashmore Emerging Markets Total Return Fund and Ashmore Emerging Markets Local Currency Bond Fund had average quarterly notional exposures of $32,561,225 and $962,249, respectively, related to interest rate swap agreements.
The Funds may enter into transactions subject to enforceable netting agreements or other similar arrangements (“netting agreements”). Generally, netting agreements allow the Funds to offset any exposure to a specific counterparty with any collateral received or delivered to that counterparty based on the terms of the agreements. Generally, the Funds manage their cash collateral and securities collateral on a counterparty basis. No amounts have been offset in the Statements of Assets and Liabilities.
Offsetting of Financial Assets and Derivative Assets as of October 31, 2022:
Over-the-Counter Financial Derivative Instruments:
Forward Currency Contracts and Interest Rate Swap Contracts
| | | | | | | | | | | | | | | | |
| |
|
| Ashmore Emerging Markets Total Return Fund | |
| |
| | | | |
| Counterparty | | Gross Amounts of Derivatives Assets Presented in the Statement of Assets and Liabilities | | | Derivatives available for offset | | | Collateral Received | | | Net Amount Due From Counterparty | |
| |
ANZ Banking | | $ | 5,634 | | | $ | — | | | $ | — | | | $ | 5,634 | |
Barclays | | | 76,361 | | | | (76,361 | ) | | | — | | | | — | |
BNP Paribas | | | 74,257 | | | | (74,257 | ) | | | — | | | | — | |
Citibank | | | 92,783 | | | | (92,783 | ) | | | — | | | | — | |
175
ASHMORE FUNDS
NOTES TO FINANCIAL STATEMENTS (CONTINUED)
As of October 31, 2022
| | | | | | | | | | | | | | | | |
| |
|
| Ashmore Emerging Markets Total Return Fund | |
| |
| | | | |
| Counterparty | | Gross Amounts of
Derivatives Assets Presented
in the Statement of Assets
and Liabilities | | | Derivatives
available for offset | | | Collateral
Received | | | Net Amount Due
From Counterparty | |
| |
HSBC Bank | | $ | 205,225 | | | $ | (205,225 | ) | | $ | — | | | $ | — | |
JP Morgan | | | 5,346 | | | | (5,346 | ) | | | — | | | | — | |
Merrill Lynch | | | 325,802 | | | | (302,418 | ) | | | — | | | | 23,384 | |
Morgan Stanley | | | 219,985 | | | | (219,985 | ) | | | — | | | | — | |
Standard Chartered | | | 17,463 | | | | (6,398 | ) | | | — | | | | 11,065 | |
Union Bank of Switzerland | | | 104,587 | | | | (104,587 | ) | | | — | | | | — | |
| | | | | | | | | | | | | | | | |
Total | | $ | 1,127,443 | | | $ | (1,087,360 | ) | | $ | — | | | $ | 40,083 | |
| | | | | | | | | | | | | | | | |
| | | | |
| | | | | | | | | | | | | | | | |
| |
|
| Ashmore Emerging Markets Total Return Fund | |
| |
| | | | |
| Counterparty | | Gross Amounts of Derivatives Liabilities Presented in the Statement of Assets and Liabilities | | | Derivatives available for offset | | | Collateral Pledged | | | Net Amount Due To Counterparty | |
| |
Banco Santander | | $ | 47,533 | | | $ | — | | | $ | — | | | $ | 47,533 | |
Barclays | | | 595,519 | | | | (76,361 | ) | | | — | | | | 519,158 | |
BNP Paribas | | | 305,080 | | | | (74,257 | ) | | | — | | | | 230,823 | |
Citibank | | | 482,937 | | | | (92,783 | ) | | | — | | | | 390,154 | |
Deutsche Bank | | | 35,157 | | | | — | | | | — | | | | 35,157 | |
HSBC Bank | | | 2,333,785 | | | | (205,225 | ) | | | (1,576,977 | ) | | | 551,583 | |
JP Morgan | | | 44,116 | | | | (5,346 | ) | | | — | | | | 38,770 | |
Merrill Lynch | | | 302,418 | | | | (302,418 | ) | | | — | | | | — | |
Morgan Stanley | | | 412,736 | | | | (219,985 | ) | | | — | | | | 192,751 | |
Standard Chartered | | | 6,398 | | | | (6,398 | ) | | | — | | | | — | |
State Street | | | 807 | | | | — | | | | — | | | | 807 | |
Union Bank of Switzerland | | | 121,791 | | | | (104,587 | ) | | | — | | | | 17,204 | |
| | | | | | | | | | | | | | | | |
Total | | $ | 4,688,277 | | | $ | (1,087,360 | ) | | $ | (1,576,977 | ) | | $ | 2,023,940 | |
| | | | | | | | | | | | | | | | |
| | | | |
| | | | | | | | | | | | | | | | |
| |
|
| Ashmore Emerging Markets Local Currency Bond Fund | |
| |
| | | | |
| Counterparty | | Gross Amounts of Derivatives Assets Presented in the Statement of Assets and Liabilities | | | Derivatives available for offset | | | Collateral Received | | | Net Amount Due From Counterparty | |
| |
ANZ Banking | | $ | 169 | | | $ | — | | | $ | — | | | $ | 169 | |
Barclays | | | 2,180 | | | | (1,005 | ) | | | — | | | | 1,175 | |
BNP Paribas | | | 986 | | | | (986 | ) | | | — | | | | — | |
Citibank | | | 1,848 | | | | (1,848 | ) | | | — | | | | — | |
HSBC Bank | | | 6,503 | | | | (6,503 | ) | | | — | | | | — | |
JP Morgan | | | 1,454 | | | | (508 | ) | | | — | | | | 946 | |
176
ASHMORE FUNDS
NOTES TO FINANCIAL STATEMENTS (CONTINUED)
As of October 31, 2022
| | | | | | | | | | | | | | | | |
| |
|
| Ashmore Emerging Markets Local Currency Bond Fund | |
| |
| | | | |
| Counterparty | | Gross Amounts of Derivatives Assets Presented in the Statement of Assets and Liabilities | | | Derivatives available for offset | | | Collateral Received | | | Net Amount Due From Counterparty | |
| |
Merrill Lynch | | $ | 9,530 | | | $ | (9,530 | ) | | $ | — | | | $ | — | |
Morgan Stanley | | | 3,549 | | | | (2,299 | ) | | | — | | | | 1,250 | |
Standard Chartered | | | 54 | | | | (54 | ) | | | — | | | | — | |
Union Bank Of Switzerland | | | 1,684 | | | | (1,684 | ) | | | — | | | | — | |
| | | | | | | | | | | | | | | | |
Total | | $ | 27,957 | | | $ | (24,417 | ) | | $ | — | | | $ | 3,540 | |
| | | | | | | | | | | | | | | | |
| | | | |
| | | | | | | | | | | | | | | | |
| |
|
| Ashmore Emerging Markets Local Currency Bond Fund | |
| |
| | | | |
| Counterparty | | Gross Amounts of Derivatives Liabilities Presented in the Statement of Assets and Liabilities | | | Derivatives available for offset | | | Collateral Pledged | | | Net Amount Due To Counterparty | |
| |
Banco Santander | | $ | 1,858 | | | $ | — | | | $ | — | | | $ | 1,858 | |
Barclays | | | 1,005 | | | | (1,005 | ) | | | — | | | | — | |
BNP Paribas | | | 3,775 | | | | (986 | ) | | | — | | | | 2,789 | |
Citibank | | | 10,455 | | | | (1,848 | ) | | | — | | | | 8,607 | |
Deutsche Bank | | | 628 | | | | — | | | | — | | | | 628 | |
HSBC Bank | | | 52,981 | | | | (6,503 | ) | | | (46,478 | ) | | | — | |
JP Morgan | | | 508 | | | | (508 | ) | | | — | | | | — | |
Merrill Lynch | | | 10,901 | | | | (9,530 | ) | | | — | | | | 1,371 | |
Morgan Stanley | | | 2,299 | | | | (2,299 | ) | | | — | | | | — | |
Standard Chartered | | | 66 | | | | (54 | ) | | | — | | | | 12 | |
State Street | | | 4 | | | | — | | | | — | | | | 4 | |
Union Bank Of Switzerland | | | 1,843 | | | | (1,684 | ) | | | — | | | | 159 | |
| | | | | | | | | | | | | | | | |
Total | | $ | 86,323 | | | $ | (24,417 | ) | | $ | (46,478 | ) | | $ | 15,428 | |
| | | | | | | | | | | | | | | | |
| | | | |
| | | | | | | | | | | | | | | | |
| |
|
| Ashmore Emerging Markets Corporate Income Fund | |
| |
| | | | |
| Counterparty | | Gross Amounts of Derivatives Assets Presented in the Statement of Assets and Liabilities | | | Derivatives available for offset | | | Collateral Received | | | Net Amount Due From Counterparty | |
| |
Deutsche Bank | | $ | 8,260 | | | $ | (8,260 | ) | | $ | — | | | $ | — | |
State Street | | | 24,491 | | | | — | | | | — | | | | 24,491 | |
| | | | | | | | | | | | | | | | |
Total | | $ | 32,751 | | | $ | (8,260 | ) | | $ | — | | | $ | 24,491 | |
| | | | | | | | | | | | | | | | |
177
ASHMORE FUNDS
NOTES TO FINANCIAL STATEMENTS (CONTINUED)
As of October 31, 2022
| | | | | | | | | | | | | | | | |
| |
| Ashmore Emerging Markets Corporate Income Fund | |
| |
| Counterparty | | Gross Amounts of
Derivatives Liabilities
Presented in the Statement of Assets and Liabilities | | | Derivatives available for offset | | | Collateral Pledged | | | Net Amount Due To Counterparty | |
| |
Deutsche Bank | | $ | 9,254 | | | $ | (8,260 | ) | | $ | — | | | $ | 994 | |
| | | | | | | | | | | | | | | | |
Total | | $ | 9,254 | | | $ | (8,260 | ) | | $ | — | | | $ | 994 | |
| | | | | | | | | | | | | | | | |
| | | | | | | | | | | | | | | | |
| |
| Ashmore Emerging Markets Short Duration Select Fund | |
| |
| Counterparty | | Gross Amounts of
Derivatives Liabilities
Presented in the Statement of
Assets and Liabilities | | | Derivatives available for offset | | | Collateral Pledged | | | Net Amount Due To Counterparty | |
| |
Morgan Stanley | | $ | 1,514 | | | $ | — | | | $ | — | | | $ | 1,514 | |
| | | | | | | | | | | | | | | | |
Total | | $ | 1,514 | | | $ | — | | | $ | — | | | $ | 1,514 | |
| | | | | | | | | | | | | | | | |
| | | | | | | | | | | | | | | | |
| |
| Ashmore Emerging Markets Investment Grade Income Fund | |
| |
| Counterparty | | Gross Amounts of
Derivatives Liabilities
Presented in the Statement of Assets and Liabilities | | | Derivatives available for offset | | | Collateral Pledged | | | Net Amount Due To Counterparty | |
| |
Citibank | | $ | 579 | | | $ | — | | | $ | — | | | $ | 579 | |
Morgan Stanley | | | 4,070 | | | | — | | | | — | | | | 4,070 | |
| | | | | | | | | | | | | | | | |
Total | | $ | 4,649 | | | $ | — | | | $ | — | | | $ | 4,649 | |
| | | | | | | | | | | | | | | | |
| | | | | | | | | | | | | | | | |
| |
| Ashmore Emerging Markets Corporate Income ESG Fund | |
| |
| Counterparty | | Gross Amounts of
Derivatives Liabilities
Presented in the Statement of Assets and Liabilities | | | Derivatives available for offset | | | Collateral Pledged | | | Net Amount Due To Counterparty | |
| |
Morgan Stanley | | $ | 1,042 | | | $ | — | | | $ | — | | | $ | 1,042 | |
| | | | | | | | | | | | | | | | |
Total | | $ | 1,042 | | | $ | — | | | $ | — | | | $ | 1,042 | |
| | | | | | | | | | | | | | | | |
Investment management fees
The Trust has an Investment Management Agreement (the “Agreement”) with the Investment Manager, with whom certain Trustees and Officers of the Trust are affiliated, to furnish investment management services to the Funds. Under the terms of the Agreement, the Trust, on behalf of the Funds, compensates the Investment Manager for its investment management services at the following rates, based on each Fund’s average daily net assets:
| | | | |
| | |
| Fund | | Rate | |
| Ashmore Emerging Markets Total Return Fund | | | 1.00% | |
| Ashmore Emerging Markets Local Currency Bond Fund | | | 0.95% | |
| Ashmore Emerging Markets Corporate Income Fund | | | 0.85%* | |
| Ashmore Emerging Markets Short Duration Fund | | | 0.65% | |
| Ashmore Emerging Markets Active Equity Fund | | | 1.00% | |
| Ashmore Emerging Markets Small-Cap Equity Fund | | | 1.50% | |
178
ASHMORE FUNDS
NOTES TO FINANCIAL STATEMENTS (CONTINUED)
As of October 31, 2022
| | | | |
| | |
| Fund | | Rate | |
| Ashmore Emerging Markets Frontier Equity Fund | | | 1.50% | |
| Ashmore Emerging Markets Equity Fund | | | 1.15% | |
| Ashmore Emerging Markets Equity ESG Fund | | | 1.15% | |
| Ashmore Emerging Markets Short Duration Select Fund | | | 0.65% | |
| Ashmore Emerging Markets Investment Grade Income Fund | | | 0.70% | |
| Ashmore Emerging Markets Corporate Income ESG Fund | | | 0.85% | |
*Prior to February 28, 2022, the contractual management fee was 1.15% of average daily net assets.
The Investment Manager has contractually agreed to waive its fees or reimburse each Fund for other expenses until February 28, 2023 to the extent that total operating expenses (other than acquired fund fees and expenses, interest expenses, taxes, extraordinary expenses and certain credits and offset arrangements) for each class of shares of each Fund exceed the rates in the table below, based on each Fund’s average daily net assets. The expense limitation arrangement may be terminated by the Board at any time.
| | | | | | |
| | | | |
| Fund | | Class A | | Class C | | Institutional
Class |
Ashmore Emerging Markets Total Return Fund | | 1.27% | | 2.02% | | 1.02% |
Ashmore Emerging Markets Local Currency Bond Fund | | 1.22% | | 1.97% | | 0.97% |
Ashmore Emerging Markets Corporate Income Fund | | 1.12% | | 1.87% | | 0.87% |
Ashmore Emerging Markets Short Duration Fund | | 0.92% | | 1.67% | | 0.67% |
Ashmore Emerging Markets Active Equity Fund | | 1.27% | | 2.02% | | 1.02% |
Ashmore Emerging Markets Small-Cap Equity Fund | | 1.77% | | 2.52% | | 1.52% |
Ashmore Emerging Markets Frontier Equity Fund | | 1.77% | | 2.52% | | 1.52% |
Ashmore Emerging Markets Equity Fund | | 1.42% | | 2.17% | | 1.17% |
Ashmore Emerging Markets Equity ESG Fund | | 1.42% | | 2.17% | | 1.17% |
Ashmore Emerging Markets Short Duration Select Fund | | 0.92% | | 1.67% | | 0.67% |
Ashmore Emerging Markets Investment Grade Income Fund | | 0.97% | | 1.72% | | 0.72% |
Ashmore Emerging Markets Corporate Income ESG Fund | | 1.12% | | 1.87% | | 0.87% |
Any such waiver or reimbursement is subject to the Investment Manager’s right to recover amounts waived or reimbursed to the extent actual fees and expenses for a future fiscal period are less than each Fund’s expense limitation cap, provided, however, that the Investment Manager shall only be entitled to recover such amounts waived or reimbursed during the previous
179
ASHMORE FUNDS
NOTES TO FINANCIAL STATEMENTS (CONTINUED)
As of October 31, 2022
three fiscal years. The amounts recaptured pursuant to the expense limitation agreement will be limited to the lesser of (1) the expense limitation amount that was in effect at the time of the waiver or reimbursement or (2) the expense limitation amount that is in effect at the time of recapture. The total amounts subject to recovery in fiscal years are shown below:
| | | | | | | | | | | | | | | | |
| | | | | |
| Fund | | 2023 | | | 2024 | | | 2025 | | | Total | |
| Ashmore Emerging Markets Total Return Fund | | $ | 1,453,580 | | | $ | 1,209,234 | | | $ | 1,119,411 | | | $ | 3,782,225 | |
| Ashmore Emerging Markets Local Currency Bond Fund | | | 198,265 | | | | 152,924 | | | | 121,907 | | | | 473,096 | |
| Ashmore Emerging Markets Corporate Income Fund | | | 404,041 | | | | 361,106 | | | | 345,989 | | | | 1,111,136 | |
| Ashmore Emerging Markets Short Duration Fund | | | 973,684 | | | | 203,439 | | | | 216,728 | | | | 1,393,851 | |
| Ashmore Emerging Markets Active Equity Fund | | | 171,181 | | | | 208,770 | | | | 220,507 | | | | 600,458 | |
| Ashmore Emerging Markets Small-Cap Equity Fund | | | 147,694 | | | | 100,902 | | | | 110,918 | | | | 359,514 | |
| Ashmore Emerging Markets Frontier Equity Fund | | | 315,267 | | | | 238,815 | | | | 342,706 | | | | 896,788 | |
| Ashmore Emerging Markets Equity Fund | | | 222,597 | | | | 172,553 | | | | 280,776 | | | | 675,926 | |
| Ashmore Emerging Markets Equity ESG Fund | | | 173,755 | | | | 148,942 | | | | 110,142 | | | | 432,839 | |
| Ashmore Emerging Markets Short Duration Select Fund | | | 150,410 | | | | 75,473 | | | | 77,472 | | | | 303,355 | |
| Ashmore Emerging Markets Investment Grade Income Fund | | | 88,408 | | | | 155,066 | | | | 86,233 | | | | 329,707 | |
| Ashmore Emerging Markets Corporate Income ESG Fund | | | — | | | | 146,750 | | | | 99,997 | | | | 246,747 | |
Distribution and Servicing fees
The Funds have adopted Amended Plans of Distribution and Servicing Fees pursuant to Rule 12b-1 under the 1940 Act (“Distribution and Servicing Fee Plans”). Under the Distribution and Servicing Fee Plans, each of the Funds may pay fees to the distributor on an ongoing basis as compensation for the services the distributor renders and the expenses it bears in connection with the sale and distribution of Fund shares (“distribution fees”) and/or in connection with personal services rendered to Fund shareholders and the maintenance of shareholder accounts (“servicing fees”). Class A and C shares each have a separate 12b-1 Plan. Class A shares pay only servicing fees. Class C shares pay both distribution and servicing fees. The following table lists the maximum annual rates at which the distribution and/or servicing fees may be paid under each 12b-1 Plan (calculated as a percentage of a Fund’s average daily net assets attributable to the particular class of shares):
| | | | |
| | | |
| | | Servicing Fee | | Distribution Fee |
| Class A shares | | 0.25% | | None |
| Class C shares | | 0.25% | | 0.75% |
Cross Trades
The 1940 Act prohibits the Funds and their affiliates from knowingly selling any security or other property to the Funds (other than securities of which the buyer is the issuer), or buying any security (other than securities of which the seller is the issuer) or other property from the Funds. Rule 17a-7 under the 1940 Act provides relief from these prohibitions for various types of “cross trades” and similar transactions that may benefit shareholders by allowing the participating funds or accounts to avoid brokerage commissions and other transaction costs of trades.
180
ASHMORE FUNDS
NOTES TO FINANCIAL STATEMENTS (CONTINUED)
As of October 31, 2022
During the year ended October 31, 2022, the following Funds bought and/or sold securities from an account or accounts that were also advised by the Trust’s investment adviser or its affiliates:
| | | | | | | | |
| | | |
| Fund | | Purchases | | | Sales | |
| Ashmore Emerging Markets Total Return Fund | | $ | — | | | $ | 1,246,680 | |
| Ashmore Emerging Markets Corporate Income Fund | | | 3,914,904 | | | | 120,445 | |
| Ashmore Emerging Markets Short Duration Fund | | | 4,642,900 | | | | 9,595,305 | |
| Ashmore Emerging Markets Investment Grade Income Fund | | | — | | | | 84,075 | |
As of October 31, 2022, Ashmore Investments UK Limited owned the following percentages of the outstanding shares of each Fund:
| | | | | | |
| | | | |
| Fund | | Class A | | Class C | | Institutional Class |
| Ashmore Emerging Markets Local Currency Bond Fund | | —% | | —% | | 69.36% |
| Ashmore Emerging Markets Active Equity Fund | | —% | | 100.00% | | —% |
| Ashmore Emerging Markets Equity ESG Fund | | 100.00% | | 100.00% | | 100.00% |
| Ashmore Emerging Markets Short Duration Select Fund | | 100.00% | | 100.00% | | 100.00% |
| Ashmore Emerging Markets Investment Grade Income Fund | | 100.00% | | 100.00% | | 100.00% |
| Ashmore Emerging Markets Corporate Income ESG Fund | | 100.00% | | 100.00% | | 100.00% |
In addition to the Ashmore Investments UK Limited ownership, shown in the table above, the following Funds had other investors owning of record or known by the Funds to own beneficially greater than 5% of the outstanding shares of such Funds:
| | | | | | |
| | | | |
| Fund | | Class | | # of Investors Owning > 5% of outstanding Shares | | % of Ownership by Investor |
| | | | |
| Ashmore Emerging Markets Total Return Fund | | Class A | | 5 | | 35.62%, 21.85%, 17.01%, 11.11%, 7.13% |
| | | | |
| | | Class C | | 4 | | 42.06%, 34.20%, 15.67%, 8.07% |
| | | | |
| | | Institutional Class | | 4 | | 39.28%, 19.88%, 8.96%, 5.75% |
| | | | |
| Ashmore Emerging Markets Local Currency Bond Fund | | Class A | | 4 | | 68.48%, 13.59%, 9.81%, 6.03% |
| | | | |
| | | Class C | | 1 | | 100% |
| | | | |
| | | Institutional Class | | 1 | | 29.18% |
181
ASHMORE FUNDS
NOTES TO FINANCIAL STATEMENTS (CONTINUED)
As of October 31, 2022
| | | | | | |
| | | | |
| Fund | | Class | | # of Investors
Owning > 5%
of outstanding
Shares | | % of Ownership by Investor |
| | | | |
| Ashmore Emerging Markets Corporate Income Fund | | Class A | | 5 | | 26.64%, 24.68%, 19.73%, 13.29%, 6.38% |
| | | | |
| | | Class C | | 6 | | 49.12%, 15.22%, 11.64%, 9.63%, 7.78%, 6.21% |
| | | | |
| | | Institutional Class | | 5 | | 19.86%, 11.29%, 9.35%, 8.57%, 8.30%, |
| | | | |
| Ashmore Emerging Markets Short Duration Fund | | Class A | | 3 | | 70.56%, 16.07%, 5.18% |
| | | | |
| | | Class C | | 2 | | 64.58%, 19.17% |
| | | | |
| | | Institutional Class | | 3 | | 44.15%, 36.94%, 7.42% |
| | | | |
| Ashmore Emerging Markets Active Equity Fund | | Class A | | 2 | | 70.99%, 27.94% |
| | | | |
| | | Institutional Class | | 4 | | 38.17%, 21.55%, 21.32%, 5.49% |
| | | | |
| Ashmore Emerging Markets Small-Cap Equity Fund | | Class A | | 4 | | 35.61%, 26.41%, 25.26%, 5.40% |
| | | | |
| | | Class C | | 3 | | 56.02%, 25.10%, 18.88% |
| | | | |
| | | Institutional Class | | 5 | | 28.54%, 26.76%, 15.53%, 15.50%, 8.93% |
| | | | |
| Ashmore Emerging Markets Frontier Equity Fund | | Class A | | 2 | | 30.08%, 15.42% |
| | | | |
| | | Class C | | 4 | | 64.41%, 19.08%, 9.05%, 6.13% |
| | | | |
| | | Institutional Class | | 4 | | 40.48%, 26.30%, 20.93%, 8.95% |
| | | | |
| Ashmore Emerging Markets Equity Fund | | Class A | | 2 | | 72.34%, 24.54% |
| | | | |
| | | Class C | | 5 | | 37.87%, 22.81%, 11.46%, 10.38%, 9.28% |
| | | | |
| | | Institutional Class | | 5 | | 40.69%, 21.38%, 10.01%, 9.63%, 7.28% |
In relation to its investments, some of the Funds of the Trust may from time to time agree to indemnify and/or pre-fund trustees or other agents, either solely or alongside other creditors on a several basis. Generally, such agreements do not have a termination date. The Trustees are not aware of and do not currently expect any claims to be made against the Funds under any such indemnity or pre-funding agreements.
182
ASHMORE FUNDS
NOTES TO FINANCIAL STATEMENTS (CONTINUED)
As of October 31, 2022
| 13. | New accounting pronouncements |
In March 2020, the FASB issued Accounting Standards Update (ASU) 2020-04, Reference Rate Reform (Topic 848) “Facilitation of the Effects of Reference Rate Reform on Financial Reporting” (“ASU 2020-04”), which provides optional temporary financial reporting relief from the effect of certain types of contract modifications due to the planned discontinuation of the LIBOR and other interbank-offered based reference rates as of the end of 2021. The new guidance is effective for certain reference rate-related contract modifications that occur during the period March 12, 2020 through December 31, 2022, and the adoption of ASU 2020-04 is elective. Management does not believe this update has a material impact on the Funds’ financial statements and disclosures.
Certain of the Funds’ investments, payment obligations, and financing terms may be based on floating rates such as LIBOR, Euro Interbank Offered Rate (“EURIBOR”), and other similar types of reference rates (each, a “Reference Rate”). In 2017 after years of regulatory and industry wide discussions about how to address issues related to Reference Rates, the UK Financial Conduct Authority (“FCA”), which regulates LIBOR announced that most LIBOR settings would no longer be published after the end of 2021 and a majority of U.S. dollar LIBOR settings would no longer be published after June 30, 2023. Accordingly, ICE Benchmark Administration (“IBA”), the administrator of LIBOR, ceased publication of such LIBOR settings on a representative basis at the end of 2021 and is expected to cease publication of the majority of U.S. dollar LIBOR settings on a representative basis after June 30, 2023. As of the end of 2021, the FCA also compelled the IBA to publish on a “synthetic” basis a subset of certain non-U.S. dollar LIBOR settings for a limited period of time and has proposed compelling the IBA to publish other “synthetic” LIBOR settings after their indicated cessation dates for a limited period of time. The FCA has made clear, however, that any such publications would be considered non-representative of the underlying market and should be used in very limited circumstances. Actions by regulators have resulted in the establishment of alternative reference rates to LIBOR in most major currencies. Various financial industry groups have been planning for the transition away from LIBOR, but there are obstacles to converting certain securities and transactions to new Reference Rates. Markets are slowly developing in response to these new Reference Rates. Questions around liquidity in these rates, and how to appropriately adjust them at the time of transition remain a concern for market participants.
In addition, LIBOR, EURIBOR and other interest rates or other types of rates and indices which are classed as “benchmarks” have been the subject of ongoing national and international regulatory reform, including under the E.U. regulation on indices used as benchmarks in financial instruments and financial contracts. The implementation of these reforms can involve, among other things, changes to the manner of administration of benchmarks (with the result that they may perform differently than in the past), restrictions on the use of benchmarks that are not compliant with the new standards by certain supervised entities, and in some cases, certain benchmarks could be eliminated entirely.
The transition away from Reference Rates may lead to increased volatility and illiquidity in markets that are tied to such Reference Rates and reduced values of Reference Rate-related instruments. Any such effects of the transition away from Reference Rates, as well as other unforeseen effects, may have an adverse impact on a Fund’s investments, performance, or financial condition.
COVID-19, the novel respiratory disease also known as “coronavirus”, which was first detected in China in December 2019 and subsequently spread internationally, has resulted in closing borders, enhanced health screenings, healthcare service shortages, quarantines, cancelations, disruptions to supply chains and vendor and customer activity, as well as general concern and uncertainty. COVID-19 has negatively affected the global economy, the economies of individual countries, and the financial performance of individual issuers, sectors, industries, asset classes, and markets in significant and unforeseen ways and may continue to do so in the future. Health crises caused by the coronavirus outbreak may exacerbate other pre-existing political, social and economic risks. The effects of the outbreak in developing or emerging market countries may be greater due to less established health care systems. The COVID-19 pandemic has resulted in significant market volatility, exchange trading suspensions and closures, declines in global financial markets, higher default rates, and a substantial economic downturn or
183
ASHMORE FUNDS
NOTES TO FINANCIAL STATEMENTS (CONTINUED)
As of October 31, 2022
recession. The COVID-19 pandemic, and other epidemics and pandemics that may arise in the future, could impair the Funds’ ability to maintain operational standards (such as with respect to satisfying redemption requests), disrupt the operations of the Funds’ service providers, adversely affect the value and liquidity of the Funds’ investments, and negatively impact the Funds’ performance and your investment in a Fund.
The Trust has evaluated subsequent events for the Funds through the date the financial statements were issued, and has concluded that there are no identified subsequent events relevant for financial statement adjustment or disclosure.
184
ASHMORE FUNDS
SUPPLEMENTARY INFORMATION (UNAUDITED)
REMUNERATION DISCLOSURE
Ashmore Investment Advisors Limited (“AIAL”) is a full-scope UK Alternative Investment Fund Manager (“AIFM”) that manages many alternative investment funds (“AIFs”). These AIFs implement a number of investment strategies including; equity, fixed income and alternatives; and invest in many different regions and industry sectors. AIAL manages both open-ended and closed-ended AIFs, several of its AIFs are leveraged and some are listed on regulated markets. Its assets under management was approximately US$2.8 billion at June 30, 2022. AIAL’s parent company (“Ashmore”) is listed on a regulated market, counts eleven offices worldwide and has a number of subsidiaries both in the UK and abroad. Taking into account guidance from the UK Financial Conduct Authority (“FCA”), AIAL has complied with the full AIFM Remuneration Code.
AIAL does not have any direct employees, and as such the amount of remuneration paid to staff by AIAL is zero. All AIAL AIFM Remuneration Code Staff are employed and paid by Ashmore Group plc. Ashmore’s remuneration principles have remained unchanged since it was listed, and are designed to align all employees with the long-term success of the business. These include significant levels of deferral, a clear link between performance and levels of remuneration and strong alignment of executive directors and employees with shareholders and clients through significant employee share ownership. The culture is therefore a collaborative one, with clients’ interests and the creation of shareholder value, including for employee shareholders, the overarching factors for success.
Executive directors, members of the investment team, and indeed all other employees, participate in a single capped incentive pool and are paid under a similar structure, with an annual cash bonus and share award, meaning that all employees are long-term shareholders in the business.
The policy includes:
–– A capped basic salary to contain the fixed cost base;
–– A cap on the total variable compensation including any awards made under Ashmore’s share plan, available for all employees at 25% of profits, which to date has not been fully utilised; and
–– A deferral for five years of a substantial portion of variable compensation into Ashmore shares (or equivalent), which, in the case of executive directors in lieu of a separate LTIP, is also partly subject to additional performance conditions measured over five years.
AIAL’s board of directors reviews the general principles of the remuneration policy and is responsible for its implementation with regard to AIAL’s AIFM Remuneration Code Staff. Ashmore’s Remuneration Committee periodically reviews the ongoing appropriateness and relevance of the remuneration policy, including in connection with the provision of services to AIAL. Ashmore employs the services of; McLagan to provide advice on remuneration benchmarking; Deloitte to provide advice on tax compliance, share plan design and administration, and as Remuneration Committee advisors. The Remuneration Committee’s terms of reference can be found here:
https://ir.ashmoregroup.com/corporate-governance.
Performance assessment for AIAL’s AIFM Remuneration Code Staff for their work relating to AIAL is based on a combination of quantitative and qualitative criteria related to the performance of AIAL, the performance of relevant AIF(s) or business units and the performance of the individual. Qualitative criteria include adherence to Ashmore Group plc’s risk and compliance policies. This performance assessment is adjusted for relevant current and future risks related to the AIFs managed by AIAL.
The compensation of control function staff is based on function specific objectives and is independent from the performance of AIAL and/or the AIFs managed by AIAL. The remuneration of the senior officers in AIAL’s control functions is directly overseen by the Remuneration Committee.
Variable remuneration awarded to AIAL’s Remuneration Code Staff in respect of AIFMD work is subject to performance adjustment which allows Ashmore to reduce the deferred amount, including to nil, in light of the ongoing financial situation and/or performance of Ashmore, AIAL, the AIFs that AIAL manages and the individual concerned.
185
ASHMORE FUNDS
SUPPLEMENTARY INFORMATION (UNAUDITED) (CONTINUED)
The total contribution of AIAL’s AIFM Remuneration Code Staff to the business of Ashmore is apportioned between work carried out for AIAL and work carried out for the other businesses and subsidiaries of Ashmore. Their remuneration is similarly apportioned between AIAL and the other businesses and subsidiaries where required.
The remuneration attributable to AIAL for its AIFMD identified staff for the financial year ended June 30, 2022 was as follows:
| | | | | | | | | | | | | | |
| | | | | |
| Fund | | Number of Beneficiaries | | Variable Remuneration | | | Fixed Remuneration | | | Total Remuneration | |
Ashmore Emerging Markets Total Return Fund | | 18 | | £ | 140,197 | | | £ | 21,838 | | | £ | 162,035 | |
Ashmore Emerging Markets Local Currency Bond Fund | | 16 | | | 911 | | | | 171 | | | | 1,082 | |
Ashmore Emerging Markets Corporate Income Fund | | 17 | | | 32,421 | | | | 5,127 | | | | 37,548 | |
Ashmore Emerging Markets Short Duration Fund | | 17 | | | 14,373 | | | | 2,273 | | | | 16,646 | |
Ashmore Emerging Markets Active Equity Fund | | 18 | | | 42,703 | | | | 7,730 | | | | 50,433 | |
Ashmore Emerging Markets Small-Cap Equity Fund | | 18 | | | 3,985 | | | | 721 | | | | 4,706 | |
Ashmore Emerging Markets Frontier Equity Fund | | 18 | | | 37,120 | | | | 6,719 | | | | 43,839 | |
Ashmore Emerging Markets Equity Fund | | 18 | | | 57,903 | | | | 10,481 | | | | 68,384 | |
Ashmore Emerging Markets Equity ESG Fund | | 18 | | | 5,559 | | | | 1,006 | | | | 6,565 | |
Ashmore Emerging Markets Short Duration Select Fund | | 17 | | | 2,140 | | | | 338 | | | | 2,478 | |
Ashmore Emerging Markets Investment Grade Income Fund | | 17 | | | 3,947 | | | | 624 | | | | 4,571 | |
Ashmore Emerging Markets Corporate Income ESG Fund | | 17 | | | 1,676 | | | | 265 | | | | 1,941 | |
Total AIAL | | 20 | | £ | 816,186 | | | £ | 138,033 | | | £ | 954,219 | |
All of the remuneration above was attributable to senior management who have a material impact on the Funds’ risk profile. The Funds’ allocation of the AIAL remuneration has been made on the basis of NAV.
186
ASHMORE FUNDS
FOR MORE INFORMATION
As of October 31, 2022
PORTFOLIO HOLDINGS
The Ashmore Funds file their complete schedule of portfolio holdings with the Securities and Exchange Commission (“SEC”) for the first and third quarters of each fiscal year on Form N-PORT. The Funds’ Form N-PORT is available on the SEC’s Web site at www.sec.gov within sixty days after the Funds’ first and third fiscal quarters. In addition, no later than thirty calendar days after the end of each calendar quarter, a list of all portfolio holdings in each Fund as of the end of such calendar quarter is made available at www.ashmoregroup.com.
PROXY VOTING
Ashmore Funds’ Proxy Voting Policies and Procedures and each Fund’s portfolio securities voting record for the most recent 12-month period ended June 30 are available upon request and without charge by visiting the Ashmore Funds’ Web site at www.ashmoregroup.com or the SEC’s Web site at www.sec.gov or by calling 866-876-8294.
187
ASHMORE FUNDS
PRIVACY POLICY
We consider customer privacy to be a fundamental aspect of our relationships with shareholders and are committed to maintaining the confidentiality, integrity and security of our current, prospective and former shareholders’ personal information. To ensure our shareholders’ privacy, we have developed policies that are designed to protect this confidentiality, while allowing shareholders’ needs to be served.
Obtaining Personal Information In the course of providing shareholders with products and services, we may obtain non-public personal information about shareholders, which may come from sources such as account applications and other forms, from other written, electronic or verbal correspondence, from shareholder transactions, from a shareholder’s brokerage or financial advisory firm, financial adviser or consultant, and/or from information captured on our internet web sites.
Respecting Your Privacy As a matter of policy, we do not disclose any personal or account information provided by shareholders or gathered by us to non-affiliated third parties, except as required for our everyday business purposes, such as to process transactions or service a shareholder’s account, or as otherwise permitted by law. As is common in the industry, non-affiliated companies may from time to time be used to provide certain services, such as preparing and mailing prospectuses, reports, account statements and other information, and gathering shareholder proxies. We may also retain non-affiliated financial services providers to market our shares or products and we may enter into joint-marketing arrangements with them and other financial companies. We may also retain marketing and research service firms to conduct research on shareholder satisfaction. These companies may have access to a shareholder’s personal and account information, but are permitted to use this information solely to provide the specific service or as otherwise permitted by law. We may also provide a shareholder’s personal and account information to their respective brokerage or financial advisory firm, Custodian, and/or to their financial advisor or consultant.
Sharing Information with Third Parties We reserve the right to disclose or report personal information to non-affiliated third parties where we believe in good faith that disclosure is required under law to cooperate with regulators or law enforcement authorities, to protect our rights or property or upon reasonable request by any investee entity in which a shareholder has chosen to invest. Of course, we may also share your information with your consent.
Sharing Information with Affiliates We may share shareholder information with our affiliates in connection with our affiliates’ everyday business purposes, such as servicing a shareholder’s account, but our affiliates may not use this information to market products and services to you except in conformance with applicable laws or regulations. The information we share includes information about our experiences and transactions with a shareholder and may include, for example, a shareholder’s participation in one of the Funds or in other investment programs, a shareholder’s ownership of certain types of accounts, or other data about a shareholder’s transactions or accounts. Our affiliates, in turn, are not permitted to share shareholder information with non-affiliated entities, except as required or permitted by law.
Procedures to Safeguard Private Information We take seriously the obligation to safeguard shareholder non-public personal information. In addition to this policy, we have also implemented procedures that are designed to restrict access to a shareholder’s non-public personal information only to internal personnel who need to know that information in order to provide products or services to such shareholders. In addition, we have physical, electronic, and procedural safeguards in place to guard a shareholder’s non-public personal information.
Disposal of Confidential Records We will dispose of records, if any, that are knowingly derived from data received from a consumer reporting agency regarding a shareholder that is an individual in a manner that ensures the confidentiality of the data is maintained. Such records include, among other things, copies of consumer reports and notes of conversations with individuals at consumer reporting agencies.
188
ASHMORE FUNDS
OTHER INFORMATION
Administrator, Custodian and Transfer Agent
The Northern Trust Company
333 South Wabash Avenue
Chicago, Illinois 60604
312-630-6000
Investment Manager
Ashmore Investment Advisors Limited
61 Aldwych
London WC2B 4AE
United Kingdom
44-20-3077-6000
Independent Registered Public Accounting Firm
KPMG LLP
Aon Center
Suite 5500
200 East Randolph Drive
Chicago, Illinois 60601-6436
Distributor
Ashmore Investment Management (US) Corporation
475 Fifth Avenue
15th Floor
New York, New York 10017
212-661-0061
Legal Counsel
Ropes & Gray LLP
Prudential Tower
800 Boylston Street
Boston, Massachusetts 02199
617-951-7000
Independent Trustees’ Counsel
Dechert LLP
One International Place
40th Floor
100 Oliver Street
Boston, Massachusetts 02110
617-728-7100
189
(THIS PAGE INTENTIONALLY LEFT BLANK)
190
ASHMORE FUNDS
TRUSTEES AND OFFICERS
Set forth below is information about the Trustees and Officers of the Ashmore Funds. Each Trustee has served in that capacity since he or she was originally elected or appointed to the Board of Trustees. Each Trustee oversees a total of eleven portfolios in the Ashmore Funds. The Ashmore Funds’ Statement of Additional Information contains additional information about the Trustees and is available upon request and without charge by calling 866-876-8294.
INDEPENDENT TRUSTEES
| | | | | | | | | | |
| | | | | | |
Name, Address* and Age of Independent Trustee | | Positions(s) Held with Trust | | Term of Office and Length of Time Served | | Principal Occupation(s) During Past 5 Years | | Number of Portfolios in Fund Complex
Overseen by Trustee | | Other Directorships Held by Trustee During
the Past 5 Years |
| Yeelong Balladon (Age 64) | | Trustee; Lead Independent Trustee | | Indefinite term; Trustee since inception in 2010 | | Freshfields Bruckhaus Deringer (a law firm) from 1982 to 2009 (Partner from 1999). | | 12 | | Microvast Board of Directors (Class III Director) since July 2022 |
| Michael Chamberlin (Age 73) | | Trustee | | Indefinite term; Trustee since 2012 | | Executive Director and CEO, Emerging Markets Traders Association(1). | | 12 | | None |
Joseph Grainger (Age 68) | | Trustee | | Indefinite term; Trustee since 2014 | | Ernst & Young LLP from 1988 to December 2013 (Partner from October 1990). | | 12 | | None |
* Each Trustee may be contacted at 61 Aldwych, London WC2B 4AE, United Kingdom.
| (1) | Mr. Chamberlin has served as the Executive Director of the Emerging Markets Traders Association (“EMTA”) since 1994. Mark Coombs is Co-Chair of EMTA’s Board of Directors, and the Investment Manager’s ultimate parent company, Ashmore Group plc, is a member of the EMTA. Mr. Coombs is the Investment Manager’s Chief Executive Officer. |
191
ASHMORE FUNDS
TRUSTEES AND OFFICERS (CONTINUED)
| | | | | | | | | | |
| | | | | | |
Name, Address* and Age of Interested Trustee | | Positions(s) Held with Trust | | Term of Office and Length of Time Served | | Principal Occupation(s) During Past 5 Years | | Number of Portfolios in Fund Complex
Overseen by Trustee | | Other Directorships Held by Trustee During the Past 5 Years |
| George Grunebaum(2) (Age 59) | | Trustee; Chairman of the Trustees; President and Chief Executive Officer | | Indefinite term; Trustee since inception | | Chief Executive Officer since November 2008, Ashmore Investment Management (US) Corporation. | | 12 | | BC Partners Lending Corp Portman Ridge Finance Corp Logan Ridge Finance Corp Alternative Credit Income Fund |
| Stephen Hicks(3) (Age 62) | | Trustee | | Indefinite term; Trustee since 2014 | | CCO of Trinity Street Asset Management LLP, a UK private asset manager, since 2014. | | 12 | | None |
| * | Each Trustee may be contacted at 61 Aldwych, London WC2B 4AE, United Kingdom. |
| (2) | Mr. Grunebaum is an “interested person” of the Trust, as defined in Section 2(a)(19) of the 1940 Act, due to, among other things, his positions with the Distributor and its affiliates. Mr. Grunebaum serves or has served as a trustee or director of other pooled investment vehicles sponsored by Ashmore Group plc (“Ashmore Group”) and its affiliates, including Ashmore Global Emerging Markets Funds, LTD and Ashmore Global Opportunities Limited. |
| (3) | Mr. Hicks is an “interested person” of the Trust, as defined in Section 2(a)(19) of the 1940 Act, due to his former position with Ashmore Group, the parent company of Ashmore Investment Advisors Limited. Ashmore Group indirectly compensates Mr. Hicks, through a separate private company, for his service as a Trustee of the Trust and as a trustee or director of other pooled investment vehicles sponsored by Ashmore Group and its affiliates. |
192
ASHMORE FUNDS
TRUSTEES AND OFFICERS (CONTINUED)
OFFICERS
| | | | | | |
| | | | |
Name, Address** and Age of Officer | | Positions(s) Held
with Trust | | Term of Office and
Length of Time
Served | | Principal Occupation(s) During Past 5 Years |
| George Grunebaum (Age 59) | | Trustee, President and Chief Executive Officer | | Indefinite term; since inception | | Chief Executive Officer, Ashmore Investment Management (US) Corporation, from November 2008 – Present. |
| Alexandra Autrey (Age 46) | | Chief Legal Officer | | Indefinite term; since inception | | Group General Counsel and Company Secretary, Ashmore Group plc, since May 2021; Group Head of Legal and Transaction Management, Ashmore Group plc, from January 2012 – April 2021. |
| Jonathan Kim (Age 36) | | Treasurer and Principal Financial and Accounting Officer | | Indefinite term; since 2018 | | Chief Financial Officer and FinOp, Ashmore Investment Management (US) Corporation, since September 2018; Institutional Account Services, Ashmore Investment Management (US) Corporation, from January 2016 - March 2021. |
| Matthew Butryman (Age 38) | | Chief Compliance Officer and Secretary | | Indefinite term; since November 2022 | | Senior Vice President and Senior Compliance Officer, Pacific Investment Management Company LLC (PIMCO), from January 2021 – October 2022; Vice President and Senior Compliance Officer, PIMCO, from January 2018 – December 2020; Vice President and Compliance Officer, PIMCO, from May 2015 – December 2018. |
| Paul Robinson (Age 49) | | Assistant Chief Legal Officer | | Indefinite term; since June 2011 | | Group Deputy Head of Legal and Transaction Management since August 2012, Ashmore Group plc. |
| ** | Each Officer may be contacted at 61 Aldwych, London WC2B 4AE, United Kingdom. |
193
(THIS PAGE INTENTIONALLY LEFT BLANK)
194
(THIS PAGE INTENTIONALLY LEFT BLANK)
195
(b) Not applicable.
Item 2. Code of Ethics.
| (a) | As of October 31, 2022, the registrant has adopted a code of ethics that applies to its principal executive officer, principal financial officer, principal accounting officer or controller, or persons performing similar functions, regardless of whether these individuals are employed by the registrant or a third party (the “Code of Ethics”). |
| (c) | The registrant has not amended its Code of Ethics during the period covered by this report. |
| (d) | The registrant has not granted any waivers, including an implicit waiver, from any provisions of its Code of Ethics during the period covered by this report. |
Item 3. Audit Committee Financial Expert.
The registrant’s Board of Trustees has determined that the registrant has at least one “audit committee financial expert” (as defined in Item 3 of Form N-CSR), serving on its audit committee. Joseph Grainger is the “audit committee financial expert” and is “independent” (as each term is defined in Item 3 of Form N-CSR).
Under applicable securities laws and regulations, a person who is determined to be an audit committee financial expert will not be deemed an “expert” for any purpose, including without limitation for purposes of Section 11 of the Securities Act of 1933, as amended, as a result of being designated or identified as an audit committee financial expert. The designation or identification of a person as an audit committee financial expert does not impose on such person any duties, obligations, or liability that are greater than the duties, obligations, and liability imposed on such person as a member of the registrant’s Audit Committee and Board of Trustees in the absence of such designation or identification. The designation or identification of a person as an audit committee financial expert does not affect the duties, obligations or liability of any other member of the registrant’s Audit Committee or Board of Trustees.
Item 4. Principal Accountant Fees and Services.
Item 4(a): Audit Fees
The aggregate fees billed for each of the last two fiscal years for professional services rendered by KPMG LLP (“KPMG”), independent registered public accounting firm, for the audit of the registrant’s annual financial statements or services that are normally provided by the accountant
2
in connection with statutory and regulatory filings or engagements for those fiscal years are $343,760 in 2022 and $323,870 in 2021.
Item 4 (b): Audit-Related Fees
The aggregate fees billed in each of the last two fiscal years for assurance and related services by KPMG that are reasonably related to the performance of the audit of the registrant’s financial statements and are not reported under paragraph (a) of this Item are NONE.
Item 4 (c): Tax Fees
The aggregate fees billed in each of the last two fiscal years for professional services rendered by KPMG for RIC tax compliance and diversification review and tax return review are NONE in 2022 and NONE in 2021.
Item 4 (d): All Other Fees
The aggregate fees billed in each of the last two fiscal years for products and services provided by KPMG and its affiliates, other than the services reported in paragraphs (a) through (c) of this Item, are GBP 100,000 in 2022 and GBP 97,750 in 2021 for reports on internal controls.
Item 4(e)(1): Pre-Approval Policies and Procedures
Pursuant to the registrant’s Audit Committee Charter adopted on November 17, 2010, as revised on December 9, 2022, the Audit Committee shall, to the extent required by applicable regulations, pre-approve (i) all audit and permitted non-audit services rendered by the independent auditors to a Fund and (ii) all non-audit services rendered by the independent auditors to a Fund’s investment adviser(s) (including any sub-advisers) and to certain of the investment adviser’s affiliates, as applicable. The Audit Committee may implement policies and procedures by which such services are pre-approved other than by the full Committee (for example, by the Committee chair).
Item 4(e)(2): Percentage of Fees Pre-Approved Pursuant to Waiver Provision of Paragraph (c)(7)(i)(C) of Rule 2-01 of Regulation S-X
No percentage of the principal accountant’s fees or services were approved pursuant to the waiver provision of paragraph (c)(7)(i)(C) of Rule 2-01 of Regulation S-X.
Item 4(f): Work Performed by Persons Other than the Principal Accountant
Not applicable.
Item 4(g): Aggregate Non-Audit Fees Disclosure
The aggregate non-audit fees and services billed by KPMG and its affiliates for services rendered to the registrant and service affiliates for the last two fiscal years are GBP 100,000 for 2022 and GBP 97,750 for 2021.
Item 4(h): Non-Audit Services and Independent Accountant’s Independence
The registrant’s Audit Committee has considered whether the provision of non-audit services to service affiliates, not pre-approved pursuant to paragraph (c)(7)(ii) of Rule 2-01 of Regulation S-X, is compatible with maintaining the registered public accountant’s independence in performing audit services.
3
Item 4(i): Not applicable.
Item 4(j): Not applicable.
Item 5. Audit Committee of Listed Registrants.
Not applicable.
Item 6. Investments.
| (a) | The registrant has elected to include the schedule of investments in securities of unaffiliated issuers as part of the report to shareholders filed under Item 1 of this report on Form N-CSR. |
Item 7. Disclosure of Proxy Voting Policies and Procedures for Closed-End Management Investment Companies.
Not applicable.
Item 8. Portfolio Managers of Closed-End Management Investment Companies.
Not applicable.
Item 9. Purchases of Equity Securities by Closed-End Management Investment Company and Affiliated Purchasers.
Not applicable.
Item 10. Submission of Matters to a Vote of Security Holders.
There have been no material changes to the procedures by which shareholders may recommend nominees to the registrant’s Board of Trustees.
Item 11. Controls and Procedures.
| (a) | The registrant’s principal executive and principal financial officers, or persons performing similar functions, have concluded that the registrant’s disclosure controls and procedures (as defined in Rule 30a-3(c) under the Investment Company Act of 1940 (the “1940 Act”)) are effective, based on the evaluation of these controls and procedures required by Rule 30a-3(b) under the 1940 Act and Rules 13a-15(b) or 15d-15(b) under the Securities Exchange Act of 1934 as of a date within 90 days of the filing date of this report. |
4
| (b) | There were no changes in the registrant’s internal control over financial reporting (as defined in Rule 30a-3(d) under the 1940 Act) that occurred during the period covered by this report that have materially affected, or are reasonably likely to materially affect, the registrant’s internal control over financial reporting. |
Item 12. Disclosure of Securities Lending Activities for Closed-End Management Investment Companies.
Not applicable.
Item 13. Exhibits.
5
SIGNATURES
Pursuant to the requirements of the Securities Exchange Act of 1934 and the Investment Company Act of 1940, the registrant has duly caused this report to be signed on its behalf by the undersigned, thereunto duly authorized.
Ashmore Funds
| | |
| By | | /s/ George Grunebaum |
| | George Grunebaum, President and Chief Executive Officer |
| | (Principal Executive Officer) |
Date: March 1, 2023
Pursuant to the requirements of the Securities Exchange Act of 1934 and the Investment Company Act of 1940, this report has been signed below by the following persons on behalf of the registrant and in the capacities and on the dates indicated.
| | |
| By | | /s/ George Grunebaum |
| | George Grunebaum, President and Chief Executive Officer |
| | (Principal Executive Officer) |
Date: March 1, 2023
| | |
| By | | /s/ Jonathan Kim |
| | Jonathan Kim, Treasurer |
| | (Principal Financial and Accounting Officer) |
Date: March 1, 2023
6