UNITED STATES
SECURITIES AND EXCHANGE COMMISSION
Washington, D.C. 20549
FORM N-CSR
CERTIFIED SHAREHOLDER REPORT OF REGISTERED MANAGEMENT
INVESTMENT COMPANIES
Investment Company Act file number 811-22468
Ashmore Funds
(Exact name of registrant as specified in charter)
c/o Ashmore Investment Advisors Limited
61 Aldwych
London WC2B 4AE
England
(Address of principal executive offices) (Zip code)
Corporation Service Company
84 State Street
Boston, MA 20109
(Name and address of agent for service)
Registrant’s telephone number, including area code: 011-44-20-3077-6000
Date of fiscal year end: October 31
Date of reporting period: October 31, 2023
Item 1. Reports to Stockholders.
(a) The following is a copy of the report transmitted to shareholders pursuant to Rule 30e-1 under the Investment Company Act of 1940 (17 CFR 270.30e-1)
ASHMORE FUNDS
ANNUAL FINANCIAL STATEMENTS
October 31, 2023

(THIS PAGE INTENTIONALLY LEFT BLANK)
ASHMORE FUNDS
TABLE OF CONTENTS
Ashmore Investment Management (US) Corporation is the Distributor for Ashmore Funds.
This material is authorized for use only when preceded or accompanied by the current Ashmore Funds’ prospectus. Investors should consider the investment objectives, principal risks, charges and expenses of these Funds carefully before investing. This and other information is contained in the Funds’ prospectus. Please read the prospectus carefully before you invest or send money.
A Fund’s past performance is not necessarily an indication of how the Fund will perform in the future.
The performance data quoted in this report represents past performance. Investment return and principal value will fluctuate, so an investor’s shares, when redeemed, may be worth more or less than the original cost. Current performance may be lower or higher than the performance data quoted in this report. For performance information current to the most recent month-end, please call (866) 876-8294.
An investment in a Fund is not a bank deposit and is not guaranteed or insured by the Federal Deposit Insurance Corporation or any other government agency. It is possible to lose money on investments in the Funds.
ASHMORE FUNDS
INVESTMENT MANAGER’S REPORT
For the period November 1, 2022 to October 31, 2023
Overview
Q4 2022 was a strong quarter for global bonds and equities, with positive returns across all the main asset classes and indices – closing the chapter on three consecutive quarters of across-the-board negative returns. The rally kicked off in October 2022 after US inflation surprised on the downside and the markets started to price in a slower pace of rate hikes by the US Federal Reserve (Fed). This coincided with the date of China’s 20th Party Congress, which led to the swift relaxation of COVID-19 policy measures: equity markets cheered China’s re-opening, but economists soon warned of growth headwinds when millions of Chinese got sick and household demand slumped yet again. Global equities jumped by 9.4% in Q4 2022, led by European stocks (DAX Index +14.9%) and Asian stocks (MSCI Asia +10.8%). Cyclical stock sectors out-performed (S&P Financials +13.0%), and tech stocks lagged (NASDAQ -0.3%). Emerging Markets (EM) equities kept pace with global markets (MSCI EM +9.2%), led by Turkey (+62.0%), China (+13.5%) and Korea (+18.1%), while Indonesia (-3.6%) and Brazil (+2.3%) lagged.
In Q1 2023, markets climbed the wall of worry and defied the bearish market expectations and a banking sector crisis to post strong returns across all asset classes. This was driven notably by strong gains in January as global markets celebrated the re-opening of China. Despite lingering inflation concerns, the rally was sustained by positive surprises in economic data releases, particularly in the US and EM. Global equities jumped by 7.2% in Q1 2023, led by European stocks (DAX Index +13.7%) and tech stocks (NASDAQ +20.5%). After a strong start, cyclical stock sectors retreated: notably financials (S&P Financials -1.6%), hit by the Silicon Valley bank (SVB) and Credit Suisse debacles. EM equities lagged the global markets’ rally (MSCI EM +4.0%), despite strong performance from EM heavyweights such as Mexico, Taiwan, and Korea (MSCI country Indices were up 20.3%, 14.8% and 9.5%, respectively). In credit markets, the lower core bond yields allowed indices to post strong returns despite tighter financial conditions: JP Morgan JULI, an Index of US IG corporate bonds rose by 3.6% in Q1 2023, as spreads widened by 4 basis points (bps) to 156 bps. This was matched by US High Yield (HY) bond prices, which posted a JP Morgan US Domestic High Yield Index return of 3.80% and saw spreads move tighter by 2 bps to 500 bps. Euro-denominated corporate IG bond prices rose by 2.0% as spreads widened by 6 bps to 1,170 bps. In a topsy turvy quarter for short-term interest rate expectations, the US dollar ended the period 1.1% lower versus developed market (DM) trading partners. EM FX outperformed, posting a 2.2% gain in nominal exchange rates owing notably to a strong rebound in Latin America and Central Europe. The uncertain growth outlook weighed on oil and gas prices, but other commodities performed well. Precious metals were buoyed by the lower interest rates, and gold rallied by 8%.
The banking crisis that started in Q1 2023 in the US continued to weigh on financial markets through the start of Q2 2023, when First Republic bank came under pressure and was eventually bought by JPMorgan Chase. This allowed global banking stocks to settle in early May, giving markets the space to focus on other things. The debt ceiling debate in the US briefly caused another period of heightened uncertainty during the month of May, when T-bill rates shot up, but the swift resolution of the issue allowed risk premia to ease again in June and markets to rally. The VIX Index of equity volatility fell back from 18 to 13.6 at the end of Q2 2023, its lowest level since the start of the pandemic. While headline inflation continued to decline in Q2 2023 (June US Consumer Price Index (CPI) 3.0% versus 5.0% in March), core inflation remained sticky (June Core CPI 4.8% versus 5.6% in March). Likewise, European core inflation came in at 5.4% in June versus 5.7% in March. Services inflation and upward pressure on wages from tight labour markets have been of concern to central banks, who tightened their policy rates further: the Fed hiked interest rates by another 25 bps in May, and then paused at the June Federal Open Market Committee (“FOMC”) for the first time in over a year but then signalled two further rate hikes for the remainder of 2023. The European Central Bank (ECB) hiked interest rates by 25 bps in both May and June, taking their deposit rate up to 3.5%. This upward pressure on funding costs caused further inversion in the core bond yield curves, especially in the US: the 2-year US treasury yield rose by 87 bps to 4.90%, and the 10-year treasury yield rose by 37 bps to 3.84%. In the UK, the 2-year Gilt yield rose by a whopping 183 bps to 5.27% during the quarter.
After a strong month in July 2023, adverse market ‘seasonality’ struck again for the rest of Q3 2023 – the weakest quarter for periodic returns for risky assets (0.09% average over 20 years), as bond and equity prices both posted losses owing to increasing signs that the Fed would be keeping interest rates higher for longer. That said, commodity prices posted strong gains, especially oil and gas prices, with Brent Crude Oil futures gaining 27% in Q3 2023. Global equities weakened by 3.8% (MSCI World), driven by European stocks (Eurostoxx50 -5.1%) and small-cap stocks (Rusell 2000 -5.5%). US stocks out-performed (S&P -3.6%), and EM were in-line (MSCI EM -3.7%), as Latin America lagged (-4.8%). The commodity-heavy UK FTSE 100 bucked the trend with a 1.0% positive return over the quarter. The bond market recorded a vicious move higher in core bond yields, led by the back end of the yield curve: the US treasury curve ‘bear-steepened’, as the ‘long bond’ (30-year) widened by 84 bps to 4.70 while the 2-year yield widened by just 15 bps
1
ASHMORE FUNDS
INVESTMENT MANAGER’S REPORT (CONTINUED)
to 5.05%. The reference 10-year bond yield widened by 73 bps to 4.57%, of which 61 bps came from higher real yields. The US 10-year real yield closed the quarter at 2.23%, the highest level since November 2008, but still 50 bps below the average of the decade prior to the global financial crisis.
Bond and equity prices fell again in October 2023, as Hamas’ attack on Israel on October 7 sent the oil prices higher and risk assets lower. In addition, a slew of stronger than expected US economic data solidified the ‘higher for longer’ narrative on US Fed funds, creating strong headwinds for financial markets. Global equities weakened by 3.0% (MSCI World), driven by small caps (Russell -6.91%). US stocks out-performed (S&P -2.2%), and EM lagged (MSCI EM -3.9%), led by Latin America (-4.8%). The bond market recorded another move higher in core bond yields, led by the back end of the yield curve: the US treasury curve ‘bear-steepened’, as the ‘long bond’ (30-year) widened by 39 bps to 5.10 while the 2-year yield widened by just 4 bps to 5.09%. The reference 10-year bond yield widened by 36 bps to 4.93%, of which 29 bps came from higher real yields (the US 10-year real yield went up to 2.51%).
Portfolio Overview
Ashmore Emerging Markets Total Return Fund
The Ashmore Emerging Markets Total Return Fund (the “Fund”) seeks to achieve its objective by investing principally in the debt instruments of sovereign, quasi-sovereign, and corporate issuers, which may be denominated in any currency, including the local currency of the issuer. The Fund tactically allocates assets between external debt, corporate debt and local currency.
Over the period, the Fund’s institutional class outperformed its benchmark, returning +12.06% (net of fees) versus +10.06% for the composite 50% JP Morgan Emerging Markets Bond Index Global Diversified (“JP Morgan EMBI GD”), 25% JP Morgan Emerging Local Markets Index Plus (“JP Morgan ELMI+”), 25% JP Morgan Government Bond Index - Emerging Markets Global Diversified (“JP Morgan GBI-EM GD”). Security selection within local currency and external debt were contributors to performance. The Fund’s off benchmark allocation to Corporate Debt was the largest detractor from performance over the period. China and Brazil also were amongst the largest detractors from Fund performance. Venezuela was the largest contributor to Fund performance over the period.
China’s underperformance was driven by exposure to the property sector, with bonds revisiting the lows seen late last year (2022). Property sales in China started the year strong, +8.2% in Q1 2023 (for top 100 developers in the country) but by the end of Q2 2023 the numbers turned back into the red with June numbers showing a year on year (yoy) decline of 40%. The post COVID-19 economic rebound in China seems to have run out of steam in Q2 2023 and the Chinese Government delivered more economic stimulus in Q3 which resulted in property sales picking up in September. Average credit spreads in China were wider by 43 bps during the quarter compared to an average tightening of 38 bps for the broad index.
Security selection and exposure to high yield bonds in the petrochemicals sector in Brazil was one of the main sources of negative alpha. With liquidity conditions remaining very tight in the country, after aggressive monetary tightening by the Central Bank to tackle inflation, the more levered names have been struggling to refinance and have been underperforming the rest of the market.
Negotiations between the Venezuelan government and opposition representatives in Barbados resulted in a political agreement on the conditions for free and fair elections. This satisfied the US Government, which announced a broad license temporarily authorising transactions involving the oil and gas sector in Venezuela, which, in our view, should lead to a rapid increase in oil and gas production and thus better recovery value for Venezuelan bonds. Moreover, the US also removed the ban on secondary trading of Venezuelan bonds by US persons, prompting many US based brokers and investors to start participating in the market for Venezuelan and Petroleos de Venezuela, S.A (PDVSA) debt again and creating sudden demand for the bonds.
Ashmore Emerging Markets Local Currency Bond Fund
The Ashmore Emerging Markets Local Currency Bond Fund (the “Fund”) seeks to achieve its objective by investing principally in the debt instruments of sovereign and quasi-sovereign issuers of emerging market countries that are denominated in the local currency of the issuer. The Fund’s returns are driven by EM currency appreciation, interest rate positioning and credit worthiness.
Over the period, the Fund’s institutional class underperformed its benchmark, returning +12.33% (net of fees) versus +13.50% for the JP Morgan GBI-EM GD. Allocations to the Turkish lira, Russian ruble and Brazilian real were the main contributors to Fund performance. Allocations to the Chinese yuan, Czech koruna and Thai bhat were the main detractors from Fund performance.
2
ASHMORE FUNDS
INVESTMENT MANAGER’S REPORT (CONTINUED)
The Turkish core CPI inflation rose by 8.8% to 64.9% and PPI inflation increased by 4.9% to 49.4% in August 2023. The move highlights the challenges faced by the new economy team headed by Mehmet Simsek. Real GDP growth rose by 3.5% quarter on quarter (qoq) in Q2 2023 as the yoy rate declined by only 10 bps to 3.8% (market consensus 3.1% yoy). Trade deficit widened to USD -12.2bn in July from USD -5.2bn the previous month, below consensus by USD 0.2bn. The manufacturing PMI declined 0.9pts to 49.0pts in August.
The Brazilian Ministry of Finance provided updated growth forecasts for the economy, upping its 2023 forecast to 3.2% from its earlier 2.5% projection. The Ministry also updated its inflation forecast to 4.9% for 2023 and to 3.4% for 2024. The rapid decline of inflation has permitted the Central Bank to commence its rate normalization, cutting its policy rate to 12.75% in September, in line with market expectations, and indicated that a steady pace of cuts would follow. President Lula’s cabinet reshuffle increased the government’s political base in Congress to 349 deputies and 58 senators, aiding the president’s reform agenda with more than sufficient representatives for a 3/5 constitutional majority. Lula acknowledged that the government will not likely meet its 0% primary fiscal target in 2024, as the administration does not intend to cut investments which are driving growth.
The Bank of Thailand increased its policy rate to 2.50%. This brings the policy rate to its highest level since November 2013. Following the eighth consecutive 25 bps hike, the central bank signalled rates do not need to go higher from here, stating the rate is “appropriate for supporting long-term sustainable growth”. This comes after the removal of language stating that decisions were “gradual and measured” in the August 2023 statement. Looking to 2024, we believe upside risks to inflation still exist, the government’s expansionary fiscal policy will support consumer demand, and El Niño may have an uncertain impact on the agriculture industry. In other news, Thailand’s current account balance was USD 401m in August, below the expected figure of USD 660m, although up from the revised July figure of USD -508m.
Ashmore Emerging Markets Corporate Income Fund
The Ashmore Emerging Markets Corporate Income Fund (the “Fund”) seeks to achieve its objective by investing principally in the debt instruments of corporate issuers, which may be denominated in any currency, including the local currency of the issuer.
Over the period, the Fund’s institutional class outperformed its benchmark, returning +12.06% (net of fees) versus +9.18% for the JP Morgan Corporate Emerging Markets Bond Index Broad Diversified (“JP Morgan CEMBI BD”). Venezuela was the main contributor to Fund performance. China and Brail were amongst the largest detractors from Fund performance.
In Venezuela, the gradual relaxation of restrictions on Venezuelan oil production and export over the period have boosted asset prices. Negotiations between the Venezuelan government and opposition representatives in Barbados resulted in a political agreement on the conditions for free and fair elections. This satisfied the US Government, which announced a broad license temporarily authorising transactions involving the oil and gas sector in Venezuela, which, in our view, should lead to a rapid increase in oil and gas production and thus better recovery value for Venezuelan bonds. Moreover, the US also removed the ban on secondary trading of Venezuelan bonds by US persons, prompting many US based brokers and investors to start participating in the market for Venezuelan and Petroleos de Venezuela, S.A (PDVSA) debt again and creating sudden demand for the bonds.
China underperformance was driven by exposure to the property sector, with bonds revisiting the lows seen late last year (2022). Property sales in China started the year strong, +8.2% in Q1 2023 (for top 100 developers in the country) but by the end of Q2 2023 the numbers turned back into the red with June numbers showing a yoy decline of 40%. The post COVID-19 economic rebound in China seems to have run out of steam in Q2 2023 and the Chinese Government delivered more economic stimulus in Q3 which resulted in property sales picking up in September. Average credit spreads in China were wider by 43 bps during the quarter compared to an average tightening of 38 bps for the broad index.
Security selection and exposure to high yield bonds in the Petrochemicals sector in Brazil was the main source of negative alpha. With liquidity conditions remaining very tight in the country, after aggressive monetary tightening by the Central Bank to effectively tackle inflation, the more levered names have been struggling to refinance and have been underperforming the rest of the market.
3
ASHMORE FUNDS
INVESTMENT MANAGER’S REPORT (CONTINUED)
Ashmore Emerging Markets Short Duration Fund
The Ashmore Emerging Markets Short Duration Fund (the “Fund”) seeks to achieve its objective by investing principally in short-term debt instruments of, and derivative instruments related to, Sovereign, Quasi-Sovereign and Corporate issuers of EM countries denominated exclusively in Hard Currencies (i.e., the U.S. dollar or any currency of a nation in the G-7). The Fund normally seeks to maintain a weighted average portfolio duration of between 1 and 3 years. The Fund has no restrictions on individual security duration.
Over the period, the Fund’s institutional class outperformed its benchmark, returning +22.63% (net of fees) versus +8.65% for the JP Morgan CEMBI BD 1-3 Year. Venezuela was the main country contributor to Fund performance. Positions in China and Brazil were amongst the largest detractors from Fund performance.
In Venezuela, the gradual relaxation of restrictions on Venezuelan oil production and export over the period have boosted asset prices. Negotiations between the Venezuelan government and opposition representatives in Barbados resulted in a political agreement on the conditions for free and fair elections. This satisfied the US Administration, which announced a broad license temporarily authorising transactions involving the oil and gas sector in Venezuela, which should lead to a rapid increase in oil and gas production and thus better recovery value for the bonds. Moreover, the US also removed the ban on secondary trading of Venezuelan bonds by US persons, prompting many US based brokers and investors to start participating in the market for Venezuela and Petroleos de Venezuela, S.A (PDVSA) debt again and creating sudden demand for the bonds.
China underperformance was driven by exposure to the Property sector, with bonds there revisiting the lows seen late last year (2022). Property sales started the year strong, +8.2% in Q1 (for top 100 developers in the country) but by the end of Q2 the numbers turned back into the red with June numbers showing a yoy decline of 40%. The post COVID-19 economic rebound in China seems to have run out of steam in Q2 2023 and the Government is now expected to deliver more economic stimulus in the next quarter to avoid the economy being trapped in a negative loop of disappointing economic growth, leading to a further drop in consumer confidence and thus impacting consumer spending going forward. Average credit spreads in China were wider by 43 bps during the quarter compared to an average tightening of 38 bps for the broad index.
Security selection and exposure to high yield bonds in the petrochemicals sector in Brazil was one of the main sources of negative alpha. With liquidity conditions remaining very tight in the country, after aggressive monetary tightening by the Central Bank to tackle inflation, the more levered names have been struggling to refinance and have been underperforming the rest of the market.
Ashmore Emerging Markets Active Equity Fund
The Ashmore Emerging Markets Active Equity Fund (the “Fund”) seeks to achieve its objective by investing principally in equity securities and equity-related investments of EM issuers, which may be denominated in any currency, including the local currency of the issuer.
Over the period, the Fund’s institutional class underperformed its benchmark, returning +7.95% (net of fees) versus +10.80% for the MSCI Emerging Markets Net.
India Banks (HDFC Bank) was amongst one of the weaker performers over the period. The company recently merged with HDFC LTD and saw market performance driven by one-off impacts from the merger. Another poor performer included South Korean Materials (LG Chem), which is home to one of the largest global producers of EV batteries. In our view, the company is well positioned to capture long-term structural growth drivers in the industry, but performance lagged as projected short-term growth in electric vehicle (EV) distribution from incumbent car manufacturers was moderated.
In October 2023, our position in Zambian Materials (First Quantum) performed poorly. The business has significant copper mines in Panama and performed poorly after the President announced a national referendum on a 20-year contract that has faced local opposition.
4
ASHMORE FUNDS
INVESTMENT MANAGER’S REPORT (CONTINUED)
Areas of the market that contributed to performance include Chinese (Xpeng) & Indian (Maruti Suzuki) autos. In the former, the company benefited from an 8.5% increase in EV sales in August as China surpassed both Germany and Japan as the largest exporter of electric vehicles in the world. In the latter, the company benefitted from a strong growth in volume and an improving product mix as SUVs increased in popularity.
The strategy’s exposure to the Gulf Cooperation Council (GCC) was a positive driver of performance. UAE Real Estate (Emaar Properties, Aldar Properties) benefitted from tight land supply and positive demand/pricing trends from overseas investors.
South Korean Capital Goods (HD Korea Shipbuilding & Offshore Engineering) contributed to performance. The company benefitted from multiple new contracts that were awarded to build Liquefied Natural Gas (LNG) carriers.
Ashmore Emerging Markets Small-Cap Equity Fund
The Ashmore Emerging Markets Small-Cap Equity Fund (the “Fund”) seeks to achieve its objective by investing at least 80% of its net assets in equity securities and equity-related investments of small-capitalization EM issuers, which may be denominated in any currency, including the local currency of the issuer.
Over the period, the Fund’s institutional class underperformed its benchmark, returning +9.85% (net of fees) versus +17.20% for the MSCI Emerging Markets Small Cap Index. Positions in South Korea, Thailand and Indonesia were amongst the largest contributors to Fund performance. Positions in Taiwan, India, Brazil and Malaysia were amongst the largest detractors from performance.
Strategy headwinds included poor performance from My EG Services, a Malaysian e-service provider for the national government. At the beginning of February, a rumour emerged that suggested the company would no longer be involved in the country’s immigration services. The stock sold-off despite indications that this rumour was unfounded. Later in the year management announced a slower role out of new projects.
In Brazil our weakness was driven by Vasta Platform (education provider) and TOTVS (ERP software provider), two domestic oriented companies that fell on fiscal policy uncertainty despite what we believe to be decent financial results.
Our investment in Dentium, a South Korean dental implant company, was the strongest performer over the period. This is a long-standing investment that was supported by a high level of profitability and a strong ROE which aided an earnings multiple re-rate.
Multi Commodity Exchange of India was the strongest performing company in Q3 2023. In our view, the exchange operates with significant market share and has proven to be resilient to new entrants over time and produces high return on invested capital.
Ashmore Emerging Markets Frontier Equity Fund
The Ashmore Emerging Markets Frontier Equity Fund (the “Fund”) seeks to achieve its objective by investing principally in equity securities and equity-related investments of Frontier Market issuers, which may be denominated in any currency, including the local currency of the issuer.
Over the period, the Fund’s institutional class outperformed its benchmark, returning -0.42% (net of fees) versus -2.57% for the MSCI Frontier Markets + Select EM Countries Capped Index.
In the UAE, Network International was the primary driver of returns. The payments solution company received multiple takeover proposals that drove the stock higher. Ultimately the company was purchased by Brookfield AM in June. Other investments that performed well include Emaar Properties and Emaar Development in the UAE. These companies benefitted from tight land supply and positive demand/pricing trends from overseas investors. In Saudi Arabia, United International transportation and Al Hammadi were the best performing companies. The former is a car rental company that has benefitted from increased tourism, while the latter is a hospital operating company that has benefitted from a significant growth in earnings over the past year.
5
ASHMORE FUNDS
INVESTMENT MANAGER’S REPORT (CONTINUED)
The Fund’s investments in Vietnam’s FPT, one of country’s largest technology companies, was supported by significant growth in top-line revenue, and strong guidance from overseas expansion. The company also expects future growth will be aided by Artificial Intelligence (AI) adoption, and predictions that Vietnam will play a larger role in the global semiconductor industry.
In Kazakhstan, our holding in Kaspi, a digital ecosystem that serves an underpenetrated market, performed well. The company has three primary verticals focused on ecommerce, financial technology and payments that all saw significant growth in revenue and profit. Growth has also been aided by selective acquisitions.
From a country perspective, Egypt was the largest headwind to performance over the period. Our exposure to Fertiglobe had performed well over the first nine months of 2022, but sold off at the end of the year on a dampened outlook for urea prices, and an investor rotation into other areas of the market.
In October 2023, our position in Zambian mining company First Quantum performed poorly. The business has significant copper mines in Panama and performed poorly after the President announced a national referendum on a 20-year contract that has faced local opposition.
In Europe, our exposure to Bank of Georgia and Banca Transilvania supported returns with net profit increasing by 40% in the first half of 2023.
Ashmore Emerging Markets Equity Fund
The Ashmore Emerging Markets Equity Fund (the “Fund”) seeks to achieve its objective by investing principally in equity securities and equity-related investments of EM issuers, which may be denominated in any currency, including the local currency of the issuer.
Over the period, the Fund’s institutional class outperformed its benchmark, returning +13.65% (net of fees) versus +10.80% for the MSCI Emerging Markets Net.
Positions in South Korea, Mexico and Saudi Arabia were amongst the largest contributors to performance.
In South Korea, SK Hynix (manufacturer of memory semiconductor chips) benefitted from structural opportunities presented by AI and the increased demand for high-end memory technology while Classys (producer of beauty/pharmaceutical devices) saw growth driven by new product launches and geographic expansion to the US and China. Our exposure to Fomento Economico (‘FEMSA’), a Mexican conglomerate driven by growth in its convenient store operations (‘Oxxo’), was the top performing company. To-date FEMSA has also seen geographic expansion across Latin America and simplified the company structure. Other companies that did well include Elm, a Saudi Arabian application developer that is well positioned to benefit from the country’s digital transformation initiatives and e-government services. In India, the Multi Commodity Exchange saw a large increase in option ADTV.
Positions in China, Brazil and Taiwan were amongst the largest detractors from performance.
Our expectation for a non-linear economic recovery was realized and driven by dampened consumer sentiment and a weak property sector. While we reduced our exposure to the country in the first quarter of the year, our position in companies like Xiabuxiabu (restaurant operator), JD.com (e-commerce) and Meituan (online marketplace/food delivery) ultimately weighed on performance. While we remain mindful of the macro challenges the country faces, and our underweight position relative to the index, we have used this period of market weakness to add to our positions in companies with strong structural growth opportunities that, in our view, are trading at attractive valuations.
Ashmore Emerging Markets Equity ESG Fund
The Ashmore Emerging Markets Equity ESG Fund (the “Fund”) seeks to achieve its objective by investing principally in equity securities and equity-related investments of Emerging Market Issuers, which may be denominated in any currency, including the local currency of the issuer, focusing on issuers that the Investment Manager believes satisfy the ESG (Environmental, Social and Governance) criteria.
6
ASHMORE FUNDS
INVESTMENT MANAGER’S REPORT (CONTINUED)
Over the period, the Fund’s institutional class outperformed its benchmark, returning +14.45% (net of fees) versus +10.80% for the MSCI Emerging Markets Net.
Our investment in Dentium, a South Korean dental implant company, was the strongest performer over the period. This is a long-standing investment that was supported by a high level of profitability and a strong ROE which aided an earnings multiple re-rate. Our exposure to Fomento Economico (‘FEMSA’), a Mexican conglomerate driven by growth in its convenient store operations (‘Oxxo’), was the top performing company. To-date FEMSA has also seen geographic expansion across Latin America and simplified the company structure. Other companies that did well include Elm, a Saudi Arabian application developer that is well positioned to benefit from the country’s digital transformation initiatives and e-government services.
The weakest performing company over the period was our investment in TOTVS, a Brazilian ERP software provider that was hurt by weak domestic demand. Arezzo Industria was another company hurt by a poor Brazilian domestic backdrop. HDFC Bank was another poor performer after the company recently merged with HDFC LTD and saw market performance driven by one-off impacts from the merger.
Ashmore Emerging Markets Low Duration Fund (formerly, Ashmore Emerging Markets Short Duration Select Fund)
The Ashmore Emerging Markets Short Duration Select Fund was renamed Ashmore Emerging Markets Low Duration Fund on August 1, 2023.
The Ashmore Emerging Markets Low Duration Fund (the “Fund”) seeks to achieve its objective by investing principally in short-term debt instruments of, and derivative instruments related to, Sovereign, Quasi-Sovereign and Corporate issuers of Emerging Market Countries denominated exclusively in Hard Currencies (i.e., the U.S. dollar or any currency of a nation in the G-7). The Fund normally seeks to maintain a weighted average portfolio duration of between 1 and 3 years and an Investment Grade weighted average credit rating. The Fund has no restrictions on individual security duration.
Over the period, the Fund’s institutional class outperformed its benchmark, returning +6.88% (net of fees) versus +5.20% for the JP Morgan CEMBI Broad Diversified Investment Grade 1-3 Year.
Security selection in Mexico and India contributed to performance whilst security selection in Colombia detracted from performance over the period.
Mexico’s government submitted its 2024 budget proposal with a 1.2% of Gross Domestic Product (GDP) primary deficit and a 5.4% of GDP total deficit, wider than had been expected, with GDP growth of 2.5%-3.5% based on a conservative oil price. Net debt is expected to reach 48.8% of GDP at the end of Andrés Manuel López Obrador’s presidency in 2024, 5.2% higher than at the start of his presidency.
Growth estimates for India were marked up following strong Q2 2023 data, with Gross Domestic Product up 7.8% year on year. The announcement that JP Morgan will add Indian government bonds to its Global Bond Index in June 2024 is expected to trigger sizeable inflows into the domestic bond market and, in our view, should produce wider benefits for Indian securities in general while pushing the balance of payments further into surplus.
The underperformance in Colombia was driven by exposure to an airline that has recently gone through a corporate merger.
Ashmore Emerging Markets Debt Fund (formerly, Ashmore Emerging Markets Investment Grade Income Fund)
The Ashmore Emerging Markets Investment Grade Income Fund was renamed Ashmore Emerging Markets Debt Fund on August 1, 2023.
Also effective August 1, 2023, the principal investment strategy of Ashmore Emerging Markets Debt Fund changed to (i) focus on investments in debt instruments of Sovereigns and Quasi-Sovereigns denominated principally in Hard Currencies (i.e., the U.S. dollar or any currency of a nation in the G-7); (ii) invest at least 80% of the Fund’s net assets in bonds and other debt instruments; (iii) reflect more limited derivatives usage; and (iv) permit investments in obligations of any credit quality, including in securities rated below investment grade.
7
ASHMORE FUNDS
INVESTMENT MANAGER’S REPORT (CONTINUED)
Over the period, the Fund’s institutional class underperformed its benchmark, returning +3.41% (net of fees) versus +8.36% for the JP Morgan EMBI GD.
Positions in the UAE, Argentina and Venezuela were the largest country detractors over the period, as was the underweight position in Turkey. The largest contributors were Pakistan and an underweight position in Panama.
Ashmore Emerging Markets Corporate Income ESG Fund
The Ashmore Emerging Markets Corporate Income ESG Fund (the “Fund”) seeks to achieve its objective by investing principally in debt instruments of corporate issuers, which may be denominated principally in hard currencies (i.e., the U.S. dollar or any currency of a nation in the G-7), focusing on issuers that the Investment Manager believes satisfy ESG (Environmental, Social and Governance) criteria.
Over the period, the Fund’s institutional class underperformed its benchmark, returning +3.36% (net of fees) versus +9.18% for the JP Morgan CEMBI BD. Positions in Brazil, Chile and Macau were amongst the largest detractors from Fund performance. Security selection in Mexico and South Africa contributed to Fund performance.
Positions in a Brazilian retailer and a telecom company, as well as a Chilean telecom company, were the main detractors from performance. Positions in Mexico, notably in the finance sector, South Africa and Poland were the main contributors to performance.
Security selection in Consumer Cyclical and communication names were the main detractors over the period. Utilities and financials were positive over the period.
8
GLOSSARY OF TERMS
MSCI Emerging Markets Net (“MSCI EM Net”): A free float-adjusted market capitalization index that is designed to measure equity market performance in the global Emerging Markets.
S&P 500 Index: Measures the value of the stocks of the 500 largest corporations by market capitalization listed on the New York Stock Exchange or Nasdaq.
JP Morgan EMBI Global Diversified (“JP Morgan EMBI GD)”: A uniquely weighted USD-denominated Emerging Markets sovereign index. It provides full coverage of the Emerging Markets asset class with representative countries, investable instruments (sovereign and quasi-sovereign), and transparent rules. It limits the weights of those index countries with larger debt stocks by only including specified portions of these countries’ eligible current face amounts of debt outstanding.
JP Morgan Government Bond Index - Emerging Markets Global Diversified (“JP Morgan GBI-EM GD”): A comprehensive global local emerging markets index, and consists of regularly traded, liquid fixed-rate, domestic currency government bonds to which international investors can gain exposure.
JP Morgan Emerging Local Markets Index Plus: Tracks total returns for local currency denominated money market instruments in 23 Emerging Markets.
JP Morgan CEMBI: Tracks the performance of US dollar-denominated bonds issued by emerging market corporate entities.
JP Morgan CEMBI Broad Diversified (“JP Morgan CEMBI BD”): Consists of an investable universe of corporate bonds and tracks total returns of USD-denominated debt instruments issued by corporate entities in Emerging Markets countries.
JP Morgan CEMBI Investment Grade Broad Diversified (“JP Morgan CEMBI IG BD”): A sub index of the JPM CEMBI BD which contains instruments that carry an investment grade rating.
JP Morgan CEMBI Broad Diversified 1-3 Year (“JP Morgan CEMBI BD 1-3 Year”): A sub index of the JPM CEMBI BD which contains instruments that have a maturity greater than 1 year and less than 3 years.
JP Morgan CEMBI Broad Diversified Investment Grade 1-3 Year (“JP Morgan CEMBI BD IG 1-3 Year”): A sub index of the JPM CEMBI BD which contains investment grade instruments that have a maturity greater than 1 year and less than 3 years.
MSCI Emerging Markets Small Cap Net (“MSCI EM Small Cap Net”): A free float-adjusted market capitalization index that is designed to measure small cap equity market performance in the global Emerging Markets.
MSCI Frontier Markets + Select EM Countries Capped Index Net TR (“MSCI FR + Select EM”): A customised benchmark that is designed to measure equity market performance of constituent companies in each of the MSCI Frontiers Market Index (50%) and emerging markets crossover markets (50%), which are the Philippines, Qatar, United Arab Emirates, Peru, Colombia, Argentina, Egypt, Pakistan and Kuwait, together with a country cap of 15%.
MSCI Frontier Markets Index Net TR: MSCI Frontier Market Index captures large and mid cap representation across Frontier Market Countries.
Basis points (“bps”): A unit of measure used in finance to describe the percentage change in the value of financial instruments or the rate change in an index or other benchmark.
Gross Domestic Product (“GDP”): Measures the monetary value of final goods and services—that is, those that are bought by the final user—produced in a country in a given period of time.
Purchase Managers Index (“PMI”): Is a survey-based indicator of business conditions, which includes individual measures (‘sub-indices’) of business output, new orders, employment, costs, selling prices, exports, purchasing activity, supplier performance, backlogs of orders and inventories of both inputs, etc.
Return on Equity (“ROE”): Is the measure of a company’s net income divided by its shareholders’ equity.
9
IMPORTANT INFORMATION ABOUT THE FUNDS
Ashmore Investment Advisors Limited
This commentary may include statements that constitute “forward-looking statements” under the U.S. securities laws. Forward-looking statements include, among other things, projections, estimates, and information about possible or future results related to the Funds and market or regulatory developments. The views expressed above are not guarantees of future performance or economic results and involve certain risks, uncertainties and assumptions that could cause actual outcomes and results to differ materially from the views expressed herein. The views expressed above are those of Ashmore Investment Advisors Limited as of the date indicated and are subject to change at any time based upon economic, market, or other conditions and Ashmore Investment Advisors Limited undertakes no obligation to update the views expressed herein. Any discussions of specific securities or markets should not be considered a recommendation to buy or sell or invest in those securities or markets. The views expressed above may not be relied upon as investment advice or as an indication of the Funds’ trading intent. Information about the Funds’ holdings, asset allocation or country diversification is historical and is not an indication of future portfolio composition, which may vary. Direct investment in any index is not possible. The performance of any index mentioned in this commentary has not been adjusted for ongoing management, distribution and operating expenses applicable to mutual fund investments. In addition, the returns do not reflect certain charges that an investor in the Funds may pay. If these additional fees were reflected, the performance shown would have been lower.
The following disclosure provides important information regarding each Fund’s Average Annual Total Return table and Cumulative Returns chart, which appear on each Fund’s individual page in this report (the “Shareholder Report” or the “Report”). Please refer to this information when reviewing the table and chart for a Fund.
On each individual Fund Summary page in this Report, the Average Annual Total Return table and Cumulative Returns chart measure performance assuming that all dividend and capital gain distributions were reinvested. Returns do not reflect the deduction of taxes that a shareholder would pay on (i) Fund distributions or (ii) the redemption of Fund shares. The Cumulative Returns Chart reflects only Institutional Class performance. Performance for Class A and Class C shares is typically lower than Institutional Class performance due to the lower expenses paid by Institutional Class shares. Except for the load-waived performance for the Class A and C shares of each Fund (as applicable), performance shown is net of fees and expenses. The load-waived performance for Class A and Class C shares does not reflect the sales charges shareholders of those classes may pay in connection with a purchase or redemption of Class A and Class C shares. The load-waived performance of those share classes is relevant only to shareholders who purchased Class A or Class C shares on a load-waived basis. The figures in the line graph are calculated at net asset value and assume the investment of $1,000,000 at the beginning of the first full month following the inception of the Institutional Class. Each Fund measures its performance against a broad-based securities market index (“benchmark index”). Each benchmark index does not take into account fees, expenses or taxes.
For periods prior to the inception date of the Class A and Class C shares (if applicable), performance information shown is based on the performance of the Fund’s Institutional Class shares, adjusted to reflect the distribution and/or service fees and other expenses paid by the Class A and Class C shares, respectively.
A Fund’s past performance, before and after taxes, is not necessarily an indication of how the Fund will perform in the future.
The expenses shown are for the fiscal year and may differ from the current prospectus.
10
IMPORTANT INFORMATION ABOUT THE FUNDS (CONTINUED)
The following disclosure provides important information regarding each Fund’s Expense Example, which appears on each Fund’s individual page in this Shareholder Report. Please refer to this information when reviewing the Expense Example for a Fund.
EXPENSE EXAMPLE
Fund Expenses
As a shareholder of the Funds, you incur two types of costs: (1) transaction costs, including sales charges (loads) on purchase payments; redemption fees; and exchange fees; and (2) ongoing costs, including management fees; distribution (12b-1) fees; and other Fund expenses. This Example is intended to help you understand your ongoing costs (in Dollars) of investing in the Funds and to compare these costs with the ongoing costs of investing in other mutual funds. The Example is based on an investment of $1,000 invested at the beginning of the period and held for the entire period, from May 1, 2023 or the inception date (if later), through October 31, 2023.
Actual Expenses
The information in the table under the heading “Actual Performance” provides information based on actual performance and actual expenses. You may use the information in these columns, together with the amount you invested, to estimate the expenses that you paid over the period. Simply divide your account value by $1,000 (for example, an $8,600 account value divided by $1,000 = $8.60), then multiply the result by the number in the appropriate column for your share class, in the row titled “Expenses Paid” to estimate the expenses you paid on your account during this period.
Hypothetical Example for Comparison Purposes
The information in the table under the heading “Hypothetical Performance” provides information about hypothetical account values and hypothetical expenses based on the Fund’s actual expense ratio and an assumed rate of return of 5% per year before expenses, which is not the Fund’s actual return. The hypothetical account values and expenses may not be used to estimate the actual ending account balance or expenses you paid for the period. You may use this information to compare the ongoing costs of investing in the Fund and other funds. To do so, compare this 5% hypothetical example with the 5% hypothetical examples that appear in the shareholder reports of the other funds.
Please note that the expenses shown in the table are meant to highlight your ongoing costs only and do not reflect any transactional costs, such as sales charges (loads), redemption fees, or exchange fees. Therefore, the information under the heading “Hypothetical Performance” is useful in comparing ongoing costs only, and will not help you determine the relative total costs of owning different funds. In addition, if these transactional costs were included, your costs would have been higher.
11
Ashmore Emerging Markets Total Return Fund
FUND SUMMARY (UNAUDITED)
| | | | | | | | | | | | | | | | | | | | | | | | | | | | | | |
Ashmore Emerging Markets Total Return Fund is an open-end U.S. mutual fund. The Fund seeks to achieve its objective by investing principally in debt instruments of sovereign, quasi-sovereign, and corporate issuers of Emerging Market countries, which may be denominated in any currency, including the local currency of the issuer. The Fund tactically allocates assets between external debt, corporate debt and local currency. | | | | | | | Share class information INSTITUTIONAL CLASS Launch date: December 8, 2010 Minimum initial investment: $1,000,000 ISIN: CUSIP: 044820405 BLOOMBERG: TICKER: EMKIX RETAIL CLASS A Launch date: May 12, 2011 Minimum initial investment: $1,000 ISIN: CUSIP: 044820835 BLOOMBERG: TICKER: EMKAX RETAIL CLASS C Launch date: May 12, 2011 Minimum initial investment: $1,000 ISIN: CUSIP: 044820827 BLOOMBERG: TICKER: EMKCX All sources are Ashmore unless otherwise indicated. |
Please refer to page 11 herein for an explanation of the information presented below in the Average Annual Total Return Table and Cumulative Return Chart. | | | | | |
Average Annual Total Return For The Period Ended Oct 31, 2023 | | | 1 Year | | | 5 Year | | | 10 Year | | | | |
Institutional Class | | | | | | | | | | | | | | | 12.06% | | | | -3.92% | | | | -1.07% | | | | | |
Retail Class A (load-waived) | | | | | | | | | | | | | | | 11.65% | | | | -4.16% | | | | -1.32%3 | | | | | |
Retail Class A (unadjusted)1 | | | | | | | | | | | | | | | 7.18% | | | | -4.93% | | | | -1.72%3 | | | | | |
Retail Class C (load-waived) | | | | | | | | | | | | | | | 11.14% | | | | -4.83% | | | | -1.90%3 | | | | | |
Retail Class C (unadjusted)1 | | | | | | | | | | | | | | | 10.14% | | | | -4.83% | | | | -1.90%3 | | | | | |
50/25/25 Composite Benchmark2 | | | | | | | | | | | | | | | 10.06% | | | | 0.12% | | | | 0.63% | | | | | |
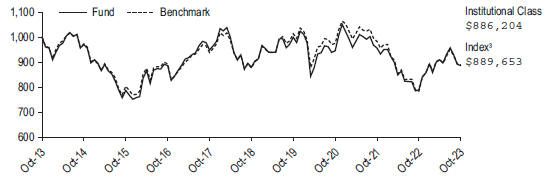
Cumulative Returns Through Oct 31, 2023 (% of NAV) | | | | | | | | | | | | | | | | | | | | | | | | | | | | |

| |
The above cumulative returns graph assumes $1,000,000 invested at the beginning of the first full month following the inception of the Institutional Class. The minimum initial investment amount for Institutional Class Shares is $1,000,000. The minimum initial investment amount for Retail Shares Classes A and C is $1,000. All Fund returns are net of fees and expenses, except for the load-waived return information for Class A and Class C shares. Performance calculations assume that all dividend, capital gain and other distributions were reinvested. The graph does not reflect the deduction of taxes that a shareholder would pay on distributions or the redemption of fund shares.
1Unadjusted Performance accounts for a maximum sales load of 4% for Class A shares and maximum deferred sales charge of 1% for the 1 year return for the Class C shares. 2The index for the Fund is 50% JP Morgan Emerging Markets Bond Index Global Diversified, 25% JP Morgan Emerging Local Markets Index Plus, and 25% JP Morgan Government Bond Index-Emerging Markets Global Diversified. 3Class C Shares performance reflects conversion to Class A Shares after eight years.
Past performance does not guarantee future results. The performance data quoted represents past performance and current returns may be lower or higher. The investment return and net asset value will fluctuate so that an investor’s shares, when redeemed, may be worth more or less than the original cost. To obtain performance information current to the most recent month-end, please call 1-855-274-6673. Periods greater than one year are annualized. Changes in rates of exchange between currencies may cause the value of investments to decrease or increase. The Fund’s performance will fluctuate over long and short term periods.
Please refer to page 12 herein for an explanation of the Expense Example information presented below.
| | | | | | | | | | | | | | |
| | | | |
Expense example | | Actual performance | | | | Hypothetical performance |
| | | | | | | | |
| | | Institutional Class | | Class A | | Class C | | | | Institutional Class | | Class A | | Class C |
| | | | | | | | |
Beginning Account Value (5/1/2023) | | $1,000.00 | | $1,000.00 | | $1,000.00 | | | | $1,000.00 | | $1,000.00 | | $1,000.00 |
| | | | | | | | |
Ending Account Value (10/31/2023) | | $987.80 | | $988.10 | | $984.40 | | | | $1,019.96 | | $1,018.72 | | $1,014.92 |
| | | | | | | | |
Expense Ratio (Gross / Net) | | 1.26% / 1.04% | | 1.49% / 1.29% | | 2.26% / 2.04% | | | | 1.26% / 1.04% | | 1.49% / 1.29% | | 2.26% / 2.04% |
| | | | | | | | |
Expenses Paid* | | $5.21 | | $6.45 | | $10.20 | | | | $5.30 | | $6.55 | | $10.36 |
*Expenses are equal to the Fund’s annualized expense ratios for the period May 1, 2023 through October 31, 2023, multiplied by the average account value over the period, multiplied by 184/365 (to reflect the one-half year period). As such, these may differ from the prospectus.
12
Ashmore Emerging Markets Local Currency Bond Fund
FUND SUMMARY (UNAUDITED)
| | | | | | | | | | | | | | | | | | | | | | | | | | | | | | |
Ashmore Emerging Markets Local Currency Bond Fund is an open-end U.S. mutual fund. The Fund seeks to achieve its objective by investing principally in debt instruments of sovereign and quasi-sovereign issuers of Emerging Market countries that are denominated in the local currency of the issuer. | | | | | | | Share class information INSTITUTIONAL CLASS Launch date: December 8, 2010 Minimum initial investment: $1,000,000 ISIN: CUSIP: 044820207 BLOOMBERG: TICKER: ELBIX RETAIL CLASS A Launch date: May 12, 2011 Minimum initial investment: $1,000 ISIN: CUSIP: 044820876 BLOOMBERG: TICKER: ELBAX RETAIL CLASS C Launch date: May 12, 2011 Minimum initial investment: $1,000 ISIN: CUSIP: 044820868 BLOOMBERG: TICKER: ELBCX All sources are Ashmore unless otherwise indicated. |
Please refer to page 11 herein for an explanation of the information presented below in the Average Annual Total Return Table and Cumulative Return Chart. | | | | | |
Average Annual Total Return For The Period Ended Oct 31, 2023 | | | 1 Year | | | 5 Year | | | 10 Year | | | | |
Institutional Class | | | | | | | | | | | | | | | 12.33% | | | | 0.14% | | | | -1.20% | | | | | |
Retail Class A (load-waived) | | | | | | | | | | | | | | | 12.11% | | | | -0.09% | | | | -1.44%3 | | | | | |
Retail Class A (unadjusted)1 | | | | | | | | | | | | | | | 7.71% | | | | -0.90% | | | | -1.84%3 | | | | | |
Retail Class C (load-waived) | | | | | | | | | | | | | | | 11.41% | | | | -0.81% | | | | -2.05%3 | | | | | |
Retail Class C (unadjusted)1 | | | | | | | | | | | | | | | 10.41% | | | | -0.81% | | | | -2.05%3 | | | | | |
JP Morgan GBI-EM GD2 | | | | | | | | | | | | | | | 13.50% | | | | 0.29% | | | | -1.16% | | | | | |
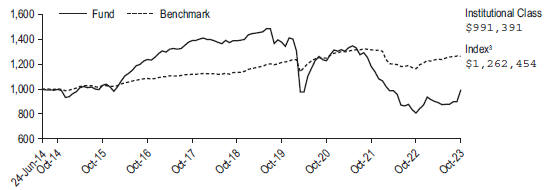
Cumulative Returns Through Oct 31, 2023 (% of NAV) | | | | | | | | | | | | | | | | | | | | | | | | | | | | |
| |
The above cumulative returns graph assumes $1,000,000 invested at the beginning of the first full month following the inception of the Institutional Class. The minimum initial investment amount for Institutional Class Shares is $1,000,000. The minimum initial investment amount for Retail Shares Classes A and C is $1,000. All Fund returns are net of fees and expenses, except for the load-waived return information for Class A and Class C shares. Performance calculations assume that all dividend, capital gain and other distributions were reinvested. The graph does not reflect the deduction of taxes that a shareholder would pay on distributions or the redemption of fund shares.
1Unadjusted Performance accounts for a maximum sales load of 4% for Class A shares and maximum deferred sales charge of 1% for the 1 year return for the Class C shares. 2The index for the Fund is the JP Morgan Global Bond Index—Emerging Markets Global Diversified. 3Class C Shares performance reflects conversion to Class A Shares after eight years.
Past performance does not guarantee future results. The performance data quoted represents past performance and current returns may be lower or higher. The investment return and net asset value will fluctuate so that an investor’s shares, when redeemed, may be worth more or less than the original cost. To obtain performance information current to the most recent month-end, please call 1-855-274-6673. Periods greater than one year are annualized. Changes in rates of exchange between currencies may cause the value of investments to decrease or increase. The Fund’s performance will fluctuate over long and short term periods.
Please refer to page 12 herein for an explanation of the Expense Example information presented below.
| | | | | | | | | | | | | | |
| | | | |
Expense example | | Actual performance | | | | Hypothetical performance |
| | | | | | | | |
| | | Institutional Class | | Class A | | Class C | | | | Institutional Class | | Class A | | Class C |
| | | | | | | | |
Beginning Account Value (5/1/2023) | | $1,000.00 | | $1,000.00 | | $1,000.00 | | | | $1,000.00 | | $1,000.00 | | $1,000.00 |
| | | | | | | | |
Ending Account Value (10/31/2023) | | $974.60 | | $973.80 | | $971.30 | | | | $1,021.32 | | $1,020.06 | | $1,016.27 |
| | | | | | | | |
Expense Ratio (Gross / Net) | | 2.57% / 0.77% | | 2.79% / 1.02% | | 3.42% / 1.77% | | | | 2.57% / 0.77% | | 2.79% / 1.02% | | 3.42% / 1.77% |
| | | | | | | | |
Expenses Paid* | | $3.83 | | $5.07 | | $8.81 | | | | $3.92 | | $5.19 | | $9.01 |
*Expenses are equal to the Fund’s annualized expense ratios for the period May 1, 2023 through October 31, 2023, multiplied by the average account value over the period, multiplied by 184/365 (to reflect the one-half year period). As such, these may differ from the prospectus.
13
Ashmore Emerging Markets Corporate Income Fund
FUND SUMMARY (UNAUDITED)
| | | | | | | | | | | | | | | | | | | | | | | | | | | | | | |
Ashmore Emerging Markets Corporate Income Fund is an open-end U.S. mutual fund. The Fund seeks to achieve its objective by investing principally in debt instruments of Emerging Market corporate issuers, which may be denominated in any currency, including the local currency of the issuer. | | | | | | | Share class information INSTITUTIONAL CLASS Launch date: December 8, 2010 Minimum initial investment: $1,000,000 ISIN: CUSIP: 044820504 BLOOMBERG: TICKER: EMCIX RETAIL CLASS A Launch date: May 12, 2011 Minimum initial investment: $1,000 ISIN: CUSIP: 044820603 BLOOMBERG: TICKER: ECDAX RETAIL CLASS C Launch date: May 12, 2011 Minimum initial investment: $1,000 ISIN: CUSIP: 044820702 BLOOMBERG: TICKER: ECDCX All sources are Ashmore unless otherwise indicated. |
Please refer to page 11 herein for an explanation of the information presented below in the Average Annual Total Return Table and Cumulative Return Chart. | | | | | |
Average Annual Total Return For The Period Ended Oct 31, 2023 | | | 1 Year | | | 5 Year | | | 10 Year | | | | |
Institutional Class | | | | | | | | | | | | | | | 12.06% | | | | -1.90% | | | | 1.32% | | | | | |
Retail Class A (load-waived) | | | | | | | | | | | | | | | 11.75% | | | | -2.15% | | | | 1.06%3 | | | | | |
Retail Class A (unadjusted)1 | | | | | | | | | | | | | | | 7.21% | | | | -2.95% | | | | 0.65%3 | | | | | |
Retail Class C (load-waived) | | | | | | | | | | | | | | | 10.75% | | | | -2.90% | | | | 0.47%3 | | | | | |
Retail Class C (unadjusted)1 | | | | | | | | | | | | | | | 9.75% | | | | -2.90% | | | | 0.47%3 | | | | | |
JP Morgan CEMBI BD2 | | | | | | | | | | | | | | | 9.18% | | | | 1.95% | | | | 3.06% | | | | | |
Cumulative Returns Through Oct 31, 2023 (% of NAV) | | | | | | | | | | | | | | | | | | | | | | | | | | | | |

| |
The above cumulative returns graph assumes $1,000,000 invested at the beginning of the first full month following the inception of the Institutional Class. The minimum initial investment amount for Institutional Class Shares is $1,000,000. The minimum initial investment amount for Retail Shares Classes A and C is $1,000. All Fund returns are net of fees and expenses, except for the load-waived return information for Class A and Class C shares. Performance calculations assume that all dividend, capital gain and other distributions were reinvested. The graph does not reflect the deduction of taxes that a shareholder would pay on distributions or the redemption of fund shares.
1Unadjusted Performance accounts for a maximum sales load of 4% for Class A shares and maximum deferred sales charge of 1% for the 1 year return for the Class C shares. 2The index for the Fund is the JP Morgan CEMBI Broad Diversified. 3Class C Shares performance reflects conversion to Class A Shares after eight years.
Past performance does not guarantee future results. The performance data quoted represents past performance and current returns may be lower or higher. The investment return and net asset value will fluctuate so that an investor’s shares, when redeemed, may be worth more or less than the original cost. To obtain performance information current to the most recent month-end, please call 1-855-274-6673. Periods greater than one year are annualized. Changes in rates of exchange between currencies may cause the value of investments to decrease or increase. The Fund’s performance will fluctuate over long and short term periods.
Please refer to page 12 herein for an explanation of the Expense Example information presented below.
| | | | | | | | | | | | | | |
| | | | |
Expense example | | Actual performance | | | | Hypothetical performance |
| | | | | | | | |
| | | Institutional Class | | Class A | | Class C | | | | Institutional Class | | Class A | | Class C |
| | | | | | | | |
Beginning Account Value (5/1/2023) | | $1,000.00 | | $1,000.00 | | $1,000.00 | | | | $1,000.00 | | $1,000.00 | | $1,000.00 |
| | | | | | | | |
Ending Account Value (10/31/2023) | | $999.20 | | $998.70 | | $993.10 | | | | $1,020.66 | | $1,019.40 | | $1,015.61 |
| | | | | | | | |
Expense Ratio (Gross / Net) | | 1.23% / 0.90% | | 1.48% / 1.15% | | 2.23% / 1.90% | | | | 1.23% / 0.90% | | 1.48% / 1.15% | | 2.23% / 1.90% |
| | | | | | | | |
Expenses Paid* | | $4.54 | | $5.80 | | $9.56 | | | | $4.59 | | $5.86 | | $9.67 |
*Expenses are equal to the Fund’s annualized expense ratios for the period May 1, 2023 through October 31, 2023, multiplied by the average account value over the period, multiplied by 184/365 (to reflect the one-half year period). As such, these may differ from the prospectus.
14
Ashmore Emerging Markets Short Duration Fund
FUND SUMMARY (UNAUDITED)
��
| | | | | | | | | | | | | | | | | | | | | | | | | | | | | | |
Ashmore Emerging Markets Short Duration Fund is an open-end U.S. mutual fund. The Fund seeks to achieve its objective by investing principally in short-term debt instruments of, and derivative instruments related to, sovereign, quasi-sovereign and corporate issuers of Emerging Markets countries denominated exclusively in hard currencies (i.e., the U.S. dollar or any currency of a nation in the G-7). The Fund normally seeks to maintain a weighted average portfolio duration of between 1 and 3 years. The Fund has no restrictions on individual security duration. | | | | | | | Share class information INSTITUTIONAL CLASS Launch date: June 24, 2014 Minimum initial investment: $1,000,000 ISIN: CUSIP: 044820694 BLOOMBERG: TICKER: ESFIX RETAIL CLASS A Launch date: September 23, 2014 Minimum initial investment: $1,000 ISIN: CUSIP: 044820728 BLOOMBERG: TICKER: ESFAX RETAIL CLASS C Launch date: June 13, 2017 Minimum initial investment: $1,000 ISIN: CUSIP: 044820710 BLOOMBERG: TICKER: ESFCX All sources are Ashmore unless otherwise indicated. |
Please refer to page 11 herein for an explanation of the information presented below in the Average Annual Total Return Table and Cumulative Return Chart. | | | | | |
Average Annual Total Return For The Period Ended Oct 31, 2023 | | | 1 Year | | | 5 Year | | | Since incpt1
| | | | |
Institutional Class | | | | | | | | | | | | | | | 22.63% | | | | -6.56% | | | | -0.09% | | | | | |
Retail Class A (load-waived) | | | | | | | | | | | | | | | 22.36% | | | | -6.77% | | | | -0.25% | | | | | |
Retail Class A (unadjusted)1 | | | | | | | | | | | | | | | 19.57% | | | | -7.53% | | | | -0.70% | | | | | |
Retail Class C (load-waived) | | | | | | | | | | | | | | | 21.32% | | | | -7.53% | | | | -5.41% | | | | | |
Retail Class C (unadjusted)1 | | | | | | | | | | | | | | | 20.32% | | | | -7.53% | | | | -5.41% | | | | | |
JP Morgan CEMBI BD 1-3 Year2 | | | | | | | | | | | | | | | 8.65% | | | | 2.19% | | | | 2.52% | | | | | |
Cumulative Returns Through Oct 31, 2023 (% of NAV) | | | | | | | | | | | | | | | | | | | | | | | | | | | | |
| |
The above cumulative returns graph assumes $1,000,000 invested at the beginning of the first full month following the inception of the Institutional Class. The minimum initial investment amount for Institutional Class Shares is $1,000,000. The minimum initial investment amount for Retail Shares Class A is $1,000. All Fund returns are net of fees and expenses, except for the load-waived return information for Class A shares. Performance calculations assume that all dividend, capital gain and other distributions were reinvested. The graph does not reflect the deduction of taxes that a shareholder would pay on distributions or the redemption of fund shares.
1Unadjusted Performance accounts for a maximum sales load of 2.25% for Class A shares and maximum deferred sales charge of 1% for the 1 year return for the Class C shares. 2The index for the Fund is the JP Morgan CEMBI Broad Diversified 1-3 Year. Since inception returns are from the inception of the Institutional Class.
Past performance does not guarantee future results. The performance data quoted represents past performance and current returns may be lower or higher. The investment return and net asset value will fluctuate so that an investor’s shares, when redeemed, may be worth more or less than the original cost. To obtain performance information current to the most recent month-end, please call 1-855-274-6673. Periods greater than one year are annualized. Changes in rates of exchange between currencies may cause the value of investments to decrease or increase. The Fund’s performance will fluctuate over long and short term periods.
Please refer to page 12 herein for an explanation of the Expense Example information presented below.
| | | | | | | | | | | | | | |
| | | | |
Expense example | | Actual performance | | | | Hypothetical performance |
| | | | | | | | |
| | | Institutional Class | | Class A | | Class C | | | | Institutional Class | | Class A | | Class C |
| | | | | | | | |
Beginning Account Value (5/1/2023) | | $1,000.00 | | $1,000.00 | | $1,000.00 | | | | $1,000.00 | | $1,000.00 | | $1,000.00 |
| | | | | | | | |
Ending Account Value (10/31/2023) | | $1,110.50 | | $1,112.60 | | $1,104.90 | | | | $1,021.26 | | $1,020.01 | | $1,016.23 |
| | | | | | | | |
Expense Ratio (Gross / Net) | | 1.19% / 0.78% | | 1.44% / 1.03% | | 2.18% / 1.78% | | | | 1.19% / 0.78% | | 1.44%
/ 1.03% | | 2.18% / 1.78% |
| | | | | | | | |
Expenses Paid* | | $4.17 | | $5.48 | | $9.44 | | | | $3.99 | | $5.24 | | $9.04 |
*Expenses are equal to the Fund’s annualized expense ratios for the period May 1, 2023 through October 31, 2023, multiplied by the average account value over the period, multiplied by 184/365 (to reflect the one-half year period). As such, these may differ from the prospectus.
15
Ashmore Emerging Markets Active Equity Fund
FUND SUMMARY (UNAUDITED)
| | | | | | | | | | | | | | | | | | | | | | | | | | | | | | |
Ashmore Emerging Markets Active Equity Fund is an open-end U.S. mutual fund. The Fund seeks to achieve its objective by investing principally in equity securities and equity-related investments of Emerging Market issuers, which may be denominated in any currency, including the local currency of the issuer. | | | | | | | Share class information INSTITUTIONAL CLASS Launch date: November 1, 2016 Minimum initial investment: $1,000,000 ISIN: CUSIP: 044820595 BLOOMBERG: TICKER: EMQIX RETAIL CLASS A Launch date: November 1, 2016 Minimum initial investment: $1,000 ISIN: CUSIP: 044820629 BLOOMBERG: TICKER: EMQAX RETAIL CLASS C Launch date: November 1, 2016 Minimum initial investment: $1,000 ISIN: CUSIP: 044820611 BLOOMBERG: TICKER: EMQCX All sources are Ashmore unless otherwise indicated. |
Please refer to page 11 herein for an explanation of the information presented below in the Average Annual Total Return Table and Cumulative Return Chart. | | | | | |
Average Annual Total Return For The Period Ended Oct 31, 2023 | | | | | | | | | | | 1 Year | | | 5 Year | | | Since incpt1 | | | | |
Institutional Class | | | | | | | | | | | | | | | 7.95% | | | | -0.48% | | | | 1.94% | | | | | |
Retail Class A (load-waived) | | | | | | | | | | | | | | | 7.68% | | | | -0.73% | | | | 1.71% | | | | | |
Retail Class A (unadjusted)1 | | | | | | | | | | | | | | | 2.00% | | | | -1.79% | | | | 0.93% | | | | | |
Retail Class C (load-waived) | | | | | | | | | | | | | | | 6.89% | | | | -1.46% | | | | 0.95% | | | | | |
Retail Class C (unadjusted)1 | | | | | | | | | | | | | | | 5.89% | | | | -1.46% | | | | 0.95% | | | | | |
MSCI EM Net2 | | | | | | | | | | | | | | | 10.80% | | | | 1.59% | | | | 2.65% | | | | | |
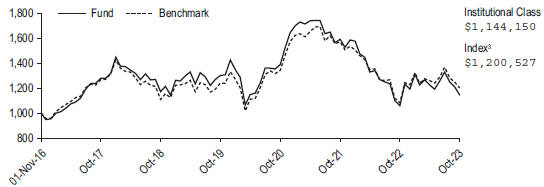
Cumulative Returns Through Oct 31, 2023 (% of NAV) | | | | | | | | | | | | | | | | | | | | | | | | | | | | |
| |
The above cumulative returns graph assumes $1,000,000 invested at the beginning of the first full month following the inception of the Institutional Class. The minimum initial investment amount for Institutional Class Shares is $1,000,000. The minimum initial investment amount for Retail Shares Classes A and C is $1,000. All Fund returns are net of fees and expenses, except for the load-waived return information for Class A and Class C shares. Performance calculations assume that all dividend, capital gain and other distributions were reinvested. The graph does not reflect the deduction of taxes that a shareholder would pay on distributions or the redemption of fund shares.
1Unadjusted Performance accounts for a maximum sales load of 5.25% for Class A shares and maximum deferred sales charge of 1% for the 1 year return for the Class C shares. 2The index for the Fund is the MSCI Emerging Markets Net.
Past performance does not guarantee future results. The performance data quoted represents past performance and current returns may be lower or higher. The investment return and net asset value will fluctuate so that an investor’s shares, when redeemed, may be worth more or less than the original cost. To obtain performance information current to the most recent month-end, please call 1-855-274-6673. Periods greater than one year are annualized. Changes in rates of exchange between currencies may cause the value of investments to decrease or increase. The Fund’s performance will fluctuate over long and short term periods.
Please refer to page 12 herein for an explanation of the Expense Example information presented below.
| | | | | | | | | | | | | | |
| | | | |
Expense example | | Actual performance | | | | Hypothetical performance |
| | | | | | | | |
| | | Institutional Class | | Class A | | Class C | | | | Institutional Class | | Class A | | Class C |
| | | | | | | | |
Beginning Account Value (5/1/2023) | | $1,000.00 | | $1,000.00 | | $1,000.00 | | | | $1,000.00 | �� | $1,000.00 | | $1,000.00 |
| | | | | | | | |
Ending Account Value (10/31/2023) | | $933.40 | | $933.50 | | $929.50 | | | | $1,020.06 | | $1,018.80 | | $1,015.04 |
| | | | | | | | |
Expense Ratio (Gross / Net) | | 2.03% / 1.02% | | 2.28% / 1.27% | | 2.93% / 2.02% | | | | 2.03% / 1.02% | | 2.28% / 1.27% | | 2.93% / 2.02% |
| | | | | | | | |
Expenses Paid* | | $4.97 | | $6.19 | | $9.81 | | | | $5.19 | | $6.46 | | $10.24 |
*Expenses are equal to the Fund’s annualized expense ratios for the period May 1, 2023 through October 31, 2023, multiplied by the average account value over the period, multiplied by 184/365 (to reflect the one-half year period). As such, these may differ from the prospectus.
16
Ashmore Emerging Markets Small-Cap Equity Fund
FUND SUMMARY (UNAUDITED)
| | | | | | | | | | | | | | | | | | | | | | | | | | | | | | |
Ashmore Emerging Markets Small-Cap Equity Fund is an open-end U.S. mutual fund. The Fund seeks to achieve its objective by investing at least 80% of its net assets in equity securities and equity-related investments of Small-Capitalization Emerging Market Issuers, which may be denominated in any currency, including the local currency of the issuer. | | | | | | | Share class information INSTITUTIONAL CLASS Launch date: October 4, 2011 Minimum initial investment: $1,000,000 ISIN: CUSIP: 044820116 BLOOMBERG: TICKER: ESCIX RETAIL CLASS A Launch date: February 1, 2012 Minimum initial investment: $1,000 ISIN: CUSIP: 044820793 BLOOMBERG: TICKER: ESSAX RETAIL CLASS C Launch date: August 23, 2012 Minimum initial investment: $1,000 ISIN: CUSIP: 044820785 BLOOMBERG: TICKER: ESSCX All sources are Ashmore unless otherwise indicated. |
Please refer to page 11 herein for an explanation of the information presented below in the Average Annual Total Return Table and Cumulative Return Chart. | | | | | |
Average Annual Total Return For The Period Ended Oct 31, 2023 | | | 1 Year | | | 5 Year | | | 10 Year | | | | |
Institutional Class | | | | | | | | | | | | | | | 9.85% | | | | 7.13% | | | | 2.86% | | | | | |
Retail Class A (load-waived) | | | | | | | | | | | | | | | 9.53% | | | | 6.88% | | | | 2.60%3 | | | | | |
Retail Class A (unadjusted)1 | | | | | | | | | | | | | | | 3.76% | | | | 5.74% | | | | 2.04%3 | | | | | |
Retail Class C (load-waived) | | | | | | | | | | | | | | | 8.69% | | | | 6.15% | | | | 2.00%3 | | | | | |
Retail Class C (unadjusted)1 | | | | | | | | | | | | | | | 7.69% | | | | 6.15% | | | | 2.00%3 | | | | | |
MSCI EM Small Cap Net2 | | | | | | | | | | | | | | | 17.20% | | | | 7.78% | | | | 3.68% | | | | | |
Cumulative Returns Through Oct 31, 2023 (% of NAV) | | | | | | | | | | | | | | | | | | | | | | | | | | | | |

| |
The above cumulative returns graph assumes $1,000,000 invested at the beginning of the first full month following the inception of the Institutional Class. The minimum initial investment amount for Institutional Class Shares is $1,000,000. The minimum initial investment amount for Retail Shares Classes A and C is $1,000. All Fund returns are net of fees and expenses, except for the load-waived return information for Class A and Class C shares. Performance calculations assume that all dividend, capital gain and other distributions were reinvested. The graph does not reflect the deduction of taxes that a shareholder would pay on distributions or the redemption of fund shares.
1Unadjusted Performance accounts for a maximum sales load of 5.25% for Class A shares and maximum deferred sales charge of 1% for the 1 year return for the Class C shares. 2The index for the Fund is the MSCI Emerging Markets Small Cap Net. 3Class C Shares performance reflects conversion to Class A Shares after eight years.
Past performance does not guarantee future results. The performance data quoted represents past performance and current returns may be lower or higher. The investment return and net asset value will fluctuate so that an investor’s shares, when redeemed, may be worth more or less than the original cost. To obtain performance information current to the most recent month-end, please call 1-855-274-6673. Periods greater than one year are annualized. Changes in rates of exchange between currencies may cause the value of investments to decrease or increase. The Fund’s performance will fluctuate over long and short term periods.
Please refer to page 12 herein for an explanation of the Expense Example information presented below.
| | | | | | | | | | | | | | |
| | | | |
Expense example | | Actual performance | | | | Hypothetical performance |
| | | | | | | | |
| | | Institutional Class �� | | Class A | | Class C | | | | Institutional Class | | Class A | | Class C |
| | | | | | | | |
Beginning Account Value (5/1/2023) | | $1,000.00 | | $1,000.00 | | $1,000.00 | | | | $1,000.00 | | $1,000.00 | | $1,000.00 |
| | | | | | | | |
Ending Account Value (10/31/2023) | | $951.10 | | $949.20 | | $946.20 | | | | $1,018.80 | | $1,017.54 | | $1,013.76 |
| | | | | | | | |
Expense Ratio (Gross / Net) | | 3.21% / 1.27% | | 3.46% / 1.52% | | 4.18% / 2.27% | | | | 3.21% / 1.27% | | 3.46% / 1.52% | | 4.18% / 2.27% |
| | | | | | | | |
Expenses Paid* | | $6.25 | | $7.47 | | $11.13 | | | | $6.46 | | $7.73 | | $11.52 |
*Expenses are equal to the Fund’s annualized expense ratios for the period May 1, 2023 through October 31, 2023, multiplied by the average account value over the period, multiplied by 184/365 (to reflect the one-half year period). As such, these may differ from the prospectus.
17
Ashmore Emerging Markets Frontier Equity Fund
FUND SUMMARY (UNAUDITED)
| | | | | | | | | | | | | | | | | | | | | | | | | | | | | | |
Ashmore Emerging Markets Frontier Equity Fund is an open-end U.S. mutual fund. The Fund seeks to achieve its objective by investing principally in equity securities and equity-related investments of Frontier Market issuers, which may be denominated in any currency, including the local currency of the issuer. | | | | | | | Share class information INSTITUTIONAL CLASS Launch date: November 1, 2013 Minimum initial investment: $1,000,000 ISIN: CUSIP: 044820736 BLOOMBERG: TICKER: EFEIX RETAIL CLASS A Launch date: May 7, 2014 Minimum initial investment: $1,000 ISIN: CUSIP: 044820751 BLOOMBERG: TICKER: EFEAX RETAIL CLASS C Launch date: May 7, 2014 Minimum initial investment: $1,000 ISIN: CUSIP: 044820744 BLOOMBERG: TICKER: EFECX All sources are Ashmore unless otherwise indicated. |
Please refer to page 11 herein for an explanation of the information presented below in the Average Annual Total Return Table and Cumulative Return Chart. | | | | | |
Average Annual Total Return For The Period Ended Oct 31, 2023 | | | 1 Year | | | 5 Year | | | Since incpt1 | | | | |
Institutional Class | | | | | | | | | | | | | | | -0.42% | | | | 2.86% | | | | 2.56% | | | | | |
Retail Class A (load-waived) | | | | | | | | | | | | | | | -0.72% | | | | 2.58% | | | | 1.20%2 | | | | | |
Retail Class A (unadjusted)1 | | | | | | | | | | | | | | | -5.89% | | | | 1.49% | | | | 0.63%2 | | | | | |
Retail Class C (load-waived) | | | | | | | | | | | | | | | -1.51% | | | | 1.81% | | | | 0.51%2 | | | | | |
Retail Class C (unadjusted)1 | | | | | | | | | | | | | | | -2.48% | | | | 1.81% | | | | 0.51%2 | | | | | |
MSCI FM + Select EM3 | | | | | | | | | | | | | | | -2.57% | | | | N/A | | | | N/A | | | | | |
MSCI Frontier Markets Net3 | | | | | | | | | | | | | | | 4.82% | | | | 1.15% | | | | 1.38% | | | | | |
Cumulative Returns Through Oct 31, 2023 (% of NAV) | | | | | | | | | | | | | | | | | | | | | | | | | | | | |
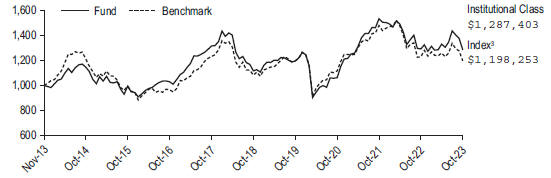
| |
The above cumulative returns graph assumes $1,000,000 invested at the beginning of the first full month following the inception of the Institutional Class. The minimum initial investment amount for Institutional Class Shares is $1,000,000. All Fund returns are net of fees and expenses. Performance calculations assume that all dividend, capital gain and other distributions were reinvested. The graph does not reflect the deduction of taxes that a shareholder would pay on distributions or the redemption of fund shares.
1Unadjusted Performance accounts for a maximum sales load of 5.25% for Class A shares and maximum deferred sales charge of 1% for the 1 year return for the Class C shares. 2Class C Shares performance reflects conversion to Class A Shares after eight years.
3The index disclosed in the line graph is the MSCI Frontier Markets Index Net TR. Effective December 31, 2019, the Fund started using the MSCI Frontier Markets +Select EM Countries Capped Index Net TR with performance of the index beginning on December 31, 2019. Prior to this, the Fund’s benchmark was the MSCI Frontier Markets Index Net TR from inception. Source: MSCI. The MSCI data is comprised of a custom index calculated by MSCI for, and as requested by, Ashmore. The MSCI data is for internal use only and may not be redistributed or used in connection with creating or offering any securities, financial products or indices. Neither MSCI nor any other third party involved in or related to compiling, computing or creating the MSCI data (the “MSCI Parties) makes any express or implied warranties or representations with respect to such data or the results to be obtained by the use thereof), and the MSCI Parties hereby expressly disclaim all warranties of originality, accuracy, completeness, merchantability or fitness for a particular purpose with respect to such data. Without limiting any of the foregoing, in no event shall any of the MSCI Parties have any liability for any direct, indirect, special, punitive, consequential or any other damages (including lost profits,) even if notified of the possibility of such damages. The MSCI Frontier + Select Emerging Markets Countries Capped Index is a customised benchmark that is designed to measure equity market performance of constituent companies in each of the MSCI Frontiers Market Index (50%) and emerging markets crossover markets (50%), which are the Philippines, Qatar, United Arab Emirates, Peru, Colombia, Argentina, Egypt and Pakistan, together with a country cap of 15%. You cannot invest directly in an index. Since inception returns are from the inception of the Institutional Class.
Past performance does not guarantee future results. The performance data quoted represents past performance and current returns may be lower or higher. The investment return and net asset value will fluctuate so that an investor’s shares, when redeemed, may be worth more or less than the original cost. To obtain performance information current to the most recent month-end, please call 1-855-274-6673. Periods greater than one year are annualized. Changes in rates of exchange between currencies may cause the value of investments to decrease or increase. The Fund’s performance will fluctuate over long and short term periods.
18
Ashmore Emerging Markets Frontier Equity Fund
FUND SUMMARY (UNAUDITED) (CONTINUED)
Please refer to page 12 herein for an explanation of the Expense Example information presented below.
| | | | | | | | | | | | | | |
| | | | |
Expense example | | Actual performance | | | | Hypothetical performance |
| | | | | | | | |
| | | Institutional Class | | Class A | | Class C | | | | Institutional Class | | Class A | | Class C |
| | | | | | | | |
Beginning Account Value (5/1/2023) | | $1,000.00 | | $1,000.00 | | $1,000.00 | | | | $1,000.00 | | $1,000.00 | | $1,000.00 |
| | | | | | | | |
Ending Account Value (10/31/2023) | | $966.70 | | $965.80 | | $961.60 | | | | $1,017.54 | | $1,016.28 | | $1,012.50 |
| | | | | | | | |
Expense Ratio (Gross / Net) | | 2.08% / 1.52% | | 2.32% / 1.77% | | 3.08% / 2.52% | | | | 2.08% / 1.52% | | 2.32% / 1.77% | | 3.08% / 2.52% |
| | | | | | | | |
Expenses Paid* | | $7.53 | | $8.77 | | $12.46 | | | | $7.73 | | $9.00 | | $12.78 |
*Expenses are equal to the Fund’s annualized expense ratios for the period May 1, 2023 through October 31, 2023, multiplied by the average account value over the period, multiplied by 184/365 (to reflect the one-half year period). As such, these may differ from the prospectus.
19
Ashmore Emerging Markets Equity Fund
FUND SUMMARY (UNAUDITED)
| | | | | | | | | | | | | | | | | | | | | | | | | | | | | | |
Ashmore Emerging Markets Equity Fund is an open-end U.S. mutual fund. The Fund seeks to achieve its objective by investing principally in equity securities and equity-related investments of Emerging Market issuers, which may be denominated in any currency, including the local currency of the issuer. | | | | | | | Share class information INSTITUTIONAL CLASS Launch date: June 21, 2011 Minimum initial investment: $1,000,000 ISIN: CUSIP: 044820819 BLOOMBERG: TICKER: EMFIX RETAIL CLASS A Launch date: February 24, 2012 Minimum initial investment: $1,000 ISIN: CUSIP: 044820777 BLOOMBERG: TICKER: EMEAX RETAIL CLASS C Launch date: August 23, 2012 Minimum initial investment: $1,000 ISIN: CUSIP: 044820769 BLOOMBERG: TICKER: EMECX All sources are Ashmore unless otherwise indicated. |
Please refer to page 11 herein for an explanation of the information presented below in the Average Annual Total Return Table and Cumulative Return Chart. | | | | | |
Average Annual Total Return For The Period Ended Oct 31, 2023 | | | 1 Year | | | 5 Year | | | 10 Year | | | | |
Institutional Class | | | | | | | | | | | | | | | 13.65% | | | | 5.50% | | | | 3.15% | | | | | |
Retail Class A (load-waived) | | | | | | | | | | | | | | | 13.26% | | | | 5.22% | | | | 2.89%4 | | | | | |
Retail Class A (unadjusted)1 | | | | | | | | | | | | | | | 7.31% | | | | 4.09% | | | | 2.34%4 | | | | | |
Retail Class C (load-waived) | | | | | | | | | | | | | | | 12.45% | | | | 4.52% | | | | 2.30%4 | | | | | |
Retail Class C (unadjusted)1 | | | | | | | | | | | | | | | 11.45% | | | | 4.52% | | | | 2.30%4 | | | | | |
MSCI EM Net2 | | | | | | | | | | | | | | | 10.80% | | | | 1.59% | | | | 1.19% | | | | | |
Cumulative Returns Through Oct 31, 2023 (% of NAV) | | | | | | | | | | | | | | | | | | | | | | | | | | | | |
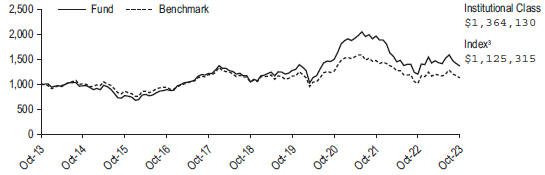
| |
The above cumulative returns graph assumes $1,000,000 invested at the beginning of the first full month following the inception of the Institutional Class. The minimum initial investment amount for Institutional Class Shares is $1,000,000. The minimum initial investment amount for Retail Shares Classes A and C is $1,000. All Fund returns are net of fees and expenses, except for the load-waived return information for Class A and Class C shares. Performance calculations assume that all dividend, capital gain and other distributions were reinvested. The graph does not reflect the deduction of taxes that a shareholder would pay on distributions or the redemption of fund shares.
1Unadjusted Performance accounts for a maximum sales load of 5.25% for Class A shares and maximum deferred sales charge of 1% for the 1 year return for the Class C shares. 2The index for the Fund is the MSCI Emerging Markets Net. 3The Fund did not have any Class C shares outstanding from August 9, 2016 to March 3, 2017 (the “Gap Period”), but had Class C shares outstanding for all other periods shown. For the Gap Period, performance shown for Class C shares is derived from the historical performance of the Fund’s Class A shares during such period, adjusted to reflect the higher Distribution and/or Service (12b-1) Fees payable by Class C shares. 4Class C Shares performance reflects conversion to Class A Shares after eight years.
Past performance does not guarantee future results. The performance data quoted represents past performance and current returns may be lower or higher. The investment return and net asset value will fluctuate so that an investor’s shares, when redeemed, may be worth more or less than the original cost. To obtain performance information current to the most recent month-end, please call 1-855-274-6673. Periods greater than one year are annualized. Changes in rates of exchange between currencies may cause the value of investments to decrease or increase. The Fund’s performance will fluctuate over long and short term periods.
Please refer to page 12 herein for an explanation of the Expense Example information presented below.
| | | | | | | | | | | | | | |
| | | | |
Expense example | | Actual performance | | | | Hypothetical performance |
| | | | | | | | |
| | | Institutional Class | | Class A | | Class C | | | | Institutional Class | | Class A | | Class C |
| | | | | | | | |
Beginning Account Value (5/1/2023) | | $1,000.00 | | $1,000.00 | | $1,000.00 | | | | $1,000.00 | | $1,000.00 | | $1,000.00 |
| | | | | | | | |
Ending Account Value (10/31/2023) | | $955.60 | | $953.30 | | $949.80 | | | | $1,020.06 | | $1,018.80 | | $1,015.02 |
| | | | | | | | |
Expense Ratio (Gross / Net) | | 1.47% / 1.02% | | 1.72% / 1.27% | | 2.47% / 2.02% | | | | 1.47% / 1.02% | | 1.72% / 1.27% | | 2.47% / 2.02% |
| | | | | | | | |
Expenses Paid* | | $5.03 | | $6.25 | | $9.93 | | | | $5.19 | | $6.46 | | $10.26 |
*Expenses are equal to the Fund’s annualized expense ratios for the period May 1, 2023 through October 31, 2023, multiplied by the average account value over the period, multiplied by 184/365 (to reflect the one-half year period). As such, these may differ from the prospectus.
20
Ashmore Emerging Markets Equity ESG Fund
FUND SUMMARY (UNAUDITED)
| | | | | | | | | | | | | | | | | | | | | | | | | | |
Ashmore Emerging Markets Equity ESG Fund is an open-end U.S. mutual fund. The Fund seeks to achieve its objective by investing principally in equity securities and equity-related investments of Emerging Market issuers which may be denominated in any currency, including the local currency of the issuer, focusing on issuers that the Investment Manager believes satisfy the ESG Criteria. | | | | | | | Share class information INSTITUTIONAL CLASS Launch date: February 26, 2020 Minimum initial investment: $1,000,000 ISIN: CUSIP: 044820454 BLOOMBERG: TICKER: ESIGX RETAIL CLASS A Launch date: February 26, 2020 Minimum initial investment: $1,000 ISIN: CUSIP: 044820470 BLOOMBERG: TICKER: ESAGX RETAIL CLASS C Launch date: February 26, 2020 Minimum initial investment: $1,000 ISIN: CUSIP: 044820462 BLOOMBERG: TICKER: ESCGX All sources are Ashmore unless otherwise indicated. |
Please refer to page 11 herein for an explanation of the information presented below in the Average Annual Total Return Table and Cumulative Return Chart. | | | | | |
Average Annual Total Return For The Period Ended Oct 31, 2023 | | | 1 Year | | | Since incpt1 | | | | |
Institutional Class | | | | | | | | | | | | | | | 14.45% | | | | 0.86% | | | | | |
Retail Class A (load-waived) | | | | | | | | | | | | | | | 14.21% | | | | 0.63% | | | | | |
Retail Class A (unadjusted)1 | | | | | | | | | | | | | | | 8.24% | | | | -0.82% | | | | | |
Retail Class C (load-waived) | | | | | | | | | | | | | | | 13.32% | | | | -0.07% | | | | | |
Retail Class C (unadjusted)1 | | | | | | | | | | | | | | | 12.32% | | | | -0.07% | | | | | |
MSCI EM Net2 | | | | | | | | | | | | | | | 10.80% | | | | -1.04% | | | | | |
Cumulative Returns Through Oct 31, 2023 (% of NAV) | | | | | | | | | | | | | | | | | | | | | | | | |

| |
The above cumulative returns graph assumes $1,000,000 invested at the beginning of the first full month following the inception of the Institutional Class. The minimum initial investment amount for Institutional Class Shares is $1,000,000. The minimum initial investment amount for Retail Shares Class A and C is $1,000. All Fund returns are net of fees and expenses, except for the load-waived return information for Class A and Class C shares. Performance calculations assume that all dividend, capital gain and other distributions were reinvested. The graph does not reflect the deduction of taxes that a shareholder would pay on distributions or the redemption of fund shares.
1Unadjusted Performance accounts for a maximum sales load of 5.25% for Class A shares and maximum deferred sales charge of 1% for the 1 year return for the Class C shares. 2The index for the Fund is the MSCI Emerging Markets Net.
Past performance does not guarantee future results. The performance data quoted represents past performance and current returns may be lower or higher. The investment return and net asset value will fluctuate so that an investor’s shares, when redeemed, may be worth more or less than the original cost. To obtain performance information current to the most recent month-end, please call 1-855-274-6673. Periods greater than one year are annualized. Changes in rates of exchange between currencies may cause the value of investments to decrease or increase. The Fund’s performance will fluctuate over long and short term periods.
Please refer to page 12 herein for an explanation of the Expense Example information presented below.
| | | | | | | | | | | | | | |
| | | | |
Expense example | | Actual performance | | | | Hypothetical performance |
| | | | | | | | |
| | | Institutional Class | | Class A | | Class C | | | | Institutional Class | | Class A | | Class C |
| | | | | | | | |
Beginning Account Value (5/1/2023) | | $1,000.00 | | $1,000.00 | | $1,000.00 | | | | $1,000.00 | | $1,000.00 | | $1,000.00 |
| | | | | | | | |
Ending Account Value (10/31/2023) | | $936.70 | | $935.50 | | $931.90 | | | | $1,020.06 | | $1,018.79 | | $1,015.04 |
| | | | | | | | |
Expense Ratio (Gross / Net) | | 2.23% / 1.02% | | 2.48% / 1.27% | | 3.22% / 2.02% | | | | 2.23% / 1.02% | | 2.48% / 1.27% | | 3.22% / 2.02% |
| | | | | | | | |
Expenses Paid* | | $4.98 | | $6.21 | | $9.82 | | | | $5.19 | | $6.47 | | $10.24 |
*Expenses are equal to the Fund’s annualized expense ratios for the period May 1, 2023 through October 31, 2023, multiplied by the average account value over the period, multiplied by 184/365 (to reflect the one-half year period). As such, these may differ from the prospectus.
21
Ashmore Emerging Markets Low Duration Fund
FUND SUMMARY (UNAUDITED)
| | | | | | | | | | | | | | | | | | | | | | | | | | |
Ashmore Emerging Markets Low Duration Fund is an open-end U.S. mutual fund. The Ashmore Emerging Markets Short Duration Select Fund was renamed Ashmore Emerging Markets Low Duration Fund on August 1, 2023. The Fund seeks to achieve its objective by investing principally in short-term debt instruments of, and derivative instruments related to, Sovereign, Quasi-Sovereign and Corporate issuers of Emerging Market Countries denominated exclusively in Hard Currencies (i.e., the U.S. dollar or any currency of a nation in the G-7). The Fund normally seeks to maintain a weighted average portfolio duration of between 1 and 3 years and an Investment Grade weighted average credit rating. The Fund has no restrictions on individual security duration. | | | | | | | Share class information INSTITUTIONAL CLASS Launch date: June 15, 2020 Minimum initial investment: $1,000,000 ISIN: CUSIP: 044820421 BLOOMBERG: TICKER: ESDIX RETAIL CLASS A Launch date: June 15, 2020 Minimum initial investment: $1,000 ISIN: CUSIP: 044820447 BLOOMBERG: TICKER: ESDAX RETAIL CLASS C Launch date: June 15, 2020 Minimum initial investment: $1,000 ISIN: CUSIP: 044820439 BLOOMBERG: TICKER: ESDCX All sources are Ashmore unless otherwise indicated. |
Please refer to page 11 herein for an explanation of the information presented below in the Average Annual Total Return Table and Cumulative Return Chart. | | | | | |
Average Annual Total Return For The Period Ended Oct 31, 2023 | | | 1 Year | | | Since incpt1 | | | | |
Institutional Class | | | | | | | | | | | | | | | 6.88% | | | | -0.75% | | | | | |
Retail Class A (load-waived) | | | | | | | | | | | | | | | 6.60% | | | | -0.96% | | | | | |
Retail Class A (unadjusted)1 | | | | | | | | | | | | | | | 4.22% | | | | -1.62% | | | | | |
Retail Class C (load-waived) | | | | | | | | | | | | | | | 5.68% | | | | -1.74% | | | | | |
Retail Class C (unadjusted)1 | | | | | | | | | | | | | | | 4.68% | | | | -1.74% | | | | | |
JP Morgan CEMBI BD IG 1-3 Year2 | | | | | | | | | | | | | | | 5.20% | | | | -0.76% | | | | | |
Cumulative Returns Through Oct 31, 2023 (% of NAV) | | | | | | | | | | | | | | | | | | | | | | | | |

| |
The above cumulative returns graph assumes $1,000,000 invested at the beginning of the first full month following the inception of the Institutional Class. The minimum initial investment amount for Institutional Class Shares is $1,000,000. The minimum initial investment amount for Retail Shares Classes A and C is $1,000. All Fund returns are net of fees and expenses, except for the load-waived return information for Class A and Class C shares. Performance calculations assume that all dividend, capital gain and other distributions were reinvested. The graph does not reflect the deduction of taxes that a shareholder would pay on distributions or the redemption of fund shares.
1Unadjusted Performance accounts for a maximum sales load of 2.25% for Class A shares and maximum deferred sales charge of 1% for the 1 year return for the Class C shares. 2The index for the Fund is the JP Morgan CEMBI Broad Diversified Investment Grade 1-3 Year.
Past performance does not guarantee future results. The performance data quoted represents past performance and current returns may be lower or higher. The investment return and net asset value will fluctuate so that an investor’s shares, when redeemed, may be worth more or less than the original cost. To obtain performance information current to the most recent month-end, please call 1-855-274-6673. Periods greater than one year are annualized. Changes in rates of exchange between currencies may cause the value of investments to decrease or increase. The Fund’s performance will fluctuate over long and short term periods.
Please refer to page 12 herein for an explanation of the Expense Example information presented below.
| | | | | | | | | | | | | | |
| | | | |
Expense example | | Actual performance | | | | Hypothetical performance |
| | | | | | | | |
| | | Institutional Class | | Class A | | Class C | | | | Institutional Class | | Class A | | Class C |
| | | | | | | | |
Beginning Account Value (5/1/2023) | | $1,000.00 | | $1,000.00 | | $1,000.00 | | | | $1,000.00 | | $1,000.00 | | $1,000.00 |
| | | | | | | | |
Ending Account Value (10/31/2023) | | $1,005.30 | | $1,004.60 | | $999.70 | | | | $1,021.83 | | $1,020.56 | | $1,016.78 |
| | | | | | | | |
Expense Ratio (Gross / Net) | | 1.73% / 0.67% | | 2.32% / 0.92% | | 2.99% / 1.67% | | | | 1.73% / 0.67% | | 2.32% / 0.92% | | 2.99% / 1.67% |
| | | | | | | | |
Expenses Paid* | | $3.39 | | $4.66 | | $8.43 | | | | $3.41 | | $4.69 | | $8.50 |
*Expenses are equal to the Fund’s annualized expense ratios for the period May 1, 2023 through October 31, 2023, multiplied by the average account value over the period, multiplied by 184/365 (to reflect the one-half year period). As such, these may differ from the prospectus.
22
Ashmore Emerging Markets Debt Fund
FUND SUMMARY (UNAUDITED)
| | | | | | | | | | | | | | | | | | | | | | | | | | |
Ashmore Emerging Markets Debt Fund is an open-end U.S. mutual fund. The Ashmore Emerging Markets Investment Grade Income Fund was renamed Ashmore Emerging Markets Debt Fund on August 1, 2023. The Fund seeks to achieve its objective by investing principally in debt instruments of Sovereigns and Quasi-Sovereigns of Emerging Market Countries and EM Supra-Nationals denominated principally in Hard Currencies (i.e., the U.S. dollar or any currency of a nation in the G-7). The Fund has no restrictions on individual security duration. The Fund observes a policy to normally invest at least 80% of its net assets (plus borrowings made for investment purposes) in bonds and other debt instruments of Sovereign or Quasi-Sovereign issues of Emerging Market Countries and EM Supra-Nationals. | | | | | | | Share class information INSTITUTIONAL CLASS Launch date: September 17, 2020 Minimum initial investment: $1,000,000 ISIN: CUSIP: 044820389 BLOOMBERG: TICKER: IGIEX RETAIL CLASS A Launch date: September 17, 2020 Minimum initial investment: $1,000 ISIN: CUSIP: 044820413 BLOOMBERG: TICKER: IGAEX RETAIL CLASS C Launch date: September 17, 2020 Minimum initial investment: $1,000 ISIN: CUSIP: 044820397 BLOOMBERG: TICKER: IGCEX All sources are Ashmore unless otherwise indicated. |
Please refer to page 11 herein for an explanation of the information presented below in the Average Annual Total Return Table and Cumulative Return Chart. | | | | | |
Average Annual Total Return For The Period Ended Oct 31, 2023 | | | 1 Year | | | Since incpt1 | | | | |
Institutional Class | | | | | | | | | | | | | | | 3.41% | | | | -5.44% | | | | | |
Retail Class A (load-waived) | | | | | | | | | | | | | | | 3.31% | | | | -5.63% | | | | | |
Retail Class A (unadjusted)1 | | | | | | | | | | | | | | | -0.78% | | | | -6.87% | | | | | |
Retail Class C (load-waived) | | | | | | | | | | | | | | | 2.59% | | | | -6.31% | | | | | |
Retail Class C (unadjusted)1 | | | | | | | | | | | | | | | 1.61% | | | | -6.31% | | | | | |
JP Morgan EMBI GD*,2 | | | | | | | | | | | | | | | 8.36% | | | | -5.42% | | | | | |
JP Morgan CEMBI IG BD3 | | | | | | | | | | | | | | | 5.80% | | | | -3.89% | | | | | |
Cumulative Returns Through Oct 31, 2023 (% of NAV) | | | | | | | | | | | | | | | | | | | | | | | | |

| |
The above cumulative returns graph assumes $1,000,000 invested at the beginning of the first full month following the inception of the Institutional Class. The minimum initial investment amount for Institutional Class Shares is $1,000,000. The minimum initial investment amount for Retail Shares Classes A and C is $1,000. All Fund returns are net of fees and expenses, except for the load-waived return information for Class A and Class C shares. Performance calculations assume that all dividend, capital gain and other distributions were reinvested. The graph does not reflect the deduction of taxes that a shareholder would pay on distributions or the redemption of fund shares.
*Effective August 1, 2023, the JP Morgan EMBI GD replaced the JP Morgan CEMBI BD Investment Grade Index as the primary benchmark for Ashmore Emerging Markets Debt Fund because Ashmore believes the JP Morgan EMBI GD is a more appropriate broad-based securities market index representing the universe of securities in which the Fund may invest. 1Unadjusted Performance accounts for a maximum sales load of 4% for Class A shares and maximum deferred sales charge of 1% for the 1 year return for the Class C shares. 2The index for the Fund is the JP Morgan EMBI Global Diversified. 3Prior to August 1, 2023, the index for the Fund was the JP Morgan CEMBI Investment Grade Broad Diversified.
Past performance does not guarantee future results. The performance data quoted represents past performance and current returns may be lower or higher. The investment return and net asset value will fluctuate so that an investor’s shares, when redeemed, may be worth more or less than the original cost. To obtain performance information current to the most recent month-end, please call 1-855-274-6673. Periods greater than one year are annualized. Changes in rates of exchange between currencies may cause the value of investments to decrease or increase. The Fund’s performance will fluctuate over long and short term periods.
23
Ashmore Emerging Markets Debt Fund
FUND SUMMARY (UNAUDITED) (CONTINUED)
Please refer to page 12 herein for an explanation of the Expense Example information presented below.
| | | | | | | | | | | | | | |
| | | | |
Expense example | | Actual performance | | | | Hypothetical performance |
| | | | | | | | |
| | | Institutional Class | | Class A | | Class C | | | | Institutional Class | | Class A | | Class C |
| | | | | | | | |
Beginning Account Value (5/1/2023) | | $1,000.00 | | $1,000.00 | | $1,000.00 | | | | $1,000.00 | | $1,000.00 | | $1,000.00 |
| | | | | | | | |
Ending Account Value (10/31/2023) | | $938.30 | | $937.70 | | $934.30 | | | | $1,021.70 | | $1,020.44 | | $1,016.66 |
| | | | | | | | |
Expense Ratio (Gross / Net) | | 1.37% / 0.70% | | 1.77% / 0.95% | | 2.18% / 1.70% | | | | 1.37% / 0.70% | | 1.77% / 0.95% | | 2.18% / 1.70% |
| | | | | | | | |
Expenses Paid* | | $3.40 | | $4.62 | | $8.26 | | | | $3.54 | | $4.81 | | $8.62 |
*Expenses are equal to the Fund’s annualized expense ratios for the period May 1, 2023 through October 31, 2023, multiplied by the average account value over the period, multiplied by 184/365 (to reflect the one-half year period). As such, these may differ from the prospectus.
24
Ashmore Emerging Markets Corporate Income ESG Fund
FUND SUMMARY (UNAUDITED)
| | | | | | | | | | | | | | | | | | | | | | | | | | |
Ashmore Emerging Markets Corporate Income ESG Fund is an open-end U.S. mutual fund. The Fund seeks to achieve its objective by investing principally in debt instruments of Corporate issuers, which may be denominated principally in Hard Currencies (i.e., the U.S. dollar or any currency of a nation in the G-7), focusing on issuers that the Investment Manager believes satisfy the ESG Criteria. | | | | | | | Share class information INSTITUTIONAL CLASS Launch date: February 26, 2021 Minimum initial investment: $1,000,000 ISIN: CUSIP: 044820355 BLOOMBERG: TICKER: ECIEX RETAIL CLASS A Launch date: February 26, 2021 Minimum initial investment: $1,000 ISIN: CUSIP: 044820371 BLOOMBERG: TICKER: ECAEX RETAIL CLASS C Launch date: February 26, 2021 Minimum initial investment: $1,000 ISIN: CUSIP: 044820363 BLOOMBERG: TICKER: ECCEX All sources are Ashmore unless otherwise indicated. |
Please refer to page 11 herein for an explanation of the information presented below in the Average Annual Total Return Table and Cumulative Return Chart. | | | | | |
Average Annual Total Return For The Period Ended Oct 31, 2023 | | | 1 Year | | | Since incpt1 | | | | |
Institutional Class | | | | | | | | | | | | | | | 3.36% | | | | -12.28% | | | | | |
Retail Class A (load-waived) | | | | | | | | | | | | | | | 2.98% | | | | -12.51% | | | | | |
Retail Class A (unadjusted)1 | | | | | | | | | | | | | | | -1.13% | | | | -13.84% | | | | | |
Retail Class C (load-waived) | | | | | | | | | | | | | | | 2.33% | | | | -13.12% | | | | | |
Retail Class C (unadjusted)1 | | | | | | | | | | | | | | | 1.37% | | | | -13.12% | | | | | |
JP Morgan CEMBI BD2 | | | | | | | | | | | | | | | 9.18% | | | | -3.64% | | | | | |
Cumulative Returns Through Oct 31, 2023 (% of NAV) | | | | | | | | | | | | | | | | | | | | | | | | |

| |
The above cumulative returns graph assumes $1,000,000 invested at the beginning of the first full month following the inception of the Institutional Class. The minimum initial investment amount for Institutional Class Shares is $1,000,000. The minimum initial investment amount for Retail Shares Classes A and C is $1,000. All Fund returns are net of fees and expenses, except for the load-waived return information for Class A and Class C shares. Performance calculations assume that all dividend, capital gain and other distributions were reinvested. The graph does not reflect the deduction of taxes that a shareholder would pay on distributions or the redemption of fund shares.
1Unadjusted Performance accounts for a maximum sales load of 4% for Class A shares and maximum deferred sales charge of 1% for the 1 year return for the Class C shares. 2The index for the Fund is the JP Morgan CEMBI Broad Diversified.
Past performance does not guarantee future results. The performance data quoted represents past performance and current returns may be lower or higher. The investment return and net asset value will fluctuate so that an investor’s shares, when redeemed, may be worth more or less than the original cost. To obtain performance information current to the most recent month-end, please call 1-855-274-6673. Periods greater than one year are annualized. Changes in rates of exchange between currencies may cause the value of investments to decrease or increase. The Fund’s performance will fluctuate over long and short term periods.
Please refer to page 12 herein for an explanation of the Expense Example information presented below.
| | | | | | | | | | | | | | |
| | | | |
Expense example | | Actual performance | | | | Hypothetical performance |
| | | | | | | | |
| | | Institutional Class | | Class A | | Class C | | | | Institutional Class | | Class A | | Class C |
| | | | | | | | |
Beginning Account Value (5/1/2023) | | $1,000.00 | | $1,000.00 | | $1,000.00 | | | | $1,000.00 | | $1,000.00 | | $1,000.00 |
| | | | | | | | |
Ending Account Value (10/31/2023) | | $966.90 | | $966.00 | | $962.60 | | | | $1,020.82 | | $1,019.54 | | $1,015.78 |
| | | | | | | | |
Expense Ratio (Gross / Net) | | 2.17% / 0.87% | | 2.15% / 1.12% | | 3.24% / 1.87% | | | | 2.17% / 0.87% | | 2.15% / 1.12% | | 3.24% / 1.87% |
| | | | | | | | |
Expenses Paid* | | $4.31 | | $5.57 | | $9.25 | | | | $4.43 | | $5.72 | | $9.50 |
*Expenses are equal to the Fund’s annualized expense ratios for the period May 1, 2023 through October 31, 2023, multiplied by the average account value over the period, multiplied by 184/365 (to reflect the one-half year period). As such, these may differ from the prospectus.
25
| | | | | | |

| | | | | | |
| | KPMG LLP Aon Center Suite 5500 200 E. Randolph Street Chicago, IL 60601-6436 | | | | |
Report of Independent Registered Public Accounting Firm
To the Shareholders of the Funds and Board of Trustees
Ashmore Funds:
Opinion on the Financial Statements
We have audited the accompanying statement of assets and liabilities of Ashmore Emerging Markets Total Return Fund, Ashmore Emerging Markets Local Currency Bond Fund, Ashmore Emerging Markets Corporate Income Fund, Ashmore Emerging Markets Short Duration Fund, Ashmore Emerging Markets Active Equity Fund, Ashmore Emerging Markets Small-Cap Equity Fund, Ashmore Emerging Markets Frontier Equity Fund, Ashmore Emerging Markets Equity Fund, Ashmore Emerging Markets Equity ESG Fund, Ashmore Emerging Markets Low Duration Fund (formerly, Ashmore Emerging Markets Short Duration Select Fund), Ashmore Emerging Markets Debt Fund (formerly, Ashmore Emerging Markets Investment Grade Income Fund), and Ashmore Emerging Markets Corporate Income ESG Fund (collectively, the Funds), including the schedule of investments, as of October 31, 2023, the related statements of operations for the year then ended, the statements of changes in net assets for each of the years in the two-year period then ended and the related notes (collectively, the financial statements) and the financial highlights for each of the years or periods in the five-year period then ended (periods from February 26, 2020, June 15, 2020, September 17, 2020, and February 26, 2021 [commencement of operations] to October 31, 2023 for Ashmore Emerging Markets Equity ESG Fund, Ashmore Emerging Markets Low Duration Fund (formerly, Ashmore Emerging Markets Short Duration Select Fund), Ashmore Emerging Markets Debt Fund (formerly, Ashmore Emerging Markets Investment Grade Income Fund), and Ashmore Emerging Markets Corporate Income ESG Fund, respectively). In our opinion, the financial statements and financial highlights present fairly, in all material respects, the financial position of the Funds as of October 31, 2023, the results of their operations for the year then ended, the changes in its net assets for each of the years or periods in the two-year period then ended, and the financial highlights for each of the years or periods as described above, in conformity with U.S. generally accepted accounting principles.
Basis for Opinion
These financial statements and financial highlights are the responsibility of the Funds’ management. Our responsibility is to express an opinion on these financial statements and financial highlights based on our audits. We are a public accounting firm registered with the Public Company Accounting Oversight Board (United States) (PCAOB) and are required to be independent with respect to the Funds in accordance with the U.S. federal securities laws and the applicable rules and regulations of the Securities and Exchange Commission and the PCAOB.
We conducted our audits in accordance with the standards of the PCAOB. Those standards require that we plan and perform the audit to obtain reasonable assurance about whether the financial statements and financial highlights are free of material misstatement, whether due to error or fraud. Our audits included performing procedures to assess the risks of material misstatement of the financial statements and financial highlights, whether due to error or fraud, and performing procedures that respond to those risks. Such procedures included examining, on a test basis, evidence regarding the amounts and disclosures in the financial statements and financial highlights. Such procedures also included confirmation of securities owned as of October 31, 2023, by correspondence with custodians and brokers; when replies were not received from brokers, we performed other auditing procedures. Our audits also included evaluating the accounting principles used and significant estimates made by management, as well as evaluating the overall presentation of the
| | | | |
| | KPMG LLP, a Delaware limited liability partnership and a member firm of the KPMG global organization of independent member firms affiliated with KPMG International Limited, a private English company limited by guarantee. | | |

financial statements and financial highlights. We believe that our audits provide a reasonable basis for our opinion.
We have served as the auditor of one or more Ashmore Funds investment companies since 2010.
Chicago, Illinois
December 20, 2023
(THIS PAGE INTENTIONALLY LEFT BLANK)
28
ASHMORE FUNDS
STATEMENTS OF ASSETS AND LIABILITIES
As of October 31, 2023
| | | | | | | | | | | | | | | | |
| | | Ashmore
Emerging
Markets
Total Return
Fund | | | Ashmore
Emerging
Markets
Local Currency
Bond Fund | | | Ashmore
Emerging Markets
Corporate Income
Fund | | | Ashmore
Emerging Markets
Short Duration
Fund | |
ASSETS: | | | | | | | | | | | | | | | | |
Investments in securities, at value | | $ | 441,497,479 | | | $ | 9,957,066 | | | $ | 71,175,863 | | | $ | 59,803,605 | |
Deposit held at broker | | | 1,238,691 | | | | 20 | | | | — | | | | — | |
Cash | | | 8,196,974 | | | | 188,329 | | | | 1,105,543 | | | | 89,838 | |
Foreign currency, at value | | | 908,079 | | | | 19,979 | | | | 841 | | | | 19,312 | |
Unrealized appreciation on forward foreign currency exchange contracts | | | 912,413 | | | | 55,266 | | | | 55,934 | | | | 392 | |
Variation margin receivable on centrally cleared swap contracts | | | 11,070 | | | | 962 | | | | — | | | | — | |
Due from broker | | | 499,659 | | | | 47,538 | | | | — | | | | — | |
Receivable for securities and currencies sold | | | 34,914 | | | | 41,794 | | | | 505,345 | | | | — | |
Receivable for fund shares sold | | | — | | | | — | | | | 19,404 | | | | 6 | |
Receivable from Investment Manager | | | 164,852 | | | | 29,653 | | | | 34,040 | | | | 29,524 | |
Interest and dividends receivable | | | 6,732,944 | | | | 177,604 | | | | 942,442 | | | | 646,892 | |
Other assets | | | 28,724 | | | | 631 | | | | 4,758 | | | | 3,375 | |
Total Assets | | | 460,225,799 | | | | 10,518,842 | | | | 73,844,170 | | | | 60,592,944 | |
LIABILITIES: | | | | | | | | | | | | | | | | |
Unrealized depreciation on forward foreign currency exchange contracts | | | 2,049,754 | | | | 68,420 | | | | 20,569 | | | | — | |
Variation margin payable on centrally cleared swap contracts | | | 13,855 | | | | 507 | | | | — | | | | — | |
Unrealized depreciation on interest rate swap contracts | | | — | | | | 3,300 | | | | — | | | | — | |
Payable for securities and currencies purchased | | | 3,675,472 | | | | 64,550 | | | | 630,920 | | | | — | |
Payable for fund shares redeemed | | | 352,797 | | | | — | | | | 11,702 | | | | 8,082 | |
Distributions payable | | | 493,268 | | | | — | | | | 67,259 | | | | 58,179 | |
Due to broker | | | 216,715 | | | | 13,828 | | | | — | | | | — | |
Investment Manager fee payable | | | 393,293 | | | | 6,579 | | | | 51,994 | | | | 31,302 | |
Trustees’ fees payable | | | 29,799 | | | | 654 | | | | 4,603 | | | | 3,371 | |
Deferred foreign capital gains taxes payable | | | — | | | | — | | | | — | | | | — | |
Administration fees payable | | | 40,654 | | | | 912 | | | | 6,458 | | | | 4,803 | |
Custody fees payable | | | 93,526 | | | | 18,399 | | | | 11,248 | | | | 6,297 | |
Professional fees payable | | | 250,788 | | | | 28,670 | | | | 67,892 | | | | 79,987 | |
Regulatory fees payable | | | 11,794 | | | | 4,455 | | | | 5,626 | | | | 5,164 | |
Other liabilities | | | 3,652 | | | | 2,117 | | | | 5,709 | | | | 2,930 | |
Total Liabilities | | | 7,625,367 | | | | 212,391 | | | | 883,980 | | | | 200,115 | |
Net Assets | | $ | 452,600,432 | | | $ | 10,306,451 | | | $ | 72,960,190 | | | $ | 60,392,829 | |
NET ASSETS: | | | | | | | | | | | | | | | | |
Paid in capital | | $ | 964,321,501 | | | $ | 11,833,253 | | | $ | 242,087,198 | | | $ | 470,367,103 | |
Accumulated loss | | | (511,721,069 | ) | | | (1,526,802 | ) | | | (169,127,008 | ) | | | (409,974,274 | ) |
Net Assets | | $ | 452,600,432 | | | $ | 10,306,451 | | | $ | 72,960,190 | | | $ | 60,392,829 | |
| | | | |
Net Assets: | | | | | | | | | | | | | | | | |
Class A | | $ | 1,446,251 | | | $ | 1,197,329 | | | $ | 3,778,955 | | | $ | 8,498,825 | |
Class C | | | 815,282 | | | | 1,013 | | | | 1,491,725 | | | | 170,626 | |
Institutional Class | | | 450,338,899 | | | | 9,108,109 | | | | 67,689,510 | | | | 51,723,378 | |
| | | | |
Shares Issued and Outstanding (no par value, unlimited shares authorized): | | | | | | | | | | | | | | | | |
Class A | | | 317,702 | | | | 195,561 | | | | 735,608 | | | | 1,779,360 | |
Class C | | | 179,755 | | | | 170 | | | | 291,264 | | | | 37,380 | |
Institutional Class | | | 97,442,250 | | | | 1,413,338 | | | | 12,639,150 | | | | 11,023,865 | |
| | | | |
Net Asset Value and Redemption Price Per Share (Net Asset Per Share Outstanding): | | | | | | | | | | | | | | | | |
Class A | | $ | 4.55 | | | $ | 6.12 | | | $ | 5.14 | | | $ | 4.78 | |
Class C | | | 4.54 | | | | 5.95 | | | | 5.12 | | | | 4.56 | |
Institutional Class | | | 4.62 | | | | 6.44 | | | | 5.36 | | | | 4.69 | |
| | | | | |
Cost of Investments in securities | | $ | 614,120,836 | | | $ | 10,439,270 | | | $ | 115,003,114 | | | $ | 119,244,162 | |
Cost of foreign currency held | | $ | 749,727 | | | $ | 19,979 | | | $ | 840 | | | $ | 19,372 | |
See accompanying notes to the financial statements.
29
| | | | | | | | | | | | | | | | | | | | | | | | | | | | | | |
Ashmore
Emerging Markets
Active Equity
Fund | | | Ashmore
Emerging Markets
Small-Cap
Equity Fund | | | Ashmore
Emerging Markets
Frontier Equity
Fund | | | Ashmore
Emerging Markets
Equity Fund | | | Ashmore
Emerging Markets
Equity ESG Fund | | | Ashmore
Emerging Markets
Low Duration
Fund | | | Ashmore
Emerging Markets
Debt Fund | | | Ashmore
Emerging Markets
Corporate Income
ESG Fund | |
| | | | | | | | | | | | | | | | | | | | | | | | | | | | | | |
| $ | 22,686,348 | | | $ | 8,415,007 | | | $ | 59,437,076 | | | $ | 91,608,287 | | | $ | 9,729,617 | | | $ | 9,094,194 | | | $ | 16,113,754 | | | $ | 6,708,157 | |
| | — | | | | — | | | | — | | | | — | | | | — | | | | — | | | | — | | | | — | |
| | 115,213 | | | | 116,604 | | | | 1,024,022 | | | | 946,419 | | | | 367,709 | | | | 323,701 | | | | 31,333 | | | | 77,365 | |
| | 16,564 | | | | 769 | | | | 1,592,735 | | | | 32,867 | | | | 139 | | | | 170 | | | | 7,281 | | | | 814 | |
| | — | | | | — | | | | — | | | | — | | | | — | | | | 155 | | | | 227 | | | | 266 | |
| | — | | | | — | | | | — | | | | — | | | | — | | | | — | | | | — | | | | — | |
| | — | | | | — | | | | — | | | | — | | | | — | | | | — | | | | — | | | | — | |
| | 110,879 | | | | — | | | | 789,516 | | | | 940,197 | | | | 86,584 | | | | — | | | | — | | | | — | |
| | — | | | | 5,900 | | | | 19,493 | | | | 12,089 | | | | — | | | | 935 | | | | 2,240 | | | | 1,027 | |
| | 27,546 | | | | 23,559 | | | | 47,881 | | | | 61,175 | | | | 13,547 | | | | 11,899 | | | | 13,887 | | | | 8,776 | |
| | 33,167 | | | | 18,299 | | | | 130,177 | | | | 111,749 | | | | 2,217 | | | | 104,331 | | | | 274,550 | | | | 81,781 | |
| | 10,198 | | | | 522 | | | | 4,111 | | | | 6,364 | | | | 629 | | | | 552 | | | | 1,019 | | | | 412 | |
| | 22,999,915 | | | | 8,580,660 | | | | 63,045,011 | | | | 93,719,147 | | | | 10,200,442 | | | | 9,535,937 | | | | 16,444,291 | | | | 6,878,598 | |
| | | | | | | | | | | | | | | | | | | | | | | | | | | | | | |
| | — | | | | — | | | | — | | | | — | | | | — | | | | 18 | | | | — | | | | — | |
| | — | | | | — | | | | — | | | | — | | | | — | | | | — | | | | — | | | | — | |
| | — | | | | — | | | | — | | | | — | | | | — | | | | — | | | | — | | | | — | |
| | — | | | | — | | | | 66 | | | | — | | | | — | | | | — | | | | 26,895 | | | | — | |
| | — | | | | 990 | | | | 5,343 | | | | 752,014 | | | | — | | | | — | | | | — | | | | — | |
| | — | | | | — | | | | — | | | | — | | | | — | | | | 7,394 | | | | 23,664 | | | | 8,403 | |
| | — | | | | — | | | | — | | | | — | | | | — | | | | — | | | | — | | | | — | |
| | 20,111 | | | | 9,350 | | | | 83,541 | | | | 82,929 | | | | 8,868 | | | | 5,254 | | | | 9,047 | | | | 4,994 | |
| | 1,478 | | | | 557 | | | | 4,249 | | | | 5,663 | | | | 646 | | | | 603 | | | | 1,053 | | | | 442 | |
| | 35,475 | | | | 28,673 | | | | — | | | | 174,298 | | | | 6,826 | | | | — | | | | — | | | | — | |
| | 2,140 | | | | 789 | | | | 5,653 | | | | 9,156 | | | | 930 | | | | 798 | | | | 1,445 | | | | 594 | |
| | 18,494 | | | | 13,796 | | | | 71,576 | | | | 54,896 | | | | 5,693 | | | | 1,345 | | | | 2,187 | | | | 1,043 | |
| | 25,629 | | | | 22,797 | | | | 40,174 | | | | 48,154 | | | | 20,921 | | | | 22,943 | | | | 25,031 | | | | 22,220 | |
| | 4,702 | | | | 3,307 | | | | 4,047 | | | | 5,731 | | | | 3,334 | | | | 4,489 | | | | 4,663 | | | | 4,465 | |
| | 2,151 | | | | 2,227 | | | | 3,039 | | | | 3,332 | | | | 2,066 | | | | 1,285 | | | | 1,286 | | | | 1,285 | |
| | 110,180 | | | | 82,486 | | | | 217,688 | | | | 1,136,173 | | | | 49,284 | | | | 44,129 | | | | 95,271 | | | | 43,446 | |
| $ | 22,889,735 | | | $ | 8,498,174 | | | $ | 62,827,323 | | | $ | 92,582,974 | | | $ | 10,151,158 | | | $ | 9,491,808 | | | $ | 16,349,020 | | | $ | 6,835,152 | |
| | | | | | | | | | | | | | | | | | | | | | | | | | | | | | |
| $ | 47,920,210 | | | $ | 13,561,005 | | | $ | 72,364,365 | | | $ | 118,973,301 | | | $ | 11,932,670 | | | $ | 11,082,541 | | | $ | 21,877,522 | | | $ | 10,954,341 | |
| | (25,030,475 | ) | | | (5,062,831 | ) | | | (9,537,042 | ) | | | (26,390,327 | ) | | | (1,781,512 | ) | | | (1,590,733 | ) | | | (5,528,502 | ) | | | (4,119,189 | ) |
| $ | 22,889,735 | | | $ | 8,498,174 | | | $ | 62,827,323 | | | $ | 92,582,974 | | | $ | 10,151,158 | | | $ | 9,491,808 | | | $ | 16,349,020 | | | $ | 6,835,152 | |
| | | | | | | |
| | | | | | | | | | | | | | | | | | | | | | | | | | | | | | |
| $ | 39,653 | | | $ | 440,753 | | | $ | 1,597,196 | | | $ | 4,469,163 | | | $ | 1,007 | | | $ | 944 | | | $ | 813 | | | $ | 680 | |
| | 1,136 | | | | 13,733 | | | | 204,100 | | | | 69,618 | | | | 983 | | | | 924 | | | | 798 | | | | 670 | |
| | 22,848,946 | | | | 8,043,688 | | | | 61,026,027 | | | | 88,044,193 | | | | 10,149,168 | | | | 9,489,940 | | | | 16,347,409 | | | | 6,833,802 | |
| | | | | | | | | | | | | | | | | | | | | | | | | | | | | | |
| | 6,122 | | | | 39,945 | | | | 196,402 | | | | 481,372 | | | | 117 | | | | 111 | | | | 111 | | | | 112 | |
| | 180 | | | | 1,219 | | | | 26,220 | | | | 8,084 | | | | 116 | | | | 109 | | | | 109 | | | | 110 | |
| | 3,491,726 | | | | 559,469 | | | | 6,423,162 | | | | 9,861,943 | | | | 1,167,740 | | | | 1,115,766 | | | | 2,222,893 | | | | 1,125,932 | |
| | | | | | | | | | | | | | | | | | | | | | | | | | | | | | |
| $ | 6.48 | | | $ | 11.03 | | | $ | 8.13 | | | $ | 9.28 | | | $ | 8.64 | | | $ | 8.50 | | | $ | 7.34 | | | $ | 6.07 | |
| | 6.30 | | | | 11.26 | | | | 7.78 | | | | 8.61 | | | | 8.45 | | | | 8.49 | | | | 7.34 | | | | 6.06 | |
| | 6.54 | | | | 14.38 | | | | 9.50 | | | | 8.93 | | | | 8.69 | | | | 8.51 | | | | 7.35 | | | | 6.07 | |
| | | | | | | | |
| $ | 26,702,841 | | | $ | 9,181,836 | | | $ | 60,664,796 | | | $ | 99,603,421 | | | $ | 9,973,865 | | | $ | 9,439,746 | | | $ | 17,955,278 | | | $ | 9,349,712 | |
| $ | 16,736 | | | $ | 769 | | | $ | 1,593,756 | | | $ | 32,872 | | | $ | 139 | | | $ | 169 | | | $ | 7,272 | | | $ | 812 | |
See accompanying notes to the financial statements.
30
ASHMORE FUNDS
STATEMENTS OF OPERATIONS
For the Year Ended October 31, 2023
| | | | | | | | | | | | | | | | |
| | | Ashmore
Emerging
Markets
Total Return
Fund | | | Ashmore
Emerging
Markets
Local Currency
Bond Fund | | | Ashmore
Emerging Markets
Corporate Income
Fund | | | Ashmore
Emerging Markets
Short Duration
Fund | |
INVESTMENT INCOME: | | | | | | | | | | | | | | | | |
Interest, net of foreign tax withholdings* | | $ | 34,739,947 | | | $ | 686,684 | | | $ | 5,799,901 | | | $ | 5,133,226 | |
Dividends, net of foreign tax withholdings* | | | — | | | | — | | | | — | | | | — | |
Total Income | | | 34,739,947 | | | | 686,684 | | | | 5,799,901 | | | | 5,133,226 | |
EXPENSES: | | | | | | | | | | | | | | | | |
Investment Manager fees | | | 4,911,140 | | | | 76,648 | | | | 718,948 | | | | 388,786 | |
Administration fees | | | 103,367 | | | | 1,870 | | | | 18,741 | | | | 11,987 | |
Custody fees | | | 158,418 | | | | 46,129 | | | | 14,594 | | | | 8,765 | |
Professional fees | | | 625,865 | | | | 47,986 | | | | 153,424 | | | | 161,442 | |
Trustees’ fees | | | 126,419 | | | | 2,597 | | | | 21,285 | | | | 15,304 | |
Offering expenses and registration fees | | | 53,307 | | | | 46,804 | | | | 50,456 | | | | 46,173 | |
Insurance fees | | | 65,258 | | | | 980 | | | | 16,572 | | | | 8,179 | |
Printing fees | | | 15,926 | | | | 11,085 | | | | 17,645 | | | | 13,448 | |
Distribution and servicing fees - Class A | | | 5,360 | | | | 3,445 | | | | 10,568 | | | | 18,960 | |
Distribution and servicing fees - Class C | | | 9,917 | | | | 25 | | | | 16,129 | | | | 2,415 | |
Regulatory fees | | | 29,303 | | | | 13,425 | | | | 15,648 | | | | 15,055 | |
Total Expenses | | | 6,104,280 | | | | 250,994 | | | | 1,054,010 | | | | 690,514 | |
Less expenses reimbursed by the Investment Manager | | | (1,023,234 | ) | | | (168,860 | ) | | | (276,983 | ) | | | (228,856 | ) |
Net Expenses | | | 5,081,046 | | | | 82,134 | | | | 777,027 | | | | 461,658 | |
Net Investment Income | | | 29,658,901 | | | | 604,550 | | | | 5,022,874 | | | | 4,671,568 | |
NET REALIZED AND UNREALIZED GAINS (LOSSES): | | | | | | | | | | | | | | | | |
NET REALIZED GAIN (LOSS) ON: | | | | | | | | | | | | | | | | |
Investments in securities (net of increase (decrease) in deferred foreign taxes of $-, $-, $-, $-, $51,510, $592, $11,125, $22,581, $(7), $-, $-, and $-, respectively) | | | (69,785,814 | ) | | | (144,230 | ) | | | (19,614,031 | ) | | | (14,191,114 | ) |
Forward foreign currency exchange contracts | | | (2,364,837 | ) | | | (175,508 | ) | | | (201,130 | ) | | | 12,100 | |
Interest rate swap contracts | | | 345,357 | | | | (28,570 | ) | | | — | | | | — | |
Foreign exchange transactions | | | (1,131,513 | ) | | | (39,863 | ) | | | (46,902 | ) | | | 472 | |
Net Realized Gain (Loss) | | | (72,936,807 | ) | | | (388,171 | ) | | | (19,862,063 | ) | | | (14,178,542 | ) |
NET CHANGE IN UNREALIZED APPRECIATION (DEPRECIATION) ON: | | | | | | | | | | | | | | | | |
Investments in securities (net of increase (decrease) in deferred foreign taxes of $-, $-, $-, $-, $(18,909), $27,235, $(83,911), $116,609, $6,691, $-, $-, and $-, respectively) | | | 95,969,124 | | | | 512,730 | | | | 24,956,855 | | | | 21,058,738 | |
Forward foreign currency exchange contracts | | | 2,423,493 | | | | 40,996 | | | | 11,868 | | | | 392 | |
Interest rate swap contracts | | | (108,313 | ) | | | 28,940 | | | | — | | | | — | |
Foreign exchange translations | | | 197,095 | | | | (1,269 | ) | | | 802 | | | | (230 | ) |
Change in Net Unrealized Appreciation (Depreciation) | | | 98,481,399 | | | | 581,397 | | | | 24,969,525 | | | | 21,058,900 | |
Net Realized and Unrealized Gains (Losses) | | | 25,544,592 | | | | 193,226 | | | | 5,107,462 | | | | 6,880,358 | |
Net Increase (Decrease) in Net Assets Resulting from Operations | | $ | 55,203,493 | | | $ | 797,776 | | | $ | 10,130,336 | | | $ | 11,551,926 | |
* Foreign Tax Withholdings | | $ | 177,961 | | | $ | 13,429 | | | $ | — | | | $ | — | |
See accompanying notes to the financial statements.
31
| | | | | | | | | | | | | | | | | | | | | | | | | | | | | | |
Ashmore
Emerging Markets
Active Equity
Fund | | | Ashmore
Emerging Markets
Small-Cap
Equity Fund | | | Ashmore
Emerging Markets
Frontier Equity
Fund | | | Ashmore
Emerging Markets
Equity Fund | | | Ashmore
Emerging Markets
Equity ESG Fund | | | Ashmore
Emerging Markets
Low Duration
Fund | | | Ashmore
Emerging Markets
Debt Fund | | | Ashmore
Emerging Markets
Corporate Income
ESG Fund | |
| | | | | | | | | | | | | | | | | | | | | | | | | | | | | | | |
| $ | 63,676 | | | $ | 7,131 | | | $ | 136,434 | | | $ | 52,027 | | | $ | 6,237 | | | $ | 446,852 | | | $ | 975,457 | | | $ | 429,579 | |
| | 846,146 | | | | 158,172 | | | | 2,467,285 | | | | 2,475,260 | | | | 162,769 | | | | — | | | | — | | | | — | |
| | 909,822 | | | | 165,303 | | | | 2,603,719 | | | | 2,527,287 | | | | 169,006 | | | | 446,852 | | | | 975,457 | | | | 429,579 | |
| | | | | | | | |
| | 454,251 | | | | 118,156 | | | | 1,036,430 | | | | 1,163,908 | | | | 113,763 | | | | 61,362 | | | | 118,818 | | | | 60,438 | |
| | 9,369 | | | | 1,832 | | | | 14,160 | | | | 22,624 | | | | 2,220 | | | | 1,906 | | | | 3,513 | | | | 1,451 | |
| | 85,448 | | | | 34,828 | | | | 142,294 | | | | 159,403 | | | | 14,198 | | | | 3,532 | | | | 4,992 | | | | 2,389 | |
| | 79,999 | | | | 43,423 | | | | 98,236 | | | | 125,338 | | | | 35,528 | | | | 38,373 | | | | 45,305 | | | | 36,357 | |
| | 10,244 | | | | 2,369 | | | | 17,816 | | | | 28,238 | | | | 2,849 | | | | 2,464 | | | | 4,491 | | | | 1,847 | |
| | 56,153 | | | | 47,179 | | | | 46,385 | | | | 53,168 | | | | 45,454 | | | | 20,294 | | | | 20,669 | | | | 19,342 | |
| | 7,707 | | | | 1,102 | | | | 8,973 | | | | 14,050 | | | | 1,313 | | | | 1,169 | | | | 2,174 | | | | 922 | |
| | 11,024 | | | | 11,126 | | | | 28,498 | | | | 14,730 | | | | 11,869 | | | | 12,043 | | | | 12,043 | | | | 10,906 | |
| | 545 | | | | 1,169 | | | | 6,077 | | | | 11,477 | | | | 4 | | | | 4 | | | | 4 | | | | — | |
| | 12 | | | | 272 | | | | 2,110 | | | | 824 | | | | 11 | | | | 10 | | | | 7 | | | | 7 | |
| | 13,265 | | | | 10,273 | | | | 12,450 | | | | 16,815 | | | | 10,331 | | | | 13,187 | | | | 13,504 | | | | 13,222 | |
| | 728,017 | | | | 271,729 | | | | 1,413,429 | | | | 1,610,575 | | | | 237,540 | | | | 154,344 | | | | 225,520 | | | | 146,881 | |
| | (266,050 | ) | | | (150,305 | ) | | | (355,358 | ) | | | (412,520 | ) | | | (121,592 | ) | | | (91,077 | ) | | | (103,221 | ) | | | (85,004 | ) |
| | 461,967 | | | | 121,424 | | | | 1,058,071 | | | | 1,198,055 | | | | 115,948 | | | | 63,267 | | | | 122,299 | | | | 61,877 | |
| | 447,855 | | | | 43,879 | | | | 1,545,648 | | | | 1,329,232 | | | | 53,058 | | | | 383,585 | | | | 853,158 | | | | 367,702 | |
| | | | | | | | |
| | 3,141,415 | | | | (904,886 | ) | | | (3,828,650 | ) | | | (11,254,795 | ) | | | (1,143,560 | ) | | | (354,558 | ) | | | (1,774,981 | ) | | | (644,789 | ) |
| | (954 | ) | | | — | | | | 664 | | | | — | | | | — | | | | (31,340 | ) | | | (98,220 | ) | | | (6,166 | ) |
| | — | | | | — | | | | — | | | | — | | | | — | | | | — | | | | — | | | | — | |
| | (131,308 | ) | | | 27,181 | | | | (70,289 | ) | | | (50,392 | ) | | | (8,164 | ) | | | 4,311 | | | | (421 | ) | | | (18,634 | ) |
| | 3,009,153 | | | | (877,705 | ) | | | (3,898,275 | ) | | | (11,305,187 | ) | | | (1,151,724 | ) | | | (381,587 | ) | | | (1,873,622 | ) | | | (669,589 | ) |
| | | | | | | | |
| | 12,153,130 | | | | 1,538,240 | | | | 2,281,817 | | | | 22,982,182 | | | | 2,388,829 | | | | 604,315 | | | | 1,594,361 | | | | 531,399 | |
| | — | | | | — | | | | — | | | | — | | | | — | | | | 1,651 | | | | 4,876 | | | | 1,308 | |
| | — | | | | — | | | | — | | | | — | | | | — | | | | — | | | | — | | | | — | |
| | 11,532 | | | | (28,675 | ) | | | (30,685 | ) | | | 42 | | | | 11 | | | | 164 | | | | 217 | | | | 50 | |
| | 12,164,662 | | | | 1,509,565 | | | | 2,251,132 | | | | 22,982,224 | | | | 2,388,840 | | | | 606,130 | | | | 1,599,454 | | | | 532,757 | |
| | 15,173,815 | | | | 631,860 | | | | (1,647,143 | ) | | | 11,677,037 | | | | 1,237,116 | | | | 224,543 | | | | (274,168 | ) | | | (136,832 | ) |
| $ | 15,621,670 | | | $ | 675,739 | | | $ | (101,495 | ) | | $ | 13,006,269 | | | $ | 1,290,174 | | | $ | 608,128 | | | $ | 578,990 | | | $ | 230,870 | |
| $ | 113,733 | | | $ | 14,373 | | | $ | 104,393 | | | $ | 223,718 | | | $ | 21,299 | | | $ | 271 | | | $ | 355 | | | $ | 224 | |
See accompanying notes to the financial statements.
32
ASHMORE FUNDS
STATEMENTS OF CHANGES IN NET ASSETS
For the Fiscal Years Ended October 31, 2023
| | | | | | | | | | | | | | | | | | | | | | | | |
| | | Ashmore Emerging Markets Total Return Fund | | | Ashmore Emerging Markets Local Currency Bond Fund | | | Ashmore Emerging Markets Corporate Income Fund | |
| | | 2023 | | | 2022 | | | 2023 | | | 2022 | | | 2023 | | | 2022 | |
OPERATIONS: | | | | | | | | | | | | | | | | | | | | | | | | |
Net investment income (loss) | | $ | 29,658,901 | | | $ | 45,555,709 | | | $ | 604,550 | | | $ | 341,843 | | | $ | 5,022,874 | | | $ | 12,949,114 | |
Net realized gain (loss) | | | (72,936,807 | ) | | | (209,122,942 | ) | | | (388,171 | ) | | | (1,102,008 | ) | | | (19,862,063 | ) | | | (36,003,457 | ) |
Net change in unrealized appreciation (depreciation) | | | 98,481,399 | | | | (110,036,273 | ) | | | 581,397 | | | | (511,998 | ) | | | 24,969,525 | | | | (39,359,413 | ) |
Net Increase (Decrease) in Net Assets Resulting from Operations | | | 55,203,493 | | | | (273,603,506 | ) | | | 797,776 | | | | (1,272,163 | ) | | | 10,130,336 | | | | (62,413,756 | ) |
| | | | | | |
DISTRIBUTIONS TO SHAREHOLDERS: | | | | | | | | | | | | | | | | | | | | | | | | |
Class A | | | (123,510 | ) | | | (37,990 | ) | | | (35,119 | ) | | | — | | | | (331,612 | ) | | | (591,756 | ) |
Class C | | | (50,117 | ) | | | (13,646 | ) | | | (19 | ) | | | — | | | | (114,377 | ) | | | (213,937 | ) |
Institutional Class | | | (29,018,557 | ) | | | (8,198,044 | ) | | | (257,574 | ) | | | — | | | | (6,381,041 | ) | | | (12,611,307 | ) |
| | | | | | | | | | | | | | | | | | | | | | | | |
Total Distributions to Shareholders | | | (29,192,184 | ) | | | (8,249,680 | ) | | | (292,712 | ) | | | — | | | | (6,827,030 | ) | | | (13,417,000 | ) |
TAX RETURN OF CAPITAL DISTRIBUTIONS TO SHAREHOLDERS: | | | | | | | | | | | | | | | | | | | | | | | | |
Class A | | | (1,789 | ) | | | (156,233 | ) | | | — | | | | (20,107 | ) | | | — | | | | — | |
Class C | | | (899 | ) | | | (66,934 | ) | | | — | | | | (298 | ) | | | — | | | | — | |
Institutional Class | | | (605,079 | ) | | | (34,684,669 | ) | | | — | | | | (76,188 | ) | | | — | | | | — | |
| | | | | | | | | | | | | | | | | | | | | | | | |
Total Tax Return of Capital Distributions to Shareholders | | | (607,767 | ) | | | (34,907,836 | ) | | | — | | | | (96,593 | ) | | | — | | | | — | |
FUND SHARE TRANSACTIONS: | | | | | | | | | | | | | | | | | | | | | | | | |
Net increase (decrease) in net assets resulting from Class A share transactions | | | (523,848 | ) | | | (2,480,460 | ) | | | (172,954 | ) | | | (51,180 | ) | | | (1,152,404 | ) | | | (2,985,423 | ) |
Net increase (decrease) in net assets resulting from Class C share transactions | | | (336,451 | ) | | | (582,173 | ) | | | (1,610 | ) | | | (21,775 | ) | | | (361,460 | ) | | | (2,614,851 | ) |
Net increase (decrease) in net assets resulting from Institutional Class share transactions | | | (63,807,005 | ) | | | (413,280,851 | ) | | | 4,595,131 | | | | (1,104,070 | ) | | | (21,700,083 | ) | | | (119,801,222 | ) |
| | | | | | | | | | | | | | | | | | | | | | | | |
| | | | | | |
Net Increase (Decrease) in Net Assets Resulting from Fund Share Transactions | | | (64,667,304 | ) | | | (416,343,484 | ) | | | 4,420,567 | | | | (1,177,025 | ) | | | (23,213,947 | ) | | | (125,401,496 | ) |
Total Increase (Decrease) in Net Assets | | | (39,263,762 | ) | | | (733,104,506 | ) | | | 4,925,631 | | | | (2,545,781 | ) | | | (19,910,641 | ) | | | (201,232,252 | ) |
NET ASSETS: | | | | | | | | | | | | | | | | | | | | | | | | |
Net Assets at the Beginning of year | | | 491,864,194 | | | | 1,224,968,700 | | | | 5,380,820 | | | | 7,926,601 | | | | 92,870,831 | | | | 294,103,083 | |
Net Assets at the End of year | | $ | 452,600,432 | | | $ | 491,864,194 | | | $ | 10,306,451 | | | $ | 5,380,820 | | | $ | 72,960,190 | | | $ | 92,870,831 | |
See accompanying notes to the financial statements.
33
| | | | | | | | | | | | | | | | | | | | | | |
Ashmore Emerging Markets Short Duration Fund | | | Ashmore Emerging Markets Active Equity Fund | | | Ashmore Emerging Markets Small-Cap Equity Fund | |
| | | | | | |
| 2023 | | | 2022 | | | 2023 | | | 2022 | | | 2023 | | | 2022 | |
| | | | | | | | | | | | | | | | | | | | | | |
| $ | 4,671,568 | | | $ | 5,562,392 | | | $ | 447,855 | | | $ | 983,247 | | | $ | 43,879 | | | $ | 50,751 | |
| | (14,178,542 | ) | | | (61,800,609 | ) | | | 3,009,153 | | | | (21,706,306 | ) | | | (877,705 | ) | | | (415,838 | ) |
| | | | | | | | | | | | | | | | | | | | | | |
| | 21,058,900 | | | | 22,922,301 | | | | 12,164,662 | | | | (16,867,095 | ) | | | 1,509,565 | | | | (3,455,025 | ) |
| | | | | | | | | | | | | | | | | | | | | | |
| | | | | | | | | | | | | | | | | | | | | | |
| | 11,551,926 | | | | (33,315,916 | ) | | | 15,621,670 | | | | (37,590,154 | ) | | | 675,739 | | | | (3,820,112 | ) |
| | | | | | | | | | | | | | | | | | | | | | |
| | | | | | | | | | | | | | | | | | | | | | |
| | (659,086 | ) | | | (336,688 | ) | | | (1,508 | ) | | | (396,907 | ) | | | — | | | | — | |
| | (21,214 | ) | | | (36,298 | ) | | | (14 | ) | | | (433 | ) | | | — | | | | — | |
| | (4,965,284 | ) | | | (7,232,408 | ) | | | (526,876 | ) | | | (17,159,925 | ) | | | — | | | | — | |
| | | | | | | | | | | | | | | | | | | | | | |
| | (5,645,584 | ) | | | (7,605,394 | ) | | | (528,398 | ) | | | (17,557,265 | ) | | | — | | | | — | |
| | | | | | | | | | | | | | | | | | | | | | |
| | | | | | | | | | | | | | | | | | | | | | |
| | | | | | | | | | | | | | | | | | | | | | |
| | — | | | | — | | | | — | | | | (1,429 | ) | | | — | | | | (4,734 | ) |
| | — | | | | — | | | | — | | | | (1 | ) | | | — | | | | (704 | ) |
| | — | | | | — | | | | — | | | | (177,587 | ) | | | — | | | | (88,237 | ) |
| | | | | | | | | | | | | | | | | | | | | | |
| | | | | | | | | | | | | | | | | | | | | | |
| | — | | | | — | | | | — | | | | (179,017 | ) | | | — | | | | (93,675 | ) |
| | | | | | | | | | | | | | | | | | | | | | |
| | | | | | | | | | | | | | | | | | | | | | |
| | | | | | | | | | | | | | | | | | | | | | |
| | | | | | | | | | | | | | | | | | | | | | |
| | 5,102,313 | | | | (1,945,708 | ) | | | (876,851 | ) | | | 10,980 | | | | (2,456 | ) | | | 213,811 | |
| | | | | | | | | | | | | | | | | | | | | | |
| | | | | | | | | | | | | | | | | | | | | | |
| | (140,916 | ) | | | (696,358 | ) | | | 10 | | | | 383 | | | | (32,766 | ) | | | (69,661 | ) |
| | | | | | | | | | | | | | | | | | | | | | |
| | | | | | | | | | | | | | | | | | | | | | |
| | | | | | | | | | | | | | | | | | | | | | |
| | (5,814,038 | ) | | | (34,104,155 | ) | | | (67,395,911 | ) | | | 33,353,791 | | | | 1,186,826 | | | | (1,036,778 | ) |
| | | | | | | | | | | | | | | | | | | | | | |
| | | | | | | | | | | | | | | | | | | | | | |
| | | | | | | | | | | | | | | | | | | | | | |
| | (852,641 | ) | | | (36,746,221 | ) | | | (68,272,752 | ) | | | 33,365,154 | | | | 1,151,604 | | | | (892,628 | ) |
| | | | | | | | | | | | | | | | | | | | | | |
| | 5,053,701 | | | | (77,667,531 | ) | | | (53,179,480 | ) | | | (21,961,282 | ) | | | 1,827,343 | | | | (4,806,415 | ) |
| | | | | | | | | | | | | | | | | | | | | | |
| | | | | | | | | | | | | | | | | | | | | | |
| | 55,339,128 | | | | 133,006,659 | | | | 76,069,215 | | | | 98,030,497 | | | | 6,670,831 | | | | 11,477,246 | |
| $ | 60,392,829 | | | $ | 55,339,128 | | | $ | 22,889,735 | | | $ | 76,069,215 | | | $ | 8,498,174 | | | $ | 6,670,831 | |
See accompanying notes to the financial statements.
34
ASHMORE FUNDS
STATEMENTS OF CHANGES IN NET ASSETS
For the Fiscal Years Ended October 31, 2023
| | | | | | | | | | | | | | | | | | | | | | | | |
| | | Ashmore Emerging Markets Frontier Equity Fund | | | Ashmore Emerging Markets Equity Fund | | | Ashmore Emerging Markets Equity ESG Fund | |
| | | | | | | |
| | | 2023 | | | 2022 | | | 2023 | | | 2022 | | | 2023 | | | 2022 | |
OPERATIONS: | | | | | | | | | | | | | | | | | | | | | | | | |
Net investment income (loss) | | $ | 1,545,648 | | | $ | 811,561 | | | $ | 1,329,232 | | | $ | 1,546,877 | | | $ | 53,058 | | | $ | 24,001 | |
Net realized gain (loss) | | | (3,898,275 | ) | | | 3,198,559 | | | | (11,305,187 | ) | | | (5,783,512 | ) | | | (1,151,724 | ) | | | (297,442 | ) |
Net change in unrealized appreciation (depreciation) | | | 2,251,132 | | | | (17,036,443 | ) | | | 22,982,224 | | | | (53,872,291 | ) | | | 2,388,840 | | | | (5,695,888 | ) |
Net Increase (Decrease) in Net Assets Resulting from Operations | | | (101,495 | ) | | | (13,026,323 | ) | | | 13,006,269 | | | | (58,108,926 | ) | | | 1,290,174 | | | | (5,969,329 | ) |
| | | | | | |
DISTRIBUTIONS TO SHAREHOLDERS: | | | | | | | | | | | | | | | | | | | | | | | | |
Class A | | | (37,283 | ) | | | (52,312 | ) | | | (53,244 | ) | | | (638,531 | ) | | | (6 | ) | | | (204 | ) |
Class C | | | (3,513 | ) | | | (3,008 | ) | | | (414 | ) | | | (9,143 | ) | | | (2 | ) | | | (204 | ) |
Institutional Class | | | (1,244,000 | ) | | | (1,320,948 | ) | | | (1,526,332 | ) | | | (20,900,163 | ) | | | (81,878 | ) | | | (2,040,719 | ) |
| | | | | | | | | | | | | | | | | | | | | | | | |
Total Distributions to Shareholders | | | (1,284,796 | ) | | | (1,376,268 | ) | | | (1,579,990 | ) | | | (21,547,837 | ) | | | (81,886 | ) | | | (2,041,127 | ) |
Class A | | | — | | | | — | | | | — | | | | (3,640 | ) | | | — | | | | (1 | ) |
Class C | | | — | | | | — | | | | — | | | | (98 | ) | | | — | | | | — | |
Institutional Class | | | — | | | | — | | | | — | | | | (247,762 | ) | | | — | | | | (25,235 | ) |
| | | | | | | | | | | | | | | | | | | | | | | | |
Total Tax Return of Capital Distributions to Shareholders | | | — | | | | — | | | | — | | | | (251,500 | ) | | | — | | | | (25,236 | ) |
FUND SHARE TRANSACTIONS: | | | | | | | | | | | | | | | | | | | | | | | | |
Net increase (decrease) in net assets resulting from Class A share transactions | | | (1,402,870 | ) | | | 1,042,220 | | | | 999,830 | | | | 1,135,776 | | | | 4 | | | | 186 | |
Net increase (decrease) in net assets resulting from Class C share transactions | | | (83,940 | ) | | | 147,108 | | | | (50,648 | ) | | | 67,535 | | | | 1 | | | | 186 | |
Net increase (decrease) in net assets resulting from Institutional Class share transactions | | | (6,930,954 | ) | | | 5,534,158 | | | | (13,899,497 | ) | | | 52,105,586 | | | | 57,295 | | | | 1,877,075 | |
| | | | | | | | | | | | | | | | | | | | | | | | |
| | | | | | |
Net Increase (Decrease) in Net Assets Resulting from Fund Share Transactions | | | (8,417,764 | ) | | | 6,723,486 | | | | (12,950,315 | ) | | | 53,308,897 | | | | 57,300 | | | | 1,877,447 | |
Total Increase (Decrease) in Net Assets | | | (9,804,055 | ) | | | (7,679,105 | ) | | | (1,524,036 | ) | | | (26,599,366 | ) | | | 1,265,588 | | | | (6,158,245 | ) |
NET ASSETS: | | | | | | | | | | | | | | | | | | | | | | | | |
Net Assets at the Beginning of year | | | 72,631,378 | | | | 80,310,483 | | | | 94,107,010 | | | | 120,706,376 | | | | 8,885,570 | | | | 15,043,815 | |
Net Assets at the End of year | | $ | 62,827,323 | | | $ | 72,631,378 | | | $ | 92,582,974 | | | $ | 94,107,010 | | | $ | 10,151,158 | | | $ | 8,885,570 | |
See accompanying notes to the financial statements.
35
| | | | | | | | | | | | | | | | | | | | | | |
Ashmore
Emerging Markets
Low Duration Fund | | | Ashmore Emerging Markets Debt Fund | | | Ashmore
Emerging Markets
Corporate Income
ESG Fund | |
| 2023 | | | 2022 | | | 2023 | | | 2022 | | | 2023 | | | 2022 | |
| | | | | | | | | | | | | | | | | | | | | | | |
| $ | 383,585 | | | $ | 321,561 | | | $ | 853,158 | | | $ | 671,024 | | | $ | 367,702 | | | $ | 391,264 | |
| | (381,587 | ) | | | (501,007 | ) | | | (1,873,622 | ) | | | (1,536,318 | ) | | | (669,589 | ) | | | (615,618 | ) |
|
606,130 |
| | | (1,063,847 | ) | | | 1,599,454 | | | | (3,433,117 | ) | | | 532,757 | | | | (2,349,309 | ) |
|
608,128 |
| | | (1,243,293 | ) | | | 578,990 | | | | (4,298,411 | ) | | | 230,870 | | | | (2,573,663 | ) |
| | | | | |
|
|
| | | | | | | | | | | | | | | | | | | | |
| | (39 | ) | | | (32 | ) | | | (45 | ) | | | (32 | ) | | | (44 | ) | | | (41 | ) |
| | (31 | ) | | | (23 | ) | | | (39 | ) | | | (25 | ) | | | (39 | ) | | | (34 | ) |
| | (399,404 | ) | | | (324,438 | ) | | | (923,023 | ) | | | (675,972 | ) | | | (454,900 | ) | | | (415,833 | ) |
| | | | | | | | | | | | | | | | | | | | | | |
| | (399,474 | ) | | | (324,493 | ) | | | (923,107 | ) | | | (676,029 | ) | | | (454,983 | ) | | | (415,908 | ) |
| | (1 | ) | | | — | | | | (4 | ) | | | — | | | | — | | | | — | |
| | (1 | ) | | | — | | | | (3 | ) | | | — | | | | — | | | | — | |
| | (16,038 | ) | | | — | | | | (71,993 | ) | | | — | | | | — | | | | — | |
| | | | | | | | | | | | | | | | | | | | | | |
| | | | | | | | | | | | | | | | | | | | | | |
| | (16,040 | ) | | | — | | | | (72,000 | ) | | | — | | | | — | | | | — | |
| | | | | | | | | | | | | | | | | | | | | | | |
|
29 |
| | | 27 | | | | 35 | | | | 28 | | | | 32 | | | | 34 | |
|
25 |
| | | 19 | | | | 31 | | | | 21 | | | | 29 | | | | 29 | |
|
300,749 |
| | | 278,378 | | | | 720,925 | | | | 574,521 | | | | 337,089 | | | | 353,954 | |
| | | | | | | | | | | | | | | | | | | | | | |
| | | | | |
|
300,803 |
| | | 278,424 | | | | 720,991 | | | | 574,570 | | | | 337,150 | | | | 354,017 | |
| | 493,417 | | | | (1,289,362 | ) | | | 304,874 | | | | (4,399,870 | ) | | | 113,037 | | | | (2,635,554 | ) |
| | | | | | | | | | | | | | | | | | | | | | | |
| | 8,998,391 | | | | 10,287,753 | | | | 16,044,146 | | | | 20,444,016 | | | | 6,722,115 | | | | 9,357,669 | |
| $ | 9,491,808 | | | $ | 8,998,391 | | | $ | 16,349,020 | | | $ | 16,044,146 | | | $ | 6,835,152 | | | $ | 6,722,115 | |
See accompanying notes to the financial statements.
36
ASHMORE FUNDS
FINANCIAL HIGHLIGHTS
Ashmore Emerging Markets Total Return Fund
| | | | | | | | | | | | | | | | | | | | |
| | | | | | Class A | | | | | | | |
| | | | | |
| | | Year Ended October 31,
2023 | | | Year Ended
October 31,
2022 | | | Year Ended
October 31,
2021 | | | Year Ended
October 31,
2020 | | | Year Ended October 31, 2019 | |
| | | | |
Net asset value at beginning of year | | $ | 4.32 | | | $ | 6.60 | | | $ | 6.80 | | | $ | 7.54 | | | $ | 7.31 | |
| | | | | |
Income (loss) from investment operations: | | | | | | | | | | | | | | | | | | | | |
Net investment income | | | 0.27 | 1 | | | 0.32 | 1 | | | 0.33 | 1 | | | 0.34 | | | | 0.40 | |
Net realized and unrealized gain (loss) | | | 0.23 | | | | (2.30 | ) | | | (0.20 | ) | | | (0.74 | ) | | | 0.24 | |
| | | | |
Total from investment operations | | | 0.50 | | | | (1.98 | ) | | | 0.13 | | | | (0.40 | ) | | | 0.64 | |
| | | | | |
Less distributions: | | | | | | | | | | | | | | | | | | | | |
| | | | | |
From net investment income | | | (0.26 | ) | | | (0.05 | ) | | | (0.31 | ) | | | (0.12 | ) | | | (0.33 | ) |
From net realized gain | | | — | | | | — | | | | — | | | | — | | | | — | |
Tax return of capital | | | (0.01 | ) | | | (0.25 | ) | | | (0.02 | ) | | | (0.22 | ) | | | (0.08 | ) |
| | | | |
| | | | | |
Total distributions | | | (0.27 | ) | | | (0.30 | ) | | | (0.33 | ) | | | (0.34 | ) | | | (0.41 | ) |
| | | | |
Net asset value at end of year | | $ | 4.55 | | | $ | 4.32 | | | $ | 6.60 | | | $ | 6.80 | | | $ | 7.54 | |
| | | | |
| | | | | |
Total return2 | | | 11.65 | % | | | (30.79 | )% | | | 1.68 | % | | | (5.31 | )% | | | 8.68 | % |
| | | | | |
Portfolio turnover rate3 | | | 56 | % | | | 32 | % | | | 54 | % | | | 67 | % | | | 49 | % |
| | | | | |
Net assets, end of year (in thousands) | | $ | 1,446 | | | $ | 1,920 | | | $ | 5,917 | | | $ | 10,377 | | | $ | 11,108 | |
| | | | | |
Ratios to average net assets: | | | | | | | | | | | | | | | | | | | | |
Total expenses to average net assets: | | | | | | | | | | | | | | | | | | | | |
Expenses before reimbursements | | | 1.48 | %4 | | | 1.42 | % | | | 1.37 | %4 | | | 1.42 | %4 | | | 1.36 | % |
Expenses after reimbursements | | | 1.28 | %4 | | | 1.27 | % | | | 1.28 | %4 | | | 1.32 | %4 | | | 1.27 | % |
| | | | | |
Net investment income to average net assets: | | | | | | | | | | | | | | | | | | | | |
Net investment income before reimbursements | | | 5.61 | %4 | | | 5.50 | % | | | 4.53 | %4 | | | 4.72 | %4 | | | 5.16 | % |
Net investment income after reimbursements | | | 5.81 | %4 | | | 5.65 | % | | | 4.62 | %4 | | | 4.82 | %4 | | | 5.25 | % |
See accompanying notes to the financial statements.
37
ASHMORE FUNDS
FINANCIAL HIGHLIGHTS
Ashmore Emerging Markets Total Return Fund
| | | | | | | | | | | | | | | | | | | | |
| | | | | | Class C | | | | | | | |
| | | | | |
| | | Year Ended October 31,
2023 | | | Year Ended
October 31,
2022 | | | Year Ended
October 31,
2021 | | | Year Ended
October 31,
2020 | | | Year Ended October 31, 2019 | |
| | | | |
Net asset value at beginning of year | | $ | 4.30 | | | $ | 6.58 | | | $ | 6.78 | | | $ | 7.53 | | | $ | 7.29 | |
| | | | | |
Income (loss) from investment operations: | | | | | | | | | | | | | | | | | | | | |
Net investment income | | | 0.24 | 1 | | | 0.27 | 1 | | | 0.27 | 1 | | | 0.30 | | | | 0.34 | |
Net realized and unrealized gain (loss) | | | 0.24 | | | | (2.29 | ) | | | (0.19 | ) | | | (0.76 | ) | | | 0.25 | |
| | | | |
Total from investment operations | | | 0.48 | | | | (2.02 | ) | | | 0.08 | | | | (0.46 | ) | | | 0.59 | |
| | | | | |
Less distributions: | | | | | | | | | | | | | | | | | | | | |
| | | | | |
From net investment income | | | (0.23 | ) | | | (0.04 | ) | | | (0.26 | ) | | | (0.11 | ) | | | (0.28 | ) |
From net realized gain | | | — | | | | — | | | | — | | | | — | | | | — | |
Tax return of capital | | | (0.01 | ) | | | (0.22 | ) | | | (0.02 | ) | | | (0.18 | ) | | | (0.07 | ) |
| | | | |
| | | | | |
Total distributions | | | (0.24 | ) | | | (0.26 | ) | | | (0.28 | ) | | | (0.29 | ) | | | (0.35 | ) |
| | | | |
Net asset value at end of year | | $ | 4.54 | | | $ | 4.30 | | | $ | 6.58 | | | $ | 6.78 | | | $ | 7.53 | |
| | | | |
| | | | | |
Total return2 | | | 11.14 | % | | | (31.39 | )% | | | 0.93 | % | | | (6.09 | )% | | | 8.02 | % |
| | | | | |
Portfolio turnover rate3 | | | 56 | % | | | 32 | % | | | 54 | % | | | 67 | % | | | 49 | % |
| | | | | |
Net assets, end of year (in thousands) | | $ | 815 | | | $ | 1,080 | | | $ | 2,386 | | | $ | 3,905 | | | $ | 5,506 | |
| | | | | |
Ratios to average net assets: | | | | | | | | | | | | | | | | | | | | |
Total expenses to average net assets: | | | | | | | | | | | | | | | | | | | | |
Expenses before reimbursements | | | 2.24 | %5 | | | 2.17 | % | | | 2.12 | %5 | | | 2.17 | %5 | | | 2.11 | % |
Expenses after reimbursements | | | 2.03 | %5 | | | 2.02 | % | | | 2.03 | %5 | | | 2.06 | %5 | | | 2.02 | % |
| | | | | |
Net investment income to average net assets: | | | | | | | | | | | | | | | | | | | | |
Net investment income before reimbursements | | | 4.85 | %5 | | | 4.74 | % | | | 3.76 | %5 | | | 4.01 | %5 | | | 4.41 | % |
Net investment income after reimbursements | | | 5.06 | %5 | | | 4.89 | % | | | 3.85 | %5 | | | 4.12 | %5 | | | 4.50 | % |
See accompanying notes to the financial statements.
38
ASHMORE FUNDS
FINANCIAL HIGHLIGHTS
Ashmore Emerging Markets Total Return Fund
| | | | | | | | | | | | | | | | | | | | |
| | | Institutional Class | |
| | | | | |
| | | Year Ended
October 31,
2023 | | | Year Ended
October 31,
2022 | | | Year Ended
October 31,
2021 | | | Year Ended
October 31,
2020 | | | Year Ended
October 31,
2019 | |
| | | | |
Net asset value at beginning of year | | $ | 4.38 | | | $ | 6.70 | | | $ | 6.90 | | | $ | 7.65 | | | $ | 7.41 | |
Income (loss) from investment operations: | | | | | | | | | | | | | | | | | | | | |
Net investment income | | | 0.29 | 1 | | | 0.33 | 1 | | | 0.35 | 1 | | | 0.36 | | | | 0.44 | |
Net realized and unrealized gain (loss) | | | 0.24 | | | | (2.34 | ) | | | (0.20 | ) | | | (0.75 | ) | | | 0.24 | |
| | | | |
Total from investment operations | | | 0.53 | | | | (2.01 | ) | | | 0.15 | | | | (0.39 | ) | | | 0.68 | |
| | | | | |
Less distributions: | | | | | | | | | | | | | | | | | | | | |
| | | | | |
From net investment income | | | (0.28 | ) | | | (0.05 | ) | | | (0.33 | ) | | | (0.13 | ) | | | (0.35 | ) |
From net realized gain | | | — | | | | — | | | | — | | | | — | | | | — | |
Tax return of capital | | | (0.01 | ) | | | (0.26 | ) | | | (0.02 | ) | | | (0.23 | ) | | | (0.09 | ) |
| | | | |
| | | | | |
Total distributions | | | (0.29 | ) | | | (0.31 | ) | | | (0.35 | ) | | | (0.36 | ) | | | (0.44 | ) |
| | | | |
Net asset value at end of year | | $ | 4.62 | | | $ | 4.38 | | | $ | 6.70 | | | $ | 6.90 | | | $ | 7.65 | |
| | | | |
| | | | | |
Total return2 | | | 12.06 | % | | | (30.74 | )% | | | 1.94 | % | | | (5.09 | )% | | | 9.04 | % |
| | | | | |
Portfolio turnover rate3 | | | 56 | % | | | 32 | % | | | 54 | % | | | 67 | % | | | 49 | % |
| | | | | |
Net assets, end of year (in thousands) | | $ | 450,339 | | | $ | 488,864 | | | $ | 1,216,666 | | | $ | 1,229,181 | | | $ | 1,528,196 | |
| | | | | |
Ratios to average net assets: | | | | | | | | | | | | | | | | | | | | |
Total expenses to average net assets: | | | | | | | | | | | | | | | | | | | | |
Expenses before reimbursements | | | 1.24 | %6 | | | 1.17 | % | | | 1.12 | %6 | | | 1.17 | %6 | | | 1.11 | % |
Expenses after reimbursements | | | 1.03 | %6 | | | 1.02 | % | | | 1.03 | %6 | | | 1.07 | %6 | | | 1.02 | % |
| | | | | |
Net investment income to average net assets: | | | | | | | | | | | | | | | | | | | | |
Net investment income before reimbursements | | | 5.84 | %6 | | | 5.79 | % | | | 4.78 | %6 | | | 4.99 | %6 | | | 5.40 | % |
Net investment income after reimbursements | | | 6.05 | %6 | | | 5.94 | % | | | 4.87 | %6 | | | 5.09 | %6 | | | 5.49 | % |
| 1 | Per share amounts are based on average number of shares outstanding during the period. |
| 2 | Assumes investment at net asset value at the beginning of the year, reinvestment of all distributions at net asset value on distribution date, and a complete redemption of the investment at net asset value at the end of the year, excluding the impact of sales charges. |
| 3 | The portfolio turnover rate is calculated by dividing the lesser of cost of purchases or proceeds from sales of long term portfolio securities by the monthly average of the value of the long term portfolio securities. |
| 4 | Ratios include legal expenses of $229, $3,181 and $5,146 that are outside of the expense cap under the expense limitation agreement for the years ended October 31, 2023, 2021 and 2020, respectively. Expense ratios would have been lower by 0.01%, 0.01% and 0.05% and Net investment income ratios would have been higher by 0.01%, 0.01% and 0.05% excluding these expenses. |
| 5 | Ratios include legal expenses of $111, $1,113 and $1,990 that are outside of the expense cap under the expense limitation agreement for the years ended October 31, 2023, 2021 and 2020, respectively. Expense ratios would have been lower by 0.01%, 0.01% and 0.04% and Net investment income ratios would have been higher by 0.01%, 0.01% and 0.04% excluding these expenses. |
| 6 | Ratios include legal expenses of $59,051, $433,533 and $640,665 that are outside of the expense cap under the expense limitation agreement for the years ended October 31, 2023, 2021 and 2020, respectively. Expense ratios would have been lower by 0.01%, 0.01% and 0.05% and Net investment income ratios would have been higher by 0.01%, 0.01% and 0.05% excluding these expenses. |
See accompanying notes to the financial statements.
39
ASHMORE FUNDS
FINANCIAL HIGHLIGHTS
Ashmore Emerging Markets Local Currency Bond Fund
| | | | | | | | | | | | | | | | | | | | |
| | | | | | Class A | | | | | | | |
| | | | | |
| | | Year Ended | | | Year Ended | | | Year Ended | | | Year Ended | | | Year Ended | |
| | | October 31, | | | October 31, | | | October 31, | | | October 31, | | | October 31, | |
| | | 2023 | | | 2022 | | | 2021 | | | 2020 | | | 2019 | |
| | | | |
Net asset value at beginning of year | | $ | 5.62 | | | $ | 6.92 | | | $ | 6.86 | | | $ | 7.35 | | | $ | 6.53 | |
| | | | | |
Income (loss) from investment operations: | | | | | | | | | | | | | | | | | | | | |
Net investment income | | | 0.38 | 1 | | | 0.32 | 1 | | | 0.28 | 1 | | | 0.35 | 1 | | | 0.59 | |
Net realized and unrealized gain (loss) | | | 0.30 | | | | (1.53 | ) | | | (0.22 | ) | | | (0.75 | ) | | | 0.27 | |
| | | | |
Total from investment operations | | | 0.68 | | | | (1.21 | ) | | | 0.06 | | | | (0.40 | ) | | | 0.86 | |
| | | | | |
Less distributions: | | | | | | | | | | | | | | | | | | | | |
| | | | | |
From net investment income | | | (0.18 | ) | | | — | | | | — | | | | — | | | | — | |
From net realized gain | | | — | | | | — | | | | — | | | | — | | | | — | |
Tax return of capital | | | — | | | | (0.09 | ) | | | — | | | | (0.09 | ) | | | (0.04 | ) |
| | | | |
| | | | | |
Total distributions | | | (0.18 | ) | | | (0.09 | ) | | | — | | | | (0.09 | ) | | | (0.04 | ) |
| | | | |
Net asset value at end of year | | $ | 6.12 | | | $ | 5.62 | | | $ | 6.92 | | | $ | 6.86 | | | $ | 7.35 | |
| | | | |
| | | | | |
Total return2 | | | 12.11 | % | | | (17.75 | )% | | | 0.87 | % | | | (5.51 | )% | | | 13.24 | % |
| | | | | |
Portfolio turnover rate3 | | | 79 | % | | | 53 | % | | | 34 | % | | | 47 | % | | | 56 | % |
| | | | | |
Net assets, end of year (in thousands) | | $ | 1,197 | | | $ | 1,248 | | | $ | 1,592 | | | $ | 1,755 | | | $ | 1,933 | |
| | | | | |
Ratios to average net assets: | | | | | | | | | | | | | | | | | | | | |
Total expenses to average net assets: | | | | | | | | | | | | | | | | | | | | |
Expenses before reimbursements | | | 2.89 | % | | | 3.10 | % | | | 2.97 | % | | | 1.75 | % | | | 1.55 | % |
Expenses after reimbursements | | | 1.07 | % | | | 1.22 | % | | | 1.22 | % | | | 1.22 | % | | | 1.22 | % |
| | | | | |
Net investment income to average net assets: | | | | | | | | | | | | | | | | | | | | |
Net investment income before reimbursements | | | 4.23 | % | | | 3.16 | % | | | 2.11 | % | | | 4.45 | % | | | 5.08 | % |
Net investment income after reimbursements | | | 6.05 | % | | | 5.04 | % | | | 3.86 | % | | | 4.98 | % | | | 5.41 | % |
See accompanying notes to the financial statements.
40
ASHMORE FUNDS
FINANCIAL HIGHLIGHTS
Ashmore Emerging Markets Local Currency Bond Fund
| | | | | | | | | | | | | | | | | | | | |
| | | Class C | |
| | | | | |
| | | Year Ended | | | Year Ended | | | Year Ended | | | Year Ended | | | Year Ended | |
| | | October 31, | | | October 31, | | | October 31, | | | October 31, | | | October 31, | |
| | | 2023 | | | 2022 | | | 2021 | | | 2020 | | | 2019 | |
| | | | |
Net asset value at beginning of year | | $ | 5.44 | | | $ | 6.75 | | | $ | 6.74 | | | $ | 7.27 | | | $ | 6.47 | |
| | | | | |
Income (loss) from investment operations: | | | | | | | | | | | | | | | | | | | | |
Net investment income | | | 0.32 | 1 | | | 0.30 | 1 | | | 0.22 | 1 | | | 0.29 | 1 | | | 0.34 | |
Net realized and unrealized gain (loss) | | | 0.30 | | | | (1.53 | ) | | | (0.21 | ) | | | (0.74 | ) | | | 0.47 | |
| | | | |
Total from investment operations | | | 0.62 | | | | (1.23 | ) | | | 0.01 | | | | (0.45 | ) | | | 0.81 | |
| | | | | |
Less distributions: | | | | | | | | | | | | | | | | | | | | |
| | | | | |
From net investment income | | | (0.11 | ) | | | — | | | | — | | | | — | | | | — | |
From net realized gain | | | — | | | | — | | | | — | | | | — | | | | — | |
Tax return of capital | | | — | | | | (0.08 | ) | | | — | | | | (0.08 | ) | | | (0.01 | ) |
| | | | |
| | | | | |
Total distributions | | | (0.11 | ) | | | (0.08 | ) | | | — | | | | (0.08 | ) | | | (0.01 | ) |
| | | | |
Net asset value at end of year | | $ | 5.95 | | | $ | 5.44 | | | $ | 6.75 | | | $ | 6.74 | | | $ | 7.27 | |
| | | | |
| | | | | |
Total return2 | | | 11.41 | % | | | (18.30 | )% | | | 0.15 | % | | | (6.25 | )% | | | 12.54 | % |
| | | | | |
Portfolio turnover rate3 | | | 79 | % | | | 53 | % | | | 34 | % | | | 47 | % | | | 56 | % |
| | | | | |
Net assets, end of year (in thousands) | | $ | 1 | | | $ | 2 | | | $ | 25 | | | $ | 30 | | | $ | 55 | |
| | | | | |
Ratios to average net assets: | | | | | | | | | | | | | | | | | | | | |
Total expenses to average net assets: | | | | | | | | | | | | | | | | | | | | |
Expenses before reimbursements | | | 3.59 | % | | | 3.74 | % | | | 3.75 | % | | | 2.50 | % | | | 2.29 | % |
Expenses after reimbursements | | | 1.82 | % | | | 1.97 | % | | | 1.97 | % | | | 1.97 | % | | | 1.97 | % |
| | | | | |
Net investment income to average net assets: | | | | | | | | | | | | | | | | | | | | |
Net investment income before reimbursements | | | 3.52 | % | | | 2.85 | % | | | 1.35 | % | | | 3.77 | % | | | 4.33 | % |
Net investment income after reimbursements | | | 5.29 | % | | | 4.62 | % | | | 3.13 | % | | | 4.30 | % | | | 4.65 | % |
See accompanying notes to the financial statements.
41
ASHMORE FUNDS
FINANCIAL HIGHLIGHTS
Ashmore Emerging Markets Local Currency Bond Fund
| | | | | | | | | | | | | | | | | | | | |
| | | Institutional Class | |
| | | | | |
| | | Year Ended | | | Year Ended | | | Year Ended | | | Year Ended | | | Year Ended | |
| | | October 31, | | | October 31, | | | October 31, | | | October 31, | | | October 31, | |
| | | 2023 | | | 2022 | | | 2021 | | | 2020 | | | 2019 | |
| | | | |
Net asset value at beginning of year | | $ | 5.90 | | | $ | 7.24 | | | $ | 7.16 | | | $ | 7.66 | | | $ | 6.79 | |
Income (loss) from investment operations: | | | | | | | | | | | | | | | | | | | | |
Net investment income | | | 0.43 | 1 | | | 0.35 | 1 | | | 0.31 | 1 | | | 0.38 | 1 | | | 0.65 | |
Net realized and unrealized gain (loss) | | | 0.30 | | | | (1.60 | ) | | | (0.23 | ) | | | (0.78 | ) | | | 0.27 | |
| | | | |
Total from investment operations | | | 0.73 | | | | (1.25 | ) | | | 0.08 | | | | (0.40 | ) | | | 0.92 | |
| | | | | |
Less distributions: | | | | | | | | | | | | | | | | | | | | |
| | | | | |
From net investment income | | | (0.19 | ) | | | — | | | | — | | | | — | | | | — | |
From net realized gain | | | — | | | | — | | | | — | | | | — | | | | — | |
Tax return of capital | | | — | | | | (0.09 | ) | | | — | | | | (0.10 | ) | | | (0.05 | ) |
| | | | |
| | | | | |
Total distributions | | | (0.19 | ) | | | (0.09 | ) | | | — | | | | (0.10 | ) | | | (0.05 | ) |
| | | | |
Net asset value at end of year | | $ | 6.44 | | | $ | 5.90 | | | $ | 7.24 | | | $ | 7.16 | | | $ | 7.66 | |
| | | | |
| | | | | |
Total return2 | | | 12.33 | % | | | (17.49 | )% | | | 1.12 | % | | | (5.38 | )% | | | 13.59 | % |
| | | | | |
Portfolio turnover rate3 | | | 79 | % | | | 53 | % | | | 34 | % | | | 47 | % | | | 56 | % |
| | | | | |
Net assets, end of year (in thousands) | | $ | 9,108 | | | $ | 4,131 | | | $ | 6,310 | | | $ | 28,257 | | | $ | 42,545 | |
| | | | | |
Ratios to average net assets: | | | | | | | | | | | | | | | | | | | | |
Total expenses to average net assets: | | | | | | | | | | | | | | | | | | | | |
Expenses before reimbursements | | | 2.57 | % | | | 2.83 | % | | | 2.61 | % | | | 1.50 | % | | | 1.28 | % |
Expenses after reimbursements | | | 0.82 | % | | | 0.97 | % | | | 0.97 | % | | | 0.97 | % | | | 0.97 | % |
| | | | | |
Net investment income to average net assets: | | | | | | | | | | | | | | | | | | | | |
Net investment income before reimbursements | | | 4.60 | % | | | 3.43 | % | | | 2.46 | % | | | 4.75 | % | | | 5.31 | % |
Net investment income after reimbursements | | | 6.35 | % | | | 5.29 | % | | | 4.10 | % | | | 5.28 | % | | | 5.62 | % |
| 1 | Per share amounts are based on average number of shares outstanding during the period. |
| 2 | Assumes investment at net asset value at the beginning of the year, reinvestment of all distributions at net asset value on distribution date, and a complete redemption of the investment at net asset value at the end of the year, excluding the impact of sales charges. |
| 3 | The portfolio turnover rate is calculated by dividing the lesser of cost of purchases or proceeds from sales of long term portfolio securities by the monthly average of the value of the long term portfolio securities. |
See accompanying notes to the financial statements.
42
ASHMORE FUNDS
FINANCIAL HIGHLIGHTS
Ashmore Emerging Markets Corporate Income Fund
| | | | | | | | | | | | | | | | | | | | |
| | | | | | Class A | | | | | | | |
| | | | | |
| | | Year Ended | | | Year Ended | | | Year Ended | | | Year Ended | | | Year Ended | |
| | | October 31, | | | October 31, | | | October 31, | | | October 31, | | | October 31, | |
| | | 2023 | | | 2022 | | | 2021 | | | 2020 | | | 2019 | |
| | | | |
Net asset value at beginning of year | | $ | 4.96 | | | $ | 7.53 | | | $ | 7.53 | | | $ | 7.92 | | | $ | 7.87 | |
| | | | | |
Income (loss) from investment operations: | | | | | | | | | | | | | | | | | | | | |
Net investment income | | | 0.27 | | | | 0.40 | | | | 0.37 | | | | 0.44 | | | | 0.52 | |
Net realized and unrealized gain (loss) | | | 0.31 | | | | (2.54 | ) | | | — | | | | (0.39 | ) | | | 0.03 | |
| | | | |
Total from investment operations | | | 0.58 | | | | (2.14 | ) | | | 0.37 | | | | 0.05 | | | | 0.55 | |
| | | | | |
Less distributions: | | | | | | | | | | | | | | | | | | | | |
| | | | | |
From net investment income | | | (0.40 | ) | | | (0.42 | ) | | | (0.37 | ) | | | (0.44 | ) | | | (0.50 | ) |
From net realized gain | | | — | | | | (0.01 | ) | | | — | | | | — | | | | (— | )1 |
Tax return of capital | | | — | | | | — | | | | — | | | | (— | )1 | | | — | |
| | | | |
| | | | | |
Total distributions | | | (0.40 | ) | | | (0.43 | ) | | | (0.37 | ) | | | (0.44 | ) | | | (0.50 | ) |
| | | | |
Net asset value at end of year | | $ | 5.14 | | | $ | 4.96 | | | $ | 7.53 | | | $ | 7.53 | | | $ | 7.92 | |
| | | | |
| | | | | |
Total return2 | | | 11.75 | % | | | (29.30 | )% | | | 4.85 | % | | | 0.85 | % | | | 7.37 | % |
| | | | | |
Portfolio turnover rate3 | | | 56 | % | | | 55 | % | | | 73 | % | | | 117 | % | | | 96 | % |
| | | | | |
Net assets, end of year (in thousands) | | $ | 3,779 | | | $ | 4,742 | | | $ | 11,153 | | | $ | 11,198 | | | $ | 13,383 | |
| | | | | |
Ratios to average net assets: | | | | | | | | | | | | | | | | | | | | |
Total expenses to average net assets: | | | | | | | | | | | | | | | | | | | | |
Expenses before reimbursements | | | 1.47 | %4 | | | 1.44 | %4 | | | 1.55 | %4 | | | 1.58 | %4 | | | 1.51 | % |
Expenses after reimbursements | | | 1.14 | %4 | | | 1.24 | %4 | | | 1.43 | %4 | | | 1.47 | %4 | | | 1.42 | % |
| | | | | |
Net investment income to average net assets: | | | | | | | | | | | | | | | | | | | | |
Net investment income before reimbursements | | | 5.40 | %4 | | | 6.62 | %4 | | | 4.61 | %4 | | | 5.76 | %4 | | | 6.39 | % |
Net investment income after reimbursements | | | 5.73 | %4 | | | 6.82 | %4 | | | 4.73 | %4 | | | 5.87 | %4 | | | 6.48 | % |
See accompanying notes to the financial statements.
43
ASHMORE FUNDS
FINANCIAL HIGHLIGHTS
Ashmore Emerging Markets Corporate Income Fund
| | | | | | | | | | | | | | | | | | | | |
| | | | | | Class C | | | | | | | |
| | | | | |
| | | Year Ended | | | Year Ended | | | Year Ended | | | Year Ended | | | Year Ended | |
| | | October 31, | | | October 31, | | | October 31, | | | October 31, | | | October 31, | |
| | | 2023 | | | 2022 | | | 2021 | | | 2020 | | | 2019 | |
| | | | |
Net asset value at beginning of year | | $ | 4.95 | | | $ | 7.52 | | | $ | 7.51 | | | $ | 7.91 | | | $ | 7.86 | |
| | | | | |
Income (loss) from investment operations: | | | | | | | | | | | | | | | | | | | | |
Net investment income | | | 0.24 | | | | 0.35 | | | | 0.31 | | | | 0.39 | | | | 0.45 | |
Net realized and unrealized gain (loss) | | | 0.29 | | | | (2.53 | ) | | | 0.02 | | | | (0.40 | ) | | | 0.04 | |
| | | | |
Total from investment operations | | | 0.53 | | | | (2.18 | ) | | | 0.33 | | | | (0.01 | ) | | | 0.49 | |
| | | | | |
Less distributions: | | | | | | | | | | | | | | | | | | | | |
| | | | | |
From net investment income | | | (0.36 | ) | | | (0.38 | ) | | | (0.32 | ) | | | (0.39 | ) | | | (0.44 | ) |
From net realized gain | | | — | | | | (0.01 | ) | | | — | | | | — | | | | (— | )1 |
Tax return of capital | | | — | | | | — | | | | — | | | | (— | )1 | | | — | |
| | | | |
| | | | | |
Total distributions | | | (0.36 | ) | | | (0.39 | ) | | | (0.32 | ) | | | (0.39 | ) | | | (0.44 | ) |
| | | | |
Net asset value at end of year | | $ | 5.12 | | | $ | 4.95 | | | $ | 7.52 | | | $ | 7.51 | | | $ | 7.91 | |
| | | | |
| | | | | |
Total return2 | | | 10.75 | % | | | (29.86 | )% | | | 4.25 | % | | | (0.01 | )% | | | 6.58 | % |
| | | | | |
Portfolio turnover rate3 | | | 56 | % | | | 55 | % | | | 73 | % | | | 117 | % | | | 96 | % |
| | | | | |
Net assets, end of year (in thousands) | | $ | 1,492 | | | $ | 1,782 | | | $ | 5,762 | | | $ | 7,466 | | | $ | 10,745 | |
| | | | | |
Ratios to average net assets: | | | | | | | | | | | | | | | | | | | | |
Total expenses to average net assets: | | | | | | | | | | | | | | | | | | | | |
Expenses before reimbursements | | | 2.22 | %5 | | | 2.20 | %5 | | | 2.30 | %5 | | | 2.33 | %5 | | | 2.26 | % |
Expenses after reimbursements | | | 1.89 | %5 | | | 2.01 | %5 | | | 2.18 | %5 | | | 2.22 | %5 | | | 2.17 | % |
| | | | | |
Net investment income to average net assets: | | | | | | | | | | | | | | | | | | | | |
Net investment income before reimbursements | | | 4.65 | %5 | | | 5.89 | %5 | | | 3.88 | %5 | | | 5.01 | %5 | | | 5.65 | % |
Net investment income after reimbursements | | | 4.98 | %5 | | | 6.08 | %5 | | | 4.00 | %5 | | | 5.12 | %5 | | | 5.74 | % |
See accompanying notes to the financial statements.
44
ASHMORE FUNDS
FINANCIAL HIGHLIGHTS
Ashmore Emerging Markets Corporate Income Fund
| | | | | | | | | | | | | | | | | | | | |
| | | Institutional Class | |
| | | | | |
| | | Year Ended | | | Year Ended | | | Year Ended | | | Year Ended | | | Year Ended | |
| | | October 31, | | | October 31, | | | October 31, | | | October 31, | | | October 31, | |
| | | 2023 | | | 2022 | | | 2021 | | | 2020 | | | 2019 | |
| | | | |
Net asset value at beginning of year | | $ | 5.17 | | | $ | 7.85 | | | $ | 7.84 | | | $ | 8.25 | | | $ | 8.20 | |
Income (loss) from investment operations: | | | | | | | | | | | | | | | | | | | | |
Net investment income | | | 0.31 | | | | 0.45 | | | | 0.41 | | | | 0.48 | | | | 0.55 | |
Net realized and unrealized gain (loss) | | | 0.31 | | | | (2.66 | ) | | | 0.01 | | | | (0.41 | ) | | | 0.04 | |
| | | | |
Total from investment operations | | | 0.62 | | | | (2.21 | ) | | | 0.42 | | | | 0.07 | | | | 0.59 | |
| | | | | |
Less distributions: | | | | | | | | | | | | | | | | | | | | |
| | | | | |
From net investment income | | | (0.43 | ) | | | (0.46 | ) | | | (0.41 | ) | | | (0.48 | ) | | | (0.54 | ) |
From net realized gain | | | — | | | | (0.01 | ) | | | — | | | | — | | | | (— | )1 |
Tax return of capital | | | — | | | | — | | | | — | | | | (— | )1 | | | — | |
| | | | |
| | | | | |
Total distributions | | | (0.43 | ) | | | (0.47 | ) | | | (0.41 | ) | | | (0.48 | ) | | | (0.54 | ) |
| | | | |
Net asset value at end of year | | $ | 5.36 | | | $ | 5.17 | | | $ | 7.85 | | | $ | 7.84 | | | $ | 8.25 | |
| | | | |
| | | | | |
Total return2 | | | 12.06 | % | | | (29.15 | )% | | | 5.24 | % | | | 1.04 | % | | | 7.61 | % |
| | | | | |
Portfolio turnover rate3 | | | 56 | % | | | 55 | % | | | 73 | % | | | 117 | % | | | 96 | % |
| | | | | |
Net assets, end of year (in thousands) | | $ | 67,689 | | | $ | 86,347 | | | $ | 277,188 | | | $ | 261,307 | | | $ | 443,880 | |
| | | | | |
Ratios to average net assets: | | | | | | | | | | | | | | | | | | | | |
Total expenses to average net assets: | | | | | | | | | | | | | | | | | | | | |
Expenses before reimbursements | | | 1.22 | %6 | | | 1.20 | %6 | | | 1.30 | %6 | | | 1.32 | %6 | | | 1.26 | % |
Expenses after reimbursements | | | 0.89 | %6 | | | 1.01 | %6 | | | 1.18 | %6 | | | 1.21 | %6 | | | 1.17 | % |
| | | | | |
Net investment income to average net assets: | | | | | | | | | | | | | | | | | | | | |
Net investment income before reimbursements | | | 5.65 | %6 | | | 6.90 | %6 | | | 4.86 | %6 | | | 6.00 | %6 | | | 6.66 | % |
Net investment income after reimbursements | | | 5.98 | %6 | | | 7.09 | %6 | | | 4.98 | %6 | | | 6.11 | %6 | | | 6.75 | % |
| 1 | Amount is less than $0.005 per share. |
| 2 | Assumes investment at net asset value at the beginning of the year, reinvestment of all distributions at net asset value on distribution date, and a complete redemption of the investment at net asset value at the end of the year, excluding the impact of sales charges. |
| 3 | The portfolio turnover rate is calculated by dividing the lesser of cost of purchases or proceeds from sales of long term portfolio securities by the monthly average of the value of the long term portfolio securities. |
| 4 | Ratios include legal expenses of $770, $63, $1,438 and $6,538 that are outside of the expense cap under the expense limitation agreement for the years ended October 31, 2023, 2022, 2021 and 2020, respectively. Expense ratios would have been lower by 0.02%, 0.12%, 0.01% and 0.05% and Net investment income ratios would have been higher by 0.02%, 0.07%, 0.01% and 0.05% excluding these expenses. |
| 5 | Ratios include legal expenses of $298, $79, $756 and $4,394 that are outside of the expense cap under the expense limitation agreement for the years ended October 31, 2023, 2022, 2021 and 2020, respectively. Expense ratios would have been lower by 0.02%, 0.14%, 0.01% and 0.05% and Net investment income ratios would have been higher by 0.02%, 0.07%, 0.01% and 0.05% excluding these expenses. |
| 6 | Ratios include legal expenses of $13,964, $3,742, $34,379 and $153,663 that are outside of the expense cap under the expense limitation agreement for the years ended October 31, 2023, 2022, 2021 and 2020, respectively. Expense ratios would have been lower by 0.02%, 0.14%, 0.01% and 0.04% and Net investment income ratios would have been higher by 0.02%, 0.07%, 0.01% and 0.04% excluding these expenses. |
See accompanying notes to the financial statements.
45
ASHMORE FUNDS
FINANCIAL HIGHLIGHTS
Ashmore Emerging Markets Short Duration Fund
| | | | | | | | | | | | | | | | | | | | |
| | | | | | Class A | | | | | | | |
| | | | | |
| | | Year Ended | | | Year Ended | | | Year Ended | | | Year Ended | | | Year Ended | |
| | | October 31, | | | October 31, | | | October 31, | | | October 31, | | | October 31, | |
| | | 2023 | | | 2022 | | | 2021 | | | 2020 | | | 2019 | |
| | | | |
Net asset value at beginning of year | | $ | 4.28 | | | $ | 6.80 | | | $ | 7.52 | | | $ | 9.00 | | | $ | 9.78 | |
| | | | | |
Income (loss) from investment operations: | | | | | | | | | | | | | | | | | | | | |
Net investment income | | | 0.34 | 1 | | | 0.32 | | | | 0.44 | | | | 0.46 | | | | 0.68 | |
Net realized and unrealized gain (loss) | | | 0.57 | | | | (2.39 | ) | | | (0.69 | ) | | | (1.46 | ) | | | (0.75 | ) |
| | | | |
Total from investment operations | | | 0.91 | | | | (2.07 | ) | | | (0.25 | ) | | | (1.00 | ) | | | (0.07 | ) |
| | | | | |
Less distributions: | | | | | | | | | | | | | | | | | | | | |
| | | | | |
From net investment income | | | (0.41 | ) | | | (0.34 | ) | | | (0.47 | ) | | | (0.48 | ) | | | (0.68 | ) |
From net realized gain | | | — | | | | (0.11 | ) | | | — | | | | — | | | | (0.03 | ) |
Tax return of capital | | | — | | | | — | | | | — | | | | — | | | | — | |
| | | | |
| | | | | |
Total distributions | | | (0.41 | ) | | | (0.45 | ) | | | (0.47 | ) | | | (0.48 | ) | | | (0.71 | ) |
| | | | |
Net asset value at end of year | | $ | 4.78 | | | $ | 4.28 | | | $ | 6.80 | | | $ | 7.52 | | | $ | 9.00 | |
| | | | |
| | | | | |
Total return2 | | | 22.36 | % | | | (31.54 | )% | | | (4.07 | )% | | | (11.25 | )% | | | (1.22 | )% |
| | | | | |
Portfolio turnover rate3 | | | 49 | % | | | 41 | % | | | 32 | % | | | 80 | % | | | 53 | % |
| | | | | |
Net assets, end of year (in thousands) | | $ | 8,499 | | | $ | 2,975 | | | $ | 6,834 | | | $ | 19,865 | | | $ | 110,771 | |
| | | | | |
Ratios to average net assets: | | | | | | | | | | | | | | | | | | | | |
Total expenses to average net assets: | | | | | | | | | | | | | | | | | | | | |
Expenses before reimbursements | | | 1.37 | %4 | | | 1.14 | %4 | | | 1.10 | %4 | | | 1.13 | %4 | | | 1.00 | % |
Expenses after reimbursements | | | 0.99 | %4 | | | 0.89 | %4 | | | 1.00 | %4 | | | 0.99 | %4 | | | 0.92 | % |
| | | | | |
Net investment income to average net assets: | | | | | | | | | | | | | | | | | | | | |
Net investment income before reimbursements | | | 7.19 | %4 | | | 6.06 | %4 | | | 6.17 | %4 | | | 7.07 | %4 | | | 6.74 | % |
Net investment income after reimbursements | | | 7.57 | %4 | | | 6.31 | %4 | | | 6.27 | %4 | | | 7.21 | %4 | | | 6.82 | % |
See accompanying notes to the financial statements.
46
ASHMORE FUNDS
FINANCIAL HIGHLIGHTS
Ashmore Emerging Markets Short Duration Fund
| | | | | | | | | | | | | | | | | | | | |
| | | | | | Class C | | | | | | | |
| | | | | |
| | | Year Ended | | | Year Ended | | | Year Ended | | | Year Ended | | | Year Ended | |
| | | October 31, | | | October 31, | | | October 31, | | | October 31, | | | October 31, | |
| | | 2023 | | | 2022 | | | 2021 | | | 2020 | | | 2019 | |
| | | | |
Net asset value at beginning of year | | $ | 4.09 | | | $ | 6.53 | | | $ | 7.22 | | | $ | 8.66 | | | $ | 9.41 | |
| | | | | |
Income (loss) from investment operations: | | | | | | | | | | | | | | | | | | | | |
Net investment income | | | 0.30 | 1 | | | 0.29 | | | | 0.40 | | | | 0.42 | | | | 0.58 | |
Net realized and unrealized gain (loss) | | | 0.54 | | | | (2.33 | ) | | | (0.69 | ) | | | (1.45 | ) | | | (0.72 | ) |
| | | | |
Total from investment operations | | | 0.84 | | | | (2.04 | ) | | | (0.29 | ) | | | (1.03 | ) | | | (0.14 | ) |
| | | | | |
Less distributions: | | | | | | | | | | | | | | | | | | | | |
| | | | | |
From net investment income | | | (0.37 | ) | | | (0.29 | ) | | | (0.40 | ) | | | (0.41 | ) | | | (0.58 | ) |
From net realized gain | | | — | | | | (0.11 | ) | | | — | | | | — | | | | (0.03 | ) |
Tax return of capital | | | — | | | | — | | | | — | | | | — | | | | — | |
| | | | |
| | | | | |
Total distributions | | | (0.37 | ) | | | (0.40 | ) | | | (0.40 | ) | | | (0.41 | ) | | | (0.61 | ) |
| | | | |
Net asset value at end of year | | $ | 4.56 | | | $ | 4.09 | | | $ | 6.53 | | | $ | 7.22 | | | $ | 8.66 | |
| | | | |
| | | | | |
Total return2 | | | 21.32 | % | | | (32.29 | )% | | | (4.56 | )% | | | (12.05 | )% | | | (1.94 | )% |
| | | | | |
Portfolio turnover rate3 | | | 49 | % | | | 41 | % | | | 32 | % | | | 80 | % | | | 53 | % |
| | | | | |
Net assets, end of year (in thousands) | | $ | 171 | | | $ | 291 | | | $ | 1,219 | | | $ | 1,572 | | | $ | 2,342 | |
| | | | | |
Ratios to average net assets: | | | | | | | | | | | | | | | | | | | | |
Total expenses to average net assets: | | | | | | | | | | | | | | | | | | | | |
Expenses before reimbursements | | | 2.11 | %5 | | | 1.91 | %5 | | | 1.84 | %5 | | | 1.96 | %5 | | | 1.75 | % |
Expenses after reimbursements | | | 1.74 | %5 | | | 1.66 | %5 | | | 1.76 | %5 | | | 1.83 | %5 | | | 1.67 | % |
| | | | | |
Net investment income to average net assets: | | | | | | | | | | | | | | | | | | | | |
Net investment income before reimbursements | | | 6.57 | %5 | | | 5.09 | %5 | | | 5.36 | %5 | | | 5.20 | %5 | | | 5.96 | % |
Net investment income after reimbursements | | | 6.94 | %5 | | | 5.34 | %5 | | | 5.44 | %5 | | | 5.33 | %5 | | | 6.04 | % |
See accompanying notes to the financial statements.
47
ASHMORE FUNDS
FINANCIAL HIGHLIGHTS
Ashmore Emerging Markets Short Duration Fund
| | | | | | | | | | | | | | | | | | | | |
| | | Institutional Class | |
| | | | | |
| | | Year Ended | | | Year Ended | | | Year Ended | | | Year Ended | | | Year Ended | |
| | | October 31, | | | October 31, | | | October 31, | | | October 31, | | | October 31, | |
| | | 2023 | | | 2022 | | | 2021 | | | 2020 | | | 2019 | |
| | | | |
Net asset value at beginning of year | | $ | 4.20 | | | $ | 6.69 | | | $ | 7.40 | | | $ | 8.83 | | | $ | 9.60 | |
Income (loss) from investment operations: | | | | | | | | | | | | | | | | | | | | |
Net investment income | | | 0.34 | 1 | | | 0.37 | | | | 0.50 | | | | 0.49 | | | | 0.69 | |
Net realized and unrealized gain (loss) | | | 0.57 | | | | (2.40 | ) | | | (0.73 | ) | | | (1.44 | ) | | | (0.74 | ) |
| | | | |
Total from investment operations | | | 0.91 | | | | (2.03 | ) | | | (0.23 | ) | | | (0.95 | ) | | | (0.05 | ) |
| | | | | |
Less distributions: | | | | | | | | | | | | | | | | | | | | |
| | | | | |
From net investment income | | | (0.42 | ) | | | (0.35 | ) | | | (0.48 | ) | | | (0.48 | ) | | | (0.69 | ) |
From net realized gain | | | — | | | | (0.11 | ) | | | — | | | | — | | | | (0.03 | ) |
Tax return of capital | | | — | | | | — | | | | — | | | | — | | | | — | |
| | | | |
| | | | | |
Total distributions | | | (0.42 | ) | | | (0.46 | ) | | | (0.48 | ) | | | (0.48 | ) | | | (0.72 | ) |
| | | | |
Net asset value at end of year | | $ | 4.69 | | | $ | 4.20 | | | $ | 6.69 | | | $ | 7.40 | | | $ | 8.83 | |
| | | | |
| | | | | |
Total return2 | | | 22.63 | % | | | (31.54 | )% | | | (3.75 | )% | | | (10.94 | )% | | | (1.01 | )% |
| | | | | |
Portfolio turnover rate3 | | | 49 | % | | | 41 | % | | | 32 | % | | | 80 | % | | | 53 | % |
| | | | | |
Net assets, end of year (in thousands) | | $ | 51,723 | | | $ | 52,073 | | | $ | 124,954 | | | $ | 441,467 | | | $ | 1,195,492 | |
| | | | | |
Ratios to average net assets: | | | | | | | | | | | | | | | | | | | | |
Total expenses to average net assets: | | | | | | | | | | | | | | | | | | | | |
Expenses before reimbursements | | | 1.12 | %6 | | | 0.90 | %6 | | | 0.84 | %6 | | | 0.91 | %6 | | | 0.75 | % |
Expenses after reimbursements | | | 0.74 | %6 | | | 0.65 | %6 | | | 0.75 | %6 | | | 0.79 | %6 | | | 0.67 | % |
| | | | | |
Net investment income to average net assets: | | | | | | | | | | | | | | | | | | | | |
Net investment income before reimbursements | | | 7.47 | %6 | | | 6.22 | %6 | | | 6.38 | %6 | | | 6.98 | %6 | | | 7.04 | % |
Net investment income after reimbursements | | | 7.85 | %6 | | | 6.47 | %6 | | | 6.47 | %6 | | | 7.10 | %6 | | | 7.12 | % |
| 1 | Per share amounts are based on average number of shares outstanding during the period. |
| 2 | Assumes investment at net asset value at the beginning of the year, reinvestment of all distributions at net asset value on distribution date, and a complete redemption of the investment at net asset value at the end of the year, excluding the impact of sales charges. |
| 3 | The portfolio turnover rate is calculated by dividing the lesser of cost of purchases or proceeds from sales of long term portfolio securities by the monthly average of the value of the long term portfolio securities. |
| 4 | Ratios include legal expenses of $5,360, $(1,101), $10,827 and $37,676 that are outside of the expense cap under the expense limitation agreement for the years ended October 31, 2023, 2022, 2021 and 2020, respectively. Expense ratios would have been lower by 0.07%, higher by 0.03% and lower by 0.08% and 0.07% and Net investment income ratios would have been higher by 0.07%, lower by 0.03% and higher by 0.08% and 0.07% excluding these expenses. |
| 5 | Ratios include legal expenses of $141, $(46), $1,388 and $2,841 that are outside of the expense cap under the expense limitation agreement for the years ended October 31, 2023, 2022, 2021 and 2020, respectively. Expense ratios would have been lower by 0.07%, higher by 0.01% and lower by 0.09% and 0.16% and Net investment income ratios would have been higher by 0.07%, lower by 0.01% and higher by 0.09% and 0.16% excluding these expenses. |
| 6 | Ratios include legal expenses of $34,017, $(12,847), $182,441 and $835,457 that are outside of the expense cap under the expense limitation agreement for the years ended October 31, 2023, 2022, 2021 and 2020, respectively. Expense ratios would have been lower by 0.07%, higher by 0.02% and lower by 0.08% and 0.12% and Net investment income ratios would have been higher by 0.07%, lower by 0.02% and higher by 0.08% and 0.12% excluding these expenses. |
See accompanying notes to the financial statements.
48
ASHMORE FUNDS
FINANCIAL HIGHLIGHTS
Ashmore Emerging Markets Active Equity Fund
| | | | | | | | | | | | | | | | | | | | |
| | | | | | Class A | | | | | | | |
| | | | | |
| | | Year Ended | | | Year Ended | | | Year Ended | | | Year Ended | | | Year Ended | |
| | | October 31, | | | October 31, | | | October 31, | | | October 31, | | | October 31, | |
| | | 2023 | | | 2022 | | | 2021 | | | 2020 | | | 2019 | |
| | | | |
Net asset value at beginning of year | | $ | 6.11 | | | $ | 12.55 | | | $ | 11.08 | | | $ | 10.46 | | | $ | 10.53 | |
| | | | | |
Income (loss) from investment operations: | | | | | | | | | | | | | | | | | | | | |
Net investment income | | | 0.01 | 1 | | | 0.08 | 1 | | | 0.15 | | | | 0.11 | 1 | | | 0.13 | |
Net realized and unrealized gain (loss) | | | 0.47 | | | | (3.26 | ) | | | 1.44 | | | | 0.56 | | | | 0.85 | |
| | | | |
Total from investment operations | | | 0.48 | | | | (3.18 | ) | | | 1.59 | | | | 0.67 | | | | 0.98 | |
| | | | | |
Less distributions: | | | | | | | | | | | | | | | | | | | | |
| | | | | |
From net investment income | | | (0.11 | ) | | | (0.18 | ) | | | (0.12 | ) | | | (0.05 | ) | | | (0.09 | ) |
From net realized gain | | | — | | | | (3.07 | ) | | | — | | | | — | | | | (0.94 | ) |
Tax return of capital | | | — | | | | (0.01 | ) | | | — | | | | — | | | | (0.02 | ) |
| | | | |
| | | | | |
Total distributions | | | (0.11 | ) | | | (3.26 | ) | | | (0.12 | ) | | | (0.05 | ) | | | (1.05 | ) |
| | | | |
Net asset value at end of year | | $ | 6.48 | | | $ | 6.11 | | | $ | 12.55 | | | $ | 11.08 | | | $ | 10.46 | |
| | | | |
| | | | | |
Total return2 | | | 7.68 | % | | | (33.53 | )% | | | 14.23 | % | | | 6.49 | % | | | 10.73 | % |
| | | | | |
Portfolio turnover rate3 | | | 189 | % | | | 264 | % | | | 206 | % | | | 228 | % | | | 153 | % |
| | | | | |
Net assets, end of year (in thousands) | | $ | 40 | | | $ | 804 | | | $ | 1,611 | | | $ | 1,616 | | | $ | 209 | |
| | | | | |
Ratios to average net assets: | | | | | | | | | | | | | | | | | | | | |
Total expenses to average net assets: | | | | | | | | | | | | | | | | | | | | |
Expenses before reimbursements | | | 1.69 | % | | | 1.52 | % | | | 1.49 | % | | | 1.55 | % | | | 1.96 | % |
Expenses after reimbursements | | | 1.27 | % | | | 1.27 | % | | | 1.27 | % | | | 1.27 | % | | | 1.27 | % |
| | | | | |
Net investment income (loss) to average net assets: | | | | | | | | | | | | | | | | | | | | |
Net investment income (loss) before reimbursements | | | (0.25 | )% | | | 0.68 | % | | | 0.91 | % | | | 0.73 | % | | | 0.55 | % |
Net investment income after reimbursements | | | 0.17 | % | | | 0.93 | % | | | 1.13 | % | | | 1.01 | % | | | 1.24 | % |
See accompanying notes to the financial statements.
49
ASHMORE FUNDS
FINANCIAL HIGHLIGHTS
Ashmore Emerging Markets Active Equity Fund
| | | | | | | | | | | | | | | | | | | | |
| | | | | | Class C | | | | | | | |
| | | | | |
| | | Year Ended | | | Year Ended | | | Year Ended | | | Year Ended | | | Year Ended | |
| | | October 31, | | | October 31, | | | October 31, | | | October 31, | | | October 31, | |
| | | 2023 | | | 2022 | | | 2021 | | | 2020 | | | 2019 | |
| | | | |
Net asset value at beginning of year | | $ | 5.96 | | | $ | 12.33 | | | $ | 10.90 | | | $ | 10.32 | | | $ | 10.43 | |
| | | | | |
Income (loss) from investment operations: | | | | | | | | | | | | | | | | | | | | |
Net investment income | | | 0.01 | 1 | | | 0.01 | 1 | | | 0.05 | | | | — | 1,4 | | | 0.07 | |
Net realized and unrealized gain (loss) | | | 0.41 | | | | (3.18 | ) | | | 1.42 | | | | 0.58 | | | | 0.83 | |
| | | | |
Total from investment operations | | | 0.42 | | | | (3.17 | ) | | | 1.47 | | | | 0.58 | | | | 0.90 | |
| | | | | |
Less distributions: | | | | | | | | | | | | | | | | | | | | |
| | | | | |
From net investment income | | | (0.08 | ) | | | (0.13 | ) | | | (0.04 | ) | | | (— | )4 | | | (0.05 | ) |
From net realized gain | | | — | | | | (3.07 | ) | | | — | | | | — | | | | (0.94 | ) |
Tax return of capital | | | — | | | | (— | )4 | | | — | | | | — | | | | (0.02 | ) |
| | | | |
| | | | | |
Total distributions | | | (0.08 | ) | | | (3.20 | ) | | | (0.04 | ) | | | — | | | | (1.01 | ) |
| | | | |
Net asset value at end of year | | $ | 6.30 | | | $ | 5.96 | | | $ | 12.33 | | | $ | 10.90 | | | $ | 10.32 | |
| | | | |
| | | | | |
Total return2 | | | 6.89 | % | | | (34.05 | )% | | | 13.41 | % | | | 5.76 | % | | | 9.88 | % |
| | | | | |
Portfolio turnover rate3 | | | 189 | % | | | 264 | % | | | 206 | % | | | 228 | % | | | 153 | % |
| | | | | |
Net assets, end of year (in thousands) | | $ | 1 | | | $ | 1 | | | $ | 2 | | | $ | 2 | | | $ | 12 | |
| | | | | |
Ratios to average net assets: | | | | | | | | | | | | | | | | | | | | |
Total expenses to average net assets: | | | | | | | | | | | | | | | | | | | | |
Expenses before reimbursements | | | 2.79 | % | | | 2.30 | % | | | 2.25 | % | | | 2.31 | % | | | 2.71 | % |
Expenses after reimbursements | | | 2.02 | % | | | 2.02 | % | | | 2.02 | % | | | 2.02 | % | | | 2.02 | % |
| | | | | |
Net investment income (loss) to average net assets: | | | | | | | | | | | | | | | | | | | | |
Net investment income (loss) before reimbursements | | | (0.65 | )% | | | (0.10 | )% | | | 0.14 | % | | | (0.30 | )% | | | (0.17 | )% |
Net investment income (loss) after reimbursements | | | 0.12 | % | | | 0.18 | % | | | 0.37 | % | | | (0.01 | )% | | | 0.52 | % |
See accompanying notes to the financial statements.
50
ASHMORE FUNDS
FINANCIAL HIGHLIGHTS
Ashmore Emerging Markets Active Equity Fund
| | | | | | | | | | | | | | | | | | | | |
| | | Institutional Class | |
| | | | | |
| | | Year Ended | | | Year Ended | | | Year Ended | | | Year Ended | | | Year Ended | |
| | | October 31, | | | October 31, | | | October 31, | | | October 31, | | | October 31, | |
| | | 2023 | | | 2022 | | | 2021 | | | 2020 | | | 2019 | |
| | | | |
Net asset value at beginning of year | | $ | 6.16 | | | $ | 12.63 | | | $ | 11.15 | | | $ | 10.51 | | | $ | 10.56 | |
Income (loss) from investment operations: | | | | | | | | | | | | | | | | | | | | |
Net investment income | | | 0.07 | 1 | | | 0.09 | 1 | | | 0.18 | | | | 0.10 | 1 | | | 0.16 | |
Net realized and unrealized gain (loss) | | | 0.43 | | | | (3.28 | ) | | | 1.45 | | | | 0.60 | | | | 0.86 | |
| | | | |
Total from investment operations | | | 0.50 | | | | (3.19 | ) | | | 1.63 | | | | 0.70 | | | | 1.02 | |
| | | | | |
Less distributions: | | | | | | | | | | | | | | | | | | | | |
| | | | | |
From net investment income | | | (0.12 | ) | | | (0.20 | ) | | | (0.15 | ) | | | (0.06 | ) | | | (0.10 | ) |
From net realized gain | | | — | | | | (3.07 | ) | | | — | | | | — | | | | (0.94 | ) |
Tax return of capital | | | — | | | | (0.01 | ) | | | — | | | | — | | | | (0.03 | ) |
| | | | |
| | | | | |
Total distributions | | | (0.12 | ) | | | (3.28 | ) | | | (0.15 | ) | | | (0.06 | ) | | | (1.07 | ) |
| | | | |
Net asset value at end of year | | $ | 6.54 | | | $ | 6.16 | | | $ | 12.63 | | | $ | 11.15 | | | $ | 10.51 | |
| | | | |
| | | | | |
Total return2 | | | 7.95 | % | | | (33.40 | )% | | | 14.50 | % | | | 6.79 | % | | | 11.05 | % |
| | | | | |
Portfolio turnover rate3 | | | 189 | % | | | 264 | % | | | 206 | % | | | 228 | % | | | 153 | % |
| | | | | |
Net assets, end of year (in thousands) | | $ | 22,849 | | | $ | 75,264 | | | $ | 96,417 | | | $ | 80,474 | | | $ | 20,502 | |
| | | | | |
Ratios to average net assets: | | | | | | | | | | | | | | | | | | | | |
Total expenses to average net assets: | | | | | | | | | | | | | | | | | | | | |
Expenses before reimbursements | | | 1.61 | % | | | 1.27 | % | | | 1.24 | % | | | 1.29 | % | | | 1.72 | % |
Expenses after reimbursements | | | 1.02 | % | | | 1.02 | % | | | 1.02 | % | | | 1.02 | % | | | 1.02 | % |
| | | | | |
Net investment income to average net assets: | | | | | | | | | | | | | | | | | | | | |
Net investment income before reimbursements | | | 0.41 | % | | | 0.87 | % | | | 1.15 | % | | | 0.67 | % | | | 0.83 | % |
Net investment income after reimbursements | | | 1.00 | % | | | 1.12 | % | | | 1.37 | % | | | 0.94 | % | | | 1.53 | % |
| 1 | Per share amounts are based on average number of shares outstanding during the period. |
| 2 | Assumes investment at net asset value at the beginning of the year, reinvestment of all distributions at net asset value on distribution date, and a complete redemption of the investment at net asset value at the end of the year, excluding the impact of sales charges. |
| 3 | The portfolio turnover rate is calculated by dividing the lesser of cost of purchases or proceeds from sales of long term portfolio securities by the monthly average of the value of the long term portfolio securities. Portfolio turnover is not annualized for periods less than one year. |
| 4 | Amount is less than $0.005 per share. |
See accompanying notes to the financial statements.
51
ASHMORE FUNDS
FINANCIAL HIGHLIGHTS
Ashmore Emerging Markets Small-Cap Equity Fund
| | | | | | | | | | | | | | | | | | | | |
| | | | | | Class A | | | | | | | |
| | | | | |
| | | Year Ended | | | Year Ended | | | Year Ended | | | Year Ended | | | Year Ended | |
| | | October 31, | | | October 31, | | | October 31, | | | October 31, | | | October 31, | |
| | | 2023 | | | 2022 | | | 2021 | | | 2020 | | | 2019 | |
| | | | |
Net asset value at beginning of year | | $ | 10.07 | | | $ | 15.32 | | | $ | 10.99 | | | $ | 8.84 | | | $ | 8.02 | |
| | | | | |
Income (loss) from investment operations: | | | | | | | | | | | | | | | | | | | | |
Net investment income (loss) | | | 0.03 | 1 | | | 0.06 | 1 | | | (0.18 | ) | | | (0.20 | ) | | | (0.01 | ) |
Net realized and unrealized gain (loss) | | | 0.93 | | | | (5.15 | ) | | | 4.51 | | | | 2.35 | | | | 0.83 | |
| | | | |
Total from investment operations | | | 0.96 | | | | (5.09 | ) | | | 4.33 | | | | 2.15 | | | | 0.82 | |
| | | | | |
Less distributions: | | | | | | | | | | | | | | | | | | | | |
| | | | | |
From net investment income | | | — | | | | — | | | | — | | | | — | | | | (— | )2 |
From net realized gain | | | — | | | | — | | | | — | | | | — | | | | — | |
Tax return of capital | | | — | | | | (0.16 | ) | | | — | | | | — | | | | (— | )2 |
| | | | |
| | | | | |
Total distributions | | | — | | | | (0.16 | ) | | | — | | | | — | | | | — | |
| | | | |
Net asset value at end of year | | $ | 11.03 | | | $ | 10.07 | | | $ | 15.32 | | | $ | 10.99 | | | $ | 8.84 | |
| | | | |
| | | | | |
Total return3 | | | 9.53 | % | | | (33.37 | )% | | | 39.40 | % | | | 24.32 | % | | | 10.27 | % |
| | | | | |
Portfolio turnover rate4 | | | 79 | % | | | 50 | % | | | 77 | % | | | 62 | % | | | 60 | % |
| | | | | |
Net assets, end of year (in thousands) | | $ | 441 | | | $ | 393 | | | $ | 321 | | | $ | 388 | | | $ | 1,356 | |
| | | | | |
Ratios to average net assets: | | | | | | | | | | | | | | | | | | | | |
Total expenses to average net assets: | | | | | | | | | | | | | | | | | | | | |
Expenses before reimbursements | | | 3.29 | % | | | 3.08 | % | | | 2.75 | % | | | 2.78 | % | | | 2.30 | % |
Expenses after reimbursements | | | 1.59 | % | | | 1.77 | % | | | 1.77 | % | | | 1.77 | % | | | 1.77 | % |
| | | | | |
Net investment income (loss) to average net assets: | | | | | | | | | | | | | | | | | | | | |
Net investment loss before reimbursements | | | (1.41 | )% | | | (0.78 | )% | | | (1.48 | )% | | | (1.74 | )% | | | (0.62 | )% |
Net investment income (loss) after reimbursements | | | 0.29 | % | | | 0.53 | % | | | (0.50 | )% | | | (0.73 | )% | | | (0.09 | )% |
See accompanying notes to the financial statements.
52
ASHMORE FUNDS
FINANCIAL HIGHLIGHTS
Ashmore Emerging Markets Small-Cap Equity Fund
| | | | | | | | | | | | | | | | | | | | |
| | | Class C | |
| | | | | |
| | | Year Ended | | | Year Ended | | | Year Ended | | | Year Ended | | | Year Ended | |
| | | October 31, | | | October 31, | | | October 31, | | | October 31, | | | October 31, | |
| | | 2023 | | | 2022 | | | 2021 | | | 2020 | | | 2019 | |
| | | | |
Net asset value at beginning of year | | $ | 10.36 | | | $ | 15.79 | | | $ | 11.40 | | | $ | 9.22 | | | $ | 8.42 | |
| | | | | |
Income (loss) from investment operations: | | | | | | | | | | | | | | | | | | | | |
Net investment loss | | | (0.09 | )1 | | | (0.06 | )1 | | | (0.32 | ) | | | (0.34 | ) | | | (0.38 | ) |
Net realized and unrealized gain (loss) | | | 0.99 | | | | (5.28 | ) | | | 4.71 | | | | 2.52 | | | | 1.18 | |
| | | | |
Total from investment operations | | | 0.90 | | | | (5.34 | ) | | | 4.39 | | | | 2.18 | | | | 0.80 | |
| | | | | |
Less distributions: | | | | | | | | | | | | | | | | | | | | |
| | | | | |
From net investment income | | | — | | | | — | | | | — | | | | — | | | | — | |
From net realized gain | | | — | | | | — | | | | — | | | | — | | | | — | |
Tax return of capital | | | — | | | | (0.09 | ) | | | — | | | | — | | | | — | |
| | | | |
| | | | | |
Total distributions | | | — | | | | (0.09 | ) | | | — | | | | — | | | | — | |
| | | | |
Net asset value at end of year | | $ | 11.26 | | | $ | 10.36 | �� | | $ | 15.79 | | | $ | 11.40 | | | $ | 9.22 | |
| | | | |
| | | | | |
Total return3 | | | 8.69 | % | | | (33.91 | )% | | | 38.51 | % | | | 23.64 | % | | | 9.50 | % |
| | | | | |
Portfolio turnover rate4 | | | 79 | % | | | 50 | % | | | 77 | % | | | 62 | % | | | 60 | % |
| | | | | |
Net assets, end of year (in thousands) | | $ | 14 | | | $ | 41 | | | $ | 162 | | | $ | 135 | | | $ | 144 | |
| | | | | |
Ratios to average net assets: | | | | | | | | | | | | | | | | | | | | |
Total expenses to average net assets: | | | | | | | | | | | | | | | | | | | | |
Expenses before reimbursements | | | 3.96 | % | | | 3.72 | % | | | 3.47 | % | | | 3.91 | % | | | 3.05 | % |
Expenses after reimbursements | | | 2.34 | % | | | 2.52 | % | | | 2.52 | % | | | 2.52 | % | | | 2.52 | % |
| | | | | |
Net investment loss to average net assets: | | | | | | | | | | | | | | | | | | | | |
Net investment loss before reimbursements | | | (2.35 | )% | | | (1.67 | )% | | | (2.09 | )% | | | (2.70 | )% | | | (1.48 | )% |
Net investment loss after reimbursements | | | (0.73 | )% | | | (0.47 | )% | | | (1.14 | )% | | | (1.31 | )% | | | (0.95 | )% |
See accompanying notes to the financial statements.
53
ASHMORE FUNDS
FINANCIAL HIGHLIGHTS
Ashmore Emerging Markets Small-Cap Equity Fund
| | | | | | | | | | | | | | | | | | | | |
| | | Institutional Class | |
| | | | | |
| | | Year Ended | | | Year Ended | | | Year Ended | | | Year Ended | | | Year Ended | |
| | | October 31, | | | October 31, | | | October 31, | | | October 31, | | | October 31, | |
| | | 2023 | | | 2022 | | | 2021 | | | 2020 | | | 2019 | |
| | | | |
Net asset value at beginning of year | | $ | 13.09 | | | $ | 19.82 | | | $ | 14.19 | | | $ | 11.39 | | | $ | 10.32 | |
Income (loss) from investment operations: | | | | | | | | | | | | | | | | | | | | |
Net investment income (loss) | | | 0.08 | 1 | | | 0.09 | 1 | | | (0.02 | ) | | | (0.10 | ) | | | 0.02 | |
Net realized and unrealized gain (loss) | | | 1.21 | | | | (6.65 | ) | | | 5.65 | | | | 2.90 | | | | 1.06 | |
| | | | |
Total from investment operations | | | 1.29 | | | | (6.56 | ) | | | 5.63 | | | | 2.80 | | | | 1.08 | |
| | | | | |
Less distributions: | | | | | | | | | | | | | | | | | | | | |
| | | | | |
From net investment income | | | — | | | | — | | | | — | | | | — | | | | (0.01 | ) |
From net realized gain | | | — | | | | — | | | | — | | | | — | | | | — | |
Tax return of capital | | | — | | | | (0.17 | ) | | | — | | | | — | | | | (— | )2 |
| | | | |
| | | | | |
Total distributions | | | — | | | | (0.17 | ) | | | — | | | | — | | | | (0.01 | ) |
| | | | |
Net asset value at end of year | | $ | 14.38 | | | $ | 13.09 | | | $ | 19.82 | | | $ | 14.19 | | | $ | 11.39 | |
| | | | |
| | | | | |
Total return3 | | | 9.85 | % | | | (33.21 | )% | | | 39.68 | % | | | 24.58 | % | | | 10.52 | % |
| | | | | |
Portfolio turnover rate4 | | | 79 | % | | | 50 | % | | | 77 | % | | | 62 | % | | | 60 | % |
| | | | | |
Net assets, end of year (in thousands) | | $ | 8,043 | | | $ | 6,237 | | | $ | 10,994 | | | $ | 7,419 | | | $ | 26,296 | |
| | | | | |
Ratios to average net assets: | | | | | | | | | | | | | | | | | | | | |
Total expenses to average net assets: | | | | | | | | | | | | | | | | | | | | |
Expenses before reimbursements | | | 3.03 | % | | | 2.77 | % | | | 2.45 | % | | | 2.56 | % | | | 2.05 | % |
Expenses after reimbursements | | | 1.34 | % | | | 1.52 | % | | | 1.52 | % | | | 1.52 | % | | | 1.52 | % |
| | | | | |
Net investment income (loss) to average net assets: | | | | | | | | | | | | | | | | | | | | |
Net investment loss before reimbursements | | | (1.18 | )% | | | (0.66 | )% | | | (1.02 | )% | | | (1.51 | )% | | | (0.38 | )% |
Net investment income (loss) after reimbursements | | | 0.51 | % | | | 0.59 | % | | | (0.09 | )% | | | (0.47 | )% | | | 0.15 | % |
| 1 | Per share amounts are based on average number of shares outstanding during the period. |
| 2 | Amount is less than $0.005 per share. |
| 3 | Assumes investment at net asset value at the beginning of the year, reinvestment of all distributions at net asset value on distribution date, and a complete redemption of the investment at net asset value at the end of the year, excluding the impact of sales charges. |
| 4 | The portfolio turnover rate is calculated by dividing the lesser of cost of purchases or proceeds from sales of long term portfolio securities by the monthly average of the value of the long term portfolio securities. |
See accompanying notes to the financial statements.
54
ASHMORE FUNDS
FINANCIAL HIGHLIGHTS
Ashmore Emerging Markets Frontier Equity Fund
| | | | | | | | | | | | | | | | | | | | |
| | | | | | Class A | | | | | | | |
| | | | | |
| | | Year Ended | | | Year Ended | | | Year Ended | | | Year Ended | | | Year Ended | |
| | | October 31, | | | October 31, | | | October 31, | | | October 31, | | | October 31, | |
| | | 2023 | | | 2022 | | | 2021 | | | 2020 | | | 2019 | |
| | | | |
Net asset value at beginning of year | | $ | 8.36 | | | $ | 10.13 | | | $ | 7.07 | | | $ | 8.02 | | | $ | 7.66 | |
| | | | | |
Income (loss) from investment operations: | | | | | | | | | | | | | | | | | | | | |
Net investment income (loss) | | | 0.09 | | | | 0.08 | 1 | | | 0.02 | 1 | | | (0.01 | )1 | | | 0.14 | |
Net realized and unrealized gain (loss) | | | (0.14 | ) | | | (1.67 | ) | | | 3.10 | | | | (0.91 | ) | | | 0.37 | |
| | | | |
Total from investment operations | | | (0.05 | ) | | | (1.59 | ) | | | 3.12 | | | | (0.92 | ) | | | 0.51 | |
| | | | | |
Less distributions: | | | | | | | | | | | | | | | | | | | | |
| | | | | |
From net investment income | | | (0.18 | ) | | | (0.18 | ) | | | (0.06 | ) | | | (0.03 | ) | | | (0.15 | ) |
From net realized gain | | | — | | | | — | | | | — | | | | — | | | | — | |
Tax return of capital | | | — | | | | — | | | | — | | | | — | | | | — | |
| | | | |
| | | | | |
Total distributions | | | (0.18 | ) | | | (0.18 | ) | | | (0.06 | ) | | | (0.03 | ) | | | (0.15 | ) |
| | | | |
Net asset value at end of year | | $ | 8.13 | | | $ | 8.36 | | | $ | 10.13 | | | $ | 7.07 | | | $ | 8.02 | |
| | | | |
| | | | | |
Total return2 | | | (0.72 | )% | | | (15.92 | )% | | | 44.20 | % | | | (11.47 | )% | | | 6.58 | % |
| | | | | |
Portfolio turnover rate3 | | | 94 | % | | | 95 | % | | | 87 | % | | | 108 | % | | | 93 | % |
| | | | | |
Net assets, end of year (in thousands) | | $ | 1,597 | | | $ | 3,018 | | | $ | 2,561 | | | $ | 656 | | | $ | 6,985 | |
| | | | | |
Ratios to average net assets: | | | | | | | | | | | | | | | | | | | | |
Total expenses to average net assets: | | | | | | | | | | | | | | | | | | | | |
Expenses before reimbursements | | | 2.27 | % | | | 2.24 | % | | | 2.11 | % | | | 2.18 | % | | | 2.12 | % |
Expenses after reimbursements | | | 1.77 | % | | | 1.77 | % | | | 1.77 | % | | | 1.77 | % | | | 1.77 | % |
| | | | | |
Net investment income (loss) to average net assets: | | | | | | | | | | | | | | | | | | | | |
Net investment income (loss) before reimbursements | | | 1.57 | % | | | 0.49 | % | | | (0.09 | )% | | | (0.59 | )% | | | 1.61 | % |
Net investment income (loss) after reimbursements | | | 2.07 | % | | | 0.96 | % | | | 0.25 | % | | | (0.18 | )% | | | 1.96 | % |
See accompanying notes to the financial statements.
55
ASHMORE FUNDS
FINANCIAL HIGHLIGHTS
Ashmore Emerging Markets Frontier Equity Fund
| | | | | | | | | | | | | | | | | | | | |
| | | | | | Class C | | | | | | | |
| | | | | |
| | | Year Ended | | | Year Ended | | | Year Ended | | | Year Ended | | | Year Ended | |
| | | October 31, | | | October 31, | | | October 31, | | | October 31, | | | October 31, | |
| | | 2023 | | | 2022 | | | 2021 | | | 2020 | | | 2019 | |
| | | | |
Net asset value at beginning of year | | $ | 8.03 | | | $ | 9.75 | | | $ | 6.82 | | | $ | 7.80 | | | $ | 7.47 | |
| | | | | |
Income (loss) from investment operations: | | | | | | | | | | | | | | | | | | | | |
Net investment income (loss) | | | (0.02 | ) | | | 0.02 | 1 | | | (0.03 | )1 | | | 0.01 | 1 | | | 0.02 | |
Net realized and unrealized gain (loss) | | | (0.10 | ) | | | (1.62 | ) | | | 2.97 | | | | (0.96 | ) | | | 0.42 | |
| | | | |
Total from investment operations | | | (0.12 | ) | | | (1.60 | ) | | | 2.94 | | | | (0.95 | ) | | | 0.44 | |
| | | | | |
Less distributions: | | | | | | | | | | | | | | | | | | | | |
| | | | | |
From net investment income | | | (0.13 | ) | | | (0.12 | ) | | | (0.01 | ) | | | (0.03 | ) | | | (0.11 | ) |
From net realized gain | | | — | | | | — | | | | — | | | | — | | | | — | |
Tax return of capital | | | — | | | | — | | | | — | | | | — | | | | — | |
| | | | |
| | | | | |
Total distributions | | | (0.13 | ) | | | (0.12 | ) | | | (0.01 | ) | | | (0.03 | ) | | | (0.11 | ) |
| | | | |
Net asset value at end of year | | $ | 7.78 | | | $ | 8.03 | | | $ | 9.75 | | | $ | 6.82 | | | $ | 7.80 | |
| | | | |
| | | | | |
Total return2 | | | (1.51 | )% | | | (16.58 | )% | | | 43.13 | % | | | (12.13 | )% | | | 5.87 | % |
| | | | | |
Portfolio turnover rate3 | | | 94 | % | | | 95 | % | | | 87 | % | | | 108 | % | | | 93 | % |
| | | | | |
Net assets, end of year (in thousands) | | $ | 204 | | | $ | 293 | | | $ | 209 | | | $ | 286 | | | $ | 305 | |
| | | | | |
Ratios to average net assets: | | | | | | | | | | | | | | | | | | | | |
Total expenses to average net assets: | | | | | | | | | | | | | | | | | | | | |
Expenses before reimbursements | | | 3.04 | % | | | 3.00 | % | | | 2.89 | % | | | 3.01 | % | | | 2.88 | % |
Expenses after reimbursements | | | 2.52 | % | | | 2.52 | % | | | 2.52 | % | | | 2.52 | % | | | 2.52 | % |
| | | | | |
Net investment income (loss) to average net assets: | | | | | | | | | | | | | | | | | | | | |
Net investment income (loss) before reimbursements | | | 0.77 | % | | | (0.21 | )% | | | (0.77 | )% | | | (0.41 | )% | | | 0.48 | % |
Net investment income (loss) after reimbursements | | | 1.29 | % | | | 0.27 | % | | | (0.40 | )% | | | 0.08 | % | | | 0.84 | % |
See accompanying notes to the financial statements.
56
ASHMORE FUNDS
FINANCIAL HIGHLIGHTS
Ashmore Emerging Markets Frontier Equity Fund
| | | | | | | | | | | | | | | | | | | | |
| | | Institutional Class | |
| | | | | |
| | | Year Ended | | | Year Ended | | | Year Ended | | | Year Ended | | | Year Ended | |
| | | October 31, | | | October 31, | | | October 31, | | | October 31, | | | October 31, | |
| | | 2023 | | | 2022 | | | 2021 | | | 2020 | | | 2019 | |
| | | | |
Net asset value at beginning of year | | $ | 9.73 | | | $ | 11.77 | | | $ | 8.20 | | | $ | 9.32 | | | $ | 8.86 | |
Income (loss) from investment operations: | | | | | | | | | | | | | | | | | | | | |
Net investment income | | | 0.24 | | | | 0.11 | 1 | | | 0.06 | 1 | | | 0.09 | 1 | | | 0.16 | |
Net realized and unrealized gain (loss) | | | (0.27 | ) | | | (1.95 | ) | | | 3.58 | | | | (1.13 | ) | | | 0.46 | |
| | | | |
Total from investment operations | | | (0.03 | ) | | | (1.84 | ) | | | 3.64 | | | | (1.04 | ) | | | 0.62 | |
| | | | | |
Less distributions: | | | | | | | | | | | | | | | | | | | | |
| | | | | |
From net investment income | | | (0.20 | ) | | | (0.20 | ) | | | (0.07 | ) | | | (0.08 | ) | | | (0.16 | ) |
From net realized gain | | | — | | | | — | | | | — | | | | — | | | | — | |
Tax return of capital | | | — | | | | — | | | | — | | | | — | | | | — | |
| | | | |
| | | | | |
Total distributions | | | (0.20 | ) | | | (0.20 | ) | | | (0.07 | ) | | | (0.08 | ) | | | (0.16 | ) |
| | | | |
Net asset value at end of year | | $ | 9.50 | | | $ | 9.73 | | | $ | 11.77 | | | $ | 8.20 | | | $ | 9.32 | |
| | | | |
| | | | | |
Total return2 | | | (0.42 | )% | | | (15.78 | )% | | | 44.50 | % | | | (11.17 | )% | | | 6.97 | % |
| | | | | |
Portfolio turnover rate3 | | | 94 | % | | | 95 | % | | | 87 | % | | | 108 | % | | | 93 | % |
| | | | | |
Net assets, end of year (in thousands) | | $ | 61,026 | | | $ | 69,320 | | | $ | 77,540 | | | $ | 53,053 | | | $ | 81,047 | |
| | | | | |
Ratios to average net assets: | | | | | | | | | | | | | | | | | | | | |
Total expenses to average net assets: | | | | | | | | | | | | | | | | | | | | |
Expenses before reimbursements | | | 2.03 | % | | | 1.98 | % | | | 1.88 | % | | | 2.00 | % | | | 1.88 | % |
Expenses after reimbursements | | | 1.52 | % | | | 1.52 | % | | | 1.52 | % | | | 1.52 | % | | | 1.52 | % |
| | | | | |
Net investment income to average net assets: | | | | | | | | | | | | | | | | | | | | |
Net investment income before reimbursements | | | 1.73 | % | | | 0.64 | % | | | 0.23 | % | | | 0.58 | % | | | 1.39 | % |
Net investment income after reimbursements | | | 2.24 | % | | | 1.10 | % | | | 0.59 | % | | | 1.06 | % | | | 1.75 | % |
| 1 | Per share amounts are based on average number of shares outstanding during the period. |
| 2 | Assumes investment at net asset value at the beginning of the year, reinvestment of all distributions at net asset value on distribution date, and a complete redemption of the investment at net asset value at the end of the year, excluding the impact of sales charges. |
| 3 | The portfolio turnover rate is calculated by dividing the lesser of cost of purchases or proceeds from sales of long term portfolio securities by the monthly average of the value of the long term portfolio securities. |
See accompanying notes to the financial statements.
57
ASHMORE FUNDS
FINANCIAL HIGHLIGHTS
Ashmore Emerging Markets Equity Fund
| | | | | | | | | | | | | | | | | | | | |
| | | | | | Class A | | | | | | | |
| | | | | |
| | | Year Ended | | | Year Ended | | | Year Ended | | | Year Ended | | | Year Ended | |
| | | October 31, | | | October 31, | | | October 31, | | | October 31, | | | October 31, | |
| | | 2023 | | | 2022 | | | 2021 | | | 2020 | | | 2019 | |
| | | | |
Net asset value at beginning of year | | $ | 8.29 | | | $ | 16.77 | | | $ | 13.08 | | | $ | 11.18 | | | $ | 9.38 | |
| | | | | |
Income (loss) from investment operations: | | | | | | | | | | | | | | | | | | | | |
Net investment income (loss) | | | 0.10 | 1 | | | 0.13 | | | | (0.06 | )1 | | | 0.08 | | | | 0.05 | |
Net realized and unrealized gain (loss) | | | 1.01 | | | | (5.67 | ) | | | 4.07 | | | | 1.84 | | | | 1.97 | |
| | | | |
Total from investment operations | | | 1.11 | | | | (5.54 | ) | | | 4.01 | | | | 1.92 | | | | 2.02 | |
| | | | | |
Less distributions: | | | | | | | | | | | | | | | | | | | | |
| | | | | |
From net investment income | | | (0.12 | ) | | | (0.09 | ) | | | (0.10 | ) | | | (0.02 | ) | | | (0.22 | ) |
From net realized gain | | | — | | | | (2.83 | ) | | | (0.22 | ) | | | — | | | | — | |
Tax return of capital | | | — | | | | (0.02 | ) | | | — | | | | — | | | | — | |
| | | | |
| | | | | |
Total distributions | | | (0.12 | ) | | | (2.94 | ) | | | (0.32 | ) | | | (0.02 | ) | | | (0.22 | ) |
| | | | |
Net asset value at end of year | | $ | 9.28 | | | $ | 8.29 | | | $ | 16.77 | | | $ | 13.08 | | | $ | 11.18 | |
| | | | |
| | | | | |
Total return2 | | | 13.26 | % | | | (39.01 | )% | | | 30.92 | % | | | 17.21 | % | | | 21.66 | % |
| | | | | |
Portfolio turnover rate3 | | | 79 | % | | | 85 | % | | | 77 | % | | | 76 | % | | | 76 | % |
| | | | | |
Net assets, end of year (in thousands) | | $ | 4,469 | | | $ | 3,081 | | | $ | 3,872 | | | $ | 1,394 | | | $ | 641 | |
| | | | | |
Ratios to average net assets: | | | | | | | | | | | | | | | | | | | | |
Total expenses to average net assets: | | | | | | | | | | | | | | | | | | | | |
Expenses before reimbursements | | | 1.69 | % | | | 1.65 | % | | | 1.56 | % | | | 1.81 | % | | | 1.91 | % |
Expenses after reimbursements | | | 1.32 | % | | | 1.42 | % | | | 1.42 | % | | | 1.42 | % | | | 1.42 | % |
| | | | | |
Net investment income (loss) to average net assets: | | | | | | | | | | | | | | | | | | | | |
Net investment income (loss) before reimbursements | | | 0.59 | % | | | 0.75 | % | | | (0.48 | )% | | | (0.42 | )% | | | (0.01 | )% |
Net investment income (loss) after reimbursements | | | 0.96 | % | | | 0.98 | % | | | (0.34 | )% | | | (0.03 | )% | | | 0.48 | % |
See accompanying notes to the financial statements.
58
ASHMORE FUNDS
FINANCIAL HIGHLIGHTS
Ashmore Emerging Markets Equity Fund
| | | | | | | | | | | | | | | | | | | | |
| | | | | | Class C | | | | | | | |
| | | | | |
| | | Year Ended | | | Year Ended | | | Year Ended | | | Year Ended | | | Year Ended | |
| | | October 31, | | | October 31, | | | October 31, | | | October 31, | | | October 31, | |
| | | 2023 | | | 2022 | | | 2021 | | | 2020 | | | 2019 | |
| | | | |
Net asset value at beginning of year | | $ | 7.70 | | | $ | 15.80 | | | $ | 12.39 | | | $ | 10.64 | | | $ | 8.96 | |
| | | | | |
Income (loss) from investment operations: | | | | | | | | | | | | | | | | | | | | |
Net investment income (loss) | | | 0.03 | 1 | | | 0.02 | | | | (0.16 | )1 | | | (0.10 | ) | | | (0.04 | ) |
Net realized and unrealized gain (loss) | | | 0.93 | | | | (5.25 | ) | | | 3.86 | | | | 1.85 | | | | 1.91 | |
| | | | |
Total from investment operations | | | 0.96 | | | | (5.23 | ) | | | 3.70 | | | | 1.75 | | | | 1.87 | |
| | | | | |
Less distributions: | | | | | | | | | | | | | | | | | | | | |
| | | | | |
From net investment income | | | (0.05 | ) | | | (0.03 | ) | | | (0.07 | ) | | | — | | | | (0.19 | ) |
From net realized gain | | | — | | | | (2.83 | ) | | | (0.22 | ) | | | — | | | | — | |
Tax return of capital | | | — | | | | (0.01 | ) | | | — | | | | — | | | | — | |
| | | | |
| | | | | |
Total distributions | | | (0.05 | ) | | | (2.87 | ) | | | (0.29 | ) | | | — | | | | (0.19 | ) |
| | | | |
Net asset value at end of year | | $ | 8.61 | | | $ | 7.70 | | | $ | 15.80 | | | $ | 12.39 | | | $ | 10.64 | |
| | | | |
| | | | | |
Total return2 | | | 12.45 | % | | | (39.46 | )% | | | 30.13 | % | | | 16.45 | % | | | 20.89 | % |
| | | | | |
Portfolio turnover rate3 | | | 79 | % | | | 85 | % | | | 77 | % | | | 76 | % | | | 76 | % |
| | | | | |
Net assets, end of year (in thousands) | | $ | 70 | | | $ | 105 | | | $ | 107 | | | $ | 2 | | | $ | 1 | |
| | | | | |
Ratios to average net assets: | | | | | | | | | | | | | | | | | | | | |
Total expenses to average net assets: | | | | | | | | | | | | | | | | | | | | |
Expenses before reimbursements | | | 2.45 | % | | | 2.42 | % | | | 2.29 | % | | | 2.49 | % | | | 2.66 | % |
Expenses after reimbursements | | | 2.07 | % | | | 2.17 | % | | | 2.17 | % | | | 2.17 | % | | | 2.17 | % |
| | | | | |
Net investment income (loss) to average net assets: | | | | | | | | | | | | | | | | | | | | |
Net investment income (loss) before reimbursements | | | (0.09 | )% | | | 0.12 | % | | | (1.11 | )% | | | (1.22 | )% | | | (0.95 | )% |
Net investment income (loss) after reimbursements | | | 0.29 | % | | | 0.37 | % | | | (0.99 | )% | | | (0.90 | )% | | | (0.46 | )% |
See accompanying notes to the financial statements.
59
ASHMORE FUNDS
FINANCIAL HIGHLIGHTS
Ashmore Emerging Markets Equity Fund
| | | | | | | | | | | | | | | | | | | | |
| | | Institutional Class | |
| | | | | |
| | | Year Ended | | | Year Ended | | | Year Ended | | | Year Ended | | | Year Ended | |
| | | October 31, | | | October 31, | | | October 31, | | | October 31, | | | October 31, | |
| | | 2023 | | | 2022 | | | 2021 | | | 2020 | | | 2019 | |
| | | | |
Net asset value at beginning of year | | $ | 7.97 | | | $ | 16.23 | | | $ | 12.65 | | | $ | 10.81 | | | $ | 9.06 | |
Income (loss) from investment operations: | | | | | | | | | | | | | | | | | | | | |
Net investment income (loss) | | | 0.12 | 1 | | | 0.17 | | | | (0.02 | )1 | | | 0.11 | | | | 0.06 | |
Net realized and unrealized gain (loss) | | | 0.98 | | | | (5.47 | ) | | | 3.92 | | | | 1.77 | | | | 1.93 | |
| | | | |
Total from investment operations | | | 1.10 | | | | (5.30 | ) | | | 3.90 | | | | 1.88 | | | | 1.99 | |
| | | | | |
Less distributions: | | | | | | | | | | | | | | | | | | | | |
| | | | | |
From net investment income | | | (0.14 | ) | | | (0.11 | ) | | | (0.10 | ) | | | (0.04 | ) | | | (0.24 | ) |
From net realized gain | | | — | | | | (2.83 | ) | | | (0.22 | ) | | | — | | | | — | |
Tax return of capital | | | — | | | | (0.02 | ) | | | — | | | | — | | | | — | |
| | | | |
| | | | | |
Total distributions | | | (0.14 | ) | | | (2.96 | ) | | | (0.32 | ) | | | (0.04 | ) | | | (0.24 | ) |
| | | | |
Net asset value at end of year | | $ | 8.93 | | | $ | 7.97 | | | $ | 16.23 | | | $ | 12.65 | | | $ | 10.81 | |
| | | | |
| | | | | |
Total return2 | | | 13.65 | % | | | (38.85 | )% | | | 31.24 | % | | | 17.41 | % | | | 22.05 | % |
| | | | | |
Portfolio turnover rate3 | | | 79 | % | | | 85 | % | | | 77 | % | | | 76 | % | | | 76 | % |
| | | | | |
Net assets, end of year (in thousands) | | $ | 88,044 | | | $ | 90,921 | | | $ | 116,727 | | | $ | 82,385 | | | $ | 35,011 | |
| | | | | |
Ratios to average net assets: | | | | | | | | | | | | | | | | | | | | |
Total expenses to average net assets: | | | | | | | | | | | | | | | | | | | | |
Expenses before reimbursements | | | 1.44 | % | | | 1.41 | % | | | 1.32 | % | | | 1.56 | % | | | 1.66 | % |
Expenses after reimbursements | | | 1.07 | % | | | 1.17 | % | | | 1.17 | % | | | 1.17 | % | | | 1.17 | % |
| | | | | |
Net investment income (loss) to average net assets: | | | | | | | | | | | | | | | | | | | | |
Net investment income (loss) before reimbursements | | | 0.84 | % | | | 1.10 | % | | | (0.26 | )% | | | (0.22 | )% | | | 0.09 | % |
Net investment income (loss) after reimbursements | | | 1.21 | % | | | 1.34 | % | | | (0.11 | )% | | | 0.17 | % | | | 0.58 | % |
| 1 | Per share amounts are based on average number of shares outstanding during the period. |
| 2 | Assumes investment at net asset value at the beginning of the year, reinvestment of all distributions at net asset value on distribution date, and a complete redemption of the investment at net asset value at the end of the year, excluding the impact of sales charges. |
| 3 | The portfolio turnover rate is calculated by dividing the lesser of cost of purchases or proceeds from sales of long term portfolio securities by the monthly average of the value of the long term portfolio securities. |
See accompanying notes to the financial statements.
60
ASHMORE FUNDS
FINANCIAL HIGHLIGHTS
Ashmore Emerging Markets Equity ESG Fund
| | | | | | | | | | | | | | | | |
| | | Class A | |
| | | | |
| | | Year Ended | | | Year Ended | | | Year Ended | | | Period Ended | |
| | | October 31, | | | October 31, | | | October 31, | | | October 31, | |
| | | 2023 | | | 2022 | | | 2021 | | | 20201 | |
| | | | |
Net asset value at beginning of period | | $ | 7.61 | | | $ | 14.91 | | | $ | 12.05 | | | $ | 10.00 | |
| | | | |
Income (loss) from investment operations: | | | | | | | | | | | | | | | | |
Net investment income (loss) | | | 0.03 | | | | 0.01 | | | | (0.09 | ) | | | (0.01 | ) |
Net realized and unrealized gain (loss) | | | 1.06 | | | | (5.27 | ) | | | 3.04 | | | | 2.06 | |
| | | | |
Total from investment operations | | | 1.09 | | | | (5.26 | ) | | | 2.95 | | | | 2.05 | |
| | | | |
Less distributions: | | | | | | | | | | | | | | | | |
| | | | |
From net investment income | | | (0.06 | ) | | | — | | | | (0.09 | ) | | | — | |
From net realized gain | | | — | | | | (2.03 | ) | | | — | | | | — | |
Tax return of capital | | | — | | | | (0.01 | ) | | | — | | | | — | |
| | | | |
| | | | |
Total distributions | | | (0.06 | ) | | | (2.04 | ) | | | (0.09 | ) | | | — | |
| | | | |
Net asset value at end of period | | $ | 8.64 | | | $ | 7.61 | | | $ | 14.91 | | | $ | 12.05 | |
| | | | |
| | | | |
Total return2 | | | 14.21 | % | | | (40.26 | )% | | | 24.50 | % | | | 20.50 | % |
| | | | |
Portfolio turnover rate3 | | | 51 | % | | | 49 | % | | | 55 | % | | | 45 | % |
| | | | |
Net assets, end of period (in thousands) | | $ | 1 | | | $ | 1 | | | $ | 2 | | | $ | 1 | |
| | | | |
Ratios to average net assets:4 | | | | | | | | | | | | | | | | |
Total expenses to average net assets: | | | | | | | | | | | | | | | | |
Expenses before reimbursements | | | 2.49 | % | | | 2.49 | % | | | 2.39 | % | | | 4.16 | % |
Expenses after reimbursements | | | 1.32 | % | | | 1.42 | % | | | 1.42 | % | | | 1.42 | % |
| | | | |
Net investment income (loss) to average net assets: | | | | | | | | | | | | | | | | |
Net investment loss before reimbursements | | | (0.95 | )% | | | (1.12 | )% | | | (1.56 | )% | | | (2.89 | )% |
Net investment income (loss) after reimbursements | | | 0.22 | % | | | (0.05 | )% | | | (0.59 | )% | | | (0.15 | )% |
See accompanying notes to the financial statements.
61
ASHMORE FUNDS
FINANCIAL HIGHLIGHTS
Ashmore Emerging Markets Equity ESG Fund
| | | | | | | | | | | | | | | | |
| | | | | | Class C | | | | | | | |
| | | | |
| | | Year Ended | | | Year Ended | | | Year Ended | | | Period Ended | |
| | | October 31, | | | October 31, | | | October 31, | | | October 31, | |
| | | 2023 | | | 2022 | | | 2021 | | | 20201 | |
| | | | |
Net asset value at beginning of period | | $ | 7.47 | | | $ | 14.77 | | | $ | 12.00 | | | $ | 10.00 | |
| | | | |
Income (loss) from investment operations: | | | | | | | | | | | | | | | | |
Net investment loss | | | (0.05 | ) | | | (0.04 | ) | | | (0.20 | ) | | | (0.06 | ) |
Net realized and unrealized gain (loss) | | | 1.05 | | | | (5.23 | ) | | | 3.05 | | | | 2.06 | |
| | | | |
Total from investment operations | | | 1.00 | | | | (5.27 | ) | | | 2.85 | | | | 2.00 | |
| | | | |
Less distributions: | | | | | | | | | | | | | | | | |
| | | | |
From net investment income | | | (0.02 | ) | | | — | | | | (0.08 | ) | | | — | |
From net realized gain | | | — | | | | (2.03 | ) | | | — | | | | — | |
Tax return of capital | | | — | | | | — | | | | — | | | | — | |
| | | | |
| | | | |
Total distributions | | | (0.02 | ) | | | (2.03 | ) | | | (0.08 | ) | | | — | |
| | | | |
Net asset value at end of period | | $ | 8.45 | | | $ | 7.47 | | | $ | 14.77 | | | $ | 12.00 | |
| | | | |
| | | | |
Total return2 | | | 13.32 | % | | | (40.76 | )% | | | 23.81 | % | | | 20.00 | % |
| | | | |
Portfolio turnover rate3 | | | 51 | % | | | 49 | % | | | 55 | % | | | 45 | % |
| | | | |
Net assets, end of period (in thousands) | | $ | 1 | | | $ | 1 | | | $ | 1 | | | $ | 1 | |
| | | | |
Ratios to average net assets:4 | | | | | | | | | | | | | | | | |
Total expenses to average net assets: | | | | | | | | | | | | | | | | |
Expenses before reimbursements | | | 3.22 | % | | | 3.22 | % | | | 3.14 | % | | | 4.77 | % |
Expenses after reimbursements | | | 2.07 | % | | | 2.17 | % | | | 2.17 | % | | | 2.17 | %�� |
| | | | |
Net investment loss to average net assets: | | | | | | | | | | | | | | | | |
Net investment loss before reimbursements | | | (1.70 | )% | | | (1.85 | )% | | | (2.32 | )% | | | (3.50 | )% |
Net investment loss after reimbursements | | | (0.55 | )% | | | (0.80 | )% | | | (1.35 | )% | | | (0.90 | )% |
See accompanying notes to the financial statements.
62
ASHMORE FUNDS
FINANCIAL HIGHLIGHTS
Ashmore Emerging Markets Equity ESG Fund
| | | | | | | | | | | | | | | | |
| | | Institutional Class | |
| | | | |
| | | Year Ended | | | Year Ended | | | Year Ended | | | Period Ended | |
| | | October 31, | | | October 31, | | | October 31, | | | October 31, | |
| | | 2023 | | | 2022 | | | 2021 | | | 20201 | |
| | | | |
Net asset value at beginning of period | | $ | 7.65 | | | $ | 14.96 | | | $ | 12.06 | | | $ | 10.00 | |
| | | | |
Income (loss) from investment operations: | | | | | | | | | | | | | | | | |
Net investment income (loss) | | | 0.05 | | | | 0.03 | | | | (0.05 | ) | | | 0.01 | |
Net realized and unrealized gain (loss) | | | 1.06 | | | | (5.29 | ) | | | 3.04 | | | | 2.05 | |
| | | | |
Total from investment operations | | | 1.11 | | | | (5.26 | ) | | | 2.99 | | | | 2.06 | |
| | | | |
Less distributions: | | | | | | | | | | | | | | | | |
| | | | |
From net investment income | | | (0.07 | ) | | | — | | | | (0.09 | ) | | | (— | )5 |
From net realized gain | | | — | | | | (2.03 | ) | | | — | | | | — | |
Tax return of capital | | | — | | | | (0.02 | ) | | | — | | | | — | |
| | | | |
| | | | |
Total distributions | | | (0.07 | ) | | | (2.05 | ) | | | (0.09 | ) | | | — | |
| | | | |
Net asset value at end of period | | $ | 8.69 | | | $ | 7.65 | | | $ | 14.96 | | | $ | 12.06 | |
| | | | |
| | | | |
Total return2 | | | 14.45 | % | | | (40.10 | )% | | | 24.82 | % | | | 20.60 | % |
| | | | |
Portfolio turnover rate3 | | | 51 | % | | | 49 | % | | | 55 | % | | | 45 | % |
| | | | |
Net assets, end of period (in thousands) | | $ | 10,149 | | | $ | 8,884 | | | $ | 15,041 | | | $ | 12,062 | |
| | | | |
Ratios to average net assets:4 | | | | | | | | | | | | | | | | |
Total expenses to average net assets: | | | | | | | | | | | | | | | | |
Expenses before reimbursements | | | 2.19 | % | | | 2.12 | % | | | 2.16 | % | | | 3.68 | % |
Expenses after reimbursements | | | 1.07 | % | | | 1.17 | % | | | 1.17 | % | | | 1.17 | % |
| | | | |
Net investment income (loss) to average net assets: | | | | | | | | | | | | | | | | |
Net investment loss before reimbursements | | | (0.63 | )% | | | (0.74 | )% | | | (1.34 | )% | | | (2.41 | )% |
Net investment income (loss) after reimbursements | | | 0.49 | % | | | 0.21 | % | | | (0.35 | )% | | | 0.10 | % |
| 1 | Class A, Class C and the Institutional Class commenced investment operations on February 26, 2020. |
| 2 | Assumes investment at net asset value at the beginning of the period, reinvestment of distributions at net asset value on distribution date, and a complete redemption of the investment at net asset value at the end of the period, excluding the impact of sales charges. Total return is not annualized for periods less than one year. |
| 3 | The portfolio turnover rate is calculated by dividing the lesser of cost of purchases or proceeds from sales of long term portfolio securities by the monthly average of the value of the long term portfolio securities. Portfolio turnover is not annualized for periods less than one year. |
| 4 | Annualized for periods less than one year. |
| 5 | Amount is less than $0.005 per share. |
See accompanying notes to the financial statements.
63
ASHMORE FUNDS
FINANCIAL HIGHLIGHTS
Ashmore Emerging Markets Low Duration Fund
| | | | | | | | | | | | | | | | |
| | | Class A | |
| | | | |
| | | Year Ended | | | Year Ended | | | Year Ended | | | Period Ended | |
| | | October 31, | | | October 31, | | | October 31, | | | October 31, | |
| | | 2023 | | | 2022 | | | 2021 | | | 20201 | |
| | | | |
Net asset value at beginning of period | | $ | 8.32 | | | $ | 9.80 | | | $ | 10.18 | | | $ | 10.00 | |
| | | | |
Income (loss) from investment operations: | | | | | | | | | | | | | | | | |
Net investment income | | | 0.33 | | | | 0.29 | | | | 0.38 | | | | 0.14 | |
Net realized and unrealized gain (loss) | | | 0.21 | | | | (1.48 | ) | | | (0.35 | ) | | | 0.19 | |
| | | | |
Total from investment operations | | | 0.54 | | | | (1.19 | ) | | | 0.03 | | | | 0.33 | |
| | | | |
Less distributions: | | | | | | | | | | | | | | | | |
| | | | |
From net investment income | | | (0.35 | ) | | | (0.29 | ) | | | (0.38 | ) | | | (0.15 | ) |
From net realized gain | | | — | | | | (— | )2 | | | (0.03 | ) | | | — | |
Tax return of capital | | | (0.01 | ) | | | — | | | | — | | | | — | |
| | | | |
| | | | |
Total distributions | | | (0.36 | ) | | | (0.29 | ) | | | (0.41 | ) | | | (0.15 | ) |
| | | | |
Net asset value at end of period | | $ | 8.50 | | | $ | 8.32 | | | $ | 9.80 | | | $ | 10.18 | |
| | | | |
| | | | |
Total return3 | | | 6.60 | % | | | (12.27 | )% | | | 0.20 | % | | | 3.30 | % |
| | | | |
Portfolio turnover rate4 | | | 50 | % | | | 52 | % | | | 43 | % | | | 12 | % |
| | | | |
Net assets, end of period (in thousands) | | $ | 1 | | | $ | 1 | | | $ | 1 | | | $ | 1 | |
| | | | |
Ratios to average net assets:5 | | | | | | | | | | | | | | | | |
Total expenses to average net assets: | | | | | | | | | | | | | | | | |
Expenses before reimbursements | | | 2.14 | % | | | 2.05 | % | | | 1.71 | % | | | 4.87 | % |
Expenses after reimbursements | | | 0.92 | % | | | 0.92 | % | | | 0.92 | % | | | 0.92 | % |
| | | | |
Net investment income to average net assets: | | | | | | | | | | | | | | | | |
Net investment income before reimbursements | | | 2.68 | % | | | 2.06 | % | | | 2.88 | % | | | 0.05 | % |
Net investment income after reimbursements | | | 3.90 | % | | | 3.19 | % | | | 3.67 | % | | | 4.00 | % |
See accompanying notes to the financial statements.
64
ASHMORE FUNDS
FINANCIAL HIGHLIGHTS
Ashmore Emerging Markets Low Duration Fund
| | | | | | | | | | | | | | | | |
| | | Class C | |
| | | | |
| | | Year Ended | | | Year Ended | | | Year Ended | | | Period Ended | |
| | | October 31, | | | October 31, | | | October 31, | | | October 31, | |
| | | 2023 | | | 2022 | | | 2021 | | | 20201 | |
| | | | |
Net asset value at beginning of period | | $ | 8.32 | | | $ | 9.80 | | | $ | 10.18 | | | $ | 10.00 | |
| | | | |
Income (loss) from investment operations: | | | | | | | | | | | | | | | | |
Net investment income | | | 0.27 | | | | 0.22 | | | | 0.30 | | | | 0.12 | |
Net realized and unrealized gain (loss) | | | 0.20 | | | | (1.48 | ) | | | (0.35 | ) | | | 0.18 | |
| | | | |
Total from investment operations | | | 0.47 | | | | (1.26 | ) | | | (0.05 | ) | | | 0.30 | |
| | | | |
Less distributions: | | | | | | | | | | | | | | | | |
| | | | |
From net investment income | | | (0.29 | ) | | | (0.22 | ) | | | (0.30 | ) | | | (0.12 | ) |
From net realized gain | | | — | | | | (— | )2 | | | (0.03 | ) | | | — | |
Tax return of capital | | | (0.01 | ) | | | — | | | | — | | | | — | |
| | | | |
| | | | |
Total distributions | | | (0.30 | ) | | | (0.22 | ) | | | (0.33 | ) | | | (0.12 | ) |
| | | | |
Net asset value at end of period | | $ | 8.49 | | | $ | 8.32 | | | $ | 9.80 | | | $ | 10.18 | |
| | | | |
| | | | |
Total return3 | | | 5.68 | % | | | (12.94 | )% | | | (0.57 | )% | | | 3.03 | % |
| | | | |
Portfolio turnover rate4 | | | 50 | % | | | 52 | % | | | 43 | % | | | 12 | % |
| | | | |
Net assets, end of period (in thousands) | | $ | 1 | | | $ | 1 | | | $ | 1 | | | $ | 1 | |
| | | | |
Ratios to average net assets:5 | | | | | | | | | | | | | | | | |
Total expenses to average net assets: | | | | | | | | | | | | | | | | |
Expenses before reimbursements | | | 2.82 | % | | | 2.72 | % | | | 2.42 | % | | | 5.60 | % |
Expenses after reimbursements | | | 1.67 | % | | | 1.67 | % | | | 1.67 | % | | | 1.67 | % |
| | | | |
Net investment income (loss) to average net assets: | | | | | | | | | | | | | | | | |
Net investment income (loss) before reimbursements | | | 2.01 | % | | | 1.39 | % | | | 2.16 | % | | | (0.68 | )% |
Net investment income after reimbursements | | | 3.16 | % | | | 2.44 | % | | | 2.91 | % | | | 3.25 | % |
See accompanying notes to the financial statements.
65
ASHMORE FUNDS
FINANCIAL HIGHLIGHTS
Ashmore Emerging Markets Low Duration Fund
| | | | | | | | | | | | | | | | |
| | | Institutional Class | |
| | | | |
| | | Year Ended | | | Year Ended | | | Year Ended | | | Period Ended | |
| | | October 31, | | | October 31, | | | October 31, | | | October 31, | |
| | | 2023 | | | 2022 | | | 2021 | | | 20201 | |
| | | | |
Net asset value at beginning of period | | $ | 8.32 | | | $ | 9.80 | | | $ | 10.18 | | | $ | 10.00 | |
| | | | |
Income (loss) from investment operations: | | | | | | | | | | | | | | | | |
Net investment income | | | 0.34 | | | | 0.30 | | | | 0.40 | | | | 0.16 | |
Net realized and unrealized gain (loss) | | | 0.22 | | | | (1.48 | ) | | | (0.35 | ) | | | 0.18 | |
| | | | |
Total from investment operations | | | 0.56 | | | | (1.18 | ) | | | 0.05 | | | | 0.34 | |
| | | | |
Less distributions: | | | | | | | | | | | | | | | | |
| | | | |
From net investment income | | | (0.36 | ) | | | (0.30 | ) | | | (0.40 | ) | | | (0.16 | ) |
From net realized gain | | | — | | | | (— | )2 | | | (0.03 | ) | | | — | |
Tax return of capital | | | (0.01 | ) | | | — | | | | — | | | | — | |
| | | | |
| | | | |
Total distributions | | | (0.37 | ) | | | (0.30 | ) | | | (0.43 | ) | | | (0.16 | ) |
| | | | |
Net asset value at end of period | | $ | 8.51 | | | $ | 8.32 | | | $ | 9.80 | | | $ | 10.18 | |
| | | | |
| | | | |
Total return3 | | | 6.88 | % | | | (12.16 | )% | | | 0.40 | % | | | 3.43 | % |
| | | | |
Portfolio turnover rate4 | | | 50 | % | | | 52 | % | | | 43 | % | | | 12 | % |
| | | | |
Net assets, end of period (in thousands) | | $ | 9,490 | | | $ | 8,996 | | | $ | 10,286 | | | $ | 10,317 | |
| | | | |
Ratios to average net assets:5 | | | | | | | | | | | | | | | | |
Total expenses to average net assets: | | | | | | | | | | | | | | | | |
Expenses before reimbursements | | | 1.63 | % | | | 1.48 | % | | | 1.38 | % | | | 4.58 | % |
Expenses after reimbursements | | | 0.67 | % | | | 0.67 | % | | | 0.67 | % | | | 0.67 | % |
| | | | |
Net investment income to average net assets: | | | | | | | | | | | | | | | | |
Net investment income before reimbursements | | | 3.10 | % | | | 2.54 | % | | | 3.21 | % | | | 0.29 | % |
Net investment income after reimbursements | | | 4.06 | % | | | 3.35 | % | | | 3.92 | % | | | 4.20 | % |
| 1 | Class A, Class C and the Institutional Class commenced investment operations on June 15, 2020. |
| 2 | Amount is less than $0.005 per share. |
| 3 | Assumes investment at net asset value at the beginning of the period, reinvestment of distributions at net asset value on distribution date, and a complete redemption of the investment at net asset value at the end of the period, excluding the impact of sales charges. Total return is not annualized for periods less than one year. |
| 4 | The portfolio turnover rate is calculated by dividing the lesser of cost of purchases or proceeds from sales of long term portfolio securities by the monthly average of the value of the long term portfolio securities. Portfolio turnover is not annualized for periods less than one year. |
| 5 | Annualized for periods less than one year. |
See accompanying notes to the financial statements.
66
ASHMORE FUNDS
FINANCIAL HIGHLIGHTS
Ashmore Emerging Markets Debt Fund
| | | | | | | | | | | | | | | | |
| | | Class A | |
| | | | |
| | | Year Ended | | | Year Ended | | | Year Ended | | | Period Ended | |
| | | October 31, | | | October 31, | | | October 31, | | | October 31, | |
| | | 2023 | | | 2022 | | | 2021 | | | 20201 | |
| | | | |
Net asset value at beginning of period | | $ | 7.52 | | | $ | 9.90 | | | $ | 9.85 | | | $ | 10.00 | |
| | | | |
Income (loss) from investment operations: | | | | | | | | | | | | | | | | |
Net investment income | | | 0.37 | | | | 0.30 | | | | 0.32 | | | | 0.03 | |
Net realized and unrealized gain (loss) | | | (0.11 | ) | | | (2.37 | ) | | | 0.06 | | | | (0.15 | ) |
| | | | |
Total from investment operations | | | 0.26 | | | | (2.07 | ) | | | 0.38 | | | | (0.12 | ) |
| | | | |
Less distributions: | | | | | | | | | | | | | | | | |
| | | | |
From net investment income | | | (0.41 | ) | | | (0.31 | ) | | | (0.33 | ) | | | (0.03 | ) |
From net realized gain | | | — | | | | — | | | | — | | | | — | |
Tax return of capital | | | (0.03 | ) | | | — | | | | — | | | | — | |
| | | | |
| | | | |
Total distributions | | | (0.44 | ) | | | (0.31 | ) | | | (0.33 | ) | | | (0.03 | ) |
| | | | |
Net asset value at end of period | | $ | 7.34 | | | $ | 7.52 | | | $ | 9.90 | | | $ | 9.85 | |
| | | | |
| | | | |
Total return2 | | | 3.31 | % | | | (21.27 | )% | | | 3.85 | % | | | (1.19 | )% |
| | | | |
Portfolio turnover rate3 | | | 109 | % | | | 53 | % | | | 44 | % | | | 3 | % |
| | | | |
Net assets, end of period (in thousands) | | $ | 1 | | | $ | 1 | | | $ | 1 | | | $ | 1 | |
| | | | |
Ratios to average net assets:4 | | | | | | | | | | | | | | | | |
Total expenses to average net assets: | | | | | | | | | | | | | | | | |
Expenses before reimbursements | | | 1.74 | % | | | 1.56 | % | | | 1.77 | % | | | 4.88 | % |
Expenses after reimbursements | | | 0.96 | % | | | 0.97 | % | | | 0.97 | % | | | 0.97 | % |
| | | | |
Net investment income (loss) to average net assets: | | | | | | | | | | | | | | | | |
Net investment income (loss) before reimbursements | | | 4.02 | % | | | 2.87 | % | | | 2.42 | % | | | (1.27 | )% |
Net investment income after reimbursements | | | 4.80 | % | | | 3.46 | % | | | 3.22 | % | | | 2.64 | % |
See accompanying notes to the financial statements.
67
ASHMORE FUNDS
FINANCIAL HIGHLIGHTS
Ashmore Emerging Markets Debt Fund
| | | | | | | | | | | | | | | | |
| | | Class C | |
| | | | |
| | | Year Ended | | | Year Ended | | | Year Ended | | | Period Ended | |
| | | October 31, | | | October 31, | | | October 31, | | | October 31, | |
| | | 2023 | | | 2022 | | | 2021 | | | 20201 | |
| | | | |
Net asset value at beginning of period | | $ | 7.52 | | | $ | 9.90 | | | $ | 9.85 | | | $ | 10.00 | |
| | | | |
Income (loss) from investment operations: | | | | | | | | | | | | | | | | |
Net investment income | | | 0.32 | | | | 0.24 | | | | 0.25 | | | | 0.02 | |
Net realized and unrealized gain (loss) | | | (0.11 | ) | | | (2.38 | ) | | | 0.05 | | | | (0.15 | ) |
| | | | |
Total from investment operations | | | 0.21 | | | | (2.14 | ) | | | 0.30 | | | | (0.13 | ) |
| | | | |
Less distributions: | | | | | | | | | | | | | | | | |
| | | | |
From net investment income | | | (0.36 | ) | | | (0.24 | ) | | | (0.25 | ) | | | (0.02 | ) |
From net realized gain | | | — | | | | — | | | | — | | | | — | |
Tax return of capital | | | (0.03 | ) | | | — | | | | — | | | | — | |
| | | | |
| | | | |
Total distributions | | | (0.39 | ) | | | (0.24 | ) | | | (0.25 | ) | | | (0.02 | ) |
| | | | |
Net asset value at end of period | | $ | 7.34 | | | $ | 7.52 | | | $ | 9.90 | | | $ | 9.85 | |
| | | | |
| | | | |
Total return2 | | | 2.59 | % | | | (21.84 | )% | | | 3.08 | % | | | (1.26 | )% |
| | | | |
Portfolio turnover rate3 | | | 109 | % | | | 53 | % | | | 44 | % | | | 3 | % |
| | | | |
Net assets, end of period (in thousands) | | $ | 1 | | | $ | 1 | | | $ | 1 | | | $ | 1 | |
| | | | |
Ratios to average net assets:4 | | | | | | | | | | | | | | | | |
Total expenses to average net assets: | | | | | | | | | | | | | | | | |
Expenses before reimbursements | | | 2.17 | % | | | 2.12 | % | | | 2.49 | % | | | 5.62 | % |
Expenses after reimbursements | | | 1.71 | % | | | 1.72 | % | | | 1.72 | % | | | 1.72 | % |
| | | | |
Net investment income (loss) to average net assets: | | | | | | | | | | | | | | | | |
Net investment income (loss) before reimbursements | | | 3.67 | % | | | 2.34 | % | | | 1.70 | % | | | (2.02 | )% |
Net investment income after reimbursements | | | 4.13 | % | | | 2.74 | % | | | 2.47 | % | | | 1.88 | % |
See accompanying notes to the financial statements.
68
ASHMORE FUNDS
FINANCIAL HIGHLIGHTS
Ashmore Emerging Markets Debt Fund
| | | | | | | | | | | | | | | | |
| | | Institutional Class | |
| | | | |
| | | Year Ended | | | Year Ended | | | Year Ended | | | Period Ended | |
| | | October 31, | | | October 31, | | | October 31, | | | October 31, | |
| | | 2023 | | | 2022 | | | 2021 | | | 20201 | |
| | | | |
Net asset value at beginning of period | | $ | 7.53 | | | $ | 9.90 | | | $ | 9.85 | | | $ | 10.00 | |
| | | | |
Income (loss) from investment operations: | | | | | | | | | | | | | | | | |
Net investment income | | | 0.38 | | | | 0.32 | | | | 0.35 | | | | 0.03 | |
Net realized and unrealized gain (loss) | | | (0.11 | ) | | | (2.37 | ) | | | 0.05 | | | | (0.15 | ) |
| | | | |
Total from investment operations | | | 0.27 | | | | (2.05 | ) | | | 0.40 | | | | (0.12 | ) |
| | | | |
Less distributions: | | | | | | | | | | | | | | | | |
| | | | |
From net investment income | | | (0.42 | ) | | | (0.32 | ) | | | (0.35 | ) | | | (0.03 | ) |
From net realized gain | | | — | | | | — | | | | — | | | | — | |
Tax return of capital | | | (0.03 | ) | | | — | | | | — | | | | — | |
| | | | |
| | | | |
Total distributions | | | (0.45 | ) | | | (0.32 | ) | | | (0.35 | ) | | | (0.03 | ) |
| | | | |
Net asset value at end of period | | $ | 7.35 | | | $ | 7.53 | | | $ | 9.90 | | | $ | 9.85 | |
| | | | |
| | | | |
Total return2 | | | 3.41 | % | | | (21.02 | )% | | | 4.03 | % | | | (1.16 | )% |
| | | | |
Portfolio turnover rate3 | | | 109 | % | | | 53 | % | | | 44 | % | | | 3 | % |
| | | | |
Net assets, end of period (in thousands) | | $ | 16,347 | | | $ | 16,042 | | | $ | 20,442 | | | $ | 19,757 | |
| | | | |
Ratios to average net assets:4 | | | | | | | | | | | | | | | | |
Total expenses to average net assets: | | | | | | | | | | | | | | | | |
Expenses before reimbursements | | | 1.31 | % | | | 1.19 | % | | | 1.48 | % | | | 4.43 | % |
Expenses after reimbursements | | | 0.71 | % | | | 0.72 | % | | | 0.72 | % | | | 0.72 | % |
| | | | |
Net investment income (loss) to average net assets: | | | | | | | | | | | | | | | | |
Net investment income (loss) before reimbursements | | | 4.34 | % | | | 3.21 | % | | | 2.66 | % | | | (0.92 | )% |
Net investment income after reimbursements | | | 4.94 | % | | | 3.68 | % | | | 3.42 | % | | | 2.79 | % |
| 1 | Class A, Class C and the Institutional Class commenced investment operations on September 17, 2020. |
| 2 | Assumes investment at net asset value at the beginning of the period, reinvestment of distributions at net asset value on distribution date, and a complete redemption of the investment at net asset value at the end of the period, excluding the impact of sales charges. Total return is not annualized for periods less than one year. |
| 3 | The portfolio turnover rate is calculated by dividing the lesser of cost of purchases or proceeds from sales of long term portfolio securities by the monthly average of the value of the long term portfolio securities. Portfolio turnover is not annualized for periods less than one year. |
| 4 | Annualized for periods less than one year. |
See accompanying notes to the financial statements.
69
ASHMORE FUNDS
FINANCIAL HIGHLIGHTS
Ashmore Emerging Markets Corporate Income ESG Fund
| | | | | | | | | | | | |
| | | Class A | |
| | | |
| | | Year Ended | | | Year Ended | | | Period Ended | |
| | | October 31, | | | October 31, | | | October 31, | |
| | | 2023 | | | 2022 | | | 20211 | |
| | | | |
Net asset value at beginning of period | | $ | 6.26 | | | $ | 9.11 | | | $ | 10.00 | |
| | | |
Income (loss) from investment operations: | | | | | | | | | | | | |
Net investment income | | | 0.32 | | | | 0.36 | | | | 0.29 | |
Net realized and unrealized loss | | | (0.11 | ) | | | (2.83 | ) | | | (0.89 | ) |
| | | | |
Total from investment operations | | | 0.21 | | | | (2.47 | ) | | | (0.60 | ) |
| | | |
Less distributions: | | | | | | | | | | | | |
| | | |
From net investment income | | | (0.40 | ) | | | (0.36 | ) | | | (0.29 | ) |
From net realized gain | | | — | | | | (0.02 | ) | | | — | |
Tax return of capital | | | — | | | | — | | | | — | |
| | | | |
| | | |
Total distributions | | | (0.40 | ) | | | (0.38 | ) | | | (0.29 | ) |
| | | | |
Net asset value at end of period | | $ | 6.07 | | | $ | 6.26 | | | $ | 9.11 | |
| | | | |
| | | |
Total return2 | | | 2.98 | % | | | (27.67 | )% | | | (6.11 | )% |
| | | |
Portfolio turnover rate3 | | | 32 | % | | | 34 | % | | | 15 | % |
| | | |
Net assets, end of period (in thousands) | | $ | 1 | | | $ | 1 | | | $ | 1 | |
| | | |
Ratios to average net assets:4 | | | | | | | | | | | | |
Total expenses to average net assets: | | | | | | | | | | | | |
Expenses before reimbursements | | | 2.13 | % | | | 2.59 | % | | | 3.35 | % |
Expenses after reimbursements | | | 1.12 | % | | | 1.12 | % | | | 1.12 | % |
| | | |
Net investment income to average net assets: | | | | | | | | | | | | |
Net investment income before reimbursements | | | 3.93 | % | | | 3.26 | % | | | 2.26 | % |
Net investment income after reimbursements | | | 4.94 | % | | | 4.73 | % | | | 4.49 | % |
See accompanying notes to the financial statements.
70
ASHMORE FUNDS
FINANCIAL HIGHLIGHTS
Ashmore Emerging Markets Corporate Income ESG Fund
| | | | | | | | | | | | |
| | | | | | Class C | | | | |
| | | |
| | | Year Ended | | | Year Ended | | | Period Ended | |
| | | October 31, | | | October 31, | | | October 31, | |
| | | 2023 | | | 2022 | | | 20211 | |
| | | | |
Net asset value at beginning of period | | $ | 6.26 | | | $ | 9.11 | | | $ | 10.00 | |
| | | |
Income (loss) from investment operations: | | | | | | | | | | | | |
Net investment income | | | 0.27 | | | | 0.30 | | | | 0.24 | |
Net realized and unrealized loss | | | (0.11 | ) | | | (2.82 | ) | | | (0.88 | ) |
| | | | |
Total from investment operations | | | 0.16 | | | | (2.52 | ) | | | (0.64 | ) |
| | | |
Less distributions: | | | | | | | | | | | | |
| | | |
From net investment income | | | (0.36 | ) | | | (0.31 | ) | | | (0.25 | ) |
From net realized gain | | | — | | | | (0.02 | ) | | | — | |
Tax return of capital | | | — | | | | — | | | | — | |
| | | | |
| | | |
Total distributions | | | (0.36 | ) | | | (0.33 | ) | | | (0.25 | ) |
| | | | |
Net asset value at end of period | | $ | 6.06 | | | $ | 6.26 | | | $ | 9.11 | |
| | | | |
| | | |
Total return2 | | | 2.33 | % | | | (28.23 | )% | | | (6.55 | )% |
| | | |
Portfolio turnover rate3 | | | 32 | % | | | 34 | % | | | 15 | % |
| | | |
Net assets, end of period (in thousands) | | $ | 1 | | | $ | 1 | | | $ | 1 | |
| | | |
Ratios to average net assets:4 | | | | | | | | | | | | |
Total expenses to average net assets: | | | | | | | | | | | | |
Expenses before reimbursements | | | 3.18 | % | | | 3.32 | % | | | 4.10 | % |
Expenses after reimbursements | | | 1.87 | % | | | 1.87 | % | | | 1.87 | % |
| | | |
Net investment income to average net assets: | | | | | | | | | | | | |
Net investment income before reimbursements | | | 2.93 | % | | | 2.53 | % | | | 1.52 | % |
Net investment income after reimbursements | | | 4.24 | % | | | 3.98 | % | | | 3.75 | % |
See accompanying notes to the financial statements.
71
ASHMORE FUNDS
FINANCIAL HIGHLIGHTS
Ashmore Emerging Markets Corporate Income ESG Fund
| | | | | | | | | | | | |
| | | Institutional Class | |
| | | |
| | | Year Ended | | | Year Ended | | | Period Ended | |
| | | October 31, | | | October 31, | | | October 31, | |
| | | 2023 | | | 2022 | | | 20211 | |
| | | | |
Net asset value at beginning of period | | $ | 6.26 | | | $ | 9.11 | | | $ | 10.00 | |
| | | |
Income (loss) from investment operations: | | | | | | | | | | | | |
Net investment income | | | 0.33 | | | | 0.37 | | | | 0.31 | |
Net realized and unrealized loss | | | (0.11 | ) | | | (2.83 | ) | | | (0.89 | ) |
| | | | |
Total from investment operations | | | 0.22 | | | | (2.46 | ) | | | (0.58 | ) |
| | | |
Less distributions: | | | | | | | | | | | | |
| | | |
From net investment income | | | (0.41 | ) | | | (0.37 | ) | | | (0.31 | ) |
From net realized gain | | | — | | | | (0.02 | ) | | | — | |
Tax return of capital | | | — | | | | — | | | | — | |
| | | | |
| | | |
Total distributions | | | (0.41 | ) | | | (0.39 | ) | | | (0.31 | ) |
| | | | |
Net asset value at end of period | | $ | 6.07 | | | $ | 6.26 | | | $ | 9.11 | |
| | | | |
| | | |
Total return2 | | | 3.36 | % | | | (27.56 | )% | | | (5.96 | )% |
| | | |
Portfolio turnover rate3 | | | 32 | % | | | 34 | % | | | 15 | % |
| | | |
Net assets, end of period (in thousands) | | $ | 6,833 | | | $ | 6,720 | | | $ | 9,356 | |
| | | |
Ratios to average net assets:4 | | | | | | | | | | | | |
Total expenses to average net assets: | | | | | | | | | | | | |
Expenses before reimbursements | | | 2.07 | % | | | 2.12 | % | | | 3.08 | % |
Expenses after reimbursements | | | 0.87 | % | | | 0.87 | % | | | 0.87 | % |
| | | |
Net investment income to average net assets: | | | | | | | | | | | | |
Net investment income before reimbursements | | | 3.98 | % | | | 3.66 | % | | | 2.52 | % |
Net investment income after reimbursements | | | 5.18 | % | | | 4.91 | % | | | 4.73 | % |
| 1 | Class A, Class C and the Institutional Class commenced investment operations on February 26, 2021. |
| 2 | Assumes investment at net asset value at the beginning of the period, reinvestment of distributions at net asset value on distribution date, and a complete redemption of the investment at net asset value at the end of the period, excluding the impact of sales charges. Total return is not annualized for periods less than one year. |
| 3 | The portfolio turnover rate is calculated by dividing the lesser of cost of purchases or proceeds from sales of long term portfolio securities by the monthly average of the value of the long term portfolio securities. |
| 4 | Annualized for periods less than one year. |
See accompanying notes to the financial statements.
72
ASHMORE EMERGING MARKETS TOTAL RETURN FUND
SCHEDULE OF INVESTMENTS
As of October 31, 2023
| | | | | | | | | | | | | | | | |
| | | Currency1 | | | Par | | | Value | | | % of Net
Assets | |
Debt Securities | | | | | | | | | | | | | | | | |
| | | | |
Angola (Cost $7,347,796) | | | | | | | | | | | | | | | | |
Angola (Rep of), 8.250%, 05/09/2028 | | | | | | | 825,000 | | | $ | 700,219 | | | | 0.16 | |
Angola (Rep of), 8.000%, 11/26/2029 | | | | | | | 1,071,000 | | | | 856,800 | | | | 0.19 | |
Angola (Rep of), 8.750%, 04/14/2032 | | | | | | | 814,000 | | | | 636,955 | | | | 0.14 | |
Angola (Rep of), 9.375%, 05/08/2048 | | | | | | | 2,501,000 | | | | 1,781,963 | | | | 0.39 | |
Angola (Rep of), 9.125%, 11/26/2049 | | | | | | | 3,271,000 | | | | 2,297,877 | | | | 0.51 | |
| | | | | | | | | | | 6,273,814 | | | | 1.39 | |
| | | | |
Argentina (Cost $10,888,127) | | | | | | | | | | | | | | | | |
Argentina (Rep of), 1.000%, 07/09/2029 | | | | | | | 1,404,920 | | | | 375,816 | | | | 0.08 | |
Argentina (Rep of), (Step to 1.750% on 07/09/2027), 0.750%, 07/09/20302 | | | | | | | 17,836,451 | | | | 4,958,534 | | | | 1.10 | |
Argentina (Rep of), (Step to 4.125% on 07/09/2024), 3.625%, 07/09/20352 | | | | | | | 6,082,271 | | | | 1,496,239 | | | | 0.33 | |
Argentina (Rep of), (Step to 5.000% on 07/09/2024), 4.250%, 01/09/20382 | | | | | | | 2,211,373 | | | | 665,623 | | | | 0.15 | |
Argentina (Rep of), (Step to 4.875% on 07/09/2029), 3.500%, 07/09/20412 | | | | | | | 3,674,926 | | | | 956,629 | | | | 0.21 | |
| | | | | | | | | | | 8,452,841 | | | | 1.87 | |
| | | | |
Azerbaijan (Cost $2,931,041) | | | | | | | | | | | | | | | | |
Southern Gas Corridor CJSC, 6.875%, 03/24/2026 | | | | | | | 1,491,000 | | | | 1,467,308 | | | | 0.32 | |
State Oil Co. of the Azerbaijan Republic, 6.950%, 03/18/2030 | | | | | | | 1,191,000 | | | | 1,152,293 | | | | 0.26 | |
| | | | | | | | | | | 2,619,601 | | | | 0.58 | |
| | | | |
Bahrain (Cost $1,825,473) | | | | | | | | | | | | | | | | |
Bahrain (Rep of), 7.500%, 09/20/2047 | | | | | | | 1,148,000 | | | | 958,580 | | | | 0.21 | |
Oil and Gas Holding (The) Co. BSCC, 8.375%, 11/07/2028 | | | | | | | 750,000 | | | | 777,187 | | | | 0.17 | |
| | | | | | | | | | | 1,735,767 | | | | 0.38 | |
| | | | |
Brazil (Cost $60,150,386) | | | | | �� | | | | | | | | | | | |
Brazil (Rep of), 4.250%, 01/07/2025 | | | | | | | 1,620,000 | | | | 1,582,060 | | | | 0.35 | |
Brazil (Rep of), 2.875%, 06/06/2025 | | | | | | | 1,505,000 | | | | 1,429,238 | | | | 0.32 | |
Brazil (Rep of), 6.000%, 04/07/2026 | | | | | | | 780,000 | | | | 786,848 | | | | 0.17 | |
Brazil (Rep of), 4.625%, 01/13/2028 | | | | | | | 820,000 | | | | 781,624 | | | | 0.17 | |
Brazil (Rep of), 8.250%, 01/20/2034 | | | | | | | 418,000 | | | | 447,051 | | | | 0.10 | |
Brazil (Rep of), 5.000%, 01/27/2045 | | | | | | | 1,251,000 | | | | 895,090 | | | | 0.20 | |
Brazil (Rep of), 5.625%, 02/21/2047 | | | | | | | 739,000 | | | | 566,444 | | | | 0.12 | |
Brazil Letras do Tesouro Nacional, 0.000%, 07/01/20253 | | | BRL | | | | 76,708,000 | | | | 12,789,197 | | | | 2.83 | |
Brazil Letras do Tesouro Nacional, 0.000%, 01/01/20263 | | | BRL | | | | 18,302,000 | | | | 2,886,071 | | | | 0.64 | |
Brazil Letras do Tesouro Nacional, 0.000%, 07/01/20263 | | | BRL | | | | 26,785,000 | | | | 4,000,698 | | | | 0.88 | |
Brazil Notas do Tesouro Nacional Serie F, 10.000%, 01/01/2027 | | | BRL | | | | 47,357,000 | | | | 9,081,743 | | | | 2.01 | |
MC Brazil Downstream Trading S.a.r.l., 7.250%, 06/30/2031 | | | | | | | 3,009,874 | | | | 2,141,525 | | | | 0.47 | |
Oi S.A., 14.000%, (66% PIK), 09/07/20244,5,6 | | | | | | | 2,269,529 | | | | 2,258,181 | | | | 0.50 | |
Oi S.A., 14.000%, (100% Cash), 09/07/20244,5,6,7 | | | | | | | 24,464 | | | | 24,342 | | | | 0.01 | |
See accompanying notes to the financial statements.
73
ASHMORE EMERGING MARKETS TOTAL RETURN FUND
SCHEDULE OF INVESTMENTS (CONTINUED)
As of October 31, 2023
| | | | | | | | | | | | | | | | |
| | | Currency1 | | | Par | | | Value | | | % of Net
Assets | |
Brazil (continued) | | | | | | | | | | | | | | | | |
Oi S.A., 10.000%, 07/27/20255,8 | | | | | | | 23,583,000 | | | $ | 1,061,235 | | | | 0.23 | |
| | | | | | | | | | | 40,731,347 | | | | 9.00 | |
| | | | |
Chile (Cost $9,765,925) | | | | | | | | | | | | | | | | |
Chile (Rep of), 2.750%, 01/31/2027 | | | | | | | 273,000 | | | | 249,118 | | | | 0.05 | |
Chile (Rep of), 3.240%, 02/06/2028 | | | | | | | 493,000 | | | | 448,630 | | | | 0.10 | |
Chile (Rep of), 2.550%, 07/27/2033 | | | | | | | 347,000 | | | | 259,383 | | | | 0.06 | |
Chile (Rep of), 3.100%, 05/07/2041 | | | | | | | 1,528,000 | | | | 993,200 | | | | 0.22 | |
Chile (Rep of), 3.500%, 01/25/2050 | | | | | | | 200,000 | | | | 126,100 | | | | 0.03 | |
Chile (Rep of), 3.100%, 01/22/2061 | | | | | | | 1,327,000 | | | | 709,281 | | | | 0.16 | |
Corp. Nacional del Cobre de Chile, 5.625%, 10/18/2043 | | | | | | | 809,000 | | | | 671,066 | | | | 0.15 | |
Corp. Nacional del Cobre de Chile, 4.875%, 11/04/2044 | | | | | | | 390,000 | | | | 287,040 | | | | 0.06 | |
Corp. Nacional del Cobre de Chile, 4.500%, 08/01/2047 | | | | | | | 368,000 | | | | 252,816 | | | | 0.05 | |
Corp. Nacional del Cobre de Chile, 4.375%, 02/05/2049 | | | | | | | 979,000 | | | | 661,804 | | | | 0.15 | |
Corp. Nacional del Cobre de Chile, 3.700%, 01/30/2050 | | | | | | | 200,000 | | | | 117,400 | | | | 0.03 | |
Corp. Nacional del Cobre de Chile, 3.150%, 01/15/2051 | | | | | | | 446,000 | | | | 233,258 | | | | 0.05 | |
Empresa de Transporte de Pasajeros Metro S.A., 4.700%, 05/07/2050 | | | | | | | 1,081,000 | | | | 775,563 | | | | 0.17 | |
Empresa Nacional del Petroleo, 3.750%, 08/05/2026 | | | | | | | 530,000 | | | | 489,381 | | | | 0.11 | |
Empresa Nacional del Petroleo, 3.450%, 09/16/2031 | | | | | | | 200,000 | | | | 154,798 | | | | 0.03 | |
Empresa Nacional del Petroleo, 4.500%, 09/14/2047 | | | | | | | 817,000 | | | | 535,094 | | | | 0.12 | |
| | | | | | | | | | | 6,963,932 | | | | 1.54 | |
| | | | |
China (Cost $73,117,233) | | | | | | | | | | | | | | | | |
Agile Group Holdings Ltd., 5.750%, 01/02/2025 | | | | | | | 5,665,000 | | | | 566,500 | | | | 0.13 | |
Agile Group Holdings Ltd., 5.500%, 04/21/2025 | | | | | | | 200,000 | | | | 18,956 | | | | — | |
Central China Real Estate Ltd., 7.650%, 08/27/20238,9 | | | | | | | 2,500,000 | | | | 87,500 | | | | 0.02 | |
Central China Real Estate Ltd., 7.900%, 11/07/20238 | | | | | | | 1,910,000 | | | | 66,850 | | | | 0.02 | |
Central China Real Estate Ltd., 7.750%, 05/24/20248 | | | | | | | 3,100,000 | | | | 120,900 | | | | 0.03 | |
Central China Real Estate Ltd., 7.250%, 07/16/20248 | | | | | | | 2,060,000 | | | | 61,800 | | | | 0.01 | |
Central China Real Estate Ltd., 7.250%, 08/13/20248 | | | | | | | 1,082,000 | | | | 32,460 | | | | 0.01 | |
Central China Real Estate Ltd., 7.250%, 04/28/20258 | | | | | | | 190,000 | | | | 6,650 | | | | — | |
Central China Real Estate Ltd., 7.500%, 07/14/20258 | | | | | | | 1,225,000 | | | | 45,901 | | | | 0.01 | |
Central China Real Estate Ltd., 7.650%, 08/27/20258 | | | | | | | 480,000 | | | | 16,800 | | | | — | |
CFLD Cayman Investment Ltd., 2.500%, 01/31/20314 | | | | | | | 4,891,338 | | | | 364,160 | | | | 0.08 | |
China (Rep of), 2.800%, 03/25/2030 | | | CNY | | | | 12,270,000 | | | | 1,688,360 | | | | 0.37 | |
China Evergrande Group, 7.500%, 06/28/20238,9 | | | | | | | 10,219,000 | | | | 204,380 | | | | 0.05 | |
China SCE Group Holdings Ltd., 7.375%, 04/09/20248 | | | | | | | 2,040,000 | | | | 96,900 | | | | 0.02 | |
China SCE Group Holdings Ltd., 5.950%, 09/29/20248 | | | | | | | 910,000 | | | | 41,234 | | | | 0.01 | |
China SCE Group Holdings Ltd., 7.000%, 05/02/20258 | | | | | | | 1,461,000 | | | | 64,284 | | | | 0.01 | |
China SCE Group Holdings Ltd., 6.000%, 02/04/20268 | | | | | | | 955,000 | | | | 42,020 | | | | 0.01 | |
CIFI Holdings Group Co. Ltd., 6.450%, 11/07/20248 | | | | | | | 380,000 | | | | 20,900 | | | | 0.01 | |
CIFI Holdings Group Co. Ltd., 6.000%, 07/16/20258 | | | | | | | 1,300,000 | | | | 71,500 | | | | 0.02 | |
CIFI Holdings Group Co. Ltd., 5.950%, 10/20/20258 | | | | | | | 1,936,000 | | | | 106,480 | | | | 0.02 | |
CIFI Holdings Group Co. Ltd., 5.250%, 05/13/20268 | | | | | | | 3,374,000 | | | | 185,570 | | | | 0.04 | |
CIFI Holdings Group Co. Ltd., 4.375%, 04/12/20278 | | | | | | | 801,000 | | | | 44,055 | | | | 0.01 | |
See accompanying notes to the financial statements.
74
ASHMORE EMERGING MARKETS TOTAL RETURN FUND
SCHEDULE OF INVESTMENTS (CONTINUED)
As of October 31, 2023
| | | | | | | | | | | | | | | | |
| | | Currency1 | | | Par | | | Value | | | % of Net
Assets | |
China (continued) | | | | | | | | | | | | | | | | |
CIFI Holdings Group Co. Ltd., 4.800%, 05/17/20288 | | | | | | | 470,000 | | | $ | 27,415 | | | | 0.01 | |
Country Garden Holdings Co. Ltd., 5.625%, 01/14/20308 | | | | | | | 1,965,000 | | | | 71,231 | | | | 0.02 | |
Fantasia Holdings Group Co. Ltd., 15.000%, 12/18/20218,9 | | | | | | | 4,515,000 | | | | 135,450 | | | | 0.03 | |
Fantasia Holdings Group Co. Ltd., 7.950%, 07/05/20228,9 | | | | | | | 5,635,000 | | | | 195,929 | | | | 0.04 | |
Fantasia Holdings Group Co. Ltd., 12.250%, 10/18/20228,9 | | | | | | | 1,189,000 | | | | 35,670 | | | | 0.01 | |
Fantasia Holdings Group Co. Ltd., 10.875%, 01/09/20238,9 | | | | | | | 2,175,000 | | | | 65,250 | | | | 0.02 | |
Kaisa Group Holdings Ltd., 11.250%, 04/09/20228,9 | | | | | | | 1,260,000 | | | | 53,550 | | | | 0.01 | |
Kaisa Group Holdings Ltd., 8.500%, 06/30/20228,9 | | | | | | | 3,500,000 | | | | 148,750 | | | | 0.03 | |
Kaisa Group Holdings Ltd., 11.950%, 10/22/20228,9 | | | | | | | 1,300,000 | | | | 55,250 | | | | 0.01 | |
Kaisa Group Holdings Ltd., 11.500%, 01/30/20238,9 | | | | | | | 1,700,000 | | | | 72,250 | | | | 0.02 | |
Kaisa Group Holdings Ltd., 10.875%, 07/23/20238,9 | | | | | | | 2,500,000 | | | | 106,250 | | | | 0.02 | |
Kaisa Group Holdings Ltd., 9.375%, 06/30/20248 | | | | | | | 2,600,000 | | | | 110,500 | | | | 0.02 | |
Kaisa Group Holdings Ltd., 11.700%, 11/11/20258 | | | | | | | 2,000,000 | | | | 85,000 | | | | 0.02 | |
Kaisa Group Holdings Ltd., 11.650%, 06/01/20268 | | | | | | | 1,300,000 | | | | 55,250 | | | | 0.01 | |
KWG Group Holdings Ltd., 6.000%, 01/14/20248 | | | | | | | 1,200,000 | | | | 84,000 | | | | 0.02 | |
KWG Group Holdings Ltd., 5.875%, 11/10/20248 | | | | | | | 490,000 | | | | 34,300 | | | | 0.01 | |
KWG Group Holdings Ltd., 7.400%, 01/13/20278 | | | | | | | 395,000 | | | | 27,650 | | | | 0.01 | |
Shimao Group Holdings Ltd., 4.750%, 07/03/20228,9 | | | | | | | 200,000 | | | | 7,500 | | | | — | |
Sinopec Group Overseas Development 2012 Ltd., 4.875%, 05/17/2042 | | | | | | | 710,000 | | | | 607,015 | | | | 0.13 | |
Sinopec Group Overseas Development 2018 Ltd., 2.700%, 05/13/2030 | | | | | | | 980,000 | | | | 827,610 | | | | 0.18 | |
Sinopec Group Overseas Development 2018 Ltd., 3.350%, 05/13/2050 | | | | | | | 231,000 | | | | 146,277 | | | | 0.03 | |
Sunac China Holdings Ltd., 7.250%, 06/14/20228,9 | | | | | | | 3,157,000 | | | | 434,088 | | | | 0.10 | |
Sunac China Holdings Ltd., 7.950%, 08/08/20228,9 | | | | | | | 3,430,000 | | | | 471,625 | | | | 0.10 | |
Sunac China Holdings Ltd., 8.350%, 04/19/20238,9 | | | | | | | 4,040,000 | | | | 545,400 | | | | 0.12 | |
Sunac China Holdings Ltd., 7.950%, 10/11/20238,9 | | | | | | | 3,900,000 | | | | 536,250 | | | | 0.12 | |
Sunac China Holdings Ltd., 7.500%, 02/01/20248 | | | | | | | 200,000 | | | | 27,500 | | | | 0.01 | |
Sunac China Holdings Ltd., 5.950%, 04/26/20248 | | | | | | | 1,660,000 | | | | 228,250 | | | | 0.05 | |
Sunac China Holdings Ltd., 6.650%, 08/03/20248 | | | | | | | 675,000 | | | | 92,813 | | | | 0.02 | |
Sunac China Holdings Ltd., 6.500%, 01/10/20258 | | | | | | | 450,000 | | | | 60,750 | | | | 0.01 | |
Sunac China Holdings Ltd., 7.000%, 07/09/20258 | | | | | | | 200,000 | | | | 27,500 | | | | 0.01 | |
Yuzhou Group Holdings Co. Ltd., 7.813%, 01/21/20238,9 | | | | | | | 1,000,000 | | | | 60,000 | | | | 0.01 | |
Yuzhou Group Holdings Co. Ltd., 8.500%, 02/04/20238,9 | | | | | | | 5,620,000 | | | | 337,200 | | | | 0.08 | |
Yuzhou Group Holdings Co. Ltd., 9.950%, 06/08/20238,9 | | | | | | | 1,595,000 | | | | 94,089 | | | | 0.02 | |
Yuzhou Group Holdings Co. Ltd., 6.000%, 10/25/20238,9 | | | | | | | 3,962,000 | | | | 237,720 | | | | 0.05 | |
Yuzhou Group Holdings Co. Ltd., 8.500%, 02/26/20248 | | | | | | | 425,000 | | | | 25,500 | | | | 0.01 | |
Yuzhou Group Holdings Co. Ltd., 7.700%, 02/20/20258 | | | | | | | 1,080,000 | | | | 64,800 | | | | 0.01 | |
Yuzhou Group Holdings Co. Ltd., 7.375%, 01/13/20268 | | | | | | | 5,250,000 | | | | 315,000 | | | | 0.07 | |
Yuzhou Group Holdings Co. Ltd., 7.850%, 08/12/20268 | | | | | | | 1,330,000 | | | | 79,800 | | | | 0.02 | |
Yuzhou Group Holdings Co. Ltd., 6.350%, 01/13/20278 | | | | | | | 2,620,000 | | | | 153,925 | | | | 0.03 | |
Zhenro Properties Group Ltd., 8.700%, 08/03/20228,9 | | | | | | | 1,110,000 | | | | 4,684 | | | | — | |
Zhenro Properties Group Ltd., 8.000%, 03/06/20238,9 | | | | | | | 1,532,000 | | | | 7,660 | | | | — | |
Zhenro Properties Group Ltd., 9.150%, 05/06/20238,9 | | | | | | | 400,000 | | | | 2,000 | | | | — | |
See accompanying notes to the financial statements.
75
ASHMORE EMERGING MARKETS TOTAL RETURN FUND
SCHEDULE OF INVESTMENTS (CONTINUED)
As of October 31, 2023
| | | | | | | | | | | | | | | | |
| | | Currency1 | | | Par | | | Value | | | % of Net
Assets | |
China (continued) | | | | | | | | | | | | | | | | |
Zhenro Properties Group Ltd., 8.300%, 09/15/20238,9 | | | | | | | 3,158,000 | | | $ | 15,790 | | | | — | |
Zhenro Properties Group Ltd., 14.724%, 12/04/20238 | | | | | | | 1,360,000 | | | | 3,400 | | | | — | |
Zhenro Properties Group Ltd., 8.350%, 03/10/20248 | | | | | | | 387,000 | | | | 1,935 | | | | — | |
Zhenro Properties Group Ltd., 7.875%, 04/14/20248 | | | | | | | 3,591,000 | | | | 17,955 | | | | — | |
Zhenro Properties Group Ltd., 7.100%, 09/10/20248 | | | | | | | 4,406,000 | | | | 22,030 | | | | 0.01 | |
Zhenro Properties Group Ltd., 7.350%, 02/05/20258 | | | | | | | 8,407,000 | | | | 42,035 | | | | 0.01 | |
Zhenro Properties Group Ltd., 6.630%, 01/07/20268 | | | | | | | 2,065,000 | | | | 10,325 | | | | — | |
Zhenro Properties Group Ltd., 6.700%, 08/04/20268 | | | | | | | 5,713,000 | | | | 28,565 | | | | 0.01 | |
| | | | | | | | | | | 10,854,846 | | | | 2.40 | |
| | | | |
Colombia (Cost $16,004,684) | | | | | | | | | | | | | | | | |
Colombia (Rep of), 3.875%, 04/25/2027 | | | | | | | 983,000 | | | | 893,547 | | | | 0.20 | |
Colombia (Rep of), 7.375%, 09/18/2037 | | | | | | | 777,000 | | | | 697,357 | | | | 0.15 | |
Colombia (Rep of), 5.625%, 02/26/2044 | | | | | | | 1,530,000 | | | | 1,062,585 | | | | 0.23 | |
Colombia (Rep of), 5.000%, 06/15/2045 | | | | | | | 544,000 | | | | 345,440 | | | | 0.08 | |
Colombia (Rep of), 4.125%, 05/15/2051 | | | | | | | 813,000 | | | | 447,150 | | | | 0.10 | |
Colombian TES, 5.750%, 11/03/2027 | | | COP | | | | 9,276,700,000 | | | | 1,881,929 | | | | 0.42 | |
Colombian TES, 6.000%, 04/28/2028 | | | COP | | | | 9,803,600,000 | | | | 1,969,098 | | | | 0.43 | |
Colombian TES, 7.750%, 09/18/2030 | | | COP | | | | 2,105,600,000 | | | | 428,594 | | | | 0.09 | |
Colombian TES, 7.000%, 03/26/2031 | | | COP | | | | 8,353,400,000 | | | | 1,601,393 | | �� | | 0.35 | |
Colombian TES, 7.000%, 06/30/2032 | | | COP | | | | 4,011,700,000 | | | | 736,782 | | | | 0.16 | |
Colombian TES, 13.250%, 02/09/2033 | | | COP | | | | 1,684,300,000 | | | | 441,728 | | | | 0.10 | |
Colombian TES, 9.250%, 05/28/2042 | | | COP | | | | 2,498,500,000 | | | | 483,150 | | | | 0.11 | |
Empresas Publicas de Medellin ESP, 8.375%, 11/08/2027 | | | COP | | | | 8,747,000,000 | | | | 1,704,156 | | | | 0.38 | |
| | | | | | | | | | | 12,692,909 | | | | 2.80 | |
| | | | |
Costa Rica (Cost $1,858,740) | | | | | | | | | | | | | | | | |
Costa Rica (Rep of), 6.125%, 02/19/2031 | | | | | | | 641,000 | | | | 608,950 | | | | 0.13 | |
Costa Rica (Rep of), 6.550%, 04/03/2034 | | | | | | | 369,000 | | | | 350,734 | | | | 0.08 | |
Costa Rica (Rep of), 5.625%, 04/30/2043 | | | | | | | 710,000 | | | | 564,450 | | | | 0.13 | |
Costa Rica (Rep of), 7.000%, 04/04/2044 | | | | | | | 200,000 | | | | 183,100 | | | | 0.04 | |
| | | | | | | | | | | 1,707,234 | | | | 0.38 | |
| | | | |
Croatia (Cost $1,207,230) | | | | | | | | | | | | | | | | |
Croatia (Rep of), 6.000%, 01/26/2024 | | | | | | | 1,200,000 | | | | 1,200,108 | | | | 0.26 | |
| | | | | | | | | | | 1,200,108 | | | | 0.26 | |
| | | | |
Czech Republic (Cost $12,283,650) | | | | | | | | | | | | | | | | |
Czech (Rep of), 2.500%, 08/25/2028 | | | CZK | | | | 24,570,000 | | | | 966,795 | | | | 0.21 | |
Czech (Rep of), 2.750%, 07/23/2029 | | | CZK | | | | 72,900,000 | | | | 2,853,927 | | | | 0.63 | |
Czech (Rep of), 0.050%, 11/29/2029 | | | CZK | | | | 18,410,000 | | | | 605,694 | | | | 0.14 | |
Czech (Rep of), 0.950%, 05/15/2030 | | | CZK | | | | 5,640,000 | | | | 193,984 | | | | 0.04 | |
Czech (Rep of), 5.000%, 09/30/2030 | | | CZK | | | | 47,990,000 | | | | 2,117,608 | | | | 0.47 | |
Czech (Rep of), 1.750%, 06/23/2032 | | | CZK | | | | 14,820,000 | | | | 509,137 | | | | 0.11 | |
Czech (Rep of), 2.000%, 10/13/2033 | | | CZK | | | | 8,260,000 | | | | 280,696 | | | | 0.06 | |
Czech (Rep of), 4.900%, 04/14/2034 | | | CZK | | | | 24,780,000 | | | | 1,079,227 | | | | 0.24 | |
Czech (Rep of), 4.200%, 12/04/2036 | | | CZK | | | | 6,350,000 | | | | 259,333 | | | | 0.06 | |
See accompanying notes to the financial statements.
76
ASHMORE EMERGING MARKETS TOTAL RETURN FUND
SCHEDULE OF INVESTMENTS (CONTINUED)
As of October 31, 2023
| | | | | | | | | | | | | | | | |
| | | Currency1 | | | Par | | | Value | | | % of Net
Assets | |
Czech Republic (continued) | | | | | | | | | | | | | | | | |
New World Resources N.V., 8.000%, 04/07/20208,9,10 | | | EUR | | | | 1,938,518 | | | $ | — | | | | — | |
New World Resources N.V., 4.000%, 10/07/20208,9,10 | | | EUR | | | | 669,526 | | | | — | | | | — | |
| | | | | | | | | | | 8,866,401 | | | | 1.96 | |
| | | | |
Dominican Republic (Cost $14,166,789) | | | | | | | | | | | | | | | | |
Dominican (Rep of), 5.500%, 01/27/2025 | | | | | | | 614,000 | | | | 602,408 | | | | 0.13 | |
Dominican (Rep of), 6.875%, 01/29/2026 | | | | | | | 1,288,000 | | | | 1,280,903 | | | | 0.28 | |
Dominican (Rep of), 6.000%, 07/19/2028 | | | | | | | 710,000 | | | | 670,950 | | | | 0.15 | |
Dominican (Rep of), 5.500%, 02/22/2029 | | | | | | | 483,000 | | | | 439,289 | | | | 0.10 | |
Dominican (Rep of), 4.875%, 09/23/2032 | | | | | | | 3,824,000 | | | | 3,091,704 | | | | 0.68 | |
Dominican (Rep of), 13.625%, 02/03/2033 | | | DOP | | | | 15,000,000 | | | | 303,260 | | | | 0.07 | |
Dominican (Rep of), 11.250%, 09/15/20354 | | | DOP | | | | 32,200,000 | | | | 562,736 | | | | 0.12 | |
Dominican (Rep of), 5.300%, 01/21/2041 | | | | | | | 973,000 | | | | 706,398 | | | | 0.16 | |
Dominican (Rep of), 6.850%, 01/27/2045 | | | | | | | 363,000 | | | | 302,198 | | | | 0.07 | |
Dominican (Rep of), 6.500%, 02/15/2048 | | | | | | | 1,501,000 | | | | 1,191,794 | | | | 0.26 | |
Dominican (Rep of), 6.400%, 06/05/2049 | | | | | | | 403,000 | | | | 315,146 | | | | 0.07 | |
Dominican (Rep of), 5.875%, 01/30/2060 | | | | | | | 3,380,000 | | | | 2,396,420 | | | | 0.53 | |
Dominican Republic Central Bank Notes, 13.000%, 01/30/2026 | | | DOP | | | | 18,550,000 | | | | 343,080 | | | | 0.08 | |
| | | | | | | | | | | 12,206,286 | | | | 2.70 | |
| | | | |
Ecuador (Cost $1,016,045) | | | | | | | | | | | | | | | | |
Ecuador (Rep of), (Step to 5.000% on 07/31/2024), 2.500%, 07/31/20402 | | | | | | | 2,368,572 | | | | 792,287 | | | | 0.17 | |
| | | | | | | | | | | 792,287 | | | | 0.17 | |
| | | | |
Egypt (Cost $10,044,602) | | | | | | | | | | | | | | | | |
Egypt (Rep of), 6.588%, 02/21/2028 | | | | | | | 391,000 | | | | 248,285 | | | | 0.06 | |
Egypt (Rep of), 7.600%, 03/01/2029 | | | | | | | 795,000 | | | | 492,900 | | | | 0.11 | |
Egypt (Rep of), 5.875%, 02/16/2031 | | | | | | | 910,000 | | | | 497,088 | | | | 0.11 | |
Egypt (Rep of), 7.625%, 05/29/2032 | | | | | | | 844,000 | | | | 481,080 | | | | 0.11 | |
Egypt (Rep of), 8.500%, 01/31/2047 | | | | | | | 2,028,000 | | | | 1,051,619 | | | | 0.23 | |
Egypt (Rep of), 7.903%, 02/21/2048 | | | | | | | 2,669,000 | | | | 1,351,181 | | | | 0.30 | |
Egypt (Rep of), 8.700%, 03/01/2049 | | | | | | | 1,580,000 | | | | 827,525 | | | | 0.18 | |
Egypt (Rep of), 8.875%, 05/29/2050 | | | | | | | 1,443,000 | | | | 761,182 | | | | 0.17 | |
Egypt (Rep of), 8.750%, 09/30/2051 | | | | | | | 1,057,000 | | | | 553,604 | | | | 0.12 | |
Egypt (Rep of), 8.150%, 11/20/2059 | | | | | | | 200,000 | | | | 102,000 | | | | 0.02 | |
| | | | | | | | | | | 6,366,464 | | | | 1.41 | |
| | | | |
Gabon (Cost $1,086,184) | | | | | | | | | | | | | | | | |
Gabon (Rep of), 6.625%, 02/06/2031 | | | | | | | 1,415,000 | | | | 994,038 | | | | 0.22 | |
| | | | | | | | | | | 994,038 | | | | 0.22 | |
| | | | |
Ghana (Cost $4,394,023) | | | | | | | | | | | | | | | | |
Ghana (Rep of), 6.375%, 02/11/20278 | | | | | | | 1,807,000 | | | | 786,045 | | | | 0.18 | |
Ghana (Rep of), 7.750%, 04/07/20298 | | | | | | | 1,062,000 | | | | 457,987 | | | | 0.10 | |
Ghana (Rep of), 7.625%, 05/16/20298 | | | | | | | 1,582,000 | | | | 680,260 | | | | 0.15 | |
Ghana (Rep of), 8.125%, 03/26/20328 | | | | | | | 633,000 | | | | 267,443 | | | | 0.06 | |
Ghana (Rep of), 8.625%, 04/07/20348 | | | | | | | 1,441,000 | | | | 621,431 | | | | 0.14 | |
See accompanying notes to the financial statements.
77
ASHMORE EMERGING MARKETS TOTAL RETURN FUND
SCHEDULE OF INVESTMENTS (CONTINUED)
As of October 31, 2023
| | | | | | | | | | | | | | | | |
| | | Currency1 | | | Par | | | Value | | | % of Net
Assets | |
Ghana (continued) | | | | | | | | | | | | | | | | |
Ghana (Rep of), 7.875%, 02/11/20358 | | | | | | | 438,000 | | | $ | 189,983 | | | | 0.04 | |
Ghana (Rep of), 8.875%, 05/07/20428 | | | | | | | 1,540,000 | | | | 646,800 | | | | 0.14 | |
| | | | | | | | | | | 3,649,949 | | | | 0.81 | |
| | | | |
Guatemala (Cost $1,832,086) | | | | | | | | | | | | | | | | |
Guatemala (Rep of), 5.375%, 04/24/2032 | | | | | | | 242,000 | | | | 215,017 | | | | 0.05 | |
Guatemala (Rep of), 6.600%, 06/13/2036 | | | | | | | 426,000 | | | | 393,624 | | | | 0.09 | |
Guatemala (Rep of), 4.650%, 10/07/2041 | | | | | | | 408,000 | | | | 281,520 | | | | 0.06 | |
Guatemala (Rep of), 6.125%, 06/01/2050 | | | | | | | 665,000 | | | | 528,675 | | | | 0.11 | |
| | | | | | | | | | | 1,418,836 | | | | 0.31 | |
| | | | |
Hungary (Cost $6,536,333) | | | | | | | | | | | | | | | | |
Hungary (Rep of), 5.375%, 03/25/2024 | | | | | | | 694,000 | | | | 691,853 | | | | 0.16 | |
Hungary (Rep of), 6.750%, 10/22/2028 | | | HUF | | | | 216,810,000 | | | | 581,456 | | | | 0.13 | |
Hungary (Rep of), 3.000%, 08/21/2030 | | | HUF | | | | 443,460,000 | | | | 953,608 | | | | 0.21 | |
Hungary (Rep of), 2.125%, 09/22/2031 | | | | | | | 764,000 | | | | 549,620 | | | | 0.12 | |
Hungary (Rep of), 3.000%, 10/27/2038 | | | HUF | | | | 248,590,000 | | | | 414,757 | | | | 0.09 | |
Hungary (Rep of), 3.125%, 09/21/2051 | | | | | | | 2,231,000 | | | | 1,178,102 | | | | 0.26 | |
Hungary (Rep of), 6.750%, 09/25/2052 | | | | | | | 834,000 | | | | 771,450 | | | | 0.17 | |
| | | | | | | | | | | 5,140,846 | | | | 1.14 | |
| | | | |
India (Cost $1,817,675) | | | | | | | | | | | | | | | | |
Export-Import Bank of India, 3.375%, 08/05/2026 | | | | | | | 440,000 | | | | 413,125 | | | | 0.09 | |
Export-Import Bank of India, 2.250%, 01/13/2031 | | | | | | | 789,000 | | | | 602,630 | | | | 0.13 | |
Export-Import Bank of India, 5.500%, 01/18/2033 | | | | | | | 651,000 | | | | 609,870 | | | | 0.14 | |
| | | | | | | | | | | 1,625,625 | | | | 0.36 | |
| | | | |
Indonesia (Cost $37,906,699) | | | | | | | | | | | | | | | | |
Indonesia (Rep of), 8.375%, 03/15/2024 | | | IDR | | | | 45,715,000,000 | | | | 2,892,262 | | | | 0.64 | |
Indonesia (Rep of), 8.125%, 05/15/2024 | | | IDR | | | | 19,857,000,000 | | | | 1,257,816 | | | | 0.28 | |
Indonesia (Rep of), 4.150%, 09/20/2027 | | | | | | | 620,000 | | | | 587,047 | | | | 0.13 | |
Indonesia (Rep of), 4.550%, 01/11/2028 | | | | | | | 717,000 | | | | 688,772 | | | | 0.15 | |
Indonesia (Rep of), 6.375%, 08/15/2028 | | | IDR | | | | 6,882,000,000 | | | | 421,541 | | | | 0.09 | |
Indonesia (Rep of), 9.000%, 03/15/2029 | | | IDR | | | | 11,300,000,000 | | | | 770,762 | | | | 0.17 | |
Indonesia (Rep of), 8.250%, 05/15/2029 | | | IDR | | | | 23,273,000,000 | | | | 1,541,278 | | | | 0.34 | |
Indonesia (Rep of), 7.000%, 09/15/2030 | | | IDR | | | | 9,202,000,000 | | | | 576,971 | | | | 0.13 | |
Indonesia (Rep of), 6.500%, 02/15/2031 | | | IDR | | | | 3,078,000,000 | | | | 186,986 | | | | 0.04 | |
Indonesia (Rep of), 7.750%, 04/15/2031 | | | IDR | | | | 12,825,000,000 | | | | 831,586 | | | | 0.18 | |
Indonesia (Rep of), 8.750%, 05/15/2031 | | | IDR | | | | 16,566,000,000 | | | | 1,134,122 | | | | 0.25 | |
Indonesia (Rep of), 7.000%, 02/15/2033 | | | IDR | | | | 30,424,000,000 | | | | 1,905,690 | | | | 0.42 | |
Indonesia (Rep of), 6.625%, 02/15/2034 | | | IDR | | | | 14,448,000,000 | | | | 872,337 | | | | 0.19 | |
Indonesia (Rep of), 8.375%, 03/15/2034 | | | IDR | | | | 12,504,000,000 | | | | 851,311 | | | | 0.19 | |
Indonesia (Rep of), 7.500%, 06/15/2035 | | | IDR | | | | 10,880,000,000 | | | | 698,621 | | | | 0.15 | |
Indonesia (Rep of), 8.500%, 10/12/2035 | | | | | | | 624,000 | | | | 744,432 | | | | 0.16 | |
Indonesia (Rep of), 8.250%, 05/15/2036 | | | IDR | | | | 10,391,000,000 | | | | 706,470 | | | | 0.16 | |
Indonesia (Rep of), 6.625%, 02/17/2037 | | | | | | | 751,000 | | | | 780,349 | | | | 0.17 | |
Indonesia (Rep of), 7.750%, 01/17/2038 | | | | | | | 971,000 | | | | 1,107,688 | | | | 0.25 | |
See accompanying notes to the financial statements.
78
ASHMORE EMERGING MARKETS TOTAL RETURN FUND
SCHEDULE OF INVESTMENTS (CONTINUED)
As of October 31, 2023
| | | | | | | | | | | | | | | | |
| | | Currency1 | | | Par | | | Value | | | % of Net
Assets | |
Indonesia (continued) | | | | | | | | | | | | | | | | |
Indonesia (Rep of), 7.500%, 05/15/2038 | | | IDR | | | | 8,539,000,000 | | | $ | 549,646 | | | | 0.12 | |
Indonesia (Rep of), 7.125%, 06/15/2038 | | | IDR | | | | 33,262,000,000 | | | | 2,083,455 | | | | 0.46 | |
Indonesia (Rep of), 8.375%, 04/15/2039 | | | IDR | | | | 12,332,000,000 | | | | 853,963 | | | | 0.19 | |
Indonesia (Rep of), 5.250%, 01/17/2042 | | | | | | | 833,000 | | | | 748,076 | | | | 0.17 | |
Indonesia (Rep of), 5.950%, 01/08/2046 | | | | | | | 616,000 | | | | 587,381 | | | | 0.13 | |
Indonesia (Rep of), 5.250%, 01/08/2047 | | | | | | | 546,000 | | | | 477,996 | | | | 0.11 | |
Indonesia (Rep of), 4.750%, 07/18/2047 | | | | | | | 750,000 | | | | 611,880 | | | | 0.14 | |
Indonesia (Rep of), 4.200%, 10/15/2050 | | | | | | | 976,000 | | | | 714,676 | | | | 0.16 | |
Indonesia Asahan Aluminium PT/Mineral Industri Indonesia Persero PT, 4.750%, 05/15/2025 | | | | | | | 576,000 | | | | 562,464 | | | | 0.12 | |
Indonesia Asahan Aluminium PT/Mineral Industri Indonesia Persero PT, 5.450%, 05/15/2030 | | | | | | | 899,000 | | | | 830,865 | | | | 0.18 | |
Indonesia Asahan Aluminium PT/Mineral Industri Indonesia Persero PT, 5.800%, 05/15/2050 | | | | | | | 200,000 | | | | 157,992 | | | | 0.04 | |
Pertamina Persero PT, 6.000%, 05/03/2042 | | | | | | | 329,000 | | | | 289,859 | | | | 0.06 | |
Pertamina Persero PT, 6.450%, 05/30/2044 | | | | | | | 581,000 | | | | 535,601 | | | | 0.12 | |
Pertamina Persero PT, 6.500%, 11/07/2048 | | | | | | | 367,000 | | | | 341,743 | | | | 0.08 | |
Pertamina Persero PT, 4.175%, 01/21/2050 | | | | | | | 372,000 | | | | 247,469 | | | | 0.06 | |
Perusahaan Penerbit SBSN Indonesia III, 4.325%, 05/28/2025 | | | | | | | 417,000 | | | | 408,790 | | | | 0.09 | |
Perusahaan Penerbit SBSN Indonesia III, 4.550%, 03/29/2026 | | | | | | | 929,000 | | | | 904,939 | | | | 0.20 | |
Perusahaan Penerbit SBSN Indonesia III, 4.700%, 06/06/2032 | | | | | | | 453,000 | | | | 420,574 | | | | 0.09 | |
Perusahaan Penerbit SBSN Indonesia III, 3.800%, 06/23/2050 | | | | | | | 298,000 | | | | 201,710 | | | | 0.05 | |
Perusahaan Perseroan Persero PT Perusahaan Listrik Negara, 5.250%, 10/24/2042 | | | | | | | 620,000 | | | | 484,177 | | | | 0.11 | |
Perusahaan Perseroan Persero PT Perusahaan Listrik Negara, 5.250%, 05/15/2047 | | | | | | | 857,000 | | | | 653,368 | | | | 0.14 | |
Perusahaan Perseroan Persero PT Perusahaan Listrik Negara, 6.150%, 05/21/2048 | | | | | | | 1,404,000 | | | | 1,189,890 | | | | 0.26 | |
Perusahaan Perseroan Persero PT Perusahaan Listrik Negara, 4.875%, 07/17/2049 | | | | | | | 1,184,000 | | | | 835,312 | | | | 0.18 | |
| | | | | | | | | | | 33,247,867 | | | | 7.35 | |
| | | | |
Ivory Coast (Cost $5,226,509) | | | | | | | | | | | | | | | | |
Ivory Coast (Rep of), 5.875%, 10/17/2031 | | | EUR | | | | 1,089,000 | | | | 929,019 | | | | 0.20 | |
Ivory Coast (Rep of), 4.875%, 01/30/2032 | | | EUR | | | | 947,000 | | | | 755,273 | | | | 0.17 | |
Ivory Coast (Rep of), 6.875%, 10/17/2040 | | | EUR | | | | 885,000 | | | | 677,733 | | | | 0.15 | |
Ivory Coast (Rep of), 6.625%, 03/22/2048 | | | EUR | | | | 2,709,000 | | | | 1,913,317 | | | | 0.42 | |
| | | | | | | | | | | 4,275,342 | | | | 0.94 | |
| | | | |
Jamaica (Cost $990,962) | | | | | | | | | | | | | | | | |
Jamaica (Rep of), 7.875%, 07/28/2045 | | | | | | | 750,000 | | | | 801,750 | | | | 0.18 | |
| | | | | | | | | | | 801,750 | | | | 0.18 | |
| | | | |
Kazakhstan (Cost $1,456,218) | | | | | | | | | | | | | | | | |
Kazakhstan (Rep of), 6.500%, 07/21/2045 | | | | | | | 1,017,000 | | | | 996,660 | | | | 0.22 | |
| | | | | | | | | | | 996,660 | | | | 0.22 | |
See accompanying notes to the financial statements.
79
ASHMORE EMERGING MARKETS TOTAL RETURN FUND
SCHEDULE OF INVESTMENTS (CONTINUED)
As of October 31, 2023
| | | | | | | | | | | | | | | | |
| | | Currency1 | | | Par | | | Value | | | % of Net
Assets | |
Kenya (Cost $880,639) | | | | | | | | | | | | | | | | |
Kenya (Rep of), 8.000%, 05/22/2032 | | | | | | | 449,000 | | | $ | 351,904 | | | | 0.08 | |
Kenya (Rep of), 8.250%, 02/28/2048 | | | | | | | 643,000 | | | | 451,707 | | | | 0.10 | |
| | | | | | | | | | | 803,611 | | | | 0.18 | |
| | | | |
Lebanon (Cost $9,964,128) | | | | | | | | | | | | | | | | |
Lebanon (Rep of), 6.375%, 03/09/20208,9 | | | | | | | 1,855,000 | | | | 111,300 | | | | 0.03 | |
Lebanon (Rep of), 5.800%, 04/14/20208,9 | | | | | | | 1,219,000 | | | | 73,140 | | | | 0.02 | |
Lebanon (Rep of), 6.150%, 06/19/20208,9 | | | | | | | 2,648,000 | | | | 158,880 | | | | 0.04 | |
Lebanon (Rep of), 8.250%, 04/12/20218,9 | | | | | | | 1,610,000 | | | | 95,682 | | | | 0.02 | |
Lebanon (Rep of), 6.600%, 08/23/20228,9 | | | | | | | 1,089,000 | | | | 63,914 | | | | 0.01 | |
Lebanon (Rep of), 6.100%, 10/04/20228,9 | | | | | | | 3,808,000 | | | | 232,364 | | | | 0.05 | |
Lebanon (Rep of), 6.000%, 01/27/20238,9 | | | | | | | 1,000 | | | | 61 | | | | — | |
Lebanon (Rep of), 6.850%, 03/23/20278 | | | | | | | 2,314,000 | | | | 141,034 | | | | 0.03 | |
Lebanon (Rep of), 7.000%, 03/23/20328 | | | | | | | 895,000 | | | | 53,709 | | | | 0.01 | |
Lebanon (Rep of), 7.050%, 11/02/20358 | | | | | | | 244,000 | | | | 14,974 | | | | — | |
Lebanon (Rep of), 7.250%, 03/23/20378 | | | | | | | 867,000 | | | | 51,231 | | | | 0.01 | |
| | | | | | | | | | | 996,289 | | | | 0.22 | |
| | | | |
Malaysia (Cost $28,345,386) | | | | | | | | | | | | | | | | |
Malaysia (Rep of), 3.478%, 06/14/2024 | | | MYR | | | | 54,561,000 | | | | 11,454,317 | | | | 2.53 | |
Malaysia (Rep of), 4.504%, 04/30/2029 | | | MYR | | | | 4,435,000 | | | | 954,812 | | | | 0.21 | |
Malaysia (Rep of), 4.498%, 04/15/2030 | | | MYR | | | | 565,000 | | | | 121,211 | | | | 0.03 | |
Malaysia (Rep of), 4.232%, 06/30/2031 | | | MYR | | | | 2,488,000 | | | | 526,122 | | | | 0.12 | |
Malaysia (Rep of), 3.582%, 07/15/2032 | | | MYR | | | | 4,569,000 | | | | 921,894 | | | | 0.20 | |
Malaysia (Rep of), 3.828%, 07/05/2034 | | | MYR | | | | 2,342,000 | | | | 476,683 | | | | 0.10 | |
Malaysia (Rep of), 4.254%, 05/31/2035 | | | MYR | | | | 2,888,000 | | | | 609,477 | | | | 0.13 | |
Malaysia (Rep of), 4.762%, 04/07/2037 | | | MYR | | | | 566,000 | | | | 124,851 | | | | 0.03 | |
Malaysia (Rep of), 4.893%, 06/08/2038 | | | MYR | | | | 3,968,000 | | | | 891,216 | | | | 0.20 | |
Malaysia (Rep of), 3.757%, 05/22/2040 | | | MYR | | | | 2,004,000 | | | | 387,963 | | | | 0.09 | |
Malaysia (Rep of), 4.696%, 10/15/2042 | | | MYR | | | | 444,000 | | | | 96,489 | | | | 0.02 | |
Malaysia (Rep of), 4.935%, 09/30/2043 | | | MYR | | | | 747,000 | | | | 165,721 | | | | 0.04 | |
Malaysia (Rep of), 4.921%, 07/06/2048 | | | MYR | | | | 1,743,000 | | | | 387,126 | | | | 0.08 | |
Malaysia (Rep of), 4.065%, 06/15/2050 | | | MYR | | | | 2,911,000 | | | | 564,237 | | | | 0.12 | |
Malaysia Government Investment Issue, 4.193%, 10/07/2032 | | | MYR | | | | 329,000 | | | | 69,285 | | | | 0.01 | |
Petronas Capital Ltd., 2.480%, 01/28/2032 | | | | | | | 2,139,000 | | | | 1,660,313 | | | | 0.37 | |
Petronas Capital Ltd., 4.550%, 04/21/2050 | | | | | | | 3,632,000 | | | | 2,785,962 | | | | 0.62 | |
Petronas Capital Ltd., 4.800%, 04/21/2060 | | | | | | | 718,000 | | | | 557,592 | | | | 0.12 | |
Petronas Capital Ltd., 3.404%, 04/28/2061 | | | | | | | 1,543,000 | | | | 892,487 | | | | 0.20 | |
| | | | | | | | | | | 23,647,758 | | | | 5.22 | |
| | | | |
Mexico (Cost $41,110,443) | | | | | | | | | | | | | | | | |
Comision Federal de Electricidad, 3.875%, 07/26/2033 | | | | | | | 1,175,000 | | | | 851,875 | | | | 0.19 | |
Mexican Bonos, 10.000%, 12/05/2024 | | | MXN | | | | 9,790,000 | | | | 535,610 | | | | 0.12 | |
Mexican Bonos, 5.750%, 03/05/2026 | | | MXN | | | | 93,590,000 | | | | 4,655,712 | | | | 1.03 | |
Mexican Bonos, 5.500%, 03/04/2027 | | | MXN | | | | 75,570,000 | | | | 3,619,838 | | | | 0.80 | |
Mexican Bonos, 7.750%, 05/29/2031 | | | MXN | | | | 17,570,000 | | | | 848,530 | | | | 0.19 | |
See accompanying notes to the financial statements.
80
ASHMORE EMERGING MARKETS TOTAL RETURN FUND
SCHEDULE OF INVESTMENTS (CONTINUED)
As of October 31, 2023
| | | | | | | | | | | | | | | | |
| | | Currency1 | | | Par | | | Value | | | % of Net
Assets | |
Mexico (continued) | | | | | | | | | | | | | | | | |
Mexican Bonos, 7.500%, 05/26/2033 | | | MXN | | | | 33,920,000 | | | $ | 1,571,568 | | | | 0.34 | |
Mexican Bonos, 7.750%, 11/23/2034 | | | MXN | | | | 32,200,000 | | | | 1,501,000 | | | | 0.33 | |
Mexican Bonos, 10.000%, 11/20/2036 | | | MXN | | | | 37,020,000 | | | | 2,030,402 | | | | 0.45 | |
Mexican Bonos, 8.500%, 11/18/2038 | | | MXN | | | | 30,270,000 | | | | 1,463,681 | | | | 0.32 | |
Mexican Bonos, 7.750%, 11/13/2042 | | | MXN | | | | 14,250,000 | | | | 630,734 | | | | 0.14 | |
Mexico (Rep of), 5.400%, 02/09/2028 | | | | | | | 412,000 | | | | 404,172 | | | | 0.09 | |
Mexico (Rep of), 2.659%, 05/24/2031 | | | | | | | 692,000 | | | | 538,722 | | | | 0.12 | |
Mexico (Rep of), 4.875%, 05/19/2033 | | | | | | | 911,000 | | | | 799,402 | | | | 0.17 | |
Mexico (Rep of), 6.050%, 01/11/2040 | | | | | | | 556,000 | | | | 497,620 | | | | 0.11 | |
Mexico (Rep of), 4.750%, 03/08/2044 | | | | | | | 488,000 | | | | 359,793 | | | | 0.08 | |
Mexico (Rep of), 5.550%, 01/21/2045 | | | | | | | 807,000 | | | | 667,793 | | | | 0.15 | |
Mexico (Rep of), 6.338%, 05/04/2053 | | | | | | | 839,000 | | | | 726,994 | | | | 0.16 | |
Mexico (Rep of), 3.771%, 05/24/2061 | | | | | | | 2,492,000 | | | | 1,393,028 | | | | 0.31 | |
Mexico (Rep of), 3.750%, 04/19/2071 | | | | | | | 3,044,000 | | | | 1,666,590 | | | | 0.37 | |
Mexico (Rep of), 5.750%, 10/12/2110 | | | | | | | 896,000 | | | | 677,824 | | | | 0.15 | |
Petroleos Mexicanos, 6.750%, 09/21/2047 | | | | | | | 3,604,000 | | | | 2,039,864 | | | | 0.45 | |
Petroleos Mexicanos, 6.350%, 02/12/2048 | | | | | | | 1,237,000 | | | | 675,711 | | | | 0.15 | |
Petroleos Mexicanos, 7.690%, 01/23/2050 | | | | | | | 4,673,000 | | | | 2,885,577 | | | | 0.64 | |
Petroleos Mexicanos, 6.950%, 01/28/2060 | | | | | | | 5,053,000 | | | | 2,861,261 | | | | 0.63 | |
| | | | | | | | | | | 33,903,301 | | | | 7.49 | |
| | | | |
Mongolia (Cost $779,142) | | | | | | | | | | | | | | | | |
Mongolia (Rep of), 8.650%, 01/19/2028 | | | | | | | 276,000 | | | | 273,820 | | | | 0.06 | |
Mongolia (Rep of), 4.450%, 07/07/2031 | | | | | | | 657,000 | | | | 497,257 | | | | 0.11 | |
| | | | | | | | | | | 771,077 | | | | 0.17 | |
| | | | |
Morocco (Cost $4,184,491) | | | | | | | | | | | | | | | | |
Morocco (Rep of), 2.375%, 12/15/2027 | | | | | | | 723,000 | | | | 618,165 | | | | 0.14 | |
Morocco (Rep of), 5.950%, 03/08/2028 | | | | | | | 453,000 | | | | 443,374 | | | | 0.10 | |
Morocco (Rep of), 3.000%, 12/15/2032 | | | | | | | 774,000 | | | | 577,597 | | | | 0.13 | |
Morocco (Rep of), 6.500%, 09/08/2033 | | | | | | | 1,505,000 | | | | 1,442,919 | | | | 0.32 | |
Morocco (Rep of), 5.500%, 12/11/2042 | | | | | | | 533,000 | | | | 415,740 | | | | 0.09 | |
Morocco (Rep of), 4.000%, 12/15/2050 | | | | | | | 410,000 | | | | 242,412 | | | | 0.05 | |
| | | | | | | | | | | 3,740,207 | | | | 0.83 | |
| | | | |
Nigeria (Cost $5,745,173) | | | | | | | | | | | | | | | | |
Nigeria (Rep of), 6.500%, 11/28/2027 | | | | | | | 947,000 | | | | 814,420 | | | | 0.18 | |
Nigeria (Rep of), 7.375%, 09/28/2033 | | | | | | | 1,179,000 | | | | 884,250 | | | | 0.20 | |
Nigeria (Rep of), 7.696%, 02/23/2038 | | | | | | | 963,000 | | | | 683,730 | | | | 0.15 | |
Nigeria (Rep of), 7.625%, 11/28/2047 | | | | | | | 3,601,000 | | | | 2,421,672 | | | | 0.53 | |
Nigeria (Rep of), 9.248%, 01/21/2049 | | | | | | | 480,000 | | | | 371,400 | | | | 0.08 | |
| | | | | | | | | | | 5,175,472 | | | | 1.14 | |
| | | | |
Oman (Cost $8,554,288) | | | | | | | | | | | | | | | | |
Oman (Rep of), 4.750%, 06/15/2026 | | | | | | | 1,444,000 | | | | 1,384,680 | | | | 0.31 | |
Oman (Rep of), 6.750%, 10/28/2027 | | | | | | | 1,645,000 | | | | 1,658,880 | | | | 0.37 | |
Oman (Rep of), 6.000%, 08/01/2029 | | | | | | | 1,211,000 | | | | 1,174,670 | | | | 0.26 | |
See accompanying notes to the financial statements.
81
ASHMORE EMERGING MARKETS TOTAL RETURN FUND
SCHEDULE OF INVESTMENTS (CONTINUED)
As of October 31, 2023
| | | | | | | | | | | | | | | | |
| | | Currency1 | | | Par | | | Value | | | % of Net
Assets | |
Oman (continued) | | | | | | | | | | | | | | | | |
Oman (Rep of), 6.250%, 01/25/2031 | | | | | | | 430,000 | | | $ | 417,638 | | | | 0.09 | |
Oman (Rep of), 6.500%, 03/08/2047 | | | | | | | 1,586,000 | | | | 1,375,855 | | | | 0.30 | |
Oman (Rep of), 6.750%, 01/17/2048 | | | | | | | 1,424,000 | | | | 1,269,140 | | | | 0.28 | |
Oman (Rep of), 7.000%, 01/25/2051 | | | | | | | 830,000 | | | | 761,525 | | | | 0.17 | |
| | | | | | | | | | | 8,042,388 | | | | 1.78 | |
| | | | |
Pakistan (Cost $6,769,488) | | | | | | | | | | | | | | | | |
Pakistan (Rep of), 8.250%, 04/15/2024 | | | | | | | 1,491,000 | | | | 1,330,837 | | | | 0.29 | |
Pakistan (Rep of), 8.250%, 09/30/2025 | | | | | | | 794,000 | | | | 556,483 | | | | 0.12 | |
Pakistan (Rep of), 6.875%, 12/05/2027 | | | | | | | 1,267,000 | | | | 661,627 | | | | 0.15 | |
Pakistan (Rep of), 7.375%, 04/08/2031 | | | | | | | 2,302,000 | | | | 1,116,976 | | | | 0.25 | |
Pakistan (Rep of), 8.875%, 04/08/2051 | | | | | | | 2,157,000 | | | | 1,036,288 | | | | 0.23 | |
Pakistan Water & Power Development Authority, 7.500%, 06/04/2031 | | | | | | | 761,000 | | | | 322,382 | | | | 0.07 | |
| | | | | | | | | | | 5,024,593 | | | | 1.11 | |
| | | | |
Panama (Cost $4,374,024) | | | | | | | | | | | | | | | | |
Panama (Rep of), 3.875%, 03/17/2028 | | | | | | | 266,000 | | | | 238,336 | | | | 0.05 | |
Panama (Rep of), 9.375%, 04/01/2029 | | | | | | | 800,000 | | | | 883,200 | | | | 0.19 | |
Panama (Rep of), 6.700%, 01/26/2036 | | | | | | | 1,100,000 | | | | 1,023,550 | | | | 0.23 | |
Panama (Rep of), 4.500%, 05/15/2047 | | | | | | | 460,000 | | | | 295,550 | | | | 0.07 | |
Panama (Rep of), 4.300%, 04/29/2053 | | | | | | | 1,081,000 | | | | 643,735 | | | | 0.14 | |
| | | | | | | | | | | 3,084,371 | | | | 0.68 | |
| | | | |
Paraguay (Cost $1,976,827) | | | | | | | | | | | | | | | | |
Paraguay (Rep of), 4.700%, 03/27/2027 | | | | | | | 446,000 | | | | 424,146 | | | | 0.09 | |
Paraguay (Rep of), 5.850%, 08/21/2033 | | | | | | | 835,000 | | | | 768,200 | | | | 0.17 | |
Paraguay (Rep of), 5.400%, 03/30/2050 | | | | | | | 690,000 | | | | 515,775 | | | | 0.12 | |
| | | | | | | | | | | 1,708,121 | | | | 0.38 | |
| | | | |
Peru (Cost $16,136,039) | | | | | | | | | | | | | | | | |
Peru (Rep of), 7.350%, 07/21/2025 | | | | | | | 723,000 | | | | 738,776 | | | | 0.16 | |
Peru (Rep of), 5.940%, 02/12/2029 | | | PEN | | | | 5,105,000 | | | | 1,272,584 | | | | 0.28 | |
Peru (Rep of), 6.150%, 08/12/2032 | | | PEN | | | | 7,922,000 | | | | 1,883,646 | | | | 0.42 | |
Peru (Rep of), 7.300%, 08/12/20334 | | | PEN | | | | 5,844,000 | | | | 1,490,434 | | | | 0.33 | |
Peru (Rep of), 8.750%, 11/21/2033 | | | | | | | 1,897,000 | | | | 2,212,206 | | | | 0.49 | |
Peru (Rep of), 5.400%, 08/12/2034 | | | PEN | | | | 6,591,000 | | | | 1,434,649 | | | | 0.32 | |
Peru (Rep of), 3.300%, 03/11/2041 | | | | | | | 810,000 | | | | 535,005 | | | | 0.12 | |
Peru (Rep of), 5.625%, 11/18/2050 | | | | | | | 739,000 | | | | 651,059 | | | | 0.14 | |
Peru (Rep of), 2.780%, 12/01/2060 | | | | | | | 1,334,000 | | | | 667,667 | | | | 0.15 | |
Peru (Rep of), 3.230%, 07/28/2121 | | | | | | | 584,000 | | | | 292,876 | | | | 0.06 | |
Petroleos del Peru S.A., 5.625%, 06/19/2047 | | | | | | | 2,939,000 | | | | 1,603,048 | | | | 0.35 | |
| | | | | | | | | | | 12,781,950 | | | | 2.82 | |
| | | | |
Philippines (Cost $7,840,370) | | | | | | | | | | | | | | | | |
Philippines (Rep of), 10.625%, 03/16/2025 | | | | | | | 588,000 | | | | 626,649 | | | | 0.14 | |
Philippines (Rep of), 9.500%, 02/02/2030 | | | | | | | 820,000 | | | | 972,028 | | | | 0.21 | |
Philippines (Rep of), 7.750%, 01/14/2031 | | | | | | | 903,000 | | | | 1,004,732 | | | | 0.22 | |
See accompanying notes to the financial statements.
82
ASHMORE EMERGING MARKETS TOTAL RETURN FUND
SCHEDULE OF INVESTMENTS (CONTINUED)
As of October 31, 2023
| | | | | | | | | | | | | | | | |
| | | Currency1 | | | Par | | | Value | | | % of Net
Assets | |
Philippines (continued) | | | | | | | | | | | | | | | | |
Philippines (Rep of), 5.000%, 07/17/2033 | | | | | | | 274,000 | | | $ | 257,560 | | | | 0.06 | |
Philippines (Rep of), 6.375%, 10/23/2034 | | | | | | | 991,000 | | | | 1,017,222 | | | | 0.22 | |
Philippines (Rep of), 6.250%, 01/14/2036 | | | PHP | | | | 12,000,000 | | | | 198,802 | | | | 0.04 | |
Philippines (Rep of), 3.950%, 01/20/2040 | | | | | | | 2,087,000 | | | | 1,594,113 | | | | 0.35 | |
Philippines (Rep of), 2.950%, 05/05/2045 | | | | | | | 784,000 | | | | 480,341 | | | | 0.11 | |
Philippines (Rep of), 4.200%, 03/29/2047 | | | | | | | 216,000 | | | | 160,458 | | | | 0.04 | |
| | | | | | | | | | | 6,311,905 | | | | 1.39 | |
| | | | |
Poland (Cost $11,414,586) | | | | | | | | | | | | | | | | |
Bank Gospodarstwa Krajowego, 6.250%, 10/31/20284 | | | | | | | 305,000 | | | | 308,431 | | | | 0.07 | |
Bank Gospodarstwa Krajowego, 5.375%, 05/22/2033 | | | | | | | 444,000 | | | | 412,920 | | | | 0.09 | |
Poland (Rep of), 2.500%, 04/25/2024 | | | PLN | | | | 6,737,000 | | | | 1,579,977 | | | | 0.35 | |
Poland (Rep of), 2.500%, 07/25/2026 | | | PLN | | | | 1,468,000 | | | | 325,786 | | | | 0.07 | |
Poland (Rep of), 0.250%, 10/25/2026 | | | PLN | | | | 1,469,000 | | | | 302,965 | | | | 0.07 | |
Poland (Rep of), 3.750%, 05/25/2027 | | | PLN | | | | 10,121,000 | | | | 2,294,210 | | | | 0.51 | |
Poland (Rep of), 2.500%, 07/25/2027 | | | PLN | | | | 1,529,000 | | | | 331,138 | | | | 0.07 | |
Poland (Rep of), 5.500%, 11/16/2027 | | | | | | | 723,000 | | | | 725,943 | | | | 0.16 | |
Poland (Rep of), 2.750%, 04/25/2028 | | | PLN | | | | 5,360,000 | | | | 1,150,032 | | | | 0.25 | |
Poland (Rep of), 7.500%, 07/25/2028 | | | PLN | | | | 8,521,000 | | | | 2,203,498 | | | | 0.49 | |
Poland (Rep of), 1.250%, 10/25/2030 | | | PLN | | | | 3,286,000 | | | | 596,669 | | | | 0.13 | |
Poland (Rep of), 4.875%, 10/04/2033 | | | | | | | 1,018,000 | | | | 941,518 | | | | 0.21 | |
Poland (Rep of), 5.500%, 04/04/2053 | | | | | | | 465,000 | | | | 408,489 | | | | 0.09 | |
| | | | | | | | | | | 11,581,576 | | | | 2.56 | |
| | | | |
Qatar (Cost $8,379,866) | | | | | | | | | | | | | | | | |
Qatar (Rep of), 3.250%, 06/02/2026 | | | | | | | 1,637,000 | | | | 1,550,665 | | | | 0.34 | |
Qatar (Rep of), 4.817%, 03/14/2049 | | | | | | | 2,792,000 | | | | 2,281,587 | | | | 0.51 | |
Qatar (Rep of), 4.400%, 04/16/2050 | | | | | | | 530,000 | | | | 408,431 | | | | 0.09 | |
QatarEnergy, 3.125%, 07/12/2041 | | | | | | | 2,962,000 | | | | 1,943,813 | | | | 0.43 | |
| | | | | | | | | | | 6,184,496 | | | | 1.37 | |
| | | | |
Romania (Cost $14,428,810) | | | | | | | | | | | | | | | | |
Romania (Rep of), 3.000%, 02/27/2027 | | | | | | | 444,000 | | | | 401,651 | | | | 0.09 | |
Romania (Rep of), 5.800%, 07/26/2027 | | | RON | | | | 9,470,000 | | | | 1,967,114 | | | | 0.43 | |
Romania (Rep of), 4.150%, 01/26/2028 | | | RON | | | | 5,100,000 | | | | 986,058 | | | | 0.22 | |
Romania (Rep of), 8.000%, 04/29/2030 | | | RON | | | | 4,905,000 | | | | 1,098,955 | | | | 0.24 | |
Romania (Rep of), 4.150%, 10/24/2030 | | | RON | | | | 6,155,000 | | | | 1,119,307 | | | | 0.25 | |
Romania (Rep of), 3.000%, 02/14/2031 | | | | | | | 354,000 | | | | 279,660 | | | | 0.06 | |
Romania (Rep of), 3.625%, 03/27/2032 | | | | | | | 1,798,000 | | | | 1,419,557 | | | | 0.31 | |
Romania (Rep of), 8.250%, 09/29/2032 | | | RON | | | | 12,855,000 | | | | 2,953,820 | | | | 0.65 | |
Romania (Rep of), 7.125%, 01/17/2033 | | | | | | | 434,000 | | | | 430,551 | | | | 0.10 | |
Romania (Rep of), 6.125%, 01/22/2044 | | | | | | | 294,000 | | | | 252,928 | | | | 0.06 | |
Romania (Rep of), 4.000%, 02/14/2051 | | | | | | | 2,298,000 | | | | 1,403,934 | | | | 0.31 | |
| | | | | | | | | | | 12,313,535 | | | | 2.72 | |
| | | | |
Saudi Arabia (Cost $13,146,277) | | | | | | | | | | | | | | | | |
Gaci First Investment Co., 5.000%, 10/13/2027 | | | | | | | 710,000 | | | | 688,478 | | | | 0.15 | |
See accompanying notes to the financial statements.
83
ASHMORE EMERGING MARKETS TOTAL RETURN FUND
SCHEDULE OF INVESTMENTS (CONTINUED)
As of October 31, 2023
| | | | | | | | | | | | | | | | |
| | | Currency1 | | | Par | | | Value | | | % of Net
Assets | |
Saudi Arabia (continued) | | | | | | | | | | | | | | | | |
Gaci First Investment Co., 5.250%, 10/13/2032 | | | | | | | 1,217,000 | | | $ | 1,154,629 | | | | 0.26 | |
Gaci First Investment Co., 5.125%, 02/14/2053 | | | | | | | 1,160,000 | | | | 894,650 | | | | 0.20 | |
Saudi (Rep of), 4.750%, 01/18/2028 | | | | | | | 1,032,000 | | | | 998,460 | | | | 0.22 | |
Saudi (Rep of), 4.625%, 10/04/2047 | | | | | | | 808,000 | | | | 608,020 | | | | 0.13 | |
Saudi (Rep of), 5.000%, 04/17/2049 | | | | | | | 1,903,000 | | | | 1,510,506 | | | | 0.33 | |
Saudi (Rep of), 5.250%, 01/16/2050 | | | | | | | 1,310,000 | | | | 1,077,475 | | | | 0.24 | |
Saudi (Rep of), 3.750%, 01/21/2055 | | | | | | | 1,457,000 | | | | 917,910 | | | | 0.20 | |
Saudi (Rep of), 4.500%, 04/22/2060 | | | | | | | 1,128,000 | | | | 814,980 | | | | 0.18 | |
Saudi (Rep of), 3.450%, 02/02/2061 | | | | | | | 2,242,000 | | | | 1,300,360 | | | | 0.29 | |
| | | | | | | | | | | 9,965,468 | | | | 2.20 | |
| | | | |
South Africa (Cost $20,799,907) | | | | | | | | | | | | | | | | |
South Africa (Rep of), 10.500%, 12/21/2026 | | | ZAR | | | | 64,454,965 | | | | 3,562,626 | | | | 0.79 | |
South Africa (Rep of), 4.300%, 10/12/2028 | | | | | | | 2,754,000 | | | | 2,368,440 | | | | 0.52 | |
South Africa (Rep of), 8.000%, 01/31/2030 | | | ZAR | | | | 78,585,521 | | | | 3,709,522 | | | | 0.82 | |
South Africa (Rep of), 8.250%, 03/31/2032 | | | ZAR | | | | 10,672,931 | | | | 470,752 | | | | 0.11 | |
South Africa (Rep of), 5.875%, 04/20/2032 | | | | | | | 1,509,000 | | | | 1,273,219 | | | | 0.28 | |
South Africa (Rep of), 8.875%, 02/28/2035 | | | ZAR | | | | 36,310,362 | | | | 1,549,936 | | | | 0.34 | |
South Africa (Rep of), 8.500%, 01/31/2037 | | | ZAR | | | | 35,823,288 | | | | 1,419,827 | | | | 0.31 | |
South Africa (Rep of), 9.000%, 01/31/2040 | | | ZAR | | | | 24,388,389 | | | | 970,548 | | | | 0.22 | |
South Africa (Rep of), 8.750%, 01/31/2044 | | | ZAR | | | | 14,396,066 | | | | 544,187 | | | | 0.12 | |
South Africa (Rep of), 5.000%, 10/12/2046 | | | | | | | 467,000 | | | | 282,535 | | | | 0.06 | |
South Africa (Rep of), 5.650%, 09/27/2047 | | | | | | | 955,000 | | | | 620,750 | | | | 0.14 | |
South Africa (Rep of), 8.750%, 02/28/2048 | | | ZAR | | | | 14,337,218 | | | | 537,892 | | | | 0.12 | |
South Africa (Rep of), 5.750%, 09/30/2049 | | | | | | | 1,338,000 | | | | 869,700 | | | | 0.19 | |
| | | | | | | | | | | 18,179,934 | | | | 4.02 | |
| | | | |
South Korea (Cost $5,678,677) | | | | | | | | | | | | | | | | |
Korea (Rep of), 4.250%, 12/10/2032 | | | KRW | | | | 7,054,930,000 | | | | 5,179,895 | | | | 1.14 | |
| | | | | | | | | | | 5,179,895 | | | | 1.14 | |
| | | | |
Thailand (Cost $8,318,116) | | | | | | | | | | | | | | | | |
Thailand (Rep of), 2.350%, 06/17/2026 | | | THB | | | | 88,425,000 | | | | 2,431,814 | | | | 0.54 | |
Thailand (Rep of), 2.650%, 06/17/2028 | | | THB | | | | 23,434,000 | | | | 641,815 | | | | 0.14 | |
Thailand (Rep of), 2.000%, 12/17/2031 | | | THB | | | | 24,345,000 | | | | 617,036 | | | | 0.14 | |
Thailand (Rep of), 1.585%, 12/17/2035 | | | THB | | | | 19,716,000 | | | | 447,232 | | | | 0.10 | |
Thailand (Rep of), 3.400%, 06/17/2036 | | | THB | | | | 17,483,000 | | | | 478,215 | | | | 0.11 | |
Thailand (Rep of), 3.300%, 06/17/2038 | | | THB | | | | 27,502,000 | | | | 734,797 | | | | 0.16 | |
Thailand (Rep of), 2.000%, 06/17/2042 | | | THB | | | | 44,923,000 | | | | 963,740 | | | | 0.21 | |
Thailand (Rep of), 2.875%, 06/17/2046 | | | THB | | | | 4,854,000 | | | | 114,756 | | | | 0.02 | |
Thailand (Rep of), 3.600%, 06/17/2067 | | | THB | | | | 18,378,000 | | | | 470,079 | | | | 0.10 | |
| | | | | | | | | | | 6,899,484 | | | | 1.52 | |
| | | | |
Tunisia (Cost $969,432) | | | | | | | | | | | | | | | | |
Tunisia (Rep of), 6.375%, 07/15/2026 | | | EUR | | | | 1,481,000 | | | | 944,145 | | | | 0.21 | |
| | | | | | | | | | | 944,145 | | | | 0.21 | |
See accompanying notes to the financial statements.
84
ASHMORE EMERGING MARKETS TOTAL RETURN FUND
SCHEDULE OF INVESTMENTS (CONTINUED)
As of October 31, 2023
| | | | | | | | | | | | | | | | |
| | | Currency1 | | | Par | | | Value | | | % of Net
Assets | |
Turkey (Cost $5,253,205) | | | | | | | | | | | | | | | | |
Turkey (Rep of), 6.000%, 01/14/2041 | | | | | | | 465,000 | | | $ | 330,150 | | | | 0.07 | |
Turkey (Rep of), 4.875%, 04/16/2043 | | | | | | | 2,888,000 | | | | 1,750,850 | | | | 0.39 | |
Turkey (Rep of), 5.750%, 05/11/2047 | | | | | | | 3,236,000 | | | | 2,107,445 | | | | 0.47 | |
Turkiye Ihracat Kredi Bankasi A.S., 9.000%, 01/28/20274 | | | | | | | 586,000 | | | | 587,465 | | | | 0.13 | |
| | | | | | | | | | | 4,775,910 | | | | 1.06 | |
| | | | |
Ukraine (Cost $1,626,014) | | | | | | | | | | | | | | | | |
Ukraine (Rep of), 9.750%, 11/01/20308 | | | | | | | 1,005,000 | | | | 291,450 | | | | 0.06 | |
Ukraine (Rep of), 6.876%, 05/21/20318 | | | | | | | 1,268,000 | | | | 312,562 | | | | 0.07 | |
| | | | | | | | | | | 604,012 | | | | 0.13 | |
| | | | |
United Arab Emirates (Cost $5,859,787) | | | | | | | | | | | | | | | | |
Abu Dhabi (Gov’t of), 3.125%, 09/30/2049 | | | | | | | 2,175,000 | | | | 1,330,828 | | | | 0.29 | |
DP World Crescent Ltd., 3.875%, 07/18/2029 | | | | | | | 641,000 | | | | 568,086 | | | | 0.13 | |
DP World Crescent Ltd., 3.750%, 01/30/2030 | | | | | | | 804,000 | | | | 702,746 | | | | 0.16 | |
DP World Crescent Ltd., 5.500%, 09/13/2033 | | | | | | | 1,739,000 | | | | 1,637,269 | | | | 0.36 | |
DP World Ltd., 5.625%, 09/25/2048 | | | | | | | 843,000 | | | | 691,429 | | | | 0.15 | |
| | | | | | | | | | | 4,930,358 | | | | 1.09 | |
| | | | |
United States (Cost $6,581,354) | | | | | | | | | | | | | | | | |
U.S. Treasury Bill, 5.231%, 01/16/202411 | | | | | | | 6,655,700 | | | | 6,581,110 | | | | 1.45 | |
| | | | | | | | | | | 6,581,110 | | | | 1.45 | |
| | | | |
Uruguay (Cost $9,374,180) | | | | | | | | | | | | | | | | |
Uruguay (Rep of), 4.375%, (Inflation Index), 12/15/2028 | | | UYU | | | | 22,439,733 | | | | 578,887 | | | | 0.13 | |
Uruguay (Rep of), 8.250%, 05/21/2031 | | | UYU | | | | 43,056,886 | | | | 982,085 | | | | 0.22 | |
Uruguay (Rep of), 7.875%, (100% Cash), 01/15/20335 | | | | | | | 1,177,380 | | | | 1,344,568 | | | | 0.30 | |
Uruguay (Rep of), 9.750%, 07/20/2033 | | | UYU | | | | 485,717 | | | | 12,036 | | | | — | |
Uruguay (Rep of), 5.750%, 10/28/2034 | | | | | | | 1,293,750 | | | | 1,291,809 | | | | 0.28 | |
Uruguay (Rep of), 7.625%, 03/21/2036 | | | | | | | 853,660 | | | | 964,209 | | | | 0.21 | |
Uruguay (Rep of), 4.125%, 11/20/2045 | | | | | | | 719,435 | | | | 568,354 | | | | 0.12 | |
Uruguay (Rep of), 5.100%, 06/18/2050 | | | | | | | 722,744 | | | | 623,005 | | | | 0.14 | |
Uruguay (Rep of), 4.975%, 04/20/2055 | | | | | | | 1,673,300 | | | | 1,393,859 | | | | 0.31 | |
| | | | | | | | | | | 7,758,812 | | | | 1.71 | |
| | | | |
Venezuela (Cost $54,755,630) | | | | | | | | | | | | | | | | |
Petroleos de Venezuela S.A., 8.500%, 10/27/20208,9 | | | | | | | 28,100,000 | | | | 23,604,000 | | | | 5.21 | |
Petroleos de Venezuela S.A., 9.000%, 11/17/20218,9 | | | | | | | 3,789,076 | | | | 483,107 | | | | 0.11 | |
Petroleos de Venezuela S.A., 12.750%, 02/17/20228,9 | | | | | | | 1,695,000 | | | | 258,488 | | | | 0.06 | |
Petroleos de Venezuela S.A., 5.375%, 04/12/20278 | | | | | | | 1,590,000 | | | | 211,470 | | | | 0.05 | |
Petroleos de Venezuela S.A., 9.750%, 05/17/20358 | | | | | | | 5,253,147 | | | | 735,441 | | | | 0.16 | |
Venezuela (Rep of), 7.750%, 10/13/20198,9 | | | | | | | 1,638,000 | | | | 221,130 | | | | 0.05 | |
Venezuela (Rep of), 12.750%, 08/23/20228,9 | | | | | | | 3,246,000 | | | | 572,919 | | | | 0.13 | |
Venezuela (Rep of), 9.000%, 05/07/20238,9 | | | | | | | 1,407,000 | | | | 235,673 | | | | 0.05 | |
Venezuela (Rep of), 8.250%, 10/13/20248 | | | | | | | 3,213,200 | | | | 530,178 | | | | 0.12 | |
Venezuela (Rep of), 11.750%, 10/21/20268 | | | | | | | 20,397,000 | | | | 3,875,430 | | | | 0.85 | |
Venezuela (Rep of), 9.250%, 09/15/20278 | | | | | | | 13,541,000 | | | | 2,538,937 | | | | 0.56 | |
See accompanying notes to the financial statements.
85
ASHMORE EMERGING MARKETS TOTAL RETURN FUND
SCHEDULE OF INVESTMENTS (CONTINUED)
As of October 31, 2023
| | | | | | | | | | | | | | | | |
| | | Currency1 | | | Par | | | Value | | | % of Net
Assets | |
Venezuela (continued) | | | | | | | | | | | | | | | | |
Venezuela (Rep of), 9.250%, 05/07/20288 | | | | | | | 2,317,000 | | | $ | 401,999 | | | | 0.09 | |
Venezuela (Rep of), 11.950%, 08/05/20318 | | | | | | | 28,899,800 | | | | 5,418,712 | | | | 1.20 | |
| | | | | | | | | | | 39,087,484 | | | | 8.64 | |
| | | | |
Vietnam (Cost $1,250,588) | | | | | | | | | | | | | | | | |
Vietnam (Rep of), 4.800%, 11/19/2024 | | | | | | | 1,241,000 | | | | 1,214,592 | | | | 0.27 | |
| | | | | | | | | | | 1,214,592 | | | | 0.27 | |
| | | | |
Zambia (Cost $769,559) | | | | | | | | | | | | | | | | |
Zambia (Rep of), 8.970%, 07/30/20278 | | | | | | | 1,139,000 | | | | 690,875 | | | | 0.15 | |
| | | | | | | | | | | 690,875 | | | | 0.15 | |
| | | | |
Total Debt Securities (Cost $589,120,836) | | | | | | | | | | | 416,497,479 | | | | 92.02 | |
| | | | |
Short-Term Investments | | | | | | | | | | | | | | | | |
| | | | |
Canada (Cost $20,000,000) | | | | | | | | | | | | | | | | |
Canadian Imperial Bank of Commerce, Time Deposit, 5.310% | | | | | | | 20,000,000 | | | | 20,000,000 | | | | 4.42 | |
| | | | | | | | | | | 20,000,000 | | | | 4.42 | |
| | | | |
United States (Cost $5,000,000) | | | | | | | | | | | | | | | | |
Societe Generale, New York Branch, Time Deposit, 5.270% | | | | | | | 5,000,000 | | | | 5,000,000 | | | | 1.11 | |
| | | | | | | | | | | 5,000,000 | | | | 1.11 | |
| | | | |
Total Short-Term Investments (Cost $25,000,000) | | | | | | | | | | | 25,000,000 | | | | 5.53 | |
| | | | |
Total Investments (Total Cost $614,120,836) | | | | | | | | | | | 441,497,479 | | | | 97.55 | |
| | | | |
Other Assets Less Liabilities (See Statements of Assets and Liabilities for further detail) | | | | | | | | | | | 11,102,953 | | | | 2.45 | |
| | | | |
Net Assets | | | | | | | | | | $ | 452,600,432 | | | | 100.00 | |
| 1 | Local currency is United States Dollars unless otherwise noted below. |
| 2 | Step coupon bond. Rate as of October 31, 2023 is disclosed. |
| 4 | Securities exempt from registration under Rule 144A of the Securities Act of 1933. These securities may not be publicly traded without registration under the Securities Act of 1933. |
| 5 | Security is a payment-in-kind bond, and unless otherwise noted in the description of the security, pays its entire coupon on an in-kind basis. |
| 6 | Restricted security that has been deemed illiquid. At October 31, 2023 the value of these restricted illiquid securities amount to $2,282,523 or 0.50% of net assets. Additional information on each restricted illiquid security is as follows: |
| | | | | | |
| SECURITY | | ACQUISITION DATE | | ACQUISITION COST | |
| |
Oi S.A., 14.000%, 09/07/2024 | | 4/21/23-10/19/23 | | $ | 2,269,529 | |
Oi S.A., 14.000%, 09/07/2024 | | 10/4/23-10/24/23 | | | 122 | |
| |
| 7 | Security is a Level 3 investment. |
| 8 | Issuer has defaulted on terms of debt obligation. |
| 9 | Maturity has been extended under the terms of a plan of reorganization. |
| 10 | Security has been deemed worthless and is a Level 3 investment. |
| 11 | Zero coupon bond – interest rate reflects effective yield on the date of purchase. |
See accompanying notes to the financial statements.
86
ASHMORE EMERGING MARKETS TOTAL RETURN FUND
SCHEDULE OF INVESTMENTS (CONTINUED)
As of October 31, 2023
Percentages shown are based on net assets.
At October 31, 2023, the Ashmore Emerging Markets Total Return Fund had outstanding forward foreign currency exchange contracts as follows:
| | | | | | | | | | | | | | | | | | |
Settlement Date | | Counterparty | | Currency Buy | | Currency Buy Amount (Local Currency) | | | Currency Sell | | Currency Sell Amount
(Local Currency) | | | Unrealized
Gain/(Loss) | |
| |
| | | | | | |
| 11/03/2023 | | Citibank | | Brazilian Real | | | 13,520,780 | | | United States Dollar | | | 2,660,000 | | | $ | 20,751 | |
| | | | | | |
| 11/03/2023 | | HSBC Bank | | United States Dollar | | | 9,796,455 | | | Brazilian Real | | | 48,814,267 | | | | 118,101 | |
| | | | | | |
| 11/10/2023 | | State Street | | United States Dollar | | | 312,690 | | | Indian Rupee | | | 26,009,929 | | | | 399 | |
| | | | | | |
| 11/10/2023 | | HSBC Bank | | United States Dollar | | | 2,150,000 | | | Indonesian Rupiah | | | 34,131,250,000 | | | | 3,725 | |
| | | | | | |
| 11/10/2023 | | State Street | | United States Dollar | | | 418,770 | | | Indonesian Rupiah | | | 6,650,869,545 | | | | 543 | |
| | | | | | |
| 11/10/2023 | | Morgan Stanley | | United States Dollar | | | 2,767,000 | | | Korean Won | | | 3,734,814,974 | | | | 1,616 | |
| | | | | | |
| 11/10/2023 | | BNP Paribas | | United States Dollar | | | 2,660,665 | | | Singapore Dollar | | | 3,639,523 | | | | 1,182 | |
| | | | | | |
| 11/20/2023 | | BNP Paribas | | United States Dollar | | | 340,630 | | | Chinese Offshore Yuan | | | 2,475,304 | | | | 2,987 | |
| | | | | | |
| 11/20/2023 | | Merrill Lynch | | United States Dollar | | | 457,420 | | | Chinese Offshore Yuan | | | 3,349,085 | | | | 589 | |
| | | | | | |
| 11/20/2023 | | Morgan Stanley | | United States Dollar | | | 274,000 | | | Chinese Offshore Yuan | | | 2,005,859 | | | | 391 | |
| | | | | | |
| 11/22/2023 | | HSBC Bank | | United States Dollar | | | 5,520,053 | | | Euro | | | 5,205,949 | | | | 6,465 | |
| | | | | | |
| 11/24/2023 | | Morgan Stanley | | United States Dollar | | | 1,379,538 | | | Korean Won | | | 1,862,790,148 | | | | 280 | |
| | | | | | |
| 11/30/2023 | | BNP Paribas | | Thai Baht | | | 24,262,000 | | | United States Dollar | | | 669,536 | | | | 7,294 | |
| | | | | | |
| 11/30/2023 | | HSBC Bank | | Thai Baht | | | 18,081,620 | | | United States Dollar | | | 498,935 | | | | 5,483 | |
| | | | | | |
| 11/30/2023 | | Morgan Stanley | | Thai Baht | | | 219,770,094 | | | United States Dollar | | | 6,091,189 | | | | 39,677 | |
| | | | | | |
| 11/30/2023 | | HSBC Bank | | United States Dollar | | | 1,358,602 | | | Malaysian Ringgit | | | 6,374,790 | | | | 17,896 | |
| | | | | | |
| 11/30/2023 | | JP Morgan | | United States Dollar | | | 263,330 | | | Philippine Peso | | | 14,952,667 | | | | 56 | |
| | | | | | |
| 12/04/2023 | | Morgan Stanley | | United States Dollar | | | 9,676,639 | | | Brazilian Real | | | 48,486,250 | | | | 99,999 | |
| | | | | | |
| 12/08/2023 | | Merrill Lynch | | United States Dollar | | | 429,190 | | | Taiwan Dollar | | | 13,866,356 | | | | 1,085 | |
| | | | | | |
| 12/11/2023 | | Merrill Lynch | | United States Dollar | | | 179,000 | | | Indian Rupee | | | 14,916,249 | | | | 101 | |
| | | | | | |
| 12/11/2023 | | BNP Paribas | | United States Dollar | | | 925,586 | | | Indonesian Rupiah | | | 14,137,404,917 | | | | 38,690 | |
| | | | | | |
| 12/11/2023 | | JP Morgan | | United States Dollar | | | 87,585 | | | Indonesian Rupiah | | | 1,371,663,078 | | | | 1,535 | |
| | | | | | |
| 12/11/2023 | | State Street | | United States Dollar | | | 213,000 | | | Singapore Dollar | | | 290,289 | | | | 580 | |
| | | | | | |
| 12/13/2023 | | HSBC Bank | | Egyptian Pound | | | 1,870,816 | | | United States Dollar | | | 58,136 | | | | 700 | |
| | | | | | |
| 01/12/2024 | | HSBC Bank | | Korean Won | | | 1,164,366,820 | | | United States Dollar | | | 864,319 | | | | 78 | |
| | | | | | |
| 01/12/2024 | | HSBC Bank | | United States Dollar | | | 1,725,774 | | | Indonesian Rupiah | | | 26,766,758,284 | | | | 47,525 | |
| | | | | | |
| 01/12/2024 | | Barclays | | United States Dollar | | | 1,324,902 | | | Korean Won | | | 1,779,329,647 | | | | 3,972 | |
| | | | | | |
| 01/12/2024 | | State Street | | United States Dollar | | | 312,000 | | | Korean Won | | | 418,794,480 | | | | 1,097 | |
| | | | | | |
| 01/16/2024 | | HSBC Bank | | United States Dollar | | | 55,845 | | | Egyptian Pound | | | 1,870,816 | | | | 1,938 | |
| | | | | | |
| 01/31/2024 | | Merrill Lynch | | Chilean Peso | | | 3,693,999,021 | | | United States Dollar | | | 3,874,756 | | | | 228,926 | |
| | | | | | |
| 01/31/2024 | | Morgan Stanley | | Czech Koruna | | | 73,354,351 | | | United States Dollar | | | 3,134,298 | | | | 19,144 | |
| | | | | | |
| 01/31/2024 | | BNP Paribas | | Hungarian Forint | | | 1,754,027,136 | | | United States Dollar | | | 4,740,303 | | | | 47,895 | |
| | | | | | |
| 01/31/2024 | | JP Morgan | | Israeli Shekel | | | 6,202,106 | | | United States Dollar | | | 1,536,575 | | | | 7,087 | |
| | | | | | |
| 01/31/2024 | | Merrill Lynch | | Mexican Peso | | | 110,894,370 | | | United States Dollar | | | 5,965,751 | | | | 86,006 | |
| | | | | | |
| 01/31/2024 | | Morgan Stanley | | South African Rand | | | 27,748,516 | | | United States Dollar | | | 1,430,456 | | | | 46,244 | |
| | | | | | |
| 01/31/2024 | | Morgan Stanley | | Turkish Lira | | | 35,157,353 | | | United States Dollar | | | 1,133,455 | | | | 15,155 | |
| | | | | | |
| 01/31/2024 | | Morgan Stanley | | United States Dollar | | | 233,000 | | | Czech Koruna | | | 5,387,158 | | | | 1,411 | |
| | | | | | |
| 01/31/2024 | | Citibank | | United States Dollar | | | 1,170,000 | | | Hungarian Forint | | | 426,219,300 | | | | 6,493 | |
| | | | | | |
| 01/31/2024 | | HSBC Bank | | United States Dollar | | | 1,170,000 | | | Hungarian Forint | | | 428,139,270 | | | | 1,252 | |
See accompanying notes to the financial statements.
87
ASHMORE EMERGING MARKETS TOTAL RETURN FUND
SCHEDULE OF INVESTMENTS (CONTINUED)
As of October 31, 2023
| | | | | | | | | | | | | | | | | | |
Settlement Date | | Counterparty | | Currency Buy | | Currency Buy Amount (Local Currency) | | | Currency Sell | | Currency Sell Amount
(Local Currency) | | | Unrealized
Gain/(Loss) | |
| |
| | | | | | |
| 01/31/2024 | | State Street | | United States Dollar | | | 139,000 | | | Hungarian Forint | | | 50,558,741 | | | $ | 983 | |
| | | | | | |
| 01/31/2024 | | BNP Paribas | | United States Dollar | | | 180,000 | | | Mexican Peso | | | 3,295,568 | | | | 153 | |
| | | | | | |
| 01/31/2024 | | Morgan Stanley | | United States Dollar | | | 180,000 | | | Mexican Peso | | | 3,296,312 | | | | 113 | |
| | | | | | |
| 01/31/2024 | | JP Morgan | | United States Dollar | | | 193,000 | | | Peruvian Nuevo Sol | | | 742,510 | | | | 419 | |
| | | | | | |
| 01/31/2024 | | Morgan Stanley | | United States Dollar | | | 303,000 | | | Polish Zloty | | | 1,267,740 | | | | 2,864 | |
| | | | | | |
| 01/31/2024 | | Citibank | | United States Dollar | | | 258,000 | | | Romanian Leu | | | 1,204,983 | | | | 1,569 | |
| | | | | | |
| 02/12/2024 | | HSBC Bank | | United States Dollar | | | 2,392,683 | | | Indian Rupee | | | 199,921,810 | | | | 1,876 | |
| | | | | | |
| 02/12/2024 | | HSBC Bank | | United States Dollar | | | 700,624 | | | Indonesian Rupiah | | | 11,146,576,000 | | | | 2,146 | |
| | | | | | |
| 03/25/2024 | | Citibank | | United States Dollar | | | 6,073,235 | | | Chinese Offshore Yuan | | | 43,994,106 | | | | 17,942 | |
| | | | | | | | | | | | | | | | | | |
| | | | | |
Subtotal Appreciation | | | | | | | | | | | | | | | 912,413 | |
| | | | | | | | | | | | | | | | | | |
| | | | | | |
| 11/03/2023 | | Morgan Stanley | | Brazilian Real | | | 48,486,250 | | | United States Dollar | | | 9,712,790 | | | | (99,471 | ) |
| | | | | | |
| 11/03/2023 | | Santander | | Brazilian Real | | | 2,310,000 | | | United States Dollar | | | 459,894 | | | | (1,892 | ) |
| | | | | | |
| 11/03/2023 | | Deutsche Bank | | United States Dollar | | | 3,041,230 | | | Brazilian Real | | | 15,502,762 | | | | (32,486 | ) |
| | | | | | |
| 11/10/2023 | | HSBC Bank | | Indian Rupee | | | 290,666,369 | | | United States Dollar | | | 3,495,247 | | | | (5,331 | ) |
| | | | | | |
| 11/10/2023 | | HSBC Bank | | Indonesian Rupiah | | | 18,470,200,000 | | | United States Dollar | | | 1,163,705 | | | | (2,243 | ) |
| | | | | | |
| 11/10/2023 | | Barclays | | Korean Won | | | 1,779,329,647 | | | United States Dollar | | | 1,319,977 | | | | (2,501 | ) |
| | | | | | |
| 11/10/2023 | | HSBC Bank | | Korean Won | | | 2,173,327,897 | | | United States Dollar | | | 1,638,035 | | | | (28,829 | ) |
| | | | | | |
| 11/10/2023 | | HSBC Bank | | Singapore Dollar | | | 3,840,868 | | | United States Dollar | | | 2,887,271 | | | | (80,661 | ) |
| | | | | | |
| 11/10/2023 | | Standard Chartered | | Singapore Dollar | | | 299,127 | | | United States Dollar | | | 221,260 | | | | (2,681 | ) |
| | | | | | |
| 11/10/2023 | | Deutsche Bank | | United States Dollar | | | 3,173,000 | | | Indian Rupee | | | 264,656,440 | | | | (4,626 | ) |
| | | | | | |
| 11/10/2023 | | Deutsche Bank | | United States Dollar | | | 161,150 | | | Korean Won | | | 217,842,570 | | | | (148 | ) |
| | | | | | |
| 11/10/2023 | | Morgan Stanley | | United States Dollar | | | 364,730 | | | Singapore Dollar | | | 500,471 | | | | (976 | ) |
| | | | | | |
| 11/15/2023 | | Citibank | | Thai Baht | | | 51,107,297 | | | United States Dollar | | | 1,466,999 | | | | (43,176 | ) |
| | | | | | |
| 11/15/2023 | | Standard Chartered | | Thai Baht | | | 57,299,000 | | | United States Dollar | | | 1,636,404 | | | | (40,084 | ) |
| | | | | | |
| 11/20/2023 | | BNP Paribas | | Chinese Offshore Yuan | | | 4,941,174 | | | United States Dollar | | | 682,150 | | | | (8,151 | ) |
| | | | | | |
| 11/20/2023 | | Citibank | | Chinese Offshore Yuan | | | 165,064,125 | | | United States Dollar | | | 23,181,861 | | | | (666,336 | ) |
| | | | | | |
| 11/24/2023 | | Deutsche Bank | | United States Dollar | | | 2,455,000 | | | Korean Won | | | 3,329,962,000 | | | | (10,590 | ) |
| | | | | | |
| 11/24/2023 | | HSBC Bank | | United States Dollar | | | 1,044,462 | | | Korean Won | | | 1,410,890,617 | | | | (198 | ) |
| | | | | | |
| 11/30/2023 | | BNP Paribas | | Malaysian Ringgit | | | 3,550,699 | | | United States Dollar | | | 768,350 | | | | (21,589 | ) |
| | | | | | |
| 11/30/2023 | | Merrill Lynch | | Philippine Peso | | | 124,524,759 | | | United States Dollar | | | 2,211,022 | | | | (18,492 | ) |
| | | | | | |
| 11/30/2023 | | Deutsche Bank | | Thai Baht | | | 56,611,000 | | | United States Dollar | | | 1,628,461 | | | | (49,199 | ) |
| | | | | | |
| 11/30/2023 | | UBS | | Thai Baht | | | 60,087,000 | | | United States Dollar | | | 1,734,904 | | | | (58,673 | ) |
| | | | | | |
| 11/30/2023 | | BNP Paribas | | United States Dollar | | | 161,430 | | | Malaysian Ringgit | �� | | 768,262 | | | | (146 | ) |
| | | | | | |
| 11/30/2023 | | Deutsche Bank | | United States Dollar | | | 3,331,220 | | | Thai Baht | | | 119,617,103 | | | | (5,706 | ) |
| | | | | | |
| 11/30/2023 | | Morgan Stanley | | United States Dollar | | | 478,000 | | | Thai Baht | | | 17,135,440 | | | | (23 | ) |
| | | | | | |
| 12/08/2023 | | Standard Chartered | | Taiwan Dollar | | | 276,464,610 | | | United States Dollar | | | 8,746,859 | | | | (211,395 | ) |
| | | | | | |
| 12/11/2023 | | HSBC Bank | | Indian Rupee | | | 303,674,000 | | | United States Dollar | | | 3,654,936 | | | | (12,799 | ) |
| | | | | | |
| 12/11/2023 | | Deutsche Bank | | Indonesian Rupiah | | | 768,957,000 | | | United States Dollar | | | 49,000 | | | | (760 | ) |
| | | | | | |
| 12/11/2023 | | BNP Paribas | | Korean Won | | | 15,872,755,581 | | | United States Dollar | | | 12,065,032 | | | | (305,288 | ) |
| | | | | | |
| 12/11/2023 | | HSBC Bank | | Singapore Dollar | | | 4,333,000 | | | United States Dollar | | | 3,218,212 | | | | (47,521 | ) |
| | | | | | |
| 12/11/2023 | | BNP Paribas | | United States Dollar | | | 63,868 | | | Indian Rupee | | | 5,328,914 | | | | (44 | ) |
| | | | | | |
| 12/11/2023 | | JP Morgan | | United States Dollar | | | 3,173,000 | | | Indian Rupee | | | 265,043,863 | | | | (5,823 | ) |
See accompanying notes to the financial statements.
88
ASHMORE EMERGING MARKETS TOTAL RETURN FUND
SCHEDULE OF INVESTMENTS (CONTINUED)
As of October 31, 2023
| | | | | | | | | | | | | | | | | | |
Settlement Date | | Counterparty | | Currency Buy | | Currency Buy Amount (Local Currency) | | | Currency Sell | | Currency Sell Amount
(Local Currency) | | | Unrealized
Gain/(Loss) | |
| |
| | | | | | |
| 01/12/2024 | | Deutsche Bank | | Indonesian Rupiah | | | 769,986,000 | | | United States Dollar | | | 49,000 | | | $ | (723 | ) |
| | | | | | |
| 01/12/2024 | | HSBC Bank | | Indonesian Rupiah | | | 15,289,950,000 | | | United States Dollar | | | 975,000 | | | | (16,335 | ) |
| | | | | | |
| 01/12/2024 | | JP Morgan | | Indonesian Rupiah | | | 16,863,268,000 | | | United States Dollar | | | 1,073,000 | | | | (15,690 | ) |
| | | | | | |
| 01/12/2024 | | BNP Paribas | | Singapore Dollar | | | 4,659,000 | | | United States Dollar | | | 3,436,429 | | | | (22,219 | ) |
| | | | | | |
| 01/16/2024 | | Morgan Stanley | | Egyptian Pound | | | 4,276,628 | | | United States Dollar | | | 127,356 | | | | (4,126 | ) |
| | | | | | |
| 01/31/2024 | | BNP Paribas | | Polish Zloty | | | 30,474,287 | | | United States Dollar | | | 7,227,055 | | | | (12,305 | ) |
| | | | | | |
| 01/31/2024 | | JP Morgan | | United States Dollar | | | 70,000 | | | Colombian Peso | | | 294,816,900 | | | | (66 | ) |
| | | | | | |
| 01/31/2024 | | Merrill Lynch | | United States Dollar | | | 2,965,618 | | | Colombian Peso | | | 12,810,305,572 | | | | (78,880 | ) |
| | | | | | |
| 01/31/2024 | | Barclays | | United States Dollar | | | 293,030 | | | Czech Koruna | | | 6,849,436 | | | | (1,421 | ) |
| | | | | | |
| 01/31/2024 | | Morgan Stanley | | United States Dollar | | | 2,574,988 | | | Peruvian Nuevo Sol | | | 10,027,776 | | | | (25,866 | ) |
| | | | | | |
| 01/31/2024 | | State Street | | United States Dollar | | | 344,350 | | | Polish Zloty | | | 1,458,127 | | | | (860 | ) |
| | | | | | |
| 01/31/2024 | | Citibank | | United States Dollar | | | 1,611,773 | | | Romanian Leu | | | 7,594,029 | | | | (4,303 | ) |
| | | | | | |
| 01/31/2024 | | Deutsche Bank | | United States Dollar | | | 410,000 | | | Romanian Leu | | | 1,931,191 | | | | (975 | ) |
| | | | | | |
| 01/31/2024 | | Barclays | | United States Dollar | | | 205,940 | | | South African Rand | | | 3,958,074 | | | | (4,698 | ) |
| | | | | | |
| 01/31/2024 | | Morgan Stanley | | United States Dollar | | | 2,327,986 | | | South African Rand | | | 44,739,591 | | | | (52,934 | ) |
| | | | | | |
| 01/31/2024 | | State Street | | United States Dollar | | | 148,000 | | | South African Rand | | | 2,793,633 | | | | (670 | ) |
| | | | | | |
| 02/09/2024 | | BNP Paribas | | Singapore Dollar | | | 3,639,523 | | | United States Dollar | | | 2,671,690 | | | | (857 | ) |
| | | | | | |
| 02/12/2024 | | Deutsche Bank | | Indian Rupee | | | 1,037,649,281 | | | United States Dollar | | | 12,447,937 | | | | (38,988 | ) |
| | | | | | | | | | | | | | | | | | |
| | | | | |
Subtotal Depreciation | | | | | | | | | | | | | | | (2,049,754 | ) |
| | | | | | | | | | | | | | | | | | |
| | | | | | |
| Total | | | | | | | | | | | | | | | | $ | (1,137,341 | ) |
| | | | | | | | | | | | | | | | | | |
At October 31, 2023, the Ashmore Emerging Markets Total Return Fund had the following centrally cleared interest rate swap contracts outstanding:
| | | | | | | | | | | | | | | | | | | | | | |
Pay Rate Index/ Pay Rate | | Receive Rate/ Receive Rate Index | | | | | Notional
Amount | | | Expiration
Date | | | Fair Value/
Unrealized
Appreciation
(Depreciation)** | | Variation
Margin
Receivable (Payable) | | Counterparty | |
| |
| | | | | | | |
5.430% (Pay Semiannually) | | CLP-CLICP 1 Day Rate
(Receive Semiannually) | | | CLP | | | | 848,900,000 | | | | 8/17/2033 | | | $50,021 | | $515 | | | HSBC Bank | |
| | | | | | | |
5.550% (Pay Semiannually) | | CLP-CLICP 1 Day Rate
(Receive Semiannually) | | | CLP | | | | 1,441,500,000 | | | | 8/22/2028 | | | 51,688 | | (23) | | | Merrill Lynch | |
| | | | | | | |
6.235% (Pay Semiannually) | | CLP-CLICP 1 Day Rate
(Receive Semiannually) | | | CLP | | | | 1,965,200,000 | | | | 10/25/2028 | | | (11,744) | | (1,424) | | | HSBC Bank | |
| | | | | | | |
CFETS China Fixing Repo Rates 7 Day (Pay Quarterly) | | 2.535% (Receive
Quarterly) | | | CNY | | | | 19,040,000 | | | | 9/16/2025 | | | 21,764 | | 222 | | | Merrill Lynch | |
| | | | | | | |
CZK-PRIBOR-P 6 Month Rate (Pay Semiannually) | | 5.049% (Receive
Annually) | | | CZK | | | | 73,631,586 | | | | 12/20/2025 | | | 16,791 | | 6,648 | | | BNP Paribas | |
| | | | | | | |
KWDCD 3 Month Rate (Pay Quarterly) | | 3.535% (Receive
Quarterly) | | | KRW | | | | 2,350,610,000 | | | | 7/19/2026 | | | (23,907) | | (337) | | | BNP Paribas | |
| | | | | | | |
KWDCD 3 Month Rate (Pay Quarterly) | | 3.540% (Receive
Quarterly) | | | KRW | | | | 2,376,280,000 | | | | 7/21/2026 | | | (23,902) | | (342) | | | BNP Paribas | |
| | | | | | | |
KWDCD 3 Month Rate (Pay Quarterly) | | 3.490% (Receive
Quarterly) | | | KRW | | | | 2,363,448,000 | | | | 7/20/2026 | | | (26,084) | | (340) | | | HSBC Bank | |
See accompanying notes to the financial statements.
89
ASHMORE EMERGING MARKETS TOTAL RETURN FUND
SCHEDULE OF INVESTMENTS (CONTINUED)
As of October 31, 2023
| | | | | | | | | | | | | | | | | | | | | | | | | | |
Pay Rate Index/ Pay Rate | | Receive Rate/ Receive Rate Index | | | | | Notional
Amount | | | Expiration
Date | | | Fair Value/
Unrealized
Appreciation
(Depreciation)** | | | Variation
Margin
Receivable (Payable) | | | Counterparty | |
| |
| | | | | | | |
KWDCD 3 Month Rate (Pay Quarterly) | | 3.565% (Receive
Quarterly) | | | KRW | | | | 2,389,120,000 | | | | 7/25/2026 | | | | $(22,992) | | | | $(347) | | | | BNP Paribas | |
| | | | | | | |
KWDCD 3 Month Rate (Pay Quarterly) | | 3.560% (Receive
Quarterly) | | | KWR | | | | 2,363,450,000 | | | | 7/17/2026 | | | | (22,852) | | | | (338) | | | | BNP Paribas | |
| | | | | | | |
MXN-TIIE-BANXICO 28 Day Rate (Pay Lunar) | | 8.880% (Receive
Lunar) | | | MXN | | | | 49,000,000 | | | | 8/9/2028 | | | | (94,498) | | | | 3,685 | | | | BNP Paribas | |
| | | | | | | |
2.425% (Pay Quarterly) | | Thai Overnight
Repurchase Rate
(THOR) (Receive
Quarterly) | | | THB | | | | 122,170,000 | | | | 6/21/2028 | | | | 54,544 | | | | (1,976) | | | | Merrill Lynch | |
| | | | | | | |
9.605% (Pay Quarterly) | | ZAR-JIBAR 3 Month
Rate (Receive
Quarterly) | | | ZAR | | | | 34,800,000 | | | | 12/20/2033 | | | | 31,510 | | | | (8,728) | | | | Deutsche Bank | |
| | | | | | | | | | | | | | | | | | | | | | | | | | |
| | | | | | | |
| | | | | | | | | | | | | | | | | $ 339 | | | | $(2,785) | | | | | |
| | | | | | | | | | | | | | | | | | | | | | | | | | |
**Includes cumulative appreciation/depreciation on centrally cleared interest rate swap agreements. Only the current day’s variation margin is reported within the Statements of Assets and Liabilities.
The inputs of methodologies used for valuing securities are not necessarily an indication of the risks associated with investing in those securities and other financial instruments, if any. See note 4 in the Notes to the Financial Statements for more information regarding pricing inputs and valuation techniques. The following is a summary of the inputs used in valuing the Ashmore Emerging Markets Total Return Fund’s investments and other financial instruments, which are carried at fair value, as of October 31, 2023:
| | | | | | | | | | | | | | | | |
| | | Level 1 | | | Level 2 | | | Level 3 | | | Total | |
Investments | | | | | | | | | | | | | | | | |
| | | | |
Assets: | | | | | | | | | | | | | | | | |
| | | | |
Debt Securities | | | | | | | | | | | | | | | | |
| | | | |
Corporate Bonds | | $ | — | | | $ | 50,315,513 | | | $ | 24,342 | | | $ | 50,339,855 | |
| | | | |
Corporate Convertible Bonds | | | — | | | | 364,160 | | | | — | | | | 364,160 | |
| | | | |
Financial Certificates | | | — | | | | 4,913,400 | | | | — | | | | 4,913,400 | |
| | | | |
Government Agencies | | | — | | | | 31,035,820 | | | | — | | | | 31,035,820 | |
| | | | |
Government Bonds | | | — | | | | 322,684,247 | | | | — | | | | 322,684,247 | |
| | | | |
Index Linked Government Bonds | | | — | | | | 578,887 | | | | — | | | | 578,887 | |
| | | | |
Short Term Bills and Notes | | | — | | | | 6,581,110 | | | | — | | | | 6,581,110 | |
| | | | | | | | | | | | | | | | |
| | | | |
Total Debt Securities | | | — | | | | 416,473,137 | | | | 24,342 | | | | 416,497,479 | |
| | | | |
Short-Term Investments | | | — | | | | 25,000,000 | | | | — | | | | 25,000,000 | |
| |
| | | | |
Total Investments | | | $— | | | | $441,473,137 | | | | $24,342 | | | | $441,497,479 | |
| |
See accompanying notes to the financial statements.
90
ASHMORE EMERGING MARKETS TOTAL RETURN FUND
SCHEDULE OF INVESTMENTS (CONTINUED)
As of October 31, 2023
| | | | | | | | | | | | | | | | |
| | | Level 1 | | | Level 2 | | | Level 3 | | | Total | |
| | | | |
Other Financial Instruments | | | | | | | | | | | | | | | | |
| | | | |
Assets: | | | | | | | | | | | | | | | | |
| | | | |
Forward Foreign Currency Exchange Contracts | | | $— | | | | $ 912,413 | | | | $— | | | | $ 912,413 | |
| | | | |
Centrally Cleared Interest Rate Swap Contracts† | | | — | | | | 226,318 | | | | — | | | | 226,318 | |
| | | | |
Liabilities: | | | | | | | | | | | | | | | | |
| | | | |
Forward Foreign Currency Exchange Contracts | | | — | | | | (2,049,754 | ) | | | — | | | | (2,049,754 | ) |
| | | | |
Centrally Cleared Interest Rate Swap Contracts† | | | — | | | | (225,979 | ) | | | — | | | | (225,979 | ) |
| |
| | | | |
Total Other Financial Instruments | | | $— | | | | $(1,137,002 | ) | | | $— | | | | $(1,137,002 | ) |
| |
†Includes cumulative appreciation/depreciation on centrally cleared interest rate swap agreements. Only the current day’s variation margin is reported within the Statements of Assets and Liabilities.
There were no transfers to or from Level 3 during the year ended October 31, 2023.
The amount of Level 3 securities compared to total net assets is not material; therefore, the reconciliation of Level 3 securities and assumptions is not shown for the year ended October 31, 2023.
The following is a summary of the fair values of the Fund’s derivative instruments*:
Fair Values of Financial Derivative Instruments on the Statements of Assets and Liabilities as of October 31, 2023:
| | | | | | | | |
| | | Derivatives Not Accounted for as
Hedging Instruments | |
| | | Foreign | | | Interest | |
| | | Exchange Risk | | | Rate Risk | |
| |
Assets: | | | | | | | | |
Unrealized Appreciation on Centrally Cleared Interest Rate Swap Contracts | | $ | — | | | $ | 226,318 | † |
Unrealized Appreciation on Forward Foreign Currency Exchange Contracts | | | 912,413 | | | | — | |
| | | | |
| | $ | 912,413 | | | $ | 226,318 | |
| | | | |
| | |
Liabilities: | | | | | | | | |
Unrealized Depreciation on Centrally Cleared Interest Rate Swap Contracts | | $ | — | | | $ | (225,979 | )† |
Unrealized Depreciation on Forward Foreign Currency Exchange Contracts | | | (2,049,754 | ) | | | — | |
| | | | |
| | $ | (2,049,754 | ) | | $ | (225,979 | ) |
| | | | |
| † | Includes cumulative appreciation/depreciation on centrally cleared interest rate swap agreements. Only the current day’s variation margin is reported within the Statements of Assets and Liabilities. |
See accompanying notes to the financial statements.
91
ASHMORE EMERGING MARKETS TOTAL RETURN FUND
SCHEDULE OF INVESTMENTS (CONTINUED)
As of October 31, 2023
The Effect of Financial Derivative Instruments on the Statements of Operations for the Year Ended October 31, 2023:
| | | | | | | | |
| | | Derivatives Not Accounted for as
Hedging Instruments | |
| | | Foreign | | | Interest | |
| | | Exchange Risk | | | Rate Risk | |
| |
Realized Gain (Loss) on Derivatives Recognized resulting from Operations: | | | | | | | | |
Net Realized Loss on Forward Foreign Currency Exchange Contracts | | $ | (2,364,837 | ) | | $ | — | |
Net Realized Gain on Interest Rate Swap Contracts | | | — | | | | 345,357 | |
| | | | |
| | $ | (2,364,837 | ) | | $ | 345,357 | |
| | | | |
| | |
Net Change in Unrealized Appreciation (Depreciation) on Derivatives Recognized resulting from Operations: | | | | | | | | |
Net Change in Unrealized Appreciation on Forward Foreign Currency Exchange Contracts | | $ | 2,423,493 | | | $ | — | |
Net Change in Unrealized Depreciation on Interest Rate Swap Contracts | | | — | | | | (108,313 | ) |
| | | | |
| | $ | 2,423,493 | | | $ | (108,313 | ) |
| | | | |
* See Note 10 in the Notes to the Financial Statements for additional information.
See accompanying notes to the financial statements.
92
ASHMORE EMERGING MARKETS LOCAL CURRENCY BOND FUND
SCHEDULE OF INVESTMENTS
As of October 31, 2023
| | | | | | | | | | | | | | | | |
| | | Currency1 | | | Par | | | Value | | | % of Net Assets | |
| |
Debt Securities | | | | | | | | | | | | | | | | |
| | | | |
Brazil (Cost $1,546,131) | | | | | | | | | | | | | | | | |
Brazil Letras do Tesouro Nacional, 0.000%, 07/01/20252 | | | BRL | | | | 1,722,000 | | | $ | 287,102 | | | | 2.79 | |
Brazil Letras do Tesouro Nacional, 0.000%, 01/01/20262 | | | BRL | | | | 2,140,000 | | | | 337,460 | | | | 3.27 | |
Brazil Letras do Tesouro Nacional, 0.000%, 07/01/20262 | | | BRL | | | | 1,990,000 | | | | 297,233 | | | | 2.88 | |
Brazil Notas do Tesouro Nacional Serie F, 10.000%, 01/01/2027 | | | BRL | | | | 2,723,000 | | | | 522,195 | | | | 5.07 | |
Brazil Notas do Tesouro Nacional Serie F, 10.000%, 01/01/2029 | | | BRL | | | | 898,000 | | | | 167,471 | | | | 1.63 | |
| | | | | | | | | | | 1,611,461 | | | | 15.64 | |
| | | | |
Chile (Cost $65,998) | | | | | | | | | | | | | | | | |
Bonos de la Tesoreria de la Republica en pesos, 5.000%, 10/01/20283 | | | CLP | | | | 20,000,000 | | | | 20,878 | | | | 0.20 | |
Bonos de la Tesoreria de la Republica en pesos, 6.000%, 04/01/20333 | | | CLP | | | | 15,000,000 | | | | 16,047 | | | | 0.16 | |
Bonos de la Tesoreria de la Republica en pesos, 7.000%, 05/01/20343 | | | CLP | | | | 20,000,000 | | | | 23,079 | | | | 0.22 | |
| | | | | | | | | | | 60,004 | | | | 0.58 | |
| | | | |
China (Cost $484,635) | | | | | | | | | | | | | | | | |
China (Rep of), 2.850%, 06/04/2027 | | | CNY | | | | 920,000 | | | | 127,368 | | | | 1.23 | |
China (Rep of), 2.620%, 09/25/2029 | | | CNY | | | | 440,000 | | | | 59,982 | | | | 0.58 | |
China (Rep of), 2.680%, 05/21/2030 | | | CNY | | | | 400,000 | | | | 54,607 | | | | 0.53 | |
China (Rep of), 2.750%, 02/17/2032 | | | CNY | | | | 170,000 | | | | 23,281 | | | | 0.23 | |
China (Rep of), 2.800%, 11/15/2032 | | | CNY | | | | 120,000 | | | | 16,515 | | | | 0.16 | |
China (Rep of), 2.880%, 02/25/2033 | | | CNY | | | | 750,000 | | | | 103,895 | | | | 1.01 | |
China (Rep of), 3.720%, 04/12/2051 | | | CNY | | | | 540,000 | | | | 82,035 | | | | 0.80 | |
| | | | | | | | | | | 467,683 | | | | 4.54 | |
| | | | |
Colombia (Cost $488,381) | | | | | | | | | | | | | | | | |
Colombian TES, 5.750%, 11/03/2027 | | | COP | | | | 91,500,000 | | | | 18,562 | | | | 0.18 | |
Colombian TES, 6.000%, 04/28/2028 | | | COP | | | | 357,700,000 | | | | 71,846 | | | | 0.70 | |
Colombian TES, 7.750%, 09/18/2030 | | | COP | | | | 219,000,000 | | | | 44,577 | | | | 0.43 | |
Colombian TES, 7.000%, 03/26/2031 | | | COP | | | | 324,400,000 | | | | 62,189 | | | | 0.60 | |
Colombian TES, 7.000%, 06/30/2032 | | | COP | | | | 306,900,000 | | | | 56,365 | | | | 0.55 | |
Colombian TES, 13.250%, 02/09/2033 | | | COP | | | | 142,000,000 | | | | 37,241 | | | | 0.36 | |
Colombian TES, 7.250%, 10/18/2034 | | | COP | | | | 341,200,000 | | | | 60,333 | | | | 0.59 | |
Colombian TES, 9.250%, 05/28/2042 | | | COP | | | | 619,300,000 | | | | 119,758 | | | | 1.16 | |
Colombian TES, 7.250%, 10/26/2050 | | | COP | | | | 115,500,000 | | | | 17,595 | | | | 0.17 | |
| | | | | | | | | | | 488,466 | | | | 4.74 | |
| | | | |
Czech Republic (Cost $541,721) | | | | | | | | | | | | | | | | |
Czech (Rep of), 2.500%, 08/25/2028 | | | CZK | | | | 270,000 | | | | 10,624 | | | | 0.10 | |
Czech (Rep of), 2.750%, 07/23/2029 | | | CZK | | | | 2,120,000 | | | | 82,995 | | | | 0.80 | |
Czech (Rep of), 0.050%, 11/29/2029 | | | CZK | | | | 630,000 | | | | 20,727 | | | | 0.20 | |
Czech (Rep of), 0.950%, 05/15/2030 | | | CZK | | | | 590,000 | | | | 20,293 | | | | 0.20 | |
Czech (Rep of), 1.200%, 03/13/2031 | | | CZK | | | | 1,850,000 | | | | 62,977 | | | | 0.61 | |
See accompanying notes to the financial statements.
93
ASHMORE EMERGING MARKETS LOCAL CURRENCY BOND FUND
SCHEDULE OF INVESTMENTS (CONTINUED)
As of October 31, 2023
| | | | | | | | | | | | | | | | |
| | | Currency1 | | | Par | | | Value | | | % of Net Assets | |
| |
Czech Republic (continued) | | | | | | | | | | | | | | | | |
Czech (Rep of), 1.750%, 06/23/2032 | | | CZK | | | | 1,430,000 | | | $ | 49,127 | | | | 0.48 | |
Czech (Rep of), 2.000%, 10/13/2033 | | | CZK | | | | 1,790,000 | | | | 60,829 | | | | 0.59 | |
Czech (Rep of), 4.900%, 04/14/2034 | | | CZK | | | | 3,220,000 | | | | 140,239 | | | | 1.36 | |
Czech (Rep of), 1.950%, 07/30/2037 | | | CZK | | | | 1,740,000 | | | | 54,303 | | | | 0.53 | |
| | | | | | | | | | | 502,114 | | | | 4.87 | |
| | | | |
Dominican Republic (Cost $53,073) | | | | | | | | | | | | | | | | |
Dominican Republic Central Bank Notes, 13.000%, 01/30/2026 | | | DOP | | | | 2,800,000 | | | | 51,786 | | | | 0.50 | |
| | | | | | | | | | | 51,786 | | | | 0.50 | |
| | | | |
Hungary (Cost $207,692) | | | | | | | | | | | | | | | | |
Hungary (Rep of), 9.500%, 10/21/2026 | | | HUF | | | | 25,770,000 | | | | 73,707 | | | | 0.72 | |
Hungary (Rep of), 3.000%, 10/27/2027 | | | HUF | | | | 13,320,000 | | | | 31,276 | | | | 0.30 | |
Hungary (Rep of), 4.500%, 03/23/2028 | | | HUF | | | | 11,150,000 | | | | 27,467 | | | | 0.27 | |
Hungary (Rep of), 6.750%, 10/22/2028 | | | HUF | | | | 2,410,000 | | | | 6,463 | | | | 0.06 | |
Hungary (Rep of), 3.000%, 08/21/2030 | | | HUF | | | | 14,890,000 | | | | 32,019 | | | | 0.31 | |
Hungary (Rep of), 4.750%, 11/24/2032 | | | HUF | | | | 7,690,000 | | | | 17,513 | | | | 0.17 | |
Hungary (Rep of), 3.000%, 10/27/2038 | | | HUF | | | | 5,640,000 | | | | 9,410 | | | | 0.09 | |
| | | | | | | | | | | 197,855 | | | | 1.92 | |
| | | | |
Indonesia (Cost $1,524,797) | | | | | | | | | | | | | | | | |
Indonesia (Rep of), 8.375%, 03/15/2024 | | | IDR | | | | 1,145,000,000 | | | | 72,441 | | | | 0.70 | |
Indonesia (Rep of), 8.125%, 05/15/2024 | | | IDR | | | | 3,163,000,000 | | | | 200,356 | | | | 1.95 | |
Indonesia (Rep of), 7.000%, 05/15/2027 | | | IDR | | | | 1,318,000,000 | | | | 82,764 | | | | 0.80 | |
Indonesia (Rep of), 6.375%, 08/15/2028 | | | IDR | | | | 2,621,000,000 | | | | 160,544 | | | | 1.56 | |
Indonesia (Rep of), 10.500%, 08/15/2030 | | | IDR | | | | 213,000,000 | | | | 15,823 | | | | 0.15 | |
Indonesia (Rep of), 7.000%, 09/15/2030 | | | IDR | | | | 1,038,000,000 | | | | 65,083 | | | | 0.63 | |
Indonesia (Rep of), 6.500%, 02/15/2031 | | | IDR | | | | 1,258,000,000 | | | | 76,422 | | | | 0.74 | |
Indonesia (Rep of), 8.750%, 05/15/2031 | | | IDR | | | | 1,159,000,000 | | | | 79,346 | | | | 0.77 | |
Indonesia (Rep of), 6.375%, 04/15/2032 | | | IDR | | | | 702,000,000 | | | | 42,160 | | | | 0.41 | |
Indonesia (Rep of), 7.500%, 08/15/2032 | | | IDR | | | | 583,000,000 | | | | 37,227 | | | | 0.36 | |
Indonesia (Rep of), 7.000%, 02/15/2033 | | | IDR | | | | 2,898,000,000 | | | | 181,524 | | | | 1.76 | |
Indonesia (Rep of), 6.625%, 02/15/2034 | | | IDR | | | | 1,305,000,000 | | | | 78,793 | | | | 0.77 | |
Indonesia (Rep of), 8.375%, 03/15/2034 | | | IDR | | | | 974,000,000 | | | | 66,313 | | | | 0.64 | |
Indonesia (Rep of), 8.250%, 05/15/2036 | | | IDR | | | | 635,000,000 | | | | 43,173 | | | | 0.42 | |
Indonesia (Rep of), 7.125%, 06/15/2038 | | | IDR | | | | 2,622,000,000 | | | | 164,236 | | | | 1.59 | |
Indonesia (Rep of), 8.375%, 04/15/2039 | | | IDR | | | | 788,000,000 | | | | 54,567 | | | | 0.53 | |
| | | | | | | | | | | 1,420,772 | | | | 13.78 | |
| | | | |
Malaysia (Cost $527,767) | | | | | | | | | | | | | | | | |
Malaysia (Rep of), 3.733%, 06/15/2028 | | | MYR | | | | 119,000 | | | | 24,802 | | | | 0.24 | |
Malaysia (Rep of), 3.885%, 08/15/2029 | | | MYR | | | | 193,000 | | | | 40,267 | | | | 0.39 | |
Malaysia (Rep of), 4.642%, 11/07/2033 | | | MYR | | | | 293,000 | | | | 64,186 | | | | 0.62 | |
Malaysia (Rep of), 3.828%, 07/05/2034 | | | MYR | | | | 440,000 | | | | 89,556 | | | | 0.87 | |
Malaysia (Rep of), 4.893%, 06/08/2038 | | | MYR | | | | 268,000 | | | | 60,193 | | | | 0.58 | |
Malaysia (Rep of), 3.757%, 05/22/2040 | | | MYR | | | | 100,000 | | | | 19,360 | | | | 0.19 | |
Malaysia (Rep of), 4.696%, 10/15/2042 | | | MYR | | | | 250,000 | | | | 54,329 | | | | 0.53 | |
See accompanying notes to the financial statements.
94
ASHMORE EMERGING MARKETS LOCAL CURRENCY BOND FUND
SCHEDULE OF INVESTMENTS (CONTINUED)
As of October 31, 2023
| | | | | | | | | | | | | | | | |
| | | Currency1 | | Par | | | Value | | | % of Net Assets | |
| |
Malaysia (continued) | | | | | | | | | | | | | | | | |
Malaysia (Rep of), 4.065%, 06/15/2050 | | | MYR | | | | 412,000 | | | $ | 79,858 | | | | 0.77 | |
Malaysia Government Investment Issue, 3.465%, 10/15/2030 | | | MYR | | | | 55,000 | | | | 11,106 | | | | 0.11 | |
Malaysia Government Investment Issue, 5.357%, 05/15/2052 | | | MYR | | | | 95,000 | | | | 22,223 | | | | 0.22 | |
| | | | | | | | | | | 465,880 | | | | 4.52 | |
| | | | |
Mexico (Cost $842,816) | | | | | | | | | | | | | | | | |
Mexican Bonos, 5.750%, 03/05/2026 | | | MXN | | | | 920,000 | | | | 45,766 | | | | 0.44 | |
Mexican Bonos, 5.500%, 03/04/2027 | | | MXN | | | | 1,290,000 | | | | 61,792 | | | | 0.60 | |
Mexican Bonos, 7.500%, 06/03/2027 | | | MXN | | | | 840,000 | | | | 42,630 | | | | 0.41 | |
Mexican Bonos, 7.750%, 05/29/2031 | | | MXN | | | | 5,710,000 | | | | 275,760 | | | | 2.68 | |
Mexican Bonos, 10.000%, 11/20/2036 | | | MXN | | | | 2,510,000 | | | | 137,664 | | | | 1.34 | |
Mexican Bonos, 8.500%, 11/18/2038 | | | MXN | | | | 2,050,000 | | | | 99,126 | | | | 0.96 | |
Mexican Bonos, 7.750%, 11/13/2042 | | | MXN | | | | 3,640,000 | | | | 161,114 | | | | 1.56 | |
| | | | | | | | | | | 823,852 | | | | 7.99 | |
| | | | |
Peru (Cost $496,153) | | | | | | | | | | | | | | | | |
Fondo MIVIVIENDA S.A., 7.000%, 02/14/2024 | | | PEN | | | | 133,000 | | | | 34,367 | | | | 0.33 | |
Peru (Rep of), 5.940%, 02/12/2029 | | | PEN | | | | 152,000 | | | | 37,891 | | | | 0.37 | |
Peru (Rep of), 6.150%, 08/12/2032 | | | PEN | | | | 814,000 | | | | 193,548 | | | | 1.88 | |
Peru (Rep of), 7.300%, 08/12/20333 | | | PEN | | | | 479,000 | | | | 122,162 | | | | 1.19 | |
Peru (Rep of), 5.400%, 08/12/2034 | | | PEN | | | | 219,000 | | | | 47,669 | | | | 0.46 | |
Peru (Rep of), 5.350%, 08/12/2040 | | | PEN | | | | 63,000 | | | | 12,734 | | | | 0.12 | |
| | | | | | | | | | | 448,371 | | | | 4.35 | |
| | | | |
Poland (Cost $477,924) | | | | | | | | | | | | | | | | |
Poland (Rep of), 2.250%, 10/25/2024 | | | PLN | | | | 3,000 | | | | 693 | | | | 0.01 | |
Poland (Rep of), 3.750%, 05/25/2027 | | | PLN | | | | 726,000 | | | | 164,568 | | | | 1.60 | |
Poland (Rep of), 2.750%, 04/25/2028 | | | PLN | | | | 194,000 | | | | 41,624 | | | | 0.40 | |
Poland (Rep of), 2.750%, 10/25/2029 | | | PLN | | | | 271,000 | | | | 56,031 | | | | 0.54 | |
Poland (Rep of), 1.250%, 10/25/2030 | | | PLN | | | | 362,000 | | | | 65,732 | | | | 0.64 | |
Poland (Rep of), 1.750%, 04/25/2032 | | | PLN | | | | 302,000 | | | | 53,416 | | | | 0.52 | |
Poland (Rep of), 6.000%, 10/25/2033 | | | PLN | | | | 478,000 | | | | 116,353 | | | | 1.13 | |
| | | | | | | | | | | 498,417 | | | | 4.84 | |
| | | | |
Romania (Cost $511,543) | | | | | | | | | | | | | | | | |
Romania (Rep of), 5.800%, 07/26/2027 | | | RON | | | | 230,000 | | | | 47,776 | | | | 0.46 | |
Romania (Rep of), 4.150%, 01/26/2028 | | | RON | | | | 315,000 | | | | 60,904 | | | | 0.59 | |
Romania (Rep of), 4.850%, 07/25/2029 | | | RON | | | | 240,000 | | | | 46,455 | | | | 0.45 | |
Romania (Rep of), 8.000%, 04/29/2030 | | | RON | | | | 505,000 | | | | 113,144 | | | | 1.10 | |
Romania (Rep of), 4.150%, 10/24/2030 | | | RON | | | | 115,000 | | | | 20,913 | | | | 0.20 | |
Romania (Rep of), 7.350%, 04/28/2031 | | | RON | | | | 90,000 | | | | 19,521 | | | | 0.19 | |
Romania (Rep of), 6.700%, 02/25/2032 | | | RON | | | | 65,000 | | | | 13,523 | | | | 0.13 | |
Romania (Rep of), 8.250%, 09/29/2032 | | | RON | | | | 620,000 | | | | 142,464 | | | | 1.38 | |
Romania (Rep of), 4.750%, 10/11/2034 | | | RON | | | | 185,000 | | | | 32,446 | | | | 0.32 | |
| | | | | | | | | | | 497,146 | | | | 4.82 | |
See accompanying notes to the financial statements.
95
ASHMORE EMERGING MARKETS LOCAL CURRENCY BOND FUND
SCHEDULE OF INVESTMENTS (CONTINUED)
As of October 31, 2023
| | | | | | | | | | | | | | | | |
| | | Currency1 | | | Par | | | Value | | | % of Net Assets | |
| |
South Africa (Cost $1,127,427) | | | | | | | | | | | | | | | | |
South Africa (Rep of), 10.500%, 12/21/2026 | | | ZAR | | | | 3,768,410 | | | $ | 208,292 | | | | 2.02 | |
South Africa (Rep of), 8.000%, 01/31/2030 | | | ZAR | | | | 3,640,516 | | | | 171,845 | | | | 1.67 | |
South Africa (Rep of), 7.000%, 02/28/2031 | | | ZAR | | | | 2,717,492 | | | | 115,274 | | | | 1.12 | |
South Africa (Rep of), 8.250%, 03/31/2032 | | | ZAR | | | | 3,658,334 | | | | 161,359 | | | | 1.57 | |
South Africa (Rep of), 8.875%, 02/28/2035 | | | ZAR | | | | 1,133,384 | | | | 48,379 | | | | 0.47 | |
South Africa (Rep of), 8.500%, 01/31/2037 | | | ZAR | | | | 1,217,357 | | | | 48,249 | | | | 0.47 | |
South Africa (Rep of), 9.000%, 01/31/2040 | | | ZAR | | | | 1,995,720 | | | | 79,421 | | | | 0.77 | |
South Africa (Rep of), 8.750%, 01/31/2044 | | | ZAR | | | | 2,438,141 | | | | 92,164 | | | | 0.89 | |
South Africa (Rep of), 8.750%, 02/28/2048 | | | ZAR | | | | 2,154,187 | | | | 80,819 | | | | 0.78 | |
| | | | | | | | | | | 1,005,802 | | | | 9.76 | |
| | | | |
South Korea (Cost $447,772) | | | | | | | | | | | | | | | | |
Korea (Rep of), 3.000%, 09/10/2024 | | | KRW | | | | 412,270,000 | | | | 303,437 | | | | 2.95 | |
Korea (Rep of), 4.250%, 12/10/2032 | | | KRW | | | | 157,660,000 | | | | 115,758 | | | | 1.12 | |
| | | | | | | | | | | 419,195 | | | | 4.07 | |
| | | | |
Thailand (Cost $598,823) | | | | | | | | | | | | | | | | |
Thailand (Rep of), 2.650%, 06/17/2028 | | | THB | | | | 789,000 | | | | 21,609 | | | | 0.21 | |
Thailand (Rep of), 3.775%, 06/25/2032 | | | THB | | | | 1,527,000 | | | | 44,037 | | | | 0.43 | |
Thailand (Rep of), 3.350%, 06/17/2033 | | | THB | | | | 2,158,000 | | | | 60,485 | | | | 0.59 | |
Thailand (Rep of), 1.585%, 12/17/2035 | | | THB | | | | 2,210,000 | | | | 50,131 | | | | 0.49 | |
Thailand (Rep of), 3.400%, 06/17/2036 | | | THB | | | | 2,306,000 | | | | 63,076 | | | | 0.61 | |
Thailand (Rep of), 3.390%, 06/17/2037 | | | THB | | | | 3,497,000 | | | | 95,598 | | | | 0.93 | |
Thailand (Rep of), 3.300%, 06/17/2038 | | | THB | | | | 1,967,000 | | | | 52,554 | | | | 0.51 | |
Thailand (Rep of), 2.000%, 06/17/2042 | | | THB | | | | 2,203,000 | | | | 47,261 | | | | 0.46 | |
Thailand (Rep of), 2.875%, 06/17/2046 | | | THB | | | | 1,983,000 | | | | 46,882 | | | | 0.45 | |
Thailand (Rep of), 3.600%, 06/17/2067 | | | THB | | | | 901,000 | | | | 23,046 | | | | 0.22 | |
| | | | | | | | | | | 504,679 | | | | 4.90 | |
| | | | |
United States (Cost $404,213) | | | | | | | | | | | | | | | | |
U.S. Treasury Bill, 5.260%, 01/16/20244 | | | | | | | 408,800 | | | | 404,219 | | | | 3.92 | |
| | | | | | | | | | | 404,219 | | | | 3.92 | |
Uruguay (Cost $92,404) | | | | | | | | | | | | | | | | |
Uruguay (Rep of), 4.375%, (Inflation Index), 12/15/2028 | | | UYU | | | | 841,690 | | | | 15,562 | | | | 0.15 | |
Uruguay (Rep of), 8.250%, 05/21/2031 | | | UYU | | | | 743,171 | | | | 16,951 | | | | 0.17 | |
Uruguay (Rep of), 9.750%, 07/20/2033 | | | UYU | | | | 1,876,662 | | | | 46,503 | | | | 0.45 | |
See accompanying notes to the financial statements.
96
ASHMORE EMERGING MARKETS LOCAL CURRENCY BOND FUND
SCHEDULE OF INVESTMENTS (CONTINUED)
As of October 31, 2023
| | | | | | | | | | | | | | | | |
| | | Currency1 | | | Par | | | Value | | | % of Net Assets | |
| |
Uruguay (continued) | | | | | | | | | | | | | | | | |
Uruguay (Rep of), 3.875%, (Inflation Index), 07/02/2040 | | | UYU | | | | 743,612 | | | $ | 10,348 | | | | 0.10 | |
| | | | | | | | | | | 89,364 | | | | 0.87 | |
| | | | |
Total Debt Securities (Cost $10,439,270) | | | | | | | | | | | 9,957,066 | | | | 96.61 | |
| | | | |
Total Investments in Securities (Cost $10,439,270) | | | | | | | | | | | 9,957,066 | | | | 96.61 | |
| | | | |
Total Investments (Total Cost $10,439,270) | | | | | | | | | | | 9,957,066 | | | | 96.61 | |
| | | | |
Other Assets Less Liabilities (See Statements of Assets and Liabilities for further detail) | | | | | | | | | | | 349,385 | | | | 3.39 | |
| | | | |
Net Assets | | | | | | | | | | $ | 10,306,451 | | | | 100.00 | |
| 1 | Local currency is United States Dollars unless otherwise noted below. |
| 3 | Securities exempt from registration under Rule 144A of the Securities Act of 1933. These securities may not be publicly traded without registration under the Securities Act of 1933. |
| 4 | Zero coupon bond – interest rate reflects effective yield on the date of purchase. |
Percentages shown are based on net assets.
At October 31, 2023, the Ashmore Emerging Markets Local Currency Bond Fund had outstanding forward foreign currency exchange contracts as follows:
| | | | | | | | | | | | | | | | | | |
Settlement
Date | | Counterparty | | Currency Buy | | Currency
Buy Amount
(Local
Currency) | | | Currency Sell | | Currency
Sell Amount
(Local
Currency) | | | Unrealized
Gain/(Loss) | |
| | | | | | |
11/03/2023 | | Citibank | | Brazilian Real | | | 508,300 | | | United States Dollar | | | 100,000 | | | $ | 780 | |
| | | | | | |
11/03/2023 | | HSBC Bank | | United States Dollar | | | 465,103 | | | Brazilian Real | | | 2,317,540 | | | | 5,607 | |
| | | | | | |
11/10/2023 | | HSBC Bank | | United States Dollar | | | 125,169 | | | Indonesian Rupiah | | | 1,986,993,467 | | | | 221 | |
| | | | | | |
11/10/2023 | | Standard Chartered | | United States Dollar | | | 8,491 | | | Indonesian Rupiah | | | 134,851,116 | | | | 11 | |
| | | | | | |
11/10/2023 | | Morgan Stanley | | United States Dollar | | | 96,000 | | | Korean Won | | | 129,577,968 | | | | 56 | |
| | | | | | |
11/20/2023 | | Deutsche Bank | | United States Dollar | | | 8,000 | | | Chinese Offshore Yuan | | | 58,044 | | | | 82 | |
| | | | | | |
11/20/2023 | | Morgan Stanley | | United States Dollar | | | 5,140 | | | Chinese Offshore Yuan | | | 37,592 | | | | 12 | |
| | | | | | |
11/20/2023 | | HSBC Bank | | United States Dollar | | | 131,000 | | | Chinese Yuan Renminbi | | | 901,201 | | | | 7,606 | |
| | | | | | |
11/24/2023 | | Morgan Stanley | | United States Dollar | | | 57,481 | | | Korean Won | | | 77,616,257 | | | | 12 | |
| | | | | | |
11/30/2023 | | BNP Paribas | | Thai Baht | | | 1,472,000 | | | United States Dollar | | | 40,621 | | | | 442 | |
| | | | | | |
11/30/2023 | | Deutsche Bank | | Thai Baht | | | 9,851,402 | | | United States Dollar | | | 273,043 | | | | 1,779 | |
| | | | | | |
11/30/2023 | | HSBC Bank | | Thai Baht | | | 1,097,831 | | | United States Dollar | | | 30,293 | | | | 333 | |
| | | | | | |
11/30/2023 | | HSBC Bank | | United States Dollar | | | 32,000 | | | Malaysian Ringgit | | | 150,143 | | | | 423 | |
| | | | | | |
12/04/2023 | | JP Morgan | | United States Dollar | | | 22,970 | | | Brazilian Real | | | 115,419 | | | | 173 | |
| | | | | | |
12/04/2023 | | Morgan Stanley | | United States Dollar | | | 493,392 | | | Brazilian Real | | | 2,472,214 | | | | 5,099 | |
| | | | | | |
12/11/2023 | | BNP Paribas | | Indian Rupee | | | 791,576 | | | United States Dollar | | | 9,487 | | | | 7 | |
| | | | | | |
12/11/2023 | | BNP Paribas | | United States Dollar | | | 210,638 | | | Indonesian Rupiah | | | 3,217,291,053 | | | | 8,805 | |
| | | | | | |
12/11/2023 | | JP Morgan | | United States Dollar | | | 3,884 | | | Indonesian Rupiah | | | 60,831,982 | | | | 68 | |
| | | | | | |
12/13/2023 | | HSBC Bank | | Egyptian Pound | | | 157,257 | | | United States Dollar | | | 4,887 | | | | 59 | |
See accompanying notes to the financial statements.
97
ASHMORE EMERGING MARKETS LOCAL CURRENCY BOND FUND
SCHEDULE OF INVESTMENTS (CONTINUED)
As of October 31, 2023
| | | | | | | | | | | | | | | | | | |
Settlement
Date | | Counterparty | | Currency Buy | | Currency Buy Amount
(Local
Currency) | | | Currency Sell | | Currency Sell Amount
(Local
Currency) | | | Unrealized
Gain/(Loss) |
| | | | | | |
01/12/2024 | | HSBC Bank | | Hungarian Forint | | | 26,854,452 | | | United States Dollar | | | 68,427 | | | $ | 5,090 | |
| | | | | | |
01/12/2024 | | HSBC Bank | | United States Dollar | | | 191,688 | | | Indonesian Rupiah | | | 2,973,085,575 | | | | 5,279 | |
| | | | | | |
01/12/2024 | | Barclays | | United States Dollar | | | 96,485 | | | Korean Won | | | 129,577,968 | | | | 289 | |
| | | | | | |
01/16/2024 | | HSBC Bank | | United States Dollar | | | 4,694 | | | Egyptian Pound | | | 157,257 | | | | 163 | |
| | | | | | |
01/31/2024 | | HSBC Bank | | Chilean Peso | | | 48,115,852 | | | United States Dollar | | | 51,193 | | | | 2,259 | |
| | | | | | |
01/31/2024 | | Merrill Lynch | | Chilean Peso | | | 75,625,719 | | | United States Dollar | | | 79,326 | | | | 4,687 | |
| | | | | | |
01/31/2024 | | Morgan Stanley | | Czech Koruna | | | 3,499,257 | | | United States Dollar | | | 149,517 | | | | 913 | |
| | | | | | |
01/31/2024 | | BNP Paribas | | Hungarian Forint | | | 18,155,542 | | | United States Dollar | | | 49,066 | | | | 496 | |
| | | | | | |
01/31/2024 | | Merrill Lynch | | Mexican Peso | | | 4,007,197 | | | United States Dollar | | | 215,574 | | | | 3,108 | |
| | | | | | |
01/31/2024 | | State Street | | Mexican Peso | | | 642,765 | | | United States Dollar | | | 35,000 | | | | 77 | |
| | | | | | |
01/31/2024 | | Citibank | | United States Dollar | | | 51,000 | | | Hungarian Forint | | | 18,578,790 | | | | 283 | |
| | | | | | |
01/31/2024 | | HSBC Bank | | United States Dollar | | | 51,000 | | | Hungarian Forint | | | 18,662,481 | | | | 55 | |
| | | | | | |
02/12/2024 | | HSBC Bank | | United States Dollar | | | 97,180 | | | Indian Rupee | | | 8,119,952 | | | | 76 | |
| | | | | | |
02/12/2024 | | HSBC Bank | | United States Dollar | | | 39,604 | | | Indonesian Rupiah | | | 630,077,000 | | | | 121 | |
| | | | | | |
03/25/2024 | | Citibank | | United States Dollar | | | 269,000 | | | Chinese Offshore Yuan | | | 1,948,618 | | | | 795 | |
| | | | | | | | | | | | | | | | | | |
| | | | | |
Subtotal Appreciation | | | | | | | | | | | | | | | 55,266 | |
| | | | | | | | | | | | | | | | |
| | | | | | |
11/03/2023 | | Morgan Stanley | | Brazilian Real | | | 2,472,214 | | | United States Dollar | | | 495,235 | | | | (5,072 | ) |
| | | | | | |
11/03/2023 | | Deutsche Bank | | United States Dollar | | | 130,000 | | | Brazilian Real | | | 662,974 | | | | (1,447 | ) |
| | | | | | |
11/10/2023 | | HSBC Bank | | Indian Rupee | | | 11,093,384 | | | United States Dollar | | | 133,378 | | | | (185 | ) |
| | | | | | |
11/10/2023 | | HSBC Bank | | Indonesian Rupiah | | | 785,426,600 | | | United States Dollar | | | 49,465 | | | | (75 | ) |
| | | | | | |
11/10/2023 | | Barclays | | Korean Won | | | 129,577,968 | | | United States Dollar | | | 96,126 | | | | (182 | ) |
| | | | | | |
11/10/2023 | | Deutsche Bank | | United States Dollar | | | 133,000 | | | Indian Rupee | | | 11,093,384 | | | | (194 | ) |
| | | | | | |
11/10/2023 | | HSBC Bank | | United States Dollar | | | 11,507 | | | Indonesian Rupiah | | | 183,427,671 | | | | (27 | ) |
| | | | | | |
11/15/2023 | | Citibank | | Thai Baht | | | 2,316,584 | | | United States Dollar | | | 66,496 | | | | (1,957 | ) |
| | | | | | |
11/15/2023 | | Standard Chartered | | Thai Baht | | | 2,597,000 | | | United States Dollar | | | 74,168 | | | | (1,817 | ) |
| | | | | | |
11/15/2023 | | Deutsche Bank | | United States Dollar | | | 7,754 | | | Thai Baht | | | 284,050 | | | | (159 | ) |
| | | | | | |
11/15/2023 | | HSBC Bank | | United States Dollar | | | 2,917 | | | Thai Baht | | | 106,988 | | | | (64 | ) |
| | | | | | |
11/20/2023 | | Citibank | | Chinese Offshore Yuan | | | 5,024,853 | | | United States Dollar | | | 705,698 | | | | (20,284 | ) |
| | | | | | |
11/20/2023 | | HSBC Bank | | Chinese Offshore Yuan | | | 393,534 | | | United States Dollar | | | 54,247 | | | | (567 | ) |
| | | | | | |
11/20/2023 | | Merrill Lynch | | Chinese Offshore Yuan | | | 152,931 | | | United States Dollar | | | 21,000 | | | | (140 | ) |
| | | | | | |
11/20/2023 | | Standard Chartered | | Chinese Offshore Yuan | | | 70,300 | | | United States Dollar | | | 9,688 | | | | (99 | ) |
| | | | | | |
11/24/2023 | | Deutsche Bank | | United States Dollar | | | 110,000 | | | Korean Won | | | 149,204,000 | | | | (475 | ) |
| | | | | | |
11/24/2023 | | HSBC Bank | | United States Dollar | | | 43,519 | | | Korean Won | | | 58,787,108 | | | | (8 | ) |
| | | | | | |
11/30/2023 | | Standard Chartered | | Malaysian Ringgit | | | 2,842,556 | | | United States Dollar | | | 614,932 | | | | (17,104 | ) |
| | | | | | |
11/30/2023 | | Merrill Lynch | | Philippine Peso | | | 280,655 | | | United States Dollar | | | 4,983 | | | | (42 | ) |
| | | | | | |
11/30/2023 | | Deutsche Bank | | Thai Baht | | | 2,932,000 | | | United States Dollar | | | 84,341 | | | | (2,548 | ) |
| | | | | | |
11/30/2023 | | UBS | | Thai Baht | | | 3,113,000 | | | United States Dollar | | | 89,882 | | | | (3,040 | ) |
| | | | | | |
11/30/2023 | | Deutsche Bank | | United States Dollar | | | 106,829 | | | Thai Baht | | | 3,834,068 | | | | (129 | ) |
| | | | | | |
11/30/2023 | | UBS | | United States Dollar | | | 14,800 | | | Thai Baht | | | 533,115 | | | | (72 | ) |
| | | | | | |
12/11/2023 | | HSBC Bank | | Indian Rupee | | | 9,951,000 | | | United States Dollar | | | 119,767 | | | | (419 | ) |
| | | | | | |
12/11/2023 | | Deutsche Bank | | Indonesian Rupiah | | | 31,386,000 | | | United States Dollar | | | 2,000 | | | | (31 | ) |
| | | | | | |
12/11/2023 | | BNP Paribas | | Korean Won | | | 110,641,577 | | | United States Dollar | | | 84,100 | | | | (2,128 | ) |
See accompanying notes to the financial statements.
98
ASHMORE EMERGING MARKETS LOCAL CURRENCY BOND FUND
SCHEDULE OF INVESTMENTS (CONTINUED)
As of October 31, 2023
| | | | | | | | | | | | | | | | | | |
Settlement
Date | | Counterparty | | Currency Buy | | Currency Buy Amount
(Local
Currency) | | | Currency Sell | | Currency Sell Amount
(Local
Currency) | | | Unrealized
Gain/(Loss) |
| | | | | | |
| 12/11/2023 | | JP Morgan | | United States Dollar | | | 134,000 | | | Indian Rupee | | | 11,193,154 | | | | $ (246) | |
| | | | | | |
| 01/12/2024 | | Deutsche Bank | | Indonesian Rupiah | | | 31,428,000 | | | United States Dollar | | | 2,000 | | | | (30) | |
| | | | | | |
| 01/12/2024 | | HSBC Bank | | Indonesian Rupiah | | | 768,418,000 | | | United States Dollar | | | 49,000 | | | | (821) | |
| | | | | | |
| 01/12/2024 | | JP Morgan | | Indonesian Rupiah | | | 817,232,000 | | | United States Dollar | | | 52,000 | | | | (760) | |
| | | | | | |
| 01/12/2024 | | HSBC Bank | | United States Dollar | | | 194,153 | | | Korean Won | | | 261,552,711 | | | | (18) | |
| | | | | | |
| 01/16/2024 | | Morgan Stanley | | Egyptian Pound | | | 359,485 | | | United States Dollar | | | 10,705 | | | | (347) | |
| | | | | | |
| 01/31/2024 | | Morgan Stanley | | Czech Koruna | | | 213,238 | | | United States Dollar | | | 9,170 | | | | (3) | |
| | | | | | |
| 01/31/2024 | | BNP Paribas | | Polish Zloty | | | 1,110,555 | | | United States Dollar | | | 263,371 | | | | (448) | |
| | | | | | |
| 01/31/2024 | | Morgan Stanley | | Polish Zloty | | | 43,456 | | | United States Dollar | | | 10,313 | | | | (24) | |
| | | | | | |
| 01/31/2024 | | BNP Paribas | | United States Dollar | | | 6,160 | | | Colombian Peso | | | 26,631,431 | | | | (169) | |
| | | | | | |
| 01/31/2024 | | Merrill Lynch | | United States Dollar | | | 16,458 | | | Colombian Peso | | | 71,136,276 | | | | (448) | |
| | | | | | |
| 01/31/2024 | | UBS | | United States Dollar | | | 12,010 | | | Czech Koruna | | | 280,986 | | | | (69) | |
| | | | | | |
| 01/31/2024 | | Morgan Stanley | | United States Dollar | | | 12,120 | | | Mexican Peso | | | 224,920 | | | | (154) | |
| | | | | | |
| 01/31/2024 | | JP Morgan | | United States Dollar | | | 13,580 | | | Peruvian Nuevo Sol | | | 52,738 | | | | (98) | |
| | | | | | |
| 01/31/2024 | | Morgan Stanley | | United States Dollar | | | 216,509 | | | Peruvian Nuevo Sol | | | 843,151 | | | | (2,175) | |
| | | | | | |
| 01/31/2024 | | State Street | | United States Dollar | | | 7,230 | | | Polish Zloty | | | 30,722 | | | | (43) | |
| | | | | | |
| 01/31/2024 | | Barclays | | United States Dollar | | | 6,710 | | | Romanian Leu | | | 31,549 | | | | (4) | |
| | | | | | |
| 01/31/2024 | | Citibank | | United States Dollar | | | 100,400 | | | Romanian Leu | | | 473,046 | | | | (268) | |
| | | | | | |
| 01/31/2024 | | HSBC Bank | | United States Dollar | | | 10,190 | | | South African Rand | | | 196,897 | | | | (288) | |
| | | | | | |
| 01/31/2024 | | Morgan Stanley | | United States Dollar | | | 132,764 | | | South African Rand | | | 2,558,809 | | | | (3,409) | |
| | | | | | |
| 02/12/2024 | | Deutsche Bank | | Indian Rupee | | | 8,855,196 | | | United States Dollar | | | 106,230 | | | | (333) | |
| | | | | | | | | | | | | | | | | | |
| | | | | |
Subtotal Depreciation | | | | | | | | | | | | | | | (68,420) | |
| | | | | | | | | | | | | | | | |
| | | | | | |
| Total | | | | | | | | | | | | | | | | | $(13,154) | |
| | | | | | | | | | | | | | | | | | |
At October 31, 2023, the Ashmore Emerging Markets Local Currency Bond Fund had the following over the counter interest rate swap contracts outstanding:
| | | | | | | | | | | | | | | | | | | | | | | | | | | | |
Pay Rate Index/ Pay Rate | | Receive Rate/
Receive Rate
Index | | Notional Amount | | | Expiration
Date | | | Fair
Value | | | Premiums
Paid/
(Received) | | Unrealized
Appreciation
(Depreciation) | | | Counterparty | |
MYR-KLIBOR-BNM 3 Month Rate
(Pay Quarterly) | | 3.622% (Receive Quarterly) | | | MYR | | | | 500,000 | | | | 3/15/2028 | | | | $(1,272) | | | $— | | | $(1,272) | | | | HSBC Bank | |
MYR-KLIBOR-BNM 3 Month Rate
(Pay Quarterly) | | 3.680% (Receive Quarterly) | | | MYR | | | | 1,000,000 | | | | 3/15/2028 | | | | (2,028) | | | — | | | (2,028) | | | | HSBC Bank | |
| | | | | | | | | | | | | | | | | | | | | | | | | | | | |
| | | | | | | | | | | | | | | | | | | | | | | $(3,300) | | | | | |
| | | | | | | | | | | | | | | | | | | | | | | | | | | | |
See accompanying notes to the financial statements.
99
ASHMORE EMERGING MARKETS LOCAL CURRENCY BOND FUND
SCHEDULE OF INVESTMENTS (CONTINUED)
As of October 31, 2023
At October 31, 2023, the Ashmore Emerging Markets Local Currency Bond Fund had the following centrally cleared interest rate swap contracts outstanding:
| | | | | | | | | | | | | | | | | | | | | | | | | | |
Pay Rate Index/ Pay Rate | | Receive Rate/ Receive Rate Index | | | Notional Amount | | | Expiration
Date | | | Fair Value/
Unrealized
Appreciation
(Depreciation)** | | | Variation
Margin
Receivable
(Payable) | | Counterparty | |
| |
| | | | | | | |
5.430% (Pay Semiannually) | |
| CLP-CLICP 1 Day Rate
(Receive Semiannually) |
| | | CLP | | | | 38,700,000 | | | | 8/17/2033 | | | | $ 2,280 | | | $23 | | | HSBC Bank | |
| | | | | | | |
5.550% (Pay Semiannually) | |
| CLP-CLICP 1 Day Rate
(Receive Semiannually) |
| | | CLP | | | | 65,800,000 | | | | 8/22/2028 | | | | 2,359 | | | (1) | | | Merrill Lynch | |
| | | | | | | |
CFETS China Fixing Repo Rates 7 Day (Pay Quarterly) | |
| 2.775% (Receive
Quarterly) |
| | | CNY | | | | 1,700,000 | | | | 3/15/2028 | | | | 4,097 | | | 98 | | | HSBC Bank | |
| | | | | | | |
CZK-PRIBOR-P 6 Month Rate (Pay Semiannually) | |
| 5.049% (Receive
Annually) |
| | | CZK | | | | 3,255,818 | | | | 12/20/2025 | | | | 743 | | | 294 | | | BNP Paribas | |
| | | | | | | |
KWDCD 3 Month Rate (Pay Quarterly) | |
| 3.560% (Receive
Quarterly) |
| | | KRW | | | | 96,700,000 | | | | 7/17/2026 | | | | (935) | | | (14) | | | BNP Paribas | |
| | | | | | | |
KWDCD 3 Month Rate (Pay Quarterly) | |
| 3.490% (Receive
Quarterly) |
| | | KRW | | | | 96,703,000 | | | | 7/20/2026 | | | | (1,067) | | | (14) | | | HSBC Bank | |
| | | | | | | |
KWDCD 3 Month Rate (Pay Quarterly) | |
| 3.535% (Receive
Quarterly) |
| | | KRW | | | | 96,180,000 | | | | 7/19/2026 | | | | (978) | | | (14) | | | BNP Paribas | |
| | | | | | | |
KWDCD 3 Month Rate (Pay Quarterly) | |
| 3.540% (Receive
Quarterly) |
| | | KRW | | | | 97,230,000 | | | | 7/21/2026 | | | | (978) | | | (14) | | | BNP Paribas | |
| | | | | | | |
KWDCD 3 Month Rate (Pay Quarterly) | |
| 3.565% (Receive
Quarterly) |
| | | KRW | | | | 97,750,000 | | | | 7/25/2026 | | | | (941) | | | (14) | | | BNP Paribas | |
| | | | | | | |
MXN-TIIE-BANXICO 28 Day Rate (Pay Lunar) | |
| 8.880% (Receive
Lunar) |
| | | MXN | | | | 2,200,000 | | | | 8/9/2028 | | | | (4,243) | | | 165 | | | BNP Paribas | |
| | | | | | | |
MXN-TIIE-BANXICO 28 Day Rate (Pay Lunar) | |
| 9.015% (Receive
Lunar) |
| | | MXN | | | | 2,450,000 | | | | 8/14/2028 | | | | (3,970) | | | 186 | | | HSBC Bank | |
| | | | | | | |
MXN-TIIE-BANXICO 28 Day Rate (Pay Lunar) | |
| 9.435% (Receive
Lunar) |
| | | MXN | | | | 2,400,000 | | | | 12/13/2028 | | | | (1,131) | | | 196 | | | Merrill Lynch | |
| | | | | | | |
2.425% (Pay Quarterly) | |
| Thai Overnight
Repurchase Rate
(THOR) (Receive
Quarterly) |
| | | THB | | | | 3,680,000 | | | | 6/21/2028 | | | | 1,643 | | | (60) | | | Merrill Lynch | |
| | | | | | | |
9.605% (Pay Quarterly) | |
| ZAR-JIBAR 3 Month
Rate (Receive
Quarterly) |
| | | ZAR | | | | 1,500,000 | | | | 12/20/2033 | | | | 1,358 | | | (376) | | | Deutsche Bank | |
| | | | | | | | | | | | | | | | | | | | | | | | | | |
| | | | | | | | | | | | | | | | | | | $(1,763) | | | $455 | | | | |
| | | | | | | | | | | | | | | | | | | | | | | | | | |
**Includes cumulative appreciation/depreciation on centrally cleared interest rate swap agreements. Only the current day’s variation margin is reported within the Statements of Assets and Liabilities.
See accompanying notes to the financial statements.
100
ASHMORE EMERGING MARKETS LOCAL CURRENCY BOND FUND
SCHEDULE OF INVESTMENTS (CONTINUED)
As of October 31, 2023
The inputs of methodologies used for valuing securities are not necessarily an indication of the risks associated with investing in those securities and other financial instruments, if any. See note 4 in the Notes to the Financial Statements for more information regarding pricing inputs and valuation techniques. The following is a summary of the inputs used in valuing the Ashmore Emerging Markets Local Currency Bond Fund’s investments and other financial instruments, which are carried at fair value, as of October 31, 2023:
| | | | | | | | | | | | | | | | |
| | | Level 1 | | | Level 2 | | | Level 3 | | | Total | |
Investments | | | | | | | | | | | | | | | | |
| | | | |
Assets: | | | | | | | | | | | | | | | | |
| | | | |
Debt Securities | | | | | | | | | | | | | | | | |
| | | | |
Financial Certificates | | | $— | | | | $ 22,223 | | | | $— | | | | $ 22,223 | |
| | | | |
Government Agencies | | | — | | | | 34,367 | | | | — | | | | 34,367 | |
| | | | |
Government Bonds | | | — | | | | 9,470,347 | | | | — | | | | 9,470,347 | |
| | | | |
Index Linked Government Bonds | | | — | | | | 25,910 | | | | — | | | | 25,910 | |
| | | | |
Short Term Bills and Notes | | | — | | | | 404,219 | | | | — | | | | 404,219 | |
| | | | | | | | | | | | | | | | |
Total Debt Securities | | | — | | | | 9,957,066 | | | | — | | | | 9,957,066 | |
| |
Total Investments | | | $— | | | | $9,957,066 | | | | $— | | | | $9,957,066 | |
| |
| | | | |
Other Financial Instruments | | | | | | | | | | | | | | | | |
| | | | |
Assets: | | | | | | | | | | | | | | | | |
Forward Foreign Currency Exchange Contracts | | | $— | | | | $ 55,266 | | | | $— | | | | $ 55,266 | |
Centrally Cleared Interest Rate Swap Contracts† | | | — | | | | 12,480 | | | | — | | | | 12,480 | |
Liabilities: | | | | | | | | | | | | | | | | |
Forward Foreign Currency Exchange Contracts | | | — | | | | (68,420 | ) | | | — | | | | (68,420 | ) |
Over the Counter Interest Rate Swap Contracts | | | — | | | | (3,300 | ) | | | — | | | | (3,300 | ) |
Centrally Cleared Interest Rate Swap Contracts† | | | — | | | | (14,243 | ) | | | — | | | | (14,243 | ) |
| |
Total Other Financial Instruments | | | $— | | | | $(18,217 | ) | | | $— | | | | $(18,217 | ) |
| |
†Includes cumulative appreciation/depreciation on centrally cleared interest rate swap agreements. Only the current day’s variation margin is reported within the Statements of Assets and Liabilities.
See accompanying notes to the financial statements.
101
ASHMORE EMERGING MARKETS LOCAL CURRENCY BOND FUND
SCHEDULE OF INVESTMENTS (CONTINUED)
As of October 31, 2023
The following is a summary of the fair values of the Fund’s derivative instruments*:
Fair Values of Financial Derivative Instruments on the Statements of Assets and Liabilities as of October 31, 2023:
| | | | | | | | |
| | | Derivatives Not Accounted for as
Hedging Instruments | |
| | | Foreign | | | Interest | |
| | | Exchange Risk | | | Rate Risk | |
| |
Assets: | | | | | | | | |
Unrealized Appreciation on Centrally Cleared Interest Rate Swap Contracts | | | $ — | | | | $ 12,480 | † |
Unrealized Appreciation on Forward Foreign Currency Exchange Contracts | | | 55,266 | | | | — | |
| | | | |
| | | $ 55,266 | | | | $ 12,480 | |
| | | | |
Liabilities: | | | | | | | | |
Unrealized Depreciation on Centrally Cleared Interest Rate Swap Contracts | | | $ — | | | | $(14,243 | )† |
Unrealized Depreciation on Over the Counter Interest Rate Swap Contracts | | | — | | | | (3,300 | ) |
Unrealized Depreciation on Forward Foreign Currency Exchange Contracts | | | (68,420 | ) | | | — | |
| | | | |
| | | $(68,420 | ) | | | $(17,543 | ) |
| | | | |
| † | Includes cumulative appreciation/depreciation on centrally cleared interest rate swap agreements. Only the current day’s variation margin is reported within the Statements of Assets and Liabilities. |
The Effect of Financial Derivative Instruments on the Statements of Operations for the Year Ended October 31, 2023:
| | | | | | | | |
| | | Derivatives Not Accounted for as
Hedging Instruments | |
| | | Foreign | | | Interest | |
| | | Exchange Risk | | | Rate Risk | |
| |
Realized Gain (Loss) on Derivatives Recognized resulting from Operations: | | | | | | | | |
Net Realized Loss on Forward Foreign Currency Exchange Contracts | | | $(175,508 | ) | | | $ — | |
Net Realized Loss on Interest Rate Swap Contracts | | | — | | | | (28,570 | ) |
| | | | |
| | | $(175,508 | ) | | | $(28,570 | ) |
| | | | |
| | |
Net Change in Unrealized Appreciation (Depreciation) on Derivatives Recognized resulting from Operations: | | | | | | | | |
Net Change in Unrealized Appreciation on Forward Foreign Currency Exchange Contracts | | | $ 40,996 | | | | $ — | |
Net Change in Unrealized Appreciation on Interest Rate Swap Contracts | | | — | | | | 28,940 | |
| | | | |
| | | $ 40,996 | | | | $ 28,940 | |
| | | | |
* See note 10 in the Notes to the Financial Statements for additional information.
See accompanying notes to the financial statements.
102
ASHMORE EMERGING MARKETS CORPORATE INCOME FUND
SCHEDULE OF INVESTMENTS
As of October 31, 2023
| | | | | | | | | | | | | | | | |
| | | | | | | | | | | | % of Net | |
| | | Currency1 | | | Par | | | Value | | | Assets | |
| |
Debt Securities | | | | | | | | | | | | | | | | |
| | | | |
Bahrain (Cost $258,839) | | | | | | | | | | | | | | | | |
BBK BSC, 5.500%, 07/09/2024 | | | | | | | 260,000 | | | $ | 255,531 | | | | 0.35 | |
| | | | | | | | | | | 255,531 | | | | 0.35 | |
| | | | |
Brazil (Cost $9,019,340) | | | | | | | | | | | | | | | | |
Aegea Finance S.a.r.l., 9.000%, 01/20/20312 | | | | | | | 300,000 | | | | 299,250 | | | | 0.41 | |
Banco do Brasil S.A., (Variable, U.S. Treasury Yield Curve Rate CMT 10Y + 4.398%), 6.250%, 04/15/20243 | | | | | | | 323,000 | | | | 308,869 | | | | 0.42 | |
Braskem Netherlands Finance B.V., (Variable, U.S. Treasury Yield Curve Rate CMT 5Y + 8.220%), 8.500%, 01/23/20813 | | | | | | | 350,000 | | | | 339,920 | | | | 0.47 | |
BRF S.A., 5.750%, 09/21/2050 | | | | | | | 210,000 | | | | 136,172 | | | | 0.19 | |
CSN Inova Ventures, 6.750%, 01/28/2028 | | | | | | | 425,000 | | | | 388,747 | | | | 0.53 | |
Globo Comunicacao e Participacoes S.A., 5.500%, 01/14/2032 | | | | | | | 400,000 | | | | 313,000 | | | | 0.43 | |
InterCement Financial Operations B.V., 5.750%, 07/17/2024 | | | | | | | 730,000 | | | | 453,520 | | | | 0.62 | |
JBS U.S.A. LUX S.A./JBS U.S.A. Food Co./JBS U.S.A. Finance, Inc., 2.500%, 01/15/2027 | | | | | | | 200,000 | | | | 175,326 | | | | 0.24 | |
JBS U.S.A. LUX S.A./JBS U.S.A. Food Co./JBS U.S.A. Finance, Inc., 5.125%, 02/01/2028 | | | | | | | 60,000 | | | | 56,311 | | | | 0.08 | |
JBS U.S.A. LUX S.A./JBS U.S.A. Food Co./JBS U.S.A. Finance, Inc., 3.625%, 01/15/2032 | | | | | | | 100,000 | | | | 76,327 | | | | 0.10 | |
MARB BondCo PLC, 3.950%, 01/29/2031 | | | | | | | 335,000 | | | | 243,713 | | | | 0.33 | |
MC Brazil Downstream Trading S.a.r.l., 7.250%, 06/30/2031 | | | | | | | 739,182 | | | | 525,928 | | | | 0.72 | |
Minerva Luxembourg S.A., 8.875%, 09/13/20332 | | | | | | | 200,000 | | | | 195,890 | | | | 0.27 | |
Oi S.A., 14.000%, (66% PIK), 09/07/20242,4,5 | | | | | | | 400,053 | | | | 398,052 | | | | 0.55 | |
Oi S.A., 14.000%, (100% Cash), 09/07/20242,4,5,6 | | | | | | | 4,312 | | | | 4,291 | | | | 0.01 | |
Oi S.A., 10.000%, 07/27/20254,7 | | | | | | | 4,374,000 | | | | 196,830 | | | | 0.27 | |
Petrobras Global Finance B.V., 6.850%, 06/05/2115 | | | | | | | 220,000 | | | | 184,767 | | | | 0.25 | |
Sitios Latinoamerica S.A.B. de C.V., 5.375%, 04/04/2032 | | | | | | | 275,000 | | | | 228,938 | | | | 0.31 | |
Suzano Austria GmbH, 3.125%, 01/15/2032 | | | | | | | 360,000 | | | | 270,562 | | | | 0.37 | |
| | | | | | | | | | | 4,796,413 | | | | 6.57 | |
| | | | |
Chile (Cost $3,726,772) | | | | | | | | | | | | | | | | |
Antofagasta PLC, 5.625%, 05/13/2032 | | | | | | | 200,000 | | | | 184,000 | | | | 0.25 | |
Banco de Chile, 2.990%, 12/09/2031 | | | | | | | 370,000 | | | | 292,415 | | | | 0.40 | |
Banco de Credito e Inversiones S.A., 3.500%, 10/12/2027 | | | | | | | 230,000 | | | | 207,575 | | | | 0.29 | |
Banco Santander Chile, 2.700%, 01/10/2025 | | | | | | | 225,000 | | | | 214,641 | | | | 0.30 | |
BPCE S.A., 3.150%, 03/06/2030 | | | | | | | 245,000 | | | | 199,565 | | | | 0.27 | |
Cencosud S.A., 4.375%, 07/17/2027 | | | | | | | 200,000 | | | | 183,300 | | | | 0.25 | |
GNL Quintero S.A., 4.634%, 07/31/2029 | | | | | | | 589,510 | | | | 557,087 | | | | 0.76 | |
Inversiones CMPC S.A., 4.750%, 09/15/2024 | | | | | | | 210,000 | | | | 206,132 | | | | 0.28 | |
VTR Comunicaciones S.p.A., 5.125%, 01/15/2028 | | | | | | | 500,000 | | | | 218,750 | | | | 0.30 | |
VTR Finance N.V., 6.375%, 07/15/2028 | | | | | | | 1,000,000 | | | | 171,850 | | | | 0.24 | |
| | | | | | | | | | | 2,435,315 | | | | 3.34 | |
| | | | |
China (Cost $30,489,265) | | | | | | | | | | | | | | | | |
Agile Group Holdings Ltd., 5.500%, 04/21/2025 | | | | | | | 260,000 | | | | 24,643 | | | | 0.03 | |
Alibaba Group Holding Ltd., 3.400%, 12/06/2027 | | | | | | | 200,000 | | | | 182,521 | | | | 0.25 | |
See accompanying notes to the financial statements.
103
ASHMORE EMERGING MARKETS CORPORATE INCOME FUND
SCHEDULE OF INVESTMENTS (CONTINUED)
As of October 31, 2023
| | | | | | | | | | | | | | | | |
| | | | | | | | | | | | % of Net | |
| | | Currency1 | | | Par | | | Value | | | Assets | |
| |
China (continued) | | | | | | | | | | | | | | | | |
Bank of China Ltd., 5.000%, 11/13/2024 | | | | | | | 295,000 | | | $ | 291,796 | | | | 0.40 | |
Central China Real Estate Ltd., 7.250%, 07/16/20247 | | | | | | | 465,000 | | | | 13,950 | | | | 0.02 | |
Central China Real Estate Ltd., 7.250%, 08/13/20247 | | | | | | | 1,846,000 | | | | 55,380 | | | | 0.08 | |
Central China Real Estate Ltd., 7.250%, 04/28/20257 | | | | | | | 190,000 | | | | 6,650 | | | | 0.01 | |
Central China Real Estate Ltd., 7.650%, 08/27/20257 | | | | | | | 200,000 | | | | 7,000 | | | | 0.01 | |
CFLD Cayman Investment Ltd., 2.500%, 01/31/20312 | | | | | | | 2,405,720 | | | | 179,106 | | | | 0.25 | |
China Evergrande Group, 7.500%, 06/28/20237,8 | | | | | | | 3,444,000 | | | | 68,880 | | | | 0.09 | |
China SCE Group Holdings Ltd., 7.375%, 04/09/20247 | | | | | | | 200,000 | | | | 9,500 | | | | 0.01 | |
China SCE Group Holdings Ltd., 5.950%, 09/29/20247 | | | | | | | 420,000 | | | | 19,031 | | | | 0.03 | |
China SCE Group Holdings Ltd., 7.000%, 05/02/20257 | | | | | | | 851,000 | | | | 37,444 | | | | 0.05 | |
China SCE Group Holdings Ltd., 6.000%, 02/04/20267 | | | | | | | 560,000 | | | | 24,640 | | | | 0.03 | |
CIFI Holdings Group Co. Ltd., 5.950%, 10/20/20257 | | | | | | | 560,000 | | | | 30,800 | | | | 0.04 | |
ENN Energy Holdings Ltd., 4.625%, 05/17/2027 | | | | | | | 200,000 | | | | 191,216 | | | | 0.26 | |
ENN Energy Holdings Ltd., 2.625%, 09/17/2030 | | | | | | | 200,000 | | | | 158,281 | | | | 0.22 | |
Fantasia Holdings Group Co. Ltd., 15.000%, 12/18/20217,8 | | | | | | | 830,000 | | | | 24,900 | | | | 0.03 | |
Fantasia Holdings Group Co. Ltd., 7.950%, 07/05/20227,8 | | | | | | | 3,360,000 | | | | 116,827 | | | | 0.16 | |
Fantasia Holdings Group Co. Ltd., 12.250%, 10/18/20227,8 | | | | | | | 1,840,000 | | | | 55,200 | | | | 0.08 | |
Fantasia Holdings Group Co. Ltd., 10.875%, 01/09/20237,8 | | | | | | | 925,000 | | | | 27,750 | | | | 0.04 | |
Fantasia Holdings Group Co. Ltd., 11.875%, 06/01/20237,8 | | | | | | | 770,000 | | | | 23,100 | | | | 0.03 | |
Kaisa Group Holdings Ltd., 8.500%, 06/30/20227,8 | | | | | | | 1,577,000 | | | | 67,022 | | | | 0.09 | |
Kaisa Group Holdings Ltd., 11.500%, 01/30/20237,8 | | | | | | | 1,850,000 | | | | 78,625 | | | | 0.11 | |
Kaisa Group Holdings Ltd., 10.875%, 07/23/20237,8 | | | | | | | 690,000 | | | | 29,325 | | | | 0.04 | |
Kaisa Group Holdings Ltd., 9.375%, 06/30/20247 | | | | | | | 1,350,000 | | | | 57,375 | | | | 0.08 | |
Kaisa Group Holdings Ltd., 11.250%, 04/16/20257 | | | | | | | 1,180,000 | | | | 50,150 | | | | 0.07 | |
Kaisa Group Holdings Ltd., 11.700%, 11/11/20257 | | | | | | | 625,000 | | | | 26,563 | | | | 0.04 | |
KWG Group Holdings Ltd., 6.000%, 01/14/20247 | | | | | | | 490,000 | | | | 34,300 | | | | 0.05 | |
KWG Group Holdings Ltd., 7.400%, 01/13/20277 | | | | | | | 225,000 | | | | 15,750 | | | | 0.02 | |
Meituan, 0.000%, 04/27/20279 | | | | | | | 400,000 | | | | 357,600 | | | | 0.49 | |
New Metro Global Ltd., 4.625%, 10/15/2025 | | | | | | | 210,000 | | | | 45,098 | | | | 0.06 | |
Prime Bloom Holdings Ltd., 6.950%, 07/05/20227,8 | | | | | | | 960,000 | | | | 33,600 | | | | 0.05 | |
Redco Properties Group Ltd., 9.900%, 02/17/20247 | | | | | | | 980,000 | | | | 39,200 | | | | 0.05 | |
Shimao Group Holdings Ltd., 4.750%, 07/03/20227,8 | | | | | | | 860,000 | | | | 32,250 | | | | 0.04 | |
Sunac China Holdings Ltd., 7.250%, 06/14/20227,8 | | | | | | | 1,675,000 | | | | 230,312 | | | | 0.32 | |
Sunac China Holdings Ltd., 7.950%, 08/08/20227,8 | | | | | | | 200,000 | | | | 27,500 | | | | 0.04 | |
Sunac China Holdings Ltd., 7.500%, 02/01/20247 | | | | | | | 1,015,000 | | | | 139,562 | | | | 0.19 | |
Sunac China Holdings Ltd., 6.650%, 08/03/20247 | | | | | | | 200,000 | | | | 27,500 | | | | 0.04 | |
Sunac China Holdings Ltd., 6.500%, 01/10/20257 | | | | | | | 725,000 | | | | 97,875 | | | | 0.13 | |
Tencent Holdings Ltd., 3.975%, 04/11/2029 | | | | | | | 220,000 | | | | 197,457 | | | | 0.27 | |
Tunghsu Venus Holdings Ltd., 7.000%, 06/12/20207,8 | | | | | | | 2,785,000 | | | | 167,100 | | | | 0.23 | |
Xiaomi Best Time International Ltd., 0.000%, 12/17/20279 | | | | | | | 200,000 | | | | 172,599 | | | | 0.24 | |
Yuzhou Group Holdings Co. Ltd., 7.813%, 01/21/20237,8 | | | | | | | 3,200,550 | | | | 192,033 | | | | 0.26 | |
Yuzhou Group Holdings Co. Ltd., 6.350%, 01/13/20277 | | | | | | | 810,000 | | | | 47,588 | | | | 0.06 | |
Zhenro Properties Group Ltd., 8.700%, 08/03/20227,8 | | | | | | | 1,360,000 | | | | 5,739 | | | | 0.01 | |
Zhenro Properties Group Ltd., 6.500%, 09/01/20227,8 | | | | | | | 2,095,000 | | | | 10,035 | | | | 0.01 | |
Zhenro Properties Group Ltd., 9.150%, 05/06/20237,8 | | | | | | | 700,000 | | | | 3,500 | | | | — | |
See accompanying notes to the financial statements.
104
ASHMORE EMERGING MARKETS CORPORATE INCOME FUND
SCHEDULE OF INVESTMENTS (CONTINUED)
As of October 31, 2023
| | | | | | | | | | | | | | | | |
| | | | | | | | | | | | % of Net | |
| | | Currency1 | | | Par | | | Value | | | Assets | |
| |
China (continued) | | | | | | | | | | | | | | | | |
Zhenro Properties Group Ltd., 7.875%, 04/14/20247 | | | | | | | 2,315,000 | | | $ | 11,575 | | | | 0.02 | |
| | | | | | | | | | | 3,745,848 | | | | 5.13 | |
Colombia (Cost $2,869,112) | | | | | | | | | | | | | | | | |
ABRA Global Finance, 11.500%, 03/02/20284 | | | | | | | 883,320 | | | | 682,806 | | | | 0.94 | |
Bancolombia S.A., (Variable, U.S. Treasury Yield Curve Rate CMT 5Y + 2.944%), 4.625%, 12/18/20293 | | | | | | | 200,000 | | | | 173,680 | | | | 0.24 | |
Ecopetrol S.A., 6.875%, 04/29/2030 | | | | | | | 230,000 | | | | 206,184 | | | | 0.28 | |
Ecopetrol S.A., 8.875%, 01/13/2033 | | | | | | | 220,000 | | | | 210,320 | | | | 0.29 | |
Ecopetrol S.A., 5.875%, 05/28/2045 | | | | | | | 525,000 | | | | 339,780 | | | | 0.47 | |
Frontera Energy Corp., 7.875%, 06/21/2028 | | | | | | | 275,000 | | | | 207,240 | | | | 0.28 | |
Grupo Aval Ltd., 4.375%, 02/04/2030 | | | | | | | 400,000 | | | | 295,000 | | | | 0.40 | |
Oleoducto Central S.A., 4.000%, 07/14/2027 | | | | | | | 222,000 | | | | 194,425 | | | | 0.27 | |
Promigas S.A. ESP/Gases del Pacifico SAC, 3.750%,
10/16/2029 | | | | | | | 200,000 | | | | 161,000 | | | | 0.22 | |
| | | | | | | | | | | 2,470,435 | | | | 3.39 | |
| | | | |
Czech Republic (Cost $2,194,321) | | | | | | | | | | | | | | | | |
CETIN Group N.V., 3.125%, 04/14/2027 | | | EUR | | | | 220,000 | | | | 216,294 | | | | 0.30 | |
New World Resources N.V., 8.000%, 04/07/20207,8,10 | | | EUR | | | | 1,685,299 | | | | — | | | | — | |
New World Resources N.V., 0.000%, 10/07/20202,5,7,8,10 | | | EUR | | | | 101,612 | | | | — | | | | — | |
New World Resources N.V., 4.000%, 10/07/20207,8,10 | | | EUR | | | | 700,590 | | | | — | | | | — | |
| | | | | | | | | | | 216,294 | | | | 0.30 | |
| | | | |
Ecuador (Cost $218,640) | | | | | | | | | | | | | | | | |
International Airport Finance S.A., 12.000%, 03/15/2033 | | | | | | | 240,584 | | | | 227,953 | | | | 0.31 | |
| | | | | | | | | | | 227,953 | | | | 0.31 | |
| | | | |
Ghana (Cost $757,777) | | | | | | | | | | | | | | | | |
Kosmos Energy Ltd., 7.750%, 05/01/2027 | | | | | | | 440,000 | | | | 395,155 | | | | 0.54 | |
Tullow Oil PLC, 10.250%, 05/15/2026 | | | | | | | 340,000 | | | | 291,338 | | | | 0.40 | |
| | | | | | | | | | | 686,493 | | | | 0.94 | |
| | | | |
Guatemala (Cost $355,050) | | | | | | | | | | | | | | | | |
Millicom International Cellular S.A., 6.250%, 03/25/2029 | | | | | | | 369,000 | | | | 319,185 | | | | 0.44 | |
| | | | | | | | | | | 319,185 | | | | 0.44 | |
| | | | |
Hong Kong (Cost $2,026,296) | | | | | | | | | | | | | | | | |
AIA Group Ltd., (Variable, U.S. Treasury Yield Curve Rate CMT 5Y + 1.758%), 2.700%, 04/07/20263 | | | | | | | 200,000 | | | | 173,618 | | | | 0.24 | |
Bank of East Asia (The) Ltd., (Variable, U.S. Treasury Yield Curve Rate CMT 5Y + 3.750%), 4.000%, 05/29/20303 | | | | | | | 250,000 | | | | 229,750 | | | | 0.31 | |
HKT Capital No. 6 Ltd., 3.000%, 01/18/2032 | | | | | | | 240,000 | | | | 189,346 | | | | 0.26 | |
Phoenix Lead Ltd., 4.850%, 02/23/2024 | | | | | | | 475,000 | | | | 327,522 | | | | 0.45 | |
Standard Chartered PLC, (Variable, U.S. Treasury Yield Curve Rate CMT 1Y + 3.100%), 7.776%, 11/16/20253 | | | | | | | 385,000 | | | | 389,728 | | | | 0.53 | |
Standard Chartered PLC, (Variable, U.S. Treasury Yield Curve Rate CMT 1Y + 1.850%), 6.187%, 07/06/20273 | | | | | | | 260,000 | | | | 257,122 | | | | 0.35 | |
See accompanying notes to the financial statements.
105
ASHMORE EMERGING MARKETS CORPORATE INCOME FUND
SCHEDULE OF INVESTMENTS (CONTINUED)
As of October 31, 2023
| | | | | | | | | | | | | | | | |
| | | | | | | | | | | | % of Net | |
| | | Currency1 | | | Par | | | Value | | | Assets | |
| |
Hong Kong (continued) | | | | | | | | | | | | | | | | |
Standard Chartered PLC, (Variable, U.S. Treasury Yield Curve Rate CMT 1Y + 1.850%), 6.750%, 02/08/20283 | | | | | | | 260,000 | | | $ | 259,896 | | | | 0.36 | |
| | | | | | | | | | | 1,826,982 | | | | 2.50 | |
| | | | |
India (Cost $3,238,584) | | | | | | | | | | | | | | | | |
Bharti Airtel Ltd., 3.250%, 06/03/2031 | | | | | | | 715,000 | | | | 577,920 | | | | 0.79 | |
Greenko Power II Ltd., 4.300%, 12/13/2028 | | | | | | | 324,625 | | | | 272,312 | | | | 0.37 | |
Greenko Solar Mauritius Ltd., 5.950%, 07/29/2026 | | | | | | | 200,000 | | | | 183,650 | | | | 0.25 | |
HDFC Bank Ltd., 5.686%, 03/02/2026 | | | | | | | 400,000 | | | | 399,052 | | | | 0.55 | |
Network i2i Ltd., (Variable, U.S. Treasury Yield Curve Rate CMT 5Y + 3.390%), 3.975%, 03/03/20263 | | | | | | | 500,000 | | | | 450,375 | | | | 0.62 | |
Power Finance Corp. Ltd., 4.500%, 06/18/2029 | | | | | | | 640,000 | | | | 579,353 | | | | 0.79 | |
REC Ltd., 3.500%, 12/12/2024 | | | | | | | 210,000 | | | | 203,528 | | | | 0.28 | |
State Bank of India, 4.875%, 05/05/2028 | | | | | | | 380,000 | | | | 363,375 | | | | 0.50 | |
| | | | | | | | | | | 3,029,565 | | | | 4.15 | |
| | | | |
Indonesia (Cost $2,361,113) | | | | | | | | | | | | | | | | |
Bank Negara Indonesia Persero Tbk PT, 3.750%, 03/30/2026 | | | | | | | 275,000 | | | | 252,656 | | | | 0.35 | |
Bank Rakyat Indonesia Persero Tbk PT, 3.950%, 03/28/2024 | | | | | | | 200,000 | | | | 197,772 | | | | 0.27 | |
Freeport Indonesia PT, 4.763%, 04/14/2027 | | | | | | | 295,000 | | | | 279,460 | | | | 0.38 | |
Freeport Indonesia PT, 5.315%, 04/14/2032 | | | | | | | 200,000 | | | | 177,652 | | | | 0.24 | |
Indofood CBP Sukses Makmur Tbk PT, 3.398%, 06/09/2031 | | | | | | | 200,000 | | | | 158,164 | | | | 0.22 | |
Medco Bell Pte. Ltd., 6.375%, 01/30/2027 | | | | | | | 555,000 | | | | 519,624 | | | | 0.71 | |
Minejesa Capital B.V., 4.625%, 08/10/2030 | | | | | | | 200,000 | | | | 178,028 | | | | 0.25 | |
Minejesa Capital B.V., 5.625%, 08/10/2037 | | | | | | | 200,000 | | | | 147,512 | | | | 0.20 | |
Star Energy Geothermal Darajat II/Star Energy Geothermal Salak, 4.850%, 10/14/2038 | | | | | | | 510,000 | | | | 421,005 | | | | 0.58 | |
| | | | | | | | | | | 2,331,873 | | | | 3.20 | |
| | | | |
Iraq (Cost $882,693) | | | | | | | | | | | | | | | | |
DNO A.S.A., 7.875%, 09/09/20262 | | | | | | | 900,000 | | | | 835,313 | | | | 1.14 | |
| | | | | | | | | | | 835,313 | | | | 1.14 | |
| | | | |
Israel (Cost $3,630,187) | | | | | | | | | | | | | | | | |
Energian Israel Finance Ltd., 8.500%, 09/30/20332 | | | | | | | 490,000 | | | | 426,913 | | | | 0.59 | |
Leviathan Bond Ltd., 6.125%, 06/30/20252 | | | | | | | 400,000 | | | | 367,500 | | | | 0.50 | |
Leviathan Bond Ltd., 6.500%, 06/30/20272 | | | | | | | 413,000 | | | | 360,343 | | | | 0.49 | |
Leviathan Bond Ltd., 6.750%, 06/30/20302 | | | | | | | 600,000 | | | | 492,600 | | | | 0.68 | |
Teva Pharmaceutical Finance Netherlands II B.V., 4.375%, 05/09/2030 | | | EUR | | | | 600,000 | | | | 539,269 | | | | 0.74 | |
Teva Pharmaceutical Finance Netherlands III B.V., 6.750%, 03/01/2028 | | | | | | | 950,000 | | | | 906,822 | | | | 1.24 | |
| | | | | | | | | | | 3,093,447 | | | | 4.24 | |
| | | | |
Jordan (Cost $197,766) | | | | | | | | | | | | | | | | |
Hikma Finance U.S.A. LLC, 3.250%, 07/09/2025 | | | | | | | 200,000 | | | | 186,698 | | | | 0.26 | |
| | | | | | | | | | | 186,698 | | | | 0.26 | |
See accompanying notes to the financial statements.
106
ASHMORE EMERGING MARKETS CORPORATE INCOME FUND
SCHEDULE OF INVESTMENTS (CONTINUED)
As of October 31, 2023
| | | | | | | | | | | | | | | | |
| | | | | | | | | | | | % of Net | |
| | | Currency1 | | | Par | | | Value | | | Assets | |
| |
Kazakhstan (Cost $1,340,361) | | | | | | | | | | | | | | | | |
KazMunayGas National Co. JSC, 4.750%, 04/19/2027 | | | | | | | 200,000 | | | $ | 186,400 | | | | 0.26 | |
KazMunayGas National Co. JSC, 5.375%, 04/24/2030 | | | | | | | 610,000 | | | | 543,815 | | | | 0.74 | |
Tengizchevroil Finance Co. International Ltd., 4.000%, 08/15/2026 | | | | | | | 630,000 | | | | 560,858 | | | | 0.77 | |
| | | | | | | | | | | 1,291,073 | | | | 1.77 | |
| | | | |
Kuwait (Cost $1,220,957) | | | | | | | | | | | | | | | | |
MEGlobal Canada ULC, 5.000%, 05/18/2025 | | | | | | | 390,000 | | | | 378,909 | | | | 0.52 | |
NBK Tier 1 Financing 2 Ltd., (Variable, USD CMT 6Y + 2.832%), 4.500%, 08/27/20253 | | | | | | | 465,000 | | | | 425,475 | | | | 0.58 | |
NBK Tier 1 Ltd., (Variable, USD CMT 6Y + 2.875%), 3.625%, 08/24/20263 | | | | | | | 400,000 | | | | 344,250 | | | | 0.47 | |
| | | | | | | | | | | 1,148,634 | | | | 1.57 | |
| | | | |
Malaysia (Cost $302,558) | | | | | | | | | | | | | | | | |
MISC Capital Two Labuan Ltd., 3.750%, 04/06/2027 | | | | | | | 315,000 | | | | 289,602 | | | | 0.40 | |
| | | | | | | | | | | 289,602 | | | | 0.40 | |
| | | | |
Mexico (Cost $7,279,841) | | | | | | | | | | | | | | | | |
Alfa S.A.B. de C.V., 6.875%, 03/25/2044 | | | | | | | 240,000 | | | | 214,500 | | | | 0.29 | |
America Movil S.A.B. de C.V., 3.625%, 04/22/2029 | | | | | | | 235,000 | | | | 208,797 | | | | 0.29 | |
America Movil S.A.B. de C.V., 2.875%, 05/07/2030 | | | | | | | 245,000 | | | | 200,900 | | | | 0.28 | |
Banco Bilbao Vizcaya Argentaria S.A., (Variable,
U.S. Treasury Yield Curve Rate CMT 1Y + 2.300%), 5.862%, 09/14/20263 | | | | | | | 200,000 | | | | 197,187 | | | | 0.27 | |
Banco Mercantil del Norte S.A., (Variable, U.S. Treasury Yield Curve Rate CMT 5Y + 4.967%), 6.750%, 09/27/20243 | | | | | | | 800,000 | | | | 775,048 | | | | 1.06 | |
Banco Mercantil del Norte S.A., (Variable, U.S. Treasury Yield Curve Rate CMT 10Y + 7.760%), 8.375%, 10/14/20303 | | | | | | | 415,000 | | | | 378,039 | | | | 0.52 | |
Banco Santander Mexico S.A. Institucion de Banca Multiple Grupo Financiero Santander, 5.375%, 04/17/2025 | | | | | | | 170,000 | | | | 166,579 | | | | 0.23 | |
BBVA Bancomer S.A., (Variable, U.S. Treasury Yield Curve Rate CMT 5Y + 2.650%), 5.125%, 01/18/20333 | | | | | | | 535,000 | | | | 451,112 | | | | 0.62 | |
Cemex S.A.B. de C.V., (Variable, U.S. Treasury Yield Curve Rate CMT 5Y + 4.534%), 5.125%, 06/08/20263 | | | | | | | 450,000 | | | | 414,162 | | | | 0.57 | |
Cemex S.A.B. de C.V., (Variable, U.S. Treasury Yield Curve Rate CMT 5Y + 5.157%), 9.125%, 03/14/20283 | | | | | | | 330,000 | | | | 337,012 | | | | 0.46 | |
Cometa Energia S.A. de C.V., 6.375%, 04/24/2035 | | | | | | | 252,630 | | | | 229,681 | | | | 0.32 | |
Comision Federal de Electricidad, 3.348%, 02/09/2031 | | | | | | | 280,000 | | | | 212,100 | | | | 0.29 | |
Corp. Inmobiliaria Vesta S.A.B. de C.V., 3.625%, 05/13/2031 | | | | | | | 200,000 | | | | 157,994 | | | | 0.22 | |
El Puerto de Liverpool S.A.B. de C.V., 3.875%, 10/06/2026 | | | | | | | 200,000 | | | | 185,642 | | | | 0.25 | |
Grupo Bimbo S.A.B. de C.V., 3.875%, 06/27/2024 | | | | | | | 215,000 | | | | 211,749 | | | | 0.29 | |
Metalsa S.A.P.I de C.V., 3.750%, 05/04/2031 | | | | | | | 350,000 | | | | 261,275 | | | | 0.36 | |
Mexico Generadora de Energia S. de R.L., 5.500%, 12/06/2032 | | | | | | | 226,945 | | | | 207,513 | | | | 0.28 | |
Nemak S.A.B. de C.V., 3.625%, 06/28/2031 | | | | | | | 200,000 | | | | 146,750 | | | | 0.20 | |
Orbia Advance Corp. S.A.B. de C.V., 1.875%, 05/11/2026 | | | | | | | 200,000 | | | | 177,946 | | | | 0.24 | |
Orbia Advance Corp. S.A.B. de C.V., 4.000%, 10/04/2027 | | | | | | | 200,000 | | | | 180,618 | | | | 0.25 | |
Petroleos Mexicanos, 6.750%, 09/21/2047 | | | | | | | 450,000 | | | | 254,700 | | | | 0.35 | |
See accompanying notes to the financial statements.
107
ASHMORE EMERGING MARKETS CORPORATE INCOME FUND
SCHEDULE OF INVESTMENTS (CONTINUED)
As of October 31, 2023
| | | | | | | | | | | | | | | | |
| | | | | | | | | | | | % of Net | |
| | | Currency1 | | | Par | | | Value | | | Assets | |
| |
Mexico (continued) | | | | | | | | | | | | | | | | |
Petroleos Mexicanos, 6.950%, 01/28/2060 | | | | | | | 360,000 | | | $ | 203,850 | | | | 0.28 | |
Trust Fibra Uno, 4.869%, 01/15/2030 | | | | | | | 275,000 | | | | 228,250 | | | | 0.31 | |
Trust Fibra Uno, 6.390%, 01/15/2050 | | | | | | | 423,000 | | | | 294,382 | | | | 0.40 | |
| | | | | | | | | | | 6,295,786 | | | | 8.63 | |
| | | | |
Morocco (Cost $844,401) | | | | | | | | | | | | | | | | |
OCP S.A., 3.750%, 06/23/2031 | | | | | | | 320,000 | | | | 250,538 | | | | 0.34 | |
OCP S.A., 6.875%, 04/25/2044 | | | | | | | 200,000 | | | | 163,500 | | | | 0.23 | |
OCP S.A., 5.125%, 06/23/2051 | | | | | | | 400,000 | | | | 256,000 | | | | 0.35 | |
| | | | | | | | | | | 670,038 | | | | 0.92 | |
| | | | |
Nigeria (Cost $265,295) | | | | | | | | | | | | | | | | |
IHS Netherlands Holdco B.V., 8.000%, 09/18/2027 | | | | | | | 270,000 | | | | 220,253 | | | | 0.30 | |
| | | | | | | | | | | 220,253 | | | | 0.30 | |
| | | | |
Oman (Cost $487,411) | | | | | | | | | | | | | | | | |
Bank Muscat SAOG, 4.750%, 03/17/2026 | | | | | | | 200,000 | | | | 190,590 | | | | 0.26 | |
Oryx Funding Ltd., 5.800%, 02/03/2031 | | | | | | | 300,000 | | | | 276,387 | | | | 0.38 | |
| | | | | | | | | | | 466,977 | | | | 0.64 | |
| | | | |
Panama (Cost $548,305) | | | | | | | | | | | | | | | | |
C&W Senior Financing DAC, 6.875%, 09/15/2027 | | | | | | | 600,000 | | | | 512,880 | | | | 0.70 | |
| | | | | | | | | | | 512,880 | | | | 0.70 | |
| | | | |
Papua New Guinea (Cost $571,710) | | | | | | | | | | | | | | | | |
Puma International Financing S.A., 5.000%, 01/24/2026 | | | | | | | 600,000 | | | | 536,538 | | | | 0.73 | |
| | | | | | | | | | | 536,538 | | | | 0.73 | |
| | | | |
Peru (Cost $2,319,824) | | | | | | | | | | | | | | | | |
Banco de Credito del Peru S.A., 2.700%, 01/11/2025 | | | | | | | 240,000 | | | | 228,653 | | | | 0.31 | |
Banco de Credito del Peru S.A., (Variable, U.S. Treasury Yield Curve Rate CMT 5Y + 3.000%), 3.125%, 07/01/20303 | | | | | | | 175,000 | | | | 159,906 | | | | 0.22 | |
Banco Internacional del Peru S.A.A. Interbank, (Variable, ICE LIBOR USD 3M + 5.760%), 6.625%, 03/19/20293 | | | | | | | 150,000 | | | | 147,709 | | | | 0.20 | |
InRetail Shopping Malls, 5.750%, 04/03/2028 | | | | | | | 245,000 | | | | 225,527 | | | | 0.31 | |
Intercorp Peru Ltd., 3.875%, 08/15/2029 | | | | | | | 220,000 | | | | 177,782 | | | | 0.24 | |
Kallpa Generacion S.A., 4.125%, 08/16/2027 | | | | | | | 200,000 | | | | 179,750 | | | | 0.25 | |
Minsur S.A., 4.500%, 10/28/2031 | | | | | | | 615,000 | | | | 496,920 | | | | 0.68 | |
Nexa Resources S.A., 6.500%, 01/18/2028 | | | | | | | 200,000 | | | | 186,750 | | | | 0.26 | |
Southern Copper Corp., 3.875%, 04/23/2025 | | | | | | | 110,000 | | | | 105,738 | | | | 0.15 | |
Transportadora de Gas del Peru S.A., 4.250%, 04/30/2028 | | | | | | | 220,000 | | | | 206,754 | | | | 0.28 | |
| | | | | | | | | | | 2,115,489 | | | | 2.90 | |
| | | | |
Philippines (Cost $1,018,186) | | | | | | | | | | | | | | | | |
BDO Unibank, Inc., 2.125%, 01/13/2026 | | | | | | | 225,000 | | | | 207,655 | | | | 0.28 | |
Development Bank of the Philippines, 2.375%, 03/11/2031 | | | | | | | 450,000 | | | | 342,140 | | | | 0.47 | |
Metropolitan Bank & Trust Co., 2.125%, 01/15/2026 | | | | | | | 200,000 | | | | 184,310 | | | | 0.25 | |
See accompanying notes to the financial statements.
108
ASHMORE EMERGING MARKETS CORPORATE INCOME FUND
SCHEDULE OF INVESTMENTS (CONTINUED)
As of October 31, 2023
| | | | | | | | | | | | | | | | |
| | | | | | | | | | | | % of Net | |
| | | Currency1 | | | Par | | | Value | | | Assets | |
| |
Philippines (continued) | | | | | | | | | | | | | | | | |
Petron Corp., (Variable, 7.574% - U.S. Treasury Yield Curve Rate CMT 5Y), 5.950%, 04/19/20263 | | | | | | | 270,000 | | | $ | 246,731 | | | | 0.34 | |
| | | | | | | | | | | 980,836 | | | | 1.34 | |
| | | | |
Poland (Cost $612,151) | | | | | | | | | | | | | | | | |
GTC Aurora Luxembourg S.A., 2.250%, 06/23/2026 | | | EUR | | | | 300,000 | | | | 208,552 | | | | 0.29 | |
ORLEN S.A., 4.750%, 07/13/2030 | | | EUR | | | | 320,000 | | | | 335,521 | | | | 0.46 | |
| | | | | | | | | | | 544,073 | | | | 0.75 | |
| | | | |
Qatar (Cost $2,651,083) | | | | | | | | | | | | | | | | |
ABQ Finance Ltd., 3.125%, 09/24/2024 | | | | | | | 325,000 | | | | 315,048 | | | | 0.43 | |
ABQ Finance Ltd., 1.875%, 09/08/2025 | | | | | | | 250,000 | | | | 228,480 | | | | 0.31 | |
CBQ Finance Ltd., 2.000%, 09/15/2025 | | | | | | | 250,000 | | | | 229,332 | | | | 0.31 | |
CBQ Finance Ltd., 2.000%, 05/12/2026 | | | | | | | 260,000 | | | | 233,015 | | | | 0.32 | |
Doha Finance Ltd., 2.375%, 03/31/2026 | | | | | | | 635,000 | | | | 573,234 | | | | 0.79 | |
Nakilat, Inc., 6.067%, 12/31/2033 | | | | | | | 120,777 | | | | 120,297 | | | | 0.17 | |
Ooredoo International Finance Ltd., 5.000%, 10/19/2025 | | | | | | | 300,000 | | | | 295,312 | | | | 0.40 | |
QIB Sukuk Ltd., (Floating, ICE LIBOR USD 3M + 1.350%), 7.004%, 02/07/2025 | | | | | | | 600,000 | | | | 603,000 | | | | 0.83 | |
| | | | | | | | | | | 2,597,718 | | | | 3.56 | |
| | | | |
Romania (Cost $138,212) | | | | | | | | | | | | | | | | |
NE Property B.V., 2.000%, 01/20/2030 | | | EUR | | | | 175,000 | | | | 135,635 | | | | 0.19 | |
| | | | | | | | | | | 135,635 | | | | 0.19 | |
| | | | |
Russian Federation (Cost $1,481,647) | | | | | | | | | | | | | | | | |
Sovcombank Via SovCom Capital DAC, 7.600%, 02/17/20276,7 | | | | | | | 1,605,000 | | | | 2 | | | | — | |
| | | | | | | | | | | 2 | | | | — | |
| | | | |
Saudi Arabia (Cost $4,310,186) | | | | | | | | | | | | | | | | |
Acwa Power Management And Investments One Ltd., 5.950%, 12/15/2039 | | | | | | | 758,260 | | | | 710,489 | | | | 0.97 | |
Arabian Centres Sukuk II Ltd., 5.625%, 10/07/2026 | | | | | | | 800,000 | | | | 717,336 | | | | 0.98 | |
BSF Finance, 5.500%, 11/23/2027 | | | | | | | 200,000 | | | | 196,860 | | | | 0.27 | |
Dar Al-Arkan Sukuk Co. Ltd., 6.750%, 02/15/2025 | | | | | | | 600,000 | | | | 591,750 | | | | 0.81 | |
EIG Pearl Holdings S.a.r.l., 3.545%, 08/31/2036 | | | | | | | 420,000 | | | | 326,550 | | | | 0.45 | |
EIG Pearl Holdings S.a.r.l., 4.387%, 11/30/2046 | | | | | | | 540,000 | | | | 369,225 | | | | 0.51 | |
Gaci First Investment Co., 5.000%, 10/13/2027 | | | | | | | 200,000 | | | | 193,938 | | | | 0.27 | |
SA Global Sukuk Ltd., 1.602%, 06/17/2026 | | | | | | | 450,000 | | | | 402,750 | | | | 0.55 | |
Saudi Arabian Oil Co., 2.875%, 04/16/2024 | | | | | | | 340,000 | | | | 334,432 | | | | 0.46 | |
SNB Funding Ltd., 2.750%, 10/02/2024 | | | | | | | 200,000 | | | | 192,802 | | | | 0.26 | |
| | | | | | | | | | | 4,036,132 | | | | 5.53 | |
| | | | |
Singapore (Cost $985,358) | | | | | | | | | | | | | | | | |
DBS Group Holdings Ltd., (Variable, U.S. Treasury Yield Curve Rate CMT 5Y + 1.915%), 3.300%, 02/27/20253 | | | | | | | 370,000 | | | | 351,196 | | | | 0.48 | |
DBS Group Holdings Ltd., 5.479%, 09/12/20252 | | | | | | | 200,000 | | | | 199,942 | | | | 0.28 | |
Oversea-Chinese Banking Corp. Ltd., 4.250%, 06/19/2024 | | | | | | | 200,000 | | | | 197,618 | | | | 0.27 | |
See accompanying notes to the financial statements.
109
ASHMORE EMERGING MARKETS CORPORATE INCOME FUND
SCHEDULE OF INVESTMENTS (CONTINUED)
As of October 31, 2023
| | | | | | | | | | | | | | | | |
| | | | | | | | | | | | % of Net | |
| | | Currency1 | | | Par | | | Value | | | Assets | |
| |
Singapore (continued) | | | | | | | | | | | | | | | | |
Oversea-Chinese Banking Corp. Ltd., (Variable, U.S. Treasury Yield Curve Rate CMT 5Y + 1.580%), 1.832%, 09/10/20303 | | | | | | | 230,000 | | | $ | 211,867 | | | | 0.29 | |
| | | | | | | | | | | 960,623 | | | | 1.32 | |
| | | | |
South Africa (Cost $5,367,574) | | | | | | | | | | | | | | | | |
Absa Group Ltd., (Variable, U.S. Treasury Yield Curve Rate CMT 5Y + 5.411%), 6.375%, 05/27/20263 | | | | | | | 400,000 | | | | 359,880 | | | | 0.49 | |
Anglo American Capital PLC, 4.750%, 04/10/2027 | | | | | | | 200,000 | | | | 190,598 | | | | 0.26 | |
Anglo American Capital PLC, 4.000%, 09/11/2027 | | | | | | | 200,000 | | | | 184,880 | | | | 0.25 | |
Anglo American Capital PLC, 4.500%, 03/15/2028 | | | | | | | 404,000 | | | | 376,249 | | | | 0.52 | |
Anglo American Capital PLC, 3.875%, 03/16/2029 | | | | | | | 200,000 | | | | 176,326 | | | | 0.24 | |
Anglo American Capital PLC, 5.625%, 04/01/2030 | | | | | | | 230,000 | | | | 217,381 | | | | 0.30 | |
Anglo American Capital PLC, 5.500%, 05/02/2033 | | | | | | | 400,000 | | | | 363,864 | | | | 0.50 | |
AngloGold Ashanti Holdings PLC, 3.375%, 11/01/2028 | | | | | | | 270,000 | | | | 222,109 | | | | 0.31 | |
Gold Fields Orogen Holdings BVI Ltd., 5.125%, 05/15/2024 | | | | | | | 230,000 | | | | 227,635 | | | | 0.31 | |
Gold Fields Orogen Holdings BVI Ltd., 6.125%, 05/15/2029 | | | | | | | 210,000 | | | | 200,340 | | | | 0.28 | |
Liquid Telecommunications Financing PLC, 5.500%, 09/04/2026 | | | | | | | 600,000 | | | | 364,374 | | | | 0.50 | |
MTN Mauritius Investments Ltd., 6.500%, 10/13/2026 | | | | | | | 325,000 | | | | 316,875 | | | | 0.43 | |
Prosus N.V., 3.257%, 01/19/2027 | | | | | | | 200,000 | | | | 176,540 | | | | 0.24 | |
Prosus N.V., 3.680%, 01/21/2030 | | | | | | | 500,000 | | | | 396,250 | | | | 0.54 | |
Prosus N.V., 3.061%, 07/13/2031 | | | | | | | 320,000 | | | | 231,200 | | | | 0.32 | |
Sasol Financing U.S.A. LLC, 4.375%, 09/18/2026 | | | | | | | 300,000 | | | | 264,000 | | | | 0.36 | |
Sasol Financing U.S.A. LLC, 5.500%, 03/18/2031 | | | | | | | 445,000 | | | | 342,094 | | | | 0.47 | |
| | | | | | | | | | | 4,610,595 | | | | 6.32 | |
| | | | |
South Korea (Cost $1,951,975) | | | | | | | | | | | | | | | | |
Korea Gas Corp., 4.875%, 07/05/2028 | | | | | | | 200,000 | | | | 193,308 | | | | 0.27 | |
Kyobo Life Insurance Co. Ltd., (Variable, U.S. Treasury Yield Curve Rate CMT 5Y + 2.887%), 5.900%, 06/15/20523 | | | | | | | 425,000 | | | | 407,469 | | | | 0.56 | |
Shinhan Financial Group Co. Ltd., (Variable, U.S. Treasury Yield Curve Rate CMT 5Y + 2.064%), 2.875%, 05/12/20263 | | | | | | | 210,000 | | | | 182,958 | | | | 0.25 | |
Shinhan Financial Group Co. Ltd., (Variable, U.S. Treasury Yield Curve Rate CMT 5Y + 1.500%), 3.340%, 02/05/20303 | | | | | | | 315,000 | | | | 302,268 | | | | 0.42 | |
SK Hynix, Inc., 6.250%, 01/17/2026 | | | | | | | 200,000 | | | | 199,284 | | | | 0.27 | |
SK On Co. Ltd., 5.375%, 05/11/2026 | | | | | | | 200,000 | | | | 197,884 | | | | 0.27 | |
Woori Bank, 4.750%, 04/30/2024 | | | | | | | 430,000 | | | | 426,018 | | | | 0.58 | |
| | | | | | | | | | | 1,909,189 | | | | 2.62 | |
| | | | |
Taiwan (Cost $346,506) | | | | | | | | | | | | | | | | |
Foxconn Far East Ltd., 2.500%, 10/28/2030 | | | | | | | 200,000 | | | | 154,902 | | | | 0.21 | |
TSMC Global Ltd., 1.250%, 04/23/2026 | | | | | | | 200,000 | | | | 179,918 | | | | 0.25 | |
| | | | | | | | | | | 334,820 | | | | 0.46 | |
| | | | |
Tanzania (Cost $789,254) | | | | | | | | | | | | | | | | |
HTA Group Ltd., 7.000%, 12/18/2025 | | | | | | | 255,000 | | | | 245,608 | | | | 0.34 | |
HTA Group Ltd., 2.875%, 03/18/2027 | | | | | | | 600,000 | | | | 482,822 | | | | 0.66 | |
| | | | | | | | | | | 728,430 | | | | 1.00 | |
See accompanying notes to the financial statements.
110
ASHMORE EMERGING MARKETS CORPORATE INCOME FUND
SCHEDULE OF INVESTMENTS (CONTINUED)
As of October 31, 2023
| | | | | | | | | | | | | | | | |
| | | | | | | | | | | | % of Net | |
| | | Currency1 | | | Par | | | Value | | | Assets | |
| |
Thailand (Cost $1,530,999) | | | | | | | | | | | | | | | | |
Bangkok Bank PCL, (Variable, U.S. Treasury Yield Curve Rate CMT 5Y + 4.729%), 5.000%, 09/23/20253 | | | | | | | 270,000 | | | $ | 251,767 | | | | 0.34 | |
Bangkok Bank PCL, 9.025%, 03/15/2029 | | | | | | | 430,000 | | | | 470,781 | | | | 0.65 | |
GC Treasury Center Co. Ltd., 2.980%, 03/18/2031 | | | | | | | 400,000 | | | | 308,328 | | | | 0.42 | |
GC Treasury Center Co. Ltd., 4.400%, 03/30/2032 | | | | | | | 200,000 | | | | 166,298 | | | | 0.23 | |
Kasikornbank PCL, 5.458%, 03/07/2028 | | | | | | | 200,000 | | | | 195,820 | | | | 0.27 | |
| | | | | | | | | | | 1,392,994 | | | | 1.91 | |
| | | | |
Turkey (Cost $498,984) | | | | | | | | | | | | | | | | |
WE Soda Investments Holding PLC, 9.500%, 10/06/20282 | | | | | | | 300,000 | | | | 299,475 | | | | 0.41 | |
Yapi ve Kredi Bankasi A.S., 9.250%, 10/16/20282 | | | | | | | 200,000 | | | | 201,000 | | | | 0.28 | |
| | | | | | | | | | | 500,475 | | | | 0.69 | |
| | | | |
United Arab Emirates (Cost $4,132,175) | | | | | | | | | | | | | | | | |
Abu Dhabi National Energy Co. PJSC, 4.375%, 01/24/2029 | | | | | | | 200,000 | | | | 187,750 | | | | 0.26 | |
Abu Dhabi National Energy Co. PJSC, 4.696%, 04/24/2033 | | | | | | | 200,000 | | | | 183,500 | | | | 0.25 | |
DP World Ltd., 6.850%, 07/02/2037 | | | | | | | 410,000 | | | | 403,850 | | | | 0.55 | |
DP World Salaam, (Variable, U.S. Treasury Yield Curve Rate CMT 5Y + 5.750%), 6.000%, 10/01/20253 | | | | | | | 450,000 | | | | 439,317 | | | | 0.60 | |
Emirates NBD Bank PJSC, 5.625%, 10/21/2027 | | | | | | | 220,000 | | | | 216,425 | | | | 0.30 | |
First Abu Dhabi Bank PJSC, (Variable, U.S. Treasury Yield Curve Rate CMT 5Y + 4.138%), 4.500%, 04/05/20263 | | | | | | | 500,000 | | | | 468,125 | | | | 0.64 | |
First Abu Dhabi Bank PJSC, 5.125%, 10/13/2027 | | | | | | | 200,000 | | | | 195,986 | | | | 0.27 | |
Galaxy Pipeline Assets Bidco Ltd., 1.750%, 09/30/2027 | | | | | | | 226,310 | | | | 207,427 | | | | 0.28 | |
Galaxy Pipeline Assets Bidco Ltd., 2.940%, 09/30/2040 | | | | | | | 998,438 | | | | 735,849 | | | | 1.01 | |
GEMS MENASA Cayman Ltd./GEMS Education Delaware LLC, 7.125%, 07/31/2026 | | | | | | | 200,000 | | | | 191,500 | | | | 0.26 | |
MAF Global Securities Ltd., (Variable, U.S. Treasury Yield Curve Rate CMT 5Y + 3.539%), 6.375%, 03/20/20263 | | | | | | | 380,000 | | | | 361,475 | | | | 0.50 | |
MAF Global Securities Ltd., (Variable, U.S. Treasury Yield Curve Rate CMT 5Y + 4.893%), 7.875%, 06/30/20273 | | | | | | | 200,000 | | | | 196,875 | | | | 0.27 | |
| | | | | | | | | | | 3,788,079 | | | | 5.19 | |
| | | | |
Venezuela (Cost $8,318,882) | | | | | | | | | | | | | | | | |
Petroleos de Venezuela S.A., 8.500%, 10/27/20207,8 | | | | | | | 7,112,500 | | | | 5,974,500 | | | | 8.19 | |
Petroleos de Venezuela S.A., 9.750%, 05/17/20357 | | | | | | | 6,744,093 | | | | 944,173 | | | | 1.29 | |
| | | | | | | | | | | 6,918,673 | | | | 9.48 | |
| | | | |
Vietnam (Cost $328,903) | | | | | | | | | | | | | | | | |
Mong Duong Finance Holdings B.V., 5.125%, 05/07/2029 | | | | | | | 385,000 | | | | 346,700 | | | | 0.47 | |
| | | | | | | | | | | 346,700 | | | | 0.47 | |
| | | | |
Zambia (Cost $800,938) | | | | | | | | | | | | | | | | |
First Quantum Minerals Ltd., 8.625%, 06/01/2031 | | | | | | | 790,000 | | | | 665,575 | | | | 0.91 | |
| | | | | | | | | | | 665,575 | | | | 0.91 | |
| | | | |
Total Debt Securities (Cost $112,669,431) | | | | | | | | | | | 70,455,164 | | | | 96.56 | |
See accompanying notes to the financial statements.
111
ASHMORE EMERGING MARKETS CORPORATE INCOME FUND
SCHEDULE OF INVESTMENTS (CONTINUED)
As of October 31, 2023
| | | | | | | | | | | | | | | | |
| | | | | | | | | | | | % of Net | |
| | | Currency1 | | | Par | | | Value | | | Assets | |
| |
Bank Loans | | | | | | | | | | | | | | | | |
| | | | |
Czech Republic (Cost $362,933) | | | | | | | | | | | | | | | | |
New World Resources N.V., 8.500%, 10/07/20168,10 | | | EUR | | | | 952,167 | | | $ | — | | | | — | |
| | | | | | | | | | | — | | | | — | |
| | | | |
Total Bank Loans (Cost $362,933) | | | | | | | | | | | — | | | | — | |
| | | | |
| | | | | | | | | | | | % of Net | |
| | | Currency1 | | | Shares | | | Value | | | Assets | |
| |
Equity Securities | | | | | | | | | | | | | | | | |
| | | | |
Czech Republic (Cost $1,093,254) | | | | | | | | | | | | | | | | |
New World Resources PLC, Class A*,10 | | | GBP | | | | 36,580,138 | | | $ | — | | | | — | |
| | | | | | | | | | | — | | | | — | |
| | | | |
Niger (Cost $877,496) | | | | | | | | | | | | | | | | |
Savannah Energy PLC*,6 | | | GBP | | | | 2,258,852 | | | | 720,699 | | | | 0.99 | |
| | | | | | | | | | | 720,699 | | | | 0.99 | |
| | | | |
Total Equity Securities (Cost $1,970,750) | | | | | | | | | | | 720,699 | | | | 0.99 | |
| | | | |
Total Investments (Total Cost $115,003,114) | | | | | | | | | | | 71,175,863 | | | | 97.55 | |
| | | | |
Other Assets Less Liabilities (See Statements of Assets and Liabilities for further detail) | | | | | | | | | | | 1,784,327 | | | | 2.45 | |
| | | | |
Net Assets | | | | | | | | | | $ | 72,960,190 | | | | 100.00 | |
| * | Non-income producing security. |
| 1 | Local currency is United States Dollars unless otherwise noted below. |
| 2 | Securities exempt from registration under Rule 144A of the Securities Act of 1933. These securities may not be publicly traded without registration under the Securities Act of 1933. |
| 3 | Variable rate security. Security issued at a fixed coupon rate, which converts to a variable rate at a specified date. Rate shown is the rate in effect as of period end. |
| 4 | Security is a payment-in-kind bond, and unless otherwise noted in the description of the security, pays its entire coupon on an in-kind basis. |
| 5 | Restricted security that has been deemed illiquid. At October 31, 2023 the value of these restricted illiquid securities amount to $402,343 or 0.55% of net assets. Additional information on each restricted illiquid security is as follows: |
| | | | | | | | | | | | | | | | | | | | |
| SECURITY | | | | ACQUISITION DATE | | | | ACQUISITION COST |
| | | | |
New World Resources N.V., 0.0000%, 10/07/2020 | | | | | | | 10/7/14 | | | | | | | | | $— | |
| | | | |
Oi S.A., 14.000%, 09/07/2024 | | | | | | | 4/21/23-10/19/23 | | | | | | | | | 400,053 | |
| | | | |
Oi S.A., 14.000%, 09/07/2024 | | | | | | | 10/4/23-10/24/23 | | | | | | | | | 21 | |
| 6 | Security is a Level 3 investment. |
| 7 | Issuer has defaulted on terms of debt obligation. |
| 8 | Maturity has been extended under the terms of a plan of reorganization. |
| 10 | Security has been deemed worthless and is a Level 3 investment. |
Percentages shown are based on net assets.
See accompanying notes to the financial statements.
112
ASHMORE EMERGING MARKETS CORPORATE INCOME FUND
SCHEDULE OF INVESTMENTS (CONTINUED)
As of October 31, 2023
At October 31, 2023, the Ashmore Emerging Markets Corporate Income Fund had outstanding forward foreign currency exchange contracts as follows:
| | | | | | | | | | | | | | | | | | |
Settlement
Date | | Counterparty | | Currency Buy | | Currency
Buy Amount
(Local
Currency) | | | Currency Sell | | Currency
Sell Amount
(Local
Currency) | | | Unrealized
Gain/(Loss) | |
| |
| | | | | | |
| 11/01/2023 | | State Street | | United States Dollar | | | 746,358 | | | British Pound | | | 570,129 | | | | $53,395 | |
| | | | | | |
| 11/22/2023 | | Standard Chartered | | Euro | | | 100,621 | | | United States Dollar | | | 106,094 | | | | 473 | |
| | | | | | |
| 11/22/2023 | | HSBC Bank | | United States Dollar | | | 1,764,422 | | | Euro | | | 1,664,023 | | | | 2,066 | |
| | | | | | | | | | | | | | | | | | |
| | | | | |
Subtotal Appreciation | | | | | | | | | | | | | | | 55,934 | |
| | | | | | | | | | | | | | | | | | |
| | | | | | |
| 11/01/2023 | | Barclays | | British Pound | | | 570,129 | | | United States Dollar | | | 711,120 | | | | (18,157 | ) |
| | | | | | |
| 11/22/2023 | | Standard Chartered | | Euro | | | 176,000 | | | United States Dollar | | | 187,048 | | | | (648 | ) |
| | | | | | |
| 11/22/2023 | | Citibank | | United States Dollar | | | 691,294 | | | British Pound | | | 570,129 | | | | (1,764 | ) |
| | | | | | | | | | | | | | | | | | |
| | | | | |
Subtotal Depreciation | | | | | | | | | | | | | | | (20,569 | ) |
| | | | | | | | | | | | | | | | | | |
| | | | | | |
| Total | | | | | | | | | | | | | | | | | $35,365 | |
| | | | | | | | | | | | | | | | | | |
The inputs of methodologies used for valuing securities are not necessarily an indication of the risks associated with investing in those securities and other financial instruments, if any. See note 4 in the Notes to the Financial Statements for more information regarding pricing inputs and valuation techniques. The following is a summary of the inputs used in valuing the Ashmore Emerging Markets Corporate Income Fund’s investments and other financial instruments, which are carried at fair value, as of October 31, 2023:
| | | | | | | | | | | | | | | | |
| | | Level 1 | | | Level 2 | | | Level 3 | | | Total | |
Investments | | | | | | | | | | | | | | | | |
Assets: | | | | | | | | | | | | | | | | |
Debt Securities | | | | | | | | | | | | | | | | |
Corporate Bonds | | | $— | | | | $56,299,273 | | | | $ 4,293 | | | | $56,303,566 | |
Corporate Convertible Bonds | | | — | | | | 3,581,652 | | | | — | | | | 3,581,652 | |
Financial Certificates | | | — | | | | 2,754,153 | | | | — | | | | 2,754,153 | |
Government Agencies | | | — | | | | 7,815,793 | | | | — | | | | 7,815,793 | |
| | | | | | | | | | | | | | | | |
Total Debt Securities | | | — | | | | 70,450,871 | | | | 4,293 | | | | 70,455,164 | |
Bank Loans | | | | | | | | | | | | | | | | |
Equity Securities | | | | | | | | | | | | | | | | |
Common Stock | | | | | | | | | | | | | | | | |
Niger | | | — | | | | — | | | | 720,699 | | | | 720,699 | |
| | | | | | | | | | | | | | | | |
Total Common Stock | | | — | | | | — | | | | 720,699 | | | | 720,699 | |
| |
Total Investments | | | $— | | | | $70,450,871 | | | | $724,992 | | | | $71,175,863 | |
| |
Other Financial Instruments | | | | | | | | | | | | | | | | |
Assets: | | | | | | | | | | | | | | | | |
Forward Foreign Currency Exchange Contracts | | | $— | | | | $ 55,934 | | | | $— | | | | $ 55,934 | |
Liabilities: | | | | | | | | | | | | | | | | |
Forward Foreign Currency Exchange Contracts | | | — | | | | (20,569 | ) | | | — | | | | (20,569 | ) |
| |
Total Other Financial Instruments | | | $— | | | | $ 35,365 | | | | $— | | | | $ 35,365 | |
| |
See accompanying notes to the financial statements.
113
ASHMORE EMERGING MARKETS CORPORATE INCOME FUND
SCHEDULE OF INVESTMENTS (CONTINUED)
As of October 31, 2023
The following is a reconciliation of investments in which significant unobservable inputs (Level 3) were used for the Fund during the period ended October 31, 2023:
| | | | | | | | | | | | | | | | | | | | | | | | | | | | | | | | | | | | | | | | | | | | | | | | | | |
| Category and Subcategory | | Beginning
Balance
at 10/31/2022 | | Accrued
Discounts
(Premiums) | | Purchases | | Sales | | Realized
Gains
(Losses) | | Change in
Unrealized
Appreciation
(Depreciation) | | Transfers
into
Level 3 | | Transfers
out of
Level 3 | | Ending
Balance
at 10/31/2023 | | Change in
Unrealized
Appreciation
(Depreciation)
from Investments
still held
10/31/2023 |
| | | | | | | | | | |
Investments, at value | | | | | | | | | | | | | | | | | | | | | | | | | | | | | | | | | | | | | | | | | | | | | | | | | | |
| | | | | | | | | | |
Common Stock | | | | | | | | | | | | | | | | | | | | | | | | | | | | | | | | | | | | | | | | | | | | | | | | | | |
| | | | | | | | | | |
Niger | | | $ | — | | | | $ | — | | | | $ | — | | | | $ | — | | | | $ | — | | | | $ | — | | | | $ | 720,699 | | | | $ | — | | | | $ | 720,699 | | | | $ | 720,699 | |
| | | | | | | | | | |
Corporate Bonds | | | | | | | | | | | | | | | | | | | | | | | | | | | | | | | | | | | | | | | | | | | | | | | | | | |
| | | | | | | | | | |
Russian Federation | | | | 2 | | | | | — | | | | | — | | | | | — | | | | | — | | | | | — | | | | | — | | | | | — | | | | | 2 | | | | | — | |
| | | | | | | | | | |
Brazil | | | | — | | | | | — | | | | | 22 | | | | | — | | | | | — | | | | | 4,269 | | | | | — | | | | | — | | | | | 4,291 | | | | | 4,269 | |
Total | | | $ | 2 | | | | $ | — | | | | $ | 22 | | | | $ | — | | | | $ | — | | | | $ | 4,269 | | | | $ | 720,699 | | | | $ | — | | | | $ | 724,992 | | | | $ | 724,968 | |
The following table on “Quantitative information about Level 3 Fair Value measurements” provides information on the valuation techniques and inputs used to value Level 3 securities at October 31, 2023:
| | | | | | | | | | | | |
| Quantitative Information about Level 3 Fair Value Measurements | |
| | | |
| | | Fair Value at | | | Valuation | | | Unobservable | |
| | | 10/31/2023 | | | Technique | | | Input | |
| | | |
Common Stock | | | $720,699 | | | | Transaction Price | | | | $0.26 | |
| | | |
Corporate Bonds | | | 4,293 | | | | Transaction Price | | | | $99.50 | |
| | | |
Total | | | $724,992 | | | | | | | | | |
| | | | | | | | | | | | | |
The following is a summary of the fair values of the Fund’s derivative instruments*:
Fair Values of Financial Derivative Instruments on the Statements of Assets and Liabilities as of October 31, 2023:
| | | | |
| | | Derivatives Not Accounted for as
Hedging Instruments | |
| | | Foreign Exchange Risk | |
Assets: | | | | |
Unrealized Appreciation on Forward Foreign Currency Exchange Contracts | | | $ 55,934 | |
| | | | |
| |
Liabilities: | | | | |
Unrealized Depreciation on Forward Foreign Currency Exchange Contracts | | | $(20,569 | ) |
| | | | |
See accompanying notes to the financial statements.
114
ASHMORE EMERGING MARKETS CORPORATE INCOME FUND
SCHEDULE OF INVESTMENTS (CONTINUED)
As of October 31, 2023
The Effect of Financial Derivative Instruments on the Statements of Operations for the Year Ended October 31, 2023:
| | | | |
| | | Derivatives Not Accounted for as
Hedging Instruments | |
| | | Foreign
Exchange Risk | |
Realized Gain (Loss) on Derivatives Recognized resulting from Operations: | | | | |
Net Realized Loss on Forward Foreign Currency Exchange Contracts | | | $(201,130) | |
| | | | |
| |
Net Change in Unrealized Appreciation (Depreciation) on Derivatives Recognized resulting from Operations: | | | | |
Net Change in Unrealized Appreciation on Forward Foreign Currency Exchange Contracts | | | $ 11,868 | |
| | | | |
* See note 10 in the Notes to the Financial Statements for additional information.
See accompanying notes to the financial statements.
115
ASHMORE EMERGING MARKETS SHORT DURATION FUND
SCHEDULE OF INVESTMENTS
As of October 31, 2023
| | | | | | | | | | | | | | | | |
| | | | | | | | | | | | % of Net | |
| | | Currency1 | | | Par | | | Value | | | Assets | |
| |
Debt Securities | | | | | | | | | | | | | | | | |
| | | | |
Argentina (Cost $705,999) | | | | | | | | | | | | | | | | |
YPF S.A., 9.000%, 02/12/2026 | | | | | | | 769,231 | | | $ | 744,231 | | | | 1.23 | |
| | | | | | | | | | | 744,231 | | | | 1.23 | |
| | | | |
Bahrain (Cost $870,568) | | | | | | | | | | | | | | | | |
BBK BSC, 5.500%, 07/09/2024 | | | | | | | 880,000 | | | | 864,875 | | | | 1.43 | |
| | | | | | | | | | | 864,875 | | | | 1.43 | |
| | | | |
Brazil (Cost $10,044,547) | | | | | | | | | | | | | | | | |
CSN Resources S.A., 7.625%, 04/17/2026 | | | | | | | 500,000 | | | | 494,695 | | | | 0.82 | |
InterCement Financial Operations B.V., 5.750%, 07/17/2024 | | | | | | | 4,090,000 | | | | 2,540,954 | | | | 4.21 | |
JBS U.S.A. LUX S.A./JBS U.S.A. Food Co./JBS U.S.A.
Finance, Inc., 2.500%, 01/15/2027 | | | | | | | 200,000 | | | | 175,326 | | | | 0.29 | |
NBM U.S. Holdings, Inc., 7.000%, 05/14/2026 | | | | | | | 200,000 | | | | 198,262 | | | | 0.33 | |
Oi S.A., 14.000%, (66% PIK), 09/07/20242,3,4 | | | | | | | 288,499 | | | | 287,057 | | | | 0.48 | |
Oi S.A., 14.000%, (100% Cash), 09/07/20242,3,4 | | | | | | | 3,110 | | | | 3,094 | | | | — | |
Oi S.A., 10.000%, 07/27/20253,5 | | | | | | | 5,400,000 | | | | 243,000 | | | | 0.40 | |
| | | | | | | | | | | 3,942,388 | | | | 6.53 | |
| | | | |
Chile (Cost $874,249) | | | | | | | | | | | | | | | | |
Inversiones CMPC S.A., 4.750%, 09/15/2024 | | | | | | | 880,000 | | | | 863,790 | | | | 1.43 | |
| | | | | | | | | | | 863,790 | | | | 1.43 | |
| | | | |
China (Cost $40,495,873) | | | | | | | | | | | | | | | | |
Agile Group Holdings Ltd., 5.750%, 01/02/2025 | | | | | | | 380,000 | | | | 38,000 | | | | 0.06 | |
Central China Real Estate Ltd., 7.900%, 11/07/20235 | | | | | | | 560,000 | | | | 19,600 | | | | 0.03 | |
Central China Real Estate Ltd., 7.250%, 07/16/20245 | | | | | | | 1,275,000 | | | | 38,250 | | | | 0.06 | |
Central China Real Estate Ltd., 7.250%, 08/13/20245 | | | | | | | 299,000 | | | | 8,970 | | | | 0.01 | |
Central China Real Estate Ltd., 7.250%, 04/28/20255 | | | | | | | 190,000 | | | | 6,650 | | | | 0.01 | |
Central China Real Estate Ltd., 7.500%, 07/14/20255 | | | | | | | 422,000 | | | | 15,812 | | | | 0.03 | |
Central China Real Estate Ltd., 7.650%, 08/27/20255 | | | | | | | 270,000 | | | | 9,450 | | | | 0.02 | |
CFLD Cayman Investment Ltd., 2.500%, 01/31/20312 | | | | | | | 2,366,210 | | | | 176,164 | | | | 0.29 | |
China Evergrande Group, 10.000%, 04/11/20235,6 | | | | | | | 4,937,000 | | | | 98,740 | | | | 0.16 | |
China SCE Group Holdings Ltd., 7.375%, 04/09/20245 | | | | | | | 410,000 | | | | 19,475 | | | | 0.03 | |
China SCE Group Holdings Ltd., 5.950%, 09/29/20245 | | | | | | | 210,000 | | | | 9,516 | | | | 0.02 | |
China SCE Group Holdings Ltd., 7.000%, 05/02/20255 | | | | | | | 560,000 | | | | 24,640 | | | | 0.04 | |
China SCE Group Holdings Ltd., 6.000%, 02/04/20265 | | | | | | | 545,000 | | | | 23,980 | | | | 0.04 | |
Fantasia Holdings Group Co. Ltd., 12.250%, 10/18/20225,6 | | | | | | | 4,000,000 | | | | 120,000 | | | | 0.20 | |
Fantasia Holdings Group Co. Ltd., 10.875%, 01/09/20235,6 | | | | | | | 4,160,000 | | | | 124,800 | | | | 0.21 | |
Fantasia Holdings Group Co. Ltd., 11.875%, 06/01/20235,6 | | | | | | | 1,510,000 | | | | 45,300 | | | | 0.08 | |
Kaisa Group Holdings Ltd., 11.500%, 01/30/20235,6 | | | | | | | 4,875,000 | | | | 207,187 | | | | 0.34 | |
Kaisa Group Holdings Ltd., 10.875%, 07/23/20235,6 | | | | | | | 3,930,000 | | | | 167,025 | | | | 0.28 | |
Kaisa Group Holdings Ltd., 11.250%, 04/16/20255 | | | | | | | 4,280,000 | | | | 181,900 | | | | 0.30 | |
KWG Group Holdings Ltd., 6.000%, 01/14/20245 | | | | | | | 410,000 | | | | 28,700 | | | | 0.05 | |
KWG Group Holdings Ltd., 5.875%, 11/10/20245 | | | | | | | 435,000 | | | | 30,450 | | | | 0.05 | |
KWG Group Holdings Ltd., 7.400%, 01/13/20275 | | | | | | | 380,000 | | | | 26,600 | | | | 0.04 | |
New Metro Global Ltd., 4.625%, 10/15/2025 | | | | | | | 310,000 | | | | 66,573 | | | | 0.11 | |
See accompanying notes to the financial statements.
116
ASHMORE EMERGING MARKETS SHORT DURATION FUND
SCHEDULE OF INVESTMENTS (CONTINUED)
As of October 31, 2023
| | | | | | | | | | | | | | | | |
| | | | | | | | | | | | % of Net | |
| | | Currency1 | | | Par | | | Value | | | Assets | |
China (continued) | | | | | | | | | | | | | | | | |
Prime Bloom Holdings Ltd., 6.950%, 07/05/20225,6 | | | | | | | 6,470,000 | | | $ | 226,450 | | | | 0.38 | |
Shimao Group Holdings Ltd., 4.750%, 07/03/20225,6 | | | | | | | 200,000 | | | | 7,500 | | | | 0.01 | |
Sunac China Holdings Ltd., 7.250%, 06/14/20225,6 | | | | | | | 690,000 | | | | 94,875 | | | | 0.16 | |
Sunac China Holdings Ltd., 7.950%, 08/08/20225,6 | | | | | | | 730,000 | | | | 100,375 | | | | 0.17 | |
Sunac China Holdings Ltd., 8.350%, 04/19/20235,6 | | | | | | | 200,000 | | | | 27,000 | | | | 0.04 | |
Sunac China Holdings Ltd., 6.650%, 08/03/20245 | | | | | | | 450,000 | | | | 61,875 | | | | 0.10 | |
Tunghsu Venus Holdings Ltd., 7.000%, 06/12/20205,6 | | | | | | | 2,640,000 | | | | 158,400 | | | | 0.26 | |
Yuzhou Group Holdings Co. Ltd., 7.813%, 01/21/20235,6 | | | | | | | 670,000 | | | | 40,200 | | | | 0.07 | |
Yuzhou Group Holdings Co. Ltd., 6.000%, 10/25/20235,6 | | | | | | | 4,940,000 | | | | 296,400 | | | | 0.49 | |
Zhenro Properties Group Ltd., 8.000%, 03/06/20235,6 | | | | | | | 4,920,000 | | | | 24,600 | | | | 0.04 | |
Zhenro Properties Group Ltd., 9.150%, 05/06/20235,6 | | | | | | | 813,000 | | | | 4,065 | | | | 0.01 | |
Zhenro Properties Group Ltd., 8.300%, 09/15/20235,6 | | | | | | | 1,017,000 | | | | 5,085 | | | | 0.01 | |
Zhenro Properties Group Ltd., 7.875%, 04/14/20245 | | | | | | | 575,000 | | | | 2,875 | | | | — | |
| | | | | | | | | | | 2,537,482 | | | | 4.20 | |
| | | | |
Colombia (Cost $4,484,501) | | | | | | | | | | | | | | | | |
ABRA Global Finance, 11.500%, (100% Cash), 03/02/20282,3 | | | | | | | 3,288,926 | | | | 2,542,340 | �� | | | 4.21 | |
Bancolombia S.A., (Variable, U.S. Treasury Yield Curve Rate
CMT 5Y + 2.929%), 6.909%, 10/18/20277 | | | | | | | 680,000 | | | | 622,183 | | | | 1.03 | |
Ecopetrol S.A., 4.125%, 01/16/2025 | | | | | | | 610,000 | | | | 587,308 | | | | 0.97 | |
| | | | | | | | | | | 3,751,831 | | | | 6.21 | |
| | | | |
Ghana (Cost $1,947,005) | | | | | | | | | | | | | | | | |
Kosmos Energy Ltd., 7.125%, 04/04/2026 | | | | | | | 650,000 | | | | 597,538 | | | | 0.99 | |
Tullow Oil PLC, 10.250%, 05/15/2026 | | | | | | | 1,322,000 | | | | 1,132,789 | | | | 1.87 | |
| | | | | | | | | | | 1,730,327 | | | | 2.86 | |
| | | | |
Guatemala (Cost $163,054) | | | | | | | | | | | | | | | | |
Millicom International Cellular S.A., 5.125%, 01/15/2028 | | | | | | | 180,000 | | | | 154,350 | | | | 0.26 | |
| | | | | | | | | | | 154,350 | | | | 0.26 | |
| | | | |
Hungary (Cost $202,260) | | | | | | | | | | | | | | | | |
OTP Bank Nyrt., (Variable, U.S. Treasury Yield Curve Rate
CMT 1Y + 3.711%), 7.500%, 05/25/20277 | | | | | | | 200,000 | | | | 200,382 | | | | 0.33 | |
| | | | | | | | | | | 200,382 | | | | 0.33 | |
| | | | |
India (Cost $3,679,386) | | | | | | | | | | | | | | | | |
Clean Renewable Power Mauritius Pte. Ltd., 4.250%, 03/25/2027 | | | | | | | 1,062,900 | | | | 906,367 | | | | 1.50 | |
Greenko Solar Mauritius Ltd., 5.950%, 07/29/2026 | | | | | | | 1,360,000 | | | | 1,248,820 | | | | 2.07 | |
HDFC Bank Ltd., 5.686%, 03/02/2026 | | | | | | | 200,000 | | | | 199,526 | | | | 0.33 | |
India Airport Infra, 6.250%, 10/25/2025 | | | | | | | 404,000 | | | | 390,615 | | | | 0.65 | |
Power Finance Corp. Ltd., 3.750%, 06/18/2024 | | | | | | | 655,000 | | | | 643,793 | | | | 1.06 | |
State Bank of India, 4.875%, 05/05/2028 | | | | | | | 200,000 | | | | 191,250 | | | | 0.32 | |
| | | | | | | | | | | 3,580,371 | | | | 5.93 | |
See accompanying notes to the financial statements.
117
ASHMORE EMERGING MARKETS SHORT DURATION FUND
SCHEDULE OF INVESTMENTS (CONTINUED)
As of October 31, 2023
| | | | | | | | | | | | | | | | |
| | | | | | | | | | | | % of Net | |
| | | Currency1 | | | Par | | | Value | | | Assets | |
Indonesia (Cost $620,765) | | | | | | | | | | | | | | | | |
Medco Bell Pte. Ltd., 6.375%, 01/30/2027 | | | | | | | 670,000 | | | $ | 627,294 | | | | 1.04 | |
| | | | | | | | | | | 627,294 | | | | 1.04 | |
| | | | |
Jordan (Cost $1,328,811) | | | | | | | | | | | | | | | | |
Hikma Finance U.S.A. LLC, 3.250%, 07/09/2025 | | | | | | | 1,340,000 | | | | 1,250,877 | | | | 2.07 | |
| | | | | | | | | | | 1,250,877 | | | | 2.07 | |
| | | | |
Kazakhstan (Cost $859,072) | | | | | | | | | | | | | | | | |
KazMunayGas National Co. JSC, 4.750%, 04/19/2027 | | | | | | | 978,000 | | | | 911,496 | | | | 1.51 | |
| | | | | | | | | | | 911,496 | | | | 1.51 | |
| | | | |
Kuwait (Cost $196,926) | | | | | | | | | | | | | | | | |
MEGlobal Canada ULC, 5.000%, 05/18/2025 | | | | | | | 200,000 | | | | 194,313 | | | | 0.32 | |
| | | | | | | | | | | 194,313 | | | | 0.32 | |
| | | | |
Lebanon (Cost $13,433,289) | | | | | | | | | | | | | | | | |
Lebanon (Rep of), 6.375%, 03/09/20205,6 | | | | | | | 1,527,000 | | | | 91,620 | | | | 0.15 | |
Lebanon (Rep of), 5.800%, 04/14/20205,6 | | | | | | | 7,070,000 | | | | 424,200 | | | | 0.70 | |
Lebanon (Rep of), 6.150%, 06/19/20205,6 | | | | | | | 6,506,000 | | | | 390,360 | | | | 0.65 | |
| | | | | | | | | | | 906,180 | | | | 1.50 | |
| | | | |
Malaysia (Cost $188,443) | | | | | | | | | | | | | | | | |
MISC Capital Two Labuan Ltd., 3.750%, 04/06/2027 | | | | | | | 200,000 | | | | 183,874 | | | | 0.30 | |
| | | | | | | | | | | 183,874 | | | | 0.30 | |
| | | | |
Mexico (Cost $8,503,918) | | | | | | | | | | | | | | | | |
Banco Santander Mexico S.A. Institucion de Banca Multiple Grupo Financiero Santander, 5.375%, 04/17/2025 | | | | | | | 300,000 | | | | 293,963 | | | | 0.49 | |
|
Grupo Axo S.A.P.I. de C.V., 5.750%, 06/08/2026 | | | | | | | 1,567,000 | | | | 1,369,010 | | | | 2.27 | |
Orbia Advance Corp. S.A.B. de C.V., 4.000%, 10/04/2027 | | | | | | | 200,000 | | | | 180,618 | | | | 0.30 | |
Petroleos Mexicanos, 6.875%, 10/16/2025 | | | | | | | 5,652,000 | | | | 5,420,268 | | | | 8.97 | |
Trust Fibra Uno, 5.250%, 01/30/2026 | | | | | | | 630,000 | | | | 599,350 | | | | 0.99 | |
| | | | | | | | | | | 7,863,209 | | | | 13.02 | |
| | | | |
Morocco (Cost $1,129,197) | | | | | | | | | | | | | | | | |
OCP S.A., 4.500%, 10/22/2025 | | | | | | | 1,100,000 | | | | 1,050,500 | | | | 1.74 | |
| | | | | | | | | | | 1,050,500 | | | | 1.74 | |
| | | | |
Papua New Guinea (Cost $518,626) | | | | | | | | | | | | | | | | |
Puma International Financing S.A., 5.000%, 01/24/2026 | | | | | | | 550,000 | | | | 491,827 | | | | 0.81 | |
| | | | | | | | | | | 491,827 | | | | 0.81 | |
| | | | |
Peru (Cost $367,370) | | | | | | | | | | | | | | | | |
Nexa Resources S.A., 6.500%, 01/18/2028 | | | | | | | 200,000 | | | | 186,750 | | | | 0.31 | |
Southern Copper Corp., 3.875%, 04/23/2025 | | | | | | | 175,000 | | | | 168,219 | | | | 0.28 | |
| | | | | | | | | | | 354,969 | | | | 0.59 | |
| | | | |
Qatar (Cost $292,818) | | | | | | | | | | | | | | | | |
ABQ Finance Ltd., 3.125%, 09/24/2024 | | | | | | | 300,000 | | | | 290,814 | | | | 0.48 | |
| | | | | | | | | | | 290,814 | | | | 0.48 | |
See accompanying notes to the financial statements.
118
ASHMORE EMERGING MARKETS SHORT DURATION FUND
SCHEDULE OF INVESTMENTS (CONTINUED)
As of October 31, 2023
| | | | | | | | | | | | | | | | |
| | | Currency1 | | | Par | | | Value | | | % of Net
Assets | |
Romania (Cost $337,879) | | | | | | | | | | | | | | | | |
NE Property B.V., 1.875%, 10/09/2026 | | | EUR | | | | 350,000 | | | $ | 323,180 | | | | 0.53 | |
| | | | | | | | | | | 323,180 | | | | 0.53 | |
| | | | |
Saudi Arabia (Cost $4,443,335) | | | | | | | | | | | | | | | | |
Arabian Centres Sukuk Ltd., 5.375%, 11/26/2024 | | | | | | | 2,000,000 | | | | 1,908,125 | | | | 3.16 | |
Dar Al-Arkan Sukuk Co. Ltd., 6.750%, 02/15/2025 | | | | | | | 2,502,000 | | | | 2,467,597 | | | | 4.09 | |
| | | | | | | | | | | 4,375,722 | | | | 7.25 | |
| | | | |
South Africa (Cost $1,581,186) | | | | | | | | | | | | | | | | |
Liquid Telecommunications Financing PLC, 5.500%, 09/04/2026 | | | | | | | 500,000 | | | | 303,645 | | | | 0.50 | |
Sasol Financing U.S.A. LLC, 5.875%, 03/27/2024 | | | | | | | 1,100,000 | | | | 1,084,831 | | | | 1.80 | |
| | | | | | | | | | | 1,388,476 | | | | 2.30 | |
| | | | |
South Korea (Cost $199,741) | | | | | | | | | | | | | | | | |
SK On Co. Ltd., 5.375%, 05/11/2026 | | | | | | | 200,000 | | | | 197,884 | | | | 0.33 | |
| | | | | | | | | | | 197,884 | | | | 0.33 | |
| | | | |
Tanzania (Cost $604,333) | | | | | | | | | | | | | | | | |
HTA Group Ltd., 7.000%, 12/18/2025 | | | | | | | 650,000 | | | | 626,060 | | | | 1.04 | |
| | | | | | | | | | | 626,060 | | | | 1.04 | |
| | | | |
United Arab Emirates (Cost $439,559) | | | | | | | | | | | | | | | | |
BOS Funding Ltd., 4.000%, 09/18/2024 | | | | | | | 450,000 | | | | 435,398 | | | | 0.72 | |
| | | | | | | | | | | 435,398 | | | | 0.72 | |
| | | | |
United States (Cost $4,080,231) | | | | | | | | | | | | | | | | |
U.S. Treasury Bill, 5.240%, 01/16/20248 | | | | | | | 4,126,400 | | | | 4,080,155 | | | | 6.76 | |
| | | | | | | | | | | 4,080,155 | | | | 6.76 | |
| | | | |
Venezuela (Cost $16,453,222) | | | | | | | | | | | | | | | | |
Petroleos de Venezuela S.A., 8.500%, 10/27/20205,6 | | | | | | | 18,697,500 | | | | 15,705,900 | | | | 26.01 | |
| | | | | | | | | | | 15,705,900 | | | | 26.01 | |
| | | | |
Zambia (Cost $197,999) | | | | | | | | | | | | | | | | |
First Quantum Minerals Ltd., 6.875%, 03/01/2026 | | | | | | | 200,000 | | | | 175,450 | | | | 0.29 | |
| | | | | | | | | | | 175,450 | | | | 0.29 | |
| | | | |
Total Debt Securities (Cost $119,244,162) | | | | | | | | | | | 59,803,605 | | | | 99.02 | |
| | | | |
Total Investments (Total Cost $119,244,162) | | | | | | | | | | | 59,803,605 | | | | 99.02 | |
| | | | |
Other Assets Less Liabilities (See Statements of Assets and Liabilities for further detail) | | | | | | | | | | | 589,224 | | | | 0.98 | |
| | | | |
Net Assets | | | | | | | | | | $ | 60,392,829 | | | | 100.00 | |
| 1 | Local currency is United States Dollars unless otherwise noted below. |
| 2 | Securities exempt from registration under Rule 144A of the Securities Act of 1933. These securities may not be publicly traded without registration under the Securities Act of 1933. |
| 3 | Security is a payment-in-kind bond, and unless otherwise noted in the description of the security, pays its entire coupon on an in-kind basis. |
See accompanying notes to the financial statements.
119
ASHMORE EMERGING MARKETS SHORT DURATION FUND
SCHEDULE OF INVESTMENTS (CONTINUED)
As of October 31, 2023
| 4 | Restricted security that has been deemed illiquid. At October 31, 2023 the value of these restricted illiquid securities amount to $290,151 or 0.48% of net assets. Additional information on each restricted illiquid security is as follows: |
| | | | | | | | | | | | | | | | | | | | |
| SECURITY | | | | ACQUISITION DATE | | | | ACQUISITION COST |
Oi S.A., 14.000%, 09/07/2024 | | | | | | | 4/21/23-10/24/23 | | | | | | | | | $288,499 | |
Oi S.A., 14.000%, 09/07/2024 | | | | | | | 10/4/23-10/24/23 | | | | | | | | | 15 | |
| 5 | Issuer has defaulted on terms of debt obligation. |
| 6 | Maturity has been extended under the terms of a plan of reorganization. |
| 7 | Variable rate security. Security issued at a fixed coupon rate, which converts to a variable rate at a specified date. Rate shown is the rate in effect as of period end. |
| 8 | Zero coupon bond – interest rate reflects effective yield on the date of purchase. |
Percentages shown are based on net assets.
At October 31, 2023, the Ashmore Emerging Markets Short Duration Fund had outstanding forward foreign currency exchange contracts as follows:
| | | | | | | | | | | | | | | | | | |
Settlement Date | | Counterparty | | Currency Buy | | Currency
Buy Amount
(Local
Currency) | | | Currency
Sell | | Currency
Sell Amount
(Local
Currency) | | | Unrealized
Gain/(Loss) | |
11/22/2023 | | HSBC Bank | | United States Dollar | | | 334,815 | | | Euro | | | 315,764 | | | | $392 | |
| | | | |
Subtotal Appreciation | | | | | | | | | | | | | 392 | |
| | | | |
Total | | | | | | | | | | | | | $392 | |
The inputs of methodologies used for valuing securities are not necessarily an indication of the risks associated with investing in those securities and other financial instruments, if any. See note 4 in the Notes to the Financial Statements for more information regarding pricing inputs and valuation techniques. The following is a summary of the inputs used in valuing the Ashmore Emerging Markets Short Duration Fund’s investments and other financial instruments, which are carried at fair value, as of October 31, 2023:
| | | | | | | | | | | | | | | | |
| | | Level 1 | | | Level 2 | | | Level 3 | | | Total | |
Investments | | | | | | | | | | | | | | | | |
Assets: | | | | | | | | | | | | | | | | |
Debt Securities | | | | | | | | | | | | | | | | |
Corporate Bonds | | | $— | | | $ | 41,886,538 | | | | $3,094 | | | $ | 41,889,632 | |
Corporate Convertible Bonds | | | — | | | | 176,164 | | | | — | | | | 176,164 | |
Financial Certificates | | | — | | | | 4,375,723 | | | | — | | | | 4,375,723 | |
Government Agencies | | | — | | | | 8,375,751 | | | | — | | | | 8,375,751 | |
Government Bonds | | | — | | | | 906,180 | | | | — | | | | 906,180 | |
Short Term Bills and Notes | | | — | | | | 4,080,155 | | | | — | | | | 4,080,155 | |
| | | | | | | | | | | | | | | | |
Total Debt Securities | | | — | | | | 59,800,511 | | | | 3,094 | | | | 59,803,605 | |
| |
Total Investments | | | $— | | | $ | 59,800,511 | | | | $3,094 | | | $ | 59,803,605 | |
| |
| | | | |
Other Financial Instruments | | | | | | | | | | | | | | | | |
Assets: | | | | | | | | | | | | | | | | |
Forward Foreign Currency Exchange Contracts | | | $— | | | | $392 | | | | $— | | | | $392 | |
| |
Total Other Financial Instruments | | | $— | | | | $392 | | | | $— | | | | $392 | |
| |
There were no transfers to or from Level 3 during the year ended October 31, 2023.
See accompanying notes to the financial statements.
120
ASHMORE EMERGING MARKETS SHORT DURATION FUND
SCHEDULE OF INVESTMENTS (CONTINUED)
As of October 31, 2023
The amount of Level 3 securities compared to total net assets is not material; therefore, the reconciliation of Level 3 securities and assumptions is not shown for the year ended October 31, 2023.
The following is a summary of the fair values of the Fund’s derivative instruments*:
Fair Values of Financial Derivative Instruments on the Statements of Assets and Liabilities as of October 31, 2023:
| | | | |
| | | Derivatives Not Accounted for as
Hedging Instruments | |
| | | Foreign Exchange Risk | |
Assets: | | | | |
| |
Unrealized Appreciation on Forward Foreign Currency Exchange Contracts | | | $392 | |
| | | | |
The Effect of Financial Derivative Instruments on the Statements of Operations for the Year Ended October 31, 2023:
| | | | |
| | | Derivatives Not Accounted for as
Hedging Instruments | |
| | | Foreign Exchange Risk | |
Realized Gain (Loss) on Derivatives Recognized resulting from Operations: | | | | |
| |
Net Realized Gain on Forward Foreign Currency Exchange Contracts | | | $12,100 | |
| | | | |
| |
Net Change in Unrealized Appreciation (Depreciation) on Derivatives Recognized resulting from Operations: | | | | |
Net Change in Unrealized Appreciation on Forward Foreign Currency Exchange Contracts | | | $ 392 | |
| | | | |
* See Note 10 in the Notes to the Financial Statements for additional information.
See accompanying notes to the financial statements.
121
ASHMORE EMERGING MARKETS ACTIVE EQUITY FUND
SCHEDULE OF INVESTMENTS
As of October 31, 2023
| | | | | | | | | | | | | | | | |
| | | Currency1 | | | Shares | | | Value | | | % of Net Assets | |
Common Stocks | | | | | | | | | | | | | | | | |
| | | | |
Argentina (Cost $494,025) | | | | | | | | | | | | | | | | |
Globant S.A.* | | | | | | | 2,620 | | | $ | 446,160 | | | | 1.95 | |
| | | | | | | | | | | 446,160 | | | | 1.95 | |
| | | | |
Brazil (Cost $1,402,035) | | | | | | | | | | | | | | | | |
B3 S.A. - Brasil Bolsa Balcao | | | BRL | | | | 124,360 | | | | 273,793 | | | | 1.20 | |
Banco do Brasil S.A. | | | BRL | | | | 11,800 | | | | 113,161 | | | | 0.49 | |
Hypera S.A.* | | | BRL | | | | 46,800 | | | | 281,167 | | | | 1.23 | |
MercadoLibre, Inc.* | | | | | | | 290 | | | | 359,814 | | | | 1.57 | |
Vale S.A. | | | BRL | | | | 14,580 | | | | 199,538 | | | | 0.87 | |
| | | | | | | | | | | 1,227,473 | | | | 5.36 | |
| | | | |
China (Cost $7,837,046) | | | | | | | | | | | | | | | | |
Alibaba Group Holding Ltd.* | | | HKD | | | | 86,800 | | | | 894,282 | | | | 3.91 | |
ANTA Sports Products Ltd. | | | HKD | | | | 40,600 | | | | 457,161 | | | | 2.00 | |
Baidu, Inc. ADR* | | | | | | | 2,719 | | | | 285,495 | | | | 1.25 | |
Baidu, Inc., Class A* | | | HKD | | | | 37,700 | | | | 493,998 | | | | 2.16 | |
China International Capital Corp. Ltd., Class H2 | | | HKD | | | | 176,800 | | | | 283,693 | | | | 1.24 | |
KE Holdings, Inc. ADR | | | | | | | 17,292 | | | | 254,365 | | | | 1.11 | |
Meituan, Class B*,2 | | | HKD | | | | 43,340 | | | | 615,722 | | | | 2.69 | |
NARI Technology Co. Ltd., Class A | | | CNH | | | | 70,449 | | | | 216,477 | | | | 0.95 | |
PDD Holdings, Inc. ADR* | | | | | | | 3,314 | | | | 336,106 | | | | 1.47 | |
Shenzhen Inovance Technology Co. Ltd., Class A | | | CNH | | | | 48,597 | | | | 401,474 | | | | 1.75 | |
Tencent Holdings Ltd. | | | HKD | | | | 44,400 | | | | 1,644,791 | | | | 7.18 | |
XPeng, Inc. ADR* | | | | | | | 16,803 | | | | 243,308 | | | | 1.06 | |
Yum China Holdings, Inc. | | | | | | | 5,266 | | | | 276,781 | | | | 1.21 | |
Zijin Mining Group Co. Ltd., Class H | | | HKD | | | | 296,000 | | | | 459,804 | | | | 2.01 | |
| | | | | | | | | | | 6,863,457 | | | | 29.99 | |
| | | | |
India (Cost $3,221,805) | | | | | | | | | | | | | | | | |
HDFC Bank Ltd. ADR | | | | | | | 14,626 | | | | 827,100 | | | | 3.61 | |
Hindalco Industries Ltd. | | | INR | | | | 48,735 | | | | 269,698 | | | | 1.18 | |
ICICI Bank Ltd. ADR | | | | | | | 32,415 | | | | 719,289 | | | | 3.14 | |
Larsen & Toubro Ltd. | | | INR | | | | 6,208 | | | | 218,515 | | | | 0.95 | |
Maruti Suzuki India Ltd. | | | INR | | | | 5,398 | | | | 674,060 | | | | 2.95 | |
Reliance Industries Ltd. | | | INR | | | | 20,244 | | | | 558,357 | | | | 2.44 | |
| | | | | | | | | | | 3,267,019 | | | | 14.27 | |
| | | | |
Indonesia (Cost $345,888) | | | | | | | | | | | | | | | | |
Bank Central Asia Tbk PT | | | IDR | | | | 619,800 | | | | 341,709 | | | | 1.49 | |
| | | | | | | | | | | 341,709 | | | | 1.49 | |
| | | | |
Malaysia (Cost $362,194) | | | | | | | | | | | | | | | | |
CIMB Group Holdings Bhd. | | | MYR | | | | 307,800 | | | | 369,045 | | | | 1.61 | |
| | | | | | | | | | | 369,045 | | | | 1.61 | |
See accompanying notes to the financial statements.
122
ASHMORE EMERGING MARKETS ACTIVE EQUITY FUND
SCHEDULE OF INVESTMENTS (CONTINUED)
As of October 31, 2023
| | | | | | | | | | | | | | |
| | | Currency1 | | Shares | | | Value | | | % of Net Assets | |
Mexico (Cost $672,169) | | | | | | | | | | | | | | |
Grupo Financiero Banorte S.A.B. de C.V., Class O | | MXN | | | 80,500 | | | $ | 653,323 | | | | 2.86 | |
| | | | | | | | | 653,323 | | | | 2.86 | |
| | | | |
Russian Federation (Cost $2,514,310) | | | | | | | | | | | | | | |
Gazprom PJSC*,3 | | RUB | | | 84,440 | | | | — | | | | — | |
LUKOIL PJSC3 | | RUB | | | 12,180 | | | | — | | | | — | |
Moscow Exchange MICEX-RTS PJSC4 | | RUB | | | 528,670 | | | | 1 | | | | — | |
| | | | | | | | | 1 | | | | — | |
| | | | |
Saudi Arabia (Cost $718,913) | | | | | | | | | | | | | | |
Saudi Arabian Oil Co.2 | | SAR | | | 91,612 | | | | 813,164 | | | | 3.55 | |
| | | | | | | | | 813,164 | | | | 3.55 | |
| | | | |
South Africa (Cost $291,329) | | | | | | | | | | | | | | |
Clicks Group Ltd. | | ZAR | | | 8,827 | | | | 129,947 | | | | 0.57 | |
Naspers Ltd., Class N* | | ZAR | | | 758 | | | | 118,168 | | | | 0.52 | |
| | | | | | | | | 248,115 | | | | 1.09 | |
| | | | |
South Korea (Cost $3,234,203) | | | | | | | | | | | | | | |
HD Korea Shipbuilding & Offshore Engineering Co. Ltd.* | | KRW | | | 3,178 | | | | 213,885 | | | | 0.94 | |
NAVER Corp. | | KRW | | | 2,634 | | | | 369,301 | | | | 1.61 | |
Samsung Biologics Co. Ltd.*,2 | | KRW | | | 703 | | | | 369,214 | | | | 1.61 | |
Samsung Electronics Co. Ltd. | | KRW | | | 33,740 | | | | 1,682,468 | | | | 7.35 | |
SK Hynix, Inc. | | KRW | | | 3,933 | | | | 343,590 | | | | 1.50 | |
| | | | | | | | | 2,978,458 | | | | 13.01 | |
| | | | |
Taiwan (Cost $3,583,396) | | | | | | | | | | | | | | |
ASE Technology Holding Co. Ltd. | | TWD | | | 47,000 | | | | 166,197 | | | | 0.73 | |
Delta Electronics, Inc. | | TWD | | | 30,000 | | | | 271,580 | | | | 1.19 | |
MediaTek, Inc. | | TWD | | | 6,000 | | | | 158,081 | | | | 0.69 | |
Realtek Semiconductor Corp. | | TWD | | | 20,000 | | | | 249,598 | | | | 1.09 | |
Sea Ltd. ADR* | | | | | 8,315 | | | | 346,735 | | | | 1.51 | |
Taiwan Semiconductor Manufacturing Co. Ltd. | | TWD | | | 115,021 | | | | 1,895,043 | | | | 8.28 | |
Taiwan Semiconductor Manufacturing Co. Ltd. ADR | | | | | 2,448 | | | | 211,287 | | | | 0.92 | |
United Microelectronics Corp. ADR | | | | | 57,596 | | | | 410,083 | | | | 1.79 | |
| | | | | | | | | 3,708,604 | | | | 16.20 | |
| | | | |
Thailand (Cost $832,640) | | | | | | | | | | | | | | |
Kasikornbank PCL (Registered) | | THB | | | 76,700 | | | | 280,616 | | | | 1.23 | |
PTT Exploration & Production PCL (Registered) | | THB | | | 116,200 | | | | 544,751 | | | | 2.38 | |
| | | | | | | | | 825,367 | | | | 3.61 | |
| | | | |
United Arab Emirates (Cost $393,344) | | | | | | | | | | | | | | |
Aldar Properties PJSC | | AED | | | 200,510 | | | | 283,977 | | | | 1.24 | |
Dubai Islamic Bank PJSC | | AED | | | 84,067 | | | | 123,580 | | | | 0.54 | |
| | | | | | | | | 407,557 | | | | 1.78 | |
See accompanying notes to the financial statements.
123
ASHMORE EMERGING MARKETS ACTIVE EQUITY FUND
SCHEDULE OF INVESTMENTS (CONTINUED)
As of October 31, 2023
| | | | | | | | | | | | | | | | |
| | | Currency1 | | | Shares | | | Value | | | % of Net Assets | |
Zambia (Cost $522,296) | | | | | | | | | | | | | | | | |
First Quantum Minerals Ltd. | | | CAD | | | | 20,200 | | | $ | 234,083 | | | | 1.02 | |
| | | | | | | | | | | 234,083 | | | | 1.02 | |
| | | | |
Total Common Stocks (Cost $26,425,593) | | | | | | | | | | | 22,383,535 | | | | 97.79 | |
| | | | |
Preferred Stocks | | | | | | | | | | | | | | | | |
| | | | |
Brazil (Cost $277,248) | | | | | | | | | | | | | | | | |
Itau Unibanco Holding S.A. ADR* | | | | | | | 57,027 | | | | 302,813 | | | | 1.32 | |
| | | | | | | | | | | 302,813 | | | | 1.32 | |
| | | | |
Total Preferred Stocks (Cost $277,248) | | | | | | | | | | | 302,813 | | | | 1.32 | |
| | | | |
Total Investments (Total Cost $26,702,841) | | | | | | | | | | | 22,686,348 | | | | 99.11 | |
| | | | |
Other Assets Less Liabilities (See Statements of Assets and Liabilities for further detail) | | | | | | | | | | | 203,387 | | | | 0.89 | |
| | | | |
Net Assets | | | | | | | | | | $ | 22,889,735 | | | | 100.00 | |
| * | Non-income producing security. |
| 1 | Local currency is United States Dollars unless otherwise noted below. |
| 2 | Securities exempt from registration under Rule 144A of the Securities Act of 1933. These securities may not be publicly traded without registration under the Securities Act of 1933. |
| 3 | Security has been deemed worthless and is a Level 3 investment. |
| 4 | Security is a Level 3 investment. |
Percentages shown are based on net assets.
At October 31, 2023, the industry sectors for the Ashmore Emerging Markets Active Equity Fund were:
| | | | | | | | |
Sector | | | | | Percentage of Net Assets |
Communication Services | | | | | | | 13.7 | % |
Consumer Discretionary | | | | | | | 17.4 | |
Consumer Staples | | | | | | | 0.6 | |
Energy | | | | | | | 8.4 | |
Financials | | | | | | | 18.7 | |
Health Care | | | | | | | 2.8 | |
Industrials | | | | | | | 4.6 | |
Information Technology | | | | | | | 25.5 | |
Materials | | | | | | | 5.1 | |
Real Estate | | | | | | | 2.3 | |
Total Investments | | | | | | | 99.1 | |
Other Assets Less Liabilities | | | | | | | 0.9 | |
Net Assets | | | | | | | 100.0 | % |
See accompanying notes to the financial statements.
124
ASHMORE EMERGING MARKETS ACTIVE EQUITY FUND
SCHEDULE OF INVESTMENTS (CONTINUED)
As of October 31, 2023
The inputs of methodologies used for valuing securities are not necessarily an indication of the risks associated with investing in those securities and other financial instruments, if any. See note 4 in the Notes to the Financial Statements for more information regarding pricing inputs and valuation techniques. The following is a summary of the inputs used in valuing the Ashmore Emerging Markets Active Equity Fund’s investments and other financial instruments, which are carried at fair value, as of October 31, 2023:
| | | | | | | | | | | | | | | | |
| | | Level 1 | | | Level 2 | | | Level 3 | | | Total | |
Investments | | | | | | | | | | | | | | | | |
Assets: | | | | | | | | | | | | | | | | |
Common Stocks | | | | | | | | | | | | | | | | |
Argentina | | | $ 446,160 | | | | $ — | | | | $— | | | | $ 446,160 | |
Brazil | | | 1,227,473 | | | | — | | | | — | | | | 1,227,473 | |
China | | | 1,396,055 | | | | 5,467,402 | | | | — | | | | 6,863,457 | |
India | | | 1,546,389 | | | | 1,720,630 | | | | — | | | | 3,267,019 | |
Indonesia | | | — | | | | 341,709 | | | | — | | | | 341,709 | |
Malaysia | | | — | | | | 369,045 | | | | — | | | | 369,045 | |
Mexico | | | 653,323 | | | | — | | | | — | | | | 653,323 | |
Russian Federation | | | — | | | | — | | | | 1 | | | | 1 | |
Saudi Arabia | | | — | | | | 813,164 | | | | — | | | | 813,164 | |
South Africa | | | — | | | | 248,115 | | | | — | | | | 248,115 | |
South Korea | | | — | | | | 2,978,458 | | | | — | | | | 2,978,458 | |
Taiwan | | | 968,105 | | | | 2,740,499 | | | | — | | | | 3,708,604 | |
Thailand | | | — | | | | 825,367 | | | | — | | | | 825,367 | |
United Arab Emirates | | | — | | | | 407,557 | | | | — | | | | 407,557 | |
Zambia | | | 234,083 | | | | — | | | | — | | | | 234,083 | |
| | | | | | | | | | | | | | | | |
Total Common Stocks | | | 6,471,588 | | | | 15,911,946 | | | | 1 | | | | 22,383,535 | |
Preferred Stocks | | | | | | | | | | | | | | | | |
Brazil | | | 302,813 | | | | — | | | | — | | | | 302,813 | |
| |
Total Investments | | | $6,774,401 | | | | $15,911,946 | | | | $1 | | | | $22,686,348 | |
| |
There were no transfers to or from Level 3 during the year ended October 31, 2023.
The amount of Level 3 securities compared to total net assets is not material; therefore, the reconciliation of Level 3 securities and assumptions is not shown for the year ended October 31, 2023.
The following is a summary of the fair values of the Fund’s derivative instruments*:
The Effect of Financial Derivative Instruments on the Statements of Operations for the Year Ended October 31, 2023:
| | | | |
| | | Derivatives Not Accounted for as
Hedging Instruments | |
| | | Foreign Exchange Risk | |
| |
Realized Gain (Loss) on Derivatives Recognized resulting from Operations: | | | | |
Net Realized Loss on Forward Foreign Currency Exchange Contracts | | | $(954) | |
| | | | |
* See Note 10 in the Notes to the Financial Statements for additional information.
See accompanying notes to the financial statements.
125
ASHMORE EMERGING MARKETS SMALL-CAP EQUITY FUND
SCHEDULE OF INVESTMENTS
As of October 31, 2023
| | | | | | | | | | | | | | |
| | | Currency1 | | Shares | | | Value | | % of Net Assets | |
Common Stocks | | | | | | | | | | | | | | |
| | | | |
Argentina (Cost $116,445) | | | | | | | | | | | | | | |
Globant S.A.* | | | | | 700 | | | | $ 119,203 | | | | 1.40 | |
| | | | | | | | | 119,203 | | | | 1.40 | |
| | | | |
Brazil (Cost $779,589) | | | | | | | | | | | | | | |
Arcos Dorados Holdings, Inc., Class A | | | | | 18,600 | | | | 167,772 | | | | 1.97 | |
Arezzo Industria e Comercio S.A.* | | BRL | | | 7,400 | | | | 85,702 | | | | 1.01 | |
Oncoclinicas do Brasil Servicos Medicos S.A.* | | BRL | | | 80,900 | | | | 152,116 | | | | 1.79 | |
TOTVS S.A.* | | BRL | | | 55,300 | | | | 277,611 | | | | 3.27 | |
| | | | | | | | | 683,201 | | | | 8.04 | |
| | | | |
China (Cost $1,703,834) | | | | | | | | | | | | | | |
CIMC Enric Holdings Ltd. | | HKD | | | 218,000 | | | | 185,452 | | | | 2.18 | |
Fu Shou Yuan International Group Ltd. | | HKD | | | 281,000 | | | | 188,413 | | | | 2.22 | |
Hongfa Technology Co. Ltd., Class A | | CNH | | | 73,600 | | | | 291,699 | | | | 3.43 | |
JNBY Design Ltd. | | HKD | | | 193,000 | | | | 235,813 | | | | 2.78 | |
Lufax Holding Ltd. ADR | | | | | 117,417 | | | | 112,110 | | | | 1.32 | |
Sieyuan Electric Co. Ltd., Class A | | CNH | | | 12,800 | | | | 86,158 | | | | 1.01 | |
Xiabuxiabu Catering Management China Holdings Co. Ltd.2 | | HKD | | | 360,000 | | | | 133,786 | | | | 1.58 | |
| | | | | | | | | 1,233,431 | | | | 14.52 | |
| | | | |
Greece (Cost $173,178) | | | | | | | | | | | | | | |
Piraeus Financial Holdings S.A.* | | EUR | | | 61,654 | | | | 182,126 | | | | 2.14 | |
| | | | | | | | | 182,126 | | | | 2.14 | |
| | | | |
India (Cost $1,548,291) | | | | | | | | | | | | | | |
Aarti Industries Ltd. | | INR | | | 21,406 | | | | 116,931 | | | | 1.38 | |
APL Apollo Tubes Ltd. | | INR | | | 9,483 | | | | 178,396 | | | | 2.10 | |
Granules India Ltd. | | INR | | | 60,822 | | | | 238,083 | | | | 2.80 | |
JB Chemicals & Pharmaceuticals Ltd. | | INR | | | 5,630 | | | | 94,568 | | | | 1.11 | |
Multi Commodity Exchange of India Ltd. | | INR | | | 15,205 | | | | 425,906 | | | | 5.01 | |
PB Fintech Ltd.* | | INR | | | 37,208 | | | | 313,284 | | | | 3.69 | |
Prince Pipes & Fittings Ltd.* | | INR | | | 31,062 | | | | 234,911 | | | | 2.76 | |
Radico Khaitan Ltd. | | INR | | | 9,646 | | | | 141,216 | | | | 1.66 | |
| | | | | | | | | 1,743,295 | | | | 20.51 | |
| | | | |
Indonesia (Cost $388,566) | | | | | | | | | | | | | | |
Bank Syariah Indonesia Tbk PT | | IDR | | | 1,796,700 | | | | 169,679 | | | | 2.00 | |
Ciputra Development Tbk PT | | IDR | | | 2,911,400 | | | | 203,434 | | | | 2.39 | |
| | | | | | | | | 373,113 | | | | 4.39 | |
| | | | |
Malaysia (Cost $520,323) | | | | | | | | | | | | | | |
My EG Services Bhd. | | MYR | | | 2,544,897 | | | | 416,993 | | | | 4.91 | |
| | | | | | | | | 416,993 | | | | 4.91 | |
| | | | |
Mexico (Cost $292,511) | | | | | | | | | | | | | | |
Grupo Aeroportuario del Centro Norte S.A.B. de C.V. ADR | | | | | 2,200 | | | | 134,574 | | | | 1.58 | |
| | | | | | | | | | | | | | |
See accompanying notes to the financial statements.
126
ASHMORE EMERGING MARKETS SMALL-CAP EQUITY FUND
SCHEDULE OF INVESTMENTS (CONTINUED)
As of October 31, 2023
| | | | | | | | | | | | | | |
| | | Currency1 | | Shares | | | Value | | % of Net Assets | |
Mexico (continued) | | | | | | | | | | | | | | |
Grupo Traxion S.A.B. de C.V.*,2 | | MXN | | | 81,500 | | | | $ 120,426 | | | | 1.42 | |
| | | | | | | | | 255,000 | | | | 3.00 | |
| | | | |
South Africa (Cost $198,931) | | | | | | | | | | | | | | |
Karooooo Ltd. | | | | | 7,218 | | | | 173,232 | | | | 2.04 | |
| | | | | | | | | 173,232 | | | | 2.04 | |
| | | | |
South Korea (Cost $1,554,266) | | | | | | | | | | | | | | |
Classys, Inc. | | KRW | | | 5,704 | | | | 140,491 | | | | 1.65 | |
Dentium Co. Ltd. | | KRW | | | 4,143 | | | | 337,330 | | | | 3.97 | |
Eugene Technology Co. Ltd. | | KRW | | | 5,781 | | | | 165,088 | | | | 1.94 | |
Hana Materials, Inc. | | KRW | | | 4,857 | | | | 172,363 | | | | 2.03 | |
Hansol Chemical Co. Ltd. | | KRW | | | 1,995 | | | | 223,829 | | | | 2.63 | |
Jeisys Medical, Inc.* | | KRW | | | 11,311 | | | | 88,832 | | | | 1.05 | |
KoMiCo Ltd. | | KRW | | | 9,132 | | | | 301,990 | | | | 3.55 | |
Park Systems Corp. | | KRW | | | 1,070 | | | | 111,018 | | | | 1.31 | |
| | | | | | | | | 1,540,941 | | | | 18.13 | |
| | | | |
Taiwan (Cost $1,905,902) | | | | | | | | | | | | | | |
Andes Technology Corp. | | TWD | | | 18,000 | | | | 216,626 | | | | 2.55 | |
E Ink Holdings, Inc. | | TWD | | | 51,000 | | | | 264,738 | | | | 3.11 | |
eCloudvalley Digital Technology Co. Ltd. | | TWD | | | 53,977 | | | | 179,451 | | | | 2.11 | |
Kaori Heat Treatment Co. Ltd. | | TWD | | | 31,000 | | | | 202,423 | | | | 2.38 | |
Parade Technologies Ltd. | | TWD | | | 7,000 | | | | 230,910 | | | | 2.72 | |
Poya International Co. Ltd. | | TWD | | | 14,873 | | | | 228,225 | | | | 2.69 | |
Sinbon Electronics Co. Ltd. | | TWD | | | 13,000 | | | | 111,093 | | | | 1.31 | |
WinWay Technology Co. Ltd. | | TWD | | | 13,000 | | | | 261,006 | | | | 3.07 | |
| | | | | | | | | 1,694,472 | | | | 19.94 | |
| | | | |
Total Common Stocks (Cost $9,181,836) | | | | | | | | | 8,415,007 | | | | 99.02 | |
| | | | |
Total Investments (Total Cost $9,181,836) | | | | | | | | | 8,415,007 | | | | 99.02 | |
Other Assets Less Liabilities (See Statements of Assets and Liabilities for further detail) | | | | | | | | | 83,167 | | | | 0.98 | |
| | | | |
Net Assets | | | | | | | | $ | 8,498,174 | | | | 100.00 | |
| * | Non-income producing security. |
| 1 | Local currency is United States Dollars unless otherwise noted below. |
| 2 | Securities exempt from registration under Rule 144A of the Securities Act of 1933. These securities may not be publicly traded without registration under the Securities Act of 1933. |
Percentages shown are based on net assets.
See accompanying notes to the financial statements.
127
ASHMORE EMERGING MARKETS SMALL-CAP EQUITY FUND
SCHEDULE OF INVESTMENTS (CONTINUED)
As of October 31, 2023
At October 31, 2023, the industry sectors for the Ashmore Emerging Markets Small-Cap Equity Fund were:
| | | | | | | | |
Sector | | | | | Percentage of Net Assets |
Consumer Discretionary | | | | | | | 12.2 | % |
Consumer Staples | | | | | | | 1.7 | |
Financials | | | | | | | 14.1 | |
Health Care | | | | | | | 12.4 | |
Industrials | | | | | | | 19.7 | |
Information Technology | | | | | | | 30.4 | |
Materials | | | | | | | 6.1 | |
Real Estate | | | | | | | 2.4 | |
Total Investments | | | | | | | 99.0 | |
Other Assets Less Liabilities | | | | | | | 1.0 | |
Net Assets | | | | | | | 100.0 | % |
The inputs of methodologies used for valuing securities are not necessarily an indication of the risks associated with investing in those securities and other financial instruments, if any. See note 4 in the Notes to the Financial Statements for more information regarding pricing inputs and valuation techniques. The following is a summary of the inputs used in valuing the Ashmore Emerging Markets Small-Cap Equity Fund’s investments and other financial instruments, which are carried at fair value, as of October 31, 2023:
| | | | | | | | | | | | | | | | |
| | | Level 1 | | | Level 2 | | | Level 3 | | | Total | |
Investments | | | | | | | | | | | | | | | | |
Assets: | | | | | | | | | | | | | | | | |
Common Stocks | | | | | | | | | | | | | | | | |
Argentina | | | $ 119,203 | | | | $ — | | | | $— | | | | $ 119,203 | |
Brazil | | | 683,201 | | | | — | | | | — | | | | 683,201 | |
China | | | 112,110 | | | | 1,121,321 | | | | — | | | | 1,233,431 | |
Greece | | | — | | | | 182,126 | | | | — | | | | 182,126 | |
India | | | — | | | | 1,743,295 | | | | — | | | | 1,743,295 | |
Indonesia | | | — | | | | 373,113 | | | | — | | | | 373,113 | |
Malaysia | | | — | | | | 416,993 | | | | — | | | | 416,993 | |
Mexico | | | 255,000 | | | | — | | | | — | | | | 255,000 | |
South Africa | | | 173,232 | | | | — | | | | — | | | | 173,232 | |
South Korea | | | — | | | | 1,540,941 | | | | — | | | | 1,540,941 | |
Taiwan | | | — | | | | 1,694,472 | | | | — | | | | 1,694,472 | |
| | | | | | | | | | | | | | | | |
Total Common Stocks | | | 1,342,746 | | | | 7,072,261 | | | | — | | | | 8,415,007 | |
| |
Total Investments | | | $1,342,746 | | | | $7,072,261 | | | | $— | | | | $8,415,007 | |
| |
There were no transfers to or from Level 3 during the year ended October 31, 2023.
The amount of Level 3 securities compared to total net assets is not material; therefore, the reconciliation of Level 3 securities and assumptions is not shown for the year ended October 31, 2023.
See accompanying notes to the financial statements.
128
ASHMORE EMERGING MARKETS FRONTIER EQUITY FUND
SCHEDULE OF INVESTMENTS
As of October 31, 2023
| | | | | | | | | | | | | | | | |
| | | Currency1 | | | Shares | | | Value | | | % of Net Assets | |
Common Stocks | | | | | | | | | | | | | | | | |
| | | | |
Argentina (Cost $567,145) | | | | | | | | | | | | | | | | |
|
Globant S.A.* | | | | | | | 3,150 | | | $ | 536,414 | | | | 0.85 | |
| | | | | | | | | | | 536,414 | | | | 0.85 | |
| | | | |
Cambodia (Cost $1,542,169) | | | | | | | | | | | | | | | | |
NagaCorp Ltd.* | | | HKD | | | | 2,247,263 | | | | 967,659 | | | | 1.54 | |
| | | | | | | | | | | 967,659 | | | | 1.54 | |
| | | | |
Egypt (Cost $502,283) | | | | | | | | | | | | | | | | |
Fertiglobe PLC | | | AED | | | | 572,000 | | | | 500,246 | | | | 0.80 | |
| | | | | | | | | | | 500,246 | | | | 0.80 | |
| | | | |
Georgia (Cost $792,843) | | | | | | | | | | | | | | | | |
Bank of Georgia Group PLC | | | GBP | | | | 22,739 | | | | 924,961 | | | | 1.47 | |
| | | | | | | | | | | 924,961 | | | | 1.47 | |
| | | | |
Ghana (Cost $571,693) | | | | | | | | | | | | | | | | |
Kosmos Energy Ltd.* | | | | | | | 96,300 | | | | 697,212 | | | | 1.11 | |
| | | | | | | | | | | 697,212 | | | | 1.11 | |
| | | | |
Iceland (Cost $1,595,187) | | | | | | | | | | | | | | | | |
Arion Banki HF2 | | | ISK | | | | 1,492,231 | | | | 1,370,962 | | | | 2.18 | |
| | | | | | | | | | | 1,370,962 | | | | 2.18 | |
| | | | |
Kazakhstan (Cost $5,791,819) | | | | | | | | | | | | | | | | |
Halyk Savings Bank of Kazakhstan JSC GDR (Registered) | | | | | | | 149,946 | | | | 1,878,165 | | | | 2.99 | |
Kaspi.KZ JSC GDR (Registered) | | | | | | | 44,164 | | | | 3,992,917 | | | | 6.35 | |
NAC Kazatomprom JSC GDR (Registered) | | | | | | | 20,510 | | | | 834,434 | | | | 1.33 | |
| | | | | | | | | | | 6,705,516 | | | | 10.67 | |
| | | | |
Kuwait (Cost $2,235,147) | | | | | | | | | | | | | | | | |
National Bank of Kuwait S.A.K.P. | | | KWD | | | | 704,107 | | | | 1,996,920 | | | | 3.18 | |
| | | | | | | | | | | 1,996,920 | | | | 3.18 | |
| | | | |
Mauritius (Cost $1,288,873) | | | | | | | | | | | | | | | | |
MCB Group Ltd. | | | MUR | | | | 187,685 | | | | 1,393,675 | | | | 2.22 | |
| | | | | | | | | | | 1,393,675 | | | | 2.22 | |
| | | | |
Morocco (Cost $1,998,855) | | | | | | | | | | | | | | | | |
Attijariwafa Bank | | | MAD | | | | 15,495 | | | | 700,736 | | | | 1.12 | |
Label Vie | | | MAD | | | | 2,920 | | | | 1,259,725 | | | | 2.00 | |
| | | | | | | | | | | 1,960,461 | | | | 3.12 | |
| | | | |
Oman (Cost $374,951) | | | | | | | | | | | | | | | | |
OQ Gas Networks S.A.O.C* | | | OMR | | | | 1,031,078 | | | | 401,875 | | | | 0.64 | |
| | | | | | | | | | | 401,875 | | | | 0.64 | |
| | | | |
Pakistan (Cost $1,358,015) | | | | | | | | | | | | | | | | |
Systems Ltd. | | | PKR | | | | 797,283 | | | | 1,174,263 | | | | 1.87 | |
| | | | | | | | | | | 1,174,263 | | | | 1.87 | |
See accompanying notes to the financial statements.
129
ASHMORE EMERGING MARKETS FRONTIER EQUITY FUND
SCHEDULE OF INVESTMENTS (CONTINUED)
As of October 31, 2023
| | | | | | | | | | | | | | | | |
| | | Currency1 | | | Shares | | | Value | | | % of Net Assets | |
Peru (Cost $1,239,792) | | | | | | | | | | | | | | | | |
Credicorp Ltd. | | | | | | | 9,936 | | | $ | 1,241,603 | | | | 1.98 | |
| | | | | | | | | | | 1,241,603 | | | | 1.98 | |
| | | | |
Philippines (Cost $4,130,898) | | | | | | | | | | | | | | | | |
Bank of the Philippine Islands | | | PHP | | | | 340,190 | | | | 602,886 | | | | 0.96 | |
BDO Unibank, Inc. | | | PHP | | | | 545,172 | | | | 1,228,189 | | | | 1.95 | |
DigiPlus Interactive Corp.* | | | PHP | | | | 8,452,300 | | | | 990,297 | | | | 1.58 | |
SM Investments Corp. | | | PHP | | | | 40,000 | | | | 564,706 | | | | 0.90 | |
Wilcon Depot, Inc. | | | PHP | | | | 1,565,200 | | | | 546,292 | | | | 0.87 | |
| | | | | | | | | | | 3,932,370 | | | | 6.26 | |
| | | | |
Qatar (Cost $5,466,372) | | | | | | | | | | | | | | | | |
Industries Qatar QSC | | | QAR | | | | 265,971 | | | | 892,703 | | | | 1.42 | |
Ooredoo QPSC | | | QAR | | | | 236,699 | | | | 641,932 | | | | 1.02 | |
Qatar Gas Transport Co. Ltd. | | | QAR | | | | 1,195,025 | | | | 1,154,827 | | | | 1.84 | |
Qatar Islamic Bank S.A.Q. | | | QAR | | | | 127,919 | | | | 611,281 | | | | 0.98 | |
Qatar National Bank QPSC | | | QAR | | | | 322,905 | | | | 1,320,670 | | | | 2.10 | |
| | | | | | | | | | | 4,621,413 | | | | 7.36 | |
| | | | |
Romania (Cost $4,635,845) | | | | | | | | | | | | | | | | |
Banca Transilvania S.A. | | | RON | | | | 532,029 | | | | 2,523,088 | | | | 4.01 | |
OMV Petrom S.A. | | | RON | | | | 11,990,104 | | | | 1,369,869 | | | | 2.18 | |
Societatea De Producere A Energiei Electrice in Hidrocentrale Hidroelectrica S.A.* | | | RON | | | | 52,788 | | | | 1,311,882 | | | | 2.09 | |
| | | | | | | | | | | 5,204,839 | | | | 8.28 | |
| | | | |
Saudi Arabia (Cost $2,000,382) | | | | | | | | | | | | | | | | |
Riyadh Cables Group Co. | | | SAR | | | | 49,750 | | | | 972,009 | | | | 1.55 | |
Seera Group Holding* | | | SAR | | | | 79,000 | | | | 497,054 | | | | 0.79 | |
United International Transportation Co. | | | SAR | | | | 28,396 | | | | 509,065 | | | | 0.81 | |
| | | | | | | | | | | 1,978,128 | | | | 3.15 | |
| | | | |
Slovenia (Cost $1,476,336) | | | | | | | | | | | | | | | | |
Nova Ljubljanska Banka dd GDR (Registered) | | | EUR | | | | 102,193 | | | | 1,564,413 | | | | 2.49 | |
| | | | | | | | | | | 1,564,413 | | | | 2.49 | |
| | | | |
United Arab Emirates (Cost $9,071,127) | | | | | | | | | | | | | | | | |
Abu Dhabi Islamic Bank PJSC | | | AED | | | | 544,723 | | | | 1,526,646 | | | | 2.43 | |
ADNOC Drilling Co. PJSC | | | AED | | | | 510,000 | | | | 505,591 | | | | 0.81 | |
Al Ansari Financial Services PJSC* | | | AED | | | | 2,116,998 | | | | 662,442 | | | | 1.06 | |
Aldar Properties PJSC | | | AED | | | | 948,958 | | | | 1,343,984 | | | | 2.14 | |
Americana Restaurants International PLC | | | AED | | | | 607,175 | | | | 611,539 | | | | 0.97 | |
Dubai Islamic Bank PJSC | | | AED | | | | 320,035 | | | | 470,458 | | | | 0.75 | |
Emaar Properties PJSC | | | AED | | | | 864,464 | | | | 1,573,287 | | | | 2.50 | |
Emirates NBD Bank PJSC | | | AED | | | | 274,382 | | | | 1,265,498 | | | | 2.01 | |
First Abu Dhabi Bank PJSC | | | AED | | | | 300,894 | | | | 1,038,818 | | | | 1.65 | |
| | | | | | | | | | | 8,998,263 | | | | 14.32 | |
See accompanying notes to the financial statements.
130
ASHMORE EMERGING MARKETS FRONTIER EQUITY FUND
SCHEDULE OF INVESTMENTS (CONTINUED)
As of October 31, 2023
| | | | | | | | | | | | | | | | |
| | | Currency1 | | | Shares | | | Value | | | % of Net Assets | |
Vietnam (Cost $11,992,501) | | | | | | | | | | | | | | | | |
Bank for Foreign Trade of Vietnam JSC* | | | VND | | | | 461,084 | | | $ | 1,631,709 | | | | 2.60 | |
FPT Corp. | | | VND | | | | 1,119,635 | | | | 3,794,301 | | | | 6.04 | |
Gemadept Corp. | | | VND | | | | 549,100 | | | | 1,324,658 | | | | 2.11 | |
IDICO Corp. JSC | | | VND | | | | 600,000 | | | | 1,038,983 | | | | 1.65 | |
Khang Dien House Trading and Investment JSC* | | | VND | | | | 83,170 | | | | 97,165 | | | | 0.15 | |
Phu Nhuan Jewelry JSC | | | VND | | | | 253,966 | | | | 745,553 | | | | 1.19 | |
Vietnam Dairy Products JSC | | | VND | | | | 428,400 | | | | 1,188,177 | | | | 1.89 | |
Vinhomes JSC* | | | VND | | | | 1,064,911 | | | | 1,703,314 | | | | 2.71 | |
| | | | | | | | | 11,523,860 | | | 18.34 | |
| | | | |
Total Common Stocks (Cost $58,632,233) | | | | | | | | | | | 57,695,053 | | | | 91.83 | |
| | | | |
Investment Companies | | | | | | | | | | | | | | | | |
| | | | |
Vietnam Enterprise Investments Ltd., Class C *,2 | | | GBP | | | | 275,709 | | | | 1,742,023 | | | | 2.77 | |
Total Investment Companies (Cost $2,032,563) | | | | | | | | | | | 1,742,023 | | | | 2.77 | |
| | | | |
Total Investments (Total Cost $60,664,796) | | | | | | | | | | | 59,437,076 | | | | 94.60 | |
| | | | |
Other Assets Less Liabilities (See Statements of Assets and
Liabilities for further detail) | | | | | | | | | | | 3,390,247 | | | | 5.40 | |
| | | | |
Net Assets | | | | | | | | | | $ | 62,827,323 | | | | 100.00 | |
| * | Non-income producing security. |
| 1 | Local currency is United States Dollars unless otherwise noted below. |
| 2 | Securities exempt from registration under Rule 144A of the Securities Act of 1933. These securities may not be publicly traded without registration under the Securities Act of 1933. |
Percentages shown are based on net assets.
At October 31, 2023, the industry sectors for the Ashmore Emerging Markets Frontier Equity Fund were:
| | | | | |
Sector | | Percentage of Net Assets |
|
Communication Services | | | | 1.0 | % |
Consumer Discretionary | | | | 6.9 | |
Consumer Staples | | | | 3.9 | |
Energy | | | | 7.9 | |
Financials | | | | 47.3 | |
Industrials | | | | 8.4 | |
Information Technology | | | | 8.8 | |
Materials | | | | 0.8 | |
Real Estate | | | | 7.5 | |
Utilities | | | | 2.1 | |
Total Investments | | | | 94.6 | |
Other Assets Less Liabilities | | | | 5.4 | |
Net Assets | | | | 100.0 | % |
See accompanying notes to the financial statements.
131
ASHMORE EMERGING MARKETS FRONTIER EQUITY FUND
SCHEDULE OF INVESTMENTS (CONTINUED)
As of October 31, 2023
The inputs of methodologies used for valuing securities are not necessarily an indication of the risks associated with investing in those securities and other financial instruments, if any. See note 4 in the Notes to the Financial Statements for more information regarding pricing inputs and valuation techniques. The following is a summary of the inputs used in valuing the Ashmore Emerging Markets Frontier Equity Fund’s investments and other financial instruments, which are carried at fair value, as of October 31, 2023:
| | | | | | | | | | | | | | | | |
| | | Level 1 | | | Level 2 | | | Level 3 | | | Total | |
Investments | | | | | | | | | | | | | | | | |
Assets: | | | | | | | | | | | | | | | | |
Common Stocks | | | | | | | | | | | | | | | | |
Argentina | | $ | 536,414 | | | $ | — | | | | $— | | | $ | 536,414 | |
Cambodia | | | — | | | | 967,659 | | | | — | | | | 967,659 | |
Egypt | | | — | | | | 500,246 | | | | — | | | | 500,246 | |
Georgia | | | — | | | | 924,961 | | | | — | | | | 924,961 | |
Ghana | | | 697,212 | | | | | | | | — | | | | 697,212 | |
Iceland | | | — | | | | 1,370,962 | | | | — | | | | 1,370,962 | |
Kazakhstan | | | — | | | | 6,705,516 | | | | — | | | | 6,705,516 | |
Kuwait | | | — | | | | 1,996,920 | | | | — | | | | 1,996,920 | |
Mauritius | | | — | | | | 1,393,675 | | | | — | | | | 1,393,675 | |
Morocco | | | — | | | | 1,960,461 | | | | — | | | | 1,960,461 | |
Oman | | | 401,875 | | | | | | | | — | | | | 401,875 | |
Pakistan | | | — | | | | 1,174,263 | | | | — | | | | 1,174,263 | |
Peru | | | 1,241,603 | | | | | | | | — | | | | 1,241,603 | |
Philippines | | | — | | | | 3,932,370 | | | | — | | | | 3,932,370 | |
Qatar | | | — | | | | 4,621,413 | | | | — | | | | 4,621,413 | |
Romania | | | — | | | | 5,204,839 | | | | — | | | | 5,204,839 | |
Saudi Arabia | | | — | | | | 1,978,128 | | | | — | | | | 1,978,128 | |
Slovenia | | | — | | | | 1,564,413 | | | | — | | | | 1,564,413 | |
United Arab Emirates | | | — | | | | 8,998,263 | | | | — | | | | 8,998,263 | |
Vietnam | | | — | | | | 11,523,860 | | | | — | | | | 11,523,860 | |
| | | | | | | | | | | | | | | | |
Total Common Stocks | | | 2,877,104 | | | | 54,817,949 | | | | — | | | | 57,695,053 | |
Investment Companies | | | | | | | | | | | | | | | | |
Vietnam | | | — | | | | 1,742,023 | | | | — | | | | 1,742,023 | |
Total Investments | | $ | 2,877,104 | | | $ | 56,559,972 | | | | $— | | | $ | 59,437,076 | |
The following is a summary of the fair values of the Fund’s derivative instruments*:
The Effect of Financial Derivative Instruments on the Statements of Operations for the Year Ended October 31, 2023:
| | | | |
| | | Derivatives Not Accounted for as
Hedging Instruments | |
|
| | | Foreign Exchange Risk | |
|
Realized Gain (Loss) on Derivatives Recognized resulting from Operations: | | | | |
Net Realized Gain on Forward Foreign Currency Exchange Contracts | | | $664 | |
| | | | |
* See Note 10 in the Notes to the Financial Statements for additional information.
See accompanying notes to the financial statements.
132
ASHMORE EMERGING MARKETS EQUITY FUND
SCHEDULE OF INVESTMENTS
As of October 31, 2023
| | | | | | | | | | | | | | |
| | | Currency1 | | Shares | | | Value | | | % of Net Assets | |
Common Stocks | | | | | | | | | | | | | | |
| | | | |
Argentina (Cost $842,552) | | | | | | | | | | | | | | |
Globant S.A.* | | | | | 4,800 | | | $ | 817,392 | | | | 0.88 | |
| | | | | | | | | 817,392 | | | | 0.88 | |
| | | | |
Brazil (Cost $7,938,825) | | | | | | | | | | | | | | |
Arcos Dorados Holdings, Inc., Class A | | | | | 135,600 | | | | 1,223,112 | | | | 1.32 | |
Arezzo Industria e Comercio S.A.* | | BRL | | | 58,800 | | | | 680,980 | | | | 0.73 | |
Localiza Rent a Car S.A.* | | BRL | | | 76,800 | | | | 774,893 | | | | 0.84 | |
Oncoclinicas do Brasil Servicos Medicos S.A.* | | BRL | | | 414,600 | | | | 779,572 | | | | 0.84 | |
TOTVS S.A.* | | BRL | | | 548,800 | | | | 2,755,021 | | | | 2.98 | |
XP, Inc., Class A | | | | | 37,100 | | | | 742,000 | | | | 0.80 | |
| | | | | | | | | 6,955,578 | | | | 7.51 | |
| | | | |
China (Cost $33,525,127) | | | | | | | | | | | | | | |
ANTA Sports Products Ltd. | | HKD | | | 270,800 | | | | 3,049,242 | | | | 3.29 | |
CIMC Enric Holdings Ltd. | | HKD | | | 784,000 | | | | 666,947 | | | | 0.72 | |
ENN Energy Holdings Ltd. | | HKD | | | 121,300 | | | | 925,756 | | | | 1.00 | |
H World Group Ltd. ADR* | | | | | 41,110 | | | | 1,548,203 | | | | 1.67 | |
Hongfa Technology Co. Ltd., Class A | | CNH | | | 503,611 | | | | 1,995,960 | | | | 2.16 | |
JD.com, Inc. ADR | | | | | 18,721 | | | | 475,888 | | | | 0.51 | |
Lufax Holding Ltd. ADR | | | | | 730,674 | | | | 697,648 | | | | 0.75 | |
Meituan, Class B*,2 | | HKD | | | 146,330 | | | | 2,078,878 | | | | 2.25 | |
NARI Technology Co. Ltd., Class A | | CNH | | | 302,580 | | | | 929,775 | | | | 1.00 | |
NetEase, Inc. ADR | | | | | 24,734 | | | | 2,644,559 | | | | 2.86 | |
Prosus N.V.* | | EUR | | | 27,399 | | | | 767,430 | | | | 0.83 | |
Sieyuan Electric Co. Ltd., Class A | | CNH | | | 142,700 | | | | 960,532 | | | | 1.04 | |
Tencent Holdings Ltd. | | HKD | | | 170,600 | | | | 6,319,849 | | | | 6.83 | |
Tencent Music Entertainment Group ADR* | | | | | 175,566 | | | | 1,274,609 | | | | 1.38 | |
Wuliangye Yibin Co. Ltd., Class A | | CNH | | | 65,800 | | | | 1,399,439 | | | | 1.51 | |
WuXi AppTec Co. Ltd., Class H2 | | HKD | | | 105,800 | | | | 1,277,929 | | | | 1.38 | |
Xiabuxiabu Catering Management China Holdings Co. Ltd.2 | | HKD | | | 2,293,500 | | | | 852,326 | | | | 0.92 | |
| | | | | | | | | 27,864,970 | | | | 30.10 | |
| | | | |
Greece (Cost $1,171,624) | | | | | | | | | | | | | | |
Piraeus Financial Holdings S.A.* | | EUR | | | 412,346 | | | | 1,218,070 | | | | 1.32 | |
| | | | | | | | | 1,218,070 | | | | 1.32 | |
| | | | |
Hong Kong (Cost $2,416,713) | | | | | | | | | | | | | | |
AIA Group Ltd. | | HKD | | | 242,800 | | | | 2,114,592 | | | | 2.29 | |
| | | | | | | | | 2,114,592 | | | | 2.29 | |
| | | | |
India (Cost $10,786,971) | | | | | | | | | | | | | | |
Aarti Industries Ltd. | | INR | | | 146,524 | | | | 800,389 | | | | 0.86 | |
APL Apollo Tubes Ltd. | | INR | | | 41,553 | | | | 781,705 | | | | 0.84 | |
Granules India Ltd. | | INR | | | 261,357 | | | | 1,023,061 | | | | 1.11 | |
HDFC Bank Ltd. ADR | | | | | 50,461 | | | | 2,853,570 | | | | 3.08 | |
Hindalco Industries Ltd. | | INR | | | 165,359 | | | | 915,092 | | | | 0.99 | |
See accompanying notes to the financial statements.
133
ASHMORE EMERGING MARKETS EQUITY FUND
SCHEDULE OF INVESTMENTS (CONTINUED)
As of October 31, 2023
| | | | | | | | | | | | | | | | |
| | | Currency1 | | | Shares | | | Value | | | % of Net Assets | |
India (continued) | | | | | | | | | | | | | | | | |
ICICI Bank Ltd. ADR | | | | | | | 40,387 | | | $ | 896,188 | | | | 0.97 | |
Larsen & Toubro Ltd. | | | INR | | | | 30,571 | | | | 1,076,067 | | | | 1.16 | |
Multi Commodity Exchange of India Ltd. | | | INR | | | | 63,797 | | | | 1,787,014 | | | | 1.93 | |
PB Fintech Ltd.* | | | INR | | | | 164,420 | | | | 1,384,385 | | | | 1.50 | |
| | | | | | | | | | | 11,517,471 | | | | 12.44 | |
| | | | |
Indonesia (Cost $630,610) | | | | | | | | | | | | | | | | |
Bank Syariah Indonesia Tbk PT | | | IDR | | | | 5,660,200 | | | | 534,547 | | | | 0.58 | |
| | | | | | | | | | | 534,547 | | | | 0.58 | |
| | | | |
Kazakhstan (Cost $1,017,983) | | | | | | | | | | | | | | | | |
Kaspi.KZ JSC GDR (Registered) | | | | | | | 15,666 | | | | 1,416,381 | | | | 1.53 | |
| | | | | | | | | | | 1,416,381 | | | | 1.53 | |
| | | | |
Malaysia (Cost $1,404,189) | | | | | | | | | | | | | | | | |
My EG Services Bhd. | | | MYR | | | | 8,552,106 | | | | 1,401,301 | | | | 1.51 | |
| | | | | | | | | | | 1,401,301 | | | | 1.51 | |
| | | | |
Mexico (Cost $4,661,200) | | | | | | | | | | | | | | | | |
Fomento Economico Mexicano S.A.B. de C.V. ADR | | | | | | | 35,188 | | | | 3,990,671 | | | | 4.31 | |
Grupo Aeroportuario del Pacifico S.A.B. de C.V., Class B | | | MXN | | | | 61,800 | | | | 720,903 | | | | 0.78 | |
Grupo Financiero Banorte S.A.B. de C.V., Class O | | | MXN | | | | 161,400 | | | | 1,309,892 | | | | 1.41 | |
| | | | | | | | | | | 6,021,466 | | | | 6.50 | |
| | | | |
Russian Federation (Cost $1,633,271) | | | | | | | | | | | | | | | | |
LUKOIL PJSC3 | | | RUB | | | | 21,299 | | | | — | | | | — | |
| | | | | | | | | | | — | | | | — | |
| | | | |
Saudi Arabia (Cost $1,525,696) | | | | | | | | | | | | | | | | |
Bupa Arabia for Cooperative Insurance Co. | | | SAR | | | | 17,243 | | | | 978,923 | | | | 1.06 | |
Elm Co. | | | SAR | | | | 5,004 | | | | 936,750 | | | | 1.01 | |
| | | | | | | | | | | 1,915,673 | | | | 2.07 | |
| | | | |
South Korea (Cost $9,576,234) | | | | | | | | | | | | | | | | |
Classys, Inc. | | | KRW | | | | 39,755 | | | | 979,175 | | | | 1.06 | |
Dentium Co. Ltd. | | | KRW | | | | 20,831 | | | | 1,696,095 | | | | 1.83 | |
Hana Materials, Inc. | | | KRW | | | | 26,151 | | | | 928,033 | | | | 1.00 | |
Hansol Chemical Co. Ltd. | | | KRW | | | | 12,238 | | | | 1,373,041 | | | | 1.48 | |
KoMiCo Ltd. | | | KRW | | | | 20,691 | | | | 684,240 | | | | 0.74 | |
LG Chem Ltd. | | | KRW | | | | 1,446 | | | | 476,489 | | | | 0.52 | |
SK Hynix, Inc. | | | KRW | | | | 38,511 | | | | 3,364,353 | | | | 3.63 | |
| | | | | | | | | | | 9,501,426 | | | | 10.26 | |
| | | | |
Taiwan (Cost $20,950,461) | | | | | | | | | | | | | | | | |
Andes Technology Corp. | | | TWD | | | | 69,000 | | | | 830,399 | | | | 0.90 | |
Delta Electronics, Inc. | | | TWD | | | | 167,000 | | | | 1,511,797 | | | | 1.63 | |
E Ink Holdings, Inc. | | | TWD | | | | 221,000 | | | | 1,147,196 | | | | 1.24 | |
Kaori Heat Treatment Co. Ltd. | | | TWD | | | | 74,000 | | | | 483,204 | | | | 0.52 | |
Lotes Co. Ltd. | | | TWD | | | | 38,000 | | | | 965,947 | | | | 1.04 | |
See accompanying notes to the financial statements.
134
ASHMORE EMERGING MARKETS EQUITY FUND
SCHEDULE OF INVESTMENTS (CONTINUED)
As of October 31, 2023
| | | | | | | | | | | | | | |
| | | Currency1 | | Shares | | | Value | | | % of Net Assets | |
Taiwan (continued) | | | | | | | | | | | | | | |
Parade Technologies Ltd. | | TWD | | | 48,000 | | | $ | 1,583,384 | | | | 1.71 | |
Poya International Co. Ltd. | | TWD | | | 77,298 | | | | 1,186,167 | | | | 1.28 | |
Sinbon Electronics Co. Ltd. | | TWD | | | 84,000 | | | | 717,830 | | | | 0.77 | |
Taiwan Semiconductor Manufacturing Co. Ltd. | | TWD | | | 283,000 | | | | 4,662,601 | | | | 5.04 | |
Taiwan Semiconductor Manufacturing Co. Ltd. ADR | | | | | 43,288 | | | | 3,736,187 | | | | 4.04 | |
WinWay Technology Co. Ltd. | | TWD | | | 71,000 | | | | 1,425,496 | | | | 1.54 | |
| | | | | | | | | 18,250,208 | | | | 19.71 | |
| | | | |
United Arab Emirates (Cost $600,650) | | | | | | | | | | | | | | |
Americana Restaurants International PLC | | AED | | | 716,462 | | | | 721,611 | | | | 0.78 | |
| | | | | | | | | 721,611 | | | | 0.78 | |
| | | | |
Total Common Stocks (Cost $98,682,106) | | | | | | | | | 90,250,686 | | | | 97.48 | |
| | | | |
Preferred Stocks | | | | | | | | | | | | | | |
| | | | |
Brazil (Cost $921,315) | | | | | | | | | | | | | | |
Petroleo Brasileiro S.A. ADR, 2.479%4 | | | | | 98,104 | | | | 1,356,778 | | | | 1.47 | |
| | | | | | | | | 1,356,778 | | | | 1.47 | |
| | | | |
Total Preferred Stocks (Cost $921,315) | | | | | | | | | 1,356,778 | | | | 1.47 | |
| | | | |
Rights | | | | | | | | | | | | | | |
| | | | |
Brazil (Cost $—) | | | | | | | | | | | | | | |
Localiza Rent a Car S.A.* | | BRL | | | 593 | | | | 823 | | | | — | |
| | | | | | | | 823 | | | — | |
| | | | |
Total Rights (Cost $—) | | | | | | | | | 823 | | | | — | |
| | | | |
Total Investments (Total Cost $99,603,421) | | | | | | | | | 91,608,287 | | | | 98.95 | |
| | | | |
Other Assets Less Liabilities (See Statements of Assets and Liabilities for further detail) | | | | | | | | | 974,687 | | | | 1.05 | |
| | | | |
Net Assets | | | | | | | | $ | 92,582,974 | | | | 100.00 | |
| * | Non-income producing security. |
| 1 | Local currency is United States Dollars unless otherwise noted below. |
| 2 | Securities exempt from registration under Rule 144A of the Securities Act of 1933. These securities may not be publicly traded without registration under the Securities Act of 1933. |
| 3 | Security has been deemed worthless and is a Level 3 investment. |
| 4 | Current yield is disclosed. Dividends are calculated based on a percentage of the issuer’s net income. |
Percentages shown are based on net assets.
See accompanying notes to the financial statements.
135
ASHMORE EMERGING MARKETS EQUITY FUND
SCHEDULE OF INVESTMENTS (CONTINUED)
As of October 31, 2023
At October 31, 2023, the industry sectors for the Ashmore Emerging Markets Equity Fund were:
| | | | |
Sector | | Percentage of Net Assets |
Communication Services | | | 11.1 | % |
Consumer Discretionary | | | 13.6 | |
Consumer Staples | | | 5.8 | |
Energy | | | 1.5 | |
Financials | | | 17.2 | |
Health Care | | | 6.2 | |
Industrials | | | 9.7 | |
Information Technology | | | 28.1 | |
Materials | | | 4.7 | |
Utilities | | | 1.0 | |
Total Investments | | | 98.9 | |
Other Assets Less Liabilities | | | 1.1 | |
Net Assets | | | 100.0 | % |
The inputs of methodologies used for valuing securities are not necessarily an indication of the risks associated with investing in those securities and other financial instruments, if any. See note 4 in the Notes to the Financial Statements for more information regarding pricing inputs and valuation techniques. The following is a summary of the inputs used in valuing the Ashmore Emerging Markets Equity Fund’s investments and other financial instruments, which are carried at fair value, as of October 31, 2023:
| | | | | | | | | | | | | | | | |
| | | Level 1 | | | Level 2 | | | Level 3 | | | Total | |
Investments | | | | | | | | | | | | | | | | |
Assets: | | | | | | | | | | | | | | | | |
Common Stocks | | | | | | | | | | | | | | | | |
Argentina | | | $ 817,392 | | | | $ — | | | | $— | | | | $ 817,392 | |
Brazil | | | 6,955,578 | | | | — | | | | — | | | | 6,955,578 | |
China | | | 6,640,907 | | | | 21,224,063 | | | | — | | | | 27,864,970 | |
Greece | | | — | | | | 1,218,070 | | | | — | | | | 1,218,070 | |
Hong Kong | | | — | | | | 2,114,592 | | | | — | | | | 2,114,592 | |
India | | | 3,749,758 | | | | 7,767,713 | | | | — | | | | 11,517,471 | |
Indonesia | | | — | | | | 534,547 | | | | — | | | | 534,547 | |
Kazakhstan | | | — | | | | 1,416,381 | | | | — | | | | 1,416,381 | |
Malaysia | | | — | | | | 1,401,301 | | | | — | | | | 1,401,301 | |
Mexico | | | 6,021,466 | | | | — | | | | — | | | | 6,021,466 | |
Saudi Arabia | | | — | | | | 1,915,673 | | | | — | | | | 1,915,673 | |
South Korea | | | — | | | | 9,501,426 | | | | — | | | | 9,501,426 | |
Taiwan | | | 3,736,187 | | | | 14,514,021 | | | | — | | | | 18,250,208 | |
United Arab Emirates | | | — | | | | 721,611 | | | | — | | | | 721,611 | |
| | | | | | | | | | | | | | | | |
Total Common Stocks | | | 27,921,288 | | | | 62,329,398 | | | | — | | | | 90,250,686 | |
Preferred Stocks | | | | | | | | | | | | | | | | |
Brazil | | | 1,356,778 | | | | — | | | | — | | | | 1,356,778 | |
Rights | | | | | | | | | | | | | | | | |
Brazil | | | 823 | | | | — | | | | — | | | | 823 | |
Total Investments | | | $29,278,889 | | | | $62,329,398 | | | | $— | | | | $91,608,287 | |
There were no transfers to or from Level 3 during the year ended October 31, 2023.
See accompanying notes to the financial statements.
136
ASHMORE EMERGING MARKETS EQUITY FUND
SCHEDULE OF INVESTMENTS (CONTINUED)
As of October 31, 2023
The amount of Level 3 securities compared to total net assets is not material; therefore, the reconciliation of Level 3 securities and assumptions is not shown for the year ended October 31, 2023.
See accompanying notes to the financial statements.
137
ASHMORE EMERGING MARKETS EQUITY ESG FUND
SCHEDULE OF INVESTMENTS
As of October 31, 2023
| | | | | | | | | | | | | | |
| | | Currency1 | | Shares | | | Value | | | % of Net Assets | |
Common Stocks | | | | | | | | | | | | | | |
| | | | |
Argentina (Cost $139,116) | | | | | | | | | | | | | | |
Globant S.A.* | | | | | 800 | | | $ | 136,232 | | | | 1.34 | |
| | | | | | | | | 136,232 | | | | 1.34 | |
| | | | |
Brazil (Cost $766,183) | | | | | | | | | | | | | | |
Arezzo Industria e Comercio S.A.* | | BRL | | | 10,100 | | | | 116,971 | | | | 1.15 | |
Oncoclinicas do Brasil Servicos Medicos S.A.* | | BRL | | | 95,200 | | | | 179,005 | | | | 1.76 | |
TOTVS S.A.* | | BRL | | | 74,500 | | | | 373,996 | | | | 3.69 | |
| | | | | | | | | 669,972 | | | | 6.60 | |
| | | | |
China (Cost $3,314,555) | | | | | | | | | | | | | | |
ANTA Sports Products Ltd. | | HKD | | | 28,200 | | | | 317,535 | | | | 3.13 | |
Hongfa Technology Co. Ltd., Class A | | CNH | | | 90,700 | | | | 359,471 | | | | 3.54 | |
Meituan, Class B*,2 | | HKD | | | 14,150 | | | | 201,026 | | | | 1.98 | |
NARI Technology Co. Ltd., Class A | | CNH | | | 72,640 | | | | 223,210 | | | | 2.20 | |
Prosus N.V.* | | EUR | | | 1,645 | | | | 46,075 | | | | 0.45 | |
Sieyuan Electric Co. Ltd., Class A | | CNH | | | 28,000 | | | | 188,472 | | | | 1.86 | |
Sunresin New Materials Co. Ltd., Class A | | CNH | | | 33,150 | | | | 245,293 | | | | 2.42 | |
Tencent Holdings Ltd. | | HKD | | | 17,300 | | | | 640,876 | | | | 6.31 | |
WuXi AppTec Co. Ltd., Class H2 | | HKD | | | 30,880 | | | | 372,991 | | | | 3.67 | |
Xiabuxiabu Catering Management China Holdings Co. Ltd.2 | | HKD | | | 286,500 | | | | 106,471 | | | | 1.05 | |
| | | | | | | | | 2,701,420 | | | | 26.61 | |
| | | | |
Hong Kong (Cost $352,838) | | | | | | | | | | | | | | |
AIA Group Ltd. | | HKD | | | 35,200 | | | | 306,564 | | | | 3.02 | |
| | | | | | | | | 306,564 | | | | 3.02 | |
| | | | |
India (Cost $998,237) | | | | | | | | | | | | | | |
Alkem Laboratories Ltd. | | INR | | | 2,940 | | | | 131,488 | | | | 1.29 | |
Granules India Ltd. | | INR | | | 51,294 | | | | 200,786 | | | | 1.98 | |
HDFC Bank Ltd. ADR | | | | | 7,356 | | | | 415,982 | | | | 4.10 | |
ICICI Bank Ltd. ADR | | | | | 6,777 | | | | 150,382 | | | | 1.48 | |
PB Fintech Ltd.* | | INR | | | 26,376 | | | | 222,081 | | | | 2.19 | |
| | | | | | | | | 1,120,719 | | | | 11.04 | |
| | | | |
Indonesia (Cost $92,687) | | | | | | | | | | | | | | |
Bank Syariah Indonesia Tbk PT | | IDR | | | 832,800 | | | | 78,649 | | | | 0.77 | |
| | | | | | | | | 78,649 | | | | 0.77 | |
| | | | |
Malaysia (Cost $246,539) | | | | | | | | | | | | | | |
My EG Services Bhd. | | MYR | | | 1,486,806 | | | | 243,620 | | | | 2.40 | |
| | | | | | | | | 243,620 | | | | 2.40 | |
| | | | |
Mexico (Cost $413,206) | | | | | | | | | | | | | | |
Fomento Economico Mexicano S.A.B. de C.V. ADR | | | | | 4,259 | | | | 483,013 | | | | 4.76 | |
Grupo Financiero Banorte S.A.B. de C.V., Class O | | MXN | | | 22,100 | | | | 179,360 | | | | 1.77 | |
| | | | | | | | | 662,373 | | | | 6.53 | |
See accompanying notes to the financial statements.
138
ASHMORE EMERGING MARKETS EQUITY ESG FUND
SCHEDULE OF INVESTMENTS (CONTINUED)
As of October 31, 2023
| | | | | | | | | | | | | | |
| | | Currency1 | | Shares | | | Value | | | % of Net Assets | |
Saudi Arabia (Cost $205,300) | | | | | | | | | | | | | | |
Bupa Arabia for Cooperative Insurance Co. | | SAR | | | 2,380 | | | $ | 135,118 | | | | 1.33 | |
Elm Co. | | SAR | | | 634 | | | | 118,685 | | | | 1.17 | |
| | | | | | | | | 253,803 | | | | 2.50 | |
| | | | |
South Korea (Cost $941,182) | | | | | | | | | | | | | | |
Dentium Co. Ltd. | | KRW | | | 4,080 | | | | 332,200 | | | | 3.27 | |
Hansol Chemical Co. Ltd. | | KRW | | | 2,180 | | | | 244,585 | | | | 2.41 | |
LG Chem Ltd. | | KRW | | | 252 | | | | 83,040 | | | | 0.82 | |
SK Hynix, Inc. | | KRW | | | 2,865 | | | | 250,289 | | | | 2.47 | |
| | | | | | | | | 910,114 | | | | 8.97 | |
| | | | |
Taiwan (Cost $2,406,847) | | | | | | | | | | | | | | |
Andes Technology Corp. | | TWD | | | 13,000 | | | | 156,452 | | | | 1.54 | |
Delta Electronics, Inc. | | TWD | | | 22,000 | | | | 199,159 | | | | 1.96 | |
E Ink Holdings, Inc. | | TWD | | | 57,000 | | | | 295,883 | | | | 2.92 | |
Kaori Heat Treatment Co. Ltd. | | TWD | | | 17,000 | | | | 111,006 | | | | 1.09 | |
Parade Technologies Ltd. | | TWD | | | 7,000 | | | | 230,910 | | | | 2.27 | |
Poya International Co. Ltd. | | TWD | | | 12,090 | | | | 185,526 | | | | 1.83 | |
Sinbon Electronics Co. Ltd. | | TWD | | | 23,000 | | | | 196,549 | | | | 1.94 | |
Taiwan Semiconductor Manufacturing Co. Ltd. | | TWD | | | 29,000 | | | | 477,793 | | | | 4.71 | |
Taiwan Semiconductor Manufacturing Co. Ltd. ADR | | | | | 5,240 | | | | 452,264 | | | | 4.46 | |
WinWay Technology Co. Ltd. | | TWD | | | 12,000 | | | | 240,929 | | | | 2.37 | |
| | | | | | | | | 2,546,471 | | | | 25.09 | |
| | | | |
United Arab Emirates (Cost $97,175) | | | | | | | | | | | | | | |
Abu Dhabi Islamic Bank PJSC | | AED | | | 35,567 | | | | 99,680 | | | | 0.98 | |
| | | | | | | | | 99,680 | | | | 0.98 | |
| | | | |
Total Common Stocks (Cost $9,973,865) | | | | | | | | | 9,729,617 | | | | 95.85 | |
| | | | |
Total Investments (Total Cost $9,973,865) | | | | | | | | | 9,729,617 | | | | 95.85 | |
| | | | |
Other Assets Less Liabilities (See Statements of Assets and Liabilities for further detail) | | | | | | | | | 421,541 | | | | 4.15 | |
| | | | |
Net Assets | | | | | | | | $ | 10,151,158 | | | | 100.00 | |
| * | Non-income producing security. |
| 1 | Local currency is United States Dollars unless otherwise noted below. |
| 2 | Securities exempt from registration under Rule 144A of the Securities Act of 1933. These securities may not be publicly traded without registration under the Securities Act of 1933. |
Percentages shown are based on net assets.
At October 31, 2023, the industry sectors for the Ashmore Emerging Markets Equity ESG Fund were:
| | | | | |
Sector | | Percentage of Net Assets |
|
Communication Services | | | | 6.3 | % |
See accompanying notes to the financial statements.
139
ASHMORE EMERGING MARKETS EQUITY ESG FUND
SCHEDULE OF INVESTMENTS (CONTINUED)
As of October 31, 2023
| | | | |
| Sector | | Percentage of Net Assets |
Consumer Discretionary | | | 9.6 | % |
Consumer Staples | | | 4.8 | |
Financials | | | 15.6 | |
Health Care | | | 12.0 | |
Industrials | | | 11.1 | |
Information Technology | | | 30.8 | |
Materials | | | 5.6 | |
Total Investments | | | 95.8 | |
Other Assets Less Liabilities | | | 4.2 | |
Net Assets | | | 100.0 | % |
The inputs of methodologies used for valuing securities are not necessarily an indication of the risks associated with investing in those securities and other financial instruments, if any. See note 4 in the Notes to the Financial Statements for more information regarding pricing inputs and valuation techniques. The following is a summary of the inputs used in valuing the Ashmore Emerging Markets Equity ESG Fund’s investments and other financial instruments, which are carried at fair value, as of October 31, 2023:
| | | | | | | | | | | | | | | | |
| | | Level 1 | | | Level 2 | | | Level 3 | | | Total | |
Investments | | | | | | | | | | | | | | | | |
Assets: | | | | | | | | | | | | | | | | |
Common Stocks | | | | | | | | | | | | | | | | |
Argentina | | | $ 136,232 | | | | $ — | | | | $— | | | | $ 136,232 | |
Brazil | | | 669,972 | | | | — | | | | — | | | | 669,972 | |
China | | | — | | | | 2,701,420 | | | | — | | | | 2,701,420 | |
Hong Kong | | | — | | | | 306,564 | | | | — | | | | 306,564 | |
India | | | 566,364 | | | | 554,355 | | | | — | | | | 1,120,719 | |
Indonesia | | | — | | | | 78,649 | | | | — | | | | 78,649 | |
Malaysia | | | — | | | | 243,620 | | | | — | | | | 243,620 | |
Mexico | | | 662,373 | | | | — | | | | — | | | | 662,373 | |
Saudi Arabia | | | — | | | | 253,803 | | | | — | | | | 253,803 | |
South Korea | | | — | | | | 910,114 | | | | — | | | | 910,114 | |
Taiwan | | | 452,264 | | | | 2,094,207 | | | | — | | | | 2,546,471 | |
United Arab Emirates | | | — | | | | 99,680 | | | | — | | | | 99,680 | |
| | | | | | | | | | | | | | | | |
Total Common Stocks | | | 2,487,205 | | | | 7,242,412 | | | | — | | | | 9,729,617 | |
Total Investments | | | $2,487,205 | | | | $7,242,412 | | | | $— | | | | $9,729,617 | |
See accompanying notes to the financial statements.
140
ASHMORE EMERGING MARKETS LOW DURATION FUND
SCHEDULE OF INVESTMENTS
As of October 31, 2023
| | | | | | | | | | | | | | |
| | | Currency1 | | Par | | | Value | | | % of Net
Assets | |
Debt Securities | | | | | | | | | | | | | | |
| | | | |
Brazil (Cost $777,598) | | | | | | | | | | | | | | |
Banco do Brasil S.A., 4.625%, 01/15/2025 | | | | | 200,000 | | | $ | 194,970 | | | | 2.05 | |
BRF GmbH, 4.350%, 09/29/2026 | | | | | 200,000 | | | | 183,000 | | | | 1.93 | |
JBS U.S.A. LUX S.A./JBS U.S.A. Food Co./JBS U.S.A. Finance, Inc., 2.500%, 01/15/2027 | | | | | 200,000 | | | | 175,326 | | | | 1.85 | |
MercadoLibre, Inc., 2.375%, 01/14/2026 | | | | | 200,000 | | | | 180,328 | | | | 1.90 | |
| | | | | | | | | 733,624 | | | | 7.73 | |
| | | | |
Chile (Cost $531,330) | | | | | | | | | | | | | | |
Banco Santander Chile, 2.700%, 01/10/2025 | | | | | 150,000 | | | | 143,094 | | | | 1.51 | |
Celulosa Arauco y Constitucion S.A., 3.875%, 11/02/2027 | | | | | 200,000 | | | | 178,718 | | | | 1.88 | |
Inversiones CMPC S.A., 4.750%, 09/15/2024 | | | | | 200,000 | | | | 196,316 | | | | 2.07 | |
| | | | | | | | | 518,128 | | | | 5.46 | |
| | | | |
China (Cost $401,837) | | | | | | | | | | | | | | |
ENN Energy Holdings Ltd., 4.625%, 05/17/2027 | | | | | 200,000 | | | | 191,216 | | | | 2.01 | |
Tencent Holdings Ltd., (Floating, CME Term SOFR 3M + 1.172%), 6.578%, 04/11/2024 | | | | | 200,000 | | | | 200,210 | | | | 2.11 | |
| | | | | | | | | 391,426 | | | | 4.12 | |
| | | | |
Colombia (Cost $245,274) | | | | | | | | | | | | | | |
Ecopetrol S.A., 4.125%, 01/16/2025 | | | | | 140,000 | | | | 134,792 | | | | 1.42 | |
Ecopetrol S.A., 5.375%, 06/26/2026 | | | | | 100,000 | | | | 95,473 | | | | 1.01 | |
| | | | | | | | | 230,265 | | | | 2.43 | |
| | | | |
Czech Republic (Cost $93,446) | | | | | | | | | | | | | | |
CETIN Group N.V., 3.125%, 04/14/2027 | | EUR | | | 100,000 | | | | 98,315 | | | | 1.04 | |
| | | | | | | | | 98,315 | | | | 1.04 | |
| | | | |
Hong Kong (Cost $394,916) | | | | | | | | | | | | | | |
HKT Capital No. 4 Ltd., 3.000%, 07/14/2026 | | | | | 200,000 | | | | 185,860 | | | | 1.96 | |
Standard Chartered PLC, (Variable, U.S. Treasury Yield Curve Rate CMT 1Y + 3.100%), 7.776%, 11/16/20252 | | | | | 200,000 | | | | 202,456 | | | | 2.13 | |
| | | | | | | | | 388,316 | | | | 4.09 | |
| | | | |
India (Cost $797,591) | | | | | | | | | | | | | | |
ABJA Investment Co. Pte. Ltd., 5.950%, 07/31/2024 | | | | | 200,000 | | | | 198,824 | | | | 2.09 | |
Bharti Airtel Ltd., 4.375%, 06/10/2025 | | | | | 200,000 | | | | 195,118 | | | | 2.06 | |
Greenko Solar Mauritius Ltd., 5.950%, 07/29/2026 | | | | | 200,000 | | | | 183,650 | | | | 1.94 | |
HDFC Bank Ltd., 5.686%, 03/02/2026 | | | | | 200,000 | | | | 199,526 | | | | 2.10 | |
| | | | | | | | | 777,118 | | | | 8.19 | |
| | | | |
Indonesia (Cost $597,980) | | | | | | | | | | | | | | |
Bank Mandiri Persero Tbk PT, 2.000%, 04/19/2026 | | | | | 200,000 | | | | 181,588 | | | | 1.91 | |
Indonesia Asahan Aluminium PT/Mineral Industri Indonesia Persero PT, 4.750%, 05/15/2025 | | | | | 400,000 | | | | 390,600 | | | | 4.12 | |
| | | | | | | | | 572,188 | | | | 6.03 | |
See accompanying notes to the financial statements.
141
ASHMORE EMERGING MARKETS LOW DURATION FUND
SCHEDULE OF INVESTMENTS (CONTINUED)
As of October 31, 2023
| | | | | | | | | | | | | | |
| | | Currency1 | | Par | | | Value | | | % of Net
Assets | |
Jordan (Cost $202,542) | | | | | | | | | | | | | | |
Hikma Finance U.S.A. LLC, 3.250%, 07/09/2025 | | | | | 200,000 | | | $ | 186,698 | | | | 1.97 | |
| | | | | | | | | 186,698 | | | | 1.97 | |
Kazakhstan (Cost $372,154) | | | | | | | | | | | | | | |
KazMunayGas National Co. JSC, 4.750%, 04/19/2027 | | | | | 200,000 | | | | 186,400 | | | | 1.96 | |
Tengizchevroil Finance Co. International Ltd., 4.000%, 08/15/2026 | | | | | 200,000 | | | | 178,050 | | | | 1.88 | |
| | | | | | | | | 364,450 | | | | 3.84 | |
Kuwait (Cost $207,642) | | | | | | | | | | | | | | |
MEGlobal Canada ULC, 5.000%, 05/18/2025 | | | | | 200,000 | | | | 194,313 | | | | 2.05 | |
| | | | | | | | | 194,313 | | | | 2.05 | |
Malaysia (Cost $190,388) | | | | | | | | | | | | | | |
MISC Capital Two Labuan Ltd., 3.750%, 04/06/2027 | | | | | 200,000 | | | | 183,874 | | | | 1.94 | |
| | | | | | | | | 183,874 | | | | 1.94 | |
Mexico (Cost $755,044) | | | | | | | | | | | | | | |
Grupo Bimbo S.A.B. de C.V., 3.875%, 06/27/2024 | | | | | 200,000 | | | | 196,976 | | | | 2.08 | |
Petroleos Mexicanos, 6.875%, 10/16/2025 | | | | | 331,000 | | | | 317,429 | | | | 3.34 | |
Trust Fibra Uno, 5.250%, 01/30/2026 | | | | | 200,000 | | | | 190,270 | | | | 2.00 | |
| | | | | | | | | 704,675 | | | | 7.42 | |
Oman (Cost $205,929) | | | | | | | | | | | | | | |
Bank Muscat SAOG, 4.750%, 03/17/2026 | | | | | 200,000 | | | | 190,590 | | | | 2.01 | |
| | | | | | | | | 190,590 | | | | 2.01 | |
Panama (Cost $202,203) | | | | | | | | | | | | | | |
Banco Latinoamericano de Comercio Exterior S.A., 2.375%, 09/14/2025 | | | | | 200,000 | | | | 184,104 | | | | 1.94 | |
| | | | | | | | | 184,104 | | | | 1.94 | |
Peru (Cost $772,791) | | | | | | | | | | | | | | |
Banco de Credito del Peru S.A., 2.700%, 01/11/2025 | | | | | 150,000 | | | | 142,908 | | | | 1.50 | |
Credicorp Ltd., 2.750%, 06/17/2025 | | | | | 200,000 | | | | 186,918 | | | | 1.97 | |
Kallpa Generacion S.A., 4.125%, 08/16/2027 | | | | | 200,000 | | | | 179,750 | | | | 1.89 | |
Southern Copper Corp., 3.875%, 04/23/2025 | | | | | 50,000 | | | | 48,063 | | | | 0.51 | |
Transportadora de Gas del Peru S.A., 4.250%, 04/30/2028 | | | | | 200,000 | | | | 187,958 | | | | 1.98 | |
| | | | | | | | | 745,597 | | | | 7.85 | |
Romania (Cost $96,233) | | | | | | | | | | | | | | |
NE Property B.V., 1.875%, 10/09/2026 | | EUR | | | 100,000 | | | | 92,337 | | | | 0.97 | |
| | | | | | | | | 92,337 | | | | 0.97 | |
Saudi Arabia (Cost $581,673) | | | | | | | | | | | | | | |
Arabian Centres Sukuk Ltd., 5.375%, 11/26/2024 | | | | | 256,000 | | | | 244,240 | | | | 2.57 | |
SNB Funding Ltd., 2.750%, 10/02/2024 | | | | | 333,000 | | | | 321,015 | | | | 3.38 | |
| | | | | | | | | 565,255 | | | | 5.95 | |
See accompanying notes to the financial statements.
142
ASHMORE EMERGING MARKETS LOW DURATION FUND
SCHEDULE OF INVESTMENTS (CONTINUED)
As of October 31, 2023
| | | | | | | | | | | | | | |
| | �� | Currency1 | | Par | | | Value | | | % of Net
Assets | |
Singapore (Cost $190,331) | | | | | | | | | | | | | | |
BOC Aviation Ltd., 3.500%, 09/18/2027 | | | | | 200,000 | | | $ | 182,860 | | | | 1.93 | |
| | | | | | | | | 182,860 | | | | 1.93 | |
| | | | |
South Africa (Cost $585,303) | | | | | | | | | | | | | | |
Gold Fields Orogen Holdings BVI Ltd., 5.125%, 05/15/2024 | | | | | 200,000 | | | | 197,944 | | | | 2.09 | |
MTN Mauritius Investments Ltd., 6.500%, 10/13/2026 | | | | | 200,000 | | | | 195,000 | | | | 2.05 | |
Prosus N.V., 3.257%, 01/19/2027 | | | | | 205,000 | | | | 180,954 | | | | 1.91 | |
| | | | | | | | | 573,898 | | | | 6.05 | |
| | | | |
South Korea (Cost $199,257) | | | | | | | | | | | | | | |
SK On Co. Ltd., 5.375%, 05/11/2026 | | | | | 200,000 | | | | 197,884 | | | | 2.08 | |
| | | | | | | | | 197,884 | | | | 2.08 | |
| | | | |
Thailand (Cost $204,360) | | | | | | | | | | | | | | |
Kasikornbank PCL, 5.458%, 03/07/2028 | | | | | 200,000 | | | | 195,820 | | | | 2.06 | |
| | | | | | | | | 195,820 | | | | 2.06 | |
| | | | |
United Arab Emirates (Cost $833,924) | | | | | | | | | | | | | | |
DIB Sukuk Ltd., 2.950%, 01/16/2026 | | | | | 200,000 | | | | 186,937 | | | | 1.97 | |
Galaxy Pipeline Assets Bidco Ltd., 1.750%, 09/30/2027 | | | | | 129,320 | | | | 118,530 | | | | 1.25 | |
MAF Global Securities Ltd., 4.750%, 05/07/2024 | | | | | 200,000 | | | | 198,328 | | | | 2.09 | |
Mashreqbank PSC, 4.250%, 02/26/2024 | | | | | 322,000 | | | | 318,664 | | | | 3.35 | |
| | | | | | | | | 822,459 | | | | 8.66 | |
| | | | |
Total Debt Securities (Cost $9,439,746) | | | | | | | | | 9,094,194 | | | | 95.81 | |
| | | | |
Total Investments (Total Cost $9,439,746) | | | | | | | | | 9,094,194 | | | | 95.81 | |
| | | | |
Other Assets Less Liabilities (See Statements of Assets and Liabilities for further detail) | | | | | | | | | 397,614 | | | | 4.19 | |
| | | | |
Net Assets | | | | | | | | $ | 9,491,808 | | | | 100.00 | |
| 1 | Local currency is United States Dollars unless otherwise noted below. |
| 2 | Variable rate security. Security issued at a fixed coupon rate, which converts to a variable rate at a specified date. Rate shown is the rate in effect as of period end. |
Percentages shown are based on net assets.
See accompanying notes to the financial statements.
143
ASHMORE EMERGING MARKETS LOW DURATION FUND
SCHEDULE OF INVESTMENTS (CONTINUED)
As of October 31, 2023
At October 31, 2023, the Ashmore Emerging Markets Low Duration Fund had outstanding forward foreign currency exchange contracts as follows:
| | | | | | | | | | | | | | | | | | |
Settlement
Date | | Counterparty | | Currency Buy | | Currency
Buy Amount
(Local
Currency) | | | Currency Sell | | Currency
Sell Amount
(Local
Currency) | | | Unrealized
Gain/(Loss) | |
| |
| | | | | | |
11/22/2023 | | Barclays | | United States Dollar | | | 195,893 | | | Euro | | | 184,816 | | | | $155 | |
| | | | | | | | | | | | | | | | | | |
| | | | |
Subtotal Appreciation | | | | | | | | | | | | | 155 | |
| | | | | | | | | | | | | | | | | | |
| | | | | | |
11/22/2023 | | Barclays | | Euro | | | 5,000 | | | United States Dollar | | | 5,314 | | | | (18) | |
| | | | | | | | | | | | | | | | | | |
| | | | |
Subtotal Depreciation | | | | | | | | | | | | | (18) | |
| | | | | | | | | | | | | | | | | | |
| | | | | | |
Total | | | | | | | | | | | | | | | | | $137 | |
| | | | | | | | | | | | | | | | | | |
The inputs of methodologies used for valuing securities are not necessarily an indication of the risks associated with investing in those securities and other financial instruments, if any. See note 4 in the Notes to the Financial Statements for more information regarding pricing inputs and valuation techniques. The following is a summary of the inputs used in valuing the Ashmore Emerging Markets Low Duration Fund’s investments and other financial instruments, which are carried at fair value, as of October 31, 2023:
| | | | | | | | | | | | | | | | |
| | | Level 1 | | | Level 2 | | | Level 3 | | | Total | |
Investments | | | | | | | | | | | | | | | | |
| | | | |
Assets: | | | | | | | | | | | | | | | | |
| | | | |
Debt Securities | | | | | | | | | | | | | | | | |
| | | | |
Corporate Bonds | | | $— | | | | $6,968,449 | | | | $— | | | | $6,968,449 | |
| | | | |
Financial Certificates | | | — | | | | 431,178 | | | | — | | | | 431,178 | |
| | | | |
Government Agencies | | | — | | | | 1,510,463 | | | | — | | | | 1,510,463 | |
| | | | |
Municipal Bonds | | | — | | | | 184,104 | | | | — | | | | 184,104 | |
| | | | | | | | | | | | | | | | |
| | | | |
Total Debt Securities | | | — | | | | 9,094,194 | | | | — | | | | 9,094,194 | |
| |
| | | | |
Total Investments | | | $— | | | | $9,094,194 | | | | $— | | | | $9,094,194 | |
| |
| | | | |
Other Financial Instruments | | | | | | | | | | | | | | | | |
| | | | |
Assets: | | | | | | | | | | | | | | | | |
| | | | |
Forward Foreign Currency Exchange Contracts | | | $— | | | | $155 | | | | $— | | | | $155 | |
| | | | |
Liabilities: | | | | | | | | | | | | | | | | |
| | | | |
Forward Foreign Currency Exchange Contracts | | | — | | | | (18 | ) | | | — | | | | (18 | ) |
| |
| | | | |
Total Other Financial Instruments | | | $— | | | | $137 | | | | $— | | | | $137 | |
| |
See accompanying notes to the financial statements.
144
ASHMORE EMERGING MARKETS LOW DURATION FUND
SCHEDULE OF INVESTMENTS (CONTINUED)
As of October 31, 2023
The following is a summary of the fair values of the Fund’s derivative instruments*:
Fair Values of Financial Derivative Instruments on the Statements of Assets and Liabilities as of October 31, 2023:
| | | | |
| | | Derivatives Not Accounted for as
Hedging Instruments | |
| | | Foreign Exchange Risk | |
Assets: | | | | |
Unrealized Appreciation on Forward Foreign Currency Exchange Contracts | | | $155 | |
| | | | |
| |
Liabilities: | | | | |
Unrealized Depreciation on Forward Foreign Currency Exchange Contracts | | | $(18 | ) |
| | | | |
The Effect of Financial Derivative Instruments on the Statements of Operations for the Year Ended October 31, 2023:
| | | | |
| | | Derivatives Not Accounted for as
Hedging Instruments | |
| | | Foreign Exchange Risk | |
Realized Gain (Loss) on Derivatives Recognized resulting from Operations: | | | | |
Net Realized Loss on Forward Foreign Currency Exchange Contracts | | | $(31,340 | ) |
| | | | |
| |
Net Change in Unrealized Appreciation (Depreciation) on Derivatives Recognized resulting from Operations: | | | | |
Net Change in Unrealized Appreciation on Forward Foreign Currency Exchange Contracts | | | $ 1,651 | |
| | | | |
* See note 10 in the Notes to the Financial Statements for additional information
See accompanying notes to the financial statements.
145
ASHMORE EMERGING MARKETS DEBT FUND
SCHEDULE OF INVESTMENTS
As of October 31, 2023
| | | | | | | | | | | | | | | | |
| | | Currency1 | | | Par | | | Value | | | % of Net
Assets | |
Debt Securities | | | | | | | | | | | | | | | | |
| | | | |
Angola (Cost $380,585) | | | | | | | | | | | | | | | | |
Angola (Rep of), 8.000%, 11/26/2029 | | | | | | | 200,000 | | | $ | 160,000 | | | | 0.98 | |
Angola (Rep of), 9.125%, 11/26/2049 | | | | | | | 250,000 | | | | 175,625 | | | | 1.07 | |
| | | | | | | | | | | 335,625 | | | | 2.05 | |
| | | | |
Argentina (Cost $713,271) | | | | | | | | | | | | | | | | |
Argentina (Rep of), 1.000%, 07/09/2029 | | | | | | | 124,000 | | | | 33,170 | | | | 0.20 | |
Argentina (Rep of), (Step to 1.750% on 07/09/2027), 0.750%, 07/09/20302 | | | | | | | 980,000 | | | | 272,440 | | | | 1.67 | |
Argentina (Rep of), (Step to 4.125% on 07/09/2024), 3.625%, 07/09/20352 | | | | | | | 561,000 | | | | 138,006 | | | | 0.84 | |
Argentina (Rep of), (Step to 5.000% on 07/09/2024), 4.250%, 01/09/20382 | | | | | | | 160,000 | | | | 48,160 | | | | 0.29 | |
Argentina (Rep of), (Step to 4.875% on 07/09/2029), 3.500%, 07/09/20412 | | | | | | | 311,000 | | | | 80,957 | | | | 0.50 | |
| | | | | | | | | | | 572,733 | | | | 3.50 | |
| | | | |
Azerbaijan (Cost $203,085) | | | | | | | | | | | | | | | | |
Southern Gas Corridor CJSC, 6.875%, 03/24/2026 | | | | | | | 200,000 | | | | 196,822 | | | | 1.20 | |
| | | | | | | | | | | 196,822 | | | | 1.20 | |
| | | | |
Bahrain (Cost $212,727) | | | | | | | | | | | | | | | | |
Oil and Gas Holding (The) Co. BSCC, 8.375%, 11/07/2028 | | | | | | | 200,000 | | | | 207,250 | | | | 1.27 | |
| | | | | | | | | | | 207,250 | | | | 1.27 | |
| | | | |
Brazil (Cost $574,224) | | | | | | | | | | | | | | | | |
Brazil (Rep of), 4.250%, 01/07/2025 | | | | | | | 400,000 | | | | 390,632 | | | | 2.39 | |
Brazil (Rep of), 8.250%, 01/20/2034 | | | | | | | 15,000 | | | | 16,042 | | | | 0.10 | |
Brazil (Rep of), 5.000%, 01/27/2045 | | | | | | | 200,000 | | | | 143,100 | | | | 0.87 | |
| | | | | | | | | | | 549,774 | | | | 3.36 | |
| | | | |
Chile (Cost $751,157) | | | | | | | | | | | | | | | | |
Chile (Rep of), 3.100%, 05/07/2041 | | | | | | | 200,000 | | | | 130,000 | | | | 0.80 | |
Chile (Rep of), 3.100%, 01/22/2061 | | | | | | | 200,000 | | | | 106,900 | | | | 0.65 | |
Corp. Nacional del Cobre de Chile, 4.375%, 02/05/2049 | | | | | | | 200,000 | | | | 135,200 | | | | 0.83 | |
Empresa Nacional del Petroleo, 5.250%, 11/06/2029 | | | | | | | 268,000 | | | | 245,217 | | | | 1.50 | |
| | | | | | | | | | | 617,317 | | | | 3.78 | |
| | | | |
China (Cost $179,294) | | | | | | | | | | | | | | | | |
Sinopec Group Overseas Development 2018 Ltd., 2.700%, 05/13/2030 | | | | | | | 200,000 | | | | 168,900 | | | | 1.03 | |
| | | | | | | | | | | 168,900 | | | | 1.03 | |
| | | | |
Colombia (Cost $255,977) | | | | | | | | | | | | | | | | |
Colombia (Rep of), 7.375%, 09/18/2037 | | | | | | | 100,000 | | | | 89,750 | | | | 0.55 | |
Colombia (Rep of), 5.625%, 02/26/2044 | | | | | | | 200,000 | | | | 138,900 | | | | 0.85 | |
| | | | | | | | | | | 228,650 | | | | 1.40 | |
See accompanying notes to the financial statements.
146
ASHMORE EMERGING MARKETS DEBT FUND
SCHEDULE OF INVESTMENTS (CONTINUED)
As of October 31, 2023
| | | | | | | | | | | | | | | | |
| | | Currency1 | | | Par | | | Value | | | % of Net
Assets | |
Costa Rica (Cost $176,645) | | | | | | | | | | | | | | | | |
Costa Rica (Rep of), 5.625%, 04/30/2043 | | | | | | | 200,000 | | | $ | 159,000 | | | | 0.97 | |
| | | | | | | | | | | 159,000 | | | | 0.97 | |
| | | | |
Croatia (Cost $200,042) | | | | | | | | | | | | | | | | |
Croatia (Rep of), 6.000%, 01/26/2024 | | | | | | | 200,000 | | | | 200,018 | | | | 1.22 | |
| | | | | | | | | | | 200,018 | | | | 1.22 | |
| | | | |
Dominican Republic (Cost $740,659) | | | | | | | | | | | | | | | | |
Dominican (Rep of), 5.500%, 01/27/2025 | | | | | | | 100,000 | | | | 98,112 | | | | 0.60 | |
Dominican (Rep of), 6.875%, 01/29/2026 | | | | | | | 100,000 | | | | 99,449 | | | | 0.61 | |
Dominican (Rep of), 4.875%, 09/23/2032 | | | | | | | 225,000 | | | | 181,912 | | | | 1.11 | |
Dominican (Rep of), 5.300%, 01/21/2041 | | | | | | | 150,000 | | | | 108,900 | | | | 0.67 | |
Dominican (Rep of), 5.875%, 01/30/2060 | | | | | | | 282,000 | | | | 199,938 | | | | 1.22 | |
| | | | | | | | | | | 688,311 | | | | 4.21 | |
| | | | |
Ecuador (Cost $75,033) | | | | | | | | | | | | | | | | |
Ecuador (Rep of), (Step to 5.500% on 07/31/2024), 3.500%, 07/31/20352 | | | | | | | 34,900 | | | | 13,227 | | | | 0.08 | |
Ecuador (Rep of), (Step to 5.000% on 07/31/2024), 2.500%, 07/31/20402 | | | | | | | 194,000 | | | | 64,893 | | | | 0.40 | |
| | | | | | | | | | | 78,120 | | | | 0.48 | |
| | | | |
Egypt (Cost $501,115) | | | | | | | | | | | | | | | | |
Egypt (Rep of), 7.600%, 03/01/2029 | | | | | | | 200,000 | | | | 124,000 | | | | 0.76 | |
Egypt (Rep of), 8.500%, 01/31/2047 | | | | | | | 200,000 | | | | 103,710 | | | | 0.63 | |
Egypt (Rep of), 8.700%, 03/01/2049 | | | | | | | 200,000 | | | | 104,750 | | | | 0.64 | |
Egypt (Rep of), 8.875%, 05/29/2050 | | | | | | | 200,000 | | | | 105,500 | | | | 0.65 | |
| | | | | | | | | | | 437,960 | | | | 2.68 | |
| | | | |
Gabon (Cost $171,437) | | | | | | | | | | | | | | | | |
Gabon (Rep of), 6.625%, 02/06/2031 | | | | | | | 200,000 | | | | 140,500 | | | | 0.86 | |
| | | | | | | | | | | 140,500 | | | | 0.86 | |
| | | | |
Ghana (Cost $270,000) | | | | | | | | | | | | | | | | |
Ghana (Rep of), 6.375%, 02/11/20273 | | | | | | | 200,000 | | | | 87,000 | | | | 0.53 | |
Ghana (Rep of), 7.625%, 05/16/20293 | | | | | | | 200,000 | | | | 86,000 | | | | 0.53 | |
Ghana (Rep of), 8.625%, 04/07/20343 | | | | | | | 200,000 | | | | 86,250 | | | | 0.53 | |
| | | | | | | | | | | 259,250 | | | | 1.59 | |
| | | | |
Guatemala (Cost $205,331) | | | | | | | | | | | | | | | | |
Guatemala (Rep of), 6.600%, 06/13/2036 | | | | | | | 200,000 | | | | 184,800 | | | | 1.13 | |
| | | | | | | | | | | 184,800 | | | | 1.13 | |
| | | | |
Hungary (Cost $220,568) | | | | | | | | | | | | | | | | |
Hungary (Rep of), 5.375%, 03/25/2024 | | | | | | | 92,000 | | | | 91,715 | | | | 0.56 | |
Hungary (Rep of), 3.125%, 09/21/2051 | | | | | | | 200,000 | | | | 105,612 | | | | 0.65 | |
| | | | | | | | | | | 197,327 | | | | 1.21 | |
See accompanying notes to the financial statements.
147
ASHMORE EMERGING MARKETS DEBT FUND
SCHEDULE OF INVESTMENTS (CONTINUED)
As of October 31, 2023
| | | | | | | | | | | | | | | | |
| | | Currency1 | | | Par | | | Value | | | % of Net
Assets | |
India (Cost $189,714) | | | | | | | | | | | | | | | | |
Export-Import Bank of India, 3.375%, 08/05/2026 | | | | | | | 200,000 | | | $ | 187,784 | | | | 1.15 | |
| | | | | | | | | | | 187,784 | | | | 1.15 | |
| | | | |
Indonesia (Cost $1,254,486) | | | | | | | | | | | | | | | | |
Indonesia (Rep of), 4.150%, 09/20/2027 | | | | | | | 200,000 | | | | 189,370 | | | | 1.16 | |
Indonesia (Rep of), 6.625%, 02/17/2037 | | | | | | | 100,000 | | | | 103,908 | | | | 0.63 | |
Indonesia (Rep of), 7.750%, 01/17/2038 | | | | | | | 100,000 | | | | 114,077 | | | | 0.70 | |
Indonesia (Rep of), 4.200%, 10/15/2050 | | | | | | | 200,000 | | | | 146,450 | | | | 0.90 | |
Indonesia Asahan Aluminium PT/Mineral Industri Indonesia Persero PT, 4.750%, 05/15/2025 | | | | | | | 200,000 | | | | 195,300 | | | | 1.19 | |
Pertamina Persero PT, 6.000%, 05/03/2042 | | | | | | | 200,000 | | | | 176,206 | | | | 1.08 | |
Pertamina Persero PT, 6.500%, 11/07/2048 | | | | | | | 200,000 | | | | 186,236 | | | | 1.14 | |
| | | | | | | | | | | 1,111,547 | | | | 6.80 | |
| | | | |
Ivory Coast (Cost $262,449) | | | | | | | | | | | | | | | | |
Ivory Coast (Rep of), 4.875%, 01/30/2032 | | | EUR | | | | 100,000 | | | | 79,754 | | | | 0.49 | |
Ivory Coast (Rep of), 6.875%, 10/17/2040 | | | EUR | | | | 100,000 | | | | 76,580 | | | | 0.47 | |
Ivory Coast (Rep of), 6.625%, 03/22/2048 | | | EUR | | | | 100,000 | | | | 70,628 | | | | 0.43 | |
| | | | | | | | | | | 226,962 | | | | 1.39 | |
| | | | |
Kazakhstan (Cost $215,135) | | | | | | | | | | | | | | | | |
Kazakhstan (Rep of), 6.500%, 07/21/2045 | | | | | | | 200,000 | | | | 196,000 | | | | 1.20 | |
| | | | | | | | | | | 196,000 | | | | 1.20 | |
| | | | |
Malaysia (Cost $424,851) | | | | | | | | | | | | | | | | |
Petronas Capital Ltd., 2.480%, 01/28/2032 | | | | | | | 200,000 | | | | 155,242 | | | | 0.95 | |
Petronas Capital Ltd., 4.550%, 04/21/2050 | | | | | | | 282,000 | | | | 216,311 | | | | 1.32 | |
| | | | | | | | | | | 371,553 | | | | 2.27 | |
| | | | |
Mexico (Cost $1,532,953) | | | | | | | | | | | | | | | | |
Comision Federal de Electricidad, 3.875%, 07/26/2033 | | | | | | | 200,000 | | | | 145,000 | | | | 0.89 | |
Mexico (Rep of), 5.400%, 02/09/2028 | | | | | | | 200,000 | | | | 196,200 | | | | 1.20 | |
Mexico (Rep of), 6.050%, 01/11/2040 | | | | | | | 44,000 | | | | 39,380 | | | | 0.24 | |
Mexico (Rep of), 5.550%, 01/21/2045 | | | | | | | 64,000 | | | | 52,960 | | | | 0.32 | |
Mexico (Rep of), 3.771%, 05/24/2061 | | | | | | | 200,000 | | | | 111,800 | | | | 0.68 | |
Mexico (Rep of), 3.750%, 04/19/2071 | | | | | | | 200,000 | | | | 109,500 | | | | 0.67 | |
Mexico (Rep of), 5.750%, 10/12/2110 | | | | | | | 76,000 | | | | 57,494 | | | | 0.35 | |
Petroleos Mexicanos, 6.350%, 02/12/2048 | | | | | | | 101,000 | | | | 55,171 | | | | 0.34 | |
Petroleos Mexicanos, 7.690%, 01/23/2050 | | | | | | | 450,000 | | | | 277,875 | | | | 1.70 | |
Petroleos Mexicanos, 6.950%, 01/28/2060 | | | | | | | 418,000 | | | | 236,693 | | | | 1.45 | |
| | | | | | | | | | | 1,282,073 | | | | 7.84 | |
| | | | |
Mongolia (Cost $161,893) | | | | | | | | | | | | | | | | |
Mongolia (Rep of), 4.450%, 07/07/2031 | | | | | | | 200,000 | | | | 151,372 | | | | 0.93 | |
| | | | | | | | | | | 151,372 | | | | 0.93 | |
| | | | |
Morocco (Cost $207,266) | | | | | | | | | | | | | | | | |
Morocco (Rep of), 6.500%, 09/08/2033 | | | | | | | 200,000 | | | | 191,750 | | | | 1.17 | |
| | | | | | | | | | | 191,750 | | | | 1.17 | |
See accompanying notes to the financial statements.
148
ASHMORE EMERGING MARKETS DEBT FUND
SCHEDULE OF INVESTMENTS (CONTINUED)
As of October 31, 2023
| | | | | | | | | | | | | | | | |
| | | Currency1 | | | Par | | | Value | | | % of Net
Assets | |
Nigeria (Cost $448,697) | | | | | | | | | | | | | | | | |
Nigeria (Rep of), 7.696%, 02/23/2038 | | | | | | | 200,000 | | | $ | 142,000 | | | | 0.87 | |
Nigeria (Rep of), 7.625%, 11/28/2047 | | | | | | | 405,000 | | | | 272,363 | | | | 1.67 | |
| | | | | | | | | | | 414,363 | | | | 2.54 | |
| | | | |
Oman (Cost $894,319) | | | | | | | | | | | | | | | | |
Oman (Rep of), 4.750%, 06/15/2026 | | | | | | | 200,000 | | | | 191,784 | | | | 1.17 | |
Oman (Rep of), 6.750%, 10/28/2027 | | | | | | | 200,000 | | | | 201,687 | | | | 1.23 | |
Oman (Rep of), 6.500%, 03/08/2047 | | | | | | | 200,000 | | | | 173,500 | | | | 1.06 | |
Oman (Rep of), 6.750%, 01/17/2048 | | | | | | | 300,000 | | | | 267,375 | | | | 1.64 | |
| | | | | | | | | | | 834,346 | | | | 5.10 | |
| | | | |
Pakistan (Cost $373,073) | | | | | | | | | | | | | | | | |
Pakistan (Rep of), 8.250%, 04/15/2024 | | | | | | | 200,000 | | | | 178,516 | | | | 1.09 | |
Pakistan (Rep of), 7.375%, 04/08/2031 | | | | | | | 200,000 | | | | 97,044 | | | | 0.59 | |
Pakistan (Rep of), 8.875%, 04/08/2051 | | | | | | | 200,000 | | | | 96,086 | | | | 0.59 | |
| | | | | | | | | | | 371,646 | | | | 2.27 | |
| | | | |
Panama (Cost $328,343) | | | | | | | | | | | | | | | | |
Panama (Rep of), 7.125%, 01/29/2026 | | | | | | | 100,000 | | | | 100,700 | | | | 0.62 | |
Panama (Rep of), 8.875%, 09/30/2027 | | | | | | | 49,000 | | | | 52,381 | | | | 0.32 | |
Panama (Rep of), 9.375%, 04/01/2029 | | | | | | | 63,000 | | | | 69,552 | | | | 0.42 | |
Panama (Rep of), 6.700%, 01/26/2036 | | | | | | | 88,000 | | | | 81,884 | | | | 0.50 | |
| | | | | | | | | | | 304,517 | | | | 1.86 | |
| | | | |
Paraguay (Cost $193,108) | | | | | | | | | | | | | | | | |
Paraguay (Rep of), 5.850%, 08/21/2033 | | | | | | | 200,000 | | | | 184,000 | | | | 1.13 | |
| | | | | | | | | | | 184,000 | | | | 1.13 | |
| | | | |
Peru (Cost $604,118) | | | | | | | | | | | | | | | | |
Peru (Rep of), 7.350%, 07/21/2025 | | | | | | | 100,000 | | | | 102,182 | | | | 0.63 | |
Peru (Rep of), 8.750%, 11/21/2033 | | | | | | | 149,000 | | | | 173,758 | | | | 1.06 | |
Peru (Rep of), 3.300%, 03/11/2041 | | | | | | | 69,000 | | | | 45,574 | | | | 0.28 | |
Peru (Rep of), 2.780%, 12/01/2060 | | | | | | | 119,000 | | | | 59,559 | | | | 0.36 | |
Peru (Rep of), 3.230%, 07/28/2121 | | | | | | | 53,000 | | | | 26,580 | | | | 0.16 | |
Petroleos del Peru S.A., 5.625%, 06/19/2047 | | | | | | | 234,000 | | | | 127,633 | | | | 0.78 | |
| | | | | | | | | | | 535,286 | | | | 3.27 | |
| | | | |
Philippines (Cost $593,713) | | | | | | | | | | | | | | | | |
Philippines (Rep of), 10.625%, 03/16/2025 | | | | | | | 53,000 | | | | 56,484 | | | | 0.35 | |
Philippines (Rep of), 9.500%, 02/02/2030 | | | | | | | 105,000 | | | | 124,467 | | | | 0.76 | |
Philippines (Rep of), 7.750%, 01/14/2031 | | | | | | | 100,000 | | | | 111,266 | | | | 0.68 | |
Philippines (Rep of), 6.375%, 10/23/2034 | | | | | | | 100,000 | | | | 102,646 | | | | 0.63 | |
Philippines (Rep of), 3.950%, 01/20/2040 | | | | | | | 200,000 | | | | 152,766 | | | | 0.93 | |
| | | | | | | | | | | 547,629 | | | | 3.35 | |
| | | | |
Poland (Cost $185,405) | | | | | | | | | | | | | | | | |
Poland (Rep of), 5.500%, 11/16/2027 | | | | | | | 69,000 | | | | 69,281 | | | | 0.42 | |
Poland (Rep of), 4.875%, 10/04/2033 | | | | | | | 72,000 | | | | 66,591 | | | | 0.41 | |
See accompanying notes to the financial statements.
149
ASHMORE EMERGING MARKETS DEBT FUND
SCHEDULE OF INVESTMENTS (CONTINUED)
As of October 31, 2023
| | | | | | | | | | | | | | | | |
| | | Currency1 | | | Par | | | Value | | | % of Net
Assets | |
Poland (continued) | | | | | | | | | | | | | | | | |
Poland (Rep of), 5.500%, 04/04/2053 | | | | | | | 43,000 | | | $ | 37,774 | | | | 0.23 | |
| | | | | | | | | | | 173,646 | | | | 1.06 | |
| | | | |
Qatar (Cost $586,118) | | | | | | | | | | | | | | | | |
Qatar (Rep of), 3.250%, 06/02/2026 | | | | | | | 200,000 | | | | 189,452 | | | | 1.16 | |
Qatar (Rep of), 4.817%, 03/14/2049 | | | | | | | 250,000 | | | | 204,297 | | | | 1.25 | |
QatarEnergy, 3.125%, 07/12/2041 | | | | | | | 200,000 | | | | 131,250 | | | | 0.80 | |
| | | | | | | | | | | 524,999 | | | | 3.21 | |
| | | | |
Romania (Cost $392,926) | | | | | | | | | | | | | | | | |
Romania (Rep of), 3.000%, 02/27/2027 | | | | | | | 40,000 | | | | 36,185 | | | | 0.22 | |
Romania (Rep of), 3.000%, 02/14/2031 | | | | | | | 30,000 | | | | 23,700 | | | | 0.15 | |
Romania (Rep of), 3.625%, 03/27/2032 | | | | | | | 150,000 | | | | 118,428 | | | | 0.72 | |
Romania (Rep of), 7.125%, 01/17/2033 | | | | | | | 36,000 | | | | 35,714 | | | | 0.22 | |
Romania (Rep of), 6.125%, 01/22/2044 | | | | | | | 24,000 | | | | 20,647 | | | | 0.13 | |
Romania (Rep of), 4.000%, 02/14/2051 | | | | | | | 194,000 | | | | 118,522 | | | | 0.72 | |
| | | | | | | | | | | 353,196 | | | | 2.16 | |
| | | | |
South Africa (Cost $516,730) | | | | | | | | | | | | | | | | |
South Africa (Rep of), 4.300%, 10/12/2028 | | | | | | | 200,000 | | | | 172,000 | | | | 1.05 | |
South Africa (Rep of), 5.875%, 04/20/2032 | | | | | | | 200,000 | | | | 168,750 | | | | 1.03 | |
South Africa (Rep of), 5.750%, 09/30/2049 | | | | | | | 200,000 | | | | 130,000 | | | | 0.80 | |
| | | | | | | | | | | 470,750 | | | | 2.88 | |
| | | | |
Tunisia (Cost $83,479) | | | | | | | | | | | | | | | | |
Tunisia (Rep of), 6.375%, 07/15/2026 | | | EUR | | | | 118,000 | | | | 75,226 | | | | 0.46 | |
| | | | | | | | | | | 75,226 | | | | 0.46 | |
| | | | |
Turkey (Cost $385,615) | | | | | | | | | | | | | | | | |
Turkey (Rep of), 4.875%, 04/16/2043 | | | | | | | 238,000 | | | | 144,288 | | | | 0.88 | |
Turkey (Rep of), 5.750%, 05/11/2047 | | | | | | | 302,000 | | | | 196,677 | | | | 1.21 | |
| | | | | | | | | | | 340,965 | | | | 2.09 | |
| | | | |
Ukraine (Cost $61,500) | | | | | | | | | | | | | | | | |
Ukraine (Rep of), 6.876%, 05/21/20313 | | | | | | | 200,000 | | | | 49,300 | | | | 0.30 | |
| | | | | | | | | | | 49,300 | | | | 0.30 | |
| | | | |
United Arab Emirates (Cost $1,046,351) | | | | | | | | | | | | | | | | |
Abu Dhabi (Gov’t of), 1.875%, 09/15/2031 | | | | | | | 200,000 | | | | 155,746 | | | | 0.95 | |
Abu Dhabi (Gov’t of), 3.125%, 09/30/2049 | | | | | | | 200,000 | | | | 122,375 | | | | 0.75 | |
Abu Dhabi (Gov’t of), 3.875%, 04/16/2050 | | | | | | | 280,000 | | | | 197,837 | | | | 1.21 | |
Abu Dhabi (Gov’t of), 2.700%, 09/02/2070 | | | | | | | 200,000 | | | | 101,438 | | | | 0.62 | |
DP World Crescent Ltd., 3.750%, 01/30/2030 | | | | | | | 361,000 | | | | 315,537 | | | | 1.93 | |
| | | | | | | | | | | 892,933 | | | | 5.46 | |
| | | | |
United States (Cost $78,114) | | | | | | | | | | | | | | | | |
U.S. Treasury Bill, 5.260%, 01/16/20244 | | | | | | | 79,000 | | | | 78,115 | | | | 0.48 | |
| | | | | | | | | | | 78,115 | | | | 0.48 | |
See accompanying notes to the financial statements.
150
ASHMORE EMERGING MARKETS DEBT FUND
SCHEDULE OF INVESTMENTS (CONTINUED)
As of October 31, 2023
| | | | | | | | | | | | | | | | |
| | | Currency1 | | | Par | | | Value | | | % of Net
Assets | |
Uruguay (Cost $548,649) | | | | | | | | | | | | | | | | |
Uruguay (Rep of), 7.875%, 01/15/20335 | | | | | | | 103,000 | | | $ | 117,626 | | | | 0.72 | |
Uruguay (Rep of), 5.750%, 10/28/2034 | | | | | | | 70,000 | | | | 69,895 | | | | 0.43 | |
Uruguay (Rep of), 7.625%, 03/21/2036 | | | | | | | 75,000 | | | | 84,713 | | | | 0.52 | |
Uruguay (Rep of), 4.125%, 11/20/2045 | | | | | �� | | 62,000 | | | | 48,980 | | | | 0.30 | |
Uruguay (Rep of), 5.100%, 06/18/2050 | | | | | | | 67,000 | | | | 57,754 | | | | 0.35 | |
Uruguay (Rep of), 4.975%, 04/20/2055 | | | | | | | 137,000 | | | | 114,121 | | | | 0.70 | |
| | | | | | | | | | | 493,089 | | | | 3.02 | |
| | | | |
Venezuela (Cost $555,123) | | | | | | | | | | | | | | | | |
Petroleos de Venezuela S.A., 8.500%, 10/27/20203,6 | | | | | | | 194,000 | | | | 162,960 | | | | 1.00 | |
Venezuela (Rep of), 11.750%, 10/21/20263 | | | | | | | 581,000 | | | | 110,390 | | | | 0.67 | |
Venezuela (Rep of), 9.250%, 09/15/20273 | | | | | | | 779,000 | | | | 146,062 | | | | 0.89 | |
Venezuela (Rep of), 11.950%, 08/05/20313 | | | | | | | 581,000 | | | | 108,938 | | | | 0.67 | |
| | | | | | | | | | | 528,350 | | | | 3.23 | |
| | | | |
Total Debt Securities (Cost $17,955,278) | | | | | | | | | | | 16,113,754 | | | | 98.56 | |
| | | | |
Total Investments in Securities (Cost $17,955,278) | | | | | | | | | | | 16,113,754 | | | | 98.56 | |
| | | | |
Total Investments (Total Cost $17,955,278) | | | | | | | | | | | 16,113,754 | | | | 98.56 | |
Other Assets Less Liabilities (See Statements of Assets and
Liabilities for further detail) | | | | | | | | | | | 235,266 | | | | 1.44 | |
| | | | |
Net Assets | | | | | | | | | | $ | 16,349,020 | | | | 100.00 | |
| 1 | Local currency is United States Dollars unless otherwise noted below. |
| 2 | Step coupon bond. Rate as of October 31, 2023 is disclosed. |
| 3 | Issuer has defaulted on terms of debt obligation. |
| 4 | Zero coupon bond – interest rate reflects effective yield on the date of purchase. |
| 5 | Security is a payment-in-kind bond, and unless otherwise noted in the description of the security, pays its entire coupon on an in-kind basis. |
| 6 | Maturity has been extended under the terms of a plan of reorganization. |
Percentages shown are based on net assets.
At October 31, 2023, the Ashmore Emerging Markets Debt Fund had outstanding forward foreign currency exchange contracts as follows:
| | | | | | | | | | | | | | | | | | | | |
| Settlement Date | | Counterparty | | Currency Buy | | Currency
Buy Amount
(Local
Currency) | | | | | | Currency Sell | | Currency
Sell Amount
(Local
Currency) | | | Unrealized
Gain/(Loss) |
| | | | | | | |
11/22/2023 | | Morgan Stanley | | United States Dollar | | | 338,588 | | | | Euro | | | | | | 319,482 | | | $227 |
| | | | | | | | | | | | | | | | | | | | |
| | | | | | | |
Subtotal Appreciation | | | | | | | | | | | | | | | | | | | | 227 |
| | | | | | | | | | | | | | | | | | | | |
| | | | | | | |
Total | | | | | | | | | | | | | | | | | | | | $227 |
| | | | | | | | | | | | | | | | | | | | |
See accompanying notes to the financial statements.
151
ASHMORE EMERGING MARKETS DEBT FUND
SCHEDULE OF INVESTMENTS (CONTINUED)
As of October 31, 2023
The inputs of methodologies used for valuing securities are not necessarily an indication of the risks associated with investing in those securities and other financial instruments, if any. See note 4 in the Notes to the Financial Statements for more information regarding pricing inputs and valuation techniques. The following is a summary of the inputs used in valuing the Ashmore Emerging Markets Debt Fund’s investments and other financial instruments, which are carried at fair value, as of October 31, 2023:
| | | | | | | | | | | | | | | | |
| | | Level 1 | | | Level 2 | | | Level 3 | | | Total | |
Investments | | | | | | | | | | | | | | | | |
Assets: | | | | | | | | | | | | | | | | |
Debt Securities | | | | | | | | | | | | | | | | |
Corporate Bonds | | | $— | | | | $ 1,357,495 | | | | $— | | | | $ 1,357,495 | |
Financial Certificates | | | — | | | | 315,537 | | | | — | | | | 315,537 | |
Government Agencies | | | — | | | | 1,924,780 | | | | — | | | | 1,924,780 | |
Government Bonds | | | — | | | | 12,437,827 | | | | — | | | | 12,437,827 | |
Short Term Bills and Notes | | | — | | | | 78,115 | | | | — | | | | 78,115 | |
| | | | | | | | | | | | | | | | |
Total Debt Securities | | | — | | | | 16,113,754 | | | | — | | | | 16,113,754 | |
Total Investments | | | $— | | | | $16,113,754 | | | | $— | | | | $16,113,754 | |
| | | | |
Other Financial Instruments | | | | | | | | | | | | | | | | |
Assets: | | | | | | | | | | | | | | | | |
Forward Foreign Currency Exchange Contracts | | | $— | | | | $227 | | | | $— | | | | $227 | |
Total Other Financial Instruments | | | $— | | | | $227 | | | | $— | | | | $227 | |
The following is a summary of the fair values of the Fund’s derivative instruments*:
Fair Values of Financial Derivative Instruments on the Statements of Assets and Liabilities as of October 31, 2023:
| | | | |
| | | Derivatives Not Accounted for as
Hedging Instruments | |
| | | Foreign Exchange Risk | |
Assets: | | | | |
Unrealized Appreciation on Forward Foreign Currency Exchange Contracts | | | $227 | |
| | | | |
The Effect of Financial Derivative Instruments on the Statements of Operations for the Year Ended October 31, 2023:
| | | | |
| | | Derivatives Not Accounted for as
Hedging Instruments | |
| | | Foreign Exchange Risk | |
Realized Gain (Loss) on Derivatives Recognized resulting from Operations: | | | | |
Net Realized Loss on Forward Foreign Currency Exchange Contracts | | | $(98,220) | |
| | | | |
| | | | |
Net Change in Unrealized Appreciation (Depreciation) on Derivatives Recognized resulting from Operations: | | | | |
Net Change in Unrealized Appreciation on Forward Foreign Currency Exchange Contracts | | | $4,876 | |
| | | | |
* See Note 10 in the Notes to the Financial Statements for additional information.
See accompanying notes to the financial statements.
152
ASHMORE EMERGING MARKETS CORPORATE INCOME ESG FUND
SCHEDULE OF INVESTMENTS
As of October 31, 2023
| | | | | | | | | | | | | | | | |
| | | Currency1 | | | Par | | | Value | | | % of Net
Assets | |
Debt Securities | | | | | | | | | | | | | | | | |
| | | | |
Brazil (Cost $1,367,125) | | | | | | | | | | | | | | | | |
Aegea Finance S.a.r.l., 9.000%, 01/20/20312 | | | | | | | 200,000 | | | $ | 199,500 | | | | 2.92 | |
Klabin Austria GmbH, 7.000%, 04/03/2049 | | | | | | | 230,000 | | | | 210,162 | | | | 3.07 | |
MARB BondCo PLC, 3.950%, 01/29/2031 | | | | | | | 300,000 | | | | 218,250 | | | | 3.19 | |
Oi S.A., 14.000%, (66% PIK), 09/07/20242,3,4 | | | | | | | 30,773 | | | | 30,620 | | | | 0.45 | |
Oi S.A., 14.000%, (100% Cash), 09/07/20242,3,4,5 | | | | | | | 332 | | | | 330 | | | | 0.01 | |
Oi S.A., 10.000%, 07/27/20253,6 | | | | | | | 290,000 | | | | 13,050 | | | | 0.19 | |
Suzano Austria GmbH, 7.000%, 03/16/2047 | | | | | | | 200,000 | | | | 185,000 | | | | 2.71 | |
| | | | | | | | | | | 856,912 | | | | 12.54 | |
| | | | |
Chile (Cost $364,189) | | | | | | | | | | | | | | | | |
Banco de Chile, 2.990%, 12/09/2031 | | | | | | | 200,000 | | | | 158,062 | | | | 2.31 | |
VTR Finance N.V., 6.375%, 07/15/2028 | | | | | | | 200,000 | | | | 34,370 | | | | 0.50 | |
| | | | | | | | | | | 192,432 | | | | 2.81 | |
| | | | |
China (Cost $1,141,465) | | | | | | | | | | | | | | | | |
Central China Real Estate Ltd., 7.250%, 08/13/20246 | | | | | | | 300,000 | | | | 9,000 | | | | 0.13 | |
Fantasia Holdings Group Co. Ltd., 11.875%, 06/01/20236,7 | | | | | | | 280,000 | | | | 8,400 | | | | 0.12 | |
Kaisa Group Holdings Ltd., 11.250%, 04/16/20256 | | | | | | | 280,000 | | | | 11,900 | | | | 0.18 | |
Zhenro Properties Group Ltd., 7.875%, 04/14/20246 | | | | | | | 290,000 | | | | 1,450 | | | | 0.02 | |
| | | | | | | | | | | 30,750 | | | | 0.45 | |
| | | | |
Guatemala (Cost $361,576) | | | | | | | | | | | | | | | | |
Central American Bottling Corp./CBC Bottling Holdco S.L./Beliv Holdco S.L., 5.250%, 04/27/2029 | | | | | | | 200,000 | | | | 175,674 | | | | 2.57 | |
Millicom International Cellular S.A., 5.125%, 01/15/2028 | | | | | | | 180,000 | | | | 154,350 | | | | 2.26 | |
| | | | | | | | | | | 330,024 | | | | 4.83 | |
| | | | |
India (Cost $922,025) | | | | | | | | | | | | | | | | |
Bharti Airtel Ltd., 3.250%, 06/03/2031 | | | | | | | 200,000 | | | | 161,656 | | | | 2.36 | |
Clean Renewable Power Mauritius Pte. Ltd., 4.250%, 03/25/2027 | | | | | | | 360,000 | | | | 306,983 | | | | 4.49 | |
Greenko Power II Ltd., 4.300%, 12/13/2028 | | | | | | | 185,500 | | | | 155,607 | | | | 2.28 | |
India Green Energy Holdings, 5.375%, 04/29/2024 | | | | | | | 250,000 | | | | 245,937 | | | | 3.60 | |
| | | | | | | | | | | 870,183 | | | | 12.73 | |
| | | | |
Indonesia (Cost $152,517) | | | | | | | | | | | | | | | | |
Star Energy Geothermal Darajat II/Star Energy Geothermal Salak, 4.850%, 10/14/2038 | | | | | | | 200,000 | | | | 165,100 | | | | 2.41 | |
| | | | | | | | | | | 165,100 | | | | 2.41 | |
| | | | |
Kuwait (Cost $426,576) | | | | | | | | | | | | | | | | |
MEGlobal Canada ULC, 5.875%, 05/18/2030 | | | | | | | 200,000 | | | | 194,748 | | | | 2.85 | |
NBK Tier 1 Financing 2 Ltd., (Variable, USD CMT 6Y + 2.832%), 4.500%, 08/27/20258 | | | | | | | 200,000 | | | | 183,000 | | | | 2.68 | |
| | | | | | | | | | | 377,748 | | | | 5.53 | |
See accompanying notes to the financial statements.
153
ASHMORE EMERGING MARKETS CORPORATE INCOME ESG FUND
SCHEDULE OF INVESTMENTS (CONTINUED)
As of October 31, 2023
| | | | | | | | | | | | | | | | |
| | | Currency1 | | | Par | | | Value | | | % of Net
Assets | |
Mexico (Cost $1,211,174) | | | | | | | | | | | | | | | | |
Banco Mercantil del Norte S.A., (Variable, U.S. Treasury Yield
Curve Rate CMT 10Y + 7.760%), 8.375%, 10/14/20308 | | | | | | | 260,000 | | | $ | 236,844 | | | | 3.47 | |
BBVA Bancomer S.A., (Variable, U.S. Treasury Yield Curve
Rate CMT 5Y + 2.650%), 5.125%, 01/18/20338 | | | | | | | 240,000 | | | | 202,368 | | | | 2.96 | |
Corp. Inmobiliaria Vesta S.A.B. de C.V., 3.625%, 05/13/2031 | | | | | | | 200,000 | | | | 157,994 | | | | 2.31 | |
Orbia Advance Corp. S.A.B. de C.V., 5.875%, 09/17/2044 | | | | | | | 200,000 | | | | 156,000 | | | | 2.28 | |
Trust Fibra Uno, 6.390%, 01/15/2050 | | | | | | | 220,000 | | | | 153,106 | | | | 2.24 | |
| | | | | | | | | | | 906,312 | | | | 13.26 | |
| | | | |
Panama (Cost $199,105) | | | | | | | | | | | | | | | | |
C&W Senior Financing DAC, 6.875%, 09/15/2027 | | | | | | | 200,000 | | | | 170,960 | | | | 2.50 | |
| | | | | | | | | | | 170,960 | | | | 2.50 | |
| | | | |
Peru (Cost $187,100) | | | | | | | | | | | | | | | | |
Intercorp Peru Ltd., 3.875%, 08/15/2029 | | | | | | | 200,000 | | | | 161,620 | | | | 2.36 | |
| | | | | | | | | | | 161,620 | | | | 2.36 | |
| | | | |
Qatar (Cost $281,571) | | | | | | | | | | | | | | | | |
QIB Sukuk Ltd., (Floating, ICE LIBOR USD 3M + 1.350%),
7.004%, 02/07/2025 | | | | | | | 280,000 | | | | 281,400 | | | | 4.12 | |
| | | | | | | | | | | 281,400 | | | | 4.12 | |
| | | | |
Romania (Cost $173,900) | | | | | | | | | | | | | | | | |
NE Property B.V., 2.000%, 01/20/2030 | | | EUR | | | | 200,000 | | | | 155,012 | | | | 2.27 | |
| | | | | | | | | | | 155,012 | | | | 2.27 | |
| | | | |
Russian Federation (Cost $184,629) | | | | | | | | | | | | | | | | |
Sovcombank Via SovCom Capital DAC, 7.600%, 02/17/20276,9 | | | | | | | 200,000 | | | | — | | | | — | |
| | | | | | | | | | | — | | | | — | |
| | | | |
South Africa (Cost $588,538) | | | | | | | | | | | | | | | | |
Absa Group Ltd., (Variable, U.S. Treasury Yield Curve Rate
CMT 5Y + 5.411%), 6.375%, 05/27/20268 | | | | | | | 200,000 | | | | 179,940 | | | | 2.63 | |
MTN Mauritius Investments Ltd., 6.500%, 10/13/2026 | | | | | | | 210,000 | | | | 204,750 | | | | 3.00 | |
Prosus N.V., 3.680%, 01/21/2030 | | | | | | | 200,000 | | | | 158,500 | | | | 2.32 | |
| | | | | | | | | | | 543,190 | | | | 7.95 | |
| | | | |
United Arab Emirates (Cost $1,090,118) | | | | | | | | | | | | | | | | |
DIB Sukuk Ltd., 2.950%, 01/16/2026 | | | | | | | 240,000 | | | | 224,325 | | | | 3.28 | |
DP World Ltd., 6.850%, 07/02/2037 | | | | | | | 200,000 | | | | 197,000 | | | | 2.88 | |
DP World Salaam, (Variable, U.S. Treasury Yield Curve Rate
CMT 5Y + 5.750%), 6.000%, 10/01/20258 | | | | | | | 200,000 | | | | 195,252 | | | | 2.86 | |
Emirates Telecommunications Group Co. PJSC, 0.875%, 05/17/2033 | | | EUR | | | | 200,000 | | | | 154,974 | | | | 2.27 | |
MAF Global Securities Ltd., (Variable, U.S. Treasury Yield
Curve Rate CMT 5Y + 4.893%), 7.875%, 06/30/20278 | | | | | | | 200,000 | | | | 196,875 | | | | 2.88 | |
| | | | | | | | | | | 968,426 | | | | 14.17 | |
See accompanying notes to the financial statements.
154
ASHMORE EMERGING MARKETS CORPORATE INCOME ESG FUND
SCHEDULE OF INVESTMENTS (CONTINUED)
As of October 31, 2023
| | | | | | | | | | | | | | | | |
| | | Currency1 | | | Par | | | Value | | | % of Net
Assets | |
United States (Cost $698,104) | | | | | | | | | | | | | | | | |
U.S. Treasury Bill, 5.260%, 01/16/202410 | | | | | | | 706,000 | | | $ | 698,088 | | | | 10.21 | |
| | | | | | | | | | | 698,088 | | | | 10.21 | |
| | | | |
Total Debt Securities (Cost $9,349,712) | | | | | | | | | | | 6,708,157 | | | | 98.14 | |
| | | | |
Total Investments in Securities (Cost $9,349,712) | | | | | | | | | | | 6,708,157 | | | | 98.14 | |
| | | | |
Total Investments (Total Cost $9,349,712) | | | | | | | | | | | 6,708,157 | | | | 98.14 | |
| | | | |
Other Assets Less Liabilities (See Statements of Assets and
Liabilities for further detail) | | | | | | | | | | | 126,995 | | | | 1.86 | |
| | | | |
Net Assets | | | | | | | | | | $ | 6,835,152 | | | | 100.00 | |
| 1 | Local currency is United States Dollars unless otherwise noted below. |
| 2 | Securities exempt from registration under Rule 144A of the Securities Act of 1933. These securities may not be publicly traded without registration under the Securities Act of 1933. |
| 3 | Security is a payment-in-kind bond, and unless otherwise noted in the description of the security, pays its entire coupon on an in-kind basis. |
| 4 | Restricted security that has been deemed illiquid. At October 31, 2023 the value of these restricted illiquid securities amount to $30,950 or 0.45% of net assets. Additional information on each restricted illiquid security is as follows: |
| | | | | | | | |
| SECURITY | | ACQUISITION DATE | | | ACQUISITION COST | |
| | |
Oi S.A., 14.000%, 09/07/2024 | | | 4/21/23-10/19/23 | | | | $30,773 | |
Oi S.A., 14.000%, 09/07/2024 | | | 10/4/23-10/24/23 | | | | 2 | |
| 5 | Security is a Level 3 investment. |
| 6 | Issuer has defaulted on terms of debt obligation. |
| 7 | Maturity has been extended under the terms of a plan of reorganization. |
| 8 | Variable rate security. Security issued at a fixed coupon rate, which converts to a variable rate at a specified date. Rate shown is the rate in effect as of period end. |
| 9 | Security has been deemed worthless and is a Level 3 investment. |
| 10 | Zero coupon bond – interest rate reflects effective yield on the date of purchase. |
Percentages shown are based on net assets.
At October 31, 2023, the Ashmore Emerging Markets Corporate Income ESG Fund had outstanding forward foreign currency exchange contracts as follows:
| | | | | | | | | | | | | | | | | | | | |
| Settlement Date | | Counterparty | | Currency Buy | | Currency
Buy Amount
(Local
Currency) | | | | | | Currency Sell | | Currency
Sell Amount
(Local
Currency) | | | Unrealized
Gain/(Loss) |
| | | | | | | |
11/22/2023 | | Standard Chartered | | United States Dollar | | | 327,602 | | | | Euro | | | | | | 309,072 | | | $266 |
| | | | | | | | | | | | | | | | | | | | |
| | | | | | | |
Subtotal Appreciation | | | | | | | | | | | | | | | | | | | | 266 |
| | | | | | | | | | | | | | | | | | | | |
| | | | | | | |
Total | | | | | | | | | | | | | | | | | | | | $266 |
| | | | | | | | | | | | | | | | | | | | |
See accompanying notes to the financial statements.
155
ASHMORE EMERGING MARKETS CORPORATE INCOME ESG FUND
SCHEDULE OF INVESTMENTS (CONTINUED)
As of October 31, 2023
The inputs of methodologies used for valuing securities are not necessarily an indication of the risks associated with investing in those securities and other financial instruments, if any. See note 4 in the Notes to the Financial Statements for more information regarding pricing inputs and valuation techniques. The following is a summary of the inputs used in valuing the Ashmore Emerging Markets Corporate Income ESG Fund’s investments and other financial instruments, which are carried at fair value, as of October 31, 2023:
| | | | | | | | | | | | | | | | |
| | | Level 1 | | | Level 2 | | | Level 3 | | | Total | |
Investments | | | | | | | | | | | | | | | | |
Assets: | | | | | | | | | | | | | | | | |
Debt Securities | | | | | | | | | | | | | | | | |
Corporate Bonds | | | $— | | | | $4,337,003 | | | | $330 | | | | $4,337,333 | |
Corporate Convertible Bonds | | | — | | | | 619,152 | | | | — | | | | 619,152 | |
Financial Certificates | | | — | | | | 700,977 | | | | — | | | | 700,977 | |
Government Agencies | | | — | | | | 352,607 | | | | — | | | | 352,607 | |
Short Term Bills and Notes | | | — | | | | 698,088 | | | | — | | | | 698,088 | |
| | | | | | | | | | | | | | | | |
Total Debt Securities | | | — | | | | 6,707,827 | | | | 330 | | | | 6,708,157 | |
Total Investments | | | $— | | | | $6,707,827 | | | | $330 | | | | $6,708,157 | |
| | | | |
Other Financial Instruments | | | | | | | | | | | | | | | | |
Assets: | | | | | | | | | | | | | | | | |
Forward Foreign Currency Exchange Contracts | | | $— | | | | $266 | | | | $— | | | | $266 | |
Total Other Financial Instruments | | | $— | | | | $266 | | | | $— | | | | $266 | |
There were no transfers to or from Level 3 during the year ended October 31, 2023.
The amount of Level 3 securities compared to total net assets is not material; therefore, the reconciliation of Level 3 securities and assumptions is not shown for the year ended October 31, 2023.
The following is a summary of the fair values of the Fund’s derivative instruments*:
Fair Values of Financial Derivative Instruments on the Statements of Assets and Liabilities as of October 31, 2023:
| | | | |
| | | Derivatives Not Accounted for as
Hedging Instruments | |
| | | Foreign Exchange Risk | |
Assets: | | | | |
Unrealized Appreciation on Forward Foreign Currency Exchange Contracts | | | $266 | |
| | | | |
See accompanying notes to the financial statements.
156
ASHMORE EMERGING MARKETS CORPORATE INCOME ESG FUND
SCHEDULE OF INVESTMENTS (CONTINUED)
As of October 31, 2023
The Effect of Financial Derivative Instruments on the Statements of Operations for the Year Ended October 31, 2023:
| | | | |
| | | Derivatives Not Accounted for as
Hedging Instruments | |
| | | Foreign Exchange Risk | |
Realized Gain (Loss) on Derivatives Recognized resulting from Operations: | | | | |
Net Realized Loss on Forward Foreign Currency Exchange Contracts | | | $(6,166 | ) |
| | | | |
| |
Net Change in Unrealized Appreciation (Depreciation) on Derivatives Recognized resulting from Operations: | | | | |
Net Change in Unrealized Appreciation on Forward Foreign Currency Exchange Contracts | | | $ 1,308 | |
| | | | |
* See Note 10 in the Notes to the Financial Statements for additional information.
See accompanying notes to the financial statements.
157
ASHMORE FUNDS
NOTES TO FINANCIAL STATEMENTS
As of October 31, 2023
Ashmore Funds (the “Trust”) is a Massachusetts business trust organized under the laws of the Commonwealth of Massachusetts on August 6, 2010 (inception date) and is registered under the Investment Company Act of 1940, as amended (the “Investment Company Act” or “1940 Act”), as an open-end management investment company. The Trust follows accounting and reporting guidance under Financial Accounting Standards Codification Topic 946, “Financial Services – Investment Companies.” The Trust includes twelve funds as of October 31, 2023, each with its own investment objective. The Ashmore Emerging Markets Total Return Fund, Ashmore Emerging Markets Local Currency Bond Fund, Ashmore Emerging Markets Corporate Income Fund, Ashmore Emerging Markets Short Duration Fund, Ashmore Emerging Markets Active Equity Fund, Ashmore Emerging Markets Small-Cap Equity Fund, Ashmore Emerging Markets Frontier Equity Fund, Ashmore Emerging Markets Equity Fund, Ashmore Emerging Markets Equity ESG Fund, Ashmore Emerging Markets Low Duration Fund (formerly, Ashmore Emerging Markets Short Duration Select Fund), Ashmore Emerging Markets Debt Fund (formerly, Ashmore Emerging Markets Investment Grade Income Fund) and Ashmore Emerging Markets Corporate Income ESG Fund (each a “Fund” and collectively, the “Funds”) are separate series of the Trust. The Ashmore Emerging Markets Local Currency Bond Fund and the Ashmore Emerging Markets Short Duration Fund are each non-diversified funds. Non-diversified funds may invest a relatively large portion of their net assets in a single issuer or a small number of issuers. Each of the Funds’ financial statements are presented herein.
Ashmore Investment Advisors Limited (“AIAL” or the “Investment Manager”) serves as investment manager to the Funds. AIAL is a wholly owned subsidiary of Ashmore Investments (UK) Limited, which is a wholly owned subsidiary of Ashmore Group plc (“Ashmore Group”). Ashmore Investment Management (US) Corporation (“AIMUS”) is the principal underwriter of shares of the Funds. AIMUS is an affiliate of the Investment Manager. The Northern Trust Company (“Northern Trust”) serves as the administrator, custodian and transfer agent of the Funds.
Related parties or personnel of the Investment Manager may invest in the Funds. The Investment Manager could face a conflict of interest if a related party is invested in a Fund and that party’s interests diverge from those of the Fund, but equally this co-investment may serve to better align the interests of the Funds and the personnel of the Investment Manager. When a related party provides capital for a Fund, it may do so with the intention of redeeming all or part of its interest in the Fund at a future point in time.
The Funds have assessed the impact of the Alternative Investment Fund Managers Directive (AIFMD) (the “Directive”) on the financial statements of the Trust and have concluded that the Trust is exempt from following Chapter V. Section 1. Articles 103-111 of the European Commission’s Level 2 Delegated Regulation on the basis of the operations of the Trust (i) being Non-EEA AIFs (“European Economic Area Alternative Investment Funds”), and (ii) not being marketed in the European Union, as defined by the Directive.
| 2. | Significant accounting policies |
The significant accounting policies adopted and consistently followed in the preparation of the Funds’ financial statements are set out below:
(a) Basis of preparation
The financial statements have been prepared in accordance with accounting principles generally accepted in the United States of America (“U.S. GAAP”).
(b) Use of estimates
The preparation of financial statements in accordance with U.S. GAAP requires estimates and assumptions that affect the reported amounts of assets and liabilities and the disclosure of contingent assets and liabilities at the date of the financial statements, as well as the reported amounts of revenues generated and expenses incurred during the reporting period. Actual
158
ASHMORE FUNDS
NOTES TO FINANCIAL STATEMENTS (CONTINUED)
As of October 31, 2023
results could differ from these estimates. These financial statements contain all adjustments which are, in the opinion of the Trust, necessary to portray a fair statement of the period presented. Such adjustments are normal and recurring in nature. Valuation models used to determine the fair value of hard to value investments require the use of a number of market based assumptions.
(c) Determination of the Net Asset Value
The net asset value (“NAV”) of a Fund’s shares is calculated at the close of regular trading (normally 4:00 p.m. Eastern time) (the “NYSE Close”) on each day that the New York Stock Exchange (“NYSE”) is open for regular trading.
(d) Investment valuation
For the purposes of calculating NAV, portfolio securities and other assets for which market quotations are readily available are valued at market value. A market quotation is readily available only when that quotation is a quoted price (unadjusted) in active markets for identical investments that the Fund can access at the measurement date, provided that a quotation will not be readily available if it is not reliable. Market value is generally determined on the basis of official closing prices. With respect to any portion of a Fund’s assets that are invested in one or more open-ended investment management companies, a Fund’s NAV will be calculated based upon the NAVs of such investments. The prospectuses for these open-end management investment companies explain the circumstances under which those companies will use fair value pricing and the effects of using fair value pricing.
If a Fund’s non-U.S. (foreign) security’s value has materially changed after the close of the security’s primary exchange or principal market but before the time as of which the Funds calculate their NAVs, the security will be valued at fair value based on procedures approved by the Board. The fair value of investments may be determined based on information provided by pricing services and other third-party vendors, which may recommend fair value prices or adjustments with reference to other securities, indices or assets. The Funds may use fair value pricing more frequently for foreign securities or assets because, amongst other things, many foreign markets close well before the NAV of the Funds’ shares is next calculated. In considering whether fair value pricing is required and in determining fair values, the Valuation Designee (as defined below) may, amongst other things, consider significant events (which may be considered to include changes in the value of U.S. securities or securities indices) that occur after the close of the relevant market and before the time as of which the Funds calculate their NAVs. The Valuation Designee (as defined below) may utilize modeling tools provided by third-party vendors to determine the fair values of non-U.S. securities. Foreign exchanges may permit trading in foreign securities on days when the Trust is not open for business, which may result in the values of a Fund’s portfolio investments being affected when investors are unable to buy, sell or exchange shares of the Fund.
Investments initially valued in currencies other than the United States Dollar are converted to the United States Dollar using exchange rates obtained from pricing services. Foreign exchange rates are calculated as of 4:00 p.m. Eastern time on each day that the NYSE opens for regular trading. As a result, the NAV of a Fund’s shares may be affected by changes in the value of currencies in relation to the United States Dollar. The value of securities traded in markets outside the United States or denominated in currencies other than the United States Dollar may be affected significantly on a day that the NYSE is closed and an investor is not able to purchase, redeem or exchange shares of the Funds.
Investments for which market quotations are not readily available are valued at fair value as determined in good faith pursuant to Rule 2a-5 under the 1940 Act. As a general principle, the fair value of a security or other asset is the price that would be received to sell an asset or paid to transfer a liability in an orderly transaction between market participants at the measurement date. Pursuant to Rule 2a-5, the Board has designated the Investment Manager as the valuation designee (“Valuation Designee”) for the Funds to perform the fair value determination relating to all Fund investments. The Investment Manager may carry out its designated responsibilities as Valuation Designee through various committees. The Valuation Designee’s policies and procedures govern the Valuation Designee’s selection and application of methodologies for determining and calculating the fair value of Fund investments. The Valuation Designee may value Fund portfolio securities for which market quotations are not readily available and other Fund assets utilizing inputs from pricing services, quotation reporting systems, valuation agents and other third-party sources (together, “Pricing Sources”).
159
ASHMORE FUNDS
NOTES TO FINANCIAL STATEMENTS (CONTINUED)
As of October 31, 2023
Domestic and foreign debt securities for which the close of trading does not coincide with the NYSE close and non-exchange traded derivatives are normally valued on the basis of quotes obtained from brokers and dealers or Pricing Sources using data reflecting the earlier closing of the principal markets for those securities. Prices obtained from Pricing Sources may be based on, among other things, information provided by market makers or estimates of market values obtained from yield data relating to investments or securities with similar characteristics. Certain debt securities purchased on a delayed delivery basis are marked-to-market daily until settlement. Exchange traded options, futures and options on futures are generally valued at the settlement price determined by the exchange on which the instrument is primarily traded.
The Valuation Designee primarily employs a market-based approach which may use related or comparable assets or liabilities, recent transactions, market multiples, book values, and other relevant information to determine the fair value of an investment. The Valuation Designee may also apply a discount to the last traded price in situations where the last traded price may not represent the fair value of the security, such as if a security’s trading has been suspended on its primary trading market, a security has been de-listed from its primary trading market, a security has not traded for an extended period of time, or a security’s primary trading market is temporarily closed at a time when under normal conditions it would be open. Any such discount is based on a number of factors including but not limited to the circumstances surrounding any potential suspension or de-listing, market and industry conditions, competitor information, and the period of time since the last trading took place.
Fair valuation may require subjective determinations about the value of a security or asset. While the Funds’ and Valuation Designee’s policies and procedures are intended to result in a calculation of a Fund’s NAV that fairly reflects security and asset values as of the time of pricing, the Funds cannot ensure that fair values accurately reflect the price that a Fund could obtain for a security or asset if it were to dispose of that security or asset at the time of pricing (for instance, in a forced or distressed sale). The prices used by a Fund may differ from the value that would be realized if the securities were sold.
(e) Investment transactions, income and expenses
Investment transactions are recorded at the trade date. The Funds determine the gain or loss realized from investment transactions using an identified cost basis method. Interest income is recognized on an accrual basis and includes the amortization of premiums and the accretion of discounts using the effective yield method, net of any applicable tax withholding. Dividend income is recognized on the ex-dividend date. Dividends from foreign securities are recorded on the ex-dividend date, or as soon as such information is available, net of any applicable tax withholding. Other non-cash dividends are recognized as investment income at the fair value of the property received. Debt obligations may be placed on non-accrual status and related interest income may be reduced by ceasing current accruals and writing off interest receivable when the collection of all or a portion of interest has become doubtful based on consistently applied procedures. A debt obligation is removed from non-accrual status when the issuer resumes interest payments or when collectability of interest is probable.
Expenses are recorded on an accrual basis. Each Fund is charged for those expenses that are directly attributable to that Fund. Certain expenses arising in connection with a class of shares are charged to that class of shares. Expenses incurred which do not specifically relate to an individual Fund are allocated amongst all the Funds in the Trust in proportion to each Fund’s relative net assets.
(f) Foreign Currency
Assets and liabilities denominated in foreign currencies are translated into U.S. dollar amounts at the date of valuation. Purchases and sales of investment securities and income and expense items denominated in foreign currencies are translated into U.S. dollar amounts on the respective dates of such transactions.
The Funds do not isolate that portion of the results of operations resulting from changes in foreign exchange rates on investments from the fluctuations arising from changes in market prices of securities held. Such fluctuations are included with the net realized gain or loss and change in unrealized appreciation or depreciation on investments.
Reported net realized foreign exchange gains or losses arise from sales of foreign currencies, currency gains or losses realized between the trade and settlement dates on securities transactions, and the difference between the amounts of dividends, interest and foreign withholding taxes recorded on the Funds’ books and the U.S. dollar equivalent of the amounts actually received or
160
ASHMORE FUNDS
NOTES TO FINANCIAL STATEMENTS (CONTINUED)
As of October 31, 2023
paid. Net unrealized foreign exchange gains and losses arise from changes in the fair values of assets and liabilities, other than investments in securities at fiscal year-end, resulting from changes in exchange rates. Such fluctuations are included with the net realized gain or loss and unrealized appreciation or depreciation from foreign currency exchange transactions.
(g) Equity-Linked Securities
Certain Funds may purchase equity-linked securities, also known as participation notes. Equity-linked securities are primarily used by the Funds as an alternate means to access what is generally an emerging securities market. A Fund deposits cash with its custodian (or broker) in an amount near or equal to the value of the underlying security in exchange for an equity linked security. Upon sale, the Fund receives cash from the broker or custodian, equal to the value of the underlying security. In addition to the market risk and credit risk of the underlying securities, there is a risk of default by the counterparty to the transaction. In the event of insolvency of the counterparty, a Fund might be unable to obtain its expected benefit. In addition, while the Funds will seek to enter into such transactions only with parties that are capable of entering into closing transactions with a Fund, there can be no assurance that a Fund will be able to close out such a transaction with the counterparty or obtain an offsetting position with any counterparty at a time prior to the end of the term of the underlying agreement.
(h) Inflation Index Securities
Certain Funds may invest in inflation-indexed bonds which are fixed income securities whose principal value is periodically adjusted based on a measure of rate of inflation. The interest rate on these bonds is generally fixed at issuance at a rate lower than typical bonds. Over the life of an inflation-indexed bond interest will be paid based on a principal value which is adjusted for inflation. Any increase or decrease in the principal amount of an inflation-indexed bond will be included as interest income on the Statements of Operations, even though investors do not receive their principal until maturity. At October 31, 2023, all inflation-indexed bonds were shown on the Schedule of Investments with their stated coupon rate.
(i) Credit-Linked Notes
Certain Funds may invest in credit-linked notes to provide exposure to the high yield or another fixed income market. The value of a credit-linked note is based on the price movements of a particular credit, known as a reference credit. Credit-linked notes that a Fund invests in are typically listed instruments that typically provide the same return as the underlying reference credit. A Fund generally will receive a fixed or floating coupon and the note’s par value upon maturity. If a specified credit event occurs, such as default or bankruptcy, the Fund may experience a delay in payment or forego interest. The maximum potential risk of loss is limited to the par amount of the credit linked note plus any accrued interest.
In the normal course of business, the Funds trade financial instruments and enter into financial transactions where a risk of potential loss exists due to, amongst other things, changes in the market (market risk), or the failure or inability of the other party to a transaction to perform (credit and counterparty risk). See below for a summary description of select principal risks, some of which may not apply to a particular Fund. A discussion of the principal risks of investing in each Fund is included in that Fund’s prospectus.
Counterparty and Third Party Risk
Transactions involving a counterparty to a derivative or other instrument, or a third party responsible for servicing the instrument, are subject to the credit risk of the counterparty or third party, and to the counterparty’s or third party’s ability to perform in accordance with the terms of the transaction.
161
ASHMORE FUNDS
NOTES TO FINANCIAL STATEMENTS (CONTINUED)
As of October 31, 2023
Credit Risk
The Funds could lose money if the issuer or guarantor of a debt security or other instrument is unable or unwilling to meet its financial obligations, and the lack of ability, or perceived lack of ability, of the issuer to make timely payments of interest and/or principal will negatively affect the value of the security or instrument.
Market Risk
The value of securities and instruments owned by the Funds may rise and fall, sometimes rapidly or unpredictably, due to factors affecting securities markets generally or particular industries or geographic areas. Recent instability in the financial markets has led governments around the world to take a number of unprecedented actions designed to support certain financial institutions and segments of the financial markets that have experienced extreme volatility, and in some cases a lack of liquidity. The withdrawal of this support, failure of these efforts, or investor perception that these efforts are not succeeding could negatively affect financial markets generally as well as the values and liquidity of a Fund’s portfolio securities and other assets.
Derivative financial instruments may result in off-balance sheet market and credit risk. If the markets should move against one or more positions that the Funds hold, the Funds could incur losses greater than the unrealized amounts recorded in the Statements of Assets and Liabilities. Derivative risk exposures are discussed in note 10.
In addition, wars, terrorism, environmental and public health risks, and other geopolitical events may contribute to instability in world economies and markets generally. For example, the COVID-19 pandemic has resulted, and may continue to result, in significant market volatility, exchange trading suspensions and closures, declines in global financial markets, higher default rates, significant changes in fiscal and monetary policies, and a substantial economic downturn in economies throughout the world. The COVID-19 pandemic, and other epidemics and pandemics that may arise in the future, the effects of which may be greater in developing or emerging market countries due to less established health care systems, could impair the Funds’ ability to maintain operational standards (such as with respect to satisfying redemption requests), disrupt the operations of the Funds’ service providers, adversely affect the value and liquidity of the Funds’ investments, and negatively impact the Funds’ performance and your investment in a Fund.
On February 24, 2022, the Russian government invaded Ukraine, resulting in sanctions imposed upon various Russian entities and persons by the US and other governments. The Funds may invest in securities and instruments that are economically tied to Russia. Such investments may be negatively impacted by such sanctions and counter-sanctions by Russia, including declines in value and reductions in liquidity. The reductions in liquidity in investments tied to Russia may cause a Fund to sell portfolio holdings at a disadvantageous time or price or to continue to hold investments tied to Russia that the Fund may no longer seek to hold. Ashmore will continue to actively manage these positions in the best interests of the Funds and their shareholders.
Foreign/Emerging Markets Risks
Investments in foreign securities entail risks in addition to those customarily associated with investing in U.S. securities. Economic, political and social instability could disrupt financial markets in which the Fund invests and adversely affect the value of the Fund’s assets. In addition, national policies may restrict investment opportunities. In foreign markets there may be a lower degree of market volume and liquidity than in U.S. markets, and this may result in greater price volatility. The securities markets in many Emerging-Market countries are substantially smaller, less developed, less liquid and more volatile than the securities markets of developed countries. Furthermore, since the composition of each Fund will differ from that of market indexes, its performance generally will not mirror the returns provided by a specific market index.
| 4. | Fair value measurements |
U.S. GAAP includes a topic which defines fair value as the price that the Fund would receive upon selling an investment in an orderly and timely transaction to a market participant in the principal or most advantageous market of the investment. This topic establishes a three-tier hierarchy to maximize the use of observable market data, minimize the use of unobservable inputs and establish classification of fair value measurements for disclosure purposes. Inputs may be observable or unobservable and refer broadly to the assumptions that market participants would use in pricing the asset or liability including assumptions about risk.
162
ASHMORE FUNDS
NOTES TO FINANCIAL STATEMENTS (CONTINUED)
As of October 31, 2023
Such risks include the inherent risk in a particular valuation technique which is used to measure fair value. Observable inputs are inputs that reflect the assumptions market participants would use in pricing the asset or liability developed based on market data obtained from sources independent of the reporting entity. Unobservable inputs are inputs that reflect the reporting entity’s own assumptions about the assumptions market participants would use in pricing the asset or liability, developed based on the best information available in the circumstances. The three-tier hierarchy of inputs is summarized in the three broad levels listed below.
| | • | | Level 1 – Inputs using unadjusted quoted prices in active markets or exchanges for identical assets and liabilities. |
| | • | | Level 2 – Significant observable inputs other than those used in Level 1, which may include, but are not limited to, quoted prices for similar assets or liabilities in markets that are active, quoted prices for identical or similar assets or liabilities in markets that are not active, inputs other than quoted prices that are observable for the assets or liabilities (such as interest rates, yield curves, volatilities, prepayment rates, loss severities, credit risks and default rates) or other market corroborated inputs. |
| | • | | Level 3 – Significant unobservable inputs based on the best information available in the circumstances, to the extent observable inputs are not available, which may include assumptions made by the Board or persons acting at their discretion that are used in determining the fair market value of investments. |
Fixed income securities including corporate, convertible and municipal bonds and notes, U.S. government agency securities, U.S. treasury obligations, sovereign issues, bank loans, convertible preferred securities and non-U.S. bonds are normally priced using data reflecting the earlier closing of the principal markets for those securities, subject to possible fair value adjustments. Information that becomes known to a Fund or its agents after NAV has been calculated on a particular day will not generally be used to retroactively adjust the price of a security or NAV determined earlier that day.
Portfolio securities and other assets for which market quotations are readily available are typically categorized as Level 1 of the fair value hierarchy. Domestic and foreign debt securities where the close of trading does not coincide with the NYSE close and non-exchange traded derivatives are normally valued on the basis of quotes obtained from brokers and dealers or Pricing Sources using data reflecting the earlier closing of the principal markets for those securities. Prices obtained from Pricing Sources are based on, among other things, information provided by market makers or estimates of market values obtained from yield data relating to investments or securities with similar characteristics. Securities using these valuation adjustments are typically categorized as Level 2 of the fair value hierarchy. Preferred securities, equity linked notes and other equities traded on inactive markets or valued by reference to similar instruments are also typically categorized as Level 2 of the fair value hierarchy.
Investments and derivatives classified within Level 3 have significant unobservable inputs, as they trade infrequently or not at all. Level 3 instruments may include bank loan agreements and less-liquid corporate debt securities (including distressed debt instruments). Also included in this category are certain bonds and loans for which independent broker prices are used and information relating to the inputs of the price models is not available.
Rule 2a-5, Good Faith Determinations of Fair Value, under the 1940 Act, addresses valuation practices and the role of the board of directors with respect to the fair value of the investments of a registered investment company, including related oversight and reporting requirements intended to ensure that the Board receives the information it needs to oversee the investment adviser’s fair value determinations. Among other things, Rule 2a-5 permits the Board to designate the Funds’ investment adviser to perform the Funds’ fair value determinations, which are subject to Board oversight. Pursuant to Rule 2a-5, the Board approved changes to the Funds’ valuation policies and procedures and designated the Funds’ investment adviser, Ashmore Investment Advisors Limited, to serve as the “valuation designee” to perform the Funds’ fair value determinations.
163
ASHMORE FUNDS
NOTES TO FINANCIAL STATEMENTS (CONTINUED)
As of October 31, 2023
| 5. | Reverse repurchase agreements |
Certain Funds may enter into reverse repurchase agreements. In a reverse repurchase agreement, a Fund delivers a security in exchange for cash to a financial institution, the counterparty, with a simultaneous agreement to repurchase the same or substantially the same security at an agreed upon price and date. The Fund is entitled to receive principal and interest payments, if any, made on the security delivered to the counterparty during the term of the agreement. Cash received in exchange for securities delivered plus accrued interest payments to be made by the Fund to counterparties are reflected as a liability on the Statements of Assets and Liabilities. Interest payments made by the Fund to counterparties are recorded as a component of interest expense on the Statements of Operations. In periods of increased demand for the security, a Fund may receive a fee for use of the security by the counterparty, which may result in interest income to the Fund.
As of October 31, 2023, the Funds did not hold any reverse repurchase agreements.
| 6. | Capital share transactions |
Transactions in Class A shares for the year ended October 31, 2023, were as follows:
| | | | | | | | | | | | | | | | | | | | | | | | | | | | | | | | |
| | | | | | | | | |
| Fund | | Shares Sold | | | Proceeds from
Shares Sold | | | Shares from
Reinvested
Distributions | | | Proceeds from
Reinvestment of Distributions | | | Shares
Redeemed | | | Payments for
Shares
Redeemed | | | Net Increase/
(Decrease) in
Shares | | | Net Increase/
(Decrease) in
Net Assets | |
Ashmore Emerging Markets Total Return Fund | | | 284,055 | | | $ | 1,383,736 | | | | 22,112 | | | $ | 104,055 | | | | (432,918 | ) | | $ | (2,011,639 | ) | | | (126,751 | ) | | $ | (523,848 | ) |
Ashmore Emerging Markets Local Currency Bond Fund | | | 3,650 | | | | 24,374 | | | | 657 | | | | 3,993 | | | | (30,829 | ) | | | (201,321 | ) | | | (26,522 | ) | | | (172,954 | ) |
Ashmore Emerging Markets Corporate Income Fund | | | 261,821 | | | | 1,359,697 | | | | 48,112 | | | | 253,902 | | | | (529,621 | ) | | | (2,766,003 | ) | | | (219,688 | ) | | | (1,152,404 | ) |
Ashmore Emerging Markets Short Duration Fund | | | 2,286,924 | | | | 10,381,902 | | | | 143,671 | | | | 643,004 | | | | (1,347,038 | ) | | | (5,922,593 | ) | | | 1,083,557 | | | | 5,102,313 | |
Ashmore Emerging Markets Active Equity Fund | | | 98 | | | | 753 | | | | 145 | | | | 1,014 | | | | (125,762 | ) | | | (878,618 | ) | | | (125,519 | ) | | | (876,851 | ) |
Ashmore Emerging Markets Small-Cap Equity Fund | | | 140,142 | | | | 1,540,647 | | | | — | | | | — | | | | (139,219 | ) | | | (1,543,103 | ) | | | 923 | | | | (2,456 | ) |
Ashmore Emerging Markets Frontier Equity Fund | | | 38,001 | | | | 323,023 | | | | 4,293 | | | | 36,169 | | | | (206,937 | ) | | | (1,762,062 | ) | | | (164,643 | ) | | | (1,402,870 | ) |
164
ASHMORE FUNDS
NOTES TO FINANCIAL STATEMENTS (CONTINUED)
As of October 31, 2023
| | | | | | | | | | | | | | | | | | | | | | | | | | | | | | | | |
| | | | | | | | | |
| Fund | | Shares Sold | | | Proceeds from
Shares Sold | | | Shares from
Reinvested
Distributions | | | Proceeds from
Reinvestment of Distributions | | | Shares
Redeemed | | | Payments for
Shares
Redeemed | | | Net Increase/
(Decrease) in
Shares | | | Net Increase/
(Decrease) in
Net Assets | |
Ashmore Emerging Markets Equity Fund | | | 460,109 | | | $ | 4,522,664 | | | | 1,253 | | | $ | 12,505 | | | | (351,596 | ) | | $ | (3,535,339 | ) | | | 109,766 | | | $ | 999,830 | |
Ashmore Emerging Markets Equity ESG Fund | | | — | | | | — | | | | 1 | | | | 4 | | | | — | | | | — | | | | 1 | | | | 4 | |
Ashmore Emerging Markets Low Duration Fund | | | — | | | | — | | | | 3 | | | | 29 | | | | — | | | | — | | | | 3 | | | | 29 | |
Ashmore Emerging Markets Debt Fund | | | — | | | | — | | | | 5 | | | | 35 | | | | — | | | | — | | | | 5 | | | | 35 | |
Ashmore Emerging Markets Corporate Income ESG Fund | | | — | | | | — | | | | 5 | | | | 32 | | | | — | | | | — | | | | 5 | | | | 32 | |
|
Transactions in Class C shares for the year ended October 31, 2023, were as follows: | |
| | | | | | | | | |
| Fund | | Shares Sold | | | Proceeds from
Shares Sold | | | Shares from
Reinvested
Distributions | | | Proceeds from
Reinvestment of Distributions | | | Shares
Redeemed | | | Payments for
Shares
Redeemed | | | Net Increase/
(Decrease) in
Shares | | | Net Increase/
(Decrease) in
Net Assets | |
Ashmore Emerging Markets Total Return Fund | | | 2,768 | | | $ | 13,075 | | | | 9,215 | | | $ | 43,244 | | | | (83,318 | ) | | $ | (392,770 | ) | | | (71,335 | ) | | $ | (336,451 | ) |
Ashmore Emerging Markets Local Currency Bond Fund | | | 168 | | | | 1,000 | | | | 2 | | | | 13 | | | | (435 | ) | | | (2,623 | ) | | | (265 | ) | | | (1,610 | ) |
Ashmore Emerging Markets Corporate Income Fund | | | 19,840 | | | | 106,650 | | | | 20,469 | | | | 107,863 | | | | (108,926 | ) | | | (575,973 | ) | | | (68,617 | ) | | | (361,460 | ) |
Ashmore Emerging Markets Short Duration Fund | | | — | | | | — | | | | 4,981 | | | | 21,358 | | | | (38,682 | ) | | | (162,274 | ) | | | (33,701 | ) | | | (140,916 | ) |
Ashmore Emerging Markets Active Equity Fund | | | — | | | | — | | | | 1 | | | | 10 | | | | — | | | | — | | | | 1 | | | | 10 | |
165
ASHMORE FUNDS
NOTES TO FINANCIAL STATEMENTS (CONTINUED)
As of October 31, 2023
| | | | | | | | | | | | | | | | | | | | | | | | | | | | | | | | |
| | | | | | | | | |
| Fund | | Shares Sold | | | Proceeds from
Shares Sold | | | Shares from
Reinvested
Distributions | | | Proceeds from
Reinvestment of Distributions | | | Shares
Redeemed | | | Payments for
Shares
Redeemed | | | Net Increase/
(Decrease) in
Shares | | | Net Increase/
(Decrease) in
Net Assets | |
Ashmore Emerging Markets Small-Cap Equity Fund | | | — | | | $ | — | | | | — | | | $ | — | | | | (2,780 | ) | | $ | (32,766 | ) | | | (2,780 | ) | | $ | (32,766 | ) |
Ashmore Emerging Markets Frontier Equity Fund | | | 10,431 | | | | 85,000 | | | | 105 | | | | 856 | | | | (20,850 | ) | | | (169,796 | ) | | | (10,314 | ) | | | (83,940 | ) |
Ashmore Emerging Markets Equity Fund | | | 525 | | | | 5,000 | | | | 44 | | | | 415 | | | | (6,099 | ) | | | (56,063 | ) | | | (5,530 | ) | | | (50,648 | ) |
Ashmore Emerging Markets Equity ESG Fund | | | — | | | | — | | | | — | | | | 1 | | | | — | | | | — | | | | — | | | | 1 | |
Ashmore Emerging Markets Low Duration Fund | | | — | | | | — | | | | 3 | | | | 25 | | | | — | | | | — | | | | 3 | | | | 25 | |
Ashmore Emerging Markets Debt Fund | | | — | | | | — | | | | 4 | | | | 31 | | | | — | | | | — | | | | 4 | | | | 31 | |
Ashmore Emerging Markets Corporate Income ESG Fund | | | — | | | | — | | | | 4 | | | | 29 | | | | — | | | | — | | | | 4 | | | | 29 | |
|
Transactions in Institutional Class shares for the year ended October 31, 2023, were as follows: | |
| | | | | | | | | |
| Fund | | Shares Sold | | | Proceeds from
Shares Sold | | | Shares from
Reinvested
Distributions | | | Proceeds from
Reinvestment of Distributions | | | Shares
Redeemed | | | Payments for
Shares
Redeemed | | | Net Increase/
(Decrease) in
Shares | | | Net Increase/
(Decrease) in
Net Assets | |
Ashmore Emerging Markets Total Return Fund | | | 21,462,386 | | | $ | 103,688,703 | | | | 5,751,175 | | | $ | 27,466,748 | | | | (41,319,719 | ) | | $ | (194,962,456 | ) | | | (14,106,158 | ) | | $ | (63,807,005 | ) |
Ashmore Emerging Markets Local Currency Bond Fund | | | 926,798 | | | | 5,962,700 | | | | 29,415 | | | | 188,256 | | | | (243,450 | ) | | | (1,555,825 | ) | | | 712,763 | | | | 4,595,131 | |
Ashmore Emerging Markets Corporate Income Fund | | | 4,608,281 | | | | 25,902,099 | | | | 886,855 | | | | 4,880,428 | | | | (9,541,955 | ) | | | (52,482,610 | ) | | | (4,046,819 | ) | | | (21,700,083 | ) |
166
ASHMORE FUNDS
NOTES TO FINANCIAL STATEMENTS (CONTINUED)
As of October 31, 2023
| | | | | | | | | | | | | | | | | | | | | | | | | | | | | | | | |
| | | | | | | | | |
| Fund | | Shares Sold | | | Proceeds from
Shares Sold | | | Shares from
Reinvested
Distributions | | | Proceeds from
Reinvestment of Distributions | | | Shares
Redeemed | | | Payments for
Shares
Redeemed | | | Net Increase/
(Decrease) in
Shares | | | Net Increase/
(Decrease) in
Net Assets | |
Ashmore Emerging Markets Short Duration Fund | | | 1,706,959 | | | $ | 7,924,774 | | | | 191,162 | | | $ | 843,363 | | | | (3,269,750 | ) | | $ | (14,582,175 | ) | | | (1,371,629 | ) | | $ | (5,814,038 | ) |
Ashmore Emerging Markets Active Equity Fund | | | 5,963,911 | | | | 43,140,305 | | | | 50,777 | | | | 358,852 | | | | (14,732,134 | ) | | | (110,895,068 | ) | | | (8,717,446 | ) | | | (67,395,911 | ) |
Ashmore Emerging Markets Small-Cap Equity Fund | | | 105,339 | | | | 1,528,927 | | | | — | | | | — | | | | (22,369 | ) | | | (342,101 | ) | | | 82,970 | | | | 1,186,826 | |
Ashmore Emerging Markets Frontier Equity Fund | | | 1,447,138 | | | | 14,280,948 | | | | 120,113 | | | | 1,184,204 | | | | (2,266,405 | ) | | | (22,396,106 | ) | | | (699,154 | ) | | | (6,930,954 | ) |
Ashmore Emerging Markets Equity Fund | | | 4,734,389 | | | | 45,556,845 | | | | 91,838 | | | | 879,491 | | | | (6,369,748 | ) | | | (60,335,833 | ) | | | (1,543,521 | ) | | | (13,899,497 | ) |
Ashmore Emerging Markets Equity ESG Fund | | | — | | | | — | | | | 6,122 | | | | 57,295 | | | | — | | | | — | | | | 6,122 | | | | 57,295 | |
Ashmore Emerging Markets Low Duration Fund | | | 110 | | | | 935 | | | | 34,976 | | | | 299,814 | | | | — | | | | — | | | | 35,086 | | | | 300,749 | |
Ashmore Emerging Markets Debt Fund | | | 305 | | | | 2,240 | | | | 90,996 | | | | 718,685 | | | | — | | | | — | | | | 91,301 | | | | 720,925 | |
Ashmore Emerging Markets Corporate Income ESG Fund | | | 169 | | | | 1,027 | | | | 52,024 | | | | 336,062 | | | | — | | | | — | | | | 52,193 | | | | 337,089 | |
|
Transactions in Class A shares for the year ended October 31, 2022, were as follows: | |
| | | | | | | | | |
| Fund | | Shares Sold | | | Proceeds from
Shares Sold | | | Shares from
Reinvested
Distributions | | | Proceeds from
Reinvestment of Distributions | | | Shares
Redeemed | | | Payments for
Shares
Redeemed | | | Net Increase/
(Decrease) in
Shares | | | Net Increase/
(Decrease) in
Net Assets | |
Ashmore Emerging Markets Total Return Fund | | | 135,533 | | | $ | 746,025 | | | | 29,232 | | | $ | 161,915 | | | | (616,950 | ) | | $ | (3,388,400 | ) | | | (452,185 | ) | | $ | (2,480,460 | ) |
167
ASHMORE FUNDS
NOTES TO FINANCIAL STATEMENTS (CONTINUED)
As of October 31, 2023
| | | | | | | | | | | | | | | | | | | | | | | | | | | | | | | | |
| | | | | | | | | |
| Fund | | Shares Sold | | | Proceeds from
Shares Sold | | | Shares from
Reinvested
Distributions | | | Proceeds from
Reinvestment of Distributions | | | Shares
Redeemed | | | Payments for
Shares
Redeemed | | | Net Increase/
(Decrease) in
Shares | | | Net Increase/
(Decrease) in
Net Assets | |
Ashmore Emerging Markets Local Currency Bond Fund | | | — | | | $ | — | | | | 288 | | | $ | 1,965 | | | | (8,274 | ) | | $ | (53,145 | ) | | | (7,986 | ) | | $ | (51,180 | ) |
Ashmore Emerging Markets Corporate Income Fund | | | 463,186 | | | | 2,972,787 | | | | 73,956 | | | | 460,197 | | | | (1,062,469 | ) | | | (6,418,407 | ) | | | (525,327 | ) | | | (2,985,423 | ) |
Ashmore Emerging Markets Short Duration Fund | | | 790,721 | | | | 4,146,328 | | | | 58,372 | | | | 321,960 | | | | (1,157,545 | ) | | | (6,413,996 | ) | | | (308,452 | ) | | | (1,945,708 | ) |
Ashmore Emerging Markets Active Equity Fund | | | 66,229 | | | | 829,209 | | | | 12,344 | | | | 110,600 | | | | (75,330 | ) | | | (928,829 | ) | | | 3,243 | | | | 10,980 | |
Ashmore Emerging Markets Small-Cap Equity Fund | | | 20,187 | | | | 236,302 | | | | 395 | | | | 4,383 | | | | (2,514 | ) | | | (26,874 | ) | | | 18,068 | | | | 213,811 | |
Ashmore Emerging Markets Frontier Equity Fund | | | 121,153 | | | | 1,162,585 | | | | 5,305 | | | | 49,448 | | | | (18,226 | ) | | | (169,813 | ) | | | 108,232 | | | | 1,042,220 | |
Ashmore Emerging Markets Equity Fund | | | 526,316 | | | | 4,873,180 | | | | 30,195 | | | | 385,536 | | | | (415,892 | ) | | | (4,122,940 | ) | | | 140,619 | | | | 1,135,776 | |
Ashmore Emerging Markets Equity ESG Fund | | | — | | | | — | | | | 15 | | | | 186 | | | | — | | | | — | | | | 15 | | | | 186 | |
Ashmore Emerging Markets Low Duration Fund | | | — | | | | — | | | | 3 | | | | 27 | | | | — | | | | — | | | | 3 | | | | 27 | |
Ashmore Emerging Markets Debt Fund | | | — | | | | 1 | | | | 3 | | | | 27 | | | | — | | | | — | | | | 3 | | | | 28 | |
Ashmore Emerging Markets Corporate Income ESG Fund | | | — | | | | — | | | | 4 | | | | 34 | | | | — | | | | — | | | | 4 | | | | 34 | |
168
ASHMORE FUNDS
NOTES TO FINANCIAL STATEMENTS (CONTINUED)
As of October 31, 2023
Transactions in Class C shares for the year ended October 31, 2022, were as follows:
| | | | | | | | | | | | | | | | | | | | | | | | | | | | | | | | |
| | | | | | | | | |
| Fund | | Shares Sold | | | Proceeds from
Shares Sold | | | Shares from Reinvested
Distributions | | | Proceeds from
Reinvestment of Distributions | | | Shares
Redeemed | | | Payments for
Shares
Redeemed | | | Net Increase/
(Decrease) in
Shares | | | Net Increase/
(Decrease) in
Net Assets | |
Ashmore Emerging Markets Total Return Fund | | | 21,745 | | | $ | 132,090 | | | | 12,015 | | | $ | 64,413 | | | | (145,407 | ) | | $ | (778,676 | ) | | | (111,647 | ) | | $ | (582,173 | ) |
Ashmore Emerging Markets Local Currency Bond Fund | | | — | | | | 14 | | | | 45 | | | | 298 | | | | (3,277 | ) | | | (22,087 | ) | | | (3,232 | ) | | | (21,775 | ) |
Ashmore Emerging Markets Corporate Income Fund | | | 5,577 | | | | 36,731 | | | | 30,372 | | | | 191,362 | | | | (442,674 | ) | | | (2,842,944 | ) | | | (406,725 | ) | | | (2,614,851 | ) |
Ashmore Emerging Markets Short Duration Fund | | | 2,014 | | | | 10,128 | | | | 6,702 | | | | 35,870 | | | | (124,451 | ) | | | (742,356 | ) | | | (115,735 | ) | | | (696,358 | ) |
Ashmore Emerging Markets Active Equity Fund | | | — | | | | — | | | | 44 | | | | 383 | | | | — | | | | — | | | | 44 | | | | 383 | |
Ashmore Emerging Markets Small-Cap Equity Fund | | | 3,716 | | | | 57,747 | | | | 58 | | | | 704 | | | | (10,010 | ) | | | (128,112 | ) | | | (6,236 | ) | | | (69,661 | ) |
Ashmore Emerging Markets Frontier Equity Fund | | | 21,355 | | | | 199,113 | | | | 264 | | | | 2,406 | | | | (6,547 | ) | | | (54,411 | ) | | | 15,072 | | | | 147,108 | |
Ashmore Emerging Markets Equity Fund | | | 9,853 | | | | 118,464 | | | | 789 | | | | 9,242 | | | | (3,817 | ) | | | (60,171 | ) | | | 6,825 | | | | 67,535 | |
Ashmore Emerging Markets Equity ESG Fund | | | — | | | | — | | | | 16 | | | | 186 | | | | — | | | | — | | | | 16 | | | | 186 | |
Ashmore Emerging Markets Low Duration Fund | | | — | | | | — | | | | 2 | | | | 20 | | | | — | | | | (1 | ) | | | 2 | | | | 19 | |
Ashmore Emerging Markets Debt Fund | | | — | | | | 1 | | | | 3 | | | | 21 | | | | — | | | | (1 | ) | | | 3 | | | | 21 | |
169
ASHMORE FUNDS
NOTES TO FINANCIAL STATEMENTS (CONTINUED)
As of October 31, 2023
| | | | | | | | | | | | | | | | | | | | | | | | | | | | | | | | |
| | | | | | | | | |
| Fund | | Shares Sold | | | Proceeds from Shares Sold | | | Shares from
Reinvested
Distributions | | | Proceeds from
Reinvestment of Distributions | | | Shares
Redeemed | | | Payments for
Shares
Redeemed | | | Net Increase/
(Decrease) in
Shares | | | Net Increase/
(Decrease) in
Net Assets | |
Ashmore Emerging Markets Corporate Income ESG Fund | | | — | | | $ | — | | | | 4 | | | $ | 29 | | | | — | | | $ | — | | | | 4 | | | $ | 29 | |
|
Transactions in Institutional Class shares for the year ended October 31, 2022, were as follows: | |
| | | | | | | | | |
| Fund | | Shares Sold | | | Proceeds from
Shares Sold | | | Shares from
Reinvested
Distributions | | | Proceeds from
Reinvestment of Distributions | | | Shares
Redeemed | | | Payments for
Shares
Redeemed | | | Net Increase/
(Decrease) in
Shares | | | Net Increase/
(Decrease) in
Net Assets | |
Ashmore Emerging Markets Total Return Fund | | | 35,097,385 | | | $ | 198,826,280 | | | | 7,263,823 | | | $ | 40,206,127 | | | | (112,493,148 | ) | | $ | (652,313,258 | ) | | | (70,131,940 | ) | | $ | (413,280,851 | ) |
Ashmore Emerging Markets Local Currency Bond Fund | | | — | | | | — | | | | 9,772 | | | | 69,775 | | | | (180,201 | ) | | | (1,173,845 | ) | | | (170,429 | ) | | | (1,104,070 | ) |
Ashmore Emerging Markets Corporate Income Fund | | | 6,216,439 | | | | 43,405,532 | | | | 1,216,017 | | | | 7,981,464 | | | | (26,058,215 | ) | | | (171,188,218 | ) | | | (18,625,759 | ) | | | (119,801,222 | ) |
Ashmore Emerging Markets Short Duration Fund | | | 2,592,971 | | | | 14,632,635 | | | | 786,529 | | | | 4,355,127 | | | | (9,665,352 | ) | | | (53,091,917 | ) | | | (6,285,852 | ) | | | (34,104,155 | ) |
Ashmore Emerging Markets Active Equity Fund | | | 10,481,613 | | | | 85,638,558 | | | | 1,843,774 | | | | 16,690,212 | | | | (7,752,534 | ) | | | (68,974,979 | ) | | | 4,572,853 | | | | 33,353,791 | |
Ashmore Emerging Markets Small-Cap Equity Fund | | | 60,566 | | | | 1,072,241 | | | | 5,607 | | | | 83,575 | | | | (144,386 | ) | | | (2,192,594 | ) | | | (78,213 | ) | | | (1,036,778 | ) |
Ashmore Emerging Markets Frontier Equity Fund | | | 2,379,362 | | | | 25,822,772 | | | | 114,240 | | | | 1,241,797 | | | | (1,960,274 | ) | | | (21,530,411 | ) | | | 533,328 | | | | 5,534,158 | |
Ashmore Emerging Markets Equity Fund | | | 9,518,704 | | | | 108,344,606 | | | | 922,024 | | | | 11,164,600 | | | | (6,225,169 | ) | | | (67,403,620 | ) | | | 4,215,559 | | | | 52,105,586 | |
170
ASHMORE FUNDS
NOTES TO FINANCIAL STATEMENTS (CONTINUED)
As of October 31, 2023
| | | | | | | | | | | | | | | | | | | | | | | | | | | | | | | | |
| | | | | | | | | |
| Fund | | Shares Sold | | | Proceeds from
Shares Sold | | | Shares from
Reinvested
Distributions | | | Proceeds from
Reinvestment of Distributions | | | Shares
Redeemed | | | Payments for
Shares
Redeemed | | | Net Increase/
(Decrease) in
Shares | | | Net Increase/
(Decrease) in
Net Assets | |
Ashmore Emerging Markets Equity ESG Fund | | | — | | | $ | — | | | | 156,478 | | | $ | 1,877,075 | | | | — | | | $ | — | | | | 156,478 | | | $ | 1,877,075 | |
Ashmore Emerging Markets Low Duration Fund | | | 10,968 | | | | 104,841 | | | | 30,711 | | | | 274,449 | | | | (11,004 | ) | | | (100,912 | ) | | | 30,675 | | | | 278,378 | |
Ashmore Emerging Markets Debt Fund | | | — | | | | 801 | | | | 67,001 | | | | 573,721 | | | | — | | | | (1 | ) | | | 67,001 | | | | 574,521 | |
Ashmore Emerging Markets Corporate Income ESG Fund | | | — | | | | — | | | | 47,045 | | | | 353,954 | | | | — | | | | — | | | | 47,045 | | | | 353,954 | |
Capital shares
Class A shares are issued at the Fund’s relevant NAV per share plus any applicable sales charge. Institutional Class and Class C shares are issued at the Fund’s relevant NAV per share without a sales charge. Shares confer upon the holders the right to receive notice of and attend, speak and vote at shareholder meetings of the Funds. The shares confer upon the holders the right to any or all dividends or distributions which the Trustees in their sole discretion may from time to time resolve to make or declare.
| 7. | Investment transactions |
For the year ended October 31, 2023, the aggregate cost of purchases and proceeds from sales of investments (excluding short-term investments) for the Funds were as follows:
| | | | | | | | |
| | | |
| Fund | | Purchases | | | Sales | |
| Ashmore Emerging Markets Total Return Fund | | $ | 240,350,099 | | | $ | 271,552,162 | |
| Ashmore Emerging Markets Local Currency Bond Fund | | | 10,989,964 | | | | 6,489,196 | |
| Ashmore Emerging Markets Corporate Income Fund | | | 44,229,177 | | | | 71,344,451 | |
| Ashmore Emerging Markets Short Duration Fund | | | 25,725,995 | | | | 26,786,719 | |
| Ashmore Emerging Markets Active Equity Fund | | | 78,988,584 | | | | 146,176,851 | |
| Ashmore Emerging Markets Small-Cap Equity Fund | | | 8,013,312 | | | | 6,901,008 | |
| Ashmore Emerging Markets Frontier Equity Fund | | | 60,578,713 | | | | 65,713,071 | |
| Ashmore Emerging Markets Equity Fund | | | 85,217,708 | | | | 96,872,522 | |
| Ashmore Emerging Markets Equity ESG Fund | | | 5,350,249 | | | | 5,518,808 | |
| Ashmore Emerging Markets Low Duration Fund | | | 4,470,133 | | | | 4,557,218 | |
| Ashmore Emerging Markets Debt Fund | | | 18,186,203 | | | | 17,833,238 | |
| Ashmore Emerging Markets Corporate Income ESG Fund | | | 2,321,434 | | | | 1,943,699 | |
171
ASHMORE FUNDS
NOTES TO FINANCIAL STATEMENTS (CONTINUED)
As of October 31, 2023
The difference between book basis and tax basis net unrealized appreciation (depreciation) is attributable primarily to the tax deferral of losses on wash sales and the recharacterization of income recognition on investments in PFICs. At October 31, 2023, for federal income tax purposes, gross unrealized appreciation, gross unrealized depreciation, net unrealized appreciation (depreciation) on investments (including the effects of foreign currency translation and derivative instruments, if any) and the cost basis of investments (including derivative instruments, if any) were as follows:
| | | | | | | | | | | | | | | | |
| | | | | |
| Amounts in Thousands | | Unrealized
Appreciation | | | Unrealized
Depreciation | | | Net Appreciation
(Depreciation) | | | Cost Basis of
Investments | |
Ashmore Emerging Markets Total Return Fund | | $ | 3,601,457 | | | $ | (190,072,029 | ) | | $ | (186,470,572 | ) | | $ | 627,000,980 | |
Ashmore Emerging Markets Local Currency Bond Fund | | | 220,592 | | | | (842,146 | ) | | | (621,554 | ) | | | 10,544,617 | |
Ashmore Emerging Markets Corporate Income Fund | | | 192,491 | | | | (45,910,515 | ) | | | (45,718,024 | ) | | | 116,928,707 | |
Ashmore Emerging Markets Short Duration Fund | | | 149,942 | | | | (59,720,987 | ) | | | (59,571,045 | ) | | | 119,374,982 | |
Ashmore Emerging Markets Active Equity Fund | | | 551,245 | | | | (6,215,781 | ) | | | (5,664,536 | ) | | | 28,314,889 | |
Ashmore Emerging Markets Small-Cap Equity Fund | | | 543,744 | | | | (1,688,674 | ) | | | (1,144,930 | ) | | | 9,500,387 | |
Ashmore Emerging Markets Frontier Equity Fund | | | 3,815,300 | | | | (6,176,783 | ) | | | (2,361,483 | ) | | | 61,624,157 | |
Ashmore Emerging Markets Equity Fund | | | 6,880,965 | | | | (19,860,172 | ) | | | (12,979,207 | ) | | | 104,413,331 | |
Ashmore Emerging Markets Equity ESG Fund | | | 879,461 | | | | (1,175,814 | ) | | | (296,353 | ) | | | 10,019,172 | |
Ashmore Emerging Markets Low Duration Fund | | | 5,157 | | | | (350,751 | ) | | | (345,594 | ) | | | 9,439,883 | |
Ashmore Emerging Markets Debt Fund | | | 6,692 | | | | (1,848,488 | ) | | | (1,841,796 | ) | | | 17,955,505 | |
Ashmore Emerging Markets Corporate Income ESG Fund | | | 13,176 | | | | (2,654,867 | ) | | | (2,641,691 | ) | | | 9,349,978 | |
No provision for U.S. federal income taxes has been made since each Fund’s policy is to comply with the requirements of Subchapter M of the Internal Revenue Code of 1986, as amended, applicable to regulated investment companies, and to distribute, each year, substantially all of its taxable income and capital gains to its shareholders.
For financial reporting purposes the Funds may periodically make reclassifications among components of capital accounts to reflect permanent differences between U.S. GAAP and taxable income. The reclassifications have no impact on the net assets of the Funds. As a result, the following reclassifications were made to the Statements of Assets and Liabilities:
| | | | | | | | |
| | | |
| Fund | | Paid in Capital | | | Distributable earnings/
(Accumulated loss) | |
| Ashmore Emerging Markets Total Return Fund | | $ | (607,767) | | | $ | 607,767 | |
| Ashmore Emerging Markets Low Duration Fund | | | (16,040) | | | | 16,040 | |
| Ashmore Emerging Markets Debt Fund | | | (72,000) | | | | 72,000 | |
172
ASHMORE FUNDS
NOTES TO FINANCIAL STATEMENTS (CONTINUED)
As of October 31, 2023
The following Funds have available capital loss carryforwards for which there is no expiration date:
| | | | | | | | |
| | | |
| Fund | | Short-Term Capital Loss
Carryforward at
October 31, 2023 | | | Long-Term Capital Loss
Carryforward at
October 31, 2023 | |
| Ashmore Emerging Markets Total Return Fund | | $ | (38,359,674 | ) | | $ | (286,429,687 | ) |
| Ashmore Emerging Markets Local Currency Bond Fund | | | — | | | | (1,075,418 | ) |
| Ashmore Emerging Markets Corporate Income Fund | | | (28,118,434 | ) | | | (95,411,393 | ) |
| Ashmore Emerging Markets Short Duration Fund | | | (100,241,311 | ) | | | (248,270,199 | ) |
| Ashmore Emerging Markets Active Equity Fund | | | (12,237,024 | ) | | | (7,154,292 | ) |
| Ashmore Emerging Markets Small-Cap Equity Fund | | | (209,933 | ) | | | (3,764,066 | ) |
| Ashmore Emerging Markets Frontier Equity Fund | | | (5,177,700 | ) | | | (2,257,239 | ) |
| Ashmore Emerging Markets Equity Fund | | | (4,430,401 | ) | | | (9,097,261 | ) |
| Ashmore Emerging Markets Equity ESG Fund | | | (437,934 | ) | | | (1,046,143 | ) |
| Ashmore Emerging Markets Low Duration Fund | | | (566,988 | ) | | | (667,272 | ) |
| Ashmore Emerging Markets Debt Fund | | | (603,561 | ) | | | (3,060,822 | ) |
| Ashmore Emerging Markets Corporate Income ESG Fund | | | (406,919 | ) | | | (989,361 | ) |
The Funds are subject to the provisions of the Financial Accounting Standards Board (“FASB”) Accounting Standards Codification (“ASC”) Topic 740-10, Income Taxes. This standard provides guidance as to how uncertain tax positions should be recognized, measured, presented and disclosed in the Funds’ financial statements. The Funds recognize the tax benefits of uncertain tax positions only where the position is more-likely-than-not (i.e. greater than 50-percent) to be sustained assuming examination by a tax authority based on the technical merits of the position. In evaluating whether a tax position has met the recognition threshold, the Funds must presume that the position will be examined by the appropriate taxing authority that has full knowledge of all relevant information. A tax position that meets the more-likely-than-not recognition threshold is measured to determine the amount of benefit to recognize in the Funds’ financial statements. Income tax and related interest and penalties would be recognized by the Funds as tax expense in the Statement of Operations if the tax positions were deemed not to meet the more-likely-than-not threshold. The Funds analyze all open tax years for all major taxing jurisdictions. Open tax years are those that are open to examination by taxing authorities, as defined by the Statute of Limitations in each jurisdiction. The Funds have no examinations by tax authorities in progress. The Trust has analyzed the Funds’ tax positions, and has concluded that no liability for unrecognized tax benefits should be recorded related to uncertain tax positions. Further, the Trust is not aware of any tax positions for which it is reasonably possible that the total amounts of unrecognized tax benefits will significantly change in the next twelve months.
As of October 31, 2023, the components of distributable taxable earnings, including temporary differences were as follows:
| | | | | | | | | | | | | | | | | | | | |
| | | | | | |
| Fund | | Undistributed
Ordinary Income | | | Undistributed
Long Term
Capital Gain | | | Accumulated
Capital Losses
and Other | | | Undistributed
Appreciation
(Depreciation) on
Investments and
Foreign Currencies | | | Total Accumulated
Earnings (Deficit) | |
Ashmore Emerging Markets Total Return Fund | | $ | — | | | $ | — | | | $ | (325,250,496 | ) | | $ | (186,470,572 | ) | | $ | (511,721,068 | ) |
Ashmore Emerging Markets Local Currency Bond Fund | | | 175,785 | | | | — | | | | (1,081,033 | ) | | | (621,554 | ) | | | (1,526,802 | ) |
Ashmore Emerging Markets Corporate Income Fund | | | 190,406 | | | | — | | | | (123,599,392 | ) | | | (45,718,023 | ) | | | (169,127,009 | ) |
173
ASHMORE FUNDS
NOTES TO FINANCIAL STATEMENTS (CONTINUED)
As of October 31, 2023
| | | | | | | | | | | | | | | | | | | | |
| | | | | | |
| Fund | | Undistributed
Ordinary Income | | | Undistributed
Long Term
Capital Gain | | | Accumulated
Capital Losses
and Other | | | Undistributed
Appreciation
(Depreciation) on
Investments and
Foreign Currencies | | | Total Accumulated
Earnings (Deficit) | |
Ashmore Emerging Markets Short Duration Fund | | $ | 539,909 | | | $ | — | | | $ | (350,943,138 | ) | | $ | (59,571,045 | ) | | $ | (409,974,274 | ) |
Ashmore Emerging Markets Active Equity Fund | | | 25,377 | | | | — | | | | (19,391,316 | ) | | | (5,664,536 | ) | | | (25,030,475 | ) |
Ashmore Emerging Markets Small-Cap Equity Fund | | | 56,098 | | | | — | | | | (3,973,999 | ) | | | (1,144,930 | ) | | | (5,062,831 | ) |
Ashmore Emerging Markets Frontier Equity Fund | | | 261,945 | | | | — | | | | (7,437,504 | ) | | | (2,361,483 | ) | | | (9,537,042 | ) |
Ashmore Emerging Markets Equity Fund | | | 116,584 | | | | — | | | | (13,527,706 | ) | | | (12,979,207 | ) | | | (26,390,329 | ) |
Ashmore Emerging Markets Equity ESG Fund | | | 6,302 | | | | — | | | | (1,491,461 | ) | | | (296,353 | ) | | | (1,781,512 | ) |
Ashmore Emerging Markets Low Duration Fund | | | — | | | | — | | | | (1,245,139 | ) | | | (345,594 | ) | | | (1,590,733 | ) |
Ashmore Emerging Markets Debt Fund | | | — | | | | — | | | | (3,686,707 | ) | | | (1,841,796 | ) | | | (5,528,503 | ) |
Ashmore Emerging Markets Corporate Income ESG Fund | | | 14,368 | | | | — | | | | (1,491,866 | ) | | | (2,641,691 | ) | | | (4,119,189 | ) |
|
The taxable character of distributions paid during the fiscal year ended October 31, 2023, were as follows: | |
| | | | |
| | | Distributions From | | | | | | | |
| | | | | | |
| Fund | | Ordinary Income | | | Short-Term
Capital Gains | | | Long-Term
Capital Gains | | | Return of Capital | | | Total Distributions Paid | |
| Ashmore Emerging Markets Total Return Fund | | $ | 29,192,184 | | | $ | — | | | $ | — | | | $ | 607,767 | | | $ | 29,799,951 | |
| Ashmore Emerging Markets Local Currency Bond Fund | | | 292,712 | | | | — | | | | — | | | | — | | | | 292,712 | |
| Ashmore Emerging Markets Corporate Income Fund | | | 6,827,030 | | | | — | | | | — | | | | — | | | | 6,827,030 | |
| Ashmore Emerging Markets Short Duration Fund | | | 5,645,584 | | | | — | | | | — | | | | — | | | | 5,645,584 | |
| Ashmore Emerging Markets Active Equity Fund | | | 528,398 | | | | — | | | | — | | | | — | | | | 528,398 | |
174
ASHMORE FUNDS
NOTES TO FINANCIAL STATEMENTS (CONTINUED)
As of October 31, 2023
| | | | | | | | | | | | | | | | | | | | |
| | | | |
| | | Distributions From | | | | | | | |
| | | | | | |
| Fund | | Ordinary
Income | | | Short-Term
Capital Gains | | | Long-Term
Capital Gains | | | Return of
Capital | | | Total
Distributions
Paid | |
Ashmore Emerging Markets Small-Cap Equity Fund | | $ | — | | | $ | — | | | $ | — | | | $ | — | | | $ | — | |
Ashmore Emerging Markets Frontier Equity Fund | | | 1,284,796 | | | | — | | | | — | | | | — | | | | 1,284,796 | |
Ashmore Emerging Markets Equity Fund | | | 1,579,990 | | | | — | | | | — | | | | — | | | | 1,579,990 | |
Ashmore Emerging Markets Equity ESG Fund | | | 81,886 | | | | — | | | | — | | | | — | | | | 81,886 | |
Ashmore Emerging Markets Low Duration Fund | | | 399,474 | | | | — | | | | — | | | | 16,040 | | | | 415,514 | |
Ashmore Emerging Markets Debt Fund | | | 923,107 | | | | — | | | | — | | | | 72,000 | | | | 995,107 | |
Ashmore Emerging Markets Corporate Income ESG Fund | | | 454,983 | | | | — | | | | — | | | | — | | | | 454,983 | |
|
The taxable character of distributions paid during the fiscal year ended October 31, 2022, were as follows: | |
| | | | |
| | | Distributions From | | | | | | | |
| | | | | | |
| Fund | | Ordinary
Income | | | Short-Term
Capital Gains | | | Long-Term
Capital Gains | | | Return of Capital | | | Total Distributions Paid | |
| Ashmore Emerging Markets Total Return Fund | | $ | 8,689,581 | | | $ | — | | | $ | — | | | $ | 34,907,836 | | | $ | 43,597,417 | |
| Ashmore Emerging Markets Local Currency Bond Fund | | | — | | | | — | | | | — | | | | 96,593 | | | | 96,593 | |
| Ashmore Emerging Markets Corporate Income Fund | | | 13,585,220 | | | | — | | | | — | | | | — | | | | 13,585,220 | |
| Ashmore Emerging Markets Short Duration Fund | | | 7,632,749 | | | | — | | | | — | | | | — | | | | 7,632,749 | |
| Ashmore Emerging Markets Active Equity Fund | | | 1,317,312 | | | | 12,469,758 | | | | 3,770,195 | | | | 179,017 | | | | 17,736,282 | |
| Ashmore Emerging Markets Small-Cap Equity Fund | | | — | | | | — | | | | — | | | | 93,675 | | | | 93,675 | |
| Ashmore Emerging Markets Frontier Equity Fund | | | 1,376,268 | | | | — | | | | — | | | | — | | | | 1,376,268 | |
175
ASHMORE FUNDS
NOTES TO FINANCIAL STATEMENTS (CONTINUED)
As of October 31, 2023
| | | | | | | | | | | | | | | | | | | | |
| | | | |
| | | Distributions From | | | | | | | |
| | | | | | |
| Fund | | Ordinary Income | | | Short-Term Capital Gains | | | Long-Term Capital Gains | | | Return of Capital | | | Total Distributions Paid | |
| Ashmore Emerging Markets Equity Fund | | $ | 1,320,223 | | | $ | 9,747,840 | | | $ | 10,479,774 | | | $ | 251,500 | | | $ | 21,799,337 | |
| Ashmore Emerging Markets Equity ESG Fund | | | — | | | | 1,234,205 | | | | 806,922 | | | | 25,236 | | | | 2,066,363 | |
| Ashmore Emerging Markets Low Duration Fund | | | 322,963 | | | | — | | | | — | | | | — | | | | 322,963 | |
| Ashmore Emerging Markets Debt Fund | | | 675,024 | | | | — | | | | — | | | | — | | | | 675,024 | |
| Ashmore Emerging Markets Corporate Income ESG Fund | | | 416,491 | | | | — | | | | — | | | | — | | | | 416,491 | |
| 9. | Distributions to shareholders |
The Ashmore Emerging Markets Total Return Fund, Ashmore Emerging Markets Corporate Income Fund, Ashmore Emerging Markets Short Duration Fund, Ashmore Emerging Markets Low Duration Fund, Ashmore Emerging Markets Debt Fund and Ashmore Emerging Markets Corporate Income ESG Fund declare distributions of their net investment income daily and pay such distributions monthly. The Ashmore Emerging Markets Local Currency Bond Fund, Ashmore Emerging Markets Active Equity Fund, Ashmore Emerging Markets Small-Cap Equity Fund, Ashmore Emerging Markets Frontier Equity Fund, Ashmore Emerging Markets Equity Fund and Ashmore Emerging Markets Equity ESG Fund declare and pay distributions of their net investment income at least quarterly.
Distributions of net realized capital gains, if any, are declared and paid at least annually. The Funds may also make a special distribution to comply with federal tax requirements. Income dividends and capital gains distributions determined in accordance with federal income tax regulations may differ from U.S. GAAP. Differences between tax regulations and U.S. GAAP may change the fiscal period in which income and capital items are recognized for tax and U.S. GAAP purposes. Examples of events that give rise to timing differences include wash sales, straddles and capital loss carryforwards. Further, the character of investment income and capital gains may be different for certain transactions under the two methods of accounting. Examples of characterization differences include the treatment of foreign currency transactions and swap transactions. As a result, income dividends and capital gain distributions declared during a fiscal period for federal tax purposes may differ significantly from the net investment income and realized capital gain reported on each Fund’s financial statements presented under U.S. GAAP. In general, to the extent that any differences which are permanent in nature result in over distributions to shareholders, the amount of the over distribution may be reported as return of capital. Temporary differences do not require reclassification. See note 8 for further details.
| 10. | Derivative instruments and hedging activities |
FASB ASC Topic 815-10 (“Topic 815-10”), Disclosures about Derivative Instruments and Hedging Activities, required disclosures to enable investors to better understand how and why the Funds use derivative instruments, how these derivative instruments are accounted for and their effects on the Funds’ financial position and results of operations.
None of the derivatives held in the Funds have been designated as hedging instruments under Topic 815-10. A discussion of the strategies for these derivatives and their counterparty credit risk can be found below.
176
ASHMORE FUNDS
NOTES TO FINANCIAL STATEMENTS (CONTINUED)
As of October 31, 2023
In accordance with Topic 815-10, the Funds record their trading-related derivative activities on a fair value basis (as described in note 4). Fair values represent the amount at which the instrument could be exchanged in a current transaction between willing parties, other than in a forced or liquidation sale.
Rule 18f-4 under the 1940 Act provides for the regulation of a registered investment company’s use of derivatives and certain related instruments. Among other things, Rule 18f-4 limits a fund’s derivatives exposure through a value-at-risk test and requires the adoption and implementation of a derivatives risk management program for certain derivatives users. Subject to certain conditions, limited derivatives users (as defined in Rule 18f-4), however, are not subject to the full requirements of Rule 18f-4. In connection with the adoption of Rule 18f-4, the SEC eliminated the asset segregation framework arising from prior SEC guidance for covering derivatives and certain financial instruments. Rule 18f-4 may limit a Fund’s ability to use derivatives as part of its investment strategy, make derivatives more costly or otherwise adversely affect Fund performance.
The following disclosures contain information on how and why the Funds used derivative financial instruments; the credit-risk-related contingent features in certain derivative financial instruments; and how derivative financial instruments affected the Funds’ financial position, results of operations and cash flows. The location and fair value of these instruments on the Statements of Assets and Liabilities and the realized, and changes in unrealized, gains and losses on the Statements of Operations, are included in tables following each Fund’s Schedule of Investments and are categorized by type of financial derivative contract.
(a) Forward foreign currency exchange contracts
A forward foreign exchange contract involves an obligation to purchase or sell a specific currency at a future date at a price set at the time the contract is made. The Funds may enter into forward foreign currency exchange contracts in connection with settling planned purchases or sales of securities, as part of an investment strategy to protect against uncertainty in the level of future foreign exchange rates in the purchase and sale of securities, or to gain or limit exposure to foreign currencies. All forward foreign currency exchange contracts are valued daily at the applicable exchange rates. Any resulting unrealized gains or losses are recorded in net change in unrealized appreciation/(depreciation) on forward foreign currency exchange contracts in the Statements of Operations. A Fund records realized gains or losses at the time the forward foreign exchange contract is offset by entering into a closing transaction with the same counterparty or is extinguished by delivery of the currency. Realized gains or losses, if any, are included in net realized gain/(loss) on forward foreign exchange contracts in the Statements of Operations.
Risks arise upon entering into these contracts from the potential inability of counterparties to meet the terms of their contracts and from unanticipated movements in the value of a foreign currency relative to the United States Dollar. The contractual amounts of forward foreign currency exchange contracts do not necessarily represent the amounts potentially subject to risk. The measurement of the risks associated with these instruments should be considered in light of all related and offsetting transactions. The Funds bear market risk from changes in foreign currency exchange rates and credit risk if the counterparty fails to perform. Further information on the impact of these positions on the Funds’ financial statements can be found in the notes to the Schedules of Investments.
During the year ended October 31, 2023, the Ashmore Emerging Markets Total Return Fund, Ashmore Emerging Markets Local Currency Bond Fund, Ashmore Emerging Markets Corporate Income Fund, Ashmore Emerging Markets Short Duration Fund, Ashmore Emerging Markets Small-Cap Equity Fund, Ashmore Emerging Markets Equity Fund, Ashmore Emerging Markets Low Duration Fund, Ashmore Emerging Markets Debt Fund and Ashmore Emerging Markets Corporate Income ESG Fund had average quarterly contract notional exposures of $261,331,578, $7,811,671, $2,898,774, $83,704, $10,270, $4,135, $188,434, $768,563 and $226,267, respectively, related to forward foreign currency exchange contracts.
(b) Swap Agreements
During the reporting period, certain Funds entered into swap agreements, which are arrangements between two parties to exchange cash flows based on a notional principal amount. Swap agreements are either privately negotiated in the over-the-counter market (“OTC swaps”) or may be executed in a multilateral or other trade facility platform such as a registered exchange (“centrally cleared swaps”). Swap agreements are recorded at their fair value. The fair value is based on quoted
177
ASHMORE FUNDS
NOTES TO FINANCIAL STATEMENTS (CONTINUED)
As of October 31, 2023
market prices or prices obtained from a third party provider at the date of the Statements of Assets and Liabilities without any deduction for estimated future selling costs. Swap agreements are marked to market daily and the change in fair value, if any, is recorded as unrealized gain or loss. Payments made or received are recorded as part of realized gains and losses. Daily changes in valuation of centrally cleared swaps, if any, are recorded as a receivable or payable for the change in value as appropriate (“variation margin”) on the Statements of Assets and Liabilities.
The periodic payments on the swap agreements entered into by the Funds are reflected in the Statements of Operations within net realized gain/(loss) on interest rate swap contracts. Unrealized gains are reported as an asset and unrealized losses are reported as a liability in the Statements of Assets and Liabilities for OTC swaps. Changes in the fair value are reflected in the Statements of Operations within net change in unrealized appreciation/(depreciation) on interest rate and centrally cleared swap contracts in the period in which they occur. Certain Funds could be exposed to credit or market risk due to unfavorable changes in the fluctuation of interest rates or if the counterparty defaults on its obligations to perform.
During the year ended October 31, 2023, the Ashmore Emerging Markets Total Return Fund and Ashmore Emerging Markets Local Currency Bond Fund had average quarterly notional exposures of $28,008,121 and $1,772,249 , respectively, related to interest rate swap agreements.
The Funds may enter into transactions subject to enforceable netting agreements or other similar arrangements (“netting agreements”). Generally, netting agreements allow the Funds to offset any exposure to a specific counterparty with any collateral received or delivered to that counterparty based on the terms of the agreements. Generally, the Funds manage their cash collateral and securities collateral on a counterparty basis. No amounts have been offset in the Statements of Assets and Liabilities.
Offsetting of Financial Assets and Derivative Assets as of October 31, 2023:
Over-the-Counter Financial Derivative Instruments:
Forward Currency Contracts and Interest Rate Swap Contracts
| | | | | | | | | | | | | | | | |
| |
|
| Ashmore Emerging Markets Total Return Fund | |
| |
| | | | |
| Counterparty | | Gross Amounts of
Derivatives Assets Presented in the Statement of Assets and Liabilities | | | Derivatives available for offset | | | Collateral Received | | | Net Amount Due From Counterparty | |
| |
Barclays | | $ | 3,972 | | | $ | (3,972 | ) | | $ | — | | | $ | — | |
BNP Paribas | | | 98,201 | | | | (98,201 | ) | | | — | | | | — | |
Citibank | | | 46,755 | | | | (46,755 | ) | | | — | | | | — | |
HSBC Bank | | | 207,185 | | | | (193,917 | ) | | | (13,268 | ) | | | — | |
JP Morgan | | | 9,097 | | | | (9,097 | ) | | | — | | | | — | |
Merrill Lynch | | | 316,707 | | | | (97,372 | ) | | | — | | | | 219,335 | |
Morgan Stanley | | | 226,894 | | | | (183,396 | ) | | | — | | | | 43,498 | |
State Street | | | 3,602 | | | | (1,530 | ) | | | — | | | | 2,072 | |
| | | | | | | | | | | | | | | | |
Total | | $ | 912,413 | | | $ | (634,240 | ) | | $ | (13,268 | ) | | $ | 264,905 | |
| | | | | | | | | | | | | | | | |
| | | | |
| | | | | | | | | | | | | | | | |
| |
|
| Ashmore Emerging Markets Total Return Fund | |
| |
| | | | |
| Counterparty | | Gross Amounts of
Derivatives Liabilities
Presented in the Statement of
Assets and Liabilities | | | Derivatives available for offset | | | Collateral Pledged | | | Net Amount Due To Counterparty | |
| |
Barclays | | $ | 8,620 | | | $ | (3,972 | ) | | $ | — | | | $ | 4,648 | |
178
ASHMORE FUNDS
NOTES TO FINANCIAL STATEMENTS (CONTINUED)
As of October 31, 2023
| | | | | | | | | | | | | | | | |
| |
|
| Ashmore Emerging Markets Total Return Fund | |
| |
| | | | |
| Counterparty | | Gross Amounts of Derivatives Liabilities Presented in the Statement of Assets and Liabilities | | | Derivatives available for offset | | | Collateral Pledged | | | Net Amount Due To Counterparty | |
| |
BNP Paribas | | $ | 370,599 | | | $ | (98,201 | ) | | $ | — | | | $ | 272,398 | |
Citibank | | | 713,815 | | | | (46,755 | ) | | | — | | | | 667,060 | |
Deutsche Bank | | | 144,201 | | | | — | | | | — | | | | 144,201 | |
HSBC Bank | | | 193,917 | | | | (193,917 | ) | | | — | | | | — | |
JP Morgan | | | 21,579 | | | | (9,097 | ) | | | — | | | | 12,482 | |
Merrill Lynch | | | 97,372 | | | | (97,372 | ) | | | — | | | | — | |
Morgan Stanley | | | 183,396 | | | | (183,396 | ) | | | — | | | | — | |
Santander | | | 1,892 | | | | — | | | | — | | | | 1,892 | |
Standard Chartered | | | 254,160 | | | | — | | | | — | | | | 254,160 | |
State Street | | | 1,530 | | | | (1,530 | ) | | | — | | | | — | |
UBS | | | 58,673 | | | | — | | | | — | | | | 58,673 | |
| | | | | | | | | | | | | | | | |
Total | | $ | 2,049,754 | | | $ | (634,240 | ) | | $ | — | | | $ | 1,415,514 | |
| | | | | | | | | | | | | | | | |
| | | | | | | | | | | | | | | | |
| |
|
| Ashmore Emerging Markets Local Currency Bond Fund | |
| |
| | | | |
| Counterparty | | Gross Amounts of Derivatives Assets Presented in the Statement of Assets and Liabilities | | | Derivatives available for offset | | | Collateral Received | | | Net Amount Due From Counterparty | |
| |
Barclays | | $ | 289 | | | $ | (186 | ) | | $ | — | | | $ | 103 | |
BNP Paribas | | | 9,750 | | | | (2,745 | ) | | | — | | | | 7,005 | |
Citibank | | | 1,858 | | | | (1,858 | ) | | | — | | | | — | |
Deutsche Bank | | | 1,861 | | | | (1,861 | ) | | | — | | | | — | |
HSBC Bank | | | 27,292 | | | | (5,772 | ) | | | — | | | | 21,520 | |
JP Morgan | | | 241 | | | | (241 | ) | | | — | | | | — | |
Merrill Lynch | | | 7,795 | | | | (630 | ) | | | — | | | | 7,165 | |
Morgan Stanley | | | 6,092 | | | | (6,092 | ) | | | — | | | | — | |
Standard Chartered | | | 11 | | | | (11 | ) | | | — | | | | — | |
State Street | | | 77 | | | | (43 | ) | | | — | | | | 34 | |
| | | | | | | | | | | | | | | | |
Total | | $ | 55,266 | | | $ | (19,439 | ) | | $ | — | | | $ | 35,827 | |
| | | | | | | | | | | | | | | | |
| | | | | | | | | | | | | | | | |
| |
|
| Ashmore Emerging Markets Local Currency Bond Fund | |
| |
| | | | |
| Counterparty | | Gross Amounts of Derivatives Liabilities Presented in the Statement of Assets and Liabilities | | | Derivatives available for offset | | | Collateral Pledged | | | Net Amount Due To Counterparty | |
| |
Barclays | | $ | 186 | | | $ | (186 | ) | | $ | — | | | $ | — | |
BNP Paribas | | | 2,745 | | | | (2,745 | ) | | | — | | | | — | |
Citibank | | | 22,509 | | | | (1,858 | ) | | | — | | | | 20,651 | |
Deutsche Bank | | | 5,346 | | | | (1,861 | ) | | | — | | | | 3,485 | |
HSBC Bank | | | 5,772 | | | | (5,772 | ) | | | — | | | | — | |
JP Morgan | | | 1,104 | | | | (241 | ) | | | — | | | | 863 | |
179
ASHMORE FUNDS
NOTES TO FINANCIAL STATEMENTS (CONTINUED)
As of October 31, 2023
| | | | | | | | | | | | | | | | |
| |
| Ashmore Emerging Markets Local Currency Bond Fund | |
| |
| | | | |
| Counterparty | | Gross Amounts of Derivatives Liabilities Presented in the Statement of Assets and Liabilities | | | Derivatives available for offset | | | Collateral Pledged | | | Net Amount Due To Counterparty | |
| |
Merrill Lynch | | $ | 630 | | | $ | (630 | ) | | $ | — | | | $ | — | |
Morgan Stanley | | | 11,184 | | | | (6,092 | ) | | | — | | | | 5,092 | |
Standard Chartered | | | 19,020 | | | | (11 | ) | | | — | | | | 19,009 | |
State Street | | | 43 | | | | (43 | ) | | | — | | | | — | |
UBS | | | 3,181 | | | | — | | | | — | | | | 3,181 | |
| | | | | | | | | | | | | | | | |
Total | | $ | 71,720 | | | $ | (19,439 | ) | | $ | — | | | $ | 52,281 | |
| | | | | | | | | | | | | | | | |
| | | | | | | | | | | | | | | | |
| |
| Ashmore Emerging Markets Corporate Income Fund | |
| |
| | | | |
| Counterparty | | Gross Amounts of Derivatives Assets Presented in the Statement of Assets and Liabilities | | | Derivatives available for offset | | | Collateral Received | | | Net Amount Due From Counterparty | |
| |
HSBC Bank | | $ | 2,066 | | | $ | — | | | $ | — | | | $ | 2,066 | |
Standard Chartered | | | 473 | | | | (473 | ) | | | — | | | | — | |
State Street | | | 53,395 | | | | — | | | | — | | | | 53,395 | |
| | | | | | | | | | | | | | | | |
Total | | $ | 55,934 | | | $ | (473 | ) | | $ | — | | | $ | 55,461 | |
| | | | | | | | | | | | | | | | |
| | | | | | | | | | | | | | | | |
| |
| Ashmore Emerging Markets Corporate Income Fund | |
| |
| | | | |
| Counterparty | | Gross Amounts of Derivatives Liabilities Presented in the Statement of Assets and Liabilities | | | Derivatives available for offset | | | Collateral Pledged | | | Net Amount Due To Counterparty | |
| |
Barclays | | $ | 18,157 | | | $ | — | | | $ | — | | | $ | 18,157 | |
Citibank | | | 1,764 | | | | — | | | | — | | | | 1,764 | |
Standard Chartered | | | 648 | | | | (473 | ) | | | — | | | | 175 | |
| | | | | | | | | | | | | | | | |
Total | | $ | 20,569 | | | $ | (473 | ) | | $ | — | | | $ | 20,096 | |
| | | | | | | | | | | | | | | | |
| | | | | | | | | | | | | | | | |
| |
| Ashmore Emerging Markets Short Duration Fund | |
| |
| | | | |
| Counterparty | | Gross Amounts of Derivatives Assets Presented in the Statement of Assets and Liabilities | | | Derivatives available for offset | | | Collateral Received | | | Net Amount Due From Counterparty | |
| |
HSBC Bank | | $ | 392 | | | $ | — | | | $ | — | | | $ | 392 | |
| | | | | | | | | | | | | | | | |
Total | | $ | 392 | | | $ | — | | | $ | — | | | $ | 392 | |
| | | | | | | | | | | | | | | | |
180
ASHMORE FUNDS
NOTES TO FINANCIAL STATEMENTS (CONTINUED)
As of October 31, 2023
| | | | | | | | | | | | | | | | |
| |
|
| Ashmore Emerging Markets Low Duration Fund | |
| |
| | | | |
| Counterparty | | Gross Amounts of Derivatives Assets Presented in the Statement of Assets and Liabilities | | | Derivatives available for offset | | | Collateral Received | | | Net Amount Due
From Counterparty | |
| |
Barclays | | $ | 155 | | | $ | (18 | ) | | $ | — | | | $ | 137 | |
| | | | | | | | | | | | | | | | |
Total | | $ | 155 | | | $ | (18 | ) | | $ | — | | | $ | 137 | |
| | | | | | | | | | | | | | | | |
| | | | | | | | | | | | | | | | |
| |
|
| Ashmore Emerging Markets Low Duration Fund | |
| |
| | | | |
| Counterparty | | Gross Amounts of Derivatives Liabilities Presented in the Statement of Assets and Liabilities | | | Derivatives available for offset | | | Collateral Pledged | | | Net Amount Due To Counterparty | |
| |
Barclays | | $ | 18 | | | $ | (18 | ) | | $ | — | | | $ | — | |
| | | | | | | | | | | | | | | | |
Total | | $ | 18 | | | $ | (18 | ) | | $ | — | | | $ | — | |
| | | | | | | | | | | | | | | | |
| | | | | | | | | | | | | | | | |
| |
|
| Ashmore Emerging Markets Debt Fund | |
| |
| | | | |
| Counterparty | | Gross Amounts of Derivatives Assets Presented in the Statement of Assets and Liabilities | | | Derivatives available for offset | | | Collateral Received | | | Net Amount Due From Counterparty | |
| |
Morgan Stanley | | $ | 227 | | | $ | — | | | $ | — | | | $ | 227 | |
| | | | | | | | | | | | | | | | |
Total | | $ | 227 | | | $ | — | | | $ | — | | | $ | 227 | |
| | | | | | | | | | | | | | | | |
| | | | | | | | | | | | | | | | |
| |
|
| Ashmore Emerging Markets Corporate Income ESG Fund | |
| |
| | | | |
| Counterparty | | Gross Amounts of
Derivatives Assets Presented in the Statement of Assets and Liabilities | | | Derivatives
available for offset | | | Collateral
Received | | | Net Amount Due
From Counterparty | |
| |
Standard Chartered | | $ | 266 | | | $ | — | | | $ | — | | | $ | 266 | |
| | | | | | | | | | | | | | | | |
Total | | $ | 266 | | | $ | — | | | $ | — | | | $ | 266 | |
| | | | | | | | | | | | | | | | |
Investment management fees
The Trust has an Investment Management Agreement (the “Agreement”) with the Investment Manager, with whom certain Trustees and Officers of the Trust are affiliated, to furnish investment management services to the Funds. Under the terms of the Agreement, the Trust, on behalf of the Funds, compensates the Investment Manager for its investment management services at the following rates, based on each Fund’s average daily net assets:
| | | | |
| | |
| Fund | | Rate | |
| Ashmore Emerging Markets Total Return Fund | | | 1.00% | |
| Ashmore Emerging Markets Local Currency Bond Fund | | | 0.75%* | |
| Ashmore Emerging Markets Corporate Income Fund | | | 0.85% | |
| Ashmore Emerging Markets Short Duration Fund | | | 0.65% | |
| Ashmore Emerging Markets Active Equity Fund | | | 1.00% | |
| Ashmore Emerging Markets Small-Cap Equity Fund | | | 1.25%** | |
181
ASHMORE FUNDS
NOTES TO FINANCIAL STATEMENTS (CONTINUED)
As of October 31, 2023
| | | | |
| | |
| Fund | | Rate | |
| Ashmore Emerging Markets Frontier Equity Fund | | | 1.50% | |
| Ashmore Emerging Markets Equity Fund | | | 1.00%*** | |
| Ashmore Emerging Markets Equity ESG Fund | | | 1.00%*** | |
| Ashmore Emerging Markets Low Duration Fund | | | 0.65% | |
| Ashmore Emerging Markets Debt Fund | | | 0.65%**** | |
| Ashmore Emerging Markets Corporate Income ESG Fund | | | 0.85% | |
*Prior to February 28, 2023, the contractual management fee was 0.95% of average daily net assets.
**Prior to February 28, 2023, the contractual management fee was 1.50% of average daily net assets.
***Prior to February 28, 2023, the contractual management fee was 1.15% of average daily net assets.
****Prior to August 1, 2023, the contractual management fee was 0.70% of average daily net assets.
The Investment Manager has contractually agreed to waive its fees or reimburse each Fund for certain other expenses to the extent that a Fund’s Total Annual Fund Operating Expenses (other than Acquired Fund Fees and Expenses, interest expenses, taxes, custodial credits, transfer agency credits, expense offset arrangements, and extraordinary expenses, which may include non-recurring expenses such as, for example, litigation expenses and shareholder meeting expenses) for the Fund’s Class A, Class C and Institutional Class Shares exceed the percentage of the average daily net assets attributable to the particular share class shown below. Under the Expense Limitation Agreement, the Investment Manager may recoup amounts waived or reimbursed for 36 months following the end of the month when the waiver or reimbursement occurred, provided total expenses, including such recoupment, do not exceed the annual expense limit, and further that expenses may be recouped only if and to the extent that the expense ratio at the time of such recoupment is less than the annual expense limit in place at the time such expenses were waived or reimbursed. The contractual expense limitation arrangement is expected to continue until at least February 28, 2024 (and, with respect to Ashmore Emerging Markets Debt Fund, until at least February 28, 2025). The arrangement may be terminated by the Trust, subject to approval by the Board of Trustees of the Trust, upon ninety (90) days’ written notice to the Investment Manager. The expense limitation arrangement may be terminated before February 28, 2024 (and, with respect to Ashmore Emerging Markets Debt Fund, before February 28, 2025) only by the Board of Trustees.
| | | | | | |
| | | | |
| Fund | | Class A | | Class C | | Institutional Class |
Ashmore Emerging Markets Total Return Fund | | 1.27% | | 2.02% | | 1.02% |
Ashmore Emerging Markets Local Currency Bond Fund | | 1.02% | | 1.77% | | 0.77% |
Ashmore Emerging Markets Corporate Income Fund | | 1.12% | | 1.87% | | 0.87% |
Ashmore Emerging Markets Short Duration Fund | | 0.92% | | 1.67% | | 0.67% |
Ashmore Emerging Markets Active Equity Fund | | 1.27% | | 2.02% | | 1.02% |
Ashmore Emerging Markets Small-Cap Equity Fund | | 1.52% | | 2.27% | | 1.27% |
Ashmore Emerging Markets Frontier Equity Fund | | 1.77% | | 2.52% | | 1.52% |
Ashmore Emerging Markets Equity Fund | | 1.27% | | 2.02% | | 1.02% |
Ashmore Emerging Markets Equity ESG Fund | | 1.27% | | 2.02% | | 1.02% |
Ashmore Emerging Markets Low Duration Fund | | 0.92% | | 1.67% | | 0.67% |
Ashmore Emerging Markets Debt Fund | | 0.92% | | 1.67% | | 0.67% |
182
ASHMORE FUNDS
NOTES TO FINANCIAL STATEMENTS (CONTINUED)
As of October 31, 2023
| | | | | | |
| | | | |
| Fund | | Class A | | Class C | | Institutional Class |
Ashmore Emerging Markets Corporate Income ESG Fund | | 1.12% | | 1.87% | | 0.87% |
Any such waiver or reimbursement is subject to the Investment Manager’s right to recover amounts waived or reimbursed to the extent actual fees and expenses for a future fiscal period are less than each Fund’s expense limitation cap, provided, however, that the Investment Manager shall only be entitled to recover such amounts waived or reimbursed during the previous three fiscal years. The amounts recaptured pursuant to the expense limitation agreement will be limited to the lesser of (1) the expense limitation amount that was in effect at the time of the waiver or reimbursement or (2) the expense limitation amount that is in effect at the time of recapture. The total amounts subject to recovery in fiscal years are shown below:
| | | | | | | | | | | | | | | | |
| | | | | |
| Fund | | 2024 | | | 2025 | | | 2026 | | | Total | |
| Ashmore Emerging Markets Total Return Fund | | $ | 1,209,234 | | | $ | 1,119,411 | | | $ | 1,023,234 | | | $ | 3,351,879 | |
| Ashmore Emerging Markets Local Currency Bond Fund | | | 152,924 | | | | 121,907 | | | | 168,860 | | | | 443,691 | |
| Ashmore Emerging Markets Corporate Income Fund | | | 361,106 | | | | 345,989 | | | | 276,983 | | | | 984,078 | |
| Ashmore Emerging Markets Short Duration Fund | | | 203,439 | | | | 216,728 | | | | 228,856 | | | | 649,023 | |
| Ashmore Emerging Markets Active Equity Fund | | | 208,770 | | | | 220,507 | | | | 266,050 | | | | 695,327 | |
| Ashmore Emerging Markets Small-Cap Equity Fund | | | 100,902 | | | | 110,918 | | | | 150,305 | | | | 362,125 | |
| Ashmore Emerging Markets Frontier Equity Fund | | | 238,815 | | | | 342,706 | | | | 355,358 | | | | 936,879 | |
| Ashmore Emerging Markets Equity Fund | | | 172,553 | | | | 280,776 | | | | 412,520 | | | | 865,849 | |
| Ashmore Emerging Markets Equity ESG Fund | | | 148,942 | | | | 110,142 | | | | 121,592 | | | | 380,676 | |
| Ashmore Emerging Markets Low Duration Fund | | | 75,473 | | | | 77,472 | | | | 91,077 | | | | 244,022 | |
| Ashmore Emerging Markets Debt Fund | | | 155,066 | | | | 86,233 | | | | 103,221 | | | | 344,520 | |
| Ashmore Emerging Markets Corporate Income ESG Fund | | | 146,750 | | | | 99,997 | | | | 85,004 | | | | 331,751 | |
Distribution and Servicing fees
The Funds have adopted Amended Plans of Distribution and Servicing Fees pursuant to Rule 12b-1 under the 1940 Act (“Distribution and Servicing Fee Plans”). Under the Distribution and Servicing Fee Plans, each of the Funds may pay fees to the distributor on an ongoing basis as compensation for the services the distributor renders and the expenses it bears in connection with the sale and distribution of Fund shares (“distribution fees”) and/or in connection with personal services rendered to Fund shareholders and the maintenance of shareholder accounts (“servicing fees”). Class A and C shares each have a separate 12b-1 Plan. Class A shares pay only servicing fees. Class C shares pay both distribution and servicing fees. The following table lists the maximum annual rates at which the distribution and/or servicing fees may be paid under each 12b-1 Plan (calculated as a percentage of a Fund’s average daily net assets attributable to the particular class of shares):
| | | | |
| | | |
| | | Servicing Fee | | Distribution Fee |
| Class A shares | | 0.25% | | None |
| Class C shares | | 0.25% | | 0.75% |
183
ASHMORE FUNDS
NOTES TO FINANCIAL STATEMENTS (CONTINUED)
As of October 31, 2023
Cross Trades
The 1940 Act prohibits the Funds and their affiliates from knowingly selling any security or other property to the Funds (other than securities of which the buyer is the issuer), or buying any security (other than securities of which the seller is the issuer) or other property from the Funds. Rule 17a-7 under the 1940 Act provides relief from these prohibitions for various types of “cross trades” and similar transactions that may benefit shareholders by allowing the participating funds or accounts to avoid brokerage commissions and other transaction costs of trades.
During the year ended October 31, 2023, none of the Funds bought and/or sold securities from an account or accounts that were also advised by the Trust’s investment adviser or its affiliates.
As of October 31, 2023, Ashmore Management Company Limited owned the following percentages of the outstanding shares of each Fund:
| | | | | | |
| | | | |
| Fund | | Class A | | Class C | | Institutional Class |
| Ashmore Emerging Markets Local Currency Bond Fund | | —% | | 100.00% | | 89.59% |
| Ashmore Emerging Markets Active Equity Fund | | —% | | 100.00% | | 75.78% |
| Ashmore Emerging Markets Equity ESG Fund | | 100.00% | | 100.00% | | 100.00% |
| Ashmore Emerging Markets Low Duration Fund | | 100.00% | | 100.00% | | 100.00% |
| Ashmore Emerging Markets Debt Fund | | 100.00% | | 100.00% | | 100.00% |
| Ashmore Emerging Markets Corporate Income ESG Fund | | 100.00% | | 100.00% | | 100.00% |
In addition to the Ashmore Management Company Limited ownership, shown in the table above, the following Funds had other investors owning of record or known by the Funds to own beneficially greater than 5% of the outstanding shares of such Funds:
| | | | | | |
| | | | |
| Fund | | Class | | # of Investors Owning > 5% of outstanding Shares | | % of Ownership by Investor |
| | | | |
| Ashmore Emerging Markets Total Return Fund | | Class A | | 5 | | 22.92%, 22.64%, 18.70%, 15.64%, 10.17% |
| | | | |
| | | Class C | | 4 | | 51.58%, 24.36%, 17.02%, 7.03% |
| | | | |
| | | Institutional Class | | 4 | | 52.27%, 13.09%, 12.72%, 7.30% |
| | | | |
| Ashmore Emerging Markets Local Currency Bond Fund | | Class A | | 3 | | 77.77%, 11.14%, 6.85% |
| | | | |
| | | Institutional Class | | 1 | | 9.91% |
184
ASHMORE FUNDS
NOTES TO FINANCIAL STATEMENTS (CONTINUED)
As of October 31, 2023
| | | | | | |
| | | | |
| Fund | | Class | | # of Investors Owning > 5% of outstanding Shares | | % of Ownership by Investor |
| | | | |
| Ashmore Emerging Markets Corporate Income Fund | | Class A | | 5 | | 32.90%, 23.94%, 20.23%, 10.31%, 6.12% |
| | | | |
| | | Class C | | 5 | | 59.15%, 11.45%, 10.70%, 8.62%, 5.79% |
| | | | |
| | | Institutional Class | | 5 | | 26.03%, 17.27%, 9.32%, 7.77%, 6.02% |
| | | | |
| Ashmore Emerging Markets Short Duration Fund | | Class A | | 2 | | 88.47%, 8.06% |
| | | | |
| | | Class C | | 5 | | 39.69%, 32.24%, 9.79%, 8.85%, 7.27% |
| | | | |
| | | Institutional Class | | 3 | | 48.71%, 40.98%, 7.00% |
| | | | |
| Ashmore Emerging Markets Active Equity Fund | | Class A | | 2 | | 84.38%, 15.60% |
| | | | |
| | | Institutional Class | | 2 | | 13.34%, 8.20% |
| | | | |
| Ashmore Emerging Markets Small-Cap Equity Fund | | Class A | | 4 | | 33.41%, 29.56%, 27.45%, 6.66% |
| | | | |
| | | Class C | | 2 | | 61.92%, 38.08% |
| | | | |
| | | Institutional Class | | 6 | | 25.71%, 24.32%, 22.81%, 12.82%, 5.86%, 5.85% |
| | | | |
| Ashmore Emerging Markets Frontier Equity Fund | | Class A | | 2 | | 61.98%, 28.90% |
| | | | |
| | | Class C | | 2 | | 89.52%, 7.99% |
| | | | |
| | | Institutional Class | | 3 | | 42.61%, 30.45%, 21.85% |
| | | | |
| Ashmore Emerging Markets Equity Fund | | Class A | | 2 | | 79.77%, 18.63% |
| | | | |
| | | Class C | | 5 | | 42.61%, 19.40%, 17.57%, 6.50%, 6.28% |
| | | | |
| | | Institutional Class | | 5 | | 38.68%, 19.17%, 13.40%, 10.14%, 8.42% |
In relation to its investments, some of the Funds of the Trust may from time to time agree to indemnify and/or pre-fund trustees or other agents, either solely or alongside other creditors on a several basis. Generally, such agreements do not have a termination date. The Trustees are not aware of and do not currently expect any claims to be made against the Funds under any such indemnity or pre-funding agreements.
185
ASHMORE FUNDS
NOTES TO FINANCIAL STATEMENTS (CONTINUED)
As of October 31, 2023
At its meeting on December 13, 2023, the Board appointed Taurai Sigauke as the Trust’s Treasurer and Principal Financial and Accounting Officer, such appointment to be effective January 31, 2024, in replacement of Richard Longstaff, who will resign from these officer positions with the Trust effective as of the same date.
The Trust has evaluated subsequent events for the Funds through the date the financial statements were issued, and has concluded that there are no additional subsequent events relevant for financial statement adjustment or disclosure, other than the item mentioned above.
186
ASHMORE FUNDS
SUPPLEMENTARY INFORMATION (UNAUDITED)
REMUNERATION DISCLOSURE
Ashmore Investment Advisors Limited (“AIAL”) is a full-scope UK Alternative Investment Fund Manager (“AIFM”) that manages many alternative investment funds (“AIFs”). These AIFs implement a number of investment strategies including; equity, fixed income and alternatives; and invest in many different regions and industry sectors. AIAL manages both open-ended and closed-ended AIFs, several of its AIFs are leveraged and some are listed on regulated markets. Its assets under management was approximately US$2.2 billion at June 30, 2023. AIAL’s parent company (“Ashmore”) is listed on a regulated market, counts eleven offices worldwide and has a number of subsidiaries both in the UK and abroad. Taking into account guidance from the UK Financial Conduct Authority (“FCA”), AIAL has complied with the full AIFM Remuneration Code.
AIAL does not have any direct employees, and as such the amount of remuneration paid to staff by AIAL is zero. All AIAL AIFM Remuneration Code Staff are employed and paid by Ashmore Group plc. Ashmore’s remuneration principles have remained unchanged since it was listed, and are designed to align all employees with the long-term success of the business. These include significant levels of deferral, a clear link between performance and levels of remuneration and strong alignment of executive directors and employees with shareholders and clients through significant employee share ownership. The culture is therefore a collaborative one, with clients’ interests and the creation of shareholder value, including for employee shareholders, the overarching factors for success.
Executive directors, members of the investment team, and indeed all other employees, participate in a single capped incentive pool and are paid under a similar structure, with an annual cash bonus and share award, meaning that all employees are long-term shareholders in the business.
The policy includes:
–– A capped basic salary to contain the fixed cost base;
–– A cap on the total variable compensation including any awards made under Ashmore’s share plan, available for all employees at 25% of profits, which to date has not been fully utilised; and
–– A deferral for five years of a substantial portion of variable compensation into Ashmore shares (or equivalent), which, in the case of executive directors in lieu of a separate LTIP, is also partly subject to additional performance conditions measured over five years.
AIAL’s board of directors reviews the general principles of the remuneration policy and is responsible for its implementation with regard to AIAL’s AIFM Remuneration Code Staff. Ashmore’s Remuneration Committee periodically reviews the ongoing appropriateness and relevance of the remuneration policy, including in connection with the provision of services to AIAL. Ashmore employs the services of; McLagan to provide advice on remuneration benchmarking; Deloitte to provide advice on tax compliance, share plan design and administration, and as Remuneration Committee advisors. The Remuneration Committee’s terms of reference can be found here:
https://ir.ashmoregroup.com/corporate-governance.
Performance assessment for AIAL’s AIFM Remuneration Code Staff for their work relating to AIAL is based on a combination of quantitative and qualitative criteria related to the performance of AIAL, the performance of relevant AIF(s) or business units and the performance of the individual. Qualitative criteria include adherence to Ashmore Group plc’s risk and compliance policies. This performance assessment is adjusted for relevant current and future risks related to the AIFs managed by AIAL.
The compensation of control function staff is based on function specific objectives and is independent from the performance of AIAL and/or the AIFs managed by AIAL. The remuneration of the senior officers in AIAL’s control functions is directly overseen by the Remuneration Committee.
Variable remuneration awarded to AIAL’s Remuneration Code Staff in respect of AIFMD work is subject to performance adjustment which allows Ashmore to reduce the deferred amount, including to nil, in light of the ongoing financial situation and/or performance of Ashmore, AIAL, the AIFs that AIAL manages and the individual concerned.
187
ASHMORE FUNDS
SUPPLEMENTARY INFORMATION (UNAUDITED) (CONTINUED)
The total contribution of AIAL’s AIFM Remuneration Code Staff to the business of Ashmore is apportioned between work carried out for AIAL and work carried out for the other businesses and subsidiaries of Ashmore. Their remuneration is similarly apportioned between AIAL and the other businesses and subsidiaries where required.
The remuneration attributable to AIAL for its AIFMD identified staff for the financial year ended June 30, 2023 was as follows:
| | | | | | | | | | | | | | |
| | | | | |
| Fund | | Number of
Beneficiaries | | Variable
Remuneration | | | Fixed
Remuneration | | | Total
Remuneration | |
Ashmore Emerging Markets Total Return Fund | | 18 | | £ | 177,023 | | | £ | 23,415 | | | £ | 200,438 | |
Ashmore Emerging Markets Local Currency Bond Fund | | 16 | | | 2,768 | | | | 378 | | | | 3,146 | |
Ashmore Emerging Markets Corporate Income Fund | | 17 | | | 24,708 | | | | 3,382 | | | | 28,090 | |
Ashmore Emerging Markets Short Duration Fund | | 17 | | | 17,857 | | | | 2,444 | | | | 20,301 | |
Ashmore Emerging Markets Active Equity Fund | | 18 | | | 21,784 | | | | 3,493 | | | | 25,277 | |
Ashmore Emerging Markets Small-Cap Equity Fund | | 18 | | | 8,165 | | | | 1,309 | | | | 9,474 | |
Ashmore Emerging Markets Frontier Equity Fund | | 18 | | | 54,492 | | | | 8,738 | | | | 63,230 | |
Ashmore Emerging Markets Equity Fund | | 18 | | | 98,047 | | | | 15,722 | | | | 113,769 | |
Ashmore Emerging Markets Equity ESG Fund | | 18 | | | 9,623 | | | | 1,543 | | | | 11,166 | |
Ashmore Emerging Markets Low Duration Fund | | 17 | | | 2,947 | | | | 403 | | | | 3,350 | |
Ashmore Emerging Markets Debt Fund | | 17 | | | 5,488 | | | | 751 | | | | 6,239 | |
Ashmore Emerging Markets Corporate Income ESG Fund | | 17 | | | 2,205 | | | | 302 | | | | 2,507 | |
Total AIAL | | 18 | | £ | 879,903 | | | £ | 125,827 | | | £ | 1,005,730 | |
All of the remuneration above was attributable to senior management who have a material impact on the Funds’ risk profile. The Funds’ allocation of the AIAL remuneration has been made on the basis of NAV.
188
ASHMORE FUNDS
FOR MORE INFORMATION
As of October 31, 2023
PORTFOLIO HOLDINGS
The Ashmore Funds file their complete schedule of portfolio holdings with the Securities and Exchange Commission (“SEC”) for the first and third quarters of each fiscal year on Form N-PORT. The Funds’ Form N-PORT is available on the SEC’s Web site at www.sec.gov within sixty days after the Funds’ first and third fiscal quarters. In addition, no later than thirty calendar days after the end of each calendar quarter, a list of all portfolio holdings in each Fund as of the end of such calendar quarter is made available at www.ashmoregroup.com.
PROXY VOTING
Ashmore Funds’ Proxy Voting Policies and Procedures and each Fund’s portfolio securities voting record for the most recent 12-month period ended June 30 are available upon request and without charge by visiting the Ashmore Funds’ Web site at www.ashmoregroup.com or the SEC’s Web site at www.sec.gov or by calling 866-876-8294.
189
ASHMORE FUNDS
PRIVACY POLICY
We consider customer privacy to be a fundamental aspect of our relationships with shareholders and are committed to maintaining the confidentiality, integrity and security of our current, prospective and former shareholders’ personal information. To ensure our shareholders’ privacy, we have developed policies that are designed to protect this confidentiality, while allowing shareholders’ needs to be served.
Obtaining Personal Information In the course of providing shareholders with products and services, we may obtain non-public personal information about shareholders, which may come from sources such as account applications and other forms, from other written, electronic or verbal correspondence, from shareholder transactions, from a shareholder’s brokerage or financial advisory firm, financial adviser or consultant, and/or from information captured on our internet web sites.
Respecting Your Privacy As a matter of policy, we do not disclose any personal or account information provided by shareholders or gathered by us to non-affiliated third parties, except as required for our everyday business purposes, such as to process transactions or service a shareholder’s account, or as otherwise permitted by law. As is common in the industry, non-affiliated companies may from time to time be used to provide certain services, such as preparing and mailing prospectuses, reports, account statements and other information, and gathering shareholder proxies. We may also retain non-affiliated financial services providers to market our shares or products and we may enter into joint-marketing arrangements with them and other financial companies. We may also retain marketing and research service firms to conduct research on shareholder satisfaction. These companies may have access to a shareholder’s personal and account information, but are permitted to use this information solely to provide the specific service or as otherwise permitted by law. We may also provide a shareholder’s personal and account information to their respective brokerage or financial advisory firm, Custodian, and/or to their financial advisor or consultant.
Sharing Information with Third Parties We reserve the right to disclose or report personal information to non-affiliated third parties where we believe in good faith that disclosure is required under law to cooperate with regulators or law enforcement authorities, to protect our rights or property or upon reasonable request by any investee entity in which a shareholder has chosen to invest. Of course, we may also share your information with your consent.
Sharing Information with Affiliates We may share shareholder information with our affiliates in connection with our affiliates’ everyday business purposes, such as servicing a shareholder’s account, but our affiliates may not use this information to market products and services to you except in conformance with applicable laws or regulations. The information we share includes information about our experiences and transactions with a shareholder and may include, for example, a shareholder’s participation in one of the Funds or in other investment programs, a shareholder’s ownership of certain types of accounts, or other data about a shareholder’s transactions or accounts. Our affiliates, in turn, are not permitted to share shareholder information with non-affiliated entities, except as required or permitted by law.
Procedures to Safeguard Private Information We take seriously the obligation to safeguard shareholder non-public personal information. In addition to this policy, we have also implemented procedures that are designed to restrict access to a shareholder’s non-public personal information only to internal personnel who need to know that information in order to provide products or services to such shareholders. In addition, we have physical, electronic, and procedural safeguards in place to guard a shareholder’s non-public personal information.
Disposal of Confidential Records We will dispose of records, if any, that are knowingly derived from data received from a consumer reporting agency regarding a shareholder that is an individual in a manner that ensures the confidentiality of the data is maintained. Such records include, among other things, copies of consumer reports and notes of conversations with individuals at consumer reporting agencies.
190
ASHMORE FUNDS
OTHER INFORMATION
Administrator, Custodian and Transfer Agent
The Northern Trust Company
50 S. LaSalle Street
Chicago, Illinois 60603
312-630-6000
Investment Manager
Ashmore Investment Advisors Limited
61 Aldwych
London WC2B 4AE
United Kingdom
44-20-3077-6000
Independent Registered Public Accounting Firm
KPMG LLP
Aon Center
Suite 5500
200 East Randolph Street
Chicago, Illinois 60601-6436
Distributor
Ashmore Investment Management (US) Corporation
475 Fifth Avenue
15th Floor
New York, New York 10017
212-661-0061
Legal Counsel
Ropes & Gray LLP
Prudential Tower
800 Boylston Street
Boston, Massachusetts 02199-3600
617-951-7000
Independent Trustees’ Counsel
Dechert LLP
One International Place
40th Floor
100 Oliver Street
Boston, Massachusetts 02110-2605
617-728-7100
191
(THIS PAGE INTENTIONALLY LEFT BLANK)
192
ASHMORE FUNDS
TRUSTEES AND OFFICERS
Set forth below is information about the Trustees and Officers of the Ashmore Funds. Each Trustee has served in that capacity since he or she was originally elected or appointed to the Board of Trustees. Each Trustee oversees a total of eleven portfolios in the Ashmore Funds. The Ashmore Funds’ Statement of Additional Information contains additional information about the Trustees and is available upon request and without charge by calling 866-876-8294.
INDEPENDENT TRUSTEES
| | | | | | | | | | |
| | | | | | |
Name, Address* and Age of Independent Trustee | | Positions(s) Held with Trust | | Term of Office and Length of Time Served | | Principal Occupation(s) During Past 5 Years | | Number of Portfolios in Fund Complex Overseen by Trustee | | Other Directorships Held by Trustee During the Past 5 Years |
Yeelong Balladon (Age 65) | | Trustee; Lead Independent Trustee | | Indefinite term; Trustee since inception in 2010 | | Freshfields Bruckhaus Deringer (a law firm) from 1982 to 2009 (Partner from 1999). | | 12 | | Microvast Holdings, Inc. Board of Directors (Class III Director) since July 2022 |
Michael Chamberlin (Age 74) | | Trustee | | Indefinite term; Trustee since 2012 | | Executive Director and CEO, Emerging Markets Traders Association(1). | | 12 | | None |
Joseph Grainger (Age 69) | | Trustee | | Indefinite term; Trustee since 2014 | | Ernst & Young LLP from 1988 to December 2013 (Partner from October 1990). | | 12 | | None |
| * | Each Trustee may be contacted at 61 Aldwych, London WC2B 4AE, United Kingdom. |
| (1) | Mr. Chamberlin has served as the Executive Director of the Emerging Markets Traders Association (“EMTA”) since 1994. Mark Coombs is Co-Chair of EMTA’s Board of Directors, and the Investment Manager’s ultimate parent company, Ashmore Group plc, is a member of the EMTA. Mr. Coombs is the Investment Manager’s Chief Executive Officer. |
193
ASHMORE FUNDS
TRUSTEES AND OFFICERS (CONTINUED)
| | | | | | | | | | |
| | | | | | |
Name, Address* and Age of Interested Trustee | | Positions(s) Held with Trust | | Term of Office and Length of Time Served | | Principal Occupation(s) During Past 5 Years | | Number of Portfolios in Fund Complex Overseen by Trustee | | Other Directorships Held by Trustee During the Past 5 Years |
George Grunebaum(2) (Age 60) | | Trustee; Chairman of the Trustees; President and Chief Executive Officer | | Indefinite term; Trustee since inception | | Chief Executive Officer since November 2008, Ashmore Investment Management (US) Corporation. | | 12 | | BC Partners Lending Corp Portman Ridge Finance Corp Logan Ridge Finance Corp Alternative Credit Income Fund Opportunistic Credit Interval Fund |
Stephen Hicks(3) (Age 63) | | Trustee | | Indefinite term; Trustee since 2014 | | CCO of Trinity Street Asset Management LLP, a UK private asset manager, since 2014. | | 12 | | None |
| * | Each Trustee may be contacted at 61 Aldwych, London WC2B 4AE, United Kingdom. |
| (2) | Mr. Grunebaum is an “interested person” of the Trust, as defined in Section 2(a)(19) of the 1940 Act, due to, among other things, his positions with the Distributor and its affiliates. Mr. Grunebaum serves or has served as a trustee or director of other pooled investment vehicles sponsored by Ashmore Group plc (“Ashmore Group”) and its affiliates, including Ashmore Global Emerging Markets Funds, LTD and Ashmore Global Opportunities Limited. |
| (3) | Mr. Hicks is an “interested person” of the Trust, as defined in Section 2(a)(19) of the 1940 Act, due to his former position with Ashmore Group, the parent company of Ashmore Investment Advisors Limited. Ashmore Group indirectly compensates Mr. Hicks, through a separate private company, for his service as a Trustee of the Trust and as a trustee or director of other pooled investment vehicles sponsored by Ashmore Group and its affiliates. |
194
ASHMORE FUNDS
TRUSTEES AND OFFICERS (CONTINUED)
OFFICERS
| | | | | | |
| | | | |
Name, Address** and Age of Officer | | Positions(s) Held with Trust | | Term of Office and Length of Time Served | | Principal Occupation(s) During Past 5 Years |
George Grunebaum (Age 60) | | Trustee, Chairman of the Trustees; President and Chief Executive Officer | | Indefinite term; since inception | | Chief Executive Officer, Ashmore Investment Management (US) Corp., since November 2008 – Present. |
Alexandra Autrey (Age 47) | | Chief Legal Officer | | Indefinite term; since inception | | Group General Counsel and Company Secretary, Ashmore Group plc, since May 2021; Group Head of Legal and Transaction Management, Ashmore Group plc, from January 2012 – April 2021. |
Richard Longstaff(4) (Age 43) | | Treasurer and Principal Financial and Accounting Officer | | Indefinite term; since October 2023 | | Head of Fund Accounting and 40 Act Treasurer, since October 2023. |
Matthew Butryman (Age 39) | | Secretary and Chief Compliance Officer | | Indefinite term; since November 2022 | | Chief Compliance Officer, Ashmore Investment Management (US) Corp., from October 2022 – Present; Senior Vice President and Senior Compliance Officer, Pacific Investment Management Company LLC (PIMCO), from January 2021 – October 2022; Vice President and Senior Compliance Officer, PIMCO, January 2018 – December 2020. |
| ** | Each Officer may be contacted at 61 Aldwych, London WC2B 4AE, United Kingdom. |
| (4) | At its meeting on December 13, 2023, the Board appointed Taurai Sigauke as the Trust’s Treasurer and Principal Financial and Accounting Officer, such appointment to be effective January 31, 2024, in replacement of Richard Longstaff, who will resign from these officer positions with the Trust effective as of the same date. |
195
(b) Not applicable.
Item 2. Code of Ethics.
| (a) | As of October 31, 2023, the registrant has adopted a code of ethics that applies to its principal executive officer, principal financial officer, principal accounting officer or controller, or persons performing similar functions, regardless of whether these individuals are employed by the registrant or a third party (the “Code of Ethics”). |
| (c) | The registrant has not amended its Code of Ethics during the period covered by this report. |
| (d) | The registrant has not granted any waivers, including an implicit waiver, from any provisions of its Code of Ethics during the period covered by this report. |
Item 3. Audit Committee Financial Expert.
The registrant’s Board of Trustees has determined that the registrant has at least one “audit committee financial expert” (as defined in Item 3 of Form N-CSR), serving on its audit committee. Joseph Grainger is the “audit committee financial expert” and is “independent” (as each term is defined in Item 3 of Form N-CSR).
Under applicable securities laws and regulations, a person who is determined to be an audit committee financial expert will not be deemed an “expert” for any purpose, including without limitation for purposes of Section 11 of the Securities Act of 1933, as amended, as a result of being designated or identified as an audit committee financial expert. The designation or identification of a person as an audit committee financial expert does not impose on such person any duties, obligations, or liability that are greater than the duties, obligations, and liability imposed on such person as a member of the registrant’s Audit Committee and Board of Trustees in the absence of such designation or identification. The designation or identification of a person as an audit committee financial expert does not affect the duties, obligations or liability of any other member of the registrant’s Audit Committee or Board of Trustees.
Item 4. Principal Accountant Fees and Services.
Item 4(a): Audit Fees
The aggregate fees billed for each of the last two fiscal years for professional services rendered by KPMG LLP (“KPMG”), independent registered public accounting firm, for the audit of the registrant’s annual financial statements or services that are normally provided by the accountant
2
in connection with statutory and regulatory filings or engagements for those fiscal years are $360,950 in 2023 and $343,760 in 2022.
Item 4 (b): Audit-Related Fees
The aggregate fees billed in each of the last two fiscal years for assurance and related services by KPMG that are reasonably related to the performance of the audit of the registrant’s financial statements and are not reported under paragraph (a) of this Item are NONE.
Item 4 (c): Tax Fees
The aggregate fees billed in each of the last two fiscal years for professional services rendered by KPMG for RIC tax compliance and diversification review and tax return review are NONE in 2023 and NONE in 2022.
Item 4 (d): All Other Fees
The aggregate fees billed in each of the last two fiscal years for products and services provided by KPMG and its affiliates, other than the services reported in paragraphs (a) through (c) of this Item, are GBP 103,000 in 2023 and GBP 100,000 in 2022 for reports on internal controls.
Item 4(e)(1): Pre-Approval Policies and Procedures
Pursuant to the registrant’s Audit Committee Charter adopted on November 17, 2010, as revised on December 9, 2022, the Audit Committee shall, to the extent required by applicable regulations, pre-approve (i) all audit and permitted non-audit services rendered by the independent auditors to a Fund and (ii) all non-audit services rendered by the independent auditors to a Fund’s investment adviser(s) (including any sub-advisers) and to certain of the investment adviser’s affiliates, as applicable. The Audit Committee may implement policies and procedures by which such services are pre-approved other than by the full Committee (for example, by the Committee chair).
Item 4(e)(2): Percentage of Fees Pre-Approved Pursuant to Waiver Provision of Paragraph (c)(7)(i)(C) of Rule 2-01 of Regulation S-X
No percentage of the principal accountant’s fees or services were approved pursuant to the waiver provision of paragraph (c)(7)(i)(C) of Rule 2-01 of Regulation S-X.
Item 4(f): Work Performed by Persons Other than the Principal Accountant
Not applicable.
Item 4(g): Aggregate Non-Audit Fees Disclosure
The aggregate non-audit fees and services billed by KPMG and its affiliates for services rendered to the registrant and service affiliates for the last two fiscal years are GBP 103,000 for 2023 and GBP 100,000 for 2022.
Item 4(h): Non-Audit Services and Independent Accountant’s Independence
The registrant’s Audit Committee has considered whether the provision of non-audit services to service affiliates, not pre-approved pursuant to paragraph (c)(7)(ii) of Rule 2-01 of Regulation S-X, is compatible with maintaining the registered public accountant’s independence in performing audit services.
3
Item 4(i): Not applicable.
Item 4(j): Not applicable.
Item 5. Audit Committee of Listed Registrants.
Not applicable.
Item 6. Investments.
| (a) | The registrant has elected to include the schedule of investments in securities of unaffiliated issuers as part of the report to shareholders filed under Item 1 of this report on Form N-CSR. |
Item 7. Disclosure of Proxy Voting Policies and Procedures for Closed-End Management Investment Companies.
Not applicable.
Item 8. Portfolio Managers of Closed-End Management Investment Companies.
Not applicable.
Item 9. Purchases of Equity Securities by Closed-End Management Investment Company and Affiliated Purchasers.
Not applicable.
Item 10. Submission of Matters to a Vote of Security Holders.
There have been no material changes to the procedures by which shareholders may recommend nominees to the registrant’s Board of Trustees.
Item 11. Controls and Procedures.
| (a) | The registrant’s principal executive and principal financial officers, or persons performing similar functions, have concluded that the registrant’s disclosure controls and procedures (as defined in Rule 30a-3(c) under the Investment Company Act of 1940 (the “1940 Act”)) are effective, based on the evaluation of these controls and procedures required by Rule 30a-3(b) under the 1940 Act and Rules 13a-15(b) or 15d-15(b) under the Securities Exchange Act of 1934 as of a date within 90 days of the filing date of this report. |
| (b) | There were no changes in the registrant’s internal control over financial reporting (as defined in Rule 30a-3(d) under the 1940 Act) that occurred during the period covered by |
4
| | this report that have materially affected, or are reasonably likely to materially affect, the registrant’s internal control over financial reporting. |
Item 12. Disclosure of Securities Lending Activities for Closed-End Management Investment Companies.
Not applicable.
Item 13. Exhibits.
5
SIGNATURES
Pursuant to the requirements of the Securities Exchange Act of 1934 and the Investment Company Act of 1940, the registrant has duly caused this report to be signed on its behalf by the undersigned, thereunto duly authorized.
Ashmore Funds
| | |
| By | | /s/ George Grunebaum |
| | George Grunebaum, President and Chief Executive Officer |
| | (Principal Executive Officer) |
|
| Date: January 4, 2024 |
Pursuant to the requirements of the Securities Exchange Act of 1934 and the Investment Company Act of 1940, this report has been signed below by the following persons on behalf of the registrant and in the capacities and on the dates indicated.
| | |
| By | | /s/ George Grunebaum |
| | George Grunebaum, President and Chief Executive Officer |
| | (Principal Executive Officer) |
Date: January 4, 2024
| | |
| By | | /s/ Richard Longstaff |
| | Richard Longstaff, Treasurer |
| | (Principal Financial and Accounting Officer) |
Date: January 4, 2024
6