
Spirit of Texas Bancshares, Inc. Western Financial Services Conference March 2, 2021 Exhibit 99.1
Important Information ABOUT SPIRIT OF TEXAS BANCSHARES, INC. Spirit of Texas Bancshares, Inc. (“Spirit,” “STXB,” “Company,” “we,” “our” or “us”), through its wholly-owned subsidiary, Spirit of Texas Bank (the “Bank”), provides a wide range of relationship-driven commercial banking products and services tailored to meet the needs of businesses, professionals and individuals. Spirit of Texas Bank has 36 locations in the Houston, Dallas/Fort Worth, Bryan/College Station, San Antonio-New Braunfels, Austin, Tyler and Corpus Christi metropolitan areas, as well as in North Central and North East Texas. Please visit www.sotb.com for more information. Our website is an inactive textual reference only. FORWARD-LOOKING STATEMENTS This presentation contains, and future oral and written statements of the Company and its management may contain, forward-looking statements within the meaning of the Private Securities Litigation Reform Act of 1995 that are subject to risks and uncertainties and are made pursuant to the safe harbor provisions of Section 27A of the Securities Act of 1933, as amended, and Section 21E of the Securities Exchange Act of 1934, as amended. Any statements about our expectations, beliefs, plans, predictions, protections, forecasts, objectives, assumptions or future events or performance are not historical facts and may be forward-looking. Forward-looking statements are typically, but not exclusively, identified by the use of forward-looking terminology such as “believes,” “expects,” “could,” “may,” “will, “should,” “seeks,” “likely,” “intends” “plans,” “pro forma,” “projects,” “estimates” or “anticipates” or the negative of these words and phrases or similar words or phrases that are predictions of or indicate future events or trends and that do not relate solely to historical matters. You can also identify forward-looking statements by discussions of strategy, plans or intentions. Forward-looking statements involve numerous risks and uncertainties and you should not rely on them as predictions of future events. The following factors, among others, could cause actual results and future events to differ materially from those set forth or contemplated in the forward-looking statements: the impact of the COVID-19 pandemic on our business, including the impact of actions taken by governmental and regulatory authorities in response to such pandemic, such as the Coronavirus Aid, Relief, and Economic Security Act (“CARES Act”) and the programs established thereunder, and the Bank’s participation in such programs; business and economic conditions generally and in the bank and non-bank financial services industries, nationally and within our local market areas; our ability to mitigate our risk exposures; our ability to maintain our historical earnings trends; risks related to the integration of acquired businesses and any future acquisitions; the inability to realize expected cost savings or achieve other anticipated benefits in connection with business combinations or other acquisitions; our ability to successfully identify and address the risks associated with our recent, pending and possible future acquisitions; changes in management personnel; interest rate risk; credit risk associated with our loan portfolio; deteriorating asset quality and higher loan charge-offs; time and effort necessary to resolve nonperforming assets; adequacy of loan loss reserves; inaccuracy of the assumptions and estimates we make in establishing reserves for probable loan losses and other estimates and projections; lack of liquidity; fluctuations in the fair value and liquidity of the securities we hold for sale; impairment of investment securities, goodwill, other intangible assets or deferred tax assets; our risk management strategies; increased competition in the bank and non-bank financial services industries, nationally, regionally or locally, which may adversely affect pricing and terms; the accuracy of our financial statements and related disclosures and those of companies we acquire; material weaknesses in our internal control over financial reporting; system failures or failures to prevent breaches of our network security; other economic, competitive, governmental, or technological factors affecting our operation, markets, products, services, and prices; the institution and outcome of litigation and other legal proceedings against us or to which we become subject; unanticipated regulatory or judicial proceedings and liabilities and other costs; changes in any applicable law, rule, regulation, policy, guideline, or practice governing or affecting bank holding companies and their subsidiaries, or with respect to tax or accounting principles, securities or otherwise, and their application by our regulators; governmental monetary and fiscal policies; increases in our capital requirements; and other risks identified in Spirit’s Annual Report on Form 10-K for the year ended December 31, 2019, filed with the Securities and Exchange Commission (“SEC”) on March 16, 2020, its Quarterly Reports on Form 10-Q, its Current Reports on form 8-K and its other filings with the SEC. While forward-looking statements reflect our good-faith beliefs, they are not guarantees of future performance. All forward-looking statements are necessarily only estimates of future results. Accordingly, actual results may differ materially from those expressed in or contemplated by the particular forward-looking statement, and, therefore, you are cautioned not to place undue reliance on such statements. Further, any forward-looking statement speaks only as of the date on which it is made, and we undertake no obligation to update any forward-looking statement to reflect events or circumstances after the date on which the statement is made or to reflect the occurrence of unanticipated events or circumstances, except as required by applicable law.
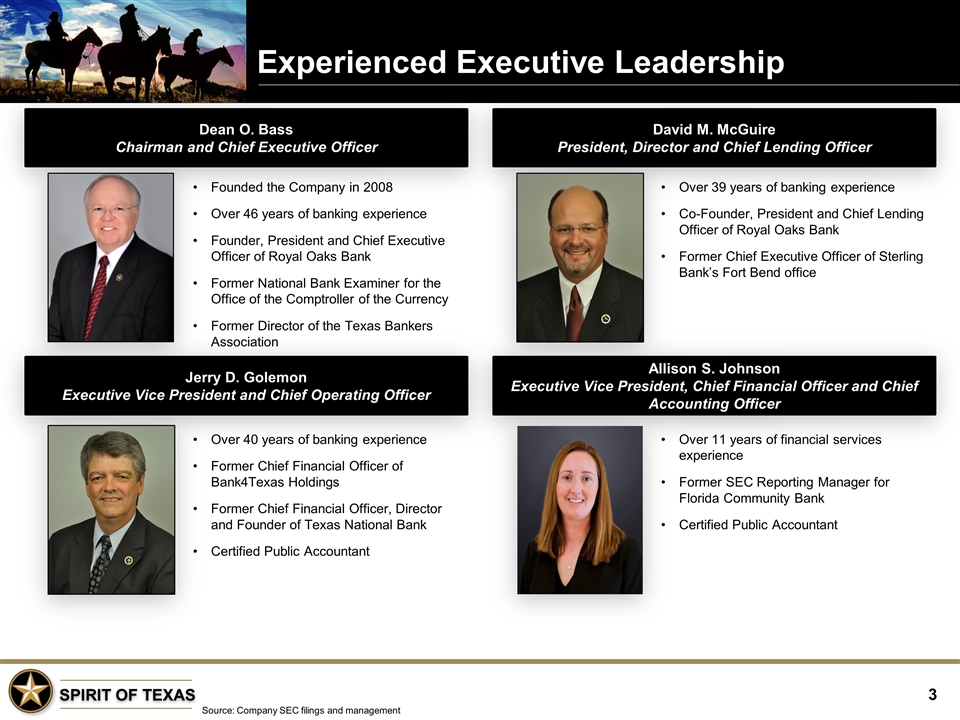
Experienced Executive Leadership Dean O. Bass Chairman and Chief Executive Officer David M. McGuire President, Director and Chief Lending Officer Founded the Company in 2008 Over 46 years of banking experience Founder, President and Chief Executive Officer of Royal Oaks Bank Former National Bank Examiner for the Office of the Comptroller of the Currency Former Director of the Texas Bankers Association Over 39 years of banking experience Co-Founder, President and Chief Lending Officer of Royal Oaks Bank Former Chief Executive Officer of Sterling Bank’s Fort Bend office Jerry D. Golemon Executive Vice President and Chief Operating Officer Over 40 years of banking experience Former Chief Financial Officer of Bank4Texas Holdings Former Chief Financial Officer, Director and Founder of Texas National Bank Certified Public Accountant Allison S. Johnson Executive Vice President, Chief Financial Officer and Chief Accounting Officer Over 11 years of financial services experience Former SEC Reporting Manager for Florida Community Bank Certified Public Accountant Source: Company SEC filings and management
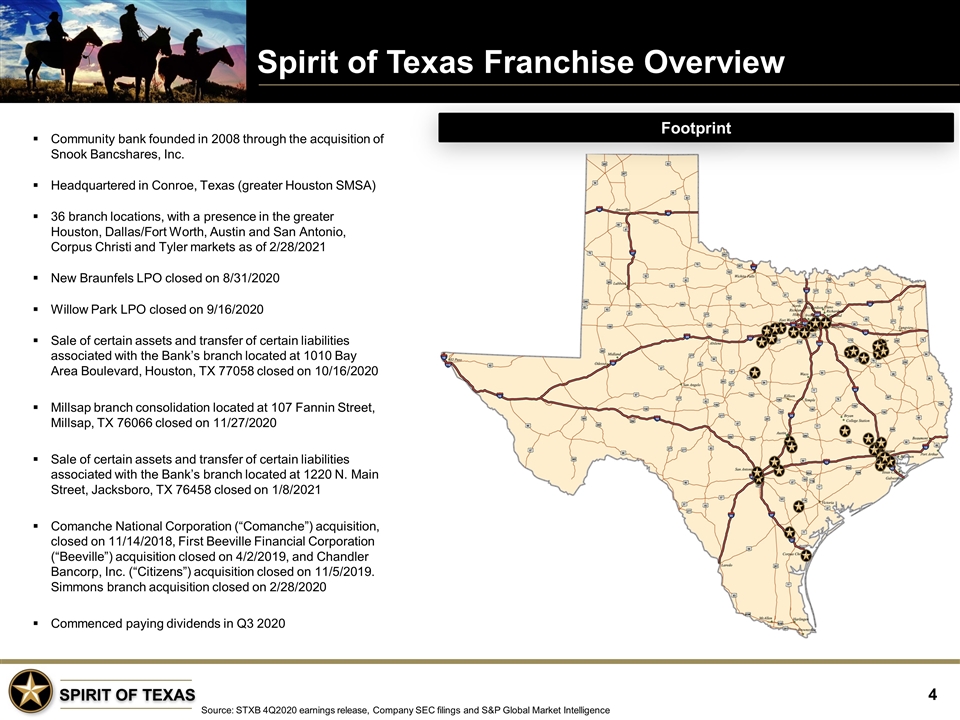
Spirit of Texas Franchise Overview Source: STXB 4Q2020 earnings release, Company SEC filings and S&P Global Market Intelligence Community bank founded in 2008 through the acquisition of Snook Bancshares, Inc. Headquartered in Conroe, Texas (greater Houston SMSA) 36 branch locations, with a presence in the greater Houston, Dallas/Fort Worth, Austin and San Antonio, Corpus Christi and Tyler markets as of 2/28/2021 New Braunfels LPO closed on 8/31/2020 Willow Park LPO closed on 9/16/2020 Sale of certain assets and transfer of certain liabilities associated with the Bank’s branch located at 1010 Bay Area Boulevard, Houston, TX 77058 closed on 10/16/2020 Millsap branch consolidation located at 107 Fannin Street, Millsap, TX 76066 closed on 11/27/2020 Sale of certain assets and transfer of certain liabilities associated with the Bank’s branch located at 1220 N. Main Street, Jacksboro, TX 76458 closed on 1/8/2021 Comanche National Corporation (“Comanche”) acquisition, closed on 11/14/2018, First Beeville Financial Corporation (“Beeville”) acquisition closed on 4/2/2019, and Chandler Bancorp, Inc. (“Citizens”) acquisition closed on 11/5/2019. Simmons branch acquisition closed on 2/28/2020 Commenced paying dividends in Q3 2020 Footprint
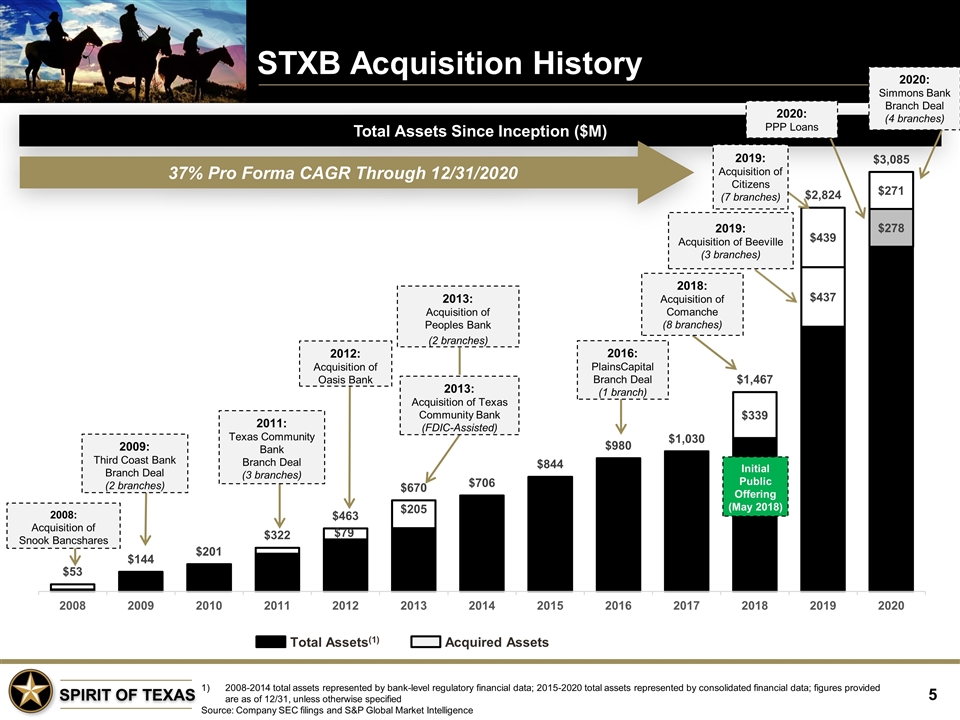
STXB Acquisition History 2008-2014 total assets represented by bank-level regulatory financial data; 2015-2020 total assets represented by consolidated financial data; figures provided are as of 12/31, unless otherwise specified Source: Company SEC filings and S&P Global Market Intelligence Total Assets Since Inception ($M) 2009: Third Coast Bank Branch Deal (2 branches) 2011: Texas Community Bank Branch Deal (3 branches) 2012: Acquisition of Oasis Bank 2013: Acquisition of Peoples Bank (2 branches) 2016: PlainsCapital Branch Deal (1 branch) 2013: Acquisition of Texas Community Bank (FDIC-Assisted) Total Assets(1) Acquired Assets 2018: Acquisition of Comanche (8 branches) 2019: Acquisition of Citizens (7 branches) 2019: Acquisition of Beeville (3 branches) 2008: Acquisition of Snook Bancshares Initial Public Offering (May 2018) 37% Pro Forma CAGR Through 12/31/2020 2020: Simmons Bank Branch Deal (4 branches) 2020: PPP Loans
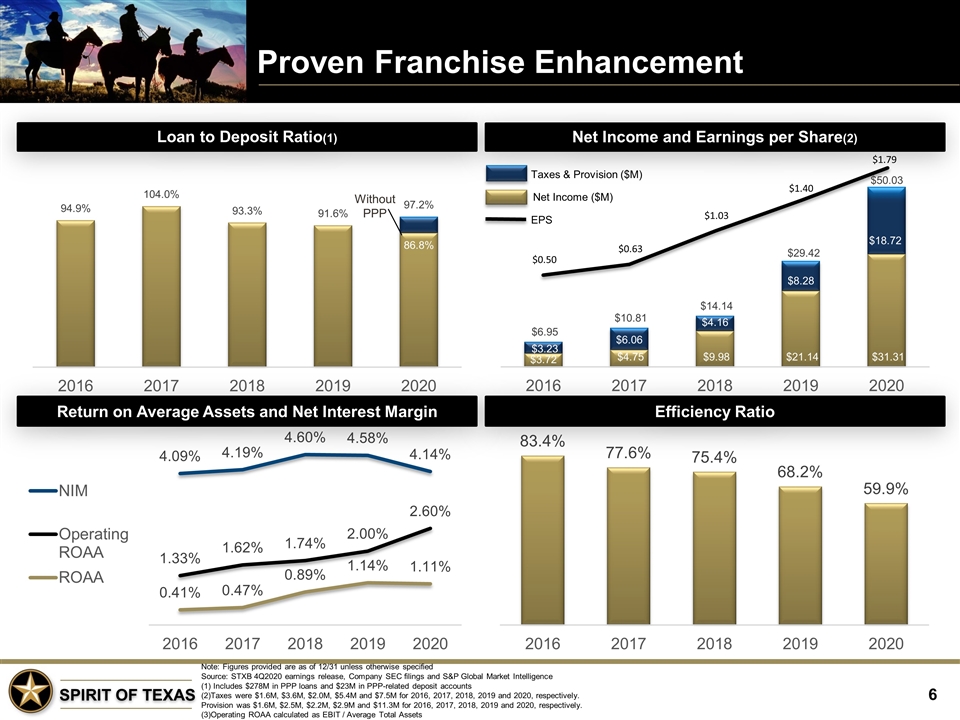
Net Income and Earnings per Share(2) Proven Franchise Enhancement Note: Figures provided are as of 12/31 unless otherwise specified Source: STXB 4Q2020 earnings release, Company SEC filings and S&P Global Market Intelligence (1) Includes $278M in PPP loans and $23M in PPP-related deposit accounts (2)Taxes were $1.6M, $3.6M, $2.0M, $5.4M and $7.5M for 2016, 2017, 2018, 2019 and 2020, respectively. Provision was $1.6M, $2.5M, $2.2M, $2.9M and $11.3M for 2016, 2017, 2018, 2019 and 2020, respectively. (3)Operating ROAA calculated as EBIT / Average Total Assets Efficiency Ratio Loan to Deposit Ratio(1) Return on Average Assets and Net Interest Margin EPS Net Income ($M) Taxes & Provision ($M) Without PPP
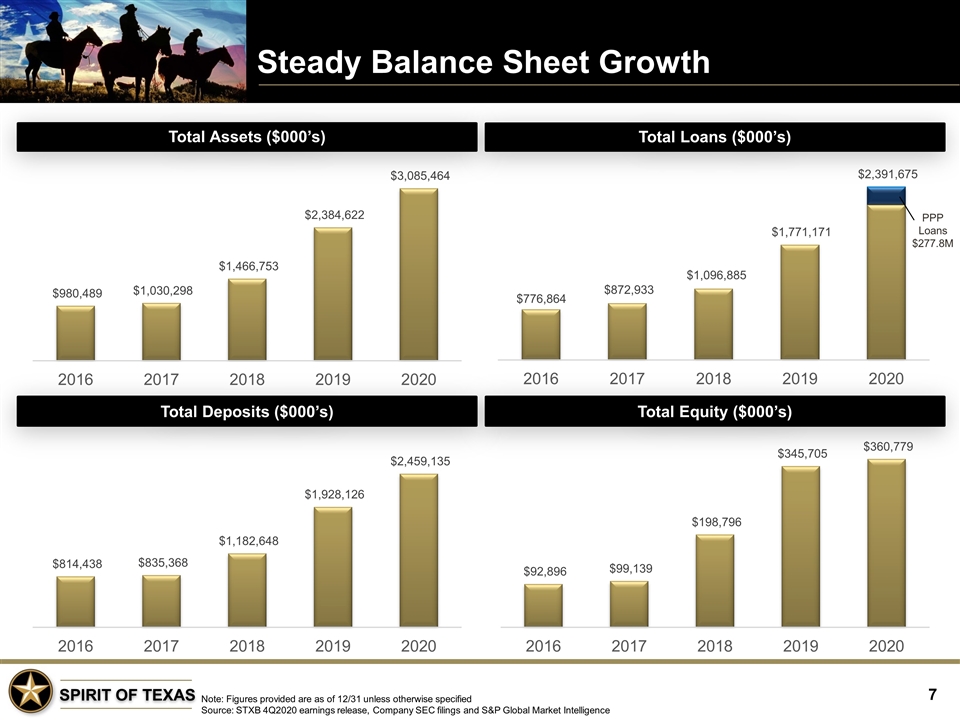
Steady Balance Sheet Growth Note: Figures provided are as of 12/31 unless otherwise specified Source: STXB 4Q2020 earnings release, Company SEC filings and S&P Global Market Intelligence Total Equity ($000’s) Total Assets ($000’s) Total Deposits ($000’s) Total Loans ($000’s) PPP Loans $277.8M
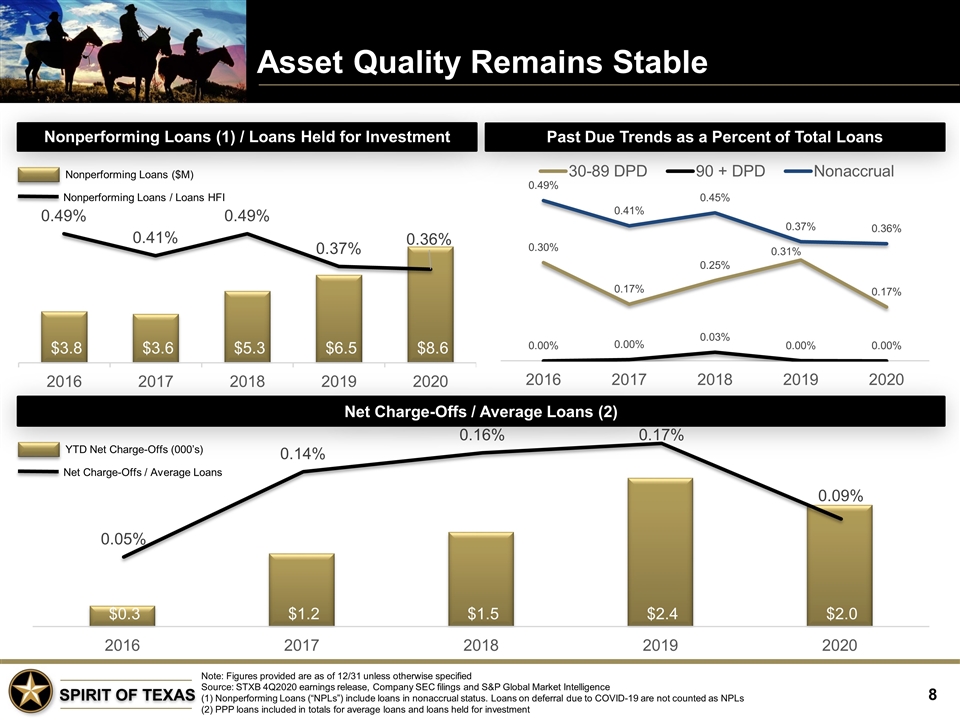
Asset Quality Remains Stable Note: Figures provided are as of 12/31 unless otherwise specified Source: STXB 4Q2020 earnings release, Company SEC filings and S&P Global Market Intelligence (1) Nonperforming Loans (“NPLs”) include loans in nonaccrual status. Loans on deferral due to COVID-19 are not counted as NPLs (2) PPP loans included in totals for average loans and loans held for investment Net Charge-Offs / Average Loans (2) Nonperforming Loans (1) / Loans Held for Investment Past Due Trends as a Percent of Total Loans Net Charge-Offs / Average Loans YTD Net Charge-Offs (000’s) Nonperforming Loans / Loans HFI Nonperforming Loans ($M)
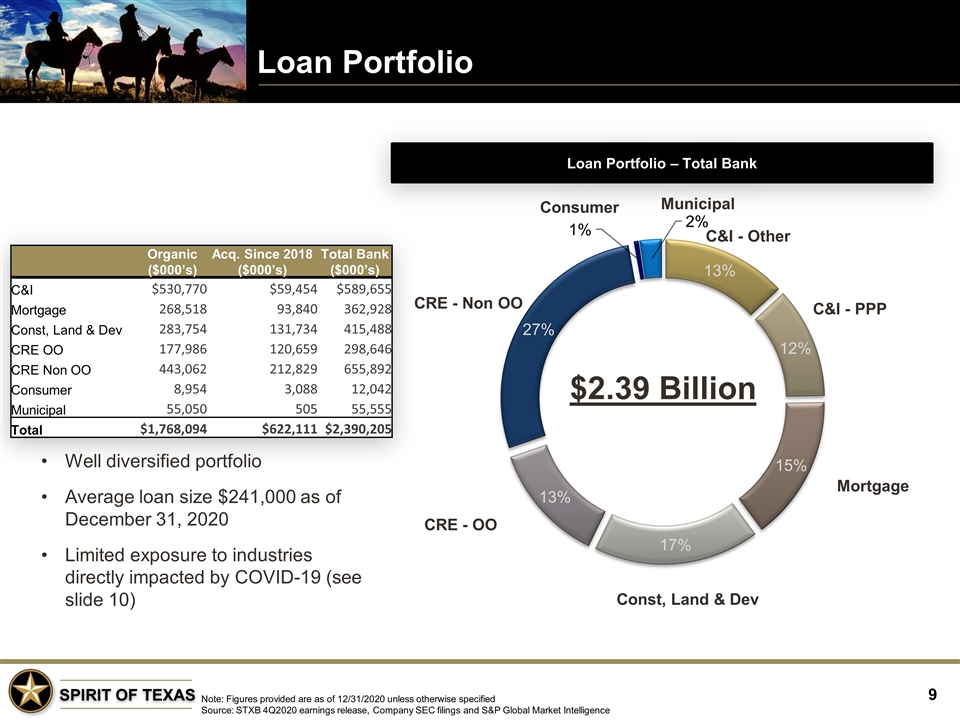
Loan Portfolio Note: Figures provided are as of 12/31/2020 unless otherwise specified Source: STXB 4Q2020 earnings release, Company SEC filings and S&P Global Market Intelligence Well diversified portfolio Average loan size $241,000 as of December 31, 2020 Limited exposure to industries directly impacted by COVID-19 (see slide 10) Loan Portfolio – Total Bank Municipal CRE - Non OO C&I - Other C&I - PPP Mortgage Const, Land & Dev CRE - OO Organic ($000’s) Acq. Since 2018 ($000’s) Total Bank ($000’s) C&I $530,770 $59,454 $589,655 Mortgage 268,518 93,840 362,928 Const, Land & Dev 283,754 131,734 415,488 CRE OO 177,986 120,659 298,646 CRE Non OO 443,062 212,829 655,892 Consumer 8,954 3,088 12,042 Municipal 55,050 505 55,555 Total $1,768,094 $622,111 $2,390,205 Consumer $2.39 Billion
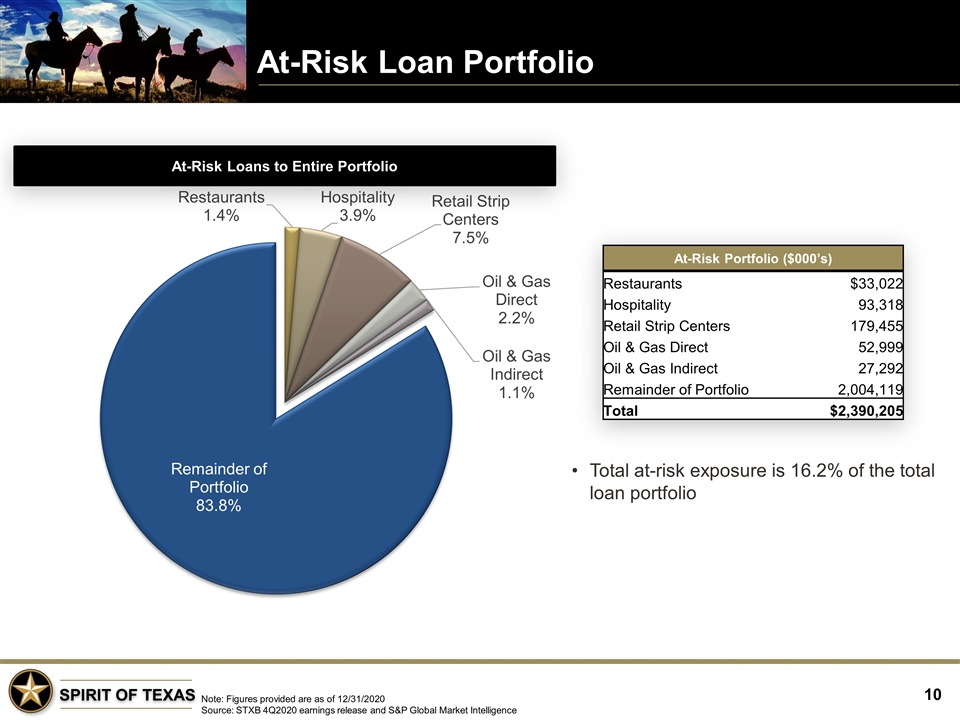
At-Risk Loan Portfolio Note: Figures provided are as of 12/31/2020 Source: STXB 4Q2020 earnings release and S&P Global Market Intelligence Total at-risk exposure is 16.2% of the total loan portfolio At-Risk Loans to Entire Portfolio At-Risk Portfolio ($000’s) Restaurants $33,022 Hospitality 93,318 Retail Strip Centers 179,455 Oil & Gas Direct 52,999 Oil & Gas Indirect 27,292 Remainder of Portfolio 2,004,119 Total $2,390,205
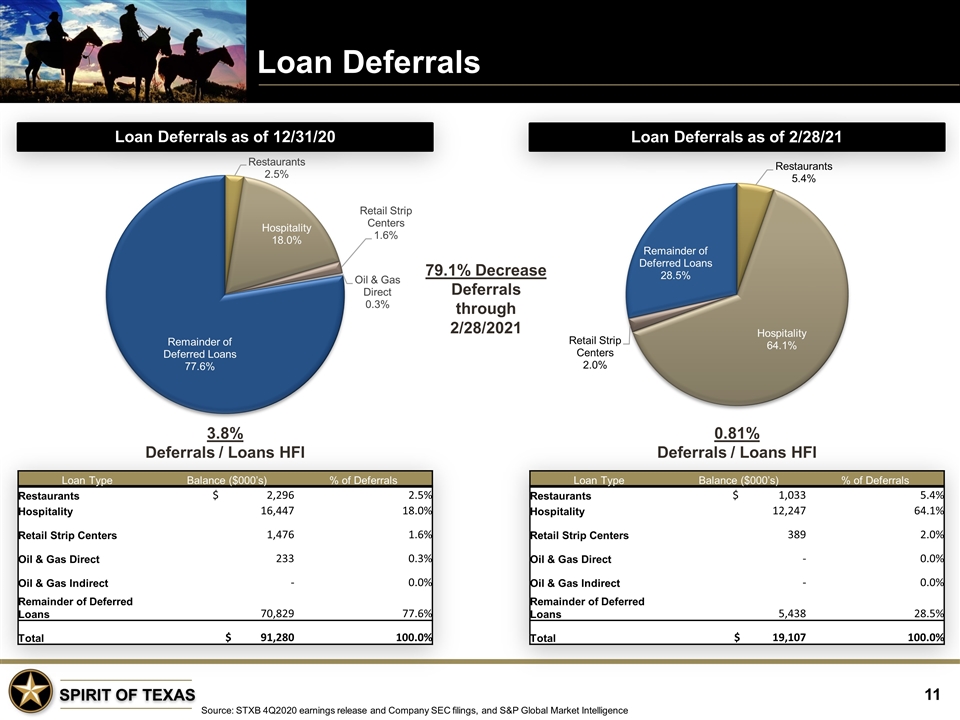
Loan Deferrals Source: STXB 4Q2020 earnings release and Company SEC filings, and S&P Global Market Intelligence Loan Deferrals as of 12/31/20 Loan Deferrals as of 2/28/21 79.1% Decrease Deferrals through 2/28/2021 Loan Type Balance ($000’s) % of Deferrals Restaurants $ 2,296 2.5% Hospitality 16,447 18.0% Retail Strip Centers 1,476 1.6% Oil & Gas Direct 233 0.3% Oil & Gas Indirect - 0.0% Remainder of Deferred Loans 70,829 77.6% Total $ 91,280 100.0% Loan Type Balance ($000’s) % of Deferrals Restaurants $ 1,033 5.4% Hospitality 12,247 64.1% Retail Strip Centers 389 2.0% Oil & Gas Direct - 0.0% Oil & Gas Indirect - 0.0% Remainder of Deferred Loans 5,438 28.5% Total $ 19,107 100.0% 3.8% Deferrals / Loans HFI 0.81% Deferrals / Loans HFI
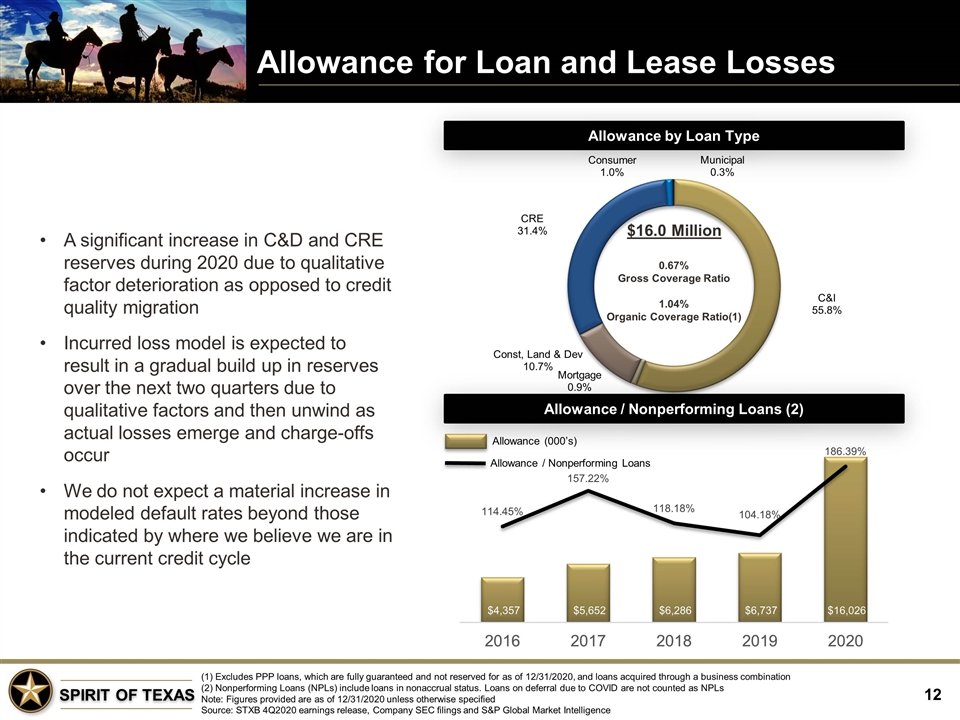
Allowance for Loan and Lease Losses (1) Excludes PPP loans, which are fully guaranteed and not reserved for as of 12/31/2020, and loans acquired through a business combination (2) Nonperforming Loans (NPLs) include loans in nonaccrual status. Loans on deferral due to COVID are not counted as NPLs Note: Figures provided are as of 12/31/2020 unless otherwise specified Source: STXB 4Q2020 earnings release, Company SEC filings and S&P Global Market Intelligence A significant increase in C&D and CRE reserves during 2020 due to qualitative factor deterioration as opposed to credit quality migration Incurred loss model is expected to result in a gradual build up in reserves over the next two quarters due to qualitative factors and then unwind as actual losses emerge and charge-offs occur We do not expect a material increase in modeled default rates beyond those indicated by where we believe we are in the current credit cycle Allowance by Loan Type Allowance / Nonperforming Loans (2) Allowance / Nonperforming Loans Allowance (000’s)
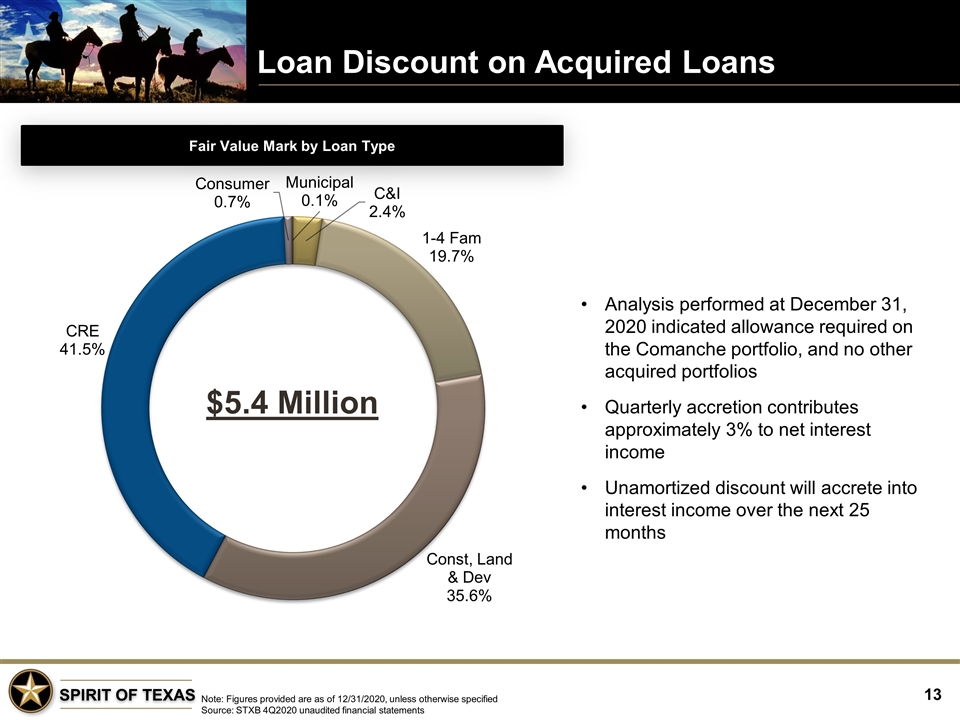
Loan Discount on Acquired Loans Note: Figures provided are as of 12/31/2020, unless otherwise specified Source: STXB 4Q2020 unaudited financial statements Analysis performed at December 31, 2020 indicated allowance required on the Comanche portfolio, and no other acquired portfolios Quarterly accretion contributes approximately 3% to net interest income Unamortized discount will accrete into interest income over the next 25 months Fair Value Mark by Loan Type $5.4 Million
Payroll Protection Program (“PPP”) Source: STXB 4Q2020 unaudited financial statements PPP Rounds 1 and 2 Approved and funded $428.0 million in 3,321 loans as of December 31, 2020 under the CARES Act As of February 28, 2021, year to date PPP fee income recognized was $815.8 thousand, net of deferred costs As of February 28, 2021, $195.6 million of PPP loans have received full forgiveness Remaining PPP fee income to be recognized, net of deferred costs is $1.9 million PPP Round 3 Approved and funded $41.2 million in 354 loans as of February 28, 2021 under the CARES Act, or $1.8 million in estimate gross fee income


