UNITED STATES
SECURITIES AND EXCHANGE COMMISSION
SECURITIES AND EXCHANGE COMMISSION
Washington, D.C. 20549
FORM 6-K
Report of Foreign Private Issuer
Pursuant to Rule 13a-16 or 15d-16 under the
Securities Exchange Act of 1934
Securities Exchange Act of 1934
For the month of August, 2011
Commission File Number 001-35052
Commission File Number 001-35052
Adecoagro S.A.
(Translation of registrant’s name into English)
13-15 Avenue de la Liberté
L-1931 Luxembourg
R.C.S. Luxembourg B 153 681
(Address of principal executive office)
L-1931 Luxembourg
R.C.S. Luxembourg B 153 681
(Address of principal executive office)
Indicate by check mark whether the registrant files or will file annual reports under cover of Form 20-F or Form 40-F.
Form 20-Fþ Form 40-Fo
Indicate by check mark if the registrant is submitting the Form 6-K in paper as permitted by Regulation S-T Rule 101(b)(1): ____
Indicate by check mark if the registrant is submitting the Form 6-K in paper as permitted by Regulation S-T Rule 101(b)(7): ____
Indicate by check mark whether the registrant by furnishing the information contained in this Form is also thereby furnishing the information to the Commission pursuant to Rule 12g3-2(b) under the Securities Exchange Act of 1934.
Yeso Noþ
If “Yes” is marked, indicate below the file number assigned to the registrant in connection with Rule 12g3-2(b): 82-___________.
ANNOUNCEMENT OF RESULTS OF OPERATIONS FOR THE THREE MONTHS ENDED JUNE 30, 2011
On August 16, 2011, the registrant issued a press release pertaining to its results of operations for the three months ended June 30, 2011. Attached hereto is a copy of the press release. The financial and operational information contained in the press release is based on unaudited condensed consolidated financial statements presented in U.S. Dollars and prepared in accordance with International Financial Reporting Standards.
The attachment contains forward-looking statements. The registrant desires to qualify for the “safe-harbor” provisions of the Private Securities Litigation Reform Act of 1995, and consequently is hereby filing cautionary statements identifying important factors that could cause the registrant’s actual results to differ materially from those set forth in the attachment.
The registrant’s forward-looking statements are based on the registrant’s current expectations, assumptions, estimates and projections about the registrant and its industry. These forward-looking statements can be identified by words or phrases such as “anticipate,” “believe,” “continue,” “estimate,” “expect,” “intend,” “is/are likely to,” “may,” “plan,” “should,” “would,” or other similar expressions.
The forward-looking statements included in the attached relate to, among others: (i) the registrant’s business prospects and future results of operations; (ii) weather and other natural phenomena; (iii) developments in, or changes to, the laws, regulations and governmental policies governing the registrant’s business, including limitations on ownership of farmland by foreign entities in certain jurisdictions in which the registrant operate, environmental laws and regulations; (iv) the implementation of the registrant’s business strategy, including its development of the Ivinhema mill and other current projects; (v) the registrant’s plans relating to acquisitions, joint ventures, strategic alliances or divestitures; (vi) the implementation of the registrant’s financing strategy and capital expenditure plan; (vii) the maintenance of the registrant’s relationships with customers; (viii) the competitive nature of the industries in which the registrant operates; (ix) the cost and availability of financing; (x) future demand for the commodities the registrant produces; (xi) international prices for commodities; (xii) the condition of the registrant’s land holdings; (xiii) the development of the logistics and infrastructure for transportation of the registrant’s products in the countries where it operates; (xiv) the performance of the South American and world economies; and (xv) the relative value of the Brazilian Real, the Argentine Peso, and the Uruguayan Peso compared to other currencies; as well as other risks included in the registrant’s other filings and submissions with the United States Securities and Exchange Commission.
These forward-looking statements involve various risks and uncertainties. Although the registrant believes that its expectations expressed in these forward-looking statements are reasonable, its expectations may turn out to be incorrect. The registrant’s actual results could be materially different from its expectations. In light of the risks and uncertainties described above, the estimates and forward-looking statements discussed in the attached might not occur, and the registrant’s future results and its performance may differ materially from those expressed in these forward-looking statements due to, inclusive, but not limited to, the factors mentioned above. Because of these uncertainties, you should not make any investment decision based on these estimates and forward-looking statements.
The forward-looking statements made in the attached relate only to events or information as of the date on which the statements are made in the attached. The registrant undertakes no obligation to update any forward-looking statements to reflect events or circumstances after the date on which the statements are made or to reflect the occurrence of unanticipated events.
SIGNATURES
Pursuant to the requirements of the Securities Exchange Act of 1934, the registrant has duly caused this report to be signed on its behalf by the undersigned, thereunto duly authorized.
| Adecoagro S.A. | ||||
| By: | /s/ Carlos A. Boero Hughes | |||
| Name: | Carlos A. Boero Hughes | |||
| Title: | Chief Financial Officer and Chief Accounting Officer | |||
Date: August 16, 2011
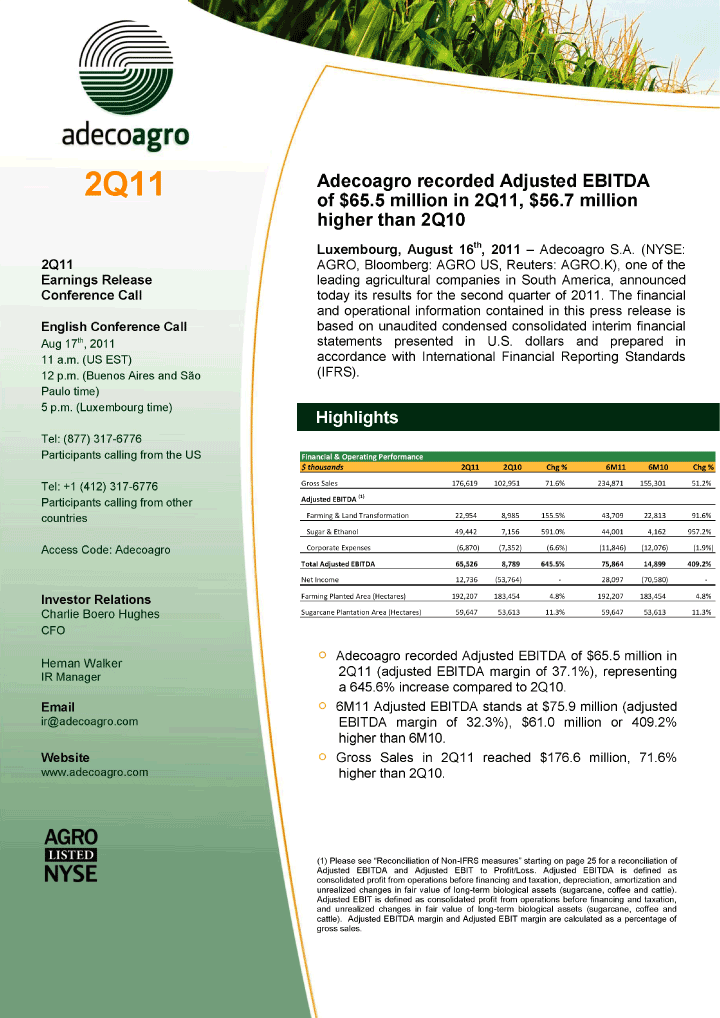
| 2Q11 Adecoagro recorded Adjusted EBITDA of $65.5 million in 2Q11, $56.7 million higher than 2Q10 Luxembourg, August 16th, 2011 — Adecoagro S.A. (NYSE: 2Q11 AGRO, Bloomberg: AGRO US, Reuters: AGRO.K), one of the Earnings Release leading agricultural companies in South America, announced Conference Call today its results for the second quarter of 2011. The financial and operational information contained in this press release is English Conference Call based on unaudited condensed consolidated interim financial Aug 17th, 2011 statements presented in U.S. dollars and prepared in 11 a.m. (US EST) accordance with International Financial Reporting Standards 12 p.m. (Buenos Aires and São (IFRS). Paulo time) 5 p.m. (Luxembourg time) Highlights Tel: (877) 317-6776 Participants calling from the US Financial & Operating Performance $ thousands 2Q11 2Q10 Chg % 6M11 6M10 Tel: +1 (412) 317-6776 Gross Sales 176,619 102,951 71.6% 234,871 155,301 Participants calling from other Adjusted EBITDA (1) countries Farming & Land Transformation 22,954 8,985 155.5% 43,709 22,813 Sugar & Ethanol 49,442 7,156 591.0% 44,001 4,162 Access Code: Adecoagro Corporate Expenses (6,870) (7,352) (6.6%) (11,846) (12,076) Total Adjusted EBITDA 65,526 8,789 645.5% 75,864 14,899 409 Net Income 12,736 (53,764) — 28,097 (70,580) Investor Relations Farming Planted Area (Hectares) 192,207 183,454 4.8% 192,207 183,454 Charlie Boero Hughes Sugarcane Plantation Area (Hectares) 59,647 53,613 11.3% 59,647 53,613 CFO Adecoagro recorded Adjusted EBITDA of $65.5 million in Hernan Walker IR Manager 2Q11 (adjusted EBITDA margin of 37.1%), representing a 645.6% increase compared to 2Q10. Email 6M11 Adjusted EBITDA stands at $75.9 million (adjusted ir@adecoagro.com EBITDA margin of 32.3%), $61.0 million or 409.2% higher than 6M10. Website Gross Sales in 2Q11 reached $176.6 million, 71.6% www.adecoagro.com higher than 2Q10. (1) Please see “Reconciliation of Non-IFRS measures” starting on page 25 for a reconciliation of Adjusted EBITDA and Adjusted EBIT to Profit/Loss. Adjusted EBITDA is defined as consolidated profit from operations before financing and taxation, depreciation, amortization and unrealized changes in fair value of long-term biological assets (sugarcane, coffee and cattle). Adjusted EBIT is defined as consolidated profit from operations before financing and taxation, and unrealized changes in fair value of long-term biological assets (sugarcane, coffee and cattle). Adjusted EBITDA margin and Adjusted EBIT margin are calculated as a percentage of gross sales. |
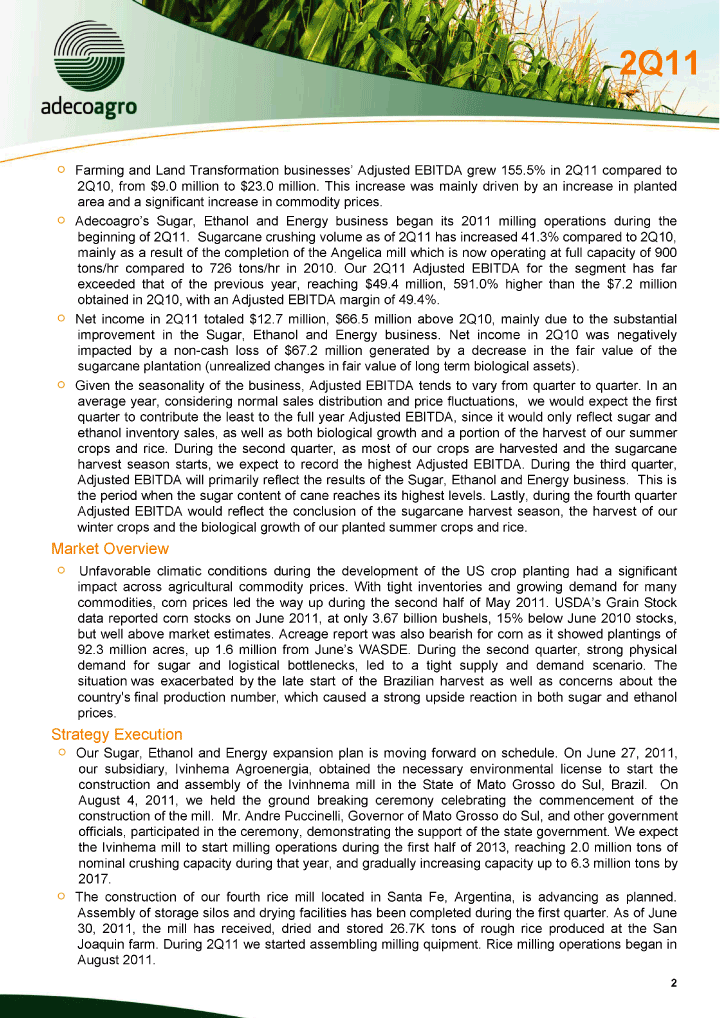
| Farming and Land Transformation businesses’ Adjusted EBITDA grew 155.5% in 2Q11 compared to 2Q10, from $9.0 million to $23.0 million. This increase was mainly driven by an increase in planted area and a significant increase in commodity prices. Adecoagro’s Sugar, Ethanol and Energy business began its 2011 milling operations during the beginning of 2Q11. Sugarcane crushing volume as of 2Q11 has increased 41.3% compared to 2Q10, mainly as a re sult of the completion of the Angelica mill which is now operating at full capacity of 900 tons/hr compared to 726 tons/hr in 2010. Our 2Q11 Adjusted EBITDA for the segment has far exceeded that of the previous year, reaching $49.4 million, 591.0% higher than the $7.2 million obtained in 2Q10, with an Adjusted EBITDA margin of 49.4%. Net income in 2Q11 totaled $12.7 million, $66.5 million above 2Q10, mainly due to the substantial improvement in the Sugar, Ethanol and Energy business. Net income in 2Q10 was negatively impacted by a non-cash loss of $67.2 million generated by a decrease in the fair value of the sugarcane plantation (unrealized changes in fair value of long term biological assets). Given the seasonality of the business, Adjusted EBITDA tends to vary from quarter to quarter. In an average year, considering normal sales distribution and price fluctuations, we would expect the first quarter to contribute the least to the full year Adjusted EBITDA, since it would only reflec t sugar and ethanol inventory sales, as well as both biological growth and a portion of the harvest of our summer crops and rice. During the second quarter, as most of our crops are harvested and the sugarcane harvest season starts, we expect to record the highest Adjusted EBITDA. During the third quarter, Adjusted EBITDA will primarily reflect the results of the Sugar, Ethanol and Energy business. This is the period when the sugar content of cane reaches its highest levels. Lastly, during the fourth quarte r Adjusted EBITDA would reflect the conclusion of the sugarcane harvest season, the harvest of our winter crops and the biological growth of our planted summer crops and rice. Market Overview Unfavorable climatic conditions during the development of the US crop planting had a significant impact across agricultural commodity prices. With tight inventories and growing demand for many commodities, corn prices led the way up during the second half of May 2011. USDA’s Grain Stock data reported corn sto cks on June 2011, at only 3.67 billion bushels, 15% below June 2010 stocks, but well above market estimates. Acreage report was also bearish for corn as it showed plantings of 92.3 million acres, up 1.6 million from June’s WASDE. During the second quarter, strong physical demand for sugar and logistical bottlenecks, led to a tight supply and demand scenario. The situation was exacerbated by the late start of the Brazilian harvest as well as concerns about the country’s fin al production number, which caused a strong upside reaction in both sugar and ethanol prices. Strategy Execution The construction of our fourth rice mill located in Santa Fe, Argentina, is advancing as planned. Assembly of storage silos and drying facilities has been completed during the first quarter. As of June 30, 2011, the mill has received, dried and stored 26.7K tons of rough rice produced at the San Joaquin farm. During 2Q11 we started assembling milling quipment. Rice milling operations began i n August 2011. |
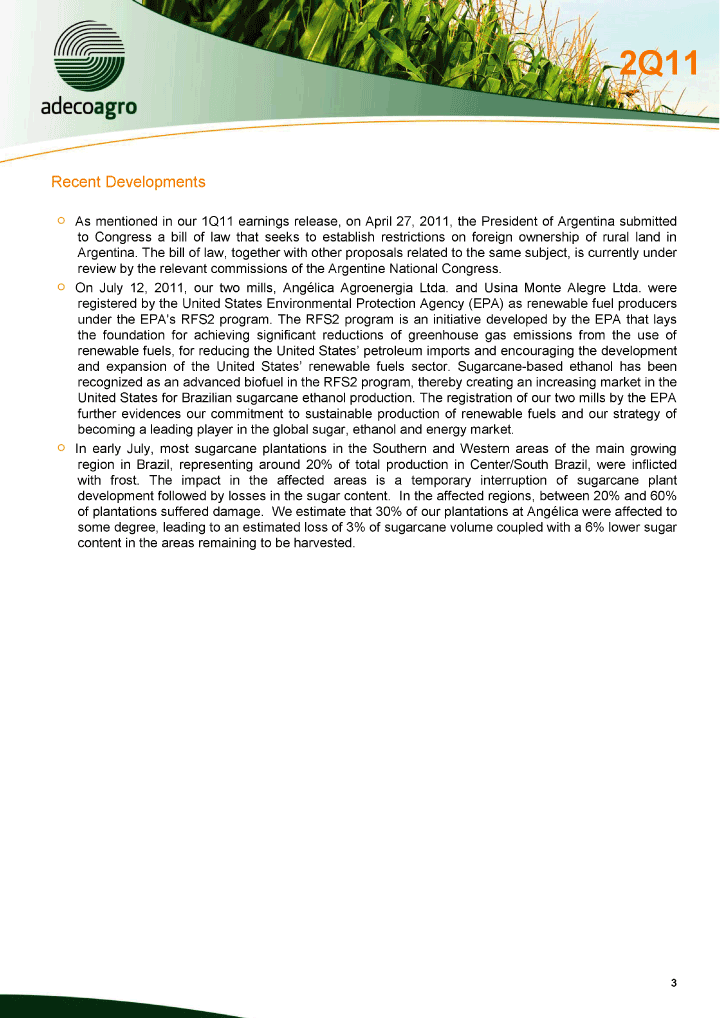
| Our Sugar, Ethanol and Energy expansion plan is moving forward on schedule. On June 27, 2011, our subsidiary, Ivinhema Agroenergia, obtained the necessary environmental license to start the construction and assembly of the Ivinhnema mill in the State of Mato Grosso do Sul, Brazil. On August 4, 2011, we held the ground breaking ceremony celebrating the commencement of the construction of the mill. Mr. Andre Puccinelli, Governor of Mato Grosso do S ul, and other government officials, participated in the ceremony, demonstrating the support of the state government. We expect the Ivinhema mill to start milling operations during the first half of 2013, reaching 2.0 million tons of nominal crushing capacity during that year, and gradually increasing capacity up to 6.3 million tons by 2017. Recent Developments As mentioned in our 1Q11 earnings release, on April 27, 2011, the President of Argentina submitted to Congress a bill of law that seek s to establish restrictions on foreign ownership of rural land in Argentina. The bill of law, together with other proposals related to the same subject, is currently under review by the relevant commissions of the Argentine National Congress. On July 12, 2011, our two mills, Angélica Agroenergia Ltda. and Usina Monte Alegre Ltda. were registered by the United States Environmental Protection Agency (EPA) as renewable fuel producers under the EPA’s RFS2 program. The RFS2 program is an init iative developed by the EPA that lays the foundation for achieving significant reductions of greenhouse gas emissions from the use of renewable fuels, for reducing the United States’ petroleum imports and encouraging the development and expansion of the United States’ renewable fuels sector. Sugarcane-based ethanol has been recognized as an advanced biofuel in the RFS2 program, thereby creating an increasing market in the United States for Brazilian sugarcane ethanol production. The registration o f our two mills by the EPA further evidences our commitment to sustainable production of renewable fuels and our strategy of becoming a leading player in the global sugar, ethanol and energy market. In early July, most sugarcane plantations in the Southern and Western areas of the main growing region in Brazil, representing around 20% of total production in Center/South Brazil, were inflicted with frost. The impact in the affected areas is a temporary interruption of sugarcane plant development followed by losses in the sugar content. In the affected regions, between 20% and 60% of plantations suffered damage. We estimate that 30% of our plantations at Angélica were affected to some degree, leading to an estimated loss of 3% of sugarcane volume coupled with a 6% lower sugar content in the areas remaining to be harvested. |
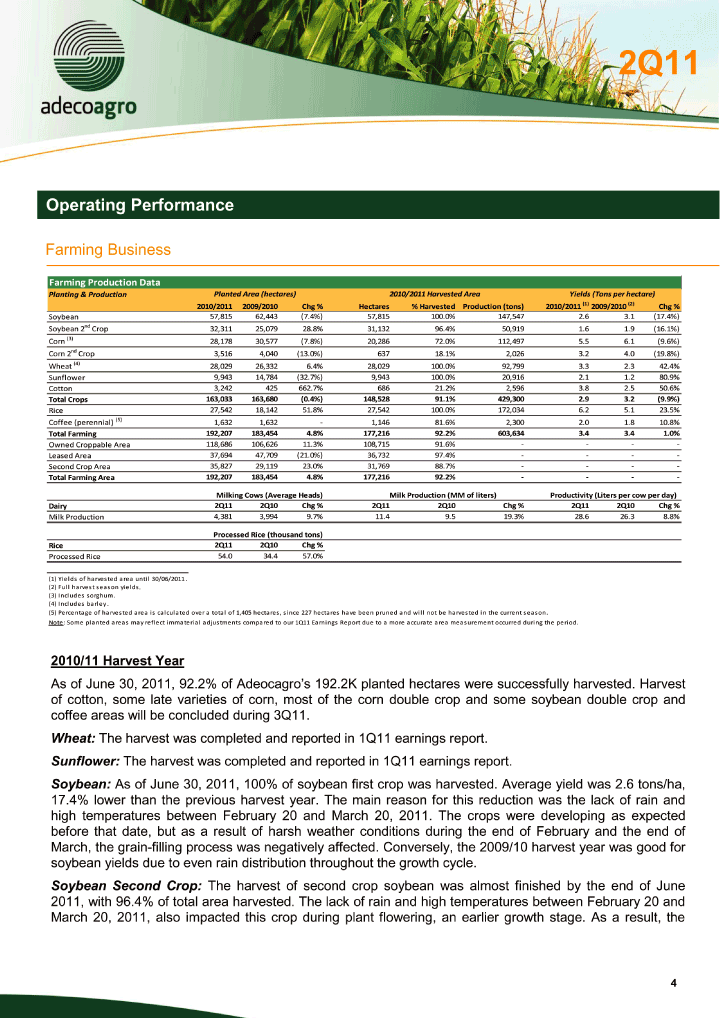
| Operating Performance Farming Business Farming Production Data Planting & Production Planted Area (hectares) 2010/ 2011 Harvested Area Yields (Tons per hectare) 2010/2011 2009/2010 Chg % Hectares % Harvested Production (tons) 2010/2011 (1) 2009/2010 (2) Chg % Soybean 57,815 62,443 (7.4%) 57,815 100.0% 147,547 2.6 3.1 (17.4%) Soybean 2nd Crop 32,311 25,079 28.8% 31,132 96.4% 50,919 1.6 1.9 (16.1%) Corn (3) 28,178 30,577 (7.8%) 20,28 6 72.0% 112,497 5.5 6.1 (9.6%) Corn 2nd Crop 3,516 4,040 (13.0%) 637 18.1% 2,026 3.2 4.0 (19.8%) Wheat (4) 28,029 26,332 6.4% 28,029 100.0% 92,799 3.3 2.3 42.4% Sunflower 9,943 14,784 (32.7%) 9,943 100.0% 20,916 2.1 1.2 80.9% Cotton 3,242 425 662.7% 686 21.2% 2,596 3.8 2.5 50.6% Total Crops 163,033 163,680 (0.4%) 148,528 91.1% 429,300 2.9 3.2 (9.9%) Rice 27,542 18,142 51.8% 27,542 100.0% 172,034 6.2 5.1 23.5% Coffee (perennial) (5) 1,632 1,632 — 1,146 81.6% 2,300 2.0 1.8 10.8% Total Farming 1 92,207 183,454 4.8% 177,216 92.2% 603,634 3.4 3.4 1.0% Owned Croppable Area 118,686 106,626 11.3% 108,715 91.6% — - — -Leased Area 37,694 47,709 (21.0%) 36,732 97.4% — - — -Second Crop Area 35,827 29,119 23.0% 31,769 88.7% — - — - Total Farming Area 192,207 183,454 4.8% 177,216 92.2% — - — - Milking Cows (Average Heads) Milk Production (MM of liters) Productivity (Liters per cow per day) Dairy 2Q11 2Q10 Chg % 2Q11 2Q10 Chg % 2Q11 2Q10 Chg % Milk Production 4,381 3,994 9.7% 11.4 9.5 19.3% 28.6 26.3 8.8% Processed Rice (thousand tons) Rice 2Q11 2Q10 Chg % Processed Rice 54.0 34.4 57.0% (1) Yields of harvested area until 30/ 06/ 2011 (2) Full harvest season yields (3) Includes sorghum (4) Includes barley (5) Percentage of harvested area is calculated over a total of 1,405 hectares, since 227 hectares have been pruned and will not be harvested in the current season Note: Some planted areas may reflect immaterial adjustments compared to our 1Q11 Earn ings Report due to a more accurate area measurement occurred during the period. 2010/11 Harvest Year As of June 30, 2011, 92.2% of Adeocagro’s 192.2K planted hectares were successfully harvested. Harvest of cotton, some late varieties of corn, most of the corn double crop and some soybean double crop and coffee areas will be concluded during 3Q11. Wheat: The harvest was completed and reported in 1Q11 earnings report. Sunflower: The harvest was completed and reported in 1Q11 earnings report. Soybea n: As of June 30, 2011, 100% of soybean first crop was harvested. Average yield was 2.6 tons/ha, 17.4% lower than the previous harvest year. The main reason for this reduction was the lack of rain and high temperatures between February 20 and March 20, 2011. The crops were developing as expected before that date, but as a result of harsh weather conditions during the end of February and the end of March, the grain-filling process was negatively affected. Conversely, the 2009/10 harvest year w as good for soybean yields due to even rain distribution throughout the growth cycle. Soybean Second Crop: The harvest of second crop soybean was almost finished by the end of June 2011, with 96.4% of total area harvested. The lack of rain and high temperatures between February 20 and March 20, 2011, also impacted this crop during plant flowering, an earlier growth stage. As a result, the |
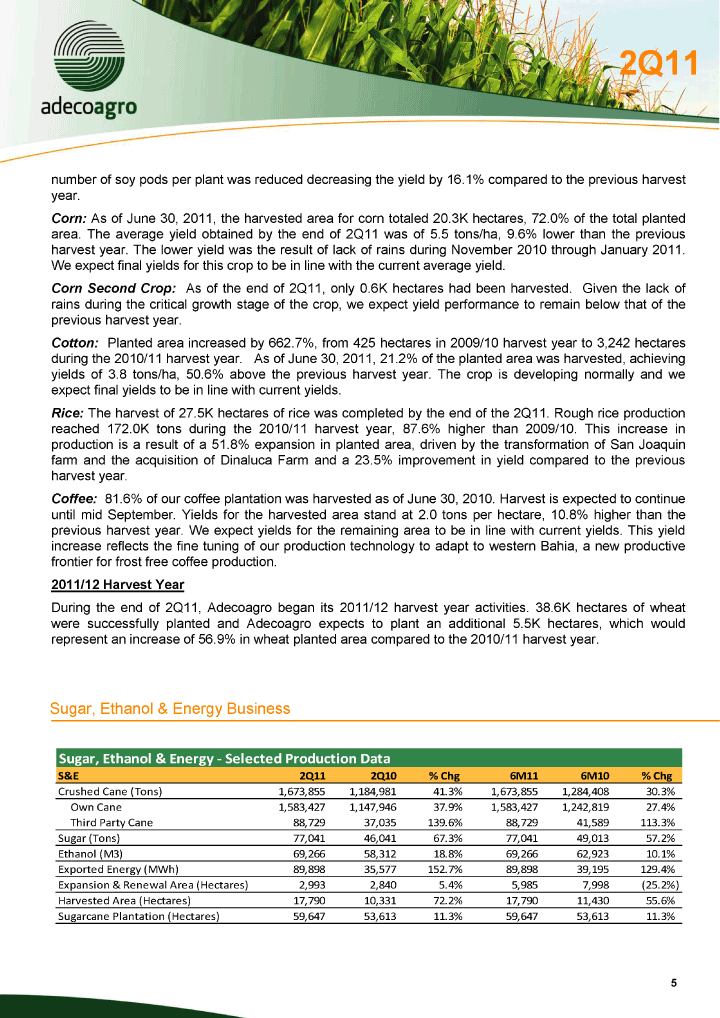
| number of soy pods per plant was reduced decreasing the yield by 16.1% compared to the previous harvest year. Corn: As of June 30, 2011, the harvested area for corn totaled 20.3K hectares, 72.0% of the total planted area. The average yield obtained by the end of 2Q11 was of 5.5 tons/ha, 9.6% lower than the previous harvest year. The lower yield was the result of lack of rains during November 2010 through January 2011. We expect final yields for t his crop to be in line with the current average yield. Corn Second Crop: As of the end of 2Q11, only 0.6K hectares had been harvested. Given the lack of rains during the critical growth stage of the crop, we expect yield performance to remain below that of the previous harvest year. Cotton: Planted area increased by 662.7%, from 425 hectares in 2009/10 harvest year to 3,242 hectares during the 2010/11 harvest year. As of June 30, 2011, 21.2% of the planted area was harvested, achieving yields of 3.8 to ns/ha, 50.6% above the previous harvest year. The crop is developing normally and we expect final yields to be in line with current yields. Rice: The harvest of 27.5K hectares of rice was completed by the end of the 2Q11. Rough rice production reached 172.0K tons during the 2010/11 harvest year, 87.6% higher than 2009/10. This increase in production is a result of a 51.8% expansion in planted area, driven by the transformation of San Joaquin farm and the acquisition of Dinaluca Farm and a 23.5% improvement in yield compared to the previous harvest year. Coffee: 81.6% of our coffee plantation was harvested as of June 30, 2010. Harvest is expected to continue until mid September. Yields for the harvested area stand at 2.0 tons per hectare, 10.8% higher than the previous harvest year. We expect yields for the remaining area to be in line with current yields. This yield increase reflects the fine tuning of our production technology to adapt to western Bahia, a new productive frontier for frost free coffee pr oduction. 2011/12 Harvest Year During the end of 2Q11, Adecoagro began its 2011/12 harvest year activities. 38.6K hectares of wheat were successfully planted and Adecoagro expects to plant an additional 5.5K hectares, which would represent an increase of 56.9% in wheat planted area compared to the 2010/11 harvest year. Sugar, Ethanol & Energy Business Sugar, Ethanol & Energy — Selected Production Data S&E 2Q11 2Q10 % Chg 6M11 6M10 % Chg Crushed Cane (Tons) 1,673,855 1,184,981 41.3% 1,673 ,855 1,284,408 30.3% Own Cane 1,583,427 1,147,946 37.9% 1,583,427 1,242,819 27.4% Third Party Cane 88,729 37,035 139.6% 88,729 41,589 113.3% Sugar (Tons) 77,041 46,041 67.3% 77,041 49,013 57.2% Ethanol (M3) 69,266 58,312 18.8% 69,266 62,923 10.1% Exported Energy (MWh) 89,898 35,577 152.7% 89,898 39,195 129.4% Expansion & Renewal Area (Hectares) 2,993 2,840 5.4% 5,985 7,998 (25.2%) Harvested Area (Hectares) 17,790 10,331 72.2% 17,790 11,430 55.6% Sugarcane Plantation (Hectares) 59,647 53,613 11.3% 59,64 7 53,613 11.3% |
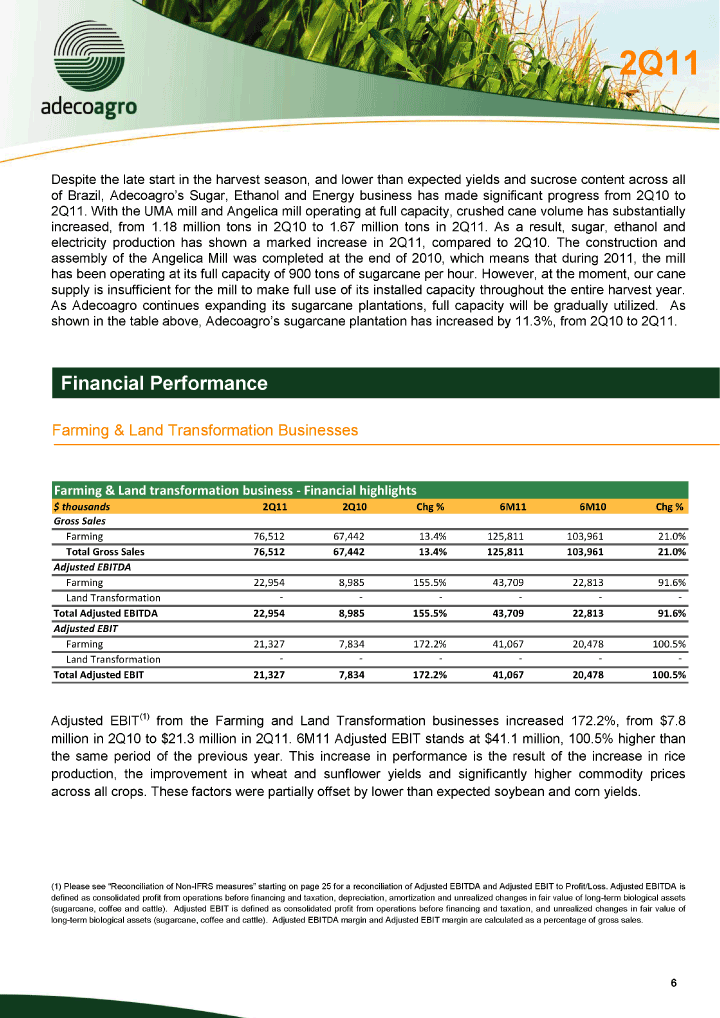
| Despite the late start in the harvest season, and lower than expected yields and sucrose content across all of Brazil, Adecoagro’s Sugar, Ethanol and Energy business has made significant progress from 2Q10 to 2Q11. With the UMA mill and Angelica mill operating at full capacity, crushed cane volume has substantially increased, from 1.18 million tons in 2Q10 to 1.67 million tons in 2Q11. As a result, sugar, ethanol and electricity production has sh own a marked increase in 2Q11, compared to 2Q10. The construction and assembly of the Angelica Mill was completed at the end of 2010, which means that during 2011, the mill has been operating at its full capacity of 900 tons of sugarcane per hour. However, at the moment, our cane supply is insufficient for the mill to make full use of its installed capacity throughout the entire harvest year. As Adecoagro continues expanding its sugarcane plantations, full capacity will be gradually utilized. As shown in th e table above, Adecoagro’s sugarcane plantation has increased by 11.3%, from 2Q10 to 2Q11. Financial Performance Farming & Land Transformation Businesses Farming & Land transformation business — Financial highlights $ thousands 2Q11 2Q10 Chg % 6M11 6M10 Chg % Gross Sales Farming 76,512 67,442 13.4% 125,811 103,961 21.0% Total Gross Sales 76,512 67,442 13.4% 125,811 103,961 21.0% Adjusted EBITDA Farming 22,954 8,985 155.5% 43,709 22,813 91.6% Land Transformation — - — - — - Total Adjusted EBITDA 22,954 8,985 155.5% 43,709 22,813 91.6% Adjusted EBIT Farming 21,327 7,834 172.2% 41,067 20,478 100.5% Land Transformation — - — - — - Total Adjusted EBIT 21,327 7,834 172.2% 41,067 20,478 100.5% Adjusted EBIT(1) from the Farming and Land Transformation businesses increased 172.2%, from $7.8 million in 2Q10 to $21.3 million in 2Q11. 6M11 Adjusted EBIT stands at $41.1 million, 100.5% higher than the same period of the previous year. This increase in perfor mance is the result of the increase in rice production, the improvement in wheat and sunflower yields and significantly higher commodity prices across all crops. These factors were partially offset by lower than expected soybean and corn yields. (1) Please see “Reconciliation of Non-IFRS measures” starting on page 25 for a reconciliation of Adjusted EBITDA and Adjusted EBIT to Profit/Loss. Adjusted EBITDA is defined as consolidated profit from operations before financing and taxation, depreci ation, amortization and unrealized changes in fair value of long-term biological assets (sugarcane, coffee and cattle). Adjusted EBIT is defined as consolidated profit from operations before financing and taxation, and unrealized changes in fair value of long-term biological assets (sugarcane, coffee and cattle). Adjusted EBITDA margin and Adjusted EBIT margin are calculated as a percentage of gross sales. |
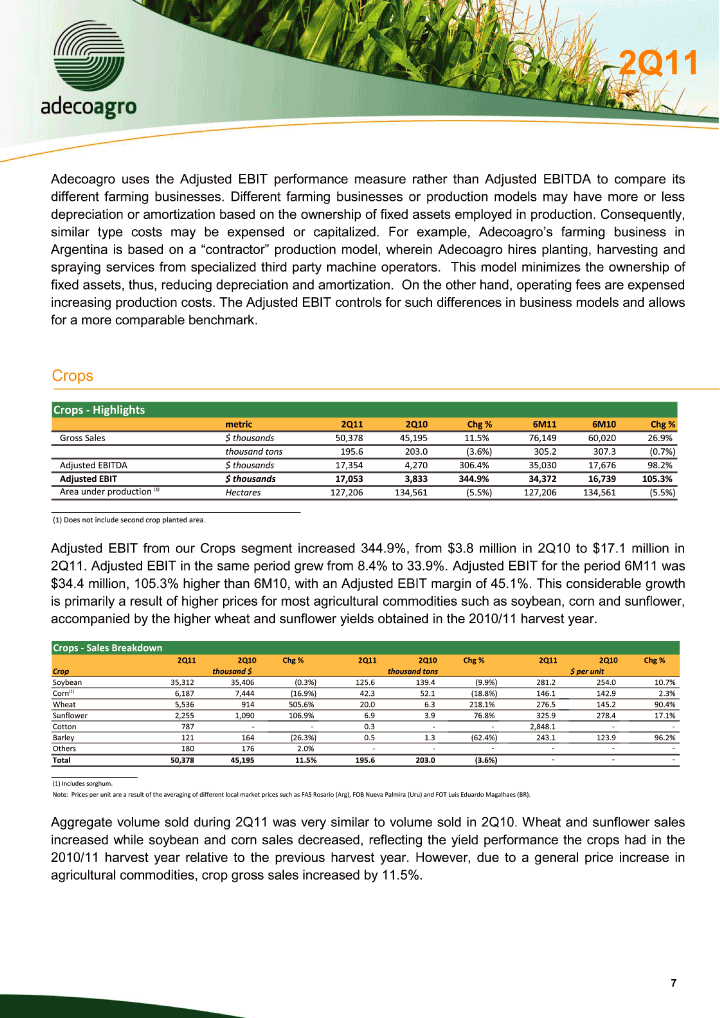
| Adecoagro uses the Adjusted EBIT performance measure rather than Adjusted EBITDA to compare its different farming businesses. Different farming businesses or production models may have more or less depreciation or amortization based on the ownership of fixed assets employed in production. Consequently, similar type costs may be expensed or capitalized. For example, Adecoagro’s farming business in Argentina is based on a “contractor” production mo del, wherein Adecoagro hires planting, harvesting and spraying services from specialized third party machine operators. This model minimizes the ownership of fixed assets, thus, reducing depreciation and amortization. On the other hand, operating fees are expensed increasing production costs. The Adjusted EBIT controls for such differences in business models and allows for a more comparable benchmark. Crops Crops — Highlights metric 2Q11 2Q10 Chg % 6M11 6M10 Chg % Gross Sales $ thousands 50,378 45,195 11.5% 76,149 60,020 26.9% thousand tons 195.6 203.0 (3.6%) 305.2 307.3 (0.7%) Adjusted EBITDA $ thousands 17,354 4,270 306.4% 35,030 17,676 98.2% Adjusted EBIT $ thousands 17,053 3,833 344.9% 34,372 16,739 105.3% Area under production (1) Hectares 127,206 134,561 (5.5%) 127,206 134,561 (5.5%) (1) Does not include second crop planted area Adjusted EBIT from our Crops segment increased 344.9%, from $3.8 million in 2Q10 to $17.1 million in 2Q11. Adjusted EBIT in the same period grew from 8. 4% to 33.9%. Adjusted EBIT for the period 6M11 was $34.4 million, 105.3% higher than 6M10, with an Adjusted EBIT margin of 45.1%. This considerable growth is primarily a result of higher prices for most agricultural commodities such as soybean, corn and sunflower, accompanied by the higher wheat and sunflower yields obtained in the 2010/11 harvest year. Crops — Sales Breakdown 2Q11 2Q10 Chg % 2Q11 2Q10 Chg % 2Q11 2Q10 Chg % Crop thousand $ thousand tons $ per unit Soybean 35,312 35,406 (0.3%) 125.6 139.4 (9.9%) 281.2 254.0 10.7% Corn(1) 6,187 7,444 (16.9%) 42.3 52.1 (18.8%) 146.1 142.9 2.3% Wheat 5,536 914 505.6% 20.0 6.3 218.1% 276.5 145.2 90.4% Sunflower 2,255 1,090 106.9% 6.9 3.9 76.8% 325.9 278.4 17.1% Cotton 787 — - 0.3 — - 2,848.1 — -Barley 121 164 (26.3%) 0.5 1.3 (62.4%) 243.1 123.9 96.2% Others 180 176 2.0% — - — - — - Total 50,378 45,195 11.5% 195.6 203.0 (3.6%) — - — (1) Includes sorghum. Note: Prices per unit are a result of the aver aging of different local market prices such as FAS Rosario (Arg), FOB Nueva Palmira (Uru) and FOT Luis Eduardo Magalhaes (BR). Aggregate volume sold during 2Q11 was very similar to volume sold in 2Q10. Wheat and sunflower sales increased while soybean and corn sales decreased, reflecting the yield performance the crops had in the 2010/11 harvest year relative to the previous harvest year. However, due to a general price increase in agricultural commodities, crop gross sales increased by 11.5%. |
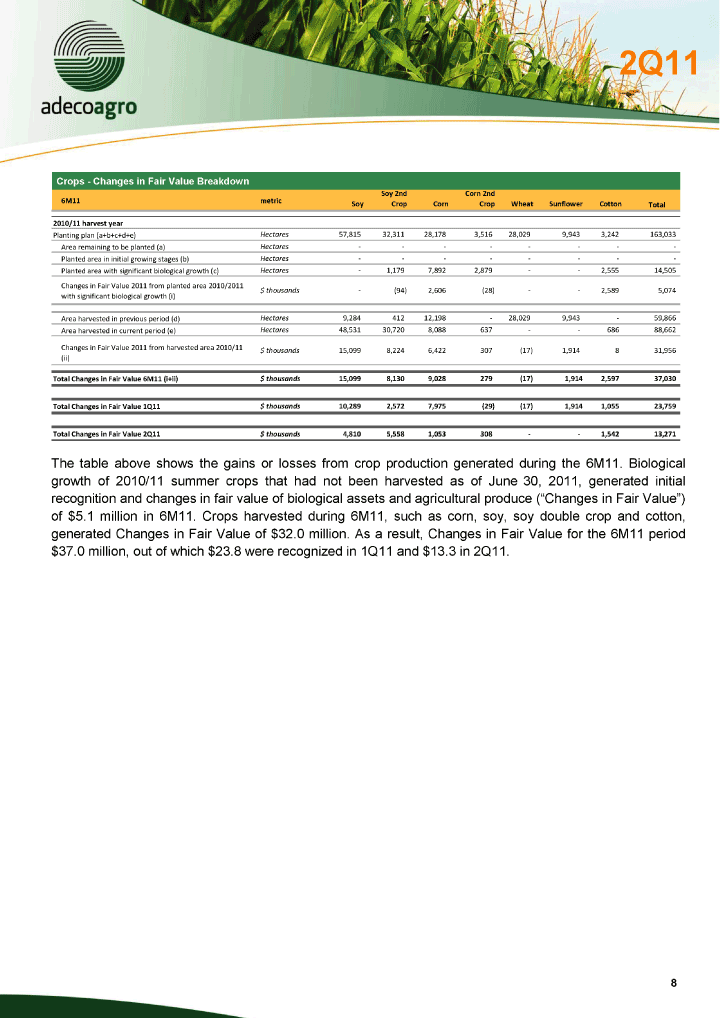
| Crops — Changes in Fair Value Breakdown Soy 2nd Corn 2nd 6M11 metric Soy Crop Corn Crop Wheat Sunflower Cotton Total 2010/ 11 harvest year Planting plan (a+b+c+d+e) Hectares 57,815 32,311 28,178 3,516 28,029 9,943 3,242 163,033 Area remaining to be planted (a) Hectares — - — - — - — -Planted area in initial growing stages (b) Hectares — - — - — - — -Planted area with significant biologic al growth (c) Hectares — 1,179 7,892 2,879 — - 2,555 14,505 Changes in Fair Value 2011 from planted area 2010/2011 $ thousands — (94) 2,606 (28) — - 2,589 5,074 with significant biological growth (i) Area harvested in previous period (d) Hectares 9,284 412 12,198 — 28,029 9,943 — 59,866 Area harvested in current period (e) Hectares 48,531 30,720 8,088 637 — - 686 88,662 Changes in Fair Value 2011 from harvested area 2010/11 $ thousands 15,099 8,224 6,422 307 (17) 1,914 8 31,956 (ii) Total Changes in Fair Value 6M11 (i+ii) $ thousands 15,099 8,130 9,028 279 (17) 1,914 2,597 37,030 Total Changes in Fair Value 1Q11 $ thousands 10,289 2,572 7,975 (29) (17) 1,914 1,055 23,759 Total Changes in Fair Value 2Q11 $ thousands 4,810 5,558 1,053 308 — - 1,542 13,271 The table above shows the gains or losses from crop production generated during the 6M11. Biological growth of 2010/11 summer crops that had not been harvested as of June 30, 2011, generated initial recognition and changes in fair value of biological assets and agricultural produce (“Changes in Fair Value”) of $5.1 million in 6M11. Crops harvested during 6M11, such as corn, soy, soy double crop and cotton, generated Changes in Fair Value of $32.0 million. As a result, Changes in Fair Value for the 6M11 period $37.0 million, out of which $23.8 were recognized in 1Q11 and $13.3 in 2Q11. |
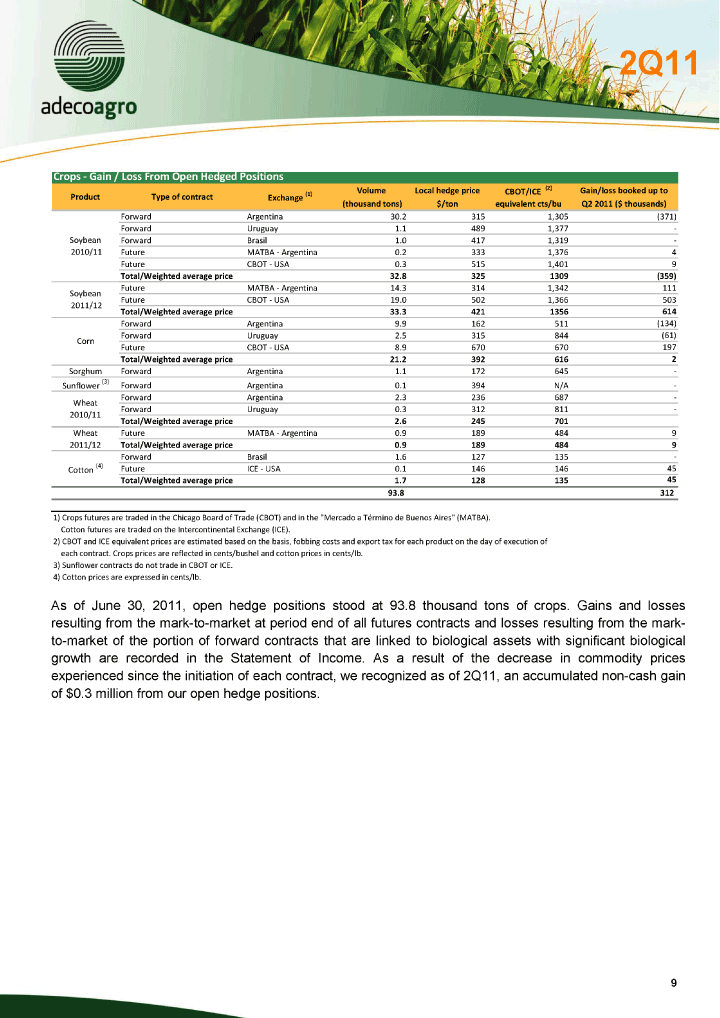
| Crops — Gain / Loss From Open Hedged Positions Volume Local hedge price CBOT/ ICE (2) Gain/ loss booked up to Product Type of contract Exchange (1) (thousand tons) $/ ton equivalent cts/ bu Q2 2011 ($ thousands) Forward Argentina 30.2 315 1,305 (371) Forward Uruguay 1.1 489 1,377 — Soybean Forward Brasil 1.0 417 1,319 — 2010/11 Future MATBA — Argentina 0.2 333 1,376 4 Future CBOT — USA 0.3 515 1,401 9 Total/ Weighted average p rice 32.8 325 1309 (359) Future MATBA — Argentina 14.3 314 1,342 111 Soybean Future CBOT — USA 19.0 502 1,366 503 2011/12 Total/ Weighted average price 33.3 421 1356 614 Forward Argentina 9.9 162 511 (134) Forward Uruguay 2.5 315 844 (61) Corn Future CBOT — USA 8.9 670 670 197 Total/ Weighted average price 21.2 392 616 2 Sorghum Forward Argentina 1.1 172 645 — Sunflower (3) Forward Argentina 0.1 394 N/A — Forward Argentina 2.3 236 687 — Wheat Forward Urugua y 0.3 312 811 — 2010/11 Total/ Weighted average price 2.6 245 701 Wheat Future MATBA — Argentina 0.9 189 484 9 2011/12 Total/ Weighted average price 0.9 189 484 9 Forward Brasil 1.6 127 135 — Cotton (4) Future ICE — USA 0.1 146 146 45 Total/ Weighted average price 1.7 128 135 45 93.8 312 1) Crops futures are traded in the Chicago Board of Trade (CBOT) and in the “Mercado a Término de Buenos Aires” (MATBA). Cotton futures are traded on the Intercontinental Exchang e (ICE). 2) CBOT and ICE equivalent prices are estimated based on the basis, fobbing costs and export tax for each product on the day of execution of each contract. Crops prices are reflected in cents/bushel and cotton prices in cents/lb. 3) Sunflower contracts do not trade in CBOT or ICE. 4) Cotton prices are expressed in cents/lb. As of June 30, 2011, open hedge positions stood at 93.8 thousand tons of crops. Gains and losses resulting from the mark-to-market at period end of all futures contracts an d losses resulting from the mark-to-market of the portion of forward contracts that are linked to biological assets with significant biological growth are recorded in the Statement of Income. As a result of the decrease in commodity prices experienced since the initiation of each contract, we recognized as of 2Q11, an accumulated non-cash gain of $0.3 million from our open hedge positions. |
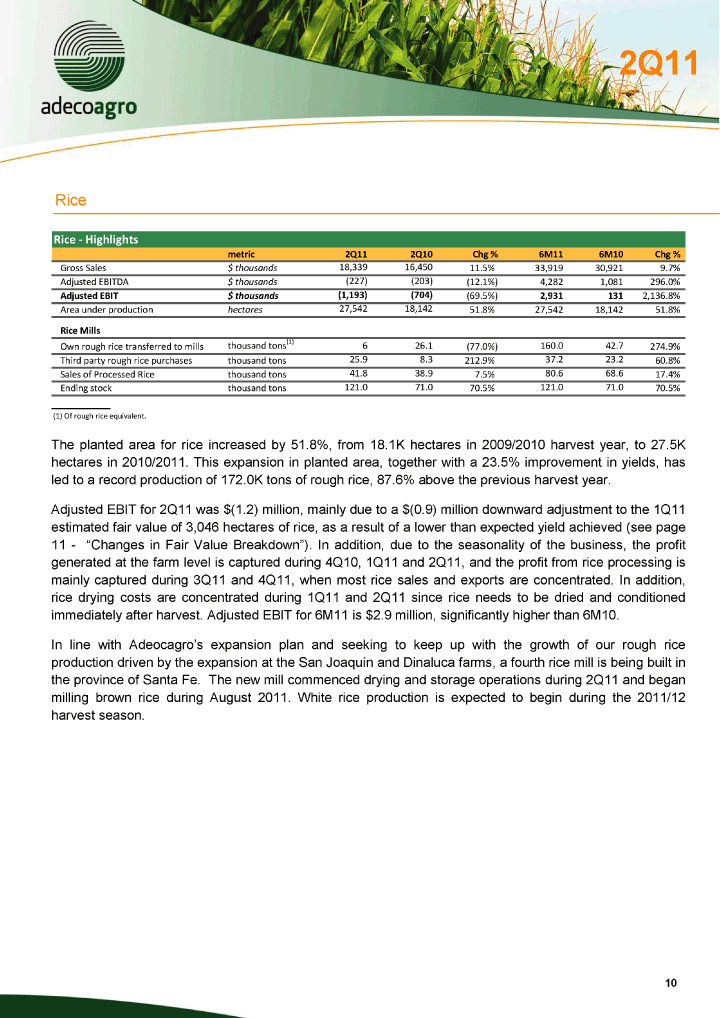
| Rice Rice — Highlights metric 2Q11 2Q10 Chg % 6M11 6M10 Chg % Gross Sales $ thousands 18,339 16,450 11.5% 33,919 30,921 9.7% Adjusted EBITDA $ thousands (227) (203) (12.1%) 4,282 1,081 296.0% Adjusted EBIT $ thousands (1,193) (704) (69.5%) 2,931 131 2,136.8% Area under production hectares 27,542 18,142 51.8% 27,542 18,142 51.8% Rice Mills Own rough rice transferred to mills thousand tons(1) 6 26.1 (77.0%) 160.0 42.7 274.9% Third party rough rice purchases thousand tons 25.9 8.3 212.9% 37.2 23.2 60.8% Sales of Processed Rice thousand tons 41.8 38.9 7.5% 80.6 68.6 17.4% Ending stock thousand tons 121.0 71.0 70.5% 121.0 71.0 70.5% (1) Of rough rice equivalent. The planted area for rice increased by 51.8%, from 18.1K hectares in 2009/2010 harvest year, to 27.5K hectares in 2010/2011. This expansion in planted area, together with a 23.5% improvement in yields, has led to a record production of 172.0K tons of rough rice, 87.6% above the previous harvest year. Adjusted EBIT for 2Q11 was $(1.2) million, mainly due to a $(0.9) million downward adjustment to the 1Q11 estimated fair value of 3,046 hectares of rice, as a result of a lower than expected yield achieved (see page 11 — “Changes in Fair Value Breakdown”). In addition, due to the seasonality of the business, the profit generated at the farm level is captured during 4Q10, 1Q11 and 2Q11, and the profit from rice processing is mainly captured during 3Q11 and 4Q11, when most rice sales and expor ts are concentrated. In addition, rice drying costs are concentrated during 1Q11 and 2Q11 since rice needs to be dried and conditioned immediately after harvest. Adjusted EBIT for 6M11 is $2.9 million, significantly higher than 6M10. In line with Adeocagro’s expansion plan and seeking to keep up with the growth of our rough rice production driven by the expansion at the San Joaquín and Dinaluca farms, a fourth rice mill is being built in the province of Santa Fe. The new mill commenced drying and storage operations during 2Q11 and began milling brown rice during August 2011. White rice production is expected to begin during the 2011/12 harvest season. |
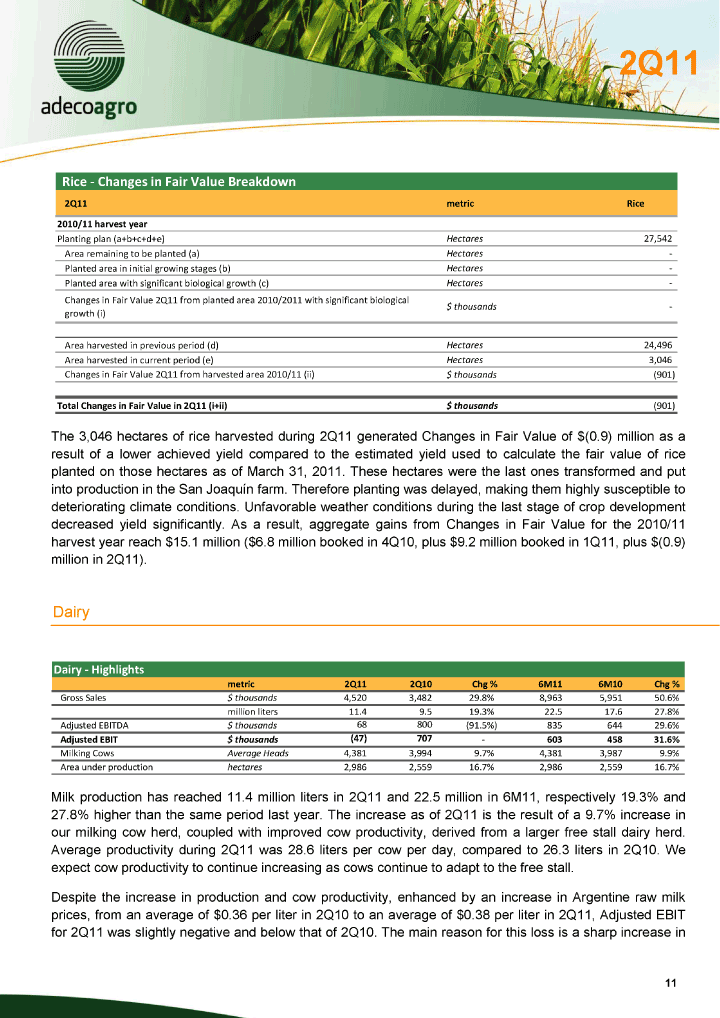
| Rice — Changes in Fair Value Breakdown 2Q11 metric Rice 2010/ 11 harvest year Planting plan (a+b+c+d+e) Hectares 27,542 Area remaining to be planted (a) Hectares -Planted area in initial growing stages (b) Hectares -Planted area with significant biological growth (c) Hectares -Changes in Fair Value 2Q11 from planted area 2010/2011 with significant biological $ thousands -growth (i) Area harvested in previous period ( d) Hectares 24,496 Area harvested in current period (e) Hectares 3,046 Changes in Fair Value 2Q11 from harvested area 2010/11 (ii) $ thousands (901) Total Changes in Fair Value in 2Q11 (i+ii) $ thousands (901) The 3,046 hectares of rice harvested during 2Q11 generated Changes in Fair Value of $(0.9) million as a result of a lower achieved yield compared to the estimated yield used to calculate the fair value of rice planted on those hectares as of March 31, 2011. These hectares were the last ones transformed and put into production in the San Joaquín farm. Therefore planting was delayed, making them highly susceptible to deteriorating climate conditions. Unfavorable weather conditions during the last stage of crop development decreased yield significantly. As a result, aggregate gains from Changes in Fair Value for the 2010/11 harvest year reach $15.1 million ($6.8 million booked in 4Q10, plus $9.2 million booked in 1Q11, plus $(0.9) million in 2Q11). Dairy Da iry — Highlights metric 2Q11 2Q10 Chg % 6M11 6M10 Chg % Gross Sales $ thousands 4,520 3,482 29.8% 8,963 5,951 50.6% million liters 11.4 9.5 19.3% 22.5 17.6 27.8% Adjusted EBITDA $ thousands 68 800 (91.5%) 835 644 29.6% Adjusted EBIT $ thousands (47) 707 — 603 458 31.6% Milking Cows Average Heads 4,381 3,994 9.7% 4,381 3,987 9.9% Area under production hectares 2,986 2,559 16.7% 2,986 2,559 16.7% Milk production has reached 11.4 million liters in 2Q11 and 22.5 million in 6M11, respect ively 19.3% and 27.8% higher than the same period last year. The increase as of 2Q11 is the result of a 9.7% increase in our milking cow herd, coupled with improved cow productivity, derived from a larger free stall dairy herd. Average productivity during 2Q11 was 28.6 liters per cow per day, compared to 26.3 liters in 2Q10. We expect cow productivity to continue increasing as cows continue to adapt to the free stall. Despite the increase in production and cow productivity, enhanced by an increase in Argent ine raw milk prices, from an average of $0.36 per liter in 2Q10 to an average of $0.38 per liter in 2Q11, Adjusted EBIT for 2Q11 was slightly negative and below that of 2Q10. The main reason for this loss is a sharp increase in |
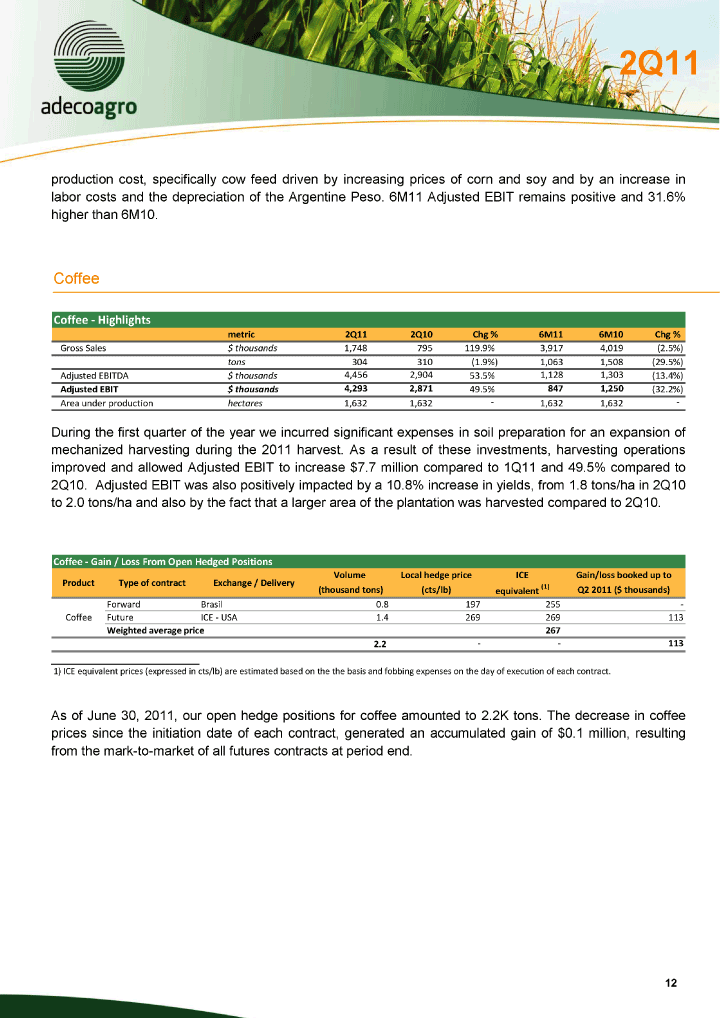
| production cost, specifically cow feed driven by increasing prices of corn and soy and by an increase in labor costs and the depreciation of the Argentine Peso. 6M11 Adjusted EBIT remains positive and 31.6% higher than 6M10. Coffee Coffee — Highlights metric 2Q11 2Q10 Chg % 6M11 6M10 Chg % Gross Sales $ thousands 1,748 795 119.9% 3,917 4,019 (2.5%) tons 304 310 (1.9%) 1,063 1,508 (29.5%) Adjusted EBITDA $ thousands 4,456 2,904 53.5% 1,128 1,303 (13.4%) Adj usted EBIT $ thousands 4,293 2,871 49.5% 847 1,250 (32.2%) Area under production hectares 1,632 1,632 — 1,632 1,632 — During the first quarter of the year we incurred significant expenses in soil preparation for an expansion of mechanized harvesting during the 2011 harvest. As a result of these investments, harvesting operations improved and allowed Adjusted EBIT to increase $7.7 million compared to 1Q11 and 49.5% compared to 2Q10. Adjusted EBIT was also positively impacted by a 10.8% increa se in yields, from 1.8 tons/ha in 2Q10 to 2.0 tons/ha and also by the fact that a larger area of the plantation was harvested compared to 2Q10. Coffee — Gain / Loss From Open Hedged Positions Volume Local hedge price ICE Gain/ loss booked up to Product Type of contract Exchange / Delivery (thousand tons) (cts/ lb) equivalent (1) Q2 2011 ($ thousands) Forward Brasil 0.8 197 255 — Coffee Future ICE — USA 1.4 269 269 113 Weighted average price 267 2.2 — - 113 1) ICE equivalent prices ( expressed in cts/lb) are estimated based on the the basis and fobbing expenses on the day of execution of each contract. As of June 30, 2011, our open hedge positions for coffee amounted to 2.2K tons. The decrease in coffee prices since the initiation date of each contract, generated an accumulated gain of $0.1 million, resulting from the mark-to-market of all futures contracts at period end. |
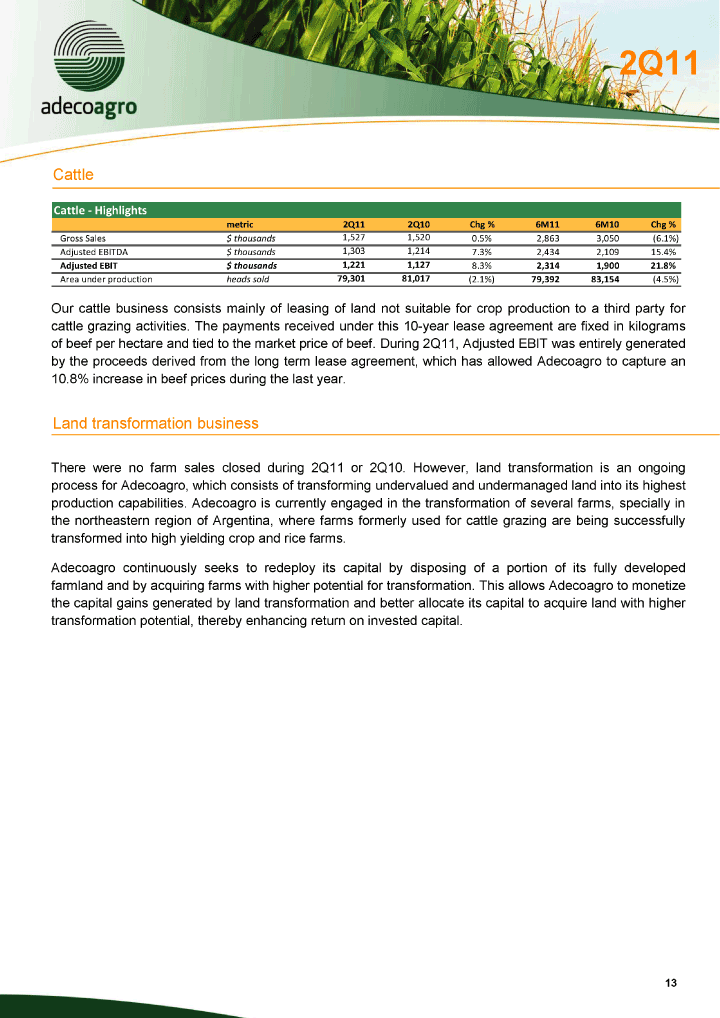
| Cattle Cattle — Highlights metric 2Q11 2Q10 Chg % 6M11 6M10 Chg % Gross Sales $ thousands 1,527 1,520 0.5% 2,863 3,050 (6.1%) Adjusted EBITDA $ thousands 1,303 1,214 7.3% 2,434 2,109 15.4% Adjusted EBIT $ thousands 1,221 1,127 8.3% 2,314 1,900 21.8% Area under production heads sold 79,301 81,017 (2.1%) 79,392 83,154 (4.5%) Our cattle business consists mainly of leasing of land not suitable for crop production to a third party for cattle grazing activities. The payments received under this 10-year lease agreement are fixed in kilograms of beef per hectare and tied to the market price of beef. During 2Q11, Adjusted EBIT was entirely generated by the proceeds derived from the long term lease agreement, which has allowed Adecoagro to capture an 10.8% increase in beef prices during the last year. Land transformation business There were no farm sales closed during 2Q11 or 2Q10. However, land transformation is an ongoing process for Adecoagro, which consists of tra nsforming undervalued and undermanaged land into its highest production capabilities. Adecoagro is currently engaged in the transformation of several farms, specially in the northeastern region of Argentina, where farms formerly used for cattle grazing are being successfully transformed into high yielding crop and rice farms. Adecoagro continuously seeks to redeploy its capital by disposing of a portion of its fully developed farmland and by acquiring farms with higher potential for transformation. This all ows Adecoagro to monetize the capital gains generated by land transformation and better allocate its capital to acquire land with higher transformation potential, thereby enhancing return on invested capital. |
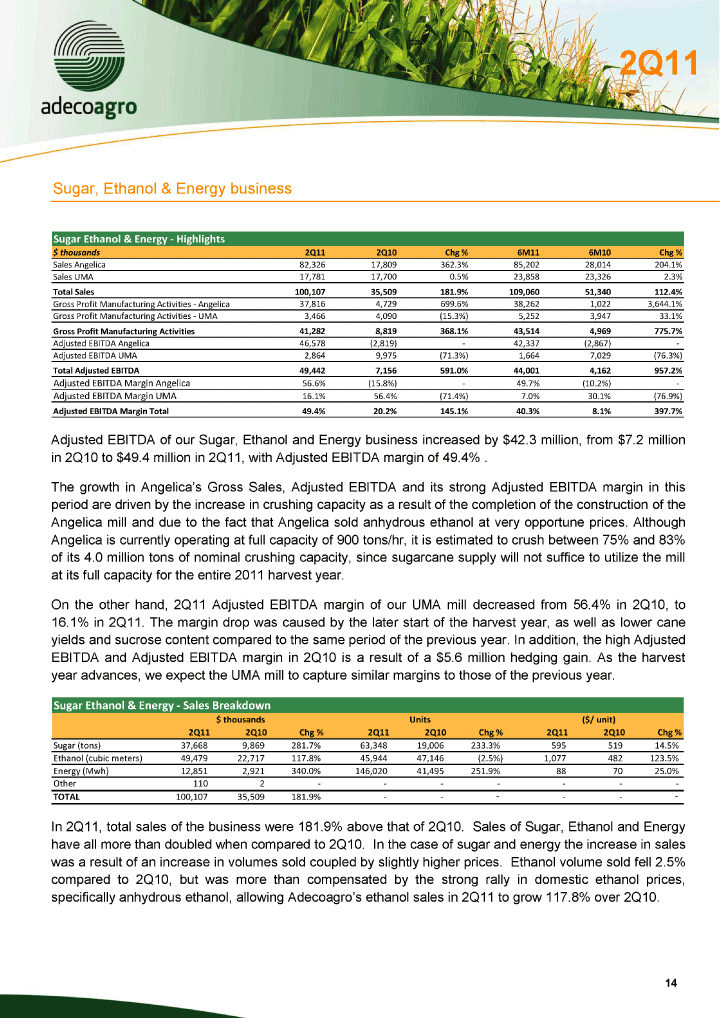
| Sugar, Ethanol & Energy business Sugar Ethanol & Energy — Highlights $ thousands 2Q11 2Q10 Chg % 6M11 6M10 Chg % Sales Angelica 82,326 17,809 362.3% 85,202 28,014 204.1% Sales UMA 17,781 17,700 0.5% 23,858 23,326 2.3% Total Sales 100,107 35,509 181.9% 109,060 51,340 112.4% Gross Profit Manufacturing Activities — Angelica 37,816 4,729 699.6% 38,262 1,022 3,644.1% Gross Profit Manufacturing Activities — UMA 3,466 4,090 (15.3%) 5,252 3,947 33.1% Gross Profit Manufacturing Activities 41,282 8,819 368.1% 43,514 4,969 775.7% Adjusted EBITDA Angelica 46,578 (2,819) — 42,337 (2,867) -Adjusted EBITDA UMA 2,864 9,975 (71.3%) 1,664 7,029 (76.3%) Total Adjusted EBITDA 49,442 7,156 591.0% 44,001 4,162 957.2% Adjusted EBITDA Margin Angelica 56.6% (15.8%) — 49.7% (10.2%) — Adjusted EBITDA Margin UMA 16.1% 56.4% (71.4%) 7.0% 30.1% (76.9%) Adjusted EBITDA Margin Total 49.4% 20.2% 145.1% 40.3% 8.1% 397.7% Adjusted EBITDA of our Sugar, Ethano l and Energy business increased by $42.3 million, from $7.2 million in 2Q10 to $49.4 million in 2Q11, with Adjusted EBITDA margin of 49.4%. The growth in Angelica’s Gross Sales, Adjusted EBITDA and its strong Adjusted EBITDA margin in this period are driven by the increase in crushing capacity as a result of the completion of the construction of the Angelica mill and due to the fact that Angelica sold anhydrous ethanol at very opportune prices. Although Angelica is currently operating at full capacity of 900 tons/hr, it is estimated to crush between 75% and 83% of its 4.0 million tons of nominal crushing capacity, since sugarcane supply will not suffice to utilize the mill at its full capacity for the entire 2011 harvest year. On the other hand, 2Q11 Adjusted EBITDA margin of our UMA mill decreased from 56.4% in 2Q10, to 16.1% in 2Q11. The margin drop was caused by the later start of the harvest year, as well as lower cane yields and sucrose content compared to the same period of the previous year. In addition, the high Adjusted EBITDA and Adjusted EBITDA margin in 2Q10 is a result of a $5.6 million hedging gain. As the harvest year advances, we expect the UMA mill to capture similar margins to those of the previous year. Sugar Ethanol & Energy — Sales Breakdown $ thousands Units ($/ unit) 2Q11 2Q10 Chg % 2Q11 2Q10 Chg % 2Q11 2Q10 Chg % Sugar (tons) 37,668 9,869 281.7% 63,348 19,006 233.3% 595 519 14.5% Ethanol (cubic meters) 49,479 22,717 117.8% 45,944 47,146 (2.5%) 1,077 482 123.5% Energy (Mwh) 12,851 2,921 340.0% 146,020 41,495 251.9% 88 70 25.0% Other 110 2 — - — - — - -TOTAL 100,107 35,509 181.9% — - — - — - In 2Q11, total sales of the business were 181.9% above that of 2Q10. Sales of Sugar, Ethanol and Energy have all more than doubled when compared to 2Q10. In the case of sugar and energy the increase in sales was a result of an increase in volumes sold coupled by slightly higher prices. Ethanol volume sold fell 2.5% compared to 2Q1 0, but was more than compensated by the strong rally in domestic ethanol prices, specifically anhydrous ethanol, allowing Adecoagro’s ethanol sales in 2Q11 to grow 117.8% over 2Q10. |
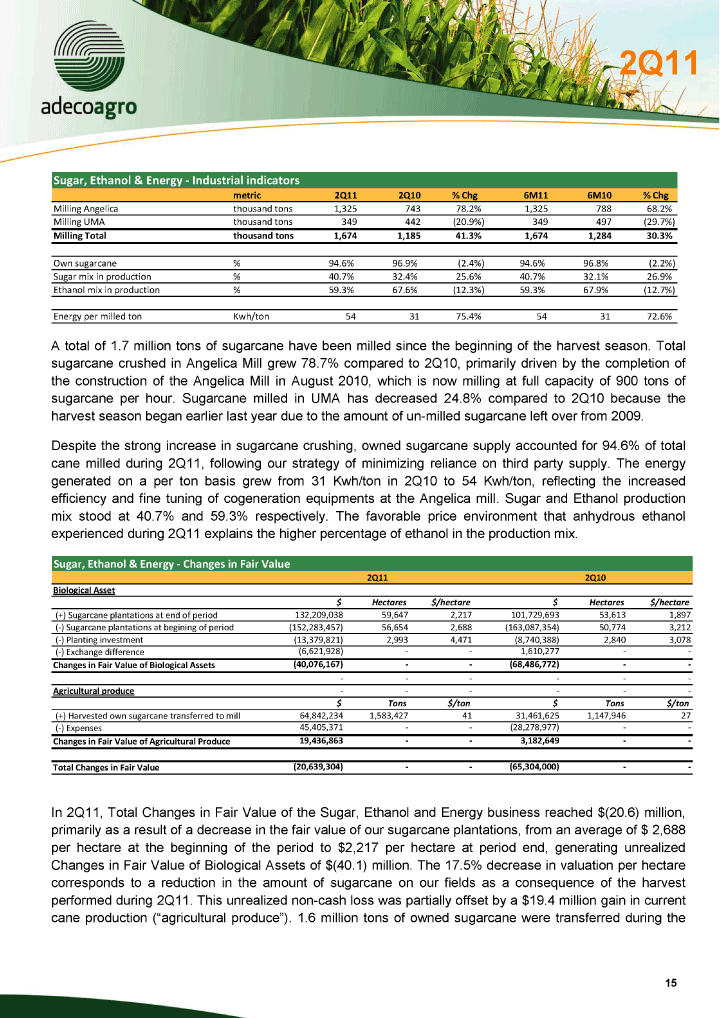
| Sugar, Ethanol & Energy — Industrial indicators metric 2Q11 2Q10 % Chg 6M11 6M10 % Chg Milling Angelica thousand tons 1,325 743 78.2% 1,325 788 68.2% Milling UMA thousand tons 349 442 (20.9%) 349 497 (29.7%) Milling Total thousand tons 1,674 1,185 41.3% 1,674 1,284 30.3% Own sugarcane % 94.6% 96.9% (2.4%) 94.6% 96.8% (2.2%) Sugar mix in production % 40.7% 32.4% 25.6% 40.7% 32.1% 26.9% Ethanol mix in production % 59.3% 67.6% (12.3%) 59.3% 67.9% (12.7%) Energy per milled ton Kwh/ton 54 31 75.4% 54 31 72.6% A total of 1.7 million tons of sugarcane have been milled since the beginning of the harvest season. Total sugarcane crushed in Angelica Mill grew 78.7% compared to 2Q10, primarily driven by the completion of the construction of the Angelica Mill in August 2010, which is now milling at full capacity of 900 tons of sugarcane per hour. Sugarcane milled in UMA has decreased 24.8% compared to 2Q10 because the harvest season began earlier last year due to the amount of un-milled sugarcane left over from 2009. Despite the strong increase in sugarcane crushing, owned sugarcane supply accounted for 94.6% of total cane milled during 2Q11, following our strategy of minimizing reliance on third party supply. The energy generated on a per ton basis grew from 31 Kwh/ton in 2Q10 to 54 Kwh/ton, reflecting the increased efficiency and fine tuning of cogeneration equipments at the Angelica mill. Sugar and Ethanol production mix stood at 40.7% and 59.3% respectiv ely. The favorable price environment that anhydrous ethanol experienced during 2Q11 explains the higher percentage of ethanol in the production mix. Sugar, Ethanol & Energy — Changes in Fair Value 2Q11 2Q10 Biological Asset $ Hectares $/ hectare $ Hectares $/ hectare (+) Sugarcane plantations at end of period 132,209,038 59,647 2,217 101,729,693 53,613 1,897 (-) Sugarcane plantations at begining of period (152,283,457) 56,654 2,688 (163,087,354) 50,774 3,212 (-) Planting investment (13,379,82 1) 2,993 4,471 (8,740,388) 2,840 3,078 (-) Exchange difference (6,621,928) — - 1,610,277 — - Changes in Fair Value of Biological Assets (40,076,167) — - (68,486,772) — - — - — - — - Agricultural produce — - — - — - $ Tons $/ ton $ Tons $/ ton (+) Harvested own sugarcane transferred to mill 64,842,234 1,583,427 41 31,461,625 1,147,946 27 (-) Expenses 45,405,371 — - (28,278,977) — - Changes in Fair Value of Agricultural Produce 19,436,863 — - 3,182,649 — - Total Changes in Fair Value (20,639,304) — - (65,304,000) — - In 2Q11, Total Changes in Fair Value of the Sugar, Ethanol and Energy business reached $(20.6) million, primarily as a result of a decrease in the fair value of our sugarcane plantations, from an average of $ 2,688 per hectare at the beginning of the period to $2,217 per hectare at period end, generating unrealized Changes in Fair Value of Biological Assets of $(40.1) million. The 17.5% decrease in valuation per h ectare corresponds to a reduction in the amount of sugarcane on our fields as a consequence of the harvest performed during 2Q11. This unrealized non-cash loss was partially offset by a $19.4 million gain in current cane production (“agricultural produce”). 1.6 million tons of owned sugarcane were transferred during the |
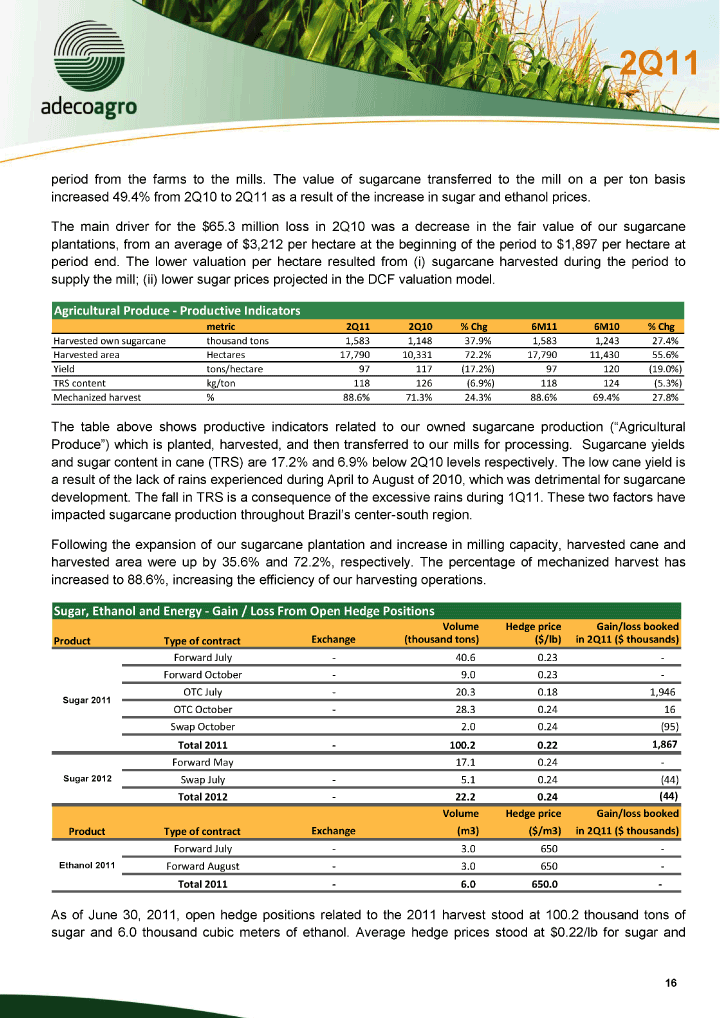
| period from the farms to the mills. The value of sugarcane transferred to the mill on a per ton basis increased 49.4% from 2Q10 to 2Q11 as a result of the increase in sugar and ethanol prices. The main driver for the $65.3 million loss in 2Q10 was a decrease in the fair value of our sugarcane plantations, from an average of $3,212 per hectare at the beginning of the period to $1,897 per hectare at period end. The lower valuation per hectare resulted from ( i) sugarcane harvested during the period to supply the mill; (ii) lower sugar prices projected in the DCF valuation model. Agricultural Produce — Productive Indicators metric 2Q11 2Q10 % Chg 6M11 6M10 % Chg Harvested own sugarcane thousand tons 1,583 1,148 37.9% 1,583 1,243 27.4% Harvested area Hectares 17,790 10,331 72.2% 17,790 11,430 55.6% Yield tons/hectare 97 117 (17.2%) 97 120 (19.0%) TRS content kg/ton 118 126 (6.9%) 118 124 (5.3%) Mechanized harvest % 88.6% 71.3% 24.3% 88.6% 69.4% 27. 8% The table above shows productive indicators related to our owned sugarcane production (“Agricultural Produce”) which is planted, harvested, and then transferred to our mills for processing. Sugarcane yields and sugar content in cane (TRS) are 17.2% and 6.9% below 2Q10 levels respectively. The low cane yield is a result of the lack of rains experienced during April to August of 2010, which was detrimental for sugarcane development. The fall in TRS is a consequence of the excessive rains dur ing 1Q11. These two factors have impacted sugarcane production throughout Brazil’s center-south region. Following the expansion of our sugarcane plantation and increase in milling capacity, harvested cane and harvested area were up by 35.6% and 72.2%, respectively. The percentage of mechanized harvest has increased to 88.6%, increasing the efficiency of our harvesting operations. Sugar, Ethanol and Energy — Gain / Loss From Open Hedge Positions Volume Hedge price Gain/ loss booked Product Type of contract Exchange (thousand tons) ($/ lb) in 2Q11 ($ thousands) Forward July — 40.6 0.23 -Forward October — 9.0 0.23 -OTC July — 20.3 0.18 1,946 Sugar 2011 OTC October — 28.3 0.24 16 Swap October 2.0 0.24 (95) Total 2011 — 100.2 0.22 1,867 Forward May 17.1 0.24 -Sugar 2012 Swap July — 5.1 0.24 (44) Total 2012 — 22.2 0.24 (44) Volume Hedge price Gain/ loss booked Product Type of contract Exchange (m3) ($/ m3) in 2Q11 ($ thousands) Forward July — 3.0 650 -Ethanol 2011 Forward August — 3.0 650 — Total 2011 — 6.0 650.0 — As of June 30, 2011, open hedge positions related to the 2011 harvest stood at 100.2 thousand tons of sugar and 6.0 thousand cubic meters of ethanol. Average hedge prices stood at $0.22/lb for sugar and |
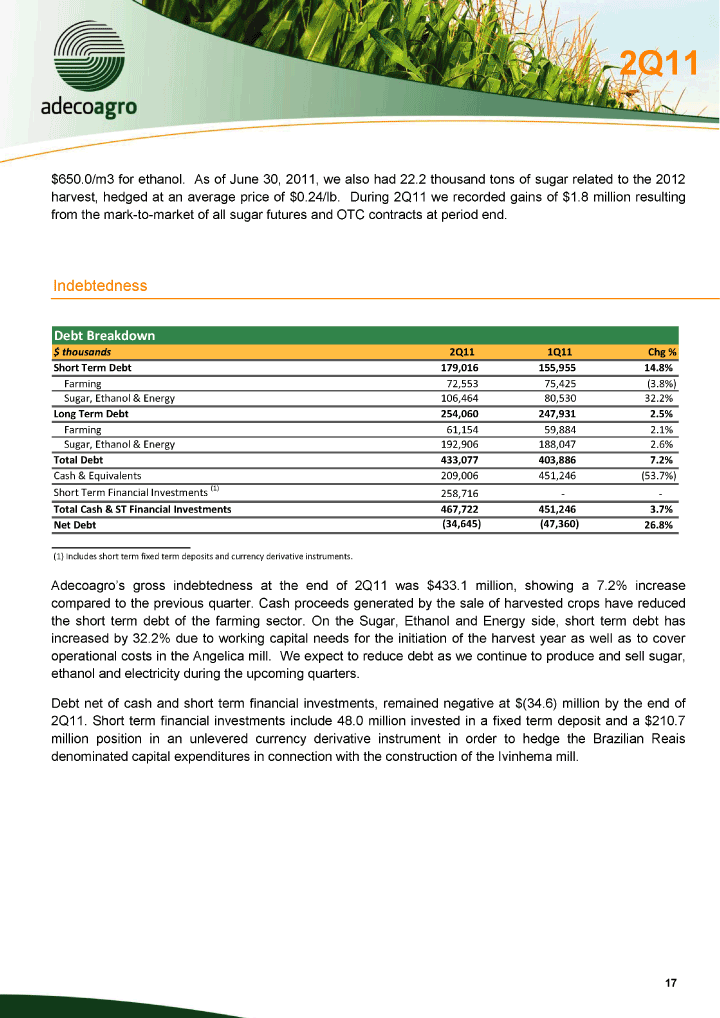
| $650.0/m3 for ethanol. As of June 30, 2011, we also had 22.2 thousand tons of sugar related to the 2012 harvest, hedged at an average price of $0.24/lb. During 2Q11 we recorded gains of $1.8 million resulting from the mark-to-market of all sugar futures and OTC contracts at period end. Indebtedness Debt Breakdown $ thousands 2Q11 1Q11 Chg % Short Term Debt 179,016 155,955 14.8% Farming 72,553 75,425 (3.8%) Sugar, Ethanol & Energy 106,464 80,530 3 2.2% Long Term Debt 254,060 247,931 2.5% Farming 61,154 59,884 2.1% Sugar, Ethanol & Energy 192,906 188,047 2.6% Total Debt 433,077 403,886 7.2% Cash & Equivalents 209,006 451,246 (53.7%) Short Term Financial Investments (1) 258,716 — - Total Cash & ST Financial Investments 467,722 451,246 3.7% Net Debt (34,645) (47,360) 26.8% (1) Includes short term fixed term deposits and currency derivative instruments. Adecoagro’s gross indebtedness at the end of 2Q11 was $433.1 m illion, showing a 7.2% increase compared to the previous quarter. Cash proceeds generated by the sale of harvested crops have reduced the short term debt of the farming sector. On the Sugar, Ethanol and Energy side, short term debt has increased by 32.2% due to working capital needs for the initiation of the harvest year as well as to cover operational costs in the Angelica mill. We expect to reduce debt as we continue to produce and sell sugar, ethanol and electricity during the upcoming quarters. Debt net of cash and short term financial investments, remained negative at $(34.6) million by the end of 2Q11. Short term financial investments include 48.0 million invested in a fixed term deposit and a $210.7 million position in an unlevered currency derivative instrument in order to hedge the Brazilian Reais denominated capital expenditures in connection with the construction of the Ivinhema mill. |
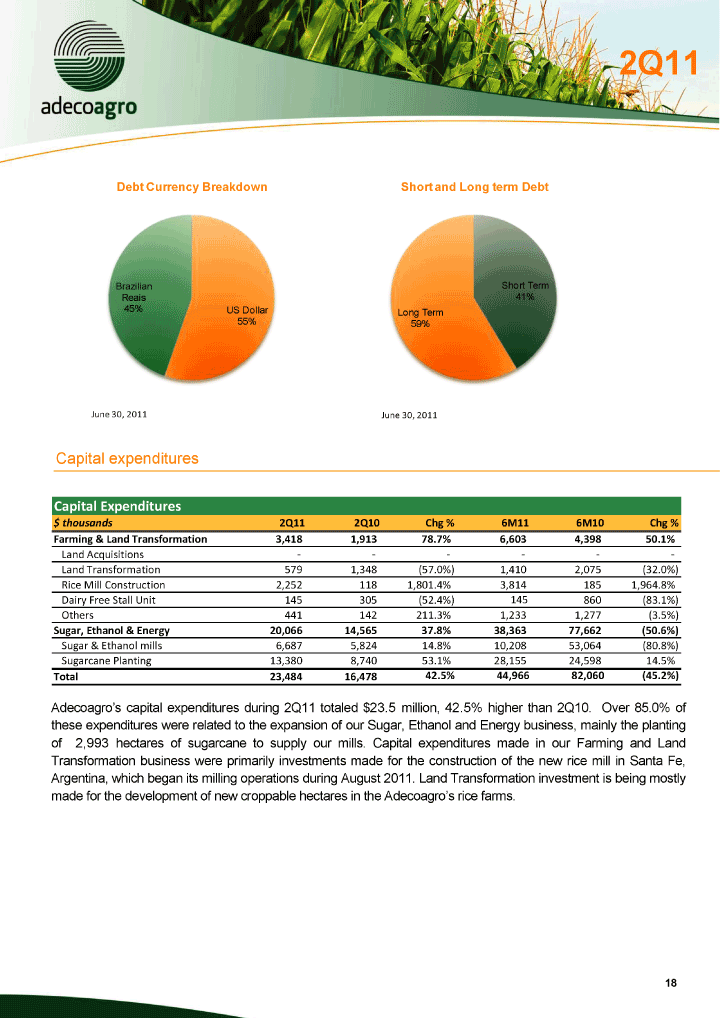
| Debt Currency Breakdown Short and Long term Debt Brazilian Short Term Reais 41% 45% US Dollar Long Term 55% 59% June 30, 2011 June30, 2011 Capital expenditures Capital Expenditures $ thousands 2Q11 2Q10 Chg % 6M11 6M10 Chg % Farming & Land Transformation 3,418 1,913 78.7% 6,603 4,398 50.1% Land Acquisitions — - — - — -Land Transformation 579 1,348 (57.0%) 1,410 2,075 (32.0%) Rice Mill Construction 2,252 118 1,801.4% 3,814 185 1,964.8% D airy Free Stall Unit 145 305 (52.4%) 145 860 (83.1%) Others 441 142 211.3% 1,233 1,277 (3.5%) Sugar, Ethanol & Energy 20,066 14,565 37.8% 38,363 77,662 (50.6%) Sugar & Ethanol mills 6,687 5,824 14.8% 10,208 53,064 (80.8%) Sugarcane Planting 13,380 8,740 53.1% 28,155 24,598 14.5% Total 23,484 16,478 42.5% 44,966 82,060 (45.2%) Adecoagro’s capital expenditures during 2Q11 totaled $23.5 million, 42.5% higher than 2Q10. Over 85.0% of these expenditures were related to the expansion of our Su gar, Ethanol and Energy business, mainly the planting of 2,993 hectares of sugarcane to supply our mills. Capital expenditures made in our Farming and Land Transformation business were primarily investments made for the construction of the new rice mill in Santa Fe, Argentina, which began its milling operations during August 2011. Land Transformation investment is being mostly made for the development of new croppable hectares in the Adecoagro’s rice farms. |
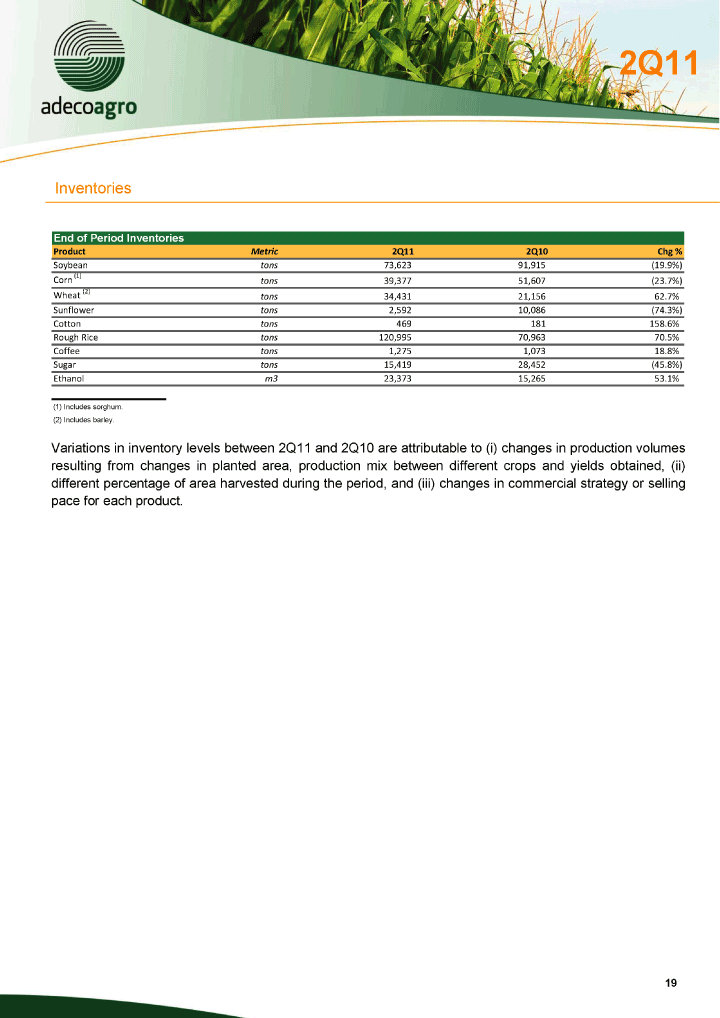
| Inventories End of Period Inventories Product Metric 2Q11 2Q10 Chg % Soybean tons 73,623 91,915 (19.9%) Corn (1) tons 39,377 51,607 (23.7%) Wheat (2) tons 34,431 21,156 62.7% Sunflower tons 2,592 10,086 (74.3%) Cotton tons 469 181 158.6% Rough Rice tons 120,995 70,963 70.5% Coffee tons 1,275 1,073 18.8% Sugar tons 15,419 28,452 (45.8%) Ethanol m3 23,373 15,265 53.1% (1) Includes sorghum. (2) Includes barley. Variations in inventory levels be tween 2Q11 and 2Q10 are attributable to (i) changes in production volumes resulting from changes in planted area, production mix between different crops and yields obtained, (ii) different percentage of area harvested during the period, and (iii) changes in commercial strategy or selling pace for each product. |
| Forward-looking Statements This press release contains forward-looking statements that are based on our current expectations, assumptions, estimates and projections about us and our industry. These forward-looking statements can be identified by words or phrases such as “anticipate,” “forecast”, “believe,” “continue,” “estimate,” “expect,” “intend,” “is/are likely to,” “may,” “plan,” “should,” “would,” or other similar expressions. The forward-looking statements included in this press release relate to, among others: (i) our business prospects and future results of operations; (ii) weather and other natural phenomena; (iii) developments in, or changes to, the laws, regulations and governmental policies governing our business, including limitations on ownership of farmland by foreign entities in certain jurisdictions in which we op erate, environmental laws and regulations; (iv) the implementation of our business strategy, including our development of the Ivinhema mill and other current projects; (v) our plans relating to acquisitions, joint ventures, strategic alliances or divestitures; (vi) the implementation of our financing strategy and capital expenditure plan; (vii) the maintenance of our relationships with customers; (viii) the competitive nature of the industries in which we operate; (ix) the cost and availability of financing; (x) future demand for the commodities we produce; (xi) international prices for commodities; (xii) the condition of our land holdings; (xiii) the development of the logistics and infrastructure for transportation of our products in the countries where we operate; (xiv) the performance of the South American and world economies; and (xv) the relative value of the Brazilian Real, the Argentine Peso, and the Uruguayan Peso compared to other currencie s; as well as other risks included in the registrant’s other filings and submissions with the United States Securities and Exchange Commission. These forward-looking statements involve various risks and uncertainties. Although we believe that our expectations expressed in these forward-looking statements are reasonable, our expectations may turn out to be incorrect. Our actual results could be materially different from our expectations. In light of the risks and uncertainties described above, the estim ates and forward-looking statements discussed in this press release might not occur, and our future results and our performance may differ materially from those expressed in these forward-looking statements due to, inclusive, but not limited to, the factors mentioned above. Because of these uncertainties, you should not make any investment decision based on these estimates and forward-looking statements. The forward-looking statements made in this press release related only to events or information as of th e date on which the statements are made in this press release. We undertake no obligation to update any forward-looking statements to reflect events or circumstances after the date on which the statements are made or to reflect the occurrence of unanticipated events. |
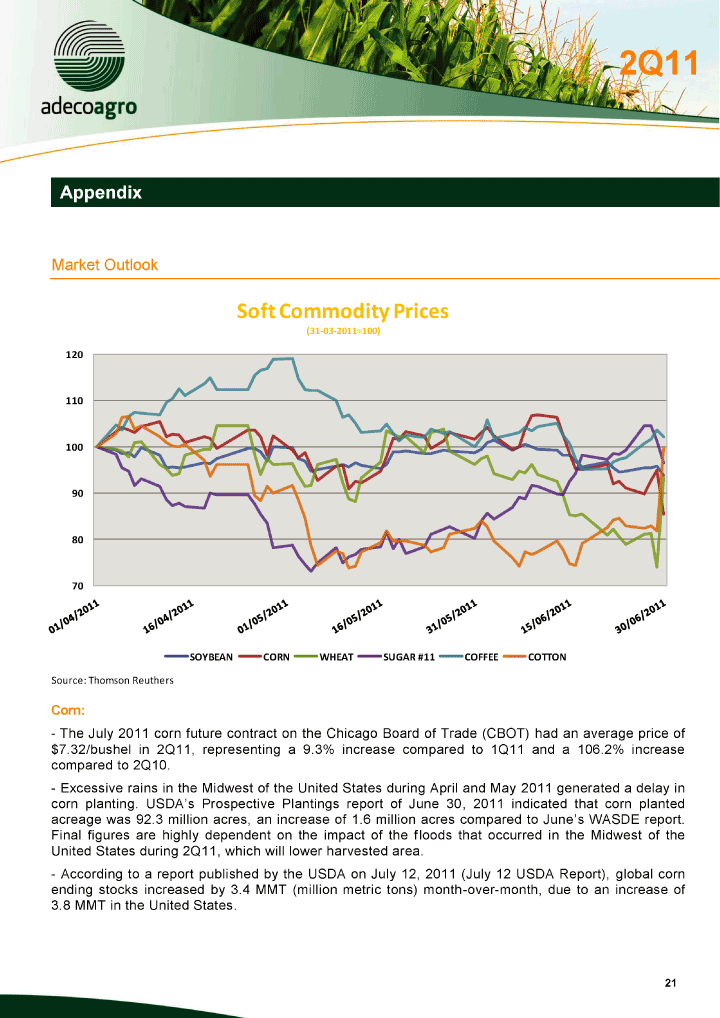
| Appendix Market Outlook Soft Commodity Prices (31-03-2011=100) 120 110 100 90 80 70 SOYBEAN CORN WHEAT SUGAR #11 COFFEE COTTON Source: Thomson Reuthers Corn: — The July 2011 corn future contract on the Chicago Board of Trade (CBOT) had an average price of $7.32/bushel in 2Q11, representing a 9.3% increase compared to 1Q11 and a 106.2% increase compared to 2Q10. — Excessive rains in the Midwest of the United States during April and May 2011 generated a delay in corn planting. USDA’s Prospective Plantings report of June 30, 2011 indicated that corn planted acreage was 92.3 million acres, an increase of 1.6 million acres compared to June’s WASDE report. Final figures are highly dependent on the impact of the floods that occurred in the Midwest of the United States during 2Q11, which will lower harvested area. — According to a report published by the USDA on July 12, 2011 (July 12 USDA Report), gl obal corn ending stocks increased by 3.4 MMT (million metric tons) month-over-month, due to an increase of 3.8 MMT in the United States. |
| - USDA’s Grain Stocks report of June 30, 2011 showed that corn stocks on June 1, 2011 were 3.67 billion bushels, above market estimates of 3.29 billion bushels. — USDA’s current yield estimate is 158.7 bu/acre (below-trend), according to July 12 USDA Report. On August 8, 2011, the USDA National Agricultural Statistics Service reported that corn crop condition is 60% “good to excellent”, compared to 71% a y ear before. — The US Senate approved an amendment to end the $0.45/gallon subsidy the government gives American blenders and the $0.54/gallon import tariff on ethanol from Brazil and other countries. This amendment must still be approved by the House of Representatives and the President and there is consensus that the subsidy will not be eliminated before 2012. — Frosts occurred in much of southern Brazil causing additional damage to immature second crop corn (safrinha). Corn harvest could be sig nificantly reduced from the official 57.1 MMT calculated by the Companhia Nacional de Abastecimento (CONAB). — The Bolsa de Cereales de Buenos Aires maintains its corn production estimate in Argentina at 21 MMT in 2010/11 crop. Soybean: — The average price for the July 2011 soybean future contract on CBOT was $13.61/bushel in 2Q11, representing a 1.5% decrease compared to 1Q11 and a 42.1% increase compared to 2Q10. — According to the July 12 USDA Report, global soybean ending stocks for the 2010/11 crop increased by 1.3 MMT. In the United States, soybean ending stocks were reported 0.5 MMT higher and exports were lowered by the same amount. — According to the July 12 USDA Report, 2011/12 soybean supply outlook in the United States was lowered by 1.6 MMT compared to a USDA report published in June. USDA expects a higher carry in for 2011/12, but global production (261.5 MMT) is lower by 1.3 MMT compared to 2010/11. Production risks remain in the United States as yields and pl anted area are likely to decline year-over-year. — The Grain Stocks report showed that soybeans stocks, as of June 1, 2011 stood at 619 million bushels, above market estimates of 592 million bushels. — According to the Prospective Plantings report, US soybean acreage is calculated at 75.2 million acres, down 2% from the June’s WASDE. — USDA’s current yield estimate is 43.4 bushels/acre, according to the July 12 USDA Report. As per USDA’s Crop Progres s report released on August 8, 2011, 61% of the soybeans are rated from “good to excellent”, compared to 66% a year before. — China is the world’s largest soy importer. The USDA lowered its forecast for China’s soybean imports from 54.0 to 52 MMT for 2010/11. — South American soybean production will offset the decreased production in the Northern Hemisphere. Argentina’s soybean production, according to the local Bolsa de Cereales de Buenos Aires, is estimated at 49.2 MMT with the harvest already finished. In Brazil, CONAB estimates a record 75 MMT harvest in 2010/11. According to Cámara Paraguaya de Exportadores de Cereales y Oleaginosas, Paraguay’ soybean harvest reached 8.4 MMT in 2010/11. |
| Wheat: — The July 2011 wheat future contract on CBOT had an average price of $7.45/bushel in 2Q11, a 5.6% decrease compared to 1Q11 and a 59.2% increase compared to 2Q10. — Kansas, Texas and Oklahoma, the three largest winter wheat producing states in the United States suffered from a severe to extreme drought during 2Q11. Drought also affected wheat growing regions of Germany and France. — Russia lifted the export ban on grains on July 1, 2011. According to USDA, wheat production in Russia will reach 41.51 MMT during the 2010/11 crop and 53 MMT in 2011/12. India, the second largest global wheat exporter, also eliminated its grain export ban. — The USDA cut the global 2011/12 production forecast in July by 1.9 MMT, compared to its June forecast, due to dryness and reduced acreage in Canada. — In the United States, winter wheat harvest progress was 85% according to the August 8, 2011 USDA Crop Progress report. Spring wheat , rated from “good to excellent”, reached 66% of the entire crop production. — The expectation of greater Black Sea region exports diminished uncertainty regarding new crop supplies. The year-over-year decline in the European Union’s wheat production due to climatic issues is already priced into the market. — Regarding Argentina, the USDA estimates production will reach 15 MMT in 2011/12. Cotton: — The average price for the July 2011 cotton future contract traded on ICE F utures U.S. (ICE) was US¢ 168.1/lb in 2Q11. This represents a 5.6% decrease compared to 1Q11 and a 106.6% increase compared to 2Q10. — According to the USDA July 12 report, 2010/11 global production increased by 0.3 MM bales and consumption was down by 0.6 MM bales. Global cotton ending stocks are 1.2 MM bales higher. Exports from the United States were lowered 0.5 MM bales to 14.5 MM bales, reflecting concerns that export cancellations could persist during the marketing year. For the 20 11/12 season, the USDA lowered production by 1 MM bales monthly in the United States. United States cotton ending stocks were raised by 0.5 MM bales due to a higher carry-in, but a 1 MM bales reduction in exports. — In its Prospective Plantings report, the USDA lifted their cotton planted area estimate by nearly 1.2 million acres in the United States, but harvested area was down by 0.6 million acres. Since March 2011, more than 95% of Texas has been affected by droughts. This could leav e as many as 3.2 million Texas cotton acres abandoned and presents a risk of sub-trend yields, according to a report by Morgan Stanley. — Despite the reduction in United States cotton production, global production is expected to be higher in 2011/12. It is expected that combined Chinese, Indian and Pakistani production will be higher by 1.5 MMT, which will offset a 0.3 MMT reduction in United States cotton production. According to the China Cotton Association, China will plant 4.4 million hec tares of cotton in 2011, up 5% year-over-year. |
| Rice: — The South American market for high quality milled rice stood at $500/ton FOB during 2Q11, compared to an average of $515/ton in 2Q10. — The Brazilian government continues to support paddy prices by export subsidies and government acquisitions. The parboiled industry in Brazil is operating at full capacity, with a global export budget of 1.3 MMT (paddy basis). This Brazilian export of parboiled rice, will allow Mercosur partners (Argentina/Urug uay/Paraguay) to export approximately 800K tons of rough rice equivalent. — Uncertainty regarding the 2011/12 rice crop in the United States could allow South American rice production to break into rice markets traditionally supplied by the United States (including Central America and the Caribbean). Coffee: — The July 2011 coffee future contract traded on ICE at an average price of US¢271.1/lb in 1Q11, a 6.4% increase compared to 1Q11 and an 94.1% increase compared to 2Q10. — A recent spike in coffee prices was caused by reports of frost in two Brazilian producing regions. The freeze, however, seems to have only impacted only minor regions of coffee production and the outlook remains for a record off-year harvest in Brazil for the 2011/12 harvest year. — The outlook for lower global 2011/12 production due to Brazil’s off-year for the Arabica coffee plant two-year cycle, strong demand in emerging markets and low beginning stocks will keep coffee prices elevated in 2011. — The low quality Robusta coffee plant market is supported by a lack of available supplies in Vietnam and a disappointing Indonesian harvest. Prices are expected to come under pressure due to better Robusta supply in Brazil and the anticipation of a large 2011/12 Vietnamese crop. Sugar and Ethanol: The start of the sugarcane crush in the Centre-South region of Brazil was delayed due to excess rains in early April 2011. In addition to the late start to the harvest, both the sucrose content and yiel d of the cane have been much lower than expected and production figures in 2Q11 remained below original forecasts. Crushing totaled 177 MM tons up to the end of June 2011, an 18% decrease compared to 2010. As a consequence, total sugar production decreased 19%. This caused sugar prices to increase by 57% in the nearby sugar futures contract on ICE in comparison with 2Q10 (average of $0.2445 /lb in 2Q11), even though it was 20% lower than in the previous quarter. The ethanol shortage at the end of the o ff-season, which caused prices to peak in 2Q11 (hydrous ESALQ index averaged 1,401 R$/m3 gross, 2% higher than in 1Q11 and 54% than in 2Q10), stimulated production, especially of anhydrous ethanol despite the low sucrose content in the sugarcane. The disappointing production figures have made market players revise their sugar crop forecasts. On July 14, 2011, the Brazilian Sugarcane Industry Association (UNICA) released a new sugarcane c rush estimate of 533.5 MM tons (55 MM tons less than their first estimate released in March 2011), which, if correct, will result in the first reduction in Brazilian Center-South production since 2000 and 2 to 3 MM tons less sugar than previously expected. |
| The definition of new market regulations and possible reduction in blending ratios are still being discussed. The principle alteration expected is the mandate for mills to stock 8% of their yearly anhydrous production until March 31st of the following year. Mills are trying to anticipate the expected shortage and are planning on importing large volumes of anhydrous ethanol from the United States. Additionally, the monsoons in India are marginally higher th an the historical average. According to the Indian Ministry of Agriculture, planted area in the country was up by 4% at the beginning of July. The Indian Sugar Mills Association (ISMA) is forecasting sugar production between 26 and 26.5 MM tons for their 2011/12 crop, an increase of 8% compared to 2010/11 crop. In Thailand, where a much larger than average sugar production was reported in 2010/11, is expected to repeat last crop’s above average sugar production of 10 MM tons. In Europe, July and A ugust weather will be critical in determining beet yields and thereby the overall crop output. Segment Information — Reconciliation of Non-IFRS measures (Adjusted EBITDA & Adjusted EBIT) to Profit/(Loss) We define Adjusted EBITDA for each of our operating segments as the segment’s share of consolidated profit from operations before financing and taxation for the year or period, as applicable, before depreciation and amortization and unrealized changes in fair value of long-term biological ass ets. We define Adjusted EBIT for each of our operating segments as the segment’s share of consolidated profit from operations before financing and taxation for the year or period, as applicable, before unrealized changes in fair value of long-term biological assets. We believe that Adjusted EBITDA and Adjusted EBIT are for the Company and each operating segment, respectively important measures of operating performance because they allow investors and others to evaluate and compare our consolidated oper ating results and to evaluate and compare the operating performance of our segments, respectively, including our return on capital and operating efficiencies, from period to period by removing the impact of our capital structure (interest expense from our outstanding debt), asset base (depreciation and amortization), tax consequences (income taxes), unrealized changes in fair value of long term biological assets (a significant non-cash gain or loss to our consolidated statements of income following IAS 41 a ccounting), foreign exchange gains or losses and other financial expenses. Other companies may calculate Adjusted EBITDA and Adjusted EBIT differently, and therefore Adjusted EBITDA and Adjusted EBIT may not be comparable to similarly titled measures used by other companies. Adjusted EBITDA and Adjusted EBIT are not a measures of financial performance under IFRS, and should not be considered in isolation or as an alternative to consolidated net profit (loss), cash flows from operating activities, profit fro m operations before financing and taxation and other measures determined in accordance with IFRS. |
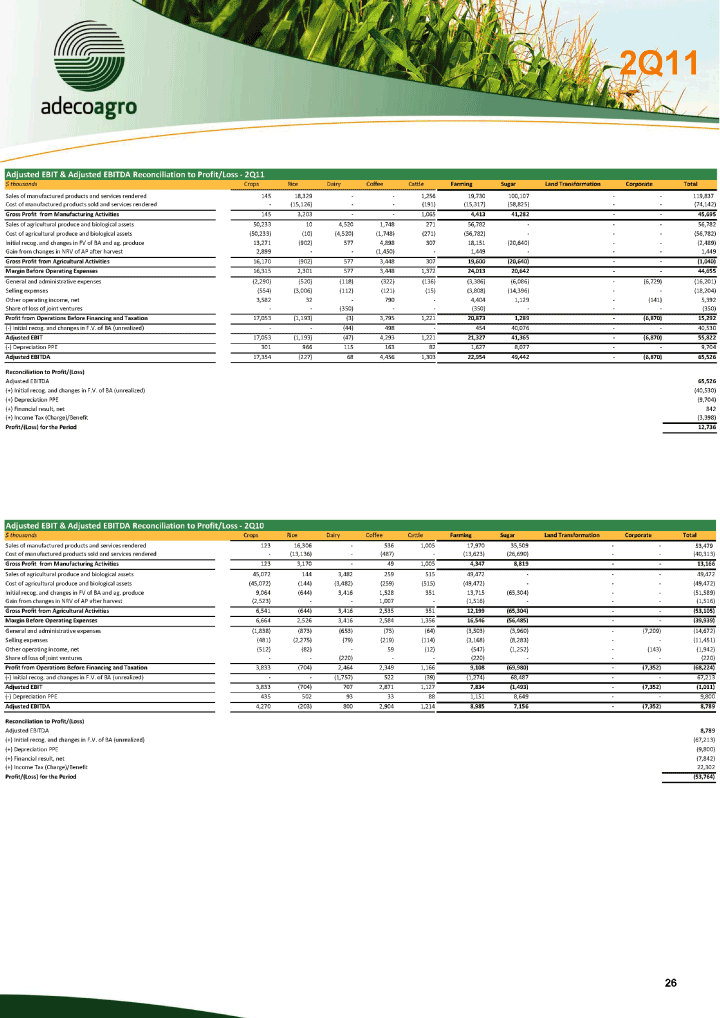
| Adjusted EBIT & Adjusted EBITDA Reconciliation to Profit/ Loss — 2Q11 $ thousands Crops Rice Dairy Coffee Cattle Farming Sugar Land Transformation Corporate Total Sales of manufactured products and services rendered 145 18,329 — - 1,256 19,730 100,107 — - 119,837 Cost of manufactured products sold and services rendered — (15,126) — - (191) (15,317) (58,825) — - (74,142) Gross Profit from Manufacturing Activities 145 3,203 — - 1,065 4,413 41,282 — - 45,695 Sales of agricultural produce and biological assets 50,233 10 4,520 1,748 271 56,782 — - — 56,782 Cost of agricultural produce and biological assets (50,233) (10) (4,520) (1,748) (271) (56,782) — - — (56,782) Initial recog. and changes in FV of BA and ag. produce 13,271 (902) 577 4,898 307 18,151 (20,640) — - (2,489) Gain from changes in NRV of AP after harvest 2,899 — - (1,450) — 1,449 — - — 1,449 Gross Profit from Ag ricultural Activities 16,170 (902) 577 3,448 307 19,600 (20,640) — - (1,040) Margin Before Operating Expenses 16,315 2,301 577 3,448 1,372 24,013 20,642 — - 44,655 General and administrative expenses (2,290) (520) (118) (322) (136) (3,386) (6,086) — (6,729) (16,201) Selling expenses (554) (3,006) (112) (121) (15) (3,808) (14,396) — - (18,204) Other operating income, net 3,582 32 — 790 — 4,404 1,129 — (141) 5,392 Share of loss of joint ventures — - (350) — - (350) — - — (350) Profit from Operations Before Financing and Taxation 17,053 (1,193) (3) 3,795 1,221 20,873 1,289 — (6,870) 15,292 (-) Initial recog. and changes in F.V. of BA (unrealized) — - (44) 498 — 454 40,076 — - 40,530 Adjusted EBIT 17,053 (1,193) (47) 4,293 1,221 21,327 41,365 — (6,870) 55,822 (-) Depreciation PPE 301 966 115 163 82 1,627 8,077 — - 9,704 Adjusted EBITDA 17,354 (227) 68 4,456 1,303 22,954 49,442 — (6,870) 65, 526 Reconciliation to Profit/ (Loss) Adjusted EBITDA 65,526 (+) Initial recog. and changes in F.V. of BA (unrealized) (40,530) (+) Depreciation PPE (9,704) (+) Financial result, net 842 (+) Income Tax (Charge)/Benefit (3,398) Profit/ (Loss) for the Period 12,736 Adjusted EBIT & Adjusted EBITDA Reconciliation to Profit/ Loss — 2Q10 $ thousands Crops Rice Dairy Coffee Cattle Farming Sugar Land Transformation Corporate Total Sales of manufactured products and services rendered 123 16,306 — 536 1,005 17,970 35,509 — - 53,479 Cost of manufactured products sold and services rendered — (13,136) — (487) — (13,623) (26,690) — - (40,313) Gross Profit from Manufacturing Activities 123 3,170 — 49 1,005 4,347 8,819 — - 13,166 Sales of agricultural produce and biological assets 45,072 144 3,482 259 515 49,472 — - — 49,472 Cost of agricultural produce and biological assets (45,072) (144) (3,482) (259) (515) (49,472) — - — (49,472) Init ial recog. and changes in FV of BA and ag. produce 9,064 (644) 3,416 1,528 351 13,715 (65,304) — - (51,589) Gain from changes in NRV of AP after harvest (2,523) — - 1,007 — (1,516) — - — (1,516) Gross Profit from Agricultural Activities 6,541 (644) 3,416 2,535 351 12,199 (65,304) — - (53,105) Margin Before Operating Expenses 6,664 2,526 3,416 2,584 1,356 16,546 (56,485) — - (39,939) General and administrative expenses (1,838) (873) (653) (75) (64) (3,503) (3,960) — (7,209) (14,672) Selling expenses (481) (2,275) (79) (219) (114) (3,168) (8,283) — - (11,451) Other operating income, net (512) (82) — 59 (12) (547) (1,252) — (143) (1,942) Share of loss of joint ventures — - (220) — - (220) — - — (220) Profit from Operations Before Financing and Taxation 3,833 (704) 2,464 2,349 1,166 9,108 (69,980) — (7,352) (68,224) (-) Initial recog. and changes in F.V. of BA (unrealized) — - (1,757) 522 (39) (1,274) 68,487 — - 67,213 Adjusted EBIT 3,833 (704) 707 2,871 1,127 7,834 (1,493) — (7,352) (1,011) (-) Depreciation PPE 435 502 93 33 88 1,151 8,649 — - 9,800 Adjusted EBITDA 4,270 (203) 800 2,904 1,214 8,985 7,156 — (7,352) 8,789 Reconciliation to Profit/ (Loss) Adjusted EBITDA 8,789 (+) Initial recog. and changes in F.V. of BA (unrealized) (67,213) (+) Depreciation PPE (9,800) (+) Financial result, net (7,842) (+) Income Tax (Charge)/Benefit 22,3 02 Profit |
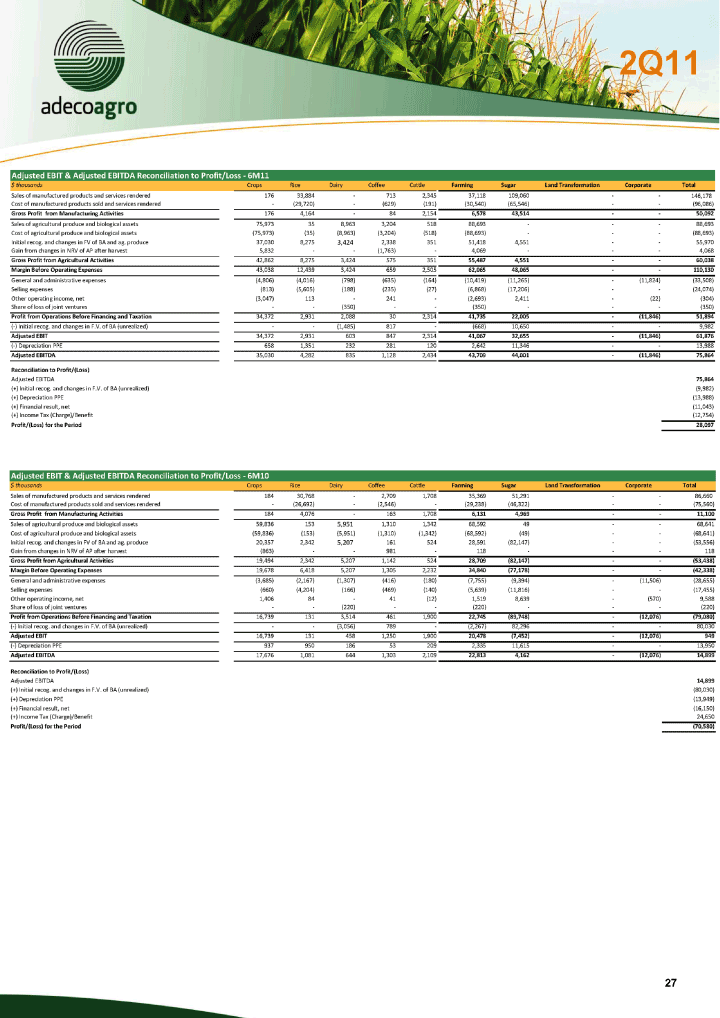
| Adjusted EBIT & Adjusted EBITDA Reconciliation to Profit/ Loss — 6M11 $ thousands Crops Rice Dairy Coffee Cattle Farming Sugar Land Transformation Corporate Total Sales of manufactured products and services rendered 176 33,884 — 713 2,345 37,118 109,060 — - 146,178 Cost of manufactured products sold and services rendered — (29,720) — (629) (191) (30,540) (65,546) — - (96,086) Gross Profit from Manufacturing Activities 176 4,16 4 — 84 2,154 6,578 43,514 — - 50,092 Sales of agricultural produce and biological assets 75,973 35 8,963 3,204 518 88,693 — - — 88,693 Cost of agricultural produce and biological assets (75,973) (35) (8,963) (3,204) (518) (88,693) — - — (88,693) Initial recog. and changes in FV of BA and ag. produce 37,030 8,275 3,424 2,338 351 51,418 4,551 — - 55,970 Gain from changes in NRV of AP after harvest 5,832 — - (1,763) — 4,069 — - — 4,068 Gross Profit from Ag ricultural Activities 42,862 8,275 3,424 575 351 55,487 4,551 — - 60,038 Margin Before Operating Expenses 43,038 12,439 3,424 659 2,505 62,065 48,065 — - 110,130 General and administrative expenses (4,806) (4,016) (798) (635) (164) (10,419) (11,265) — (11,824) (33,508) Selling expenses (813) (5,605) (188) (235) (27) (6,868) (17,206) — - (24,074) Other operating income, net (3,047) 113 — 241 — (2,693) 2,411 — (22) (304) Share of loss of joint ventures — - (350) — - (350) — - — (350) Profit from Operations Before Financing and Taxation 34,372 2,931 2,088 30 2,314 41,735 22,005 — (11,846) 51,894 (-) Initial recog. and changes in F.V. of BA (unrealized) — - (1,485) 817 — (668) 10,650 — - 9,982 Adjusted EBIT 34,372 2,931 603 847 2,314 41,067 32,655 — (11,846) 61,876 (-) Depreciation PPE 658 1,351 232 281 120 2,642 11,346 — - 13,988 Adjusted EBITDA 35,030 4,282 835 1,128 2,434 43,709 44,001 — (11,846) 75,864 Rec onciliation to Profit/ (Loss) Adjusted EBITDA 75,864 (+) Initial recog. and changes in F.V. of BA (unrealized) (9,982) (+) Depreciation PPE (13,988) (+) Financial result, net (11,043) (+) Income Tax (Charge)/Benefit (12,754) Profit/ (Loss) for the Period 28,097 Adjusted EBIT & Adjusted EBITDA Reconciliation to Profit/ Loss — 6M10 $ thousands Crops Rice Dairy Coffee Cattle Farming Sugar Land Transformation Corporate Total Sales of manufactured products and services rendered 184 30,768 — 2,709 1,708 35,369 51,291 — - 86,660 Cost of manufactured products sold and services rendered — (26,692) — (2,546) — (29,238) (46,322) — - (75,560) Gross Profit from Manufacturing Activities 184 4,076 — 163 1,708 6,131 4,969 — - 11,100 Sales of agricultural produce and biological assets 59,836 153 5,951 1,310 1,342 68,592 49 — - 68,641 Cost of agricultural produce and biological assets (59,836) (153) (5,951) (1,310) (1,342) (68,592) (49) — - (68,641 ) Initial recog. and changes in FV of BA and ag. produce 20,357 2,342 5,207 161 524 28,591 (82,147) — - (53,556) Gain from changes in NRV of AP after harvest (863) — - 981 — 118 — - — 118 Gross Profit from Agricultural Activities 19,494 2,342 5,207 1,142 524 28,709 (82,147) — - (53,438) Margin Before Operating Expenses 19,678 6,418 5,207 1,305 2,232 34,840 (77,178) — - (42,338) General and administrative expenses (3,685) (2,167) (1,307) (416) (180) (7,755) (9,394) — ( 11,506) (28,655) Selling expenses (660) (4,204) (166) (469) (140) (5,639) (11,816) — - (17,455) Other operating income, net 1,406 84 — 41 (12) 1,519 8,639 — (570) 9,588 Share of loss of joint ventures — - (220) — - (220) — - — (220) Profit from Operations Before Financing and Taxation 16,739 131 3,514 461 1,900 22,745 (89,748) — (12,076) (79,080) (-) Initial recog. and changes in F.V. of BA (unrealized) — - (3,056) 789 — (2,267) 82,296 — - 80,030 Adjusted EBIT 16,739 131 458 1,250 1,900 20,478 (7,452) — (12,076) 949 (-) Depreciation PPE 937 950 186 53 209 2,335 11,615 — - 13,950 Adjusted EBITDA 17,676 1,081 644 1,303 2,109 22,813 4,162 — (12,076) 14,899 Reconciliation to Profit/ (Loss) Adjusted EBITDA 14,899 (+) Initial recog. and changes in F.V. of BA (unrealized) (80,030) (+) Depreciation PPE (13,949) (+) Financial result, net (16,15 0) (+) Inc |
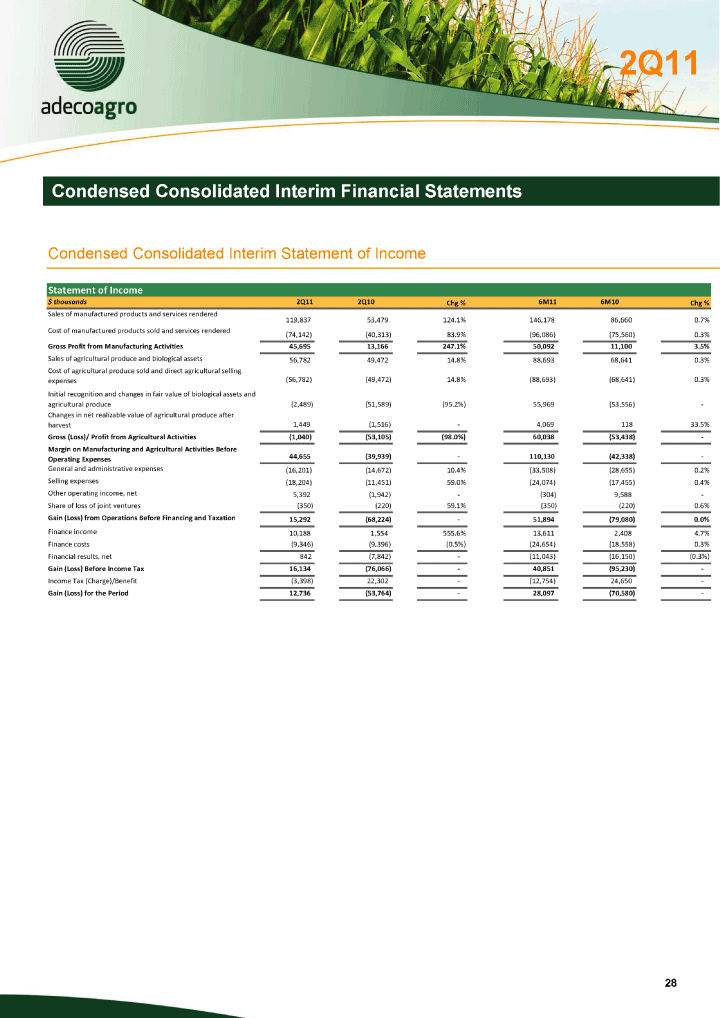
| Condensed Consolidated Interim Financial Statements Condensed Consolidated Interim Statement of Income Statement of Income $ thousands 2Q11 2Q10 Chg % 6M11 6M10 Chg % Sales of manufactured products and services rendered 119,837 53,479 124.1% 146,178 86,660 0.7% Cost of manufactured products sold and services rendered (74,142) (40,313) 83.9% (96,086) (75,560) 0.3% Gross Profit from Manufacturing Activities 45,695 13,166 247.1% 50,092 11,100 3.5% Sales of agricul tural produce and biological assets 56,782 49,472 14.8% 88,693 68,641 0.3% Cost of agricultural produce sold and direct agricultural selling expenses (56,782) (49,472) 14.8% (88,693) (68,641) 0.3% Initial recognition and changes in fair value of biological assets and agricultural produce (2,489) (51,589) (95.2%) 55,969 (53,556) -Changes in net realizable value of agricultural produce after harvest 1,449 (1,516) — 4,069 118 33.5% Gross (Loss)/ Profit from Agricultural Activities (1,040) (53,105) (98.0%) 60,038 (53,438) -Margin on Manufacturing and Agricultural Activities Before Operating Expenses 44,655 (39,939) — 110,130 (42,338) — General and administrative expenses (16,201) (14,672) 10.4% (33,508) (28,655) 0.2% Selling expenses (18,204) (11,451) 59.0% (24,074) (17,455) 0.4% Other operating income, net 5,392 (1,942) — (304) 9,588 -Share of loss of joint ventures (350) (220) 59.1% (350) (220) 0.6% Gain (Loss) from Operations Before Financing and Taxation 15,292 (68,224) — 51,894 (79,080) 0.0% Finance income 10,188 1,554 555.6% 13,611 2,408 4.7% Finance costs (9,346) (9,396) (0.5%) (24,654) (18,558) 0.3% Financial results, net 842 (7,842) — (11,043) (16,150) (0.3%) Gain (Loss) Before Income Tax 16,134 (76,066) — 40,851 (95,230) — Income Tax (Charge)/Benefit (3,398) 22,302 — (12,754) 24,650 -Gain (Loss) for the Period 12,736 (53,764) — 28,097 (70,580) - |
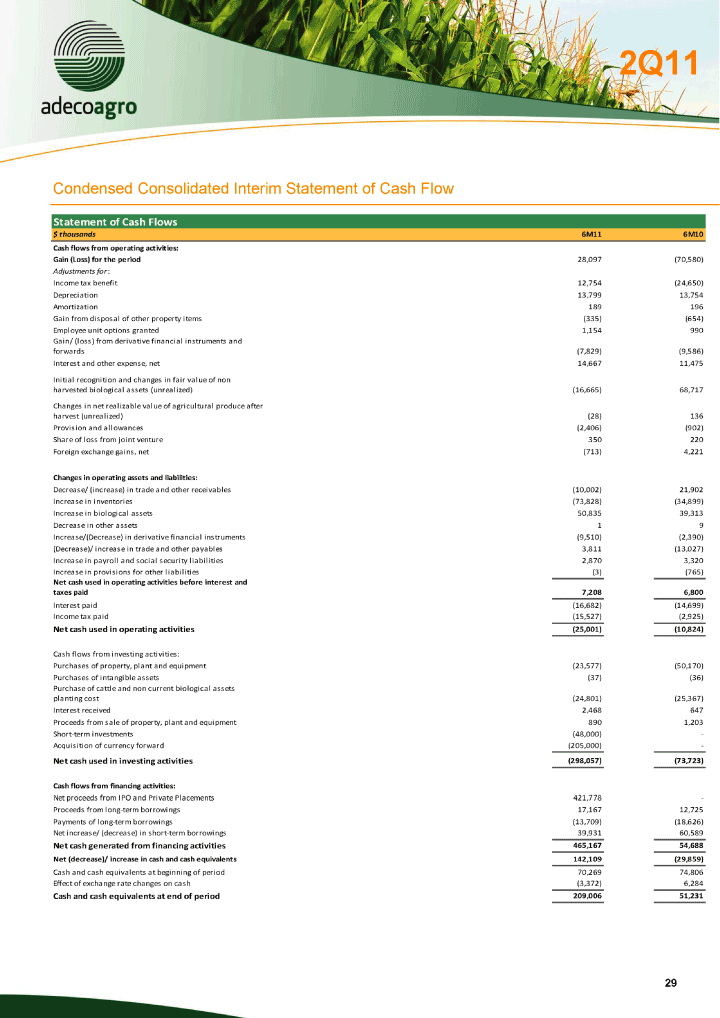
| Condensed Consolidated Interim Statement of Cash Flow Statement of Cash Flows $ thousands 6M11 6M10 Cash flows from operating activities: Gain (Loss) for the period 28,097 (70,580) Adjustments for : Income tax benefit 12,754 (24,650) Depreciation 13,799 13,754 Amortization 189 196 Gain from disposal of other property items (335) (654) Employee unit options granted 1,154 990 Gain/ (loss) from derivative financial instruments and forwards (7,829) (9,586 ) Interest and other expense, net 14,667 11,475 Initial recognition and changes in fair value of non harvested biological assets (unrealized) (16,665) 68,717 Changes in net realizable value of agricultural produce after harvest (unrealized) (28) 136 Provision and allowances (2,406) (902) Share of loss from joint venture 350 220 Foreign exchange gains, net (713) 4,221 Changes in operating assets and liabilities: Decrease/ (increase) in trade and other receivables (10,002) 21,902 Increase in inventories (73,828) (34,899) Increase in biological assets 50,835 39,313 Decrease in other assets 1 9 Increase/(Decrease) in derivative financial instruments (9,510) (2,390) (Decrease)/ increase in trade and other payables 3,811 (13,027) Increase in payroll and social security liabilities 2,870 3,320 Increase in provisions for other liabilities (3) (765) Net cash used in operating activities before interest and taxes paid 7,208 6,800 Interest paid (16,682) (14,699) Income tax paid (15,527) (2,925) Net cash used in operating activities (25,001) (10,824) Cash flows from investing activities: Purchases of property, plant and equipment (23,577) (50,170) Purchases of intangible assets (37) (36) Purchase of cattle and non current biological assets planting cost (24,801) (25,367) Interest received 2,468 647 Proceeds from sale of property, plant and equipment 890 1,203 Short-term investments (48,000) — Acquisition of currency forward (205,000) — Net cash used in investing activities (298,057) (73,723) Cash flows from financing activities: Net proceeds from IPO and Private Placements 421,778 — Proceeds from long-term borrowings 17,167 12,725 Payments of long-term borrowings (13,709) (18,626) Net increase/ (decrease) in short-term borrowings 39,931 60,589 Net cash generated from financing activities 465,167 54,688 Net (decrease)/ increase in cash and cash equivalents 142,109 (29,859) Cash and cash equivalents at beginning of period 70,269 74,806 Effect of exchange rate changes on cash ( 3,372) 6,284 Cash and cash equivalents at end of period 209,006 51,231 |
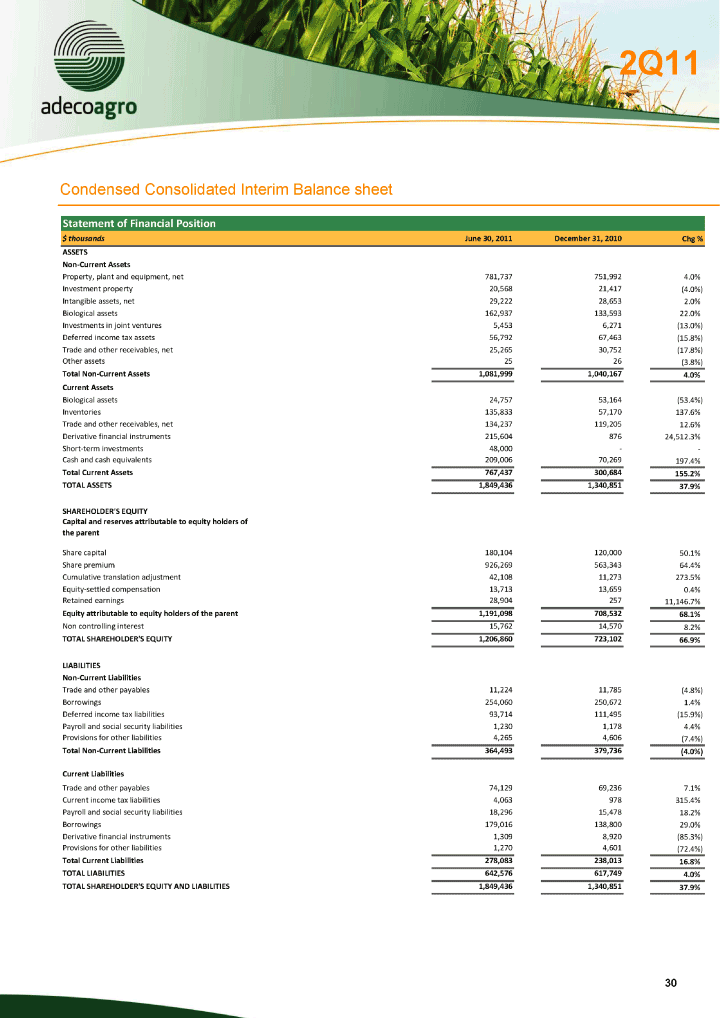
| Condensed Consolidated Interim Balance sheet Statement of Financial Position $ thousands June 30, 2011 December 31, 2010 Chg % ASSETS Non-Current Assets Property, plant and equipment, net 781,737 751,992 4.0% Investment property 20,568 21,417 (4.0%) Intangible assets, net 29,222 28,653 2.0% Biological assets 162,937 133,593 22.0% Investments in joint ventures 5,453 6,271 (13.0%) Deferred income tax assets 56,792 67,463 (15.8%) Trade and other receivab les, net 25,265 30,752 (17.8%) Other assets 25 26 (3.8%) Total Non-Current Assets 1,081,999 1,040,167 4.0% Current Assets Biological assets 24,757 53,164 (53.4%) Inventories 135,833 57,170 137.6% Trade and other receivables, net 134,237 119,205 12.6% Derivative financial instruments 215,604 876 24,512.3% Short-term investments 48,000 — -Cash and cash equivalents 209,006 70,269 197.4% Total Current Assets 767,437 300,684 155.2% TOTAL ASSETS 1,849,436 1,340,851 37.9% SHAREHOLDER’S EQUITY Capital and reserves attributable to equity holders of the parent Share capital 180,104 120,000 50.1% Share premium 926,269 563,343 64.4% Cumulative translation adjustment 42,108 11,273 273.5% Equity-settled compensation 13,713 13,659 0.4% Retained earnings 28,904 257 11,146.7% Equity attributable to equity holders of the parent 1,191,098 708,532 68.1% Non controlling interest 15,762 14,570 8.2% TOTAL SHAREHOLDER’S EQUITY 1,206,860 723,102 66.9% LIABILITIES Non-Current Liabilities Trade and other payables 11,224 11,785 (4.8%) Borrowings 254,060 250,672 1.4% Deferred income tax liabilities 93,714 111,495 (15.9%) Payroll and social security liabilities 1,230 1,178 4.4% Provisions for other liabilities 4,265 4,606 (7.4%) Total Non-Current Liabilities 364,493 379,736 (4.0%) Current Liabilities Trade and other payables 74,129 69,236 7.1% Current income tax liabilities 4,063 978 315.4% Payroll and social security liabilities 18,296 15,478 18.2% Borrowings 179,016 138,800 29.0% Derivative financial instruments 1,309 8,920 (85.3%) Provisions for other liabilities 1,270 4,601 (72.4%) Total Current Liabilities 278,083 238,013 16.8% TOTAL LIABILITIES 642,576 617,749 4.0% TOTAL SHAREHOLDER’S EQUITY AND LIABILITIES 1,849,436 1,340,851 37.9% |