Exhibit 99.1
Operating and Financial Review and Prospects
OPERATING RESULTS
Trends and Factors Affecting Our Results of Operations
Description of accounting policies changed during the period.
During the period ended September 30, 2018, the group has adopted the revaluation model for its Farmlands within Property, plant and equipment. Previously, the Company valued Farmlands at cost. The adoption of the revaluation model has resulted in an increase of Property, plant and equipment of US$ 578 million for the period. This higher valuation resulted in an increase of the deferred tax liability of US$ 148 million, which, in accordance with IAS 16 is applied prospectively.
The Company also adopted the revaluation model for its Investment property. The higher valuation resulted in an increase in Retained earning of US$ 45 million; an increase in Investment property of US$ 40 million as of December 31, 2017 and an increase in Deferred tax liability of US$ 12.6 million, which was applied retrospectively, in accordance with IAS 8. Consequently, prior year figures have been recast (For a detailed information, please see Note 27 - Basis of preparation and presentation - Description of accounting principles changed during the period).
Application of IAS 29 / Hyperinflation accounting:
IAS 29 “Financial Reporting in Hyperinflationary Economies” requires that the financial statements of entities whose functional currency is that of a hyperinflationary economy be adjusted for the effects of changes in the general price index and be expressed in terms of the current unit of measurement at the closing date of the reporting period (“inflation accounting”). In order to determine whether an economy is classified as hyperinflationary, IAS 29 sets forth a series of factors to be considered, including whether the amount of cumulative inflation nears or exceeds a threshold of 100 %. Accordingly, Argentina has been classified as a hyperinflationary economy under the terms of IAS 29 from July 1, 2018. (For a detailed information, please see Note 27 - Basis of preparation and presentation). Accordingly our financial statements. as of September 30, 2018 and for the nine month period then ended are the first ones presented applying IAS 29.
IAS 29 requires, to adjust all non-monetary items in the statement of financial position by applying a general price index
from the day they were booked to the end of the reporting period. At the same time, it also requires that all items in the statement of income are expressed in terms of the measuring unit current at the end of the reporting period.
After the restatement under IAS 29 described above, under IAS 21 all amounts are translated at the closing rate at the date of the most recent statement of financial position. Accordingly, monthly results of operations in Argentine Pesos, after adjustment for inflation pursuant to IAS 29, as described above, must then be converted into U.S dollars at the closing exchange rate for such monthly reported period. As a result the impact of monthly inflationary adjustments and monthly conversion adjustments vary the results of operation month to month until year end.
Our results of operations have been influenced and will continue to be influenced by the following factors:
(i) Effects of Yield Fluctuations
The occurrence of severe adverse weather conditions, especially droughts, hail, floods or frost, are unpredictable and may have a potentially devastating impact on agricultural production and may otherwise adversely affect the supply and prices of the agricultural commodities that we sell and use in our business. The effects of severe adverse weather conditions may also reduce yields at our farms. Yields may also be affected by plague, disease or weed infection and operational problems.
The following table sets forth our average crop, rice and sugarcane yields per hectare for the periods indicated:
1
| 2017/2018 | 2016/2017 | % Change | ||
| Harvest Year (1) | Harvest Year (1) | 2017/2018 - 2016/2017 | ||
Corn (2) | 4.3 | 5.3 | (1.9 | )% |
| Soybean | 2.5 | 2.8 | (10.7 | )% |
| Soybean (second harvest) | 1.2 | 2.5 | (52.0 | )% |
Wheat (3) | 2.2 | 3.0 | (26.7 | )% |
| Sunflower | 1.8 | 1.9 | (5.3 | )% |
| Rice | 6.9 | 5.9 | 16.9 | % |
| Sugarcane | 89.8 | 84.3 | 6.5 | % |
| (1) | The table above sets forth current yields in respect of harvest years as of September 30. The portion of harvested area completed as of September 30, 2018 was 99.7% for corn, 100% for soybean (first and second harvest), wheat, sunflower and rice. The portion of harvested area completed as of September 30, 2017 was 89.7% for corn, 100% for soybean (first and second harvest), wheat, sunflower and rice. |
| (2) | Includes sorghum, chia and peanut. |
| (3) | Includes barley, rye, oats and chickpea. |
(ii) Effects of Fluctuations in Production Costs
We experience fluctuations in our production costs due to the fluctuation in the costs of (i) fertilizers, (ii) agrochemicals, (iii) seeds, (iv) fuel, (v) farm leases and (vi) labor. The use of advanced technology, however, allows us to increase our efficiency, in large part mitigating the fluctuations in production costs. Some examples of how the implementation of production technology has allowed us to increase our efficiency and reduce our costs include the use of no-till technology (also known as “direct sowing”, which involves farming without the use of tillage, leaving plant residues on the soil to form a protective cover which positively impacts costs, yields and the soil), crop rotation, second harvest in one year, integrated pest management, and balanced fertilization techniques to increase the productive efficiency in our farmland. Increased mechanization of harvesting and planting operations in our sugarcane plantations and utilization of modern, high pressure boilers in our sugar and ethanol mills has also yielded higher rates of energy production per ton of sugarcane milled.
(iii) Effects of Fluctuations in Commodities Prices
Commodity prices have historically experienced substantial fluctuations. For example, between January 1, 2018 and September 30, 2018, ethanol prices decreased by 3.5%, according to Escola Superior de Agricultura “Luiz de Queiroz” (“ESALQ”) data, sugar prices decreased by 31.3%, according to Intercontinental Exchange of New York (“ICE-NY”) data. Also, based on Chicago Board of Trade (“CBOT”) data, from January 1, 2018 to September 30, 2018, soybean prices decreased 11.2% and corn prices increased by 1.6%. Commodity price fluctuations impact our statement of income as follows:
| • | Initial recognition and changes in the fair value of biological assets and agricultural produce in respect of unharvested biological assets undergoing biological transformation; |
| • | Changes in net realizable value of agricultural produce for inventory carried at its net realizable value; and |
| • | Sales of manufactured products and agricultural produce to third parties. |
The following graphs show the spot market price of some of our products since June 30, 2013 to September 30, 2018, highlighting the periods from January 1 to September 30, 2017 and January 1 to September 30, 2018:
2
(iv) Fiscal Year and Harvest Year
Our fiscal year begins on January 1 and ends on December 31 of each year. However, our production is based on the harvest year for each of our crops and rice. A harvest year varies according to the crop or rice plant and to the climate in which it is grown. Due to the geographic diversity of our farms, the planting period for a given crop or rice may start earlier on one farm than on another, causing differences for their respective harvesting periods. The presentation of production volume (tons) and production area (hectares) in this report in respect of the harvest years for each of our crops and rice starts with the first day of the planting period at the first farm to start planting in that harvest year to the last day of the harvesting period of the crop or rice planting on the last farm to finish harvesting that harvest year.
On the other hand, production volumes for dairy and production volume and production area for sugar, ethanol and energy business are presented on a fiscal year basis.
The financial results in respect of all of our products are presented on a fiscal year basis.
(v) Effects of Fluctuations of the Production Area
Our results of operations also depend on the size of the production area. The size of our own and leased area devoted to crop, rice and sugarcane production fluctuates from period to period in connection with the purchase and development of new farmland, the sale of developed farmland, the lease of new farmland and the termination of existing farmland lease agreements. Lease agreements are usually settled following the harvest season, from July to September in crops and rice, and from May to April in sugarcane. The length of the lease agreements are usually one year for crops, one to five years for rice and six to seven years for sugarcane. Regarding crops, the production area can be planted and harvested one or two times per year. As an example, wheat can be planted in July and harvested in December. Right after its harvest, soybean can be planted in the same area and harvested in April. As a result, planted and harvested area can exceed the production area during one year. The production area for sugarcane can exceed the harvested area in one year. Grown sugarcane can be left in the fields and then harvested the following year. The following table sets forth the production area for the periods indicated:
3
| Nine-month period ended September 30, | ||||||
| 2018 | 2017 | Chg (%) | ||||
| (Hectares) | ||||||
| Crops (1) | 153,970 | 145,410 | 5.9 | % | ||
| Rice | 40,289 | 39,728 | 1.4 | % | ||
| Sugar, Ethanol and Energy | 151,597 | 142,133 | 6.7 | % | ||
(1) Does not include second crop area or forage.
The increase in crop and rice production area in 2018 compared to 2017 was mainly driven by the transformation of underdeveloped hectares and by the increase in leased hectares due to higher projected margins. The increase in sugar, ethanol and energy production area in 2018 is explained by an increase in leased hectares that provide sufficient cane supply for the entire year.
(vi) Effect of Acquisitions, dispositions and land transformation
Our business model includes the transformation of pasture and unproductive land into land suitable for growing various crops and the transformation of inefficient farms into farms suitable for more efficient uses through the implementation of advanced and sustainable agricultural practices, such as "no-till" technology and crop rotation. During approximately the first three to five years of the land transformation process of any given parcel, we must invest heavily in transforming the land, and, accordingly, crop yields during such period tend to be lower than crop yields once the land is completely transformed. After the transformation process has been completed, the land requires less investment, and crop yields gradually increase. As a result, there may be variations in our results from one season to the next according to the amount of land in the process of transformation.
Our business model also includes the identification, acquisition, development and selective disposition of farmlands or other rural properties that after implementing agricultural best practices and increasing crop yields we believe have the potential to appreciate in terms of their market value. As a part of this strategy, we purchase and sell farms and other rural properties from time to time. Please see also “Risk Factors—Risks Related to Argentina-Argentine law concerning foreign ownership of rural properties may adversely affect our results of operations and future investments in rural properties in Argentina” and “Risk Factors—Risks Related to Brazil—Changes in Brazilian rules concerning foreign investment in rural properties may adversely affect our investments.” included in “Item 3. Risk Factors” in our Form 20-F.
The results included in the Land Transformation segment are related to the acquisition and disposition of farmland businesses and not to the physical transformation of the land. The decision to acquire and/or dispose of a farmland business depends on several market factors that vary from period to period, rendering the results of these activities in one financial period when an acquisition of disposition occurs not directly comparable to the results in other financial periods when no acquisitions or dispositions occurred.
Our results of operations for earlier periods that do not include a recently completed acquisition or do include farming operations subsequently disposed of may not be comparable to the results of a more recent period that reflects the results of such acquisition or disposition. During the nine-month period ended September 30, 2018 we sold two farms in Brazil, "Rio de Janeiro" and "Conquista", for a total consideration of $52.4 million for 9,300 hectares.
(vii) Macroeconomic Developments in Emerging Markets
We generate nearly all of our revenue from the production of food and renewable energy in emerging markets. Therefore, our operating results and financial condition are directly impacted by macroeconomic and fiscal developments, including fluctuations in currency exchange rates, inflation and interest rate fluctuations, in those markets. The emerging markets where we conduct our business (including Argentina, Brazil and Uruguay) remain subject to such fluctuations.
(viii) Effects of Export Taxes on Our Products
Following the economic and financial crisis experienced by Argentina in 2002, the Argentine government increased export taxes on agricultural products. Since December 2015, the only product that had remained subject to export taxes was soybean and its derivatives. However, in September 2018 due to economic volatility, the government imposed a 12% export tax on all goods exported from Argentina. The 12% export tax will be imposed on the FOB export price of “primary product” goods (including agricultural goods), subject to a cap of four pesos (ARS 4) per U.S. dollar of the corresponding tax value or official FOB price for primary product goods. For all other products, the cap amount will be fixed at three pesos (ARS 3) per U.S. dollar of the corresponding tax value or official FOB price.
4
As local prices are determined taking into consideration the export parity reference, any increase or decrease in export taxes would affect our financial results.
(ix) Effects of Foreign Currency Fluctuations
Each of our Argentine, Brazilian and Uruguayan subsidiaries use local currency as its functional currency. A significant portion of our operating costs in Argentina are denominated in Argentine Pesos and most of our operating costs in Brazil are denominated in Brazilian Reais. For each of our subsidiaries’ statements of income, foreign currency transactions are translated to local currency, as such subsidiaries’ functional currency, using the exchange rates prevailing as of the dates of the relevant specific transactions. Exchange differences resulting from the settlement of such transactions and from the translation at year-end exchange rates of monetary assets and liabilities denominated in foreign currencies are recognized in the statement of income under “finance income” or “finance costs,” as applicable. Our Consolidated Financial Statements are presented in U.S. dollars, and foreign exchange differences that arise in the translation process are disclosed in the consolidated statement of comprehensive income.
As of September 30, 2018, the Peso-U.S. dollar exchange rate was Ps. 41.3 per U.S. dollar as compared to Ps.17.3 per U.S. dollar as of September 30, 2017. As of September 30, 2018, the Real-U.S. dollar exchange rate was R$4.1 per U.S. dollar as compared to R$3.2 per U.S. dollar as of September 30, 2017.
The following graph shows the Argentine Peso-U.S. dollar rate and the Real-U.S. dollar rate of exchange for the periods since September 30, 2013 to September 30, 2018, highlighting the periods January 1 to September 30, 2017 and January 1 to September 30, 2018:
Our principal foreign currency fluctuation risk involves changes in the value of the Brazilian Reais relative to the U.S. dollar. Periodically, we evaluate our exposure and consider opportunities to mitigate the effects of currency fluctuations by entering into currency forward contracts and other hedging instruments.
(x) Seasonality
Our business activities are inherently seasonal. We generally harvest and sell corn, soybean, rice and sunflower between February and August, and wheat from December to January. With the implementation of “continuous harvest”, sugarcane production is more stable during the year; however, the typical harvesting period in Brazil begins between April and May and ends between November and December. Sales of ethanol are generally concentrated during off-season to capture higher seasonal prices. Sales in other business segments, such as in our Dairy segment, tend to be more stable. However, milk sales are generally higher during the fourth quarter, when weather conditions are more favorable for production. As a result of the above factors, there may be significant variations in our results of operations from one quarter to another, since planting activities may be more concentrated in one quarter whereas harvesting activities may be more concentrated in another quarter. In addition,our quarterly results may vary as a result of the effects of fluctuations in commodity prices and production yields and costs related to the “Initial recognition and changes in fair value of biological assets and agricultural produce” line item. See “Item 5. Operating and Financial Review and Prospects—Critical Accounting Policies and Estimates—Biological Assets and Agricultural Produce” in our Form 20-F.
5
(xi) Capital Expenditures and Other Investments
Our capital expenditures during the last two years consisted mainly of expenses related to (i) transforming and increasing the productivity of our land, (ii) planting sugarcane and (iii) expanding and upgrading our production facilities in concordance to our five year plan. Capital expenditures (including both maintenance and expansion) totaled $158.4 million for the nine-month period ended September 30, 2018 in comparison to $144.6 million in the same period of 2017. See also “—Capital Expenditure Commitments.”
(xii) Effects of Corporate Taxes on Our Income
We are subject to a variety of taxes on our results of operations. The following table shows the income tax rates in effect for 2018 in each of the countries in which we operate:
| Tax Rate (%) | |
| Argentina(1) | 30 |
| Brazil(2) | 34 |
| Uruguay | 25 |
____________
| (1) | During 2017, the Argentine Goverment introduced changes in the income tax. The income tax rate will be reduced to 30% for the years 2018 and 2019, and to 25% from 2020 onwards. A new tax on dividends is created with a rate of 7% for the years 2018 and 2019, and 13% from 2020 onwards. |
| (2) | Including the Social Contribution on Net Profit (CSLL) |
Critical Accounting Policies and Estimates
The Company’s critical accounting policies and estimates are consistent with those described in Note 33 to the Audited Consolidated Financial Statements included in our Form 20-F, except for the fair value adopted for Farmlands and Investment properties. (See "Trends and Factors Affecting Our Results of Operations - Description of accounting policies changed during the period").
.
Operating Segments
IFRS 8 “Operating Segments” requires an entity to report financial and descriptive information about its reportable segments, which are operating segments or aggregations of operating segments that meet specified criteria. Operating segments are components of an entity about which separate financial information is available that is evaluated regularly by the chief operating decision maker (“CODM”) in deciding how to allocate resources and in assessing performance. The CODM evaluates the business based on the differences in the nature of its operations, products and services. The amount reported for each segment item is the measure reported to the CODM for these purposes.
The Company operates in three major lines of business, namely, Farming; Sugar, Ethanol and Energy; and Land Transformation.
•The Company’s ‘Farming’ business is comprised of four reportable segments:
| • | The Company’s ‘Crops’ segment consists of planting, harvesting and sale of grains, oilseeds and fibers (including wheat, corn, soybeans, cotton and sunflowers, among others), and to a lesser extent the provision of grain warehousing/conditioning, handling and drying services to third parties and the purchase and sale of crops produced by third parties. Each underlying crop in this segment does not represent a separate operating segment. Management seeks to maximize the use of the land through the cultivation of one or more type of crops. Types and surface amount of crops cultivated may vary from harvest year to harvest year depending on several factors, some of them out of the Group´s control. Management is focused on the long-term performance of the productive land, and to that extent, the performance is assessed considering the aggregated combination, if any, of crops planted in the land. A single manager is responsible for the management of operating activity of all crops rather than for each individual crop. |
| • | The Company’s ‘Rice’ segment consists of planting, harvesting, processing and marketing of rice; |
| • | The Company’s ‘Dairy’ segment consists of the production and sale of milk; |
6
| • | The Company’s ‘All other segments’ segment consists of the aggregation of the remaining non-reportable operating segments, which do not meet the quantitative thresholds for disclosure and for which the Group’s management does not consider them to be of continuing significance, namely, Coffee and Cattle. |
•The Company’s ‘Sugar, Ethanol and Energy’ segment consists of cultivating sugarcane which is processed in owned sugar mills, transformed into ethanol, sugar and electricity and marketed;
•The Company’s ‘Land Transformation’ segment comprises the (i) identification and acquisition of underdeveloped and undermanaged farmland businesses; and (ii) realization of value through the strategic disposition of assets (generating profits).
•The Company’s ‘Corporate’ segment comprises certain other activities of a holding function nature not allocable to the segments
In order to evaluate the economic performance of businesses on a monthly basis, results of operations are based on monthly data that have been adjusted for inflation and converted into the average exchange rate of the US dollar each month in Argentine subsidiaries. These already converted figures are subsequently not readjusted and reconverted. It should be noted that this translation methodology for evaluating segment information is the same that the company uses to translate results of operation from its other subsidiaries from other countries that have not been designated hyperinflationary economies because it allows for a more accurate analysis of the economic performance of its business as a whole.
In this report we will analyze figures as presented in the segment report and include a reconciliation between figures as reported in segment information and figures presented in the statement of income.
The following table presents selected historical financial and operating data solely for the periods indicated below as it is used for our discussion of results of operations. In respect of production data only as of September 30, 2018, we have not yet completed the 2017/2018 harvest year crops. The harvested tons presented correspond to the harvest completed as of September 30, 2018.
| Nine-month period ended September 30, | ||||||
| 2018 (Unaudited) | 2017 (Unaudited) | Chg (%) | ||||
| (In thousands of $) | ||||||
| Sales | ||||||
Farming Business | 228,130 | 232,660 | (1.9 | )% | ||
| Crops | 115,316 | 144,097 | (20.0 | )% | ||
| Soybean (1) | 70,209 | 66,977 | 4.8 | % | ||
| Corn (2) | 31,289 | 58,696 | (46.7 | )% | ||
| Wheat (3) | 7,483 | 11,078 | (32.5 | )% | ||
| Sunflower | 1,454 | 2,932 | (50.4 | )% | ||
| Cotton Lint | — | 310 | N/A | |||
| Other crops (4) | 4,881 | 4,104 | 18.9 | % | ||
| Rice (5) | 87,482 | 59,497 | 47.0 | % | ||
| Dairy | 24,184 | 28,253 | (14.4 | )% | ||
| All other segments (6) | 1,148 | 813 | 41.2 | % | ||
Sugar, Ethanol and Energy Business | 356,309 | 424,949 | (16.2 | )% | ||
| Sugar | 95,407 | 232,442 | (59.0 | )% | ||
| Ethanol | 216,049 | 146,418 | 47.6 | % | ||
| Energy | 44,769 | 46,088 | (2.9 | )% | ||
| Other (7) | 84 | 1 | 8,300.0 | % | ||
| Total sales - Segment information | 584,439 | 657,609 | (11.1 | )% | ||
Land Transformation | 36,227 | — | N/A | |||
| Other operating income (8) | 36,227 | — | N/A | |||
7
| 2017/2018 | 2016/2017 | |||||
Harvest Year (9) (Unaudited) | Harvest Year (9) (Unaudited) | Chg (%) | ||||
| Production | ||||||
| Farming Business | ||||||
| Crops (tons) (10) | 532,338 | 591,179 | (10.0 | )% | ||
| Soybean (tons) | 171,844 | 206,099 | (16.6 | )% | ||
| Corn (tons) (2) | 276,150 | 259,432 | 6.4 | % | ||
| Wheat (tons) (3) | 78,640 | 115,338 | (31.8 | )% | ||
| Sunflower (tons) | 5,181 | 10,112 | (48.8 | )% | ||
| Cotton Lint (tons) | 523 | 198 | 164.1 | % | ||
| Rice (11) (tons) | 276,693 | 234,818 | 17.8 | % | ||
| Nine-month period ended September 30, | ||||||
| 2018 (Unaudited) | 2017 (Unaudited) | Chg (%) | ||||
| Processed rice (12) (tons) | 217,362 | 187,946 | 15.7 | % | ||
| Dairy (13) (thousand liters) | 73,452 | 68,054 | 7.9 | % | ||
| Sugar, Ethanol and Energy Business | ||||||
| Sugar (tons) | 282,474 | 470,129 | (39.9 | )% | ||
| Ethanol (cubic meters) | 504,116 | 327,778 | 53.8 | % | ||
| Energy (MWh) | 554,211 | 543,583 | 2.0 | % | ||
| Land Transformation Business (hectares traded) | — | — | – | |||
| 2017/2018 | 2016/2017 | |||||
Harvest Year (Unaudited) | Harvest Year (Unaudited) | Chg (%) | ||||
| (Hectares) | ||||||
| Planted Area | ||||||
| Farming Business (14) | ||||||
| Crops | 195,928 | 190,327 | 2.9 | % | ||
| Soybean | 81,269 | 84,435 | (3.7 | )% | ||
| Corn (2) | 66,115 | 54,653 | 21.0 | % | ||
| Wheat (3) | 36,533 | 38,009 | (3.9 | )% | ||
| Sunflower | 2,869 | 5,413 | (47.0 | )% | ||
| Cotton | 3,132 | 2,640 | 18.6 | % | ||
| Forage | 6,010 | 5,177 | 16.1 | % | ||
| Rice | 40,289 | 39,728 | 1.4 | % | ||
| Total Planted Area | 236,217 | 230,054 | 2.7 | % | ||
| Second Harvest Area | 35,948 | 39,739 | (9.5 | )% | ||
| Leased Area | 72,115 | 64,245 | 12.2 | % | ||
| Owned Croppable Area (15) | 122,144 | 120,893 | 1.0 | % | ||
8
| 2018 | 2017 | Chg (%) | ||||
| Sugar, Ethanol and Energy Business | ||||||
| Sugarcane plantation | 151,597 | 142,133 | 6.7 | % | ||
| Owned land | 9,145 | 9,145 | 0.0 | % | ||
| Leased land | 142,452 | 132,988 | 7.1 | % | ||
| (1) | Includes soybean, soybean oil and soybean meal. |
| (2) | Includes sorghum, chia and peanuts. |
| (3) | Includes barley. |
| (4) | Includes seeds and farming services. |
| (5) | Sales of processed rice including rough rice purchased from third parties and processed in our own facilities, rice seeds and services. |
| (6) | All other segments include our cattle business which primarily consists of leasing land to a third party based on the price of beef. See “Item 4. Information on the Company—B. Business Overview—Cattle Business.” in our Form 20-F. |
(7) Includes operating leases and other services.
(8) Represents capital gain from the sale of land.
(9) The table reflects the production in respect of harvest years as of June 30.
| (10) | Crop production does not include tons 120,262 and 28,100 tons of forage produced as of September 30, in the 2017/2018 and 2016/2017 harvest years, respectively. |
| (11) | Expressed in tons of rough rice produced on owned and leased farms. The rough rice we produce, along with additional rough rice we purchase from third parties, is ultimately processed and constitutes the product sold in respect of the rice business. |
| (12) | Includes rough rice purchased from third parties and processed in our own facilities. Expressed in tons of rough rice (1 ton of processed rice is approximately equivalent to 1.6 tons of rough rice). |
| (13) | Raw milk produced at our dairy farms. |
| (14) | Includes hectares planted in the second harvest. |
| (15) | Does not include potential croppable areas being evaluated for transformation and does not include forage area. |
Nine-month period ended September 30, 2018 as compared to nine-month period ended September 30, 2017
The following table sets forth certain financial information with respect to our consolidated results of operations for the periods indicated.
9
| Nine-month period ended September 30, | ||
| 2018 (Unaudited) | 2017 (Unaudited) | |
| (In thousands of $ ) | ||
| Sales of goods and services rendered | 550,230 | 657,609 |
| Cost of goods sold and services rendered | (415,449) | (542,199) |
| Initial recognition and Changes in fair value of biological assets and agricultural produce | 12,139 | 24,226 |
| Changes in net realizable value of agricultural produce after harvest | 9,552 | 8,036 |
Margin on Manufacturing and Agricultural Activities Before Operating Expenses | 156,472 | 147,672 |
| General and administrative expenses | (39,312) | (44,483) |
| Selling expenses | (61,332) | (64,758) |
| Other operating income, net | 107,521 | 43,034 |
Profit from Operations Before Financing and Taxation | 163,349 | 81,465 |
| Finance income | 6,494 | 8,742 |
| Finance costs | (242,342) | (76,679) |
| Other financial results - Net gain of inflation effects on the monetary items | 50,370 | |
| Financial results, net | (185,478) | (67,937) |
(Loss) / Profit Before Income Tax | (22,129) | 13,528 |
| Income tax expense | 3,151 | (3,993) |
(Loss) / Profit for the Period | (18,978) | 9,535 |
Sales of Goods and Services Rendered
| Nine-month period ended September 30, | Crops | Rice | Dairy | All other segments | Sugar, Ethanol and Energy | Total segment reporting | Adjustment | Total as per statement of income | ||||||||
| (In thousands of $) | ||||||||||||||||
| 2018 (Unaudited) | 115,316 | 87,482 | 24,184 | 1,148 | 356,309 | 584,439 | (34,209 | ) | 550,230 | |||||||
| 2017 (Unaudited) | 144,097 | 59,497 | 28,253 | 813 | 424,949 | 657,609 | — | 657,609 | ||||||||
Total sales of goods and service rendered totaled $ 550 million, 16.3% less than in 2017. Without considering the effect of $ 34.2 million which reflects the effect of inflation accounting and translation for the nine-month period ended September 30, 2018 for our Argentine operations, total sales would have decreased 11.1% from $657.6 million during the nine-month period ended September 30, 2017 to $584.4 million during the same period in 2018, primarily as a result of:
• A $68.6 million decrease in our Sugar, Ethanol and Energy segment, mainly due to: (i) a 14.7% decrease in the price of sugar, from $351.5 per ton during the nine-month period ended September 30, 2017 to $299.7 per ton during the same period in 2018; (ii) a 6.7% decrease in the price of ethanol, from $545.9 per cubic meter during the nine-month period ended September 30, 2017 to $509.4 per cubic meter during the same period in 2018 (iii) a 8.3% decrease in the volume of sugar and ethanol sold, measured in TRS(*), from 1.2 million tons during the nine-month period ended September 30, 2017 to 1.1 million tons during the same period in 2018; and (iv) a 10.1% decrease in the volume of energy sold, from 647.0 MWh during the nine-month period ended September 30, 2017 to 581.8 MWh during the same period in 2018.
The decrease in volume of sugar and ethanol sold was mainly due to: (a) a 45.1% decrease in commercialization of third parties sugar, from 149.6 thousand tons during the nine-month period ended September 30, 2017 to 82.1 thousand tons during the same period in 2018; and (b) to an inventories build-up, of 168.4 thousand tons in 2018 compared to an inventories build-up of 130.5 thousand tons measured in TRS in 2017. These decreases were partially offset by a 7.5% increase in milling, from 8.0 million tons during the nine-month period ended September 30, 2017 to 8.6 million tons during the same period in 2018 related to an improve in our efficiencies gained in mill that allow us to increase the milling per hour from 2.061 tons per hour to 2.134 tons per hour.
10
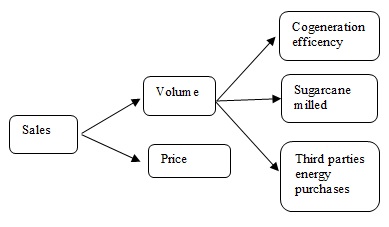
The decrease in the volume of energy sold was due to (a) lower third parties energy purchases from 112.2 MWh millions during the nine-month period ended September 30, 2017 to 27.6 MWh millions during the same period in 2018 (b) a 4.7% decrease in cogeneration efficiency, from 67.6 KWh per ton during the nine-month period ended September 30, 2017 to 64.4 KWh per ton during the same period in 2018, which was primarily due to the fact that: (i) energy consumption in Angelica is now higher as a result of the increase in crushing capacity; (ii) during 2018 we adopted a strategy to redirect steam to maximize sugarcane crushing and also, we are producing a higher mix of ethanol, that consumes more energy. This decrease was partially offset by (a) an increase in milling (b) a 8.1% increase in energy prices, from $71.2 per MWh during the nine-month period ended September 30, 2017 to $77.0 per MWh during the same period in 2018.
The following chart sets forth the variables that determine our Sugar and Ethanol sales:
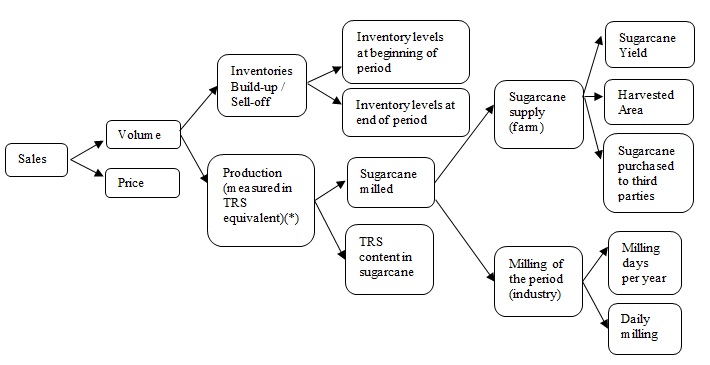
(*) On average, one metric ton of sugarcane contains 140 kilograms of TRS (Total Recoverable Sugar). While a mill can produce either sugar or ethanol, the TRS input requirements differ between these two products. On average, 1.045 kilograms of TRS equivalent are required to produce 1.0 kilogram of sugar, while the amount of TRS required to produce 1 liter of ethanol is 1.691 kilograms.
The following chart sets forth the variables that determine our Energy sales:
11
The following table sets forth the breakdown of sales of manufactured products for the periods indicated.
| Nine-month period ended September 30, | ||||||||||||
| 2018 | 2017 | Chg % | 2018 | 2017 | Chg % | 2018 | 2017 | Chg % | ||||
| (Unaudited) | ||||||||||||
| (In millions of $) | (In thousands units) | (In dollars per unit) | ||||||||||
| Ethanol (M3) | 216.0 | 146.4 | 47.5 | % | 424.1 | 268.2 | 58.1 | % | 509.4 | 545.9 | (6.7 | )% |
| Sugar (tons) | 95.4 | 232.4 | (59.0 | )% | 318.3 | 661.3 | (51.9 | )% | 299.7 | 351.5 | (14.7 | )% |
| Energy (MWh) | 44.8 | 46.1 | (2.8 | )% | 581.8 | 647.0 | (10.1 | )% | 77.0 | 71.2 | 8.1 | % |
Total | 356.2 | 424.9 | (16.2 | )% | ||||||||
| • | a $28.8 million decrease in our Crops segment mainly driven by: (i) a 42.3% decrease in the volume of corn sold, from 348.9 thousand tons in the nine-month period ended September 30, 2017 to 201.3 thousand tons in the same period in 2018; (ii) a 40.6% decrease in the volume of wheat sold, from 72.7 thousand tons during the nine-month period ended September 30, 2017 to 43.2 thousand tons in the same period in 2018; and (iii) a 7.6% decrease in corn prices, from $168.2 per ton in the nine-month period ended September 30, 2017 to $155.54 per ton in the same period in 2018. The decrease in the volume of corn sold was mainly driven by: (i) lower sales of commercialized corn for third parties, from 163.7 thousand tons during the nine-month period ended September 30, 2017 to 41.8 thousand tons in 2018; and (ii) decrease in yields, from 5.3 tons per hectare during the nine month-period ended September 30, 2017 to 5.2 tons per hectare during the same period in 2018. The decrease in the volume of wheat sold, was mainly due to a 31.8% decrease in wheat production, from 115.3 thousand tons during the nine-month period ended September 30, 2017 to 78.6 thousand tons during the same period in 2018. These decreases were partially offset by a 17.6% increase in the price of soybean sold, from $189.4 per ton during the nine-month period ended September 30, 2017 to $222.8 per ton during the same period in 2018, this was due to an increase in local Argentinean prices due to the lack of supply caused by the severe drought. |
| Nine-month period ended September 30, | ||||||||||||
| 2018 | 2017 | Chg % | 2018 | 2017 | Chg % | 2018 | 2017 | Chg % | ||||
| (Unaudited) | ||||||||||||
| (In millions of $) | (In thousands of tons) | (In $ per ton) | ||||||||||
| Soybean | 48.9 | 40.8 | 19.9 | % | 219.5 | 215.4 | 1.9 | % | 222.8 | 189.4 | 17.6 | % |
| Corn (1) | 31.3 | 58.7 | (46.7 | )% | 201.3 | 348.9 | (42.3 | )% | 155.5 | 168.2 | (7.6 | )% |
| Wheat (2) | 7.5 | 11.1 | (32.4 | )% | 43.2 | 72.7 | (40.6 | )% | 173.6 | 152.7 | 13.7 | % |
| Others | 27.6 | 33.6 | (17.9 | )% | ||||||||
Total | 115.3 | 144.2 | (20.0 | )% | ||||||||
____________
(1) Includes sorghum.
(2) Includes barley.
| • | a $4.1 million decrease in our Dairy segment mainly caused by a 19.4% decrease in fluid milk prices from $0.36 per liter in the nine-month period ended September 30, 2017 to $0.29 per liter in the same period in 2018 related to the sharp depreciation of the Agentine peso |
12
This was partially offset by:
| • | a $27.9 million increase in our Rice segment, mainly due to: (i) a 34.4% increase in the volume of white rice sold measured in tons of rough rice, from 163.0 thousand tons during the nine-month period ended September 30, 2017 to 219.0 thousand tons during the same period in 2018; and (ii) a 98.3% increase in the sale of by products, from $12.5 million during the nine-month period ended September 30, 2017 to $24.9 million during the same period in 2018. The increase in the volume of white rice sold is, mainly due to (i) a 16.94% increase in rice yields, from 5.9 tons per hectare during the nine-month period ended September 30, 2017 to 6.9 tons per hectare during the same period in 2018 (ii) Lower build-up inventories in 2018 from 37.1 million tons during the nine-month period ended September 30, 2017 to 27.7 million tons during the same period in 2018. |
Cost of Goods and Services Rendered
| Nine-month period ended September 30, | Crops | Rice | Dairy | All other segments | Sugar, Ethanol and Energy | Total segment reporting | Adjustment | Total as per statement of income | ||||||||
| (In thousands of $) | ||||||||||||||||
| 2018 (Unaudited) | (115,449 | ) | (66,037 | ) | (22,977 | ) | (761 | ) | (237,551 | ) | (442,775 | ) | 27,326 | (415,449 | ) | |
| 2017 (Unaudited) | (143,355 | ) | (50,133 | ) | (27,921 | ) | (324 | ) | (320,466 | ) | (542,199 | ) | — | (542,199 | ) | |
In the case of our agricultural produce sold to third parties (i.e. soybean, corn, wheat and fluid milk), the value of Cost of Goods and Services Rendered is equal to the value of Sales and Services Rendered. The profit of these products is fully recognized under the line items “Initial recognition and changes in fair value of biological assets and agricultural produce” and “Changes in net realizable value of agricultural produce after harvest.” When the agricultural produce is sold to third parties we do not record any additional profit as the gain or loss has already been recognized.
In the case of our manufactured products sold to third parties (i.e. sugar, ethanol, energy and white rice), the profit is recognized when they are sold. The Cost of Goods and Services Rendered of these products includes, among others, the cost of the agricultural produce (i.e. harvested sugarcane and rough rice), which is the raw material used in the industrial process and is transferred internally from the farm to the industry at fair market value.
Cost of manufactured products sold and services rendered totaled $ 415 million, 23.4% less than 2017. Without considering the effect of $ 27.3 million which reflect the effect of inflation accounting and translation for the nine-month period ended September 30, 2018 for our Argentine operations, total costs would have decreased 18.3%, from $542.2 million during the nine-month period ended September 30, 2017 to $442.8 million during the same period in 2018. This decrease was primarily due to:
a $82.9 million decrease in our Sugar, Ethanol and Energy segment, mainly due to: (i) the 8.3% decrease in the volume of sugar and ethanol sold measured in TRS; and (ii) a lower unitary cost in dollar terms due to the 7.1% increase in milling which diluted fixed cost per tons, coupled with the depreciation of the Brazilian Real during the nine-month period ended September 30, 2018 compared to the same period in 2017 and lower purchase of third parties sugarcane from 940 K tons during the nine-month period ended September 30, 2017 to 509 k tons during the same period in 2018.
| • | a $27.9 million decrease in our Crops segment mainly due to the decrease in Sales of Goods and Services Rendered. |
| • | a $4.9 million decrease in our Dairy segment mainly due to the decrease in Sales of Goods and Services Rendered. |
Partially offset by:
| • | a $15.9 million increase in our Rice segment, mainly due to the 34.4% increase in volume sold. |
13
Initial Recognition and Changes in Fair Value of Biological Assets and Agricultural Produce
| Nine-month period ended September 30, | Crops | Rice | Dairy | All other segments | Sugar, Ethanol and Energy | Total segment reporting | Adjustment | Total as per statement of income | |||||||
| (In thousands of $) | |||||||||||||||
| 2018 (Unaudited) | 27,530 | 13,192 | 6,263 | (456 | ) | (14,851 | ) | 31,678 | (19,539 | ) | 12,139 | ||||
| 2017 (Unaudited) | 13,451 | 6,228 | 7,426 | (244 | ) | (2,635 | ) | 24,226 | — | 24,226 | |||||
Initial recognition and changes in fair value of biological assets and agricultural produce totaled $ 12.1 million, 49.9% less than 2017. Without considering the effect of $ 19.5 million which reflect the effect of inflation accounting and translation for the nine-month period ended September 30, 2018 for our Argentine operations, total changes would have increased 30.8%, from $24.4 million during the nine-month period ended September 30, 2017 to $31.7 million during the same period in 2018. This increase was primarily due to:
| • | A $14.1 million increase in our Crops segment from $13.5 million during the nine-month period ended September 30, 2017 (of which $10.4 million were unrealized) to $27.5 million during the same period in 2018 (of which $3.7 million were unrealized). This increase is primarily due to: |
- An increase of $13.4 million in the recognition at fair value less cost to sell of harvested crops, from $13.4 million in the nine-month period ended September 30, 2017 to $26.8 million in the same period in 2018, mainly due to lower production costs in dollar terms, due to the depreciation of the Argentine Peso, partially offset by lower grain production.
| • | A $6.96 million increase in our Rice segment, due to an increase in the recognition at fair value less cost to sell of harvested rice at the point of harvest, from $6.2 million during the nine-month period ended September 30, 2017 (of which $ 2.6 million were realized) to $13.2 million during the same period in 2018 (of which $7.8 million were realized), mainly explained by the 16.9% increase in yields, coupled with lower costs in dollar terms, due to the Argentine Peso depreciation. |
Partially offset by:
| • | A $12.2 million decrease in our Sugar, Ethanol and Energy segment from a loss of $2.6 million during the nine-month period ended September 30, 2017 (of which $16.1 million were unrealized losses) to a loss of $14.9 million during the same period in 2018 (which includes $24.0 million of unrealized losses). This decrease was mainly due to: |
- A $7.9 million decrease in the recognition at fair value less cost to sell of non-harvested sugarcane, from a loss of $16.1 million during the nine-month period ended September 30, 2017 to a loss of $24.0 million in the same period in 2018, mainly generated by a decrease in sugar prices.
- A $4.3 million decrease in the recognition at fair value less cost to sell of harvested sugarcane, from $13.4 million during the nine-month period ended September 30, 2017 to $9.1 million during the same period in 2018 due to the decrease in sugarcane prices.
| • | a $1.2 million decrease in our Dairy segment, mainly due to the decrease in the recognition at fair value less cost to sell of fluid milk, from $7.4 million during the nine-month period ended September 30, 2017 (of which $ 6.9 million were realized) to $6.3 million during the same period in 2018 (of which $6.1 million were realized), mainly due to lower fluid milk prices partially offset by the 7.7% increase in milking cows from an average of 6,901 heads in the nine-month period ended September 30, 2017 to an average of 7,429 heads in the same period in 2018 which are used to populate free-stall #3 |
14
Changes in Net Realizable Value of Agricultural Produce after Harvest
| Nine-month period ended September 30, | Crops | Rice | Dairy | All other segments | Sugar, Ethanol and Energy | Total segment reporting | Adjustment | Total as per statement of income | ||||||||
| (In thousands of $) | ||||||||||||||||
| 2018 (Unaudited) | 14,584 | — | — | — | — | 14,584 | (5,032 | ) | 9,552 | |||||||
| 2017 (Unaudited) | 8,036 | — | — | — | — | 8,036 | — | 8,036 | ||||||||
Changes in net realizable value of agricultural produce after harvest is mainly composed by: (i) profit or loss from commodity price fluctuations during the period of time the agricultural produce is in inventory, which impacts its fair value; (ii) profit or loss from the valuation of forward contracts related to agricultural produce in inventory; and (iii) profit from direct exports.
Changes in net realizable value of agricultural produce after harvest totaled $ 9.6 million, 18.9% more than 2017. Without considering the effect of $ 5.0 million which reflect the effect of inflation accounting and translation for the nine-month period ended September 30, 2018 for our Argentine operations, total changes in net realized value would have increased 81.5%, from $8.0 million during the nine-month period ended September 30, 2017 to $14.6 million during the same period in 2018. This result is mainly explained by the impact of the increase in local prices on the fair value of soybean and corn held inventories during the nine-month period ended September 30, 2018.
General and Administrative Expenses
| Nine-month period ended September 30, | Crops | Rice | Dairy | All other segments | Sugar, Ethanol and Energy | Corporate | Total segment reporting | Adjustment | Total as per statement of income | |
| (In thousands of $) | ||||||||||
| 2018 (Unaudited) | (3,111) | (3,443) | (611) | (59) | (20,181) | (14,460) | (41,865) | 2,553 | (39,312) | |
| 2017 (Unaudited) | (2,168) | (3,384) | (742) | (130) | (21,850) | (16,209) | (44,483) | — | (44,483) | |
General and administrative expenses totaled $ 39.3 million, 11.6% less than 2017. Without considering the effect of $ 2.6 million which reflect the effect of inflation accounting and translation for the nine-month period ended September 30, 2018 for our Argentine operations, total expenses would have decreased 5.9%, from $44.5 million during the nine-month period ended September 30, 2017 to $41.9 million during the same period in 2018. The decrease is mainly explained as a result of the depreciation of the Brazilian Real and the Argentine peso.
Selling Expenses
| Nine-month period ended September 30, | Crops | Rice | Dairy | All other segments | Sugar, Ethanol and Energy | Corporate | Total segment reporting | Adjustment | Total as per statement of income | ||
| (In thousands of $) | |||||||||||
| 2018 (Unaudited) | (4,499) | (12,920) | (417) | (91) | (47,456) | (127) | (65,510) | 4,178 | (61,332) | ||
| 2017 (Unaudited) | (5,250) | (8,721) | (667) | (39) | (49,990) | (91 | ) | (64,758) | — | (64,758) | |
Selling expenses totaled $ 61.3 million, 5.3% less than 2017. Without considering the effect of $ 4.2 million which reflect the effect of inflation accounting and translation for the nine-month period ended September 30, 2018 for our Argentine operations, total expenses would have increased 1.2 %, from 64.8 million during the nine-month period ended September 30, 2017 to $65.5
15
million during the same period in 2018, mainly due to (i) a $4.2 million increase in our Rice segment, due to a 34.4% increase in white rice sales (ii) partially offset by a $ 2.5 million decrease in our Sugar, ethanol and energy segment due to a 16.2% decrease in total segment sales.
Other Operating Income, Net
| Nine-month period ended September 30, | Crops | Rice | Dairy | All other segments | Sugar, Ethanol and Energy | Land Transformation | Corporate | Total segment reporting | Adjustment | Total as per statement of income | ||||||||||
| (In thousands of $) | ||||||||||||||||||||
| 2018 (Unaudited) | 1,518 | 247 | (1,147 | ) | 19,756 | 50,225 | 36,227 | (99 | ) | 106,727 | 794 | 107,521 | ||||||||
| 2017 (Unaudited) | 7,201 | 623 | 530 | 3,473 | 31,236 | — | (29 | ) | 43,034 | — | 43,034 | |||||||||
Other operating income totaled $ 107.5 million, 149.85% more than 2017. Without considering the effect of $ 0.8 million which reflect the effect of inflation accounting and translation for the nine-month period ended September 30, 2018 for our Argentine operations, total other operating income would have increased 170.9 %, from 39.4 million during the nine-month period ended September 30, 2017 to $106.7 million during the same period in 2018 primarily due to:
| • | a $36.2 million increase in Land Transformation segment due to the sale of "Rio de Janeiro" and "Conquista" farms, located in Brazil, for a total consideration of $53.0 million for 9,300 croppable hectares. |
| • | a $16.3 million increase in all other segments related to net gains from the fair value adjustment of Investment property, composed of farms under lease agreements |
•a $19 million increase in our Sugar, Ethanol & Energy segment mainly explained by the mark-to-market effect of our sugar hedge positions;
Partially offset by:
| • | a $5.7 million decrease in our Crops segment due to the mark-to-market effect of our soybean and corn hedge positions. |
Financial Results, Net
Our financial results, net decreased from a loss of $67.9 million during the nine-month period ended September 30, in 2017 to a loss of $185.5 million during the same period in 2018. This was mainly due to the 916.8% increase in foreign exchange losses, from a loss of $18.5 million during the nine-month period ended September 30, 2017 to a loss of $188.2 million during the same period in 2018,mainly due to the impact on our dollar denominated debt of the 121.2% and 21% depreciation of the Argentine Peso and the Brazilean Real during the nine-month period ended September 30, 2018 compared to a 8.9% and -2.8% depreciation of the Argentine Peso and the Brazilean Real during the same period in 2017. This loss was partially offset by a a positive impact of $ 50.4 million regarding inflation accounting effect.
The following table sets forth the breakdown of financial results for the periods indicated.
16
| Nine-month period ended September 30, | |||||
| 2018 (Unaudited) | 2017 (Unaudited) | % Change (Unaudited) | |||
| (In $ thousands) | |||||
| Interest income | 5,780 | 8,446 | (31.6 | )% | |
| Interest expense | (36,323) | (39,953) | 9.1 | % | |
| Foreign exchange losses, net | (188,204) | (18,510) | (916.8 | )% | |
| Cash flow hedge – transfer from equity | (7,846) | (10,689) | 26.6 | % | |
| Loss from interest rate /foreign exchange rate derivative financial instruments | (5,836) | (2,052) | (184.4 | )% | |
| Other financial results - Net gain of inflation effects on the monetary items | 50,370 | — | 100.0 | % | |
| Taxes | (2,081) | (2,276) | 8.6 | % | |
| Other expenses | (1,338) | (2,903) | 53.9 | % | |
Total Financial Results | (185,478) | (67,937) | (173.0 | )% | |
17
Income Tax expense
Current income tax benefit totaled a gain of $3.2 million during the nine-month period ended September 30, 2018, which equates to a consolidated effective tax rate of 14.2%. For the same period in 2017, we registered an income tax loss of $4.0 million. In 2018, we recorded non-taxable income in the amount of $10.6 million, mainly related to a Complementary Law in Brazil, which allows the Company to consider as a non-taxable income the Government grant related to the ICMS tax. This effects was partially offset by a loss of $10.7 related to the effects of the application of IAS 29 on Argentina Shareholders's equity . In 2017, the effective tax rate was 29.5% based on non-deductible expenses in Brazil and Uruguay for an amount of 1.2 million.
(Loss)/Profit for the period
As a result of the foregoing, our net income during the nine-month period ended September 30, 2018 decreased $28.5 million, from a gain of $9.5 million during the same period in 2017 to a loss of $19 million in 2018.
18
LIQUIDITY AND CAPITAL RESOURCES
Our liquidity and capital resources are and will be influenced by a variety of factors, including:
| • | our ability to generate cash flows from our operations; |
| • | the level of our outstanding indebtedness and the interest that we are obligated to pay on such outstanding indebtedness; |
| • | our capital expenditure requirements, which consist primarily of investments in new farmland, in our operations, in equipment and plant facilities and maintenance costs; and |
| • | our working capital requirements. |
Our principal sources of liquidity have traditionally consisted of shareholders’ contributions, short and long term borrowings and proceeds received from the disposition of transformed farmland or subsidiaries.
We believe that our working capital will be sufficient during the next 12 months to meet our liquidity requirements.
Nine-month period ended September 30, 2018 and 2017
The table below reflects our statements of Cash Flow for the nine-month period ended September 30, 2018 and 2017.
| For the nine-month period ended September 30, | |||
| 2018 | 2017 | ||
| (Unaudited, in thousands of $) | |||
| Cash and cash equivalent at the beginning of the period | 269,195 | 158,568 | |
| Net cash generated from operating activities | 101,424 | 98,614 | |
| Net cash used in investing activities | (119,878 | ) | (134,315) |
| Net cash (used by)/generated from financial activities | (46,790 | ) | 405,295 |
| Effect of exchange rate changes on cash and cash equivalent | (23,123 | ) | (4,987) |
| Cash and cash equivalent at the end of the period | 180,828 | 523,175 | |
Operating Activities
Period ended September 30, 2018
Net cash generated by operating activities was $101.4 million for the nine-month period ended September 30, 2018. During this period, we generated a net loss of $19.0 million that included non-cash charges relating primarily to depreciation and amortization of $112.9 million, losses from interest and other expenses, net of $30.9 million, losses from foreign exchange, net of $188.2 million and $7.8 million Cash Flow hedge transfer from Equity. All these effects were partially offset by a gain from the sale of subsidiaries of $36.2, a gain from derivative financial instruments of $46.1 million, net gain from the fair value adjustment of Investment Property of $18.5 million and changes in net realizable value of agricultural produce after harvest unrealized of $11.4.
In addition, other changes in operating assets and liability balances resulted in a net decrease in cash of $64.8 million, primarily due to an increase of $69.7 million in inventories and an increase of $112.7 million in trade and other receivables. All these effects were partially offset by a decrease of $51.0 million in derivative financial instruments, a decrease of $37.9 million in biological assets and an increase in trade and other payables of $23.2 million.
Period ended September 30, 2017
Net cash generated by operating activities was $98.6 million for the nine-month period ended September 30, 2017. During this period, we generated a net profit of $9.5 million that included non-cash charges relating primarily to depreciation and amortization of $109.4 million, losses from interest and other expenses, net of $33.7 million and losses from foreign exchange, net of $18.5 million and $10.7 million Cash Flow hedge transfer from Equity. All these effects were partially offset by a gain from derivative financial instruments of $38.8 million.
19
In addition, other changes in operating assets and liability balances resulted in a net decrease in cash of $53.2 million, primarily due to an increase of $48.5 million in trade and other receivables, an increase of $56.9 million in inventories and a decrease of $19.9 million in trade and other payables. All these effects were partially offset by a decrease of $40.1 million in derivative financial instruments, a decrease of $24.6 million in biological assets and an increase of $7.3 million in payroll and social security liabilities.
Investing Activities
Period ended September 30, 2018
Net cash used in investing activities totaled $119.9 million in the nine-month period ended September 30, 2018. Capital expenditures totaled $158.4 million, with the following amounts directed as follows: (i) $70.6 million, to the renewal and expansion of our sugarcane plantation and (ii) $85.4 million, to the construction of our Free stall number 3, which started operating as of August 27, 2018, coupled with the purchase of agricultural and industrial equipment related to the ongoing investment in the expansion of crushing capacity in Ivinhema, partially offset by collections from farm sales of $31.5 million and interest gains of $5.8 million.
Period ended September 30, 2017
Net cash used in investing activities totaled $134.3 million in the nine-month period ended September 30, 2017, primarily due to $61.6 million related to the renewal and expansion of our sugarcane plantation and $80.6 million related to the purchase of agricultural and industrial equipment. All these effects were partially offset by Interest received of $8.4 million.
Financing Activities
Period ended September 30, 2018
Net cash used in financing activities was $46.8 million in the period ended September 30, 2018, primarily derived from the incurrence of (i) a new $37.2 million long term loan with Rabobank which will be used to finance part of the capital expenditure plan; and (ii) a short term debt of $27.5 million to finance working capital. This effect was primarily offset by net payments of long term borrowings in the amounts of $49.8 million, $43.5 million of interest paid and $15.7 million of shares repurchased.
Period ended September 30, 2017
Net cash provided by financing activities was $405.3 million in the period ended September 30, 2017, primarily derived from the issuance of senior notes 2027 (*) for $496.2 million with the main objective of cancelling financial debt in Brazil, the incurrence of a new syndicated long term loan lead by Rabobank and ING among others in the amounts of $230.4 million and short term loan of $92.7 million, respectively, mainly for our Brazilian Sugar, Ethanol and Energy business. This effect was partially offset by net payments of long and short term borrowings in the amounts of $329.9 million and $28.5 million, respectively, interest paid for $33.4 million and purchase of own shares for $11.3 million.
(*) Senior Notes 2027
On September 21, 2017, the Company issued senior notes (the “Notes”) for US$ 500 million, at an annual nominal rate of 6%. The Notes will mature on September 21, 2027. Interest on the Notes are payable semi-annually in arrears on March 21 and September 21 of each year, beginning on March 21, 2018. The total proceeds nets of expenses was US$ 496.5 million.
Cash and Cash Equivalents
Historically, since our cash flows from operations were insufficient to fund our working capital needs and investment plans, we funded our operations with proceeds from short-term and long-term indebtedness and capital contributions from existing and new private investors. In 2011 we obtained $421.8 million from the IPO and the sale of shares in a concurrent private placement (See “Item 4. Information on the Company—A. History and Development of the Company” in our Form 20-F). As of September 30, 2018, our cash and cash equivalents amounted to $180.8 million.
However, we may need additional cash resources in the future to continue our investment plans. Also, we may need additional cash if we experience a change in business conditions or other developments. We also might need additional cash resources in the future if we find and wish to pursue opportunities for investment, acquisitions, strategic alliances or other similar investments. If we ever determine that our cash requirements exceed our amounts of cash and cash equivalents on hand, we might seek to issue debt or additional equity securities or obtain additional credit facilities or realize the disposition of transformed farmland and/or
20
subsidiaries. Any issuance of equity securities could cause dilution for our shareholders. Any incurrence of additional indebtedness could increase our debt service obligations and cause us to become subject to additional restrictive operating and financial covenants, and could require that we pledge collateral to secure those borrowings, if permitted to do so. It is possible that, when we need additional cash resources, financing will not be available to us in amounts or on terms that would be acceptable to us or at all.
We believe we have sufficient liquidity to meet our current working capital requirements for next twelve months.
Projected Sources and Uses of Cash
We anticipate that we will generate cash from the following sources:
| • | operating cash flow; |
| • | debt financing; |
| • | the dispositions of transformed farmland and/or subsidiaries; and |
| • | debt or equity offerings. |
We anticipate that we will use our cash:
| • | for other working capital purposes; |
| • | to meet our budgeted capital expenditures; |
| • | to make investment in new projects related to our business; and |
| • | to refinance our current debts. |
Indebtedness and Financial Instruments
The table below illustrates the maturity of our indebtedness (excluding obligations under finance leases) and our exposure to fixed and variable interest rates:
| September 30, 2018 | December 31, 2017 | |||
| (unaudited) | ||||
| Fixed rate: | ||||
| Less than 1 year | 127,748 | 132,998 | ||
| Between 1 and 2 years | 18,785 | 35,762 | ||
| Between 2 and 3 years | 15,954 | 20,097 | ||
| Between 3 and 4 years | 15,366 | 20,130 | ||
| Between 4 and 5 years | 1,889 | 16,310 | ||
| More than 5 years | 496,001 | 495,754 | ||
| 675,743 | 721,051 | |||
| Variable rate: | ||||
| Less than 1 year | 37,423 | 21,833 | ||
| Between 1 and 2 years | 16,332 | 22,871 | ||
| Between 2 and 3 years | 29,748 | 17,945 | ||
| Between 3 and 4 years | 22,737 | 18,215 | ||
| Between 4 and 5 years | 19,965 | 11,164 | ||
| More than 5 years | 12,501 | 4,774 | ||
| 138,706 | 96,802 | |||
| 814,449 | 817,853 | |||
| (1) | The Company plans to partially rollover its short term debt using new available lines of credit, or on using operating cash flow to cancel such debt. |
21
During 2018 and 2017 the Company was in compliance with all financial covenants.
Short-term Debt.
As of September 30, 2018, our short term debt totaled $165.4 million.
We maintain lines of credit with several banks in order to finance our working capital requirements. We believe that we will continue to be able to obtain additional credit to finance our working capital needs in the future based on our past track record and current market conditions.
Capital Expenditure Commitments
During the nine-month period ended September 30, 2018, our capital expenditures totalled $158.4 million. Our capital expenditures consisted mainly of purchases of property, plant and equipment, mainly related to the renewal and expansion of our sugarcane plantation $70.6 million, and $81.7 million related to purchase of agricultural and industrial equipment, totaling $152.3 million.
22