MANAGEMENT’S DISCUSSION AND ANALYSIS OF FINANCIAL CONDITION
AND RESULTS OF OPERATIONS
General
Management’s discussion and analysis of financial condition and results of operations is intended to assist in understanding changes in the Company’s financial condition as of December 31, 2013 and 2012 and the results of operations for the years ended December 31, 2013, 2012 and 2011. The information contained in this section should be read in conjunction with the consolidated financial statements and notes contained elsewhere in this annual report.
This report may contain certain “forward-looking statements” within the meaning of the federal securities laws, which are made in good faith pursuant to the “safe harbor” provisions of the Private Securities Litigation Reform Act of 1995. Forward-looking statements are generally preceded by terms such as “expects,” “believes,” “anticipates,” “intends,” “estimates,” “projects” and similar expressions. These statements are not historical facts; rather, they are statements based on management’s current expectations regarding our business strategies, intended results and future performance.
Management’s ability to predict results of the effect of future plans or strategies is inherently uncertain. Factors that could have a material adverse effect on the operations of the Company and its subsidiaries include, but are not limited to, changes in interest rates, national and regional economic conditions, legislative and regulatory changes, monetary and fiscal policies of the United States government, including policies of the United States Treasury and the Federal Reserve Board, the quality and composition of the loan or investment portfolios, demand for loan products, deposit flows, competition, difficulties in integrating Newport Federal Savings Bank or failing to achieve the expected cost savings or revenue synergies, demand for financial services in the Company’s market area, changes in real estate market values in the Company’s market area and changes in relevant accounting principles and guidelines. Additional factors that may affect the Company’s results are discussed in Item 1A. “Risk Factors” in the Company’s annual report on Form 10-K and in other reports filed with the Securities and Exchange Commission (the “SEC”). These risks and uncertainties should be considered in evaluating forward-looking statements and undue reliance should not be placed on such statements. Except as required by applicable law or regulation, the Company does not undertake, and specifically disclaims any obligation, to release publicly the result of any revisions that may be made to any forward-looking statements to reflect events or circumstances after the date of the statements or to reflect the occurrence of anticipated or unanticipated events.
Management Strategies
The Company’s mission is to operate and grow a profitable community-oriented financial institution. The Company plans to achieve this mission by continuing its strategies of:
| |
| ◦ | Offering a full range of financial products and services. The Bank has a long tradition of focusing on the needs of consumers and small and medium-sized businesses in the community and being an active corporate citizen. The Bank believes its community orientation, quicker decision-making process and customized products are attractive to its customers and distinguishes it from the large regional banks that operate in its market area. The Bank serves as a financial services company offering one-stop shopping for all of its customers’ financial needs through banking, investments, insurance and trust products and services. The Bank believes that its broad array of product offerings deepen its relationships with its current customers and entice new customers to begin banking with them, ultimately increasing fee income and profitability. |
| |
| ◦ | Actively managing the balance sheet and diversifying the asset mix. The recent economic recession has underscored the importance of a strong balance sheet. The Company manages its balance sheet by: (1) prudently increasing the Bank's multi-family and commercial real estate and commercial business loan portfolios, which offer higher yields, shorter maturities and more sensitivity to interest rate fluctuations; |
(2) managing its interest rate risk by diversifying the type and maturity of its assets in its loan and investment portfolios and monitoring the maturities in its deposit portfolio; and (3) maintaining strong capital levels and liquidity. Multi-family and commercial real estate and commercial business loans increased $124.5 million, $89.3 million and $23.4 million for the years ended December 31, 2013, 2012 and 2011, respectively, and comprised 51.3% of total loans at December 31, 2013. The Company intends to continue to pursue the opportunities from the many multi-family and commercial properties and businesses located in its market area and areas outside its market area where lenders have specialized knowledge.
| |
| ◦ | Continuing conservative underwriting practices and maintaining a high quality loan portfolio. The Bank believes that strong asset quality is a key to long-term financial success. The Bank has sought to maintain a high level of asset quality and moderate credit risk by using what the Bank believes are conservative underwriting standards and by diligent monitoring and collection efforts. Nonperforming loans decreased from $7.7 million at December 31, 2012 to $7.0 million at December 31, 2013. At December 31, 2013, nonperforming loans were 0.66% of the total loan portfolio and 0.52% of total assets. Although the Bank intends to increase its multi-family and commercial real estate and commercial business lending, it intends to continue its philosophy of managing large loan exposures through conservative loan underwriting and credit administration standards. |
| |
| ◦ | Increasing core deposits. The Bank’s primary source of funds is retail deposit accounts. At December 31, 2013, 64.4% of the Bank's deposits were core deposits, consisting of demand, savings and money market accounts. The Bank values core deposits because they represent longer-term customer relationships and a lower cost of funding compared to certificates of deposit. Core deposits will continue to increase primarily due to the investments the Bank has made in its branch network, new product offerings, competitive interest rates and the movement of customer funds out of riskier investments, including the stock market. The Bank intends to continue to increase its core deposits and to focus on gaining market share in counties outside of Windham County in Connecticut and Newport and Washington Counties in Rhode Island by continuing to offer exceptional customer service, cross-selling its loan and deposit products and trust, insurance and investment services and increasing its commercial deposits from small and medium-sized businesses through additional business banking and cash management products. |
| |
| ◦ | Supplementing fee income through expanded mortgage banking operations. The Company views the changing regulatory landscape and historically low interest rate environment as an opportunity to gain noninterest income by leveraging its expertise in originating residential mortgages and selling such increased originations in the secondary market. This strategy enables the Company to have a much larger lending capacity, provide a more comprehensive product offering and reduce the interest rate, prepayment and credit risks associated with originating residential loans for retention in its loan portfolio. Further, this strategy allows the Company to be more selective with the single-family residential loans that are held in portfolio. |
| |
| ◦ | Grow through acquisitions. The Company intends to pursue expansion opportunities in its existing market areas or adjacent areas in strategic locations that maximize growth opportunities or with companies that add complementary products to its existing business. The Company believes that the recent economic recession will increase the rate of consolidation in the banking industry. The Company will look to be opportunistic to expand through the acquisition of banks or other financial service companies. |
Critical Accounting Policies
The discussion and analysis of the financial condition and results of operations are based on the Company’s consolidated financial statements, which are prepared in conformity with generally accepted accounting principles in the United States of America. The preparation of these financial statements requires management to make estimates and assumptions affecting the reported amounts of assets and liabilities, disclosure of contingent assets and liabilities and the reported amounts of income and expenses. The Company considers accounting policies
involving significant judgments and assumptions by management that have, or could have, a material impact on the carrying value of certain assets or on income, to be its critical accounting policies. The Company considers the determination of allowance for loan losses, other-than-temporary impairment of securities, deferred income taxes and the impairment of long-lived assets to be its critical accounting policies.
Allowance for Loan Losses. Determining the amount of allowance for loan losses necessarily involves a high degree of judgment. Management reviews the level of the allowance on a monthly basis and establishes the provision for loan losses based on the size and the composition of the loan portfolio, delinquency levels, loss experience, economic conditions and other factors related to the collectibility of the loan portfolio. The level of the allowance for loan losses fluctuates primarily due to changes in the size and composition of the loan portfolio and in the level of nonperforming loans, delinquencies, classified assets and loan charge-offs. A portion of the allowance is established by segregating the loans by loan category and assigning allocation percentages based on our historical loss experience, delinquency trends, economic conditions and other qualitative factors. The allocation percentages are re-evaluated quarterly to ensure their relevance in the current economic environment. Accordingly, increases in the size of the loan portfolio and the increased emphasis on commercial real estate and commercial business loans, which carry a higher degree of risk of default and, thus, a higher allocation percentage, increases the allowance. Additionally, a portion of the allowance is established based on the impairment analysis of specific nonperforming loans and classified assets.
Although management believes that it uses the best information available to establish the allowance for loan losses, which is based on estimates that are susceptible to change, future additions to the allowance may be necessary as a result of changes in economic conditions and other factors. Additionally, the Bank’s regulators, as a part of their examination process, periodically review the allowance for loan losses and may require the Bank to increase the allowance for loan losses by recognizing additional provisions for loan losses charged to expense, or to decrease its allowance for loan losses by recognizing loan charge-offs. See Notes 1 and 4 in the Company’s Consolidated Financial Statements for additional information.
Other-Than-Temporary Impairment of Securities. One of the significant estimates related to securities is the evaluation of investments for other-than-temporary impairment (“OTTI”). Marketable equity securities are evaluated for OTTI based on the severity and duration of the impairment and, if deemed to be other-than-temporary, the declines in fair value are reflected in earnings as realized losses. For those debt securities for which the fair value is less than its amortized cost and the Company does not intend to sell such security and it is not more likely than not that it will be required to sell such security prior to the recovery of its amortized cost basis (which may be maturity) less any credit losses, the credit-related OTTI loss is recognized as a charge to earnings. Noncredit-related OTTI losses for debt securities are recognized in other comprehensive income (loss), net of applicable taxes.
The evaluation of securities for impairment is a quantitative and qualitative process, which is subject to risks and uncertainties and is intended to determine whether declines in the fair value of investments should be recognized in current period earnings. The risks and uncertainties arise as changes in general economic conditions, the issuer’s financial condition or future prospects, the effects of changes in interest rates or credit spreads and the expected recovery period could differ from the assumptions used by management. Management evaluates securities for OTTI at least on a quarterly basis and more frequently when economic or market conditions warrant such evaluation. See Notes 1 and 3 in the Company’s Consolidated Financial Statements for additional information.
Deferred Income Taxes. The Company uses the asset and liability method of accounting for income taxes. Under this method, deferred tax assets and liabilities are recognized for the future tax consequences attributable to differences between the financial statement carrying amounts of existing assets and liabilities and their respective tax bases. If current available information raises doubt as to the realization of the deferred tax asset, a valuation allowance is established. Deferred tax assets and liabilities are measured using enacted tax rates expected to apply to taxable income in the years in which those temporary differences are expected to be recovered or settled. The Company exercises significant judgment in evaluating the amount and timing of recognition of the resulting tax assets and liabilities. These judgments require the Company to make projections of future taxable income. These judgments and estimates, which are inherently subjective, are reviewed periodically as regulatory
and business factors change. A reduction in estimated future taxable income may require the Company to record a valuation allowance against its deferred tax asset. A valuation allowance would result in additional income tax expense in the period, which would negatively affect earnings. See Notes 1 and 10 in the Company’s Consolidated Financial Statements.
Impairment of Long-Lived Assets. The Company is required to record certain assets it has acquired, including identifiable intangible assets such as core deposit intangibles and goodwill, at fair value, which may involve making estimates based on third-party valuations, such as appraisals or internal valuations based on discounted cash flow analyses or other valuation techniques. Further, long-lived assets, including intangible assets and premises and equipment, that are held and used by the Company, are presumed to have a useful life. The determination of the useful lives of intangible assets is subjective, as is the appropriate amortization period for such intangible and long-lived assets. Additionally, long-lived assets are reviewed for impairment at least annually or whenever events or changes in circumstances indicate that the carrying amount of the asset may not be recoverable. If impairment is indicated by that review, the asset is written down to its estimated fair value through a charge to noninterest expenses. Testing for impairment is a subjective process, the application of which could result in different evaluations of impairment. See Notes 1, 6 and 7 in the Company’s Consolidated Financial Statements for additional information.
Analysis of Net Interest Income
Average Balance Sheet. The following sets forth information regarding average balances of assets and liabilities as well as the total dollar amounts of interest income from average interest-earning assets and interest expense on average interest-bearing liabilities, resulting yields and rates paid, interest rate spread, net interest margin and the ratio of average interest-earning assets to average interest-bearing liabilities for the periods indicated.
|
| | | | | | | | | | | | | | | | | | | | | | | | | | | | | | | | |
| | Years Ended December 31, |
| | 2013 | | 2012 | | 2011 |
| | Average Balance | | Interest & Dividends | | Average Yield/ Rate | | Average Balance | | Interest & Dividends | | Average Yield/ Rate | | Average Balance | | Interest & Dividends | | Average Yield/ Rate |
| | (Dollars in Thousands) |
| Interest-earning assets: | | | | | | | | | | | | | | | | | |
Loans (1) (2) | $ | 797,296 |
| | $ | 33,989 |
| | 4.26 | % | | $ | 661,087 |
| | $ | 30,462 |
| | 4.61 | % | | $ | 621,363 |
| | $ | 30,969 |
| | 4.98 | % |
Securities (3) | 197,047 |
| | 4,195 |
| | 2.13 |
| | 218,679 |
| | 5,317 |
| | 2.43 |
| | 232,737 |
| | 6,788 |
| | 2.92 |
|
| Other interest-earning assets | 22,165 |
| | 43 |
| | 0.19 |
| | 28,149 |
| | 46 |
| | 0.16 |
| | 40,237 |
| | 65 |
| | 0.16 |
|
| Total interest-earning assets | 1,016,508 |
| | 38,227 |
| | 3.76 |
| | 907,915 |
| | 35,825 |
| | 3.95 |
| | 894,337 |
| | 37,822 |
| | 4.23 |
|
| | | | | | | | | | | | | | | | | | |
| Noninterest-earning assets | 66,689 |
| | | | | | 48,407 |
| | |
| | |
| | 52,115 |
| | |
| | |
|
| Total assets | $ | 1,083,197 |
| | | | | | $ | 956,322 |
| | |
| | |
| | $ | 946,452 |
| | |
| | |
|
| | | | | | | | | | | | | | | | | | |
| Interest-bearing liabilities: | | | | | | | |
| | |
| | |
| | |
| | |
| | |
|
| Deposits: | | | | | | | |
| | |
| | |
| | |
| | |
| | |
|
| Business checking | $ | 26 |
| | — |
| | — |
| | $ | 35 |
| | — |
| | — |
| | $ | — |
| | — |
| | — |
|
| NOW and money market | 357,736 |
| | 504 |
| | 0.14 |
| | 305,784 |
| | 627 |
| | 0.21 |
| | 286,000 |
| | 1,294 |
| | 0.45 |
|
Savings (4) | 43,253 |
| | 75 |
| | 0.17 |
| | 40,348 |
| | 106 |
| | 0.26 |
| | 48,413 |
| | 197 |
| | 0.41 |
|
Certificates of deposit (5) | 294,354 |
| | 4,633 |
| | 1.57 |
| | 277,052 |
| | 5,286 |
| | 1.91 |
| | 278,687 |
| | 5,771 |
| | 2.07 |
|
| Total interest-bearing deposits | 695,369 |
| | 5,212 |
| | 0.75 |
| | 623,219 |
| | 6,019 |
| | 0.97 |
| | 613,100 |
| | 7,262 |
| | 1.18 |
|
| | | | | | | | | | | | | | | | | | |
| Federal Home Loan Bank advances | 120,771 |
| | 2,897 |
| | 2.40 |
| | 95,776 |
| | 3,276 |
| | 3.42 |
| | 107,555 |
| | 3,779 |
| | 3.51 |
|
| Subordinated debt | 8,248 |
| | 336 |
| | 4.07 |
| | 8,248 |
| | 338 |
| | 4.10 |
| | 8,248 |
| | 336 |
| | 4.07 |
|
| Other borrowed funds | 3,093 |
| | 9 |
| | 0.29 |
| | — |
| | — |
| | — |
| | — |
| | — |
| | — |
|
| Total interest-bearing liabilities | 827,481 |
| | 8,454 |
| | 1.02 |
| | 727,243 |
| | 9,633 |
| | 1.32 |
| | 728,903 |
| | 11,377 |
| | 1.56 |
|
| | | | | | | | | | | | | | | | | | |
| Noninterest-bearing liabilities | 119,248 |
| | | | | | 99,125 |
| | |
| | |
| | 86,957 |
| | |
| | |
|
| Total liabilities | 946,729 |
| | | | | | 826,368 |
| | |
| | |
| | 815,860 |
| | |
| | |
|
| | | | | | | | | | | | | | | | | | |
| Total shareholders' equity | 136,468 |
| | | | | | 129,954 |
| | |
| | |
| | 130,592 |
| | |
| | |
|
| | | | | | | | | | | | | | | | | | |
| Total liabilities and shareholders' equity | $ | 1,083,197 |
| | | | | | $ | 956,322 |
| | |
| | |
| | $ | 946,452 |
| | |
| | |
|
| | | | | | | | | | | | | | | | | | |
| Net interest-earning assets | $ | 189,027 |
| | | | | | $ | 180,672 |
| | |
| | |
| | $ | 165,434 |
| | |
| | |
|
| | | | | | | | | | | | | | | | | | |
Tax equivalent net interest income(3) | | | 29,773 |
| | | | |
| | 26,192 |
| | |
| | |
| | 26,445 |
| | |
|
Tax equivalent interest rate spread(6) | | | | | 2.74 | % | | |
| | |
| | 2.63 | % | | |
| | |
| | 2.67 | % |
Tax equivalent net interest margin as a percentage of interest-earning assets (7) | | | | | 2.93 | % | | |
| | |
| | 2.88 | % | | |
| | |
| | 2.96 | % |
| Average of interest-earning assets to average interest-bearing liabilities | | | | | 122.84 | % | | |
| | |
| | 124.84 | % | | |
| | |
| | 122.70 | % |
Less tax equivalent adjustment (3) | | | (35 | ) | | | | |
| | (1 | ) | | |
| | |
| | (2 | ) | | |
|
| Net interest income | | | $ | 29,738 |
| | | | |
| | $ | 26,191 |
| | |
| | |
| | $ | 26,443 |
| | |
|
|
| |
| | |
(1) Amount is net of deferred loan origination fees and costs. Average balances include nonaccrual loans and loans held for sale and excludes the allowance for loan losses. |
(2) Loan fees are included in interest income and are immaterial. |
(3) Municipal securities income and net interest income are presented on a tax equivalent basis using a tax rate of 34%. The tax equivalent adjustment is deducted from tax equivalent net interest income to agree to the amounts reported in the statements of operations. |
(4) Includes mortgagors' and investors' escrow accounts. |
(5) Includes brokered deposits. |
(6) Tax equivalent net interest rate spread represents the difference between the weighted average yield on interest-earning assets and the weighted average cost of interest-bearing liabilities. |
(7) Tax equivalent net interest margin represents tax equivalent net interest income divided by average interest-earning assets. |
Rate/Volume Analysis. The following table sets forth the extent to which changes in interest rates and changes in volume of interest-earning assets and interest-bearing liabilities have on the Company’s interest income and interest expense for the periods presented. The rate column shows the effects attributable to changes in rate (changes in rate multiplied by prior volume). The volume column shows the effects attributable to changes in volume (changes in volume multiplied by prior rate). The net column represents the sum of the rate and volume columns. For purposes of this table, changes attributable to both changes in rate and volume that cannot be segregated have been allocated proportionately based on the changes due to rate and the changes due to volume.
|
| | | | | | | | | | | | | | | | | | | | | | | |
| | 2013 Compared to 2012 | | 2012 Compared to 2011 |
| | Increase (Decrease) Due To | | Increase (Decrease) Due To |
| | Rate | | Volume | | Net | | Rate | | Volume | | Net |
| | (In Thousands) |
| Interest-earning assets: | | | | | | | | | | | |
| Interest and dividend income: | | | | | | | | | | | |
Loans (1)(2) | $ | (2,405 | ) | | $ | 5,932 |
| | $ | 3,527 |
| | $ | (2,418 | ) | | $ | 1,911 |
| | $ | (507 | ) |
Securities (3) | (625 | ) | | (497 | ) | | (1,122 | ) | | (1,079 | ) | | (392 | ) | | (1,471 | ) |
| Other interest-earning assets | 6 |
| | (9 | ) | | (3 | ) | | 1 |
| | (20 | ) | | (19 | ) |
| Total interest-earning assets | (3,024 | ) | | 5,426 |
| | 2,402 |
| | (3,496 | ) | | 1,499 |
| | (1,997 | ) |
| | | | | | | | | | | | |
| Interest-bearing liabilities: | | | | | | | |
| | |
| | |
|
| Interest expense: | | | | | | | |
| | |
| | |
|
Deposits (4) | (1,224 | ) | | 417 |
| | (807 | ) | | (1,264 | ) | | 21 |
| | (1,243 | ) |
| Federal Home Loan Bank advances | (1,115 | ) | | 736 |
| | (379 | ) | | (98 | ) | | (405 | ) | | (503 | ) |
| Subordinated debt | (2 | ) | | — |
| | (2 | ) | | 2 |
| | — |
| | 2 |
|
| Other borrowed funds | — |
| | 9 |
| | 9 |
| | — |
| | — |
| | — |
|
| Total interest-bearing liabilities | (2,341 | ) | | 1,162 |
| | (1,179 | ) | | (1,360 | ) | | (384 | ) | | (1,744 | ) |
| | | | | | | | | | | | |
Change in net interest income (5) | $ | (683 | ) | | $ | 4,264 |
| | $ | 3,581 |
| | $ | (2,136 | ) | | $ | 1,883 |
| | $ | (253 | ) |
|
| |
| | |
(1) Amount is net of deferred loan origination fees and costs. Average balances include nonaccrual loans and loans held for sale. |
(2) Loan fees are included in interest income and are immaterial. |
(3) Municipal securities income and net interest income are presented on a tax equivalent basis using a tax rate of 34%. The tax equivalent adjustment is deducted from tax equivalent net interest income to agree to the amounts reported in the statements of operations. |
(4) Includes mortgagors' and investors' escrow accounts and brokered deposits. |
(5) Presented on a tax equivalent basis using a tax rate of 34%. |
Comparison of Financial Condition at December 31, 2013 and December 31, 2012
Assets:
Summary. Total assets increased $393.5 million, or 41.3%, to $1.35 billion at December 31, 2013 from $952.9 million at December 31, 2012, primarily due to increases of $362.2 million in net loans receivable, $16.1 million in intangible assets, $11.7 million in bank-owned life insurance and $9.9 million in premises and equipment. Of the increase, the acquisition of Newport Bancorp, Inc. ("Newport") contributed $361.1 million in loans receivable, $16.3 million in intangible assets, $11.3 million in bank-owned life insurance and $9.7 million in premises and equipment. The increases were offset by decreases of $10.4 million in cash and cash equivalents, $6.3 million in available for sale securities and $3.3 million in loans held for sale.
Loans Receivable, Net. Net loans receivable increased $362.2 million during 2013 compared to 2012. Residential and commercial mortgage, commercial business and home equity loans increased $309.7 million, $40.8 million and $15.9 million, respectively. Loan originations totaled $217.5 million for 2013, an increase of $4.8 million, or 2.3%, over 2012. Changes in the loan portfolio consisted of the following:
| |
| ◦ | Residential Real Estate. Residential mortgage loans comprise 42.7% of total loans at December 31, |
2013. The residential mortgage portfolio increased $219.1 million, or 95.0%, due to the acquisition of $241.5 million in loans from the Newport acquisition and loan originations of $79.5 million, offset by the sale of $49.5 million of fixed-rate residential mortgage loans. Residential mortgage loan originations decreased $13.2 million during 2013 compared to the same period in 2012 partly as a result of interest rate volatility.
| |
| ◦ | Multi-family and Commercial Real Estate. At December 31, 2013, multi-family and commercial real estate represented 27.1% of the Company’s total loan portfolio. Multi-family and commercial real estate loans increased $83.7 million, or 41.5%, of which $79.7 million were acquired in the Newport merger. Loan originations for commercial real estate loans were $44.1 million during 2013, representing a decrease of $23.2 million compared to 2012 due to intense competition and lower demand in the market. |
| |
| ◦ | Construction. Construction loans, which include both residential and commercial construction loans, increased $6.9 million during 2013. |
| |
| ◦ | Commercial Business. Commercial business loans represented 24.2% of total loans at December 31, 2013 and increased $40.8 million, or 19.1%, of which $27.1 million were acquired in the Newport merger. Contributing to the increase for 2013 was the purchase of $23.0 million in commercial business loans, of which $15.5 million were SBA and USDA guaranteed loans, and loan originations of $70.0 million, partially offset by the sale of $3.0 million in SBA and USDA guaranteed loans. Commercial business loan originations increased $27.5 million during 2013, which included growth in specialized products such as time share lending and condominiums of $5.3 million and $2.9 million, respectively. At December 31, 2013, unfunded lines of credit related to time share lending totaled $29.5 million. The growth in time share lending is a result of an experienced lender dedicated to identifying new opportunities for growth within the time share industry. |
| |
| ◦ | Consumer Loans. Consumer loans represented 5.0% of the Company’s total loan portfolio and increased $12.4 million, or 30.6%, during 2013. Home equity loans increased $15.9 million, offset by decreases in indirect automobile lending and other consumer loans of $3.3 million and $237,000, respectively. Loan originations for consumer loans totaled $24.0 million for 2013, representing an increase of $13.7 million compared to the same period in 2012, as a result of a home equity line of credit promotion. |
The allowance for loan losses totaled $6.9 million at December 31, 2013 compared to $6.4 million at December 31, 2012. The ratio of the allowance for loan losses to total loans decreased from 0.93% at December 31, 2012 to 0.66% at December 31, 2013 predominately as the loans acquired from the Newport merger were recorded at fair value on the date of the merger and required no further allowance subsequent to the acquisition.
Liabilities. Total liabilities increased $366.4 million, or 44.3%, to $1.19 billion at December 31, 2013 compared to $827.1 million at December 31, 2012. Borrowings increased $78.6 million from $105.9 million at December 31, 2012 to $184.5 million at December 31, 2013, which included $74.8 million in Federal Home Loan Bank ("FHLB')advances from the Newport merger. Deposits increased $279.6 million, or 39.7%, which included increases in NOW and money market accounts of $149.6 million, certificates of deposit of $73.3 million, noninterest-bearing deposits of $49.6 million and savings account $7.1 million. The growth in deposits included $288.4 million assumed in the Newport acquisition. The increase in other liabilities included $7.1 million in deferred compensation and accrued expenses assumed in the Newport acquisition.
Equity:
Summary. Shareholders’ equity increased $27.1 million from $125.8 million at December 31, 2012 to $152.8 million at December 31, 2013. The increase in shareholders’ equity was attributable to the acquisition of Newport resulting in an increase in equity of $30.1 million and an unrealized gain of $104,000 on an interest-rate swap derivative, offset by an increase in unrealized losses on available for sale securities aggregating $2.4 million (net of taxes), dividends of $1.2 million and a net loss of $855,000.
Accumulated Other Comprehensive Income (Loss). Accumulated other comprehensive income (loss) comprises the unrealized gains and losses on available for sale securities and a derivative instrument designated as a cash flow hedge, net of taxes. Net unrealized losses on available for sale securities, net of taxes, totaled $642,000 at December 31, 2013 compared to net unrealized gains on available for sale securities, net of taxes, of $1.7 million
at December 31, 2012. Unrealized holding losses on available for sale securities primarily resulted from a decrease in the market value of mortgage-backed securities, which was recognized in accumulated other comprehensive loss on the consolidated balance sheet and a component of comprehensive loss on the consolidated statements of comprehensive income (loss). Net unrealized losses on derivative instruments, net of taxes, totaled $206,000 and $310,000 at December 31, 2013 and 2012, respectively.
Comparison of Operating Results for the Years Ended December 31, 2013 and 2012
General. The Company’s results of operations depends primarily on net interest income, which is the difference between the interest income earned on the Company’s interest-earning assets, such as loans and investments, and the interest expense on its interest-bearing liabilities, such as deposits and borrowings. The Company also generates noninterest income such as gains on the sale of securities, fees earned from mortgage banking activities, fees from deposit and trust and investment management services, insurance commissions and other fees. The Company’s noninterest expenses primarily consist of employee compensation and benefits, occupancy, computer services, furniture and equipment, outside professional services, electronic banking fees, marketing and other general and administrative expenses. The Company’s results of operations are also significantly affected by general economic and competitive conditions, particularly changes in market interest rates, governmental policies and actions of regulatory agencies.
The Company recorded a net loss of $855,000 for 2013, a decrease of $2.0 million, compared to net income of $1.1 million for 2012.
Contributing to the net loss for the year ended December 31, 2013 were $2.6 million in pretax costs associated with the Newport acquisition, losses realized on security sales of $1.2 million and penalties of $659,000 related to the prepayment of FHLB advances.
Interest and Dividend Income. Total interest and dividend income increased $2.4 million, or 6.6%, for 2013, primarily due to an increase in the average balance of interest-earning assets. Average interest-earning assets increased $108.6 million to $1.02 billion in 2013, due to a higher average balance of loans of $136.2 million, offset by decreases in the average balance of securities and federal funds and other interest-earning assets of $21.6 million and $6.0 million, respectively. The increase was offset by a 19 basis point decrease in yield on interest-earning assets to 3.76%. Lower market interest rates contributed to decreases in the yields of 35 basis points on loans and 30 basis points on securities during 2013. The yield on federal funds and other interest-earning assets increased 3 basis points during 2013. Additionally, the yield on loans continues to be negatively impacted by unrecognized interest related to nonaccrual loans.
Interest Expense. Interest expense decreased $1.2 million, or 12.2%, to $8.5 million for 2013 compared to $9.6 million in 2012, primarily due to lower rates paid on deposits and borrowings, offset by an increase in the average balance of interest-bearing liabilities. Average interest-bearing deposits rose $72.2 million to $695.4 million and the average rate decreased 22 basis points to 0.75%. Increases in the average balance of NOW and money market accounts of $52.0 million and certificate of deposit accounts of $17.3 million contributed to the increase in the average balance of deposit accounts. The average balance of FHLB advances increased $25.0 million and the average rate decreased 102 basis points to 2.40% for 2013. The lower rate on FHLB advances was attributable to the prepayment or modification of certain higher rate advances and new advances at significantly lower rates. The average balance of other borrowed funds increased $3.1 million with an average rate of 29 basis points as a result of the $15.0 million repurchase agreement assumed in the Newport merger.
Provision for Loan Losses. The provision for loan losses decreased $1.6 million to $1.3 million in 2013. The lower provision resulted from a decrease in nonperforming loans and net loan charge-offs. At December 31, 2013, nonperforming loans totaled $7.0 million, compared to $7.7 million at December 31, 2012, primarily due to decreases in nonperforming residential mortgage loans and consumer loans of $1.4 million and $297,000, respectively, offset by an increase in nonperforming commercial mortgage loans of $1.2 million. For 2013, net loan charge-offs totaled $790,000, consisting primarily of residential mortgage loan charge-offs, compared to $1.5
million for 2012. Two commercial loan relationships contributed to the higher level of loan charge-offs for 2012. Unfavorable economic conditions and Connecticut's extended foreclosure process may continue to have a negative impact on the Company’s residential and commercial real estate loan portfolios.
Noninterest Income. Total noninterest income decreased $412,000 to $8.3 million in 2013. The following table shows the components of noninterest income and the dollar and percentage changes from 2012 to 2013.
|
| | | | | | | | | | | | | | |
| | Years Ended December 31, | | Change |
| | 2013 | | 2012 | | Dollars | | Percent |
| | (Dollars in Thousands) |
| Service fees | $ | 5,766 |
| | $ | 4,935 |
| | $ | 831 |
| | 16.8 | % |
| Wealth management fees | 1,157 |
| | 1,975 |
| | (818 | ) | | (41.4 | ) |
| Increase in cash surrender value of bank-owned life insurance | 400 |
| | 284 |
| | 116 |
| | 40.8 |
|
| Net (loss) gain on sale of securities | (1,155 | ) | | 273 |
| | (1,428 | ) | | (523.1 | ) |
| Net impairment losses recognized in earnings | (8 | ) | | (123 | ) | | 115 |
| | (93.5 | ) |
| Mortgage banking | 1,083 |
| | 1,893 |
| | (810 | ) | | (42.8 | ) |
| Net gain (loss) on trading securities and derivatives | 205 |
| | (358 | ) | | 563 |
| | (157.3 | ) |
| Net loss on disposal of SI Trust Servicing operations | — |
| | (698 | ) | | 698 |
| | (100.0 | ) |
| Impairment loss on long-lived assets | — |
| | (392 | ) | | 392 |
| | (100.0 | ) |
| Net loss on disposal of equipment | — |
| | (5 | ) | | 5 |
| | (100.0 | ) |
| Other | 857 |
| | 933 |
| | (76 | ) | | (8.1 | ) |
| Total noninterest income | $ | 8,305 |
| | $ | 8,717 |
| | $ | (412 | ) | | (4.7 | )% |
The Company realized a net loss of $1.2 million on the sale of securities during 2013, primarily related to the sale of $6.0 million in collateralized debt obligations and non-agency mortgage-backed securities previously classified as substandard. The sale of SI Trust Servicing, a third-party provider of trust outsourcing services for community banks, in April 2012 contributed to the decline in wealth management fees of $818,000 during 2013. Mortgage banking fees declined as a result of lower gains on residential mortgage loan sales. The increase in service fees for 2013 were attributable to fees associated with additional deposit accounts from the Newport acquisition, higher electronic banking usage and the overdraft privilege program. The Company recognized increases in fair value adjustments of $563,000 on certain derivative instruments during 2013 compared to 2012. Additionally, noninterest income for 2013 included a gain of $201,000 on the sale of $3.0 million in commercial business loans held for investment. For 2012, the Company recognized an aggregate loss of $698,000 (pre-tax) on the sale of SI Trust Servicing and a write-down of $392,000 on leasehold improvements and certain equipment related to the closure of the New London, Connecticut branch office, offset by an investment gain of $355,000 received from one of the Bank's small business investment company limited partnerships ("SBIC") and a gain of $349,000 resulting from death benefit proceeds from a bank-owned life insurance policy included in other noninterest income.
Noninterest Expenses. Noninterest expenses increased $7.0 million for 2013 compared to 2012. The following table shows the components of noninterest expenses and the dollar and percentage changes from 2012 to 2013.
|
| | | | | | | | | | | | | | |
| | Years Ended December 31, | | Change |
| | 2013 | | 2012 | | Dollars | | Percent |
| | (Dollars in Thousands) |
| Salaries and employee benefits | $ | 17,924 |
| | $ | 15,868 |
| | $ | 2,056 |
| | 13.0 | % |
| Occupancy and equipment | 5,971 |
| | 5,480 |
| | 491 |
| | 9.0 |
|
| Computer and electronic banking services | 4,177 |
| | 3,738 |
| | 439 |
| | 11.7 |
|
| Outside professional services | 1,296 |
| | 1,309 |
| | (13 | ) | | (1.0 | ) |
| Marketing and advertising | 705 |
| | 705 |
| | — |
| | — |
|
| Supplies | 459 |
| | 442 |
| | 17 |
| | 3.8 |
|
| FDIC deposit insurance and regulatory assessments | 1,058 |
| | 933 |
| | 125 |
| | 13.4 |
|
| Merger expenses | 2,608 |
| | — |
| | 2,608 |
| | N/A |
| Other | 3,479 |
| | 2,178 |
| | 1,301 |
| | 59.7 |
|
| Total noninterest expenses | $ | 37,677 |
| | $ | 30,653 |
| | $ | 7,024 |
| | 22.9 | % |
Noninterest expenses were higher for 2013 compared to 2012 mainly due to merger-related costs totaling $2.6 million (pre-tax), which included investment banking fees, legal and accounting costs. Additionally, noninterest expenses for 2013 included incremental costs attributed to six branches acquired in the Newport merger. Increases in salaries and benefits were associated with additional lending staff and higher benefit costs related to equity-based incentive plan compensation and health insurance. Other noninterest expenses for 2013 included prepayment penalties totaling $659,000 for the early extinguishment of certain higher rate FHLB borrowings.
Income Tax Provision. For 2013, the Company recorded an income tax benefit of $98,000 compared to an income tax provision of $241,000 in 2012. The effective tax rate was 10.3% and 17.8% for 2013 and 2012, respectively. The effective tax rate for 2013 was impacted by nondeductible costs associated with the Newport merger. The tax-exempt gain on bank-owned life insurance proceeds reduced the effective tax rate for 2012. See Note 10 in the Company's Consolidated Financial Statements for more details.
Comparison of Operating Results for the Years Ended December 31, 2012 and 2011
The Company recorded net income of $1.1 million for 2012, a decrease of $1.3 million compared to a net income of $2.4 million for 2011.
Interest and Dividend Income. Total interest and dividend income decreased $2.0 million, or 5.3%, for 2012, primarily due to a 28 basis point decrease in yield on interest-earning assets to 3.95%. Lower market interest rates contributed to decreases in the yields of 37 basis points on loans and 49 basis points on securities during 2012. The yield on federal funds and other interest-earning assets remained unchanged. Additionally, the yield on loans continues to be negatively impacted by unrecognized interest related to nonaccrual loans. Average interest-earning assets increased $13.6 million to $907.9 million in 2012, due to a higher average balance of loans of $39.7 million, offset by decreases in the average balance of securities and federal funds and other interest-earning assets of $14.1 million and $12.1 million, respectively.
Interest Expense. Interest expense decreased $1.7 million, or 15.3%, to $9.6 million for 2012 compared to $11.4 million in 2011, primarily due to lower rates paid on deposits and borrowings and a decrease in the average balance of FHLB borrowings, savings deposits and certificates of deposit, offset by an increase in the average balance of NOW and money market deposits. Average interest-bearing deposits rose $10.1 million and the average rate decreased 21 basis points. An increase in the average balance of NOW and money market accounts totaling $19.8 million contributed to the increase in the average balance for deposit accounts, as customers shifted from savings and certificates of deposit accounts to NOW and money market accounts. The average rate on these deposits decreased 24 basis points to 0.21%. The average balance of savings deposits and certificates of deposit
decreased $8.1 million and $1.6 million, respectively and the average rate paid decreased 15 basis points and 16 basis points to 0.26% and 1.91%, respectively. The average balance of FHLB advances decreased $11.8 million and the average rate decreased 9 basis points to 3.42% for 2012. The lower rate on FHLB advances was attributable to the prepayment or modification of certain higher rate advances and new advances at significantly lower rates. Impacted by the interest rate swap, the average rate on subordinated debt increased 3 basis points to 4.10%.
Provision for Loan Losses. The provision for loan losses increased $1.3 million to $2.9 million in 2012. The higher provision resulted from an increase in net loan charge-offs and an increased allowance for loan losses required for the growing commercial portfolio. For 2012, net loan charge-offs totaled $1.5 million, consisting primarily of commercial mortgage loan charge-offs, compared to $1.4 million for 2011. Two commercial loan relationships contributed to the higher level of loan charge-offs for 2012. At December 31, 2012, nonperforming loans totaled $7.7 million, compared to $10.6 million at December 31, 2011. A decrease in nonperforming commercial mortgage and residential mortgage loans of $2.3 million and $601,000, respectively, contributed to the lower balance of nonperforming loans at December 31, 2012. Unfavorable economic conditions and Connecticut's extended foreclosure process continue to have a negative impact on the Company’s residential and commercial real estate loan portfolio.
Noninterest Income. Total noninterest income decreased $2.4 million to $8.7 million in 2012. The following table shows the components of noninterest income and the dollar and percentage changes from 2011 to 2012.
|
| | | | | | | | | | | | | | |
| | Years Ended December 31, | | Change |
| | 2012 | | 2011 | | Dollars | | Percent |
| | (Dollars in Thousands) |
| Service fees | $ | 4,935 |
| | $ | 4,820 |
| | $ | 115 |
| | 2.4 | % |
| Wealth management fees | 1,975 |
| | 4,108 |
| | (2,133 | ) | | (51.9 | ) |
| Increase in cash surrender value of bank-owned life insurance | 284 |
| | 289 |
| | (5 | ) | | (1.7 | ) |
| Net gain on sale of securities | 273 |
| | 486 |
| | (213 | ) | | (43.8 | ) |
| Net impairment losses recognized in earnings | (123 | ) | | (148 | ) | | 25 |
| | (16.9 | ) |
| Mortgage banking | 1,893 |
| | 814 |
| | 1,079 |
| | 132.6 |
|
| Net (loss) gain on trading securities and derivatives | (358 | ) | | 195 |
| | (553 | ) | | (283.6 | ) |
| Net loss on disposal of SI Trust Servicing operations | (698 | ) | | — |
| | (698 | ) | | N/A |
| Impairment loss on long-lived assets | (392 | ) | | — |
| | (392 | ) | | N/A |
| Net loss on disposal of equipment | (5 | ) | | (41 | ) | | 36 |
| | (87.8 | ) |
| Other | 933 |
| | 604 |
| | 329 |
| | 54.5 |
|
| Total noninterest income | $ | 8,717 |
| | $ | 11,127 |
| | $ | (2,410 | ) | | (21.7 | )% |
Lower noninterest income for 2012 is attributed to a decline in wealth management fees of $2.1 million as a result of the sale of SI Trust Servicing, a third-party provider of trust outsourcing services for community banks. During 2012, the Company recorded a loss on the sale of SI Trust Servicing of $698,000 (pre-tax). The Company recognized a loss of $358,000 in 2012 resulting from the change in fair value of derivative instruments as compared to a gain of $195,000 in 2011. Write-downs of $392,000 on leasehold improvements and certain equipment related to the closure of the New London, Connecticut branch office were recognized during 2012. The Company realized a reduction in net gains on the sale of securities of $213,000 for 2012 compared to 2011. These decreases were offset by an increase in mortgage banking fees of $1.1 million as a result of higher proceeds on the sale of $54.0 million of fixed-rate residential mortgage loans for 2012, versus the sale of $48.9 million for the comparable period in 2011. Service fees increased $115,000 due to an increase in fees associated with higher electronic banking usage, offset by a reduction in overdraft privilege fees. The Company recorded an other-than-temporary impairment charge on two non-agency mortgage-backed securities totaling $123,000 for 2012, compared to $148,000 on one non-agency mortgage-backed security and one collateralized debt obligation during 2011. During 2012, other noninterest income included a gain of $349,000 resulting from death benefit proceeds from a bank-owned life insurance policy and an investment gain of $355,000 received from one of the Bank's small business investment company limited partnerships.
Noninterest Expenses. Noninterest expenses decreased $1.9 million for 2012 compared to 2011. The following table shows the components of noninterest expenses and the dollar and percentage changes from 2011 to 2012.
|
| | | | | | | | | | | | | | |
| | Years Ended December 31, | | Change |
| | 2012 | | 2011 | | Dollars | | Percent |
| | (Dollars in Thousands) |
| Salaries and employee benefits | $ | 15,868 |
| | $ | 16,043 |
| | $ | (175 | ) | | (1.1 | )% |
| Occupancy and equipment | 5,480 |
| | 5,838 |
| | (358 | ) | | (6.1 | ) |
| Computer and electronic banking services | 3,738 |
| | 3,867 |
| | (129 | ) | | (3.3 | ) |
| Outside professional services | 1,309 |
| | 1,054 |
| | 255 |
| | 24.2 |
|
| Marketing and advertising | 705 |
| | 823 |
| | (118 | ) | | (14.3 | ) |
| Supplies | 442 |
| | 467 |
| | (25 | ) | | (5.4 | ) |
| FDIC deposit insurance and regulatory assessments | 933 |
| | 894 |
| | 39 |
| | 4.4 |
|
| Contribution to SI Financial Group Foundation | — |
| | 500 |
| | (500 | ) | | N/A |
| Other | 2,178 |
| | 3,106 |
| | (928 | ) | | (29.9 | ) |
| Total noninterest expenses | $ | 30,653 |
| | $ | 32,592 |
| | $ | (1,939 | ) | | (5.9 | )% |
Higher expenses in 2011 were mainly due to SI Trust Servicing operations and a $500,000 charitable contribution to SI Financial Group Foundation, a charitable foundation dedicated to providing assistance to charitable causes within the communities we serve, in connection with the public stock offering and concurrent second-step conversion completed during the first quarter of 2011. The sale of SI Trust Servicing in 2012 contributed to lower noninterest expenses for 2012. Notwithstanding the sale of SI Trust Servicing, salaries and benefits, computer and electronic banking and legal expenses increased during 2012. Salaries and related benefit costs increased with the addition of commercial and residential lending staff. Legal costs related to collection and foreclosure activities were higher in 2012, while maintenance, real estate taxes and utility costs associated with foreclosure activities and other real estate owned declined compared to 2011.
Income Tax Provision. For 2012, the Company’s income tax provision decreased to $241,000 from $1.0 million for 2011 primarily as a result of lower taxable income and a tax-exempt gain on bank-owned life insurance proceeds. The effective tax rate was 17.8% and 29.3% for 2012 and 2011, respectively.
Liquidity and Capital Resources
Liquidity is the ability to meet current and future financial obligations of a short- and long-term nature. The Bank's primary sources of funds consist of deposit inflows, loan sales and repayments, maturities and sales of securities and FHLB borrowings. While maturities and scheduled amortization of loans and securities are predictable sources of funds, deposit flows, mortgage prepayments and loan and security sales are greatly influenced by general interest rates, economic conditions and competition.
The Bank regularly adjusts its investment in liquid assets based upon its assessment of (1) expected loan demand, (2) expected deposit flows, (3) yields available on interest-earning deposits and securities and (4) the objectives of the Company’s asset/liability management, funds management and liquidity policies. The Company’s policy is to maintain liquid assets less short-term liabilities within a range of 9.0% to 20.0% of total assets. Liquid assets were less than policy at 7.7% of total assets at December 31, 2013, as a result of the restructuring of certain financial instruments subsequent to the Newport acquisition. Excess liquid assets are generally invested in interest-earning deposits and short- and intermediate-term securities.
The Bank’s most liquid assets are cash and cash equivalents. The levels of these assets depend on the Bank’s operating, financing, lending and investing activities during any given period. At December 31, 2013, cash and cash equivalents totaled $27.3 million. Securities classified as available for sale, which provide additional sources of liquidity, totaled $170.2 million at December 31, 2013. In addition, at December 31, 2013, the Bank had the ability to borrow an additional $96.0 million from the FHLB, which includes overnight lines of credit of $10.0
million. On that date, the Bank had FHLB advances outstanding of $176.3 million and no overnight advances outstanding. Additionally, the Bank has the ability to access the Federal Reserve Bank’s Discount Window on a collateralized basis and maintains a $7.0 million unsecured line of credit with a financial institution to access federal funds. The Bank believes that its liquid assets combined with the available line from the FHLB provide adequate liquidity to meet its current financial obligations.
In addition, the Bank believes that its branch network, which is presently comprised of 26 full-service retail banking offices located throughout its primary market area, and the general cash flows from its existing lending and investment activities, will afford it sufficient long-term liquidity.
The Bank’s primary investing activities are the origination, purchase and sale of loans and the purchase and sale of securities. For the year ended December 31, 2013, the Bank originated $217.5 million of loans and purchased $54.7 million of securities and $23.0 million of loans. In fiscal 2012, the Bank originated $212.7 million of loans and purchased $41.7 million of securities and $49.8 million of loans.
At December 31, 2013, the Bank had $120.2 million in loan commitments outstanding, which included $8.7 million in commitments to grant loans, $41.0 million in unused home equity lines of credit, $59.9 million in commercial lines of credit, $9.2 million in undisbursed construction loans, $1.2 million in overdraft protection lines and $81,000 in standby letters of credit.
Financing activities consist primarily of activity in deposit accounts and in borrowed funds. The increased liquidity needed to fund asset growth has been provided through proceeds from the sale of loans and securities and increased deposits. The net increase in total deposits, including mortgagors’ and investors’ escrow accounts, was $279.6 million and $3.1 million for the years ended December 31, 2013 and 2012, respectively. Certificates of deposit due within one year of December 31, 2013 totaled $135.4 million, or 13.8% of total deposits.
Management believes that the amount of deposits in shorter-term certificates of deposit reflects customers’ hesitancy to invest their funds in longer-term certificates of deposit due to the uncertain interest rate environment. To compensate, the Bank has increased the duration of its borrowings with the FHLB. The Bank will be required to seek other sources of funds, including other certificates of deposit and lines of credit, if maturing certificates of deposit are not retained. Depending on market conditions, the Bank may be required to pay higher rates on such deposits or other borrowings than are currently paid on certificates of deposit. Additionally, a shorter duration in the securities portfolio may be necessary to provide liquidity to compensate for any deposit outflows. The Bank believes, however, based on past experience, a significant portion of its certificates of deposit will be retained. The Bank has the ability, if necessary, to adjust the interest rates offered to its customers in an effort to attract and retain deposits.
Deposit flows are affected by the overall level of interest rates, the interest rates and products offered by the Bank and its local competitors and other factors. The Bank generally manages the pricing of its deposits to be competitive and to increase core deposits and commercial banking relationships. Occasionally, the Bank offers promotional rates on certain deposit products to attract deposits.
FHLB advances increased $78.6 million for the year ended December 31, 2013 and decreased $2.4 million for the year ended December 31, 2012.
SI Financial Group, Inc. is a separate legal entity from the Bank and must provide for its own liquidity. In addition to its operating expenses, SI Financial Group is responsible for paying any dividends declared to its shareholders and making payments on its subordinated debentures. SI Financial Group may continue to repurchase shares of its common stock in the future. SI Financial Group's primary sources of funds are interest and dividends on securities and dividends received from the Bank. The amount of dividends that the Bank may declare and pay to SI Financial Group in any calendar year, without the receipt of prior approval from the Office of the Comptroller of the Currency (“OCC”) but with prior notice to the OCC, cannot exceed net income for that year to date plus retained net income (as defined) for the preceding two calendar years. SI Financial Group believes that such restriction will not have an impact on SI Financial Group's ability to meet its ongoing cash obligations. At December 31, 2013 and
2012, SI Financial Group had cash and cash equivalents of $6.6 million and $9.6 million, respectively.
The Company's Board of Directors approved the repurchase of up to 5%, or 528,815 shares, of the Company's outstanding common stock. During 2013, the Company repurchased 8,336 shares at a cost of $98,000. During 2012, the Company repurchased 465,788 shares at a cost of $5.3 million under the approved repurchase plan.
The Bank has managed its capital to maintain strong protection for depositors and creditors. The Bank is subject to various regulatory capital requirements administered by the OCC, including a risk-based capital measure. The risk-based capital guidelines include both a definition of capital and a framework for calculating risk-weighted assets by assigning balance sheet assets and off-balance sheet items to broad risk categories. At December 31, 2013, the Bank exceeded all of its regulatory capital requirements and is considered “well capitalized” under regulatory guidelines. As a savings and loan holding company regulated by the Federal Reserve Board ("FRB"), the Company is not currently subject to any separate regulatory capital requirements. See Note 14 in the Company’s Consolidated Financial Statements for additional information relating to the Bank’s regulatory capital requirements.
Payments Due Under Contractual Obligations
The following table presents information relating to the Company’s payments due under contractual obligations as of December 31, 2013.
|
| | | | | | | | | | | | | | | | | | | | |
| | | Payments Due by Period |
| | | Less Than One Year | | One to Three Years | | Three to Five Years | | More Than Five Years | | Total |
| | | (In Thousands) |
| Federal Home Loan Bank advances | $ | 38,736 |
| | $ | 96,246 |
| | $ | 39,290 |
| | $ | 2,000 |
| | $ | 176,272 |
|
Operating lease obligations (1) | 1,617 |
| | 2,743 |
| | 2,143 |
| | 8,424 |
| | 14,927 |
|
| Purchase obligations | 1,265 |
| | 2,646 |
| | 681 |
| | — |
| | 4,592 |
|
Other long-term liabilities reflected on the balance sheet (2) | — |
| | — |
| | — |
| | 8,248 |
| | 8,248 |
|
| Total contractual obligations | $ | 41,618 |
| | $ | 101,635 |
| | $ | 42,114 |
| | $ | 18,672 |
| | $ | 204,039 |
|
| | | | | | | | | | | |
(1) Payments are for the lease of real property.
(2) Represents junior subordinated debt owed to an unconsolidated trust.
Off-Balance Sheet Arrangements
As a financial services provider, we routinely are a party to various financial instruments with off-balance sheet risks, such as commitments to extend credit, standby letters of credit and unused lines of credit. While these contractual obligations represent our future cash requirements, a significant portion of the commitments to extend credit may expire without being drawn upon. The contractual amounts of commitments to extend credit represent the amounts of potential accounting loss should the contract be fully drawn upon, the customer defaults and the value of any existing collateral becomes worthless. The Company uses the same credit policies in making commitments and conditional obligations as it does for on-balance sheet instruments.
Financial instruments whose contract amounts represent credit risk at December 31, 2013 and 2012 are as follows:
|
| | | | | | | |
| | December 31, |
| | 2013 | | 2012 |
| | (In Thousands) |
| Commitments to extend credit: | | | |
| Commitments to originate loans | $ | 8,742 |
| | $ | 11,123 |
|
| Undisbursed construction loans | 9,193 |
| | 3,406 |
|
| Undisbursed home equity lines of credit | 41,031 |
| | 23,019 |
|
| Undisbursed commercial lines of credit | 59,930 |
| | 23,842 |
|
| Overdraft protection lines | 1,221 |
| | 1,190 |
|
| Standby letters of credit | 81 |
| | 611 |
|
| Total commitments | $ | 120,198 |
| | $ | 63,191 |
|
Commitments to originate loans at December 31, 2013 and 2012 included fixed rate loan commitments of $6.9 million and $10.6 million, respectively, at interest rates ranging from 2.75% to 5.75% and 2.63% to 7.00%, respectively.
Commitments to extend credit are agreements to lend to a customer as long as there is no violation of any condition established in the contract. Commitments generally have fixed expiration dates or other termination clauses and may require payment of a fee. The Company evaluates each customer’s creditworthiness on a case-by-case basis. The amount of collateral obtained, if deemed necessary by the Company upon extension of credit, is based on management’s credit evaluation of the counterparty. Collateral held varies but may include residential and commercial property, accounts receivable, inventory, property, plant and equipment, deposits and securities.
Undisbursed commitments under construction, home equity or commercial lines of credit are commitments for future extensions of credit to existing customers. Total undisbursed amounts on lines of credit may expire without being fully drawn upon and therefore, do not necessarily represent future cash requirements.
Standby letters of credit are conditional commitments issued by the Company to guarantee the performance of a customer to a third party. Letters of credit are primarily issued to support public or private borrowing arrangements. Essentially all letters of credit issued have expiration dates within one year.
The Bank is a limited partner in three small business investment corporations. At December 31, 2013, the Bank’s remaining off-balance sheet commitment for the capital investments was $766,000. See Note 12 in the Company’s Consolidated Financial Statements.
In 2004, the Bank established an Employee Stock Ownership Plan (“ESOP”) for the benefit of its eligible employees. In conjunction with the "second step" public stock offering completed on January 12, 2011, the Company provided an additional loan to the ESOP totaling $3.1 million to purchase additional common shares to fund the ESOP. As of December 31, 2013, the Bank had repaid principal payments on the loan to the ESOP of $2.9 million. Allocated shares, including shares committed to be allocated to participants, totaled 262,783 at December 31, 2013. As of December 31, 2013, the amount of unallocated common shares held in suspense totaled 507,801, with a fair value of $6.1 million. See Note 11 in the Company’s Consolidated Financial Statements.
As of December 31, 2013, the Company did not engage in any off-balance sheet transactions reasonably likely to have a material effect on its financial condition, results of operations or cash flows. See Note 12 in the Company’s Consolidated Financial Statements.
Impact of Inflation and Changes in Prices
The financial statements and financial data presented within this document have been prepared in accordance with U.S. generally accepted accounting principles, which require the measurement of financial condition and operating results in terms of historical dollars without considering the change in the relative purchasing power of money over time due to inflation. The primary impact of inflation on the Company’s operations is reflected in increased operating costs. Unlike most industrial companies, virtually all the assets and liabilities of a financial institution are monetary in nature. As a result, interest rates generally have a more significant impact on a financial institution’s performance than do the effects of general levels of inflation. Interest rates do not necessarily move in the same direction or to the same extent as the prices of goods and services.
Impact of Recent Accounting Standards
For information relating to new accounting pronouncements, reference Note 1 – “Nature of Business and Summary of Significant Accounting Policies – Recent Accounting Pronouncements” in the Company’s Consolidated Financial Statements.
Quantitative and Qualitative Disclosures About Market Risk
Qualitative Aspects of Market Risk
The primary market risk affecting the financial condition and operating results of the Company is interest rate risk. Interest rate risk is the exposure of current and future earnings and capital arising from movements in interest rates. The Company manages the interest rate sensitivity of its interest-bearing liabilities and interest-earning assets in an effort to minimize the adverse effects of changes in the interest rate environment. To reduce the volatility of its earnings, the Company has sought to improve the match between asset and liability maturities and rates, while maintaining an acceptable interest rate spread. The Company’s strategy for managing interest rate risk generally is to emphasize the origination of adjustable-rate mortgage loans for retention in its loan portfolio. However, the ability to originate adjustable-rate loans depends to a great extent on market interest rates and borrowers’ preferences. As an alternative to adjustable-rate mortgage loans, the Company purchases variable-rate SBA and USDA loans in the secondary market that are fully guaranteed by the U.S. government. These loans have a significantly shorter duration than fixed-rate mortgage loans. Fixed-rate mortgage loans typically have an adverse effect on interest rate sensitivity compared to adjustable-rate loans. Accordingly, the Company has sold more longer-term fixed-rate mortgage loans in the secondary market in recent years to manage interest rate risk. The Company offers 10-year fixed-rate mortgage loans that it retains in its portfolio. The Company may offer attractive rates for existing certificates of deposit accounts to extend their maturities. The Company also uses shorter-term investment securities and longer-term borrowings from the FHLB to help manage interest rate risk.
The Company has an Asset/Liability Committee to communicate, coordinate and control all aspects involving asset/liability management. The committee establishes and monitors the volume, maturities, pricing and mix of assets and funding sources with the objective of managing assets and funding sources to provide results that are consistent with liquidity, growth, risk limits and profitability goals.
In July 2010, the Company entered into an interest rate swap agreement with a third-party financial institution with a notional amount of $8.0 million whereby the counterparty will pay a variable rate equal to three-month LIBOR and the Company will pay a fixed rate of 2.44%. The agreement was effective on December 15, 2010 and terminates on December 15, 2015. This agreement was designated as a cash flow hedge against the trust preferred securities issued by SI Capital Trust II. This effectively fixes the interest rate on the $8.0 million of trust preferred securities at 4.14% for the period December 15, 2010 through December 15, 2015.
In January 2012, the Company entered into an interest rate swap agreement with a third-party financial institution with a notional amount of $15.0 million, whereby the counterparty will pay a variable rate equal to three-month LIBOR and the Company will pay a fixed rate of 1.255%. The agreement was effective on January 11, 2012 and terminates on January 11, 2017. This agreement was not designated as a hedging instrument.
Quantitative Aspects of Market Risk
The Company analyzes its interest rate sensitivity position to manage the risk associated with interest rate movements through the use of interest income simulation. The matching of assets and liabilities may be analyzed by examining the extent to which such assets and liabilities are “interest rate sensitive.” An asset or liability is said to be interest rate sensitive within a specific time period if it will mature or reprice within that time period. The Company’s goal is to manage asset and liability positions to moderate the effect of interest rate fluctuations on net interest income.
Net Interest Income Simulation Analysis
Interest income simulations are completed quarterly and presented to the Asset/Liability Committee. The simulations provide an estimate of the impact of changes in interest rates on net interest income under a range of assumptions. The numerous assumptions used in the simulation process are reviewed by the Asset/Liability Committee on a quarterly basis. Changes to these assumptions can significantly affect the results of the simulation. The simulation incorporates assumptions regarding the potential timing in the repricing of certain assets and liabilities when market rates change and the changes in spreads between different market rates. The simulation analysis incorporates management’s current assessment of the risk that pricing margins will change adversely over time due to competition or other factors. Simulation analysis is only an estimate of the Company’s interest rate risk exposure at a particular point in time. The Company continually reviews the potential effect changes in interest rates could have on the repayment of rate sensitive assets and funding requirements of rate sensitive liabilities.
The table below sets forth an approximation of the Company’s exposure as a percentage of estimated net interest income for the next 12- and 24-month periods using interest income simulation. The simulation uses projected repricing of assets and liabilities at December 31, 2013 on the basis of contractual maturities, anticipated repayments and scheduled rate adjustments. Prepayment rates can have a significant impact on interest income simulation. Because of the large percentage of loans and mortgage-backed securities the Company holds, rising or falling interest rates have a significant impact on the prepayment speeds of the Company’s earning assets that in turn affect the rate sensitivity position. When interest rates rise, prepayments tend to slow. When interest rates fall, prepayments tend to rise. The Company’s asset sensitivity would be reduced if prepayments slow and vice versa. While the Company believes such assumptions to be reasonable, there can be no assurance that assumed prepayment rates will approximate actual future mortgage-backed security and loan repayment activity.
The following table reflects changes in estimated net interest income at December 31, 2013.
|
| | | | | |
| | Percentage Change in Estimated Net Interest Income Over |
| | 12 Months | | 24 Months |
| 100 basis point decrease in rates | (2.78 | )% | | (4.43 | )% |
| 300 basis point increase in rates | (1.38 | ) | | (0.90 | ) |
| 400 basis point increase in rates | 0.09 |
| | 0.90 |
|
As indicated by the results of the above scenarios, net interest income would be adversely affected (within our internal guidelines) in the 12- and 24-month periods if rates decreased 100 basis points. As indicated above, net interest income would be positively impacted in the 12- and 24-month periods if rates increased 400 basis points and only minimally impacted if rates increased 300 basis points as a result of the Company's strategy to position the balance sheet for the anticipated increase in market interest rates. The Company's strategy for mitigating interest rate risk includes the purchase of adjustable-rate investment securities and SBA and USDA loans that will reprice in a rising rate environment, selling longer-term and lower fixed-rate residential mortgage loans in the secondary market, restructuring FHLB advances to current lower market interest rates while extending their duration and utilizing certain derivative instruments such as forward loan sale commitments to manage the risk of loss associated with its mortgage banking activities. Additionally, the interest rate swap agreement used to hedge the interest rate of the Company's long-term variable-rate debt effectively converts the debt to a fixed-rate of interest, which reflects favorably on net interest income in a rising rate environment.
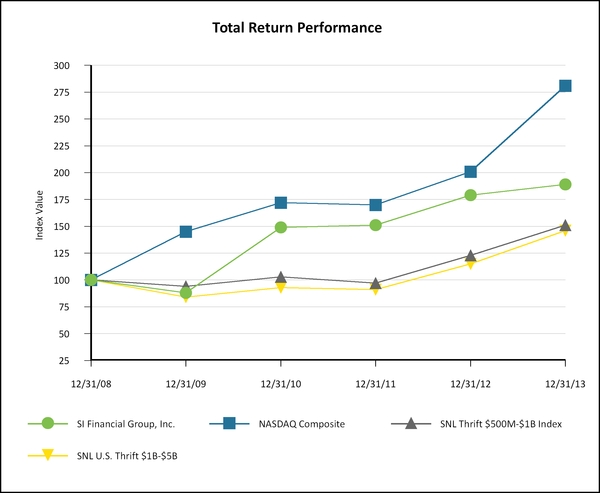
Stock Performance Graph
The following graph compares the cumulative total shareholder return on the Company's common stock with: (1) the cumulative total return on the Nasdaq Composite (U.S. Companies); (2) with the SNL $500M - $1B Thrift Index; and (3) with the SNL $1B - $5B Thrift Index. The SNL $1B - $5B Thrift Index has been included to reflect the increase in the asset size of the Company in 2013 to over $1 billion. Total return assumes the reinvestment of all dividends. The graph assumes $100 was invested at the close of business on December 31, 2008.
 .
.
|
| | | | | | | | | | | | |
| | Period Ending |
| Index | 12/31/08 |
| 12/31/09 |
| 12/31/10 |
| 12/31/11 |
| 12/31/12 |
| 12/31/13 |
|
| SI Financial Group, Inc. | 100.00 |
| 87.50 |
| 149.31 |
| 151.47 |
| 178.77 |
| 189.31 |
|
| NASDAQ Composite | 100.00 |
| 145.36 |
| 171.74 |
| 170.38 |
| 200.63 |
| 281.22 |
|
| SNL Thrift $500M-$1B Index | 100.00 |
| 93.99 |
| 103.16 |
| 97.36 |
| 123.16 |
| 151.68 |
|
| SNL U.S. Thrift $1B-$5B | 100.00 |
| 83.95 |
| 93.23 |
| 90.60 |
| 114.62 |
| 146.28 |
|
Common Stock Information
The common stock of the Company is listed on NASDAQ Global Market ("NASDAQ") under the trading symbol "SIFI." As of March 3, 2014, there were 12,801,657 shares of common stock outstanding, which were held by approximately 1,318 shareholders of record.
The following table sets forth the market price and dividend information for the Company's common stock for the periods indicated, as reported by NASDAQ.
|
| | | | | | | | | | | | | | | | | | | | | | | |
| | Years Ended December 31, |
| | 2013 | | 2012 |
| | Price Range | | Dividends Declared | | Price Range | | Dividends Declared |
| | High | | Low | | | High | | Low | |
| First Quarter | $ | 12.34 |
| | $ | 11.01 |
| | $ | 0.03 |
| | $ | 11.59 |
| | $ | 9.69 |
| | $ | 0.03 |
|
| Second Quarter | 12.30 |
| | 10.34 |
| | 0.03 |
| | 11.75 |
| | 10.38 |
| | 0.03 |
|
| Third Quarter | 11.97 |
| | 10.73 |
| | 0.03 |
| | 11.90 |
| | 11.08 |
| | 0.03 |
|
| Fourth Quarter | 12.16 |
| | 11.21 |
| | 0.03 |
| | 11.82 |
| | 10.76 |
| | 0.03 |
|
REPORT OF INDEPENDENT REGISTERED PUBLIC ACCOUNTING FIRM ON
INTERNAL CONTROL OVER FINANCIAL REPORTING
The Board of Directors and Shareholders
of SI Financial Group, Inc.
We have audited SI Financial Group, Inc. and subsidiaries' (the “Company”) internal control over financial reporting as of December 31, 2013, based on criteria established in Internal Control - Integrated Framework (1992) issued by the Committee of Sponsoring Organizations of the Treadway Commission. SI Financial Group, Inc. and subsidiaries' management is responsible for maintaining effective internal control over financial reporting and for its assessment of the effectiveness of internal control over financial reporting. Our responsibility is to express an opinion on the Company's internal control over financial reporting based on our audit.
We conducted our audit in accordance with the standards of the Public Company Accounting Oversight Board (United States). Those standards require that we plan and perform the audit to obtain reasonable assurance about whether effective internal control over financial reporting was maintained in all material respects. Our audit included obtaining an understanding of internal control over financial reporting, assessing the risk that a material weakness exists, and testing and evaluating the design and operating effectiveness of internal control based on the assessed risk. Our audit also included performing such other procedures as we considered necessary in the circumstances. We believe that our audit provides a reasonable basis for our opinion.
A company's internal control over financial reporting is a process designed to provide reasonable assurance regarding the reliability of financial reporting and the preparation of financial statements for external purposes in accordance with the accounting principles generally accepted in the United States of America. A company's internal control over financial reporting includes those policies and procedures that (a) pertain to the maintenance of records that, in reasonable detail, accurately and fairly reflect the transactions and dispositions of the assets of the company; (b) provide reasonable assurance that transactions are recorded as necessary to permit preparation of financial statements in accordance with generally accepted accounting principles, and that receipts and expenditures of the company are being made only in accordance with authorizations of management and directors of the company; and (c) provide reasonable assurance regarding prevention or timely detection of unauthorized acquisition, use, or disposition of the company's assets that could have a material effect on the financial statements.
Because of its inherent limitations, internal control over financial reporting may not prevent or detect misstatements. Also, projections of any evaluation of effectiveness to future periods are subject to the risk that controls may become inadequate because of changes in conditions, or that the degree of compliance with the policies or procedures may deteriorate.
In our opinion, SI Financial Group, Inc. and subsidiaries maintained, in all material respects, effective internal control over financial reporting as of December 31, 2013, based on criteria established in Internal Control - Integrated Framework (1992) issued by the Committee of Sponsoring Organizations of the Treadway Commission.
We have also audited, in accordance with the standards of the Public Company Accounting Oversight Board (United States), the December 31, 2013 consolidated financial statements of SI Financial Group, Inc. and our report dated March 12, 2014 expressed an unqualified opinion thereon.
/s/ Wolf & Company, P.C.
Boston, Massachusetts
March 12, 2014
REPORT OF INDEPENDENT REGISTERED PUBLIC ACCOUNTING FIRM
The Board of Directors and Shareholders
of SI Financial Group, Inc.
We have audited the accompanying consolidated balance sheets of SI Financial Group, Inc. and subsidiaries (the “Company”) as of December 31, 2013 and 2012, and the related consolidated statements of operations, comprehensive income (loss), changes in shareholders' equity and cash flows for each of the years in the three-year period ended December 31, 2013. These consolidated financial statements are the responsibility of the Company's management. Our responsibility is to express an opinion on these consolidated financial statements based on our audits.
We conducted our audits in accordance with the standards of the Public Company Accounting Oversight Board (United States). Those standards require that we plan and perform the audit to obtain reasonable assurance about whether the financial statements are free of material misstatement. An audit includes examining, on a test basis, evidence supporting the amounts and disclosures in the financial statements. An audit also includes assessing the accounting principles used and significant estimates made by management, as well as evaluating the overall financial statement presentation. We believe that our audits provide a reasonable basis for our opinion.
In our opinion, the consolidated financial statements referred to above present fairly, in all material respects, the financial position of SI Financial Group, Inc. and subsidiaries as of December 31, 2013 and 2012, and the results of their operations and their cash flows for each of the years in the three-year period ended December 31, 2013, in conformity with accounting principles generally accepted in the United States of America.
We also have audited, in accordance with the standards of the Public Company Accounting Oversight Board (United States), SI Financial Group, Inc. and subsidiaries' internal control over financial reporting as of December 31, 2013, based on criteria established in Internal Control- Integrated Framework (1992) issued by the Committee of Sponsoring Organizations of the Treadway Commission (COSO) and our report dated March 12, 2014 expressed an unqualified opinion thereon.
/s/ Wolf & Company, P.C.
Boston, Massachusetts
March 12, 2014
SI FINANCIAL GROUP, INC.
CONSOLIDATED BALANCE SHEETS
(In Thousands, Except Share and Per Share Amounts)
|
| | | | | | | |
| | December 31, |
| | 2013 | | 2012 |
| ASSETS: | | | |
| Cash and due from banks: | | | |
| Noninterest-bearing | $ | 20,554 |
| | $ | 16,364 |
|
| Interest-bearing | 4,849 |
| | 21,325 |
|
| Federal funds sold | 1,918 |
| | — |
|
| Total cash and cash equivalents | 27,321 |
| | 37,689 |
|
| | | | |
| Available for sale securities, at fair value | 170,220 |
| | 176,513 |
|
| Loans held for sale | 1,764 |
| | 5,069 |
|
| Loans receivable (net of allowance for loan losses of $6,916 and $6,387 at December 31, 2013 and 2012, respectively) | 1,047,410 |
| | 685,163 |
|
| Federal Home Loan Bank stock, at cost | 13,109 |
| | 8,078 |
|
| Bank-owned life insurance | 20,726 |
| | 9,060 |
|
| Premises and equipment, net | 21,090 |
| | 11,216 |
|
| Goodwill and other intangibles | 19,566 |
| | 3,451 |
|
| Accrued interest receivable | 4,021 |
| | 3,215 |
|
| Deferred tax asset, net | 9,705 |
| | 4,639 |
|
| Other real estate owned, net | 2,429 |
| | 1,293 |
|
| Prepaid FDIC deposit insurance assessment | — |
| | 1,312 |
|
| Other assets | 9,018 |
| | 6,182 |
|
| Total assets | $ | 1,346,379 |
| | $ | 952,880 |
|
| | | | |
| LIABILITIES AND SHAREHOLDERS' EQUITY: | |
| | |
|
| Liabilities: | |
| | |
|
| Deposits: | |
| | |
|
| Noninterest-bearing | $ | 139,428 |
| | $ | 89,834 |
|
| Interest-bearing | 845,321 |
| | 615,314 |
|
| Total deposits | 984,749 |
| | 705,148 |
|
| | | | |
| Mortgagors' and investors' escrow accounts | 3,214 |
| | 3,207 |
|
| Federal Home Loan Bank advances | 176,272 |
| | 97,699 |
|
| Junior subordinated debt owed to unconsolidated trust | 8,248 |
| | 8,248 |
|
| Accrued expenses and other liabilities | 21,054 |
| | 12,819 |
|
| Total liabilities | 1,193,537 |
| | 827,121 |
|
| | | | |
| Commitments and contingencies (Notes 6, 11 and 12) |
|
| |
|
|
| | | | |
| Shareholders' Equity: | |
| | |
|
| Preferred stock ($0.01 par value per share; 1,000,000 shares authorized; none issued) | — |
| | — |
|
| Common stock ($0.01 par value per share; 35,000,000 shares authorized; 12,798,461 shares and 10,112,310 shares issued and outstanding at December 31, 2013 and 2012, respectively) | 128 |
| | 101 |
|
| Additional paid-in-capital | 125,277 |
| | 94,810 |
|
| Unallocated common shares held by ESOP | (4,608 | ) | | (5,088 | ) |
| Unearned restricted shares | (1,751 | ) | | (2,210 | ) |
| Retained earnings | 34,644 |
| | 36,733 |
|
| Accumulated other comprehensive (loss) income | (848 | ) | | 1,413 |
|
| Total shareholders' equity | 152,842 |
| | 125,759 |
|
| Total liabilities and shareholders' equity | $ | 1,346,379 |
| | $ | 952,880 |
|
See accompanying notes to consolidated financial statements.
SI FINANCIAL GROUP, INC.
CONSOLIDATED STATEMENTS OF OPERATIONS
(In Thousands, Except Per Share Amounts)
|
| | | | | | | | | | | |
| | Years Ended December 31, |
| | 2013 | | 2012 | | 2011 |
| Interest and dividend income: | | | | | |
| Loans, including fees | $ | 33,989 |
| | $ | 30,462 |
| | $ | 30,969 |
|
| Securities: | |
| | |
| | |
|
| Taxable interest | 4,030 |
| | 5,267 |
| | 6,702 |
|
| Tax-exempt interest | 103 |
| | 3 |
| | 5 |
|
| Dividends | 27 |
| | 46 |
| | 79 |
|
| Other | 43 |
| | 46 |
| | 65 |
|
| Total interest and dividend income | 38,192 |
| | 35,824 |
| | 37,820 |
|
| | | | | | |
| Interest expense: | |
| | |
| | |
|
| Deposits | 5,212 |
| | 6,019 |
| | 7,262 |
|
| Federal Home Loan Bank advances | 2,897 |
| | 3,276 |
| | 3,779 |
|
| Subordinated debt and other borrowings | 345 |
| | 338 |
| | 336 |
|
| Total interest expense | 8,454 |
| | 9,633 |
| | 11,377 |
|
| | | | | | |
| Net interest income | 29,738 |
| | 26,191 |
| | 26,443 |
|
| | | | | | |
| Provision for loan losses | 1,319 |
| | 2,896 |
| | 1,558 |
|
| | | | | | |
| Net interest income after provision for loan losses | 28,419 |
| | 23,295 |
| | 24,885 |
|
| | | | | | |
| Noninterest income: | |
| | |
| | |
|
| Total other-than-temporary impairment losses on securities | (8 | ) | | (239 | ) | | (1,841 | ) |
| Portion of losses recognized in other comprehensive income | — |
| | 116 |
| | 1,693 |
|
| Net impairment losses recognized in earnings | (8 | ) | | (123 | ) | | (148 | ) |
| Service fees | 5,766 |
| | 4,935 |
| | 4,820 |
|
| Wealth management fees | 1,157 |
| | 1,975 |
| | 4,108 |
|
| Increase in cash surrender value of bank-owned life insurance | 400 |
| | 284 |
| | 289 |
|
| Net (loss) gain on sale of securities | (1,155 | ) | | 273 |
| | 486 |
|
| Mortgage banking | 1,083 |
| | 1,893 |
| | 814 |
|
| Net gain (loss) on trading securities and derivatives | 205 |
| | (358 | ) | | 195 |
|
| Net loss on disposal of SI Trust Servicing operations | — |
| | (698 | ) | | — |
|
| Impairment loss on long-lived assets | — |
| | (392 | ) | | — |
|
| Net loss on disposal of equipment | — |
| | (5 | ) | | (41 | ) |
| Other | 857 |
| | 933 |
| | 604 |
|
| Total noninterest income | 8,305 |
| | 8,717 |
| | 11,127 |
|
| | | | | | |
| Noninterest expenses: | |
| | |
| | |
|
| Salaries and employee benefits | 17,924 |
| | 15,868 |
| | 16,043 |
|
| Occupancy and equipment | 5,971 |
| | 5,480 |
| | 5,838 |
|
| Computer and electronic banking services | 4,177 |
| | 3,738 |
| | 3,867 |
|
| Outside professional services | 1,296 |
| | 1,309 |
| | 1,054 |
|
| Marketing and advertising | 705 |
| | 705 |
| | 823 |
|
| Supplies | 459 |
| | 442 |
| | 467 |
|
| FDIC deposit insurance and regulatory assessments | 1,058 |
| | 933 |
| | 894 |
|
| Contribution to SI Financial Group Foundation | — |
| | — |
| | 500 |
|
| Merger expenses | 2,608 |
| | — |
| | — |
|
| Other | 3,479 |
| | 2,178 |
| | 3,106 |
|
| Total noninterest expenses | 37,677 |
| | 30,653 |
| | 32,592 |
|
| | | | | | |
| (Loss) income before income tax (benefit) provision | (953 | ) | | 1,359 |
| | 3,420 |
|
| (Loss) income tax (benefit) provision | (98 | ) | | 241 |
| | 1,003 |
|
| Net (loss) income | $ | (855 | ) | | $ | 1,118 |
| | $ | 2,417 |
|
| | | | | | |
| (Loss) earnings per share: | |
| | |
| | |
|
| Basic | $ | (0.08 | ) | | $ | 0.11 |
| | $ | 0.24 |
|
| Diluted | $ | (0.08 | ) | | $ | 0.11 |
| | $ | 0.24 |
|
See accompanying notes to consolidated financial statements.
SI FINANCIAL GROUP, INC.
CONSOLIDATED STATEMENTS OF COMPREHENSIVE INCOME (LOSS)
(In Thousands)
|
| | | | | | | | | | | | |
| | | Years Ended December 31, |
| | | 2013 | | 2012 | | 2011 |
| | | |
| Net (loss) income | $ | (855 | ) | | $ | 1,118 |
| | $ | 2,417 |
|
| | | | | | |
| Other comprehensive (loss) income, net of tax: | | | | | |
| Net unrealized (loss) gain on available for sale securities: | | | | | |
| Net unrealized holding (loss) gain on available for sale securities | (3,308 | ) | | 1,258 |
| | 2,018 |
|
Reclassification adjustment for losses (gains) recognized in net (loss) income(1) | 762 |
| | (180 | ) | | (321 | ) |
Plus: credit portion of OTTI losses recognized in net (loss) income(2) | 5 |
| | 81 |
| | 98 |
|
| Plus: noncredit portion of OTTI gains (losses) on available for sale securities | 176 |
| | 934 |
| | (1,142 | ) |
| Net unrealized holding (loss) gain on available for sale securities | (2,365 | ) | | 2,093 |
| | 653 |
|
| Net unrealized gain (loss) on interest-rate swap derivative | 104 |
| | (5 | ) | | (220 | ) |
| Other comprehensive (loss) income | (2,261 | ) | | 2,088 |
| | 433 |
|
| Comprehensive (loss) income | $ | (3,116 | ) | | $ | 3,206 |
| | $ | 2,850 |
|
| | | | | | | |
(1) Amounts are included in net gain (loss) on the sale of securities in noninterest income on the consolidated statements of operations. Income tax expense (benefit) associated with the reclassification adjustment for the years ended December 31, 2013, 2012 and 2011 was $(393,000), $93,000 and $165,000, respectively.
(2) Amounts are included in net impairment losses recognized in noninterest income on the consolidated statements of operations. Income tax benefit associated with the reclassification adjustment for the years ended December 31, 2013, 2012 and 2011 totaled $3,000, $42,000 and $50,000, respectively.
See accompanying notes to consolidated financial statements.
SI FINANCIAL GROUP, INC.
CONSOLIDATED STATEMENTS OF CHANGES IN SHAREHOLDERS' EQUITY
FOR THE YEARS ENDED DECEMBER 31, 2013, 2012 AND 2011
(In Thousands, Except Share Amounts)
|
| | | | | | | | | | | | | | | | | | | | | | | | | | | | | | | | | | |
| | Common Stock | | Additional Paid-in Capital | | Unallocated Common Shares Held by ESOP | | Unearned Restricted Shares | | Retained Earnings | | Accumulated Other Comprehensive Income (Loss) | | Treasury Stock | | Total Shareholders' Equity |
| | Shares | | Dollars | | | | | | | |
| | | | | | | | | | | | | | | | | | |
| Balance at December 31, 2010 | 12,563,750 |
| | $ | 126 |
| | $ | 52,198 |
| | $ | (2,907 | ) | | $ | (25 | ) | | $ | 40,859 |
| | $ | (1,108 | ) | | $ | (8,039 | ) | | $ | 81,104 |
|
| | | | | | | | | | | | | | | | | | |
| Comprehensive income | — |
| | — |
| | — |
| | — |
| | — |
| | 2,417 |
| | 433 |
| | — |
| | 2,850 |
|
| Exchange of common stock pursuant to reorganization and concurrent stock offering | (1,986,901 | ) | | (20 | ) | | 42,311 |
| | — |
| | — |
| | — |
| | — |
| | 8,039 |
| | 50,330 |
|
| Cash dividends declared ($0.12 per share) | — |
| | — |
| | — |
| | — |
| | — |
| | (1,191 | ) | | — |
| | — |
| | (1,191 | ) |
| Restricted shares activity | — |
| | — |
| | 22 |
| | — |
| | (22 | ) | | — |
| | — |
| | — |
| | — |
|
| Equity incentive plan compensation | — |
| | — |
| | 91 |
| | — |
| | 9 |
| | — |
| | — |
| | — |
| | 100 |
|
| Shares purchased by ESOP pursuant to reorganization (392,670 shares) | — |
| | — |
| | — |
| | (3,141 | ) | | — |
| | — |
| | — |
| | — |
| | (3,141 | ) |
| Allocation of 48,637 ESOP shares | — |
| | — |
| | (13 | ) | | 480 |
| | — |
| | — |
| | — |
| | — |
| | 467 |
|
| Tax benefit from share-based compensation | — |
| | — |
| | 3 |
| | — |
| | — |
| | — |
| | — |
| | — |
| | 3 |
|
| Treasury stock purchased | (547 | ) | | — |
| | — |
| | — |
| | — |
| | (5 | ) | | — |
| | — |
| | (5 | ) |
| Balance at December 31, 2011 | 10,576,302 |
| | 106 |
| | 94,612 |
| | (5,568 | ) | | (38 | ) | | 42,080 |
| | (675 | ) | | — |
| | 130,517 |
|
| | | | | | | | | | | | | | | | | | |
| Comprehensive income | — |
| | — |
| | — |
| | — |
| | — |
| | 1,118 |
| | 2,088 |
| | — |
| | 3,206 |
|
| Cash dividends declared ($0.12 per share) | — |
| | — |
| | — |
| | — |
| | — |
| | (1,171 | ) | | — |
| | — |
| | (1,171 | ) |
| Restricted shares activity | — |
| | — |
| | — |
| | — |
| | (2,226 | ) | | (12 | ) | | — |
| | — |
| | (2,238 | ) |
| Equity incentive plan compensation | — |
| | — |
| | 135 |
| | — |
| | 54 |
| | — |
| | — |
| | — |
| | 189 |
|
| Allocation of 48,637 ESOP shares | — |
| | — |
| | 63 |
| | 480 |
| | — |
| | — |
| | — |
| | — |
| | 543 |
|
| Tax benefit from share-based compensation | — |
| | — |
| | 4 |
| | — |
| | — |
| | — |
| | — |
| | — |
| | 4 |
|
| Stock options exercised | 1,796 |
| | — |
| | (4 | ) | | — |
| | — |
| | 14 |
| | — |
| | — |
| | 10 |
|
| Common shares repurchased | (465,788 | ) | | (5 | ) | | — |
| | — |
| | — |
| | (5,296 | ) | | — |
| | — |
| | (5,301 | ) |
| Balance at December 31, 2012 | 10,112,310 |
| | 101 |
| | 94,810 |
| | (5,088 | ) | | (2,210 | ) | | 36,733 |
| | 1,413 |
| | — |
| | 125,759 |
|
| | | | | | | | | | | | | | | | | | |
| Comprehensive loss | — |
| | — |
| | — |
| | — |
| | — |
| | (855 | ) | | (2,261 | ) | | — |
| | (3,116 | ) |
| Acquisition of Newport Federal Savings Bank | 2,683,099 |
| | 27 |
| | 30,078 |
| | — |
| | — |
| | — |
| | — |
| | — |
| | 30,105 |
|
| Cash dividends declared ($0.12 per share) | — |
| | — |
| | — |
| | — |
| | — |
| | (1,227 | ) | | — |
| | — |
| | (1,227 | ) |
| Restricted shares activity | — |
| | — |
| | 5 |
| | — |
| | (5 | ) | | — |
| | — |
| | — |
| | — |
|
| Equity incentive plan compensation | — |
| | — |
| | 293 |
| | — |
| | 464 |
| | — |
| | — |
| | — |
| | 757 |
|
| Allocation of 48,637 ESOP shares | — |
| | — |
| | 79 |
| | 480 |
| | — |
| | — |
| | — |
| | — |
| | 559 |
|
| Tax benefit from share-based compensation | — |
| | — |
| | 9 |
| | — |
| | — |
| | — |
| | — |
| | — |
| | 9 |
|
| Stock options exercised | 11,388 |
| | — |
| | 94 |
| | — |
| | — |
| | — |
| | — |
| | — |
| | 94 |
|
| Common shares repurchased | (8,336 | ) | | — |
| | (91 | ) | | — |
| | — |
| | (7 | ) | | — |
| | — |
| | (98 | ) |
| Balance at December 31, 2013 | 12,798,461 |
| | $ | 128 |
| | $ | 125,277 |
| | $ | (4,608 | ) | | $ | (1,751 | ) | | $ | 34,644 |
| | $ | (848 | ) | | $ | — |
| | $ | 152,842 |
|
See accompanying notes to consolidated financial statements.
SI FINANCIAL GROUP, INC. CONSOLIDATED STATEMENTS OF CASH FLOWS (In Thousands) |
| | | | | | | | | | | |
| | Years Ended December 31, |
| | 2013 | | 2012 | | 2011 |
| Cash flows from operating activities: | | | | | |
| Net (loss) income | $ | (855 | ) | | $ | 1,118 |
| | $ | 2,417 |
|
| Adjustments to reconcile net (loss) income to net cash provided by operating activities: | |
| | |
| | |
|
| Provision for loan losses | 1,319 |
| | 2,896 |
| | 1,558 |
|
| Employee stock ownership plan expense | 559 |
| | 543 |
| | 467 |
|
| Equity incentive plan expense | 757 |
| | 189 |
| | 100 |
|
| Excess tax benefit from share-based compensation | (9 | ) | | (4 | ) | | (3 | ) |
| Amortization of investment premiums and discounts, net | 1,259 |
| | 1,168 |
| | 650 |
|
| Amortization of loan premiums and discounts, net | 1,473 |
| | 1,423 |
| | 1,458 |
|
| Depreciation and amortization of premises and equipment | 1,992 |
| | 1,852 |
| | 1,947 |
|
| Amortization of core deposit intangible | 220 |
| | 11 |
| | 21 |
|
| Amortization of deferred debt issue costs | 262 |
| | 211 |
| | 203 |
|
| Net loss (gain) on sale of securities | 1,155 |
| | (273 | ) | | (486 | ) |
| Other-than-temporary impairment losses on securities | 8 |
| | 123 |
| | 148 |
|
| Net (gain) loss on trading securities and derivatives | (205 | ) | | 358 |
| | (195 | ) |
| Deferred income tax (benefit) provision | (1,073 | ) | | (1,100 | ) | | 891 |
|
| Loans originated for sale | (46,239 | ) | | (53,552 | ) | | (47,134 | ) |
| Proceeds from sale of loans held for sale | 49,985 |
| | 55,260 |
| | 49,098 |
|
| Net gain on sale of loans held for sale | (835 | ) | | (1,646 | ) | | (611 | ) |
| Net loss on disposal of SI Trust Servicing operations | — |
| | 698 |
| | — |
|
| Net gain on sale of loans held for investment | (201 | ) | | — |
| | (275 | ) |
| Net loss on disposal of equipment | — |
| | 5 |
| | 41 |
|
| Impairment loss on long-lived assets | — |
| | 392 |
| | — |
|
| Net loss on sales or write-downs of other real estate owned | 43 |
| | 60 |
| | 236 |
|
| Increase in cash surrender value of bank-owned life insurance | (400 | ) | | (284 | ) | | (289 | ) |
| Gain on bank-owned life insurance proceeds | — |
| | (349 | ) | | (122 | ) |
| Change in operating assets and liabilities: | |
| | |
| | |
|
| Accrued interest receivable | 42 |
| | 324 |
| | (443 | ) |
| Other assets | (609 | ) | | 1,585 |
| | 1,580 |
|
| Accrued expenses and other liabilities | 1,509 |
| | 1,232 |
| | 62 |
|
| Net cash provided by operating activities | 10,157 |
| | 12,240 |
| | 11,319 |
|
| | | | | | |
| Cash flows from investing activities: | |
| | |
| | |
|
| Purchases of available for sale securities | (54,671 | ) | | (41,721 | ) | | (139,919 | ) |
| Proceeds from sales of available for sale securities | 26,115 |
| | 44,033 |
| | 36,883 |
|
| Proceeds from maturities of and principal repayments on available for sale securities | 45,275 |
| | 54,452 |
| | 53,366 |
|
| Redemption of Federal Home Loan Bank stock | 325 |
| | — |
| | — |
|
| Loan principal collections (originations), net | 13,585 |
| | (22,875 | ) | | 23,016 |
|
| Purchases of loans | (22,950 | ) | | (49,768 | ) | | (46,999 | ) |
| Proceeds from sale of loans held for investment | 3,189 |
| | — |
| | 7,966 |
|
| Proceeds from sale of other real estate owned | 1,314 |
| | 1,361 |
| | 954 |
|
| Purchases of premises and equipment | (2,140 | ) | | (1,472 | ) | | (2,516 | ) |
| Proceeds from bank-owned life insurance | — |
| | 585 |
| | 603 |
|
| Net cash paid for Newport acquisition | (8,935 | ) | | — |
| | — |
|
| Net cash provided by (used in) investing activities | 1,107 |
| | (15,405 | ) | | (66,646 | ) |
| | | | | | |
| Cash flows from financing activities: | |
| | |
| | |
|
| Net (decrease) increase in deposits | (8,836 | ) | | 3,222 |
| | 41,212 |
|
| Net increase (decrease) in mortgagors' and investors' escrow accounts | 7 |
| | (84 | ) | | (134 | ) |
| Proceeds from Federal Home Loan Bank advances | 63,000 |
| | 7,000 |
| | 23,000 |
|
| Repayments of Federal Home Loan Bank advances, net of amortization of discount | (59,509 | ) | | (9,000 | ) | | (37,100 | ) |
| Repayments of other borrowings, net of amortization of discount | (15,072 | ) | | — |
| | — |
|
| Net proceeds from common stock offering | — |
| | — |
| | 2,774 |
|
| Excess tax benefit from share-based compensation | 9 |
| | 4 |
| | 3 |
|
| Purchase of shares by ESOP pursuant to reorganization | — |
| | — |
| | (3,141 | ) |
| Purchase of shares for equity plan | — |
| | (2,238 | ) | | — |
|
| Stock options exercised | 94 |
| | 10 |
| | — |
|
| Cash dividends on common stock | (1,227 | ) | | (1,171 | ) | | (1,191 | ) |
| Common shares repurchased | (98 | ) | | (5,301 | ) | | (5 | ) |
| Net cash (used in) provided by financing activities | (21,632 | ) | | (7,558 | ) | | 25,418 |
|
| | | | | | |
| Net change in cash and cash equivalents | (10,368 | ) | | (10,723 | ) | | (29,909 | ) |
| Cash and cash equivalents at beginning of year | 37,689 |
| | 48,412 |
| | 78,321 |
|
| Cash and cash equivalents at end of year | $ | 27,321 |
| | $ | 37,689 |
| | $ | 48,412 |
|
| | | | | | |
| | | | | | |
| Supplemental cash flow information: | |
| | |
| | |
|
| Interest paid | $ | 8,335 |
| | $ | 9,682 |
| | $ | 11,440 |
|
| Income taxes paid (received), net | 1,562 |
| | (321 | ) | | 790 |
|
| Transfer of stock offering escrow for issuance of common shares | — |
| | — |
| | 47,556 |
|
| Transfer of loans to other real estate owned | 2,393 |
| | 1,787 |
| | 881 |
|
| | | | | | |
| In connection with the purchase acquisition detailed in Note 22: | | | | | |
| Fair value of non-cash tangible assets acquired | $ | 408,136 |
| | $ | — |
| | $ | — |
|
| Goodwill and core deposit intangibles | 16,335 |
| | — |
| | — |
|
| Fair value of liabilities assumed | 385,431 |
| | — |
| | — |
|
| Value of common shares issued | 30,105 |
| | — |
| | — |
|
SI FINANCIAL GROUP, INC.
NOTES TO CONSOLIDATED FINANCIAL STATEMENTS
DECEMBER 31, 2013, 2012 AND 2011
NOTE 1. NATURE OF BUSINESS AND SUMMARY OF SIGNIFICANT ACCOUNTING POLICIES
Nature of Business
SI Financial Group, Inc. (the “Company”) is the holding company for Savings Institute Bank and Trust Company (the “Bank”). Established in 1842, the Bank is a community-oriented financial institution headquartered in Willimantic, Connecticut. The Bank provides a variety of financial services to individuals, businesses and municipalities through its twenty-six offices in eastern Connecticut and Rhode Island. Its primary products include savings, checking and certificate of deposit accounts, residential and commercial mortgage loans, commercial business loans and consumer loans. In addition, wealth management services, which include trust, financial planning, life insurance and investment services, are offered to individuals and businesses through the Bank’s offices. The Company does not conduct any material business other than owning all of the stock of the Bank and making payments on the subordinated debentures held by the Company.
The Company is the successor to the former federally-chartered SI Financial Group, Inc., the former holding company for the Bank when the Bank was organized in the mutual holding company structure. In January 2011, the Company completed a public stock offering and concurrent conversion of the Bank from the mutual holding company to the stock form of organization. A total of 6,544,493 shares of common stock were sold at $8.00 per share. Additional shares totaling 4,032,356 were issued in exchange for shares of the former federally-chartered SI Financial Group, Inc., at an exchange ratio of 0.8981. Shares outstanding after the stock offering and the exchange totaled 10,576,849.
On September 6, 2013, the Company acquired Newport Bancorp, Inc. ("Newport"), the holding company for Newport Federal Savings Bank. The acquisition added six full-service banking offices located in eastern Connecticut and Rhode Island. See Note 22 - Acquisition of Newport Bancorp, Inc. for additional details.
Principles of Consolidation
The accompanying consolidated financial statements include the accounts of the Company, its wholly-owned subsidiary, the Bank, and the Bank’s wholly-owned subsidiaries, 803 Financial Corp., SI Mortgage Company and SI Realty Company, Inc. All significant intercompany accounts and transactions have been eliminated.
Basis of Financial Statement Presentation
The consolidated financial statements have been prepared in accordance with accounting principles generally accepted in the United States of America (“GAAP”) and general practices within the banking industry. In preparing the consolidated financial statements, management is required to make estimates and assumptions that affect the reported amounts of assets and liabilities, and disclosures of contingent assets and liabilities, as of the date of the balance sheets and reported amounts of revenues and expenses for the years presented. Actual results could differ from those estimates. Material estimates that are particularly susceptible to significant change in the near term relate to the determination of the allowance for loan losses, other-than-temporary impairment (“OTTI”) of securities, deferred income taxes and the impairment of long-lived assets.
Reclassifications
Certain amounts in the Company’s prior year consolidated financial statements were reclassified to conform to the current year presentation. Such reclassifications had no effect on net income (loss).
Significant Group Concentrations of Credit Risk
A majority of the Company’s activities are with customers located within eastern Connecticut and Rhode Island. The Company does not have any significant concentrations in any one industry or customer. See Notes 3 and 4 for details relating to the Company’s investment and lending activities.
SI FINANCIAL GROUP, INC.
NOTES TO CONSOLIDATED FINANCIAL STATEMENTS
DECEMBER 31, 2013, 2012 AND 2011
Cash and Cash Equivalents and Statements of Cash Flows
Cash and due from banks, federal funds sold and short-term investments with maturities at date of purchase of less than 90 days are recognized as cash equivalents in the statements of cash flows. Federal funds sold generally mature in one day. For purposes of reporting cash flows, the Company considers all highly liquid debt instruments purchased with a maturity of three months or less to be cash equivalents. Cash flows from loans and deposits are reported on a net basis. The Company maintains amounts due from banks and federal funds sold that, at times, may exceed federally insured limits. The Company has not experienced any losses from such concentrations.
Fair Value Hierarchy
The Company groups its assets and liabilities in three levels, based on the markets in which the assets and liabilities are traded and the reliability of the assumptions used to determine fair value.
Level 1 – Valuation is based on quoted prices in active markets for identical assets or liabilities. Level 1 assets and liabilities generally include debt and equity securities that are traded in an active exchange market. Valuations are obtained from readily available pricing sources for market transactions involving identical assets or liabilities.
Level 2 – Valuation is based on observable inputs other than Level 1 prices, such as quoted prices for similar assets or liabilities; quoted prices in markets that are not active; or other inputs that are observable or can be corroborated by observable market data for substantially the full term of the assets or liabilities.
Level 3 – Valuation is based on unobservable inputs that are supported by little or no market activity and that are significant to the fair value of the assets or liabilities. Level 3 assets and liabilities include financial instruments whose value is determined using unobservable inputs to pricing models, discounted cash flow methodologies, or similar techniques, as well as instruments for which the determination of fair value requires significant management judgment or estimation.
Transfers between levels are recognized at the end of a reporting period, if applicable.
Securities
Management determines the appropriate classification of securities at the date individual securities are acquired, and the appropriateness of such classification is reassessed at each reporting date.
Debt securities that management has the positive intent and ability to hold to maturity are classified as “held to maturity” and recorded at amortized cost. Securities that are held principally for the purpose of trading in the near term are classified as “trading securities.” Trading securities are carried at fair value, with unrealized gains and losses recognized in earnings. Interest and dividends are included in net interest income. Securities not classified as held to maturity or trading, including equity securities with readily determinable fair values, are classified as “available for sale” and recorded at fair value, with unrealized gains and losses excluded from earnings and reported in other comprehensive income (loss), net of taxes.
Purchase premiums and discounts are recognized in interest income using the interest method over the terms of the securities. Gains and losses on the sale of securities are recorded on the trade date and are determined using the specific identification method.
At each reporting period, the Company evaluates securities with a decline in fair value below the amortized cost of the investment to determine whether or not the impairment is deemed to be other than temporary. The evaluation is based upon factors such as the creditworthiness of the issuers/guarantors, the underlying collateral, if applicable, and the continuing performance of the securities. Management also evaluates other facts and circumstances that may be indicative of an OTTI condition, such as the type of security, length of time and extent to which the fair value has been less than cost and near-term prospects of the issuers. OTTI is required to be
SI FINANCIAL GROUP, INC.
NOTES TO CONSOLIDATED FINANCIAL STATEMENTS
DECEMBER 31, 2013, 2012 AND 2011
recognized if (1) the Company intends to sell the security; (2) it is more likely than not that the Company will be
required to sell the security before recovery of its amortized cost basis; or (3) for debt securities, the present value of expected cash flows is not sufficient to recover the entire amortized cost basis. Marketable equity securities are evaluated for OTTI based on the severity and duration of the impairment and, if deemed to be other-than-temporary, the declines in fair value are reflected in earnings as realized losses. For impaired debt securities that the Company intends to sell, or more likely than not will be required to sell, the full amount of the depreciation is recognized as OTTI through earnings. For all other impaired debt securities, credit-related OTTI is recognized through earnings and noncredit-related OTTI is recognized in other comprehensive income (loss), net of applicable taxes. See Notes 3 and 15 for more details.
Federal Home Loan Bank Stock
The Bank, as a member of the Federal Home Loan Bank of Boston (“FHLB”), is required to maintain an investment in capital stock of the FHLB. Based on redemption provisions of the FHLB, the stock has no quoted market value and is carried at cost. At its discretion, the FHLB may declare dividends on its stock. The stock is redeemable at par by the FHLB and the Company’s ability to redeem the shares owned is dependent on the redemption practices of the FHLB. The Company reviews its investment in FHLB stock for impairment based on the ultimate recoverability of the cost basis in the FHLB stock. No impairment charges were recognized for the years ended December 31, 2013, 2012 and 2011.
Loans Held for Sale
Loans originated and intended for sale in the secondary market are carried at the lower of amortized cost or fair value, as determined by aggregate outstanding commitments from investors or current investor yield requirements. Net unrealized losses, if any, are recognized through a valuation allowance by charges to noninterest income. Gains or losses on sales of mortgage loans are recognized based on the difference between the selling price and the carrying value of the related mortgage loans sold on the trade date and reported within mortgage banking activities on the accompanying consolidated statements of operations.
Loans Receivable
Loans receivable are stated at current unpaid principal balances, net of the allowance for loan losses and deferred loan origination fees and costs. Management has the ability and intent to hold its loans receivable for the foreseeable future or until maturity or pay-off.
A loan is impaired when, based on current information and events, it is probable the Company will be unable to collect all contractual principal and interest payments due in accordance with the terms of the loan agreement. Factors considered by management in determining impairment include payment status, collateral value and the probability of collecting scheduled principal and interest payments when due. Impairment is measured on a loan by loan basis for residential and commercial mortgage loans and commercial business loans by either the present value of expected future cash flows discounted at the loan's effective interest rate or, as a practical expedient, at the loan's observable market price or the fair value of the collateral if the loan is collateral dependent. Large groups of smaller balance homogeneous loans are collectively evaluated for impairment. Accordingly, the Company does not typically identify individual consumer loans for impairment disclosures, unless such loans are subject to a troubled debt restructuring agreement.
The Company periodically may agree to modify the contractual terms of loans. When a loan is modified and concessions have been made to the original contractual terms, such as reductions of interest rates or deferral of interest or principal payments, due to the borrower’s financial condition, the modification is considered a troubled debt restructuring (“TDR”).
SI FINANCIAL GROUP, INC.
NOTES TO CONSOLIDATED FINANCIAL STATEMENTS
DECEMBER 31, 2013, 2012 AND 2011
Management considers all nonaccrual loans, with the exception of certain consumer loans, to be impaired. Also, all TDRs are initially classified as impaired. In most cases, loan payments less than 90 days past due are considered minor collection delays and the related loans are generally not considered impaired.
Allowance for Loan Losses
The allowance for loan losses, a material estimate which could change significantly in the near-term, is established through a provision for loan losses charged to earnings to account for losses that are inherent in the loan portfolio and estimated to occur, and is maintained at a level that management considers adequate to absorb losses in the
loan portfolio. Loan losses are charged against the allowance for loan losses when management believes that the uncollectibility of the principal loan balance is confirmed. Subsequent recoveries, if any, are credited to the allowance for loan losses when received. In the determination of the allowance for loan losses, management may obtain independent appraisals for significant properties, if necessary.
Management's judgment in determining the adequacy of the allowance is inherently subjective as it requires estimates that are susceptible to significant revision as more information becomes available. The allowance for loan losses is evaluated on a monthly basis by management and is based on the evaluation of the known and inherent risk characteristics and size and composition of the loan portfolio, the assessment of current economic and real estate market conditions, adverse situations that may affect the borrower’s ability to repay, estimated value of any underlying collateral, historical loan loss experience, the level and trends of nonperforming loans, delinquencies, classified assets and loan charge-offs and evaluations of loans and other relevant factors.
The allowance for loan losses consists of the following key elements:
| |
| ◦ | Specific allowance for identified impaired loans. For loans that are identified as impaired, an allowance is established when the present value of expected cash flows (or observable market price of the loan or fair value of the collateral if the loan is collateral dependent) of the impaired loan is lower than the carrying value of that loan. |
| |
| ◦ | General valuation allowance. The general component represents a valuation allowance on the remainder of the loan portfolio, after excluding impaired loans. For this portion of the allowance, loans are segregated by category and assigned an allowance percentage based on historical loan loss experience adjusted for qualitative factors stratified by the following loan segments: residential one- to four-family, multi-family and commercial real estate, construction, commercial business and consumer. Management uses a rolling average of historical losses based on the time frame appropriate to capture relevant loss data for each loan segment. This historical loss factor is adjusted for the following qualitative factors: levels/trends in delinquencies, classified loans and nonaccrual loans; level of loan charge-offs; trends in volume, nature and terms of loans; existence and effect of/or changes in the level of credit concentrations; effects of changes in risk selection, underwriting standards and other changes in lending policies, procedures and practices; experience/ability and depth of lending management and staff, national and local economic trends and conditions and impact on value of underlying collateral for collateral dependent loans. |
The qualitative factors are determined based on the following various risk characteristics for each loan segment. Risk characteristics relevant to each portfolio segment are as follows:
Residential – One- to Four-Family – The Bank primarily originates conventional loans with loan-to-value ratios less than 95% and generally originates loans with loan-to-value ratios in excess of 80% only when secured by first liens on owner-occupied one- to four-family residences. Loans with loan-to-value ratios in excess of 80% generally require private mortgage insurance or additional collateral. All loans in this segment are collateralized by owner-occupied residential real estate and repayment is
SI FINANCIAL GROUP, INC.
NOTES TO CONSOLIDATED FINANCIAL STATEMENTS
DECEMBER 31, 2013, 2012 AND 2011
dependent on the credit quality of the individual borrower. The overall health of the economy,
including unemployment rates and housing prices, will have an effect on the credit quality of this segment.
Multi-family and Commercial – Loans in this segment are originated for the purpose of acquiring, developing, improving or refinancing multi-family and commercial real estate where the property is the primary collateral securing the loan, and the income generated from the property is the primary repayment source. The underlying cash flows generated by the properties are adversely impacted by a downturn in the economy as evidenced by increased vacancy rates, which in turn, will have an effect on the credit quality in this segment. Payments on loans secured by income-producing properties often depend on the successful operation and management of the properties. Management continually monitors the cash flows of these loans.
Construction – This segment includes loans to individuals, and to a lesser extent builders, to finance the construction of residential dwellings. The Bank also originates construction loans for commercial development projects. Upon the completion of construction, the loan generally converts to a permanent mortgage loan. Credit risk is affected by cost overruns, time to sell at an adequate price and market conditions.
Commercial Business – Loans in this segment are made to businesses and are generally secured by assets of the business. Repayment is expected from the cash flows of the business. A weakened economy and reduced viability of the industry in which the customer operates will have a negative impact on the credit quality in this segment. To a lesser but increasing extent, the Bank provides loans to investors in the time share industry, which are secured by consumer receivables, and provides loans for capital improvements to condominium associations, which are secured by the assigned rights to levy special assessments to condominium owners.
Consumer – Loans in this segment primarily include home equity lines of credit (representing both first and second liens), and indirect automobile loans and, to a lesser extent, loans secured by marketable securities, passbook or certificate accounts, motorcycles, automobiles and recreational vehicles, as well as unsecured loans. Consumer loan collections depend on the borrower’s continuing financial stability, and therefore, are more likely to be adversely affected by job loss, divorce, illness or personal bankruptcy.
In computing the allowance for loan losses, we do not assign a general valuation allowance to the Small Business Administration ("SBA") and United States Department of Agriculture ("USDA") loans that we purchase as such loans are fully guaranteed. These loans are included in commercial business loans. See Note 4 for details.
The majority of the Company's loans are collateralized by real estate located in eastern Connecticut and Rhode Island. To a lesser extent, certain commercial real estate loans are secured by collateral located outside of our primary market area. Accordingly, the collateral value of a substantial portion of the Company's loan portfolio and real estate acquired through foreclosure is susceptible to changes in market conditions.
Although management believes that it uses the best information available to establish the allowance for loan losses, future adjustments to the allowance for loan losses may be necessary and the Company’s results of operations could be adversely affected if circumstances differ substantially from the assumptions used in making the determinations. Furthermore, while management believes it has established the allowance for loan losses in conformity with GAAP, the regulatory agencies, in reviewing the loan portfolio, may request us to increase our allowance for loan losses based on judgments different from ours. In addition, because future events affecting borrowers and collateral cannot be predicted with certainty, the existing allowance for loan losses may not be
SI FINANCIAL GROUP, INC.
NOTES TO CONSOLIDATED FINANCIAL STATEMENTS
DECEMBER 31, 2013, 2012 AND 2011
adequate or increases may be necessary should the quality of any loans deteriorate as a result of the factors discussed above. Any material increase in the allowance for loan losses would adversely affect the Company’s financial condition and results of operations.
Loans Acquired with Deteriorating Credit Quality
Loans acquired in a transfer, including business combinations, where there is evidence of credit deterioration since origination and it is probable at the date of acquisition the Company will not collect all contractually required principal and interest payments, are accounted for under accounting guidance for purchased credit-impaired loans. This guidance provides that the excess of the cash flows initially expected to be collected over the fair value of the loans at the acquisition date (i.e., the accretable yield) is accreted into interest income over the estimated remaining life of the loans, provided that the timing and amount of future cash flows is reasonably estimable. Accordingly, such loans are not classified as impaired and they are considered to be accruing because their interest income relates to the accretable yield and not to contractual interest payments. The difference between the contractually required payments and the cash flows expected to be collected at acquisition is referred to as the nonaccretable difference. Subsequent to acquisition, probable decreases in expected cash flows are recognized through a provision for loan losses, resulting in an increase to the allowance for loan losses. If the Company has probable and significant increases in cash flows expected to be collected, the Company will first reverse any previously established allowance for loan losses and then increase interest income as a prospective yield adjustment.
Interest and Fees on Loans
Interest on loans is accrued and included in net interest income based on contractual rates applied to principal amounts outstanding. Accrual of interest is discontinued when loan payments are 90 days or more past due, based on contractual terms, or when, in the judgment of management, collectibility of the loan or loan interest becomes uncertain. Subsequent recognition of income occurs only to the extent payment is received subject to management's assessment of the collectibility of the remaining interest and principal. A nonaccrual loan is restored to accrual status when it is no longer delinquent and collectibility of interest and principal is no longer in doubt and the borrower has made regular payments in accordance with the terms of the loan over a period of at least six months. Interest collected on nonaccrual loans is recognized only to the extent cash payments are received, and may be recorded as a reduction to principal if the collectibility of the principal balance of the loan is unlikely.
Loan origination fees and direct loan origination costs are deferred, and the net amount is recognized as an adjustment of the related loan's yield utilizing the interest method over the contractual life of the loan.
Derivative Financial Instruments
Derivative financial instruments are recognized as assets and liabilities on the consolidated balance sheets and measured at fair value.
Interest Rate Swap Agreements - The Company uses interest rate swap agreements as part of its interest rate risk management strategy. Interest rate swaps are contracts in which a series of interest rate flows are exchanged over a prescribed period. The notional amount on which the interest payments are based is not exchanged. The Company’s swap agreements are derivative instruments and convert a portion of the Company’s variable-rate debt to a fixed-rate.
Interest rate derivative financial instruments receive hedge accounting treatment only if they are designated as a hedge and are expected to be, and are, effective in substantially reducing interest rate risk arising from the assets and liabilities identified as exposing the Company to risk. If periodic assessment indicates derivatives no longer provide an effective hedge, the derivative contracts would be closed out and settled, or classified as a trading activity. For cash flow hedges, the net settlement (upon close-out or termination) that offsets changes in the value
SI FINANCIAL GROUP, INC.
NOTES TO CONSOLIDATED FINANCIAL STATEMENTS
DECEMBER 31, 2013, 2012 AND 2011
of the hedged debt is deferred and amortized into net interest income over the life of the hedged debt. The portion, if any, of the net settlement amount that did not offset changes in the value of the hedged asset or liability is recognized immediately in noninterest income.
The Company has characterized one of its interest rate swaps as a cash flow hedge. Cash flow hedges are used to minimize the variability in cash flows of assets or liabilities, or forecasted transactions caused by interest rate fluctuations, and are recorded at fair value in other assets or liabilities within the Company’s balance sheets. Changes in the fair value of these cash flow hedges are initially recorded as a component of other comprehensive income (loss) and subsequently reclassified into earnings when the hedged transaction affects earnings. The ineffective portion of the gain or loss on derivative instruments, if any, is recognized in earnings.
Cash flows resulting from the derivative financial instruments that are accounted for as hedges of assets and liabilities are classified in the cash flow statement in the same category as the cash flows of the items being hedged.
Certain derivative instruments do not meet the requirements to be accounted for as hedging instruments. These undesignated derivative instruments are recognized on the consolidated balance sheets at fair value, with changes in fair value recorded in other noninterest income. One of the Company's interest rate swap agreements is not designated as a hedge.
Derivative Loan Commitments - Mortgage loan commitments are referred to as derivative loan commitments if the loan that will result from exercise of the commitment will be held for sale upon funding. Loan commitments that are derivatives are recognized at fair value on the consolidated balance sheets in other assets and other liabilities with changes in their fair values recorded in noninterest income.
Forward Loan Sale Commitments - To protect against the price risk inherent in derivative loan commitments, the Company utilizes “mandatory delivery” forward loan sale commitments to mitigate the risk of potential decreases in the values of loans that would result from the exercise of the derivative loan commitments. Mandatory delivery contracts are accounted for as derivative instruments. Mandatory delivery forward loan sale commitments are recognized at fair value on the consolidated balance sheets in other assets and other liabilities with changes in their fair values recorded in noninterest income.
Transfers of Financial Assets
Transfers of financial assets are accounted for as sales, when control over the assets has been surrendered. Control over transferred assets is deemed to be surrendered when (1) the assets have been isolated from the Company, (2) the transferee obtains the right to pledge or exchange the transferred assets and no condition both constrains the transferee from taking advantage of that right and provides more than a trivial benefit for the transferor and (3) the transferor does not maintain effective control over the transferred assets through either (a) an agreement that both entitles and obligates the transferor to repurchase or redeem the assets before maturity or (b) the ability to unilaterally cause the holder to return specific assets.
During the normal course of business, the Company may transfer a portion of a financial asset, for example, a participation loan or the government guaranteed portion of a loan. In order to be eligible for sales treatment, the transfer of the portion of the loan must meet the criteria of a participating interest. If it does not meet the criteria of a participating interest, the transfer must be accounted for as a secured borrowing. In order to meet the criteria for a participating interest, all cash flows from the loan must be divided proportionately, the rights of each loan holder must have the same priority, the loan holders must have no recourse to the transferor other than standard representations and warranties and no loan holder has the right to pledge or exchange the entire loan.
SI FINANCIAL GROUP, INC.
NOTES TO CONSOLIDATED FINANCIAL STATEMENTS
DECEMBER 31, 2013, 2012 AND 2011
Other Real Estate Owned
Other real estate owned consists of properties acquired through, or in lieu of, loan foreclosure or other proceedings and is initially recorded at fair value at the date of foreclosure, establishing a new cost basis. Subsequent to foreclosure, the properties are held for sale and are carried at the lower of carrying amount or fair value less estimated costs of disposal. Any write-down to fair value at the time of acquisition is charged to the allowance for loan losses. Properties are evaluated regularly to ensure the recorded amounts are supported by current fair values, and a charge to operations is recorded as necessary to reduce the carrying amount to fair value less estimated costs to dispose. Revenue and expense from the operation of other real estate owned and the provision to establish and adjust valuation allowances are included in noninterest expenses. Costs relating to the development and improvement of the property are capitalized, subject to the limit of fair value of the collateral. Gains or losses are included in noninterest expenses upon disposal. See Note 5 for additional details related to other real estate owned.
Premises and Equipment
Land is carried at cost. Premises and equipment are stated at cost, net of accumulated depreciation and amortization. Depreciation is charged to operations using the straight-line method over the estimated useful lives of the related assets. Leasehold improvements are amortized over the shorter of the estimated economic lives of the improvements or the expected lease terms. Expected terms include lease option periods to the extent that the exercise of such options is reasonably assured.
The estimated useful lives of the assets are as follows:
|
| |
| Classification | Estimated Useful Lives |
| Buildings | 5 to 40 years |
| Furniture and equipment | 3 to 10 years |
| Leasehold improvements | 5 to 20 years |
Gains and losses on dispositions are recognized upon realization. Maintenance and repairs are expensed as incurred and improvements are capitalized.
Bank-owned Life Insurance
Bank-owned life insurance policies are presented on the consolidated balance sheets at cash surrender value. Changes in cash surrender value, as well as gains on the surrender of policies, are reflected in noninterest income in the consolidated statements of operations and are not subject to income taxes. See Note 11 for additional discussion.
Servicing
The Company services mortgage loans for others. Mortgage servicing assets are recognized as separate assets at fair value when rights are acquired through purchase or retained through the sale of financial assets. Fair value is based on a valuation model that calculates the present value of estimated future net servicing income. The valuation model incorporates assumptions that market participants would use in estimating future net servicing income, such as the cost to service, the discount rate, the custodial earnings rate, an inflation rate, ancillary income, prepayment speeds and default rates and losses. Capitalized servicing rights are reported in other assets and are amortized into mortgage banking income in proportion to, and over the period of, the estimated future net servicing income of the underlying financial assets.
Servicing assets are evaluated for impairment based upon the fair value of the rights as compared to the amortized cost. Impairment is determined by stratifying rights by predominant risk characteristics, such as interest rate, loan type and investor type. Impairment is recognized through a valuation allowance for an individual stratum, to the extent that the fair value is less than the capitalized amount for the stratum. Changes in the valuation allowance are reported in loan servicing fee income.
SI FINANCIAL GROUP, INC.
NOTES TO CONSOLIDATED FINANCIAL STATEMENTS
DECEMBER 31, 2013, 2012 AND 2011
Servicing fee income is recorded for fees earned for servicing loans, which is included in mortgage banking income. The fees are based on a contractual percentage of the outstanding principal or a fixed amount per loan and are recorded as income when earned.
Impairment of Long-lived Assets
Long-lived assets, including premises and equipment and certain identifiable intangible assets that are held and used by the Company, are reviewed for impairment whenever events or changes in circumstances indicate that the carrying amount of an asset may not be recoverable. If impairment is indicated by that review, the asset is written down to its estimated fair value through a charge to earnings.
Goodwill is measured as the excess of the cost of a business combination over the sum of the amounts assigned to identifiable intangible assets acquired less liabilities assumed. Goodwill is not amortized but rather assessed for impairment annually or more frequently if circumstances warrant.
Management has the option of first assessing qualitative factors, such as events and circumstances, to determine whether it is more likely than not, meaning a likelihood of more than 50%, the value of a reporting unit is less than its carrying amount. If, after considering all relevant events and circumstances, management determines it is not more likely than not the fair value of a reporting unit is less than its carrying amount, then performing an impairment test is unnecessary. For the year ended December 31, 2013, management determined that it was not more likely than not the fair value of the reporting unit (the consolidated Company, in our case) was less than its carrying amount. If management had determined otherwise, the two-step process would have been completed to determine the impairment and necessary write-down of goodwill.
Other Investments
The Company is a limited partner in three Small Business Investment Companies (“SBICs”), which are licensed by the Small Business Administration. They provide mezzanine financing and private equity investments to small companies which may not otherwise qualify for standard bank financing. The Company records its investment in the SBICs at cost and evaluates its investment for impairment on a quarterly basis. Impairment that is considered by management to be other-than-temporary results in a write-down of the investment which is recognized as a charge to earnings. See Note 12 regarding the Bank's investment in and outstanding capital commitments to the limited partnerships.
Trust Assets
Trust assets held in a fiduciary or agency capacity, other than trust cash on deposit at the Bank, are not included in these consolidated financial statements because they are not assets of the Company. Trust fees are recognized on the accrual basis of accounting.
Related Party Transactions
Directors, officers and affiliates of the Company and the Bank have been customers of and have had transactions with the Bank, and it is expected that such persons will continue to have such transactions in the future. Management believes that all deposit accounts, loans, services and commitments comprising such transactions were made in the ordinary course of business, on substantially the same terms, including interest rates and collateral, as those prevailing at the time for comparable transactions with other customers who were not directors, officers or affiliates. In the opinion of management, the transactions with related parties did not involve more than the normal risk of collectibility, favored treatment or terms or present other unfavorable features. See Note 13 for details regarding related party transactions.
Employee Stock Ownership Plan
The loans to the Employee Stock Ownership Plan ("ESOP") are repaid from the Bank’s contributions to the ESOP and dividends payable on common stock held by the ESOP over an initial period of 15 years for the first loan and
SI FINANCIAL GROUP, INC.
NOTES TO CONSOLIDATED FINANCIAL STATEMENTS
DECEMBER 31, 2013, 2012 AND 2011
20 years for the second loan. Unearned compensation applicable to the ESOP is reflected as a reduction of shareholders’ equity on the consolidated balance sheets. Compensation expense is recognized as ESOP shares are committed to be released and is based on the average fair market value of the shares during the period. The difference between the average fair value and the cost of the shares allocated by the ESOP is recorded as an adjustment to additional paid-in capital. Unallocated ESOP shares are not considered outstanding for calculating earnings per share. Dividends paid on allocated ESOP shares are charged to retained earnings and dividends paid on unallocated ESOP shares are used to satisfy debt service. See Note 11 for additional discussion.
Equity Incentive Plan
The Company measures and recognizes compensation cost relating to share-based compensation based on the grant date fair value of the equity instruments issued. Share-based compensation is recognized on a straight-line basis over the period of service or performance for the award. Reductions in compensation expense associated with forfeited options are estimated at the date of grant, and this estimated forfeiture rate is adjusted based on actual forfeiture experience. The fair value of each restricted stock allocation, equal to the market price at the date of grant, is recorded as unearned restricted shares. The fair value of each stock option award is determined on the date of grant using the Black-Scholes option pricing model, which includes several assumptions such as expected volatility, dividends, term and risk-free rate for each stock option award. See Note 11 for additional discussion.
Income Taxes
Deferred income tax assets and liabilities are determined using the asset and liability (or balance sheet) method. Under this method, deferred tax assets and liabilities are recognized for the future tax consequences attributable to differences between the financial statement carrying amounts of existing assets and liabilities and their respective tax bases. Deferred tax assets and liabilities are measured using enacted tax rates expected to apply to taxable income in the years in which those temporary differences are expected to be recovered or settled. The Company exercises significant judgment in evaluating the amount and timing of recognition of the resulting tax assets and liabilities. These judgments require the Company to make projections of future taxable income. These judgments and estimates, which are inherently subjective, are reviewed periodically as regulatory and business factors change. Deferred tax assets are reduced by a valuation allowance when, in the opinion of management, it is more likely than not that all or some portion of the deferred tax assets will not be realized.
The Company does not have any uncertain tax positions which require accrual or disclosure at December 31, 2013 or 2012. In accordance with the provisions of applicable accounting guidance, in future periods, the Company may record a liability for unrecognized tax benefits related to the recognition, derecognition or change in measurement of a tax position as a result of new tax positions, changes in management’s judgment about the level of uncertainty of existing tax positions, expiration of open income tax returns due to the statutes of limitation, status of examinations and litigation and legislative activity. The Company has elected to report future interest and penalties related to unrecognized tax benefits, if any, as income tax expense in the Company’s consolidated statements of operations. No interest or penalties were recorded for the years ended December 31, 2013, 2012 or 2011.
Income tax benefits related to stock compensation in excess of grant date fair value less any proceeds on exercise are recognized as an increase to additional paid-in capital upon vesting or exercising and delivery of the stock. Any income tax effects related to stock compensation that are less than grant date fair value less any proceeds on exercise would be recognized as a reduction of additional paid-in capital to the extent of previously recognized income tax benefits and then through income tax expense for the remaining amount.
Comprehensive Income (Loss)
Accounting principles generally require that recognized revenue, expenses, gains and losses be included in net income. Although certain changes in assets and liabilities, such as unrealized gains and losses on available for sale
SI FINANCIAL GROUP, INC.
NOTES TO CONSOLIDATED FINANCIAL STATEMENTS
DECEMBER 31, 2013, 2012 AND 2011
securities and certain cash flow hedges, are reported as a separate component of shareholders’ equity, such items, along with net income (loss), are components of comprehensive income (loss). See Note 15 for components of other comprehensive income (loss) and the related tax effects.
Common Share Repurchases
The Company is chartered in the state of Maryland. Maryland law does not provide for treasury shares, rather shares repurchased by the Company constitute authorized but unissued shares. Accounting principles generally accepted in the United States of America state that accounting for treasury stock shall conform to state law. Therefore, the cost of shares repurchased by the Company has been allocated to common stock and retained earnings balances.
Earnings (Loss) Per Share
Basic earnings (loss) per share is calculated by dividing the net income (loss) available to common shareholders by the weighted average number of common shares outstanding during the period. Unvested restricted shares are considered outstanding in the computation of basic earnings (loss) per share since the shares participate in dividends and the rights to the dividends are non-forfeitable. Diluted earnings (loss) per share is computed in a manner similar to basic earnings (loss) per share except that the weighted average number of common shares outstanding is increased to include the incremental common shares (as computed using the treasury stock method) that would have been outstanding if all potentially dilutive common stock equivalents were issued during the period. The Company’s common stock equivalents relate solely to stock options. Repurchased common shares and unallocated common shares held by the Bank's ESOP are not deemed outstanding for earnings (loss)
per share calculations.
Anti-dilutive shares are common stock equivalents with weighted average exercise prices in excess of the weighted average market value for the periods presented, and are not considered in diluted earnings (loss) per share calculations. The Company had 554,029, 323,011 and 443,026 anti-dilutive common shares outstanding for the years ended December 31, 2013, 2012 and 2011, respectively. The computation of earnings (loss) per share is as follows:
|
| | | | | | | | | | | | |
| | | Years Ended December 31, |
| | | 2013 | | 2012 | | 2011 |
| | | (Dollars In Thousands, Except Per Share Amounts) |
| | | | | | | |
| Net (loss) income | $ | (855 | ) | | $ | 1,118 |
| | $ | 2,417 |
|
| Weighted average common shares outstanding: | | | |
| | |
|
| Basic | 10,434,191 |
| | 9,730,797 |
| | 9,988,322 |
|
| Effect of dilutive stock options | — |
| | 24,895 |
| | 20,538 |
|
| Diluted | 10,434,191 |
| | 9,755,692 |
| | 10,008,860 |
|
| | | | | | | |
| (Loss) earnings per share: | | | |
| | |
|
| Basic | $ | (0.08 | ) | | $ | 0.11 |
| | $ | 0.24 |
|
| Diluted | $ | (0.08 | ) | | $ | 0.11 |
| | $ | 0.24 |
|
Business Segment Reporting
Public companies are required to report (i) certain financial and descriptive information about “reportable operating segments,” as defined, and (ii) certain enterprise-wide financial information about products and services, geographic areas and major customers. An operating segment is a component of a business for which separate financial information is available and evaluated regularly by the chief operating decision-maker in deciding how to allocate resources and evaluate performance. The Company’s operations are limited to financial services provided within the framework of a community bank, and decisions are generally based on specific market areas and or product offerings. Accordingly, based on the financial information presently evaluated by the
SI FINANCIAL GROUP, INC.
NOTES TO CONSOLIDATED FINANCIAL STATEMENTS
DECEMBER 31, 2013, 2012 AND 2011
Company’s chief operating decision-maker, the Company’s operations are aggregated in one reportable operating segment.
Advertising Costs
Advertising costs are expensed as incurred.
Recent Accounting Pronouncements
Comprehensive Income - Reporting of Amounts Reclassified Out of Accumulated Other Comprehensive Income - In February 2013, the Financial Accounting Standards Board ("FASB") issued an amendment to improve the transparency of reporting these reclassifications by requiring an organization to 1) present the effects on the line items of net income (loss) of significant amounts reclassified out of accumulated other comprehensive income (loss) and 2) cross-reference to other disclosures currently required under GAAP for other reclassification items to be reclassified directly to net income (loss) in their entirety in the same reporting period. The amendments were effective for reporting periods beginning after December 15, 2012. The adoption of this amendment did not have a material impact on the Company's consolidated financial statements. See Consolidated Statements of Comprehensive Income (Loss).
Reclassification of Residential Real Estate Collateralized Consumer Mortgage Loans upon Foreclosure - In January 2014, the FASB issued amended guidance that clarifies when a creditor should be considered to have received physical possession of residential real estate property collateralizing a consumer mortgage loan such that the loan receivable should be derecognized and the real estate property recognized. The amended guidance clarifies that an in substance repossession or foreclosure occurs, and a creditor is considered to have received physical possession of residential real estate property collateralizing a consumer mortgage loan, upon either (1) the creditor obtaining legal title to the residential real estate property upon completion of a foreclosure or (2) the borrower conveying all interest in the residential real estate property to the creditor to satisfy that loan through completion of a deed in lieu of foreclosure or through a similar legal agreement. In addition, the amended guidance requires interim and annual disclosures of both (1) the amount of foreclosed residential real estate property held by the creditor and (2) the recorded investment in consumer mortgage loans collateralized by residential real estate property that are in the process of foreclosure according to local requirements of the applicable jurisdiction. The amended guidance may be applied prospectively or through a modified retrospective approach and is effective for fiscal years, and interim periods within those years, beginning after December 15, 2014, with early adoption permitted. The adoption of the amended guidance is not expected to have a material impact on the Company’s consolidated financial statements.
NOTE 2. RESTRICTIONS ON CASH AND AMOUNTS DUE FROM BANKS
The Bank is required to maintain cash reserve balances against its respective transaction accounts and non-personal time deposits. At December 31, 2013 and 2012, the Bank was required to maintain cash and liquid asset reserves of $1.4 million and $700,000, respectively.
SI FINANCIAL GROUP, INC.
NOTES TO CONSOLIDATED FINANCIAL STATEMENTS
DECEMBER 31, 2013, 2012 AND 2011
NOTE 3. SECURITIES
The amortized cost, gross unrealized gains and losses and fair values of available for sale securities at December 31, 2013 and 2012 are as follows:
|
| | | | | | | | | | | | | | | | |
| | | December 31, 2013 |
| | | Amortized Cost | | Gross Unrealized Gains | | Gross Unrealized Losses | | Fair Value |
| | | (In Thousands) |
| Debt securities: | | | | | | | |
| U.S. Government and agency obligations | $ | 54,228 |
| | $ | 485 |
| | $ | (168 | ) | | $ | 54,545 |
|
| Government-sponsored enterprises | 26,551 |
| | 134 |
| | (393 | ) | | 26,292 |
|
Mortgage-backed securities:(1) | | | | | | | |
| Agency - residential | 77,037 |
| | 889 |
| | (1,809 | ) | | 76,117 |
|
| Non-agency - residential | 530 |
| | 26 |
| | (2 | ) | | 554 |
|
| Corporate debt securities | 3,708 |
| | 90 |
| | — |
| | 3,798 |
|
| Collateralized debt obligations | 1,210 |
| | — |
| | (19 | ) | | 1,191 |
|
| Obligations of state and political subdivisions | 4,063 |
| | 141 |
| | (81 | ) | | 4,123 |
|
| Tax-exempt securities | 3,841 |
| | — |
| | (266 | ) | | 3,575 |
|
| Foreign government securities | 25 |
| | — |
| | — |
| | 25 |
|
| Total available for sale securities | $ | 171,193 |
| | $ | 1,765 |
| | $ | (2,738 | ) | | $ | 170,220 |
|
| | | | | | | | | |
(1) Agency securities refer to debt obligations issued or guaranteed by government corporations or government-sponsored enterprises (“GSEs”). Non-agency securities, or private-label securities, are the sole obligation of their issuer and are not guaranteed by one of the GSEs or the U.S. Government.
|
| | | | | | | | | | | | | | | | |
| | | December 31, 2012 |
| | | Amortized Cost (1) | | Gross Unrealized Gains | | Gross Unrealized Losses | | Fair Value |
| | | (In Thousands) |
| Debt securities: | | | | | | | |
| U.S. Government and agency obligations | $ | 55,027 |
| | $ | 1,255 |
| | $ | (23 | ) | | $ | 56,259 |
|
| Government-sponsored enterprises | 23,388 |
| | 579 |
| | — |
| | 23,967 |
|
Mortgage-backed securities:(2) | |
| | |
| | |
| | |
|
| Agency - residential | 69,399 |
| | 2,211 |
| | (66 | ) | | 71,544 |
|
| Non-agency - residential | 4,784 |
| | 52 |
| | (124 | ) | | 4,712 |
|
| Non-agency - HELOC | 2,555 |
| | — |
| | (78 | ) | | 2,477 |
|
| Corporate debt securities | 7,555 |
| | 188 |
| | (49 | ) | | 7,694 |
|
| Collateralized debt obligations | 5,993 |
| | — |
| | (1,597 | ) | | 4,396 |
|
| Obligations of state and political subdivisions | 5,152 |
| | 262 |
| | — |
| | 5,414 |
|
| Foreign government securities | 50 |
| | — |
| | — |
| | 50 |
|
| Total available for sale securities | $ | 173,903 |
| | $ | 4,547 |
| | $ | (1,937 | ) | | $ | 176,513 |
|
| | | | | | | | | |
(1) Net of OTTI write-downs recognized in earnings.
(2) Agency securities refer to debt obligations issued or guaranteed by government corporations or government-sponsored enterprises (“GSEs”) Non-agency securities, or private-label securities, are the sole obligation of their issuer and are not guaranteed by one of the GSEs or the U.S. Government.
SI FINANCIAL GROUP, INC.
NOTES TO CONSOLIDATED FINANCIAL STATEMENTS
DECEMBER 31, 2013, 2012 AND 2011
At December 31, 2013 and 2012, U.S. government and agency obligations and government-sponsored enterprise securities with an amortized cost of $6.0 million and $4.5 million, respectively, and a fair value of $6.0 million and $4.6 million, respectively, were pledged to secure public deposits and for other purposes required or permitted by law.
The amortized cost and fair value of debt securities by contractual maturities at December 31, 2013 are presented below. Maturities are based on the final contractual payment dates, and do not reflect the impact of potential prepayments or early redemptions. Because mortgage-backed securities ("MBS") are not due at a single maturity date, they are not included in the maturity categories in the following maturity summary.
|
| | | | | | | |
| | Amortized Cost | | Fair Value |
| | (In Thousands) |
| Within 1 year | $ | 5,783 |
| | $ | 5,875 |
|
| After 1 but within 5 years | 27,381 |
| | 27,498 |
|
| After 5 but within 10 years | 18,259 |
| | 18,095 |
|
| After 10 years | 42,203 |
| | 42,081 |
|
| | 93,626 |
| | 93,549 |
|
| Mortgage-backed securities | 77,567 |
| | 76,671 |
|
| Total debt securities | $ | 171,193 |
| | $ | 170,220 |
|
The following is a summary of realized gains and losses on the sale of securities for the years ended December 31, 2013, 2012 and 2011:
|
| | | | | | | | | | | |
| | Years Ended December 31, |
| | 2013 | | 2012 | | 2011 |
| | (In Thousands) |
| Gross gains on sales | $ | 626 |
| | $ | 798 |
| | $ | 589 |
|
| Gross losses on sales | (1,781 | ) | | (525 | ) | | (103 | ) |
| Net (loss) gain on sale of securities | $ | (1,155 | ) | | $ | 273 |
| | $ | 486 |
|
The tax provision (benefit) applicable to the above net realized gains (losses) amounted to $(393,000), $93,000 and $165,000 for the years ended December 31, 2013, 2012 and 2011, respectively. Proceeds from the sale of available for sale securities totaled $26.1 million, $44.0 million and $36.9 million for the years ended December 31, 2013, 2012 and 2011, respectively.
SI FINANCIAL GROUP, INC.
NOTES TO CONSOLIDATED FINANCIAL STATEMENTS
DECEMBER 31, 2013, 2012 AND 2011
The following tables present information pertaining to securities with gross unrealized losses at December 31, 2013 and 2012, aggregated by investment category and length of time the individual securities have been in a continuous unrealized loss position. |
| | | | | | | | | | | | | | | | | | | | | | | |
| | Less Than 12 Months | | 12 Months or More | | Total |
| December 31, 2013: | Fair Value | | Unrealized Losses | | Fair Value | | Unrealized Losses | | Fair Value | | Unrealized Losses |
| | (In Thousands) |
| U.S. Government and agency obligations | $ | 21,921 |
| | $ | 142 |
| | $ | 883 |
| | $ | 26 |
| | $ | 22,804 |
| | $ | 168 |
|
| Government-sponsored enterprises | 12,376 |
| | 393 |
| | — |
| | — |
| | 12,376 |
| | 393 |
|
| Mortgage-backed securities: | |
| | |
| | |
| | |
| | |
| | |
|
| Agency - residential | 38,119 |
| | 1,772 |
| | 2,686 |
| | 37 |
| | 40,805 |
| | 1,809 |
|
| Non-agency - residential | 169 |
| | 2 |
| | — |
| | — |
| | 169 |
| | 2 |
|
| Collateralized debt obligations | — |
| | — |
| | 1,191 |
| | 19 |
| | 1,191 |
| | 19 |
|
| Obligations of state and political subdivisions | 1,187 |
| | 81 |
| | — |
| | — |
| | 1,187 |
| | 81 |
|
| Tax-exempt securities | 3,575 |
| | 266 |
| | — |
| | — |
| | 3,575 |
| | 266 |
|
| Total | $ | 77,347 |
| | $ | 2,656 |
| | $ | 4,760 |
| | $ | 82 |
| | $ | 82,107 |
| | $ | 2,738 |
|
|
| | | | | | | | | | | | | | | | | | | | | | | |
| | Less Than 12 Months | | 12 Months Or More | | Total |
| December 31, 2012: | Fair Value | | Unrealized Losses | | Fair Value | | Unrealized Losses | | Fair Value | | Unrealized Losses |
| | (In Thousands) |
| U.S. Government and agency obligations | $ | — |
| | $ | — |
| | $ | 1,367 |
| | $ | 23 |
| | $ | 1,367 |
| | $ | 23 |
|
| Mortgage-backed securities: | | | | | | | | |
| |
|
| Agency - residential | 6,923 |
| | 37 |
| | 1,404 |
| | 29 |
| | 8,327 |
| | 66 |
|
| Non-agency - residential | 1,926 |
| | 8 |
| | 1,417 |
| | 116 |
| | 3,343 |
| | 124 |
|
| Non-agency - HELOC | — |
| | — |
| | 2,477 |
| | 78 |
| | 2,477 |
| | 78 |
|
| Corporate debt securities | — |
| | — |
| | 946 |
| | 49 |
| | 946 |
| | 49 |
|
| Collateralized debt obligations | — |
| | — |
| | 4,396 |
| | 1,597 |
| | 4,396 |
| | 1,597 |
|
| Total | $ | 8,849 |
| | $ | 45 |
| | $ | 12,007 |
| | $ | 1,892 |
| | $ | 20,856 |
| | $ | 1,937 |
|
For debt securities with OTTI losses, the Company estimated the portion of loss attributable to credit using a discounted cash flow model in accordance with applicable guidance. Significant inputs for the non-agency mortgage-backed securities included the estimated cash flows of the underlying collateral based on key assumptions, such as default rate, loss severity and prepayment rate. Assumptions used can vary widely from loan to loan, and are influenced by such factors as loan interest rate, geographical location of the borrower, borrower characteristics and collateral type. Significant inputs for the collateralized debt obligations included estimated cash flows and prospective deferrals, defaults and recoveries based on the underlying seniority status and subordination structure of the pooled trust preferred debt tranche at the time of measurement. Prospective deferral, default and recovery estimates affecting projected cash flows were based on an analysis of the underlying financial condition of the individual issuers, with consideration of the account’s capital adequacy, credit quality, lending concentrations and other factors. All cash flow estimates were based on the securities’ tranche structure and contractual rate and maturity terms. The Company utilized the services of an independent third-party valuation firm to obtain information about the structure in order to determine how the underlying collateral cash flows will be distributed to each security issued from the structure. The present value of the expected cash flows
was compared to the Company’s holdings to determine the credit-related impairment loss, if any.
SI FINANCIAL GROUP, INC.
NOTES TO CONSOLIDATED FINANCIAL STATEMENTS
DECEMBER 31, 2013, 2012 AND 2011
To the extent that continued changes in interest rates, credit movements and other factors that influence fair value of investments occur, the Company may be required to record additional impairment charges for OTTI in future periods.
At December 31, 2013, forty-one debt securities with gross unrealized losses had aggregate depreciation of approximately 3.2% of the Company’s amortized cost basis. The majority of the unrealized losses related to the Company’s mortgage-backed securities. For the years ended December 31, 2013, 2012 and 2011, the Company recognized $8,000, $123,000 and $148,000, respectively, of net impairment charges on investments deemed other-than-temporarily impaired. The following summarizes, by security type, the basis for management’s determination during the preparation of the financial statements of whether the applicable investments within the Company’s securities portfolio were other-than-temporarily impaired at December 31, 2013.
U.S. Government and Agency Obligations. The unrealized losses on the Company’s U.S. Government and agency obligations related primarily to a widening of the rate spread to comparable treasury securities. Because the decline in market value is attributable to changes in interest rates and not credit quality, and because the Company does not intend to sell these securities and it is not more likely than not the Company will be required to sell the securities before their anticipated recovery, which may be at maturity, the Company did not consider these securities to be other-than-temporarily impaired at December 31, 2013.
Mortgage-backed Securities - Agency - Residential. The unrealized losses on the Company’s agency–residential mortgage-backed securities were caused by increases in the rate spread to comparable treasury securities. The Company does not expect these securities to settle at a price less than the amortized cost basis of the investments. Because the Company does not intend to sell the investments and it is not more likely than not the Company will be required to sell the investments before the recovery of their amortized cost basis, which may be at maturity, the Company did not consider these investments to be other-than-temporarily impaired at December 31, 2013.
Collateralized Debt Obligations. The unrealized losses on the Company’s collateralized debt obligations relate to one investment in a pooled trust preferred security (“PTPS”). The PTPS market has stabilized at depressed market values as a result of market saturation. Transactions for PTPS have been limited and have occurred primarily as a result of distressed or forced liquidation sales. The securities were widely held by hedge funds and European banks and used to offset interest rate exposure tied to LIBOR. As the positions have unwound, an excess supply of these securities have saturated the market.
Management evaluated current credit ratings, credit support and stress testing for future defaults related to the Company’s PTPS. Management also reviewed analytics provided by the trustee and independent OTTI reviews and associated cash flow analyses performed by an independent third party. The unrealized losses on the Company’s PTPS investment were caused by a lack of liquidity, credit downgrades and decreasing credit support. The increased number of bank and insurance company failures has decreased the level of credit support for this investment. A number of lower tranches have foregone payments or have received payment in kind through increased principal allocations. However, the number of deferring securities has been decreasing and a number of reinstatements have occurred recently. The Company's PTPS was upgraded to investment grade and based on its senior credit profile, management does not believe this investment will suffer from any further credit-related losses. Because the Company does not intend to sell the investment and it is not more likely than not the Company will be required to sell the investment before recovery of its amortized cost basis, which may be at maturity, the Company did not record impairment losses as of December 31, 2013.
SI FINANCIAL GROUP, INC.
NOTES TO CONSOLIDATED FINANCIAL STATEMENTS
DECEMBER 31, 2013, 2012 AND 2011
The following table presents a roll-forward of the balance of credit losses on the Company’s debt securities for which a portion of OTTI was recognized in other comprehensive income (loss) for the years ended December 31, 2013, 2012 and 2011.
|
| | | | | | | | | | | |
| | Years Ended December 31, |
| | 2013 |
| 2012 | | 2011 |
| | (In Thousands) |
| Balance at beginning of year | $ | 259 |
| | $ | 1,207 |
| | $ | 1,093 |
|
| Amounts related to credit losses for which OTTI losses were not previously recognized | 8 |
| | — |
| | 148 |
|
| Additional credit losses for which OTTI losses were previously recognized | — |
| | 123 |
| | — |
|
| Reduction for permanent loss in value of securities during the period | — |
| | (1,071 | ) | | — |
|
| Reduction for securities sold during the period (realized) | (267 | ) | | — |
| | (34 | ) |
| Balance at end of year | $ | — |
| | $ | 259 |
| | $ | 1,207 |
|
NOTE 4. LOANS RECEIVABLE AND ALLOWANCE FOR LOAN LOSSES
Loan Portfolio
The composition of the Company's loan portfolio at December 31, 2013 and 2012 is as follows:
|
| | | | | | | |
| | December 31, |
| | 2013 | | 2012 |
| | (In Thousands) |
| Real estate loans: | | | |
| Residential - 1 to 4 family | $ | 449,812 |
| | $ | 230,664 |
|
| Multi-family and commercial | 285,660 |
| | 201,951 |
|
| Construction | 10,162 |
| | 3,284 |
|
| Total real estate loans | 745,634 |
| | 435,899 |
|
| | | | |
| Commercial business loans: | |
| | |
|
| SBA and USDA guaranteed | 137,578 |
| | 148,385 |
|
| Time share | 28,615 |
| | 23,310 |
|
| Condominium association | 18,442 |
| | 15,493 |
|
| Other | 69,705 |
| | 26,339 |
|
| Total commercial business loans | 254,340 |
| | 213,527 |
|
| | | | |
| Consumer loans: | |
| | |
|
| Home equity | 44,284 |
| | 28,375 |
|
| Indirect automobile | 6,354 |
| | 9,652 |
|
| Other | 2,116 |
| | 2,353 |
|
| Total consumer loans | 52,754 |
| | 40,380 |
|
| | | | |
| Total loans | 1,052,728 |
| | 689,806 |
|
| | | | |
| Deferred loan origination costs, net of fees | 1,598 |
| | 1,744 |
|
| Allowance for loan losses | (6,916 | ) | | (6,387 | ) |
| Loans receivable, net | $ | 1,047,410 |
| | $ | 685,163 |
|
SI FINANCIAL GROUP, INC.
NOTES TO CONSOLIDATED FINANCIAL STATEMENTS
DECEMBER 31, 2013, 2012 AND 2011
The Company has transferred a portion of its originated commercial real estate loans to participating lenders. The amounts transferred have been accounted for as sales and are therefore, not included in the Company's accompanying consolidated balance sheets. The Company and participating lenders share ratably in cash flows and any gains or losses that may result from a borrower's lack of compliance with contractual terms of the loan. The Company continues to service the loans on behalf of the participating lenders and, as such, collects cash payments from the borrowers, remits payments (net of servicing fees) to participating lenders and disburses required escrow funds to relevant parties. At December 31, 2013 and 2012, the Company was servicing loans for participations aggregating $7.7 million and $7.9 million, respectively.
The Company purchased commercial business loans totaling $23.0 million and $42.9 million during 2013 and 2012, respectively. During 2012, the Company purchased consumer loans totaling $6.9 million.
Allowance for Loan Losses
Changes in the allowance for loan losses for the years ended December 31, 2013, 2012 and 2011 are as follows:
|
| | | | | | | | | | | | | | | | | | | | | | | | |
| | | Residential - 1 to 4 Family | | Multi-family and Commercial | | Construction | | Commercial Business | | Consumer | | Total |
| |
| | | (In Thousands) |
| | | | | | | | | | | | | |
| | Balance at December 31, 2010 | $ | 915 |
| | $ | 2,700 |
| | $ | 64 |
| | $ | 790 |
| | $ | 330 |
| | $ | 4,799 |
|
| | Provision for loan losses | 530 |
| | 228 |
| | 15 |
| | 588 |
| | 197 |
| | 1,558 |
|
| | Loans charged-off | (686 | ) | | (606 | ) | | (83 | ) | | (267 | ) | | (84 | ) | | (1,726 | ) |
| | Recoveries of loans previously charged-off | — |
| | 15 |
| | 284 |
| | 37 |
| | 3 |
| | 339 |
|
| | Balance at December 31, 2011 | 759 |
| | 2,337 |
| | 280 |
| | 1,148 |
| | 446 |
| | 4,970 |
|
| | Provision (credit) for loan losses | 561 |
| | 1,818 |
| | (258 | ) | | 556 |
| | 219 |
| | 2,896 |
|
| | Loans charged-off | (299 | ) | | (1,267 | ) | | — |
| | — |
| | (251 | ) | | (1,817 | ) |
| | Recoveries of loans previously charged-off | 104 |
| | 140 |
| | — |
| | 31 |
| | 63 |
| | 338 |
|
| | Balance at December 31, 2012 | 1,125 |
| | 3,028 |
| | 22 |
| | 1,735 |
| | 477 |
| | 6,387 |
|
| | Provision for loan losses | 522 |
| | 523 |
| | 56 |
| | 159 |
| | 59 |
| | 1,319 |
|
| | Loans charged-off | (712 | ) | | (228 | ) | | — |
| | (22 | ) | | (95 | ) | | (1,057 | ) |
| | Recoveries of loans previously charged-off | 40 |
| | 72 |
| | 91 |
| | 3 |
| | 61 |
| | 267 |
|
| | Balance at December 31, 2013 | $ | 975 |
| | $ | 3,395 |
| | $ | 169 |
| | $ | 1,875 |
| | $ | 502 |
| | $ | 6,916 |
|
SI FINANCIAL GROUP, INC.
NOTES TO CONSOLIDATED FINANCIAL STATEMENTS
DECEMBER 31, 2013, 2012 AND 2011
Further information pertaining to the allowance for loan losses at December 31, 2013 and 2012 is as follows:
|
| | | | | | | | | | | | | | | | | | | | | | | |
| December 31, 2013 | Residential - 1 to 4 Family | | Multi-family and Commercial | | Construction | | Commercial Business | | Consumer | | Total |
| | (In Thousands) |
| Allowance for loans individually evaluated and deemed to be impaired | $ | 341 |
| | $ | 185 |
| | $ | — |
| | $ | 4 |
| | $ | — |
| | $ | 530 |
|
| Allowance for loans individually or collectively evaluated and not deemed to be impaired | 634 |
| | 3,210 |
| | 169 |
| | 1,871 |
| | 502 |
| | 6,386 |
|
| Allowance for loans acquired with deteriorated credit quality | — |
| | — |
| | — |
| | — |
| | — |
| | — |
|
| Total loan loss allowance | $ | 975 |
| | $ | 3,395 |
| | $ | 169 |
| | $ | 1,875 |
| | $ | 502 |
| | $ | 6,916 |
|
| | | | | | | | | | | | |
| Loans individually evaluated and deemed to be impaired | $ | 5,695 |
| | $ | 3,036 |
| | $ | — |
| | $ | 385 |
| | $ | — |
| | $ | 9,116 |
|
| Loans individually or collectively evaluated and not deemed to be impaired | 443,734 |
| | 277,483 |
| | 10,162 |
| | 252,930 |
| | 52,754 |
| | 1,037,063 |
|
| Amount of loans acquired with deteriorated credit quality | 383 |
| | 5,141 |
| | — |
| | 1,025 |
| | — |
| | 6,549 |
|
| Total loans | $ | 449,812 |
| | $ | 285,660 |
| | $ | 10,162 |
| | $ | 254,340 |
| | $ | 52,754 |
| | $ | 1,052,728 |
|
|
| | | | | | | | | | | | | | | | | | | | | | | |
| December 31, 2012 | Residential - 1 to 4 Family | | Multi-family and Commercial | | Construction | | Commercial Business | | Consumer | | Total |
| | (In Thousands) |
| Allowance for loans individually evaluated and deemed to be impaired | $ | 454 |
| | $ | 88 |
| | $ | — |
| | $ | 39 |
| | $ | — |
| | $ | 581 |
|
| Allowance for loans individually or collectively evaluated and not deemed to be impaired | 671 |
| | 2,940 |
| | 22 |
| | 1,696 |
| | 477 |
| | 5,806 |
|
| Total loan loss allowance | $ | 1,125 |
| | $ | 3,028 |
| | $ | 22 |
| | $ | 1,735 |
| | $ | 477 |
| | $ | 6,387 |
|
| | | | | | | | | | | | |
| Loans individually evaluated and deemed to be impaired | $ | 6,991 |
| | $ | 5,873 |
| | $ | — |
| | $ | 618 |
| | $ | 361 |
| | $ | 13,843 |
|
| Loans individually or collectively evaluated and not deemed to be impaired | 223,673 |
| | 196,078 |
| | 3,284 |
| | 212,909 |
| | 40,019 |
| | 675,963 |
|
| Total loans | $ | 230,664 |
| | $ | 201,951 |
| | $ | 3,284 |
| | $ | 213,527 |
| | $ | 40,380 |
| | $ | 689,806 |
|
SI FINANCIAL GROUP, INC.
NOTES TO CONSOLIDATED FINANCIAL STATEMENTS
DECEMBER 31, 2013, 2012 AND 2011
Past Due Loans
The following represents an aging of loans at December 31, 2013 and 2012:
|
| | | | | | | | | | | | | | | | | | | | | | | |
| December 31, 2013 | 30-59 Days Past Due | | 60-89 Days Past Due | | 90 Days or More Past Due | | Total 30 Days or More Past Due | | Current | | Total Loans |
| | (In Thousands) |
| Real Estate: | | | | | | | | | | | |
| Residential - 1 to 4 family | $ | 5,402 |
| | $ | 783 |
| | $ | 1,473 |
| | $ | 7,658 |
| | $ | 442,154 |
| | $ | 449,812 |
|
| Multi-family and commercial | 1,057 |
| | — |
| | 1,388 |
| | 2,445 |
| | 283,215 |
| | 285,660 |
|
| Construction | — |
| | — |
| | — |
| | — |
| | 10,162 |
| | 10,162 |
|
| Commercial Business: | |
| | |
| | |
| | |
| | |
| |
|
|
| SBA and USDA guaranteed | 7,266 |
| | 1,161 |
| | 66 |
| | 8,493 |
| | 129,085 |
| | 137,578 |
|
| Time share | — |
| | — |
| | — |
| | — |
| | 28,615 |
| | 28,615 |
|
| Condominium association | — |
| | — |
| | — |
| | — |
| | 18,442 |
| | 18,442 |
|
| Other | — |
| | 171 |
| | 338 |
| | 509 |
| | 69,196 |
| | 69,705 |
|
| Consumer: | |
| | |
| | |
| | |
| | |
| |
|
|
| Home equity | 258 |
| | 36 |
| | 49 |
| | 343 |
| | 43,941 |
| | 44,284 |
|
| Indirect automobile | 80 |
| | 47 |
| | 16 |
| | 143 |
| | 6,211 |
| | 6,354 |
|
| Other | 1 |
| | 1 |
| | — |
| | 2 |
| | 2,114 |
| | 2,116 |
|
| Total | $ | 14,064 |
| | $ | 2,199 |
| | $ | 3,330 |
| | $ | 19,593 |
| | $ | 1,033,135 |
| | $ | 1,052,728 |
|
|
| | | | | | | | | | | | | | | | | | | | | | | |
| December 31, 2012 | 30-59 Days Past Due | | 60-89 Days Past Due | | 90 Days or More Past Due | | Total 30 Days or More Past Due | | Current | | Total Loans |
| | (In Thousands) |
| Real Estate: | | | | | | | | | | | |
| Residential - 1 to 4 family | $ | 3,245 |
| | $ | 1,725 |
| | $ | 3,285 |
| | $ | 8,255 |
| | $ | 222,409 |
| | $ | 230,664 |
|
| Multi-family and commercial | 4,149 |
| | — |
| | 1,266 |
| | 5,415 |
| | 196,536 |
| | 201,951 |
|
| Construction | — |
| | — |
| | — |
| | — |
| | 3,284 |
| | 3,284 |
|
| Commercial Business: | |
| | |
| | |
| |
|
| | |
| |
|
|
| SBA and USDA guaranteed | 5,014 |
| | 1,087 |
| | — |
| | 6,101 |
| | 142,284 |
| | 148,385 |
|
| Time share | — |
| | — |
| | — |
| | — |
| | 23,310 |
| | 23,310 |
|
| Condominium association | — |
| | — |
| | — |
| | — |
| | 15,493 |
| | 15,493 |
|
| Other | — |
| | — |
| | 541 |
| | 541 |
| | 25,798 |
| | 26,339 |
|
| Consumer: | |
| | |
| | |
| |
|
| | |
| |
|
|
| Home equity | 216 |
| | — |
| | 361 |
| | 577 |
| | 27,798 |
| | 28,375 |
|
| Indirect automobile | 19 |
| | — |
| | — |
| | 19 |
| | 9,633 |
| | 9,652 |
|
| Other | 21 |
| | — |
| | — |
| | 21 |
| | 2,332 |
| | 2,353 |
|
| Total | $ | 12,664 |
| | $ | 2,812 |
| | $ | 5,453 |
| | $ | 20,929 |
| | $ | 668,877 |
| | $ | 689,806 |
|
The Company did not have any loans that were past due 90 days or more and still accruing at December 31, 2013 or 2012.
SI FINANCIAL GROUP, INC.
NOTES TO CONSOLIDATED FINANCIAL STATEMENTS
DECEMBER 31, 2013, 2012 AND 2011
Impaired and Nonaccrual Loans
The following is a summary of impaired and nonaccrual loans at December 31, 2013 and 2012:
|
| | | | | | | | | | | | | | | | |
| | | Impaired Loans (1) | | |
| December 31, 2013 | Recorded Investment | | Unpaid Principal Balance | | Related Allowance | | Nonaccrual Loans |
| | | (In Thousands) |
Impaired loans without valuation allowance: (2) | | | | | | | |
| Real Estate: | | | | | | | |
| Residential - 1 to 4 family | $ | 3,641 |
| | $ | 3,822 |
| | $ | — |
| | $ | 3,241 |
|
| Multi-family and commercial | 6,853 |
| | 7,050 |
| | — |
| | 1,655 |
|
| Commercial business - Other | 1,402 |
| | 1,402 |
| | — |
| | 377 |
|
| Consumer - Home equity | — |
| | — |
| | — |
| | 53 |
|
| Consumer - Indirect automobile | — |
| | — |
| | — |
| | 16 |
|
| Total impaired loans without valuation allowance | 11,896 |
| | 12,274 |
| | — |
| | 5,342 |
|
| | | | | | | | | |
| Impaired loans with valuation allowance: | |
| | |
| | |
| | |
|
| Real Estate: | |
| | |
| | |
| | |
|
| Residential - 1 to 4 family | 2,437 |
| | 2,448 |
| | 341 |
| | 319 |
|
| Multi-family and commercial | 1,324 |
| | 1,414 |
| | 185 |
| | 1,324 |
|
| Commercial business - Other | 8 |
| | 8 |
| | 4 |
| | 8 |
|
| Total impaired loans with valuation allowance | 3,769 |
| | 3,870 |
| | 530 |
| | 1,651 |
|
| Total impaired loans | $ | 15,665 |
| | $ | 16,144 |
| | $ | 530 |
| | $ | 6,993 |
|
| | | | | | | | | |
(1) Includes loans acquired with deteriorated credit quality and performing troubled debt restructurings.
(2) Includes loans acquired with deteriorated credit quality from the Newport merger.
|
| | | | | | | | | | | | | | | |
| | Impaired Loans | | |
| December 31, 2012 | Recorded Investment | | Unpaid Principal Balance | | Related Allowance | | Nonaccrual Loans |
| | (In Thousands) |
| Impaired loans without valuation allowance: | | | | | | | |
| Real Estate: | | | | | | | |
| Residential - 1 to 4 family | $ | 3,866 |
| | $ | 4,013 |
| | $ | — |
| | $ | 3,855 |
|
| Multi-family and commercial | 4,407 |
| | 4,407 |
| | — |
| | 1,522 |
|
| Commercial business - Other | 546 |
| | 546 |
| | — |
| | 470 |
|
| Consumer - Home equity | 361 |
| | 435 |
| | — |
| | 366 |
|
| Total impaired loans without valuation allowance | 9,180 |
| | 9,401 |
| | — |
| | 6,213 |
|
| | | | | | | | |
| Impaired loans with valuation allowance: | |
| | |
| | |
| | |
|
| Real Estate: | |
| | |
| | |
| | |
|
| Residential - 1 to 4 family | 3,125 |
| | 3,125 |
| | 454 |
| | 1,133 |
|
| Multi-family and commercial | 1,466 |
| | 1,556 |
| | 88 |
| | 236 |
|
| Commercial business - Other | 72 |
| | 72 |
| | 39 |
| | 72 |
|
| Total impaired loans with valuation allowance | 4,663 |
| | 4,753 |
| | 581 |
| | 1,441 |
|
| Total impaired loans | $ | 13,843 |
| | $ | 14,154 |
| | $ | 581 |
| | $ | 7,654 |
|
The Company reviews and establishes, if necessary, an allowance for certain impaired loans for the amount by which the present value of expected cash flows (or observable market price of loan or fair value of the collateral if
SI FINANCIAL GROUP, INC.
NOTES TO CONSOLIDATED FINANCIAL STATEMENTS
DECEMBER 31, 2013, 2012 AND 2011
the loan is collateral dependent) are lower than the carrying value of the loan. For the periods presented, the Company concluded that certain impaired loans required no valuation allowance as a result of management’s measurement of impairment. No additional funds are committed to be advanced to those borrowers whose loans are deemed impaired.
Additional information related to impaired loans is as follows:
|
| | | | | | | | | | | |
| | Average Recorded Investment | | Interest Income Recognized | | Interest Income Recognized on Cash Basis |
| | (In Thousands) |
| Year Ended December 31, 2013 | | | | | |
| Residential - 1 to 4 family | $ | 6,940 |
| | $ | 257 |
| | $ | 180 |
|
| Multi-family and commercial | 5,653 |
| | 164 |
| | — |
|
| Commercial business - Other | 924 |
| | 23 |
| | 5 |
|
| Consumer - Home equity | 224 |
| | 36 |
| | 36 |
|
| Total | $ | 13,741 |
| | $ | 480 |
| | $ | 221 |
|
| | | | | | |
| Year Ended December 31, 2012 | | | | | |
| Residential - 1 to 4 family | $ | 6,113 |
| | $ | 151 |
| | $ | 126 |
|
| Multi-family and commercial | 8,048 |
| | 260 |
| | 32 |
|
| Commercial business - Other | 602 |
| | 4 |
| | 2 |
|
| Consumer - Home equity | 413 |
| | 4 |
| | 4 |
|
| Total | $ | 15,176 |
| | $ | 419 |
| | $ | 164 |
|
| | | | | | |
| Year Ended December 31, 2011 | | | | | |
| Residential - 1 to 4 family | $ | 5,739 |
| | $ | 64 |
| | $ | 29 |
|
| Multi-family and commercial | 8,035 |
| | 312 |
| | — |
|
| Commercial business - Other | 421 |
| | — |
| | — |
|
| Consumer - Home equity | 196 |
| | — |
| | — |
|
| Total | $ | 14,391 |
| | $ | 376 |
| | $ | 29 |
|
Credit Quality Information
The Company utilizes an eight-grade internal loan rating system for all loans in the portfolio, with the exception of its purchased SBA and USDA commercial business loans that are fully guaranteed by the U.S. government, as follows:
| |
| ◦ | Pass (Ratings 1-4): Loans in these categories are considered low to average risk. |
| |
| ◦ | Special Mention (Rating 5): Loans in this category are starting to show signs of potential weakness and are being closely monitored by management. |
| |
| ◦ | Substandard (Rating 6): Generally, a loan is considered substandard if it is inadequately protected by the current net worth and paying capacity of the obligors and/or the collateral pledged. There is a distinct possibility that the Company will sustain some loss if the weakness is not corrected. |
| |
| ◦ | Doubtful (Rating 7): Loans classified as doubtful have all the weaknesses inherent in those classified substandard with the added characteristic that the weaknesses make collection or liquidation in full, on |
SI FINANCIAL GROUP, INC.
NOTES TO CONSOLIDATED FINANCIAL STATEMENTS
DECEMBER 31, 2013, 2012 AND 2011
the basis of currently existing facts, highly questionable and improbable.
| |
| ◦ | Loss (Rating 8): Loans in this category are considered uncollectible and of such little value that their continuance as loans is not warranted. |
Management periodically reviews the ratings described above and the Company’s internal audit function reviews components of the credit files, including the assigned risk ratings, of certain commercial loans as part of its loan review.
The following tables present the Company’s loans by risk rating at December 31, 2013 and 2012.
|
| | | | | | | | | | | | | | | | | | | | | | | | | | | |
| December 31, 2013 | Not Rated | | Pass | | Special Mention | | Substandard | | Doubtful | | Loss | | Total |
| | (In Thousands) |
| Real estate loans: | | | | | | | | | | | | | |
| Residential - 1 to 4 family | $ | — |
| | $ | 441,646 |
| | $ | 1,296 |
| | $ | 6,870 |
| | $ | — |
| | $ | — |
| | $ | 449,812 |
|
| Multi-family and commercial | — |
| | 250,667 |
| | 18,363 |
| | 16,630 |
| | — |
| | — |
| | 285,660 |
|
| Construction | — |
| | 10,162 |
| | — |
| | — |
| | — |
| | — |
| | 10,162 |
|
| Total real estate loans | — |
| | 702,475 |
| | 19,659 |
| | 23,500 |
| | — |
| | — |
| | 745,634 |
|
| | | | | | | | | | | | | | |
| Commercial business loans: | | | | | | | | | | | | | |
| SBA and USDA guaranteed | 137,578 |
| | — |
| | — |
| | — |
| | — |
| | — |
| | 137,578 |
|
| Time share | — |
| | 28,615 |
| | — |
| | — |
| | — |
| | — |
| | 28,615 |
|
| Condominium association | — |
| | 18,442 |
| | — |
| | — |
| | — |
| | — |
| | 18,442 |
|
| Other | — |
| | 63,959 |
| | 2,230 |
| | 3,516 |
| | — |
| | — |
| | 69,705 |
|
| Total commercial business loans | 137,578 |
| | 111,016 |
| | 2,230 |
| | 3,516 |
| | — |
| | — |
| | 254,340 |
|
| | | | | | | | | | | | | | |
| Consumer loans: | | | | | | | | | | | | | |
| Home equity | — |
| | 44,117 |
| | 66 |
| | 101 |
| | — |
| | — |
| | 44,284 |
|
| Indirect automobile | — |
| | 6,338 |
| | — |
| | 16 |
| | — |
| | — |
| | 6,354 |
|
| Other | — |
| | 2,116 |
| | — |
| | — |
| | — |
| | — |
| | 2,116 |
|
| Total consumer loans | — |
| | 52,571 |
| | 66 |
| | 117 |
| | — |
| | — |
| | 52,754 |
|
| | | | | | | | | | | | | | |
| Total loans | $ | 137,578 |
| | $ | 866,062 |
| | $ | 21,955 |
| | $ | 27,133 |
| | $ | — |
| | $ | — |
| | $ | 1,052,728 |
|
SI FINANCIAL GROUP, INC.
NOTES TO CONSOLIDATED FINANCIAL STATEMENTS
DECEMBER 31, 2013, 2012 AND 2011
|
| | | | | | | | | | | | | | | | | | | | | | | | | | | |
| December 31, 2012 | Not Rated | | Pass | | Special Mention | | Substandard | | Doubtful | | Loss | | Total |
| | (In Thousands) |
| Real estate loans: | | | | | | | | | | | | | |
| Residential - 1 to 4 family | $ | — |
| | $ | 222,262 |
| | $ | 723 |
| | $ | 7,679 |
| | $ | — |
| | $ | — |
| | $ | 230,664 |
|
| Multi-family and commercial | — |
| | 185,141 |
| | 5,321 |
| | 11,489 |
| | — |
| | — |
| | 201,951 |
|
| Construction | — |
| | 3,284 |
| | — |
| | — |
| | — |
| | — |
| | 3,284 |
|
| Total real estate loans | — |
| | 410,687 |
| | 6,044 |
| | 19,168 |
| | — |
| | — |
| | 435,899 |
|
| | | | | | | | | | | | | | |
| Commercial business loans: | | | | | | | | | | | | | |
| SBA and USDA guaranteed | 148,385 |
| | — |
| | — |
| | — |
| | — |
| | — |
| | 148,385 |
|
| Time share | — |
| | 23,310 |
| | — |
| | — |
| | — |
| | — |
| | 23,310 |
|
| Condominium association | — |
| | 15,493 |
| | — |
| | — |
| | — |
| | — |
| | 15,493 |
|
| Other | — |
| | 22,244 |
| | 3,399 |
| | 696 |
| | — |
| | — |
| | 26,339 |
|
| Total commercial business loans | 148,385 |
| | 61,047 |
| | 3,399 |
| | 696 |
| | — |
| | — |
| | 213,527 |
|
| | | | | | | | | | | | | | |
| Consumer loans: | | | | | | | | | | | | | |
| Home equity | — |
| | 27,960 |
| | — |
| | 415 |
| | — |
| | — |
| | 28,375 |
|
| Indirect automobile | — |
| | 9,652 |
| | — |
| | — |
| | — |
| | — |
| | 9,652 |
|
| Other | — |
| | 2,353 |
| | — |
| | — |
| | — |
| | — |
| | 2,353 |
|
| Total consumer loans | — |
| | 39,965 |
| | — |
| | 415 |
| | — |
| | — |
| | 40,380 |
|
| | | | | | | | | | | | | | |
| Total loans | $ | 148,385 |
| | $ | 511,699 |
| | $ | 9,443 |
| | $ | 20,279 |
| | $ | — |
| | $ | — |
| | $ | 689,806 |
|
Troubled Debt Restructurings
A modified loan is considered a TDR when two conditions are met: 1) the borrower is experiencing documented financial difficulty and 2) concessions are made by the Company that would not otherwise be considered for a borrower with similar risk characteristics. The most common types of modifications include below market interest rate reductions, deferrals of principal and maturity extensions. Modified terms are dependent upon the financial position and needs of the individual borrower. If the modification agreement is violated, the loan is handled by the Company's Collections Department for resolution, which may result in foreclosure. The Company's determination of whether a loan modification is a TDR considers the individual facts and circumstances surrounding each modification.
The Company's nonaccrual policy is followed for TDRs. If the loan was current prior to modification, nonaccrual status would not be required. If the loan was on nonaccrual prior to modification or if the payment amount significantly increases, the loan will remain on nonaccrual for a period of at least six months. Loans qualify for return to accrual status once the borrower has demonstrated the willingness and the ability to perform in accordance with the restructured terms of the loan agreement for a period of not less than six consecutive months.
All TDRs are initially reported as impaired. Impaired classification may be removed after the year of restructure if the borrower demonstrates compliance with the modified terms and the restructuring agreement specifies an interest rate equal to that which would be provided to a borrower with similar risk characteristics at the time of restructuring.
SI FINANCIAL GROUP, INC.
NOTES TO CONSOLIDATED FINANCIAL STATEMENTS
DECEMBER 31, 2013, 2012 AND 2011
The following table provides information on loans modified as a TDR during the years ended December 31, 2013 and 2012.
|
| | | | | | | | | | | | | | | | | | | | |
| | Years Ended December 31, |
| | 2013 | | 2012 |
| | | | | | Allowance for | | | | | | Allowance for |
| | Number | | Recorded | | Loan Losses | | Number | | Recorded | | Loan Losses |
| | of Loans | | Investment | | (End of Period) | | of Loans | | Investment | | (End of Period) |
| | (Dollars in Thousands) |
| Residential - 1 to 4 family | 1 | | $ | 152 |
| | $ | 17 |
| | 16 |
| | $ | 2,507 |
| | $ | 296 |
|
| Multi-family and commercial | — | | — |
| | — |
| | 1 |
| | 77 |
| | — |
|
| Total | 1 | | $ | 152 |
| | $ | 17 |
| | 17 |
| | $ | 2,584 |
| | $ | 296 |
|
During the modification process, there were no loan charge-offs or principal reductions for loans included in the table above for all periods presented.
The following table provides the recorded investment, by type of modification, for modified loans identified as TDRs during the years ended December 31, 2013 and 2012.
|
| | | | | | | | |
| | | Years Ended December 31, |
| | | 2013 | | 2012 |
| | | (In Thousands) |
| Interest rate adjustments | $ | — |
| | $ | 917 |
|
Combination of rate and payment (1) | — |
| | 869 |
|
Combination of rate and maturity (2) | 152 |
| | 721 |
|
| Maturity only | — |
| | 77 |
|
| Total | $ | 152 |
| | $ | 2,584 |
|
| | | | | |
(1) Terms include combination of interest rate adjustments and interest-only payments with deferral of principal.
(2) Terms include combination of interest rate adjustments and extensions of maturity.
For the years ended December 31, 2013 and 2012, there were no TDRs that were in payment default (defined as 90 days or more past due).
Loans Acquired with Deteriorated Credit Quality
The following is a summary of loans acquired with evidence of credit deterioration from Newport as of
December 31, 2013.
|
| | | | | | | | | | | | | | | | | | | |
| | Contractual Required Payments Receivable | | Cash Expected To Be Collected | | Non-Accretable Discount | | Accretable Yield | | Loans Receivable |
| | (In Thousands) |
| Balance at acquisition date of September 6, 2013 | $ | 8,112 |
| | $ | 6,885 |
| | $ | 1,227 |
| | $ | — |
| | $ | 6,885 |
|
| 2013 Collections | (336 | ) | | (336 | ) | | — |
| | — |
| | (336 | ) |
| Balance at December 31, 2013 | $ | 7,776 |
| | $ | 6,549 |
| | $ | 1,227 |
| | $ | — |
| | $ | 6,549 |
|
SI FINANCIAL GROUP, INC.
NOTES TO CONSOLIDATED FINANCIAL STATEMENTS
DECEMBER 31, 2013, 2012 AND 2011
Related Party Loans
Related party transactions, including loans with related parties, are discussed in further detail in Note 13.
Loans Held for Sale
Total loans held for sale amounted to $1.8 million and $5.1 million, consisting of fixed-rate residential mortgage loans, at December 31, 2013 and 2012, respectively.
Residential Mortgage Loans Serviced for Others
The Company services certain loans that it has sold with and without recourse to third parties and other loans for which the Company acquired the servicing rights. Loans serviced for others are not included in the Company’s consolidated balance sheets. The risks inherent in mortgage servicing assets relate primarily to changes in prepayments that result from shifts in mortgage interest rates. The fair value of servicing rights was determined using a discount rate of 10.59%, prepayment speeds ranging from 110% to 373% and minimal anticipated credit losses. At December 31, 2013, 2012 and 2011, the aggregate of residential mortgage loans serviced for others amounted to $218.0 million, $195.5 million and $178.5 million, respectively.
The following summarizes activity in capitalized mortgage servicing rights:
|
| | | | | | | | | | | |
| | Years Ended December 31, |
| | 2013 | | 2012 | | 2011 |
| | (In Thousands) |
| Balance at beginning of year | $ | 1,313 |
| | $ | 1,177 |
| | $ | 977 |
|
| Additions | 384 |
| | 427 |
| | 460 |
|
| Amortization | (343 | ) | | (291 | ) | | (260 | ) |
| Balance at end of year | $ | 1,354 |
| | $ | 1,313 |
| | $ | 1,177 |
|
| Fair value of mortgage servicing assets | $ | 1,918 |
| | $ | 1,349 |
| | $ | 1,462 |
|
Contractually specified servicing fees included in mortgage banking income were $587,000, $531,000 and $463,000 for the years ended December 31, 2013, 2012 and 2011, respectively.
NOTE 5. OTHER REAL ESTATE OWNED
At December 31, 2013, other real estate owned consisted of eight residential and four commercial real estate properties. At December 31, 2012, other real estate owned consisted of three residential and three commercial real estate properties which were held for sale. A summary of expenses applicable to other real estate operations for the years ended December 31, 2013, 2012 and 2011, is as follows:
|
| | | | | | | | | | | |
| | Years Ended December 31, |
| | 2013 | | 2012 | | 2011 |
| | (In Thousands) |
| Net loss from sales or write-downs of other real estate owned | $ | 43 |
| | $ | 60 |
| | $ | 236 |
|
| Other real estate expense, net of rental income | 521 |
| | 441 |
| | 540 |
|
| Expense from other real estate operations, net | $ | 564 |
| | $ | 501 |
| | $ | 776 |
|
SI FINANCIAL GROUP, INC.
NOTES TO CONSOLIDATED FINANCIAL STATEMENTS
DECEMBER 31, 2013, 2012 AND 2011
NOTE 6. PREMISES AND EQUIPMENT
Premises and equipment at December 31, 2013 and 2012 are summarized as follows:
|
| | | | | | | |
| | December 31, |
| | 2013 | | 2012 |
| | (In Thousands) |
| Land | $ | 4,311 |
| | $ | 2,098 |
|
| Buildings | 11,497 |
| | 7,052 |
|
| Leasehold improvements | 10,762 |
| | 7,563 |
|
| Furniture and equipment | 12,549 |
| | 10,867 |
|
| Construction in process | 45 |
| | 84 |
|
| | 39,164 |
| | 27,664 |
|
| Accumulated depreciation and amortization | (18,074 | ) | | (16,448 | ) |
| Premises and equipment, net | $ | 21,090 |
| | $ | 11,216 |
|
At December 31, 2013 and 2012, construction in process related to design and site costs associated with a new branch location. At December 31, 2012, the Company had an outstanding commitment for the purchase of land totaling $450,000, which was purchased during the quarter ended March 31, 2013.
Depreciation and amortization expense was $2.0 million, $1.9 million and $1.9 million for the years ended December 31, 2013, 2012 and 2011, respectively. See Note 12 for a schedule of future minimum rental commitments pursuant to the terms of noncancelable lease agreements.
NOTE 7. GOODWILL AND OTHER INTANGIBLES
Goodwill
Goodwill for the years ended December 31, 2013, 2012 and 2011 is summarized as follows:
|
| | | | | | | | | | | |
| | Years Ended December 31, |
| | 2013 | | 2012 | | 2011 |
| | (In Thousands) |
| Balance at beginning of year | $ | 3,451 |
| | $ | 4,094 |
| | $ | 4,094 |
|
| Acquisition of Newport | 7,762 |
| | — |
| | — |
|
| Disposal of SI Trust Servicing | — |
| | (643 | ) | | — |
|
| Balance at end of year | $ | 11,213 |
| | $ | 3,451 |
| | $ | 4,094 |
|
At December 31, 2013, the Company’s goodwill related to the acquisition of Newport in 2013 and two branch locations acquired in 2008. During 2012, the Company sold its SI Trust Servicing operations and, in connection with the sale, disposed of the associated goodwill. Annually, or more frequently if events or changes in circumstances warrant such evaluation, the Company evaluates its goodwill for impairment. No goodwill impairment was recorded for the years ended December 31, 2013, 2012 and 2011.
Core Deposit Intangibles
In connection with the assumption of $288.4 million of deposit liabilities from the Newport acquisition in September 2013, of which $216.2 million were core deposits, the Bank recorded a core deposit intangible of $8.6 million. The resulting core deposit intangible is amortized over thirteen years using the straight-line method. In connection with the assumption of $18.4 million of deposit liabilities from the Colchester, Connecticut branch office acquisition in January 2008, the Bank recorded a core deposit intangible of $159,000. The resulting core
SI FINANCIAL GROUP, INC.
NOTES TO CONSOLIDATED FINANCIAL STATEMENTS
DECEMBER 31, 2013, 2012 AND 2011
deposit intangible was amortized over five years using the sum-of-the-years-digits method and was fully amortized as of December 31, 2012. Core deposit intangibles are summarized as follows:
|
| | | | | | | |
| | Years Ended December 31, |
| | 2013 | | 2012 |
| | (In Thousands) |
| Core deposit intangible | $ | 8,573 |
| | $ | 159 |
|
| Accumulated amortization | (220 | ) | | (159 | ) |
| Core deposit intangible, net | $ | 8,353 |
| | $ | — |
|
Amortization expense was $220,000, $11,000 and $21,000 for the years ended December 31, 2013, 2012 and 2011, respectively. At December 31, 2013, future amortization of the core deposit intangible totals $659,000 for each of the next five years and $5.1 million thereafter.
NOTE 8. DEPOSITS
A summary of deposit balances, by type, at December 31, 2013 and 2012 is as follows:
|
| | | | | | | | |
| | | December 31, |
| | | 2013 | | 2012 |
| | | (In Thousands) |
| Noninterest-bearing demand deposits | $ | 139,428 |
| | $ | 89,834 |
|
| | | | | |
| Interest-bearing accounts: | |
| | |
|
| Business checking | — |
| | 2 |
|
| NOW and money market accounts | 449,675 |
| | 300,050 |
|
| Savings accounts | 45,090 |
| | 38,026 |
|
Certificates of deposit (1) | 350,556 |
| | 277,236 |
|
| Total interest-bearing accounts | 845,321 |
| | 615,314 |
|
| Total deposits | $ | 984,749 |
| | $ | 705,148 |
|
| | | | | |
( 1) Includes brokered deposits of $20.7 million and $4.2 million at December 31, 2013 and 2012, respectively.
Certificates of deposit in denominations of $100,000 or more were $150.4 million and $112.4 million at December 31, 2013 and 2012, respectively. Effective July 21, 2010, with the enactment of the Dodd-Frank Wall Street Reform and Consumer Protection Act, the FDIC permanently raised deposit insurance levels to $250,000 per depositor. Prior to the increase, deposits in excess of $100,000, with the exception of self-directed retirement accounts which are insured up to $250,000, were not federally insured.
Contractual maturities of certificates of deposit as of December 31, 2013 are summarized below (in thousands).
|
| | | |
| 2014 | $ | 135,371 |
|
| 2015 | 96,386 |
|
| 2016 | 61,252 |
|
| 2017 | 31,951 |
|
| 2018 | 22,219 |
|
| Thereafter | 3,377 |
|
| Total certificates of deposit | $ | 350,556 |
|
SI FINANCIAL GROUP, INC.
NOTES TO CONSOLIDATED FINANCIAL STATEMENTS
DECEMBER 31, 2013, 2012 AND 2011
A summary of interest expense, by account type, for the years ended December 31, 2013, 2012 and 2011 is as follows:
|
| | | | | | | | | | | | |
| | Years Ended December 31, |
| | 2013 | | 2012 | | 2011 |
| | (In Thousands) |
| NOW and money market accounts | $ | 504 |
| | $ | 627 |
| | $ | 1,294 |
|
Savings accounts (1) | 75 |
| | 106 |
| | 197 |
|
Certificates of deposit (2) | 4,633 |
| | 5,286 |
| | 5,771 |
|
| Total | $ | 5,212 |
| | $ | 6,019 |
| | $ | 7,262 |
|
| | | | | | | |
(1) Includes interest expense on mortgagors' and investors' escrow accounts.
(2) Includes interest expense on brokered deposits.
Related Party Deposits
Reference Note 13 for a discussion of related party transactions, including deposits from related parties.
NOTE 9. BORROWINGS
Federal Home Loan Bank Advances
As a member of the FHLB, the Bank has access to a pre-approved secured line of credit with the FHLB of $10.0 million and the capacity to obtain additional advances up to a certain percentage of the value of its qualified collateral, as defined in the FHLB Statement of Credit Policy. FHLB advances are secured by qualified collateral, which is based on a percentage of its outstanding residential first mortgage loans. In accordance with an agreement with the FHLB, the qualified collateral must be free and clear of liens, pledges and encumbrances. At December 31, 2013 and 2012, there were no advances outstanding under the line of credit. Other outstanding advances from the FHLB aggregated $176.3 million and $97.7 million at December 31, 2013 and 2012, respectively, at interest rates ranging from 0.20% to 3.99% and 0.80% to 4.97%, respectively.
Junior Subordinated Debt Owed to Unconsolidated Trust
SI Capital Trust II (the “Trust”), a wholly-owned subsidiary of the Company, was formed on August 31, 2006. The Trust had no independent assets or operations, and was formed to issue $8.0 million of trust securities and invest the proceeds thereof in an equivalent amount of junior subordinated debentures issued by the Company. The trust preferred securities mature in 2036 and bear interest at three-month LIBOR plus 1.70%. The Company may redeem the trust preferred securities, in whole or in part.
The Company entered into an interest rate swap agreement on July 1, 2010 to effectively convert the floating rate interest on its junior subordinated debentures to a fixed interest rate. See Note 17 for a discussion of derivative instruments and hedging activities.
The subordinated debt securities are unsecured obligations of the Company and are subordinate and junior in right of payment to all present and future senior indebtedness of the Company. The Company has entered into a guarantee, which together with its obligations under the subordinated debt securities and the declaration of trust governing the Trust, including its obligations to pay costs, expenses, debts and liabilities, other than trust securities, provides a full and unconditional guarantee of amounts on the capital securities. If the Company defers interest payments on the junior subordinated debt securities, or otherwise is in default of the obligations, the Company would be prohibited from making dividend payments to its shareholders.
SI FINANCIAL GROUP, INC.
NOTES TO CONSOLIDATED FINANCIAL STATEMENTS
DECEMBER 31, 2013, 2012 AND 2011
The contractual maturities of borrowings, by year, at December 31, 2013 are as follows:
|
| | | | | | | | | | | | |
| | | FHLB Advances | | Subordinated Debt | | Total |
| | | (Dollars in Thousands) |
| 2014 | | $ | 38,736 |
| | $ | — |
| | $ | 38,736 |
|
| 2015 | | 53,940 |
| | — |
| | 53,940 |
|
| 2016 | | 42,306 |
| | — |
| | 42,306 |
|
2017 (1) | | 29,290 |
| | — |
| | 29,290 |
|
| 2018 | | 10,000 |
| | — |
| | 10,000 |
|
| Thereafter | 2,000 |
| | 8,248 |
| | 10,248 |
|
| Total | | $ | 176,272 |
| | $ | 8,248 |
| | $ | 184,520 |
|
| Weighted average rate | 1.57 | % | | 4.14 | % | | 1.69 | % |
| | | | | | | |
(1) Includes FHLB advance of $21.5 million that is callable during 2014.
NOTE 10. INCOME TAXES
The components of the income tax provision (benefit) for the years ended December 31, 2013, 2012 and 2011 are as follows:
|
| | | | | | | | | | | |
| | Years Ended December 31, |
| | 2013 | | 2012 | | 2011 |
| | (In Thousands) |
| Current income tax provision: | | | | | |
| Federal | $ | 971 |
| | $ | 1,338 |
| | $ | 108 |
|
| State | 4 |
| | 3 |
| | 4 |
|
| Total current income tax provision | 975 |
| | 1,341 |
| | 112 |
|
| | | | | | |
| Deferred income tax (benefit) provision: | |
| | |
| | |
|
| Federal | (1,073 | ) | | (1,100 | ) | | 891 |
|
| Total deferred income tax (benefit) provision | (1,073 | ) | | (1,100 | ) | | 891 |
|
| Total income tax (benefit) provision | $ | (98 | ) | | $ | 241 |
| | $ | 1,003 |
|
SI FINANCIAL GROUP, INC.
NOTES TO CONSOLIDATED FINANCIAL STATEMENTS
DECEMBER 31, 2013, 2012 AND 2011
A reconciliation of the anticipated income tax provision (benefit), based on the statutory tax rate of 34.0%, to the income tax provision (benefit) as reported in the consolidated statements of operations is as follows:
|
| | | | | | | | | | | |
| | Years Ended December 31, |
| | 2013 | | 2012 | | 2011 |
| | (Dollars in Thousands) |
| Income tax (benefit) provision at statutory tax rate | $ | (324 | ) | | $ | 462 |
| | $ | 1,162 |
|
| Increase (decrease) resulting from: | |
| | |
| | |
|
| Dividends received deduction | (7 | ) | | (2 | ) | | (13 | ) |
| Bank-owned life insurance | (136 | ) | | (215 | ) | | (139 | ) |
| Tax-exempt income | (56 | ) | | (26 | ) | | (39 | ) |
| Compensation and employee benefit plans | 162 |
| | 81 |
| | 35 |
|
| Nondeductible expenses | 317 |
| | 5 |
| | 8 |
|
| Tax credits/adjustments | (56 | ) | | (63 | ) | | — |
|
| State taxes, net of federal tax benefit | 2 |
| | 2 |
| | 2 |
|
| Other | — |
| | (3 | ) | | (13 | ) |
| Total income tax (benefit) provision | $ | (98 | ) | | $ | 241 |
| | $ | 1,003 |
|
| | | | | | |
| Effective tax rate | 10.3 | % | | 17.8 | % | | 29.3 | % |
SI FINANCIAL GROUP, INC.
NOTES TO CONSOLIDATED FINANCIAL STATEMENTS
DECEMBER 31, 2013, 2012 AND 2011
The tax effects of temporary differences that give rise to significant components of the deferred tax assets and deferred tax liabilities are presented below:
|
| | | | | | | |
| | December 31, |
| | 2013 | | 2012 |
| | (In Thousands) |
| Deferred tax assets: | | | |
| Allowance for loan losses | $ | 3,919 |
| | $ | 2,303 |
|
| Unrealized losses on available for sale securities | 931 |
| | 659 |
|
| Depreciation of premises and equipment | 2,331 |
| | 765 |
|
| Other-than-temporary impairment | 455 |
| | 452 |
|
| Impairment - long lived asset | — |
| | 133 |
|
| Deferred compensation | 5,686 |
| | 2,313 |
|
| Employee benefit plans | 904 |
| | 380 |
|
| Capital loss carry-forward | 303 |
| | 65 |
|
| Alternative minimum tax credit carry-forward | 168 |
| | — |
|
| Net operating loss carry-forward | 81 |
| | — |
|
| Interest receivable on nonaccrual loans | 139 |
| | 159 |
|
| Deferred other real estate owned expenses | 21 |
| | 38 |
|
| Net unrealized loss on derivative instruments | 160 |
| | 284 |
|
| Other | 361 |
| | 304 |
|
| Total deferred tax assets | 15,459 |
| | 7,855 |
|
| Less valuation allowance | (349 | ) | | (49 | ) |
| Total deferred tax assets, net of valuation allowance | 15,110 |
| | 7,806 |
|
| | | | |
| Deferred tax liabilities: | |
| | |
|
| Unrealized gains on available for sale securities | 600 |
| | 1,546 |
|
| Goodwill and other intangibles | 3,377 |
| | 330 |
|
| Deferred loan costs | 407 |
| | 844 |
|
| Mortgage servicing asset | 460 |
| | 447 |
|
| Merger expenses and purchase adjustments | 561 |
| | — |
|
| Total deferred tax liabilities | 5,405 |
| | 3,167 |
|
| Deferred tax asset, net | $ | 9,705 |
| | $ | 4,639 |
|
Due to the uncertainties of realization, the Company maintains a valuation allowance of $349,000 related to capital loss carry-forwards and other-than-temporary impairment losses on certain securities at December 31, 2013. The increase in the valuation allowance from December 31, 2012 to December 31, 2013 is attributed to capital losses acquired in the Newport merger that were considered not realizable and continue to be not realizable at December 31, 2013. At December 31, 2012, the Company maintained a charitable contribution carry-forward, primarily related to a cash contribution paid to SI Financial Group Foundation, Inc. in 2011. The utilization of charitable contributions for any tax year is limited to 10% of taxable income without regard to charitable contributions, net operating losses and dividend received deductions. An organization is permitted to carry over contributions that exceed the annual 10% limitation as a deduction to the five succeeding tax years provided the organization has sufficient earnings.
SI FINANCIAL GROUP, INC.
NOTES TO CONSOLIDATED FINANCIAL STATEMENTS
DECEMBER 31, 2013, 2012 AND 2011
Retained earnings at December 31, 2013 and 2012 includes a contingency reserve for loan losses of $3.7 million, which represents the tax reserve balance existing at December 31, 1987, and is maintained in accordance with provisions of the Internal Revenue Code applicable to savings banks. Amounts transferred to the reserve have been claimed as deductions from taxable income, and, if the reserve is used for purposes other than to absorb losses on loans, a federal income tax liability could be incurred. It is not anticipated that the Company will incur a federal income tax liability relating to this reserve balance, and accordingly, deferred income taxes of approximately $1.3 million at December 31, 2013 and 2012 have not been recognized.
Financial service companies doing business in Connecticut are permitted to establish a “passive investment company” (“PIC”) to hold and manage loans secured by real property. PICs are exempt from Connecticut corporation business tax, and dividends received by the financial services companies from PICs are not taxable. In January 1999, the Bank established a PIC, as a wholly-owned subsidiary, and in June 2000, transferred a portion of its residential and commercial mortgage loan portfolios from the Bank to the PIC. A substantial portion of the Company’s interest income is now derived from the PIC, an entity whose net income is exempt from State of Connecticut taxes, and accordingly, state income taxes are minimal. The Bank’s ability to continue to realize the tax benefits of the PIC is subject to the PIC continuing to comply with all statutory requirements related to the operations of the PIC.
With limited exception, the Company is no longer subject to United States federal, state and local income tax examinations by the tax authorities for the years prior to 2010.
NOTE 11. BENEFIT PLANS
Defined Benefit Plan
As a result of the Newport acquisition, the Company participates in the Pentegra Defined Benefit Plan for Financial Institutions (the "Pentegra DB Plan"), a tax-qualified defined benefit pension plan. The Pentegra DB Plan operates as a multi-employer plan for accounting purposes and as a multi-employer plan under the Employee Retirement Income Security Act of 1974 and the Internal Revenue Code. There are no collective bargaining agreements in place that require contributions to the Pentegra DB Plan. In connection with the Newport acquisition, the plan was frozen effective September 6, 2013.
The Pentegra DB Plan is a single plan under Internal Revenue Code Section 413(c) and, as a result, all of the assets stand behind all of the liabilities. Accordingly, under the Pentegra DB Plan contributions made by a participating employer may be used to provide benefits to participants of other participating employers.
The funded status (market value of plan assets divided by funding target) of the Pentegra DB Plan, as of July 1, 2013 was 95.56% per the valuation reports. Market value of plan assets reflects any contributions received through June 30, 2013.
The Bank's contributions to the Pentegra DB Plan are not more than 5% of the total contributions to the Pentegra DB Plan. During the year ended December 31, 2013, total contributions of $163,000 were paid by either the Bank or Newport. The Bank did not recognize pension expense under the plan for the year ended December 31, 2013.
Defined Contribution Plan
The Bank’s Profit Sharing and 401(k) Savings Plan (the “Plan”) is a tax-qualified defined contribution plan for the benefit of its eligible employees. The Bank’s profit sharing contribution to the Plan is a discretionary amount authorized by the Board of Directors, based on the financial results of the Bank. An employee’s share of the profit sharing contribution represents the ratio of the employee’s salary to the total salary expense of the Bank. Participants vest in the Bank’s discretionary profit sharing contributions based on years of service, with 100%
SI FINANCIAL GROUP, INC.
NOTES TO CONSOLIDATED FINANCIAL STATEMENTS
DECEMBER 31, 2013, 2012 AND 2011
vesting attained upon five years of service. There were no profit sharing contributions for the years ended December 31, 2013, 2012 and 2011.
The Plan also includes a 401(k) feature. Eligible participants may make salary deferral contributions of up to 100% of earnings subject to Internal Revenue Services limitations. The Bank makes matching contributions equal to 50% of the participants’ contributions up to 6% of the participants’ earnings. Participants are immediately vested in their salary deferral contributions, employer matching contributions and earnings thereon. Bank contributions were $250,000, $248,000 and $260,000 for the years ended December 31, 2013, 2012 and 2011, respectively.
Group Term Replacement Plan
The Bank maintains the Group Term Replacement Plan to provide a death benefit to executives designated by the Compensation Committee of the Board of Directors. The death benefits are funded through certain insurance policies that are owned by the Bank on the lives of the participating executives. The Bank pays the life insurance premiums, which fund the death benefits from its general assets, and is the beneficiary of any death benefits exceeding any executive’s maximum dollar amount specified in his or her split-dollar endorsement policy. The maximum dollar amount of each executive’s split-dollar death benefit equals three times the executive’s annual compensation less amount of pre-retirement life insurance benefit and three times final annual compensation post-retirement not to exceed a specified dollar amount. For purposes of the plan, annual compensation includes an executive’s base compensation, commissions and cash bonuses earned under the Bank’s bonus plan. Participation in the plan ceases if an executive is terminated for cause or the executive terminates employment for reasons other than death, disability or retirement. If the Bank wishes to maintain the insurance after a participant’s termination in the plan, the Bank will be the direct beneficiary of the entire death proceeds of the insurance policies. Total expense recognized under this plan was $106,000, $47,000 and $40,000 for the years ended December 31, 2013, 2012 and 2011, respectively.
Executive Supplemental Retirement Agreements – Defined Benefit
The Bank maintains unfunded supplemental defined benefit retirement agreements with its directors and certain members of senior management, as well as certain former officers and directors of Newport. These agreements provide for supplemental retirement benefits to certain executives based upon average annual compensation and years of service. Entitlement of benefits commence upon the earlier of the executive’s termination of employment (other than for cause), at or after attaining age 65 or, depending on the executive, on the date when the executive’s years of service and age total 80 or 78. Total expense incurred under these agreements for the years ended December 31, 2013, 2012 and 2011 was $737,000, $725,000 and $882,000, respectively.
Performance-Based Incentive Plan
The Bank has an incentive plan whereby all employees are eligible to receive a bonus tied to both the Company and individual performance. Non-discretionary contributions to the plan require the approval of the Board of Directors’ Compensation Committee. Total expense recognized was $112,000, $339,000 and $366,000 for the years ended December 31, 2013, 2012 and 2011, respectively.
Supplemental Executive Retirement Plan
The Bank maintains the Supplemental Executive Retirement Plan to provide restorative payments to executives, designated by the Board of Directors, who are prevented from receiving the full benefits of the Bank’s Profit Sharing and 401(k) Savings Plan and Employee Stock Ownership Plan. The supplemental executive retirement plan also provides supplemental benefits to participants upon a change in control prior to the complete scheduled repayment of the ESOP loan. For the years ended December 31, 2013, 2012 and 2011, the President and Chief Executive Officer and the Chief Financial Officer were designated by the Board of Directors to participate in the plan. Total expense incurred under this plan was $13,000, $19,000 and $11,000 for the years ended December 31, 2013, 2012 and 2011, respectively.
SI FINANCIAL GROUP, INC.
NOTES TO CONSOLIDATED FINANCIAL STATEMENTS
DECEMBER 31, 2013, 2012 AND 2011
Employee Stock Ownership Plan
In September 2004, the Bank established an ESOP for the benefit of its eligible employees. The Company provided a loan to the Savings Institute Bank and Trust Company Employee Stock Ownership Plan of $4.9 million which was used to purchase 492,499 shares of the Company’s outstanding stock. The loan bears interest equal to 4.75% and provides for annual payments of interest and principal over the 15-year term of the loan.
In January 2011, the Company completed its public stock offering. At that time, the Company provided an additional loan to the Savings Institute Bank and Trust Employee Stock Ownership Plan of $3.1 million, which was used to purchase 392,670 shares of the Company's common stock. The new loan bears interest equal to 3.25% and provides for annual payments of interest and principal over the 20-year term of the loan.
At December 31, 2013, the remaining principal balance on the ESOP debt is payable as follows (in thousands):
|
| | | |
| | |
| 2014 | $ | 475 |
|
| 2015 | 495 |
|
| 2016 | 516 |
|
| 2017 | 539 |
|
| 2018 | 563 |
|
| Thereafter | 2,557 |
|
| Total | $ | 5,145 |
|
The Bank has committed to make contributions to the ESOP sufficient to support the debt service of the loans. The loans are secured by the shares purchased, which are held in a suspense account for allocation among participants as the loans are repaid. Shares held by the ESOP include the following at December 31, 2013 and 2012:
|
| | | | | | | |
| | December 31, |
| | 2013 | | 2012 |
| | (Dollars In Thousands) |
| Allocated | 214,146 |
| | 184,674 |
|
| Committed to be allocated | 48,637 |
| | 48,637 |
|
| Unallocated | 507,801 |
| | 556,438 |
|
| Total shares | 770,584 |
| | 789,749 |
|
| Fair value of unallocated shares | $ | 6,119 |
| | $ | 6,399 |
|
Total compensation expense recognized in connection with the ESOP was $559,000, $543,000 and $467,000 for the years ended December 31, 2013, 2012 and 2011, respectively.
Equity Incentive Plans
The Company's equity incentive plans consist of stock options and shares of restricted stock that may be granted to its employees, officers, directors and directors emeritus. Both incentive stock options and non-statutory stock options may be granted under these plans. The 2005 Equity Incentive Plan allows the Company to grant up to 552,891 stock options and 221,154 shares of restricted stock. The 2012 Equity Incentive Plan allows the Company to grant up to 504,794 stock options and 201,918 shares of restricted stock. All options have a contractual life of ten years and vest equally over a period of five years beginning on the first anniversary of the date of grant. Under the 2012 Equity Incentive Plan, both performance and time-based restricted stock awards may be granted under the plan. At December 31, 2013, a total of 191,456 stock options and 31,191 shares of restricted stock were available for future grants under the plans.
SI FINANCIAL GROUP, INC.
NOTES TO CONSOLIDATED FINANCIAL STATEMENTS
DECEMBER 31, 2013, 2012 AND 2011
For the years ended December 31, 2013, 2012 and 2011, the Company recognized share-based compensation expense related to the stock option and restricted stock awards of $757,000, $189,000 and $100,000, respectively.
The Company granted stock options totaling 412,500 and 67,500 during the years ended December 31, 2012 and 2011, respectively. No stock options were granted during the year ended December 31, 2013. The fair value of each option was determined at the grant date using the Black-Scholes option pricing model with the following weighted average assumptions:
|
| | | | | | | |
| | 2012 | | 2011 |
| Expected term (years) | 10.00 |
| | 10.00 |
|
| Expected dividend yield | 1.45 | % | | 1.70 | % |
| Expected volatility | 24.06 | % | | 39.27 | % |
| Risk-free interest rate | 1.86 | % | | 3.36 | % |
| Fair value of options granted | $ | 2.96 |
| | $ | 4.04 |
|
The expected term was based on the estimated life of the stock options. The dividend yield assumption was based on the Company’s historical and expected dividend pay-outs. The expected volatility represents the Company’s historical volatility. The risk-free interest rate was based on the implied yields of U.S. Treasury zero-coupon issues for periods within the contractual life of the awards in effect at the time of the stock option grants.
The following is a summary of activity for the Company’s stock options for the year ended December 31, 2013:
|
| | | | | | | | |
| | Shares | | Weighted Average Exercise Price | | Weighted Average Remaining Contractual Term (in years) |
| | | | | | |
| Options outstanding at beginning of year | 905,599 |
| | $ | 10.73 |
| | |
| Options exercised | (11,388 | ) | | 8.22 |
| | |
| Options forfeited | (41,166 | ) | | 10.55 |
| | |
| Options outstanding at end of year | 853,045 |
| | 10.78 |
| | 5.37 |
| Options exercisable at end of year | 499,096 |
| | 10.95 |
| | 3.18 |
There were 11,388 and 1,796 options exercised during the year ended December 31, 2013 and 2012, respectively. The intrinsic value of stock options outstanding and exercisable at December 31, 2013 was $1.1 million and $604,000, respectively. At December 31, 2013, there was $955,000 of total unrecognized compensation costs related to outstanding stock options, which is expected to be recognized over a weighted average period of 2.1 years.
SI FINANCIAL GROUP, INC.
NOTES TO CONSOLIDATED FINANCIAL STATEMENTS
DECEMBER 31, 2013, 2012 AND 2011
The following table presents the summary of activity for the Company’s unvested restricted shares for the year ended December 31, 2013.
|
| | | | | | |
| | Shares | | Weighted Average Grant Date Fair Value |
| | | | |
| Unvested restricted shares at beginning of year | 173,102 |
| | $ | 10.87 |
|
| Restricted shares granted | 8,000 |
| | 11.77 |
|
| Restricted shares vested | (25,334 | ) | | 10.58 |
|
| Restricted shares forfeited | (5,273 | ) | | 9.91 |
|
| Unvested restricted shares at end of year | 150,495 |
| | 11.01 |
|
The aggregate fair value of restricted stock awards that vested during the years ended December 31, 2013, 2012 and 2011 was $296,000, $23,000 and $15,000, respectively. At December 31, 2013, there was $1.4 million of total unrecognized compensation costs related to unvested restricted stock awards granted under the incentive plans, which are expected to be recognized over a weighted average period of 1.8 years.
Bank-Owned Life Insurance
The Company has an investment in, and is the beneficiary of, life insurance policies on the lives of certain officers and former officers and directors of Newport. The purpose of these life insurance investments is to provide income through the appreciation in cash surrender value of the policies, which is used to offset the costs of various benefit and retirement plans. The Company’s investment in bank-owned life insurance does not exceed the regulatory limitation of 25 percent of Tier 1 capital plus the allowance for loan and lease losses. The aggregate cash surrender value of all policies owned by the Company amounted to $20.7 million and $9.1 million at December 31, 2013 and 2012, respectively. Income earned on these life insurance policies aggregated $400,000, $284,000 and $289,000 for the years ended December 31, 2013, 2012 and 2011, respectively. The Company recognized gains of $349,000 and $122,000 on death benefit proceeds received from a bank-owned life insurance policy during the years ended December 31, 2012 and 2011, respectively. There were no gains recognized on death benefit proceeds received during the year ended December 31, 2013.
NOTE 12. OTHER COMMITMENTS AND CONTINGENCIES
In the normal course of business, there are outstanding commitments and contingencies that are not reflected in the accompanying consolidated financial statements. The Company is a party to financial instruments with off-balance sheet risk to meet the financing needs of its customers. These financial instruments include commitments to extend credit and standby letters of credit and involve, to varying degrees, elements of credit and interest rate risk in excess of the amounts recognized on the balance sheets. The contractual amounts of those instruments reflect the extent of involvement the Company has in particular classes of financial instruments.
Loan Commitments and Letters of Credit
The contractual amounts of commitments to extend credit represent the amount of potential loss should the contract be fully drawn upon, the customer defaults and the value of any existing collateral be determined as worthless. The Company uses the same credit policies in making commitments and conditional obligations as it does for on-balance sheet instruments.
SI FINANCIAL GROUP, INC.
NOTES TO CONSOLIDATED FINANCIAL STATEMENTS
DECEMBER 31, 2013, 2012 AND 2011
Financial instruments whose contract amounts represent credit risk at December 31, 2013 and 2012 were as follows:
|
| | | | | | | |
| | December 31, |
| | 2013 | | 2012 |
| | (In Thousands) |
| Commitments to extend credit: | | | |
| Commitments to originate loans | $ | 8,742 |
| | $ | 11,123 |
|
| Undisbursed construction loans | 9,193 |
| | 3,406 |
|
| Undisbursed home equity lines of credit | 41,031 |
| | 23,019 |
|
| Undisbursed commercial lines of credit | 59,930 |
| | 23,842 |
|
| Overdraft protection lines | 1,221 |
| | 1,190 |
|
| Standby letters of credit | 81 |
| | 611 |
|
| Total commitments | $ | 120,198 |
| | $ | 63,191 |
|
Commitments to originate loans at December 31, 2013 and 2012 included fixed rate loan commitments of $6.9 million and $10.6 million, respectively, at interest rates ranging from 2.75% to 5.75% and 2.63% to 7.00%, respectively.
Commitments to extend credit are agreements to lend to a customer as long as there is no violation of any condition established in the contract. Commitments generally have fixed expiration dates or other termination clauses and may require payment of a fee. The Company evaluates each customer's creditworthiness on a case-by-case basis. The amount of collateral obtained, if deemed necessary by the Company upon extension of credit, is based on management's credit evaluation of the counterparty. Collateral held varies but may include residential and commercial property, accounts receivable, inventory, property, plant and equipment, deposits and securities.
Undisbursed commitments under construction, home equity or commercial lines of credit are commitments for future extensions of credit to existing customers. Total undisbursed amounts on lines of credit may expire without being fully drawn upon and therefore, do not necessarily represent future cash requirements.
Standby letters of credit are conditional commitments issued by the Company to guarantee the performance of a customer to a third party. Letters of credit are primarily issued to support public or private borrowing arrangements. Essentially all letters of credit issued have expiration dates within one year.
Operating Lease Commitments
The Company leases certain of its branch offices and equipment under operating lease agreements that expire at various dates through 2039. At December 31, 2013, future minimum rental commitments pursuant to the terms of noncancelable lease agreements, by year and in the aggregate, are as follows (in thousands):
|
| | | |
| 2014 | $ | 1,617 |
|
| 2015 | 1,452 |
|
| 2016 | 1,291 |
|
| 2017 | 1,130 |
|
| 2018 | 1,013 |
|
| Thereafter | 8,424 |
|
| Total | $ | 14,927 |
|
SI FINANCIAL GROUP, INC.
NOTES TO CONSOLIDATED FINANCIAL STATEMENTS
DECEMBER 31, 2013, 2012 AND 2011
Certain leases contain options to extend for periods of 5 to 30 years. The cost of such extensions is not included in the above amounts. Rental expense charged to operations for cancelable and noncancelable operating leases was $1.3 million, $1.3 million and $1.4 million for the years ended December 31, 2013, 2012 and 2011, respectively.
Rental Income Under Subleases
The Company is subleasing excess office space under a noncancelable operating lease that expires on June 24, 2024. At December 31, 2013, future minimum lease payments receivable for the noncancelable lease agreement is as follows:
|
| | | |
| 2014 | $ | 19 |
|
| 2015 | 19 |
|
| 2016 | 19 |
|
| 2017 | 19 |
|
| 2018 | 19 |
|
| Thereafter | 106 |
|
| Total | $ | 201 |
|
Rental income under the noncancelable lease agreement was $19,200, $18,500 and $17,400 for the years ended December 31, 2013, 2012 and 2011, respectively.
Legal Matters
Various legal claims arise from time to time in the normal course of business. Management believes that the resolution of these matters will not have a material effect on the Company’s financial condition or results of operations.
Investment Commitments
The Bank is a limited partner in three SBICs and committed to contribute capital of $3.0 million to the limited partnerships. The Bank recognized write-downs totaling $72,000 and $12,000 on its investment in the SBICs during the years ended December 31, 2012 and 2011, respectively. There were no write-downs on the Bank's investment in SBICs during the year ended December 31, 2013. The SBICs, with a combined net book value of $1.3 million at December 31, 2013 and 2012, net of impairment charges and distributions are included in other assets. At December 31, 2013, the Bank’s remaining off-balance sheet commitment for capital investment in the SBICs was $766,000.
NOTE 13. RELATED PARTY TRANSACTIONS
Loans Receivable
In the normal course of business, the Bank grants loans to related parties. Related parties include directors and certain officers of the Company and its subsidiaries and their immediate family members and respective affiliates in which they have a controlling interest. These loans were made on substantially the same terms, including interest rates and collateral, as those prevailing at the time for comparable transactions with customers, and did not involve more than the normal risk of collectibility. At December 31, 2013 and 2012, all related party loans were performing in accordance with their terms.
SI FINANCIAL GROUP, INC.
NOTES TO CONSOLIDATED FINANCIAL STATEMENTS
DECEMBER 31, 2013, 2012 AND 2011
Changes in loans outstanding to such related parties during the years ended December 31, 2013 and 2012 are as follows:
|
| | | | | | | |
| | Years Ended December 31, |
| | 2013 | | 2012 |
| | (In Thousands) |
| Balance at beginning of year | $ | 1,948 |
| | $ | 2,063 |
|
| Additions | 426 |
| | 362 |
|
| Repayments | (345 | ) | | (477 | ) |
| Balance at end of year | $ | 2,029 |
| | $ | 1,948 |
|
Deposits
Deposit accounts of directors, certain officers and other related parties aggregated $2.0 million and $1.3 million at December 31, 2013 and 2012, respectively.
NOTE 14. REGULATORY CAPITAL
The Bank is subject to various regulatory capital requirements administered by the federal banking agencies. Failure to meet minimum capital requirements can initiate certain mandatory, and possibly additional discretionary, actions by regulators that, if undertaken, could have a direct material effect on the Company's consolidated financial statements. Under capital adequacy guidelines and the regulatory framework for prompt corrective action, the Bank must meet specific capital guidelines that involve quantitative measures of the Bank’s assets, liabilities and certain off-balance sheet items, as calculated under regulatory accounting practices. The Bank’s capital amounts and classification are also subject to qualitative judgments by the regulators about components, risk weightings and other factors.
Quantitative measures established by regulation to ensure capital adequacy require the Bank to maintain minimum amounts and ratios (set forth in the table below) of total and Tier I capital (as defined in the regulations) to risk-weighted assets (as defined) and of Tier I capital (as defined) to total assets (as defined). As of December 31, 2013 and 2012, the Bank met the conditions to be classified as “well capitalized” under the regulatory framework for prompt corrective action. There are no conditions or events since then that management believes have changed the Bank’s regulatory category. As a savings and loan holding company regulated by the FRB, the Company is not currently subject to any separate regulatory capital requirements. The Dodd-Frank Act, however, requires the FRB to promulgate consolidated capital requirements for depository institution holding companies that are no less stringent, quantitatively in terms of components of capital, than those applicable to institutions themselves. There is a five-year transition period before the capital requirements will apply to savings and loan holding companies.
SI FINANCIAL GROUP, INC.
NOTES TO CONSOLIDATED FINANCIAL STATEMENTS
DECEMBER 31, 2013, 2012 AND 2011
The Bank's actual capital amounts and ratios at December 31, 2013 and 2012 were as follows:
|
| | | | | | | | | | | | | | | | | | | | |
| December 31, 2013 | Actual | | For Capital
Adequacy Purposes | | To Be Well
Capitalized Under
Prompt Corrective Action Provisions |
| | Amount | | Ratio | | Amount | | Ratio | | Amount | | Ratio |
| | (Dollars in Thousands) |
| Tier I Capital Ratio | $ | 117,477 |
| | 8.94 | % | | $ | 52,550 |
| | 4.00 | % | | $ | 65,688 |
| | 5.00 | % |
| Tier I Risk-based Capital Ratio | 117,477 |
| | 14.71 |
| | 31,936 |
| | 4.00 |
| | 47,905 |
| | 6.00 |
|
| Total Risk-based Capital Ratio | 124,964 |
| | 15.65 |
| | 63,873 |
| | 8.00 |
| | 79,841 |
| | 10.00 |
|
| Tangible Equity Ratio | 117,477 |
| | 8.94 |
| | 19,706 |
| | 1.50 |
| | N/A |
| | N/A |
|
| | | | | | | | | | | | | | | | | | | | |
| December 31, 2012 | Actual | | For Capital Adequacy Purposes | | To Be Well Capitalized Under Prompt Corrective Action Provisions |
| | Amount | | Ratio | | Amount | | Ratio | | Amount | | Ratio |
| | (Dollars in Thousands) |
| Tier I Capital Ratio | $ | 103,547 |
| | 11.08 | % | | $ | 37,382 |
| | 4.00 | % | | $ | 46,727 |
| | 5.00 | % |
| Tier I Risk-based Capital Ratio | 103,547 |
| | 20.20 |
| | 20,504 |
| | 4.00 |
| | 30,757 |
| | 6.00 |
|
| Total Risk-based Capital Ratio | 109,751 |
| | 21.41 |
| | 41,009 |
| | 8.00 |
| | 51,262 |
| | 10.00 |
|
| Tangible Equity Ratio | 103,547 |
| | 11.08 |
| | 14,018 |
| | 1.50 |
| | N/A |
| | N/A |
Reconciliations of the Company’s total capital to the Bank’s regulatory capital are as follows:
|
| | | | | | | |
| | December 31, |
| | 2013 | | 2012 |
| | (In Thousands) |
| Total capital per consolidated financial statements | $ | 152,842 |
| | $ | 125,759 |
|
| Holding company equity not available for regulatory capital | (14,336 | ) | | (15,811 | ) |
| Accumulated losses (gains) on available for sale securities | 689 |
| | (1,619 | ) |
| Intangible assets | (19,566 | ) | | (3,451 | ) |
| Disallowed servicing asset | — |
| | (100 | ) |
| Disallowed deferred tax asset | (2,152 | ) | | (1,231 | ) |
| Total tier 1 capital | 117,477 |
| | 103,547 |
|
| Adjustments for total capital: | | | |
|
| Allowance for loan and credit losses | 7,487 |
| | 6,204 |
|
| Total capital per regulatory reporting | $ | 124,964 |
| | $ | 109,751 |
|
SI FINANCIAL GROUP, INC.
NOTES TO CONSOLIDATED FINANCIAL STATEMENTS
DECEMBER 31, 2013, 2012 AND 2011
NOTE 15. OTHER COMPREHENSIVE INCOME (LOSS)
Accounting principles generally require that recognized revenue, expenses, gains and losses be included in net income (loss). Although certain changes in assets and liabilities are reported as a separate component of shareholders' equity on the balance sheet, such items along with net income (loss) are components of comprehensive income (loss).
Components of other comprehensive income (loss) and related tax effects are as follows:
|
| | | | | | | | | | | |
| | Year Ended December 31, 2013 |
| | Before Tax Amount | | Tax Effects | | Net of Tax Amount |
| | (In Thousands) |
| Securities: | | | | | |
| Unrealized holding losses on available for sale securities | $ | (5,012 | ) | | $ | 1,704 |
| | $ | (3,308 | ) |
| Reclassification adjustment for losses realized in net loss | 1,155 |
| | (393 | ) | | 762 |
|
| Credit portion of OTTI losses recognized in net loss | 8 |
| | (3 | ) | | 5 |
|
| Noncredit portion of OTTI gains on available for sale securities | 266 |
| | (90 | ) | | 176 |
|
| Unrealized holding losses on available for sale securities, net of taxes | (3,583 | ) | | 1,218 |
| | (2,365 | ) |
| Derivative instrument: | |
| | |
| | |
|
| Change in fair value of effective cash flow hedging derivative | 158 |
| | (54 | ) | | 104 |
|
| Other comprehensive loss | $ | (3,425 | ) | | $ | 1,164 |
| | $ | (2,261 | ) |
|
| | | | | | | | | | | |
| | Year Ended December 31, 2012 |
| | Before Tax Amount | | Tax Effects | | Net of Tax Amount |
| | (In Thousands) |
| Securities: | | | | | |
| Unrealized holding gains on available for sale securities | $ | 1,905 |
| | $ | (647 | ) | | $ | 1,258 |
|
| Reclassification adjustment for gains realized in net income | (273 | ) | | 93 |
| | (180 | ) |
| Credit portion of OTTI losses recognized in net income | 123 |
| | (42 | ) | | 81 |
|
| Noncredit portion of OTTI gains on available for sale securities | 1,416 |
| | (482 | ) | | 934 |
|
| Unrealized holding gains on available for sale securities, net of taxes | 3,171 |
| | (1,078 | ) | | 2,093 |
|
| Derivative instrument: | | | | | |
|
| Change in fair value of effective cash flow hedging derivative | (8 | ) | | 3 |
| | (5 | ) |
| Other comprehensive income | $ | 3,163 |
| | $ | (1,075 | ) | | $ | 2,088 |
|
SI FINANCIAL GROUP, INC.
NOTES TO CONSOLIDATED FINANCIAL STATEMENTS
DECEMBER 31, 2013, 2012 AND 2011
|
| | | | | | | | | | | |
| | Year Ended December 31, 2011 |
| | Before Tax Amount | | Tax Effects | | Net of Tax Amount |
| | (In Thousands) |
| Securities: | | | | | |
| Unrealized holding gains on available for sale securities | $ | 3,058 |
| | $ | (1,040 | ) | | $ | 2,018 |
|
| Reclassification adjustment for gains realized in net income | (486 | ) | | 165 |
| | (321 | ) |
| Credit portion of OTTI losses recognized in net income | 148 |
| | (50 | ) | | 98 |
|
| Noncredit portion of OTTI losses on available for sale securities | (1,730 | ) | | 588 |
| | (1,142 | ) |
| Unrealized holding gains on available for sale securities, net of taxes | 990 |
| | (337 | ) | | 653 |
|
| Derivative instrument: | |
| | |
| | |
|
| Change in fair value of effective cash flow hedging derivative | (333 | ) | | 113 |
| | (220 | ) |
| Other comprehensive loss | $ | 657 |
| | $ | (224 | ) | | $ | 433 |
|
The components of accumulated other comprehensive (loss) income included in shareholders’ equity are as follows:
|
| | | | | | | | | | | |
| | December 31, 2013 |
| | Before Tax Amount | | Tax Effects | | Net of Tax Amount |
| | (In Thousands) |
| Net unrealized losses on available for sale securities | $ | (973 | ) | | $ | 331 |
| | $ | (642 | ) |
| Net unrealized loss on effective cash flow hedging derivative | (312 | ) | | 106 |
| | (206 | ) |
| | | | | | |
| Accumulated other comprehensive loss | $ | (1,285 | ) | | $ | 437 |
| | $ | (848 | ) |
|
| | | | | | | | | | | |
| | December 31, 2012 |
| | Before Tax Amount | | Tax Effects | | Net of Tax Amount |
| | (In Thousands) |
| Net unrealized gains on available for sale securities | $ | 2,876 |
| | $ | (977 | ) | | $ | 1,899 |
|
| Noncredit portion of OTTI losses on available for sale securities | (266 | ) | | 90 |
| | (176 | ) |
| Net unrealized loss on effective cash flow hedging derivative | (470 | ) | | 160 |
| | (310 | ) |
| | | | | | |
| Accumulated other comprehensive income | $ | 2,140 |
| | $ | (727 | ) | | $ | 1,413 |
|
NOTE 16. FAIR VALUE OF ASSETS AND LIABILITIES
Determination of Fair Value
The Company uses fair value measurements to record fair value adjustments to certain assets and liabilities and to determine fair value disclosures. The fair value of a financial instrument is the price that would be received to sell an asset or paid to transfer a liability in an orderly transaction between market participants at the measurement date. Fair value is best determined based upon quoted market prices. However, in many instances, there are no quoted market prices for the Company’s various financial instruments. In cases where quoted market prices are not available, fair values are based on estimates using present value or other valuation techniques. Those techniques are significantly affected by the assumptions used, including the discount rate and estimates of future cash flows. Accordingly, the fair value estimates may not be realized in an immediate settlement of the instrument.
SI FINANCIAL GROUP, INC.
NOTES TO CONSOLIDATED FINANCIAL STATEMENTS
DECEMBER 31, 2013, 2012 AND 2011
The following methods and assumptions were used by the Company in estimating fair value disclosures of its financial instruments:
| |
| ◦ | Cash and cash equivalents. The carrying amounts of cash and short-term instruments approximate the fair values based on the short-term nature of the assets. |
| |
| ◦ | Securities available for sale. Included in the available for sale category are both debt and equity securities. The securities measured at fair value in Level 1 are based on quoted market prices in an active exchange market. Securities measured at fair value in Level 2 are based on pricing models that consider standard input factors such as observable market data, benchmark yields, interest rate volatilities, broker/dealer quotes, credit spreads and new issue data. The Company utilizes a nationally-recognized third-party pricing service to estimate fair value measurements for the majority of its portfolio. The pricing service evaluates each asset class based on relevant market information considering observable data, but these prices do not represent binding quotes. The fair value prices on all investments are reviewed for reasonableness by management. Securities measured at fair value in Level 3 include collateralized debt obligations that are backed by trust preferred securities issued by banks, thrifts and insurance companies. Management determined that an orderly and active market for these securities and similar securities did not exist based on a significant reduction in trading volume and widening spreads relative to historical levels. The Company estimates future cash flows discounted using a rate management believes is representative of current market conditions. Factors in determining the discount rate include the current level of deferrals and/or defaults, changes in credit rating and the financial condition of the debtors within the underlying securities, broker quotes for securities with similar structure and credit risk, interest rate movements and pricing for new issuances. |
| |
| ◦ | Federal Home Loan Bank stock. The carrying value of FHLB stock approximates fair value based on the redemption provisions of the FHLB. |
| |
| ◦ | Loans held for sale. The fair value of loans held for sale is estimated using quoted market prices. |
| |
| ◦ | Loans receivable. For variable rate loans that reprice frequently and have no significant change in credit risk, fair values are based on carrying values. The fair value of fixed-rate loans are estimated by discounting the future cash flows using the rates at the end of the period in which similar loans would be made to borrowers with similar credit ratings and for the same remaining maturities. |
| |
| ◦ | Accrued interest receivable. The carrying amount of accrued interest approximates fair value. |
| |
| ◦ | Deposits. The fair value of demand deposits, negotiable orders of withdrawal, regular savings, certain money market deposits and mortgagors’ and investors’ escrow accounts is the amount payable on demand at the reporting date. The fair value of certificates of deposit and other time deposits is estimated using a discounted cash flow calculation that applies interest rates currently being offered for deposits of similar remaining maturities to a schedule of aggregated expected maturities on such deposits. |
| |
| ◦ | Federal Home Loan Bank advances. The fair value of the advances is estimated using a discounted cash flow calculation that applies current FHLB interest rates for advances of similar maturity to a schedule of maturities of such advances. |
| |
| ◦ | Junior subordinated debt owed to unconsolidated trust. Rates currently available for debt with similar terms and remaining maturities are used to estimate fair value of existing debt. |
| |
| ◦ | Interest rate swap agreements. The fair value of the Company’s interest rate swaps are obtained from a third-party pricing service and are determined using a discounted cash flow analysis on the expected cash |
SI FINANCIAL GROUP, INC.
NOTES TO CONSOLIDATED FINANCIAL STATEMENTS
DECEMBER 31, 2013, 2012 AND 2011
flows of the derivative. The pricing analysis is based on observable inputs for the contractual term of the derivative, including the period to maturity and interest rate curves.
| |
| ◦ | Forward loan sale commitments and derivative loan commitments. Forward loan sale commitments and derivative loan commitments are based on the fair values of the underlying mortgage loans, including the servicing rights for derivative loan commitments, and the probability of such commitments being exercised. Significant management judgment and estimation is required in determining these fair value measurements. |
| |
| ◦ | Off-balance sheet instruments. Fair values for off-balance sheet lending commitments are based on fees currently charged to enter into similar agreements, taking into account the remaining terms of the agreements and the counterparties' credit standings. |
Assets and Liabilities Measured at Fair Value on a Recurring Basis
The following table presents assets and liabilities measured at fair value on a recurring basis as of December 31, 2013 and 2012. The Company had no significant transfers into or out of Levels 1, 2 or 3 during the years ended December 31, 2013 and 2012.
|
| | | | | | | | | | | | | | | |
| | December 31, 2013 |
| | Level 1 | | Level 2 | | Level 3 | | Total |
| | (In Thousands) |
| Assets: | | | | | | | |
| U.S. Government and agency obligations | $ | 8,975 |
| | $ | 45,570 |
| | $ | — |
| | $ | 54,545 |
|
| Government-sponsored enterprises | — |
| | 26,292 |
| | — |
| | 26,292 |
|
| Mortgage-backed securities | — |
| | 76,671 |
| | — |
| | 76,671 |
|
| Corporate debt securities | — |
| | 3,798 |
| | — |
| | 3,798 |
|
| Collateralized debt obligations | — |
| | — |
| | 1,191 |
| | 1,191 |
|
| Obligations of state and political subdivisions | — |
| | 4,123 |
| | — |
| | 4,123 |
|
| Tax-exempt securities | — |
| | 3,575 |
| | — |
| | 3,575 |
|
| Foreign government securities | — |
| | 25 |
| | — |
| | 25 |
|
| Forward loan sale commitments and derivative loan commitments | — |
| | — |
| | 22 |
| | 22 |
|
| Total assets | $ | 8,975 |
| | $ | 160,054 |
| | $ | 1,213 |
| | $ | 170,242 |
|
| | | | | | | | |
| Liabilities: | |
| | |
| | |
| | |
|
| Interest rate swap agreements | $ | — |
| | $ | 486 |
| | $ | — |
| | $ | 486 |
|
| Total liabilities | $ | — |
| | $ | 486 |
| | $ | — |
| | $ | 486 |
|
SI FINANCIAL GROUP, INC.
NOTES TO CONSOLIDATED FINANCIAL STATEMENTS
DECEMBER 31, 2013, 2012 AND 2011
|
| | | | | | | | | | | | | | | |
| | December 31, 2012 |
| | Level 1 | | Level 2 | | Level 3 | | Total |
| | (In Thousands) |
| Assets: | | | | | | | |
| U.S. Government and agency obligations | $ | 1,035 |
| | $ | 55,224 |
| | $ | — |
| | $ | 56,259 |
|
| Government-sponsored enterprises | — |
| | 23,967 |
| | — |
| | 23,967 |
|
| Mortgage-backed securities | — |
| | 78,733 |
| | — |
| | 78,733 |
|
| Corporate debt securities | — |
| | 7,694 |
| | — |
| | 7,694 |
|
| Collateralized debt obligations | — |
| | — |
| | 4,396 |
| | 4,396 |
|
| Obligations of state and political subdivisions | — |
| | 5,414 |
| | — |
| | 5,414 |
|
| Foreign government securities | — |
| | 50 |
| | — |
| | 50 |
|
| Forward loan sale commitments and derivative loan commitments | — |
| | — |
| | 17 |
| | 17 |
|
| Total assets | $ | 1,035 |
| | $ | 171,082 |
| | $ | 4,413 |
| | $ | 176,530 |
|
| | | | | | | | |
| Liabilities: | |
| | |
| | |
| | |
|
| Forward loan sale commitments and derivative loan commitments | $ | — |
| | $ | — |
| | $ | 4 |
| | $ | 4 |
|
| Interest rate swap agreement | — |
| | 849 |
| | — |
| | 849 |
|
| Total liabilities | $ | — |
| | $ | 849 |
| | $ | 4 |
| | $ | 853 |
|
The following table shows a reconciliation of the beginning and ending balances for Level 3 assets (liabilities):
|
| | | | | | | |
| | Collateralized Debt Obligations | | Derivatives and Forward Loan Sale Commitments, Net |
| | (In Thousands) |
| Balance at December 31, 2011 | $ | 2,917 |
| | $ | (8 | ) |
| Total unrealized gains included in other comprehensive income | 1,479 |
| | 21 |
|
| Balance at December 31, 2012 | 4,396 |
| | 13 |
|
| Total unrealized (losses) gains included in other comprehensive loss | (17 | ) | | 9 |
|
| Sales | (3,188 | ) | | — |
|
| Balance at December 31, 2013 | $ | 1,191 |
| | $ | 22 |
|
Assets and Liabilities Measured at Fair Value on a Nonrecurring Basis
The Company may also be required, from time to time, to measure certain other financial assets on a nonrecurring basis in accordance with generally accepted accounting principles. These adjustments to fair value usually result from the application of lower-of-cost-or-market accounting or write-downs of individual assets. The following table summarizes the fair value hierarchy used to determine each adjustment and the carrying value of the related individual assets as of December 31, 2013 and 2012. There were no liabilities measured at fair value on a nonrecurring basis as of December 31, 2013 and 2012.
SI FINANCIAL GROUP, INC.
NOTES TO CONSOLIDATED FINANCIAL STATEMENTS
DECEMBER 31, 2013, 2012 AND 2011
|
| | | | | | | | | | | | | | | | | | | | | | | |
| | At December 31, 2013 | | At December 31, 2012 |
| | Level 1 | | Level 2 | | Level 3 | | Level 1 | | Level 2 | | Level 3 |
| | (In Thousands) |
| Impaired loans | $ | — |
| | $ | — |
| | $ | 1,384 |
| | $ | — |
| | $ | — |
| | $ | 1,616 |
|
| Other real estate owned | — |
| | — |
| | 2,429 |
| | — |
| | — |
| | 1,293 |
|
| Total assets | $ | — |
| | $ | — |
| | $ | 3,813 |
| | $ | — |
| | $ | — |
| | $ | 2,909 |
|
The following table summarizes losses resulting from fair value adjustments for assets measured at fair value on a nonrecurring basis.
|
| | | | | | | | | | | |
| | Years Ended December 31, |
| | 2013 | | 2012 | | 2011 |
| | (In Thousands) |
| Impaired loans | $ | 404 |
| | $ | 367 |
| | $ | 998 |
|
| Other real estate owned | 39 |
| | 28 |
| | 175 |
|
| Total assets | $ | 443 |
| | $ | 395 |
| | $ | 1,173 |
|
The Company measures the impairment of loans that are collateral dependent based on the fair value of the collateral (Level 3). The fair value of collateral used by the Company represents the amount expected to be received from the sale of the property, net of selling costs, as determined by an independent, licensed or certified appraiser using observable market data. This data includes information such as selling price of similar properties, expected future cash flows or earnings of the subject property based on current market expectations and relevant legal, physical and economic factors. The appraised values of collateral are adjusted as necessary by management based on unobservable inputs for specific properties. Losses applicable to write-downs of impaired loans are based on the appraised market value of the underlying collateral, assuming foreclosure of these loans is imminent.
The amount of other real estate owned represents the carrying value of the collateral based on the appraised value of the underlying collateral less estimated selling costs. The loss on foreclosed assets represents adjustments in the valuation recorded during the time period indicated and not for losses incurred on sales.
In accordance with applicable accounting guidance, the Company evaluates its goodwill for impairment. Based on this evaluation, no goodwill impairment was recorded during the years ended December 31, 2013, 2012 and 2011.
Summary of Fair Values of Financial Instruments
The estimated fair values, and related carrying or notional amounts, of the Company’s financial instruments are presented in the following table. Certain financial instruments and all nonfinancial instruments are exempt from disclosure requirements. Accordingly, the aggregate fair value amounts presented do not represent the underlying value of the Company.
Management uses its best judgment in estimating the fair value of the Company's financial instruments; however, there are inherent weaknesses in any estimation technique. Therefore, for substantially all financial instruments, the fair value estimates presented herein are not necessarily indicative of the amounts the Company could have realized in a sales transaction at December 31, 2013 or 2012. The estimated fair value amounts for 2013 and 2012 have been measured as of their respective year-ends, and have not been re-evaluated or updated for purposes of these consolidated financial statements subsequent to those respective dates. As such, the estimated fair values of these financial instruments subsequent to the respective reporting dates may be different than the amounts reported at each year-end. The information presented should not be interpreted as an estimate of the fair value of the entire Company since a fair value calculation is only required for a limited portion of the Company's assets.
SI FINANCIAL GROUP, INC.
NOTES TO CONSOLIDATED FINANCIAL STATEMENTS
DECEMBER 31, 2013, 2012 AND 2011
Due to the wide range of valuation techniques and the degree of subjectivity used in making the estimate, comparisons between the Company's disclosures and those of other banks may not be meaningful.
As of December 31, 2013 and 2012, the recorded carrying amounts and estimated fair values of the Company's financial instruments are as follows: |
| | | | | | | | | | | | | | | | | | | |
| | December 31, 2013 |
| | Carrying Amount | | Level 1 | | Level 2 | | Level 3 | | Total |
| Financial Assets: | (In Thousands) |
| Cash and cash equivalents | $ | 27,321 |
| | $ | 27,321 |
| | $ | — |
| | $ | — |
| | $ | 27,321 |
|
| Available for sale securities | 170,220 |
| | 8,975 |
| | 160,054 |
| | 1,191 |
| | 170,220 |
|
| Loans held for sale | 1,764 |
| | — |
| | — |
| | 1,766 |
| | 1,766 |
|
| Loans receivable, net | 1,047,410 |
| | — |
| | — |
| | 1,050,834 |
| | 1,050,834 |
|
| Federal Home Loan Bank stock | 13,109 |
| | — |
| | — |
| | 13,109 |
| | 13,109 |
|
| Accrued interest receivable | 4,021 |
| | — |
| | — |
| | 4,021 |
| | 4,021 |
|
| Financial Liabilities: | |
| | |
| | |
| | |
| | |
| Deposits | 984,749 |
| | — |
| | — |
| | 987,705 |
| | 987,705 |
|
| Mortgagors' and investors' escrow accounts | 3,214 |
| | — |
| | — |
| | 3,214 |
| | 3,214 |
|
| Federal Home Loan Bank advances | 176,272 |
| | — |
| | 178,448 |
| | — |
| | 178,448 |
|
| Junior subordinated debt owed to unconsolidated trust | 8,248 |
| | — |
| | 6,337 |
| | — |
| | 6,337 |
|
| On-balance Sheet Derivative Financial Instruments: | | | | | | | | | |
| Assets: | | | | | | | | | |
| Derivative loan commitments | 14 |
| | — |
| | — |
| | 14 |
| | 14 |
|
| Forward loan sale commitments | 8 |
| | — |
| | — |
| | 8 |
| | 8 |
|
| Liabilities: | | | | | | | | | |
| Interest rate swap agreements | 486 |
| | — |
| | 486 |
| | — |
| | 486 |
|
|
| | | | | | | | | | | | | | | | | | | |
| | December 31, 2012 |
| | Carrying Amount | | Level 1 | | Level 2 | | Level 3 | | Total |
| Financial Assets: | (In Thousands) |
| Cash and cash equivalents | $ | 37,689 |
| | $ | 37,689 |
| | $ | — |
| | $ | — |
| | $ | 37,689 |
|
| Available for sale securities | 176,513 |
| | 1,035 |
| | 171,082 |
| | 4,396 |
| | 176,513 |
|
| Loans held for sale | 5,069 |
| | — |
| | — |
| | 5,232 |
| | 5,232 |
|
| Loans receivable, net | 685,163 |
| | — |
| | — |
| | 703,925 |
| | 703,925 |
|
| Federal Home Loan Bank stock | 8,078 |
| | — |
| | — |
| | 8,078 |
| | 8,078 |
|
| Accrued interest receivable | 3,215 |
| | — |
| | — |
| | 3,215 |
| | 3,215 |
|
| Financial Liabilities: | | | | | | | | | |
| Deposits | 705,148 |
| | — |
| | — |
| | 709,357 |
| | 709,357 |
|
| Mortgagors' and investors' escrow accounts | 3,207 |
| | — |
| | — |
| | 3,207 |
| | 3,207 |
|
| Federal Home Loan Bank advances | 97,699 |
| | — |
| | 102,919 |
| | — |
| | 102,919 |
|
| Junior subordinated debt owed to unconsolidated trust | 8,248 |
| | — |
| | 5,268 |
| | — |
| | 5,268 |
|
| On-balance Sheet Derivative Financial Instruments: | | | | | | | | | |
| Assets: | | | | | | | | | |
| Derivative loan commitments | 13 |
| | — |
| | — |
| | 13 |
| | 13 |
|
| Forward loan sale commitments | 4 |
| | — |
| | — |
| | 4 |
| | 4 |
|
| Liabilities: | | | | | | | | | |
| Derivative loan commitments | 3 |
| | — |
| | — |
| | 3 |
| | 3 |
|
| Forward loan sale commitments | 1 |
| | — |
| | — |
| | 1 |
| | 1 |
|
| Interest rate swap agreement | 849 |
| | — |
| | 849 |
| | — |
| | 849 |
|
SI FINANCIAL GROUP, INC.
NOTES TO CONSOLIDATED FINANCIAL STATEMENTS
DECEMBER 31, 2013, 2012 AND 2011
NOTE 17. DERIVATIVE INSTRUMENTS AND HEDGING ACTIVITIES
Derivative Financial Instruments
The Company has stand-alone derivative financial instruments in the form of interest rate swap agreements, which derive their value from underlying interest rates. These transactions involve both credit and market risk. The notional amounts are amounts on which calculations, payments and the value of the derivatives are based. Notional amounts do not represent direct credit exposures. Direct credit exposure is limited to the net difference between the calculated amounts to be received and paid, if any. Such difference, which represents the fair value of the derivative instruments, is reflected on the Company’s balance sheets as other assets and other liabilities.
The Company is exposed to credit-related losses in the event of nonperformance by the counterparties to these agreements. The Company controls the credit risk of its financial contracts through credit approvals, limits and monitoring procedures and does not expect any counterparties to fail their obligations.
Derivative instruments are generally either negotiated over-the-counter contracts or standardized contracts executed on a recognized exchange. Negotiated over-the-counter derivative contracts are generally entered into between two counterparties that negotiate specific agreement terms, including the underlying instrument, amount, exercise prices and maturity.
Derivative Instruments Designated As Hedging Instruments
The Company uses long-term variable rate debt as a source of funds for use in the Company’s lending and investment activities and other general business purposes. These debt obligations expose the Company to variability in interest payments due to changes in interest rates. If interest rates increase, interest expense increases. Conversely, if interest rates decrease, interest expense decreases. Management believes it is prudent to limit the variability of a portion of its interest payments and, therefore, generally hedges a portion of its variable-rate interest payments. To meet this objective, management entered into an interest rate swap agreement, characterized as a cash flow hedge, whereby the Company receives variable interest rate payments determined by three-month LIBOR in exchange for making payments at a fixed interest rate.
At December 31, 2013 and 2012, the information pertaining to the outstanding interest rate swap agreement used to hedge variable rate debt is as follows:
|
| | | | | | | |
| | December 31, |
| | 2013 | | 2012 |
| | (Dollars in Thousands) |
| Notional amount | $ | 8,000 |
| | $ | 8,000 |
|
| Weighted average fixed pay rate | 2.44 | % | | 2.44 | % |
| Weighted average variable receive rate | 0.24 | % | | 0.31 | % |
| Weighted average maturity in years | 2.0 |
| | 3.0 |
|
| Unrealized loss relating to interest rate swap | $ | 312 |
| | $ | 470 |
|
At December 31, 2013 and 2012, the unrealized loss related to the above mentioned interest rate swap was recorded as a derivative liability. Changes in the fair value of an interest rate swap designated as a hedging instrument of the variability of cash flows associated with long-term debt are reported in other comprehensive income (loss). These amounts are subsequently reclassified into interest expense as a yield adjustment in the same period in which the related interest on the long-term debt affects earnings.
Risk management results for the years ended December 31, 2013 and 2012 related to the balance sheet hedging of long-term debt indicate that the hedge was 100% effective and that there was no component of the derivative instrument’s loss which was excluded from the assessment of hedge effectiveness.
SI FINANCIAL GROUP, INC.
NOTES TO CONSOLIDATED FINANCIAL STATEMENTS
DECEMBER 31, 2013, 2012 AND 2011
The Company’s derivative contract contains a provision establishing a collateral requirement (subject to minimum collateral posting thresholds) based on the Company’s external credit rating. If the Company’s junior subordinated debt rating was to fall below the level generally recognized as investment grade, the counterparty to such derivative contract could require additional collateral on the derivative transaction in a net liability position (after considering the effect of bilateral netting arrangements and posted collateral). The Company had previously posted collateral of $600,000 in the normal course of business for a derivative instrument, with a credit-related contingent feature, that was in a net liability position at December 31, 2012. During the fourth quarter of 2013, the posted collateral was reduced to $400,000 for the derivative instrument, with a credit-related contingent feature, that was in a net liability position at December 31, 2013.
Derivative Instruments Not Designated As Hedging Instruments
Certain derivative instruments do not meet the requirements to be accounted for as hedging instruments. These undesignated derivative instruments are recognized on the consolidated balance sheets at fair value, with changes in fair value recorded in other noninterest income.
Interest Rate Swap Agreement - During the first quarter of 2012, management entered into an interest rate swap agreement that does not meet the strict hedge accounting requirements of FASB's "Derivatives and Hedging" standard to manage the Company's exposure to interest rate movements and other identified risks. Changes in fair value of this instrument are recorded as a component of noninterest income. At December 31, 2013 and 2012 information pertaining to the Company's interest rate swap agreement not designated as a hedge is as follows:
|
| | | | | | | |
| | December 31, |
| | 2013 | | 2012 |
| | (Dollars in Thousands) |
| Notional amount | $ | 15,000 |
| | $ | 15,000 |
|
| Weighted average fixed pay rate | 1.26 | % | | 1.26 | % |
| Weighted average variable receive rate | 0.25 | % | | 0.35 | % |
| Weighted average maturity in years | 3.0 |
| | 4.0 |
|
| Unrealized loss relating to interest rate swap | $ | 174 |
| | $ | 379 |
|
The Company reported a gain in fair value on the interest rate swap not designated as a hedge of $205,000 in noninterest income for the year ended December 31, 2013 and a loss in fair value of $379,000 in noninterest income for the year ended December 31, 2012.
Derivative Loan Commitments - Mortgage loan commitments are referred to as derivative loan commitments if the loan that will result from exercise of the commitment will be held for sale upon funding. The Company enters into commitments to fund residential mortgage loans at specified times in the future, with the intention that these loans will subsequently be sold in the secondary market. A mortgage loan commitment binds the Company to lend funds to a potential borrower at a specified interest rate and within a specified period of time, generally up to 60 days after inception of the rate lock.
Outstanding derivative loan commitments expose the Company to the risk that the price of the loans arising from exercise of the loan commitment might decline from inception of the rate lock to funding of the loan due to increases in mortgage interest rates. If interest rates increase, the value of these loan commitments decrease. Conversely, if interest rates decrease, the value of these loan commitments increase. The notional amount of undesignated mortgage loan commitments was $3.1 million and $7.8 million at December 31, 2013 and 2012, respectively. At December 31, 2013 and 2012, the fair values of such commitments were a net asset of $14,000 and $10,000, respectively.
SI FINANCIAL GROUP, INC.
NOTES TO CONSOLIDATED FINANCIAL STATEMENTS
DECEMBER 31, 2013, 2012 AND 2011
Forward Loan Sale Commitments - To protect against the price risk inherent in derivative loan commitments, the Company utilizes “mandatory delivery” forward loan sale commitments to mitigate the risk of potential decreases in the values of loans that would result from the exercise of the derivative loan commitments.
With a “mandatory delivery” contract, the Company commits to deliver a certain principal amount of mortgage loans to an investor at a specified price on or before a specified date. If the Company fails to deliver the amount of mortgages necessary to fulfill the commitment by the specified date, it is obligated to pay a “pair-off” fee, based on then-current market prices, to the investor to compensate the investor for the shortfall.
The Company expects that these forward loan sale commitments will experience changes in fair value opposite to the change in fair value of derivative loan commitments. The notional amount of undesignated forward loan sale commitments was $3.6 million and $5.9 million at December 31, 2013 and 2012, respectively. At December 31, 2013 and 2012, the fair value of such commitments were a net asset of $8,000 and $3,000, respectively.
Interest Rate Risk Management - Derivative Instruments
The following table presents the fair values of derivative instruments as well as their classification on the consolidated balance sheets at December 31, 2013 and 2012.
|
| | | | | | | | | | | | | | | | |
| | | | December 31, 2013 | | December 31, 2012 |
| | Balance Sheet Location | | Notional Amount | | Estimated Fair Value | | Notional Amount | | Estimated Fair Value |
| | | | (In Thousands) |
| Derivative designated as hedging instrument: | | | | | | | | | |
| Interest rate swap | Other Liabilities | | $ | 8,000 |
| | $ | (312 | ) | | $ | 8,000 |
| | (470 | ) |
| Derivatives not designated as hedging instruments: | | | | | | | | | |
| Interest rate swap | Other Liabilities | | 15,000 |
| | (174 | ) | | 15,000 |
| | (379 | ) |
| Derivative loan commitments | Other Assets | | 3,129 |
| | 14 |
| | 7,844 |
| | 10 |
|
| Forward loan sale commitments | Other Assets | | 3,581 |
| | 8 |
| | 5,919 |
| | 3 |
|
NOTE 18. RESTRICTIONS ON DIVIDENDS, LOANS AND ADVANCES
Federal regulations place certain restrictions on dividends paid and loans or advances made by the Bank to the Company. The total amount of dividends which may be declared in a given calendar year without regulatory approval is generally limited to the net income of the Bank for that year plus retained net income for the preceding two years.
At December 31, 2013 and 2012, the Bank’s retained earnings available for payment of dividends was $3.9 million and $6.4 million, respectively. Accordingly, $134.6 million and $103.5 million of the Company’s equity in the net assets of the Bank were restricted at December 31, 2013 and 2012, respectively.
In addition, the Company is further restricted, under its junior subordinated debt obligation, from paying dividends to its shareholders if the Company has deferred interest payments or has otherwise defaulted on its junior subordinated debt obligation.
Under federal regulation, the Bank is also limited to the amount it may loan to the Company, unless such loans are collateralized by specific obligations. Loans or advances to the Company by the Bank are limited to 10% of the Bank’s capital stock and surplus on a secured basis. In addition, dividends paid by the Bank to the Company would be prohibited if the effect thereof, would cause the Bank’s capital to be reduced below applicable minimum capital requirements.
SI FINANCIAL GROUP, INC.
NOTES TO CONSOLIDATED FINANCIAL STATEMENTS
DECEMBER 31, 2013, 2012 AND 2011
NOTE 19. COMMON STOCK REPURCHASE PROGRAM
The Company repurchases stock primarily to create economic value for its shareholders and to provide additional liquidity to the stock. In accordance with applicable regulations, the Company could not repurchase shares of its common stock during the first year following the completion of its public offering and concurrent conversion in January 2011, except to fund equity benefit plans other than stock options, or, with prior regulatory approval, when extraordinary circumstances exist. The Company repurchased 547 shares of the Company's common stock withheld on behalf of plan participants to satisfy tax withholding obligations related to the vesting of restricted shares at a cost of $5,000 during the year ended December 31, 2011.
In May 2012, the Board of Directors approved a plan to repurchase up to 5%, or approximately 528,815 shares, of the Company’s common stock through open market purchases or privately negotiated transactions. Shares repurchased under the program are retired and reflected as a reduction in shareholders’ equity. As of December 31, 2012, the Company repurchased 465,788 shares at a cost of approximately $5.3 million under this plan. The Company repurchased 8,336 shares of the Company's common stock withheld on behalf of plan participants to satisfy tax withholding obligations related to the vesting of restricted shares at a cost of $98,000 during the year ended December 31, 2013.
NOTE 20. CONDENSED FINANCIAL STATEMENTS OF PARENT COMPANY
Condensed financial information pertaining only to the parent company, SI Financial Group, Inc., is as follows:
|
| | | | | | | |
| | December 31, |
| Condensed Balance Sheets | 2013 | | 2012 |
| Assets: | (In Thousands) |
| Cash and cash equivalents | $ | 6,589 |
| | $ | 9,591 |
|
| Available for sale securities | 5,082 |
| | 8,380 |
|
| Investment in Savings Institute Bank and Trust Company | 138,506 |
| | 109,948 |
|
| ESOP note receivable | 5,145 |
| | 5,600 |
|
| Taxes receivable | 3,885 |
| | — |
|
| Other assets | 2,322 |
| | 991 |
|
| Total assets | $ | 161,529 |
| | $ | 134,510 |
|
| | | | |
| Liabilities and Shareholders' Equity: | |
| | |
|
| Liabilities | $ | 8,687 |
| | $ | 8,751 |
|
| Shareholders' equity | 152,842 |
| | 125,759 |
|
| Total liabilities and shareholders' equity | $ | 161,529 |
| | $ | 134,510 |
|
SI FINANCIAL GROUP, INC.
NOTES TO CONSOLIDATED FINANCIAL STATEMENTS
DECEMBER 31, 2013, 2012 AND 2011
|
| | | | | | | | | | | |
| Condensed Statements of Operations | Years Ended December 31, |
| | 2013 | | 2012 | | 2011 |
| | (In Thousands) |
| Dividend from subsidiary | $ | 24,400 |
| | $ | — |
| | $ | — |
|
| Interest and dividends on investments | 123 |
| | 159 |
| | 248 |
|
| Other income | 276 |
| | 399 |
| | 484 |
|
| Total income | 24,799 |
| | 558 |
| | 732 |
|
| | | | | | |
| Operating expenses | 2,152 |
| | 758 |
| | 1,275 |
|
| Income (loss) before income taxes and equity in undistributed net income | 22,647 |
| | (200 | ) | | (543 | ) |
| Income tax benefit | (418 | ) | | (35 | ) | | (185 | ) |
| Income (loss) before equity in undistributed net (loss) income of subsidiary | 23,065 |
| | (165 | ) | | (358 | ) |
| Equity in undistributed net (loss) income of subsidiary | (23,920 | ) | | 1,283 |
| | 2,775 |
|
| Net (loss) income | $ | (855 | ) | | $ | 1,118 |
| | $ | 2,417 |
|
|
| | | | | | | | | | | |
| Condensed Statements of Cash Flows | Years Ended December 31, |
| | 2013 | | 2012 | | 2011 |
| Cash flows from operating activities: | (In Thousands) |
| Net (loss) income | $ | (855 | ) | | $ | 1,118 |
| | $ | 2,417 |
|
| Adjustments to reconcile net (loss) income to net cash (used in) provided by operating activities: | |
| | |
| | |
|
| Equity in undistributed (loss) income of subsidiary | 23,920 |
| | (1,283 | ) | | (2,775 | ) |
| Excess tax benefit from share-based payment arrangements | (9 | ) | | (4 | ) | | (3 | ) |
| Deferred income taxes | (1,050 | ) | | 60 |
| | (104 | ) |
| Other, net | 211 |
| | 163 |
| | (497 | ) |
| Cash provided by (used in) operating activities | 22,217 |
| | 54 |
| | (962 | ) |
| | | | | | |
| Cash flows from investing activities: | |
| | |
| | |
|
| Purchase of available for sale securities | — |
| | (1,907 | ) | | (8,277 | ) |
| Proceeds from maturities of available for sale securities | 3,165 |
| | 2,069 |
| | 2,000 |
|
| Proceeds from sale of available for sale securities | — |
| | 2,025 |
| | 2,300 |
|
| Net cash paid for Newport acquisition | (28,272 | ) | | — |
| | — |
|
| Payments received on ESOP note receivable | 455 |
| | 435 |
| | 421 |
|
| Issuance of ESOP note receivable | — |
| | — |
| | (3,141 | ) |
| Investment in subsidiary | 655 |
| | 499 |
| | (29,450 | ) |
| Cash (used in) provided by investing activities | (23,997 | ) | | 3,121 |
| | (36,147 | ) |
| | | | | | |
| Cash flows from financing activities: | |
| | |
| | |
|
| Purchase of shares for equity plan | — |
| | (2,238 | ) | | — |
|
| Stock options exercised | 94 |
| | 10 |
| | — |
|
| Common shares repurchased | (98 | ) | | (5,301 | ) | | (5 | ) |
| Cash dividends on common stock | (1,227 | ) | | (1,171 | ) | | (1,191 | ) |
| Excess tax benefit from share-based payment arrangements | 9 |
| | 4 |
| | 3 |
|
| Net proceeds from common stock offering | — |
| | — |
| | 51,099 |
|
| Cash (used in) provided by financing activities | (1,222 | ) | | (8,696 | ) | | 49,906 |
|
| | | | | | |
| Net change in cash and cash equivalents | (3,002 | ) | | (5,521 | ) | | 12,797 |
|
| Cash and cash equivalents at beginning of year | 9,591 |
| | 15,112 |
| | 2,315 |
|
| Cash and cash equivalents at end of year | $ | 6,589 |
| | $ | 9,591 |
| | $ | 15,112 |
|
SI FINANCIAL GROUP, INC.
NOTES TO CONSOLIDATED FINANCIAL STATEMENTS
DECEMBER 31, 2013, 2012 AND 2011
NOTE 21. QUARTERLY DATA (UNAUDITED)
Quarterly results of operations for the years ended December 31, 2013 and 2012 are as follows:
|
| | | | | | | | | | | | | | | | | | | | | | | | | | | | | | | | |
| | Year Ended December 31, 2013 | | Year Ended December 31, 2012 |
| | Fourth Quarter | | Third Quarter | | Second Quarter | | First Quarter | | Fourth Quarter | | Third Quarter | | Second Quarter | | First Quarter |
| | (In Thousands, Except Share Amounts) |
| Interest and dividend income | $ | 12,184 |
| | $ | 9,151 |
| | $ | 8,302 |
| | $ | 8,555 |
| | $ | 8,863 |
| | $ | 8,862 |
| | $ | 8,878 |
| | $ | 9,221 |
|
| | | | | | | | | | | | | | | | |
| Interest expense | 2,097 |
| | 2,064 |
| | 2,083 |
| | 2,210 |
| | 2,322 |
| | 2,368 |
| | 2,392 |
| | 2,551 |
|
| | | | | | | | | | | | | | | | |
| Net interest and dividend income | 10,087 |
| | 7,087 |
| | 6,219 |
| | 6,345 |
| | 6,541 |
| | 6,494 |
| | 6,486 |
| | 6,670 |
|
| | | | | | | | | | | | | | | | |
| Provision for loan losses | 686 |
| | 443 |
| | 55 |
| | 135 |
| | 646 |
| | 1,334 |
| | 432 |
| | 484 |
|
| | | | | | | | | | | | | | | | |
| Net interest and dividend income after provision for loan losses | 9,401 |
| | 6,644 |
| | 6,164 |
| | 6,210 |
| | 5,895 |
| | 5,160 |
| | 6,054 |
| | 6,186 |
|
| | | | | | | | | | | | | | | | |
| Noninterest income | 2,560 |
| | 1,233 |
| | 2,072 |
| | 2,440 |
| | 2,398 |
| | 1,232 |
| | 2,326 |
| | 2,761 |
|
| | | | | | | | | | | | | | | | |
| Noninterest expenses | 10,513 |
| | 10,374 |
| | 8,209 |
| | 8,581 |
| | 7,338 |
| | 7,408 |
| | 7,557 |
| | 8,350 |
|
| | | | | | | | | | | | | | | | |
| Income (loss) before income taxes | 1,448 |
| | (2,497 | ) | | 27 |
| | 69 |
| | 955 |
| | (1,016 | ) | | 823 |
| | 597 |
|
| | | | | | | | | | | | | | | | |
| Income tax provision (benefit) | 424 |
| | (755 | ) | | 87 |
| | 146 |
| | 210 |
| | (316 | ) | | 153 |
| | 194 |
|
| | | | | | | | | | | | | | | | |
| Net income (loss) | $ | 1,024 |
| | $ | (1,742 | ) | | $ | (60 | ) | | $ | (77 | ) | | $ | 745 |
| | $ | (700 | ) | | $ | 670 |
| | $ | 403 |
|
| | | | | | | | | | | | | | | | |
| Earnings (loss) per share: | | | | | | | | | |
| | |
| | |
| | |
|
| Basic | $ | 0.08 |
| | $ | (0.17 | ) | | $ | (0.01 | ) | | $ | (0.01 | ) | | $ | 0.08 |
| | $ | (0.07 | ) | | $ | 0.07 |
| | $ | 0.04 |
|
| Diluted | $ | 0.08 |
| | $ | (0.17 | ) | | $ | (0.01 | ) | | $ | (0.01 | ) | | $ | 0.08 |
| | $ | (0.07 | ) | | $ | 0.07 |
| | $ | 0.04 |
|
| | | | | | | | | | | | | | | | | |
Quarterly per share data may not add to annual data due to rounding
NOTE 22. ACQUISITION OF NEWPORT BANCORP, INC.
On September 6, 2013, the Company acquired Newport. The primary purpose of the acquisition with Newport was to expand the Company's presence in Rhode Island and diversify its market area. The transaction qualified as a tax-free reorganization for federal income tax purposes. Merger consideration paid in the transaction to shareholders of Newport totaled $61.0 million, consisting of 2,683,099 shares of Company common stock and $30.9 million in cash.
The Company accounted for the transaction using the acquisition method. Accordingly, the Company recorded acquisition expenses totaling $2.6 million (pre-tax) during 2013. The acquisition method requires an acquirer to recognize the assets acquired and the liabilities assumed at fair value as of the acquisition date. Additionally, the Company's results of operations include Newport's operating results from the date of acquisition.
SI FINANCIAL GROUP, INC.
NOTES TO CONSOLIDATED FINANCIAL STATEMENTS
DECEMBER 31, 2013, 2012 AND 2011
The following table summarizes the estimated fair value of the assets acquired and liabilities assumed as of the date of the acquisition (in thousands).
|
| | | |
| Assets: | |
| Cash and cash equivalents | $ | 21,955 |
|
| Investment securities | 16,431 |
|
| Loans receivable, net | 361,055 |
|
| Premises and equipment | 9,726 |
|
| Federal Home Loan Bank stock | 5,356 |
|
| Goodwill | 7,762 |
|
| Core deposit intangible | 8,573 |
|
| Other real estate owned | 100 |
|
| Bank-owned life insurance | 11,266 |
|
| Accrued interest receivable | 848 |
|
| Deferred tax asset, net | 2,829 |
|
| Other assets | 525 |
|
| Total assets acquired | 446,426 |
|
| | |
| Liabilities: | |
| Deposits | 288,437 |
|
| FHLB advances | 74,820 |
|
| Repurchase agreement | 15,072 |
|
| Accrued expense and other liabilities | 7,102 |
|
| Total liabilities assumed | 385,431 |
|
| Net assets acquired | $ | 60,995 |
|
As noted above, the Company acquired loans with a fair value of $361.1 million. Included in this amount was $6.9 million of loans with evidence of deterioration of credit quality since origination for which it was probable, at the time of the acquisition, that the Company would be unable to collect all contractually required payments receivable. The Company recorded an aggregate nonaccretable credit discount of $1.2 million, which is defined as the loans' contractually required payments receivable in excess of the amount of its cash flows expected to be collected. The Company considered factors such as payment history, collateral values and accrual status when determining whether there was evidence of deterioration of the loans' credit quality at the acquisition date.
The following table summarizes the unaudited pro forma financial results of operations as if the Company acquired Newport on January 1, 2012. Newport's operating results for 2013 included activity through September 6, 2013.
|
| | | | | | | | |
| | | Years Ended December 31, |
| (In Thousands, Except Per Share Amounts) | | 2013 | | 2012 |
| | |
| Net interest income | | $ | 39,735 |
| | $ | 41,614 |
|
| Net income | | 2,324 |
| | 3,322 |
|
| Earnings per share - Basic | | 0.19 |
| | 0.27 |
|
| Earnings per share - Diluted | | 0.19 |
| | 0.27 |
|