Exhibit (c)-(3)
|
Project Iris
Special Committee Discussion Materials
Goldman Sachs (Asia) L.L.C.
October 29, 2013
Investment Banking Division
|
Disclaimer
Goldman Sachs (Asia) L.L.C. (“Goldman Sachs”) has prepared and provided these materials and Goldman Sachs’ related presentation (the “Confidential
Information”) solely for the information and assistance of the Special Committee of the Board of Directors the “Special Committee” of Iris (the “Company”) in connection with its consideration of the matters referred to herein. Without Goldman Sachs’ prior written consent, the Confidential Information may not be circulated or referred to publicly, disclosed to or relied upon by any other person, or used or relied upon for any other purpose. Notwithstanding anything herein to the contrary, the Company may disclose to any person the US federal income and state income tax treatment and tax structure of any transaction described herein and all materials of any kind (including tax opinions and other tax analyses) that are provided to the Company relating to such tax treatment and tax structure, without Goldman Sachs imposing any limitation of any kind. The Confidential Information, including this disclaimer, is subject to, and governed by, any written agreement between the Company, the Board and/or any committee thereof, on the one hand, and Goldman Sachs, on the other hand.
Goldman Sachs and its affiliates are engaged in advisory, underwriting and financing, principal investing, sales and trading, research, investment management and other financial and non-financial activities and services for various persons and entities. Goldman Sachs and its affiliates and employees, and funds or other entities in which they invest or with which they co-invest, may at any time purchase, sell, hold or vote long or short positions and investments in securities, derivatives, loans, commodities, currencies, credit default swaps and other financial instruments of the Company, any other party to any transaction and any of their respective affiliates or any currency or commodity that may be involved in any transaction for the accounts of Goldman Sachs and its affiliates and employees and their customers.
The Confidential Information has been prepared and based on information obtained by Goldman Sachs from publicly available sources. In preparing the Confidential Information, Goldman Sachs has relied upon and assumed, without assuming any responsibility for independent verification, the accuracy and completeness of all of the financial, legal, regulatory, tax, accounting and other information provided to, discussed with or reviewed by, Goldman Sachs. Goldman Sachs does not provide accounting, tax, legal or regulatory advice. Goldman Sachs’ role in any due diligence review is limited solely to performing such a review as it shall deem necessary to support its own advice and analysis and shall not be on behalf of the Company. Analyses based upon forecasts of future results are not necessarily indicative of actual future results, which may be significantly more or less favorable than suggested by these analyses, and Goldman Sachs does not assume responsibility if future results are materially different from those forecast.
Goldman Sachs has not made an independent evaluation or appraisal of the assets and liabilities of the Company (including any contingent, derivative or other off-balance-sheet assets and liabilities) or any other person and has no obligation to evaluate the solvency of the Company or any person under any law. The analyses in the Confidential Information are not appraisals nor do they necessarily reflect the prices at which businesses or securities actually may be sold or purchased. The Confidential Information does not address the underlying business decision of the Company to engage in any transaction, or the relative merits of any strategic alternative referred to herein as compared to any other alternative that may be available to the Company. The Confidential Information is necessarily based on economic, monetary, market and other conditions as in effect on, and the information made available to Goldman Sachs as of, the date of such Confidential Information and Goldman Sachs assumes no responsibility for updating or revising the Confidential Information. Investment Banking Division
1 |
|
|
Table of Contents
I. Review of Consortium’s Offer
II. Market Perspectives on Iris III. Financial Analysis Appendix A: Additional Materials
Appendix B: Comparison of Selected Companies and Precedent Transactions Appendix C: WACC Calculation
Investment Banking Division
2 |
|
|
I. Review of Consortium’s Offer Investment Banking Division
|
Key Terms of Consortium’s Offer
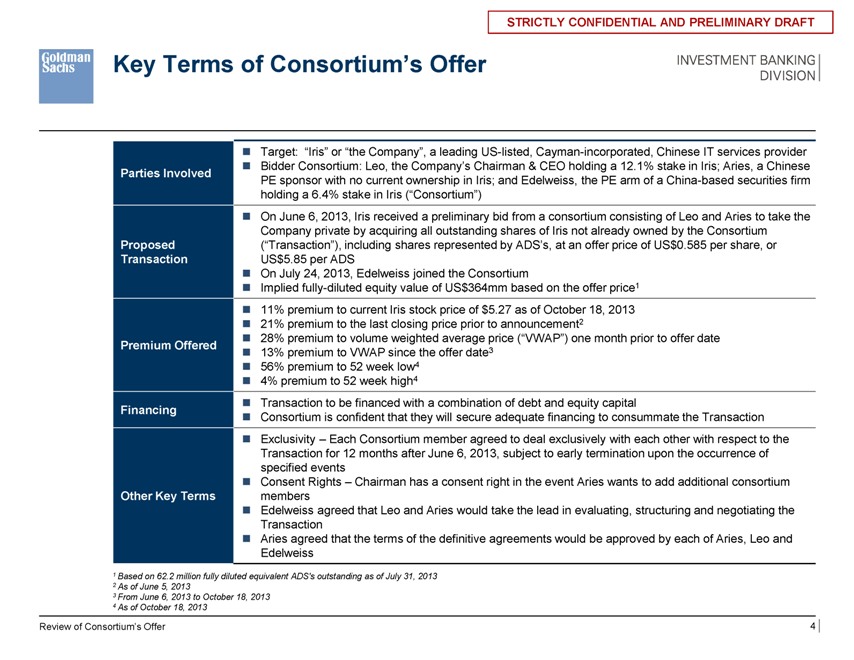
Target: “Iris” or “the Company”, a leading US-listed, Cayman-incorporated, Chinese IT services provider
Parties Involved Bidder Consortium: Leo, the Company’s Chairman & CEO holding a 12.1% stake in Iris; Aries, a Chinese
PE sponsor with no current ownership in Iris; and Edelweiss, the PE arm of a China-based securities firm
holding a 6.4% stake in Iris (“Consortium”)
On June 6, 2013, Iris received a preliminary bid from a consortium consisting of Leo and Aries to take the
Company private by acquiring all outstanding shares of Iris not already owned by the Consortium
Proposed (“Transaction”), including shares represented by ADS’s, at an offer price of US$0.585 per share, or
Transaction US$5.85 per ADS
On July 24, 2013, Edelweiss joined the Consortium
Implied fully-diluted equity value of US$364mm based on the offer price1
11% premium to current Iris stock price of $5.27 as of October 18, 2013
21% premium to the last closing price prior to announcement2
28% premium to volume weighted average price (“VWAP”) one month prior to offer date
Premium Offered 13% premium to VWAP since the offer date3
56% premium to 52 week low4
4% premium to 52 week high4
Transaction to be financed with a combination of debt and equity capital
Financing Consortium is confident that they will secure adequate financing to consummate the Transaction
Exclusivity – Each Consortium member agreed to deal exclusively with each other with respect to the
Transaction for 12 months after June 6, 2013, subject to early termination upon the occurrence of
specified events Investment Banking Division
Consent Rights – Chairman has a consent right in the event Aries wants to add additional consortium
Other Key Terms members
Edelweiss agreed that Leo and Aries would take the lead in evaluating, structuring and negotiating the
Transaction
Aries agreed that the terms of the definitive agreements would be approved by each of Aries, Leo and
Edelweiss
1 |
| Based on 62.2 million fully diluted equivalent ADS’s outstanding as of July 31, 2013 |
2 |
| As of June 5, 2013 |
3 |
| From June 6, 2013 to October 18, 2013 |
4 |
| As of October 18, 2013 |
Review of Consortium’s Offer 4
|
Illustrative Offer Price Premium and Multiples
(US$ in millions except per share data)
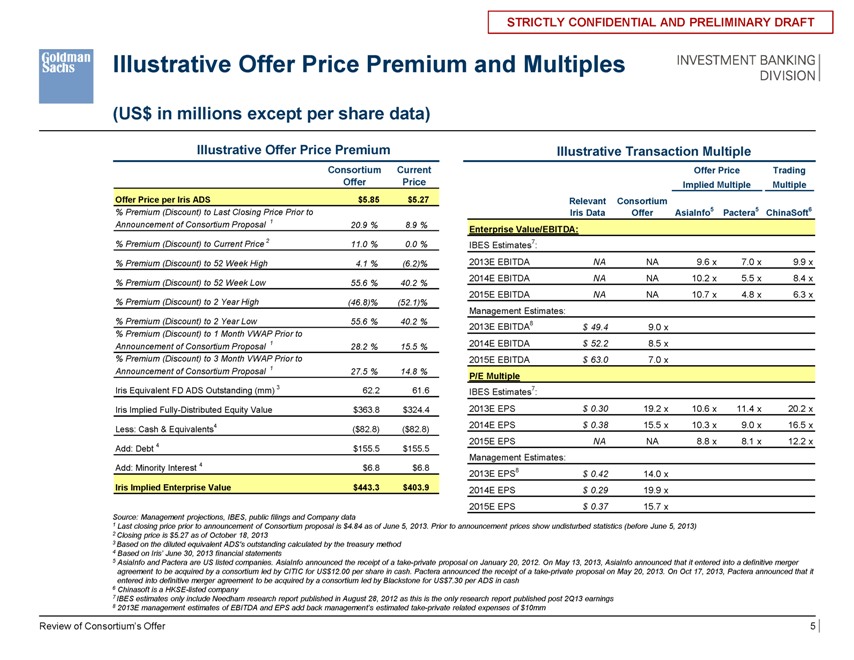
Illustrative Offer Price Premium Illustrative Transaction Multiple
Consortium Current Offer Price Trading
Offer Price Implied Multiple Multiple
Offer Price per Iris ADS $5.85 $5.27 Relevant Consortium
% Premium (Discount) to Last Closing Price Prior to Iris Data Offer AsiaInfo5 Pactera5 ChinaSoft6
Announcement of Consortium Proposal 1 20.9 % 8.9 % Enterprise Value/EBITDA:
% Premium (Discount) to Current Price 2 11.0 % 0.0 % IBES Estimates7 :
% Premium (Discount) to 52 Week High 4.1 % (6.2)% 2013E EBITDA NA NA 9.6 x 7.0 x 9.9 x
% Premium (Discount) to 52 Week Low 55.6 % 40.2 % 2014E EBITDA NA NA 10.2 x 5.5 x 8.4 x
2015E EBITDA NA NA 10.7 x 4.8 x 6.3 x
% Premium (Discount) to 2 Year High (46.8)% (52.1)%
Management Estimates:
% Premium (Discount) to 2 Year Low 55.6 % 40.2 % 2013E EBITDA8 $ 49.4 9.0 x
% Premium (Discount) to 1 Month VWAP Prior to
Announcement of Consortium Proposal 1 28.2 % 15.5 % 2014E EBITDA $ 52.2 8.5 x
% Premium (Discount) to 3 Month VWAP Prior to 2015E EBITDA $ 63.0 7.0 x
Announcement of Consortium Proposal 1 27.5 % 14.8 % P/E Multiple
Iris Equivalent FD ADS Outstanding (mm) 3 62.2 61.6 IBES Estimates7 :
Iris Implied Fully-Distributed Equity Value $363.8 $324.4 2013E EPS $ 0.30 19.2 x 10.6 x 11.4 x 20.2 x
4 2014E EPS $ 0.38 15.5 x 10.3 x 9.0 x 16.5 x
Less: Cash & Equivalents ($82.8) ($82.8) Investment Banking Division
2015E EPS NA NA 8.8 x 8.1 x 12.2 x
Add: Debt 4 $155.5 $155.5
Management Estimates:
Add: Minority Interest 4 $6.8 $6.8 2013E EPS8 $ 0.42 14.0 x
Iris Implied Enterprise Value $443.3 $403.9 2014E EPS $ 0.29 19.9 x
2015E EPS $ 0.37 15.7 x
Source: Management projections, IBES, public filings and Company data
1 Last closing price prior to announcement of Consortium proposal is $4.84 as of June 5, 2013. Prior to announcement prices show undisturbed statistics (before June 5, 2013)
2 Closing price is $5.27 as of October 18, 2013
3 Based on the diluted equivalent ADS’s outstanding calculated by the treasury method
4 Based on Iris’ June 30, 2013 financial statements
5 AsiaInfo and Pactera are US listed companies. AsiaInfo announced the receipt of a take-private proposal on January 20, 2012. On May 13, 2013, AsiaInfo announced that it entered into a definitive merger agreement to be acquired by a consortium led by CITIC for US$12.00 per share in cash. Pactera announced the receipt of a take-private proposal on May 20, 2013. On Oct 17, 2013, Pactera announced that it entered into definitive merger agreement to be acquired by a consortium led by Blackstone for US$7.30 per ADS in cash
6 Chinasoft is a HKSE-listed company
7 IBES estimates only include Needham research report published in August 28, 2012 as this is the only research report published post 2Q13 earnings
8 2013E management estimates of EBITDA and EPS add back management’s estimated take-private related expenses of $10mm
Review of Consortium’s Offer 5
|
II. Market Perspectives on Iris
Investment Banking Division
|
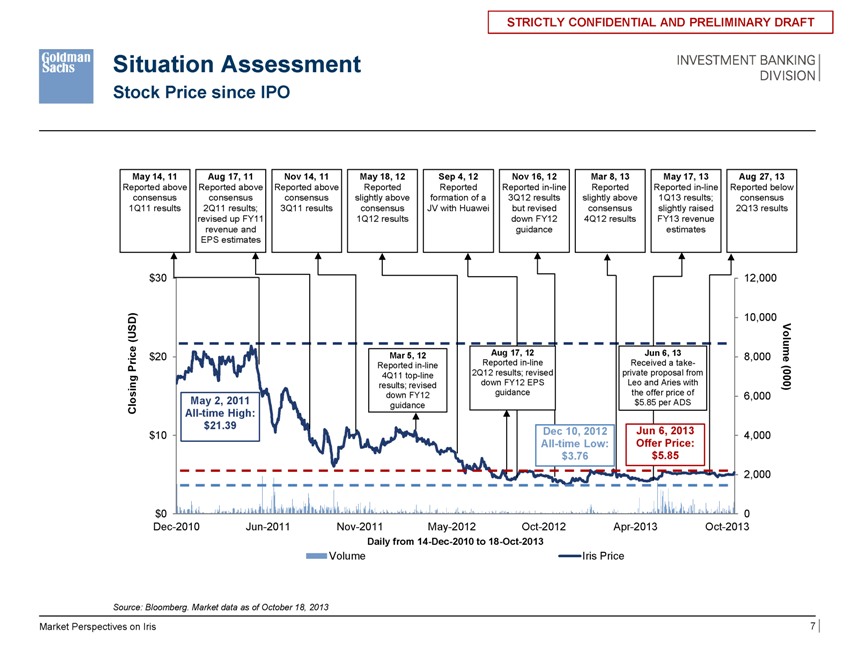
Situation Assessment
Stock Price since IPO
May 14, 11 Aug 17, 11 Nov 14, 11 May 18, 12 Sep 4, 12 Nov 16, 12 Mar 8, 13 May 17, 13 Aug 27, 13
Reported above Reported above Reported above Reported Reported Reported in-line Reported Reported in-line Reported below
consensus consensus consensus slightly above formation of a 3Q12 results slightly above 1Q13 results; consensus
1Q11 results 2Q11 results; 3Q11 results consensus JV with Huawei but revised consensus slightly raised 2Q13 results
revised up FY11 1Q12 results down FY12 4Q12 results FY13 revenue
revenue and guidance estimates
EPS estimates
$30 12,000
10,000
(USD) Vo
ice $20 Mar 5, 12 Aug 17, 12 Jun 6, 13 8,000 lume
Pr Reported in-line 2Q12 Reported results; in-line revised private Received proposal a take- from
4Q11 top-line (00 results; revised down FY12 EPS Leo and Aries with 0)
down FY12 guidance the offer price of 6,000
Closing May 2, 2011 guidance $5.85 per ADS
All-time High:
$21.39 Dec 10, 2012 Jun 6, 2013
$10 4,000
All-time Low: Offer Price:
$3.76 $5.85
2,000
$0 0
Dec-2010 Jun-2011 Nov-2011 May-2012 Oct-2012 Apr-2013 Oct-2013
Daily from 14-Dec-2010 to 18-Oct-2013
Volume Iris Price
Source: Bloomberg. Market data as of October 18, 2013
Investment Banking Division
Market Perspectives on Iris 7
|
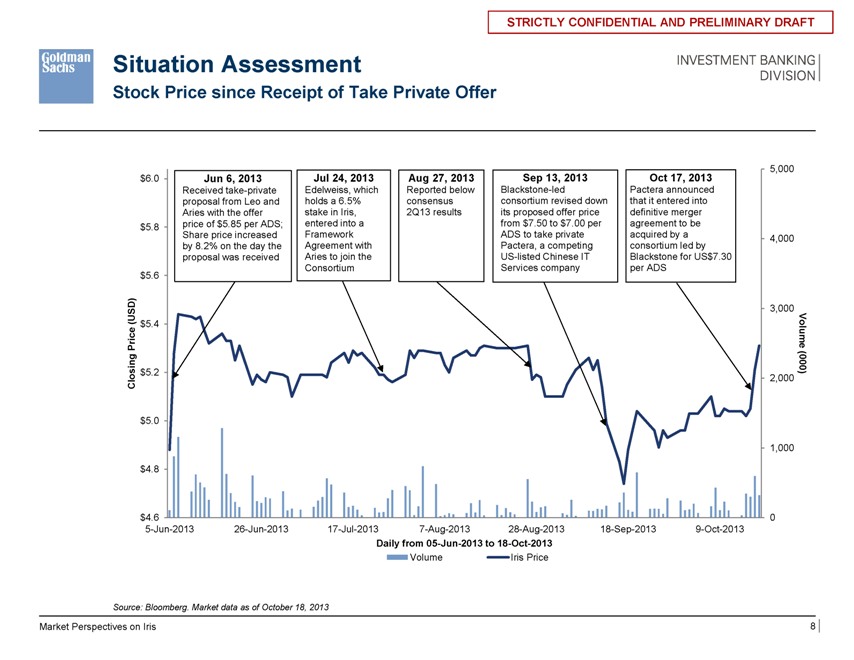
Situation Assessment
Stock Price since Receipt of Take Private Offer
5,000
$6.0 Jun 6, 2013 Jul 24, 2013 Aug 27, 2013 Sep 13, 2013 Oct 17, 2013
Received take-private Edelweiss, which Reported below Blackstone-led Pactera announced
proposal from Leo and holds a 6.5% consensus consortium revised down that it entered into
Aries with the offer stake in Iris, 2Q13 results its proposed offer price definitive merger
$5.8 price of $5.85 per ADS; entered into a from $7.50 to $7.00 per agreement to be
Share price increased Framework ADS to take private acquired by a 4,000
by 8.2% on the day the Agreement with Pactera, a competing consortium led by
proposal was received Aries to join the US-listed Chinese IT Blackstone for US$7.30
Consortium Services company per ADS
$5.6
(USD) 3,000
Price $5.4 Volume
g (00
in $5.2 0)
Clos 2,000
$5.0
1,000
$4.8
$4.6 0
5-Jun-2013 26-Jun-2013 17-Jul-2013 7-Aug-2013 28-Aug-2013 18-Sep-2013 9-Oct-2013
Daily from 05-Jun-2013 to 18-Oct-2013
Volume Iris Price
Source: Bloomberg. Market data as of October 18, 2013
Market Perspectives on Iris 8 Investment Banking Division
|
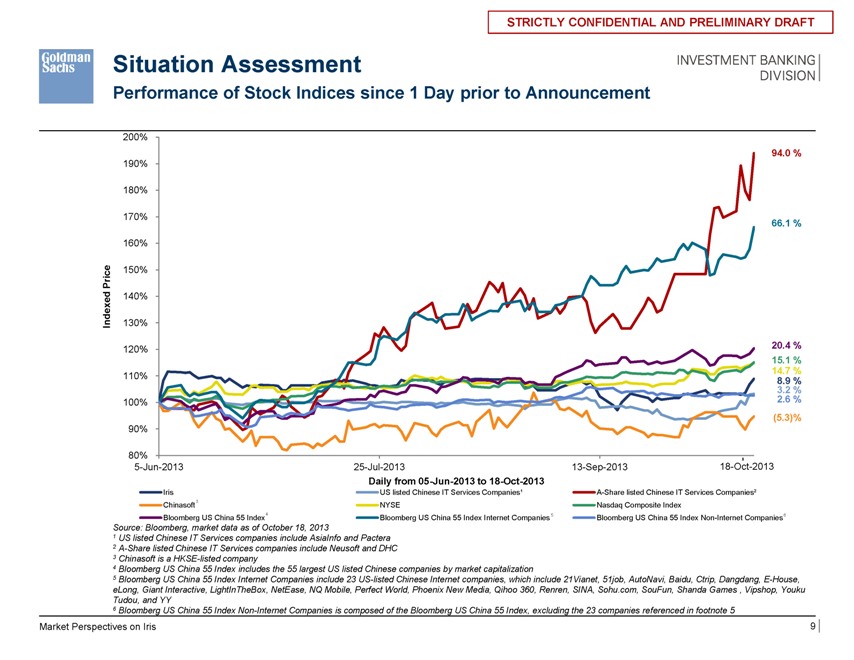
Situation Assessment
Performance of Stock Indices since 1 Day prior to Announcement
200%
94.0 %
190%
180%
170%
66.1 %
160%
e 150%
Pric
d 140%
e
dex
In 130%
120% 20.4 %
15.1 %
110% 14.7 %
8.9 %
3.2 %
100% 2.6 %
(5.3)%
90%
80%
5-Jun-2013 25-Jul-2013 13-Sep-2013 18-Oct-2013
Daily from 05-Jun-2013 to 18-Oct-2013
Iris US listed Chinese IT Services Companies¹ A-Share listed Chinese IT Services Companies²
Chinasoft 3 NYSE Nasdaq Composite Index
Bloomberg US China 55 Index4 Bloomberg US China 55 Index Internet Companies 5 Bloomberg US China 55 Index Non-Internet Companies 6
Source: Bloomberg, market data as of October 18, 2013
1 US listed Chinese IT Services companies include AsiaInfo and Pactera
2 A-Share listed Chinese IT Services companies include Neusoft and DHC
3 Chinasoft is a HKSE-listed company
4 Bloomberg US China 55 Index includes the 55 largest US listed Chinese companies by market capitalization
5 Bloomberg US China 55 Index Internet Companies include 23 US-listed Chinese Internet companies, which include 21Vianet, 51job, AutoNavi, Baidu, Ctrip, Dangdang, E-House, eLong, Giant Interactive, LightInTheBox, NetEase, NQ Mobile, Perfect World, Phoenix New Media, Qihoo 360, Renren, SINA, Sohu.com, SouFun, Shanda Games , Vipshop, Youku Tudou, and YY
6 Bloomberg US China 55 Index Non-Internet Companies is composed of the Bloomberg US China 55 Index, excluding the 23 companies referenced in footnote 5 Investment Banking Division
Market Perspectives on Iris 9
|
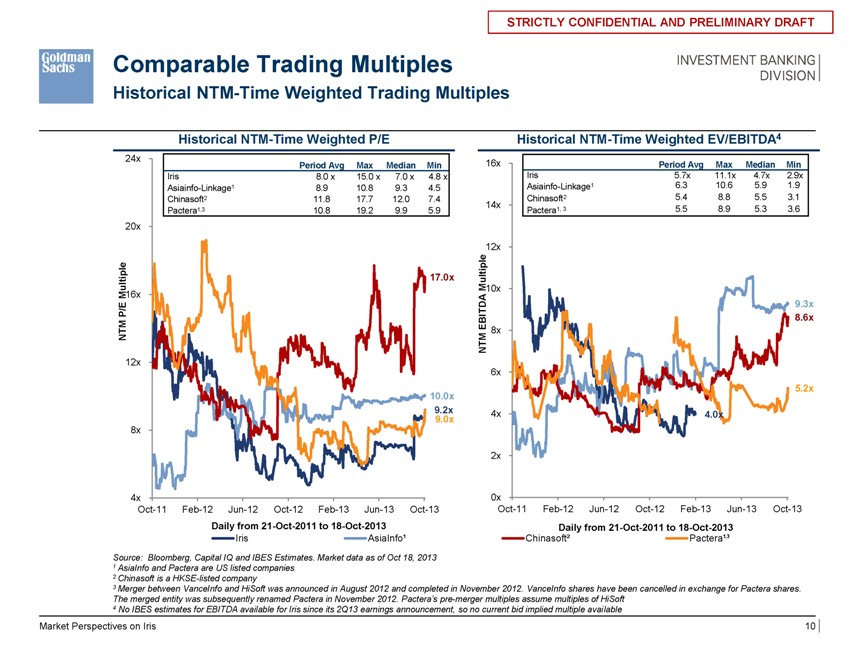
Comparable Trading Multiples
Historical NTM-Time Weighted Trading Multiples
Historical NTM-Time Weighted P/E
24x
Period Avg Max Median Min
Iris 8.0 x 15.0 x 7.0 x 4.8 x
Asiainfo-Linkage1 8.9 10.8 9.3 4.5
Chinasoft2 11.8 17.7 12.0 7.4
Pactera1,3 10.8 19.2 9.9 5.9
20x
tiple 17.0x
Mul16x
P/E
NTM
12x
10.0x
9.2x
9.0x
8x
4x
Oct-11 Feb-12 Jun-12 Oct-12 Feb-13 Jun-13 Oct-13
Daily from 21-Oct-2011 to 18-Oct-2013
Iris AsiaInfo¹
Historical NTM-Time Weighted EV/EBITDA4
16x Period Avg Max Median Min
Iris 5.7x 11.1x 4.7x 2.9x
Asiainfo-Linkage1 6.3 10.6 5.9 1.9
Chinasoft2 5.4 8.8 5.5 3.1
14x Pactera1, 3 5.5 8.9 5.3 3.6
12x
Multiple10x
9.3x
EBITDA 8.6x
NTM 8x
6x
5.2x
4x 4.0x
2x
0x
Oct-11 Feb-12 Jun-12 Oct-12 Feb-13 Jun-13 Oct-13
Daily from 21-Oct-2011 to 18-Oct-2013
Chinasoft² Pactera¹,3
Source: Bloomberg, Capital IQ and IBES Estimates. Market data as of Oct 18, 2013
1 AsiaInfo and Pactera are US listed companies
2 Chinasoft is a HKSE-listed company
3 Merger between VanceInfo and HiSoft was announced in August 2012 and completed in November 2012. VanceInfo shares have been cancelled in exchange for Pactera shares.
The merged entity was subsequently renamed Pactera in November 2012. Pactera’s pre-merger multiples assume multiples of HiSoft
4 No IBES estimates for EBITDA available for Iris since its 2Q13 earnings announcement, so no current bid implied multiple available Investment Banking Division
Market Perspectives on Iris 10
|
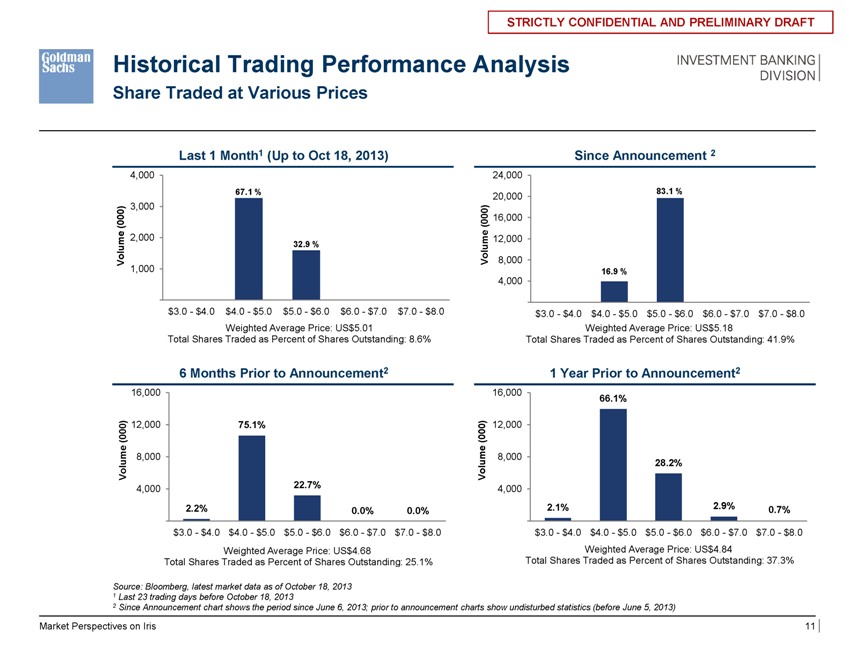
Historical Trading Performance Analysis
Share Traded at Various Prices
Last 1 Month1 (Up to Oct 18, 2013) Since Announcement 2
4,000 24,000
67.1 % 83.1 %
20,000
3,000
(000) (000) 16,000
2,000 m e 12,000
32.9 % u
Volume Vol 8,000
1,000 16.9 %
4,000
$3.0—$4.0 $4.0—$5.0 $5.0—$6.0 $6.0—$7.0 $7.0—$8.0 $3.0—$4.0 $4.0—$5.0 $5.0—$6.0 $6.0—$7.0 $7.0—$8.0
Weighted Average Price: US$5.01 Weighted Average Price: US$5.18 Total Shares Traded as Percent of Shares Outstanding: 8.6% Total Shares Traded as Percent of Shares Outstanding: 41.9%
6 Months Prior to Announcement2 1 Year Prior to Announcement2
16,000 16,000 66.1%
(000) 12,000 75.1% (000) 12,000
Volume 8,000 Volume 8,000 28.2%
4,000 22.7% 4,000
2.2% 0.0% 0.0% 2.1% 2.9% 0.7%
$3.0—$4.0 $4.0—$5.0 $5.0—$6.0 $6.0—$7.0 $7.0—$8.0 $3.0—$4.0 $4.0—$5.0 $5.0—$6.0 $6.0—$7.0 $7.0—$8.0
Weighted Average Price: US$4.68 Weighted Average Price: US$4.84
Total Shares Traded as Percent of Shares Outstanding: 25.1% Total Shares Traded as Percent of Shares Outstanding: 37.3%
Source: Bloomberg, latest market data as of October 18, 2013
1 Last 23 trading days before October 18, 2013
2 Since Announcement chart shows the period since June 6, 2013; prior to announcement charts show undisturbed statistics (before June 5, 2013) Investment Banking Division
Market Perspectives on Iris 11
|
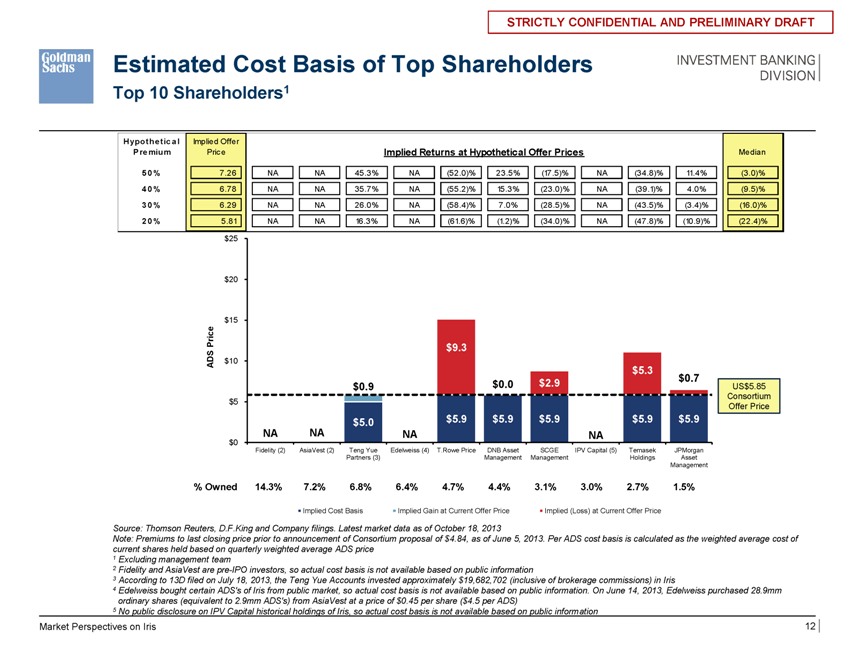
Estimated Cost Basis of Top Shareholders
Top 10 Shareholders1
Hypothe tic a l Implied Offer
P re mium Price Implied Returns at Hypothetical Offer Prices Median
5 |
| 0 % 7.26 NA NA 45.3% NA (52.0)% 23.5% (17.5)% NA (34.8)% 11.4% (3.0)% |
40% 6.78 NA NA 35.7% NA (55.2)% 15.3% (23.0)% NA (39.1)% 4.0% (9.5)%
30% 6.29 NA NA 26.0% NA (58.4)% 7.0% (28.5)% NA (43.5)% (3.4)% (16.0)%
20% 5.81 NA NA 16.3% NA (61.6)% (1.2)% (34.0)% NA (47.8)% (10.9)% (22.4)%
$25
$20
$15
Price $ 9.3
S
D $10
A $ 5.3
$ 0.7
$ 0.9 $ 0.0 $ 2.9 US$5.85
Consortium
$5 Offer Price
$ 5.0 $ 5.9 $ 5.9 $ 5.9 $ 5.9 $ 5.9
NA NA NA NA
$0
Fidelity (2) AsiaVest (2) Teng Yue Edelweiss (4) T.Rowe Price DNB Asset SCGE IPV Capital (5) Temasek JPMorgan
Partners (3) Management Management Holdings Asset
Management
% Owned 14.3% 7.2% 6.8% 6.4% 4.7% 4.4% 3.1% 3.0% 2.7% 1.5%
Implied Cost Basis Implied Gain at Current Offer Price Implied (Loss) at Current Offer Price
Source: Thomson Reuters, D.F.King and Company filings. Latest market data as of October 18, 2013
Note: Premiums to last closing price prior to announcement of Consortium proposal of $4.84, as of June 5, 2013. Per ADS cost basis is calculated as the weighted average cost ofcurrent shares held based on quarterly weighted average ADS price
1 Excluding management team
2 Fidelity and AsiaVest are pre-IPO investors, so actual cost basis is not available based on public information
3 According to 13D filed on July 18, 2013, the Teng Yue Accounts invested approximately $19,682,702 (inclusive of brokerage commissions) in Iris
4 Edelweiss bought certain ADS’s of Iris from public market, so actual cost basis is not available based on public information. On June 14, 2013, Edelweiss purchased 28.9mmordinary shares (equivalent to 2.9mm ADS’s) from AsiaVest at a price of $0.45 per share ($4.5 per ADS)
5 No public disclosure on IPV Capital historical holdings of Iris, so actual cost basis is not available based on public information
Market Perspectives on Iris 12 Investment Banking Division
|
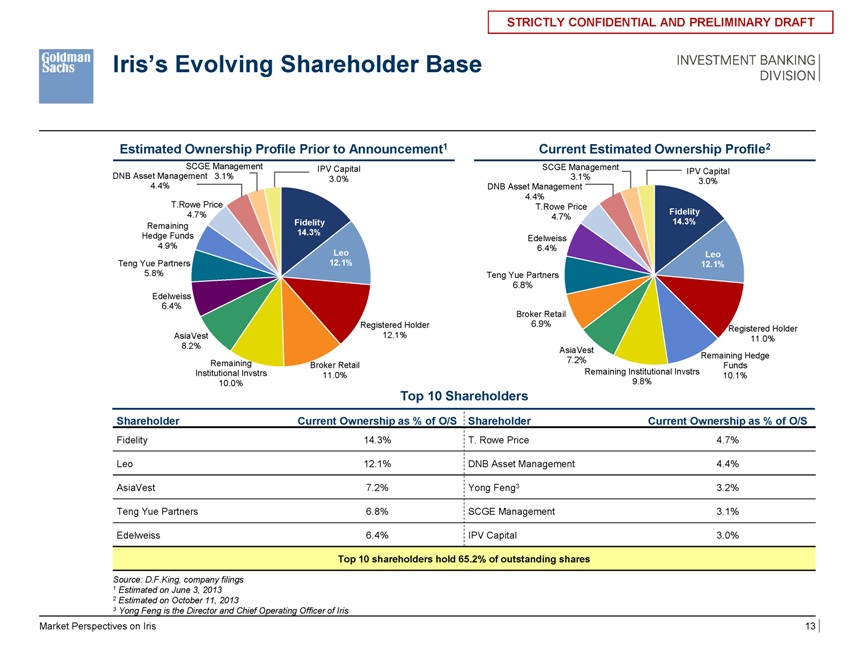
Iris’s Evolving Shareholder Base
Estimated Ownership Profile Prior to Announcement1 Current Estimated Ownership Profile2
SCGE Management IPV Capital SCGE Management IPV Capital
DNB Asset Management 3.1% 3.0% 3.1% 3.0%
4.4% DNB Asset Management
4.4%
T.Rowe Price T.Rowe Price
4.7% 4.7% Fidelity
Remaining Fidelity 14.3%
Hedge Funds 14.3% Edelweiss
4.9% 6.4%
Leo Leo
Teng Yue Partners 12.1% 12.1%
5.8% Teng Yue Partners
6.8%
Edelweiss
6.4%
Broker Retail
Registered Holder 6.9% Registered Holder
AsiaVest 12.1% 11.0%
8.2% AsiaVest
7.2% Remaining Hedge
Remaining Broker Retail Funds
Institutional Invstrs 11.0% Remaining Institutional Invstrs 10.1%
10.0% 9.8%
Top 10 Shareholders
Shareholder Current Ownership as % of O/S Shareholder Current Ownership as % of O/S
Fidelity 14.3% T. Rowe Price 4.7%
Leo 12.1% DNB Asset Management 4.4%
AsiaVest 7.2% Yong Feng3 3.2%
Teng Yue Partners 6.8% SCGE Management 3.1%
Edelweiss 6.4% IPV Capital 3.0%
Top 10 shareholders hold 65.2% of outstanding shares
Source: D.F.King, company filings
1 Estimated on June 3, 2013
2 Estimated on October 11, 2013
3 Yong Feng is the Director and Chief Operating Officer of Iris
Perspectives on Iris
Market Perspectives on Iris 13 Investment Banking Division
|
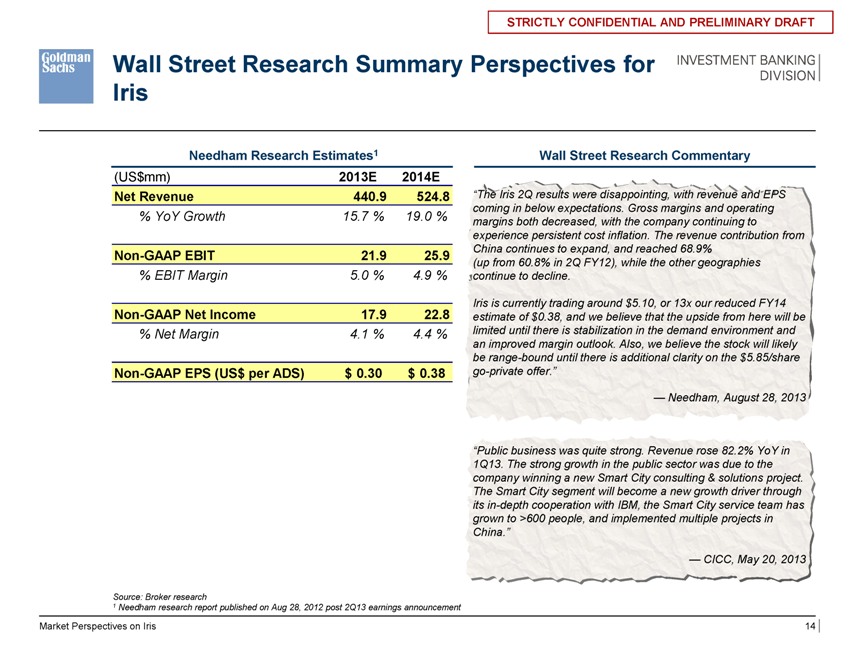
Wall Street Research Summary Perspectives for Iris
Needham Research Estimates1
(US$mm) 2013E 2014E
Net Revenue 440.9 524.8
% YoY Growth 15.7 % 19.0 %
Non-GAAP EBIT 21.9 25.9
% EBIT Margin 5.0 % 4.9 %
Non-GAAP Net Income 17.9 22.8
% Net Margin 4.1 % 4.4 %
Non-GAAP EPS (US$ per ADS) $ 0.30 $ 0.38
Wall Street Research Commentary
“The Iris 2Q results were disappointing, with revenue and EPS coming in below expectations. Gross margins and operating margins both decreased, with the company continuing to experience persistent cost inflation. The revenue contribution from China continues to expand, and reached 68.9% (up from 60.8% in 2Q FY12), while the other geographies continue to decline.
Iris is currently trading around $5.10, or 13x our reduced FY14 estimate of $0.38, and we believe that the upside from here will be limited until there is stabilization in the demand environment and an improved margin outlook. Also, we believe the stock will likely be range-bound until there is additional clarity on the $5.85/share go-private offer.”
— Needham, August 28, 2013
“Public business was quite strong. Revenue rose 82.2% YoY in
1Q13. The strong growth in the public sector was due to the company winning a new Smart City consulting & solutions project. The Smart City segment will become a new growth driver through its in-depth cooperation with IBM, the Smart City service team has grown to >600 people, and implemented multiple projects in China.”
— CICC, May 20, 2013
Source: Broker research
1 |
| Needham research report published on Aug 28, 2012 post 2Q13 earnings announcement |
Market Perspectives on Iris 14 Investment Banking Division
|
STRICTLY CONFIDENTIAL AND PRELIMINARY DRAFT
III. Financial Analysis Investment Banking Division
|
STRICTLY CONFIDENTIAL AND PRELIMINARY DRAFT
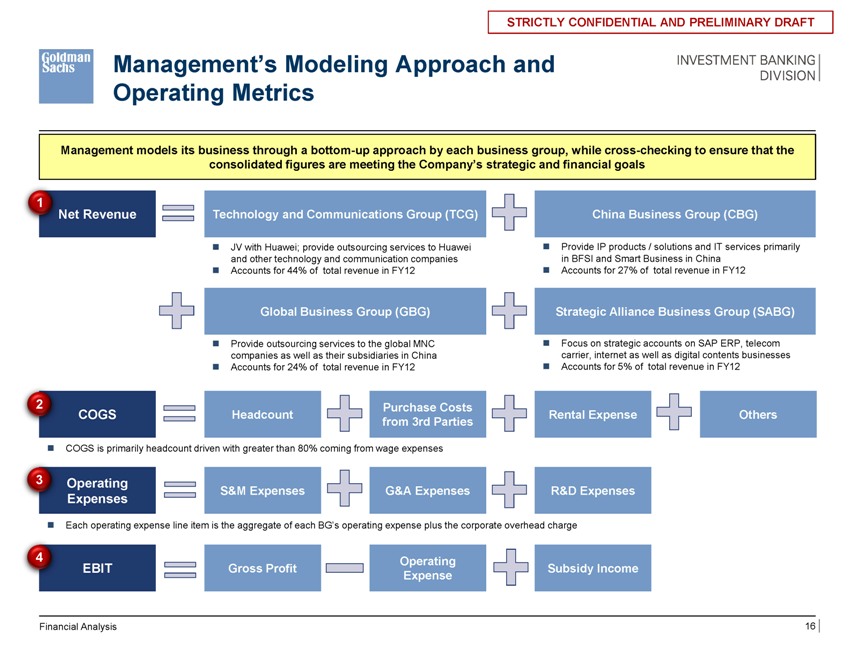
Management’s Modeling Approach and
Operating Metrics
Management models its business through a bottom-up approach by each business group, while cross-checking to ensure that the consolidated figures are meeting the Company’s strategic and financial goals
Net Revenue
COGS
Operating Expenses
EBIT
Technology and Communications Group (TCG)
JV with Huawei; provide outsourcing services to Huawei and other technology and communication companies Accounts for 44% of total revenue in FY12
Global Business Group (GBG)
Provide outsourcing services to the global MNC companies as well as their subsidiaries in China Accounts for 24% of total revenue in FY12
COGS is primarily headcount driven with greater than 80% coming from wage expenses
Each operating expense line item is the aggregate of each BG’s operating expense plus the corporate overhead charge
Headcount
Purchase Costs from 3rd Parties
S&M Expenses
G&A Expenses
Gross Profit
Operating Expense
China Business Group (CBG)
Provide IP products / solutions and IT services primarily in BFSI and Smart Business in China Accounts for 27% of total revenue in FY12
Strategic Alliance Business Group (SABG)
Focus on strategic accounts on SAP ERP, telecom carrier, internet as well as digital contents businesses Accounts for 5% of total revenue in FY12
Rental Expense
Others
R&D Expenses
Subsidy Income
Financial Analysis
16 Investment Banking Division
|
STRICTLY CONFIDENTIAL AND PRELIMINARY DRAFT
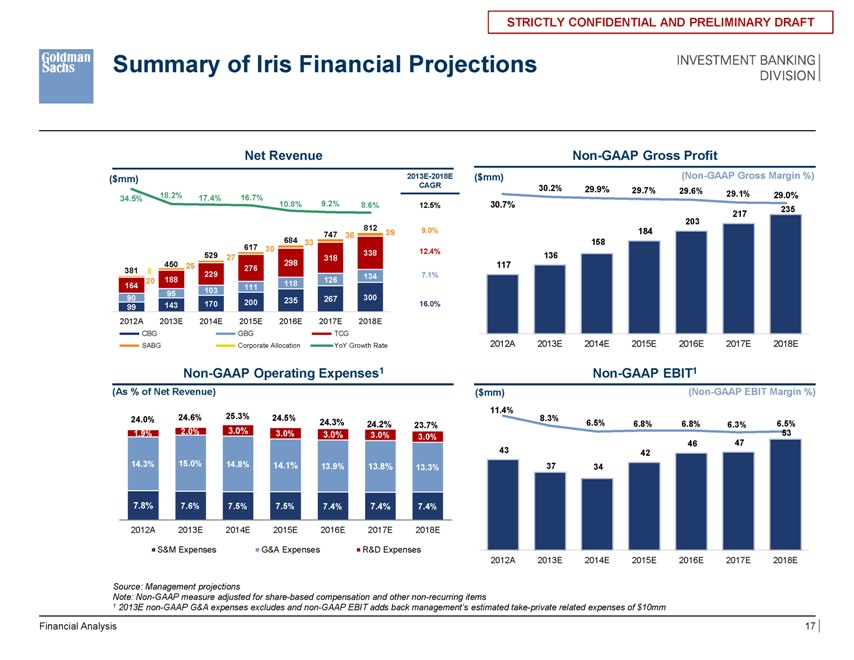
Summary of Iris Financial Projections
Net Revenue
($mm)
34.5% 18.2% 17.4% 16.7% 10.8% 9.2% 8.6% 812 747 36 39 684 33
529 27 617 30 318 338 381 450 25 276 298 8 229 134
20 188 118 126 164 103 111 95 99 90 143 170 200 235 267 300
2012A 2013E 2014E 2015E 2016E 2017E 2018E
CBG GBG TCG
SABG Corporate Allocation YoY Growth Rate
Non-GAAP Operating Expenses1
(As % of Net Revenue)
24.0% 24.6% 25.3% 24.5% 24.3% 24.2% 23.7%
1.9% 2.0% 3.0% 3.0% 3.0% 3.0% 3.0%
14.3% 15.0% 14.8% 14.1% 13.9% 13.8% 13.3%
7.8% 7.6% 7.5% 7.5% 7.4% 7.4% 7.4%
2012A 2013E 2014E 2015E 2016E 2017E 2018E
S&M Expenses G&A Expenses R&D Expenses
2013E-2018E
CAGR
12.5% 9.0% 12.4% 7.1% 16.0%
Non-GAAP Gross Profit
($mm) (Non-GAAP Gross Margin %)
30.2% 29.9% 29.7% 29.6% 29.1% 29.0%
30.7% 235 217 203 184 158 136 117
2012A 2013E 2014E 2015E 2016E 2017E 2018E
Non-GAAP EBIT1
($mm) (Non-GAAP EBIT Margin %)
11.4%
8.3% 6.5% 6.8% 6.8% 6.3% 6.5%
53 46 47 43 42 37 34 2012A 2013E 2014E 2015E 2016E 2017E 2018E
Source: Management projections
Note: Non-GAAP measure adjusted for share-based compensation and other non-recurring items
1 2013E non-GAAP G&A expenses excludes and non-GAAP EBIT adds back management’s estimated take-private related expenses of $10mm
Financial Analysis
17 Investment Banking Division
|
STRICTLY CONFIDENTIAL AND PRELIMINARY DRAFT
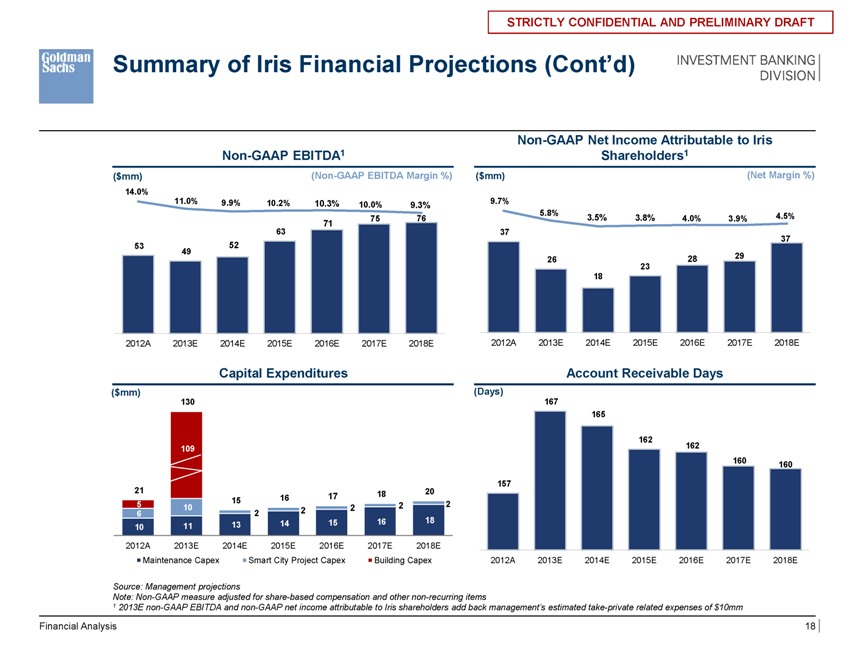
Summary of Iris Financial Projections (Cont’d)
Non-GAAP EBITDA1
($mm) (Non-GAAP EBITDA Margin %)
14.0%
11.0% 9.9% 10.2% 10.3% 10.0% 9.3%
71 75 76
63
53 52
49
2012A 2013E 2014E 2015E 2016E 2017E 2018E
Capital Expenditures
($mm)
130
109
21 15 16 17 18 20
6 5 10 2 2 2 2 2
10 11 13 14 15 16 18
2012A 2013E 2014E 2015E 2016E 2017E 2018E
Maintenance Capex Smart City Project Capex Building Capex
Non-GAAP Net Income Attributable to Iris Shareholders1
($mm) (Net Margin %)
9.7%
5.8% 3.5% 3.8% 4.0% 3.9% 4.5%
37 37 26 28 29 23 18
2012A 2013E 2014E 2015E 2016E 2017E 2018E
Account Receivable Days
(Days)
167 165 162 162 160 160 157
2012A 2013E 2014E 2015E 2016E 2017E 2018E
Source: Management projections
Note: Non-GAAP measure adjusted for share-based compensation and other non-recurring items
1 2013E non-GAAP EBITDA and non-GAAP net income attributable to Iris shareholders add back management’s estimated take-private related expenses of $10mm
Financial Analysis
18 Investment Banking Division
|
STRICTLY CONFIDENTIAL AND PRELIMINARY DRAFT
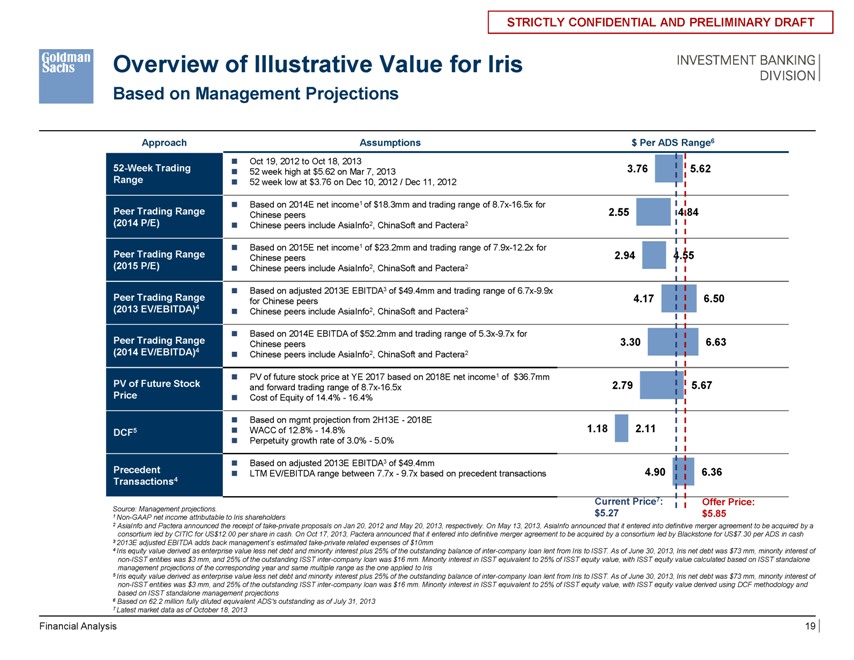
Overview of Illustrative Value for Iris
Based on Management Projections
Approach Assumptions $ Per ADS Range6
52-Week Trading Range
Peer Trading Range (2014 P/E)
Peer Trading Range (2015 P/E)
Peer Trading Range (2013 EV/EBITDA)4
Peer Trading Range (2014 EV/EBITDA)4
PV of Future Stock Price DCF5 Precedent Transactions4
Oct 19, 2012 to Oct 18, 2013 52 week high at $5.62 on Mar 7, 2013 52 week low at $3.76 on Dec 10, 2012 / Dec 11, 2012
Based on 2014E net income1 of $18.3mm and trading range of 8.7x-16.5x for Chinese peers Chinese peers include AsiaInfo2, ChinaSoft and Pactera2
Based on 2015E net income1 of $23.2mm and trading range of 7.9x-12.2x for Chinese peers Chinese peers include AsiaInfo2, ChinaSoft and Pactera2
Based on adjusted 2013E EBITDA3 of $49.4mm and trading range of 6.7x-9.9x for Chinese peers Chinese peers include AsiaInfo2, ChinaSoft and Pactera2
Based on 2014E EBITDA of $52.2mm and trading range of 5.3x-9.7x for Chinese peers Chinese peers include AsiaInfo2, ChinaSoft and Pactera2
PV of future stock price at YE 2017 based on 2018E net income1 of $36.7mm and forward trading range of 8.7x-16.5x Cost of Equity of 14.4%—16.4%
Based on mgmt projection from 2H13E—2018E WACC of 12.8%—14.8% Perpetuity growth rate of 3.0%—5.0%
Based on adjusted 2013E EBITDA3 of $49.4mm
LTM EV/EBITDA range between 7.7x—9.7x based on precedent transactions
3.76 5.62
2.55 4.84 2.94 4.55 4.17 6.50 3.30 6.63 2.79 5.67 1.18 2.11 4.90 6.36
Current Price7: Offer Price:
$5.27 $5.85
Source: Management projections. $5.27
1 Non-GAAP net income attributable to Iris shareholders $5.85
2 AsiaInfo and Pactera announced the receipt of take-private proposals on Jan 20, 2012 and May 20, 2013, respectively. On May 13, 2013, AsiaInfo announced that it entered into definitive merger agreement to be acquired by a
consortium led by CITIC for US$12.00 per share in cash. On Oct 17, 2013, Pactera announced that it entered into definitive merger agreement to be acquired by a consortium led by Blackstone for US$7.30 per ADS in cash
3 2013E adjusted EBITDA adds back management’s estimated take-private related expenses of $10mm
4 Iris equity value derived as enterprise value less net debt and minority interest plus 25% of the outstanding balance of inter-company loan lent from Iris to ISST. As of June 30, 2013, Iris net debt was $73 mm, minority interest of
non-ISST entities was $3 mm, and 25% of the outstanding ISST inter-company loan was $16 mm. Minority interest in ISST equivalent to 25% of ISST equity value, with ISST equity value calculated based on ISST standalone
management projections of the corresponding year and same multiple range as the one applied to Iris
5 Iris equity value derived as enterprise value less net debt and minority interest plus 25% of the outstanding balance of inter-company loan lent from Iris to ISST. As of June 30, 2013, Iris net debt was $73 mm, minority interest of
non-ISST entities was $3 mm, and 25% of the outstanding ISST inter-company loan was $16 mm. Minority interest in ISST equivalent to 25% of ISST equity value, with ISST equity value derived using DCF methodology and based on ISST standalone management projections
6 Based on 62.2 million fully diluted equivalent ADS’s outstanding as of July 31, 2013
7
Financial Analysis Investment Banking Division
19
|
STRICTLY CONFIDENTIAL AND PRELIMINARY DRAFT
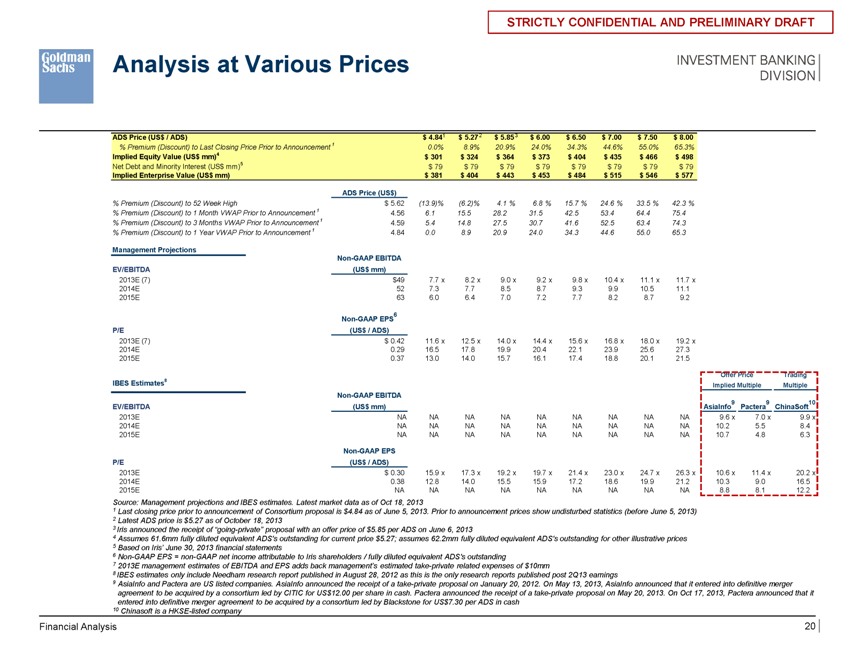
Analysis at Various Prices
ADS Price (US$ / ADS) $ 4.841 $ 5.272 $ 5.85 3 $ 6.00 $ 6.50 $ 7.00 $ 7.50 $ 8.00
% Premium (Discount) to Last Closing Price Prior to Announcement 1 0.0% 8.9% 20.9% 24.0% 34.3% 44.6% 55.0% 65.3%
Implied Equity Value (US$ mm)4 $ 301 $ 324 $ 364 $ 373 $ 404 $ 435 $ 466 $ 498
Net Debt and Minority Interest (US$ mm)5 $ 79 $ 79 $ 79 $ 79 $ 79 $ 79 $ 79 $ 79
Implied Enterprise Value (US$ mm) $ 381 $ 404 $ 443 $ 453 $ 484 $ 515 $ 546 $ 577
ADS Price (US$)
% Premium (Discount) to 52 Week High $ 5.62 (13.9)% (6.2)% 4.1 % 6.8 % 15.7 % 24.6 % 33.5 % 42.3 %
% Premium (Discount) to 1 Month VWAP Prior to Announcement 1 4.56 6.1 15.5 28.2 31.5 42.5 53.4 64.4 75.4
% Premium (Discount) to 3 Months VWAP Prior to Announcement 1 4.59 5.4 14.8 27.5 30.7 41.6 52.5 63.4 74.3
% Premium (Discount) to 1 Year VWAP Prior to Announcement 1 4.84 0.0 8.9 20.9 24.0 34.3 44.6 55.0 65.3
Management Projections
Non-GAAP EBITDA
EV/EBITDA (US$ mm)
2013E (7) $49 7.7 x 8.2 x 9.0 x 9.2 x 9.8 x 10.4 x 11.1 x 11.7 x
2014E 52 7.3 7.7 8.5 8.7 9.3 9.9 10.5 11.1
2015E 63 6.0 6.4 7.0 7.2 7.7 8.2 8.7 9.2
Non-GAAP EPS6
P/E (US$ / ADS)
2013E (7) $ 0.42 11.6 x 12.5 x 14.0 x 14.4 x 15.6 x 16.8 x 18.0 x 19.2 x
2014E 0.29 16.5 17.8 19.9 20.4 22.1 23.9 25.6 27.3
2015E 0.37 13.0 14.0 15.7 16.1 17.4 18.8 20.1 21.5
IBES Estimates8
Non-GAAP EBITDA
EV/EBITDA (US$ mm)
2013E NA NA NA NA NA NA NA NA NA
2014E NA NA NA NA NA NA NA NA NA
2015E NA NA NA NA NA NA NA NA NA
Non-GAAP EPS
P/E (US$ / ADS)
2013E $ 0.30 15.9 x 17.3 x 19.2 x 19.7 x 21.4 x 23.0 x 24.7 x 26.3 x
2014E 0.38 12.8 14.0 15.5 15.9 17.2 18.6 19.9 21.2
2015E NA NA NA NA NA NA NA NA NA
2015E NA NA NA NA NA NA NA NA NA 8.8 8.1 12.2
Source: Management projections and IBES estimates. Latest market data as of Oct 18, 2013
1 Last closing price prior to announcement of Consortium proposal is $4.84 as of June 5, 2013. Prior to announcement prices show undisturbed statistics (before June 5, 2013)
2 Latest ADS price is $5.27 as of October 18, 2013
3 Iris announced the receipt of “going-private” proposal with an offer price of $5.85 per ADS on June 6, 2013
4 Assumes 61.6mm fully diluted equivalent ADS’s outstanding for current price $5.27; assumes 62.2mm fully diluted equivalent ADS’s outstanding for other illustrative prices
5 Based on Iris’ June 30, 2013 financial statements
6 Non-GAAP EPS = non-GAAP net income attributable to Iris shareholders / fully diluted equivalent ADS’s outstanding
7 2013E management estimates of EBITDA and EPS adds back management’s estimated take-private related expenses of $10mm
8 IBES estimates only include Needham research report published in August 28, 2012 as this is the only research reports published post 2Q13 earnings
9 AsiaInfo and Pactera are US listed companies. AsiaInfo announced the receipt of a take-private proposal on January 20, 2012. On May 13, 2013, AsiaInfo announced that it entered into definitive merger agreement to be acquired by a consortium led by CITIC for US$12.00 per share in cash. Pactera announced the receipt of a take-private proposal on May 20, 2013. On Oct 17, 2013, Pactera announced that it entered into definitive merger agreement to be acquired by a consortium led by Blackstone for US$7.30 per ADS in cash
10 Chinasoft is a HKSE-listed company
Offer Price Trading
Implied Multiple Multiple
AsiaInfo9 Pactera9 ChinaSoft10
9.6 x 7.0 x 9.9 x 10.2 5.5 8.4 10.7 4.8 6.3 10.6 x 11.4 x 20.2 x 10.3 9.0 16.5 8.8 8.1 12.2
Financial Analysis Investment Banking Division
20
|
STRICTLY CONFIDENTIAL AND PRELIMINARY DRAFT
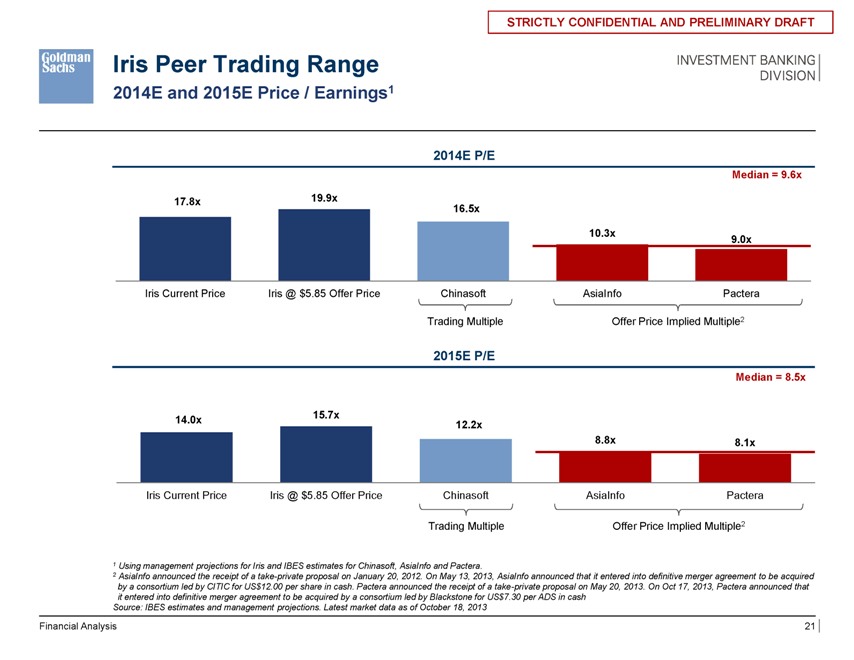
Iris Peer Trading Range
2014E and 2015E Price / Earnings1
2014E P/E
Median = 9.6x
17.8x 19.9x
16.5x
10.3x 9.0x
Iris Current Price Iris @ $5.85 Offer Price Chinasoft AsiaInfo Pactera
Trading Multiple Offer Price Implied Multiple2
2015E P/E
Median = 8.5x
15.7x
14.0x 12.2x
8.8x 8.1x
Iris Current Price Iris @ $5.85 Offer Price Chinasoft AsiaInfo Pactera
Trading Multiple Offer Price Implied Multiple2
1 Using management projections for Iris and IBES estimates for Chinasoft, AsiaInfo and Pactera.
2 AsiaInfo announced the receipt of a take-private proposal on January 20, 2012. On May 13, 2013, AsiaInfo announced that it entered into definitive merger agreement to be acquired by a consortium led by CITIC for US$12.00 per share in cash. Pactera announced the receipt of a take-private proposal on May 20, 2013. On Oct 17, 2013, Pactera announced that it entered into definitive merger agreement to be acquired by a consortium led by Blackstone for US$7.30 per ADS in cash Source: IBES estimates and management projections. Latest market data as of October 18, 2013
Financial Analysis
STRICTLY CONFIDENTIAL AND PRELIMINARY DRAFT
INVESTMENT BANKING DIVISION
|
21
STRICTLY CONFIDENTIAL AND PRELIMINARY DRAFT
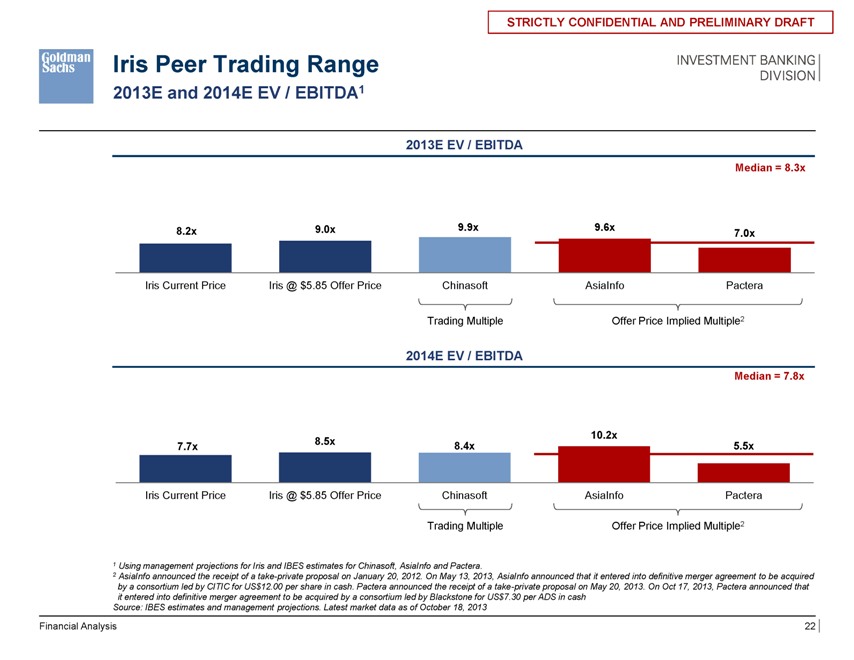
Iris Peer Trading Range
2013E and 2014E EV / EBITDA1
2013E EV / EBITDA
Median = 8.3x
8.2x 9.0x 9.9x 9.6x 7.0x
Iris Current Price Iris @ $5.85 Offer Price Chinasoft AsiaInfo Pactera
Trading Multiple Offer Price Implied Multiple2
2014E EV / EBITDA
Median = 7.8x
8.5x 10.2x
7.7x 8.4x 5.5x
Iris Current Price Iris @ $ 5.85 Offer Price Chinasoft AsiaInfo Pactera
Trading Multiple Offer Price Implied Multiple2
1 Using management projections for Iris and IBES estimates for Chinasoft, AsiaInfo and Pactera.
2 AsiaInfo announced the receipt of a take-private proposal on January 20, 2012. On May 13, 2013, AsiaInfo announced that it entered into definitive merger agreement to be acquired by a consortium led by CITIC for US$12.00 per share in cash. Pactera announced the receipt of a take-private proposal on May 20, 2013. On Oct 17, 2013, Pactera announced that it entered into definitive merger agreement to be acquired by a consortium led by Blackstone for US$7.30 per ADS in cash Source: IBES estimates and management projections. Latest market data as of October 18, 2013
Financial Analysis
STRICTLY CONFIDENTIAL AND PRELIMINARY DRAFT
INVESTMENT BANKING DIVISION
|
22
STRICTLY CONFIDENTIAL AND PRELIMINARY DRAFT
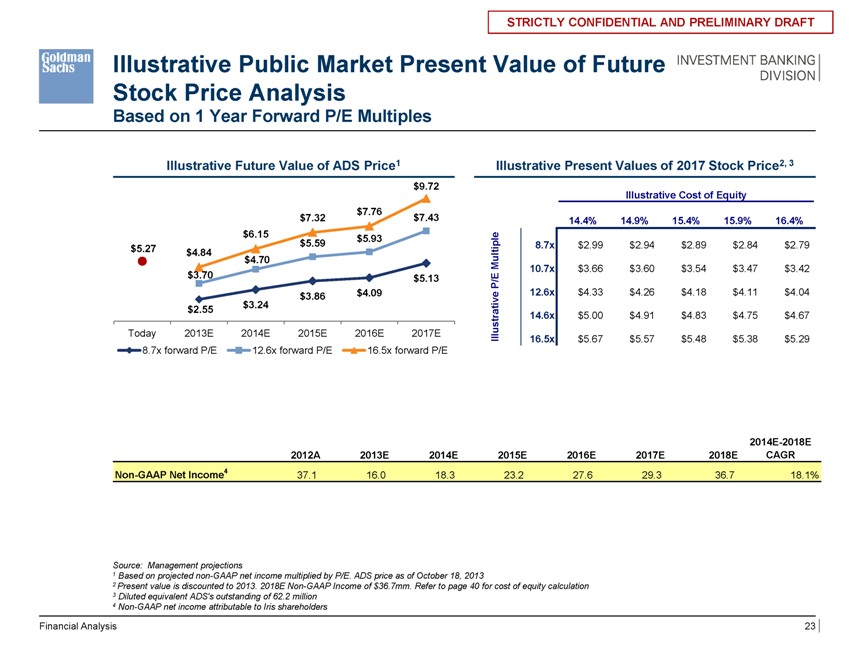
Illustrative Public Market Present Value of Future Stock Price Analysis
Based on 1 Year Forward P/E Multiples
Illustrative Future Value of ADS Price1
$ 9.72
$ 7.76
$ 7.32 $ 7.43
$6.15 $ 5.93
$ 5.59
$5.27 $4.84
$4.70
$3.70 $ 5.13
$ 3.86 $ 4.09
$2.55 $3.24
Today 2013E 2014E 2015E 2016E 2017E
8.7x forward P/E 12.6x forward P/E 16.5x forward P/E
Illustrative Present Values of 2017 Stock Price2, 3
Illustrative Cost of Equity
$3.32 14.4% 14.9% 15.4% 15.9% 16.4%
Multiple 8.7x $ 2.99 $ 2.94 $ 2.89 $ 2.84 $ 2.79
10.7x $ 3.66 $ 3.60 $ 3.54 $ 3.47 $ 3.42
P/E
12.6x $ 4.33 $ 4.26 $ 4.18 $ 4.11 $ 4.04
ative
r 14.6x $ 5.00 $ 4.91 $ 4.83 $ 4.75 $ 4.67
Illust 16.5x $ 5.67 $ 5.57 $ 5.48 $ 5.38 $ 5.29
2014E-2018E
2012A 2013E 2014E 2015E 2016E 2017E 2018E CAGR
Non-GAAP Net Income4 37.1 16.0 18.3 23.2 27.6 29.3 36.7 18.1%
Source: Management projections
1 Based on projected non-GAAP net income multiplied by P/E. ADS price as of October 18, 2013
2 Present value is discounted to 2013. 2018E Non-GAAP Income of $36.7mm. Refer to page 40 for cost of equity calculation
3 Diluted equivalent ADS’s outstanding of 62.2 million
4 Non-GAAP net income attributable to Iris shareholders
Financial Analysis
23
STRICTLY CONFIDENTIAL AND PRELIMINARY DRAFT
INVESTMENT BANKING DIVISION
|
STRICTLY CONFIDENTIAL AND PRELIMINARY DRAFT
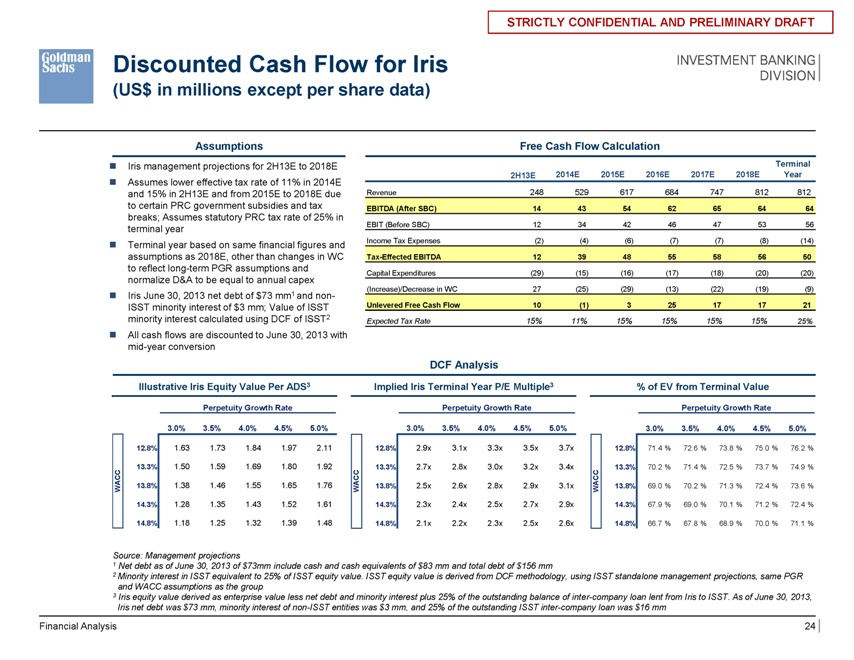
Discounted Cash Flow for Iris
(US$ in millions except per share data)
Assumptions
?Iris management projections for 2H13E to 2018E ?Assumes lower effective tax rate of 11% in 2014E and 15% in 2H13E and from 2015E to 2018E due to certain PRC government subsidies and tax breaks; Assumes statutory PRC tax rate of 25% in terminal year ?Terminal year based on same financial figures and assumptions as 2018E, other than changes in WC to reflect long-term PGR assumptions and normalize D&A to be equal to annual capex ?Iris June 30, 2013 net debt of $73 mm1 and non-ISST minority interest of $3 mm; Value of ISST minority interest calculated using DCF of ISST2 ?All cash flows are discounted to June 30, 2013 with mid-year conversion
Free Cash Flow Calculation
Terminal
2H13E 2014E 2015E 2016E 2017E 2018E Year
Revenue 248 529 617 684 747 812 812
EBITDA (After SBC) 14 43 54 62 65 64 64
EBIT (Before SBC) 12 34 42 46 47 53 56
Income Tax Expenses (2) (4) (6) (7) (7) (8) (14)
Tax-Effected EBITDA 12 39 48 55 58 56 50
Capital Expenditures (29) (15) (16) (17) (18) (20) (20)
(Increase)/Decrease in WC 27 (25) (29) (13) (22) (19) (9)
Unlevered Free Cash Flow 10 (1) 3 25 17 17 21
Expected Tax Rate 15% 11% 15% 15% 15% 15% 25%
DCF Analysis
Illustrative Iris Equity Value Per ADS3 Implied Iris Terminal Year P/E Multiple3 % of EV from Terminal Value
Perpetuity Growth Rate Perpetuity Growth Rate Perpetuity Growth Rate
$1.539 3.0% 3.5% 4.0% 4.5% 5.0% 276.2% 3.0% 3.5% 4.0% 4.5% 5.0% 71% 3.0% 3.5% 4.0% 4.5% 5.0%
12.8% 1.63 1.73 1.84 1.97 2.11 12.8% 2.9x 3.1x 3.3x 3.5x 3.7x 12.8% 71.4 % 72.6 % 73.8 % 75.0 % 76.2 %
13.3% 1.50 1.59 1.69 1.80 1.92 13.3% 2.7x 2.8x 3.0x 3.2x 3.4x 13.3% 70.2 % 71.4 % 72.5 % 73.7 % 74.9 %
WACC 13.8% 1.38 1.46 1.55 1.65 1.76 WACC 13.8% 2.5x 2.6x 2.8x 2.9x 3.1x WACC 13.8% 69.0 % 70.2 % 71.3 % 72.4 % 73.6 %
14.3% 1.28 1.35 1.43 1.52 1.61 14.3% 2.3x 2.4x 2.5x 2.7x 2.9x 14.3% 67.9 % 69.0 % 70.1 % 71.2 % 72.4 %
14.8% 1.18 1.25 1.32 1.39 1.48 14.8% 2.1x 2.2x 2.3x 2.5x 2.6x 14.8% 66.7 % 67.8 % 68.9 % 70.0 % 71.1 %
Source: Management projections
1 Net debt as of June 30, 2013 of $73mm include cash and cash equivalents of $83 mm and total debt of $156 mm
2 Minority interest in ISST equivalent to 25% of ISST equity value. ISST equity value is derived from DCF methodology, using ISST standalone management projections, same PGR and WACC assumptions as the group
3 Iris equity value derived as enterprise value less net debt and minority interest plus 25% of the outstanding balance of inter-company loan lent from Iris to ISST. As of June 30, 2013, Iris net debt was $73 mm, minority interest of non-ISST entities was $3 mm, and 25% of the outstanding ISST inter-company loan was $16 mm
Financial Analysis
24
STRICTLY CONFIDENTIAL AND PRELIMINARY DRAFT
INVESTMENT BANKING DIVISION
|
STRICTLY CONFIDENTIAL AND PRELIMINARY DRAFT
Appendix A: Additional Materials
STRICTLY CONFIDENTIAL AND PRELIMINARY DRAFT
INVESTMENT BANKING DIVISION
|
STRICTLY CONFIDENTIAL AND PRELIMINARY DRAFT
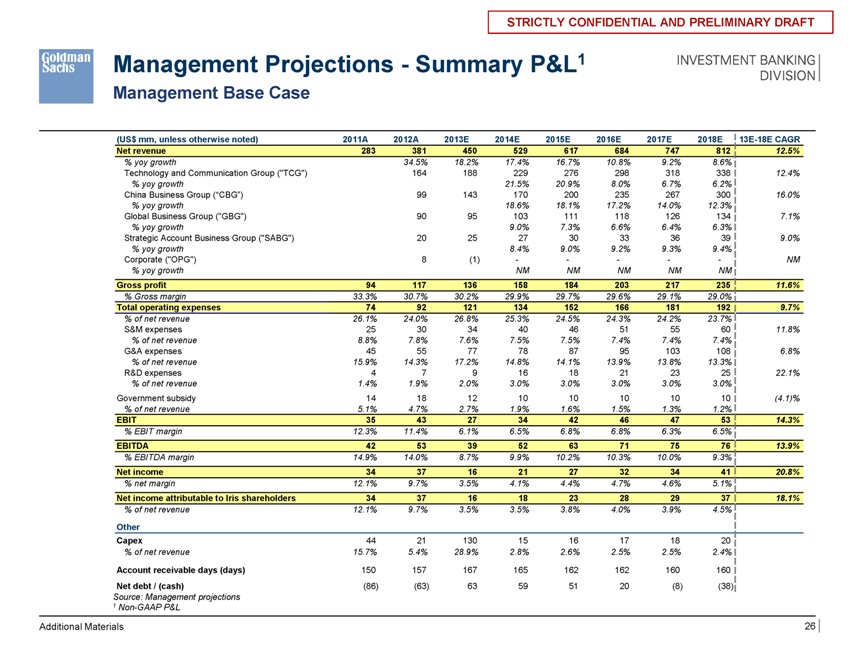
Management Projections—Summary P&L1
Management Base Case
(US$ mm, unless otherwise noted) 2011A 2012A 2013E 2014E 2015E 2016E 2017E 2018E 13E-18E CAGR
Net revenue 283 381 450 529 617 684 747 812 12.5%
% yoy growth 34.5% 18.2% 17.4% 16.7% 10.8% 9.2% 8.6%
Technology and Communication Group (“TCG”) 164 188 229 276 298 318 338 12.4%
% yoy growth 21.5% 20.9% 8.0% 6.7% 6.2%
China Business Group (“CBG”) 99 143 170 200 235 267 300 16.0%
% yoy growth 18.6% 18.1% 17.2% 14.0% 12.3%
Global Business Group (“GBG”) 90 95 103 111 118 126 134 7.1%
% yoy growth 9.0% 7.3% 6.6% 6.4% 6.3%
Strategic Account Business Group (“SABG”) 20 25 27 30 33 36 39 9.0%
% yoy growth 8.4% 9.0% 9.2% 9.3% 9.4%
Corporate (“OPG”) 8 (1) — ——NM
% yoy growth NM NM NM NM NM
Gross profit 94 117 136 158 184 203 217 235 11.6%
% Gross margin 33.3% 30.7% 30.2% 29.9% 29.7% 29.6% 29.1% 29.0%
Total operating expenses 74 92 121 134 152 166 181 192 9.7%
% of net revenue 26.1% 24.0% 26.8% 25.3% 24.5% 24.3% 24.2% 23.7%
S&M expenses 25 30 34 40 46 51 55 60 11.8%
% of net revenue 8.8% 7.8% 7.6% 7.5% 7.5% 7.4% 7.4% 7.4%
G&A expenses 45 55 77 78 87 95 103 108 6.8%
% of net revenue 15.9% 14.3% 17.2% 14.8% 14.1% 13.9% 13.8% 13.3%
R&D expenses 4 7 9 16 18 21 23 25 22.1%
% of net revenue 1.4% 1.9% 2.0% 3.0% 3.0% 3.0% 3.0% 3.0%
Government subsidy 14 18 12 10 10 10 10 10 (4.1)%
% of net revenue 5.1% 4.7% 2.7% 1.9% 1.6% 1.5% 1.3% 1.2%
EBIT 35 43 27 34 42 46 47 53 14.3%
% EBIT margin 12.3% 11.4% 6.1% 6.5% 6.8% 6.8% 6.3% 6.5%
EBITDA 42 53 39 52 63 71 75 76 13.9%
% EBITDA margin 14.9% 14.0% 8.7% 9.9% 10.2% 10.3% 10.0% 9.3%
Net income 34 37 16 21 27 32 34 41 20.8%
% net margin 12.1% 9.7% 3.5% 4.1% 4.4% 4.7% 4.6% 5.1%
Net income attributable to Iris shareholders 34 37 16 18 23 28 29 37 18.1%
% of net revenue 12.1% 9.7% 3.5% 3.5% 3.8% 4.0% 3.9% 4.5%
Other
Capex 44 21 130 15 16 17 18 20
% of net revenue 15.7% 5.4% 28.9% 2.8% 2.6% 2.5% 2.5% 2.4%
Account receivable days (days) 150 157 167 165 162 162 160 160
Net debt / (cash) (86) (63) 63 59 51 20 (8) (38)
Source: Management projections
1 |
| Non-GAAP P&L |
Additional Materials
26
STRICTLY CONFIDENTIAL AND PRELIMINARY DRAFT
INVESTMENT BANKING DIVISION
|
STRICTLY CONFIDENTIAL AND PRELIMINARY DRAFT
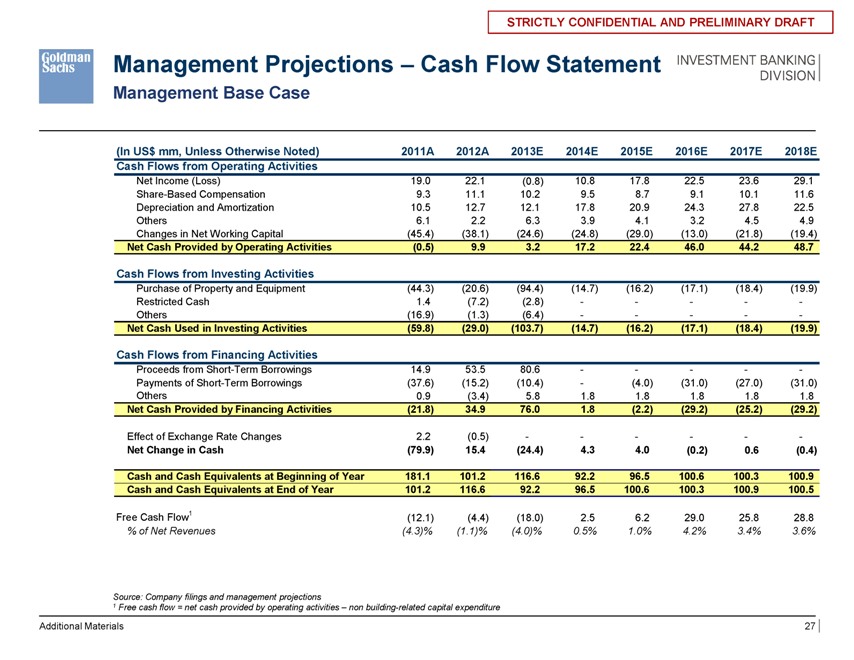
Management Projections – Cash Flow Statement
Management Base Case
(In US$ mm, Unless Otherwise Noted) 2011A 2012A 2013E 2014E 2015E 2016E 2017E 2018E
Cash Flows from Operating Activities
Net Income (Loss) 19.0 22.1 (0.8) 10.8 17.8 22.5 23.6 29.1
Share-Based Compensation 9.3 11.1 10.2 9.5 8.7 9.1 10.1 11.6
Depreciation and Amortization 10.5 12.7 12.1 17.8 20.9 24.3 27.8 22.5
Others 6.1 2.2 6.3 3.9 4.1 3.2 4.5 4.9
Changes in Net Working Capital (45.4) (38.1) (24.6) (24.8) (29.0) (13.0) (21.8) (19.4)
Net Cash Provided by Operating Activities (0.5) 9.9 3.2 17.2 22.4 46.0 44.2 48.7
Cash Flows from Investing Activities
Purchase of Property and Equipment (44.3) (20.6) (94.4) (14.7) (16.2) (17.1) (18.4) (19.9)
Restricted Cash 1.4 (7.2) (2.8) — — -
Others (16.9) (1.3) (6.4)
Net Cash Used in Investing Activities (59.8) (29.0) (103.7) (14.7) (16.2) (17.1) (18.4) (19.9)
Cash Flows from Financing Activities
Proceeds from Short-Term Borrowings 14.9 53.5 80.6
Payments of Short-Term Borrowings (37.6) (15.2) (10.4)—(4.0) (31.0) (27.0) (31.0)
Others 0.9 (3.4) 5.8 1.8 1.8 1.8 1.8 1.8
Net Cash Provided by Financing Activities (21.8) 34.9 76.0 1.8 (2.2) (29.2) (25.2) (29.2)
Effect of Exchange Rate Changes 2.2 (0.5
Net Change in Cash (79.9) 15.4 (24.4) 4.3 4.0 (0.2) 0.6 (0.4)
Cash and Cash Equivalents at Beginning of Year 181.1 101.2 116.6 92.2 96.5 100.6 100.3 100.9
Cash and Cash Equivalents at End of Year 101.2 116.6 92.2 96.5 100.6 100.3 100.9 100.5
Free Cash Flow1 (12.1) (4.4) (18.0) 2.5 6.2 29.0 25.8 28.8
% of Net Revenues (4.3)% (1.1)% (4.0)% 0.5% 1.0% 4.2% 3.4% 3.6%
Source: Company filings and management projections
1 |
| Free cash flow = net cash provided by operating activities – non building-related capital expenditure |
Materials
Additional Materials
27
STRICTLY CONFIDENTIAL AND PRELIMINARY DRAFT
INVESTMENT BANKING DIVISION
|
STRICTLY CONFIDENTIAL AND PRELIMINARY DRAFT
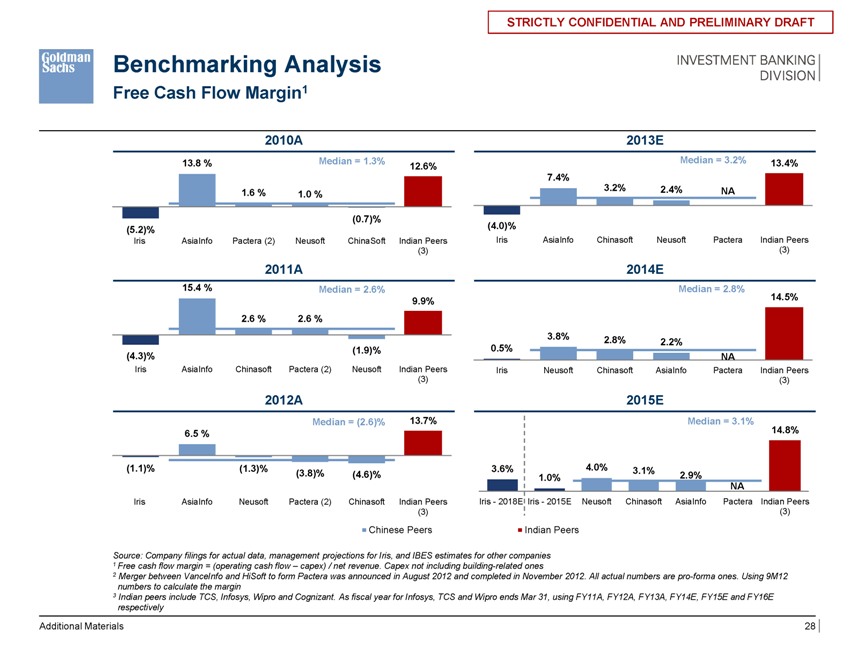
Benchmarking Analysis
Free Cash Flow Margin1
2010A 2013E
13.8 % Median = 1.3% 12.6% Median = 3.2% 13.4%
7.4%
1.6 % 1.0 % 3.2% 2.4% NA
(0.7)%
(5.2)% (4.0)%
Iris AsiaInfo Pactera (2) Neusoft ChinaSoft Indian Peers Iris AsiaInfo Chinasoft Neusoft Pactera Indian Peers
(3) |
| (3) |
2011A 2014E
15.4 % Median = 2.6% Median = 2.8%
9.9% 14.5%
2.6 % 2.6 %
3.8% 2.8% 2.2%
(1.9)% 0.5%
(4.3)% NA
Iris AsiaInfo Chinasoft Pactera (2) Neusoft Indian Peers Iris Neusoft Chinasoft AsiaInfo Pactera Indian Peers
(3) |
| (3) |
2012A 2015E
Median = (2.6)% 13.7% Median = 3.1%
6.5 % 14.8%
(1.1)% (1.3)% (3.8)% (4.6)% 3.6% 4.0% 3.1% 2.9%
1.0%
NA
Iris AsiaInfo Neusoft Pactera (2) Chinasoft Indian Peers Iris—2018E Iris—2015E Neusoft Chinasoft AsiaInfo Pactera Indian Peers
(3) |
| (3) |
Chinese Peers Indian Peers
Source: Company filings for actual data, management projections for Iris, and IBES estimates for other companies
1 |
| Free cash flow margin = (operating cash flow – capex) / net revenue. Capex not including building-related ones |
2 Merger between VanceInfo and HiSoft to form Pactera was announced in August 2012 and completed in November 2012. All actual numbers are pro-forma ones. Using 9M12 numbers to calculate the margin
3 Indian peers include TCS, Infosys, Wipro and Cognizant. As fiscal year for Infosys, TCS and Wipro ends Mar 31, using FY11A, FY12A, FY13A, FY14E, FY15E and FY16E respectively
Additional Materials
28
STRICTLY CONFIDENTIAL AND PRELIMINARY DRAFT
INVESTMENT BANKING DIVISION
|
STRICTLY CONFIDENTIAL AND PRELIMINARY DRAFT
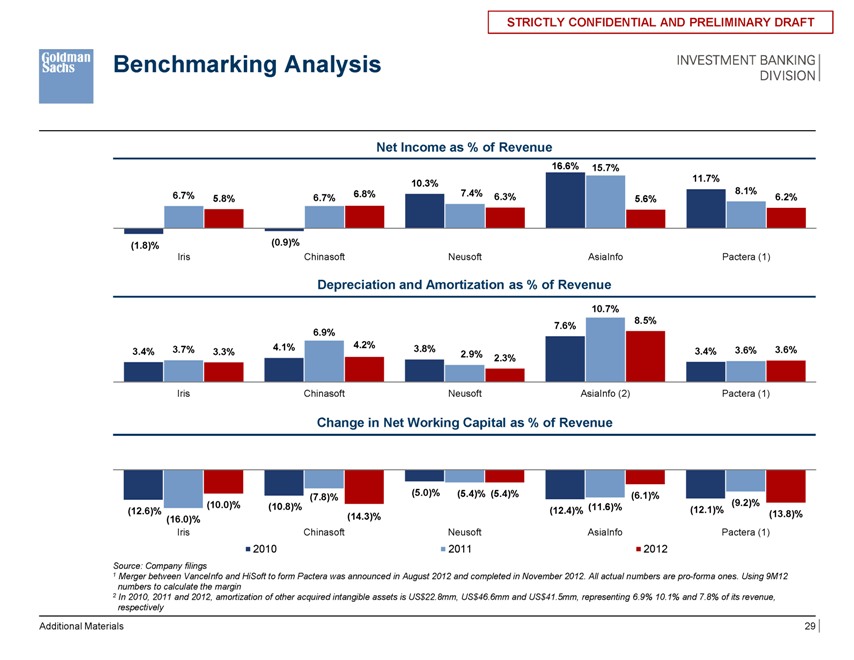
Benchmarking Analysis
Net Income as % of Revenue
16.6% 15.7%
10.3% 11.7%
6.7% 5.8% 6.7% 6.8% 7.4% 6.3% 5.6% 8.1% 6.2%
(1.8)% (0.9)%
Iris Chinasoft Neusoft AsiaInfo Pactera (1)
Depreciation and Amortization as % of Revenue
10.7%
7.6% 8.5%
6.9%
3.4% 3.7% 3.3% 4.1% 4.2% 3.8% 2.9% 3.4% 3.6% 3.6%
2.3%
Iris Chinasoft Neusoft AsiaInfo (2) Pactera (1)
Change in Net Working Capital as % of Revenue
6.7% 5.8% 6.7% 6.8% 10.3% 7.4% 6.3% 16.6% 15.7% 5.6% 11.7% 8.1% 6.2%
(7.8)% (5.0)% (5.4)% (5.4)% (6.1)%
(1.8)% (10.0)% (0.9)%(10.8)% (11.6)% (9.2)%
(12.6)% (16.0)% (14.3)% (12.4)% (12.1)% (13.8)%
Iris Chinasoft Neusoft AsiaInfo Pactera (1)
Iris Chinasoft Neusoft AsiaInfo Pactera (1)
2010 2011 2012
2010 2011 2012
Source: Company filings
1 Merger between VanceInfo and HiSoft to form Pactera was announced in August 2012 and completed in November 2012. All actual numbers are pro-forma ones. Using 9M12
numbers to calculate the margin
2 In 2010, 2011 and 2012, amortization of other acquired intangible assets is US$22.8mm, US$46.6mm and US$41.5mm, representing 6.9% 10.1% and 7.8% of its revenue,
respectively
Additional Materials
29
STRICTLY CONFIDENTIAL AND PRELIMINARY DRAFT
INVESTMENT BANKING DIVISION
|
STRICTLY CONFIDENTIAL AND PRELIMINARY DRAFT
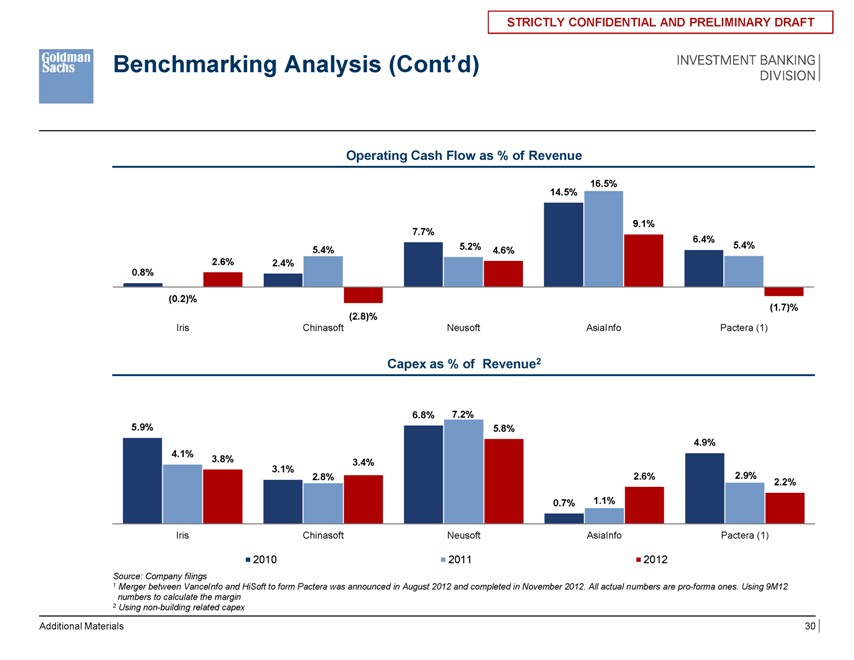
Benchmarking Analysis (Cont’d)
Operating Cash Flow as % of Revenue
16.5%
14.5%
9.1%
7.7%
6.4%
5.4% 5.2% 4.6% 5.4%
2.6% 2.4%
0.8%
(0.2)%
(1.7)%
(2.8)%
Iris Chinasoft Neusoft AsiaInfo Pactera (1)
Capex as % of Revenue2
6.8% 7.2%
5.9% 5.8%
4.9%
4.1%
3.8% 3.4%
3.1%
2.8% 2.6% 2.9% 2.2%
1 |
| 16.6% 15.7% 6.2% |
0.7% 1.1%
(1.8)% (0.9)
Iris Iris ChinasoftChinasoft NeNeusoftsoft AsiaInfoiaI f PacteraPactera(1)(1)
2010 2011 2012
Source: Company filings
1 Merger between VanceInfo and HiSoft to form Pactera was announced in August 2012 and completed in November 2012. All actual numbers are pro-forma ones. Using 9M12 numbers to calculate the margin
2 |
| Using non-building related capex |
Additional Materials
30
STRICTLY CONFIDENTIAL AND PRELIMINARY DRAFT
INVESTMENT BANKING DIVISION
|
STRICTLY CONFIDENTIAL AND PRELIMINARY DRAFT
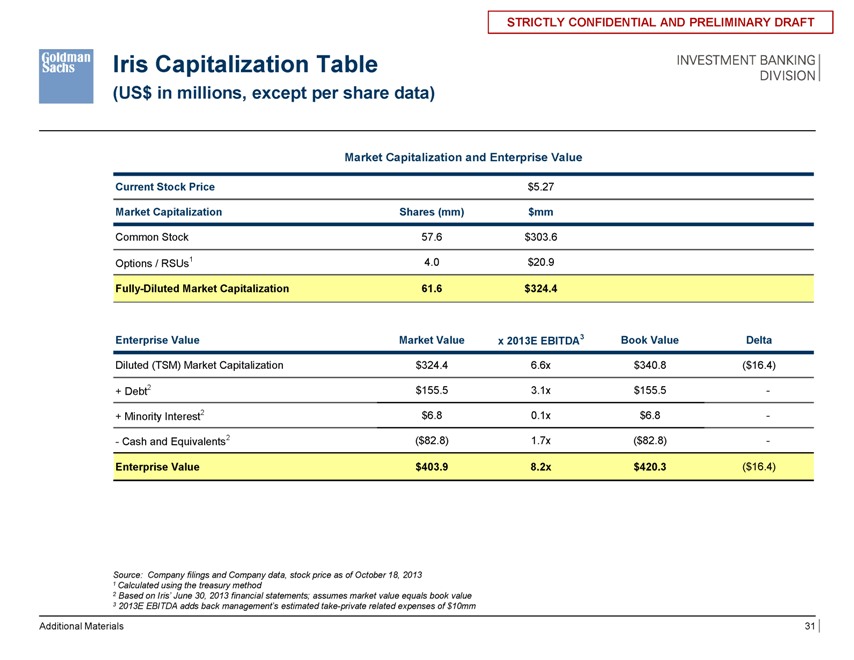
Iris Capitalization Table
(US$ in millions, except per share data)
Market Capitalization and Enterprise Value
Current Stock Price $5.27
Market Capitalization Shares (mm) $mm
Common Stock 57.6 $303.6
Options / RSUs1 4.0 $20.9
Fully-Diluted Market Capitalization 61.6 $324.4
Enterprise Value Market Value x 2013E EBITDA3 Book Value Delta
Diluted (TSM) Market Capitalization $324.4 6.6x $340.8 ($ 16.4)
+ Debt2 $155.5 3.1x $155.5 -
+ Minority Interest2 $6.8 0.1x $6.8 -
- Cash and Equivalents2 ($82.8) 1.7x ($82.8) -
Enterprise Value $403.9 8.2x $420.3 ($ 16.4)
Source: Company filings and Company data, stock price as of October 18, 2013
1 |
| Calculated using the treasury method |
2 |
| Based on Iris’ June 30, 2013 financial statements; assumes market value equals book value |
3 |
| 2013E EBITDA adds back management’s estimated take-private related expenses of $10mm |
Additional Materials
31
|
STRICTLY CONFIDENTIAL AND PRELIMINARY DRAFT
Iris Capitalization Table
Equity
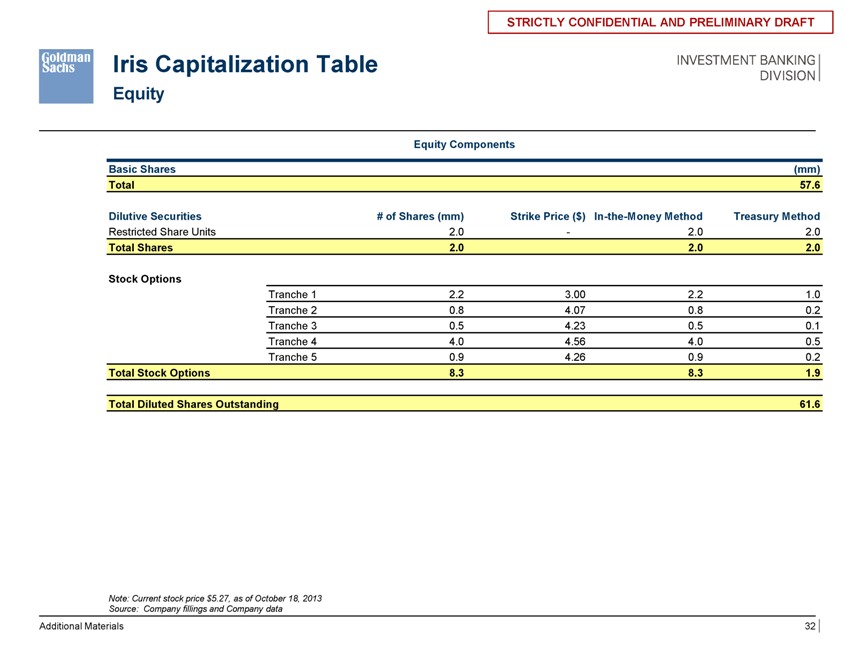
Equity Components
Basic Shares (mm)
Total 57.6
Dilutive Securities # of Shares (mm) Strike Price ($) In-the-Money Method Treasury Method
Restricted Share Units 2.0 — 2.0 2.0
Total Shares 2.0 2.0 2.0
Stock Options
Tranche 1 2.2 3.00 2.2 1.0
Tranche 2 0.8 4.07 0.8 0.2
Tranche 3 0.5 4.23 0.5 0.1
Tranche 4 4.0 4.56 4.0 0.5
Tranche 5 0.9 4.26 0.9 0.2
Total Stock Options 8.3 8.3 1.9
Total Diluted Shares Outstanding 61.6
Note: Current stock price $5.27, as of October 18, 2013 Source: Company fillings and Company data
Additional Materials
32
STRICTLY CONFIDENTIAL AND PRELIMINARY DRAFT
INVESTMENT BANKING DIVISION
|
STRICTLY CONFIDENTIAL AND PRELIMINARY DRAFT
Aries Profile
Overview of Aries
Aries is an alternative investment platform and an affiliate of China Asset Management (Hong Kong) Limited China Asset Management (Hong Kong) Limited is a wholly-owned subsidiary of China Asset Management Co., Ltd. and strategically develops the international investment business, offering a range of both traditional and alternative investment products
Overview of China Asset Management Co., Ltd.
China Asset Management Co., Ltd. is one of the leading asset management firms in China, with total assets under management and advisory amounted to US$56.71 billion as of March 31, 2013 China Asset Management Co., Ltd. has a highly skilled and experienced team of more than 150 investment and research professionals focusing on China and acts as investment manager for various clients and funds, including mutual funds, National Social Securities Fund, corporate annuities, QDII (Qualified Domestic Institutional Investor) funds and Exchange Traded Funds in China
Source: Company filings
Additional Materials
33
STRICTLY CONFIDENTIAL AND PRELIMINARY DRAFT
INVESTMENT BANKING DIVISION
|
STRICTLY CONFIDENTIAL AND PRELIMINARY DRAFT
Edelweiss Profile
Overview
Edelweiss has been managing private equity investments in Mainland China through its subsidiary, China Edelweiss Investment Management Limited Its Fund I, SeaBright China Special Opportunities Fund
(“SOF I”) and Fund II, China Special Opportunities Fund, L.P. (“CSOF”) established in 2004 and 2008 respectively, with portfolio companies listed on stock exchanges in Hong Kong, Shenzhen and the U.S Edelweiss Private Equity launched its third fund, China Special Opportunities Fund III, L.P.
(“CSOF III”) in 2010 focusing on sectors with high growth potential in China Both CSOF and CSOF III hold Iris shares
SOF I
AUM: US$50mm
Focuses on companies based in China with strong growth prospects. Single investment size US$5mm to US$10mm with expected 25% average annual return
CSOF
AUM: US$200mm
Focuses on companies with strong growth prospect in China in telecom, agriculture, domestic consumption, service industries. Single investment size US$5mm to US$30mm with expected 25% average annual return
CSOF III
AUM: US$399mm
Focuses on investments in the domestic consumption, alternative energy, healthcare and financial services sectors
Management Members
Ling He, Chief Investment Officer
Joined Edelweiss in 2000. Prior to joining Edelweiss, she was Assistant to Chief Executive Officer of Edelweiss Securities Company Limited
Over 20 years of experience and knowledge in securities investment and fund management Cheng Liu, Managing Director
Joined Edelweiss in 2001. Prior to joining Edelweiss, he worked in the Asset Management Departments of China Edelweiss Securities and China Merchants Securities
Over 17 years of investment experience in the Hong Kong and China markets
Selected Portfolio Companies
Home of Health, China’s largest home medical appliances and equipment retail chain Global Market Group, an international trade-marketing corp China Outfitters Holdings, a designer and seller of menswear in China Beijing Jingneng Clean Energy, largest gas-fired cogeneration provider in Beijing, China Other investments include: China UnionPay Merchant Services, Zhejiang Beingmate Technology Industry & Trade, Harbin Sego Sports Franchise, Liaoning Wufeng Rice Industry Group, etc.
Source: Public information
Additional Materials
34
STRICTLY CONFIDENTIAL AND PRELIMINARY DRAFT
INVESTMENT BANKING DIVISION
|
STRICTLY CONFIDENTIAL AND PRELIMINARY DRAFT
Appendix B: Comparison of Selected Companies and Precedent Transactions
STRICTLY CONFIDENTIAL AND PRELIMINARY DRAFT
INVESTMENT BANKING DIVISION
|
STRICTLY CONFIDENTIAL AND PRELIMINARY DRAFT
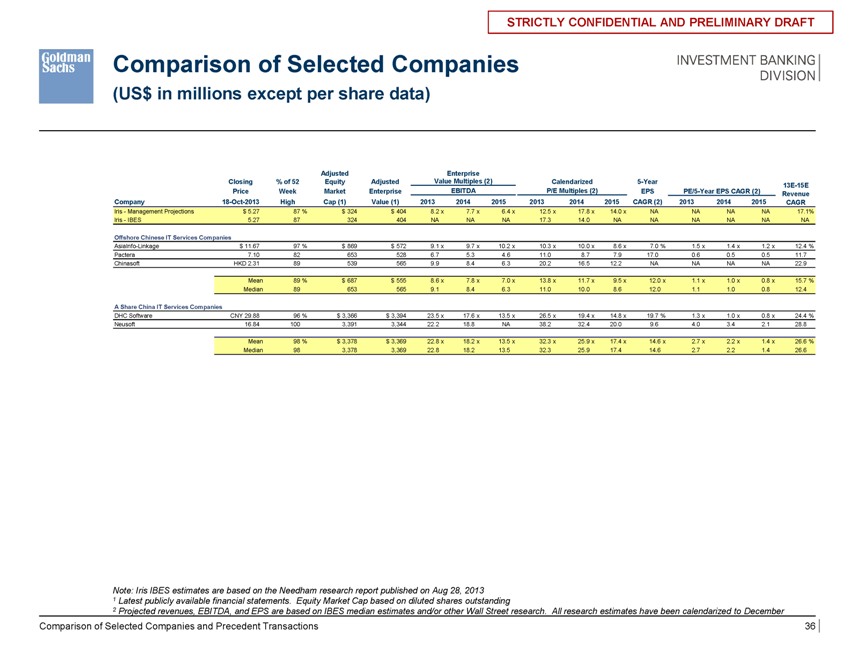
Comparison of Selected Companies
(US$ in millions except per share data)
Adjusted Enterprise
Closing % of 52 Equity Adjusted Value Multiples (2) Calendarized 5-Year 13E-15E
Price Week Market Enterprise EBITDA P/E Multiples (2) EPS PE/5-Year EPS CAGR (2) Revenue
Company 18-Oct-2013 High Cap (1) Value (1) 2013 2014 2015 2013 2014 2015 CAGR (2) 2013 2014 2015 CAGR
Iris—Management Projections $ 5.27 87 % $ 324 $ 404 8.2 x 7.7 x 6.4 x 12.5 x 17.8 x 14.0 x NA NA NA NA 17.1%
Iris—IBES 5.27 87 324 404 NA NA NA 17.3 14.0 NA NA NA NA NA NA
Offshore Chinese IT Services Companies
AsiaInfo-Linkage $ 11.67 97 % $ 869 $ 572 9.1 x 9.7 x 10.2 x 10.3 x 10.0 x 8.6 x 7.0 % 1.5 x 1.4 x 1.2 x 12.4 %
Pactera 7.10 82 653 528 6.7 5.3 4.6 11.0 8.7 7.9 17.0 0.6 0.5 0.5 11.7
Chinasoft HKD 2.31 89 539 565 9.9 8.4 6.3 20.2 16.5 12.2 NA NA NA NA 22.9
Mean 89 % $ 687 $ 555 8.6 x 7.8 x 7.0 x 13.8 x 11.7 x 9.5 x 12.0 x 1.1 x 1.0 x 0.8 x 15.7 %
Median 89 653 565 9.1 8.4 6.3 11.0 10.0 8.6 12.0 1.1 1.0 0.8 12.4
A Share China IT Services Companies
DHC Software CNY 29.88 96 % $ 3,366 $ 3,394 23.5 x 17.6 x 13.5 x 26.5 x 19.4 x 14.8 x 19.7 % 1.3 x 1.0 x 0.8 x 24.4 %
Neusoft 16.84 100 3,391 3,344 22.2 18.8 NA 38.2 32.4 20.0 9.6 4.0 3.4 2.1 28.8
Mean 98 % $ 3,378 $ 3,369 22.8 x 18.2 x 13.5 x 32.3 x 25.9 x 17.4 x 14.6 x 2.7 x 2.2 x 1.4 x 26.6 %
Median 98 3,378 3,369 22.8 18.2 13.5 32.3 25.9 17.4 14.6 2.7 2.2 1.4 26.6
Note: Iris IBES estimates are based on the Needham research report published on Aug 28, 2013
1 |
| Latest publicly available financial statements. Equity Market Cap based on diluted shares outstanding |
2 Projected revenues, EBITDA, and EPS are based on IBES median estimates and/or other Wall Street research. All research estimates have been calendarized to December
Comparison of Selected Companies and Precedent Transactions
36
STRICTLY CONFIDENTIAL AND PRELIMINARY DRAFT
INVESTMENT BANKING DIVISION
|
STRICTLY CONFIDENTIAL AND PRELIMINARY DRAFT
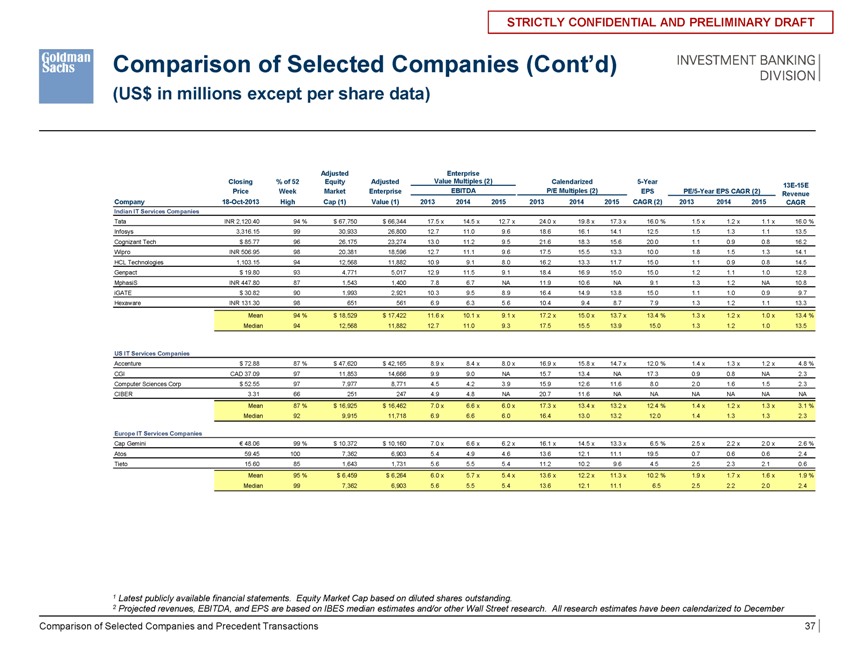
Comparison of Selected Companies (Cont’d)
(US$ in millions except per share data)
Adjusted Enterprise
Closing % of 52 Equity Adjusted Value Multiples (2) Calendarized 5-Year 13E-15E
Price Week Market Enterprise EBITDA P/E Multiples (2) EPS PE/5-Year EPS CAGR (2) Revenue
Company 18-Oct-2013 High Cap (1) Value (1) 2013 2014 2015 2013 2014 2015 CAGR (2) 2013 2014 2015 CAGR
Indian IT Services Companies
Tata INR 2,120.40 94 % $ 67,750 $ 66,344 17.5 x 14.5 x 12.7 x 24.0 x 19.8 x 17.3 x 16.0 % 1.5 x 1.2 x 1.1 x 16.0 %
Infosys 3,316.15 99 30,933 26,800 12.7 11.0 9.6 18.6 16.1 14.1 12.5 1.5 1.3 1.1 13.5
Cognizant Tech $ 85.77 96 26,175 23,274 13.0 11.2 9.5 21.6 18.3 15.6 20.0 1.1 0.9 0.8 16.2
Wipro INR 506.95 98 20,381 18,596 12.7 11.1 9.6 17.5 15.5 13.3 10.0 1.8 1.5 1.3 14.1
HCL Technologies 1,103.15 94 12,568 11,882 10.9 9.1 8.0 16.2 13.3 11.7 15.0 1.1 0.9 0.8 14.5
Genpact $ 19.80 93 4,771 5,017 12.9 11.5 9.1 18.4 16.9 15.0 15.0 1.2 1.1 1.0 12.8
MphasiS INR 447.80 87 1,543 1,400 7.8 6.7 NA 11.9 10.6 NA 9.1 1.3 1.2 NA 10.8
iGATE $ 30.82 90 1,993 2,921 10.3 9.5 8.9 16.4 14.9 13.8 15.0 1.1 1.0 0.9 9.7
Hexaware INR 131.30 98 651 561 6.9 6.3 5.6 10.4 9.4 8.7 7.9 1.3 1.2 1.1 13.3
Mean 94 % $ 18,529 $ 17,422 11.6 x 10.1 x 9.1 x 17.2 x 15.0 x 13.7 x 13.4 % 1.3 x 1.2 x 1.0 x 13.4 %
Median 94 12,568 11,882 12.7 11.0 9.3 17.5 15.5 13.9 15.0 1.3 1.2 1.0 13.5
US IT Services Companies
Accenture $ 72.88 87 % $ 47,620 $ 42,165 8.9 x 8.4 x 8.0 x 16.9 x 15.8 x 14.7 x 12.0 % 1.4 x 1.3 x 1.2 x 4.8 %
CGI CAD 37.09 97 11,853 14,666 9.9 9.0 NA 15.7 13.4 NA 17.3 0.9 0.8 NA 2.3
Computer Sciences Corp $ 52.55 97 7,977 8,771 4.5 4.2 3.9 15.9 12.6 11.6 8.0 2.0 1.6 1.5 2.3
CIBER 3.31 66 251 247 4.9 4.8 NA 20.7 11.6 NA NA NA NA NA NA
Mean 87 % $ 16,925 $ 16,462 7.0 x 6.6 x 6.0 x 17.3 x 13.4 x 13.2 x 12.4 % 1.4 x 1.2 x 1.3 x 3.1 %
Median 92 9,915 11,718 6.9 6.6 6.0 16.4 13.0 13.2 12.0 1.4 1.3 1.3 2.3
Europe IT Services Companies
Cap Gemini € 48.06 99 % $ 10,372 $ 10,160 7.0 x 6.6 x 6.2 x 16.1 x 14.5 x 13.3 x 6.5 % 2.5 x 2.2 x 2.0 x 2.6 %
Atos 59.45 100 7,362 6,903 5.4 4.9 4.6 13.6 12.1 11.1 19.5 0.7 0.6 0.6 2.4
Tieto 15.60 85 1,643 1,731 5.6 5.5 5.4 11.2 10.2 9.6 4.5 2.5 2.3 2.1 0.6
Mean 95 % $ 6,459 $ 6,264 6.0 x 5.7 x 5.4 x 13.6 x 12.2 x 11.3 x 10.2 % 1.9 x 1.7 x 1.6 x 1.9 %
Median 99 7,362 6,903 5.6 5.5 5.4 13.6 12.1 11.1 6.5 2.5 2.2 2.0 2.4
1 |
| Latest publicly available financial statements. Equity Market Cap based on diluted shares outstanding. |
2 Projected revenues, EBITDA, and EPS are based on IBES median estimates and/or other Wall Street research. All research estimates have been calendarized to December
Comparison of Selected Companies and Precedent Transactions
37
|
STRICTLY CONFIDENTIAL AND PRELIMINARY DRAFT
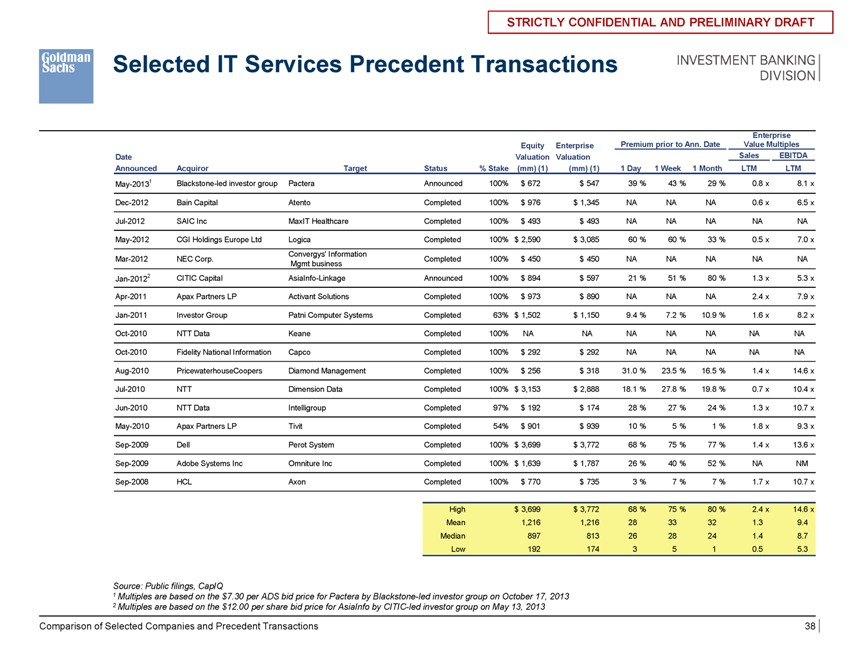
Selected IT Services Precedent Transactions
Enterprise
Equity Enterprise Premium prior to Ann. Date Value Multiples
Date Valuation Valuation Sales EBITDA
Announced Acquiror Target Status % Stake (mm) (1) (mm) (1) 1 Day 1 Week 1 Month LTM LTM
May-20131 Blackstone-led investor group Pactera Announced 100% $ 672 $ 547 39 % 43 % 29 % 0.8 x 8.1 x
Dec-2012 Bain Capital Atento Completed 100% $ 976 $ 1,345 NA NA NA 0.6 x 6.5 x
Jul-2012 SAIC Inc MaxIT Healthcare Completed 100% $ 493 $ 493 NA NA NA NA NA
May-2012 CGI Holdings Europe Ltd Logica Completed 100% $ 2,590 $ 3,085 60 % 60 % 33 % 0.5 x 7.0 x
Convergys’ Information
Mar-2012 NEC Corp. Completed 100% $ 450 $ 450 NA NA NA NA NA
Mgmt business
Jan-20122 CITIC Capital AsiaInfo-Linkage Announced 100% $ 894 $ 597 21 % 51 % 80 % 1.3 x 5.3 x
Apr-2011 Apax Partners LP Activant Solutions Completed 100% $ 973 $ 890 NA NA NA 2.4 x 7.9 x
Jan-2011 Investor Group Patni Computer Systems Completed 63% $ 1,502 $ 1,150 9.4 % 7.2 % 10.9 % 1.6 x 8.2 x
Oct-2010 NTT Data Keane Completed 100% NA NA NA NA NA NA NA
Oct-2010 Fidelity National Information Capco Completed 100% $ 292 $ 292 NA NA NA NA NA
Aug-2010 PricewaterhouseCoopers Diamond Management Completed 100% $ 256 $ 318 31.0 % 23.5 % 16.5 % 1.4 x 14.6 x
Jul-2010 NTT Dimension Data Completed 100% $ 3,153 $ 2,888 18.1 % 27.8 % 19.8 % 0.7 x 10.4 x
Jun-2010 NTT Data Intelligroup Completed 97% $ 192 $ 174 28 % 27 % 24 % 1.3 x 10.7 x
May-2010 Apax Partners LP Tivit Completed 54% $ 901 $ 939 10 % 5 % 1 % 1.8 x 9.3 x
Sep-2009 Dell Perot System Completed 100% $ 3,699 $ 3,772 68 % 75 % 77 % 1.4 x 13.6 x
Sep-2009 Adobe Systems Inc Omniture Inc Completed 100% $ 1,639 $ 1,787 26 % 40 % 52 % NA NM
Sep-2008 HCL Axon Completed 100% $ 770 $ 735 3 % 7 % 7 % 1.7 x 10.7 x
High $ 3,699 $ 3,772 68 % 75 % 80 % 2.4 x 14.6 x
Mean 1,216 1,216 28 33 32 1.3 9.4
Median 897 813 26 28 24 1.4 8.7
Low 192 174 3 5 1 0.5 5.3
Source: Public filings, CapIQ
1 |
| Multiples are based on the $7.30 per ADS bid price for Pactera by Blackstone-led investor group on October 17, 2013 |
2 |
| Multiples are based on the $12.00 per share bid price for AsiaInfo by CITIC-led investor group on May 13, 2013 |
Comparison of Selected Companies and Precedent Transactions
38
|
STRICTLY CONFIDENTIAL AND PRELIMINARY DRAFT
Appendix C: WACC Calculation
STRICTLY CONFIDENTIAL AND PRELIMINARY DRAFT
INVESTMENT BANKING DIVISION
|
STRICTLY CONFIDENTIAL AND PRELIMINARY DRAFT
WACC Calculation
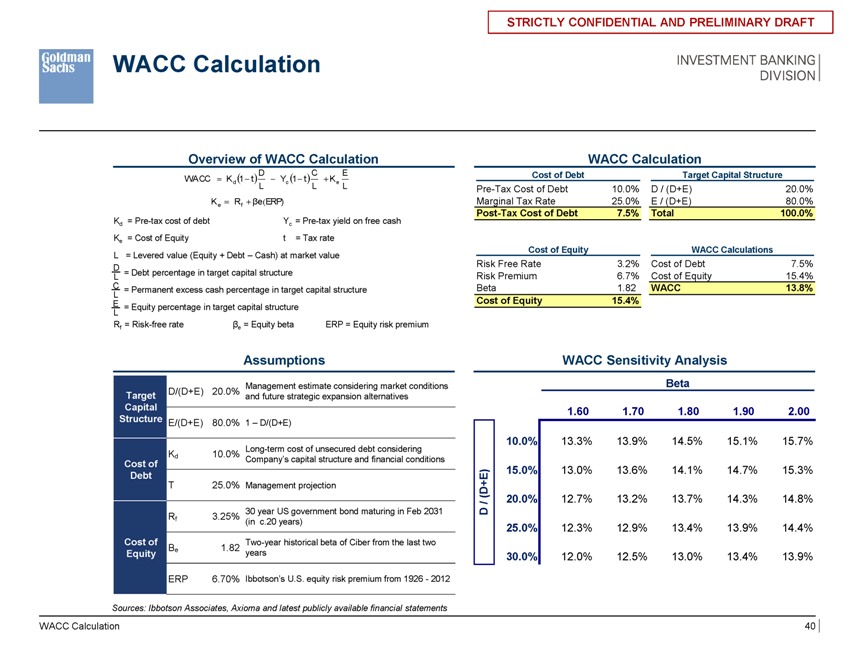
Overview of WACC Calculation
WACC ? Kd ?1??t??D ??Yc ?1??t??C ??Ke E
L L L
Ke ??Rf ???e?ERP)
Kd = Pre-tax cost of debt Yc = Pre-tax yield on free cash
Ke = Cost of Equity t = Tax rate
L = Levered value (Equity + Debt – Cash) at market value
DL = Debt percentage in target capital structure
C = Permanent excess cash percentage in target capital structure
L
E = Equity percentage in target capital structure
L
Rf = Risk-free rate ?e = Equity beta ERP = Equity risk premium
WACC Calculation
Cost of Debt Target Capital Structure
Pre-Tax Cost of Debt 10.0% D / (D+E) 20.0%
Marginal Tax Rate 25.0% E / (D+E) 80.0%
Post-Tax Cost of Debt 7.5% Total 100.0%
Cost of Equity WACC Calculations
Risk Free Rate 3.2% Cost of Debt 7.5%
Risk Premium 6.7% Cost of Equity 15.4%
Beta 1.82 WACC 13.8%
Cost of Equity 15.4%
Assumptions
D/(D+E) 20.0% Management estimate considering market conditions
Target and future strategic expansion alternatives
Capital
Structure E/(D+E) 80.0% 1 – D/(D+E)
Long-term cost of unsecured debt considering
Cost of Kd 10.0% Company’s capital structure and financial conditions
Debt
T 25.0% Management projection
30 year US government bond maturing in Feb 2031
Rf 3.25% (in c.20 years)
Cost of Two-year historical beta of Ciber from the last two
?e 1.82
Equity years
ERP 6.70% Ibbotson’s U.S. equity risk premium from 1926—2012
WACC Sensitivity Analysis
Beta
D / (D+E)
$0.14 1.60 1.70 1.80 1.90 2.00
10.0% 13.3% 13.9% 14.5% 15.1% 15.7%
15.0% 13.0% 13.6% 14.1% 14.7% 15.3%
20.0% 12.7% 13.2% 13.7% 14.3% 14.8%
25.0% 12.3% 12.9% 13.4% 13.9% 14.4%
30.0% 12.0% 12.5% 13.0% 13.4% 13.9%
Sources: Ibbotson Associates, Axioma and latest publicly available financial statements
WACC Calculation
40
STRICTLY CONFIDENTIAL AND PRELIMINARY DRAFT
INVESTMENT BANKING DIVISION
|
STRICTLY CONFIDENTIAL AND PRELIMINARY DRAFT
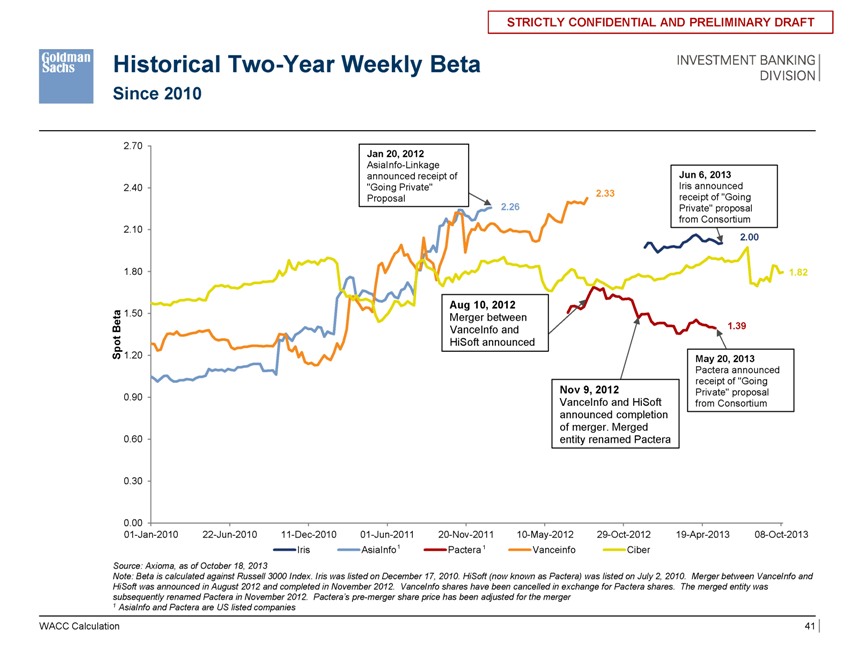
Historical Two-Year Weekly Beta
Since 2010
Jan 20, 2012
AsiaInfo-Linkage announced receipt of “Going Private” Proposal
Jun 6, 2013
Iris announced receipt of “Going Private” proposal from Consortium
Aug 10, 2012
Merger between
VanceInfo and
HiSoft announced
Nov 9, 2012
VanceInfo and HiSoft announced completion of merger. Merged entity renamed Pactera
May 20, 2013
Pactera announced receipt of “Going Private” proposal from Consortium
2.70 2.40 2.10 1.80 Beta 1.50 t po S 1.20 0.90 0.60 0.30 0.00
01-Jan-2010 22-Jun-2010 11-Dec-2010 01-Jun-2011 20-Nov-2011 10-May-2012 29-Oct-2012 19-Apr-2013 08-Oct-2013 Iris AsiaInfo1 Pactera 1 Vanceinfo Ciber
2.26 2.33 1.39 1.82 2.00
Source: Axioma, as of October 18, 2013
Note: Beta is calculated against Russell 3000 Index. Iris was listed on December 17, 2010. HiSoft (now known as Pactera) was listed on July 2, 2010. Merger between VanceInfo and HiSoft was announced in August 2012 and completed in November 2012. VanceInfo shares have been cancelled in exchange for Pactera shares. The merged entity was subsequently renamed Pactera in November 2012. Pactera’s pre-merger share price has been adjusted for the merger
1 |
| AsiaInfo and Pactera are US listed companies |
WACC Calculation
41
STRICTLY CONFIDENTIAL AND PRELIMINARY DRAFT
INVESTMENT BANKING DIVISION