Exhibit (c)-(4)
|
Exhibit (c)-(4)
STRICTLY CONFIDENTAL AND PRELIMINARY DRAFT
INVESTMENT BANKING DIVISION
Project Iris
Special Committee Discussion Materials
Goldman Sachs (Asia) L.L.C.
January 21, 2014
|
STRICTLY CONFIDENTAL AND PRELIMINARY DRAFT
INVESTMENT BANKING DIVISION
Disclaimer
Goldman Sachs (Asia) L.L.C. (“Goldman Sachs”) has prepared and provided these materials and Goldman Sachs’ related presentation (the “Confidential Information”) solely for the information and assistance of the Special Committee of the Board of Directors the “Special Committee” of Iris (the “Company”) in connection with its consideration of the matters referred to herein. Without Goldman Sachs’ prior written consent, the Confidential Information may not be circulated or referred to publicly, disclosed to or relied upon by any other person, or used or relied upon for any other purpose. Notwithstanding anything herein to the contrary, the Company may disclose to any person the US federal income and state income tax treatment and tax structure of any transaction described herein and all materials of any kind (including tax opinions and other tax analyses) that are provided to the Company relating to such tax treatment and tax structure, without Goldman Sachs imposing any limitation of any kind. The Confidential Information, including this disclaimer, is subject to, and governed by, any written agreement between the Company, the Board and/or any committee thereof, on the one hand, and Goldman Sachs, on the other hand.
Goldman Sachs and its affiliates are engaged in advisory, underwriting and financing, principal investing, sales and trading, research, investment management and other financial and non-financial activities and services for various persons and entities. Goldman Sachs and its affiliates and employees, and funds or other entities in which they invest or with which they co-invest, may at any time purchase, sell, hold or vote long or short positions and investments in securities, derivatives, loans, commodities, currencies, credit default swaps and other financial instruments of the Company, any other party to any transaction and any of their respective affiliates or any currency or commodity that may be involved in any transaction for the accounts of Goldman Sachs and its affiliates and employees and their customers.
The Confidential Information has been prepared and based on information obtained by Goldman Sachs from publicly available sources. In preparing the Confidential Information, Goldman Sachs has relied upon and assumed, without assuming any responsibility for independent verification, the accuracy and completeness of all of the financial, legal, regulatory, tax, accounting and other information provided to, discussed with or reviewed by, Goldman Sachs. Goldman Sachs does not provide accounting, tax, legal or regulatory advice. Goldman Sachs’ role in any due diligence review is limited solely to performing such a review as it shall deem necessary to support its own advice and analysis and shall not be on behalf of the Company. Analyses based upon forecasts of future results are not necessarily indicative of actual future results, which may be significantly more or less favorable than suggested by these analyses, and Goldman Sachs does not assume responsibility if future results are materially different from those forecast.
Goldman Sachs has not made an independent evaluation or appraisal of the assets and liabilities of the Company (including any contingent, derivative or other off-balance-sheet assets and liabilities) or any other person and has no obligation to evaluate the solvency of the Company or any person under any law. The analyses in the Confidential Information are not appraisals nor do they necessarily reflect the prices at which businesses or securities actually may be sold or purchased. The Confidential Information does not address the underlying business decision of the Company to engage in any transaction, or the relative merits of any strategic alternative referred to herein as compared to any other alternative that may be available to the Company. The Confidential Information is necessarily based on economic, monetary, market and other conditions as in effect on, and the information made available to Goldman Sachs as of, the date of such Confidential Information and Goldman Sachs assumes no responsibility for updating or revising the Confidential Information.
1 |
|
|
STRICTLY CONFIDENTAL AND PRELIMINARY DRAFT
INVESTMENT BANKING DIVISION
Key Terms of Consortium’s Offer
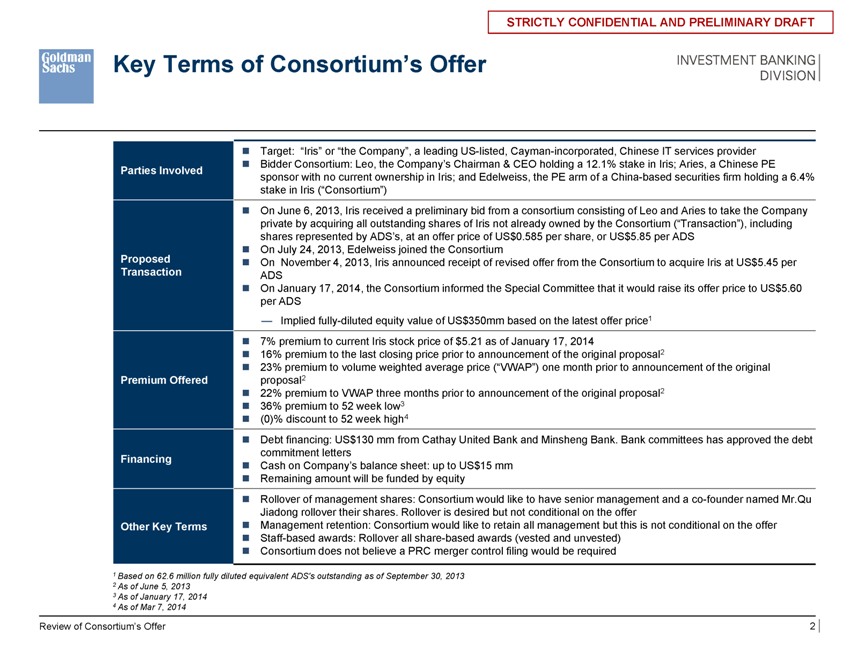
Target: “Iris” or “the Company”, a leading US-listed, Cayman-incorporated, Chinese IT services provider
Parties Involved Bidder Consortium: Leo, the Company’s Chairman & CEO holding a 12.1% stake in Iris; Aries, a Chinese PE
sponsor with no current ownership in Iris; and Edelweiss, the PE arm of a China-based securities firm holding a 6.4%
stake in Iris (“Consortium”)
On June 6, 2013, Iris received a preliminary bid from a consortium consisting of Leo and Aries to take the Company
private by acquiring all outstanding shares of Iris not already owned by the Consortium (“Transaction”), including
shares represented by ADS’s, at an offer price of US$0.585 per share, or US$5.85 per ADS
On July 24, 2013, Edelweiss joined the Consortium
Proposed On November 4, 2013, Iris announced receipt of revised offer from the Consortium to acquire Iris at US$5.45 per
Transaction ADS
On January 17, 2014, the Consortium informed the Special Committee that it would raise its offer price to US$5.60
per ADS
Implied fully-diluted equity value of US$350mm based on the latest offer price1
7% premium to current Iris stock price of $5.21 as of January 17, 2014
16% premium to the last closing price prior to announcement of the original proposal2
23% premium to volume weighted average price (“VWAP”) one month prior to announcement of the original
Premium Offered proposal2
22% premium to VWAP three months prior to announcement of the original proposal2
36% premium to 52 week low3
(0)% discount to 52 week high4
Debt financing: US$130 mm from Cathay United Bank and Minsheng Bank. Bank committees has approved the debt
commitment letters
Financing Cash on Company’s balance sheet: up to US$15 mm
Remaining amount will be funded by equity
Rollover of management shares: Consortium would like to have senior management and a co-founder named Mr.Qu
Jiadong rollover their shares. Rollover is desired but not conditional on the offer
Other Key Terms Management retention: Consortium would like to retain all management but this is not conditional on the offer
Staff-based awards: Rollover all share-based awards (vested and unvested)
Consortium does not believe a PRC merger control filing would be required
1 Based on 62.6 million fully diluted equivalent ADS’s outstanding as of September 30, 2013
2 As of June 5, 2013
3 As of January 17, 2014
4 As of Mar 7, 2014
Review of Consortium’s Offer 2
|
STRICTLY CONFIDENTAL AND PRELIMINARY DRAFT
INVESTMENT BANKING DIVISION
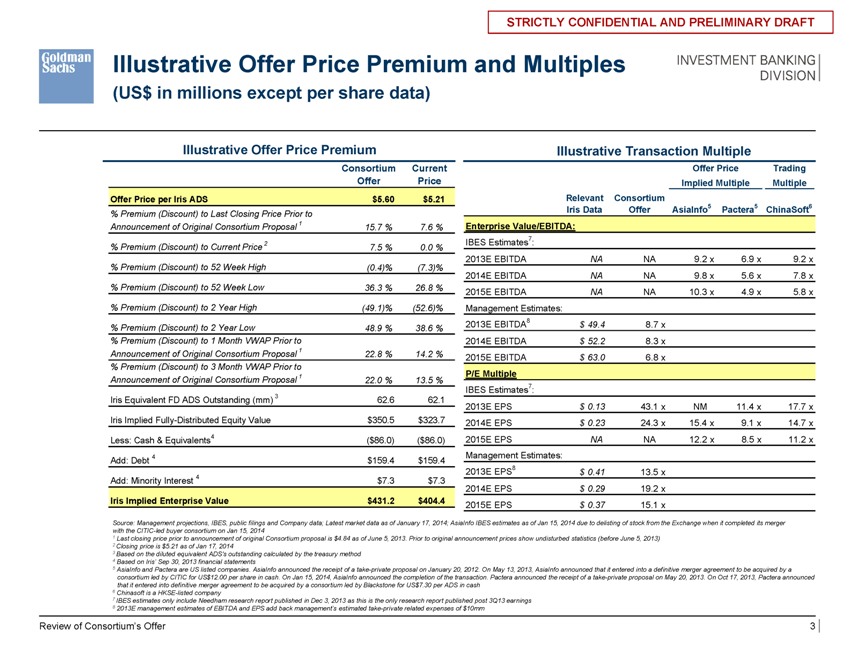
Illustrative Offer Price Premium and Multiples
(US$ in millions except per share data)
Illustrative Offer Price Premium Illustrative Transaction Multiple
Consortium Current Offer Price Trading
Offer Price Implied Multiple Multiple
Offer Price per Iris ADS $5.60 $5.21 Relevant Consortium
% Premium (Discount) to Last Closing Price Prior to Iris Data Offer AsiaInfo5 Pactera5 ChinaSoft6
Announcement of Original Consortium Proposal 1 15.7 % 7.6 % Enterprise Value/EBITDA:
2 IBES Estimates7 :
% Premium (Discount) to Current Price 7.5 % 0.0 %
2013E EBITDA NA NA 9.2 x 6.9 x 9.2 x
% Premium (Discount) to 52 Week High (0.4)% (7.3)%
2014E EBITDA NA NA 9.8 x 5.6 x 7.8 x
% Premium (Discount) to 52 Week Low 36.3 % 26.8 % 2015E EBITDA NA NA 10.3 x 4.9 x 5.8 x
% Premium (Discount) to 2 Year High (49.1)% (52.6)% Management Estimates:
% Premium (Discount) to 2 Year Low 48.9 % 38.6 % 2013E EBITDA8 $ 49.4 8.7 x
% Premium (Discount) to 1 Month VWAP Prior to 2014E EBITDA $ 52.2 8.3 x
Announcement of Original Consortium Proposal 1 22.8 % 14.2 % 2015E EBITDA $ 63.0 6.8 x
% Premium (Discount) to 3 Month VWAP Prior to
P/E Multiple
Announcement of Original Consortium Proposal1 22.0 % 13.5 %
IBES Estimates7 :
Iris Equivalent FD ADS Outstanding (mm) 3 62.6 62.1
2013E EPS $ 0.13 43.1 x NM 11.4 x 17.7 x
Iris Implied Fully-Distributed Equity Value $350.5 $323.7 2014E EPS $ 0.23 24.3 x 15.4 x 9.1 x 14.7 x
Less: Cash & Equivalents4 ($86.0) ($86.0) 2015E EPS NA NA 12.2 x 8.5 x 11.2 x
4 Management Estimates:
Add: Debt4 $159.4 $159.4
4 2013E EPS8 $ 0.41 13.5 x
Add: Minority Interest4 $7.3 $7.3
2014E EPS $ 0.29 19.2 x
Iris Implied Enterprise Value $431.2 $404.4 2015E EPS $ 0.37 15.1 x
Source: Management projections, IBES, public filings and Company data; Latest market data as of January 17, 2014; AsiaInfo IBES estimates as of Jan 15, 2014 due to delisting of stock from the Exchange when it completed its merger with the CITIC-led buyer consortium on Jan 15, 2014
1 Last closing price prior to announcement of original Consortium proposal is $4.84 as of June 5, 2013. Prior to original announcement prices show undisturbed statistics (before June 5, 2013)
Closing price is $5.21 as of Jan 17, 2014
Based on the diluted equivalent ADS’s outstanding calculated by the treasury method
Based on Iris’ Sep 30, 2013 financial statements
AsiaInfo and Pactera are US listed companies. AsiaInfo announced the receipt of a take-private proposal on January 20, 2012. On May 13, 2013, AsiaInfo announced that it entered into a definitive merger agreement to be acquired by a consortium led by CITIC for US$12.00 per share in cash. On Jan 15, 2014, AsiaInfo announced the completion of the transaction. Pactera announced the receipt of a take-private proposal on May 20, 2013. On Oct 17, 2013, Pactera announced that it entered into definitive merger agreement to be acquired by a consortium led by Blackstone for US$7.30 per ADS in cash
Chinasoft is a HKSE-listed company
IBES estimates only include Needham research report published in Dec 3, 2013 as this is the only research report published post 3Q13 earnings
2013E management estimates of EBITDA and EPS add back management’s estimated take-private related expenses of $10mm
Review of Consortium’s Offer 3
|
STRICTLY CONFIDENTAL AND PRELIMINARY DRAFT
INVESTMENT BANKING DIVISION
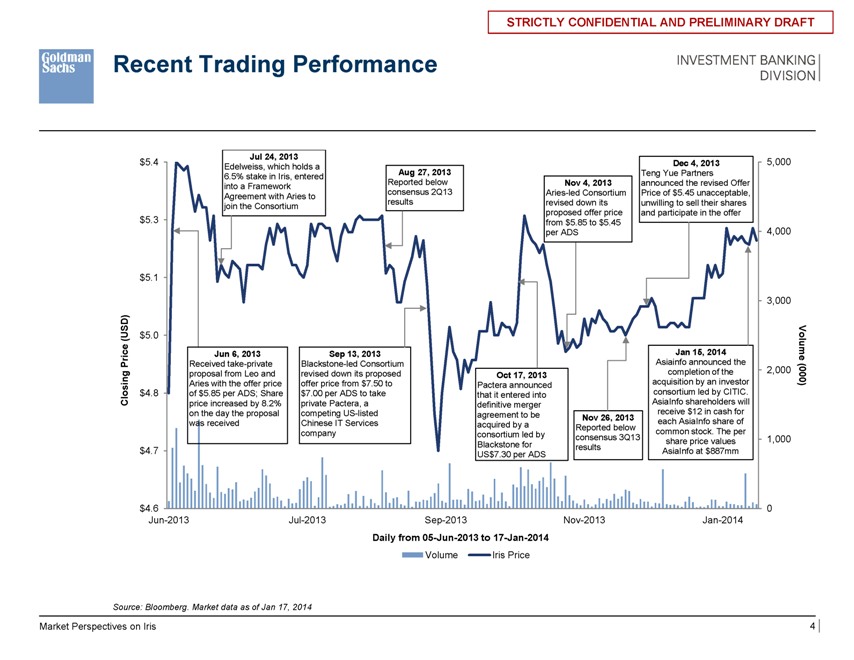
Recent Trading Performance
Jul 24, 2013
$5.4 Edelweiss, which holds a Dec 4, 2013 5,000
6.5% stake in Iris, entered Aug 27, 2013 Teng Yue Partners
into a Framework Reported below Nov 4, 2013 announced the revised Offer
Agreement with Aries to consensus 2Q13 Aries-led Consortium Price of $5.45 unacceptable,
join the Consortium results revised down its unwilling to sell their shares
proposed offer price and participate in the offer
$5.3 from $5.85 to $5.45
per ADS 4,000
$5.1
3,000
(USD) $5.0
Jun 6, 2013 Sep 13, 2013 Jan 15, 2014
Price Received take-private Blackstone-led Consortium Asiainfo announced the Volume
proposal from Leo and revised down its proposed Oct 17, 2013 completion of the 2,000 (000)
Aries with the offer price offer price from $7.50 to Pactera announced acquisition by an investor
Closing $4.8 of $5.85 per ADS; Share $7.00 per ADS to take that it entered into consortium led by CITIC.
price increased by 8.2% private Pactera, a definitive merger AsiaInfo shareholders will
on the day the proposal competing US-listed agreement to be Nov 26, 2013 receive $12 in cash for
was received Chinese IT Services acquired by a Reported below each AsiaInfo share of
company consortium led by common stock. The per
consensus 3Q13 share price values 1,000
$4.7 Blackstone for results AsiaInfo at $887mm
US $7.30 per ADS
$4.6 0
Jun-2013 Jul-2013 Sep-2013 Nov-2013 Jan-2014
Daily from 05-Jun-2013 to 17-Jan-2014
Volume Iris Price
Source: Bloomberg. Market data as of Jan 17, 2014
Market Perspectives on Iris 4
|
STRICTLY CONFIDENTAL AND PRELIMINARY DRAFT
INVESTMENT BANKING DIVISION
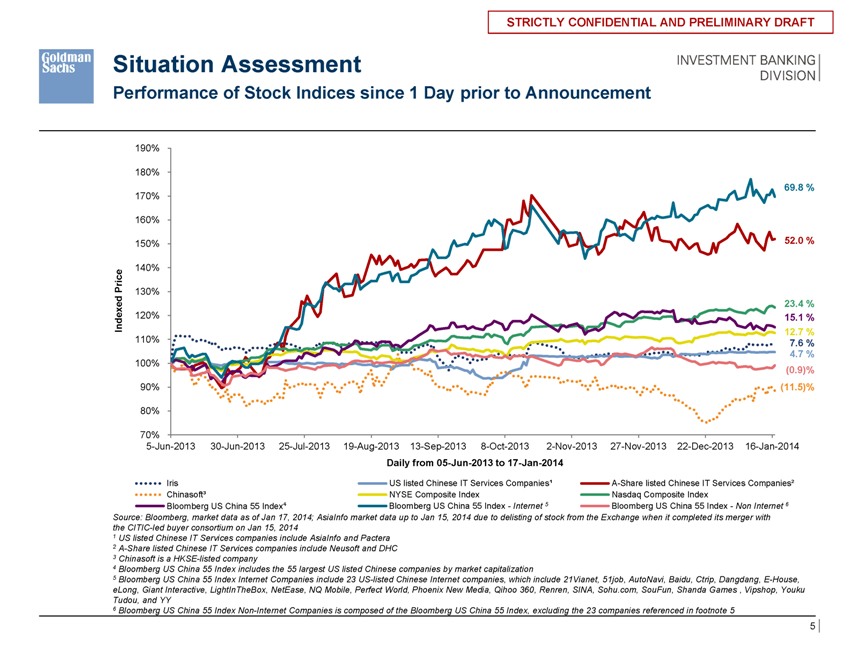
Situation Assessment
Performance of Stock Indices since 1 Day prior to Announcement
190%
180%
69.8 %
170%
160%
150% 52.0 %
Price 140%
130%
23.4 %
Indexed 120% 15.1 %
12.7 %
110% 7.6 %
4.7 %
100%
(0.9)%
90% (11.5)%
80%
70%
5-Jun-2013 30-Jun-2013 25-Jul-2013 19-Aug-2013 13-Sep-2013 8-Oct-2013 2-Nov-2013 27-Nov-2013 22-Dec-2013 16-Jan-2014
Daily from 05-Jun-2013 to 17-Jan-2014
Iris US listed Chinese IT Services Companies¹ A-Share listed Chinese IT Services Companies²
Chinasoft³ NYSE Composite Index Nasdaq Composite Index
Bloomberg US China 55 Index4 Bloomberg US China 55 Index-Internet 5 Bloombergberg US China 55 Index— Non Internet 6
Source: Bloomberg, market data as of Jan 17, 2014; AsiaInfo market data up to Jan 15, 2014 due to delisting of stock from the Exchange when it completed its merger with the CITIC-led buyer consortium on Jan 15, 2014
1 US listed Chinese IT Services companies include AsiaInfo and Pactera
2 A-Share listed Chinese IT Services companies include Neusoft and DHC
3 Chinasoft is a HKSE-listed company
4 Bloomberg US China 55 Index includes the 55 largest US listed Chinese companies by market capitalization
5 Bloomberg US China 55 Index Internet Companies include 23 US-listed Chinese Internet companies, which include 21Vianet, 51job, AutoNavi, Baidu, Ctrip, Dangdang, E-House, eLong, Giant Interactive, LightInTheBox, NetEase, NQ Mobile, Perfect World, Phoenix New Media, Qihoo 360, Renren, SINA, Sohu.com, SouFun, Shanda Games, Vipshop, Youku Tudou, and YY
6 Bloomberg US China 55 Index Non-Internet Companies is composed of the Bloomberg US China 55 Index, excluding the 23 companies referenced in footnote 5
5 |
|
|
STRICTLY CONFIDENTAL AND PRELIMINARY DRAFT
INVESTMENT BANKING DIVISION
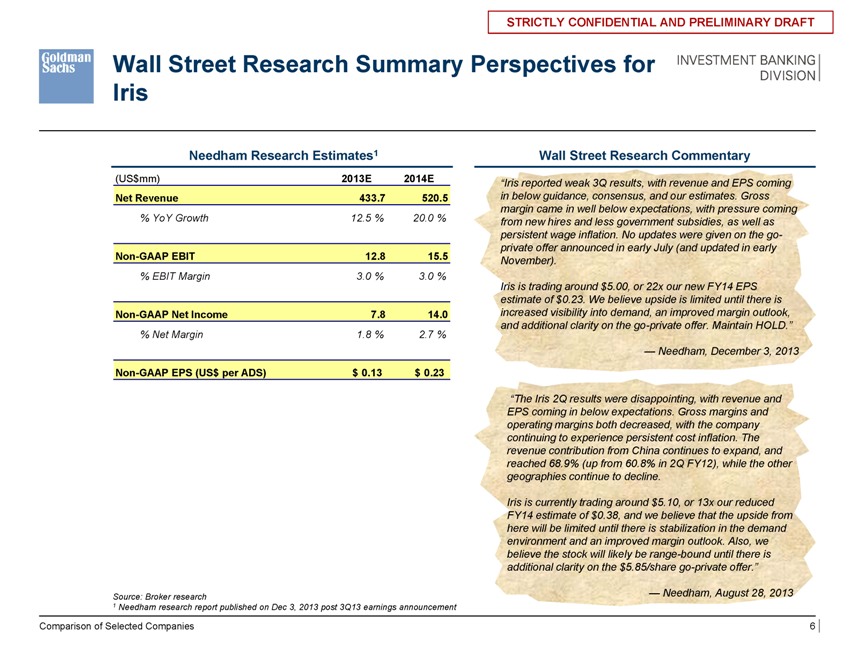
Wall Street Research Summary Perspectives for Iris
Needham Research Estimates1
(US$mm) 2013E 2014E Net Revenue 433.7 520.5
% YoY Growth 12.5 % 20.0 %
Non-GAAP EBIT 12.8 15.5
% EBIT Margin 3.0 % 3.0 %
Non-GAAP Net Income 7.8 14.0
% Net Margin 1.8 % 2.7 %
Non-GAAP EPS (US$ per ADS) $ 0.13 $ 0.23
Wall Street Research Commentary
“Iris reported weak 3Q results, with revenue and EPS coming in below guidance, consensus, and our estimates. Gross margin came in well below expectations, with pressure coming from new hires and less government subsidies, as well as persistent wage inflation. No updates were given on the go-private offer announced in early July (and updated in early November).
Iris is trading around $5.00, or 22x our new FY14 EPS estimate of $0.23. We believe upside is limited until there is increased visibility into demand, an improved margin outlook, and additional clarity on the go-private offer. Maintain HOLD.”
—Needham, December 3, 2013
“The Iris 2Q results were disappointing, with revenue and EPS coming in below expectations. Gross margins and operating margins both decreased, with the company continuing to experience persistent cost inflation. The revenue contribution from China continues to expand, and reached 68.9% (up from 60.8% in 2Q FY12), while the other geographies continue to decline.
Iris is currently trading around $5.10, or 13x our reduced FY14 estimate of $0.38, and we believe that the upside from here will be limited until there is stabilization in the demand environment and an improved margin outlook. Also, we believe the stock will likely be range-bound until there is additional clarity on the $5.85/share go-private offer.”
—Needham, August 28, 2013
Source: Broker research
1 Needham research report published on Dec 3, 2013 post 3Q13 earnings announcement
Comparison of Selected Companies 6
|
STRICTLY CONFIDENTAL AND PRELIMINARY DRAFT
INVESTMENT BANKING DIVISION
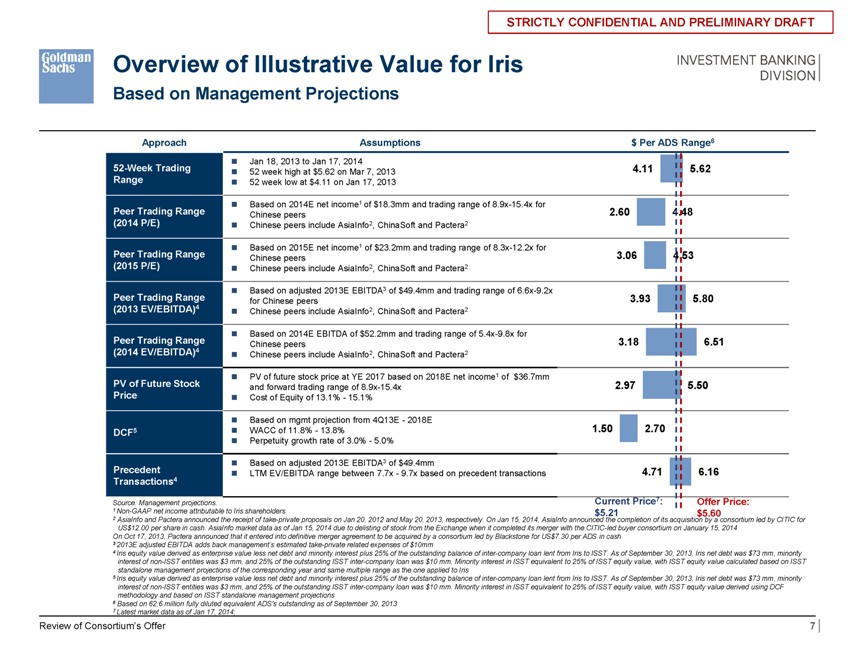
Overview of Illustrative Value for Iris
Based on Management Projections
Approach Assumptions $ Per ADS Range6
Jan 18, 2013 to Jan 17, 2014
52-Week Trading 52 week high at $5.62 on Mar 7, 2013 4.11 5.62
Range 52 week low at $4.11 on Jan 17, 2013
Based on 2014E net income1 of $18.3mm and trading range of 8.9x-15.4x for
Peer Trading Range Chinese peers 2.60 4.48
(2014 P/E) Chinese peers include AsiaInfo2, ChinaSoft and Pactera2
Based on 2015E net income1 of $23.2mm and trading range of 8.3x-12.2x for
Peer Trading Range Chinese peers 3.06 4.53
(2015 P/E) Chinese peers include AsiaInfo2, ChinaSoft and Pactera2
Based on adjusted 2013E EBITDA3 of $49.4mm and trading range of 6.6x-9.2x
Peer Trading Range for Chinese peers 3.93 5.80
(2013 EV/EBITDA)4 Chinese peers include AsiaInfo2, ChinaSoft and Pactera2
Based on 2014E EBITDA of $52.2mm and trading range of 5.4x-9.8x for
Peer Trading Range Chinese peers 3.18 6.51
(2014 EV/EBITDA)4 Chinese peers include AsiaInfo2, ChinaSoft and Pactera2
PV of future stock price at YE 2017 based on 2018E net income1 of $36.7mm
PV of Future Stock and forward trading range of 8.9x-15.4x 2.97 5.50
Price Cost of Equity of 13.1%—15.1%
Based on mgmt projection from 4Q13E—2018E
DCF5 WACC of 11.8%—13.8% 1.50 2.70
Perpetuity growth rate of 3.0%—5.0%
Based on adjusted 2013E EBITDA3 of $49.4mm
Precedent LTM EV/EBITDA range between 7.7x—9.7x based on precedent transactions 4.71 6.16
Transactions4
Current Price7: Offer Price:
Source: Management projections.
1 Non-GAAP net income attributable to Iris shareholders $5.21 $5.60
2 AsiaInfo and Pactera announced the receipt of take-private proposals on Jan 20, 2012 and May 20, 2013, respectively. On Jan 15, 2014, AsiaInfo announced the completion of its acquisition by a consortium led by CITIC for US$12.00 per share in cash. AsiaInfo market data as of Jan 15, 2014 due to delisting of stock from the Exchange when it completed its merger with the CITIC-led buyer consortium on January 15, 2014 On Oct 17, 2013, Pactera announced that it entered into definitive merger agreement to be acquired by a consortium led by Blackstone for US$7.30 per ADS in cash
3 2013E adjusted EBITDA adds back management’s estimated take-private related expenses of $10mm
4 Iris equity value derived as enterprise value less net debt and minority interest plus 25% of the outstanding balance of inter-company loan lent from Iris to ISST. As of September 30, 2013, Iris net debt was $73 mm, minority interest of non-ISST entities was $3 mm, and 25% of the outstanding ISST inter-company loan was $10 mm. Minority interest in ISST equivalent to 25% of ISST equity value, with ISST equity value calculated based on ISST standalone management projections of the corresponding year and same multiple range as the one applied to Iris
5 Iris equity value derived as enterprise value less net debt and minority interest plus 25% of the outstanding balance of inter-company loan lent from Iris to ISST. As of September 30, 2013, Iris net debt was $73 mm, minority interest of non-ISST entities was $3 mm, and 25% of the outstanding ISST inter-company loan was $10 mm. Minority interest in ISST equivalent to 25% of ISST equity value, with ISST equity value derived using DCF methodology and based on ISST standalone management projections
6 Based on 62.6 million fully diluted equivalent ADS’s outstanding as of September 30, 2013
7 Latest market data as of Jan 17, 2014;
Review of Consortium’s Offer 7
|
STRICTLY CONFIDENTAL AND PRELIMINARY DRAFT
INVESTMENT BANKING DIVISION
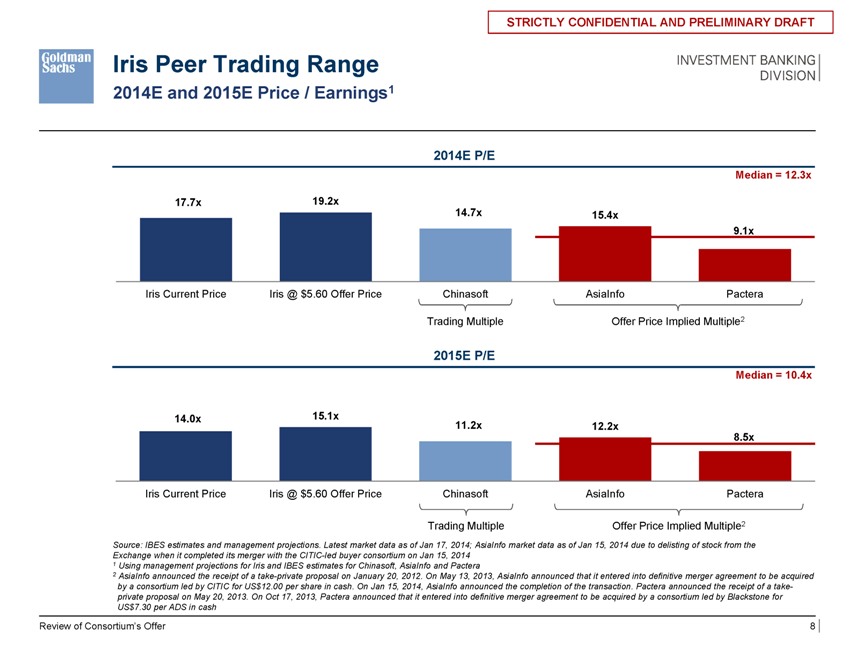
Iris Peer Trading Range
2014E and 2015E Price / Earnings1
2014E P/E
Median = 12.3x
17.7x 19.2x
14.7x 15.4x
9.1x
Iris Current Price Iris @ $5.60 Offer Price Chinasoft AsiaInfo Pactera
Trading Multiple Offer Price Implied Multiple2
2015E P/E
Median = 10.4x
14.0x 15.1x 11.2x 12.2x
8.5x
Iris Current Price Iris @ $ 5.60 Offer Price Chinasoft AsiaInfo Pactera
Trading Multiple Offer Price Implied Multiple2
Source: IBES estimates and management projections. Latest market data as of Jan 17, 2014; AsiaInfo market data as of Jan 15, 2014 due to delisting of stock from the Exchange when it completed its merger with the CITIC-led buyer consortium on Jan 15, 2014
1 Using management projections for Iris and IBES estimates for Chinasoft, AsiaInfo and Pactera
2 AsiaInfo announced the receipt of a take-private proposal on January 20, 2012. On May 13, 2013, AsiaInfo announced that it entered into definitive merger agreement to be acquired by a consortium led by CITIC for US$12.00 per share in cash. On Jan 15, 2014, AsiaInfo announced the completion of the transaction. Pactera announced the receipt of a take-private proposal on May 20, 2013. On Oct 17, 2013, Pactera announced that it entered into definitive merger agreement to be acquired by a consortium led by Blackstone for US$7.30 per ADS in cash
Review of Consortium’s Offer 8
|
STRICTLY CONFIDENTAL AND PRELIMINARY DRAFT
INVESTMENT BANKING DIVISION
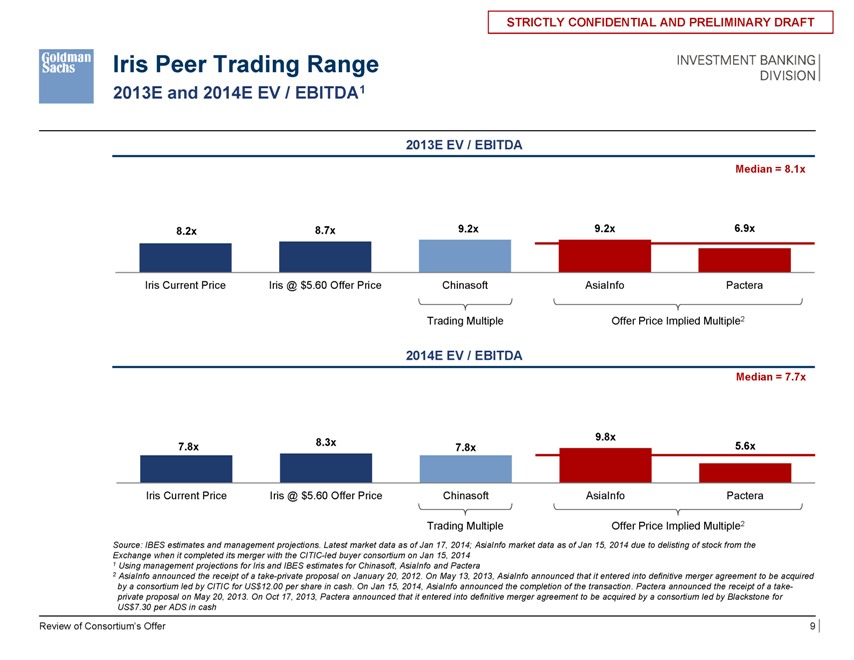
Iris Peer Trading Range
2013E and 2014E EV / EBITDA1
2013E EV / EBITDA
Median = 8.1x
8.2x 8.7x 9.2x 9.2x 6.9x
Iris Current Price Iris @ $5.60 Offer Price Chinasoft AsiaInfo Pactera
Trading Multiple Offer Price Implied Multiple2
2014E EV / EBITDA
Median = 7.7x
8.3x 9.8x
7.8x 7.8x 5.6x
Iris Current Price Iris @ $5.60 Offer Price Chinasoft AsiaInfo Pactera
Trading Multiple Offer Price Implied Multiple2
Source: IBES estimates and management projections. Latest market data as of Jan 17, 2014; AsiaInfo market data as of Jan 15, 2014 due to delisting of stock from the Exchange when it completed its merger with the CITIC-led buyer consortium on Jan 15, 2014
1 Using management projections for Iris and IBES estimates for Chinasoft, AsiaInfo and Pactera
2 AsiaInfo announced the receipt of a take-private proposal on January 20, 2012. On May 13, 2013, AsiaInfo announced that it entered into definitive merger agreement to be acquired by a consortium led by CITIC for US$12.00 per share in cash. On Jan 15, 2014, AsiaInfo announced the completion of the transaction. Pactera announced the receipt of a take-private proposal on May 20, 2013. On Oct 17, 2013, Pactera announced that it entered into definitive merger agreement to be acquired by a consortium led by Blackstone for US$7.30 per ADS in cash
Review of Consortium’s Offer 9
|
STRICTLY CONFIDENTAL AND PRELIMINARY DRAFT
INVESTMENT BANKING DIVISION
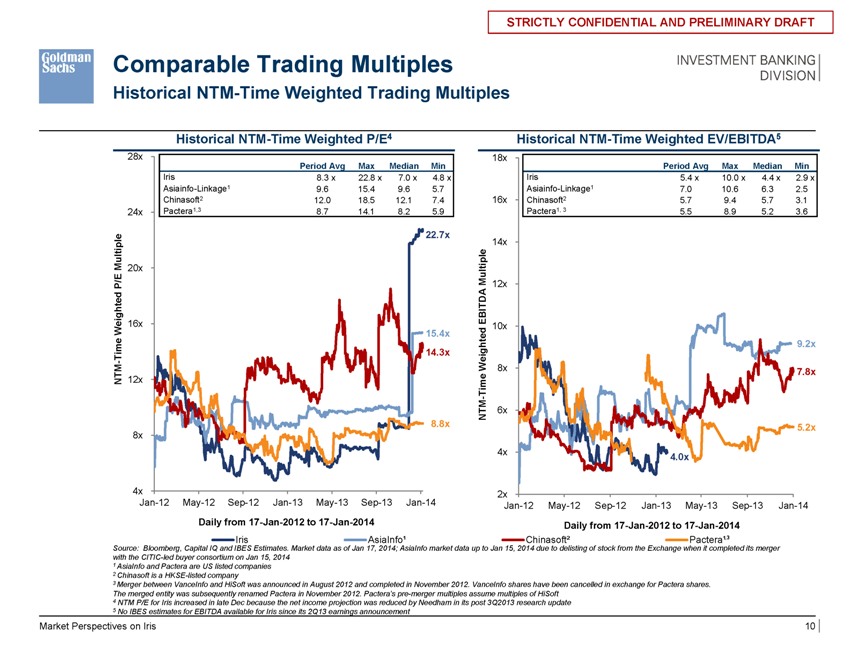
Comparable Trading Multiples
Historical NTM-Time Weighted Trading Multiples
Historical NTM-Time Weighted P/E4
28x
Period Avg Max Median Min
Iris 8.3 x 22.8 x 7.0 x 4.8 x
Asiainfo-Linkage1 9.6 15.4 9.6 5.7
Chinasoft2 12.0 18.5 12.1 7.4
24x Pactera1,3 8.7 14.1 8.2 5.9
22.7x
Multiple 20x
P/E
Weighted 16x
15.4x
Time 14.3x
-
NTM 12x
8.8x
8x
4x
Jan-12 May-12 Sep-12 Jan-13 May-13 Sep-13 Jan-14
Daily from 17-Jan-2012 to 17-Jan-2014
Iris AsiaInfo¹
Historical NTM-Time Weighted EV/EBITDA5
18x
Period Avg Max Median Min
Iris 5.4 x 10.0 x 4.4 x 2.9 x
Asiainfo-Linkage1 7.0 10.6 6.3 2.5
16x Chinasoft2 5.7 9.4 5.7 3.1
Pactera1, 3 5.5 8.9 5.2 3.6
14x
Multiple 12x
EBITDA 10x
Weighted 9.2x
8x 7.8x
Time
-
NTM 6x
5.2x
4x 4.0x
2x
Jan-12 May-12 Sep-12 Jan-13 May-13 Sep-13 Jan-14
Daily from 17-Jan-2012 to 17-Jan-2014
Chinasoft² Pactera¹,3
Source: Bloomberg, Capital IQ and IBES Estimates. Market data as of Jan 17, 2014; AsiaInfo market data up to Jan 15, 2014 due to delisting of stock from the Exchange when it completed its merger with the CITIC-led buyer consortium on Jan 15, 2014
1 AsiaInfo and Pactera are US listed companies
2 Chinasoft is a HKSE-listed company
3 Merger between VanceInfo and HiSoft was announced in August 2012 and completed in November 2012. VanceInfo shares have been cancelled in exchange for Pactera shares.
The merged entity was subsequently renamed Pactera in November 2012. Pactera’s pre-merger multiples assume multiples of HiSoft
4 NTM P/E for Iris increased in late Dec because the net income projection was reduced by Needham in its post 3Q2013 research update
5 No IBES estimates for EBITDA available for Iris since its 2Q13 earnings announcement
Market Perspectives on Iris 10
|
STRICTLY CONFIDENTAL AND PRELIMINARY DRAFT
INVESTMENT BANKING DIVISION
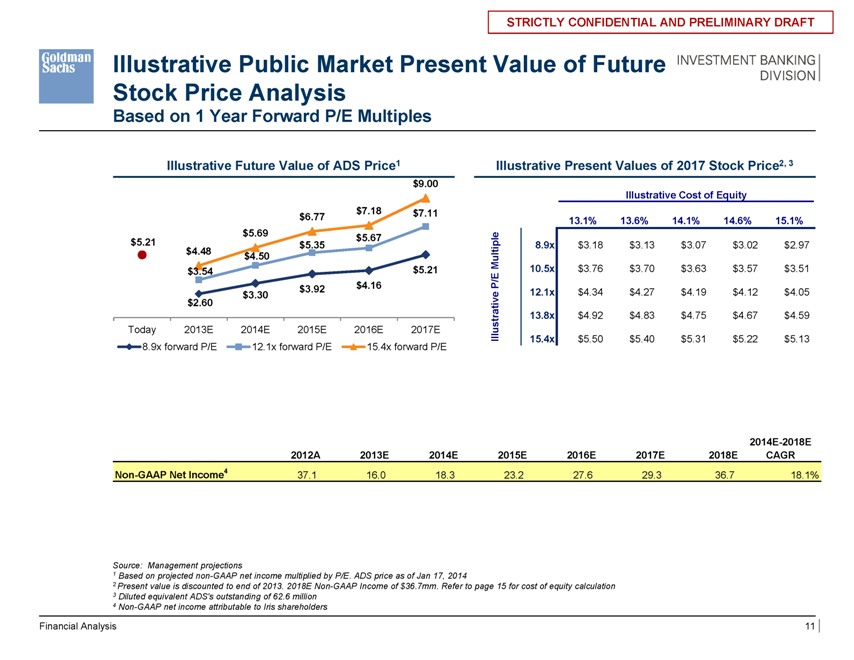
Illustrative Public Market Present Value of Future Stock Price Analysis
Based on 1 Year Forward P/E Multiples
Illustrative Future Value of ADS Price1 Illustrative Present Values of 2017 Stock Price2, 3
$ 9.00
Illustrative Cost of Equity
$ 6.77 $7.18 $ 7.11
$3.45 13.1% 13.6% 14.1% 14.6% 15.1%
$5.69 $ 5.67
$5.21 $ 5.35 8.9x $ 3.18 $ 3.13 $ 3.07 $ 3.02 $ 2.97
$4.48 $4.50 Multiple
$3.54 $ 5.21 10.5x $ 3.76 $ 3.70 $ 3.63 $ 3.57 $ 3.51
$4.16 P/E
$3.30 $ 3.92 12.1x $ 4.34 $ 4.27 $ 4.19 $ 4.12 $ 4.05
$2.60
13.8x $ 4.92 $ 4.83 $ 4.75 $ 4.67 $ 4.59
Today 2013E 2014E 2015E 2016E 2017E Illustrative
15.4x $ 5.50 $ 5.40 $ 5.31 $ 5.22 $ 5.13
8.9x forward P/E 12.1x forward P/E 15.4x forward P/E
2014E-2018E
2012A 2013E 2014E 2015E 2016E 2017E 2018E CAGR
Non-GAAP Net Income4 37.1 16.0 18.3 23.2 27.6 29.3 36.7 18.1%
Source: Management projections
1 Based on projected non-GAAP net income multiplied by P/E. ADS price as of Jan 17, 2014
2 Present value is discounted to end of 2013. 2018E Non-GAAP Income of $36.7mm. Refer to page 15 for cost of equity calculation
3 Diluted equivalent ADS’s outstanding of 62.6 million
4 Non-GAAP net income attributable to Iris shareholders
Financial Analysis 11
|

STRICTLY CONFIDENTAL AND PRELIMINARY DRAFT
INVESTMENT BANKING DIVISION
Discounted Cash Flow for Iris
(US$ in millions except per share data)
Assumptions Free Cash Flow Calculation
Iris management projections for 4Q13E to 2018E Terminal
4Q13E 2014E 2015E 2016E 2017E 2018E Year
Assumes lower effective tax rate of 11% in 2014E
and 15% in 4Q13E and from 2015E to 2018E due Revenue 131 529 617 684 747 812 812
to certain PRC government subsidies and tax EBITDA (After SBC) 9 43 54 62 65 64 64
breaks; Assumes statutory PRC tax rate of 25% in
terminal year EBIT (Before SBC) 8 34 42 46 47 53 56
Terminal year based on same financial figures and Income Tax Expenses (1) (4) (6) (7) (7) (8) (14)
assumptions as 2018E, other than changes in WC Tax-Effected EBITDA 8 39 48 55 58 56 50
to reflect long-term PGR assumptions and Capital Expenditures (16) (15) (16) (17) (18) (20) (20)
normalize D&A to be equal to annual capex
(Increase)/Decrease in WC 29 (25) (29) (13) (22) (19) (9)
Iris Sep 30, 2013 net debt of $73 mm1 and non-
ISST minority interest of $3 mm; Value of ISST Unlevered Free Cash Flow 21 (1) 3 25 17 17 21
minority interest calculated using DCF of ISST2 Expected Tax Rate 15% 11% 15% 15% 15% 15% 25%
All cash flows are discounted to September 30,
2013 with mid-year conversion
DCF Analysis
Illustrative Iris Equity Value Per ADS3 Implied Iris Terminal Year P/E Multiple3 % of EV from Terminal Value
Perpetuity Growth Rate Perpetuity Growth Rate Perpetuity Growth Rate
$1.926 3.0% 3.5% 4.0% 4.5% 5.0% 347.8% 3.0% 3.5% 4.0% 4.5% 5.0% 70% 3.0% 3.5% 4.0% 4.5% 5.0%
11.8% 2.05 2.18 2.33 2.51 2.70 11.8% 3.7x 3.9x 4.2x 4.5x 4.9x 11.8% 70.2 % 71.5 % 72.8 % 74.2 % 75.6 %
12.3% 1.89 2.01 2.14 2.29 2.46 12.3% 3.4x 3.6x 3.9x 4.1x 4.4x 12.3% 68.8 % 70.0 % 71.4 % 72.7 % 74.1 %
WACC 12.8% 1.75 1.85 1.97 2.10 2.24 WACC 12.8% 3.2x 3.3x 3.6x 3.8x 4.0x WACC 12.8% 67.4 % 68.6 % 69.9 % 71.2 % 72.6 %
13.3% 1.62 1.71 1.81 1.93 2.05 13.3% 2.9x 3.1x 3.3x 3.5x 3.7x 13.3% 66.1 % 67.3 % 68.5 % 69.8 % 71.1 %
13.8% 1.50 1.58 1.67 1.77 1.89 13.8% 2.7x 2.9x 3.0x 3.2x 3.4x 13.8% 64.7 % 65.9 % 67.1 % 68.4 % 69.7 %
Source: Management projections
1 Net debt as of September 30, 2013 of $73 mm include cash and cash equivalents of $86 mm and total debt of $159 mm
2 Minority interest in ISST equivalent to 25% of ISST equity value. ISST equity value is derived from DCF methodology, using ISST standalone management projections, same PGR and WACC assumptions as the group
3 Iris equity value derived as enterprise value less net debt and minority interest plus 25% of the outstanding balance of inter-company loan lent from Iris to ISST. As of September 30, 2013, Iris net debt was $73 mm, minority interest of non-ISST entities was $3 mm, and 25% of the outstanding ISST inter-company loan was $10 mm
Financial Analysis 12
|
STRICTLY CONFIDENTAL AND PRELIMINARY DRAFT
INVESTMENT BANKING DIVISION
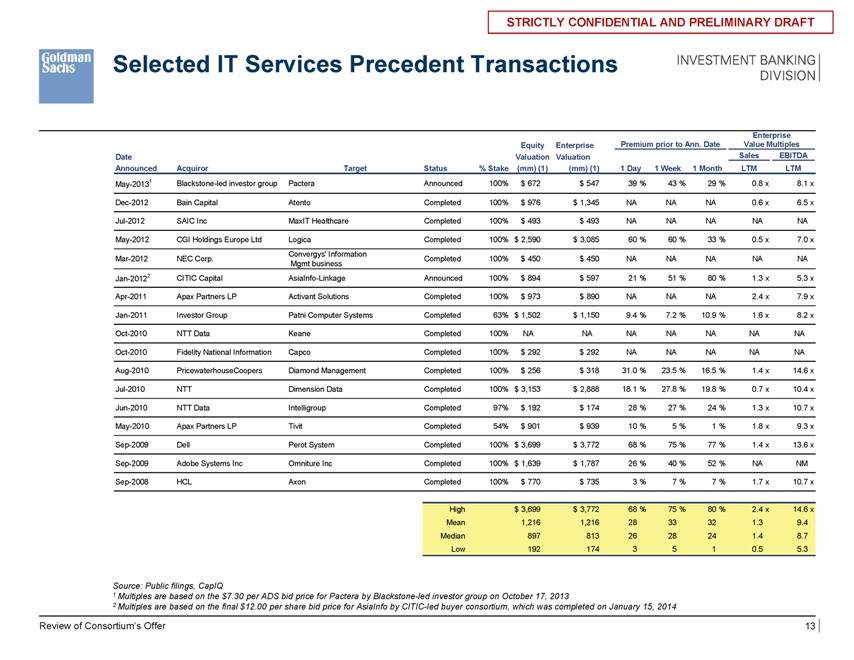
Selected IT Services Precedent Transactions
Enterprise
Equity Enterprise Premium prior to Ann. Date Value Multiples
Date Valuation Valuation Sales EBITDA
Announced Acquiror Target Status % Stake (mm) (1) (mm) (1) 1 Day 1 Week 1 Month LTM LTM
May-20131 Blackstone-led investor group Pactera Announced 100% $ 672 $ 547 39 % 43 % 29 % 0.8 x 8.1 x
Dec-2012 Bain Capital Atento Completed 100% $ 976 $ 1,345 NA NA NA 0.6 x 6.5 x
Jul-2012 SAIC Inc MaxIT Healthcare Completed 100% $ 493 $ 493 NA NA NA NA NA
May-2012 CGI Holdings Europe Ltd Logica Completed 100% $ 2,590 $ 3,085 60 % 60 % 33 % 0.5 x 7.0 x
Convergys’ Information
Mar-2012 NEC Corp. Completed 100% $ 450 $ 450 NA NA NA NA NA
Mgmt business
Jan-20122 CITIC Capital AsiaInfo-Linkage Announced 100% $ 894 $ 597 21 % 51 % 80 % 1.3 x 5.3 x
Apr-2011 Apax Partners LP Activant Solutions Completed 100% $ 973 $ 890 NA NA NA 2.4 x 7.9 x
Jan-2011 Investor Group Patni Computer Systems Completed 63% $ 1,502 $ 1,150 9.4 % 7.2 % 10.9 % 1.6 x 8.2 x
Oct-2010 NTT Data Keane Completed 100% NA NA NA NA NA NA NA
Oct-2010 Fidelity National Information Capco Completed 100% $ 292 $ 292 NA NA NA NA NA
Aug-2010 PricewaterhouseCoopers Diamond Management Completed 100% $ 256 $ 318 31.0 % 23.5 % 16.5 % 1.4 x 14.6 x
Jul-2010 NTT Dimension Data Completed 100% $ 3,153 $ 2,888 18.1 % 27.8 % 19.8 % 0.7 x 10.4 x
Jun-2010 NTT Data Intelligroup Completed 97% $ 192 $ 174 28 % 27 % 24 % 1.3 x 10.7 x
May-2010 Apax Partners LP Tivit Completed 54% $ 901 $ 939 10 % 5 % 1 % 1.8 x 9.3 x
Sep-2009 Dell Perot System Completed 100% $ 3,699 $ 3,772 68 % 75 % 77 % 1.4 x 13.6 x
Sep-2009 Adobe Systems Inc Omniture Inc Completed 100% $ 1,639 $ 1,787 26 % 40 % 52 % NA NM
Sep-2008 HCL Axon Completed 100% $ 770 $ 735 3 % 7 % 7 % 1.7 x 10.7 x
High $ 3,699 $ 3,772 68 % 75 % 80 % 2.4 x 14.6 x
Mean 1,216 1,216 28 33 32 1.3 9.4
Median 897 813 26 28 24 1.4 8.7
Low 192 174 3 5 1 0.5 5.3
Source: Public filings, CapIQ
1 Multiples are based on the $7.30 per ADS bid price for Pactera by Blackstone-led investor group on October 17, 2013
2 Multiples are based on the final $12.00 per share bid price for AsiaInfo by CITIC-led buyer consortium, which was completed on January 15, 2014
Review of Consortium’s Offer 13
|
STRICTLY CONFIDENTAL AND PRELIMINARY DRAFT
INVESTMENT BANKING DIVISION
Appendix A: Illustrative Weighted Average Cost of Capital Calculation
|
STRICTLY CONFIDENTAL AND PRELIMINARY DRAFT
INVESTMENT BANKING DIVISION
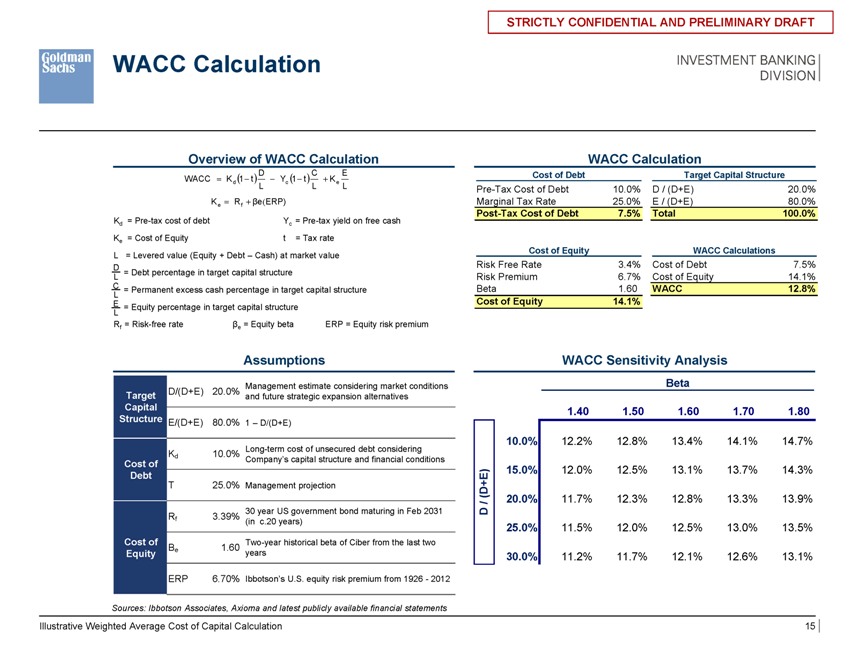
WACC Calculation
Overview of WACC Calculation
WACC K d1 t D Yc 1 t C K e E
L L L
K e R f eERP)
Kd = Pre-tax cost of debt Yc = Pre-tax yield on free cash
Ke = Cost of Equity t = Tax rate
L = Levered value (Equity + Debt – Cash) at market value
DL = Debt percentage in target capital structure
C = Permanent excess cash percentage in target capital structure
L
E = Equity percentage in target capital structure
L
Rf = Risk-free rate ?e = Equity beta ERP = Equity risk premium
WACC Calculation
Cost of Debt Target Capital Structure
Pre-Tax Cost of Debt 10.0% D / (D+E) 20.0%
Marginal Tax Rate 25.0% E / (D+E) 80.0%
Post-Tax Cost of Debt 7.5% Total 100.0%
Cost of Equity WACC Calculations
Risk Free Rate 3.4% Cost of Debt 7.5%
Risk Premium 6.7% Cost of Equity 14.1%
Beta 1.60 WACC 12.8%
Cost of Equity 14.1%
Assumptions
D/(D+E) 20.0% Management estimate considering market conditions
Target and future strategic expansion alternatives
Capital
Structure E/(D+E) 80.0% 1 – D/(D+E)
Long-term cost of unsecured debt considering
Cost of Kd 10.0% Company’s capital structure and financial conditions
Debt
T 25.0% Management projection
30 year US government bond maturing in Feb 2031
Rf 3.39% (in c.20 years)
Cost of Two-year historical beta of Ciber from the last two
Equity ?e 1.60 years
ERP 6.70% Ibbotson’s U.S. equity risk premium from 1926—2012
Sources: Ibbotson Associates, Axioma and latest publicly available financial statements
WACC Sensitivity Analysis
Beta
$0.13 1.40 1.50 1.60 1.70 1.80
10.0% 12.2% 12.8% 13.4% 14.1% 14.7%
15.0% 12.0% 12.5% 13.1% 13.7% 14.3%
(D+E) 20.0% 11.7% 12.3% 12.8% 13.3% 13.9%
/
D
25.0% 11.5% 12.0% 12.5% 13.0% 13.5%
30.0% 11.2% 11.7% 12.1% 12.6% 13.1%
Illustrative Weighted Average Cost of Capital Calculation 15
|
STRICTLY CONFIDENTAL AND PRELIMINARY DRAFT
INVESTMENT BANKING DIVISION
Appendix B: Comparison of Selected Companies
|
STRICTLY CONFIDENTAL AND PRELIMINARY DRAFT
INVESTMENT BANKING DIVISION
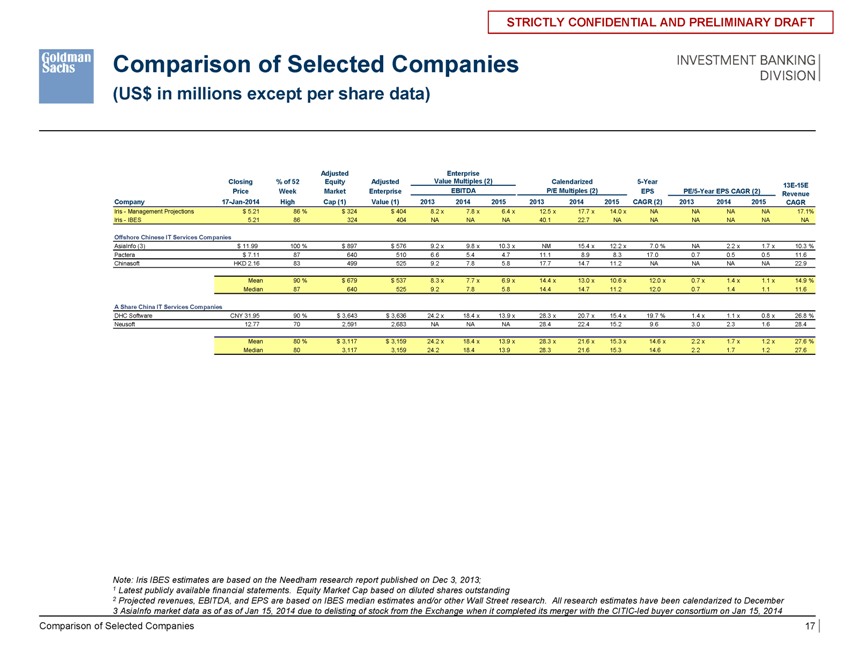
Comparison of Selected Companies
(US$ in millions except per share data)
Adjusted Enterprise
Closing % of 52 Equity Adjusted Value Multiples (2) Calendarized 5-Year 13E-15E
Price Week Market Enterprise EBITDA P/E Multiples (2) EPS PE/5-Year EPS CAGR (2) Revenue
Company 17-Jan-2014 High Cap (1) Value (1) 2013 2014 2015 2013 2014 2015 CAGR (2) 2013 2014 2015 CAGR
Iris—Management Projections $ 5.21 86 % $ 324 $ 404 8.2 x 7.8 x 6.4 x 12.5 x 17.7 x 14.0 x NA NA NA NA 17.1%
Iris—IBES 5.21 86 324 404 NA NA NA 40.1 22.7 NA NA NA NA NA NA
Offshore Chinese IT Services Companies
AsiaInfo (3) $ 11.99 100 % $ 897 $ 576 9.2 x 9.8 x 10.3 x NM 15.4 x 12.2 x 7.0 % NA 2.2 x 1.7 x 10.3 %
Pactera $ 7.11 87 640 510 6.6 5.4 4.7 11.1 8.9 8.3 17.0 0.7 0.5 0.5 11.6
Chinasoft HKD 2.16 83 499 525 9.2 7.8 5.8 17.7 14.7 11.2 NA NA NA NA 22.9
Mean 90 % $ 679 $ 537 8.3 x 7.7 x 6.9 x 14.4 x 13.0 x 10.6 x 12.0 x 0.7 x 1.4 x 1.1 x 14.9 %
Median 87 640 525 9.2 7.8 5.8 14.4 14.7 11.2 12.0 0.7 1.4 1.1 11.6
A Share China IT Services Companies
DHC Software CNY 31.95 90 % $ 3,643 $ 3,636 24.2 x 18.4 x 13.9 x 28.3 x 20.7 x 15.4 x 19.7 % 1.4 x 1.1 x 0.8 x 26.8 %
Neusoft 12.77 70 2,591 2,683 NA NA NA 28.4 22.4 15.2 9.6 3.0 2.3 1.6 28.4
Mean 80 % $ 3,117 $ 3,159 24.2 x 18.4 x 13.9 x 28.3 x 21.6 x 15.3 x 14.6 x 2.2 x 1.7 x 1.2 x 27.6 %
Median 80 3,117 3,159 24.2 18.4 13.9 28.3 21.6 15.3 14.6 2.2 1.7 1.2 27.6
Note: Iris IBES estimates are based on the Needham research report published on Dec 3, 2013;
1 Latest publicly available financial statements. Equity Market Cap based on diluted shares outstanding
2 Projected revenues, EBITDA, and EPS are based on IBES median estimates and/or other Wall Street research. All research estimates have been calendarized to December
3 AsiaInfo market data as of as of Jan 15, 2014 due to delisting of stock from the Exchange when it completed its merger with the CITIC-led buyer consortium on Jan 15, 2014
Comparison of Selected Companies 17
|
STRICTLY CONFIDENTAL AND PRELIMINARY DRAFT
INVESTMENT BANKING DIVISION
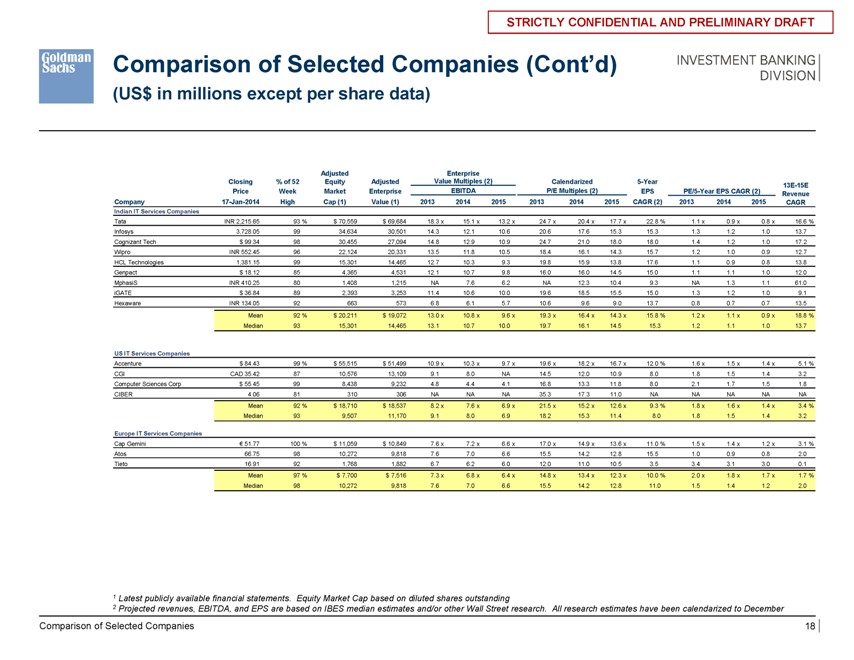
Comparison of Selected Companies (Cont’d)
(US$ in millions except per share data)
Adjusted Enterprise
Closing % of 52 Equity Adjusted Value Multiples (2) Calendarized 5-Year 13E-15E
Price Week Market Enterprise EBITDA P/E Multiples (2) EPS PE/5-Year EPS CAGR (2) Revenue
Company 17-Jan-2014 High Cap (1) Value (1) 2013 2014 2015 2013 2014 2015 CAGR (2) 2013 2014 2015 CAGR
Indian IT Services Companies
Tata INR 2,215.65 93 % $ 70,559 $ 69,684 18.3 x 15.1 x 13.2 x 24.7 x 20.4 x 17.7 x 22.8 % 1.1 x 0.9 x 0.8 x 16.6 %
Infosys 3,728.05 99 34,634 30,501 14.3 12.1 10.6 20.6 17.6 15.3 15.3 1.3 1.2 1.0 13.7
Cognizant Tech $ 99.34 98 30,455 27,094 14.8 12.9 10.9 24.7 21.0 18.0 18.0 1.4 1.2 1.0 17.2
Wipro INR 552.45 96 22,124 20,331 13.5 11.8 10.5 18.4 16.1 14.3 15.7 1.2 1.0 0.9 12.7
HCL Technologies 1,381.15 99 15,301 14,465 12.7 10.3 9.3 19.8 15.9 13.8 17.6 1.1 0.9 0.8 13.8
Genpact $ 18.12 85 4,365 4,531 12.1 10.7 9.8 16.0 16.0 14.5 15.0 1.1 1.1 1.0 12.0
MphasiS INR 410.25 80 1,408 1,215 NA 7.6 6.2 NA 12.3 10.4 9.3 NA 1.3 1.1 61.0
iGATE $ 36.84 89 2,393 3,253 11.4 10.6 10.0 19.6 18.5 15.5 15.0 1.3 1.2 1.0 9.1
Hexaware INR 134.05 92 663 573 6.8 6.1 5.7 10.6 9.6 9.0 13.7 0.8 0.7 0.7 13.5
Mean 92 % $ 20,211 $ 19,072 13.0 x 10.8 x 9.6 x 19.3 x 16.4 x 14.3 x 15.8 % 1.2 x 1.1 x 0.9 x 18.8 %
Median 93 15,301 14,465 13.1 10.7 10.0 19.7 16.1 14.5 15.3 1.2 1.1 1.0 13.7
US IT Services Companies
Accenture $ 84.43 99 % $ 55,515 $ 51,499 10.9 x 10.3 x 9.7 x 19.6 x 18.2 x 16.7 x 12.0 % 1.6 x 1.5 x 1.4 x 5.1 %
CGI CAD 35.42 87 10,576 13,109 9.1 8.0 NA 14.5 12.0 10.9 8.0 1.8 1.5 1.4 3.2
Computer Sciences Corp $ 55.45 99 8,438 9,232 4.8 4.4 4.1 16.8 13.3 11.8 8.0 2.1 1.7 1.5 1.8
CIBER 4.06 81 310 306 NA NA NA 35.3 17.3 11.0 NA NA NA NA NA
Mean 92 % $ 18,710 $ 18,537 8.2 x 7.6 x 6.9 x 21.5 x 15.2 x 12.6 x 9.3 % 1.8 x 1.6 x 1.4 x 3.4 %
Median 93 9,507 11,170 9.1 8.0 6.9 18.2 15.3 11.4 8.0 1.8 1.5 1.4 3.2
Europe IT Services Companies
Cap Gemini € 51.77 100 % $ 11,059 $ 10,849 7.6 x 7.2 x 6.6 x 17.0 x 14.9 x 13.6 x 11.0 % 1.5 x 1.4 x 1.2 x 3.1 %
Atos 66.75 98 10,272 9,818 7.6 7.0 6.6 15.5 14.2 12.8 15.5 1.0 0.9 0.8 2.0
Tieto 16.91 92 1,768 1,882 6.7 6.2 6.0 12.0 11.0 10.5 3.5 3.4 3.1 3.0 0.1
Mean 97 % $ 7,700 $ 7,516 7.3 x 6.8 x 6.4 x 14.8 x 13.4 x 12.3 x 10.0 % 2.0 x 1.8 x 1.7 x 1.7 %
Median 98 10,272 9,818 7.6 7.0 6.6 15.5 14.2 12.8 11.0 1.5 1.4 1.2 2.0
1 Latest publicly available financial statements. Equity Market Cap based on diluted shares outstanding
2 Projected revenues, EBITDA, and EPS are based on IBES median estimates and/or other Wall Street research. All research estimates have been calendarized to December
Comparison of Selected Companies 18