Filed by Breitburn Energy Partners LP
Commission File No. 001-33055
Pursuant to Rule 425 Under the Securities Act of 1933
And Deemed Filed Pursuant to Rule 14a-12
Under the Securities Exchange Act of 1934
Subject Company: QR Energy, LP
Commission File No. 001-35010
This filing relates to a proposed business combination involving QR Energy, LP, a Delaware limited partnership, and Breitburn Energy Partners LP, a Delaware limited partnership.
NASDAQ: BBEP INVESTOR PRESENTATION BREITBURN ENERGY PARTNERS LP JAMES G. JACKSON EXECUTIVE VICE PRESIDENT CHIEF FINANCIAL OFFICER SEPTEMBER 2014
pg. 2 This presentation contains forward - looking statements relating to Breitburn’s operations that are based on management’s current expectations, estimates and projections about its operations. Words and phrases such as “expected,” “guidance,” “expansion,” “opportunities,” “target,” “estimated,” “future,” “be lieve,” “potential,” “will be” and variations of such words and similar expressions are intended to identify such forward - looking statements. These statements are not guarantees of future performance and are subject to certain risks, uncertainties and other factors, some of which are beyond our control and are difficult to predict. These include risk s r elating to Breitburn’s financial performance and results, availability of sufficient cash flow and other sources of liquidity to execute our business plan, prices and demand for natural gas and oil, increases in operating costs, uncertainties inherent in estimating our reserves and production, our ability to replace reserves and efficiently develop our cu rrent reserves, our ability to obtain sufficient quantities of CO 2 necessary to carry out our enhanced oil recovery projects, political and regulatory developments relating to taxes, derivativ es and our oil and gas operations, risks relating to our proposed acquisition of QR Energy, LP (“QR Energy”) and other acquisitions, and the factors set forth under t he heading “Risk Factors” incorporated by reference from our Annual Report on Form 10 - K filed with the Securities and Exchange Commission (the “SEC”), and if applicable, our Quarte rly Reports on Form 10 - Q and our Current Reports on Form 8 - K. Therefore, actual outcomes and results may differ materially from what is expressed or forecasted in such f orward - looking statements. The reader should not place undue reliance on these forward - looking statements, which speak only as of the date of this presentation. Unless legally r equired, Breitburn undertakes no obligation to update publicly any forward - looking statements, whether as a result of new information, future events or otherwise. Unpredictabl e or unknown factors not discussed herein also could have material adverse effects on forward - looking statements. References to “Breitburn,” “we,” “our” or like terms refer to Breitburn Energy Partners LP and its subsidiaries. CAUTIONARY STATEMENT REGARDING FORWARD - LOOKING INFORMATION LEGAL DISCLOSURE ADDITIONAL INFORMATION ABOUT THE PROPOSED QR ENERGY TRANSACTION AND WHERE TO FIND IT In connection with its previously announced proposed acquisition of QR Energy (the “Transaction”), Breitburn has filed with t he SEC a registration statement on Form S - 4 that includes a prospectus of Breitburn and a proxy statement of QR Energy. Each of Breitburn and QR Energy also plan to file oth er relevant documents with the SEC regarding the Transaction. INVESTORS ARE URGED TO READ THE PROXY STATEMENT/PROSPECTUS (INCLUDING ANY AMENDMENTS OR SUPPLEMENTS THERETO) AND OTHER RELEVANT DOCUMENTS FILED WITH THE SEC IF AND WHEN THEY BECOME AVAILABLE BECAUSE THEY WILL CONTAIN IMPORTANT INFORMATION ABOUT THE TRANSACTION AND RELATED MATTERS. You may obtain a free copy of the proxy statement/prospectus and other re levant documents filed by Breitburn and QR Energy with the SEC at the SEC’s website at www.sec.gov. You may also obtain these documents by contactin g B reitburn Investor Relations in writing at 515 S. Flower Street, Suite 4800, Los Angeles, CA, 90071, or via e - mail by using the “Contact Form” located at the Investor Rela tions tab at www.breitburn.com or by calling (213) 225 - 0390; or by contacting QR Energy Investor Relations in writing at 1401 McKinney Street, Suite 2400, Houston, TX 77010, or via e - mail at ir@qracq.com or by calling (713) 452 - 2990. PARTICIPANTS IN THE SOLICITATION Breitburn and QR Energy and their respective directors and executive officers and other members of management and employees m ay be deemed to be participants in the solicitation of proxies in respect of the Transaction. Information about Breitburn’s directors and executive officers is ava ila ble in Breitburn’s proxy statement dated April 25, 2014, for its 2014 Annual Meeting of Unitholders. Information about QR Energy’s directors and executive officers is availabl e i n QR Energy’s proxy statement dated February 3, 2014, for its Special Meeting of Unitholders held on March 10, 2014. Other information regarding the participants in the prox y s olicitations and a description of their direct and indirect interests, by security holdings or otherwise, will be contained in the proxy statement/prospectus filed with, and ot her relevant materials to be filed with, the SEC regarding the Transaction when they become available. Investors should read the proxy statement/prospectus carefully before making any vot ing or investment decisions. You may obtain free copies of these documents from Breitburn or QR Energy using the sources indicated above. This presentation shall not constitute an offer to sell or the solicitation of an offer to buy any securities, nor shall ther e b e any sale of securities in any jurisdiction in which such offer, solicitation or sale would be unlawful prior to registration or qualification under the securities laws of any such ju ris diction. No offering of securities shall be made except by means of a prospectus meeting the requirements of Section 10 of the U.S. Securities Act of 1933, as amended.
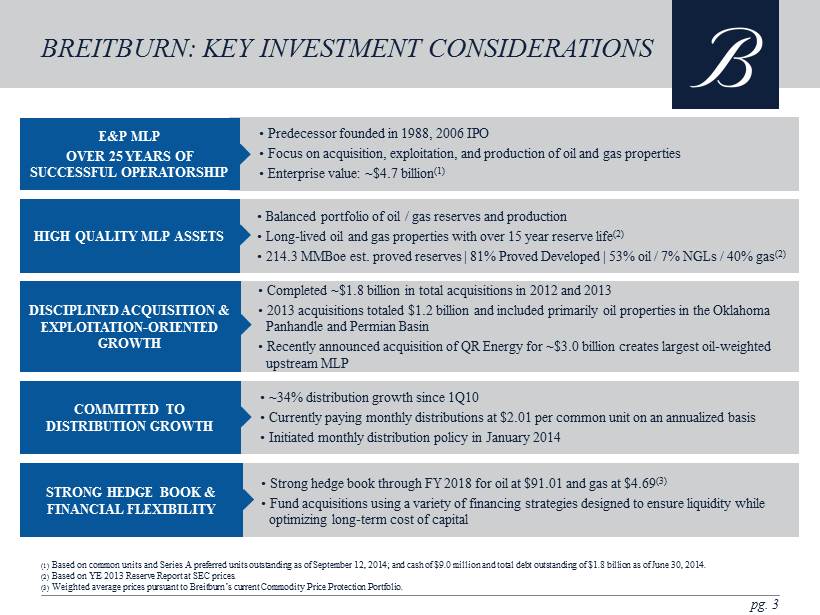
STRONG HEDGE BOOK & FINANCIAL FLEXIBILITY COMMITTED TO DISTRIBUTION GROWTH E&P MLP OVER 25 YEARS OF SUCCESSFUL OPERATORSHIP pg. 3 • Predecessor founded in 1988, 2006 IPO • Focus on acquisition, exploitation, and production of oil and gas properties • Enterprise value: ~$4.7 billion (1) BREITBURN: KEY INVESTMENT CONSIDERATIONS HIGH QUALITY MLP ASSETS • Balanced portfolio of oil / gas reserves and production • Long - lived oil and gas properties with over 15 year reserve life (2 ) • 214.3 MMBoe est. proved reserves | 81% Proved Developed | 53% oil / 7% NGLs / 40% gas (2 ) • Completed ~$ 1.8 billion in total acquisitions in 2012 and 2013 • 2013 acquisitions totaled $1.2 billion and included primarily oil properties in the Oklahoma Panhandle and Permian Basin • Recently announced acquisition of QR Energy for ~$3.0 billion creates largest oil - weighted upstream MLP • ~34% distribution growth since 1Q10 • Currently paying monthly distributions at $2.01 per common unit on an annualized basis • Initiated monthly distribution policy in January 2014 • Strong hedge book through FY 2018 for oil at $91.01 and gas at $4.69 (3) • Fund acquisitions using a variety of financing strategies designed to ensure liquidity while optimizing long - term cost of capital DISCIPLINED ACQUISITION & EXPLOITATION - ORIENTED GROWTH (1) Based on common units and Series A preferred units outstanding as of September 12, 2014; and cash of $9.0 million and total debt outstanding of $1.8 billion as of June 30, 2014. (2) Based on YE 2013 Reserve Report at SEC prices . (3) Weighted average prices pursuant to Breitburn’s current Commodity Price Protection Portfolio.

NASDAQ: BBEP QR ENERGY ACQUISITION
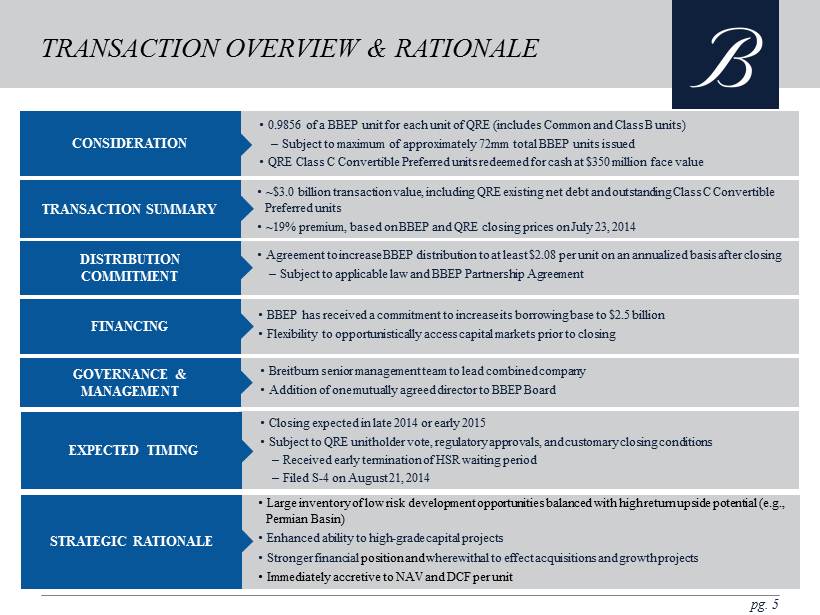
CONSIDERATION pg. 5 • 0.9856 of a BBEP unit for each unit of QRE (includes Common and Class B units) – Subject to maximum of approximately 72mm total BBEP units issued • QRE Class C Convertible Preferred units redeemed for cash at $350 million face value TRANSACTION OVERVIEW & RATIONALE TRANSACTION SUMMARY • ~$3.0 b illion transaction value, including QRE existing net debt and outstanding Class C Convertible Preferred units • ~19% premium, based on BBEP and QRE closing prices on July 23, 2014 GOVERNANCE & MANAGEMENT • Breitburn senior management team to lead combined company • Addition of one mutually agreed director to BBEP Board EXPECTED TIMING • Closing expected in late 2014 or early 2015 • Subject to QRE unitholder vote, regulatory approvals, and customary closing conditions – Received early termination of HSR waiting period – F iled S - 4 on August 21, 2014 • BBEP has received a commitment to increase its borrowing base to $2.5 billion • Flexibility to opportunistically access capital markets prior to closing FINANCING STRATEGIC RATIONALE • Large inventory of low risk development opportunities balanced with high return upside potential (e.g., Permian Basin ) • Enhanced ability to high - grade capital projects • Stronger financial position and w herewithal to effect acquisitions and growth projects • Immediately accretive to NAV and DCF per unit DISTRIBUTION COMMITMENT • Agreement to increase BBEP distribution to at least $2.08 per unit on an annualized basis after closing – Subject to applicable law and BBEP Partnership Agreement
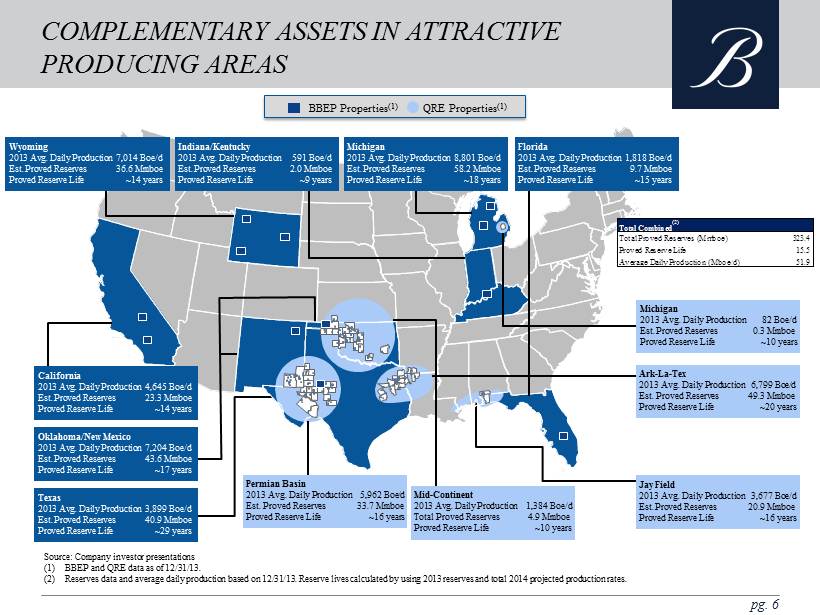
California 2013 Avg. Daily Production 4,645 Boe/d Est. Proved Reserves 23.3 M m b oe Proved Reserve Life ~14 years Texas 2013 Avg. Daily Production 3,899 Boe/d Est. Proved Reserves 40.9 M m b oe Proved Reserve Life ~29 years Oklahoma/New Mexico 2013 Avg. Daily Production 7,204 Boe/d Est. Proved Reserves 43.6 M m b oe Proved Reserve Life ~17 years Jay Field 2013 Avg. Daily Production 3,677 Boe/d Est. Proved Reserves 20.9 Mmboe Proved Reserve Life ~16 years Indiana/Kentucky 2013 Avg. Daily Production 591 Boe/d Est. Proved Reserves 2.0 M m b oe Proved Reserve Life ~9 years Michigan 2013 Avg. Daily Production 8,801 Boe/d Est. Proved Reserves 58.2 M m b oe Proved Reserve Life ~18 years Florida 2013 Avg. Daily Production 1,818 Boe/d Est. Proved Reserves 9.7 M m b oe Proved Reserve Life ~15 years Wyoming 2013 Avg. Daily Production 7,014 Boe/d Est. Proved Reserves 36.6 M m b oe Proved Reserve Life ~14 years BBEP Properties (1) Total Pro Forma QRE Properties (1) COMPLEMENTARY ASSETS IN ATTRACTIVE PRODUCING AREAS Mid - Continent 2013 Avg. Daily Production 1,384 Boe/d Total Proved Reserves 4.9 Mmboe Proved Reserve Life ~10 years Permian Basin 2013 Avg. Daily Production 5,962 Boe/d Est. Proved Reserves 33.7 Mmboe Proved Reserve Life ~16 years pg. 6 Michigan 2013 Avg. Daily Production 82 Boe/d Est. Proved Reserves 0.3 Mmboe Proved Reserve Life ~10 years Source: Company investor presentations (1) BBEP and QRE data as of 12/31/13. (2) Reserves data and average daily production based on 12/31/13. Reserve lives calculated by using 2013 reserves and total 2014 pro jected production rates. Ark - La - Tex 2013 Avg. Daily Production 6,799 Boe/d Est. Proved Reserves 49.3 Mmboe Proved Reserve Life ~20 years Total Combined (2) Total Proved Reserves (Mmboe) 323.4 Proved Reserve Life 15.5 Average Daily Production (Mboe/d) 51.9
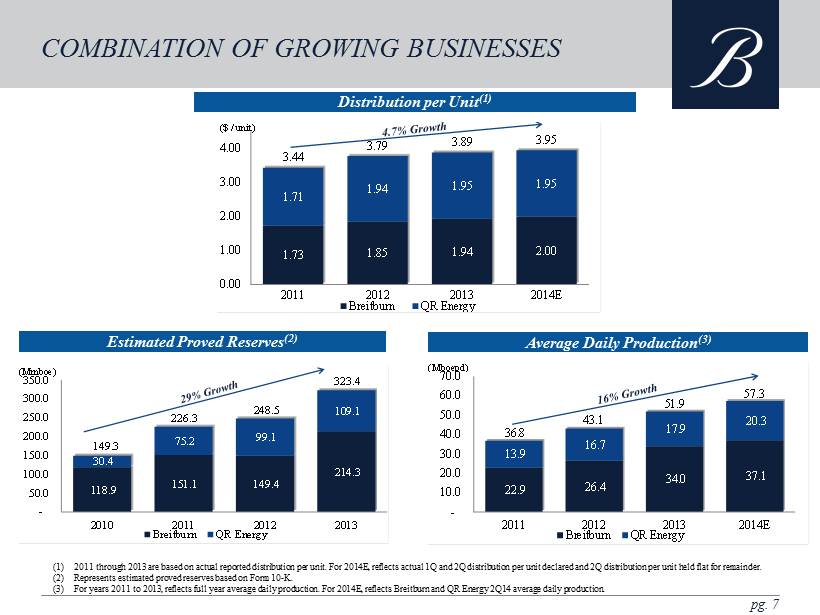
pg. 7 COMBINATION OF GROWING BUSINESSES Estimated Proved Reserves (2) Average Daily Production (3) Distribution per Unit (1) (1) 2011 through 2013 are based on actual reported distribution per unit. For 2014E, reflects actual 1Q and 2Q distribution per u nit declared and 2Q distribution per unit held flat for remainder. (2) Represents estimated proved reserves based on Form 10 - K. (3) For years 2011 to 2013, reflects full year average daily production. For 2014E, reflects Breitburn and QR Energy 2Q14 average da ily production. 1.73 1.85 1.94 2.00 1.71 1.94 1.95 1.95 3.44 3.79 3.89 3.95 0.00 1.00 2.00 3.00 4.00 2011 2012 2013 2014E Breitburn QR Energy ($ / unit) 118.9 151.1 149.4 214.3 30.4 75.2 99.1 109.1 - 50.0 100.0 150.0 200.0 250.0 300.0 350.0 2010 2011 2012 2013 Breitburn QR Energy 226.3 248.5 323.4 (Mmboe) 149.3 22.9 26.4 34.0 37.1 13.9 16.7 17.9 20.3 - 10.0 20.0 30.0 40.0 50.0 60.0 70.0 2011 2012 2013 2014E Breitburn QR Energy 36.8 43.1 51.9 57.3 (Mboepd)
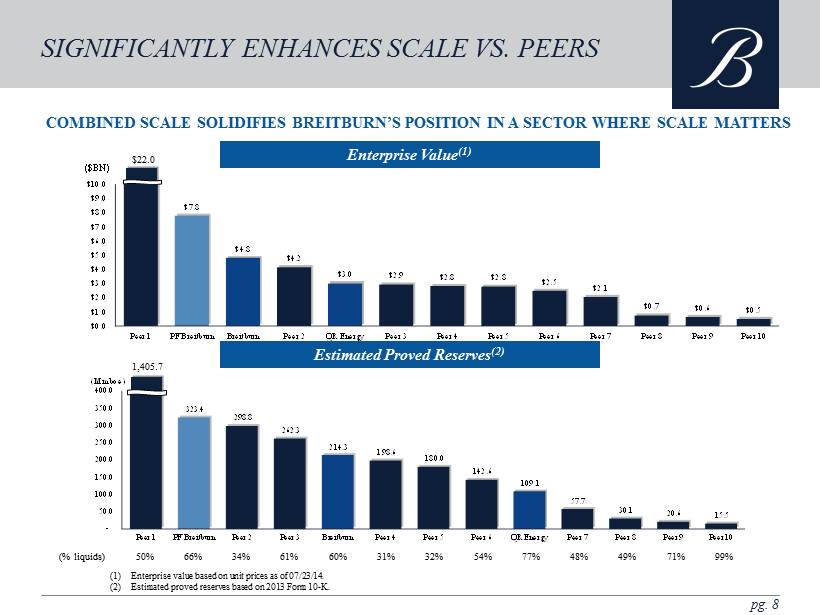
pg. 8 SIGNIFICANTLY ENHANCES SCALE VS. PEERS $ 22.0 323.4 298.8 262.3 214.3 198.6 180.0 142.6 109.1 57.7 30.1 20.6 15.5 - 50.0 100.0 150.0 200.0 250.0 300.0 350.0 400.0 Peer 1 PF Breitburn Peer 2 Peer 3 Breitburn Peer 4 Peer 5 Peer 6 QR Energy Peer 7 Peer 8 Peer 9 Peer 10 (Mmboe) 1,405.7 Enterprise Value (1) Estimated Proved Reserves (2) (1) Enterprise value based on unit prices as of 07/23/14. (2) Estimated proved reserves based on 2013 Form 10 - K. COMBINED SCALE SOLIDIFIES BREITBURN’S POSITION IN A SECTOR WHERE SCALE MATTERS 50% 66% 34% 61% 60% 31% 32% 54% 77% 48% 49% 71% 99% (% liquids) $7.8 $4.8 $4.2 $3.0 $2.9 $2.8 $2.8 $2.5 $2.1 $0.7 $0.6 $0.5 $0.0 $1.0 $2.0 $3.0 $4.0 $5.0 $6.0 $7.0 $8.0 $9.0 $10.0 Peer 1 PF Breitburn Breitburn Peer 2 QR Energy Peer 3 Peer 4 Peer 5 Peer 6 Peer 7 Peer 8 Peer 9 Peer 10 ($BN)
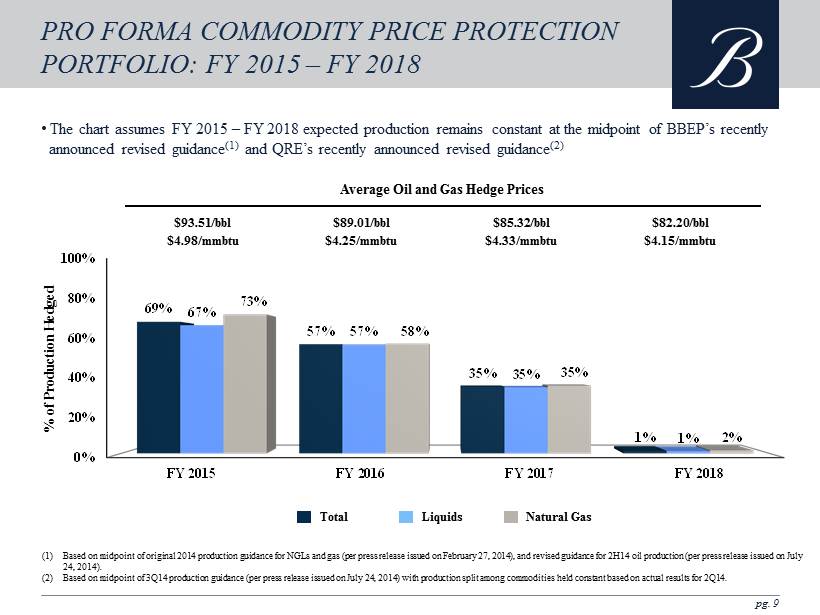
0% 20% 40% 60% 80% 100% FY 2015 FY 2016 FY 2017 FY 2018 69% 57% 35% 1% 67% 57% 35% 1% 73% 58% 35% 2% PRO FORMA COMMODITY PRICE PROTECTION PORTFOLIO: FY 2015 – FY 2018 • The chart assumes FY 2015 – FY 2018 expected production remains constant at the midpoint of BBEP’s recently announced revised guidance (1) and QRE’s recently announced revised guidance (2) $93.51/bbl $4.98/mmbtu $89.01/bbl $4.25/mmbtu $85.32/bbl $4.33/mmbtu $82.20/bbl $4.15/mmbtu % of Production Hedged Natural Gas Total Liquids Average Oil and Gas Hedge Prices (1) Based on midpoint of original 2014 production guidance for NGLs and gas (per press release issued on February 27, 2014), and rev ised guidance for 2H14 oil production (per press release issued on July 24, 2014). (2) Based on midpoint of 3Q14 production guidance (per press release issued on July 24, 2014) with production split among commodi tie s held constant based on actual results for 2Q14. pg. 9

NASDAQ: BBEP ACQUISITIONS OVERVIEW
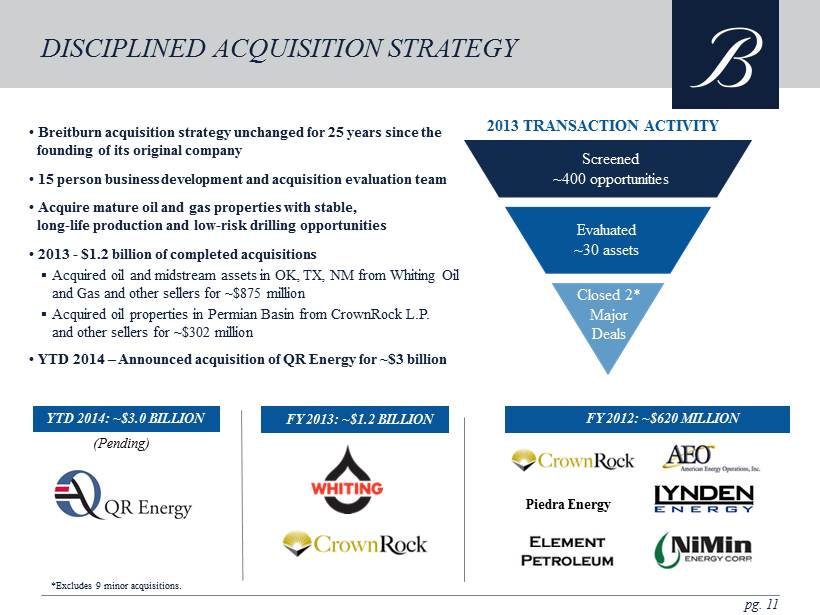
• Breitburn acquisition strategy unchanged for 25 years since the founding of its original company • 15 person business development and acquisition evaluation team • Acquire mature oil and gas properties with stable, long - life production and low - risk drilling opportunities • 2013 - $1.2 billion of completed acquisitions ▪ Acquired oil and midstream assets in OK, TX, NM from Whiting Oil and Gas and other sellers for ~$875 million ▪ Acquired oil properties in Permian Basin from CrownRock L.P. a nd other sellers for ~$302 million • YTD 2014 – Announced acquisition of QR Energy for ~$3 billion pg. 11 2013 TRANSACTION ACTIVITY DISCIPLINED ACQUISITION STRATEGY Piedra Energy Screened~400 opportunities \ Evaluated~30 assets \ Closed 2* Major Acquisitions *Excludes 9 minor acquisitions. Screened ~ 400 opportunities Evaluated ~ 30 assets Closed 2* Major Deals FY 2012: ~$620 MILLION YTD 2014: ~$3.0 BILLION FY 2013: ~$1.2 BILLION (Pending)
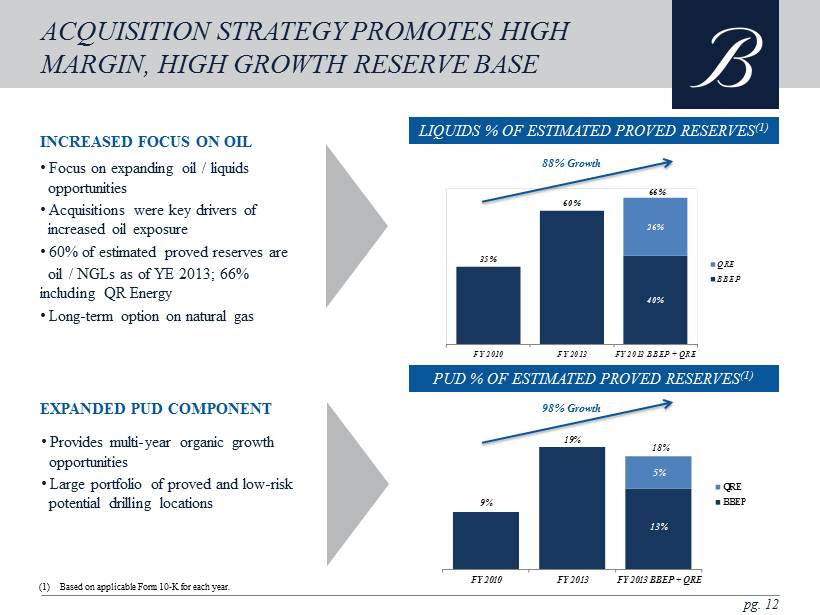
• Focus on expanding oil / liquids opportunities • Acquisitions were key drivers of increased oil exposure • 60% of estimated proved reserves are oil / NGLs as of YE 2013; 66% including QR Energy • Long - term option on natural gas INCREASED FOCUS ON OIL pg. 12 • Provides multi - year organic growth opportunities • Large portfolio of proved and low - risk potential drilling locations EXPANDED PUD COMPONENT ACQUISITION STRATEGY PROMOTES HIGH MARGIN, HIGH GROWTH RESERVE BASE LIQUIDS % OF ESTIMATED PROVED RESERVES (1) PUD % OF ESTIMATED PROVED RESERVES (1) 88% Growth 98% Growth 9% 19% 13% 5% FY 2010 FY 2013 FY 2013 BBEP + QRE QRE BBEP 18 % 35% 60% 40% 26% FY 2010 FY 2013 FY 2013 BBEP + QRE QRE BBEP 66% (1) Based on applicable Form 10 - K for each year.

NASDAQ: BBEP FINANCIAL OVERVIEW
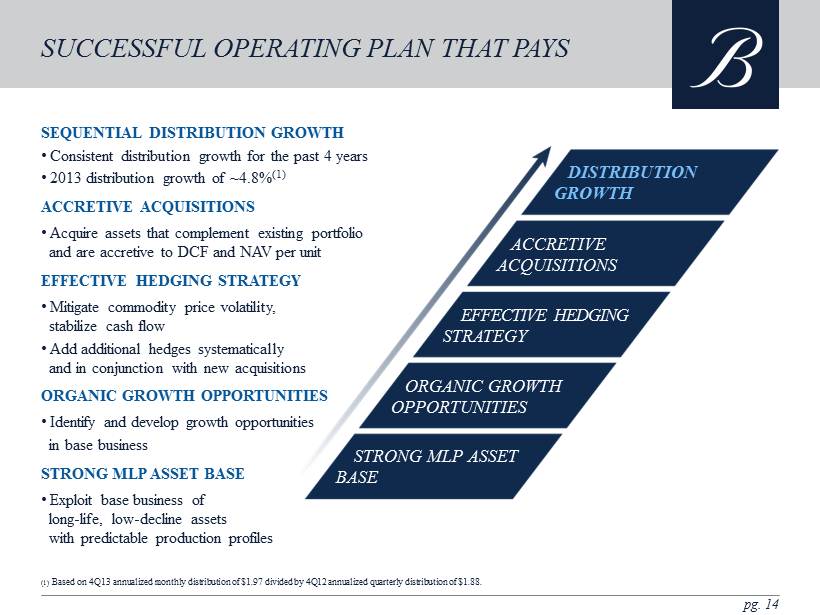
SEQUENTIAL DISTRIBUTION GROWTH • Consistent distribution growth for the past 4 years • 2013 distribution growth of ~4.8% (1) ACCRETIVE ACQUISITIONS • Acquire assets that complement existing portfolio and are accretive to DCF and NAV per unit EFFECTIVE HEDGING STRATEGY • Mitigate commodity price volatility, stabilize cash flow • Add additional hedges systematically and in conjunction with new acquisitions ORGANIC GROWTH OPPORTUNITIES • Identify and develop growth opportunities in base business STRONG MLP ASSET BASE • Exploit base business of long - life, low - decline assets with predictable production profiles pg. 14 SUCCESSFUL OPERATING PLAN THAT PAYS (1) Based on 4Q13 annualized monthly distribution of $1.97 divided by 4Q12 annualized quarterly distribution of $1.88. DISTRIBUTION GROWTH ACCRETIVE ACQUISITIONS EFFECTIVE HEDGING STRATEGY ORGANIC GROWTH OPPORTUNITIES STRONG MLP ASSET BASE

pg. 15 BBEP: LAST FIVE YEARS OPERATING AND FINANCIAL PERFORMANCE ADJUSTED EBITDA (1) ($MM) 17% CAGR PRODUCTION (MBOE) 14% CAGR (1) Adjusted EBITDA conformed to exclude net operating cash flow from acquisitions from the effective date through the closing date. Strong Operating and Financial Performance Supported by Successful Growth Through Acquisitions Strategy
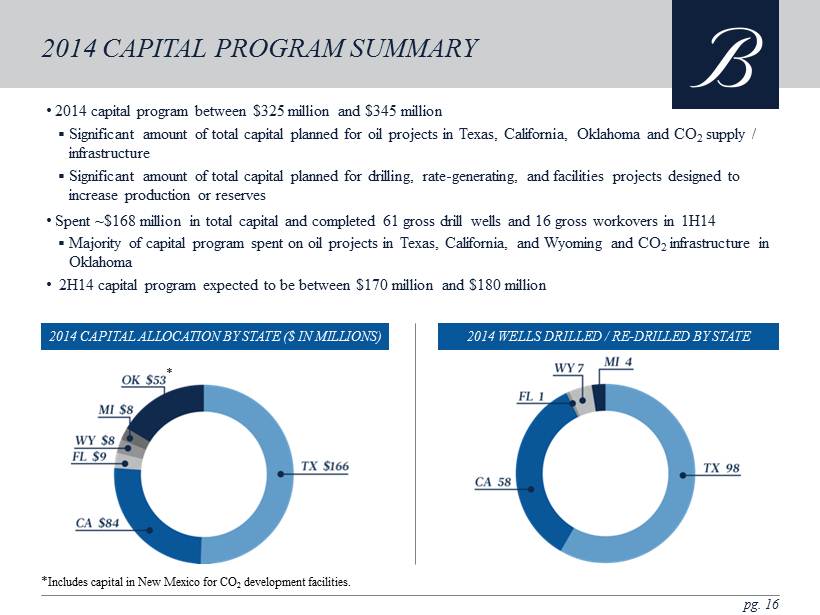
• 2014 capital program between $325 million and $345 million ▪ Significant amount of total capital planned for oil projects in Texas, California, Oklahoma and CO 2 supply / infrastructure ▪ Significant amount of total capital planned for drilling, rate - generating, and facilities projects designed to increase production or reserves • S pent ~$168 million in total capital and completed 61 gross drill wells and 16 gross workovers in 1H14 ▪ Majority of capital program spent on oil projects in Texas, California, and Wyoming and CO 2 infrastructure in Oklahoma • 2H14 capital program expected to be between $170 million and $180 million pg. 16 2014 CAPITAL PROGRAM SUMMARY 2014 WELLS DRILLED / RE - DRILLED BY STATE 2014 CAPITAL ALLOCATION BY STATE ($ IN MILLIONS) * * Includes capital in New Mexico for CO 2 development facilities.

pg. 17 SIGNIFICANT FINANCIAL FLEXIBILITY Recent Financing Activities Credit Facility Existing Senior Notes ATM PROGRAM ▪ Launched ATM program offering common units for aggregate proceeds of up to $200 million in March 2014 COMMON AND PREFERRED ▪ Issued 8 million 8.25% Series A Cumulative Redeemable Perpetual Preferred Units in May 2014 ▪ Issued 18.98 million common units in November 2013 SENIOR NOTES ▪ Issued $400 million 7.875% Add - On Senior Notes in November 2013 ▪ Amended credit facility in April 2014, eliminating the maximum total leverage ratio and maximum senior secured leverage ratio requirements and adding a provision to maintain an interest coverage ratio of no less than 2.5x ▪ Received commitment in July to increase borrowing base of credit facility from $1.6 billion to $2.5 billion in connection with QR Energy acquisition Breitburn Has Demonstrated Ability to Broadly Access the Equity, Preferred and Debt Markets Issue Principal Amount ($MM) Maturity First Call Date Rating 8.625% Senior Notes $305 10/15/20 10/15/15 B3/B- 7.875% Senior Notes 850 4/15/22 1/15/17 B3/B-
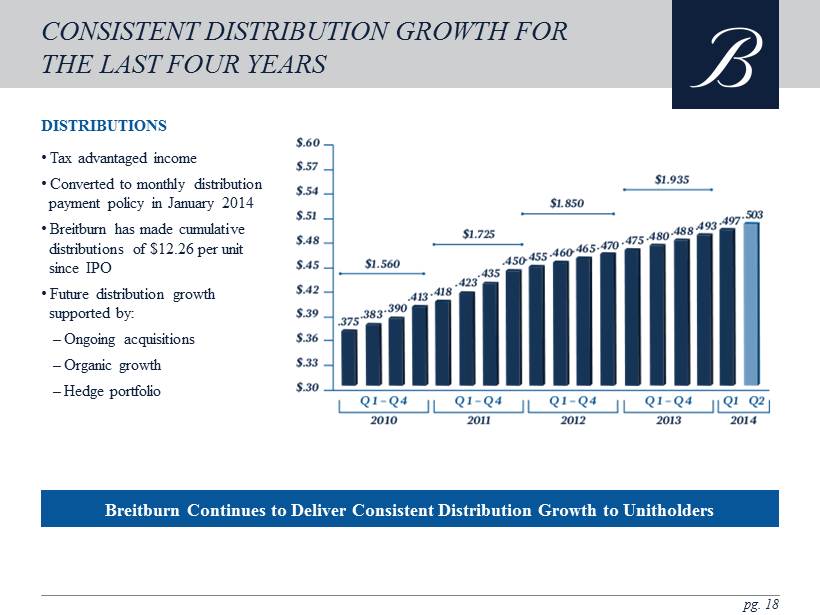
pg. 18 • Tax advantaged income • Converted to monthly distribution payment policy in January 2014 • Breitburn has made cumulative distributions of $12.26 per unit since IPO • Future distribution growth supported by: – Ongoing acquisitions – Organic growth – Hedge portfolio DISTRIBUTIONS CONSISTENT DISTRIBUTION GROWTH FOR THE LAST FOUR YEARS Breitburn Continues to Deliver Consistent Distribution Growth to Unitholders
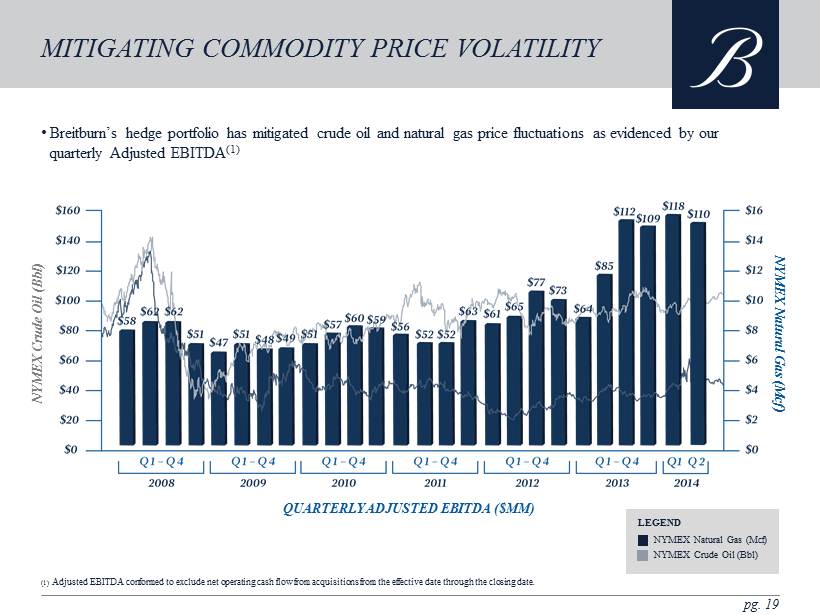
• Breitburn’s hedge portfolio has mitigated crude oil and natural gas price fluctuations as evidenced by our quarterly Adjusted EBITDA (1) pg. 19 MITIGATING COMMODITY PRICE VOLATILITY (1) Adjusted EBITDA conformed to exclude net operating cash flow from acquisitions from the effective date through the closing date. LEGEND NYMEX Natural Gas (Mcf ) NYMEX Crude Oil ( Bbl ) QUARTERLY ADJUSTED EBITDA ($MM) NYMEX Crude Oil ( Bbl ) NYMEX Natural Gas ( Mcf )
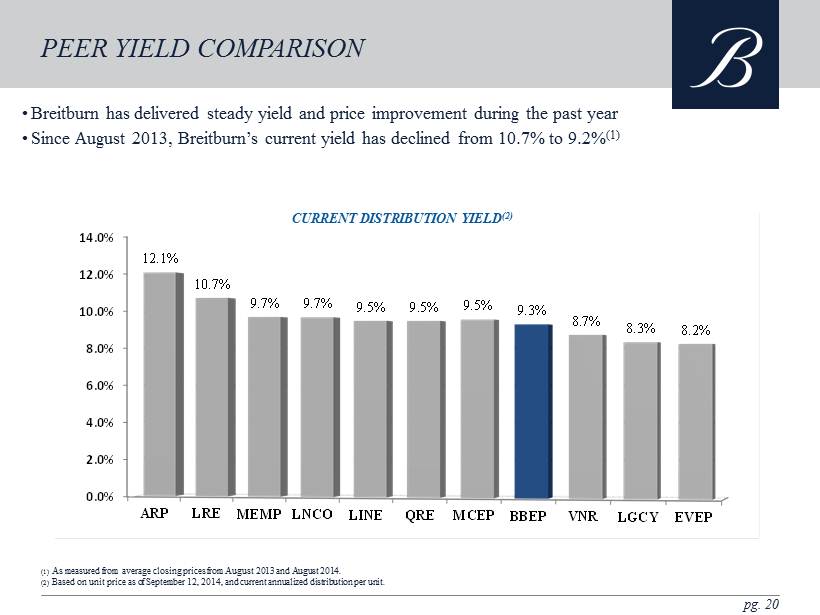
• Breitburn has delivered steady yield and price improvement during the past year • Since August 2013, Breitburn’s current yield has declined from 10.7% to 9.2% (1) pg. 20 PEER YIELD COMPARISON (1) As measured from average closing prices from August 2013 and August 2014. (2) Based on unit price as of September 12, 2014, and current annualized distribution per unit. 0.0% 2.0% 4.0% 6.0% 8.0% 10.0% 12.0% 14.0% ARP LRE MEMP LNCO LINE QRE MCEP BBEP VNR LGCY EVEP 12.1% 10.7% 9.7% 9.7% 9.5% 9.5% 9.5% 9.3% 8.7% 8.3% 8.2% CURRENT DISTRIBUTION YIELD (2)

STRONG HEDGE BOOK & FINANCIAL FLEXIBILITY COMMITTED TO DISTRIBUTION GROWTH E&P MLP OVER 25 YEARS OF SUCCESSFUL OPERATORSHIP pg. 21 • Predecessor founded in 1988, 2006 IPO • Focus on acquisition, exploitation, and production of oil and gas properties • Enterprise value: ~$4.7 billion (1) BREITBURN: KEY INVESTMENT CONSIDERATIONS HIGH QUALITY MLP ASSETS • Balanced portfolio of oil / gas reserves and production • Long - lived oil and gas properties with over 15 year reserve life (2 ) • 214.3 MMBoe est. proved reserves | 81% Proved Developed | 53% oil / 7% NGLs / 40% gas (2 ) • Completed ~$ 1.8 billion in total acquisitions in 2012 and 2013 • 2013 acquisitions totaled $1.2 billion and included primarily oil properties in the Oklahoma Panhandle and Permian Basin • Recently announced acquisition of QR Energy for ~$3.0 billion creates largest oil - weighted upstream MLP • ~34% distribution growth since 1Q10 • Currently paying monthly distributions at $2.01 per common unit on an annualized basis • Initiated monthly distribution policy in January 2014 • Strong hedge book through FY 2018 for oil at $91.01 and gas at $4.69 (3) • Fund acquisitions using a variety of financing strategies designed to ensure liquidity while optimizing long - term cost of capital DISCIPLINED ACQUISITION & EXPLOITATION - ORIENTED GROWTH (1) Based on common units and Series A preferred units outstanding as of September 12, 2014; and cash of $9.0 million and total debt outstanding of $1.8 billion as of June 30, 2014. (2) Based on YE 2013 Reserve Report at SEC prices . (3) Weighted average prices pursuant to Breitburn’s current Commodity Price Protection Portfolio.
NASDAQ: BBEP APPENDIX OPERATIONS & FINANCIAL INFORMATION 1 (1) Financial statements included in the Appendix are from the 2Q14 10 - Q.

• Key Assets: Postle and Northeast Hardesty Fields in Oklahoma Panhandle and associated midstream assets in Oklahoma, New Mexico and Texas • 100% owned Transpetco, Libby Lateral, and Hardesty Lateral CO 2 pipelines, Hough Oil Pipeline, and Dry Trails Gas Plant • Postle field discovered in 1958, water flood in 1967, CO 2 injection in 1996 • Total acreage: 30,257 gross, 29,357 net • Gross producing wells: 242 • Mature fields with low risk development opportunities and significant original oil in place – OOIP of ~400 MMboe in Morrow ‘A’ Sands • Additional expansion and bolt on acquisition opportunities ASSET OVERVIEW pg. 23 • Estimated proved reserves: 43.6 MMboe • Production: 1,217 Mboe (83% oil, 13% NGLs) (2) • 2013 Capital Program – $43.9 million – Drilled 4 new productive development wells • 98% operated producing wells and injectors • ~97% WI in Postle Field; ~95% WI in NE Hardesty Field • Contracted supply of CO 2 in the Bravo Dome, with step - in rights for ~140 B c f over 10 to 15 years ASSET MAP OKLAHOMA OPERATING AREA (1) Estimated proved reserves and production based on YE 2013 Reserve Report at SEC prices. (2) For acquisitions closed in 2013, production reflects activities from acquisition date to December 31, 2013. NE Hardesty Field Hough Oil Pipeline Postle Field Dry Trails Gas Plant Transpecto CO 2 Pipeline Hardesty Lateral CO 2 Pipeline Libby Lateral CO 2 Pipeline 2013 OPERATIONAL HIGHLIGHTS ESTIMATED PROVED RESERVES BY RESOURCE MIX (1)
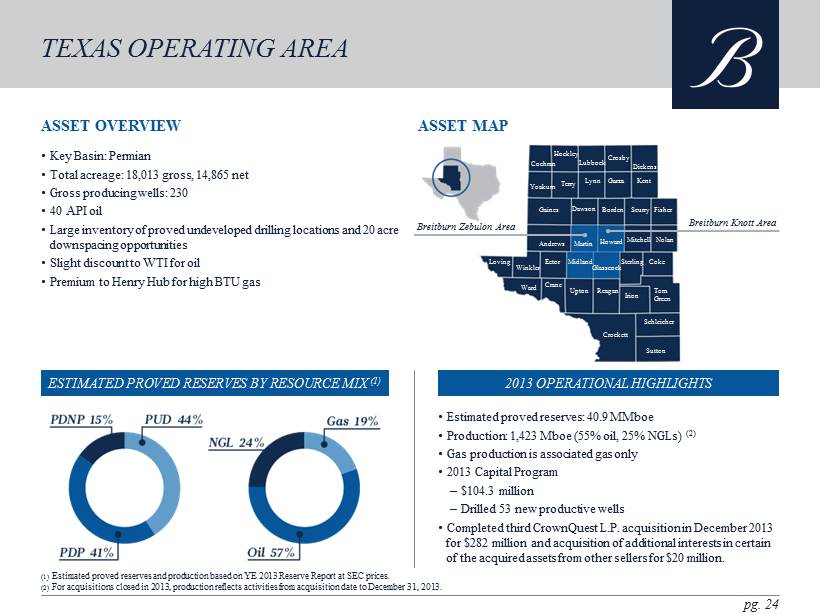
• Key Basin: Permian • Total acreage: 18,013 gross, 14,865 net • Gross producing wells: 230 • 40 API oil • Large inventory of proved undeveloped drilling locations and 20 acre downspacing opportunities • Slight discount to WTI for oil • Premium to Henry Hub for high BTU gas ASSET OVERVIEW pg. 24 • Estimated proved reserves: 40.9 MMboe • Production: 1,423 Mboe (55% oil, 25% NGLs ) (2) • Gas production is associated gas only • 2013 Capital Program – $104.3 million – Drilled 53 new productive wells • Completed third CrownQuest L.P. acquisition in December 2013 for $282 million and acquisition of additional interests in certain of the acquired assets from other sellers for $ 20 million . ASSET MAP TEXAS OPERATING AREA (1) Estimated proved reserves and production based on YE 2013 Reserve Report at SEC prices. (2) For acquisitions closed in 2013, production reflects activities from acquisition date to December 31, 2013. Breitburn Knott Area Breitburn Zebulon Area 2013 OPERATIONAL HIGHLIGHTS ESTIMATED PROVED RESERVES BY RESOURCE MIX (1) Sutton Schleicher Crockett Irion Ward Reagan Crane Upton Tom Green Loving Coke Winkler Ector Midland Glasscock Sterling Andrews Martin Nolan Mitchell Howard Borden Scurry Gaines Dawson Fisher Terry Yoakum Lynn Garza Kent Hockley Cochran Lubbock Crosby Dickens
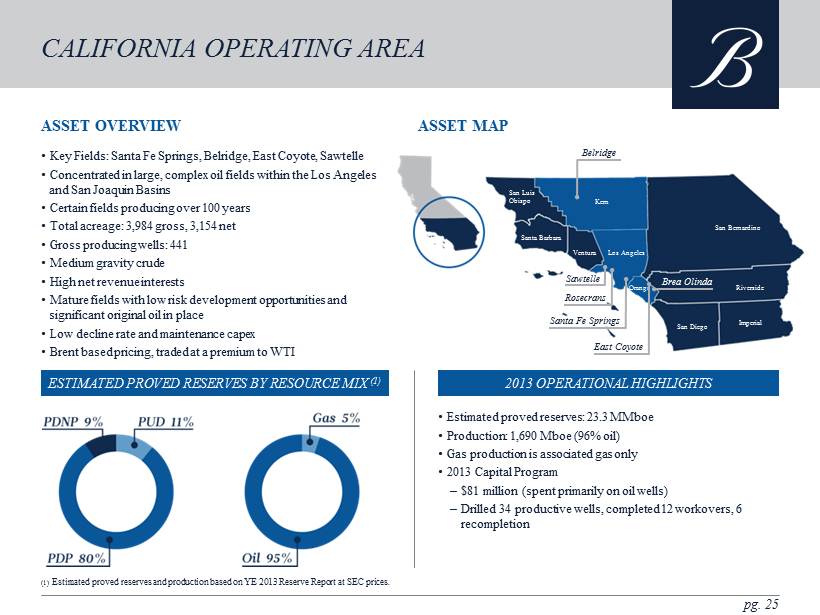
• Key Fields: Santa Fe Springs, Belridge, East Coyote, Sawtelle • Concentrated in large, complex oil fields within the Los Angeles and San Joaquin Basins • Certain fields producing over 100 years • Total acreage: 3,984 gross, 3,154 net • Gross producing wells: 441 • Medium gravity crude • High net revenue interests • Mature fields with low risk development opportunities and significant original oil in place • Low decline rate and maintenance capex • Brent based pricing, traded at a premium to WTI ASSET OVERVIEW pg. 25 • Estimated proved reserves: 23.3 MMboe • Production: 1,690 Mboe (96% oil) • Gas production is associated gas only • 2013 Capital Program – $81 million (spent primarily on oil wells) – Drilled 34 productive wells, completed 12 workovers, 6 recompletion ASSET MAP CALIFORNIA OPERATING AREA Imperial San Diego Orange Riverside Los Angeles Ventura Kern San Luis Obispo San Bernardino Belridge Santa Barbara Brea Olinda East Coyote Sawtelle Rosecrans Santa Fe Springs (1) Estimated proved reserves and production based on YE 2013 Reserve Report at SEC prices. 2013 OPERATIONAL HIGHLIGHTS ESTIMATED PROVED RESERVES BY RESOURCE MIX (1)
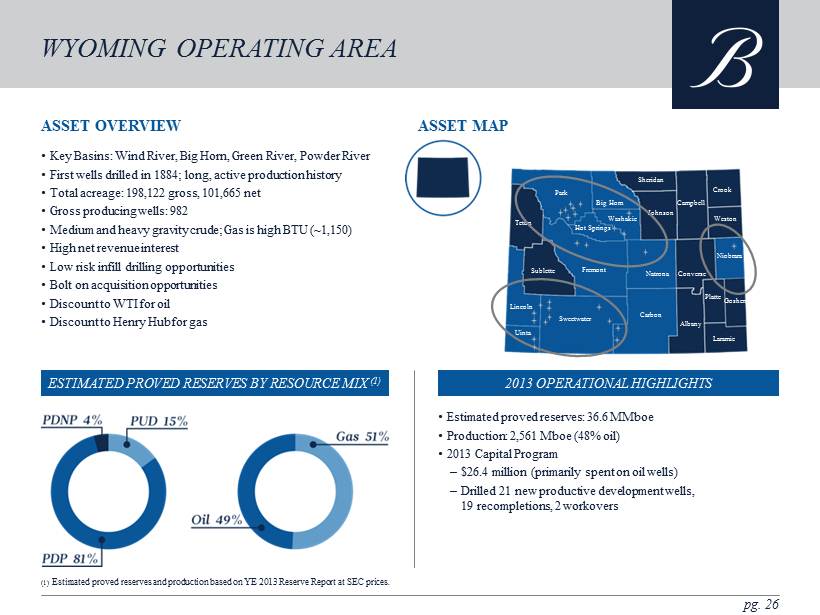
• Key Basins : Wind River, Big Horn, Green River, Powder River • F irst wells drilled in 1884; long, active production history • Total acreage: 198,122 gross, 101,665 net • Gross producing wells: 982 • Medium and heavy gravity crude; Gas is high BTU (~1,150) • High net revenue interest • Low risk infill drilling opportunities • Bolt on acquisition opportunities • Discount to WTI for oil • Discount to Henry Hub for gas ASSET OVERVIEW pg. 26 • Estimated proved reserves: 36.6 MMboe • Production: 2,561 Mboe (48% oil) • 2013 Capital Program – $26.4 million (primarily spent on oil wells) – Drilled 21 new productive development wells, 19 recompletions, 2 workovers ASSET MAP WYOMING OPERATING AREA (1) Estimated proved reserves and production based on YE 2013 Reserve Report at SEC prices. Uinta Laramie Sweetwater Albany Carbon Platte Goshen Lincoln Sublette Natrona Niobrara Fremont Hot Springs Washakie Weston Johnson Teton Crook Sheridan Campbell Big Horn Park Converse 2013 OPERATIONAL HIGHLIGHTS ESTIMATED PROVED RESERVES BY RESOURCE MIX (1)

• Key fields: Raccoon Point, Bear Island, West Felda, Lehigh Park • Production is from the Cretaceous Sunniland Trend of South Florida • Operate 5 fields (100% oil) • Total acreage: 42,422 gross, 36,590 net • Gross producing wells: 27 active wells • 24 API oil • High net revenue interests • Traded at a discount to WTI • Production transported via barge ASSET OVERVIEW pg. 27 • Estimated proved reserves: 9.7 MMboe • Production: 664 Mboe (100% oil) • 2013 Capital Program – $29.5 million for all capital programs – Drilled 3 productive wells for $21.8 million ASSET MAP FLORIDA OPERATING AREA (1) Estimated proved reserves and production based on YE 2013 Reserve Report at SEC prices . Miami - Dade Broward Collier Lee Hendry Palm Beach Charlotte Glades Martin Monroe Sunoco Felda Raccoon Point Bear Island West Felda Lehigh Park 2013 OPERATIONAL HIGHLIGHTS ESTIMATED PROVED RESERVES BY RESOURCE MIX (1)
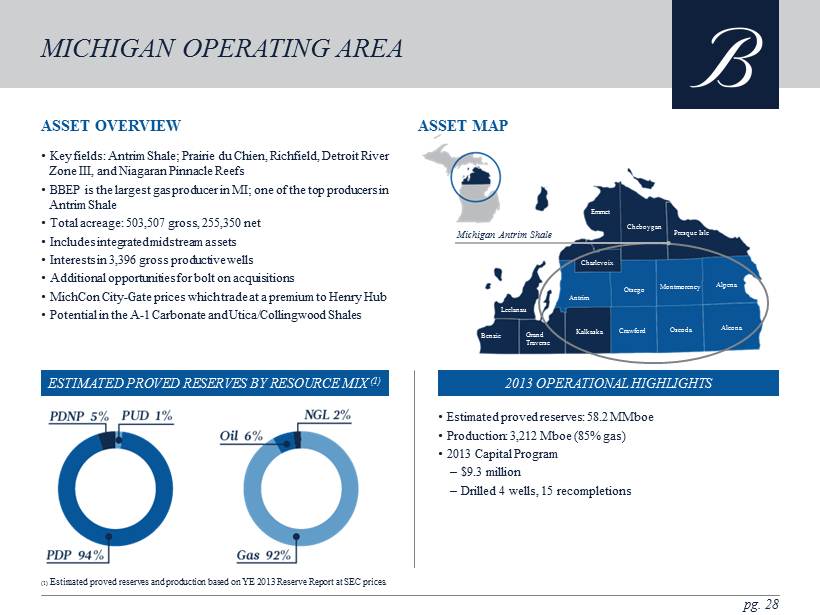
• Key fields: Antrim Shale; Prairie du Chien, Richfield, Detroit River Zone III, and Niagaran Pinnacle Reefs • BBEP is the largest gas producer in MI; one of the top producers in Antrim Shale • Total acreage: 503,507 gross, 255,350 net • Includes integrated midstream assets • Interests in 3,396 gross productive wells • Additional opportunities for bolt on acquisitions • MichCon City - Gate prices which trade at a premium to Henry Hub • Potential in the A - 1 Carbonate and Utica/Collingwood Shales ASSET OVERVIEW pg. 28 • Estimated proved reserves: 58.2 MMboe • Production: 3,212 Mboe (85% gas) • 2013 Capital Program – $9.3 million – Drilled 4 wells, 15 recompletions ASSET MAP MICHIGAN OPERATING AREA (1) Estimated proved reserves and production based on YE 2013 Reserve Report at SEC prices . Benzie Oscoda Crawford Kalkaska Alcona Grand Traverse Montmorency Otsego Antrim Alpena Leelanau Charlevoix Charlevoix Presque Isle Cheboygan Emmet Michigan Antrim Shale 2013 OPERATIONAL HIGHLIGHTS ESTIMATED PROVED RESERVES BY RESOURCE MIX (1)

pg. 29 PUBLIC GUIDANCE & NON - GAAP FINANCIAL MEASURES Excluding the effect of any acquisitions, Breitburn is forecasting total production for the second half of 2014 to be between 6 . 8 million and 7 . 2 million Boe , with oil production now expected to be between 3 . 8 million and 4 . 2 million barrels, and still expects to achieve its targeted December 2014 production exit rate of between 38 , 400 and 40 , 800 Boe /d . This revised production outlook is principally due to the recent performance of Breitburn’s operations in the Permian Basin . Breitburn also expects second half Adjusted EBITDA to be between $ 235 million and $ 255 million, principally as a result of lower expected oil revenues . Total oil and gas capital expenditures for the second half of 2014 are expected to be between $ 170 million and $ 180 million . Reconciliation of Adjusted EBITDA . The Adjusted EBITDA range above assumes estimated net income (before non - cash compensation) between $ 80 million and $ 102 million, less mark - to - market gains on commodity derivative instruments of $ 40 million, plus DD&A of $ 137 million, plus interest expense between $ 56 million (high end of Adjusted EBITDA) and $ 58 million (low end of Adjusted EBITDA) . Estimated 2014 net income is based on oil prices of $ 105 per barrel for WTI oil, $ 110 per barrel Brent oil, and $ 4 . 00 per Mcfe for natural gas . Consequently, differences between actual and forecast prices could result in changes to gains or losses on mark to market of commodity derivative instruments, DD&A, including potential impairments of long - lived assets, and ultimately, net income . The foregoing guidance is subject to all of the cautionary statements and limitations described in this presentation, including “Cautionary Statement Regarding Forward - Looking Information . ” In addition, estimates for Breitburn’s future production volumes are based on, among other things, assumptions of capital expenditure levels and the assumption that market demand and prices for oil and gas will continue at levels that allow for economic production of these products . The production, transportation and marketing of oil and gas are extremely complex and are subject to disruption due to transportation and processing availability, mechanical failure, human error, weather, and numerous other factors, including the inability to obtain expected supply of CO 2 . Breitburn’s estimates are based on certain other assumptions, such as well performance, which may actually prove to vary significantly from those assumed . Lease operating costs, including major maintenance costs, vary in response to changes in prices of services and materials used in the operation of our properties and the amount of maintenance activity required . Lease operating costs, including taxes, utilities and service company costs, move directionally with increases and decreases in commodity prices, and we cannot fully predict such future commodity or operating costs . Similarly, interest rates and price differentials are set by the market and are not within our control, and they can vary dramatically from time to time . Capital expenditures are based on our current expectations as to the level of capital expenditures that will be justified based upon the other assumptions set forth below as well as expectations about other operating and economic factors not set forth below . The foregoing guidance does not constitute any form of guarantee, assurance or promise that the matters indicated will actually be achieved . Rather, the foregoing guidance simply sets forth our best estimate today for these matters based upon our current expectations about the future based upon both stated and unstated assumptions . Actual conditions and those assumptions may, and probably will, change over the course of the year . Second Half 2014 Guidance Financial tables and other supplemental information in this presentation, including the reconciliations of certain non - generally accepted accounting principles (“non - GAAP”) measures to their nearest comparable generally accepted accounting principles (“GAAP”) measures, may be used periodically by management when discussing the Breitburn’s financial results with investors and analysts, and they are also available on the Breitburn's website under the Investor Relations tab . Among the non - GAAP financial measures used are “Adjusted EBITDA” and “distributable cash flow . ” These non - GAAP financial measures should not be considered as alternatives to GAAP measures, such as net income, operating income, cash flow from operating activities or any other GAAP measure of liquidity or financial performance . Management believes that these non - GAAP financial measures enhance comparability to prior periods . Adjusted EBITDA is presented because management believes it provides additional information relative to the performance of the Breitburn’s business, such as our ability to meet our debt covenant compliance tests . Distributable cash flow is used by management as a tool to measure the cash distributions we could pay to our unitholders . This financial measure indicates to investors whether or not we are generating cash flow at a level that can support our distribution rate to our unitholders . These non - GAAP financial measures may not be comparable to similarly titled measures of other publicly traded partnerships or limited liability companies because all companies may not calculate Adjusted EBITDA or distributable cash flow in the same manner . Non - GAAP Financial Measures
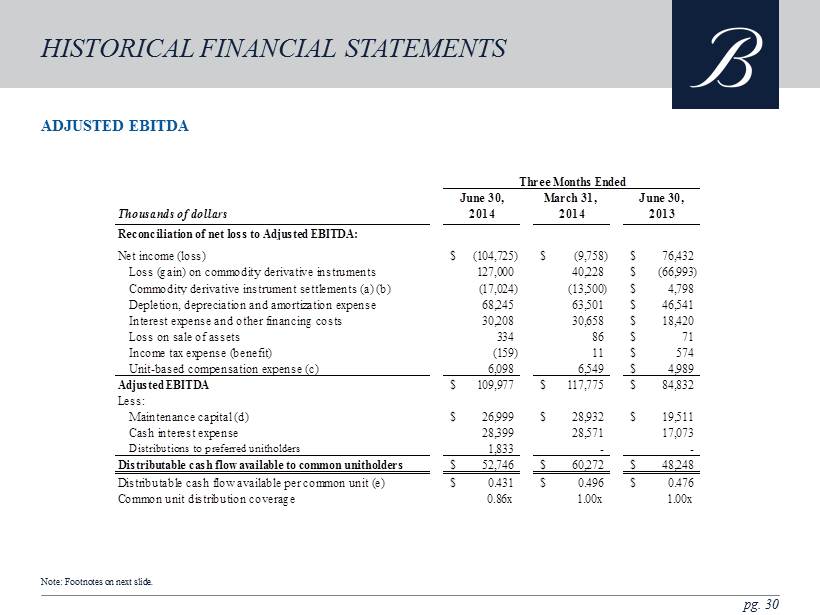
pg. 30 ADJUSTED EBITDA HISTORICAL FINANCIAL STATEMENTS Note: Footnotes on next slide. June 30, March 31, June 30, Thousands of dollars 2014 2014 2013 Reconciliation of net loss to Adjusted EBITDA: Net income (loss) (104,725)$ (9,758)$ 76,432$ Loss (gain) on commodity derivative instruments 127,000 40,228 (66,993)$ Commodity derivative instrument settlements (a) (b) (17,024) (13,500) 4,798$ Depletion, depreciation and amortization expense 68,245 63,501 46,541$ Interest expense and other financing costs 30,208 30,658 18,420$ Loss on sale of assets 334 86 71$ Income tax expense (benefit) (159) 11 574$ Unit-based compensation expense (c) 6,098 6,549 4,989$ Adjusted EBITDA 109,977$ 117,775$ 84,832$ Less: Maintenance capital (d) 26,999$ 28,932$ 19,511$ Cash interest expense 28,399 28,571 17,073 Distributions to preferred unitholders 1,833 - - Distributable cash flow available to common unitholders 52,746$ 60,272$ 48,248$ Distributable cash flow available per common unit (e) 0.431$ 0.496$ 0.476$ Common unit distribution coverage 0.86x 1.00x 1.00x Three Months Ended
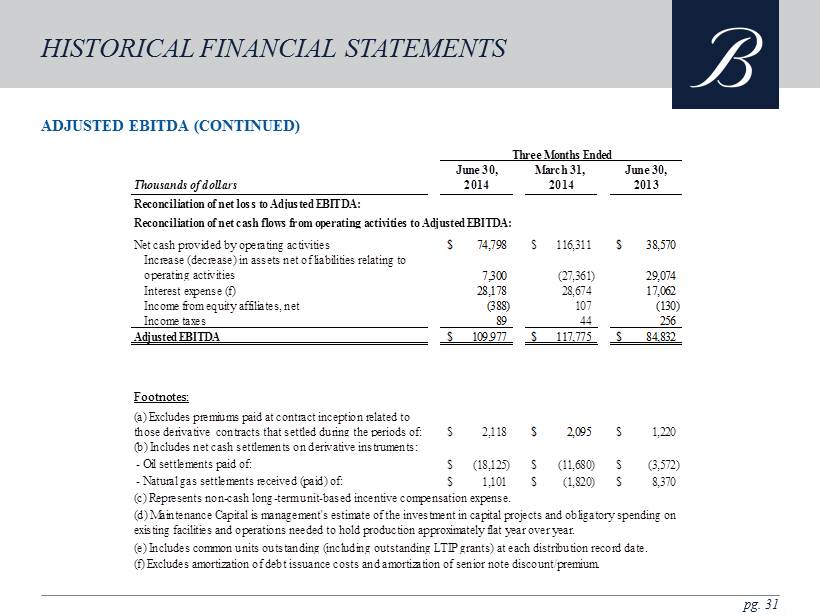
pg. 31 ADJUSTED EBITDA (CONTINUED) HISTORICAL FINANCIAL STATEMENTS June 30, March 31, June 30, Thousands of dollars 2014 2014 2013 Reconciliation of net loss to Adjusted EBITDA: Net cash provided by operating activities 74,798$ 116,311$ 38,570$ Increase (decrease) in assets net of liabilities relating to operating activities 7,300 (27,361) 29,074 Interest expense (f) 28,178 28,674 17,062 Income from equity affiliates, net (388) 107 (130) Income taxes 89 44 256 Adjusted EBITDA 109,977$ 117,775$ 84,832$ (a) Excludes premiums paid at contract inception related to those derivative contracts that settled during the periods of: 2,118$ 2,095$ 1,220$ (b) Includes net cash settlements on derivative instruments: - Oil settlements paid of: (18,125)$ (11,680)$ (3,572)$ - Natural gas settlements received (paid) of: 1,101$ (1,820)$ 8,370$ (f) Excludes amortization of debt issuance costs and amortization of senior note discount/premium. (c) Represents non-cash long-term unit-based incentive compensation expense. (d) Maintenance Capital is management's estimate of the investment in capital projects and obligatory spending on existing facilities and operations needed to hold production approximately flat year over year. (e) Includes common units outstanding (including outstanding LTIP grants) at each distribution record date. Three Months Ended Reconciliation of net cash flows from operating activities to Adjusted EBITDA: Footnotes:
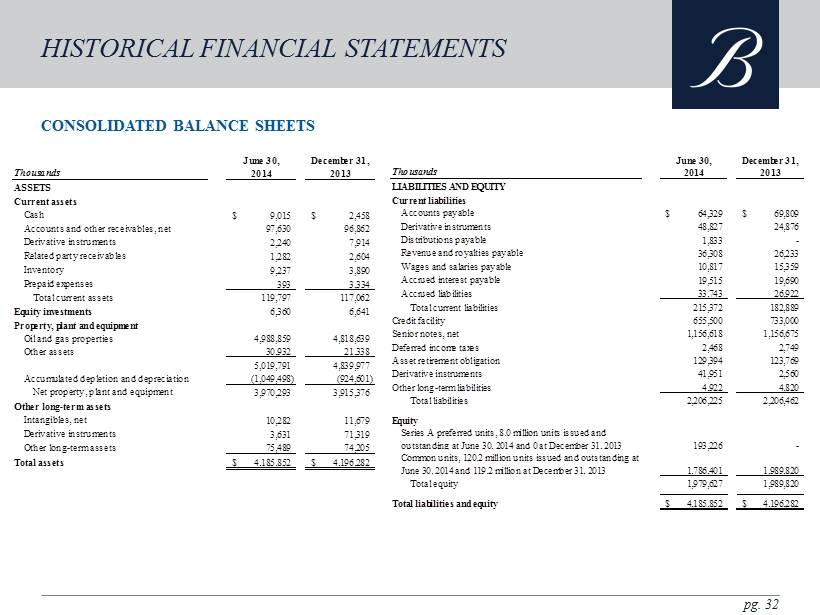
pg. 32 CONSOLIDATED BALANCE SHEETS HISTORICAL FINANCIAL STATEMENTS June 30, December 31, Thousands 2014 2013 ASSETS Current assets Cash 9,015$ 2,458$ Accounts and other receivables, net 97,630 96,862 Derivative instruments 2,240 7,914 Related party receivables 1,282 2,604 Inventory 9,237 3,890 Prepaid expenses 393 3,334 Total current assets 119,797 117,062 Equity investments 6,360 6,641 Property, plant and equipment Oil and gas properties 4,988,859 4,818,639 Other assets 30,932 21,338 5,019,791 4,839,977 Accumulated depletion and depreciation (1,049,498) (924,601) Net property, plant and equipment 3,970,293 3,915,376 Other long-term assets Intangibles, net 10,282 11,679 Derivative instruments 3,631 71,319 Other long-term assets 75,489 74,205 Total assets 4,185,852$ 4,196,282$ June 30, December 31, Thousands 2014 2013 LIABILITIES AND EQUITY Current liabilities Accounts payable 64,329$ 69,809$ Derivative instruments 48,827 24,876 Distributions payable 1,833 - Revenue and royalties payable 36,308 26,233 Wages and salaries payable 10,817 15,359 Accrued interest payable 19,515 19,690 Accrued liabilities 33,743 26,922 Total current liabilities 215,372 182,889 Credit facility 655,500 733,000 Senior notes, net 1,156,618 1,156,675 Deferred income taxes 2,468 2,749 Asset retirement obligation 129,394 123,769 Derivative instruments 41,951 2,560 Other long-term liabilities 4,922 4,820 Total liabilities 2,206,225 2,206,462 Equity Series A preferred units, 8.0 million units issued and outstanding at June 30, 2014 and 0 at December 31, 2013 193,226 - Common units, 120.2 million units issued and outstanding at June 30, 2014 and 119.2 million at December 31, 2013 1,786,401 1,989,820 Total equity 1,979,627 1,989,820 Total liabilities and equity 4,185,852$ 4,196,282$
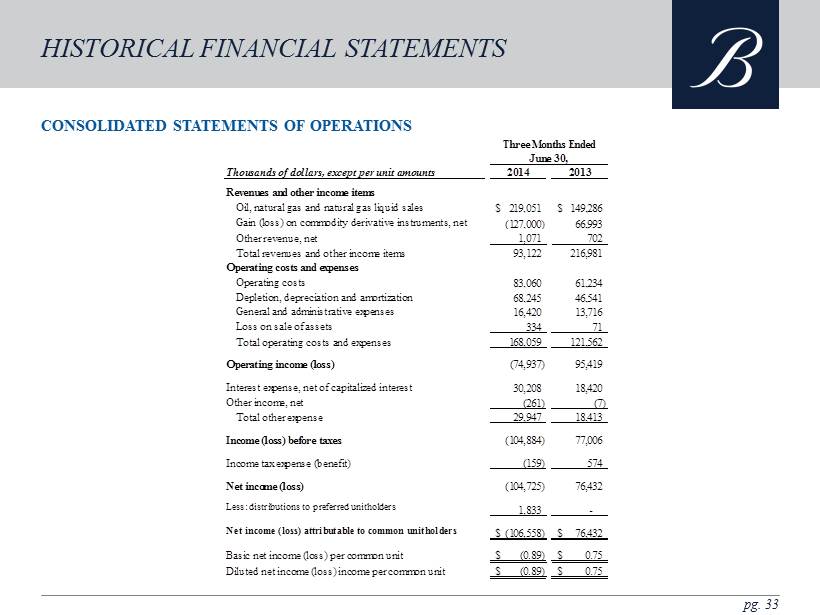
pg. 33 CONSOLIDATED STATEMENTS OF OPERATIONS HISTORICAL FINANCIAL STATEMENTS Thousands of dollars, except per unit amounts 2014 2013 Revenues and other income items Oil, natural gas and natural gas liquid sales 219,051$ 149,286$ Gain (loss) on commodity derivative instruments, net (127,000) 66,993 Other revenue, net 1,071 702 Total revenues and other income items 93,122 216,981 Operating costs and expenses Operating costs 83,060 61,234 Depletion, depreciation and amortization 68,245 46,541 General and administrative expenses 16,420 13,716 Loss on sale of assets 334 71 Total operating costs and expenses 168,059 121,562 Operating income (loss) (74,937) 95,419 Interest expense, net of capitalized interest 30,208 18,420 Other income, net (261) (7) Total other expense 29,947 18,413 Income (loss) before taxes (104,884) 77,006 Income tax expense (benefit) (159) 574 Net income (loss) (104,725) 76,432 Less: distributions to preferred unitholders 1,833 - Net income (loss) attributable to common unitholders (106,558)$ 76,432$ Basic net income (loss) per common unit (0.89)$ 0.75$ Diluted net income (loss) income per common unit (0.89)$ 0.75$ June 30, Three Months Ended

pg. 34 CONSOLIDATED STATEMENTS OF CASH FLOWS HISTORICAL FINANCIAL STATEMENTS Thousands of dollars 2014 2013 Cash flows from operating activities Net income (loss) (114,483)$ 40,132$ Adjustments to reconcile net loss to cash flow from operating activities: Depletion, depreciation and amortization 131,746 94,331 Unit-based compensation expense 12,647 9,797 Loss (gain) on derivative instruments 167,228 (42,817) Derivative instrument settlement receipts (payments) (30,524) 9,956 Income from equity affiliates, net 281 (1) Deferred income taxes (281) 297 Loss on sale of assets 420 62 Other 3,487 2,239 Changes in assets and liabilities: Accounts receivable and other assets 2,097 (13,050) Inventory (5,347) (1,801) Net change in related party receivables and payables 1,322 649 Accounts payable and other liabilities 22,516 (2,372) Net cash provided by operating activities 191,109 97,422 Six Months Ended June 30, Thousands of dollars 2014 2013 Cash flows from investing activities Property acquisitions (2,684) 598 Capital expenditures (188,758) (100,211) Other (5,706) - Deposit for oil and gas properties - (85,980) Proceeds from sale of assets 542 160 Net cash used in investing activities (196,606) (185,433) Cash flows from financing activities Proceeds from issuance of preferred units, net 193,397 - Proceeds from issuance of common units, net 20,273 285,016 Distributions to preferred unitholders - - Distributions to common unitholders (120,059) (88,757) Proceeds from issuance of long-term debt, net 466,000 397,000 Repayments of long-term debt (543,500) (507,000) Change in book overdraft (2,425) (291) Long-term debt issuance costs (1,632) (328) Net cash provided by financing activities 12,054 85,640 Increase (decrease) in cash 6,557 (2,371) Cash beginning of period 2,458 4,507 Cash end of period 9,015$ 2,136$ Six Months Ended June 30,

NASDAQ: BBEP INVESTOR PRESENTATION BREITBURN ENERGY PARTNERS LP