Exhibit 99.84

TIMMINS GOLD CORP.
NI 43-101 F1 TECHNICAL REPORT
UPDATED RESOURCES AND RESERVES
AND MINE PLAN FOR THE
SAN FRANCISCO GOLD MINE
SONORA, MÉXICO
November 30, 2010
Amended August 3, 2011
Prepared by:
William J. Lewis, B.Sc., P.Geo.
Ing. Alan J. San Martin, MAusIMM
Mani Verma, P.Eng.
Christopher A. Jacobs, CEng,l MIMMM
Richard M. Gowans, B.Sc. P.Eng.
SUITE 900 - 390 BAY STREET, TORONTO ONTARIO, CANADA M5H 2Y2
Telephone (1) (416) 362-5135 Fax (1) (416) 362 5763

Table of Contents
i
ii
iii
APPENDIXES
| APPENDIX I | Glossary of Mining and Other Related Terms | At end of Report |
| | | |
| APPENDIX 2 | 2008 to June, 2010, Summary of Significant Drill Assays in the NW, S-SW and E-SE Areas around the San Francisco Pit | At end of Report |
iv
List of Tables
Page
v
| Table 13.9 | Summary of the Comparison of the San Francisco Mine and IPL Laboratories Assay Results against the SRM CDN-GS-P8 | 107 |
| Table 13.10 | Summary of the Comparison of the San Francisco Mine and IPL Laboratories versus the SRM OXF-65 | 108 |
| Table 13.11 | Summary of the Comparison of the San Francisco Mine and IPL Laboratories versus SRM SG-31 | 109 |
| Table 13.12 | Summary of the Comparison of the San Francisco Mine and IPL Laboratories versus the SRM CDN-GS-1E | 110 |
| Table 13.13 | Summary of the Comparison of the San Francisco Mine and IPL Laboratories against the SRM OXH-66 | 111 |
| Table 13.14 | Summary of the Comparison of the San Francisco Mine Laboratory against SRM OXI-67 | 112 |
| Table 13.15 | Summary of the Comparison of the San Francisco Mine Laboratory against SRM CDN-GS-2C | 113 |
| Table 13.16 | Summary of the Comparison of the San Francisco Mine Laboratory against SRM CDN-GS-3E | 113 |
| Table 13.17 | Summary of the Comparison of the San Francisco Mine Laboratory against SRM CDN-GS-3FN | 114 |
| Table 13.18 | Summary of the Comparison of the San Francisco Mine Laboratory against the SRM CDN-GS-5C | 115 |
| Table 13.19 | Summary of Blank Assay Data for the September, 2009 to March, 2010 Drill Program (San Francisco Laboratory) | 116 |
| Table 13.20 | Summary of Blank Assay Data for the September, 2009 to March, 2010 Drill Program (IPL and IPL-Inspectorate Laboratory) | 116 |
| Table 13.21 | Summary of the Results for the Duplicate Samples, September, 2009 to June, 2010 Drilling Program | 117 |
| Table 14.1 | Summary of April to June, 2010, Quarter Production | 121 |
| Table 16.1 | Summary of the Two Composites | 125 |
| Table 16.2 | Summary of the Leach Column Tests September, 2009 to July, 2010 | 126 |
| Table 16.3 | Summary of the Mineralization Type and Corresponding Test Gold Recoveries | 127 |
| Table 17.1 | Mineral Resource Estimate for the San Francisco Project (Inclusive of Mineral Reserves) | 128 |
| Table 17.2 | 3-D Block Model Limits and Dimensions | 130 |
| Table 17.3 | Rock Domain Code and Specific Gravity | 131 |
| Table 17.4 | Measured, Indicated and Inferred Resource Blocks, August, 2010 | 133 |
vi
vii
List of Figures
Page
viii
ix
x
xi
xii
1.0 SUMMARY
1.1 GENERAL
Timmins Gold Corp. (TSX-V:TMM) (TMM) has retained Micon International Limited (Micon) to conduct an audit of its resource and reserve estimation and prepare an update of its 2008/2009 preliminary feasibility study on the San Francisco project in the state of Sonora, Mexico. The purpose of this Technical Report is to support disclosure of the results of Micon’s resource and reserve audit and the updated preliminary feasibility study, compliant with Canadian National Instrument (NI) 43-101.
Previously, Micon prepared a Technical Report, entitled “NI 43-101 Technical Report on the Preliminary Feasibility Study for the San Francisco Gold Property, Estación Llano, Sonora, Mexico”, describing the preliminary feasibility study on the San Francisco project, dated March 31, 2008 and amended January 13, 2009.
At the request of the British Columbia Securities Commission (BCSC) the certificates in this report were amended on August 3, 2011.
1.2 PROPERTY DESCRIPTION AND LOCATION
The San Francisco property is situated in the north central portion of the state of Sonora, Mexico, approximately 150 km north of the state capital, Hermosillo. In this report, the term San Francisco project (the project) refers to the area within the exploitation or mining concessions optioned by TMM, while the term San Francisco property (the property) refers to the entire land package (mineral exploitation and exploration concessions) optioned and owned by TMM.
The project is comprised of two previously mined open pits (San Francisco and La Chicharra), together with heap leach processing facilities and associated infrastructure located close to the San Francisco pit.
TMM advises that it holds its interest in the San Francisco property through its wholly-owned Mexican subsidiary Timmins Goldcorp Mexico, S.A. de C.V. (Timmins). Timmins originally acquired the rights to the exploitation concessions on April 18, 2005, upon signing an option agreement with Geomaque de Mexico, S.A. de C.V. (Geomaque de Mexico). The option agreement has now been superseded by an acquisition agreement. The purchase price was set at USD 5,000,000 plus 10,000,000 shares at a deemed price of USD 0.50 per share. The existing equipment had an additional purchase price of USD 3,500,000 plus value added tax (VAT), which amount is due without interest at the end of the three years from May, 2007. A portion of the equipment purchase price remains outstanding. The security documentation to place a lien against the equipment is being finalized.
In 2005, Timmins staked a number of exploration concessions surrounding the exploitation concessions. Interspersed within the Timmins concessions were four mineral concessions controlled by other parties, but these do not impact the main area of interest covering the San Francisco project. All concessions are subject to a semi-annual fee and the filing of reports in May of each year covering the work accomplished on the property between January and December of the preceding year. The total semi-annual fee payable to the Mexican government for the group of concessions is presently estimated to be USD 72,929.
1
The Mexican mining laws were changed in 2005 and, as a result of these changes, all mineral concessions granted by the Dirección General de Minas (DGM) became mining concessions and there are no longer separate specifications for a mineral exploration or exploitation concession. A second change to the mining laws was that all mining concessions are granted for 50 years provided that the concessions remain in good standing. As part of this change, all former exploration concessions which were previously granted for 6 years became eligible for the 50-year term.
In 2006, Timmins concluded an access agreement with an agrarian community (an “Ejido” in Mexico) called Los Chinos whereby Timmins was granted access privileges to 674 ha, the use of the Ejido’s roads, as well as being able to perform all exploration work on the area covered by the agreement. The agreement is for a period of 10 years with an option to extend the access beyond the 10-year period. In consideration for the Ejido granting the access privileges to a portion of its land, Timmins paid the Ejido the sum of USD 30,000.
1.3 ACCESSIBILITY, CLIMATE, PHYSIOGRAPHY, LOCAL RESOURCES AND INFRASTRUCTURE
The project is located in the Arizona-Sonora desert in the northern portion of the Mexican state of Sonora, 2 km west of the town of Estación Llano (Estación), approximately 150 km north of Hermosillo and 120 km south of the United States/Mexico border city of Nogales along Highway 15 (Pan American highway). The closest accommodations are located in Santa Ana, a small city located 21 km to the north on Highway 15.
The climate at the project site ranges from semi-arid to arid. The average ambient temperature is 21°C, with minimum and maximum temperatures of -5ºC and 50ºC, respectively. The average rainfall for the area is 330 millimetres (mm) with an upper extreme of 880 mm. The desert vegetation surrounding the San Francisco mine is composed of low lying scrub, thickets and various types of cacti, with the vegetation type classified as Sarrocaulus Thicket.
Physiographically, the San Francisco property is situated within the southern Basin and Range Province, characterized by elongate, northwest-trending ranges separated by wide alluvial valleys. The San Francisco mine is located in a relatively flat area of the desert with the topography ranging between 700 and 750 m above sea level.
2
1.4 HISTORY
After conducting exploration on the project between 1983 and 1992, Compania Fresnillo S.A. de C.V. (Fresnillo) sold the property in 1992 to Geomaque Explorations Ltd. (Geomaque). After conducting further exploration, Geomaque decided to bring the project into production in 1995. Due to economic conditions, mining ceased and the operation entered into the leach-only mode in November, 2000. In May, 2002, the last gold pour was conducted; the plant was mothballed, and clean-up activities at the mine site began.
In 2003, Geomaque sought and received shareholder approval to amalgamate the corporation under a new Canadian company, Defiance Mining Corporation (Defiance). On November 24, 2003, Defiance sold its Mexican subsidiaries (Geomaque de Mexico and Mina San Francisco), which held the San Francisco gold mine, to the Astiazaran family of Sonora and their private company for a total consideration of USD 235,000.
Since June, 2006, the Astiazaran family and their company Desarrollos Prodesa S.A. de C.V. have been extracting sand and gravel intermittently from both the waste dumps and the leach pads for use in highway construction as well as other construction projects.
Timmins acquired an option to earn an interest in the property in early 2005, whereupon Timmins conducted a review of the available data and started a reverse circulation drilling program in August and September, 2005. This was followed by a second drilling program comprised of both reverse circulation and diamond drilling in 2006, based on the results of the 2005 drilling program.
1.5 GEOLOGICAL SETTING AND MINERALIZATION
The San Francisco project is a gold occurrence with trace to small amounts of other metallic minerals. The gold occurs in granitic gneiss and the deposit contains principally free gold and occasionally electrum. The associated mineralogy, the possibility of associated tourmaline, the style of mineralization, and fluid inclusion studies suggest that the San Francisco deposits may be of mesothermal origin.
The San Francisco deposits are roughly tabular with multiple phases of gold mineralization. The deposits strike 60° west to 65° west, dip to the northeast, range in thickness from 4 to 50 m, extend over 1,500 m along strike and are open ended. Another deposit, the La Chicharra zone, was mined during the last two years of production, as a separate pit.
1.6 EXPLORATION AND OTHER PROGRAMS
After acquiring the project, Timmins undertook a review of all available geological data surrounding the previous mining areas and identified a number of immediate exploration targets both to the northwest and to the southeast of the San Francisco pit which required further work. Timmins also spent the first few months staking the surrounding area and laying out an appropriate drilling program with the objective of confirming and extending the known mineralization around the open pit.
3
Beginning in 2005 and continuing to the present time, TMM/Timmins has been conducting aggressive exploration programs to delineate and expand on the known mineralization at the San Francisco mine. The exploration drilling programs have primarily been concentrated around the existing pits but other mineral exposures previously identified by Geomaque, as well as new areas identified by TMM/Timmins, been have targeted as well.
As a result of the successful exploration campaigns around the existing pits, TMM/Timmins has been able to expand on the previously known mineralization, to re-open the San Francisco mine and expand the resources and reserves.
Between 2008 and 2010 Timmins also conducted a number of other exploration programs such as geochemical soil and chip sampling, an air magnetic and radiometric survey, a natural source audio-frequency magnetotelluric survey (NSAMT) and a structural review of the San Francisco gold deposit.
The TMM/Timmins budget for the next phase of exploration for the San Francisco mine is the result of the successful 2009-2010 drilling program. Infill and exploration drilling will continue for the remainder of 2010 and into 2011 in order to expand the mineral resources and reserves.
Of particular interest is the southeast extension where the last section line of drilling (200E) contained three RC holes which were drilled to maximum depth of 170 m. Two of the three holes intersected mineralization, with hole TF-810 intersecting three mineralized intervals of low grade and narrow thickness: 1.52 m grading 0.31 g/t gold; 1.52 m grading 0.24 g/t gold and 1.52 m grading 0.41 g/t gold. Hole TF-812, located 50 m to the north on the same section line intersected 9.12 m grading 0.98 g/t gold and 6.08 m grading 0.52 g/t gold. All mineralized intervals were located within the first 60 m from surface and are related to a chargeability anomaly open at depth for a further 300 m. TMM/Timmins has outlined a further core drilling program totalling 5,000 m.
Near the perimeter of the pit, infill drilling has been planned to follow-up previous mineralized intersections that could increase the resources immediately east and north of the San Francisco pit and the new pit limit which resulted from the recent resource update. The infill drill program outlined by Timmins is comprised of approximately 30,000 m of reverse circulation drilling.
A program of exploration has been also outlined to define and test at least 4 of the 13 targets to the north of the San Francisco pit: these are the most favourable targets when geochemistry, lithology, structural lineament and relationship with the northwest mineral trend are considered. Timmins has estimated that this program will be approximately 30,000 m, involving a combination of reverse circulation drilling and a mobile RAB drill to acquire fast samples to outline drill targets for the RC drill.
4
The total expenditures for the next phase of exploration, including other related payments such as access, are estimated to USD 6.1 million.
1.7 RESOURCE AND RESERVE ESTIMATES
1.7.1 Mineral Resource Estimate
The resource estimate completed by Timmins in July, 2010 and audited by Micon in August/September, 2010 is compliant with the current CIM standards and definitions specified by NI 43-101, and supersedes the March, 2008 resource estimate for the San Francisco mine.
Both Canadian NI 43-101 and the Australasian Joint Ore Reserves Committee (JORC) code state that mineral resources must meet the condition of “a reasonable prospect for eventual economic extraction.” For open pit material, Timmins utilized Lerchs Grossman pit shell geometry at reasonable long term prices, and reasonable costs and recovery assumptions, as meeting this condition for mineral resources. The resource is based on a pit shell at a gold price of USD 1,100/oz and additional cost and recovery parameters developed by Timmins which meet the conditions for classification of the material as a mineral resource. Pit optimization was based on Measured, Indicated and Inferred resources.
Table 1.1 summarizes the economic parameters used for the analysis. The parameters are a combination of Independent Mining Consultants, Inc. (IMC) and Timmins inputs taking into account the actual costs obtained from the first year of operation.
Pit bench heights were set at 6.0 m (the block height of the 3-D block model). Base case slope angles used for the pit optimization were based on inter-ramp angles recommended by Golder Associates (December, 1996 report) and adjusted to allow for haul roads of 25 m width.
Table 1.1
Pit Optimization Parameters for the San Francisco Project
| Costs (USD) | Rock Densities and Recoveries |
| Description | Units | Amount | Name | Code | Density | Recovery % |
| Waste mining cost | $/t | 1.70 | Diorite | 2 | 2.72 | 60.50 |
| Ore mining cost | $/t ore | 1.70 | Gneiss | 4 | 2.75 | 70.70 |
| Process cost | $/t ore | 2.83 | Granite | 5 | 2.76 | 84.50 |
| G & A cost | $/t ore | 0.42 | Schist | 6 | 2.75 | 65.37 |
| Total Cost | $/t ore | 4.95 | Lamprophrite Dyke | 8 | 2.76 | 60.50 |
| Gold price | $/oz | 1,100 | Gabbro | 11 | 2.81 | 60.53 |
| | General Recovery | | 70.00 |
Table provided by Timmins Goldcorp Mexico, S.A. de C.V.
The mineral resource, as estimated by Timmins, is presented in Table 1.2. This resource estimate includes the undiluted mineral reserve material as of August 31, 2010.
5
Table 1.2
Mineral Resource Estimate for the San Francisco Project (Inclusive of Mineral Reserves)
(Cut-off Grade of 0.131 g/t Gold, USD 1,100 Gold Price)
| Resource Classification | Tonnes (x 1,000) | Gold Grade (g/t) | Contained Gold (oz) |
| Measured | 19,089 | 0.797 | 489,000 |
| Indicated | 23,442 | 0.658 | 495,000 |
| Total Measured and Indicated | 42,531 | 0.720 | 984,000 |
| Inferred | 10,308 | 0.628 | 208,000 |
Micon believes that no environmental, permitting, legal, title, taxation, socio-economic, marketing or political issues exist which would adversely affect the Mineral Resources estimated above, at this time. However, Mineral Resources that are not Mineral Reserves do not have demonstrated economic viability. The figures in Table 1.2 have been rounded to reflect that they are an estimate.
The Mineral Resource estimate has been reviewed and audited by Micon. It is Micon’s opinion that the August 31, 2010 Mineral Resource estimate has been prepared in accordance with the CIM standards and definitions for Mineral Resource estimates and that TMM/Timmins can use this estimate as a basis for further exploration and economic evaluation of the San Francisco mine project.
1.7.2 Mineral Reserve
Having established a Measured and Indicated mineral resource estimate from the initial pit optimization analysis, Timmins then designed an open pit with haul roads capable of accepting trucks in the 91-t class, and prepared a production schedule and second pit optimization for the extraction of the measured and indicated mineral resources.
Mining recovery for the San Francisco deposit has been assumed to be 99% based on open pit mining methods. Micon agrees with the mining recovery as initially presented, although this number may change based on actual year-to-year reconciliation studies.
The dilution for the San Francisco deposit is defined according to the type of mineralization and the size of the modelled blocks. The deposit varies in size and shape of the mineralization from one bench to another. The potential dilution varies for each of the blocks due to the proportion of waste in contact with the economic material. Therefore, the larger economic zones carry a lower percent of dilution than the smaller zones.
Timmins believes that its current method for estimating dilution is a close approximation of what can be expected during the operational period of the mine. The method consists of identifying sub-economic blocks in contact with ore blocks and adding 30% of this material as mining dilution.
An overall average of 12% dilution was estimated for the pit. Table 1.3 presents the total reserves estimated within the pit design outline, including the mine recovery and dilution factors.
6
Table 1.3
Mineral Reserves within the San Francisco Pit Design (August 31, 2010) at USD 900/oz and after Mining
Recovery and Dilution
| In Pit Reserves | In Pit Waste |
| Classification | Tonnes
(x 1,000) | Grade (g/t) | Contained
Ounces | Waste Tonnes
(x 1,000) | Total Tonnes
(x 1,000) | Stripping
Ratio |
| Proven | 17,194 | 0.756 | 418,000 | | | |
| Probable | 17,738 | 0.635 | 362,000 | | | |
| Total | 34,932 | 0.695 | 780,000 | 60,417 | 95,349 | 1.73 |
The Proven and Probable Reserves in Table 1.3 have been derived from the Measured and Indicated mineral resources summarized in Table 1.2 and account for mining recovery and dilution. The figures in Table 1.3 have been rounded to reflect that they are an estimate.
The Mineral Reserve estimate has been reviewed and audited by Micon. It is Micon’s opinion that the August 31, 2010 Mineral Reserve estimate has been prepared in accordance with the CIM standards and definitions for Mineral Reserve estimates and that TMM/Timmins can use this estimate as a basis for further exploration and economic evaluation of the San Francisco mine project.
The San Francisco mine commenced commercial production in April, 2010. To the end of September, 2010, the mine had sold 26,999 ounces of gold.
1.8 OPERATIONAL DATA
1.8.1 Open Pit Design
1.8.1.1 Geotechnical Studies and Pit Design Criteria
The most recent geotechnical study carried out on the San Francisco pit was conducted by Golder Associates in December, 1996 for the previous owners of the property, Geomaque de Mexico. Golder’s scope of work was to carry out site investigations, testing and analysis to develop final slope angle recommendations for the pit design.
The recommended overall slope angles ranged from 37° for single 6 m benches along the northeast facing slopes to a maximum slope of 56° for double benching in schist units. In its report Golder presented a table of recommended inter-ramp slope angles and catch bench widths to achieve the recommended overall slope angles.
Timmins used this information when carrying out the pit optimization analysis and included an allowance for 25 m ramp widths in the overall slope angles.
7
1.8.1.2 Hydrological Considerations
Micon has no information on hydrology in the pit area. At the time of Micon’s visit, the pit floor was under water but this was understood to represent accumulated precipitation rather than inflows of groundwater. The existing pit walls were generally dry, with a few minor seepages along shear zones.
1.8.1.3 Phased Pit Designs
In 2010, the three-phase open pit design was extended to incorporate additional, recently discovered resources to the northwest of the existing pit outline. The ultimate pit design is based on the USD 900/oz gold optimized pit shell.
Both the ultimate pit design and interim mining phases conform to the current topography, including the existing pit outline. The interim phase boundaries were adjusted to ensure mineable bench widths and include ramps for access and haulage by 91-t trucks.
Mining phases were designed to have a balanced waste distribution during the mine life and continuous availability of ore.
For the mine plan and production schedule, tonnages within the initial mining phase were adjusted to match the current pit outline. Phase one extends down to the bench on elevation 590. Then, the phase two push back will expand the pit about 280 m west and deepen the pit to the bench at elevation 536. The third phase and ultimate pit outline has a 120 m push back on the north wall and the final pit bottom is at bench elevation 464.
1.8.1.4 Waste Rock Management
Existing waste rock dumps are located to the south of the San Francisco open pit, close to the pit rim and the dumps cannot be extended to the north. They are also limited to the east by a property boundary and to the west by ground not yet condemned by exploration drilling. With the re-establishment of the operations, these existing dumps will be extended further south, where adequate space does exist. For the expansion of the reserves, additional waste dump volume is required and a site located northwest of the pit has been identified that would contain the majority of waste rock produced during the mine life. Currently, a condemnation drilling program is underway in this area.
1.8.2 Mine Production Schedule
Using the phased pit designs described above, Timmins has developed a mine production schedule that is based on producing a minimum of 18,000 tonnes of ore per day. The mine plan has been developed on monthly intervals for the initial 16-month period to December 2011, on a quarterly basis for 2012 and annually for the remainder of the mine life to 2015.
8
The mine schedule considers ore between the internal cut-off of 0.16 g/t gold and 0.5 g/t gold as low grade, and high grade ore to be above 0.5 g/t gold. Blended ore will be fed to the crusher.
1.8.3 Mine Operations
All mining activities are being carried out by the contractor, Peal Mexico, S.A. de C.V., of Navojoa, Mexico. The contractor provides all the mining equipment and personnel required to produce the tonnage mandated by Timmins, in accordance with the mining plan.
1.8.3.1 Mining Contract
Under the contract dated May 23, 2007 and updated August 14, 2008, the contractor’s performance of mining operations at the San Francisco mine includes the following: drilling and blasting, loading and transportation of waste rock and ore, pit drainage, building slopes and roads as needed, scaling of pit walls to design limits, maintenance of equipment, and providing safe and orderly working conditions. The contractor is obliged to supply and maintain appropriate principal and auxiliary mining equipment and personnel.
1.8.3.2 Owner Mining Requirements
Mining engineering and design services are provided by Timmins. These services include:
- Obtaining of all permits and licences for mining.
- Mine design and planning, grade control and surveying services.
- Supply of electric power, water and telecommunications.
- Security services, safety plans and personnel and first aid stations.
Timmins provides contract supervision, geology, engineering, planning and survey services using its own employees.
1.8.4 Conclusion
Micon has reviewed the resource and reserve estimates, the mine design, the mining schedule and the contract terms, including the contractor’s ability to meet the mining schedule, and concludes that the estimations and designs have been properly carried out and that the contractor is capable of meeting the schedule.
1.9 PROCESSING
1.9.1 Crushing and Conveying
Ore extracted from the pit is transported in haulage trucks with a capacity of 91 tonnes, which feed directly into the gyratory primary crusher with dimensions of 42” x 65”. The crusher has nominal capacity of 1,200 t/h. The crushed product is then transported on conveyor belts to a stockpile with a capacity of 10,000 tonnes.
9
Two feeders beneath the stockpile deliver the ore to a conveyor belt for transport to the secondary crushing circuit. The ore is screened at ½”. Screen undersize reports to the final product, while screen oversize is fed to two secondary crushers.
Product from the secondary crushers is transported on conveyor belts to the tertiary crushing circuit, which consists of two tertiary crushers operating in closed circuit with ½” screens. Undersize from the screens is delivered to the leach pad.
An additional crusher and screen, both for the tertiary circuit and with the same specifications as the existing ones, are planned to be installed to increase throughput from 12,000 t/d to 18,000 t/d.
1.9.2 Leach Pad
The current leach pad occupies approximately 40 ha and is divided into 7 sections. Material from the crushing plant is transported to the leach pad on overland conveyors and deposited on the pad with a stacker forming 6 m lifts. A bulldozer passes on top of the lifts to level the surface. The irrigation pipelines are then installed, through which the leach solution is distributed over the entire surface of the lift.
Leach solution infiltrates the crushed ore, dissolving gold and silver. The solution percolates to the bottom of the lift and flows to the canal that carries the pregnant solution to the storage pond from which it is pumped to the ADR plant.
Barren solution exiting the ADR plant flows to a storage pond. Fresh water is added to the barren solution to replace losses during the process, and sodium cyanide is added before the solution is pumped back to the leach pad.
Due to the increase in mineral reserves and the planned increase in production capacity, an additional 35.2 ha will be prepared to construct a new leach pad.
1.9.3 Absorption/Desorption/Recovery Plant
Pregnant solution is fed to the adsorption plant which consists of 2 lines of carbon columns each with 5 tanks through which the carbon is advanced counter-currently. Gold is adsorbed on the carbon to a concentration of approximately 5,000 g/t. Desorption of the carbon is achieved in a Zedra circuit using stainless steel electrodes in a stainless steel electrolytic cell.
A new line of carbon columns with 5 tanks and a flow of 3,500 g/m is planned to be installed to accommodate the increase in production capacity.
Manpower for the processing section of the project is currently 147.
10
1.9.4 General Manpower and Infrastructure
The current total workforce for the San Francisco mine stands at 267.
Office space for the mine is provided in a structure of approximately 450 m2 located southeast of the ADR plant. The building has adequate working space for the on-site mine administration and also provides basic catering and ablution facilities.
A vehicle workshop south of the ADR plant and north of the open pit occupies more than 660 m2 and accommodates the off-road haul trucks, excavators and ancillary vehicles used in the mining operation.
A general warehouse of approximately 200 m2 located north of the ADR plant accommodates process reagents and mechanical spares. Bulk lime for the heap leach process is stored in a silo near the crushing plant.
1.9.5 Electrical Power Supply
Electrical power to the mine is delivered through a 33 kV overhead line from the utility company, Comisión Federal de Electricidad (CFE). From the main metering point, the power is distributed to the crushing and screening plant and other site infrastructure at 480/220/110 V. At the crushing and screening plant, separate transformers feed the principal equipment.
The current electrical power supply is sufficient for the planned production capacity of 18,000 t/d of ore.
1.9.6 Water Supply
The current demand of fresh water is 2 000 m3/d, of which 1,100 m3/d are for the leach area and ADR plant and 900 m3/d for the mine and services.
The Comisión Nacional del Agua (CONAGUA) authorized the total and definitive transfer of the rights for two concession titles to exploit and use national water previously held by Geomaque de Mexico, to Timmins’ Mexican subsidiary Molimentales del Noroeste, S. A. de C. V. (Molimentales) on May 30, 2008. Molimentales acquired an additional 2 water rights concessions in August, 2010
1.9.7 Environmental Considerations
The Secretaría de Medio Ambiente y Recursos Naturales (SEMARNAT) determined that the project as described in the environmental impact assessment (Manifiesto de Impacto Ambiental – Modalidad Particular) and a level 2 environmental risk study (Estudio de Riesgo Ambiental Nivel 2) for San Francisco mine submitted on December 17, 2007, is environmentally viable, and authorized the project with conditions specifically regarding reforestation and groundwater monitoring on August 1, 2008. Groundwater monitoring is currently being performed monthly on four monitoring wells to determine the level of cyanide. Reforestation activities have continued every month with three specific species: palo fierro, palo verde and mezquite.
11
On May 30, 2008, SEMARNAT registered Molimentales as a generator of hazardous waste. Molimentales is complying with hazardous waste management standards using an on-site storage facility exclusively for hazardous waste which is collected by an accredited company. The mine contractor, Peal Mexico, was registered by SEMARNAT as a generator of hazardous waste on August 26, 2010, and is responsible for the management of the hazardous waste generated by the mining operations.
Due to the proposed increase in in production capacity from 12,000 t/d to 18,000 t/d of ore, Molimentales will update all of its environmental permits to include the additional use of land.
1.10 ECONOMIC EVALUATION
Micon conducted the economic evaluation of the San Francisco project based on the information supplied to it by TMM and its subsidiary Timmins.
1.10.1 Macro-Economic Assumptions
Economic analysis of the San Francisco project has been carried out in United States dollars (USD). Conversion of local Mexican costs, principally labour and power, has been made at the rate of MXN 12.50/:USD 1.00, which is considered appropriate given recent trends in actual rates (see Figure 1.1) .
Figure 1.1
Exchange Rate (MXN/USD) 2010

The cash flow projection has been made in constant, third quarter 2010 money terms. The net cash flows have been discounted to year-end 2010 for the purposes of calculating net present value (NPV). A base discount rate of 8.0% per year has been selected as most likely to represent the weighted average cost of capital to the project. Other rates are provided for ease of comparison.
12
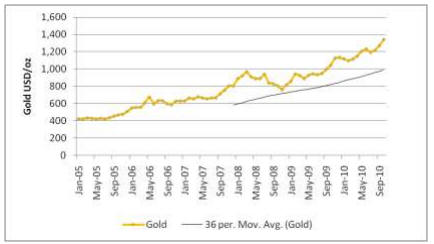
1.10.2 Metal Price Forecast
Revenue projections are based on a constant gold price of USD 1,000/oz in real terms, closely approximating the 3-year trailing average price but significantly lower than spot prices at the time of writing (see Figure 1.2) .. Accordingly, the sensitivity of the project to gold price in a range of up to USD 1,400/oz has also been evaluated. A price of USD 17/oz has been used for the minor amount of silver produced.
Figure 1.2
Spot Gold Price
1.10.3 Royalties and Taxes
Micon understands that no liability for NSR royalty interests in the San Francisco mine has extended to the present owners. Therefore, no royalty has been provided for.
Mexican corporate taxation has been provided for at the base rate of 28%, with provision for temporary rates of 30% up to the end of 2012 and 29% during 2013, which Timmins expects to be applicable. The World Bank/IFC website estimates a typical effective rate of tax on profits in Mexico of 22.9% ..
1.10.4 Working Capital
Provision has been made for working capital represented by 7 and 30 days of accounts receivable and payable, respectively, as well as 45 days of stores and 30 days of product inventory. The life-of-mine cash flow assumes that an amount of $9 million presently in working capital will be released once operations cease.
13
1.10.5 Base Case
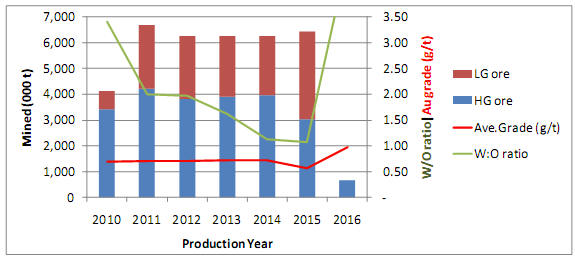
The base case evaluation of the San Francisco project has been made using the nominal treatment rate of 18,000 t/d, which is expected to be achieved from July, 2011. The mining schedule that supports this production plan is given in Figure 1.3.
Figure 1.3
Mining Schedule
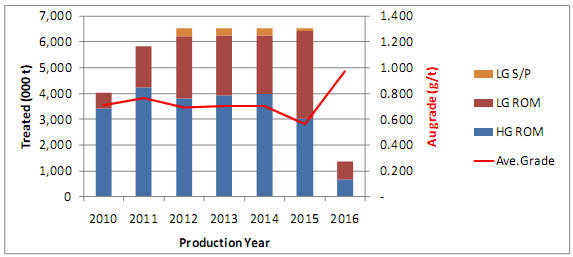
Open pit mining ceases early in 2016 and, as shown in Figure 1.4, processing of both high grade and low grade run-of-mine (ROM) material is carried out in parallel, with a small tonnage of low grade material (< 1 million tonnes) stockpiled during 2011/2012 treated later in the operating period. The cost for rehandling this low grade material has been conservatively estimated at USD 0.50/t.
Figure 1.4
Processing Schedule
14
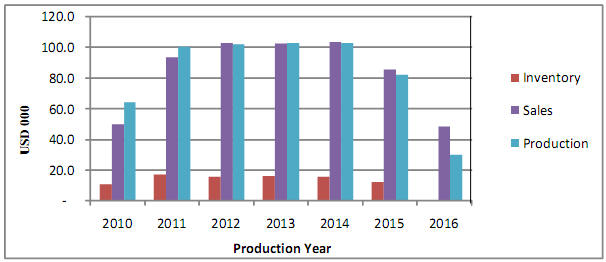
Overall process recovery averages 70% of contained gold in ore treated. Sales forecasts take into consideration the lockup of gold in the heap, as shown in Figure 1.5.
Figure 1.5
Gold Production, Sales and Inventory
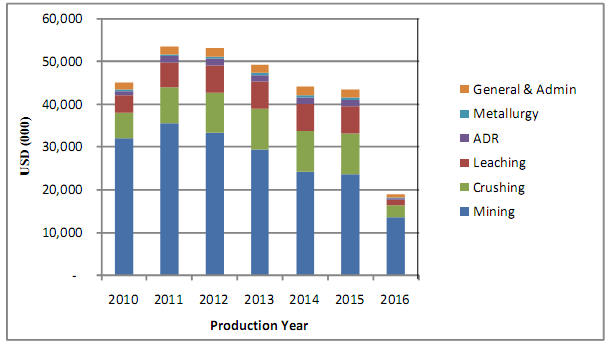
Cash operating costs are forecast to remain steady over the open pit mining period. Annual cash operating costs are shown in Figure 1.6.
Figure 1.6
Operating Costs Schedule
15
Pre-production capital costs for re-establishment of mining operations, refurbishment of the crushing and ADR plants and for extension of the heap leach pad at the San Francisco mine were all incurred in the period prior to the re-commencement of commercial production in April, 2010. As such, these costs have been treated as sunk costs for the purposes of the economic evaluation and, where shown in the project cash flow schedules and charts, are included for illustration of pay-back period only.
Sustaining capital expenditures are included in the cash flow projections at a level which allows for the overhaul of plant and equipment on an as-required basis. Additional capital expenditure to be incurred in the expansion from 12,000 t/d to 18,000 t/d has been estimated at USD 11.2 million and is provided for in the cash flow model. The costs of rehabilitation and mine closure bonding have also been included in sustaining capital.
A summary of the base case life-of-mine statistics is provided in Table 1.4. Annual cash flows for the base case are summarized in Table 1.5. The base case cash flow profile is presented graphically in Figure 1.7. The calculated NPV and cumulative DCF exclude sunk costs, but sunk costs are included in the cumulative undiscounted cash flow.
It will be seen that, for the base case, the net present value of the project cash flow at a discount rate of 8%/y (NPV8) evaluates to approximately USD 216.8 million before tax and USD 163.1 million after tax. Since capital costs have been treated as sunk, no internal rate of return can be calculated. The average cash cost of production equates to USD 489.05/oz gold, or USD 7.88/t treated.
Table 1.4
Summary Life-of-Mine Statistics
| | Life-of-Mine Cash Flow
(US$ millions) | Life-of-Mine Averages |
| Undiscounted | NPV at 8.0% | Unit Cost | Margin | USD/oz |
| US$/t | % | Gold |
| Net Revenue | 537.6 | 438.5 | 16.13 | 100.0% | 1,001.54 |
| | | | | | |
| Mining costs | 159.8 | 132.3 | 4.79 | 29.7% | 297.68 |
| Crushing costs | 49.0 | 40.1 | 1.47 | 9.1% | 91.36 |
| Leach costs | 32.4 | 26.6 | 0.97 | 6.0% | 60.37 |
| ADR costs | 8.2 | 6.7 | 0.25 | 1.5% | 15.22 |
| Metallurgy and Lab costs | 2.4 | 2.0 | 0.07 | 0.5% | 4.53 |
| General & Admin costs | 10.7 | 8.7 | 0.32 | 2.0% | 19.88 |
| Total cash operating cost | 262.5 | 216.3 | 7.88 | 48.8% | 489.05 |
| | | | | | |
| Cash operating margin | 275.1 | 222.1 | 8.25 | 51.2% | 512.48 |
| | | | | | |
| Capital Expenditure | 1.5 | 5.4 | 0.04 | 0.3% | 2.71 |
| | | | | | |
| Net Cash Flow (before tax) | 273.6 | 216.8 | 8.21 | 50.9% | 509.78 |
| | | | | | |
| Taxation | 66.5 | 53.7 | 2.00 | 12.4% | 123.94 |
| | | | | | |
| Net Cash Flow (after tax) | 207.1 | 163.1 | 6.21 | 38.5% | 385.84 |
16
Table 1.5
Project Base Case Annual Cash Flows
| | USD 000 | 2011 | 2012 | 2013 | 2014 | 2015 | 2016 | LOM total |
| Revenue | Gross Sales | 94,272 | 103,502 | 103,042 | 103,913 | 86,217 | 48,744 | 539,689 |
| | Bullion delivery | 274 | 305 | 278 | 280 | 236 | 124 | 1,497 |
| | Bullion refining | 112 | 123 | 120 | 121 | 101 | 52 | 629 |
| | Net Sales Revenue | 93,885 | 103,074 | 102,644 | 103,513 | 85,880 | 48,567 | 537,564 |
| | | | | | | | | |
| Cash Op. Costs | Mining costs | 35,528 | 33,279 | 29,418 | 24,260 | 23,722 | 13,572 | 159,779 |
| | Crushing costs | 8,525 | 9,455 | 9,454 | 9,454 | 9,439 | 2,709 | 49,036 |
| | Leach costs | 5,666 | 6,340 | 6,340 | 6,340 | 6,337 | 1,380 | 32,405 |
| | ADR costs | 1,442 | 1,576 | 1,576 | 1,576 | 1,570 | 428 | 8,168 |
| | Metallurgy & Lab costs | 441 | 451 | 451 | 451 | 446 | 193 | 2,434 |
| | G&A costs | 1,923 | 1,997 | 1,997 | 1,997 | 1,977 | 781 | 10,672 |
| | Total Cash Operating Costs | 53,526 | 53,098 | 49,236 | 44,077 | 43,491 | 19,065 | 262,494 |
| | | | | | | | | |
| Net Cash Operating Margin (EBITDA) | 40,359 | 49,975 | 53,408 | 59,435 | 42,389 | 29,502 | 275,070 |
| | | | | | | | | |
| Capital | Initial/expansion capital | - | - | - | - | - | - | - |
| | Sustaining capital | 6,143 | 690 | 2,729 | 393 | 302 | 302 | 10,559 |
| | Changes in working capital | 5,915 | 1,013 | -375 | -321 | -2,247 | -13,090 | -9,107 |
| | | | | | | | | |
| Net cash flow before tax | 28,302 | 48,273 | 51,055 | 59,363 | 44,335 | 42,291 | 273,618 |
| Taxation payable | 9,082 | 12,706 | 13,195 | 14,370 | 9,512 | 7,658 | 66,523 |
| Net cash flow after tax | 19,220 | 35,567 | 37,859 | 44,993 | 34,823 | 34,633 | 207,095 |
| | | | | | | | | |
| Discounted Cash Flow (8 %/y) Pre-Tax | 27,234 | 43,010 | 42,119 | 45,345 | 31,357 | 27,696 | 216,760 |
| Cumulative DCF (8 %/y) Pre-tax | 27,234 | 70,243 | 112,362 | 157,707 | 189,064 | 216,760 | |
| | | | | | | | | |
| Discounted Cash Flow (8 %/y) After tax | 18,494 | 31,689 | 31,233 | 34,369 | 24,630 | 22,681 | 163,096 |
| Cumulative DCF (8 %/y) After tax | 18,494 | 50,183 | 81,416 | 115,785 | 140,415 | 163,096 | |
17
Figure 1.7
Cash Flow Projection
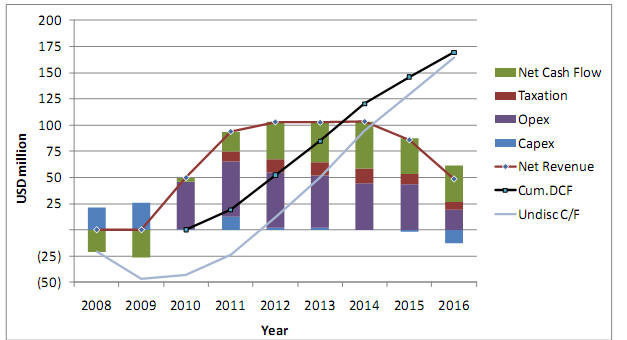
Note: In this chart, cumulative undiscounted cash flow includes sunk capital, whereas cumulative discounted cash flow (DCF) does not.
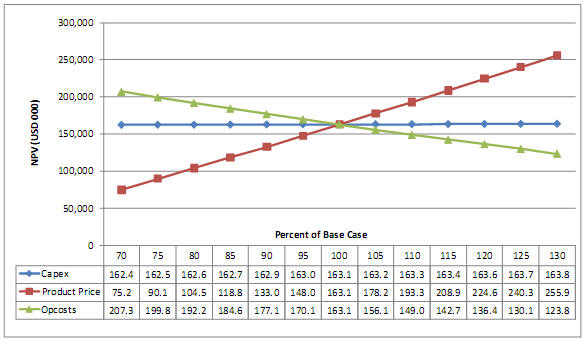
1.11 SENSITIVITY STUDY
Sensitivity of the NPV8 to changes in gold price, operating and capital costs has been analyzed (Figure 1.8) . Project revenues are directly proportional to process recovery and grade, and hence gold price may also be used as a proxy in this model for changes in both recovery and reserve grade as revenue drivers.
The sensitivity results show that, as expected, the project is most sensitive to the revenue drivers described above. However, even with an adverse change of 30% (i.e., a reduction in price to USD 700/oz), NPV8 remains strongly positive; economic break-even occurs with a gold price of around USD 510/oz. At the time of writing, the spot gold price was in excess of USD 1,300/oz, at which price NPV8 is estimated at approximately USD 256 million.
The project is also moderately sensitive to operating costs, with a 30% adverse change sufficient to reduce NPV8 by approximately USD 40 million. With the bulk of project capital costs already sunk, however, sensitivity to capital expenditure is negligible.
18
Figure 1.8
Sensitivity of NPV8 to Prices, Operating and Capital Costs
Micon selected a discount rate of 8% as representing an expected cost of capital for the project in its base case. Sensitivity of the project NPV has been determined for a range of discount rates from 5% to 10%, as shown in Table 1.6.
Table 1.6
Sensitivity of NPV to Discount Rate
| Discount Rate | NPV before tax
(US$ 000) | NPV after tax
(US$ 000) |
| 5% | 235,655 | 177,696 |
| 6% | 229,070 | 172,605 |
| 7% | 222,778 | 167,743 |
| 8% | 216,760 | 163,096 |
| 9% | 211,003 | 158,651 |
| 10% | 205,491 | 154,399 |
Sensitivity of the project NPV8 has also been determined for a specified range of gold prices, as shown in Table 1.7.
19
Table 1.7
Sensitivity of NPV to Gold Price
Gold Price
US$/oz | NPV before tax
(US$ 000) | NPV after tax
(US$ 000) |
| 600 | 40,309 | 39,764 |
| 700 | 84,422 | 75,151 |
| 800 | 128,535 | 104,487 |
| 900 | 172,648 | 132,981 |
| 1,000 | 216,760 | 163,096 |
| 1,100 | 260,873 | 193,292 |
| 1,200 | 304,986 | 224,666 |
| 1,300 | 349,099 | 256,040 |
| 1,400 | 393,211 | 287,415 |
1.12 �� CONCLUSIONS AND RECOMMENDATIONS
Micon has reviewed the proposed exploration program for the San Francisco property and, in light of the observations made in this report, supports the concepts as outlined by TMM/Timmins. Given the prospective nature of the property, it is Micon’s opinion that the San Francisco project and property merit further exploration and that TMM/Timmins’ proposed exploration plans are properly conceived and justified.
Micon agrees with the general direction of TMM/Timmins’ exploration and development program for the property and makes the following additional recommendations:
| | 1) | Micon recommends that TMM/Timmins reviews its criteria for the classification of resources in the areas outside of the existing pit limits. |
| | | |
| | 2) | Micon recommends that TMM/Timmins proceeds with its economic studies to increase the crushing capacity at the San Francisco project. |
| | | |
| | 3) | Micon recommends that Timmins has an independent consultant review the laboratory operations and procedures in order to improve the quality of its results. |
Given the known extent of mineralization on the property, compared to the amount of mining activity, the San Francisco project has the potential to host further deposits or lenses of gold mineralization, similar in character and grade to those exploited in the past, outside the present resource base.
Additionally, Micon has reviewed TMM/Timmins’ operational plans for the San Francisco mine and believes that the mine plan and operational parameters have been well thought out. It is Micon’s opinion that the San Francisco mine is a well-run operation. Micon supports the further economic studies to determine the impact of increasing the crusher throughput to 18,000 t/d.
20
2.0 INTRODUCTION AND TERMS OF REFERENCE
At the request of Mr. Arturo Bonillas, President and Mr. Bruce Bragagnolo, CEO of Timmins Gold Corp. (TSX-V:TMM) (TMM), Micon International Limited (Micon) has been retained to provide an audit of the current internal resource and reserve estimates and an update to its previous 2008/2009 preliminary feasibility study for the San Francisco gold project located in the state of Sonora, Mexico. The previous Micon Technical Report was entitled “NI 43-101 F1 Technical Report on the Preliminary Feasibility Study for the San Francisco Gold Project, Sonora, Mexico” dated March 31, 2008 and amended January 13,2009.
At the request of the British Columbia Securities Commission (BCSC) the certificates in this report were amended on August 3, 2011.
TMM advises that it holds its interest in the San Francisco property through its wholly-owned Mexican subsidiary Timmins Goldcorp Mexico, S.A. de C.V. (Timmins) which holds two mining concessions, three exploration concessions, and seven exploitation concessions through a wholly-owned subsidiary, Molimentales del Noroeste de S.A. de C.V. (Molimentales).
In this Technical Report, TMM and its subsidiary Timmins are used interchangeably and for the purposes of the report are considered to be one and the same.
The current study is based on the internal resource and reserve estimates and mine plan prepared in-house by Timmins and Molimentales personnel and their consultants. Micon has audited the resource and reserve estimates as well as conducting a review of the mine plan and its various components. The material in this report was derived from a number of sources in addition to the material provided by TMM/Timmins and these sources are noted in Section 21 of this report. A site visit was conducted by Micon between August 3 and 6, 2010, during which the resources and reserves as well as various aspects of the operation and mine plan were discussed. The current and future exploration programs were discussed as well. The site visit included a tour through the open pit, leach pad, crushing circuit and the process plant.
The qualified persons responsible for the preparation of this report are Mr.William J. Lewis, B.Sc., P.Geo., Ing. Alan J. San Martin, MAusIMM., Mr. Mani Verma, P.Eng., Mr. Christopher A. Jacobs, CEng., MIMMM, and Mr. Richard M./ Gowans, P.Eng.
Messrs. Verma and Lewis conducted the August, 2010 site visit. Messrs. Jacobs, San Martin, Gowans conducted their desk top reviews in Toronto based on the information provided to them by TMM/Timmins.
Mr. Lewis, a Senior Geologist with Micon, is responsible for the independent summary and review of the exploration on the San Francisco project, the comments on the propriety of Timmins’ exploration drilling program, the plans and budget for the next phase of exploration and the review of Timmins Quality Assurance/Quality Control (QA/QC) program at the mine site. Mr. Lewis and Mr. San Martin, a Mineral Resource Modeller with Micon, conducted the review and audit of the resource estimate.
21
Mr Verma, an Associate Mining Engineer with Micon, is responsible for the review of the mine plan, production scheduling, operations and the terms of the existing mining contract and related cost estimates. Mr. Jacobs, a Vice President and Senior Mineral Economist with Micon, has reviewed the capital and operating cost estimates for the project and compiled the discounted cash flow analysis and sensitivity studies used to evaluate project economics. Mr. Gowans, President and Principal Metallurgist of Micon, reviewed the metallurgical aspect of the San Francisco project.
All currency amounts are stated in US dollars (USD) or Mexican pesos (MXN), as specified, with costs and commodity prices typically expressed in US dollars. Quantities are generally stated in metric units, the standard Canadian and international practice, including metric tons (tonnes, t) and kilograms (kg) for weight, kilometres (km) or metres (m) for distance, hectares (ha) for area, grams (g) and grams per metric tonne (g/t) for gold and silver grades (g/t Au, g/t Ag). Wherever applicable, imperial units have been converted to Système International d’Unités (SI) units for reporting consistency. Precious metal grades may be expressed in parts per million (ppm) or parts per billion (ppb) and their quantities may also be reported in troy ounces (ounces, oz), a common practice in the mining industry. A list of abbreviations is provided in Table 2.1. Appendix 1 contains a glossary of mining and other related terms.
The review of the San Francisco project was based on published material researched by Micon, as well as data, professional opinions and unpublished material submitted by the professional staff of TMM/Timmins or its consultants. Much of these data came from reports prepared and provided by TMM/Timmins.
Micon does not have nor has it previously had any material interest in TMM, Timmins or related entities or interests. The relationship with TMM and Timmins is solely a professional association between the client and the independent consultant. This report is prepared in return for fees based upon agreed commercial rates and the payment of these fees is in no way contingent on the results of this report.
This report includes technical information which requires subsequent calculations or estimates to derive sub-totals, totals and weighted averages. Such calculations or estimations inherently involve a degree of rounding and consequently introduce a margin of error. Where these occur, Micon does not consider them to be material.
22
Table 2.1
List of Abbreviations
| Name | Abbreviation | Name | Abbreviation |
| Accurassay Laboratories | Accurassay | Metre(s) | m |
| Acme Analytical Laboratories Ltd. | ACME | Mexican peso | MXN |
| Adsorption/desorption/reactivation | ADR | Micon International Limited | Micon |
| ALS Chemex Laboratories | ALS Chemex | Million (eg Million tonnes, Million ounces, Million years) | M (Mt, Moz, Ma) |
| Canadian Institute of Mining, Metallurgy and Petroleum | CIM | Milligram(s) | mg |
| Canadian National Instrument 43-101 | NI 43-101 | Millimetre(s) | mm |
| Centimetre(s) | Cm | Molimentales del Noroeste de S.A. de C.V. | Molimentales |
| Compania Fresnillo S.A. de C.V. | Fresnillo | North American Datum | NAD |
| Defiance Mining Corporation | Defiance | Net present value, at discount rate of 8%/y | NPV, NPV8 |
| Degree(s), Degrees Celsius | o ,o C | Net smelter return | NSR |
| Digital elevation model | DEM | Not available/applicable | n.a. |
| Dirección General de Minas | DGM | Ounces (troy)/ounces per year | oz, oz/y |
| Discounted cash flow | DCF | Parts per billion, part per million | ppb, ppm |
| Diversified Drilling, S.A. de C.V. | Diversified | Percent(age) | % |
| Explotaciones Mineras Del Noroeste S.A. de C.V. | Explotaciones Mineras | Quality Assurance/Quality Control | QA/QC |
| Geomaque de Mexico, S.A. de C.V. | Geomaque de Mexico | Run of mine | ROM |
| Geomaque Explorations Inc. | Geomaque | Servicios Industriales Peñoles, S.A. de C.V. | Peñoles |
| Golder Associates Ltd. | Golder Associates | SGS Mineral Services | SGS |
| Grams per metric tonne | g/t | Sol & Adobe Ingenieros Asociados S.A. de C.V. | Sol & Adobe. |
| Hectare(s) | Ha | Specific gravity | SG |
| Inch(es) | In | Square kilometre(s) | km2 |
| Independent Mining Consultants, Inc. | IMC | Three-dimensional | 3-D |
| Inductively Coupled Plasma – Emission Spectrometry | ICP-ES | Timmins Gold Corp. | TMM |
| Internal diameter | ID | Timmins Goldcorp Mexico, S.A. de C.V. | Timmins |
| Internal rate of return | IRR | Tonne (metric)/tonnes per day | t, t/d |
| Impuesto al Valor Agregado (or VAT) | IVA | Tonne-kilometre | t-km |
| Kappes, Cassiday and Associates | Kappes Cassiday | Tonnes per cubic metre | t/m3 |
| Kilogram(s) | Kg | TSL Laboratories Inc. | TSL |
| Kilometre(s) | Km | United States Dollar(s) | USD |
| Life of mine | LOM | Universal Transverse Mercator | UTM |
| Litre(s) | L | Value Added Tax or Impuesto al Valor Agregado | VAT or IVA |
| McCelland Laboratories Inc. | McCelland | Year | y |
| METCON Research Inc. | METCON | | |
23
3.0 RELIANCE ON OTHER EXPERTS
Micon has reviewed and analyzed data provided by TMM/Timmins, its consultants and the previous operator of the project, and has drawn its own conclusions therefrom, augmented by its direct field examination. Micon has not carried out any independent exploration work, drilled any holes or carried out an extensive program of sampling and assaying on the property. However, previous sampling (Lewis, 2006) was conducted to independently substantiate the mineralization at the San Francisco project and further samples were not obtained during the 2006, 2007, 2010 site visits.
Micon has reviewed and audited the work conducted on the resource and reserve estimates, the mine plan and other material related to the operating San Francisco mine which was supplied by TMM and Timmins.
While exercising all reasonable diligence in checking, confirming and testing it, Micon has relied upon Timmins’ presentation of the project data, including data from the previous operator, in formulating its opinion with respect to the San Francisco property.
The English translations for the various agreements under which TMM and its wholly-owned Mexican subsidiary, Timmins, hold title to the mineral concessions for this project have been previously reviewed by Micon. Micon, however, offers no legal opinion as to the validity of the mineral title claimed. A description of the property, and ownership thereof, is provided for general information purposes only. A legal opinion regarding the mineral concessions was provided to Micon by Timmins in conjunction with the publication of the previous Technical Report. Micon has continued to rely on this expert opinion as Timmins validation regarding title to the mineral concessions. The legal opinion regarding the mineral title was undertaken by Roberto Herrera Piñon, a mining lawyer and master in corporate law, located in Hermosillo, Mexico. The legal opinion regarding the mineral concessions was dated April 26, 2007.
Micon has relied also upon a legal opinion dated April 25, 2007 and prepared by Francisco Manuel Cordova Celaya, Dr. En Derecho regarding the transfer of the San Francisco project to Molimentales and Timmins. The legal opinion was prepared and executed in Hermosillo, Mexico.
The existing environmental conditions, liabilities and remediation have been described where required by NI 43-101 regulations. However, these statements are provided for information purposes only and Micon offers no opinion in this regard.
24
The descriptions of geology, mineralization and exploration used in this report are taken from reports prepared by various companies or their contracted consultants, as well as from various government and academic publications. The conclusions of this report rely in part on data available in published and unpublished reports supplied by the companies which have conducted the exploration on the property, and information supplied by Timmins. The information provided to Timmins was supplied by reputable companies and Micon has no reason to doubt its validity.
Micon is pleased to acknowledge the helpful cooperation of Timmins management and consulting field staff, all of whom made any and all data requested available and responded openly and helpfully to all questions, queries and requests for material.
Some of the figures and tables for this report were reproduced or derived from historical reports written on the property by various individuals and/or supplied to Micon by TMM and Timmins. Most of the photographs were taken by the authors of this report during their respective site visits. In the cases where photographs, figures or tables were supplied by other individuals or TMM and Timmins they are referenced below the inserted item.
25
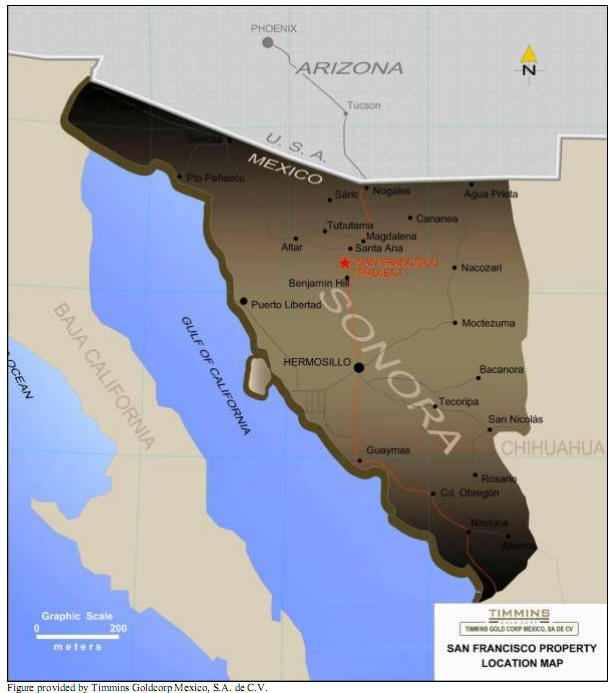
4.0 PROPERTY DESCRIPTION AND LOCATION
Timmins’ San Francisco property is located in the north central portion of the Mexican state of Sonora, which borders on the American state of Arizona, and is approximately 150 km north of the city of Hermosillo, the capital of Sonora. The latitude and longitude for the project site are approximately 30°21’13” N, 111°06’52” W. The UTM coordinates are 3,357,802 N, 489,017 E and the datum used was NAD 27 Mexico. The project is located 2 km west of the town of Estación Llano (Estación) and is accessed via Mexican State Highway 15 (Pan American highway) from Hermosillo.
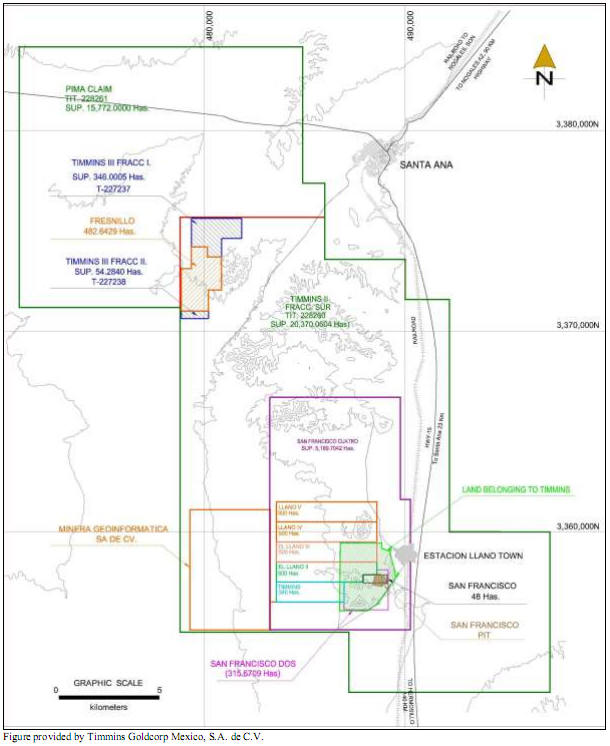
The term San Francisco project refers to the area related to the exploitation concessions optioned by TMM, while the term San Francisco property refers to the entire land package (mineral exploitation and exploration concessions) optioned and owned by TMM. The location of the San Francisco property is shown in Figure 4.1.
The exploration program carried out by Timmins during the last three years (2008 to 2010) has been focused primarily on exploring the extension, both along strike and in the dip direction, of the mineralization related to the San Francisco gold deposit. Secondary exploration programs have been undertaken at the La Chicharra gold deposit located 2 km west of the San Francisco pit. The exploration programs have been accelerated on the targets located to the north of the San Francisco project, including a short drill exploration program to confirm the presence of gold and favourable lithology. The results have proven to be favourable and further exploration is planned over the next two years on these targets.
TMM advises that it holds the San Francisco property, which consists of 12 mining concessions, through its wholly-owned Mexican subsidiary. All the concessions are contiguous and each varies in size for a total property area of 43,432.72 hectares (ha). In late 2005, the original Timmins II concession was subdivided into two concessions (Timmins II Fraccion Sur and Pima) as part of separate exploration strategies for the original Timmins II concession. All concessions are subject to a bi-annual fee and the filing of reports in May of each year covering the work accomplished on the property between January and December of the preceding year.
The information for the twelve concessions is summarized in Table 4.1. A map of the mineral concessions for the San Francisco property is provided in Figure 4.2.
Timmins advises that it acquired the first seven concessions shown in Table 4.1, covering the San Francisco mine, through its purchase of Molimentales in April, 2007.
26
Figure 4.1
San Francisco Project Location Map
27
Table 4.1
San Francisco Project, Summary of Mineral Concessions
| Mineral Concession Name | Title Number | Owner | Location (UTM Nad 27 Mex) | Mineral Concession Type3 | Area (hectares) | Location Date | Expiry Date3 | Bi-Annual Fee (USD)4 |
| San Francisco | 198971 | Molimentales del Noroeste, S.A de C.V. | 488,675.174 E 3,359,396.801 N | Mining Concession | 48.0000 | Nov 13, 1993 | Feb. 10, 2044 | 450 |
| San Francisco Dos | 209618 | Molimentales del Noroeste, S.A de C.V. | 488,675.174 E 3,359,396.801 N | Mining Concession | 315.6709 | Dec 4, 1996 | Aug. 2, 2049 | 2,810 |
| San Francisco Cuatro | 219301 | Molimentales del Noroeste, S.A de C.V. | 488,675.174 E 3,359,396.801 N | Mining Concession | 5,189.7041 | Aug 18, 2000 | Feb. 25, 2053 | 13,128 |
| Llano II | 197203 | Molimentales del Noroeste, S.A. de C.V. | 483,652.702 E 3,356,290.081 N | Mining Concession | 500.0000 | Oct 23, 1986 | Aug. 18, 2043 | 4,450 |
| Llano III | 197202 | Molimentales del Noroeste, S.A de C.V. | 483,652.702 E 3,356,290.081 N | Mining Concession | 500.0000 | Oct 23, 1986 | Aug. 26, 2043 | 4.450 |
| Llano IV | 222787 | Molimentales del Noroeste, S.A. de C.V. | 488,675.174 E 3,359,396.801 N | Mining Concession | 500.0000 | May 17, 2004 | Aug 30, 2054 | 630 |
| Llano V | 222788 | Molimentales del Noroeste, S.A. de C.V. | 483,652.702 E 3,356,290.081 N | Mining Concession | 500.0000 | May 17, 2004 | Aug 30, 2054 | 630 |
| Timmins | 226519 | Timmins Goldcorp México, S.A. de C.V. | 488,675.174 E 3,359,396.801 N | Mining Concession | 337.0000 | Aug. 26, 2005 | Jan. 23, 2056 | 424 |
| Timmins III Fraccion 1 | 227237 | Timmins Goldcorp México, S.A. de C.V. | 481,529.246 E 3,371,837.280 N | Mining Concession | 346.0004 | Feb. 15, 2006 | May 25, 2056 | 436 |
| Timmins III Fraccion 2 | 227238 | Timmins Goldcorp México, S.A. de C.V. | 481,529.246 E 3,371,837.280 N | Mining Concession | 54.2835 | Feb. 15, 2006 | May 25, 2056 | 69 |
| Timmins II Fraccion Sur2 | 228260 | Timmins Goldcorp México, S.A. de C.V. | 488,675.174 E 3,359,396.801 N | Mining Concession | 20,370.0604 | Nov. 17, 2005 | Mar. 13, 2056 | 25,617 |
| Pima2 | 228261 | Timmins Goldcorp México, S.A. de C.V. | 486,058.775 E 3,375,493.728 N | Mining Concession | 15,772.0000 | Nov. 17, 2005 | Mar. 13, 2056 | 19,835 |
| Total: | - | - | - | - | 44,792.7193 | - | - | 72,929 |
Table provided by Timmins Goldcorp Mexico, S.A. de C.V.
Notes:
2 The Timmins II claim, originally staked with a surface of 39.403.0000 ha., was titled for the Direccion General de Minas (DGM), after survey works, with a surface of 36,142.0604 ha. In 2008, due to a change in exploration strategy, the Timmins II claim was divided into two claims, Timmins II Fraccion Sur and Pima.
3 In 2006 the mining law was modified and the distinction between exploitation concessions and exploration concessions was abolished. Therefore all concessions granted by the DGM as of 2006 are legally “mining concessions”. The amendment to the mining law also granted the new mining concessions for a term of 50 years which is the same length of time granted to the old exploitation concessions under the mining law before the amendment.
4 Fees are estimated in US dollars based on payments in 2010. Inflation and other factors are considered by the Mexican government each year.
28
Figure 4.2
San Francisco Property (Concessions) Map
29
In 2006, Timmins signed a temporary occupancy agreement with an agrarian community (Ejido) in Mexico called Los Chinos whereby Timmins was granted access privileges to 674 ha, the use of the Ejido’s roads, as well as being able to perform all exploration work on the area covered by the agreement. The agreement is for a period of 10 years with an option to extend the access beyond the 10-year period. As consideration for the ejido granting access to a portion of its land, Timmins paid it the sum of USD 30,000.
During August and September, 2009, Molimentales acquired the 800 hectares on which the San Francisco mine is currently located, by means of five purchase agreements covering every one of the Ejido Jesus Garcia Heroe de Nacozari’s five former parcels that altogether form the 800 ha. Timmins and/or Molimentales paid the former Ejido members, as consideration for the purchase and acquisition of the 5 parcels, the amount of USD 1 million.
Other parties control four mineral concessions which are contained within the area of the mineral concessions owned by Timmins but none of these concessions impacts the main area of the San Francisco project.
When the Mexican mining law was amended in 2006, all mineral concessions granted by the Dirección General de Minas (DGM) became simple mining concessions and there was no longer a distinction between mineral exploration or exploitation concessions. A second change to the mining law resulted in all mining concessions being granted for a period of 50 years, provided that the concessions remained in good standing. As part of the second change all former exploration concessions which were previously granted for a period of 6 years became eligible for the 50-year term.
For any concession to remain valid, the bi-annual fees must be paid and a report has to be filed during the month of May of each year which covers the work conducted during the preceding year (This report is commonly known in Mexico as “Comprobacion de Obras”). Concessions are extendable provided that the application is made within the five-year period prior to the expiry of the concession and the bi-annual fee and work requirements are in good standing. The bi-annual fee, payable to the Mexican government for Timmins to hold the group of contiguous mining concessions under exploitation or exploration is USD 72,929.
All mineral concessions must have their boundaries orientated astronomically north-south and east-west and the lengths of the sides must be one hundred metres or multiples thereof, except where these conditions cannot be satisfied because they border on other mineral concessions. The locations of the concessions are determined on the basis of a fixed point on the land, called the starting point, which is either linked to the perimeter of the concession or located thereupon. Prior to being granted a concession, the company must present a topographic survey to the DGM within 60 days of staking. Once this is completed the DGM will usually grant the concession. The starting point (white cairn on the hilltop) for one of the mineral concessions comprising the San Francisco project is shown in Figure 4.3.
30
Figure 4.3
View of the Starting Point for One of the Concessions on the San Francisco Property

Since the San Francisco project is located on a number of mining concessions upon which mining has previously been conducted, all exploration work continues to be covered by the environmental permitting already in place and no further notice is required to be given to any division of the Mexican government. The specific environmental permitting of the San Francisco mine site was obtained in December, 2007, via an environmental assessment, and it is valid for the duration of the seven mining concessions that comprise the mine, provided that Molimentales keeps the permitting in good standing. Water for any drilling programs at the San Francisco project is obtained from the on-site water wells.
Micon is unaware of any outstanding environmental liabilities attached to the San Francisco project and is unable to comment on any remediation which may have been undertaken by previous owners.
31
5.0 ACCESSIBILITY, CLIMATE, LOCAL RESOURCES, INFRASTRUCTURE AND PHYSIOGRAPHY
5.1 ACCESSIBILITY
The San Francisco property is readily accessible from Hermosillo, the state capital of Sonora, via Mexican State Highway 15 (Pan American Highway), north from Hermosillo for 150 km. The property is 120 km south of the United States/Mexico border city of Nogales, also on Highway 15. The San Francisco mine site is 2 km west of the town of Estación. The major population centre for the region is Magdalena de Kino (Magdalena) to the north with a population of over 50,000 inhabitants.
The mineral concessions are located approximately due west and north of Estación, with the closest accommodations located in Santa Ana, a small city located to the north on Highway 15.
5.2 LOCAL RESOURCES AND INFRASTRUCTURE
Timmins maintains guarded gates across the access road to the mine and immediate project area. Exploration can be conducted year round, with the desert monsoon season occurring between July and September. Materials needed to supply the mine are transported by either truck (utilizing Mexican State Highway 15) or by rail (utilizing the Ferrocarril del Pacifico railway), both of which pass through the community of Estación.
Timmins has been granted the temporary occupation of surface rights at the San Francisco mine by the DGM for the duration of the exploitation concessions. In the case of an exploration concession, the holder is granted temporary occupancy for creation of land easements needed to carry out exploration for the duration of the mineral concession. In order to commence mining, the holder of the concession is required to negotiate the surface rights with the legal holder of these rights or to acquire the surface rights through a temporary expropriation.
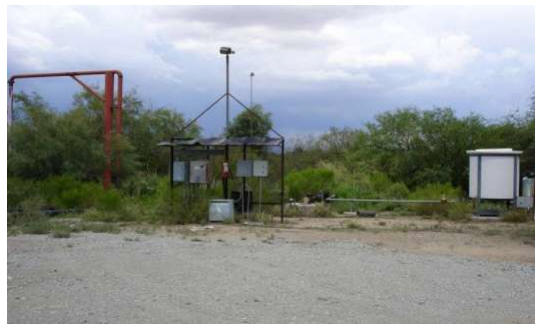
Water for the drilling programs is available from wells located on the mine site. The water table in the area of the mine is approximately 25 m below the surface. A typical water well is shown in Figure 5.1.
The surrounding cities and towns supply the majority of the workers, with the professional staff coming from other parts of Mexico.
The site consists of all the necessary infrastructure to maintain and operate the equipment and mine.
32
Figure 5.1
View of the Water Well Located on the San Francisco Project
5.3 CLIMATE AND PHYSIOGRAPHY
The project is located in the Arizona-Sonora desert in the northern portion of the Mexican state of Sonora. The climate at the project site ranges from semi-arid to arid. The average ambient temperature is 21°C, with minimum and maximum temperatures of -5ºC and 50ºC, respectively. The average rainfall for the area is 330 mm with an upper extreme of 880 mm.
The wet season or desert monsoon season is between July and September and heavy rainfall can hamper exploration at times.
The San Francisco property is situated within the southern Basin and Range physiographic province, which is characterized by elongate, northwest-trending ranges separated by wide alluvial valleys. San Francisco is located in a relatively flat area of the desert with the topography ranging between 700 and 750 m above sea level.
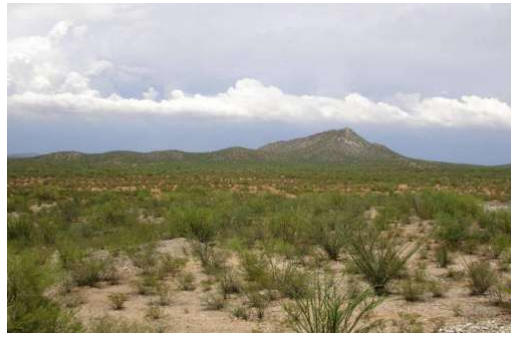
The desert vegetation surrounding the San Francisco mine is composed of low lying scrub, thickets and various types of cacti, with the vegetation type classified as Sarrocaulus Thicket. The state of Sonora is well known for its mining and cattle industries, although US manufacturing firms are starting to move into the larger centres as a result of the North American Free Trade Agreement (NAFTA). See Figure 5.2 for a view of the desert surrounding the San Francisco property.
33
Figure 5.2
View of the Sonora Desert Surrounding the Property
34
6.0 HISTORY
6.1 SAN FRANCISCO PROPERTY AND GOLD MINE
The San Francisco gold mine is a past producing heap leach operation which was in production originally between 1995 and 2002. However, during the last two years of operation, gold was being recovered from the leach pads only, with no mining being conducted from the San Francisco and La Chicharra open pits.
Placer mining and small scale underground mining began in the San Francisco mine area during the early 1940s. This limited work drew Fresnillo to the area in 1983. In 1985, three diamond drill holes and 30 conventional percussion drill holes were completed on the property. The results of these drill holes were encouraging enough to warrant drilling additional diamond drill holes during 1986. In 1987, 540 m of underground development was conducted, including a decline and a number of drifts and cross-cuts. The decline was completed to the 685 m elevation above sea level, where numerous 1.8 by 1.5 m drifts and cross-cuts were developed. Fresnillo drilled 10 diamond drill holes and 25 reverse circulation drill holes in 1988, and an additional 226 reverse circulation drill holes in 1989. In addition, metallurgical testing and an induced polarization survey were completed in 1989. In 1990 and 1991, Fresnillo completed an additional 108 reverse circulation drill holes. Fresnillo decided to sell the property in 1992, at which time it was acquired by Geomaque. See Figure 6.1 for an example of one of the rotary drill site locations southeast of the main pit. As part of the Geomaque purchase, Fresnillo retained a 3% NSR royalty and the option to re-acquire a 50% interest by paying Geomaque twice the amount which it had expended. Geomaque completed a feasibility study in 1993 and drilled a further 69 reverse circulation drill holes in 1994. Geomaque acquired the NSR royalty and option back from Fresnillo in 1995 for USD 4,700,000.
Geomaque conducted its activities in Mexico through its subsidiaries, Geomaque de Mexico, S.A. de C.V. (Geomaque de Mexico) and Mina San Francisco, S.A. de C.V. (Mina San Francisco).
Geomaque began construction of the San Francisco mine in 1995, with production beginning in late 1995. Production began at the rate of 3,000 t/d of ore or 30,000 oz/y of gold. However, as a result of the discovery of additional reserves, an expansion of the mining fleet, crushing system and gold recovery plant was undertaken in an effort to increase production to 10,000 t/d of ore. Due to the prevailing market conditions in February, 2000, Geomaque announced a revised mine plan whereby higher grade ore with a lower stripping ratio would be mined from the San Francisco pit and the La Chicharra deposit, which is located west of the San Francisco pit.
The San Francisco deposits consisted of the El Manto, the San Francisco, the En Medio and the El Polvorin deposits. All of these deposits were later incorporated into the main San Francisco pit. Another deposit, the La Chicharra zone, was mined during the last two years of production as a second pit.
35
Mining ended and the operation entered into a leach only mode in November, 2000. In May, 2002, the last gold pour was conducted, the plant was mothballed, and clean-up activities at the mine site began. See Figure 6.2 for a photographic overview of the San Francisco pit and leach pad taken from a hill to the southwest of the mine site prior to the current phase of production.
Figure 6.1
Location of One of the Rotary Drill Sites Located to Southeast of the Main Pit
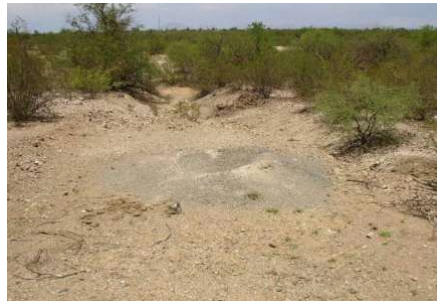
Figure 6.2
View of the San Francisco Gold Mine with Estación Llano in the Background

36
In 2001, to settle debts related to lease arrangements of construction equipment to Geomaque de Mexico, Butler Machinery Co. (Butler) accepted a payment of USD 500,000, the proceeds in excess of USD 500,000 on the sale of certain equipment from the San Francisco mine and a 1% net smelter return (NSR) royalty on any future gold production from the unmined resources in the main pit of the San Francisco mine. No present value was ascribed to the rights at the time of the agreement. Micon has been advised by Timmins that the agreement between Geomaque and Butler has ended and has received an opinion that the property was transferred to Molimentales free of any royalties. It is the opinion of Timmins solicitors that Timmins has free and clear title to the equipment on the property and no obligations to pay any NSR royalties.
Geomaque signed a Surface Rights Agreement with a group of rights holders (the Ejido Jesus Garcia Heroe De Nacozari (Ejido Jesus Garcia)). Based on a letter agreement dated July 7, 1999, the Ejido Jesus Garcia agreed to transfer to the company a surface area of 800 ha, for a total consideration of USD 1,000,000, of which USD 75,000 was due and payable on signing of the agreement. The letter agreement and its efficacy were the subject of litigation between Geomaque and the Ejido Jesus Garcia, whereby the company sought to have the agreement declared void, its deposit returned and other remedies, and the Ejido Jesus Garcia sought to have the agreement held effective and sought, inter alia, the payment of the balance of the purchase price and other relief.
In the summer of 2003, Geomaque sought and received shareholder approval to amalgamate the corporation under a new Canadian company, Defiance Mining Corporation (Defiance).
On November 24, 2003, Defiance sold its Mexican subsidiaries, Geomaque de Mexico and Mina San Francisco, to the Astiazaran family and their private Mexican company for a total consideration of USD 235,000. The Mexican subsidiaries held the San Francisco gold mine and the sale relieved Defiance of long-term liabilities totalling USD 1,900,000, including a USD 925,000 surface rights purchase obligation, approximately USD 760,000 in reclamation provisions and other payables totalling USD 263,000. The litigation of the surface rights between the Ejido Jesus Garcia and Geomaque de Mexico was settled in favour of Geomaque de Mexico on January 20, 2005. Geomaque de Mexico has been granted by the DGM the temporary occupation of surface rights at the San Francisco mine for the duration of the exploitation concessions.
Since June, 2006, the Astiazaran family and their company, Desarrollos Prodesa S.A. de C.V. (Prodesa) retained ownership of the waste dumps and the original leach pads, and have been extracting sand and gravel intermittently for use in highway construction and other construction projects. Timmins is continuing to negotiate the purchase of these heap leach piles and waste rock dumps. See Figure 6.3 for a view of the gravel extraction from the old leach pads at the San Francisco mine site.
37
Figure 6.3
Extraction of Gravel from the Leach Pad for Construction Use
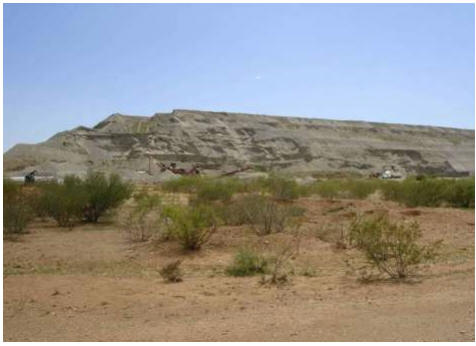
TMM was incorporated on March 17, 2005 under the Business Corporations Act of British Columbia. TMM originally acquired the exploitation concessions covering the San Francisco project through its wholly-owned Mexican subsidiary, Timmins, via an option agreement with Geomaque de Mexico on April 18, 2005. That option agreement was subsequently superseded by an acquisition agreement. Initially, Timmins had the option to earn a 50% interest in the exploitation concessions by spending USD 2,500,000 on exploration and development over a two-year period and, after Timmins had earned its interest, the property would be operated as a joint venture with Timmins as the operator.
In a press release dated March 19, 2007, TMM announced that it had agreed to increase its interest from 50% and had entered into an agreement to acquire a 100% interest in Molimentales, a company specifically formed to own 100% of the past producing San Francisco mine.
On October 29, 2007, TMM announced, in a press release, that it had paid the full and final USD 2.5 million to complete the acquisition of the San Francisco mine.
During August and September, 2005, Timmins conducted a drilling program comprised of 14 reverse circulation (RC) holes, based on the results of previous drilling conducted by both Fresnillo and Geomaque. The 2005 RC drilling program focused on confirming and exploring extensions of the gold mineralization to the northwest and southeast of the existing San Francisco pit. The results of the drilling program confirmed the extension of the gold mineralization to the northwest beyond the limits of the present pit and the presence of a higher grade gold zone. To the southeast, the 2005 drilling results did not confirm the previous drilling conducted by Geomaque, with only erratic values detected. However, drill hole TF-06 ended in 6.10 m averaging 2.817 g/t gold and this drill hole will be re-interpreted as part of a future exploration program focusing on reassessing the mineralization to the southeast.
38
In 2006, Timmins conducted an intensive exploration drill program which was based on the analysis of Geomaque’s drilling results, the 2005 Timmins drill results and the geological, geochemical data and a structural re-interpretation of the gold mineralization controls within the known deposit. The drilling program consisted of 28 reverse circulation and 28 diamond drill holes within three general target areas. The first area covered by the drilling program was the immediate area north and northwest of the existing San Francisco pit, with a particular emphasis placed on drilling in the area covered by the former crusher. The second area covered by the 2006 drilling program was located to the north and south of the La Chicharra pit. The La Chicharra pit was the second pit mined by Geomaque at the project site and is located west of the San Francisco pit on the other side of a small mountain. The third area covered by the drill program investigated places where direct observations by Timmins geologists and previous geological mapping indicated favourable lithology, hydrothermal alteration and geochemical results for the continuation of the mineralization. The details of the 2006 exploration program and its results were discussed in a February, 2007, Technical Report entitled “NI 43-101 Technical Report and Resource Estimate for the San Francisco Gold Property, Estación Llano, Sonora, Mexico.” This report was filed on the SEDAR website on February 27, 2007 by TMM.
Timmins subsequently conducted a follow-up drilling program in 2007. Details of the 2007 exploration program were outlined in a November, 2007 TMM press release. Although, the results of the Timmins exploration program are commented on in Sections 10 and 11 of this report, the results of the 2007 exploration program have not been reviewed by Micon and only the details mentioned in the press release are included in this report.
6.2 RESOURCE ESTIMATES, HISTORICAL AND RECENT
A discussion regarding the historical mineral resource estimate was contained in a December 20, 2005 Technical Report entitled “Technical Report on the San Francisco Mine property, Estación Llano, Sonora, Mexico.” The Technical Report was posted to the SEDAR website on April 28, 2006.
The historical resource estimate for the San Francisco mine was superseded by the January, 2007, updated resource estimate by Independent Mining Consultants, Inc. (IMC). In 2006, IMC was asked by Timmins to update/develop a resource block model and to estimate the mineral resources for the San Francisco mine using the historical Geomaque data, along with the results of Timmins’ 2005 and 2006 exploration drilling programs. The resource estimate for the San Francisco mine was completed by IMC in January, 2007.
The resource estimate by IMC was compliant with the current CIM standards and definitions required by NI 43-101 and was therefore reportable as a mineral resource by TMM.
39
There are no known resource estimates for any of the other portions of the San Francisco property.
The current August 31, 2010 mineral resource estimate supersedes the previous IMC, 2007, estimate. The details of the August, 2010 resource estimate are discussed in Section 17 of this report.
6.3 PRODUCTION FROM THE SAN FRANCISCO PROJECT
6.3.1 Historical Production
Historical production occurred at the San Francisco gold mine between 1996 and 2002. Production was conducted using open pit mining methods with gold recovered by heap leaching. During its production phase the San Francisco mine extracted 13,490,184 t at a grade of 1.13 g/t gold for a total of 488,680 contained ounces of gold (Table 6.1) . A total of 300,281 oz gold and 96,149 oz of silver were recovered, with the gold recovery estimated to be 61.4% ..
Table 6.1
San Francisco Project, Geomaque Annual Production 1996 to 2000
| Year | Dry Crush on
Pads (t) | Grade (g/t) | Ounces on Pad | Gold/Silver
Ounces Doré | Gold Ounces
Doré | Gold Recovered
(%) |
| 1996 | 1,735,550 | 1.32 | 73,655 | 46,787 | 36,127 | 49.0 |
| 1997 | 2,288,662 | 1.12 | 82,412 | 75,847 | 54,519 | 66.2 |
| 1998 | 3,074,902 | 1.05 | 103,803 | 86,940 | 58,808 | 56.7 |
| 1999 | 3,010,639 | 1.14 | 110,345 | 98,726 | 64,371 | 58.3 |
| 2000 | 3,380,431 | 1.09 | 118,465 | 104,953 | 69,100 | 58.3 |
| 2001 | | | | | 17,092 | |
| 2002 | | | | | 264 | |
| Total | 13,490,184 | 1.13 | 488,680 | | 300,281 | 61.4 |
Note: 301,893 tonnes of mineral and 975,900 tonnes of waste rock were mined in 1995.
Table taken from the 2006 San Francisco Scoping Study by Sol & Adobe Ingenieros Asociados S.A. de C.V.
Other mines or exploratory shafts within the district are El Durazno (gold/silver), El Aguaje (gold), El Jabali (manganese), La Jarra (gold), El Refugio (gold), Caracahui (copper/gold), Sonora Copper (copper/gold), Las Animas (gold/copper), La Colorada (gold), Libertad (gold) and the La Chicharra (placer gold). Production statistics for these mines or exploratory shafts are unavailable and in some cases there is very little published data on these workings.
6.3.2 Current Production
The San Francisco mine resumed commercial production in April, 2010. To the end of September, 2010, the mine had sold 26,999 ounces of gold.
40
7.0 GEOLOGICAL SETTING
7.1 REGIONAL GEOLOGY
The following descriptions of the regional geology were extracted from Prenn (1995).
“The San Francisco property is situated in a belt of metamorphic rocks that hosts numerous gold occurrences along the trace of the Mojave-Sonora megashear, which trends southeast from south-central California into Sonora. The megashear is a left-lateral transform fault which became active during the Jurassic period and exhibits up to 800 km of displacement. Deformation along the megashear occurred along with metamorphism (Calmus et al, 1992) and since the formation of the megashear the area has been subjected to both tectonic compressional and tensional forces.”
“The following description is extracted from Silberman (1992). The northwest-trending range-front faults and numerous low-angle shear zones related to thrust or detachment faults are the most common structures. The Mojave-Sonora megashear as defined by Silver and Anderson (1974) is a regional northwest-trending feature. It separates the Precambrian basement rocks of slightly differing ages. The Jurassic rocks which occupy the zone are strongly deformed along low-angle thrust faults and the associated sedimentary rocks are tightly folded. The south-western boundary of the megashear appears to be a major fault that juxtaposes Precambrian basement rocks against the Jurassic magmatic terrane (Anderson and Silver, 1979). Up to 800 km of left lateral movement has been proposed for this shear after the Middle Jurassic period. Others (Jaques et al., 1989) have suggested that the megashear is a Cretaceous thrust front reactivated as a middle Tertiary detachment. The metamorphism in the area has been postulated to have occurred with the megashear or the magmatic activity of the Middle to Late Jurassic periods (Tosdal et al, 1989). However, others propose a close relationship between deformation and the closing of the marginal basin after its subduction below the volcanic arc, or the result of Late Cretaceous or Tertiary compression associated with uplift and low-grade metamorphism (De Jong et al, 1988). Calmus (1992) believes it is unquestionable that a Cretaceous-Tertiary (Larimide) tectonic event occurred but that it is superimposed upon older Nevada and Lower Cretaceous compressional and extensional phases. Many of the Sonoran gold deposits are located at or near the Mojave-Sonora megashear.”
The Basin and Range province which extends into Sonora, from the United States, is characterized by northwest-trending valleys and ranges. Paleozoic rocks, including quartzite and limestone, overlie the Precambrian locally. The valleys are covered and in-filled by recent gravels. See Figure 7.1 for the regional geology map of the San Francisco mine area and location of the San Francisco and La Chicharra pits.
7.2 PROPERTY GEOLOGY
The San Francisco property lies in a portion of Mojave-Sonora megashear belt characterized by the presence of Precambrian to Tertiary age rocks represented by different grades of deformation and metamorphism as evidenced in the field by imbricate tectonic laminates. The rocks principally involved in the process of deformation and associated with the gold mineralization in the region are of Precambrian, Jurassic and Cretaceous age.
41
Figure 7.1
Geology of the San Francisco Property
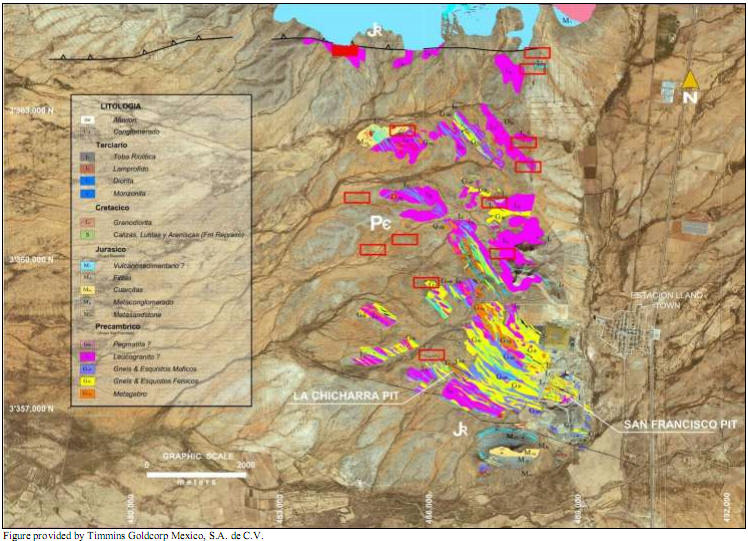
42
The oldest rocks within the property are a package of metamorphic rocks which include banded quartz-feldspathic gneiss and augen gneiss, green schist, amphibolite gneiss and some amphibolite and marble lenses (Calmus et al., 1992). All metamorphic rocks exhibit foliation which generally varies in strike direction from between 30° to 72° west and dips to the northeast from 24° to 68°. See Figure 7.2 for a geological map of the San Francisco mine site.
Figure 7.2
San Francisco Minesite Geology Map
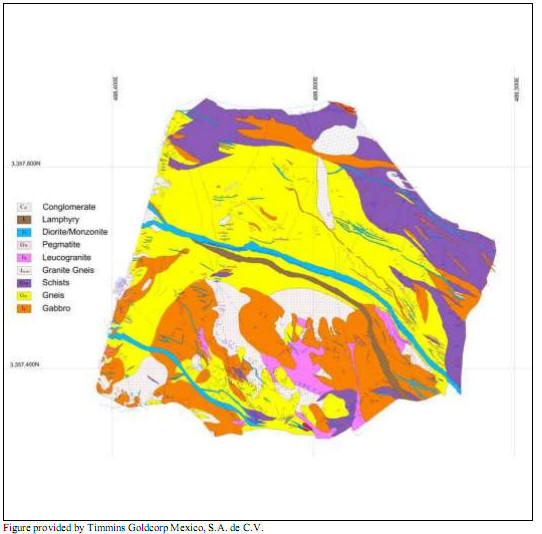
The metamorphic rocks are intruded by a Tertiary volcanic package, which includes leucocratic granite with visible feldspar and quartz, and is porphyritic to gneissic in texture.
43
It appears that the granite was emplaced along low angle northwest-southeast shear zones in the system which developed between an older gabbro and the metamorphic sequence. This is the reason that in some places the granite bodies appear as stratiform lenses that vary in width from centimetres to more than 40 m and are subparallel to the foliation. However, it is seen that the emplacement of leucocratic granite also favours the N30°W fault system, causing the granite to take an elongated form, principally in direction N60°W, but with extensions along of the N30°W system.
Besides the gabbro and the granite, dikes of different composition, including diorite, andesite, monzonite and lamprophyre, intrude the metamorphic sequence. In addition, lenses of pegmatite associated with the schist have been mapped, emplaced along the foliation planes, occasionally forming lenses within the gabbro and within the gneiss and on the border of the leucocratic granite bodies. All of the rocks described above form the San Francisco unit which is the most important unit for exploration, with the leucocratic granite especially significant because it is the primary host rock for gold mineralization.
Mapping of isolated outcrops and geological interpretation of the outcrops demonstrate that the San Francisco unit is extensive within the property, covering a surface area of approximately 100 km2. The unit hosts at least 15 gold occurrences which are considered to be favourable exploration targets, in addition to the known San Francisco and La Chicharra gold deposits.
In the north and south, the San Francisco unit is in contact with the Coyotillo unit which is a weakly metamorphosed package of sandstone, quartzite, phyllite, conglomerate, volcanics and limestones of Jurassic age.
The granitic gneiss containing the mineralization at the San Francisco project is intensely fractured with a total of five fracture sets having been identified, although there are only two primary sets. One of the primary sets strikes 36° to 60° east and dips northwest 70° to 90°, while the other strikes 64° to 73° west and dips northeast 46° to 66°. The regional fracture sets are generally parallel to major faults and perpendicular to foliation planes.
The main vein systems in the region strike 50° to 80° west with dips ranging from northeast to southwest. These vein systems are the San Francisco, La Playa, El Diez, La Chicharra, and several systems in the La Mexicana area, Area 1B and La Escondida. A secondary system of veins is the La Trinchera, Casa de Piedra, unnamed veins in portions of Area 1B and the La Mexicana veins which strike 60° to 80° east and dip northwest to southeast.Although the age relation between the two systems is unknown, it is believed that the northeast system is probably later stage.
The metamorphic foliation in the San Francisco deposit primarily strikes 78° west and dips to the northeast at 68°. Regionally the foliation is variable, generally ranging from east-west to 60° west with varying dips to the northest.
44
The original bedding is recognized in the metavolcanic-sedimentary rocks to the south at Cerro La Bajarita, and is variable with strikes ranging from 70° to 80° west and dips to the north. The sedimentary beds of the Represo Formation in the northern portion of the property strike 60° to 70° west and dip to the northeast.
Dykes of intermediate composition in the project area strike predominantly 63° west and dip to the northeast at 58°. Several dykes are intruded along planes of foliation, and others cut foliation of the metamorphic units. In the Sierra La Vetatierra mountains in the northern portion of the project, dykes strike 60° to the east, dip to the northwest, and represent a later system of fractures.
Metamorphic folds, including isoclinal, open symmetrical and kink folds, have been described, but no systematic description of folds has been found in the literature.
7.2.1 Geology of the La Chicharra Pit
The La Chicharra pit is located 2 km west of the San Francisco pit. Discovered by Geomaque in the late 1990’s, it is estimated that approximately 37,000 oz of gold were extracted and processed during Geomaque’s last year of operations.
The discovery of this deposit was the consequence of exploration programs comprised of magnetic ground surveys and soil geochemistry, using both conventional soil sampling and MMI techniques. In both cases, samples returned very high values for the main mineralized zone in an area of low magnetics. Trenches were excavated to conduct chip sampling which confirmed the presence of gold mineralization in the bedrock and drilling delineated a deposit with a resource of 60 to 70,000 oz of gold.
The geology of the La Chicharra deposit, although it is hosted in the San Francisco group, differs with the geology found in the San Francisco pit. While the geology consists of quartz-feldspar gneiss, pegmatite, schist, granite and gabbro, the mineralization is hosted principally in gabbro. The gabbro has a very sheared appearance, almost like a breccia, comprised of large fragments with lenses of pegmatite between the fragments. Due to the shearing process, the blocks of gabbro are very fractured and the fractures are filled with quartz veins and veinlets. The gold mineralization is hosted by the pegmatite lenses and in the veins and veinlets within the gabbro. The limits of the mineralized gabbro are very well delineated by the shear zones, at both the hangingwall and footwall. This geological control also allowed for better operational control during the exploitation by Geomaque.
The gabbro at La Chicharra is different from the gabbro bodies at the San Francisco mine, as it contains no magnetic minerals which are generally produced by the destruction of the original minerals contained within the gabbro during the tectonic and mineralization processes. As well, due to strong shearing, the minerals are oxidized. The gabbro is a tabular body dipping to the northeast at approximately 30 to 40° and striking approximately 60° west, with the mineralization potentially open both along strike and down dip.
45
Timmins completed a program of core drilling seeking the extension of mineralization down dip and along strike, and confirming continuity for the first 150 m from the northern limit of the pit, with the mineralization open in the northwest direction towards La Severiana.
Structurally, all of the metamorphic and igneous interpretation is based on the High Resolution Air Magnetics which indicate a regional lineament varying in direction from 60° to 30° to the west. The gold deposits are located in the southern portion on each side of this main lineament, and are related to the extension faulting of the system west-northwest and west-east. Other grassroots gold targets are located along this lineament, related to quartz veins with gold mineralization emplaced along the shear zones of the system to the west-northwest and west-east
Figure 7.3 is a view of the La Chicharra pit looking towards the southwest and showing the lineament.
Figure 7.3
La Chicharra Pit Looking Southwest showing the Lineament
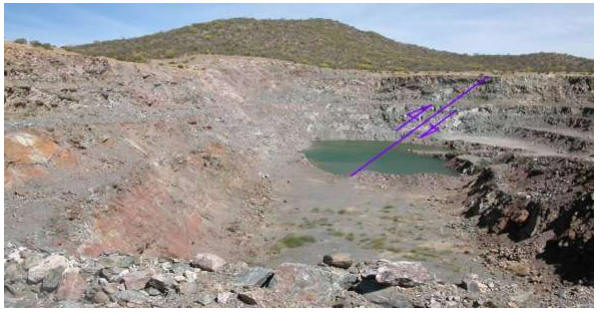
46
8.0 DEPOSIT TYPES
At the San Francisco project, Timmins is targeting large volume, low grade disseminated gold deposits contained within leucocratic granite, granite-gneiss, gneiss and schist horizons. Leucocratic granitic and gneiss are the main rocks hosting the gold mineralization.
The gold mineralization occurs in a series of west-northwest to east-northeast trending quartz-tourmaline veins and veinlets that lie sub-parallel to the local lithology and foliation trends, dipping to the southwest, within the more brittle rocks such as the leucocratic granite and more felsic lithologies within the Precambrian sequence. Extensive studies of the veins and alteration describe the mineralization as mesothermal/orogenic in style, but with a potential link to magmatic fluids and an intrusive source (Calmus et al., 1992; Luna and Gastelum, 1992; Perez Segura, 1992; Perezsegura et al., 1996; Perez Segura, 2008; Albinson, 1997; Poulsen and Mortensen, 2008).
47
9.0 MINERALIZATION
The San Francisco property is located within the Sierra Madre Occidental metallogenic province which extends along western Mexico from the state of Sonora, south to the state of Jalisco. In the state of Sonora, the most important metal produced in the Sierra Madre province is copper, with the Cananea porphyry copper deposit being the most well known. Gold and silver projects are next in importance and are hosted mainly in sedimentary rocks and brecciated volcanic domes.
At the San Francisco project, gold occurs principally as free gold and as electrum occasionally. Gold is found, in decreasing abundance, with goethite after pyrite, with pyrite and, to a much lesser extent, with quartz, galena and petzite (Ag3AuTe2). Although it is clear that the gold was deposited at the same time as the sulphides, the paragenetic relationships are not well understood. There is the possibility that some secondary remobilization may have occurred as evidenced by minor amounts of gold occurring in irregular forms along with or on top of drusy quartz (Prenn, 1995).
The gold occurs in a granitic gneiss and the presence of pyrite (or goethite after pyrite) may be an indication of gold. Stockwork quartz veinlets, some with tourmaline, also exist in the mineralized zone. However, the presence of quartz, even with tourmaline, is not necessarily an indication of the presence of gold. Quartz veinlets with tourmaline but without gold mineralization were found hundreds of metres away from the San Francisco deposit. Alvarez (in Prenn, 1995) suggested that some tourmaline was part of the mineralizing system, but could be distinguished from the tourmaline found elsewhere.
The relationship between the quartz and tourmaline at the project is not well understood, though at least one event is closely related to the gold mineralization. Calmus (1992) and Perez (1992) described the gold as being in quartz, acicular tourmaline, and albite veins and breccias. It was noted (Perez, 1992) that two types of tourmaline exist: schorl and dravite, but these are difficult to distinguish. There is some suggestion that a more greenish tourmaline is associated with the San Francisco zone while the black tourmaline (schorl) is generally barren of gold. If this can be verified, it could become a valuable exploration tool for the region. Horner (in Prenn, 1995) also noted the possibility of two or more types of tourmaline in the cobbles sampled in the stream beds. Horner believes that only one set of the tourmaline veins is associated with the gold and suggests that bismuth is also associated with one tourmaline quartz vein event.
Other metallic minerals associated with the deposit include trace to small amounts of chalcopyrite, galena, sphalerite, covelite, bornite, argentite-acanthite and pyrrhotite. Trace amounts of molybdenite and wulfenite have also been reported. Metal mineralization is low, with copper reaching into the hundreds of ppm, arsenic reaches about 100 ppm, and antimony is rarely over 10 ppm. Petzite was recognized but tellurium values rarely reached over 10 ppm. The mineral relationships, the possibility of associated tourmaline, and the style of mineralization suggests that the San Francisco deposit might be of mesothermal origin (see Prenn, 1995 for discussion). Others have suggested the same genesis based on these and other factors including fluid inclusion studies (in Prenn, 1995).
48
The San Francisco deposits are roughly tabular with multiple phases of gold mineralization. The deposits strike 60° west to 65° west, dip to the northeast, range in thickness from 4 to 50 m, extend over 1,500 m along strike and are open ended. The San Francisco deposits consisted of the El Manto, the San Francisco, the En Medio, and the El Polvorin deposits. All these deposits were later incorporated into the main San Francisco pit. The El Manto deposit (north pit), to the north of the San Francisco (main pit), is tabular, strikes 65° west, dips relatively shallowly to the northeast, and ranges in thickness from 5 to 35 m. The En Medio (in the main pit north of San Francisco) strikes 60° west, dips to the northeast and varies in thickness from 4 to 20 m. The El Polvorin (west pit) is a northwest extension of the San Francisco mineralization which strikes 65° west, dips moderately to the northeast and ranges in thickness from 4 to 20 m.
Alteration related to the mineralization consists of negligible to locally intense sericitization, course-grained pyritization, and rare local silicification. This alteration forms a halo extending a few metres from the mineral deposits, but may also be absent. Supergene alteration consisting of oxidation of pyrite to goethite is common. Additionally, there is supergene alteration of feldspar to kaolin and sericite.
Analysis by Geomaque of 110 samples in seven mineralized zones showed a silver/gold ratio of less than 1 to 10, with very low values of zinc, copper, molybdenum, bismuth, antimony and mercury. Lead is occasionally high, but not above 1%. Gold shows a good correlation locally with arsenic and lead. However, none of the other elements are good indicators for gold.
49
10.0 EXPLORATION
If available, a description of the historical exploration conducted on the San Francisco project is provided in Section 6.
10.1 DESCRIPTION OF EXPLORATION PROGRAMS 2005 TO 2007
The following is a brief description of the exploration work conducted by TMM/Timmins on the San Francisco property between 2005 and the third quarter of 2007.
TMM acquired the rights to explore the exploitation concession on April 18, 2005, upon signing of an option agreement between its Mexican subsidiary Timmins and Geomaque de Mexico. After a period of reviewing the available geological data previously compiled on the property, Timmins identified a number of exploration targets. A summary of the exploration targets in and around the existing San Francisco project, as well as the secondary targets on the property, was provided in the December, 2005, Technical Report entitled “Technical Report on the San Francisco Mine Property, Estación Llano, Sonora, Mexico.” This report was filed on the SEDAR website on April 28, 2006 by TMM.
TMM conducted its first exploration drilling program on the San Francisco project in August and September, 2005, with the results of the program being described in the December, 2005, Technical Report.
The drilling program conducted by Timmins from September to November, 2006 was based primarily on the results of the 2005 drilling program and the results of the historical drilling programs conducted by Geomaque and Fresnillo. The results of these earlier drilling programs indicated that there were areas to the north and northwest of the existing San Francisco pit and to the north of the La Chicharra pit where the mineralization appeared to continue beyond the former mining areas. Also, during its review of the geological mapping and geochemical sampling data, and after a re-interpretation of the structural controls for the mineralization, Timmins identified a number of favourable drill targets where there was either a gap in the earlier drilling data or where no drilling had been conducted.
The 2006 exploration drilling program and its results were discussed in a February, 2007, Technical Report which was filed on the SEDAR website on February 27, 2007 by TMM.
During 2007, Timmins conducted field work and exploration drilling to evaluate the extent of the gold mineralization in other zones on the property. This program was primarily concentrated to the north of the existing San Francisco pit limits and to the north of the La Chicharra pit. Forty holes totalling 4,838 m of core drilling were completed in this program which also included 1,327 m of condemnation drilling west of the original leach pads. In the previous “NI 43-101 F1 Technical Report on the Preliminary Feasibility Study for the San Francisco Gold Project, Sonora, Mexico” dated on March 31, 2008, a portion of this work was included, but not the conclusions and interpretation of the geophysical and geochemical survey. The next paragraphs discuss this material along with the exploration work conducted from 2008 to July, 2010.
50
10.2 EXPLORATION PROGRAMS 2008 TO 2010
Between 2008 and 2010, Timmins’ exploration programs focused on determining the drill priorities which best achieved its aim of increasing the mineral resources in and around the areas near the San Francisco and La Chicharra pits, in the area between the two pits and in geochemically anomalous areas along the projection of the San Francisco mineral trend to the northwest. As well, exploration targets to the north of the igneous-metamorphic package were investigated.
During the period from 2008 to the end of July, 2010, a total of 57,753 m in 613 drill holes were completed. Of this total, 48 holes totalling 3,723 m were exploration RAB type holes drilled in the area between the La Chicharra and San Francisco pits and 50 holes totalling 5,207 m were condemnation drilling in the area of the waste piles and new leach pads. Details of the drilling programs are outlined in Section 11 of this report.
For the exploration drilling and other programs conducted on the San Francisco property, during 2008, 2009 and up to June, 2010, Timmins has expended approximately USD 6.7 million. Table 10.1 summarizes the 2008, 2009 and 2010 exploration expenditures on the San Francisco property.
Table 10.1
Summary of the Exploration Expenditures for 2008, 2009 and up to June, 2010
(USD)
Description
| Year | Total (USD)
|
| 2008 | 2009 | 2010 (To July) |
| Geologist (salaries and consulting fees ) | 676,439 | 591,494 | 679,584 | 1,947,517 |
| Project management | 75,160 | - | - | 75,160 |
| Camp and accommodation | 36,133 | 35,488 | 23,016 | 94,637 |
| Exploration expenses and supplies | 118,102 | 96,127 | 245,692 | 459,921 |
| Drilling | 355,529 | 506,402 | 2,241,591 | 3,103,522 |
| Assaying | 82,766 | 16,038 | 232,310 | 331,114 |
| Geophysical surveying | 1,526 | - | 118 | 1,644 |
| Metallurgical testwork | 190 | - | - | 190 |
| Drafting, reporting, reproduction, maps | 4,545 | 4,296 | 15,938 | 24,779 |
| Telecomunications | 6,518 | 6,332 | 2,205 | 15,055 |
| Travel expenses | 99,747 | 33,904 | 10,599 | 144,250 |
| Vehicle rental | 11,936 | - | - | 11,936 |
| Other equipment rental | 13,459 | 13,983 | 98,432 | 125,874 |
| Office expenses | 3,616 | 8,052 | 74,023 | 85,691 |
| Mining taxes | 48,250 | 42,038 | 67,501 | 157,789 |
| Claim staking | 1,008 | 363 | - | 1,371 |
| Legal cost | 15,928 | - | - | 15,928 |
| Social security and labour related taxes | 46,705 | 35,927 | 19,946 | 102,578 |
| Miscellaneous | 1,188 | 1,310 | 6,935 | 9,433 |
| Total | 1,598,745 | 1,391,754 | 3,717,890 | 6,708,389 |
Table provided by Timmins Goldcorp Mexico, S.A. de C.V.
51
10.2.1 Geochemical Surveys
The geochemical survey results were not available for the March, 2008, report; they are discussed here for completeness in reporting the program results. In 2007 and early 2008, geochemical surveys were conducted over the area occupied by the package of igneous and metamorphic rocks within the concessions. A total of 222 chip samples and 2,697 soil samples were collected. The sampling covered an area of just over 60 km2 using a sampling grid of 100 m x 50 m, oriented 25° E. Most of the area is covered by alluvium and the presence of the igneous-metamorphic package has been interpreted and defined from isolated outcrops distributed in the area (80 km2).
The results confirmed the targets already identified from historical shallow underground workings developed by former miners along quartz veins containing high gold values. Extending sampling along the dominant structural trend allowed for new interpretations to identify possible conduits which could be feeder zones. The area covering the favourable lithologic unit between the San Francisco and La Chicharra pits was broadly sampled to identify further potential targets.
The configurations resulting from ordinary kriging performed with gold values for each case (soil and rock) are shown in Figures 10.1 and 10.2.
Figure 10.1
Soil Geochemical Sampling Configuration
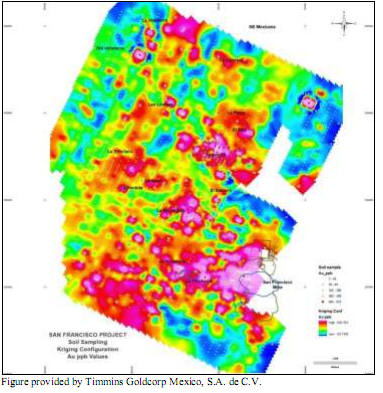
52
Figure 10.2
Chips Geochemical Sampling Configuration

10.2.2 Geophysics
10.2.2.1 Air Magnetic and Radiometric Survey
During May, 2007, Timmins contracted the Mexican Geological Service to survey 1,227 km of high resolution aeromagnetic lineaments and radiometry and acquired raw data for a further 1,569 km previously surveyed by the same institution which fully covered the surface of the property, over 40,000 hectares. The resolution of the data varies due to the flight height, which ranged between 75 and 100 m, with the lines spaced every 100 m. Information sets were given to Engineering Zonge in Tucson for processing and interpretation.
The conclusion of this study was the definition of the indicative structural lineaments of the tectonic sequence in northern Sonora. For the San Francisco project these lineaments should be correlated with geological and geochemical controls, combined with geological mapping and geochemistry, to identify the best exploration targets for gold and other types of mineralization, particularly in the northern portion of property where the metamorphic package hosts the El Durazno and La Pima mineral areas which are favourable for silver deposits and base metals in a replacement environment within the limestone rocks.
The study had a regional focus and a more detailed interpretation will be possible once a correlation with a specific target is identified.
53
The following is quoted for the most part from the Zonge report.
“The aeromagnetic data suggest a regional structural fabric with strong a) NW-SE and b) ENE-WSW trends. Magnetic lineaments have been interpreted using the various filtered magnetic maps, particularly the First Vertical Derivative map, in order to highlight these trends. Note that the term “magnetic lineament” as presented here refers to spatially correlated patterns such as strong gradients or changes in signal character which are likely correlated with geologic features such as faults, contacts, or other features where there are changes in magnetic susceptibility.
Figure 10.3 shows the lineament interpretation overlain on the RTP total magnetic intensity map. A strong linear feature can be seen trending SE to NW across the entire region. The feature appears to bound changes in structural fabric from the west to the east side. Major magnetic highs and mapped igneous outcrops are also aligned along this trend.
Figure 10.3
Interpretation of Lineaments on Basis of the Total Magnetic Field Data
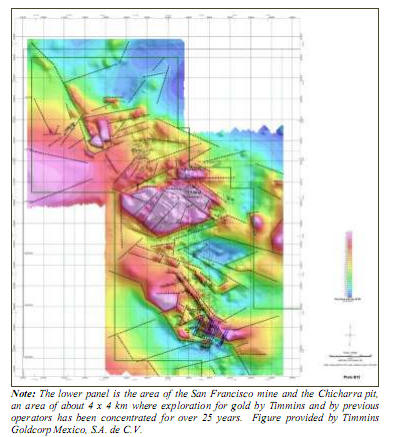
Most of the NW lineaments are concentrated within a few kilometre wide swath; the other prominent lineaments (ENE) are distributed more randomly across the region and generally appear truncated along the NW lineament. Also of note are the large, rhomboid-shaped magnetic lows that flank the NW trend especially in the south/south-central part of the map.
54
A very large magnetic high can be observed in the central part of the region which is probably related to a large igneous intrusion indicated by the topography and mapped geology. The feature is bounded by the regional NW trending lineament on its west side. The magnetic data show a similar feature about 10 km NW of this (in the SW corner of the Pima project area) that may be from a related, somewhat deeper (not outcropping), intrusive source body. If this is the case, then the offset is consistent with a regional right-lateral shear along the NW magnetic lineament.
Previous work (personal communication, Miguel Soto and others, Timmins Gold) has suggested NW striking thrust faults in the southern San Francisco and Pima survey areas. This is consistent with the regional geologic/tectonic setting. Laramide compressional tectonics were likely responsible for initial NW trending structures (thrust faults, folding), accompanied by igneous intrusion, alteration, and volcanism in back- and intra-arc settings. The system has since been overprinted by the current trans-tensional regime (post 40 Mya) which is characterized by NW trending right-lateral shear and associated extension in the Basin and Range tectonic province.
Figure 10.4 shows the regional total radiometric intensity. Recall that the radiometric intensity is only sensitive to the surface geology. The linear trending radiometric highs seen on the regional map may be related to surface sedimentation and drainage patterns. In general, more acidic (felsic) rock outcrops tend to be higher in total radiometric content than more mafic rocks. A radiometric high is observed in the central region where the large magnetic high is centered. Flanking this, and in the outcropping geology of the San Francisco and Pima project areas, the total radiometric content is low. Target mineralization might be expected in areas where there are strong, sharp contrasts in radiometric content that are observed in bedrock outcrop areas.
These may correspond to fault boundaries where mineralization may be concentrated, or to sharp intrusive boundaries where contact metamorphism and mineralization may also be concentrated.
Figure 10.5 shows a conceptual interpretation of the magnetic trends in the San Francisco project area. There are several key lineament trends in this area: 1) NW trending, or approximately N30W; 2) ENE trending, or approximately N65E, and 3) another set of approximately N70W trending lineaments.
The N30W trends are coincident with the regional feature discussed above. They are concentrated in an approximately 6 km wide swath through the area and are bounded on either side by rhombohedral-shaped magnetic lows. Local magnetic highs are observed on the east side of these and form a left-stepping pattern toward the NW.
The N65E linear trends are truncated in the central zone but are present across the entire area. They tend to bound the magnetic highs on the south, and form the north/south boundaries of the magnetic lows. These N65E trends have a strong sense of left-lateral shear, which is especially notable in the offset magnetic lows in the western area.
55
Figure 10.4
Regional Total Radiometric Intensity
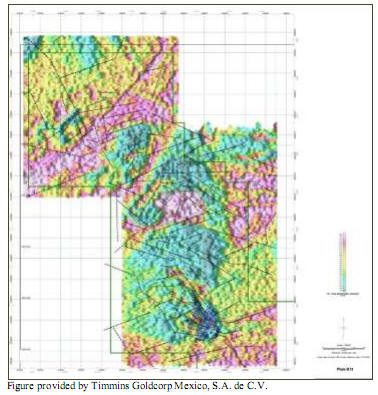
Figure 10.5
A Conceptual Interpretation of the Magnetic Trends
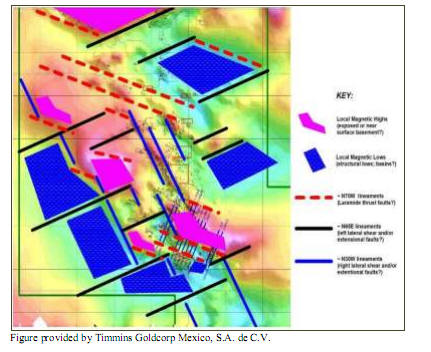
56
A third set of lineaments are observed in the San Francisco project area. These are a set of approximately N70W lineaments that are particularly prevalent in the central zone. These are less prominent magnetically; however, one particularly strong one is seen trending through the immediate vicinity of the San Francisco mine pit and Zonge NSAMT survey area. The N70W set do not show a clear sense of offset. They are also more variable in bounding both highs and lows or are seen within magnetic high zones.
The overall structural pattern is indicative of distributed, right-lateral shear zone trending approximately N30W. The shear zone is flanked on either side by magnetic lows indicative of extensional basins or other structural lows. A second set of lineaments with apparent left-lateral offset appears that may be a conjugate fault set (possibly rotated or influenced by older fabrics). The third set of trends, approximately N70W, are concentrated in the central shear zone and are probably related to older, Laramide thrust faults.
Figures 10.6 and 10.7 show magnetic and radiometric Thorium intensity, respectively, in the immediate vicinity of the San Francisco mine pit. The Zonge NSAMT survey lines and stations are posted, along with the San Francisco and West pit outlines. The San Francisco pit appears within a magnetic high trend and is bounded on the south by a strong magnetic gradient (one of the N70W lineaments). Note that there is a slight low within the magnetic high directly over the pit; this is likely a terrain effect because the helicopter could not precisely follow the pit topography. The magnetic signature over the West pit is quite different. The West pit is in local magnetic low and the primary magnetic gradients trend more north (NNW).
In general, the total radiometric content is low over the survey area. However, there is a local anomalous Thorium high trending through the area. Its northern boundary is approximately station 800 on the Zonge survey lines; the southern boundary is less defined. Both the San Francisco and the West pit are located approximately on the edge of this Thorium anomaly.
Conclusions and Recommendations
Despite being highly conductive, gold mineralization does not usually appear in high enough concentration to be directly detected with airborne geophysics. However, the effects of the geological processes that resulted in the mineralization may be detectable. It is these larger scale features that are often the target of airborne and local geophysical surveys.
The aeromagnetic and radiometric data discussed in this report have some regional and local trends that are very indicative of the expected geologic/tectonic setting of northern Sonora. These trends should be correlated with ground-based geologic and geochemical control in order to delineate the best local prospect areas to target gold or other mineralization. More detailed interpretation is possible once a target correlation scenario is identified.
57
Figure 10.6
Reduced to Pole Total Field Magnetic on the San Francisco and La Chicharra Areas
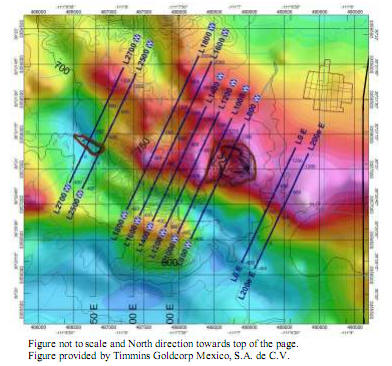
Figure 10.7
Radiometric Thorium with Reduced to Pole Total Field Magnetic on the San Francisco and La
Chicharra Areas
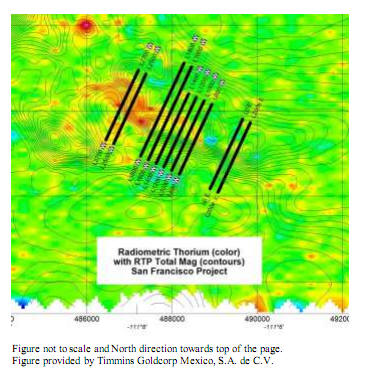
58
For example, the San Francisco survey area in general is characterized by a relatively low total radiometric intensity and relatively high magnetic intensity with three coherent directional trends. The primary local structures of interest (mineralization source) may be the N70E trending magnetic lineaments which are possible Laramide thrust faults; the associated regional trend being the NW trending shear zone and associated left-lateral fault set.
Locally, the San Francisco pit is within a magnetic high zone. The West pit, however, is in a small, local, magnetic low and is characterized by different directional gradients as well. This may indicate that the source rock is different in the two pit areas. Relatively high Thorium content may be associated in some manner with these source rocks as well.”
10.2.2.2 Natural Source Audio-Frequency Magnetotelluric Survey (NSAMT)
With a view to a more detailed interpretation as mentioned by Zonge in its conclusions, a Natural Source Audio-Frequency Magnetotelluric (NSAMT) survey was completed on the San Francisco mine along the lines 200E, 0, 800W, 1,000W, 1,200W, 1,400W, 1,600W and on the La Chicharra pit along the lines 2,500W and 2,700W. A total of 19.2 km of coverage in 10 survey lines with dipoles of 25 m was completed. Two lines were 2,400 m long and the remainder were 1,800 m. The distribution and position of the lineaments can be seen in Figures 10.6 and 10.7, included previously.
Lines 800W and 1,000W oriented along the main mineralized zone in the San Francisco pit and the line 2,700W on the main mineralized zone of La Chicharra were conducted with the aim of obtaining a geophysical signature for the mineral deposits of San Francisco.
The ten NSAMT lines completed on the San Francisco project provide a detailed image of resistivity changes relating to geology in the vicinity of the San Francisco open pit mine. As this area is centred on a shear zone associated with a thrust fault, the geology is complex. Intrusive rocks are present as pegmatites, granites and gabbros. Gneiss and schist, with what is assumed to be various degrees of alteration, are also present in this zone. Rock property measurements indicate that the resistivities differ between rock types, ranging from intrusive to a metamorphosed host.
Figures 10.8 and 10.9 provide a basic summary of the imaged NSAMT results. These are plan view plots. At depths of 300 m, the 2-D imaged resistivity shown on Figure 10.8 would be strongly influenced by near-surface geology and topography. The 200 m 2-D imaged resistivity, shown on Figure 10.9, more accurately shows resistivity changes at moderate depth, with results corrected for topography. The 2-D imaged sections for individual lines show that, with the exception of geology associated with the San Francisco peak, conductive and resistive features are associated with contacts generally dipping to the northeast. These are thought to be associated with the known thrust-fault hosting the San Francisco pits.
59
Figure 10.8
2D-Smooth-Model Resistivity at 300 m Depth
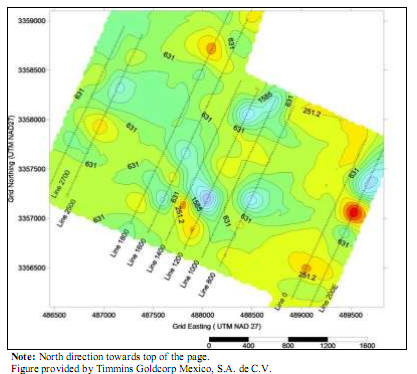
Figure 10.9
2D-Smooth-Model Resistivity at 200 m Depth
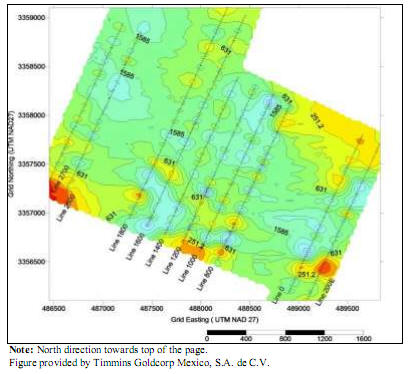
60
In the shear zone, gold is associated to some degree with granite, gneiss and gabbro rocks. Both the La Chichara and the San Francisco pits are located in zones with conductive contacts (Figure 10.8) . In contrast, these locations are associated with moderately resistive areas on Figure 10.9. This difference indicates that, while surface resistivities are high, there is differentiation between resistive rocks (intrusive?) and more conductive rocks (pegmatite or altered rock?) at moderate depth.
Individual 2-D vertical imaged sections suggest that resistive and conductive banding, identified in the vicinity of the San Francisco mine, dips to the northeast. Recent drilling indicates that gold values are typically associated with pyrite in the more resistive intrusive rocks. Except possibly along contacts, conductive geology (possibly altered host rock) may not be important. The resistive trend coincident with the San Francisco peak may be due to the presence of gold in this area, but is not the focus of this project. The shear zone associated with the thrust-fault defines the area hosting gold.
The magnetic and radiometric data provide a different view of the geology under investigation. Clearly magnetic high values are associated with the San Francisco pit. The contact between magnetic highs (warm colours) and magnetic lows (cool colours) appears to match resistive trends identified in Figure 10.8. This imaged section is more representative of surface and near-surface geology. In contrast to the San Francisco pit, the La Chichara pit is located in a zone of magnetic lows. The difference here could simply be due to the intrusive rock hosting primary gold values in each pit. For example, the rock properties demonstrate that the gabbro (at 550 uCGS) has over 100 times the magnetic susceptibility of granite (at 3 uCGS). However, drilling results along Line 800 suggest that both rock types may host gold. Based on these observations, it would be expected that the granite would be the primary source of gold in the La Chichara pit, with gabbro at the San Francisco pit. Gneiss may host gold at either site.
Radiometric data identify trends that match changes in the Total Magnetic Field plan view map, as well as resistive-conductive trends. Radiometric gamma radiation is strongly controlled by conditions at the surface, as radiation from deeper sources is absorbed by overlying geology. The thorium gamma count appears to identify patterns of surface weathering that may relate to outcropping structures. Magnetic and radiometric data in the vicinity of the La Chichara and San Francisco pits may be controlled by the thrust fault passing through this zone (the 2-D NSAMT imaged sections for Lines 800, 1,400 and 1,600 identify similar contacts associated with this thrust fault, which dip to the northeast). While the San Francisco peak is centred between NSAMT Lines 1,400 and 1,600, the peak itself appears non-magnetic, with the peak and associated ridge, extending to the northwest, defining a boundary between non-magnetic rock (granite or pegmatite for example) to the southwest and more magnetic rock (gabbro and gneiss for example) to the northeast.
The San Francisco pit is clearly located within the magnetic high zone, positioned along a linear contact seen in the radiometric data. In contrast, the La Chichara pit is located in a non-magnetic zone positioned along a linear contact observed in the radiometric data. Both pit locations are within the area thought to be the shear zone, and locally in areas characterized by contacts between intrusive (more resistive) and possibly altered (more conductive) rock types. The NSAMT program has successfully identified the shear zone and provides sub-surface imaging of geologic trends that have been identified by airborne magnetic and radiometric surveys, in the test area.
61
Recommendations would be to extend the NSAMT survey further to the west, and possibly north using airborne magnetic and radiometric coverage to help map structural trends that may be associated with the thrust fault. While the thrust fault passing through the San Francisco mine area is the primary focus of the survey, extending investigations into areas surrounding the West and San Francisco pits could be important to guide future exploration programs.
Additional NSAMT survey coverage could be critical in locating and imaging subsurface structures, along with detailing the associated geology. The magnetic and radiometric data could be useful in helping plan broader (more open) NSAMT survey coverage, to further detail geologic contacts and changes in geology. On the basis of the study, detailed NSAMT coverage could be provided selectively using more closely spaced lines.
Timmins has concluded that the interpretation of NSAMT is a useful indicator of the different lithologies associated with the mineralization or host rock. The linking of areas of high resistivity at the gabbro basement together with the overlying metamorphic sequence that was affected by several phases of tectonism, resulted in large shear zones and/or thrusting of the Precambrian metamorphic rocks over younger rocks, without generating areas of weakness. This resulted principally in high and low angle faulting through which granite bodies have been emplaced, some of which were subjected to compression and tension and consequent fracturing.
Timmins believes that the gold mineralization has flowed through the areas of weakness and is located in fractures caused by tectonic activity mainly in granite and the most competent or brittle rocks that overlie and underlie it. In areas of shale, usually a ductile zone is distorted and invaded along the foliation planes by quartz bodies or bodies of pegmatite and gold mineralization. Typically, the mineralized zones have less resistivity due to the presence of pyrite and, occasionally, chalcopyrite. However, the observed rock mass has moderate to strong silicification.
Figures 10.10 and 10.11 are a reflection of the NSAMT results along the 800W and 1,000W sections, which cover the central area of San Francisco pit and 200 m to the west, towards the western extension of the San Francisco mineralization.
62
Figure 10.10
2D-Smooth-Model Inversion on Section 800W (centre of the San Francisco Gold Deposit)
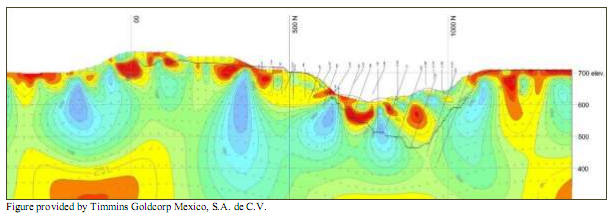
According to geology interpreted from the drilling and the direct measurements along section 800W, the resistive zones near the surface correspond to gabbro (blue) and near surface conductive or less resistive areas, possibly granite, gneiss and schist. Below 300 m the conductive areas are again possibly related to intrusive bodies at the regional level. The areas of greatest contrast between the areas of high and low resistivity may correspond to low angle shear zones or fault planes.
In section 1,000W the most resistive areas are practically at the surface and into the southern portion of the final pit outline. The exposed mineralized granite in the southern ramp may correspond to a zone of high resistivity.
Figure 10.11
2D-Smooth-Model Inversion on Section 1,000W (200 m west of the section 800W)
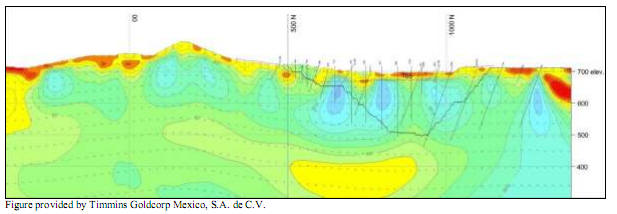
10.2.3 Structural Review of the San Francisco Gold Deposit
At the end of 2008, the services of a structural geologist, Mr. Tony Starling, were recruited to obtain a greater understanding of the structural evolution of the region and in particular the tectonic complex in the San Francisco mine area, and thereby to define the structural controls for the mineralization. The goal of the study was to generate a series of geological and structural criteria that could be applied to the exploration of the property. The work consisted of 10 field days and a further 10 days for the review of existing information and discussions with field geologists.
63
Several conclusions can be drawn from the results of the study:
There are several deformation events evident in the district (D1-D6) that comprise three pre-mineralization contractional/metamorphic phases and two post- mineralization extensional phases (D5 and D6), but it is the compressional deformation associated with the Laramide orogeny (D4) that controls gold mineralization at San Francisco and La Chicharra.
South-directed Laramide compression resulted in thrusting of the Precambrian sequence over the Mesozoic rocks with gold-bearing fluids controlled principally by west-northwest trending reverse faults/thrusts. In addition to the main west-northwest trending structures, local steep veins formed along lateral/oblique ramps along north- south to north-northwest and northeast trends (e.g. the Valenzuela vein).
Within the main deformation corridors, the principal hosts of economic grade are intermediate-sized brittle rock packages (i.e. granitoid, felsic gneiss, silicified rocks) that fractured preferentially in a relatively ductile matrix of the more mafic rocks. The thrusting was accompanied by asymmetrical/south-vergent folding that in places produced favourable sites for pervasive silicification/phyllic alteration. In the San Francisco pit, the economic mineralization occurs in the footwall of a thrust hosted by fractured granite/migmatite and silicified gneiss.
From Aster satellite data, there are two main corridors of west-northwest trending Laramide deformation that overprint the north-northwest trending earlier fabric in the Precambrian sequence; one zone crosses through the La Chichara-San Francisco area and the other across the southern edge of Cerro Gauna. As the tourmaline-rich gold- bearing fluids are seen to the south around Cerro Barajita and to the north at Veta Tierra, there appears to be significant potential for other San Francisco-type mineralization in the main west-northwest trending structural corridors.
The age of mineralization is the same as the development of porphyry copper deposits in Sonora (62-58 Ma?) and there may be an association with porphyry gold fluids as well as an orogenic (metamorphic) signature.
The granitoid rocks seen in the San Francisco pit have been described as a leucogranite intrusion but the textures of the coarse-grained felsic rocks and pegmatites appear to be migmatitic in origin, having been injected during the main stage of high temperature metamorphism. This concurs with Precambrian age dating for the granitoid.
64
- Following mineralization, there were two phases of extension; the first (D5) event was oriented north-northeast-south-southwest and controlled the emplacement of west-northwest trending lamprophyre dykes along with some quartz-sericite veining to the north. This event may have been coeval with silver-base metal mineralization to the north at La Pima. The second phase of post-mineralization east-northeast to east-west extension (D6) produced large-scale listric normal fault zones that are limited in the San Francisco pit area but are common in the district. It is likely that there is some displacement of the mineralized horizon due to post-mineralization faulting. To the north, D6 faults are associated with the Magdalena metamorphic core complex.
65
11.0 DRILLING
If available, a description of the historical drilling conducted on the San Francisco project is provided in Section 6.
11.1 EXPLORATION DRILLING FROM 2005 TO 2007
Timmins conducted exploration drilling between 2005 and 2007, which provided data for the resource estimate prepared in 2007.
In the fall of 2005, Timmins conducted a reverse circulation drilling program comprised of 14 holes on the San Francisco project site. The details and results of the drilling program were published previously in a Technical Report entitled “Technical Report on the San Francisco Mine Property, Estacion Llano, Sonora, Mexico.” This Technical Report was published on the SEDAR website on April 28, 2005, by TMM.
Between September and November, 2006, Timmins conducted a follow-up drilling program which consisted of 56 holes, comprised of 28 diamond drill holes and 28 reverse circulation drill holes. While the drilling was primarily concentrated to the north and northwest of the present San Francisco pit and to the north and northwest of the existing La Chicharra pit, a number of widely spaced holes were drilled to test specific geological and geochemical targets around the San Francisco pit and to the south and west of the La Chicharra and La Severiana areas.
A total of 13 diamond drill and five reverse circulation holes were focused on confirming the drill intersections of widely spaced Geomaque drilling in the former crusher area to the north of the San Francisco pit, particularly after a re-interpretation of the structural controls of the mineralization indicated that the projected trend of the mineralization was in this direction. These drill holes are concentrated between Sections 880NE and 1,040NE, and cover an area of 280 m by 300 m. Diamond drill hole TFD-27 was drilled to twin the previous 2005 reverse circulation hole TF-13, in order to confirm the high grade mineralization in this hole. The assay results from hole TFD-27 indicated a length of 107.35 m averaging 3.346 g/t gold, influenced by very high gold grades in the weighted intervals. Three diamond drill and five reverse circulation holes were drilled around the area of the San Francisco pit to test favourable lithology and geochemical anomalies.
In the La Chicharra area, five diamond drill and two reverse circulation holes were drilled to test the continuity of the gold mineralization to the north of the existing pit and are concentrated between Sections 2,500NE and 3,100NE. Another six diamond drill and 13 reverse circulation holes were drilled to test geological and geochemical targets to the south, southwest and west of the La Chicharra pit. These holes were distributed between Sections 2,500NE and 3,600NE. Finally, two reverse circulation holes were drilled in the La Severiana area to test at depth gold anomalies in surficial placer deposits.
66
The total estimated expenditure for the exploration program to the end of December, 2006, at the San Francisco property was USD 2,042,312. The 2006 exploration drilling program and its results were discussed in a February, 2007, Technical Report filed on the SEDAR website.
In 2007, Timmins conducted a follow-up exploration and condemnation drilling program which was based partly on the results of the 2006 program. The results of the 2007 drilling were contained in a press release dated November 28, 2007.
11.2 2008 TO 2010 DRILLING PROGRAM
From 2008 to June, 2010, 613 holes were drilled for a total of 57,753 m of reverse circulation and RAB drilling. These holes were drilled to cover several objectives, including an initial stage of drilling totalling 3,045 m in 30 holes distributed over eleven grassroots targets located in the northern portion of the package of igneous and metamorphic rocks which host the gold mineralization on the project. In addition, 2,921 m in 35 drill holes consisted of condemnation drilling in a number of areas utilized by operations, 3,723 m of RAB drilling in 48 holes was conducted to explore isolated gold anomalies around and between the La Chicharra and the San Francisco pits and more than 5,500 m of reverse circulation drilling was performed with the same objective as the RAB drilling. This drilling discovered gold mineralization that will require additional follow-up drilling. However, more than 80% of the drilling was concentrated in the near perimeter of the San Francisco pit, within a distance that varied from 50 to 250 m from the limit of the pit design established for the preliminary feasibility study in 2008. Table 11.1 summarizes the distribution, type and location of the drilling conducted between 2008 and June, 2010.
Timmins has expended approximately USD 6.7 million for the exploration drilling and other programs on the San Francisco gold property, during 2008, 2009 and up to June, 2010.
All the geological, engineering, drilling, planning and supervision portions of the exploration drilling program were overseen by the Timmins staff, principally geologists Miguel Angel Soto, COO of Timmins Gold Corp. and Daniel Maya, lead geologist on the San Francisco property.
Intercore Perforaciones, S de RL de C.V., based in Tlajomulco (near Guadalajara), Jalisco, was the drilling contractor chosen for the 2008 drilling program on the north targets, using a truck mounted Schramm T450W RC drill rig. For the rest of the drilling in 2008, including the initial short exploration program and condemnation drilling, the drilling contractor was Globexplore Drilling, S.A. de C.V. (Globexplore), a drilling contractor based in Hermosillo. For the 2009 and 2010 drilling program, it was decided to continue using Globexplore. However, due to the strong demand for rigs in the last portion of 2009, Timmins also contracted some drilling out to HD Drilling, S de RL de C.V. (HD Drilling), a drill contractor based in Durango.
67
Table 11.1
2008-2010 Drilling Program on the San Francisco Project
Year
| RC Drilling | RAB Drilling | Total | Location
| Type
|
| Holes | Metres | Holes | Metres | Holes | Metres |
2008
| 30 | 3,045 | | | 30 | 3,045 | North targets (1B, El Socorro, etc.) | Exploration |
| 5 | 498 | | | 5 | 498 | Various condemnation | Condemnation |
| 31 | 1,904 | | | 31 | 1,904 | Eastern extension | Exploration |
| 2008 Total | 66 | 5,447 | | | 66 | 5,447 | | |
2009
| 35 | 2,154 | | | 35 | 2,154 | Southern wall of SF pit | Exploration |
| 27 | 2,216 | | | 27 | 2,216 | Eastern extension | Add resources |
| 68 | 7,195 | | | 68 | 7,195 | NW extension (Loma 200) | Add resources |
| 13 | 671 | | | 13 | 671 | Condemnation leach pad extension | Condemnation |
| 2009 Total | 143 | 12,235 | | | 143 | 12,235 | | |
Updated
June, 2010
| 119 | 10,553 | | | 119 | 10,553 | NW extension (Loma 200) | Add resources |
| 136 | 14,676 | | | 136 | 14,676 | W, SW and S of the San Francisco pit, near area surrounding the pit design. | Add resources |
| 24 | 2,545 | | | 24 | 2,545 | North pit (within) | Add resources |
| 41 | 3,968 | 17 | 1,491 | 58 | 5,459 | NW projection of the San | Exploration |
| 19 | 2,854 | 31 | 2,232 | 50 | 5,086 | Francisco mineral trend SE and NW projection of the La Chicharra mineral trend | Exploration |
| 17 | 1,752 | | | 17 | 1,752 | Waste dumps and Low grade stockpile | Condemnation |
| 2010 Total | 356 | 36,348 | 48 | 3,723 | 404 | 40,071 | |
| Grand total | 565 | 54,030 | 48 | 3,723 | 613 | 57,753 | |
Table provided by Timmins Goldcorp Mexico, S.A. de C.V.
Globexplore continues to drill on the property and its performance has been meeting the requirements established by the Timmins exploration staff. Globexplore has been using two and sometimes three track-mounted rigs, equipped with down-return hammer and a 350/500 psi and 900/1150 cfm Sullair compressor. The diameter of the bit varies from 11.43 to 12.5 cm (4.5 to 5 inches) and the diameter of the rods is 10 cm (4 inches). See Figures 11.1 and 11.2 for photographs of the drill equipment at the San Francisco property.
Since the San Francisco project is located on a number of exploitation concessions upon which mining has been conducted, any exploration work on these concessions continues to fall under the environmental permitting already in place for the mine and no further notice is required to be given to any division of the Mexican government. The original environmental permitting of the San Francisco mine site is valid for the duration of the exploitation concessions. Water for the drilling programs at the San Francisco project is obtained from the on-site water wells.
68
Figure 11.1
RC Rig on the South Wall of the San Francisco Pit, 2009 Drill Program
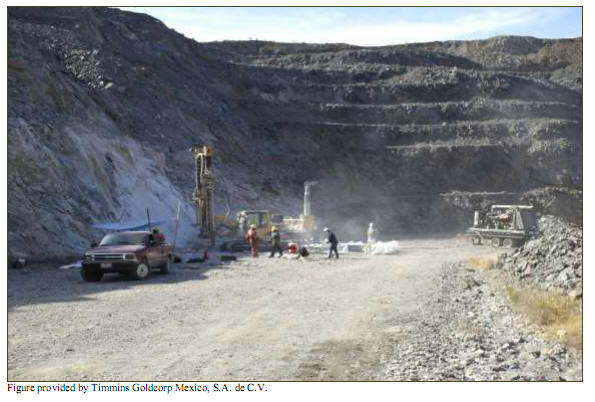
Figure 11.2
RC Rigs on the Loma 200, Northwest of the San Francisco Pit, 2010 Drill Program

69
The initial drill hole collar locations were established using a high precision GPS Trimble model 5700 movil and rover 5700 (base) and marked prior to drilling with wooden stakes denoting the drill hole collar plus a front sight line to indicate the azimuth of the hole. After a drill hole was completed, the collar location was marked with a cement marker denoting the drill hole number. See Figure 11.3 for a photograph of the cement marker located on drill hole TF-213. Once the drilling program was completed, all drill hole collars were surveyed, most of them by the surveyor of the San Francisco mine, and eventually by an independent contractor (InterGeografica de Mexico, S.A. de C.V.) using a GPS Total Station Trimble 5700 movil and 4700 rover (base), and then linked to the original project grid by calculating the orthogonal UTM coordinates for the drill holes.
Figure 11.3
Cement Marker Denoting the Site of the Drill Hole TF-213 near the San Francisco pit
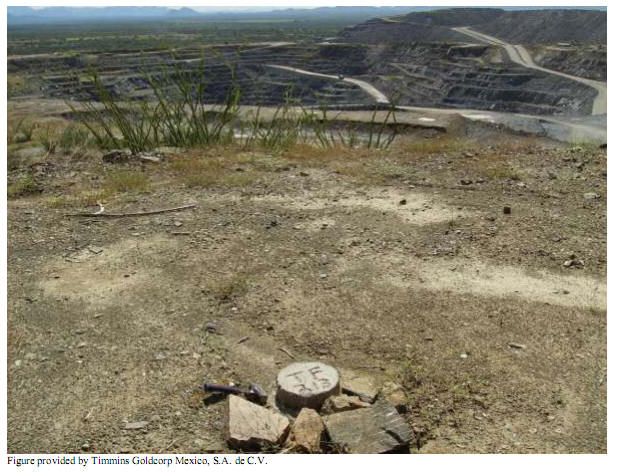
The lithologies and alteration features encountered by the reverse circulation holes were described on hand-written logs and sampled as drilling was in progress. A portion of the material generated for each sample interval was retained in a plastic specimen tray. Each compartment in the specimen tray was marked with both the sample interval and sample number. Blank compartments within the trays were left for the locations where blank samples and standard samples were inserted into the sample stream. Compartments within the trays were also designated for duplicate samples.
70
Both the blank samples and the standard samples were inserted into the sample stream using a sequential numbering scheme. Also introduced into the sequential numbering scheme were numbers for duplicate samples.
See Figure 11.4 for the locations of the drill holes in relationship to the previous drilling and the existing San Francisco and La Chicharra pits. See Appendix 2 for a summary of the 2008 to June, 2010, significant assays for drilling in the areas around the San Francisco pit.
Figure 11.4
2008-2010 Drill Hole Location Map Around the San Francisco Mine
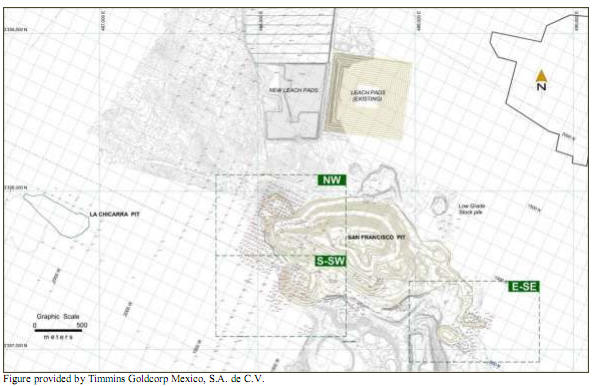
11.2.1 Drilling Results in the Northwest Area (LOMA 200) of the San Francisco Pit
To the northwest of the San Francisco pit, there is a small hill which lies in the direction of the projected trend of the gold mineralization to the north of the San Francisco deposit. Exploration and infill drilling were used to explore this area, following the encouraging assay results obtained for hole TF-200. This area has been designated as Loma 200 (Hill 200), and comprises the area to the northwest of the San Francisco pit from the section 1,350W towards the northwest to section 1,550W. This area currently lies outside the current pit.
71
An intensive and aggressive program of drilling was started in September, 2008, at the areas northeast and simultaneously at the east-southeast of the San Francisco pit, considering the potential extension of the San Francisco mineral trend in both of those directions. The drilling in the northwest began in the first week of October and, by the end of 2009, 68 holes were drilled for 7.195 m of reverse circulation drilling. The drilling continued during 2010 until March, at which time it was decided to suspend drilling and make an evaluation of results, to determine if the drilling would add to the existing mineral resource base. By the end of March, 214 holes had been drilled for a total of 19,099 m, at an average depth of 89 m.
See Figure 11.5 for a map showing the locations of the drill holes on Loma 200 in relation to the existing San Francisco pit and the previous drilling programs. See Appendix 2 for a summary of the significant assay results for the area to the northwest of the San Francisco pit.
Figure 11.5
Drill Hole Location Map on the Northwest Projection of the San Francisco Pit
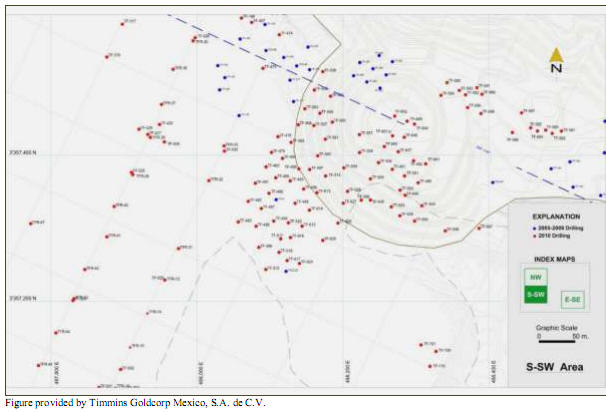
The holes conducted on Loma 200 are distributed on a grid of 20 x 25 m, following the drilling pattern of the San Francisco deposit.
The order in which the holes were drilled in the Loma 200 area was selected recognizing that the mineral trend appears to follow a northwest strike direction from the current pit design.
72
Surface sampling in the immediate area and up to a distance of 300 m from the pit returned gold values that allowed Timmins to complete gold contours above 0.30 g/t gold over an area of 300 m x 300 m. These results were used to conduct the initial drilling campaign with holes spaced 50 m along the section and 40 m between sections. This spacing was then reduced by further infill drilling, with holes spaced 20 and 25 m along the section lines and 20 m apart between sections.
With two rigs in operation, the first holes drilled were the TF-186 and TF-189. The first hole was drilled to a depth of 151 m with an alluvium cover of 1.50 m. The hole immediately intercepted multiple mineralized intervals varying in width from 1.50 m to 9 m, with the waste intervals between them being relatively short. The best intercepts in hole TF-186 were from 73.50 to 82.50 m, an interval of 9 m averaging 0.53 g/t gold, and from 109.50 m to 117.0 m, an interval of 7.50 m grading 1.37 g/t gold. Between the two main mineral zones intersected in this hole were further mineral intersections, each 1.50 m in length, where the gold grade varied from 0.28 g/t gold to 1.2 g/t Au.
Drill hole TF-189 was drilled to a depth of 135.0 m, starting in bedrock and intersected five mineralized intervals: from 12.0 to 13.50 m graded 2.23 g/t gold over the 1.50 m, from 19.50 m to 25.5 m graded 1.72 g/t gold over the 6 m interval, from 36.0 m to 51.0 m graded 1.59 g/t gold over the 15.0 m interval, from 60.0 m to 64.5 m graded 0.96 g/t gold over 4.5 m and from 133.5 m to 135.0 m, at the bottom of the hole, a 1.5 m interval graded 1.50 g/t gold with the mineralization open at depth. The intermediate zones between the mineralized intervals contain low grade mineralization varying from 0.23 to 0.53 g/t gold over widths of 1.50 to 3 m.
Drill hole TF-185 was drilled to a depth of 139.50 m on the section 1360W, almost on the western edge of the area of anomalous mineralization as defined by the surface sampling. The drill hole began in bedrock, intercepting two important mineral zones and a number of smaller intervals. The first interval extends from surface to 13.5 m and grades 1.05 g/t gold; from 25.5 m to 39.0 m, a 13.50 m interval grades 1.77 g/t gold; from 45.0 to 49.5, a mineralized interval of 4.5 m grades 0.82 g/t gold; between 55.5 m and 61.5 m there is a 6 m wide mineralized zone grading 0.27 g/t gold; between 69.0 m and 70.5 m, a 1.50 m interval grades 0.33 g/t gold and from 72.0 m to 75.0 m, a 3.0 m interval grades 0.37 g/t gold.
Drill hole TF-200 was the primary drill hole upon which follow-up drilling was initiated in this area as it was drilled to a depth of 199.5 m and intersected three mineralized zones. The first mineralized zone was encountered from 28.5 to 64.0 m, an interval of 34.5 m that graded 1.43 g/t gold, a second zone was encountered from 109.5 m to 112.5 m grading 1.05 g/t over 3 m and a third zone was encountered immediately afterward from 114.0 m to 118.50 m, grading 1.32 g/t gold over the 4.5 m interval.
Hole TF-201 is a neighbour of the previous hole TF-200. The hole was drilled to a depth of 163.50 m and intersected two significant mineral intervals. The first interval was between 10.50 and 12.0 m that graded 0.50 g/t gold and the second interval graded 2.15 g/t gold from 16.5 m to 33.0 m for a total of 16.5 m. The drill hole continued to cut further mineralized intervals down to a depth of 142.50 m, but in general they were low grade.
73
Other interesting results are:
| | Hole TF-213, which was drilled to a depth of 73.5 m, focused on pursuing the shallow mineralization reported in previous holes. This hole contained two mineralized zones, the first one from 30.0 m to 33.0 m grading 2.08 g/t gold over 3 m, and from 37.5 m to 57.0 m grading 1.17 g/t gold over 19.5 m. |
| | |
| | The hole TF-214 intercepted three mineral zones, and was drilled to a depth of 73.50m. The mineralized zones were from 3.0 m to 6. 0 m, a width of 3.0 m, grading 0.23 g/t gold; from 28.5 m to 40.5 m, a width of 12.0 m, grading 1.04 g/t gold and, at the bottom of the hole, the assays returned 0.38 g/t gold over a 3.0 m interval from 70.5m to 73.5 m. |
| | |
| | Hole TF-215 was drilled to a depth of 86.50 m and intersected a 19.50 m wide mineralized zone grading 0.57 g/t gold between 34.5 to 54.0 m. Hole TF-220, drilled to a depth of 121.5 m, began in bedrock and encountered three zones of mineralization. The first zone from 6.0 to 9.0 m graded 3.15 g/t gold over 3 m, with the other zones encountered from 10.5 m to 22.5 m which graded 1.25 g/t gold and from 115.5 to 121.5 m (the bottom of the hole) which graded of 1.28 g/t Au. The final interval was interrupted by the termination of the hole and the mineralization is still open. |
| | |
| | TF-221 was initiated in bedrock, drilled to a depth of 103.5 m and intercepted nine mineral zones. The most significant interval graded 15.61 g/t gold over 6 m between 33.0 m and 39.0 m, with the remaining mineral intersections varying from 1.50 m to 6m in width and from 0.43 g/t to 0.64 g/t gold. |
| | |
| | Hole TF-222 intersected five mineralized zones with the most important zones located between 73.5 m and the bottom of the hole at 133.50 m. The first zone averaged 1.31 g/t gold over a width of 18.0 m width between 73.15 and 91.50 m, a second zone was located from 102.0 m to 106.50 m (4.5 m) which averaged 1.48 g/t gold and a third zone over a width of 9 m graded 1.83 g/t gold between 124.5 m and 133.5 m. |
| | |
| | Hole TF-223 which began in bedrock, was drilled to a depth of 133.5 m and intersected eight mineral zones. The first of the mineralized zones was intersected from 22.15 to 31.5 m and graded 3.94 g/t gold over the 9 m width. A second mineralized zone was encountered between 60.0 to 63.0 m which graded 1.56 g/t gold. A further 6 mineralized intersections were encountered between 66.0 m and the bottom of the drill hole at 133.5 m, with the zones varying in length from 1.5 m to 9m and in grade from 0.24 g/t to 1.00 g/t. |
74
All significant assays from the 2008 to June, 2010 drilling programs at the San Francisco property are tabulated in Appendix 2.
In general, the drilling results have confirmed the continuity of the mineralization to the northwest along the main mineral trend from Section 1300W to the Section 1550W and from longitudinal lines 700N to the 1100N in the northeast direction. This has added an additional 250 m to the zone and the mineralization remains open at depth.
Figures 11.6, 11.7 and 11.8, Section 1400W, 1440W and 1460W, show the mineral intervals in the holes drilled by Timmins as well as the intersections from holes drilled previously.
11.2.2 Drilling Results in the East-Southeast Area of the San Francisco Pit
The area to the east-southeast comprises the projection in this direction of the mineral trend of the San Francisco mine, starting at Section 400W and proceeding to Section 200E, a length of 600 m. The width is estimated to be similar to the existing San Francisco mineral trend.
The history of exploration in this area goes back to a series of widely spaced reverse circulation holes drilled by Geomaque in the late 90’s over an area of 600 m x 600 m. The original drilling was conducted on an area with a significant alluvial cover, but with some isolated outcrops of granite, granite-gneiss and gabbro, all of which are cross-cut by a monzonite dike, appear to be the similar to the exposures in the middle of the San Francisco pit and are closely related to the outcrops of granite. There are some historical trenches and shallow mine workings excavated to extract gold from veinlets in the granite and from possible alluvial deposits. However, while a number of the drill holes obtained interesting mineral intersections, the drilling was too widely spaced and there was no follow up. Later, a few rotary holes were conducted to explore the areas containing the best shallow gold grades, after which the area was abandoned. After Timmins acquired the project in 2005, this area has seen a renewal of exploration activity once the original data were reviewed.
Between 2005 and 2009, Timmins applied a portion of its exploration budget to drilling in this area. By the end of 2009, the drilling campaign had completed holes on a 25 m x 25 m grid, resulting in the definition of two parallel and closely spaced elongated mineral deposits 200 to 250 m in length and 60 to 80 m in width, amenable to be mined by open pit to a depth of 80 m. The mineralization remains open along strike and there is the possibility of further parallel zones. These lenses are located about 250 m east-southeast of the existing limit of the San Francisco pit and are interrupted by the La Barajita creek. The creek bed has been interpretated to be either a north-south or northwest-southeast fault. The relevance of the drilling results is that, in addition to the availability of further resources, the northern portion of the drilling done by both Geomaque and Timmins for the purposes of condemnation has generated some zones of shallowly dipping mineralization based on widely spaced holes, which may be an extension of this mineralization and will need to be followed up by further drilling campaigns.
75
Figure 11.6
Cross-Section 1400W Showing the Drilling Intersections
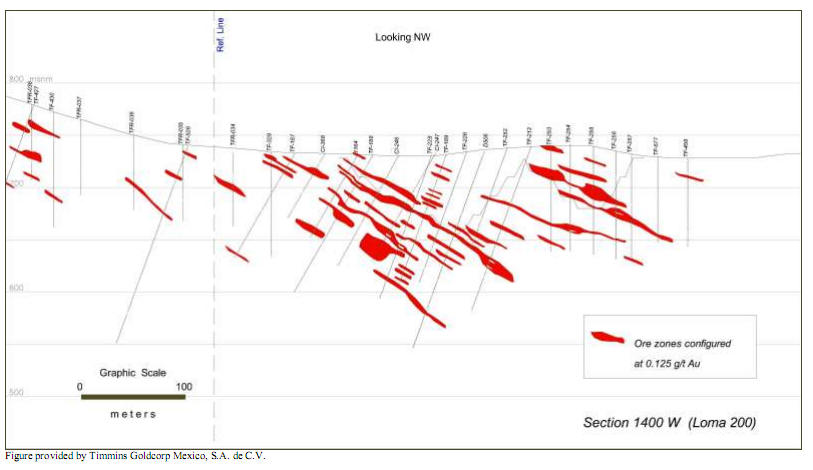
76
Figure 11.7
Cross-Section 1440W Showing the Drilling Intersections
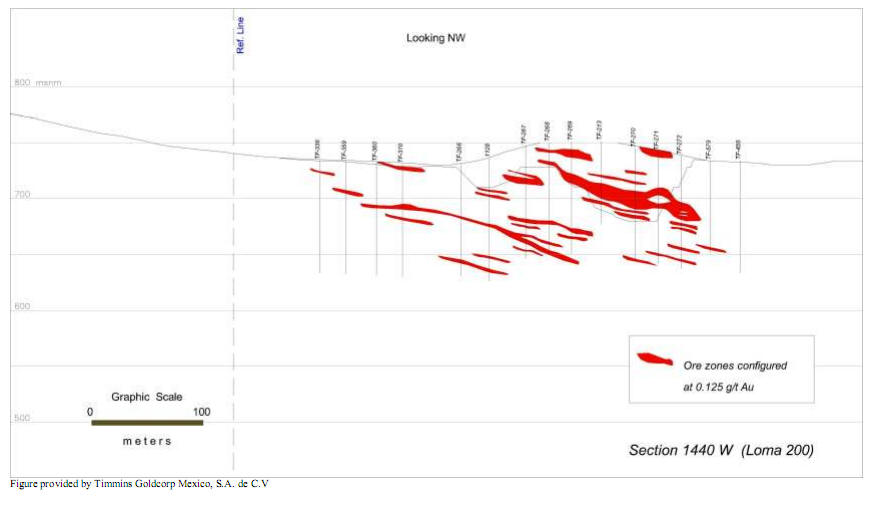
77
Figure 11.8
Cross-Section 1460W Showing the Drilling Intersections
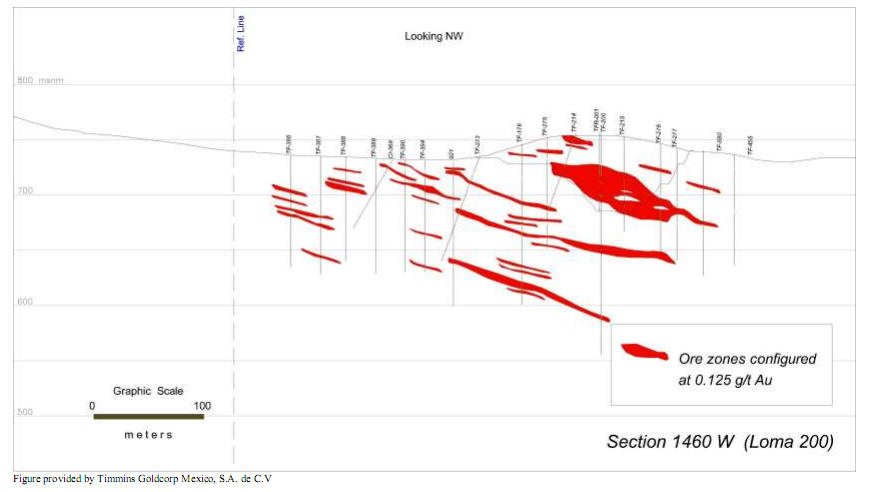
78
The Figure 11.9 is the drilling map of holes in this portion of the property for 2008 and 2009.
Figure 11.9
Drill Hole Location Map on the East-Southeast Area of the San Francisco Pit
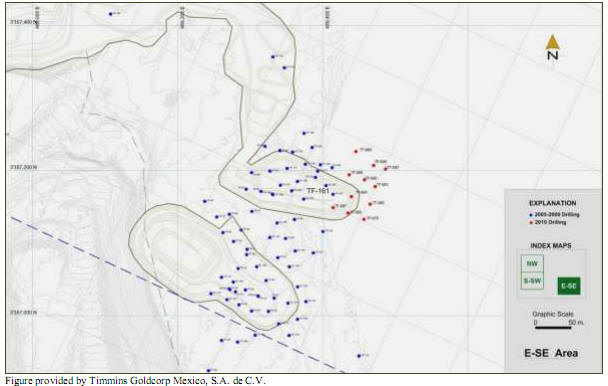
The total drilling in the east-southeast area for 2008 and 2009 was 4,120 m in 58 holes with an average depth of 71 m.
During 2008, 31 RC holes were drilled for a total of 1,904 m that averaged 61.4 m in depth. The short holes in 2008 were conducted to follow-up on the near surface mineralization indicated in previous drill campaigns.
In 2009, 27 RC holes were drilled for a total of 2,216 m which averaged 82 m in depth.
A summary of the most significant 2008 and 2009 assays results are shown in Appendix 2.
Following is a brief description of some the most important drill hole results in this area.
Hole TF-84 was drilled to a depth of 48.77 m starting in bedrock. The hole intersected three mineralized zones, with the first zone starting at surface and continuing to a depth of 9.14 m grading 0.256 g/t gold. Due to the general dip of the host lithology and the perpendicular angle of the drill holes, the resulting width is a true width for the mineralization. A second mineralized interval was intersected between 13.72 m and 15.24 m which graded 0.533 g/t gold, with a third interval intersected from 42.67 to 45.72 m grading 0.583 g/t gold.
79
Hole TF-86 encountered alluvial cover of 4.57 m before entering bedrock and had three mineral intercepts. The first intercept graded 0.311 g/t gold over 4.57 m between 15.24 and 19.81 m, a second interval intersected 1.53 m grading 0.300 g/t gold from 27.43 to 28.96 m, with the third interval intersecting 0.300 g/t gold over a width of 1.53 m between 57.91 m and 59.44 m.
Drill hole TF-87 was collared in bedrock and intersected a mineral zone from surface to 7.62 m, grading 2.28 g/t gold over a width of 7.62 m, including a 3.05 m interval grading 5.534 g/t gold. A second intersection occurred from 27.43 m to 28.96 m (1.53 m) and graded 0.233 g/t gold.
Drill hole TF-88 was drilled to a depth of 51.82 m and intersected alluvial cover of 1.52 m before entering bedrock and immediately intersecting 1.52 m grading 0.867 g/t gold. A second interval was encountered from 10.67 m to 13.72 m that graded 0.200 g/t gold over a width of 3.05 m. A third intersection occurred from 36.58 m to 41.15 m, which graded 1.267 g/t gold over the 4.57 m.
Drill hole TF-89 encountered two mineral intercepts, with the first occurring from surface to 1.52 m grading 0.233 g/t gold, and the second from 32.0 m to 35.05 m grading 0.783 g/t gold.
The above holes were all drilled along of section line 60W, spaced 25 m apart and inclined at -70°, with an azimuth of 205°.
On section line 40W, holes TF-90, TF-91, TF-92, TF-93 and TF-94 were drilled, with the first two, TF-90 and TF-91, not intersecting any mineralization. Drill hole TF-92 had four mineral intersections: the first from 12.19 m to 18.29 m, graded 0.375 g/t gold over 6.10 m; the second from 21.34 m to 36.58 m, graded 1.207 g/t gold over 15.24 m; the third from 42.6 m to 44.20 m, graded 0.467 g/t gold over 1.53 m and the fourth from 47.24 m to 50.29 m, graded 2.767 g/t gold over 3.5 m. Drill hole TF-93, drilled to a depth of 60.96 m, cut alluvial cover of 1.52 m before immediately entering a mineralized interval that extended to 30.48 m. The 28.96 m wide mineralized interval graded 0.433 g/t gold. The drill hole continued to cut short mineralized intervals; 33.53 m to 35.05 m graded 0.433 g/t gold, 38.10 m to 39.62 m graded 0.367 g/t gold and 47.24 m to 48.77 m graded 2.267 g/t gold.
On section line 20E, drill hole TF-101 was drilled to a depth of 64.01 m and intercepted three mineralized zones. The first intersection occurred from 15.24 m to 19.81 m and graded 0.967 g/t gold over 4.57 m, the second interval was from 27.43 m to 36.58 m and graded 0.600 g/t gold over 9.15 m, and the third interval occurred from 56.39 m to 64.01 m and graded 3.307 g/t gold over 7.62 m.
Hole TF-113, on section line 60E, was drilled to a depth of 60.96 m and encountered mineralized intersections from 4.47 m to 7.62 m grading 0.300 g/t gold, from 30.48 m to 32.00 grading 0.267 g/t gold and from 48.77 m to 54.86 grading 0.700 g/t gold. Hole TF-114, on the same section line, was drilled to a depth of 51.82 m and intersected four mineralized zones. The mineralized zones intersected by hole TF-114 occurred from surface to 1.52 m, grading 0.267 g/t gold; from 6.10 m to 7.62 m, grading 0.367 g/t gold; from 16.76 m to 24.38 m, grading 0.78 g/t gold, and from 28.96 m to 35.05 m, grading 0.492 g/t gold.
80
In September, 2009, based on the previous results, Timmins decided to conduct a short drilling program in this portion of the San Francisco project. The following describes some of the significant results obtained from this drilling campaign.
On Section 0, hole TF-156, drilled to a total depth of 94.5 m, encountered a number of mineral intersections. The mineralized intervals encountered in hole TF-156 are as follows; from surface to 3.0 m grading 0.20 g/t gold, from 6.0 m to 7.5 m grading 0.20 g/t gold, from 25.5 m to 27.0 m grading 0.70 g/t gold and from 66.0 m to 75.0 m grading 1.48 g/t gold. Also on Section 0, hole TF-159, which was drilled to a depth of 88.5 m, intercepted the following mineralized zones: from 1.5 m to 16.5 m grading 2.31 g/t gold, from 24.0 m to 28.5 m grading 0.28 g/t gold and from 78.0 m to 82.5 m grading 0.30 g/t gold.
On Section 60E, drill hole TF-161 which was drilled to a depth of 91.5 m, continued to keep the mineralization open to the southeast after it intersected four zones. The mineralized zones were intersected from 9.0 m to 24.0 m for a true width of 15 m averaging 1.45 g/t gold, from 52.5 m to 54.0 m grading 0.43 g/t gold, from 76.5 m to 78.0 m grading 0.27 g/t gold and from 84.0 m to 87.0 m grading 0.85 g/t gold.
On Section 20W, drill hole TF-170, drilled to a depth of 130.5 m, intersected mineralization from 3.0 m to 10.5 m grading 0.64 g/t gold, as well as several intersections 1.5 m in width containing grades that varied from 0.25 to 0.57 g/t gold, throughout the drill hole.
Hole TF-172, on section 40W, leaves the mineralization open to the southwest as it intersected a number of mineralized intervals which ranged in length from 1.5 m to 7.5 m and in grade from 0.27 to 0.56 g/t gold.
Hole TF-199, located on Section 20E, indicates that the mineralization remains open towards the northwest, based on the following mineral intercepts encountered in the hole: a 1.5 m wide interval grading 0.38 g/t gold from 18.0 m to 19.5 m, a second 3.0 m interval grading 1.05 g/t gold from 27.0 m to 30.0 m, a third interval of 6.0 m from 34.5 m to 40.5 m grading 0.52 g/t gold, a fourth from 45.0 m to 54.0 m (9.0 m) grading 0.33 g/t gold and two more intersections 1.5 m in width grading 0.43 and 0.20 g/t gold, respectively.
In the east-northeastern area of the San Francisco pit, condemnation drilling occurred with 7 RC holes drilled, all of which returned interesting mineral interceptions. These holes were TF-606 through TF-612 and the results are summarized in Appendix 2.
81
11.2.3 Drilling Results for the Areas West, Southwest and South of the San Francisco Pit
The following discussion includes the portion of land located to the west, southwest and south of the existing San Francisco pit. In these directions, the results of the drilling have demonstrated the continuity of the gold mineralization which occurs in parallel zones located in the hangingwall of the mineral zone exploited in the pit by Geomaque.
Up to June, 2010, Timmins drilled 136 RC holes totalling 14,676 m and averaging 107.91 m in depth in this area. The drilling results obtained have allowed Timmins to outline an extension to the mineralization of approximately 150 m in the southwestern portion of the San Francisco pit.
The area comprises that immediate portion of land located between the current powder and cap magazines and the existing waste dumps formed during the last exploitation period from 1995 to 2000. Geochemical sampling in very small windows between the dumps reveals the existence of mineralized zones, the projection of which goes underneath the waste dumps. As a consequence, this area is difficult and expensive to explore.
The results of the most significant drill assays are summarized in Appendix 2. Figure 11.10 is the drill hole location map on this portion of the area around the San Francisco pit. Some of the more significant assay results from the drilling are described below.
Hole TF-185, drilled to a depth of 139.5 m, is located on Section 1360W. The hole begins in bedrock and intersected 6 mineralized intervals. The mineralized intersections for hole TF-185 are as follows: from surface to 1.5 m grading 1.05 g/t gold, from 25.5 m to 39.0 m grading 1.77 g/t gold over 13.5 m, from 45.0 m to 49.5 m grading 0.82 g/t gold, from 51.0 m to 52.5 m grading 0.42 g/t gold, from 55.5 m to 61.5 m grading 0.41 g/t gold, and a further two short intersections each 1.5 m wide and grading 0.27 and 0.33 g/t gold. Given the inclination of the drill hole with respect to the general dip of the host lithology, the reported length is equal to the true thickness.
On section 520W, hole TF-418 was drilled to a depth of 128.01 m. Hole TF-418 cut mineralization from 25.90 m to 36.57 m grading 1.74 g/t gold and from 120.4 m to 124.97 m grading 0.42 g/t gold. Hole TF-467, drilled to a depth of 103.63 m, is located on Section 1340W. This hole intersected mineralization grading 6.14 g/t gold over a true width of 6.10 m from 41.14 m to 47.24 m.
82
Figure 11.10
Drill Hole Location Map on the West, Southwest and South of the San Francisco Pit
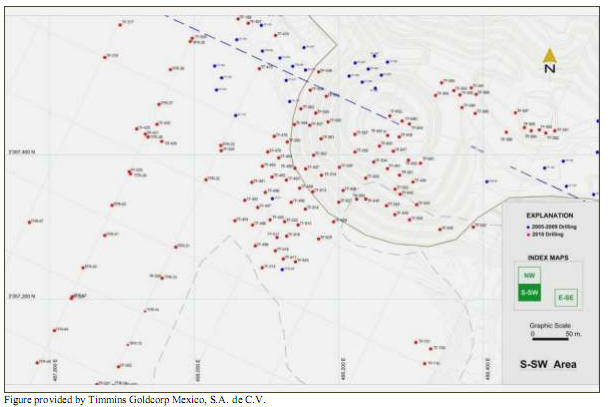
Hole TF-481, drilled to a depth of 103.63 m and located on Section 1240W, cut mineralization from surface to 3.0 m grading 1.11 g/t gold and from 70.10 m to 80.77 m grading 1.97 g/t gold. These were true width intersections.
On Section 1040W, hole TF-490 was drilled to a depth of 152.39 m and intersected mineralized zones from 57.91 m to 70.10 m grading 0.49 g/t gold and from 83.82 m to 92.96 grading 1.26 g/t gold.
Hole TF-491 on section 1180W was drilled to a depth of 152.40 m and intersected mineralization from 59.44 m to 74.68 m grading 1.86 g/t gold over a true width of 15.24 m.
On section 1060W, hole TF-492 drilled to a depth of 152.40 m, returned two significant mineral intersections, the first from 39.62 m to 53.34 m grading 0.95 g/t gold and the second from 57.91 m to 71.62 m grading 1.20 g/t gold. The hole also contained a number of other intersections up to 3 m in width with grades varying from 0.55 to 0.65 g/t gold.
Hole TF-548 on Section 980W was drilled to a depth of 82.29 m and returned three mineralized intervals, from 50.29 m to 56.38 m grading 0.37 g/t gold, from 57.91 to 67.05 grading 1.14 g/t gold and from 67.05 m to 77.72 m grading 0.21 g/t gold. Hole TF-551, drilled to a depth of 82.29 m, contained three mineralized intervals, from 32.0 m to 50.29 m grading 0.94 g/t gold, from 56.38 m to 64.0 m grading 1.14 g/t gold and from 68.58 m to 82.29 m grading 10.28 g/t gold. Hole TF-551 ended in mineralization and should be extended or followed up by drilling another nearby hole to fully intersect the mineralization. Hole TF-563, drilled to 82.29 m, cut a significant mineralized interval from 60.96 m to 73.15 m grading 1.08 g/t gold. Hole TF-564, drilled to a depth of 82.29 m, intersected a mineralized intersection from 64.0 m to 74.67 m grading 1.07 g/t gold.
83
Hole TF-585 was drilled to 42.67 m and is located on Section 930W. The hole intersected mineralization from surface to 3.04 m grading 0.37 g/t gold, a second interval from 4.57 to 13.71 m grading 2.27 g/t gold and a third from 15.24 m to 27.43 m grading 1.08 g/t gold.
On Section 950W, hole TF-587 intersected two mineral zones near surface, one from 10.66 m to 13.71 m grading 0.25 g/t gold and another from 18.28 m to 32.0 m grading 2.07 g/t gold.
On Section 1000W, a short drill hole TF-588, totalling 30.48 m in depth, intersected a mineralized zone from 1.52 m to 6.09 m (true width of 4.47) grading 7.60 g/t gold and a second zone from 7.60 m to 10.66 m grading 0.55 g/t gold.
On the section 1040W, hole TF-641, drilled to a depth of 121.92 m, contained several intersections as follows: from 4.57 m to 12.19 m grading 2.07 g/t gold, from 18.29 m to 25.91 m grading 5.22 g/t gold, from 68.58 m to 71.63 m grading 2.18 g/t gold, from 76.20 m to 80.77 m grading 2.44 g/t gold, from 86.87 m to 92.96 m grading 1.54 g/t gold and from 112.78 m to 117.35 m grading 0.91 g/t gold.
On Section 1060W, hole TF-644, drilled to a depth of 131.06 m, intersected four mineralized zones, the first from 12.19 m to 13.73 m grading 0.93 g/t gold, from 50.29 m to 54.86 m grading 0.36 g/t gold, from 56.39 m to 59.44 m grading 0.87 g/t gold and from 100.58 m to 106.68 m grading 5.07 g/t gold.
On the section 1080W, hole TF-647 intersected two mineralized intervals, from 71.63 m to 79.25 m, a width of 6.62 m, grading 2.29 g/t gold and from 83.82 m to 91.44 m, a width of 7.62 m, grading 0.34 g/t gold. TF-649, drilled to a depth of 121.92 m, intersected mineralization from 96.01 m to 109.73 m, a width of 13.72 m, grading 3.87 g/t gold.
On Section 1100W, TF-651, which was drilled to a depth of 100.58 m, intercepted three mineral zones: from surface to 10.67 m grading 0.85 g/t gold, from 54.86 m to 67.06 m (12.20 m width) grading 0.31 g/t gold and from 88.39 m to 100.58 m grading 4.39 g/t gold over a width of 12.19 m. Also, on Section 1100W, but to the northeast, hole TF-652, drilled to a depth of 137.16 m, intercepted mineralization from 48.77 m to 51.82 m grading 0.47 g/t gold, from 53.34 m to 54.86 m grading 2.97 g/t gold and from 96.01 m to 117.35 m (interval of 21.34 m width) grading 2.52 g/t gold.
Towards the west of Section 1520W is hole TF-723, which was drilled to a depth of 103.63 m and intersected three mineralized zones. The first zone was from 1.52 m to 6.09 m grading 1.98 g/t gold, the second zone was located between 30.48 m and 33.53 m grading 0.57 g/t gold and the third zone was from 76.20 m to 100.58 m, a width of 24.38 m grading 1.02 g/t gold.
84
11.2.4 Drilling Results of the Exploration at the Western Projection of the San Francisco Mineral Trend and Southeast of the La Chicharra Pit
This area, which comprises the land to the west of Section 1550W, has had very little exploration drilling conducted on it by both the previous operator and Timmins. The area between the San Francisco and La Chicharra pits includes both of the main mineral trends, which are the west and northwest projections of the San Francisco mineral trend in a northerly direction towards the targets La Perdida, La Escondida, etc, and the projection to the southeast and northwest of the La Chicharra mineral trend.
Most of this area is covered by alluvial material which obscures the geological features. Timmins completed a program of geological mapping and sampling which it used to orient the drilling. Timmins used both RAB and RC drilling, as well as a rotary drill, in order to explore this area in a rapid manner.
From January to June, 2010, Timmins drilled 41 RC holes totalling 3,968 m and 48 RAB drill holes totalling 3,723 m in this area. The holes were distributed along lines to the west-northwest of the La Loma 200 area, spaced 50 m along the lines, starting on line 1600W and continuing to line 2400W. Holes were not drilled on a regular pattern but most were drilled at specific sites where sampling and mapping indicated favourable traces of gold mineralization.
Assays indicated narrow mineralized intersections with generally very low gold grades. The best intersections were followed-up but did not confirm the extension of mineralization from the previous holes. The positions of the holes drilled in this section of the property correspond to the west portion of the quadrangles previously identified as northwest and west-northwest.
The most significant results obtained along the projection of the La Chicharra mineral trend occurred in hole TFR-16 (RAB nomenclature), located 500 m to the south of the San Francisco mine and 1,200 to the southeast of the La Chicharra pit. This hole intercepted a mineral interval of 21 m averaging 1.11 g/t gold, which included a 3 m interval grading 5.28 g/t gold. Four RC holes were drilled surrounding hole TFR-16 (TF-500, 501, 502 and 503). The assay results are summarized in Appendix 2 and have been interpreted preliminarily as confirmation of the continuity of the La Chicharra mineral trend for a further 1,400 m from the existing La Chicharra pit, or as belonging to a parallel mineral system to the San Francisco deposit.
85
11.2.5 Exploration Drilling Results on the Northern Targets
Drilling on the northern targets in 2008 began with a 3,045 m RC campaign totalling 30 drill holes distributed on 10 of the exploration targets located to the north of the San Francisco pit, at a distance of between 2 and 8 km. The areas covered correspond to the 1B area, El Socorro, La Perdida, La Escondida, La Trinchera, La Playa, El Diez and La Vann targets and the La Grande geochemistry anomaly located close to the La Vann target. The rest of the drill targets are related to old, small shallow underground developments located on mineralized quartz structures containing gold that have certain similarities to the San Francisco vein. The location of the drill holes on the north targets with respect to the San Francisco mine is shown in Figure 11.11.
Figure 11.11
Exploration Drilling On the North Targets
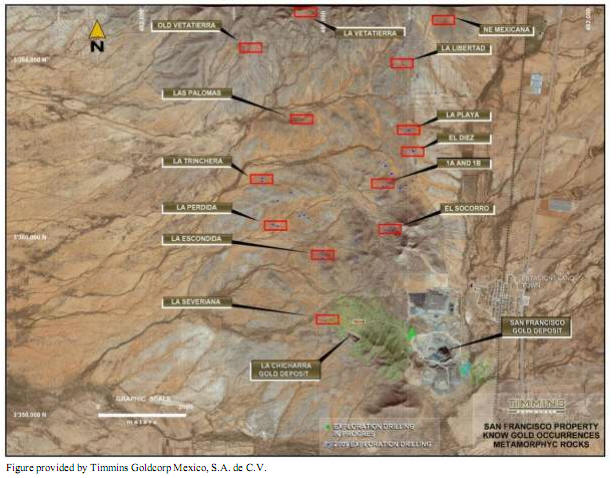
The results of the drilling demonstrate that further exploration potential exists to the north of the San Francisco mine.
86
In the 1B area, drill hole TF-48 intercepted an 18 m wide mineralized interval grading 0.43 g/t gold, from surface to 18 m. This hole was drilled perpendicular to the dip of the host rock, a granite-gneiss, and therefore the core length is also the true thickness. Drill hole TF-50 intersected 0.220 g/t gold over a width of 7.50 m from 42.0 to 49.50 m. Hole TF-51 intersected a 3 m mineralized interval grading 0.890 g/t gold between 36 and 39 m. Finally, drill holes TF-71, TF-72 and TF-73 contained multiple low grade mineralized intercepts with a reduced thickness which may reflect a broader mineralized area and the possibility of further discoveries.
Hole TF-74 drilled in the El Diez area, 2 km north of the 1B area, contained a mineral intercept 7.50 m wide grading 1.30 g/t gold and second 3 m wide intersection grading 0.170 g/t gold. In the same direction, but 1 km further north in the La Playa area, holes TF-57 and TF-75 intersected gold values ranging from 0.220 g/t and 0.320 g/t gold with widths varying from 1.50 to 6 m.
In the La Vann and La Grande areas, three drill holes had multiple mineralized intersections containing grades varying from 0.20 g/t to 0.32 g/t gold. Although these intersections were low grade, they demonstrate that there is the exploration potential for hidden mineral deposits to be located below the alluvium cover in this portion of the property. The most significant intersection for this area was located in hole TF-79. The intersection is 19.50 m wide and grades 0.32 g/t gold.
In the La Trinchera area the best intersections were 4.50 m wide grading 0.280 g/t gold and 1.52 m wide grading 0.760 g/t gold.
The brief drilling program conducted on the 10 northern exploration targets in the igneous-metamorphic package favourable for gold mineralization was successful. This program was important first to confirm the presence of the same lithology as that located at the San Francisco and La Chicharra gold deposits to the south, secondly to confirm the presence of anomalous gold values, in small concentrations, and finally to investigate the relationship between the drill results and air-magnetic structural interpretation.
Table 11.2 summarizes the significant drill intercepts on the exploration targets north of the San Francisco deposit.
87
Table 11.2
Summary of the Significant Drill Intersetions on the Exploration Targets North of the San Francisco
Deposit
Area
| Hole
Number | Depth
(m) | Mineral Interval |
| From (m) | To (m) | True Width (m) | Gold Grade (g/t) |
El Socorro and North
Socorro | TF-44 | 102.00 | 0.00 | 1.50 | 1.50 | 0.700 |
| TF-53 | 102.00 | 24.00 | 31.50 | 7.50 | 0.350 |
Area 1B
| TF-48 | 102.00 | 0.00 | 18.00 | 18.00 | 0.430 |
| TF-50 | 102.00 | 42.00 | 49.50 | 7.50 | 0.220 |
| TF-51 | 102.00 | 36.00 | 39.00 | 3.00 | 0.890 |
TF-71
|
99.00
| 13.50 | 15.00 | 1.50 | 0.140 |
| 49.50 | 51.00 | 1.50 | 0.340 |
| 54.00 | 55.00 | 1.00 | 0.170 |
| 63.00 | 64.50 | 1.50 | 0.230 |
| 70.50 | 72.00 | 1.50 | 0.480 |
TF-72
| 102.00 | 7.50 | 9.00 | 1.50 | 0.140 |
| | 28.50 | 30.00 | 1.50 | 0.370 |
| | 48.00 | 49.50 | 1.50 | 0.280 |
| TF-73 | 102.00 | 33.00 | 34.50 | 1.50 | 0.660 |
La Escondida
| TF-54 | 102.00 | 40.50 | 42.00 | 1.50 | 0.370 |
| | | 73.50 | 75.00 | 1.50 | 0.370 |
La Trinchera
|
TF-56 |
102.00 | 10.50 | 15.00 | 4.50 | 0.280 |
| 61.50 | 64.50 | 3.00 | 0.140 |
TF-77
|
102.00
| 6.00 | 7.50 | 1.50 | 0.120 |
| 12.00 | 13.50 | 1.50 | 0.570 |
| 99.00 | 100.50 | 1.50 | 0.760 |
La Playa
| TF-57
| 102.00
| 31.50 | 39.00 | 7.50 | 0.320 |
| 91.50 | 94.50 | 3.00 | 0.230 |
TF-75
|
102.00
| 12.00 | 13.50 | 1.50 | 0.220 |
| 24.00 | 30.00 | 6.00 | 0.390 |
| 43.50 | 45.00 | 1.50 | 0.300 |
| 55.50 | 57.00 | 1.50 | 0.270 |
| 70.50 | 72.00 | 1.50 | 0.250 |
La Vann
|
TF-79
|
102.00
| 25.50 | 28.50 | 3.00 | 0.230 |
| 33.00 | 37.50 | 4.50 | 0.210 |
| 63.00 | 82.50 | 19.50 | 0.320 |
El Diez |
TF-74 |
102.00 | 39.00 | 46.50 | 7.50 | 1.300 |
| 52.50 | 55.50 | 3.00 | 0.170 |
Gochemical
Anomaly La Grande
|
TF-58
|
102.00
| 16.50 | 21.00 | 4.50 | 0.290 |
| 22.50 | 28.50 | 6.00 | 0.220 |
| 30.00 | 33.00 | 3.00 | 0.200 |
| 39.00 | 40.50 | 1.50 | 0.551 |
| 46.50 | 48.00 | 1.50 | 0.220 |
| 60.00 | 61.50 | 1.50 | 0.380 |
TF-59 |
102.00 | 19.50 | 30.00 | 10.50 | 0.280 |
| 46.50 | 63.00 | 16.50 | 0.280 |
Table provided by Timmins Goldcorp Mexico, S.A. de C.V.
88
12.0 SAMPLING METHOD AND APPROACH
If known, a description of the historical sampling methods conducted on the San Francisco project is provided in Section 6. TMM, through its Mexican subsidiary (Timmins), conducted its initial exploration drilling program on the project in August and September, 2005, and instituted sampling procedures for the reverse circulation drilling program. These sampling procedures have been discussed in the 2005, 2007 and 2008 Technical Reports which have been filed on SEDAR.
12.1 2008 TO 2010 PROGRAMS
During the 2008 to June, 2010, drilling program, Timmins continued to use the sampling procedures instituted for the 2005 to 2007 reverse circulation drilling campaign. Micon discussed and examined the sampling procedures during the August, 2010, site visit and is satisfied that they were accurately carried out and were in accordance with the best practices currently in use by the mining industry, and that they are well documented. Micon concludes that the results produced by the procedures are reliable enough to form the basis for a mineral resource estimate.
Timmins’ 2008 to 2010 exploration drilling program consisted of 613 drill holes, totalling 57,753 m. All drill holes were field logged and sampled as the holes were in progress. During the drilling and each day that the drilling was completed, the information contained on the hand-written drilling logs (field logs) was transcribed into an Excel® spreadsheet. The Excel® spreadsheet contains the basic drill hole data, individual sample data and assay results, as well as the codes for the lithology, alteration and mineralization. This information was converted to an ASCII file to import it into the database which supports the present resource estimate by Timmins. Geological and mineralization interpretation was conducted based on cross-sections which were produced using an AutoCAD® software package.
The drilling completed in this period was based on analysis of the results of the exploration drill programs of previous years conducted by Timmins, and of the block model and interpretation of the probable extensions of the mineralization in the area near the San Francisco pit.
12.2 REVERSE CIRCULATION DRILLING
From the RC drilling, a portion of the material generated for each sample interval was retained in a plastic specimen tray created specifically for the reverse circulation program. The samples in plastic specimen trays constitute the primary reference for the hole in much the same way as the core does for diamond drilling. The specimen tray was marked with the drill hole number and each compartment within the tray was marked with both the interval and number for the respective sequential sample it contained. Empty compartments were left for the locations where both the blank and standard samples were inserted into the sequential sample stream and two compartments were filled and identified for each duplicate sample.
89
Due to the nature of RC drilling, only rock chip fragments are produced, and these range from a very fine grained powder up to coarse chips 2 cm in size. Since the stratigraphic contact between the different rock units cannot be identified exactly, the holes were sampled on equal 1.52 m (5 ft) intervals from the collar to the toe of the hole. The sample interval was chosen because it represented two samples per drill rod (3.04 m or 10 ft). In general, this is considered to be the standard sampling length within the industry.
Samples were taken in the overlying alluvium as well as within the underlying rock units. The alluvium samples were subject to random assaying, whereas every sample originating from the underlying rock units was assayed. The recovery of the material during the drilling program was excellent, in the order of 90% to 95%, in both near surface sulphide-oxide and sulphide zones.
A common feature in the sampling process for RC drilling is that a unique sample tag is inserted into the sample bag with each sample, and each sample bag is marked with its individual sample number. The bags containing the blank and standard samples were added into the sequential numbering system prior to shipment of the samples to the preparation facility. Sample preparation and assaying were performed at the San Francisco mine. Approximately 15% of the samples assayed in the laboratory at the San Francisco mine were checked at an external laboratory. The principal external laboratory has been the IPL-Inspectorate Laboratory in Vancouver, B.C.
Samples identified as field-duplicate samples during the RC drilling were split into two separate sequentially numbered samples during the sampling process at the drill.
12.3 SIGNIFICANT OR RELEVANT SAMPLES
The significant 2008 to 2010 drilling intersections for the San Francisco property were previously discussed in Section 11 and are summarized in Appendix 2. The significant drilling intersections from prior drilling campaigns are contained in the previous Technical reports posted by TMM on SEDAR.
12.4 MICON COMMENTS
Micon has reviewed Timmins sampling methods and approach and believes that they follow the “Exploration Best Practices Guidelines” as established by the CIM and published in August, 2000.
90
13.0 SAMPLE PREPARATION, ANALYSIS AND SECURITY
Details of sample preparation, analysis and security are not available for the historical work conducted by Geomaque during its operational period. However, a laboratory was located on the mine site and some of the sample preparation equipment was available for Timmins to use during its exploration programs.
Prior to its initial RC drilling program in August and September, 2005, Timmins did not conduct any sample preparation or analysis, since no samples were collected.
13.1 SAMPLE COLLECTION AND TRANSPORTATION
The RC drilling sampling was conducted by a team of two or three geological assistants under the close supervision of the TMM/Timmins staff geologists in charge of the on-site program. The staff geologists were responsible for the integrity of the samples from the time they were taken until they were delivered to the preparation facilities at the San Francisco mine.
13.1.1 Reverse Circulation Drilling
The RC sample collected at the drill site was discharged from the drill hole through a hose into a cyclone where it was collected in a plastic pail. Sampling of the material generated during the RC drilling was conducted at the drill rig using a stainless steel riffle splitter if the material was dry and a rotary splitter situated below the cyclone if the material was wet. The cyclone and splitters were cleaned between samples and, in the case of wet samples, the cyclone and splitters were blown out using compressed air and also washed out between each sample using clean water. Using a 12.5 cm drill bit and a sample length of 1.52 m, it is estimated that the original sample weighed 48.3 kg, prior to making allowance of recovery. It is estimated that the average recovery was between 90% and 95%, which would indicate that the mass of the recovered sample varied between 42 and 45 kg.
The method of splitting the samples derived from the RC drilling was as follows:
| | 1) | If the sample was dry, the entire sample interval was collected in a bucket and then passed through the riffle splitter twice before the final sample of 21 to 23 kg was collected with the remaining 21 to 23 kg rejected. The 21 to 23 kg sample was subjected to a second split to obtain two samples of 10 to 12 kg (an original and a witness sample). The geologist or an assistant (under supervision) had previously marked the drill hole number and sample number on the plastic sample bags and inserted the sample tag into the sample bag for the original sample. Both bags were closed and sealed at the drill with plastic tie wraps and transported to the camp facilities. |
| | | |
| | 2) | If the sample was wet, it was discharged to a cyclone and then passed through a rotary cone splitter to divide the sample into two equal portions, one of which wasautomatically rejected and the other collected and simultaneously split into two equal halves by means of a mechanism designed for this purpose and installed in the lower portion of the rotary splitter (See Figures 13.1 and 13.2) . The two samples were collected in fabrine (micropore) sample bags to allow retention of the solids and the slow dissipation of the drilling water through the pores in the sample bags without sample loss. In all cases, a flocculent was used to settle the solids, including the fine portion, prior to tying the fabrine bag. The outside of each sample bag was marked with the sample’s individual number which corresponded to the number on the sample tag which was inserted into the sample bag. |
91
Figure 13.1
Rotary Cone Splitter Set-up on Drill Hole TF-20 R
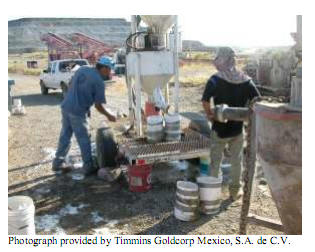
Figure 13.2
Close-up of the Final Discharge Splitter Set-up for a Wet Sample
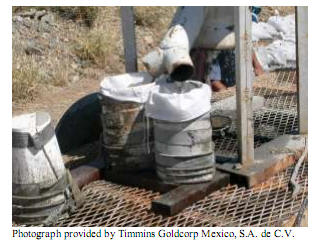
All samples from the RC drilling were prepared at the drill site by the TMM/Timmins staff geologists and their assistants. Each time that a hole was completed, a truck was dispatched from the drill site to the preparation facilities of the Timmins assaying laboratory, which currently supports the mining and processing operations of the San Francisco gold mine and the exploration in the area surrounding the pit.
92
For check assays and their preparation, a truck was periodically dispatched to deliver samples to the Hermosillo assay preparation facility of IPL Laboratories and, from January, 2010, to IPL-Inspectorate. Sample bags containing the blank and standard samples were added into the sequential numbering system prior to shipment of samples to the preparation facilities, both at the San Francisco mine and in Hermosillo. Samples selected as duplicates were split into two separate sequentially numbered samples during the sampling process at the drill.
13.1.2 General Procedures
As part of Timmins’ QA/QC procedures, a set of samples comprised of a blank sample, a standard reference sample and a field duplicate sample were inserted randomly into the sample sequence. The insertion rate for the blanks, standards and duplicate samples was one in every 25 samples.
13.1.2.1 Blank Samples
The blank sample used for the San Francisco drilling program was obtained from a tonalite dyke that crops out at the southwestern extent of the existing San Francisco pit. Geologically, the rock unit is younger than both the host rock of the gold mineralization and the mineralizing events in the region. A geologist currently working for Timmins and previously for both Geomaque and Fresnillo, considered the material in the dyke to be barren. This condition was verified during the 2005, 2006 and 2007 Timmins drill programs and confirmed again for the current report.
A 1 ton sample was obtained from the tonalite dyke in the outcrop, and washed thoroughly with fresh water to remove any dust that could have contaminated the sample because of its proximity to the mining operations within the San Francisco pit. The sample was then dried and crushed to minus 1 inch in size. The crushed material was homogenized in an agitated tank for 12 hours and finally passed through a splitter to be distributed in 1 kg sample bags which were sealed with tie wraps.
For the drill program in 2006 and 2007, five of the 1 kg samples were randomly selected and sent to different laboratories to be assayed for gold using the fire assay method and multi-element analysis using multi-acid digestion. All five laboratories were given a sample which corresponded to number 636741. All samples were prepared using the same procedure and the selected laboratories to which the samples were sent for assaying were ALS Chemex, ACME, Accurassay Laboratories (Accurassay), TSL Laboratories Inc. (TSL) and SGS Mineral Services (SGS), all of which are certified laboratories based in Canada.
Table 13.1 shows the assay results for the five samples for the group of elements of interest. The assay results obtained from the five separate independent laboratories indicate a very low to negligible content for gold, so that the material from the tonalite dyke can be used as a local blank sample for the drilling program.
93
Table 13.1
Assays for the Blank Samples Used for the San Francisco Project Drilling Program
| Laboratory | Gold
(ppb) | Silver
(ppb) | Arsenic
(ppm) | Copper
(ppm) | Molybdenum
(ppm) | Lead
(ppm) | Tungsten
(ppm) | Zinc
(ppm) |
| ALS Chemex | 6 | 0.75 | 1.6 | 84 | 0.75 | 31.2 | 2 | 122 |
| ACME | 10 | <2 | <0.02% | <0.00004 | <0.001% | <0.02% | <0.01% | <0.01% |
| SGS | 7 | <2 | <3 | 26 | 1 | 75 | <10 | 148 |
| TSL | <5 | 0.3 | 2 | 43 | 0.7 | 32.2 | 1.5 | 144 |
| Accurassay | 11 | <1 | 12 | 81 | 14 | 32 | <10 | 123 |
Table provided by Timmins Goldcorp Mexico, S.A. de C.V.
13.1.2.2 Standard Reference Materials
Certified standard reference materials (SRM’s) were submitted with each sample shipment during the course of the drill programs. A total of sixteen different standards were used and are summarized in the Table 13.2. Standard pulps, consisting of 70 to 100 g of material, were randomly inserted into each batch of 25 samples. The sixteen standards include low, medium and high gold grades in relation to the average grade of the known deposits in the area.
Table 13.2
Standard Reference Material Samples used During the 2008 to 2010 Drilling Program
| | Accepted Gold Value | Lower Gold
Limit (g/t) | Upper Gold
Limit (g/t) | | |
| Standard | g/t | +/- | Source | Material |
| OXA-71 | 0.085 | 0.002 | 0.083 | 0.087 | Rocklabs | Basalt and feldspar with gold |
| OXC-72 | 0.205 | 0.003 | 0.202 | 0.208 | Rocklabs | Basalt and feldspar with gold |
| CDN-GS-P5B | 0.440 | 0.040 | 0.400 | 0.480 | CDN | Low sulphidation gold system |
| OXE-74 | 0.615 | 0.006 | 0.609 | 0.621 | Rocklabs | Basalt and feldspar with gold |
| CDN-GS-P8 | 0.780 | 0.060 | 0.720 | 0.840 | CDN | High sulphidation gold system |
| OXF-65 | 0.805 | 0.014 | 0.791 | 0.819 | Rocklabs | Basalt and feldspar with gold |
| SG-31 | 0.996 | 0.011 | 0.985 | 1.007 | Rocklabs | Feldspars and iron pyrite |
| OXG-83 | 1.002 | 0.009 | 0.993 | 1.011 | Rocklabs | Basalt and feldspar with gold |
| CDN-GS-1E | 1.160 | 0.060 | 1.100 | 1.220 | CDN | High sulphidation gold system |
| OXH-66 | 1.285 | 0.012 | 1.273 | 1.297 | Rocklabs | Basalt and feldspar with gold |
| OXI-67 | 1.817 | 0.024 | 1.793 | 1.841 | Rocklabs | Basalt and feldspar with gold |
| CDN-HLHC | 1.970 | 0.220 | 1.750 | 2.190 | CDN | VMS Deposit, Specogna |
| CDN-GS-2C | 2.060 | 0.150 | 1.910 | 2.210 | CDN | Black granite and high gold ore |
| CDN-GS-3E | 2.970 | 0.270 | 2.700 | 3.240 | CDN | Quartz tourmaline veins |
| CDN-GS-3F | 3.100 | 0.240 | 2.860 | 3.340 | CDN | Agnico Eagle mines |
| CDN-GS-5C | 4.740 | 0.280 | 4.460 | 5.020 | CDN | VMS Deposit, Specogna |
Table provided by Timmins Goldcorp Mexico, S.A. de C.V.
Low, medium and high grade standard reference materials were used during the different drilling campaigns.
13.1.2.3 Duplicate Samples
For the RC drilling, the samples which were identified for duplication (field-duplicates) were processed and split in the same way as the regular samples taken on either side of them.
94
However, in the case of dry samples, the final 21 to 23 kg sample was subjected to a further split in the field which yielded two 10.5 to 11.5 kg samples. Wet samples were dried and then passed through the riffle splitter to obtain a second (duplicate) sample of approximately the same mass as the original. The duplicate samples were given sequential numbers and submitted as two separate samples for the purpose of assaying.
13.1.2.4 Preparation Laboratories
For all drilling during 2008, Timmins sent the samples to be prepared at the IPL-SSP facility in Hermosillo, prior to shipping the prepared samples to the IPL laboratory in Vancouver, British Columbia, for final analysis. RC drilling samples for the 2009 and 2010 drill program were prepared in the facility at the San Francisco mine. The sample preparation procedures for both SSP and the San Francisco laboratory are outlined below.
SSP Preparation Facilities
IPL conducts its sample preparation through the SSP preparation facilities in Hermosillo and, while SSP does not have its own ISO certification, it is operated under IPL’s ISO certification. IPL was subsequently acquired by Inspectorate and Timmins continues to work with the Inspectorate laboratories, on the condition that all of the samples to be assayed are sent to the IPL laboratory in Vancouver.
San Francisco Mine Preparation Facilities
The procedure used at the San Francisco mine for preparation of samples to be assayed for gold is as follows:
| | 1. | The samples received are inspected by the laboratory supervisor or an assigned deputy, ensuring that each is identified and that the original packing is not damaged. All of the samples are placed in the designated reception area. |
| | | |
| | 2. | On the registration form (Filling Reception Sample Format), the user must enter the date and time, the Work Order number assigned by the laboratory, and record the origin of the sample, elements to be analyzed, requested assay method, sample type (rock fragments, soil, etc.) and priority of the sample. The registration form is filled out in duplicate. |
| | | |
| | 3. | Once reviewed, the form is then registered with the name and signature of the people who submitted and received the samples. |
| | | |
| | 4. | All exploration and mine samples are weighted individually, with the weight recorded in the designated notebooks. The samples are then delivered to sampling preparation staff. |
95
| | 5. | All samples received are dried in trays that are of an adequate size to ensure that they remain free of any contaminating material. |
| | | |
| | 6. | Using a permanent marker, each sample is labelled according to its original identification number. Each sample is poured into a corresponding tray, ensuring that 100% of the sample is contained within the tray to avoid cross contamination of samples. Inside each tray is an identification card that matches the original identification label. |
| | | |
| | 7. | Each tray containing a sample is placed in the oven. |
| | | |
| | 8. | Samples with a low moisture content are checked after 60 minutes to see if they have dried. Samples with high moisture content are checked after 3, 6, or 8 hours, at discretion of the supervisor. Once the samples are completely dry, they are removed from the oven and placed on trolleys for transport. |
| | | |
| | 9. | The initial crushing is done in a jaw crusher, after it has been cleaned with compressed air. A first pass is conducted to reduce the size of particles to 85% passing a ¼ inch mesh. The material is then transferred to another tray that has already been labelled with the original sample number. Once the crushing is completed, the crusher and trays used in the process are cleaned using compressed air, and then the crusher is cleaned using fragments of monzonite dike. This material is monitored by the laboratory periodically to ensure that it is unmineralized. |
| | | |
| | 10. | A second crushing pass is performed using a roll crusher with an opening between the rollers of 10 mesh (2 mm), in order to obtain a product of minus 10 mesh. |
| | | |
| | 11. | The minus 10 mesh product is homogenized by rolling it on a rectangular blanket, canvas or plastic liner approximately 50 x 60 cm. Once the sample homogenized, it is placed back into the tray to be split in a Jones Riffle Splitter. |
| | | |
| | 12. | Prior to splitting the sample, the splitter is checked to ensure that it is free of particles that could contaminate the sample. Compressed air is used where necessary to clean the splitter. The sample is then split, with one half being returned to the original sample bag and the other portion being split again. |
| | | |
| | 13. | The sample continues to be split between 3 to 8 times, until a sample of approximately 250 grams is obtained. This sample is then sent to the pulverizer. |
| | | |
| | 14. | Pulverizing is conducted such that 90% of the material is minus 150 mesh. The samples arrive at the pulverizing process in laminated kraft envelopes, with each one identified according to the sample number and the work order. Once each sample has been pulverized, it is delivered to the laboratory for assaying. |
96
13.2 RESULTS OF THE QA/QC PROGRAM
13.2.1 Check Assaying
A total of 1,593 RC samples were chosen during the laboratory sample preparation procedure for check assaying, and additional pulps from these samples were sent to IPL-Inspectorate as a check against the assays obtained at the San Francisco mine laboratory. From the set of 1,593 samples, 143 pulps were sent to ACME Laboratories, as a third check against the original assays. Both IPL-Inspectorate and ACME are located in Vancouver. Samples for the check assaying program were selected randomly from the mineralized zones and from above and below those zones. Most of the samples selected were of low grade. Of the total population sent to be checked, 118 samples were eliminated. Those were samples for which zero gold assays were reported by the San Francisco mine laboratory or with gold values close to the lower detection limit of IPL-Inspectorate.
Table 13.3 summarizes the correlation between the mean grade for the San Francisco mine laboratory gold assays and the IPL assays for the duplicate pulps. Figure 13.3 is a histogram of the frequency of the gold assays from the primary laboratory, showing that most of the samples were in the lower range of gold grade, with more that 80% in the range of 0.1 to 1 g/t gold.
Table 13.3 indicates that, taken overall, the mean grade of the 1,593 check samples, as determined by the two laboratories, is in reasonable agreement.
Table 13.3
Check Assay Results for the 2008 to 2010 Drilling Program
| Number of Samples | 1,593 |
| SF Mine Lab Mean Grade | 0.84 g/t Au |
| IPL-Inspectorate Mean Grade | 0.81 g/t Au |
| Difference Between Means | 0.03 |
| Mean Difference % | 3.98% |
| Correlation Factor | 0.9733 |
Table provided by Timmins Goldcorp Mexico, S.A. de C.V.
97
Figure 13.3
Histogram of Frequency of Check Assays
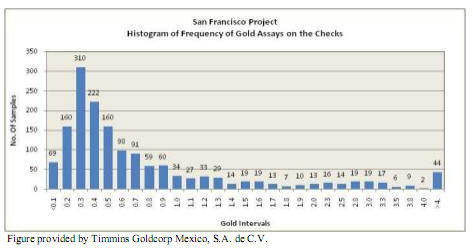
Figures 13.4, 13.5 and 13.6 are scatter plots of the correlation between the San Francisco mine assays and the IPL-Inspectorate assays for the same pulp samples. These charts show that, although different assay results were obtained on a significant number of samples, there is not indication of any overall bias.
Figure 13.4
Scatter Plot for Gold SF Mine Laboratory Check Assays vs. IPL-Inspectorate (all samples)
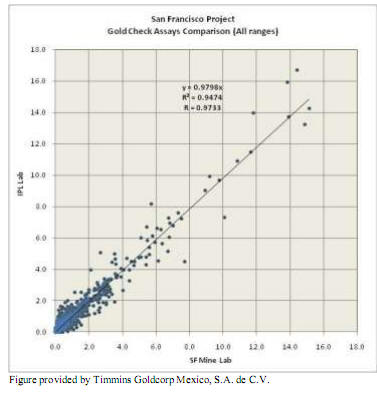
98
Figure 13.5
Scatter Plot for Gold SF Mine Laboratory Check Assays vs. IPL-Inspectorate (0.10 to 3 g/t Gold)
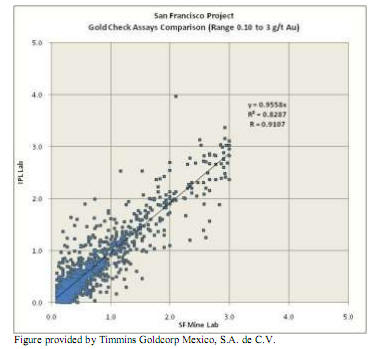
Figure 13.6
Scatter Plot for Gold SF Mine Laboratory Check Assays vs. IPL-Inspectorate (0.10 to 5 g/t Gold)
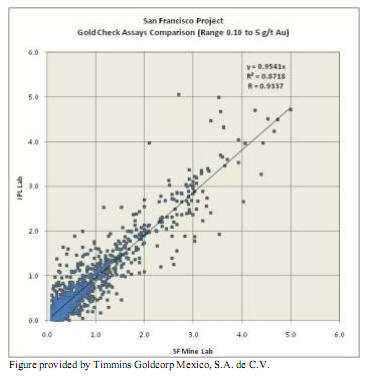
99
13.2.2 Standard Reference Material Samples
Sixteen standards, including three ranges of gold grades, were purchased from two different suppliers. The OX standards were purchased from Proveedora de Laboratorios del Norestes, S.A. de C.V., which distributes Standard Reference Material samples prepared by Rocklabs Ltd. (RockLabs) of Auckland, New Zealand. The CDN SRM’s were purchased directly from CDN Resource Laboratories Ltd., of Langley, B. C., Canada.
The Table 13.4 shows the assays and standard deviations used to compare the results from the San Francisco mine laboratory and IPL s against the SRM’s.
Both the accepted value and the standard deviation correspond to those included in the certificate for each standard, based on a minimum of 12 laboratories with each one assaying a pulp of the same material 10 times in the case of the CDN standards and up to 32 different laboratories reporting 2 assays of a pulp of the same material for RockLabs. RockLabs recommends that the standard deviation should be used as a basis for setting control limits when plotting the assay results of an individual laboratory.
Normally, the range of accepted values corresponds to a variation ±5% of the averaged assay for each SRM; however, RockLabs notes that this parameter does not reflect the variability that any particular laboratory may experience in its own repetitive testing.
Table 13.4
Standard Deviation (SD) for each of the SRM’s, Comparison with the Accepted Value
Standard
| Accepted Gold Value | Standard
Deviation | 2 Standard
Deviations |
| g/t | +/- |
| OXA-71 | 0.085 | 0.002 | 0.006 | 0.011 |
| OXC-72 | 0.205 | 0.003 | 0.008 | 0.016 |
| CDN-GS-P5B | 0.440 | 0.040 | 0.018 | 0.036 |
| OXE-74 | 0.615 | 0.006 | 0.017 | 0.034 |
| CDN-GS-P8 | 0.780 | 0.060 | 0.025 | 0.050 |
| OXF-65 | 0.805 | 0.014 | 0.034 | 0.068 |
| SG-31 | 0.996 | 0.011 | 0.028 | 0.056 |
| OXG-83 | 1.002 | 0.009 | 0.027 | 0.054 |
| CDN-GS-1E | 1.160 | 0.060 | 0.032 | 0.063 |
| OXH-66 | 1.285 | 0.012 | 0.320 | 0.640 |
| OXI-67 | 1.817 | 0.024 | 0.062 | 0.124 |
| CDN-HLHC | 1.970 | 0.220 | 0.111 | 0.222 |
| CDN-GS-2C | 2.060 | 0.150 | 0.083 | 0.166 |
| CDN-GS-3E | 2.970 | 0.270 | 0.130 | 0.260 |
| CDN-GS-3F | 3.100 | 0.240 | 0.105 | 0.209 |
| CDN-GS-5C | 4.740 | 0.280 | 0.102 | 0.204 |
Table provided by Timmins Goldcorp Mexico, S.A. de C.V.
SRM OXA-71 - Gold Concentration of 0.085 g/t Au
All standards starting with the letters OX in their description originated with RockLabs.
100
SRM OXA-71 is formed from basalt and feldspar minerals, with minor quantities of finely divided minerals containing gold that have been screened to ensure there is no gold nugget effect. The certificate establishes that pulverized basalt rock and feldspar minerals were blended with finely pulverized and screened gold-containing minerals. Once the powders were uniformly mixed, the composite was placed into 2,448 wide-mouthed jars, each bearing a unique number.
SRM sample OXA-71 is the lowest in the range of the gold grades among the SRM’s used. Table 13.6 is a summary of the assays obtained for this standard by both the San Francisco mine laboratory and IPL. Neither laboratory obtained consistent or acceptable results.
Given the low grade of this standard, it was considered that a variation of 10% above or below the accepted value was a reasonable control limit. It can be seen from Table 13.4 that 94% of the assays of this standard performed buy the San Francisco laboratory, and 69% of those performed by IPL, fall outside this control limit. It is recommended that this standard be re-assayed a number of times at San Francisco, to determine if the standard has been thoroughly homoginized.
Table 13.5
Summary of the Comparison of the San Francisco Mine and IPL Laboratories against SRM OXA-71
(0.085 g/t Gold)
| Details | San Francisco Mine
Laboratory | IPL Laboratory |
| Number of samples | 53 | 23 |
| Standard value (g/t Au) | 0.085 | 0.085 |
| Average (g/t Au) | 0.089 | 0.077 |
| Absolute difference | 0.004 | -0.008 |
| Difference % | 4.79 | -9.70 |
| Samples outside the limit | 50 | 16 |
| Percentage % | 94.34 | 69.57 |
Table provided by Timmins Goldcorp Mexico, S.A. de C.V.
Figures 13.7 and 13.8 shows the control charts for each laboratory for SRM OXA-71.
101
Figure 13.7
Control Chart for SRM OXA-71 against the Assay Results from the San Francisco Mine Laboratory
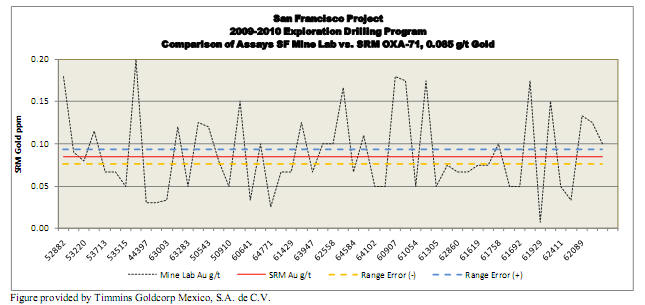
Figure 13.8
Control Chart for SRM OXA-71 against the Assay Results from IPL Laboratories
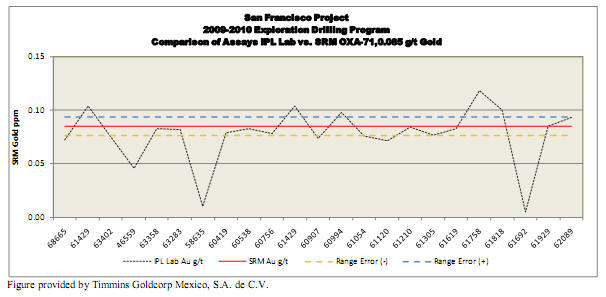
SRM OXC-72 - Gold Concentration of 0.205 g/t
SRM OXC-72 has a gold concentration of 0.205 g/t and is comprised of basalt and feldspar minerals with minor quantities of finely divided gold-containing minerals that have been screened to ensure that there is no gold nugget effect.
102
A total of 131 samples of this material were sent to the assay laboratories, 92 to the San Francisco mine laboratory and 39 to the IPL laboratory. Table 13.7 summarizes the assay results for both laboratories for the SRM OXC-72 material. Figures 13.9 and 13.10 are the corresponding control charts.
SRM OXC-72 is a low grade sample, which tends to magnify any variation in repetitive analysis above or below the standard value. This is observed in the large fluctuations shown in Figures 13.9 and 13.10. For the San Francisco mine laboratory, almost 85% of the assays fall outside of the accepted limits, 43 below and 49 above, although the average assay obtained at San Francisco is very close to the accepted value of the standard.
The average assay obtained y IPL was also very close to the accepted value of the standard. Although nearly 44% of the IPL assays fell outside the accepted limits, the degree of variation is not nearly as marked as that experienced at San Francisco.
Table 13.6
Comparison of the San Francisco Mine and IPL Laboratories against SRM OXC-72
| Details | SF Mine Laboratory | IPL Laboratory |
| Number of samples | 87 | 39 |
| Average (g/t gold) | 0.202 | 0.21 |
| Standard value (g/t gold) | 0.205 | 0.21 |
| Absolute difference | 0.003 | 0.00 |
| Difference (%) | -1.71% | 2.17% |
| Samples outside the limit | 75 | 17 |
| Percent (%) | 86.21% | 43.6% |
Table provided by Timmins Goldcorp Mexico, S.A. de C.V.
Figure 13.9
Control Chart for SRM OXC-72 against the Assay Results from the SF Mine Laboratory
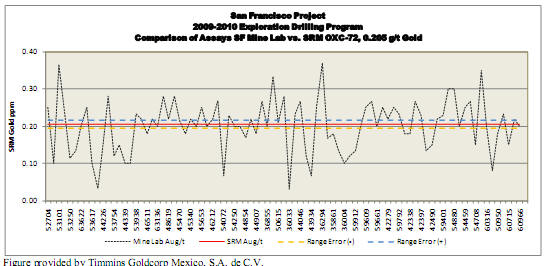
103
Figure 13.10
Control Chart for SRM OXC-72 against the Assay Results from the IPL Laboratory
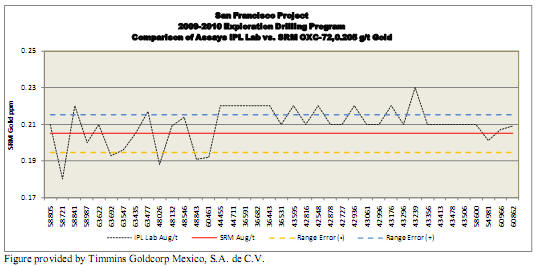
SRM CDN-GS-P5B – Gold Concentration of 0.440 g/t Au
Standard CDN-GS-P5B was submitted only to the San Francisco mine laboratory. Results are shown in Table 13.7 and Figure 13.11. The average grade of this standard, assayed by San Francisco, was 21.5% lower than the accepted value, and more than half of the assays fell outside the control value.
Table 13.7
Summary of the Comparison of the San Francisco Mine Laboratory Results versus SRM CDN-GS-P5B
| Details | San Francisco Mine
Laboratory |
| Number of samples | 55 |
| Standard value (g/t gold) | 0.440 |
| Average (g/t gold) | 0.362 |
| Absolute difference | -0.078 |
| Difference (%) | -21.49% |
| Samples outside the limit | 30 |
| Percent (%) | 54.55% |
Table provided by Timmins Goldcorp Mexico, S.A. de C.V.
104
Figure 13.11
Control Chart for SRM CDN-GS-P5B Versus the Assay Results from the San Francisco Mine
Laboratory
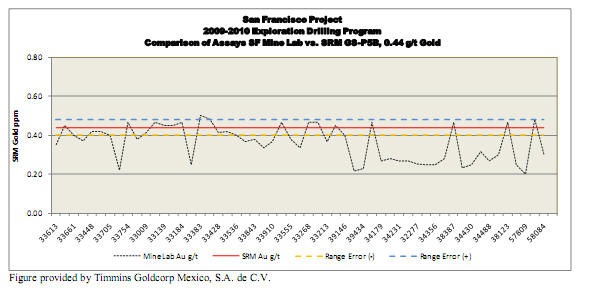
SRM OXE-74 – Gold Concentration of 0.615 g/t Au
The results obtained on standard OXE-74, by both the San Francisco mine and IPL, are summarized in Table 13.8 and Figures 13.12 and 13.13. Again, variable results were obtained with a high proportion of assays falling outside the control limits, particularly at San Francisco.
Table 13.8
Comparison of the San Francisco Mine and IPL Laboratory Results for SRM OXE-74
| Details | San Francisco Mine Laboratory | IPL Laboratory |
| Number of samples | 126 | 60 |
| Average (g/t gold) | 0.555 | 0.579 |
| Standard value (g/t gold) | 0.615 | 0.615 |
| Absolute difference | -0.060 | -0.036 |
| Difference % | -9.75% | -5.91% |
| Samples outside the limit | 85 | 18 |
| Percent (%) | 67.46% | 30.00% |
Table provided by Timmins Goldcorp Mexico, S.A. de C.V.
105
Figure 13.12
Control Chart for SRM OXE-74 Versus the Assay Results from the San Francisco Mine Laboratory
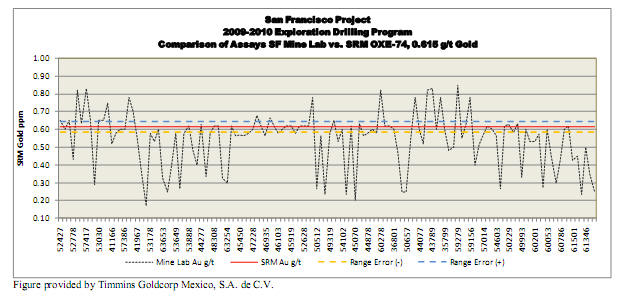
Figure 13.13
Control Chart for SRM OXE-74 against the Assay Results from the IPL Laboratory
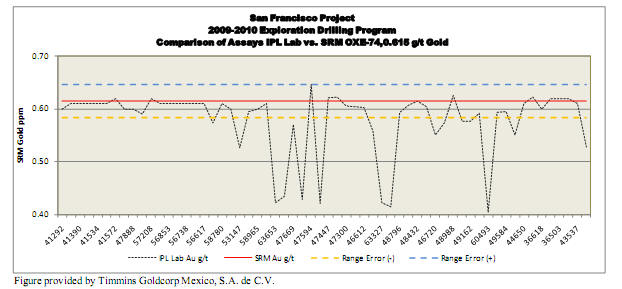
SRM CDN-GS-P8 – Gold Concentration of 0.780 g/t Au
The results obtained by both laboratories on standard CDN-GS-P8 were generally satisfactory, as shown in Table 13.9 and Figures 13.14 and 13.15, although the San Francisco results again exhibit variability.
106
Table 13.9
Summary of the Comparison of the San Francisco Mine and IPL Laboratories Assay Results against the SRM CDN-GS-P8
| Details | San Francisco Mine Laboratory | IPL Laboratory |
| Number of samples | 102 | 16 |
| Average (g/t gold) | 0.783 | 0.753 |
| Standard value (g/t gold) | 0.780 | 0.780 |
| Absolute difference | 0.003 | -0.028 |
| Difference (%) | 0.43% | -3.53% |
| Samples outside the limit | 42 | 3 |
| Percent (%) | 41.18% | 18.75% |
Table provided by Timmins Goldcorp Mexico, S.A. de C.V.
Figure 13.14
Control Chart for SRM CDN-GS-P8 against the Assay Results from the San Francisco Mine Laboratory
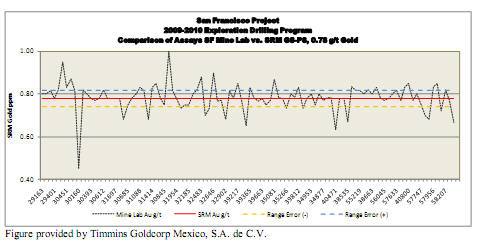
Figure 13.15
Control Chart for SRM CDN-GS-P8 against the Assay Results from the IPL Laboratory
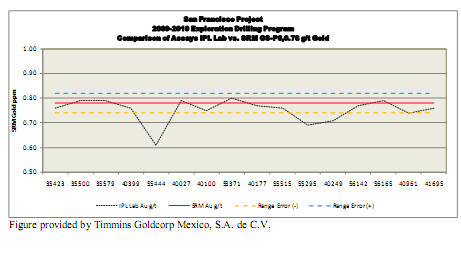
107
SRM OXF-65 – Gold Concentration of 0.805 g/t Au
The results obtained by both laboratories on standard OXF-65 are shown in Table 13.10 and Figures 13.16 and 13.17. The results from IPL are satisfactory, but nearly 90% of the San Francisco assays fell outside the control limits.
Table 13.10
Summary of the Comparison of the San Francisco Mine and IPL Laboratories versus the SRM OXF-65
| Details | San Francisco Mine Laboratory | IPL Laboratory |
| Number of samples | 27 | 11 |
| Average | 0.702 | 0.787 |
| Standard value | 0.805 | 0.805 |
| Absolute difference | -0.103 | -0.018 |
| Difference % | -12.74% | -2.20% |
| Samples outside the limit | 24 | ---- |
| Percent | 88.89% | 0.00% |
Table provided by Timmins Goldcorp Mexico, S.A. de C.V.
Figure 13.16
Control Chart for SRM OXF-65 versus the Assay Results from the San Francisco Mine Laboratory
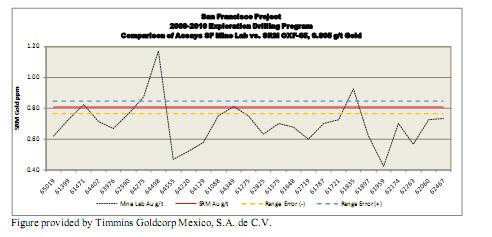
Figure 13.17
Control Chart for SRM OXF-65 against the Assay Results from the IPL Laboratory
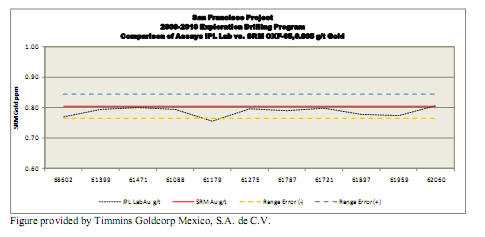
108
SRM SG-31 – Gold Concentration of 0.996 g/t Au
SRM SG-31 was prepared by RockLabs using feldspars and barren iron pyrites with minor quantities of finely divided gold-containing minerals that have been screened to ensure there is no gold nugget effect. The results obtained by both the San Francisco and IPL laboratories are provided in Table 13.11 and Figures 13.18 and 13.19. In this instance, the assays by both laboratories show a high degree of variation, compared to the accepted value of the standard.
Table 13.11
Summary of the Comparison of the San Francisco Mine and IPL Laboratories versus SRM SG-31
| Details | San Francisco Mine Laboratory | IPL Laboratory |
| Number of samples | 16 | 14 |
| Average (g/t gold) | 0.890 | 0.938 |
| Standard value (g/t gold) | 0.996 | 0.996 |
| Absolute difference | -0.106 | -0.58 |
| Difference (%) | -10.62% | -5.84% |
| Samples outside the limit | 10 | 5 |
| Percent (%) | 62.50% | 35.71% |
Table provided by Timmins Goldcorp Mexico, S.A. de C.V.
Figure 13.18
Control Chart for SRM SG-31 versus the Assay Results from the San Francisco Mine Laboratory
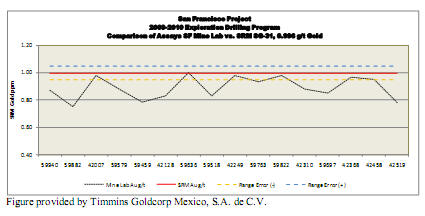
Figure 13.19
Control Chart for SRM SG-31 versus the Assay Results from the IPL Laboratory
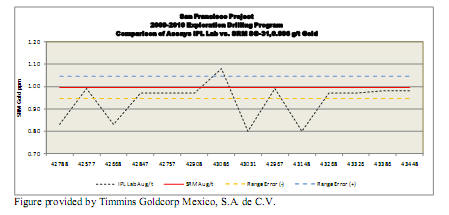
109
SRM CDN-GS-1E – Gold Concentration 1.160 g/t Au
The assays obtained by the San Francisco and IPL laboratories as standard CDN-GS-1E are presented in Table 13.12 and Figures 13.20 and 13.21. The patterns are similar to those obtained from other standards.
Table 13.12
Summary of the Comparison of the San Francisco Mine and IPL Laboratories
versus the SRM CDN-GS-1E
| Details | San Francisco Mine Laboratory | IPL Laboratory |
| Number of samples | 106 | 19 |
| Average (g/t gold) | 1.113 | 1.153 |
| Standard value (g/t gold) | 1.160 | 1.160 |
| Absolute difference (%) | -0.047 | -0.007 |
| Difference % | -4.09% | -0.64% |
| Samples outside the limit | 49 | 8 |
| Percent (%) | 46.23% | 42.11% |
Table provided by Timmins Goldcorp Mexico, S.A. de C.V.
Figure 13.20
Control Chart for SRM CDN-GS-1E versus the Assay Results from the San Francisco Mine Laboratory
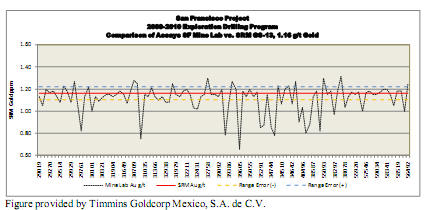
Figure 13.21
Charts Control for SRM CDN-GS-1E against the Assay Results from the IPL Laboratory
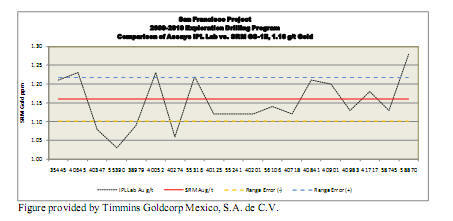
110
SRM OXH-66 – Gold Concentration of 1.285 g/t Au
As shown in Table 13.13 and Figures 13.22 and 13.23, the results obtained by IPL on standard OXH-66 are satisfactory, but those obtained by the San Francisco laboratory exhibit extreme variability.
Table 13.13
Summary of the Comparison of the San Francisco Mine and IPL Laboratories against the SRM OXH-66
| Details | San Francisco Mine Laboratory | IPL Laboratory |
| Number of samples | 97 | 49 |
| Average (g/t gold) | 1.182 | 1.278 |
| Standard value (g/t gold) | 1.285 | 1.285 |
| Absolute difference | -0.103 | -0.007 |
| Difference (%) | -8.04% | -0.54% |
| Samples outside the limit | 42 | 3 |
| Percent (%) | 43.30% | 6.12% |
Table provided by Timmins Goldcorp Mexico, S.A. de C.V.
Figure 13.22
Control Chart for SRM OXH-66 versus the Assay Results from the San Francisco Mine Laboratory
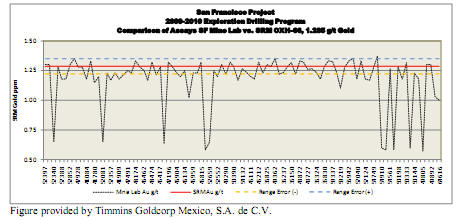
Figure 13.23
Control Chart for SRM OXH-66 against the Assay Results from the IPL Laboratory
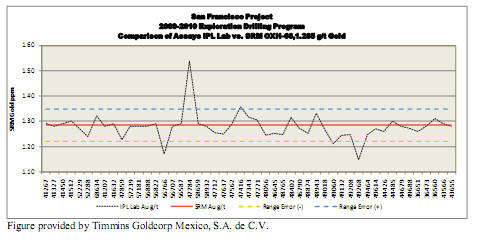
111
SRM OXI-67 – Gold Concentration of 1.817 g/t Au
Standard OXI-67 was submitted to the San Francisco laboratory only, yielding the results shown in Table 13.14 and Figure 13.24. Generally, these results are satisfactory.
Table 13.14
Summary of the Comparison of the San Francisco Mine Laboratory against SRM OXI-67
| Details | San Francisco Mine Laboratory |
| Number of samples | 14 |
| Average (g/t gold) | 1.803 |
| Standard value (g/t gold) | 1.817 |
| Absolute difference | 0.014 |
| Difference (%) | 0.75% |
| Samples outside the limit | 5 |
| Percent (%) | 35.71% |
Table provided by Timmins Goldcorp Mexico, S.A. de C.V.
Figure 13.24
Control Chart for SRM OXI-67 against the Assay Results from the San Francisco Mine Laboratory

SRM CDN-GS-2C – Gold Concentration of 2.060 g/t Au
Standard CDN-GS-2C was also submitted only to the San Francisco laboratory, yielding the results shown in Table 13.15 and Figure 13.25. Again, the assays obtained by this laboratory are highly variable, with nearly half falling outside the control limit.
112
Table 13.15
Summary of the Comparison of the San Francisco Mine Laboratory against SRM CDN-GS-2C
| Details | San Francisco Mine Laboratory |
| Number of samples | 63 |
| Average (g/t gold) | 2.171 |
| Standard value (g/t gold) | 2.060 |
| Absolute difference | 0.111 |
| Difference (%) | 5.41% |
| Samples outside the limit | 30 |
| Percent (%) | 47.62% |
Table provided by Timmins Goldcorp Mexico, S.A. de C.V.
Figure 13.25
Control Chart for SRM CDN-GS-2C against the Assay Results from the San Francisco Mine Laboratory
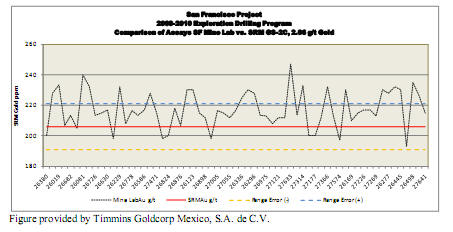
SRM CDN-GS-3E – Gold Concentration of 2.970 g/t Au
The results obtained by the San Francisco laboratory on standard CDN-GS-3E were highly variable, as shown in Table 13.16 and Figure 13.26.
Table 13.16
Summary of the Comparison of the San Francisco Mine Laboratory against SRM CDN-GS-3E
| Details | San Francisco Mine Laboratory |
| Number of samples | 51 |
| Average (g/t) | 2.940 |
| Standard value (g/t) | 2.970 |
| Absolute difference | -0.030 |
| Difference (%) | -1.02% |
| Samples outside the limit | 20 |
| Percent (%) | 39.22% |
Table provided by Timmins Goldcorp Mexico, S.A. de C.V.
113
Figure 13.26
Control Chart for SRM CDN-GS-3E against the Assay Results from the San Francisco Mine Laboratory
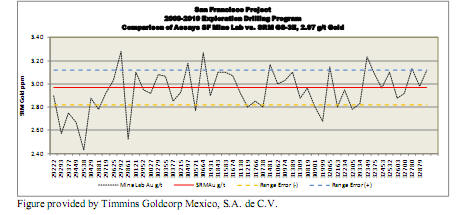
SRM CDN-GS-3F – Gold Concentration of 3.100 g/t Au
As shown in Table 13.17 and Figure 13.27, the San Francisco laboratory also obtained variable results in assaying standard CDN-GS-3F.
Table 13.17
Summary of the Comparison of the San Francisco Mine Laboratory against SRM CDN-GS-3F
| Details | San Francisco Mine Laboratory |
| Number of samples | 15 |
| Average (g/t gold) | 3.183 |
| Standard value (g/t gold) | 3.100 |
| Absolute difference | 0.083 |
| Difference (%) | 2.69% |
| Samples outside the limit | 4 |
| Percent (%) | 26.67% |
Table provided by Timmins Goldcorp Mexico, S.A. de C.V.
Figure 13.27
Control Chart for SRM CDN-GS-3F against the Assay Results from the San Francisco Mine Laboratory
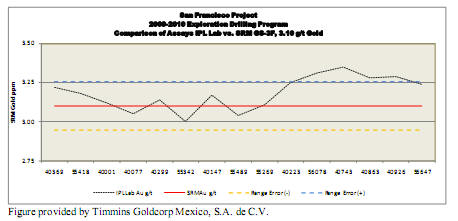
114
SRM CDN-GS-5C – Gold Concentration of 4.740 g/t Au
Standard CDN-GS-5C is the highest grade standard used at the San Francisco property. As shown in Table 13.18 and Figure 13.28, the assays obtained on this standard by the San Francisco laboratory were relatively consistent, but below the accepted value.
Table 13.18
Summary of the Comparison of the San Francisco Mine Laboratory against the SRM CDN-GS-5C
| Details | San Francisco Mine Laboratory |
| Number of samples | 8 |
| Average | 4.519 |
| Standard value | 4.740 |
| Absolute difference | -0.221 |
| Difference % | -4.66% |
| Samples outside the limit | 1 |
| Percent | 12.50% |
Table provided by Timmins Goldcorp Mexico, S.A. de C.V.
Figure 13.28
Control Chart for SRM CDN-GS-5C against the Assay Results from the San Francisco Mine Laboratory

13.2.3 Blanks
Blanks samples were inserted into the stream sampling in an average of one for every 25 samples submitted to the laboratory. For the period September, 2009 to March, 2010, a total of 1,363 blanks were submitted for analysis.
Of the 1,363 blank samples, 973 were assayed in the laboratory at the San Francisco mine and the remaining 390 were assayed by IPL during 2009 and IPL-Inspectorate in 2010. Table 13.19 summarizes the overall assay results obtained by the San Francisco mine laboratory for the blank samples and Table 13.20 shows the results for IPL and IPL-Inspectorate.
115
The results obtained by IPL and IPL-Inspectorate were satisfactory. The San Francisco laboratory, however, obtained three assays for the blank samples in the range of 0.100 to 0.367 g/t gold. Given that the San Francisco laboratory assayed 973 blank samples, it is possible that the three significant outliers were either mislabelled or contaminated samples. Re-assaying of these samples, by both the San Francisco laboratory and IPL-Inspectorate, is recommended.
Table 13.19
Summary of Blank Assay Data for the September, 2009 to March, 2010 Drill Program (San Francisco
Laboratory)
| Details | San Francisco Mine Laboratory Results |
| Number of samples | 973 |
| Mean grade (g/t gold) | 0.111 |
| Maximum grade (g/t gold) | 0.367 |
| Minimum gold grade (g/t gold) | <0.030 |
| Standard deviation | 0.105 |
Table provided by Timmins Goldcorp Mexico, S.A. de C.V.
Table 13.20
Summary of Blank Assay Data for the September, 2009 to March, 2010 Drill Program (IPL and IPL-
Inspectorate Laboratory)
| Details | IPL/IPL-Inspectorate Laboratory Results |
| Number of samples | 390 |
| Mean grade (g/t gold) | 0.015 |
| Maximum grade (g/t gold) | 0.190 |
| Minimum gold grade (g/t gold) | 0.005 |
| Standard deviation | 0.019 |
Table provided by Timmins Goldcorp Mexico, S.A. de C.V.
13.2.4 Duplicates
Field duplicate samples are taken during the drill program at the rate of one duplicate for every 25 samples. For the reverse circulation drilling, the duplicate samples were taken after the initial drill sample (41 to 45 kg) had been split in the field to obtain a 21- to 23- kg sample. To obtain duplicate samples, the initial sample was split again in the field, to provide two samples of approximately 11 kg each.
The duplicate samples were assigned consecutive numbers in the sample numbering sequence, so that the laboratory did not know it was receiving duplicate samples. These samples were submitted in the same shipment as their matching original samples but were not necessarily placed in the same furnace load as the matching original sample.
A total of 742 randomly selected intervals were selected for duplicate analyses during the drilling conducted from September, 2009 to June, 2010, on the San Francisco property. Of the total, 449 duplicate pairs were submitted to the San Francisco mine laboratory and 293 pairs were submitted to IPL-Inspectorate.
116
Table 13.21 summarizes the results of the comparison between the duplicate sample assays.
Table 13.21
Summary of the Results for the Duplicate Samples, September, 2009 to June, 2010 Drilling Program
Description
| San Francisco Mine
Laboratory (g/t gold) | IPL-Inspectorate
Laboratory (g/t gold) | Entire Drilling Program
(g/t gold) |
| Original | Duplicate | Original | Duplicate | Original | Duplicate |
| Number of pairs | 449 | 449 | 293 | 293 | 742 | 742 |
| Average grade (g/t gold) | 0.078 | 0.081 | 0.117 | 0.117 | 0.091 | 0.095 |
| Maximum (g/t gold) | 3.700 | 3.433 | 5.570 | 5.510 | 5.570 | 5.710 |
| Minimum (g/t gold) | 0.007 | 0.005 | 0.005 | 0.005 | 0.005 | 0.005 |
| Absolute difference between avg. grades | | 0.003 | | 0.00012 | | 0.001 |
| Difference (%) | | -3.211% | | 0.102 | | 1.559 |
| Correlation coefficent | | 0.9150 | | 0.9784 | | 0.9394 |
Table provided by Timmins Goldcorp Mexico, S.A. de C.V.
The results of the 742 duplicate samples submitted were plotted on scatter diagrams. Figures 13.29 and 13.30 show the best fit regression lines drawn through the duplicate gold assays returned from the San Francisco laboratory and IPL, respectively. Figure 13.31 shows the combined results for all duplicate assays reported by both laboratories. Highly anomalous results from two pairs of duplicates assayed at San Francisco have been ignored in determining the best fit regression line. Figure 13.32 is a histogram of the gold grades of the duplicate samples.
The results of the duplicate assaying conducted by IPL-Inspectorate are satisfactory, with a correlation coefficient of 0.98. The results obtained by the San Francisco laboratory show a greater degree of scatter and a significantly lower correlation coefficient of 0.915. More than 80% of the duplicate pairs analyzed, however, contained approximately 0.03 g/t gold, which is within the lower detection limit for the San Francisco laboratory.
117
Figure 13.29
Scatter Plot for Gold for Duplicates Assayed in the San Francisco Mine Laboratory
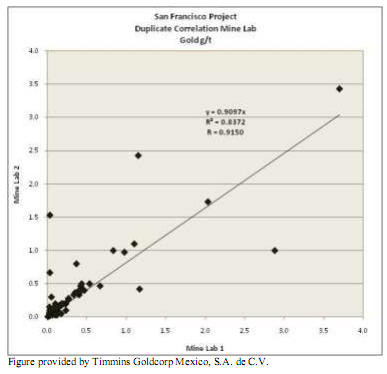
Figure 13.30
Scatter Plot for Gold for Duplicates Assayed in the IPL-Inspectorate Laboratory
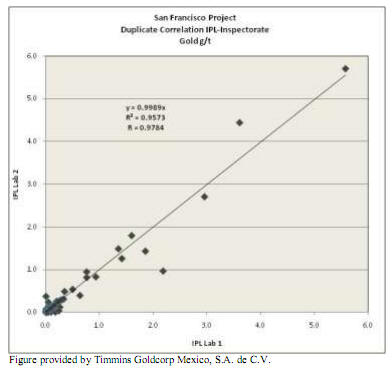
118
Figure 13.31
Scatter Plot for Gold for All Duplicates, San Francisco Mine and IPL-Inspectorate Laboratories
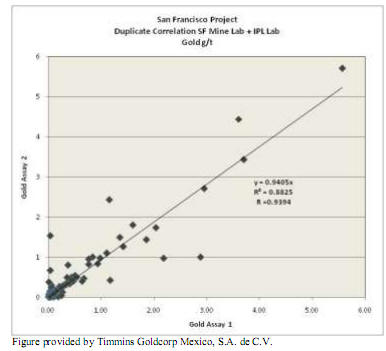
Figure 13.32
Histogram of Frequency of the Gold Values in the Duplicate Assayed by the SF mine Lab
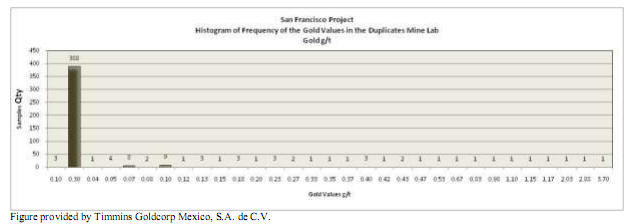
119
13.3 MICON COMMENTS
Timmins has chosen to assay the majority of the production and exploration drill samples at its assay laboratory on-site at the San Francisco mine. In addition, the mine laboratory submits between 5 and 10% of its samples to an outside laboratory as checks against its assay results. The mine laboratory also participates in a round-robin assay process through CANMET, which is the Materials Technology Laboratory at Natural Resources Canada, a branch of the Canadian Government. Timmins’ decision to use its own laboratory is in line with many mining operations across Canada and the rest of the world. Micon inspected the laboratory facilities during its August site visit and noted that the laboratory was clean and appeared to be well run. However, the laboratory is still in the early stages of operation and its processes and procedures will improve as its staff become more familiar with standard laboratory practices.
In terms of overall averages, the blank and duplicate assay results were satisfactory for the San Francisco laboratory. However, in the case of the standards, a high variation was seen with the individual samples, although in most cases the average of all of the samples was similar or within the accepted two standard deviations. This could be in part due to the low grade nature of the samples, as both the mine and the independent check laboratory had difficulties when the assays were close to the detection limits of the assaying process. In some cases, there appeared also to be possible problems of homogeneity with the standards themselves. Micon recommends that Timmins has an independent consultant review the laboratory operations and procedures in order to improve the quality of its results.
120
14.0 DATA VERIFICATION
Micon has written a number of Technical Reports on the San Francisco mine for Timmins since 2005. These Technical Reports have been filed on SEDAR and are referenced in Section 21 of this report.
14.1 AUGUST, 2010 SITE VISIT
Micon’s most recent visit to the San Francisco mine occurred between August 3 and 6, 2010. During this site visit, the latest data were collected from the mine department and exploration personnel, and a number of discussions were held relating to the resource and reserve estimations, operational parameters, expansion of the crushing facilities, and further exploration opportunities, in a series of meetings held on the mine site, in Magdalena and in Hermosillo. During the site visit, the pit and the crushing, leach stacking, processing and laboratory facilities were visited, in addition to the administration offices.
The QP’s reviewing the data presented to Micon by Timmins during the trip were Messrs. William Lewis and Mani Verma.
14.2 OPERATIONAL REVIEW
Timmins’ San Francisco mine is an operating property consisting of mining operations that are being carried out by a contractor. The crushing, leaching and gold recovery facilities are operated by Timmins personnel. The project commenced operation early in 2010 and was in commercial production during the April to June, 2010, quarter. Micon has reviewed the production data for this quarter and relevant statistics are summarized in Table 14.1.
Table 14.1
Summary of April to June, 2010, Quarter Production
Description
| Months | Total Quarter
| Budget
|
| April | May | June |
| Ore tonnes/day | 10,600 | 9,600 | 10,000 | 10,100 | 11,200 |
| Grade (g/t) | 0.628 | 0.732 | 0.800 | 0.718 | 0.826 |
| Ounces mined | 6,421 | 6,780 | 7,699 | 20,899 | 26,826 |
| Ounces recoverable | 4,247 | 4,624 | 5,274 | 14,145 | 18,183 |
| Cash cost (US$/oz Au) | 933 | 837 | 786 | 847 | 621 |
| Waste/ore ratio | 4.5 | 4.5 | 4.5 | 4.5 | 4.5 |
Timmins has used its actual production and cost experience as the basis for its future projections. Micon has reviewed the future operational and production plans developed by Timmins, and regards them as appropriate.
121
14.3 DATABASE AND RESOURCE REVIEW
14.3.1 Database Verification
On October 10, 2010, Micon conducted a data verification of the entire San Francisco mine database. While the entire database was reviewed, the focus was primarily on the drill collars, survey and assays portions of the database. Micon found that, in the assay tables, a large number of the sample numbers were missing and recommended that the missing sample numbers be included in the database as a matter of priority. Cross checks were conducted randomly with the existing sample numbers and no problems were found. The review of the collar and survey tables indicated that there were no issues with these portions of the database.
14.3.2 Resource Audit
Micon also conducted an audit of the resource estimation data and procedures used by Timmins.
14.3.2.1 Visual Inspection
The block model was imported into Surpac Software version 6.3.1 in order to view it graphically and perform a visual examination of the blocks compared against the source drill hole data. Attributes such us gold grade and categorization were reviewed. Gold grade values in the San Francisco block model were appropriately related spatially to the drill hole grade intercepts and the grade ranges were similar.
Categorization attributes were reviewed in the San Francisco block model, in which the number 1 is used for measured, number 2 for indicated and number 3 for inferred resources. Micon applied the CIM Standards and Definitions as the basis for its review and found that the San Francisco block model has a “Spotted Dog Effect” in certain areas, in that the various resource categories are distributed in islands across the deposit. This is noted especially in the more scattered drilling grids. Deficiencies of this nature appear when the resource categorization is based solely on software algorithms and there is no visual or manual check conducted to ensure that both grade and geological continuity is maintained as required by the CIM definitions. Timmins was informed about this issue by Micon, with the recommendation that it critically review the resource classification criteria. However, the Spotted Dog Effect is not noted in the area covered by and adjacent to the San Francisco pit, due to the drilling and data density used for the resource and reserve estimations in this area.
14.3.2.2 Statistical Analysis
A basic check of the input (composite data) versus the output (blocks) was performed in order to confirm that the output block model appropriately reflected the distribution of the input data.
122
First, the composite data were processed to create charts and statistical reports, and then the same graphics and reports were prepared for the block model output. Both sets of statistical information were compared for accuracy, with the results deemed to be acceptable.
Indicator kriging was used to interpolate grade in the block. Figure 14.1 is a log-normal histogram of the interpolated block grades. A break in the distribution can be observed at a grade of approximately 0.125 g/t gold.
Figure 14.1
Model Log-Normal Histogram of Interpolated Gold Grade
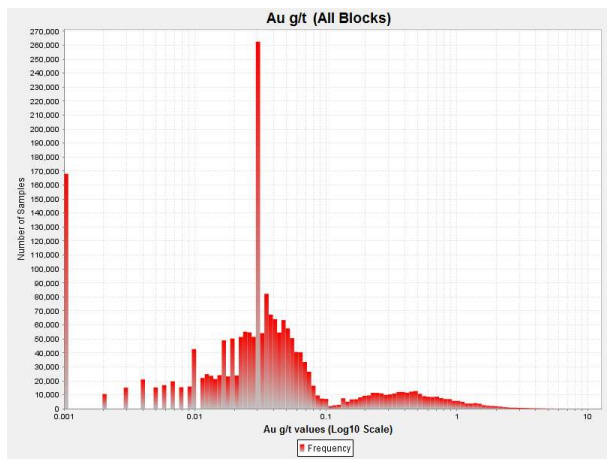
14.3.3 Conclusion of the Database Verification and Resource Audit
In general, the San Francisco database was found to be of sufficient quality and free of errors to be used as the basis of the updated resource and reserve estimates.
Micon believes, based on the results of the audit, that the current block model for the San Francisco mine is also acceptable to be used as the basis for the resource and reserve estimation.
123
15.0 ADJACENT PROPERTIES
The San Francisco property exists within the Sierra Madre Occidental metallogenic province and is known to host a number of separate zones of anomalous gold mineralization. There are other metallic mineral deposits in the area, but very little information is available on those properties. There are no immediately adjacent properties which directly affect the interpretation and evaluation of the mineralization or anomalies found at San Francisco. However, the 1995 San Francisco Property Reserve and Resource document by Mine Development Associates of Reno, Nevada, listed a number of exploration possibilities in the immediate area of the mine, including La Chicharra which was mined during the last two years of production.
Among the targets which remain are the bedrock area surrounding the Arroyo La Perra, a placer deposit located approximately 2 km northwest of the San Francisco pit. The 1995 report mentions that seven holes had been drilled in bedrock to that point and that one of the holes intercepted 8 m of 1.6 g/t gold at 42.5 m down-hole, while another intercepted 18 m of 0.422 g/t gold at 4 m down-hole. According to the report, other targets with fair to good exploration potential for the discovery of significant gold deposits were La Desconocida, Casa de Piedras Oeste and La Trinchera, all of which are located between 2 km to 5 km northwest of the San Francisco pit.
Micon considers that the previous mining history of the San Francisco and La Chicharra deposits and the stated exploration potential of the area as contained in previous reports, positively affect the prospectivity of the ground.
124
16.0 MINERAL PROCESSING AND METALLURGICAL TESTING
Historical metallurgical testwork was discussed in the previous Technical Reports, the most recent of which is entitled “NI 43-101 F1 Technical Report on the Preliminary Feasibility Study for the San Francisco Gold Project, Sonora, Mexico” dated March 31, 2008. This Technical Report was posted on SEDAR by TMM.
16.1 RECENT TESTWORK CONDUCTED ON-SITE
16.1.1 Column Test Development
Mineral samples for a recent program of column cyanide leach tests were gathered from the mineral monitoring area, which is located at the end of overland conveyor No. 1. The samples, which represent material being delivered to the leach pad, were cut every 15 minutes and composited, homogenized and split.
16.1.2 Test Procedure
Tests were conducted using two different sized columns, with the selection of the test type being based on the size of the composite. The characteristics of the two types of test are summarized in Table 16.1.
Table 16.1
Summary of the Two Composites
| Column | Composited Tonnes | Leach Days | Kg Per Sample |
| 200 mm dia x 2 m high | 50,000 | 13 – 15 | 75 – 80 kg |
| 150 mm dia x 6 m high | 150,000 | 30 – 35 | 175 – 184 kg |
Table provided by Timmins Goldcorp Mexico, S.A. de C.V.
When the leach pads reach 150,000 t, a composite is prepared from daily samples composited in proportion to the daily tonnage. Half of the composite is subjected to physical and leach extraction testing at the San Francisco site, by personnel employed by Timmins.
A summary of the leach column tests conducted from September, 2009 to July, 2010 is provided in Table 16.2.
125
Table 16.2
Summary of the Leach Column Tests September, 2009 to July, 2010
Date | Leach Time (Days) | Mineral | Feed Size | NaCN Solution | Column Size | Test Number | Sample Weight (Kg) | Gold Grade (g/t) | Gold Recovery (%) |
September 22, 2009
| 13 | Leach Pad Feed
| - 12 mm
| 500 mg/L
| 200 mm x 2 m
| LMB-02 | 75
| 0.39 | 69.43 |
| 13 | LMB-03 | 0.39 | 50.52 |
| 15 | LMB-01 | 0.47 | 63.89 |
| 14 | LMB-05 | 0.47 | 70.28 |
| 13 | # 6 | 0.39 | 65.55 |
| October 01, 2009 | 10 | Leach Pad Feed
| - 12 mm
| 500 mg/L
| 200 mm x 2 m
| LMB-04 | 75 | 0.97 | 55.89 |
| October 10, 2009 | 13 | LMB-02 | 75 | 0.73 | 71.78 |
| October 10, 2009 | 13 | LMB-03 | 75 | 0.73 | 67.11 |
| October 12, 2009 | 14 | LMB-01 | 75 | 1.02 | 77.66 |
| October 16, 2009 | 10 | LMB-05 | 75 | 0.98 | 61.23 |
| October 29, 2009 | 14 | LMB-03 | 80.4 | 0.34 | 70.98 |
| October 30, 2009 | 15 | LMB-02 | 78.2 | 0.41 | 74.47 |
| November 08, 2009 | 16 | Leach Pad Feed
| - 12 mm
| 500 mg/L
| 200 mm x 2 m
| LMB-01 | 74.6 | 0.48 | 69.02 |
| November 08, 2009 | 16 | LMB-04 | 80.8 | 0.50 | 68.47 |
| November 17, 2009 | 16 | LMB-02 | 77 | 0.53 | 72.68 |
| November 17, 2009 | 16 | LMB-06 | 76.5 | 0.53 | 64.69 |
| November 30, 2009 | 17 | LMB-01 | 80.2 | 0.50 | 71.11 |
| November 30, 2009 | 17 | LMB-03 | 82 | 0.47 | 72.46 |
| December 8, 2009 | 17 | Leach Pad Feed
| - 12 mm
| 500 mg/L
| 200 mm x 2 m
| LMB-06 | 79.4 | 0.59 | 69.62 |
| December 8, 2009 | 16 | LMB-05 | 81.4 | 0.65 | 69.33 |
| December 14, 2009 | 30 | 260 mg/L | 150 mm x 6 m
| LMA-02 | 188 | 0.87 | 73.60 |
| December 14, 2009 | 29 | 500 mg/L | LMA-01 | 180 | 0.75 | 78.53 |
| January 6, 2010 | 34 | Leach Pad Feed
| - 12 mm
| 260 mg/L | 150 mm x 6 m
| # 14 | 177 | 0.70 | 74.42 |
| January 6, 2010 | 33 | 250 mg/L | LMA-04 | 175.8 | 0.80 | 66.06 |
| January 27, 2010 | 32 | Plant Barren Solution
| # 17 | 182 | 0.53 | 71.03 |
| January 27, 2010 | 32 | # 18 | 174.6 | 0.51 | 57.06 |
| January 27, 2010 | 32 | # 19 | 174.6 | 0.43 | 70.84 |
| February 11, 2010 | 33 | Leach Pad Feed
| - 12 mm
| Plant Barren Solution
| 150 mm x 6 m
| # 20 | 168.2 | 0.42 | 64.02 |
| February 18, 2010 | 33 | # 21 | 176.6 | 0.37 | 63.40 |
| February 23, 2010 | 32 | # 22 | 182.4 | 0.47 | 74.79 |
| March 1, 2010 | 35 | Leach Pad Feed
| - 12 mm | Plant Barren Solution
| 150 mm x 6 m
| # 23 | 182 | 0.65 | 72.87 |
| March 9, 2010 | 35 | # 24 | 172 | 0.55 | 62.47 |
| March 11, 2010 | 33 | # 25 | 180.6 | 0.50 | 66.19 |
| March 16, 2010 | 36 | # 26 | 179 | 0.50 | 68.15 |
| March 29, 2010 | 32 | | # 27 | 177.8 | 0.38 | 70.86 |
| April 19, 2010 | 46 | Leach Pad Feed | - 12 mm
| Plant Barren Solution
| 150 mm x 6 m
| # 28 | 182.3 | 0.47 | 73.56 |
| May 1, 2010 | 43 | * Leach Pad Feed | # 29 | 181.5 | 0.73 | 56.10 |
| May 10, 2010 | 29 | Leach Pad Feed | # 30 | 182.3 | 0.50 | 63.87 |
| May 21, 2010 | 30 | Leach Pad Feed | # 31 | 172.1 | 0.52 | 73.96 |
| May 21, 2010 | 30 | Leach Pad Feed | # 32 | 182.2 | 0.56 | 73.99 |
| June 4, 2010 | 31 | Leach Pad Feed
| - 12 mm
| Plant Barren Solution
| 150 mm x 6 m
| # 33 | 177.2 | 0.54 | 66.15 |
| June 4, 2010 | 33 | # 34 | 167.8 | 0.61 | 78.93 |
| June 28, 2010 | 33 | # 35 | 180 | 0.80 | 53.00 |
| July 5, 2010 | 36 | Leach Pad Feed
| - 12 mm
| Plant Barren Solution
| 150 mm x 6 m
| # 36 | 180 | 0.78 | 40.67 |
| July 17, 2010 | 32 | # 37 | 178.4 | 0.68 | 56.95 |
| July 27, 2010 | 31 | #38 | 180 | 0.72 | 53.00 |
- Composites are started at 150,000 tonnes.
- Table provided by Timmins Goldcorp Mexico, S.A. de C.V.
126
The standard column test procedure is as follows:
- Size: 80 to 90% passing 12 mm.
- Irrigation rate: 7 to 12 L/h/m2 .
- Leach time: 34 days.
- Barren solution from plant: 300 ppm NaCN.
- Resting time: 3 days.
Note: These parameters were developed from previous testwork which defined the leach column and operation gold recoveries.
Table 16.2 shows that the average column leach test gold extraction is approximately 70%, except for tests 29, 35, 36 and 38 which show significantly lower recovery.
Based on geological and mineralogical information on the material mined and tested, the lower metallurgical performance was correlated to ore type (see Table 16.3) .
Table 16.3
Summary of the Mineralization Type and Corresponding Test Gold Recoveries
Test No.
| Percentage of Mineral | Au Recovery (%)
|
| Granite | Gabbro | Gneiss -Basic | Gneiss - Pegmatite |
| 29 | 20 | 10 | 60 | 10 | 56.10 |
| 35 | 10 | 40 | 30 | 10 | 53.00 |
| 36 | 15 | 0 | 70 | 15 | 40.67 |
| 38 | 30 | 0 | 40 | 30 | 53.00 |
Table provided by Timmins Goldcorp Mexico, S.A. de C.V.
16.2 CONCLUSIONS
Gold recoveries obtained in the column tests correspond well with the preliminary operating results achieved from the leach pads. Reduced gold recoveries correlate generally with the presence of significant quantities of gabbro or gneiss-pegmatite in the leach feed.
127
17.0 MINERAL RESOURCES AND MINERAL RESERVE ESTIMATES
Timmins has updated the mineral resource estimate at the San Francisco mine. This update includes drill holes completed between 2008 and June, 2010, subsequent to the resource estimation by Independent Mining Consultants (IMC) in March, 2008, that was included in the Micon Preliminary Feasibility Study Technical Report of March, 2008, and amended in January, 2009. The updated resource estimate has been audited by Micon.
The resource estimate completed by Timmins in July, 2010 and audited by Micon in August/September, 2010 is compliant with the current CIM standards and definitions specified by NI 43-101, and supersedes the March, 2008 resource estimate for the San Francisco mine.
17.1 MINERAL RESOURCE ESTIMATE
The mineral resource, as estimated by Timmins, is presented in Table 17.1. This resource estimate includes the mineral reserve material below the topographic surface as of the end of August, 2010.
Table 17.1
Mineral Resource Estimate for the San Francisco Project (Inclusive of Mineral Reserves)
(Cut-off Grade of 0.131 g/t Gold and a USD 1,100 Gold Price)
| Resource Classification | Tonnes (x 1,000) | Gold Grade (g/t) | Contained Gold (oz) |
| Measured | 19,089 | 0.797 | 489,000 |
| Indicated | 23,442 | 0.658 | 495,000 |
| Total Measured and Indicated | 42,531 | 0.720 | 984,000 |
| Inferred | 10,308 | 0.628 | 208,000 |
Both Canadian NI 43-101 and the Australasian Joint Ore Reserves Committee (JORC) code state that mineral resources must meet the condition of “a reasonable prospect for eventual economic extraction.” For open pit material, Timmins developed a Lerchs Grossman pit shell geometry at reasonable long term prices, and reasonable costs and recovery assumptions, as meeting this condition for mineral resources. The resource presented in Table 17.1 is based on a pit shell designed at a gold price of USD 1,100 per ounce and additional cost and recovery parameters developed by Timmins, in order to meet the conditions for classification of the material as a mineral resource. The resource estimate within the pit shell includes all material in the measured, indicated and inferred categories.
17.2 MINERAL RESOURCE ESTIMATION PROCEDURES
This section provides a summary of the data, resource modelling methods, and other procedures used to develop the updated resource estimate.
The block model is based on 5 m by 5 m by 6 m high blocks. The coordinate limits of the previous model were retained for this current work. The topography was updated to reflect the surface at the end of August, 2010. The undisturbed pre-mining topographic surfaces are also available in the model.
128
For this study, Timmins has used the indicator kriging (IK) estimation method previously employed by IMC in 2008, to eliminate the manual interpretation of the mineralized zones and allow quicker incorporation of new data. Overall, the method is similar to the 2008 method, except that the grade zones are computer designed.
17.2.1 Database
The database of the San Francisco deposit consists of 1,667 drill holes with 96,279 intervals, amounting to 167,174 m of drilling. Twenty of these holes lie beyond the model limits and have not been included in the study. The current database includes 534 new holes drilled from 2008 to 2010, with 34,142 intervals and 51,174 m of drilling. Figure 17.1 is a plan view of the drill hole collar locations.
Figure 17.1
Plan View of the Drill Hole Collars at the San Francisco Project

Approximately 46% of the sampling intervals are 2 m length, about 39% of the intervals are 1.5 m in length, and about 2% of the intervals are 1 m in length. In the case of duplicate samples, the original sample was used in the database. Figure 17.2 shows a 3-D profile of the current topography and the drill holes, looking south.
129
High grade outlier assays were capped at 30 g/t gold, which is the same value as that used in the previous resource estimate. This impacted 25 assays in the database ranging from 30.29 g/t to 154.8 g/t gold.
Figure 17.2
3-D Profile of the Current Topography and the Drill Holes at the San Francisco Mine (Looking South)
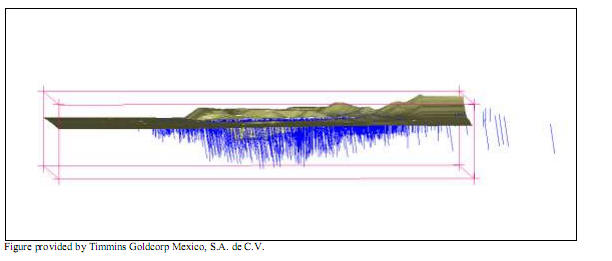
17.2.2 Compositing
The assay database was composited to 3 m regular down-hole lengths, which is half the block height of 6 m. Assays were length-weighted for each composite. The reason for the relatively short composite is to unsmooth the resultant block grade distribution to try to better match the likely distribution of mined blocks.
17.2.3 Block Model
The model is based on regular 5 m by 5 m by 6 m blocks and covers an area of 2,560 m by 2,560 m in plan, and 456 m vertically. Table 17.2 gives the model coordinate limits and dimensions.
Table 17.2
3-D Block Model Limits and Dimensions
| Coordinates | Minimum | Maximum | Block Size | Number |
| Easting | 487500 | 490060 | 5 m | 512 columns |
| Northing | 3356500 | 3359060 | 5 m | 512 rows |
| Elevation | 398 | 854 | 6 m | 76 Levels |
| No Rotation |
Table provided by Timmins Goldcorp Mexico, S.A. de C.V.
17.2.4 Mineralized Outlines
Mineralized zones within the model were identified by indicator kriging of the gold grades using a discriminator of 0.125 g/t. Composites greater than 0.125 g/t gold were assigned a value of 1 and composites less than 0.125 g/t were assigned a value of 0. The ones and zeros were then kriged to obtain a value between 0 and 1 for each block, representing the probability that the block is above 0.125 g/t gold. Blocks with a probability in excess of 0.5 were assigned a code to designate them as being inside the mineralized zone.
130
To define the mineralized zones, a search radius of 60 m along strike (N65°W), 50 m down dip (30°NE) and 30 m in the tertiary direction was used. A maximum of 10 and a minimum of 1 composite were used, with a limit of 2 composites per hole. No discrimination between rock types was applied in determining the mineralized outlines.
A nested spherical variogram model was used for the indicator kriging. The first structure had ranges of 70 m along strike, 58 m down dip and 25 m in the tertiary direction. The second structure had ranges of 216 m along strike, 180 m down dip and 72 m in the tertiary direction. The nugget was 0.1444, the first covariance 0.0704 and the second covariance 0.0312, for a total sill of 0.2460.
Composites containing less than 0.125 g/t gold but located within zones defined as having a 0.75 or more probability of being greater than 0.125 g/t were also included within the mineralized outlines, to account for internal dilution.
17.2.5 Block Model Rock Domains
Timmins updated the rock domain interpretation developed previously for the February, 2008, model. Monzonite was combined with diorite, andesite was eliminated as a rock type and pegmatite was combined with schist. Table 7.3 summarizes the rock domains, with the corresponding codes and specific gravities.
Bench polygons for each rock type were derived from this interpretation and imported into the block model. Blocks were coded based on 12 m bench polygons, projecting 6 m above and 6 m below the bench, in accordance with the principal rock type present in each block.
Composites were assigned the rock type of the block in which they were located. This was necessary since much of the drilling, particularly many of the Geomaque holes, does not have a logged rock type.
Table 17.3
Rock Domain Code and Specific Gravity
| Rock Name | Rock Code | Specific Gravity |
| Diorite | 2 | 2.72 |
| Gneiss | 4 | 2.75 |
| Granite | 5 | 2.76 |
| Schist | 6 | 2.75 |
| Lamprophrite | 8 | 2.76 |
| Gabbro | 11 | 2.81 |
Table provided by Timmins Goldcorp Mexico, S.A. de C.V.
131
17.2.6 Specific Gravity
A total of 68 specific gravity determinations were made, covering all rock domains. Results range from a high of 2.84 to a low of 2.61, with an arithmetic mean of 2.76. The specific gravity for each rock type, as used in the resource estimate, is summarized in Table 17.3 above.
17.2.7 Grade Interpolation
Gold grades were estimated by ordinary kriging. Blocks were estimated inside and outside the mineralized zones. The composites respected the mineralized zone codes and rock types. The search radius for the estimation was 60 m along strike (N65°W), 50 m down dip (30°NE) and 20 m in the tertiary direction. A maximum of 8 and a minimum of 1 composite were used to assign grade, with a limit of 2 composites per hole. The search radii used represent approximately 85% of the estimated ranges of the gold grade variogram, calculated using composites inside the mineralized zone.
The variogram was a spherical model, with one structure, and had ranges of 70 m along strike, 58 m down dip, and 25 m in the tertiary direction. The variogram had a nugget of 0.4145 and a structural covariance of 0.5645, for a total sill of 0.979. The grade estimation respected rock types. Composites could only be used to estimate the corresponding rock type in the block model.
17.2.8 Mineral Resource Classification
Mineralization in the San Francisco deposit is classified as a mineral resource according to the CIM definitions. The mineralized zones display good geologic continuity, as demonstrated by the drill results.
Separate kriging was carried out exclusively for the purpose of resource classification. The number of samples and kriging standard deviation were used as the basis for resource classification, without reference to the gold grades within the mineralized zones. The resource classification procedure used was as follows:
| | 1. | The search radius for the kriging was set to 53 m along strike, 44 m down dip and 26 m in the tertiary direction. This represents about 75% of the variogram range, using an assessment that measured/indicated resources should be defined within 65% to 75% of the variogram range. The variogram was also normalized to a sill of 1 and a nugget of 10% of the sill. A maximum of two composites per drill hole was allowed in the kriging and the mineralized zones used in the grade kriging were respected. The kriging procedure provides a count of the number of holes within 75% of the maximum search radius and also calculates a kriging standard deviation based on these data. The number of holes and kriging standard deviation were stored in the model. Variations in rock type were ignored during this procedure. |
132
| | 2. | Probability plots of the kriging standard deviation by the number of holes were created. Resource classification was then established as follows: First, all blocks with an estimated gold grade were set to a minimal classification of inferred (code 3). The following blocks were then set to indicated resource (code 2): a) blocks estimated with five or more holes, b) blocks estimated with four holes and with a kriging standard deviation less than or equal to 1.05, c) blocks estimated with three holes and a kriging standard deviation less than or equal to 0.95, d) blocks estimated with two holes and a kriging standard deviation less than or equal to 0.85, and e) blocks estimated with one hole and a kriging standard deviation less than 0.75. In the final step, blocks with a kriging standard deviation less than or equal to 0.55 were set to measured resource (code 1). The assignment was then reviewed on cross-sections for reasonableness. |
Visually, the described method was found to give satisfactory results. Indicated resources are not extrapolated far outside the drilling data and measured resources are developed only in well-drilled areas. Blocks kriged with one or two holes can generate indicated resources only very close to the holes.
Table 17.4 summarizes the tonnages and grades of all mineralized blocks in the model, below the surface topography at August 31, 2010, over a range of cut-off grades. Tonnages and grades are reported in situ, with no allowance for mining recovery or dilution.
Table 17.4
Measured, Indicated and Inferred Resource Blocks, August, 2010
| Cut-Off | Measured | Indicated | Measured and Indicated | Inferred |
| Au g/t | Tonnes | Au g/t | Au oz | Tonnes | Au g/t | Au oz | Tonnes | Au g/t | Au oz | Tonnes | Au g/t | Au oz |
| >= 0.100 | 22,191,898 | 0.739 | 527,551 | 32,882,600 | 0.583 | 616,770 | 55,074,498 | 0.646 | 1,144,321 | 48,386,338 | 0.374 | 582,282 |
| >= 0.150 | 21,971,754 | 0.746 | 526,698 | 32,167,216 | 0.594 | 613,901 | 54,138,970 | 0.655 | 1,140,598 | 40,101,719 | 0.426 | 549,370 |
| >= 0.200 | 21,350,466 | 0.762 | 523,062 | 30,426,469 | 0.617 | 603,961 | 51,776,935 | 0.677 | 1,127,023 | 30,732,335 | 0.504 | 497,492 |
| >= 0.250 | 19,861,345 | 0.802 | 512,250 | 27,526,937 | 0.659 | 582,957 | 47,388,282 | 0.719 | 1,095,207 | 23,432,948 | 0.591 | 445,101 |
| >= 0.300 | 18,050,927 | 0.855 | 496,258 | 24,289,445 | 0.710 | 554,455 | 42,340,372 | 0.772 | 1,050,713 | 18,984,972 | 0.667 | 406,880 |
| >= 0.350 | 16,236,838 | 0.914 | 477,341 | 21,294,765 | 0.764 | 523,203 | 37,531,603 | 0.829 | 1,000,544 | 16,222,097 | 0.725 | 378,334 |
| >= 0.400 | 14,523,411 | 0.978 | 456,712 | 18,252,914 | 0.829 | 486,611 | 32,776,325 | 0.895 | 943,324 | 13,566,582 | 0.795 | 346,541 |
| >= 0.450 | 12,899,356 | 1.048 | 434,589 | 15,584,091 | 0.899 | 450,234 | 28,483,447 | 0.966 | 884,823 | 11,948,868 | 0.845 | 324,581 |
| >= 0.500 | 11,452,279 | 1.120 | 412,530 | 13,319,318 | 0.971 | 415,764 | 24,771,597 | 1.040 | 828,295 | 9,211,916 | 0.956 | 283,168 |
| >= 1.000 | 4,363,019 | 1.816 | 254,752 | 3,822,711 | 1.674 | 205,727 | 8,185,730 | 1.750 | 460,479 | 2,708,550 | 1.549 | 134,890 |
| >= 2.000 | 1,163,297 | 3.056 | 114,301 | 794,944 | 2.982 | 76,224 | 1,958,241 | 3.026 | 190,525 | 388,189 | 2.808 | 35,047 |
Table provided by Timmins Goldcorp Mexico, S.A. de C.V.
Figure 17.3 is a N25oE vertical section showing drill holes, current topography and block grades. Drill holes within 20 m of the section are included in the view.
133
Figure 17.3
Sample Section Showing Drill Holes, Current Topography and Block Grades
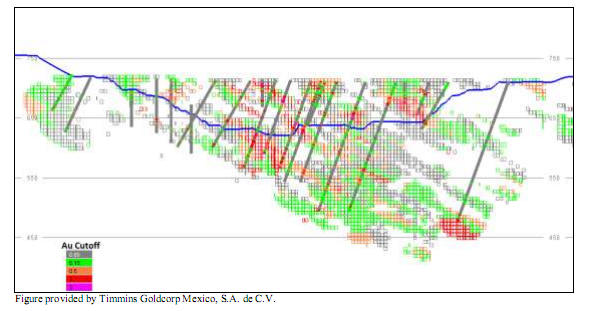
17.2.9 Model Validation
The block model was validated by comparing the tonnages and grades of those blocks above the August, 2010, topography which had been mined by Geomaque between 1996 and 2002 and by Timmins prior to the end of August, 2010, against the production records for those periods. The comparison was based on cut-off grades of 0.4 g/t gold for the Geomaque operation and 0.35 g/t for Timmins, in accordance with the available mining records. As summarized in Table 17.5, the block model estimates compared reasonably with the reported production.
Table 17.5
Comparison of the Block Model with Historic Production for the San Francisco Pit
| | Tonnes | Au g/t | Gold oz |
| Geomaque | | | |
| Historical Geomaque Production | 12,255,278 | 1.146 | 451,718 |
| Block Model at 0.4cut-off grade | 13,170,242 | 1.156 | 489,294 |
| Difference | 7.5% | 0.8% | 8.3% |
| Timmins to August, 2010 | | | |
| Historical Timmins Production | 2,647,784 | 0.745 | 63,403 |
| Block Model at 0.35 cut-off grade | 2,790,932 | 0.759 | 68,073 |
| Difference | 5.4% | 1.9% | 7.4% |
| TOTAL MINED OUT | | | |
| Historical Production, Geomaque+Timmins | 14,903,062 | 1.075 | 515,121 |
| Block Model | 15,961,174 | 1.086 | 557,367 |
| Difference | 7.1% | 1.0% | 8.2% |
Table provided by Timmins Goldcorp Mexico, S.A. de C.V.
134
17.2.10 Pit Optimization
Timmins performed a pit optimization analysis using the Lerchs Grossman algorithm to constrain the mineral resources within an economic pit outline.
Two sets of optimizations were carried out: the first considered all resource material, including inferred resources, for the mineral resource statement, and the second considered only measured and indicated resources, to generate a pit design in support of the statement of mineral reserves, discussed subsequently.
17.2.10.1 Economic Parameters
Table 17.6 summarizes the economic parameters used for the pit shell analysis. The parameters are a combination of IMC and Timmins inputs, taking into account the actual costs obtained from the first year of operation.
Table 17.6
Pit Optimization Parameters for the San Francisco Project
| Costs | Rock Densities and Recoveries |
| Description | Units | Amount | Name | Code | Density | Recovery % |
| Waste mining cost | USD/t | 1.70 | Diorite | 2 | 2.72 | 60.50 |
| Ore mining cost | USD/t ore | 1.70 | Gneiss | 4 | 2.75 | 70.70 |
| Process cost | USD/t ore | 2.83 | Granite | 5 | 2.76 | 84.50 |
| G & A cost | USD/t ore | 0.42 | Schist | 6 | 2.75 | 65.37 |
| Total Cost | USD/t ore | 4.95 | Lamprophrite Dyke | 8 | 2.76 | 60.50 |
| Gold price | USD/oz | 1,100 | Gabbro | 11 | 2.81 | 60.53 |
| | General Recovery | | 70.00 |
Table provided by Timmins Goldcorp Mexico, S.A. de C.V.
Pit bench heights were set at 6.0 m (the block height used in the model) and slope angles were based on inter-ramp angles recommended by Golder Associates in its December, 1996, report and adjusted to allow for haul roads of 25 m width.
17.2.10.2 Resource Statement
The pit shell adopted for reporting resources was estimated at a gold price of USD1,100/troy ounce, using the economic parameters summarized in Table 17.6 and the topographic surface as of August, 2010. Table 17.7 summarizes the August, 2010, mineral resource estimate.
Table 17.7
Mineral Resource Estimate for the San Francisco Project (Inclusive of Mineral Reserves)
(Cut-off Grade of 0.131 g/t Gold and a USD 1,100 Gold Price)
| Resource Classification | Tonnes (x 1,000) | Gold Grade (g/t) | Contained Gold (oz) |
| Measured | 19,089 | 0.797 | 489,000 |
| Indicated | 23,442 | 0.658 | 495,000 |
| Total Measured and Indicated | 42,531 | 0.720 | 984,000 |
| Inferred | 10,308 | 0.628 | 208,000 |
135
17.2.10.3 Mineral Reserve Analysis
The second set of pit optimizations, based on measured and indicated resources only, was used to estimate mineral reserves. Table 17.8 present the results of the optimizations at different gold prices.
Table 17.8
Pit Optimization Using Measured and Indicated Resources as of August 31, 2010
Case
| Gold Price
(USD/oz) | Cut-Off
(g/t Au) | Measured and Indicated Resources | Tonnes
| Total Tonnes
| Waste
Ratio |
| Tonnes | Au g/t | Au oz |
| 1 | USD400 | 0.361 | 9,934,748 | 1.147 | 366,445 | 12,879,891 | 22,814,639 | 1.30 |
| 2 | USD450 | 0.321 | 14,306,460 | 1.019 | 468,556 | 18,616,085 | 32,922,545 | 1.30 |
| 3 | USD500 | 0.289 | 16,090,240 | 0.973 | 503,286 | 20,218,514 | 36,308,754 | 1.26 |
| 4 | USD550 | 0.263 | 18,475,189 | 0.929 | 551,904 | 23,949,205 | 42,424,394 | 1.30 |
| 5 | USD600 | 0.241 | 20,957,620 | 0.921 | 620,710 | 33,067,582 | 54,025,202 | 1.58 |
| 6 | USD650 | 0.222 | 22,662,060 | 0.890 | 648,589 | 35,413,509 | 58,075,569 | 1.56 |
| 7 | USD700 | 0.206 | 25,199,680 | 0.854 | 691,619 | 40,239,613 | 65,439,293 | 1.60 |
| 8 | USD725 | 0.199 | 25,952,569 | 0.846 | 705,863 | 42,283,233 | 68,235,802 | 1.63 |
| 9 | USD750 | 0.193 | 26,654,151 | 0.836 | 716,139 | 43,357,916 | 70,012,067 | 1.63 |
| 10 | USD775 | 0.186 | 27,387,963 | 0.827 | 728,353 | 45,036,148 | 72,424,111 | 1.64 |
| 11 | USD800 | 0.181 | 28,748,690 | 0.815 | 753,366 | 49,111,805 | 77,860,495 | 1.71 |
| 12 | USD825 | 0.175 | 29,442,020 | 0.807 | 763,887 | 50,594,823 | 80,036,843 | 1.72 |
| 13 | USD850 | 0.170 | 30,070,001 | 0.800 | 773,428 | 52,051,663 | 82,121,664 | 1.73 |
| 14 | USD875 | 0.165 | 31,092,385 | 0.790 | 789,563 | 54,858,049 | 85,950,434 | 1.76 |
| 15 | USD900 | 0.160 | 31,993,919 | 0.782 | 804,185 | 57,540,685 | 89,534,604 | 1.80 |
| 16 | USD925 | 0.156 | 32,879,690 | 0.775 | 819,758 | 60,893,793 | 93,773,483 | 1.85 |
| 17 | USD950 | 0.152 | 33,271,379 | 0.771 | 824,887 | 61,695,731 | 94,967,110 | 1.85 |
| 18 | USD975 | 0.148 | 34,303,449 | 0.762 | 840,886 | 64,843,984 | 99,147,433 | 1.89 |
| 19 | USD1,000 | 0.144 | 35,058,022 | 0.758 | 854,089 | 67,934,386 | 102,992,408 | 1.94 |
| 20 | USD1,050 | 0.138 | 36,095,580 | 0.751 | 871,348 | 72,049,514 | 108,145,094 | 2.00 |
| 21 | USD1,100 | 0.131 | 37,638,540 | 0.741 | 896,302 | 78,690,980 | 116,329,520 | 2.09 |
| 22 | USD1,150 | 0.126 | 39,082,627 | 0.733 | 921,623 | 85,918,220 | 125,000,847 | 2.20 |
| 23 | USD1,200 | 0.120 | 39,827,132 | 0.729 | 933,079 | 89,220,207 | 129,047,339 | 2.24 |
Table provided by Timmins Goldcorp Mexico, S.A. de C.V.
17.2.10.4 Sensitivity Analysis Based on Measured and Indicated Resource
Timmins conducted a series of analyses to test the sensitivity of the pit optimizations to changes in the cost and recovery parameters. Table 17.9 summarizes the sensitivity analysis. The base case pit contains 32 Mt of measured and indicated resource at 0.782 g/t gold, for 804,000 contained ounces. Total material within the pit is 89.5 Mt. The base case pit is that shown in Table 17.8, at a gold price of USD900/oz.
Cases 2 and 3 show the sensitivity of the pit shell to gold price. A 10% price increase results in a 8.6% increase in tonnes, a 5.7% increase in contained ounces, and a 13.9% increase in total material within the pit, compared to the base case. A 10% decrease in price results in a 9% decrease in tonnes, a 5.9% decrease in contained ounces, and a 12.5% decrease in total tonnes. Cases 4 and 5 indicate that changes in the metallurgical recovery have similar effect to changes in gold price, as it to be expected.
Cases 6 and 7 indicate a moderate sensitivity to changes in process and G&A costs. A 10% increase in costs reduces tonnes, contained ounces and total tonnes by 3.3%, 1.8% and 3.6%, respectively. A 10% decrease in costs increases tonnes, contained ounces and total tonnes 2.9%, 1.8% and 4%, respectively.
136
Table 17.9
Sensitivity Analysis for Pit Optimization Based on Measured and Indicated Resources
Case
| Case
| Variation
| Cut-Off
(g/t Au) | Measured and Indicated Resources | Waste
Tonnes | Total Tonnes
| Waste
Ratio |
| Tonnes | Au g/t | Au oc |
| 1 | Base Case USD900 | 0 | 0.160 | 31,993,919 | 0.782 | 804,185 | 57,540,685 | 89,534,604 | 1.80 |
| 2 | Gold Price USD810
% Change from base case | -10% | 0.160 | 29,114,186
-9.0% | 0.809
3.4% | 756,851
-5.9% | 49,200,693
-14.5% | 78,314,879
-12.5% | 1.69
-6.0% |
| 3 | Gold Price USD990
% Change from base case | +10% | 0.160 | 34,756,021
8.6% | 0.761
-2.7% | 850,065
5.7% | 67,207,575
16.8% | 101,963,596
13.9% | 1.93
7.5% |
| 4 | Process Recovery 63%
% Change from base case | -10% | 0.160 | 29,114,186
-9.0% | 0.809
3.4% | 756,851
-5.9% | 49,200,693
-14.5% | 78,314,879
-12.5% | 1.69
-6.0% |
| 5 | Process Recovery 77%
% Change from base case | +10% | 0.160 | 34,752,307
8.6% | 0.761
-2.7% | 850,025
5.7% | 67,197,152
16.8% | 101,949,459
13.9% | 1.93
7.5% |
| 6 | Process/G&A Cost USD2.92
% Change from base case | -10% | 0.160 | 32,926,863
2.9% | 0.773
-1.1% | 818,501
1.8% | 60,177,976
4.6% | 93,104,839
4.0% | 1.83
1.6% |
| 7 | Process/G&A Cost USD3.57
% Change from base case | +10% | 0.160 | 30,945,729
-3.3% | 0.794
1.5% | 789,775
-1.8% | 55,390,382
-3.7% | 86,336,111
-3.6% | 1.79
-0.5% |
| 8 | Mining Cost USD1.53
% Change from base case | -10% | 0.160 | 33,703,088
5.3% | 0.769
-1.6% | 833,795
3.7% | 63,887,005
11.0% | 97,590,093
9.0% | 1.90
5.4% |
| 9 | Mining Cost USD1.87
% Change from base case | +10% | 0.160 | 30,872,756
-3.5% | 0.789
1.0% | 783,390
-2.6% | 55,266,143
-4.0% | 86,138,899
-3.8% | 1.79
-0.5% |
| 10 | Pit Slope Angle Flatter
% Change from base case | -10% | 0.160 | 30,658,669
-4.2% | 0.791
1.2% | 780,087
-3.0% | 59,473,226
3.4% | 90,131,895
0.7% | 1.94
7.9% |
| 11 | Pit Slope Angle Steeper
% Change from base case | +10% | 0.160 | 33,428,036
4.5% | 0.776
-0.8% | 833,510
3.6% | 56,635,143
-1.6% | 90,063,179
0.6% | 1.69
-5.8% |
Table provided by Timmins Goldcorp Mexico, S.A. de C.V.
Cases 8 and 9 show moderate to low sensitivity to changes in mining costs. A 10% increase in mining costs results in a 3.5% decrease in tonnes, a 2.6% decrease in contained ounces and a 3.8% decrease in total tonnes. A 10% decrease in mining costs results in a 5.3% increase in tonnes, a 3.7% increase in contained ounces and a 9.0% increase in total tonnes.
Cases 10 and 11 indicate that the pit shell is not very sensitive to slope angle when only measured and indicated resource are used. A 10% steeper angles result in a 4.5% increase in tonnes, a 3.6% increase in contained ounces and a 0.6% increase in total tonnes. At 10% flatter slope angles, there is a decrease of 4.2% in tonnes, a 3.0% decrease in contained ounces and a 0.7% increase in total tonnes.
17.3 MINERAL RESERVES
Having established an unsmoothed ultimate pit shell from the pit optimization analysis, Timmins designed an open pit with haul roads capable of accepting trucks in the 91-t class, and prepared a production schedule for the extraction of the measured and indicated mineral resources contained within the pit.
17.3.1 Mining Recovery and Dilution
Mining recovery for the San Francisco deposit has been assumed to be 99%. Micon agrees with the mining recovery as initially presented, although this number may change based on actual year-to-year reconciliation studies.
The dilution for the San Francisco deposit is defined according to the type of mineralization and the size of the modelled blocks. The deposit varies in size and shape of the mineralization from one bench to another. Figure 17.4 shows a typical bench at the mining cut-off grades (low and high grade), containing both large and small discrete mineralized zones. The potential dilution varies with the amount of waste in contact with mineralized material; larger mineralized zones would carry a lower percentage of dilution than smaller zones.
137
Figure 17.4
Mineralized Blocks (Measured and Indicated) at Bench 620
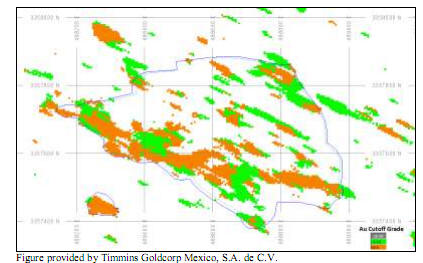
Timmins believes that its method for estimating dilution achieves a close approximation of what can be expected during operations. The method consists of identifying the sub-economic blocks in contact with ore blocks that are located within the pit outline, and adding 30% of this material as mining dilution.
An overall average of 12% dilution was estimated for the pit. Table 17.10 presents the total reserves estimated within the pit design outline, including mine recovery and dilution factors.
Table 17.10
Mineral Reserves within the San Francisco Pit Design (August, 2010) after Mining Recovery and Dilution
| In Pit Reserves at USD900/oz Gold Price | In Pit Waste |
| Classification | Tonnes
(x 1,000) | Grade (g/t) | Contained
Ounces | Waste Tonnes
(x 1,000) | Total Tonnes
(x 1,000) | Stripping
Ratio |
| Proven | 17,194 | 0.756 | 418,000 | | | |
| Probable | 17,738 | 0.635 | 362,000 | | | |
| Total | 34,932 | 0.695 | 780,000 | 60,417 | 95,349 | 1.73 |
The proven and probable reserves in Table 17.10 have been derived from the measured and indicated mineral resources summarized in Table 17.7 and account for mining recovery and dilution. The figures in Table 17.10 have been rounded to reflect that the figures are an estimate.
138
17.3.2 Mineral Reserve Statement
On the basis of the information presented in Section 18 of this report, the economic viability of the proposed mining and treatment of that portion of the measured and indicated mineral resource contained within the designed open pit has been demonstrated.
Micon therefore considers the measured and indicated mineral resource contained within the open pit design to be a mineral reserve, estimated in accordance with the CIM definitions.
139
18.0 OTHER RELEVANT DATA AND INFORMATION
This section of the Technical report incorporates both Item 20 “Other Relevant Data and Information” and Item 25 “Additional Requirements for Technical Reports on Development Properties and Production Properties”, as identified in Form 43-101 F1.
18.1 MINING
18.1.1 Open Pit Mine Design
18.1.1.1 Geotechnical Studies and Slope Design Criteria
The most recent geotechnical study carried out on the San Francisco pit was conducted by Golder Associates in December, 1996, for the previous owners of the property, Geomaque de Mexico. Golder’s scope of work was to carry out site investigations, testing and analysis to develop slope angle recommendations for the pit design.
The recommended overall slope angles ranged from 37° for single 6 m benches along the northeast facing slopes to a maximum slope of 56° for double benching in schist units. Golder presented a table of recommended inter-ramp slope angles and catch bench widths to achieve the recommended overall slope angles.
Timmins used this information when carrying out the pit optimization analysis and included an allowance for 25 m ramp widths in the overall slope angles.
18.1.1.2 Hydrological Considerations
Micon has no information on hydrology in the pit area. At the time of Micon’s visit, the pit floor was under water but this was understood to represent accumulated precipitation rather than groundwater. The existing pit walls were generally dry, with a few minor seepages along shear zones. Table 18.1 summarizes the water volume pumped out of the pit for each month from May to November, 2010.
Table 18.1
Water Level and Volume Pumped Out of Pit from May to November, 2010
| Pit Elevation | Water Volume (m3 ) | Month |
| 601 | 183,611 | May |
| 599 | 162,491 | June |
| 598 | 123,131 | July |
| 597.5 | 104,051 | August |
| 596.6 | 98,322 | September |
| 595.49 | 83,507 | October |
| 594.59 | 74,307 | October |
| 594.23 | 70,531 | November |
Table provided by Timmins Goldcorp Mexico, S.A. de C.V.
140
18.1.1.3 Phased Pit Designs
Before Timmins commenced mining within the San Francisco pit in June, 2009, pit designs were revised from the two mining phases developed previously by IMC, to three mining phases designed by Timmins. The latter designs were used for re-starting operations, in order to achieve a favourable distribution of waste tonnage during the mine life and enhance the availability of heap leach feed.
In 2010, the three-phase open pit design was extended to incorporate additional, recently discovered resources to the northwest of the previous pit outline. The ultimate pit design is based on the USD900/oz Au optimized pit shell.
Both the ultimate pit design and the interim mining phases conform to the current topography, including the existing pit contours. The interim phase boundaries were adjusted to ensure mineable bench widths and include ramps for access and haulage by 91-t trucks. Figure 18.1 shows the ultimate pit design.
Figure 18.1
San Francisco Ultimate Pit Design, Dumps and Low Grade Stockpile Layout
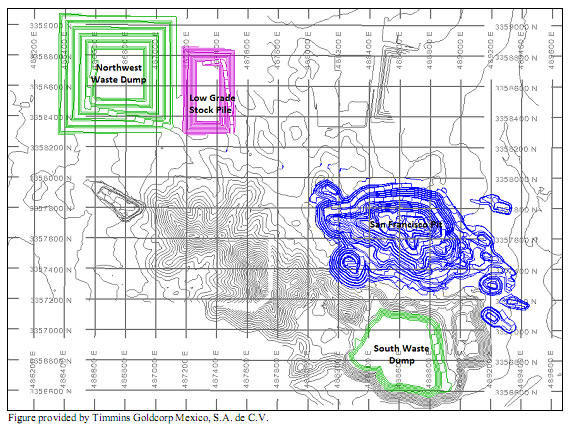
For the mine plan, phase one develops to pit down to elevation 590. The phase two push back expands the pit about 280 m west, with the lowest bench at elevation 536. The third phase and ultimate pit outline has a 120 m push back of the north wall and the final pit bottom is at elevation 464. The estimated tonnage for each design phase is listed in Table 18.2.
141
Table 18.2
Summary of the Mining Tonnages for the San Francisco Mining Phases as of the end of August, 2010
| Pit | Ore
Tonnage | Gold (g/t) | Gold (oz) | Waste
Tonnage | Total
Tonnes | Stripping
Ratio |
| Phase 1 | 2,093,000 | 0.852 | 57,000 | 1,670,000 | 3,764,000 | 0.8 |
| Phase 2 | 10,288,00 | 0.788 | 262,000 | 11,901,000 | 22,189,000 | 1.2 |
| Phase 3 | 22,551,000 | 0.637 | 461,000 | 46,846,000 | 69,396,000 | 2.1 |
| Total | 34,932,000 | 0.694 | 780,000 | 60,417,000 | 95,349,000 | 1.7 |
Figures 18.2 to 18.6 show the progressive annual pit outlines, with the access ramp included.
Figure 18.2
San Francisco Open Pit Layout, End of 2010
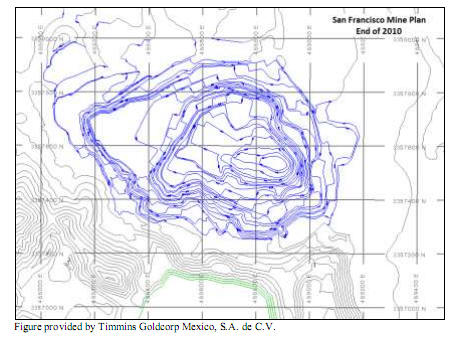
142
Figure 18.3
San Francisco Open Pit Layout, End of 2011
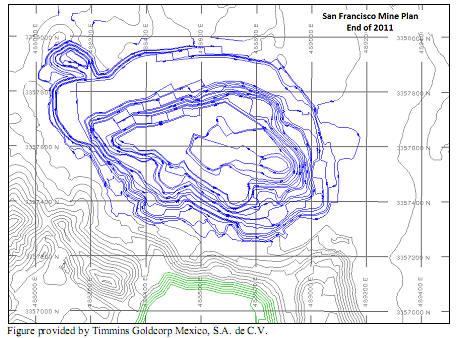
Figure 18.4
San Francisco Open Pit Layout, End of 2012
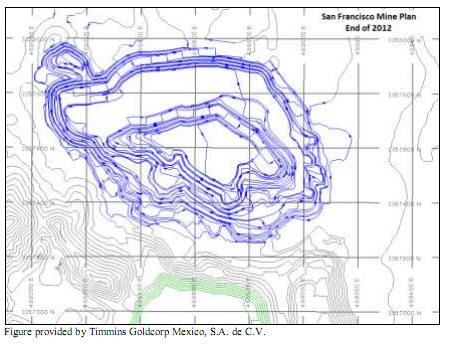
143
Figure 18.5
San Francisco Open Pit Layout, End of 2013
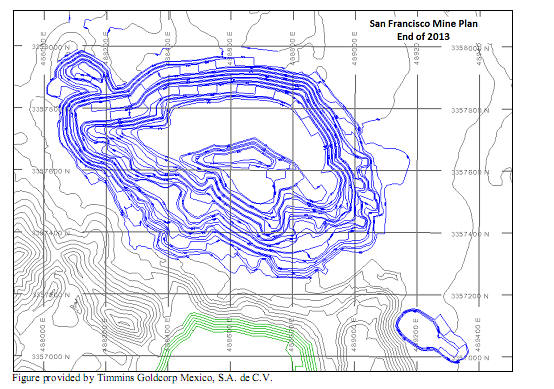
Figure 18.6
San Francisco Open Pit Layout, End of 2014
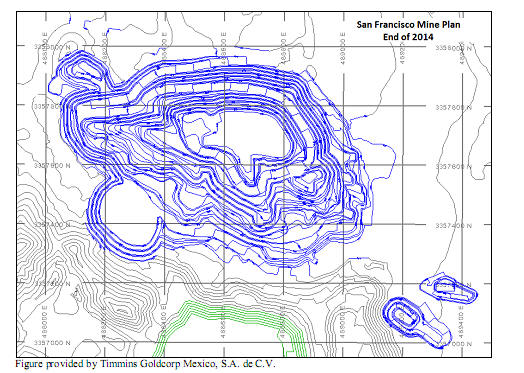
144
Figure 18.7
San Francisco Open Pit Layout, End of 2015
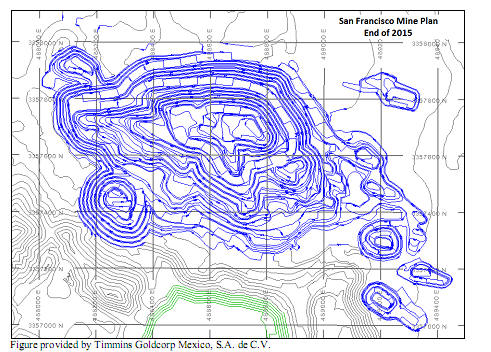
18.1.1.4 Waste Rock Management
Existing waste rock dumps are located to the south of the San Francisco open pit, close to the pit rim and cannot be extended to the north. They are also limited to the east by a property boundary and to the west by ground not yet condemned by drilling. Accordingly, with the re-establishment of the operations, the existing dumps will be extended further south, where adequate space does exist. For the expansion of reserves, additional waste dump volume is required and a site located northwest of the pit has been identified that would contain the majority of waste rock produced during the mine life. Currently, a condemnation drilling program is underway in this area.
18.1.2 Mine Production Schedule
Using the phased pit designs, Timmins has developed a mine production schedule that is based on producing a minimum of 18,000 tonnes of ore per day. The mine plan has been developed on monthly intervals for the initial 16-month period to December 2011, on a quarterly basis for 2012 and annually for the remainder of the mine life to 2016.
The mine schedule considers ore between the internal cut-off of 0.16 g/t Au and 0.5 g/t Au as low grade, and high grade ore to be above 0.5 g/t Au. A summary schedule of annual mine production by grade type is presented in Table 18.3, including actual production of the first eight months of 2010.
145
Table 18.3
San Francisco Annual Production Schedule
(Including Actual Production: January through August, 2010)
| MINE SCHEDULE | | | Actual | Plan | Plan | Plan | Plan | Plan | Plan | Plan | |
| | | | Jan.-Aug. 2010 | Total 2010 | Total 2011 | Total 2012 | 2013 | 2014 | 2015 | 2016 | TOTAL |
High Grade Ore
>0.50 Au | Ore Tonnes | | 2,325,305 | 3,410,586 | 4,224,520 | 3,806,196 | 3,912,549 | 3,966,959 | 3,031,769 | 678,173 | 23,030,753 |
| Au g/t | | 0.726 | 0.780 | 0.939 | 0.964 | 0.966 | 0.953 | 0.845 | 1.659 | 0.935 |
| Au oz | | 54,244 | 85,561 | 127,472 | 118,017 | 121,540 | 121,508 | 82,405 | 36,173 | 692,676 |
| | | | | | | | | | | | |
Low Grade Ore
0.16-0.50Au | Ore Tonnes | | 93,163 | 703,301 | 2,445,915 | 2,463,078 | 2,335,184 | 2,279,647 | 3,399,052 | 693,400 | 14,319,576 |
| Au g/t | | 0.364 | 0.306 | 0.308 | 0.313 | 0.305 | 0.312 | 0.313 | 0.296 | 0.310 |
| Au oz | | 1,091 | 6,927 | 24,244 | 24,819 | 22,867 | 22,893 | 34,212 | 6,589 | 142,551 |
| | | | | | | | | | | | |
Total
| Ore Tonnes | | 2,418,468 | 4,113,887 | 6,670,435 | 6,269,274 | 6,247,733 | 6,246,606 | 6,430,821 | 1,371,572 | 37,350,329 |
| Au g/t | | 0.712 | 0.699 | 0.707 | 0.709 | 0.719 | 0.719 | 0.564 | 0.970 | 0.696 |
| Au oz | | 55,335 | 92,488 | 151,716 | 142,836 | 144,407 | 144,401 | 116,617 | 42,762 | 835,227 |
| Waste Tonnes | | 9,618,934 | 14,007,293 | 13,316,234 | 12,329,271 | 10,087,382 | 7,054,227 | 6,874,162 | 6,367,364 | 70,035,935 |
| Total Tonnes Mined | | 12,037,402 | 18,121,180 | 19,986,669 | 18,598,545 | 16,335,115 | 13,300,833 | 13,304,984 | 7,738,936 | 107,386,263 |
| S/R wo LG Ore | | 4 | 4.3 | 3.7 | 3.9 | 3.2 | 2.4 | 3.4 | 10.4 | 3.0 |
| S/R | | 4.0 | 3.4 | 2.0 | 2.0 | 1.6 | 1.1 | 1.1 | 4.6 | 1.9 |
| Total Material Mined | Tonnes/day | | 49,741 | 49,921 | 55,060 | 51,236 | 45,000 | 36,641 | 36,653 | 21,319 | |
Note: Production numbers are higher than current reserve estimate because they also account for the production prior to the August, 2010 estimate. Table provided by Timmins Goldcorp Mexico, S.A. de C.V.
146
18.1.3 Mine Operations
All mining activities are being carried out by the contractor, Peal Mexico, S.A. de C.V., of Navojoa, Mexico. The contractor provides all the mining equipment and personnel required to produce the tonnage mandated by Timmins, in accordance with the mining plan.
Timmins provides contract supervision, geology, engineering and planning and survey services, using its own employees.
18.1.3.1 Mining Contract
Under the contract dated May 23, 2007, and updated August 14, 2008, the contractor’s performance of mining operations at the San Francisco mine includes the following; drilling and blasting, loading and transportation of waste rock and ore, pit drainage, building slopes and roads as needed, scaling of pit walls to design limits, maintenance of equipment, and providing safe and orderly working conditions. The contractor is obliged to supply and maintain appropriate principal and auxiliary mining equipment and personnel. Table 18.4 is summary of the contractor’s mining equipment currently in place.
Table 18.4
Contractor’s Mining Equipment
| Brand | Model | Quantity | Type |
| CATERPILLAR | 777F | 12 | Trucks |
| KENWORTH | T300 | 2 | Auxiliary |
| CATERPILLAR | D10T | 1 | Dozer |
| INGERSOLL | 2475 | 1 | Auxiliary |
| CATERPILLAR | 775B | 1 | Truck |
| CATERPILLAR | PIPAS | 2 | Auxiliary |
| CATERPILLAR | M318CH | 1 | Auxiliary |
| CATERPILLAR | 834G | 1 | Dozer |
| CATERPILLAR | 16M | 1 | Grader |
| CATERPILLAR | CS583 | 1 | Pipe layer |
| CATERPILLAR | 993K | 1 | Loader |
| KOMATSU | PC2000 | 2 | Shover |
| KOMATSU | 1250 | 1 | Shovel |
| SANDVIK | D245S | 3 | Drilling |
| SANDVIK | D40KS | 1 | Drilling |
| ATLAS COPCO | DM45 | 1 | Drilling |
| INGERSOLL | DM645-D | 1 | Drilling |
| INGERSOLL | IR-780 | 1 | Drilling |
| TAMROCK | GATOR D25KS | 1 | Drilling |
Table provided by Timmins Goldcorp Mexico, S.A. de C.V.
The following technical parameters are part of the contract:
The unit price for executing the work is USD 1.59/t of material.
The assumed powder factor is 0.200 kg ANFO per tonne of rock blasted. The base cost per tonne of material blasted (including items such as explosives, supplies and accessories, drill service for blasting etc.), is USD 0.19/t.
147
The drill pattern is 4.5 m by 5.0 m, using 6.5 inch diameter blasthole drills.
The base cost of diesel fuel is USD 0.52 per litre.
Design rock densities are ore 2.66 t/m3 and waste 2.77 t/m3 .
The work schedule is based on two shifts of 12 hours per day, 360 days per year.
18.1.3.2 Owner Mining Requirements
Mining engineering and design services are provided by Timmins. These services include:
Obtaining of all permits and licences for mining.
Mine design and planning, grade control and surveying services.
Supply of electric power, water and telecommunications.
Security services, safety plans and personnel and first aid stations.
18.1.4 Conclusion
Micon has reviewed the resource and reserve estimations, the mine design, the mining schedule and the contract terms, including the contractor’s ability to meet the mining schedule, and concludes that the estimations and designs have been properly carried out and that the contractor is capable of meeting the production schedule.
18.2 PROCESSING
18.2.1 Crushing and Conveying
Ore extracted from the pit is transported in haulage trucks with a capacity of 91 tonnes, which feed directly into the gyratory primary crusher with dimensions of 42” x 65”. The crusher has nominal capacity of 1,200 t/h. The crushed product is then transported on conveyor belts to a stockpile with a capacity of 10,000 tonnes.
Two feeders beneath the stockpile deliver the ore to a conveyor belt for transport to the secondary crushing circuit. The ore is screened at ½”. Screen undersize reports to the final product, while screen oversize is fed to two secondary crushers.
Product from the secondary crushers is transported on conveyor belts to the tertiary crushing circuit, which consists of two tertiary crushers operating in closed circuit with ½” screens. Undersize from the screens is delivered to the leach pad.
148
An additional crusher and screen, both for the tertiary circuit and with the same specifications as the existing ones, are planned to be installed to increase throughput from 12,000 t/d to 18,000 t/d.
18.2.2 Leaching
The current leach pad occupies approximately 40 ha and is divided into 7 sections. Product from the crushing plant is transported to the leach pad on overland conveyors and deposited on the pad with a stacker, forming lifts 6 m in height. A bulldozer is used to level the surface of each lift. The irrigation pipelines are then installed to distribute the leach solution over the entire surface of the lift.
The leach solution, consisting of 0.03% sodium cyanide and having a pH of 10.5 to 11, flows downward through the crushed ore, dissolving gold and silver. The solution percolates to the bottom of the lift and flows to the canal that carries the pregnant solution to a storage pond, from which it is pumped to the ADR plant.
Barren solution exiting the ADR plant flows to a second storage pond where fresh water is added, to replace the losses during the process, and sodium cyanide is added, before the solution is pumped back to the leach pad.
Due to the increased mineral reserves and the planned increase in production, permits will be sought for an additional 35.2 hectares for the construction of a new leach pad.
18.2.3 Adsorption/Desorption/Recovery Plant
Pregnant solution is fed to the adsorption plant which consists of 2 lines of carbon columns, each with 5 tanks through which the carbon is advanced counter-currently. One line of columns contains approximately 2.0 t of carbon and the other 2.5 t. Gold is adsorbed on the carbon to a concentration of approximately 5,000 g/t. Desorption of the carbon is achieved in a Zedra circuit, using stainless steel electrodes in a stainless steel electrolytic cell. The stainless cell and cathodes are relatively new and replace the original polypropylene cell with steel wool cathodes. The use of stainless cathodes is more efficient, as it does not require the fluxing of substantial quantities of steel wool which is time consuming, requires substantially more flux, and can lead to inferior grade doré.
A new line of carbon column with 5 tanks and a flow of 3,500 g/m is planned to be installed to accommodate the increase in production capacity.
18.2.4 Process Plant Layout
Figure 18.8 shows the San Francisco mine site layout, with the current operations and the new proposed use of land for the pit, leach pad, waste storage expansion, and the low grade ore stockpile. Figures 18.9 to 18.12 show the crushing circuit, leach plant solution flow, material balance, solution balance, and the existing ADR circuit.
149
Figure 18.8
Site Layout

Figure 18.9
Crushing Circuit
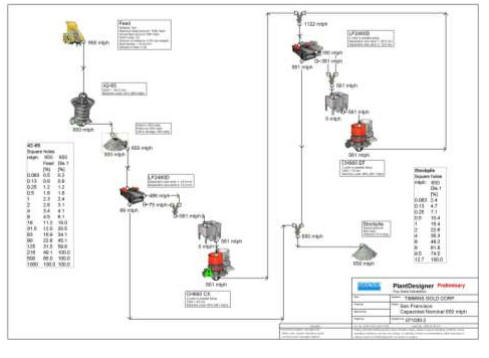
150
Figure 18.10
Heap Leach Process Flowsheet
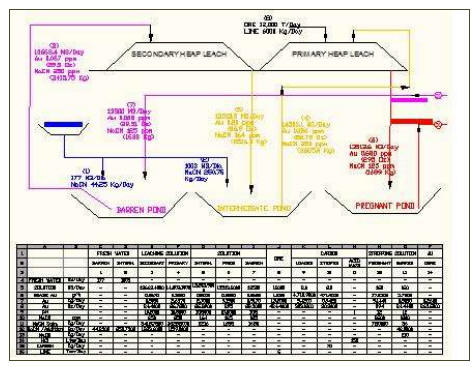
Figure 18.11
Heap Leach Circuit Showing Proposed Solution Balance
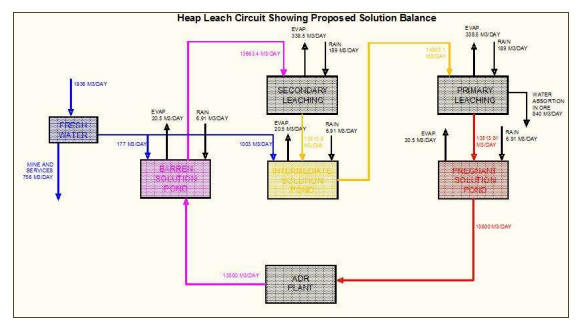
151
Figure 18.12
Gold Recovery Circuit (ARD) Flowsheet
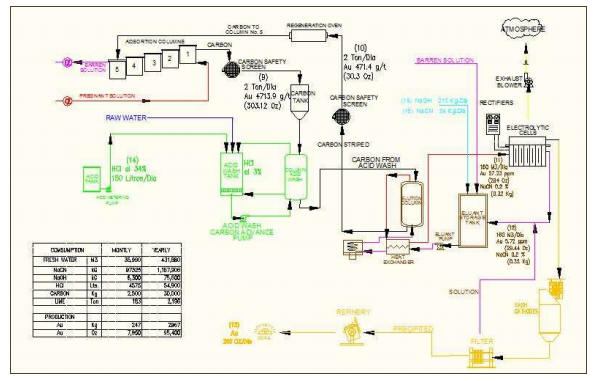
18.2.5 Manpower
The current process plant manpower is summarized in Table 18.5.
Table 18.5
Manpower at the San Francisco Mine
| DEPARTMENT | DESCRIPTION | QUANTITY |
| ADR plant | Superintendent / Supervisor | 3 |
| Hourly personnel | 18 |
Leach
| Superintendent / Supervisor | 2 |
| Hourly personnel | 17 |
Crushing
| Superintendent / Supervisor | 9 |
| Hourly personnel | 28 |
Laboratory
| Superintendent / Supervisor | 5 |
| Hourly personnel | 21 |
Maintenance contractors
| Coordinator / Supervisor | 4 |
| Hourly personnel | 40 |
| TOTAL | 147 |
Table provided by Timmins Goldcorp Mexico, S.A. de C.V.
18.2.6 Consumables and Maintenance
The usage rates and costs of process reagents are summarized in Table 18.6.
152
Table 18.6
San Francisco Process Reagents (Consumables)
| Reagent | Consumption
(Unit/Tonne) | Annual Consumption
(Unit/a) | Unit Cost
(USD) | Annual Cost
(USD) |
| Antiscalent | 0.0134 L | 57,888 L | 2.79 | 161,507 |
| Sodium Cyanide | 0.1105 Kg | 477,497 Kg | 2.60 | 1,241,491 |
| Caustic Soda | 0.0091 Kg | 39,107 Kg | 0.81 | 31,676 |
| Lime | 0.4278 Kg | 1,848,050 Kg | 1.33 | 2,457,906 |
| Carbon | 0.0110 Kg | 47,374 Kg | 2.80 | 132,648 |
| Hydrochloric Acid | 0.0207 Kg | 89,278 Kg | 0.40 | 35,711 |
| Propane | 0.1227 L | 529,908 L | 0.38 | 201,365 |
| Borax | | 2,304 Kg | 1.00 | 2,304 |
| Silica | | 1,404 Kg | 1.10 | 1,544 |
| Sodium Carbonate | | 468 Kg | 0.52 | 243 |
| Potassium Nitrate | | 230 Kg | 0.96 | 221 |
| Fluorite | | 230 Kg | 2.06 | 474 |
| Total Cost | 4,267,093 |
Total Cost Per
Tonne | 0.99 |
18.3 ADMINISTRATION, ENGINEERING AND EXISTING INFRASTRUCTURE
18.3.1 Manpower Organization
The current total manpower at the San Francisco mine is shown in Table 18.7, excluding the mine contract personnel.
Table 18.7
Total Manpower for the San Francisco Mine
| DEPARTMENT | DESCRIPTION | QUANTITY |
| ADR plant | Superintendent / Supervisor | 3 |
| Hourly personnel | 18 |
| Leach | Superintendent / Supervisor | 2 |
| Hourly personnel | 17 |
| Crushing | Superintendent / Supervisor | 9 |
| Hourly personnel | 28 |
| Warehouse | Supervisor | 1 |
| Hourly personnel | 3 |
| Exploration | Superintendent / Supervisor | 8 |
| Hourly personnel | 31 |
| Direction | General Manager | 1 |
| Superintendent / Supervisor | 3 |
| Geology | Superintendent / Supervisor | 4 |
| Hourly personnel | 8 |
| Mine | Superintendent / Supervisor | 8 |
| Hourly personnel | 1 |
| Engineering | Superintendent / Supervisor | 3 |
| Hourly personnel | 3 |
| Laboratory | Superintendent / Supervisor | 5 |
| Hourly personnel | 21 |
| Metallurgy | Superintendent / Supervisor | 3 |
| Hourly personnel | 1 |
| Electric Maintenance | Superintendent / Supervisor | 3 |
| Hourly personnel | 7 |
153
| Administrative / Accounting | Superintendent | 1 |
| Supervisor / Assistant | 4 |
| Purchasing | Superintendent | 1 |
| Supervisor / Assistant | 5 |
| Human Resources | Superintendent / Supervisor | 3 |
| Hourly personnel | 12 |
| Safety and Environment | Superintendent / Supervisor | 4 |
| Hourly personnel | 2 |
| Maintenance Contractors | Coordinator / Supervisor | 4 |
| Hourly personnel | 40 |
| TOTAL | 267 |
Table provided by Timmins Goldcorp Mexico, S.A. de C.V.
18.3.2 Offices, Workshops and Stores
Office space for the mine is provided in a structure of approximately 450 m2 located on the property, southeast of the ADR plant. The building has adequate working space for the on-site mine administration and also provides basic catering and ablution facilities.
A vehicle workshop south of the ADR plant and north of the open pit occupies more than 660 m2 and accommodates the off-road haul trucks, excavators and ancillary vehicles used in the open pit mining operation.
A general warehouse of approximately 200 m2, located north of the ADR plant, accommodates process reagents and mechanical spares. Bulk lime for the heap leach process is stored in a silo near the crushing plant.
18.3.3 Electrical Power Supply
Electrical power supply to the mine is delivered through a 33 kV overhead line from the utility company, Comisión Federal de Electricidad (CFE). From the main metering point, the power is distributed to the crushing and screening plant and other site infrastructure at 480/220/110 V. At the crushing and screening plant, separate transformers feed the principal equipment. Installed transformer capacity is as follows:
| | kVA | |
- Primary crusher
- Secondary/tertiary crushers
- Stacker conveyors
- Leach solution pumps
- ADR plant
- Laboratory
- Office
- Workshop
- Water well #1
- Water well #2
- Lighting
| 1,000
3,000
2,000
1,500
500
150
75
75
75
45
50 | |
154
The current electrical power supply is sufficient for the planned production capacity of 18,000 t/d of ore.
18.3.4 Water Supply
The current demand of fresh water is 2 000 m3/d, of which 1,100 m3/d are for the leach area and ADR plant and 900 m3/d for the mine and services.
Comisión Nacional del Agua (CONAGUA) authorized the total and definitive transfer of the rights for two concession titles to exploit and use national water previously held by Geomaque de Mexico, to Timmins’ Mexican subsidiary Molimentales on May 30, 2008. Concession title No. 1SON104008/08FMGR97 is authorized for the industrial use of 300,000 m3/y over a ten-year term from August 1, 2007. Concession title No. 02SON109912/08FMGR04 is authorized for industrial use of 300,000 m3/y over a ten-year term from October 8, 2007.
Rights to exploit an additional 200,000 m3/y of national water were assigned to Molimentales from concession title No. 02SON124622/08AMOC08 on August 2, 2010, and the rights to a further 100,000 m3/y of national water were assigned to Molimentales from concession title No. 02SON124710/ 08AMOC08 on August 9, 2010.
A drilling permit will be solicited to construct a new water extraction well.
A new water tank and a pressure pump will be installed to comply with regulation NOM – 002 – STPS of the Secretaría del Trabajo y Previsión Social (STPS) relevant to the prevention of and protection against fire in the workplace, which states that water pressure for fire control should be at least 7 kg/cm2.
18.4 ENVIRONMENTAL CONSIDERATIONS
The Secretaría de Medio Ambiente y Recursos Naturales (SEMARNAT) determined that the project as described in the environmental impact assessment (Manifiesto de Impacto Ambiental – Modalidad Particular) and a level 2 environmental risk study (Estudio de Riesgo Ambiental Nivel 2) for San Francisco mine submitted on December 17, 2007, is environmentally viable and authorized the project with conditions specifically regarding reforestation and groundwater monitoring on August 1, 2008. Groundwater monitoring is currently being performed monthly on four monitoring wells to determine the level of cyanide. Reforestation activities have continued every month with three specific species: palo fierro, palo verde and mezquite.
On May 30, 2008, SEMARNAT registered Molimentales as a generator of hazardous waste. Molimentales is complying with hazardous waste management standards using an on-site storage facility exclusively for hazardous waste which is collected by an accredited company. The mine contractor, Peal Mexico, was registered by SEMARNAT as a generator of hazardous waste on August 26, 2010, and is responsible for the management of the hazardous waste generated by the mining operations.
155
On January 11, 2010, Molimentales submitted a request for an environmental license (Licencia Ambiental Única) which was authorized with conditions on March 17, 2010. A scrubber was purchased and installed in the laboratory to increase the efficiency of the emissions control system. Two domes will be purchased and installed to cover the stockpiles of material from the crushers, to control the emission of dust.
Due to the proposed increase in production capacity from 12,000 t/d of ore to 18,000 t/d, Molimentales will update all of its environmental permits to include the additional use of land. The additional use of land includes:
- The pit area will use 21 additional ha.
- The leach pad area will use 35.2 additional ha.
- The waste storage area will use 90 additional ha.
- The low grade ore stockpile area will use 30 new ha.
The total new area that will be solicited for authorization is 176.2 ha.
A new environmental impact assessment (Manifiesto de Impacto Ambiental – Modalidad Particular) will be submitted to SEMARNAT to include the proposed future operation of the project and the new use of land, infrastructure, equipment and manpower required for the increase of production capacity.
A new level 2 environmental risk study (Estudio de Riesgo Ambiental Nivel 2) will be submitted to SEMARNAT to include an update of the new use of land, hazardous materials, hazardous waste, atmospheric emissions and risk identification models to be used for the handling of hazardous materials.
A technical justification study for the change of land usage (Estudio Técnico Jusitificativo para el Cambio de Uso de Suelo) will be submitted for authorization to SEMARNAT, to identify and register the new areas of land to be used, and to inventory the natural resources to be affected.
A payment for Environmental Compensation for the Change of Land Usage of Forest Land will be made to the Comisión Nacional Forestal (CONAFOR).
Modifications will be made to the Land Usage and Construction licenses granted by the City Council of Santa Ana, Sonora.
The registration by SEMARNAT of Molimentales as a generator of hazardous waste will be modified to update the increase in hazardous waste.
156
Modifications will be made to the environmental license (Licencia Ambiental Única) to be submitted for authorization by SEMARNAT, including new equipment and increased production capacity, new inventory and registration of atmospheric emissions, modifications to the blasting program, and an updated air quality model.
18.5 ECONOMIC EVALUATION
Micon conducted the economic evaluation of the San Francisco project based on the information supplied to it by TMM and its subsidiary Timmins.
18.5.1 Macro-Economic Assumptions
Economic analysis of the San Francisco project has been carried out in United States dollars (USD). Conversion of local Mexican costs, principally labour and power, has been made at the rate of MXN 12.50/USD 1.00, which is considered appropriate given recent trends in actual rates (see Figure 18.13) .
Figure 18.13
Exchange Rate (MXN/USD) 2010
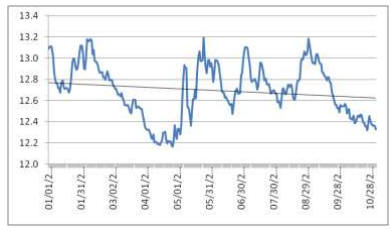
The cash flow projection has been made in constant, third quarter 2010 money terms. The net cash flows have been discounted to mid-2010 for the purposes of calculating net present value (NPV). A base discount rate of 8.0% per year has been selected as most likely to represent the weighted average cost of capital to the project. Other rates are provided for ease of comparison.
18.5.2 Metal Price Forecast
Revenue projections are based on a constant gold price of USD 1,000/oz in real terms, closely approximating the 3-year trailing average price but significantly lower than spot prices at the time of writing (see Figure 18.14) . Accordingly, the sensitivity of the project to gold price in a range of up to USD 1,400/oz has also been evaluated. A price of USD 17/oz has been used for the minor amount of silver produced.
157
Figure 18.14
Spot Gold Price
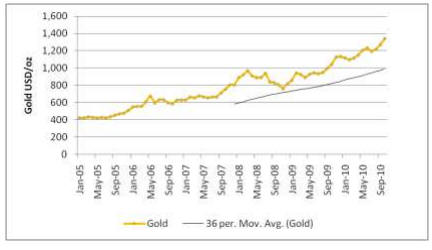
18.5.3 Royalties and Taxes
Micon understands that no liability for NSR royalty interests in the San Francisco mine has extended to the present owners. Therefore, no royalty has been provided for.
Mexican corporate taxation has been provided for at the base rate of 28%, with provision for temporary rates of 30% up to the end of 2012 and 29% during 2013, which Timmins expects to be applicable. The World Bank/IFC website estimates a typical effective rate of tax on profits in Mexico of 22.9%.
18.5.4 Working Capital
Provision has been made for working capital represented by 7 and 30 days of accounts receivable and payable, respectively, as well as 45 days of stores and 30 days of product inventory. The life-of-mine cash flow assumes that an amount of $9 million presently in working capital will be released once operations cease.
18.5.5 Base Case
The base case evaluation of the San Francisco project has been made using the nominal treatment rate of 18,000 t/d, which is expected to be achieved from July, 2011. The mining schedule that supports this production plan is given in Figure 18.15.
158
Figure 18.15
Mining Schedule
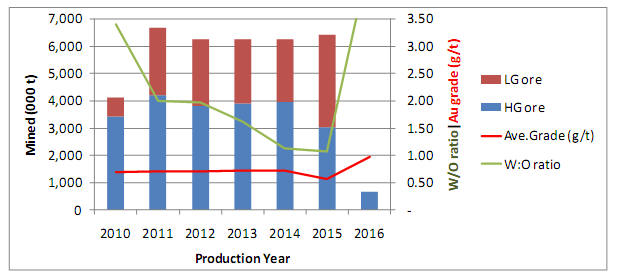
Open pit mining ceases early in 2016 and, as shown in Figure 18.16, processing of both high grade and low grade run-of-mine (ROM) material is carried out in parallel, with a small tonnage of low grade material (< 1 million tonnes) stockpiled during 2011/2012 treated later in the operating period. The cost for rehandling this low grade material has been conservatively estimated at USD 0.50/t.
Figure 18.16
Processing Schedule

Overall process recovery averages 70% of contained gold in ore treated. Sales forecasts take into consideration the lockup of gold in the heap, as shown in Figure 18.17.
159
Figure 18.17
Gold Production, Sales and Inventory
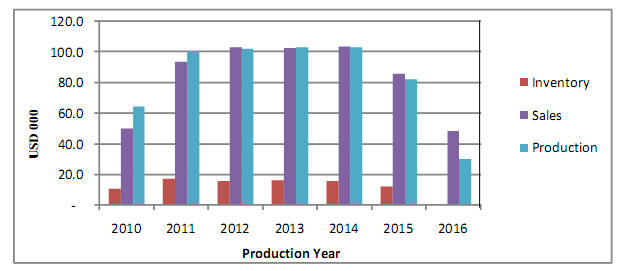
Cash operating costs are forecast to remain steady over the open pit mining period. Annual cash operating costs are shown in Figure 18.18.
Figure 18.18
Operating Costs Schedule
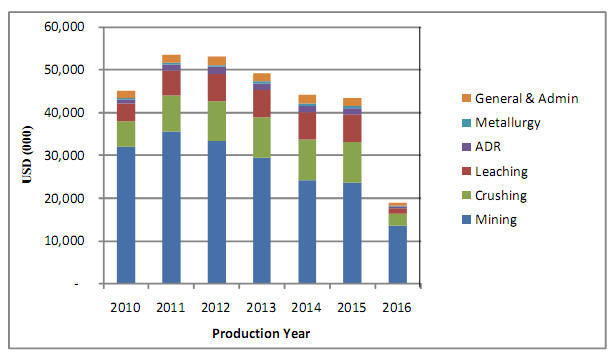
Pre-production capital costs for re-establishment of mining operations, refurbishment of the crushing and ADR plants and for extension of the heap leach pad at the San Francisco mine were all incurred in the period prior to the re-commencement of commercial production in
160
April, 2010. As such, these costs have been treated as sunk costs for the purposes of the economic evaluation and, where shown in the project cash flow schedules and charts, are included for illustration of pay-back period only.
Sustaining capital expenditures are included in the cash flow projections at a level which allows for the overhaul of plant and equipment on an as-required basis. Additional capital expenditure to be incurred in the expansion from 12,000 t/d to 18,000 t/d has been estimated at USD 11.2 million and is provided for in the cash flow model. The costs of rehabilitation and mine closure bonding have also been included in sustaining capital.
A summary of the base case life-of-mine statistics is provided in Table 18.8. Annual cash flows for the base case are summarized in Table 18.9. The base case cash flow profile is presented graphically in Figure 18.19. The calculated NPV and cumulative DCF exclude sunk costs, but sunk costs are included in the cumulative undiscounted cash flow.
It will be seen that, for the base case, the net present value of the project cash flow at a discount rate of 8%/y (NPV8) evaluates to approximately USD 216.8 million before tax and USD 163.1 million after tax. Since capital costs have been treated as sunk, no internal rate of return can be calculated. The average cash cost of production equates to USD 489.05/oz gold, or USD 7.88/t treated.
Table 18.8
Summary Life-of-Mine Statistics
| Life-of-Mine Cash Flow
(US$ millions) | Life-of-Mine Averages |
Undiscounted
| NPV at 8.0%
| Unit Cost | Margin | USD/oz |
| US$/t | % | Gold |
| Net Revenue | 537.6 | 438.5 | 16.13 | 100.0% | 1,001.54 |
| | | | | | |
| Mining costs | 159.8 | 132.3 | 4.79 | 29.7% | 297.68 |
| Crushing costs | 49.0 | 40.1 | 1.47 | 9.1% | 91.36 |
| Leach costs | 32.4 | 26.6 | 0.97 | 6.0% | 60.37 |
| ADR costs | 8.2 | 6.7 | 0.25 | 1.5% | 15.22 |
| Metallurgy and Lab costs | 2.4 | 2.0 | 0.07 | 0.5% | 4.53 |
| General & Admin costs | 10.7 | 8.7 | 0.32 | 2.0% | 19.88 |
| Total cash operating cost | 262.5 | 216.3 | 7.88 | 48.8% | 489.05 |
| | | | | | |
| Cash operating margin | 275.1 | 222.1 | 8.25 | 51.2% | 512.48 |
| | | | | | |
| Capital Expenditure | 1.5 | 5.4 | 0.04 | 0.3% | 2.71 |
| | | | | | |
| Net Cash Flow (before tax) | 273.6 | 216.8 | 8.21 | 50.9% | 509.78 |
| | | | | | |
| Taxation | 66.5 | 53.7 | 2.00 | 12.4% | 123.94 |
| | | | | | |
| Net Cash Flow (after tax) | 207.1 | 163.1 | 6.21 | 38.5% | 385.84 |
161
Table 18.9
Project Base Case Annual Cash Flows
| | USD 000 | 2011 | 2012 | 2013 | 2014 | 2015 | 2016 | LOM total |
| Revenue | Gross Sales | 94,272 | 103,502 | 103,042 | 103,913 | 86,217 | 48,744 | 539,689 |
| | Bullion delivery | 274 | 305 | 278 | 280 | 236 | 124 | 1,497 |
| | Bullion refining | 112 | 123 | 120 | 121 | 101 | 52 | 629 |
| | Net Sales Revenue | 93,885 | 103,074 | 102,644 | 103,513 | 85,880 | 48,567 | 537,564 |
| | | | | | | | | |
| Cash Op. Costs | Mining costs | 35,528 | 33,279 | 29,418 | 24,260 | 23,722 | 13,572 | 159,779 |
| | Crushing costs | 8,525 | 9,455 | 9,454 | 9,454 | 9,439 | 2,709 | 49,036 |
| | Leach costs | 5,666 | 6,340 | 6,340 | 6,340 | 6,337 | 1,380 | 32,405 |
| | ADR costs | 1,442 | 1,576 | 1,576 | 1,576 | 1,570 | 428 | 8,168 |
| | Metallurgy & Lab costs | 441 | 451 | 451 | 451 | 446 | 193 | 2,434 |
| | G&A costs | 1,923 | 1,997 | 1,997 | 1,997 | 1,977 | 781 | 10,672 |
| | Total Cash Operating Costs | 53,526 | 53,098 | 49,236 | 44,077 | 43,491 | 19,065 | 262,494 |
| | | | | | | | | |
| Net Cash Operating Margin (EBITDA) | 40,359 | 49,975 | 53,408 | 59,435 | 42,389 | 29,502 | 275,070 |
| | | | | | | | | |
| Capital | Initial/expansion capital | - | - | - | - | - | - | - |
| | Sustaining capital | 6,143 | 690 | 2,729 | 393 | 302 | 302 | 10,559 |
| | Changes in working capital | 5,915 | 1,013 | -375 | -321 | -2,247 | -13,090 | -9,107 |
| | | | | | | | | |
| Net cash flow before tax | 28,302 | 48,273 | 51,055 | 59,363 | 44,335 | 42,291 | 273,618 |
| Taxation payable | | 9,082 | 12,706 | 13,195 | 14,370 | 9,512 | 7,658 | 66,523 |
| Net cash flow after tax | 19,220 | 35,567 | 37,859 | 44,993 | 34,823 | 34,633 | 207,095 |
| | | | | | | | | |
| Discounted Cash Flow (8 %/y) Pre-Tax | 27,234 | 43,010 | 42,119 | 45,345 | 31,357 | 27,696 | 216,760 |
| Cumulative DCF (8 %/y) Pre-tax | 27,234 | 70,243 | 112,362 | 157,707 | 189,064 | 216,760 | |
| | | | | | | | | |
| Discounted Cash Flow (8 %/y) After tax | 18,494 | 31,689 | 31,233 | 34,369 | 24,630 | 22,681 | 163,096 |
| Cumulative DCF (8 %/y) After tax | 18,494 | 50,183 | 81,416 | 115,785 | 140,415 | 163,096 | |
162
Figure 18.19
Cash Flow Projection
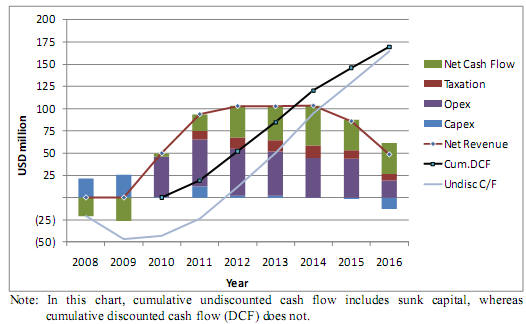
18.6 SENSITIVITY STUDY
Sensitivity of the NPV8 to changes in gold price, operating and capital costs has been analyzed (Figure 18.20) . Project revenues are directly proportional to process recovery and grade, and hence gold price may also be used as a proxy in this model for changes in both recovery and reserve grade as revenue drivers.
The sensitivity results show that, as expected, the project is most sensitive to the revenue drivers described above. However, even with an adverse change of 30% (i.e., a reduction in price to USD 700/oz), NPV8 remains strongly positive; economic break-even occurs with a gold price of around USD 510/oz. At the time of writing, the spot gold price was in excess of USD 1,300/oz, at which price NPV8 is estimated at approximately USD 256 million.
The project is also moderately sensitive to operating costs, with a 30% adverse change sufficient to reduce NPV8 by approximately USD 40 million. With the bulk of project capital costs already sunk, however, sensitivity to capital expenditure is negligible.
163
Figure 18.20
Sensitivity of NPV8 to Prices, Operating and Capital Costs
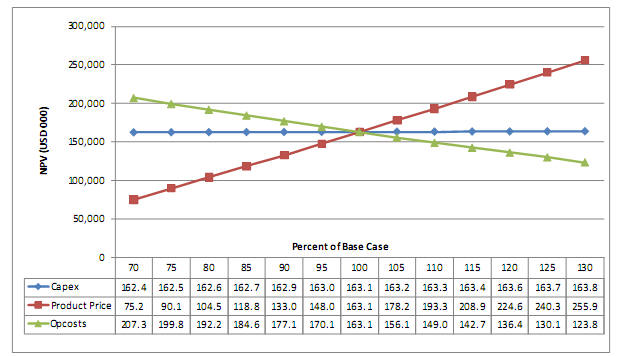
Micon selected a discount rate of 8% as representing an expected cost of capital for the project in its base case. Sensitivity of the project NPV has been determined for a range of discount rates from 5% to 10%, as shown in Table 18.10.
Table 18.10
Sensitivity of NPV to Discount Rate
| Discount Rate | NPV before tax
(US$ 000) | NPV after tax
(US$ 000) |
| 5% | 235,655 | 177,696 |
| 6% | 229,070 | 172,605 |
| 7% | 222,778 | 167,743 |
| 8% | 216,760 | 163,096 |
| 9% | 211,003 | 158,651 |
| 10% | 205,491 | 154,399 |
Sensitivity of the project NPV8 has also been determined for a specified range of gold prices, as shown in Table 18.11.
164
Table 18.11
Sensitivity of NPV to Gold Price
Gold Price
US$/oz | NPV before tax
(US$ 000) | NPV after tax
(US$ 000) |
| 600 | 40,309 | 39,764 |
| 700 | 84,422 | 75,151 |
| 800 | 128,535 | 104,487 |
| 900 | 172,648 | 132,981 |
| 1,000 | 216,760 | 163,096 |
| 1,100 | 260,873 | 193,292 |
| 1,200 | 304,986 | 224,666 |
| 1,300 | 349,099 | 256,040 |
| 1,400 | 393,211 | 287,415 |
165
19.0 INTERPRETATION AND CONCLUSIONS
In 2005, TMM/Timmins acquired the San Francisco project and all the historical technical, geological and geochemical data from Geomaque. As part of the transaction, TMM/Timmins obtained an abundance of data not only related to the mine site but also on the exploration programs conducted by Geomaque during its tenure. TMM/Timmins then used the data as the basis for its exploration and development programs at the San Francisco mine.
After acquiring the project, Timmins undertook a review of all available geological data surrounding the previous mining areas and identified a number of immediate exploration targets both to the northwest and to the southeast of the San Francisco pit which required further work. Timmins also spent the first few months staking the surrounding area and laying out an appropriate drilling program with the objective of confirming and extending the known mineralization around the open pit.
Beginning in 2005, TMM/Timmins has been conducting aggressive exploration programs to delineate and expand the known mineralization at the San Francisco mine. The exploration drilling programs have primarily been concentrated around the existing pits. However, other mineral exposures previously identified by Geomaque, as well as new areas identified by TMM/Timmins, have been targeted as well.
As a result of successful exploration campaigns around the existing pits, TMM/Timmins has been able to expand the previously known mineralization, to re-open the San Francisco mine and expand the resources and reserves.
Between 2008 and 2010, Timmins also conducted a number of other exploration programs such as geochemical soil and chip sampling, an air magnetic and radiometric survey, a natural source audio-frequency magnetotelluric survey (NSAMT) and a structural review of the San Francisco gold deposit.
The resource and reserve estimate completed by Timmins in July, 2010, and audited by Micon in August/September, 2010, is compliant with the current CIM standards and definitions specified by NI 43-101, and supersedes the estimate made for the San Francisco mine in March, 2008.
19.1 MINERAL RESOURCE ESTIMATE
Both Canadian NI 43-101 and the Australasian Joint Ore Reserves Committee (JORC) code state that mineral resources must meet the condition of “a reasonable prospect for eventual economic extraction.” For open pit material, Timmins utilized a Lerchs Grossman pit shell geometry at reasonable long term prices, and reasonable costs and recovery assumptions, as meeting this condition for mineral resources. The resource is based on a pit shell at a gold price of USD 1,100/oz and additional cost and recovery parameters developed by Timmins which meet the conditions for classification of the material as a mineral resource.
166
Table 19.1 summarizes the economic parameters used for the analysis. The parameters are a combination of IMC and Timmins inputs, taking into account the actual costs obtained from the first year of operation.
Pit bench heights were set at 6.0 m (the block height of the 3-D block model) and the slope angles used for the pit optimization were based on inter-ramp angles recommended by Golder Associates in its December, 1996, report and adjusted to allow for haul roads of 25 m width.
Table 19.1
Pit Optimization Parameters for the San Francisco Project
| Costs | Rock Densities and Recoveries |
| Description | Units | Amount | Name | Code | Density | Recovery % |
| Waste mining cost | $/t | 1.70 | Diorite | 2 | 2.72 | 60.50 |
| Ore mining cost | $/t ore | 1.70 | Gneiss | 4 | 2.75 | 70.70 |
| Process cost | $/t ore | 2.83 | Granite | 5 | 2.76 | 84.50 |
| G & A cost | $/t ore | 0.42 | Schist | 6 | 2.75 | 65.37 |
| Total Cost | $/t ore | 4.95 | Lamprophrite Dyke | 8 | 2.76 | 60.50 |
| Gold price | $/oz | 1,100 | Gabbro | 11 | 2.81 | 60.53 |
| | General Recovery | | 70.00 |
Table provided by Timmins Goldcorp Mexico, S.A. de C.V.
The mineral resource, as estimated by Timmins and audited by Micon is presented in Table 19.2. This resource estimate includes the undiluted mineral reserve material as of August 31, 2010.
Table 19.2
Mineral Resource Estimate for the San Francisco Project (Inclusive of Mineral Reserves)
(Cut-off Grade of 0.131 g/t Gold and USD 1,100 Gold Price)
| Resource Classification | Tonnes (x 1,000) | Gold Grade (g/t) | Contained Gold (oz) |
| Measured | 19,089 | 0.797 | 489,000 |
| Indicated | 23,442 | 0.658 | 495,000 |
| Total Measured and Indicated | 42,531 | 0.720 | 984,000 |
| Inferred | 10,308 | 0.628 | 208,000 |
Micon believes that no environmental, permitting, legal, title, taxation, socio-economic, marketing or political issues exist which would adversely affect the Mineral Resources estimated above, at this time. However, Mineral Resources that are not Mineral Reserves do not have demonstrated economic viability. The figures in Table 19.2 have been rounded to reflect that the figures are an estimate.
The Mineral Resource estimate has been reviewed and audited by Micon. It is Micon’s opinion that the August 31, 2010 Mineral Resource estimate has been prepared in accordance with the CIM standards and definitions for Mineral Resource estimates and that TMM/Timmins can use this estimate as a basis for further exploration and economic evaluation of the San Francisco mine project.
167
19.2 MINERAL RESERVE
Having established a Measured and Indicated mineral resource estimate from the pit optimization analysis, Timmins designed an open pit with haul roads capable of accepting trucks in the 91-t class, and prepared a production schedule for the extraction of the measured and indicated mineral resources.
Mining recovery for the San Francisco deposit has been assumed to be 99%. Micon agrees with the mining recovery as initially presented, although this number may change based on actual year-to-year reconciliation studies.
The dilution for the San Francisco deposit is defined according to the type of mineralization and the size of the modelled blocks. The deposit varies in size and shape of the mineralization from one bench to another. The potential dilution varies with the amount of waste in contact with economic material; larger mineralized zones would carry a lower percentage of dilution than the smaller zones.
Timmins believes that its method for estimating dilution achieves a close approximation of what can be expected during operations. The method consists of identifying the sub-economic blocks (tonnage and grade) in contact with ore blocks, and adding 30% of this material as mining dilution.
An overall average of 12% dilution was estimated for the pit. Table 19.3 presents the total reserves estimated within the pit design outline, including the mine recovery and dilution factors.
Table 19.3
Mineral Reserves of the San Francisco Mine (August 31, 2010), Including Mining Recovery and Dilution
| Mineral Reserves (In-Pit) at USD 900/oz Gold Price | Waste (In-Pit) |
| Classification | Tonnes
(x 1,000) | Grade (g/t) | Contained Ounces | Waste Tonnes
(x 1,000) | Total Tonnes
(x 1,000) | Stripping
Ratio |
| Proven | 17,194 | 0.756 | 418,000 | | | |
| Probable | 17,738 | 0.635 | 362,000 | | | |
| Total | 34,932 | 0.695 | 780,000 | 60,417 | 95,349 | 1.73 |
The Proven and Probable Reserves in Table 19.3 have been derived from the Measured and Indicated mineral resources summarized in Table 19.2 and account for mining recovery and dilution. The figures in Table 19.3 have been rounded to reflect that the figures are an estimate.
The Mineral Reserve estimate has been reviewed and audited by Micon. It is Micon’s opinion that the August 31, 2010 Mineral Reserve estimate has been prepared in accordance with the CIM standards and definitions for Mineral Reserve estimates and that TMM/Timmins can use this estimate as a basis for production planning and forecasting at the San Francisco mine project.
168
The San Francisco mine commenced commercial production in April, 2010. By the end of September, 2010, the San Francisco mine sold 26,999 ounces of gold.
Micon has reviewed the resource and reserve estimates, the mine design, the mining schedule, the mining contract terms and the ability of the contractor to meet the mining schedule, and concludes that the estimations and designs have been properly carried out and that the contractor is capable of meeting the schedule.
Micon has reviewed the crushing, heap leach and ADR facilities and concludes that they are adequate for the treatment of the scheduled process feed material and the recovery of gold in doré as forecast in the production plan.
Micon has reviewed the economics of the San Francisco operation and concludes that it is viable and meets the criteria for publication of a Mineral Reserve.
169
20.0 RECOMMENDATIONS
20.1 FURTHER EXPLORATION EXPENDITURES AND BUDGET
The TMM/Timmins budget for the next phase of exploration for the San Francisco mine is the result of the successful 2009-2010 drilling program. Infill and exploration drilling will continue for the remainder of 2010 and continue into 2011, in order to expand the mineral resources and reserves.
Of particular interest is the southeast extension where the last section line of drilling (200E) contained three RC holes which were drilled to maximum depth of 170 m. Two of the three holes intersected mineralization, with hole TF-810 intersecting three mineralized intervals of low grade and narrow thickness: 1.52 m grading 0.31 g/t gold; 1.52 m grading 0.24 g/t gold and 1.52 m grading 0.41 g/t gold. Hole TF-812, located 50 m to the north on the same section line, intersected 9.12 m grading 0.98 g/t gold and 6.08 m grading 0.52 g/t gold. All mineral intervals were located within the first 60 m from surface and are related to a chargeability anomaly open at depth for a further 300 m. TMM/Timmins has outlined a further core drilling program totalling 5,000 m.
Near the perimeter of the pit, infill drilling has been planned to follow-up previous mineral intersections that could increase the resources immediately east and north of the San Francisco pit, between the existing pit limit and the new pit limit which resulted from the mine plan based on the resource update. The infill drill program outlined by Timmins is comprised of approximately 30,000 m of reverse circulation drilling.
A program of exploration has been also outlined to define and test at least 4 of the 13 targets to the north of the San Francisco pit: these are the most favourable targets when geochemistry, structural lineament and relationship with the northwest mineral trend are considered. Timmins has estimated that this program will be approximately 30,000 m, involving a combination of reverse circulation drilling and a mobile RAB drill to acquire fast samples to outline drill targets for the RC drill.
In order to undertake this exploration drilling program, Timmins needed to negotiate with the Ejido El Claro for access. Preliminary negotiations indicate that Timmins will be allowed to drill on the Ejido ground in return for payments in the form of equipment rental, such as a dozer or in construction (new roads, fences, etc).
Table 20.1 is a summary of Timmins’ estimated exploration budget for the next phase of work on the San Francisco property.
170
Table 20.1
Estimated Budget for the Next Phase of Exploration at the San Francisco Project
| CATEGORY | Unit | Unit Cost
USD | No. Units | Total Cost
USD |
| Geology and Exploration | | | | |
| Project Management | Month | 5,000 | 12 | 60,000 |
| Geologist (Salaries and Consulting Fees ) | Month | 20,000 | 12 | 240,000 |
| Field Hands | Month | 6,800 | 12 | 81,600 |
| Camp and Accommodation | Month | 4,000 | 12 | 48,000 |
| Exploration Expenses and Supplies | Lump | 10,000 | 3 | 30,000 |
| Reverse Circulation Drilling | Meters | 45 | 60,000 | 2,700,000 |
| Core Drilling | Meters | 140 | 5,000 | 700,000 |
| Trenching and Road Works | Hours | 120 | 1,200 | 144,000 |
| Undeground Development and Rehabilitation | | | | - |
| Assaying | Samples | 25 | 50,000 | 1,250,000 |
| Geophysical Surveying | Km | 1,500 | 50 | 75,000 |
| Enginnering and Feasibility | | | | - |
| Metallurgical Testwork | | | | - |
| Drafting, Reporting, Reproduction, Maps | Lump | 5,000 | 12 | 60,000 |
| Office Expenses | Lump | 2,000 | 12 | 24,000 |
| Telecomunications | Monthly | 500 | 12 | 6,000 |
| Travel Expenses | Lump | 1,000 | 12 | 12,000 |
| Vehicle (Acquisition New) | Vehicle | 40,000 | 2 | 80,000 |
| Safety Equipment | Lump | 10,000 | 3 | 30,000 |
| Social Security and Labour Related Taxes | Estimated | 441,600 | 10% | 44,160 |
| Subtotal | 5,584,760 |
| General and Adminstration | 5% Exploration | 5,584,760 | 5% | 279,238 |
| Total Geology and Administration | | | | 5,863,998 |
| |
| Property Acquisition and Maintenance |
| Mining Taxes | Semester | 79,929 | 2 | 159,858 |
| Surface Rights and Rights of Way | Annual | 100,000 | 1 | 100,000 |
| Total Property Acquisition and Maintenance | | | | 259,858 |
| Grand Total | 6,123,856 |
Table provided by Timmins Goldcorp Mexico, S.A. de C.V.
Micon has reviewed TMM/Timmins’ proposal for further exploration and studies on its San Francisco property and considers that the budget for the proposed program is reasonable. Micon recommends that TMM/Timmins implements the program as proposed, subject to either funding or other matters which may cause the proposed program to be altered in the normal course of its business activities, or alterations which may affect the program as a result of the exploration activities themselves.
20.2 FURTHER RECOMMENDATIONS
Micon agrees with the general direction of TMM/Timmins’ exploration and development program for the property and makes the following additional recommendations:
| | 1) | Micon recommends that TMM/Timmins reviews its criteria for the classification of resources in the areas outside of the existing pit limits. |
171
| | 2) | Micon recommends that TMM/Timmins proceeds with its economic studies to increase the crushing capacity at the San Francisco project. |
| | | |
| | 3) | Micon recommends that Timmins has an independent consultant review the laboratory operations and procedures in order to improve the quality of its results. |
Given the known extent of mineralization on the property, compared to the amount of mining activity, the San Francisco project has the potential to host further deposits or lenses of gold mineralization, similar in character and grade to those exploited in the past, outside the present resource base.
Micon has reviewed the proposed exploration program for the property and, in light of the observations made in this report, supports the concepts as outlined by TMM/Timmins. Given the prospective nature of the property, it is Micon’s opinion that the San Francisco project merits further exploration and that TMM/Timmins’ proposed exploration plans are properly conceived and justified.
| MICON INTERNATIONAL LIMITED | |
| | |
| “William J. Lewis” {signed and sealed} | |
| William J. Lewis, B.Sc., P.Geo. | November 30, 2010 |
| Senior Geologist | Amended August 3, 2011 |
| | |
| “Alan J. San Martin” | |
| Ing. Alan J. San Martin, MAusIMM | November 30, 2010 |
| Mineral Resource Modeller | Amended August 3, 2011 |
| | |
| “Mani Verma” {signed and sealed} | |
| Mani M. Verma, P.Eng | November 30, 2010 |
| Associate Mining Engineer | Amended August 3, 2011 |
| | |
| “Christopher A. Jacobs” | |
| Christopher A. Jacobs, CEng, MIMMM | November 30, 2010 |
| Vice President | Amended August 3, 2011 |
| | |
| “Richard Gowans” {signed and sealed} | |
| Richard M. Gowans, B.Sc., P.Eng. | November 30, 2010 |
| President | Amended August 3, 2011 |
172
21.0 REFERENCES
Anderson, T.H., and Silver, L.T., (1979), The role of the Mojave-Sonora Megashear in the Tectonic Evolution of Northern Sonora, in Clark, K.F. et al., editors, Geology and Mineral Resources of Northern Sierra Madre Occidental, Mexico, Guidebook for the 1992 Field Conference, El Paso Geological Society, 479 p.
Calmus, T. et al., (1992), Geology of Estación Liano (Sonora): A New Proterozoic Basement and the San Francisco Gold Deposit, in Clark, K.F. et al., editors, Geology and Mineral Resources of Northern Sierra Madre Occidental, Mexico, Guidebook for the 1992 Field Conference, El Paso Geological Society, 479 p.
De Jong, K., et al., (1988), Eastward Thrusting, Southwestward Folding and Backsliding in the Sierra La Vibora, Sonora, Mexico: Geology, V. 16.
Defiance Mining Corporation, (2004), Annual Report 2003, 30 p.
Geomaque Explorations Ltd, (2001), Annual Report 2000, 19 p.
Geomaque Explorations Ltd, (2002), Annual Report 2001, 26 p.
Geomaque Explorations Ltd, (2003), Annual Information Form for the Year Ended December 31, 2002, 68 p.
Geomaque of Mexico, S.A. de C.V., (1994), Presentation by Geomaque de Mexico, S.A. de C.V. for the evaluation of Environmental Impact Report, General Category, for the Geological-Mining Project Named “San Francisco” Mining Project.
Golder and Associates, (1996), Final pitwall Stability Evaluation, San Francisco Mine Project Draft Report prepared for Geomaque De Mexico, 39 p.
Hester, M., (2007), San Francisco Mineral Resource, Memo prepared for Timmins Gold Corporation by Independent Mining Consultants Inc., 11 p.
Independent Mining Consultants Inc., (1997), San Francisco Project, Minable Reserves and Geological Resources as of April 30, 1997 prepared for Geomaque Exploration Ltd., 42 p.
Jacques-Ayala, C., et al., (1991), The Interpreted Trace of the Mojave-Sonora Megashear in Northwest Sonora-A Laramide Thrust Front and Middle Tertiary Detachment Zone: Primer Congreso Mexicano Mineralogia, Conv. Evolucion Geologica de Mexico, Memoria.
Lewis, W.J., (2005), Technical Report on the San Francisco Mine Property, Estación Llano, Sonora, Mexico, 68 p.
173
Lewis, W.J. and Hester, M.G. (2007), NI 43-101 Technical Report and Resource Estimate for the San Francisco Gold Property, Estación Llano, Sonora, Mexico, www.sedar.com 140 p.
Lewis, W.J. et al., (2008), NI 43-101 Technical Report on the Preliminary Feasibility Study for the San Francisco Gold Property, Estación Llano, Sonora, Mexico, 207 p.
Lewis, W.J. et al., (2009), NI 43-101 Technical Report on the Preliminary Feasibility Study for the San Francisco Gold Property, Estación Llano, Sonora, Mexico, Amended 2008 Technical Report, 205 p.
Luna, R. and Gastelum, G., (1992), Geology of the San Francisco Project Estación Llano, Sonora in Clark, K.F. et al., editors, Geology and Mineral Resources of Northern Sierra Madre Occidental, Mexico, Guidebook for the 1992 Field Conference, El Paso Geological Society, 479 p.
Perez Segura, E., (1992), The Au-Te Mineralogy of the San Francisco Deposit, Sonora, Mexico, in Clark, K.F. et al., editors, Geology and Mineral Resources of Northern Sierra Madre Occidental, Mexico, Guidebook for the 1992 Field Conference, El Paso Geological Society, 479 p.
Prenn, N.B., et al., (1995), San Francisco Property Resource and Reserve Sonora, Mexico prepared by Mine Development Associates for Geomaque Exploration Ltd., 46 p.
Salas, G.P., et al, (1991), Economic Geology, Mexico, Volume P-3 of the Geology of North America, in The Decade of North American Geology Project series by The Geological Society of America, Inc., 438 p.
Silberman, M., (1992), Characteristics and Complex History of Gold-Bearing Quartz veins along the Mojave-Sonora Megashear Zone, northern Sonora, Mexico, in Clark, K.F. et al., editors, Geology and Mineral Resources of Northern Sierra Madre Occidental, Mexico, Guidebook for the 1992 Field Conference, El Paso Geological Society, 479 p.
Silver, L.T., and Anderson, T.H., (1974), Possible Left-lateral Early to Middle Mesozoic Disruption of the Southwestern North American Craton Margin, in Geological Society of America, Abstracts with Programs, v. 6, 955 p.
Sol & Adobe Ingenieros Asociado S.A. de C.V. (2006) San Francisco Scoping Study, 9-1 to 9 7 p.
Telluris Consulting Ltd., (2009), Structural Review of the San Francisco Deposit, Sonora Mexico, Prepared for Timmins Gold Corp. Molimentales del Noroeste S.A. de C.V., 35 p.
Timmins Gold Corp., (2005), San Francisco Gold Mine, Sonora Mexico, May, 2005, Power Point Presentation, 13 p.
174
Timmins Gold Corp., (2005), Promotional Information Brochure, 2 p.
Tosdal, R.M., Haxel, G.B., and Wright, J.E., (1989), Jurassic Geology of the Sonoran Desert Region, Southern Arizona, Southeastern California and Northwestern Sonora: Construction of a Continental-Margin magmatic Arc, in J.P. Jenny, and S.H. Reynolds (editors), Geological Evolution of Arizona, Tucson, Arizona Geological Society Digest.
Vargas, J.C., et al, (1994), Geological – Mining Monograph of the State of Sonora, M-8E, published by the Consejo de Recursos Minerales, 220 p.
Zonge Engineering and Research Organization Inc., (2007), Processing and Interpretation of High Resolution Aeromagnetic and Radiometric Data for the San Francisco and Pima Project Areas, Sonora, Mexico, for Timmins Gold Corporation, 19 p.
175
22.0 CERTIFICATES OF AUTHORS
176
CERTIFICATE OF AUTHOR
William J. Lewis
As the co-author of this report for Timmins Gold Corp. entitled “NI 43-101 F1 Technical Report Updated Resources and Reserves and Mine Plan for the San Francisco Gold Project in Sonora, Mexico” dated November 30, 2010 and amended August 3, 2011, I, William J. Lewis do hereby certify that:
| 1. | I am employed by, and carried out this assignment for, Micon International Limited, Suite 900, 390 Bay Street, Toronto, Ontario M5H 2Y2, tel. (416) 362-5135, fax (416) 362-5763, e-mail wlewis@micon-international.com; |
| | |
| 2. | This certificate applies to the Technical Report titled “NI 43-101 F1 Technical Report Updated Resources and Reserves and Mine Plan for the San Francisco Gold Project in Sonora, Mexico” dated November 30, 2010 and amended August 3, 2011; |
| | |
| 3. | I hold the following academic qualifications: |
| | B.Sc. (Geology) | University of British Columbia | 1985 |
| 4. | I am a registered Professional Geoscientist with the Association of Professional Engineers and Geoscientists of Manitoba (membership # 20480); as well, I am a member in good standing of several other technical associations and societies, including: |
Association of Professional Engineers and Geoscientists of British Columbia (Membership # 20333)
Association of Professional Engineers, Geologists and Geophysicists of the Northwest Territories (Membership # 1450)
Professional Association of Geoscientists of Ontario (Membership # 1522)
The Geological Association of Canada (Associate Member # A5975)
The Canadian Institute of Mining, Metallurgy and Petroleum (Member # 94758)
| 5. | I have worked as a geologist in the minerals industry for 25 years; |
| | |
| 6. | I am familiar with NI 43-101 and, by reason of education, experience and professional registration, I fulfill the requirements of a Qualified Person as defined in NI 43-101. My work experience includes 4 years as an exploration geologist looking for gold and base metal deposits, more than 11 years as a mine geologist in underground mines and 5 years as a surficial geologist and consulting geologist on precious and base metals and industrial minerals; |
| | |
| 7. | I have read NI 43-101 and this Technical Report has been prepared in compliance with the instrument; |
| | |
| 8. | I visited the San Francisco mine project on several previous occasions since 2005 and most recently between August 3 and 6, 2010 to review the resource and reserve estimates and exploration programs on the property and discuss the ongoing QA/QC program; |
| | |
| 9. | I have written or co-authored previous Technical Reports for the mineral property that is the subject of this Technical Report; |
| | |
| 10. | I am independent Timmins Gold Corp. according to the definition described in NI 43-101 and the Companion Policy 43-101 CP; |
| | |
| 11. | I am responsible for Sections 1 to 15 of this report, and Sections 17, 19, 20 and 21. |
| | |
| 12. | As of the date of this certificate, to the best of my knowledge, information and belief, the Technical Report contains all scientific and technical information that is required to be disclosed to make this technical report not misleading; |
Dated this 30th day of November, 2010 and amended this 3rd day of August, 2011.
“William J. Lewis” {signed and sealed}
William J. Lewis, B.Sc., P.Geo.
177
CERTIFICATE OF AUTHOR
Alan J. San Martin
As the co-author of this report for Timmins Gold Corp. entitled “NI 43-101 F1 Technical Report Updated Resources and Reserves and Mine Plan for the San Francisco Gold Project in Sonora, Mexico” dated November 30, 2010 and amended August 3, 2011, I, Alan J. San Martin do hereby certify that:
| 1) | I am employed as a Mineral Resource Modeller by Micon International Limited, Suite 900,390 Bay Street, Toronto, Ontario M5H 2Y2, tel. (416) 362-5135, fax (416) 362-5763, e-mail asanmartin@micon-international.com; |
| | |
| 2) | I hold a Bachelor Degree in Mining Engineering (equivalent to B.Sc.) from the National University of Piura, Peru, 1999; |
| | |
| 3) | I am a member of The Australasian Institute of Mining and Metallurgy (Membership #301778) |
| | |
| 4) | I am a registered Engineer with the Colegio de Ingenieros del Peru (CIP) Membership # 79184; |
| | |
| 5) | I have worked as a mining engineer in the minerals industry for 11 years; |
| | |
| 6) | I am familiar with NI 43-101 regulations and by reason of education, experience and professional registration, I fulfill the requirements of a Qualified Person as defined in NI 43-101. My work experience includes exploration database management, mineral deposit 3-Dmodelling, mineral resource estimation and consulting services for the mining industry; |
| | |
| 7) | I have not visited the San Francisco Mine; |
| | |
| 8) | As of the date of this certificate to the best of my knowledge, information and belief, the Technical Report contains all scientific and technical information that is required to be disclosed to make this report not misleading; |
| | |
| 9) | I am independent of the parties involved in the transaction for which this report is required, other than providing consulting services; |
| | |
| 10) | I have contributed in the preparation of Section 17 of this Technical Report. |
Dated this 30th day of November, 2010 and amended this 3rd day of August, 2011.
“Alan J. San Martin”
Ing. Alan J. San Martin, MAusIMM
Micon International Limited
178
CERTIFICATE OF AUTHOR
Mani Verma
As the co-author of this report for Timmins Gold Corp. entitled “NI 43-101 F1 Technical Report Updated Resources and Reserves and Mine Plan for the San Francisco Gold Project in Sonora, Mexico” dated November 30, 2010 and amended August 3, 2011, I, Mani M. Verma do hereby certify that:
| 1) | I am an associate of, and carried out this assignment for, Micon International Limited, Suite 900, 390,Bay Street, Toronto, M5H 2Y2 tel. (416) 362-5135 fax (416) 362-5763. |
| | |
| 2) | I hold the following academic qualifications: |
| | B.Eng. Mining Sheffield University, UK1963. |
| | M.Eng. (Mineral Economics) | McGill University, Montreal, Quebec 1981 |
| 3) | I am a registered Professional Engineer with the Association of Professional Engineers of Ontario (Membership #48070015), I am a member in good standing of |
| | |
| • The Canadian Institute of Mining, Metallurgy and Petroleum |
| | |
| 4) | I have worked as a mining engineer in the minerals industry for over 30 years; |
| | |
| 5) | I have read National Instrument NI 43-101 and, by reason of education, experience and professional registration, I fulfill the requirements of a Qualified Person as defined in NI 43- 101. My work experience includes open pit and underground mining, engineering, project evaluation, due diligence reviews and consulting services. |
| | |
| 6) | In this report I am responsible for preparation of sections 18.1 and 18.3. |
| | |
| 7) | I have visited the San Francisco mine between August 3 and 6, 2010; |
| | |
| 8) | I have had no prior involvement with the mineral properties in question; |
| | |
| 9) | I am independent of the parties involved in the transaction for which this report is required, other than providing consulting services; |
| | |
| 10) | As of the date of this certificate to the best of my knowledge, information and belief, the Technical Report contains all scientific and technical information that is required to be disclosed to make this report not misleading; |
Dated this 30 November, 2010 and amended this 3rd day of August, 2011.
“Mani Verma” {signed and sealed}
Mani Verma P.Eng.
179
CERTIFICATE OF AUTHOR
Christopher A. Jacobs
As the co-author of this report for Timmins Gold Corp. entitled “NI 43-101 F1 Technical Report Updated Resources and Reserves and Mine Plan for the San Francisco Gold Project in Sonora, Mexico” dated November 30, 2010 and amended August 3, 2011, I, Christopher A. Jacobs do hereby certify that:
| 1. | I am employed by, and carried out this assignment for, Micon International Limited, Suite 900, 390 Bay Street, Toronto, Ontario M5H 2Y2, tel. (416) 362-5135, fax (416) 362-5763, e-mail cjacobs@micon-international.com; |
| | |
| 2. | I hold the following academic qualifications: |
| | B.Sc. (Hons) (Geochemistry) | University of Reading, UK | 1980 |
| | M.B.A. | Gordon Inst. of Bus. Sci., University of Pretoria | 2004 |
| 3. | I am a Chartered Engineer, registered with the UK Engineering Council (registration number 369178), and a Professional Member of the Institute of Materials, Minerals and Mining (IOM3, Membership number 46209); as well, I am a member in good standing of the Canadian Institute of Mining, Metallurgy and Petroleum (Member No. 140649); |
| | |
| 4. | I have worked in the mining industry as an exploration and mining geologist (9 years), technical director and operations director of mining companies (11 years) and as a mineral economist (10 years); I have worked as an independent consultant with Micon since 2004. |
| | |
| 5. | I am familiar with NI 43-101 and, by reason of education, experience and professional registration, I fulfill the requirements of a Qualified Person as defined in NI 43-101; |
| | |
| 6. | I have read NI 43-101 and this Technical Report has been prepared in compliance with the instrument; |
| | |
| 7. | I visited the San Francisco mine property on September 25-28, 2007; |
| | |
| 8. | In March, 2008 I co-authored a Prefeasibility Study for Timmins Gold Corp. on the San Francisco project which was re-issued in January, 2009; |
| | |
| 9. | I am independent of Timmins Gold Corp.; |
| | |
| 10. | I am responsible for Sections 18.4, 18.5 and 18.6; |
| | |
| 11. | As of the date of this certificate, to the best of my knowledge, information and belief, the Technical Report contains all scientific and technical information that is required to be disclosed to make this technical report not misleading; |
Dated this 30 November, 2010 and amended this 3rd day of August, 2011.
“Christopher A. Jacobs”
Christopher A. Jacobs, CEng MIMMM
180
CERTIFICATE OF AUTHOR
Richard M. Gowans
As the co-author of this report for Timmins Gold Corp. entitled “NI 43-101 F1 Technical Report Updated Resources and Reserves and Mine Plan for the San Francisco Gold Project in Sonora, Mexico” dated November 30, 2010 and amended August 3, 2011, I, Richard Gowans do hereby certify that:
| 1. | I am employed by, and carried out this assignment for, Micon International Limited, Suite 900, 390 Bay Street, Toronto, Ontario M5H 2Y2, tel. (416) 362-5135, fax (416) 362-5763, e-mail rgowans@micon-international.com; |
| | |
| 2. | I hold the following academic qualifications: |
B.Sc. (Hons) Minerals Engineering, The University of Birmingham, U.K.1980
| 3. | I am a registered Professional Engineer of Ontario (membership number 90529389); as well, I am a member in good standing of the Canadian Institute of Mining, Metallurgy and Petroleum. |
| | |
| 4. | I am familiar with NI 43-101 and by reason of education, experience and professional registration, fulfill the requirements of a Qualified Person as defined in NI 43-101. My work experience includes over 20 years of the management of technical studies and design of numerous metallurgical testwork programs and metallurgical processing plants. |
| | |
| 5. | I have read NI 43-101 and this Technical Report has been prepared in compliance with the instrument; |
| | |
| 6. | I have not visited the mine site; |
| | |
| 7. | I have had no prior involvement with the mineral property in question. |
| | |
| 8. | I am independent of Timmins Gold Corp.; |
| | |
| 9. | I am responsible for Section 16, and Section 18.2 of this report; |
| | |
| 10. | As of the date of this certificate, to the best of my knowledge, information and belief, the Technical Report contains all scientific and technical information that is required to be disclosed to make this technical report not misleading; |
Dated this 30 November, 2010 and amended this 3rd day of August, 2011.
“Richard Gowans” {signed and sealed}
Richard Gowans P.Eng.
181
APPENDIX 1
GLOSSARY OF MINING AND OTHER RELATED TERMS
182
GLOSSARY AND DEFINED TERMS
|
The following is a glossary of certain mining terms that may be used in this Technical Report.
| A | |
| Ag | Silver. |
| Assay | A chemical test performed on a sample of ores or minerals to determine the amount of valuable metals contained. |
| Au | Gold. |
| | |
| B | |
| Base metal | Any non-precious metal (e.g. copper, lead, zinc, nickel, etc.). |
| Bulk mining | Any large-scale, mechanized method of mining involving many thousands of tonnes of ore being brought to surface per day. |
| Bulk sample | A large sample of mineralized rock, frequently hundreds of tonnes, selected in such a manner as to be representative of the potential orebody being sampled. The sample is usually used to determine metallurgical characteristics. |
| Bullion | Precious metal formed into bars or ingots. |
| By-product | A secondary metal or mineral product recovered in the milling process. |
| | |
| C | |
| | |
| Channel sample | A sample composed of pieces of vein or mineral deposit that have been cut out of a small trench or channel, usually about 10 cm wide and 2 cm deep. |
| Chip sample | A method of sampling a rock exposure whereby a regular series of small chips of rock is broken off along a line across the face. |
| CIM Standards | The CIM Definition Standards on Mineral Resources and Mineral Reserves adopted by CIM Council from time to time. |
| CIM | The Canadian Institute of Mining, Metallurgy and Petroleum. |
| Concentrate | A fine, powdery product of the milling process containing a high percentage of valuable metal. |
| Contact | A geological term used to describe the line or plane along which two different rock formations meet. |
183
Core | The long cylindrical piece of rock, about an inch in diameter, brought to surface by diamond drilling. |
Core sample | One or several pieces of whole or split parts of core selected as a sample for analysis or assay. |
Cross-cut | A horizontal opening driven from a shaft and (or near) right angles to the strike of a vein or other orebody. The term is also used to signify that a drill hole is crossing the mineralization at or near right angles to it. |
Cut-off grade | The lowest grade of mineralized rock that qualifies as ore grade in a given deposit, and is also used as the lowest grade below which the mineralized rock currently cannot be profitably exploited. Cut-off grades vary between deposits depending upon the amenability of ore to gold extraction and upon costs of production. |
| |
D | |
Dacite | The extrusive (volcanic) equivalent of quartz diorite. |
Deposit | An informal term for an accumulation of mineralization or other valuable earth material of any origin. |
Development drilling | Drilling to establish accurate estimates of mineral resources or reserves usually in an operating mine or advanced project. |
Dilution | Rock that is, by necessity, removed along with the ore in the mining process, subsequently lowering the grade of the ore. |
Diorite | An intrusive igneous rock composed chiefly of sodic plagioclase, hornblende, biotite or pyroxene. |
Dip | The angle at which a vein, structure or rock bed is inclined from the horizontal as measured at right angles to the strike. |
| |
E | |
Epithermal | Hydrothermal mineral deposit formed within one kilometre of the earth’s surface, in the temperature range of 50 to 200°C. |
Epithermal deposit | A mineral deposit consisting of veins and replacement bodies, usually in volcanic or sedimentary rocks, containing precious metals or, more rarely, base metals. |
Exploration | Prospecting, sampling, mapping, diamond drilling and other work involved in searching for ore. |
184
F | |
Face | The end of a drift, cross-cut or stope in which work is taking place. |
Fault | A break in the Earth's crust caused by tectonic forces which have moved the rock on one side with respect to the other. |
Flotation | A milling process in which valuable mineral particles are induced to become attached to bubbles and float as others sink. |
Fold | Any bending or wrinkling of rock strata. |
Footwall | The rock on the underside of a vein or mineralized structure or deposit. |
Fracture | A break in the rock, the opening of which allows mineral-bearing solutions to enter. A "cross-fracture" is a minor break extending at more-or-less right angles to the direction of the principal fractures. |
| |
G | |
g/t | Grams per metric tonne. |
Galena | Lead sulphide, the most common ore mineral of lead. |
gpt | Grams per tonne. |
Golden Minerals | Golden Minerals Company, including, unless the context otherwise requires, the Company's subsidiaries. |
Grade | Term used to indicate the concentration of an economically desirable mineral or element in its host rock as a function of its relative mass. With gold, this term may be expressed as grams per tonne (g/t) or ounces per tonne (opt). |
Gram | 0.0321507 troy ounces. |
| |
H | |
Hanging wall | The rock on the upper side of a vein or mineral deposit. |
High grade | Rich mineralization or ore. As a verb, it refers to selective mining of the best ore in a deposit. |
Host rock | The rock surrounding an ore deposit. |
| Hydrothermal | Processes associated with heated or superheated water, especially mineralization or alteration. |
185
| I | |
| | |
Indicated Mineral Resource | An Indicated Mineral Resource is that part of a Mineral Resource for which quantity, grade or quality, densities, shape and physical characteristics, can be estimated with a level of confidence sufficient to allow the appropriate application of technical and economic parameters, to support mine planning and evaluation of the economic viability of the deposit. The estimate is based on detailed and reliable exploration and testing information gathered through appropriate techniques from locations such as outcrops, trenches, pits, workings and drill holes that are spaced closely enough for geological and grade continuity to be reasonably assumed. |
Inferred Mineral Resource | An Inferred Mineral Resource is that part of a Mineral Resource for which quantity and grade or quality can be estimated on the basis of geological evidence and limited sampling and reasonably assumed, but not verified, geological and grade continuity. The estimate is based on limited information and sampling gathered through appropriate techniques from locations such as outcrops, trenches, pits, workings and drill holes. |
| Intrusive | A body of igneous rock formed by the consolidation of magma intruded into other. |
| | |
| K | |
| km | Kilometre(s). Equal to 0.62 miles. |
| | |
| L | |
| The separation, selective removal or dissolving-out of soluble constituents from a rock or ore body by the natural actions of percolating solutions. |
| Level | The horizontal openings on a working horizon in a mine; it is customary to work mines from a shaft, establishing levels at regular intervals, generally about 50 m or more apart. |
| Limestone | A bedded, sedimentary deposit consisting chiefly of calcium carbonate. |
| | |
| M | |
| m | Metre(s). Equal to 3.28 feet. |
| Marble | A metamorphic rock derived from the recrystallization of limestone under intense heat and pressure. |
186
Measured Mineral Resource | A Measured Mineral Resource is that part of a Mineral Resource for which quantity, grade or quality, densities, shape, physical characteristics are so well established that they can be estimated with confidence sufficient to allow the appropriate application of technical and economic parameters, to support production planning and evaluation of the economic viability of the deposit. The estimate is based on detailed and reliable exploration, sampling and testing information gathered through appropriate techniques from locations such as outcrops, trenches, pits, workings and drill holes that are spaced closely enough to confirm both geological and grade continuity. |
Metallurgy | The science and art of separating metals and metallic minerals from their ores by mechanical and chemical processes. |
Metamorphic | Affected by physical, chemical, and structural processes imposed by depth in the earth’s crust. |
Mill | A plant in which ore is treated and metals are recovered or prepared for smelting; also a revolving drum used for the grinding of ores in preparation for treatment. |
Mine | An excavation beneath the surface of the ground from which mineral matter of value is extracted. |
Mineral | A naturally occurring homogeneous substance having definite physical properties and chemical composition and, if formed under favourable conditions, a definite crystal form. |
Mineral Claim | That portion of public mineral lands which a party has staked or marked out in accordance with federal or state mining laws to acquire the right to explore for and exploit the minerals under the surface. |
Mineralization | The process or processes by which mineral or minerals are introduced into a rock, resulting in a valuable or potentially valuable deposit. |
Mineral Resource | A concentration or occurrence of natural, solid, inorganic or fossilized organic material in or on the earth's crust in such form and quantity and of such grade or quality that it has reasonable prospects for economic extraction. The location, quantity, grade, geological characteristics and continuity of a mineral resource are known, estimated or interpreted from specific geological evidence and knowledge. The term mineral resource covers mineralization and natural material of intrinsic economic interest which has been identified and estimated through exploration and sampling and within which mineral reserves may subsequently be defined by the consideration and application of technical, economic, legal, environmental, socio-economic and governmental factors. The phrase reasonable prospect for economic extraction implies a judgment by the Qualified Person in respect of the technical and economic factors likely to influence the |
187
| prospect of economic extraction. A mineral resource is an inventory of mineralization that under realistically assumed and justifiable technical and economic conditions, might become economically extractable. The term mineral resource used in this report is a Canadian mining term as defined in accordance with NI 43-101 – Standards of Disclosure for Mineral Projects under the guidelines set out in the Canadian Institute of Mining, Metallurgy and Petroleum (the CIM), Standards on Mineral Resource and Mineral Reserves Definitions and guidelines adopted by the CIM Council on December 11, 2005 (the CIM Standards). |
| | |
| N | |
| |
Net Smelter Return | A payment made by a producer of metals based on the value of the gross metal production from the property, less deduction of certain limited costs including smelting, refining, transportation and insurance costs. |
NI 43-101 | National Instrument 43-101is a national instrument for the Standards of Disclosure for Mineral Projects within Canada. The Instrument is a codified set of rules and guidelines for reporting and displaying information related to mineral properties owned by, or explored by, companies which report these results on stock exchanges within Canada. This includes foreign-owned mining entities who trade on stock exchanges overseen by the Canadian Securities Administrators (CSA), even if they only trade on Over The Counter (OTC) derivatives or other instrumented securities. |
| | |
| | |
| O | |
| Outcrop | An exposure of rock or mineral deposit that can be seen on surface, that is, not covered by soil or water. |
| Oxidation | A chemical reaction caused by exposure to oxygen that results in a change in the chemical composition of a mineral. |
| Ounce | A measure of weight in gold and other precious metals, correctly troy ounces, which weigh 31.2 grams as distinct from an imperial ounce which weigh 28.4 grams. |
| oz | Ounce |
| | |
| P | |
| Plant | A building or group of buildings in which a process or function is carried out; at a mine site it will include warehouses, hoisting equipment, compressors, maintenance shops, offices and the mill or concentrator. |
188
| Pyrite | A common, pale-bronze or brass-yellow, mineral composed of iron and sulphur. Pyrite has a brilliant metallic luster and has been mistaken for gold. Pyrite is the most wide-spread and abundant of the sulfide minerals and occurs in all kinds of rocks. |
| | |
| Q | |
| Qualified Person | Conforms to that definition under NI 43-101 for an individual: (a) to be an engineer or geoscientist with at least five years' experience in mineral exploration, mine development or operation or mineral project assessment, or any combination of these; (b) to have experience relevant to the subject matter of the mineral project and the technical report; and (c) to be a member in good standing of a professional association that, among other things, is self-regulatory, has been given authority by statute, admits members based on their qualifications and experience, requires compliance with professional standards of competence and ethics and has disciplinary powers to suspend or expel a member. |
| | |
| | |
| R | |
| Reclamation | The restoration of a site after mining or exploration activity is completed. |
| | |
| S | |
| Shoot | A concentration of mineral values; that part of a vein or zone carrying values of ore grade. |
| Skarn | Name for the metamorphic rocks surrounding an igneous intrusive where it comes in contact with a limestone or dolostone formation. |
| Stockpile | Broken ore heaped on surface, pending treatment or shipment. |
| Strike | The direction, or bearing from true north, of a vein or rock formation measure on a horizontal surface. |
| Stringer | A narrow vein or irregular filament of a mineral or minerals traversing a rock mass. |
| Sulphides | A group of minerals which contains sulphur and other metallic elements such as copper and zinc. Gold and silver are usually associated with sulphide enrichment in mineral deposits. |
| | |
| T | |
| Tonne | A metric ton of 1,000 kilograms (2,205 pounds). |
189
| V | |
| Vein | A fissure, fault or crack in a rock filled by minerals that have travelled upwards from some deep source. |
| | |
| W | |
| Wall rocks | Rock units on either side of an orebody. The hangingwall and footwall rocks of a mineral deposit or orebody. |
| Waste | Unmineralized, or sometimes mineralized, rock that is not minable at a profit. |
| | |
| Z | |
| Zone | An area of distinct mineralization. |
190
APPENDIX 2
2008 TO JUNE, 2010,
SUMMARY OF SIGNIFICANT DRILL ASSAYS
IN THE NW, S-SW AND E-SE AREAS
AROUND THE SAN FRANCISCO PIT
191
Summary of the Significant Drill Assay Results for the Area to the W-NW of the San
Francisco Pit (Loma 200)
| Drill Hole Description | Mineralized Intervals |
| Number | Depth
(m) | Hole Angle
(°) | Azimuth
(°) | Section
Line | From
(m) | To (m) | Width
(m) | Gold
(g/t) |
TF 163
|
121.50
|
70
|
205
| 1320 W | 22.50 | 24.00 | 1.50 | 0.37 |
| and | 28.50 | 33.00 | 4.50 | 1.05 |
| and | 60.00 | 61.50 | 1.50 | 0.60 |
| and | 64.50 | 66.00 | 1.50 | 0.87 |
| and | 82.50 | 84.00 | 1.50 | 0.40 |
| and | 85.50 | 103.50 | 15.00 | 0.67 |
TF 176
|
145.50
|
90
|
0
| 1460 W | 9.00 | 10.50 | 1.50 | 0.33 |
| and | 52.50 | 55.50 | 3.00 | 1.67 |
| and | 67.50 | 69.00 | 1.50 | 0.30 |
| and | 72.00 | 75.00 | 3.00 | 0.23 |
| and | 79.50 | 84.00 | 4.50 | 0.35 |
| and | 111.00 | 112.50 | 1.50 | 0.43 |
| and | 115.50 | 117.00 | 1.50 | 0.50 |
| and | 126.00 | 132.00 | 6.00 | 0.53 |
| and | 133.50 | 135.00 | 1.50 | 0.33 |
TF 183
|
181.50
|
70
|
205
| 1340 W | 1.50 | 3.00 | 1.50 | 1.13 |
| and | 6.00 | 9.00 | 3.00 | 0.71 |
| and | 10.50 | 18.00 | 7.50 | 0.91 |
| and | 27.00 | 28.50 | 1.50 | 2.67 |
| and | 31.50 | 33.00 | 1.50 | 0.53 |
| and | 45.00 | 46.50 | 1.50 | 0.22 |
| and | 51.00 | 54.00 | 3.00 | 1.48 |
| and | 60.00 | 67.50 | 7.50 | 0.21 |
| and | 69.00 | 70.50 | 1.50 | 0.23 |
| and | 76.50 | 106.50 | 30.00 | 0.80 |
| and | 117.00 | 118.50 | 1.50 | 0.23 |
| and | 121.50 | 123.00 | 1.50 | 0.20 |
| and | 136.50 | 138.00 | 1.50 | 0.60 |
TF 186
|
151.50
|
70
|
205
| 1360 W | 1.50 | 3.00 | 1.50 | 0.37 |
| and | 15.00 | 16.50 | 1.50 | 0.97 |
| and | 34.50 | 36.00 | 1.50 | 0.30 |
| and | 37.50 | 39.00 | 1.50 | 0.27 |
| and | 40.50 | 42.00 | 1.50 | 1.23 |
| and | 49.50 | 51.00 | 1.50 | 0.27 |
| and | 61.50 | 69.00 | 7.50 | 0.28 |
| and | 73.50 | 82.50 | 9.00 | 0.53 |
| and | 84.00 | 85.50 | 1.50 | 0.57 |
| and | 87.00 | 91.50 | 4.50 | 0.28 |
| and | 94.50 | 96.00 | 1.50 | 0.30 |
| and | 100.50 | 102.00 | 1.50 | 0.43 |
| and | 109.50 | 117.00 | 7.50 | 1.37 |
| and | 120.00 | 121.50 | 1.50 | 0.43 |
| and | 148.50 | 150.00 | 1.50 | 0.27 |
TF 189
|
135.00
|
70
|
205
| 1400 W | 12.00 | 13.50 | 1.50 | 2.23 |
| and | 19.50 | 25.50 | 6.00 | 1.72 |
| and | 31.50 | 33.00 | 1.50 | 0.23 |
192
|
|
|
| and | 36.00 | 51.00 | 15.00 | 1.59 |
| and | 60.00 | 64.50 | 4.50 | 0.96 |
| and | 73.50 | 75.00 | 1.50 | 0.20 |
| and | 87.00 | 90.00 | 3.00 | 0.41 |
| and | 102.00 | 103.50 | 1.50 | 0.33 |
| and | 115.50 | 117.00 | 1.50 | 0.53 |
| and | 120.00 | 123.00 | 3.00 | 0.29 |
| and | 127.50 | 129.00 | 1.50 | 0.27 |
| and | 133.50 | 135.00 | 1.50 | 1.50 |
TF 200
|
199.50
|
90
|
0
| 1460 W | 28.50 | 63.00 | 34.50 | 1.43 |
| and | 109.50 | 112.50 | 3.00 | 1.05 |
| and | 114.00 | 118.50 | 4.50 | 1.32 |
| and | 135.00 | 136.50 | 1.50 | 0.20 |
| and | 144.00 | 150.00 | 6.00 | 0.31 |
TF 201
|
163.50
|
70
|
205
| 1480 W | 10.50 | 12.00 | 1.50 | 0.50 |
| and | 16.50 | 33.00 | 16.50 | 2.15 |
| and | 58.50 | 60.00 | 1.50 | 0.37 |
| and | 61.50 | 63.00 | 1.50 | 0.57 |
| and | 70.50 | 75.00 | 4.50 | 0.44 |
| and | 79.50 | 81.00 | 1.50 | 0.20 |
| and | 88.50 | 90.00 | 1.50 | 0.20 |
| and | 106.50 | 108.00 | 1.50 | 0.20 |
| and | 115.50 | 117.00 | 1.50 | 0.30 |
| and | 141.00 | 142.50 | 1.50 | 0.63 |
| TF 202 | 151.50 | 70 | 205 | 1500 W | 0.00 | 3.00 | 3.00 | 0.75 |
| | | | | and | 13.50 | 18.00 | 4.50 | 0.62 |
| | | | | and | 19.50 | 24.00 | 4.50 | 0.90 |
| | | | | and | 72.00 | 81.00 | 9.00 | 0.56 |
| | | | | and | 96.00 | 100.50 | 4.50 | 0.24 |
| TF 212 | 168.00 | 70 | 205 | 1400 W | 58.50 | 60.00 | 1.50 | 0.33 |
| | | | | and | 81.00 | 85.50 | 4.50 | 0.79 |
| | | | | and | 97.50 | 99.00 | 1.50 | 0.57 |
| | | | | and | 111.00 | 121.50 | 10.50 | 0.32 |
| | | | | and | 123.00 | 127.50 | 4.50 | 0.29 |
| | | | | and | 132.00 | 133.50 | 1.50 | 0.20 |
| TF 213 | 73.50 | 90 | 0 | 1440 W | 30.00 | 33.00 | 3.00 | 2.08 |
| | | | | and | 37.50 | 57.00 | 19.50 | 1.17 |
| TF 214 | 73.50 | 70 | 205 | 1340 W | 3.00 | 6.00 | 3.00 | 0.92 |
| | | | | and | 7.50 | 13.50 | 6.00 | 0.38 |
| | | | | and | 28.50 | 40.50 | 12.00 | 1.04 |
| | | | | and | 70.50 | 73.50 | 3.00 | 0.38 |
| TF 215 | 85.50 | 90 | 0 | 1460 W | 4.50 | 6.00 | 1.50 | 0.23 |
| | | | | and | 34.50 | 54.00 | 19.50 | 0.57 |
| | | | | and | 67.50 | 69.00 | 1.50 | 0.33 |
| | | | | and | 70.50 | 72.00 | 1.50 | 0.47 |
| TF 220 | 121.50 | 70 | 205 | 1320 W | 6.00 | 9.00 | 3.00 | 3.15 |
| | | | | and | 10.50 | 22.50 | 12.00 | 1.25 |
| | | | | and | 34.50 | 37.50 | 3.00 | 0.20 |
| | | | | and | 54.00 | 60.00 | 6.00 | 0.43 |
| | | | | and | 61.50 | 64.50 | 3.00 | 0.20 |
| | | | | and | 66.00 | 70.50 | 4.50 | 0.26 |
| | | | | and | 84.00 | 96.00 | 12.00 | 0.68 |
193
| | | | | and | 99.00 | 106.50 | 7.50 | 0.80 |
| | | | | and | 115.50 | 121.50 | 6.00 | 1.28 |
| TF 221 | 103.50 | 70 | 205 | 1340 W | 6.00 | 7.50 | 1.50 | 0.43 |
| | | | | and | 24.00 | 25.50 | 1.50 | 0.40 |
| | | | | and | 33.00 | 39.00 | 6.00 | 15.61 |
| | | | | and | 43.50 | 45.00 | 1.50 | 0.23 |
| | | | | and | 48.00 | 51.00 | 3.00 | 0.38 |
| | | | | and | 55.50 | 61.50 | 6.00 | 0.74 |
| | | | | and | 64.50 | 69.00 | 4.50 | 0.53 |
| | | | | and | 75.00 | 78.00 | 3.00 | 0.54 |
| | | | | and | 94.50 | 99.00 | 4.50 | 0.70 |
| TF 222 | 133.50 | 70 | 205 | 1340 W | 15.00 | 16.50 | 1.50 | 0.30 |
| | | | | and | 60.00 | 61.50 | 1.50 | 0.20 |
| | | | | and | 73.50 | 91.50 | 18.00 | 1.31 |
| | | | | and | 102.00 | 106.50 | 4.50 | 1.48 |
| | | | | and | 124.50 | 133.50 | 9.00 | 1.83 |
| TF 223 | 133.50 | 70 | 205 | 1360 W | 22.50 | 31.50 | 9.00 | 3.94 |
| | | | | and | 60.00 | 63.00 | 3.00 | 1.56 |
| | | | | and | 66.00 | 67.50 | 1.50 | 0.30 |
| | | | | and | 73.50 | 76.50 | 3.00 | 0.24 |
| | | | | and | 82.50 | 88.50 | 6.00 | 0.87 |
| | | | | and | 96.00 | 105.00 | 9.00 | 0.71 |
| | | | | and | 109.50 | 115.50 | 6.00 | 0.97 |
| | | | | and | 117.00 | 126.00 | 9.00 | 1.00 |
| TF 224 | 151.50 | 70 | 205 | 1380 W | 15.00 | 25.50 | 10.50 | 2.17 |
| | | | | and | 30.00 | 33.00 | 3.00 | 0.53 |
| | | | | and | 34.50 | 36.00 | 1.50 | 0.27 |
| | | | | and | 39.00 | 45.00 | 6.00 | 1.66 |
| | | | | and | 45.00 | 46.50 | 1.50 | 0.33 |
| | | | | and | 54.00 | 57.00 | 3.00 | 0.33 |
| | | | | and | 90.00 | 91.50 | 1.50 | 0.57 |
| | | | | and | 97.50 | 103.50 | 6.00 | 0.91 |
| | | | | and | 112.50 | 114.00 | 1.50 | 0.77 |
| | | | | and | 117.00 | 118.50 | 1.50 | 0.40 |
| | | | | and | 121.50 | 123.00 | 1.50 | 0.50 |
| TF 225 | 145.50 | 70 | 205 | 1400 W | 16.50 | 18.00 | 1.50 | 0.23 |
| | | | | and | 45.00 | 48.00 | 3.00 | 0.37 |
| | | | | and | 55.50 | 57.00 | 1.50 | 0.77 |
| | | | | and | 69.00 | 72.00 | 3.00 | 0.70 |
| | | | | and | 75.00 | 76.50 | 1.50 | 0.23 |
| | | | | and | 81.00 | 82.50 | 1.50 | 0.25 |
| | | | | and | 84.00 | 93.00 | 9.00 | 0.42 |
| | | | | and | 94.50 | 100.50 | 6.00 | 1.17 |
| TF 226 | 133.50 | 70 | 205 | 1400 W | 40.50 | 42.00 | 1.50 | 0.33 |
| | | | | and | 75.00 | 78.00 | 3.00 | 0.85 |
| | | | | and | 88.50 | 91.50 | 3.00 | 0.65 |
| | | | | and | 103.50 | 105.00 | 1.50 | 0.60 |
| TF 227 | 109.50 | 70 | 205 | 1420 W | 15.00 | 16.50 | 1.50 | 0.40 |
| | | | | and | 45.00 | 46.50 | 1.50 | 0.63 |
| | | | | and | 49.50 | 51.00 | 1.50 | 2.33 |
| | | | | and | 63.00 | 66.00 | 3.00 | 0.35 |
| | | | | and | 73.50 | 79.50 | 6.00 | 0.43 |
194
| | | | | and | 99.00 | 100.50 | 1.50 | 0.25 |
| TF 228 | 73.50 | 90 | 0 | 1480 W | 27.00 | 28.50 | 1.50 | 0.58 |
| | | | | and | 45.00 | 61.50 | 16.50 | 0.69 |
| TF 229 | 100.58 | 90 | 0 | 1340 W | 35.05 | 42.67 | 7.62 | 4.98 |
| | | | | and | 50.29 | 56.38 | 6.09 | 0.39 |
| | | | | and | 59.43 | 65.53 | 6.10 | 0.45 |
| | | | | and | 68.58 | 70.10 | 1.52 | 0.53 |
| | | | | and | 91.44 | 97.43 | 6.08 | 1.16 |
| TF 230 | 100.58 | 90 | 0 | 1340 W | 45.72 | 51.81 | 6.09 | 0.80 |
| | | | | and | 62.48 | 64.00 | 1.52 | 0.20 |
| | | | | and | 68.58 | 70.10 | 1.52 | 0.37 |
| | | | | and | 73.15 | 77.72 | 4.56 | 0.28 |
| TF 231 | 100.58 | 90 | 0 | 1340 W | 7.62 | 13.71 | 6.09 | 0.72 |
| | | | | and | 56.38 | 57.91 | 1.52 | 1.20 |
| | | | | and | 65.53 | 67.05 | 1.52 | 0.87 |
| | | | | and | 74.67 | 77.72 | 3.05 | 1.05 |
| | | | | and | 79.24 | 89.91 | 10.67 | 1.09 |
| | | | | and | 92.96 | 96.01 | 3.05 | 0.23 |
| TF 232 | 100.58 | 90 | 0 | 1340 W | 19.81 | 21.33 | 1.52 | 6.07 |
| | | | | and | 25.90 | 38.10 | 12.20 | 0.73 |
| | | | | and | 53.34 | 54.86 | 1.52 | 1.33 |
| | | | | and | 97.53 | 99.06 | 1.52 | 0.37 |
| TF 233 | 103.50 | 90 | 0 | 1340 W | 7.50 | 9.00 | 1.50 | 0.20 |
| | | | | and | 66.00 | 67.50 | 1.50 | 0.15 |
| | | | | and | 82.50 | 85.50 | 3.00 | 0.18 |
| TF 234 | 100.58 | 90 | 0 | 1340 W | 12.19 | 16.76 | 4.56 | 2.70 |
| | | | | and | 28.95 | 33.52 | 4.56 | 0.74 |
| | | | | and | 89.91 | 91.44 | 1.52 | 0.77 |
| TF 235 | 103.50 | 90 | 0 | 1340 W | 34.50 | 37.50 | 3.00 | 0.16 |
| | | | | and | 40.50 | 42.00 | 1.50 | 0.12 |
| | | | | and | 43.50 | 45.00 | 1.50 | 0.15 |
| | | | | and | 48.00 | 52.50 | 4.50 | 0.36 |
| | | | | and | 58.50 | 61.50 | 3.00 | 0.22 |
| | | | | and | 84.00 | 90.00 | 6.00 | 0.41 |
| TF 236 | 100.58 | 90 | 0 | 1340 W | 65.53 | 67.05 | 1.52 | 0.32 |
| TF 237 | 100.58 | 90 | 0 | 1360 W | 50.29 | 51.81 | 1.52 | 0.50 |
| | | | | and | 62.48 | 65.53 | 1.52 | 2.47 |
| | | | | and | 74.67 | 76.20 | 1.52 | 0.50 |
| | | | | and | 92.96 | 94.48 | 1.52 | 1.73 |
| TF 238 | 103.50 | 90 | 0 | 1360 W | 73.50 | 75.00 | 1.50 | 5.25 |
| | | | | and | 76.50 | 78.00 | 1.50 | 0.30 |
| | | | | and | 82.50 | 85.50 | 3.00 | 0.32 |
| | | | | and | 100.50 | 103.50 | 3.00 | 0.35 |
| TF 239 | 100.58 | 90 | 0 | 1360 W | 16.76 | 18.28 | 1.52 | 0.20 |
| | | | | and | 36.57 | 38.10 | 1.52 | 0.43 |
| | | | | and | 91.44 | 96.01 | 4.57 | 0.84 |
| TF 240 | 103.50 | 90 | 0 | 1360 W | 1.52 | 10.50 | 9.00 | 1.01 |
| | | | | and | 19.50 | 22.50 | 3.00 | 0.45 |
| | | | | and | 30.00 | 37.50 | 7.50 | 0.16 |
| | | | | and | 43.50 | 45.00 | 1.50 | 0.27 |
| | | | | and | 88.50 | 90.00 | 1.50 | 0.50 |
| TF 241 | 100.58 | 90 | 0 | 1360 W | 6.09 | 7.62 | 1.52 | 0.23 |
195
| | | | | and | 10.66 | 12.19 | 1.52 | 0.50 |
| | | | | and | 13.71 | 15.24 | 1.52 | 1.90 |
| | | | | and | 27.43 | 33.52 | 6.09 | 0.94 |
| | | | | and | 41.14 | 42.67 | 1.52 | 0.87 |
| | | | | and | 51.81 | 53.34 | 1.52 | 0.60 |
| | | | | and | 77.72 | 85.34 | 7.62 | 0.45 |
| | | | | and | 89.91 | 91.44 | 1.52 | 6.70 |
| TF 242 | 103.50 | 90 | 0 | 1360 W | 12.00 | 13.50 | 1.50 | 0.35 |
| | | | | and | 34.50 | 36.00 | 1.50 | 0.22 |
| | | | | and | 37.50 | 39.00 | 1.50 | 0.20 |
| | | | | and | 43.50 | 49.50 | 6.00 | 0.30 |
| | | | | and | 79.50 | 82.50 | 3.00 | 0.55 |
| TF 243 | 100.58 | 90 | 0 | 1360 W | 50.29 | 53.34 | 1.52 | 0.40 |
| | | | | and | 65.53 | 67.05 | 1.52 | 0.33 |
| | | | | and | 82.29 | 83.82 | 1.52 | 0.40 |
| | | | | and | 94.48 | 96.01 | 1.52 | 0.40 |
| TF 244 | 100.58 | 90 | 0 | 1360 W | 54.86 | 57.91 | 3.04 | 0.55 |
| | | | | and | 77.72 | 80.77 | 3.04 | 4.10 |
| TF 245 | 103.50 | 90 | 0 | 1380 W | 43.50 | 45.00 | 1.50 | 0.23 |
| | | | | and | 49.50 | 52.50 | 3.00 | 0.35 |
| | | | | and | 60.00 | 61.50 | 1.50 | 0.53 |
| | | | | and | 81.00 | 84.00 | 3.00 | 0.47 |
| | | | | and | 85.50 | 87.00 | 1.50 | 0.60 |
| | | | | and | 91.50 | 94.50 | 3.00 | 0.28 |
| TF 246 | 102.00 | 90 | 0 | 1380 W | 13.50 | 18.00 | 4.50 | 1.40 |
| | | | | and | 57.00 | 61.50 | 4.50 | 0.23 |
| | | | | and | 66.00 | 67.50 | 1.50 | 0.67 |
| | | | | and | 96.00 | 99.00 | 3.00 | 0.75 |
| TF 247 | 103.50 | 90 | 0 | 1380 W | 0.00 | 7.50 | 7.50 | 0.37 |
| | | | | and | 18.00 | 21.00 | 3.00 | 0.25 |
| | | | | and | 24.00 | 30.00 | 6.00 | 0.84 |
| | | | | and | 40.50 | 43.50 | 3.00 | 0.15 |
| | | | | and | 94.50 | 103.50 | 9.00 | 0.16 |
| TF 248 | 103.50 | 90 | 0 | 1380 W | 12.00 | 13.50 | 1.50 | 0.97 |
| | | | | and | 28.50 | 30.00 | 1.50 | 1.09 |
| | | | | and | 36.00 | 45.00 | 9.00 | 0.66 |
| | | | | and | 54.00 | 55.50 | 1.50 | 1.70 |
| | | | | and | 79.50 | 85.50 | 6.00 | 0.59 |
| TF 249 | 100.58 | 90 | 0 | 1380 W | 9.14 | 13.71 | 4.57 | 0.27 |
| | | | | and | 32.00 | 39.62 | 7.62 | 0.51 |
| | | | | and | 44.19 | 47.24 | 3.04 | 0.63 |
| | | | | and | 48.76 | 57.91 | 9.15 | 0.26 |
| TF 250 | 103.50 | 90 | 0 | 1380 W | 48.00 | 49.50 | 1.50 | 0.23 |
| | | | | and | 52.50 | 55.50 | 3.00 | 0.50 |
| | | | | and | 60.00 | 61.50 | 1.50 | 1.47 |
| | | | | and | 85.50 | 93.00 | 7.50 | 1.38 |
| TF 251 | 102.00 | 90 | 0 | 1380 W | 63.00 | 69.00 | 6.00 | 0.21 |
| | | | | and | 91.50 | 94.50 | 3.00 | 0.25 |
| TF 252 | 103.50 | 70 | 205 | 1400 W | 49.50 | 52.50 | 3.00 | 0.33 |
| | | | | and | 85.50 | 97.50 | 12.00 | 1.14 |
| | | | | and | 99.00 | 103.50 | 4.50 | 0.47 |
| TF 253 | 100.58 | 90 | 0 | 1400 W | 0.00 | 1.52 | 1.52 | 0.30 |
196
| | | | | and | 3.04 | 4.57 | 1.52 | 0.52 |
| | | | | and | 12.19 | 13.71 | 1.52 | 0.71 |
| | | | | and | 22.86 | 33.52 | 10.66 | 1.20 |
| | | | | and | 45.72 | 47.24 | 1.52 | 0.40 |
| | | | | and | 74.67 | 76.20 | 1.52 | 1.20 |
| | | | | and | 91.44 | 97.53 | 6.09 | 1.00 |
| TF 254 | 102.00 | 90 | 0 | 1400 W | 25.50 | 28.50 | 3.00 | 0.32 |
| | | | | and | 37.50 | 40.50 | 3.00 | 0.32 |
| | | | | and | 46.50 | 54.00 | 7.50 | 0.87 |
| | | | | and | 76.50 | 85.50 | 9.00 | 0.82 |
| TF 255 | 103.50 | 90 | 0 | 1400 W | 15.00 | 16.50 | 1.50 | 0.33 |
| | | | | and | 28.50 | 33.00 | 4.50 | 0.93 |
| | | | | and | 37.50 | 52.50 | 13.50 | 1.09 |
| | | | | and | 58.50 | 63.00 | 4.50 | 0.58 |
| | | | | and | 82.50 | 84.00 | 1.50 | 1.27 |
| TF 256 | 103.50 | 90 | 0 | 1400 W | 27.00 | 28.50 | 1.50 | 0.20 |
| | | | | and | 48.00 | 54.00 | 6.00 | 0.35 |
| | | | | and | 55.50 | 58.50 | 3.00 | 0.27 |
| | | | | and | 60.00 | 66.00 | 6.00 | 0.42 |
| | | | | and | 85.50 | 87.00 | 1.50 | 3.20 |
| TF 257 | 103.50 | 90 | 0 | 1400 W | 40.50 | 42.00 | 1.50 | 0.43 |
| | | | | and | 43.50 | 45.00 | 1.50 | 0.37 |
| | | | | and | 63.00 | 69.00 | 6.00 | 0.33 |
| | | | | and | 102.00 | 103.50 | 1.50 | 0.97 |
| TF 258 | 100.58 | 90 | 0 | 1420 W | 47.24 | 48.76 | 1.52 | 0.45 |
| | | | | and | 50.29 | 51.81 | 1.52 | 0.47 |
| | | | | and | 67.05 | 68.58 | 1.52 | 0.50 |
| | | | | and | 80.77 | 85.34 | 4.57 | 0.50 |
| TF 259 | 103.50 | 90 | 0 | 1420 W | 0.00 | 3.00 | 3.00 | 0.15 |
| | | | | and | 18.00 | 19.50 | 1.50 | 0.16 |
| | | | | and | 37.50 | 42.00 | 4.50 | 0.17 |
| | | | | and | 60.00 | 61.50 | 1.50 | 0.46 |
| | | | | and | 72.00 | 75.00 | 3.00 | 0.33 |
| | | | | and | 78.00 | 87.00 | 9.00 | 0.15 |
| | | | | and | 90.00 | 93.00 | 3.00 | 0.87 |
| | | | | and | 94.50 | 99.00 | 4.50 | 0.86 |
| TF 260 | 103.50 | 90 | 0 | 1420 W | 3.00 | 12.00 | 9.00 | 0.30 |
| | | | | and | 19.50 | 28.50 | 9.00 | 0.41 |
| | | | | and | 31.50 | 33.00 | 1.50 | 0.24 |
| | | | | and | 45.00 | 48.00 | 3.00 | 0.33 |
| | | | | and | 63.00 | 66.00 | 3.00 | 0.18 |
| | | | | and | 67.50 | 73.50 | 6.00 | 1.41 |
| | | | | and | 75.00 | 78.00 | 3.00 | 0.16 |
| | | | | and | 78.00 | 84.00 | 6.00 | 0.63 |
| | | | | and | 90.00 | 91.50 | 1.50 | 0.12 |
| | | | | and | 94.50 | 96.00 | 1.50 | 0.13 |
| | | | | and | 100.50 | 103.50 | 3.00 | 3.02 |
| TF 261 | 103.50 | 90 | 0 | 1420 W | 0.00 | 15.00 | 15.00 | 1.16 |
| | | | | and | 16.50 | 18.00 | 1.50 | 3.03 |
| | | | | and | 19.50 | 21.00 | 1.50 | 6.38 |
| | | | | and | 24.00 | 42.00 | 18.00 | 2.25 |
| | | | | and | 54.00 | 57.00 | 3.00 | 0.15 |
197
| | | | | and | 64.50 | 66.00 | 1.50 | 6.20 |
| | | | | and | 81.00 | 84.00 | 3.00 | 0.51 |
| TF 262 | 100.58 | 90 | 0 | 1420 W | 3.04 | 4.57 | 1.52 | 0.13 |
| | | | | and | 7.62 | 9.14 | 1.52 | 0.43 |
| | | | | and | 13.71 | 15.24 | 1.52 | 0.77 |
| | | | | and | 27.43 | 28.95 | 1.52 | 0.30 |
| | | | | and | 35.05 | 42.67 | 7.62 | 0.73 |
| | | | | and | 50.29 | 54.86 | 4.57 | 1.03 |
| | | | | and | 57.91 | 60.96 | 3.04 | 0.28 |
| | | | | and | 85.34 | 89.91 | 4.57 | 0.39 |
| | | | | and | 92.96 | 96.01 | 3.04 | 0.60 |
| TF 263 | 100.58 | 90 | 0 | 1420 W | 0.00 | 3.04 | 3.04 | 0.58 |
| | | | | and | 12.19 | 13.71 | 1.52 | 0.42 |
| | | | | and | 16.76 | 18.28 | 1.52 | 0.71 |
| | | | | and | 28.95 | 32.00 | 3.04 | 4.21 |
| | | | | and | 36.57 | 38.10 | 1.52 | 0.38 |
| | | | | and | 39.62 | 56.38 | 16.72 | 0.87 |
| | | | | and | 57.91 | 62.48 | 4.57 | 0.15 |
| | | | | and | 86.86 | 89.91 | 3.04 | 0.19 |
| TF 264 | 103.50 | 90 | 0 | 1420 W | 13.50 | 15.00 | 1.50 | 0.30 |
| | | | | and | 25.50 | 30.00 | 4.50 | 0.26 |
| | | | | and | 43.50 | 48.00 | 4.50 | 0.23 |
| | | | | and | 54.00 | 57.00 | 3.00 | 1.50 |
| | | | | and | 60.00 | 64.50 | 4.50 | 1.20 |
| | | | | and | 88.50 | 91.50 | 3.00 | 1.63 |
| TF 265 | 103.50 | 90 | 0 | 1420 W | 28.50 | 31.50 | 3.00 | 0.22 |
| | | | | and | 36.00 | 37.50 | 1.50 | 0.45 |
| | | | | and | 52.50 | 57.00 | 4.50 | 0.22 |
| | | | | and | 93.00 | 94.50 | 1.50 | 0.20 |
| | | | | and | 102.00 | 103.50 | 1.50 | 0.50 |
| TF 266 | 100.58 | 90 | 0 | 1440 W | 0.00 | 1.52 | 1.52 | 0.50 |
| | | | | and | 3.04 | 4.57 | 1.52 | 0.30 |
| | | | | and | 9.14 | 10.66 | 1.52 | 0.20 |
| | | | | and | 38.10 | 39.62 | 1.52 | 0.20 |
| | | | | and | 48.76 | 50.29 | 1.52 | 0.30 |
| | | | | and | 53.34 | 54.86 | 1.52 | 0.17 |
| | | | | and | 88.39 | 89.91 | 1.52 | 0.60 |
| | | | | and | 91.44 | 94.48 | 3.04 | 0.22 |
| TF 267 | 100.58 | 90 | 0 | 1440 W | 25.90 | 27.43 | 1.50 | 0.34 |
| | | | | and | 28.95 | 33.52 | 4.52 | 1.17 |
| | | | | and | 65.53 | 68.58 | 3.04 | 0.38 |
| | | | | and | 70.10 | 73.15 | 3.04 | 0.38 |
| | | | | and | 76.20 | 77.72 | 1.52 | 0.11 |
| | | | | and | 79.24 | 85.34 | 6.08 | 0.46 |
| | | | | and | 86.86 | 89.91 | 3.04 | 0.18 |
| | | | | and | 92.96 | 96.01 | 3.04 | 0.30 |
| | | | | and | 99.06 | 100.58 | 1.52 | 0.19 |
| TF 268 | 100.58 | 90 | 0 | 1440 W | 0.00 | 1.52 | 1.52 | 0.13 |
| | | | | and | 7.62 | 9.14 | 1.52 | 0.27 |
| | | | | and | 18.28 | 19.81 | 1.52 | 0.27 |
| | | | | and | 48.76 | 50.29 | 1.52 | 0.20 |
| | | | | and | 68.58 | 73.15 | 4.57 | 1.32 |
198
| | | | | and | 80.77 | 82.29 | 1.52 | 0.13 |
| | | | | and | 89.91 | 94.48 | 4.57 | 0.22 |
| | | | | and | 97.53 | 100.58 | 3.04 | 0.34 |
| TF 269 | 100.58 | 90 | 0 | 1440 W | 7.62 | 10.66 | 3.04 | 1.43 |
| | | | | and | 12.19 | 16.76 | 4.57 | 0.34 |
| | | | | and | 25.90 | 35.05 | 9.14 | 0.31 |
| | | | | and | 36.57 | 38.10 | 1.52 | 0.83 |
| | | | | and | 60.96 | 62.48 | 1.52 | 0.23 |
| | | | | and | 77.72 | 82.29 | 4.57 | 0.86 |
| | | | | and | 85.34 | 86.86 | 1.52 | 0.27 |
| TF 270 | 100.58 | 90 | 0 | 1440 W | 21.33 | 22.86 | 1.52 | 0.35 |
| | | | | and | 28.95 | 32.00 | 3.04 | 0.33 |
| | | | | and | 39.62 | 62.48 | 22.80 | 0.92 |
| | | | | and | 64.00 | 65.53 | 1.52 | 0.24 |
| | | | | and | 99.06 | 100.58 | 1.52 | 0.52 |
| TF 271 | 100.58 | 90 | 0 | 1440 W | 0.00 | 3.04 | 3.04 | 0.71 |
| | | | | and | 4.57 | 6.09 | 1.52 | 0.36 |
| | | | | and | 33.52 | 39.62 | 6.09 | 1.21 |
| | | | | and | 47.24 | 59.43 | 12.16 | 0.23 |
| | | | | and | 62.48 | 65.53 | 3.04 | 0.17 |
| TF 272 | 100.58 | 90 | 0 | 1440 W | 41.41 | 42.67 | 1.52 | 0.21 |
| | | | | and | 45.72 | 71.62 | 25.84 | 0.56 |
| | | | | and | 83.82 | 85.34 | 1.52 | 0.74 |
| | | | | and | 94.48 | 96.01 | 1.52 | 0.54 |
| TF 273 | 100.58 | 70 | 205 | 1460 W | 15.24 | 18.28 | 3.04 | 0.18 |
| | | | | and | 24.38 | 25.90 | 1.52 | 0.25 |
| | | | | and | 50.29 | 56.38 | 6.09 | 4.42 |
| TF 275 | 100.58 | 90 | 0 | 1460 W | 1.52 | 3.04 | 1.52 | 0.14 |
| | | | | and | 10.66 | 13.71 | 3.04 | 0.54 |
| | | | | and | 18.28 | 19.81 | 1.52 | 0.23 |
| | | | | and | 60.96 | 62.48 | 1.52 | 0.75 |
| | | | | and | 65.53 | 67.05 | 1.52 | 0.20 |
| | | | | and | 74.67 | 77.72 | 3.04 | 0.64 |
| | | | | and | 88.39 | 91.44 | 3.04 | 1.75 |
| TF 276 | 100.58 | 90 | 0 | 1460 W | 9.14 | 10.66 | 1.52 | 0.60 |
| | | | | and | 22.86 | 25.90 | 3.04 | 0.85 |
| | | | | and | 41.14 | 42.67 | 1.52 | 0.40 |
| | | | | and | 44.19 | 47.24 | 3.04 | 0.22 |
| | | | | and | 50.29 | 70.10 | 19.76 | 0.72 |
| | | | | and | 97.53 | 100.58 | 3.04 | 1.67 |
| TF 277 | 100.58 | 90 | 0 | 1460 W | 48.76 | 50.29 | 1.52 | 0.15 |
| | | | | and | 54.86 | 59.43 | 4.57 | 1.00 |
| | | | | and | 67.05 | 68.58 | 1.52 | 0.22 |
| TF 278 | 100.58 | 70 | 205 | 1480 W | 15.24 | 16.76 | 1.52 | 5.33 |
| | | | | and | 33.52 | 38.10 | 4.57 | 0.56 |
| | | | | and | 42.67 | 44.19 | 1.52 | 0.13 |
| | | | | and | 45.72 | 47.24 | 1.52 | 0.17 |
| | | | | and | 56.38 | 57.71 | 1.52 | 0.20 |
| | | | | and | 59.43 | 60.96 | 1.52 | 9.07 |
| | | | | and | 77.72 | 79.24 | 1.52 | 0.23 |
| TF 279 | 100.58 | 70 | 205 | 1480 W | 10.66 | 12.19 | 1.52 | 0.13 |
| | | | | and | 18.28 | 21.33 | 3.04 | 0.16 |
199
| | | | | and | 24.38 | 27.43 | 3.04 | 0.16 |
| | | | | and | 38.10 | 42.67 | 4.57 | 0.47 |
| | | | | and | 45.72 | 64.00 | 18.24 | 0.33 |
| | | | | and | 65.53 | 68.58 | 3.04 | 0.20 |
| | | | | and | 70.10 | 73.15 | 3.04 | 0.20 |
| | | | | and | 79.24 | 85.34 | 6.09 | 0.22 |
| | | | | and | 86.86 | 89.91 | 3.04 | 0.18 |
| | | | | and | 94.48 | 96.01 | 1.52 | 0.16 |
| | | | | and | 99.06 | 100.58 | 1.52 | 0.28 |
| TF 280 | 100.58 | 70 | 205 | 1480 W | 0.00 | 6.09 | 6.09 | 0.48 |
| | | | | and | 19.81 | 24.38 | 4.92 | 4.56 |
| | | | | and | 28.95 | 30.48 | 1.52 | 0.47 |
| | | | | and | 60.96 | 64.00 | 3.04 | 3.83 |
| | | | | and | 91.44 | 94.48 | 3.04 | 0.93 |
| TF 281 | 100.58 | 70 | 205 | 1480 W | 6.09 | 12.19 | 6.09 | 0.41 |
| | | | | and | 18.28 | 19.81 | 1.52 | 0.72 |
| | | | | and | 39.62 | 45.72 | 6.09 | 0.15 |
| | | | | and | 48.76 | 68.58 | 19.76 | 0.62 |
| | | | | and | 74.67 | 76.20 | 1.52 | 0.18 |
| | | | | and | 79.24 | 94.48 | 15.20 | 0.82 |
| | | | | and | 96.03 | 100.58 | 4.57 | 0.12 |
| TF 282 | 100.58 | 90 | 0 | 1480 W | 35.05 | 42.67 | 7.62 | 0.70 |
| | | | | and | 47.24 | 50.29 | 3.04 | 0.45 |
| | | | | and | 53.34 | 59.43 | 6.09 | 0.51 |
| | | | | and | 62.48 | 67.05 | 4.57 | 0.83 |
| TF 283 | 100.58 | 90 | 0 | 1480 W | 19.81 | 21.33 | 1.52 | 2.55 |
| | | | | and | 51.81 | 76.26 | 24.32 | 0.37 |
| TF 284 | 100.58 | 90 | 0 | 1480 W | 22.86 | 24.38 | 1.52 | 4.60 |
| | | | | and | 57.91 | 59.43 | 1.52 | 0.13 |
| | | | | and | 64.00 | 67.04 | 3.04 | 0.42 |
| | | | | and | 70.10 | 71.62 | 1.52 | 0.83 |
| TF 285 | 100.58 | 70 | 205 | 1500 W | 13.71 | 18.28 | 4.57 | 0.19 |
| | | | | and | 25.90 | 28.95 | 3.04 | 2.50 |
| | | | | and | 82.29 | 91.44 | 9.14 | 0.31 |
| | | | | and | 94.48 | 100.58 | 6.09 | 1.20 |
| TF 286 | 100.58 | 70 | 205 | 1500 W | 24.38 | 28.95 | 4.57 | 0.23 |
| | | | | and | 32.00 | 39.62 | 7.62 | 0.53 |
| | | | | and | 42.57 | 44.19 | 1.52 | 1.35 |
| | | | | and | 51.81 | 53.34 | 1.52 | 0.20 |
| | | | | and | 59.43 | 65.53 | 6.09 | 0.35 |
| | | | | and | 97.53 | 100.58 | 3.04 | 0.18 |
| TF 287 | 103.63 | 70 | 205 | 1500 W | 22.50 | 28.50 | 6.00 | 0.26 |
| | | | | and | 31.50 | 42.00 | 10.50 | 0.49 |
| | | | | and | 79.50 | 81.00 | 1.50 | 0.55 |
| TF 288 | 99.06 | 90 | 0 | 1500 W | 7.62 | 9.14 | 1.52 | 0.67 |
| | | | | and | 57.91 | 71.62 | 13.68 | 0.88 |
| TF 289 | 100.58 | 90 | 0 | 1500 W | 10.66 | 12.19 | 1.52 | 0.22 |
| | | | | and | 27.43 | 35.05 | 7.60 | 3.22 |
| | | | | and | 48.76 | 50.29 | 1.52 | 0.17 |
| | | | | and | 54.86 | 68.48 | 13.68 | 0.38 |
| | | | | and | 73.15 | 74.67 | 1.52 | 0.33 |
| TF 322 | 100.58 | 90 | 0 | 1500 W | 3.04 | 6.09 | 3.05 | 0.12 |
200
| | | | | and | 22.86 | 24.38 | 1.52 | 2.40 |
| | | | | and | 35.05 | 36.57 | 1.52 | 0.30 |
| | | | | and | 53.34 | 54.86 | 1.52 | 0.23 |
| | | | | and | 92.96 | 99.06 | 6.10 | 0.40 |
| TF 323 | 82.29 | 90 | 0 | 1500 W | 3.04 | 4.57 | 1.52 | 0.47 |
| | | | | and | 7.62 | 12.19 | 4.57 | 0.87 |
| | | | | and | 18.28 | 21.33 | 3.04 | 0.21 |
| | | | | and | 27.43 | 28.95 | 1.52 | 0.30 |
| | | | | and | 39.62 | 41.14 | 1.52 | 0.17 |
| | | | | and | 56.38 | 57.91 | 1.52 | 0.28 |
| | | | | and | 67.05 | 76.20 | 9.14 | 0.84 |
| TF 324 | 118.87 | 90 | 0 | 1500 W | 0.00 | 6.09 | 6.09 | 1.00 |
| | | | | and | 16.76 | 19.81 | 3.05 | 0.18 |
| | | | | and | 22.86 | 25.90 | 3.04 | 0.15 |
| | | | | and | 57.91 | 59.43 | 1.52 | 0.67 |
| TF 325 | 100.58 | 90 | 0 | 1500 W | 83.82 | 85.34 | 1.52 | 1.94 |
| TF 326 | 76.20 | 90 | 0 | 1500 W | 42.67 | 45.72 | 3.05 | 0.52 |
| | | | | and | 51.81 | 59.43 | 7.62 | 0.84 |
| TF 327 | 82.29 | 90 | 0 | 1500 W | 19.81 | 24.38 | 4.57 | 0.19 |
| TF 442 | 100.58 | 90 | 0 | 1540 W | 9.14 | 10.66 | 1.52 | 0.12 |
| | | | | and | 59.43 | 60.96 | 1.53 | 0.37 |
| TF 443 | 109.62 | 90 | 0 | 1540 W | 22.56 | 24.38 | 1.52 | 0.47 |
| | | | | and | 27.43 | 28.95 | 1.52 | 0.63 |
| | | | | and | 74.67 | 76.20 | 1.52 | 0.27 |
| | | | | and | 85.34 | 86.86 | 1.52 | 0.63 |
| TF 444 | 112.77 | 90 | 0 | 1540 W | 68.58 | 70.10 | 1.52 | 0.27 |
| | | | | and | 83.82 | 85.34 | 1.52 | 0.15 |
| | | | | and | 88.39 | 91.44 | 3.05 | 0.23 |
| TF 445 | 103.64 | 90 | 0 | 1540 W | 59.43 | 60.96 | 1.53 | 0.17 |
| TF 446 | 100.58 | 90 | 0 | 1540 W | 41.14 | 45.72 | 4.58 | 0.43 |
| TF 447 | 100.58 | 90 | 0 | 1540 W | 39.62 | 41.14 | 1.52 | 0.17 |
| | | | | and | 45.72 | 48.76 | 3.04 | 0.17 |
| | | | | and | 86.86 | 88.39 | 1.52 | 0.17 |
| TF 448 | 100.58 | 90 | 0 | 1540 W | 9.14 | 10.66 | 1.52 | 0.27 |
| | | | | and | 89.91 | 91.44 | 1.52 | 0.77 |
| TF 449 | 64.00 | 90 | 0 | 1540 W | 1.52 | 4.57 | 3.05 | 0.30 |
| | | | | and | 10.66 | 19.81 | 9.15 | 0.15 |
| | | | | and | 44.19 | 45.92 | 1.73 | 0.10 |
| TF 450 | 100.58 | 90 | 0 | 1540 W | 0.00 | 4.57 | 4.57 | 0.66 |
| | | | | and | 13.71 | 15.24 | 1.53 | 0.20 |
| | | | | and | 47.24 | 48.76 | 1.52 | 0.20 |
| TF 451 | 100.58 | 90 | 0 | 1540 W | 1.52 | 4.57 | 3.04 | 0.33 |
| | | | | and | 10.66 | 12.19 | 1.52 | 0.23 |
| | | | | and | 59.43 | 60.96 | 1.52 | 0.23 |
| TF 452 | 100.58 | 90 | 0 | 1540 W | 70.10 | 71.62 | 1.52 | 0.13 |
| | | | | and | 73.15 | 74.67 | 1.52 | 0.13 |
| | | | | and | 88.39 | 89.91 | 1.52 | 0.33 |
| TF 453 | 100.58 | 90 | 0 | 1520 W | 7.62 | 10.66 | 3.04 | 0.21 |
| | | | | and | 18.28 | 19.81 | 1.52 | 0.20 |
| | | | | and | 83.82 | 85.34 | 1.52 | 0.53 |
| | | | | and | 94.48 | 96.01 | 1.52 | 0.58 |
| TF 455 | 100.58 | 90 | 0 | 1460 W | 13.71 | 15.24 | 1.52 | 0.20 |
201
| | | | | and | 50.29 | 51.81 | 1.52 | 0.23 |
| TF 458 | 83.82 | 90 | 0 | 1400 W | 18.28 | 19.81 | 1.52 | 0.25 |
| | | | | and | 73.15 | 74.67 | 1.52 | 0.23 |
| TF 459 | 100.58 | 90 | 0 | 1380 W | 19.81 | 22.86 | 3.05 | 0.10 |
| | | | | and | 89.91 | 91.44 | 1.53 | 0.30 |
| | | | | and | 94.48 | 97.53 | 3.05 | 0.14 |
| | | | | and | 99.06 | 100.58 | 1.52 | 0.13 |
| TF 460 | 100.58 | 90 | 0 | 1340 W | 54.86 | 56.38 | 1.52 | 0.17 |
| | | | | and | 70.10 | 73.15 | 3.05 | 0.22 |
| | | | | and | 74.67 | 76.20 | 1.53 | 0.40 |
| | | | | and | 92.96 | 94.48 | 1.52 | 0.17 |
| TF 461 | 100.58 | 90 | 0 | 1340 W | 10.66 | 12.19 | 1.53 | 0.33 |
| | | | | and | 76.20 | 77.72 | 1.52 | 0.47 |
| | | | | and | 86.86 | 100.58 | 13.72 | 0.32 |
| TF 462 | 100.58 | 90 | 0 | 1320 W | 67.05 | 70.10 | 3.05 | 0.32 |
| | | | | and | 77.72 | 79.24 | 1.52 | 0.43 |
| | | | | and | 80.77 | 83.82 | 3.05 | 0.55 |
| | | | | and | 88.39 | 92.96 | 4.57 | 0.30 |
| | | | | and | 96.01 | 100.58 | 4.57 | 1.39 |
| TF 463 | 100.58 | 90 | 0 | 1300 W | 99.06 | 100.58 | 1.52 | 1.67 |
| TF 464 | 100.58 | 90 | 0 | 1300 W | 9.14 | 10.66 | 1.52 | 0.43 |
| | | | | and | 70.10 | 71.62 | 1.52 | 0.27 |
| | | | | and | 73.15 | 74.67 | 1.52 | 0.47 |
| | | | | and | 82.29 | 100.58 | 18.29 | 0.81 |
| TF 465 | 100.58 | 90 | 0 | 1300 W | 3.04 | 4.57 | 1.52 | 0.63 |
| | | | | and | 48.76 | 50.29 | 1.52 | 0.23 |
| | | | | and | 64.00 | 67.04 | 3.04 | 0.33 |
| | | | | and | 73.15 | 74.67 | 1.52 | 0.47 |
| TF 466 | 100.58 | 90 | 0 | 1300 W | 33.52 | 36.57 | 3.05 | 0.56 |
| | | | | and | 59.43 | 60.96 | 1.53 | 0.28 |
| | | | | and | 74.67 | 79.24 | 4.57 | 0.91 |
| TF 566 | 248.41 | 70 | 205 | 1360 W | 16.76 | 19.81 | 3.05 | 0.62 |
| | | | | and | 173.72 | 176.78 | 3.06 | 0.18 |
| | | | | and | 178.30 | 179.80 | 1.50 | 0.77 |
| | | | | and | 233.17 | 234.69 | 1.52 | 0.43 |
| TF 567 | 249.93 | 70 | 205 | 1260 W | 1.52 | 3.04 | 1.52 | 0.20 |
| | | | | and | 6.09 | 7.62 | 1.53 | 0.45 |
| | | | | and | 9.14 | 10.66 | 1.52 | 0.27 |
| | | | | and | 12.19 | 13.71 | 1.52 | 0.15 |
| | | | | and | 135.63 | 137.16 | 1.53 | 0.20 |
| | | | | and | 161.54 | 164.59 | 3.05 | 1.07 |
| | | | | and | 237.74 | 240.79 | 3.05 | 0.55 |
| TF 568 | 100.58 | 70 | 205 | 1520 W | 0.00 | 6.08 | 6.08 | 0.74 |
| | | | | and | 7.62 | 9.14 | 1.52 | 2.40 |
| | | | | and | 42.67 | 44.19 | 1.52 | 0.23 |
| | | | | and | 64.00 | 65.53 | 1.53 | 0.20 |
| TF 569 | 85.39 | 90 | 0 | 1500 W | 24.38 | 27.43 | 3.05 | 0.18 |
| | | | | and | 30.48 | 32.00 | 1.52 | 1.92 |
| | | | | and | 33.52 | 35.05 | 1.53 | 0.40 |
| TF 570 | 121.92 | 70 | 205 | 1320 W | 44.19 | 45.72 | 1.53 | 1.40 |
| | | | | and | 105.15 | 106.68 | 1.53 | 0.32 |
| | | | | and | 109.72 | 111.25 | 1.53 | 0.17 |
202
| TF 571 | 121.92 | 70 | 205 | 1320 W | 27.43 | 30.48 | 3.05 | 0.22 |
| | | | | and | 35.05 | 38.10 | 3.05 | 0.50 |
| | | | | and | 50.29 | 51.81 | 1.52 | 0.60 |
| | | | | and | 56.38 | 59.43 | 3.05 | 0.29 |
| | | | | and | 83.82 | 85.34 | 1.52 | 0.73 |
| | | | | and | 109.72 | 112.77 | 3.05 | 0.52 |
| | | | | and | 115.82 | 117.34 | 1.52 | 0.18 |
| TF 572 | 131.60 | 70 | 205 | 1320 W | 9.14 | 10.66 | 1.52 | 0.27 |
| | | | | and | 42.67 | 47.24 | 4.57 | 0.29 |
| | | | | and | 51.81 | 64.00 | 12.19 | 0.55 |
| | | | | and | 67.05 | 68.58 | 1.53 | 0.40 |
| | | | | and | 73.15 | 77.72 | 4.57 | 0.22 |
| | | | | and | 89.91 | 91.44 | 1.53 | 2.33 |
| | | | | and | 120.39 | 124.96 | 4.57 | 0.46 |
| TF 573 | 131.06 | 70 | 205 | 1320 W | 71.62 | 76.20 | 4.58 | 0.41 |
| | | | | and | 77.72 | 83.82 | 6.10 | 0.56 |
| | | | | and | 94.48 | 96.01 | 1.53 | 0.63 |
| | | | | and | 118.87 | 120.39 | 1.52 | 0.12 |
| | | | | and | 128.01 | 131.06 | 3.05 | 0.32 |
| TF 574 | 82.29 | 90 | 0 | 1340 W | 53.34 | 54.86 | 1.52 | 0.13 |
| | | | | and | 56.34 | 57.91 | 1.57 | 0.27 |
| | | | | and | 62.48 | 70.10 | 7.62 | 0.25 |
| TF 575 | 100.58 | 90 | 0 | 1360 W | 27.43 | 28.95 | 1.52 | 3.13 |
| | | | | and | 56.38 | 57.91 | 1.53 | 0.35 |
| | | | | and | 67.05 | 68.58 | 1.53 | 0.27 |
| TF 576 | 82.29 | 90 | 0 | 1380 W | 0.00 | 1.52 | 1.52 | 0.10 |
| | | | | and | 57.91 | 59.43 | 1.52 | 0.13 |
| | | | | and | 65.53 | 68.58 | 3.05 | 0.14 |
| | | | | and | 70.10 | 80.77 | 10.67 | 0.29 |
| TF 577 | 82.29 | 90 | 0 | 1400 W | 76.20 | 79.24 | 3.04 | 0.26 |
| TF 578 | 121.92 | 90 | 0 | 1420 W | 68.58 | 70.10 | 1.52 | 0.17 |
| | | | | and | 71.62 | 73.15 | 1.53 | 0.50 |
| | | | | and | 79.24 | 80.77 | 1.53 | 0.15 |
| | | | | and | 96.01 | 102.10 | 6.09 | 0.69 |
| TF 579 | 82.29 | 90 | 0 | 1440 W | 15.24 | 16.76 | 1.52 | 0.17 |
| | | | | and | 56.57 | 58.10 | 1.53 | 0.15 |
| | | | | and | 59.43 | 60.96 | 1.53 | 0.20 |
| | | | | and | 64.00 | 70.10 | 6.10 | 0.15 |
| | | | | and | 71.62 | 73.15 | 1.53 | 0.10 |
| | | | | and | 76.20 | 80.77 | 4.57 | 0.28 |
| TF 580 | 112.77 | 90 | 0 | 1460 W | 33.52 | 35.05 | 1.53 | 0.37 |
| | | | | and | 65.53 | 68.58 | 3.05 | 0.27 |
| TF 747 | 70.10 | 70 | 205 | 1320 W | 0.00 | 1.52 | 1.52 | 1.68 |
| | | | | and | 51.82 | 53.34 | 1.52 | 0.33 |
| | | | | and | 56.39 | 57.91 | 1.52 | 3.41 |
| TF 748 | 91.44 | 70 | 205 | 1320 W | 36.58 | 41.15 | 4.57 | 0.54 |
| | | | | and | 50.29 | 53.34 | 3.05 | 2.14 |
| | | | | include | 50.29 | 51.81 | 1.52 | 4.01 |
| | | | | and | 54.86 | 56.39 | 1.53 | 1.63 |
| | | | | and | 70.10 | 73.15 | 3.05 | 0.67 |
| | | | | and | 74.68 | 77.72 | 3.05 | 0.36 |
| | | | | and | 82.30 | 89.92 | 7.62 | 0.30 |
203
Summary of the Significant Drill Assay Results for the Area to the S-SW of the San Francisco Pit
| Drill Hole Description | Mineralized Intervals |
| Number | Depth
(m) | Hole
Angle (°) | Azimuth (°) | Section
Line | From
(m) | To
(m) | Width
(m) | Gold
(g/t) |
| TF 154 | 112.77 | 90 | 0 | 1240 W | 19.81 | 21.33 | 1.52 | 0.18 |
| | | | | and | 99.06 | 100.58 | 1.52 | 0.20 |
| TF 164 | 85.50 | 90 | 0 | 1360 W | 57.00 | 63.00 | 6.00 | 0.66 |
| TF 168 | 106.68 | 90 | 0 | 1360 W | 6.09 | 7.62 | 1.53 | 0.60 |
| | | | | and | 39.62 | 41.14 | 1.52 | 0.23 |
| | | | | and | 54.86 | 59.43 | 4.57 | 0.16 |
| | | | | and | 65.53 | 68.58 | 3.05 | 0.23 |
| TF 173 | 100.58 | 70 | 205 | 1480 W | 0.00 | 3.04 | 3.04 | 0.20 |
| | | | | and | 7.62 | 12.19 | 4.57 | 0.64 |
| | | | | and | 15.24 | 16.76 | 1.52 | 0.17 |
| | | | | and | 25.90 | 27.43 | 1.52 | 2.57 |
| | | | | and | 32.00 | 33.52 | 1.52 | 0.63 |
| | | | | and | 38.10 | 39.62 | 1.52 | 0.30 |
| | | | | and | 54.86 | 57.91 | 3.04 | 1.73 |
| | | | | and | 70.10 | 71.62 | 1.52 | 0.43 |
| TF 177 | 67.50 | 60 | 205 | 1240 W | 0.00 | 3.00 | 3.00 | 1.05 |
| | | | | and | 54.00 | 55.50 | 1.50 | 1.47 |
| TF 178 | 115.50 | 90 | 0 | 1300 W | 1.50 | 4.50 | 3.00 | 1.50 |
| | | | | and | 13.50 | 16.50 | 3.00 | 0.58 |
| | | | | and | 39.00 | 42.00 | 3.00 | 0.22 |
| | | | | and | 49.50 | 51.00 | 1.50 | 2.97 |
| | | | | and | 106.50 | 108.00 | 1.50 | 0.17 |
| | | | | and | 109.50 | 111.00 | 1.50 | 0.60 |
| TF 179 | 127.50 | 70 | 205 | 1320 W | 27.00 | 28.50 | 1.50 | 0.27 |
| | | | | and | 34.50 | 36.00 | 1.50 | 2.45 |
| | | | | and | 39.00 | 43.50 | 4.50 | 3.28 |
| | | | | and | 52.50 | 54.00 | 1.50 | 0.47 |
| | | | | and | 57.00 | 64.50 | 7.50 | 1.17 |
| TF 180 | 121.50 | 70 | 205 | 1340 W | 64.50 | 66.00 | 1.50 | 0.23 |
| TF 181 | 157.50 | 60 | 205 | 1340 W | 19.50 | 21.00 | 1.50 | 0.43 |
| | | | | and | 103.50 | 105.00 | 1.50 | 0.23 |
| | | | | and | 111.00 | 112.50 | 1.50 | 0.35 |
| TF 182 | 103.50 | 70 | 205 | 1340 W | 28.50 | 33.00 | 4.50 | 0.36 |
| | | | | and | 33.00 | 36.00 | 3.00 | 1.01 |
| | | | | and | 37.50 | 45.00 | 7.50 | 0.50 |
| TF 185 | 139.50 | 70 | 205 | 1360 W | 0.00 | 13.50 | 13.50 | 1.05 |
| | | | | and | 25.50 | 39.00 | 13.50 | 1.77 |
| | | | | and | 45.00 | 49.50 | 4.50 | 0.82 |
| | | | | and | 51.00 | 52.50 | 1.50 | 0.42 |
| | | | | and | 55.50 | 61.50 | 6.00 | 0.41 |
| | | | | and | 69.00 | 70.50 | 1.50 | 0.27 |
| | | | | and | 72.00 | 75.00 | 3.00 | 0.33 |
| TF 187 | 115.50 | 60 | 205 | 1400 W | 7.50 | 9.00 | 1.50 | 0.30 |
| | | | | and | 13.50 | 21.00 | 7.50 | 0.39 |
| | | | | and | 31.50 | 33.00 | 1.50 | 0.20 |
| | | | | and | 43.50 | 45.00 | 1.50 | 0.20 |
204
| | | | | and | 46.50 | 48.00 | 1.50 | 0.23 |
| | | | | and | 109.50 | 115.50 | 6.00 | 0.31 |
| TF 188 | 151.50 | 60 | 205 | 1400 W | 13.50 | 15.00 | 1.50 | 0.23 |
| | | | | and | 18.00 | 21.00 | 3.00 | 0.46 |
| | | | | and | 27.00 | 28.50 | 1.50 | 0.23 |
| | | | | and | 30.00 | 31.50 | 1.50 | 0.30 |
| | | | | and | 33.00 | 36.00 | 3.00 | 0.26 |
| | | | | and | 43.50 | 46.50 | 3.00 | 0.77 |
| | | | | and | 55.50 | 58.50 | 3.00 | 0.98 |
| | | | | and | 63.00 | 70.50 | 7.50 | 1.88 |
| TF 203 | 118.87 | 90 | 0 | 1360 W | 12.19 | 13.71 | 1.52 | 0.93 |
| | | | | and | 80.77 | 82.29 | 1.52 | 0.20 |
| | | | | and | 92.96 | 94.48 | 1.52 | 0.70 |
| | | | | and | 99.06 | 100.58 | 1.52 | 0.63 |
| | | | | and | 103.63 | 112.77 | 9.14 | 0.79 |
| TF 205 | 60.00 | 70 | 205 | 1320 W | 9.00 | 10.50 | 1.50 | 0.60 |
| TF 216 | 61.50 | 70 | 205 | 1240 W | 39.00 | 42.00 | 3.00 | 0.45 |
| TF 218 | 85.50 | 70 | 205 | 1260 W | 61.00 | 62.50 | 1.50 | 1.07 |
| | | | | and | 67.50 | 69.00 | 1.50 | 1.23 |
| TF 219 | 79.50 | 70 | 205 | 1280 W | 70.50 | 73.50 | 3.00 | 0.17 |
| | | | | and | 75.00 | 78.00 | 3.00 | 0.61 |
| TF 291 | 31.50 | 90 | 0 | 1140 W | 16.50 | 18.00 | 1.50 | 2.00 |
| | | | | and | 19.50 | 21.00 | 1.50 | 0.20 |
| TF 292 | 31.50 | 90 | 0 | 1140 W | 0.00 | 6.00 | 6.00 | 0.98 |
| | | | | and | 10.50 | 12.00 | 1.50 | 1.00 |
| TF 293 | 31.50 | 90 | 0 | 1160 W | 1.50 | 6.00 | 4.50 | 0.61 |
| TF 294 | 31.50 | 90 | 0 | 1160 W | 15.00 | 16.50 | 1.50 | 0.87 |
| | | | | and | 30.00 | 31.50 | 1.50 | 0.53 |
| TF 295 | 31.50 | 90 | 0 | 1160 W | 1.50 | 3.00 | 1.50 | 0.50 |
| TF 312 | 112.78 | 90 | 0 | 1350 W | 0.00 | 3.05 | 3.05 | 0.36 |
| | | | | and | 7.62 | 13.72 | 6.10 | 0.43 |
| | | | | and | 38.10 | 45.72 | 7.62 | 0.77 |
| | | | | and | 106.68 | 111.25 | 4.57 | 0.28 |
| TF 313 | 100.58 | 90 | 0 | 1380 W | 1.52 | 9.14 | 7.62 | 0.30 |
| | | | | and | 41.14 | 48.76 | 7.62 | 0.34 |
| | | | | and | 54.86 | 67.05 | 12.19 | 0.34 |
| | | | | and | 70.10 | 73.15 | 3.05 | 0.74 |
| | | | | and | 74.77 | 77.72 | 2.95 | 0.28 |
| | | | | and | 79.24 | 83.82 | 4.58 | 1.07 |
| | | | | include | 79.24 | 80.77 | 1.53 | 2.60 |
| TF 316 | 82.29 | 90 | 0 | 1500 W | 1.52 | 3.04 | 1.52 | 0.17 |
| | | | | and | 7.62 | 10.66 | 3.04 | 0.20 |
| | | | | and | 79.24 | 80.77 | 1.52 | 0.83 |
| TF 317 | 82.29 | 90 | 0 | 1500 W | 7.62 | 9.14 | 1.52 | 0.67 |
| | | | | and | 16.76 | 18.28 | 1.52 | 0.13 |
| | | | | and | 28.95 | 32.00 | 3.04 | 0.13 |
| | | | | and | 33.52 | 35.05 | 1.52 | 0.23 |
| TF 318 | 82.29 | 90 | 0 | 1500 W | 9.14 | 12.19 | 3.04 | 0.38 |
| | | | | and | 18.28 | 19.81 | 1.52 | 0.13 |
| TF 319 | 82.29 | 90 | 0 | 1500 W | 25.90 | 27.43 | 1.53 | 0.40 |
| | | | | and | 42.67 | 44.19 | 1.52 | 0.70 |
| | | | | and | 51.81 | 56.38 | 4.57 | 0.24 |
205
| TF 320 | 82.29 | 90 | 0 | 1500 W | 21.33 | 28.95 | 7.62 | 0.37 |
| | | | | and | 35.05 | 41.14 | 6.09 | 0.94 |
| | | | | and | 68.58 | 70.10 | 1.52 | 0.38 |
| TF 321 | 82.29 | 90 | 0 | 1500 W | 9.14 | 10.66 | 1.52 | 0.29 |
| | | | | and | 16.76 | 19.81 | 3.05 | 0.13 |
| TF 329 | 100.58 | 90 | 0 | 1400 W | 3.04 | 4.57 | 1.53 | 11.13 |
| | | | | and | 6.09 | 7.62 | 1.53 | 0.43 |
| | | | | and | 12.19 | 13.71 | 1.52 | 1.13 |
| | | | | and | 15.74 | 17.26 | 1.52 | 0.17 |
| TF 335 | 100.58 | 90 | 0 | 1420 W | 33.52 | 35.05 | 1.53 | 1.00 |
| | | | | and | 39.62 | 41.14 | 1.52 | 0.23 |
| | | | | and | 54.86 | 56.38 | 1.52 | 0.30 |
| TF 336 | 100.58 | 90 | 0 | 1440 W | 9.14 | 10.66 | 1.52 | 0.27 |
| TF 337 | 143.25 | 90 | 0 | 1420 W | 7.62 | 10.66 | 3.04 | 0.97 |
| | | | | and | 22.86 | 25.90 | 3.04 | 0.62 |
| | | | | and | 60.96 | 62.48 | 1.52 | 0.77 |
| TF 358 | 100.58 | 90 | 0 | 1440 W | 54.86 | 56.38 | 1.52 | 0.47 |
| | | | | and | 59.43 | 60.96 | 1.53 | 0.40 |
| TF 359 | 100.58 | 90 | 0 | 1440 W | 25.90 | 28.95 | 3.05 | 0.65 |
| TF 370 | 100.58 | 90 | 0 | 1440 W | 3.05 | 6.10 | 3.05 | 0.31 |
| | | | | and | 15.24 | 16.76 | 1.52 | 0.20 |
| | | | | and | 18.29 | 21.34 | 3.05 | 0.13 |
| | | | | and | 35.05 | 41.15 | 6.10 | 0.60 |
| | | | | and | 48.77 | 50.29 | 1.52 | 0.68 |
| TF 386 | 100.58 | 90 | 0 | 1460 W | 32.00 | 35.05 | 3.05 | 0.82 |
| | | | | and | 41.15 | 42.67 | 1.52 | 1.17 |
| | | | | and | 48.77 | 54.86 | 6.09 | 0.28 |
| TF 387 | 106.66 | 90 | 0 | 1460 W | 54.86 | 56.38 | 1.52 | 1.17 |
| | | | | and | 59.43 | 60.96 | 1.53 | 0.32 |
| | | | | and | 62.48 | 65.53 | 3.05 | 0.49 |
| TF 388 | 94.48 | 90 | 0 | 1460 W | 12.19 | 13.71 | 1.52 | 1.60 |
| | | | | and | 24.38 | 32.00 | 7.62 | 1.26 |
| | | | | include | 27.43 | 28.95 | 1.52 | 2.63 |
| TF 389 | 103.63 | 90 | 0 | 1460 W | 24.38 | 27.45 | 3.07 | 1.65 |
| | | | | include | 24.38 | 25.90 | 1.52 | 2.00 |
| TF 390 | 100.58 | 90 | 0 | 1460 W | 4.57 | 9.14 | 4.57 | 0.24 |
| | | | | and | 15.24 | 18.29 | 3.05 | 0.35 |
| | | | | and | 21.34 | 22.86 | 1.52 | 1.63 |
| TF 394 | 100.58 | 90 | 0 | 1460 W | 7.62 | 12.19 | 4.57 | 0.18 |
| | | | | and | 22.86 | 28.96 | 6.10 | 0.41 |
| | | | | and | 35.05 | 36.58 | 1.52 | 0.29 |
| | | | | and | 65.53 | 67.05 | 1.52 | 0.82 |
| TF 397 | 103.63 | 90 | 0 | 1480 W | 0.00 | 1.52 | 1.52 | 0.46 |
| | | | | and | 62.48 | 64.01 | 1.52 | 0.23 |
| TF 399 | 100.58 | 90 | 0 | 1480 W | 3.05 | 7.62 | 4.57 | 0.60 |
| | | | | and | 18.29 | 21.34 | 3.05 | 0.14 |
| | | | | and | 28.96 | 30.48 | 1.52 | 0.23 |
| | | | | and | 41.15 | 47.24 | 6.09 | 0.32 |
| | | | | and | 53.34 | 60.96 | 7.62 | 0.24 |
| | | | | and | 64.01 | 67.06 | 3.05 | 0.49 |
| | | | | and | 68.58 | 89.92 | 21.34 | 0.21 |
| TF 400 | 100.58 | 90 | 0 | 1480 W | 16.76 | 19.81 | 3.05 | 0.34 |
206
| | | | | and | 25.91 | 30.48 | 4.57 | 0.41 |
| | | | | and | 38.10 | 39.62 | 1.52 | 4.45 |
| | | | | and | 56.39 | 62.48 | 6.10 | 0.34 |
| TF 405 | 100.58 | 90 | 0 | 1480 W | 16.76 | 24.38 | 7.62 | 1.27 |
| | | | | and | 28.96 | 30.48 | 1.52 | 0.34 |
| | | | | and | 60.96 | 62.48 | 1.52 | 0.73 |
| TF 407 | 100.58 | 90 | 0 | 1500 W | 1.52 | 6.10 | 4.58 | 0.66 |
| TF 408 | 100.58 | 90 | 0 | 1500 W | 25.91 | 32.00 | 6.09 | 0.92 |
| | | | | and | 47.24 | 48.77 | 1.52 | 0.27 |
| | | | | and | 64.01 | 70.10 | 6.10 | 0.14 |
| | | | | and | 86.87 | 97.54 | 10.67 | 0.40 |
| TF 411 | 100.58 | 90 | 0 | 1500 W | 1.52 | 4.57 | 3.05 | 0.29 |
| | | | | and | 4.57 | 7.62 | 3.05 | 0.71 |
| | | | | and | 76.20 | 77.72 | 1.52 | 0.34 |
| TF 415 | 100.58 | 90 | 0 | 1520 W | 12.19 | 18.29 | 6.10 | 0.22 |
| TF 418 | 128.01 | 90 | 0 | 1520 W | 25.90 | 36.57 | 10.67 | 1.74 |
| | | | | include | 25.91 | 27.43 | 1.52 | 3.03 |
| | | | | include | 32.00 | 33.53 | 1.53 | 3.03 |
| | | | | include | 35.05 | 36.58 | 1.53 | 2.77 |
| | | | | and | 59.44 | 60.96 | 1.52 | 0.17 |
| | | | | and | 80.77 | 82.30 | 1.53 | 0.20 |
| | | | | and | 120.40 | 124.97 | 4.57 | 0.42 |
| TF 419 | 100.58 | 90 | 0 | 1520 W | 24.38 | 25.90 | 1.52 | 0.30 |
| | | | | and | 25.90 | 27.43 | 1.53 | 1.37 |
| | | | | and | 41.14 | 42.67 | 1.53 | 0.27 |
| | | | | and | 45.72 | 50.29 | 4.57 | 0.21 |
| TF 434 | 100.58 | 90 | 0 | 1540 W | 10.67 | 12.19 | 1.52 | 0.33 |
| | | | | and | 13.72 | 16.76 | 3.05 | 0.28 |
| | | | | and | 74.68 | 76.20 | 1.52 | 0.67 |
| TF 435 | 100.58 | 90 | 0 | 1540 W | 4.57 | 7.62 | 3.05 | 0.18 |
| | | | | and | 33.53 | 36.58 | 3.05 | 0.17 |
| TF 436 | 100.58 | 90 | 0 | 1540 W | 24.38 | 25.91 | 1.52 | 0.74 |
| | | | | and | 33.53 | 35.05 | 1.52 | 1.20 |
| | | | | and | 57.91 | 62.48 | 4.57 | 0.28 |
| | | | | and | 94.49 | 96.01 | 1.52 | 0.63 |
| TF 437 | 100.58 | 90 | 0 | 1540 W | 64.00 | 65.53 | 1.53 | 0.13 |
| | | | | and | 91.44 | 92.96 | 1.52 | 0.10 |
| | | | | and | 94.49 | 96.01 | 1.52 | 0.10 |
| TF 438 | 100.58 | 90 | 0 | 1540 W | 32.00 | 33.52 | 1.52 | 0.30 |
| | | | | and | 38.10 | 39.62 | 1.52 | 0.40 |
| | | | | and | 41.14 | 42.67 | 1.53 | 0.47 |
| TF 441 | 100.58 | 90 | 0 | 1540 W | 30.48 | 35.05 | 4.57 | 0.45 |
| | | | | and | 92.97 | 94.49 | 1.52 | 1.14 |
| TF 467 | 103.63 | 90 | 0 | 1340 W | 25.90 | 27.45 | 1.55 | 0.33 |
| | | | | and | 41.14 | 47.24 | 6.10 | 6.14 |
| | | | | include | 41.14 | 42.67 | 1.53 | 16.13 |
| | | | | include | 42.67 | 44.19 | 1.52 | 4.00 |
| | | | | include | 44.19 | 45.72 | 1.53 | 4.17 |
| | | | | and | 50.29 | 51.81 | 1.52 | 0.93 |
| | | | | and | 88.39 | 91.44 | 3.05 | 0.31 |
| | | | | and | 92.96 | 94.48 | 1.52 | 1.07 |
| | | | | and | 97.53 | 99.06 | 1.53 | 0.23 |
207
| TF 469 | 103.63 | 90 | 0 | 1320 W | 9.14 | 10.66 | 1.52 | 0.60 |
| | | | | and | 32.00 | 33.52 | 1.52 | 0.13 |
| | | | | and | 79.24 | 82.29 | 3.05 | 1.65 |
| | | | | and | 88.39 | 91.44 | 3.05 | 0.25 |
| TF 474 | 103.63 | 90 | 0 | 1300 W | 3.04 | 4.57 | 1.53 | 0.55 |
| | | | | and | 6.09 | 12.19 | 6.10 | 0.37 |
| | | | | and | 21.33 | 22.81 | 1.48 | 0.13 |
| | | | | and | 33.52 | 38.10 | 4.58 | 0.60 |
| | | | | and | 45.72 | 50.29 | 4.57 | 0.47 |
| | | | | and | 89.91 | 92.96 | 3.05 | 0.70 |
| TF 475 | 100.58 | 90 | 0 | 1300 W | 0.00 | 1.52 | 1.52 | 0.27 |
| | | | | and | 67.06 | 76.20 | 9.14 | 0.29 |
| TF 478 | 100.58 | 90 | 0 | 1240 W | 30.48 | 32.00 | 1.52 | 2.31 |
| | | | | and | 88.39 | 91.43 | 3.05 | 0.28 |
| | | | | and | 94.48 | 96.01 | 1.52 | 0.21 |
| TF 480 | 100.58 | 90 | 0 | 1240 W | 0.00 | 1.52 | 1.52 | 0.42 |
| | | | | and | 21.34 | 24.38 | 3.05 | 0.27 |
| | | | | and | 27.43 | 32.00 | 4.57 | 0.36 |
| TF 481 | 103.63 | 90 | 0 | 1240 W | 0.00 | 3.05 | 3.05 | 1.11 |
| | | | | and | 56.39 | 59.43 | 3.05 | 0.31 |
| | | | | and | 70.10 | 80.77 | 10.67 | 1.97 |
| TF 482 | 100.58 | 90 | 0 | 1240 W | 7.62 | 9.14 | 1.52 | 0.24 |
| | | | | and | 15.24 | 19.81 | 4.57 | 1.41 |
| | | | | and | 25.91 | 27.43 | 1.52 | 0.42 |
| | | | | and | 64.01 | 65.54 | 1.52 | 0.62 |
| TF 483 | 112.78 | 90 | 0 | 1240 W | 13.72 | 21.34 | 7.62 | 0.86 |
| | | | | and | 39.62 | 42.67 | 3.05 | 0.58 |
| | | | | and | 74.67 | 77.72 | 3.05 | 0.55 |
| TF 484 | 103.63 | 90 | 0 | 1220 W | 7.62 | 9.14 | 1.52 | 0.45 |
| | | | | and | 41.15 | 42.67 | 1.52 | 1.22 |
| TF 485 | 103.63 | 90 | 0 | 1220 W | 7.62 | 9.14 | 1.52 | 0.39 |
| | | | | and | 12.19 | 13.72 | 1.52 | 0.40 |
| | | | | and | 94.49 | 97.54 | 3.05 | 4.68 |
| TF 486 | 103.63 | 90 | 0 | 1220 W | 0.00 | 4.57 | 4.57 | 0.63 |
| | | | | and | 19.81 | 21.33 | 1.52 | 0.13 |
| | | | | and | 22.86 | 25.90 | 3.04 | 0.22 |
| | | | | and | 99.06 | 100.58 | 1.52 | 0.83 |
| TF 487 | 100.58 | 90 | 0 | 1220 W | 3.05 | 15.24 | 12.19 | 0.59 |
| | | | | and | 53.34 | 56.39 | 3.05 | 0.77 |
| TF 488 | 100.58 | 90 | 0 | 1220 W | 6.10 | 12.19 | 6.10 | 0.63 |
| | | | | and | 22.86 | 24.38 | 1.52 | 0.97 |
| | | | | and | 76.20 | 79.25 | 3.05 | 0.27 |
| TF 489 | 100.58 | 90 | 0 | 1200 W | 0.00 | 3.05 | 3.05 | 0.19 |
| | | | | and | 7.62 | 13.72 | 6.10 | 0.46 |
| | | | | and | 41.15 | 42.67 | 1.52 | 0.12 |
| TF 490 | 152.39 | 70 | 205 | 1040 W | 0.00 | 1.52 | 1.52 | 0.20 |
| | | | | and | 39.62 | 41.15 | 1.52 | 0.36 |
| | | | | and | 57.91 | 70.10 | 12.19 | 0.49 |
| | | | | and | 77.72 | 82.29 | 4.57 | 0.34 |
| | | | | and | 83.82 | 92.96 | 9.14 | 1.26 |
| | | | | and | 97.53 | 99.06 | 1.52 | 0.46 |
| | | | | and | 106.68 | 108.20 | 1.52 | 0.91 |
208
| TF 491 | 152.40 | 90 | 0 | 1180 W | 42.67 | 45.72 | 3.05 | 1.25 |
| | | | | and | 51.82 | 54.86 | 3.05 | 0.38 |
| | | | | and | 59.44 | 74.68 | 15.24 | 1.86 |
| TF 492 | 152.40 | 90 | 0 | 1060 W | 10.67 | 15.24 | 4.57 | 0.53 |
| | | | | and | 39.62 | 53.34 | 13.72 | 0.95 |
| | | | | and | 57.91 | 71.62 | 13.72 | 1.20 |
| | | | | and | 77.72 | 80.77 | 3.05 | 3.18 |
| | | | | and | 94.49 | 96.01 | 1.52 | 0.55 |
| | | | | and | 117.35 | 121.92 | 4.57 | 0.69 |
| | | | | and | 123.44 | 126.49 | 3.05 | 0.63 |
| TF 496 | 100.58 | 90 | 0 | 1200 W | 4.57 | 6.09 | 1.52 | 0.27 |
| | | | | and | 16.76 | 18.28 | 1.52 | 0.30 |
| | | | | and | 44.19 | 47.24 | 3.05 | 0.26 |
| TF 499 | 106.68 | 90 | 0 | 1180 W | 0.00 | 1.52 | 1.52 | 0.10 |
| | | | | and | 28.95 | 30.48 | 1.53 | 0.13 |
| TF 504 | 100.58 | 90 | 0 | 1200 W | 57.91 | 59.43 | 1.52 | 0.13 |
| | | | | and | 62.48 | 64.00 | 1.52 | 0.27 |
| | | | | and | 83.82 | 91.44 | 7.62 | 0.20 |
| | | | | and | 96.01 | 97.53 | 1.52 | 0.37 |
| TF 505 | 91.44 | 90 | 0 | 1200 W | 1.52 | 3.04 | 1.52 | 0.79 |
| | | | | and | 70.10 | 74.67 | 4.57 | 0.76 |
| | | | | include | 73.15 | 74.67 | 1.52 | 2.03 |
| | | | | and | 86.86 | 91.44 | 4.58 | 0.59 |
| TF 507 | 82.29 | 90 | 0 | 1200 W | 77.72 | 80.77 | 3.05 | 0.52 |
| TF 508 | 91.44 | 90 | 0 | 1220 W | 33.52 | 35.05 | 1.53 | 0.37 |
| | | | | and | 42.67 | 45.72 | 3.04 | 0.33 |
| | | | | and | 51.81 | 62.48 | 10.66 | 0.42 |
| | | | | and | 82.29 | 83.82 | 1.52 | 0.47 |
| TF 509 | 94.48 | 90 | 0 | 1220 W | 27.43 | 28.95 | 1.52 | 0.13 |
| | | | | and | 33.52 | 35.05 | 1.53 | 0.19 |
| | | | | and | 48.76 | 50.29 | 1.53 | 0.27 |
| | | | | and | 56.38 | 57.91 | 1.53 | 0.33 |
| | | | | and | 71.62 | 73.15 | 1.53 | 0.37 |
| | | | | and | 79.24 | 82.29 | 3.05 | 0.32 |
| TF 514 | 100.58 | 90 | 0 | 1160 W | 10.67 | 12.19 | 1.52 | 0.23 |
| | | | | and | 21.34 | 22.86 | 1.52 | 1.77 |
| TF 515 | 100.58 | 90 | 0 | 1180 W | 16.76 | 18.28 | 1.52 | 0.20 |
| | | | | and | 64.00 | 65.53 | 1.53 | 0.30 |
| TF 530 | 173.73 | 70 | 205 | 1300 W | 21.33 | 25.90 | 4.57 | 1.85 |
| | | | | and | 65.53 | 70.10 | 4.57 | 0.63 |
| TF 531 | 88.39 | 70 | 205 | 660 W | 4.57 | 6.09 | 1.52 | 0.10 |
| | | | | and | 13.71 | 15.24 | 1.53 | 3.67 |
| | | | | and | 25.90 | 27.43 | 1.53 | 0.33 |
| | | | | and | 59.43 | 60.96 | 1.53 | 0.30 |
| | | | | and | 68.58 | 70.10 | 1.52 | 0.17 |
| | | | | and | 82.29 | 85.34 | 3.05 | 0.10 |
| TF 532 | 82.29 | 90 | 0 | 660 W | 0.00 | 1.52 | 1.52 | 0.23 |
| | | | | and | 15.24 | 24.38 | 9.14 | 0.37 |
| | | | | and | 27.43 | 32.00 | 4.57 | 0.31 |
| | | | | and | 56.38 | 57.91 | 1.53 | 0.13 |
| | | | | and | 65.53 | 67.05 | 1.52 | 0.27 |
| | | | | and | 77.72 | 79.24 | 1.52 | 0.23 |
209
| TF 533 | 82.29 | 90 | 0 | 660 W | 3.04 | 6.09 | 3.05 | 0.32 |
| | | | | and | 18.28 | 19.81 | 1.53 | 0.83 |
| | | | | and | 36.57 | 38.10 | 1.53 | 0.17 |
| TF 535 | 85.34 | 90 | 0 | 700 W | 3.04 | 4.57 | 1.53 | 0.50 |
| | | | | and | 7.62 | 9.14 | 1.52 | 0.90 |
| | | | | and | 12.19 | 15.24 | 3.05 | 0.20 |
| | | | | and | 19.81 | 21.33 | 1.52 | 0.27 |
| | | | | and | 30.48 | 32.00 | 1.52 | 0.13 |
| | | | | and | 76.20 | 77.72 | 1.52 | 0.27 |
| TF 536 | 82.29 | 90 | 0 | 700 W | 7.62 | 9.14 | 1.52 | 0.73 |
| | | | | and | 10.66 | 12.19 | 1.53 | 0.35 |
| | | | | and | 44.19 | 45.72 | 1.53 | 0.10 |
| | | | | and | 56.38 | 57.91 | 1.53 | 0.10 |
| TF 537 | 82.29 | 90 | 0 | 740 W | 4.57 | 6.09 | 1.52 | 0.13 |
| | | | | and | 15.24 | 16.76 | 1.52 | 0.11 |
| | | | | and | 44.19 | 45.72 | 1.53 | 0.10 |
| | | | | and | 50.29 | 51.81 | 1.52 | 0.43 |
| | | | | and | 57.91 | 59.43 | 1.52 | 0.27 |
| TF 538 | 82.29 | 90 | 0 | 740 W | 9.14 | 10.67 | 1.52 | 0.20 |
| | | | | and | 16.76 | 18.29 | 1.52 | 0.27 |
| | | | | and | 35.05 | 36.58 | 1.52 | 0.87 |
| | | | | and | 39.63 | 42.67 | 3.05 | 0.67 |
| TF 540 | 82.29 | 90 | 0 | 740 W | 0.00 | 1.52 | 1.52 | 0.13 |
| | | | | and | 13.71 | 15.24 | 1.53 | 0.13 |
| | | | | and | 19.81 | 21.33 | 1.52 | 0.20 |
| | | | | and | 36.57 | 39.62 | 3.05 | 0.12 |
| | | | | and | 70.10 | 77.72 | 7.62 | 0.21 |
| | | | | and | 80.27 | 82.29 | 2.02 | 0.92 |
| TF 541 | 85.34 | 90 | 0 | 780 W | 10.67 | 12.19 | 1.52 | 0.50 |
| | | | | and | 13.72 | 15.24 | 1.52 | 0.17 |
| | | | | and | 21.34 | 28.96 | 7.62 | 0.20 |
| TF 542 | 82.29 | 90 | 0 | 780 W | 6.10 | 12.19 | 6.09 | 0.70 |
| | | | | and | 24.38 | 25.91 | 1.52 | 0.33 |
| | | | | and | 35.05 | 36.58 | 1.52 | 0.27 |
| | | | | and | 53.34 | 56.39 | 3.05 | 0.28 |
| | | | | and | 59.43 | 62.48 | 3.05 | 0.15 |
| | | | | and | 68.58 | 71.63 | 3.05 | 0.25 |
| | | | | and | 73.15 | 80.77 | 7.62 | 0.36 |
| TF 543 | 82.29 | 90 | 0 | 780 W | 0.00 | 1.52 | 1.52 | 0.10 |
| | | | | and | 32.00 | 33.52 | 1.52 | 0.13 |
| | | | | and | 60.96 | 62.48 | 1.52 | 0.12 |
| TF 544 | 82.29 | 90 | 0 | 820 W | 28.95 | 30.48 | 1.53 | 0.53 |
| | | | | and | 5.72 | 47.24 | 41.52 | 0.37 |
| TF 545 | 85.34 | 90 | 0 | 860 W | 41.14 | 42.67 | 1.53 | 0.27 |
| | | | | and | 54.86 | 56.38 | 1.52 | 0.35 |
| | | | | and | 59.43 | 60.96 | 1.53 | 0.17 |
| | | | | and | 65.53 | 68.58 | 3.05 | 0.19 |
| | | | | and | 76.20 | 80.77 | 4.57 | 2.14 |
| TF 546 | 82.29 | 90 | 0 | 900 W | 42.67 | 45.72 | 3.05 | 0.27 |
| | | | | and | 50.29 | 51.81 | 1.52 | 0.33 |
| | | | | and | 62.48 | 65.43 | 2.95 | 0.25 |
| TF 547 | 85.34 | 90 | 0 | 940 W | 39.62 | 41.14 | 1.52 | 0.20 |
210
| | | | | and | 42.67 | 53.34 | 10.67 | 0.81 |
| | | | | and | 59.46 | 64.00 | 4.54 | 0.20 |
| | | | | and | 74.67 | 77.72 | 3.05 | 0.31 |
| | | | | and | 79.24 | 80.27 | 1.03 | 0.27 |
| TF 548 | 82.29 | 90 | 0 | 980 W | 21.33 | 24.38 | 3.05 | 0.63 |
| | | | | and | 39.62 | 41.14 | 1.52 | 0.27 |
| | | | | and | 50.29 | 56.38 | 6.09 | 0.37 |
| | | | | and | 57.91 | 67.05 | 9.14 | 1.14 |
| | | | | and | 67.05 | 77.72 | 10.67 | 0.21 |
| TF 549 | 82.29 | 90 | 0 | 1020 W | 28.96 | 32.00 | 3.05 | 0.58 |
| TF 550 | 82.29 | 90 | 0 | 1020 W | 56.39 | 57.91 | 1.52 | 0.24 |
| | | | | and | 60.96 | 76.20 | 15.24 | 0.41 |
| TF 551 | 82.29 | 90 | 0 | 1060 W | 32.00 | 50.29 | 18.29 | 0.94 |
| | | | | and | 56.38 | 64.00 | 7.62 | 1.14 |
| | | | | and | 68.58 | 82.29 | 13.71 | 10.28 |
| TF 554 | 82.29 | 90 | 0 | 1100 W | 30.48 | 32.00 | 1.52 | 0.20 |
| | | | | and | 38.10 | 39.62 | 1.52 | 0.12 |
| | | | | and | 48.76 | 50.29 | 1.53 | 0.24 |
| | | | | and | 56.38 | 57.91 | 1.53 | 0.61 |
| TF 556 | 82.29 | 90 | 0 | 1100 W | 1.52 | 3.04 | 1.52 | 0.11 |
| | | | | and | 12.19 | 13.71 | 1.52 | 0.83 |
| | | | | and | 16.76 | 18.28 | 1.52 | 0.10 |
| | | | | and | 32.00 | 33.52 | 1.52 | 0.78 |
| TF 557 | 82.29 | 90 | 0 | 1140 W | 24.38 | 25.91 | 1.52 | 1.88 |
| TF 559 | 82.29 | 90 | 0 | 1140 W | 15.24 | 16.76 | 1.52 | 0.31 |
| | | | | and | 41.15 | 45.72 | 4.57 | 0.31 |
| | | | | and | 48.77 | 53.34 | 4.57 | 0.80 |
| TF 561 | 82.29 | 90 | 0 | 1180 W | 1.52 | 3.05 | 1.52 | 1.35 |
| | | | | and | 32.00 | 35.05 | 3.05 | 4.50 |
| | | | | and | 53.34 | 57.91 | 4.57 | 0.91 |
| TF 563 | 82.29 | 90 | 0 | 1220 W | 60.96 | 73.15 | 12.19 | 1.08 |
| TF 564 | 82.29 | 90 | 0 | 1220 W | 22.86 | 24.38 | 1.52 | 0.23 |
| | | | | and | 64.00 | 74.67 | 10.67 | 1.07 |
| TF 565 | 82.29 | 90 | 0 | 1220 W | 10.67 | 12.19 | 1.52 | 0.21 |
| | | | | and | 38.10 | 39.62 | 1.52 | 0.83 |
| TF 581 | 60.96 | 90 | 0 | 890 W | 19.81 | 21.33 | 1.52 | 1.43 |
| | | | | and | 41.14 | 42.17 | 1.52 | 0.43 |
| | | | | and | 44.19 | 45.72 | 1.52 | 0.17 |
| TF 582 | 42.67 | 90 | 0 | 900 W | 13.71 | 15.24 | 1.52 | 1.77 |
| | | | | and | 18.28 | 19.81 | 1.52 | 0.73 |
| | | | | and | 24.38 | 33.52 | 9.14 | 0.17 |
| | | | | and | 38.10 | 42.67 | 4.57 | 0.23 |
| TF 583 | 42.67 | 90 | 0 | 910 W | 19.81 | 24.38 | 4.54 | 0.60 |
| | | | | and | 25.90 | 33.52 | 7.62 | 0.72 |
| TF 584 | 42.67 | 90 | 0 | 920 W | 3.04 | 6.09 | 3.04 | 0.15 |
| | | | | and | 7.62 | 10.66 | 3.04 | 0.67 |
| | | | | and | 12.19 | 13.71 | 1.52 | 0.13 |
| | | | | and | 18.28 | 39.62 | 21.28 | 0.70 |
| TF 585 | 42.67 | 90 | 0 | 930 W | 0.00 | 3.04 | 3.04 | 0.37 |
| | | | | and | 4.57 | 13.71 | 9.12 | 2.27 |
| | | | | and | 15.24 | 27.43 | 12.16 | 1.08 |
| | | | | and | 33.52 | 36.57 | 3.04 | 0.87 |
211
| TF 586 | 42.67 | 90 | 0 | 950 W | 0.00 | 3.04 | 3.04 | 0.77 |
| | | | | and | 10.56 | 13.71 | 3.04 | 0.88 |
| | | | | and | 41.14 | 42.67 | 1.52 | 0.93 |
| TF 587 | 42.67 | 90 | 0 | 950 W | 10.66 | 13.71 | 3.04 | 0.25 |
| | | | | and | 18.28 | 32.00 | 13.68 | 2.07 |
| TF 588 | 30.48 | 90 | 0 | 1000 W | 1.52 | 6.09 | 4.57 | 7.60 |
| | | | | and | 7.62 | 10.66 | 3.04 | 0.55 |
| | | | | and | 15.24 | 18.28 | 3.04 | 0.20 |
| TF 589 | 42.67 | 90 | 0 | 1010 W | 3.04 | 4.57 | 1.52 | 0.27 |
| | | | | and | 7.62 | 13.71 | 6.09 | 1.02 |
| | | | | and | 16.76 | 19.81 | 3.04 | 0.23 |
| | | | | and | 56.57 | 58.10 | 1.52 | 2.30 |
| TF 590 | 30.48 | 90 | 0 | 1020 W | 0.00 | 6.09 | 6.09 | 0.36 |
| | | | | and | 10.66 | 13.71 | 3.04 | 0.41 |
| | | | | and | 21.33 | 22.86 | 1.52 | 0.47 |
| | | | | and | 24.38 | 27.43 | 3.04 | 0.38 |
| TF 591 | 45.72 | 90 | 0 | 1020 W | 9.14 | 15.24 | 6.09 | 0.61 |
| | | | | and | 21.33 | 30.48 | 9.14 | 0.57 |
| TF 592 | 36.57 | 60 | 206.57 | 1030 W | 3.04 | 13.71 | 10.64 | 0.70 |
| | | | | and | 16.76 | 21.33 | 4.57 | 0.68 |
| | | | | and | 35.05 | 36.57 | 1.52 | 0.40 |
| TF 593 | 36.57 | 90 | 0 | 1040 W | 3.04 | 9.14 | 6.09 | 0.23 |
| | | | | and | 10.66 | 16.76 | 6.09 | 0.20 |
| | | | | and | 19.81 | 21.33 | 1.52 | 0.27 |
| | | | | and | 22.86 | 24.38 | 1.52 | 0.23 |
| TF 594 | 27.43 | 90 | 0 | 1060 W | 0.00 | 1.52 | 1.52 | 1.63 |
| | | | | and | 16.76 | 18.28 | 1.52 | 0.47 |
| TF 595 | 27.43 | 90 | 0 | 1060 W | 3.04 | 6.09 | 3.04 | 0.24 |
| | | | | and | 9.14 | 16.76 | 7.62 | 0.39 |
| TF 614 | 100.58 | 90 | 0 | 1160 W | 4.57 | 10.67 | 6.10 | 0.21 |
| | | | | and | 19.81 | 21.34 | 1.53 | 0.10 |
| TF 626 | 100.58 | 90 | 0 | 1120 W | 4.57 | 12.19 | 7.62 | 0.23 |
| | | | | and | 68.58 | 70.10 | 1.52 | 0.17 |
| TF 627 | 100.58 | 90 | 0 | 1120 W | 97.54 | 99.06 | 1.52 | 0.20 |
| TF 628 | 100.58 | 90 | 0 | 1120 W | 51.82 | 53.34 | 1.52 | 0.13 |
| | | | | and | 88.39 | 91.44 | 3.05 | 0.23 |
| TF 629 | 100.58 | 90 | 0 | 1120 W | 57.91 | 59.44 | 1.52 | 0.22 |
| TF 639 | 100.58 | 70 | 205 | 1040 W | 1.52 | 3.05 | 1.53 | 0.77 |
| | | | | and | 53.34 | 56.39 | 3.05 | 0.25 |
| | | | | and | 62.48 | 65.53 | 3.05 | 0.27 |
| TF 640 | 112.77 | 70 | 205 | 1040 W | 0.00 | 4.57 | 4.57 | 0.20 |
| | | | | and | 9.14 | 12.19 | 3.05 | 0.27 |
| | | | | and | 13.72 | 16.76 | 3.04 | 0.73 |
| TF 641 | 121.92 | 70 | 205 | 1040 W | 4.57 | 12.19 | 7.62 | 2.07 |
| | | | | include | 4.57 | 6.10 | 1.53 | 3.87 |
| | | | | include | 7.62 | 9.14 | 1.52 | 2.80 |
| | | | | include | 9.14 | 10.67 | 1.53 | 2.70 |
| | | | | and | 18.29 | 25.91 | 7.62 | 5.22 |
| | | | | include | 19.81 | 21.34 | 1.53 | 2.00 |
| | | | | include | 21.34 | 22.86 | 1.52 | 18.90 |
| | | | | include | 22.86 | 24.38 | 1.52 | 4.33 |
| | | | | and | 68.58 | 71.63 | 3.05 | 2.18 |
212
| | | | | include | 68.58 | 70.10 | 1.52 | 2.10 |
| | | | | include | 70.10 | 71.63 | 1.53 | 2.27 |
| | | | | and | 76.20 | 80.77 | 4.57 | 2.44 |
| | | | | include | 76.20 | 77.72 | 1.52 | 3.70 |
| | | | | include | 77.72 | 79.25 | 1.53 | 2.65 |
| | | | | and | 86.87 | 92.96 | 6.09 | 1.54 |
| | | | | include | 89.92 | 91.44 | 1.52 | 2.43 |
| | | | | and | 112.78 | 117.35 | 4.57 | 0.91 |
| TF 644 | 131.06 | 90 | 0 | 1060 W | 12.19 | 13.72 | 1.53 | 0.93 |
| | | | | and | 50.29 | 54.86 | 4.57 | 0.36 |
| | | | | and | 56.39 | 59.44 | 3.05 | 0.87 |
| | | | | and | 100.58 | 106.68 | 6.10 | 5.07 |
| | | | | include | 100.58 | 102.11 | 1.53 | 4.33 |
| | | | | include | 102.11 | 103.63 | 1.52 | 8.47 |
| | | | | include | 103.63 | 105.16 | 1.53 | 6.97 |
| TF 645 | 70.10 | 90 | 0 | 1080 W | 15.24 | 19.81 | 4.57 | 0.50 |
| | | | | and | 28.96 | 32.00 | 3.04 | 0.93 |
| TF 647 | 91.44 | 90 | 0 | 1080 W | 0.00 | 1.52 | 1.52 | 0.20 |
| | | | | and | 71.63 | 79.25 | 7.62 | 2.29 |
| | | | | include | 73.15 | 74.68 | 1.53 | 2.90 |
| | | | | include | 74.68 | 76.20 | 1.52 | 3.33 |
| | | | | include | 76.20 | 77.72 | 1.52 | 3.37 |
| | | | | and | 83.82 | 91.44 | 7.62 | 0.34 |
| TF 648 | 100.58 | 90 | 0 | 1080 W | 92.96 | 97.54 | 4.58 | 1.16 |
| | | | | include | 92.96 | 94.49 | 1.53 | 2.67 |
| TF 649 | 121.92 | 90 | 0 | 1080 W | 96.01 | 109.73 | 13.72 | 3.87 |
| | | | | include | 96.01 | 97.54 | 1.53 | 4.73 |
| | | | | include | 97.54 | 99.06 | 1.52 | 11.17 |
| | | | | include | 99.06 | 100.58 | 1.52 | 4.83 |
| | | | | include | 100.58 | 102.11 | 1.53 | 4.50 |
| | | | | include | 102.11 | 103.63 | 1.52 | 3.17 |
| | | | | include | 103.63 | 105.16 | 1.53 | 2.80 |
| | | | | include | 106.68 | 108.20 | 1.52 | 2.17 |
| TF 650 | 85.34 | 90 | 0 | 1100 W | 73.15 | 83.82 | 10.67 | 0.74 |
| TF 651 | 100.58 | 90 | 0 | 1100 W | 0.00 | 10.67 | 10.67 | 0.85 |
| | | | | include | 3.05 | 4.57 | 1.52 | 3.65 |
| | | | | and | 54.86 | 67.06 | 12.20 | 0.31 |
| | | | | and | 88.39 | 100.58 | 12.19 | 4.39 |
| | | | | include | 89.92 | 91.44 | 1.52 | 6.83 |
| | | | | include | 92.96 | 94.49 | 1.53 | 5.10 |
| | | | | include | 94.49 | 96.01 | 1.52 | 3.93 |
| | | | | include | 96.01 | 97.54 | 1.53 | 3.60 |
| | | | | include | 97.54 | 99.06 | 1.52 | 3.65 |
| | | | | include | 99.06 | 100.58 | 1.52 | 9.07 |
| TF 652 | 137.16 | 90 | 0 | 1100 W | 48.77 | 51.82 | 3.05 | 0.47 |
| | | | | and | 53.34 | 54.86 | 1.52 | 2.97 |
| | | | | and | 96.01 | 117.35 | 21.34 | 2.52 |
| | | | | include | 96.01 | 97.54 | 1.53 | 5.60 |
| | | | | include | 97.54 | 99.06 | 1.52 | 14.43 |
| | | | | include | 99.06 | 100.58 | 1.52 | 11.67 |
| TF 710 | 100.58 | 90 | 0 | 920 W | 1.52 | 3.05 | 1.53 | 0.97 |
| TF 723 | 103.63 | 90 | 0 | 1520 W | 1.52 | 6.09 | 4.57 | 1.98 |
213
| | | | | include | 4.57 | 6.10 | 1.53 | 4.53 |
| | | | | and | 30.48 | 33.53 | 3.05 | 0.57 |
| | | | | and | 76.20 | 100.58 | 24.38 | 1.02 |
| | | | | include | 91.44 | 92.96 | 1.52 | 2.00 |
| | | | | include | 92.96 | 94.49 | 1.53 | 5.47 |
Summary of the Significant Drill Assay Results for the Area to the E-SE of the San
Francisco Pit
| Drill Hole Description | Mineralized Intervals |
| Number | Depth
(m) | Hole
Angle (°) | Azimuth (°) | Section
Line | From
(m) | To
(m) | Width
(m) | Gold
(g/t) |
| TF 151 | 55.50 | 70 | 205 | 40 E | 25.50 | 27.00 | 1.50 | 0.20 |
| TF 152 | 106.50 | 70 | 205 | 40 E | 39.00 | 40.50 | 1.50 | 0.30 |
| | | | | and | 75.00 | 78.00 | 3.00 | 0.28 |
| TF 153 | 112.50 | 90 | 0 | 40 E | 103.50 | 105.00 | 1.50 | 0.23 |
| TF 156 | 94.50 | 70 | 205 | 0 | 0.00 | 3.00 | 3.00 | 0.20 |
| | | | | and | 6.00 | 7.50 | 1.50 | 0.20 |
| | | | | and | 25.50 | 27.00 | 1.50 | 0.70 |
| | | | | and | 66.00 | 75.00 | 9.00 | 1.48 |
| TF 157 | 112.50 | 70 | 205 | 0 | 10.50 | 13.50 | 3.00 | 0.24 |
| | | | | and | 78.00 | 79.50 | 1.50 | 0.30 |
| TF 158 | 94.50 | 90 | 0 | 0 | 7.50 | 9.00 | 1.50 | 0.23 |
| | | | | and | 51.00 | 52.50 | 1.50 | 0.33 |
| TF 159 | 88.50 | 90 | 0 | 0 | 1.50 | 16.50 | 15.00 | 2.31 |
| | | | | and | 24.00 | 28.50 | 4.50 | 0.28 |
| | | | | and | 78.00 | 82.50 | 4.50 | 0.30 |
| TF 160 | 112.50 | 90 | 0 | 0 | 1.50 | 3.00 | 1.50 | 0.30 |
| | | | | and | 31.50 | 33.00 | 1.50 | 0.43 |
| | | | | and | 34.50 | 36.00 | 1.50 | 0.30 |
| | | | | and | 37.50 | 45.00 | 7.50 | 0.39 |
| | | | | and | 49.50 | 51.00 | 1.50 | 0.30 |
| | | | | and | 55.50 | 58.50 | 3.00 | 0.20 |
| TF 161 | 91.50 | 70 | 205 | 60 E | 9.00 | 24.00 | 15.00 | 1.45 |
| | | | | and | 52.50 | 54.00 | 1.50 | 0.43 |
| | | | | and | 76.50 | 78.00 | 1.50 | 0.27 |
| | | | | and | 84.00 | 87.00 | 3.00 | 0.85 |
| TF 166 | 46.50 | 70 | 205 | 20 E | 6.00 | 7.50 | 1.50 | 0.23 |
| TF 167 | 94.50 | 70 | 205 | 20 W | 16.50 | 18.00 | 1.50 | 0.27 |
| | | | | and | 21.00 | 22.50 | 1.50 | 0.40 |
| | | | | and | 36.00 | 37.50 | 1.50 | 0.40 |
| | | | | and | 55.50 | 57.00 | 1.50 | 0.23 |
| | | | | and | 78.00 | 79.50 | 1.50 | 0.33 |
| | | | | and | 91.50 | 93.00 | 1.50 | 0.53 |
| TF 169 | 91.50 | 90 | 0 | 20 W | 6.00 | 7.50 | 1.50 | 0.35 |
| | | | | and | 10.50 | 12.00 | 1.50 | 0.23 |
| | | | | and | 51.00 | 54.00 | 3.00 | 0.52 |
| TF 170 | 130.50 | 90 | 0 | 20 W | 3.00 | 10.50 | 7.50 | 0.64 |
| | | | | and | 12.00 | 13.50 | 1.50 | 0.35 |
| | | | | and | 30.00 | 31.50 | 1.50 | 0.57 |
| | | | | and | 33.00 | 34.50 | 1.50 | 0.25 |
| | | | | and | 52.50 | 54.00 | 1.50 | 0.37 |
214
| | | | | and | 108.00 | 109.50 | 1.50 | 0.28 |
| TF 171 | 97.50 | 60 | 205 | 40 W | 6.00 | 7.50 | 1.50 | 1.58 |
| | | | | and | 27.00 | 28.50 | 1.50 | 0.27 |
| | | | | and | 67.50 | 72.00 | 4.50 | 0.26 |
| | | | | and | 75.00 | 76.50 | 1.50 | 1.23 |
| TF 172 | 58.50 | 70 | 205 | 40 W | 0.00 | 7.50 | 7.50 | 0.48 |
| | | | | and | 10.50 | 12.00 | 1.50 | 0.40 |
| | | | | and | 18.00 | 24.00 | 6.00 | 0.27 |
| | | | | and | 48.00 | 51.00 | 3.00 | 0.27 |
| | | | | and | 54.00 | 58.50 | 4.50 | 0.56 |
| TF 174 | 76.50 | 70 | 205 | 80 W | 0.00 | 1.50 | 1.50 | 0.23 |
| | | | | and | 6.00 | 7.50 | 1.50 | 0.23 |
| | | | | and | 24.00 | 27.00 | 3.00 | 0.48 |
| | | | | and | 36.00 | 37.50 | 1.50 | 1.40 |
| TF 175 | 76.50 | 70 | 205 | 100 W | 1.50 | 3.00 | 1.50 | 0.20 |
| | | | | and | 4.50 | 6.00 | 1.50 | 0.23 |
| | | | | and | 13.50 | 16.50 | 3.00 | 0.44 |
| | | | | and | 18.00 | 21.00 | 3.00 | 0.62 |
| | | | | and | 24.00 | 25.50 | 1.50 | 0.20 |
| | | | | and | 36.00 | 39.00 | 3.00 | 0.72 |
| | | | | and | 46.50 | 52.50 | 6.00 | 0.55 |
| | | | | and | 61.50 | 63.00 | 1.50 | 0.23 |
| TF 190 | 52.50 | 70 | 205 | 20 W | 15.00 | 16.50 | 1.50 | 0.67 |
| | | | | and | 18.00 | 25.50 | 7.50 | 0.52 |
| TF 191 | 94.50 | 90 | 0 | 20 W | 6.00 | 7.50 | 1.50 | 0.35 |
| | | | | and | 19.50 | 27.00 | 7.50 | 4.05 |
| | | | | and | 30.00 | 34.50 | 4.50 | 0.77 |
| TF 192 | 52.50 | 90 | 0 | 0 | 6.00 | 7.50 | 1.50 | 0.83 |
| | | | | and | 15.00 | 18.00 | 3.00 | 0.25 |
| | | | | and | 21.00 | 28.50 | 7.50 | 0.65 |
| | | | | and | 34.50 | 39.00 | 4.50 | 0.38 |
| TF 193 | 76.50 | 90 | 0 | 0 | 55.50 | 57.00 | 1.50 | 0.30 |
| | | | | and | 69.00 | 72.00 | 3.00 | 0.67 |
| | | | | and | 75.00 | 76.50 | 1.50 | 0.23 |
| TF 194 | 46.50 | 90 | 0 | 20 W | 6.00 | 7.50 | 1.50 | 0.57 |
| | | | | and | 30.00 | 31.50 | 1.50 | 0.20 |
| TF 195 | 52.50 | 90 | 0 | 20 W | 46.50 | 48.00 | 1.50 | 0.23 |
| TF 196 | 52.50 | 70 | 25 | 20 W | 9.00 | 21.00 | 12.00 | 0.74 |
| | | | | and | 30.00 | 34.50 | 4.50 | 3.96 |
| | | | | and | 48.00 | 52.50 | 4.50 | 0.40 |
| TF 197 | 70.50 | 90 | 0 | 40 E | 0.00 | 1.50 | 1.50 | 0.50 |
| | | | | and | 33.00 | 34.50 | 1.50 | 0.60 |
| | | | | and | 37.50 | 40.50 | 3.00 | 0.36 |
| TF 198 | 82.50 | 90 | 0 | 40 E | 3.00 | 6.00 | 3.00 | 0.60 |
| | | | | and | 30.00 | 31.50 | 1.50 | 0.33 |
| | | | | and | 36.00 | 39.00 | 3.00 | 1.19 |
| | | | | and | 60.00 | 79.50 | 19.50 | 1.09 |
| TF 199 | 94.50 | 90 | 0 | 20 E | 18.00 | 19.50 | 1.50 | 0.38 |
| | | | | and | 27.00 | 30.00 | 3.00 | 1.05 |
| | | | | and | 34.50 | 40.50 | 6.00 | 0.52 |
| | | | | and | 45.00 | 54.00 | 9.00 | 0.33 |
| | | | | and | 64.50 | 66.00 | 1.50 | 0.43 |
215
| | | | | and | 67.50 | 69.00 | 1.50 | 0.20 |
| TF 606 | 100.58 | 90 | 0 | 340 W | 15.24 | 18.28 | 3.04 | 0.46 |
| TF 607 | 121.92 | 90 | 0 | 360 W | 4.57 | 6.09 | 1.52 | 0.33 |
| | | | | and | 16.76 | 24.38 | 7.62 | 0.43 |
| | | | | and | 30.48 | 39.62 | 9.14 | 0.42 |
| | | | | and | 42.67 | 45.72 | 3.05 | 0.38 |
| TF 608 | 100.58 | 90 | 0 | 400 W | 0.00 | 6.09 | 6.09 | 0.30 |
| | | | | and | 10.66 | 12.19 | 1.53 | 0.20 |
| | | | | and | 13.71 | 19.81 | 6.10 | 0.23 |
| | | | | and | 42.67 | 45.72 | 3.05 | 1.05 |
| TF 609 | 121.92 | 90 | 0 | 420 W | 0.00 | 12.19 | 12.19 | 1.11 |
| | | | | and | 13.71 | 36.57 | 22.86 | 0.32 |
| | | | | and | 41.14 | 45.76 | 4.62 | 0.29 |
| TF 610 | 100.58 | 90 | 0 | 440 W | 0.00 | 1.52 | 1.52 | 0.10 |
| | | | | and | 4.57 | 9.14 | 4.57 | 0.40 |
| | | | | and | 15.74 | 17.26 | 1.52 | 0.20 |
| TF 611 | 121.92 | 90 | 0 | 460 W | 0.00 | 1.52 | 1.52 | 0.17 |
| | | | | and | 6.09 | 33.52 | 27.43 | 0.21 |
| TF 612 | 100.58 | 90 | 0 | 500 W | 0.00 | 1.52 | 1.52 | 0.10 |
| | | | | and | 3.04 | 4.57 | 1.53 | 0.57 |
| | | | | and | 6.09 | 10.67 | 4.58 | 0.30 |
| | | | | and | 12.19 | 15.24 | 3.05 | 0.25 |
| | | | | and | 19.81 | 25.90 | 6.09 | 0.14 |
| | | | | and | 44.19 | 45.72 | 1.53 | 0.43 |
| | | | | and | 73.15 | 74.67 | 1.52 | 0.23 |
| | | | | and | 82.29 | 83.82 | 1.53 | 1.60 |
Summary of the Significant Drill Assay Results for the Area Between the San Francisco
and La Chicharra Pits
| Drill Hole Description | Mineralized Intervals |
| Number | Depth
(m) | Hole
Angle (°) | Azimuth (°) | Section
Line | From
(m) | To
(m) | Width
(m) | Gold
(g/t) |
| TFR-16 | 72.0 | -90° | 0° | 1300W-00N | 15.0 | 36.0 | 21.0 | 1.107 |
| | | | | Include | 18.0 | 21.0 | 1.52 | 5.280 |
| TF-500 | 82.29 | -90° | 0° | 1320W-025N | 59.43 | 62.48 | 3.05 | 0.600 |
| TF-501 | 82.29 | -90° | 0° | 1320W-025S | 18.28 | 25.90 | 7.62 | 1.190 |
| | | | | Include | 18.28 | 19.81 | 1.53 | 1.700 |
| | | | | Include | 24.38 | 25.90 | 3.05 | 2.870 |
| | | | | And | 50.29 | 5.181 | 1.52 | 0.500 |
| | | | | And | 76.20 | 77.72 | 1.52 | 0.270 |
| TF-502 | 82.29 | -90° | 0° | 1280W-025S | 27.43 | 28.95 | 1.52 | 0.330 |
| | | | | And | 67.05 | 68.58 | 1.53 | 0.770 |
| TF-503 | 82.29 | -90° | 0° | 1280W-025N | 1.52 | 9.14 | 7.62 | 0.610 |
| | | | | Include | 1.52 | 3.04 | 1.52 | 1.170 |
| | | | | Include | 3.04 | 4.56 | 1.52 | 1.070 |
| | | | | And | 21.33 | 22.86 | 1.53 | 0.400 |
| | | | | And | 54.93 | 60.96 | 1.53 | 0.270 |
| TFR-17 | 72.00 | -90° | 0° | 1300W-100S | 18.00 | 33.00 | 15.0 | 0.260 |
| TFR-31 | 72.00 | -90° | 0° | 1330W-200N | 39.00 | 45.0 | 6.00 | 0.435 |
| TFR-34 | 72.00 | -90° | 0° | 1400W-525N | 33.00 | 39.00 | 6.00 | 0.675 |
216
| TFR-35 | 72.00 | -90° | 0° | 1400W-475N | 48.00 | 54.00 | 6.00 | 0.250 |
| TFR-36 | 72.00 | -90° | 0° | 1400W-425N | 36.00 | 42.00 | 3.00 | 0.400 |
| | | | | And | 45.00 | 48.00 | 3.00 | 1.370 |
| TFR-38 | 72.00 | -90° | 0° | 1400W-325N | 45.00 | 57.00 | 12.00 | 2.997 |
| | | | | Include | 45.00 | 48.00 | 3.00 | 3.200 |
| | | | | Include | 48.00 | 51.00 | 3.00 | 7.720 |
| TFR-39 | 72.00 | -90° | 0° | 1400W-275N | 27.00 | 30.00 | 3.00 | 0.400 |
| TFR-40 | 72.00 | -90° | 0° | 1400W-225N | 6.00 | 9.00 | 3.00 | 1.670 |
| TFR-42 | 72.00 | -90° | 0° | 1400W-125N | 18.00 | 21.00 | 3.00 | 1.530 |
| | | | | And | 24.00 | 27.00 | 3.00 | 0.470 |
| | | | | And | 57.00 | 60.00 | 3.00 | 0.400 |
| TFR-44 | 72.00 | -90° | 0° | 1400W-25S | 3.00 | 6.00 | 3.00 | 0.222 |
| | | | | and | 42.00 | 45.00 | 3.00 | 0.287 |
| TFR-46 | 72.00 | -90° | 0° | 1400W-75S | 30.00 | 33.00 | 3.00 | 0.300 |
| | | | | and | 57.00 | 63.00 | 6.00 | 0.900 |
| TFR-51 | 72.00 | -90° | 0° | 2400W-125N | 51.00 | 54.00 | 3.00 | 0.230 |
| TFR-52 | 72.00 | -90° | 0° | 2400W-175N | 15.00 | 18.00 | 3.00 | 0.430 |
| TFR-55 | 72.00 | -90° | 0° | 2300W-050N | 21.00 | 24.00 | 3.00 | 0.270 |
217