Exhibit (c)(3)

PRELIMINARY DRAFT
HIGHLY CONFIDENTIAL
Project Bow River
Special Committee Discussion Materials
19 December 2014
Morgan Stanley
PRELIMINARY DRAFT
HIGHLY CONFIDENTIAL
Project Bow River
Table of Contents
Section 1 Situation Overview
Section 2 Banff Overview
Section 3 Banff Preliminary Valuation
– Historical Share Price Trading
– Banff Research Analyst Highlights
– Comparable Companies
– Precedent Transactions
– Discounted Cash Flow Analysis
– Net Asset Value Analysis
Appendix A
Supplemental Materials
Morgan Stanley 2
PRELIMINARY DRAFT
HIGHLY CONFIDENTIAL
Project Bow River
Section 1
Situation Overview
Morgan Stanley 3
PRELIMINARY DRAFT
HIGHLY CONFIDENTIAL
Project Bow River
Project Bow River
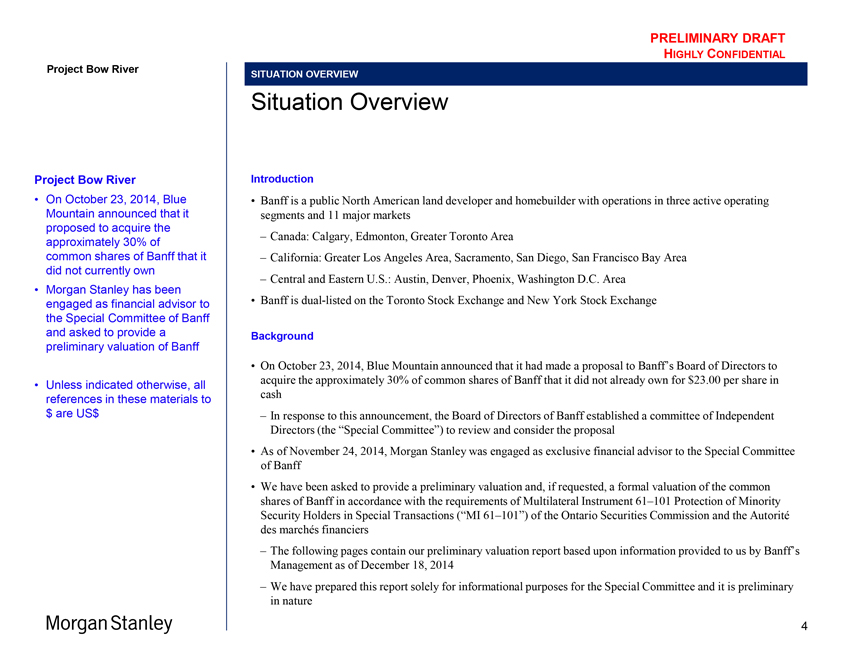
On October 23, 2014, Blue Mountain announced that it proposed to acquire the approximately 30% of common shares of Banff that it did not currently own
Morgan Stanley has been engaged as financial advisor to the Special Committee of Banff and asked to provide a preliminary valuation of Banff
Unless indicated otherwise, all references in these materials to $ are US$
SITUATION OVERVIEW
Situation Overview
Introduction
Banff is a public North American land developer and homebuilder with operations in three active operating segments and 11 major markets
– Canada: Calgary, Edmonton, Greater Toronto Area
– California: Greater Los Angeles Area, Sacramento, San Diego, San Francisco Bay Area
– Central and Eastern U.S.: Austin, Denver, Phoenix, Washington D.C. Area
Banff is dual-listed on the Toronto Stock Exchange and New York Stock Exchange
Background
On October 23, 2014, Blue Mountain announced that it had made a proposal to Banff’s Board of Directors to acquire the approximately 30% of common shares of Banff that it did not already own for $23.00 per share in cash
– In response to this announcement, the Board of Directors of Banff established a committee of Independent Directors (the “Special Committee”) to review and consider the proposal
As of November 24, 2014, Morgan Stanley was engaged as exclusive financial advisor to the Special Committee of Banff
We have been asked to provide a preliminary valuation and, if requested, a formal valuation of the common shares of Banff in accordance with the requirements of Multilateral Instrument 61–101 Protection of Minority Security Holders in Special Transactions (“MI 61–101”) of the Ontario Securities Commission and the Autorite des marches financiers
– The following pages contain our preliminary valuation report based upon information provided to us by Banff’s Management as of December 18, 2014
– We have prepared this report solely for informational purposes for the Special Committee and it is preliminary in nature
Morgan Stanley 4
PRELIMINARY DRAFT
HIGHLY CONFIDENTIAL
SITUATION OVERVIEW
Overview of Current Blue Mountain Proposal
Project Bow River
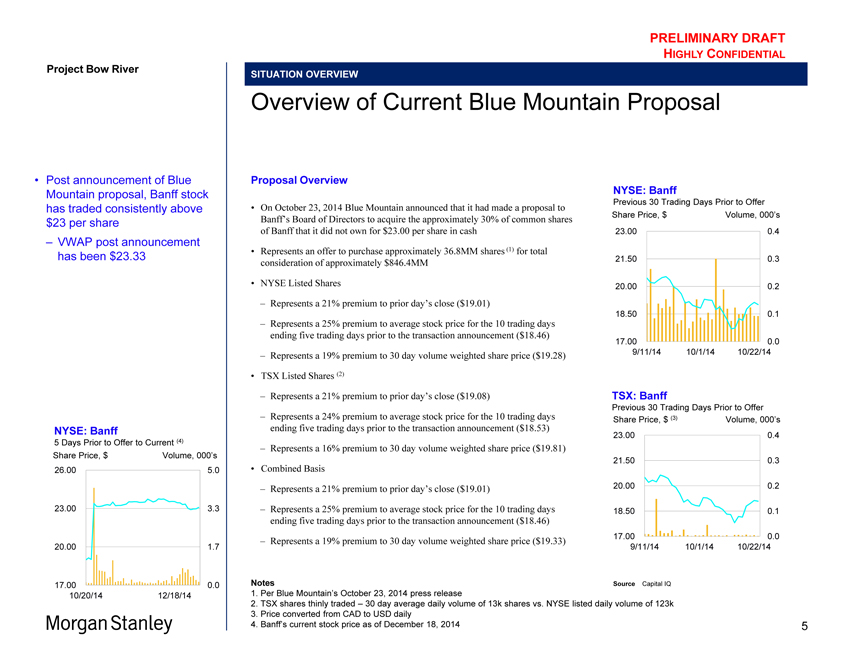
Post announcement of Blue Mountain proposal, Banff stock has traded consistently above $23 per share
– VWAP post announcement has been $23.33
NYSE: Banff
5 Days Prior to Offer to Current (4)
Share Price, $ Volume, 000’s 26.00 5.0
23.00 3.3
20.00 1.7
17.00 0.0 10/20/14 12/18/14
Proposal Overview
On October 23, 2014 Blue Mountain announced that it had made a proposal to Banff’s Board of Directors to acquire the approximately 30% of common shares of Banff that it did not own for $23.00 per share in cash
Represents an offer to purchase approximately 36.8MM shares (1) for total consideration of approximately $846.4MM
NYSE Listed Shares
– Represents a 21% premium to prior day’s close ($19.01)
– Represents a 25% premium to average stock price for the 10 trading days ending five trading days prior to the transaction announcement ($18.46)
– Represents a 19% premium to 30 day volume weighted share price ($19.28)
TSX Listed Shares (2)
– Represents a 21% premium to prior day’s close ($19.08)
– Represents a 24% premium to average stock price for the 10 trading days ending five trading days prior to the transaction announcement ($18.53)
– Represents a 16% premium to 30 day volume weighted share price ($19.81)
Combined Basis
– Represents a 21% premium to prior day’s close ($19.01)
– Represents a 25% premium to average stock price for the 10 trading days ending five trading days prior to the transaction announcement ($18.46)
– Represents a 19% premium to 30 day volume weighted share price ($19.33)
NYSE: Banff
Previous 30 Trading Days Prior to Offer Share Price, $ Volume, 000’s 23.00 0.4
21.50 0.3 20.00 0.2 18.50 0.1
17.00 0.0 9/11/14 10/1/14 10/22/14
TSX: Banff
Previous 30 Trading Days Prior to Offer Share Price, $ (3) Volume, 000’s 23.00 0.4
21.50 0.3 20.00 0.2 18.50 0.1
17.00 0.0 9/11/14 10/1/14 10/22/14
Notes Source Capital IQ
1. Per Blue Mountain’s October 23, 2014 press release
2. TSX shares thinly traded – 30 day average daily volume of 13k shares vs. NYSE listed daily volume of 123k
3. Price converted from CAD to USD daily
4. Banff’s current stock price as of December 18, 2014
5
PRELIMINARY DRAFT
HIGHLY CONFIDENTIAL
Project Bow River
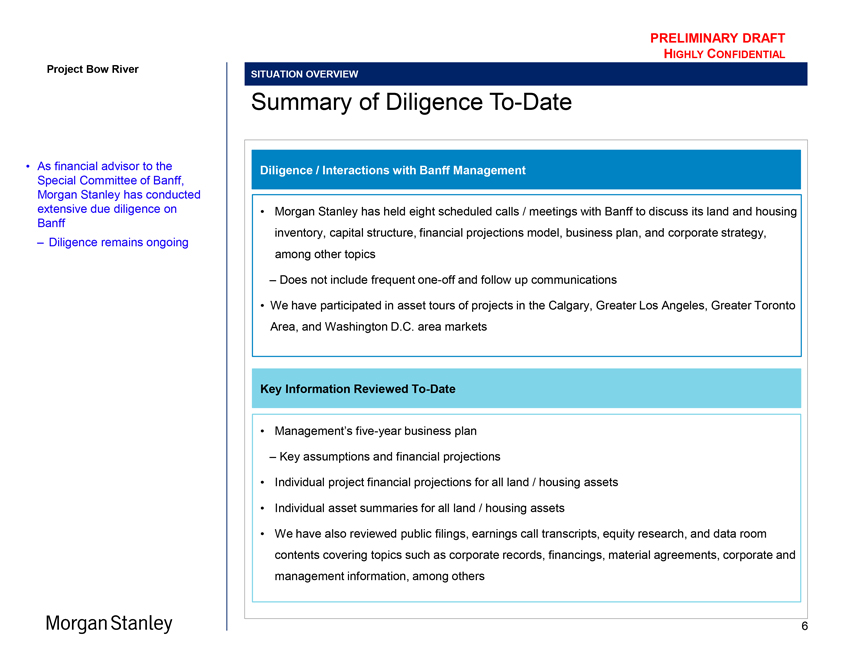
As financial advisor to the Special Committee of Banff, Morgan Stanley has conducted extensive due diligence on Banff
– Diligence remains ongoing
SITUATION OVERVIEW
Summary of Diligence To-Date
Diligence / Interactions with Banff Management
Morgan Stanley has held eight scheduled calls / meetings with Banff to discuss its land and housing inventory, capital structure, financial projections model, business plan, and corporate strategy, among other topics
– Does not include frequent one-off and follow up communications
We have participated in asset tours of projects in the Calgary, Greater Los Angeles, Greater Toronto Area, and Washington D.C. area markets
Key Information Reviewed To-Date
Management’s five-year business plan
– Key assumptions and financial projections
Individual project financial projections for all land / housing assets
Individual asset summaries for all land / housing assets
We have also reviewed public filings, earnings call transcripts, equity research, and data room contents covering topics such as corporate records, financings, material agreements, corporate and management information, among others
Morgan Stanley 6
PRELIMINARY DRAFT
HIGHLY CONFIDENTIAL
Project Bow River
Section 2
Banff Overview
Morgan Stanley
7
PRELIMINARY DRAFT
HIGHLY CONFIDENTIAL
Project Bow River
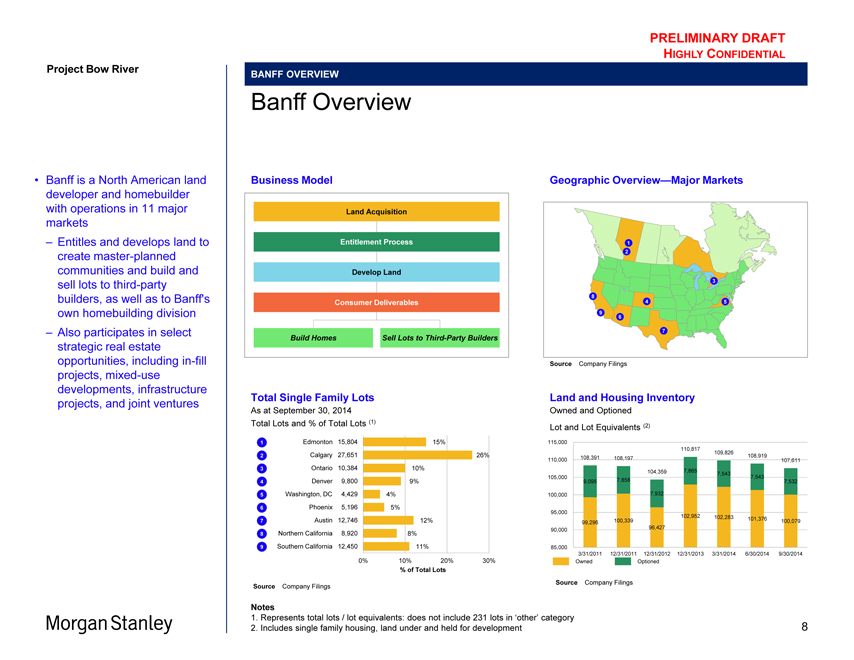
Banff is a North American land developer and homebuilder with operations in 11 major markets
– Entitles and develops land to create master-planned communities and build and sell lots to third-party builders, as well as to Banff’s own homebuilding division
– Also participates in select strategic real estate opportunities, including in-fill projects, mixed-use developments, infrastructure projects, and joint ventures
BANFF OVERVIEW
Banff Overview
Business Model Geographic Overview—Major Markets
Land Acquisition
Entitlement Process 1
2
Develop Land
3
Consumer Deliverables 8 4 5
9 6
7
Build Homes Sell Lots to Third-Party Builders
Source Company Filings
Total Single Family Lots Land and Housing Inventory
As at September 30, 2014 Owned and Optioned Total Lots and % of Total Lots (1) Lot and Lot Equivalents (2)
1 Edmonton 15,804 15% 115,000
110,817
Calgary 27,651 26% 109,826
2 108,391 108,919
110,000 108,197 107,611
3 Ontario 10,384 10% 7,865
104,359 7,543 7,543 105,000
4 Denver 9,800 9% 9,095 7,858 7,532
5 Washington, DC 4,429 4% 100,000 7,932
6 Phoenix 5,196 5% 95,000
102,952 102,283
7 Austin 12,746 12% 100,339 101,376 100,079 99,296 96,427 90,000
8 Northern California 8,920 8%
9 Southern California 12,450 11% 85,000
3/31/2011 12/31/2011 12/31/2012 12/31/2013 3/31/2014 6/30/2014 9/30/2014
0% 10% 20% 30% Owned Optioned
% of Total Lots
Source Company Filings Source Company Filings
Notes
1. Represents total lots / lot equivalents: does not include 231 lots in ‘other’ category
2. Includes single family housing, land under and held for development
8
PRELIMINARY DRAFT
HIGHLY CONFIDENTIAL
Project Bow River
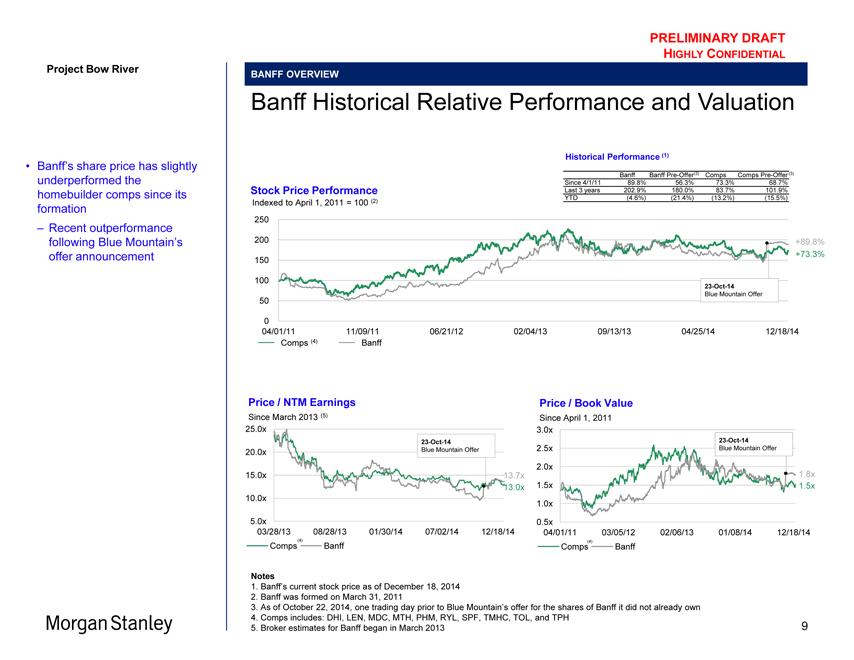
Banff’s share price has slightly underperformed the homebuilder comps since its formation
– Recent outperformance following Blue Mountain’s offer announcement
BANFF OVERVIEW
Banff Historical Relative Performance and Valuation
Historical Performance (1)
Banff Banff Pre-Offer(3) Comps Comps Pre-Offer (3) Since 4/1/11 89.8% 56.3% 73.3% 68.7% Stock Price Performance Last 3 years 202.9% 180.0% 83.7% 101.9% YTD (4.6%) (21.4%) (13.2%) (15.5%)
Indexed to April 1, 2011 = 100 (2) 250
200 +89.8% +73.3% 150
100
23-Oct-14
50 Blue Mountain Offer
0
04/01/11 11/09/11 06/21/12 02/04/13 09/13/13 04/25/14 12/18/14 Comps (4) Banff
Price / NTM Earnings Price / Book Value
Since March 2013 (5) Since April 1, 2011
25.0x 3.0x
23-Oct-14 23-Oct-14
20.0x Blue Mountain Offer 2.5x Blue Mountain Offer
2.0x 1.8x
15.0x 13.7x
13.0x 1.5x 1.5x
10.0x
1.0x
5.0x 0.5x
03/28/13 08/28/13 01/30/14 07/02/14 12/18/14 04/01/11 03/05/12 02/06/13 01/08/14 12/18/14
(4) (4)
Comps Banff Comps Banff
Notes
1. Banff’s current stock price as of December 18, 2014
2. Banff was formed on March 31, 2011
3. As of October 22, 2014, one trading day prior to Blue Mountain’s offer for the shares of Banff it did not already own
4. Comps includes: DHI, LEN, MDC, MTH, PHM, RYL, SPF, TMHC, TOL, and TPH
5. Broker estimates for Banff began in March 2013
9
PRELIMINARY DRAFT
HIGHLY CONFIDENTIAL
Project Bow River
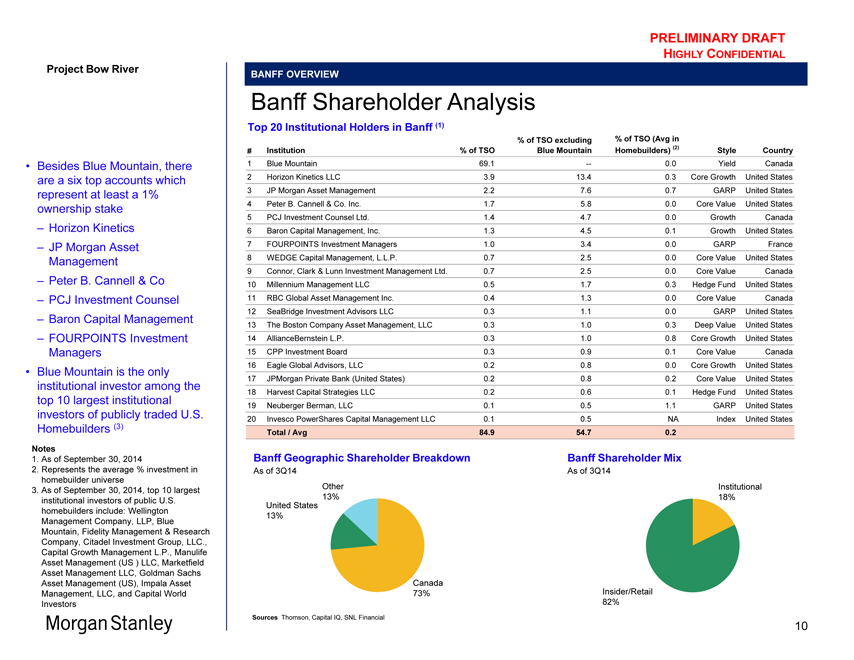
Besides Blue Mountain, there are a six top accounts which represent at least a 1% ownership stake
– Horizon Kinetics JP Morgan Asset Management
– Peter B. Cannell & Co
– PCJ Investment Counsel
– Baron Capital Management
– FOURPOINTS Investment Managers
Blue Mountain is the only institutional investor among the top 10 largest institutional investors of publicly traded U.S. Homebuilders (3)
Notes
1. As of September 30, 2014
2. Represents the average % investment in homebuilder universe
3. As of September 30, 2014, top 10 largest institutional investors of public U.S. homebuilders include: Wellington Management Company, LLP, Blue Mountain, Fidelity Management & Research Company, Citadel Investment Group, LLC., Capital Growth Management L.P., Manulife Asset Management (US ) LLC, Marketfield Asset Management LLC, Goldman Sachs Asset Management (US), Impala Asset Management, LLC, and Capital World Investors
BANFF OVERVIEW
Banff Shareholder Analysis
Top 20 Institutional Holders in Banff (1)
% of TSO excluding % of TSO (Avg in
# Institution % of TSO Blue Mountain Homebuilders) (2) Style Country
1 Blue Mountain 69.1 -- 00. Yield Canada
2 Horizon Kinetics LLC 3.9 13.4 0.3 Core Growth United States
3 JP Morgan Asset Management 2.2 7.6 0.7 GARP United States
4 Peter B. Cannell & Co. Inc. 1.7 5.8 0.0 Core Value United States
5 PCJ Investment Counsel Ltd. 1.4 4.7 0.0 Growth Canada
6 Baron Capital Management, Inc. 1.3 4.5 0.1 Growth United States
7 FOURPOINTS Investment Managers 1.0 3.4 0.0 GARP France
8 WEDGE Capital Management, L.L.P. 0.7 2.5 0.0 Core Value United States
9 Connor, Clark & Lunn Investment Management Ltd. 0.7 2.5 0.0 Core Value Canada
10 Millennium Management LLC 0.5 1.7 0.3 Hedge Fund United States
11 RBC Global Asset Management Inc. 0.4 1.3 0.0 Core Value Canada
12 SeaBridge Investment Advisors LLC 0.3 1.1 0.0 GARP United States
13 The Boston Company Asset Management, LLC 0.3 1.0 0.3 Deep Value United States
14 AllianceBernstein L.P. 0.3 1.0 0.8 Core Growth United States
15 CPP Investment Board 0.3 0.9 0.1 Core Value Canada
16 Eagle Global Advisors, LLC 0.2 0.8 0.0 Core Growth United States
17 JPMorgan Private Bank (United States) 0.2 0.8 0.2 Core Value United States
18 Harvest Capital Strategies LLC 0.2 0.6 0.1 Hedge Fund United States
19 Neuberger Berman, LLC 0.1 0.5 1.1 GARP United States
20 Invesco PowerShares Capital Management LLC 0.1 0.5 NA Index United States
Total / Avg 84.9 54.7 0.2
Banff Geographic Shareholder Breakdown Banff Shareholder Mix
As of 3Q14 As of 3Q14
Other Institutional 13% 18% United States 13%
Canada
73% Insider/Retail 82%
Sources Thomson, Capital IQ, SNL Financial
10
Project Bow River
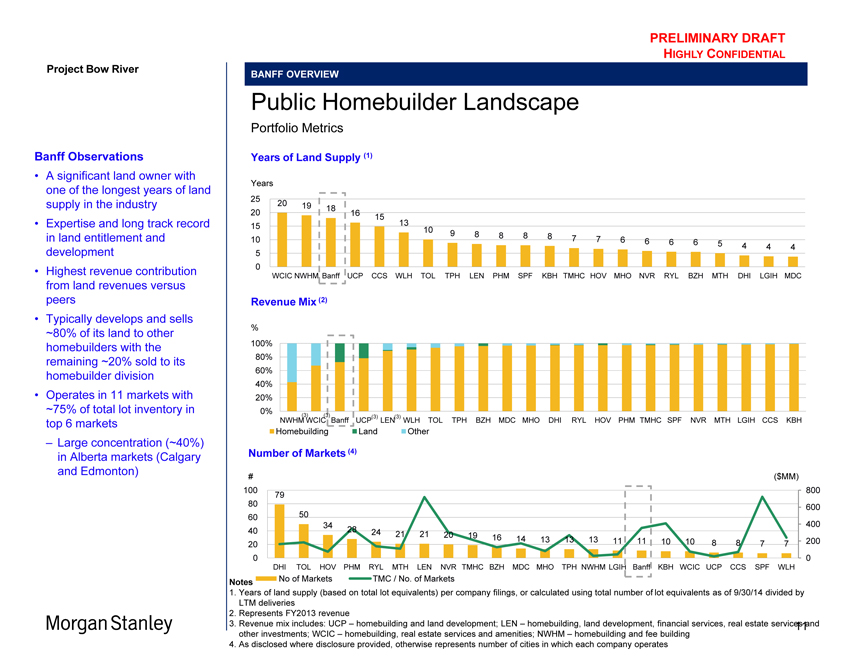
Banff Observations
A significant land owner with
one of the longest years of land
supply in the industry
Expertise and long track record
in land entitlement and
development
Highest revenue contribution
from land revenues versus
peers
Typically develops and sells
~80% of its land to other
homebuilders with the
remaining ~20% sold to its
homebuilder division
Operates in 11 markets with
~75% of total lot inventory in
top 6 markets
– Large concentration (~40%)
in Alberta markets (Calgary
and Edmonton)
PRELIMINARY DRAFT
HIGHLY CONFIDENTIAL
BANFF OVERVIEW
Public Homebuilder Landscape
Portfolio Metrics
Years of Land Supply (1)
Years
25 20 19 18
20 16 15
15 13
10 9 8 8 8 8 7 7 6 6
10 6 6 5 4 4 4
5
0
WCIC NWHM Banff UCP CCS WLH TOL TPH LEN PHM SPF KBH TMHC HOV MHO NVR RYL BZH MTH DHI LGIH MDC
Revenue Mix (2)
%
100%
80%
60%
40%
20%
0%(3) (3)(3) (3)
NWHM WCIC Banff UCP LEN WLH TOL TPH BZH MDC MHO DHI RYL HOV PHM TMHC SPF NVR MTH LGIH CCS KBH
Homebuilding Land Other
Number of Markets (4)
#($MM)
100 800
79
80 600
60 50
34 400
40 28 24 21 21 20 19 16
20 14 13 13 13 11 11 10 10 88 77 200
0 0
DHI TOL HOV PHM RYL MTH LEN NVR TMHC BZH MDC MHO TPH NWHM LGIH Banff KBH WCIC UCP CCS SPF WLH
Notes No of Markets TMC / No. of Markets
1. Years of land supply (based on total lot equivalents) per company filings, or calculated using total number of lot equivalents as of 9/30/14 divided by LTM deliveries
2. Represents FY2013 revenue
3. Revenue mix includes: UCP – homebuilding and land development; LEN – homebuilding, land development, financial services, real estate services and other investments; WCIC – homebuilding, real estate services and amenities; NWHM – homebuilding and fee building
4. As disclosed where disclosure provided, otherwise represents number of cities in which each company operates
11
Project Bow River
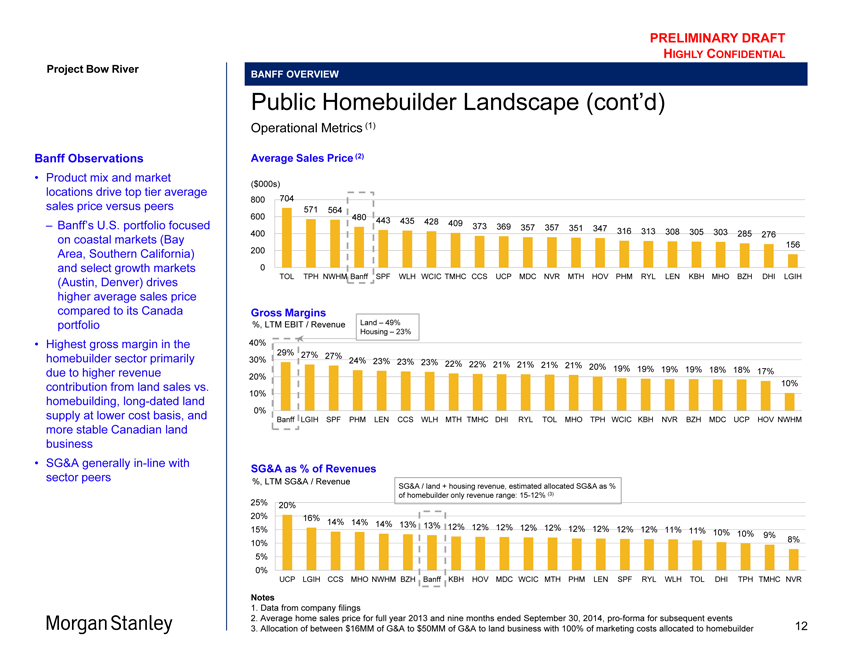
Banff Observations
Product mix and market
locations drive top tier average
sales price versus peers
– Banff’s U.S. portfolio focused
on coastal markets (Bay
Area, Southern California)
and select growth markets
(Austin, Denver) drives
higher average sales price
compared to its Canada
portfolio
Highest gross margin in the
homebuilder sector primarily
due to higher revenue
contribution from land sales vs.
homebuilding, long-dated land
supply at lower cost basis, and
more stable Canadian land
business
SG&A generally in-line with
sector peers
PRELIMINARY DRAFT
HIGHLY CONFIDENTIAL
BANFF OVERVIEW
Public Homebuilder Landscape (cont’d)
Operational Metrics (1)
Average Sales Price (2)
($000s)
800 704
571 564
600 480 443 435 428 409
400 373 369 357 357 351 347 316 313 308 305 303 285 276
200 156
0
TOL TPH NWHM Banff SPF WLH WCIC TMHC CCS UCP MDC NVR MTH HOV PHM RYL LEN KBH MHO BZH DHI LGIH
Gross Margins
%, LTM EBIT / Revenue Land – 49%
Housing – 23%
40%
29% 27% 27%
30% 24% 23% 23% 23% 22% 22% 21% 21% 21% 21% 20% 19% 19% 19% 19% 18% 18% 17%
20%
10%
10%
0%
Banff LGIH SPF PHM LEN CCS WLH MTH TMHC DHI RYL TOL MHO TPH WCIC KBH NVR BZH MDC UCP HOV NWHM
SG&A as % of Revenues
%, LTM SG&A / Revenue SG&A / land + housing revenue, estimated allocated SG&A as %
of homebuilder only revenue range: 15-12% (3)
25% 20%
20% 16%
15% 14% 14% 14% 13% 13% 12% 12% 12% 12% 12% 12% 12% 12% 12% 11% 11% 10% 10% 9%
10% 8%
5%
0%
UCP LGIH CCS MHO NWHM BZH Banff KBH HOV MDC WCIC MTH PHM LEN SPF RYL WLH TOL DHI TPH TMHC NVR
Notes
1. Data from company filings
2. Average home sales price for full year 2013 and nine months ended September 30, 2014, pro-forma for subsequent events
3. Allocation of between $16MM of G&A to $50MM of G&A to land business with 100% of marketing costs allocated to homebuilder
12
PRELIMINARY DRAFT
HIGHLY CONFIDENTIAL
Project Bow River
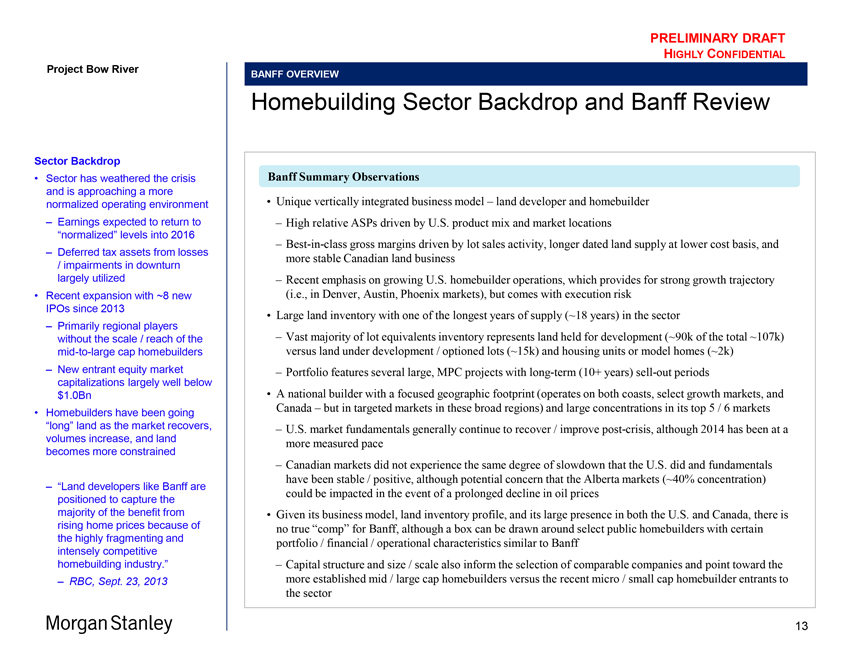
Sector Backdrop
Sector has weathered the crisis and is approaching a more normalized operating environment
– Earnings expected to return to “normalized” levels into 2016
– Deferred tax assets from losses / impairments in downturn largely utilized
Recent expansion with ~8 new IPOs since 2013
– Primarily regional players without the scale / reach of the mid-to-large cap homebuilders
– New entrant equity market capitalizations largely well below $1.0Bn
Homebuilders have been going “long” land as the market recovers, volumes increase, and land becomes more constrained
– “Land developers like Banff are positioned to capture the majority of the benefit from rising home prices because of the highly fragmenting and intensely competitive homebuilding industry.”
– RBC, Sept. 23, 2013
BANFF OVERVIEW
Homebuilding Sector Backdrop and Banff Review
Banff Summary Observations
Unique vertically integrated business model – land developer and homebuilder
– High relative ASPs driven by U.S. product mix and market locations
– Best-in-class gross margins driven by lot sales activity, longer dated land supply at lower cost basis, and more stable Canadian land business
– Recent emphasis on growing U.S. homebuilder operations, which provides for strong growth trajectory
(i.e., in Denver, Austin, Phoenix markets), but comes with execution risk
Large land inventory with one of the longest years of supply (~18 years) in the sector
– Vast majority of lot equivalents inventory represents land held for development (~90k of the total ~107k) versus land under development / optioned lots (~15k) and housing units or model homes (~2k)
– Portfolio features several large, MPC projects with long-term (10+ years) sell-out periods
A national builder with a focused geographic footprint (operates on both coasts, select growth markets, and Canada – but in targeted markets in these broad regions) and large concentrations in its top 5 / 6 markets
– U.S. market fundamentals generally continue to recover / improve post-crisis, although 2014 has been at a more measured pace
– Canadian markets did not experience the same degree of slowdown that the U.S. did and fundamentals have been stable / positive, although potential concern that the Alberta markets (~40% concentration) could be impacted in the event of a prolonged decline in oil prices
Given its business model, land inventory profile, and its large presence in both the U.S. and Canada, there is no true “comp” for Banff, although a box can be drawn around select public homebuilders with certain portfolio / financial / operational characteristics similar to Banff
– Capital structure and size / scale also inform the selection of comparable companies and point toward the more established mid / large cap homebuilders versus the recent micro / small cap homebuilder entrants to the sector
Morgan Stanley
13
PRELIMINARY DRAFT
HIGHLY CONFIDENTIAL
Project Bow River
Section 3
Banff Preliminary Valuation
Morgan Stanley
14
PRELIMINARY DRAFT
HIGHLY CONFIDENTIAL
Project Bow River
BANFF PRELIMINARY VALUATION
Introduction to Valuation: Summary of Approaches
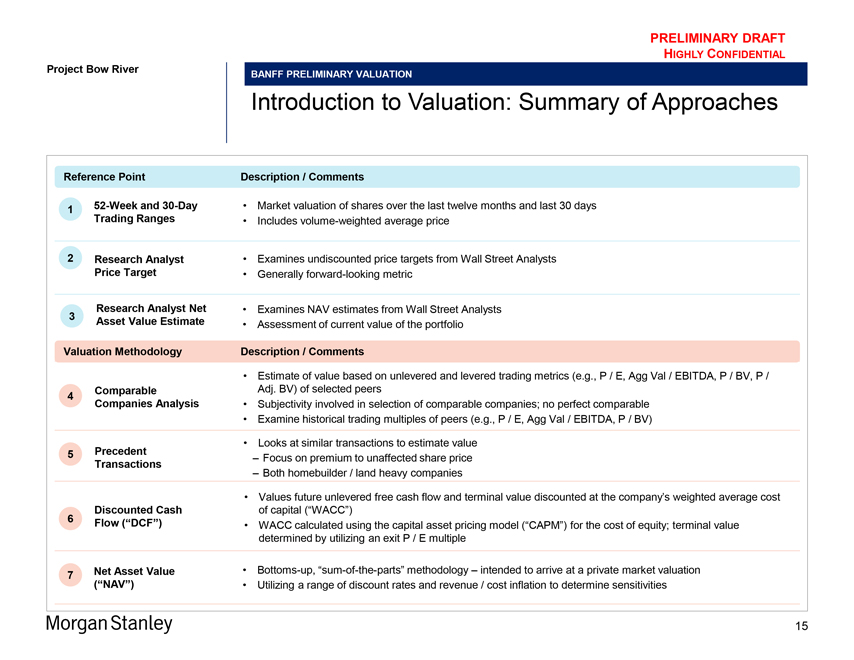
Reference Point
1 52-Week and 30-Day Trading Ranges
2 Research Analyst Price Target
Research Analyst Net
3 Asset Value Estimate
Description / Comments
Market valuation of shares over the last twelve months and last 30 days
Includes volume-weighted average price
Examines undiscounted price targets from Wall Street Analysts
Generally forward-looking metric
Examines NAV estimates from Wall Street Analysts
Assessment of current value of the portfolio
Valuation Methodology
4 Comparable Companies Analysis
5 Precedent Transactions
Discounted Cash
6 Flow (“DCF”)
7 Net Asset Value (“NAV”)
Description / Comments
Estimate of value based on unlevered and levered trading metrics (e.g., P / E, Agg Val / EBITDA, P / BV, P / Adj. BV) of selected peers
Subjectivity involved in selection of comparable companies; no perfect comparable
Examine historical trading multiples of peers (e.g., P / E, Agg Val / EBITDA, P / BV)
Looks at similar transactions to estimate value
– Focus on premium to unaffected share price
– Both homebuilder / land heavy companies
Values future unlevered free cash flow and terminal value discounted at the company’s weighted average cost of capital (“WACC”)
WACC calculated using the capital asset pricing model (“CAPM”) for the cost of equity; terminal value determined by utilizing an exit P / E multiple
Bottoms-up, “sum-of-the-parts” methodology – intended to arrive at a private market valuation
Utilizing a range of discount rates and revenue / cost inflation to determine sensitivities
Morgan Stanley
15
Project Bow River
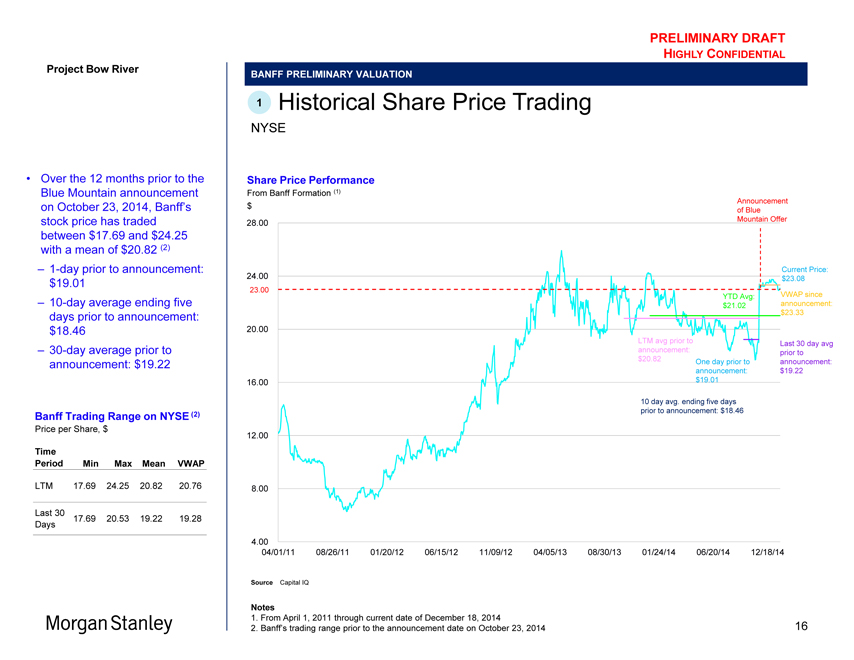
Over the 12 months prior to the Blue Mountain announcement on October 23, 2014, Banff’s stock price has traded between $17.69 and $24.25 with a mean of $20.82 (2)
1-day prior to announcement: $19.01
10-day average ending five days prior to announcement: $18.46
30-day average prior to announcement: $19.22
Banff Trading Range on NYSE (2)
Price per Share, $
Time
Period Min Max Mean VWAP
LTM 17.69 24.25 20.82 20.76
Last 30 17.69 20.53 19.22 19.28
Days
PRELIMINARY DRAFT
HIGHLY CONFIDENTIAL
BANFF PRELIMINARY VALUATION
1 Historical Share Price Trading
NYSE
Share Price Performance
From Banff Formation (1)
Announcement
$ of Blue
28.00 Mountain Offer
Current Price:
24.00 $23.08
23.00 YTD Avg: VWAP since
$21.02 announcement:
$23.33
20.00
LTM avg prior to Last 30 day avg
announcement: prior to
$20.82 One day prior to announcement:
announcement: $19.22
16.00 $19.01
10 day avg. ending five days
prior to announcement: $18.46
12.00
8.00
4.00
04/01/11 08/26/11 01/20/12 06/15/12 11/09/12 04/05/13 08/30/13 01/24/14 06/20/14 12/18/14
Source Capital IQ
Notes
1. From April 1, 2011 through current date of December 18, 2014
2. Banff’s trading range prior to the announcement date on October 23, 2014
16
Project Bow River
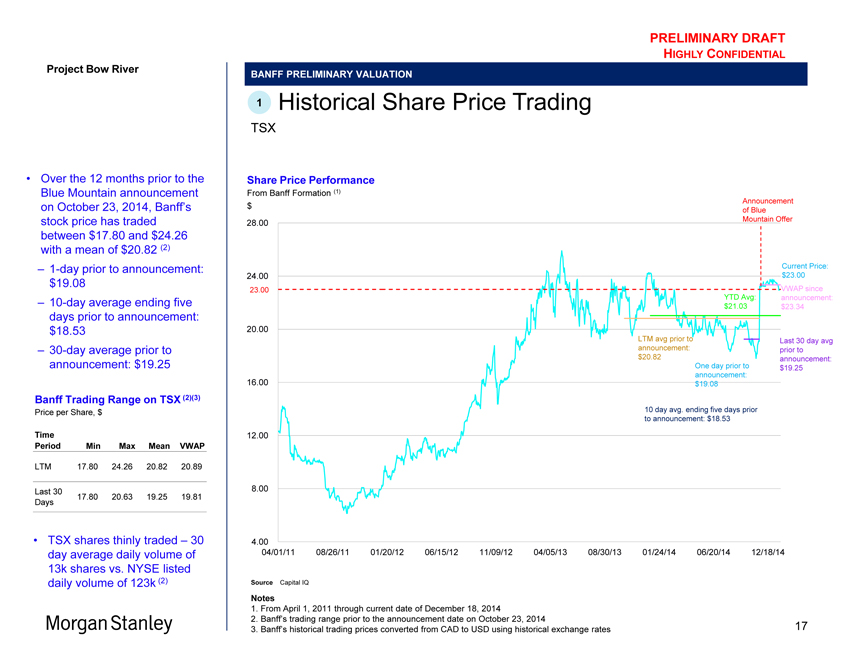
Over the 12 months prior to the Blue Mountain announcement on October 23, 2014, Banff’s stock price has traded between $17.80 and $24.26 with a mean of $20.82 (2)
1-day prior to announcement: $19.08
10-day average ending five days prior to announcement: $18.53
30-day average prior to announcement: $19.25
Banff Trading Range on TSX (2)(3)
Price per Share, $
Time
Period Min Max Mean VWAP
LTM 17.80 24.26 20.82 20.89
Last 30 17.80 20.63 19.25 19.81
Days
• TSX shares thinly traded – 30 day average daily volume of 13k shares vs. NYSE listed daily volume of 123k (2)
PRELIMINARY DRAFT
HIGHLY CONFIDENTIAL
BANFF PRELIMINARY VALUATION
1 Historical Share Price Trading
TSX
Share Price Performance
From Banff Formation (1)
Announcement
$ of Blue
28.00 Mountain Offer
Current Price:
24.00 $23.00
23.00 VWAP since
YTD Avg: announcement:
$21.03 $23.34
20.00
LTM avg prior to Last 30 day avg
announcement: prior to
$20.82 announcement:
One day prior to $19.25
announcement:
16.00 $19.08
10 day avg. ending five days prior
to announcement: $18.53
12.00
8.00
4.00
04/01/11 08/26/11 01/20/12 06/15/12 11/09/12 04/05/13 08/30/13 01/24/14 06/20/14 12/18/14
Source Capital IQ
Notes
1. From April 1, 2011 through current date of December 18, 2014
2. Banff’s trading range prior to the announcement date on October 23, 2014
3. Banff’s historical trading prices converted from CAD to USD using historical exchange rates
17
Project Bow River
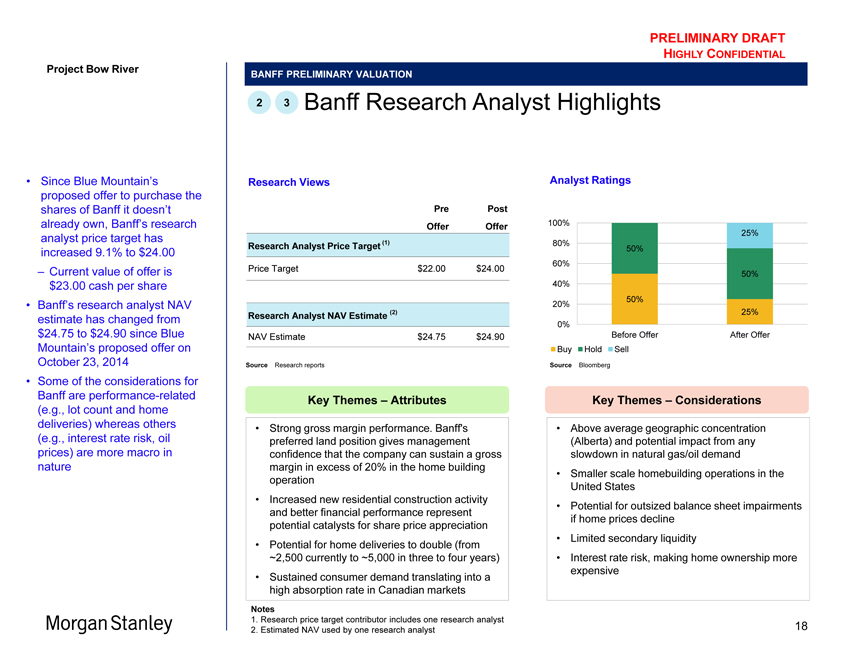
Since Blue Mountain’s proposed offer to purchase the shares of Banff it doesn’t already own, Banff’s research analyst price target has increased 9.1% to $24.00
Current value of offer is $23.00 cash per share
Banff’s research analyst NAV estimate has changed from $24.75 to $24.90 since Blue Mountain’s proposed offer on October 23, 2014
Some of the considerations for Banff are performance-related (e.g., lot count and home deliveries) whereas others (e.g., interest rate risk, oil prices) are more macro in nature
PRELIMINARY DRAFT
HIGHLY CONFIDENTIAL
BANFF PRELIMINARY VALUATION
2 3 Banff Research Analyst Highlights
Research Views
Pre Post
Offer Offer
Research Analyst Price Target (1)
Price Target $ 22.00 $ 24.00
Research Analyst NAV Estimate (2)
NAV Estimate $ 24.75 $ 24.90
Source Research reports
Analyst Ratings
100%
25%
80% 50%
60%
50%
40%
20% 50%
25%
0%
Before Offer After Offer
Buy Hold Sell
Source Bloomberg
Key Themes – Attributes
Strong gross margin performance. Banff’s preferred land position gives management confidence that the company can sustain a gross margin in excess of 20% in the home building operation
Increased new residential construction activity and better financial performance represent potential catalysts for share price appreciation
Potential for home deliveries to double (from ~2,500 currently to ~5,000 in three to four years)
Sustained consumer demand translating into a high absorption rate in Canadian markets
Key Themes – Considerations
Above average geographic concentration (Alberta) and potential impact from any slowdown in natural gas/oil demand
Smaller scale homebuilding operations in the United States
Potential for outsized balance sheet impairments if home prices decline
Limited secondary liquidity
Interest rate risk, making home ownership more expensive
Notes
1. Research price target contributor includes one research analyst
2. Estimated NAV used by one research analyst
18
PRELIMINARY DRAFT
HIGHLY CONFIDENTIAL
Project Bow River
BANFF PRELIMINARY VALUATION
2 Analyst Commentary Following Blue Mountain’s Offer
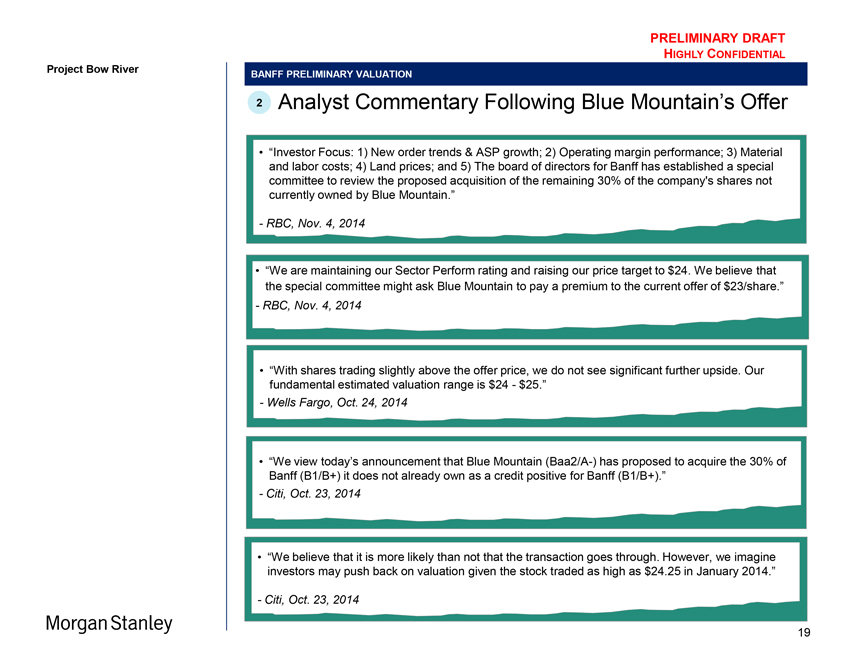
“Investor Focus: 1) New order trends & ASP growth; 2) Operating margin performance; 3) Material and labor costs; 4) Land prices; and 5) The board of directors for Banff has established a special committee to review the proposed acquisition of the remaining 30% of the company’s shares not currently owned by Blue Mountain.”
- RBC, Nov. 4, 2014
“We are maintaining our Sector Perform rating and raising our price target to $24. We believe that the special committee might ask Blue Mountain to pay a premium to the current offer of $23/share.”
- RBC, Nov. 4, 2014
“With shares trading slightly above the offer price, we do not see significant further upside. Our fundamental estimated valuation range is $24 - $25.”
- Wells Fargo, Oct. 24, 2014
“We view today’s announcement that Blue Mountain (Baa2/A-) has proposed to acquire the 30% of Banff (B1/B+) it does not already own as a credit positive for Banff (B1/B+).”
- Citi, Oct. 23, 2014
“We believe that it is more likely than not that the transaction goes through. However, we imagine investors may push back on valuation given the stock traded as high as $24.25 in January 2014.”
- Citi, Oct. 23, 2014
19
Morgan Stanley
PRELIMINARY DRAFT
HIGHLY CONFIDENTIAL
Project Bow River
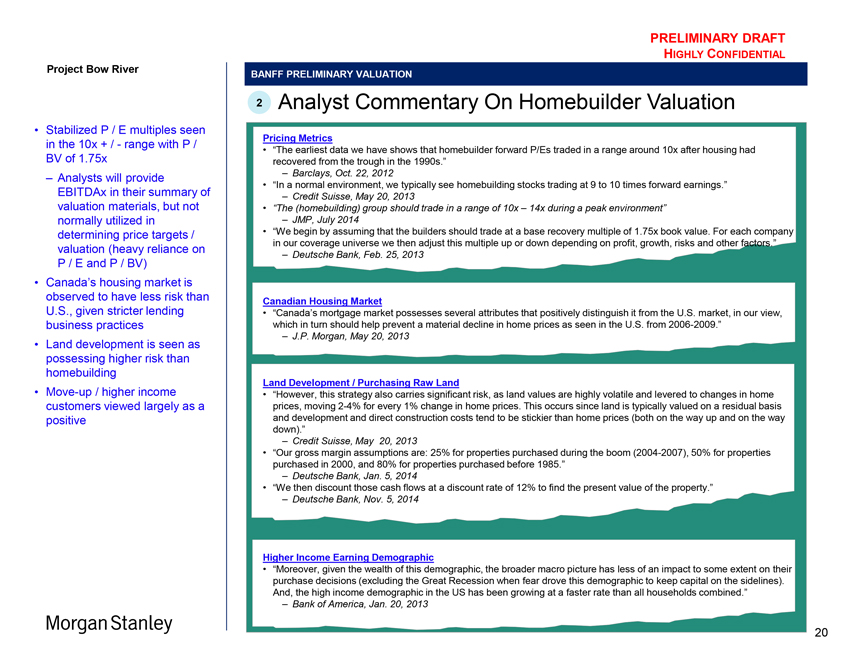
Stabilized P / E multiples seen in the 10x + / - range with P / BV of 1.75x
– Analysts will provide EBITDAx in their summary of valuation materials, but not normally utilized in determining price targets / valuation (heavy reliance on P / E and P / BV)
Canada’s housing market is observed to have less risk than U.S., given stricter lending business practices
Land development is seen as possessing higher risk than homebuilding
Move-up / higher income customers viewed largely as a positive
BANFF PRELIMINARY VALUATION
2 Analyst Commentary On Homebuilder Valuation
Pricing Metrics
“The earliest data we have shows that homebuilder forward P/Es traded in a range around 10x after housing had recovered from the trough in the 1990s.”
– Barclays, Oct. 22, 2012
“In a normal environment, we typically see homebuilding stocks trading at 9 to 10 times forward earnings.”
– Credit Suisse, May 20, 2013
“The (homebuilding) group should trade in a range of 10x – 14x during a peak environment”
– JMP, July 2014
“We begin by assuming that the builders should trade at a base recovery multiple of 1.75x book value. For each company in our coverage universe we then adjust this multiple up or down depending on profit, growth, risks and other factors.”
– Deutsche Bank, Feb. 25, 2013
Canadian Housing Market
“Canada’s mortgage market possesses several attributes that positively distinguish it from the U.S. market, in our view, which in turn should help prevent a material decline in home prices as seen in the U.S. from 2006-2009.”
– J.P. Morgan, May 20, 2013
Land Development / Purchasing Raw Land
“However, this strategy also carries significant risk, as land values are highly volatile and levered to changes in home prices, moving 2-4% for every 1% change in home prices. This occurs since land is typically valued on a residual basis and development and direct construction costs tend to be stickier than home prices (both on the way up and on the way down).”
– Credit Suisse, May 20, 2013
“Our gross margin assumptions are: 25% for properties purchased during the boom (2004-2007), 50% for properties purchased in 2000, and 80% for properties purchased before 1985.”
– Deutsche Bank, Jan. 5, 2014
“We then discount those cash flows at a discount rate of 12% to find the present value of the property.”
– Deutsche Bank, Nov. 5, 2014
Higher Income Earning Demographic
“Moreover, given the wealth of this demographic, the broader macro picture has less of an impact to some extent on their purchase decisions (excluding the Great Recession when fear drove this demographic to keep capital on the sidelines). And, the high income demographic in the US has been growing at a faster rate than all households combined.”
– Bank of America, Jan. 20, 2013
Morgan Stanley
20
Project Bow River
PRELIMINARY DRAFT
HIGHLY CONFIDENTIAL
BANFF PRELIMINARY VALUATION
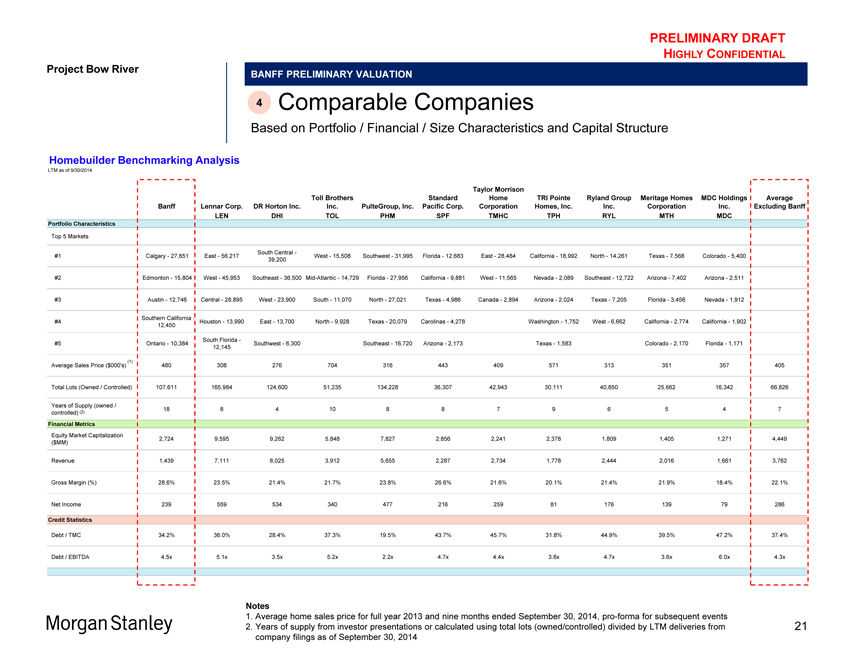
4 Comparable Companies
Based on Portfolio / Financial / Size Characteristics and Capital Structure
Homebuilder Benchmarking Analysis
LTM as of 9/30/2014
Taylor Morrison
Toll Brothers Standard Home TRI Pointe Ryland Group Meritage Homes MDC Holdings Average
Banff Lennar Corp. DR Horton Inc. Inc. PulteGroup, Inc. Pacific Corp. Corporation Homes, Inc. Inc. Corporation Inc. Excluding Banff
LEN DHI TOL PHM SPF TMHC TPH RYL MTH MDC
Portfolio Characteristics
Top 5 Markets
South Central -
#1 Calgary—27,651 East—56,217 West—15,508 Southwest—31,995 Florida—12,683 East—28,484 California—18,992 North—14,261 Texas—7,568 Colorado—5,400
39,200
#2 Edmonton—15,804 West—45,953 Southeast—36,500 Mid-Atlantic—14,729 Florida—27,956 California—9,881 West—11,565 Nevada—2,089 Southeast—12,722 Arizona—7,402 Arizona—2,511
#3 Austin—12,746 Central—28,895 West—23,900 South—11,070 North—27,021 Texas—4,986 Canada—2,894 Arizona—2,024 Texas—7,205 Florida—3,456 Nevada—1,912
Southern California -
#4 Houston—13,990 East—13,700 North—9,928 Texas—20,079 Carolinas—4,278 Washington—1,752 West—6,662 California—2,774 California—1,902
12,450
South Florida -
#5 Ontario—10,384 Southwest—6,300 Southeast—16,720 Arizona—2,173 Texas—1,583 Colorado—2,170 Florida—1,171
12,145
Average Sales Price ($000’s) (1) 480 308 276 704 316 443 409 571 313 351 357 405
Total Lots (Owned / Controlled) 107,611 165,984 124,600 51,235 134,228 36,307 42,943 30,111 40,850 25,662 16,342 66,826
Years of Supply (owned /
controlled) (2) 18 8 4 10 8 8 7 9 6 5 4 7
Financial Metrics
Equity Market Capitalization 2,724 9,595 9,262 5,848 7,827 2,856 2,241 2,378 1,809 1,405 1,271 4,449
($MM)
Revenue 1,439 7,111 8,025 3,912 5,655 2,287 2,734 1,778 2,444 2,016 1,661 3,762
Gross Margin (%) 28.6% 23.5% 21.4% 21.7% 23.8% 26.6% 21.6% 20.1% 21.4% 21.9% 18.4% 22.1%
Net Income 239 559 534 340 477 216 259 81 176 139 79 286
Credit Statistics
Debt / TMC 34.2% 36.0% 28.4% 37.3% 19.5% 43.7% 45.7% 31.8% 44.9% 39.5% 47.2% 37.4%
Debt / EBITDA 4.5x 5.1x 3.5x 5.2x 2.2x 4.7x 4.4x 3.8x 4.7x 3.6x 6.0x 4.3x
Notes
1. Average home sales price for full year 2013 and nine months ended September 30, 2014, pro-forma for subsequent events
2. Years of supply from investor presentations or calculated using total lots (owned/controlled) divided by LTM deliveries from company filings as of September 30, 2014
21
Project Bow River
PRELIMINARY DRAFT
HIGHLY CONFIDENTIAL
BANFF PRELIMINARY VALUATION
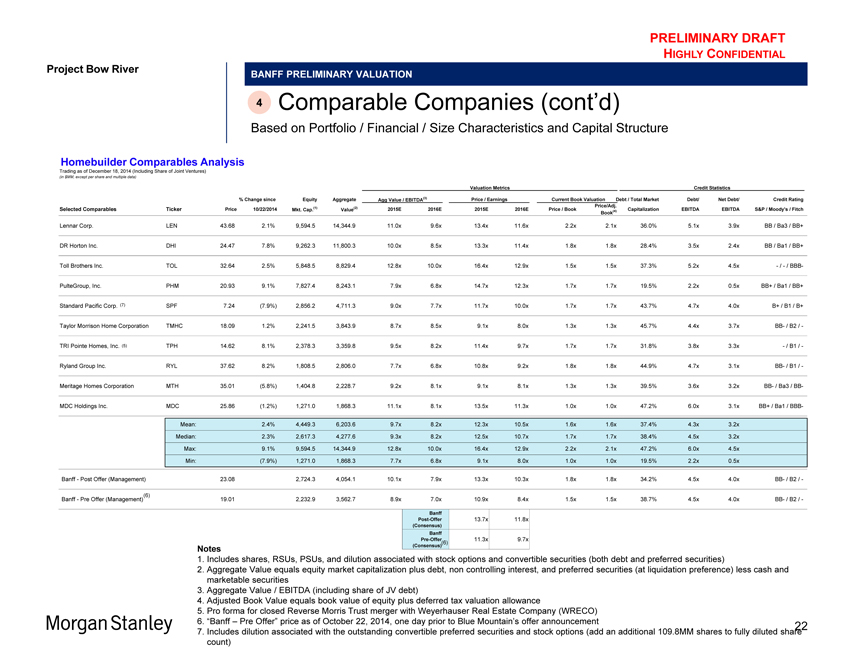
4 Comparable Companies (cont’d)
Based on Portfolio / Financial / Size Characteristics and Capital Structure
Homebuilder Comparables Analysis
Trading as of December 18, 2014 (Including Share of Joint Ventures)
(in $MM, except per share and multiple data)
Valuation Metrics Credit Statistics
% Change since Equity Aggregate Agg Value / EBITDA(3) Price / Earnings Current Book Valuation Debt / Total Market Debt/ Net Debt/ Credit Rating
Price/Adj.
Selected Comparables Ticker Price 10/22/2014 Mkt. Cap.(1) Value(2) 2015E 2016E 2015E 2016E Price / Book(4) Capitalization EBITDA EBITDA S&P / Moody’s / Fitch
Book
Lennar Corp. LEN 43.68 2.1% 9,594.5 14,344.9 11.0x 9.6x 13.4x 11.6x 2.2x 2.1x 36.0% 5.1x 3.9x BB / Ba3 / BB+
DR Horton Inc. DHI 24.47 7.8% 9,262.3 11,800.3 10.0x 8.5x 13.3x 11.4x 1.8x 1.8x 28.4% 3.5x 2.4x BB / Ba1 / BB+
Toll Brothers Inc. TOL 32.64 2.5% 5,848.5 8,829.4 12.8x 10.0x 16.4x 12.9x 1.5x 1.5x 37.3% 5.2x 4.5x—/—/ BBB-
PulteGroup, Inc. PHM 20.93 9.1% 7,827.4 8,243.1 7.9x 6.8x 14.7x 12.3x 1.7x 1.7x 19.5% 2.2x 0.5x BB+ / Ba1 / BB+
Standard Pacific Corp. (7) SPF 7.24(7.9%) 2,856.2 4,711.3 9.0x 7.7x 11.7x 10.0x 1.7x 1.7x 43.7% 4.7x 4.0x B+ / B1 / B+
Taylor Morrison Home Corporation TMHC 18.09 1.2% 2,241.5 3,843.9 8.7x 8.5x 9.1x 8.0x 1.3x 1.3x 45.7% 4.4x 3.7x BB- / B2 / -
TRI Pointe Homes, Inc. (5) TPH 14.62 8.1% 2,378.3 3,359.8 9.5x 8.2x 11.4x 9.7x 1.7x 1.7x 31.8% 3.8x 3.3x—/ B1 / -
Ryland Group Inc. RYL 37.62 8.2% 1,808.5 2,806.0 7.7x 6.8x 10.8x 9.2x 1.8x 1.8x 44.9% 4.7x 3.1x BB- / B1 / -
Meritage Homes Corporation MTH 35.01(5.8%) 1,404.8 2,228.7 9.2x 8.1x 9.1x 8.1x 1.3x 1.3x 39.5% 3.6x 3.2x BB- / Ba3 / BB-
MDC Holdings Inc. MDC 25.86(1.2%) 1,271.0 1,868.3 11.1x 8.1x 13.5x 11.3x 1.0x 1.0x 47.2% 6.0x 3.1x BB+ / Ba1 / BBB-
Mean: 2.4% 4,449.3 6,203.6 9.7x 8.2x 12.3x 10.5x 1.6x 1.6x 37.4% 4.3x 3.2x
Median: 2.3% 2,617.3 4,277.6 9.3x 8.2x 12.5x 10.7x 1.7x 1.7x 38.4% 4.5x 3.2x
Max: 9.1% 9,594.5 14,344.9 12.8x 10.0x 16.4x 12.9x 2.2x 2.1x 47.2% 6.0x 4.5x
Min:(7.9%) 1,271.0 1,868.3 7.7x 6.8x 9.1x 8.0x 1.0x 1.0x 19.5% 2.2x 0.5x
Banff—Post Offer (Management) 23.08 2,724.3 4,054.1 10.1x 7.9x 13.3x 10.3x 1.8x 1.8x 34.2% 4.5x 4.0x BB- / B2 / -
Banff—Pre Offer (Management)(6) 19.01 2,232.9 3,562.7 8.9x 7.0x 10.9x 8.4x 1.5x 1.5x 38.7% 4.5x 4.0x BB- / B2 / -
Banff
Post-Offer 13.7x 11.8x
(Consensus)
Banff
Pre-Offer 11.3x 9.7x
(Consensus) (6)
Notes
1. Includes shares, RSUs, PSUs, and dilution associated with stock options and convertible securities (both debt and preferred securities)
2. Aggregate Value equals equity market capitalization plus debt, non controlling interest, and preferred securities (at liquidation preference) less cash and marketable securities
3. Aggregate Value / EBITDA (including share of JV debt)
4. Adjusted Book Value equals book value of equity plus deferred tax valuation allowance
5. Pro forma for closed Reverse Morris Trust merger with Weyerhauser Real Estate Company (WRECO)
6. “Banff – Pre Offer” price as of October 22, 2014, one day prior to Blue Mountain’s offer announcement
7. Includes dilution associated with the outstanding convertible preferred securities and stock options (add an additional 109.8MM shares to fully diluted share count)
22
Project Bow River
PRELIMINARY DRAFT
HIGHLY CONFIDENTIAL
BANFF PRELIMINARY VALUATION
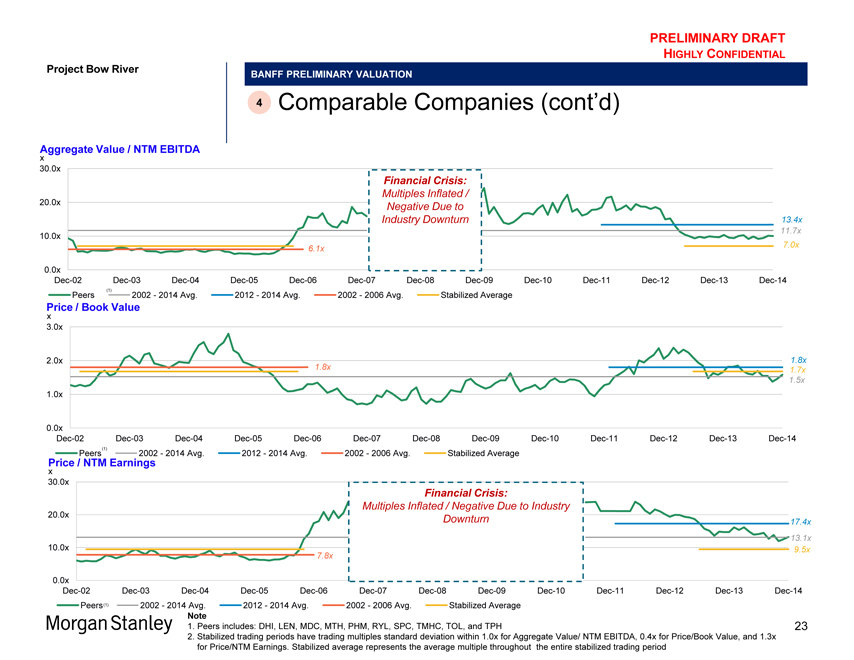
4 Comparable Companies (cont’d)
Aggregate Value / NTM EBITDA
x
30.0x
Financial Crisis:
Multiples Inflated /
20.0x Negative Due to
Industry Downturn 13.4x
10.0x 11.7x
616.1x 7.0x
0.0x
Dec-02 Dec-03 Dec-04 Dec-05 Dec-06 Dec-07 Dec-08 Dec-09 Dec-10 Dec-11 Dec-12 Dec-13 Dec-14
(1)
Peers 2002—2014 Avg. 2012—2014 Avg. 2002—2006 Avg. Stabilized Average
Price / Book Value
x
3.0x
2.0x 1.8x
1.8x 1.7x
1.5x
1.0x
0.0x
Dec-02 Dec-03 Dec-04 Dec-05 Dec-06 Dec-07 Dec-08 Dec-09 Dec-10 Dec-11 Dec-12 Dec-13 Dec-14
Peers(1) 2002—2014 Avg. 2012—2014 Avg. 2002—2006 Avg. Stabilized Average
Price / NTM Earnings
x
30.0x
Financial Crisis:
Multiples Inflated / Negative Due to Industry
20.0x
Downturn 17.4x
13.1x
10.0x 9.5x
7.8x
0.0x
Dec-02 Dec-03 Dec-04 Dec-05 Dec-06 Dec-07 Dec-08 Dec-09 Dec-10 Dec-11 Dec-12 Dec-13 Dec-14
Peers(1) 2002—2014 Avg. 2012—2014 Avg. 2002—2006 Avg. Stabilized Average
Note
1. Peers includes: DHI, LEN, MDC, MTH, PHM, RYL, SPC, TMHC, TOL, and TPH
2. Stabilized trading periods have trading multiples standard deviation within 1.0x for Aggregate Value/ NTM EBITDA, 0.4x for Price/Book Value, and 1.3x for Price/NTM Earnings. Stabilized average represents the average multiple throughout the entire stabilized trading period
23
PRELIMINARY DRAFT
HIGHLY CONFIDENTIAL
Project Bow River
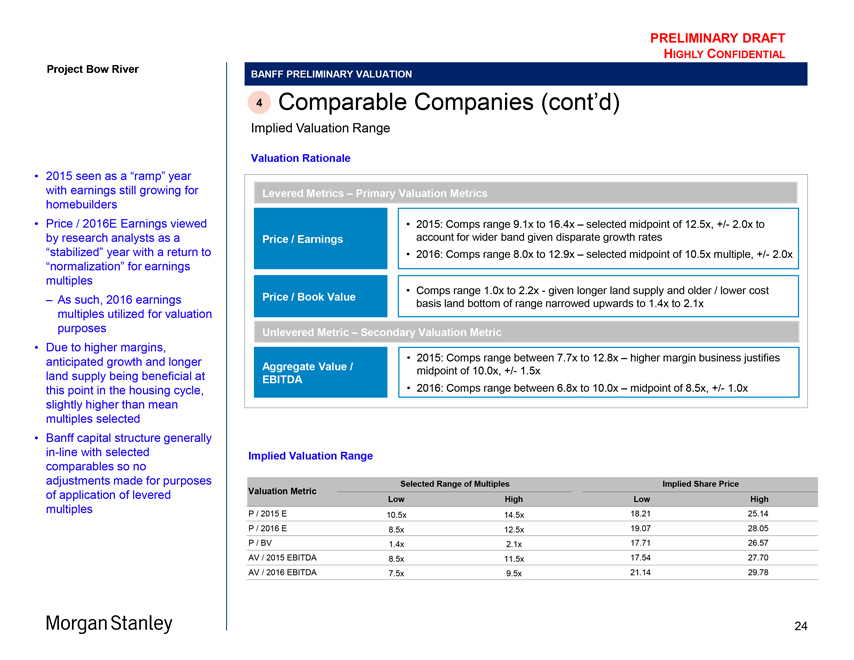
2015 seen as a “ramp” year with earnings still growing for homebuilders
Price / 2016E Earnings viewed by research analysts as a “stabilized” year with a return to “normalization” for earnings multiples
As such, 2016 earnings multiples utilized for valuation purposes
Due to higher margins, anticipated growth and longer land supply being beneficial at this point in the housing cycle, slightly higher than mean multiples selected
Banff capital structure generally in-line with selected comparables so no adjustments made for purposes of application of levered multiples
BANFF PRELIMINARY VALUATION
4 Comparable Companies (cont’d)
Implied Valuation Range
Valuation Rationale
Levered Metrics – Primary Valuation Metrics
Price / Earnings
Price / Book Value
2015: Comps range 9.1x to 16.4x – selected midpoint of 12.5x, +/- 2.0x to account for wider band given disparate growth rates
2016: Comps range 8.0x to 12.9x – selected midpoint of 10.5x multiple, +/- 2.0x
Comps range 1.0x to 2.2x - given longer land supply and older / lower cost basis land bottom of range narrowed upwards to 1.4x to 2.1x
Unlevered Metric – Secondary Valuation Metric
Aggregate Value / EBITDA
2015: Comps range between 7.7x to 12.8x – higher margin business justifies midpoint of 10.0x, +/- 1.5x
2016: Comps range between 6.8x to 10.0x – midpoint of 8.5x, +/- 1.0x
Implied Valuation Range
Valuation Metric Selected Range of Multiples Implied Share Price
Low High Low High
P / 2015 E
10.5x
14.5x
18.21
25.14
P / 2016 E
8.5x
12.5x
19.07
28.05
P / BV
1.4x
2.1x
17.71
26.57
AV / 2015 EBITDA
8.5x
11.5x
17.54
27.70
AV / 2016 EBITDA
7.5x
9.5x
21.14
29.78
Morgan Stanley
24
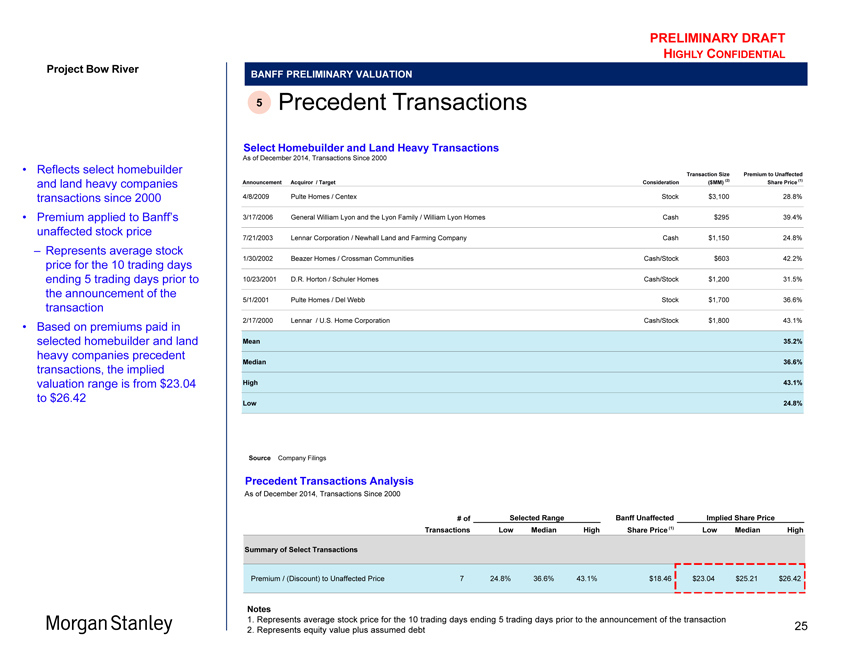
Project Bow River
Reflects select homebuilder and land heavy companies transactions since 2000
Premium applied to Banff’s unaffected stock price
Represents average stock price for the 10 trading days ending 5 trading days prior to the announcement of the transaction
Based on premiums paid in selected homebuilder and land heavy companies precedent transactions, the implied valuation range is from $23.04 to $26.42
PRELIMINARY DRAFT
HIGHLY CONFIDENTIAL
BANFF PRELIMINARY VALUATION
5 Precedent Transactions
Select Homebuilder and Land Heavy Transactions
As of December 2014, Transactions Since 2000
Transaction Size Premium to Unaffected
Announcement Acquiror / Target Consideration($MM) (2) Share Price (1)
4/8/2009 Pulte Homes / Centex Stock $3,100 28.8%
3/17/2006 General William Lyon and the Lyon Family / William Lyon Homes Cash $295 39.4%
7/21/2003 Lennar Corporation / Newhall Land and Farming Company Cash $1,150 24.8%
1/30/2002 Beazer Homes / Crossman Communities Cash/Stock $603 42.2%
10/23/2001 D.R. Horton / Schuler Homes Cash/Stock $1,200 31.5%
5/1/2001 Pulte Homes / Del Webb Stock $1,700 36.6%
2/17/2000 Lennar / U.S. Home Corporation Cash/Stock $1,800 43.1%
Mean 35.2%
Median 36.6%
High 43.1%
Low 24.8%
Source Company Filings
Precedent Transactions Analysis
As of December 2014, Transactions Since 2000
# of Selected Range Banff Unaffected Implied Share Price
Transactions Low Median High Share Price (1) Low Median High
Summary of Select Transactions
Premium / (Discount) to Unaffected Price 7 24.8% 36.6% 43.1% $18.46 $23.04 $25.21 $26.42
Notes
1. Represents average stock price for the 10 trading days ending 5 trading days prior to the announcement of the transaction
2. Represents equity value plus assumed debt
25
PRELIMINARY DRAFT
HIGHLY CONFIDENTIAL
Project Bow River
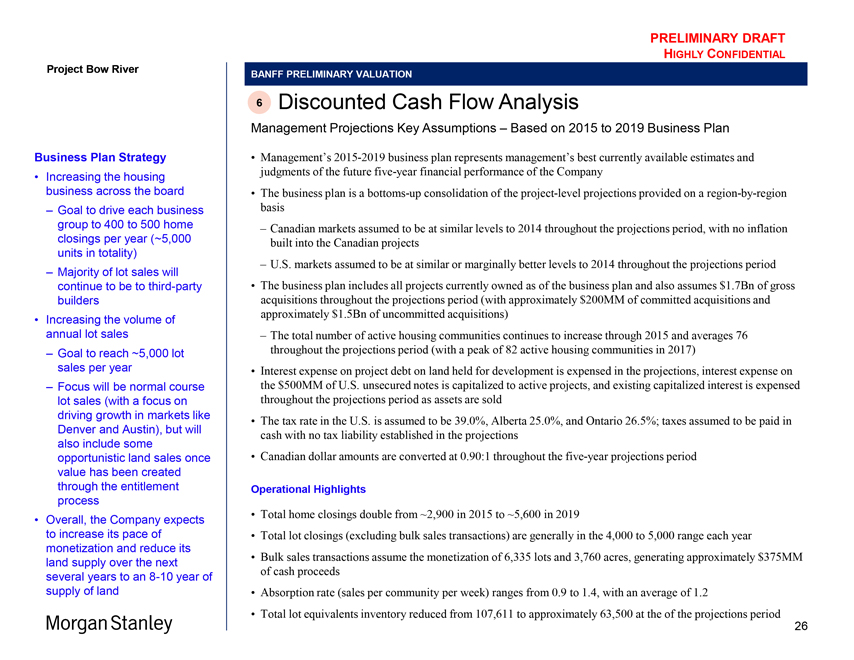
Business Plan Strategy
Increasing the housing business across the board
– Goal to drive each business group to 400 to 500 home closings per year (~5,000 units in totality)
– Majority of lot sales will continue to be to third-party builders
Increasing the volume of annual lot sales
– Goal to reach ~5,000 lot sales per year
– Focus will be normal course lot sales (with a focus on driving growth in markets like Denver and Austin), but will also include some opportunistic land sales once value has been created through the entitlement process
Overall, the Company expects to increase its pace of monetization and reduce its land supply over the next several years to an 8-10 year of supply of land
BANFF PRELIMINARY VALUATION
6 Discounted Cash Flow Analysis
Management Projections Key Assumptions – Based on 2015 to 2019 Business Plan
Management’s 2015-2019 business plan represents management’s best currently available estimates and judgments of the future five-year financial performance of the Company
The business plan is a bottoms-up consolidation of the project-level projections provided on a region-by-region basis
– Canadian markets assumed to be at similar levels to 2014 throughout the projections period, with no inflation built into the Canadian projects
– U.S. markets assumed to be at similar or marginally better levels to 2014 throughout the projections period
The business plan includes all projects currently owned as of the business plan and also assumes $1.7Bn of gross acquisitions throughout the projections period (with approximately $200MM of committed acquisitions and approximately $1.5Bn of uncommitted acquisitions)
– The total number of active housing communities continues to increase through 2015 and averages 76 throughout the projections period (with a peak of 82 active housing communities in 2017)
Interest expense on project debt on land held for development is expensed in the projections, interest expense on the $500MM of U.S. unsecured notes is capitalized to active projects, and existing capitalized interest is expensed throughout the projections period as assets are sold
The tax rate in the U.S. is assumed to be 39.0%, Alberta 25.0%, and Ontario 26.5%; taxes assumed to be paid in cash with no tax liability established in the projections
Canadian dollar amounts are converted at 0.90:1 throughout the five-year projections period
Operational Highlights
Total home closings double from ~2,900 in 2015 to ~5,600 in 2019
Total lot closings (excluding bulk sales transactions) are generally in the 4,000 to 5,000 range each year
Bulk sales transactions assume the monetization of 6,335 lots and 3,760 acres, generating approximately $375MM of cash proceeds
Absorption rate (sales per community per week) ranges from 0.9 to 1.4, with an average of 1.2
Total lot equivalents inventory reduced from 107,611 to approximately 63,500 at the of the projections period
Morgan Stanley
26
Project Bow River
Historical Pro Forma Financial Information Reference Points (for the last 9 years)
Total Revenues ($MM)
Average: $1,167
Peak: $1,535 (’05)
Housing Gross Margin
Average: 19%
Peak: 28% (’05)
Land Gross Margin
Average: 33%
Peak: 46% (’13)
Home Sales
Average: 1,793
Peak: 2,529 (’05)
Lot Sales
Average: 2,843
Peak: 4,243 (’05)
Acre Sales
Average: 211
Peak: 543 (’12)
Notes
1. Includes sale of income producing properties
2. Margins for the projections per corporate model,
do not include the allocation of interest
capitalized into the projects; reported margins
projected to be in the 43% on average range for
land and the 21% on average range for housing
from ’15 to ‘19
3. Includes rental income, interest income, JV
income, add back of interest capitalized in COS,
and other income
4. Excludes one time gain from land sale of
$33MM
5. Includes JV sales at Banff’s proportionate share
6. Blended price per lot of finished lots and
acreage (acreage converted into lots on a 1 to 4
conversion)
7. Represents nine months of historical data and
three months of projections
PRELIMINARY DRAFT
HIGHLY CONFIDENTIAL
BANFF PRELIMINARY VALUATION
6 Discounted Cash Flow Analysis (cont’d)
Detailed Company Financial and Operational Projections – Income Statement Summary
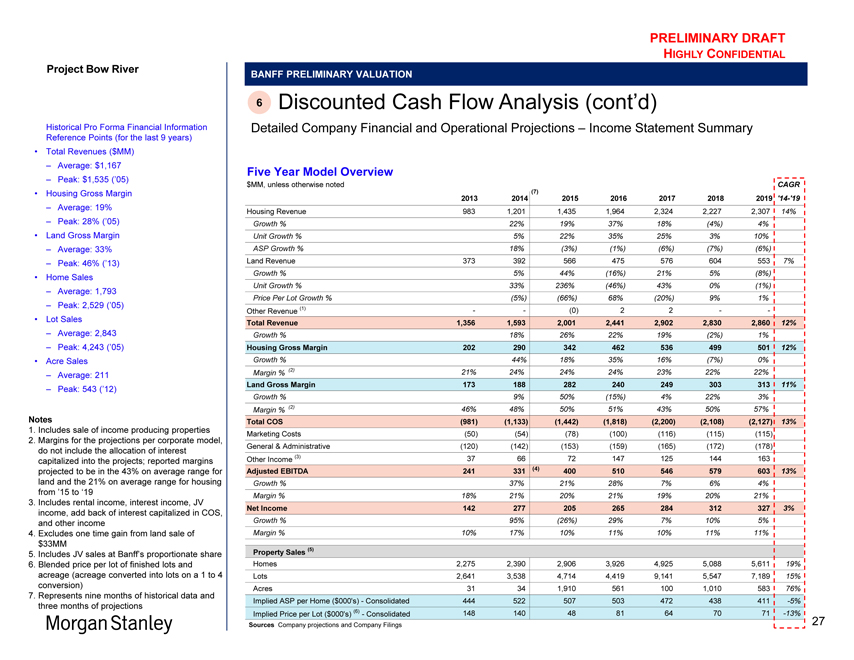
Five Year Model Overview
$MM, unless otherwise noted CAGR
(7)
2013 2014 2015 2016 2017 2018 2019 ‘14-‘19
Housing Revenue 983 1,201 1,435 1,964 2,324 2,227 2,307 14%
Growth % 22% 19% 37% 18%(4%) 4%
Unit Growth % 5% 22% 35% 25% 3% 10%
ASP Growth % 18%(3%)(1%)(6%)(7%)(6%)
Land Revenue 373 392 566 475 576 604 553 7%
Growth % 5% 44%(16%) 21% 5%(8%)
Unit Growth % 33% 236%(46%) 43% 0%(1%)
Price Per Lot Growth %(5%)(66%) 68%(20%) 9% 1%
Other Revenue (1) —(0) 2 2 —
Total Revenue 1,356 1,593 2,001 2,441 2,902 2,830 2,860 12%
Growth % 18% 26% 22% 19%(2%) 1%
Housing Gross Margin 202 290 342 462 536 499 501 12%
Growth % 44% 18% 35% 16%(7%) 0%
Margin % (2) 21% 24% 24% 24% 23% 22% 22%
Land Gross Margin 173 188 282 240 249 303 313 11%
Growth % 9% 50%(15%) 4% 22% 3%
Margin % (2) 46% 48% 50% 51% 43% 50% 57%
Total COS(981)(1,133)(1,442)(1,818)(2,200)(2,108)(2,127) 13%
Marketing Costs(50)(54)(78)(100)(116)(115)(115)
General & Administrative(120)(142)(153)(159)(165)(172)(178)
Other Income (3) 37 66 72 147 125 144 163
Adjusted EBITDA 241 331 (4) 400 510 546 579 603 13%
Growth % 37% 21% 28% 7% 6% 4%
Margin % 18% 21% 20% 21% 19% 20% 21%
Net Income 142 277 205 265 284 312 327 3%
Growth % 95%(26%) 29% 7% 10% 5%
Margin % 10% 17% 10% 11% 10% 11% 11%
Property Sales (5)
Homes 2,275 2,390 2,906 3,926 4,925 5,088 5,611 19%
Lots 2,641 3,538 4,714 4419, 9141, 5,547 7,189 15%
Acres 31 34 1,910 561 100 1,010 583 76%
Implied ASP per Home ($000’s)—Consolidated 444 522 507 503 472 438 411 -5%
Implied Price per Lot ($000’s) (6)—Consolidated 148 140 48 81 64 70 71 -13%
Sources Company projections and Company Filings
27
Project Bow River
PRELIMINARY DRAFT
HIGHLY CONFIDENTIAL
BANFF PRELIMINARY VALUATION
6 Discounted Cash Flow Analysis (cont’d)
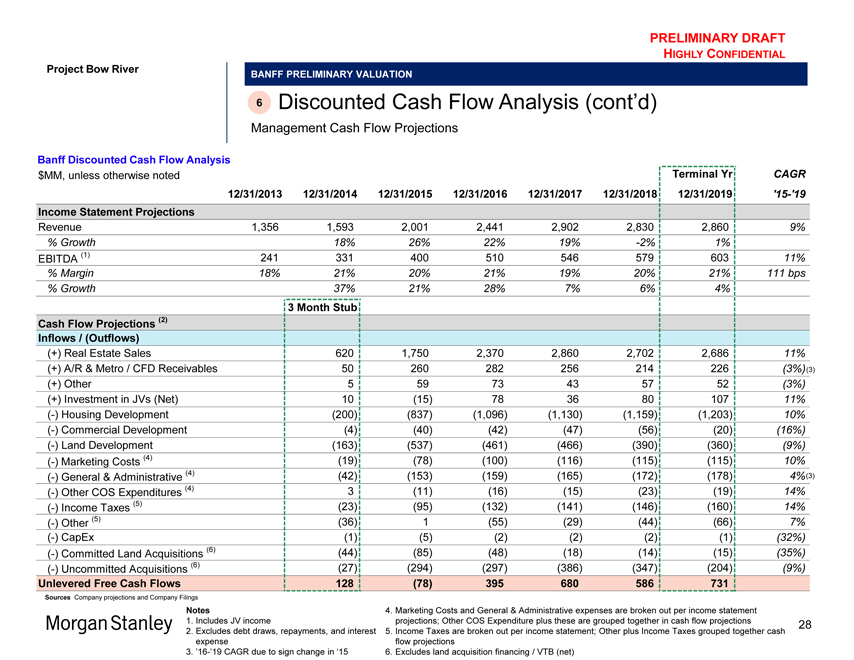
Management Cash Flow Projections
Banff Discounted Cash Flow Analysis
$MM, unless otherwise noted Terminal Yr CAGR
12/31/2013 12/31/2014 12/31/2015 12/31/2016 12/31/2017 12/31/2018 12/31/2019 ‘15-‘19
Income Statement Projections
Revenue 1,356 1,593 2,001 2,441 2,902 2,830 2,860 9%
% Growth 18% 26% 22% 19% -2% 1%
EBITDA (1) 241 331 400 510 546 579 603 11%
% Margin 18% 21% 20% 21% 19% 20% 21% 111 bps
% Growth 37% 21% 28% 7% 6% 4%
3 Month Stub
Cash Flow Projections (2)
Inflows / (Outflows)
(+) Real Estate Sales 620 1,750 2,370 2,860 2,702 2,686 11%
(+) A/R & Metro / CFD Receivables 50 260 282 256 214 226(3%)(3)
(+) Other 5 59 73 43 57 52(3%)
(+) Investment in JVs (Net) 10(15) 78 36 80 107 11%
(-) Housing Development(200)(837)(1,096)(1,130)(1,159)(1,203) 10%
(-) Commercial Development(4)(40)(42)(47)(56)(20)(16%)
(-) Land Development(163)(537)(461)(466)(390)(360)(9%)
(-) Marketing Costs (4)(19)(78)(100)(116)(115)(115) 10%
(-) General & Administrative (4)(42)(153)(159)(165)(172)(178) 4%(3)
(-) Other COS Expenditures (4) 3(11)(16)(15)(23)(19) 14%
(-) Income Taxes (5)(23)(95)(132)(141)(146)(160) 14%
(-) Other (5)(36) 1(55)(29)(44)(66) 7%
(-) CapEx(1)(5)(2)(2)(2)(1)(32%)
(-) Committed Land Acquisitions (6)(44)(85)(48)(18)(14)(15)(35%)
(-) Uncommitted Acquisitions (6)(27)(294)(297)(386)(347)(204)(9%)
Unlevered Free Cash Flows 128(78) 395 680 586 731
Sources Company projections and Company Filings
Notes
1. Includes JV income
2. Excludes debt draws, repayments, and interest expense
3. ’16-’19 CAGR due to sign change in ‘15
4. Marketing Costs and General & Administrative expenses are broken out per income statement projections; Other COS Expenditure plus these are grouped together in cash flow projections
5. Income Taxes are broken out per income statement; Other plus Income Taxes grouped together cash flow projections
6. Excludes land acquisition financing / VTB (net)
28
Project Bow River
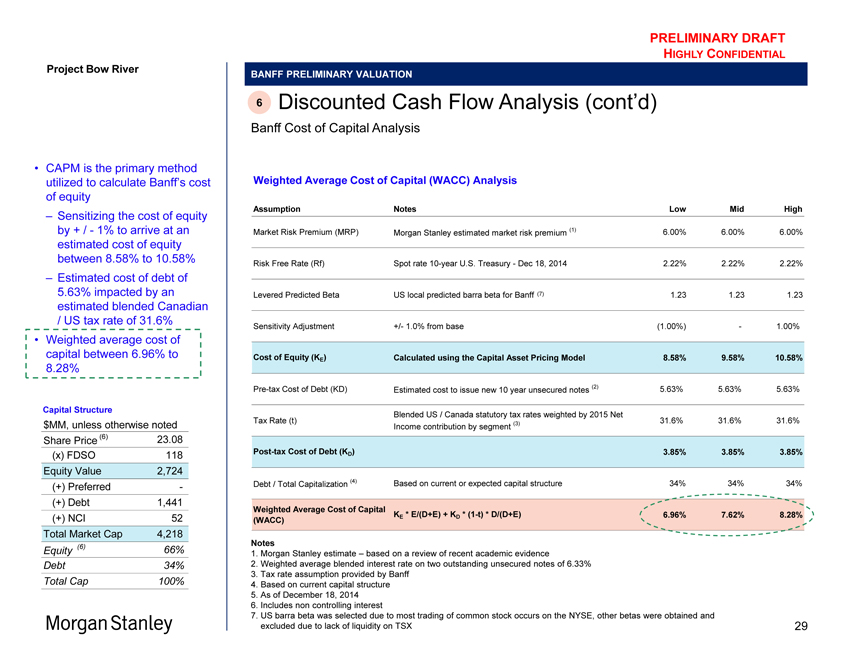
CAPM is the primary method utilized to calculate Banff’s cost of equity
Sensitizing the cost of equity by + /—1% to arrive at an estimated cost of equity between 8.58% to 10.58%
Estimated cost of debt of 5.63% impacted by an estimated blended Canadian / US tax rate of 31.6%
Weighted average cost of capital between 6.96% to 8.28%
Capital Structure
$MM, unless otherwise noted
Share Price (6) 23.08
(x) FDSO 118
Equity Value 2,724
(+) Preferred -
(+) Debt 1,441
(+) NCI 52
Total Market Cap 4,218
Equity (6) 66%
Debt 34%
Total Cap 100%
PRELIMINARY DRAFT
HIGHLY CONFIDENTIAL
BANFF PRELIMINARY VALUATION
6 Discounted Cash Flow Analysis (cont’d)
Banff Cost of Capital Analysis
Weighted Average Cost of Capital (WACC) Analysis
Assumption Notes Low Mid High
Market Risk Premium (MRP) Morgan Stanley estimated market risk premium (1) 6.00% 6.00% 6.00%
Risk Free Rate (Rf) Spot rate 10-year U.S. Treasury—Dec 18, 2014 2.22% 2.22% 2.22%
Levered Predicted Beta US local predicted barra beta for Banff (7) 1.23 1.23 1.23
Sensitivity Adjustment +/- 1.0% from base(1.00%)—1.00%
Cost of Equity (KE ) Calculated using the Capital Asset Pricing Model 8.58% 9.58% 10.58%
Pre-tax Cost of Debt (KD) Estimated cost to issue new 10 year unsecured notes (2) 5.63% 5.63% 5.63%
Blended US / Canada statutory tax rates weighted by 2015 Net
Tax Rate (t) 31.6% 31.6% 31.6%
Income contribution by segment (3)
Post-tax Cost of Debt (KD ) 3.85% 3.85% 3.85%
Debt / Total Capitalization (4) Based on current or expected capital structure 34% 34% 34%
Weighted Average Cost of Capital
(WACC) KE * E/(D+E) + KD * (1-t) * D/(D+E) 6.96% 7.62% 8.28%
Notes
1. Morgan Stanley estimate – based on a review of recent academic evidence
2. Weighted average blended interest rate on two outstanding unsecured notes of 6.33%
3. Tax rate assumption provided by Banff
4. Based on current capital structure
5. As of December 18, 2014
6. Includes non controlling interest
7. US barra beta was selected due to most trading of common stock occurs on the NYSE, other betas were obtained and excluded due to lack of liquidity on TSX
29

Project Bow River
Based on Management projections provided by Banff
Key assumptions:
– Applied exit EBITDA multiple range of 6.0x to 8.0x and P / BV range of 1.8x to 2.7x
– Implied P / E multiple range of 7.1x to 10.7x
– Discount rate assumption reflects an estimated range of Banff’s weighted average cost of capital (“WACC”) of 6.96% to 8.28%
Going concern valuation: no transaction costs assumed
Resulting implied per share range of $22.43 to $31.53
• Previous analysis included a midpoint exit EBITDA multiple of 6.4x
Notes
1. Forward year net income per Company model, exit assumes same capital structure as present
2. Current equity book value less change in equity book value over projection period
PRELIMINARY DRAFT
HIGHLY CONFIDENTIAL
BANFF PRELIMINARY VALUATION
6 Discounted Cash Flow Analysis (cont’d)
Discounted Cash Flow Sensitivities
Discounted Cash Flow Sensitivity Analysis
Price Per Share, AV / 2015 EBITDA / AV / 2016 EBITDA, P / 2015 Earnings / P / 2016 Earnings, P / Book Value
Weighted Average Cost of Capital Range
Implied
Exit Applied
P / E Exit Implied Exit
Multiple EBITDA P / BV
Range (1) Multiple Multiple (2) 6.96% 7.62% 8.28%
$24.00 $23.20 $22.43 Implied Price
Per Share
10.4x / 8.2x 10.2x / 8.0x 9.9x / 7.8x AV / EBITDA
7.1x 6.0x 1.8x
13.8x / 10.7x 13.4x / 10.3x 12.9x / 10.0x P / E
1.9x 1.8x 1.8x P / BV
$27.52 $26.64 $25.77 Implied Price
Per Share
11.4x / 9.0x 11.2x / 8.8x 10.9x / 8.6x AV / EBITDA
8.8x 7.0x 2.2x
15.9x / 12.3x 15.4x / 11.9x 14.9x / 11.5x P / E
2.2x 2.1x 2.0x P / BV
$31.53 $30.54 $29.58 Implied Price
Per Share
12.6x / 9.9x 12.3x / 9.7x 12.1x / 9.5x AV / EBITDA
10.7x 8.0x 2.7x
18.2x / 14.1x 17.6x / 13.6x 17.1x / 13.2x P / E
2.5x 2.4x 2.3x P / BV
Sources Company projections and Company Filings
30
Project Bow River
PRELIMINARY DRAFT
HIGHLY CONFIDENTIAL
BANFF PRELIMINARY VALUATION
7 Net Asset Value Analysis
Valuation Approach Summary
Methodology Summary
Project-by-project discounted cash flow analysis was used to value Banff’s land and housing assets
Other assets and liabilities are valued at their current book value as of 9/30/14, except where noted
(i.e. Banff’s notes payable which include a mark-to-market adjustment)
Net asset value analysis conducts valuation of Banff on its current portfolio, and therefore does not
include franchise value and future growth activities
Discounted Cash Flow Framework
Future cash flows were based on management projections
Discount rate methodology:
– Length of project: higher discount rates were used for projects that have a longer-term projections
period
– Status of entitlement: unentitled projects were then given an incremental discount rate increase to
account for entitlement risk
– Macro / market observations: further incremental adjustments (increase or decrease to discount
rates) were also made based on a subjective assessment of certain economic, macro fundamentals,
and / or market factors impacting Banff’s projections
Augmented NAV Analysis Methodology Summary (1)
In order to fully capture the franchise value of the continuing, retained ability of Banff to generate
homebuilder profit by buying land at market value and selling homes, an augmentation to the basic
NAV approach is implemented
– Current homebuilder value minus the present value of housing profits implied by the NAV analysis is
utilized to arrive at an incremental franchise value not captured in the underlying NAV cash flow
projections
Note
1. Included in the appendix
31
Project Bow River
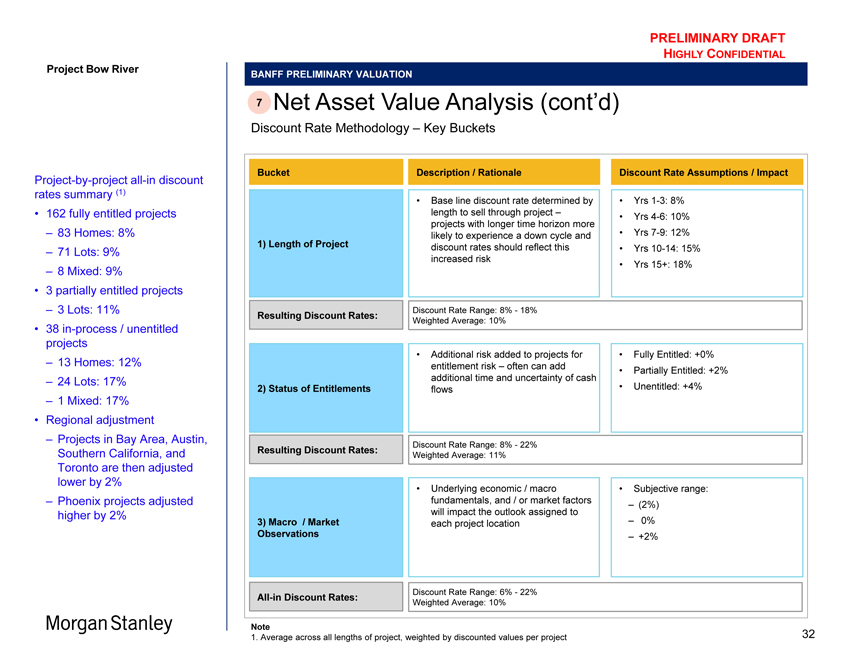
Project-by-project all-in discount
rates summary (1)
162 fully entitled projects
– 83 Homes: 8%
– 71 Lots: 9%
– 8 Mixed: 9%
3 partially entitled projects
– 3 Lots: 11%
38 in-process / unentitled
projects
– 13 Homes: 12%
– 24 Lots: 17%
– 1 Mixed: 17%
Regional adjustment
– Projects in Bay Area, Austin,
Southern California, and
Toronto are then adjusted
lower by 2%
– Phoenix projects adjusted
higher by 2%
PRELIMINARY DRAFT
HIGHLY CONFIDENTIAL
BANFF PRELIMINARY VALUATION
7 Net Asset Value Analysis (cont’d)
Discount Rate Methodology – Key Buckets
Bucket Description / Rationale Discount Rate Assumptions / Impact
• Base line discount rate determined by • Yrs 1-3: 8%
length to sell through project – • Yrs 4-6: 10%
projects with longer time horizon more
likely to experience a down cycle and • Yrs 7-9: 12%
1) Length of Project discount rates should reflect this • Yrs 10-14: 15%
increased risk • Yrs 15+: 18%
Discount Rate Range: 8%—18%
Resulting Discount Rates: Weighted Average: 10%
• Additional risk added to projects for • Fully Entitled: +0%
entitlement risk – often can add • Partially Entitled: +2%
additional time and uncertainty of cash
2) Status of Entitlements flows • Unentitled: +4%
Discount Rate Range: 8%—22%
Resulting Discount Rates: Weighted Average: 11%
• Underlying economic / macro • Subjective range:
fundamentals, and / or market factors –(2%)
will impact the outlook assigned to
3) Macro / Market each project location – 0%
Observations �� +2%
All-in Discount Rates: Discount Rate Range: 6%—22%
Weighted Average: 10%
Note
1. Average across all lengths of project, weighted by discounted values per project
32
Project Bow River
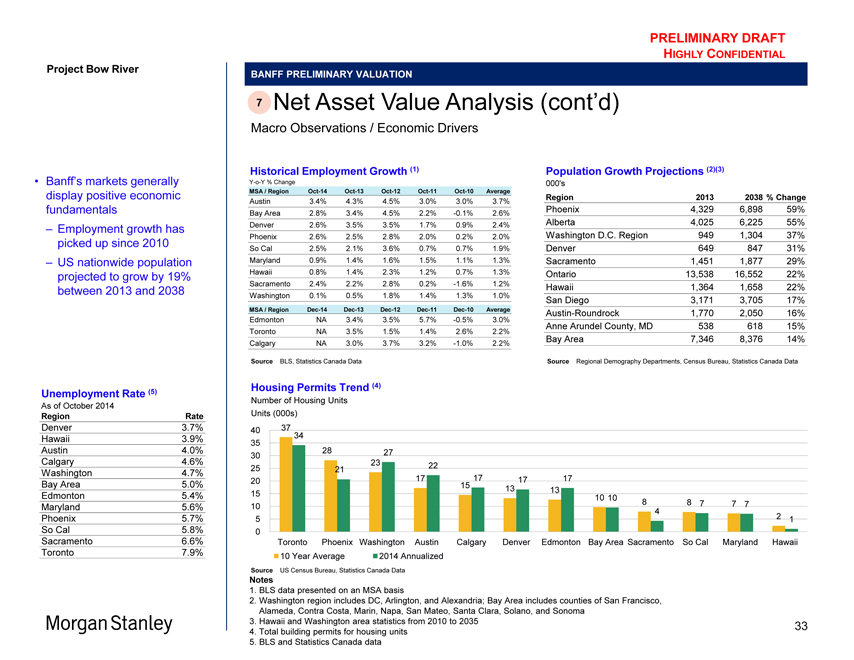
Banff’s markets generally display positive economic fundamentals
Employment growth has picked up since 2010
US nationwide population projected to grow by 19% between 2013 and 2038
Unemployment Rate (5)
As of October 2014
Region Rate
Denver 3.7%
Hawaii 3.9%
Austin 4.0%
Calgary 4.6%
Washington 4.7%
Bay Area 5.0%
Edmonton 5.4%
Maryland 5.6%
Phoenix 5.7%
So Cal 5.8%
Sacramento 6.6%
Toronto 7.9%
PRELIMINARY DRAFT
HIGHLY CONFIDENTIAL
BANFF PRELIMINARY VALUATION
7 Net Asset Value Analysis (cont’d)
Macro Observations / Economic Drivers
Historical Employment Growth (1)
Y-o-Y % Change
MSA / Region Oct-14 Oct-13 Oct-12 Oct-11 Oct-10 Average
Austin 3.4% 4.3% 4.5% 3.0% 3.0% 3.7%
Bay Area 2.8% 3.4% 4.5% 2.2% -0.1% 2.6%
Denver 2.6% 3.5% 3.5% 1.7% 0.9% 2.4%
Phoenix 2.6% 2.5% 2.8% 2.0% 0.2% 2.0%
So Cal 2.5% 2.1% 3.6% 0.7% 0.7% 1.9%
Maryland 0.9% 1.4% 1.6% 1.5% 1.1% 1.3%
Hawaii 0.8% 1.4% 2.3% 1.2% 0.7% 1.3%
Sacramento 2.4% 2.2% 2.8% 0.2% -1.6% 1.2%
Washington 0.1% 0.5% 1.8% 1.4% 1.3% 1.0%
MSA / Region Dec-14 Dec-13 Dec-12 Dec-11 Dec-10 Average
Edmonton NA 3.4% 3.5% 5.7% -0.5% 3.0%
Toronto NA 3.5% 1.5% 1.4% 2.6% 2.2%
Calgary NA 3.0% 3.7% 3.2% -1.0% 2.2%
Source BLS, Statistics Canada Data
Population Growth Projections (2)(3)
000’s
Region 2013 2038 % Change
Phoenix 4,329 6,898 59%
Alberta 4,025 6,225 55%
Washington D.C. Region 949 1,304 37%
Denver 649 847 31%
Sacramento 1,451 1,877 29%
Ontario 13,538 16,552 22%
Hawaii 1,364 1,658 22%
San Diego 3,171 3,705 17%
Austin-Roundrock 1,770 2,050 16%
Anne Arundel County, MD 538 618 15%
Bay Area 7,346 8,376 14%
Source Regional Demography Departments, Census Bureau, Statistics Canada Data
Housing Permits Trend (4)
Number of Housing Units
Units (000s)
40 37 34
35
30 28 27
23
25 21 22
20 17 17 17 17
15 13 13
15 10 10
10 8 8 7 7 7
4
5 2 1
0
Toronto Phoenix Washington Austin Calgary Denver Edmonton Bay Area Sacramento So Cal Maryland Hawaii
10 Year Average 2014 Annualized
Source US Census Bureau, Statistics Canada Data
Notes
1. BLS data presented on an MSA basis
2. Washington region includes DC, Arlington, and Alexandria; Bay Area includes counties of San Francisco, Alameda, Contra Costa, Marin, Napa, San Mateo, Santa Clara, Solano, and Sonoma
3. Hawaii and Washington area statistics from 2010 to 2035
4. Total building permits for housing units
5. BLS and Statistics Canada data
33
Project Bow River
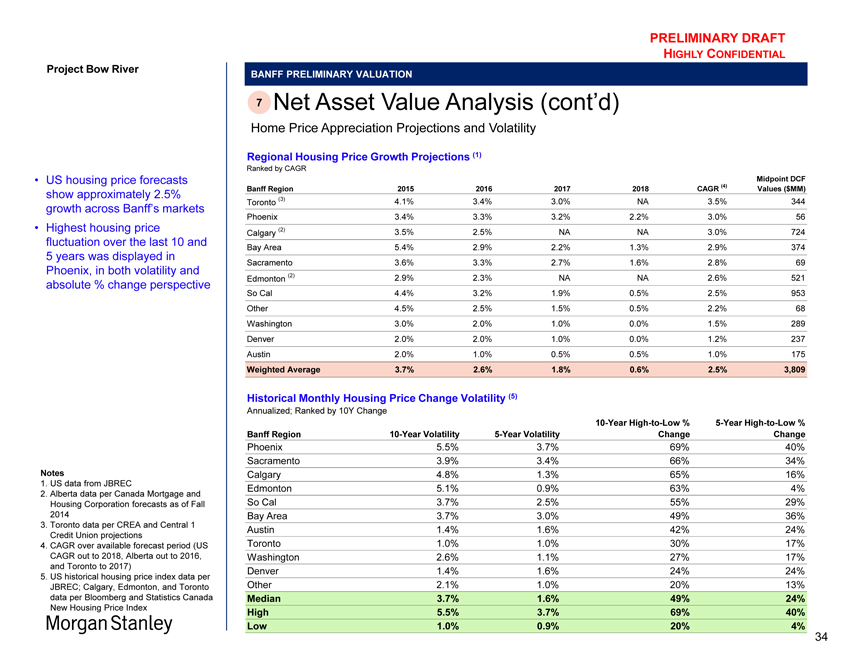
US housing price forecasts show approximately 2.5% growth across Banff’s markets
Highest housing price fluctuation over the last 10 and 5 years was displayed in Phoenix, in both volatility and absolute % change perspective
Notes
1. US data from JBREC
2. Alberta data per Canada Mortgage and Housing Corporation forecasts as of Fall 2014
3. Toronto data per CREA and Central 1 Credit Union projections
4. CAGR over available forecast period (US CAGR out to 2018, Alberta out to 2016, and Toronto to 2017)
5. US historical housing price index data per JBREC; Calgary, Edmonton, and Toronto data per Bloomberg and Statistics Canada New Housing Price Index
PRELIMINARY DRAFT
HIGHLY CONFIDENTIAL
BANFF PRELIMINARY VALUATION
7 Net Asset Value Analysis (cont’d)
Home Price Appreciation Projections and Volatility
Regional Housing Price Growth Projections (1)
Ranked by CAGR
Midpoint DCF
Banff Region 2015 2016 2017 2018 CAGR (4) Values ($MM)
Toronto (3) 4.1% 3.4% 3.0% NA 3.5% 344
Phoenix 3.4% 3.3% 3.2% 2.2% 3.0% 56
Calgary (2) 3.5% 2.5% NA NA 3.0% 724
Bay Area 5.4% 2.9% 2.2% 1.3% 2.9% 374
Sacramento 3.6% 3.3% 2.7% 1.6% 2.8% 69
Edmonton (2) 2.9% 2.3% NA NA 2.6% 521
So Cal 4.4% 3.2% 1.9% 0.5% 2.5% 953
Other 4.5% 2.5% 1.5% 0.5% 2.2% 68
Washington 3.0% 2.0% 1.0% 0.0% 1.5% 289
Denver 2.0% 2.0% 1.0% 0.0% 1.2% 237
Austin 2.0% 1.0% 0.5% 0.5% 1.0% 175
Weighted Average 3.7% 2.6% 1.8% 0.6% 2.5% 3,809
Historical Monthly Housing Price Change Volatility (5)
Annualized; Ranked by 10Y Change
10-Year High-to-Low % 5-Year High-to-Low %
Banff Region 10-Year Volatility 5-Year Volatility Change Change
Phoenix 5.5% 3.7% 69% 40%
Sacramento 3.9% 3.4% 66% 34%
Calgary 4.8% 1.3% 65% 16%
Edmonton 5.1% 0.9% 63% 4%
So Cal 3.7% 2.5% 55% 29%
Bay Area 3.7% 3.0% 49% 36%
Austin 1.4% 1.6% 42% 24%
Toronto 1.0% 1.0% 30% 17%
Washington 2.6% 1.1% 27% 17%
Denver 1.4% 1.6% 24% 24%
Other 2.1% 1.0% 20% 13%
Median 3.7% 1.6% 49% 24%
High 5.5% 3.7% 69% 40%
Low 1.0% 0.9% 20% 4%
34
Project Bow River
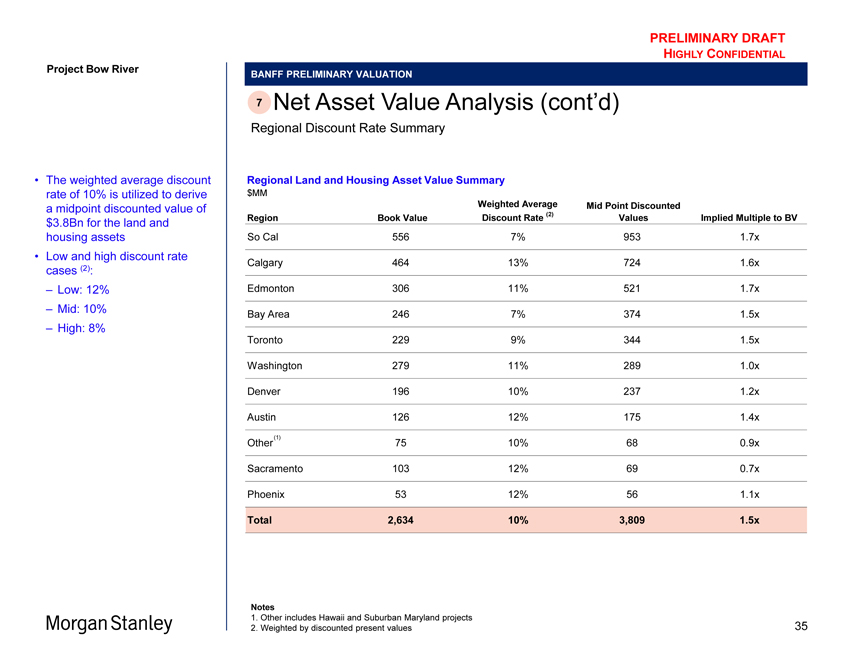
The weighted average discount rate of 10% is utilized to derive a midpoint discounted value of $3.8Bn for the land and housing assets
Low and high discount rate cases (2): – Low: 12% – Mid: 10% – High: 8%
PRELIMINARY DRAFT
HIGHLY CONFIDENTIAL
BANFF PRELIMINARY VALUATION
7 Net Asset Value Analysis (cont’d)
Regional Discount Rate Summary
Regional Land and Housing Asset Value Summary
$MM
Weighted Average Mid Point Discounted
Region Book Value Discount Rate (2) Values Implied Multiple to BV
So Cal 556 7% 953 1.7x
Calgary 464 13% 724 1.6x
Edmonton 306 11% 521 1.7x
Bay Area 246 7% 374 1.5x
Toronto 229 9% 344 1.5x
Washington 279 11% 289 1.0x
Denver 196 10% 237 1.2x
Austin 126 12% 175 1.4x
Other (1) 75 10% 68 0.9x
Sacramento 103 12% 69 0.7x
Phoenix 53 12% 56 11x.
Total 2,634 10% 3,809 1.5x
Notes
1. Other includes Hawaii and Suburban Maryland projects
2. Weighted by discounted present values
35
Project Bow River
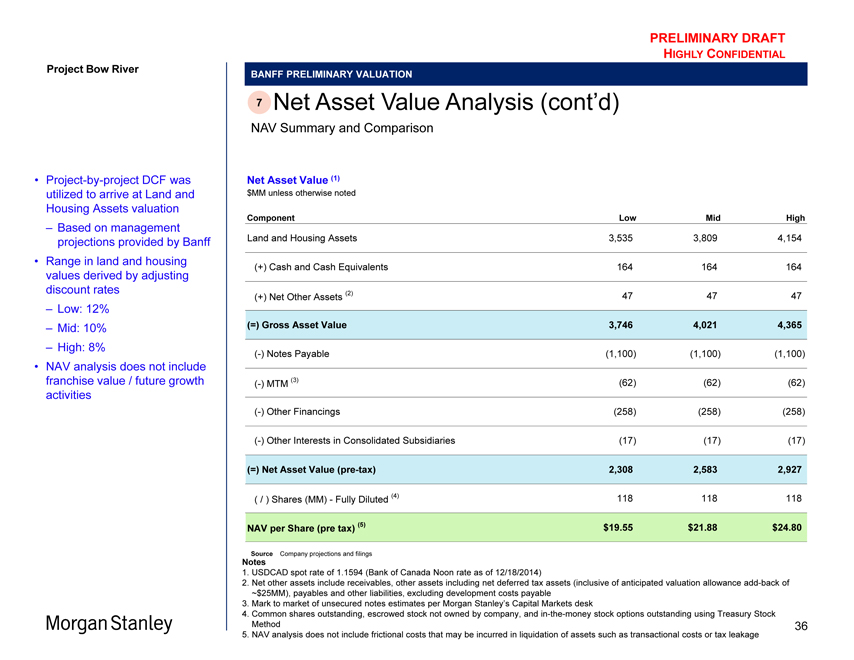
Project-by-project DCF was utilized to arrive at Land and Housing Assets valuation
Based on management projections provided by Banff
Range in land and housing values derived by adjusting discount rates
Low: 12%
Mid: 10%
High: 8%
NAV analysis does not include franchise value / future growth activities
PRELIMINARY DRAFT
HIGHLY CONFIDENTIAL
BANFF PRELIMINARY VALUATION
7 Net Asset Value Analysis (cont’d)
NAV Summary and Comparison
Net Asset Value (1)
$MM unless otherwise noted
Component Low Mid High
Land and Housing Assets 3,535 3,809 4,154
(+) Cash and Cash Equivalents 164 164 164
(+) Net Other Assets (2) 47 47 47
(=) Gross Asset Value 3,746 4,021 4,365
(-) Notes Payable(1,100)(1,100)(1,100)
(-) MTM (3)(62)(62)(62)
(-) Other Financings(258)(258)(258)
(-) Other Interests in Consolidated Subsidiaries(17)(17)(17)
(=) Net Asset Value (pre-tax) 2,308 2,583 2,927
( / ) Shares (MM)—Fully Diluted (4) 118 118 118
NAV per Share (pre tax) (5) $19.55 $21.88 $24.80
Source Company projections and filings
Notes
1. USDCAD spot rate of 1.1594 (Bank of Canada Noon rate as of 12/18/2014)
2. Net other assets include receivables, other assets including net deferred tax assets (inclusive of anticipated valuation allowance add-back of
~$25MM), payables and other liabilities, excluding development costs payable
3. Mark to market of unsecured notes estimates per Morgan Stanley’s Capital Markets desk
4. Common shares outstanding, escrowed stock not owned by company, and in-the-money stock options outstanding using Treasury Stock Method
5. NAV analysis does not include frictional costs that may be incurred in liquidation of assets such as transactional costs or tax leakage
36
Project Bow River
PRELIMINARY DRAFT
HIGHLY CONFIDENTIAL
BANFF PRELIMINARY VALUATION
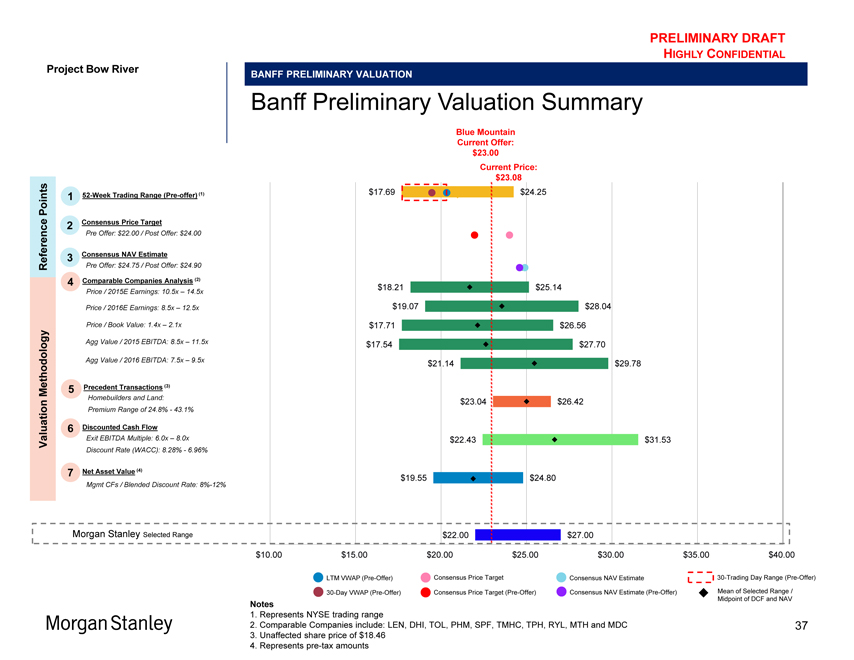
Banff Preliminary Valuation Summary
Blue Mountain
Current Offer:
$23.00
Current Price:
$23.08
Points 1 52-Week Trading Range (Pre-offer) (1) $17.69 $24.25
2 Consensus Price Target
rence Pre Offer: $ 22.00 / Post Offer: $24.00
3 Consensus NAV Estimate
Refe Pre Offer: $24.75 / Post Offer: $24.90
4 Comparable Companies Analysis (2)
Price / 2015E Earnings: 10.5x – 14.5x $18.21 $25.14
Price / 2016E Earnings: 8.5x – 12.5x $19.07 $28.04
Price / Book Value: 1.4x – 2.1x $17.71 $26.56
Agg Value / 2015 EBITDA: 8.5x – 11.5x $17.54 $27.70
Agg Value / 2016 EBITDA: 7.5x – 9.5x $21.14 $29.78
Methodology 5 Precedent Transactions (3)
Homebuilders and Land: $23.04 $26.42
on Premium Range of 24.8%—43.1%
6 Discounted Cash Flow
Valuati Exit EBITDA Multiple: 6.0x – 8.0x $22.43 $31.53
Discount Rate (WACC): 8.28%—6.96%
7 Net Asset Value (4)
$19.55 $24.80
Mgmt CFs / Blended Discount Rate: 8%-12%
Morgan Stanley Selected Range $22.00 $27.00
$10.00 $15.00 $20.00 $25.00 $30.00 $35.00 $40.00
LTM VWAP (Pre-Offer) Consensus Price Target Consensus NAV Estimate 30-Trading Day Range (Pre-Offer)
30-Day VWAP (Pre-Offer) Consensus Price Target (Pre-Offer) Consensus NAV Estimate (Pre-Offer) Mean of Selected Range /
Midpoint of DCF and NAV
Notes
1. Represents NYSE trading range
2. Comparable Companies include: LEN, DHI, TOL, PHM, SPF, TMHC, TPH, RYL, MTH and MDC
3. Unaffected share price of $18.46
4. Represents pre-tax amounts
37
PRELIMINARY DRAFT
HIGHLY CONFIDENTIAL
Project Bow River
Appendix A
Supplemental Materials
Reference materials included at the request of the Special Committee
Morgan Stanley
38
PRELIMINARY DRAFT
HIGHLY CONFIDENTIAL
Project Bow River
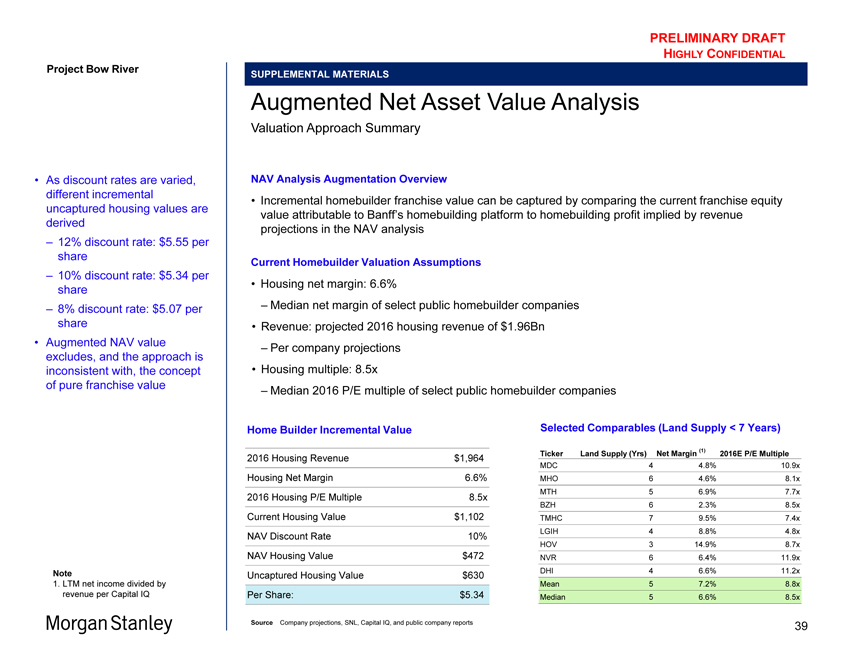
As discount rates are varied, different incremental uncaptured housing values are derived
– 12% discount rate: $5.55 per share
– 10% discount rate: $5.34 per share
– 8% discount rate: $5.07 per share
Augmented NAV value excludes, and the approach is inconsistent with, the concept of pure franchise value
SUPPLEMENTAL MATERIALS
Augmented Net Asset Value Analysis
Valuation Approach Summary
NAV Analysis Augmentation Overview
Incremental homebuilder franchise value can be captured by comparing the current franchise equity value attributable to Banff’s homebuilding platform to homebuilding profit implied by revenue projections in the NAV analysis
Current Homebuilder Valuation Assumptions
Housing net margin: 6.6%
– Median net margin of select public homebuilder companies
Revenue: projected 2016 housing revenue of $1.96Bn
– Per company projections
Housing multiple: 8.5x
– Median 2016 P/E multiple of select public homebuilder companies
Home Builder Incremental Value Selected Comparables (Land Supply < 7 Years)
2016 Housing Revenue $1,964 Ticker Land Supply (Yrs) Net Margin (1) 2016E P/E Multiple
MDC 4 4.8% 10.9x
Housing Net Margin 6.6% MHO 6 4.6% 8.1x MTH 5 6.9% 7.7x
2016 Housing P/E Multiple 8.5x BZH 6 2.3% 8.5x Current Housing Value $1,102 TMHC 7 9.5% 7.4x LGIH 4 8.8% 4.8x
NAV Discount Rate 10% HOV 3 14.9% 8.7x NAV Housing Value $472 NVR 6 6.4% 11.9x Uncaptured Housing Value $630 DHI 4 6.6% 11.2x Mean 5 7.2% 8.8x
Per Share: $5.34 Median 5 6.6% 8.5x
Source Company projections, SNL, Capital IQ, and public company reports
Note
1. LTM net income divided by revenue per Capital IQ
39
PRELIMINARY DRAFT
HIGHLY CONFIDENTIAL
Project Bow River
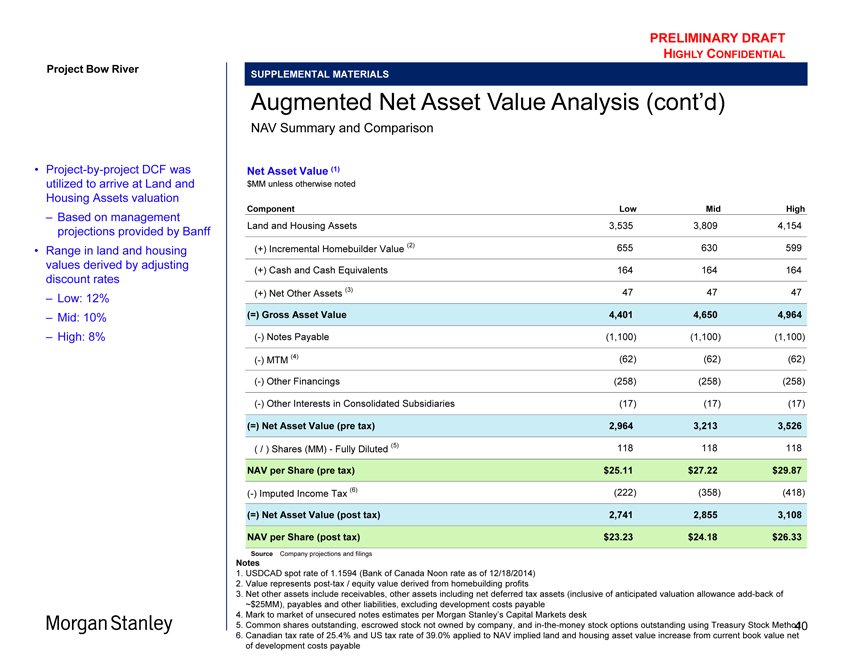
Project-by-project DCF was utilized to arrive at Land and Housing Assets valuation
Based on management projections provided by Banff
Range in land and housing values derived by adjusting discount rates
Low: 12%
Mid: 10%
High: 8%
HIGHLY CONFIDENTIAL
SUPPLEMENTAL MATERIALS
Augmented Net Asset Value Analysis (cont’d)
NAV Summary and Comparison
Net Asset Value (1)
$MM unless otherwise noted
Component Low Mid High
Land and Housing Assets 3,535 3,809 4,154
(+) Incremental Homebuilder Value (2) 655 630 599 (+) Cash and Cash Equivalents 164 164 164
(+) Net Other Assets (3) 47 47 47
(=) Gross Asset Value 4,401 4,650 4,964
(-) Notes Payable (1,100) (1,100) (1,100)
(-) MTM (4) (62) (62) (62) (-) Other Financings (258) (258) (258)
(-) Other Interests in Consolidated Subsidiaries (17) (17) (17)
(=) Net Asset Value (pre tax) 2,964 3,213 3,526
( / ) Shares (MM) - Fully Diluted (5) 118 118 118
NAV per Share (pre tax) $25.11 $27.22 $29.87
(-) Imputed Income Tax (6) (222) (358) (418)
(=) Net Asset Value (post tax) 2,741 2,855 3,108
NAV per Share (post tax) $23.23 $24.18 $26.33
Source Company projections and filings
Notes
1. USDCAD spot rate of 1.1594 (Bank of Canada Noon rate as of 12/18/2014)
2. Value represents post-tax / equity value derived from homebuilding profits
3. Net other assets include receivables, other assets including net deferred tax assets (inclusive of anticipated valuation allowance add-back of
~$25MM), payables and other liabilities, excluding development costs payable
4. Mark to market of unsecured notes estimates per Morgan Stanley’s Capital Markets desk
5. Common shares outstanding, escrowed stock not owned by company, and in-the-money stock options outstanding using Treasury Stock Method
6. Canadian tax rate of 25.4% and US tax rate of 39.0% applied to NAV implied land and housing asset value increase from current book value net of development costs payable
40
PRELIMINARY DRAFT
HIGHLY CONFIDENTIAL
Project Bow River
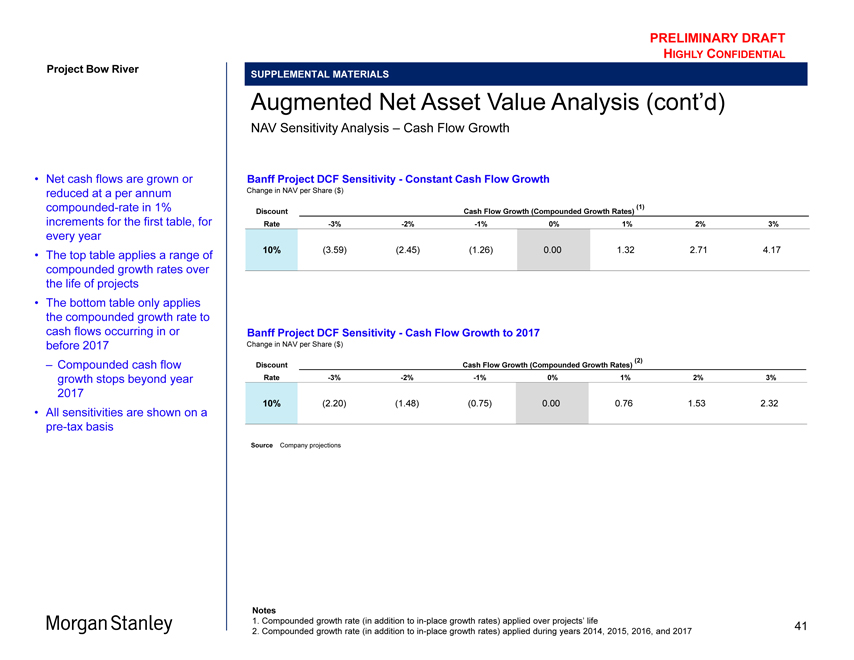
Net cash flows are grown or reduced at a per annum compounded-rate in 1% increments for the first table, for every year
The top table applies a range of compounded growth rates over the life of projects
The bottom table only applies the compounded growth rate to cash flows occurring in or before 2017
– Compounded cash flow growth stops beyond year 2017
All sensitivities are shown on a pre-tax basis
SUPPLEMENTAL MATERIALS
Augmented Net Asset Value Analysis (cont’d)
NAV Sensitivity Analysis – Cash Flow Growth
Banff Project DCF Sensitivity - Constant Cash Flow Growth
Change in NAV per Share ($)
(1)
Discount Cash Flow Growth (Compounded Growth Rates)
Rate -3% -2% -1% 0% 1% 2% 3%
10% (3.59) (2.45) (1.26) 0.00 1.32 2.71 4.17
Banff Project DCF Sensitivity - Cash Flow Growth to 2017
Change in NAV per Share ($)
(2)
Discount Cash Flow Growth (Compounded Growth Rates)
Rate -3% -2% -1% 0% 1% 2% 3%
10% (2.20) (1.48) (0.75) 0.00 0.76 1.53 2.32
Source Company projections
Notes
1. Compounded growth rate (in addition to in-place growth rates) applied over projects’ life
2. Compounded growth rate (in addition to in-place growth rates) applied during years 2014, 2015, 2016, and 2017
41
PRELIMINARY DRAFT
HIGHLY CONFIDENTIAL
Project Bow River
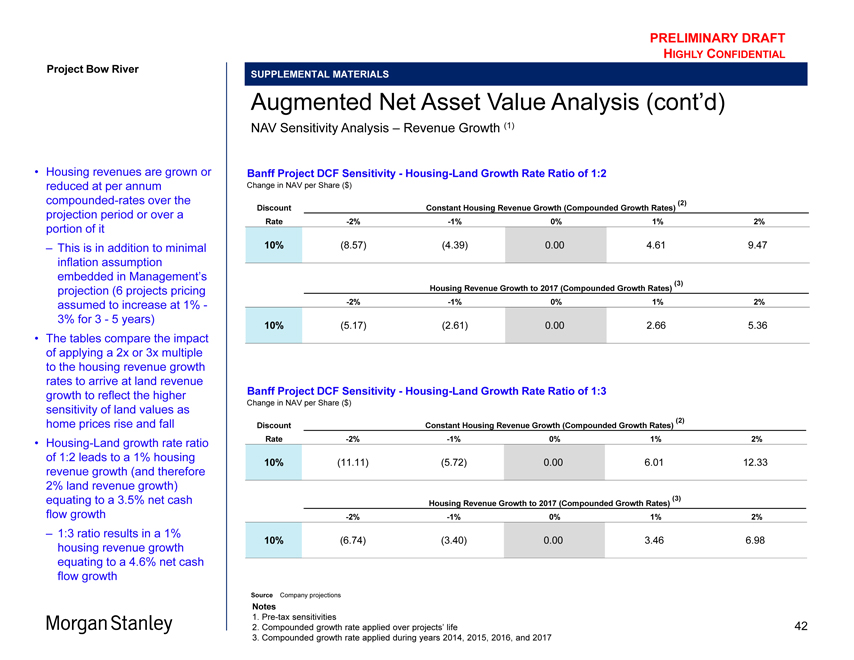
Housing revenues are grown or reduced at per annum compounded-rates over the projection period or over a portion of it This is in addition to minimal inflation assumption embedded in Management’s projection (6 projects pricing assumed to increase at 1% -3% for 3 - 5 years)
The tables compare the impact of applying a 2x or 3x multiple to the housing revenue growth rates to arrive at land revenue growth to reflect the higher sensitivity of land values as home prices rise and fall
Housing-Land growth rate ratio of 1:2 leads to a 1% housing revenue growth (and therefore 2% land revenue growth) equating to a 3.5% net cash flow growth
– 1:3 ratio results in a 1% housing revenue growth equating to a 4.6% net cash flow growth
SUPPLEMENTAL MATERIALS
Augmented Net Asset Value Analysis (cont’d)
NAV Sensitivity Analysis – Revenue Growth (1)
Banff Project DCF Sensitivity - Housing-Land Growth Rate Ratio of 1:2
Change in NAV per Share ($)
(2)
Discount Constant Housing Revenue Growth (Compounded Growth Rates)
Rate -2% -1% 0% 1% 2%
10% (8.57) (4.39) 0.00 4.61 9.47
(3)
Housing Revenue Growth to 2017 (Compounded Growth Rates)
-2% -1% 0% 1% 2%
10% (5.17) (2.61) 0.00 2.66 5.36
Banff Project DCF Sensitivity - Housing-Land Growth Rate Ratio of 1:3
Change in NAV per Share ($)
(2)
Discount Constant Housing Revenue Growth (Compounded Growth Rates)
Rate -2% -1% 0% 1% 2%
10% (11.11) (5.72) 0.00 6.01 12.33
(3)
Housing Revenue Growth to 2017 (Compounded Growth Rates)
-2% -1% 0% 1% 2%
10% (6.74) (3.40) 0.00 3.46 6.98
Source Company projections
Notes
1. Pre-tax sensitivities
2. Compounded growth rate applied over projects’ life
3. Compounded growth rate applied during years 2014, 2015, 2016, and 2017
42
PRELIMINARY DRAFT
HIGHLY CONFIDENTIAL
Project Bow River
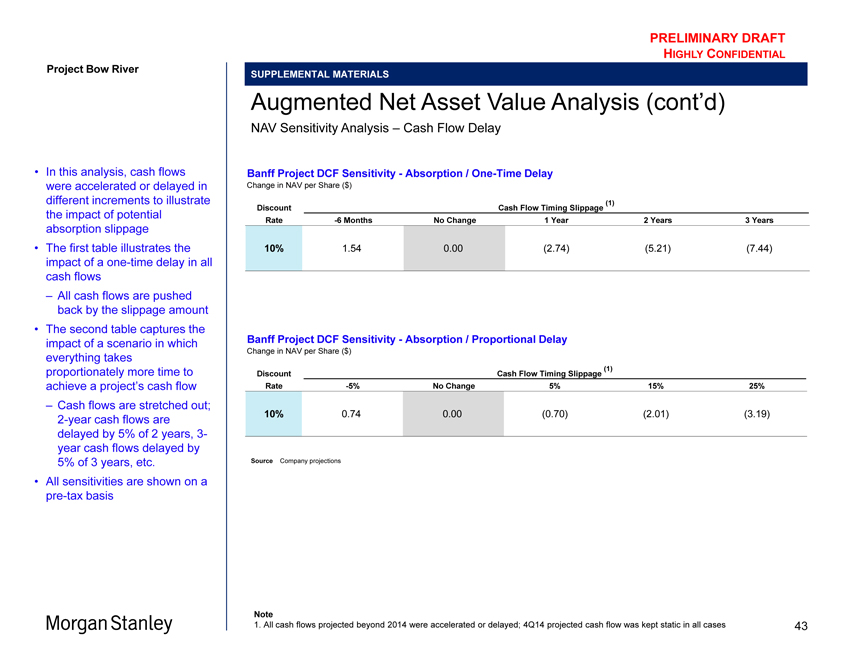
In this analysis, cash flows were accelerated or delayed in different increments to illustrate the impact of potential absorption slippage
The first table illustrates the impact of a one-time delay in all cash flows
– All cash flows are pushed back by the slippage amount
The second table captures the impact of a scenario in which everything takes proportionately more time to achieve a project’s cash flow
– Cash flows are stretched out;
2-year cash flows are delayed by 5% of 2 years, 3-year cash flows delayed by 5% of 3 years, etc.
All sensitivities are shown on a pre-tax basis
SUPPLEMENTAL MATERIALS
Augmented Net Asset Value Analysis (cont’d)
NAV Sensitivity Analysis – Cash Flow Delay
Banff Project DCF Sensitivity - Absorption / One-Time Delay
Change in NAV per Share ($)
(1)
Discount Cash Flow Timing Slippage
Rate -6 Months No Change 1 Year 2 Years 3 Years
10% 154 . 000 . (2.74) (5.21) (7.44)
Banff Project DCF Sensitivity - Absorption / Proportional Delay
Change in NAV per Share ($)
(1)
Discount Cash Flow Timing Slippage
Rate -5% No Change 5% 15% 25%
10% 0.74 0.00 (0.70) (2.01) (3.19)
Source Company projections
Note
1. All cash flows projected beyond 2014 were accelerated or delayed; 4Q14 projected cash flow was kept static in all cases
43
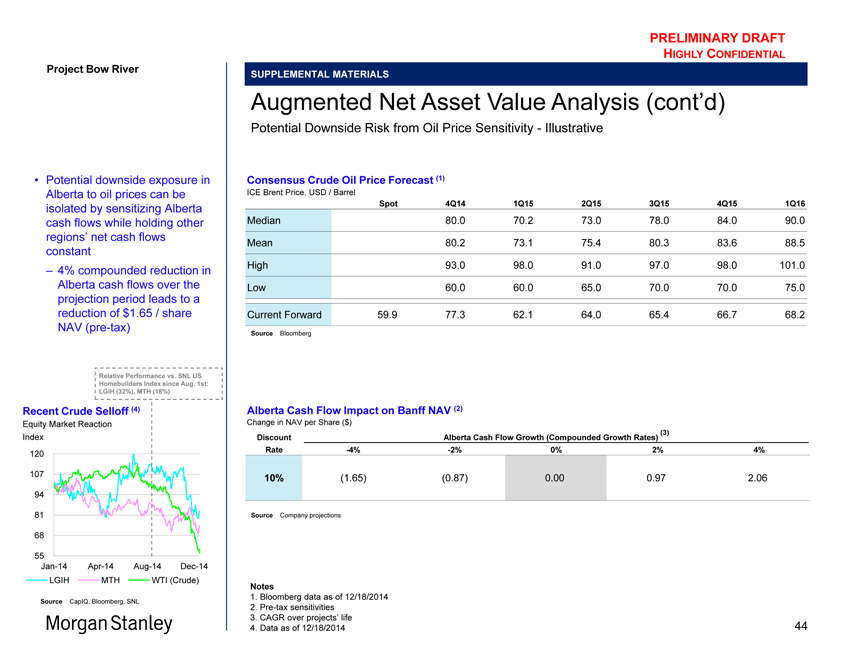
PRELIMINARY DRAFT
HIGHLY CONFIDENTIAL
Project Bow River
Potential downside exposure in Alberta to oil prices can be isolated by sensitizing Alberta cash flows while holding other regions’ net cash flows constant
– 4% compounded reduction in Alberta cash flows over the projection period leads to a reduction of $1.65 / share NAV (pre-tax)
SUPPLEMENTAL MATERIALS
Augmented Net Asset Value Analysis (cont’d)
Potential Downside Risk from Oil Price Sensitivity - Illustrative
Consensus Crude Oil Price Forecast (1)
ICE Brent Price, USD / Barrel
Spot 4Q14 1Q15 2Q15 3Q15 4Q15 1Q16
Median 80.0 70.2 73.0 78.0 84.0 90.0 Mean 80.2 73.1 75.4 80.3 83.6 88.5 High 93.0 98.0 91.0 97.0 98.0 101.0 Low 60.0 60.0 65.0 70.0 70.0 75.0
Current Forward 59.9 77.3 62.1 64.0 65.4 66.7 68.2
Source Bloomberg
Alberta Cash Flow Impact on Banff NAV (2)
Change in NAV per Share ($)
(3)
Discount Alberta Cash Flow Growth (Compounded Growth Rates)
Rate -4% -2% 0% 2% 4%
10% (1.65) (0.87) 0.00 0.97 2.06
Source Company projections
Notes
1. Bloomberg data as of 12/18/2014
2. Pre-tax sensitivities
3. CAGR over projects’ life
4. Data as of 12/18/2014
Relative Performance vs. SNL US Homebuilders Index since Aug. 1st: LGIH (32%), MTH (18%)
Recent Crude Selloff (4)
Equity Market Reaction Index 120
107 94 81 68
55
Jan-14 Apr-14 Aug-14 Dec-14 LGIH MTH WTI (Crude)
Source CapIQ, Bloomberg, SNL
44
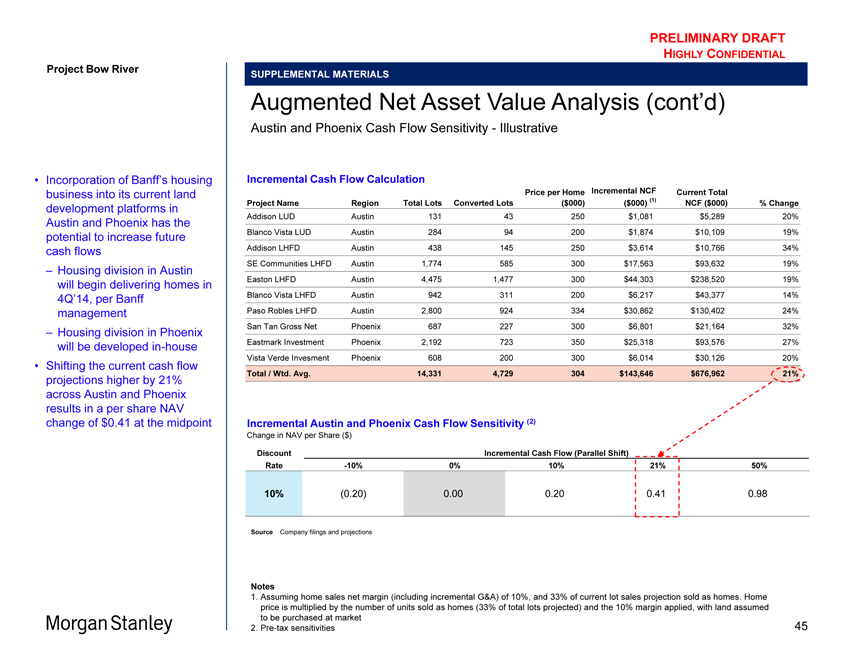
PRELIMINARY DRAFT
HIGHLY CONFIDENTIAL
Project Bow River
Incorporation of Banff’s housing business into its current land development platforms in Austin and Phoenix has the potential to increase future cash flows
– Housing division in Austin will begin delivering homes in 4Q’14, per Banff management
– Housing division in Phoenix will be developed in-house
Shifting the current cash flow projections higher by 21% across Austin and Phoenix results in a per share NAV change of $0.41 at the midpoint
SUPPLEMENTAL MATERIALS
Augmented Net Asset Value Analysis (cont’d)
Austin and Phoenix Cash Flow Sensitivity - Illustrative
Incremental Cash Flow Calculation
Price per Home Incremental NCF Current Total
Project Name Region Total Lots Converted Lots ($000) ($000) (1) NCF ($000) % Change
Addison LUD Austin 131 43 250 $1,081 $5,289 20% Blanco Vista LUD Austin 284 94 200 $1,874 $10,109 19% Addison LHFD Austin 438 145 250 $3,614 $10,766 34% SE Communities LHFD Austin 1,774 585 300 $17,563 $93,632 19% Easton LHFD Austin 4,475 1,477 300 $44,303 $238,520 19% Blanco Vista LHFD Austin 942 311 200 $6,217 $43,377 14% Paso Robles LHFD Austin 2,800 924 334 $30,862 $130,402 24% San Tan Gross Net Phoenix 687 227 300 $6,801 $21,164 32% Eastmark Investment Phoenix 2,192 723 350 $25,318 $93,576 27% Vista Verde Invesment Phoenix 608 200 300 $6,014 $30,126 20%
Total / Wtd. Avg. 14,331 4,729 304 $143,646 $676,962 21%
Incremental Austin and Phoenix Cash Flow Sensitivity (2)
Change in NAV per Share ($)
Discount Incremental Cash Flow (Parallel Shift)
Rate -10% 0% 10% 21% 50%
10% (0.20) 000. 020. 041. 098.
Source Company filings and projections
Notes
1. Assuming home sales net margin (including incremental G&A) of 10%, and 33% of current lot sales projection sold as homes. Home price is multiplied by the number of units sold as homes (33% of total lots projected) and the 10% margin applied, with land assumed to be purchased at market
2. Pre-tax sensitivities
45
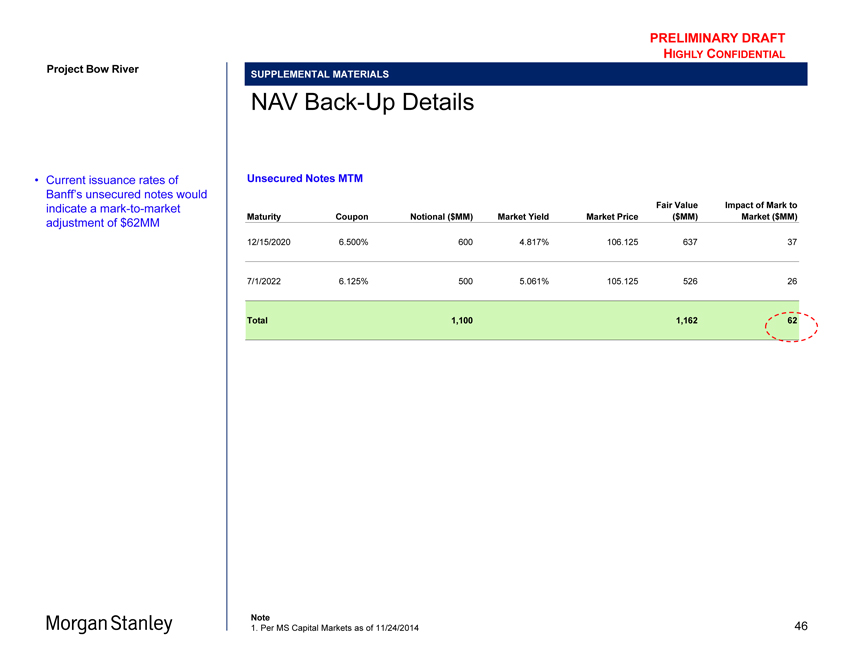
PRELIMINARY DRAFT
HIGHLY CONFIDENTIAL
Project Bow River
Current issuance rates of Banff’s unsecured notes would indicate a mark-to-market adjustment of $62MM
SUPPLEMENTAL MATERIALS
NAV Back-Up Details
Unsecured Notes MTM
Fair Value Impact of Mark to Maturity Coupon Notional ($MM) Market Yield Market Price ($MM) Market ($MM)
12/15/2020 6.500% 600 4.817% 106.125 637 37
7/1/2022 6.125% 500 5.061% 105.125 526 26
Total 1,100 1,162 62
Note
1. Per MS Capital Markets as of 11/24/2014
46
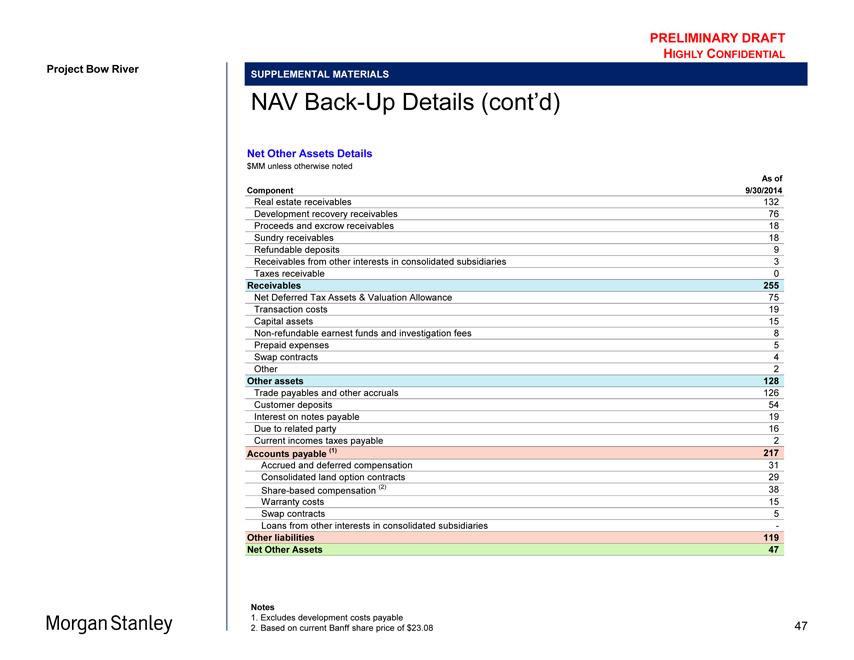
PRELIMINARY DRAFT
HIGHLY CONFIDENTIAL
Project Bow River
SUPPLEMENTAL MATERIALS
NAV Back-Up Details (cont’d)
Net Other Assets Details
$MM unless otherwise noted
As of Component 9/30/2014
Real estate receivables 132 Development recovery receivables 76 Proceeds and excrow receivables 18 Sundry receivables 18 Refundable deposits 9 Receivables from other interests in consolidated subsidiaries 3 Taxes receivable 0
Receivables 255
Net Deferred Tax Assets & Valuation Allowance 75 Transaction costs 19 Capital assets 15 Non-refundable earnest funds and investigation fees 8 Prepaid expenses 5 Swap contracts 4 Other 2
Other assets 128
Trade payables and other accruals 126 Customer deposits 54 Interest on notes payable 19 Due to related party 16 Current incomes taxes payable 2
Accounts payable (1) 217
Accrued and deferred compensation 31 Consolidated land option contracts 29 Share-based compensation (2) 38 Warranty costs 15 Swap contracts 5 Loans from other interests in consolidated subsidiaries -
Other liabilities 119 Net Other Assets 47
Notes
1. Excludes development costs payable
2. Based on current Banff share price of $23.08
47
PRELIMINARY DRAFT
HIGHLY CONFIDENTIAL
Disclaimer
We have prepared this document solely for informational purposes. You should not definitively rely upon it or use it to form the definitive basis for any decision, contract, commitment or action whatsoever, with respect to any proposed transaction or otherwise. You and your directors, officers, employees, agents and affiliates must hold this document and any oral information provided in connection with this document in strict confidence and may not communicate, reproduce, distribute or disclose it to any other person, or refer to it publicly, in whole or in part at any time except with our prior written consent. If you are not the intended recipient of this document, please delete and destroy all copies immediately.
We have prepared this document and the analyses contained in it based, in part, on certain assumptions and information obtained by us from the recipient, its directors, officers, employees, agents, affiliates and/or from other sources. Our use of such assumptions and information does not imply that we have independently verified or necessarily agree with any of such assumptions or information, and we have assumed and relied upon the accuracy and completeness of such assumptions and information for purposes of this document. Neither we nor any of our affiliates, or our or their respective officers, employees or agents, make any representation or warranty, express or implied, in relation to the accuracy or completeness of the information contained in this document or any oral information provided in connection herewith, or any data it generates and accept no responsibility, obligation or liability (whether direct or indirect, in contract, tort or otherwise) in relation to any of such information. We and our affiliates and our and their respective officers, employees and agents expressly disclaim any and all liability which may be based on this document and any errors therein or omissions therefrom. Neither we nor any of our affiliates, or our or their respective officers, employees or agents, make any representation or warranty, express or implied, that any transaction has been or may be effected on the terms or in the manner stated in this document, or as to the achievement or reasonableness of future projections, management targets, estimates, prospects or returns, if any. Any views or terms contained herein are preliminary only, and are based on financial, economic, market and other conditions prevailing as of the date of this document and are therefore subject to change. We undertake no obligation or responsibility to update any of the information contained in this document. Past performance does not guarantee or predict future performance.
This document and the information contained herein do not constitute an offer to sell or the solicitation of an offer to buy any security, commodity or instrument or related derivative, nor do they constitute an offer or commitment to lend, syndicate or arrange a financing, underwrite or purchase or act as an agent or advisor or in any other capacity with respect to any transaction, or commit capital, or to participate in any trading strategies, and do not constitute legal, regulatory, accounting or tax advice to the recipient. We recommend that the recipient seek independent third party legal, regulatory, accounting and tax advice regarding the contents of this document. This document does not constitute and should not be considered as any form of financial opinion or recommendation by us or any of our affiliates. This document is not a research report and was not prepared by the research department of Morgan Stanley or any of its affiliates.
Notwithstanding anything herein to the contrary, each recipient hereof (and their employees, representatives, and other agents) may disclose to any and all persons, without limitation of any kind from the commencement of discussions, the U.S. federal and state income tax treatment and tax structure of the proposed transaction and all materials of any kind (including opinions or other tax analyses) that are provided relating to the tax treatment and tax structure. For this purpose, “tax structure” is limited to facts relevant to the U.S. federal and state income tax treatment of the proposed transaction and does not include information relating to the identity of the parties, their affiliates, agents or advisors.
This document is provided by Morgan Stanley & Co. LLC and/or certain of its affiliates or other applicable entities, which may include Morgan Stanley Realty Incorporated, Morgan Stanley Senior Funding, Inc., Morgan Stanley Bank, N.A., Morgan Stanley & Co. International plc, Morgan Stanley Securities Limited, Morgan Stanley Bank AG, Morgan Stanley MUFG Securities Co., Ltd., Mitsubishi UFJ Morgan Stanley Securities Co., Ltd., Morgan Stanley Asia Limited, Morgan Stanley Australia Securities Limited, Morgan Stanley Australia Limited, Morgan Stanley Asia (Singapore) Pte., Morgan Stanley Services Limited, Morgan Stanley & Co. International plc Seoul Branch and/or Morgan Stanley Canada Limited Unless governing law permits otherwise, you must contact an authorized Morgan Stanley entity in your jurisdiction regarding this document or any of the information contained herein.
© Morgan Stanley and/or certain of its affiliates. All rights reserved.
Morgan Stanley
48