UNITED STATES
SECURITIES AND EXCHANGE COMMISSION
Washington, D.C. 20549
FORM N-CSR
CERTIFIED SHAREHOLDER REPORT OF REGISTERED MANAGEMENT
INVESTMENT COMPANIES
Investment Company Act file number 811‑22481
Apollo Senior Floating Rate Fund Inc.
(Exact name of registrant as specified in charter)
9 West 57th Street
New York, New York 10019
(Address of principal executive offices) (Zip code)
James Vanek, President
9 West 57th Street
New York, New York 10019
(Name and address of agent for service)
Registrant’s telephone number, including area code: (212) 515‑3200
Date of fiscal year end: December 31
Date of reporting period: June 30, 2023
Item 1. Reports to Stockholders.
| (a) | The Report to Shareholders is attached herewith. |
Apollo Senior Floating Rate Fund Inc. (NYSE: AFT)
Apollo Tactical Income Fund Inc. (NYSE: AIF)
Semi-Annual Report
June 30, 2023
(unaudited)
TABLE OF CONTENTS
Economic and market conditions change frequently.
There is no assurance that the trends described in this report will continue or commence.
This report, including the financial information herein, is transmitted to shareholders of the Funds for their information. It is not a prospectus. Past performance results shown in this report should not be considered a representation of future performance. Statements and other information herein are as dated and are subject to change.
Apollo Senior Floating Rate Fund Inc.
Apollo Tactical Income Fund Inc.
Manager Commentary
June 30, 2023 (unaudited)
Dear Shareholders,
We would like to start by saying thank you for your interest in Apollo Senior Floating Rate Fund Inc. and Apollo Tactical Income Fund Inc. (the “Funds”). We appreciate the trust and confidence you have placed with us through your investment in the Funds.
As we discussed in our annual report, although volatility remained elevated in the fixed-income markets, sentiment shifted positively in the second half of 2022 with markets stabilizing and returns for leveraged loans based on the S&P Leveraged Loan Index (S&P LII) positive for five of the last six months of the year. In the first half of 2023, the U.S. leveraged loan market was plagued by tightening credit conditions, a languishing M&A pipeline, bank contagion fears, and rising debt costs. Against such a challenging backdrop, markets have demonstrated considerable strength. Aside from a brief period of instability triggered by bank failures in March, credit markets have generally experienced upward momentum. Credit markets rose alongside equities despite persistent concerns about a pending economic slowdown later in the year and into 2024. Spreads tightened during the first half of the year, and levered credit markets rallied against a backdrop of resilient labor market data despite hawkish Federal Reserve rhetoric and policy tightening. The S&P LII outperformed its fixed coupon counterparts across high yield and investment grade, gaining approximately 6.48% year‑to‑date as of June 30, 2023, the highest reading for any comparable period since 2009. On average, loans gained 2.1% in the first six months of the year between 2010 and 2022 based on the S&P LII. Equities are the strongest performer in 2023, with year‑to‑date gains of +19.59% based on the S&P 500. High-yield bonds based on the Morningstar U.S. High-Yield Index1 and U.S. Treasuries based on the S&P U.S. 10‑year Index also participated in the rally, with January through June returns of 5.32% and 2.19%, respectively. High-yield bond yields and spreads between the Morningstar U.S. High-Yield Index and the S&P Investment Grade Corporate Bond Index2 ended June at 8.71% and 434 basis points (bps), respectively, which is 61 bps and 1 bp above their year‑to‑date low. June spreads were 434 bps compared to 511 bps at the end of 2022 and 375bps at the end of 2021. Average leveraged loan yields based on the S&P LII and spreads ended June at 9.52% and 534bps, respectively, which is 53 bps and 5 bps above their year‑to‑date lows. June spreads of 534 bps compares to the 10‑year average of 463 bps and 15‑year average of 524 bps3.
The S&P LII gained +6.48% in the first half of the year, highlighted by a calmer secondary market compared to the unprecedented pandemic in 2020 or the start of the war in Ukraine (along with rising rates, inflation, and labor shortages) in 2022. However, setting these two years aside, leveraged loan prices on average have fluctuated more in 2023 than in any other year since the Global Financial Crisis beginning in 2008. The S&P LII tracked 46 rolling seven‑day periods where loans lost or gained more than 50 bps, 26% of eligible seven‑day periods, down from 30% in 2022, but well above the 2% level in 2021. While rising rates have supported loan returns, the average bid of the S&P LII seesawed within a roughly 230 bps range so far this year, with a low point of 92.44 on January 1st and a high point of 94.71 on February 9th. June saw the strongest rally, with the weighted average bid advancing +135 bps, to close the quarter at 94.24. Year‑to‑date, the average bid has gained 180bps. Loan fund outflows, along with asset rotations, helped to keep loan prices depressed. Except for the week of June 7th, data showed 33 consecutive weeks of outflows from loan mutual funds and ETFs through June 28th, totaling $20.6 billion4. Investors have withdrawn $13.3 billion from the asset class year‑to‑date, versus a $12.0 billion inflow at the same time last year. Loan fund withdrawals were not the only factor impacting loan prices, as capital markets activity has remained muted and well below the past decades’ pace. Issuance ex‑refinancing/repricing has averaged only $5 billion per month over the past seven months, versus $34 billion per month in 2021. Even though the cost of the debt in the new‑issue market has increased substantially, the average nominal spread of outstanding loans based on the S&P LII has not changed significantly. As of June 30, the weighted average nominal spread of loans in the S&P LII stood at 364 bps versus 358 bps at the end of 2022. In our view, this is due to the lack of new supply, which translates into a very low share of new deals in the overall Index constituency. CLO supply has not provided much support to the asset class, as U.S. CLO volume in the second quarter dropped to its lowest level since the depths of the Covid‑19 pandemic, as elevated deal costs and the ongoing absence of money-center bank investment demand worsened issuance conditions. With broadly syndicated loan (BSL) CLO pricings relatively scarce ($55.2 billion/‑25% from last year), both Barclays and JP Morgan reduced their initial 2023 CLO issuance forecasts, citing ongoing challenges for managers to ramp deals in the face of elevated debt spreads and rising asset costs that have lowered arbitrage levels to their lowest in three years.
One important theme that emerged in the second half of 2022 and continued into 2023 was price decompression across the credit quality spectrum. This was exacerbated by the rising rates environment, as the potential effects of
| 1 | Morningstar U.S. High-Yield Index |
| 2 | JP Morgan High Yield Bond and Leveraged Loan Market Monitor, July 5, 2023 |
| 3 | JP Morgan High Yield Bond and Leveraged Loan Market Monitor, July 5, 2023 |
| 4 | PitchBook Data / LCD June Wrap |
Semi-Annual Report | 1
Apollo Senior Floating Rate Fund Inc.
Apollo Tactical Income Fund Inc.
Manager Commentary (continued)
June 30, 2023 (unaudited)
slower growth on credit quality, particularly for lower rated and higher levered issuers, began to wane on investor confidence. A record 36% S&P LII loans belong to borrowers rated B‑minus or lower, default rates are rising at the fastest clip since the 2020 pandemic (although below the historical average), and other stress indicators are flashing red, such as falling interest coverage ratios and increased downgrade‑to‑upgrade ratios. The uptick in B‑minus rated issuers to 36% of the S&P LII in June from 31.5% a year ago has pressured lower-rated credits and remains a concern, especially for the ratings-conscious CLO investor base5. The potential lack of demand for B rated issuers is, in our view, representative of deteriorating growth prospects and increasing cost of capital as a result of rising rates, and both factors are contributing to perceived downgrade and default risks. The trailing 12‑month default rate, measured by dollar amount of defaulted securities. rose by 99 bps, to 1.71%6. This is well below the long-term average of 2.7% since 1998, but the largest rise over a six‑month period since 2014. That said, loan prices for all rating cohorts have remained resilient, with the average bid for CCC rated loans rising 4 points (pts) year‑to‑date to 78.30, with B and BB rated issuers following suit, rising 3 pts and 1 pt year‑to‑date, respectively. In line with continued trends from the end of 2022, default and distressed exchange activity has been elevated in 2023, as rising borrowing costs and closed capital markets make it difficult for issuers to refinance near term maturities. The monthly average of $8.7 billion of bonds/loans affected by default/distressed exchange activity in 2023 compared to $2.6 billion across 2021/22 and $4.1 billion post the 2008 financial crisis. The combined total of $52.0 billion defaults/distressed exchanges already in 2023 exceeds last year’s $47.8 billion full-year total and quadruples 2021’s full-year 14‑year low of $13.9 billion7.
In terms of navigating this environment, we’re focused on high quality credit selection and risk mitigation, refinancing and downgrade risk, and being cautious of certain sectors that appear more vulnerable to negative macro trends (such as persistent inflation, the weakened consumer, and worsening credit metrics for lower-rated issuers). Although the syndicated markets have begun stepping back in to finance certain situations, 2023 has showcased Apollo’s origination capabilities and our ability to craft creative financing solutions for our corporate and sponsor counterparties. We are engaged with a growing number of companies and sponsors searching for alternative financing in a compelling private credit market that offers the benefits of speed, certainty, and flexibility. In such volatile environments and periods of uncertainty, it is our view that the weight and scale of the broader Apollo platform will present compelling opportunities that would otherwise be unavailable in normalized markets, and we are well positioned to seize and create these opportunities.
We appreciate your interest and support in the Funds. If you have any questions about the Funds, please call 1‑877‑864‑4834, or visit our website at www.apollofunds.com.
Sincerely,
Apollo Credit Management, LLC
| 5 | PitchBook Data / LCD June Wrap |
| 6 | PitchBook Data / LCD June Wrap |
| 7 | JP Morgan High Yield Bond and Leveraged Loan Market Monitor, July 5, 2023 |
2 | Semi-Annual Report
Apollo Senior Floating Rate Fund Inc.
Financial Data
June 30, 2023 (unaudited)
| | | | | |
Portfolio Composition (as % of Current Market
Value of Investment Securities) |
|
| |
| Loans | | | | 91.0% | |
| High Yield Bonds | | | | 8.4% | |
| Equity/Other | | | | 0.6% | |
|
| |
| Portfolio Characteristics(a) |
|
| |
| Weighted Average Floating-Rate Spread | | | | 4.79% | |
| Weighted Average Fixed-Rate Coupon | | | | 7.47% | |
| Weighted Average Maturity (in years) (floating assets) | | | | 4.59 | |
| Weighted Average Maturity (in years) (fixed assets) | | | | 5.55 | |
Weighted Average Modified Duration (in years)
(fixed assets) | | | | 4.08 | |
Weighted Average Modified Duration (in years)(e) | | | | 3.53 | |
Average Position Size by Issuer(f) | | | $ | 3,951,744 | |
Number of Issuers(f) | | | | 93 | |
Weighted Average S&P Rating(g) | | | | B | |
Weighted Average Rating Factor (Moody’s)(g) | | | | 3,146 | |
|
| |
| Credit Quality(b) |
|
| |
| BB | | | | 3.0% | |
| B | | | | 67.7% | |
| CCC+ or Lower | | | | 10.0% | |
| Not Rated | | | | 19.3% | |
| | | | | |
Top 5 Industries (as % of Current Market Value of
Investment Securities)(c) |
|
| |
| High Tech Industries | | | | 19.7% | |
| Services: Business | | | | 15.6% | |
| Healthcare & Pharmaceuticals | | | | 12.9% | |
| Banking, Finance, Insurance & Real Estate | | | | 9.5% | |
| Chemicals, Plastics, & Rubber | | | | 5.6% | |
| Total | | | | 63.3% | |
|
| |
Top 10 Issuers (as % of Current Market Value of
Investment Securities)(d) |
|
| |
| Garda World Security Corp. | | | | 3.0% | |
| UKG, Inc. | | | | 2.5% | |
| Solera, LLC | | | | 2.4% | |
| Gainwell Acquisition Corp. | | | | 2.4% | |
| DCert Buyer, Inc. | | | | 2.4% | |
| Peraton Corp. | | | | 2.1% | |
| Trident TPI Holdings, Inc. | | | | 2.1% | |
| LBM Acquisition, LLC | | | | 2.1% | |
| Howden Group Holdings, Ltd. | | | | 2.0% | |
| McGraw-Hill Education, Inc. | | | | 1.9% | |
| Total | | | | 22.9% | |
| (a) | Averages based on par value of investment securities, except for the weighted average modified duration, which is based on market value. |
| (b) | Credit quality is calculated as a percentage of fair value of investment securities at June 30, 2023. The quality ratings reflected were issued by S&P Global Ratings (“S&P”), an internationally recognized statistical rating organization. Credit quality ratings reflect the rating agency’s opinion of the credit quality of the underlying positions in the Fund’s portfolio and not that of the Fund itself. Credit quality ratings are subject to change. |
| (c) | The industry classifications reported are from widely recognized market indexes or rating group indexes, and/or as defined by Fund management, with the primary source being Moody’s Investors Service (“Moody’s”), an internationally recognized statistical rating organization. |
| (d) | Holdings are subject to change and are provided for informational purposes only. |
| (e) | Excludes equity investments and includes fixed and floating rate assets. |
| (f) | Excludes equity investments. |
| (g) | Excludes securities with no rating or non-performing defaulted securities as of June 30, 2023. |
Semi-Annual Report | 3
Apollo Senior Floating Rate Fund Inc.
Fund Performance
June 30, 2023 (unaudited)
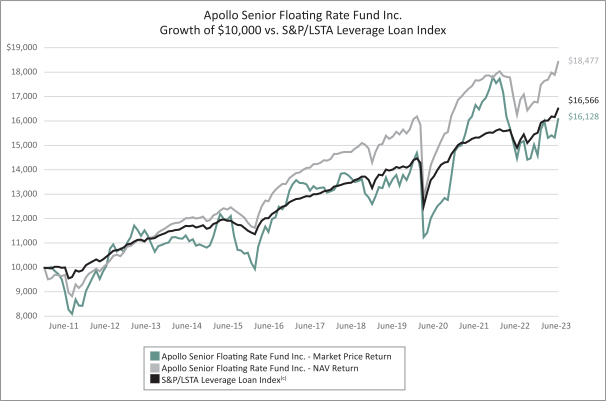
Apollo Senior Floating Rate Fund Inc. (“AFT”) returned 9.87% on a net asset value per share basis and 10.29% on a market price per share basis for the period ending June 30, 2023, outperforming the S&P/LSTA Leveraged Loan Index, which returned 6.48% for the period. As of June 30, 2023, AFT held 91.0% of its fair value of investment securities in first and second lien leveraged loans, 8.4% in high-yield bonds and 0.6% in equities and other securities. Outperformance in AFT relative to the index was driven mostly through credit selection as a number of idiosyncratic opportunities and events resulted in excess returns. Additionally, AFT was overweight B and CCC rated credits relative to the index, which also outperformed over the year.
| | | | | | | | | | | | | | | | | | | | |
| Performance Comparison | | | | | | | | |
|
| |
| | YTD | | 5 Yr | | 10 Yr | | Since
Inception(d) |
| AFT - Market Price | | | | 10.29% | (a) | | | | 3.33% | (a)(b) | | | | 3.40% | (a)(b) | | | | 3.95% | (a)(b) |
| AFT - NAV | | | | 9.87% | (a) | | | | 4.58% | (a)(b) | | | | 5.26% | (a)(b) | | | | 5.49% | (a)(b) |
S&P/LSTA Leveraged Loan Index(c) | | | | 6.48% | | | | | 4.13% | (b) | | | | 4.07% | (b) | | | | 4.16% | (b) |
| | | | | |
| | | | | |
| Distributions(e) |
|
| |
| Current Monthly Distribution (per share) | | | | $0.118 | |
Current Distribution Rate at Market Price(f) | | | | 10.97 | % |
Current Distribution Rate at NAV(f) | | | | 9.57 | % |
| (a) | Performance reflects total return assuming all distributions were reinvested at the dividend reinvestment rate. Past performance does not necessarily indicate how the Fund will perform in the future. The performance information provided does not reflect the deduction of taxes that a shareholder would pay on distributions received from the Fund. |
| (c) | The S&P/LSTA Leveraged Loan Index is a broad index designed to reflect the performance of the U.S. dollar facilities in the leveraged loan market. |
| (d) | Inception date February 23, 2011. |
| (e) | All or a portion of the Fund’s distributions may be comprised of ordinary income, capital gains and/or return of capital. Refer to Note 7 in the Notes to the Consolidated Financial Statements. |
| (f) | Distribution rates represent the latest declared regular distribution, annualized, relative to the most recent month-end market price and NAV. Special distributions are not included in the calculation. |
4 | Semi-Annual Report
Apollo Tactical Income Fund Inc.
Financial Data
June 30, 2023 (unaudited)
| | | | | |
Portfolio Composition (as % of Current Market Value of Investment Securities) |
|
| |
| Loans | | | | 72.0% | |
| High Yield Bonds | | | | 20.6% | |
| Structured Products | | | | 7.0% | |
| Equity/Other | | | | 0.4% | |
|
| |
| Portfolio Characteristics(a) |
|
| |
| Weighted Average Floating-Rate Spread | | | | 5.41% | |
| Weighted Average Fixed-Rate Coupon | | | | 6.99% | |
| Weighted Average Maturity (in years) (floating assets) | | | | 5.11 | |
| Weighted Average Maturity (in years) (fixed assets) | | | | 5.05 | |
| Weighted Average Modified Duration (in years) (fixed assets) | | | | 3.94 | |
Weighted Average Modified Duration (in years)(e) | | | | 3.57 | |
Average Position Size by Issuer(f) | | | $ | 3,567,840 | |
Number of Issuers(f) | | | | 96 | |
Weighted Average S&P Rating(g) | | | | B | |
Weighted Average Rating Factor (Moody’s)(g) | | | | 3,241 | |
|
| |
| Credit Quality (b) |
|
| |
| BB | | | | 11.8% | |
| B | | | | 46.1% | |
| CCC+ or Lower | | | | 13.2% | |
| Not Rated | | | | 28.9% | |
| | | | | |
Top 5 Industries (as % of Current Market Value of
Investment Securities)(c) |
|
| |
| High Tech Industries | | | | 18.9% | |
| Healthcare & Pharmaceuticals | | | | 14.1% | |
| Banking, Finance, Insurance & Real Estate | | | | 7.7% | |
| Services: Business | | | | 7.5% | |
| Media: Advertising, Printing, & Publishing | | | | 7.0% | |
| Total | | | | 55.2% | |
|
| |
Top 10 Issuers (as % of Current Market Value of
Investment Securities)(d) | | |
|
| |
| Howden Group Holdings, Ltd. | | | | 2.7% | |
| Gainwell Acquisition Corp. | | | | 2.7% | |
| Churchill Middle Market CLO, Ltd. | | | | 2.6% | |
| DCert Buyer, Inc. | | | | 2.4% | |
| Peraton Corp. | | | | 2.4% | |
| Solera, LLC | | | | 2.2% | |
| Mavis Tire Express Services Corp. | | | | 2.1% | |
| Inovalon Holdings, Inc. | | | | 2.0% | |
| Fortress Credit CLO, Ltd. | | | | 2.0% | |
| PetSmart, Inc. | | | | 2.0% | |
| Total | | | | 23.1% | |
| (a) | Averages based on par value of investment securities, except for the weighted average modified duration, which is based on market value. |
| (b) | Credit quality is calculated as a percentage of fair value of investment securities at June 30, 2023. The quality ratings reflected were issued by S&P, an internationally recognized statistical rating organization. Credit quality ratings reflect the rating agency’s opinion of the credit quality of the underlying positions in the Fund’s portfolio and not that of the Fund itself. Credit quality ratings are subject to change. |
| (c) | The industry classifications reported are from widely recognized market indexes or rating group indexes, and/or as defined by Fund management, with the primary source being Moody’s, an internationally recognized statistical rating organization. The Top 5 Industries table above excludes Structured Products which represents 7.0% of the portfolio as of June 30, 2023. |
| (d) | Holdings are subject to change and are provided for informational purposes only. |
| (e) | Excludes equity investments and includes fixed and floating rate assets. |
| (f) | Excludes equity investments. |
| (g) | Excludes securities with no rating or in default as of June 30, 2023. |
Semi-Annual Report | 5
Apollo Tactical Income Fund Inc.
Fund Performance
June 30, 2023 (unaudited)
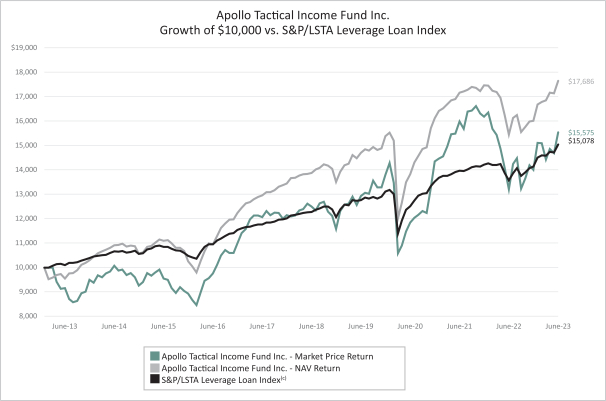
Apollo Tactical Income Fund Inc. (“AIF”) returned 10.24% on a net asset value per share basis and 10.94% on a market price per share basis for the period ending June 30, 2023, outperforming the S&P/LSTA Leveraged Loan Index, which returned 6.48% for the period. As of June 30, 2023, AIF held 72.0% of its fair value of investment securities in first and second lien leveraged loans, 20.6% in high-yield bonds, 7.0% in collateralized loan obligations (“CLOs”), and 0.4% in equities and other securities. In addition to credit selection, which contributed to most of the outperformance, AIF was also overweight B and CCC rated credits which helped to improve performance.
| | | | | | | | | | | | | | | | | | | | |
| Performance Comparison |
|
| |
| | YTD | | 5 Yr | | 10 Yr | | Since
Inception(d) |
| AIF - Market Price | | | | 10.94 | %(a) | | | | 4.47 | %(a)(b) | | | | 5.46 | %(a)(b) | | | | 4.38 | %(a)(b) |
| AIF - NAV | | | | 10.24 | %(a) | | | | 4.93 | %(a)(b) | | | | 6.35 | %(a)(b) | | | | 6.14 | %(a)(b) |
S&P/LSTA Leveraged Loan Index(c) | | | | 6.48 | % | | | | 4.13 | %(b) | | | | 4.07 | %(b) | | | | 4.03 | %(b) |
| | | | | | | | | | | | | | | |
| Distributions(e) |
| Current Monthly Distribution (per share) | | | | | | | | | | | | | | $0.122 | |
Current Distribution Rate at Market Price(f) | | | | | | | | | | | | | | 11.54 | % |
Current Distribution Rate at NAV(f) | | | | | | | | | | | | | | 10.16 | % |
| (a) | Performance reflects total return assuming all distributions were reinvested at the dividend reinvestment rate. Past performance does not necessarily indicate how the Fund will perform in the future. The performance information provided does not reflect the deduction of taxes that a shareholder would pay on distributions received from the Fund. |
| (c) | The S&P/LSTA Leveraged Loan Index is a broad index designed to reflect the performance of the U.S. dollar facilities in the leveraged loan market. |
| (d) | Inception date February 25, 2013. |
| (e) | All or a portion of the Fund’s distributions may be comprised of ordinary income, capital gains and/or return of capital. Refer to Note 7 in the Notes to the Consolidated Financial Statements. |
| (f) | Distribution rates represent the latest declared regular distribution, annualized, relative to the most recent month-end market price and NAV. Special distributions are not included in the calculation. |
6 | Semi-Annual Report
Apollo Senior Floating Rate Fund Inc.
Consolidated Schedule of Investments
June 30, 2023 (unaudited)
| | | | | | | | |
| | |
| | Principal
Amount ($) | | | Value ($) | |
| | | | | | | | |
Senior Loans - 136.7%(a) | |
| | |
| AEROSPACE & DEFENSE - 4.2% | | | | | | |
| | |
| Peraton Corporation | | | | | | | | |
First Lien Term Loan B, (1M SOFR + 3.75%, 0.75% Floor), 8.95%, 02/01/28(c) | | | 7,486,877 | | | | 7,370,568 | |
| Vertex Aerospace Services Corp. | | | | | | | | |
First Lien Term Loan, (1M SOFR + 3.75%, 0.75% Floor), 8.95%, 12/06/28(c) | | | 2,285,105 | | | | 2,287,493 | |
| | | | | | | | |
| | | | | | | 9,658,061 | |
| | | | | | | | |
|
| BANKING, FINANCE, INSURANCE & REAL ESTATE - 14.0% | |
| | |
| Alliant Holdings Intermediate, LLC | | | | | | | | |
First Lien Term Loan B4, (1M LIBOR + 3.50%, 0.50% Floor), 8.65%, 11/05/27(c) | | | 4,366,599 | | | | 4,346,316 | |
| | |
| Apex Group Treasury, LLC | | | | | | | | |
First Lien Term Loan, (3M SOFR + 5.00%, 0.50% Floor), 9.99%, 07/27/28(c) | | | 1,554,688 | | | | 1,548,857 | |
First Lien Term Loan, (3M LIBOR + 3.75%, 0.50% Floor), 9.07%, 07/27/28(c) | | | 2,926,729 | | | | 2,893,804 | |
| | |
| Asurion, LLC | | | | | | | | |
First Lien Term Loan B10, (1M SOFR + 4.00%, 0.00% Floor), 9.20%, 08/19/28(c) | | | 992,500 | | | | 941,942 | |
First Lien Term Loan B11, (1M SOFR + 4.25%, 0.00% Floor), 9.45%, 08/19/28(b)(c) | | | 1,479,410 | | | | 1,410,529 | |
Second Lien Term Loan B4, (1M SOFR + 5.20%, 0.00% Floor), 10.47%, 01/20/29(c) | | | 3,866,174 | | | | 3,253,115 | |
| | |
| Howden Group Holdings Ltd (United Kingdom) | | | | | | | | |
First Lien Term Loan, (1M SOFR + 5.25%, 0.75% Floor), 10.35%, 11/12/27(c)(d)(e) | | | 7,000,000 | | | | 7,000,000 | |
| | |
| SG Acquisition, Inc. | | | | | | | | |
First Lien Incremental Term Loan, (1M SOFR + 6.00%, 0.50% Floor), 11.20%, 01/27/27(c)(d) | | | 4,000,000 | | | | 3,920,000 | |
First Lien Term Loan, (1M SOFR + 6.00%, 0.50% Floor), 11.20%, 01/27/27(c)(d) | | | 851,064 | | | | 834,043 | |
| | |
| The Edelman Financial Center, LLC | | | | | | | | |
First Lien Term Loan B, (1M LIBOR + 3.75%, 0.75% Floor), 8.94%, 04/07/28(c) | | | 2,239,006 | | | | 2,187,095 | |
Second Lien Term Loan, (1M LIBOR + 6.75%, 0.00% Floor), 11.94%, 07/20/26(c) | | | 3,993,954 | | | | 3,869,642 | |
| | | | | | | | |
| | | | | | | 32,205,343 | |
| | | | | | | | |
| | | | | | | | |
| | |
| | Principal
Amount ($) | | | Value ($) | |
| | | | | | | | |
|
| CAPITAL EQUIPMENT - 2.7% | |
| | |
| Safe Fleet Holdings, LLC | | | | | | | | |
First Lien Term Loan, (1M SOFR + 3.75%, 0.50% Floor), 8.93%, 02/23/29(c) | | | 994,962 | | | | 995,584 | |
First Lien Term Loan, (1M SOFR + 5.00%, 0.50% Floor), 10.18%, 02/23/29(c) | | | 396,000 | | | | 396,000 | |
Second Lien Term Loan, (1M LIBOR + 6.75%, 1.00% Floor), 11.94%, 02/02/26(c) | | | 1,403,846 | | | | 1,311,894 | |
| | |
| SPX Flow, Inc. | | | | | | | | |
First Lien Term Loan, (1M SOFR + 4.50%, 0.50% Floor), 9.70%, 04/05/29(c) | | | 3,447,336 | | | | 3,411,432 | |
| | | | | | | | |
| | | | | | | 6,114,910 | |
| | | | | | | | |
|
| CHEMICALS, PLASTICS, & RUBBER - 8.1% | |
| | |
| Geon Performance Solutions, LLC | | | | | | | | |
First Lien Term Loan B, (3M LIBOR + 4.50%, 0.75% Floor), 10.04%, 08/18/28(c) | | | 3,283,892 | | | | 3,243,877 | |
| | |
| LSF11 A5 Holdco LLC | | | | | | | | |
First Lien Term Loan, (1M SOFR + 3.50%, 0.50% Floor), 8.72%, 10/15/28(c) | | | 3,733,650 | | | | 3,686,401 | |
First Lien Term Loan, (1M SOFR + 4.25%, 0.50% Floor), 9.45%, 10/15/28(c) | | | 2,874,897 | | | | 2,858,136 | |
| | |
| Luxembourg Investment Company 428 SARL (Luxembourg) | | | | | | | | |
First Lien Term Loan B, (3M SOFR + 5.00%, 0.50% Floor), 10.39%, 01/03/29(c)(e) | | | 4,695,549 | | | | 3,495,250 | |
| | |
| Olympus Water US Holding Corporation | | | | | | | | |
First Lien Incremental Term Loan, (SOFR + 5.00%, 0.50% Floor), 5.50%, 11/09/28(b)(c) | | | 909,000 | | | | 881,162 | |
First Lien Term Loan, (3M SOFR + 4.50%, 0.50% Floor), 9.84%, 11/09/28(c) | | | 2,776,233 | | | | 2,684,700 | |
First Lien Term Loan, (3M SOFR + 3.75%, 0.50% Floor), 9.25%, 11/09/28(c) | | | 423,201 | | | | 407,595 | |
| | |
| W.R. Grace Holdings, LLC | | | | | | | | |
First Lien Term Loan B, (3M LIBOR + 3.75%, 0.50% Floor), 9.31%, 09/22/28(c) | | | 1,428,482 | | | | 1,422,361 | |
| | | | | | | | |
| | | | | | | 18,679,482 | |
| | | | | | | | |
| |
| CONSTRUCTION & BUILDING - 0.8% | | | | |
| | |
| Cornerstone Building Brands, Inc. | | | | | | | | |
First Lien Term Loan, (1M SOFR + 5.63%, 0.50% Floor), 10.77%, 08/01/28(c) | | | 1,992,517 | | | | 1,917,798 | |
| | | | | | | | |
See accompanying Notes to Consolidated Financial Statements. | 7
Apollo Senior Floating Rate Fund Inc.
Consolidated Schedule of Investments (continued)
June 30, 2023 (unaudited)
| | | | | | | | |
| | |
| | Principal
Amount ($) | | | Value ($) | |
| | | | | | | | |
Senior Loans(a) (continued) | |
|
| CONSUMER GOODS: NON‑DURABLE - 3.2% | |
| | |
| ABG Intermediate Holdings 2 LLC | | | | | | | | |
First Lien Term Loan, (1M SOFR + 3.50%, 0.50% Floor), 8.70%, 12/21/28(c) | | | 2,359,726 | | | | 2,353,237 | |
First Lien Term Loan B2, (1M SOFR + 4.00%, 0.00% Floor), 9.20%, 12/21/28(c) | | | 1,694,444 | | | | 1,692,962 | |
Second Lien Term Loan, (1M SOFR + 6.00%, 0.50% Floor), 11.20%, 12/20/29(c) | | | 1,710,576 | | | | 1,599,388 | |
| Iconix Brand Group | | | | | | | | |
First Lien Term Loan, (3M SOFR + 6.00%, 1.00% Floor), 11.39%, 08/22/29(c)(d) | | | 1,811,538 | | | | 1,775,308 | |
| | | | | | | | |
| | | | | | | 7,420,895 | |
| | | | | | | | |
|
| CONTAINERS, PACKAGING & GLASS - 6.1% | |
| Anchor Glass Container Corp. | | | | | | | | |
First Lien Incremental Term Loan, (6M LIBOR + 5.00%, 1.00% Floor), 10.21%, 12/07/23(c) | | | 1,570,174 | | | | 1,224,736 | |
First Lien Term Loan, (6M LIBOR + 2.75%, 1.00% Floor), 8.04%, 12/07/23(c) | | | 4,221,080 | | | | 3,256,817 | |
| Berlin Packaging L.L.C. | | | | | | | | |
First Lien Term Loan B, (1M LIBOR + 3.75%, 0.50% Floor), 8.98%, 03/11/28(c) | | | 2,303,741 | | | | 2,269,669 | |
| Trident TPI Holdings, Inc. | | | | | | | | |
First Lien Incremental Term Loan, (3M SOFR + 5.25%, 0.50% Floor), 10.49%, 09/15/28(c) | | | 1,327,545 | | | | 1,316,480 | |
First Lien Term Loan B3, (3M LIBOR + 4.00%, 0.50% Floor), 9.54%, 09/15/28(c) | | | 5,980,501 | | | | 5,899,346 | |
| | | | | | | | |
| | | | | | | 13,967,048 | |
| | | | | | | | |
|
| ENVIRONMENTAL INDUSTRIES - 2.6% | |
| Dispatch Acquisition Holdings, LLC | | | | | | | | |
First Lien Term Loan, (3M SOFR + 4.63%, 0.75% Floor), 10.02%, 03/27/28(c) | | | 495,000 | | | | 443,025 | |
First Lien Term Loan B, (3M SOFR + 4.25%, 0.75% Floor), 9.64%, 03/27/28(c) | | | 2,940,000 | | | | 2,631,300 | |
| LTR Intermediate Holdings, Inc. | | | | | | | | |
First Lien Term Loan, (1M LIBOR + 4.50%, 1.00% Floor), 9.72%, 05/05/28(c) | | | 3,194,351 | | | | 2,853,625 | |
| | | | | | | | |
| | | | | | | 5,927,950 | |
| | | | | | | | |
|
| FOREST PRODUCTS & PAPER - 0.3% | |
| Spa US Holdco, Inc. (Finland) | | | | | | | | |
First Lien Term Loan B, (3M LIBOR + 3.75%, 0.75% Floor), 9.29%, 02/04/28(c)(e) | | | 656,539 | | | | 616,736 | |
| | | | | | | | |
| | | | | | | | |
| | |
| | Principal
Amount ($) | | | Value ($) | |
| | | | | | | | |
|
| HEALTHCARE & PHARMACEUTICALS - 18.7% | |
| Advarra Holdings, Inc. | | | | | | | | |
First Lien Term Loan, (1M SOFR + 5.75%, 0.75% Floor), 10.85%, 08/24/29(c)(d) | | | 6,387,750 | | | | 6,323,872 | |
| Athenahealth, Inc. | | | | | | | | |
First Lien Term Loan B, (1M SOFR + 3.50%, 0.50% Floor), 8.59%, 02/15/29(c) | | | 5,266,106 | | | | 5,081,793 | |
| Azurity Pharmaceuticals, Inc. | | | | | | | | |
First Lien Term Loan B, (1M LIBOR + 6.00%, 0.75% Floor), 11.22%, 09/20/27(c) | | | 1,982,142 | | | | 1,917,722 | |
| Bausch Health Companies, Inc. | | | | | | | | |
First Lien Term Loan B, (1M SOFR + 5.25%, 0.50% Floor), 10.44%, 02/01/27(b)(c) | | | 4,564,825 | | | | 3,461,507 | |
| Gainwell Acquisition Corporation | | | | | | | | |
First Lien Term Loan B, (3M SOFR + 4.00%, 0.75% Floor), 9.34%, 10/01/27(c) | | | 8,520,188 | | | | 8,403,035 | |
| Loire Finco Luxembourg SARL (United Kingdom) | | | | | | | | |
First Lien Term Loan B, (1M SOFR + 3.50%, 0.75% Floor), 8.60%, 04/21/27(c)(e) | | | 1,955,447 | | | | 1,906,561 | |
| LSCS Holdings, Inc. | | | | | | | | |
First Lien Term Loan, (1M LIBOR + 4.50%, 0.50% Floor), 9.69%, 12/16/28(c) | | | 2,011,256 | | | | 1,968,516 | |
| Medical Solutions Holdings, Inc. | | | | | | | | |
First Lien Term Loan, (3M SOFR + 3.25%, 0.50% Floor), 8.61%, 11/01/28(c) | | | 4,471,225 | | | | 4,211,894 | |
| Phoenix Newco, Inc. | | | | | | | | |
First Lien Term Loan, (1M LIBOR + 3.25%, 0.50% Floor), 8.47%, 11/15/28(c) | | | 3,984,874 | | | | 3,958,972 | |
| Resonetics, LLC | | | | | | | | |
First Lien Term Loan, (6M LIBOR + 4.00%, 0.75% Floor), 9.10%, 04/28/28(c) | | | 3,930,000 | | | | 3,828,075 | |
| Zest Acquisition Corp. | | | | | | | | |
First Lien Term Loan, (1M SOFR + 5.50%, 0.00% Floor), 10.64%, 02/08/28(c) | | | 1,995,000 | | | | 1,925,175 | |
| | | | | | | | |
| | | | | | | 42,987,122 | |
| | | | | | | | |
|
| HIGH TECH INDUSTRIES - 27.0% | |
| Anaplan, Inc. | | | | | | | | |
First Lien Term Loan, (1M SOFR + 6.50%, 0.75% Floor), 11.60%, 06/21/29(c)(d) | | | 5,650,529 | | | | 5,622,276 | |
| Avalara, Inc. | | | | | | | | |
First Lien Term Loan, (3M SOFR + 7.25%, 0.75% Floor), 12.49%, 10/19/28(c)(d) | | | 4,545,455 | | | | 4,477,273 | |
| Capstone Borrower, Inc. | | | | | | | | |
First Lien Term Loan, (3M SOFR + 3.75%, 0.00% Floor), 9.00%, 06/17/30(c) | | | 2,896,320 | | | | 2,843,824 | |
8 | See accompanying Notes to Consolidated Financial Statements.
Apollo Senior Floating Rate Fund Inc.
Consolidated Schedule of Investments (continued)
June 30, 2023 (unaudited)
| | | | | | | | |
| | |
| | Principal
Amount ($) | | | Value ($) | |
| | | | | | | | |
Senior Loans(a) (continued) | |
|
| HIGH TECH INDUSTRIES (continued) | |
| Cloud Software Group, Inc. | | | | | | | | |
First Lien Term Loan A, (3M SOFR + 4.50%, 0.50% Floor), 9.84%, 09/29/28(c) | | | 4,985,980 | | | | 4,680,189 | |
| Coupa Software, Inc. | | | | | | | | |
First Lien Term Loan, (1M SOFR + 7.50%, 0.75% Floor), 12.60%, 02/27/30(c)(d) | | | 2,591,455 | | | | 2,526,668 | |
| DCert Buyer, Inc. | | | | | | | | |
First Lien Term Loan, (3M SOFR + 4.00%, 0.00% Floor), 9.26%, 10/16/26(c) | | | 4,592,310 | | | | 4,560,026 | |
Second Lien Term Loan, (3M SOFR + 7.00%, 0.00% Floor), 12.26%, 02/19/29(c) | | | 3,927,401 | | | | 3,619,767 | |
| Electronics for Imaging, Inc. | | | | | | | | |
First Lien Term Loan, (6M LIBOR + 5.00%, 0.00% Floor), 10.21%, 07/23/26(c) | | | 4,897,059 | | | | 3,350,396 | |
| Flexera Software LLC | | | | | | | | |
First Lien Term Loan B, (1M SOFR + 3.75%, 0.75% Floor), 8.97%, 03/03/28(c) | | | 3,364,012 | | | | 3,320,902 | |
| Imperva, Inc. | | | | | | | | |
First Lien Term Loan, (3M LIBOR + 4.00%, 1.00% Floor), 9.34%, 01/12/26(c) | | | 5,451,253 | | | | 4,950,419 | |
| Imprivata, Inc. | | | | | | | | |
Second Lien Term Loan, (1M SOFR + 6.25%, 0.50% Floor), 11.35%, 12/01/28(c)(d) | | | 2,205,882 | | | | 2,117,647 | |
| Riverbed Technology, Inc. | | | | | | | | |
First Lien Exit Term Loan, (2.00% PIK), (3M LIBOR + 6.00%, 1.00% Floor), 2.00%, 12/07/26(c)(f)(g) | | | 838,660 | | | | 227,696 | |
| Sovos Compliance, LLC | | | | | | | | |
First Lien Term Loan, (1M SOFR + 4.50%, 0.50% Floor), 9.72%, 08/11/28(c) | | | 3,459,294 | | | | 3,346,556 | |
| UKG, Inc. | | | | | | | | |
First Lien Term Loan, (3M SOFR + 3.75%, 0.00% Floor), 8.90%, 05/04/26(c) | | | 7,592,004 | | | | 7,500,938 | |
Second Lien Term Loan, (3M SOFR + 5.25%, 0.50% Floor), 10.62%, 05/03/27(c) | | | 1,000,000 | | | | 972,500 | |
| Virtusa Corporation | | | | | | | | |
First Lien Term Loan, (1M SOFR + 3.75%, 0.75% Floor), 8.95%, 02/15/29(c) | | | 3,730,302 | | | | 3,692,999 | |
| Zendesk, Inc. | | | | | | | | |
First Lien Term Loan, (3.50% PIK), (3M SOFR + 7.00%, 0.75% Floor), 12.25%, 11/22/28(c)(d)(f) | | | 4,458,274 | | | | 4,391,400 | |
| | | | | | | | |
| | | | | | | 62,201,476 | |
| | | | | | | | |
|
| HOTEL, GAMING & LEISURE - 2.3% | |
| Fertitta Entertainment, LLC | | | | | | | | |
First Lien Term Loan B, (1M SOFR + 4.00%, 0.50% Floor), 9.10%, 01/27/29(c) | | | 5,428,494 | | | | 5,367,993 | |
| | | | | | | | |
| | | | | | | | |
| | |
| | Principal
Amount ($) | | | Value ($) | |
| | | | | | | | |
|
| MEDIA: ADVERTISING, PRINTING & PUBLISHING - 7.1% | |
| Associations Inc. | | | | | | | | |
First Lien Term Loan, (2.50% PIK), (3M SOFR + 6.50%, 1.00% Floor), 11.72%, 07/02/27(c)(d)(f) | | | 3,076,768 | | | | 3,076,768 | |
| Houghton Mifflin Harcourt Company | | | | | | | | |
First Lien Term Loan B, (1M SOFR + 5.25%, 0.50% Floor), 10.45%, 04/09/29(c) | | | 4,687,531 | | | | 4,025,417 | |
| McGraw-Hill Education, Inc. | | | | | | | | |
First Lien Term Loan, (6M LIBOR + 4.75%, 0.50% Floor), 9.97%, 07/28/28(b)(c) | | | 6,215,097 | | | | 5,842,192 | |
| R. R. Donnelley & Sons Company | | | | | | | | |
First Lien Term Loan, (1M SOFR + 7.25%, 0.75% Floor), 12.45%, 03/17/28(c) | | | 3,473,459 | | | | 3,460,434 | |
| | | | | | | | |
| | | | | | | 16,404,811 | |
| | | | | | | | |
|
| MEDIA: BROADCASTING & SUBSCRIPTION - 3.1% | |
| Anuvu Holdings 2, LLC | | | | | | | | |
First Lien Delayed Draw Term Loan, (3M LIBOR + 7.00%, 1.00% Floor), 12.54%, 09/25/23(c)(d) | | | 73,747 | | | | 72,641 | |
First Lien Term Loan, (3M LIBOR + 8.00%, 1.00% Floor), 13.54%, 03/24/25(c) | | | 2,479,047 | | | | 2,435,663 | |
First Lien Term Loan, (6.75% PIK), (3M LIBOR + 8.25%, 1.00% Floor), 13.79%, 03/23/26(c)(d)(f) | | | 2,111,016 | | | | 1,657,148 | |
| CSC Holdings, LLC | | | | | | | | |
First Lien Term Loan B, (1M LIBOR + 2.25%, 0.00% Floor), 7.44%, 07/17/25(c) | | | 2,992,481 | | | | 2,890,243 | |
| | | | | | | | |
| | | | | | | 7,055,695 | |
| | | | | | | | |
|
| RETAIL - 3.7% | |
| Claire’s Stores, Inc. | | | | | | | | |
First Lien Term Loan B, (1M SOFR + 6.50%, 0.00% Floor), 11.70%, 12/18/26(c) | | | 2,018,668 | | | | 1,857,175 | |
| Petco Health and Wellness Company, Inc. | | | | | | | | |
First Lien Term Loan, (3M SOFR + 3.25%, 0.75% Floor), 8.75%, 03/03/28(c) | | | 1,890,435 | | | | 1,879,688 | |
| PetSmart, Inc. | | | | | | | | |
First Lien Term Loan, (1M SOFR + 3.75%, 0.75% Floor), 8.95%, 02/11/28(c) | | | 4,714,806 | | | | 4,713,840 | |
| | | | | | | | |
| | | | | | | 8,450,703 | |
| | | | | | | | |
|
| SERVICES: BUSINESS - 21.4% | |
| Advantage Sales & Marketing Inc. | | | | | | | | |
First Lien Term Loan B1, (3M LIBOR + 4.50%, 0.75% Floor), 9.72%, 10/28/27(b)(c) | | | 2,967,950 | | | | 2,799,162 | |
See accompanying Notes to Consolidated Financial Statements. | 9
Apollo Senior Floating Rate Fund Inc.
Consolidated Schedule of Investments (continued)
June 30, 2023 (unaudited)
| | | | | | | | |
| | |
| | Principal
Amount ($) | | | Value ($) | |
| | | | | | | | |
Senior Loans(a) (continued) | |
|
| SERVICES: BUSINESS (continued) | |
| Allied Universal Holdco LLC | | | | | | | | |
First Lien Term Loan, (1M SOFR + 3.75%, 0.50% Floor), 8.95%, 05/12/28(c) | | | 4,044,186 | | | | 3,938,592 | |
| Carestream Health, Inc. | | | | | | | | |
First Lien Term Loan, (3M SOFR + 7.50%, 1.00% Floor), 12.84%, 09/30/27(c)(d) | | | 116,773 | | | | 82,325 | |
| Coretrust Purchasing Group LLC | | | | | | | | |
First Lien Term Loan, (1M SOFR + 6.75%, 0.75% Floor), 11.85%, 10/01/29(c)(d) | | | 2,311,692 | | | | 2,242,341 | |
| Deerfield Dakota Holding, LLC | | | | | | | | |
First Lien Term Loan, (3M SOFR + 3.75%, 1.00% Floor), 8.99%, 04/09/27(c) | | | 6,237,944 | | | | 6,069,738 | |
| eResearchTechnology, Inc. | | | | | | | | |
First Lien Term Loan B, (1M SOFR + 4.50%, 1.00% Floor), 9.72%, 02/04/27(c) | | | 6,343,578 | | | | 6,116,795 | |
| Garda World Security Corporation (Canada) | | | | | | | | |
First Lien Term Loan B, (1M SOFR + 4.25%, 0.00% Floor), 9.33%, 02/01/29(c)(e) | | | 1,721,737 | | | | 1,706,672 | |
First Lien Term Loan B2, (1M SOFR + 4.25%, 0.00% Floor), 9.43%, 10/30/26(c)(e) | | | 8,539,602 | | | | 8,507,579 | |
| Ingenovis Health, Inc. | | | | | | | | |
First Lien Term Loan, (6M SOFR + 4.25%, 0.50% Floor), 9.21%, 03/06/28(c) | | | 995,000 | | | | 962,663 | |
First Lien Term Loan B, (1M SOFR + 3.75%, 0.75% Floor), 8.97%, 03/06/28(c) | | | 3,933,598 | | | | 3,795,922 | |
| Planet US Buyer LLC | | | | | | | | |
First Lien Term Loan, (1M SOFR + 6.75%, 0.75% Floor), 11.85%, 02/01/30(c)(d) | | | 2,770,833 | | | | 2,687,708 | |
| Solera, LLC | | | | | | | | |
First Lien Term Loan B, (3M LIBOR + 4.00%, 0.50% Floor), 9.54%, 06/02/28(c) | | | 4,003,154 | | | | 3,696,232 | |
Second Lien Term Loan, (14.61% PIK), (3M SOFR + 9.25%, 1.00% Floor), 14.61%, 06/04/29(c)(f) | | | 5,076,906 | | | | 4,746,907 | |
| Wellsky | | | | | | | | |
First Lien Term Loan, (1M SOFR + 5.75%, 0.75% Floor), 10.97%, 03/10/28(c)(d) | | | 1,985,000 | | | | 1,915,525 | |
| | | | | | | | |
| | | | | | | 49,268,161 | |
| | | | | | | | |
|
| SERVICES: CONSUMER - 1.2% | |
| 2U, Inc. | | | | | | | | |
First Lien Term Loan B, (6M SOFR + 6.50%, 0.75% Floor), 11.32%, 12/28/26(c) | | | 1,610,333 | | | | 1,554,986 | |
| MH Sub I, LLC | | | | | | | | |
First Lien Term Loan, (1M SOFR + 4.25%, 0.50% Floor), 9.35%, 05/03/28(c) | | | 1,272,245 | | | | 1,222,309 | |
| | | | | | | | |
| | | | | | | 2,777,295 | |
| | | | | | | | |
| | | | | | | | |
| | |
| | Principal
Amount ($) | | | Value ($) | |
| | | | | | | | |
|
| TELECOMMUNICATIONS - 6.6% | |
| CommScope, Inc. | | | | | | | | |
First Lien Term Loan B, (1M SOFR + 3.25%, 0.00% Floor), 8.47%, 04/06/26(c) | | | 1,115,759 | | | | 1,071,268 | |
| Flight Bidco, Inc. | | | | | | | | |
First Lien Term Loan, (1M SOFR + 3.50%, 0.00% Floor), 8.72%, 07/23/25(c) | | | 2,591,009 | | | | 2,437,712 | |
| MLN US Holdco LLC | | | | | | | | |
First Lien Second Out Term Loan, (3M SOFR + 6.70%, 1.00% Floor), 11.78%, 10/18/27(c)(d) | | | 3,807,495 | | | | 3,245,889 | |
First Lien Term Loan, (3M SOFR + 6.44%, 1.00% Floor), 11.52%, 10/18/27(c)(d) | | | 638,138 | | | | 615,803 | |
| Orbcomm, Inc. | | | | | | | | |
First Lien Term Loan, (1M/3M LIBOR + 4.25%, 0.75% Floor), 9.58%, 09/01/28(c) | | | 1,034,270 | | | | 836,895 | |
| U.S. TelePacific Corp. | | | | | | | | |
First Lien Term Loan, (6.00% PIK), (SOFR + 7.00%, 0.00% Floor), 7.00%, 05/02/26(c)(f) | | | 3,190,859 | | | | 1,324,207 | |
Third Lien Term Loan, 0.00%, 05/02/27(c)(d)(j) | | | 319,086 | | | | — | |
| Zacapa SARL (Luxembourg) | | | | | | | | |
First Lien Term Loan, (3M SOFR + 4.00%, 0.50% Floor), 9.24%, 03/22/29(c)(e) | | | 3,753,173 | | | | 3,663,754 | |
| Zayo Group Holdings, Inc. | | | | | | | | |
First Lien Term Loan, (1M SOFR + 4.25%, 0.50% Floor), 9.43%, 03/09/27(c) | | | 2,404,129 | | | | 1,915,790 | |
| | | | | | | | |
| | | | | | | 15,111,318 | |
| | | | | | | | |
|
| TRANSPORTATION: CARGO - 0.7% | |
| Channelside AcquisitionCo, Inc. | | | | | | | | |
First Lien Term Loan, (1M SOFR + 6.75%, 1.00% Floor), 11.89%, 06/30/28(c)(d) | | | 1,621,935 | | | | 1,573,277 | |
| | | | | | | | |
|
| WHOLESALE - 3.1% | |
| LBM Acquisition, LLC | | | | | | | | |
First Lien Term Loan B, (1M LIBOR + 3.75%, 0.75% Floor), 8.95%, 12/17/27(c) | | | 7,398,965 | | | | 7,125,351 | |
| | | | | | | | |
| | |
Total Senior Loans
(Cost $328,362,188) | | | | | | | 314,831,425 | |
| | | | | | | | |
| Corporate Notes and Bonds - 12.6% | | | | | |
|
| AUTOMOTIVE - 1.6% | |
Carvana Co.
10.25%, 05/01/30(h)(i) | | | 4,735,000 | | | | 3,622,275 | |
| | | | | | | | |
|
| BANKING, FINANCE, INSURANCE & REAL ESTATE - 0.3% | |
KCF Puerto Rico, LLC (Puerto Rico)
0.00%, 06/28/28(d)(e)(j) | | | 882,529 | | | | 607,722 | |
| | | | | | | | |
10 | See accompanying Notes to Consolidated Financial Statements.
Apollo Senior Floating Rate Fund Inc.
Consolidated Schedule of Investments (continued)
June 30, 2023 (unaudited)
| | | | | | | | |
| | |
| | Principal
Amount ($) | | | Value ($) | |
| | | | | | | | |
| Corporate Notes and Bonds (continued) | |
|
| CHEMICALS, PLASTICS, & RUBBER - 0.3% | |
Cheever Escrow Issuer, LLC
7.13%, 10/01/27(h)(i) | | | 750,000 | | | | 679,112 | |
| | | | | | | | |
|
| CONTAINERS, PACKAGING & GLASS - 0.4% | |
LABL, Inc.
5.88%, 11/01/28(h)(i) | | | 1,000,000 | | | | 913,250 | |
| | | | | | | | |
|
| ENERGY: OIL & GAS - 1.1% | |
Moss Creek Resources Holdings, Inc.
10.50%, 05/15/27(h)(i) | | | 2,538,000 | | | | 2,439,494 | |
| | | | | | | | |
|
| FOREST PRODUCTS & PAPER - 0.5% | |
Spa US Holdco, Inc. (Finland)
4.88%, 02/04/28(e)(h)(i) | | | 1,500,000 | | | | 1,240,228 | |
| | | | | | | | |
|
| HEALTHCARE & PHARMACEUTICALS - 0.7% | |
Bausch Health Companies, Inc.
5.50%, 11/01/25(h)(i) | | | 750,000 | | | | 662,805 | |
Embecta Corp.
5.00%, 02/15/30(h)(i) | | | 1,063,000 | | | | 883,252 | |
| | | | | | | | |
| | | | | | | 1,546,057 | |
| | | | | | | | |
|
| HIGH TECH INDUSTRIES - 2.5% | |
Wolfspeed, Inc.
9.88%, 06/23/30(d)(h)(i) | | | 6,000,000 | | | | 5,760,000 | |
| | | | | | | | |
|
| HOTEL, GAMING & LEISURE - 1.5% | |
Carnival Corporation
10.38%, 05/01/28(h)(i) | | | 2,028,000 | | | | 2,219,393 | |
NCL Corporation Ltd.
9.75%, 02/22/28(d)(h)(i) | | | 1,153,000 | | | | 1,224,601 | |
| | | | | | | | |
| | | | | | | 3,443,994 | |
| | | | | | | | |
|
| MEDIA: ADVERTISING, PRINTING & PUBLISHING - 0.4% | |
McGraw-Hill Education, Inc.
5.75%, 08/01/28(h)(i) | | | 1,000,000 | | | | 868,542 | |
| | | | | | | | |
|
| MEDIA: BROADCASTING & SUBSCRIPTION - 0.6% | |
CSC Holdings, LLC
4.13%, 12/01/30(h)(i) | | | 2,000,000 | | | | 1,398,464 | |
| | | | | | | | |
|
| METALS & MINING - 0.0% | |
ERP Iron Ore, LLC
LIBOR + 8.00%,
0.00%, 12/31/19(d)(g)(j) | | | 18,879 | | | | — | |
Magnetation, LLC / Mag Finance Corp.
0.00%, 05/15/18(d)(g)(h)(i)(j) | | | 639,000 | | | | — | |
| | | | | | | | |
| | | | | | | — | |
| | | | | | | | |
| | |
| SERVICES: BUSINESS - 1.6% | | | | | | |
| | |
Advantage Sales & Marketing Inc.
6.50%, 11/15/28(h)(i) | | | 3,327,000 | | | | 2,815,474 | |
| | |
Allied Universal Holdco LLC
4.63%, 06/01/28(h)(i) | | | 1,000,000 | | | | 847,095 | |
| | | | | | | | |
| | | | | | | 3,662,569 | |
| | | | | | | | |
| | | | | | | | |
| | |
| | Principal
Amount ($) | | | Value ($) | |
| | | | | | | | |
| | |
| TELECOMMUNICATIONS - 1.2% | | | | | | |
| | |
Frontier Communications Holdings, LLC
5.00%, 05/01/28(h)(i) | | | 3,239,000 | | | | 2,799,873 | |
| | | | | | | | |
| |
Total Corporate Notes and Bonds
(Cost $31,274,161) | | | | 28,981,580 | |
| | | | | | | | |
| | |
| | | | | | | | |
| | |
| | Quantity | | | Value ($) | |
| Common Stocks - 0.8% | | | | | | | | |
| | |
| AUTOMOTIVE - 0.0% | | | | | | |
| | |
APC Parent, Inc.(d)(j) | | | 241,972 | | | | — | |
| | | | | | | | |
| | |
| ENERGY: OIL & GAS - 0.0% | | | | | | |
| | |
RDV Resources, Inc.(d)(j) | | | 28,252 | | | | 21,323 | |
| | | | | | | | |
| | |
| HIGH TECH INDUSTRIES - 0.0% | | | | | | |
| | |
Riverbed Holdings, Inc.(d)(j) | | | 32,644 | | | | — | |
| | | | | | | | |
|
| MEDIA: ADVERTISING, PRINTING & PUBLISHING - 0.0% | |
| | |
Acosta, Inc.(d)(j) | | | 3,133 | | | | 33,209 | |
| | | | | | | | |
|
| MEDIA: BROADCASTING & SUBSCRIPTION - 0.3% | |
| | |
Anuvu Corp.(d)(j) | | | 108,418 | | | | 533,417 | |
| | | | | | | | |
| | |
| SERVICES: BUSINESS - 0.5% | | | | | | |
| | |
Carestream Health, Inc.(d)(j) | | | 118,564 | | | | 1,145,328 | |
| | | | | | | | |
| | |
Total Common Stocks
(Cost $6,691,651) | | | | | | | 1,733,277 | |
| | | | | | | | |
| | |
| Preferred Stocks - 0.1% | | | | | | | | |
| | |
| HIGH TECH INDUSTRIES - 0.0% | | | | | | |
| | |
Riverbed Holdings, Inc.(d) | | | 22,342 | | | | – | |
| | | | | | | | |
| | |
MEDIA: ADVERTISING,
PRINTING & PUBLISHING -
0.1% | | | | | | |
| | |
Acosta, Inc., (14.50% PIK)(d)(f) | | | 4,138 | | | | 204,020 | |
| | | | | | | | |
| | |
Total Preferred Stocks
(Cost $717,268) | | | | | | | 204,020 | |
| | | | | | | | |
| | |
Total Investments - 150.1%
(Cost of $367,045,268) | | | | | | | 345,750,302 | |
| Other Assets & Liabilities, Net - 6.3% | | | | 14,435,984 | |
Loan Outstanding - (56.4%)(k)(l) | | | | | | | (129,830,022 | ) |
| | | | | | | | |
| Net Assets (Applicable to Common Shares) - 100.0% | | | | | | | 230,356,264 | |
| | | | | | | | |
See accompanying Notes to Consolidated Financial Statements. | 11
Apollo Senior Floating Rate Fund Inc.
Consolidated Schedule of Investments (continued)
June 30, 2023 (unaudited)
| (a) | “Senior Loans” are senior, secured loans made to companies whose debt is below investment grade as well as investments with similar economic characteristics. Senior Loans typically hold a first lien priority and, unless otherwise indicated, are required to pay interest at floating rates that are periodically reset by reference to a base lending rate plus a spread. In some instances, the rates shown represent the weighted average rate as of June 30, 2023. Senior Loans are generally not registered under the Securities Act of 1933 (the “1933 Act”) and often incorporate certain restrictions on resale and cannot be sold publicly. Senior Loans often require prepayments from excess cash flow or permit the borrower to repay at its election. The degree to which borrowers repay, whether as a contractual requirement or at their election, cannot be predicted with accuracy. As a result, the actual maturity may be substantially less than the stated maturity. |
| (b) | All or a portion of this Senior Loan position has not settled. Full contract rates do not take effect until settlement date and therefore are subject to change. |
| (c) | The interest rate on this Senior Loan is subject to a base lending rate plus a spread. These base lending rates are primarily the London Interbank Offered Rate (“LIBOR”) or the Secured Overnight Financing Rate (“SOFR”) and secondarily the prime rate offered by one or more major U.S. banks (“Prime”). The interest rate is subject to a minimum floor, which may be less than or greater than the prevailing period end LIBOR/SOFR/Prime rate. As of June 30, 2023, the 1, 3 and 6 month LIBOR rates were 5.22%, 5.54% and 5.76%, respectively, the 1, 3 and 6 month SOFR rates were 5.14%, 5.27%, and 5.39%, respectively, and the Prime lending rate was 8.25%. Senior Loans may contain multiple contracts of the same issuer which may be subject to base lending rates of LIBOR, SOFR and Prime (“Variable”) in addition to the stated spread. |
| (d) | Fair Value Level 3 security. |
| (e) | Foreign issuer traded in U.S. dollars. |
| (f) | Represents a payment‑in‑kind (“PIK”) security, which may pay interest in additional principal amount/share quantity. |
| (g) | Issuer filed for bankruptcy and/or is in default of principal and/or interest payments. |
| (i) | Securities exempt from registration pursuant to Rule 144A under the 1933 Act. These securities may only be resold in transactions exempt from registration to qualified institutional buyers. At June 30, 2023, these securities amounted to $28,373,859, or 12.32% of net assets. |
| (j) | Non‑income producing asset. |
| (k) | The Fund has granted a security interest in substantially all of its assets in the event of default under the credit facility. |
| (l) | Principal of $130,000,000 less unamortized deferred financing costs of $169,978. |
12 | See accompanying Notes to Consolidated Financial Statements.
Apollo Tactical Income Fund Inc.
Consolidated Schedule of Investments
June 30, 2023 (unaudited)
| | | | | | | | |
| | |
| | Principal
Amount ($) | | | Value ($) | |
| | | | | | | | |
Senior Loans - 109.4%(a) | | | | | | | | |
| | |
| AEROSPACE & DEFENSE - 3.5% | | | | | | |
| | |
| Peraton Corporation | | | | | | | | |
First Lien Term Loan B, (1M SOFR + 3.75%, 0.75% Floor), 8.95%, 02/01/28(c) | | | 7,486,877 | | | | 7,370,568 | |
| | | | | | | | |
|
| BANKING, FINANCE, INSURANCE & REAL ESTATE - 10.0% | |
| | |
| Asurion, LLC | | | | | | | | |
First Lien Term Loan B10, (1M SOFR + 4.00%, 0.00% Floor), 9.20%, 08/19/28(c) | | | 994,987 | | | | 944,302 | |
First Lien Term Loan B11, (1M SOFR + 4.25%, 0.00% Floor), 9.45%, 08/19/28(b)(c) | | | 915,825 | | | | 873,183 | |
Second Lien Term Loan B4, (1M SOFR + 5.20%, 0.00% Floor), 10.47%, 01/20/29(c) | | | 2,885,398 | | | | 2,427,860 | |
| Howden Group Holdings Ltd (United Kingdom) | | | | | | | | |
First Lien Incremental Term Loan B, (1M SOFR + 4.00%, 0.50% Floor), 9.10%, 04/18/30(c)(e) | | | 1,605,975 | | | | 1,604,971 | |
First Lien Term Loan, (1M SOFR + 5.25%, 0.75% Floor), 10.35%, 11/12/27(c)(d)(e) | | | 7,000,000 | | | | 7,000,000 | |
| SG Acquisition, Inc. | | | | | | | | |
First Lien Incremental Term Loan, (1M SOFR + 6.00%, 0.50% Floor), 11.20%, 01/27/27(c)(d) | | | 4,000,000 | | | | 3,920,000 | |
First Lien Term Loan, (1M SOFR + 6.00%, 0.50% Floor), 11.20%, 01/27/27(c)(d) | | | 851,064 | | | | 834,043 | |
| The Edelman Financial Center, LLC | | | | | | | | |
First Lien Term Loan B, (1M LIBOR + 3.75%, 0.75% Floor), 8.94%, 04/07/28(c) | | | 1,421,481 | | | | 1,388,524 | |
Second Lien Term Loan, (1M LIBOR + 6.75%, 0.00% Floor), 11.94%, 07/20/26(c) | | | 1,966,751 | | | | 1,905,536 | |
| | | | | | | | |
| | | | | | | 20,898,419 | |
| | | | | | | | |
|
| BEVERAGE, FOOD & TOBACCO - 0.9% | |
| | |
| Ultimate Baked Goods Midco LLC | | | | | | | | |
First Lien Term Loan L, (1M SOFR + 6.25%, 1.00% Floor), 11.45%, 08/13/27(c)(d) | | | 2,020,581 | | | | 1,957,741 | |
| | | | | | | | |
| | |
| CAPITAL EQUIPMENT - 1.5% | | | | | | |
| | |
| Safe Fleet Holdings, LLC | | | | | | | | |
Second Lien Term Loan, (1M LIBOR + 6.75%, 1.00% Floor), 11.94%, 02/02/26(c) | | | 1,403,846 | | | | 1,311,894 | |
| SPX Flow, Inc. | | | | | | | | |
First Lien Term Loan, (1M SOFR + 4.50%, 0.50% Floor), 9.70%, 04/05/29(c) | | | 1,748,096 | | | | 1,729,890 | |
| | | | | | | | |
| | | | | | | 3,041,784 | |
| | | | | | | | |
| | | | | | | | |
| | |
| | Principal
Amount ($) | | | Value ($) | |
| | | | | | | | |
|
| CHEMICALS, PLASTICS, & RUBBER - 5.2% | |
| | |
| LSF11 A5 Holdco LLC | | | | | | | | |
First Lien Term Loan, (1M SOFR + 4.25%, 0.50% Floor), 9.45%, 10/15/28(c) | | | 2,874,897 | | | | 2,858,136 | |
First Lien Term Loan, (1M SOFR + 3.50%, 0.50% Floor), 8.72%, 10/15/28(c) | | | 2,201,912 | | | | 2,174,047 | |
| Luxembourg Investment Company 428 SARL (Luxembourg) | | | | | | | | |
First Lien Term Loan B, (3M SOFR + 5.00%, 0.50% Floor), 10.39%, 01/03/29(c)(e) | | | 4,695,549 | | | | 3,495,250 | |
| Olympus Water US Holding Corporation | | | | | | | | |
First Lien Incremental Term Loan, (SOFR + 5.00%, 0.50% Floor), 5.50%, 11/09/28(b)(c) | | | 909,000 | | | | 881,162 | |
| W.R. Grace Holdings, LLC | | | | | | | | |
First Lien Term Loan B, (3M LIBOR + 3.75%, 0.50% Floor), 9.31%, 09/22/28(c) | | | 1,428,482 | | | | 1,422,362 | |
| | | | | | | | |
| | | | | | | 10,830,957 | |
| | | | | | | | |
|
| CONSTRUCTION & BUILDING - 0.2% | |
| | |
| Cornerstone Building Brands, Inc. | | | | | | | | |
First Lien Term Loan, (1M SOFR + 5.63%, 0.50% Floor), 10.77%, 08/01/28(c) | | | 395,805 | | | | 380,963 | |
| | | | | | | | |
|
| CONSUMER GOODS: NON‑DURABLE - 2.3% | |
| | |
| ABG Intermediate Holdings 2 LLC | | | | | | | | |
First Lien Term Loan B2, (1M SOFR + 4.00%, 0.00% Floor), 9.20%, 12/21/28(c) | | | 1,355,556 | | | | 1,354,369 | |
Second Lien Term Loan, (1M SOFR + 6.00%, 0.50% Floor), 11.20%, 12/20/29(c) | | | 1,710,576 | | | | 1,599,389 | |
| Iconix Brand Group | | | | | | | | |
First Lien Term Loan, (3M SOFR + 6.00%, 1.00% Floor), 11.39%, 08/22/29(c)(d) | | | 1,811,538 | | | | 1,775,308 | |
| | | | | | | | |
| | | | | | | 4,729,066 | |
| | | | | | | | |
|
| CONTAINERS, PACKAGING & GLASS - 3.0% | |
| | |
| Anchor Glass Container Corp. | | | | | | | | |
First Lien Incremental Term Loan, (6M LIBOR + 5.00%, 1.00% Floor), 10.21%, 12/07/23(c) | | | 1,479,007 | | | | 1,153,625 | |
First Lien Term Loan, (6M LIBOR + 2.75%, 1.00% Floor), 8.04%, 12/07/23(c) | | | 4,134,818 | | | | 3,190,260 | |
| Trident TPI Holdings, Inc. | | | | | | | | |
First Lien Incremental Term Loan, (3M SOFR + 5.25%, 0.50% Floor), 10.49%, 09/15/28(c) | | | 1,990,000 | | | | 1,973,413 | |
| | | | | | | | |
| | | | | | | 6,317,298 | |
| | | | | | | | |
See accompanying Notes to Consolidated Financial Statements. | 13
Apollo Tactical Income Fund Inc.
Consolidated Schedule of Investments (continued)
June 30, 2023 (unaudited)
| | | | | | | | |
| | |
| | Principal
Amount ($) | | | Value ($) | |
| | | | | | | | |
Senior Loans(a) (continued) | |
|
| ENVIRONMENTAL INDUSTRIES - 1.4% | |
| | |
| LTR Intermediate Holdings, Inc. | | | | | | | | |
First Lien Term Loan, (1M LIBOR + 4.50%, 1.00% Floor), 9.72%, 05/05/28(c) | | | 3,194,351 | | | | 2,853,625 | |
| | | | | | | | |
|
| FOREST PRODUCTS & PAPER - 0.5% | |
| | |
| Spa US Holdco, Inc. (Finland) | | | | | | | | |
First Lien Term Loan B, (3M LIBOR + 3.75%, 0.75% Floor), 9.29%, 02/04/28(c)(e) | | | 1,144,576 | | | | 1,075,186 | |
| | | | | | | | |
|
| HEALTHCARE & PHARMACEUTICALS - 20.8% | |
| | |
| Advarra Holdings, Inc. | | | | | | | | |
First Lien Term Loan, (1M SOFR + 5.75%, 0.75% Floor), 10.85%, 08/24/29(c)(d) | | | 6,387,750 | | | | 6,323,872 | |
| Athenahealth, Inc. | | | | | | | | |
First Lien Term Loan B, (1M SOFR + 3.50%, 0.50% Floor), 8.59%, 02/15/29(c) | | | 4,032,166 | | | | 3,891,040 | |
| Azurity Pharmaceuticals, Inc. | | | | | | | | |
First Lien Term Loan B, (1M LIBOR + 6.00%, 0.75% Floor), 11.22%, 09/20/27(c) | | | 2,510,713 | | | | 2,429,114 | |
| Bausch Health Companies, Inc. | | | | | | | | |
First Lien Term Loan B, (1M SOFR + 5.25%, 0.50% Floor), 10.44%, 02/01/27(b)(c) | | | 3,611,662 | | | | 2,738,723 | |
| Gainwell Acquisition Corporation | | | | | | | | |
First Lien Term Loan B, (3M SOFR + 4.00%, 0.75% Floor), 9.34%, 10/01/27(c) | | | 8,520,188 | | | | 8,403,035 | |
| Gateway US Holdings, Inc. | | | | | | | | |
First Lien Delayed Draw Term Loan, (3M SOFR + 6.50%, 0.75% Floor), 11.89%, 09/22/26(c)(d) | | | 122,076 | | | | 120,245 | |
First Lien Eighth AMD Delayed Draw, (3M SOFR + 6.50%, 0.75% Floor), 11.89%, 09/22/26(c)(d) | | | 642,300 | | | | 632,666 | |
First Lien Term Loan, (3M SOFR + 6.50%, 0.75% Floor), 11.89%, 09/22/26(c)(d) | | | 2,796,018 | | | | 2,754,078 | |
| Inovalon Holdings, Inc. | | | | | | | | |
First Lien Term Loan, (2.75% PIK), (3M SOFR + 6.25%, 0.75% Floor), 11.66%, 11/24/28(c)(d)(f) | | | 6,441,943 | | | | 6,313,104 | |
Second Lien Term Loan, (15.99% PIK), (3M SOFR + 10.50%, 0.75% Floor), 15.99%, 11/25/33(c)(d)(f) | | | 121,957 | | | | 118,908 | |
| Medical Solutions Holdings, Inc. | | | | | | | | |
First Lien Term Loan, (3M SOFR + 3.25%, 0.50% Floor), 8.61%, 11/01/28(c) | | | 2,984,962 | | | | 2,811,835 | |
| | | | | | | | |
| | |
| | Principal
Amount ($) | | | Value ($) | |
| | | | | | | | |
|
| HEALTHCARE & PHARMACEUTICALS (continued) | |
| | |
| Tivity Health, Inc. | | | | | | | | |
First Lien Term Loan, (3M SOFR + 6.00%, 0.75% Floor), 11.24%, 06/28/29(c)(d) | | | 4,962,500 | | | | 4,912,875 | |
| Zest Acquisition Corp. | | | | | | | | |
First Lien Term Loan, (1M SOFR + 5.50%, 0.00% Floor), 10.64%, 02/08/28(c) | | | 1,995,000 | | | | 1,925,175 | |
| | | | | | | | |
| | | | | | | 43,374,670 | |
| | | | | | | | |
|
| HIGH TECH INDUSTRIES - 25.7% | |
| | |
| Anaplan, Inc. | | | | | | | | |
First Lien Term Loan, (1M SOFR + 6.50%, 0.75% Floor), 11.60%, 06/21/29(c)(d) | | | 5,650,529 | | | | 5,622,276 | |
| Avalara, Inc. | | | | | | | | |
First Lien Term Loan, (3M SOFR + 7.25%, 0.75% Floor), 12.49%, 10/19/28(c)(d) | | | 4,545,455 | | | | 4,477,273 | |
| Capstone Borrower, Inc. | | | | | | | | |
First Lien Term Loan, (3M SOFR + 3.75%, 0.00% Floor), 9.00%, 06/17/30(c) | | | 2,896,320 | | | | 2,843,824 | |
| Cloud Software Group, Inc. | | | | | | | | |
First Lien Term Loan A, (3M SOFR + 4.50%, 0.50% Floor), 9.84%, 09/29/28(c) | | | 2,991,588 | | | | 2,808,114 | |
| Coupa Software, Inc. | | | | | | | | |
First Lien Term Loan, (1M SOFR + 7.50%, 0.75% Floor), 12.60%, 02/27/30(c)(d) | | | 1,727,637 | | | | 1,684,446 | |
| DCert Buyer, Inc. | | | | | | | | |
First Lien Term Loan, (3M SOFR + 4.00%, 0.00% Floor), 9.26%, 10/16/26(c) | | | 4,134,152 | | | | 4,105,089 | |
Second Lien Term Loan, (3M SOFR + 7.00%, 0.00% Floor), 12.26%, 02/19/29(c) | | | 3,933,068 | | | | 3,624,991 | |
| Electronics for Imaging, Inc. | | | | | | | | |
First Lien Term Loan, (6M LIBOR + 5.00%, 0.00% Floor), 10.21%, 07/23/26(c) | | | 986,180 | | | | 674,710 | |
| Imperva, Inc. | | | | | | | | |
First Lien Term Loan, (3M LIBOR + 4.00%, 1.00% Floor), 9.34%, 01/12/26(c) | | | 6,797,039 | | | | 6,172,561 | |
| Imprivata, Inc. | | | | | | | | |
First Lien Term Loan, (1M SOFR + 3.75%, 0.50% Floor), 8.97%, 12/01/27(c) | | | 492,443 | | | | 483,641 | |
Second Lien Term Loan, (1M SOFR + 6.25%, 0.50% Floor), 11.35%, 12/01/28(c)(d) | | | 2,205,882 | | | | 2,117,647 | |
| IQN Holding Corp. | | | | | | | | |
First Lien Revolving Term Loan, (1M SOFR + 5.25%, 0.75% Floor), 10.35%, 05/02/28(c)(d) | | | 53,476 | | | | 53,209 | |
14 | See accompanying Notes to Consolidated Financial Statements.
Apollo Tactical Income Fund Inc.
Consolidated Schedule of Investments (continued)
June 30, 2023 (unaudited)
| | | | | | | | |
| | |
| | Principal
Amount ($) | | | Value ($) | |
| | | | | | | | |
Senior Loans(a) (continued) | |
|
| HIGH TECH INDUSTRIES (continued) | |
| | |
First Lien Term Loan, (6M SOFR + 5.25%, 0.75% Floor), 10.38%, 05/02/29(c)(d) | | | 3,908,356 | | | | 3,888,814 | |
| Riverbed Technology, Inc. | | | | | | | | |
First Lien Exit Term Loan, (2.00% PIK), (3M LIBOR + 6.00%, 1.00% Floor), 2.00%, 12/07/26(c)(f)(g) | | | 748,804 | | | | 203,300 | |
| Sovos Compliance, LLC | | | | | | | | |
First Lien Term Loan, (1M SOFR + 4.50%, 0.50% Floor), 9.72%, 08/11/28(c) | | | 3,459,294 | | | | 3,346,556 | |
| UKG, Inc. | | | | | | | | |
First Lien Term Loan, (3M SOFR + 3.75%, 0.00% Floor), 8.90%, 05/04/26(c) | | | 3,810,596 | | | | 3,764,888 | |
Second Lien Term Loan, (3M SOFR + 5.25%, 0.50% Floor), 10.62%, 05/03/27(c) | | | 2,000,000 | | | | 1,945,000 | |
| Virtusa Corporation | | | | | | | | |
First Lien Term Loan, (1M SOFR + 3.75%, 0.75% Floor), 8.95%, 02/15/29(c) | | | 2,742,802 | | | | 2,715,374 | |
| Zendesk, Inc. | | | | | | | | |
First Lien Term Loan, (3.75% PIK), (3M SOFR + 7.00%, 0.75% Floor), 12.25%, 11/22/28(c)(d)(f) | | | 2,982,391 | | | | 2,937,655 | |
| | | | | | | | |
| | | | | | | 53,469,368 | |
| | | | | | | | |
|
| MEDIA: ADVERTISING, PRINTING & PUBLISHING - 9.5% | |
| | |
| Accelerate360 Holdings, LLC | | | | | | | | |
First Lien Revolving Term Loan, (3M SOFR + 6.00%, 0.00% Floor), 11.51%, 02/04/27(c)(d) | | | 636,092 | | | | 636,092 | |
First Lien Term Loan, (3M SOFR + 6.00%, 0.00% Floor), 11.51%, 02/04/27(c)(d) | | | 4,141,019 | | | | 4,141,019 | |
| Associations Inc. | | | | | | | | |
First Lien Term Loan, (2.50% PIK), (3M SOFR + 6.50%, 1.00% Floor), 11.72%, 07/02/27(c)(d)(f) | | | 3,076,768 | | | | 3,076,768 | |
| Houghton Mifflin Harcourt Company | | | | | | | | |
First Lien Term Loan B, (1M SOFR + 5.25%, 0.50% Floor), 10.45%, 04/09/29(c) | | | 4,149,227 | | | | 3,563,148 | |
| McGraw-Hill Education, Inc. | | | | | | | | |
First Lien Term Loan, (6M LIBOR + 4.75%, 0.50% Floor), 9.97%, 07/28/28(b)(c) | | | 5,279,598 | | | | 4,962,822 | |
| R. R. Donnelley & Sons Company | | | | | | | | |
First Lien Term Loan, (1M SOFR + 7.25%, 0.75% Floor), 12.45%, 03/17/28(c) | | | 3,473,459 | | | | 3,460,434 | |
| | | | | | | | |
| | | | | | | 19,840,283 | |
| | | | | | | | |
| | | | | | | | |
| | |
| | Principal
Amount ($) | | | Value ($) | |
| | | | | | | | |
|
| MEDIA: BROADCASTING & SUBSCRIPTION - 1.9% | |
| | |
| Anuvu Holdings 2, LLC | | | | | | | | |
First Lien Delayed Draw Term Loan, (3M LIBOR + 7.00%, 1.00% Floor), 12.54%, 09/25/23(c)(d) | | | 69,796 | | | | 68,749 | |
First Lien Term Loan, (3M LIBOR + 8.00%, 1.00% Floor), 13.54%, 03/24/25(c) | | | 2,346,207 | | | | 2,305,148 | |
First Lien Term Loan, (6.75% PIK), (3M LIBOR + 8.25%, 1.00% Floor), 13.79%, 03/23/26(c)(d)(f) | | | 1,997,898 | | | | 1,568,350 | |
| | | | | | | | |
| | | | | | | 3,942,247 | |
| | | | | | | | |
|
| RETAIL - 3.0% | |
| | |
| Claire’s Stores, Inc. | | | | | | | | |
First Lien Term Loan B, (1M SOFR + 6.50%, 0.00% Floor), 11.70%, 12/18/26(c) | | | 2,018,668 | | | | 1,857,175 | |
| PetSmart, Inc. | | | | | | | | |
First Lien Term Loan, (1M SOFR + 3.75%, 0.75% Floor), 8.95%, 02/11/28(c) | | | 4,384,688 | | | | 4,383,789 | |
| | | | | | | | |
| | | | | | | 6,240,964 | |
| | | | | | | | |
|
| SERVICES: BUSINESS - 9.2% | |
| | |
| Advantage Sales & Marketing Inc. | | | | | | | | |
First Lien Term Loan B1, (3M LIBOR + 4.50%, 0.75% Floor), 9.72%, 10/28/27(b)(c) | | | 1,483,976 | | | | 1,399,582 | |
| Allied Universal Holdco LLC | | | | | | | | |
First Lien Term Loan, (1M SOFR + 3.75%, 0.50% Floor), 8.95%, 05/12/28(c) | | | 945,424 | | | | 920,739 | |
| Carestream Health, Inc. | | | | | | | | |
First Lien Term Loan, (3M SOFR + 7.50%, 1.00% Floor), 12.84%, 09/30/27(c)(d) | | | 54,489 | | | | 38,415 | |
| Coretrust Purchasing Group LLC | | | | | | | | |
First Lien Term Loan, (1M SOFR + 6.75%, 0.75% Floor), 11.85%, 10/01/29(c)(d) | | | 2,311,692 | | | | 2,242,341 | |
| eResearchTechnology, Inc. | | | | | | | | |
First Lien Term Loan B, (1M SOFR + 4.50%, 1.00% Floor), 9.72%, 02/04/27(c) | | | 3,011,150 | | | | 2,903,502 | |
| Planet US Buyer LLC | | | | | | | | |
First Lien Term Loan, (1M SOFR + 6.75%, 0.75% Floor), 11.85%, 02/01/30(c)(d) | | | 2,770,833 | | | | 2,687,708 | |
| Solera, LLC | | | | | | | | |
First Lien Term Loan B, (3M LIBOR + 4.00%, 0.50% Floor), 9.54%, 06/02/28(c) | | | 2,817,153 | | | | 2,601,162 | |
Second Lien Term Loan, (14.61% PIK), (3M SOFR + 9.25%, 1.00% Floor), 14.61%, 06/04/29(c)(f) | | | 4,727,113 | | | | 4,419,850 | |
See accompanying Notes to Consolidated Financial Statements. | 15
Apollo Tactical Income Fund Inc.
Consolidated Schedule of Investments (continued)
June 30, 2023 (unaudited)
| | | | | | | | |
| | |
| | Principal
Amount ($) | | | Value ($) | |
| | | | | | | | |
Senior Loans(a) (continued) | |
|
| SERVICES: BUSINESS (continued) | |
| | |
| Wellsky | | | | | | | | |
First Lien Term Loan, (1M SOFR + 5.75%, 0.75% Floor), 10.97%, 03/10/28(c)(d) | | | 1,985,000 | | | | 1,915,525 | |
| | | | | | | | |
| | | | | | | 19,128,824 | |
| | | | | | | | |
|
| SERVICES: CONSUMER - 2.8% | |
| | |
| Mavis Tire Express Services Corporation | | | | | | | | |
First Lien Term Loan B, (1M SOFR + 4.00%, 0.75% Floor), 9.22%, 05/04/28(c) | | | 4,600,655 | | | | 4,567,600 | |
| MH Sub I, LLC | | | | | | | | |
First Lien Term Loan, (1M SOFR + 4.25%, 0.50% Floor), 9.35%, 05/03/28(c) | | | 1,272,245 | | | | 1,222,309 | |
| | | | | | | | |
| | | | | | | 5,789,909 | |
| | | | | | | | |
|
| TELECOMMUNICATIONS - 4.8% | |
| | |
| CommScope, Inc. | | | | | | | | |
First Lien Term Loan B, (1M SOFR + 3.25%, 0.00% Floor), 8.47%, 04/06/26(c) | | | 1,010,682 | | | | 970,381 | |
| Flight Bidco, Inc. | | | | | | | | |
First Lien Term Loan, (1M SOFR + 3.50%, 0.00% Floor), 8.72%, 07/23/25(c) | | | 2,371,702 | | | | 2,231,380 | |
| MLN US Holdco LLC | | | | | | | | |
First Lien Term Loan, (3M SOFR + 6.44%, 1.00% Floor), 11.52%, 10/18/27(c)(d) | | | 382,882 | | | | 369,481 | |
First Lien Second Out Term Loan, (3M SOFR + 6.70%, 1.00% Floor), 11.78%, 10/18/27(c)(d) | | | 2,284,497 | | | | 1,947,533 | |
| U.S. TelePacific Corp. | | | | | | | | |
First Lien Term Loan, (6.00% PIK), (SOFR + 7.00%, 0.00% Floor), 7.00%, 05/02/26(c)(f) | | | 3,190,859 | | | | 1,324,207 | |
Third Lien Term Loan, 0.00%, 05/02/27(c)(d)(j) | | | 319,086 | | | | — | |
| Zacapa SARL (Luxembourg) | | | | | | | | |
First Lien Term Loan, (3M SOFR + 4.00%, 0.50% Floor), 9.24%, 03/22/29(c)(e) | | | 2,760,711 | | | | 2,694,937 | |
| Zayo Group Holdings, Inc. | | | | | | | | |
First Lien Term Loan, (1M SOFR + 4.25%, 0.50% Floor), 9.43%, 03/09/27(c) | | | 613,612 | | | | 488,972 | |
| | | | | | | | |
| | | | | | | 10,026,891 | |
| | | | | | | | |
|
| TRANSPORTATION: CARGO - 0.8% | |
| | |
| Channelside AcquisitionCo, Inc. | | | | | | | | |
First Lien Term Loan, (1M SOFR + 6.75%, 1.00% Floor), 11.89%, 06/30/28(c)(d) | | | 1,621,935 | | | | 1,573,277 | |
| | | | | | | | |
| | | | | | | | |
| | |
| | Principal
Amount ($) | | | Value ($) | |
| | | | | | | | |
|
| WHOLESALE - 2.4% | |
| | |
| LBM Acquisition, LLC | | | | | | | | |
First Lien Term Loan B, (1M LIBOR + 3.75%, 0.75% Floor), 8.95%, 12/17/27(c) | | | 5,231,945 | | | | 5,038,468 | |
| | | | | | | | |
| | |
Total Senior Loans
(Cost $237,685,564) | | | | | | | 227,880,508 | |
| | | | | | | | |
|
| Corporate Notes and Bonds - 30.7% | |
|
| AUTOMOTIVE - 2.4% | |
| | |
| Carvana Co. | | | | | | | | |
10.25%, 05/01/30(h)(i) | | | 6,601,000 | | | | 5,049,765 | |
| | | | | | | | |
|
| BANKING, FINANCE, INSURANCE & REAL ESTATE - 1.7% | |
| | |
| Alliant Holdings Intermediate, LLC | | | | | | | | |
5.88%, 11/01/29(h)(i) | | | 3,400,000 | | | | 2,994,788 | |
| KCF Puerto Rico, LLC | | | | | | | | |
(Puerto Rico) 0.00%, 06/28/28(d)(e)(j) | | | 814,642 | | | | 560,974 | |
| | | | | | | | |
| | | | | | | 3,555,762 | |
| | | | | | | | |
|
| CHEMICALS, PLASTICS, & RUBBER - 1.8% | |
| | |
| Olympus Water US Holding Corporation | | | | | | | | |
9.75%, 11/15/28(h)(i) | | | 2,000,000 | | | | 1,951,850 | |
| W.R. Grace Holdings, LLC | | | | | | | | |
4.88%, 06/15/27(h)(i) | | | 2,000,000 | | | | 1,854,234 | |
| | | | | | | | |
| | | | | | | 3,806,084 | |
| | | | | | | | |
|
| CONTAINERS, PACKAGING & GLASS - 0.9% | |
| | |
| LABL, Inc. | | | | | | | | |
5.88%, 11/01/28(h)(i) | | | 2,000,000 | | | | 1,826,500 | |
| | | | | | | | |
|
| ENERGY: OIL & GAS - 4.2% | |
| | |
| Moss Creek Resources Holdings, Inc. | | | | | | | | |
7.50%, 01/15/26(h)(i) | | | 484,000 | | | | 445,431 | |
10.50%, 05/15/27(h)(i) | | | 5,541,000 | | | | 5,325,940 | |
| Venture Global LNG, Inc. | | | | | | | | |
8.13%, 06/01/28(h)(i) | | | 3,000,000 | | | | 3,050,595 | |
| | | | | | | | |
| | | | | | | 8,821,966 | |
| | | | | | | | |
|
| FOREST PRODUCTS & PAPER - 0.6% | |
| | |
| Spa US Holdco, Inc. (Finland) | | | | | | | | |
4.88%, 02/04/28(e)(h)(i) | | | 1,500,000 | | | | 1,240,229 | |
| | | | | | | | |
|
| HEALTHCARE & PHARMACEUTICALS - 0.6% | |
| | |
| Bausch Health Companies, Inc. | | | | | | | | |
5.50%, 11/01/25(h)(i) | | | 500,000 | | | | 441,870 | |
| Embecta Corp. | | | | | | | | |
5.00%, 02/15/30(h)(i) | | | 1,063,000 | | | | 883,252 | |
| | | | | | | | |
| | | | | | | 1,325,122 | |
| | | | | | | | |
16 | See accompanying Notes to Consolidated Financial Statements.
Apollo Tactical Income Fund Inc.
Consolidated Schedule of Investments (continued)
June 30, 2023 (unaudited)
| | | | | | | | |
| | |
| | Principal
Amount ($) | | | Value ($) | |
| | | | | | | | |
| Corporate Notes and Bonds (continued) | |
| | |
| HIGH TECH INDUSTRIES - 3.1% | | | | | | |
| | |
| Austin BidCo Inc. | | | | | | | | |
7.13%, 12/15/28(h)(i) | | | 2,000,000 | | | | 1,638,125 | |
| Wolfspeed, Inc. | | | | | | | | |
9.88%, 06/23/30(d)(h)(i) | | | 5,000,000 | | | | 4,800,000 | |
| | | | | | | | |
| | | | | | | 6,438,125 | |
| | | | | | | | |
|
| HOTEL, GAMING & LEISURE - 6.6% | |
| | |
| Allwyn Entertainment Financing PLC (Czech Republic) | | | | | | | | |
7.88%, 04/30/29(e)(h)(i) | | | 1,050,000 | | | | 1,072,005 | |
| Carnival Corporation | | | | | | | | |
10.38%, 05/01/28(h)(i) | | | 2,028,000 | | | | 2,219,392 | |
| CDI Escrow Issuer, Inc. | | | | | | | | |
5.75%, 04/01/30(h)(i) | | | 2,000,000 | | | | 1,862,500 | |
6.75%, 05/01/31(h)(i) | | | 2,500,000 | | | | 2,474,408 | |
| Life Time, Inc. | | | | | | | | |
5.75%, 01/15/26(h)(i) | | | 5,000,000 | | | | 4,879,023 | |
| NCL Corporation Ltd. | | | | | | | | |
9.75%, 02/22/28(d)(h)(i) | | | 1,153,000 | | | | 1,224,601 | |
| | | | | | | | |
| | | | | | | 13,731,929 | |
| | | | | | | | |
|
| MEDIA: ADVERTISING, PRINTING & PUBLISHING - 0.9% | |
| | |
| Outfront Media Capital, LLC | | | | | | | | |
5.00%, 08/15/27(h)(i) | | | 2,000,000 | | | | 1,816,650 | |
| | | | | | | | |
|
| METALS & MINING - 0.0% | |
| | |
| ERP Iron Ore, LLC | | | | | | | | |
LIBOR + 8.00%, 0.00%,
12/31/19(d)(g)(j) | | | 86,775 | | | | — | |
| Magnetation, LLC / Mag Finance Corp. | | | | | | | | |
0.00%, 05/15/18(d)(g)(h)(i)(j) | | | 2,937,000 | | | | — | |
| | | | | | | | |
| | | | | | | — | |
| | | | | | | | |
|
| RETAIL - 1.0% | |
| | |
| PetSmart, Inc. | | | | | | | | |
7.75%, 02/15/29(h)(i) | | | 2,000,000 | | | | 1,989,499 | |
| | | | | | | | |
|
| SERVICES: BUSINESS - 1.9% | |
| | |
| Advantage Sales & Marketing Inc. | | | | | | | | |
6.50%, 11/15/28(h)(i) | | | 2,683,000 | | | | 2,270,489 | |
| Allied Universal Holdco LLC | | | | | | | | |
4.63%, 06/01/28(h)(i) | | | 2,000,000 | | | | 1,694,190 | |
| | | | | | | | |
| | | | | | | 3,964,679 | |
| | | | | | | | |
|
| SERVICES: CONSUMER - 1.0% | |
| | |
| Mavis Tire Express Services Corporation | | | | | | | | |
6.50%, 05/15/29(h)(i) | | | 2,405,000 | | | | 2,072,990 | |
| | | | | | | | |
|
| TELECOMMUNICATIONS - 3.5% | |
| | |
| Frontier Communications Holdings, LLC | | | | | | | | |
8.63%, 03/15/31(h)(i) | | | 2,000,000 | | | | 1,939,510 | |
| | | | | | | | |
| | |
| | Principal
Amount ($) | | | Value ($) | |
| | | | | | | | |
|
| TELECOMMUNICATIONS (continued) | |
| | |
| Lumen Technologies, Inc. | | | | | | | | |
4.00%, 02/15/27(h)(i) | | | 3,000,000 | | | | 2,235,000 | |
4.25%, 07/01/28(h)(i) | | | 3,000,000 | | | | 1,938,480 | |
| Uniti Group LP | | | | | | | | |
10.50%, 02/15/28(h)(i) | | | 1,209,000 | | | | 1,202,955 | |
| | | | | | | | |
| | | | | | | 7,315,945 | |
| | | | | | | | |
|
| WHOLESALE - 0.5% | |
| | |
| LBM Acquisition, LLC | | | | | | | | |
6.25%, 01/15/29(h)(i) | | | 1,344,000 | | | | 1,112,160 | |
| | | | | | | | |
| | |
Total Corporate Notes and Bonds
(Cost $69,319,282) | | | | | | | 64,067,405 | |
| | | | | | | | |
|
| Convertible Bonds - 0.5% | |
|
| HOTEL, GAMING & LEISURE - 0.5% | |
| | |
| Peloton Interactive, Inc. | | | | | | | | |
0.00%, 02/15/26(h)(j) | | | 1,300,000 | | | | 986,375 | |
| | | | | | | | |
| | |
Total Convertible Bonds
(Cost $1,140,522) | | | | | | | 986,375 | |
| | | | | | | | |
|
Structured Products - 10.7%(m) | |
| | |
| Basswood Park CLO Ltd (Cayman Islands) | | | | | | | | |
2021‑1, Class E 11.40%,
04/20/34(e)(i)(n) | | | 2,000,000 | | | | 1,822,012 | |
| Churchill Middle Market CLO, Ltd. (Cayman Islands) | | | | | | | | |
2021‑1A E, Class E 13.43%, 10/24/33(e)(i)(n) | | | 4,000,000 | | | | 3,559,124 | |
| Fortress Credit BSL CLO, Ltd. (Cayman Islands) | | | | | | | | |
2021‑3 Class E 12.31%,
07/20/34(e)(i)(n) | | | 3,000,000 | | | | 2,739,534 | |
| Fortress Credit Opportunities CLO, Ltd. (Cayman Islands) | | | | | | | | |
2018‑11A, Class E 12.41%,
04/15/31(e)(i)(n) | | | 4,000,000 | | | | 3,692,136 | |
| Franklin Park Place CLO, Ltd. (Cayman Islands) | | | | | | | | |
2022‑1A, Class E 12.49%, 04/14/35(e)(i)(n) | | | 2,000,000 | | | | 1,775,336 | |
| Golub Capital Partners CLO, Ltd. (Cayman Islands) | | | | | | | | |
2021‑55A, Class E 11.81%, 07/20/34(e)(i)(n) | | | 2,000,000 | | | | 1,809,322 | |
| KKR Financial CLO, Ltd. (Cayman Islands) | | | | | | | | |
2017, Class ER 12.65%,
04/15/34(e)(i)(n) | | | 2,750,000 | | | | 2,356,610 | |
| TIAA Churchill Middle Market CLO, Ltd. (Cayman Islands) | | | | | | | | |
2016‑1A, Class ER 13.22%, 10/20/30(e)(i)(n) | | | 5,000,000 | | | | 4,565,060 | |
| | | | | | | | |
| | |
Total Structured Products
(Cost $24,329,509) | | | | | | | 22,319,134 | |
| | | | | | | | |
See accompanying Notes to Consolidated Financial Statements. | 17
Apollo Tactical Income Fund Inc.
Consolidated Schedule of Investments (continued)
June 30, 2023 (unaudited)
| | | | | | | | |
| | |
| | Quantity | | | Value $ | |
| | | | | | | | |
| Common Stocks - 0.5% | |
|
| AUTOMOTIVE - 0.0% | |
| | |
APC Parent, Inc.(d)(j) | | | 241,972 | | | | — | |
| | | | | | | | |
|
| ENERGY: OIL & GAS - 0.0% | |
| | |
RDV Resources, Inc.(d)(j) | | | 7,743 | | | | 5,844 | |
| | | | | | | | |
|
| HIGH TECH INDUSTRIES - 0.0% | |
| | |
Riverbed Holdings, Inc.(d)(j) | | | 29,146 | | | | — | |
| | | | | | | | |
|
| MEDIA: ADVERTISING, PRINTING & PUBLISHING - 0.0% | |
| | |
Acosta, Inc.(d)(j) | | | 3,133 | | | | 33,209 | |
| | | | | | | | |
|
| MEDIA: BROADCASTING & SUBSCRIPTION - 0.2% | |
| | |
Anuvu Corp.(d)(j) | | | 102,608 | | | | 504,831 | |
| | | | | | | | |
|
| SERVICES: BUSINESS - 0.3% | |
| | |
Carestream Health, Inc.(d)(j) | | | 55,323 | | | | 534,420 | |
| | | | | | | | |
| | |
Total Common Stocks
(Cost $5,150,061) | | | | | | | 1,078,304 | |
| | | | | | | | |
| | | | | | | | |
| | |
| | Quantity | | | Value $ | |
| | | | | | | | |
| Preferred Stocks - 0.1% | | | | | | | | |
| | |
| HIGH TECH INDUSTRIES - 0.0% | | | | | | |
| | |
Riverbed Holdings, Inc.(d) | | | 19,948 | | | | — | |
| | | | | | | | |
|
| MEDIA: ADVERTISING, PRINTING & PUBLISHING - 0.1% | |
| | |
Acosta, Inc., (14.50% PIK)(d)(f) | | | 4,138 | | | | 204,020 | |
| | | | | | | | |
| | |
Total Preferred Stocks
(Cost $658,665) | | | | | | | 204,020 | |
| | | | | | | | |
| | |
| Total Investments - 151.9% | | | | | | | 316,535,746 | |
| (Cost $338,283,603) | | | | | | | | |
Other Assets & Liabilities,
Net - 6.1% | | | | | | | 12,706,396 | |
Loan Outstanding - (58.0%)(k)(l) | | | | | | | (120,852,685 | ) |
| | | | | | | | |
| |
Net Assets (Applicable to Common
Shares) - 100.0% | | | | 208,389,457 | |
| | | | | | | | |
| (a) | “Senior Loans” are senior, secured loans made to companies whose debt is below investment grade as well as investments with similar economic characteristics. Senior Loans typically hold a first lien priority and, unless otherwise indicated, are required to pay interest at floating rates that are periodically reset by reference to a base lending rate plus a spread. In some instances, the rates shown represent the weighted average rate as of June 30, 2023. Senior Loans are generally not registered under the Securities Act of 1933 (the “1933 Act”) and often incorporate certain restrictions on resale and cannot be sold publicly. Senior Loans often require prepayments from excess cash flow or permit the borrower to repay at its election. The degree to which borrowers repay, whether as a contractual requirement or at their election, cannot be predicted with accuracy. As a result, the actual maturity may be substantially less than the stated maturity. |
| (b) | All or a portion of this Senior Loan position has not settled. Full contract rates do not take effect until settlement date and therefore are subject to change. |
| (c) | The interest rate on this Senior Loan is subject to a base lending rate plus a spread. These base lending rates are primarily the London Interbank Offered Rate (“LIBOR”) or the Secured Overnight Financing Rate (“SOFR”) and secondarily the prime rate offered by one or more major U.S. banks (“Prime”). The interest rate is subject to a minimum floor, which may be less than or greater than the prevailing period end LIBOR/SOFR/Prime rate. As of June 30, 2023, the 1, 3 and 6 month LIBOR rates were 5.22%, 5.54% and 5.76%, respectively, the 1, 3 and 6 month SOFR rates were 5.14%, 5.27%, and 5.39%, respectively, and the Prime lending rate was 8.25%. Senior Loans may contain multiple contracts of the same issuer which may be subject to base lending rates of LIBOR, SOFR and Prime (“Variable”) in addition to the stated spread. |
| (d) | Fair Value Level 3 security. |
| (e) | Foreign issuer traded in U.S. dollars. |
| (f) | Represents a payment‑in‑kind (“PIK”) security, which may pay interest in additional principal amount/share quantity. |
| (g) | Issuer filed for bankruptcy and/or is in default of principal and/or interest payments. |
| (i) | Securities exempt from registration pursuant to Rule 144A under the 1933 Act. These securities may only be resold in transactions exempt from registration to qualified institutional buyers. At June 30, 2023, these securities amounted to $85,825,563, or 41.19% of net assets. |
| (j) | Non‑income producing asset. |
| (k) | The Fund has granted a security interest in substantially all of its assets in the event of default under the credit facility. |
| (l) | Principal of $121,000,000 less unamortized deferred financing costs of $147,315. |
| (m) | Structured Products include collateralized loan obligations (“CLOs”). A CLO typically takes the form of a financing company (generally called a special purpose vehicle or “SPV”), created to reapportion the risk and return characteristics of a pool of assets. While the assets underlying CLOs are often Senior Loans or corporate notes and bonds, the assets may also include (i) subordinated loans; (ii) debt tranches of other CLOs; and (iii) equity securities incidental to investments in Senior Loans. The Fund may invest in lower tranches of CLOs, which typically experience a lower recovery, greater risk of loss or deferral or non‑payment of interest than more senior tranches of the CLO. A key feature of the CLO structure is the prioritization of the cash flows from a pool of debt securities among the several classes of the CLO. The SPV is a company founded for the purpose of securitizing payment claims arising out of this asset pool. On this basis, marketable securities are issued by the SPV and the redemption of these securities typically takes place at maturity out of the cash flow generated by the collected claims. |
| (n) | Floating rate asset. The interest rate shown reflects the rate in effect at June 30, 2023. |
18 | See accompanying Notes to Consolidated Financial Statements.
Apollo Senior Floating Rate Fund Inc.
Apollo Tactical Income Fund Inc.
Consolidated Statements of Assets and Liabilities
June 30, 2023 (unaudited)
| | | | | | | | |
| | | Apollo Senior
Floating Rate
Fund Inc. | | | Apollo
Tactical
Income
Fund Inc. | |
| Assets: | | | | | | | | |
| | |
| Investment securities at fair value (cost $367,045,268 and $338,283,603, respectively) | | $ | 345,750,302 | | | $ | 316,535,746 | |
| Cash and cash equivalents | | | 2,279,735 | | | | 3,856,020 | |
| Interest receivable | | | 1,538,010 | | | | 2,645,427 | |
| Receivable for investment securities sold | | | 17,995,373 | | | | 12,766,691 | |
| Net unrealized appreciation on unfunded commitments (Note 9) | | | — | | | | 9,037 | |
| Receivable from affiliate | | | — | | | | 25,576 | |
| Prepaid expenses | | | 239,254 | | | | 240,068 | |
| | | | | | | | |
| | |
| Total assets | | $ | 367,802,674 | | | $ | 336,078,565 | |
| | | | | | | | |
| | |
| Liabilities: | | | | | | | | |
| | |
| Borrowings under credit facility (principal $130,000,000 and $121,000,000, respectively, less unamortized deferred financing costs of $169,978 and $147,315, respectively) (Note 8) | | $ | 129,830,022 | | | $ | 120,852,685 | |
| Payable for investment securities purchased | | | 6,762,188 | | | | 6,048,228 | |
| Net unrealized depreciation on unfunded commitments (Note 9) | | | 4,418 | | | | — | |
| Interest payable | | | 241,932 | | | | 224,258 | |
| Investment advisory fee payable | | | 294,966 | | | | 269,783 | |
| Other payables and accrued expenses due to affiliates | | | 76,348 | | | | 82,297 | |
| Other payables and accrued expenses | | | 236,536 | | | | 211,857 | |
| | | | | | | | |
| | |
| Total liabilities | | $ | 137,446,410 | | | $ | 127,689,108 | |
| | | | | | | | |
| | |
| Commitments and Contingencies (Note 9) | | | | | | | | |
| | |
| Net Assets (Applicable to Common Shareholders) | | $ | 230,356,264 | | | $ | 208,389,457 | |
| | | | | | | | |
| | |
| Net Assets Consist of: | | | | | | | | |
| | |
| Paid‑in capital ($0.001 par value, 999,998,466 and 1,000,000,000 common shares authorized, respectively, and 15,573,575 and 14,464,026 issued and outstanding, respectively) (Note 6) | | $ | 295,515,991 | | | $ | 275,434,361 | |
| Total accumulated loss | | | (65,159,727 | ) | | | (67,044,904 | ) |
| | | | | | | | |
| | |
| Net Assets (Applicable to Common Shareholders) | | $ | 230,356,264 | | | $ | 208,389,457 | |
| | | | | | | | |
| | |
| Number of Common Shares Outstanding | | | 15,573,575 | | | | 14,464,026 | |
| Net Asset Value, per Common Share | | $ | 14.79 | | | $ | 14.41 | |
See accompanying Notes to Consolidated Financial Statements. | 19
Apollo Senior Floating Rate Fund Inc.
Apollo Tactical Income Fund Inc.
Consolidated Statements of Operations
For the Six Months Ended June 30, 2023 (unaudited)
| | | | | | | | |
| | | Apollo
Senior
Floating Rate
Fund Inc. | | | Apollo
Tactical
Income
Fund Inc. | |
| Investment Income: | | | | | | | | |
| | |
| Interest | | $ | 18,792,406 | | | $ | 17,522,742 | |
| | | | | | | | |
| | |
| Total investment income | | | 18,792,406 | | | | 17,522,742 | |
| | | | | | | | |
| | |
| Expenses: | | | | | | | | |
| | |
| Investment advisory fee (Note 3) | | | 1,774,941 | | | | 1,620,549 | |
| Interest and commitment fee expense (Note 8) | | | 3,761,815 | | | | 3,498,628 | |
| Professional fees | | | 72,144 | | | | 72,144 | |
| Legal fees | | | 128,378 | | | | 131,689 | |
| Administrative services of the Adviser (Note 3) | | | 300,428 | | | | 316,458 | |
| Fund administration and accounting services (Note 3) | | | 119,445 | | | | 112,693 | |
| Insurance expense | | | 170,643 | | | | 170,643 | |
| Board of Directors fees (Note 3) | | | 72,903 | | | | 72,903 | |
| Amortization of deferred financing costs (Note 8) | | | 70,651 | | | | 90,078 | |
| Other operating expenses | | | 83,762 | | | | 90,304 | |
| | | | | | | | |
| | |
| Total expenses | | | 6,555,110 | | | | 6,176,089 | |
| Less: Expense waiver (Note 3) | | | — | | | | (25,576 | ) |
| | | | | | | | |
| | |
| Net expenses | | | 6,555,110 | | | | 6,150,513 | |
| | | | | | | | |
| | |
| Net Investment Income | | | 12,237,296 | | | | 11,372,229 | |
| | | | | | | | |
| | |
| Net Realized and Unrealized Gain/(Loss) on Investments | | | | | | | | |
| | |
| Net realized loss on investments | | | (2,370,055 | ) | | | (2,547,521 | ) |
| Net change in unrealized appreciation on investments and unfunded commitments (Note 9) | | | 10,099,779 | | | | 9,818,872 | |
| | | | | | | | |
| | |
| Net realized and unrealized gain on investments | | | 7,729,724 | | | | 7,271,351 | |
| | | | | | | | |
| | |
| Net Increase in Net Assets, Applicable to Common Shareholders, Resulting From Operations | | $ | 19,967,020 | | | $ | 18,643,580 | |
| | | | | | | | |
20 | See accompanying Notes to Consolidated Financial Statements.
Apollo Senior Floating Rate Fund Inc.
Consolidated Statements of Changes in Net Assets
| | | | | | | | |
| | | For the
Six Months Ended
June 30, 2023
(unaudited) | | | For the
Year Ended
December 31, 2022 | |
| Increase/(Decrease) in Net Assets from: | | | | | | | | |
| | |
| Operations | | | | | | | | |
| | |
| Net investment income | | $ | 12,237,296 | | | $ | 17,051,351 | |
| Net realized loss on investments | | | (2,370,055 | ) | | | (9,097,630 | ) |
| Net change in unrealized appreciation/(depreciation) on investments and unfunded commitments | | | 10,099,779 | | | | (26,091,075 | ) |
| | | | | | | | |
| | |
| Net increase/(decrease) in net assets from operations | | | 19,967,020 | | | | (18,137,354 | ) |
| | | | | | | | |
| | |
| Distributions to Common Shareholders | | | | | | | | |
| Total distributions to common shareholders | | | (10,636,751 | ) | | | (17,037,490 | ) |
| | | | | | | | |
| | |
| Total increase/(decrease) in net assets | | $ | 9,330,269 | | | $ | (35,174,844 | ) |
| | |
| Net Assets Applicable to Common Shares | | | | | | | | |
| | |
| Beginning of period | | | 221,025,995 | | | | 256,200,839 | |
| | | | | | | | |
| End of period | | $ | 230,356,264 | | | $ | 221,025,995 | |
| | | | | | | | |
See accompanying Notes to Consolidated Financial Statements. | 21
Apollo Tactical Income Fund Inc.
Consolidated Statements of Changes in Net Assets
| | | | | | | | |
| | | For the
Six Months Ended
June 30, 2023
(unaudited) | | | For the
Year Ended
December 31, 2022 | |
| Increase/(Decrease) in Net Assets from: | | | | | | | | |
| | |
| Operations | | | | | | | | |
| | |
| Net investment income | | $ | 11,372,229 | | | $ | 17,236,013 | |
| Net realized loss on investments | | | (2,547,521 | ) | | | (11,050,299 | ) |
| Net change in unrealized appreciation/(depreciation) on investments and unfunded commitments | | | 9,818,872 | | | | (28,069,497 | ) |
| | | | | | | | |
| | |
| Net increase/(decrease) in net assets from operations | | | 18,643,580 | | | | (21,883,783 | ) |
| | | | | | | | |
| | |
| Distributions to Common Shareholders | | | | | | | | |
| Total distributions to common shareholders | | | (10,587,666 | ) | | | (17,009,694 | ) |
| | | | | | | | |
| | |
| Total increase/(decrease) in net assets | | $ | 8,055,914 | | | $ | (38,893,477 | ) |
| | |
| Net Assets Applicable to Common Shares | | | | | | | | |
| | |
| Beginning of period | | | 200,333,543 | | | | 239,227,020 | |
| | | | | | | | |
| End of period | | $ | 208,389,457 | | | $ | 200,333,543 | |
| | | | | | | | |
22 | See accompanying Notes to Consolidated Financial Statements.
Apollo Senior Floating Rate Fund Inc.
Consolidated Statement of Cash Flows
For the Six Months Ended June 30, 2023 (unaudited)
| | | | |
| Cash Flows from Operating Activities: | | | | |
| |
| Net increase in net assets from operations | | $ | 19,967,020 | |
| |
| Adjustments to Reconcile Net Increase in Net Assets from Operations to Net Cash Flows Used In Operating Activities: | | | | |
| Net realized loss on investments | | | 2,370,055 | |
| Net change in unrealized appreciation on investments and unfunded commitments | | | (10,099,779 | ) |
| Net amortization/(accretion) of premium/(discount) | | | (760,044 | ) |
| Purchase of investment securities | | | (88,103,131 | ) |
| Proceeds from disposition of investment securities and principal paydowns | | | 62,000,571 | |
| Payment‑in‑kind interest | | | (356,835 | ) |
| Amortization of deferred financing costs | | | 70,651 | |
| Changes in Operating Assets and Liabilities: | | | | |
| Decrease in interest receivable | | | 345,659 | |
| Decrease in prepaid expenses | | | 154,639 | |
| Decrease in interest payable | | | (245,210 | ) |
| Decrease in investment advisory fee payable | | | (5,419 | ) |
| Increase in other payables and accrued expenses due to affiliates | | | 68,366 | |
| Decrease in other payables and accrued expenses | | | (121,032 | ) |
| | | | |
| |
| Net cash flows used in operating activities | | | (14,714,489 | ) |
| | | | |
| |
| Cash Flows from Financing Activities: | | | | |
| Deferred financing cost paid | | | (1,032 | ) |
| Distributions paid to common shareholders (net of change in distributions payable to common shareholders) | | | (10,636,751 | ) |
| | | | |
| Net cash flows used in financing activities | | | (10,637,783 | ) |
| | | | |
| |
| Net Decrease in Cash and Cash Equivalents | | | (25,352,272 | ) |
| |
| Cash and cash equivalents, beginning of period | | | 27,632,007 | |
| | | | |
| |
| Cash and cash equivalents, end of period | | $ | 2,279,735 | |
| | | | |
| |
| Supplemental Disclosure of Cash Flow Information | | | | |
| Cash paid during the period for interest and commitment fee | | $ | 4,007,025 | |
| | | | |
See accompanying Notes to Consolidated Financial Statements. | 23
Apollo Tactical Income Fund Inc.
Consolidated Statement of Cash Flows
For the Six Months Ended June 30, 2023 (unaudited)
| | | | |
| Cash Flows from Operating Activities: | | | | |
| |
| Net increase in net assets from operations | | $ | 18,643,580 | |
| |
| Adjustments to Reconcile Net Increase in Net Assets from Operations to Net Cash Flows Used In Operating Activities: | | | | |
| Net realized loss on investments | | | 2,547,521 | |
| Net change in unrealized appreciation on investments and unfunded commitments | | | (9,818,872 | ) |
| Net amortization/(accretion) of premium/(discount) | | | (721,918 | ) |
| Purchase of investment securities | | | (78,921,658 | ) |
| Proceeds from disposition of investment securities and principal paydowns | | | 62,404,183 | |
| Payment-in-kind interest | | | (439,240 | ) |
| Amortization of deferred financing costs | | | 90,078 | |
| Changes in Operating Assets and Liabilities: | | | | |
| Increase in interest receivable | | | (59,588 | ) |
| Decrease in receivable from affiliate | | | 54,536 | |
| Decrease in prepaid expenses | | | 154,293 | |
| Decrease in interest payable | | | (226,590 | ) |
| Decrease in investment advisory fee payable | | | (5,233 | ) |
| Increase in other payables and accrued expenes due to affiliates | | | 69,110 | |
| Decrease in other payables and accrued expenses | | | (77,105 | ) |
| | | | |
| |
| Net cash flows used in operating activities | | | (6,306,903 | ) |
| | | | |
| Cash Flows from Financing Activities: | | | | |
| Deferred financing cost paid | | | (9,781 | ) |
| Distributions paid to common shareholders (net of change in distributions payable to common shareholders) | | | (10,587,666 | ) |
| | | | |
| Net cash flows used in financing activities | | | (10,597,447 | ) |
| | | | |
| |
| Net Decrease in Cash and Cash Equivalents | | | (16,904,350 | ) |
| |
| Cash and cash equivalents, beginning of period | | | 20,760,370 | |
| | | | |
| |
| Cash and cash equivalents, end of period | | $ | 3,856,020 | |
| | | | |
| Supplemental Disclosure of Cash Flow Information | | | | |
| Cash paid during the period for interest and commitment fee | | $ | 3,725,218 | |
| | | | |
24 | See accompanying Notes to Consolidated Financial Statements.
Apollo Senior Floating Rate Fund Inc.
Consolidated Financial Highlights
For a Common Share Outstanding
| | | | | | | | | | | | | | | | | | | | | | | | |
| Per Common Share Operating Performance: | | For the Six
Months Ended
June 30, 2023
(unaudited) | | | For the Year
Ended
December 31,
2022 | | | For the Year
Ended
December 31,
2021(f) | | | For the Year
Ended
December 31,
2020(f) | | | For the Year
Ended
December 31,
2019(f) | | | For the Year
Ended
December 31,
2018(f) | |
| Net Asset Value, Beginning of Period | | $ | 14.19 | | | $ | 16.45 | | | $ | 16.15 | | | $ | 16.94 | | | $ | 16.34 | | | $ | 17.86 | |
| | | | | | | | | | | | | | | | | | | | | | | | |
| Income from Investment Operations: | | | | | | | | | | | | | | | | | | | | | | | | |
Net investment income(a) | | | 0.79 | | | | 1.09 | | | | 0.86 | | | | 0.98 | | | | 1.21 | | | | 1.25 | |
| Net realized and unrealized gain/(loss) on investments and unfunded commitments | | | 0.49 | | | | (2.26 | ) | | | 0.41 | | | | (0.75 | ) | | | 0.59 | | | | (1.51 | ) |
| | | | | | | | | | | | | | | | | | | | | | | | |
| Total from investment operations | | | 1.28 | | | | (1.17 | ) | | | 1.27 | | | | 0.23 | | | | 1.80 | | | | (0.26 | ) |
| | | | | | | | | | | | | | | | | | | | | | | | |
| Less Distributions Paid to Common Shareholders from: | | | | | | | | | | | | | | | | | | | | | | | | |
| Net investment income | | | (0.68 | ) | | | (1.09 | ) | | | (0.90 | ) | | | (1.02 | ) | | | (1.20 | ) | | | (1.26 | ) |
| Return of capital | | | — | | | | — | | | | (0.07 | ) | | | — | | | | — | | | | — | |
| | | | | | | | | | | | | | | | | | | | | | | | |
| Total distributions paid to Common Shareholders | | | (0.68 | ) | | | (1.09 | ) | | | (0.97 | ) | | | (1.02 | ) | | | (1.20 | ) | | | (1.26 | ) |
| | | | | | | | | | | | | | | | | | | | | | | | |
| Net Asset Value, End of Period | | $ | 14.79 | | | $ | 14.19 | | | $ | 16.45 | | | $ | 16.15 | | | $ | 16.94 | | | $ | 16.34 | |
| Market Value, End of Period | | $ | 12.91 | | | $ | 12.34 | | | $ | 16.11 | | | $ | 14.40 | | | $ | 15.14 | | | $ | 14.39 | |
Total return based on net asset value(b) | | | 9.87 | %(c) | | | (6.46 | )% | | | 8.38 | % | | | 2.99 | % | | | 12.35 | % | | | (0.98 | )% |
Total return based on market value(b) | | | 10.29 | %(c) | | | (16.94 | )% | | | 19.04 | % | | | 2.75 | % | | | 14.02 | % | | | (3.98 | )% |
| Ratios to Average Net Assets Applicable to Common Shareholders: | | | | | | | | | | | | | | | | | | | | | | | | |
| Ratios to Average Net Assets (including interest expense) | | | | | | | | | | | | | | | | | | | | | | | | |
| Ratio of expenses to average net assets excluding expense waivers | | | 6.01 | %(d) | | | 3.87 | % | | | 2.91 | % | | | 3.12 | % | | | 4.01 | % | | | 3.84 | % |
| Ratio of expenses to average net assets including expense waivers | | | 6.01 | %(d) | | | 3.87 | % | | | 2.89 | % | | | 3.12 | % | | | 4.01 | % | | | 3.84 | % |
| Ratio of net investment income to average net assets | | | 10.67 | %(d) | | | 7.20 | % | | | 5.22 | % | | | 6.37 | % | | | 7.23 | % | | | 7.10 | % |
| Ratios to Average Net Assets (excluding interest expense) | | | | | | | | | | | | | | | | | | | | | | | | |
| Ratio of expenses to average net assets excluding expense waivers | | | 2.44 | %(d) | | | 2.38 | %(g) | | | 2.39 | %(g) | | | 2.24 | %(g) | | | 2.21 | %(g) | | | 2.18 | %(g) |
| Ratio of expenses to average net assets including expense waivers | | | 2.44 | %(d) | | | 2.38 | %(g) | | | 2.36 | %(g) | | | 2.24 | %(g) | | | 2.21 | %(g) | | | 2.18 | %(g) |
| Supplemental Data: | | | | | | | | | | | | | | | | | | | | | | | | |
| Portfolio turnover rate | | | 22.5 | %(c) | | | 75.2 | % | | | 123.3 | % | | | 93.6 | % | | | 101.2 | % | | | 122.4 | % |
| Net assets at end of period (000’s) | | $ | 230,356 | | | $ | 221,026 | | | $ | 256,201 | | | $ | 251,534 | | | $ | 263,807 | | | $ | 254,427 | |
| Senior Securities: | | | | | | | | | | | | | | | | | | | | | | | | |
| Principal loan outstanding (in 000’s) | | $ | 130,000 | | | $ | 130,000 | | | $ | 130,000 | | | $ | 121,000 | | | $ | 141,000 | | | $ | 141,000 | |
Asset coverage per $1,000 of loan outstanding(e) | | $ | 2,772 | | | $ | 2,700 | | | $ | 2,971 | | | $ | 3,079 | | | $ | 2,871 | | | $ | 2,804 | |
| (a) | Based on the weighted average outstanding shares. |
| (b) | Total return based on net asset value and total return based on market value assuming all distributions reinvested at reinvestment rate. |
| (e) | Calculated by subtracting the Fund’s total liabilities (not including the borrowings outstanding) from the Fund’s total assets, and dividing this by the amount of borrowings outstanding. |
| (f) | Presented on a non-consolidated basis. (Note 1) |
See accompanying Notes to Consolidated Financial Statements. | 25
Apollo Tactical Income Fund Inc.
Consolidated Financial Highlights
For a Common Share Outstanding
| | | | | | | | | | | | | | | | | | | | | | | | |
| Per Common Share Operating Performance: | | For the Six
Months Ended
June 30, 2023
(unaudited) | | | For the Year
Ended
December 31,
2022 | | | For the Year
Ended
December 31,
2021(f) | | | For the Year
Ended
December 31,
2020(f) | | | For the Year
Ended
December 31,
2019(f) | | | For the Year
Ended
December 31,
2018(f) | |
| Net Asset Value, Beginning of Period | | $ | 13.85 | | | $ | 16.54 | | | $ | 16.27 | | | $ | 16.85 | | | $ | 16.07 | | | $ | 17.44 | |
| | | | | | | | | | | | | | | | | | | | | | | | |
| Income from Investment Operations: | | | | | | | | | | | | | | | | | | | | | | | | |
Net investment income(a) | | | 0.79 | | | | 1.19 | | | | 0.94 | | | | 1.02 | | | | 1.25 | | | | 1.33 | |
| Net realized and unrealized gain/(loss) on investments and unfunded commitments | | | 0.50 | | | | (2.70 | ) | | | 0.33 | | | | (0.54 | ) | | | 0.77 | | | | (1.38 | ) |
| | | | | | | | | | | | | | | | | | | | | | | | |
| Total from investment operations | | | 1.29 | | | | (1.51 | ) | | | 1.27 | | | | 0.48 | | | | 2.02 | | | | (0.05 | ) |
| | | | | | | | | | | | | | | | | | | | | | | | |
| Less Distributions Paid to Common Shareholders from: | | | | | | | | | | | | | | | | | | | | | | | | |
| Net investment income | | | (0.73) | | | | (1.18 | ) | | | (0.99 | ) | | | (1.06 | ) | | | (1.24 | ) | | | (1.32 | ) |
| Return of capital | | | — | | | | — | | | | (0.01 | ) | | | — | | | | — | | | | — | |
| | | | | | | | | | | | | | | | | | | | | | | | |
| Total distributions paid to Common Shareholders | | | (0.73) | | | | (1.18 | ) | | | (1.00 | ) | | | (1.06 | ) | | | (1.24 | ) | | | (1.32 | ) |
| | | | | | | | | | | | | | | | | | | | | | | | |
| Net Asset Value, End of Period | | $ | 14.41 | | | $ | 13.85 | | | $ | 16.54 | | | $ | 16.27 | | | $ | 16.85 | | | $ | 16.07 | |
| Market Value, End of Period | | $ | 12.69 | | | $ | 12.12 | | | $ | 15.32 | | | $ | 14.48 | | | $ | 15.10 | | | $ | 13.77 | |
Total return based on net asset value(b) | | | 10.24 | %(c) | | | (8.38 | )% | | | 8.44 | % | | | 4.71 | % | | | 13.97 | % | | | 0.47 | % |
Total return based on market value(b) | | | 10.94 | %(c) | | | (13.44 | )% | | | 12.86 | % | | | 3.99 | % | | | 19.20 | % | | | (4.67 | )% |
| Ratios to Average Net Assets Applicable to Common Shareholders: | | | | | | | | | | | | | | | | | | | | | | | | |
| Ratios to Average Net Assets (including interest expense) | | | | | | | | | | | | | | | | | | | | | | | | |
| Ratio of expenses to average net assets excluding expense waivers | | | 6.27 | %(d) | | | 4.03 | % | | | 3.01 | % | | | 3.16 | % | | | 4.03 | % | | | 3.85 | % |
| Ratio of expenses to average net assets including expense waivers | | | 6.23 | %(d) | | | 4.00 | % | | | 2.92 | % | | | 3.16 | % | | | 4.03 | % | | | 3.85 | % |
| Ratio of net investment income to average net assets | | | 10.97 | %(d) | | | 7.96 | % | | | 5.66 | % | | | 6.72 | % | | | 7.53 | % | | | 7.65 | % |
| Ratios to Average Net Assets (excluding interest expense) | | | | | | | | | | | | | | | | | | | | | | | | |
| Ratio of expenses to average net assets excluding expense waivers | | | 2.57 | %(d) | | | 2.45 | %(g) | | | 2.45 | %(g) | | | 2.29 | %(g) | | | 2.25 | %(g) | | | 2.25 | %(g) |
| Ratio of expenses to average net assets including expense waivers | | | 2.53 | %(d) | | | 2.42 | %(g) | | | 2.36 | %(g) | | | 2.29 | %(g) | | | 2.25 | %(g) | | | 2.25 | %(g) |
| Supplemental Data: | | | | | | | | | | | | | | | | | | | | | | | | |
| Portfolio turnover rate | | | 22.1 | %(c) | | | 90.9 | % | | | 137.5 | % | | | 96.4 | % | | | 112.3 | % | | | 130.9 | % |
| Net assets at end of period (000’s) | | $ | 208,389 | | | $ | 200,334 | | | $ | 239,227 | | | $ | 235,278 | | | $ | 243,751 | | | $ | 232,432 | |
| Senior Securities: | | | | | | | | | | | | | | | | | | | | | | | | |
| Principal loan outstanding (in 000’s) | | $ | 121,000 | | | $ | 121,000 | | | $ | 121,000 | | | $ | 110,000 | | | $ | 126,500 | | | $ | 126,500 | |
Asset coverage per $1,000 of loan outstanding(e) | | $ | 2,722 | | | $ | 2,656 | | | $ | 2,977 | | | $ | 3,139 | | | $ | 2,927 | | | $ | 2,837 | |
| (a) | Based on the weighted average outstanding shares. |
| (b) | Total return based on net asset value and total return based on market value assuming all distributions reinvested at reinvestment rate. |
| (e) | Calculated by subtracting the Fund’s total liabilities (not including the borrowings outstanding) from the Fund’s total assets, and dividing this by the amount of borrowings outstanding. |
| (f) | Presented on a non-consolidated basis. (Note 1) |
26 | See accompanying Notes to Consolidated Financial Statements.
Apollo Senior Floating Rate Fund Inc.
Apollo Tactical Income Fund Inc.
Notes to Consolidated Financial Statements
June 30, 2023 (unaudited)
Note 1. Organization and Operation
Apollo Senior Floating Rate Fund Inc. (“AFT”) and Apollo Tactical Income Fund Inc. (“AIF”) (individually, a “Fund” or, together, the “Funds”) are corporations organized under the laws of the State of Maryland and registered with the U.S. Securities and Exchange Commission (the “SEC”) under the Investment Company Act of 1940, as amended (the “Investment Company Act”), as diversified, closed-end management investment companies. AFT and AIF commenced operations on February 23, 2011 and February 25, 2013, respectively. Prior to that, the Funds had no operations other than matters relating to their organization and the sale and issuance of 5,236 shares of common stock in each Fund to Apollo Credit Management, LLC (the “Adviser”) at a price of $19.10 per share. The Adviser serves as the Funds’ investment adviser and is an affiliate of Apollo Global Management, Inc. (“AGM”). The Funds’ common shares are listed on the New York Stock Exchange (“NYSE”) and trade under the symbols “AFT” and “AIF”, respectively.
AFT and AIF each has a 100% ownership interest, consolidates, and has control over significant operating, financial, and monetary decisions of AFT Alpine SPV LLC, AFT Zorro SPV LLC, AFT Mantle SPV LLC, and AFT Lender LLC (together the “AFT SPVs”), AIF Alpine SPV LLC, AIF Zorro SPV LLC, AIF Mantle SPV LLC and AIF Lender LLC (together the “AIF SPVs”) (each a “Subsidiary”, or together the “Subsidiaries”), respectively. AFT Alpine SPV LLC and AIF Alpine SPV LLC are Limited Liability Companies formed in accordance with the laws of the State of Delaware which commenced operations on June 17, 2022, and ceased operations on March 15, 2023. AFT Zorro SPV LLC and AIF Zorro SPV LLC are Limited Liability Companies formed in accordance with the laws of the State of Delaware which commenced operations on November 17, 2022, and ceased operations on March 15, 2023. AFT Mantle SPV LLC and AIF Mantle SPV LLC are Limited Liability Companies formed in accordance with the laws of the State of Delaware which commenced operations on February 27, 2023, and ceased operations on April 27, 2023. AFT Lender LLC and AIF Lender LLC are Limited Liability Companies formed in accordance with the laws of the State of Delaware which commenced operations on April 13, 2023. AFT and AIF is each a managing and sole member of the AFT SPVs and AIF SPVs, respectively, pursuant to limited liability company operating agreements. The primary purpose of the Subsidiaries is to facilitate the holding of certain investments of the Funds.
Each Funds’ board of directors (together the board of directors of AFT and AIF, “Board of Directors” or “Board”) appointed James Vanek to replace Joseph Moroney as President and Chief Investment Officer of the Funds effective May 18, 2023. Mr. Moroney’s decision to resign is not the result of any disagreement with the Adviser or its Affiliates regarding their operations, policies, practices or otherwise.
Investment Objective
AFT’s investment objective is to seek current income and preservation of capital. AFT seeks to achieve its investment objective by investing primarily in senior, secured loans made to companies whose debt is rated below investment grade (“Senior Loans”) and investments with similar characteristics. Senior Loans typically hold a first lien priority and pay interest at rates that are determined periodically on the basis of a floating base lending rate plus a spread. These base lending rates are primarily the London Interbank Offered Rate (“LIBOR”); however, the Secured Overnight Financing Rate (“SOFR”) or the prime rate offered by one or more major U.S. banks and the certificate of deposit rate used by commercial lenders may also be used. Senior Loans are typically made to U.S. and, to a limited extent, non‑U.S. corporations, partnerships and other business entities (“Borrower(s)”) that operate in various industries and geographical regions. AFT seeks to generate current income and preservation of capital through a disciplined approach to credit selection and under normal market conditions will invest at least 80% of its managed assets in floating rate Senior Loans and investments with similar economic characteristics. This policy and AFT’s investment objective are not fundamental and may be changed by the Board of AFT with at least 60 days’ prior written notice provided to shareholders. Part of AFT’s investment objective is to seek preservation of capital. AFT’s ability to achieve capital preservation may be limited by its investment in credit instruments that have speculative characteristics. There can be no assurance that AFT will achieve its investment objective.
AIF’s primary investment objective is to seek current income with a secondary objective of preservation of capital. AIF seeks to achieve its investment objectives primarily by allocating its assets among different types of credit instruments based on absolute and relative value considerations and its analysis of the credit markets. This ability to dynamically allocate AIF’s assets may result in AIF’s portfolio becoming concentrated in a particular type of credit instrument (such as Senior Loans or high yield corporate bonds) and substantially less invested in other types of credit instruments. Under normal market conditions, at least 80% of AIF’s managed assets will be invested in credit instruments and investments with similar economic characteristics. For purposes of this policy, “credit instruments” will include Senior Loans, subordinated loans, high yield corporate bonds, notes, bills, debentures, distressed securities, mezzanine securities, structured products (including, without limitation, collateralized debt obligations (“CDOs”), collateralized loan obligations (“CLOs”) and asset-backed securities), bank loans, corporate loans, convertible and preferred securities, government
Semi-Annual Report | 27
Apollo Senior Floating Rate Fund Inc.
Apollo Tactical Income Fund Inc.
Notes to Consolidated Financial Statements (continued)
June 30, 2023 (unaudited)
and municipal obligations, mortgage-backed securities, repurchase agreements, and other fixed-income instruments of a similar nature that may be represented by derivatives such as options, forwards, futures contracts or swap agreements. This policy and AIF’s investment objectives are not fundamental and may be changed by the Board with at least 60 days’ prior written notice provided to shareholders. AIF will seek to preserve capital to the extent consistent with its primary investment objective. AIF’s ability to achieve capital preservation may be limited by its investment in credit instruments that have speculative characteristics. There can be no assurance that AIF will achieve its investment objectives.
Note 2. Significant Accounting Policies
The Funds are investment companies that follow the accounting and reporting guidance of Accounting Standards Codification Topic 946 applicable to investment companies. The Funds’ consolidated financial statements have been prepared in conformity with accounting principles generally accepted in the United States of America (“U.S. GAAP”), which require management to make estimates and assumptions that affect the reported amounts and disclosures in the financial statements. Actual results may differ from those estimates.
Principles of Consolidation
The financial position and results of operations of AFT SPVs and AIF SPVs are included in AFT and AIF’s consolidated financial statements and footnotes, respectively. All intercompany transactions and balances have been eliminated in consolidation.
Fund Valuation
Each Fund’s net asset value (“NAV”) per share will be determined daily, generally as of 4:00 pm on each day that the NYSE is open for trading, or at other times as determined by the Board. The NAV of each Fund’s common shares is the total assets of the Fund (including all securities, cash and other assets) minus the sum of the Fund’s total liabilities (including accrued expenses, dividends payable, borrowings and the liquidation value of any preferred stock) divided by the total number of common shares of the Fund outstanding.
Security Valuation
The Funds value their investments primarily using the mean of the bid and ask prices provided by a nationally recognized security pricing service or broker. Senior Loans, corporate notes and bonds, common stock, structured products, preferred stock and warrants are priced based on valuations provided by an approved independent pricing service or broker, if available. If market or broker quotations are not available, or a price is not available from an independent pricing service or broker, or if the price provided by the independent pricing service or broker is believed to be unreliable, the security will be fair valued by the Adviser as the valuation designee approved by the Fund’s board of directors (the “Board”). In general, the fair value of a security is the amount that the Fund might reasonably expect to receive upon the sale of an asset or pay to transfer a liability in an orderly transaction between willing market participants at the reporting date. Fair value procedures generally take into account any factors deemed relevant, which may include, among others, (i) the nature and pricing history of the security, (ii) the liquidity or illiquidity of the market for the particular security, (iii) recent purchases or sales transactions for the particular security or similar securities and (iv) press releases and other information published about the issuer. In these cases, the Fund’s net asset value (“NAV”) will reflect the affected portfolio securities’ fair value as determined by the valuation designee instead of being determined by the market. Using a fair value pricing methodology to value securities may result in a value that is different from a security’s most recent sale price and from the prices used by other investment companies to calculate their NAV. Determination of fair value is uncertain because it involves subjective judgments and estimates. There can be no assurance that the Fund’s valuation of a security will not differ from the amount that it realizes upon the sale of such security.
Fair Value Measurements
Each Fund’s valuation designee has performed an analysis of all existing investments to determine the significance and character of all inputs to their fair value determination. The levels of fair value inputs used to measure the Fund’s investments are characterized into a fair value hierarchy. The three levels of the fair value hierarchy are described below:
Level 1 — Quoted unadjusted prices for identical assets and liabilities in active markets to which the Funds have access at the date of measurement;
Level 2 — Quoted prices for similar assets and liabilities in active markets, quoted prices for identical or similar assets and liabilities in markets that are not active, but are valued based on executed trades, broker quotations that constitute an executable price, and alternative pricing sources supported by observable inputs which, in each case, are either directly or indirectly observable for the asset in connection with market data at the measurement date; and
28 | Semi-Annual Report
Apollo Senior Floating Rate Fund Inc.
Apollo Tactical Income Fund Inc.
Notes to Consolidated Financial Statements (continued)
June 30, 2023 (unaudited)
Level 3 — Model derived valuations in which one or more significant inputs or significant value drivers are unobservable. In certain cases, investments classified within Level 3 may include securities for which the Funds have obtained indicative quotes from broker-dealers that do not necessarily represent prices the broker may be willing to trade on, as such quotes can be subject to material management judgment. Unobservable inputs are those inputs that reflect the valuation designee’s own assumptions that market participants would use to price the asset or liability based on the best available information.
At the end of each reporting period, management evaluates the Level 2 and Level 3 assets, if any, for changes in liquidity, including but not limited to: whether a broker is willing to execute at the quoted price, the depth and consistency of prices from independent pricing services, and the existence of contemporaneous, observable trades in the market.
The valuation techniques used by the valuation designee to measure fair value at June 30, 2023 maximized the use of observable inputs and minimized the use of unobservable inputs. The inputs or methodology used for valuing securities are not necessarily an indication of the risk associated with investing in those securities. A summary of the Fund’s investments categorized in the fair value hierarchy as of June 30, 2023 is as follows:
| | | | | | | | | | | | | | | | |
| Apollo Senior Floating Rate Fund Inc. | |
|
| |
| | | Total Fair Value at
June 30, 2023 | | | Level 1
Quoted Price | | | Level 2
Significant
Observable
Inputs | | | Level 3
Significant
Unobservable
Inputs | |
|
| |
| Assets: | | | | | | | | | | | | | | | | |
| Cash and Cash Equivalents | | $ | 2,279,735 | | | $ | 2,279,735 | | | $ | — | | | $ | — | |
| Senior Loans | | | 314,831,425 | | | | — | | | | 258,673,513 | | | | 56,157,912 | |
| Corporate Notes and Bonds | | | 28,981,580 | | | | — | | | | 21,389,257 | | | | 7,592,323 | |
| Common Stocks | | | 1,733,277 | | | | — | | | | — | | | | 1,733,277 | |
| Preferred Stocks | | | 204,020 | | | | — | | | | — | | | | 204,020 | |
| Unrealized appreciation on Unfunded Commitments | | | 18,638 | | | | — | | | | 7,422 | | | | 11,216 | |
| | | | | | | | | | | | | | | | |
| Total Assets | | $ | 348,048,675 | | | $ | 2,279,735 | | | $ | 280,070,192 | | | $ | 65,698,748 | |
| | | | | | | | | | | | | | | | |
| Liabilities: | | | | | | | | | | | | | | | | |
| Unrealized depreciation on Unfunded Commitments | | | (23,056 | ) | | | — | | | | (13,790 | ) | | | (9,266 | ) |
| | | | | | | | | | | | | | | | |
| Total Liabilities | | | (23,056 | ) | | | — | | | | (13,790 | ) | | | (9,266 | ) |
| | | | | | | | | | | | | | | | |
| | $ | 348,025,619 | | | $ | 2,279,735 | | | $ | 280,056,402 | | | $ | 65,689,482 | |
| | | | | | | | | | | | | | | | |
The following is a reconciliation of Level 3 holdings for which significant unobservable inputs were used in determining fair value as of June 30, 2023:
| | | | | | | | | | | | | | | | | | | | | | | | |
| Apollo Senior Floating Rate Fund Inc. | |
|
| |
| | | Total | | | Senior Loans | | | Corporate
Notes and
Bonds | | | Common
Stocks | | | Preferred
Stocks | | | Unfunded
Commitments | |
|
| |
| Total Fair Value, beginning of period | | $ | 55,573,493 | | | $ | 52,192,218 | | | $ | 596,966 | | | $ | 2,599,549 | | | $ | 190,255 | | | $ | (5,495 | ) |
| Purchases, including capitalized PIK | | | 26,366,747 | | | | 19,465,277 | | | | 6,901,470 | | | | — | | | | — | | | | — | |
| Sales/Paydowns | | | (7,717,167 | ) | | | (7,665,747 | ) | | | — | | | | (51,420 | ) | | | — | | | | — | |
| Accretion/(amortization) of discounts/ (premiums) | | | 72,092 | | | | 70,919 | | | | 1,173 | | | | — | | | | — | | | | — | |
| Net realized gain/(loss) | | | (1,816,048 | ) | | | (1,867,468 | ) | | | — | | | | 51,420 | | | | — | | | | — | |
| Change in net unrealized appreciation/ (depreciation) | | | 2,887,582 | | | | 3,639,930 | | | | 92,714 | | | | (866,272 | ) | | | 13,765 | | | | 7,445 | |
| Transfers into Level 3 | | | — | | | | — | | | | — | | | | — | | | | — | | | | — | |
| Transfers out of Level 3 | | | (9,677,217 | ) | | | (9,677,217 | ) | | | — | | | | — | | | | — | | | | — | |
| | | | | | | | | | | | | | | | | | | | | | | | |
| Total Fair Value, end of period | | $ | 65,689,482 | | | $ | 56,157,912 | | | $ | 7,592,323 | | | $ | 1,733,277 | | | $ | 204,020 | | | $ | 1,950 | |
| | | | | | | | | | | | | | | | | | | | | | | | |
Assets were transferred from Level 2 to Level 3 or from Level 3 to Level 2 as a result of changes in levels of liquid market observability when subject to various criteria as discussed above. The net change in unrealized appreciation/(depreciation) attributable to Level 3 investments still held at June 30, 2023 was $(852,770).
Semi-Annual Report | 29
Apollo Senior Floating Rate Fund Inc.
Apollo Tactical Income Fund Inc.
Notes to Consolidated Financial Statements (continued)
June 30, 2023 (unaudited)
The following table provides quantitative measures used to determine the fair values of the Level 3 investments as of June 30, 2023:
| | | | | | | | | | | | | | | | | | | |
| Apollo Senior Floating Rate Fund Inc. | | |
|
|
| Assets/Liabilities | | Fair Value at
June 30, 2023 | | Valuation Technique(s)(a) | | Unobservable Input(s) | | Range of
Unobservable
Input(s) Utilized | | Weighted Average
Unobservable Input(s) |
|
|
| Senior Loans | | | $ | 49,830,592 | | | Discounted Cash Flow(b) | | Discount Rate(b) | | 8.45% ‑ 27.71% | | 11.61% |
| | | | | |
| | | | — | | | Recoverability(c) | | Estimated Proceeds(c) | | $— | | $— |
| | | | | |
| | | | 6,327,320 | | | Transaction Appraoch(d) | | Cost(d) | | N/A | | N/A |
| | | | | |
| Corporate Notes and Bonds | | | | 1,224,601 | | | Discounted Cash Flow(b) | | Discount Rate(b) | | 7.49% | | 7.49% |
| | | | | |
| | | | 607,722 | | | Discounted Cash Flow(b) | | Discount Rate(b) | | 5.40% | | 5.40% |
| | | | | | | Recoverability(c) | | Estimated Proceeds(c) | | $55.5m | | $55.5m |
| | | | | |
| | | | — | | | Recoverability(c) | | Estimated Proceeds(c) | | $— | | $— |
| | | | | |
| | | | 5,760,000 | | | Transaction Appraoch(d) | | Cost(d) | | N/A | | N/A |
| | | | | |
| Common Stocks | | | | 21,323 | | | Discounted Cash Flow(b) | | Discount Rate(b) | | 5.44% | | 5.44% |
| | | | | | | Recoverability(c) | | Estimated Proceeds(c) | | $9.1m | | $9.1m |
| | | | | |
| | | | — | | | Recoverability(c) | | Estimated Proceeds(c) | | $— | | $— |
| | | | | |
| | | | 1,178,537 | | | Guideline Public Company(e) | | TEV / EBITDA Multiple(e) | | 2.50x ‑ 7.00x | | 3.11x |
| | | | | |
| | | | 533,417 | | | Guideline Public Company(e) | | TEV / EBITDA Multiple(e) | | 3.00x ‑ 4.00x | | 3.50x |
| | | | | | | Guideline Public Company(f) | | TEV / Revenue(f) | | 1.35x ‑ 1.55x | | 1.45x |
| | | | | |
| Preferred Stocks | | | | — | | | Recoverability(c) | | Estimated Proceeds(c) | | $— | | $— |
| | | | | |
| | | | 204,020 | | | Guideline Public Company(e) | | TEV / EBITDA Multiple(e) | | 7.00x | | 7.00x |
| | | | | |
| Unfunded Commitments | | | | 3,322 | | | Discounted Cash Flow(b) | | Discount Rate(b) | | 9.84% ‑ 21.16% | | 14.31% |
| | | | | |
| | | | (1,372 | ) | | Transaction Appraoch(d) | | Cost(d) | | N/A | | N/A |
| | | | | | | | | | | | | |
| Total Fair Value | | | $ | 65,689,482 | | | | | | | | | |
| | | | | | | | | | | | | |
| | | | | |
| | | | | | | | | | | | | |
| (a) | For the assets which have multiple valuation techniques, the Fund may rely on the techniques individually or in aggregate based on a weight ranging from 0-100%. |
| (b) | The Fund utilized a discounted cash flow model to fair value this security. The significant unobservable input used in the valuation model was the discount rate, which was determined based on the market rates an investor would expect for a similar investment with similar risks. The discount rate was applied to present value the projected cash flows in the valuation model. Significant increases in the discount rate may significantly lower the fair value of an investment; conversely, significant decreases in the discount rate may significantly increase the fair value of an investment. |
| (c) | The Fund utilized a recoverability approach to fair value this security, specifically a liquidation analysis. There are various, company specific inputs used in the valuation analysis that relate to the liquidation value of a company’s assets. The significant unobservable input used in the valuation model was estimated proceeds. Significant increases or decreases in the input in isolation may result in a significantly higher or lower fair value measurement. |
| (d) | The Fund utilized a recent transaction, specifically purchase price, to fair value this security. |
| (e) | The Fund utilized a guideline public company method to fair value this security. The significant unobservable inputs used in the valuation model were total enterprise value (“TEV”) and earnings before interest, taxes, depreciation and amortization (“EBITDA”) based on comparable multiples for a similar investment with similar risks. Significant increases or decreases in either of these inputs in isolation may result in a significantly higher or lower fair value measurement. |
| (f) | The Fund utilized a guideline public company method to fair value this security. The significant unobservable inputs used in the valuation model were total enterprise value (“TEV”) and revenue based on comparable multiples for a similar investment with similar risks. Significant increases or decreases in either of these inputs in isolation may result in a significantly higher or lower fair value measurement. |
30 | Semi-Annual Report
Apollo Senior Floating Rate Fund Inc.
Apollo Tactical Income Fund Inc.
Notes to Consolidated Financial Statements (continued)
June 30, 2023 (unaudited)
| | | | | | | | | | | | | | | | |
| Apollo Tactical Income Fund Inc. | |
|
| |
| | | Total Fair Value at
June 30, 2023 | | | Level 1
Quoted Price | | | Level 2
Significant
Observable
Inputs | | | Level 3
Significant
Unobservable
Inputs | |
|
| |
| Assets: | | | | | | | | | | | | | | | | |
| Cash and Cash Equivalents | | $ | 3,856,020 | | | $ | 3,856,020 | | | $ | — | | | $ | — | |
| Senior Loans | | | 227,880,508 | | | | — | | | | 150,171,090 | | | | 77,709,418 | |
| Corporate Notes and Bonds | | | 64,067,405 | | | | — | | | | 57,481,830 | | | | 6,585,575 | |
| Convertible Bonds | | | 986,375 | | | | — | | | | 986,375 | | | | — | |
| Structured Products | | | 22,319,134 | | | | — | | | | 22,319,134 | | | | — | |
| Common Stocks | | | 1,078,304 | | | | — | | | | — | | | | 1,078,304 | |
| Preferred Stocks | | | 204,020 | | | | — | | | | — | | | | 204,020 | |
| Unrealized appreciation on Unfunded Commitments | | | 34,915 | | | | — | | | | 5,938 | | | | 28,977 | |
| | | | | | | | | | | | | | | | |
| Total Assets | | $ | 320,426,681 | | | $ | 3,856,020 | | | $ | 230,964,367 | | | $ | 85,606,294 | |
| | | | | | | | | | | | | | | | |
| Liabilities: | | | | | | | | | | | | | | | | |
| Unrealized depreciation on Unfunded Commitments | | | (25,878 | ) | | | — | | | | (10,709 | ) | | | (15,169 | ) |
| | | | | | | | | | | | | | | | |
| Total Liabilities | | | (25,878 | ) | | | — | | | | (10,709 | ) | | | (15,169 | ) |
| | | | | | | | | | | | | | | | |
| | $ | 320,400,803 | | | $ | 3,856,020 | | | $ | 230,953,658 | | | $ | 85,591,125 | |
| | | | | | | | | | | | | | | | |
The following is a reconciliation of Level 3 holdings for which significant unobservable inputs were used in determining fair value as of June 30, 2023:
| | | | | | | | | | | | | | | | | | | | | | | | |
| Apollo Tactical Income Fund Inc. | |
|
| |
| | | Total | | | Senior Loans | | | Corporate
Notes and
Bonds | | | Common
Stocks | | | Preferred
Stocks | | | Unfunded
Commitments | |
|
| |
| Total Fair Value, beginning of period | | $ | 75,631,009 | | | $ | 73,159,804 | | | $ | 551,046 | | | $ | 1,753,260 | | | $ | 188,448 | | | $ | (21,549 | ) |
| Purchases, including capitalized PIK | | | 22,170,051 | | | | 16,228,581 | | | | 5,941,470 | | | | — | | | | — | | | | — | |
| Sales/Paydowns | | | (6,694,142 | ) | | | (6,680,049 | ) | | | — | | | | (14,093 | ) | | | — | | | | — | |
| Accretion/(amortization) of discounts/ (premiums) | | | 95,858 | | | | 94,685 | | | | 1,173 | | | | — | | | | — | | | | — | |
| Net realized gain/(loss) | | | (1,828,328 | ) | | | (1,842,421 | ) | | | — | | | | 14,093 | | | | — | | | | — | |
| Change in net unrealized appreciation/ (depreciation) | | | 3,259,851 | | | | 3,791,992 | | | | 91,886 | | | | (674,956 | ) | | | 15,572 | | | | 35,357 | |
| Transfers into Level 3 | | | — | | | | — | | | | — | | | | — | | | | — | | | | — | |
| Transfers out of Level 3 | | | (7,043,174 | ) | | | (7,043,174 | ) | | | — | | | | — | | | | — | | | | — | |
| | | | | | | | | | | | | | | | | | | | | | | | |
| Total Fair Value, end of period | | $ | 85,591,125 | | | $ | 77,709,418 | | | $ | 6,585,575 | | | $ | 1,078,304 | | | $ | 204,020 | | | $ | 13,808 | |
| | | | | | | | | | | | | | | | | | | | | | | | |
Assets were transferred from Level 2 to Level 3 or from Level 3 to Level 2 as a result of changes in levels of liquid market observability when subject to various criteria as discussed above. The net change in unrealized appreciation/(depreciation) attributable to Level 3 investments still held at June 30, 2023 was $(411,028).
Semi-Annual Report | 31
Apollo Senior Floating Rate Fund Inc.
Apollo Tactical Income Fund Inc.
Notes to Consolidated Financial Statements (continued)
June 30, 2023 (unaudited)
The following table provides quantitative measures used to determine the fair values of the Level 3 investments as of June 30, 2023:
| | | | | | | | | | | | | | | | | | | |
| Apollo Tactical Income Fund Inc. | | |
|
|
| Assets/Liabilities | | Fair Value at
June 30, 2023 | | Valuation Technique(s)(a) | | Unobservable Input(s) | | Range of
Unobservable
Input(s) Utilized | | Weighted Average
Unobservable Input(s) |
|
|
| Senior Loans | | | $ | 71,382,098 | | | Discounted Cash Flow(b) | | Discount Rate(b) | | 8.45% ‑ 27.71% | | 11.21% |
| | | | | |
| | | | — | | | Recoverability(c) | | Estimated Proceeds(c) | | $— | | $— |
| | | | | |
| | | | 6,327,320 | | | Transaction Appraoch(d) | | Cost(d) | | N/A | | N/A |
| | | | | |
| Corporate Notes and Bonds | | | | 1,224,601 | | | Discounted Cash Flow(b) | | Discount Rate(b) | | 7.49% | | 7.49% |
| | | | | |
| | | | 560,974 | | | Discounted Cash Flow(b) | | Discount Rate(b) | | 5.40% | | 5.40% |
| | | | | | | Recoverability(c) | | Estimated Proceeds(c) | | $55.5m | | $55.5m |
| | | | | |
| | | | — | | | Recoverability(c) | | Estimated Proceeds(c) | | $— | | $— |
| | | | | |
| | | | 4,800,000 | | | Transaction Appraoch(d) | | Cost(d) | | N/A | | N/A |
| | | | | |
| Common Stocks | | | | — | | | Recoverability (c) | | Estimated Proceeds(c) | | $— | | $— |
| | | | | |
| | | | 5,844 | | | Discounted Cash Flow(b) | | Discount Rate(b) | | 5.44% | | 5.44% |
| | | | | | | Recoverability(c) | | Estimated Proceeds(c) | | $9.1m | | $9.1m |
| | | | | |
| | | | 567,629 | | | Guideline Public Company(e) | | TEV / EBITDA Multiple(e) | | 2.50x - 7.00x | | 3.23x |
| | | | | |
| | | | 504,831 | | | Guideline Public Company(e) | | TEV / EBITDA Multiple(e) | | 3.00x - 4.00x | | 3.50x |
| | | | | | | Guideline Public Company(f) | | TEV / Revenue(f) | | 1.35x ‑ 1.55x | | 1.45x |
| | | | | |
| Preferred Stocks | | | | — | | | Recoverability(c) | | Estimated Proceeds(c) | | $— | | $— |
| | | | | |
| | | | 204,020 | | | Guideline Public Company(e) | | TEV / EBITDA Multiple(e) | | 7.00x | | 7.00x |
| | | | | |
| Unfunded Commitments | | | | 15,180 | | | Discounted Cash Flow (b) | | Discount Rate (b) | | 9.30% ‑ 21.16% | | 12.85% |
| | | | | |
| | | | (1,372 | ) | | Transaction Appraoch (d) | | Cost(d) | | N/A | | N/A |
| | | | | | | | | | | | | |
| Total Fair Value | | | $ | 85,591,125 | | | | | | | | | |
| | | | | | | | | | | | | |
| | | | | |
| | | | | | | | | | | | | |
| (a) | For the assets which have multiple valuation techniques, the Fund may rely on the techniques individually or in aggregate based on a weight ranging from 0‑100%. |
| (b) | The Fund utilized a discounted cash flow model to fair value this security. The significant unobservable input used in the valuation model was the discount rate, which was determined based on the market rates an investor would expect for a similar investment with similar risks. The discount rate was applied to present value the projected cash flows in the valuation model. Significant increases in the discount rate may significantly lower the fair value of an investment; conversely, significant decreases in the discount rate may significantly increase the fair value of an investment. |
| (c) | The Fund utilized a recoverability approach to fair value this security, specifically a liquidation analysis. There are various, company specific inputs used in the valuation analysis that relate to the liquidation value of a company’s assets. The significant unobservable input used in the valuation model was estimated proceeds. Significant increases or decreases in the input in isolation may result in a significantly higher or lower fair value measurement. |
| (d) | The Fund utilized a recent transaction, specifically purchase price, to fair value this security. |
| (e) | The Fund utilized a guideline public company method to fair value this security. The significant unobservable inputs used in the valuation model were total enterprise value (“TEV”) and earnings before interest, taxes, depreciation and amortization (“EBITDA”) based on comparable multiples for a similar investment with similar risks. Significant increases or decreases in either of these inputs in isolation may result in a significantly higher or lower fair value measurement. |
| (f) | The Fund utilized a guideline public company method to fair value this security. The significant unobservable inputs used in the valuation model were total enterprise value (“TEV”) and revenue based on comparable multiples for a similar investment with similar risks. Significant increases or decreases in either of these inputs in isolation may result in a significantly higher or lower fair value measurement. |
32 | Semi-Annual Report
Apollo Senior Floating Rate Fund Inc.
Apollo Tactical Income Fund Inc.
Notes to Consolidated Financial Statements (continued)
June 30, 2023 (unaudited)
Cash and Cash Equivalents
Cash and cash equivalents of the Funds consist of cash held in bank accounts and liquid investments with maturities, at the date of acquisition, not exceeding 90 days that, at times, may exceed federally insured limits. As of June 30, 2023, cash and cash equivalents were comprised of cash deposited with U.S. financial institutions in which carrying value approximated fair value and are considered to be Level 1 in the fair value hierarchy.
Industry Classifications
The industry classifications of the Funds’ investments, as presented in the accompanying Consolidated Schedules of Investments, represent management’s belief as to the most meaningful presentation of the classification of such investments. For Fund compliance purposes, the Funds’ industry classifications refer to any one or more of the industry sub‑classifications used by one or more widely recognized market indexes or rating group indexes, with the primary source being Moody’s, and/or as defined by the Funds’ management. These definitions may not apply for purposes of this report, which may combine industry sub‑classifications.
Fair Value of Financial Instruments
The fair value of the Funds’ assets and liabilities that qualify as financial instruments under U.S. GAAP approximates the carrying amounts presented in the accompanying Consolidated Statements of Assets and Liabilities.
Securities Transactions and Investment Income
Securities transactions of the Funds are recorded on the trade date for financial reporting purposes. Cost is determined based on consideration given, and the unrealized appreciation/(depreciation) on investment securities is the difference between fair value determined in compliance with the valuation policy approved by the Board and the cost. Realized gains and losses from securities transactions and foreign currency transactions, if any, are recorded on the basis of identified cost and stated separately in the Consolidated Statements of Operations. Interest income is recorded on the accrual basis and includes the accretion of original issue discounts and amortization of premiums where applicable using the effective interest rate method over the lives of the respective debt securities. Dividend income from equity investments is recorded on the ex-dividend date. The Funds record dividend income and accrue interest income from private investments pursuant to the terms of the respective investment.
The Funds hold investments that have designated payment‑in‑kind (“PIK”) interest. PIK interest is included in interest income and reflected as a receivable in accrued interest up to the payment date. On payment dates, the Funds capitalize the accrued interest receivable as an additional investment and mark it at the fair value associated with the position.
U.S. Federal Income Tax Status
The Funds intend to maintain their status each year as regulated investment companies under Subchapter M of the Internal Revenue Code of 1986, as amended, applicable to regulated investment companies and will distribute substantially all of their net investment income and net capital gains, if any, for their tax years. The Funds may elect to incur excise tax if it is deemed prudent by the Board from a cash management perspective or in the best interest of shareholders due to other facts and circumstances. For the year ended December 31, 2022, AFT and AIF did not record a U.S. federal excise tax provision. The Funds did not pay any excise tax during 2023 related to the 2022 tax year. No federal income tax provision or excise tax provision is required for the six months ended June 30, 2023.
The Funds have followed the authoritative guidance on accounting for and disclosure of uncertainty in tax positions, which requires the Funds to determine whether a tax position is more likely than not to be sustained upon examination, including resolution of any related appeals or litigation processes, based on the technical merits of the position. The Funds have determined that there was no material effect on the financial statements from following this authoritative guidance. In the normal course of business, the Funds are subject to examination by federal, state and local jurisdictions, where applicable, for tax years for which applicable statutes of limitations have not expired. The statute of limitations on AFT’s federal and state tax filings remains open for the years ended December 31, 2019 to 2022. The statute of limitations on AIF’s federal and state fillings remains open for the years ended December 31, 2019 to 2022.
Semi-Annual Report | 33
Apollo Senior Floating Rate Fund Inc.
Apollo Tactical Income Fund Inc.
Notes to Consolidated Financial Statements (continued)
June 30, 2023 (unaudited)
Distributions to Common Shareholders
The Funds intend to make regular monthly cash distributions of all or a portion of their net investment income available to common shareholders. The Funds intend to pay common shareholders at least annually all or substantially all of their capital gains and net investment income after the payment of dividends and interest owed with respect to outstanding preferred shares and/or notes or other forms of leverage utilized by the Funds, although for cash management purposes, the Funds may elect to retain distributable amounts and pay excise tax as described above. If the Funds make a long-term capital gain distribution, they will be required to allocate such gain between the common shares and any preferred shares issued by the Funds in proportion to the total dividends paid to each class for the year in which the income is realized.
The distributions for any full or partial year might not be made in equal amounts, and one distribution may be larger than the other. The Funds will make a distribution only if authorized by the Board and declared by the Funds out of assets legally available for these distributions. The Funds may pay a special distribution at the end of each calendar year, if necessary, to comply with U.S. federal income tax requirements. This distribution policy may, under certain circumstances, have certain adverse consequences to the Funds and their shareholders because it may result in a return of capital to shareholders, which would reduce the Funds’ NAV and, over time, potentially increase the Funds’ expense ratios. If the Funds distribute a return of capital, it means that the Funds are returning to shareholders a portion of their investment rather than making a distribution that is funded from the Funds’ earned income or other profits. The Board may elect to change AFT’s or AIF’s distribution policy at any time.
Derivatives
The Funds rely on certain exemptions in Rule 18f-4 under the Investment Company Act to enter into derivatives transactions and certain other transactions notwithstanding the restrictions on the issuance of “senior securities” under Section 18 of the Investment Company Act. The rule also impacts the use of unfunded commitment agreements and reverse repurchase agreements. Rule 18f-4 imposes limits on the amount of derivatives a fund can enter into, requires that a fund treats derivatives as senior securities and requires that a fund whose use of derivatives is more than a limited specified exposure amount establish and maintain a comprehensive derivatives risk management program and appoint a derivatives risk manager. In addition, a fund entering into an unfunded commitment agreement generally must determine, at the time it enters into such agreement, that it will have sufficient cash and cash equivalents to meet its obligations with respect to all of its unfunded commitment agreements as they come due. Additionally, a fund entering into reverse repurchase agreements or other similar financing transactions, must either (i) comply with the asset coverage requirements of Section 18 (combining the aggregate amount of indebtedness associated with all reverse repurchase agreements or similar financing with the aggregate amount of any other senior securities representing indebtedness when calculating the relevant asset coverage ratio) or (ii) treat all reverse repurchase agreements or similar financing transactions as derivatives transactions for all purposes under Rule 18f-4. Each Fund operates as a “limited derivatives user” for purposes of the derivatives transactions exemption in Rule 18f-4. To qualify as a limited derivatives user, a Fund’s “derivatives exposure” is limited to 10% of its net assets subject to exclusions for certain currency or interest rate hedging transactions (as calculated in accordance with Rule 18f-4). If either Fund ceases to qualify as a “limited derivatives user” as defined in Rule 18f-4, the rule would, among other things, require such Fund to establish a comprehensive derivatives risk management program, to comply with certain value-at-risk based leverage limits, to appoint a derivatives risk manager and to provide additional disclosure both publicly and to the SEC regarding its derivatives positions.
Note 3. Investment Advisory, Administration and Other Agreements with Affiliates
Investment Advisory Fee
The Adviser provides certain investment advisory, management and administrative services to the Funds pursuant to investment advisory and management agreements with each of the Funds. For its services, each Fund pays the Adviser monthly at the annual rate of 1.0% of the average daily value of the Fund’s managed assets. Managed assets are defined as the total assets of a Fund (including any assets attributable to any preferred shares that may be issued or to money borrowed or notes issued by the Fund) minus the sum of the Fund’s accrued liabilities, including accrued interest and accumulated dividends (other than liabilities for money borrowed (including the liquidation preference of preferred shares) or notes issued). The Adviser may elect from time to time, in its sole discretion, to waive its receipt of
34 | Semi-Annual Report
Apollo Senior Floating Rate Fund Inc.
Apollo Tactical Income Fund Inc.
Notes to Consolidated Financial Statements (continued)
June 30, 2023 (unaudited)
the advisory fee from a Fund. If the Adviser elects to waive its compensation, such action may have a positive effect on the Fund’s performance or yield. The Adviser is under no obligation to waive its fees, may elect not to do so, may decide to waive its compensation periodically or may decide to waive its compensation on only one of the Funds at any given time. For the six months ended June 30, 2023, the Adviser earned fees of $1,774,941 and $1,620,549 from AFT and AIF, respectively.
Administrative Services and Expense Reimbursements
The Funds and the Adviser have entered into Administrative Services and Expense Reimbursement Agreements pursuant to which the Adviser provides certain administrative services, personnel and facilities to the Funds and performs operational services necessary for the operation of the Funds not otherwise provided by other service providers of the Funds. These services may include, without limitation, certain bookkeeping and recordkeeping services, compliance and legal services, investor relations assistance, and accounting and auditing support. Pursuant to these agreements, the Funds will reimburse the Adviser at cost, at the Adviser’s request, for certain costs and expenses incurred by the Adviser that are necessary for the administration and operation of the Funds. In addition, the Adviser or one of its affiliates may pay certain expenses on behalf of the Funds and then allocate these expenses to the Funds for reimbursement. For the six months ended June 30, 2023, the Adviser provided services under these agreements totaling $300,428 and $316,458 for AFT and AIF, respectively, which is shown in the Consolidated Statements of Operations as administrative services of the Adviser. Included in these amounts is approximately $71,082 and $70,849 for AFT and AIF, respectively, of remuneration for officers of the Funds. During the six months ended June 30, 2023 only AIF had accrued a voluntary expense waiver totaling $25,576. This amount is reflected in receivable from affiliate in the Consolidated Statements of Assets and Liabilities. This waiver is completely voluntary by the Adviser and can be discontinued by the Adviser at any time without notice.
Each Fund has entered into separate agreements with U.S. Bancorp Fund Services, LLC, d/b/a U.S. Bank Global Fund Services, to provide accounting and administrative services, as well as separate agreements with U.S. Bank National Association to provide custodial services (together, “U.S. Bank”). Under the terms of the agreements, U.S. Bank is responsible for providing services necessary in the daily operations of the Funds such as maintaining the Funds’ books and records, calculating the Funds’ NAVs, settling all portfolio trades, preparing regulatory filings and acting as the corporate secretary. Each Fund has also entered into separate agreements with American Stock Transfer & Trust Company, LLC (“AST”), to serve as the Fund’s transfer agent, dividend disbursing agent and reinvestment plan administrator. U.S. Bank and AST provided services totaling $119,445 and $112,693 for AFT and AIF, respectively, for the six months ended June 30, 2023, which are included in fund administration and accounting services in the Consolidated Statements of Operations.
Board of Directors Fees
On an annual basis, AFT and AIF pay each member of the Board who is not an “interested person” (as defined in the Investment Company Act) (an “Independent Board Member”) of the Funds an annual retainer of $28,000 per Fund, plus $2,000 for each in‑person Board meeting (including meetings held via video-conference) of a single Fund ($3,000, or $1,500 per Fund, for a joint meeting of both Funds), plus $1,000 for attendance at telephonic Board meetings of a single Fund or participation in special committee meetings of a single Fund not held in conjunction with regularly scheduled Board meetings ($1,500, or $750 per Fund, for a joint meeting of both Funds). In addition, the chairman of the audit committee receives $5,000 per year from each Fund. The Funds also reimburse Independent Board Members for travel and out‑of‑pocket expenses incurred in connection with such meetings, and the Funds split the cost of such expenses for meetings involving both AFT and AIF. Included in the Consolidated Statements of Operations in Board of Directors fees for the six months ended June 30, 2023 is $72,903 and $72,903 of expenses related to the Board for each of AFT and AIF, respectively.
Other Affiliate Transactions
From time-to-time various affiliates of the Adviser are involved in transactions whereby certain fees, including but not limited to, structuring, underwriting, arrangement, placement, syndication, advisory or similar services (collectively, “Capital Solution” services) are earned and in certain circumstances are rebated back the Fund in whole or in part. For the six months ended June 30, 2023, there were no fee rebates from certain Affiliates for AFT and AIF, respectively.
Semi-Annual Report | 35
Apollo Senior Floating Rate Fund Inc.
Apollo Tactical Income Fund Inc.
Notes to Consolidated Financial Statements (continued)
June 30, 2023 (unaudited)
Note 4. Investment Transactions
For the six months ended June 30, 2023, the cost of investment purchases and proceeds from sales of securities and principal paydowns were as follows:
| | | | | | | | | | |
| Fund | | Purchases | | Sales |
|
| |
| Apollo Senior Floating Rate Fund Inc. | | | $ | 78,117,050 | | | | $ | 77,495,377 | |
| Apollo Tactical Income Fund Inc. | | | $ | 79,173,634 | | | | $ | 68,351,840 | |
|
| |
The Funds are permitted to purchase and sell securities (“Cross-Trade”) from and to other Apollo entities pursuant to procedures approved by the Board in compliance with Rule 17a‑7 under the Investment Company Act (the “Rule”). Each Cross-Trade is executed at a fair market price in compliance with the provisions of the Rule. For the six months ended June 30, 2023, the Funds did not engage in any Cross-Trade activities.
Note 5. Risks
Senior Loans
Senior Loans are usually rated below investment grade and may also be unrated. As a result, the risks associated with Senior Loans are similar to the risks of below investment grade fixed income instruments, although Senior Loans are senior and secured, in contrast to other below investment grade fixed income instruments, which are often subordinated or unsecured. Investments in Senior Loans rated below investment grade are considered speculative because of the credit risk of their issuers. Such issuers are considered more likely than investment grade issuers to default on their payments of interest and principal owed to the Funds, and such defaults could reduce the Funds’ NAV and income distributions. An economic downturn would generally lead to a higher non‑payment rate, and a Senior Loan may lose significant market value before a default occurs. Moreover, any specific collateral used to secure a Senior Loan may decline in value or become illiquid, which would adversely affect the Senior Loan’s value. Senior Loans are subject to a number of risks, including liquidity risk and the risk of investing in below investment grade fixed income instruments.
Senior Loans are subject to the risk of non‑payment of scheduled interest or principal. Such non‑payment would result in a reduction of income to the Funds, a reduction in the value of the investment and a potential decrease in the NAV of the Funds. There can be no assurance that the liquidation of any collateral securing a Senior Loan would satisfy the Borrower’s obligation in the event of non‑payment of scheduled interest or principal payments, or that the collateral could be readily liquidated. In the event of bankruptcy or insolvency of a Borrower, the Funds could experience delays or limitations with respect to their ability to realize the benefits of the collateral securing a Senior Loan. The collateral securing a Senior Loan may lose all or substantially all of its value in the event of the bankruptcy or insolvency of a Borrower. Some Senior Loans are subject to the risk that a court, pursuant to fraudulent conveyance or other similar laws, could subordinate such Senior Loans to presently existing or future indebtedness of the Borrower or take other action detrimental to the holders of Senior Loans including, in certain circumstances, invalidating such Senior Loans or causing interest previously paid to be refunded to the Borrower.
There may be less readily available and reliable information about most Senior Loans than is the case for many other types of securities, including securities issued in transactions registered under the Securities Act of 1933 (the “1933 Act”) or registered under the Securities Exchange Act of 1934. As a result, the Adviser will rely primarily on its own evaluation of a Borrower’s credit quality, rather than on any available independent sources. Therefore, the Funds will be particularly dependent on the analytical abilities of the Adviser.
In general, the secondary trading market for Senior Loans is not well developed. No active trading market may exist for certain Senior Loans, which may make it difficult to value them. Illiquidity and adverse market conditions may mean that the Funds may not be able to sell Senior Loans quickly or at a fair price. To the extent that a secondary market does exist for certain Senior Loans, the market for them may be subject to irregular trading activity, wide bid/ask spreads and extended trade settlement periods.
Senior Loans are generally not registered under the 1933 Act and often contain certain restrictions on resale and cannot be sold publicly. Senior Loans often require prepayments from excess cash flow or permit the Borrower to repay
36 | Semi-Annual Report
Apollo Senior Floating Rate Fund Inc.
Apollo Tactical Income Fund Inc.
Notes to Consolidated Financial Statements (continued)
June 30, 2023 (unaudited)
at its election. The degree to which Borrowers repay, whether as a contractual requirement or at their election, cannot be predicted with accuracy. As a result, the actual maturity may be substantially less than the stated maturity shown on the Consolidated Schedules of Investments.
The Funds may acquire Senior Loans through assignments or participations. The purchaser of an assignment typically succeeds to all the rights and obligations of the assigning institution and becomes a lender under the credit agreement with respect to the debt obligation; however, the purchaser’s rights can be more restricted than those of the assigning institution, and the Funds may not be able to unilaterally enforce all rights and remedies under the loan and with regard to any associated collateral. In general, a participation is a contractual relationship only with the institution participating out the interest, not with the Borrower. Sellers of participations typically include banks, broker-dealers and other financial and lending institutions. In purchasing participations, the Funds generally will have no right to enforce compliance by the Borrower with the terms of the loan agreement against the Borrower, and the Funds may not directly benefit from the collateral supporting the debt obligation in which they have purchased the participation. As a result, the Funds will be exposed to the credit risk of both the Borrower and the institution selling the participation. Further, in purchasing participations in lending syndicates, the Funds will not be able to conduct the due diligence on the Borrower or the quality of the Senior Loan with respect to which they are buying a participation that the Funds would otherwise conduct if they were investing directly in the Senior Loan, which may result in the Funds being exposed to greater credit or fraud risk with respect to the Borrower or the Senior Loan.
The Funds may also engage in direct origination of loans. In originating loans, the Funds rely on the Adviser’s proprietary sourcing channels, which targets large corporate and private sponsor-backed issuers. In determining whether to originate a loan, the Funds rely on the Adviser’s analysis of the creditworthiness of a borrower and/or any collateral for payment of interest and repayment of principal. The level of analytical sophistication necessary for conducting this analysis is high and the Adviser must rely more significantly on its own resources to conduct due diligence on borrowers than for secondary market debt purchases. The loans the Funds originate are generally Senior Loans, however neither Fund is limited in the type, amount or size of loans it may originate nor to a particular type of borrower. A Fund will earn origination and other types of borrower fees in connection with originating and structuring loans. Direct loans are not publicly traded and may not have a secondary market. Direct loans are subject to heightened liquidity risk and interest rate risk, and some direct loans may be deemed illiquid. The Funds may also face heightened competition for direct origination, which may result in the Funds being required to make lower yielding investments.
Corporate Bonds
The Funds may invest in a wide variety of bonds of varying maturities issued by U.S. and foreign corporations, other business entities, governments and municipalities and other issuers. Corporate bonds are issued with varying features and may differ in the way that interest is calculated, the amount and frequency of payments, the type of collateral, if any, and the presence of special features (e.g., conversion rights, call rights or other rights of the issuer). The Funds’ investments in corporate bonds may include, but are not limited to, senior, junior, secured and unsecured bonds, notes and other debt securities, and may be fixed rate, variable rate or floating rate, among other things.
The Adviser expects most of the corporate bonds in which the Funds invest will be high yield bonds (commonly referred to as “junk” bonds). An issuer of corporate bonds typically pays the investor a fixed rate of interest and must repay the amount borrowed on or before maturity. The investment return of corporate bonds reflects interest on the security and changes in the market value of the security. The market value of a corporate bond generally may be expected to rise and fall inversely with interest rates. The value of intermediate and longer-term corporate bonds normally fluctuates more in response to changes in interest rates than does the value of shorter-term corporate bonds. The market value of a corporate bond also may be affected by investors’ perceptions of the creditworthiness of the issuer, the issuer’s performance and perceptions of the issuer in the marketplace.
Subordinated Loans
Subordinated loans generally are subject to similar risks as those associated with investments in Senior Loans, except that such loans are subordinated in payment and/or lower in lien priority to first lien holders. In the event of default on a subordinated loan, the first priority lien holder has first claim to the underlying collateral of the loan. Subordinated loans are subject to the additional risk that the cash flow of the Borrower and property securing the loan or debt, if any, may be
Semi-Annual Report | 37
Apollo Senior Floating Rate Fund Inc.
Apollo Tactical Income Fund Inc.
Notes to Consolidated Financial Statements (continued)
June 30, 2023 (unaudited)
insufficient to meet scheduled payments after giving effect to the senior unsecured or senior secured obligations of the Borrower. This risk is generally higher for subordinated unsecured loans or debt that are not backed by a security interest in any specific collateral. Subordinated loans generally have greater price volatility than Senior Loans and may be less liquid.
Structured Products
Investments in structured products involve risks, including credit risk and market risk. When the Funds’ investments in structured products (such as CDOs, CLOs and asset-backed securities) are based upon the movement of one or more factors, including currency exchange rates, interest rates, reference bonds (or loans) or stock indices, depending on the factor used and the use of multipliers or deflators, changes in interest rates and movement of any factor may cause significant price fluctuations. Additionally, changes in the reference instrument or security may cause the interest rate on a structured product to be reduced to zero and any further changes in the reference instrument may then reduce the principal amount payable on maturity of the structured product. Structured products may be less liquid than other types of securities and more volatile than the reference instrument or security underlying the product.
The Funds may have the right to receive payments only from the structured product and generally do not have direct rights against the issuer or the entity that sold the assets to be securitized. While certain structured products enable the investor to acquire interests in a pool of securities without the brokerage and other expenses associated with directly holding the same securities, investors in structured products generally pay their share of the structured product’s administrative and other expenses. Although it is difficult to predict whether the prices of indices and securities underlying structured products will rise or fall, these prices (and, therefore, the prices of structured products) will be influenced by the same types of political and economic events that generally affect issuers of securities and capital markets. If the issuer of a structured product uses shorter-term financing to purchase longer-term securities, the issuer may be forced to sell its securities at below market prices if it experiences difficulty in obtaining short-term financing, which may adversely affect the value of the structured products owned by the Funds.
Certain structured products may be thinly traded or have a limited trading market. CLOs are typically privately offered and sold. As a result, investments in CLOs may be characterized by the Funds as illiquid securities. CLOs carry additional risks, including, but not limited to: (i) the possibility that distributions from collateral securities will not be adequate to make interest or other payments, (ii) the quality of the collateral may decline in value or default, (iii) the possibility that the investments in CLOs are subordinate to other classes or tranches of the CLOs and (iv) the complex structure of the security may not be fully understood at the time of investment and may produce disputes with the issuer or unexpected investment results.
Reference Rates
A Fund may invest in financial instruments that recently transitioned from using or continue to use a floating rate based on the London Interbank Offered Rate, or (“LIBOR”), which is the offered rate for short-term Eurodollar deposits between major international banks. The United Kingdom Financial Conduct Authority (“FCA”), which regulates LIBOR, announced a phase out of LIBOR such that after June 30, 2023, the overnight, 1-month, 3-month, 6-month and 12-month U.S. dollar LIBOR settings ceased to be published or are no longer representative. All other LIBOR settings and certain other interbank offered rates, such as the Euro Overnight Index Average (“EONIA”), ceased to be published after December 31, 2021. The Secured Overnight Financing Rate (“SOFR”) is a broad measure of the cost of borrowing cash overnight collateralized by U.S. Treasury securities in the repurchase agreement (“repo”) market and has been used increasingly on a voluntary basis in new instruments and transactions. On March 15, 2022, the Adjustable Interest Rate Act was signed into law, providing a statutory fallback mechanism to replace LIBOR with a benchmark rate that is selected by the Federal Reserve Board and based on SOFR for certain contracts that reference LIBOR without adequate fallback provisions. On December 16, 2022, the Federal Reserve Board adopted regulations implementing the Adjustable Interest Rate Act by identifying benchmark rates based on the SOFR that replaced LIBOR in different categories of financial contracts after June 30, 2023. These regulations apply only to contracts governed by U.S. law, among other limitations.
Neither the effect of the LIBOR transition process nor its ultimate success can yet be known. Not all existing LIBOR-based instruments may have alternative rate-setting provisions and there remains uncertainty regarding the willingness and ability of issuers to add alternative rate-setting provisions in certain existing instruments. Parties to contract, securities or other instruments using LIBOR may disagree on transition rates or the application of applicable transition regulation, potentially resulting in uncertainty of performance and the possibility of litigation. The Fund may have instruments linked to other interbank offered rates that may also cease to be published in the future.
38 | Semi-Annual Report
Apollo Senior Floating Rate Fund Inc.
Apollo Tactical Income Fund Inc.
Notes to Consolidated Financial Statements (continued)
June 30, 2023 (unaudited)
Note 6. Common Shares
Common share transactions were as follows:
| | | | | | | | | | | | | | | | | | | | |
| Apollo Senior Floating Rate Fund Inc. | | | | | | | | |
|
| |
| | | Six Months Ended
June 30, 2023 | | Year Ended
December 31, 2022 |
| | | Shares | | Amount | | Shares | | Amount |
|
| |
| Common Shares outstanding, beginning of the period | | | | 15,573,575 | | | | $ | 295,515,991 | | | | | 15,573,575 | | | | $ | 295,515,991 | |
| Common shares issued as reinvestment of dividends | | | | — | | | | | — | | | | | — | | | | | — | |
| Permanent difference reclassified (primarily non‑deductible expenses) | | | | — | | | | | — | | | | | — | | | | | — | |
| Return of Capital | | | | — | | | | | — | | | | | — | | | | | — | |
| | | | | | | | | | | | | | | | | | | | |
| Common shares outstanding, end of the period | | | | 15,573,575 | | | | $ | 295,515,991 | | | | | 15,573,575 | | | | $ | 295,515,991 | |
| | | | | | | | | | | | | | | | | | | | |
| | | | |
| | | | | | | | | | | | | | | | | | | | |
| Apollo Tactical Income Fund | | | | | | | | |
|
| |
| | | Six Months Ended
June 30, 2023 | | Year Ended
December 31, 2022 |
| | | Shares | | Amount | | Shares | | Amount |
|
| |
| Common Shares outstanding, beginning of the period | | | | 14,464,026 | | | | $ | 275,434,361 | | | | | 14,464,026 | | | | $ | 275,434,361 | |
| Common shares issued as reinvestment of dividends | | | | — | | | | | — | | | | | — | | | | | — | |
| Permanent difference reclassified (primarily non‑deductible expenses) | | | | — | | | | | — | | | | | — | | | | | — | |
| Return of Capital | | | | — | | | | | — | | | | | — | | | | | — | |
| | | | | | | | | | | | | | | | | | | | |
| Common shares outstanding, end of the period | | | | 14,464,026 | | | | $ | 275,434,361 | | | |
| 14,464,026
|
| | | $ | 275,434,361 | |
| | | | | | | | | | | | | | | | | | | | |
Dividends declared on common shares with a record date of January 1, 2023 or later through the date of this report were as follows:
| | | | | | | | | | | | | | | | | | | | | | | |
| Apollo Senior Floating Rate Fund Inc. |
|
|
Dividend Declaration Date | | Ex‑Dividend Date | | Record Date | | Payment Date | | Per
Share
Amount | | Gross
Distribution | | Cash
Distribution | | Value of new
Common
Shares
Issued |
|
|
| January 11, 2023 | | January 20, 2023 | | January 23, 2023 | | January 31, 2023 | | | $ | 0.1080 | | | | $ | 1,681,946 | | | | $ | 1,681,946 | | | — |
| February 9, 2023 | | February 17, 2023 | | February 21, 2023 | | February 28, 2023 | | | $ | 0.1130 | | | | $ | 1,759,814 | | | | $ | 1,759,814 | | | — |
| March 13, 2023 | | March 23, 2023 | | March 24, 2023 | | March 31, 2023 | | | $ | 0.1130 | | | | $ | 1,759,814 | | | | $ | 1,759,814 | | | — |
| April 10, 2023 | | April 20, 2023 | | April 21, 2023 | | April 28, 2023 | | | $ | 0.1130 | | | | $ | 1,759,814 | | | | $ | 1,759,814 | | | — |
| May 11, 2023 | | May 22, 2023 | | May 23, 2023 | | May 31, 2023 | | | $ | 0.1180 | | | | $ | 1,837,682 | | | | $ | 1,837,682 | | | — |
| June 12, 2023 | | June 22, 2023 | | June 23, 2023 | | June 30, 2023 | | | $ | 0.1180 | | | | $ | 1,837,682 | | | | $ | 1,837,682 | | | — |
| July 14, 2023* | | July 21, 2023 | | July 24, 2023 | | July 31, 2023 | | | $ | 0.1260 | | | | $ | 1,962,270 | | | | $ | 1,962,270 | | | — |
| August 11, 2023* | | August 23, 2023 | | August 24, 2023 | | August 31, 2023 | | | $ | 0.1260 | | | | | | | | | | | | | |
* Declared subsequent to June 30, 2023
| | | | | | | | | | | | | | | | | | | | | | | |
| Apollo Tactical Income Fund Inc. | | | | | | | | | | |
|
|
Dividend Declaration Date | | Ex‑Dividend Date | | Record Date | | Payment Date | | Per
Share
Amount | | Gross
Distribution | | Cash
Distribution | | Value of new
Common
Shares
Issued |
|
|
| January 11, 2023 | | January 20, 2023 | | January 23, 2023 | | January 31, 2023 | | | $ | 0.1220 | | | | $ | 1,764,611 | | | | $ | 1,764,611 | | | — |
| February 9, 2023 | | February 17, 2023 | | February 21, 2023 | | February 28, 2023 | | | $ | 0.1220 | | | | $ | 1,764,611 | | | | $ | 1,764,611 | | | — |
| March 13, 2023 | | March 23, 2023 | | March 24, 2023 | | March 31, 2023 | | | $ | 0.1220 | | | | $ | 1,764,611 | | | | $ | 1,764,611 | | | — |
| April 10, 2023 | | April 20, 2023 | | April 21, 2023 | | April 28, 2023 | | | $ | 0.1220 | | | | $ | 1,764,611 | | | | $ | 1,764,611 | | | — |
| May 11, 2023 | | May 22, 2023 | | May 23, 2023 | | May 31, 2023 | | | $ | 0.1220 | | | | $ | 1,764,611 | | | | $ | 1,764,611 | | | — |
| June 12, 2023 | | June 22, 2023 | | June 23, 2023 | | June 30, 2023 | | | $ | 0.1220 | | | | $ | 1,764,611 | | | | $ | 1,764,611 | | | — |
| July 14, 2023* | | July 21, 2023 | | July 24, 2023 | | July 31, 2023 | | | $ | 0.1220 | | | | $ | 1,764,611 | | | | $ | 1,764,611 | | | — |
| August 11, 2023* | | August 23, 2023 | | August 24, 2023 | | August 31, 2023 | | | $ | 0.1220 | | | | | | | | | | | | | |
* Declared subsequent to June 30, 2023
Semi-Annual Report | 39
Apollo Senior Floating Rate Fund Inc.
Apollo Tactical Income Fund Inc.
Notes to Consolidated Financial Statements (continued)
June 30, 2023 (unaudited)
AFT is authorized to issue 999,998,466 Common Shares. AIF is authorized to issue 1,000,000,000 Common Shares. Each Fund has filed a registration statement relating to an offering of Common Shares using the “shelf” registration process (the “Shelf Registration Statement”), each of which became effective on May 25, 2022.
The Shelf Registration Statement permits each Fund to offer and sell Common Shares having an aggregate offering value of up to $50,000,000. Under the Investment Company Act of 1940, as amended (the “Investment Company Act”), each Fund generally may not sell Common Shares at a price below the current net asset value of such Common Shares, exclusive of any distributing commission or discount. Accordingly, the offering of Common Shares may be suspended from time to time, particularly when Common Shares are trading at a discount to their NAV. Each Fund is not required to issue Common Shares pursuant to the Shelf Registration Statement, and either, or each, may choose not to do so. As of June 30, 2023, the Funds had not sold any Common Shares pursuant to the Shelf Registration Statement.
Each Fund has entered into an at-the-market sales agreement (the “Sales Agreement”) with Virtu Americas LLC (“Virtu”) under which Virtu acts as the Funds’ agent or principal for the offer and sale of the Common Shares. Virtu is entitled to compensation at a commission rate of up to 1.0% of the gross sales price per share sold under the Sales Agreement.
Costs incurred by each Fund in connection with the initial Shelf Registration Statement are recorded as a prepaid expense and included in “Prepaid Expenses” on the Consolidated Statement of Assets and Liabilities and are amortized for a period of three years after the effective date of the Shelf Registration Statement.
Note 7. Federal Tax Information
The timing and character of income and capital gain distributions are determined in accordance with income tax regulations, which may differ from U.S. GAAP. As a result, net investment income/(loss) and net realized gain/(loss) on investment transactions for a reporting period may differ significantly from distributions during such period.
The tax character of distributions paid by AFT during the fiscal year ended December 31, 2022 was as follows:
| | | | | |
| Apollo Senior Floating Rate Fund Inc. | | |
|
| |
| Distributions Paid to Common Shareholders from: | | 2022 |
|
| |
| Ordinary Income* | | | $ | 17,037,490 | |
| Return of Capital | | | | — | |
| | | | | |
| Total Distributions | | | $ | 17,037,490 | |
| | | | | |
* For tax purposes, short-term capital gains distributions, if any, are considered ordinary income distributions.
The tax character of distributions paid by AIF during the fiscal year ended December 31, 2022 was as follows:
| | | | | |
| Apollo Tactical Income Fund Inc. | | |
|
| |
| Distributions to Common Shareholders from: | | 2022 |
|
| |
| Ordinary Income* | | | $ | 17,009,694 | |
| Return of Capital | | | | — | |
| | | | | |
| Total Distributions | | | $ | 17,009,694 | |
| | | | | |
* For tax purposes, short-term capital gains distributions, if any, are considered ordinary income distributions.
40 | Semi-Annual Report
Apollo Senior Floating Rate Fund Inc.
Apollo Tactical Income Fund Inc.
Notes to Consolidated Financial Statements (continued)
June 30, 2023 (unaudited)
As of December 31, 2022, the most recent tax year end, the components of accumulated losses on a tax basis were as follows:
| | | | | | | | | | | | | | | | | | | | |
| Fund | | Undistributed
Ordinary
Income | | Undistributed
Long-Term
Capital Gains | | Net Unrealized
Appreciation/
(Depreciation)* | | Accumulated
Capital and
Other Losses |
|
| |
| Apollo Senior Floating Rate Fund Inc. | | | $ | 67,189 | | | | $ | — | | | | $ | (32,336,918 | ) | | | $ | (42,220,267 | ) |
| Apollo Tactical Income Fund Inc. | | | | 251,203 | | | | | — | | | | | (32,575,500 | ) | | | | (42,776,521 | ) |
* Any differences between book basis and tax basis net unrealized appreciation/(depreciation) are primarily due to the deferral of losses from wash sales, defaulted security interest adjustments, underlying investment partnership adjustments and tax adjustments on restructurings.
For federal income tax purposes, capital loss carryforwards are available to offset future capital gains. As of December 31, 2022, short-term and long-term capital loss carryforwards totaled $2,811,795 and $39,408,472, respectively, for AFT and $5,093,253 and $37,683,268, respectively, for AIF, which may be carried forward for an unlimited period.
Unrealized appreciation/(depreciation) and basis of investments for U.S. federal income tax purposes at June 30, 2023 as follows:
| | | | | | | | | | |
| | | Apollo Senior
Floating Rate
Fund Inc. | | Apollo Tactical
Income
Fund Inc. |
|
| |
| Federal tax basis, cost | | | $ | 367,219,695 | | | | $ | 338,530,506 | |
| | | | | | | | | | |
| Unrealized appreciation | | | $ | 2,508,379 | | | | $ | 2,202,726 | |
| Unrealized depreciation | | | | (23,977,772 | ) | | | | (24,197,486 | ) |
| | | | | | | | | | |
| Net unrealized appreciation/(depreciation)* | | | $ | (21,469,393 | ) | | | $ | (21,994,760 | ) |
| | | | | | | | | | |
* Any differences between book basis and tax basis net unrealized appreciation/(depreciation) are primarily due to the deferral of losses from wash sales, defaulted security interest adjustments, underlying investment partnership adjustments and disallowed losses due to restructuring.
Note 8. Credit Agreements and Preferred Shares
The Funds utilize leverage and may utilize leverage to the maximum extent permitted by law for investment and other general corporate purposes. The Funds may obtain leverage by issuing preferred shares and/or notes and may also borrow funds from banks and other financial institutions. The Funds may also gain leverage synthetically through swaps and other derivatives. The use of leverage to purchase additional securities creates an opportunity for increased common share dividends, but also creates risks for common shareholders, including increased variability of the Funds’ net income, distributions and/or NAV in relation to market changes. Leverage is a speculative technique that exposes the Funds to greater risk and increased costs than if it were not implemented. Increases and decreases in the value of the Funds’ portfolios will be magnified due to the use of leverage. In particular, leverage may magnify interest rate risk, which is the risk that the prices of portfolio securities will fall (or rise) if market interest rates for those types of securities rise (or fall). As a result, leverage may cause greater changes in the Funds’ NAV, which will be borne entirely by the Funds’ common shareholders. If the Funds issue preferred shares and/or notes or engage in other borrowings, they will have to pay dividends on their shares or interest on their notes or borrowings, which will increase expenses and may reduce the Funds’ return. These dividend payments or interest expenses (which will be borne entirely by the common shareholders) may be greater than the Funds’ return on the underlying investments. The Funds’ leveraging strategy may not be successful.
Apollo Senior Floating Rate Fund Inc.
On September 1, 2022, AFT entered into a third amended and restated credit facility (the “AFT Third Amended Credit Facility”) with Sumitomo Mitsui Banking Corporation (“SMBC”) as lender, which matures on September 1, 2024. Under the terms of the AFT Third Amended Credit Facility, AFT may borrow a single term loan not to exceed $121,000,000 and may borrow up to an additional $12,000,000 on a revolving basis (the “AFT Revolving Loan”). Borrowings under this facility bear interest at a rate of SOFR plus 0.90%. Any unused portion of the AFT Revolving Loan is subject to a
Semi-Annual Report | 41
Apollo Senior Floating Rate Fund Inc.
Apollo Tactical Income Fund Inc.
Notes to Consolidated Financial Statements (continued)
June 30, 2023 (unaudited)
quarterly commitment fee equal to 0.125% per annum on the average daily amount of available commitments. Additionally, the AFT Third Amended Credit Facility also permits the Fund to establish certain wholly owned subsidiaries. AFT has granted a security interest in substantially all of its assets in the event of default under the AFT Third Amended Credit Facility. As of June 30, 2023, AFT has $130,000,000 of principal outstanding under the AFT Third Amended Credit Facility, which is comprised of a term loan of $121,000,000 and a revolving loan of $9,000,000.
For the six months ended June 30, 2023 the average daily principal loan balance outstanding was $130,000,000, the weighted average annual interest rate was 5.83% and the interest expense, which is included on the Consolidated Statements of Operations in interest and commitment fee expense, was $3,759,930.
The fair value of AFT’s borrowings under the AFT Third Amended Credit Facility approximates the carrying amount presented in the accompanying Consolidated Statements of Assets and Liabilities based on a yield analysis and remaining maturities for which AFT has determined would be categorized as Level 2 in the fair-value hierarchy.
The AFT Third Amended Credit Facility contains certain customary affirmative and negative covenants, including limitations on debt, liens and restricted payments, as well as certain portfolio limitations and customary prepayment provisions, including a requirement to prepay loans or take certain other actions if certain asset value tests are not met. As of June 30, 2023 AFT was not aware of any instances of non‑compliance related to the AFT Third Amended Credit Facility.
In connection with AFT’s entry into the AFT Third Amended Credit Facility, certain debt financing costs were incurred by AFT and are shown net of the principal amount in the Consolidated Statements of Assets and Liabilities. The deferred financing costs are amortized over the life of the credit facility. The amortization of the deferred financing costs is included in the Consolidated Statements of Operations.
Apollo Tactical Income Fund Inc.
On January 24, 2023, AIF entered into a third amendment to the second amended and restated credit facility (the “AIF Third Amended Credit Facility”) with SMBC as lender, maturing on April 4, 2024, which permitted the Fund to amend certain investment policies. Under the terms of the AIF Third Amended Facility, the facility will bear interest at a rate of SOFR plus 0.875% to 1.25%. Substantially all other terms remain unchanged. AIF has granted a security interest in substantially all of its assets in the event of defaults under the AIF Third Amended Credit Facility. As of June 30, 2023, AIF has $121,000,000 of principal outstanding under the AIF Third Amended Credit Facility, which is comprised of a term loan of $110,000,000 and a revolving loan of $11,000,000.
Prior to January 24, 2023, AIF entered into a second amendment to the second amended and restated credit facility (the “AIF Second Amended Credit Facility”) with SMBC as lender, maturing on April 4, 2024, which permitted the Fund to establish certain wholly owned subsidiaries. Under the terms of the AIF Second Amended Credit Facility, AIF was permitted to borrow a single term loan not to exceed $110,000,000 and could borrow up to an additional $33,000,000 on a revolving basis (the “AIF Revolving Loan”). Borrowings under this facility bear an interest of SOFR + 0.875%. Any unused portion of the AIF Revolving Loan is subject to a quarterly commitment fee equal to 0.125% per annum daily amount of available commitments.
For the six months ended June 30, 2023, the average daily principal loan balance outstanding was $121,000,000, the weighted average annual interest rate was 5.81% and the interest expense, which is included on the Consolidated Statements of Operations in interest and commitment fee expense, was $3,484,802.
The fair value of AIF’s borrowings under the AIF Third Amended Credit Facility approximates the carrying amount presented in the accompanying Consolidated Statements of Assets and Liabilities based on a yield analysis and remaining maturities for which AIF has determined would be categorized as Level 2 in the fair-value hierarchy.
The AIF Third Amended Credit Facility contains certain customary affirmative and negative covenants, including limitations on debt, liens and restricted payments, as well as certain portfolio limitations and customary prepayment
42 | Semi-Annual Report
Apollo Senior Floating Rate Fund Inc.
Apollo Tactical Income Fund Inc.
Notes to Consolidated Financial Statements (continued)
June 30, 2023 (unaudited)
provisions, including a requirement to prepay loans or take certain other actions if certain asset value tests are not met. As of June 30, 2023, AIF was not aware of any instances of non-compliance related to the AIF Third Amended Credit Facility.
In connection with AIF’s entry into the AIF Third Amended Credit Facility, certain debt financing costs were incurred by AIF and are shown net of the principal amount in the Consolidated Statements of Assets and Liabilities. The deferred financing costs are amortized over the life of the AIF Third Amended Credit Facility. The amortization of the deferred financing costs is included in the Consolidated Statements of Operations.
Note 9. General Commitments and Contingencies
As of June 30, 2023, the Funds had unfunded commitments outstanding, which could be extended at the option of the borrower, as detailed below:
| | | | | | | | | | |
| Borrower | | AFT | | AIF |
|
| |
| ABG Intermediate Holdings 2, LLC Delayed Draw Term Loan | | | $ | 555,556 | | | | $ | 444,444 | |
| Accelerate 360 Holdings, LLC Revolving Term Loan* ** | | | | — | | | | | 890,529 | |
| Advarra Holdings, Inc. Delayed Draw Term Loan | | | | 580,151 | | | | | 580,151 | |
| Anaplan, Inc. Revolving Term Loan | | | | 349,471 | | | | | 349,471 | |
| Anuvu Holdings 2, LLC Delayed Draw Term Loan | | | | 35,074 | | | | | 33,195 | |
| Anuvu Holdings 2, LLC Delayed Draw Term Loan B | | | | 582,017 | | | | | 550,829 | |
| Athenahealth Group, Inc. Delayed Draw Term Loan | | | | 648,563 | | | | | 496,593 | |
| Avalara, Inc. Revolving Term Loan | | | | 454,545 | | | | | 454,545 | |
| Channelside AcquisitionCo, Inc. Delayed Draw Term Loan ** | | | | 207,333 | | | | | 207,333 | |
| Channelside AcquisitionCo, Inc. Revolving Term Loan | | | | 166,667 | | | | | 166,667 | |
| Coretrust Purchasing Group, LLC Delayed Draw Term Loan | | | | 338,346 | | | | | 338,346 | |
| Coretrust Purchasing Group, LLC Revolving Term Loan | | | | 338,346 | | | | | 338,346 | |
| Coupa Software, Inc. Delayed Draw Term Loan | | | | 231,380 | | | | | 154,253 | |
| Coupa Software, Inc. Revolving Term Loan | | | | 177,165 | | | | | 118,110 | |
| Gateway US Holdings, Inc. Delayed Draw Term Loan* | | | | — | | | | | 23,728 | |
| Gateway US Holdings, Inc. Revolving Term Loan* | | | | — | | | | | 112,686 | |
| Inovalon Holdings, Inc. Delayed Draw Term Loan* | | | | — | | | | | 660,211 | |
| IQN Holding Corp. Delayed Draw Term Loan* ** | | | | — | | | | | 741,711 | |
| IQN Holding Corp. Revolving Term Loan* | | | | — | | | | | 267,380 | |
| NCL Corporation Ltd. Backstop Notes | | | | 694,000 | | | | | 694,000 | |
| NCL Corporation Ltd. Class B Bridge Notes | | | | 1,153,000 | | | | | 1,153,000 | |
| Planet US Buyer LLC Revolving Term Loan | | | | 222,222 | | | | | 222,222 | |
| Ultimate Baked Goods Midco LLC Revolving Term Loan* | | | | — | | | | | 248,649 | |
| Zendesk, Inc. Delayed Draw Term Loan | | | | 1,104,901 | | | | | 739,130 | |
| Zendesk, Inc. Revolving Term Loan | | | | 454,959 | | | | | 304,348 | |
| | | | | | | | | | |
| | | $ | 8,293,696 | | | | $ | 10,289,877 | |
| | | | | | | | | | |
* The unfunded commitment was held in AFT only or AIF only.
** Subsequent to June 30, 2023, all or a portion of the outstanding unfunded commitment was funded.
Unfunded commitments are marked to market on the relevant day of the valuation in accordance with the Funds’ valuation policies. Any related unrealized appreciation/(depreciation) on unfunded commitments is recorded in the Consolidated Statements of Assets and Liabilities and the Consolidated Statements of Operations. For the six months ended June 30, 2023, AFT and AIF recorded a net change in unrealized appreciation on unfunded loan commitments totaling $52,082 and $69,820, respectively.
Additionally, from time to time, the Adviser and its affiliates may commit to an investment on behalf of the funds it manages, including the Funds. Certain terms of these investments are not finalized at the time of the commitment and each respective fund’s allocation may change prior to the date of the funding. In this regard, the Funds may have to fund additional commitments in the future that is currently not obligated to but may be at a future point in time.
Note 10. Indemnification
The Funds each have a variety of indemnification obligations under contracts with their service providers. The Funds’ maximum exposure under these arrangements is unknown as this would be dependent on future claims that may be made against the Funds. Based upon historical experience, the risk of loss from such claims is currently considered remote; however, there can be no assurance that losses will not occur or if claims are made against the Funds the losses will not be material.
Semi-Annual Report | 43
Apollo Senior Floating Rate Fund Inc.
Apollo Tactical Income Fund Inc.
Notes to Consolidated Financial Statements (continued)
June 30, 2023 (unaudited)
Note 11. Subsequent Events
Management has evaluated the impact of all subsequent events on the Funds through the date the financial statements were issued and has determined that there were no subsequent events that would require disclosure in or adjustments to the financial statements.
44 | Semi-Annual Report
Apollo Senior Floating Rate Fund Inc.
Apollo Tactical Income Fund Inc.
Fund Investment Objectives, Policies and Risks
June 30, 2023 (unaudited)
Recent Changes:
This section summarizes certain changes since December 31, 2022. This information may not reflect all of the changes that have occurred since you purchased shares of a Fund.
There have been no changes in investment policies since each Fund’s last annual report.
AFT — Investment Objective and Policies:
AFT’s investment objective is to seek current income and preservation of capital. AFT seeks to achieve its investment objective by investing primarily in senior, secured loans made to companies whose debt is rated below investment grade (“Senior Loans”) and investments with similar characteristics. Senior Loans typically hold a first lien priority and pay interest at rates that are determined periodically on the basis of a floating base lending rate plus a spread. These base lending rates are primarily the London Interbank Offered Rate (“LIBOR”) or the Secured Overnight Financing Rate (“SOFR”) and secondarily the prime rate offered by one or more major U.S. banks and the certificate of deposit rate used by commercial lenders may also be used. Senior Loans are typically made to U.S. and, to a limited extent, non‑U.S. corporations, partnerships and other business entities (“Borrower(s)”) that operate in various industries and geographical regions. AFT seeks to generate current income and preservation of capital through a disciplined approach to credit selection and under normal market conditions will invest at least 80% of its “managed assets” in floating rate Senior Loans and investments with similar economic characteristics. The Fund defines “managed assets” as the total assets of the Fund (including any assets attributable to any preferred shares that may be issued or to money borrowed or notes issued by the Fund) minus the sum of the Fund’s accrued liabilities, including accrued interest and accumulated dividends (other than liabilities for money borrowed or notes issued and the liquidation preference of preferred shares).
This 80% policy and AFT’s investment objective are not fundamental and may be changed by the board of directors of AFT with at least 60 days’ prior written notice provided to shareholders. Part of AFT’s investment objective is to seek preservation of capital. AFT’s ability to achieve capital preservation may be limited by its investment in credit instruments that have speculative characteristics. There can be no assurance that AFT will achieve its investment objective.
The Fund seeks to achieve its investment objective by investing primarily in Senior Loans and investments with similar economic characteristics. Senior Loans hold a first lien priority and typically pay interest at rates that are determined periodically on the basis of a floating base lending rate, plus a premium. Borrowers may obtain Senior Loans to, among other reasons, refinance existing debt and for acquisitions, dividends, leveraged buyouts and general corporate purposes. The Fund generally targets investments in recently issued Senior Loans that have structural characteristics, including stronger lender protections, that are more favorable for investors. These Senior Loans provide a minimum coupon (called a “floor”) that helps protect the Fund’s income in falling or flat-rate environments. The Fund may also seek to gain exposure to Senior Loans by investing in swaps, including single name credit default swaps, single name loan credit default swaps, total return swaps, collateralized loan obligations (including synthetic collateralized loan obligations), reverse repurchase agreements and other similar transactions.
The Fund may invest in subordinated loans. The Fund may invest in distressed securities, including loans purchased in the secondary market, that are the subject of bankruptcy proceedings or otherwise in default or at risk of being in default as to the repayment of principal and/or interest at the time of acquisition by the Fund. The Fund may invest in U.S. dollar and non‑U.S. dollar denominated securities of issuers located anywhere in the world, and of issuers that operate in any industry.
The Fund may invest in debt securities of any maturity, including perpetual securities, and does not manage its portfolio seeking to maintain a targeted dollar-weighted average maturity level. Under normal market conditions, the Adviser expects to maintain an average duration of less than one year (including the effect of anticipated leverage).
The Fund currently utilizes leverage from a credit facility in furtherance of this investment strategy.
In seeking to achieve the Fund’s investment objective, the Adviser actively constructs and manages a portfolio of Senior Loans and other investments. The Adviser’s investment process is rigorous, proactive and continuous. Close
Semi-Annual Report | 45
Apollo Senior Floating Rate Fund Inc.
Apollo Tactical Income Fund Inc.
Fund Investment Objectives, Policies and Risks (continued)
June 30, 2023 (unaudited)
monitoring of each investment in the portfolio provides foresight for making buy, sell and hold decisions. The Adviser utilizes what it believes to be a conservative approach that focuses on credit fundamentals, collateral coverage and structural seniority. The Adviser may also employ a sector analysis to assess industry trends and characteristics that may impact a Borrower’s potential future ability to generate cash, as well as profitability, asset values, financial needs and potential liabilities. The Adviser takes a disciplined approach to its credit investment selection process in which the credit ratings of a Borrower are evaluated but are not considered to be the sole or determinative factor of selection. The criteria used by the Adviser in credit selection may include an evaluation of whether a Senior Loan is adequately collateralized or over-collateralized and whether it is covered by sufficient earnings and cash flow to service the Borrower’s indebtedness on a timely basis. The Adviser expects to gain exposure to Borrowers across a broad range of industries and of varying characteristics and return profiles.
Similar to its investment in Senior Loans and other debt investments, the Adviser adheres to a disciplined approach with respect to the Fund’s investments in structured products, including collateralized loan obligations. The Adviser will seek to select structured products which are well-structured and collateralized by portfolios of primarily Senior Loans that the Adviser believes to be of sufficient quality, diversity and amount to support the structure and fully collateralize the tranche purchased by the Fund. Likewise, the Adviser will evaluate the creditworthiness of counterparties and the investment characteristics of reference assets when causing the Fund to enter into swaps or other derivative transactions.
AIF — Investment Objective and Policies:
AIF’s primary investment objective is to seek current income with a secondary objective of preservation of capital. AIF seeks to achieve its investment objectives primarily by allocating its assets among different types of credit instruments based on absolute and relative value considerations and its analysis of the credit markets. This ability to dynamically allocate AIF’s assets may result in AIF’s portfolio becoming concentrated in a particular type of credit instrument (such as Senior Loans or high yield corporate bonds) and substantially less invested in other types of credit instruments. Under normal market conditions, at least 80% of AIF’s “managed assets” will be invested in credit instruments and investments with similar economic characteristics. For purposes of this policy, “credit instruments” include Senior Loans, subordinated loans, high yield corporate bonds, notes, bills, debentures, distressed securities, mezzanine securities, structured products (including, without limitation, collateralized debt obligations (“CDOs”), collateralized loan obligations (“CLOs”) and asset-backed securities), bank loans, corporate loans, convertible and preferred securities, government and municipal obligations, mortgage-backed securities, repurchase agreements, and other fixed-income instruments of a similar nature that may be represented by derivatives such as options, forwards, futures contracts or swap agreements. The Fund defines “managed assets” as the total assets of the Fund (including any assets attributable to any preferred shares that may be issued or to money borrowed or notes issued by the Fund) minus the sum of the Fund’s accrued liabilities, including accrued interest and accumulated dividends (other than liabilities for money borrowed or notes issued and the liquidation preference of preferred shares).
The 80% policy and AIF’s investment objectives are not fundamental and may be changed by the board of directors of AIF with at least 60 days’ prior written notice provided to shareholders. AIF will seek to preserve capital to the extent consistent with its primary investment objective. AIF’s ability to achieve capital preservation may be limited by its investment in credit instruments that have speculative characteristics. There can be no assurance that AIF will achieve its investment objectives.
Securities Rated Below Caa or CCC. AIF has adopted a policy to not invest more than 20% of its managed assets in credit instruments that are rated Caa or lower by Moody’s or CCC or lower by S&P or Fitch. Unrated credit instruments are not subject to this policy.
Structured Products. AIF has adopted a policy to not invest more than 20% of its managed assets in structured products.
The Adviser seeks to achieve the Fund’s investment objectives primarily by allocating the Fund’s assets among different types of credit instruments based on absolute and relative value considerations and its analysis of the credit markets. The Fund’s investments consist primarily of Senior Loans and Corporate Bonds. The Fund, however, has
46 | Semi-Annual Report
Apollo Senior Floating Rate Fund Inc.
Apollo Tactical Income Fund Inc.
Fund Investment Objectives, Policies and Risks (continued)
June 30, 2023 (unaudited)
provided the Adviser with the flexibility to invest in varying types of credit instruments based on its analysis of the credit markets. This ability to dynamically allocate the Fund’s assets may result in the Fund’s portfolio becoming concentrated in a particular type of credit instrument (such as Senior Loans or Corporate Bonds) and substantially less invested in other types of credit instruments.
The Fund may invest in subordinated loans. The Fund may invest in distressed securities, including loans purchased in the secondary market, that are the subject of bankruptcy proceedings or otherwise in default or at risk of being in default as to the repayment of principal and/or interest at the time of acquisition by the Fund. The Fund may make investments in non‑U.S. entities, including issuers in emerging markets, but expects to make any investments in foreign issuers primarily in U.S. dollar denominated securities.
The Fund reserves the right to invest in credit instruments of any maturity. The Fund reserves the right to invest in credit instruments of any duration. It is anticipated that the duration of the Fund’s portfolio will be lower than that of the overall “junk bond” market. Duration is a measure of how sensitive a bond or the Fund’s portfolio may be to changes in interest rates.
The Fund currently utilizes leverage from a credit facility in furtherance of this investment strategy.
In seeking to achieve the Fund’s investment objectives, the Adviser will actively construct and manage a portfolio of credit instruments and other investments. The Adviser will periodically rebalance the Fund’s allocation of assets among different types of credit instruments based on absolute and relative value considerations and its analysis of the credit markets in order to seek to optimize the Fund’s allocation to credit instruments that the Adviser believes are positioned to contribute to the achievement of the Fund’s investment objectives under the market conditions existing at the time of investment.
The Adviser’s investment process is rigorous, proactive and continuous. Close monitoring of each investment in the portfolio provides the basis for making buy, sell and hold decisions. The Adviser utilizes what it believes to be a conservative approach that focuses on credit fundamentals, collateral coverage and structural seniority. The Adviser may also employ a sector analysis to assess industry trends and characteristics that may impact an issuer’s potential future ability to generate cash, as well as profitability, asset values, financial needs and potential liabilities. The Adviser takes a disciplined approach to its credit investment selection process in which the credit ratings of an issuer are evaluated but are not considered to be the sole or determinative factor for selection. The criteria used by the Adviser in credit selection may include an evaluation of whether an issuer’s debts are adequately collateralized or over-collateralized and whether it has sufficient earnings and cash flow to service its indebtedness on a timely basis. The Adviser expects to gain exposure to issuers across a broad range of industries and of varying characteristics and return profiles.
Similar to its investment in other credit instruments, the Adviser adheres to a disciplined approach with respect to the Fund’s investments in structured products. The Adviser will seek to select structured products which are well structured and collateralized by portfolios of credit instruments or other assets that the Adviser believes to be of sufficient quality, diversity and amount to support the structure and fully collateralize the instrument purchased by the Fund. Likewise, the Adviser will evaluate the creditworthiness of counterparties and the investment characteristics of reference assets when causing the Fund to enter into swaps or other derivative transactions.
AFT Risk Factors:
General. Investing in the common shares involves certain risks and the Fund may not be able to achieve its intended results for a variety of reasons, including, among others, the possibility that the Fund may not be able to structure its investments as anticipated. Because the value of your investment in the Fund will fluctuate, there is a risk that you will lose money. Your investment will decline in value if, among other things, the value of the Fund’s investments decreases. The value of your common shares also will be affected by the Fund’s ability to successfully implement its investment strategy, as well as by market, economic and other conditions. As with any security, complete loss of your investment is possible.
Semi-Annual Report | 47
Apollo Senior Floating Rate Fund Inc.
Apollo Tactical Income Fund Inc.
Fund Investment Objectives, Policies and Risks (continued)
June 30, 2023 (unaudited)
Senior Loans are usually rated below investment grade and may also be unrated. As a result, the risks associated with Senior Loans are similar to the risks of below investment grade fixed income instruments, although Senior Loans are senior and secured, in contrast to other below investment grade fixed income instruments, which are often subordinated or unsecured. Investments in Senior Loans rated below investment grade are considered speculative because of the credit risk of their issuers. Such issuers are considered more likely than investment grade issuers to default on their payments of interest and principal owed to the Fund, and such defaults could reduce the Fund’s net asset value and income distributions. An economic downturn would generally lead to a higher non‑payment rate, and a Senior Loan may lose significant market value before a default occurs. Moreover, any specific collateral used to secure a Senior Loan may decline in value or become illiquid, which would adversely affect the Senior Loan’s value. Senior Loans are subject to a number of risks, including liquidity risk and the risk of investing in below investment grade fixed income instruments.
Market Risk. Global economies and financial markets are increasingly interconnected, which increases the probabilities that conditions in one country or region might adversely impact issuers in a different country or region. Conditions affecting the general economy, including political, social, or economic instability at the local, regional, or global level may also affect the market value of a security. Health crises, such as pandemic and epidemic diseases, as well as other incidents that interrupt the expected course of events, such as natural disasters, war or civil disturbance, acts of terrorism, power outages and other unforeseeable and external events, and the public response to or fear of such diseases or events, may have an adverse effect on the Fund’s investments and net asset value and can lead to increased market volatility. For example, any preventative or protective actions that governments may take in respect of such diseases or events may result in periods of business disruption, inability to obtain raw materials, supplies and component parts, and reduced or disrupted operations for the issuers in which the Fund invests. The occurrence and pendency of such diseases or events could adversely affect the economies and financial markets either in specific countries or worldwide.
Russia launched a large-scale invasion of Ukraine on February 24, 2022, significantly amplifying already existing geopolitical tensions. Actual and threatened responses to such military action may impact the markets for certain commodities and various issuers and may likely have collateral impacts on markets globally. The extent and duration of the military action, resulting sanctions imposed and other punitive action taken and resulting future market disruptions, including declines in European stock markets and the value of Russian sovereign debt, cannot be easily predicted, but could be significant. Any such disruptions caused by Russian military action or other actions (including cyberattacks and espionage) or resulting actual and threatened responses to such activity, including escalating and more widespread military conflict, purchasing and financing restrictions, boycotts or changes in consumer or purchaser preferences, sanctions, tariffs or cyberattacks may impact global economies and the Fund’s investments in various markets.
Senior Loans. Senior Loans are subject to the risk of non‑payment of scheduled interest or principal. Such non‑payment would result in a reduction of income to the Fund, a reduction in the value of the investment and a potential decrease in the NAV of the Fund. There can be no assurance that the liquidation of any collateral securing a Senior Loan would satisfy the Borrower’s obligation in the event of non‑payment of scheduled interest or principal payments, or that the collateral could be readily liquidated. In the event of bankruptcy or insolvency of a Borrower, the Fund could experience delays or limitations with respect to its ability to realize the benefits of the collateral securing a Senior Loan. The collateral securing a Senior Loan may lose all or substantially all of its value in the event of the bankruptcy or insolvency of a Borrower. Some Senior Loans are subject to the risk that a court, pursuant to fraudulent conveyance or other similar laws, could subordinate such Senior Loans to presently existing or future indebtedness of the Borrower or take other action detrimental to the holders of Senior Loans including, in certain circumstances, invalidating such Senior Loans or causing interest previously paid to be refunded to the Borrower.
There may be less readily available and reliable information about most Senior Loans than is the case for many other types of securities, including securities issued in transactions registered under the 1933 Act or registered under the Securities Exchange Act of 1934. As a result, the Adviser will rely primarily on its own evaluation of a Borrower’s credit quality, rather than on any available independent sources. Therefore, the Fund will be particularly dependent on the analytical abilities of the Adviser.
48 | Semi-Annual Report
Apollo Senior Floating Rate Fund Inc.
Apollo Tactical Income Fund Inc.
Fund Investment Objectives, Policies and Risks (continued)
June 30, 2023 (unaudited)
In general, the secondary trading market for Senior Loans is not well developed. No active trading market may exist for certain Senior Loans, which may make it difficult to value them. Illiquidity and adverse market conditions may mean that the Fund may not be able to sell Senior Loans quickly or at a fair price. To the extent that a secondary market does exist for certain Senior Loans, the market for them may be subject to irregular trading activity, wide bid/ask spreads and extended trade settlement periods.
Senior Loans are generally not registered under the 1933 Act and often contain certain restrictions on resale and cannot be sold publicly. Senior Loans often require prepayments from excess cash flow or permit the Borrower to repay at its election. The degree to which Borrowers repay, whether as a contractual requirement or at their election, cannot be predicted with accuracy. As a result, the actual maturity may be substantially less than the stated maturity shown on the Consolidated Schedules of Investments.
The Fund may acquire Senior Loans through assignments or participations. The purchaser of an assignment typically succeeds to all the rights and obligations of the assigning institution and becomes a lender under the credit agreement with respect to the debt obligation; however, the purchaser’s rights can be more restricted than those of the assigning institution, and the Fund may not be able to unilaterally enforce all rights and remedies under the loan and with regard to any associated collateral. In general, a participation is a contractual relationship only with the institution participating out the interest, not with the Borrower. Sellers of participations typically include banks, broker-dealers and other financial and lending institutions. In purchasing participations, the Fund generally will have no right to enforce compliance by the Borrower with the terms of the loan agreement against the Borrower, and the Fund may not directly benefit from the collateral supporting the debt obligation in which they have purchased the participation. As a result, the Fund will be exposed to the credit risk of both the Borrower and the institution selling the participation. Further, in purchasing participations in lending syndicates, the Fund will not be able to conduct the due diligence on the Borrower or the quality of the Senior Loan with respect to which they are buying a participation that the Fund would otherwise conduct if they were investing directly in the Senior Loan, which may result in the Fund being exposed to greater credit or fraud risk with respect to the Borrower or the Senior Loan.
The Fund may also engage in direct origination of loans. In originating loans, the Fund relies on the Adviser’s proprietary sourcing channels, which targets large corporate and private sponsor-backed issuers. In determining whether to originate a loan, the Fund relies on the Adviser’s analysis of the creditworthiness of a borrower and/or any collateral for payment of interest and repayment of principal. The level of analytical sophistication necessary for conducting this analysis is high and the Adviser must rely more significantly on its own resources to conduct due diligence on borrowers than for secondary market debt purchases. The loans the Fund originates are generally Senior Loans, however the Fund is not limited in the type, amount or size of loans it may originate nor to a particular type of borrower. The Fund will earn origination and other types of borrower fees in connection with originating and structuring loans. Direct loans are not publicly traded and may not have a secondary market. Direct loans are subject to heightened liquidity risk and interest rate risk, and some direct loans may be deemed illiquid. The Fund may also face heightened competition for direct origination, which may result in the Fund being required to make lower yielding investments.
Subordinated Loans Risk. Subordinated loans generally are subject to similar risks as those associated with investments in Senior Loans, except that such loans are subordinated in payment and/or lower in lien priority to first lien holders. In the event of default on a subordinated loan, the first priority lien holder has first claim to the underlying collateral of the loan. Subordinated loans are subject to the additional risk that the cash flow of the Borrower and property securing the loan or debt, if any, may be insufficient to meet scheduled payments after giving effect to the senior unsecured or senior secured obligations of the Borrower. This risk is generally higher for subordinated unsecured loans or debt, which are not backed by a security interest in any specific collateral. Subordinated loans generally have greater price volatility than Senior Loans and may be less liquid.
Below Investment Grade Securities Risk. The Fund anticipates that it will invest the majority of its assets in Senior Loans, subordinated loans and other debt instruments that are rated below investment grade. Non‑investment grade fixed income or convertible securities, often referred to as “junk bonds,” “leveraged loans” or “high yield” securities, are debt securities that are rated below investment grade by the major rating agencies or are unrated securities that the Adviser believes are of comparable quality. While generally providing greater income and opportunity for gain, non‑investment grade debt securities and similar debt instruments may be subject to greater risks than securities or instruments that have higher credit ratings, including a high risk of default. The credit rating of a high yield security does
Semi-Annual Report | 49
Apollo Senior Floating Rate Fund Inc.
Apollo Tactical Income Fund Inc.
Fund Investment Objectives, Policies and Risks (continued)
June 30, 2023 (unaudited)
not necessarily address its market value risk, and ratings may from time to time change, positively or negatively, to reflect developments regarding the issuer’s financial condition. High yield securities and similar instruments often are considered to be speculative with respect to the capacity of the issuer to timely repay principal and pay interest or dividends in accordance with the terms of the obligation and may have more credit risk than higher rated securities. Lower grade securities and similar debt instruments may be particularly susceptible to economic downturns. It is likely that a prolonged or deepening economic recession could adversely affect the ability of Borrowers issuing such securities and similar debt instruments to repay principal and pay interest on the instrument, increase the incidence of default and severely disrupt the market value of the securities and similar debt instruments.
Covenant Lite Loan Risk. Some of the loans or debt obligations in which the Fund may invest are “covenant-lite”, which means the loans or obligations contain fewer financial maintenance covenants than other loans or obligations (in some cases, none) and do not include terms which allow the lender to monitor the borrower’s performance and declare a default if certain criteria are breached. An investment by the Fund in a covenant-lite loan may potentially hinder the ability to reprice credit risk associated with the issuer and reduce the ability to restructure a problematic loan and mitigate potential loss. The Fund may also experience difficulty, expenses or delays in enforcing its rights on its holdings of covenant-lite loans or obligations. As a result of these risks, the Fund’s exposure to losses may be increased, which could result in an adverse impact on the Fund.
Credit Risk. Credit risk is the risk that one or more debt securities in the Fund’s portfolio will decline in price or fail to pay interest or principal when due because the issuer of the security experiences a decline in its financial status. While a senior position in the capital structure of a Borrower may provide some protection with respect to the Fund’s investments in Senior Loans, losses may still occur because the market value of Senior Loans is affected by the creditworthiness of Borrowers and by general economic and specific industry conditions. To the extent the Fund invests in below investment grade securities, it will be exposed to a greater amount of credit risk than a fund that invests in investment grade securities. The prices of lower grade securities are more sensitive to negative developments, such as a decline in the issuer’s revenues or a general economic downturn, than are the prices of higher grade securities. In addition, the Fund may use credit derivatives that may expose it to additional risk in the event that the securities underlying the derivatives default.
Prepayment Risk. During periods of declining interest rates, Borrowers may exercise their option to prepay principal earlier than scheduled. For fixed rate securities, such payments often occur during periods of declining interest rates, which may require the Fund to reinvest in lower yielding securities, resulting in a possible decline in the Fund’s income and distributions to shareholders. This is known as prepayment or “call” risk. Below investment grade securities frequently have call features that allow the issuer to redeem the security at dates prior to its stated maturity at a specified price (typically greater than par) only if certain prescribed conditions are met (“Call Protection”). An issuer may redeem a below investment grade security if, for example, the issuer can refinance the debt at a lower cost due to declining interest rates or an improvement in the credit standing of the issuer. Subordinated loans typically do not have Call Protection. For premium bonds (bonds acquired at prices that exceed their par or principal value) purchased by the Fund, prepayment risk may be enhanced.
Senior Loans are subject to prepayment risk and typically do not have Call Protection. The degree to which Borrowers prepay Senior Loans, whether as a contractual requirement or at their election, may be affected by general business conditions, the financial condition of the Borrower and competitive conditions among Senior Loan investors, among others. For these reasons, prepayments cannot be predicted with accuracy. Upon a prepayment, either in part or in full, the outstanding debt on which the Fund derives interest income will be reduced. The Fund may not be able to reinvest the proceeds received on terms as favorable as the prepaid loan.
Interest Rate Risk. The market price of the Fund’s investments will change in response to changes in interest rates and other factors. During periods of declining interest rates, the market price of fixed rate instruments generally rises. Conversely, during periods of rising interest rates, the market price of such instruments generally declines. The magnitude of these fluctuations in the market price of fixed rate credit instruments is generally greater for instruments with longer maturities. Fluctuations in the market price of the Fund’s investments will not affect interest income derived from instruments already owned by the Fund, but will be reflected in the Fund’s net asset value. In addition, some credit instruments may allow an issuer to opt between LIBOR- or SOFR-based interest rates and interest rates based on bank prime rates, which may have an effect on the Fund’s net asset value. The Fund may utilize certain strategies, including investments in swaps, for the purpose of reducing the interest rate sensitivity of the portfolio and decreasing
50 | Semi-Annual Report
Apollo Senior Floating Rate Fund Inc.
Apollo Tactical Income Fund Inc.
Fund Investment Objectives, Policies and Risks (continued)
June 30, 2023 (unaudited)
the Fund’s exposure to interest rate risk, although there is no assurance that it will do so or that such strategies, if utilized, will be successful.
Reference Rate Risk. The Fund may invest in financial instruments that recently transitioned from using or continue to use a floating rate based on the London Interbank Offered Rate (“LIBOR”), which is the offered rate for short-term Eurodollar deposits between major international banks. The United Kingdom Financial Conduct Authority (“FCA”), which regulates LIBOR, announced a phase out of LIBOR such that after June 30, 2023, the overnight, 1-month, 3-month, 6-month and 12-month U.S. dollar LIBOR settings ceased to be published or are no longer representative. All other LIBOR settings and certain other interbank offered rates, such as the Euro Overnight Index Average (“EONIA”), ceased to be published after December 31, 2021. The Secured Overnight Financing Rate (“SOFR”) is a broad measure of the cost of borrowing cash overnight collateralized by U.S. Treasury securities in the repurchase agreement (“repo”) market and has been used increasingly on a voluntary basis in new instruments and transactions. On March 15, 2022, the Adjustable Interest Rate Act was signed into law, providing a statutory fallback mechanism to replace LIBOR with a benchmark rate that is selected by the Federal Reserve Board and based on SOFR for certain contracts that reference LIBOR without adequate fallback provisions. On December 16, 2022, the Federal Reserve Board adopted regulations implementing the Adjustable Interest Rate Act by identifying benchmark rates based on the SOFR that replaced LIBOR in different categories of financial contracts after June 30, 2023. These regulations apply only to contracts governed by U.S. law, among other limitations.
Neither the effect of the LIBOR transition process nor its ultimate success can yet be known. Not all existing LIBOR-based instruments may have alternative rate-setting provisions and there remains uncertainty regarding the willingness and ability of issuers to add alternative rate-setting provisions in certain existing instruments. Parties to contract, securities or other instruments using LIBOR may disagree on transition rates or the application of applicable transition regulation, potentially resulting in uncertainty of performance and the possibility of litigation. The Fund may have instruments linked to other interbank offered rates that may also cease to be published in the future.
Liquidity Risk. The Fund generally considers “illiquid securities” to be securities that cannot be sold within seven days in the ordinary course of business at approximately the value used by the Fund in determining its net asset value. The Fund may not be able to readily dispose of such securities at prices that approximate those at which the Fund could sell the securities if they were more widely-traded and, as a result of that illiquidity, the Fund may have to sell other investments or engage in borrowing transactions if necessary to raise cash to meet its obligations. Limited liquidity can also affect the market price of securities, thereby adversely affecting the Fund’s net asset value and ability to make dividend distributions.
Some Senior Loans are not readily marketable and may be subject to restrictions on resale. Senior Loans generally are not listed on any national securities exchange and no active trading market may exist for the Senior Loans in which the Fund may invest. When a secondary market exists, if at all, the market for some Senior Loans may be subject to irregular trading activity, wide bid/ask spreads and extended trade settlement periods. The Fund has no limitation on the amount of its assets that may be invested in securities that are not readily marketable or are subject to restrictions on resale.
Distressed and Defaulted Securities Risk. The Fund may invest in securities, including loans purchased in the secondary market, that are the subject of bankruptcy proceedings or otherwise in default or at risk of being in default as to the repayment of principal and/or interest at the time of acquisition by the Fund. Investment in these distressed securities is speculative and involves significant risks.
Leverage Risk. The Fund uses leverage and may utilize leverage to the maximum extent permitted by law for investment and other general corporate purposes. The Fund may obtain leverage by issuing preferred shares and/or notes and it may also borrow funds from banks and other financial institutions. The Fund may also gain leverage synthetically through swaps and other derivatives. The use of leverage to purchase additional securities creates an opportunity for increased common share dividends, but also creates risks for common shareholders, including increased variability of the Fund’s net income, distributions and/or net asset value in relation to market changes. Leverage is a speculative technique that exposes the Fund to greater risk and increased costs than if it were not implemented. Increases and decreases in the value of the Fund’s portfolio will be magnified if the Fund uses leverage. In particular, leverage may magnify interest rate risk, which is the risk that the prices of portfolio securities will fall (or rise) if market interest rates for those types of securities rise (or fall). As a result, leverage may cause greater changes in the Fund’s net asset value, which will be borne entirely by the Fund’s common shareholders. To the extent that the Fund makes investments in Senior Loans or other
Semi-Annual Report | 51
Apollo Senior Floating Rate Fund Inc.
Apollo Tactical Income Fund Inc.
Fund Investment Objectives, Policies and Risks (continued)
June 30, 2023 (unaudited)
debt instruments structured with Interest Rate floors, the Fund will not realize additional income if rates increase to levels below the Interest Rate floor but the Fund’s cost of financing is expected to increase, resulting in the potential for a decrease in the level of income available for dividends or distributions made by the Fund. If the Fund issues preferred shares and/or notes or engages in other borrowings, it will have to pay dividends on its shares or interest on its notes or borrowings, which will increase expenses and may reduce the Fund’s return. These dividend payments or interest expenses (which will be borne entirely by common shareholders) may be greater than the Fund’s return on the underlying investments. The Fund’s leveraging strategy may not be successful.
Closed‑End Structure; Market Discount from Net Asset Value. Shares of closed‑end investment companies that trade in a secondary market frequently trade at market prices that are lower than their net asset values. This is commonly referred to as “trading at a discount.” As a result, the Fund is designed primarily for long-term investors. Although the value of the Fund’s net assets is generally considered by market participants in determining whether to purchase or sell shares, whether an investor will realize gains or losses upon the sale of the shares will depend entirely upon whether the market price of the shares at the time of sale is above or below the investor’s purchase price for the shares. Because the market price of the shares will be determined by factors such as relative supply of and demand for the shares in the market, general market and economic conditions, and other factors beyond the control of the Fund, the Fund cannot predict whether the shares will trade at, below or above net asset value. As with any security, complete loss of investment is possible.
AIF Risk Factors:
General Risk. Investing in the common shares involves certain risks and the Fund may not be able to achieve its intended results for a variety of reasons, including, among others, the possibility that the Fund may not be able to structure its investments as anticipated. Because the value of your investment in the Fund will fluctuate, there is a risk that you will lose money. Your investment will decline in value if, among other things, the value of the Fund’s investments decreases. The value of your common shares also will be affected by the Fund’s ability to successfully implement its investment strategy, as well as by market, economic and other conditions. As with any security, complete loss of your investment is possible.
Market Risk. Global economies and financial markets are increasingly interconnected, which increases the probabilities that conditions in one country or region might adversely impact issuers in a different country or region. Conditions affecting the general economy, including political, social, or economic instability at the local, regional, or global level may also affect the market value of a security. Health crises, such as pandemic and epidemic diseases, as well as other incidents that interrupt the expected course of events, such as natural disasters, war or civil disturbance, acts of terrorism, power outages and other unforeseeable and external events, and the public response to or fear of such diseases or events, may have an adverse effect on the Fund’s investments and net asset value and can lead to increased market volatility. For example, any preventative or protective actions that governments may take in respect of such diseases or events may result in periods of business disruption, inability to obtain raw materials, supplies and component parts, and reduced or disrupted operations for the issuers in which the Fund invests. The occurrence and pendency of such diseases or events could adversely affect the economies and financial markets either in specific countries or worldwide.
Russia launched a large-scale invasion of Ukraine on February 24, 2022, significantly amplifying already existing geopolitical tensions. Actual and threatened responses to such military action may impact the markets for certain commodities and various issuers and may likely have collateral impacts on markets globally. The extent and duration of the military action, resulting sanctions imposed and other punitive action taken and resulting future market disruptions, including declines in European stock markets and the value of Russian sovereign debt, cannot be easily predicted, but could be significant. Any such disruptions caused by Russian military action or other actions (including cyberattacks and espionage) or resulting actual and threatened responses to such activity, including escalating and more widespread military conflict, purchasing and financing restrictions, boycotts or changes in consumer or purchaser preferences, sanctions, tariffs or cyberattacks may impact global economies and the Fund’s investments in various markets.
Below Investment Grade Instruments Risk. The Fund’s investments in below investment grade quality securities and instruments (commonly referred to as “high yield” securities, “junk bonds” or “leveraged loans”) are regarded as having predominantly speculative characteristics with respect to the issuer’s capacity to pay interest and repay principal in
52 | Semi-Annual Report
Apollo Senior Floating Rate Fund Inc.
Apollo Tactical Income Fund Inc.
Fund Investment Objectives, Policies and Risks (continued)
June 30, 2023 (unaudited)
accordance with the terms of the obligations and involve major risk exposure to adverse conditions. Credit instruments rated below investment grade generally offer a higher current yield than that available from higher rated securities, but typically involve greater risk. These investments are especially sensitive to adverse changes in general economic conditions, to changes in the financial condition of their issuers and to price fluctuation in response to changes in interest rates. During periods of economic downturn or rising interest rates, issuers of below investment grade instruments may experience financial stress that could adversely affect their ability to make payments of principal and interest on their obligations and increase the possibility of default. The secondary market for high yield instruments may not be as liquid as the secondary market for more highly rated instruments, a factor that may have an adverse effect on the Fund’s ability to dispose of a particular high yield security. There are fewer dealers in the market for high yield instruments than for investment grade obligations. The prices quoted by different dealers may vary significantly and the spread between the bid and ask price is generally much larger for high yield instruments than for higher quality instruments. Under continuing adverse market or economic conditions, the secondary market for high yield instruments could contract further, independent of any specific adverse changes in the condition of a particular issuer, and these instruments may become illiquid. In addition, adverse publicity and investor perceptions, whether or not based on fundamental analysis, may also decrease the market values and liquidity of below investment grade instruments, especially in a market characterized by a low volume of trading.
Default, or the market’s perception that an issuer is likely to default, could reduce the value and liquidity of instruments held by the Fund, which could have a material adverse impact on the Fund’s business, financial condition and results of operations. In addition, default may cause the Fund to incur expenses in seeking recovery of principal and/or interest on its portfolio holdings. In any reorganization or liquidation proceeding relating to a portfolio company, the Fund may lose its entire investment or may be required to accept cash or securities or other instruments with a value less than its original investment and/or may be subject to restrictions on the sale of such securities or instruments. Among the risks inherent in investments in a troubled entity is the fact that it frequently may be difficult to obtain information as to the true financial condition of the issuer. The Adviser’s judgment about the credit quality of an issuer and the relative value of its securities may prove to be wrong. Investments in below investment grade instruments may present special tax issues for the Fund to the extent that the issuers of these instruments default on the instruments, and the federal income tax consequences to the Fund as a holder of such instruments may not be clear.
Covenant Lite Loan Risk. Some of the loans or debt obligations in which the Fund may invest are “covenant-lite”, which means the loans or obligations contain fewer financial maintenance covenants than other loans or obligations (in some cases, none) and do not include terms which allow the lender to monitor the borrower’s performance and declare a default if certain criteria are breached. An investment by the Fund in a covenant-lite loan may potentially hinder the ability to reprice credit risk associated with the issuer and reduce the ability to restructure a problematic loan and mitigate potential loss. The Fund may also experience difficulty, expenses or delays in enforcing its rights on its holdings of covenant-lite loans or obligations. As a result of these risks, the Fund’s exposure to losses may be increased, which could result in an adverse impact on the Fund.
Fixed Income Instrument Risk. In addition to the other risks described herein, fixed income credit instruments, including high yield securities, are also subject to certain risks, including:
Issuer Risk. The value of credit instruments may decline for a number of reasons that directly relate to the issuer, such as management performance, financial leverage and reduced demand for the issuer’s goods and services.
Credit Risk. Credit risk is the risk that one or more debt securities in the Fund’s portfolio will decline in price or fail to pay interest or principal when due because the issuer of the security experiences a decline in its financial status. The prices of lower grade securities generally are more sensitive to negative developments, such as a decline in the issuer’s revenues or a general economic downturn, than are the prices of higher grade securities.
Interest Rate Risk. The market price of the Fund’s investments will change in response to changes in interest rates and other factors. During periods of declining interest rates, the market price of fixed rate instruments generally rises. Conversely, during periods of rising interest rates, the market price of such instruments generally declines. The magnitude of these fluctuations in the market price of fixed rate credit instruments is generally greater for instruments
Semi-Annual Report | 53
Apollo Senior Floating Rate Fund Inc.
Apollo Tactical Income Fund Inc.
Fund Investment Objectives, Policies and Risks (continued)
June 30, 2023 (unaudited)
with longer maturities. Fluctuations in the market price of the Fund’s investments will not affect interest income derived from instruments already owned by the Fund, but will be reflected in the Fund’s net asset value. In addition, some credit instruments may allow an issuer to opt between LIBOR- or SOFR-based interest rates and interest rates based on bank prime rates, which may have an effect on the Fund’s net asset value. The Fund may utilize certain strategies, including investments in swaps, for the purpose of reducing the interest rate sensitivity of the portfolio and decreasing the Fund’s exposure to interest rate risk, although there is no assurance that it will do so or that such strategies, if utilized, will be successful.
Reinvestment Risk. Reinvestment risk is the risk that income from the Fund’s portfolio will decline if and when the Fund invests the proceeds from matured, traded or called fixed income instruments at market interest rates that are below the portfolio’s current earnings rate. A decline in income could affect the market price of the Fund’s common stock or its overall return.
Spread Risk. Wider credit spreads and decreasing market values typically reflect a deterioration of a fixed income instrument’s credit soundness and a perceived greater likelihood or risk of default by the issuer. Fixed income instruments generally compensate for greater credit risk by paying interest at a higher rate. The difference (or “spread”) between the yield of a security and the yield of a benchmark, such as a U.S. Treasury security with a comparable maturity, measures the additional interest paid for credit risk. As the spread on a security widens (or increases), the price (or value) of the security generally falls. In addition to spreads widening due to greater credit risk with respect to a particular security, spread widening may also occur, among other reasons, as a result of market concerns over the stability of the market, excess supply, general credit concerns in other markets, market-specific credit concerns or general reductions in risk tolerance.
Prepayment Risk. During periods of declining interest rates, the issuer of a credit instrument may exercise its option to prepay principal earlier than scheduled, forcing the Fund to reinvest the proceeds from such prepayment in lower yielding instruments, which may result in a decline in the Fund’s income and distributions to common stockholders. This is known as prepayment or “call” risk. Credit instruments frequently have call features that allow the issuer to redeem the instrument at dates prior to its stated maturity at a specified price (typically greater than par) only if certain prescribed conditions are met (“call protection”). An issuer may choose to redeem a fixed income instrument if, for example, the issuer can refinance the instrument at a lower cost due to declining interest rates or an improvement in the credit standing of the issuer. For premium bonds (bonds acquired at prices that exceed their par or principal value) purchased by the Fund, prepayment risk may be increased and may result in losses to the Fund.
Senior Loans Risk. Senior Loans are usually rated below investment grade and may also be unrated. As a result, the risks associated with Senior Loans are similar to the risks of below investment grade fixed income instruments, although Senior Loans are senior and secured, in contrast to other below investment grade fixed income instruments, which are often subordinated or unsecured. Any specific collateral used to secure a Senior Loan, however, may decline in value or become illiquid, which would adversely affect the Senior Loan’s value.
There may be less readily available and reliable information about most Senior Loans than is the case for many other types of securities, including securities issued in transactions registered under the 1933 Act, or registered under the Securities Exchange Act of 1934. As a result, the Adviser will rely primarily on its own evaluation of a borrower’s credit quality rather than on any available independent sources. Therefore, the Fund will be particularly dependent on the analytical abilities of the Adviser.
In general, the secondary trading market for Senior Loans is not well developed. No active trading market may exist for certain Senior Loans, which may make it difficult to value them. Illiquidity and adverse market conditions may mean that the Fund may not be able to sell Senior Loans quickly or at a fair price. To the extent that a secondary market does exist for certain Senior Loans, the market for them may be subject to irregular trading activity, wide bid/ask spreads and extended trade settlement periods.
Senior Loans and other variable rate debt instruments are subject to the risk of payment defaults of scheduled interest or principal. Such payment defaults would result in a reduction of income to the Fund, a reduction in the value of the
54 | Semi-Annual Report
Apollo Senior Floating Rate Fund Inc.
Apollo Tactical Income Fund Inc.
Fund Investment Objectives, Policies and Risks (continued)
June 30, 2023 (unaudited)
investment and a potential decrease in the net asset value of the Fund. Similarly, a sudden and significant increase in market interest rates may increase the risk for payment defaults and cause a decline in the value of these investments and in the Fund’s net asset value. Other factors (including, but not limited to, rating downgrades, credit deterioration, a large downward movement in stock prices, a disparity in supply and demand of certain securities or market conditions that reduce liquidity) can reduce the value of Senior Loans and other debt obligations, impairing the Fund’s net asset value.
Senior Loans are subject to legislative risk. If legislation or state or federal regulations impose additional requirements or restrictions on the ability of financial institutions to make loans, the availability of Senior Loans for investment by the Fund may be adversely affected. In addition, such requirements or restrictions could reduce or eliminate sources of financing for certain issuers. This would increase the risk of default. If legislation or federal or state regulations require financial institutions to increase their capital requirements, this may cause financial institutions to dispose of Senior Loans that are considered highly levered transactions. Such sales could result in prices that, in the opinion of the Adviser, do not represent fair value. If the Fund attempts to sell a Senior Loan at a time when a financial institution is engaging in such a sale, the price the Fund could receive for the Senior Loan may be adversely affected.
The Fund may acquire Senior Loans through assignments or participations. The purchaser of an assignment typically succeeds to all the rights and obligations of the assigning institution and becomes a lender under the credit agreement with respect to the debt obligation; however, the purchaser’s rights can be more restricted than those of the assigning institution, and the Fund may not be able to unilaterally enforce all rights and remedies under the loan and with regard to any associated collateral. In general, a participation is a contractual relationship only with the institution participating out the interest, not with the borrower. Sellers of participations typically include banks, broker-dealers, other financial institutions and lending institutions. In purchasing participations, the Fund generally will have no right to enforce compliance by the borrower with the terms of the loan agreement against the borrower and the Fund may not directly benefit from the collateral supporting the debt obligation in which it has purchased the participation. As a result, the Fund will be exposed to the credit risk of both the borrower and the institution selling the participation. Further, in purchasing participations in lending syndicates, the Fund will not be able to conduct the due diligence on the borrower or the quality of the Senior Loan with respect to which it is buying a participation that the Fund would otherwise conduct if it were investing directly in the Senior Loan, which may result in the Fund being exposed to greater credit or fraud risk with respect to the borrower or the Senior Loan.
The Fund may also engage in direct origination of loans. In originating loans, the Fund relies on the Adviser’s proprietary sourcing channels, which targets large corporate and private sponsor-backed issuers. In determining whether to originate a loan, the Fund relies on the Adviser’s analysis of the creditworthiness of a borrower and/or any collateral for payment of interest and repayment of principal. The level of analytical sophistication necessary for conducting this analysis is high and the Adviser must rely more significantly on its own resources to conduct due diligence on borrowers than for secondary market debt purchases. The loans the Fund originates are generally Senior Loans, however the Fund is not limited in the type, amount or size of loans it may originate nor to a particular type of borrower. The Fund will earn origination and other types of borrower fees in connection with originating and structuring loans. Direct loans are not publicly traded and may not have a secondary market. Direct loans are subject to heightened liquidity risk and interest rate risk, and some direct loans may be deemed illiquid. The Fund may also face heightened competition for direct origination, which may result in the Fund being required to make lower yielding investments.
Subordinated Loans Risk. Subordinated loans generally are subject to similar risks as those associated with investments in Senior Loans, except that such loans are subordinated in payment and/or lower in lien priority to first lien holders. In the event of default on a subordinated loan, the first priority lien holder has first claim to the underlying collateral of the loan. These loans are subject to the additional risk that the cash flow of the borrower and property securing the loan or debt, if any, may be insufficient to meet scheduled payments after giving effect to the senior unsecured or senior secured obligations of the borrower. This risk is generally higher for subordinated unsecured loans or debt that is not backed by a security interest in any specific collateral. Subordinated loans generally have greater price volatility than Senior Loans and may be less liquid.
Semi-Annual Report | 55
Apollo Senior Floating Rate Fund Inc.
Apollo Tactical Income Fund Inc.
Fund Investment Objectives, Policies and Risks (continued)
June 30, 2023 (unaudited)
Distressed and Defaulted Securities Risk. The Fund may invest in securities that are the subject of bankruptcy proceedings or otherwise in default or at risk of being in default as to the repayment of principal and/or interest at the time of acquisition by the Fund. Investment in these distressed securities is speculative and involves significant risks.
Leverage Risk. The Fund uses leverage and may utilize leverage to the maximum extent permitted by law for investment and other general corporate purposes. The Fund may obtain leverage by issuing preferred shares and/or notes and it may also borrow funds from banks and other financial institutions. The Fund may also gain leverage synthetically through swaps and other derivatives. The use of leverage to purchase additional securities creates an opportunity for increased common share dividends, but also creates risks for common shareholders, including increased variability of the Fund’s net income, distributions and/or net asset value in relation to market changes. Leverage is a speculative technique that exposes the Fund to greater risk and increased costs than if it were not implemented. Increases and decreases in the value of the Fund’s portfolio will be magnified if the Fund uses leverage. In particular, leverage may magnify interest rate risk, which is the risk that the prices of portfolio securities will fall (or rise) if market interest rates for those types of securities rise (or fall). As a result, leverage may cause greater changes in the Fund’s net asset value, which will be borne entirely by the Fund’s common shareholders. To the extent that the Fund makes investments in Senior Loans or other debt instruments structured with Interest Rate floors, the Fund will not realize additional income if rates increase to levels below the Interest Rate floor but the Fund’s cost of financing is expected to increase, resulting in the potential for a decrease in the level of income available for dividends or distributions made by the Fund. If the Fund issues preferred shares and/or notes or engages in other borrowings, it will have to pay dividends on its shares or interest on its notes or borrowings, which will increase expenses and may reduce the Fund’s return. These dividend payments or interest expenses (which will be borne entirely by common shareholders) may be greater than the Fund’s return on the underlying investments. The Fund’s leveraging strategy may not be successful.
Reference Rate Risk. The Fund may invest in financial instruments that recently transitioned from using or continue to use a floating rate based on the London Interbank Offered Rate (“LIBOR”), which is the offered rate for short-term Eurodollar deposits between major international banks. The United Kingdom Financial Conduct Authority (“FCA”), which regulates LIBOR, announced a phase out of LIBOR such that after June 30, 2023, the overnight, 1-month, 3-month, 6-month and 12-month U.S. dollar LIBOR settings ceased to be published or are no longer representative. All other LIBOR settings and certain other interbank offered rates, such as the Euro Overnight Index Average (“EONIA”), ceased to be published after December 31, 2021. The Secured Overnight Financing Rate (“SOFR”) is a broad measure of the cost of borrowing cash overnight collateralized by U.S. Treasury securities in the repurchase agreement (“repo”) market and has been used increasingly on a voluntary basis in new instruments and transactions. On March 15, 2022, the Adjustable Interest Rate Act was signed into law, providing a statutory fallback mechanism to replace LIBOR with a benchmark rate that is selected by the Federal Reserve Board and based on SOFR for certain contracts that reference LIBOR without adequate fallback provisions. On December 16, 2022, the Federal Reserve Board adopted regulations implementing the Adjustable Interest Rate Act by identifying benchmark rates based on the SOFR that will replaced LIBOR in different categories of financial contracts after June 30, 2023. These regulations apply only to contracts governed by U.S. law, among other limitations.
Neither the effect of the LIBOR transition process nor its ultimate success can yet be known. Not all existing LIBOR-based instruments may have alternative rate-setting provisions and there remains uncertainty regarding the willingness and ability of issuers to add alternative rate-setting provisions in certain existing instruments. Parties to contract, securities or other instruments using LIBOR may disagree on transition rates or the application of applicable transition regulation, potentially resulting in uncertainty of performance and the possibility of litigation. The Fund may have instruments linked to other interbank offered rates that may also cease to be published in the future.
Closed‑End Structure; Market Discount from Net Asset Value. Shares of closed‑end investment companies that trade in a secondary market frequently trade at market prices that are lower than their net asset values. This is commonly referred to as “trading at a discount.” As a result, the Fund is designed primarily for long-term investors. Although the value of the Fund’s net assets is generally considered by market participants in determining whether to purchase or sell shares, whether an investor will realize gains or losses upon the sale of the shares will depend entirely upon whether the market price of the shares at the time of sale is above or below the investor’s purchase price for the shares.
56 | Semi-Annual Report
Apollo Senior Floating Rate Fund Inc.
Apollo Tactical Income Fund Inc.
Fund Investment Objectives, Policies and Risks (continued)
June 30, 2023 (unaudited)
Because the market price of the shares will be determined by factors such as relative supply of and demand for the shares in the market, general market and economic conditions, and other factors beyond the control of the Fund, the Fund cannot predict whether the shares will trade at, below or above net asset value. As with any security, complete loss of investment is possible.
AFT Fundamental Investment Restrictions:
The following investment restrictions are fundamental policies of the Fund and may not be changed without the approval of the holders of a majority of the Fund’s outstanding shares of common stock (which for this purpose and under the Investment Company Act means the lesser of (i) 67% of the shares of common stock represented at a meeting at which more than 50% of the outstanding shares of common stock are represented or (ii) more than 50% of the outstanding shares). Subject to such shareholder approval, the Fund may not:
1. Make investments for the purpose of exercising control or management.
2. Purchase or sell real estate, commodities or commodity contracts, except that, to the extent permitted by applicable law, the Fund may (i) invest in securities directly or indirectly secured by real estate or interests therein or issued by entities that invest in real estate or interests therein; (ii) invest in securities directly or indirectly secured by commodities or securities issued by entities that invest in or hold such commodities; and (iii) purchase and sell forward contracts, financial futures contracts and options thereon.
3. Issue senior securities or borrow money except as permitted by Section 18 of the Investment Company Act or otherwise as permitted by applicable law.
4. Underwrite securities of other issuers, except insofar as the Fund may be deemed an underwriter under the Securities Act in selling portfolio securities.
5. Make loans, except as permitted under the Investment Company Act, as interpreted or modified or otherwise permitted by regulatory authority having jurisdiction from time to time.
6. Invest more than 25% of its total assets (taken at market value at the time of each investment) in the securities of issuers in any one industry; provided that securities issued or guaranteed by the U.S. Government or its agencies or instrumentalities and tax-exempt securities of governments or their political subdivisions will not be considered to represent an industry. The Fund determines industries by reference to the Global Industry Classification Standard as it may be amended from time.
AIF Fundamental Investment Restrictions:
The following investment restrictions are fundamental policies of the Fund and may not be changed without the approval of the holders of a majority of the Fund’s outstanding shares of common stock (which for this purpose and under the Investment Company Act means the lesser of (i) 67% of the shares of common stock represented at a meeting at which more than 50% of the outstanding shares of common stock are represented or (ii) more than 50% of the outstanding shares). Subject to such shareholder approval, the Fund may not:
1. Make investments for the purpose of exercising control or management;
2. Purchase or sell real estate, commodities or commodity contracts, except that, to the extent permitted by applicable law, the Fund may (i) invest in securities directly or indirectly secured by real estate or interests therein or issued by entities that invest in real estate or interests therein; (ii) invest in securities directly or indirectly secured by commodities or securities issued by entities that invest in or hold such commodities; and (iii) purchase and sell forward contracts, swap contracts, futures contracts and options thereon;
3. Issue senior securities or borrow money except as permitted by Section 18 of the Investment Company Act or otherwise as permitted by applicable law;
Semi-Annual Report | 57
Apollo Senior Floating Rate Fund Inc.
Apollo Tactical Income Fund Inc.
Fund Investment Objectives, Policies and Risks (continued)
June 30, 2023 (unaudited)
4. Underwrite securities of other issuers, except insofar as the Fund may be deemed an underwriter under the Securities Act in selling portfolio securities;
5. Make loans, except as permitted under the Investment Company Act, as interpreted or modified or otherwise permitted by regulatory authority having jurisdiction from time to time.
6. Invest 25% or more of its total assets (taken at market value at the time of each investment) in the securities of issuers in any one industry; provided that securities issued or guaranteed by the U.S. Government or its agencies or instrumentalities and tax‑exempt securities of governments or their political subdivisions will not be considered to represent an industry. The Fund determines industries by reference to the Global Industry Classification Standard as it may be amended from time to time.
Other Corporate Governance
Each Fund has opted-in to the Maryland Control Share Acquisition Act (the “MCSAA”). The election to become subject to the MCSAA limits the ability of holders of “control shares” to vote those shares above various threshold levels that start at 10% unless the other stockholders of a Fund reinstate or approve those voting rights at a meeting of stockholders as provided in the MCSAA. The bylaws for each Fund provide that the provisions of the MCSAA do not apply to the voting rights of the holders of any shares of preferred stock of the Fund (but only with respect to such preferred stock).
The above description of the MCSAA is only a high-level summary and does not purport to be complete. Investors should refer to the actual provisions of the MCSAA and each Fund’s bylaws for more information, including definitions of key terms, various exclusions and exemptions from the statute’s scope, and the procedures by which stockholders may approve the reinstatement of voting rights to holders of “control shares.”
58 | Semi-Annual Report
Apollo Senior Floating Rate Fund Inc.
Apollo Tactical Income Fund Inc.
Additional Information
June 30, 2023 (unaudited)
Dividend Reinvestment Plan
Unless a shareholder specifically elects to receive common stock of the Funds as set forth below, all net investment income dividends and all capital gains distributions declared by the Board will be payable in cash.
A shareholder may elect to have net investment income dividends and capital gains distributions reinvested in common stock of the Funds. To exercise this option, such shareholder must notify AST, the plan administrator and the Funds’ transfer agent and registrar, in writing so that such notice is received by the plan administrator not less than 10 days prior to the record date fixed by the Board for the net investment income dividend and/or capital gains distribution involved.
The plan administrator will set up an account for shares acquired pursuant to the plan for each shareholder that elects to receive dividends and distributions in additional shares of common stock of the Funds (each a “Participant”). The plan administrator may hold each Participant’s shares, together with the shares of other Participants, in non‑certificated form in the plan administrator’s name or that of its nominee.
The shares are acquired by the plan administrator for a participant’s account, depending upon the circumstances described below, either (i) through receipt of additional unissued but authorized shares of common stock from the Funds (“Newly Issued Shares”) or (ii) by purchase of outstanding shares of common stock on the open market (“Open-Market Purchases”) on the NYSE or elsewhere. If, on the dividend payment date, the NAV per share of the common stock is equal to or less than the market price per share of the common stock plus estimated brokerage commissions (such condition being referred to as “market premium”), the plan administrator will invest the dividend amount in Newly Issued Shares on behalf of the Participant. The number of Newly Issued Shares of common stock to be credited to the Participant’s account will be determined by dividing the dollar amount of the dividend by the NAV per share on the date the shares are issued, unless the NAV is less than 95% of the then current market price per share, in which case the dollar amount of the dividend will be divided by 95% of the then current market price per share. If, on the dividend payment date, the NAV per share is greater than the market value (such condition being referred to as “market discount”), the plan administrator will invest the dividend amount in shares acquired on behalf of the Participant in Open-Market Purchases.
The plan administrator’s service fee, if any, and expenses for administering the plan will be paid for by the Funds. If a Participant elects by written notice to the plan administrator to have the plan administrator sell part or all of the shares held by the plan administrator in the Participant’s account and remit the proceeds to the Participant, the plan administrator is authorized to deduct a $15 transaction fee plus a 12¢ per share brokerage commission from the proceeds.
Shareholders who receive dividends in the form of stock are subject to the same federal, state and local tax consequences as are shareholders who elect to receive their dividends in cash. A shareholder’s basis for determining gain or loss upon the sale of stock received in a dividend from the Funds will be equal to the total dollar amount of the dividend payable to the shareholders. Any stock received in a dividend will have a new holding period for tax purposes commencing on the day following the day on which the shares are credited to the U.S. shareholder’s account.
Participants may terminate their accounts under the plan by notifying the plan administrator via its website at www.astfinancial.com, by filling out the transaction request form located at the bottom of the Participant’s statement and sending it to the plan administrator at American Stock Transfer and Trust Company, LLC, P.O. Box 922 Wall Street Station, New York, NY 10269-0560 or by calling the plan administrator at 1‑877‑864‑4834.
Semi-Annual Report | 59
Apollo Senior Floating Rate Fund Inc.
Apollo Tactical Income Fund Inc.
Additional Information (continued)
June 30, 2023 (unaudited)
The plan may be terminated by the Funds upon notice in writing mailed to each Participant at least 30 days prior to any record date for the payment of any dividend or distribution by the Funds. All correspondence, including requests for additional information, concerning the plan should be directed to the plan administrator by mail at American Stock Transfer and Trust Company, LLC, 6201 15th Avenue, Brooklyn NY 11219.
Approval of the Investment Advisory and Management Agreements for AFT and AIF
At a meeting of the Boards of Directors (together, the “Board” or the “Directors”) of Apollo Senior Floating Rate Fund Inc. (“AFT”) and Apollo Tactical Income Fund Inc. (“AIF”) (each, a “Fund” and together, the “Funds”) held on February 16, 2023, the Directors met in person to consider the approval of the Investment Advisory and Management Agreement between AFT and Apollo Credit Management, LLC (the “Adviser”) and the Investment Advisory and Management Agreement between AIF and the Adviser (each, an “Advisory Agreement” and together, the “Advisory Agreements”) for an additional one-year term. While the meetings occurred at the same time, the Directors considered each Advisory Agreement separately.
The Board has the responsibility under the Investment Company Act of 1940, as amended (the “1940 Act”), to approve the annual renewal of each Fund’s Advisory Agreement at meetings of the Board called for the purpose of voting on such renewal. The Board generally receives, reviews and evaluates information concerning the services and personnel of the Adviser and its affiliates at quarterly meetings of the Board. While particular emphasis might be placed on information concerning the investment performance of each Fund, each Fund’s fees and expenses in comparison with other funds’ fees and expenses and the Adviser’s profitability at the meeting at which the renewal of the Advisory Agreements is considered, the process of evaluating each Fund’s investment advisory and management arrangements is an ongoing one.
In preparation for their review of the Advisory Agreements, all of the Directors who are not “interested persons,” as defined in the 1940 Act (the “Independent Directors”), of the Funds present at the meeting met with their independent counsel in an executive session. In considering whether to approve the Advisory Agreements, the Directors, including the Independent Directors, reviewed materials provided in advance of the meeting by the Adviser and counsel to the Independent Directors and other materials which included, among other things: (i) information concerning the services rendered to each Fund by the Adviser; (ii) information concerning the revenues generated and expenses incurred by the Adviser from the management of each Fund; and (iii) a memorandum outlining the legal duties of the Board under the 1940 Act. The Board also reviewed information prepared by Strategic Insight, a third-party service provider, which included information in respect of each Fund comparing (1) the Fund’s performance with that of a group of comparable funds selected by Strategic Insight (the “Peer Group”) and with a broader group of funds (the “Morningstar Category”) and (2) the Fund’s contractual and net management fees and total net expenses with those of its Peer Group and Morningstar Category.
Counsel to the Independent Directors discussed the factors outlined by the federal courts as relevant to a board’s consideration of the approval of an investment advisory agreement and referred the Directors to the materials provided in connection with the meeting. The Directors also received information regarding each Fund’s operations, expenses and performance periodically throughout the year.
The nature, extent and quality of services provided by the Adviser. Representatives of the Adviser referred generally to materials it provided to the Board prior to the meeting and then discussed the nature, extent and quality of the services provided by the Adviser to each Fund, including the Adviser’s expertise in managing loan portfolios, the integrated platform of the Adviser and its affiliates and the benefits, resources and opportunities of the platform that the Adviser is able to access. Fund management discussed the size and experience of the Adviser’s staff, the experience of its key personnel in providing investment management services, the systems used by the Adviser’s personnel and the ability of the Adviser to attract and retain capable personnel. Representatives of the Adviser discussed the reputation, compliance history, compliance program and financial condition of the Adviser. They discussed the terms of each Advisory Agreement and the Adviser’s responsibilities with respect to each Fund.
60 | Semi-Annual Report
Apollo Senior Floating Rate Fund Inc.
Apollo Tactical Income Fund Inc.
Additional Information (continued)
June 30, 2023 (unaudited)
Investment performance of the Funds and the Adviser. Representatives of the Adviser reviewed with the Board the performance of each Fund. Fund management discussed each Fund’s stock price and its yield. Representatives of the Adviser compared each Fund’s yield (based on the ratio of net investment income to average net assets) to the average yield of certain of its peer funds identified by the Adviser for various periods since the Fund’s inception. Fund management then discussed each Fund’s investment performance as compared to the performance of relevant reference indexes (the “Benchmarks”), and to its Peer Group and Morningstar Category, for various periods. In general, each Fund experienced periods of outperformance and some periods of underperformance, which representatives of the Adviser explained to the satisfaction of the Independent Directors.
Cost of services provided and profits realized by the Adviser and its affiliates from the relationship with the Funds. The Directors received information from the Adviser regarding the profitability of each Fund to the Adviser and recalled information previously received and discussed about the methodology used by the Adviser in allocating its costs regarding the operations of the Funds and calculating profitability. In addition, the Directors considered whether any direct or indirect collateral benefits inured to the Adviser as a result of its affiliation with the Funds. It was noted that each Fund has entered into an Administrative Services and Reimbursement Agreement with the Adviser pursuant to which the Adviser provides the Fund with certain personnel and services not otherwise provided under the relevant Advisory Agreement, which services are required for the operations of the Fund, and the Fund generally reimburses the Adviser on an at cost basis for such services.
The extent to which economies of scale would be realized as the Funds grow and whether fee levels would reflect such economies of scale. The Directors considered the extent to which economies of scale are relevant for the Funds. It was noted that, because each Fund is a closed-end fund, any increase in asset levels generally would have to come from material appreciation through investment performance. It was also noted that an investment objective of each Fund is to seek current income and that much of each Fund’s realized income is expected to be distributed to its shareholders through monthly dividends.
Comparison of services rendered and fees paid to those under other investment advisory contracts, such as contracts of the same and other investment advisers or other clients. The Board discussed the net management fee and net total expense ratio comparisons set forth in the Strategic Insight report with representatives of the Adviser. For each Fund, the Fund’s contractual management fee was within the range of those of its Peer Group funds. Each Fund’s net total expense ratio at both managed and common asset levels ranked in the fourth quartile of its Peer Group and Morningstar Category. In considering the comparison of services rendered to and fees paid by each Fund to those under other investment advisory contracts, the Directors were aware of the nature of the investment strategies of each Fund and the fact that the relevant comparison funds may have investment strategies, restrictions and leverage different from those of the Fund. In regard to compensation paid to the Adviser with respect to other funds or accounts, the Adviser stated that none of the other funds or accounts advised by it or any of its affiliates are comparable to either Fund with respect to their investment strategies.
Conclusion. After consideration of the factors discussed above, the Directors, including the Independent Directors, unanimously voted to approve each Advisory Agreement for an additional one-year term.
Shareholder Meeting Results
On June 9, 2023, AFT held its Annual Meeting of Shareholders for the election of Directors and the ratification of the appointment of Deloitte and Touche LLP (“Deloitte”) as AFT’s independent registered public accounting firm for the 2023 fiscal year. The resolution of the voting are as follows:
| | | | | | | | | | | | | | | | | | | | |
| Name | | For | | Against | | Withheld | | Non-Vote |
| Robert L. Borden | | | | 11,682,656 | | | | | 610,266 | | | | | 136,540 | | | | | — | |
| Meredith Coffey | | | | 12,057,856 | | | | | 239,344 | | | | | 132,262 | | | | | — | |
| | | | | | | | | | | | | | | | | | | | |
| | | For | | Against | | Withheld | | Non-Vote |
| Ratification of Deloitte as independent registered public accounting firm | | | | 12,169,622 | | | | | 137,388 | | | | | 122,452 | | | | | — | |
Semi-Annual Report | 61
Apollo Senior Floating Rate Fund Inc.
Apollo Tactical Income Fund Inc.
Additional Information (continued)
June 30, 2023 (unaudited)
On June 9, 2023, AIF held its Annual Meeting of Shareholders for the election of Directors and the ratification of the appointment of Deloitte and Touche LLP (“Deloitte”) as AIF’s independent registered public accounting firm for the 2023 fiscal year. The results of the voting are as follows:
| | | | | | | | | | | | | | | | | | | | |
| Name | | For | | Against | | Withheld | | Non-Vote |
| Robert L. Borden | | | | 11,669,676 | | | | | 954,651 | | | | | 88,152 | | | | | — | |
| Meredith Coffey | | | | 11,943,864 | | | | | 690,308 | | | | | 78,307 | | | | | — | |
| | | | | | | | | | | | | | | | | | | | |
| | | For | | Against | | Withheld | | Non-Vote |
| Ratification of Deloitte as independent registered public accounting firm | | | | 12,605,289 | | | | | 26,424 | | | | | 80,766 | | | | | — | |
62 | Semi-Annual Report
Important Information About This Report
Investment Adviser
Apollo Credit Management, LLC
9 West 57th Street
New York, NY 10019
Administrator
U.S. Bancorp Fund Services, LLC
d/b/a U.S. Bank Global Fund Services
615 East Michigan Street
Milwaukee, WI 53202
Transfer Agent
American Stock Transfer & Trust Company, LLC
6201 15th Avenue
Brooklyn, NY 11219
Custodian
U.S. Bank N.A.
Corporate Trust Services
1 Federal Street
Boston, MA 02110
Independent Registered Public Accounting Firm
Deloitte & Touche LLP
30 Rockefeller Plaza
New York, NY 10112
Fund Counsel
Willkie Farr & Gallagher LLP
787 Seventh Avenue
New York, NY 10019
This report has been prepared for shareholders of Apollo Senior Floating Rate Fund Inc. and Apollo Tactical Income Fund Inc. (the “Funds”). The Funds mail one shareholder report to each shareholder address. If you would like more than one report, please call shareholder services at 1‑877‑864‑4834 and additional reports will be sent to you.
A description of the policies and procedures that the Funds use to determine how to vote proxies relating to their portfolio securities, and the Funds’ proxy voting records for the most recent period ended June 30, 2023 are available (i) without charge, upon request, by calling 1‑877‑864‑4834 and (ii) on the SEC’s website at http://www.sec.gov.
The Funds file their complete schedule of portfolio holdings with the SEC for the first and third quarters of each fiscal year on Form N-PORT. The Funds’ Forms N‑PORT are available on the SEC’s website at http://www.sec.gov.
Semi-Annual Report | 63
Important Information About This Report (continued)
Privacy Policy
We recognize and respect your privacy expectations, whether you are a visitor to our website, a potential shareholder, a current shareholder or even a former shareholder.
What Information Do We Have About You?
We may have collected your personal information in connection with our solicitation and administration of your investment in Apollo Senior Floating Rate Fund Inc. and/or Apollo Tactical Income Fund Inc., including your address, social security number, and contact information. Additionally, we may collect nonpublic personal information about you via our website, including any information captured through the use of our “cookies.”
With Whom Do We Share Your Personal Information?
We may share the information we collect with our affiliates and nonaffiliated third parties for our everyday business purposes, such as to process your transactions, maintain your investments in the Funds, and to respond to court orders and legal investigations. We also provide such information to our affiliates, attorneys, banks, auditors, securities brokers and service providers as may be necessary to facilitate the acceptance and management of your account or your investments in the Funds and to enable them to perform services on our behalf. We may also provide your name, address, telephone number, social security number or financial condition information to affiliates or nonaffiliated third parties, such as broker-dealers, engaged in marketing activities on our behalf, such as the solicitation of your investment in future funds managed by Apollo. We do not sell your personal information to third parties for their independent use.
Protecting the Confidentiality of Our Investor Information
Apollo takes our responsibility to protect the privacy and confidentiality of your personal information very seriously. As such, we maintain physical, electronic and procedural safeguards that comply with federal standards to guard your nonpublic personal information, although you should be aware that data protection cannot be guaranteed. We restrict access to nonpublic personal information about you to our employees and agents who need to know such information to provide products or services to you. Our control policies, for example, authorize access to investor information only by individuals who need such access to do their work.
Opt‑Out Notice
We reserve the right to disclose nonpublic personal information about you to a nonaffiliated third party as discussed above. If you wish to limit the distribution of your personal information with our affiliates and nonaffiliated third parties, as described herein, you may do so by:
| | • | | Calling 1‑877‑864‑4834; or |
| | • | | Writing us at the following address: |
Apollo Credit Management, LLC
c/o: Apollo Senior Floating Rate Fund Inc., Apollo Tactical Income Fund Inc.
9 West 57th Street, 42nd Floor, New York, NY 10019
Attn: Ryan Del Giudice
The ability to opt‑out of disclosure of nonpublic personal information about you may not apply to arrangements necessary to effect or administer a transaction in shares of a Fund or maintain or service your account.
If you choose to write or call us, your request should include your name, address, telephone number and account number(s) to which the opt‑out applies and the extent to which your personal information shall be withheld. If you are a joint account owner, we will apply those instructions to the entire account. If you have accounts or relationships with our affiliates, you may receive multiple privacy policies from them, and will need to separately notify those companies of your privacy choices for those accounts or relationships.
Please understand that if you limit our sharing or our affiliated companies’ use of personal information, you and any joint account holder(s) may not receive information about our affiliated companies’ products and services, including products or services that could help you manage your financial resources and achieve your investment objectives.
If your shares are held in “street name” at a bank or brokerage, we do not have access to your personal information, and you should refer to your bank’s or broker’s privacy policies for a statement of the treatment of your personal information.
If you have any questions regarding this policy, please feel free to contact privacy@apollo.com.
64 | Semi-Annual Report
9 West 57th Street, New York, NY 10019
1‑877‑864‑4834 • www.apollofunds.com
6/30/2023