UNITED STATES
SECURITIES AND EXCHANGE COMMISSION
Washington, D.C. 20549
FORM N-CSR
CERTIFIED SHAREHOLDER REPORT OF REGISTERED
MANAGEMENT INVESTMENT COMPANIES
Investment Company Act file number 811-22480
Adviser Managed Trust
(Exact name of registrant as specified in charter)
SEI Investments
One Freedom Valley Drive
Oaks, PA 19456
(Address of principal executive offices) (Zip code)
The Corporation Trust Company
Corporation Trust Center
1209 Orange Street
Wilmington, Delaware 19801
(Name and address of agent for service)
Registrant’s telephone number, including area code: 1-800-342-5734
Date of fiscal year end: July 31,
Date of reporting period: July 31, 2016
| Item 1. | Reports to Stockholders. |
| 1 | ||||
| 5 | ||||
| 10 | ||||
| 55 | ||||
| 56 | ||||
| 57 | ||||
| 58 | ||||
| 59 | ||||
| 72 | ||||
| 73 | ||||
| 77 | ||||
Board of Trustees’ Considerations in Approving the Advisory and Sub-Advisory Agreements | 78 | |||
| 81 |
The Trust files its complete schedule of portfolio holdings with the Securities and Exchange Commission for the first and third quarter of each fiscal year on Form N-Q within sixty days after the end of the period. The Trust’s Forms N-Q are available on the Commission’s website at http://www.sec.gov, and may be reviewed and copied at the Commission’s Public Reference Room in Washington, DC. Information on the operation of the Public Reference Room may be obtained by calling 1-800-SEC-0330.
A description of the policies and procedures that the Trust uses to determine how to vote proxies relating to portfolio securities, as well as information relating to how a Fund voted proxies relating to portfolio securities during the most recent 12-month period ended July 31, is available (i) without charge, upon request, by calling 1-800-DIAL-SEI; and (ii) on the Commission’s website at http://www.sec.gov.
JULY 31, 2016
To Our Shareholders:
The Funds’ fiscal year — August 1, 2015 through July 31, 2016 — was notable for several key themes: energy-sector volatility spread to other areas of the market amid continued oil-price weakness, followed by a partial recovery; major central-bank policies diverged, with the Federal Reserve (Fed) commencing rate increases while the European Central Bank (ECB), Bank of Japan (BOJ) and People’s Bank of China (PBOC) deepened their commitments to monetary accommodation; and, as a result of the diverging policies, major developed-market sovereign-bond yields continued to fall, with some edging into negative-rate territory. A vote (Brexit) by U.K. citizens in favor of leaving the European Union (EU) took place late in the reporting period, briefly upending global financial markets and presenting major questions about how the relationship will be dissolved.
Geopolitical events
Severe unrest continued in certain areas of the Middle East, driven by the sometimes-opposing and sometimes-overlapping interests of Islamic State, the Syrian regime, Syrian nationalists, Kurdish forces and the Iraqi military. Regional superpowers Iran, Saudi Arabia and Turkey also applied varying degrees of indirect influence. Broader involvement escalated, with Russia’s airpower commitment in early fall and a redoubled coalition of Western powers targeting Islamic State after a series of attacks by religious extremists across the globe. Iraqi forces, supported by U.S. air and ground resources, began to make notable progress in reversing Islamic State gains as the reporting period progressed; at the same time, incidences of terrorism appeared to increase in Africa, Asia, Europe, the Middle East and North America. While the conflict that originated in Syria and Iraq appears to have influenced destabilizing events elsewhere around the globe, and taken a terrible human toll, it has not had a significant impact on global markets or the economy at this point.
It will be interesting, however, to see the ultimate effects of the ensuing Syrian migrant crisis on the EU. Immigration served as one of the key points of contention leading up to Great Britain’s EU referendum, which led to a vote to leave the EU in late June. U.K. Prime Minister David Cameron tendered his resignation as a result, and a litany of questions entered the public dialogue on topics ranging from when the government would commence the formal withdrawal process to how negotiations would fare regarding trade agreements, and whether the immigration goals espoused by the Leave campaign would come to pass.
Immigration-driven ballot-box uncertainty has also taken center stage in the U.S. presidential election, where the leading primary candidates of the two major political parties — Hillary Clinton (Democrat) and Donald Trump (Republican) — had clinched their nominations in the weeks before the end of the reporting period.
Despite the considerable aforementioned instability in the Middle East, the price of oil remained mostly insulated from regional developments. Oil-price weakness, which persisted for the first half of the reporting period, remained primarily attributable to oversupply: members of the Organization of Petroleum Exporting Countries failed to agree on production cuts; the U.S. Congress approved the restoration of oil exports in mid-December; and Iran’s multi-lateral agreement on the scope of its nuclear program paved the way for its post-sanction return as a major low-cost oil supplier. The International Energy Agency, however, projected a return to supply-demand balance in 2017.
Energy-export-dependent Venezuela succumbed to the economically depressive effects of low oil prices during the fiscal year. Food shortages and a breakdown of the rule of law appeared to worsen as the reporting period concluded, despite a partial rebound in the price of oil. Brazil’s prospects also paled during the period, as a corruption investigation centering on its lead state-run oil company enveloped a cross-section of political leaders — culminating in the impeachment of President Dilma Rousseff.
Economic performance
U.S. economic growth in the second quarter of 2015 (prior to the start of the reporting period) bordered on impressive, due in large part to strong consumer activity. The pace of growth essentially halved during the third quarter amid slow sales and lackluster export activity. Fourth-quarter growth decelerated further, as industrial production and manufacturing came under pressure from the effects of U.S. dollar strength. Growth during the first quarter of 2016 slowed more still, and continued apace during the second quarter, reflecting a significant deceleration in overall growth during the full reporting period. The labor market improved consistently for most of the fiscal year, with the unemployment rate declining from 5.3% in July 2015 to 4.9% in July 2016. Average hourly
| Adviser Managed Trust / Annual Report / July 31, 2016 | 1 |
LETTER TO SHAREHOLDERS (Continued)
JULY 31, 2016
earnings gained with relative steadiness, bouncing around a rough mean of about 0.2% per month over the reporting period. The Fed raised its target interest rate in mid-December for the first time since 2006, leaving behind a near-zero rate that had been in place since late 2008.
Europe maintained steady (if modest) economic expansion during the second, third and fourth quarters of 2015, followed by an uptick in the growth rate during the first quarter of 2016 and then slower growth in the second quarter. The ECB’s expansion of its asset-purchase program and introduction of a negative deposit rate in early 2015 (prior to the start of the Funds’ fiscal year) was followed during the reporting period by a deeper foray into negative-rate territory and additional asset-purchase commitments. As the end of the fiscal year approached, U.K. economic data increasingly depicted moderating conditions or outright slowdown amid uncertainty caused by the looming Brexit vote.
In the Asia-Pacific region, Japan’s economy swung between advances and declines. A small contraction in gross domestic product (GDP) took place during the second quarter of 2015, followed by modest growth during the third quarter and then a fourth-quarter contraction. The first quarter of 2016 witnessed a return to expansion, followed by a flat second quarter. The yen remained in a relatively narrow range compared to the U.S. dollar during most of the reporting period, then strengthened substantially starting at the end of 2015. A renewed surge in yen value relative to other major currencies was one of the more notable post-Brexit outcomes, despite expansions during the period to the BOJ’s asset-purchase program, the adoption of a negative benchmark interest rate and a fiscal reform proposal focused on government spending. China’s steadily declining growth, albeit from a pace considerably higher than most other economies, appeared to level off in the second quarter of 2016. The PBOC loosened its monetary-policy stance, reducing benchmark interest rates and bank-reserve requirements at multiple points during the reporting period. The government’s decision to peg its currency (the renminbi) to a basket of currencies instead of just the U.S. dollar, along with the decline of the renminbi against the U.S. dollar during the first several weeks of the reporting period, had significant global repercussions — especially given the implications for a potential rebalancing of global trade and uncertainty about potential future actions.
Market developments
Risk assets were treading water at the start of the fiscal year after breaking out of a downtrend that originated with deep losses on China’s mainland stock exchanges. More severe declines in late summer, when China moderately devalued its currency, were followed by a partial recovery through October. As 2015 came to a close, the questionable health of U.S. energy companies (which was caused by a persistent multi-year oil-price decline) raised concerns among high-yield bond investors. This resulted in a selloff that likely discouraged investor risk appetite, keeping a lid on performance at year end and into the new year.
The beginning of 2016 was marked by a global flight to quality, benefitting safe-haven assets at the expense of risk assets. A trend reversal took place in mid-February, with risk assets rallying into April, followed by mixed performance until late June. The price of oil (and commodities in general) also advanced sharply from mid-February into June. Brexit caused a major spike in global stock-market volatility, yields were driven downward to record levels on perceived safe-haven investments like developed-market government bonds, and the currencies at the center of the developments — sterling and the euro — weakened substantially relative to the U.S. dollar and yen. Most of the stock-market losses, however, were recovered within a week’s time, and the rally continued as the reporting period drew to a close.
The U.S. dollar ended the fiscal year less than 2% lower against a trade-weighted basket of major currencies, having been as much as 4% higher in late January, and 5% lower in early May. The dollar finished the reporting period about 2% higher versus a broad trade-weighted basket, however, with advances and declines that mirrored those against major currencies.
Second-quarter 2016 earnings declined for companies in the S&P 500 Index; although a majority fared better than analysts’ late-quarter average estimates. The consumer discretionary sector delivered the highest second-quarter earnings growth, while the energy sector continued to lag with deep losses.
For the full reporting period, the MSCI All-Country World Index, a proxy for global equities, fell 0.44% in U.S. dollar terms. The MSCI All-Country World ex USA Index fell by 5.54%, considerably sharper than the decline of its U.S.- inclusive counterpart. Emerging-market equity returns were modestly negative in U.S. dollar terms, with the MSCI Emerging Markets Index falling by 0.75%.
| 2 | Adviser Managed Trust / Annual Report / July 31, 2016 |
U.S. equity returns were positive; the S&P 500 Index returned 5.61% during the fiscal year. U.S. large caps (represented by the Russell 1000 Index) continued to outpace small caps (represented by the Russell 2000 Index), returning 4.84% and 0.00%, respectively. The persistence of U.S. large-cap outperformance relative to other equities has been remarkable — both within the U.S. and internationally — with returns topping not just small caps, but also emerging markets, Europe, Japan and the global stock market when annualized over one, three, five and ten years through the end of the reporting period.
Defensive and less-cyclically sensitive equity sectors (which typically exhibit lower volatility in challenging market environments compared to cyclically sensitive sectors) had the best performance. Telecommunications, utilities and consumer staples were the top-performing sectors in the U.S., while technology took the place of telecommunications among the top three globally; financials, energy and healthcare suffered the steepest declines.
Global fixed income, as measured by the Barclays Global Aggregate Bond Index, advanced 9.45% in U.S. dollar terms during the fiscal year. Interest rates generally declined during the reporting period, as major central banks outside of the U.S. guided benchmark rates downward (into negative territory in some cases) and expanded their asset-purchase programs.
U.S. Treasuries generally performed well as the yield curve flattened (bond yields move inversely to prices) and rates fell across most maturities, with only the yields on Treasuries with maturities shorter than two years increasing during the full reporting period.
U.S. investment-grade corporate debt performed well, and the high-yield market was positive. The BofA Merrill Lynch US High Yield Constrained Index increased by 4.95% during the full fiscal year. Mortgage- and asset-backed securities also delivered positive returns during the reporting period.
Emerging-market debt delivered mixed gains. The J.P. Morgan GBI Emerging Markets Global Diversified Index, which tracks local-currency-denominated emerging-market bonds, increased by 5.30% in U.S. dollar terms during the reporting period, bolstered by an impressive late-period rally as U.S. dollar strength waned. Latin America led, while Africa lagged. The J.P. Morgan EMBI Global Diversified Index, which tracks emerging-market debt denominated in external currencies (such as the U.S. dollar), advanced by 11.22%.
A combination of subdued inflation and dollar strength began to ease in the latter part of the reporting period, reducing headwinds to the performance of inflation-sensitive assets such as Treasury inflation-protected securities and commodities. The latter declined by 10.5% over the Funds’ fiscal year, according to the TR/CC CRB Commodities Total Return Index, but dropped by more than 23% as recently as mid-February before staging a steep partial recovery.
Our view
The U.K.’s vote to leave the EU is a major political and economic event that will likely weigh on international financial markets, not just for weeks and months, but perhaps for years. The leap into the unknown will likely depress economic growth as business spending freezes until some clarity re-emerges on the country’s trading relationships. Sterling’s plunge immediately following the Leave vote, however, should provide a much-needed offset to the mostly negative impact of all the uncertainty, as U.K. exporters find themselves in a more competitive position.
The ability of the equity market to bounce back from the immediate shock is heartening, but it is hard to draw firm conclusions on how disruptive Brexit will be on future EU and eurozone economic activity. The fragility of the recovery going into this crisis is a matter of deep concern.
The U.S. has remained resilient despite numerous shocks over the past seven years, and we expect this resilience will once again be on display following the U.K. vote. The first hints of wage pressure have appeared, with a moderate acceleration in wages and total labor compensation apparent on a year-over-year basis. As corporate margins get squeezed by the pick-up in labor costs, the pressure to raise prices will likely intensify.
This puts the Fed in something of a quandary, since the Brexit shock has seemingly upended any possibility of a near-term rise in the funds rate. Market-implied expectations for the next policy-rate move have been pushed out to late 2017; in fact, futures traders have priced in the mild possibility of a rate cut in the near term. Yet, we admit to a growing uneasiness that the central bank may be a falling behind the inflation curve.
| Adviser Managed Trust / Annual Report / July 31, 2016 | 3 |
LETTER TO SHAREHOLDERS (Concluded)
JULY 31, 2016
We understand that the still-soggy global economy and the shock delivered by the U.K. vote argue for a very cautious process of interest-rate normalization. But if the upward trend in labor costs is sustained, a more aggressive response by the U.S. central bank eventually will be justified.
In the months immediately ahead, investors’ attention will be focused on the U.S. presidential election. Investors need to be prepared for a bit of volatility in the coming months, since the uncertainty level has been ratcheted upward, and will likely remain elevated between now and the election. For now, we lean toward the optimistic side, mainly because U.S. economic and financial fundamentals appear relatively healthy.
One of the more surprising market responses to the Brexit vote is the sharp appreciation of the yen. This is the last thing that the country needs, since an ultra-strong currency exacerbates downward pressure on inflation. Corporate earnings have begun to roll over in response to the currency’s appreciation. As Japanese yields sink further into negative territory across the curve, we wonder what measures the BOJ will introduce next, since the most recent interest rate moves have failed to weaken the currency or boost the economy.
Investor fears earlier this year of an imminent Chinese debt and currency meltdown have receded. China’s economy mostly appears to be treading water, much like the rest of the world. The government continues to encourage growth fuelled by additional debt, prop up state-owned enterprises and allow its currency to fall. Economic and financial reforms are proceeding, but at an erratic pace. Chinese equities have not shown much spark, however, despite the risk-on environment for emerging-market assets that began in late January.
Globally, the points of general consistency in our investment outlook and positioning are that stability and momentum appear expensive within equities, and that fixed-income managers favor credit at the expense of interest-rate duration.
On behalf of SEI Investments, I want to thank you for your continued confidence. We are working every day to maintain that confidence, and we look forward to serving your investment needs in the future.
Sincerely,
William Lawrence, CFA
Managing Director, Portfolio Management Team
| 4 | Adviser Managed Trust / Annual Report / July 31, 2016 |
MANAGEMENT’S DISCUSSION AND ANALYSIS OF FUND PERFORMANCE
JULY 31, 2016
Tactical Offensive Equity Fund
I. Objective
The Tactical Offensive Equity Fund (the “Fund”) seeks to provide capital appreciation.
II. Adviser Managed Strategy Component
Only persons who are clients of the Financial Adviser (as defined below) and who participate in the Adviser Managed Strategy should invest in the Fund. The Fund may not be purchased by any other investor. The Fund is designed to be a component of a broader strategy employed by a third party investment manager (“Financial Adviser”) for the benefit of its clients. The Financial Adviser seeks to take advantage of broad market changes by tactically shifting its clients’ assets among the Fund, the Tactical Offensive Fixed Income Fund, and a money market fund affiliated with the Fund, depending on the Financial Adviser’s evaluation of current market conditions (“Adviser Managed Strategy”). The Financial Adviser is not the adviser to the Fund, and is not affiliated with SEI Investments Management Corporation (“SIMC”), the adviser to the Fund. The Adviser Managed Strategy is based on models developed by the Financial Adviser and is not subject to the oversight of or input from SIMC.
When the Financial Adviser determines to reallocate its clients’ assets to one or more of the other funds that compose the Adviser Managed Strategy, the Financial Adviser may request the redemption of a substantial portion or all of the shares for which the Financial Adviser exercises investment discretion. In such an instance, the Financial Adviser’s redemption request will cause the Fund to liquidate a substantial portion or all of its assets in order to fulfill the redemption request. If the Financial Adviser redeems all of the shares for which it exercises investment discretion, the Fund will no longer be an active component of the Adviser Managed Strategy. When the Fund is not an active component of the Adviser Managed Strategy, the Fund may invest up to 100% of its remaining assets in exchange traded funds (“ETF”s) that are designed to track the performance of the broad equity market. The Fund could be invested in these types of investments for extended periods of time. At such times, SIMC will actively manage the assets of the Fund. SIMC, the Financial Adviser or one or more of their affiliates will be the only investors in the Fund when the Fund is not an active component of the Adviser Managed Strategy.
III. Investment Approach
The Fund employs a passive strategy designed to track the performance of one or more indexes that represent broad exposure to the U.S. equity market and issuers located in developed and emerging market countries outside the U.S. (each an Index, and collectively, the Indexes). The passive strategy is implemented by State Street Global Advisors (SSgA) Funds’
Management, Inc., as sub-adviser under the general supervision of SIMC. SIMC may adjust the Fund’s allocation of assets among the Indexes over time depending on its assessment of the markets.
IV. Return vs. Benchmark
For the full year ended July 31, 2016, the Fund returned (0.42)%. The Fund’s primary benchmark — the S&P 500 Index — returned 5.61%. For the period under review, the Fund was an active part of the Adviser Managed Strategy from August 1, 2015 to August 27, 2015 and from April 15, 2016 to July 31, 2016. In the earlier period, the Fund returned (10.31)% while the benchmark returned (5.32)%. In the later period, the Fund returned 4.46% while the benchmark returned 4.96%.
The Fund is designed to have exposure to a range of asset classes, not all of which are reflected in the primary benchmark of the Fund. Therefore, SIMC also utilizes a blended benchmark which reflects the Fund’s allocations to various asset classes and global markets, to assess performance. The Fund’s blended benchmark consists of the Russell 1000 Index (60%), Russell 2000 Index (10%), MSCI EAFE Index (20%), and MSCI Emerging Markets Index (10%).
V. Performance Discussion
The Fund was an active part of the Adviser Managed Strategy from August 1, 2015 to August 27, 2015 and again from April 15, 2016 to July 31, 2016. Over both periods, the Fund allocated to and sought to passively track the performance of indexes as follows: Russell 1000 Index (60%), Russell 2000 Index (10%), MSCI EAFE Index (20%) and MSCI Emerging Markets Index (10%).
During the first period of August 1, 2015 to August 27, 2015, the Fund returned (10.31)%. The Russell 1000 Index returned (6.12)%. The utilities sector was the best — and only positive-returning sector, while Energy and Information Technology were the weakest sectors. The Russell 2000 Index returned (6.53)%. Utilities was again the best-performing sector while Energy was by far the worst-performing sector. Health Care was the second weakest sector. Investors sold off healthcare stocks, which were among the most volatile in the small-cap benchmark. The MSCI EAFE Index returned (6.34)%. From a sector perspective, Telecommunication Services and Utilities were the best-performing sectors due to the
| Adviser Managed Trust / Annual Report / July 31, 2016 | 5 |
MANAGEMENT’S DISCUSSION AND ANALYSIS OF FUND PERFORMANCE
JULY 31, 2016
Tactical Offensive Equity Fund (Concluded)
global search for dividend yield. Energy and Materials were the weakest-performing sector due to slumping commodity prices. The MSCI Emerging Markets Index returned -9.78%. Unlike the MSCI EAFE Index, Health Care was the best-performing sector. Energy remained the weakest-performing sector, however, among emerging markets. Emerging markets underperformed EAFE markets due to a reduction in investor appetite for risk. The Fund’s liquidation of substantially all of its assets to meet a redemption request beginning on August 24, 2015 resulted in the Fund temporarily holding cash positions.
During the second period of April 15, 2016 to July 31, 2016, the Fund returned 4.46%. During this period, the Russell 1000 Index returned 5.13%. From a sector perspective, Telecommunication Services and Health Care were the best-performing sectors, followed by Utilities and Materials. Consumer Discretionary was the worst-performing sector. The Russell 2000 Index returned 8.53%. From a sector perspective, Consumer Staples and Materials were the top performing sectors, followed by Telecommunication Services. Unlike the other U.S. indexes, Energy was by far the worst-performing sector. The MSCI EAFE Index returned 1.44%. Among the best-performing sectors were Information Technology and Materials, while Financials was the weakest sector due to low interest rates across the globe, as addressed in the shareholder letter. From a regional point of view, the Pacific region performed well (specifically New Zealand, Hong Kong and Australia). Europe’s negative returns reflected the rising political risk and economic uncertainty in the area following the U.K.’s Brexit referendum, in which British citizens voted to leave the European Union. Despite the initial shock to the market after the Brexit vote, the U.K. bounced back and erased most of the losses in the weeks that followed. European countries such as Italy, Spain and Austria, severely underperformed, while Finland performed well. The MSCI Emerging Markets Index returned 4.57%. Information technology was the best-performing sector by far, while Materials was the second best. Industrials was the weakest-performing sector and the only one with negative returns. Regionally, emerging markets in Europe, the Middle East and Africa fared the worst given Turkey’s geopolitical tensions and questions regarding the strength of the country’s economy, as well as the ongoing Middle East refugee crisis. In the eurozone, Greece underperformed due to concerns about its debt sustainability (or repayment to the International Monetary Fund, ongoing difficulties in repaying its eurozone creditors and its credit-rating downgrade). Poland also performed poorly due to political uncertainty. Taiwan, Philippines and Indonesia delivered highly positive results, making Emerging Asia the best-performing market despite underperformance in Malaysia. In Latin America, Brazil returned positive results. The lowest returns were from Colombia, given its sensitivity to oil prices, and Mexico, as its 2016 growth projections were trimmed due to lower oil prices and sluggish manufacturing exports.
The Fund was not an active part of the Adviser Managed Strategy from August 28, 2015 until April 14, 2016. During this time the Fund was invested in the SPDR S&P 500 ETF, which returned 6.27%. The SPDR S&P 500 ETF is designed to track the performance of the S&P 500 Index, so the Fund performed generally in line with the S&P 500 Index — its primary benchmark — during this period.
AVERAGE ANNUAL TOTAL RETURN 1,2 | ||||||||||||||||
| One Year Return | 3 Year Return | 5 Year Return | Annualized Inception to Date | |||||||||||||
Tactical Offensive Equity Fund, Class A | (0.42 | )%‡ | 5.83 | % | 10.32 | %† | 9.06 | %†‡ | ||||||||
S&P 500 Index | 5.61 | % | 11.16 | % | 13.38 | % | 11.97 | % | ||||||||
Blended 60% Russell 1000 Index/10% Russell 2000 Index/20% MSCI EAFE Index/10% MSCI Emerging Markets Index | 1.30 | % | 7.65 | % | 9.30 | % | 8.38 | % | ||||||||
| 6 | Adviser Managed Trust / Annual Report / July 31, 2016 |
Comparison of Change in the Value of a $10,000 Investment in the Tactical Offensive Equity Fund, Class A, versus the S&P 500 Index, 60% Russell 1000 Index/10% Russell 2000 Index/20% MSCI EAFE Index/10% MSCI Emerging Markets Index.
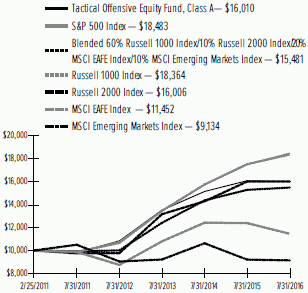
| 1 | For the year ended July 31, 2016. Past performance is no indication of future performance. Prior to October 1, 2014, the Fund’s investment approach was an “active” investment strategy where an investment manager would buy and sell securities based on its own economic, financial, and market analysis. On October 1, 2014, SIMC implemented a “passive” investment strategy which seeks to track an index return. Returns shown do not reflect the deduction of taxes that a shareholder would pay on fund distributions or the redemption of fund shares. Shares of the Fund were offered beginning February 25, 2011. |
| 2 | This table compares the Fund’s average annual total returns to those of a broad-based index and the Fund’s 60/10/20/10 Blended Benchmark, which consists of the Russell 1000 Index, Russell 2000 Index, MSCI EAFE Index, and the MSCI Emerging Markets Index. The Fund’s blended benchmark encompasses additional countries, capitalization weights and sectors than the broad-based index, and therefore we believe that it more accurately reflects the overall investment strategy of the Fund. |
| † | The Fund was not an active component of the Adviser Managed Strategy for the period of August 6, 2011 through January 25, 2012. |
| ‡ | The Fund was not an active component of the Adviser Managed Strategy for the period of August 28, 2015 through April 14, 2016. |
| Adviser Managed Trust / Annual Report / July 31, 2016 | 7 |
MANAGEMENT’S DISCUSSION AND ANALYSIS OF FUND PERFORMANCE
JULY 31, 2016
Tactical Offensive Fixed Income Fund
I. Objective
The Tactical Offensive Fixed Income Fund (the “Fund”) seeks to provide total return.
II. Adviser Managed Strategy Component
Only persons who are clients of the Financial Adviser (as defined below) and who participate in the Adviser Managed Strategy should invest in the Fund. The Fund may not be purchased by any other investor. The Fund is designed to be a component of a broader strategy employed by a third party investment manager (“Financial Adviser”) for the benefit of its clients. The Financial Adviser seeks to take advantage of broad market changes by tactically shifting its clients’ assets among the Fund, the Tactical Offensive Fixed Income Fund, and a money market fund affiliated with the Fund, depending on the Financial Adviser’s evaluation of current market conditions (“Adviser Managed Strategy”). The Financial Adviser is not the adviser to the Fund, and is not affiliated with SEI Investments Management Corporation (“SIMC”), the adviser to the Fund. The Adviser Managed Strategy is based on models developed by the Financial Adviser and is not subject to the oversight of or input from SIMC.
When the Financial Adviser determines to reallocate its clients’ assets to one or more of the other funds that compose the Adviser Managed Strategy, the Financial Adviser may request the redemption of a substantial portion or all of the shares for which the Financial Adviser exercises investment discretion. In such an instance, the Financial Adviser’s redemption request will cause the Fund to liquidate a substantial portion or all of its assets in order to fulfill the redemption request. If the Financial Adviser redeems all of the shares for which it exercises investment discretion, the Fund will no longer be an active component of the Adviser Managed Strategy. When the Fund is not an active component of the Adviser Managed Strategy, the Fund may invest up to 100% of its remaining assets in cash, money market instruments, repurchase agreements and other short-term obligations that would not ordinarily be consistent with the Fund’s investment goal. The Fund could be invested in these types of investments for extended periods of time. At such times, SIMC will actively manage the assets of the Fund. SIMC, the Financial Adviser or one or more of their affiliates will be the only investors in the Fund when the Fund is not an active component of the Adviser Managed Strategy.
III. Investment Approach
The Fund employs a passive strategy designed to track the performance of one or more U.S. Investment Grade, High Yield and Emerging Market Fixed Income Indexes (each an Index, and collectively, the Indexes) implemented by State Street Global Advisors (SSgA) Funds’ Management, Inc., as sub-adviser under the general supervision of SIMC. SIMC may adjust the Fund’s
allocation of assets among the Indexes over time depending on its assessment of the markets.
IV. Return vs. Benchmark
For the full year ended July 31, 2016 the Fund returned 6.05%. The Fund’s benchmark — the Barclays U.S. Aggregate Bond Index — returned 5.94%.
The Fund is designed to have exposure to a range of asset classes, not all of which are reflected in the primary benchmark of the Fund. Therefore, SIMC also utilizes a blended benchmark (which reflects the Fund’s allocations to various asset classes and global markets) to assess performance. The Fund’s blended benchmark consists of the Barclays U.S. Aggregate Bond Index (76%), Barclays U.S. High Yield Bond Very Liquid Index (9.5%), Citi Emerging Markets USD Government Bond Index (9.5%) and Barclays Global G6 (G7 ex-U.S.) Index (Hedged) (5%).
V. Performance Discussion
The Fund maintained strategic allocations to the Barclays U.S. Aggregate Bond Index (76%), Barclays U.S. High Yield Bond Very Liquid Index (9.5%), Citi Emerging Markets USD Government Bond Index (9.5%) and Barclays Global G6 (G7 ex-U.S.) Index (Hedged) (5%). As a result, the Fund performed in line with its blended benchmark, and outperformed the Barclays U.S. Aggregate Bond Index on a relative basis. For the reasons addressed below, the strategic allocation to U.S. dollar-denominated emerging markets debt and hedged international bonds contributed to relative performance while strategic allocations to high-yield debt detracted from relative performance.
For the period, the Barclays U.S. Aggregate Bond Index returned 5.94%. From a sector perspective, investment-grade corporates were among the best performers, particularly Utilities and Industrials, while agency mortgage-backed securities and asset-backed securities were among the worst performers.
The Barclays U.S. High Yield Bond Very Liquid Index returned 4.15%. From a sector perspective, Metals and Mining, Gaming and Fallen Angels were among the best-performing sectors. Energy and Insurance were among the worst-performing sectors.
| 8 | Adviser Managed Trust / Annual Report / July 31, 2016 |
The Citi Emerging Markets USD Government Bond Index returned 11.36% during the period. As the shareholder letter addressed, the best-performing countries were generally within Latin America, including Venezuela, Argentina and Ecuador. The worst performers were generally within Africa, specifically Mozambique and Zambia.
The Barclays Global G6 (G7 ex-U.S.) Index (Hedged) returned 9.14% during the period. As noted in the shareholder letter, further expansion of global monetary-policy easing, coupled with weak growth and inflation, pulled rates lower across the G6 ex-U.S. countries, resulting in positive returns across the countries (Japan, France, Germany, Italy, U.K. and Canada), particularly in the U.K. and Japan.
Within the international sovereign-bond sleeve, the Fund used foreign-exchange currency forwards to hedge exposure consistent with the Fund’s mandate. The associated funding costs were a minor detractor to overall Fund performance.
AVERAGE ANNUAL TOTAL RETURN 1,2 | ||||||||||||||||
| One Year Return | 3 Year Return | 5 Year Return | Annualized Inception to Date | |||||||||||||
Tactical Offensive Fixed Income Fund, Class A | 6.05 | % | 3.85 | % | 3.59 | % | 3.93 | % | ||||||||
Barclays U.S. Aggregate Bond Index | 5.94 | % | 4.23 | % | 3.57 | % | 4.05 | % | ||||||||
Blended 76% Barclays U.S. Aggregate Bond Index/9.5% Barclays U.S. High Yield Bond Very Liquid Index/9.5% Citi Emerging Markets USD Government Bond Index/5% Barclays Global G6 Hedged (G7 ex-U.S.) Index (Hedged) | 6.47 | % | 4.58 | % | 4.16 | % | 4.62 | % | ||||||||
Comparison of Change in the Value of a $10,000 Investment in the Tactical Offensive Fixed Income Fund, Class A, versus the Blended 76% Barclays U.S. Aggregate Bond Index/9.5% Barclays U.S. High Yield Bond Very Liquid Index/9.5% Citi Emerging Markets USD Government Bond Index/5% Barclays Global G6 (G7 ex-U.S.) Index (Hedged).
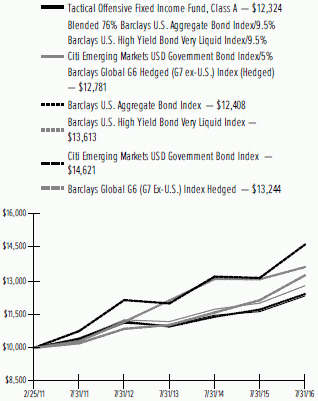
| 1 | For the year ended July 31, 2016. Past performance is no indication of future performance. Prior to October 1, 2014, the Fund’s investment approach was an “active” investment strategy where an investment manager would buy and sell securities based on its own economic, financial, and market analysis. On October 1, 2014, SIMC implemented a “passive” investment strategy which seeks to track an index return. Returns shown do not reflect the deduction of taxes that a shareholder would pay on fund distributions or the redemption of fund shares. Shares of the Fund were offered beginning February 25, 2011. |
| 2 | This table compares the Fund’s average annual total returns to those of a broad-based index and the Fund’s 76/9.5/9.5/5 Blended Benchmark, which consists of the Barclays U.S. Aggregate Bond Index, Barclays U.S. High Yield Bond Very Liquid Index, Citi Emerging Markets USD Government Bond Index, and the Barclays Global G6 (G7 ex-U.S.) Index (Hedged). The Fund’s blended benchmark encompasses additional countries, capitalization weights and sectors than the broad-based index, and therefore we believe that it more accurately reflects the overall investment strategy of the Fund. |
| Adviser Managed Trust / Annual Report / July 31, 2016 | 9 |
SUMMARY SCHEDULE OF INVESTMENTS
JULY 31, 2016
Tactical Offensive Equity Fund
| † | Percentages are based on total investments. |
Description | Percentage of Net Assets (%) | Shares | Market Value ($ Thousands) | |||||||||
COMMON STOCK — 95.8% |
| |||||||||||
Australia — 1.4% |
| |||||||||||
Other Securities *†† | 1.4 | % | $ | 26,558 | ||||||||
|
| |||||||||||
Austria — 0.0% |
| |||||||||||
Other Securities | 0.0 | 596 | ||||||||||
|
| |||||||||||
Belgium — 0.3% |
| |||||||||||
Other Securities * | 0.3 | 4,786 | ||||||||||
|
| |||||||||||
Brazil — 0.5% |
| |||||||||||
Other Securities * | 0.5 | 8,498 | ||||||||||
|
| |||||||||||
Canada — 0.1% |
| |||||||||||
Other Securities * | 0.1 | 1,519 | ||||||||||
|
| |||||||||||
Chile — 0.1% |
| |||||||||||
Other Securities * | 0.1 | 1,967 | ||||||||||
|
| |||||||||||
China — 1.4% |
| |||||||||||
Tencent Holdings | 0.3 | 250,200 | 6,013 | |||||||||
Other Securities *(A) | 1.1 | 20,412 | ||||||||||
|
| |||||||||||
| 26,425 | ||||||||||||
|
| |||||||||||
Colombia — 0.0% |
| |||||||||||
Other Securities | 0.0 | 440 | ||||||||||
|
| |||||||||||
Czech Republic — 0.0% |
| |||||||||||
Other Securities * | 0.0 | 291 | ||||||||||
|
| |||||||||||
Denmark — 0.4% |
| |||||||||||
Other Securities * | 0.4 | 7,020 | ||||||||||
|
| |||||||||||
Finland — 0.2% |
| |||||||||||
Other Securities | 0.2 | 3,481 | ||||||||||
|
| |||||||||||
France — 1.8% |
| |||||||||||
Other Securities *†† | 1.8 | 32,738 | ||||||||||
|
| |||||||||||
Germany — 1.6% |
| |||||||||||
Other Securities *(A) | 1.6 | 29,643 | ||||||||||
|
| |||||||||||
Greece — 0.0% |
| |||||||||||
Other Securities * | 0.0 | 599 | ||||||||||
|
| |||||||||||
Description | Percentage of Net Assets (%) | Shares | Market Value ($ Thousands) | |||||||||
COMMON STOCK (continued) |
| |||||||||||
Hong Kong — 1.3% |
| |||||||||||
Other Securities *††(A) | 1.3 | % | $ | 24,763 | ||||||||
|
| |||||||||||
Hungary — 0.0% |
| |||||||||||
Other Securities | 0.0 | 442 | ||||||||||
|
| |||||||||||
India — 0.1% |
| |||||||||||
Other Securities (A) | 0.1 | 2,143 | ||||||||||
|
| |||||||||||
Indonesia — 0.3% |
| |||||||||||
Other Securities * | 0.3 | 4,744 | ||||||||||
|
| |||||||||||
Ireland — 0.7% |
| |||||||||||
Other Securities * | 0.7 | 12,201 | ||||||||||
|
| |||||||||||
Israel — 0.1% |
| |||||||||||
Other Securities * | 0.1 | 2,602 | ||||||||||
|
| |||||||||||
Italy — 0.4% |
| |||||||||||
Other Securities *(A) | 0.4 | 6,737 | ||||||||||
|
| |||||||||||
Japan — 4.6% |
| |||||||||||
Other Securities *†† | 4.6 | 84,266 | ||||||||||
|
| |||||||||||
Luxembourg — 0.1% |
| |||||||||||
Other Securities * | 0.1 | 1,135 | ||||||||||
|
| |||||||||||
Macau — 0.0% |
| |||||||||||
Other Securities | 0.0 | 267 | ||||||||||
|
| |||||||||||
Malaysia — 0.3% |
| |||||||||||
Other Securities * | 0.3 | 5,082 | ||||||||||
|
| |||||||||||
Mexico — 0.4% |
| |||||||||||
Other Securities *†† | 0.4 | 6,867 | ||||||||||
|
| |||||||||||
Netherlands — 1.2% |
| |||||||||||
Other Securities *(A) | 1.2 | 21,274 | ||||||||||
|
| |||||||||||
New Zealand — 0.0% |
| |||||||||||
Other Securities | 0.0 | 714 | ||||||||||
|
| |||||||||||
Norway — 0.1% |
| |||||||||||
Other Securities | 0.1 | 2,287 | ||||||||||
|
| |||||||||||
Panama — 0.0% |
| |||||||||||
Other Securities | 0.0 | 204 | ||||||||||
|
| |||||||||||
Peru — 0.0% |
| |||||||||||
Other Securities * | 0.0 | 547 | ||||||||||
|
| |||||||||||
Philippines — 0.2% |
| |||||||||||
Other Securities | 0.2 | 2,673 | ||||||||||
|
| |||||||||||
Poland — 0.1% |
| |||||||||||
Other Securities * | 0.1 | 2,106 | ||||||||||
|
| |||||||||||
Portugal — 0.0% |
| |||||||||||
Other Securities | 0.0 | 535 | ||||||||||
|
| |||||||||||
Qatar — 0.1% |
| |||||||||||
Other Securities * | 0.1 | 1,614 | ||||||||||
|
| |||||||||||
| 10 | Adviser Managed Trust / Annual Report / July 31, 2016 |
Description | Percentage of Net Assets (%) | Shares | Market Value ($ Thousands) | |||||||||
COMMON STOCK (continued) |
| |||||||||||
Russia — 0.2% | ||||||||||||
Other Securities * | 0.2 | % | $ | 4,199 | ||||||||
|
| |||||||||||
Singapore — 0.3% |
| |||||||||||
Other Securities †† | 0.3 | 5,150 | ||||||||||
|
| |||||||||||
Slovak Republic — 0.0% |
| |||||||||||
Other Securities | 0.0 | 321 | ||||||||||
|
| |||||||||||
South Africa — 0.7% | ||||||||||||
Other Securities *†† | 0.7 | 13,516 | ||||||||||
|
| |||||||||||
South Korea — 1.3% |
| |||||||||||
Samsung Electronics | 0.3 | 4,458 | 6,125 | |||||||||
Other Securities * | 1.0 | 18,679 | ||||||||||
|
| |||||||||||
| 24,804 | ||||||||||||
|
| |||||||||||
Spain — 0.6% |
| |||||||||||
Other Securities (A) | 0.6 | 10,650 | ||||||||||
|
| |||||||||||
Sweden — 0.5% |
| |||||||||||
Other Securities * | 0.5 | 9,622 | ||||||||||
|
| |||||||||||
Switzerland — 1.8% |
| |||||||||||
Nestle | 0.4 | 92,767 | 7,458 | |||||||||
Novartis | 0.3 | 66,257 | 5,505 | |||||||||
Roche Holding | 0.3 | 20,459 | 5,239 | |||||||||
Other Securities * | 0.8 | 14,379 | ||||||||||
|
| |||||||||||
| 32,581 | ||||||||||||
|
| |||||||||||
Taiwan — 1.0% |
| |||||||||||
Other Securities * | 1.0 | 18,414 | ||||||||||
|
| |||||||||||
Thailand — 0.2% |
| |||||||||||
Other Securities * | 0.2 | 4,343 | ||||||||||
|
| |||||||||||
Turkey — 0.1% |
| |||||||||||
Other Securities *†† | 0.1 | 2,173 | ||||||||||
|
| |||||||||||
United Arab Emirates — 0.1% |
| |||||||||||
Other Securities * | 0.1 | 1,504 | ||||||||||
|
| |||||||||||
United Kingdom — 3.6% |
| |||||||||||
Other Securities *‡(A) | 3.6 | 66,319 | ||||||||||
|
| |||||||||||
United States — 67.6% |
| |||||||||||
3M | 0.3 | 30,300 | 5,404 | |||||||||
AbbVie | 0.3 | 83,454 | 5,527 | |||||||||
Allergan * | 0.3 | 20,400 | 5,160 | |||||||||
Alphabet, Cl A * | 0.7 | 15,129 | 11,972 | |||||||||
Alphabet, Cl C * | 0.7 | 15,300 | 11,763 | |||||||||
Altria Group | 0.4 | 100,700 | 6,817 | |||||||||
Amazon.com * | 0.8 | 19,973 | 15,156 | |||||||||
Amgen | 0.4 | 38,726 | 6,662 | |||||||||
Apple | 1.6 | 281,354 | 29,320 | |||||||||
AT&T | 0.7 | 316,531 | 13,703 | |||||||||
Bank of America | 0.4 | 529,330 | 7,670 | |||||||||
Berkshire Hathaway, Cl B * | 0.8 | 97,143 | 14,015 | |||||||||
Bristol-Myers Squibb | 0.3 | 86,000 | 6,434 | |||||||||
Description | Percentage of Net Assets (%) | Shares | Market Value ($ Thousands) | |||||||||
COMMON STOCK (continued) |
| |||||||||||
Chevron | 0.5 | % | 96,703 | $ | 9,910 | |||||||
Cisco Systems | 0.4 | 259,159 | 7,912 | |||||||||
Citigroup | 0.4 | 151,300 | 6,628 | |||||||||
Coca-Cola | 0.5 | 200,430 | 8,745 | |||||||||
Comcast, Cl A | 0.5 | 123,972 | 8,337 | |||||||||
CVS Health | 0.3 | 55,300 | 5,127 | |||||||||
Exxon Mobil | 1.0 | 212,835 | 18,932 | |||||||||
Facebook, Cl A * | 0.8 | 115,288 | 14,289 | |||||||||
General Electric | 0.8 | 472,757 | 14,722 | |||||||||
Gilead Sciences | 0.3 | 68,317 | 5,429 | |||||||||
Home Depot | 0.5 | 64,000 | 8,847 | |||||||||
Intel | 0.5 | 243,205 | 8,478 | |||||||||
International Business Machines | 0.4 | 45,230 | 7,265 | |||||||||
Johnson & Johnson | 1.0 | 141,079 | 17,667 | |||||||||
JPMorgan Chase | 0.6 | 187,106 | 11,969 | |||||||||
McDonald’s | 0.3 | 45,300 | 5,330 | |||||||||
Medtronic | 0.3 | 72,200 | 6,327 | |||||||||
Merck | 0.5 | 142,518 | 8,360 | |||||||||
Microsoft | 1.2 | 388,893 | 22,042 | |||||||||
Oracle | 0.3 | 152,388 | 6,254 | |||||||||
PepsiCo | 0.4 | 74,364 | 8,100 | |||||||||
Pfizer | 0.6 | 308,956 | 11,397 | |||||||||
Philip Morris International | 0.4 | 79,700 | 7,991 | |||||||||
Procter & Gamble | 0.6 | 137,000 | 11,726 | |||||||||
Schlumberger | 0.3 | 71,728 | 5,776 | |||||||||
SEI Investments † | 0.0 | 6,500 | 293 | |||||||||
UnitedHealth Group | 0.4 | 48,300 | 6,917 | |||||||||
Verizon Communications | 0.6 | 209,791 | 11,625 | |||||||||
Visa, Cl A | 0.4 | 98,140 | 7,660 | |||||||||
Wal-Mart Stores | 0.3 | 78,000 | 5,692 | |||||||||
Walt Disney | 0.4 | 83,500 | 8,012 | |||||||||
Wells Fargo | 0.6 | 234,960 | 11,271 | |||||||||
Other Securities *†† | 43.8 | 810,708 | ||||||||||
|
| |||||||||||
| 1,249,341 | ||||||||||||
|
| |||||||||||
Total Common Stock | ||||||||||||
(Cost $1,691,224) ($ Thousands) | 1,770,701 | |||||||||||
|
| |||||||||||
EXCHANGE TRADED FUNDS — 0.8% |
| |||||||||||
United States — 0.8% |
| |||||||||||
iShares MSCI India Fund | 0.6 | 405,764 | 11,990 | |||||||||
Other Securities | 0.2 | 3,861 | ||||||||||
|
| |||||||||||
Total Exchange Traded Funds | ||||||||||||
(Cost $14,609) ($ Thousands) | 15,851 | |||||||||||
|
| |||||||||||
PREFERRED STOCK — 0.5% |
| |||||||||||
Brazil — 0.3% | ||||||||||||
Other Securities | 0.3 | 4,886 | ||||||||||
|
| |||||||||||
Chile — 0.0% | ||||||||||||
Other Securities | 0.0 | 163 | ||||||||||
|
| |||||||||||
| Adviser Managed Trust / Annual Report / July 31, 2016 | 11 |
SUMMARY SCHEDULE OF INVESTMENTS
JULY 31, 2016
Tactical Offensive Equity Fund (Concluded)
Description | Percentage of Net Assets (%) | Market Value ($ Thousands) | ||||||
PREFERRED STOCK (continued) |
| |||||||
Colombia — 0.0% |
| |||||||
Other Securities | 0.0 | % | $ | 297 | ||||
|
| |||||||
Germany — 0.1% |
| |||||||
Other Securities | 0.1 | 1,902 | ||||||
|
| |||||||
South Korea — 0.1% |
| |||||||
Other Securities | 0.1 | 1,401 | ||||||
|
| |||||||
Total Preferred Stock | ||||||||
(Cost $7,610) ($ Thousands) | 8,649 | |||||||
|
| |||||||
RIGHTS — 0.0% |
| |||||||
Hong Kong — 0.0% |
| |||||||
Other Securities*‡ | 0.0 | 9 | ||||||
|
| |||||||
Spain — 0.0% |
| |||||||
Other Securities*‡ | 0.0 | 18 | ||||||
|
| |||||||
United States — 0.0% |
| |||||||
Other Securities*‡ | 0.0 | — | ||||||
|
| |||||||
Total Rights | ||||||||
(Cost $—) ($ Thousands) | 27 | |||||||
|
| |||||||
Total Investments — 97.1% |
| |||||||
(Cost $1,713,443) ($ Thousands) | $ | 1,795,228 | ||||||
|
| |||||||
| The | open futures contracts held by the Fund at July 31, 2016, are as follows: |
Type of Contract | Number of Contracts Long | Expiration Date | Unrealized Appreciation ($ Thousands) | |||||||||
MSCI EAFE Index E-MINI | 84 | Sep-2016 | $ | 446 | ||||||||
MSCI Emerging Markets | 228 | Sep-2016 | 660 | |||||||||
Russell 2000 Index | 76 | Sep-2016 | 500 | |||||||||
S&P 500 Index | 232 | Sep-2016 | 1,052 | |||||||||
S&P Mid Cap 400 Index E-MINI | 18 | Sep-2016 | 138 | |||||||||
|
| |||||||||||
| $ | 2,796 | |||||||||||
|
| |||||||||||
For the year ended July 31, 2016, the total amount of all open futures contracts, as presented in the table above, are representative of the volume of activity for this derivative type during the period.
| Percentages | are based on a Net Assets of $1,848,988 ($ Thousands). |
| * | Non-income producing security. |
| ‡ | Expiration date unavailable. |
| † | The Fund may purchase securities of certain companies with which it is affiliated to the extent these companies are represented in its benchmark index. |
| †† | Real Estate Investment Trust. |
| (A) | Security exempt from registration under Rule 144A of the Securities Act of 1933. These securities may be resold in transactions exempt from registration normally to qualified institutions. On July 31, 2016, the value of these securities amounted to $2,228 ($ Thousands), representing 0.1% of the net assets of the Fund. |
Cl — Class
EAFE — Europe, Australasia and Far East
MSCI — Morgan Stanley Capital International
S&P — Standard & Poor’s
The Summary Schedule of Investments does not reflect the complete portfolio holdings. It includes the Fund’s 50 largest holdings and each investment of any issuer that exceeds 1% of the Fund’s net assets. “Other Securities” represent all issues not required to be disclosed under the rules adopted by the U.S. Securities and Exchange Commission (“SEC”). In certain instances, securities for which footnotes listed above may otherwise apply are included in the Other Securities caption. The complete schedule of portfolio holdings is available (i) without charge, upon request, by calling (800) 342-5734; and (ii) on the SEC’s website at http://www.sec.gov.
The following is a list of the inputs used as of July 31, 2016, in valuing the Fund’s investments and other financial instruments carried at value ($ Thousands):
Investments in Securities | Level 1 | Level 2 | Level 3 | Total | ||||||||||||
Common Stock | $ | 1,770,701 | $ | — | $ | — | $ | 1,770,701 | ||||||||
Exchange Traded Funds | 15,851 | — | — | 15,851 | ||||||||||||
Preferred Stock | 8,649 | — | — | 8,649 | ||||||||||||
Rights | 27 | — | — | ^ | 27 | |||||||||||
|
|
|
|
|
|
|
| |||||||||
Total Investments in Securities | $ | 1,795,228 | $ | — | $ | — | $ | 1,795,228 | ||||||||
|
|
|
|
|
|
|
| |||||||||
Other Financial Instruments | Level 1 | Level 2 | Level 3 | Total | ||||||||||||
Futures Contracts * | ||||||||||||||||
Unrealized Appreciation | $ | 2,796 | $ | — | $ | — | $ | 2,796 | ||||||||
|
|
|
|
|
|
|
| |||||||||
Total Other Financial Instruments | $ | 2,796 | $ | — | $ | — | $ | 2,796 | ||||||||
|
|
|
|
|
|
|
| |||||||||
| * | Futures contracts are valued at the unrealized appreciation on the instruments. |
| ^ | Represents securities in which the fair value is $0 or has been rounded to $0. |
For the year ended July 31, 2016, there were transfers between Level 1 and Level 2 assets and liabilities due to the availability of quoted prices in active markets to determine fair value. For the year ended July 31, 2016, there were no transfers between Level 2 and Level 3 assets and liabilities. All transfers, if any, are recognized by the Fund at the end of the year.
For more information on valuation inputs, see Note 2 — Significant Accounting Policies in Notes to Financial Statements.
Amounts designated as “—” are either $0 or have been rounded to $0.
The accompanying notes are an integral part of the financial statements.
| 12 | Adviser Managed Trust / Annual Report / July 31, 2016 |
SCHEDULE OF INVESTMENTS
JULY 31, 2016
Tactical Offensive Fixed Income Fund
| † | Percentages are based on total investments. |
Description | Face Amount (Thousands) | Market Value ($ Thousands) | ||||||
CORPORATE OBLIGATIONS — 31.1% |
| |||||||
Consumer Discretionary — 3.8% |
| |||||||
1011778 BC ULC /New Red Finance | ||||||||
6.000%, 04/01/2022 (A) | $ | 350 | $ | 367 | ||||
4.625%, 01/15/2022 (A) | 256 | 264 | ||||||
21st Century Fox America | ||||||||
6.650%, 11/15/2037 | 100 | 135 | ||||||
6.150%, 02/15/2041 | 250 | 329 | ||||||
4.500%, 02/15/2021 | 100 | 112 | ||||||
3.000%, 09/15/2022 | 300 | 315 | ||||||
24 Hour Holdings III | ||||||||
8.000%, 06/01/2022 (A) | 125 | 98 | ||||||
Advance Auto Parts | ||||||||
4.500%, 12/01/2023 | 100 | 109 | ||||||
Amazon.com | ||||||||
4.950%, 12/05/2044 | 100 | 125 | ||||||
4.800%, 12/05/2034 | 100 | 120 | ||||||
2.500%, 11/29/2022 | 200 | 208 | ||||||
AMC Entertainment | ||||||||
5.750%, 06/15/2025 | 88 | 88 | ||||||
AMC Networks | ||||||||
5.000%, 04/01/2024 | 150 | 153 | ||||||
4.750%, 12/15/2022 | 100 | 102 | ||||||
American Axle & Manufacturing | ||||||||
6.625%, 10/15/2022 | 100 | 106 | ||||||
American Builders & Contractors Supply | ||||||||
5.625%, 04/15/2021 (A) | 100 | 103 | ||||||
American Honda Finance MTN | ||||||||
2.250%, 08/15/2019 | 200 | 206 | ||||||
1.700%, 02/22/2019 | 25 | 26 | ||||||
1.600%, 07/13/2018 | 100 | 101 | ||||||
American Tire Distributors | ||||||||
10.250%, 03/01/2022 (A) | 100 | 92 | ||||||
APX Group | ||||||||
8.750%, 12/01/2020 | 100 | 95 | ||||||
7.875%, 12/01/2022 (A) | 58 | 61 | ||||||
6.375%, 12/01/2019 | 150 | 154 | ||||||
Aramark Services | ||||||||
5.125%, 01/15/2024 (A) | 183 | 189 | ||||||
Asbury Automotive Group | ||||||||
6.000%, 12/15/2024 | 100 | 103 | ||||||
Ashtead Capital | ||||||||
5.625%, 10/01/2024 (A) | 200 | 208 | ||||||
Description | Face Amount (Thousands) | Market Value ($ Thousands) | ||||||
CORPORATE OBLIGATIONS (continued) |
| |||||||
AutoNation | ||||||||
4.500%, 10/01/2025 | $ | 100 | $ | 107 | ||||
AutoZone | ||||||||
3.700%, 04/15/2022 | 80 | 86 | ||||||
Bed Bath & Beyond | ||||||||
5.165%, 08/01/2044 | 100 | 91 | ||||||
Block Financial | ||||||||
4.125%, 10/01/2020 | 100 | 104 | ||||||
BorgWarner | ||||||||
4.375%, 03/15/2045 | 50 | 53 | ||||||
3.375%, 03/15/2025 | 100 | 103 | ||||||
Boyd Gaming | ||||||||
6.875%, 05/15/2023 | 137 | 147 | ||||||
6.375%, 04/01/2026 (A) | 100 | 106 | ||||||
Brookfield Residential Properties | ||||||||
6.500%, 12/15/2020 (A) | 100 | 102 | ||||||
6.125%, 07/01/2022 (A) | 100 | 99 | ||||||
Cablevision Systems | ||||||||
5.875%, 09/15/2022 | 100 | 92 | ||||||
Caesars Entertainment Resort Properties | ||||||||
11.000%, 10/01/2021 | 200 | 204 | ||||||
8.000%, 10/01/2020 | 150 | 151 | ||||||
Caesars Growth Properties Holdings | ||||||||
9.375%, 05/01/2022 | 100 | 99 | ||||||
CBS | ||||||||
5.500%, 05/15/2033 | 175 | 197 | ||||||
4.000%, 01/15/2026 | 235 | 253 | ||||||
3.500%, 01/15/2025 | 100 | 104 | ||||||
CCO Holdings | ||||||||
5.875%, 04/01/2024 (A) | 317 | 338 | ||||||
5.750%, 02/15/2026 (A) | 600 | 633 | ||||||
Cengage Learning | ||||||||
9.500%, 06/15/2024 (A) | 111 | 116 | ||||||
Charter Communications Operating | ||||||||
6.834%, 10/23/2055 (A) | 35 | 44 | ||||||
6.484%, 10/23/2045 (A) | 165 | 198 | ||||||
6.384%, 10/23/2035 (A) | 50 | 59 | ||||||
4.908%, 07/23/2025 (A) | 150 | 166 | ||||||
4.464%, 07/23/2022 (A) | 250 | 271 | ||||||
3.579%, 07/23/2020 (A) | 55 | 58 | ||||||
Chinos Intermediate Holdings PIK | ||||||||
7.750%, 05/01/2019 (A) | 52 | 17 | ||||||
Cinemark | ||||||||
4.875%, 06/01/2023 | 150 | 153 | ||||||
Claire’s Stores | ||||||||
9.000%, 03/15/2019 (A) | 200 | 110 | ||||||
Clear Channel Worldwide Holdings | ||||||||
7.625%, 03/15/2020 | 300 | 297 | ||||||
6.500%, 11/15/2022 | 500 | 517 | ||||||
Comcast | ||||||||
5.700%, 05/15/2018 | 250 | 271 | ||||||
4.750%, 03/01/2044 | 200 | 242 | ||||||
| Adviser Managed Trust / Annual Report / July 31, 2016 | 13 |
SCHEDULE OF INVESTMENTS
JULY 31, 2016
Tactical Offensive Fixed Income Fund (Continued)
Description | Face Amount | Market Value | ||||||
CORPORATE OBLIGATIONS (continued) |
| |||||||
4.600%, 08/15/2045 | $ | 100 | $ | 118 | ||||
4.400%, 08/15/2035 | 200 | 230 | ||||||
4.250%, 01/15/2033 | 100 | 112 | ||||||
4.200%, 08/15/2034 | 400 | 445 | ||||||
3.375%, 02/15/2025 | 150 | 163 | ||||||
3.375%, 08/15/2025 | 65 | 71 | ||||||
Council of Europe Development Bank | ||||||||
1.750%, 11/14/2019 | 50 | 51 | ||||||
1.625%, 03/10/2020 | 100 | 102 | ||||||
1.000%, 03/07/2018 | 125 | 125 | ||||||
CSC Holdings | ||||||||
6.750%, 11/15/2021 | 150 | 159 | ||||||
5.250%, 06/01/2024 | 150 | 143 | ||||||
CST Brands | ||||||||
5.000%, 05/01/2023 | 100 | 103 | ||||||
Daimler Finance North America | ||||||||
8.500%, 01/18/2031 | 50 | 83 | ||||||
Delphi Automotive PLC | ||||||||
3.150%, 11/19/2020 | 200 | 208 | ||||||
Discovery Communications | ||||||||
6.350%, 06/01/2040 | 100 | 106 | ||||||
5.050%, 06/01/2020 | 125 | 136 | ||||||
DISH DBS | ||||||||
7.750%, 07/01/2026 (A) | 176 | 183 | ||||||
5.875%, 07/15/2022 | 300 | 300 | ||||||
5.875%, 11/15/2024 | 360 | 347 | ||||||
5.000%, 03/15/2023 | 154 | 145 | ||||||
Dollar General | ||||||||
3.250%, 04/15/2023 | 100 | 105 | ||||||
Dollar Tree | ||||||||
5.750%, 03/01/2023 (A) | 400 | 430 | ||||||
5.250%, 03/01/2020 (A) | 105 | 109 | ||||||
DR Horton | ||||||||
4.000%, 02/15/2020 | 45 | 47 | ||||||
3.750%, 03/01/2019 | 100 | 103 | ||||||
ESH Hospitality | ||||||||
5.250%, 05/01/2025 (A) | 200 | 199 | ||||||
Expedia | ||||||||
4.500%, 08/15/2024 | 50 | 53 | ||||||
Fiat Chrysler Automobiles | ||||||||
5.250%, 04/15/2023 | 200 | 202 | ||||||
4.500%, 04/15/2020 | 300 | 304 | ||||||
First Quality Finance | ||||||||
4.625%, 05/15/2021 (A) | 100 | 98 | ||||||
Ford Motor | ||||||||
7.450%, 07/16/2031 | 200 | 275 | ||||||
4.750%, 01/15/2043 | 125 | 138 | ||||||
Ford Motor Credit MTN | ||||||||
5.875%, 08/02/2021 | 250 | 288 | ||||||
5.000%, 05/15/2018 | 225 | 238 | ||||||
4.389%, 01/08/2026 | 200 | 220 | ||||||
3.219%, 01/09/2022 | 200 | 207 | ||||||
Description | Face Amount | Market Value | ||||||
CORPORATE OBLIGATIONS (continued) |
| |||||||
2.943%, 01/08/2019 | $ | 400 | $ | 411 | ||||
General Motors | ||||||||
6.600%, 04/01/2036 | 100 | 124 | ||||||
6.250%, 10/02/2043 | 250 | 301 | ||||||
5.000%, 04/01/2035 | 50 | 53 | ||||||
3.500%, 10/02/2018 | 150 | 155 | ||||||
General Motors Financial | ||||||||
4.000%, 01/15/2025 | 100 | 103 | ||||||
3.700%, 05/09/2023 | 35 | 36 | ||||||
3.450%, 04/10/2022 | 150 | 153 | ||||||
3.200%, 07/13/2020 | 100 | 102 | ||||||
3.200%, 07/06/2021 | 150 | 152 | ||||||
3.100%, 01/15/2019 | 150 | 154 | ||||||
2.400%, 04/10/2018 | 125 | 126 | ||||||
2.400%, 05/09/2019 | 30 | 30 | ||||||
George Washington University | ||||||||
4.868%, 09/15/2045 | 50 | 61 | ||||||
Goodyear Tire & Rubber | ||||||||
5.125%, 11/15/2023 | 250 | 264 | ||||||
5.000%, 05/31/2026 | 185 | 195 | ||||||
Gray Television | ||||||||
7.500%, 10/01/2020 | 100 | 104 | ||||||
5.875%, 07/15/2026 (A) | 100 | 103 | ||||||
Group 1 Automotive | ||||||||
5.000%, 06/01/2022 | 100 | 99 | ||||||
Guitar Center | ||||||||
6.500%, 04/15/2019 (A) | 100 | 88 | ||||||
Hanesbrands | ||||||||
4.875%, 05/15/2026 (A) | 150 | 153 | ||||||
4.625%, 05/15/2024 (A) | 176 | 181 | ||||||
Hilton Worldwide Finance | ||||||||
5.625%, 10/15/2021 | 200 | 207 | ||||||
Home Depot | ||||||||
5.875%, 12/16/2036 | 200 | 278 | ||||||
4.400%, 04/01/2021 | 100 | 113 | ||||||
4.400%, 03/15/2045 | 150 | 180 | ||||||
3.000%, 04/01/2026 | 100 | 108 | ||||||
2.625%, 06/01/2022 | 150 | 158 | ||||||
2.000%, 06/15/2019 | 100 | 103 | ||||||
2.000%, 04/01/2021 | 50 | 51 | ||||||
iHeartCommunications | ||||||||
9.000%, 12/15/2019 | 100 | 80 | ||||||
9.000%, 09/15/2022 | 500 | 368 | ||||||
International Game Technology | ||||||||
6.250%, 02/15/2022 (A) | 300 | 314 | ||||||
5.625%, 02/15/2020 (A) | 200 | 214 | ||||||
Isle of Capri Casinos | ||||||||
5.875%, 03/15/2021 | 100 | 104 | ||||||
Jaguar Holding II | ||||||||
6.375%, 08/01/2023 (A) | 152 | 161 | ||||||
Jaguar Land Rover Automotive | ||||||||
5.625%, 02/01/2023 (A) | 150 | 158 | ||||||
| 14 | Adviser Managed Trust / Annual Report / July 31, 2016 |
Description | Face Amount | Market Value | ||||||
CORPORATE OBLIGATIONS (continued) |
| |||||||
4.250%, 11/15/2019 (A) | $ | 150 | $ | 155 | ||||
Japan Finance Organization for Municipalities | ||||||||
4.000%, 01/13/2021 | 100 | 110 | ||||||
JC Penney | ||||||||
5.875%, 07/01/2023 (A) | 100 | 103 | ||||||
Johnson Controls | ||||||||
4.950%, 07/02/2064 | 25 | 26 | ||||||
4.625%, 07/02/2044 | 100 | 110 | ||||||
3.625%, 07/02/2024 | 100 | 107 | ||||||
K Hovnanian Enterprises | ||||||||
7.250%, 10/15/2020 (A) | 100 | 91 | ||||||
KFC Holding | ||||||||
5.250%, 06/01/2026 (A) | 192 | 203 | ||||||
5.000%, 06/01/2024 (A) | 162 | 169 | ||||||
Kohl’s | ||||||||
4.750%, 12/15/2023 | 100 | 108 | ||||||
L Brands | ||||||||
6.875%, 11/01/2035 | 150 | 159 | ||||||
6.750%, 07/01/2036 | 120 | 126 | ||||||
5.625%, 02/15/2022 | 150 | 165 | ||||||
Landry’s | ||||||||
9.375%, 05/01/2020 (A) | 100 | 105 | ||||||
Laureate Education | ||||||||
9.250%, 09/01/2019 (A) | 200 | 179 | ||||||
Lear | ||||||||
5.250%, 01/15/2025 | 75 | 80 | ||||||
Lennar | ||||||||
4.750%, 11/15/2022 | 200 | 210 | ||||||
4.500%, 06/15/2019 | 100 | 105 | ||||||
Levi Strauss | ||||||||
6.875%, 05/01/2022 | 100 | 106 | ||||||
LKQ | ||||||||
4.750%, 05/15/2023 | 100 | 100 | ||||||
Lowe’s | ||||||||
6.650%, 09/15/2037 | 100 | 147 | ||||||
4.625%, 04/15/2020 | 100 | 110 | ||||||
4.250%, 09/15/2044 | 50 | 56 | ||||||
3.700%, 04/15/2046 | 150 | 158 | ||||||
3.375%, 09/15/2025 | 100 | 110 | ||||||
3.125%, 09/15/2024 | 100 | 108 | ||||||
Macy’s Retail Holdings | ||||||||
4.500%, 12/15/2034 | 100 | 92 | ||||||
3.450%, 01/15/2021 | 50 | 52 | ||||||
2.875%, 02/15/2023 | 125 | 122 | ||||||
Magna International | ||||||||
3.625%, 06/15/2024 | 100 | 105 | ||||||
Marriott International | ||||||||
3.125%, 10/15/2021 | 100 | 104 | ||||||
3.125%, 06/15/2026 | 50 | 51 | ||||||
2.300%, 01/15/2022 | 50 | 51 | ||||||
Massachusetts Institute of Technology | ||||||||
5.600%, 07/01/2111 | 100 | 147 | ||||||
Description | Face Amount | Market Value | ||||||
CORPORATE OBLIGATIONS (continued) |
| |||||||
Mattel | ||||||||
2.350%, 05/06/2019 | $ | 100 | $ | 102 | ||||
McClatchy | ||||||||
9.000%, 12/15/2022 | 100 | 102 | ||||||
McDonald’s MTN | ||||||||
6.300%, 10/15/2037 | 150 | 206 | ||||||
5.350%, 03/01/2018 | 200 | 213 | ||||||
4.875%, 12/09/2045 | 125 | 149 | ||||||
4.700%, 12/09/2035 | 175 | 203 | ||||||
3.700%, 01/30/2026 | 30 | 33 | ||||||
2.750%, 12/09/2020 | 120 | 126 | ||||||
2.100%, 12/07/2018 | 20 | 20 | ||||||
MDC Partners | ||||||||
6.500%, 05/01/2024 (A) | 150 | 145 | ||||||
Men’s Wearhouse | ||||||||
7.000%, 07/01/2022 | 150 | 132 | ||||||
MGM Growth Properties Operating Partnership | ||||||||
5.625%, 05/01/2024 (A) | 108 | 116 | ||||||
MGM Resorts International | ||||||||
7.750%, 03/15/2022 | 200 | 231 | ||||||
6.625%, 12/15/2021 | 200 | 221 | ||||||
6.000%, 03/15/2023 | 200 | 216 | ||||||
Mohegan Tribal Gaming Authority | ||||||||
9.750%, 09/01/2021 | 100 | 108 | ||||||
Monitronics International | ||||||||
9.125%, 04/01/2020 | 100 | 88 | ||||||
MPG Holdco I | ||||||||
7.375%, 10/15/2022 | 100 | 103 | ||||||
NBCUniversal Media | ||||||||
5.950%, 04/01/2041 | 100 | 136 | ||||||
5.150%, 04/30/2020 | 350 | 399 | ||||||
NCL | ||||||||
5.250%, 11/15/2019 (A) | 100 | 102 | ||||||
4.625%, 11/15/2020 (A) | 85 | 86 | ||||||
Neiman Marcus Group | ||||||||
8.000%, 10/15/2021 (A) | 300 | 254 | ||||||
Neptune Finco | ||||||||
10.875%, 10/15/2025 (A) | 300 | 351 | ||||||
10.125%, 01/15/2023 (A) | 300 | 344 | ||||||
6.625%, 10/15/2025 (A) | 200 | 215 | ||||||
Netflix | ||||||||
5.875%, 02/15/2025 | 38 | 40 | ||||||
5.500%, 02/15/2022 | 125 | 133 | ||||||
5.375%, 02/01/2021 | 100 | 107 | ||||||
Newell Brands | ||||||||
5.500%, 04/01/2046 | 100 | 125 | ||||||
5.375%, 04/01/2036 | 30 | 36 | ||||||
4.200%, 04/01/2026 | 50 | 55 | ||||||
3.850%, 04/01/2023 | 60 | 64 | ||||||
3.150%, 04/01/2021 | 50 | 52 | ||||||
2.600%, 03/29/2019 | 45 | 46 | ||||||
| Adviser Managed Trust / Annual Report / July 31, 2016 | 15 |
SCHEDULE OF INVESTMENTS
JULY 31, 2016
Tactical Offensive Fixed Income Fund (Continued)
Description | Face Amount | Market Value | ||||||
CORPORATE OBLIGATIONS (continued) |
| |||||||
Newell Rubbermaid | ||||||||
4.000%, 12/01/2024 | $ | 100 | $ | 107 | ||||
Nexstar Broadcasting | ||||||||
6.875%, 11/15/2020 | 100 | 105 | ||||||
Nexstar Escrow | ||||||||
5.625%, 08/01/2024 (A) | 82 | 83 | ||||||
NIKE | ||||||||
3.875%, 11/01/2045 | 100 | 113 | ||||||
Nordstrom | ||||||||
5.000%, 01/15/2044 | 100 | 102 | ||||||
Omnicom Group | ||||||||
3.625%, 05/01/2022 | 100 | 107 | ||||||
3.600%, 04/15/2026 | 100 | 107 | ||||||
O’Reilly Automotive | ||||||||
3.550%, 03/15/2026 | 50 | 54 | ||||||
Penske Automotive Group | ||||||||
5.750%, 10/01/2022 | 50 | 51 | ||||||
5.500%, 05/15/2026 | 105 | 103 | ||||||
Priceline Group | ||||||||
3.600%, 06/01/2026 | 50 | 52 | ||||||
Prime Security Services Borrower | ||||||||
9.250%, 05/15/2023 (A) | 488 | 521 | ||||||
PulteGroup | ||||||||
5.500%, 03/01/2026 | 100 | 104 | ||||||
5.000%, 01/15/2027 | 107 | 107 | ||||||
PVH | ||||||||
4.500%, 12/15/2022 | 100 | 103 | ||||||
Quebecor Media | ||||||||
5.750%, 01/15/2023 | 150 | 157 | ||||||
QVC | ||||||||
4.450%, 02/15/2025 | 100 | 102 | ||||||
Regal Entertainment Group | ||||||||
5.750%, 03/15/2022 | 150 | 156 | ||||||
Royal Caribbean Cruises | ||||||||
5.250%, 11/15/2022 | 100 | 108 | ||||||
RSI Home Products | ||||||||
6.500%, 03/15/2023 (A) | 67 | 70 | ||||||
Sally Holdings | ||||||||
5.750%, 06/01/2022 | 100 | 105 | ||||||
5.625%, 12/01/2025 | 150 | 161 | ||||||
Scientific Games International | ||||||||
10.000%, 12/01/2022 | 300 | 267 | ||||||
7.000%, 01/01/2022 (A) | 225 | 234 | ||||||
Scripps Networks Interactive | ||||||||
2.750%, 11/15/2019 | 100 | 102 | ||||||
Serta Simmons Bedding | ||||||||
8.125%, 10/01/2020 (A) | 100 | 105 | ||||||
Service International | ||||||||
5.375%, 05/15/2024 | 100 | 107 | ||||||
Sinclair Television Group | ||||||||
6.125%, 10/01/2022 | 100 | 105 | ||||||
5.375%, 04/01/2021 | 150 | 156 | ||||||
Description | Face Amount | Market Value | ||||||
CORPORATE OBLIGATIONS (continued) |
| |||||||
Sirius XM Radio | ||||||||
6.000%, 07/15/2024 (A) | $ | 200 | $ | 213 | ||||
5.375%, 04/15/2025 (A) | 175 | 180 | ||||||
5.375%, 07/15/2026 (A) | 157 | 160 | ||||||
Six Flags Entertainment | ||||||||
5.250%, 01/15/2021 (A) | 100 | 103 | ||||||
Staples | ||||||||
2.750%, 01/12/2018 | 150 | 152 | ||||||
Starbucks | ||||||||
2.700%, 06/15/2022 | 200 | 211 | ||||||
Starwood Hotels & Resorts Worldwide | ||||||||
3.750%, 03/15/2025 | 100 | 106 | ||||||
Starz | ||||||||
5.000%, 09/15/2019 | 150 | 153 | ||||||
Station Casinos | ||||||||
7.500%, 03/01/2021 | 25 | 26 | ||||||
Summit Materials | ||||||||
6.125%, 07/15/2023 | 200 | 202 | ||||||
Target | ||||||||
6.000%, 01/15/2018 | 100 | 107 | ||||||
3.500%, 07/01/2024 | 150 | 167 | ||||||
2.300%, 06/26/2019 | 300 | 310 | ||||||
Taylor Morrison Communities | ||||||||
5.250%, 04/15/2021 (A) | 92 | 94 | ||||||
TEGNA | ||||||||
5.125%, 07/15/2020 | 250 | 259 | ||||||
Tempur Sealy International | ||||||||
5.500%, 06/15/2026 (A) | 64 | 65 | ||||||
Tenneco | ||||||||
5.000%, 07/15/2026 | 105 | 107 | ||||||
Time | ||||||||
5.750%, 04/15/2022 (A) | 100 | 98 | ||||||
Time Warner | ||||||||
6.200%, 03/15/2040 | 275 | 359 | ||||||
3.600%, 07/15/2025 | 200 | 216 | ||||||
3.550%, 06/01/2024 | 200 | 214 | ||||||
2.950%, 07/15/2026 | 85 | 87 | ||||||
2.100%, 06/01/2019 | 350 | 357 | ||||||
Time Warner Cable | ||||||||
8.750%, 02/14/2019 | 100 | 117 | ||||||
6.550%, 05/01/2037 | 100 | 120 | ||||||
5.875%, 11/15/2040 | 200 | 224 | ||||||
5.000%, 02/01/2020 | 250 | 273 | ||||||
4.500%, 09/15/2042 | 100 | 97 | ||||||
Tops Holding | ||||||||
8.000%, 06/15/2022 (A) | 83 | 72 | ||||||
Toyota Motor Credit MTN | ||||||||
3.300%, 01/12/2022 | 200 | 216 | ||||||
2.800%, 07/13/2022 | 50 | 53 | ||||||
2.150%, 03/12/2020 | 200 | 205 | ||||||
1.900%, 04/08/2021 | 50 | 51 | ||||||
1.700%, 02/19/2019 | 50 | 51 | ||||||
| 16 | Adviser Managed Trust / Annual Report / July 31, 2016 |
Description | Face Amount | Market Value | ||||||
CORPORATE OBLIGATIONS (continued) |
| |||||||
1.550%, 07/13/2018 | $ | 175 | $ | 176 | ||||
1.200%, 04/06/2018 | 50 | 50 | ||||||
Tribune Media | ||||||||
5.875%, 07/15/2022 | 200 | 204 | ||||||
Unitymedia Hessen GmbH & KG | ||||||||
5.000%, 01/15/2025 (A) | 200 | 207 | ||||||
Univision Communications | ||||||||
6.750%, 09/15/2022 (A) | 150 | 160 | ||||||
5.125%, 05/15/2023 (A) | 100 | 103 | ||||||
5.125%, 02/15/2025 (A) | 347 | 357 | ||||||
Viacom | ||||||||
5.850%, 09/01/2043 | 100 | 107 | ||||||
4.850%, 12/15/2034 | 200 | 194 | ||||||
4.250%, 09/01/2023 | 125 | 133 | ||||||
2.200%, 04/01/2019 | 150 | 151 | ||||||
Viking Cruises | ||||||||
8.500%, 10/15/2022 (A) | 100 | 88 | ||||||
Walt Disney MTN | ||||||||
4.125%, 06/01/2044 | 125 | 144 | ||||||
3.000%, 02/13/2026 | 100 | 107 | ||||||
2.350%, 12/01/2022 | 50 | 52 | ||||||
2.300%, 02/12/2021 | 100 | 104 | ||||||
1.100%, 12/01/2017 | 200 | 201 | ||||||
Whirlpool | ||||||||
3.700%, 05/01/2025 | 200 | 214 | ||||||
WPP Finance | ||||||||
3.750%, 09/19/2024 | 100 | 107 | ||||||
Wyndham Worldwide | ||||||||
4.250%, 03/01/2022 | 100 | 106 | ||||||
Wynn Las Vegas | ||||||||
5.500%, 03/01/2025 (A) | 400 | 402 | ||||||
5.375%, 03/15/2022 | 100 | 103 | ||||||
ZF North America Capital | ||||||||
4.750%, 04/29/2025 (A) | 250 | 261 | ||||||
4.500%, 04/29/2022 (A) | 300 | 312 | ||||||
4.000%, 04/29/2020 (A) | 50 | 52 | ||||||
|
| |||||||
| 43,911 | ||||||||
|
| |||||||
Consumer Staples — 2.0% | ||||||||
Albertsons | ||||||||
6.625%, 06/15/2024 (A) | 112 | 119 | ||||||
Alliance One International | ||||||||
9.875%, 07/15/2021 | 50 | 44 | ||||||
Altria Group | ||||||||
9.700%, 11/10/2018 | 106 | 126 | ||||||
9.250%, 08/06/2019 | 100 | 123 | ||||||
5.375%, 01/31/2044 | 200 | 263 | ||||||
4.000%, 01/31/2024 | 100 | 113 | ||||||
2.850%, 08/09/2022 | 100 | 105 | ||||||
Anheuser-Busch InBev Finance | ||||||||
4.900%, 02/01/2046 | 400 | 487 | ||||||
4.700%, 02/01/2036 | 400 | 464 | ||||||
Description | Face Amount | Market Value | ||||||
CORPORATE OBLIGATIONS (continued) |
| |||||||
4.625%, 02/01/2044 | $ | 100 | $ | 117 | ||||
3.700%, 02/01/2024 | 300 | 326 | ||||||
3.650%, 02/01/2026 | 400 | 430 | ||||||
3.300%, 02/01/2023 | 300 | 316 | ||||||
2.650%, 02/01/2021 | 300 | 311 | ||||||
2.150%, 02/01/2019 | 62 | 63 | ||||||
1.900%, 02/01/2019 | 300 | 305 | ||||||
Anheuser-Busch InBev Worldwide | ||||||||
8.200%, 01/15/2039 | 100 | 163 | ||||||
5.375%, 01/15/2020 | 200 | 226 | ||||||
3.750%, 07/15/2042 | 100 | 103 | ||||||
Archer-Daniels-Midland | ||||||||
4.479%, 03/01/2021 | 50 | 56 | ||||||
4.016%, 04/16/2043 | 100 | 110 | ||||||
Avon Products | ||||||||
6.750%, 03/15/2023 | 100 | 78 | ||||||
6.350%, 03/15/2020 | 100 | 89 | ||||||
B&G Foods | ||||||||
4.625%, 06/01/2021 | 100 | 103 | ||||||
Brown-Forman | ||||||||
4.500%, 07/15/2045 | 35 | 41 | ||||||
Bunge Finance | ||||||||
3.500%, 11/24/2020 | 50 | 52 | ||||||
Campbell Soup | ||||||||
4.500%, 02/15/2019 | 100 | 108 | ||||||
Coca-Cola | ||||||||
2.875%, 10/27/2025 | 200 | 213 | ||||||
2.450%, 11/01/2020 | 200 | 211 | ||||||
1.650%, 11/01/2018 | 300 | 305 | ||||||
Coca-Cola Femsa | ||||||||
2.375%, 11/26/2018 | 150 | 153 | ||||||
Colgate-Palmolive MTN | ||||||||
4.000%, 08/15/2045 | 50 | 60 | ||||||
3.250%, 03/15/2024 | 50 | 56 | ||||||
2.300%, 05/03/2022 | 100 | 104 | ||||||
1.750%, 03/15/2019 | 50 | 51 | ||||||
ConAgra Foods | ||||||||
3.200%, 01/25/2023 | 118 | 123 | ||||||
1.900%, 01/25/2018 | 100 | 101 | ||||||
Constellation Brands | ||||||||
4.250%, 05/01/2023 | 250 | 265 | ||||||
3.750%, 05/01/2021 | 100 | 105 | ||||||
Costco Wholesale | ||||||||
1.700%, 12/15/2019 | 100 | 102 | ||||||
1.125%, 12/15/2017 | 100 | 100 | ||||||
Cott Beverages | ||||||||
6.750%, 01/01/2020 | 80 | 84 | ||||||
5.375%, 07/01/2022 | 100 | 102 | ||||||
CVS Health | ||||||||
5.300%, 12/05/2043 | 50 | 64 | ||||||
5.125%, 07/20/2045 | 255 | 324 | ||||||
4.875%, 07/20/2035 | 100 | 120 | ||||||
| Adviser Managed Trust / Annual Report / July 31, 2016 | 17 |
SCHEDULE OF INVESTMENTS
JULY 31, 2016
Tactical Offensive Fixed Income Fund (Continued)
Description | Face Amount | Market Value | ||||||
CORPORATE OBLIGATIONS (continued) |
| |||||||
4.000%, 12/05/2023 | $ | 100 | $ | 111 | ||||
3.875%, 07/20/2025 | 200 | 222 | ||||||
2.875%, 06/01/2026 | 100 | 103 | ||||||
2.800%, 07/20/2020 | 200 | 209 | ||||||
2.750%, 12/01/2022 | 100 | 104 | ||||||
2.250%, 12/05/2018 | 125 | 128 | ||||||
2.125%, 06/01/2021 | 50 | 51 | ||||||
1.900%, 07/20/2018 | 100 | 102 | ||||||
Dean Foods | ||||||||
6.500%, 03/15/2023 (A) | 47 | 50 | ||||||
Diageo Capital | ||||||||
5.750%, 10/23/2017 | 125 | 132 | ||||||
2.625%, 04/29/2023 | 100 | 104 | ||||||
Dr Pepper Snapple Group | ||||||||
2.000%, 01/15/2020 | 100 | 101 | ||||||
Edgewell Personal Care | ||||||||
4.700%, 05/24/2022 | 100 | 105 | ||||||
Energizer Holdings | ||||||||
5.500%, 06/15/2025 (A) | 113 | 115 | ||||||
Estee Lauder | ||||||||
4.375%, 06/15/2045 | 50 | 60 | ||||||
Fresh Market | ||||||||
9.750%, 05/01/2023 (A) | 265 | 246 | ||||||
General Mills | ||||||||
3.150%, 12/15/2021 | 100 | 107 | ||||||
Hershey | ||||||||
3.200%, 08/21/2025 | 100 | 105 | ||||||
HRG Group | ||||||||
7.875%, 07/15/2019 | 100 | 106 | ||||||
7.750%, 01/15/2022 | 200 | 204 | ||||||
Ingles Markets | ||||||||
5.750%, 06/15/2023 | 100 | 103 | ||||||
JBS | ||||||||
5.875%, 07/15/2024 (A) | 250 | 249 | ||||||
5.750%, 06/15/2025 (A) | 100 | 97 | ||||||
JM Smucker | ||||||||
4.375%, 03/15/2045 | 100 | 114 | ||||||
4.250%, 03/15/2035 | 20 | 22 | ||||||
3.500%, 03/15/2025 | 100 | 108 | ||||||
Kellogg | ||||||||
4.000%, 12/15/2020 | 200 | 221 | ||||||
Kimberly-Clark | ||||||||
6.625%, 08/01/2037 | 100 | 152 | ||||||
3.050%, 08/15/2025 | 50 | 54 | ||||||
2.750%, 02/15/2026 | 50 | 53 | ||||||
2.150%, 08/15/2020 | 50 | 51 | ||||||
1.400%, 02/15/2019 | 35 | 36 | ||||||
Kraft Foods Group | ||||||||
6.125%, 08/23/2018 | 200 | 219 | ||||||
5.000%, 06/04/2042 | 100 | 117 | ||||||
3.500%, 06/06/2022 | 100 | 108 | ||||||
Description | Face Amount | Market Value | ||||||
CORPORATE OBLIGATIONS (continued) |
| |||||||
Kraft Heinz Foods | ||||||||
6.875%, 01/26/2039 | $ | 100 | $ | 141 | ||||
5.200%, 07/15/2045 (A) | 100 | 121 | ||||||
4.375%, 06/01/2046 (A) | 60 | 65 | ||||||
3.950%, 07/15/2025 (A) | 100 | 110 | ||||||
3.000%, 06/01/2026 (A) | 55 | 56 | ||||||
2.800%, 07/02/2020 (A) | 200 | 209 | ||||||
Kroger | ||||||||
4.000%, 02/01/2024 | 200 | 223 | ||||||
2.000%, 01/15/2019 | 200 | 203 | ||||||
McCormick | ||||||||
3.250%, 11/15/2025 | 35 | 38 | ||||||
Mead Johnson Nutrition | ||||||||
4.125%, 11/15/2025 | 30 | 33 | ||||||
3.000%, 11/15/2020 | 230 | 242 | ||||||
Molson Coors Brewing | ||||||||
5.000%, 05/01/2042 | 93 | 109 | ||||||
4.200%, 07/15/2046 | 40 | 42 | ||||||
3.000%, 07/15/2026 | 45 | 46 | ||||||
1.450%, 07/15/2019 | 25 | 25 | ||||||
Mondelez International | ||||||||
6.500%, 08/11/2017 | 100 | 105 | ||||||
4.000%, 02/01/2024 | 260 | 287 | ||||||
NBTY | ||||||||
7.625%, 05/15/2021 (A) | 243 | 248 | ||||||
PepsiCo | ||||||||
5.500%, 01/15/2040 | 100 | 134 | ||||||
5.000%, 06/01/2018 | 150 | 161 | ||||||
4.600%, 07/17/2045 | 145 | 179 | ||||||
4.500%, 01/15/2020 | 200 | 222 | ||||||
4.250%, 10/22/2044 | 100 | 116 | ||||||
3.600%, 03/01/2024 | 200 | 221 | ||||||
3.500%, 07/17/2025 | 100 | 111 | ||||||
2.750%, 03/05/2022 | 150 | 158 | ||||||
Philip Morris International | ||||||||
6.375%, 05/16/2038 | 200 | 282 | ||||||
5.650%, 05/16/2018 | 200 | 216 | ||||||
4.500%, 03/26/2020 | 100 | 111 | ||||||
4.250%, 11/10/2044 | 50 | 57 | ||||||
4.125%, 03/04/2043 | 50 | 56 | ||||||
2.750%, 02/25/2026 | 50 | 52 | ||||||
2.125%, 05/10/2023 | 25 | 25 | ||||||
1.875%, 02/25/2021 | 50 | 51 | ||||||
1.375%, 02/25/2019 | 30 | 30 | ||||||
Pilgrim’s Pride | ||||||||
5.750%, 03/15/2025 (A) | 133 | 135 | ||||||
Post Holdings | ||||||||
7.750%, 03/15/2024 (A) | 160 | 177 | ||||||
7.375%, 02/15/2022 | 300 | 321 | ||||||
5.000%, 08/15/2026 (A) | 223 | 223 | ||||||
Procter & Gamble | ||||||||
5.550%, 03/05/2037 | 100 | 143 | ||||||
| 18 | Adviser Managed Trust / Annual Report / July 31, 2016 |
Description | Face Amount (Thousands) | Market Value ($ Thousands) | ||||||
CORPORATE OBLIGATIONS (continued) |
| |||||||
4.700%, 02/15/2019 | $ | 200 | $ | 218 | ||||
3.100%, 08/15/2023 | 100 | 109 | ||||||
Revlon Consumer Products | ||||||||
5.750%, 02/15/2021 | 100 | 101 | ||||||
Reynolds American | ||||||||
6.875%, 05/01/2020 | 100 | 118 | ||||||
5.850%, 08/15/2045 | 100 | 131 | ||||||
5.700%, 08/15/2035 | 100 | 126 | ||||||
4.450%, 06/12/2025 | 100 | 113 | ||||||
3.250%, 06/12/2020 | 254 | 269 | ||||||
Rite Aid | ||||||||
6.750%, 06/15/2021 | 400 | 421 | ||||||
6.125%, 04/01/2023 (A) | 165 | 175 | ||||||
Smithfield Foods | ||||||||
6.625%, 08/15/2022 | 200 | 212 | ||||||
Spectrum Brands | ||||||||
6.375%, 11/15/2020 | 100 | 105 | ||||||
5.750%, 07/15/2025 | 149 | 161 | ||||||
Sun Products | ||||||||
7.750%, 03/15/2021 (A) | 100 | 104 | ||||||
Sysco | ||||||||
4.850%, 10/01/2045 | 15 | 18 | ||||||
3.750%, 10/01/2025 | 25 | 27 | ||||||
3.300%, 07/15/2026 | 100 | 106 | ||||||
2.600%, 10/01/2020 | 150 | 155 | ||||||
TreeHouse Foods | ||||||||
6.000%, 02/15/2024 (A) | 120 | 129 | ||||||
Tyson Foods | ||||||||
4.500%, 06/15/2022 | 100 | 111 | ||||||
3.950%, 08/15/2024 | 50 | 55 | ||||||
Unilever Capital | ||||||||
5.900%, 11/15/2032 | 100 | 142 | ||||||
4.250%, 02/10/2021 | 100 | 112 | ||||||
1.375%, 07/28/2021 | 100 | 100 | ||||||
US Foods | ||||||||
5.875%, 06/15/2024 (A) | 165 | 172 | ||||||
Vector Group | ||||||||
7.750%, 02/15/2021 (A) | 147 | 154 | ||||||
Walgreen | ||||||||
5.250%, 01/15/2019 | 24 | 26 | ||||||
Walgreens Boots Alliance | ||||||||
4.800%, 11/18/2044 | 100 | 113 | ||||||
4.650%, 06/01/2046 | 20 | 23 | ||||||
3.800%, 11/18/2024 | 100 | 108 | ||||||
3.450%, 06/01/2026 | 30 | 31 | ||||||
3.300%, 11/18/2021 | 100 | 106 | ||||||
3.100%, 06/01/2023 | 30 | 31 | ||||||
2.600%, 06/01/2021 | 65 | 67 | ||||||
1.750%, 11/17/2017 | 150 | 151 | ||||||
1.750%, 05/30/2018 | 35 | 35 | ||||||
Wal-Mart Stores | ||||||||
6.500%, 08/15/2037 | 250 | 371 | ||||||
Description | Face Amount (Thousands) | Market Value ($ Thousands) | ||||||
CORPORATE OBLIGATIONS (continued) |
| |||||||
5.250%, 09/01/2035 | $ | 200 | $ | 270 | ||||
4.300%, 04/22/2044 | 225 | 272 | ||||||
3.300%, 04/22/2024 | 200 | 221 | ||||||
3.250%, 10/25/2020 | 100 | 109 | ||||||
2.550%, 04/11/2023 | 150 | 157 | ||||||
1.125%, 04/11/2018 | 300 | 302 | ||||||
WhiteWave Foods | ||||||||
5.375%, 10/01/2022 | 100 | 114 | ||||||
|
| |||||||
| 23,288 | ||||||||
|
| |||||||
Energy — 3.4% |
| |||||||
Anadarko Petroleum | ||||||||
6.600%, 03/15/2046 | 150 | 173 | ||||||
6.450%, 09/15/2036 | 125 | 140 | ||||||
6.375%, 09/15/2017 | 29 | 30 | ||||||
4.850%, 03/15/2021 | 250 | 265 | ||||||
Antero Resources | ||||||||
5.625%, 06/01/2023 | 44 | 42 | ||||||
5.375%, 11/01/2021 | 200 | 191 | ||||||
5.125%, 12/01/2022 | 200 | 187 | ||||||
Apache | ||||||||
5.100%, 09/01/2040 | 200 | 203 | ||||||
4.750%, 04/15/2043 | 100 | 99 | ||||||
3.250%, 04/15/2022 | 100 | 102 | ||||||
Baker Hughes | ||||||||
5.125%, 09/15/2040 | 100 | 117 | ||||||
Blue Racer Midstream | ||||||||
6.125%, 11/15/2022 (A) | 128 | 120 | ||||||
Boardwalk Pipelines | ||||||||
5.950%, 06/01/2026 | 100 | 105 | ||||||
Bonanza Creek Energy | ||||||||
6.750%, 04/15/2021 | 50 | 22 | ||||||
BP Capital Markets | ||||||||
3.994%, 09/26/2023 | 38 | 41 | ||||||
3.535%, 11/04/2024 | 100 | 106 | ||||||
3.506%, 03/17/2025 | 200 | 211 | ||||||
3.245%, 05/06/2022 | 100 | 106 | ||||||
3.119%, 05/04/2026 | 25 | 26 | ||||||
2.315%, 02/13/2020 | 200 | 205 | ||||||
2.237%, 05/10/2019 | 200 | 205 | ||||||
1.676%, 05/03/2019 | 20 | 20 | ||||||
Buckeye Partners | ||||||||
2.650%, 11/15/2018 | 150 | 152 | ||||||
California Resources | ||||||||
8.000%, 12/15/2022 (A) | 298 | 191 | ||||||
6.000%, 11/15/2024 | 308 | 132 | ||||||
5.500%, 09/15/2021 | 69 | 32 | ||||||
Calumet Specialty Products Partners | ||||||||
6.500%, 04/15/2021 | 100 | 73 | ||||||
Canadian Natural Resources | ||||||||
6.250%, 03/15/2038 | 150 | 160 | ||||||
3.900%, 02/01/2025 | 100 | 100 | ||||||
| Adviser Managed Trust / Annual Report / July 31, 2016 | 19 |
SCHEDULE OF INVESTMENTS
JULY 31, 2016
Tactical Offensive Fixed Income Fund (Continued)
Description | Face Amount (Thousands) | Market Value ($ Thousands) | ||||||
CORPORATE OBLIGATIONS (continued) |
| |||||||
Carrizo Oil & Gas | ||||||||
7.500%, 09/15/2020 | $ | 100 | $ | 100 | ||||
6.250%, 04/15/2023 | 115 | 109 | ||||||
Cenovus Energy | ||||||||
3.000%, 08/15/2022 | 200 | 188 | ||||||
Cheniere Corpus Christi Holdings | ||||||||
7.000%, 06/30/2024 (A) | 250 | 261 | ||||||
Chesapeake Energy | ||||||||
8.000%, 12/15/2022 (A) | 382 | 332 | ||||||
4.875%, 04/15/2022 | 100 | 63 | ||||||
Chevron | ||||||||
4.950%, 03/03/2019 | 225 | 246 | ||||||
3.326%, 11/17/2025 | 50 | 54 | ||||||
3.191%, 06/24/2023 | 100 | 106 | ||||||
2.954%, 05/16/2026 | 100 | 104 | ||||||
2.566%, 05/16/2023 | 100 | 102 | ||||||
2.419%, 11/17/2020 | 50 | 52 | ||||||
2.355%, 12/05/2022 | 100 | 102 | ||||||
2.193%, 11/15/2019 | 125 | 128 | ||||||
2.100%, 05/16/2021 | 100 | 102 | ||||||
1.790%, 11/16/2018 | 50 | 51 | ||||||
1.561%, 05/16/2019 | 100 | 101 | ||||||
1.344%, 11/09/2017 | 50 | 50 | ||||||
1.104%, 12/05/2017 | 100 | 100 | ||||||
CNOOC Nexen Finance | ||||||||
4.250%, 04/30/2024 | 400 | 432 | ||||||
Columbia Pipeline Group | ||||||||
3.300%, 06/01/2020 | 150 | 156 | ||||||
Comstock Resources | ||||||||
10.000%, 03/15/2020 (A) | 100 | 83 | ||||||
Concho Resources | ||||||||
5.500%, 04/01/2023 | 350 | 346 | ||||||
ConocoPhillips | ||||||||
6.500%, 02/01/2039 | 225 | 281 | ||||||
5.750%, 02/01/2019 | 100 | 109 | ||||||
4.950%, 03/15/2026 | 50 | 56 | ||||||
4.200%, 03/15/2021 | 100 | 107 | ||||||
4.150%, 11/15/2034 | 100 | 99 | ||||||
3.350%, 11/15/2024 | 100 | 100 | ||||||
3.350%, 05/15/2025 | 95 | 96 | ||||||
2.400%, 12/15/2022 | 150 | 146 | ||||||
1.050%, 12/15/2017 | 100 | 99 | ||||||
CONSOL Energy | ||||||||
8.000%, 04/01/2023 | 50 | 48 | ||||||
5.875%, 04/15/2022 | 350 | 319 | ||||||
Continental Resources | ||||||||
5.000%, 09/15/2022 | 100 | 93 | ||||||
4.500%, 04/15/2023 | 450 | 407 | ||||||
3.800%, 06/01/2024 | 250 | 214 | ||||||
Crestwood Midstream Partners | ||||||||
6.250%, 04/01/2023 | 70 | 65 | ||||||
Description | Face Amount (Thousands) | Market Value ($ Thousands) | ||||||
CORPORATE OBLIGATIONS (continued) |
| |||||||
CVR Refining | ||||||||
6.500%, 11/01/2022 | $ | 100 | $ | 85 | ||||
DCP Midstream | ||||||||
5.850%, 05/21/2043 (A)(B) | 100 | 75 | ||||||
DCP Midstream Operating | ||||||||
3.875%, 03/15/2023 | 100 | 94 | ||||||
Denbury Resources | ||||||||
9.000%, 05/15/2021 (A) | 74 | 74 | ||||||
5.500%, 05/01/2022 | 112 | 71 | ||||||
4.625%, 07/15/2023 | 156 | 97 | ||||||
Devon Energy | ||||||||
5.600%, 07/15/2041 | 100 | 96 | ||||||
5.000%, 06/15/2045 | 150 | 138 | ||||||
3.250%, 05/15/2022 | 100 | 98 | ||||||
Devon Financing | ||||||||
7.875%, 09/30/2031 | 100 | 118 | ||||||
Diamond Offshore Drilling | ||||||||
4.875%, 11/01/2043 | 125 | 97 | ||||||
Drill Rigs Holdings | ||||||||
6.500%, 10/01/2017 (A) | 85 | 39 | ||||||
Eclipse Resources | ||||||||
8.875%, 07/15/2023 | 100 | 92 | ||||||
Ecopetrol | ||||||||
5.875%, 09/18/2023 | 100 | 104 | ||||||
5.875%, 05/28/2045 | 200 | 177 | ||||||
4.125%, 01/16/2025 | 225 | 209 | ||||||
Enable Midstream Partners | ||||||||
2.400%, 05/15/2019 | 100 | 97 | ||||||
Enbridge Energy Partners | ||||||||
9.875%, 03/01/2019 | 50 | 58 | ||||||
5.500%, 09/15/2040 | 100 | 101 | ||||||
Encana | ||||||||
6.500%, 02/01/2038 | 200 | 202 | ||||||
Endeavor Energy Resources | ||||||||
7.000%, 08/15/2021 (A) | 100 | 98 | ||||||
Energy Transfer Equity | ||||||||
5.875%, 01/15/2024 | 150 | 150 | ||||||
5.500%, 06/01/2027 | 195 | 190 | ||||||
Energy Transfer Partners | ||||||||
6.125%, 12/15/2045 | 100 | 105 | ||||||
5.950%, 10/01/2043 | 100 | 104 | ||||||
5.200%, 02/01/2022 | 100 | 107 | ||||||
5.150%, 03/15/2045 | 100 | 93 | ||||||
4.900%, 03/15/2035 | 250 | 234 | ||||||
4.750%, 01/15/2026 | 150 | 153 | ||||||
3.600%, 02/01/2023 | 185 | 180 | ||||||
EnLink Midstream Partners | ||||||||
4.850%, 07/15/2026 | 45 | 44 | ||||||
Ensco | ||||||||
5.750%, 10/01/2044 | 200 | 117 | ||||||
5.200%, 03/15/2025 | 50 | 34 | ||||||
4.500%, 10/01/2024 | 120 | 82 | ||||||
| 20 | Adviser Managed Trust / Annual Report / July 31, 2016 |
Description | Face Amount (Thousands) | Market Value ($ Thousands) | ||||||
CORPORATE OBLIGATIONS (continued) |
| |||||||
Enterprise Products Operating | ||||||||
5.200%, 09/01/2020 | $ | 100 | $ | 113 | ||||
5.100%, 02/15/2045 | 225 | 244 | ||||||
4.850%, 08/15/2042 | 100 | 105 | ||||||
3.950%, 02/15/2027 | 20 | 21 | ||||||
3.700%, 02/15/2026 | 100 | 104 | ||||||
3.350%, 03/15/2023 | 200 | 207 | ||||||
2.850%, 04/15/2021 | 30 | 31 | ||||||
2.550%, 10/15/2019 | 100 | 103 | ||||||
EOG Resources | ||||||||
3.150%, 04/01/2025 | 200 | 203 | ||||||
2.625%, 03/15/2023 | 100 | 101 | ||||||
EP Energy | ||||||||
9.375%, 05/01/2020 | 300 | 171 | ||||||
6.375%, 06/15/2023 | 118 | 59 | ||||||
Extraction Oil & Gas Holdings | ||||||||
7.875%, 07/15/2021 (A) | 66 | 66 | ||||||
Exxon Mobil | ||||||||
4.114%, 03/01/2046 | 200 | 224 | ||||||
3.567%, 03/06/2045 | 50 | 53 | ||||||
3.043%, 03/01/2026 | 100 | 106 | ||||||
2.726%, 03/01/2023 | 200 | 209 | ||||||
2.709%, 03/06/2025 | 100 | 105 | ||||||
2.222%, 03/01/2021 | 40 | 41 | ||||||
1.912%, 03/06/2020 | 100 | 102 | ||||||
1.708%, 03/01/2019 | 100 | 102 | ||||||
Genesis Energy | ||||||||
6.750%, 08/01/2022 | 100 | 101 | ||||||
Gibson Energy | ||||||||
6.750%, 07/15/2021 (A) | 121 | 122 | ||||||
Globe Luxembourg SCA | ||||||||
9.625%, 05/01/2018 (A) | 200 | 166 | ||||||
Gulfport Energy | ||||||||
7.750%, 11/01/2020 | 100 | 102 | ||||||
Halliburton | ||||||||
7.450%, 09/15/2039 | 100 | 142 | ||||||
6.150%, 09/15/2019 | 100 | 113 | ||||||
5.000%, 11/15/2045 | 100 | 108 | ||||||
4.850%, 11/15/2035 | 100 | 109 | ||||||
3.800%, 11/15/2025 | 100 | 104 | ||||||
3.500%, 08/01/2023 | 100 | 104 | ||||||
Hess | ||||||||
8.125%, 02/15/2019 | 100 | 113 | ||||||
7.125%, 03/15/2033 | 100 | 113 | ||||||
5.600%, 02/15/2041 | 50 | 48 | ||||||
Hilcorp Energy I | ||||||||
5.750%, 10/01/2025 (A) | 167 | 158 | ||||||
Husky Energy | ||||||||
4.000%, 04/15/2024 | 200 | 207 | ||||||
Jupiter Resources | ||||||||
8.500%, 10/01/2022 (A) | 150 | 112 | ||||||
Description | Face Amount (Thousands) | Market Value ($ Thousands) | ||||||
CORPORATE OBLIGATIONS (continued) |
| |||||||
Kinder Morgan | ||||||||
5.550%, 06/01/2045 | $ | 100 | $ | 100 | ||||
5.300%, 12/01/2034 | 250 | 252 | ||||||
5.050%, 02/15/2046 | 90 | 85 | ||||||
4.300%, 06/01/2025 | 100 | 104 | ||||||
3.050%, 12/01/2019 | 325 | 333 | ||||||
Kinder Morgan Energy Partners | ||||||||
5.500%, 03/01/2044 | 250 | 256 | ||||||
4.300%, 05/01/2024 | 200 | 203 | ||||||
4.250%, 09/01/2024 | 100 | 102 | ||||||
2.650%, 02/01/2019 | 100 | 101 | ||||||
Laredo Petroleum | ||||||||
7.375%, 05/01/2022 | 100 | 97 | ||||||
Magellan Midstream Partners | ||||||||
4.200%, 03/15/2045 | 200 | 197 | ||||||
Marathon Oil | ||||||||
6.000%, 10/01/2017 | 100 | 104 | ||||||
5.200%, 06/01/2045 | 50 | 44 | ||||||
2.800%, 11/01/2022 | 100 | 89 | ||||||
Marathon Petroleum | ||||||||
6.500%, 03/01/2041 | 150 | 161 | ||||||
5.125%, 03/01/2021 | 50 | 56 | ||||||
2.700%, 12/14/2018 | 50 | 51 | ||||||
McDermott International | ||||||||
8.000%, 05/01/2021 (A) | 100 | 89 | ||||||
MEG Energy | ||||||||
7.000%, 03/31/2024 (A) | 100 | 72 | ||||||
6.375%, 01/30/2023 (A) | 200 | 141 | ||||||
Memorial Production Partners | ||||||||
7.625%, 05/01/2021 | 100 | 50 | ||||||
Memorial Resource Development | ||||||||
5.875%, 07/01/2022 | 100 | 100 | ||||||
MPLX | ||||||||
4.875%, 06/01/2025 (A) | 100 | 100 | ||||||
4.500%, 07/15/2023 (A) | 150 | 147 | ||||||
Murphy Oil | ||||||||
4.700%, 12/01/2022 | 50 | 45 | ||||||
4.000%, 06/01/2022 | 200 | 174 | ||||||
National Oilwell Varco | ||||||||
3.950%, 12/01/2042 | 100 | 79 | ||||||
2.600%, 12/01/2022 | 100 | 95 | ||||||
Navios Maritime Acquisition | ||||||||
8.125%, 11/15/2021 (A) | 100 | 77 | ||||||
Newfield Exploration | ||||||||
5.625%, 07/01/2024 | 195 | 193 | ||||||
5.375%, 01/01/2026 | 177 | 169 | ||||||
Nexen Energy | ||||||||
6.400%, 05/15/2037 | 200 | 258 | ||||||
NGPL PipeCo | ||||||||
9.625%, 06/01/2019 (A) | 100 | 105 | ||||||
Niska Gas Storage Canada | ||||||||
6.500%, 04/01/2019 | 100 | 97 | ||||||
| Adviser Managed Trust / Annual Report / July 31, 2016 | 21 |
SCHEDULE OF INVESTMENTS
JULY 31, 2016
Tactical Offensive Fixed Income Fund (Continued)
Description | Face Amount (Thousands) | Market Value ($ Thousands) | ||||||
CORPORATE OBLIGATIONS (continued) |
| |||||||
Noble Energy | ||||||||
5.250%, 11/15/2043 | $ | 100 | $ | 101 | ||||
4.150%, 12/15/2021 | 50 | 53 | ||||||
3.900%, 11/15/2024 | 100 | 102 | ||||||
Noble Holding International | ||||||||
5.250%, 03/15/2042 | 80 | 45 | ||||||
Northern Oil and Gas | ||||||||
8.000%, 06/01/2020 | 100 | 73 | ||||||
Oasis Petroleum | ||||||||
6.875%, 03/15/2022 | 200 | 175 | ||||||
Occidental Petroleum | ||||||||
4.400%, 04/15/2046 | 50 | 55 | ||||||
4.100%, 02/01/2021 | 200 | 218 | ||||||
2.700%, 02/15/2023 | 100 | 102 | ||||||
ONEOK | ||||||||
7.500%, 09/01/2023 | 80 | 88 | ||||||
4.250%, 02/01/2022 | 100 | 96 | ||||||
ONEOK Partners | ||||||||
6.200%, 09/15/2043 | 50 | 55 | ||||||
3.200%, 09/15/2018 | 200 | 204 | ||||||
Pacific Drilling | ||||||||
5.375%, 06/01/2020 (A) | 200 | 53 | ||||||
Parsley Energy | ||||||||
7.500%, 02/15/2022 (A) | 100 | 103 | ||||||
PBF Holding | ||||||||
8.250%, 02/15/2020 | 150 | 155 | ||||||
7.000%, 11/15/2023 (A) | 70 | 67 | ||||||
PDC Energy | ||||||||
7.750%, 10/15/2022 | 100 | 103 | ||||||
Permian Resources | ||||||||
13.000%, 11/30/2020 (A) | 100 | 115 | ||||||
7.375%, 11/01/2021 (A) | 100 | 57 | ||||||
7.125%, 11/01/2020 (A) | 150 | 86 | ||||||
Petroleos Mexicanos | ||||||||
6.875%, 08/04/2026 (A) | 100 | 112 | ||||||
6.625%, 06/15/2035 | 300 | 310 | ||||||
6.500%, 06/02/2041 | 260 | 260 | ||||||
6.375%, 02/04/2021 (A) | 100 | 110 | ||||||
5.750%, 03/01/2018 | 200 | 210 | ||||||
5.625%, 01/23/2046 | 300 | 275 | ||||||
5.500%, 02/04/2019 (A) | 60 | 63 | ||||||
4.500%, 01/23/2026 | 150 | 145 | ||||||
3.500%, 07/23/2020 | 250 | 252 | ||||||
3.500%, 01/30/2023 | 250 | 237 | ||||||
2.378%, 04/15/2025 | 86 | 88 | ||||||
PHI | ||||||||
5.250%, 03/15/2019 | 100 | 92 | ||||||
Phillips 66 | ||||||||
5.875%, 05/01/2042 | 100 | 121 | ||||||
4.875%, 11/15/2044 | 100 | 109 | ||||||
Phillips 66 Partners | ||||||||
2.646%, 02/15/2020 | 150 | 150 | ||||||
Description | Face Amount (Thousands) | Market Value ($ Thousands) | ||||||
CORPORATE OBLIGATIONS (continued) |
| |||||||
Pioneer Natural Resources | ||||||||
7.200%, 01/15/2028 | $ | 66 | $ | 81 | ||||
Plains All American Pipeline | ||||||||
4.700%, 06/15/2044 | 100 | 89 | ||||||
4.650%, 10/15/2025 | 100 | 100 | ||||||
3.600%, 11/01/2024 | 100 | 96 | ||||||
2.600%, 12/15/2019 | 100 | 100 | ||||||
Puget Energy | ||||||||
5.625%, 07/15/2022 | 100 | 115 | ||||||
3.650%, 05/15/2025 | 50 | 52 | ||||||
Puget Sound Energy | ||||||||
4.300%, 05/20/2045 | 50 | 58 | ||||||
Puma International Financing | ||||||||
6.750%, 02/01/2021 (A) | 200 | 206 | ||||||
QEP Resources | ||||||||
5.375%, 10/01/2022 | 100 | 96 | ||||||
5.250%, 05/01/2023 | 100 | 94 | ||||||
Range Resources | ||||||||
5.000%, 03/15/2023 | 150 | 138 | ||||||
4.875%, 05/15/2025 | 188 | 179 | ||||||
Rice Energy | ||||||||
6.250%, 05/01/2022 | 150 | 146 | ||||||
Rockies Express Pipeline | ||||||||
6.000%, 01/15/2019 (A) | 100 | 103 | ||||||
Rowan | ||||||||
4.875%, 06/01/2022 | 125 | 106 | ||||||
RSP Permian | ||||||||
6.625%, 10/01/2022 | 150 | 154 | ||||||
Sabine Pass Liquefaction | ||||||||
5.750%, 05/15/2024 | 200 | 205 | ||||||
5.625%, 02/01/2021 | 450 | 465 | ||||||
5.625%, 03/01/2025 | 294 | 300 | ||||||
Sanchez Energy | ||||||||
6.125%, 01/15/2023 | 300 | 202 | ||||||
Sasol Financing International | ||||||||
4.500%, 11/14/2022 | 200 | 201 | ||||||
Schlumberger Investment | ||||||||
3.650%, 12/01/2023 | 100 | 110 | ||||||
SESI | ||||||||
7.125%, 12/15/2021 | 53 | 51 | ||||||
Seven Generations Energy | ||||||||
8.250%, 05/15/2020 (A) | 100 | 103 | ||||||
Shell International Finance | ||||||||
6.375%, 12/15/2038 | 200 | 267 | ||||||
4.375%, 03/25/2020 | 100 | 110 | ||||||
4.375%, 05/11/2045 | 100 | 109 | ||||||
4.300%, 09/22/2019 | 150 | 163 | ||||||
4.125%, 05/11/2035 | 200 | 216 | ||||||
4.000%, 05/10/2046 | 50 | 51 | ||||||
2.875%, 05/10/2026 | 50 | 51 | ||||||
2.250%, 11/10/2020 | 150 | 155 | ||||||
2.250%, 01/06/2023 | 100 | 101 | ||||||
| 22 | Adviser Managed Trust / Annual Report / July 31, 2016 |
Description | Face Amount (Thousands) | Market Value ($ Thousands) | ||||||
CORPORATE OBLIGATIONS (continued) |
| |||||||
2.125%, 05/11/2020 | $ | 200 | $ | 205 | ||||
1.875%, 05/10/2021 | 50 | 50 | ||||||
1.625%, 11/10/2018 | 100 | 101 | ||||||
1.375%, 05/10/2019 | 50 | 50 | ||||||
SM Energy | ||||||||
6.125%, 11/15/2022 | 30 | 25 | ||||||
5.625%, 06/01/2025 | 113 | 94 | ||||||
5.000%, 01/15/2024 | 100 | 80 | ||||||
Southwestern Energy | ||||||||
4.100%, 03/15/2022 | 400 | 354 | ||||||
Spectra Energy Partners | ||||||||
4.750%, 03/15/2024 | 100 | 112 | ||||||
3.500%, 03/15/2025 | 100 | 102 | ||||||
2.950%, 09/25/2018 | 100 | 102 | ||||||
Statoil | ||||||||
4.800%, 11/08/2043 | 100 | 119 | ||||||
3.700%, 03/01/2024 | 200 | 218 | ||||||
2.250%, 11/08/2019 | 250 | 257 | ||||||
1.200%, 01/17/2018 | 100 | 100 | ||||||
1.150%, 05/15/2018 | 100 | 100 | ||||||
Suncor Energy | ||||||||
6.500%, 06/15/2038 | 200 | 262 | ||||||
6.100%, 06/01/2018 | 100 | 107 | ||||||
Sunoco | ||||||||
6.375%, 04/01/2023 (A) | 83 | 84 | ||||||
6.250%, 04/15/2021 (A) | 156 | 159 | ||||||
5.500%, 08/01/2020 (A) | 120 | 122 | ||||||
Sunoco Logistics Partners Operations | ||||||||
5.350%, 05/15/2045 | 125 | 125 | ||||||
3.900%, 07/15/2026 | 100 | 99 | ||||||
Targa Resources Partners | ||||||||
5.000%, 01/15/2018 | 200 | 201 | ||||||
4.250%, 11/15/2023 | 50 | 46 | ||||||
4.125%, 11/15/2019 | 115 | 115 | ||||||
Tesoro Logistics | ||||||||
6.250%, 10/15/2022 | 110 | 114 | ||||||
6.125%, 10/15/2021 | 100 | 104 | ||||||
5.500%, 10/15/2019 | 105 | 112 | ||||||
Total Capital International | ||||||||
3.750%, 04/10/2024 | 150 | 165 | ||||||
2.875%, 02/17/2022 | 100 | 105 | ||||||
2.700%, 01/25/2023 | 100 | 103 | ||||||
2.100%, 06/19/2019 | 250 | 257 | ||||||
TransCanada PipeLines | ||||||||
6.200%, 10/15/2037 | 250 | 302 | ||||||
2.500%, 08/01/2022 | 100 | 100 | ||||||
1.875%, 01/12/2018 | 150 | 151 | ||||||
Transocean | ||||||||
9.000%, 07/15/2023 (A) | 225 | 211 | ||||||
8.125%, 12/15/2021 | 200 | 167 | ||||||
Tullow Oil | ||||||||
6.250%, 04/15/2022 (A) | 200 | 164 | ||||||
Description | Face Amount (Thousands) | Market Value ($ Thousands) | ||||||
CORPORATE OBLIGATIONS (continued) |
| |||||||
Valero Energy | ||||||||
6.625%, 06/15/2037 | $ | 100 | $ | 112 | ||||
3.650%, 03/15/2025 | 200 | 202 | ||||||
Weatherford International | ||||||||
8.250%, 06/15/2023 | 139 | 130 | ||||||
7.750%, 06/15/2021 | 119 | 112 | ||||||
4.500%, 04/15/2022 | 100 | 83 | ||||||
Western Gas Partners | ||||||||
3.950%, 06/01/2025 | 100 | 98 | ||||||
Whiting Petroleum | ||||||||
5.750%, 03/15/2021 | 100 | 84 | ||||||
5.000%, 03/15/2019 | 200 | 174 | ||||||
Williams | ||||||||
5.750%, 06/24/2044 | 100 | 92 | ||||||
4.550%, 06/24/2024 | 300 | 286 | ||||||
Williams Partners | ||||||||
6.300%, 04/15/2040 | 100 | 102 | ||||||
4.875%, 03/15/2024 | 125 | 125 | ||||||
4.300%, 03/04/2024 | 260 | 256 | ||||||
3.900%, 01/15/2025 | 100 | 95 | ||||||
3.600%, 03/15/2022 | 150 | 146 | ||||||
WPX Energy | ||||||||
7.500%, 08/01/2020 | 75 | 74 | ||||||
6.000%, 01/15/2022 | 100 | 91 | ||||||
5.250%, 09/15/2024 | 150 | 128 | ||||||
XTO Energy | ||||||||
6.500%, 12/15/2018 | 100 | 112 | ||||||
|
| |||||||
| 39,053 | ||||||||
|
| |||||||
Financials — 8.1% | ||||||||
Aflac | ||||||||
3.625%, 11/15/2024 | 100 | 108 | ||||||
2.400%, 03/16/2020 | 100 | 104 | ||||||
African Development Bank MTN | ||||||||
0.875%, 03/15/2018 | 400 | 400 | ||||||
Alexandria Real Estate Equities | ||||||||
4.600%, 04/01/2022 | 350 | 380 | ||||||
Allstate | ||||||||
5.750%, 08/15/2053 (B) | 100 | 105 | ||||||
Ally Financial | ||||||||
5.750%, 11/20/2025 | 100 | 104 | ||||||
3.750%, 11/18/2019 | 200 | 203 | ||||||
3.600%, 05/21/2018 | 200 | 204 | ||||||
American Campus Communities Operating Partnership | ||||||||
3.350%, 10/01/2020 | 50 | 52 | ||||||
American Express | ||||||||
7.000%, 03/19/2018 | 150 | 164 | ||||||
4.050%, 12/03/2042 | 100 | 106 | ||||||
2.650%, 12/02/2022 | 100 | 102 | ||||||
American Express Credit MTN | ||||||||
2.375%, 05/26/2020 | 50 | 51 | ||||||
| Adviser Managed Trust / Annual Report / July 31, 2016 | 23 |
SCHEDULE OF INVESTMENTS
JULY 31, 2016
Tactical Offensive Fixed Income Fund (Continued)
Description | Face Amount (Thousands) | Market Value ($ Thousands) | ||||||
CORPORATE OBLIGATIONS (continued) |
| |||||||
2.250%, 08/15/2019 | $ | 100 | $ | 103 | ||||
2.250%, 05/05/2021 | 100 | 102 | ||||||
1.800%, 07/31/2018 | 100 | 101 | ||||||
American International Group | ||||||||
5.850%, 01/16/2018 | 150 | 160 | ||||||
4.500%, 07/16/2044 | 250 | 253 | ||||||
4.125%, 02/15/2024 | 100 | 108 | ||||||
3.875%, 01/15/2035 | 100 | 97 | ||||||
2.300%, 07/16/2019 | 200 | 205 | ||||||
American Tower | ||||||||
4.000%, 06/01/2025 | 100 | 109 | ||||||
3.450%, 09/15/2021 | 150 | 158 | ||||||
3.375%, 10/15/2026 | 150 | 155 | ||||||
2.800%, 06/01/2020 | 100 | 103 | ||||||
Ameriprise Financial | ||||||||
3.700%, 10/15/2024 | 100 | 109 | ||||||
Andina de Fomento | ||||||||
4.375%, 06/15/2022 | 100 | 111 | ||||||
Aon | ||||||||
3.500%, 06/14/2024 | 200 | 209 | ||||||
Arch Capital Group | ||||||||
5.144%, 11/01/2043 | 150 | 169 | ||||||
Argos Merger | ||||||||
7.125%, 03/15/2023 (A) | 333 | 348 | ||||||
Asian Development Bank MTN | ||||||||
2.000%, 01/22/2025 | 150 | 155 | ||||||
1.875%, 04/12/2019 | 100 | 102 | ||||||
1.750%, 09/11/2018 | 350 | 356 | ||||||
1.625%, 08/26/2020 | 100 | 102 | ||||||
1.625%, 03/16/2021 | 150 | 153 | ||||||
1.500%, 01/22/2020 | 350 | 356 | ||||||
1.375%, 01/15/2019 | 100 | 101 | ||||||
Australia & New Zealand Banking Group MTN | ||||||||
3.700%, 11/16/2025 | 250 | 277 | ||||||
AvalonBay Communities MTN | ||||||||
3.500%, 11/15/2024 | 100 | 107 | ||||||
3.500%, 11/15/2025 | 100 | 106 | ||||||
AXIS Specialty Finance | ||||||||
5.150%, 04/01/2045 | 100 | 111 | ||||||
Bank of America MTN | ||||||||
7.750%, 05/14/2038 | 275 | 401 | ||||||
6.110%, 01/29/2037 | 150 | 185 | ||||||
5.650%, 05/01/2018 | 200 | 214 | ||||||
5.625%, 07/01/2020 | 200 | 227 | ||||||
5.000%, 01/21/2044 | 150 | 178 | ||||||
4.750%, 04/21/2045 | 40 | 43 | ||||||
4.100%, 07/24/2023 | 415 | 452 | ||||||
4.000%, 04/01/2024 | 285 | 307 | ||||||
4.000%, 01/22/2025 | 250 | 260 | ||||||
3.875%, 08/01/2025 | 100 | 107 | ||||||
3.500%, 04/19/2026 | 100 | 104 | ||||||
2.650%, 04/01/2019 | 300 | 308 | ||||||
Description | Face Amount (Thousands) | Market Value ($ Thousands) | ||||||
CORPORATE OBLIGATIONS (continued) |
| |||||||
2.625%, 10/19/2020 | $ | 100 | $ | 102 | ||||
2.625%, 04/19/2021 | 100 | 102 | ||||||
2.250%, 04/21/2020 | 150 | 151 | ||||||
1.750%, 06/05/2018 | 500 | 504 | ||||||
1.700%, 08/25/2017 | 700 | 702 | ||||||
1.650%, 03/26/2018 | 300 | 302 | ||||||
Bank of Montreal MTN | ||||||||
1.800%, 07/31/2018 | 50 | 51 | ||||||
1.400%, 09/11/2017 | 150 | 150 | ||||||
Bank of New York Mellon MTN | ||||||||
3.550%, 09/23/2021 | 100 | 109 | ||||||
3.000%, 02/24/2025 | 150 | 159 | ||||||
2.800%, 05/04/2026 | 50 | 52 | ||||||
2.600%, 08/17/2020 | 200 | 208 | ||||||
2.450%, 11/27/2020 | 50 | 51 | ||||||
2.300%, 09/11/2019 | 200 | 206 | ||||||
2.050%, 05/03/2021 | 50 | 51 | ||||||
Bank of Nova Scotia | ||||||||
2.800%, 07/21/2021 | 50 | 52 | ||||||
2.450%, 03/22/2021 | 250 | 257 | ||||||
2.050%, 10/30/2018 | 100 | 102 | ||||||
1.700%, 06/11/2018 | 100 | 101 | ||||||
1.650%, 06/14/2019 | 150 | 151 | ||||||
1.450%, 04/25/2018 | 200 | 201 | ||||||
Barclays | ||||||||
5.250%, 08/17/2045 | 200 | 223 | ||||||
3.650%, 03/16/2025 | 250 | 247 | ||||||
3.250%, 01/12/2021 | 300 | 304 | ||||||
BB&T MTN | ||||||||
2.625%, 06/29/2020 | 100 | 104 | ||||||
2.450%, 01/15/2020 | 150 | 154 | ||||||
Bear Stearns | ||||||||
7.250%, 02/01/2018 | 195 | 212 | ||||||
Berkshire Hathaway | ||||||||
4.500%, 02/11/2043 | 50 | 59 | ||||||
3.125%, 03/15/2026 | 35 | 37 | ||||||
3.000%, 02/11/2023 | 150 | 160 | ||||||
2.200%, 03/15/2021 | 35 | 36 | ||||||
2.100%, 08/14/2019 | 200 | 206 | ||||||
Berkshire Hathaway Finance | ||||||||
5.400%, 05/15/2018 | 100 | 108 | ||||||
4.250%, 01/15/2021 | 100 | 111 | ||||||
1.700%, 03/15/2019 | 60 | 61 | ||||||
BlackRock | ||||||||
3.500%, 03/18/2024 | 200 | 220 | ||||||
BNP Paribas MTN | ||||||||
5.000%, 01/15/2021 | 150 | 170 | ||||||
2.450%, 03/17/2019 | 300 | 307 | ||||||
2.375%, 09/14/2017 | 150 | 152 | ||||||
2.375%, 05/21/2020 | 200 | 204 | ||||||
Boston Properties | ||||||||
3.700%, 11/15/2018 | 150 | 157 | ||||||
| 24 | Adviser Managed Trust / Annual Report / July 31, 2016 |
Description | Face Amount (Thousands) | Market Value ($ Thousands) | ||||||
CORPORATE OBLIGATIONS (continued) |
| |||||||
3.125%, 09/01/2023 | $ | 150 | $ | 156 | ||||
BPCE | ||||||||
2.500%, 12/10/2018 | 320 | 327 | ||||||
Branch Banking & Trust | ||||||||
3.625%, 09/16/2025 | 250 | 271 | ||||||
Brandywine Operating Partnership | ||||||||
4.100%, 10/01/2024 | 50 | 51 | ||||||
Brixmor Operating Partnership | ||||||||
4.125%, 06/15/2026 | 25 | 26 | ||||||
3.875%, 08/15/2022 | 30 | 31 | ||||||
Capital One | ||||||||
1.650%, 02/05/2018 | 300 | 301 | ||||||
Capital One Bank | ||||||||
2.250%, 02/13/2019 | 350 | 356 | ||||||
Capital One Financial | ||||||||
3.750%, 07/28/2026 | 50 | 50 | ||||||
3.200%, 02/05/2025 | 100 | 102 | ||||||
Charles Schwab | ||||||||
3.450%, 02/13/2026 | 70 | 75 | ||||||
Chubb INA Holdings | ||||||||
3.350%, 05/15/2024 | 200 | 216 | ||||||
3.150%, 03/15/2025 | 100 | 106 | ||||||
2.300%, 11/03/2020 | 200 | 207 | ||||||
CIT Group | ||||||||
5.500%, 02/15/2019 (A) | 300 | 318 | ||||||
5.250%, 03/15/2018 | 200 | 208 | ||||||
4.250%, 08/15/2017 | 300 | 306 | ||||||
Citigroup | ||||||||
6.675%, 09/13/2043 | 90 | 120 | ||||||
6.125%, 08/25/2036 | 200 | 243 | ||||||
4.750%, 05/18/2046 | 50 | 52 | ||||||
4.600%, 03/09/2026 | 35 | 38 | ||||||
4.450%, 09/29/2027 | 500 | 524 | ||||||
3.875%, 03/26/2025 | 300 | 311 | ||||||
3.700%, 01/12/2026 | 300 | 318 | ||||||
3.400%, 05/01/2026 | 150 | 155 | ||||||
3.300%, 04/27/2025 | 300 | 310 | ||||||
2.700%, 03/30/2021 | 100 | 102 | ||||||
2.650%, 10/26/2020 | 200 | 205 | ||||||
2.350%, 08/02/2021 | 50 | 50 | ||||||
2.150%, 07/30/2018 | 50 | 51 | ||||||
2.050%, 12/07/2018 | 150 | 151 | ||||||
1.800%, 02/05/2018 | 300 | 301 | ||||||
1.700%, 04/27/2018 | 300 | 301 | ||||||
Citizens Financial Group | ||||||||
4.350%, 08/01/2025 | 100 | 106 | ||||||
2.375%, 07/28/2021 | 30 | 30 | ||||||
CME Group | ||||||||
3.000%, 03/15/2025 | 100 | 107 | ||||||
CNA Financial | ||||||||
4.500%, 03/01/2026 | 100 | 108 | ||||||
Description | Face Amount (Thousands) | Market Value ($ Thousands) | ||||||
CORPORATE OBLIGATIONS (continued) |
| |||||||
CNO Financial Group | ||||||||
5.250%, 05/30/2025 | $ | 140 | $ | 145 | ||||
Commonwealth Bank of Australia | ||||||||
2.500%, 09/20/2018 | 250 | 256 | ||||||
2.300%, 03/12/2020 | 250 | 256 | ||||||
Communications Sales & Leasing | ||||||||
8.250%, 10/15/2023 | 210 | 215 | ||||||
6.000%, 04/15/2023 (A) | 33 | 34 | ||||||
Cooperatieve Rabobank | ||||||||
5.250%, 08/04/2045 | 250 | 290 | ||||||
4.625%, 12/01/2023 | 250 | 268 | ||||||
3.875%, 02/08/2022 | 250 | 273 | ||||||
Cooperatieve Rabobank UA MTN | ||||||||
2.500%, 01/19/2021 | 250 | 258 | ||||||
Corporate Office Properties | ||||||||
5.000%, 07/01/2025 | 50 | 54 | ||||||
Credit Suisse | ||||||||
3.625%, 09/09/2024 | 250 | 260 | ||||||
1.700%, 04/27/2018 | 300 | 300 | ||||||
Credit Suisse Group Funding Guernsey | ||||||||
3.800%, 06/09/2023 (A) | 250 | 252 | ||||||
3.750%, 03/26/2025 | 250 | 250 | ||||||
3.450%, 04/16/2021 (A) | 250 | 255 | ||||||
Crown Castle International | ||||||||
5.250%, 01/15/2023 | 125 | 143 | ||||||
4.450%, 02/15/2026 | 65 | 72 | ||||||
3.400%, 02/15/2021 | 55 | 58 | ||||||
DDR | ||||||||
3.625%, 02/01/2025 | 100 | 101 | ||||||
Deutsche Bank MTN | ||||||||
4.500%, 04/01/2025 | 200 | 184 | ||||||
4.296%, 05/24/2028 (B) | 300 | 264 | ||||||
3.700%, 05/30/2024 | 250 | 244 | ||||||
3.375%, 05/12/2021 | 100 | 100 | ||||||
2.850%, 05/10/2019 | 100 | 100 | ||||||
1.875%, 02/13/2018 | 150 | 149 | ||||||
DFC Finance | ||||||||
10.500%, 06/15/2020 (A) | 100 | 53 | ||||||
Digital Realty Trust | ||||||||
3.950%, 07/01/2022 | 100 | 106 | ||||||
Discover Bank | ||||||||
4.200%, 08/08/2023 | 250 | 268 | ||||||
Discover Financial Services | ||||||||
3.850%, 11/21/2022 | 100 | 103 | ||||||
Duke Realty | ||||||||
3.875%, 10/15/2022 | 150 | 160 | ||||||
DuPont Fabros Technology | ||||||||
5.875%, 09/15/2021 | 50 | 52 | ||||||
Enova International | ||||||||
9.750%, 06/01/2021 | 100 | 84 | ||||||
Equinix | ||||||||
5.875%, 01/15/2026 | 150 | 162 | ||||||
| Adviser Managed Trust / Annual Report / July 31, 2016 | 25 |
SCHEDULE OF INVESTMENTS
JULY 31, 2016
Tactical Offensive Fixed Income Fund (Continued)
Description | Face Amount (Thousands) | Market Value ($ Thousands) | ||||||
CORPORATE OBLIGATIONS (continued) |
| |||||||
5.375%, 01/01/2022 | $ | 145 | $ | 152 | ||||
5.375%, 04/01/2023 | 150 | 157 | ||||||
ERP Operating | ||||||||
3.375%, 06/01/2025 | 100 | 106 | ||||||
2.375%, 07/01/2019 | 150 | 154 | ||||||
Essex Portfolio | ||||||||
3.375%, 04/15/2026 | 100 | 103 | ||||||
European Bank for Reconstruction & Development MTN | ||||||||
1.750%, 06/14/2019 | 100 | 102 | ||||||
1.750%, 11/26/2019 | 200 | 204 | ||||||
0.875%, 07/22/2019 | 250 | 249 | ||||||
European Investment Bank | ||||||||
2.875%, 09/15/2020 | 125 | 133 | ||||||
2.125%, 10/15/2021 | 500 | 519 | ||||||
2.000%, 03/15/2021 | 150 | 155 | ||||||
1.875%, 02/10/2025 | 400 | 406 | ||||||
1.750%, 06/17/2019 | 200 | 204 | ||||||
1.625%, 03/16/2020 | 100 | 102 | ||||||
1.625%, 12/15/2020 | 500 | 508 | ||||||
1.625%, 06/15/2021 | 150 | 152 | ||||||
1.375%, 06/15/2020 | 300 | 302 | ||||||
1.250%, 05/15/2018 | 500 | 503 | ||||||
1.125%, 09/15/2017 | 450 | 452 | ||||||
1.125%, 08/15/2018 | 600 | 603 | ||||||
1.000%, 06/15/2018 | 250 | 251 | ||||||
Federal Realty Investment Trust | ||||||||
4.500%, 12/01/2044 | 50 | 58 | ||||||
FelCor Lodging | ||||||||
5.625%, 03/01/2023 | 100 | 103 | ||||||
Fifth Third Bancorp | ||||||||
2.875%, 07/27/2020 | 150 | 156 | ||||||
Fifth Third Bank MTN | ||||||||
2.150%, 08/20/2018 | 250 | 254 | ||||||
FMS Wertmanagement | ||||||||
1.125%, 09/05/2017 | 400 | 401 | ||||||
Franklin Resources | ||||||||
2.850%, 03/30/2025 | 150 | 156 | ||||||
GLP Capital | ||||||||
5.375%, 11/01/2023 | 100 | 107 | ||||||
5.375%, 04/15/2026 | 200 | 213 | ||||||
4.875%, 11/01/2020 | 100 | 106 | ||||||
Goldman Sachs Group | ||||||||
6.750%, 10/01/2037 | 625 | 801 | ||||||
6.250%, 02/01/2041 | 100 | 133 | ||||||
6.150%, 04/01/2018 | 150 | 161 | ||||||
6.000%, 06/15/2020 | 350 | 401 | ||||||
5.750%, 01/24/2022 | 130 | 151 | ||||||
4.800%, 07/08/2044 | 100 | 113 | ||||||
3.850%, 07/08/2024 | 200 | 215 | ||||||
3.750%, 05/22/2025 | 250 | 264 | ||||||
3.750%, 02/25/2026 | 60 | 63 | ||||||
Description | Face Amount (Thousands) | Market Value ($ Thousands) | ||||||
CORPORATE OBLIGATIONS (continued) |
| |||||||
3.500%, 01/23/2025 | $ | 300 | $ | 312 | ||||
2.875%, 02/25/2021 | 100 | 103 | ||||||
2.625%, 01/31/2019 | 250 | 256 | ||||||
2.600%, 04/23/2020 | 300 | 307 | ||||||
2.550%, 10/23/2019 | 200 | 205 | ||||||
2.375%, 01/22/2018 | 300 | 304 | ||||||
Harland Clarke Holdings | ||||||||
9.250%, 03/01/2021 (A) | 150 | 127 | ||||||
Hartford Financial Services Group | ||||||||
5.500%, 03/30/2020 | 150 | 169 | ||||||
4.300%, 04/15/2043 | 100 | 102 | ||||||
HCP | ||||||||
5.375%, 02/01/2021 | 200 | 225 | ||||||
4.000%, 12/01/2022 | 50 | 53 | ||||||
4.000%, 06/01/2025 | 100 | 102 | ||||||
Healthcare Trust of America Holdings | ||||||||
3.500%, 08/01/2026 | 40 | 40 | ||||||
Highwoods Realty | ||||||||
3.200%, 06/15/2021 | 100 | 101 | ||||||
Hospitality Properties Trust | ||||||||
4.500%, 03/15/2025 | 50 | 51 | ||||||
Host Hotels & Resorts | ||||||||
4.000%, 06/15/2025 | 65 | 67 | ||||||
Howard Hughes | ||||||||
6.875%, 10/01/2021 (A) | 100 | 104 | ||||||
HSBC | ||||||||
2.375%, 11/13/2019 | 300 | 304 | ||||||
2.350%, 03/05/2020 | 350 | 353 | ||||||
HSBC Finance | ||||||||
6.676%, 01/15/2021 | 300 | 341 | ||||||
HSBC Holdings | ||||||||
6.500%, 05/02/2036 | 200 | 254 | ||||||
6.500%, 09/15/2037 | 225 | 286 | ||||||
5.250%, 03/14/2044 | 200 | 227 | ||||||
4.300%, 03/08/2026 | 400 | 429 | ||||||
2.950%, 05/25/2021 | 250 | 254 | ||||||
HUB International | ||||||||
7.875%, 10/01/2021 (A) | 150 | 150 | ||||||
Huntington National Bank | ||||||||
1.700%, 02/26/2018 | 250 | 251 | ||||||
Inter-American Development Bank MTN | ||||||||
3.200%, 08/07/2042 | 100 | 112 | ||||||
3.000%, 02/21/2024 | 300 | 332 | ||||||
1.750%, 10/15/2019 | 700 | 714 | ||||||
1.125%, 08/28/2018 | 200 | 201 | ||||||
1.000%, 05/13/2019 | 500 | 501 | ||||||
0.875%, 03/15/2018 | 200 | 200 | ||||||
Intercontinental Exchange | ||||||||
3.750%, 12/01/2025 | 55 | 60 | ||||||
2.750%, 12/01/2020 | 55 | 58 | ||||||
| 26 | Adviser Managed Trust / Annual Report / July 31, 2016 |
Description | Face Amount (Thousands) | Market Value ($ Thousands) | ||||||
CORPORATE OBLIGATIONS (continued) |
| |||||||
International Bank for Reconstruction & Development |
| |||||||
2.500%, 11/25/2024 | $ | 200 | $ | 214 | ||||
2.500%, 07/29/2025 | 150 | 161 | ||||||
2.125%, 11/01/2020 | 450 | 468 | ||||||
1.875%, 03/15/2019 | 500 | 513 | ||||||
1.750%, 04/19/2023 | 350 | 357 | ||||||
1.625%, 03/09/2021 | 350 | 357 | ||||||
1.625%, 02/10/2022 | 200 | 203 | ||||||
1.250%, 07/26/2019 | 350 | 353 | ||||||
0.875%, 07/19/2018 | 350 | 350 | ||||||
0.875%, 08/15/2019 | 500 | 499 | ||||||
International Finance | ||||||||
1.750%, 09/04/2018 | 200 | 204 | ||||||
1.750%, 09/16/2019 | 100 | 102 | ||||||
0.875%, 06/15/2018 | 500 | 500 | ||||||
Intesa Sanpaolo MTN | ||||||||
5.710%, 01/15/2026 (A) | 200 | 199 | ||||||
5.017%, 06/26/2024 (A) | 400 | 381 | ||||||
3.875%, 01/16/2018 | 200 | 205 | ||||||
Invesco Finance | ||||||||
5.375%, 11/30/2043 | 150 | 183 | ||||||
Iron Mountain | ||||||||
6.000%, 10/01/2020 (A) | 120 | 127 | ||||||
6.000%, 08/15/2023 | 200 | 213 | ||||||
5.750%, 08/15/2024 | 200 | 205 | ||||||
iStar | ||||||||
5.000%, 07/01/2019 | 150 | 148 | ||||||
4.000%, 11/01/2017 | 100 | 99 | ||||||
Jefferies Group | ||||||||
6.875%, 04/15/2021 | 100 | 115 | ||||||
JPMorgan Chase | ||||||||
6.400%, 05/15/2038 | 100 | 139 | ||||||
6.300%, 04/23/2019 | 200 | 225 | ||||||
5.625%, 08/16/2043 | 190 | 234 | ||||||
4.950%, 06/01/2045 | 100 | 115 | ||||||
4.625%, 05/10/2021 | 150 | 167 | ||||||
4.350%, 08/15/2021 | 100 | 110 | ||||||
4.250%, 10/01/2027 | 295 | 318 | ||||||
3.900%, 07/15/2025 | 100 | 109 | ||||||
3.875%, 02/01/2024 | 200 | 219 | ||||||
3.625%, 05/13/2024 | 425 | 455 | ||||||
3.300%, 04/01/2026 | 150 | 156 | ||||||
3.250%, 09/23/2022 | 200 | 211 | ||||||
3.125%, 01/23/2025 | 200 | 205 | ||||||
2.950%, 10/01/2026 | 200 | 202 | ||||||
2.750%, 06/23/2020 | 100 | 103 | ||||||
2.700%, 05/18/2023 | 100 | 101 | ||||||
2.550%, 10/29/2020 | 485 | 498 | ||||||
2.550%, 03/01/2021 | 200 | 205 | ||||||
2.250%, 01/23/2020 | 350 | 357 | ||||||
2.200%, 10/22/2019 | 250 | 255 | ||||||
Description | Face Amount (Thousands) | Market Value ($ Thousands) | ||||||
CORPORATE OBLIGATIONS (continued) |
| |||||||
1.850%, 03/22/2019 | $ | 150 | $ | 152 | ||||
1.700%, 03/01/2018 | 150 | 151 | ||||||
Jurassic Holdings III | ||||||||
6.875%, 02/15/2021 (A) | 50 | 34 | ||||||
Kennedy-Wilson | ||||||||
5.875%, 04/01/2024 | 65 | 66 | ||||||
KeyBank | ||||||||
2.500%, 12/15/2019 | 250 | 257 | ||||||
KeyCorp MTN | ||||||||
2.900%, 09/15/2020 | 80 | 83 | ||||||
KFW | ||||||||
2.750%, 10/01/2020 | 200 | 213 | ||||||
2.500%, 11/20/2024 | 300 | 321 | ||||||
2.125%, 01/17/2023 | 150 | 157 | ||||||
2.000%, 10/04/2022 | 250 | 259 | ||||||
2.000%, 05/02/2025 | 250 | 258 | ||||||
1.875%, 04/01/2019 | 525 | 538 | ||||||
1.625%, 03/15/2021 | 250 | 255 | ||||||
1.500%, 02/06/2019 | 150 | 152 | ||||||
1.500%, 04/20/2020 | 1,500 | 1,521 | ||||||
1.000%, 01/26/2018 | 400 | 401 | ||||||
0.875%, 04/19/2018 | 250 | 250 | ||||||
Kilroy Realty | ||||||||
4.375%, 10/01/2025 | 100 | 109 | ||||||
Kimco Realty | ||||||||
3.200%, 05/01/2021 | 370 | 385 | ||||||
Korea Development Bank | ||||||||
3.500%, 08/22/2017 | 200 | 205 | ||||||
2.500%, 03/11/2020 | 200 | 205 | ||||||
Lamar Media | ||||||||
5.375%, 01/15/2024 | 100 | 105 | ||||||
5.000%, 05/01/2023 | 100 | 104 | ||||||
Landwirtschaftliche Rentenbank | ||||||||
2.375%, 06/10/2025 | 150 | 159 | ||||||
2.250%, 10/01/2021 | 150 | 157 | ||||||
2.000%, 01/13/2025 | 100 | 103 | ||||||
1.000%, 04/04/2018 | 300 | 301 | ||||||
Lazard Group | ||||||||
3.750%, 02/13/2025 | 50 | 50 | ||||||
Legg Mason | ||||||||
4.750%, 03/15/2026 | 50 | 54 | ||||||
Leucadia National | ||||||||
5.500%, 10/18/2023 | 100 | 104 | ||||||
Liberty Property | ||||||||
3.375%, 06/15/2023 | 95 | 97 | ||||||
Lincoln National | ||||||||
3.350%, 03/09/2025 | 150 | 152 | ||||||
Lloyds Bank | ||||||||
2.400%, 03/17/2020 | 200 | 204 | ||||||
2.300%, 11/27/2018 | 200 | 202 | ||||||
2.050%, 01/22/2019 | 200 | 201 | ||||||
| Adviser Managed Trust / Annual Report / July 31, 2016 | 27 |
SCHEDULE OF INVESTMENTS
JULY 31, 2016
Tactical Offensive Fixed Income Fund (Continued)
Description | Face Amount (Thousands) | Market Value ($ Thousands) | ||||||
CORPORATE OBLIGATIONS (continued) |
| |||||||
Mack-Cali Realty | ||||||||
3.150%, 05/15/2023 | $ | 100 | $ | 93 | ||||
Manufacturers & Traders Trust | ||||||||
2.100%, 02/06/2020 | 250 | 254 | ||||||
Markel | ||||||||
5.000%, 04/05/2046 | 100 | 109 | ||||||
Marsh & McLennan | ||||||||
3.750%, 03/14/2026 | 25 | 27 | ||||||
2.350%, 03/06/2020 | 100 | 102 | ||||||
MetLife | ||||||||
4.875%, 11/13/2043 | 100 | 113 | ||||||
4.600%, 05/13/2046 | 100 | 110 | ||||||
4.368%, 09/15/2023 | 285 | 318 | ||||||
4.050%, 03/01/2045 | 100 | 100 | ||||||
3.600%, 04/10/2024 | 200 | 212 | ||||||
3.600%, 11/13/2025 | 100 | 106 | ||||||
Mid-America Apartments | ||||||||
4.000%, 11/15/2025 | 50 | 53 | ||||||
Mitsubishi UFJ Financial Group | ||||||||
3.850%, 03/01/2026 | 200 | 219 | ||||||
2.950%, 03/01/2021 | 200 | 209 | ||||||
Morgan Stanley MTN | ||||||||
6.375%, 07/24/2042 | 250 | 345 | ||||||
6.250%, 08/28/2017 | 375 | 394 | ||||||
5.750%, 01/25/2021 | 175 | 202 | ||||||
5.500%, 07/24/2020 | 275 | 311 | ||||||
4.875%, 11/01/2022 | 165 | 182 | ||||||
4.350%, 09/08/2026 | 340 | 362 | ||||||
4.300%, 01/27/2045 | 100 | 108 | ||||||
4.000%, 07/23/2025 | 155 | 167 | ||||||
3.875%, 01/27/2026 | 250 | 267 | ||||||
3.125%, 07/27/2026 | 95 | 96 | ||||||
2.650%, 01/27/2020 | 200 | 205 | ||||||
2.500%, 04/21/2021 | 210 | 212 | ||||||
2.375%, 07/23/2019 | 300 | 306 | ||||||
2.200%, 12/07/2018 | 150 | 152 | ||||||
1.875%, 01/05/2018 | 150 | 151 | ||||||
MPT Operating Partnership | ||||||||
6.375%, 03/01/2024 | 100 | 109 | ||||||
5.250%, 08/01/2026 | 75 | 79 | ||||||
MSCI | ||||||||
5.750%, 08/15/2025 (A) | 62 | 68 | ||||||
5.250%, 11/15/2024 (A) | 150 | 159 | ||||||
MUFG Union Bank | ||||||||
2.625%, 09/26/2018 | 250 | 255 | ||||||
Nasdaq | ||||||||
5.250%, 01/16/2018 | 150 | 158 | ||||||
National Australia Bank MTN | ||||||||
2.625%, 01/14/2021 | 300 | 310 | ||||||
National Financial Partners | ||||||||
9.000%, 07/15/2021 (A) | 117 | 118 | ||||||
Description | Face Amount (Thousands) | Market Value ($ Thousands) | ||||||
CORPORATE OBLIGATIONS (continued) |
| |||||||
National Retail Properties | ||||||||
4.000%, 11/15/2025 | $ | 65 | $ | 70 | ||||
National Rural Utilities Cooperative Finance MTN | ||||||||
10.375%, 11/01/2018 | 150 | 180 | ||||||
3.250%, 11/01/2025 | 200 | 217 | ||||||
Nationstar Mortgage | ||||||||
6.500%, 07/01/2021 | 100 | 86 | ||||||
Navient MTN | ||||||||
5.500%, 01/15/2019 | 350 | 360 | ||||||
5.500%, 01/25/2023 | 150 | 139 | ||||||
Nomura Holdings MTN | ||||||||
2.750%, 03/19/2019 | 300 | 308 | ||||||
Nordic Investment Bank MTN | ||||||||
1.125%, 03/19/2018 | 200 | 201 | ||||||
1.125%, 02/25/2019 | 200 | 201 | ||||||
Oesterreichische Kontrollbank | ||||||||
1.875%, 01/20/2021 | 300 | 307 | ||||||
1.375%, 02/10/2020 | 100 | 101 | ||||||
Omega Healthcare Investors | ||||||||
5.250%, 01/15/2026 | 100 | 106 | ||||||
4.500%, 01/15/2025 | 50 | 50 | ||||||
OneMain Financial Holdings | ||||||||
7.250%, 12/15/2021 (A) | 50 | 50 | ||||||
6.750%, 12/15/2019 (A) | 190 | 192 | ||||||
Opal Acquisition | ||||||||
8.875%, 12/15/2021 (A) | 100 | 81 | ||||||
PNC Bank | ||||||||
3.300%, 10/30/2024 | 250 | 269 | ||||||
2.450%, 11/05/2020 | 250 | 258 | ||||||
2.250%, 07/02/2019 | 250 | 256 | ||||||
2.150%, 04/29/2021 | 250 | 255 | ||||||
1.500%, 02/23/2018 | 250 | 251 | ||||||
Principal Financial Group | ||||||||
3.400%, 05/15/2025 | 150 | 154 | ||||||
Private Export Funding | ||||||||
3.250%, 06/15/2025 | 150 | 166 | ||||||
2.300%, 09/15/2020 | 150 | 156 | ||||||
Progressive | ||||||||
3.700%, 01/26/2045 | 50 | 53 | ||||||
Prologis | ||||||||
3.750%, 11/01/2025 | 65 | 70 | ||||||
Prudential Financial | ||||||||
5.875%, 09/15/2042 (B) | 100 | 111 | ||||||
5.700%, 12/14/2036 | 100 | 121 | ||||||
5.625%, 06/15/2043 (B) | 200 | 214 | ||||||
4.600%, 05/15/2044 | 50 | 54 | ||||||
3.500%, 05/15/2024 | 100 | 105 | ||||||
2.350%, 08/15/2019 | 100 | 102 | ||||||
Quicken Loans | ||||||||
5.750%, 05/01/2025 (A) | 250 | 248 | ||||||
| 28 | Adviser Managed Trust / Annual Report / July 31, 2016 |
Description | Face Amount (Thousands) | Market Value ($ Thousands) | ||||||
CORPORATE OBLIGATIONS (continued) |
| |||||||
Realogy Group | ||||||||
5.250%, 12/01/2021 (A) | $ | 100 | $ | 104 | ||||
4.875%, 06/01/2023 (A) | 50 | 51 | ||||||
Realty Income | ||||||||
4.650%, 08/01/2023 | 150 | 166 | ||||||
3.250%, 10/15/2022 | 160 | 164 | ||||||
Regency Centers | ||||||||
3.900%, 11/01/2025 | 30 | 32 | ||||||
Regions Financial | ||||||||
3.200%, 02/08/2021 | 150 | 155 | ||||||
Reinsurance Group of America | ||||||||
3.950%, 09/15/2026 | 30 | 31 | ||||||
Royal Bank of Canada MTN | ||||||||
2.350%, 10/30/2020 | 250 | 257 | ||||||
2.300%, 03/22/2021 | 150 | 154 | ||||||
2.200%, 07/27/2018 | 250 | 254 | ||||||
2.100%, 10/14/2020 | 200 | 204 | ||||||
2.000%, 10/01/2018 | 125 | 127 | ||||||
2.000%, 12/10/2018 | 100 | 101 | ||||||
1.800%, 07/30/2018 | 50 | 51 | ||||||
1.400%, 10/13/2017 | 250 | 251 | ||||||
Royal Bank of Scotland Group | ||||||||
6.125%, 12/15/2022 | 300 | 319 | ||||||
6.000%, 12/19/2023 | 375 | 393 | ||||||
5.125%, 05/28/2024 | 300 | 301 | ||||||
4.800%, 04/05/2026 | 200 | 207 | ||||||
S&P Global | ||||||||
4.400%, 02/15/2026 | 100 | 112 | ||||||
4.000%, 06/15/2025 | 50 | 55 | ||||||
Sabra Health Care | ||||||||
5.500%, 02/01/2021 | 100 | 104 | ||||||
Santander Holdings | ||||||||
2.700%, 05/24/2019 | 100 | 101 | ||||||
2.650%, 04/17/2020 | 100 | 100 | ||||||
Santander Issuances | ||||||||
5.179%, 11/19/2025 | 200 | 205 | ||||||
Santander UK | ||||||||
3.050%, 08/23/2018 | 100 | 103 | ||||||
2.375%, 03/16/2020 | 150 | 151 | ||||||
Santander UK Group Holdings | ||||||||
2.875%, 10/16/2020 | 100 | 101 | ||||||
Select Income | ||||||||
4.500%, 02/01/2025 | 100 | 99 | ||||||
Simon Property Group | ||||||||
5.650%, 02/01/2020 | 250 | 283 | ||||||
3.500%, 09/01/2025 | 150 | 163 | ||||||
2.500%, 09/01/2020 | 100 | 104 | ||||||
Societe Generale MTN | ||||||||
2.750%, 10/12/2017 | 250 | 254 | ||||||
Springleaf Finance | ||||||||
8.250%, 12/15/2020 | 100 | 104 | ||||||
7.750%, 10/01/2021 | 100 | 99 | ||||||
Description | Face Amount (Thousands) | Market Value ($ Thousands) | ||||||
CORPORATE OBLIGATIONS (continued) |
| |||||||
5.250%, 12/15/2019 | $ | 200 | $ | 194 | ||||
Stifel Financial | ||||||||
4.250%, 07/18/2024 | 50 | 51 | ||||||
Sumitomo Mitsui Banking | ||||||||
2.450%, 01/16/2020 | 250 | 256 | ||||||
Sumitomo Mitsui Financial Group | ||||||||
3.784%, 03/09/2026 | 100 | 109 | ||||||
2.934%, 03/09/2021 | 100 | 104 | ||||||
2.632%, 07/14/2026 | 100 | 99 | ||||||
2.058%, 07/14/2021 | 50 | 50 | ||||||
SunTrust Banks | ||||||||
2.900%, 03/03/2021 | 150 | 157 | ||||||
Svenska Handelsbanken MTN | ||||||||
2.250%, 06/17/2019 | 250 | 255 | ||||||
Synchrony Financial | ||||||||
4.250%, 08/15/2024 | 100 | 106 | ||||||
2.700%, 02/03/2020 | 100 | 101 | ||||||
2.600%, 01/15/2019 | 50 | 51 | ||||||
TD Ameritrade Holding | ||||||||
2.950%, 04/01/2022 | 100 | 104 | ||||||
TMX Finance | ||||||||
8.500%, 09/15/2018 (A) | 100 | 79 | ||||||
Toronto-Dominion Bank MTN | ||||||||
2.500%, 12/14/2020 | 150 | 155 | ||||||
2.250%, 11/05/2019 | 100 | 102 | ||||||
2.125%, 04/07/2021 | 150 | 153 | ||||||
1.950%, 01/22/2019 | 100 | 102 | ||||||
1.750%, 07/23/2018 | 50 | 51 | ||||||
1.625%, 03/13/2018 | 150 | 151 | ||||||
Travelers MTN | ||||||||
6.250%, 06/15/2037 | 200 | 283 | ||||||
3.750%, 05/15/2046 | 25 | 27 | ||||||
UBS MTN | ||||||||
2.375%, 08/14/2019 | 500 | 512 | ||||||
1.375%, 08/14/2017 | 250 | 250 | ||||||
UDR MTN | ||||||||
3.750%, 07/01/2024 | 100 | 107 | ||||||
Unum Group | ||||||||
3.875%, 11/05/2025 | 50 | 51 | ||||||
3.000%, 05/15/2021 | 30 | 31 | ||||||
US Bancorp MTN | ||||||||
3.600%, 09/11/2024 | 150 | 163 | ||||||
2.375%, 07/22/2026 | 150 | 150 | ||||||
2.200%, 04/25/2019 | 250 | 257 | ||||||
US Bank | ||||||||
1.375%, 09/11/2017 | 250 | 251 | ||||||
USI | ||||||||
7.750%, 01/15/2021 (A) | 150 | 152 | ||||||
Ventas Realty | ||||||||
2.700%, 04/01/2020 | 280 | 287 | ||||||
Vereit Operating Partnership | ||||||||
4.600%, 02/06/2024 | 50 | 52 | ||||||
| Adviser Managed Trust / Annual Report / July 31, 2016 | 29 |
SCHEDULE OF INVESTMENTS
JULY 31, 2016
Tactical Offensive Fixed Income Fund (Continued)
Description | Face Amount (Thousands) | Market Value ($ Thousands) | ||||||
CORPORATE OBLIGATIONS (continued) |
| |||||||
3.000%, 02/06/2019 | $ | 100 | $ | 101 | ||||
VEREIT Operating Partnership | ||||||||
4.875%, 06/01/2026 | 157 | 165 | ||||||
Voya Financial | ||||||||
5.650%, 05/15/2053 (B) | 100 | 97 | ||||||
2.900%, 02/15/2018 | 115 | 117 | ||||||
Walter Investment Management | ||||||||
7.875%, 12/15/2021 | 225 | 109 | ||||||
Wayne Merger | ||||||||
8.250%, 08/01/2023 (A) | 100 | 100 | ||||||
Wells Fargo MTN | ||||||||
5.625%, 12/11/2017 | 150 | 159 | ||||||
5.606%, 01/15/2044 | 150 | 186 | ||||||
5.375%, 11/02/2043 | 280 | 334 | ||||||
4.900%, 11/17/2045 | 165 | 187 | ||||||
4.300%, 07/22/2027 | 100 | 110 | ||||||
4.125%, 08/15/2023 | 250 | 271 | ||||||
4.100%, 06/03/2026 | 235 | 254 | ||||||
3.900%, 05/01/2045 | 150 | 159 | ||||||
3.000%, 02/19/2025 | 100 | 103 | ||||||
3.000%, 04/22/2026 | 250 | 257 | ||||||
2.600%, 07/22/2020 | 250 | 259 | ||||||
2.500%, 03/04/2021 | 250 | 257 | ||||||
2.150%, 01/15/2019 | 250 | 255 | ||||||
2.150%, 01/30/2020 | 400 | 408 | ||||||
1.750%, 05/24/2019 | 250 | 253 | ||||||
1.650%, 01/22/2018 | 100 | 101 | ||||||
Welltower | ||||||||
6.500%, 03/15/2041 | 70 | 91 | ||||||
4.950%, 01/15/2021 | 145 | 161 | ||||||
4.250%, 04/01/2026 | 50 | 54 | ||||||
Westpac Banking | ||||||||
2.850%, 05/13/2026 | 50 | 51 | ||||||
2.600%, 11/23/2020 | 50 | 52 | ||||||
2.250%, 01/17/2019 | 100 | 102 | ||||||
2.100%, 05/13/2021 | 50 | 51 | ||||||
1.950%, 11/23/2018 | 100 | 101 | ||||||
1.650%, 05/13/2019 | 50 | 50 | ||||||
1.600%, 01/12/2018 | 100 | 101 | ||||||
Weyerhaeuser | ||||||||
7.375%, 03/15/2032 | 100 | 136 | ||||||
WP Carey | ||||||||
4.600%, 04/01/2024 | 150 | 156 | ||||||
XLIT | ||||||||
5.500%, 03/31/2045 | 100 | 100 | ||||||
4.450%, 03/31/2025 | 100 | 102 | ||||||
|
| |||||||
| 92,629 | ||||||||
|
| |||||||
Health Care — 3.0% | ||||||||
Abbott Laboratories | ||||||||
5.125%, 04/01/2019 | 100 | 110 | ||||||
2.950%, 03/15/2025 | 100 | 104 | ||||||
Description | Face Amount (Thousands) | Market Value ($ Thousands) | ||||||
CORPORATE OBLIGATIONS (continued) |
| |||||||
2.000%, 03/15/2020 | $ | 100 | $ | 102 | ||||
AbbVie | ||||||||
4.700%, 05/14/2045 | 135 | 149 | ||||||
4.500%, 05/14/2035 | 140 | 151 | ||||||
4.450%, 05/14/2046 | 100 | 106 | ||||||
4.400%, 11/06/2042 | 150 | 159 | ||||||
4.300%, 05/14/2036 | 50 | 52 | ||||||
3.600%, 05/14/2025 | 100 | 106 | ||||||
3.200%, 11/06/2022 | 45 | 47 | ||||||
3.200%, 05/14/2026 | 100 | 103 | ||||||
2.900%, 11/06/2022 | 100 | 104 | ||||||
2.850%, 05/14/2023 | 50 | 51 | ||||||
2.500%, 05/14/2020 | 100 | 103 | ||||||
2.300%, 05/14/2021 | 100 | 102 | ||||||
1.800%, 05/14/2018 | 265 | 267 | ||||||
1.750%, 11/06/2017 | 150 | 151 | ||||||
Acadia Healthcare | ||||||||
5.625%, 02/15/2023 | 100 | 99 | ||||||
Actavis | ||||||||
3.250%, 10/01/2022 | 50 | 52 | ||||||
1.875%, 10/01/2017 | 50 | 51 | ||||||
Actavis Funding | ||||||||
4.850%, 06/15/2044 | 50 | 55 | ||||||
4.750%, 03/15/2045 | 100 | 111 | ||||||
4.550%, 03/15/2035 | 300 | 323 | ||||||
3.850%, 06/15/2024 | 100 | 106 | ||||||
3.800%, 03/15/2025 | 200 | 213 | ||||||
3.450%, 03/15/2022 | 100 | 105 | ||||||
3.000%, 03/12/2020 | 300 | 312 | ||||||
Aetna | ||||||||
4.375%, 06/15/2046 | 200 | 208 | ||||||
4.250%, 06/15/2036 | 40 | 41 | ||||||
3.200%, 06/15/2026 | 200 | 205 | ||||||
2.800%, 06/15/2023 | 25 | 26 | ||||||
2.400%, 06/15/2021 | 55 | 56 | ||||||
2.200%, 03/15/2019 | 150 | 153 | ||||||
1.900%, 06/07/2019 | 70 | 71 | ||||||
1.700%, 06/07/2018 | 30 | 30 | ||||||
1.500%, 11/15/2017 | 200 | 201 | ||||||
AMAG Pharmaceuticals | ||||||||
7.875%, 09/01/2023 (A) | 65 | 63 | ||||||
AmerisourceBergen | ||||||||
4.250%, 03/01/2045 | 25 | 27 | ||||||
3.400%, 05/15/2024 | 100 | 107 | ||||||
Amgen | ||||||||
5.150%, 11/15/2041 | 200 | 235 | ||||||
4.400%, 05/01/2045 | 125 | 136 | ||||||
3.875%, 11/15/2021 | 100 | 110 | ||||||
3.625%, 05/22/2024 | 150 | 163 | ||||||
3.125%, 05/01/2025 | 150 | 159 | ||||||
2.200%, 05/22/2019 | 150 | 154 | ||||||
| 30 | Adviser Managed Trust / Annual Report / July 31, 2016 |
Description | Face Amount (Thousands) | Market Value ($ Thousands) | ||||||
CORPORATE OBLIGATIONS (continued) |
| |||||||
Amsurg | ||||||||
5.625%, 07/15/2022 | $ | 200 | $ | 210 | ||||
Anthem | ||||||||
5.100%, 01/15/2044 | 150 | 176 | ||||||
4.650%, 01/15/2043 | 150 | 166 | ||||||
3.500%, 08/15/2024 | 150 | 158 | ||||||
3.300%, 01/15/2023 | 100 | 105 | ||||||
2.250%, 08/15/2019 | 100 | 102 | ||||||
Ascension Health | ||||||||
3.945%, 11/15/2046 | 35 | 40 | ||||||
AstraZeneca | ||||||||
6.450%, 09/15/2037 | 200 | 278 | ||||||
5.900%, 09/15/2017 | 50 | 53 | ||||||
4.375%, 11/16/2045 | 100 | 112 | ||||||
3.375%, 11/16/2025 | 100 | 107 | ||||||
2.375%, 11/16/2020 | 100 | 103 | ||||||
Baxalta | ||||||||
5.250%, 06/23/2045 | 100 | 115 | ||||||
2.875%, 06/23/2020 | 50 | 51 | ||||||
2.000%, 06/22/2018 | 100 | 100 | ||||||
Becton Dickinson | ||||||||
4.685%, 12/15/2044 | 50 | 58 | ||||||
3.125%, 11/08/2021 | 100 | 105 | ||||||
2.675%, 12/15/2019 | 100 | 104 | ||||||
1.800%, 12/15/2017 | 200 | 201 | ||||||
Biogen | ||||||||
5.200%, 09/15/2045 | 100 | 120 | ||||||
3.625%, 09/15/2022 | 200 | 215 | ||||||
Boston Scientific | ||||||||
6.000%, 01/15/2020 | 100 | 114 | ||||||
3.850%, 05/15/2025 | 100 | 107 | ||||||
Bristol-Myers Squibb | ||||||||
4.500%, 03/01/2044 | 50 | 63 | ||||||
3.250%, 08/01/2042 | 100 | 103 | ||||||
1.750%, 03/01/2019 | 50 | 51 | ||||||
Capsugel | ||||||||
7.000%, 05/15/2019 (A) | 78 | 79 | ||||||
Cardinal Health | ||||||||
2.400%, 11/15/2019 | 150 | 154 | ||||||
1.700%, 03/15/2018 | 100 | 101 | ||||||
Catholic Health Initiatives | ||||||||
2.950%, 11/01/2022 | 200 | 203 | ||||||
Celgene | ||||||||
5.000%, 08/15/2045 | 150 | 175 | ||||||
3.875%, 08/15/2025 | 150 | 163 | ||||||
3.625%, 05/15/2024 | 150 | 159 | ||||||
2.875%, 08/15/2020 | 100 | 104 | ||||||
2.250%, 05/15/2019 | 100 | 102 | ||||||
Centene | ||||||||
6.125%, 02/15/2024 | 176 | 189 | ||||||
5.625%, 02/15/2021 | 154 | 162 | ||||||
4.750%, 05/15/2022 | 190 | 196 | ||||||
Description | Face Amount (Thousands) | Market Value ($ Thousands) | ||||||
CORPORATE OBLIGATIONS (continued) |
| |||||||
CHS | ||||||||
8.000%, 11/15/2019 | $ | 250 | $ | 240 | ||||
7.125%, 07/15/2020 | 300 | 273 | ||||||
6.875%, 02/01/2022 | 500 | 430 | ||||||
Cigna | ||||||||
3.250%, 04/15/2025 | 150 | 156 | ||||||
Concordia International | ||||||||
9.500%, 10/21/2022 (A) | 175 | 160 | ||||||
7.000%, 04/15/2023 (A) | 71 | 58 | ||||||
ConvaTec Finance | ||||||||
International PIK | ||||||||
8.250%, 01/15/2019 (A) | 200 | 201 | ||||||
Covidien International Finance | ||||||||
6.550%, 10/15/2037 | 50 | 70 | ||||||
6.000%, 10/15/2017 | 50 | 53 | ||||||
CR Bard | ||||||||
3.000%, 05/15/2026 | 50 | 51 | ||||||
Crimson Merger | ||||||||
6.625%, 05/15/2022 (A) | 200 | 170 | ||||||
Danaher | ||||||||
4.375%, 09/15/2045 | 20 | 24 | ||||||
3.350%, 09/15/2025 | 20 | 22 | ||||||
2.400%, 09/15/2020 | 250 | 260 | ||||||
1.650%, 09/15/2018 | 20 | 20 | ||||||
DaVita HealthCare Partners | ||||||||
5.750%, 08/15/2022 | 100 | 106 | ||||||
5.125%, 07/15/2024 | 350 | 361 | ||||||
5.000%, 05/01/2025 | 295 | 298 | ||||||
Dignity Health | ||||||||
2.637%, 11/01/2019 | 136 | 140 | ||||||
DJO Finco | ||||||||
8.125%, 06/15/2021 (A) | 144 | 131 | ||||||
Eli Lilly | ||||||||
3.700%, 03/01/2045 | 200 | 216 | ||||||
Endo | ||||||||
6.000%, 07/15/2023 (A) | 200 | 174 | ||||||
6.000%, 02/01/2025 (A) | 200 | 173 | ||||||
Endo Finance | ||||||||
5.375%, 01/15/2023 (A) | 200 | 174 | ||||||
Envision Healthcare | ||||||||
5.125%, 07/01/2022 (A) | 100 | 102 | ||||||
Express Scripts Holding | ||||||||
4.800%, 07/15/2046 | 35 | 37 | ||||||
4.750%, 11/15/2021 | 100 | 113 | ||||||
4.500%, 02/25/2026 | 150 | 167 | ||||||
3.500%, 06/15/2024 | 50 | 52 | ||||||
3.400%, 03/01/2027 | 40 | 41 | ||||||
3.000%, 07/15/2023 | 50 | 51 | ||||||
2.250%, 06/15/2019 | 200 | 204 | ||||||
Fresenius Medical Care US Finance II | ||||||||
5.875%, 01/31/2022 (A) | 200 | 226 | ||||||
5.625%, 07/31/2019 (A) | 50 | 55 | ||||||
| Adviser Managed Trust / Annual Report / July 31, 2016 | 31 |
SCHEDULE OF INVESTMENTS
JULY 31, 2016
Tactical Offensive Fixed Income Fund (Continued)
Description | Face Amount (Thousands) | Market Value ($ Thousands) | ||||||
CORPORATE OBLIGATIONS (continued) |
| |||||||
Gilead Sciences | ||||||||
5.650%, 12/01/2041 | $ | 100 | $ | 128 | ||||
4.500%, 02/01/2045 | 225 | 254 | ||||||
4.400%, 12/01/2021 | 275 | 311 | ||||||
3.700%, 04/01/2024 | 50 | 54 | ||||||
3.650%, 03/01/2026 | 175 | 191 | ||||||
1.850%, 09/04/2018 | 100 | 101 | ||||||
GlaxoSmithKline Capital | ||||||||
6.375%, 05/15/2038 | 150 | 220 | ||||||
5.650%, 05/15/2018 | 250 | 270 | ||||||
Grifols Worldwide Operations | ||||||||
5.250%, 04/01/2022 | 150 | 156 | ||||||
HCA | ||||||||
6.500%, 02/15/2020 | 400 | 441 | ||||||
5.375%, 02/01/2025 | 450 | 468 | ||||||
5.000%, 03/15/2024 | 150 | 157 | ||||||
HealthSouth | ||||||||
5.750%, 11/01/2024 | 115 | 119 | ||||||
Hologic | ||||||||
5.250%, 07/15/2022 (A) | 153 | 162 | ||||||
Howard Hughes Medical Institute | ||||||||
3.500%, 09/01/2023 | 200 | 220 | ||||||
Humana | ||||||||
3.850%, 10/01/2024 | 200 | 215 | ||||||
inVentiv Health | ||||||||
9.000%, 01/15/2018 (A) | 100 | 103 | ||||||
inVentiv Health PIK | ||||||||
10.000%, 08/15/2018 (A) | 100 | 102 | ||||||
JLL PIK | ||||||||
8.750%, 05/01/2020 (A) | 133 | 136 | ||||||
Johnson & Johnson | ||||||||
5.150%, 07/15/2018 | 100 | 108 | ||||||
4.375%, 12/05/2033 | 200 | 246 | ||||||
3.700%, 03/01/2046 | 100 | 116 | ||||||
3.550%, 03/01/2036 | 100 | 113 | ||||||
2.450%, 12/05/2021 | 50 | 53 | ||||||
2.450%, 03/01/2026 | 50 | 52 | ||||||
2.050%, 03/01/2023 | 50 | 51 | ||||||
1.875%, 12/05/2019 | 100 | 103 | ||||||
1.650%, 03/01/2021 | 50 | 51 | ||||||
1.125%, 03/01/2019 | 30 | 30 | ||||||
Kindred Healthcare | ||||||||
8.750%, 01/15/2023 | 200 | 202 | ||||||
8.000%, 01/15/2020 | 45 | 46 | ||||||
6.375%, 04/15/2022 | 100 | 92 | ||||||
Kinetic Concepts | ||||||||
12.500%, 11/01/2019 | 50 | 49 | ||||||
10.500%, 11/01/2018 | 350 | 357 | ||||||
7.875%, 02/15/2021 (A) | 86 | 93 | ||||||
Laboratory Corp of America Holdings | ||||||||
4.700%, 02/01/2045 | 50 | 55 | ||||||
2.625%, 02/01/2020 | 150 | 154 | ||||||
Description | Face Amount (Thousands) | Market Value ($ Thousands) | ||||||
CORPORATE OBLIGATIONS (continued) |
| |||||||
2.200%, 08/23/2017 | $ | 100 | $ | 101 | ||||
Life Technologies | ||||||||
6.000%, 03/01/2020 | 100 | 113 | ||||||
LifePoint Health | ||||||||
5.875%, 12/01/2023 | 50 | 53 | ||||||
5.500%, 12/01/2021 | 150 | 157 | ||||||
5.375%, 05/01/2024 (A) | 145 | 148 | ||||||
Mallinckrodt International Finance | ||||||||
5.750%, 08/01/2022 (A) | 100 | 98 | ||||||
5.625%, 10/15/2023 (A) | 150 | 144 | ||||||
4.875%, 04/15/2020 (A) | 129 | 129 | ||||||
McKesson | ||||||||
3.796%, 03/15/2024 | 100 | 109 | ||||||
2.284%, 03/15/2019 | 200 | 204 | ||||||
MEDNAX | ||||||||
5.250%, 12/01/2023 (A) | 175 | 182 | ||||||
Medtronic | ||||||||
4.625%, 03/15/2044 | 50 | 61 | ||||||
4.625%, 03/15/2045 | 200 | 245 | ||||||
4.375%, 03/15/2035 | 250 | 288 | ||||||
3.500%, 03/15/2025 | 350 | 383 | ||||||
2.750%, 04/01/2023 | 100 | 105 | ||||||
2.500%, 03/15/2020 | 200 | 208 | ||||||
1.375%, 04/01/2018 | 100 | 100 | ||||||
Memorial Sloan-Kettering Cancer Center | ||||||||
4.200%, 07/01/2055 | 50 | 57 | ||||||
Merck | ||||||||
6.550%, 09/15/2037 | 50 | 73 | ||||||
4.150%, 05/18/2043 | 100 | 115 | ||||||
3.700%, 02/10/2045 | 50 | 53 | ||||||
2.800%, 05/18/2023 | 100 | 106 | ||||||
2.750%, 02/10/2025 | 300 | 316 | ||||||
2.350%, 02/10/2022 | 100 | 103 | ||||||
Merck Sharp & Dohme | ||||||||
5.000%, 06/30/2019 | 100 | 111 | ||||||
Molina Healthcare | ||||||||
5.375%, 11/15/2022 (A) | 125 | 128 | ||||||
MPH Acquisition Holdings | ||||||||
7.125%, 06/01/2024 (A) | 170 | 181 | ||||||
Mylan | ||||||||
5.250%, 06/15/2046 (A) | 65 | 73 | ||||||
3.950%, 06/15/2026 | 100 | 104 | ||||||
3.150%, 06/15/2021 (A) | 100 | 103 | ||||||
2.600%, 06/24/2018 | 100 | 102 | ||||||
2.500%, 06/07/2019 (A) | 60 | 61 | ||||||
Novartis Capital | ||||||||
4.400%, 05/06/2044 | 150 | 183 | ||||||
4.000%, 11/20/2045 | 100 | 116 | ||||||
3.400%, 05/06/2024 | 100 | 110 | ||||||
3.000%, 11/20/2025 | 100 | 108 | ||||||
Novartis Securities Investment | ||||||||
5.125%, 02/10/2019 | 100 | 110 | ||||||
| 32 | Adviser Managed Trust / Annual Report / July 31, 2016 |
Description | Face Amount (Thousands) | Market Value ($ Thousands) | ||||||
CORPORATE OBLIGATIONS (continued) |
| |||||||
Perrigo | ||||||||
2.300%, 11/08/2018 | $ | 200 | $ | 201 | ||||
Pfizer | ||||||||
7.200%, 03/15/2039 | 150 | 232 | ||||||
6.200%, 03/15/2019 | 325 | 367 | ||||||
4.400%, 05/15/2044 | 50 | 58 | ||||||
3.400%, 05/15/2024 | 100 | 110 | ||||||
2.750%, 06/03/2026 | 50 | 52 | ||||||
1.950%, 06/03/2021 | 50 | 51 | ||||||
1.450%, 06/03/2019 | 50 | 50 | ||||||
1.200%, 06/01/2018 | 50 | 50 | ||||||
Quest Diagnostics | ||||||||
3.500%, 03/30/2025 | 200 | 210 | ||||||
Quintiles Transnational | ||||||||
4.875%, 05/15/2023 (A) | 140 | 143 | ||||||
RegionalCare Hospital Partners Holdings | ||||||||
8.250%, 05/01/2023 (A) | 112 | 117 | ||||||
Sanofi | ||||||||
4.000%, 03/29/2021 | 50 | 56 | ||||||
1.250%, 04/10/2018 | 200 | 201 | ||||||
Select Medical | ||||||||
6.375%, 06/01/2021 | 100 | 99 | ||||||
St. Jude Medical | ||||||||
4.750%, 04/15/2043 | 100 | 112 | ||||||
Stryker | ||||||||
4.625%, 03/15/2046 | 30 | 35 | ||||||
3.500%, 03/15/2026 | 25 | 27 | ||||||
3.375%, 05/15/2024 | 100 | 106 | ||||||
3.375%, 11/01/2025 | 200 | 212 | ||||||
2.000%, 03/08/2019 | 30 | 31 | ||||||
Team Health | ||||||||
7.250%, 12/15/2023 (A) | 75 | 82 | ||||||
Tenet Healthcare | ||||||||
8.125%, 04/01/2022 | 350 | 362 | ||||||
6.750%, 06/15/2023 | 428 | 412 | ||||||
6.000%, 10/01/2020 | 300 | 317 | ||||||
Teva Pharmaceutical Finance | ||||||||
2.950%, 12/18/2022 | 100 | 103 | ||||||
Teva Pharmaceutical Finance IV BV | ||||||||
3.650%, 11/10/2021 | 100 | 107 | ||||||
Teva Pharmaceutical Finance Netherlands III BV | ||||||||
4.100%, 10/01/2046 | 25 | 26 | ||||||
3.150%, 10/01/2026 | 55 | 56 | ||||||
2.800%, 07/21/2023 | 95 | 97 | ||||||
2.200%, 07/21/2021 | 75 | 75 | ||||||
Teva Pharmaceuticals | ||||||||
1.700%, 07/19/2019 | 40 | 40 | ||||||
Thermo Fisher Scientific | ||||||||
4.150%, 02/01/2024 | 150 | 165 | ||||||
3.600%, 08/15/2021 | 100 | 106 | ||||||
3.150%, 01/15/2023 | 100 | 103 | ||||||
Description | Face Amount (Thousands) | Market Value ($ Thousands) | ||||||
CORPORATE OBLIGATIONS (continued) |
| |||||||
UnitedHealth Group | ||||||||
6.875%, 02/15/2038 | $ | 100 | $ | 150 | ||||
6.000%, 02/15/2018 | 200 | 215 | ||||||
4.750%, 07/15/2045 | 50 | 62 | ||||||
4.625%, 07/15/2035 | 200 | 238 | ||||||
4.375%, 03/15/2042 | 150 | 174 | ||||||
3.950%, 10/15/2042 | 100 | 110 | ||||||
3.875%, 10/15/2020 | 100 | 109 | ||||||
3.750%, 07/15/2025 | 50 | 56 | ||||||
2.700%, 07/15/2020 | 130 | 136 | ||||||
1.900%, 07/16/2018 | 60 | 61 | ||||||
Universal Hospital Services | ||||||||
7.625%, 08/15/2020 | 100 | 93 | ||||||
Valeant Pharmaceuticals International | ||||||||
6.375%, 10/15/2020 (A) | 250 | 226 | ||||||
6.125%, 04/15/2025 (A) | 500 | 415 | ||||||
5.875%, 05/15/2023 (A) | 675 | 562 | ||||||
Vizient | ||||||||
10.375%, 03/01/2024 (A) | 80 | 90 | ||||||
WellCare Health Plans | ||||||||
5.750%, 11/15/2020 | 125 | 129 | ||||||
Wyeth | ||||||||
5.950%, 04/01/2037 | 100 | 134 | ||||||
Zimmer Biomet Holdings | ||||||||
4.450%, 08/15/2045 | 100 | 107 | ||||||
4.250%, 08/15/2035 | 100 | 105 | ||||||
3.550%, 04/01/2025 | 100 | 105 | ||||||
2.700%, 04/01/2020 | 100 | 102 | ||||||
Zoetis | ||||||||
4.500%, 11/13/2025 | 50 | 56 | ||||||
3.450%, 11/13/2020 | 25 | 26 | ||||||
1.875%, 02/01/2018 | 100 | 100 | ||||||
|
| |||||||
| 34,504 | ||||||||
|
| |||||||
Industrials — 2.7% | ||||||||
3M MTN | ||||||||
5.700%, 03/15/2037 | 100 | 138 | ||||||
3.000%, 08/07/2025 | 50 | 55 | ||||||
1.375%, 08/07/2018 | 50 | 50 | ||||||
ABB Finance | ||||||||
2.875%, 05/08/2022 | 100 | 105 | ||||||
ACCO Brands | ||||||||
6.750%, 04/30/2020 | 100 | 105 | ||||||
Accudyne Industries Borrower | ||||||||
7.750%, 12/15/2020 (A) | 50 | 42 | ||||||
ADS Waste Holdings | ||||||||
8.250%, 10/01/2020 | 50 | 52 | ||||||
ADT | ||||||||
6.250%, 10/15/2021 | 300 | 327 | ||||||
4.875%, 07/15/2032 (A) | 100 | 83 | ||||||
3.500%, 07/15/2022 | 100 | 94 | ||||||
| Adviser Managed Trust / Annual Report / July 31, 2016 | 33 |
SCHEDULE OF INVESTMENTS
JULY 31, 2016
Tactical Offensive Fixed Income Fund (Continued)
Description | Face Amount | Market Value | ||||||
CORPORATE OBLIGATIONS (continued) |
| |||||||
AECOM | ||||||||
5.875%, 10/15/2024 | $ | 50 | $ | 54 | ||||
5.750%, 10/15/2022 | 200 | 210 | ||||||
AerCap Ireland Capital | ||||||||
4.625%, 10/30/2020 | 150 | 161 | ||||||
4.500%, 05/15/2021 | 150 | 160 | ||||||
3.950%, 02/01/2022 | 175 | 183 | ||||||
3.750%, 05/15/2019 | 175 | 181 | ||||||
Ahern Rentals | ||||||||
7.375%, 05/15/2023 (A) | 138 | 97 | ||||||
Air Lease | ||||||||
3.750%, 02/01/2022 | 100 | 104 | ||||||
3.375%, 06/01/2021 | 35 | 36 | ||||||
2.625%, 09/04/2018 | 100 | 101 | ||||||
Aircastle | ||||||||
6.250%, 12/01/2019 | 100 | 110 | ||||||
5.500%, 02/15/2022 | 100 | 107 | ||||||
Algeco Scotsman Global Finance | ||||||||
8.500%, 10/15/2018 (A) | 200 | 174 | ||||||
American Airlines Group | ||||||||
5.500%, 10/01/2019 (A) | 150 | 153 | ||||||
4.625%, 03/01/2020 (A) | 100 | 98 | ||||||
American Airlines Pass-Through Trust, Ser 2015-2, Cl AA | ||||||||
3.600%, 09/22/2027 | 100 | 108 | ||||||
Amsted Industries | ||||||||
5.000%, 03/15/2022 (A) | 50 | 50 | ||||||
Avis Budget Car Rental | ||||||||
5.500%, 04/01/2023 | 150 | 149 | ||||||
BlueLine Rental Finance | ||||||||
7.000%, 02/01/2019 (A) | 100 | 92 | ||||||
Boeing | ||||||||
4.875%, 02/15/2020 | 100 | 113 | ||||||
3.500%, 03/01/2045 | 100 | 105 | ||||||
0.950%, 05/15/2018 | 200 | 200 | ||||||
Bombardier | ||||||||
7.500%, 03/15/2025 (A) | 260 | 228 | ||||||
6.125%, 01/15/2023 (A) | 100 | 87 | ||||||
6.000%, 10/15/2022 (A) | 250 | 220 | ||||||
Brand Energy & Infrastructure Services | ||||||||
8.500%, 12/01/2021 (A) | 100 | 99 | ||||||
Builders FirstSource | ||||||||
7.625%, 06/01/2021 (A) | 94 | 100 | ||||||
Burlington Northern Santa Fe | ||||||||
4.900%, 04/01/2044 | 150 | 187 | ||||||
4.700%, 10/01/2019 | 100 | 111 | ||||||
4.550%, 09/01/2044 | 100 | 120 | ||||||
4.150%, 04/01/2045 | 150 | 170 | ||||||
3.850%, 09/01/2023 | 200 | 224 | ||||||
3.400%, 09/01/2024 | 150 | 164 | ||||||
3.000%, 04/01/2025 | 100 | 106 | ||||||
Description | Face Amount | Market Value | ||||||
CORPORATE OBLIGATIONS (continued) |
| |||||||
Canadian National Railway | ||||||||
4.500%, 11/07/2043 | $ | 50 | $ | 60 | ||||
3.200%, 08/02/2046 | 100 | 100 | ||||||
2.950%, 11/21/2024 | 150 | 161 | ||||||
Canadian Pacific Railway | ||||||||
9.450%, 08/01/2021 | 75 | 99 | ||||||
6.125%, 09/15/2115 | 30 | 38 | ||||||
4.800%, 09/15/2035 | 20 | 23 | ||||||
2.900%, 02/01/2025 | 200 | 205 | ||||||
Caterpillar | ||||||||
4.300%, 05/15/2044 | 100 | 114 | ||||||
3.900%, 05/27/2021 | 100 | 111 | ||||||
3.803%, 08/15/2042 | 100 | 104 | ||||||
3.400%, 05/15/2024 | 150 | 163 | ||||||
Caterpillar Financial Services MTN | ||||||||
7.150%, 02/15/2019 | 100 | 115 | ||||||
2.100%, 06/09/2019 | 200 | 205 | ||||||
1.250%, 08/18/2017 | 100 | 100 | ||||||
Cenveo | ||||||||
6.000%, 08/01/2019 (A) | 100 | 87 | ||||||
Clean Harbors | ||||||||
5.250%, 08/01/2020 | 100 | 103 | ||||||
5.125%, 06/01/2021 | 150 | 153 | ||||||
CNH Industrial Capital | ||||||||
4.375%, 11/06/2020 | 100 | 103 | ||||||
3.875%, 07/16/2018 | 100 | 101 | ||||||
CSX | ||||||||
4.100%, 03/15/2044 | 75 | 82 | ||||||
3.700%, 10/30/2020 | 128 | 137 | ||||||
3.400%, 08/01/2024 | 150 | 162 | ||||||
Deere | ||||||||
3.900%, 06/09/2042 | 100 | 111 | ||||||
2.600%, 06/08/2022 | 50 | 52 | ||||||
DigitalGlobe | ||||||||
5.250%, 02/01/2021 (A) | 100 | 97 | ||||||
Dover | ||||||||
5.375%, 03/01/2041 | 100 | 129 | ||||||
Eaton | ||||||||
4.150%, 11/02/2042 | 100 | 111 | ||||||
4.000%, 11/02/2032 | 100 | 108 | ||||||
2.750%, 11/02/2022 | 150 | 155 | ||||||
Emerson Electric | ||||||||
5.000%, 04/15/2019 | 70 | 77 | ||||||
2.625%, 02/15/2023 | 125 | 130 | ||||||
Equifax | ||||||||
2.300%, 06/01/2021 | 50 | 51 | ||||||
FedEx | ||||||||
5.100%, 01/15/2044 | 50 | 60 | ||||||
4.550%, 04/01/2046 | 100 | 113 | ||||||
4.000%, 01/15/2024 | 200 | 223 | ||||||
3.900%, 02/01/2035 | 100 | 106 | ||||||
| 34 | Adviser Managed Trust / Annual Report / July 31, 2016 |
Description | Face Amount | Market Value | ||||||
CORPORATE OBLIGATIONS (continued) |
| |||||||
Florida East Coast Holdings | ||||||||
6.750%, 05/01/2019 (A) | $ | 200 | $ | 205 | ||||
Fluor | ||||||||
3.500%, 12/15/2024 | 200 | 214 | ||||||
Gardner Denver | ||||||||
6.875%, 08/15/2021 (A) | 50 | 46 | ||||||
Gates Global | ||||||||
6.000%, 07/15/2022 (A) | 200 | 182 | ||||||
GATX | ||||||||
2.600%, 03/30/2020 | 100 | 100 | ||||||
GCP Applied Technologies | ||||||||
9.500%, 02/01/2023 (A) | 100 | 113 | ||||||
GE Capital International Funding | ||||||||
4.418%, 11/15/2035 | 751 | 865 | ||||||
2.342%, 11/15/2020 | 1,000 | 1,037 | ||||||
General Cable | ||||||||
5.750%, 10/01/2022 | 100 | 94 | ||||||
General Dynamics | ||||||||
2.250%, 11/15/2022 | 100 | 103 | ||||||
1.000%, 11/15/2017 | 50 | 50 | ||||||
General Electric MTN | ||||||||
6.875%, 01/10/2039 | 115 | 177 | ||||||
6.750%, 03/15/2032 | 101 | 143 | ||||||
5.875%, 01/14/2038 | 200 | 275 | ||||||
5.300%, 02/11/2021 | 125 | 145 | ||||||
5.250%, 12/06/2017 | 200 | 211 | ||||||
4.500%, 03/11/2044 | 200 | 238 | ||||||
2.700%, 10/09/2022 | 250 | 263 | ||||||
GFL Environmental | ||||||||
9.875%, 02/01/2021 (A) | 130 | 141 | ||||||
Griffon | ||||||||
5.250%, 03/01/2022 | 100 | 100 | ||||||
H&E Equipment Services | ||||||||
7.000%, 09/01/2022 | 150 | 156 | ||||||
HD Supply | ||||||||
7.500%, 07/15/2020 | 150 | 157 | ||||||
5.750%, 04/15/2024 (A) | 200 | 213 | ||||||
5.250%, 12/15/2021 (A) | 135 | 143 | ||||||
Herc Rentals | ||||||||
7.750%, 06/01/2024 (A) | 67 | 68 | ||||||
7.500%, 06/01/2022 (A) | 230 | 233 | ||||||
Hertz | ||||||||
5.875%, 10/15/2020 | 200 | 206 | ||||||
Honeywell International | ||||||||
5.300%, 03/01/2018 | 200 | 214 | ||||||
Hubbell | ||||||||
3.350%, 03/01/2026 | 50 | 53 | ||||||
Huntington Ingalls Industries | ||||||||
5.000%, 11/15/2025 (A) | 200 | 213 | ||||||
Icahn Enterprises | ||||||||
6.000%, 08/01/2020 | 250 | 249 | ||||||
5.875%, 02/01/2022 | 200 | 191 | ||||||
Description | Face Amount | Market Value | ||||||
CORPORATE OBLIGATIONS (continued) |
| |||||||
4.875%, 03/15/2019 | $ | 200 | $ | 199 | ||||
IHS Markit | ||||||||
5.000%, 11/01/2022 (A) | 110 | 113 | ||||||
Illinois Tool Works | ||||||||
3.500%, 03/01/2024 | 100 | 111 | ||||||
1.950%, 03/01/2019 | 100 | 102 | ||||||
Ingersoll-Rand Global Holding | ||||||||
5.750%, 06/15/2043 | 100 | 127 | ||||||
4.250%, 06/15/2023 | 150 | 166 | ||||||
International Lease Finance | ||||||||
7.125%, 09/01/2018 (A) | 500 | 554 | ||||||
JB Hunt Transport Services | ||||||||
3.300%, 08/15/2022 | 50 | 52 | ||||||
John Deere Capital MTN | ||||||||
3.350%, 06/12/2024 | 200 | 217 | ||||||
2.550%, 01/08/2021 | 100 | 104 | ||||||
1.350%, 01/16/2018 | 250 | 252 | ||||||
Joy Global | ||||||||
5.125%, 10/15/2021 | 100 | 108 | ||||||
Kansas City Southern | ||||||||
4.950%, 08/15/2045 | 100 | 115 | ||||||
KLX | ||||||||
5.875%, 12/01/2022 (A) | 245 | 248 | ||||||
Koninklijke Philips | ||||||||
3.750%, 03/15/2022 | 150 | 162 | ||||||
L-3 Communications | ||||||||
5.200%, 10/15/2019 | 100 | 110 | ||||||
4.950%, 02/15/2021 | 100 | 111 | ||||||
Lockheed Martin | ||||||||
4.700%, 05/15/2046 | 100 | 121 | ||||||
4.500%, 05/15/2036 | 100 | 117 | ||||||
4.250%, 11/15/2019 | 100 | 109 | ||||||
4.070%, 12/15/2042 | 150 | 163 | ||||||
3.800%, 03/01/2045 | 100 | 106 | ||||||
3.550%, 01/15/2026 | 100 | 110 | ||||||
2.900%, 03/01/2025 | 25 | 26 | ||||||
2.500%, 11/23/2020 | 100 | 104 | ||||||
Masco | ||||||||
4.450%, 04/01/2025 | 145 | 154 | ||||||
4.375%, 04/01/2026 | 70 | 75 | ||||||
Navios Maritime Holdings | ||||||||
7.375%, 01/15/2022 (A) | 100 | 49 | ||||||
Nielsen Finance | ||||||||
5.000%, 04/15/2022 (A) | 450 | 464 | ||||||
Nielsen Luxembourg | ||||||||
5.500%, 10/01/2021 (A) | 100 | 104 | ||||||
Norfolk Southern | ||||||||
4.450%, 06/15/2045 | 100 | 115 | ||||||
3.950%, 10/01/2042 | 100 | 107 | ||||||
3.850%, 01/15/2024 | 200 | 221 | ||||||
2.900%, 06/15/2026 | 35 | 36 | ||||||
| Adviser Managed Trust / Annual Report / July 31, 2016 | 35 |
SCHEDULE OF INVESTMENTS
JULY 31, 2016
Tactical Offensive Fixed Income Fund (Continued)
Description | Face Amount | Market Value | ||||||
CORPORATE OBLIGATIONS (continued) |
| |||||||
Northrop Grumman | ||||||||
4.750%, 06/01/2043 | $ | 25 | $ | 31 | ||||
3.850%, 04/15/2045 | 100 | 108 | ||||||
3.250%, 08/01/2023 | 150 | 161 | ||||||
1.750%, 06/01/2018 | 50 | 50 | ||||||
Owens Corning | ||||||||
4.200%, 12/01/2024 | 100 | 106 | ||||||
PACCAR Financial | ||||||||
1.400%, 05/18/2018 | 65 | 66 | ||||||
1.300%, 05/10/2019 | 45 | 45 | ||||||
Parker-Hannifin MTN | ||||||||
4.200%, 11/21/2034 | 135 | 154 | ||||||
Pentair Finance | ||||||||
1.875%, 09/15/2017 | 100 | 100 | ||||||
Ply Gem Industries | ||||||||
6.500%, 02/01/2022 | 150 | 152 | ||||||
Precision Castparts | ||||||||
2.500%, 01/15/2023 | 100 | 105 | ||||||
1.250%, 01/15/2018 | 100 | 100 | ||||||
Raytheon | ||||||||
3.125%, 10/15/2020 | 100 | 107 | ||||||
2.500%, 12/15/2022 | 100 | 105 | ||||||
Republic Services | ||||||||
3.550%, 06/01/2022 | 150 | 162 | ||||||
2.900%, 07/01/2026 | 30 | 31 | ||||||
Rexel | ||||||||
5.250%, 06/15/2020 (A) | 100 | 104 | ||||||
Roper Technologies | ||||||||
3.850%, 12/15/2025 | 25 | 27 | ||||||
3.000%, 12/15/2020 | 100 | 103 | ||||||
Ryder System MTN | ||||||||
2.875%, 09/01/2020 | 50 | 51 | ||||||
2.650%, 03/02/2020 | 100 | 102 | ||||||
Safway Group Holding | ||||||||
7.000%, 05/15/2018 (A) | 100 | 102 | ||||||
Schaeffler Finance MTN | ||||||||
4.250%, 05/15/2021 (A) | 400 | 410 | ||||||
Sensata Technologies | ||||||||
5.000%, 10/01/2025 (A) | 40 | 41 | ||||||
4.875%, 10/15/2023 (A) | 100 | 103 | ||||||
Sensata Technologies UK Financing | ||||||||
6.250%, 02/15/2026 (A) | 200 | 216 | ||||||
Signode Industrial Group | ||||||||
6.375%, 05/01/2022 (A) | 150 | 149 | ||||||
Southwest Airlines | ||||||||
2.750%, 11/06/2019 | 100 | 104 | ||||||
Spirit AeroSystems | ||||||||
3.850%, 06/15/2026 | 25 | 26 | ||||||
Stanley Black & Decker | ||||||||
5.750%, 12/15/2053 (B) | 100 | 106 | ||||||
2.900%, 11/01/2022 | 100 | 106 | ||||||
Description | Face Amount | Market Value | ||||||
CORPORATE OBLIGATIONS (continued) |
| |||||||
Terex | ||||||||
6.000%, 05/15/2021 | $ | 300 | $ | 305 | ||||
Textron | ||||||||
7.250%, 10/01/2019 | 125 | 145 | ||||||
TransDigm | ||||||||
6.500%, 07/15/2024 | 350 | 364 | ||||||
6.375%, 06/15/2026 (A) | 77 | 79 | ||||||
5.500%, 10/15/2020 | 100 | 102 | ||||||
Tyco International Finance | ||||||||
3.900%, 02/14/2026 | 200 | 218 | ||||||
Union Pacific | ||||||||
4.821%, 02/01/2044 | 50 | 62 | ||||||
4.163%, 07/15/2022 | 100 | 113 | ||||||
4.050%, 03/01/2046 | 150 | 170 | ||||||
3.875%, 02/01/2055 | 100 | 105 | ||||||
2.250%, 02/15/2019 | 125 | 128 | ||||||
United Airlines 2016-1 Class A Pass Through Trust | ||||||||
3.450%, 07/07/2028 | 30 | 31 | ||||||
United Airlines 2016-1 Class AA Pass Through Trust | ||||||||
3.100%, 07/07/2028 | 50 | 52 | ||||||
United Airlines Pass-Through Trust, Cl AA | ||||||||
3.450%, 12/01/2027 | 50 | 53 | ||||||
United Airlines Pass-Through Trust, Cl A | ||||||||
4.300%, 08/15/2025 | 139 | 150 | ||||||
United Parcel Service | ||||||||
6.200%, 01/15/2038 | 150 | 221 | ||||||
3.125%, 01/15/2021 | 100 | 107 | ||||||
United Rentals North America | ||||||||
6.125%, 06/15/2023 | 100 | 104 | ||||||
4.625%, 07/15/2023 | 435 | 444 | ||||||
United Technologies | ||||||||
6.125%, 07/15/2038 | 200 | 279 | ||||||
5.375%, 12/15/2017 | 100 | 106 | ||||||
4.500%, 04/15/2020 | 100 | 112 | ||||||
4.500%, 06/01/2042 | 100 | 119 | ||||||
4.150%, 05/15/2045 | 100 | 114 | ||||||
3.100%, 06/01/2022 | 250 | 268 | ||||||
US Airways Pass-Through Trust, Cl A | ||||||||
5.900%, 10/01/2024 | 160 | 185 | ||||||
Verisk Analytics | ||||||||
5.500%, 06/15/2045 | 100 | 108 | ||||||
Waste Management | ||||||||
6.100%, 03/15/2018 | 100 | 108 | ||||||
4.750%, 06/30/2020 | 100 | 112 | ||||||
4.100%, 03/01/2045 | 50 | 57 | ||||||
3.125%, 03/01/2025 | 100 | 106 | ||||||
WESCO Distribution | ||||||||
5.375%, 12/15/2021 | 100 | 103 | ||||||
West | ||||||||
5.375%, 07/15/2022 (A) | 200 | 186 | ||||||
| 36 | Adviser Managed Trust / Annual Report / July 31, 2016 |
Description | Face Amount | Market Value | ||||||
CORPORATE OBLIGATIONS (continued) |
| |||||||
Wise Metals Group | ||||||||
8.750%, 12/15/2018 (A) | $ | 100 | $ | 95 | ||||
WW Grainger | ||||||||
4.600%, 06/15/2045 | 50 | 60 | ||||||
XPO Logistics | ||||||||
7.875%, 09/01/2019 (A) | 138 | 143 | ||||||
6.500%, 06/15/2022 (A) | 255 | 253 | ||||||
|
| |||||||
| 30,292 | ||||||||
|
| |||||||
Information Technology — 2.3% |
| |||||||
Adobe Systems | ||||||||
3.250%, 02/01/2025 | 150 | 159 | ||||||
Advanced Micro Devices | ||||||||
6.750%, 03/01/2019 | 100 | 100 | ||||||
Alibaba Group Holding | ||||||||
3.600%, 11/28/2024 | 200 | 208 | ||||||
2.500%, 11/28/2019 | 200 | 203 | ||||||
Alphabet | ||||||||
3.625%, 05/19/2021 | 100 | 110 | ||||||
Amkor Technology | ||||||||
6.375%, 10/01/2022 | 100 | 101 | ||||||
Analog Devices | ||||||||
3.900%, 12/15/2025 | 100 | 107 | ||||||
Apple | ||||||||
4.650%, 02/23/2046 | 200 | 228 | ||||||
4.500%, 02/23/2036 | 50 | 57 | ||||||
4.375%, 05/13/2045 | 150 | 164 | ||||||
3.850%, 05/04/2043 | 100 | 102 | ||||||
3.850%, 08/04/2046 | 35 | 35 | ||||||
3.450%, 05/06/2024 | 150 | 163 | ||||||
3.450%, 02/09/2045 | 100 | 95 | ||||||
3.250%, 02/23/2026 | 300 | 321 | ||||||
2.850%, 05/06/2021 | 175 | 185 | ||||||
2.850%, 02/23/2023 | 150 | 158 | ||||||
2.700%, 05/13/2022 | 200 | 210 | ||||||
2.500%, 02/09/2025 | 75 | 76 | ||||||
2.250%, 02/23/2021 | 50 | 52 | ||||||
1.700%, 02/22/2019 | 20 | 20 | ||||||
1.550%, 02/07/2020 | 200 | 202 | ||||||
1.550%, 08/04/2021 | 100 | 100 | ||||||
1.100%, 08/02/2019 | 100 | 100 | ||||||
1.000%, 05/03/2018 | 200 | 200 | ||||||
Applied Materials | ||||||||
5.100%, 10/01/2035 | 35 | 41 | ||||||
3.900%, 10/01/2025 | 35 | 39 | ||||||
2.625%, 10/01/2020 | 50 | 52 | ||||||
Arrow Electronics | ||||||||
4.000%, 04/01/2025 | 100 | 103 | ||||||
Autodesk | ||||||||
4.375%, 06/15/2025 | 100 | 105 | ||||||
Automatic Data Processing | ||||||||
3.375%, 09/15/2025 | 25 | 28 | ||||||
Description | Face Amount | Market Value | ||||||
CORPORATE OBLIGATIONS (continued) |
| |||||||
2.250%, 09/15/2020 | $ | 50 | $ | 52 | ||||
Avaya | ||||||||
10.500%, 03/01/2021 (A) | 200 | 54 | ||||||
Avnet | ||||||||
4.625%, 04/15/2026 | 25 | 26 | ||||||
Baidu | ||||||||
2.750%, 06/09/2019 | 200 | 203 | ||||||
Belden | ||||||||
5.500%, 09/01/2022 (A) | 50 | 52 | ||||||
BMC Software Finance | ||||||||
8.125%, 07/15/2021 (A) | 250 | 204 | ||||||
Boxer Parent PIK | ||||||||
9.000%, 10/15/2019 (A) | 100 | 85 | ||||||
CA | ||||||||
3.600%, 08/01/2020 | 50 | 52 | ||||||
CDW | ||||||||
6.000%, 08/15/2022 | 50 | 53 | ||||||
5.500%, 12/01/2024 | 75 | 78 | ||||||
5.000%, 09/01/2023 | 131 | 134 | ||||||
Cisco Systems | ||||||||
5.500%, 01/15/2040 | 100 | 134 | ||||||
4.950%, 02/15/2019 | 100 | 110 | ||||||
4.450%, 01/15/2020 | 300 | 332 | ||||||
2.950%, 02/28/2026 | 200 | 215 | ||||||
2.200%, 02/28/2021 | 50 | 51 | ||||||
1.650%, 06/15/2018 | 100 | 101 | ||||||
1.600%, 02/28/2019 | 100 | 101 | ||||||
1.400%, 02/28/2018 | 100 | 101 | ||||||
CommScope | ||||||||
5.000%, 06/15/2021 (A) | 150 | 156 | ||||||
CommScope Technologies Finance | ||||||||
6.000%, 06/15/2025 (A) | 307 | 324 | ||||||
Corning | ||||||||
1.500%, 05/08/2018 | 100 | 100 | ||||||
Diamond 1 Finance | ||||||||
8.350%, 07/15/2046 (A) | 100 | 114 | ||||||
8.100%, 07/15/2036 (A) | 150 | 171 | ||||||
7.125%, 06/15/2024 (A) | 267 | 287 | ||||||
6.020%, 06/15/2026 (A) | 200 | 214 | ||||||
5.875%, 06/15/2021 (A) | 271 | 283 | ||||||
5.450%, 06/15/2023 (A) | 115 | 122 | ||||||
4.420%, 06/15/2021 (A) | 200 | 209 | ||||||
3.480%, 06/01/2019 (A) | 200 | 206 | ||||||
eBay | ||||||||
3.450%, 08/01/2024 | 50 | 52 | ||||||
2.600%, 07/15/2022 | 100 | 101 | ||||||
2.200%, 08/01/2019 | 100 | 101 | ||||||
Electronic Arts | ||||||||
4.800%, 03/01/2026 | 50 | 55 | ||||||
3.700%, 03/01/2021 | 50 | 53 | ||||||
EMC | ||||||||
2.650%, 06/01/2020 | 100 | 99 | ||||||
| Adviser Managed Trust / Annual Report / July 31, 2016 | 37 |
SCHEDULE OF INVESTMENTS
JULY 31, 2016
Tactical Offensive Fixed Income Fund (Continued)
Description | Face Amount | Market Value | ||||||
CORPORATE OBLIGATIONS (continued) |
| |||||||
1.875%, 06/01/2018 | $ | 125 | $ | 124 | ||||
Fidelity National Information Services | ||||||||
3.625%, 10/15/2020 | 200 | 212 | ||||||
3.500%, 04/15/2023 | 100 | 105 | ||||||
First Data | ||||||||
7.000%, 12/01/2023 (A) | 565 | 581 | ||||||
5.750%, 01/15/2024 (A) | 400 | 402 | ||||||
5.000%, 01/15/2024 (A) | 250 | 252 | ||||||
Fiserv | ||||||||
4.625%, 10/01/2020 | 100 | 110 | ||||||
Flextronics International | ||||||||
4.750%, 06/15/2025 | 50 | 53 | ||||||
Gogo Intermediate Holdings | ||||||||
12.500%, 07/01/2022 (A) | 90 | 89 | ||||||
Harris | ||||||||
4.854%, 04/27/2035 | 35 | 39 | ||||||
3.832%, 04/27/2025 | 50 | 54 | ||||||
Hewlett Packard Enterprise | ||||||||
6.350%, 10/15/2045 (A) | 50 | 50 | ||||||
6.200%, 10/15/2035 (A) | 50 | 51 | ||||||
4.900%, 10/15/2025 (A) | 100 | 107 | ||||||
4.400%, 10/15/2022 (A) | 250 | 271 | ||||||
3.600%, 10/15/2020 (A) | 50 | 53 | ||||||
2.850%, 10/05/2018 (A) | 100 | 102 | ||||||
HP | ||||||||
4.300%, 06/01/2021 | 250 | 270 | ||||||
Hughes Satellite Systems | ||||||||
6.625%, 08/01/2026 (A) | 85 | 84 | ||||||
5.250%, 08/01/2026 (A) | 105 | 105 | ||||||
IMS Health | ||||||||
6.000%, 11/01/2020 (A) | 50 | 51 | ||||||
Infor Software Parent PIK | ||||||||
7.125%, 05/01/2021 (A) | 150 | 141 | ||||||
Infor US | ||||||||
6.500%, 05/15/2022 | 301 | 298 | ||||||
Informatica | ||||||||
7.125%, 07/15/2023 (A) | 151 | 149 | ||||||
Ingram Micro | ||||||||
4.950%, 12/15/2024 | 100 | 102 | ||||||
Intel | ||||||||
4.900%, 07/29/2045 | 40 | 48 | ||||||
4.800%, 10/01/2041 | 100 | 118 | ||||||
4.250%, 12/15/2042 | 150 | 165 | ||||||
3.700%, 07/29/2025 | 45 | 50 | ||||||
3.300%, 10/01/2021 | 100 | 109 | ||||||
2.700%, 12/15/2022 | 50 | 52 | ||||||
2.600%, 05/19/2026 | 150 | 154 | ||||||
2.450%, 07/29/2020 | 185 | 193 | ||||||
1.350%, 12/15/2017 | 100 | 101 | ||||||
International Business Machines | ||||||||
7.625%, 10/15/2018 | 200 | 228 | ||||||
5.700%, 09/14/2017 | 100 | 105 | ||||||
Description | Face Amount | Market Value | ||||||
CORPORATE OBLIGATIONS (continued) |
| |||||||
4.700%, 02/19/2046 | $ | 100 | $ | 117 | ||||
4.000%, 06/20/2042 | 100 | 109 | ||||||
3.625%, 02/12/2024 | 350 | 384 | ||||||
2.875%, 11/09/2022 | 100 | 106 | ||||||
2.250%, 02/19/2021 | 100 | 104 | ||||||
1.125%, 02/06/2018 | 100 | 100 | ||||||
KLA-Tencor | ||||||||
4.650%, 11/01/2024 | 100 | 110 | ||||||
Lam Research | ||||||||
3.450%, 06/15/2023 | 100 | 104 | ||||||
2.750%, 03/15/2020 | 100 | 103 | ||||||
MasterCard | ||||||||
3.375%, 04/01/2024 | 100 | 110 | ||||||
Maxim Integrated Products | ||||||||
2.500%, 11/15/2018 | 200 | 203 | ||||||
Micron Technology | ||||||||
5.500%, 02/01/2025 | 150 | 135 | ||||||
5.250%, 08/01/2023 (A) | 301 | 269 | ||||||
Microsoft | ||||||||
4.500%, 10/01/2040 | 100 | 117 | ||||||
4.450%, 11/03/2045 | 300 | 346 | ||||||
4.200%, 06/01/2019 | 100 | 109 | ||||||
4.000%, 02/12/2055 | 100 | 103 | ||||||
3.750%, 02/12/2045 | 100 | 103 | ||||||
3.500%, 02/12/2035 | 150 | 157 | ||||||
2.700%, 02/12/2025 | 200 | 208 | ||||||
2.375%, 02/12/2022 | 100 | 104 | ||||||
2.375%, 05/01/2023 | 100 | 103 | ||||||
2.000%, 11/03/2020 | 200 | 205 | ||||||
1.625%, 12/06/2018 | 100 | 101 | ||||||
Motorola Solutions | ||||||||
3.500%, 03/01/2023 | 100 | 99 | ||||||
NCR | ||||||||
6.375%, 12/15/2023 | 150 | 155 | ||||||
4.625%, 02/15/2021 | 100 | 101 | ||||||
NetApp | ||||||||
3.375%, 06/15/2021 | 150 | 154 | ||||||
Nuance Communications | ||||||||
5.375%, 08/15/2020 (A) | 125 | 128 | ||||||
NXP | ||||||||
4.625%, 06/01/2023 (A) | 200 | 207 | ||||||
4.125%, 06/01/2021 (A) | 150 | 155 | ||||||
3.750%, 06/01/2018 (A) | 100 | 102 | ||||||
Open Text | ||||||||
5.875%, 06/01/2026 (A) | 45 | 47 | ||||||
5.625%, 01/15/2023 (A) | 140 | 144 | ||||||
Oracle | ||||||||
5.750%, 04/15/2018 | 350 | 378 | ||||||
5.375%, 07/15/2040 | 150 | 183 | ||||||
4.375%, 05/15/2055 | 100 | 107 | ||||||
4.300%, 07/08/2034 | 100 | 109 | ||||||
4.125%, 05/15/2045 | 100 | 105 | ||||||
| 38 | Adviser Managed Trust / Annual Report / July 31, 2016 |
Description | Face Amount | Market Value | ||||||
CORPORATE OBLIGATIONS (continued) |
| |||||||
4.000%, 07/15/2046 | $ | 50 | $ | 52 | ||||
3.900%, 05/15/2035 | 170 | 177 | ||||||
3.850%, 07/15/2036 | 50 | 51 | ||||||
3.400%, 07/08/2024 | 100 | 107 | ||||||
2.950%, 05/15/2025 | 250 | 260 | ||||||
2.800%, 07/08/2021 | 175 | 184 | ||||||
2.650%, 07/15/2026 | 140 | 141 | ||||||
2.400%, 09/15/2023 | 50 | 50 | ||||||
2.250%, 10/08/2019 | 50 | 52 | ||||||
1.900%, 09/15/2021 | 135 | 135 | ||||||
Plantronics | ||||||||
5.500%, 05/31/2023 (A) | 126 | 128 | ||||||
PTC | ||||||||
6.000%, 05/15/2024 | 98 | 104 | ||||||
Qorvo | ||||||||
7.000%, 12/01/2025 (A) | 45 | 49 | ||||||
QUALCOMM | ||||||||
4.800%, 05/20/2045 | 100 | 111 | ||||||
4.650%, 05/20/2035 | 200 | 220 | ||||||
3.450%, 05/20/2025 | 100 | 108 | ||||||
2.250%, 05/20/2020 | 100 | 103 | ||||||
Rackspace Hosting | ||||||||
6.500%, 01/15/2024 (A) | 110 | 114 | ||||||
Riverbed Technology | ||||||||
8.875%, 03/01/2023 (A) | 80 | 84 | ||||||
Sabre | ||||||||
5.375%, 04/15/2023 (A) | 35 | 37 | ||||||
5.250%, 11/15/2023 (A) | 145 | 152 | ||||||
Seagate HDD Cayman | ||||||||
4.750%, 01/01/2025 | 100 | 87 | ||||||
3.750%, 11/15/2018 | 200 | 204 | ||||||
Solera | ||||||||
10.500%, 03/01/2024 (A) | 300 | 324 | ||||||
SS&C Technologies Holdings | ||||||||
5.875%, 07/15/2023 | 142 | 147 | ||||||
Symantec | ||||||||
3.950%, 06/15/2022 | 200 | 203 | ||||||
Telefonaktiebolaget LM Ericsson | ||||||||
4.125%, 05/15/2022 | 100 | 108 | ||||||
Texas Instruments | ||||||||
1.850%, 05/15/2022 | 100 | 101 | ||||||
1.750%, 05/01/2020 | 100 | 102 | ||||||
Thomson Reuters | ||||||||
5.650%, 11/23/2043 | 200 | 241 | ||||||
3.850%, 09/29/2024 | 125 | 135 | ||||||
TIBCO Software | ||||||||
11.375%, 12/01/2021 (A) | 150 | 129 | ||||||
Total System Services | ||||||||
3.750%, 06/01/2023 | 100 | 104 | ||||||
Tyco Electronics Group | ||||||||
2.350%, 08/01/2019 | 200 | 204 | ||||||
Description | Face Amount | Market Value | ||||||
CORPORATE OBLIGATIONS (continued) |
| |||||||
VeriSign | ||||||||
4.625%, 05/01/2023 | $ | 150 | $ | 154 | ||||
Veritas US | ||||||||
10.500%, 02/01/2024 (A) | 120 | 107 | ||||||
ViaSat | ||||||||
6.875%, 06/15/2020 | 100 | 103 | ||||||
Visa | ||||||||
4.300%, 12/14/2045 | 100 | 118 | ||||||
4.150%, 12/14/2035 | 130 | 149 | ||||||
3.150%, 12/14/2025 | 200 | 215 | ||||||
2.800%, 12/14/2022 | 100 | 106 | ||||||
2.200%, 12/14/2020 | 200 | 206 | ||||||
1.200%, 12/14/2017 | 25 | 25 | ||||||
Western Digital | ||||||||
10.500%, 04/01/2024 (A) | 550 | 619 | ||||||
Western Union | ||||||||
3.650%, 08/22/2018 | 100 | 103 | ||||||
Xerox | ||||||||
6.350%, 05/15/2018 | 150 | 161 | ||||||
5.625%, 12/15/2019 | 100 | 108 | ||||||
Xilinx | ||||||||
3.000%, 03/15/2021 | 150 | 156 | ||||||
Zebra Technologies | ||||||||
7.250%, 10/15/2022 | 150 | 160 | ||||||
|
| |||||||
| 26,569 | ||||||||
|
| |||||||
Materials — 1.7% | ||||||||
Agrium | ||||||||
5.250%, 01/15/2045 | 70 | 78 | ||||||
4.125%, 03/15/2035 | 200 | 198 | ||||||
Air Products & Chemicals | ||||||||
3.350%, 07/31/2024 | 100 | 109 | ||||||
Airgas | ||||||||
3.050%, 08/01/2020 | 100 | 104 | ||||||
Albemarle | ||||||||
4.150%, 12/01/2024 | 100 | 109 | ||||||
Alcoa | ||||||||
5.125%, 10/01/2024 | 175 | 184 | ||||||
Aleris International | ||||||||
9.500%, 04/01/2021 (A) | 100 | 106 | ||||||
Allegheny Technologies | ||||||||
7.875%, 08/15/2023 | 75 | 70 | ||||||
Anglo American Capital | ||||||||
3.625%, 05/14/2020 (A) | 300 | 290 | ||||||
ArcelorMittal | ||||||||
7.250%, 02/25/2022 | 100 | 109 | ||||||
6.125%, 06/01/2025 | 100 | 106 | ||||||
Ardagh Packaging Finance Holdings | ||||||||
8.625%, 06/15/2019 (A) | 227 | 234 | ||||||
7.250%, 05/15/2024 (A) | 275 | 290 | ||||||
4.625%, 05/15/2023 (A) | 150 | 151 | ||||||
| Adviser Managed Trust / Annual Report / July 31, 2016 | 39 |
SCHEDULE OF INVESTMENTS
JULY 31, 2016
Tactical Offensive Fixed Income Fund (Continued)
Description | Face Amount | Market Value | ||||||
CORPORATE OBLIGATIONS (continued) |
| |||||||
Ashland | ||||||||
4.750%, 08/15/2022 | $ | 200 | $ | 207 | ||||
3.875%, 04/15/2018 | 100 | 103 | ||||||
Axalta Coating Systems US Holdings | ||||||||
7.375%, 05/01/2021 (A) | 150 | 159 | ||||||
Ball | ||||||||
5.250%, 07/01/2025 | 190 | 205 | ||||||
4.375%, 12/15/2020 | 160 | 172 | ||||||
4.000%, 11/15/2023 | 150 | 152 | ||||||
Barrick | ||||||||
5.250%, 04/01/2042 | 100 | 109 | ||||||
4.100%, 05/01/2023 | 16 | 17 | ||||||
Barrick North America Finance | ||||||||
4.400%, 05/30/2021 | 175 | 192 | ||||||
Berry Plastics | ||||||||
5.125%, 07/15/2023 | 125 | 129 | ||||||
BHP Billiton Finance | ||||||||
6.500%, 04/01/2019 | 100 | 113 | ||||||
5.000%, 09/30/2043 | 100 | 120 | ||||||
3.850%, 09/30/2023 | 150 | 166 | ||||||
Blue Cube Spinco | ||||||||
10.000%, 10/15/2025 (A) | 100 | 114 | ||||||
9.750%, 10/15/2023 (A) | 75 | 86 | ||||||
BlueScope Steel Finance | ||||||||
6.500%, 05/15/2021 (A) | 83 | 87 | ||||||
BWAY Holding | ||||||||
9.125%, 08/15/2021 (A) | 50 | 50 | ||||||
Cascades | ||||||||
5.500%, 07/15/2022 (A) | 100 | 99 | ||||||
Celanese US Holdings | ||||||||
5.875%, 06/15/2021 | 30 | 34 | ||||||
4.625%, 11/15/2022 | 30 | 32 | ||||||
Celulosa Arauco y Constitucion | ||||||||
7.250%, 07/29/2019 | 100 | 114 | ||||||
CF Industries | ||||||||
5.150%, 03/15/2034 | 375 | 378 | ||||||
Chemours | ||||||||
7.000%, 05/15/2025 | 130 | 111 | ||||||
6.625%, 05/15/2023 | 180 | 155 | ||||||
Cliffs Natural Resources | ||||||||
8.250%, 03/31/2020 (A) | 50 | 51 | ||||||
Consolidated Energy Finance | ||||||||
6.750%, 10/15/2019 (A) | 200 | 198 | ||||||
Coveris Holdings | ||||||||
7.875%, 11/01/2019 (A) | 100 | 100 | ||||||
CRH America | ||||||||
8.125%, 07/15/2018 | 66 | 74 | ||||||
Crown Americas | ||||||||
4.500%, 01/15/2023 | 100 | 103 | ||||||
CVR Partners | ||||||||
9.250%, 06/15/2023 (A) | 85 | 87 | ||||||
Description | Face Amount | Market Value | ||||||
CORPORATE OBLIGATIONS (continued) |
| |||||||
Dow Chemical | ||||||||
8.550%, 05/15/2019 | $ | 200 | $ | 238 | ||||
4.375%, 11/15/2042 | 100 | 103 | ||||||
4.250%, 11/15/2020 | 100 | 109 | ||||||
4.250%, 10/01/2034 | 100 | 105 | ||||||
3.500%, 10/01/2024 | 100 | 106 | ||||||
3.000%, 11/15/2022 | 50 | 52 | ||||||
E.I. du Pont de Nemours | ||||||||
6.000%, 07/15/2018 | 100 | 109 | ||||||
4.625%, 01/15/2020 | 100 | 111 | ||||||
2.800%, 02/15/2023 | 100 | 102 | ||||||
Eagle Spinco | ||||||||
4.625%, 02/15/2021 | 150 | 154 | ||||||
Eastman Chemical | ||||||||
4.650%, 10/15/2044 | 100 | 105 | ||||||
Ecolab | ||||||||
4.350%, 12/08/2021 | 100 | 113 | ||||||
Eldorado | ||||||||
6.125%, 12/15/2020 (A) | 200 | 200 | ||||||
First Quantum Minerals | ||||||||
7.250%, 05/15/2022 (A) | 250 | 221 | ||||||
7.000%, 02/15/2021 (A) | 50 | 44 | ||||||
6.750%, 02/15/2020 (A) | 200 | 184 | ||||||
FMG Resources | ||||||||
9.750%, 03/01/2022 (A) | 346 | 388 | ||||||
Freeport-McMoRan | ||||||||
5.450%, 03/15/2043 | 350 | 269 | ||||||
3.875%, 03/15/2023 | 150 | 129 | ||||||
3.550%, 03/01/2022 | 400 | 342 | ||||||
Georgia-Pacific | ||||||||
8.875%, 05/15/2031 | 100 | 161 | ||||||
Goldcorp | ||||||||
3.700%, 03/15/2023 | 100 | 104 | ||||||
Hexion | ||||||||
6.625%, 04/15/2020 | 300 | 253 | ||||||
HudBay Minerals | ||||||||
9.500%, 10/01/2020 | 250 | 239 | ||||||
Huntsman International | ||||||||
4.875%, 11/15/2020 | 100 | 102 | ||||||
IAMGOLD | ||||||||
6.750%, 10/01/2020 (A) | 100 | 94 | ||||||
INEOS Group Holdings | ||||||||
5.875%, 02/15/2019 (A) | 200 | 206 | ||||||
International Paper | ||||||||
7.950%, 06/15/2018 | 100 | 112 | ||||||
7.500%, 08/15/2021 | 100 | 122 | ||||||
5.150%, 05/15/2046 | 100 | 116 | ||||||
4.800%, 06/15/2044 | 100 | 109 | ||||||
4.750%, 02/15/2022 | 100 | 111 | ||||||
INVISTA Finance | ||||||||
4.250%, 10/15/2019 (A) | 100 | 99 | ||||||
| 40 | Adviser Managed Trust / Annual Report / July 31, 2016 |
Description | Face Amount | Market Value | ||||||
CORPORATE OBLIGATIONS (continued) |
| |||||||
Joseph T Ryerson & Son | ||||||||
11.000%, 05/15/2022 (A) | $ | 125 | $ | 136 | ||||
Kinross | ||||||||
5.125%, 09/01/2021 | 100 | 103 | ||||||
Lubrizol | ||||||||
6.500%, 10/01/2034 | 100 | 137 | ||||||
Lundin Mining | ||||||||
7.500%, 11/01/2020 (A) | 20 | 21 | ||||||
LYB International Finance | ||||||||
4.875%, 03/15/2044 | 50 | 55 | ||||||
LyondellBasell Industries | ||||||||
5.000%, 04/15/2019 | 200 | 217 | ||||||
4.625%, 02/26/2055 | 100 | 100 | ||||||
Martin Marietta Materials | ||||||||
4.250%, 07/02/2024 | 100 | 107 | ||||||
Momentive Performance Materials | ||||||||
3.880%, 10/24/2021 | 145 | 113 | ||||||
Monsanto | ||||||||
4.700%, 07/15/2064 | 50 | 47 | ||||||
4.400%, 07/15/2044 | 150 | 154 | ||||||
3.375%, 07/15/2024 | 100 | 104 | ||||||
Mosaic | ||||||||
4.250%, 11/15/2023 | 125 | 135 | ||||||
New Gold | ||||||||
6.250%, 11/15/2022 (A) | 100 | 102 | ||||||
Newmont Mining | ||||||||
6.250%, 10/01/2039 | 50 | 58 | ||||||
4.875%, 03/15/2042 | 125 | 129 | ||||||
3.500%, 03/15/2022 | 100 | 105 | ||||||
Nucor | ||||||||
6.400%, 12/01/2037 | 100 | 125 | ||||||
4.000%, 08/01/2023 | 100 | 109 | ||||||
Owens-Brockway Glass Container | ||||||||
5.875%, 08/15/2023 (A) | 70 | 75 | ||||||
5.000%, 01/15/2022 (A) | 115 | 120 | ||||||
Platform Specialty Products | ||||||||
10.375%, 05/01/2021 (A) | 200 | 201 | ||||||
6.500%, 02/01/2022 (A) | 68 | 59 | ||||||
PolyOne | ||||||||
5.250%, 03/15/2023 | 100 | 104 | ||||||
Potash Corp of Saskatchewan | ||||||||
3.625%, 03/15/2024 | 50 | 53 | ||||||
3.000%, 04/01/2025 | 100 | 102 | ||||||
PQ | ||||||||
6.750%, 11/15/2022 (A) | 177 | 186 | ||||||
Praxair | ||||||||
3.200%, 01/30/2026 | 100 | 109 | ||||||
2.450%, 02/15/2022 | 200 | 207 | ||||||
Resolute Forest Products | ||||||||
5.875%, 05/15/2023 | 100 | 82 | ||||||
Reynolds Group Issuer | ||||||||
8.250%, 02/15/2021 | 200 | 208 | ||||||
Description | Face Amount | Market Value | ||||||
CORPORATE OBLIGATIONS (continued) |
| |||||||
5.750%, 10/15/2020 | $ | 500 | $ | 516 | ||||
5.125%, 07/15/2023 (A) | 300 | 310 | ||||||
Rio Tinto Finance | ||||||||
4.125%, 08/21/2042 | 100 | 105 | ||||||
3.750%, 09/20/2021 | 50 | 54 | ||||||
3.750%, 06/15/2025 | 350 | 376 | ||||||
3.500%, 03/22/2022 | 200 | 214 | ||||||
RPM International | ||||||||
5.250%, 06/01/2045 | 50 | 54 | ||||||
Sherwin-Williams | ||||||||
1.350%, 12/15/2017 | 100 | 100 | ||||||
Silgan Holdings | ||||||||
5.000%, 04/01/2020 | 100 | 102 | ||||||
Sonoco Products | ||||||||
5.750%, 11/01/2040 | 100 | 122 | ||||||
Southern Copper | ||||||||
6.750%, 04/16/2040 | 100 | 108 | ||||||
5.375%, 04/16/2020 | 200 | 218 | ||||||
3.875%, 04/23/2025 | 60 | 61 | ||||||
Standard Industries | ||||||||
6.000%, 10/15/2025 (A) | 150 | 163 | ||||||
5.375%, 11/15/2024 (A) | 250 | 262 | ||||||
Steel Dynamics | ||||||||
5.500%, 10/01/2024 | 100 | 106 | ||||||
5.125%, 10/01/2021 | 100 | 104 | ||||||
Teck Resources | ||||||||
8.500%, 06/01/2024 (A) | 100 | 109 | ||||||
8.000%, 06/01/2021 (A) | 38 | 40 | ||||||
3.750%, 02/01/2023 | 250 | 205 | ||||||
TPC Group | ||||||||
8.750%, 12/15/2020 (A) | 35 | 28 | ||||||
Tronox Finance | ||||||||
7.500%, 03/15/2022 (A) | 138 | 110 | ||||||
6.375%, 08/15/2020 | 100 | 81 | ||||||
United States Steel | ||||||||
8.375%, 07/01/2021 (A) | 175 | 191 | ||||||
Vale | ||||||||
5.625%, 09/11/2042 | 100 | 85 | ||||||
Vale Overseas | ||||||||
6.875%, 11/21/2036 | 150 | 144 | ||||||
5.875%, 06/10/2021 | 100 | 104 | ||||||
4.625%, 09/15/2020 | 50 | 50 | ||||||
4.375%, 01/11/2022 | 125 | 122 | ||||||
Valspar | ||||||||
7.250%, 06/15/2019 | 100 | 114 | ||||||
Vulcan Materials | ||||||||
7.500%, 06/15/2021 | 100 | 121 | ||||||
WestRock RKT | ||||||||
4.000%, 03/01/2023 | 200 | 211 | ||||||
WR Grace & Company | ||||||||
5.125%, 10/01/2021 (A) | 100 | 106 | ||||||
|
| |||||||
| 19,226 | ||||||||
|
| |||||||
| Adviser Managed Trust / Annual Report / July 31, 2016 | 41 |
SCHEDULE OF INVESTMENTS
JULY 31, 2016
Tactical Offensive Fixed Income Fund (Continued)
Description | Face Amount | Market Value | ||||||
CORPORATE OBLIGATIONS (continued) |
| |||||||
Telecommunication Services — 2.3% |
| |||||||
Acosta | ||||||||
7.750%, 10/01/2022 (A) | $ | 100 | $ | 91 | ||||
Altice Financing | ||||||||
7.500%, 05/15/2026 (A) | 425 | 429 | ||||||
6.625%, 02/15/2023 (A) | 400 | 401 | ||||||
6.500%, 01/15/2022 (A) | 150 | 155 | ||||||
Altice Luxembourg | ||||||||
7.750%, 05/15/2022 (A) | 600 | 609 | ||||||
7.625%, 02/15/2025 (A) | 250 | 246 | ||||||
Altice US Finance I | ||||||||
5.500%, 05/15/2026 (A) | 328 | 339 | ||||||
5.375%, 07/15/2023 (A) | 150 | 155 | ||||||
America Movil | ||||||||
6.125%, 03/30/2040 | 100 | 129 | ||||||
5.000%, 03/30/2020 | 250 | 278 | ||||||
AT&T | ||||||||
6.500%, 09/01/2037 | 585 | 747 | ||||||
6.000%, 08/15/2040 | 100 | 123 | ||||||
5.800%, 02/15/2019 | 100 | 111 | ||||||
5.650%, 02/15/2047 | 50 | 60 | ||||||
5.500%, 02/01/2018 | 200 | 212 | ||||||
5.150%, 03/15/2042 | 250 | 282 | ||||||
5.000%, 03/01/2021 | 150 | 170 | ||||||
4.800%, 06/15/2044 | 100 | 106 | ||||||
4.750%, 05/15/2046 | 235 | 249 | ||||||
4.500%, 05/15/2035 | 45 | 47 | ||||||
4.350%, 06/15/2045 | 100 | 100 | ||||||
4.125%, 02/17/2026 | 100 | 109 | ||||||
3.950%, 01/15/2025 | 100 | 108 | ||||||
3.900%, 03/11/2024 | 100 | 107 | ||||||
3.800%, 03/15/2022 | 150 | 162 | ||||||
3.600%, 02/17/2023 | 50 | 53 | ||||||
3.400%, 05/15/2025 | 350 | 362 | ||||||
3.000%, 02/15/2022 | 150 | 155 | ||||||
3.000%, 06/30/2022 | 200 | 207 | ||||||
2.800%, 02/17/2021 | 50 | 52 | ||||||
2.450%, 06/30/2020 | 200 | 205 | ||||||
1.750%, 01/15/2018 | 200 | 201 | ||||||
British Telecommunications | ||||||||
9.375%, 12/15/2030 | 150 | 238 | ||||||
CenturyLink | ||||||||
5.800%, 03/15/2022 | 250 | 256 | ||||||
5.625%, 04/01/2020 | 300 | 317 | ||||||
Cequel Communications Holdings | ||||||||
6.375%, 09/15/2020 (A) | 200 | 206 | ||||||
5.125%, 12/15/2021 (A) | 200 | 199 | ||||||
Consolidated Communications | ||||||||
6.500%, 10/01/2022 | 100 | 92 | ||||||
Deutsche Telekom International Finance | ||||||||
8.750%, 06/15/2030 | 200 | 314 | ||||||
Description | Face Amount | Market Value | ||||||
CORPORATE OBLIGATIONS (continued) |
| |||||||
Frontier Communications | ||||||||
11.000%, 09/15/2025 | $ | 570 | $ | 608 | ||||
10.500%, 09/15/2022 | 410 | 443 | ||||||
8.875%, 09/15/2020 | 150 | 161 | ||||||
Grupo Televisa | ||||||||
6.000%, 05/15/2018 | 100 | 108 | ||||||
5.000%, 05/13/2045 | 200 | 203 | ||||||
Inmarsat Finance | ||||||||
4.875%, 05/15/2022 (A) | 200 | 186 | ||||||
Intelsat Jackson Holdings | ||||||||
8.000%, 02/15/2024 (A) | 100 | 96 | ||||||
5.500%, 08/01/2023 | 300 | 196 | ||||||
Intelsat Luxembourg | ||||||||
7.750%, 06/01/2021 | 350 | 80 | ||||||
Koninklijke | ||||||||
8.375%, 10/01/2030 | 50 | 70 | ||||||
Level 3 Financing | ||||||||
5.375%, 08/15/2022 | 150 | 157 | ||||||
5.375%, 01/15/2024 | 140 | 147 | ||||||
5.375%, 05/01/2025 | 100 | 105 | ||||||
MHGE Parent | ||||||||
8.500%, 08/01/2019 (A) | 119 | 120 | ||||||
Millicom International Cellular | ||||||||
6.625%, 10/15/2021 (A) | 100 | 105 | ||||||
6.000%, 03/15/2025 (A) | 200 | 206 | ||||||
Orange | ||||||||
9.000%, 03/01/2031 | 100 | 159 | ||||||
5.500%, 02/06/2044 | 25 | 32 | ||||||
2.750%, 02/06/2019 | 200 | 206 | ||||||
Outfront Media Capital | ||||||||
5.250%, 02/15/2022 | 200 | 206 | ||||||
Qwest | ||||||||
6.750%, 12/01/2021 | 100 | 110 | ||||||
Rogers Communications | ||||||||
6.800%, 08/15/2018 | 100 | 110 | ||||||
5.000%, 03/15/2044 | 100 | 119 | ||||||
Sable International Finance | ||||||||
6.875%, 08/01/2022 (A) | 200 | 205 | ||||||
SBA Communications | ||||||||
4.875%, 07/15/2022 | 200 | 205 | ||||||
SBA Telecommunications | ||||||||
5.750%, 07/15/2020 | 100 | 103 | ||||||
SFR Group | ||||||||
7.375%, 05/01/2026 (A) | 750 | 749 | ||||||
6.250%, 05/15/2024 (A) | 225 | 216 | ||||||
6.000%, 05/15/2022 (A) | 700 | 682 | ||||||
SoftBank Group | ||||||||
4.500%, 04/15/2020 (A) | 400 | 415 | ||||||
Sprint | ||||||||
7.875%, 09/15/2023 | 750 | 685 | ||||||
7.125%, 06/15/2024 | 350 | 309 | ||||||
| 42 | Adviser Managed Trust / Annual Report / July 31, 2016 |
Description | Face Amount | Market Value | ||||||
CORPORATE OBLIGATIONS (continued) |
| |||||||
Sprint Communications | ||||||||
9.000%, 11/15/2018 (A) | $ | 500 | $ | 542 | ||||
Telecom Italia | ||||||||
5.303%, 05/30/2024 (A) | 200 | 203 | ||||||
Telefonica Emisiones | ||||||||
7.045%, 06/20/2036 | 100 | 132 | ||||||
5.134%, 04/27/2020 | 100 | 111 | ||||||
3.192%, 04/27/2018 | 300 | 308 | ||||||
T-Mobile | ||||||||
6.625%, 04/01/2023 | 300 | 322 | ||||||
6.500%, 01/15/2026 | 400 | 433 | ||||||
6.250%, 04/01/2021 | 250 | 262 | ||||||
Unitymedia GmbH | ||||||||
6.125%, 01/15/2025 (A) | 200 | 211 | ||||||
UPCB Finance IV | ||||||||
5.375%, 01/15/2025 (A) | 200 | 202 | ||||||
UPCB Finance V | ||||||||
7.250%, 11/15/2021 (A) | 135 | 142 | ||||||
UPCB Finance VI | ||||||||
6.875%, 01/15/2022 (A) | 135 | 142 | ||||||
Verizon Communications | ||||||||
6.550%, 09/15/2043 | 157 | 214 | ||||||
5.012%, 08/21/2054 | 379 | 417 | ||||||
4.862%, 08/21/2046 | 150 | 168 | ||||||
4.672%, 03/15/2055 | 117 | 122 | ||||||
4.522%, 09/15/2048 | 453 | 484 | ||||||
4.500%, 09/15/2020 | 500 | 556 | ||||||
4.272%, 01/15/2036 | 600 | 627 | ||||||
4.150%, 03/15/2024 | 450 | 501 | ||||||
3.650%, 09/14/2018 | 200 | 210 | ||||||
3.500%, 11/01/2024 | 500 | 539 | ||||||
2.625%, 02/21/2020 | 298 | 309 | ||||||
Videotron | ||||||||
5.375%, 06/15/2024 (A) | 100 | 104 | ||||||
5.000%, 07/15/2022 | 100 | 103 | ||||||
Virgin Media Secured Finance | ||||||||
5.375%, 04/15/2021 (A) | 180 | 187 | ||||||
5.250%, 01/15/2026 (A) | 250 | 250 | ||||||
Vodafone Group | ||||||||
6.150%, 02/27/2037 | 200 | 244 | ||||||
2.950%, 02/19/2023 | 300 | 309 | ||||||
1.250%, 09/26/2017 | 100 | 100 | ||||||
WideOpenWest Finance | ||||||||
10.250%, 07/15/2019 | 150 | 156 | ||||||
Wind Acquisition Finance | ||||||||
7.375%, 04/23/2021 (A) | 600 | 597 | ||||||
4.750%, 07/15/2020 (A) | 200 | 199 | ||||||
Windstream Services | ||||||||
6.375%, 08/01/2023 | 150 | 130 | ||||||
WMG Acquisition | ||||||||
6.750%, 04/15/2022 (A) | 100 | 105 | ||||||
Description | Face Amount | Market Value | ||||||
CORPORATE OBLIGATIONS (continued) |
| |||||||
Zayo Group | ||||||||
6.375%, 05/15/2025 | $ | 100 | $ | 104 | ||||
6.000%, 04/01/2023 | 270 | 281 | ||||||
|
| |||||||
| 25,910 | ||||||||
|
| |||||||
Utilities — 1.8% | ||||||||
AES | ||||||||
7.375%, 07/01/2021 | 100 | 114 | ||||||
4.875%, 05/15/2023 | 200 | 203 | ||||||
Alabama Power | ||||||||
3.750%, 03/01/2045 | 100 | 107 | ||||||
Ameren | ||||||||
2.700%, 11/15/2020 | 100 | 104 | ||||||
Ameren Illinois | ||||||||
3.250%, 03/01/2025 | 100 | 108 | ||||||
American Electric Power | ||||||||
1.650%, 12/15/2017 | 100 | 100 | ||||||
American Water Capital | ||||||||
6.593%, 10/15/2037 | 100 | 148 | ||||||
AmeriGas Finance | ||||||||
7.000%, 05/20/2022 | 100 | 105 | ||||||
AmeriGas Partners | ||||||||
5.875%, 08/20/2026 | 120 | 126 | ||||||
5.625%, 05/20/2024 | 120 | 124 | ||||||
Appalachian Power | ||||||||
7.000%, 04/01/2038 | 100 | 139 | ||||||
4.450%, 06/01/2045 | 100 | 111 | ||||||
3.400%, 06/01/2025 | 100 | 107 | ||||||
Arizona Public Service | ||||||||
2.200%, 01/15/2020 | 150 | 153 | ||||||
Atmos Energy | ||||||||
4.125%, 10/15/2044 | 100 | 111 | ||||||
Berkshire Hathaway Energy | ||||||||
6.500%, 09/15/2037 | 350 | 489 | ||||||
6.125%, 04/01/2036 | 200 | 269 | ||||||
2.000%, 11/15/2018 | 200 | 203 | ||||||
Black Hills | ||||||||
3.950%, 01/15/2026 | 100 | 107 | ||||||
Calpine | ||||||||
6.000%, 01/15/2022 (A) | 200 | 209 | ||||||
5.750%, 01/15/2025 | 200 | 200 | ||||||
5.375%, 01/15/2023 | 200 | 199 | ||||||
CenterPoint Energy Houston Electric | ||||||||
4.500%, 04/01/2044 | 200 | 240 | ||||||
CenterPoint Energy Resources | ||||||||
4.500%, 01/15/2021 | 100 | 108 | ||||||
Cleco Corporate Holdings | ||||||||
4.973%, 05/01/2046 (A) | 35 | 39 | ||||||
3.743%, 05/01/2026 (A) | 50 | 53 | ||||||
Commonwealth Edison | ||||||||
3.700%, 03/01/2045 | 50 | 53 | ||||||
| Adviser Managed Trust / Annual Report / July 31, 2016 | 43 |
SCHEDULE OF INVESTMENTS
JULY 31, 2016
Tactical Offensive Fixed Income Fund (Continued)
Description | Face Amount | Market Value | ||||||
CORPORATE OBLIGATIONS (continued) |
| |||||||
Connecticut Light & Power | ||||||||
4.150%, 06/01/2045 | $ | 100 | $ | 114 | ||||
Consolidated Edison | ||||||||
2.000%, 05/15/2021 | 30 | 30 | ||||||
Consolidated Edison of New York | ||||||||
6.300%, 08/15/2037 | 100 | 139 | ||||||
5.850%, 04/01/2018 | 100 | 108 | ||||||
4.450%, 03/15/2044 | 200 | 234 | ||||||
3.850%, 06/15/2046 | 50 | 54 | ||||||
Consumers Energy | ||||||||
4.350%, 08/31/2064 | 100 | 116 | ||||||
3.950%, 05/15/2043 | 50 | 56 | ||||||
2.850%, 05/15/2022 | 100 | 104 | ||||||
Dominion Gas Holdings | ||||||||
4.600%, 12/15/2044 | 25 | 27 | ||||||
3.600%, 12/15/2024 | 100 | 108 | ||||||
2.500%, 12/15/2019 | 50 | 51 | ||||||
Dominion Resources | ||||||||
5.200%, 08/15/2019 | 100 | 110 | ||||||
4.050%, 09/15/2042 | 100 | 101 | ||||||
2.750%, 09/15/2022 | 250 | 255 | ||||||
2.500%, 12/01/2019 | 100 | 103 | ||||||
DPL | ||||||||
7.250%, 10/15/2021 | 100 | 97 | ||||||
6.500%, 10/15/2016 | 30 | 30 | ||||||
DTE Electric | ||||||||
3.700%, 03/15/2045 | 50 | 54 | ||||||
3.700%, 06/01/2046 | 50 | 54 | ||||||
DTE Energy | ||||||||
3.300%, 06/15/2022 | 50 | 53 | ||||||
2.400%, 12/01/2019 | 125 | 128 | ||||||
Duke Energy | ||||||||
3.750%, 04/15/2024 | 100 | 109 | ||||||
1.625%, 08/15/2017 | 250 | 251 | ||||||
Duke Energy Carolinas | ||||||||
4.250%, 12/15/2041 | 100 | 115 | ||||||
Duke Energy Florida | ||||||||
6.400%, 06/15/2038 | 450 | 644 | ||||||
Duke Energy Florida Project Finance | ||||||||
3.112%, 09/01/2036 | 50 | 52 | ||||||
Duke Energy Indiana | ||||||||
3.750%, 05/15/2046 | 50 | 53 | ||||||
Duke Energy Progress | ||||||||
5.300%, 01/15/2019 | 100 | 110 | ||||||
4.150%, 12/01/2044 | 50 | 56 | ||||||
Dynegy | ||||||||
7.625%, 11/01/2024 | 390 | 379 | ||||||
7.375%, 11/01/2022 | 240 | 235 | ||||||
6.750%, 11/01/2019 | 225 | 229 | ||||||
Edison International | ||||||||
2.950%, 03/15/2023 | 50 | 51 | ||||||
Description | Face Amount | Market Value | ||||||
CORPORATE OBLIGATIONS (continued) |
| |||||||
El Paso Electric | ||||||||
5.000%, 12/01/2044 | $ | 50 | $ | 58 | ||||
Emera US Finance | ||||||||
4.750%, 06/15/2046 (A) | 35 | 39 | ||||||
3.550%, 06/15/2026 (A) | 35 | 37 | ||||||
2.150%, 06/15/2019 (A) | 20 | 20 | ||||||
Enel | ||||||||
8.750%, 09/24/2073 (A)(B) | 200 | 232 | ||||||
Entergy | ||||||||
5.125%, 09/15/2020 | 100 | 110 | ||||||
4.000%, 07/15/2022 | 100 | 109 | ||||||
Entergy Arkansas | ||||||||
3.700%, 06/01/2024 | 100 | 110 | ||||||
Entergy Mississippi | ||||||||
2.850%, 06/01/2028 | 25 | 26 | ||||||
Eversource Energy | ||||||||
3.150%, 01/15/2025 | 100 | 105 | ||||||
Exelon | ||||||||
5.100%, 06/15/2045 | 100 | 120 | ||||||
3.950%, 06/15/2025 | 100 | 109 | ||||||
Exelon Generation | ||||||||
6.250%, 10/01/2039 | 300 | 346 | ||||||
6.200%, 10/01/2017 | 100 | 105 | ||||||
5.600%, 06/15/2042 | 100 | 107 | ||||||
4.250%, 06/15/2022 | 100 | 107 | ||||||
2.950%, 01/15/2020 | 100 | 103 | ||||||
Ferrellgas | ||||||||
6.750%, 06/15/2023 | 100 | 88 | ||||||
FirstEnergy | ||||||||
2.750%, 03/15/2018 | 50 | 51 | ||||||
FirstEnergy Transmission | ||||||||
4.350%, 01/15/2025 (A) | 175 | 188 | ||||||
Florida Power & Light | ||||||||
5.950%, 02/01/2038 | 200 | 280 | ||||||
4.050%, 10/01/2044 | 75 | 87 | ||||||
Georgia Power | ||||||||
4.300%, 03/15/2042 | 125 | 138 | ||||||
Great Plains Energy | ||||||||
4.850%, 06/01/2021 | 155 | 170 | ||||||
Idaho Power MTN | ||||||||
3.650%, 03/01/2045 | 25 | 26 | ||||||
Interstate Power & Light | ||||||||
3.250%, 12/01/2024 | 100 | 107 | ||||||
ITC Holdings | ||||||||
3.250%, 06/30/2026 | 30 | 31 | ||||||
Kentucky Utilities | ||||||||
5.125%, 11/01/2040 | 194 | 245 | ||||||
MidAmerican Energy | ||||||||
2.400%, 03/15/2019 | 100 | 103 | ||||||
National Fuel Gas | ||||||||
5.200%, 07/15/2025 | 100 | 108 | ||||||
| 44 | Adviser Managed Trust / Annual Report / July 31, 2016 |
Description | Face Amount | Market Value | ||||||
CORPORATE OBLIGATIONS (continued) |
| |||||||
NextEra Energy Capital Holdings | ||||||||
2.400%, 09/15/2019 | $ | 150 | $ | 153 | ||||
2.056%, 09/01/2017 | 100 | 101 | ||||||
NiSource Finance | ||||||||
6.400%, 03/15/2018 | 105 | 113 | ||||||
5.650%, 02/01/2045 | 50 | 66 | ||||||
Northern States Power | ||||||||
4.125%, 05/15/2044 | 200 | 230 | ||||||
2.200%, 08/15/2020 | 100 | 103 | ||||||
NRG Energy | ||||||||
7.250%, 05/15/2026 (A) | 340 | 349 | ||||||
6.625%, 01/15/2027 (A) | 175 | 173 | ||||||
6.250%, 07/15/2022 | 150 | 151 | ||||||
NRG Yield Operating | ||||||||
5.375%, 08/15/2024 | 100 | 102 | ||||||
NSTAR Electric | ||||||||
3.250%, 11/15/2025 | 50 | 54 | ||||||
2.700%, 06/01/2026 | 50 | 51 | ||||||
Oglethorpe Power | ||||||||
4.250%, 04/01/2046 | 25 | 27 | ||||||
Ohio Edison | ||||||||
6.875%, 07/15/2036 | 200 | 260 | ||||||
Oklahoma Gas & Electric | ||||||||
4.000%, 12/15/2044 | 50 | 55 | ||||||
Oncor Electric Delivery | ||||||||
3.750%, 04/01/2045 | 100 | 107 | ||||||
2.950%, 04/01/2025 | 50 | 53 | ||||||
2.150%, 06/01/2019 | 100 | 101 | ||||||
ONE Gas | ||||||||
2.070%, 02/01/2019 | 100 | 101 | ||||||
Pacific Gas & Electric | ||||||||
8.250%, 10/15/2018 | 100 | 115 | ||||||
6.050%, 03/01/2034 | 400 | 534 | ||||||
5.800%, 03/01/2037 | 100 | 132 | ||||||
4.750%, 02/15/2044 | 50 | 60 | ||||||
4.300%, 03/15/2045 | 30 | 35 | ||||||
PacifiCorp | ||||||||
3.600%, 04/01/2024 | 100 | 110 | ||||||
Piedmont Natural Gas | ||||||||
3.640%, 11/01/2046 | 25 | 25 | ||||||
Potomac Electric Power | ||||||||
6.500%, 11/15/2037 | 100 | 144 | ||||||
PPL Capital Funding | ||||||||
3.400%, 06/01/2023 | 100 | 105 | ||||||
PPL Electric Utilities | ||||||||
4.150%, 10/01/2045 | 100 | 114 | ||||||
Progress Energy | ||||||||
4.400%, 01/15/2021 | 100 | 109 | ||||||
PSEG Power | ||||||||
8.625%, 04/15/2031 | 200 | 263 | ||||||
3.000%, 06/15/2021 | 100 | 103 | ||||||
Description | Face Amount | Market Value | ||||||
CORPORATE OBLIGATIONS (continued) |
| |||||||
Public Service Colorado | ||||||||
2.900%, 05/15/2025 | $ | 100 | $ | 106 | ||||
Public Service Electric & Gas MTN | ||||||||
4.150%, 11/01/2045 | 50 | 59 | ||||||
4.050%, 05/01/2045 | 50 | 57 | ||||||
Public Service of Colorado | ||||||||
3.550%, 06/15/2046 | 50 | 53 | ||||||
San Diego Gas & Electric | ||||||||
6.000%, 06/01/2026 | 250 | 327 | ||||||
SCANA | ||||||||
4.125%, 02/01/2022 | 50 | 53 | ||||||
Sempra Energy | ||||||||
2.850%, 11/15/2020 | 100 | 104 | ||||||
2.400%, 03/15/2020 | 50 | 51 | ||||||
South Carolina Electric & Gas | ||||||||
5.100%, 06/01/2065 | 50 | 60 | ||||||
4.500%, 06/01/2064 | 100 | 109 | ||||||
Southern | ||||||||
4.400%, 07/01/2046 | 50 | 55 | ||||||
4.250%, 07/01/2036 | 30 | 32 | ||||||
3.250%, 07/01/2026 | 50 | 52 | ||||||
2.950%, 07/01/2023 | 25 | 26 | ||||||
2.350%, 07/01/2021 | 50 | 51 | ||||||
2.150%, 09/01/2019 | 250 | 256 | ||||||
1.850%, 07/01/2019 | 35 | 36 | ||||||
1.550%, 07/01/2018 | 30 | 30 | ||||||
Southern California Edison | ||||||||
5.950%, 02/01/2038 | 200 | 278 | ||||||
4.650%, 10/01/2043 | 100 | 122 | ||||||
3.500%, 10/01/2023 | 100 | 110 | ||||||
Southern California Gas | ||||||||
1.550%, 06/15/2018 | 100 | 101 | ||||||
Southern Gas Capital | ||||||||
3.500%, 09/15/2021 | 200 | 213 | ||||||
Southern Power | ||||||||
4.150%, 12/01/2025 | 100 | 109 | ||||||
2.375%, 06/01/2020 | 50 | 51 | ||||||
1.850%, 12/01/2017 | 100 | 101 | ||||||
1.500%, 06/01/2018 | 50 | 50 | ||||||
Southwestern Electric Power | ||||||||
3.900%, 04/01/2045 | 50 | 51 | ||||||
Suburban Propane Partners | ||||||||
5.500%, 06/01/2024 | 100 | 100 | ||||||
Talen Energy Supply | ||||||||
6.500%, 06/01/2025 | 178 | 157 | ||||||
4.625%, 07/15/2019 (A) | 200 | 189 | ||||||
4.600%, 12/15/2021 | 100 | 80 | ||||||
TECO Finance | ||||||||
5.150%, 03/15/2020 | 100 | 111 | ||||||
TerraForm Global Operating | ||||||||
9.750%, 08/15/2022 (A) | 100 | 100 | ||||||
| Adviser Managed Trust / Annual Report / July 31, 2016 | 45 |
SCHEDULE OF INVESTMENTS
JULY 31, 2016
Tactical Offensive Fixed Income Fund (Continued)
Description | Face Amount (Thousands) | Market Value ($ Thousands) | ||||||
CORPORATE OBLIGATIONS (continued) |
| |||||||
TerraForm Power Operating | ||||||||
5.875%, 02/01/2023 (A) | $ | 191 | $ | 192 | ||||
Union Electric | ||||||||
3.650%, 04/15/2045 | 100 | 106 | ||||||
Virginia Electric & Power | ||||||||
8.875%, 11/15/2038 | 150 | 258 | ||||||
4.200%, 05/15/2045 | 25 | 29 | ||||||
WEC Energy Group | ||||||||
3.550%, 06/15/2025 | 100 | 109 | ||||||
2.450%, 06/15/2020 | 100 | 103 | ||||||
Westar Energy | ||||||||
4.250%, 12/01/2045 | 100 | 116 | ||||||
Wisconsin Electric Power | ||||||||
3.100%, 06/01/2025 | 100 | 107 | ||||||
Xcel Energy | ||||||||
4.700%, 05/15/2020 | 125 | 137 | ||||||
|
| |||||||
| 20,700 | ||||||||
|
| |||||||
Total Corporate Obligations (Cost $346,076) ($ Thousands) | 356,082 | |||||||
|
| |||||||
U.S. TREASURY OBLIGATIONS — 27.1% |
| |||||||
U.S. Treasury Bonds | ||||||||
6.250%, 08/15/2023 | 2,500 | 3,342 | ||||||
5.375%, 02/15/2031 | 500 | 746 | ||||||
5.000%, 05/15/2037 | 200 | 311 | ||||||
4.750%, 02/15/2037 | 750 | 1,128 | ||||||
4.750%, 02/15/2041 | 2,110 | 3,215 | ||||||
4.500%, 02/15/2036 | 5,675 | 8,252 | ||||||
4.500%, 05/15/2038 | 150 | 220 | ||||||
4.375%, 05/15/2040 | 750 | 1,083 | ||||||
4.250%, 05/15/2039 | 250 | 354 | ||||||
3.875%, 08/15/2040 | 1,225 | 1,652 | ||||||
3.625%, 02/15/2044 | 4,680 | 6,153 | ||||||
3.375%, 05/15/2044 | 3,055 | 3,844 | ||||||
3.125%, 08/15/2044 | 800 | 962 | ||||||
3.000%, 11/15/2044 | 6,025 | 7,079 | ||||||
3.000%, 11/15/2045 | 1,100 | 1,295 | ||||||
2.875%, 05/15/2043 | 3,125 | 3,590 | ||||||
2.875%, 08/15/2045 | 750 | 862 | ||||||
2.625%, 11/15/2020 | 3,500 | 3,741 | ||||||
2.500%, 02/15/2045 | 3,500 | 3,729 | ||||||
2.500%, 02/15/2046 | 2,700 | 2,880 | ||||||
2.500%, 05/15/2046 | 2,650 | 2,832 | ||||||
U.S. Treasury Notes | ||||||||
4.250%, 11/15/2017 | 6,800 | 7,117 | ||||||
3.625%, 08/15/2019 | 1,500 | 1,628 | ||||||
3.625%, 02/15/2020 | 2,250 | 2,467 | ||||||
3.625%, 02/15/2021 | 7,500 | 8,370 | ||||||
3.500%, 05/15/2020 | 4,500 | 4,934 | ||||||
3.125%, 05/15/2021 | 6,250 | 6,860 | ||||||
2.750%, 11/15/2023 | 4,500 | 4,958 | ||||||
Description | Face Amount (Thousands) | Market Value ($ Thousands) | ||||||
U.S. TREASURY OBLIGATIONS (continued) |
| |||||||
2.750%, 02/15/2024 | $ | 750 | $ | 827 | ||||
2.625%, 08/15/2020 | 1,500 | 1,600 | ||||||
2.500%, 05/15/2024 | 7,450 | 8,089 | ||||||
2.250%, 07/31/2021 | 4,000 | 4,233 | ||||||
2.250%, 11/15/2024 | 5,000 | 5,339 | ||||||
2.250%, 11/15/2025 | 6,000 | 6,416 | ||||||
2.125%, 08/31/2020 | 9,000 | 9,422 | ||||||
2.125%, 01/31/2021 | 145 | 152 | ||||||
2.125%, 09/30/2021 | 2,500 | 2,631 | ||||||
2.125%, 05/15/2025 | 2,500 | 2,645 | ||||||
2.000%, 09/30/2020 | 7,000 | 7,298 | ||||||
2.000%, 10/31/2021 | 2,000 | 2,093 | ||||||
2.000%, 11/15/2021 | 5,000 | 5,235 | ||||||
2.000%, 02/15/2025 | 2,850 | 2,986 | ||||||
2.000%, 08/15/2025 | 5,350 | 5,604 | ||||||
1.750%, 09/30/2019 | 8,800 | 9,058 | ||||||
1.750%, 12/31/2020 | 3,500 | 3,614 | ||||||
1.750%, 01/31/2023 | 2,000 | 2,062 | ||||||
1.750%, 05/15/2023 | 1,750 | 1,805 | ||||||
1.625%, 07/31/2019 | 15,130 | 15,510 | ||||||
1.625%, 02/15/2026 | 2,650 | 2,689 | ||||||
1.625%, 05/15/2026 | 3,000 | 3,045 | ||||||
1.500%, 05/31/2019 | 6,650 | 6,790 | ||||||
1.500%, 05/31/2020 | 5,000 | 5,111 | ||||||
1.500%, 02/28/2023 | 750 | 761 | ||||||
1.500%, 03/31/2023 | 2,000 | 2,029 | ||||||
1.375%, 02/29/2020 | 8,000 | 8,141 | ||||||
1.375%, 05/31/2020 | 750 | 763 | ||||||
1.375%, 01/31/2021 | 3,500 | 3,557 | ||||||
1.375%, 04/30/2021 | 4,000 | 4,065 | ||||||
1.375%, 05/31/2021 | 3,000 | 3,050 | ||||||
1.250%, 10/31/2018 | 1,500 | 1,518 | ||||||
1.250%, 11/15/2018 | 5,000 | 5,062 | ||||||
1.250%, 03/31/2021 | 5,000 | 5,054 | ||||||
1.125%, 01/15/2019 | 2,000 | 2,020 | ||||||
1.125%, 04/30/2020 | 1,000 | 1,009 | ||||||
1.125%, 02/28/2021 | 3,500 | 3,520 | ||||||
1.125%, 06/30/2021 | 5,000 | 5,021 | ||||||
1.125%, 07/31/2021 | 2,000 | 2,008 | ||||||
1.000%, 05/31/2018 | 5,000 | 5,029 | ||||||
1.000%, 09/30/2019 | 3,000 | 3,018 | ||||||
0.875%, 01/15/2018 | 9,750 | 9,781 | ||||||
0.875%, 03/31/2018 | 4,000 | 4,014 | ||||||
0.875%, 05/31/2018 | 1,000 | 1,004 | ||||||
0.875%, 07/15/2018 | 2,000 | 2,008 | ||||||
0.875%, 06/15/2019 | 2,000 | 2,006 | ||||||
0.750%, 10/31/2017 | 2,500 | 2,504 | ||||||
0.750%, 01/31/2018 | 2,000 | 2,003 | ||||||
0.750%, 02/28/2018 | 2,100 | 2,103 | ||||||
0.750%, 04/15/2018 | 4,250 | 4,256 | ||||||
0.750%, 04/30/2018 | 2,000 | 2,003 | ||||||
0.750%, 07/31/2018 | 2,000 | 2,003 | ||||||
| 46 | Adviser Managed Trust / Annual Report / July 31, 2016 |
Description | Face Amount (Thousands) | Market Value ($ Thousands) | ||||||
U.S. TREASURY OBLIGATIONS (continued) |
| |||||||
0.625%, 08/31/2017 | $ | 4,000 | $ | 4,000 | ||||
0.625%, 11/30/2017 | 6,500 | 6,499 | ||||||
0.625%, 06/30/2018 | 2,000 | 1,999 | ||||||
|
| |||||||
Total U.S. Treasury Obligations (Cost $296,987) ($ Thousands) | 309,666 | |||||||
|
| |||||||
MORTGAGE-BACKED SECURITIES — 21.6% |
| |||||||
Agency Mortgage-Backed Obligations — 21.0% |
| |||||||
FHLMC | ||||||||
5.500%, 10/01/2038 to 06/01/2041 | 2,080 | 2,340 | ||||||
5.000%, 09/01/2023 to 11/01/2041 | 3,224 | 3,557 | ||||||
4.500%, 08/01/2040 to 02/01/2045 | 4,163 | 4,550 | ||||||
4.000%, 03/01/2019 to 12/01/2045 | 10,059 | 10,847 | ||||||
3.500%, 10/01/2020 to 03/01/2046 | 17,510 | 18,519 | ||||||
3.000%, 09/01/2029 to 04/01/2046 | 14,379 | 15,020 | ||||||
2.500%, 10/01/2029 to 05/01/2031 | 3,302 | 3,427 | ||||||
FHLMC Multifamily Structured Pass-Through Certificates, Ser K005, Cl A2 | ||||||||
4.317%, 11/25/2019 | 755 | 822 | ||||||
FHLMC Multifamily Structured Pass-Through Certificates, Ser K007, Cl A2 | ||||||||
4.224%, 03/25/2020 | 760 | 831 | ||||||
FHLMC Multifamily Structured Pass-Through Certificates, Ser K038, Cl A2 | ||||||||
3.389%, 03/25/2024 | 750 | 831 | ||||||
FHLMC Multifamily Structured Pass-Through Certificates, Ser K703, Cl A2 | ||||||||
2.699%, 05/25/2018 | 100 | 102 | ||||||
FHLMC TBA | ||||||||
3.500%, 08/25/2041 | 1,050 | 1,108 | ||||||
3.000%, 08/01/2042 | 2,200 | 2,288 | ||||||
2.500%, 08/15/2027 | 2,450 | 2,540 | ||||||
FNMA | ||||||||
6.000%, 07/01/2036 to 10/01/2039 | 1,251 | 1,430 | ||||||
5.500%, 01/01/2035 to 09/01/2041 | 3,536 | 3,992 | ||||||
5.000%, 07/01/2040 to 05/01/2042 | 3,983 | 4,417 | ||||||
4.500%, 04/01/2019 to 06/01/2044 | 7,632 | 8,357 | ||||||
4.000%, 09/01/2018 to 12/01/2045 | 16,583 | 17,733 | ||||||
3.500%, 01/01/2027 to 02/01/2046 | 29,381 | 31,075 | ||||||
3.000%, 08/01/2029 to 07/01/2046 | 27,059 | 28,280 | ||||||
2.500%, 07/01/2028 to 03/01/2043 | 6,230 | 6,454 | ||||||
FNMA TBA | ||||||||
4.000%, 08/15/2043 | 2,575 | 2,761 | ||||||
3.000%, 08/01/2042 | 500 | 520 | ||||||
2.500%, 08/25/2027 | 1,200 | 1,243 | ||||||
FNMA, Ser 2012-M2, Cl A2 | ||||||||
2.717%, 02/25/2022 | 500 | 526 | ||||||
FNMA, Ser 2014-M11, Cl 2A | ||||||||
3.308%, 08/25/2026 (B) | 970 | 1,066 | ||||||
FNMA, Ser 2015-M1, Cl A2 | ||||||||
2.532%, 09/25/2024 | 350 | 364 | ||||||
Description | Face Amount (Thousands) | Market Value ($ Thousands) | ||||||
MORTGAGE-BACKED SECURITIES (continued) |
| |||||||
GNMA | ||||||||
6.500%, 11/15/2038 | $ | 117 | $ | 143 | ||||
5.500%, 01/15/2033 to 10/20/2043 | 1,684 | 1,877 | ||||||
5.000%, 10/15/2033 to 10/20/2044 | 2,701 | 2,989 | ||||||
4.500%, 04/15/2040 to 10/20/2045 | 5,977 | 6,479 | ||||||
4.000%, 04/15/2040 to 11/20/2045 | 11,698 | 12,528 | ||||||
3.500%, 06/20/2042 to 06/20/2046 | 21,437 | 22,834 | ||||||
3.000%, 05/15/2042 to 07/20/2046 | 13,298 | 13,995 | ||||||
GNMA TBA | ||||||||
3.500%, 08/15/2041 | 2,175 | 2,313 | ||||||
3.000%, 08/15/2042 | 1,200 | 1,260 | ||||||
|
| |||||||
| 239,418 | ||||||||
|
| |||||||
Non-Agency Mortgage-Backed Obligations — 0.6% |
| |||||||
Citigroup Commercial Mortgage Trust, Ser 2012-GC8, Cl A4 | ||||||||
3.024%, 09/10/2045 | 250 | 266 | ||||||
Citigroup Commercial Mortgage Trust, Ser 2014-GC21, Cl A5 | ||||||||
3.855%, 05/10/2047 | 265 | 295 | ||||||
Commercial Mortgage Trust, Ser 2013-CR13, Cl A2 | ||||||||
3.039%, 12/10/2018 | 500 | 518 | ||||||
Commercial Mortgage Trust, Ser 2013-CR6, Cl A2 | ||||||||
2.122%, 03/10/2046 | 500 | 504 | ||||||
Commercial Mortgage Trust, Ser 2014-UBS2, Cl A5 | ||||||||
3.961%, 03/10/2047 | 270 | 301 | ||||||
Commercial Mortgage Trust, Ser 2014-UBS3, Cl A3 | ||||||||
3.546%, 06/10/2047 | 700 | 760 | ||||||
GS Mortgage Securities II, Ser 2014-GC20, Cl A5 | ||||||||
3.998%, 04/10/2047 | 265 | 298 | ||||||
JPMBB Commercial Mortgage Securities Trust, Ser 2014-C22, Cl A4 | ||||||||
3.801%, 09/15/2047 | 500 | 555 | ||||||
JPMorgan Chase Commercial Mortgage Securities Trust, Ser 2012-C8, Cl A2 | ||||||||
1.797%, 10/15/2045 | 899 | 904 | ||||||
Morgan Stanley Bank of America Merrill Lynch Trust, Ser 2014-C16, Cl A3 | ||||||||
3.592%, 06/15/2047 | 1,000 | 1,070 | ||||||
Morgan Stanley Capital I, Ser 2007-IQ16, Cl A4 | ||||||||
5.809%, 12/12/2049 | 194 | 201 | ||||||
UBS-Barclays Commercial Mortgage Trust, Ser 2013-C5, Cl A4 | ||||||||
3.185%, 03/10/2046 | 305 | 326 | ||||||
WFRBS Commercial Mortgage Trust, Ser 2012- C7, Cl A2 | ||||||||
3.431%, 06/15/2045 | 500 | 542 | ||||||
| Adviser Managed Trust / Annual Report / July 31, 2016 | 47 |
SCHEDULE OF INVESTMENTS
JULY 31, 2016
Tactical Offensive Fixed Income Fund (Continued)
Description | Face Amount (Thousands) | Market Value ($ Thousands) | ||||||
MORTGAGE-BACKED SECURITIES (continued) |
| |||||||
WFRBS Commercial Mortgage Trust, Ser 2014- C19, Cl A5 | ||||||||
4.101%, 03/15/2047 | $ | 250 | $ | 283 | ||||
WFRBS Commercial Mortgage Trust, Ser 2014- C22, Cl A4 | ||||||||
3.488%, 09/15/2057 | 300 | 327 | ||||||
|
| |||||||
| 7,150 | ||||||||
|
| |||||||
Total Mortgage-Backed Securities (Cost $242,221) ($ Thousands) | 246,568 | |||||||
|
| |||||||
SOVEREIGN DEBT — 16.1% |
| |||||||
Angolan Government International Bond | ||||||||
9.500%, 11/12/2025 (A) | 300 | 285 | ||||||
Argentine Republic Government International Bond | ||||||||
8.280%, 12/31/2033 | 1,192 | 1,338 | ||||||
7.625%, 04/22/2046 (A) | 750 | 799 | ||||||
7.500%, 04/22/2026 (A) | 1,250 | 1,357 | ||||||
7.125%, 07/06/2036 (A) | 300 | 305 | ||||||
6.875%, 04/22/2021 (A) | 1,000 | 1,076 | ||||||
6.625%, 07/06/2028 (A) | 200 | 203 | ||||||
6.250%, 04/22/2019 (A) | 500 | 530 | ||||||
3.750%, 03/31/2019 (C) | 750 | 508 | ||||||
Armenia Government International Bond | ||||||||
7.150%, 03/26/2025 | 200 | 211 | ||||||
Azerbaijan Government International Bond | ||||||||
4.750%, 03/18/2024 (A) | 200 | 202 | ||||||
Bahrain Government International Bond | ||||||||
7.000%, 01/26/2026 (A) | 200 | 208 | ||||||
6.125%, 07/05/2022 (A) | 400 | 413 | ||||||
6.125%, 08/01/2023 (A) | 200 | 206 | ||||||
6.000%, 09/19/2044 (A) | 200 | 165 | ||||||
5.875%, 01/26/2021 (A) | 200 | 207 | ||||||
5.500%, 03/31/2020 (A) | 300 | 313 | ||||||
Belarus Government International Bond | ||||||||
8.950%, 01/26/2018 | 200 | 209 | ||||||
Bolivian Government International Bond | ||||||||
5.950%, 08/22/2023 | 200 | 236 | ||||||
Brazilian Government International Bond | ||||||||
8.250%, 01/20/2034 | 650 | 817 | ||||||
7.125%, 01/20/2037 | 100 | 116 | ||||||
6.000%, 04/07/2026 | 600 | 662 | ||||||
5.875%, 01/15/2019 | 500 | 546 | ||||||
5.625%, 01/07/2041 | 650 | 642 | ||||||
5.625%, 02/21/2047 | 200 | 194 | ||||||
5.000%, 01/27/2045 | 650 | 594 | ||||||
4.875%, 01/22/2021 | 600 | 637 | ||||||
4.250%, 01/07/2025 | 1,100 | 1,087 | ||||||
2.625%, 01/05/2023 | 950 | 876 | ||||||
Description | Face Amount (Thousands) | Market Value ($ Thousands) | ||||||
SOVEREIGN DEBT (continued) |
| |||||||
Bundesobligation | ||||||||
0.250%, 10/16/2020 | EUR 230 | $ | 267 | |||||
0.090%, 04/17/2020 (D) | 175 | 200 | ||||||
Bundesrepublik Deutschland | ||||||||
4.750%, 07/04/2034 | 521 | 1,067 | ||||||
2.500%, 07/04/2044 | 270 | 478 | ||||||
0.500%, 02/15/2025 | 955 | 1,142 | ||||||
Cameroon Government International Bond | ||||||||
9.500%, 11/19/2025 (A) | $ | 200 | 211 | |||||
Canadian Government International Bond | ||||||||
3.500%, 12/01/2045 | CAD | 110 | 121 | |||||
2.250%, 06/01/2025 | 744 | 635 | ||||||
1.750%, 09/01/2019 | 778 | 618 | ||||||
1.625%, 02/27/2019 | $ | 100 | 102 | |||||
1.125%, 03/19/2018 | 200 | 201 | ||||||
Chile Government International Bond | ||||||||
3.875%, 08/05/2020 | 150 | 164 | ||||||
3.625%, 10/30/2042 | 150 | 158 | ||||||
3.125%, 01/21/2026 | 810 | 863 | ||||||
Colombia Government International Bond | ||||||||
7.375%, 03/18/2019 | 950 | 1,080 | ||||||
7.375%, 09/18/2037 | 325 | 419 | ||||||
6.125%, 01/18/2041 | 700 | 803 | ||||||
5.625%, 02/26/2044 | 500 | 549 | ||||||
5.000%, 06/15/2045 | 600 | 617 | ||||||
4.500%, 01/28/2026 | 500 | 534 | ||||||
4.375%, 07/12/2021 | 400 | 429 | ||||||
4.000%, 02/26/2024 | 800 | 832 | ||||||
2.625%, 03/15/2023 | 300 | 290 | ||||||
Costa Rica Government International Bond | ||||||||
7.158%, 03/12/2045 | 200 | 213 | ||||||
7.000%, 04/04/2044 (A) | 200 | 212 | ||||||
4.375%, 04/30/2025 (A) | 200 | 192 | ||||||
4.250%, 01/26/2023 (A) | 200 | 194 | ||||||
Croatia Government International Bond | ||||||||
6.750%, 11/05/2019 | 400 | 438 | ||||||
6.625%, 07/14/2020 (A) | 100 | 110 | ||||||
6.375%, 03/24/2021 | 350 | 386 | ||||||
6.000%, 01/26/2024 | 450 | 498 | ||||||
5.500%, 04/04/2023 | 250 | 269 | ||||||
Dominican Republic International Bond | ||||||||
7.500%, 05/06/2021 | 200 | 224 | ||||||
7.450%, 04/30/2044 | 350 | 399 | ||||||
6.875%, 01/29/2026 (A) | 150 | 168 | ||||||
6.850%, 01/27/2045 | 400 | 430 | ||||||
6.600%, 01/28/2024 | 200 | 221 | ||||||
5.875%, 04/18/2024 | 200 | 212 | ||||||
5.500%, 01/27/2025 | 300 | 311 | ||||||
Ecuador Government International Bond | ||||||||
10.500%, 03/24/2020 | 400 | 401 | ||||||
7.950%, 06/20/2024 | 400 | 347 | ||||||
| 48 | Adviser Managed Trust / Annual Report / July 31, 2016 |
Description | Face Amount (Thousands) | Market Value ($ Thousands) | ||||||
SOVEREIGN DEBT (continued) |
| |||||||
Egypt Government International Bond | ||||||||
6.875%, 04/30/2040 | $ | 100 | $ | 93 | ||||
5.875%, 06/11/2025 | 300 | 279 | ||||||
5.750%, 04/29/2020 | 300 | 307 | ||||||
El Salvador Government International Bond | ||||||||
7.750%, 01/24/2023 | 150 | 165 | ||||||
7.650%, 06/15/2035 | 60 | 63 | ||||||
7.625%, 02/01/2041 (A) | 300 | 308 | ||||||
7.375%, 12/01/2019 | 250 | 268 | ||||||
6.375%, 01/18/2027 | 300 | 305 | ||||||
5.875%, 01/30/2025 | 125 | 124 | ||||||
Ethiopia Government International Bond | ||||||||
6.625%, 12/11/2024 | 200 | 190 | ||||||
Export Development Canada | ||||||||
1.625%, 12/03/2019 | 300 | 306 | ||||||
1.000%, 11/01/2018 | 100 | 100 | ||||||
Export-Import Bank of Korea | ||||||||
4.375%, 09/15/2021 | 200 | 224 | ||||||
2.875%, 01/21/2025 | 200 | 210 | ||||||
2.250%, 01/21/2020 | 200 | 203 | ||||||
France Government International Bond | ||||||||
4.250%, 10/25/2023 | EUR 858 | 1,275 | ||||||
3.750%, 04/25/2021 | 700 | 939 | ||||||
3.250%, 10/25/2021 | 600 | 800 | ||||||
3.250%, 05/25/2045 | 320 | 579 | ||||||
2.500%, 05/25/2030 | 1,130 | 1,635 | ||||||
French Treasury Note | ||||||||
1.000%, 07/25/2017 | 185 | 210 | ||||||
Gabon Government International Bond | ||||||||
6.950%, 06/16/2025 | $ | 200 | 181 | |||||
6.375%, 12/12/2024 | 200 | 180 | ||||||
Georgia Government International Bond | ||||||||
6.875%, 04/12/2021 (A) | 200 | 221 | ||||||
Ghana Government International Bond | ||||||||
10.750%, 10/14/2030 | 300 | 327 | ||||||
8.500%, 10/04/2017 | 200 | 205 | ||||||
8.125%, 01/18/2026 | 200 | 173 | ||||||
Guatemala Government International Bond | ||||||||
5.750%, 06/06/2022 (A) | 200 | 227 | ||||||
4.875%, 02/13/2028 | 200 | 219 | ||||||
Honduras Government International Bond | ||||||||
7.500%, 03/15/2024 | 200 | 225 | ||||||
Hungary Government International Bond | ||||||||
7.625%, 03/29/2041 | 250 | 371 | ||||||
6.375%, 03/29/2021 | 550 | 630 | ||||||
6.250%, 01/29/2020 | 350 | 390 | ||||||
5.750%, 11/22/2023 | 400 | 460 | ||||||
5.375%, 02/21/2023 | 400 | 448 | ||||||
5.375%, 03/25/2024 | 500 | 565 | ||||||
4.000%, 03/25/2019 | 300 | 312 | ||||||
Indonesia Government International Bond | ||||||||
11.625%, 03/04/2019 | 300 | 371 | ||||||
Description | Face Amount (Thousands) | Market Value ($ Thousands) | ||||||
SOVEREIGN DEBT (continued) |
| |||||||
8.500%, 10/12/2035 | $ | 300 | $ | 451 | ||||
7.750%, 01/17/2038 | 400 | 574 | ||||||
6.875%, 01/17/2018 | 300 | 323 | ||||||
6.750%, 01/15/2044 (A) | 275 | 372 | ||||||
6.625%, 02/17/2037 | 400 | 516 | ||||||
5.950%, 01/08/2046 (A) | 400 | 499 | ||||||
5.875%, 03/13/2020 | 700 | 782 | ||||||
5.875%, 01/15/2024 (A) | 500 | 585 | ||||||
5.375%, 10/17/2023 (A) | 200 | 228 | ||||||
5.250%, 01/17/2042 (A) | 300 | 340 | ||||||
5.125%, 01/15/2045 (A) | 400 | 450 | ||||||
4.875%, 05/05/2021 (A) | 450 | 494 | ||||||
4.750%, 01/08/2026 (A) | 600 | 668 | ||||||
4.625%, 04/15/2043 (A) | 400 | 422 | ||||||
4.125%, 01/15/2025 (A) | 400 | 424 | ||||||
3.750%, 04/25/2022 (A) | 200 | 209 | ||||||
3.375%, 04/15/2023 (A) | 200 | 204 | ||||||
Iraq Government International Bond | ||||||||
5.800%, 01/15/2028 (A) | 500 | 375 | ||||||
Israel Government International Bond | ||||||||
4.500%, 01/30/2043 | 200 | 224 | ||||||
4.000%, 06/30/2022 | 200 | 223 | ||||||
Italy Buoni Poliennali Del Tesoro | ||||||||
5.000%, 08/01/2034 | EUR 330 | 554 | ||||||
4.750%, 09/01/2028 (A) | 654 | 1,007 | ||||||
4.000%, 09/01/2020 | 310 | 401 | ||||||
3.750%, 05/01/2021 | 307 | 400 | ||||||
3.500%, 06/01/2018 | 452 | 538 | ||||||
3.250%, 09/01/2046 (A) | 190 | 266 | ||||||
2.150%, 12/15/2021 | 643 | 787 | ||||||
2.000%, 12/01/2025 | 450 | 543 | ||||||
1.150%, 05/15/2017 | 2,079 | 2,349 | ||||||
1.050%, 12/01/2019 | 422 | 488 | ||||||
0.650%, 11/01/2020 | 785 | 896 | ||||||
Italy Government International Bond MTN | ||||||||
6.875%, 09/27/2023 | $ | 100 | 126 | |||||
5.375%, 06/15/2033 | 150 | 185 | ||||||
Ivory Coast Government International Bond | ||||||||
6.375%, 03/03/2028 | 200 | 201 | ||||||
5.750%, 12/31/2032 (C) | 495 | 473 | ||||||
5.375%, 07/23/2024 | 200 | 192 | ||||||
Jamaica Government International Bond | ||||||||
7.625%, 07/09/2025 | 200 | 228 | ||||||
6.750%, 04/28/2028 | 300 | 328 | ||||||
Japan Bank for International Cooperation | ||||||||
2.125%, 02/10/2025 | 200 | 206 | ||||||
1.875%, 07/21/2026 | 200 | 201 | ||||||
1.750%, 11/13/2018 | 550 | 554 | ||||||
Japan Government Five Year Bond | ||||||||
0.200%, 06/20/2017 | JPY 70,250 | 689 | ||||||
0.200%, 12/20/2017 | 246,000 | 2,416 | ||||||
0.200%, 12/20/2018 | 292,550 | 2,886 | ||||||
| Adviser Managed Trust / Annual Report / July 31, 2016 | 49 |
SCHEDULE OF INVESTMENTS
JULY 31, 2016
Tactical Offensive Fixed Income Fund (Continued)
Description | Face Amount | Market Value | ||||||
SOVEREIGN DEBT (continued) |
| |||||||
0.100%, 03/20/2018 | JPY 86,000 | $ | 844 | |||||
0.100%, 06/20/2019 | 63,500 | 626 | ||||||
0.100%, 06/20/2020 | 115,500 | 1,143 | ||||||
0.100%, 09/20/2020 | 209,300 | 2,072 | ||||||
Japan Government Ten Year Bond | ||||||||
0.700%, 12/20/2022 | 136,400 | 1,415 | ||||||
0.600%, 03/20/2023 | 117,100 | 1,210 | ||||||
0.500%, 09/20/2024 | 339,450 | 3,517 | ||||||
0.400%, 09/20/2025 | 60,000 | 618 | ||||||
0.100%, 03/20/2026 | 81,850 | 821 | ||||||
Japan Government Thirty Year Bond | ||||||||
2.500%, 03/20/2036 | 144,150 | 2,028 | ||||||
1.700%, 09/20/2044 | 242,650 | 3,283 | ||||||
0.300%, 06/20/2046 | 13,350 | 131 | ||||||
Japan Government Twenty Year Bond | ||||||||
2.100%, 03/20/2030 | 231,500 | 2,914 | ||||||
1.600%, 03/20/2033 | 130,250 | 1,589 | ||||||
1.500%, 03/20/2033 | 140,600 | 1,692 | ||||||
Jordan Government International Bond | ||||||||
6.125%, 01/29/2026 (A) | $ | 200 | 215 | |||||
Kazakhstan Government International Bond MTN | ||||||||
6.500%, 07/21/2045 (A) | 250 | 295 | ||||||
5.125%, 07/21/2025 (A) | 550 | 603 | ||||||
4.875%, 10/14/2044 (A) | 200 | 199 | ||||||
3.875%, 10/14/2024 (A) | 200 | 202 | ||||||
Kenya Government International Bond | ||||||||
6.875%, 06/24/2024 | 400 | 379 | ||||||
5.875%, 06/24/2019 | 200 | 200 | ||||||
Korea Government International Bond | ||||||||
3.875%, 09/11/2023 | 200 | 230 | ||||||
Lebanon Government International Bond MTN | ||||||||
8.250%, 04/12/2021 | 500 | 542 | ||||||
6.650%, 11/03/2028 | 250 | 244 | ||||||
6.650%, 02/26/2030 | 350 | 339 | ||||||
6.600%, 11/27/2026 | 1,200 | 1,176 | ||||||
6.375%, 03/09/2020 | 200 | 202 | ||||||
6.100%, 10/04/2022 | 300 | 297 | ||||||
6.000%, 01/27/2023 | 50 | 49 | ||||||
5.800%, 04/14/2020 | 550 | 546 | ||||||
5.450%, 11/28/2019 | 1,100 | 1,091 | ||||||
5.150%, 11/12/2018 | 100 | 99 | ||||||
Malaysia Sukuk Global | ||||||||
4.080%, 04/27/2046 (A) | 250 | 269 | ||||||
Mexico Government International Bond | ||||||||
6.750%, 09/27/2034 | 825 | 1,122 | ||||||
6.050%, 01/11/2040 | 800 | 1,010 | ||||||
5.950%, 03/19/2019 | 250 | 279 | ||||||
5.750%, 10/12/2110 | 650 | 713 | ||||||
5.550%, 01/21/2045 | 800 | 960 | ||||||
5.125%, 01/15/2020 | 950 | 1,054 | ||||||
4.750%, 03/08/2044 | 900 | 963 | ||||||
Description | Face Amount | Market Value | ||||||
SOVEREIGN DEBT (continued) |
| |||||||
4.600%, 01/23/2046 | $ | 800 | $ | 842 | ||||
4.125%, 01/21/2026 | 700 | 760 | ||||||
4.000%, 10/02/2023 | 850 | 915 | ||||||
3.625%, 03/15/2022 | 600 | 634 | ||||||
3.600%, 01/30/2025 | 1,100 | 1,151 | ||||||
3.500%, 01/21/2021 | 500 | 530 | ||||||
Mongolia Government International Bond MTN | ||||||||
5.125%, 12/05/2022 | 200 | 181 | ||||||
4.125%, 01/05/2018 | 200 | 195 | ||||||
Morocco Government International Bond | ||||||||
5.500%, 12/11/2042 (A) | 200 | 228 | ||||||
4.250%, 12/11/2022 (A) | 200 | 215 | ||||||
Mozambique Government International Bond | ||||||||
10.500%, 01/18/2023 (A) | 200 | 141 | ||||||
Namibia Government International Bond | ||||||||
5.500%, 11/03/2021 (A) | 200 | 214 | ||||||
Nigeria Government International Bond | ||||||||
6.375%, 07/12/2023 | 200 | 195 | ||||||
5.125%, 07/12/2018 | 200 | 201 | ||||||
Oman Government International Bond | ||||||||
4.750%, 06/15/2026 (A) | 400 | 410 | ||||||
3.625%, 06/15/2021 (A) | 200 | 205 | ||||||
Pakistan Government International Bond | ||||||||
8.250%, 04/15/2024 | 200 | 222 | ||||||
7.250%, 04/15/2019 | 250 | 267 | ||||||
Panama Government International Bond | ||||||||
6.700%, 01/26/2036 | 500 | 677 | ||||||
5.200%, 01/30/2020 | 450 | 496 | ||||||
4.300%, 04/29/2053 | 200 | 210 | ||||||
4.000%, 09/22/2024 | 650 | 702 | ||||||
3.875%, 03/17/2028 | 200 | 215 | ||||||
3.750%, 03/16/2025 | 900 | 956 | ||||||
Paraguay Government International Bond | ||||||||
6.100%, 08/11/2044 | 200 | 223 | ||||||
4.625%, 01/25/2023 (A) | 200 | 209 | ||||||
Peruvian Government International Bond | ||||||||
8.750%, 11/21/2033 | 250 | 397 | ||||||
7.350%, 07/21/2025 | 750 | 1,024 | ||||||
7.125%, 03/30/2019 | 300 | 344 | ||||||
6.550%, 03/14/2037 | 500 | 682 | ||||||
5.625%, 11/18/2050 | 550 | 697 | ||||||
4.125%, 08/25/2027 | 200 | 222 | ||||||
Philippine Government International Bond | ||||||||
9.875%, 01/15/2019 | 150 | 181 | ||||||
8.375%, 06/17/2019 | 300 | 359 | ||||||
7.750%, 01/14/2031 | 650 | 1,020 | ||||||
6.500%, 01/20/2020 | 200 | 234 | ||||||
6.375%, 01/15/2032 | 100 | 143 | ||||||
6.375%, 10/23/2034 | 850 | 1,260 | ||||||
5.500%, 03/30/2026 | 850 | 1,091 | ||||||
5.000%, 01/13/2037 | 400 | 533 | ||||||
4.200%, 01/21/2024 | 650 | 750 | ||||||
| 50 | Adviser Managed Trust / Annual Report / July 31, 2016 |
Description | Face Amount | Market Value | ||||||
SOVEREIGN DEBT (continued) |
| |||||||
4.000%, 01/15/2021 | $ | 450 | $ | 496 | ||||
3.950%, 01/20/2040 | 600 | 708 | ||||||
3.700%, 03/01/2041 | 600 | 690 | ||||||
Poland Government International Bond | ||||||||
6.375%, 07/15/2019 | 850 | 968 | ||||||
5.125%, 04/21/2021 | 550 | 627 | ||||||
5.000%, 03/23/2022 | 675 | 774 | ||||||
4.000%, 01/22/2024 | 600 | 664 | ||||||
3.250%, 04/06/2026 | 450 | 472 | ||||||
3.000%, 03/17/2023 | 400 | 417 | ||||||
Province of British Columbia Canada | ||||||||
2.000%, 10/23/2022 | 225 | 232 | ||||||
Province of Manitoba Canada | ||||||||
3.050%, 05/14/2024 | 100 | 109 | ||||||
1.125%, 06/01/2018 | 100 | 100 | ||||||
Province of Ontario Canada | ||||||||
4.400%, 04/14/2020 | 200 | 222 | ||||||
3.200%, 05/16/2024 | 400 | 438 | ||||||
2.500%, 09/10/2021 | 200 | 210 | ||||||
2.500%, 04/27/2026 | 200 | 210 | ||||||
2.000%, 01/30/2019 | 100 | 102 | ||||||
Province of Quebec Canada | ||||||||
7.500%, 09/15/2029 | 300 | 458 | ||||||
3.500%, 07/29/2020 | 250 | 271 | ||||||
Qatar Government International Bond | ||||||||
9.750%, 06/15/2030 (A) | 200 | 335 | ||||||
6.550%, 04/09/2019 (A) | 200 | 225 | ||||||
6.400%, 01/20/2040 (A) | 300 | 406 | ||||||
5.750%, 01/20/2042 (A) | 200 | 252 | ||||||
5.250%, 01/20/2020 (A) | 450 | 499 | ||||||
4.625%, 06/02/2046 (A) | 400 | 429 | ||||||
4.500%, 01/20/2022 (A) | 550 | 612 | ||||||
3.250%, 06/02/2026 (A) | 800 | 819 | ||||||
2.375%, 06/02/2021 (A) | 600 | 605 | ||||||
Romanian Government International Bond MTN | ||||||||
6.750%, 02/07/2022 (A) | 400 | 479 | ||||||
6.125%, 01/22/2044 (A) | 200 | 257 | ||||||
4.875%, 01/22/2024 (A) | 250 | 280 | ||||||
4.375%, 08/22/2023 (A) | 300 | 326 | ||||||
Russian Foreign Bond -Eurobond | ||||||||
12.750%, 06/24/2028 (A) | 475 | 845 | ||||||
11.000%, 07/24/2018 (A) | 550 | 644 | ||||||
7.500%, 03/31/2030 (C) | 2,288 | 2,796 | ||||||
5.875%, 09/16/2043 (A) | 200 | 228 | ||||||
5.625%, 04/04/2042 (A) | 800 | 878 | ||||||
5.000%, 04/29/2020 | 700 | 746 | ||||||
4.875%, 09/16/2023 (A) | 800 | 866 | ||||||
4.500%, 04/04/2022 (A) | 400 | 424 | ||||||
3.500%, 01/16/2019 (A) | 400 | 408 | ||||||
Senegal Government International Bond | ||||||||
6.250%, 07/30/2024 | 200 | 196 | ||||||
Description | Face Amount | Market Value | ||||||
SOVEREIGN DEBT (continued) |
| |||||||
Serbia Government International Bond |
| |||||||
7.250%, 09/28/2021 | $ | 250 | $ | 289 | ||||
5.875%, 12/03/2018 | 200 | 213 | ||||||
5.250%, 11/21/2017 | 200 | 207 | ||||||
4.875%, 02/25/2020 | 400 | 415 | ||||||
South Africa Government International Bond | ||||||||
6.875%, 05/27/2019 | 250 | 280 | ||||||
6.250%, 03/08/2041 | 200 | 239 | ||||||
5.875%, 05/30/2022 | 200 | 225 | ||||||
5.875%, 09/16/2025 | 500 | 567 | ||||||
5.500%, 03/09/2020 | 800 | 869 | ||||||
5.375%, 07/24/2044 | 200 | 217 | ||||||
4.875%, 04/14/2026 | 200 | 211 | ||||||
4.665%, 01/17/2024 | 400 | 421 | ||||||
Sri Lanka Government International Bond | ||||||||
6.850%, 11/03/2025 (A) | 200 | 211 | ||||||
6.825%, 07/18/2026 (A) | 200 | 208 | ||||||
6.250%, 10/04/2020 (A) | 300 | 318 | ||||||
6.250%, 07/27/2021 (A) | 200 | 211 | ||||||
6.125%, 06/03/2025 | 200 | 202 | ||||||
6.000%, 01/14/2019 | 200 | 208 | ||||||
5.875%, 07/25/2022 (A) | 200 | 206 | ||||||
5.750%, 01/18/2022 (A) | 200 | 207 | ||||||
Svensk Exportkredit MTN | ||||||||
1.875%, 06/23/2020 | 200 | 204 | ||||||
1.250%, 04/12/2019 | 250 | 251 | ||||||
Turkey Government International Bond | ||||||||
7.500%, 11/07/2019 | 450 | 502 | ||||||
7.375%, 02/05/2025 | 850 | 1,010 | ||||||
7.250%, 03/05/2038 | 100 | 123 | ||||||
7.000%, 03/11/2019 | 200 | 217 | ||||||
7.000%, 06/05/2020 | 350 | 388 | ||||||
6.875%, 03/17/2036 | 1,200 | 1,410 | ||||||
6.750%, 04/03/2018 | 550 | 582 | ||||||
6.750%, 05/30/2040 | 500 | 582 | ||||||
6.625%, 02/17/2045 | 450 | 520 | ||||||
6.250%, 09/26/2022 | 700 | 768 | ||||||
6.000%, 01/14/2041 | 800 | 853 | ||||||
5.750%, 03/22/2024 | 1,000 | 1,076 | ||||||
5.625%, 03/30/2021 | 900 | 957 | ||||||
4.875%, 10/09/2026 | 200 | 203 | ||||||
4.875%, 04/16/2043 | 1,025 | 947 | ||||||
4.250%, 04/14/2026 | 800 | 775 | ||||||
3.250%, 03/23/2023 | 200 | 188 | ||||||
Ukraine Government AID Bond | ||||||||
1.847%, 05/29/2020 | 263 | 269 | ||||||
Ukraine Government International Bond | ||||||||
7.750%, 09/01/2019 (A) | 500 | 496 | ||||||
7.750%, 09/01/2020 (A) | 500 | 492 | ||||||
7.750%, 09/01/2021 (A) | 200 | 196 | ||||||
7.750%, 09/01/2025 (A) | 500 | 484 | ||||||
7.750%, 09/01/2026 (A) | 500 | 483 | ||||||
| Adviser Managed Trust / Annual Report / July 31, 2016 | 51 |
SCHEDULE OF INVESTMENTS
JULY 31, 2016
Tactical Offensive Fixed Income Fund (Continued)
Description | Face Amount | Market Value | ||||||
SOVEREIGN DEBT (continued) |
| |||||||
7.750%, 09/01/2027 (A) | $ | 400 | $ | 385 | ||||
United Kingdom Gilt | ||||||||
4.750%, 12/07/2038 | GBP | 220 | 474 | |||||
4.500%, 09/07/2034 | 128 | 256 | ||||||
4.250%, 06/07/2032 | 448 | 855 | ||||||
4.250%, 06/07/2032 | 75 | 143 | ||||||
4.250%, 12/07/2040 | 318 | 656 | ||||||
3.750%, 07/22/2052 | 640 | 1,395 | ||||||
3.500%, 01/22/2045 | 145 | 278 | ||||||
2.250%, 09/07/2023 | 470 | 702 | ||||||
2.000%, 07/22/2020 | 1,036 | 1,472 | ||||||
2.000%, 09/07/2025 | 165 | 244 | ||||||
1.250%, 07/22/2018 | 302 | 410 | ||||||
Uruguay Government International Bond | ||||||||
7.625%, 03/21/2036 | $ | 400 | 554 | |||||
5.100%, 06/18/2050 | 825 | 835 | ||||||
4.500%, 08/14/2024 | 600 | 659 | ||||||
4.375%, 10/27/2027 | 450 | 478 | ||||||
Venezuela Government International Bond | ||||||||
12.750%, 08/23/2022 | 900 | 474 | ||||||
11.950%, 08/05/2031 | 1,000 | 479 | ||||||
11.750%, 10/21/2026 | 800 | 387 | ||||||
9.375%, 01/13/2034 | 650 | 288 | ||||||
9.250%, 09/15/2027 | 500 | 241 | ||||||
9.250%, 05/07/2028 | 200 | 89 | ||||||
9.000%, 05/07/2023 | 600 | 266 | ||||||
8.250%, 10/13/2024 | 100 | 43 | ||||||
7.750%, 10/13/2019 | 250 | 120 | ||||||
7.650%, 04/21/2025 | 500 | 212 | ||||||
7.000%, 03/31/2038 | 500 | 204 | ||||||
Vietnam Government International Bond | ||||||||
6.750%, 01/29/2020 | 150 | 169 | ||||||
4.800%, 11/19/2024 | 200 | 213 | ||||||
Zambia Government International Bond | ||||||||
8.970%, 07/30/2027 | 200 | 176 | ||||||
8.500%, 04/14/2024 | 200 | 176 | ||||||
5.375%, 09/20/2022 | 200 | 158 | ||||||
|
| |||||||
Total Sovereign Debt | 183,738 | |||||||
|
| |||||||
U.S. GOVERNMENT AGENCY OBLIGATIONS — 1.8% |
| |||||||
FFCB | ||||||||
1.620%, 04/20/2021 | 250 | 250 | ||||||
1.100%, 06/01/2018 | 250 | 252 | ||||||
0.730%, 10/13/2017 | 500 | 499 | ||||||
FHLB | ||||||||
5.500%, 07/15/2036 | 225 | 334 | ||||||
1.875%, 06/07/2021 | 500 | 501 | ||||||
1.625%, 06/14/2019 | 1,250 | 1,275 | ||||||
1.125%, 04/25/2018 to 07/14/2021 | 3,000 | 3,011 | ||||||
Description | Face Amount | Market Value | ||||||
U.S. GOVERNMENT AGENCY OBLIGATIONS (continued) |
| |||||||
1.000%, 12/19/2017 | $ | 500 | $ | 502 | ||||
FHLMC | ||||||||
6.750%, 03/15/2031 | 500 | 781 | ||||||
6.250%, 07/15/2032 | 300 | 460 | ||||||
2.375%, 01/13/2022 | 375 | 397 | ||||||
1.375%, 05/01/2020 | 1,200 | 1,216 | ||||||
1.350%, 02/26/2019 | 250 | 250 | ||||||
1.250%, 07/26/2019 | 250 | 250 | ||||||
1.050%, 02/26/2018 | 250 | 250 | ||||||
0.875%, 03/07/2018 | 700 | 701 | ||||||
FNMA | ||||||||
6.625%, 11/15/2030 | 475 | 732 | ||||||
2.625%, 09/06/2024 | 600 | 646 | ||||||
2.125%, 04/24/2026 | 205 | 212 | ||||||
1.875%, 02/19/2019 to 12/28/2020 | 1,250 | 1,291 | ||||||
1.750%, 09/12/2019 | 750 | 769 | ||||||
1.625%, 01/21/2020 | 375 | 383 | ||||||
1.500%, 06/22/2020 | 300 | 305 | ||||||
1.125%, 10/19/2018 | 500 | 503 | ||||||
1.000%, 09/27/2017 to 02/26/2019 | 1,800 | 1,807 | ||||||
0.875%, 12/20/2017 to 08/02/2019 | 1,750 | 1,753 | ||||||
Tennessee Valley Authority | ||||||||
5.250%, 09/15/2039 | 275 | 386 | ||||||
3.500%, 12/15/2042 | 125 | 139 | ||||||
2.875%, 09/15/2024 | 500 | 545 | ||||||
|
| |||||||
Total U.S. Government Agency Obligations | 20,400 | |||||||
|
| |||||||
MUNICIPAL BONDS — 0.6% |
| |||||||
California — 0.2% |
| |||||||
Bay Area, Toll Authority, RB | ||||||||
6.263%, 04/01/2049 | 200 | 312 | ||||||
California State, Build America Bonds, GO | ||||||||
7.600%, 11/01/2040 | 175 | 295 | ||||||
7.550%, 04/01/2039 | 350 | 577 | ||||||
California State, Earthquake Authority, RB | ||||||||
2.805%, 07/01/2019 | 100 | 103 | ||||||
California State, East Bay Municipal Utility District, Water System Revenue, RB | ||||||||
5.874%, 06/01/2040 | 200 | 286 | ||||||
Los Angeles, Unified School District, GO | ||||||||
5.750%, 07/01/2034 | 200 | 271 | ||||||
University of California, Ser AJ, RB | ||||||||
4.601%, 05/15/2031 | 250 | 297 | ||||||
University of California, Ser AQ, RB | ||||||||
4.767%, 05/15/2115 | 250 | 284 | ||||||
|
| |||||||
| 2,425 | ||||||||
|
| |||||||
| 52 | Adviser Managed Trust / Annual Report / July 31, 2016 |
Description | Face Amount | Market Value | ||||||
MUNICIPAL BONDS (continued) |
| |||||||
Connecticut — 0.0% | ||||||||
Connecticut State, Ser A, GO | ||||||||
5.850%, 03/15/2032 | $ | 200 | $ | 259 | ||||
|
| |||||||
Georgia — 0.0% | ||||||||
Georgia State, Municipal Electric Authority, RB | ||||||||
6.655%, 04/01/2057 | 100 | 137 | ||||||
6.637%, 04/01/2057 | 200 | 276 | ||||||
|
| |||||||
| 413 | ||||||||
|
| |||||||
Illinois — 0.1% | ||||||||
Chicago, GO | ||||||||
7.781%, 01/01/2035 | 250 | 275 | ||||||
Illinois State, GO | ||||||||
5.100%, 06/01/2033 | 400 | 391 | ||||||
4.950%, 06/01/2023 | 100 | 107 | ||||||
4.350%, 06/01/2018 | 73 | 75 | ||||||
|
| |||||||
| 848 | ||||||||
|
| |||||||
New Jersey — 0.1% | ||||||||
New Jersey State, Turnpike Authority, RB | ||||||||
7.414%, 01/01/2040 | 225 | 362 | ||||||
7.102%, 01/01/2041 | 350 | 547 | ||||||
|
| |||||||
| 909 | ||||||||
|
| |||||||
New York — 0.1% | ||||||||
New York & New Jersey, Port Authority, RB | ||||||||
4.458%, 10/01/2062 | 200 | 243 | ||||||
New York & New Jersey, Port Authority, RB Callable 06/01/2025 @ 100 | ||||||||
4.823%, 06/01/2045 | 50 | 56 | ||||||
New York City, GO Callable 12/01/2020 @ 100 | ||||||||
6.646%, 12/01/2031 | 200 | 239 | ||||||
New York City, Water & Sewer System, RB | ||||||||
5.750%, 06/15/2041 | 100 | 145 | ||||||
New York State, Dormitory Authority, RB | ||||||||
5.500%, 03/15/2030 | 100 | 129 | ||||||
5.289%, 03/15/2033 | 100 | 129 | ||||||
New York State, Metropolitan Transportation Authority, RB | ||||||||
6.814%, 11/15/2040 | 250 | 373 | ||||||
|
| |||||||
| 1,314 | ||||||||
|
| |||||||
Ohio — 0.0% | ||||||||
American Municipal Power, Ser B, RB | ||||||||
8.084%, 02/15/2050 | 100 | 170 | ||||||
Ohio State University, Ser A, RB | ||||||||
4.048%, 12/01/2056 | 100 | 115 | ||||||
|
| |||||||
| 285 | ||||||||
|
| |||||||
Description | Face Amount | Market Value | ||||||
MUNICIPAL BONDS (continued) |
| |||||||
South Carolina — 0.0% | ||||||||
South Carolina, Public Service Authority, Ser D | ||||||||
2.388%, 12/01/2023 | $ | 50 | $ | 51 | ||||
|
| |||||||
Tennessee — 0.0% | ||||||||
Metropolitan Government Nashville & Davidson County, Health & Educational Facilities Board, Ser B, RB Callable 04/01/2026 @ 100 | ||||||||
4.053%, 07/01/2026 | 100 | 111 | ||||||
|
| |||||||
Texas — 0.1% | ||||||||
Houston, Ser A, GO | ||||||||
6.290%, 03/01/2032 | 90 | 117 | ||||||
Texas State, Build America Bonds, GO | ||||||||
5.517%, 04/01/2039 | 200 | 285 | ||||||
Texas State, Transportation Commission State Highway Fund, Ser B, RB | ||||||||
5.178%, 04/01/2030 | 200 | 259 | ||||||
University of Texas, Ser A, RB | ||||||||
3.852%, 08/15/2046 | 50 | 59 | ||||||
|
| |||||||
| 720 | ||||||||
|
| |||||||
Total Municipal Bonds (Cost $6,615) ($ Thousands) | 7,335 | |||||||
|
| |||||||
ASSET-BACKED SECURITIES — 0.6% |
| |||||||
BA Credit Card Trust, Ser 2015-A2, Cl A | ||||||||
1.360%, 09/15/2020 | 150 | 150 | ||||||
Capital Auto Receivables Asset Trust, Ser 2015- 3, Cl A3 | ||||||||
1.940%, 01/21/2020 | 500 | 504 | ||||||
Capital One Multi-Asset Execution Trust, Ser 2015-A1, Cl A1 | ||||||||
1.390%, 01/15/2021 | 500 | 503 | ||||||
Chase Issuance Trust, Ser 2012-A7, Cl A7 | ||||||||
2.160%, 09/16/2024 | 300 | 307 | ||||||
Citibank Credit Card Issuance Trust, Ser 2008-A1, Cl A1 | ||||||||
5.350%, 02/07/2020 | 188 | 200 | ||||||
Citibank Credit Card Issuance Trust, Ser 2014-A5, Cl A5 | ||||||||
2.680%, 06/07/2023 | 200 | 211 | ||||||
CSAIL Commercial Mortgage Trust, Ser 2015-C3, Cl A4 | ||||||||
3.718%, 08/15/2048 | 245 | 271 | ||||||
Discover Card Execution Note Trust, Ser 2007-A1, Cl A1 | ||||||||
5.650%, 03/16/2020 | 200 | 210 | ||||||
Discover Card Execution Note Trust, Ser 2014-A4, Cl A4 | ||||||||
2.120%, 12/15/2021 | 200 | 204 | ||||||
| Adviser Managed Trust / Annual Report / July 31, 2016 | 53 |
SCHEDULE OF INVESTMENTS
JULY 31, 2016
Tactical Offensive Fixed Income Fund (Concluded)
Description | Face Amount | Market Value | ||||||
ASSET-BACKED SECURITIES (continued) |
| |||||||
FHLMC Multifamily Structured Pass-Through Certificates, Ser K050, Cl A2 | ||||||||
3.334%, 08/25/2025 (B) | $ | 900 | $ | 998 | ||||
GS Mortgage Securities Trust, Ser 2015-GC34, Cl A4 | ||||||||
3.506%, 10/10/2048 | 500 | 546 | ||||||
Mercedes-Benz Auto Receivables Trust, Ser 2015-1, Cl A3 | ||||||||
1.340%, 12/16/2019 | 500 | 502 | ||||||
Synchrony Credit Card Master Note Trust, Ser 2012-7, Cl A | ||||||||
1.760%, 09/15/2022 | 300 | 302 | ||||||
Wells Fargo Commercial Mortgage Trust, Ser 2015-C28, Cl A3 | ||||||||
3.290%, 05/15/2048 | 650 | 697 | ||||||
World Financial Network Credit Card Master Trust, Ser 2013-A, Cl A | ||||||||
1.610%, 12/15/2021 | 155 | 156 | ||||||
World Omni Auto Receivables Trust, Ser 2013- B, Cl A4 | ||||||||
1.320%, 01/15/2020 | 750 | 752 | ||||||
|
| |||||||
Total Asset-Backed Securities (Cost $6,407) ($ Thousands) | 6,513 | |||||||
|
| |||||||
Total Investments — 98.9% (Cost $1,091,908) ($ Thousands) | $ | 1,130,302 | ||||||
|
| |||||||
A list of open forward foreign currency contracts held by the Fund at July 31, 2016, is as follows:
Settlement Date | Currency to Deliver (Thousands) | Currency To Receive (Thousands) | Unrealized Appreciation (Depreciation) ($ Thousands) | |||||||||||||||||
08/02/16-09/02/16 | CAD | 3,587 | USD | 2,751 | $ | — | ||||||||||||||
08/02/16-09/02/16 | GBP | 9,918 | USD | 13,201 | 30 | |||||||||||||||
08/02/16-09/02/16 | EUR | 30,075 | USD | 33,525 | (127 | ) | ||||||||||||||
08/02/16-09/02/16 | JPY | 6,164,642 | USD | 60,062 | (130 | ) | ||||||||||||||
|
| |||||||||||||||||||
| $ | (227 | ) | ||||||||||||||||||
|
| |||||||||||||||||||
A list of the counterparties for the outstanding forward foreign currency contracts held by the Fund at July 31, 2016, is as follows:
Counterparty | Currency to Deliver ($ Thousands) | Currency to Receive ($ Thousands) | Unrealized (Depreciation) ($ Thousands) | |||||||||
Brown Brothers Harriman | $ | (109,766 | ) | $ | 109,539 | $ | (227 | ) | ||||
|
| |||||||||||
| $ | (227 | ) | ||||||||||
|
| |||||||||||
For the year ended July 31, 2016, the total amount of all open forward foreign currency contracts, as presented in the tables above, are representative of the volume of activity for this derivative type during the period.
| Percentages are based on a Net Assets of $1,143,375 ($ Thousands). |
| (A) | Security exempt from registration under Rule 144A of the Securities Act of 1933. These securities may be resold in transactions exempt from registration normally to qualified institutions. On July 31, 2016, the value of these securities amounted to $91,662 ($ Thousands), representing 8.0% of the net assets of the Fund. |
| (B) | Variable Rate Security — The rate reported on the Schedule of Investments is the rate in effect as of July 31, 2016. |
| (C) | Step Bonds – The rate reflected on the Schedule of Investments is the effective yield on July 31, 2016. The coupon on a step bond changes on a specified date. |
| (D) | Zero coupon security. The rate shown on the schedule of investments represents the security’s effective yield at the time of purchase. |
AID — Agency for International Development
CAD — Canadian Dollar
Cl — Class
EUR — Euro
FFCB — Federal Farm Credit Bank
FHLB — Federal Home Loan Bank
FHLMC — Federal Home Loan Mortgage Corporation
FNMA — Federal National Mortgage Association
GBP — British Pound Sterling
GNMA — Government National Mortgage Association
GO — General Obligation
JPY — Japanese Yen
MTN — Medium Term Note
PIK — Payment-in-Kind
PLC — Public Limited Company
RB — Revenue Bond
S&P— Standard & Poor’s
Ser — Series
TBA — To Be Announced
USD — United States Dollar
As of July 31, 2016, all of the Fund’s investments and other financial instruments were considered Level 2 in accordance with the authoritative guidance on fair value measurements and disclosure under U.S. GAAP.
As of July 31, 2016, there were no transfers between Level 1, Level 2, and/or Level 3 assets and liabilities.
For more information on valuation inputs, see Note 2 — Significant Accounting Policies in Notes to Financial Statements.
Amounts designated as “—” are either $0 or have been rounded to $0.
The accompanying notes are an integral part of the financial statements.
| 54 | Adviser Managed Trust / Annual Report / July 31, 2016 |
STATEMENTS OF ASSETS AND LIABILITIES ($ Thousands)
JULY 31, 2016
| Tactical Offensive Equity Fund | Tactical Offensive Fixed Income Fund | |||||||
Assets: | ||||||||
Investments, at value † | $ | 1,795,228 | $ | 1,130,302 | ||||
Cash | 49,342 | 29,116 | ||||||
Foreign currency, at value †† | 1,452 | 69 | ||||||
Cash pledged as collateral for futures contracts | 2,429 | — | ||||||
Dividends and interest receivable | 1,760 | 8,498 | ||||||
Receivable for fund shares sold | 327 | 381 | ||||||
Receivable for variation margin | 217 | — | ||||||
Foreign tax reclaim receivable | 82 | — | ||||||
Receivable for investment securities sold | 37 | 2,678 | ||||||
Unrealized gain on forward foreign currency contracts | — | 30 | ||||||
Unrealized gain on foreign spot currency contracts | — | 79 | ||||||
Prepaid expenses | 15 | 18 | ||||||
|
|
|
| |||||
Total Assets | 1,850,889 | 1,171,171 | ||||||
|
|
|
| |||||
Liabilities: | ||||||||
Payable for fund shares redeemed | 792 | 306 | ||||||
Shareholder servicing fees payable | 360 | 242 | ||||||
Payable for investment securities purchased | 353 | 26,799 | ||||||
Administration fees payable | 222 | 12 | ||||||
Investment advisory fees payable | 41 | 46 | ||||||
Chief Compliance Officer fees payable | 4 | 2 | ||||||
Trustees fees payable | 1 | 1 | ||||||
Unrealized loss on forward foreign currency contracts | — | 257 | ||||||
Accrued expense payable | 128 | 131 | ||||||
|
|
|
| |||||
Total Liabilities | 1,901 | 27,796 | ||||||
|
|
|
| |||||
Net Assets | $ | 1,848,988 | $ | 1,143,375 | ||||
|
|
|
| |||||
† Cost of investments | $ | 1,713,443 | $ | 1,091,908 | ||||
†† Cost of foreign currency | 1,438 | 69 | ||||||
Net Assets: | ||||||||
Paid-in Capital — (unlimited authorization — no par value) | $ | 1,789,031 | $ | 1,107,903 | ||||
Undistributed net investment income | 4,205 | 5,550 | ||||||
Accumulated net realized loss on investments, futures contracts and foreign currency | (28,839 | ) | (8,328 | ) | ||||
Net unrealized appreciation on investments | 81,785 | 38,394 | ||||||
Net unrealized appreciation on futures contracts | 2,796 | — | ||||||
Net unrealized appreciation/(depreciation) on forward foreign currency contracts, foreign currencies and translation of other assets and liabilities denominated in foreign currencies | 10 | (144 | ) | |||||
|
|
|
| |||||
Net Assets | $ | 1,848,988 | $ | 1,143,375 | ||||
|
|
|
| |||||
Net Asset Value, Offering and Redemption Price Per Share | $ | 13.59 | $ | 10.59 | ||||
| ($ | 1,848,988,139 ÷ | ($ | 1,143,374,798 ÷ | |||||
| 136,013,221 shares | ) | 107,933,352 shares | ) | |||||
Amounts designated as “—” are $0 or have been rounded to $0.
The accompanying notes are an integral part of the financial statements.
| Adviser Managed Trust / Annual Report / July 31, 2016 | 55 |
STATEMENTS OF OPERATIONS ($ Thousands)
For the year ended July 31, 2016
| Tactical Offensive Equity Fund | Tactical Offensive Fixed Income Fund | |||||||
Investment income: | ||||||||
Dividends | $ | 10,206 | $ | — | ||||
Dividends from affiliated registered investment company (1) | 1 | — | ||||||
Interest income | 19 | 29,670 | ||||||
Less: foreign taxes withheld | (832 | ) | (3 | ) | ||||
|
|
|
| |||||
Total investment income | 9,394 | 29,667 | ||||||
|
|
|
| |||||
Expenses: | ||||||||
Shareholder servicing fees | 1,157 | 2,621 | ||||||
Administration fees | 925 | 2,097 | ||||||
Investment advisory fees | 925 | 1,572 | ||||||
Trustee fees | 9 | 13 | ||||||
Chief Compliance Officer fees | 5 | 5 | ||||||
Professional fees | 75 | 85 | ||||||
Custodian/wire agent fees | 67 | 32 | ||||||
Registration fees | 43 | 34 | ||||||
Printing fees | 33 | 81 | ||||||
Overdraft fees | — | 23 | ||||||
Other expenses | 42 | 356 | ||||||
|
|
|
| |||||
Total expenses | 3,281 | 6,919 | ||||||
|
|
|
| |||||
Less: | ||||||||
Waiver of investment advisory fees | (795 | ) | (1,090 | ) | ||||
Waiver of administration fees | (165 | ) | (1,810 | ) | ||||
|
|
|
| |||||
Net expenses | 2,321 | 4,019 | ||||||
|
|
|
| |||||
Net investment income | 7,073 | 25,648 | ||||||
|
|
|
| |||||
Net realized gain/(loss) on: | ||||||||
Investments | (19,915 | ) | (4,196 | ) | ||||
Affiliated investments | 62 | — | ||||||
Futures contracts | (4,235 | ) | — | |||||
Foreign currency transactions | 101 | (3,927 | ) | |||||
Net change in unrealized appreciation/(depreciation) on: | ||||||||
Investments | (71,087 | ) | 47,726 | |||||
Affiliated investments | (115 | ) | — | |||||
Futures contracts | 3,179 | — | ||||||
Foreign currency and translation of other assets and liabilities denominated in foreign currency | 103 | (339 | ) | |||||
|
|
|
| |||||
Net increase/(decrease) in net assets resulting from operations | $ | (84,834 | ) | $ | 64,912 | |||
|
|
|
| |||||
| (1) | See Note 5 in the Notes to Financial Statements. |
Amounts designated as “—” are $0 or have been rounded to $0.
The accompanying notes are an integral part of the financial statements.
| 56 | Adviser Managed Trust / Annual Report / July 31, 2016 |
STATEMENTS OF CHANGES IN NET ASSETS ($ Thousands)
For the years ended July 31,
| Tactical Offensive Equity Fund | Tactical Offensive Fixed Income Fund | |||||||||||||||
| 2016 | 2015 | 2016 | 2015 | |||||||||||||
Operations: | ||||||||||||||||
Net investment income | $ | 7,073 | $ | 22,352 | $ | 25,648 | $ | 12,784 | ||||||||
Net realized gain/(loss) from investments, affiliated investments and futures contracts | (24,088 | ) | 91,768 | (4,196 | ) | 3,122 | ||||||||||
Net realized gain/(loss) on foreign currency transactions | 101 | (341 | ) | (3,927 | ) | 2,731 | ||||||||||
Net change in unrealized appreciation/(depreciation) on investments, affiliated investments and futures contracts | (68,023 | ) | (21,870 | ) | 47,726 | (15,724 | ) | |||||||||
Net change in unrealized appreciation/(depreciation) on foreign currency and translation of other assets and liabilities denominated in foreign currency | 103 | (89 | ) | (339 | ) | (20 | ) | |||||||||
|
|
|
|
|
|
|
| |||||||||
Net increase/(decrease) in net assets resulting from operations | (84,834 | ) | 91,820 | 64,912 | 2,893 | |||||||||||
|
|
|
|
|
|
|
| |||||||||
Dividends and distributions from: | ||||||||||||||||
Net investment income | (18,071 | ) | (14,787 | ) | (21,066 | ) | (12,412 | ) | ||||||||
Net realized gains | (12,906 | ) | (124,670 | ) | — | (132 | ) | |||||||||
|
|
|
|
|
|
|
| |||||||||
Total dividends and distributions | (30,977 | ) | (139,457 | ) | (21,066 | ) | (12,544 | ) | ||||||||
|
|
|
|
|
|
|
| |||||||||
Capital share transactions:(1) | ||||||||||||||||
Proceeds from shares issued | 1,831,274 | 425,922 | 342,224 | 603,575 | ||||||||||||
Reinvestment of dividends & distributions | 3 | 138,911 | 20,853 | 12,497 | ||||||||||||
Cost of shares redeemed | (1,549,210 | ) | (222,841 | ) | (240,686 | ) | (59,228 | ) | ||||||||
|
|
|
|
|
|
|
| |||||||||
Increase in net assets derived from capital share transactions | 282,067 | 341,992 | 122,391 | 556,844 | ||||||||||||
|
|
|
|
|
|
|
| |||||||||
Net increase in net assets | 166,256 | 294,355 | 166,237 | 547,193 | ||||||||||||
|
|
|
|
|
|
|
| |||||||||
Net assets: | ||||||||||||||||
Beginning of year | 1,682,732 | 1,388,377 | 977,138 | 429,945 | ||||||||||||
|
|
|
|
|
|
|
| |||||||||
End of year | $ | 1,848,988 | $ | 1,682,732 | $ | 1,143,375 | $ | 977,138 | ||||||||
|
|
|
|
|
|
|
| |||||||||
Undistributed net investment income included in net assets at year end | $ | 4,205 | $ | 14,663 | $ | 5,550 | $ | 3,480 | ||||||||
|
|
|
|
|
|
|
| |||||||||
| (1) | See Note 6 in the Notes to Financial Statements for additional information. |
Amount designated as “—” is $0 or has been rounded to $0.
The accompanying notes are an integral part of the financial statements.
| Adviser Managed Trust / Annual Report / July 31, 2016 | 57 |
For the years ended July 31,
For a share outstanding throughout each year
| Net asset value, beginning of year | Net investment income(1) | Net realized and unrealized gains/(losses) on securities(1) | Total from operations | Dividends from Net Investment Income | Distributions from realized gains | Total dividends and distributions | Net asset value, end of year | Total Return † | Net assets, end of year ($ Thousands) | Ratio of net expenses to average net assets | Ratio of expenses to average net assets (excluding fees paid indirectly and including waivers) | Ratio of expenses to average net assets (excluding fees paid indirectly and waivers) | Ratio of net investment income to average net assets | Portfolio turnover ‡ | |||||||||||||||||||||||||||||||||||||||||||||||||||||||||||||
Tactical Offensive Equity Fund |
| ||||||||||||||||||||||||||||||||||||||||||||||||||||||||||||||||||||||||||
2016 | $ | 13.93 | $ | 0.20 | $ | (0.28 | ) | $ | (0.08 | ) | $ | (0.15 | ) | $ | (0.11 | ) | $ | (0.26 | ) | $ | 13.59 | (0.42 | )% | $1,848,988 | 0.50 | % | 0.50 | % | 0.71 | % | 1.53 | % | 319 | % | |||||||||||||||||||||||||||||||||||||||||
2015 | 14.43 | 0.20 | 0.63 | 0.83 | (0.13 | ) | (1.20 | ) | (1.33 | ) | 13.93 | 6.18 | 1,682,732 | 0.59 | 0.59 | 0.78 | 1.44 | 64 | |||||||||||||||||||||||||||||||||||||||||||||||||||||||||
2014 | 13.15 | 0.10 | 1.48 | 1.58 | (0.09 | ) | (0.21 | ) | (0.30 | ) | 14.43 | 12.08 | 1,388,377 | 1.10 | 1.10 | 1.19 | 0.72 | 62 | |||||||||||||||||||||||||||||||||||||||||||||||||||||||||
2013 | 10.76 | 0.11 | 2.51 | 2.62 | (0.23 | ) | – | (0.23 | ) | 13.15 | 24.64 | 1,026,593 | 1.10 | 1.10 | 1.19 | 0.93 | 93 | ||||||||||||||||||||||||||||||||||||||||||||||||||||||||||
2012 | 9.80 | 0.14 | 0.89 | ^ | 1.03 | (0.07 | ) | – | (0.07 | ) | 10.76 | 10.60 | 796,618 | 1.10 | 1.10 | 1.22 | 1.29 | 194 | |||||||||||||||||||||||||||||||||||||||||||||||||||||||||
Tactical Offensive Fixed Income Fund |
| ||||||||||||||||||||||||||||||||||||||||||||||||||||||||||||||||||||||||||
2016 | $ | 10.19 | $ | 0.25 | $ | 0.36 | $ | 0.61 | $ | (0.21 | ) | $ | – | $ | (0.21 | ) | $ | 10.59 | 6.05 | % | $1,143,375 | 0.38 | % | 0.38 | % | 0.66 | % | 2.45 | % | 101 | % | ||||||||||||||||||||||||||||||||||||||||||||
2015 | 10.25 | 0.22 | (0.08 | ) | 0.14 | (0.20 | ) | – | (0.20 | ) | 10.19 | 1.40 | 977,138 | 0.43 | 0.43 | 0.68 | 2.11 | 257 | |||||||||||||||||||||||||||||||||||||||||||||||||||||||||
2014 | 10.03 | 0.13 | 0.28 | 0.41 | (0.19 | ) | – | (0.19 | ) | 10.25 | 4.16 | 429,945 | 0.80 | 0.80 | 0.85 | 1.31 | 389 | ||||||||||||||||||||||||||||||||||||||||||||||||||||||||||
2013 | 10.56 | 0.14 | (0.22 | ) | (0.08 | ) | (0.21 | ) | (0.24 | ) | (0.45 | ) | 10.03 | (0.89 | ) | 655,548 | 0.80 | 0.80 | 0.84 | 1.30 | 292 | ||||||||||||||||||||||||||||||||||||||||||||||||||||||
2012 | 10.26 | 0.17 | 0.57 | 0.74 | (0.24 | ) | (0.20 | ) | (0.44 | ) | 10.56 | 7.44 | 586,652 | 0.80 | 0.86 | 0.86 | 1.63 | 310 | |||||||||||||||||||||||||||||||||||||||||||||||||||||||||
| ^ | The amount shown for a share outstanding throughout the period does not accord with the aggregate net realized and unrealized losses for that period because of the sales and repurchases of fund shares in relation to fluctuating market value of the investments of the Fund. |
| † | Returns are for the period indicated and have not been annualized. Returns do not reflect the deduction of taxes the shareholder would pay on fund distributions or redemption of fund shares. Effective October 1, 2014, the Fund’s investment strategy was changed from “active” to “passive”. The Fund’s past performance is not necessarily indicative of how the Fund will perform in the future. |
| ‡ | Portfolio turnover rates are for the period indicated and have not been annualized. |
| (1) | Per share net investment income and net realized and unrealized gains/(losses) on securities calculated using average shares. |
| Amounts designated as “—” are $0 or have been rounded to $0. |
The accompanying notes are an integral part of the financial statements.
| 58 | Adviser Managed Trust / Annual Report / July 31, 2016 |
July 31, 2016
1. ORGANIZATION
Adviser Managed Trust (the “Trust”) was established as a Delaware statutory trust under an Agreement and Declaration of Trust dated September 22, 2010. The Trust commenced operations on February 25, 2011.
The Trust is registered under the Investment Company Act of 1940, as amended, as an open-end investment management company with two registered funds: Tactical Offensive Equity and Tactical Offensive Fixed Income (each a “Fund,” collectively, the “Funds”) each of which are diversified Funds. The assets of each Fund are segregated, and a shareholder’s interest is limited to the Fund in which shares are held. The Trust’s prospectus provides a description of each Fund’s investment objective and strategies.
Only persons who are clients of the Financial Adviser (as defined below) and who participate in the Adviser Managed Strategy should invest in the Funds. The Funds may not be purchased by any other investor. The Funds are designed to be a component of a broader strategy employed by a third party investment manager (“Financial Adviser”) for the benefit of its clients. The Financial Adviser seeks to take advantage of broad market changes by tactically shifting its clients’ assets among the Tactical Offensive Equity Fund, the Tactical Offensive Fixed Income Fund and a money market fund affiliated with the Funds, depending on the Financial Adviser’s evaluation of current market conditions (“Adviser Managed Strategy”). The Financial Adviser is not the adviser to the Funds, and is not affiliated with SEI Investments Management Corporation (“SIMC”), the adviser to the Funds. The Adviser Managed Strategy is based on models developed by the Financial Adviser and is not subject to the oversight of or input from SIMC.
When the Financial Adviser determines to reallocate its clients’ assets to one or more of the Funds that compose the Adviser Managed Strategy, the Financial Adviser may request the redemption of a substantial portion or all of the shares for which the Financial Adviser exercises investment discretion. In such an instance, the Financial Adviser’s redemption request will cause a Fund to liquidate a substantial portion or substantially all of its assets in order to fulfill the redemption request. If the Financial Adviser redeems all of the shares for which it exercises investment discretion, the Fund will no longer be an active component of the Adviser Managed Strategy.
When the Tactical Offensive Equity Fund is not an active component of the Adviser Managed Strategy, the Fund may invest up to 100% of its remaining assets in exchange traded funds (“ETF”s) that are designed to track the performance of the broad equity market. When the Tactical Offensive Fixed Income
Fund is not an active component of the Adviser Managed Strategy, the Fund may invest up to 100% of its remaining assets in cash, money market instruments, repurchase agreements and other short-term obligations that would not ordinarily be consistent with the Fund’s investment goal.
The Funds could be invested in these types of investments for extended periods of time. At such times, SIMC will actively manage the assets of the Funds. SIMC, the Financial Adviser or one or more of their affiliates will be the only investors in a Fund when the Fund is not an active component of the Adviser Managed Strategy.
2. SIGNIFICANT ACCOUNTING POLICIES
The following is a summary of significant accounting policies consistently followed by the Funds.
Use of Estimates — The preparation of financial statements, in conformity with U.S. generally accepted accounting principles (“U.S. GAAP”), requires management to make estimates and assumptions that affect the reported amount of assets and liabilities and disclosure of contingent assets and liabilities as of the date of the financial statements and the reported amounts of increases and decreases in net assets from operations during the reporting period. Actual results could differ from those estimates.
Security Valuation — Securities listed on a securities exchange, market or automated quotation system for which quotations are readily available (other than securities traded on National Association of Securities Dealers Automated Quotations (NASDAQ) or as otherwise noted below) at the last quoted sale price on an exchange or market (foreign or domestic) on which the securities are traded, or, if there is no such reported sale, at the most recent quoted bid price. The Funds value securities traded on NASDAQ at the NASDAQ Official Closing Price. If available, debt securities, swaps (which are not centrally cleared), bank loans or collateralized debt obligations (including collateralized loan obligations), such as those held by the Funds, are priced based upon valuations provided by independent, third-party pricing agents. Such values generally reflect the last reported sales price if the security is actively traded. The third-party pricing agents may also value debt securities at an evaluated bid price by employing methodologies that utilize actual market transactions, broker supplied valuations or other methodologies designed to identify the market value for such securities. Redeemable securities issued by open-end investment companies are valued at the investment company’s applicable net asset value, with the exception of ETFs, which are priced as equity securities. The prices of foreign securities are reported in local currency and
| Adviser Managed Trust / Annual Report / July 31, 2016 | 59 |
NOTES TO FINANCIAL STATEMENTS (Continued)
July 31, 2016
converted to U.S. dollars using currency exchange rates. If a security’s price cannot be obtained, as noted above, the Funds will value the securities using a bid price from at least one independent broker. If such prices are not readily available or cannot be valued using the methodologies described above, the Funds will value the security using the Funds’ Fair Value Pricing Policies and Procedures (“Fair Value Procedures”), as described below.
On the first day a new debt security purchase is recorded, if a price is not available from a third-party pricing agent or an independent broker, the security may be valued at its purchase price. Each day thereafter, the debt security will be valued according to the Funds’ Fair Value Procedures until a price from an independent source can be secured. Securities held by a Fund with remaining maturities of 60 days or less may be valued by the amortized cost method, which involves valuing a security at its cost on the date of purchase and thereafter (absent unusual circumstances) assuming a constant amortization to maturity of any discount or premium, regardless of the impact of fluctuations in general market rates of interest on the value of the instrument. While this method provides certainty in valuation, it may result in periods during which value, as determined by this method, is higher or lower than the price a Fund would receive if it sold the instrument. Further, the value of securities in the Fund can be expected to vary inversely with changes in prevailing interest rates. Should existing credit, liquidity or interest rate conditions in the relevant markets and issuer specific circumstances suggest that amortized cost does not approximate fair value, then the amortized cost method may not be used.
Options and warrants are valued at the last quoted sales price. If there is no such reported sale on the valuation date, long positions are valued at the most recent bid price, and short positions are valued at the most recent ask price.
Futures and swaps cleared through a central clearing house (“centrally cleared swaps”) are valued at the settlement price established each day by the board of exchange on which they are traded. The daily settlement prices for financial futures and centrally cleared swaps are provided by an independent source. On days when there is excessive volume, market volatility or the future or centrally cleared swap does not end trading by the time a Fund calculates its NAV, the settlement price may not be available at the time at which the Fund calculates its NAV. On such days, the best available price (which is typically the last sales price) may be used to value a Fund’s futures or centrally cleared swaps position.
Foreign currency forward contracts are valued at the current day’s interpolated foreign exchange rate, as calculated using the
current day’s spot rate, and the thirty, sixty, ninety and one-hundred eighty day forward rates provided by an independent source.
Prices for most securities held by a Fund are provided daily by third-party independent pricing agents. SIMC or a Sub-Adviser (“Sub Adviser”), as applicable, reasonably believes that prices provided by independent pricing agents are reliable. However, there can be no assurance that such pricing service’s prices will be reliable. SIMC or a Sub-Adviser, as applicable, will continuously monitor the reliability of prices obtained from any pricing service and shall promptly notify the Funds’ administrator if it believes that a particular pricing service is no longer a reliable source of prices. The Funds’ administrator, in turn, will notify the Fair Value Pricing Committee (the “Committee”) if it receives such notification from SIMC or a Sub-Adviser, as applicable, or if the Funds’ administrator reasonably believes that a particular pricing service is no longer a reliable source for prices.
The Funds’ Fair Value Procedures provide that any change in a primary pricing agent or a pricing methodology requires prior approval by the Board of Trustees (“Board”) or its designated sub-committee. However, when the change would not materially affect valuation of a Fund’s net assets or involve a material departure in pricing methodology from that of the Fund’s existing pricing agent or pricing methodology, approval may be obtained at the next regularly scheduled meeting of the Board.
Securities for which market prices are not readily available, for which market prices are determined to be unreliable, or which cannot be valued using the methodologies described above are valued in accordance with the Fair Value Procedures established by the Board. The Funds’ Fair Value Procedures are implemented through the Committee designated by the Board. The Committee is currently composed of two members of the Board, as well as representatives from SIMC and its affiliates. Some of the more common reasons that may necessitate that a security be valued using Fair Value Procedures include: (i) the security’s trading has been halted or suspended, (ii) the security has been delisted from a national exchange, (iii) the security’s primary trading market is temporarily closed at a time when under normal conditions it would be open, or (iv) the security’s primary pricing source is not able or willing to provide a price. When a security is valued in accordance with the Fair Value Procedures, the Committee will determine the value after taking into consideration relevant information reasonably available to the Committee. Examples of factors the Committee
| 60 | Adviser Managed Trust / Annual Report / July 31, 2016 |
may consider include: (i) the facts giving rise to the need to fair value, (ii) the last trade price, (iii) the performance of the market or the issuer’s industry, (iv) the liquidity of the security, (v) the size of the holding in a Fund, or (vi) any other appropriate information.
The determination of a security’s fair value price often involves the consideration of a number of subjective factors, and is therefore subject to the unavoidable risk that the value assigned to a security may be higher or lower than the security’s value would be if a reliable market quotation for the security was readily available.
For securities that principally trade on a foreign market or exchange, a significant gap in time can exist between the time of a particular security’s last trade and the time at which a Fund calculates its Net Asset Value (“NAV”). The closing prices of such securities may no longer reflect their market value at the time a Fund calculates NAV if an event that could materially affect the value of those securities (a “Significant Event”), including substantial fluctuations in domestic or foreign markets or occurrences not tied directly to the securities markets, such as natural disasters, armed conflicts or significant governmental actions, has occurred between the time of the security’s last close and the time that the Fund calculates NAV. A Fund may invest in securities that are primarily listed on foreign exchanges that trade on weekends or other days when the Fund does not price its shares. As a result, the NAV of the Fund’s shares may change on days when shareholders will not be able to purchase or redeem Fund shares.
A Significant Event may relate to a single issuer or to an entire market sector. If SIMC or a Sub-Adviser becomes aware of a Significant Event that has occurred with respect to a security or group of securities after the closing of the exchange or market on which the security or securities principally trade, but before the time at which the Funds calculate NAV, it may request that a Committee meeting be called. In addition, the Funds use several processes, with respect to certain securities to monitor the pricing data supplied by various sources, including price comparisons and price movements. Any identified discrepancies are researched and subject to the procedures described above.
Funds that hold international securities also use a third-party fair valuation vendor. The vendor provides a fair value for foreign securities held by the Funds based on certain factors and methodologies (involving, generally, tracking valuation correlations between the U.S. market and each non-U.S. security). Values from the fair value vendor are applied in the event that there is a movement in the U.S. market that exceeds a specific threshold that has been established by the Committee. The Committee has also established a “confidence interval” which is used to determine the level of historical correlation
between the value of a specific foreign security and movements in the U.S. market before a particular security will be fair valued when the threshold is exceeded. In the event that the threshold established by the Committee is exceeded on a specific day, these Funds will value the non-U.S. securities in their portfolios that exceed the applicable “confidence interval” based upon the adjusted prices provided by the fair valuation vendor.
In accordance with U.S. GAAP, fair value is defined as the price that a Fund would receive upon selling an investment in an orderly transaction to an independent buyer in the principal or most advantageous market of the investment. A three tier hierarchy has been established to maximize the use of observable and minimize the use of unobservable inputs and to establish classification of fair value measurements for disclosure purposes. Inputs refer broadly to the assumptions that market participants would use in pricing an asset. Inputs may be observable or unobservable. Observable inputs are inputs that reflect the assumptions market participants would use in pricing the asset or liability based on market data obtained from sources independent of the reporting entity. Unobservable inputs are inputs that reflect the reporting entity’s own assumptions about the assumptions market participants would use in pricing the asset or liability based on the best information available in the circumstances.
The three-tier hierarchy of inputs is summarized in the three broad Levels listed below:
Level 1 — quoted prices in active markets for identical investments
Level 2 — other significant observable inputs (including quoted prices for similar investments, interest rates, prepayment speeds, credit risks, etc.)
Level 3 — significant unobservable inputs (including the Fund’s own assumptions in determining the fair value of investments)
Investments are classified within the level of the lowest significant input considered in determining fair value. Investments classified within Level 3 whose fair value measurement considers several inputs may include Level 1 or Level 2 inputs as components of the overall fair value measurement.
Debt securities are valued in accordance with the evaluated bid price supplied by the pricing service and generally categorized as Level 2 in the hierarchy. Other securities that are categorized as Level 2 in the hierarchy include, but are not limited to, preferred stocks, bank loans, warrants, swaps and forward
| Adviser Managed Trust / Annual Report / July 31, 2016 | 61 |
NOTES TO FINANCIAL STATEMENTS (Continued)
July 31, 2016
contracts. The Fund may use a systematic fair valuation model provided by an independent pricing service to value foreign equity securities in order to adjust for stale pricing, which may occur between the close of certain foreign exchanges and the New York Stock Exchange. These are generally categorized as Level 2 in the hierarchy.
When independent prices are unavailable or unreliable, debt securities and swaps may be valued utilizing pricing matrices which consider similar factors that would be used by independent pricing services. These are generally categorized as Level 2 in the hierarchy but may be Level 3 depending on the circumstances. For certain collateralized debt obligations, corporate obligations, mortgage backed securities, auction rate preferred securities and loan participations where observable inputs are limited, assumptions about market activity and risk are used and are categorized as Level 3 in the hierarchy.
The valuation techniques used by the Funds to measure fair value during the year ended July 31, 2016, maximized the use of observable inputs and minimized the use of unobservable inputs.
For the year ended July 31, 2016, there have been no significant changes to the Trust’s fair valuation methodologies.
For details of the investment classification, reference the Summary Schedule of Investments/Schedule of Investments.
Security Transactions and Investment Income — Security transactions are recorded on the trade date. Cost used in determining realized capital gains and losses on the sale of securities is determined on the basis of specific identification. Dividend income and expense recognized on the ex-dividend date, and interest income or expense recognized using the accrual basis of accounting.
Distributions received on securities that represent a return of capital or capital gains are recorded as a reduction of cost of investments and/or as a realized gain. The Trust estimates the components of distributions received that may be considered nontaxable distributions or capital gain distributions.
Amortization and accretion is calculated using the scientific interest method, which approximates the effective interest method over the holding period of the security. Amortization of premiums and discounts is included in interest income.
Repurchase Agreements — Securities pledged as collateral for repurchase agreements are held by each Fund’s custodian bank until the repurchase date of the repurchase agreement. The Funds also invest in tri-party repurchase agreements. Securities held as collateral for tri-party repurchase agreements are maintained by
the broker’s custodian bank in a segregated account until the repurchase date of the repurchase agreement. Provisions of the repurchase agreements and the Trust’s policies require that the market value of the collateral, including accrued interest thereon, is sufficient in the event of default by the counterparty. If the counterparty defaults and the value of the collateral declines, or if the counterparty enters into an insolvency proceeding, realization of the collateral by the Funds may be delayed or limited. There were no outstanding repurchase agreements as of July 31, 2016.
Reverse Repurchase Agreements — To the extent consistent with its investment objective and strategies, a Fund may issue reverse repurchase agreements. A reverse repurchase agreement involves the sale of portfolio assets together with an agreement to repurchase the same assets later at a fixed price. Additional assets are maintained in a segregated account with the custodian. The segregated assets may consist of cash, U.S. Government securities, or other liquid securities at least equal in value to the obligations under the reverse repurchase agreements. In the event the buyer of securities under a reverse repurchase agreement files for bankruptcy or becomes insolvent, the Funds’ use of the proceeds under the reverse repurchase agreement may be restricted pending a determination by the other party, or its trustee or receiver, whether to enforce the obligation to repurchase the securities. There were no outstanding reverse repurchase agreements as of July 31, 2016.
Expenses — Expenses that are directly related to one of the Funds are charged directly to that Fund. Other operating expenses of the Funds are prorated to the Funds on the basis of relative net assets.
Foreign Currency Translation — The books and records of the Funds’ investments in international securities are maintained in U.S. dollars on the following basis:
(i) market value of investment securities, assets and liabilities at the current rate of exchange; and
(ii) purchases and sales of investment securities, income and expenses at the relevant rates of exchange prevailing on the respective dates of such transactions.
The Funds do not isolate that portion of gains and losses on investments in equity securities that is due to changes in the foreign exchange rates from that which is due to changes in market prices of equity securities.
The Funds report certain foreign-currency-related transactions as components of realized gains for financial reporting purposes, whereas such components are treated as ordinary income for Federal income tax purposes.
| 62 | Adviser Managed Trust / Annual Report / July 31, 2016 |
Forward Foreign Currency Contracts — To the extent consistent with its investment objective and strategies, a Fund may enter into forward foreign currency contracts for hedging or speculative purposes with respect to either specific transactions, fund positions or anticipated fund positions. All commitments are marked-to-market daily at the applicable foreign exchange rate, and any resulting unrealized gains or losses are recorded currently. The Fund realizes gains and losses at the time forward contracts are extinguished. Unrealized gains or losses on outstanding positions in forward foreign currency contracts held at the close of the period are recognized as ordinary income or loss for Federal income tax purposes. A Fund could be exposed to risk if the counterparties to the contracts are unable to meet the terms of the contract and from unanticipated movements in the value of a foreign currency relative to the U.S. dollar.
Finally, the risk exists that losses could exceed amounts disclosed on the Statements of Assets and Liabilities. Refer to each Fund’s Schedule of Investments for details regarding open forward foreign currency contracts as of July 31, 2016, if applicable.
Futures Contracts — To the extent consistent with its investment objective and strategies, a Fund may use futures contracts for tactical hedging purposes as well as to enhance
the Fund’s returns. Initial margin deposits of cash or securities are made upon entering into futures contracts. The contracts are marked to market daily and the resulting changes in value are accounted for as unrealized gains and losses. Variation margin payments are paid or received, depending upon whether unrealized gains or losses are incurred. When the contract is closed, the Funds record a realized gain or loss equal to the difference between the proceeds from (or cost of) the closing transaction and the amount invested in the contract.
Risks of entering into futures contracts include the possibility that there will be an imperfect price correlation between the futures and the underlying securities. Second, it is possible that a lack of liquidity for futures contracts could exist in the secondary market, resulting in an inability to close a position prior to its maturity date. Third, the futures contract involves the risk that a Fund could lose more than the original margin deposit required to initiate a futures transaction.
Finally, the risk exists that losses could exceed amounts disclosed on the Statements of Assets and Liabilities. Refer to each Fund’s Schedule of Investments for details regarding open futures contracts as of July 31, 2016, if applicable.
Options/Swaptions Writing/Purchasing — To the extent consistent with its investment objective and strategies, a Fund
may invest in financial options/swaptions contracts for the purpose of hedging its existing portfolio securities, or securities that a Fund intends to purchase, against fluctuations in fair market value caused by changes in prevailing market interest rates. A Fund may also invest in financial option/swaption contracts to enhance its returns. When the Fund writes or purchases an option/swaption, an amount equal to the premium received or paid by the Fund is recorded as a liability or an asset and is subsequently adjusted to the current market value of the option/swaption written or purchased. Premiums received or paid from writing or purchasing options/swaptions which expire unexercised are treated by the Fund on the expiration date as realized gains or losses. The difference between the premium and the amount paid or received on effecting a closing purchase or sale transaction, including brokerage commissions, is also treated as a realized gain or loss. If an option/swaption is exercised, the premium paid or received is added to the cost of the purchase or proceeds from the sale in determining whether the Fund has realized a gain or a loss.
The risk in writing a call option/swaption is a Fund may give up the opportunity for profit if the market price of the security increases. The risk in writing a put option/swaption is a Fund may incur a loss if the market price of the security decreases and the option/swaption is exercised. The risk in purchasing an option/swaption is a Fund may pay a premium whether or not the option/swaption is exercised. The Funds also have the additional risk of being unable to enter into a closing transaction at an acceptable price if a liquid secondary market does not exist. Option/swaption contracts also involve the risk that they may not work as intended due to unanticipated developments in market conditions or other causes.
Finally, the risk exists that losses on written options could exceed amounts disclosed on the Statements of Assets and Liabilities. Refer to each Fund’s Schedule of Investments for details regarding open option/swaption contracts as of July 31, 2016, if applicable. There were no outstanding option/swaption contracts during the year ended July 31, 2016.
Swap Agreements — To the extent consistent with its investment objective and strategies, a Fund may invest in swap contracts for speculative or hedging purposes. Swaps may be used to synthetically obtain exposure to securities or baskets of securities. A swap agreement is a two-party contract under which an agreement is made to exchange returns from predetermined investments or instruments, including a
| Adviser Managed Trust / Annual Report / July 31, 2016 | 63 |
NOTES TO FINANCIAL STATEMENTS (Continued)
July 31, 2016
particular interest rate, foreign currency, or “basket” of securities representing a particular index. Interest rate swaps involve the exchange by a Fund with another party of their respective commitments to pay or receive interest (e.g., an exchange of floating rate payments for fixed rate payments) with respect to a notional amount of principal. Credit-default swaps involve periodic payments by a Fund or counterparty based on a specified rate multiplied by a notional amount assigned to an underlying debt instrument or group of debt instruments in exchange for the assumption of credit risk on the same instruments. In the event of a credit event, usually in the form of a credit rating downgrade, the party receiving periodic payments (i.e. floating rate payer) must pay the other party (i.e. fixed rate payer) an amount equal to the recovery rate used to settle the contracts. The recovery rate is a function of how many credit default swap investors wish to deliver the security or receive the security. The recovery rate is determined through an auction process. Total return swaps allow an investor to benefit from the cash flow without ever actually owning the underlying security. The receiver must pay any decline in value to the payer at the end of the total return swap. However, the investor does not need to make a payment if there is no decline in price. Payments can be made on various indices, bonds (i.e. mortgage backed securities, bank debt and corporate), loans or commodities. The value of a total return swap is equal to the change in value of the underlying asset versus the accrued income payment based on LIBOR or some other form of indices on the notional amount. Interest rate swaps involve the exchange by a Fund with another party of their respective commitments to pay or receive interest (e.g., an exchange of floating rate payments for fixed rate payments) with respect to a notional amount of principal to manage a Fund’s exposure to interest rates. Payments received or made are recorded as realized gains or loss. A Fund could be exposed to credit or market risk due to unfavorable changes in the fluctuation of interest rates or if the counterparty defaults on its obligation to perform. Risk of loss may exceed amounts recognized on the statement of assets and liabilities. In connection with swap agreements securities may be set aside as collateral by a Fund’s custodian.
Swaps are marked-to-market daily based upon quotations from market makers and the resulting changes in market values, if any, are recorded as unrealized gains or losses in the Statement of Operations. Net payments of interest are recorded as realized gains or losses.
Entering into swap agreements involves, to varying degrees, elements of credit and market risk in excess of the amounts recognized on the Statement of Assets and Liabilities. Such risks
involve the possibility that there will be no liquid market for these agreements, that the counterparty to the agreement may default on its obligation to perform and that there may be unfavorable changes in the fluctuation of interest rates. Risks also arise from potential losses from adverse market movements.
These risks may be mitigated by having a master netting arrangement between a Fund and the counterparty and by having the counterparty post collateral to cover a Fund’s exposure to the counterparty. See Note 3 for further details. There were no outstanding swap agreements as of July 31, 2016.
Delayed Delivery Transactions — To the extent consistent with its investment objective and strategies, a Fund may purchase or sell securities on a when-issued or delayed delivery basis. These transactions involve a commitment by those Funds to purchase or sell securities for a predetermined price or yield, with payment and delivery taking place beyond the customary settlement period. When purchasing a security on a delayed delivery basis, that Fund assumes the rights and risks of ownership of the security, including the risk of price and yield fluctuations, and takes such fluctuations into account when determining its net asset value. Those Funds may dispose of or renegotiate a delayed delivery transaction after it is entered into, and may sell when-issued securities before they are delivered, which may result in a capital gain or loss. When those Funds have sold a security on a delayed delivery basis, that Fund does not participate in future gains and losses with respect to the security.
Loan Participations and Brady Bonds — To the extent consistent with its investment objective and strategies, a Fund may invest in U.S. dollar-denominated fixed — and floating-rate loans (“Loans”) arranged through private negotiations between a foreign sovereign entity and one or more financial institutions (“Lenders”). The Fund invests in such Loans in the form of participations in Loans (“Participations”) or assignments of all or a portion of Loans from third parties. Participations typically result in this Fund having a contractual relationship only with the Lenders, not with the sovereign borrowers. This Fund has the right to receive payments of principal, interest and any fees to which it is entitled from the Lender selling the Participation and only upon receipt by the Lender of the payments from the borrower. In connection with purchasing Participations, the Fund generally has no right to enforce compliance by the borrower with the terms of the loan agreement relating to the Loan, nor any rights of set-off against the borrower, and the Fund will not benefit directly from any collateral supporting the Loan in which it has purchased
| 64 | Adviser Managed Trust / Annual Report / July 31, 2016 |
the Participation. As a result, the Fund assumes the credit risk of both the borrower and the Lender that is selling the Participation.
Certain debt obligations, customarily referred to as “Brady Bonds,” are created through the exchange of existing commercial bank loans to foreign entities for new obligations in connection with debt restructuring under a plan introduced by former U.S. Secretary of the Treasury Nicholas F. Brady. Brady Bonds have only been issued since 1989, and, accordingly, do not have a long payment history. They are issued by governments that may have previously defaulted on the loans being restructured by the Brady Bonds, so they are subject to the risk of default by the issuer. They may be fully or partially collateralized or uncollateralized and issued in various currencies. As of July 31, 2016, the Funds did not hold any loans.
Collateralized Debt Obligations — To the extent consistent with its investment objective and strategies, a Fund may invest in collateralized debt obligations (“CDOs”), which include collateralized loan obligations (“CLOs”) and other similarly structured securities. CLOs are a type of asset-backed security. A CLO is a trust, typically collateralized by a pool of loans, which may include, among others, domestic and foreign senior secured loans, senior unsecured loans and subordinate corporate loans, including loans that may be rated below investment grade or equivalent unrated loans. CDOs may charge management fees and administrative expenses.
For CDOs, the cash flows from the Trust are split into two or more portions, called tranches, varying in risk and yield. The riskiest portion is the “equity” tranche which bears the bulk of defaults from the bonds or loans in the trust and serves to protect the other, more senior tranches from default in all but the most severe circumstances. Since it is partially protected from defaults, a senior tranche from a CDO trust typically has a higher rating and lower yield than their underlying securities, and can be rated investment grade. Despite the protection from the equity tranche, CDO tranches can experience substantial losses due to actual defaults, increased sensitivity to defaults due to collateral default and disappearance of protecting tranches, market anticipation of defaults, as well as aversion to CDO securities as a class.
The risks of an investment in a CDO depend largely on the type of the collateral securities and the class of the CDO in which a Fund invests. Normally, CLOs and other CDOs are privately offered and sold, and thus, are not registered under the securities laws. As a result, investments in CDOs may be characterized by a Fund as illiquid securities; however, an active dealer market may exist for CDOs allowing a CDO to qualify for Rule 144A
transactions. In addition to the normal risks associated with fixed income securities (e.g., interest rate risk and default risk), CDOs carry additional risks including, but not limited to: (i) the possibility that distributions from collateral securities will not be adequate to make interest or other payments; (ii) the quality of the collateral may decline CDOs that are subordinate structure of the investment and investment results. The Funds did not hold any CDO’s or CLO’s during the year ended July 31, 2016.
Dividends and Distributions to Shareholders — Dividends from net investment income are declared and paid to shareholders annually for the Tactical Offensive Equity Fund and declared and paid quarterly for the Tactical Offensive Fixed Income Fund. Dividends and distributions are recorded on the ex-dividend date. Any net realized capital gains will be distributed at least annually by the Funds.
Illiquid Securities — A security is considered illiquid if it cannot be sold or disposed of in the ordinary course of business within seven days or less for its approximate carrying value on the books of a Fund. Valuations of illiquid securities may differ significantly from the values that would have been used had an active market value for these securities existed.
Investments in Real Estate Investment Trusts (“REITs”) — Dividend income is recorded based on the income included in distributions received from the REIT investments using published REIT reclassifications including some management estimates when actual amounts are not available. Distributions received in excess of this estimated amount are recorded as a reduction of the cost of investments or reclassified to capital gains. The actual amounts of income, return of capital, and capital gains are only determined by each REIT after its fiscal year-end, and may differ from the estimated amounts.
3. CREDIT DERIVATIVES
When a Fund seeks to take an active long or short position with respect to the likelihood of an event of default of a security or basket of securities, the Fund may use credit default swaps. The Fund may buy credit default swaps in an attempt to manage credit risk where the Fund has credit exposure to an issuer and the Fund may sell credit default swaps to more efficiently gain credit exposure to such security or basket of securities. The reference obligation of the swap can be a single issuer, a “basket” of issuers, or an index. The underlying referenced assets are corporate debt, sovereign debt and asset-backed securities.
| Adviser Managed Trust / Annual Report / July 31, 2016 | 65 |
NOTES TO FINANCIAL STATEMENTS (Continued)
July 31, 2016
The buyer of a credit default swap is generally obligated to pay the seller a periodic stream of payments over the term of the contract in return for a contingent payment upon the occurrence of a credit event with respect to an underlying reference obligation. Generally, a credit event for corporate or sovereign reference obligations means bankruptcy, failure to pay, obligation acceleration, repudiation/moratorium or restructuring. For credit default swaps on asset-backed securities, a credit event may be triggered by events such as failure to pay principal, maturity extension, rating downgrade or write-down.
If a Fund is a seller of protection, and a credit event occurs, as defined under the terms of that particular swap agreement, a Fund will generally either (i) pay to the buyer an amount equal to the notional amount of the swap and take delivery of the referenced obligation, other deliverable obligations, or underlying securities comprising a referenced index or (ii) pay a net settlement amount in the form of cash or securities equal to the notional amount of the swap less the recovery value of the referenced obligation or underlying securities comprising a referenced index.
If a Fund is a buyer of protection and a credit event occurs, as defined under the terms of that particular swap agreement, a Fund will either (i) receive from the seller of protection an amount equal to the notional amount of the swap and deliver the referenced obligation, other deliverable obligations or underlying securities comprising the referenced index or (ii) receive a net settlement amount in the form of cash or securities equal to the notional amount of the swap less the recovery value of the referenced obligation or underlying securities comprising the referenced index. Recovery values are assumed by market makers considering either industry standard recovery rates or entity specific factors and considerations until a credit event occurs. If a credit event has occurred, the recovery value is determined by a facilitated auction whereby a minimum number of allowable broker bids, together with a specified valuation method, are used to calculate the settlement value.
The Funds are party to International Swap Dealers Association, Inc. Master Agreements (“ISDA Master Agreements”). These agreements are with select counterparties and they govern transactions, including certain over-the-counter derivative and foreign exchange contracts, entered into by the Funds and the counterparty.
There were no outstanding credit default swaps as of July 31, 2016.
4. DERIVATIVE TRANSACTIONS
A Fund is subject to various netting arrangements with select counterparties (“Master Agreements”). Master Agreements govern the terms of certain transactions, and reduce the counterparty risk associated with relevant transactions by specifying credit protection mechanisms and providing standardization that improves legal certainty. Since different types of transactions have different mechanics and are sometimes traded out of different legal entities of a particular counterparty organization, each type of transaction may be covered by a different Master Agreement, resulting in the need for multiple agreements with a single counterparty. As the Master Agreements are specific to unique operations of different asset types, they allow a Fund to close out and net its total exposure to a specific counterparty entity in the event of a default with respect to all the transactions governed under a single agreement with a specific counterparty entity.
Master Agreements can also help limit counterparty risk by specifying collateral posting arrangements at pre-arranged exposure levels. Under the Master Agreements, collateral is routinely transferred if the total net exposure to certain transactions (net of existing collateral already in place) governed under the relevant Master Agreement with a counterparty in a given account exceeds a specified threshold, which typically ranges from zero to $250,000 depending on the counterparty and the type of Master Agreement. United States Treasury Securities and U.S. dollar cash are generally the preferred forms of collateral. Securities and cash pledged as collateral are reflected as assets on the Statements of Assets and Liabilities as either a component of investments at value (securities) or deposits due from counterparties (cash). Cash collateral received is not typically held in a segregated account and as such is reflected as a liability on the Statements of Assets and Liabilities as deposits due to counterparties. The market value of any securities received as collateral is not reflected as a component of net asset value. A Fund’s overall exposure to counterparty risk can change substantially within a short period, as it is affected by each transaction subject to the relevant Master Agreement.
| 66 | Adviser Managed Trust / Annual Report / July 31, 2016 |
Customer account agreements and related addendums govern exchange traded derivatives transactions such as futures, options on futures, and centrally cleared swaps. Exchange traded derivative transactions require posting of initial margin as determined by each relevant clearing agency which is segregated at a broker account registered with the Commodities Futures Trading Commission (CFTC), or the applicable regulator. In the US, counterparty risk is significantly reduced as creditors of the futures broker do not have claim to Fund assets in the segregated account. Additionally, portability of exposure in the event of default further reduces risk to the Funds. Variation margin, or changes in market value, are exchanged daily, but may not be netted between futures and cleared Over the Counter (“OTC”) derivatives.
The following is a summary of the variation margin of exchange-traded or centrally cleared financial derivative instruments as of July 31, 2016 ($ Thousands):
| Financial Derivative Assets | Financial Derivative Liabilities | |||||||||||||||
| Variation Margin Asset | Variation Margin Liability | |||||||||||||||
| Futures | Total | Futures | Total | |||||||||||||
Tactical Offensive Equity Fund | $ | 217 | $ | 217 | $ | — | $ | — | ||||||||
|
|
|
|
|
|
|
| |||||||||
Total Exchange-Traded or Centrally Cleared | $ | 217 | $ | 217 | $ | — | $ | — | ||||||||
|
|
|
|
|
|
|
| |||||||||
Cash with an aggregate market value of $2,429 ($ Thousands) has been pledged as collateral for exchange-traded and centrally cleared derivative instruments as of July 31, 2016.
International Swaps and Derivatives Association, Inc. Master Agreements and Credit Support Annexes (“ISDA Master Agreements”) govern OTC financial derivative transactions entered into by a Fund and select counterparties. ISDA Master Agreements maintain provisions for general obligations, representations, agreements, collateral and events of default or
termination. Events of termination include conditions that may entitle counterparties to elect to terminate early and cause settlement of all outstanding transactions under the applicable ISDA Master Agreement. Any election to terminate early could be material to the financial statements. In limited circumstances, the ISDA Master Agreement may contain additional provisions that add additional counterparty protection beyond coverage of existing daily exposure if the counterparty has a decline in credit quality below a predefined level. These amounts, if any, may be segregated with a third party custodian.
The following is a summary by counterparty of the market value of OTC financial derivative instruments and collateral (received)/pledged as of July 31, 2016 ($ Thousands):
| Financial Derivative Assets | Financial Derivative Liabilities | |||||||||||||||||||||||||||
Tactical Offensive Fixed Income Fund | Forward Foreign Currency Contracts | Total Over the Counter | Forward Foreign Currency Contracts | Total Over the Counter | Net Market Value of OTC Derivatives | Collateral (Received)/ Pledged | Net Exposures (1) | |||||||||||||||||||||
Brown Brothers Harriman | $ | 30 | $ | 30 | $ | 257 | $ | 257 | $ | (227 | ) | $ | — | $ | (227 | ) | ||||||||||||
|
|
|
|
|
|
|
| |||||||||||||||||||||
Total Exchange-Traded or Centrally Cleared | $ | 30 | $ | 30 | $ | 257 | $ | 257 | ||||||||||||||||||||
|
|
|
|
|
|
|
| |||||||||||||||||||||
| (1) | Net Exposures represents the net receivable/(payable) that would be due from/to the counterparty in the event of default. Exposure to OTC financial derivative instruments can only be netted across transactions governed under the same master netting agreement with the same legal entity. |
Securities with an aggregate market value of $0 have been pledged and $0 have been received as collateral for financial derivative instruments as governed by ISDA Master Agreements as of July 31, 2016.
5. INVESTMENT ADVISORY, ADMINISTRATION AND DISTRIBUTION AGREEMENTS, INVESTMENT SUB-ADVISORY AGREEMENTS AND OTHER TRANSACTIONS WITH AFFILIATES
Investment Advisory, Administration & Distribution Agreements — SIMC serves as investment adviser (the
“Adviser”) to each Fund. In connection with serving as Adviser, SIMC is entitled to a fee that is calculated daily and paid monthly, based on the average daily net assets of each Fund.
The Trust and SEI Investments Global Funds Services (the “Administrator”) are parties to an Administration and Transfer Agency Agreement under which the Administrator provides administrative and transfer agency services for annual fees, based on the average daily net assets of each Fund.
SEI Investments Distribution Co. (the “Distributor”), serves as each Fund’s Distributor pursuant to a distribution agreement with the Trust. The Funds have adopted a shareholder services plan (the “Service Plan”)
| Adviser Managed Trust / Annual Report / July 31, 2016 | 67 |
NOTES TO FINANCIAL STATEMENTS (Continued)
July 31, 2016
with respect to the Shares that allows such Shares to pay service providers a fee in connection with the ongoing servicing of shareholder accounts owning such Shares at an annual rate of average daily net assets of the Shares. The Funds’ Service Plan provides that shareholder servicing fees on the Shares will be paid to the Distributor, which may be used by the Distributor to compensate financial intermediaries for providing shareholder services with respect to the Shares.
Effective November 30, 2015, the Funds’ administrator and/or its affiliates have contractually agreed to waive fees or reimburse expenses for each Fund until November 30, 2016, in order to keep total fund operating expenses (exclusive of interest from borrowings, brokerage commissions, taxes and other extraordinary expenses not incurred in the ordinary course of the Fund’s business) from exceeding the levels specified in the table below. These contractual waivers and reimbursements will only apply if a Fund’s total operating costs exceed the applicable thresholds and will not affect the Fund’s total operating costs if they are less than the applicable thresholds. In other words, shareholders will pay the lower of a Fund’s actual
total fund operating expenses or total fund operating expenses after contractual waivers and expense reimbursements. The contractual waiver and expense reimbursement are limited to the Fund’s direct operating expenses and, therefore, do not apply to indirect expenses incurred by the Fund, such as acquired fund fees and expenses (“AFFE”). The agreement may be amended or terminated only with the consent of the Board of Trustees.
The Funds’ adviser, the Funds’ administrator and/ or the Funds’ distributor have voluntarily agreed to waive a portion of their fees in order to keep total direct operating expenses (exclusive of interest from borrowings, brokerage commissions, trustee fees, taxes and extraordinary expenses not incurred in the ordinary course of the Funds’ business) at the levels specified in the table below. The voluntary waivers of the Funds’ adviser, Funds’ administrator and Funds’ distributor are limited to the Funds’ direct operating expenses and therefore do not apply to indirect expenses incurred by the Funds, such as AFFE, if any. The Funds’ adviser, the Funds’ administrator and/or the Funds’ distributor may discontinue all or part of these waivers at any time.
The following is a summary of annual fees payable to the Adviser, Administrator and Distributor and the expense limitations for each Fund for the year ended July 31, 2016:
| Advisory Fee | Administration Fee | Shareholder Servicing Fee | Contractual Expense Limitation | Voluntary Expense Limitation | ||||||||||||||||
Tactical Offensive Equity Fund | 0.20 | % | 0.20 | % | 0.25 | % | 0.75 | % | 0.50 | % | ||||||||||
Tactical Offensive Fixed Income Fund | 0.15 | 0.20 | 0.25 | 0.70 | 0.38 | |||||||||||||||
As of July 31, 2016, SIMC has entered into an investment sub-advisory agreement with the following party and pays the sub-adviser out of the fee that it receives from the Funds:
Investment Sub-Adviser
Tactical Offensive Equity Fund
SSgA Funds Management, Inc.
Tactical Offensive Fixed Income Fund
SSgA Funds Management, Inc.
Other — The Distribution Agreement between the Distributor and the Trust provides that the Distributor may receive compensation on Fund transactions effected for the Trust in accordance with Securities and Exchange Commission (“SEC”) rules. Accordingly, it is expected that Fund transactions may result in brokerage commissions being paid to the Distributor. The SEC rules require that such commissions not exceed usual and customary commissions.
There were no such commissions for the year ended July 31, 2016.
Payments to Affiliates — Certain officers and/or trustees of the Trust are also officers or directors of the Distributor or the Adviser. The Trust pays each unaffiliated Trustee an annual fee for attendance at quarterly, interim and committee meetings.
Compensation of officers and affiliated Trustees of the Trust is paid by the Adviser or Administrator.
A portion of the services provided by the Chief Compliance Officer (“CCO”) and his staff, whom are employees of the Administrator, are paid for by the Trust as incurred.
Fees Paid Indirectly — The Funds may direct certain fund trades to the Distributor who pays a portion of each Fund’s expenses. Accordingly, the expenses reduced, which were used to pay third party expenses, can be found on the Statements of Operations and the effect on each Fund’s expense ratio, as a percentage of each Fund’s average daily net assets for the year ended July 31, 2016, can be found on the Financial Highlights, if applicable.
| 68 | Adviser Managed Trust / Annual Report / July 31, 2016 |
Investment in Affiliated Security — The Funds may invest in the SEI Daily Income Trust Government Fund, an affiliated money market fund to manage excess cash or to serve as margin or collateral for derivative positions. The Funds may also purchase securities of certain companies with which it is
affiliated to the extent these companies are represented in an index that the adviser or sub-adviser is passively seeking to replicate in accordance with the Fund’s investment strategy.
The following is a summary of the transactions the Tactical Offensive Equity Fund had with affiliates for the year ended July 31, 2016 ($ Thousands):
| Security Description | Value 8/1/2016 | Purchases at Cost | Proceeds from Sales | Realized Gain | Change in Unrealized (Depreciation) | Value 7/31/2016 | Dividend Income | |||||||||||||||||||||
SEI Investments Company | $ | 362 | $ | 308 | $ | (324 | ) | $ | 62 | $ | (115 | ) | $ | 293 | $ | 1 | ||||||||||||
|
|
|
|
|
|
|
|
|
|
|
|
|
| |||||||||||||||
Interfund Lending — The SEC has granted an exemption that permits the Trust to participate in an interfund lending program (“the Program”) with existing or future investment companies registered under the 1940 Act that are advised by SIMC (the “SEI Funds”). The Program allows the SEI Funds to lend money to and borrow money from each other for temporary or emergency purposes. Participation in the Program is voluntary for both borrowing and lending funds. Interfund loans may be made only when the rate of interest to be charged is more favorable to the lending fund than an investment
in overnight repurchase agreements (“Repo Rate”), and more favorable to the borrowing fund than the rate of interest that would be charged by a bank for short-term borrowings (“Bank Loan Rate”). The Bank Loan Rate will be determined using a formula reviewed annually by the SEI Funds’ Board of Trustees. The interest rate imposed on interfund loans is the average of the Repo Rate and the Bank Loan Rate.
As of, and during the year ended July 31, 2016, the Trust had not participated in the Program.
6. CAPITAL SHARE TRANSACTIONS
Capital Share Transactions for the Funds were as follows (Thousands):
| Tactical Offensive Equity Fund | Tactical Offensive Fixed Income Fund | |||||||||||||||
| 2016 | 2015 | 2016 | 2015 | |||||||||||||
Shares Issued | 141,438 | 30,270 | 33,431 | 58,475 | ||||||||||||
Shares Issued in Lieu of Dividends and Distributions | 1 | 10,340 | 2,045 | 1,218 | ||||||||||||
Shares Redeemed | (126,253 | ) | (15,969 | ) | (23,408 | ) | (5,761 | ) | ||||||||
|
|
|
|
|
|
|
| |||||||||
Increase in capital share transactions | 15,186 | 24,641 | 12,068 | 53,932 | ||||||||||||
|
|
|
|
|
|
|
| |||||||||
7. INVESTMENT TRANSACTIONS
The cost of security purchases and the proceeds from the sale and maturities of securities other than temporary cash investments during the year ended July 31, 2016, were as follows:
| U.S. Gov’t ($ Thousands) | Other ($ Thousands) | Total ($ Thousands) | ||||||||||
Tactical Offensive Equity Fund |
| |||||||||||
Purchases | $ | — | $ | 1,796,034 | $ | 1,796,034 | ||||||
Sales | — | 1,555,910 | 1,555,910 | |||||||||
Tactical Offensive Fixed Income Fund |
| |||||||||||
Purchases | 987,626 | 183,181 | 1,170,807 | |||||||||
Sales | 926,724 | 114,880 | 1,041,604 | |||||||||
8. FEDERAL TAX INFORMATION
It is each Fund’s intention to continue to qualify as a regulated investment company, under Sub chapter M of the Internal Revenue Code, and to distribute all of its taxable income and net capital gains. Accordingly, no provision for Federal income taxes is required.
Dividends from net investment income and distributions from net realized capital gains are determined in accordance with U.S. Federal income tax regulations, which may differ from those amounts determined under U.S. GAAP. These book/tax differences are either temporary or permanent in nature. To the extent these differences are permanent, they are charged or credited to paid-in capital, undistributed net investment income or accumulated net realized gain, as appropriate, in the period that the differences arise.
Accordingly, the following permanent differences, primarily attributable to investments in Passive Foreign Investment Companies, reclass of distributions,
| Adviser Managed Trust / Annual Report / July 31, 2016 | 69 |
NOTES TO FINANCIAL STATEMENTS (Continued)
July 31, 2016
different treatment for gains and losses on paydowns of mortgage and asset-backed securities for tax purposes, reclassification of long-term capital gain distributions on Real Estate Investment Trust securities, write-off of capital losses, partnership reclassifications, and gains and losses on certain foreign currency related transactions have been reclassified to/from the following accounts as of July 31, 2016.
| Undistributed Net Investment Income (Loss) ($ Thousands) | Accumulated Realized Gain (Loss) ($Thousands) | Paid-in- Capital ($ Thousands) | ||||||||||
Tactical Offensive Equity Fund | $ | 540 | $ | 1,446 | $ | (1,986 | ) | |||||
Tactical Offensive Fixed Income Fund | (2,512 | ) | 2,512 | — | ||||||||
These reclassifications have no impact on net assets or net asset value per share.
The tax character of dividends and distributions paid during the last two fiscal years were as follows:
| Ordinary Income ($ Thousands) | Long-term Capital Gain ($ Thousands) | Return of Capital ($ Thousands) | Total ($ Thousands) | |||||||||||||||||
Tactical Offensive Equity Fund | ||||||||||||||||||||
| 2016 | $ | 24,315 | $ | 6,662 | $ | — | $ | 30,977 | ||||||||||||
| 2015 | 40,516 | 98,941 | — | 139,457 | ||||||||||||||||
Tactical Offensive Fixed Income Fund | ||||||||||||||||||||
| 2016 | 21,066 | — | — | 21,066 | ||||||||||||||||
| 2015 | 12,413 | 131 | — | 12,544 | ||||||||||||||||
As of July 31, 2016, the components of Distributable Earnings on a tax basis were as follows:
| Undistributed Ordinary Income ($ Thousands) | Capital Loss Carryforwards ($ Thousands) | Unrealized Appreciation ($ Thousands) | Other Temporary Differences ($ Thousands) | Total Distributable Earnings ($ Thousands) | ||||||||||||||||
Tactical Offensive Equity Fund | $ | 4,902 | $ | (24,863 | ) | $ | 82,713 | $ | (2,795 | ) | $ | 59,957 | ||||||||
Tactical Offensive Fixed Income Fund | 11,026 | (6,120 | ) | 37,544 | (6,978 | ) | 35,472 | |||||||||||||
For Federal income tax purposes, capital loss carryforwards may be carried forward and applied against future capital gains as follows:
| Short-Term Loss ($ Thousands) | Long-Term Loss ($ Thousands) | Total ($ Thousands) | ||||||||||
Tactical Offensive Equity Fund | $ | 24,863 | $ | — | $ | 24,863 | ||||||
Tactical Offensive Fixed Income Fund | 2,100 | 4,020 | 6,120 | |||||||||
For Federal income tax purposes, the cost of securities owned at July 31, 2016, and the net realized gains or losses on securities sold for the period were not materially different from amounts reported for financial reporting purposes. These differences are primarily due to investments in passive foreign investment companies, swap accruals and wash sales which cannot be used for Federal income tax purposes in the current year and have been deferred for use in future years.
The aggregate gross unrealized appreciation and depreciation on total investments held by the Funds at July 31, 2016, was as follows:
| Federal Tax Cost ($ Thousands) | Appreciated Securities ($ Thousands) | Depreciated Securities ($ Thousands) | Net Unrealized Appreciation ($ Thousands) | |||||||||||||
Tactical Offensive Equity Fund | $ | 1,715,322 | $ | 99,657 | $ | (19,751 | ) | $ | 79,906 | |||||||
Tactical Offensive Fixed Income Fund | 1,092,615 | 44,248 | (6,561 | ) | 37,687 | |||||||||||
Management has analyzed the Funds’ tax positions taken on Federal income tax returns for all open tax years and has concluded that as of July 31, 2016, no provision for income tax would be required in the Funds’ financial statements. The Funds’ Federal and state income and Federal excise tax returns for tax years for which the applicable statutes of limitations have not expired are subject to examination by the Internal Revenue Service and state departments of revenue.
9. CONCENTRATION/RISKS
In the normal course of business, the Trust enters into contracts that provide general indemnifications by the Trust to the counterparty to the contract. The Trust’s maximum exposure under these arrangements is dependent on future claims that may be made against the Trust and, therefore, cannot be estimated; however, management believes that, based on experience, the risk of loss from such claims is considered remote.
| 70 | Adviser Managed Trust / Annual Report / July 31, 2016 |
The Tactical Offensive Equity and Tactical Offensive Fixed Income Funds may invest its assets in securities of foreign issuers in various countries. These investments may involve certain considerations and risks not typically associated with investments in the United States, as a result of, among other factors, the possibility of future political and economic developments and the level of governmental supervision and regulation of securities markets in the respective countries.
The market value of the Tactical Offensive Fixed Income Fund’s investments may change in response to interest rate changes and other factors. During periods of falling interest rates, the values of fixed income securities generally rise. Conversely, during periods of rising interest rates, the values of such securities generally decline. Changes by recognized rating agencies in the ratings of any fixed income security and in the ability of an issuer to make payments of interest and principal may also affect the value of these investments.
The foregoing is not intended to be a complete discussion of the risks associated with investing in a Fund. Please review each Fund’s prospectus for additional disclosures regarding the principal risks associated with investing in a Fund.
10. CONCENTRATION OF SHAREHOLDERS
SEI Private Trust Company (“SPTC”) and SIMC are subsidiaries of SEI Investments Company (“SEI”). As of July 31, 2016, SPTC held of record the following percentage of outstanding shares of each Fund:
Tactical Offensive Equity Fund | 99.94 | % | ||
Tactical Offensive Fixed Income Fund | 99.94 | % |
SPTC is not a direct service provider to the Funds. However, SPTC performs a key role in the comprehensive investment solution that SEI provides to investors. SPTC holds the vast majority of shares in the Funds as custodian for shareholders that are clients of the Financial Adviser. SPTC maintains omnibus accounts at the Funds’ transfer agent.
11. SUBSEQUENT EVENTS
Management has evaluated the need for disclosures and/or adjustments resulting from subsequent events through the date the financial statements were issued. Based on this evaluation, no disclosures and/or adjustments were required to the financial statements as of July 31, 2016.
| Adviser Managed Trust / Annual Report / July 31, 2016 | 71 |
REPORT OF INDEPENDENT REGISTERED ACCOUNTING FIRM
To the Shareholder and Board of Trustees
Adviser Managed Trust:
We have audited the accompanying statement of assets and liabilities, including the summary schedule of investments, of the Tactical Offensive Equity Fund and the accompanying statement of assets and liabilities, including the schedule of investments, of the Tactical Offensive Fixed Income Fund comprising the Adviser Managed Trust (the “Trust”), as of July 31, 2016, and the related statements of operations for the year then ended, the statements of changes in net assets for each of the years in the two-year period then ended, and the financial highlights for each of the years in the five-year period then ended. These financial statements and financial highlights are the responsibility of the Trust’s management. Our responsibility is to express an opinion on these financial statements and financial highlights based on our audits.
We conducted our audits in accordance with the standards of the Public Company Accounting Oversight Board (United States). Those standards require that we plan and perform the audit to obtain reasonable assurance about whether the financial statements and financial highlights are free of material misstatement. An audit includes examining, on a test basis, evidence supporting the amounts and disclosures in the financial statements. Our procedures included confirmation of securities owned as of July 31, 2016, by correspondence with the custodian and brokers or other appropriate auditing procedures. An audit also includes assessing the accounting principles used and significant estimates made by management, as well as evaluating the overall financial statement presentation. We believe that our audits provide a reasonable basis for our opinion.
In our opinion, the financial statements and financial highlights referred to above present fairly, in all material respects, the financial position of each of the funds comprising Adviser Managed Trust as of July 31, 2016, the results of their operations for the year then ended, the changes in their net assets for each of the years in the two-year period then ended, and the financial highlights for each of the years in the five-year period then ended, in conformity with U.S. generally accepted accounting principles.

September 28, 2016
| 72 | Adviser Managed Trust / Annual Report / July 31, 2016 |
TRUSTEES AND OFFICERS OF THE TRUST (Unaudited)
The following chart lists Trustees and Officers as of September 14, 2016.
Set forth below are the names, addresses, ages, position with the Trust, Term of Office and Length of Time Served, the principal occupations for the last five years, number of portfolios in fund complex overseen by trustee, and other directorships outside the fund complex of each of the persons currently serving as Trustees and Officers of the Trust. The Trust’s Statement of Additional Information (“SAI”) includes additional information about the Trustees and Officers. The SAI may be obtained without charge by calling 1-800-342-5734.
Name | Position(s) | Term of | Principal Occupation(s) | Number of Portfolios in Fund Complex Overseen by Trustee 2 | Other | |||||||
INTERESTED TRUSTEES | ||||||||||||
Robert A. Nesher One Freedom Valley Drive Oaks, PA 19456 68 yrs. old | Chairman of the Board of Trustees * | since 1995 | Currently performs various services on behalf of SEI for which Mr. Nesher is compensated. | 104 | Vice Chairman of The Advisors’ Inner Circle Fund III, O’Connor EQUUS, Winton Series Trust and Winton Diversified Opportunities Fund since 2014. Vice Chairman of Gallery Trust since 2015. President and Director of SEI Structured Credit Fund, LP. Director of SEI Global Master Fund plc, SEI Global Assets Fund plc, SEI Global Investments Fund plc, SEI Investments — Global Funds Services, Limited, SEI Investments Global, Limited, SEI Investments (Europe) Ltd., SEI Multi-Strategy Funds PLC, SEI Global Nominee Ltd and SEI Investments — Unit Trust Management (UK) Limited. Director and President of SEI Opportunity Fund, L.P. to 2010. Director of SEI Alpha Strategy Portfolios, LP from 2007 to 2013. Trustee of The Advisors’ Inner Circle Fund, The Advisors’ Inner Circle Fund II, Bishop Street Funds and The KP Funds. | |||||||
William M. Doran One Freedom Valley Drive Oaks, PA 19456 74 yrs. old | Trustee * | since 1995 | Self-employed consultant since 2003. Partner, Morgan, Lewis & Bockius LLP (law firm) from 1976 to 2003, counsel to the Trust, SEI, SIMC, the Administrator and the Distributor. | 104 | Director of SEI since 1974;. Director of SEI Investments Distribution Co. since 2003. Director of SEI Investments — Global Funds Services, Limited, SEI Investments Global, Limited, SEI Investments (Europe), Limited, SEI Investments (Asia) Limited, SEI Global Nominee Ltd. and SEI Investments — Unit Trust Management (UK) Limited. Director of SEI Opportunity Fund, L.P. to 2010. Director of SEI Alpha Strategy Portfolios, LP from 2007 to 2013. Trustee/Director of The Advisors’ Inner Circle Fund, The Advisors’ Inner Circle Fund II, The Advisors’ Inner Circle Fund III, O’Connor EQUUS, Winton Series Trust, Winton Diversified Opportunities Fund, Gallery Trust, Bishop Street Funds, and The KP Funds. | |||||||
| * | Messrs. Nesher and Doran are Trustees who may be deemed as “interested” persons of the Trust as that term is defined in the 1940 Act by virtue of their affiliation with SIMC and the Trust’s Distributor. |
| 1 | There is no stated term of office for the Trustees of the Trust. However, a Trustee must retire from the Board by the end of the calendar year in which the Trustee turns 75 provided that, although there shall be a presumption that each Trustee attaining such age shall retire, the Board may, if it deems doing so to be consistent with the best interest of the Trust, and with the consent of any Trustee that is eligible for retirement, by unanimous vote, extend the term of such Trustee for successive periods of one year. |
| 2 | The Fund Complex includes the following Trusts: SEI Asset Allocation Trust, SEI Daily Income Trust, SEI Institutional Investments Trust, Adviser Managed Trust, SEI Institutional International Trust, SEI Institutional Managed Trust, SEI Liquid Asset Trust, SEI Tax Exempt Trust, SEI Insurance Products Trust, New Covenant Funds and SEI Catholic Values Trust. |
| Adviser Managed Trust / Annual Report / July 31, 2016 | 73 |
TRUSTEES AND OFFICERS OF THE TRUST (Unaudited) (Continued)
Name | Position(s) | Term of | Principal Occupation(s) | Number of Portfolios in Fund Complex Overseen by Trustee 2 | Other | |||||||
TRUSTEES | ||||||||||||
George J. Sullivan, Jr. One Freedom Valley Drive Oaks, PA 19456 72 yrs. old | Trustee | since 1996 | Retired since January 2012. Self-Employed Consultant, Newfound Consultants Inc. April 1997-December 2011. | 104 | Director of SEI Opportunity Fund, L.P. to 2010. Director of SEI Alpha Strategy Portfolios, LP from 2007 to 2013. Trustee/Director of State Street Navigator Securities Lending Trust, The Advisors’ Inner Circle Fund, The Advisors’ Inner Circle Fund II, Bishop Street Funds, and The KP Funds. | |||||||
Nina Lesavoy One Freedom Valley Drive Oaks, PA 19456 57 yrs. old | Trustee | since 2003 | Founder and Managing Director, Avec Capital since 2008. Managing Director, Cue Capital from March 2002-March 2008. | 104 | Director of SEI Opportunity Fund, L.P. to 2010. Director of SEI Alpha Strategy Portfolios, LP from 2007 to 2013. Director of SEI Structured Credit Fund, L.P. | |||||||
James M. Williams One Freedom Valley Drive Oaks, PA 19456 67 yrs. old | Trustee | since 2004 | Vice President and Chief Investment Officer, J. Paul Getty Trust, Non-Profit Foundation for Visual Arts, since December 2002. President, Harbor Capital Advisors and Harbor Mutual Funds, 2000-2002. Manager, Pension Asset Management, Ford Motor Company, 1997-1999. | 104 | Director of SEI Opportunity Fund, L.P. to 2010. Director of SEI Alpha Strategy Portfolios, LP from 2007 to 2013. Trustee/Director of Ariel Mutual Funds, and SEI Structured Credit Fund, L.P. | |||||||
Mitchell A. Johnson One Freedom Valley Drive Oaks, PA 19456 73 yrs. old | Trustee | since 2007 | Retired Private Investor since 1994. | 104 | Director, Federal Agricultural Mortgage Corporation (Farmer Mac) since 1997. Director of SEI Alpha Strategy Portfolios, LP from 2007 to 2013. Trustee of the Advisors’ Inner Circle Fund, The Advisors’ Inner Circle Fund II, and Bishop Street Funds and The KP Funds. | |||||||
Hubert L. Harris, Jr. One Freedom Valley Drive Oaks, PA 19456 71 yrs. old | Trustee | since 2008 | Retired since December 2005. Owner of Harris Plantation, Inc. since 1995. Chief Executive Officer of Harris CAPM, a consulting asset and property management entity. Chief Executive Officer, INVESCO North America, August 2003-December 2005. Chief Executive Officer and Chair of the Board of Directors, AMVESCAP Retirement, Inc., January 1998- August 2003. | 104 | Director of AMVESCAP PLC from 1993-2004. Served as a director of a bank holding company, 2003-2009. Director, Aaron’s Inc., 2012-present. President and CEO, Oasis Ornamentals LLC, 2011-present. Serves as a member of the Board of Councilors of the Carter Center (nonprofit corporation) and served on the board of other non-profit organizations. Director of SEI Alpha Strategy Portfolios, LP from 2008 to 2013. | |||||||
Susan C. Cote One Freedom Valley Drive Oaks, PA 19456 61 years old | Trustee | since 2015 | Retired since July 2015. Americas Director of Asset Management, Ernst & Young LLP from 2006-2013. Global Asset Management Assurance Leader, Ernst & Young LLP from 2006-2015. Partner, Ernst & Young LLP from 1997-2015. Prudential, 1983-1997. Member of Ernst & Young LLP Retirement Investment Committee. Treasurer and Chair of Finance, Investment and Audit Committee of the New York Women’s Foundation. Independent Consultant to SEI Liquid Asset Allocation Trust. | 104 | N/A | |||||||
| 74 | Adviser Managed Trust / Annual Report / July 31, 2016 |
Name | Position(s) | Term of | Principal Occupation(s) | Number of Portfolios in Fund Complex Overseen by Trustee 2 | Other | |||||||
OFFICERS | ||||||||||||
Robert A. Nesher One Freedom Valley Drive Oaks, PA 19456 68 yrs. old | President and CEO | since 2005 | Currently performs various services on behalf of SEI for which Mr. Nesher is compensated. | N/A | N/A | |||||||
James J. Hoffmayer One Freedom Valley Drive Oaks, PA 19456 42 yrs. old | Controller and Chief Financial Officer | since 2016 | Senior Director, Funds Accounting and Fund Administration, SEI Investments Global Funds Services (since September 2016); Senior Director of Fund Administration, SEI Investments Global Funds Services (since October 2014). Director of Financial Reporting, SEI Investments Global Funds Services (November 2004 — October 2014). | N/A | N/A | |||||||
Russell Emery One Freedom Valley Drive Oaks, PA 19456 52 yrs. old | Chief Compliance Officer | since 2006 | Chief Compliance Officer of SEI Institutional Investments Trust, SEI Asset Allocation Trust, SEI Institutional International Trust, SEI Liquid Asset Trust, SEI Daily Income Trust, SEI Institutional Managed Trust, SEI Tax Exempt Trust, The Advisors’ Inner Circle Fund, The Advisors’ Inner Circle Fund II and Bishop Street Funds since March 2006. Chief Compliance Officer of SEI Structured Credit Fund, LP since June 2007. Chief Compliance Officer of SEI Opportunity Fund, L.P. to 2010. Chief Compliance Officer of SEI Alpha Strategy Portfolios, LP from 2007 to 2013. Chief Compliance Officer of Adviser Managed Trust since December 2010. Chief Compliance Officer of New Covenant Funds since February 2012. Chief Compliance Officer of SEI Insurance Products Trust and The KP Funds since 2013. Chief Compliance Officer of The Advisors’ Inner Circle Fund III, O’Connor EQUUS, Winton Series Trust and Winton Diversified Opportunities Fund since 2014. Chief Compliance Officer of SEI Catholic Values Trust and Gallery Trust since 2015. | N/A | N/A | |||||||
Timothy D. Barto One Freedom Valley Drive Oaks, PA 19456 47 yrs. old | Vice President and Secretary | since 2002 | Vice President and Secretary of SEI Institutional Transfer Agent, Inc. since 2009. General Counsel and Secretary of SIMC and the Administrator since 2004. Vice President of SIMC and the Administrator since 1999. Vice President and Assistant Secretary of SEI since 2001. | N/A | N/A | |||||||
Aaron Buser One Freedom Valley Drive Oaks, PA 19456 44 yrs. old | Vice President and Assistant Secretary | since 2008 | Vice President and Assistant Secretary of SEI Institutional Transfer Agent, Inc. since 2009. Vice President and Assistant Secretary of SIMC since 2007. Attorney, Stark & Stark (law firm), March 2004-July 2007. | N/A | N/A | |||||||
David F. McCann One Freedom Valley Drive Oaks, PA 19456 39 yrs. old | Vice President and Assistant Secretary | since 2009 | Vice President and Assistant Secretary of SEI Institutional Transfer Agent, Inc. since 2009. Vice President and Assistant Secretary of SIMC since 2008. Attorney, Drinker Biddle & Reath, LLP (law firm), May 2005-October 2008. | N/A | N/A | |||||||
| Adviser Managed Trust / Annual Report / July 31, 2016 | 75 |
TRUSTEES AND OFFICERS OF THE TRUST (Unaudited) (Concluded)
Name | Position(s) | Term of | Principal Occupation(s) | Number of Portfolios in Fund Complex Overseen by Trustee 2 | Other Directorships Held by Trustee | |||||
Stephen G. MacRae One Freedom V alley Drive Oaks, PA 19456 47 yrs. old | Vice President | since 2012 | Director of Global Investment Product Management, January 2004 to present. | N/A | N/A | |||||
Bridget E. Sudall One Freedom Valley Drive Oaks, PA 19456 35 yrs. old | Anti-Money Laundering Compliance Officer and Privacy Officer | since 2015 | Anti-Money Laundering Compliance Officer and Privacy Officer (since 2015), Senior Associate and AML Officer, Morgan Stanley Alternative Investment Partners, April 2011-March 2015, Investor Services Team Lead, Morgan Stanley Alternative Investment Partners, July 2007-April 2011. | N/A | N/A | |||||
| 1 | There is no stated term of office for the Trustees of the Trust. However, a Trustee must retire from the Board by the end of the calendar year in which the Trustee turns 75 provided that, although there shall be a presumption that each Trustee attaining such age shall retire, the Board may, if it deems doing so to be consistent with the best interest of the Trust, and with the consent of any Trustee that is eligible for retirement, by unanimous vote, extend the term of such Trustee for successive periods of one year. |
| 2 | The Fund Complex includes the following Trusts: SEI Asset Allocation Trust, SEI Daily Income Trust, SEI Institutional Investments Trust, Adviser Managed Trust, SEI Institutional International Trust, SEI Institutional Managed Trust, SEI Liquid Asset Trust, SEI Tax Exempt Trust, SEI Insurance Products Trust, New Covenant Funds and SEI Catholic Values Trust. |
| 76 | Adviser Managed Trust / Annual Report / July 31, 2016 |
DISCLOSURE OF FUND EXPENSES (Unaudited)
July 31, 2016
All mutual funds have operating expenses. As a shareholder of a fund, your investment is affected by these ongoing costs, which include (among others) costs for portfolio management, administrative services, and shareholder reports like this one. It is important for you to understand the impact of these costs on your investment returns.
Operating expenses such as these are deducted from the fund’s gross income and directly reduce your final investment return. These expenses are expressed as a percentage of the fund’s average net assets; this percentage is known as the fund’s expense ratio.
The following examples use the expense ratio and are intended to help you understand the ongoing costs (in dollars) of investing in your fund and to compare these costs with those of other mutual funds. The examples are based on an investment of $1,000 made at the beginning of the period shown and held for the entire period (February 1, 2016 through July 31, 2016).
The table on this page illustrates your fund’s costs in two ways:
Actual fund return: This section helps you to estimate the actual expenses after fee waivers that your Fund incurred over the period. The “Expenses Paid During Period” column shows the actual dollar expense cost incurred by a $1,000 investment in the Fund, and the “Ending Account Value” number is derived from deducting that expense cost from the Fund’s gross investment return.
You can use this information, together with the actual amount you invested in the Fund, to estimate the expenses you paid over that period. Simply divide your actual account value by $1,000 to arrive at a ratio (for example, an $8,600 account value divided by $1,000 = 8.6), then multiply that ratio by the number shown for your Fund under “Expenses Paid During Period.”
Hypothetical 5% return: This section helps you compare your Fund’s costs with those of other mutual funds. It assumes that the fund had an annual 5% return before expenses during the year, but that the expense ratio (Column 3) for the period is unchanged. This example is useful in making comparisons because the Securities and Exchange Commission requires all mutual funds to make this 5% calculation. You can assess your Fund’s comparative cost by comparing the hypothetical result for your Fund in the “Expense Paid During Period” column with those that appear in the same charts in the shareholder reports for other funds.
NOTE: Because the return is set at 5% for comparison purposes — NOT your Fund’s actual return — the account values shown may not apply to your specific investment.
| Beginning Account Value 2/1/16 | Ending Account Value 7/31/16 | Annualized Expense Ratios | Expenses Paid During Period * | |||||||||||||
Tactical Offensive Equity Fund |
| |||||||||||||||
Actual Fund Return |
| |||||||||||||||
Class A | $ | 1,000.00 | $ | 1,128.70 | 0.50 | % | $ | 2.65 | ||||||||
Hypothetical 5% Return |
| |||||||||||||||
Class A | $ | 1,000.00 | $ | 1,022.38 | 0.50 | % | $ | 2.51 | ||||||||
| Beginning Account Value 2/1/16 | Ending Account Value 7/31/16 | Annualized Expense Ratios | Expenses Paid During Period * | |||||||||||||
Tactical Offensive Fixed Income Fund |
| |||||||||||||||
Actual Fund Return |
| |||||||||||||||
Class A | $ | 1,000.00 | $ | 1,058.70 | 0.38 | % | $ | 1.95 | ||||||||
Hypothetical 5% Return |
| |||||||||||||||
Class A | $ | 1,000.00 | $ | 1,022.97 | 0.38 | % | $ | 1.91 | ||||||||
| * | Expenses are equal to the Fund’s annualized expense ratio multiplied by the average account value over the period, multiplied by 182/366 (to reflect the one-half year period shown). |
| Adviser Managed Trust / Annual Report / July 31, 2016 | 77 |
BOARD OF TRUSTEES’ CONSIDERATIONS IN APPROVING THE ADVISORY AND SUB-ADVISORY AGREEMENTS (Unaudited)
Adviser Managed Trust (the “Trust”) and SEI Investments Management Corporation (“SIMC”) have entered into an investment advisory agreement (the “Advisory Agreement”). Pursuant to the Advisory Agreement, SIMC is responsible for the investment advisory services provided to the series of the Trust (the “Funds”). Pursuant to a sub-advisory agreement with SIMC (the “Sub-Advisory Agreement” and, together with the Advisory Agreement, the “Investment Advisory Agreements”), and under the supervision of SIMC and the Trust’s Board of Trustees (the “Board”), the sub-adviser (the “Sub-Adviser”) provides security selection and certain other advisory services with respect to all or a discrete portion of the assets of the Funds. The Sub-Adviser is also responsible for managing its employees who provide services to the Funds. Sub-Advisers are selected based primarily upon the research and recommendations of SIMC, which evaluates quantitatively and qualitatively the Sub-Advisers’ skills and investment results in managing assets for specific asset classes, investment styles and strategies.
The Investment Company Act of 1940, as amended (the “1940 Act”), requires that the initial approval of, as well as the continuation of, the Funds’ Investment Advisory Agreements be specifically approved: (i) by the vote of the Board or by a vote of the shareholders of the Funds; and (ii) by the vote of a majority of the Trustees who are not parties to the Investment Advisory Agreements or “interested persons” of any party (the “Independent Trustees”), cast in person at a meeting called for the purpose of voting on such approval(s). In connection with their consideration of such approval(s), the Funds’ Trustees must request and evaluate, and SIMC and the Sub-Adviser are required to furnish, such information as may be reasonably necessary to evaluate the terms of the Investment Advisory Agreements. In addition, the Securities and Exchange Commission takes the position that, as part of their fiduciary duties with respect to a mutual fund’s fees, mutual fund boards are required to evaluate the material factors applicable to a decision to approve an Investment Advisory Agreement.
Consistent with these responsibilities, the Board calls and holds meetings each year to consider whether to approve new and/or renew existing Investment Advisory Agreements between the Trust and SIMC and SIMC and the Sub-Adviser with respect to the Funds of the Trust. In preparation for these meetings, the Board requests and reviews a wide variety of materials provided by SIMC and the Sub-Adviser, including information about SIMC’s and the Sub-Adviser’s affiliates, personnel and operations and the services provided pursuant to the Investment Advisory Agreements. The Board also receives data from third parties. This information is provided in addition to the detailed information about the Funds that the Board reviews during the course of each year, including information that relates to Fund operations and Fund performance. The Trustees also receive a memorandum from counsel regarding the responsibilities of Trustees in connection with their consideration of whether to approve the Trust’s Investment Advisory Agreements. Finally, the Independent Trustees receive advice from independent counsel to the Independent Trustees, meet in executive sessions outside the presence of Fund management and participate in question and answer sessions with representatives of SIMC and the Sub-Adviser.
Specifically, during the course of the Trust’s fiscal year, the Board requested and received written materials from SIMC and the Sub-Adviser regarding: (i) the quality of SIMC’s and the Sub-Adviser’s investment management and other services; (ii) SIMC’s and the Sub-Adviser’s investment management personnel; (iii) SIMC’s and the Sub-Adviser’s operations and financial condition; (iv) SIMC’s and the Sub-Adviser’s brokerage practices (including any soft dollar arrangements) and investment strategies; (v) the level of the advisory fees that SIMC charges the Funds and the level of the sub-advisory fees that SIMC pays the Sub-Adviser, compared with fees each charge to comparable accounts; (vi) the advisory fees charged by SIMC and the Funds’ overall fees and operating expenses compared with peer groups of mutual funds prepared by Broadridge, an independent provider of investment company data; (vii) the level of SIMC’s and the Sub-Adviser’s profitability from their Fund-related operations; (viii) SIMC’s and the Sub-Adviser’s compliance program, including a description of material compliance matters and material compliance violations; (ix) SIMC’s potential economies of scale; (x) SIMC’s and the Sub-Adviser’s policies on and compliance procedures for personal securities transactions; (xi) SIMC’s and the Sub-Adviser’s expertise and resources in domestic and/or international financial markets; and (xii) the Funds’ performance over various periods of time compared with peer groups of mutual funds prepared by Broadridge and the Funds’ benchmark indices.
At the March 28-30, 2016 meeting of the Board, the Trustees, including a majority of the Independent Trustees, approved the renewal of the Advisory Agreement. Also, the Sub-Advisory Agreement was renewed at a meeting of the Board during the course of the Trust’s fiscal year. In each case, the Board’s decisions were based on its consideration and evaluation of the factors described above, as discussed at the meetings and at prior meetings. The following discusses some, but not all, of the factors that were considered by the Board in connection with its assessment of the Investment Advisory Agreements.
| 78 | Adviser Managed Trust / Annual Report / July 31, 2016 |
Nature, Extent and Quality of Services. The Board considered the nature, extent and quality of the services provided by SIMC and the Sub-Adviser to the Funds and the resources of SIMC and the Sub-Adviser and their affiliates dedicated to the Funds. In this regard, the Trustees evaluated, among other things, SIMC’s and the Sub-Adviser’s personnel, experience, track record and compliance program. Following evaluation, the Board concluded that, within the context of its full deliberations, the nature, extent and quality of services provided by SIMC and the Sub-Adviser to the Funds and the resources of SIMC and the Sub-Adviser and their affiliates dedicated to the Funds were sufficient to support renewal of the Investment Advisory Agreements. In addition to advisory services, the Board considered the nature and quality of certain administrative, transfer agency and other non-investment advisory services provided to the Funds by SIMC and/or its affiliates.
Performance. In determining whether to renew SIMC’s Advisory Agreement, the Trustees considered the Funds’ performance relative to their peer groups and appropriate indices/benchmarks. The Trustees reviewed performance information for each Fund, noting that they receive performance reports that permit them to monitor each Fund’s performance at board meetings throughout the year. As part of this review, the Trustees considered the composition of each peer group and selection criteria. In assessing Fund performance, the Trustees considered a report compiled by Broadridge, an independent third-party, which was engaged to prepare an assessment of the Funds in connection with the renewal of the Advisory Agreement (the “Broadridge Report”). The Broadridge Report included metrics on net total return for the Funds and a universe of comparable funds. Based on the materials considered and discussed at the meetings, the Trustees found Fund performance satisfactory, or, where performance was materially below the benchmark and/or peer group, the Trustees were satisfied with the reasons provided to explain such performance. In connection with the renewal of the Sub-Advisory Agreement, the Board considered the performance of the Sub-Adviser relative to appropriate indices/benchmarks. Following evaluation, the Board concluded that, within the context of its full deliberations, the performance of the Funds was sufficient to support renewal of SIMC’s Advisory Agreement, and the performance of the Sub-Adviser was sufficient to support renewal of the Sub-Advisory Agreement.
Fees. With respect to the Funds’ expenses under the Investment Advisory Agreements, the Trustees considered the rate of compensation called for by the Investment Advisory Agreements and the Funds’ net operating expense ratio in comparison to those of the Funds’ respective peer groups. In assessing Fund expenses, the Trustees considered the information in the Broadridge Report, which included various metrics related to fund expenses, including, but not limited to, contractual management fees at various fee levels, actual management fees, and actual total expenses for the Funds and a universe of comparable funds. Based on the materials considered and discussion at the meetings, the Trustees further determined that fees were either shown to be below the peer average in the comparative fee analysis, or that there was a reasonable basis for the fee level. The Trustees also considered the effects of SIMC’s voluntary and contractual waiver of management and other fees to prevent total Fund operating expenses from exceeding a specified cap and concluded that SIMC, through waivers, has maintained the Funds’ net operating expenses at competitive levels for its distribution channels. The Board also took into consideration compensation earned from the Funds by SIMC or its affiliates for non-advisory services, such as administration, transfer agency, shareholder services or brokerage, and considered whether SIMC and its affiliates may have realized other benefits from their relationship with the Funds, such as any research and brokerage services received under soft dollar arrangements. When considering fees paid to the Sub-Adviser, the Board took into account the fact that the Sub-Adviser is compensated by SIMC and not by the Funds directly, and that such compensation with respect to any unaffiliated Sub-Adviser reflects an arms-length negotiation between the Sub-Adviser and SIMC. Following evaluation, the Board concluded that, within the context of its full deliberations, the expenses of the Funds are reasonable and supported renewal of the Investment Advisory Agreements. The Board also considered whether the Sub-Adviser and its affiliates may have realized other benefits from their relationship with the Funds, such as any research and brokerage services received under soft dollar arrangements.
Profitability. With regard to profitability, the Trustees considered compensation flowing to SIMC and the Sub-Adviser and their affiliates, directly or indirectly. The Trustees considered whether the levels of compensation and profitability were reasonable. As with the fee levels, when considering the profitability of the Sub-Adviser, the Board took into account the fact that compensation with respect to any unaffiliated Sub-Adviser reflects an arms-length negotiation between the Sub-Adviser and SIMC. In connection with the renewal of the Sub-Advisory Agreement, the Board also took into consideration the impact that the fees paid to the Sub-Adviser have on SIMC’s advisory fee margin and profitability. Based on this evaluation, the Board concluded that, within the context of its full deliberations, the profitability of each of SIMC and the Sub-Adviser is reasonable and supported renewal of the Investment Advisory Agreements.
| Adviser Managed Trust / Annual Report / July 31, 2016 | 79 |
BOARD OF TRUSTEES’ CONSIDERATIONS IN APPROVING THE ADVISORY AND SUB-ADVISORY AGREEMENTS (Unaudited) (Concluded)
Economies of Scale. With respect to the Advisory Agreement, the Trustees considered whether any economies of scale were being realized by SIMC and its affiliates and, if so, whether the benefits of such economies of scale were passed along to the Funds’ shareholders through a graduated investment advisory fee schedule or other means, including any fee waivers by SIMC and its affiliates. The Trustees recognized that economies of scale are difficult to identify and quantify and are rarely identifiable on a fund-by-fund basis. Based on this evaluation, the Board determined that the fees were reasonable in light of the information that was provided by SIMC with respect to economies of scale.
Based on the Trustees’ deliberation and their evaluation of the information described above, the Board, including all of the Independent Trustees, with the assistance of Fund counsel and Independent Trustees’ counsel, unanimously approved the renewal of the Investment Advisory Agreements and concluded that the compensation under the Investment Advisory Agreements is fair and reasonable in light of such services and expenses and such other matters as the Trustees considered to be relevant in the exercise of their reasonable judgment. In the course of its deliberations, the Board did not identify any particular factor (or conclusion with respect thereto) or single piece of information that was all-important, controlling or determinative of its decision, but considered all of the factors together, and each Trustee may have attributed different weights to the various factors (and conclusions with respect thereto) and information.
| 80 | Adviser Managed Trust / Annual Report / July 31, 2016 |
NOTICE TO SHAREHOLDERS (Unaudited)
For shareholders that do not have a July 31, 2016 taxable year end, this notice is for informational purposes only. For shareholders with a July 31, 2016 year end, please consult your tax advisor as to the pertinence of this notice.
For the fiscal year ended July 31, 2016, the funds of the Adviser Managed Trust are designating the following items with regard to distributions paid during the year:
| (A) Long-Term Capital Gains Distributions | (B) Ordinary Income Distributions (Tax Basis) | Total Distributions | (C) Dividends Qualifying for Corporate Dividends Received Deduction (1) | |||||||||||||
Tactical Offensive Equity Fund | 21.51 | % | 78.49 | % | 100.00 | % | 46.70 | % | ||||||||
Tactical Offensive Fixed Income Fund | 0.00 | % | 100.00 | % | 100.00 | % | 0.00 | % | ||||||||
| (D) Qualifying Dividend Income (15% Tax Rate for QDI) (2) | (E) U.S. Government Interest (3) | Interest Related Dividends (4) | Short-Term Capital Gain Dividends (5) | |||||||||||||
Tactical Offensive Equity Fund | 80.78 | % | 0.00 | % | 0.03 | % | 100.00 | % | ||||||||
Tactical Offensive Fixed Income Fund | 0.00 | % | 19.28 | % | 84.37 | % | 0.00 | % | ||||||||
| (1) | Qualifying dividends represent dividends which qualify for the corporate dividends received deduction. |
| (2) | The percentage in this column represents the amount of “Qualifying Dividend Income” is reflected as a percentage of “Ordinary Income Distributions.” It is the intention of each of the aforementioned funds to designate the maximum amount permitted by the law. The information reported herein may differ from the information and distributions taxable to the shareholders for the calendar year ending December 31, 2016. Complete information will be computed and reported in conjunction with your 2016 Form 1099-DIV. |
| (3) | “U.S. Government Interest” represents the amount of interest that was derived from direct U.S. Government obligations and distributed during the fiscal year. This amount is reflected as a percentage of total ordinary income distributions (the total of short term capital gain and net investment income distributions). Generally, interest from direct U.S. Government obligations is exempt from state income tax. However, for shareholders who are residents of California, Connecticut and New York, the statutory threshold requirements were not satisfied to permit exemption of these amounts from state income. |
| (4) | The percentage in this column represents the amount of “Interest Related Dividend” is reflected as a percentage of net investment income distributions that is exempt from U.S. withholding tax when paid to foreign investors. |
| (5) | The percentage in this column represents the amount of “Short-Term Capital Gain” is reflected as a percentage of short-term capital gain distributions that is exempt from U.S. withholding tax when paid to foreign investors. |
Items (A) and (B) are based on the percentage of the Funds total distribution.
Items (C) and (D) are based on the percentage of ordinary income distributions of each fund. Item (E) is based on the percentage of gross income of each fund.
Please consult your tax adviser for proper treatment of this information. This notification should be kept with your permanent tax records.
| Adviser Managed Trust / Annual Report / July 31, 2016 | 81 |
(This page intentionally left blank)
(This page intentionally left blank)
(This page intentionally left blank)
ADVISER MANAGED TRUST ANNUAL REPORT JULY 31, 2016
Robert A. Nesher, Chairman
Trustees
William M. Doran
George J. Sullivan, Jr.
Nina Lesavoy
James M. Williams
Mitchell A. Johnson
Hubert L. Harris, Jr.
Susan C. Cote
Officers
Robert A. Nesher
President and Chief Executive Officer
James J. Hoffmayer
Controller and Chief Financial Officer
Russell Emery
Chief Compliance Officer
Timothy D. Barto
Vice President, Secretary
Aaron Buser
Vice President, Assistant Secretary
David F. McCann
Vice President, Assistant Secretary
Stephen G. MacRae
Vice President
Bridget E. Sudall
Anti-Money Laundering Compliance Officer
Privacy Officer
Investment Adviser
SEI Investments Management Corporation
Administrator
SEI Investments Global Funds Services
Distributor
SEI Investments Distribution Co.
Legal Counsel
Morgan, Lewis & Bockius LLP
Independent Registered Public Accounting Firm
KPMG LLP
This report and the financial statements contained herein are submitted for the general information of the shareholders of the Trust and must be preceded or accompanied by a current prospectus. Shares of the Funds are not deposits or obligations of, or guaranteed or endorsed by, any bank. The shares are not federally insured by the Federal Deposit Insurance Corporation (FDIC), the Federal Reserve Board, or any other government agency. Investment in the shares involves risk, including the possible loss of principal.
For more information call
1 800 DIAL SEI
(1 800 342 5734)

1 Freedom Valley Drive, P.O. Box 1100, Oaks, PA 19456
AMT (7/16)
| Item 2. | Code of Ethics. |
The Registrant has adopted a code of ethics that applies to the Registrant’s principal executive officer, principal financial officer, controller or principal accounting officer.
| Item 3. | Audit Committee Financial Expert. |
(a)(1) The Registrant’s Board of Trustees (the “Board”) has determined that the Registrant has at least two Audit Committee financial experts serving on the audit committee.
(a)(2) The Audit Committee financial experts are George J. Sullivan, Jr and Hubert L. Harris, Jr. Mr. Sullivan and Mr. Harris are independent trustees as defined in Form N-CSR Item 3(a)(2).
| Item 4. | Principal Accountant Fees and Services. |
Fees billed by KPMG LLP (“KPMG”) related to the Registrant.
KPMG billed the Registrant aggregate fees for services rendered to the Registrant for the last two fiscal years as follows:
| Fiscal Year 2016 | Fiscal Year 2015 | |||||||||||||||||||||||||
| All fees and services to the Registrant that were pre-approved | All fees and services to service affiliates that were pre- approved | All other fees and services to service affiliates that did not require pre-approval | All fees and services to the Registrant that were pre-approved | All fees and services to service affiliates that were pre- approved | All other fees and services to service affiliates that did not require pre-approval | |||||||||||||||||||||
| (a) | Audit Fees (1) | $ | 61,000 | $ | 0 | $ | 0 | $ | 61,000 | $ | 0 | $ | 0 | |||||||||||||
| (b) | Audit-Related Fees | $ | 0 | $ | 0 | $ | 0 | $ | 0 | $ | 0 | $ | 0 | |||||||||||||
| (c) | Tax Fees | $ | 0 | $ | 0 | $ | 0 | $ | 0 | $ | 0 | $ | 0 | |||||||||||||
| (d) | All Other Fees (2) | $ | 0 | $ | 280,445 | $ | 0 | $ | 0 | $ | 246,385 | $ | 0 | |||||||||||||
Notes:
| (1) | Audit fees include amounts related to the audit of the Registrant’s annual financial statements and services normally provided by the accountant in connection with statutory and regulatory filings. |
| (2) | See Item 4(g) for a description of the services comprising the fees disclosed under this category. |
(e)(1) The Registrant’s Audit Committee has adopted and the Board of Trustees has ratified an Audit and Non-Audit Services Pre-Approval Policy (the “Policy”), which sets forth the procedures and the conditions pursuant to which services proposed to be performed by the independent auditor of the Registrant may be pre-approved.
The Policy provides that all requests or applications for proposed services to be provided by the independent auditor must be submitted to the Chief Financial Officer (“CFO”) of the Registrant and must include a detailed description of the services proposed to be rendered. The Registrant’s CFO will determine whether such services (1) require specific pre-approval, (2) are included within the list of services that have received the general pre-approval of the Audit Committee or (3) have been previously pre-approved in connection with the independent auditor’s annual engagement letter for the applicable year or otherwise.
Requests or applications to provide services that require specific pre-approval by the Audit Committee will be submitted to the Audit Committee by the CFO. The Audit Committee will be informed by the CFO on a quarterly basis of all services rendered by the independent auditor. The Audit Committee has delegated specific pre-approval authority to either the Audit Committee Chair or financial expert, provided that the estimated fee for any such proposed pre-approved service does not exceed $100,000 and any pre-approval decisions are reported to the Audit Committee at its next regularly scheduled meeting.
All services to be provided by the independent auditor shall be provided pursuant to a signed written engagement letter with the Registrant, the investment advisor or applicable control affiliate (except that matters as to which an engagement letter would be impractical because of timing issues or because the matter is small may not be the subject of an engagement letter) that sets forth both the services to be provided by the independent auditor and the total fees to be paid to the independent auditor for those services.
In addition, the Audit Committee has determined to take additional measures on an annual basis to meet its responsibility to oversee the work of the independent auditor and to assure the auditor’s independence from the Registrant, such as reviewing a formal written statement from the independent auditor delineating all relationships between the independent auditor and the Registrant, and discussing with the independent auditor its methods and procedures for ensuring independence.
(e)(2) Percentage of fees billed applicable to non-audit services pursuant to waiver of pre-approval requirement were as follows:
| 2016 | 2015 | |||||||
Audit-Related Fees | 0 | % | 0 | % | ||||
Tax Fees | 0 | % | 0 | % | ||||
All Other Fees | 0 | % | 0 | % | ||||
(f) Not applicable.
(g) The aggregate non-audit fees and services billed by KPMG for fiscal years 2016 and 2015 were $280,445 and $246,385 respectively. Non-audit fees consist of SSAE No.16 review of fund accounting and administration operations and attestation report in accordance with Rule 17 Ad-13.
(h) During the past fiscal year, Registrant’s principal accountant provided certain non-audit services to Registrant’s investment adviser or to entities controlling, controlled by, or under common control with Registrant’s investment adviser that provide ongoing services to Registrant that were not subject to pre-approval pursuant to paragraph (c)(7)(ii) of Rule 2-01 of Regulation S-X. The Registrant’s Audit Committee reviewed and considered these non-audit services provided by Registrant’s principal accountant to Registrant’s affiliates, including whether the provision of these non-audit services is compatible with maintaining the principal accountant’s independence.
Item 5. Audit Committee of Listed Registrants.
Not applicable.
Item 6. Schedule of Investments
(a) The Schedule of Investments in securities of unaffiliated issuers as of the close of the reporting period for the Tactical Offensive Equity Fund is listed below. The Schedule of Investments in securities of unaffiliated issuers as of the close of the reporting period for the Tactical Offensive Fixed Income Fund is included as part of the report to shareholders filed under Item 1 of this form.
SCHEDULE OF INVESTMENTS
July 31, 2016
Tactical Offensive Equity Fund
Description | Shares | Market Value ($ Thousands) | ||||||
COMMON STOCK — 95.8% |
| |||||||
Australia — 1.4% | ||||||||
AGL Energy | 19,548 | $ | 306 | |||||
Alumina | 70,920 | 71 | ||||||
Amcor | 33,554 | 383 | ||||||
AMP | 85,692 | 378 | ||||||
APA Group | 32,284 | 238 | ||||||
Aristocrat Leisure | 15,690 | 190 | ||||||
Asciano | 16,955 | 118 | ||||||
ASX | 5,609 | 212 | ||||||
Aurizon Holdings | 60,649 | 240 | ||||||
AusNet Services | 51,246 | 69 | ||||||
Australia & New Zealand Banking Group | 84,528 | 1,660 | ||||||
Bank of Queensland | 10,898 | 87 | ||||||
Bendigo & Adelaide Bank | 13,234 | 102 | ||||||
BHP Billiton | 93,049 | 1,381 | ||||||
Boral | 21,544 | 113 | ||||||
Brambles | 45,746 | 468 | ||||||
Caltex Australia | 7,822 | 197 | ||||||
Challenger | 16,532 | 119 | ||||||
CIMIC Group | 2,912 | 65 | ||||||
Coca-Cola Amatil | 16,592 | 116 | ||||||
Cochlear | 1,657 | 167 | ||||||
Commonwealth Bank of Australia | 49,833 | 2,930 | ||||||
Computershare | 13,507 | 91 | ||||||
Crown Resorts | 10,552 | 105 | ||||||
CSL | 13,410 | 1,203 | ||||||
Dexus Property Group †† | 28,043 | 208 | ||||||
Domino’s Pizza Enterprises | 1,778 | 102 | ||||||
DUET Group | 67,250 | 138 | ||||||
Flight Centre Travel Group | 1,608 | 39 | ||||||
Fortescue Metals Group | 45,106 | 152 | ||||||
Goodman Group †† | 51,521 | 295 | ||||||
GPT Group †† | 52,060 | 222 | ||||||
Harvey Norman Holdings | 16,099 | 59 | ||||||
Healthscope | 50,269 | 113 | ||||||
Incitec Pivot | 48,881 | 107 | ||||||
Insurance Australia Group | 70,442 | 323 | ||||||
Lend Lease Group | 15,997 | 163 | ||||||
Macquarie Group | 8,873 | 502 | ||||||
Medibank | 79,789 | 186 | ||||||
Mirvac Group †† | 107,231 | 179 | ||||||
National Australia Bank | 76,425 | 1,542 | ||||||
Newcrest Mining * | 22,207 | 422 | ||||||
Oil Search | 39,704 | 214 | ||||||
Orica | 10,819 | 116 | ||||||
Origin Energy | 50,698 | 212 | ||||||
Platinum Asset Management | 6,799 | 31 | ||||||
Qantas Airways | 14,938 | 36 | ||||||
QBE Insurance Group | 39,728 | 331 | ||||||
Description | Shares | Market Value ($ Thousands) | ||||||
COMMON STOCK (continued) |
| |||||||
Ramsay Health Care | 4,098 | $ | 245 | |||||
REA Group | 1,526 | 76 | ||||||
Rio Tinto | 12,290 | 463 | ||||||
Santos | 46,056 | 154 | ||||||
Scentre Group †† | 154,256 | 621 | ||||||
Seek | 9,480 | 120 | ||||||
Sonic Healthcare | 11,377 | 199 | ||||||
South32 | 154,240 | 215 | ||||||
Stockland †† | 69,302 | 265 | ||||||
Suncorp Group | 37,275 | 380 | ||||||
Sydney Airport | 31,650 | 182 | ||||||
Tabcorp Holdings | 24,089 | 90 | ||||||
Tatts Group | 42,430 | 133 | ||||||
Teekay Tankers, Cl A | 12,174 | 36 | ||||||
Telstra | 123,971 | 544 | ||||||
TPG Telecom | 9,833 | 96 | ||||||
Transurban Group | 58,973 | 563 | ||||||
Treasury Wine Estates | 21,385 | 157 | ||||||
Tronox, Cl A | 6,765 | 44 | ||||||
Vicinity Centres †† | 97,487 | 256 | ||||||
Vocus Communications | 14,088 | 96 | ||||||
Wesfarmers | 32,626 | 1,065 | ||||||
Westfield †† | 57,196 | 464 | ||||||
Westpac Banking | 97,535 | 2,305 | ||||||
Woodside Petroleum | 21,483 | 433 | ||||||
Woolworths | 36,822 | 655 | ||||||
|
| |||||||
| 26,558 | ||||||||
|
| |||||||
Austria — 0.0% | ||||||||
ANDRITZ | 2,109 | 107 | ||||||
Erste Group Bank | 8,094 | 215 | ||||||
OMV | 4,267 | 113 | ||||||
Raiffeisen Bank International | 3,395 | 45 | ||||||
voestalpine | 3,295 | 116 | ||||||
|
| |||||||
| 596 | ||||||||
|
| |||||||
Belgium — 0.3% | ||||||||
Ageas | 5,835 | 196 | ||||||
Anheuser-Busch InBev | 23,475 | 3,027 | ||||||
Colruyt | 1,951 | 109 | ||||||
Groupe Bruxelles Lambert | 2,337 | 197 | ||||||
KBC Group | 7,268 | 378 | ||||||
Proximus | 4,407 | 137 | ||||||
Solvay | 2,147 | 223 | ||||||
Telenet Group Holding * | 1,528 | 72 | ||||||
UCB | 3,663 | 287 | ||||||
Umicore | 2,758 | 160 | ||||||
|
| |||||||
| 4,786 | ||||||||
|
| |||||||
Brazil — 0.5% | ||||||||
AES Tiete Energia | 9,700 | 52 | ||||||
Ambev | 202,691 | 1,176 | ||||||
Banco Bradesco | 36,510 | 331 | ||||||
Banco do Brasil | 38,200 | 249 | ||||||
Banco Santander Brasil | 19,200 | 122 | ||||||
BB Seguridade Participacoes | 30,800 | 289 | ||||||
| Adviser Managed Trust / Annual Report / July 31, 2016 | 3 |
SCHEDULE OF INVESTMENTS
July 31, 2016
Tactical Offensive Equity Fund (Continued)
Description | Shares | Market Value ($ Thousands) | ||||||
COMMON STOCK (continued) |
| |||||||
BM&FBovespa — Bolsa de Valores Mercadorias e Futuros | 75,100 | $ | 443 | |||||
BR Malls Participacoes * | 26,490 | 115 | ||||||
BRF | 26,600 | 446 | ||||||
CCR | 39,200 | 226 | ||||||
CETIP — Mercados Organizados | 10,100 | 136 | ||||||
Cia de Saneamento Basico do Estado de Sao Paulo | 15,500 | 147 | ||||||
Cia Siderurgica Nacional * | 38,000 | 131 | ||||||
Cielo | 44,300 | 507 | ||||||
Cosan Industria e Comercio | 6,000 | 63 | ||||||
CPFL Energia | 9,970 | 70 | ||||||
Duratex | 16,300 | 49 | ||||||
EDP — Energias do Brasil | 14,847 | 66 | ||||||
Embraer | 29,900 | 138 | ||||||
Engie Brasil Energia | 9,500 | 126 | ||||||
Equatorial Energia | 9,000 | 154 | ||||||
Fibria Celulose | 11,800 | 72 | ||||||
Hypermarcas | 15,900 | 136 | ||||||
JBS | 33,100 | 112 | ||||||
Klabin | 25,365 | 134 | ||||||
Kroton Educacional | 60,900 | 275 | ||||||
Localiza Rent a Car | 9,900 | 123 | ||||||
Lojas Americanas | 10,300 | 42 | ||||||
Lojas Renner | 28,400 | 239 | ||||||
M Dias Branco | 1,700 | 62 | ||||||
Multiplan Empreendimentos Imobiliarios | 4,000 | 78 | ||||||
Natura Cosmeticos | 8,400 | 88 | ||||||
Odontoprev | 13,300 | 54 | ||||||
Petroleo Brasileiro * | 129,300 | 564 | ||||||
Porto Seguro | 5,800 | 51 | ||||||
Qualicorp | 10,700 | 71 | ||||||
Raia Drogasil | 10,300 | 213 | ||||||
Rumo Logistica Operadora Multimodal * | 39,659 | 74 | ||||||
Sul America | 9,200 | 49 | ||||||
TIM Participacoes | 42,200 | 110 | ||||||
TOTVS | 6,100 | 62 | ||||||
Transmissora Alianca de Energia Eletrica | 5,400 | 43 | ||||||
Ultrapar Participacoes | 15,800 | 362 | ||||||
Vale | 56,500 | 325 | ||||||
WEG | 26,000 | 123 | ||||||
|
| |||||||
| 8,498 | ||||||||
|
| |||||||
Canada — 0.1% | ||||||||
Atlantic Power | 12,789 | 32 | ||||||
IMAX * | 6,169 | 195 | ||||||
Lions Gate Entertainment | 4,700 | 94 | ||||||
Masonite International * | 3,178 | 222 | ||||||
MDC Partners, Cl A | 5,579 | 71 | ||||||
Tahoe Resources | 15,200 | 236 | ||||||
Teekay | 4,604 | 29 | ||||||
Thomson Reuters | 15,200 | 640 | ||||||
|
| |||||||
| 1,519 | ||||||||
|
| |||||||
Description | Shares | Market Value ($ Thousands) | ||||||
COMMON STOCK (continued) | ||||||||
Chile — 0.1% | ||||||||
AES Gener | 139,105 | $ | 67 | |||||
Aguas Andinas, Cl A | 110,966 | 67 | ||||||
Banco de Chile | 841,211 | 93 | ||||||
Banco de Credito e Inversiones | 1,700 | 77 | ||||||
Banco Santander Chile | 3,038,891 | 156 | ||||||
Cencosud | 57,162 | 163 | ||||||
Cia Cervecerias Unidas | 7,031 | 80 | ||||||
Colbun | 369,931 | 91 | ||||||
Empresa Nacional de Electricidad | 148,748 | 136 | ||||||
Empresa Nacional de Telecomunicaciones * | 7,963 | 79 | ||||||
Empresas CMPC | 57,207 | 120 | ||||||
Empresas COPEC | 20,357 | 185 | ||||||
Endesa Americas | 157,817 | 74 | ||||||
Enersis | 885,239 | 156 | ||||||
Enersis Chile | 697,667 | 81 | ||||||
Itau CorpBanca | 2,192,200 | 19 | ||||||
Latam Airlines Group * | 14,011 | 122 | ||||||
SACI Falabella | 27,315 | 201 | ||||||
|
| |||||||
| 1,967 | ||||||||
|
| |||||||
China — 1.4% | ||||||||
AAC Technologies Holdings | 33,500 | 313 | ||||||
Agricultural Bank of China | 1,110,000 | 408 | ||||||
Air China | 92,000 | 70 | ||||||
Aluminum Corp of China * | 228,000 | 73 | ||||||
Anhui Conch Cement | 57,500 | 151 | ||||||
ANTA Sports Products | 57,000 | 127 | ||||||
AviChina Industry & Technology | 108,000 | 79 | ||||||
Baidu ADR * | 11,400 | 1,819 | ||||||
Bank of China | 3,512,000 | 1,444 | ||||||
Bank of Communications | 398,000 | 268 | ||||||
Beijing Capital International Airport | 70,000 | 81 | ||||||
Byd * | 29,000 | 184 | ||||||
CGN Power (A) | 501,000 | 148 | ||||||
China Cinda Asset Management | 408,000 | 132 | ||||||
China CITIC Bank | 409,000 | 258 | ||||||
China Coal Energy | 109,000 | 57 | ||||||
China Communications Construction | 203,000 | 222 | ||||||
China Communications Services | 148,000 | 80 | ||||||
China Construction Bank | 3,711,000 | 2,487 | ||||||
China COSCO Holdings * | 37,000 | 13 | ||||||
China Everbright Bank | 174,000 | 76 | ||||||
China Galaxy Securities | 152,500 | 132 | ||||||
China Longyuan Power Group | 163,000 | 131 | ||||||
China Merchants Bank | 172,500 | 369 | ||||||
China National Building Material | 162,000 | 74 | ||||||
China Oilfield Services | 90,000 | 70 | ||||||
China Pacific Insurance Group | 118,400 | 418 | ||||||
China Petroleum & Chemical | 1,132,000 | 804 | ||||||
China Railway Construction | 103,000 | 123 | ||||||
China Railway Group | 187,000 | 141 | ||||||
| 4 | Adviser Managed Trust / Annual Report / July 31, 2016 |
SCHEDULE OF INVESTMENTS
July 31, 2016
Tactical Offensive Equity Fund (Continued)
Description | Shares | Market Value ($ Thousands) | ||||||
COMMON STOCK (continued) |
| |||||||
China Shipping Container Lines * | 54,000 | $ | 11 | |||||
China Telecom | 628,000 | 309 | ||||||
China Vanke | 61,900 | 140 | ||||||
Chongqing Changan Automobile, Cl B | 45,400 | 75 | ||||||
Chongqing Rural Commercial Bank | 151,000 | 79 | ||||||
CITIC Securities | 99,000 | 211 | ||||||
Country Garden Holdings | 295,000 | 120 | ||||||
CRRC | 192,000 | 176 | ||||||
ENN Energy Holdings | 34,000 | 162 | ||||||
Fosun International | 121,000 | 158 | ||||||
Great Wall Motor | 167,000 | 173 | ||||||
Guangzhou R&F Properties | 59,200 | 90 | ||||||
Huadian Power International | 112,000 | 53 | ||||||
Huaneng Power International | 198,000 | 121 | ||||||
Industrial & Commercial Bank of China | 3,257,000 | 1,843 | ||||||
Jiangsu Expressway | 70,000 | 99 | ||||||
Jiangxi Copper | 78,000 | 89 | ||||||
Kingsoft | 50,000 | 85 | ||||||
NetEase ADR | 3,500 | 715 | ||||||
New Oriental Education & Technology Group ADR | 6,100 | 269 | ||||||
PetroChina | 940,000 | 637 | ||||||
PICC Property & Casualty | 208,000 | 322 | ||||||
Ping An Insurance Group of China | 231,000 | 1,078 | ||||||
Qunar Cayman Islands ADR * | 2,300 | 69 | ||||||
Semiconductor Manufacturing | ||||||||
International * | 979,000 | 79 | ||||||
Shandong Weigao Group Medical Polymer | 100,000 | 56 | ||||||
Shanghai Electric Group | 144,000 | 60 | ||||||
Shanghai Fosun Pharmaceutical Group | 22,000 | 54 | ||||||
Shanghai Lujiazui Finance & Trade Zone Development, Cl B | 46,340 | 68 | ||||||
Shanghai Pharmaceuticals Holding | 33,100 | 78 | ||||||
Shenzhou International Group Holdings | 26,000 | 137 | ||||||
Shimao Property Holdings | 58,500 | 76 | ||||||
Sino-Ocean Group Holding | 157,000 | 66 | ||||||
Sinopec Engineering Group | 81,500 | 71 | ||||||
Sinopec Shanghai Petrochemical | 190,000 | 93 | ||||||
Sinopharm Group | 54,400 | 263 | ||||||
Sinotrans | 113,000 | 52 | ||||||
SOHO China | 113,000 | 52 | ||||||
SouFun Holdings ADR * | 17,700 | 91 | ||||||
Sun Art Retail Group | 109,000 | 76 | ||||||
Tencent Holdings | 250,200 | 6,013 | ||||||
Tingyi Cayman Islands Holding | 108,000 | 93 | ||||||
Travelsky Technology | 56,000 | 107 | ||||||
Tsingtao Brewery | 20,000 | 70 | ||||||
Vipshop Holdings ADR * | 18,600 | 265 | ||||||
Want Want China Holdings | 264,000 | 162 | ||||||
Weichai Power | 62,000 | 74 | ||||||
Yanzhou Coal Mining | 98,000 | 60 | ||||||
YY ADR * | 1,800 | 71 | ||||||
Description | Shares | Market Value ($ Thousands) | ||||||
COMMON STOCK (continued) |
| |||||||
Zhuzhou CSR Times Electric | 25,500 | $ | 141 | |||||
Zijin Mining Group | 288,000 | 105 | ||||||
ZTE | 41,400 | 56 | ||||||
|
| |||||||
| 26,425 | ||||||||
|
| |||||||
Colombia — 0.0% | ||||||||
Cementos Argos | 18,351 | 69 | ||||||
Ecopetrol | 173,833 | 73 | ||||||
Financiera Colombiana | 4,768 | 59 | ||||||
Grupo Argos | 12,098 | 73 | ||||||
Grupo de Inversiones Suramericana | 8,928 | 111 | ||||||
Interconexion Electrica ESP | 18,670 | 55 | ||||||
|
| |||||||
| 440 | ||||||||
|
| |||||||
Czech Republic — 0.0% | ||||||||
Central European Media Enterprises, Cl A * | 8,376 | 19 | ||||||
CEZ | 6,044 | 114 | ||||||
Komercni banka | 2,771 | 109 | ||||||
O2 Czech Republic | 5,020 | 49 | ||||||
|
| |||||||
| 291 | ||||||||
|
| |||||||
Denmark — 0.4% | ||||||||
AP Moeller — Maersk, Cl A | 111 | 145 | ||||||
AP Moeller — Maersk, Cl B | 185 | 251 | ||||||
Carlsberg, Cl B | 3,099 | 308 | ||||||
Chr Hansen Holding | 2,865 | 180 | ||||||
Coloplast, Cl B | 3,511 | 276 | ||||||
Danske Bank | 20,455 | 556 | ||||||
DSV | 5,577 | 248 | ||||||
Genmab * | 1,643 | 298 | ||||||
ISS | 4,841 | 187 | ||||||
Novo Nordisk, Cl B | 54,193 | 3,089 | ||||||
Novozymes, Cl B | 6,760 | 332 | ||||||
Pandora | 3,366 | 438 | ||||||
TDC | 23,500 | 124 | ||||||
Tryg | 3,356 | 63 | ||||||
Vestas Wind Systems | 6,492 | 453 | ||||||
William Demant Holding * | 3,548 | 72 | ||||||
|
| |||||||
| 7,020 | ||||||||
|
| |||||||
Finland — 0.2% | ||||||||
Elisa | 4,121 | 149 | ||||||
Fortum | 12,869 | 214 | ||||||
Kone, Cl B | 9,761 | 494 | ||||||
Metso | 3,267 | 91 | ||||||
Neste | 3,714 | 141 | ||||||
Nokia | 167,152 | 961 | ||||||
Nokian Renkaat | 3,317 | 123 | ||||||
Orion, Cl B | 2,965 | 121 | ||||||
Sampo, Cl A | 12,952 | 537 | ||||||
Stora Enso, Cl R | 15,961 | 145 | ||||||
UPM-Kymmene | 15,463 | 319 | ||||||
Wartsila | 4,286 | 186 | ||||||
|
| |||||||
| 3,481 | ||||||||
|
| |||||||
| Adviser Managed Trust / Annual Report / July 31, 2016 | 5 |
SCHEDULE OF INVESTMENTS
July 31, 2016
Tactical Offensive Equity Fund (Continued)
Description | Shares | Market Value ($ Thousands) | ||||||
COMMON STOCK (continued) | ||||||||
France — 1.8% | ||||||||
Accor | 5,114 | $ | 214 | |||||
Aeroports de Paris | 860 | 91 | ||||||
Air Liquide | 9,973 | 1,064 | ||||||
Alstom | 4,444 | 109 | ||||||
Arkema | 1,942 | 166 | ||||||
Atos | 2,549 | 250 | ||||||
AXA | 56,240 | 1,147 | ||||||
BNP Paribas | 30,694 | 1,522 | ||||||
Bollore | 25,143 | 91 | ||||||
Bouygues | 6,000 | 178 | ||||||
Bureau Veritas | 7,674 | 167 | ||||||
Capital Gemini | 4,739 | 456 | ||||||
Carrefour | 16,046 | 402 | ||||||
Casino Guichard Perrachon | 1,640 | 89 | ||||||
Christian Dior | 1,579 | 286 | ||||||
Cie de Saint-Gobain | 13,814 | 585 | ||||||
Cie Generale des Etablissements Michelin | 5,270 | 539 | ||||||
CNP Assurances | 4,973 | 76 | ||||||
Credit Agricole | 30,587 | 271 | ||||||
Danone | 17,078 | 1,315 | ||||||
Dassault Systemes | 3,719 | 307 | ||||||
Edenred | 6,005 | 136 | ||||||
Eiffage | 1,659 | 128 | ||||||
Electricite de France | 7,232 | 95 | ||||||
Engie | 42,333 | 697 | ||||||
Essilor International | 5,958 | 763 | ||||||
Eurazeo | 1,174 | 75 | ||||||
Eutelsat Communications | 5,058 | 101 | ||||||
Fonciere Des Regions †† | 966 | 91 | ||||||
Gecina †† | 1,191 | 180 | ||||||
Groupe Eurotunnel | 13,544 | 141 | ||||||
Hermes International | 765 | 329 | ||||||
ICADE †† | 1,074 | 83 | ||||||
Iliad | 765 | 149 | ||||||
Imerys | 1,037 | 74 | ||||||
Ingenico Group | 1,590 | 174 | ||||||
JCDecaux | 2,153 | 74 | ||||||
Kering | 2,195 | 417 | ||||||
Klepierre †† | 6,375 | 305 | ||||||
Lagardere | 3,419 | 87 | ||||||
Legrand | 7,734 | 427 | ||||||
L’Oreal | 7,340 | 1,397 | ||||||
LVMH Moet Hennessy Louis Vuitton | 8,079 | 1,386 | ||||||
Natixis | 27,188 | 112 | ||||||
Orange | 57,558 | 881 | ||||||
Pernod Ricard | 6,152 | 703 | ||||||
Peugeot * | 14,056 | 212 | ||||||
Publicis Groupe | 5,480 | 408 | ||||||
Remy Cointreau | 635 | 56 | ||||||
Description | Shares | Market Value ($ Thousands) | ||||||
COMMON STOCK (continued) | ||||||||
Renault | 5,569 | $ | 487 | |||||
Rexel | 8,746 | 130 | ||||||
Safran | 9,062 | 616 | ||||||
Sanofi | 34,318 | 2,922 | ||||||
Schneider Electric | 16,173 | 1,058 | ||||||
SCOR | 4,728 | 138 | ||||||
SFR Group | 3,174 | 75 | ||||||
Societe BIC | 833 | 123 | ||||||
Societe Generale | 22,190 | 758 | ||||||
Sodexo | 2,731 | 320 | ||||||
Suez | 9,433 | 153 | ||||||
Technip | 3,104 | 173 | ||||||
Thales | 3,056 | 278 | ||||||
TOTAL | 64,467 | 3,083 | ||||||
Unibail-Rodamco †† | 2,858 | 787 | ||||||
Valeo | 6,907 | 355 | ||||||
Veolia Environnement | 13,057 | 290 | ||||||
Vinci | 14,513 | 1,102 | ||||||
Vivendi | 33,699 | 663 | ||||||
Wendel | 834 | 89 | ||||||
Zodiac Aerospace | 5,869 | 132 | ||||||
|
| |||||||
| 32,738 | ||||||||
|
| |||||||
Germany — 1.6% | ||||||||
adidas | 5,455 | 895 | ||||||
Allianz | 13,351 | 1,916 | ||||||
Axel Springer | 1,250 | 69 | ||||||
BASF | 26,814 | 2,107 | ||||||
Bayer | 24,126 | 2,596 | ||||||
Bayerische Motoren Werke | 9,593 | 827 | ||||||
Beiersdorf | 2,920 | 274 | ||||||
Brenntag | 4,476 | 222 | ||||||
Commerzbank | 30,841 | 203 | ||||||
Continental | 3,187 | 668 | ||||||
Covestro (A) | 2,053 | 96 | ||||||
Daimler | 28,133 | 1,913 | ||||||
Deutsche Bank | 39,960 | 537 | ||||||
Deutsche Boerse | 5,592 | 470 | ||||||
Deutsche Lufthansa | 6,729 | 80 | ||||||
Deutsche Post | 28,109 | 839 | ||||||
Deutsche Telekom | 93,425 | 1,591 | ||||||
Deutsche Wohnen | 9,776 | 366 | ||||||
E.ON | 57,973 | 622 | ||||||
Evonik Industries | 4,050 | 126 | ||||||
Fraport Frankfurt Airport Services Worldwide | 1,204 | 66 | ||||||
Fresenius & KGaA | 11,858 | 886 | ||||||
Fresenius Medical Care & KGaA | 6,345 | 580 | ||||||
GEA Group | 5,298 | 283 | ||||||
Hannover Rueck | 1,747 | 179 | ||||||
HeidelbergCement | 4,083 | 346 | ||||||
Henkel & KGaA | 3,011 | 327 | ||||||
HOCHTIEF | 602 | 79 | ||||||
HUGO BOSS | 1,938 | 115 | ||||||
Infineon Technologies | 32,767 | 542 | ||||||
| 6 | Adviser Managed Trust / Annual Report / July 31, 2016 |
SCHEDULE OF INVESTMENTS
July 31, 2016
Tactical Offensive Equity Fund (Continued)
Description | Shares | Market Value ($ Thousands) | ||||||
COMMON STOCK (continued) |
| |||||||
K+S | 5,545 | $ | 116 | |||||
LANXESS | 2,652 | 125 | ||||||
Linde | 5,381 | 774 | ||||||
MAN | 1,021 | 107 | ||||||
Merck KGaA | 3,744 | 414 | ||||||
METRO | 5,165 | 166 | ||||||
Muenchener Rueckversicherungs- Gesellschaft in Muenchen | 4,834 | 807 | ||||||
OSRAM Licht | 2,578 | 134 | ||||||
ProSiebenSat.1 Media | 6,339 | 290 | ||||||
RWE | 14,178 | 252 | ||||||
SAP | 28,676 | 2,514 | ||||||
Siemens | 22,323 | 2,424 | ||||||
Symrise | 3,573 | 252 | ||||||
Telefonica Deutschland Holding | 21,545 | 88 | ||||||
ThyssenKrupp | 10,658 | 244 | ||||||
TUI | 14,450 | 189 | ||||||
United Internet | 3,564 | 158 | ||||||
Volkswagen | 940 | 139 | ||||||
Vonovia | 13,501 | 535 | ||||||
Zalando * (A) | 2,505 | 95 | ||||||
|
| |||||||
| 29,643 | ||||||||
|
| |||||||
Greece — 0.0% | ||||||||
Alpha Bank AE * | 65,706 | 130 | ||||||
Costamare | 2,869 | 28 | ||||||
Eurobank Ergasias * | 68,356 | 39 | ||||||
FF Group | 1,785 | 44 | ||||||
Hellenic Telecommunications Organization | 8,266 | 80 | ||||||
JUMBO | 4,857 | 57 | ||||||
National Bank of Greece * | 222,352 | 50 | ||||||
OPAP | 9,582 | 77 | ||||||
Piraeus Bank * | 243,852 | 41 | ||||||
Titan Cement | 2,299 | 53 | ||||||
|
| |||||||
| 599 | ||||||||
|
| |||||||
Hong Kong — 1.3% | ||||||||
3SBio * (A) | 60,300 | 60 | ||||||
AIA Group | 351,600 | 2,177 | ||||||
Alibaba Health Information Technology * | 166,000 | 115 | ||||||
Alibaba Pictures Group * | 530,000 | 113 | ||||||
ASM Pacific Technology | 7,000 | 52 | ||||||
Bank of East Asia | 34,400 | 142 | ||||||
Beijing Enterprises Holdings | 24,000 | 135 | ||||||
Beijing Enterprises Water Group | 204,000 | 124 | ||||||
Belle International Holdings | 297,000 | 196 | ||||||
BOC Hong Kong Holdings | 107,000 | 351 | ||||||
Brilliance China Automotive Holdings | 140,000 | 155 | ||||||
Cathay Pacific Airways | 34,000 | 55 | ||||||
Cheung Kong Infrastructure Holdings | 19,000 | 168 | ||||||
Cheung Kong Property Holdings | 78,276 | 559 | ||||||
China Conch Venture Holdings | 63,500 | 121 | ||||||
China Everbright | 50,000 | 95 | ||||||
China Everbright International | 116,000 | 125 | ||||||
Description | Shares | Market Value ($ Thousands) | ||||||
COMMON STOCK (continued) |
| |||||||
China Evergrande Group | 193,000 | $ | 122 | |||||
China Gas Holdings | 82,000 | 130 | ||||||
China Huishan Dairy Holdings | 228,000 | 90 | ||||||
China Life Insurance | 330,000 | 752 | ||||||
China Medical System Holdings | 57,000 | 84 | ||||||
China Mengniu Dairy | 125,000 | 209 | ||||||
China Merchants Holdings International | 61,048 | 179 | ||||||
China Minsheng Banking | 268,000 | 279 | ||||||
China Mobile | 271,000 | 3,340 | ||||||
China Overseas Land & Investment | 174,000 | 572 | ||||||
China Power International Development | 164,000 | 67 | ||||||
China Resources Enterprise | 66,000 | 128 | ||||||
China Resources Gas Group | 40,000 | 117 | ||||||
China Resources Land | 124,000 | 308 | ||||||
China Resources Power Holdings | 90,000 | 143 | ||||||
China Shenhua Energy | 154,500 | 295 | ||||||
China Southern Airlines | 98,000 | 65 | ||||||
China State Construction International Holdings | 96,000 | 128 | ||||||
China Taiping Insurance Holdings * | 75,800 | 148 | ||||||
China Unicom | 272,000 | 290 | ||||||
CITIC | 198,000 | 299 | ||||||
CK Hutchison Holdings | 78,500 | 919 | ||||||
CLP Holdings | 47,500 | 495 | ||||||
CNOOC | 791,000 | 946 | ||||||
COSCO Pacific | 26,000 | 27 | ||||||
CSPC Pharmaceutical Group | 190,000 | 164 | ||||||
Dalian Wanda Commercial Properties (A) | 28,300 | 179 | ||||||
Dongfeng Motor Group | 126,000 | 155 | ||||||
Far East Horizon | 99,000 | 78 | ||||||
First Pacific | 62,000 | 48 | ||||||
Franshion Properties China | 200,000 | 56 | ||||||
Galaxy Entertainment Group | 68,000 | 226 | ||||||
GCL-Poly Energy Holdings | 526,000 | 72 | ||||||
Geely Automobile Holdings | 245,000 | 161 | ||||||
Genting Singapore | 175,000 | 102 | ||||||
GF Securities | 63,600 | 139 | ||||||
GOME Electrical Appliances Holding | 606,000 | 73 | ||||||
Guangdong Investment | 128,000 | 196 | ||||||
Guangzhou Automobile Group | 110,000 | 141 | ||||||
Haier Electronics Group | 72,000 | 121 | ||||||
Haitian International Holdings | 34,000 | 57 | ||||||
Haitong Securities | 139,200 | 226 | ||||||
Hang Lung Properties | 65,000 | 141 | ||||||
Hang Seng Bank | 22,200 | 396 | ||||||
Henderson Land Development | 31,200 | 186 | ||||||
Hengan International Group | 32,500 | 273 | ||||||
HK Electric Investments & HK Electric Investments (A) | 76,500 | 73 | ||||||
HKT Trust & HKT | 77,000 | 122 | ||||||
Hong Kong & China Gas | 221,400 | 411 | ||||||
Hong Kong Exchanges and Clearing | 33,279 | 821 | ||||||
| Adviser Managed Trust / Annual Report / July 31, 2016 | 7 |
SCHEDULE OF INVESTMENTS
July 31, 2016
Tactical Offensive Equity Fund (Continued)
Description | Shares | Market Value ($ Thousands) | ||||||
COMMON STOCK (continued) |
| |||||||
Huaneng Renewables | 218,000 | $ | 70 | |||||
Huatai Securities (A) | 68,200 | 139 | ||||||
Hysan Development | 18,000 | 83 | ||||||
Kerry Properties | 19,000 | 52 | ||||||
Kunlun Energy | 152,000 | 115 | ||||||
Lenovo Group | 332,000 | 215 | ||||||
Li & Fung | 170,000 | 85 | ||||||
Link †† | 65,000 | 485 | ||||||
Longfor Properties | 76,500 | 104 | ||||||
Luye Pharma Group * | 75,000 | 49 | ||||||
Melco Crown Entertainment ADR | 5,513 | 77 | ||||||
MGM China Holdings | 27,600 | 40 | ||||||
MTR | 42,639 | 241 | ||||||
New China Life Insurance | 42,300 | 150 | ||||||
New World Development | 161,000 | 187 | ||||||
Nine Dragons Paper Holdings | 104,000 | 83 | ||||||
Noble Group | 254,000 | 31 | ||||||
NWS Holdings | 44,000 | 72 | ||||||
PCCW | 121,000 | 88 | ||||||
People’s Insurance Group of China | 328,000 | 126 | ||||||
Power Assets Holdings | 40,000 | 391 | ||||||
Shanghai Industrial Holdings | 25,000 | 58 | ||||||
Shangri-La Asia | 36,000 | 39 | ||||||
Shui On Land | 199,500 | 54 | ||||||
Sino Biopharmaceutical | 210,000 | 140 | ||||||
Sino Land | 88,000 | 157 | ||||||
SJM Holdings | 57,000 | 36 | ||||||
Sun Hung Kai Properties | 42,000 | 601 | ||||||
Sunac China Holdings | 111,000 | 70 | ||||||
Swire Pacific, Cl A | 15,500 | 185 | ||||||
Swire Properties | 33,800 | 94 | ||||||
Techtronic Industries | 40,000 | 169 | ||||||
WH Group (A) | 169,500 | 133 | ||||||
Wharf Holdings | 40,000 | 276 | ||||||
Wheelock | 24,000 | 129 | ||||||
Wynn Macau | 45,200 | 73 | ||||||
Yue Yuen Industrial Holdings | 21,500 | 87 | ||||||
Zhejiang Expressway | 84,000 | 87 | ||||||
|
| |||||||
| 24,763 | ||||||||
|
| |||||||
Hungary — 0.0% | ||||||||
MOL Hungarian Oil & Gas | 1,343 | 84 | ||||||
OTP Bank | 9,779 | 238 | ||||||
Richter Gedeon | 5,643 | 120 | ||||||
|
| |||||||
| 442 | ||||||||
|
| |||||||
India — 0.1% | ||||||||
Dr Reddy’s Laboratories ADR | 4,000 | 175 | ||||||
ICICI Bank ADR | 30,000 | 227 | ||||||
Infosys ADR | 40,000 | 657 | ||||||
Reliance Industries GDR (A) | 12,000 | 362 | ||||||
Tata Motors ADR | 10,100 | 382 | ||||||
Description | Shares | Market Value ($ Thousands) | ||||||
COMMON STOCK (continued) |
| |||||||
Wipro ADR | 30,000 | $ | 340 | |||||
|
| |||||||
| 2,143 | ||||||||
|
| |||||||
Indonesia — 0.3% | ||||||||
Adaro Energy | 206,000 | 16 | ||||||
AKR Corporindo | 92,500 | 48 | ||||||
Astra International | 878,500 | 518 | ||||||
Bank Central Asia | 534,500 | 590 | ||||||
Bank Danamon Indonesia | 173,000 | 46 | ||||||
Bank Mandiri Persero | 409,500 | 316 | ||||||
Bank Negara Indonesia Persero | 339,000 | 138 | ||||||
Bank Rakyat Indonesia Persero | 484,000 | 426 | ||||||
Bumi Serpong Damai | 379,000 | 60 | ||||||
Charoen Pokphand | 324,000 | 93 | ||||||
Global Indemnity, Cl A * | 887 | 27 | ||||||
Gudang Garam | 22,000 | 113 | ||||||
Hanjaya Mandala Sampoerna | 425,000 | 118 | ||||||
Indocement Tunggal Prakarsa | 72,000 | 94 | ||||||
Indofood CBP Sukses Makmur | 112,000 | 74 | ||||||
Indofood Sukses Makmur | 202,000 | 128 | ||||||
Jasa Marga Persero | 107,000 | 43 | ||||||
Kalbe Farma | 895,500 | 114 | ||||||
Lippo Karawaci | 353,500 | 31 | ||||||
Matahari Department Store | 105,000 | 160 | ||||||
Media Nusantara Citra | 261,500 | 43 | ||||||
Perusahaan Gas Negara Persero | 535,500 | 134 | ||||||
Semen Indonesia Persero | 138,000 | 99 | ||||||
Summarecon Agung | 489,500 | 63 | ||||||
Surya Citra Media | 298,000 | 72 | ||||||
Telekomunikasi Indonesia Persero | 2,178,500 | 704 | ||||||
Tower Bersama Infrastructure | 118,500 | 52 | ||||||
Unilever Indonesia | 67,500 | 232 | ||||||
United Tractors | 72,000 | 87 | ||||||
Waskita Karya Persero | 244,500 | 52 | ||||||
XL Axiata * | 188,250 | 53 | ||||||
|
| |||||||
| 4,744 | ||||||||
|
| |||||||
Ireland — 0.7% | ||||||||
Accenture, Cl A | 32,264 | 3,640 | ||||||
Alkermes * | 7,600 | 379 | ||||||
Ardmore Shipping | 2,345 | 16 | ||||||
Bank of Ireland * | 796,985 | 165 | ||||||
CRH | 23,847 | 733 | ||||||
Eaton | 23,600 | 1,496 | ||||||
Endo International * | 10,400 | 181 | ||||||
Experian | 27,807 | 545 | ||||||
Fleetmatics Group * | 4,106 | 176 | ||||||
Horizon Pharma * | 16,864 | 325 | ||||||
Ingersoll-Rand | 13,000 | 861 | ||||||
Kerry Group, Cl A | 4,586 | 393 | ||||||
Mallinckrodt * | 5,500 | 370 | ||||||
Paddy Power Betfair | 2,304 | 271 | ||||||
Pentair | 8,400 | 536 | ||||||
Perrigo | 7,000 | 640 | ||||||
| 8 | Adviser Managed Trust / Annual Report / July 31, 2016 |
SCHEDULE OF INVESTMENTS
July 31, 2016
Tactical Offensive Equity Fund (Continued)
Description | Shares | Market Value ($ Thousands) | ||||||
COMMON STOCK (continued) |
| |||||||
Prothena * | 3,769 | $ | 207 | |||||
Ryanair Holdings ADR | 1,258 | 89 | ||||||
Tyco International | 20,200 | 921 | ||||||
Weatherford International * | 45,200 | 257 | ||||||
|
| |||||||
| 12,201 | ||||||||
|
| |||||||
Israel — 0.1% | ||||||||
Azrieli Group | 1,230 | 54 | ||||||
Bank Hapoalim | 30,841 | 157 | ||||||
Bank Leumi Le-Israel * | 40,564 | 146 | ||||||
Bezeq The Israeli Telecommunication | 60,090 | 119 | ||||||
Check Point Software Technologies * | 3,800 | 292 | ||||||
Israel Chemicals | 14,778 | 60 | ||||||
Mizrahi Tefahot Bank | 4,031 | 49 | ||||||
Nice | 1,758 | 121 | ||||||
Silicom | 615 | 22 | ||||||
Stratasys * | 5,308 | 111 | ||||||
Teva Pharmaceutical Industries | 26,634 | 1,471 | ||||||
|
| |||||||
| 2,602 | ||||||||
|
| |||||||
Italy — 0.4% | ||||||||
Assicurazioni Generali | 33,829 | 446 | ||||||
Atlantia | 11,962 | 299 | ||||||
CNH Industrial | 29,450 | 210 | ||||||
Enel | 220,912 | 1,017 | ||||||
Eni | 73,703 | 1,128 | ||||||
EXOR | 3,210 | 125 | ||||||
Ferrari | 3,558 | 161 | ||||||
Fiat Chrysler Automobiles | 26,059 | 168 | ||||||
Intesa Sanpaolo | 394,603 | 866 | ||||||
Leonardo-Finmeccanica * | 11,725 | 134 | ||||||
Luxottica Group | 4,904 | 238 | ||||||
Mediobanca | 16,403 | 115 | ||||||
Poste Italiane (A) | 15,136 | 105 | ||||||
Prysmian | 5,651 | 132 | ||||||
Saipem | 176,438 | 77 | ||||||
Snam | 70,994 | 411 | ||||||
Telecom Italia | 467,977 | 372 | ||||||
Terna Rete Elettrica Nazionale | 43,675 | 238 | ||||||
UniCredit | 146,949 | 360 | ||||||
Unione di Banche Italiane | 26,125 | 80 | ||||||
UnipolSai | 32,793 | 55 | ||||||
|
| |||||||
| 6,737 | ||||||||
|
| |||||||
Japan — 4.6% | ||||||||
ABC-Mart | 1,000 | 64 | ||||||
Acom * | 11,600 | 55 | ||||||
Aeon | 18,900 | 273 | ||||||
AEON Financial Service | 3,000 | 70 | ||||||
Aeon Mall | 3,300 | 45 | ||||||
Air Water | 5,000 | 86 | ||||||
Aisin Seiki | 5,500 | 255 | ||||||
Ajinomoto | 16,100 | 415 | ||||||
Alfresa Holdings | 5,400 | 120 | ||||||
Alps Electric | 5,400 | 123 | ||||||
Description | Shares | Market Value ($ Thousands) | ||||||
COMMON STOCK (continued) |
| |||||||
Amada Holdings | 9,900 | $ | 109 | |||||
ANA Holdings | 34,000 | 98 | ||||||
Aozora Bank | 34,000 | 126 | ||||||
Asahi Glass | 29,000 | 169 | ||||||
Asahi Group Holdings | 11,200 | 382 | ||||||
Asahi Kasei | 37,000 | 283 | ||||||
Asics | 4,600 | 85 | ||||||
Astellas Pharma | 61,200 | 1,028 | ||||||
Bandai Namco Holdings | 5,800 | 155 | ||||||
Bank of Kyoto | 9,000 | 61 | ||||||
Benesse Holdings | 1,900 | 46 | ||||||
Bridgestone | 18,800 | 661 | ||||||
Brother Industries | 6,800 | 78 | ||||||
Calbee | 2,300 | 101 | ||||||
Canon | 30,900 | 885 | ||||||
Casio Computer | 6,600 | 95 | ||||||
Central Japan Railway | 4,200 | 788 | ||||||
Chiba Bank | 20,000 | 97 | ||||||
Chubu Electric Power | 18,700 | 275 | ||||||
Chugai Pharmaceutical | 6,500 | 245 | ||||||
Chugoku Bank | 4,900 | 56 | ||||||
Chugoku Electric Power | 8,100 | 102 | ||||||
Concordia Financial Group * | 34,000 | 147 | ||||||
Credit Saison | 4,300 | 72 | ||||||
CYBERDYNE * | 3,000 | 58 | ||||||
Dai Nippon Printing | 16,000 | 180 | ||||||
Daicel | 8,500 | 97 | ||||||
Dai-ichi Life Insurance | 31,200 | 413 | ||||||
Daiichi Sankyo | 17,500 | 420 | ||||||
Daikin Industries | 6,800 | 598 | ||||||
Daito Trust Construction | 2,100 | 352 | ||||||
Daiwa House Industry | 16,400 | 464 | ||||||
Daiwa Securities Group | 48,000 | 274 | ||||||
Denso | 14,100 | 557 | ||||||
Dentsu | 6,300 | 304 | ||||||
Don Quijote Holdings | 3,400 | 135 | ||||||
East Japan Railway | 9,700 | 898 | ||||||
Eisai | 7,300 | 431 | ||||||
Electric Power Development | 4,200 | 97 | ||||||
FamilyMart | 1,600 | 95 | ||||||
FANUC | 5,700 | 964 | ||||||
Fast Retailing | 1,600 | 522 | ||||||
Fuji Electric | 16,000 | 71 | ||||||
Fuji Heavy Industries | 17,000 | 666 | ||||||
FUJIFILM Holdings | 12,700 | 462 | ||||||
Fujitsu | 54,000 | 228 | ||||||
Fukuoka Financial Group | 22,000 | 85 | ||||||
GungHo Online Entertainment | 12,300 | 28 | ||||||
Hachijuni Bank | 11,800 | 56 | ||||||
Hakuhodo DY Holdings | 6,200 | 73 | ||||||
Hamamatsu Photonics | 4,100 | 122 | ||||||
| Adviser Managed Trust / Annual Report / July 31, 2016 | 9 |
SCHEDULE OF INVESTMENTS
July 31, 2016
Tactical Offensive Equity Fund (Continued)
Description | Shares | Market Value ($ Thousands) | ||||||
COMMON STOCK (continued) |
| |||||||
Hankyu Hanshin Holdings | 7,000 | $ | 262 | |||||
Hikari Tsushin | 600 | 50 | ||||||
Hino Motors | 7,500 | 80 | ||||||
Hirose Electric | 900 | 113 | ||||||
Hiroshima Bank | 14,000 | 51 | ||||||
Hisamitsu Pharmaceutical | 1,800 | 102 | ||||||
Hitachi | 140,000 | 651 | ||||||
Hitachi Chemical | 3,000 | 63 | ||||||
Hitachi Construction Machinery | 3,100 | 51 | ||||||
Hitachi High-Technologies | 2,000 | 69 | ||||||
Hitachi Metals | 6,200 | 70 | ||||||
Hokuriku Electric Power | 4,900 | 58 | ||||||
Honda Motor | 47,200 | 1,309 | ||||||
Hoshizaki | 1,500 | 137 | ||||||
Hoya | 11,700 | 420 | ||||||
Hulic | 8,600 | 90 | ||||||
Idemitsu Kosan | 2,500 | 49 | ||||||
IHI | 43,000 | 122 | ||||||
Iida Group Holdings | 5,100 | 102 | ||||||
Inpex | 27,500 | 219 | ||||||
Isetan Mitsukoshi Holdings | 9,700 | 96 | ||||||
Isuzu Motors | 17,200 | 226 | ||||||
ITOCHU | 43,400 | 497 | ||||||
Iyo Bank | 7,000 | 46 | ||||||
J Front Retailing | 7,000 | 82 | ||||||
Japan Airlines | 4,000 | 125 | ||||||
Japan Airport Terminal | 1,300 | 58 | ||||||
Japan Exchange Group | 15,100 | 217 | ||||||
Japan Post Bank | 12,000 | 148 | ||||||
Japan Post Holdings | 13,000 | 173 | ||||||
Japan Prime Realty Investment †† | 24 | 106 | ||||||
Japan Real Estate Investment †† | 38 | 230 | ||||||
Japan Retail Fund Investment †† | 74 | 182 | ||||||
Japan Tobacco | 31,900 | 1,253 | ||||||
JFE Holdings | 15,100 | 200 | ||||||
JGC | 6,000 | 89 | ||||||
Joyo Bank | 18,000 | 71 | ||||||
JSR | 5,600 | 77 | ||||||
JTEKT | 6,500 | 92 | ||||||
JX Holdings | 61,500 | 233 | ||||||
Kajima | 26,000 | 193 | ||||||
Kakaku.com | 4,100 | 86 | ||||||
Kamigumi | 7,000 | 64 | ||||||
Kaneka | 8,000 | 61 | ||||||
Kansai Electric Power * | 20,400 | 190 | ||||||
Kansai Paint | 6,300 | 133 | ||||||
Kao | 14,600 | 791 | ||||||
Kawasaki Heavy Industries | 41,000 | 123 | ||||||
KDDI | 54,600 | 1,676 | ||||||
Keihan Electric Railway | 15,000 | 108 | ||||||
Keikyu | 14,000 | 143 | ||||||
Keio | 17,000 | 159 | ||||||
Keisei Electric Railway | 8,000 | 106 | ||||||
Description | Shares | Market Value ($ Thousands) | ||||||
COMMON STOCK (continued) |
| |||||||
Keyence | 1,300 | $ | 925 | |||||
Kikkoman | 5,000 | 178 | ||||||
Kintetsu Group Holdings | 52,000 | 226 | ||||||
Kirin Holdings | 23,800 | 410 | ||||||
Kobe Steel | 90,000 | 79 | ||||||
Koito Manufacturing | 3,300 | 165 | ||||||
Komatsu | 26,800 | 528 | ||||||
Konami | 2,700 | 105 | ||||||
Konica Minolta | 13,100 | 107 | ||||||
Kose | 900 | 84 | ||||||
Kubota | 30,700 | 455 | ||||||
Kuraray | 10,300 | 131 | ||||||
Kurita Water Industries | 2,900 | 65 | ||||||
Kyocera | 9,300 | 444 | ||||||
Kyowa Hakko Kirin | 7,500 | 132 | ||||||
Kyushu Electric Power | 12,400 | 117 | ||||||
Kyushu Financial Group | 10,000 | 56 | ||||||
Lawson | 1,900 | 147 | ||||||
LIXIL Group | 7,700 | 145 | ||||||
M3 | 5,600 | 181 | ||||||
Mabuchi Motor | 1,400 | 64 | ||||||
Makita | 3,200 | 226 | ||||||
Marubeni | 47,800 | 224 | ||||||
Marui Group | 6,100 | 89 | ||||||
Maruichi Steel Tube | 1,600 | 59 | ||||||
Mazda Motor | 16,500 | 249 | ||||||
McDonald’s Holdings Japan | 1,900 | 58 | ||||||
Medipal Holdings | 5,000 | 83 | ||||||
MEIJI Holdings | 3,300 | 346 | ||||||
Minebea | 9,800 | 79 | ||||||
Miraca Holdings | 1,700 | 78 | ||||||
Mitsubishi | 43,800 | 760 | ||||||
Mitsubishi Chemical Holdings | 39,300 | 216 | ||||||
Mitsubishi Electric | 56,000 | 665 | ||||||
Mitsubishi Estate | 37,000 | 696 | ||||||
Mitsubishi Gas Chemical | 11,000 | 63 | ||||||
Mitsubishi Heavy Industries | 93,000 | 402 | ||||||
Mitsubishi Logistics | 3,000 | 42 | ||||||
Mitsubishi Materials | 32,000 | 85 | ||||||
Mitsubishi Motors | 19,900 | 94 | ||||||
Mitsubishi Tanabe Pharma | 6,500 | 122 | ||||||
Mitsubishi UFJ Financial Group | 369,500 | 1,882 | ||||||
Mitsubishi UFJ Lease & Finance | 13,000 | 53 | ||||||
Mitsui | 49,400 | 583 | ||||||
Mitsui Chemicals | 27,000 | 116 | ||||||
Mitsui Fudosan | 26,000 | 572 | ||||||
Mitsui OSK Lines | 33,000 | 71 | ||||||
Mixi | 1,300 | 47 | ||||||
Mizuho Financial Group | 685,100 | 1,117 | ||||||
MS&AD Insurance Group Holdings | 14,700 | 431 | ||||||
Murata Manufacturing | 5,700 | 713 | ||||||
| 10 | Adviser Managed Trust / Annual Report / July 31, 2016 |
SCHEDULE OF INVESTMENTS
July 31, 2016
Tactical Offensive Equity Fund (Continued)
Description | Shares | Market Value ($ Thousands) | ||||||
COMMON STOCK (continued) |
| |||||||
Nabtesco | 3,300 | $ | 89 | |||||
Nagoya Railroad | 27,000 | 152 | ||||||
NEC | 75,000 | 208 | ||||||
Nexon | 5,000 | 75 | ||||||
NGK Insulators | 7,600 | 185 | ||||||
NGK Spark Plug | 5,200 | 87 | ||||||
NH Foods | 5,000 | 122 | ||||||
NHK Spring | 6,000 | 53 | ||||||
Nidec | 6,900 | 635 | ||||||
Nikon | 9,900 | 141 | ||||||
Nintendo | 3,300 | 692 | ||||||
Nippon Building Fund †† | 41 | 252 | ||||||
Nippon Electric Glass | 12,000 | 55 | ||||||
Nippon Express | 24,000 | 122 | ||||||
Nippon Paint Holdings | 4,700 | 130 | ||||||
Nippon Prologis †† | 45 | 112 | ||||||
Nippon Steel & Sumitomo Metal | 23,400 | 445 | ||||||
Nippon Telegraph & Telephone | 20,000 | 953 | ||||||
Nippon Yusen | 47,000 | 84 | ||||||
Nissan Motor | 72,000 | 711 | ||||||
Nisshin Seifun Group | 5,700 | 94 | ||||||
Nissin Foods Holdings | 1,700 | 97 | ||||||
Nitori Holdings | 2,300 | 286 | ||||||
Nitto Denko | 4,800 | 324 | ||||||
NOK | 2,800 | 54 | ||||||
Nomura Holdings | 105,200 | 482 | ||||||
Nomura Real Estate Holdings | 3,600 | 63 | ||||||
Nomura Real Estate Master Fund †† | 102 | 169 | ||||||
Nomura Research Institute | 3,600 | 128 | ||||||
NSK | 12,800 | 110 | ||||||
NTT Data | 3,700 | 184 | ||||||
NTT DOCOMO | 41,400 | 1,111 | ||||||
NTT Urban Development | 3,300 | 36 | ||||||
Obayashi | 18,800 | 207 | ||||||
Obic | 1,900 | 112 | ||||||
Odakyu Electric Railway | 17,000 | 202 | ||||||
Oji Holdings | 25,000 | 105 | ||||||
Olympus | 8,400 | 293 | ||||||
Omron | 5,600 | 188 | ||||||
Ono Pharmaceutical | 11,900 | 430 | ||||||
Oracle Japan | 1,100 | 67 | ||||||
Oriental Land | 6,300 | 400 | ||||||
ORIX | 38,400 | 549 | ||||||
Osaka Gas | 54,000 | 219 | ||||||
Otsuka | 1,500 | 77 | ||||||
Otsuka Holdings | 11,300 | 540 | ||||||
Panasonic | 64,000 | 631 | ||||||
Park24 | 3,000 | 102 | ||||||
Pola Orbis Holdings | 700 | 69 | ||||||
Rakuten | 26,900 | 309 | ||||||
Recruit Holdings | 8,600 | 329 | ||||||
Resona Holdings | 64,000 | 259 | ||||||
Ricoh | 19,400 | 173 | ||||||
Description | Shares | Market Value ($ Thousands) | ||||||
COMMON STOCK (continued) |
| |||||||
Rinnai | 1,000 | $ | 99 | |||||
Rohm | 2,600 | 112 | ||||||
Ryohin Keikaku | 700 | 157 | ||||||
Sankyo | 1,300 | 48 | ||||||
Santen Pharmaceutical | 10,800 | 181 | ||||||
SBI Holdings | 6,200 | 68 | ||||||
Secom | 6,100 | 462 | ||||||
Sega Sammy Holdings | 5,400 | 60 | ||||||
Seibu Holdings | 5,000 | 89 | ||||||
Seiko Epson | 8,100 | 145 | ||||||
Sekisui Chemical | 11,800 | 174 | ||||||
Sekisui House | 17,500 | 295 | ||||||
Seven & i Holdings | 21,800 | 915 | ||||||
Seven Bank | 17,300 | 60 | ||||||
Shikoku Electric Power | 4,800 | 50 | ||||||
Shimadzu | 7,000 | 103 | ||||||
Shimamura | 700 | 103 | ||||||
Shimano | 2,300 | 365 | ||||||
Shimizu | 16,000 | 164 | ||||||
Shin-Etsu Chemical | 11,300 | 779 | ||||||
Shinsei Bank | 52,000 | 79 | ||||||
Shionogi | 8,600 | 449 | ||||||
Shiseido | 11,000 | 311 | ||||||
Shizuoka Bank | 15,000 | 113 | ||||||
Showa Shell Sekiyu | 5,500 | 49 | ||||||
SMC | 1,700 | 451 | ||||||
SoftBank Group | 28,100 | 1,564 | ||||||
Sohgo Security Services | 2,100 | 105 | ||||||
Sompo Japan Nipponkoa Holdings | 10,200 | 335 | ||||||
Sony | 36,600 | 1,172 | ||||||
Sony Financial Holdings | 5,000 | 64 | ||||||
Stanley Electric | 4,400 | 108 | ||||||
Start Today | 1,700 | 81 | ||||||
Sumitomo | 34,400 | 364 | ||||||
Sumitomo Chemical | 46,000 | 206 | ||||||
Sumitomo Dainippon Pharma | 4,600 | 86 | ||||||
Sumitomo Electric Industries | 21,900 | 307 | ||||||
Sumitomo Heavy Industries | 16,000 | 77 | ||||||
Sumitomo Metal Mining | 14,000 | 170 | ||||||
Sumitomo Mitsui Financial Group | 38,900 | 1,256 | ||||||
Sumitomo Mitsui Trust Holdings | 96,000 | 325 | ||||||
Sumitomo Realty & Development | 11,000 | 288 | ||||||
Sumitomo Rubber Industries | 5,000 | 71 | ||||||
Sundrug | 1,100 | 96 | ||||||
Suntory Beverage & Food | 4,000 | 175 | ||||||
Suruga Bank | 5,000 | 115 | ||||||
Suzuken | 2,200 | 71 | ||||||
Suzuki Motor | 10,600 | 330 | ||||||
Sysmex | 4,500 | 315 | ||||||
T&D Holdings | 16,800 | 175 | ||||||
Taiheiyo Cement | 34,000 | 99 | ||||||
| Adviser Managed Trust / Annual Report / July 31, 2016 | 11 |
SCHEDULE OF INVESTMENTS
July 31, 2016
Tactical Offensive Equity Fund (Continued)
Description | Shares | Market Value ($ Thousands) | ||||||
COMMON STOCK (continued) |
| |||||||
Taisei | 31,000 | $ | 280 | |||||
Taisho Pharmaceutical Holdings | 1,200 | 132 | ||||||
Taiyo Nippon Sanso | 3,800 | 37 | ||||||
Takashimaya | 9,000 | 69 | ||||||
Takeda Pharmaceutical | 20,600 | 922 | ||||||
TDK | 3,600 | 224 | ||||||
Teijin | 27,000 | 102 | ||||||
Terumo | 9,900 | 428 | ||||||
THK | 3,500 | 70 | ||||||
Tobu Railway | 28,000 | 152 | ||||||
Toho | 3,300 | 97 | ||||||
Toho Gas | 11,000 | 97 | ||||||
Tohoku Electric Power | 13,100 | 169 | ||||||
Tokio Marine Holdings | 19,800 | 781 | ||||||
Tokyo Electric Power * | 41,900 | 165 | ||||||
Tokyo Electron | 4,700 | 414 | ||||||
Tokyo Gas | 59,000 | 253 | ||||||
Tokyo Tatemono | 6,000 | 75 | ||||||
Tokyu | 31,000 | 256 | ||||||
Tokyu Fudosan Holdings | 14,900 | 90 | ||||||
TonenGeneral Sekiyu | 8,000 | 73 | ||||||
Toppan Printing | 15,000 | 133 | ||||||
Toray Industries | 43,000 | 395 | ||||||
Toshiba | 117,000 | 307 | ||||||
TOTO | 4,100 | 177 | ||||||
Toyo Seikan Group Holdings | 4,700 | 92 | ||||||
Toyo Suisan Kaisha | 2,600 | 116 | ||||||
Toyoda Gosei | 1,900 | 42 | ||||||
Toyota Industries | 4,700 | 214 | ||||||
Toyota Motor | 77,800 | 4,474 | ||||||
Toyota Tsusho | 6,200 | 138 | ||||||
Trend Micro | 3,300 | 120 | ||||||
Tsuruha Holdings | 1,100 | 126 | ||||||
Unicharm | 11,700 | 242 | ||||||
United Urban Investment †† | 85 | 159 | ||||||
USS | 6,400 | 109 | ||||||
West Japan Railway | 4,800 | 300 | ||||||
Yahoo Japan | 41,300 | 183 | ||||||
Yakult Honsha | 2,500 | 121 | ||||||
Yamada Denki | 18,200 | 96 | ||||||
Yamaguchi Financial Group | 6,000 | 60 | ||||||
Yamaha | 4,900 | 137 | ||||||
Yamaha Motor | 8,100 | 139 | ||||||
Yamato Holdings | 10,500 | 259 | ||||||
Yamazaki Baking | 3,800 | 105 | ||||||
Yaskawa Electric | 7,300 | 101 | ||||||
Yokogawa Electric | 6,600 | 86 | ||||||
Yokohama Rubber | 3,200 | 44 | ||||||
|
| |||||||
| 84,266 | ||||||||
|
| |||||||
Luxembourg — 0.1% | ||||||||
Altisource Portfolio Solutions * | 1,210 | 28 | ||||||
Description | Shares | Market Value ($ Thousands) | ||||||
COMMON STOCK (continued) |
| |||||||
ArcelorMittal | 53,292 | $ | 343 | |||||
Millicom International Cellular | 1,915 | 102 | ||||||
RTL Group | 1,121 | 96 | ||||||
SES, Cl A | 10,554 | 231 | ||||||
Tenaris | 13,681 | 183 | ||||||
Trinseo | 3,055 | 152 | ||||||
|
| |||||||
| 1,135 | ||||||||
|
| |||||||
Macau — 0.0% | ||||||||
Sands China | 70,000 | 267 | ||||||
|
| |||||||
Malaysia — 0.3% | ||||||||
AirAsia | 65,900 | 47 | ||||||
Alliance Financial Group | 51,000 | 50 | ||||||
AMMB Holdings | 89,500 | 95 | ||||||
Astro Malaysia Holdings | 77,700 | 56 | ||||||
Axiata Group | 118,667 | 166 | ||||||
Berjaya Sports Toto | 39,500 | 32 | ||||||
British American Tobacco | 6,700 | 81 | ||||||
CIMB Group Holdings | 161,200 | 174 | ||||||
Dialog Group | 154,400 | 58 | ||||||
DiGi.Com | 156,100 | 190 | ||||||
Felda Global Ventures Holdings | 75,900 | 34 | ||||||
Gamuda | 78,600 | 93 | ||||||
Genting | 99,800 | 202 | ||||||
Genting Malaysia | 134,000 | 141 | ||||||
Genting Plantations | 16,000 | 41 | ||||||
HAP Seng Consolidated | 28,200 | 54 | ||||||
Hartalega Holdings | 35,500 | 37 | ||||||
Hong Leong Bank | 32,900 | 106 | ||||||
Hong Leong Financial Group | 12,000 | 45 | ||||||
IHH Healthcare | 127,800 | 205 | ||||||
IJM | 131,600 | 110 | ||||||
IOI | 106,700 | 111 | ||||||
IOI Properties Group | 79,800 | 46 | ||||||
Kuala Lumpur Kepong | 19,600 | 111 | ||||||
Lafarge Malaysia | 18,600 | 36 | ||||||
Malayan Banking | 149,904 | 295 | ||||||
Malaysia Airports Holdings | 43,700 | 64 | ||||||
Maxis | 85,600 | 127 | ||||||
MISC | 52,000 | 96 | ||||||
Petronas Chemicals Group | 107,400 | 173 | ||||||
Petronas Dagangan | 9,900 | 57 | ||||||
Petronas Gas | 31,000 | 169 | ||||||
PPB Group | 23,300 | 92 | ||||||
Public Bank | 117,700 | 564 | ||||||
RHB Bank | 40,407 | 50 | ||||||
SapuraKencana Petroleum * | 162,700 | 57 | ||||||
Sime Darby | 112,300 | 205 | ||||||
Telekom | 51,300 | 86 | ||||||
Tenaga Nasional | 146,900 | 519 | ||||||
UMW Holdings | 25,600 | 36 | ||||||
Westports Holdings | 51,400 | 57 | ||||||
YTL | 184,500 | 76 | ||||||
| 12 | Adviser Managed Trust / Annual Report / July 31, 2016 |
SCHEDULE OF INVESTMENTS
July 31, 2016
Tactical Offensive Equity Fund (Continued)
Description | Shares | Market Value ($ Thousands) | ||||||
COMMON STOCK (continued) |
| |||||||
YTL Power International | 109,400 | $ | 38 | |||||
|
| |||||||
| 5,082 | ||||||||
|
| |||||||
Mexico — 0.4% | ||||||||
Alfa, Cl A | 124,900 | 204 | ||||||
America Movil | 1,389,400 | 800 | ||||||
Arca Continental | 19,000 | 122 | ||||||
Cemex * | 627,204 | 478 | ||||||
Coca-Cola Femsa | 22,200 | 174 | ||||||
El Puerto de Liverpool | 8,800 | 85 | ||||||
Fibra Uno Administracion †† | 113,000 | 230 | ||||||
Fomento Economico Mexicano | 81,300 | 728 | ||||||
Gentera | 50,100 | 93 | ||||||
Gruma, Cl B | 9,800 | 141 | ||||||
Grupo Aeroportuario del Pacifico, Cl B | 16,100 | 158 | ||||||
Grupo Aeroportuario del Sureste, Cl B | 9,400 | 145 | ||||||
Grupo Bimbo, Ser A | 72,900 | 218 | ||||||
Grupo Carso | 26,100 | 107 | ||||||
Grupo Comercial Chedraui | 17,600 | 40 | ||||||
Grupo Financiero Banorte, Cl O | 111,500 | 611 | ||||||
Grupo Financiero Inbursa, Cl O | 104,300 | 168 | ||||||
Grupo Financiero Santander Mexico, Cl B | 82,500 | 151 | ||||||
Grupo Lala, Cl B | 30,100 | 65 | ||||||
Grupo Mexico | 170,800 | 413 | ||||||
Grupo Televisa | 109,500 | 582 | ||||||
Industrias Penoles | 6,310 | 162 | ||||||
Kimberly-Clark de Mexico, Cl A | 68,700 | 155 | ||||||
Mexichem | 48,700 | 106 | ||||||
OHL Mexico * | 39,900 | 55 | ||||||
Promotora y Operadora de Infraestructura | 12,000 | 140 | ||||||
Wal-Mart de Mexico | 234,600 | 536 | ||||||
|
| |||||||
| 6,867 | ||||||||
|
| |||||||
Netherlands — 1.2% | ||||||||
ABN AMRO Group (A) | 6,808 | 126 | ||||||
Aegon | 52,873 | 216 | ||||||
AerCap Holdings * | 4,934 | 180 | ||||||
Airbus Group | 17,065 | 1,004 | ||||||
Akzo Nobel | 7,174 | 465 | ||||||
Altice, Cl B * | 3,165 | 47 | ||||||
Altice * | 10,706 | 159 | ||||||
ASML Holding | 10,671 | 1,181 | ||||||
Boskalis Westminster | 2,548 | 94 | ||||||
Chicago Bridge & Iron | 5,300 | 179 | ||||||
Cimpress * | 2,625 | 249 | ||||||
Coca-Cola European Partners * | 6,274 | 237 | ||||||
Frank’s International | 1,200 | 15 | ||||||
Gemalto | 2,321 | 153 | ||||||
Heineken | 6,675 | 630 | ||||||
Heineken Holding | 2,921 | 245 | ||||||
ING Groep | 112,116 | 1,254 | ||||||
James Hardie Industries | 12,907 | 214 | ||||||
Koninklijke Ahold Delhaize | 37,096 | 886 | ||||||
Koninklijke DSM | 5,256 | 336 | ||||||
Koninklijke KPN | 98,974 | 326 | ||||||
Description | Shares | Market Value ($ Thousands) | ||||||
COMMON STOCK (continued) |
| |||||||
Koninklijke Philips | 26,977 | $ | 720 | |||||
Koninklijke Vopak | 2,037 | 105 | ||||||
LyondellBasell Industries, Cl A | 17,600 | 1,325 | ||||||
NN Group | 9,181 | 248 | ||||||
NXP Semiconductor * | 8,521 | 716 | ||||||
OCI * | 2,747 | 42 | ||||||
QIAGEN * | 17,906 | 476 | ||||||
Randstad Holding | 3,447 | 148 | ||||||
RELX | 28,823 | 521 | ||||||
Royal Dutch Shell, Cl A | 122,716 | 3,167 | ||||||
Royal Dutch Shell, Cl B | 109,247 | 2,904 | ||||||
STMicroelectronics | 18,467 | 135 | ||||||
Unilever | 47,549 | 2,203 | ||||||
Wolters Kluwer | 8,747 | 368 | ||||||
|
| |||||||
| 21,274 | ||||||||
|
| |||||||
New Zealand — 0.0% | ||||||||
Auckland International Airport | 27,599 | 147 | ||||||
Contact Energy | 20,872 | 81 | ||||||
Fletcher Building | 20,008 | 140 | ||||||
Mercury NZ | 20,281 | 46 | ||||||
Meridian Energy | 37,128 | 75 | ||||||
Ryman Healthcare | 10,865 | 74 | ||||||
Spark New Zealand | 53,009 | 151 | ||||||
|
| |||||||
| 714 | ||||||||
|
| |||||||
Norway — 0.1% | ||||||||
DNB | 28,314 | 312 | ||||||
Gjensidige Forsikring | 5,794 | 98 | ||||||
Marine Harvest | 11,084 | 189 | ||||||
Nordic American Tankers | 9,329 | 115 | ||||||
Norsk Hydro | 38,963 | 167 | ||||||
Orkla | 23,616 | 219 | ||||||
Schibsted, Cl B | 2,581 | 76 | ||||||
Schibsted, Cl A | 2,190 | 69 | ||||||
Statoil | 32,296 | 509 | ||||||
Telenor | 21,750 | 364 | ||||||
Yara International | 5,180 | 169 | ||||||
|
| |||||||
| 2,287 | ||||||||
|
| |||||||
Panama — 0.0% | ||||||||
Banco Latinoamericano de Comercio Exterior, Cl E | 3,123 | 85 | ||||||
Copa Holdings, Cl A | 1,766 | 119 | ||||||
|
| |||||||
| 204 | ||||||||
|
| |||||||
Peru — 0.0% | ||||||||
Cia de Minas Buenaventura ADR * | 7,800 | 114 | ||||||
Credicorp | 2,700 | 433 | ||||||
|
| |||||||
| 547 | ||||||||
|
| |||||||
Philippines — 0.2% | ||||||||
Aboitiz Equity Ventures | 87,890 | 146 | ||||||
Aboitiz Power | 71,000 | 68 | ||||||
| Adviser Managed Trust / Annual Report / July 31, 2016 | 13 |
SCHEDULE OF INVESTMENTS
July 31, 2016
Tactical Offensive Equity Fund (Continued)
Description | Shares | Market Value ($ Thousands) | ||||||
COMMON STOCK (continued) |
| |||||||
Alliance Global Group | 113,100 | $ | 39 | |||||
Ayala | 11,040 | 204 | ||||||
Ayala Land | 323,500 | 271 | ||||||
Bank of the Philippine Islands | 34,120 | 70 | ||||||
BDO Unibank | 73,450 | 177 | ||||||
DMCI Holdings | 242,100 | 67 | ||||||
Energy Development | 265,600 | 33 | ||||||
Globe Telecom | 1,535 | 74 | ||||||
GT Capital Holdings | 3,650 | 119 | ||||||
International Container Terminal Services | 27,800 | 38 | ||||||
JG Summit Holdings | 126,700 | 225 | ||||||
Jollibee Foods | 20,690 | 112 | ||||||
Megaworld | 162,000 | 17 | ||||||
Metro Pacific Investments | 586,000 | 93 | ||||||
Metropolitan Bank & Trust | 31,300 | 63 | ||||||
Philippine Long Distance Telephone | 4,370 | 194 | ||||||
Robinsons Land | 82,700 | 56 | ||||||
Security Bank | 11,600 | 54 | ||||||
SM Investments | 10,905 | 159 | ||||||
SM Prime Holdings | 367,800 | 228 | ||||||
Universal Robina | 39,080 | 166 | ||||||
|
| |||||||
| 2,673 | ||||||||
|
| |||||||
Poland — 0.1% | ||||||||
Alior Bank * | 4,438 | 58 | ||||||
Bank Handlowy w Warszawie | 911 | 16 | ||||||
Bank Millennium | 16,894 | 20 | ||||||
Bank Pekao | 7,005 | 222 | ||||||
Bank Zachodni | 1,651 | 119 | ||||||
CCC | 1,316 | 60 | ||||||
Cyfrowy Polsat * | 9,600 | 58 | ||||||
Enea | 17,824 | 50 | ||||||
Energa | 12,200 | 30 | ||||||
Eurocash | 1,992 | 27 | ||||||
Grupa Azoty | 2,400 | 45 | ||||||
Grupa Lotos * | 6,419 | 48 | ||||||
KGHM Polska Miedz | 6,427 | 130 | ||||||
LPP * | 139 | 175 | ||||||
mBank | 771 | 60 | ||||||
Orange Polska | 19,851 | 27 | ||||||
PGE Polska Grupa Energetyczna | 38,568 | 127 | ||||||
Polski Koncern Naftowy Orlen | 14,192 | 228 | ||||||
Polskie Gornictwo Naftowe i Gazownictwo | 81,272 | 113 | ||||||
Powszechna Kasa Oszczednosci Bank Polski | 38,691 | 236 | ||||||
Powszechny Zaklad Ubezpieczen | 25,043 | 181 | ||||||
Synthos | 31,400 | 32 | ||||||
Tauron Polska Energia | 56,049 | 44 | ||||||
|
| |||||||
| 2,106 | ||||||||
|
| |||||||
Portugal — 0.0% | ||||||||
Energias de Portugal | 67,094 | 230 | ||||||
Galp Energia | 13,405 | 183 | ||||||
Jeronimo Martins | 7,293 | 122 | ||||||
|
| |||||||
| 535 | ||||||||
|
| |||||||
Description | Shares | Market Value ($ Thousands) | ||||||
COMMON STOCK (continued) |
| |||||||
Qatar — 0.1% | ||||||||
Barwa Real Estate | 5,000 | $ | 48 | |||||
Commercial Bank | 7,957 | 83 | ||||||
Doha Bank | 6,273 | 64 | ||||||
Ezdan Holding Group | 35,630 | 193 | ||||||
Industries Qatar | 6,707 | 197 | ||||||
Masraf Al Rayan | 16,583 | 164 | ||||||
Ooredoo | 3,398 | 89 | ||||||
Qatar Electricity & Water | 1,272 | 79 | ||||||
Qatar Gas Transport | 12,817 | 86 | ||||||
Qatar Insurance SAQ | 4,127 | 92 | ||||||
Qatar Islamic Bank SAQ | 2,676 | 80 | ||||||
Qatar National Bank SAQ | 9,200 | 387 | ||||||
Vodafone Qatar * | 17,228 | 52 | ||||||
|
| |||||||
| 1,614 | ||||||||
|
| |||||||
Russia — 0.2% | ||||||||
Gazprom PJSC ADR | 258,445 | 1,052 | ||||||
Magnit PJSC GDR | 14,303 | 549 | ||||||
MegaFon OAO GDR | 5,861 | 58 | ||||||
Mobile TeleSystems ADR | 31,000 | 276 | ||||||
Novatek GDR | 4,269 | 426 | ||||||
Rostelecom * | 9,408 | 72 | ||||||
Sberbank of Russia ADR | 111,658 | 971 | ||||||
Severstal PJSC GDR | 10,731 | 127 | ||||||
Sistema GDR | 17,410 | 142 | ||||||
Surgutneftegas ADR | 40,953 | 191 | ||||||
Tatneft PJSC ADR | 11,874 | 335 | ||||||
|
| |||||||
| 4,199 | ||||||||
|
| |||||||
Singapore — 0.3% | ||||||||
Ascendas †† | 63,000 | 115 | ||||||
CapitaLand | 74,000 | 175 | ||||||
CapitaLand Commercial Trust †† | 60,000 | 67 | ||||||
CapitaLand Mall Trust †† | 72,000 | 115 | ||||||
City Developments | 12,000 | 76 | ||||||
ComfortDelGro | 62,000 | 130 | ||||||
DBS Group Holdings | 51,000 | 585 | ||||||
Global Logistic Properties | 77,000 | 110 | ||||||
Golden Agri-Resources | 205,000 | 55 | ||||||
Hongkong Land Holdings | 34,000 | 218 | ||||||
Hutchison Port Holdings Trust, Cl U | 151,000 | 72 | ||||||
Jardine Cycle & Carriage | 3,000 | 88 | ||||||
Jardine Matheson Holdings | 7,200 | 427 | ||||||
Keppel | 42,000 | 164 | ||||||
Oversea-Chinese Banking | 89,665 | 574 | ||||||
Sembcorp Industries | 28,000 | 58 | ||||||
Sembcorp Marine | 24,000 | 25 | ||||||
Singapore Airlines | 16,000 | 131 | ||||||
Singapore Exchange | 23,000 | 129 | ||||||
Singapore Press Holdings | 46,000 | 129 | ||||||
| 14 | Adviser Managed Trust / Annual Report / July 31, 2016 |
SCHEDULE OF INVESTMENTS
July 31, 2016
Tactical Offensive Equity Fund (Continued)
Description | Shares | Market Value ($ Thousands) | ||||||
COMMON STOCK (continued) |
| |||||||
Singapore Technologies Engineering | 45,000 | $ | 110 | |||||
Singapore Telecommunications | 231,000 | 719 | ||||||
StarHub | 18,000 | 52 | ||||||
Suntec Real Estate Investment Trust †† | 69,000 | 86 | ||||||
United Overseas Bank | 38,000 | 515 | ||||||
UOL Group | 14,000 | 60 | ||||||
Wilmar International | 56,000 | 129 | ||||||
Yangzijiang Shipbuilding Holdings | 56,000 | 36 | ||||||
|
| |||||||
| 5,150 | ||||||||
|
| |||||||
Slovak Republic — 0.0% | ||||||||
Celltrion | 3,459 | 321 | ||||||
|
| |||||||
South Africa — 0.7% | ||||||||
Anglo American Platinum * | 3,100 | 98 | ||||||
AngloGold Ashanti * | 17,749 | 388 | ||||||
Aspen Pharmacare Holdings | 14,897 | 403 | ||||||
Barclays Africa Group | 18,952 | 210 | ||||||
Bid * | 14,000 | 262 | ||||||
Bidvest Group | 14,500 | 167 | ||||||
Brait * | 16,702 | 150 | ||||||
Capitec Bank Holdings | 2,300 | 102 | ||||||
Coronation Fund Managers | 14,000 | 75 | ||||||
Discovery | 16,115 | 145 | ||||||
Exxaro Resources | 7,900 | 47 | ||||||
FirstRand | 146,373 | 513 | ||||||
Fortress Income Fund, Cl A †† | 60,100 | 73 | ||||||
Fortress Income Fund, Cl B †† | 37,346 | 98 | ||||||
Foschini Group | 10,432 | 112 | ||||||
Gold Fields | 34,899 | 216 | ||||||
Growthpoint Properties †† | 92,030 | 175 | ||||||
Hyprop Investments †† | 11,891 | 116 | ||||||
Impala Platinum Holdings * | 29,171 | 128 | ||||||
Imperial Holdings | 8,264 | 99 | ||||||
Investec | 14,855 | 90 | ||||||
Liberty Holdings | 7,400 | 65 | ||||||
Life Healthcare Group Holdings | 44,328 | 121 | ||||||
Massmart Holdings | 6,800 | 71 | ||||||
MMI Holdings | 56,800 | 95 | ||||||
Mondi | 6,157 | 125 | ||||||
Mr Price Group | 10,891 | 180 | ||||||
MTN Group | 71,710 | 726 | ||||||
Naspers, Cl N | 18,715 | 2,943 | ||||||
Nedbank Group | 9,117 | 131 | ||||||
Netcare | 44,348 | 103 | ||||||
New Europe Property Investments | 12,579 | 151 | ||||||
Pick n Pay Stores | 13,480 | 76 | ||||||
Pioneer Foods Group | 6,425 | 83 | ||||||
PSG Group | 6,000 | 86 | ||||||
Rand Merchant Investment Holdings | 40,188 | 128 | ||||||
Redefine Properties †† | 196,740 | 170 | ||||||
Remgro | 20,999 | 394 | ||||||
Resilient †† | 13,185 | 128 | ||||||
RMB Holdings | 32,236 | 145 | ||||||
Sanlam | 62,081 | 293 | ||||||
Sappi * | 24,823 | 126 | ||||||
Sasol | 23,951 | 637 | ||||||
Shoprite Holdings | 19,037 | 279 | ||||||
Sibanye Gold | 33,585 | 156 | ||||||
SPAR Group | 8,534 | 127 | ||||||
Standard Bank Group | 56,172 | 561 | ||||||
Steinhoff International Holdings | 125,399 | 794 | ||||||
Telkom | 17,000 | 79 | ||||||
Tiger Brands | 7,259 | 204 | ||||||
Truworths International | 20,258 | 130 | ||||||
Description | Shares | Market Value ($ Thousands) | ||||||
COMMON STOCK (continued) |
| |||||||
Tsogo Sun Holdings | 30,131 | $ | 63 | |||||
Vodacom Group | 16,584 | 193 | ||||||
Woolworths Holdings | 44,375 | 286 | ||||||
|
| |||||||
| 13,516 | ||||||||
|
| |||||||
South Korea — 1.3% | ||||||||
Amorepacific | 1,435 | 497 | ||||||
AMOREPACIFIC Group | 1,207 | 156 | ||||||
BGF retail | 570 | 102 | ||||||
BNK Financial Group | 12,800 | 101 | ||||||
Cheil Worldwide | 3,600 | 58 | ||||||
CJ | 671 | 120 | ||||||
CJ CheilJedang | 387 | 136 | ||||||
CJ E&M | 900 | 57 | ||||||
CJ Korea Express * | 450 | 81 | ||||||
Coway | 2,360 | 181 | ||||||
Daelim Industrial | 1,424 | 107 | ||||||
Daewoo Engineering & Construction * | 7,140 | 40 | ||||||
Daewoo International | 2,400 | 46 | ||||||
Daum Kakao | 1,377 | 112 | ||||||
DGB Financial Group | 8,630 | 69 | ||||||
Dongbu Insurance | 2,220 | 126 | ||||||
Dongsuh | 1,777 | 52 | ||||||
Doosan Heavy Industries & Construction | 2,600 | 61 | ||||||
E-Mart | 878 | 128 | ||||||
GS Engineering & Construction | 2,600 | 67 | ||||||
GS Holdings | 2,397 | 103 | ||||||
GS Retail | 1,330 | 60 | ||||||
Hana Financial Group | 13,230 | 325 | ||||||
Hankook Tire | 3,460 | 167 | ||||||
Hanmi Pharm | 299 | 163 | ||||||
Hanmi Science ltd | 600 | 77 | ||||||
Hanon Systems | 10,980 | 112 | ||||||
Hanssem | 470 | 72 | ||||||
Hanwha | 2,090 | 66 | ||||||
Hanwha Chemical | 4,930 | 112 | ||||||
Hanwha Life Insurance | 11,300 | 58 | ||||||
Hotel Shilla | 1,620 | 86 | ||||||
Hyosung | 991 | 123 | ||||||
Hyundai Department Store | 824 | 91 | ||||||
Hyundai Development —Engineering & Construction | 2,700 | 107 | ||||||
| Adviser Managed Trust / Annual Report / July 31, 2016 | 15 |
SCHEDULE OF INVESTMENTS
July 31, 2016
Tactical Offensive Equity Fund (Continued)
Description | Shares | Market Value ($ Thousands) | ||||||
COMMON STOCK (continued) |
| |||||||
Hyundai Engineering & Construction | 3,328 | $ | 109 | |||||
Hyundai Glovis | 813 | 122 | ||||||
Hyundai Heavy Industries | 1,842 | 206 | ||||||
Hyundai Marine & Fire Insurance | 3,730 | 101 | ||||||
Hyundai Mobis | 2,899 | 660 | ||||||
Hyundai Motor | 6,289 | 741 | ||||||
Hyundai Steel | 3,755 | 170 | ||||||
Hyundai Wia | 800 | 61 | ||||||
Industrial Bank of Korea | 11,650 | 123 | ||||||
Kangwon Land | 5,400 | 198 | ||||||
KB Financial Group | 17,021 | 535 | ||||||
KCC | 344 | 121 | ||||||
KEPCO Plant Service & Engineering | 1,090 | 67 | ||||||
Kia Motors | 11,620 | 437 | ||||||
Korea Aerospace Industries | 2,660 | 191 | ||||||
Korea Electric Power | 11,370 | 622 | ||||||
Korea Gas | 1,500 | 57 | ||||||
Korea Investment Holdings | 1,970 | 82 | ||||||
Korea Zinc | 409 | 186 | ||||||
Korean Air Lines * | 2,000 | 51 | ||||||
KT | 1,650 | 47 | ||||||
KT&G | 5,142 | 555 | ||||||
Kumho Petrochemical | 900 | 49 | ||||||
LG | 4,286 | 243 | ||||||
LG Chemical | 2,007 | 436 | ||||||
LG Display | 10,500 | 291 | ||||||
LG Electronics | 4,861 | 232 | ||||||
LG Household & Health Care | 399 | 359 | ||||||
LG Innotek | 700 | 56 | ||||||
LG Uplus | 10,120 | 99 | ||||||
Lotte Chemical | 662 | 179 | ||||||
Lotte Chilsung Beverage | 116 | 171 | ||||||
Lotte Confectionery | 340 | 58 | ||||||
Lotte Shopping | 550 | 95 | ||||||
Mirae Asset Daewoo | 9,200 | 75 | ||||||
Mirae Asset Securities | 3,640 | 86 | ||||||
NAVER | 1,171 | 742 | ||||||
NCSoft | 847 | 190 | ||||||
NH Investment & Securities | 7,300 | 68 | ||||||
OCI | 1,108 | 92 | ||||||
Orion | 200 | 164 | ||||||
Ottogi | 124 | 86 | ||||||
Paradise | 2,686 | 38 | ||||||
POSCO | 3,156 | 638 | ||||||
S-1, Cl 1 | 888 | 80 | ||||||
Samsung C&T | 3,460 | 419 | ||||||
Samsung Card | 1,800 | 69 | ||||||
Samsung Electro-Mechanics | 2,553 | 126 | ||||||
Samsung Electronics | 4,458 | 6,125 | ||||||
Samsung Fire & Marine Insurance | 1,411 | 336 | ||||||
Samsung Heavy Industries | 7,700 | 68 | ||||||
Samsung Life Insurance | 3,073 | 267 | ||||||
Samsung SDI | 2,402 | 226 | ||||||
Samsung SDS | 1,540 | 216 | ||||||
Samsung Securities | 2,882 | 97 | ||||||
Description | Shares | Market Value ($ Thousands) | ||||||
COMMON STOCK (continued) |
| |||||||
Shinhan Financial Group | 18,810 | $ | 671 | |||||
Shinsegae | 400 | 65 | ||||||
SK C&C | 1,994 | 371 | ||||||
SK Hynix | 25,530 | 784 | ||||||
SK Innovation | 2,789 | 364 | ||||||
SK Networks | 7,030 | 39 | ||||||
SK Telecom | 927 | 190 | ||||||
S-Oil | 2,014 | 138 | ||||||
Woori Bank | 14,080 | 127 | ||||||
Yuhan | 431 | 118 | ||||||
|
| |||||||
| 24,804 | ||||||||
|
| |||||||
Spain — 0.6% | ||||||||
Abertis Infraestructuras | 18,651 | 294 | ||||||
ACS Actividades de Construccion y Servicios | 5,713 | 164 | ||||||
Aena (A) | 1,956 | 282 | ||||||
Amadeus IT Holding, Cl A | 12,714 | 597 | ||||||
Banco Bilbao Vizcaya Argentaria | 188,465 | 1,101 | ||||||
Banco de Sabadell | 154,110 | 211 | ||||||
Banco Popular Espanol | 96,690 | 135 | ||||||
Banco Santander | 421,816 | 1,790 | ||||||
Bankia | 133,472 | 102 | ||||||
Bankinter | 19,531 | 136 | ||||||
CaixaBank | 77,135 | 194 | ||||||
Distribuidora Internacional de Alimentacion | 18,034 | 113 | ||||||
Enagas | 6,571 | 200 | ||||||
Endesa | 9,202 | 193 | ||||||
Ferrovial | 14,027 | 290 | ||||||
Gas Natural | 10,147 | 210 | ||||||
Grifols | 8,642 | 190 | ||||||
Iberdrola | 161,618 | 1,111 | ||||||
Industria de Diseno Textil | 31,603 | 1,093 | ||||||
International Consolidated Airlines Group | 23,444 | 127 | ||||||
Mapfre | 31,227 | 77 | ||||||
Red Electrica | 12,540 | 287 | ||||||
Repsol | 34,058 | 429 | ||||||
Telefonica | 129,727 | 1,272 | ||||||
Zardoya Otis | 5,242 | 52 | ||||||
|
| |||||||
| 10,650 | ||||||||
|
| |||||||
Sweden — 0.5% | ||||||||
Alfa Laval | 8,507 | 135 | ||||||
Assa Abloy, Cl B | 29,039 | 639 | ||||||
Atlas Copco, Cl B | 11,305 | 290 | ||||||
Atlas Copco, Cl A | 19,455 | 548 | ||||||
Boliden | 7,924 | 175 | ||||||
Electrolux | 6,970 | 189 | ||||||
Getinge, Cl B | 5,799 | 118 | ||||||
Hennes & Mauritz, Cl B | 27,507 | 833 | ||||||
| 16 | Adviser Managed Trust / Annual Report / July 31, 2016 |
SCHEDULE OF INVESTMENTS
July 31, 2016
Tactical Offensive Equity Fund (Continued)
Description | Shares | Market Value ($ Thousands) | ||||||
COMMON STOCK (continued) |
| |||||||
Hexagon, Cl B | 7,488 | $ | 296 | |||||
Husqvarna, Cl B | 12,063 | 104 | ||||||
ICA Gruppen | 2,331 | 78 | ||||||
Industrivarden, Cl C | 4,756 | 80 | ||||||
Investor, Cl B | 13,196 | 456 | ||||||
Kinnevik | 6,820 | 174 | ||||||
Lundin Petroleum * | 5,407 | 90 | ||||||
Nordea Bank | 88,001 | 786 | ||||||
Sandvik | 30,891 | 332 | ||||||
Securitas, Cl B | 9,072 | 150 | ||||||
Skandinaviska Enskilda Banken, Cl A | 44,009 | 387 | ||||||
Skanska, Cl B | 9,852 | 210 | ||||||
SKF, Cl B | 11,534 | 183 | ||||||
Svenska Cellulosa, Cl B | 17,552 | 524 | ||||||
Svenska Handelsbanken, Cl A | 43,384 | 524 | ||||||
Swedbank, Cl A | 26,237 | 553 | ||||||
Swedish Match | 5,693 | 208 | ||||||
Tele2, Cl B | 9,320 | 79 | ||||||
Telefonaktiebolaget LM Ericsson, Cl B | 88,170 | 659 | ||||||
TeliaSonera | 75,271 | 345 | ||||||
Volvo, Cl B | 44,669 | 477 | ||||||
|
| |||||||
| 9,622 | ||||||||
|
| |||||||
Switzerland — 1.8% | ||||||||
ABB | 57,003 | 1,215 | ||||||
Actelion | 2,976 | 529 | ||||||
Adecco Group | 4,802 | 264 | ||||||
Aryzta | 2,527 | 95 | ||||||
Baloise Holding | 1,449 | 164 | ||||||
Barry Callebaut | 64 | 84 | ||||||
Chocoladefabriken Lindt & Spruengli | 32 | 384 | ||||||
Cie Financiere Richemont | 15,123 | 923 | ||||||
Coca-Cola | 5,240 | 109 | ||||||
Credit Suisse Group | 53,874 | 622 | ||||||
Dufry * | 1,327 | 153 | ||||||
EMS-Chemie Holding | 237 | 130 | ||||||
Galenica | 113 | 146 | ||||||
Geberit | 1,095 | 424 | ||||||
Givaudan | 268 | 552 | ||||||
Julius Baer Group | 6,484 | 267 | ||||||
Kuehne + Nagel International | 1,564 | 220 | ||||||
LafargeHolcim | 13,188 | 629 | ||||||
Lonza Group | 1,533 | 290 | ||||||
Nestle | 92,767 | 7,458 | ||||||
Novartis | 66,257 | 5,505 | ||||||
Pargesa Holding | 1,007 | 70 | ||||||
Partners Group Holding | 503 | 231 | ||||||
Roche Holding | 20,459 | 5,239 | ||||||
Schindler Holding | 1,874 | 361 | ||||||
SGS | 159 | 353 | ||||||
Sika | 62 | 292 | ||||||
Sonova Holding | 1,544 | 212 | ||||||
Swatch Group | 2,331 | 309 | ||||||
Description | Shares | Market Value ($ Thousands) | ||||||
COMMON STOCK (continued) |
| |||||||
Swiss Life Holding | 929 | $ | 213 | |||||
Swiss Prime Site | 2,018 | 186 | ||||||
Swiss Re | 9,666 | 814 | ||||||
Swisscom | 750 | 370 | ||||||
Syngenta * | 2,693 | 1,062 | ||||||
Transocean | 17,500 | 192 | ||||||
UBS Group | 105,960 | 1,464 | ||||||
Zurich Insurance Group | 4,358 | 1,050 | ||||||
|
| |||||||
| 32,581 | ||||||||
|
| |||||||
Taiwan — 1.0% | ||||||||
Advanced Semiconductor Engineering | 129,000 | 154 | ||||||
Advanced Semiconductor Engineering ADR | 29,600 | 170 | ||||||
Advantech | 7,000 | 54 | ||||||
Asia Cement | 63,000 | 58 | ||||||
Asustek Computer | 31,000 | 269 | ||||||
AU Optronics | 186,000 | 75 | ||||||
Catcher Technology | 29,000 | 202 | ||||||
Cathay Financial Holding | 356,000 | 400 | ||||||
Chailease Holding | 32,000 | 57 | ||||||
Chang Hwa Commercial Bank | 119,000 | 64 | ||||||
Cheng Shin Rubber Industry | 87,000 | 181 | ||||||
Chicony Electronics | 22,110 | 55 | ||||||
China Development Financial Holding | 324,000 | 79 | ||||||
China Life Insurance | 86,320 | 71 | ||||||
China Steel | 516,000 | 356 | ||||||
Chunghwa Telecom | 165,000 | 587 | ||||||
Compal Electronics | 94,000 | 59 | ||||||
CTBC Financial Holding | 709,000 | 391 | ||||||
Delta Electronics | 85,000 | 447 | ||||||
E.Sun Financial Holding | 350,900 | 196 | ||||||
Eclat Textile | 6,000 | 67 | ||||||
Far Eastern New Century | 77,000 | 60 | ||||||
Far EasTone Telecommunications | 71,000 | 163 | ||||||
First Financial Holding | 407,000 | 226 | ||||||
Formosa Chemicals & Fibre | 141,000 | 367 | ||||||
Formosa Petrochemical | 52,000 | 148 | ||||||
Formosa Plastics | 180,000 | 439 | ||||||
Foxconn Technology | 25,000 | 61 | ||||||
Fubon Financial Holding | 291,000 | 361 | ||||||
Giant Manufacturing | 9,000 | 61 | ||||||
Hermes Microvision | 2,000 | 85 | ||||||
Hon Hai Precision Industry | 604,000 | 1,663 | ||||||
Hotai Motor | 6,000 | 60 | ||||||
HTC | 27,000 | 80 | ||||||
Hua Nan Financial Holdings | 312,000 | 170 | ||||||
Innolux | 406,000 | 150 | ||||||
Inotera Memories * | 56,000 | 46 | ||||||
Inventec | 80,000 | 62 | ||||||
Largan Precision | 4,000 | 429 | ||||||
Lite-On Technology | 45,000 | 67 | ||||||
MediaTek | 65,000 | 496 | ||||||
Mega Financial Holding | 475,000 | 372 | ||||||
| Adviser Managed Trust / Annual Report / July 31, 2016 | 17 |
SCHEDULE OF INVESTMENTS
July 31, 2016
Tactical Offensive Equity Fund (Continued)
Description | Shares | Market Value ($ Thousands) | ||||||
COMMON STOCK (continued) |
| |||||||
Nan Ya Plastics | 207,000 | $ | 392 | |||||
Novatek Microelectronics | 15,000 | 53 | ||||||
OBI Pharma * | 5,000 | 77 | ||||||
Pegatron | 87,000 | 213 | ||||||
Pou Chen | 50,000 | 68 | ||||||
Powertech Technology | 25,000 | 64 | ||||||
President Chain Store | 25,000 | 203 | ||||||
Quanta Computer | 120,000 | 244 | ||||||
Shin Kong Financial Holding | 261,000 | 53 | ||||||
Siliconware Precision Industries ADR | 10,000 | 74 | ||||||
SinoPac Financial Holdings | 236,000 | 76 | ||||||
Synnex Technology International * | 54,000 | 64 | ||||||
Taishin Financial Holding * | 197,000 | 79 | ||||||
Taiwan Business Bank * | 201,000 | 53 | ||||||
Taiwan Cement | 150,000 | 159 | ||||||
Taiwan Cooperative Financial Holding | 195,000 | 91 | ||||||
Taiwan Mobile | 74,000 | 255 | ||||||
Taiwan Semiconductor Manufacturing | 756,000 | 4,085 | ||||||
Taiwan Semiconductor Manufacturing ADR | 57,200 | 1,589 | ||||||
Teco Electric and Machinery | 65,000 | 57 | ||||||
Uni-President Enterprises | 210,000 | 429 | ||||||
United Microelectronics | 538,000 | 201 | ||||||
Vanguard International Semiconductor | 32,000 | 58 | ||||||
Wistron | 95,000 | 75 | ||||||
WPG Holdings | 48,000 | 61 | ||||||
Yuanta Financial Holding | 236,000 | 83 | ||||||
|
| |||||||
| 18,414 | ||||||||
|
| |||||||
Thailand — 0.2% |
| |||||||
Advanced Info Service NVDR | 46,200 | 236 | ||||||
Airports of Thailand NVDR | 19,000 | 215 | ||||||
Bangkok Bank NVDR | 12,600 | 62 | ||||||
Bangkok Dusit Medical Services NVDR | 142,100 | 92 | ||||||
Bangkok Expressway & Metro NVDR | 334,400 | 81 | ||||||
Banpu NVDR | 85,300 | 38 | ||||||
BEC World NVDR | 14,000 | 10 | ||||||
BTS Group Holdings NVDR | 276,100 | 74 | ||||||
Bumrungrad Hospital NVDR | 14,900 | 79 | ||||||
Central Pattana NVDR | 51,300 | 85 | ||||||
Charoen Pokphand Foods NVDR | 120,200 | 97 | ||||||
CP ALL NVDR | 216,600 | 322 | ||||||
Delta Electronics Thailand NVDR | 25,400 | 52 | ||||||
Electricity Generating NVDR | 7,100 | 41 | ||||||
Energy Absolute NVDR | 27,000 | 20 | ||||||
Fabrinet * | 3,784 | 143 | ||||||
Glow Energy NVDR | 25,100 | 62 | ||||||
Home Product Center NVDR | 196,900 | 57 | ||||||
Indorama Ventures NVDR | 79,100 | 75 | ||||||
IRPC NVDR | 496,500 | 71 | ||||||
Kasikornbank | 51,700 | 296 | ||||||
Kasikornbank NVDR | 55,000 | 312 | ||||||
Krung Thai Bank NVDR | 166,400 | 83 | ||||||
Minor International NVDR | 99,100 | 116 | ||||||
Description | Shares | Market Value ($ Thousands) | ||||||
COMMON STOCK (continued) |
| |||||||
PTT NVDR | 43,600 | $ | 413 | |||||
PTT Exploration & Production NVDR | 62,700 | 148 | ||||||
PTT Global Chemical NVDR | 93,300 | 163 | ||||||
Robinson Department Store NVDR | 25,500 | 48 | ||||||
Siam Cement | 13,400 | 197 | ||||||
Siam Cement NVDR | 5,800 | 85 | ||||||
Siam Commercial Bank NVDR | 68,700 | 313 | ||||||
Thai Oil NVDR | 39,100 | 68 | ||||||
Thai Union Frozen Products NVDR | 94,300 | 59 | ||||||
TMB Bank NVDR | 278,100 | 18 | ||||||
True NVDR | 434,932 | 112 | ||||||
|
| |||||||
| 4,343 | ||||||||
|
| |||||||
Turkey — 0.1% | ||||||||
Akbank | 96,778 | 249 | ||||||
Anadolu Efes Biracilik Ve Malt Sanayii | 10,784 | 73 | ||||||
Arcelik | 11,123 | 76 | ||||||
BIM Birlesik Magazalar | 9,509 | 176 | ||||||
Coca-Cola Icecek | 3,923 | 49 | ||||||
Emlak Konut Gayrimenkul Yatirim Ortakligi †† | 80,676 | 72 | ||||||
Eregli Demir ve Celik Fabrikalari | 65,474 | 99 | ||||||
Ford Otomotiv Sanayi | 3,700 | 40 | ||||||
Haci Omer Sabanci Holding | 41,698 | 124 | ||||||
KOC Holding | 28,835 | 123 | ||||||
Petkim Petrokimya Holding | 34,800 | 50 | ||||||
TAV Havalimanlari Holding | 8,800 | 32 | ||||||
Tofas Turk Otomobil Fabrikasi | 6,300 | 50 | ||||||
Tupras Turkiye Petrol Rafinerileri | 5,735 | 122 | ||||||
Turk Hava Yollari * | 27,600 | 48 | ||||||
Turk Telekomunikasyon | 23,200 | 47 | ||||||
Turkcell Iletisim Hizmetleri | 39,779 | 138 | ||||||
Turkiye Garanti Bankasi | 101,672 | 249 | ||||||
Turkiye Halk Bankasi | 29,352 | 77 | ||||||
Turkiye Is Bankasi, Cl C | 72,297 | 111 | ||||||
Turkiye Sise ve Cam Fabrikalari | 10,248 | 12 | ||||||
Turkiye Vakiflar Bankasi, Cl D | 37,100 | 55 | ||||||
Ulker Biskuvi Sanayi | 7,649 | 51 | ||||||
Yapi ve Kredi Bankasi | 42,900 | 50 | ||||||
|
| |||||||
| 2,173 | ||||||||
|
| |||||||
United Arab Emirates — 0.1% |
| |||||||
Abu Dhabi Commercial Bank PJSC | 85,164 | 158 | ||||||
Aldar Properties PJSC | 125,248 | 98 | ||||||
Arabtec Holding PJSC * | 112,794 | 45 | ||||||
DP World * | 7,288 | 124 | ||||||
Dubai Financial Market PJSC | 51,960 | 19 | ||||||
Dubai Islamic Bank PJSC | 56,144 | 83 | ||||||
Emaar Malls Group PJSC | 101,378 | 80 | ||||||
Emaar Properties PJSC | 148,944 | 279 | ||||||
Emirates Telecommunications Group PJSC | 73,127 | 398 | ||||||
First Gulf Bank PJSC | 39,258 | 129 | ||||||
| 18 | Adviser Managed Trust / Annual Report / July 31, 2016 |
SCHEDULE OF INVESTMENTS
July 31, 2016
Tactical Offensive Equity Fund (Continued)
Description | Shares | Market Value ($ Thousands) | ||||||
COMMON STOCK (continued) |
| |||||||
National Bank of Abu Dhabi PJSC | 34,357 | $ | 91 | |||||
|
| |||||||
| 1,504 | ||||||||
|
| |||||||
United Kingdom — 3.6% |
| |||||||
3i Group | 28,179 | 231 | ||||||
Aberdeen Asset Management | 26,728 | 113 | ||||||
Admiral Group | 6,119 | 176 | ||||||
Aggreko | 7,421 | 127 | ||||||
Anglo American | 40,615 | 448 | ||||||
Antofagasta | 11,425 | 76 | ||||||
Aon | 13,600 | 1,456 | ||||||
ARM Holdings | 40,805 | 906 | ||||||
Ashtead Group | 14,583 | 232 | ||||||
Associated British Foods | 10,321 | 369 | ||||||
AstraZeneca | 36,899 | 2,473 | ||||||
Auto Trader Group (A) | 29,002 | 143 | ||||||
Aviva | 117,301 | 609 | ||||||
Babcock International Group | 7,304 | 94 | ||||||
BAE Systems | 91,746 | 650 | ||||||
Barclays | 486,932 | 999 | ||||||
Barratt Developments | 29,038 | 169 | ||||||
Berkeley Group Holdings | 3,761 | 134 | ||||||
BHP Billiton | 61,191 | 767 | ||||||
BP | 539,026 | 3,055 | ||||||
British American Tobacco | 54,332 | 3,480 | ||||||
British Land †† | 28,329 | 252 | ||||||
BT Group, Cl A | 245,327 | 1,346 | ||||||
Bunzl | 9,711 | 305 | ||||||
Burberry Group | 12,893 | 226 | ||||||
Capita | 19,254 | 245 | ||||||
Carnival | 5,492 | 266 | ||||||
Centrica | 157,189 | 503 | ||||||
Cobham | 49,480 | 112 | ||||||
Compass Group | 47,636 | 908 | ||||||
Croda International | 3,803 | 168 | ||||||
DCC | 2,565 | 230 | ||||||
Delphi Automotive | 13,800 | 936 | ||||||
Diageo | 73,480 | 2,108 | ||||||
Direct Line Insurance Group | 39,837 | 185 | ||||||
Dixons Carphone | 28,356 | 132 | ||||||
easyJet | 4,603 | 64 | ||||||
Ensco, Cl A | 15,300 | 140 | ||||||
Fresnillo | 6,405 | 164 | ||||||
G4S | 44,953 | 111 | ||||||
GKN | 49,657 | 191 | ||||||
GlaxoSmithKline | 142,031 | 3,183 | ||||||
Glencore | 354,488 | 879 | ||||||
Hammerson †† | 22,727 | 168 | ||||||
Hargreaves Lansdown | 7,558 | 130 | ||||||
Hikma Pharmaceuticals | 4,161 | 145 | ||||||
HSBC Holdings | 573,767 | 3,772 | ||||||
ICAP | 16,045 | 95 | ||||||
IMI | 7,879 | 112 | ||||||
Description | Shares | Market Value ($ Thousands) | ||||||
COMMON STOCK (continued) |
| |||||||
Imperial Tobacco Group | 27,776 | $ | 1,469 | |||||
Inmarsat | 13,035 | 135 | ||||||
InterContinental Hotels Group | 5,416 | 217 | ||||||
Intertek Group | 4,676 | 225 | ||||||
Intu Properties †† | 27,270 | 109 | ||||||
Investec | 17,888 | 107 | ||||||
ITV | 105,131 | 274 | ||||||
J Sainsbury | 39,015 | 116 | ||||||
Johnson Matthey | 5,607 | 244 | ||||||
Kingfisher | 66,082 | 295 | ||||||
Land Securities Group †† | 22,907 | 333 | ||||||
Larsen & Toubro GDR | 12,000 | 279 | ||||||
Legal & General Group | 172,351 | 471 | ||||||
Lloyds Banking Group | 1,861,057 | 1,313 | ||||||
London Stock Exchange Group | 9,084 | 335 | ||||||
Lukoil PJSC ADR | 19,182 | 820 | ||||||
Marks & Spencer Group | 46,998 | 199 | ||||||
Mediclinic International | 10,680 | 152 | ||||||
Meggitt | 22,459 | 131 | ||||||
Merlin Entertainments (A) | 20,559 | 129 | ||||||
MMC Norilsk Nickel PJSC ADR | 26,901 | 393 | ||||||
Mondi | 10,640 | 216 | ||||||
National Grid | 106,416 | 1,530 | ||||||
Next | 4,147 | 277 | ||||||
Old Mutual | 142,793 | 399 | ||||||
Pearson | 23,804 | 279 | ||||||
Persimmon | 8,911 | 200 | ||||||
Petrofac | 7,516 | 74 | ||||||
Provident Financial | 4,265 | 153 | ||||||
Prudential | 74,532 | 1,321 | ||||||
Randgold Resources | 2,708 | 319 | ||||||
Reckitt Benckiser Group | 18,578 | 1,806 | ||||||
RELX | 32,078 | 611 | ||||||
Rio Tinto | 35,828 | 1,171 | ||||||
Rolls-Royce Holdings | 53,271 | 559 | ||||||
Rosneft PJSC GDR | 59,343 | 287 | ||||||
Rowan, Cl A | 6,400 | 98 | ||||||
Royal Bank of Scotland | ||||||||
Group * | 101,042 | 258 | ||||||
Royal Mail | 26,075 | 176 | ||||||
RSA Insurance Group | 29,467 | 195 | ||||||
SABMiller | 28,177 | 1,651 | ||||||
Sage Group | 31,270 | 296 | ||||||
Schroders | 3,929 | 137 | ||||||
Segro †† | 21,663 | 127 | ||||||
Severn Trent | 6,814 | 222 | ||||||
Shire | 25,992 | 1,681 | ||||||
Sky | 29,913 | 366 | ||||||
Smith & Nephew | 25,944 | 428 | ||||||
Smiths Group | 11,447 | 192 | ||||||
SSE | 29,152 | 587 | ||||||
St. James’s Place | 15,201 | 187 | ||||||
| Adviser Managed Trust / Annual Report / July 31, 2016 | 19 |
SCHEDULE OF INVESTMENTS
July 31, 2016
Tactical Offensive Equity Fund (Continued)
Description | Shares | Market Value ($ Thousands) | ||||||
COMMON STOCK (continued) |
| |||||||
Standard Chartered | 94,975 | $ | 762 | |||||
Standard Life | 57,075 | 229 | ||||||
State Bank of India GDR | 6,500 | 220 | ||||||
Tata Steel GDR | 20,000 | 104 | ||||||
Tate & Lyle | 13,513 | 130 | ||||||
Taylor Wimpey | 94,427 | 194 | ||||||
Tesco | 235,863 | 488 | ||||||
Travis Perkins | 7,240 | 150 | ||||||
Unilever | 37,507 | 1,760 | ||||||
United Utilities Group | 19,756 | 267 | ||||||
Vodafone Group | 775,963 | 2,365 | ||||||
VTB Bank GDR | 121,518 | 241 | ||||||
Weir Group | 6,199 | 121 | ||||||
Whitbread | 5,287 | 271 | ||||||
William Hill | 25,627 | 109 | ||||||
WM Morrison Supermarkets | 64,271 | 159 | ||||||
Wolseley | 7,395 | 413 | ||||||
Worldpay Group * (A) | 40,561 | 158 | ||||||
WPP | 37,511 | 846 | ||||||
|
| |||||||
| 66,319 | ||||||||
|
| |||||||
United States — 67.6% |
| |||||||
Consumer Discretionary — 8.9% |
| |||||||
1-800-Flowers.com, Cl A * | 2,752 | 25 | ||||||
Aaron’s | 6,889 | 165 | ||||||
Abercrombie & Fitch, Cl A | 7,302 | 151 | ||||||
Advance Auto Parts | 3,600 | 611 | ||||||
Amazon.com * | 19,973 | 15,156 | ||||||
AMC Entertainment Holdings, Cl A | 2,241 | 66 | ||||||
AMC Networks, Cl A * | 3,000 | 166 | ||||||
American Axle & Manufacturing Holdings * | 8,282 | 144 | ||||||
American Eagle Outfitters | 17,421 | 312 | ||||||
American Public Education * | 1,612 | 46 | ||||||
America’s Car-Mart * | 853 | 30 | ||||||
Apollo Education Group, Cl A * | 8,816 | 79 | ||||||
Aramark | 12,300 | 441 | ||||||
Arctic Cat | 1,385 | 22 | ||||||
Asbury Automotive Group * | 2,161 | 131 | ||||||
Ascena Retail Group * | 18,592 | 151 | ||||||
Ascent Capital Group, Cl A * | 1,119 | 19 | ||||||
AutoNation * | 3,300 | 176 | ||||||
AutoZone * | 1,500 | 1,221 | ||||||
Barnes & Noble | 6,527 | 85 | ||||||
Barnes & Noble Education * | 4,172 | 48 | ||||||
Bassett Furniture Industries | 1,085 | 28 | ||||||
Beazer Homes USA * | 3,320 | 32 | ||||||
Bed Bath & Beyond | 7,500 | 337 | ||||||
Belmond, Cl A * | 8,633 | 99 | ||||||
Best Buy | 14,000 | 470 | ||||||
Big 5 Sporting Goods | 1,942 | 21 | ||||||
Big Lots | 4,718 | 251 | ||||||
Biglari Holdings * | 107 | 44 | ||||||
BJ’s Restaurants * | 2,404 | 93 | ||||||
Description | Shares | Market Value ($ Thousands) | ||||||
COMMON STOCK (continued) |
| |||||||
Bloomin’ Brands | 11,915 | $ | 214 | |||||
Blue Nile | 1,158 | 34 | ||||||
Bob Evans Farms | 2,050 | 75 | ||||||
Bojangles’ * | 1,050 | 18 | ||||||
Boot Barn Holdings * | 1,483 | 16 | ||||||
BorgWarner | 11,000 | 365 | ||||||
Boyd Gaming * | 8,649 | 170 | ||||||
Bridgepoint Education * | 1,977 | 14 | ||||||
Bright Horizons Family Solutions * | 4,591 | 308 | ||||||
Brinker International | 2,800 | 132 | ||||||
Brunswick | 4,600 | 228 | ||||||
Buckle | 2,956 | 81 | ||||||
Buffalo Wild Wings * | 1,979 | 332 | ||||||
Build-A-Bear Workshop, Cl A * | 1,447 | 20 | ||||||
Burlington Stores * | 3,600 | 275 | ||||||
Cabela’s * | 2,500 | 129 | ||||||
Cable One | 300 | 157 | ||||||
Caesars Acquisition, Cl A * | 4,939 | 53 | ||||||
Caesars Entertainment * | 5,883 | 41 | ||||||
CalAtlantic Group | 3,800 | 138 | ||||||
Caleres | 4,633 | 122 | ||||||
Callaway Golf | 9,713 | 104 | ||||||
Cambium Learning Group * | 1,588 | 8 | ||||||
Capella Education | 1,171 | 70 | ||||||
Career Education * | 6,965 | 48 | ||||||
CarMax * | 9,800 | 571 | ||||||
Carmike Cinemas * | 2,488 | 77 | ||||||
Carnival | 20,700 | 967 | ||||||
Carriage Services, Cl A | 1,546 | 38 | ||||||
Carrols Restaurant Group * | 3,576 | 43 | ||||||
Carter’s | 2,500 | 253 | ||||||
Cato, Cl A | 2,782 | 100 | ||||||
Cavco Industries * | 874 | 87 | ||||||
CBS, Cl B | 20,500 | 1,071 | ||||||
Century Casinos * | 2,308 | 15 | ||||||
Century Communities * | 1,602 | 28 | ||||||
Charter Communications, Cl A * | 10,353 | 2,432 | ||||||
Cheesecake Factory | 4,753 | 246 | ||||||
Chegg * | 8,388 | 45 | ||||||
Chico’s FAS | 13,679 | 164 | ||||||
Children’s Place | 1,963 | 164 | ||||||
Chipotle Mexican Grill, Cl A * | 1,457 | 618 | ||||||
Choice Hotels International | 2,300 | 111 | ||||||
Churchill Downs | 1,414 | 185 | ||||||
Chuy’s Holdings * | 1,695 | 57 | ||||||
Cinemark Holdings | 5,400 | 203 | ||||||
Citi Trends | 1,554 | 26 | ||||||
Clear Channel Outdoor Holdings, Cl A | 1,200 | 8 | ||||||
ClubCorp Holdings | 6,639 | 96 | ||||||
Coach | 14,100 | 608 | ||||||
Collectors Universe | 822 | 18 | ||||||
Columbia Sportswear | 2,826 | 162 | ||||||
| 20 | Adviser Managed Trust / Annual Report / July 31, 2016 |
SCHEDULE OF INVESTMENTS
July 31, 2016
Tactical Offensive Equity Fund (Continued)
Description | Shares | Market Value ($ Thousands) | ||||||
COMMON STOCK (continued) |
| |||||||
Comcast, Cl A | 123,972 | $ | 8,337 | |||||
Conn’s * | 2,229 | 16 | ||||||
Container Store Group * | 1,817 | 10 | ||||||
Cooper Tire & Rubber | 5,800 | 191 | ||||||
Cooper-Standard Holding * | 1,625 | 143 | ||||||
Core-Mark Holding | 4,779 | 234 | ||||||
Cracker Barrel Old Country Store | 2,006 | 316 | ||||||
Crocs * | 7,603 | 86 | ||||||
CSS Industries | 923 | 24 | ||||||
CST Brands | 3,800 | 170 | ||||||
Ctrip.com International ADR * | 15,200 | 664 | ||||||
Culp | 1,130 | 32 | ||||||
Daily Journal * | 117 | 27 | ||||||
Dana | 15,618 | 213 | ||||||
Darden Restaurants | 5,900 | 363 | ||||||
Dave & Buster’s Entertainment * | 3,969 | 177 | ||||||
Deckers Outdoor * | 3,396 | 224 | ||||||
Del Frisco’s Restaurant Group * | 2,475 | 37 | ||||||
Del Taco Restaurants * | 2,504 | 26 | ||||||
Delta Apparel * | 780 | 19 | ||||||
Denny’s * | 7,822 | 87 | ||||||
Destination XL Group * | 3,954 | 20 | ||||||
DeVry Education Group | 6,735 | 150 | ||||||
Diamond Resorts International * | 4,018 | 121 | ||||||
Dick’s Sporting Goods | 4,400 | 226 | ||||||
Dillard’s, Cl A | 1,100 | 74 | ||||||
DineEquity | 1,834 | 149 | ||||||
Discovery Communications, Cl A * | 7,600 | 191 | ||||||
Discovery Communications, Cl C * | 11,900 | 292 | ||||||
DISH Network, Cl A * | 11,100 | 593 | ||||||
Dollar General | 14,700 | 1,393 | ||||||
Dollar Tree * | 11,500 | 1,107 | ||||||
Domino’s Pizza | 2,500 | 368 | ||||||
Dorman Products * | 2,778 | 177 | ||||||
DR Horton | 17,100 | 562 | ||||||
DreamWorks Animation, Cl A * | 8,099 | 332 | ||||||
Drew Industries | 2,484 | 228 | ||||||
DSW, Cl A | 7,054 | 171 | ||||||
Duluth Holdings, Cl B * | 1,015 | 25 | ||||||
Dunkin’ Brands Group | 4,600 | 208 | ||||||
El Pollo Loco Holdings * | 2,135 | 28 | ||||||
Eldorado Resorts * | 2,981 | 43 | ||||||
Empire Resorts * | 235 | 4 | ||||||
Entercom Communications, Cl A | 2,712 | 40 | ||||||
Entravision Communications, Cl A | 6,766 | 49 | ||||||
Eros International * | 3,073 | 54 | ||||||
Escalade | 1,183 | 13 | ||||||
Ethan Allen Interiors | 2,548 | 88 | ||||||
Etsy * | 10,812 | 109 | ||||||
EW Scripps, Cl A * | 6,134 | 104 | ||||||
Expedia | 6,000 | 700 | ||||||
Express * | 8,054 | 120 | ||||||
Description | Shares | Market Value ($ Thousands) | ||||||
COMMON STOCK (continued) |
| |||||||
Extended Stay America | 4,411 | $ | 62 | |||||
Federal-Mogul Holdings * | 3,233 | 29 | ||||||
Fiesta Restaurant Group * | 2,758 | 62 | ||||||
Finish Line, Cl A | 4,311 | 94 | ||||||
Five Below * | 5,602 | 286 | ||||||
Flexsteel Industries | 684 | 28 | ||||||
Fogo De Chao * | 583 | 8 | ||||||
Foot Locker | 6,800 | 405 | ||||||
Ford Motor | 201,400 | 2,550 | ||||||
Fossil Group * | 4,514 | 143 | ||||||
Fox Factory Holding * | 2,334 | 45 | ||||||
Francesca’s Holdings * | 4,195 | 53 | ||||||
Fred’s, Cl A | 3,661 | 58 | ||||||
FTD * | 1,814 | 46 | ||||||
Gaia, Cl A * | 1,484 | 12 | ||||||
GameStop, Cl A | 5,200 | 161 | ||||||
Gannett | 12,315 | 157 | ||||||
Gap | 11,300 | 291 | ||||||
Garmin | 5,600 | 304 | ||||||
General Motors | 72,900 | 2,299 | ||||||
Genesco * | 2,211 | 153 | ||||||
Gentex | 14,300 | 253 | ||||||
Gentherm * | 3,949 | 133 | ||||||
Genuine Parts | 7,400 | 757 | ||||||
G-III Apparel Group * | 4,500 | 180 | ||||||
Global Eagle Entertainment * | 4,904 | 40 | ||||||
GNC Holdings, Cl A | 7,188 | 147 | ||||||
Golden Entertainment | 1,124 | 15 | ||||||
Goodyear Tire & Rubber | 13,500 | 387 | ||||||
GoPro, Cl A * | 10,895 | 138 | ||||||
Graham Holdings, Cl B | 200 | 101 | ||||||
Grand Canyon Education * | 4,708 | 198 | ||||||
Gray Television * | 6,628 | 66 | ||||||
Green Brick Partners * | 2,540 | 18 | ||||||
Group 1 Automotive | 2,250 | 140 | ||||||
Groupon, Cl A * | 21,800 | 105 | ||||||
Guess? | 6,656 | 98 | ||||||
H&R Block | 11,400 | 271 | ||||||
Habit Restaurants, Cl A * | 1,427 | 23 | ||||||
Hanesbrands | 19,100 | 509 | ||||||
Harley-Davidson | 9,200 | 487 | ||||||
Harman International Industries | 3,600 | 298 | ||||||
Hasbro | 5,700 | 463 | ||||||
Haverty Furniture | 2,053 | 38 | ||||||
Helen of Troy * | 2,928 | 292 | ||||||
Hemisphere Media Group, Cl A * | 691 | 9 | ||||||
Hibbett Sports * | 2,358 | 82 | ||||||
Hilton Worldwide Holdings | 26,500 | 615 | ||||||
Home Depot | 64,000 | 8,847 | ||||||
Hooker Furniture | 1,197 | 28 | ||||||
Horizon Global * | 1,934 | 25 | ||||||
Houghton Mifflin Harcourt * | 12,982 | 220 | ||||||
| Adviser Managed Trust / Annual Report / July 31, 2016 | 21 |
SCHEDULE OF INVESTMENTS
July 31, 2016
Tactical Offensive Equity Fund (Continued)
Description | Shares | Market Value ($ Thousands) | ||||||
COMMON STOCK (continued) |
| |||||||
Hovnanian Enterprises, Cl A * | 12,938 | $ | 24 | |||||
HSN | 3,279 | 168 | ||||||
Hyatt Hotels, Cl A * | 1,100 | 55 | ||||||
Iconix Brand Group * | 4,498 | 32 | ||||||
Installed Building Products * | 2,078 | 74 | ||||||
International Game Technology | 5,309 | 111 | ||||||
International Speedway, Cl A | 2,869 | 97 | ||||||
Interpublic Group | 20,300 | 468 | ||||||
Interval Leisure Group | 11,847 | 213 | ||||||
Intrawest Resorts Holdings * | 1,707 | 25 | ||||||
iRobot * | 2,920 | 111 | ||||||
Isle of Capri Casinos * | 2,600 | 49 | ||||||
J Alexander’s Holdings * | 1,477 | 14 | ||||||
Jack in the Box | 3,413 | 302 | ||||||
JAKKS Pacific * | 1,703 | 16 | ||||||
Jamba * | 1,410 | 15 | ||||||
JC Penney * | 15,600 | 151 | ||||||
JD.com ADR * | 30,800 | 667 | ||||||
John Wiley & Sons, Cl A | 2,200 | 127 | ||||||
Johnson Controls | 33,500 | 1,538 | ||||||
Johnson Outdoors, Cl A | 543 | 17 | ||||||
K12 * | 3,519 | 44 | ||||||
Kate Spade * | 6,500 | 141 | ||||||
KB Home | 8,977 | 141 | ||||||
Kirkland’s * | 1,593 | 24 | ||||||
Kohl’s | 9,300 | 387 | ||||||
Kona Grill * | 947 | 12 | ||||||
L Brands | 12,300 | 909 | ||||||
La Quinta Holdings * | 8,737 | 108 | ||||||
Lands’ End * | 1,574 | 22 | ||||||
Las Vegas Sands | 18,400 | 932 | ||||||
La-Z-Boy, Cl Z | 5,246 | 159 | ||||||
Lear | 3,700 | 420 | ||||||
Leggett & Platt | 6,700 | 352 | ||||||
Lennar, Cl B | 300 | 11 | ||||||
Lennar, Cl A | 9,200 | 431 | ||||||
LGI Homes * | 1,603 | 55 | ||||||
Libbey | 2,294 | 43 | ||||||
Liberty Braves Group, Cl A * | 990 | 16 | ||||||
Liberty Braves Group, Cl C * | 3,783 | 60 | ||||||
Liberty Broadband, Cl A * | 1,800 | 113 | ||||||
Liberty Broadband, Cl C * | 5,200 | 329 | ||||||
Liberty Interactive QVC Group, Cl A * | 22,500 | 603 | ||||||
Liberty Media Group, Cl C * | 4,760 | 107 | ||||||
Liberty Media Group, Cl A * | 2,381 | 54 | ||||||
Liberty SiriusXM Group, Cl A * | 4,600 | 164 | ||||||
Liberty SiriusXM Group, Cl C * | 9,300 | 328 | ||||||
Liberty Tax | 772 | 11 | ||||||
Liberty TripAdvisor Holdings, Cl A * | 7,606 | 180 | ||||||
Liberty Ventures, Ser A * | 6,700 | 253 | ||||||
LifeLock * | 9,088 | 152 | ||||||
Lifetime Brands | 1,210 | 16 | ||||||
Description | Shares | Market Value ($ Thousands) | ||||||
COMMON STOCK (continued) |
| |||||||
Lindblad Expeditions Holdings * | 1,589 | $ | 16 | |||||
Lithia Motors, Cl A | 2,487 | 215 | ||||||
Live Nation Entertainment * | 6,600 | 181 | ||||||
LKQ * | 15,400 | 530 | ||||||
Loral Space & Communications * | 1,338 | 47 | ||||||
Lowe’s | 46,200 | 3,801 | ||||||
Luby’s * | 2,155 | 10 | ||||||
lululemon athletica * | 4,900 | 380 | ||||||
Lumber Liquidators Holdings * | 2,742 | 41 | ||||||
M/I Homes * | 2,462 | 56 | ||||||
Macy’s | 15,600 | 559 | ||||||
Madison Square Garden * | 1,000 | 183 | ||||||
Malibu Boats, Cl A * | 1,912 | 26 | ||||||
Marcus | 1,939 | 43 | ||||||
Marine Products | 1,225 | 11 | �� | |||||
MarineMax * | 2,572 | 52 | ||||||
Marriott International, Cl A | 9,500 | 681 | ||||||
Marriott Vacations Worldwide | 2,348 | 179 | ||||||
Mattel | 17,300 | 577 | ||||||
Mattress Firm Holding * | 1,744 | 52 | ||||||
MCBC Holdings | 880 | 10 | ||||||
McDonald’s | 45,300 | 5,330 | ||||||
MDC Holdings | 4,077 | 107 | ||||||
Media General * | 11,419 | 201 | ||||||
Meredith | 3,928 | 214 | ||||||
Meritage Homes * | 4,009 | 146 | ||||||
Metaldyne Performance Group | 1,596 | 25 | ||||||
MGM Resorts International * | 24,000 | 576 | ||||||
Michael Kors Holdings * | 8,700 | 450 | ||||||
Michaels * | 4,700 | 124 | ||||||
Modine Manufacturing * | 4,905 | 47 | ||||||
Mohawk Industries * | 3,100 | 648 | ||||||
Monarch Casino & Resort * | 1,123 | 26 | ||||||
Monro Muffler Brake | 3,286 | 206 | ||||||
Motorcar Parts of America * | 1,900 | 53 | ||||||
Movado Group | 1,609 | 36 | ||||||
MSG Networks * | 6,470 | 104 | ||||||
Murphy USA * | 1,900 | 146 | ||||||
NACCO Industries, Cl A | 419 | 24 | ||||||
Nathan’s Famous * | 329 | 16 | ||||||
National CineMedia | 6,692 | 104 | ||||||
Nautilus * | 3,178 | 60 | ||||||
Netflix * | 21,200 | 1,934 | ||||||
New Home * | 1,409 | 14 | ||||||
New Media Investment Group | 4,014 | 71 | ||||||
New York Times, Cl A | 13,042 | 169 | ||||||
Newell Rubbermaid | 22,300 | 1,170 | ||||||
News | 8,900 | 120 | ||||||
News, Cl A | 19,200 | 249 | ||||||
Nexstar Broadcasting Group, Cl A | 3,129 | 158 | ||||||
NIKE, Cl B | 68,400 | 3,796 | ||||||
Noodles, Cl A * | 1,238 | 9 | ||||||
| 22 | Adviser Managed Trust / Annual Report / July 31, 2016 |
SCHEDULE OF INVESTMENTS
July 31, 2016
Tactical Offensive Equity Fund (Continued)
Description | Shares | Market Value ($ Thousands) | ||||||
COMMON STOCK (continued) |
| |||||||
Nordstrom | 6,200 | $ | 274 | |||||
Norwegian Cruise Line Holdings * | 8,100 | 345 | ||||||
Nutrisystem | 3,008 | 89 | ||||||
NVR * | 200 | 341 | ||||||
Office Depot * | 57,927 | 200 | ||||||
Ollie’s Bargain Outlet Holdings * | 2,099 | 55 | ||||||
Omnicom Group | 12,000 | 987 | ||||||
O’Reilly Automotive * | 4,800 | 1,395 | ||||||
Outerwall | 1,757 | 93 | ||||||
Overstock.com * | 1,401 | 23 | ||||||
Oxford Industries | 1,567 | 90 | ||||||
Panera Bread, Cl A * | 1,181 | 259 | ||||||
Papa John’s International | 2,846 | 210 | ||||||
Party City Holdco * | 2,810 | 45 | ||||||
Penn National Gaming * | 7,674 | 115 | ||||||
Penske Automotive Group | 2,300 | 91 | ||||||
Performance Sports Group * | 4,263 | 14 | ||||||
Perry Ellis International * | 1,325 | 28 | ||||||
PetMed Express | 2,069 | 43 | ||||||
Pier 1 Imports | 8,424 | 43 | ||||||
Pinnacle Entertainment * | 6,015 | 66 | ||||||
Planet Fitness, Cl A * | 1,649 | 34 | ||||||
Polaris Industries | 3,000 | 296 | ||||||
Pool | 2,000 | 205 | ||||||
Popeyes Louisiana Kitchen * | 2,328 | 133 | ||||||
Potbelly * | 2,501 | 33 | ||||||
Priceline Group * | 2,560 | 3,458 | ||||||
PulteGroup | 17,400 | 369 | ||||||
PVH | 4,100 | 414 | ||||||
Radio One, Cl D * | 2,779 | 9 | ||||||
Ralph Lauren, Cl A | 2,900 | 284 | ||||||
Reading International, Cl A * | 1,787 | 25 | ||||||
Red Lion Hotels * | 1,568 | 12 | ||||||
Red Robin Gourmet Burgers * | 1,508 | 73 | ||||||
Red Rock Resorts, Cl A | 3,109 | 72 | ||||||
Regal Entertainment Group, Cl A | 4,560 | 107 | ||||||
Regis * | 3,860 | 52 | ||||||
Rent-A-Center, Cl A | 5,366 | 58 | ||||||
Restoration Hardware Holdings * | 4,181 | 129 | ||||||
Ross Stores | 20,400 | 1,261 | ||||||
Royal Caribbean Cruises | 8,500 | 616 | ||||||
Ruby Tuesday * | 6,295 | 25 | ||||||
Ruth’s Hospitality Group | 3,305 | 53 | ||||||
Saga Communications, Cl A | 403 | 17 | ||||||
Salem Media Group, Cl A | 1,242 | 9 | ||||||
Sally Beauty Holdings * | 7,400 | 217 | ||||||
Scholastic | 2,928 | 120 | ||||||
Scientific Games, Cl A * | 5,393 | 57 | ||||||
Scripps Networks Interactive, Cl A | 4,200 | 277 | ||||||
Sears Holdings * | 1,235 | 19 | ||||||
Sears Hometown and Outlet Stores * | 1,278 | 9 | ||||||
SeaWorld Entertainment | 6,892 | 106 | ||||||
Description | Shares | Market Value ($ Thousands) | ||||||
COMMON STOCK (continued) |
| |||||||
Select Comfort * | 5,018 | $ | 120 | |||||
Sequential Brands Group * | 4,116 | 33 | ||||||
Service International | 9,500 | 263 | ||||||
ServiceMaster Global Holdings * | 6,900 | 261 | ||||||
Shake Shack, Cl A * | 1,627 | 65 | ||||||
Shoe Carnival | 1,494 | 39 | ||||||
Shutterfly * | 3,619 | 192 | ||||||
Signet Jewelers | 4,000 | 352 | ||||||
Sinclair Broadcast Group, Cl A | 6,922 | 193 | ||||||
Sirius XM Holdings * | 90,100 | 396 | ||||||
Six Flags Entertainment | 3,600 | 203 | ||||||
Skechers, Cl A * | 6,600 | 159 | ||||||
Smith & Wesson Holding * | 5,742 | 169 | ||||||
Sonic | 5,038 | 136 | ||||||
Sonic Automotive, Cl A | 2,905 | 53 | ||||||
Sotheby’s | 5,484 | 178 | ||||||
Spartan Motors | 3,601 | 31 | ||||||
Speedway Motorsports | 1,247 | 22 | ||||||
Sportsman’s Warehouse Holdings * | 2,737 | 28 | ||||||
Stage Stores | 2,837 | 17 | ||||||
Standard Motor Products | 2,215 | 93 | ||||||
Staples | 32,600 | 303 | ||||||
Starbucks | 73,700 | 4,278 | ||||||
Starwood Hotels & Resorts Worldwide | 8,600 | 671 | ||||||
Starz * | 4,300 | 130 | ||||||
Stein Mart | 3,291 | 28 | ||||||
Steven Madden * | 6,444 | 226 | ||||||
Stoneridge * | 2,796 | 47 | ||||||
Strattec Security | 383 | 17 | ||||||
Strayer Education * | 1,094 | 50 | ||||||
Sturm Ruger | 2,008 | 137 | ||||||
Superior Industries International | 2,596 | 79 | ||||||
Superior Uniform Group | 883 | 14 | ||||||
Tailored Brands | 5,059 | 74 | ||||||
TAL Education Group ADR * | 1,900 | 114 | ||||||
Target | 30,700 | 2,313 | ||||||
Taylor Morrison Home, Cl A * | 3,160 | 51 | ||||||
TEGNA | 11,000 | 241 | ||||||
Tempur Sealy International * | 2,700 | 204 | ||||||
Tenneco * | 5,896 | 333 | ||||||
Tesla Motors * | 5,987 | 1,406 | ||||||
Texas Roadhouse, Cl A | 6,926 | 327 | ||||||
Thor Industries | 2,400 | 184 | ||||||
Tiffany | 5,500 | 355 | ||||||
Tile Shop Holdings * | 3,369 | 57 | ||||||
Tilly’s, Cl A * | 1,360 | 8 | ||||||
Time | 10,764 | 176 | ||||||
Time Warner | 40,700 | 3,120 | ||||||
TJX | 34,300 | 2,803 | ||||||
Toll Brothers * | 7,800 | 218 | ||||||
TopBuild * | 4,160 | 157 | ||||||
Tower International | 2,134 | 49 | ||||||
| Adviser Managed Trust / Annual Report / July 31, 2016 | 23 |
SCHEDULE OF INVESTMENTS
July 31, 2016
Tactical Offensive Equity Fund (Continued)
Description | Shares | Market Value ($ Thousands) | ||||||
COMMON STOCK (continued) |
| |||||||
Townsquare Media, Cl A * | 1,006 | $ | 8 | |||||
Tractor Supply | 6,800 | 623 | ||||||
TRI Pointe Group * | 15,593 | 210 | ||||||
Tribune Media, Cl A | 3,900 | 144 | ||||||
TripAdvisor * | 5,800 | 406 | ||||||
tronc | 2,786 | 42 | ||||||
Tuesday Morning * | 4,702 | 37 | ||||||
Tumi Holdings * | 5,918 | 158 | ||||||
Tupperware Brands | 2,500 | 157 | ||||||
Twenty-First Century Fox, Cl A | 56,100 | 1,495 | ||||||
Twenty-First Century Fox | 24,800 | 670 | ||||||
UCP, Cl A * | 931 | 8 | ||||||
Ulta Salon Cosmetics & Fragrance * | 3,000 | 784 | ||||||
Under Armour, Cl A * | 9,300 | 367 | ||||||
Under Armour, Cl C * | 9,343 | 334 | ||||||
Unifi * | 1,630 | 44 | ||||||
Unique Fabricating | 737 | 10 | ||||||
Universal Electronics * | 1,535 | 119 | ||||||
Urban Outfitters * | 4,500 | 135 | ||||||
Vail Resorts | 1,800 | 258 | ||||||
Vera Bradley * | 2,130 | 31 | ||||||
VF | 17,600 | 1,099 | ||||||
Viacom, Cl B | 17,500 | 796 | ||||||
Viacom, Cl A | 400 | 20 | ||||||
Vince Holding * | 2,411 | 12 | ||||||
Vista Outdoor * | 3,100 | 155 | ||||||
Visteon | 1,700 | 119 | ||||||
Vitamin Shoppe * | 2,496 | 73 | ||||||
Walt Disney | 83,500 | 8,012 | ||||||
Wayfair, Cl A * | 3,344 | 145 | ||||||
WCI Communities * | 2,261 | 38 | ||||||
Weight Watchers International * | 2,905 | 35 | ||||||
Wendy’s | 10,600 | 102 | ||||||
West Marine * | 2,021 | 18 | ||||||
Weyco Group | 709 | 20 | ||||||
Whirlpool | 3,800 | 731 | ||||||
William Lyon Homes, Cl A * | 2,494 | 43 | ||||||
Williams-Sonoma | 4,500 | 243 | ||||||
Wingstop | 1,637 | 43 | ||||||
Winmark | 239 | 24 | ||||||
Winnebago Industries | 2,775 | 66 | ||||||
Wolverine World Wide | 10,142 | 248 | ||||||
Workhorse Group * | 1,294 | 9 | ||||||
World Wrestling Entertainment, Cl A | 3,738 | 74 | ||||||
Wyndham Worldwide | 5,600 | 398 | ||||||
Wynn Resorts | 4,000 | 392 | ||||||
Yum! Brands | 19,900 | 1,779 | ||||||
ZAGG * | 3,037 | 19 | ||||||
Zoe’s Kitchen * | 1,974 | 70 | ||||||
Description | Shares | Market Value ($ Thousands) | ||||||
COMMON STOCK (continued) |
| |||||||
Zumiez * | 1,900 | $ | 32 | |||||
|
| |||||||
| 163,746 | ||||||||
|
| |||||||
Consumer Staples — 5.8% | ||||||||
Alico | 360 | 11 | ||||||
Alliance One International * | 904 | 16 | ||||||
Altria Group | 100,700 | 6,817 | ||||||
Amplify Snack Brands * | 3,044 | 43 | ||||||
Andersons | 2,922 | 108 | ||||||
Archer-Daniels-Midland | 29,200 | 1,316 | ||||||
Avon Products | 46,131 | 188 | ||||||
B&G Foods, Cl A | 6,481 | 334 | ||||||
Blue Buffalo Pet Products * | 3,000 | 77 | ||||||
Boston Beer, Cl A * | 925 | 169 | ||||||
Brown-Forman, Cl A | 1,400 | 148 | ||||||
Brown-Forman, Cl B | 5,000 | 491 | ||||||
Bunge | 7,000 | 461 | ||||||
Calavo Growers | 1,678 | 110 | ||||||
Cal-Maine Foods | 3,279 | 137 | ||||||
Campbell Soup | 9,400 | 585 | ||||||
Casey’s General Stores | 2,000 | 267 | ||||||
Central Garden & Pet, Cl A * | 3,454 | 79 | ||||||
Central Garden & Pet * | 1,092 | 27 | ||||||
Chefs’ Warehouse * | 2,029 | 33 | ||||||
Church & Dwight | 6,500 | 639 | ||||||
Clorox | 6,600 | 865 | ||||||
Coca-Cola | 200,430 | 8,745 | ||||||
Coca-Cola Bottling Consolidated | 520 | 74 | ||||||
Colgate-Palmolive | 44,900 | 3,342 | ||||||
ConAgra Foods | 22,100 | 1,033 | ||||||
Constellation Brands, Cl A | 8,400 | 1,383 | ||||||
Costco Wholesale | 22,500 | 3,762 | ||||||
Coty, Cl A | 2,600 | 70 | ||||||
Craft Brew Alliance * | 1,395 | 16 | ||||||
CVS Health | 55,300 | 5,127 | ||||||
Darling Ingredients * | 17,178 | 271 | ||||||
Dean Foods | 9,597 | 177 | ||||||
Dr Pepper Snapple Group | 9,400 | 926 | ||||||
Edgewell Personal Care | 3,000 | 254 | ||||||
Elizabeth Arden * | 2,508 | 35 | ||||||
Energizer Holdings | 3,100 | 160 | ||||||
Estee Lauder, Cl A | 11,000 | 1,022 | ||||||
Farmer Bros * | 853 | 26 | ||||||
Flowers Foods | 8,700 | 160 | ||||||
Fresh Del Monte Produce | 3,386 | 193 | ||||||
Freshpet * | 2,367 | 21 | ||||||
General Mills | 30,600 | 2,200 | ||||||
Hain Celestial Group * | 5,100 | 269 | ||||||
Herbalife * | 3,700 | 252 | ||||||
Hershey | 7,100 | 786 | ||||||
Hormel Foods | 13,700 | 512 | ||||||
HRG Group * | 12,430 | 185 | ||||||
Ingles Markets, Cl A | 1,450 | 56 | ||||||
| 24 | Adviser Managed Trust / Annual Report / July 31, 2016 |
SCHEDULE OF INVESTMENTS
July 31, 2016
Tactical Offensive Equity Fund (Continued)
Description | Shares | Market Value ($ Thousands) | ||||||
COMMON STOCK (continued) |
| |||||||
Ingredion | 3,600 | $ | 480 | |||||
Inter Parfums | 1,814 | 59 | ||||||
Inventure Foods * | 2,085 | 18 | ||||||
J&J Snack Foods | 1,572 | 191 | ||||||
JM Smucker | 5,900 | 910 | ||||||
John B Sanfilippo & Son | 890 | 42 | ||||||
Kellogg | 12,600 | 1,042 | ||||||
Kimberly-Clark | 18,600 | 2,410 | ||||||
Kraft Heinz | 30,687 | 2,651 | ||||||
Kroger | 49,500 | 1,692 | ||||||
Lancaster Colony | 1,965 | 255 | ||||||
Landec * | 2,810 | 32 | ||||||
Lifevantage * | 1,494 | 21 | ||||||
Lifeway Foods * | 366 | 4 | ||||||
Limoneira | 1,244 | 22 | ||||||
McCormick | 5,900 | 603 | ||||||
Mead Johnson Nutrition, Cl A | 9,500 | 847 | ||||||
Medifast | 1,093 | 39 | ||||||
MGP Ingredients | 1,303 | 56 | ||||||
Molson Coors Brewing, Cl B | 8,700 | 889 | ||||||
Mondelez International, Cl A | 77,300 | 3,400 | ||||||
Monster Beverage * | 7,605 | 1,222 | ||||||
National Beverage * | 1,210 | 69 | ||||||
Natural Grocers by Vitamin Cottage * | 1,014 | 14 | ||||||
Natural Health Trends | 788 | 26 | ||||||
Nature’s Sunshine Products | 724 | 9 | ||||||
Nu Skin Enterprises, Cl A | 2,800 | 150 | ||||||
Nutraceutical International * | 897 | 23 | ||||||
Oil-Dri Corp of America | 545 | 20 | ||||||
Omega Protein * | 2,276 | 51 | ||||||
Orchids Paper Products | 947 | 29 | ||||||
PepsiCo | 74,364 | 8,100 | ||||||
Performance Food Group * | 3,856 | 106 | ||||||
Philip Morris International | 79,700 | 7,991 | ||||||
Pilgrim’s Pride | 4,300 | 100 | ||||||
Pinnacle Foods | 5,800 | 291 | ||||||
Post Holdings * | 3,200 | 277 | ||||||
PriceSmart | 2,097 | 163 | ||||||
Primo Water * | 2,275 | 27 | ||||||
Procter & Gamble | 137,000 | 11,726 | ||||||
Revlon, Cl A * | 1,225 | 43 | ||||||
Reynolds American | 42,900 | 2,148 | ||||||
Rite Aid * | 52,100 | 365 | ||||||
Sanderson Farms | 2,095 | 184 | ||||||
Seaboard * | 29 | 85 | ||||||
Seneca Foods, Cl A * | 706 | 28 | ||||||
Smart & Final Stores * | 2,418 | 33 | ||||||
Snyder’s-Lance | 8,419 | 288 | ||||||
SpartanNash | 3,994 | 126 | ||||||
Spectrum Brands Holdings | 1,200 | 155 | ||||||
Sprouts Farmers Market * | 7,100 | 164 | ||||||
SUPERVALU * | 28,542 | 139 | ||||||
Description | Shares | Market Value ($ Thousands) | ||||||
COMMON STOCK (continued) |
| |||||||
Synutra International * | 2,428 | $ | 8 | |||||
Sysco | 27,100 | 1,404 | ||||||
Tootsie Roll Industries | 1,781 | 66 | ||||||
TreeHouse Foods * | 2,800 | 289 | ||||||
Turning Point Brands * | 706 | 8 | ||||||
Tyson Foods, Cl A | 14,800 | 1,089 | ||||||
United Natural Foods * | 5,189 | 259 | ||||||
Universal | 2,381 | 141 | ||||||
US Foods Holding * | 2,700 | 65 | ||||||
USANA Health Sciences * | 538 | 74 | ||||||
Vector Group | 9,251 | 204 | ||||||
Village Super Market, Cl A | 776 | 25 | ||||||
Walgreens Boots Alliance | 44,392 | 3,518 | ||||||
Wal-Mart Stores | 78,000 | 5,692 | ||||||
WD-40 | 1,475 | 170 | ||||||
Weis Markets | 996 | 51 | ||||||
WhiteWave Foods, Cl A * | 8,800 | 488 | ||||||
Whole Foods Market | 16,100 | 491 | ||||||
|
| |||||||
| 107,835 | ||||||||
|
| |||||||
Energy — 4.1% | ||||||||
Abraxas Petroleum * | 13,336 | 15 | ||||||
Adams Resources & Energy | 241 | 7 | ||||||
Alon USA Energy | 3,351 | 24 | ||||||
Anadarko Petroleum | 26,400 | 1,440 | ||||||
Antero Resources * | 8,300 | 217 | ||||||
Apache | 19,200 | 1,008 | ||||||
Archrock | 7,191 | 64 | ||||||
Atwood Oceanics | 6,283 | 67 | ||||||
Baker Hughes | 22,200 | 1,062 | ||||||
Bill Barrett * | 5,135 | 31 | ||||||
Bristow Group | 3,501 | 38 | ||||||
Cabot Oil & Gas | 23,300 | 575 | �� | |||||
California Resources | 3,302 | 34 | ||||||
Callon Petroleum * | 12,710 | 145 | ||||||
CARBO Ceramics | 2,047 | 29 | ||||||
Carrizo Oil & Gas * | 5,840 | 192 | ||||||
Cheniere Energy * | 10,100 | 422 | ||||||
Chesapeake Energy * | 30,800 | 167 | ||||||
Chevron | 96,703 | 9,910 | ||||||
Cimarex Energy | 4,700 | 564 | ||||||
Clayton Williams Energy * | 639 | 24 | ||||||
Clean Energy Fuels * | 9,190 | 27 | ||||||
Cobalt International Energy * | 42,310 | 63 | ||||||
Concho Resources * | 6,600 | 820 | ||||||
ConocoPhillips | 64,300 | 2,625 | ||||||
CONSOL Energy | 11,500 | 223 | ||||||
Contango Oil & Gas * | 1,883 | 17 | ||||||
Continental Resources * | 4,400 | 194 | ||||||
CVR Energy | 1,669 | 25 | ||||||
Dawson Geophysical * | 2,162 | 16 | ||||||
Delek US Holdings | 6,360 | 80 | ||||||
Denbury Resources | 37,859 | 110 | ||||||
| Adviser Managed Trust / Annual Report / July 31, 2016 | 25 |
SCHEDULE OF INVESTMENTS
July 31, 2016
Tactical Offensive Equity Fund (Continued)
Description | Shares | Market Value ($ Thousands) | ||||||
COMMON STOCK (continued) |
| |||||||
Devon Energy | 26,500 | $ | 1,014 | |||||
DHT Holdings | 9,540 | 44 | ||||||
Diamond Offshore Drilling | 3,662 | 83 | ||||||
Diamondback Energy * | 3,600 | 316 | ||||||
Dorian LPG * | 2,638 | 16 | ||||||
Dril-Quip * | 1,900 | 103 | ||||||
Earthstone Energy * | 292 | 3 | ||||||
Eclipse Resources * | 5,339 | 17 | ||||||
Energen | 4,900 | 232 | ||||||
EOG Resources | 28,500 | 2,328 | ||||||
EP Energy, Cl A * | 4,198 | 17 | ||||||
EQT | 8,700 | 634 | ||||||
Era Group * | 2,125 | 19 | ||||||
Erin Energy * | 1,500 | 4 | ||||||
Evolution Petroleum | 2,696 | 15 | ||||||
EXCO Resources * | 14,937 | 21 | ||||||
Exterran * | 3,298 | 42 | ||||||
Exxon Mobil | 212,835 | 18,932 | ||||||
Fairmount Santrol Holdings * | 6,831 | 47 | ||||||
FMC Technologies * | 11,400 | 289 | ||||||
Forum Energy Technologies * | 6,182 | 101 | ||||||
Frontline | 6,743 | 54 | ||||||
GasLog | 4,241 | 57 | ||||||
Gener8 Maritime * | 4,143 | 22 | ||||||
Geospace Technologies * | 1,380 | 23 | ||||||
Golar LNG | 9,321 | 158 | ||||||
Green Plains | 3,737 | 85 | ||||||
Gulfport Energy * | 6,300 | 183 | ||||||
Halliburton | 44,200 | 1,930 | ||||||
Helix Energy Solutions Group * | 10,399 | 83 | ||||||
Helmerich & Payne | 4,900 | 304 | ||||||
Hess | 14,300 | 767 | ||||||
HollyFrontier | 8,200 | 208 | ||||||
Hornbeck Offshore Services * | 3,415 | 27 | ||||||
Independence Contract Drilling * | 3,276 | 16 | ||||||
Isramco * | 61 | 5 | ||||||
Jones Energy, Cl A * | 3,413 | 13 | ||||||
Kinder Morgan | 99,200 | 2,017 | ||||||
Kosmos Energy * | 9,900 | 55 | ||||||
Laredo Petroleum * | 7,728 | 77 | ||||||
Marathon Oil | 42,900 | 585 | ||||||
Marathon Petroleum | 26,700 | 1,052 | ||||||
Matador Resources * | 8,696 | 183 | ||||||
Matrix Service * | 2,766 | 46 | ||||||
McDermott International * | 25,963 | 134 | ||||||
Memorial Resource Development * | 5,100 | 76 | ||||||
Murphy Oil | 8,300 | 228 | ||||||
Nabors Industries | 13,900 | 125 | ||||||
National Oilwell Varco | 19,100 | 618 | ||||||
Natural Gas Services Group * | 1,295 | 33 | ||||||
Navios Maritime Acquisition | 8,951 | 14 | ||||||
Newfield Exploration * | 10,000 | 433 | ||||||
Description | Shares | Market Value ($ Thousands) | ||||||
COMMON STOCK (continued) |
| |||||||
Newpark Resources * | 8,613 | $ | 54 | |||||
Noble | 12,200 | 90 | ||||||
Noble Energy | 21,500 | 768 | ||||||
Northern Oil and Gas * | 5,052 | 20 | ||||||
Oasis Petroleum * | 18,641 | 142 | ||||||
Occidental Petroleum | 39,500 | 2,952 | ||||||
Oceaneering International | 5,000 | 139 | ||||||
Oil States International * | 5,362 | 166 | ||||||
ONEOK | 10,600 | 475 | ||||||
Overseas Shipholding Group, Cl A | 5,249 | 67 | ||||||
Pacific Ethanol * | 3,133 | 21 | ||||||
Panhandle Oil and Gas, Cl A | 1,616 | 26 | ||||||
Par Pacific Holdings * | 2,911 | 44 | ||||||
Parker Drilling * | 12,702 | 26 | ||||||
Parsley Energy, Cl A * | 7,600 | 217 | ||||||
Patterson-UTI Energy | 7,300 | 142 | ||||||
PBF Energy, Cl A | 4,900 | 109 | ||||||
PDC Energy * | 4,820 | 264 | ||||||
PHI * | 1,270 | 25 | ||||||
Phillips 66 | 23,300 | 1,772 | ||||||
Pioneer Energy Services * | 6,691 | 21 | ||||||
Pioneer Natural Resources | 8,319 | 1,352 | ||||||
QEP Resources | 10,900 | 198 | ||||||
Range Resources | 8,400 | 339 | ||||||
Renewable Energy Group * | 4,517 | 44 | ||||||
REX American Resources * | 592 | 39 | ||||||
Rice Energy * | 6,000 | 140 | ||||||
RigNet * | 1,379 | 16 | ||||||
Ring Energy * | 3,744 | 30 | ||||||
RPC | 3,700 | 54 | ||||||
RSP Permian * | 8,224 | 296 | ||||||
Sanchez Energy * | 5,823 | 37 | ||||||
Schlumberger | 71,728 | 5,776 | ||||||
Scorpio Tankers | 16,891 | 80 | ||||||
SEACOR Holdings * | 1,737 | 98 | ||||||
Seadrill * | 40,671 | 121 | ||||||
SemGroup, Cl A | 5,543 | 161 | ||||||
Ship Finance International | 6,179 | 93 | ||||||
SM Energy | 3,400 | 92 | ||||||
Southwestern Energy * | 19,800 | 289 | ||||||
Spectra Energy | 35,500 | 1,277 | ||||||
Superior Energy Services | 7,600 | 121 | ||||||
Surgutneftegas ADR | 33,837 | 168 | ||||||
Synergy Resources * | 20,008 | 130 | ||||||
Targa Resources | 7,900 | 294 | ||||||
Tesco | 4,118 | 27 | ||||||
Tesoro | 6,000 | 457 | ||||||
TETRA Technologies * | 9,496 | 57 | ||||||
Tidewater | 5,009 | 21 | ||||||
Unit * | 5,221 | 65 | ||||||
US Silica Holdings | 6,696 | 231 | ||||||
Valero Energy | 23,800 | 1,244 | ||||||
| 26 | Adviser Managed Trust / Annual Report / July 31, 2016 |
SCHEDULE OF INVESTMENTS
July 31, 2016
Tactical Offensive Equity Fund (Continued)
Description | Shares | Market Value ($ Thousands) | ||||||
COMMON STOCK (continued) |
| |||||||
W&T Offshore * | 4,080 | $ | 8 | |||||
Western Refining | 7,120 | 148 | ||||||
Westmoreland Coal * | 1,965 | 19 | ||||||
Whiting Petroleum * | 10,200 | 75 | ||||||
Willbros Group * | 4,741 | 10 | ||||||
Williams | 34,900 | 837 | ||||||
World Fuel Services | 3,500 | 167 | ||||||
WPX Energy * | 14,000 | 140 | ||||||
|
| |||||||
| 76,414 | ||||||||
|
| |||||||
Financials — 12.2% |
| |||||||
1st Source | 1,624 | 55 | ||||||
Acadia Realty Trust †† | 7,408 | 279 | ||||||
Access National | 877 | 20 | ||||||
ACNB | 642 | 17 | ||||||
Affiliated Managers Group * | 2,700 | 396 | ||||||
Aflac | 20,800 | 1,503 | ||||||
Agree Realty †† | 2,460 | 125 | ||||||
Alexander & Baldwin | 4,884 | 192 | ||||||
Alexander’s †† | 232 | 100 | ||||||
Alexandria Real Estate Equities †† | 3,700 | 416 | ||||||
Alleghany * | 800 | 435 | ||||||
Allegiance Bancshares * | 1,157 | 29 | ||||||
Allied World Assurance Holdings | 4,400 | 180 | ||||||
Allstate | 19,000 | 1,298 | ||||||
Ally Financial | 22,500 | 406 | ||||||
Altisource Residential †† | 5,436 | 52 | ||||||
Ambac Financial Group * | 4,653 | 85 | ||||||
American Assets Trust †† | 4,097 | 188 | ||||||
American Campus Communities †† | 6,600 | 357 | ||||||
American Capital Agency †† | 16,800 | 329 | ||||||
American Capital Mortgage Investment †† | 4,752 | 78 | ||||||
American Equity Investment Life Holding | 8,647 | 138 | ||||||
American Express | 41,500 | 2,675 | ||||||
American Financial Group | 3,500 | 256 | ||||||
American Homes 4 Rent, Cl A †† | 8,400 | 182 | ||||||
American International Group | 57,400 | 3,125 | ||||||
American National Bankshares | 889 | 23 | ||||||
American National Insurance | 700 | 80 | ||||||
American Tower, Cl A †† | 21,900 | 2,535 | ||||||
Ameriprise Financial | 7,900 | 757 | ||||||
Ameris Bancorp | 3,506 | 116 | ||||||
AMERISAFE | 2,049 | 120 | ||||||
Ames National | 925 | 25 | ||||||
AmTrust Financial Services | 4,500 | 107 | ||||||
Annaly Capital Management †† | 46,800 | 514 | ||||||
Anworth Mortgage Asset †† | 9,958 | 49 | ||||||
Apartment Investment & Management, Cl A †† | 7,900 | 363 | ||||||
Apollo Commercial Real Estate Finance †† | 6,398 | 104 | ||||||
Apollo Residential Mortgage †† | 3,328 | 45 | ||||||
Apple Hospitality †† | 8,300 | 169 | ||||||
Arch Capital Group * | 5,800 | 421 | ||||||
Description | Shares | Market Value ($ Thousands) | ||||||
COMMON STOCK (continued) |
| |||||||
Ares Commercial Real Estate †† | 2,813 | $ | 36 | |||||
Argo Group International Holdings | 3,021 | 157 | ||||||
Arlington Asset Investment, Cl A | 2,368 | 33 | ||||||
Armada Hoffler Properties †† | 3,239 | 49 | ||||||
ARMOUR Residential †† | 3,796 | 81 | ||||||
Arrow Financial | 1,150 | 36 | ||||||
Arthur J Gallagher | 8,900 | 438 | ||||||
Artisan Partners Asset Management, Cl A | 3,000 | 84 | ||||||
Ashford Hospitality Prime †† | 2,682 | 40 | ||||||
Ashford Hospitality Trust †† | 8,136 | 49 | ||||||
Aspen Insurance Holdings | 3,000 | 138 | ||||||
Associated Banc-Corp | 7,500 | 140 | ||||||
Associated Capital Group | 432 | 13 | ||||||
Assurant | 3,100 | 257 | ||||||
Assured Guaranty | 6,700 | 180 | ||||||
Astoria Financial | 9,861 | 145 | ||||||
Atlantic Capital Bancshares * | 1,827 | 27 | ||||||
Atlas Financial Holdings * | 1,157 | 20 | ||||||
AV Homes * | 1,346 | 19 | ||||||
AvalonBay Communities †† | 7,009 | 1,301 | ||||||
Axis Capital Holdings | 4,600 | 256 | ||||||
B. Riley Financial | 1,039 | 9 | ||||||
Baldwin & Lyons, Cl B | 954 | 25 | ||||||
Banc of California | 5,032 | 112 | ||||||
BancFirst | 814 | 53 | ||||||
Bancorp * | 3,721 | 20 | ||||||
BancorpSouth | 9,065 | 216 | ||||||
Bank Mutual | 4,279 | 33 | ||||||
Bank of America | 529,330 | 7,670 | ||||||
Bank of Hawaii | 2,100 | 145 | ||||||
Bank of Marin Bancorp | 627 | 31 | ||||||
Bank of New York Mellon | 54,500 | 2,147 | ||||||
Bank of the Ozarks | 9,282 | 334 | ||||||
BankFinancial | 1,654 | 20 | ||||||
BankUnited | 5,000 | 150 | ||||||
Bankwell Financial Group | 622 | 14 | ||||||
Banner | 3,187 | 133 | ||||||
Bar Harbor Bankshares | 631 | 23 | ||||||
BB&T | 42,000 | 1,549 | ||||||
BBCN Bancorp | 8,392 | 129 | ||||||
BBX Capital, Cl A * | 213 | 4 | ||||||
Bear State Financial | 1,924 | 18 | ||||||
Beneficial Bancorp | 7,238 | 98 | ||||||
Berkshire Hathaway, Cl B * | 97,143 | 14,015 | ||||||
Berkshire Hills Bancorp | 3,175 | 84 | ||||||
BGC Partners, Cl A | 22,792 | 202 | ||||||
BlackRock, Cl A | 6,374 | 2,334 | ||||||
Blue Capital Reinsurance Holdings | 649 | 12 | ||||||
Blue Hills Bancorp | 2,575 | 37 | ||||||
Bluerock Residential Growth, Cl A †† | 1,982 | 26 | ||||||
BNC Bancorp | 3,905 | 95 | ||||||
BofI Holding * | 6,491 | 109 | ||||||
| Adviser Managed Trust / Annual Report / July 31, 2016 | 27 |
SCHEDULE OF INVESTMENTS
July 31, 2016
Tactical Offensive Equity Fund (Continued)
Description | Shares | Market Value ($ Thousands) | ||||||
COMMON STOCK (continued) |
| |||||||
BOK Financial | 1,800 | $ | 117 | |||||
Boston Private Financial Holdings | 8,435 | 102 | ||||||
Boston Properties †† | 7,800 | 1,109 | ||||||
Brandywine Realty Trust †† | 8,700 | 147 | ||||||
Bridge Bancorp | 1,738 | 51 | ||||||
Brixmor Property Group †† | 9,700 | 275 | ||||||
Brookline Bancorp | 7,149 | 81 | ||||||
Brown & Brown | 5,900 | 216 | ||||||
Bryn Mawr Bank | 1,730 | 51 | ||||||
BSB Bancorp * | 878 | 20 | ||||||
C&F Financial | 348 | 16 | ||||||
Calamos Asset Management, Cl A | 1,876 | 13 | ||||||
California First National Bancorp | 303 | 4 | ||||||
Camden National | 1,060 | 46 | ||||||
Camden Property Trust †† | 4,300 | 385 | ||||||
Capital Bank Financial, Cl A | 2,054 | 61 | ||||||
Capital City Bank Group | 1,209 | 17 | ||||||
Capital One Financial | 26,300 | 1,764 | ||||||
Capitol Federal Financial | 13,352 | 189 | ||||||
Capstead Mortgage †† | 10,397 | 103 | ||||||
Cardinal Financial | 3,249 | 84 | ||||||
Care Capital Properties †† | 4,200 | 124 | ||||||
CareTrust †† | 5,941 | 86 | ||||||
Carolina Financial | 1,112 | 21 | ||||||
Cascade Bancorp * | 3,425 | 19 | ||||||
Cash America International | 2,462 | 106 | ||||||
CatchMark Timber Trust, Cl A †† | 4,037 | 49 | ||||||
Cathay General Bancorp | 7,771 | 233 | ||||||
CBL & Associates Properties †† | 17,682 | 217 | ||||||
CBOE Holdings | 4,100 | 282 | ||||||
CBRE Group, Cl A * | 15,200 | 432 | ||||||
Cedar Realty Trust †† | 8,546 | 69 | ||||||
CenterState Banks | 4,790 | 80 | ||||||
Central Pacific Financial | 3,128 | 77 | ||||||
Central Valley Community Bancorp | 953 | 14 | ||||||
Century Bancorp, Cl A | 330 | 14 | ||||||
Charles Schwab | 60,200 | 1,711 | ||||||
Charter Financial | 1,484 | 19 | ||||||
Chatham Lodging Trust †† | 3,871 | 93 | ||||||
Chemical Financial | 4,011 | 166 | ||||||
Chemung Financial | 349 | 11 | ||||||
Chesapeake Lodging Trust †† | 6,231 | 157 | ||||||
Chimera Investment †† | 9,500 | 159 | ||||||
Chubb | 23,900 | 2,994 | ||||||
Cincinnati Financial | 7,600 | 568 | ||||||
CIT Group | 10,100 | 349 | ||||||
Citigroup | 151,300 | 6,628 | ||||||
Citizens, Cl A * | 4,856 | 41 | ||||||
Citizens & Northern | 1,238 | 26 | ||||||
Citizens Financial Group | 26,800 | 598 | ||||||
City Holding | 1,509 | 70 | ||||||
City Office †† | 1,984 | 27 | ||||||
Description | Shares | Market Value ($ Thousands) | ||||||
COMMON STOCK (continued) |
| |||||||
Clifton Bancorp | 2,292 | $ | 34 | |||||
CME Group, Cl A | 17,600 | 1,799 | ||||||
CNA Financial | 1,700 | 54 | ||||||
CNB Financial | 1,462 | 27 | ||||||
CNO Financial Group | 18,728 | 325 | ||||||
CoBiz Financial | 3,870 | 48 | ||||||
Codorus Valley Bancorp | 846 | 18 | ||||||
Cohen & Steers | 2,155 | 93 | ||||||
Colony Capital †† | 11,784 | 210 | ||||||
Colony Starwood Homes †† | 6,805 | 223 | ||||||
Columbia Banking System | 6,083 | 184 | ||||||
Columbia Property Trust †† | 6,300 | 153 | ||||||
Comerica | 8,800 | 398 | ||||||
Commerce Bancshares | 4,200 | 199 | ||||||
Communications Sales & Leasing †† | 6,200 | 193 | ||||||
Community Bank System | 4,509 | 199 | ||||||
Community Healthcare Trust †† | 1,353 | 31 | ||||||
Community Trust Bancorp | 1,580 | 55 | ||||||
CommunityOne Bancorp * | 411 | 5 | ||||||
ConnectOne Bancorp | 2,956 | 50 | ||||||
Consolidated-Tomoka Land | 444 | 22 | ||||||
CorEnergy Infrastructure Trust †† | 1,250 | 37 | ||||||
CoreSite Realty †† | 3,504 | 289 | ||||||
Corporate Office Properties Trust †† | 4,800 | 144 | ||||||
Corrections Corp of America †† | 5,900 | 189 | ||||||
County Bancorp | 531 | 11 | ||||||
Cousins Properties †† | 21,741 | 231 | ||||||
Cowen Group, Cl A * | 10,713 | 33 | ||||||
Crawford, Cl B | 1,946 | 21 | ||||||
Credit Acceptance * | 600 | 108 | ||||||
Crown Castle International †† | 17,500 | 1,698 | ||||||
CU Bancorp * | 1,695 | 40 | ||||||
CubeSmart †† | 9,000 | 267 | ||||||
Cullen | 2,700 | 183 | ||||||
Customers Bancorp * | 2,521 | 65 | ||||||
CVB Financial | 10,596 | 174 | ||||||
CyrusOne †† | 3,600 | 197 | ||||||
CYS Investments †† | 16,281 | 146 | ||||||
DCT Industrial Trust †† | 4,600 | 231 | ||||||
DDR †† | 15,600 | 308 | ||||||
Diamond Hill Investment Group | 314 | 60 | ||||||
DiamondRock Hospitality †† | 21,023 | 206 | ||||||
Digital Realty Trust †† | 7,400 | 773 | ||||||
Dime Community Bancshares | 3,244 | 56 | ||||||
Discover Financial Services | 20,800 | 1,182 | ||||||
Donegal Group, Cl A | 920 | 15 | ||||||
Douglas Emmett †† | 7,100 | 270 | ||||||
Duke Realty †† | 17,500 | 504 | ||||||
DuPont Fabros Technology †† | 7,795 | 373 | ||||||
Dynex Capital †† | 4,707 | 33 | ||||||
E*TRADE Financial * | 14,100 | 354 | ||||||
Eagle Bancorp * | 3,205 | 165 | ||||||
| 28 | Adviser Managed Trust / Annual Report / July 31, 2016 |
SCHEDULE OF INVESTMENTS
July 31, 2016
Tactical Offensive Equity Fund (Continued)
Description | Shares | Market Value ($ Thousands) | ||||||
COMMON STOCK (continued) |
| |||||||
East West Bancorp | 7,300 | $ | 250 | |||||
Easterly Government Properties †† | 3,377 | 69 | ||||||
EastGroup Properties †† | 3,306 | 243 | ||||||
Eaton Vance | 5,500 | 208 | ||||||
Education Realty Trust †† | 6,948 | 334 | ||||||
eHealth * | 1,904 | 18 | ||||||
EMC Insurance Group | 883 | 25 | ||||||
Empire State Realty Trust, Cl A †† | 6,100 | 128 | ||||||
Employers Holdings | 3,307 | 94 | ||||||
Encore Capital Group * | 2,468 | 60 | ||||||
Endurance Specialty Holdings | 3,200 | 216 | ||||||
Enova International * | 2,821 | 26 | ||||||
Enstar Group * | 1,192 | 199 | ||||||
Enterprise Bancorp | 892 | 21 | ||||||
Enterprise Financial Services | 1,991 | 57 | ||||||
EPR Properties †† | 3,200 | 269 | ||||||
Equinix †† | 3,600 | 1,342 | ||||||
Equity Bancshares, Cl A * | 554 | 13 | ||||||
Equity Commonwealth *†† | 6,200 | 186 | ||||||
Equity LifeStyle Properties †† | 3,900 | 321 | ||||||
Equity One †† | 4,600 | 153 | ||||||
Equity Residential †† | 18,100 | 1,231 | ||||||
Erie Indemnity, Cl A | 1,200 | 117 | ||||||
ESSA Bancorp | 896 | 13 | ||||||
Essent Group * | 7,824 | 187 | ||||||
Essex Property Trust †† | 3,300 | 772 | ||||||
EverBank Financial | 10,793 | 194 | ||||||
Evercore Partners, Cl A | 4,089 | 207 | ||||||
Everest Re Group | 2,100 | 397 | ||||||
Extra Space Storage †† | 6,100 | 525 | ||||||
Ezcorp, Cl A * | 5,282 | 48 | ||||||
FactSet Research Systems | 2,000 | 344 | ||||||
Farmers Capital Bank | 798 | 24 | ||||||
Farmers National Banc | 2,687 | 26 | ||||||
Farmland Partners †† | 1,262 | 15 | ||||||
FBL Financial Group, Cl A | 1,019 | 64 | ||||||
FBR | 696 | 11 | ||||||
FCB Financial Holdings, Cl A * | 3,248 | 114 | ||||||
Federal Agricultural Mortgage, Cl C | 901 | 35 | ||||||
Federal Realty Investment Trust †† | 3,600 | 611 | ||||||
Federated Investors, Cl B | 4,700 | 148 | ||||||
Federated National Holding | 1,355 | 28 | ||||||
FelCor Lodging Trust †† | 14,058 | 89 | ||||||
Fidelity & Guaranty Life | 1,253 | 27 | ||||||
Fidelity Southern | 2,173 | 37 | ||||||
Fifth Street Asset Management, Cl A | 932 | 4 | ||||||
Fifth Third Bancorp | 38,700 | 735 | ||||||
Financial Engines | 5,697 | 150 | ||||||
Financial Institutions | 1,449 | 39 | ||||||
First American Financial | 5,400 | 226 | ||||||
First Bancorp | 3,159 | 63 | ||||||
First BanCorp * | 12,352 | 57 | ||||||
Description | Shares | Market Value ($ Thousands) | ||||||
COMMON STOCK (continued) |
| |||||||
First Busey | 3,202 | $ | 72 | |||||
First Business Financial Services | 878 | 21 | ||||||
First Cash Financial Services | 2,926 | 150 | ||||||
First Citizens BancShares, Cl A | 794 | 206 | ||||||
First Commonwealth Financial | 9,140 | 88 | ||||||
First Community Bancshares | 1,634 | 37 | ||||||
First Community Financial Partners * | 1,485 | 13 | ||||||
First Connecticut Bancorp | 1,508 | 24 | ||||||
First Defiance Financial | 921 | 38 | ||||||
First Financial | 1,045 | 40 | ||||||
First Financial Bancorp | 6,604 | 141 | ||||||
First Financial Bankshares | 6,679 | 228 | ||||||
First Financial Northwest | 992 | 14 | ||||||
First Foundation * | 1,387 | 33 | ||||||
First Horizon National | 11,700 | 170 | ||||||
First Industrial Realty Trust †† | 12,139 | 358 | ||||||
First Internet Bancorp | 565 | 13 | ||||||
First Interstate BancSystem, Cl A | 2,043 | 59 | ||||||
First Merchants | 4,196 | 110 | ||||||
First Mid-Illinois Bancshares | 620 | 16 | ||||||
First Midwest Bancorp | 8,671 | 162 | ||||||
First NBC Bank Holding * | 1,648 | 31 | ||||||
First Niagara Financial Group | 17,800 | 181 | ||||||
First Northwest Bancorp * | 1,198 | 16 | ||||||
First of Long Island | 1,484 | 45 | ||||||
First Potomac Realty Trust †† | 6,015 | 61 | ||||||
First Republic Bank | 7,400 | 530 | ||||||
FirstMerit | 17,298 | 367 | ||||||
Flagstar Bancorp * | 2,172 | 57 | ||||||
Flushing Financial | 2,880 | 64 | ||||||
FNB | 21,977 | 263 | ||||||
FNF Group | 13,300 | 501 | ||||||
FNFV Group * | 6,793 | 81 | ||||||
Forest City Realty Trust, Cl A †† | 11,600 | 274 | ||||||
Forestar Group * | 3,562 | 44 | ||||||
Four Corners Property Trust †† | 6,513 | 141 | ||||||
Franklin Financial Network * | 984 | 33 | ||||||
Franklin Resources | 18,300 | 662 | ||||||
Franklin Street Properties †† | 10,539 | 135 | ||||||
FRP Holdings * | 680 | 25 | ||||||
Fulton Financial | 17,993 | 246 | ||||||
GAIN Capital Holdings | 3,940 | 26 | ||||||
GAMCO Investors, Cl A | 432 | 15 | ||||||
Gaming and Leisure Properties †† | 9,500 | 340 | ||||||
General Growth Properties †† | 29,200 | 933 | ||||||
Genworth Financial, Cl A * | 54,145 | 155 | ||||||
GEO Group †† | 7,766 | 269 | ||||||
German American Bancorp | 1,476 | 50 | ||||||
Getty Realty †† | 2,715 | 62 | ||||||
Glacier Bancorp | 7,978 | 220 | ||||||
Gladstone Commercial †† | 2,332 | 42 | ||||||
Global Net Lease †† | 18,332 | 160 | ||||||
| Adviser Managed Trust / Annual Report / July 31, 2016 | 29 |
SCHEDULE OF INVESTMENTS
July 31, 2016
Tactical Offensive Equity Fund (Continued)
Description | Shares | Market Value ($ Thousands) | ||||||
COMMON STOCK (continued) |
| |||||||
Goldman Sachs Group | 20,000 | $ | 3,176 | |||||
Government Properties Income Trust †† | 7,345 | 175 | ||||||
Gramercy Property Trust †† | 44,736 | 447 | ||||||
Great Ajax †† | 1,383 | 19 | ||||||
Great Southern Bancorp | 1,119 | 44 | ||||||
Great Western Bancorp | 6,183 | 205 | ||||||
Green Bancorp * | 2,210 | 22 | ||||||
Green Dot, Cl A * | 4,395 | 106 | ||||||
Greene County Bancorp | 367 | 6 | ||||||
Greenhill | 2,889 | 57 | ||||||
Greenlight Capital Re, Cl A * | 3,043 | 63 | ||||||
Griffin Industrial Realty | 101 | 3 | ||||||
Guaranty Bancorp | 1,584 | 27 | ||||||
Hallmark Financial Services * | 1,528 | 16 | ||||||
Hampton Roads Bankshares * | 4,109 | 8 | ||||||
Hancock Holding | 8,103 | 235 | ||||||
Hanmi Financial | 3,240 | 79 | ||||||
Hannon Armstrong Sustainable Infrastructure Capital †† | 4,274 | 96 | ||||||
Hanover Insurance Group | 2,100 | 173 | ||||||
Hartford Financial Services Group | 19,800 | 789 | ||||||
HCI Group | 913 | 28 | ||||||
HCP †† | 23,700 | 930 | ||||||
Healthcare Realty Trust †† | 11,804 | 427 | ||||||
Healthcare Trust of America, Cl A †† | 6,800 | 232 | ||||||
Heartland Financial | 2,267 | 83 | ||||||
Hennessy Advisors | 319 | 11 | ||||||
Heritage Commerce | 2,745 | 29 | ||||||
Heritage Financial | 3,060 | 53 | ||||||
Heritage Insurance Holdings | 2,785 | 35 | ||||||
Heritage Oaks Bancorp | 2,556 | 21 | ||||||
Hersha Hospitality Trust, Cl A †† | 4,277 | 81 | ||||||
HFF, Cl A | 3,696 | 104 | ||||||
Highwoods Properties †† | 4,800 | 267 | ||||||
Hilltop Holdings * | 7,861 | 171 | ||||||
Hingham Institution | 147 | 19 | ||||||
Home Bancorp | 630 | 18 | ||||||
Home BancShares | 12,658 | 264 | ||||||
HomeStreet * | 2,456 | 55 | ||||||
HomeTrust Bancshares * | 1,735 | 32 | ||||||
Horace Mann Educators | 4,366 | 149 | ||||||
Horizon Bancorp | 1,180 | 32 | ||||||
Hospitality Properties Trust †† | 7,600 | 243 | ||||||
Host Hotels & Resorts | 37,300 | 662 | ||||||
Houlihan Lokey, Cl A | 1,284 | 29 | ||||||
Howard Hughes * | 1,800 | 215 | ||||||
Hudson Pacific Properties †† | 9,810 | 332 | ||||||
Huntington Bancshares | 40,200 | 382 | ||||||
IBERIABANK | 4,284 | 268 | ||||||
Impac Mortgage Holdings * | 879 | 15 | ||||||
Independence Holding | 787 | 14 | ||||||
Independence Realty Trust †† | 4,222 | 38 | ||||||
Description | Shares | Market Value ($ Thousands) | ||||||
COMMON STOCK (continued) |
| |||||||
Independent Bank | 4,899 | $ | 172 | |||||
Independent Bank Group | 1,156 | 49 | ||||||
Infinity Property & Casualty | 1,113 | 91 | ||||||
InfraREIT †† | 4,117 | 73 | ||||||
Interactive Brokers Group, Cl A | 3,200 | 112 | ||||||
Intercontinental Exchange | 6,000 | 1,585 | ||||||
International Bancshares | 5,826 | 160 | ||||||
INTL. FCStone * | 1,569 | 46 | ||||||
Invesco | 20,800 | 607 | ||||||
Invesco Mortgage Capital †† | 11,797 | 170 | ||||||
Investment Technology Group | 3,412 | 57 | ||||||
Investors Bancorp | 31,093 | 353 | ||||||
Investors Real Estate Trust †† | 12,506 | 83 | ||||||
Investors Title | 155 | 16 | ||||||
Iron Mountain †† | 13,200 | 544 | ||||||
iStar Financial *†† | 7,512 | 78 | ||||||
James River Group Holdings | 1,482 | 50 | ||||||
Janus Capital Group | 15,116 | 228 | ||||||
Jones Lang LaSalle | 2,300 | 252 | ||||||
JPMorgan Chase | 187,106 | 11,969 | ||||||
KCG Holdings, Cl A * | 5,422 | 82 | ||||||
Kearny Financial | 9,892 | 129 | ||||||
Kemper | 4,279 | 147 | ||||||
Kennedy-Wilson Holdings | 8,644 | 182 | ||||||
KeyCorp | 42,500 | 497 | ||||||
Kilroy Realty †† | 4,600 | 337 | ||||||
Kimco Realty †† | 20,400 | 655 | ||||||
Kite Realty Group Trust †† | 8,649 | 263 | ||||||
Ladder Capital, Cl A †† | 3,983 | 52 | ||||||
Ladenburg Thalmann Financial Services * | 10,681 | 26 | ||||||
Lake Sunapee Bank Group | 849 | 16 | ||||||
Lakeland Bancorp | 4,038 | 48 | ||||||
Lakeland Financial | 1,660 | 85 | ||||||
Lamar Advertising, Cl A †† | 4,100 | 278 | ||||||
LaSalle Hotel Properties †† | 11,160 | 307 | ||||||
Lazard, Cl A | 6,400 | 229 | ||||||
LCNB | 952 | 17 | ||||||
LegacyTexas Financial Group | 4,763 | 136 | ||||||
Legg Mason | 5,300 | 181 | ||||||
LendingClub * | 34,476 | 159 | ||||||
LendingTree * | 658 | 66 | ||||||
Leucadia National | 16,600 | 303 | ||||||
Lexington Realty Trust †† | 24,051 | 261 | ||||||
Liberty Property Trust †† | 7,400 | 306 | ||||||
Lincoln National | 12,100 | 528 | ||||||
Live Oak Bancshares | 2,058 | 27 | ||||||
Loews | 14,200 | 587 | ||||||
LPL Financial Holdings | 4,300 | 116 | ||||||
LTC Properties †† | 3,945 | 211 | ||||||
M&T Bank | 7,600 | 871 | ||||||
Macatawa Bank | 2,871 | 22 | ||||||
Macerich †† | 7,300 | 651 | ||||||
| 30 | Adviser Managed Trust / Annual Report / July 31, 2016 |
SCHEDULE OF INVESTMENTS
July 31, 2016
Tactical Offensive Equity Fund (Continued)
Description | Shares | Market Value ($ Thousands) | ||||||
COMMON STOCK (continued) |
| |||||||
Mack-Cali Realty †† | 9,337 | $ | 263 | |||||
Maiden Holdings | 6,108 | 85 | ||||||
MainSource Financial Group | 2,395 | 53 | ||||||
Manning & Napier, Cl A | 1,617 | 13 | ||||||
Marcus & Millichap * | 1,517 | 41 | ||||||
Markel * | 700 | 664 | ||||||
MarketAxess Holdings | 1,900 | 307 | ||||||
Marlin Business Services | 915 | 17 | ||||||
Marsh & McLennan | 27,200 | 1,788 | ||||||
MB Financial | 7,320 | 281 | ||||||
MBIA * | 13,560 | 114 | ||||||
MBT Financial | 1,920 | 17 | ||||||
Medical Properties Trust †† | 24,780 | 389 | ||||||
Medley Management, Cl A | 508 | 4 | ||||||
Mercantile Bank | 1,659 | 42 | ||||||
Merchants Bancshares | 615 | 20 | ||||||
Mercury General | 1,573 | 87 | ||||||
Meridian Bancorp | 4,984 | 73 | ||||||
Meta Financial Group | 858 | 47 | ||||||
MetLife | 48,000 | 2,052 | ||||||
MFA Financial †† | 18,700 | 141 | ||||||
MGIC Investment * | 35,717 | 257 | ||||||
Mid-America Apartment Communities †† | 3,800 | 403 | ||||||
Middleburg Financial | 511 | 14 | ||||||
Midland States Bancorp | 415 | 9 | ||||||
MidWestOne Financial Group | 873 | 25 | ||||||
Moelis, Cl A | 1,935 | 48 | ||||||
Monmouth Real Estate Investment †† | 6,506 | 90 | ||||||
Monogram Residential Trust †† | 17,642 | 189 | ||||||
Moody’s | 8,600 | 912 | ||||||
Morgan Stanley | 74,400 | 2,138 | ||||||
Morningstar | 1,033 | 87 | ||||||
Mortgage Investment Trust †† | 2,927 | 44 | ||||||
MSCI, Cl A | 4,600 | 396 | ||||||
MutualFirst Financial | 586 | 17 | ||||||
NASDAQ OMX Group | 5,700 | 403 | ||||||
National Bank Holdings, Cl A | 2,717 | 54 | ||||||
National Bankshares | 720 | 25 | ||||||
National Commerce * | 900 | 22 | ||||||
National General Holdings | 4,985 | 103 | ||||||
National Health Investors †† | 3,896 | 306 | ||||||
National Interstate | 793 | 26 | ||||||
National Retail Properties †† | 7,200 | 383 | ||||||
National Storage Affiliates Trust †† | 3,691 | 79 | ||||||
National Western Life Group, Cl A | 235 | 44 | ||||||
Nationstar Mortgage Holdings * | 3,564 | 45 | ||||||
Navient | 16,600 | 236 | ||||||
Navigators Group | 1,156 | 108 | ||||||
NBT Bancorp | 4,562 | 136 | ||||||
Nelnet, Cl A | 2,090 | 84 | ||||||
New Residential Investment †† | 23,373 | 320 | ||||||
New Senior Investment Group †† | 7,875 | 94 | ||||||
Description | Shares | Market Value ($ Thousands) | ||||||
COMMON STOCK (continued) |
| |||||||
New York †† | 17,318 | $ | 165 | |||||
New York Community Bancorp | 24,000 | 347 | ||||||
New York Mortgage Trust †† | 12,147 | 79 | ||||||
NewStar Financial * | 2,604 | 27 | ||||||
NexPoint Residential Trust †† | 1,879 | 37 | ||||||
Nicolet Bankshares * | 798 | 29 | ||||||
NMI Holdings, Cl A * | 5,196 | 33 | ||||||
Northern Trust | 10,500 | 710 | ||||||
Northfield Bancorp | 4,356 | 65 | ||||||
Northrim BanCorp | 733 | 21 | ||||||
NorthStar Asset Management Group | 10,352 | 123 | ||||||
NorthStar Realty Europe †† | 6,183 | 57 | ||||||
NorthStar Realty Finance †† | 9,100 | 122 | ||||||
Northwest Bancshares | 10,072 | 150 | ||||||
OceanFirst Financial | 2,140 | 40 | ||||||
Ocwen Financial * | 10,977 | 22 | ||||||
OFG Bancorp | 4,519 | 48 | ||||||
Old Line Bancshares | 900 | 17 | ||||||
Old National Bancorp | 13,918 | 183 | ||||||
Old Republic International | 12,200 | 236 | ||||||
Old Second Bancorp | 3,119 | 24 | ||||||
OM Asset Management | 4,162 | 58 | ||||||
Omega Healthcare Investors †† | 9,300 | 321 | ||||||
On Deck Capital * | 5,163 | 27 | ||||||
One Liberty Properties †† | 1,385 | 35 | ||||||
OneBeacon Insurance Group, Cl A | 2,098 | 29 | ||||||
OneMain Holdings, Cl A * | 4,200 | 121 | ||||||
Oppenheimer Holdings, Cl A | 1,086 | 17 | ||||||
Opus Bank | 1,777 | 57 | ||||||
Orchid Island Capital, Cl A †† | 2,216 | 25 | ||||||
Oritani Financial | 3,994 | 65 | ||||||
Orrstown Financial Services | 802 | 16 | ||||||
Outfront Media †† | 7,000 | 163 | ||||||
Owens Realty Mortgage †† | 1,097 | 18 | ||||||
Pacific Continental | 2,005 | 29 | ||||||
Pacific Mercantile Bancorp * | 1,689 | 12 | ||||||
Pacific Premier Bancorp * | 3,004 | 73 | ||||||
PacWest Bancorp | 6,000 | 248 | ||||||
Paramount Group †† | 9,100 | 160 | ||||||
Park National | 1,468 | 131 | ||||||
Park Sterling | 5,382 | 42 | ||||||
Parkway Properties †† | 8,644 | 150 | ||||||
Patriot National * | 1,238 | 10 | ||||||
Peapack Gladstone Financial | 1,650 | 33 | ||||||
Pebblebrook Hotel Trust †† | 7,486 | 222 | ||||||
Penns Woods Bancorp | 503 | 21 | ||||||
Pennsylvania †† | 7,160 | 182 | ||||||
PennyMac Financial Services, Cl A * | 1,488 | 19 | ||||||
PennyMac Mortgage Investment Trust †† | 7,366 | 120 | ||||||
Peoples Bancorp | 1,680 | 38 | ||||||
Peoples Financial Services | 724 | 29 | ||||||
People’s United Financial | 15,600 | 237 | ||||||
| Adviser Managed Trust / Annual Report / July 31, 2016 | 31 |
SCHEDULE OF INVESTMENTS
July 31, 2016
Tactical Offensive Equity Fund (Continued)
Description | Shares | Market Value ($ Thousands) | ||||||
COMMON STOCK (continued) |
| |||||||
People’s Utah Bancorp | 1,405 | $ | 25 | |||||
PHH * | 5,473 | 80 | ||||||
Physicians Realty Trust †† | 14,127 | 307 | ||||||
PICO Holdings * | 2,366 | 24 | ||||||
Piedmont Office Realty Trust, Cl A †† | 7,300 | 160 | ||||||
Pinnacle Financial Partners | 4,510 | 240 | ||||||
Piper Jaffray * | 1,587 | 66 | ||||||
PJT Partners | 1,847 | 47 | ||||||
PNC Financial Services Group | 26,000 | 2,149 | ||||||
Post Properties †† | 2,700 | 172 | ||||||
Potlatch †† | 4,260 | 163 | ||||||
PRA Group * | 4,977 | 139 | ||||||
Preferred Apartment Communities, Cl A †† | 2,373 | 35 | ||||||
Preferred Bank | 1,268 | 41 | ||||||
Premier Financial Bancorp | 918 | 16 | ||||||
Primerica | 4,915 | 253 | ||||||
Principal Financial Group | 13,600 | 634 | ||||||
PrivateBancorp | 8,206 | 363 | ||||||
ProAssurance | 2,700 | 139 | ||||||
Progressive | 29,500 | 959 | ||||||
Prologis †† | 26,500 | 1,444 | ||||||
Prosperity Bancshares | 6,994 | 357 | ||||||
Provident Bancorp * | 505 | 8 | ||||||
Provident Financial Holdings | 720 | 14 | ||||||
Provident Financial Services | 6,582 | 133 | ||||||
Prudential Financial | 22,800 | 1,717 | ||||||
PS Business Parks †† | 2,063 | 229 | ||||||
Public Storage †† | 7,600 | 1,816 | ||||||
Pzena Investment Management, Cl A | 1,636 | 13 | ||||||
QCR Holdings | 1,247 | 37 | ||||||
QTS Realty Trust, Cl A †† | 4,896 | 280 | ||||||
Radian Group | 22,528 | 291 | ||||||
RAIT Financial Trust †† | 9,643 | 31 | ||||||
Ramco-Gershenson Properties Trust †† | 8,254 | 164 | ||||||
Raymond James Financial | 6,400 | 351 | ||||||
Rayonier †† | 6,200 | 169 | ||||||
RE/MAX Holdings, Cl A | 1,834 | 79 | ||||||
Realogy Holdings * | 7,300 | 226 | ||||||
Realty Income †† | 13,100 | 936 | ||||||
Redwood Trust †† | 8,259 | 118 | ||||||
Regency Centers †† | 4,900 | 416 | ||||||
Regional Management * | 1,159 | 22 | ||||||
Regions Financial | 64,200 | 589 | ||||||
Reinsurance Group of America, Cl A | 3,200 | 318 | ||||||
RenaissanceRe Holdings | 2,100 | 247 | ||||||
Renasant | 4,399 | 142 | ||||||
Republic Bancorp, Cl A | 1,018 | 30 | ||||||
Republic First Bancorp * | 3,629 | 16 | ||||||
Resource America, Cl A | 1,314 | 13 | ||||||
Resource Capital †† | 3,160 | 43 | ||||||
Retail Opportunity Investments †† | 11,310 | 258 | ||||||
Retail Properties of America, Cl A †† | 12,000 | 212 | ||||||
Description | Shares | Market Value ($ Thousands) | ||||||
COMMON STOCK (continued) |
| |||||||
Rexford Industrial Realty †† | 7,042 | $ | 161 | |||||
RLI | 3,977 | 271 | ||||||
RLJ Lodging Trust †† | 12,750 | 303 | ||||||
RMR Group | 734 | 25 | ||||||
Ryman Hospitality Properties †† | 4,546 | 256 | ||||||
S&P Global | 13,400 | 1,637 | ||||||
S&T Bancorp | 3,523 | 90 | ||||||
Sabra Health Care †† | 6,940 | 166 | ||||||
Safeguard Scientifics * | 2,123 | 27 | ||||||
Safety Insurance Group | 1,483 | 94 | ||||||
Sandy Spring Bancorp | 2,433 | 73 | ||||||
Santander Consumer USA Holdings * | 6,312 | 69 | ||||||
Saul Centers †† | 994 | 67 | ||||||
Seacoast Banking Corp of Florida * | 3,077 | 49 | ||||||
SEI Investments † | 6,500 | 293 | ||||||
Select Income †† | 6,643 | 184 | ||||||
Selective Insurance Group | 5,948 | 233 | ||||||
Senior Housing Properties Trust †† | 11,900 | 264 | ||||||
Seritage Growth Properties †† | 2,667 | 134 | ||||||
ServisFirst Bancshares | 2,491 | 126 | ||||||
Shore Bancshares | 1,351 | 16 | ||||||
SI Financial Group | 1,225 | 16 | ||||||
Sierra Bancorp | 1,265 | 23 | ||||||
Signature Bank * | 2,700 | 325 | ||||||
Silver Bay Realty Trust †† | 3,445 | 62 | ||||||
Silvercrest Asset Management Group, Cl A | 787 | 10 | ||||||
Simmons First National, Cl A | 3,112 | 143 | ||||||
Simon Property Group †† | 15,874 | 3,604 | ||||||
SL Green Realty †† | 4,900 | 577 | ||||||
SLM * | 21,600 | 155 | ||||||
South State | 2,477 | 181 | ||||||
Southern First Bancshares * | 619 | 17 | ||||||
Southern Missouri Bancorp | 631 | 15 | ||||||
Southern National Bancorp of Virginia | 1,212 | 16 | ||||||
Southside Bancshares | 2,531 | 77 | ||||||
Southwest Bancorp | 1,894 | 37 | ||||||
Sovran Self Storage †† | 2,300 | 235 | ||||||
Spirit Realty Capital †† | 24,300 | 332 | ||||||
St. Joe * | 5,503 | 101 | ||||||
STAG Industrial †† | 7,201 | 183 | ||||||
Starwood Property Trust †† | 11,700 | 255 | ||||||
State Auto Financial | 1,618 | 37 | ||||||
State Bank Financial | 3,613 | 79 | ||||||
State National | 3,197 | 35 | ||||||
State Street | 20,000 | 1,316 | ||||||
Sterling Bancorp | 13,268 | 224 | ||||||
Stewart Information Services | 2,355 | 101 | ||||||
Stifel Financial * | 6,715 | 237 | ||||||
Stock Yards Bancorp | 2,200 | 65 | ||||||
Stonegate Bank | 1,196 | 38 | ||||||
STORE Capital †† | 7,600 | 237 | ||||||
Stratus Properties * | 681 | 12 | ||||||
| 32 | Adviser Managed Trust / Annual Report / July 31, 2016 |
SCHEDULE OF INVESTMENTS
July 31, 2016
Tactical Offensive Equity Fund (Continued)
Description | Shares | Market Value ($ Thousands) | ||||||
COMMON STOCK (continued) |
| |||||||
Suffolk Bancorp | 1,196 | $ | 39 | |||||
Summit Financial Group | 900 | 18 | ||||||
Summit Hotel Properties †† | 9,343 | 132 | ||||||
Sun Bancorp | 1,137 | 24 | ||||||
Sun Communities †† | 3,200 | 253 | ||||||
Sunstone Hotel Investors †† | 22,730 | 302 | ||||||
SunTrust Banks | 25,400 | 1,074 | ||||||
SVB Financial Group * | 2,600 | 261 | ||||||
Synchrony Financial | 42,400 | 1,182 | ||||||
Synovus Financial | 6,300 | 192 | ||||||
T Rowe Price Group | 12,300 | 870 | ||||||
Talmer Bancorp, Cl A | 6,325 | 133 | ||||||
Tanger Factory Outlet Centers †† | 4,700 | 196 | ||||||
Taubman Centers †† | 3,000 | 243 | ||||||
TCF Financial | 8,779 | 119 | ||||||
TD Ameritrade Holding | 12,600 | 383 | ||||||
Tejon Ranch * | 1,457 | 38 | ||||||
Terreno Realty †† | 4,617 | 129 | ||||||
Territorial Bancorp | 821 | 22 | ||||||
Texas Capital Bancshares * | 4,833 | 235 | ||||||
TFS Financial | 2,200 | 40 | ||||||
Third Point Reinsurance * | 6,822 | 86 | ||||||
Tier †† | 4,932 | 86 | ||||||
Tiptree Financial | 2,995 | 16 | ||||||
Tompkins Financial | 1,495 | 109 | ||||||
Torchmark | 6,000 | 371 | ||||||
Towne Bank | 6,048 | 139 | ||||||
Travelers | 15,100 | 1,755 | ||||||
TriCo Bancshares | 2,097 | 55 | ||||||
Trinity Place Holdings * | 2,091 | 17 | ||||||
TriState Capital Holdings * | 2,302 | 33 | ||||||
Triumph Bancorp * | 1,632 | 29 | ||||||
Trupanion * | 1,563 | 24 | ||||||
TrustCo Bank | 9,461 | 63 | ||||||
Trustmark | 7,064 | 184 | ||||||
Two Harbors Investment †† | 17,500 | 153 | ||||||
UDR †† | 13,400 | 499 | ||||||
UMB Financial | 4,696 | 260 | ||||||
UMH Properties †† | 2,562 | 32 | ||||||
Umpqua Holdings | 23,093 | 352 | ||||||
Union Bankshares | 5,114 | 141 | ||||||
United Bankshares | 6,869 | 263 | ||||||
United Community Banks | 7,516 | 145 | ||||||
United Community Financial | 4,890 | 32 | ||||||
United Financial Bancorp | 5,187 | 68 | ||||||
United Fire Group | 2,227 | 94 | ||||||
United Insurance Holdings | 1,805 | 29 | ||||||
Universal Health Realty Income Trust †† | 1,284 | 77 | ||||||
Universal Insurance Holdings | 3,385 | 74 | ||||||
Univest Corp of Pennsylvania | 2,928 | 62 | ||||||
Unum Group | 12,000 | 401 | ||||||
Urban Edge Properties †† | 9,385 | 281 | ||||||
Description | Shares | Market Value ($ Thousands) | ||||||
COMMON STOCK (continued) |
| |||||||
Urstadt Biddle Properties, Cl A †† | 2,704 | $ | 67 | |||||
US Bancorp | 84,000 | 3,542 | ||||||
Validus Holdings | 3,800 | 188 | ||||||
Valley National Bancorp | 25,916 | 235 | ||||||
Ventas †† | 17,500 | 1,333 | ||||||
VEREIT †† | 46,000 | 509 | ||||||
Veritex Holdings * | 895 | 16 | ||||||
Virtu Financial, Cl A | 2,621 | 45 | ||||||
Virtus Investment Partners | 651 | 55 | ||||||
Vornado Realty Trust †† | 8,700 | 934 | ||||||
Voya Financial | 10,300 | 264 | ||||||
Waddell & Reed Financial, Cl A | 8,561 | 156 | ||||||
Walker & Dunlop * | 2,848 | 67 | ||||||
Walter Investment Management * | 2,434 | 7 | ||||||
Washington †† | 7,682 | 263 | ||||||
Washington Federal | 9,513 | 238 | ||||||
Washington Trust Bancorp | 1,543 | 59 | ||||||
WashingtonFirst Bankshares | 881 | 21 | ||||||
Waterstone Financial | 2,654 | 42 | ||||||
Webster Financial | 9,593 | 345 | ||||||
Weingarten Realty Investors †† | 5,900 | 255 | ||||||
Wells Fargo | 234,960 | 11,271 | ||||||
Welltower †† | 18,400 | 1,460 | ||||||
WesBanco | 3,832 | 118 | ||||||
West Bancorporation | 1,667 | 32 | ||||||
Westamerica Bancorporation | 2,639 | 124 | ||||||
Western Alliance Bancorp * | 4,700 | 160 | ||||||
Western Asset Mortgage Capital †† | 4,271 | 42 | ||||||
Westfield Financial | 1,734 | 14 | ||||||
Westwood Holdings Group | 831 | 45 | ||||||
Weyerhaeuser †† | 37,600 | 1,230 | ||||||
White Mountains Insurance Group | 250 | 205 | ||||||
Whitestone, Cl B †† | 2,729 | 44 | ||||||
Wilshire Bancorp | 7,426 | 80 | ||||||
Wintrust Financial | 5,466 | 289 | ||||||
WisdomTree Investments | 12,414 | 123 | ||||||
WMIH * | 21,113 | 51 | ||||||
World Acceptance * | 648 | 28 | ||||||
WP Carey †† | 5,200 | 378 | ||||||
WP GLIMCHER †† | 19,444 | 247 | ||||||
WR Berkley | 4,800 | 279 | ||||||
WSFS Financial | 2,952 | 104 | ||||||
Xenia Hotels & Resorts †† | 10,833 | 195 | ||||||
XL Group | 14,000 | 485 | ||||||
Yadkin Financial | 5,330 | 134 | ||||||
Your Community Bankshares | 536 | 20 | ||||||
Zions Bancorporation | 10,200 | 284 | ||||||
|
| |||||||
| 225,661 | ||||||||
|
| |||||||
Health Care — 9.8% | ||||||||
AAC Holdings * | 1,050 | 24 | ||||||
Abaxis | 2,371 | 117 | ||||||
Abbott Laboratories | 76,000 | 3,401 | ||||||
| Adviser Managed Trust / Annual Report / July 31, 2016 | 33 |
SCHEDULE OF INVESTMENTS
July 31, 2016
Tactical Offensive Equity Fund (Continued)
Description | Shares | Market Value ($ Thousands) | ||||||
COMMON STOCK (continued) |
| |||||||
AbbVie | 83,454 | $ | 5,527 | |||||
ABIOMED * | 2,000 | 236 | ||||||
Acadia Healthcare * | 3,700 | 209 | ||||||
ACADIA Pharmaceuticals * | 4,600 | 170 | ||||||
Accelerate Diagnostics * | 2,405 | 47 | ||||||
Acceleron Pharma * | 2,981 | 101 | ||||||
Accuray * | 8,306 | 46 | ||||||
AcelRx Pharmaceuticals * | 3,926 | 14 | ||||||
Aceto | 3,009 | 77 | ||||||
Achillion Pharmaceuticals * | 12,072 | 100 | ||||||
Aclaris Therapeutics * | 964 | 19 | ||||||
Acorda Therapeutics * | 4,653 | 118 | ||||||
Adamas Pharmaceuticals * | 1,759 | 27 | ||||||
Addus HomeCare * | 819 | 15 | ||||||
Adeptus Health, Cl A * | 1,480 | 66 | ||||||
Aduro Biotech * | 3,691 | 54 | ||||||
Advaxis * | 3,514 | 29 | ||||||
Adverum Biotechnologies * | 2,654 | 10 | ||||||
Aerie Pharmaceuticals * | 2,508 | 44 | ||||||
Aetna | 17,333 | 1,997 | ||||||
Agenus * | 7,664 | 43 | ||||||
Agile Therapeutics * | 1,495 | 10 | ||||||
Agilent Technologies | 16,500 | 794 | ||||||
Agios Pharmaceuticals * | 2,200 | 100 | ||||||
Aimmune Therapeutics * | 2,761 | 33 | ||||||
Air Methods * | 3,858 | 128 | ||||||
Akebia Therapeutics * | 3,780 | 34 | ||||||
Akorn * | 4,200 | 144 | ||||||
Albany Molecular Research * | 2,716 | 39 | ||||||
Alder Biopharmaceuticals * | 5,017 | 161 | ||||||
Alere * | 4,400 | 165 | ||||||
Alexion Pharmaceuticals * | 11,200 | 1,440 | ||||||
Align Technology * | 3,700 | 330 | ||||||
Allergan * | 20,400 | 5,160 | ||||||
Allscripts Healthcare Solutions * | 9,400 | 133 | ||||||
Almost Family * | 848 | 34 | ||||||
Alnylam Pharmaceuticals * | 3,800 | 259 | ||||||
AMAG Pharmaceuticals * | 3,596 | 95 | ||||||
Amedisys * | 2,931 | 157 | ||||||
American Renal Associates Holdings * | 940 | 22 | ||||||
AmerisourceBergen, Cl A | 9,000 | 767 | ||||||
Amgen | 38,726 | 6,662 | ||||||
Amicus Therapeutics * | 13,153 | 88 | ||||||
AMN Healthcare Services * | 4,954 | 210 | ||||||
Amphastar Pharmaceuticals * | 3,687 | 60 | ||||||
Ampio Pharmaceuticals * | 3,100 | 3 | ||||||
Amsurg * | 2,700 | 203 | ||||||
Analogic | 1,282 | 108 | ||||||
Anavex Life Sciences * | 3,885 | 15 | ||||||
AngioDynamics * | 2,815 | 47 | ||||||
ANI Pharmaceuticals * | 824 | 50 | ||||||
Anika Therapeutics * | 1,455 | 73 | ||||||
Description | Shares | Market Value ($ Thousands) | ||||||
COMMON STOCK (continued) |
| |||||||
Anthem | 13,400 | $ | 1,760 | |||||
Anthera Pharmaceuticals * | 4,367 | 13 | ||||||
Applied Genetic Technologies * | 1,352 | 20 | ||||||
Aratana Therapeutics * | 3,536 | 27 | ||||||
Ardelyx * | 2,432 | 26 | ||||||
Arena Pharmaceuticals * | 25,548 | 43 | ||||||
Argos Therapeutics * | 1,219 | 6 | ||||||
ARIAD Pharmaceuticals * | 18,984 | 181 | ||||||
Array BioPharma * | 14,984 | 56 | ||||||
Arrowhead Pharmaceuticals * | 6,334 | 38 | ||||||
Asterias Biotherapeutics * | 2,695 | 8 | ||||||
Atara Biotherapeutics * | 2,409 | 58 | ||||||
athenahealth * | 2,000 | 256 | ||||||
Athersys * | 8,319 | 18 | ||||||
AtriCure * | 3,268 | 50 | ||||||
Atrion | 141 | 67 | ||||||
Avexis * | 515 | 19 | ||||||
Avinger * | 1,210 | 6 | ||||||
AxoGen * | 2,637 | 18 | ||||||
Axovant Sciences * | 2,559 | 38 | ||||||
Axsome Therapeutics * | 1,248 | 10 | ||||||
Baxter International | 25,300 | 1,215 | ||||||
Becton Dickinson and | 10,900 | 1,918 | ||||||
Bellicum Pharmaceuticals * | 2,202 | 35 | ||||||
BioCryst Pharmaceuticals * | 7,787 | 28 | ||||||
Biogen * | 11,300 | 3,276 | ||||||
BioMarin Pharmaceutical * | 8,200 | 815 | ||||||
Bio-Path Holdings * | 9,090 | 15 | ||||||
Bio-Rad Laboratories, Cl A * | 1,123 | 163 | ||||||
BioScrip * | 11,796 | 30 | ||||||
BioSpecifics Technologies * | 572 | 23 | ||||||
Bio-Techne | 1,900 | 214 | ||||||
BioTelemetry * | 2,808 | 53 | ||||||
BioTime * | 6,837 | 21 | ||||||
Bluebird Bio * | 3,879 | 222 | ||||||
Blueprint Medicines * | 2,085 | 46 | ||||||
Boston Scientific * | 69,500 | 1,687 | ||||||
Bristol-Myers Squibb | 86,000 | 6,434 | ||||||
Brookdale Senior Living, Cl A * | 9,300 | 172 | ||||||
Bruker | 5,300 | 132 | ||||||
Cambrex * | 3,337 | 175 | ||||||
Cantel Medical | 3,746 | 251 | ||||||
Capital Senior Living * | 2,921 | 57 | ||||||
Cara Therapeutics * | 2,356 | 14 | ||||||
Cardinal Health | 16,800 | 1,404 | ||||||
Cardiovascular Systems * | 3,298 | 65 | ||||||
Castlight Health, Cl B * | 4,333 | 16 | ||||||
Catalent * | 10,419 | 266 | ||||||
Celgene * | 39,700 | 4,454 | ||||||
Celldex Therapeutics * | 9,944 | 46 | ||||||
Cellular Biomedicine Group * | 1,311 | 20 | ||||||
Cempra * | 4,276 | 77 | ||||||
| 34 | Adviser Managed Trust / Annual Report / July 31, 2016 |
SCHEDULE OF INVESTMENTS
July 31, 2016
Tactical Offensive Equity Fund (Continued)
Description | Shares | Market Value ($ Thousands) | ||||||
COMMON STOCK (continued) |
| |||||||
Centene * | 8,500 | $ | 600 | |||||
Cepheid * | 7,603 | 269 | ||||||
Cerner * | 14,900 | 930 | ||||||
Cerus * | 10,479 | 77 | ||||||
Charles River Laboratories International * | 2,400 | 211 | ||||||
Chemed | 1,692 | 249 | ||||||
ChemoCentryx * | 1,914 | 9 | ||||||
Chimerix * | 4,659 | 19 | ||||||
ChromaDex * | 3,127 | 13 | ||||||
Cidara Therapeutics * | 1,176 | 14 | ||||||
Cigna | 13,100 | 1,689 | ||||||
Civitas Solutions * | 1,582 | 34 | ||||||
Clovis Oncology * | 3,303 | 47 | ||||||
Coherus Biosciences * | 3,062 | 78 | ||||||
Collegium Pharmaceutical * | 1,450 | 18 | ||||||
Community Health Systems * | 11,845 | 151 | ||||||
Computer Programs & Systems | 1,165 | 46 | ||||||
Concert Pharmaceuticals * | 1,759 | 20 | ||||||
ConforMIS * | 3,767 | 26 | ||||||
CONMED | 2,934 | 119 | ||||||
Cooper | 2,400 | 438 | ||||||
Corcept Therapeutics * | 7,780 | 45 | ||||||
Corindus Vascular Robotics * | 6,347 | 9 | ||||||
CorVel * | 1,030 | 47 | ||||||
Corvus Pharmaceuticals * | 405 | 5 | ||||||
Cotiviti Holdings * | 1,892 | 46 | ||||||
CR Bard | 3,767 | 843 | ||||||
Cross Country Healthcare * | 3,333 | 49 | ||||||
CryoLife | 3,289 | 48 | ||||||
Curis * | 12,173 | 20 | ||||||
Cutera * | 1,299 | 14 | ||||||
Cynosure, Cl A * | 2,539 | 140 | ||||||
Cytokinetics * | 3,545 | 39 | ||||||
CytomX Therapeutics * | 2,167 | 22 | ||||||
CytRx * | 7,338 | 5 | ||||||
Danaher | 31,400 | 2,557 | ||||||
DaVita HealthCare Partners * | 8,500 | 659 | ||||||
DENTSPLY SIRONA | 11,600 | 743 | ||||||
Depomed * | 6,578 | 125 | ||||||
Dermira * | 2,572 | 86 | ||||||
DexCom * | 4,200 | 387 | ||||||
Dimension Therapeutics * | 1,411 | 10 | ||||||
Diplomat Pharmacy * | 4,790 | 172 | ||||||
Durect * | 13,835 | 27 | ||||||
Dynavax Technologies * | 4,025 | 62 | ||||||
Eagle Pharmaceuticals * | 926 | 40 | ||||||
Edge Therapeutics * | 1,738 | 17 | ||||||
Editas Medicine * | 750 | 19 | ||||||
Edwards Lifesciences * | 10,700 | 1,225 | ||||||
Egalet * | 2,476 | 18 | ||||||
Eiger BioPharmaceuticals * | 396 | 8 | ||||||
Eli Lilly | 50,400 | 4,178 | ||||||
Description | Shares | Market Value ($ Thousands) | ||||||
COMMON STOCK (continued) |
| |||||||
Emergent BioSolutions * | 3,347 | $ | 112 | |||||
Enanta Pharmaceuticals * | 1,632 | 37 | ||||||
Endocyte * | 4,224 | 13 | ||||||
Endologix * | 8,762 | 124 | ||||||
Ensign Group | 4,917 | 106 | ||||||
Entellus Medical * | 807 | 14 | ||||||
Envision Healthcare Holdings * | 9,400 | 231 | ||||||
Enzo Biochem * | 4,279 | 30 | ||||||
Epizyme * | 4,191 | 43 | ||||||
Esperion Therapeutics * | 1,574 | 17 | ||||||
Evolent Health, Cl A * | 1,600 | 38 | ||||||
Exact Sciences * | 10,458 | 182 | ||||||
Exactech * | 1,096 | 30 | ||||||
Exelixis * | 23,798 | 218 | ||||||
Express Scripts Holding * | 32,800 | 2,495 | ||||||
FibroGen * | 5,399 | 103 | ||||||
Five Prime Therapeutics * | 2,911 | 148 | ||||||
Flex Pharma * | 1,167 | 14 | ||||||
Flexion Therapeutics * | 1,945 | 32 | ||||||
Fluidigm * | 3,060 | 32 | ||||||
Fortress Biotech * | 3,790 | 11 | ||||||
Foundation Medicine * | 1,419 | 33 | ||||||
Galena Biopharma * | 20,494 | 9 | ||||||
Genesis Healthcare, Cl A * | 4,394 | 9 | ||||||
GenMark Diagnostics * | 4,192 | 45 | ||||||
Genomic Health * | 1,939 | 56 | ||||||
Geron * | 15,725 | 42 | ||||||
Gilead Sciences | 68,317 | 5,429 | ||||||
Glaukos * | 1,736 | 61 | ||||||
Global Blood Therapeutics * | 1,485 | 27 | ||||||
Globus Medical, Cl A * | 7,337 | 168 | ||||||
GlycoMimetics * | 1,158 | 10 | ||||||
Haemonetics * | 5,361 | 163 | ||||||
Halozyme Therapeutics * | 11,228 | 112 | ||||||
Halyard Health * | 4,904 | 170 | ||||||
HCA Holdings * | 15,600 | 1,203 | ||||||
HealthEquity * | 4,635 | 137 | ||||||
HealthSouth | 9,269 | 399 | ||||||
HealthStream * | 2,660 | 64 | ||||||
Healthways * | 3,327 | 56 | ||||||
HeartWare International * | 1,794 | 104 | ||||||
Henry Schein * | 4,207 | 761 | ||||||
Heron Therapeutics * | 3,291 | 55 | ||||||
Heska * | 644 | 27 | ||||||
Hill-Rom Holdings | 3,300 | 176 | ||||||
HMS Holdings * | 8,833 | 176 | ||||||
Hologic * | 14,100 | 543 | ||||||
Humana | 7,600 | 1,311 | ||||||
ICU Medical * | 1,540 | 180 | ||||||
Idera Pharmaceuticals * | 9,802 | 17 | ||||||
IDEXX Laboratories * | 4,500 | 422 | ||||||
Ignyta * | 3,221 | 18 | ||||||
| Adviser Managed Trust / Annual Report / July 31, 2016 | 35 |
SCHEDULE OF INVESTMENTS
July 31, 2016
Tactical Offensive Equity Fund (Continued)
Description | Shares | Market Value ($ Thousands) | ||||||
COMMON STOCK (continued) |
| |||||||
Illumina * | 7,400 | $ | 1,231 | |||||
Immune Design * | 1,270 | 10 | ||||||
ImmunoGen * | 8,864 | 25 | ||||||
Immunomedics * | 9,456 | 25 | ||||||
Impax Laboratories * | 7,661 | 241 | ||||||
Imprivata * | 1,694 | 32 | ||||||
IMS Health Holdings * | 7,700 | 231 | ||||||
INC Research Holdings, Cl A * | 4,338 | 193 | ||||||
Incyte * | 8,200 | 740 | ||||||
Infinity Pharmaceuticals * | 5,743 | 10 | ||||||
Innoviva | 8,797 | 113 | ||||||
Inogen * | 1,683 | 90 | ||||||
Inotek Pharmaceuticals * | 1,930 | 18 | ||||||
Inovalon Holdings, Cl A * | 3,000 | 56 | ||||||
Inovio Pharmaceuticals * | 6,867 | 68 | ||||||
Insmed * | 6,408 | 73 | ||||||
Insulet * | 6,039 | 214 | ||||||
Insys Therapeutics * | 2,462 | 39 | ||||||
Integer Holdings * | 3,150 | 70 | ||||||
Integra LifeSciences Holdings * | 3,161 | 266 | ||||||
Intellia Therapeutics * | 993 | 19 | ||||||
Intercept Pharmaceuticals * | 800 | 138 | ||||||
Intersect ENT * | 2,670 | 42 | ||||||
Intra-Cellular Therapies, Cl A * | 3,726 | 152 | ||||||
Intrexon * | 3,193 | 81 | ||||||
Intuitive Surgical * | 1,931 | 1,344 | ||||||
Invacare | 3,306 | 38 | ||||||
Invitae * | 2,483 | 22 | ||||||
InVivo Therapeutics Holdings * | 3,501 | 23 | ||||||
Ionis Pharmaceuticals * | 6,100 | 178 | ||||||
iRadimed * | 462 | 9 | ||||||
IRIDEX * | 841 | 14 | ||||||
Ironwood Pharmaceuticals, Cl A * | 13,547 | 191 | ||||||
Johnson & Johnson | 141,079 | 17,667 | ||||||
Juno Therapeutics * | 3,200 | 99 | ||||||
K2M Group Holdings * | 2,682 | 45 | ||||||
Karyopharm Therapeutics * | 2,581 | 19 | ||||||
Keryx Biopharmaceuticals * | 8,187 | 60 | ||||||
Kindred Healthcare | 8,679 | 106 | ||||||
Kite Pharma * | 4,100 | 232 | ||||||
La Jolla Pharmaceutical * | 1,474 | 25 | ||||||
Laboratory Corp of America Holdings * | 5,200 | 726 | ||||||
Landauer | 997 | 42 | ||||||
Lannett * | 2,864 | 89 | ||||||
LeMaitre Vascular | 1,440 | 25 | ||||||
Lexicon Pharmaceuticals * | 4,375 | 71 | ||||||
LHC Group * | 1,654 | 75 | ||||||
LifePoint Health * | 2,000 | 118 | ||||||
Ligand Pharmaceuticals * | 1,992 | 269 | ||||||
Lion Biotechnologies * | 5,549 | 49 | ||||||
Lipocine * | 1,200 | 4 | ||||||
Loxo Oncology * | 1,398 | 36 | ||||||
Description | Shares | Market Value ($ Thousands) | ||||||
COMMON STOCK (continued) |
| |||||||
Luminex * | 4,097 | $ | 88 | |||||
MacroGenics * | 3,287 | 101 | ||||||
Magellan Health * | 2,603 | 178 | ||||||
MannKind * | 33,831 | 33 | ||||||
Masimo * | 4,275 | 226 | ||||||
McKesson | 11,700 | 2,276 | ||||||
Medgenics * | 2,688 | 16 | ||||||
Medicines * | 7,042 | 275 | ||||||
MediciNova * | 3,202 | 20 | ||||||
Medidata Solutions * | 5,749 | 306 | ||||||
Medivation * | 8,100 | 518 | ||||||
MEDNAX * | 4,600 | 317 | ||||||
Medtronic | 72,200 | 6,327 | ||||||
Merck | 142,518 | 8,360 | ||||||
Meridian Bioscience | 4,302 | 83 | ||||||
Merit Medical Systems * | 4,437 | 104 | ||||||
Merrimack Pharmaceuticals * | 12,616 | 73 | ||||||
Mettler-Toledo International * | 1,358 | 558 | ||||||
MiMedx Group * | 10,544 | 79 | ||||||
Minerva Neurosciences * | 1,749 | 19 | ||||||
Mirati Therapeutics * | 1,476 | 7 | ||||||
Molina Healthcare * | 4,527 | 257 | ||||||
Momenta Pharmaceuticals * | 6,713 | 76 | ||||||
Mylan * | 22,100 | 1,034 | ||||||
MyoKardia * | 1,214 | 21 | ||||||
Myriad Genetics * | 7,063 | 219 | ||||||
NanoString Technologies * | 1,579 | 21 | ||||||
NantKwest * | 1,830 | 12 | ||||||
Natera * | 2,732 | 36 | ||||||
National HealthCare | 1,156 | 75 | ||||||
National Research, Cl A | 936 | 14 | ||||||
Natus Medical * | 3,544 | 139 | ||||||
Nektar Therapeutics * | 13,553 | 234 | ||||||
Neogen * | 3,811 | 210 | ||||||
NeoGenomics * | 5,519 | 48 | ||||||
Neos Therapeutics * | 1,490 | 13 | ||||||
Neurocrine Biosciences * | 4,300 | 216 | ||||||
Nevro * | 2,514 | 208 | ||||||
NewLink Genetics * | 2,282 | 24 | ||||||
Nobilis Health * | 6,051 | 17 | ||||||
Novavax * | 28,252 | 207 | ||||||
Novocure * | 5,242 | 39 | ||||||
NuVasive * | 5,179 | 322 | ||||||
NxStage Medical * | 6,674 | 148 | ||||||
Ocular Therapeutix * | 2,040 | 9 | ||||||
Omeros * | 3,856 | 45 | ||||||
Omnicell * | 3,859 | 149 | ||||||
OncoMed Pharmaceuticals * | 1,855 | 23 | ||||||
Ophthotech * | 3,194 | 205 | ||||||
OPKO Health * | 16,300 | 162 | ||||||
OraSure Technologies * | 5,671 | 39 | ||||||
Organovo Holdings * | 9,013 | 39 | ||||||
| 36 | Adviser Managed Trust / Annual Report / July 31, 2016 |
SCHEDULE OF INVESTMENTS
July 31, 2016
Tactical Offensive Equity Fund (Continued)
Description | Shares | Market Value ($ Thousands) | ||||||
COMMON STOCK (continued) |
| |||||||
Orthofix International * | 1,807 | $ | 86 | |||||
Osiris Therapeutics | 2,241 | 11 | ||||||
Otonomy * | 2,507 | 36 | ||||||
OvaScience * | 3,356 | 17 | ||||||
Owens & Minor | 6,531 | 233 | ||||||
Oxford Immunotec Global * | 2,360 | 19 | ||||||
Pacific Biosciences of California * | 7,902 | 68 | ||||||
Pacira Pharmaceuticals * | 3,947 | 143 | ||||||
Paratek Pharmaceuticals * | 1,533 | 20 | ||||||
PAREXEL International * | 5,487 | 367 | ||||||
Patterson | 4,200 | 207 | ||||||
PDL BioPharma | 17,136 | 60 | ||||||
Penumbra * | 2,667 | 182 | ||||||
PerkinElmer | 5,500 | 313 | ||||||
Pfenex * | 1,997 | 16 | ||||||
Pfizer | 308,956 | 11,397 | ||||||
PharmAthene * | 6,845 | 18 | ||||||
PharMerica * | 3,050 | 81 | ||||||
Phibro Animal Health, Cl A | 1,958 | 40 | ||||||
Portola Pharmaceuticals, Cl A * | 5,266 | 137 | ||||||
PRA Health Sciences * | 2,492 | 116 | ||||||
Premier, Cl A * | 2,300 | 75 | ||||||
Press Ganey Holdings * | 2,283 | 91 | ||||||
Prestige Brands Holdings * | 5,561 | 298 | ||||||
Progenics Pharmaceuticals * | 7,299 | 43 | ||||||
Proteostasis Therapeutics * | 733 | 8 | ||||||
Providence Service * | 1,341 | 65 | ||||||
PTC Therapeutics * | 3,514 | 21 | ||||||
Puma Biotechnology * | 2,550 | 127 | ||||||
Quality Systems | 5,288 | 65 | ||||||
Quest Diagnostics | 7,200 | 622 | ||||||
Quidel * | 2,789 | 64 | ||||||
Quintiles Transnational Holdings * | 4,200 | 326 | ||||||
Quorum Health * | 3,106 | 34 | ||||||
Radius Health * | 3,345 | 158 | ||||||
RadNet * | 3,949 | 24 | ||||||
Raptor Pharmaceutical * | 8,885 | 52 | ||||||
Reata Pharmaceuticals, Cl A * | 635 | 10 | ||||||
Regeneron Pharmaceuticals * | 3,966 | 1,686 | ||||||
REGENXBIO * | 2,218 | 18 | ||||||
Regulus Therapeutics * | 4,308 | 15 | ||||||
Relypsa * | 3,900 | 125 | ||||||
Repligen * | 3,678 | 105 | ||||||
ResMed | 7,000 | 482 | ||||||
Retrophin * | 3,744 | 67 | ||||||
Revance Therapeutics * | 2,150 | 29 | ||||||
Rigel Pharmaceuticals * | 9,893 | 23 | ||||||
Rockwell Medical * | 4,999 | 40 | ||||||
RTI Surgical * | 6,102 | 20 | ||||||
Sage Therapeutics * | 2,732 | 123 | ||||||
Sagent Pharmaceuticals * | 2,681 | 58 | ||||||
Sangamo BioSciences * | 7,231 | 46 | ||||||
Description | Shares | Market Value ($ Thousands) | ||||||
COMMON STOCK (continued) |
| |||||||
Sarepta Therapeutics * | 4,406 | $ | 111 | |||||
SciClone Pharmaceuticals * | 5,182 | 55 | ||||||
Seattle Genetics * | 4,900 | 235 | ||||||
Second Sight Medical Products * | 2,343 | 9 | ||||||
Select Medical Holdings * | 11,525 | 133 | ||||||
Senseonics Holdings * | 3,964 | 13 | ||||||
Seres Therapeutics * | 1,849 | 20 | ||||||
Sorrento Therapeutics * | 3,134 | 20 | ||||||
Spark Therapeutics * | 1,866 | 108 | ||||||
Spectranetics * | 4,408 | 102 | ||||||
Spectrum Pharmaceuticals * | 6,956 | 48 | ||||||
St. Jude Medical | 14,100 | 1,171 | ||||||
STAAR Surgical * | 4,233 | 29 | ||||||
Stemline Therapeutics * | 1,883 | 14 | ||||||
Stryker | 17,300 | 2,012 | ||||||
Sucampo Pharmaceuticals, Cl A * | 2,518 | 30 | ||||||
Supernus Pharmaceuticals * | 4,832 | 107 | ||||||
Surgery Partners * | 1,947 | 35 | ||||||
Surgical Care Affiliates * | 2,859 | 149 | ||||||
Surmodics * | 1,359 | 37 | ||||||
Syndax Pharmaceuticals * | 577 | 7 | ||||||
Synergy Pharmaceuticals * | 18,747 | 76 | ||||||
Synthetic Biologics * | 8,359 | 15 | ||||||
T2 Biosystems * | 1,631 | 9 | ||||||
Tandem Diabetes Care * | 2,048 | 14 | ||||||
Taro Pharmaceutical Industries * | 434 | 61 | ||||||
Team Health Holdings * | 7,094 | 290 | ||||||
Teladoc * | 2,171 | 38 | ||||||
Teleflex | 2,200 | 397 | ||||||
Teligent * | 4,341 | 35 | ||||||
Tenet Healthcare * | 5,200 | 159 | ||||||
TESARO * | 2,869 | 268 | ||||||
Tetraphase Pharmaceuticals * | 3,983 | 16 | ||||||
TG Therapeutics * | 3,893 | 23 | ||||||
TherapeuticsMD * | 16,126 | 125 | ||||||
Theravance Biopharma | 3,741 | 95 | ||||||
Thermo Fisher Scientific | 20,300 | 3,224 | ||||||
Titan Pharmaceuticals * | 2,117 | 10 | ||||||
Tobira Therapeutics * | 970 | 4 | ||||||
Tokai Pharmaceuticals * | 1,183 | 1 | ||||||
TransEnterix * | 7,930 | 11 | ||||||
Trevena * | 4,699 | 29 | ||||||
Triple-S Management, Cl B * | 2,414 | 60 | ||||||
Trovagene * | 3,685 | 21 | ||||||
Ultragenyx Pharmaceutical * | 3,771 | 239 | ||||||
United Therapeutics * | 2,200 | 266 | ||||||
UnitedHealth Group | 48,300 | 6,917 | ||||||
Universal American | 6,026 | 46 | ||||||
Universal Health Services, Cl B | 4,300 | 557 | ||||||
US Physical Therapy | 1,250 | 75 | ||||||
USMD Holdings * | 289 | 6 | ||||||
Utah Medical Products | 372 | 24 | ||||||
| Adviser Managed Trust / Annual Report / July 31, 2016 | 37 |
SCHEDULE OF INVESTMENTS
July 31, 2016
Tactical Offensive Equity Fund (Continued)
Description | Shares | Market Value ($ Thousands) | ||||||
COMMON STOCK (continued) |
| |||||||
Vanda Pharmaceuticals * | 3,816 | $ | 44 | |||||
Varian Medical Systems * | 4,800 | 455 | ||||||
Vascular Solutions * | 1,741 | 80 | ||||||
VCA * | 3,900 | 278 | ||||||
Veeva Systems, Cl A * | 4,900 | 186 | ||||||
Veracyte * | 1,630 | 8 | ||||||
Versartis * | 2,868 | 33 | ||||||
Vertex Pharmaceuticals * | 12,500 | 1,212 | ||||||
ViewRay * | 902 | 3 | ||||||
Vitae Pharmaceuticals * | 2,767 | 29 | ||||||
Vital Therapies * | 2,600 | 16 | ||||||
Vocera Communications * | 2,592 | 38 | ||||||
Voyager Therapeutics * | 1,274 | 19 | ||||||
vTv Therapeutics, Cl A * | 501 | 3 | ||||||
VWR * | 3,900 | 122 | ||||||
Waters * | 3,900 | 620 | ||||||
WaVe Life Sciences * | 814 | 16 | ||||||
WellCare Health Plans * | 2,200 | 235 | ||||||
West Pharmaceutical Services | 3,600 | 289 | ||||||
Wright Medical Group * | 10,800 | 237 | ||||||
XBiotech * | 1,820 | 26 | ||||||
Xencor * | 3,329 | 63 | ||||||
Zafgen * | 2,468 | 8 | ||||||
Zeltiq Aesthetics * | 3,652 | 124 | ||||||
Zimmer Biomet Holdings | 9,400 | 1,233 | ||||||
ZIOPHARM Oncology * | 12,554 | 61 | ||||||
Zoetis, Cl A | 23,100 | 1,166 | ||||||
Zogenix * | 2,637 | 24 | ||||||
|
| |||||||
| 181,461 | ||||||||
|
| |||||||
Industrials — 7.0% | ||||||||
3M | 30,300 | 5,404 | ||||||
AAON | 4,368 | 116 | ||||||
AAR | 3,413 | 82 | ||||||
ABM Industries | 5,835 | 217 | ||||||
Acacia Research | 5,293 | 29 | ||||||
ACCO Brands * | 11,490 | 129 | ||||||
Actuant, Cl A | 6,340 | 151 | ||||||
Acuity Brands | 2,200 | 577 | ||||||
Advanced Drainage Systems | 3,776 | 101 | ||||||
Advisory Board * | 4,293 | 179 | ||||||
AECOM * | 7,700 | 273 | ||||||
Aegion, Cl A * | 3,613 | 74 | ||||||
Aerojet Rocketdyne Holdings * | 6,448 | 122 | ||||||
Aerovironment * | 2,121 | 60 | ||||||
AGCO | 3,500 | 169 | ||||||
Air Lease, Cl A | 4,900 | 141 | ||||||
Air Transport Services Group * | 5,362 | 78 | ||||||
Aircastle | 4,920 | 109 | ||||||
Alamo Group | 977 | 66 | ||||||
Alaska Air Group | 6,100 | 410 | ||||||
Albany International, Cl A | 3,092 | 131 | ||||||
Allegiant Travel, Cl A | 1,382 | 179 | ||||||
Description | Shares | Market Value ($ Thousands) | ||||||
COMMON STOCK (continued) |
| |||||||
Allegion | 4,900 | $ | 355 | |||||
Allied Motion Technologies | 683 | 15 | ||||||
Allison Transmission Holdings | 7,200 | 207 | ||||||
Altra Industrial Motion | 2,604 | 74 | ||||||
AMERCO | 300 | 119 | ||||||
Ameresco, Cl A * | 2,406 | 12 | ||||||
American Airlines Group | 29,200 | 1,037 | ||||||
American Railcar Industries | 813 | 34 | ||||||
American Science & Engineering | 752 | 28 | ||||||
American Superconductor * | 1,297 | 12 | ||||||
American Woodmark * | 1,425 | 106 | ||||||
AMETEK | 11,700 | 550 | ||||||
AO Smith | 3,700 | 344 | ||||||
Apogee Enterprises | 3,019 | 141 | ||||||
Applied Industrial Technologies | 3,804 | 179 | ||||||
Aqua Metals * | 1,166 | 11 | ||||||
ARC Document Solutions * | 4,499 | 18 | ||||||
ArcBest | 2,564 | 48 | ||||||
Argan | 1,386 | 64 | ||||||
Armstrong Flooring * | 2,440 | 49 | ||||||
Armstrong World Industries * | 2,300 | 98 | ||||||
Astec Industries | 2,093 | 126 | ||||||
Astronics * | 1,997 | 76 | ||||||
Atlas Air Worldwide Holdings * | 2,525 | 109 | ||||||
Avis Budget Group * | 4,200 | 154 | ||||||
AZZ | 2,714 | 168 | ||||||
Babcock & Wilcox Enterprises * | 4,727 | 73 | ||||||
Barnes Group | 5,264 | 200 | ||||||
Barrett Business Services | 742 | 32 | ||||||
BE Aerospace | 5,200 | 249 | ||||||
Beacon Roofing Supply * | 6,251 | 294 | ||||||
Blue Bird * | 635 | 9 | ||||||
BMC Stock Holdings * | 5,973 | 122 | ||||||
Boeing | 30,800 | 4,117 | ||||||
Brady, Cl A | 4,901 | 158 | ||||||
Briggs & Stratton | 4,622 | 105 | ||||||
Brink’s | 4,832 | 159 | ||||||
Builders FirstSource * | 9,082 | 117 | ||||||
BWX Technologies, Cl W | 4,700 | 173 | ||||||
Caesarstone * | 2,458 | 92 | ||||||
CAI International * | 1,744 | 15 | ||||||
Carlisle | 3,200 | 331 | ||||||
Casella Waste Systems, Cl A * | 4,055 | 38 | ||||||
Caterpillar | 29,000 | 2,400 | ||||||
CBIZ * | 5,122 | 55 | ||||||
CEB | 3,364 | 202 | ||||||
CECO Environmental | 3,085 | 29 | ||||||
Celadon Group | 2,886 | 24 | ||||||
CH Robinson Worldwide | 7,200 | 501 | ||||||
Chart Industries * | 3,158 | 95 | ||||||
Cintas | 4,500 | 483 | ||||||
CIRCOR International | 1,699 | 97 | ||||||
| 38 | Adviser Managed Trust / Annual Report / July 31, 2016 |
SCHEDULE OF INVESTMENTS
July 31, 2016
Tactical Offensive Equity Fund (Continued)
Description | Shares | Market Value ($ Thousands) | ||||||
COMMON STOCK (continued) |
| |||||||
CLARCOR | 4,978 | $ | 310 | |||||
Clean Harbors * | 2,600 | 134 | ||||||
Colfax * | 5,000 | 147 | ||||||
Columbus McKinnon | 2,041 | 34 | ||||||
Comfort Systems | 4,015 | 122 | ||||||
Continental Building Products * | 3,637 | 85 | ||||||
Copart * | 4,900 | 247 | ||||||
Covanta Holding | 5,900 | 94 | ||||||
Covenant Transportation Group, Cl A * | 1,257 | 28 | ||||||
CRA International * | 925 | 26 | ||||||
Crane | 2,500 | 156 | ||||||
CSW Industrials * | 1,498 | 51 | ||||||
CSX | 48,400 | 1,371 | ||||||
Cubic | 2,595 | 106 | ||||||
Cummins | 8,000 | 982 | ||||||
Curtiss-Wright | 4,694 | 418 | ||||||
Deere | 16,000 | 1,243 | ||||||
Delta Air Lines | 39,800 | 1,542 | ||||||
Deluxe | 5,110 | 345 | ||||||
DigitalGlobe * | 6,789 | 183 | ||||||
Donaldson | 6,400 | 231 | ||||||
Douglas Dynamics | 2,292 | 61 | ||||||
Dover | 7,800 | 557 | ||||||
Ducommun * | 1,127 | 22 | ||||||
Dun & Bradstreet | 1,800 | 233 | ||||||
DXP Enterprises * | 1,377 | 23 | ||||||
Dycom Industries * | 3,195 | 300 | ||||||
Dynamic Materials | 1,508 | 15 | ||||||
Echo Global Logistics * | 2,973 | 74 | ||||||
EMCOR Group | 6,332 | 353 | ||||||
Emerson Electric | 33,000 | 1,845 | ||||||
Encore Wire | 2,087 | 78 | ||||||
Energous * | 1,615 | 20 | ||||||
Energy Recovery * | 3,611 | 39 | ||||||
EnerSys | 4,556 | 284 | ||||||
Engility Holdings * | 1,880 | 55 | ||||||
Ennis | 2,657 | 46 | ||||||
EnPro Industries | 2,224 | 102 | ||||||
Equifax | 6,000 | 795 | ||||||
ESCO Technologies | 2,753 | 117 | ||||||
Essendant | 4,026 | 81 | ||||||
Esterline Technologies * | 3,096 | 188 | ||||||
ExOne * | 1,220 | 12 | ||||||
Expeditors International of Washington | 9,200 | 455 | ||||||
Exponent | 2,680 | 136 | ||||||
Fastenal | 14,600 | 624 | ||||||
Federal Signal | 6,193 | 81 | ||||||
FedEx | 12,900 | 2,088 | ||||||
Flowserve | 6,600 | 316 | ||||||
Fluor | 7,100 | 380 | ||||||
Fortive * | 15,572 | 751 | ||||||
Fortune Brands Home & Security | 7,700 | 487 | ||||||
Description | Shares | Market Value ($ Thousands) | ||||||
COMMON STOCK (continued) |
| |||||||
Forward Air | 3,160 | $ | 146 | |||||
Franklin Covey * | 1,126 | 18 | ||||||
Franklin Electric | 4,826 | 187 | ||||||
FreightCar America | 1,322 | 20 | ||||||
FTI Consulting * | 4,347 | 186 | ||||||
FuelCell Energy * | 2,721 | 15 | ||||||
G&K Services, Cl A | 2,053 | 165 | ||||||
GATX | 4,282 | 192 | ||||||
Gencor Industries * | 581 | 10 | ||||||
Generac Holdings * | 6,836 | 258 | ||||||
General Cable | 5,019 | 74 | ||||||
General Dynamics | 12,600 | 1,851 | ||||||
General Electric | 472,757 | 14,722 | ||||||
Genesee & Wyoming, Cl A * | 2,900 | 188 | ||||||
Gibraltar Industries * | 3,412 | 120 | ||||||
Global Brass & Copper Holdings | 2,188 | 62 | ||||||
GMS * | 780 | 20 | ||||||
Gorman-Rupp | 1,831 | 50 | ||||||
GP Strategies * | 1,340 | 28 | ||||||
Graco | 2,800 | 207 | ||||||
Graham | 1,041 | 19 | ||||||
Granite Construction | 4,138 | 206 | ||||||
Great Lakes Dredge & Dock * | 6,228 | 28 | ||||||
Greenbrier | 2,799 | 92 | ||||||
Griffon | 3,139 | 54 | ||||||
H&E Equipment Services | 3,268 | 61 | ||||||
Hardinge | 1,277 | 13 | ||||||
Harsco | 8,353 | 82 | ||||||
Hawaiian Holdings * | 5,519 | 251 | ||||||
HC2 Holdings * | 3,606 | 17 | ||||||
HD Supply Holdings * | 10,200 | 369 | ||||||
Healthcare Services Group | 7,359 | 286 | ||||||
Heartland Express | 4,753 | 88 | ||||||
HEICO | 1,500 | 104 | ||||||
HEICO, Cl A | 1,900 | 110 | ||||||
Heidrick & Struggles International | 1,920 | 37 | ||||||
Herc Holdings * | 846 | 30 | ||||||
Heritage-Crystal Clean * | 1,400 | 18 | ||||||
Herman Miller | 6,270 | 205 | ||||||
Hertz Global Holdings * | 3,640 | 177 | ||||||
Hexcel | 4,700 | 203 | ||||||
Hill International * | 3,575 | 15 | ||||||
Hillenbrand | 6,182 | 200 | ||||||
HNI | 4,743 | 247 | ||||||
Honeywell International | 39,238 | 4,565 | ||||||
Hub Group, Cl A * | 3,646 | 149 | ||||||
Hubbell, Cl B | 2,800 | 302 | ||||||
Huntington Ingalls Industries | 2,400 | 414 | ||||||
Hurco | 692 | 18 | ||||||
Huron Consulting Group * | 2,322 | 143 | ||||||
Hyster-Yale Materials Handling, Cl A | 977 | 62 | ||||||
ICF International * | 1,864 | 77 | ||||||
| Adviser Managed Trust / Annual Report / July 31, 2016 | 39 |
SCHEDULE OF INVESTMENTS
July 31, 2016
Tactical Offensive Equity Fund (Continued)
Description | Shares | Market Value ($ Thousands) | ||||||
COMMON STOCK (continued) |
| |||||||
IDEX | 3,800 | $ | 341 | |||||
IDI * | 1,727 | 9 | ||||||
IES Holdings * | 864 | 13 | ||||||
Illinois Tool Works | 15,400 | 1,777 | ||||||
InnerWorkings * | 4,025 | 34 | ||||||
Insperity | 1,714 | 135 | ||||||
Insteel Industries | 1,819 | 63 | ||||||
Interface, Cl A | 6,664 | 119 | ||||||
ITT | 4,600 | 146 | ||||||
Jacobs Engineering Group * | 6,100 | 326 | ||||||
JB Hunt Transport Services | 4,500 | 374 | ||||||
JetBlue Airways * | 16,300 | 299 | ||||||
John Bean Technologies | 3,050 | 204 | ||||||
Joy Global | 10,316 | 285 | ||||||
Kadant | 1,111 | 61 | ||||||
Kaman | 2,899 | 125 | ||||||
Kansas City Southern | 5,500 | 529 | ||||||
KAR Auction Services | 7,000 | 299 | ||||||
KBR | 7,200 | 101 | ||||||
Kelly Services, Cl A | 3,043 | 62 | ||||||
Kennametal | 8,273 | 206 | ||||||
KEYW Holding * | 3,744 | 38 | ||||||
Kforce | 2,554 | 46 | ||||||
Kimball International, Cl B | 3,845 | 44 | ||||||
Kirby * | 2,700 | 147 | ||||||
KLX * | 5,533 | 179 | ||||||
Knight Transportation | 7,010 | 209 | ||||||
Knoll | 5,144 | 130 | ||||||
Korn | 6,193 | 142 | ||||||
Kratos Defense & Security Solutions * | 4,938 | 22 | ||||||
L-3 Communications Holdings, Cl 3 | 3,900 | 591 | ||||||
Landstar System | 2,100 | 148 | ||||||
Lawson Products * | 701 | 11 | ||||||
Layne Christensen * | 1,952 | 16 | ||||||
Lennox International | 2,000 | 314 | ||||||
Lincoln Electric Holdings | 3,100 | 192 | ||||||
Lindsay | 1,095 | 77 | ||||||
Lockheed Martin | 13,600 | 3,437 | ||||||
LSI Industries | 2,505 | 27 | ||||||
Lydall * | 1,718 | 77 | ||||||
Macquarie Infrastructure | 3,800 | 291 | ||||||
Manitowoc | 13,143 | 73 | ||||||
Manitowoc Foodservice * | 6,400 | 117 | ||||||
ManpowerGroup | 3,600 | 250 | ||||||
Marten Transport | 2,389 | 52 | ||||||
Masco | 16,800 | 613 | ||||||
MasTec * | 6,939 | 170 | ||||||
Matson | 4,535 | 169 | ||||||
Matthews International, Cl A | 3,347 | 201 | ||||||
McGrath RentCorp | 2,425 | 77 | ||||||
Mercury Systems * | 4,014 | 104 | ||||||
Meritor * | 8,973 | 75 | ||||||
Description | Shares | Market Value ($ Thousands) | ||||||
COMMON STOCK (continued) |
| |||||||
Middleby * | 2,900 | $ | 349 | |||||
Milacron Holdings * | 1,541 | 27 | ||||||
Miller Industries | 1,166 | 25 | ||||||
Mistras Group * | 1,787 | 45 | ||||||
Mobile Mini | 4,642 | 151 | ||||||
Moog, Cl A * | 3,348 | 184 | ||||||
MRC Global * | 10,037 | 133 | ||||||
MSA Safety | 3,254 | 182 | ||||||
MSC Industrial Direct, Cl A | 2,400 | 172 | ||||||
Mueller Industries | 5,932 | 202 | ||||||
Mueller Water Products, Cl A | 16,322 | 194 | ||||||
Multi-Color | 1,401 | 90 | ||||||
MYR Group * | 1,771 | 44 | ||||||
National Presto Industries | 512 | 46 | ||||||
Navigant Consulting * | 4,909 | 97 | ||||||
Navistar International * | 5,127 | 66 | ||||||
NCI Building Systems * | 2,830 | 46 | ||||||
Neff, Cl A * | 1,074 | 10 | ||||||
Nielsen Holdings | 18,300 | 986 | ||||||
NL Industries * | 1,180 | 3 | ||||||
NN | 2,739 | 46 | ||||||
Nordson | 2,900 | 256 | ||||||
Norfolk Southern | 15,000 | 1,347 | ||||||
Nortek * | 1,019 | 89 | ||||||
Northrop Grumman | 8,493 | 1,840 | ||||||
NOW * | 11,200 | 205 | ||||||
NV5 Holdings * | 797 | 26 | ||||||
Old Dominion Freight Line * | 3,400 | 237 | ||||||
Omega Flex | 327 | 11 | ||||||
On Assignment * | 5,325 | 197 | ||||||
Orbital ATK | 3,000 | 261 | ||||||
Orion Group Holdings * | 2,964 | 17 | ||||||
Oshkosh | 3,700 | 204 | ||||||
Owens Corning | 5,800 | 307 | ||||||
PACCAR | 17,300 | 1,020 | ||||||
PAM Transportation Services * | 184 | 4 | ||||||
Parker-Hannifin | 6,800 | 776 | ||||||
Park-Ohio Holdings | 898 | 27 | ||||||
Patrick Industries * | 1,579 | 102 | ||||||
PGT * | 4,961 | 60 | ||||||
Pitney Bowes | 9,500 | 183 | ||||||
Plug Power * | 18,899 | 34 | ||||||
Ply Gem Holdings * | 2,305 | 35 | ||||||
Powell Industries | 910 | 34 | ||||||
Power Solutions International * | 546 | 10 | ||||||
Preformed Line Products | 283 | 14 | ||||||
Primoris Services | 4,156 | 75 | ||||||
Proto Labs * | 2,586 | 142 | ||||||
Quad | 2,998 | 76 | ||||||
Quanex Building Products | 3,540 | 71 | ||||||
Quanta Services * | 7,300 | 187 | ||||||
Radiant Logistics * | 4,219 | 13 | ||||||
| 40 | Adviser Managed Trust / Annual Report / July 31, 2016 |
SCHEDULE OF INVESTMENTS
July 31, 2016
Tactical Offensive Equity Fund (Continued)
Description | Shares | Market Value ($ Thousands) | ||||||
COMMON STOCK (continued) |
| |||||||
Raven Industries | 3,751 | $ | 78 | |||||
Raytheon | 15,300 | 2,135 | ||||||
RBC Bearings * | 2,376 | 181 | ||||||
Regal Beloit | 2,300 | 140 | ||||||
Republic Services, Cl A | 11,900 | 610 | ||||||
Resources Connection | 3,697 | 55 | ||||||
Rexnord * | 8,685 | 185 | ||||||
Roadrunner Transportation Systems * | 3,232 | 24 | ||||||
Robert Half International | 6,400 | 234 | ||||||
Rockwell Automation | 6,600 | 755 | ||||||
Rockwell Collins | 6,600 | 558 | ||||||
Rollins | 4,900 | 138 | ||||||
Roper Technologies | 5,100 | 869 | ||||||
RPX * | 5,163 | 52 | ||||||
RR Donnelley & Sons | 10,500 | 188 | ||||||
Rush Enterprises, Cl B * | 713 | 17 | ||||||
Rush Enterprises, Cl A * | 3,049 | 70 | ||||||
Ryder System | 2,700 | 178 | ||||||
Saia * | 2,607 | 75 | ||||||
Scorpio Bulkers * | 4,260 | 14 | ||||||
Simpson Manufacturing | 4,348 | 177 | ||||||
SiteOne Landscape Supply * | 1,212 | 47 | ||||||
SkyWest | 5,363 | 154 | ||||||
Snap-on | 2,900 | 456 | ||||||
SolarCity * | 3,300 | 88 | ||||||
Southwest Airlines | 32,400 | 1,199 | ||||||
SP Plus * | 1,801 | 43 | ||||||
Sparton * | 1,015 | 21 | ||||||
Spirit AeroSystems Holdings, Cl A * | 6,700 | 291 | ||||||
Spirit Airlines * | 3,600 | 154 | ||||||
SPX * | 4,303 | 65 | ||||||
SPX FLOW * | 3,841 | 105 | ||||||
Standex International | 1,375 | 122 | ||||||
Stanley Black & Decker | 7,600 | 925 | ||||||
Steelcase, Cl A | 9,255 | 134 | ||||||
Stericycle * | 4,200 | 379 | ||||||
Sun Hydraulics | 2,404 | 73 | ||||||
Sunrun * | 6,614 | 34 | ||||||
Supreme Industries, Cl A | 1,411 | 24 | ||||||
Swift Transportation, Cl A * | 8,084 | 156 | ||||||
TASER International * | 5,567 | 161 | ||||||
Team * | 2,985 | 82 | ||||||
Teledyne Technologies * | 3,575 | 375 | ||||||
Tennant | 1,805 | 116 | ||||||
Terex | 5,400 | 130 | ||||||
Tetra Tech | 6,052 | 199 | ||||||
Textainer Group Holdings | 2,392 | 28 | ||||||
Textron | 13,700 | 534 | ||||||
Thermon Group Holdings * | 3,310 | 67 | ||||||
Timken | 3,600 | 120 | ||||||
Titan International | 4,651 | 31 | ||||||
Titan Machinery * | 1,882 | 21 | ||||||
Description | Shares | Market Value ($ Thousands) | ||||||
COMMON STOCK (continued) |
| |||||||
Toro | 2,700 | $ | 248 | |||||
TransDigm Group * | 2,578 | 721 | ||||||
TransUnion * | 2,990 | 98 | ||||||
TRC * | 2,071 | 15 | ||||||
Trex * | 3,132 | 152 | ||||||
TriMas * | 4,650 | 83 | ||||||
TriNet Group * | 4,343 | 94 | ||||||
Trinity Industries | 7,600 | 176 | ||||||
Triton International | 4,252 | 71 | ||||||
Triumph Group | 5,164 | 159 | ||||||
TrueBlue * | 4,346 | 97 | ||||||
Tutor Perini * | 4,110 | 103 | ||||||
UniFirst | 1,583 | 185 | ||||||
Union Pacific | 43,600 | 4,057 | ||||||
United Continental Holdings * | 17,000 | 797 | ||||||
United Parcel Service, Cl B | 35,700 | 3,859 | ||||||
United Rentals * | 4,500 | 358 | ||||||
United Technologies | 40,100 | 4,317 | ||||||
Univar * | 4,436 | 81 | ||||||
Universal Forest Products | 2,075 | 224 | ||||||
Universal Truckload Services | 934 | 14 | ||||||
US Ecology | 2,249 | 102 | ||||||
USA Truck * | 981 | 19 | ||||||
USG * | 4,400 | 124 | ||||||
Valmont Industries | 1,100 | 144 | ||||||
Vectrus * | 1,120 | 35 | ||||||
Verisk Analytics, Cl A * | 7,800 | 665 | ||||||
Veritiv * | 863 | 36 | ||||||
Viad | 2,082 | 72 | ||||||
Vicor * | 1,803 | 19 | ||||||
Virgin America * | 2,095 | 117 | ||||||
VSE | 452 | 29 | ||||||
Wabash National * | 6,657 | 96 | ||||||
WABCO Holdings * | 2,700 | 271 | ||||||
Wabtec | 4,400 | 301 | ||||||
WageWorks * | 3,819 | 236 | ||||||
Waste Management | 22,900 | 1,514 | ||||||
Watsco | 1,300 | 187 | ||||||
Watts Water Technologies, Cl A | 2,914 | 180 | ||||||
Werner Enterprises | 4,841 | 122 | ||||||
Wesco Aircraft Holdings * | 5,746 | 74 | ||||||
WESCO International * | 2,100 | 117 | ||||||
West | 4,457 | 99 | ||||||
Willis Lease Finance * | 471 | 13 | ||||||
Woodward | 5,534 | 324 | ||||||
WW Grainger | 2,800 | 613 | ||||||
XPO Logistics * | 10,240 | 303 | ||||||
Xylem | 9,100 | 435 | ||||||
YRC Worldwide * | 3,418 | 41 | ||||||
|
| |||||||
| 128,504 | ||||||||
|
| |||||||
Information Technology — 13.4% |
| |||||||
2U * | 3,959 | 139 | ||||||
| Adviser Managed Trust / Annual Report / July 31, 2016 | 41 |
SCHEDULE OF INVESTMENTS
July 31, 2016
Tactical Offensive Equity Fund (Continued)
Description | Shares | Market Value ($ Thousands) | ||||||
COMMON STOCK (continued) |
| |||||||
3D Systems * | 11,246 | $ | 151 | |||||
58.com ADR * | 3,600 | 187 | ||||||
8x8 * | 9,470 | 130 | ||||||
A10 Networks * | 4,629 | 36 | ||||||
Acacia Communications * | 566 | 37 | ||||||
ACI Worldwide * | 12,069 | 239 | ||||||
Activision Blizzard | 28,400 | 1,141 | ||||||
Actua * | 3,767 | 38 | ||||||
Acxiom * | 8,121 | 186 | ||||||
Adobe Systems * | 24,868 | 2,434 | ||||||
ADTRAN | 5,346 | 97 | ||||||
Advanced Energy Industries * | 4,140 | 169 | ||||||
Advanced Micro Devices * | 68,503 | 470 | ||||||
Aerohive Networks * | 2,621 | 19 | ||||||
Agilysys * | 1,661 | 19 | ||||||
Akamai Technologies * | 8,700 | 440 | ||||||
Alarm.com Holdings * | 1,085 | 31 | ||||||
Alibaba Group Holding ADR * | 41,300 | 3,406 | ||||||
ALJ Regional Holdings * | 2,059 | 10 | ||||||
Alliance Data Systems * | 2,900 | 672 | ||||||
Alpha & Omega Semiconductor * | 1,916 | 27 | ||||||
Alphabet, Cl A * | 15,129 | 11,972 | ||||||
Alphabet, Cl C * | 15,300 | 11,763 | ||||||
Ambarella * | 3,354 | 194 | ||||||
Amber Road * | 1,954 | 17 | ||||||
Amdocs | 7,500 | 438 | ||||||
American Software, Cl A | 2,714 | 30 | ||||||
Amkor Technology * | 10,374 | 65 | ||||||
Amphenol, Cl A | 15,200 | 905 | ||||||
Analog Devices | 15,500 | 989 | ||||||
Angie’s List * | 4,189 | 34 | ||||||
Anixter International * | 3,038 | 186 | ||||||
ANSYS * | 4,500 | 402 | ||||||
Apigee * | 1,639 | 20 | ||||||
Appfolio, Cl A * | 851 | 14 | ||||||
Apple | 281,354 | 29,320 | ||||||
Applied Materials | 55,300 | 1,454 | ||||||
Applied Micro Circuits * | 7,885 | 52 | ||||||
Applied Optoelectronics * | 1,795 | 21 | ||||||
Arista Networks * | 2,000 | 143 | ||||||
ARRIS International * | 9,500 | 259 | ||||||
Arrow Electronics * | 4,600 | 306 | ||||||
Aspen Technology * | 8,641 | 362 | ||||||
Atlassian, Cl A * | 900 | 27 | ||||||
Autobytel * | 951 | 14 | ||||||
Autodesk * | 10,700 | 636 | ||||||
Automatic Data Processing | 23,700 | 2,108 | ||||||
AVG Technologies * | 4,344 | 107 | ||||||
Avid Technology * | 3,498 | 23 | ||||||
Avnet | 6,500 | 267 | ||||||
AVX | 4,815 | 66 | ||||||
Axcelis Technologies * | 3,053 | 33 | ||||||
Description | Shares | Market Value ($ Thousands) | ||||||
COMMON STOCK (continued) |
| |||||||
Badger Meter | 1,445 | $ | 101 | |||||
Bankrate * | 5,052 | 40 | ||||||
Barracuda Networks * | 2,303 | 51 | ||||||
Bazaarvoice * | 8,597 | 36 | ||||||
Bel Fuse, Cl B | 1,012 | 21 | ||||||
Belden | 4,385 | 321 | ||||||
Benchmark Electronics * | 5,358 | 126 | ||||||
Benefitfocus * | 1,337 | 58 | ||||||
Black Box | 1,629 | 22 | ||||||
Black Knight Financial Services, Cl A * | 1,500 | 58 | ||||||
Blackbaud | 4,933 | 330 | ||||||
Blackhawk Network Holdings, Cl A * | 5,750 | 200 | ||||||
Blucora * | 4,083 | 42 | ||||||
Booz Allen Hamilton Holding, Cl A | 5,700 | 176 | ||||||
Bottomline Technologies * | 4,143 | 87 | ||||||
Box, Cl A * | 5,067 | 59 | ||||||
Brightcove * | 3,154 | 33 | ||||||
Broadcom | 19,407 | 3,144 | ||||||
Broadridge Financial Solutions | 6,000 | 406 | ||||||
BroadSoft * | 3,124 | 140 | ||||||
Brocade Communications Systems | 23,600 | 219 | ||||||
Brooks Automation | 7,015 | 88 | ||||||
CA | 14,800 | 513 | ||||||
Cabot Microelectronics | 2,551 | 134 | ||||||
CACI International, Cl A * | 2,545 | 243 | ||||||
Cadence Design Systems * | 15,100 | 363 | ||||||
CalAmp * | 3,715 | 53 | ||||||
Calix * | 4,334 | 33 | ||||||
Callidus Software * | 6,012 | 123 | ||||||
Carbonite * | 1,940 | 21 | ||||||
Cardtronics * | 4,719 | 208 | ||||||
Care.com * | 1,743 | 19 | ||||||
Cass Information Systems | 1,136 | 59 | ||||||
Cavium * | 5,888 | 275 | ||||||
CDK Global | 7,900 | 457 | ||||||
CDW | 8,200 | 352 | ||||||
CEVA * | 2,043 | 61 | ||||||
ChannelAdvisor * | 2,428 | 38 | ||||||
Ciena * | 14,361 | 276 | ||||||
Cirrus Logic * | 6,555 | 319 | ||||||
Cisco Systems | 259,159 | 7,912 | ||||||
Citrix Systems * | 7,900 | 704 | ||||||
Clearfield * | 1,217 | 24 | ||||||
Cognex | 4,100 | 185 | ||||||
Cognizant Technology Solutions, Cl A * | 31,500 | 1,811 | ||||||
Coherent * | 2,532 | 269 | ||||||
Cohu | 2,773 | 29 | ||||||
CommerceHub * | 2,010 | 28 | ||||||
CommScope Holding * | 6,500 | 195 | ||||||
CommVault Systems * | 4,054 | 210 | ||||||
Computer Sciences | 7,000 | 335 | ||||||
comScore * | 5,111 | 133 | ||||||
| 42 | Adviser Managed Trust / Annual Report / July 31, 2016 |
SCHEDULE OF INVESTMENTS
July 31, 2016
Tactical Offensive Equity Fund (Continued)
Description | Shares | Market Value ($ Thousands) | ||||||
COMMON STOCK (continued) |
| |||||||
Comtech Telecommunications | 1,697 | $ | 22 | |||||
Control4 * | 2,200 | 19 | ||||||
Convergys | 9,306 | 248 | ||||||
CoreLogic * | 4,500 | 181 | ||||||
Cornerstone OnDemand * | 5,270 | 228 | ||||||
Corning | 54,500 | 1,211 | ||||||
CoStar Group * | 1,600 | 333 | ||||||
CPI Card Group | 2,359 | 11 | ||||||
Cray * | 4,340 | 137 | ||||||
Cree * | 5,000 | 143 | ||||||
CSG Systems International | 3,396 | 137 | ||||||
CSRA | 8,300 | 223 | ||||||
CTS | 3,247 | 62 | ||||||
Cvent * | 3,268 | 107 | ||||||
Cypress Semiconductor | 15,800 | 184 | ||||||
Daktronics | 3,879 | 25 | ||||||
Datalink * | 2,211 | 19 | ||||||
DHI Group * | 5,258 | 38 | ||||||
Diebold | 6,258 | 177 | ||||||
Digi International * | 2,728 | 30 | ||||||
Digimarc * | 881 | 32 | ||||||
Diodes * | 3,937 | 73 | ||||||
Dolby Laboratories, Cl A | 2,600 | 131 | ||||||
DSP Group * | 2,286 | 25 | ||||||
DST Systems | 1,700 | 210 | ||||||
DTS * | 1,813 | 50 | ||||||
EarthLink Holdings | 10,866 | 74 | ||||||
Eastman Kodak * | 1,792 | 30 | ||||||
eBay * | 55,200 | 1,720 | ||||||
Ebix | 2,693 | 144 | ||||||
EchoStar, Cl A * | 2,300 | 90 | ||||||
Electro Rent | 1,792 | 28 | ||||||
Electro Scientific Industries * | 3,007 | 20 | ||||||
Electronic Arts * | 15,000 | 1,145 | ||||||
Electronics For Imaging * | 4,920 | 218 | ||||||
Ellie Mae * | 3,080 | 284 | ||||||
EMC | 101,100 | 2,859 | ||||||
EMCORE * | 2,813 | 18 | ||||||
Endurance International Group Holdings * | 6,222 | 56 | ||||||
EnerNOC * | 2,922 | 22 | ||||||
Entegris * | 14,801 | 253 | ||||||
Envestnet * | 4,342 | 166 | ||||||
EPAM Systems * | 5,039 | 354 | ||||||
Epiq Systems | 2,492 | 41 | ||||||
ePlus * | 656 | 55 | ||||||
Euronet Worldwide * | 2,500 | 191 | ||||||
EVERTEC | 6,544 | 113 | ||||||
Everyday Health * | 2,998 | 24 | ||||||
Exa * | 1,504 | 22 | ||||||
Exar * | 4,278 | 36 | ||||||
ExlService Holdings * | 3,408 | 169 | ||||||
Extreme Networks * | 10,800 | 42 | ||||||
Description | Shares | Market Value ($ Thousands) | ||||||
COMMON STOCK (continued) |
| |||||||
F5 Networks * | 3,400 | $ | 420 | |||||
Facebook, Cl A * | 115,288 | 14,289 | ||||||
Fair Isaac | 3,237 | 410 | ||||||
Fairchild Semiconductor International, Cl A * | 8,169 | 161 | ||||||
FARO Technologies * | 1,719 | 60 | ||||||
FEI | 2,100 | 223 | ||||||
Fidelity National Information Services | 16,800 | 1,336 | ||||||
Finisar * | 11,257 | 211 | ||||||
FireEye * | 7,700 | 134 | ||||||
First Data, Cl A * | 15,800 | 196 | ||||||
First Solar * | 3,800 | 177 | ||||||
Fiserv * | 11,346 | 1,252 | ||||||
Fitbit, Cl A * | 7,209 | 98 | ||||||
Five9 * | 3,444 | 43 | ||||||
FleetCor Technologies * | 4,713 | 715 | ||||||
FLIR Systems | 6,900 | 225 | ||||||
FormFactor * | 7,115 | 67 | ||||||
Forrester Research | 1,037 | 42 | ||||||
Fortinet * | 7,300 | 253 | ||||||
Gartner * | 4,000 | 401 | ||||||
Genpact * | 7,600 | 203 | ||||||
Gigamon * | 3,542 | 165 | ||||||
GigPeak * | 5,164 | 10 | ||||||
Global Payments | 7,800 | 582 | ||||||
Global Sources * | 929 | 8 | ||||||
Globant * | 2,647 | 112 | ||||||
Glu Mobile * | 11,101 | 26 | ||||||
GoDaddy, Cl A * | 3,400 | 102 | ||||||
Gogo * | 5,844 | 49 | ||||||
GrubHub * | 8,447 | 320 | ||||||
GTT Communications * | 2,741 | 56 | ||||||
Guidance Software * | 2,492 | 15 | ||||||
Guidewire Software * | 3,700 | 227 | ||||||
Hackett Group | 2,354 | 32 | ||||||
Harmonic * | 8,090 | 27 | ||||||
Harris | 6,300 | 546 | ||||||
Hewlett Packard Enterprise | 89,100 | 1,873 | ||||||
Higher One Holdings * | 3,304 | 17 | ||||||
Hortonworks * | 4,199 | 49 | ||||||
HP | 87,700 | 1,229 | ||||||
HubSpot * | 3,068 | 167 | ||||||
IAC | 3,600 | 209 | ||||||
II-VI * | 6,433 | 129 | ||||||
Immersion * | 3,071 | 23 | ||||||
Imperva * | 3,049 | 144 | ||||||
inContact * | 6,061 | 84 | ||||||
Infinera * | 14,722 | 129 | ||||||
Infoblox * | 6,097 | 114 | ||||||
Information Services Group * | 3,397 | 13 | ||||||
Ingram Micro, Cl A | 7,300 | 250 | ||||||
Inphi * | 4,330 | 152 | ||||||
| Adviser Managed Trust / Annual Report / July 31, 2016 | 43 |
SCHEDULE OF INVESTMENTS
July 31, 2016
Tactical Offensive Equity Fund (Continued)
Description | Shares | Market Value ($ Thousands) | ||||||
COMMON STOCK (continued) |
| |||||||
Insight Enterprises * | 3,989 | $ | 106 | |||||
Instructure * | 1,117 | 24 | ||||||
Integrated Device Technology * | 14,092 | 310 | ||||||
Intel | 243,205 | 8,478 | ||||||
Interactive Intelligence Group * | 1,856 | 100 | ||||||
InterDigital | 3,627 | 214 | ||||||
International Business Machines | 45,230 | 7,265 | ||||||
Intersil, Cl A | 14,063 | 215 | ||||||
Intralinks Holdings * | 4,353 | 30 | ||||||
Intuit | 12,400 | 1,376 | ||||||
InvenSense, Cl A * | 8,489 | 58 | ||||||
IPG Photonics * | 1,800 | 152 | ||||||
Itron * | 3,506 | 150 | ||||||
Ixia * | 6,640 | 76 | ||||||
IXYS | 2,647 | 29 | ||||||
j2 Global | 4,921 | 329 | ||||||
Jabil Circuit | 9,500 | 193 | ||||||
Jack Henry & Associates | 4,000 | 357 | ||||||
Jive Software * | 6,117 | 23 | ||||||
Juniper Networks | 18,900 | 429 | ||||||
Keysight Technologies * | 8,700 | 254 | ||||||
Kimball Electronics * | 2,938 | 37 | ||||||
KLA-Tencor | 7,900 | 598 | ||||||
Knowles * | 9,481 | 127 | ||||||
Kopin * | 6,804 | 16 | ||||||
KVH Industries * | 1,684 | 15 | ||||||
Lam Research | 8,100 | 727 | ||||||
Lattice Semiconductor * | 12,410 | 75 | ||||||
Leidos Holdings | 3,300 | 165 | ||||||
Lexmark International, Cl A | 3,100 | 114 | ||||||
Limelight Networks * | 7,942 | 13 | ||||||
Linear Technology | 12,100 | 726 | ||||||
LinkedIn, Cl A * | 6,000 | 1,156 | ||||||
Lionbridge Technologies * | 6,157 | 28 | ||||||
Liquidity Services * | 2,654 | 21 | ||||||
Littelfuse | 2,314 | 289 | ||||||
LivePerson * | 5,573 | 37 | ||||||
LogMeIn * | 2,638 | 227 | ||||||
Lumentum Holdings * | 5,397 | 163 | ||||||
MACOM Technology Solutions Holdings * | 2,404 | 95 | ||||||
Majesco * | 770 | 4 | ||||||
Manhattan Associates * | 3,600 | 209 | ||||||
ManTech International, Cl A | 2,688 | 106 | ||||||
Marchex, Cl B * | 3,755 | 12 | ||||||
Marketo * | 4,354 | 153 | ||||||
Marvell Technology Group | 20,400 | 240 | ||||||
MasterCard, Cl A | 49,700 | 4,733 | ||||||
Match Group * | 1,200 | 19 | ||||||
Maxim Integrated Products | 14,300 | 583 | ||||||
MAXIMUS | 6,706 | 395 | ||||||
MaxLinear, Cl A * | 6,039 | 132 | ||||||
Maxwell Technologies * | 3,445 | 19 | ||||||
Description | Shares | Market Value ($ Thousands) | ||||||
COMMON STOCK (continued) |
| |||||||
MeetMe * | 4,457 | $ | 29 | |||||
Mentor Graphics | 11,210 | 239 | ||||||
Mesa Laboratories | 313 | 36 | ||||||
Methode Electronics | 3,951 | 138 | ||||||
Microchip Technology | 10,600 | 590 | ||||||
Micron Technology * | 52,500 | 721 | ||||||
Microsemi * | 12,064 | 471 | ||||||
Microsoft | 388,893 | 22,042 | ||||||
MicroStrategy, Cl A * | 995 | 174 | ||||||
MINDBODY, Cl A * | 1,523 | 27 | ||||||
Mitek Systems * | 3,186 | 24 | ||||||
MKS Instruments | 5,569 | 254 | ||||||
MobileIron * | 5,121 | 17 | ||||||
Mobileye * | 5,081 | 243 | ||||||
Model N * | 2,332 | 30 | ||||||
MoneyGram International * | 3,142 | 22 | ||||||
Monolithic Power Systems | 4,073 | 296 | ||||||
Monotype Imaging Holdings | 4,179 | 83 | ||||||
Monster Worldwide * | 9,489 | 24 | ||||||
Motorola Solutions | 8,800 | 611 | ||||||
MTS Systems | 1,638 | 78 | ||||||
Nanometrics * | 2,458 | 49 | ||||||
National Instruments | 5,200 | 149 | ||||||
NCI, Cl A | 677 | 9 | ||||||
NCR * | 6,200 | 204 | ||||||
NeoPhotonics * | 3,238 | 41 | ||||||
NetApp | 14,700 | 387 | ||||||
NETGEAR * | 3,393 | 175 | ||||||
NetScout Systems * | 10,047 | 281 | ||||||
NetSuite * | 2,000 | 218 | ||||||
NeuStar, Cl A * | 5,766 | 145 | ||||||
New Relic * | 2,272 | 78 | ||||||
NIC | 6,824 | 159 | ||||||
Nimble Storage * | 6,537 | 49 | ||||||
Novanta * | 3,286 | 52 | ||||||
Nuance Communications * | 11,300 | 182 | ||||||
Numerex, Cl A * | 1,525 | 12 | ||||||
NVE | 502 | 29 | ||||||
NVIDIA | 25,800 | 1,473 | ||||||
Oclaro * | 10,256 | 59 | ||||||
ON Semiconductor * | 20,900 | 210 | ||||||
Oracle | 152,388 | 6,254 | ||||||
OSI Systems * | 1,803 | 107 | ||||||
Palo Alto Networks * | 4,400 | 576 | ||||||
Pandora Media * | 11,100 | 151 | ||||||
Park City Group * | 1,440 | 14 | ||||||
Park Electrochemical | 2,032 | 33 | ||||||
Paychex | 16,300 | 966 | ||||||
Paycom Software * | 4,606 | 217 | ||||||
Paylocity Holding * | 2,344 | 105 | ||||||
PayPal Holdings * | 58,800 | 2,190 | ||||||
PC Connection | 1,195 | 31 | ||||||
| 44 | Adviser Managed Trust / Annual Report / July 31, 2016 |
SCHEDULE OF INVESTMENTS
July 31, 2016
Tactical Offensive Equity Fund (Continued)
Description | Shares | Market Value ($ Thousands) | ||||||
COMMON STOCK (continued) |
| |||||||
PDF Solutions * | 2,820 | $ | 47 | |||||
Pegasystems | 3,716 | 104 | ||||||
Perficient * | 3,643 | 81 | ||||||
PFSweb * | 1,620 | 16 | ||||||
Photronics * | 6,762 | 65 | ||||||
Planet Payment * | 4,605 | 22 | ||||||
Plantronics | 3,479 | 168 | ||||||
Plexus * | 3,496 | 161 | ||||||
Polycom * | 14,266 | 177 | ||||||
Power Integrations | 2,918 | 167 | ||||||
Progress Software * | 5,347 | 155 | ||||||
Proofpoint * | 4,268 | 324 | ||||||
PROS Holdings * | 2,620 | 49 | ||||||
PTC * | 5,800 | 230 | ||||||
Pure Storage, Cl A * | 7,212 | 91 | ||||||
Q2 Holdings * | 2,641 | 78 | ||||||
QAD, Cl A | 1,026 | 19 | ||||||
Qlik Technologies * | 9,814 | 296 | ||||||
QLogic * | 9,030 | 140 | ||||||
Qorvo * | 6,900 | 436 | ||||||
QUALCOMM | 75,900 | 4,750 | ||||||
Qualys * | 2,806 | 88 | ||||||
QuinStreet * | 4,054 | 15 | ||||||
Quotient Technology * | 6,609 | 84 | ||||||
Rackspace Hosting * | 5,400 | 127 | ||||||
Radisys * | 3,900 | 19 | ||||||
Rambus * | 11,680 | 158 | ||||||
Rapid7 * | 2,141 | 30 | ||||||
RealNetworks * | 2,647 | 11 | ||||||
RealPage * | 5,859 | 147 | ||||||
Red Hat * | 9,200 | 693 | ||||||
Reis | 927 | 23 | ||||||
RetailMeNot * | 4,046 | 34 | ||||||
Rightside Group * | 1,266 | 15 | ||||||
RingCentral, Cl A * | 6,317 | 145 | ||||||
Rofin-Sinar Technologies * | 2,788 | 88 | ||||||
Rogers * | 1,948 | 133 | ||||||
Rosetta Stone * | 2,078 | 16 | ||||||
Rovi * | 8,719 | 164 | ||||||
Rubicon Project * | 3,863 | 55 | ||||||
Rudolph Technologies * | 3,113 | 55 | ||||||
Sabre | 10,500 | 306 | ||||||
salesforce.com * | 33,200 | 2,716 | ||||||
Sanmina * | 7,689 | 195 | ||||||
Sapiens International | 2,552 | 33 | ||||||
ScanSource * | 2,731 | 112 | ||||||
Science Applications International | 4,424 | 269 | ||||||
SecureWorks, Cl A * | 679 | 10 | ||||||
Semtech * | 6,774 | 172 | ||||||
ServiceNow * | 8,000 | 599 | ||||||
ServiceSource International * | 6,439 | 29 | ||||||
ShoreTel * | 6,997 | 51 | ||||||
Description | Shares | Market Value ($ Thousands) | ||||||
COMMON STOCK (continued) |
| |||||||
Shutterstock * | 1,955 | $ | 108 | |||||
Sigma Designs * | 3,795 | 25 | ||||||
Silicon Graphics International * | 3,866 | 21 | ||||||
Silicon Laboratories * | 4,321 | 230 | ||||||
Silver Springs Network * | 3,939 | 50 | ||||||
Skyworks Solutions | 9,600 | 634 | ||||||
Sonus Networks * | 4,970 | 43 | ||||||
Splunk * | 6,600 | 413 | ||||||
SPS Commerce * | 1,706 | 108 | ||||||
Square, Cl A * | 1,100 | 11 | ||||||
SS&C Technologies Holdings | 8,500 | 274 | ||||||
Stamps.com * | 1,696 | 129 | ||||||
SunPower, Cl A * | 3,700 | 54 | ||||||
Super Micro Computer * | 3,982 | 86 | ||||||
Sykes Enterprises * | 4,181 | 128 | ||||||
Symantec | 31,100 | 635 | ||||||
Synaptics * | 3,885 | 202 | ||||||
Synchronoss Technologies * | 4,443 | 166 | ||||||
SYNNEX | 3,056 | 307 | ||||||
Synopsys * | 7,700 | 417 | ||||||
Syntel * | 3,384 | 153 | ||||||
Systemax * | 1,298 | 12 | ||||||
Tableau Software, Cl A * | 2,800 | 158 | ||||||
Take-Two Interactive Software * | 8,697 | 349 | ||||||
Tangoe * | 2,669 | 22 | ||||||
Tech Data * | 3,660 | 285 | ||||||
TechTarget * | 2,056 | 19 | ||||||
Telenav * | 3,493 | 17 | ||||||
TeleTech Holdings | 1,708 | 49 | ||||||
Teradata * | 6,600 | 187 | ||||||
Teradyne | 10,300 | 203 | ||||||
Tessera Technologies | 5,161 | 166 | ||||||
Texas Instruments | 52,000 | 3,627 | ||||||
TiVo * | 10,217 | 108 | ||||||
Total System Services | 8,400 | 428 | ||||||
Travelport Worldwide | 12,110 | 163 | ||||||
Trimble Navigation * | 12,700 | 336 | ||||||
TrueCar * | 5,656 | 53 | ||||||
TTM Technologies * | 7,517 | 75 | ||||||
TubeMogul * | 2,320 | 26 | ||||||
Twitter * | 32,100 | 534 | ||||||
Tyler Technologies * | 1,700 | 277 | ||||||
Ubiquiti Networks | 2,673 | 120 | ||||||
Ultimate Software Group * | 1,400 | 293 | ||||||
Ultra Clean Holdings * | 3,496 | 22 | ||||||
Ultratech * | 2,245 | 55 | ||||||
Unisys * | 5,248 | 52 | ||||||
Universal Display * | 4,336 | 307 | ||||||
USA Technologies * | 3,864 | 18 | ||||||
Vantiv, Cl A * | 7,800 | 427 | ||||||
Varonis Systems * | 1,127 | 29 | ||||||
VASCO Data Security International * | 3,132 | 52 | ||||||
| Adviser Managed Trust / Annual Report / July 31, 2016 | 45 |
SCHEDULE OF INVESTMENTS
July 31, 2016
Tactical Offensive Equity Fund (Continued)
Description | Shares | Market Value ($ Thousands) | ||||||
COMMON STOCK (continued) |
| |||||||
Veeco Instruments * | 4,113 | $ | 69 | |||||
VeriFone Systems * | 6,097 | 117 | ||||||
Verint Systems * | 6,500 | 229 | ||||||
VeriSign * | 4,800 | 416 | ||||||
ViaSat * | 4,646 | 343 | ||||||
Viavi Solutions * | 24,582 | 175 | ||||||
VirnetX Holding * | 5,261 | 23 | ||||||
Virtusa * | 2,854 | 78 | ||||||
Visa, Cl A | 98,140 | 7,660 | ||||||
Vishay Intertechnology | 14,290 | 191 | ||||||
Vishay Precision Group * | 1,325 | 17 | ||||||
VMware, Cl A * | 4,100 | 299 | ||||||
Web.com Group * | 4,388 | 83 | ||||||
WebMD Health, Cl A * | 3,905 | 238 | ||||||
Western Digital | 14,335 | 681 | ||||||
Western Union | 24,900 | 498 | ||||||
WEX * | 2,000 | 187 | ||||||
Workday, Cl A * | 5,900 | 492 | ||||||
Workiva, Cl A * | 2,306 | 32 | ||||||
Xactly * | 2,400 | 30 | ||||||
Xcerra * | 5,551 | 34 | ||||||
Xerox | 51,000 | 525 | ||||||
Xilinx | 12,900 | 659 | ||||||
XO Group * | 2,644 | 48 | ||||||
Xura * | 2,469 | 61 | ||||||
Yahoo! * | 44,700 | 1,707 | ||||||
Yelp, Cl A * | 3,400 | 109 | ||||||
Zebra Technologies, Cl A * | 2,600 | 138 | ||||||
Zendesk * | 8,494 | 257 | ||||||
Zillow Group, Cl A * | 2,600 | 102 | ||||||
Zillow Group, Cl C * | 5,200 | 204 | ||||||
Zix * | 5,773 | 23 | ||||||
Zynga, Cl A * | 36,700 | 105 | ||||||
|
| |||||||
| 248,267 | ||||||||
|
| |||||||
Materials — 2.3% | ||||||||
A Schulman | 2,971 | 87 | ||||||
AEP Industries | 422 | 34 | ||||||
AgroFresh Solutions * | 2,402 | 15 | ||||||
Air Products & Chemicals | 10,100 | 1,509 | ||||||
AK Steel Holding * | 25,505 | 167 | ||||||
Albemarle | 5,700 | 480 | ||||||
Alcoa | 66,700 | 708 | ||||||
Allegheny Technologies | 11,379 | 203 | ||||||
American Vanguard | 2,937 | 44 | ||||||
Ampco-Pittsburgh | 947 | 13 | ||||||
AptarGroup | 3,100 | 242 | ||||||
Ashland | 3,100 | 351 | ||||||
Avery Dennison | 4,500 | 350 | ||||||
Axalta Coating Systems * | 8,300 | 237 | ||||||
Axiall | 7,424 | 242 | ||||||
Balchem | 3,294 | 210 | ||||||
Ball | 8,700 | 615 | ||||||
Description | Shares | Market Value ($ Thousands) | ||||||
COMMON STOCK (continued) |
| |||||||
Bemis | 4,800 | $ | 245 | |||||
Berry Plastics Group * | 6,100 | 250 | ||||||
Boise Cascade * | 4,025 | 109 | ||||||
Cabot | 3,100 | 151 | ||||||
Calgon Carbon | 5,210 | 72 | ||||||
Carpenter Technology | 4,845 | 190 | ||||||
Celanese, Cl A | 7,500 | 476 | ||||||
Century Aluminum * | 5,218 | 40 | ||||||
CF Industries Holdings | 11,800 | 291 | ||||||
Chase | 736 | 45 | ||||||
Chemours | 19,202 | 179 | ||||||
Chemtura * | 6,673 | 187 | ||||||
Clearwater Paper * | 1,834 | 115 | ||||||
Cliffs Natural Resources * | 18,983 | 150 | ||||||
Codexis * | 3,706 | 16 | ||||||
Coeur Mining * | 16,999 | 260 | ||||||
Commercial Metals | 12,026 | 199 | ||||||
Compass Minerals International | 1,700 | 118 | ||||||
Crown Holdings * | 6,800 | 360 | ||||||
Deltic Timber | 1,097 | 76 | ||||||
Domtar | 3,200 | 126 | ||||||
Dow Chemical | 58,100 | 3,118 | ||||||
E.I. du Pont de Nemours | 45,300 | 3,133 | ||||||
Eagle Materials | 2,400 | 201 | ||||||
Eastman Chemical | 7,500 | 489 | ||||||
Ecolab | 13,400 | 1,586 | ||||||
Ferro * | 8,987 | 116 | ||||||
Ferroglobe | 6,775 | 63 | ||||||
Flotek Industries * | 5,377 | 76 | ||||||
FMC | 6,800 | 323 | ||||||
Freeport-McMoRan | 63,400 | 822 | ||||||
FutureFuel | 2,626 | 30 | ||||||
GCP Applied Technologies * | 7,425 | 204 | ||||||
Gold Resource | 5,430 | 31 | ||||||
Graphic Packaging Holding | 16,100 | 220 | ||||||
Greif, Cl A | 2,638 | 106 | ||||||
Greif, Cl B | 600 | 32 | ||||||
Handy & Harman * | 338 | 9 | ||||||
Hawkins | 1,001 | 43 | ||||||
Haynes International | 1,295 | 49 | ||||||
HB Fuller | 5,245 | 244 | ||||||
Headwaters * | 7,778 | 155 | ||||||
Hecla Mining | 39,937 | 259 | ||||||
Huntsman | 10,000 | 155 | ||||||
Ingevity * | 4,464 | 171 | ||||||
Innophos Holdings | 1,995 | 86 | ||||||
Innospec | 2,554 | 128 | ||||||
International Flavors & Fragrances | 4,000 | 533 | ||||||
International Paper | 20,800 | 953 | ||||||
Kaiser Aluminum | 1,855 | 154 | ||||||
KapStone Paper and Packaging | 9,332 | 133 | ||||||
KMG Chemicals | 953 | 26 | ||||||
| 46 | Adviser Managed Trust / Annual Report / July 31, 2016 |
SCHEDULE OF INVESTMENTS
July 31, 2016
Tactical Offensive Equity Fund (Continued)
Description | Shares | Market Value ($ Thousands) | ||||||
COMMON STOCK (continued) |
| |||||||
Koppers Holdings * | 2,105 | $ | 67 | |||||
Kraton Performance Polymers * | 3,053 | 91 | ||||||
Kronos Worldwide | 2,454 | 14 | ||||||
Louisiana-Pacific * | 15,078 | 305 | ||||||
LSB Industries * | 2,173 | 25 | ||||||
Martin Marietta Materials | 3,200 | 648 | ||||||
Materion | 2,066 | 55 | ||||||
Minerals Technologies | 3,628 | 237 | ||||||
Monsanto | 22,700 | 2,424 | ||||||
Mosaic | 17,700 | 478 | ||||||
Multi Packaging Solutions International * | 2,227 | 32 | ||||||
Myers Industries | 2,274 | 34 | ||||||
Neenah Paper | 1,807 | 136 | ||||||
NewMarket | 398 | 170 | ||||||
Newmont Mining | 26,900 | 1,184 | ||||||
Nucor | 16,100 | 864 | ||||||
Olin | 17,537 | 367 | ||||||
Olympic Steel | 967 | 28 | ||||||
OMNOVA Solutions * | 4,451 | 42 | ||||||
Owens-Illinois * | 8,200 | 154 | ||||||
Packaging Corp of America | 4,700 | 351 | ||||||
PH Glatfelter | 4,483 | 93 | ||||||
Platform Specialty Products * | 8,300 | 76 | ||||||
PolyOne | 8,772 | 308 | ||||||
PPG Industries | 13,556 | 1,419 | ||||||
Praxair | 14,700 | 1,713 | ||||||
Quaker Chemical | 1,396 | 134 | ||||||
Rayonier Advanced Materials | 4,457 | 61 | ||||||
Real Industry * | 2,782 | 22 | ||||||
Reliance Steel & Aluminum | 3,500 | 275 | ||||||
Royal Gold | 3,300 | 279 | ||||||
RPM International | 6,600 | 358 | ||||||
Ryerson Holding * | 1,184 | 17 | ||||||
Schnitzer Steel Industries, Cl A | 2,714 | 53 | ||||||
Schweitzer-Mauduit International | 3,278 | 124 | ||||||
Scotts Miracle-Gro, Cl A | 2,300 | 170 | ||||||
Sealed Air | 9,900 | 467 | ||||||
Sensient Technologies | 4,653 | 344 | ||||||
Sherwin-Williams | 4,100 | 1,229 | ||||||
Silgan Holdings | 2,100 | 104 | ||||||
Sonoco Products | 5,000 | 255 | ||||||
Southern Copper | 8,500 | 221 | ||||||
Steel Dynamics | 11,900 | 319 | ||||||
Stepan | 2,121 | 136 | ||||||
Stillwater Mining * | 12,812 | 196 | ||||||
Summit Materials, Cl A * | 8,000 | 177 | ||||||
SunCoke Energy | 6,723 | 51 | ||||||
TerraVia Holdings * | 8,538 | 22 | ||||||
TimkenSteel | 4,110 | 41 | ||||||
Trecora Resources * | 2,105 | 24 | ||||||
Tredegar | 2,648 | 47 | ||||||
UFP Technologies * | 692 | 16 | ||||||
Description | Shares | Market Value ($ Thousands) | ||||||
COMMON STOCK (continued) |
| |||||||
United States Lime & Minerals | 219 | $ | 14 | |||||
United States Steel | 6,900 | 190 | ||||||
US Concrete * | 1,476 | 95 | ||||||
Valhi | 1,555 | 3 | ||||||
Valspar | 4,000 | 426 | ||||||
Vedanta ADR | 15,000 | 146 | ||||||
Vulcan Materials | 6,700 | 831 | ||||||
Westlake Chemical | 2,700 | 123 | ||||||
WestRock | 12,700 | 545 | ||||||
Worthington Industries | 4,716 | 209 | ||||||
WR Grace | 3,600 | 270 | ||||||
|
| |||||||
| 42,119 | ||||||||
|
| |||||||
Telecommunication Services — 1.7% |
| |||||||
AT&T | 316,531 | 13,703 | ||||||
ATN International | 1,088 | 80 | ||||||
Boingo Wireless * | 3,731 | 34 | ||||||
CenturyLink | 27,200 | 855 | ||||||
Cincinnati Bell * | 21,678 | 108 | ||||||
Cogent Communications Holdings | 4,353 | 186 | ||||||
Consolidated Communications Holdings | 5,306 | 148 | ||||||
FairPoint Communications * | 2,224 | 36 | ||||||
Frontier Communications | 59,100 | 307 | ||||||
General Communication, Cl A * | 3,009 | 46 | ||||||
Globalstar * | 38,815 | 46 | ||||||
Hawaiian Telcom Holdco * | 785 | 17 | ||||||
IDT, Cl B | 1,830 | 28 | ||||||
Inteliquent | 3,372 | 69 | ||||||
Intelsat * | 3,368 | 8 | ||||||
Iridium Communications * | 8,520 | 77 | ||||||
Level 3 Communications * | 14,800 | 749 | ||||||
Lumos Networks * | 2,040 | 24 | ||||||
NII Holdings * | 5,860 | 18 | ||||||
ORBCOMM * | 6,687 | 71 | ||||||
pdvWireless * | 1,057 | 23 | ||||||
SBA Communications, Cl A * | 6,300 | 725 | ||||||
Shenandoah Telecommunications | 4,844 | 199 | ||||||
Spok Holdings | 2,137 | 39 | ||||||
Sprint * | 38,300 | 235 | ||||||
Straight Path Communications * | 1,008 | 18 | ||||||
Telephone & Data Systems | 4,800 | 151 | ||||||
T-Mobile US * | 14,500 | 672 | ||||||
United States Cellular * | 400 | 16 | ||||||
Verizon Communications | 209,791 | 11,625 | ||||||
Vonage Holdings * | 20,663 | 123 | ||||||
Windstream Holdings | 9,900 | 92 | ||||||
Zayo Group Holdings * | 8,300 | 235 | ||||||
|
| |||||||
| 30,763 | ||||||||
|
| |||||||
Utilities — 2.4% | ||||||||
AES | 33,400 | 413 | ||||||
ALLETE | 5,189 | 331 | ||||||
Alliant Energy | 11,500 | 463 | ||||||
| Adviser Managed Trust / Annual Report / July 31, 2016 | 47 |
SCHEDULE OF INVESTMENTS
July 31, 2016
Tactical Offensive Equity Fund (Continued)
Description | Shares | Market Value ($ Thousands) | ||||||
COMMON STOCK (continued) | ||||||||
Ameren | 12,300 | $ | 645 | |||||
American Electric Power | 25,400 | 1,760 | ||||||
American States Water | 3,828 | 165 | ||||||
American Water Works | 9,000 | 743 | ||||||
Aqua America | 9,000 | 312 | ||||||
Artesian Resources, Cl A | 816 | 28 | ||||||
Atlantica Yield | 6,352 | 128 | ||||||
Atmos Energy | 5,100 | 407 | ||||||
Avangrid | 2,800 | 126 | ||||||
Avista | 6,620 | 288 | ||||||
Black Hills | 5,395 | 340 | ||||||
California Water Service Group | 5,033 | 170 | ||||||
Calpine * | 18,100 | 249 | ||||||
CenterPoint Energy | 21,900 | 524 | ||||||
Chesapeake Utilities | 1,595 | 102 | ||||||
CMS Energy | 14,100 | 637 | ||||||
Connecticut Water Service | 1,122 | 57 | ||||||
Consolidated Edison | 15,500 | 1,241 | ||||||
Consolidated Water | 1,582 | 21 | ||||||
Delta Natural Gas | 744 | 20 | ||||||
Dominion Resources | 31,900 | 2,489 | ||||||
DTE Energy | 9,100 | 887 | ||||||
Duke Energy | 35,700 | 3,056 | ||||||
Dynegy, Cl A * | 12,232 | 185 | ||||||
Edison International | 16,300 | 1,261 | ||||||
El Paso Electric | 4,231 | 202 | ||||||
Empire District Electric | 4,626 | 156 | ||||||
Entergy | 9,100 | 741 | ||||||
Eversource Energy | 16,100 | 942 | ||||||
Exelon | 45,800 | 1,707 | ||||||
FirstEnergy | 21,600 | 754 | ||||||
Genie Energy, Cl B | 1,470 | 9 | ||||||
Global Water Resources | 935 | 8 | ||||||
Great Plains Energy | 7,800 | 232 | ||||||
Hawaiian Electric Industries * | 5,400 | 168 | ||||||
IDACORP | 5,352 | 433 | ||||||
ITC Holdings | 7,600 | 352 | ||||||
MDU Resources Group | 9,800 | 236 | ||||||
MGE Energy | 3,661 | 206 | ||||||
Middlesex Water | 1,641 | 68 | ||||||
National Fuel Gas | 3,700 | 209 | ||||||
New Jersey Resources | 8,970 | 334 | ||||||
NextEra Energy | 23,800 | 3,053 | ||||||
NiSource | 16,300 | 418 | ||||||
Northwest Natural Gas | 2,845 | 185 | ||||||
NorthWestern | 5,088 | 309 | ||||||
NRG Energy | 15,900 | 220 | ||||||
NRG Yield, Cl C | 6,535 | 117 | ||||||
NRG Yield, Cl A | 3,623 | 62 | ||||||
OGE Energy | 10,100 | 325 | ||||||
ONE Gas | 5,445 | 354 | ||||||
Ormat Technologies | 4,073 | 186 | ||||||
Description | Shares | Market Value ($ Thousands) | ||||||
COMMON STOCK (continued) | ||||||||
Otter Tail | 4,104 | $ | 143 | |||||
Pattern Energy Group, Cl A | 6,227 | 152 | ||||||
PG&E | 25,600 | 1,637 | ||||||
Piedmont Natural Gas | 4,100 | 245 | ||||||
Pinnacle West Capital | 5,600 | 442 | ||||||
PNM Resources | 8,362 | 287 | ||||||
Portland General Electric | 9,483 | 414 | ||||||
PPL | 34,400 | 1,297 | ||||||
Public Service Enterprise Group | 25,600 | 1,178 | ||||||
Questar | 8,900 | 224 | ||||||
SCANA | 6,600 | 495 | ||||||
Sempra Energy | 12,700 | 1,421 | ||||||
SJW | 1,690 | 72 | ||||||
South Jersey Industries | 8,352 | 266 | ||||||
Southern | 48,700 | 2,605 | ||||||
Southwest Gas | 5,020 | 389 | ||||||
Spark Energy, Cl A | 525 | 13 | ||||||
Spire | 4,673 | 324 | ||||||
Talen Energy * | 9,074 | 123 | ||||||
TerraForm Global, Cl A | 9,596 | 33 | ||||||
TerraForm Power, Cl A | 9,010 | 106 | ||||||
UGI | 8,700 | 394 | ||||||
Unitil | 1,439 | 63 | ||||||
Vectren | 4,200 | 217 | ||||||
Vivint Solar * | 2,653 | 8 | ||||||
WEC Energy Group | 16,000 | 1,039 | ||||||
Westar Energy, Cl A | 7,200 | 400 | ||||||
WGL Holdings | 5,275 | 373 | ||||||
Xcel Energy | 25,800 | 1,135 | ||||||
York Water | 1,341 | 42 | ||||||
|
| |||||||
| 44,571 | ||||||||
|
| |||||||
| 1,249,341 | ||||||||
|
| |||||||
Total Common Stock | ||||||||
(Cost $1,691,224) ($ Thousands) | 1,770,701 | |||||||
|
| |||||||
EXCHANGE TRADED FUNDS — 0.8% |
| |||||||
United States — 0.8% | ||||||||
iShares MSCI India Fund | 405,764 | 11,990 | ||||||
iShares Trust MSCI Taiwan Index Fund | 246,000 | 3,698 | ||||||
SPDR S&P 500 Trust Fund | 752 | 163 | ||||||
|
| |||||||
| 15,851 | ||||||||
|
| |||||||
Total Exchange Traded Funds | ||||||||
(Cost $14,609) ($ Thousands) | 15,851 | |||||||
|
| |||||||
PREFERRED STOCK — 0.5% | ||||||||
Brazil — 0.3% | ||||||||
Banco Bradesco | 119,630 | 1,055 | ||||||
Braskem | 8,000 | 46 | ||||||
Centrais Eletricas Brasileiras * | 11,100 | 77 | ||||||
| 48 | Adviser Managed Trust / Annual Report / July 31, 2016 |
SCHEDULE OF INVESTMENTS
July 31, 2016
Tactical Offensive Equity Fund (Continued)
Description | Shares | Market Value ($ Thousands) | ||||||
PREFERRED STOCK (continued) |
| |||||||
Cia Brasileira de Distribuicao | 7,300 | $ | 111 | |||||
Cia Energetica de Minas Gerais | 36,500 | 103 | ||||||
Cia Energetica de Sao Paulo | 10,300 | 44 | ||||||
Cia Paranaense de Energia | 5,300 | 53 | ||||||
Gerdau | 47,100 | 113 | ||||||
Itau Unibanco Holding | 124,000 | 1,301 | ||||||
Itausa — Investimentos Itau | 169,610 | 441 | ||||||
Lojas Americanas | 26,700 | 159 | ||||||
Petroleo Brasileiro * | 170,200 | 627 | ||||||
Suzano Papel e Celulose, Cl A | 21,300 | 65 | ||||||
Telefonica Brasil | 19,700 | 301 | ||||||
Vale | 84,200 | 390 | ||||||
|
| |||||||
| 4,886 | ||||||||
|
| |||||||
Chile — 0.0% | ||||||||
Embotelladora Andina | 13,317 | 53 | ||||||
Sociedad Quimica y Minera de Chile, Cl B | 4,440 | 110 | ||||||
|
| |||||||
| 163 | ||||||||
|
| |||||||
Colombia — 0.0% | ||||||||
Bancolombia | 19,672 | 168 | ||||||
Grupo Aval Acciones y Valores | 185,117 | 70 | ||||||
Grupo de Inversiones Suramericana | 4,812 | 59 | ||||||
|
| |||||||
| 297 | ||||||||
|
| |||||||
Germany — 0.1% | ||||||||
Bayerische Motoren Werke | 1,579 | 115 | ||||||
FUCHS PETROLUB | 2,014 | 85 | ||||||
Henkel & KGaA | 5,162 | 643 | ||||||
Porsche Automobil Holding | 4,436 | 233 | ||||||
Schaeffler | 4,809 | 70 | ||||||
Volkswagen | 5,377 | 756 | ||||||
|
| |||||||
| 1,902 | ||||||||
|
| |||||||
South Korea — 0.1% | ||||||||
Amorepacific | 630 | 127 | ||||||
Hyundai Motor | 2,908 | 258 | ||||||
LG Chemical | 400 | 63 | ||||||
LG Household & Health Care | 100 | 52 | ||||||
Samsung Electronics | 798 | 901 | ||||||
|
| |||||||
| 1,401 | ||||||||
|
| |||||||
Total Preferred Stock | ||||||||
(Cost $7,610) ($ Thousands) | 8,649 | |||||||
|
| |||||||
| Number of Rights | ||||||||
RIGHTS — 0.0% | ||||||||
Hong Kong — 0.0% | ||||||||
China Resources Beer Holdings *‡ | 22 | 9 | ||||||
|
| |||||||
Spain — 0.0% | ||||||||
Iberdrola *‡ | 106 | 16 | ||||||
Zardoya Otis *‡ | 5 | 2 | ||||||
|
| |||||||
| 18 | ||||||||
|
| |||||||
Description | Number of Rights | Market Value ($ Thousands) | ||||||
RIGHTS (continued) | ||||||||
United States — 0.0% | ||||||||
Durata Therapeutics *‡ | 1 | $ | – | |||||
|
| |||||||
Total Rights | 27 | |||||||
|
| |||||||
Total Investments — 97.1% | ||||||||
(Cost $1,713,443) ($ Thousands) | $ | 1,795,228 | ||||||
|
| |||||||
A list of the open futures contracts held by the Fund at July 31, 2016, is as follows:
Type of Contract | Number of Contracts Long | Expiration Date | Unrealized Appreciation ($ Thousands) | |||||||||
MSCI EAFE Index E-MINI | 84 | Sep-2016 | $ | 446 | ||||||||
MSCI Emerging Markets E-MINI | 228 | Sep-2016 | 660 | |||||||||
Russell 2000 Index E-MINI | 76 | Sep-2016 | 500 | |||||||||
S&P 500 Index E-MINI | 232 | Sep-2016 | 1,052 | |||||||||
S&P Mid Cap 400 Index E-MINI | 18 | Sep-2016 | 138 | |||||||||
|
| |||||||||||
| $ | 2,796 | |||||||||||
|
| |||||||||||
For the year ended July 31, 2016, the total amount of all open futures contracts, as presented in the table above, are representative of the volume of activity for this derivative type during the period.
| Percentages are based on a Net Assets of $1,848,988 ($ Thousands). |
| * | Non-income producing security. |
| ‡ | Expiration date unavailable. |
| † | The Fund may purchase securities of certain companies with which it is affiliated to the extent these companies are represented in its benchmark index. |
| †† | Real Estate Investment Trust. |
| (A) | Security exempt from registration under Rule 144A of the Securities Act of 1933. These securities may be resold in transactions exempt from registration normally to qualified institutions. On July 31, 2016, the value of these securities amounted to $2,228 ($ Thousands), representing 0.1% of the net assets of the |
| Fund. |
ADR — American Depositary Receipt
Cl — Class
EAFE — Europe, Australasia and Far East
GDR — Global Depositary Receipt
MSCI — Morgan Stanley Capital International
PJSC — Private Joint Stock Company
S&P — Standard & Poor’s
Ser — Series
SPDR — Standard & Poor’s Depository Receipt
| Adviser Managed Trust / Annual Report / July 31, 2016 | 49 |
SCHEDULE OF INVESTMENTS
July 31, 2016
Tactical Offensive Equity Fund (Concluded)
The following is a list of the level of inputs used as of July 31, 2016, in valuing the Fund’s investments and other financial instruments carried at value ($ Thousands):
Investments in Securities | Level 1 | Level 2 | Level 3 | Total | ||||||||||||
Common Stock | $ | 1,770,701 | $ | — | $ | — | $ | 1,770,701 | ||||||||
Exchange Traded Funds | 15,851 | — | — | 15,851 | ||||||||||||
Preferred Stock | 8,649 | — | — | 8,649 | ||||||||||||
Rights | 27 | — | —^ | 27 | ||||||||||||
|
|
|
|
|
|
|
| |||||||||
Total Investments in Securities | $ | 1,795,228 | $ | — | $ | — | $ | 1,795,228 | ||||||||
|
|
|
|
|
|
|
| |||||||||
Other Financial Instruments | Level 1 | Level 2 | Level 3 | Total | ||||||||||||
Futures Contracts * | ||||||||||||||||
Unrealized Appreciation | $ | 2,796 | $ | — | $ | — | $ | 2,796 | ||||||||
|
|
|
|
|
| �� |
|
| ||||||||
Total Other Financial Instruments | $ | 2,796 | $ | — | $ | — | $ | 2,796 | ||||||||
|
|
|
|
|
|
|
| |||||||||
| * | Futures contracts are valued at the unrealized appreciation on the instrument. |
| ^ | Represents securities in which the fair value is $0 or has been rounded to $0. |
For the year ended July 31, 2016, there were transfers between Level 1 and Level 2 assets and liabilities due to the availability of quoted prices in active markets to determine fair value. For the year ended July 31, 2016, there were no transfers between Level 2 and Level 3 assets and liabilities. All transfers, if any, are recognized by the Fund at the end of the year.
Amounts designated as “—” are either $0 or have been rounded to $0.
The accompanying notes are an integral part of the financial statements.
| 50 | Adviser Managed Trust / Annual Report / July 31, 2016 |
Report of Independent Registered Public Accounting Firm
The Board of Trustees and Shareholders
Adviser Managed Trust:
We have audited the accompanying statement of assets and liabilities, including the summary schedule of investments, of the Tactical Offensive Equity Fund and the accompanying statement of assets and liabilities, including the schedule of investments, of the Tactical Offensive Fixed Income Fund comprising the Adviser Managed Trust (the “Trust”), as of July 31, 2016, and the related statements of operations for the year then ended, the statements of changes in net assets for each of the years in the two-year period then ended, and the financial highlights for each of the years in the five-year period then ended. The financial statements and financial highlights are included in Item 1 of this Form N-CSR and the schedule of investments in securities of the Tactical Offensive Equity Fund, as of July 31, 2016 is included in Item 6 of this Form N-CSR. These financial statements and financial highlights and the schedule of investments in securities are the responsibility of the Trust’s management. Our responsibility is to express an opinion on these financial statements, financial highlights, and schedule of investments in securities based on our audits.
We conducted our audits in accordance with the standards of the Public Company Accounting Oversight Board (United States). Those standards require that we plan and perform the audit to obtain reasonable assurance about whether the financial statements and financial highlights are free of material misstatement. An audit includes examining, on a test basis, evidence supporting the amounts and disclosures in the financial statements. Our procedures included confirmation of securities owned as of July 31, 2016, by correspondence with custodians and brokers or other appropriate auditing procedures. An audit also includes assessing the accounting principles used and significant estimates made by management, as well as evaluating the overall financial statement presentation. We believe that our audits provide a reasonable basis for our opinion.
In our opinion, the financial statements and financial highlights and schedule of investments in securities referred to above present fairly, in all material respects, the financial position of each of the funds comprising the Adviser Managed Trust as of July 31, 2016, the results of their operations for the year then ended, the changes in their net assets for each of the years in the two-year period then ended, and the financial highlights for each of the years in the five-year period then ended, in conformity with U.S. generally accepted accounting principles.
/s/ KPMG LLP
Philadelphia, Pennsylvania
September 28, 2016
Item 7. Disclosure of Proxy Voting Policies and Procedures for Closed-End Management Investment Companies.
Not applicable.
Item 8. Portfolio Managers of Closed-End Management Investment Companies
Not applicable.
Item 9. Purchases of Equity Securities by Closed-End Management Company and Affiliated Purchasers.
Not applicable.
Item 10. Submission of Matters to a Vote of Security Holders.
The Registrant has a standing Governance Committee (the “Committee”) currently consisting of the Independent Trustees on the Board. The Committee is responsible for evaluating and recommending nominees for election to the Board. Pursuant to the Committee’s Charter, adopted on June 18th 2004, as amended, the Committee will review all shareholder recommendations for nominations to fill vacancies on the Board if such recommendations are submitted in writing and addressed to the Committee at the Registrant’s office.
Item 11. Controls and Procedures.
(a) The Registrant’s principal executive and principal financial officers, or persons performing similar functions, have concluded that the Registrant’s disclosure controls and procedures (as defined in Rule 30a-3(c) under the Investment Company Act of 1940 (the “1940 Act”)) are effective, based on the evaluation of these controls and procedures required by Rule 30a-3(b) under the 1940 Act and Rules 13a-15(b) or 15d-15(b) under the Securities Exchange Act of 1934 as of a date within 90 days of the filing date of this report.
(b) There were no changes in the Registrant’s internal control over financial reporting (as defined in Rule 30a-3(d) under the 1940 Act) that occurred during the second fiscal quarter of the period covered by this report that have materially affected, or are reasonably likely to materially affect, the Registrant’s internal control over financial reporting.
Items 12. Exhibits.
(a)(1) Code of Ethics attached hereto.
(a)(2) A separate certification for the principal executive officer and the principal financial officer of the Registrant as required by Rule 30a-2(a) under the 1940 Act, as amended (17 CFR 270.30a-2(a)), are filed herewith.
(b) Officer certifications as required by Rule 30a-2(b) under the Investment Company Act of 1940, as amended (17 CFR 270.30a-2(b)) also accompany this filing as an exhibit.
| 52 | Adviser Managed Trust / Annual Report / July 31, 2016 |
SIGNATURES
Pursuant to the requirements of the Securities Exchange Act of 1934 and the Investment Company Act of 1940, the Registrant has duly caused this report to be signed on its behalf by the undersigned, thereunto duly authorized.
| Adviser Managed Trust | ||
| By | /s/ Robert A. Nesher | |
| Robert A. Nesher | ||
| President & CEO | ||
Date: October 7, 2016
Pursuant to the requirements of the Securities Exchange Act of 1934 and the Investment Company Act of 1940, this report has been signed below by the following persons on behalf of the Registrant and in the capacities and on the dates indicated.
| By | /s/ Robert A. Nesher | |
| Robert A. Nesher | ||
| President & CEO | ||
Date: October 7, 2016
| By | /s/ James J. Hoffmayer | |
| James J. Hoffmayer | ||
| Controller & CFO | ||
Date: October 7, 2016