UNITED STATES
SECURITIES AND EXCHANGE COMMISSION
Washington, D.C. 20549
FORMN-CSR
CERTIFIED SHAREHOLDER REPORT OF REGISTERED
MANAGEMENT INVESTMENT COMPANIES
Investment Company Act file number811-22480
Adviser Managed Trust
(Exact name of registrant as specified in charter)
SEI Investments
One Freedom Valley Drive
Oaks, PA 19456
(Address of principal executive offices) (Zip code)
Timothy D. Barto, Esq.
SEI Investments Co.
One Freedom Valley Drive
Oaks, PA 19456
(Name and address of agent for service)
Registrant’s telephone number, including area code:1-610-676-1000
Date of fiscal year end: July 31, 2019
Date of reporting period: July 31, 2019
| Item 1. | Reports to Stockholders. |
Beginning on January 1, 2021, as permitted by regulations adopted by the Securities and Exchange Commission, paper copies of the Funds’ shareholder reports like this one will no longer be sent by mail, unless you specifically request paper copies of the reports from the Funds or from your financial intermediary, such as a broker-dealer or bank. Instead, the reports will be made available on a website, and you will be notified by mail each time a report is posted and provided with a website link to access the report.
If you already elected to receive shareholder reports electronically, you will not be affected by this change and you need not take any action. You may elect to receive shareholder reports and other communications from the Funds electronically by contacting your financial intermediary.
You may elect to receive all future reports in paper free of charge. If you invest through a financial intermediary, you can follow the instructions included with this disclosure, if applicable, or you can contact your financial intermediary to inform it that you wish to continue receiving paper copies of your shareholder reports. If you invest directly with the Funds, you can inform the Funds that you wish to continue receiving paper copies of your shareholder reports by calling1-800-DIAL-SEI. Your election to receive reports in paper will apply to all funds held with the SEI Funds or your financial intermediary.
| 1 | ||||
| 6 | ||||
| 11 | ||||
| 72 | ||||
| 73 | ||||
| 74 | ||||
| 75 | ||||
| 76 | ||||
| 92 | ||||
| 93 | ||||
| 96 | ||||
Board of Trustees’ Considerations in Approving the Advisory andSub-Advisory Agreements | 97 | |||
| 100 | ||||
The Trust files its complete schedule of portfolio holdings with the Securities and Exchange Commission for the first and third quarter of each fiscal year on FormN-PORT. The Trust’s FormsN-PORT are available on the Commission’s website at http://www.sec.gov.
A description of the policies and procedures that the Trust uses to determine how to vote proxies relating to portfolio securities, as well as information relating to how a Fund voted proxies relating to portfolio securities during the most recent12-month period ended July 31, is available (i) without charge, upon request, by calling1-800-DIAL-SEI; and (ii) on the Commission’s website at http://www.sec.gov.
LETTER TO SHAREHOLDERS (Unaudited)
JULY 31, 2019
To Our Shareholders:
After an extended period of historical calm and steady gains, volatility returned to financial markets during the fiscal year ending July 31, 2019, with a selloff toward the end of 2018 that sent most global indexes into or near bear market territory before an early-2019 rebound that saw the S&P 500 Index deliver its best first-quarter performance in 20 years. Trade war fears, ongoing Brexit discussions and the U.S. yield curve all weighed on investor expectations.
The pace of interest-rate increases by the Federal Reserve (Fed) mostly followed the market’s projections. Long-term rates fell by a greater magnitude than short-term rates after the Federal Reserve raised rates twice during the reporting period; the yield curve flattened to a post-recession low and even inverted at multiple maturities. On the final day of the reporting period, the central bank cut rates for the first time since 2008 (amid the great financial crisis), with new economic projections showing zero interest-rate increases in 2019.
The European Central Bank ended its bond-buying program at the end of 2018 but made assurances that it would reinvest maturing securities for some time to help keep rates low. Christine Lagarde (who resigned as president of the International Monetary Fund after the reporting period) was named to succeed Mario Draghi as European Central Bank (ECB) President at the end of October 2019. Lagarde is expected to maintain her predecessor’s dovish policies.
The Japanese yen, typically viewed as a safe-haven asset in“risk-off” environments, finished the period higher against the U.S. dollar while the Bank of Japan (BOJ) held monetary policy stable. Driven by trade-related tensions, the Chinese yuan slid to an11-year low against the U.S. dollar during the fiscal period. While China’s currency strengthened earlier this year as U.S.-China trade negotiations appeared to be reaching a favorable conclusion, its value weakened again following a breakdown in talks at the beginning of May.
Oil prices rose during the first half of the reporting period to a four-year high, supported by geopolitical tensions and news that Saudi Arabia and Russia would extend an agreement to curb output. However, growing concerns over falling demand and increasing global supply, along with a broad selloff in risk assets, helped drive a correction during the last three months of 2018 that sent the commodity down over 40% from its earlier highs. Support at the start of the New Year saw a 50% recovery from its lows, and oil closed the fiscal year down about 15%.
Geopolitical Events
U.S. elections in November 2018 produced a partial shift in power away from Republicans and toward Democrats in Congress and statehouses across the country. The new balance of authority in Congress could substantially limit the ability of President Donald Trump and Republicans to pass meaningful legislation; it also enhances the investigatory powers available to Democrats, thereby adding to political risk for the Trump administration.
The partial shutdown of the U.S. government in December lasted over a month due to an impasse between Congress and President Trump’s administration about whether to fund a multi-billion dollar wall on the U.S.-Mexico border championed by the president. The Trump administration also received a measure of resolution in March, when the special counsel investigating the 2016 election “did not establish that members of the Trump campaign conspired or coordinated with the Russian government” to sway the election. The special counsel reportedly could not conclude that the president committed criminal obstruction of justice, although neither did it exonerate him. Congressional Democrats intend to review the special counsel’s report to make a separate determination in conjunction with information gathered through Congressional investigations.
The North American Free Trade Agreement’s successor came into focus during the year—first when the U.S. and Mexico came to an agreement in August, and then when the U.S. and Canada finally ironed out their differences in September. Now called the United States-Mexico-Canada Agreement, the revised deal is expected to strengthen its predecessor’s provisions and improve labor standards. The U.S. is projected to offer Canada and Mexico relief from automobile-related trade barriers as a result of the new agreement, although aluminum and steel tariffs will remain.
Top-level U.S. negotiators wrapped up recently-resumed trade talks with China at the end of July. President Donald Trump announced that the U.S. would impose 10% tariffs on $300 billion of Chinese goods beginning in September, primarily covering all remainingyet-to-be-tariffed imports. China responded that it would retaliate if the tariffs are enacted, but the uneven trade relationship leaves a limited pool of U.S. exports to China that can be tariffed. The
| Adviser Managed Trust / Annual Report / July 31, 2019 | 1 |
LETTER TO SHAREHOLDERS (Unaudited) (Continued)
JULY 31, 2019
Congress approved atwo-year budget agreement in late July, as was expected given sufficient bipartisan support for the deal.
U.K. Prime Minister Theresa May announced on May 24 her intention to resign following a poor showing for Conservatives in European Parliamentary elections. May’s inability to establish sufficient support for her Brexit deal or a viable alternative had become an impasse, and her recent overtures for a second referendum alienated a large subset of her party’s leadership. Boris Johnson began serving as U.K. Prime Minister and leader of the Conservative Party toward the end of July, using his new platform to double down on his campaign promise to depart the EU—with or without a Brexit deal—on October 31. EU negotiators, for their part, have expressed no plans to renegotiate the withdrawal agreement struck with Johnson’s predecessor.
Elections for European Parliament exposed support for centrist parties shifting toward more polarizing alternatives on the left and right. Concerns about the impact of climate change bolstered the Green Party alliance, especially in Germany, where it outpaced the Social Democratic Party (which serves as the junior partner in Chancellor Angela Merkel’s coalition government). Eurosceptic nationalist parties also fared well, particularly in France and Italy, where they earned a plurality of votes.
Economic Performance
The U.S. economy grew 3.4% during the third quarter of 2018, a drop from 4.2% in the previous quarter, pointing to a slight decrease in consumer spending and a broader decline in exports. Economic growth slowed further to 2.2% in the fourth quarter of 2018, primarily due to a softer environment for business investment that was only modestly affected by the partial government shutdown. Still, GDP for the 2018 calendar year finished at 2.9%, equaling growth in 2015 as the best in 10 years. The government shutdown that continued through most of January likely detracted in 2019; however, growth rebounded to 3.1% in the first quarter, driven by increases in inventories and trade. Robust consumer spending countered a decline in business investment in the second quarter of 2019, allowing the10-year expansion to continue despite decelerating global activity.
The labor market remained robust throughout the fiscal year: the unemployment rate fell, finishing the period near a49-year low at 3.7%; the labor-force participation rate ended at 63.0%, marginally higher from a year ago. Average hourly earnings gained 3.2% over the year, although a modest increase in price pressures weighed on real personal income growth. The historically strong labor market and improving wage growth helped boost the debt profile of the U.S. consumer. The Fed’s dovish pivot at the end of the reporting period involved an early conclusion to its balance-sheet reduction program, which was initially scheduled to end in September. These accommodative actions came amid below-target inflation and uncertainty about trade developments.
The ECB held its benchmark interest rate unchanged at a historic low through the fiscal year, while the Bank of England raised its official bank rate for only the second time since the global financial crisis, by 0.25%, at the start of the fiscal year. Committee guidance later in the reporting period noted a bias toward higher rates in the future depending on the Brexit outcome, in contrast to the looser monetary policy shift of the Fed and ECB. Broad economic growth in the eurozone slowed to its weakest pace in six years at the end of the second quarter of 2019, as slumping exports in Germany and a stagnating Italian economy hampered expansion; the slowdown strengthens the case for continued accommodative policy by the ECB for some time. The U.K. economy grew 1.2%year-on-year through the second quarter of 2019, its weakest level since the beginning of 2018.
Japanese GDP grew 1.2%year-on-year at the end of the second quarter of 2019; the BOJ maintained monetary stimulus in an attempt to counter slowing growth and weak productivity gains. Meanwhile, GDP in China expanded by just 6.2%year-on-year in the second quarter of 2019, its weakest pace in 28 years, as a lack of consumer confidence due to the U.S. trade war continued to put pressure on economic growth.
Market Developments
For the fiscal year ending July 31, 2019, growth stocks generally outperformed value stocks in the U.S. The U.S. equity market experienced a significant decline midway through the fiscal year as concerns about rising interest rates, trade issues, and softening global economic growth weighed on investor sentiment. The highly-cyclical energy sector experienced a significant selloff, while the consumer staples and utilities sectors, in particular, outperformed and helped mitigate some damage in the falling market. However, January marked the best start for equities in thirty
| 2 | Adviser Managed Trust / Annual Report / July 31, 2019 |
years; the recovery rally continued until a slight retreat in May but touched a record high in July before the end of the fiscal year.
The Russell 1000 Growth Index finished up 10.82% during the fiscal year, while the Russell 1000 Value Index lagged, gaining 5.20% over the same period.Small-cap stocks (Russell 2000 Index) failed to keep up with large caps (Russell 1000 Index) in the U.S. during the fiscal year. Large caps finished up 8.00%, easily outpacing small caps, which lost 4.42%.
Brexit concerns continued to overshadow the outlook for business in the U.K.; the FTSE UK SeriesAll-Share Index shed 5.47% in U.S. dollar terms but managed to gain 1.27% in sterling. The MSCI ACWI (Net), a proxy for global equities in both developed and emerging markets, rose 2.95% in U.S. dollar terms; U.S. markets did better, as the S&P 500 Index returned 7.99%. Despite continued accommodative monetary policy from the ECB, European equities lagged, as fears over trade wars and policy uncertainty grew. The MSCI Europe Index (Net) finished down 3.31% in U.S. dollar terms but 1.61% higher in euros; the euro finished down 4.79% versus the U.S. dollar for the period.
Emerging markets failed to keep pace over the full reporting period. The MSCI Emerging Markets Index (Net) finished the fiscal year off 2.18% in U.S. dollar terms, after a generous rally over the final six months. Asian markets ended the period lower as trade-related concerns drove regional market weakness.
Led by the dovish tone of global central banks and better-than-expected earnings toward the end of the reporting period, global high-yield bonds outperformed global government bonds. A continuing theme for U.S. fixed-income markets was the flattening yield curve, as short-term yields fell less than long-term yields. In early December, the spread between2-year and10-year Treasury bonds compressed to 11 basis points, its narrowest point in more than 12 years. At the same time, the spread between2-year and5-year Treasurys inverted, as did the spread between3-year and5-year Treasurys. Notably, the3-month and10-year rates inverted toward the end of the reporting period, a signal of impending recession to some market watchers. The Federal Open Market Committee increased the federal-funds rate inmid-December—the second hike of the reporting period and ninth during this tightening cycle—while softening its projections for future rate increases. The rate hikes failed to sustain an impact on higher short-term yields, while subdued inflation and long-term economic growth expectations pressured the long end of the curve. On the final day of the fiscal year, the central bank cut rates for the first time in 11 years. Yields for10-year government bonds declined and ended the period 94 basis points lower at 2.02%, while2-year yields rose to almost 3% during the first half of the fiscal year but finished the period down 78 basis points at 1.89%.
Inflation-sensitive assets, such as commodities and Treasury inflation-protected securities (TIPS), were mixed. The Bloomberg Commodity Total Return Index (which represents the broad commodity market) slid 5.36%, primarily due to oil market headwinds, while the Bloomberg Barclays1-10 Year US TIPS Index (USD) moved 5.72% higher.
Global fixed income, as measured by the Bloomberg Barclays Global Aggregate Index, climbed 5.73% in U.S. dollar terms during the reporting period, while the high-yield market did slightly better, with the ICE BofAML US High Yield Constrained Index up 6.93%.
U.S. investment-grade corporate debt performed well, as the Bloomberg Barclays US Corporate Investment Grade Index returned 10.42%. U.S. asset-backed and mortgage-backed securities also managed gains during the fiscal year.
Emerging-market debt delivered strong performance. The JP Morgan GBI Emerging Markets Global Diversified Index, which tracks local-currency-denominated emerging-market bonds, climbed 7.95% higher in U.S. dollar terms, after starting 2019 down for the reporting period to date. The J.P. Morgan EMBI Global Diversified Index, which tracks emerging-market debt denominated in external currencies (such as the U.S. dollar), gained 10.98%, and also overcame a negative start as it began the calendar year.
Our View
The U.S. economic expansion turned 10 years old in July. The bull market in the S&P 500 Index marked its tenth anniversary back in March, and it appears to be celebrating these achievements by poking intonew-high territory. But there is anxiety that the bull market in equities is on its last legs, the victim of a slowing global economy, the lagged impact of last year’s interest-rate increases and, most importantly, a trade war between the U.S. and China.
To be sure, the U.S. economy is hardly firing on all cylinders. There’s a good chance that capital spending will continue to ease in the months ahead, but we’re not forecasting a significant downturn. Corporate cash generation
| Adviser Managed Trust / Annual Report / July 31, 2019 | 3 |
LETTER TO SHAREHOLDERS (Unaudited) (Concluded)
JULY 31, 2019
continues to run slightly ahead of capital expenditures. The main point to remember: It’s not unusual for capital expenditures to run well in excess of cash flow, especially toward the end of the economicup-cycle. That’s not happening yet.
We need to see a severe deterioration in financial and leading economic indicators before climbing onto the recession train. Even after the past two years of multiple Fed rate increases, there are still few signs of abuild-up in financial stress.
The big question, of course, is how the evolving tariff war with China affects U.S. economic growth and global trade in the months ahead. Tensions with China and worries about global growth have so far put only a modest dent in the confidence of U.S. businesses. But it certainly looks as if the U.S.-China trade relationship is getting frostier.
We believe the U.S. economy should be able to weather this storm. Anall-out tariff war between the two largest economies in the world will undoubtedly be disruptive to supply chains and will likely lead to higher prices for a broad range of consumer goods. Still, it is helpful to keep the problem in perspective. Even if a 25% tariff is eventually imposed on all Chinese imports into the U.S., total duties would equal roughly 0.5% of U.S. GDP.
It is not our intention to minimize the importance of the shift in U.S. trade policy toward protectionism. The speed and ease with which supply chains can be relocated to other countries will be a critical factor, either exacerbating or tempering the tariff impact on consumers and companies in both the U.S. and China. An escalation of the trade wars by the U.S. against other countries would prove far more dangerous for the near-term growth prospects in the U.S. than if trade is disrupted only with China.
We have been thinking that the U.S. would avoid waging multiple tariff wars as it concentrated its firepower on China. But our persistent optimism might not hold.
In all, we think the U.S. economy will show resilience in the face of what is admittedly a stiff headwind. Household income growth continues to advance at a good pace. The decline in interest rates that began late last year will also certainly help consumers.
The market-implied rate (based on federal-funds futures contracts as of August 1) projects a federal-funds rate of 1.65% by the close of 2019, according to the CME Group, consistent with two additional 25 basis-point cuts. Although the forecasts of the Federal Open Market Committee members are more cautious, they are moving in the direction of the markets. The recent decline in bond yields to levels last seen in 2016 ranks as one of the biggest surprises of the year. We find it hard to justify these moves. In our view, recession is not likely in the absence of a severe policy mistake, such as fighting a tariff war on multiple fronts.
In emerging economies, when one considers all the headwinds they face—a significant slowdown in Chinese economic growth, theon-going trade tensions between the U.S. and China, weak commodity pricing and a still-resilient U.S. dollar—it’s surprising that emerging stock markets have appreciated at all this year. Scores of measures, both monetary and fiscal, have been put in place over the past year.
Europe currently faces a variety of distinctive challenges, both economic and political, that makes it hard even for a contrarian investor to get enthusiastic about the near term. Economically, the downward trajectory is similar to that of the2011-to-2012 period, when the region was in the midst of the periphery debt crisis. However, this time, Germany’s industrial economy is fully participating in the slowdown.
It’s not just the region’s massive exposure to manufacturing and international trade that makes German industrialists glum. There is also a worrisome vacuum of political leadership. Chancellor Angela Merkel is on her way out, and given the country’s central importance in the eurozone and EU, a politically distracted Germany is a concerning issue.
And then, there’s the looming cloud of Brexit. Although it has been delayed until October 31, there is little sign that the breathing space will be put to good use. Boris Johnson was named Prime Minister at the end of the fiscal year. It’s hard to see how that improves the chances of an orderly exit.
Although economic growth is sluggish, the U.K. economy is not exactly cratering as the deadline approaches. In fact, the unemployment rate has fallen to a multi-decade low. The eurozone also is recording steady labor-market improvement, although the jobless rate itself remains far higher owing to structural factors.
| 4 | Adviser Managed Trust / Annual Report / July 31, 2019 |
That said, we can’t help but think Brexit will prove to be a highly disruptive event for the U.K. and the EU if it indeed occurs. Roughly half of the U.K.’s trade in goods, both imports and exports, is with the EU.
We think there is still life in the economic expansion, both in the U.S. and globally. If we’re right, that means corporate profits should continue to expand and push global stock markets to higher levels in the months ahead. This may seem like a bold statement at a time when the world looks increasingly unpredictable, and the economic data point to slowing growth. But we do not yet see the economic imbalances or nosebleed equity-market valuations that typically bring on recessions and an associated contraction in earnings and stock prices. It is also clear, in our opinion, that central banks have investors’ backs, as monetary policymakers promise to, or already are, cutting interest rates and providing additional liquidity to their banking systems in both developed and emerging countries.
Sincerely,

William T. Lawrence, CFA
Head & Chief Investment Officer of Traditional Asset Management, SEI
| Adviser Managed Trust / Annual Report / July 31, 2019 | 5 |
MANAGEMENT’S DISCUSSION AND ANALYSIS OF FUND PERFORMANCE (Unaudited)
JULY 31, 2019
Tactical Offensive Equity Fund
I. Objective
The Tactical Offensive Equity Fund (the “Fund”) seeks to provide capital appreciation.
II. Adviser Managed Strategy Component
Only persons who are clients of the Financial Adviser (as defined below) and who participate in the Adviser Managed Strategy should invest in the Fund. The Fund may not be purchased by any other investor. The Fund is designed to be a component of a broader strategy employed by a third party investment manager (Financial Adviser) for the benefit of its clients. The Financial Adviser seeks to take advantage of broad market changes by tactically shifting its clients’ assets among the Fund, the Tactical Offensive Fixed Income Fund and a money market fund affiliated with the Fund, depending on the Financial Adviser’s evaluation of current market conditions (Adviser Managed Strategy). The Financial Adviser is not the adviser to the Fund and is not affiliated with SEI Investments Management Corporation (SIMC), the adviser to the Fund. The Adviser Managed Strategy is based on models developed by the Financial Adviser and is not subject to the oversight of or input from SIMC.
When the Financial Adviser determines to reallocate its clients’ assets to one or more of the other funds that compose the Adviser Managed Strategy, the Financial Adviser may request the redemption of a substantial portion of or all of the shares for which the Financial Adviser exercises investment discretion. In such an instance, the Financial Adviser’s redemption request will cause the Fund to liquidate a substantial portion of or substantially all of its assets in order to fulfill the redemption request. If the Financial Adviser redeems all of the shares for which it exercises investment discretion, the Fund will no longer be an active component of the Adviser Managed Strategy. When the Fund is not an active component of the Adviser Managed Strategy, the Fund may invest up to 100% of its remaining assets in exchange traded funds (“ETF“s) that are designed to track the performance of the broad equity market. The Fund could be invested in these types of investments for extended periods of time. At such times, SIMC will manage the assets of the Fund. SIMC, the Financial Adviser or one or more of their affiliates will be the only investors in the Fund when the Fund is not an active component of the Adviser Managed Strategy.
III. Investment Approach
The Fund employs a passive strategy designed to track, before fees and expenses, the performance of one or more indexes that represent broad exposure to the
U.S. equity market and issuers located in developed and emerging market countries outside the U.S. (each an Index, and collectively, the Indexes). The passive strategy is implemented by SSGA Funds Management, Inc., assub-advisor under the general supervision of SEI Investments Management Corporation (SIMC). SIMC may adjust the Fund’s allocation of assets among the Indexes over time depending on its assessment of the markets.
IV. Return vs. Benchmark
For the full year ended July 31, 2019, the Fund returned 4.12%. The Fund’s primary benchmark—the S&P 500 Index (Gross)—returned 7.99%.
The Fund is designed to have exposure to a range of asset classes. Therefore, SEI utilizes a blended benchmark (which reflects the Fund’s allocations to various asset classes and global markets) to assess performance. The Fund’s blended benchmark consists of the Russell 1000 Index (60%), MSCI EAFE Index (Net) (20%), Russell 2000 Index (10%) and MSCI Emerging Markets Index (Net) (10%). The blended benchmark returned 3.61% during the fiscal year.
For the period under review, the Fund was an active part of the Adviser Managed Strategy from August 1, 2018, to December 17, 2018, and from March 25, 2019, to July 31, 2019. In the earlier period, the Fund returned-10.90%, while the blended benchmark returned-10.83%. In the later period, the Fund returned 4.97%, while the blended benchmark returned 5.42%.
V. Performance Discussion
The Fund was an active part of the Adviser Managed Strategy from August 1, 2018, to December 17, 2018, and from March 25, 2019, to July 31, 2019. Over both periods, the Fund sought to passively track the performance of indexes as follows: Russell 1000 Index (60%), MSCI EAFE Index (Net) (20%), Russell 2000 Index (10%) and MSCI Emerging Markets Index (Net) (10%). During the fiscal year ending July 31, 2019, the Fund underperformed its primary benchmark, the S&P 500 Index, but outperformed its blended benchmark. The Fund was not an active part of the Adviser Managed Strategy from December 18, 2018 until March 24, 2019, and during this time, the Fund was solely invested in the SPDR S&P 500 ETF, which returned 10.48%. The SPDR S&P 500 ETF is designed to track the performance of the S&P 500 Index, and the Fund performed generally in line with the S&P 500 Index - its primary benchmark - during this period.
| 6 | Adviser Managed Trust / Annual Report / July 31, 2019 |
During the first period of August 1, 2018, to December 17, 2018, the Fund returned-10.90%, while the blended benchmark returned-10.83%. The Russell 1000 Index was down-9.38%. Concerns surrounding slowing growth in 2019, along with the potential prospect of additional rate hikes by the Federal Reserve, prompted a selloff in global equities. Energy and materials stocks were the worst performers due to global growth concerns that weighed on demand forecasts. Utilities was the only advancing sector, as markets sold off during this time on bearish sentiment around a global economic slowdown, as noted in the shareholder letter. Consumer staples and healthcare were the next-best performing sectors due to their defensive properties. The Russell 2000 Index returned-17.20%, as cyclical sectors like energy, materials and industrials fell on likewise concerns of slowing global growth, while defensive sectors like utilities, communication services and real-estate stocks were higher. The MSCI EAFE Index (Net) returned-12.21% and experienced similar headwinds. Cyclical sectors like materials and financials led developed markets down, while utilities, real estate and communication services softened the decline. Regionally, U.K. stocks lagged amidst continuing Brexit uncertainty. In Europe, protests in France and decelerating GDP growth across the continent weighed on sentiment. Japan outpaced the market as investors sought safety in the Japanese yen. The MSCI Emerging Markets Index (Net) returned-10.43% as the U.S. dollar rose. China, Taiwan and Korea all experienced negative returns amidst continuing trade tensions between China and the U.S. and reduced global growth. The fall in oil prices was a headwind for Russia and Colombia, both of which also experienced negative returns. By contrast, Brazil posted a strong period as investors cheered the victory of market-friendly candidate Jair Bolsonaro.
During the second period of March 25, 2019, to July 31, 2019, the Fund returned 4.97%, while the blended benchmark returned 5.42%. The Fund lagged its benchmark during this time due to the associated trading costs in rebuilding the portfolio after it again became an active component. The Russell 1000 Index was up 7.12%, driven by positive market sentiment over progress in U.S.-China trade talks and expectations for lower rates to jumpstart growth in the global economy. The“risk-on” period was interrupted by a short bout of volatility in May, however, when trade talks between the U.S. and China broke down, and the U.S. threatened tariffs on Mexico, as discussed in the shareholder letter. Higher-volatility sectors, like financials and information technology, led the Russell 1000 Index. Financials saw strong earnings during the period, while information
technology stocks outperformed on general investor optimism. Interest-rate-sensitive defensive sectors in healthcare, utilities and real estate lagged as their defensive nature failed to keep up with the market rally. Energy was the worst-performing sector as oil prices fell. The Russell 2000 Index rose by 4.42% but trailed itslarger-cap peers. Industrials and financials were the best-performing sectors during this“risk-on” period. Similar to large caps, energy was the worst-performing sector. Communication services and materials were the next-worst performing sectors as value stocks lagged. The MSCI EAFE Index (Net) returned 3.17% during this period as investors chased growth stocks in information technology, consumer discretionary and industrials. Rate-sensitive sectors in real estate and utilities lagged, and energy was the worst performer again. From a regional standpoint, Pacificex-Japan was the best-performer due to strong returns in Australia after a surprise election victory for prime minister by Scott Morrison, a market-friendly candidate. The U.K. was the worst-performing sector, as Brexit uncertainty led to the eventual resignation of Prime Minister Teresa May and the nomination of Boris Johnson weighed on investor attitudes. The MSCI Emerging Markets Index (Net) returned 0.73% in a volatile period marked by a trade-driven selloff in May sandwiched between stronger return periods. Consumer staples and utilities led alongside information technology stocks, while healthcare and materials stocks lagged. Performance was more differentiated alongside country and regional lines, where Greek and Russian equities saw strong returns following Greek election outcomes and positive dividend surprises in Russia. Brazil also saw strong returns as investors were optimistic on pension reform in the country. Emerging markets in Asia were the worst performers, as performance was muted after the choppy period.
| AVERAGE ANNUAL TOTAL RETURN1,2 | ||||||||||||
| One Year Return | Annualized 3-Year Return | Annualized 5-Year Return | Annualized Inception to Date | |||||||||
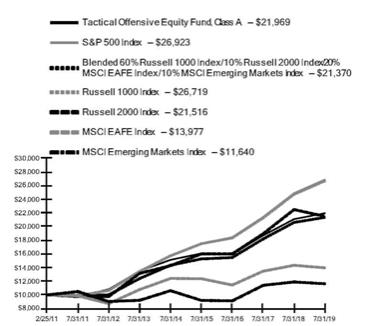
Tactical Offensive Equity Fund, Class A | 4.12 | %^ | 11.12%^ | 7.73%^‡ | 9.79 | %^†‡ | ||||||
S&P 500 Index | 7.99 | % | 13.36% | 11.34% | 12.48 | % | ||||||
| Blended 60% Russell 1000 Index/10% Russell 2000 Index/20% MSCI EAFE Index/10% MSCI Emerging Markets Index | 3.61 | % | 11.35% | 8.28% | 9.42 | % | ||||||
Comparison of Change in the Value of a $10,000 Investment in the Tactical Offensive Equity Fund, Class A, versus the S&P 500 Index and a blended benchmark consisting of, 60% Russell 1000 Index/10% Russell 2000 Index/20% MSCI EAFE Index/10% MSCI Emerging Markets Index.
| Adviser Managed Trust / Annual Report / July 31, 2019 | 7 |
MANAGEMENT’S DISCUSSION AND ANALYSIS OF FUND PERFORMANCE (Unaudited)
JULY 31, 2019
Tactical Offensive Equity Fund(Concluded)
| 1 | For the year ended July 31, 2019. Past performance is no indication of future performance. Prior to October 1, 2014, the Fund’s investment approach was an “active” investment strategy where an investment manager would buy and sell securities based on its own economic, financial, and market analysis. On October 1, 2014, SIMC implemented a “passive” investment strategy which seeks to track an index return. Returns shown do not reflect the deduction of taxes that a shareholder would pay on fund distributions or the redemption of fund shares. Shares of the Fund were offered beginning February 25, 2011. |
| 2 | This table compares the Fund’s average annual total returns to those of a broad-based index and the Fund’s 60/10/20/10 Blended Benchmark, which consists of the Russell 1000 Index, Russell 2000 Index, MSCI EAFE Index, and the MSCI Emerging Markets Index. The Fund’s blended benchmark encompasses additional countries, capitalization weights and sectors than the broad-based index, and therefore we believe that it more accurately reflects the overall investment strategy of the Fund. |
| † | The Fund was not an active component of the Adviser Managed Strategy for the period of August 6, 2011 through January 25, 2012. |
| ‡ | The Fund was not an active component of the Adviser Managed Strategy for the period of August 28, 2015 through April 14, 2016. |
| ^ | The Fund was not an active component of the Adviser Managed Strategy for the period of December 18, 2018 through March 24, 2019. |
| 8 | Adviser Managed Trust / Annual Report / July 31, 2019 |
MANAGEMENT’S DISCUSSION AND ANALYSIS OF FUND PERFORMANCE (Unaudited)
July 31, 2019
Tactical Offensive Fixed Income Fund
I. Objective
The Tactical Offensive Fixed Income Fund (the “Fund”) seeks to provide total return.
II. Adviser Managed Strategy Component
Only persons who are clients of the Financial Adviser (as defined below) and who participate in the Adviser Managed Strategy should invest in the Fund. The Fund may not be purchased by any other investor. The Fund is designed to be a component of a broader strategy employed by a third party investment manager (Financial Adviser) for the benefit of its clients. The Financial Adviser seeks to take advantage of broad market changes by tactically shifting its clients’ assets among the Fund, the Tactical Offensive Equity Fund and a money market fund affiliated with the Fund, depending on the Financial Adviser’s evaluation of current market conditions (Adviser Managed Strategy). The Financial Adviser is not the adviser to the Fund and is not affiliated with SEI Investments Management Corporation (SIMC), the adviser to the Fund. The Adviser Managed Strategy is based on models developed by the Financial Adviser and is not subject to the oversight of or input from SIMC.
When the Financial Adviser determines to reallocate its clients’ assets to one or more of the other funds that compose the Adviser Managed Strategy, the Financial Adviser may request the redemption of a substantial portion of or all of the shares for which the Financial Adviser exercises investment discretion. In such an instance, the Financial Adviser’s redemption request will cause the Fund to liquidate a substantial portion of or substantially all of its assets in order to fulfill the redemption request. If the Financial Adviser redeems all of the shares for which it exercises investment discretion, the Fund will no longer be an active component of the Adviser Managed Strategy. When the Fund is not an active component of the Adviser Managed Strategy, the Fund may invest up to 100% of its remaining assets in cash, money market instruments, repurchase agreements and other short-term obligations that would not ordinarily be consistent with the Fund’s investment goal. The Fund could be invested in these types of investments for extended periods of time. At such times, SIMC will manage the assets of the Fund. SIMC, the Financial Adviser or one or more of their affiliates will be the only investors in the Fund when the Fund is not an active component of the Adviser Managed Strategy.
III. Investment Approach
The Fund employs a passive strategy designed to track, before fees and expenses, the performance of one or
more U.S. Investment Grade, High Yield and Emerging Market Fixed Income Indexes (each an Index, and collectively, the Indexes) implemented by SSGA Funds Management, Inc., assub-advisor under the general supervision of SEI Investments Management Corporation (SIMC). In addition, SIMC will directly manage a portion of the Fund’s assets. SIMC will generally invest in a portfolio of securities designed to track, before fees and expenses, the performance of one or more Foreign Sovereign Debt Indexes. SIMC may adjust the Fund’s allocation of assets among the Indexes over time depending on its assessment of the markets.
IV. Return vs. Benchmark
For the full year ended July 31, 2019, the Fund returned 8.03%. The Fund’s primary benchmark—the Bloomberg Barclays U.S. Aggregate Bond Index—returned 8.08%.
The Fund is designed to have exposure to a range of asset classes, not all of which are reflected in the primary benchmark of the Fund. Therefore, SEI also utilizes a blended benchmark (which reflects the Fund’s allocations to various asset classes and global markets) to assess performance. The Fund’s blended benchmark consists of the Bloomberg Barclays U.S. Aggregate Bond Index (76%), Bloomberg Barclays U.S. High Yield Very Liquid Index (9.5%), FTSE Emerging Markets USD Government Bond Index (9.5%) and Bloomberg Barclays Global Treasury G6 (G7ex-U.S.) Index, (Hedged, USD) (5%). The blended benchmark returned 8.44% during the fiscal year.
V. Performance Discussion
The Fund maintained strategic allocations intended to track the Bloomberg Barclays U.S. Aggregate Bond Index (76%), Bloomberg Barclays U.S. High Yield Very Liquid Index (9.5%), FTSE Emerging Markets USD Government Bond Index (9.5%) and Bloomberg Barclays Global Treasury G6 (G7ex-U.S.) Index (Hedged, USD) (5%). During the fiscal year ending July 31, 2019, the Fund performed in line with both its blended benchmark and primary benchmark, the Bloomberg Barclays U.S. Aggregate Bond Index. For the reasons addressed below, the Fund’s strategic allocations to U.S. dollar-denominated debt contributed to relative performance, while the strategic exposure to high-yield debt detracted from performance relative to the Bloomberg Barclays U.S. Aggregate Bond Index. The Fund experienced a large inflow in February 2019, resulting in higher tracking error due to sampling and transaction costs, particularly within the High Yield and Emerging Markets Debt strategies. Despite the cash inflow, each of the four
| ||||
| Adviser Managed Trust / Annual Report / July 31, 2019 | 9 | |||
MANAGEMENT’S DISCUSSION AND ANALYSIS OF FUND PERFORMANCE (Unaudited)
July 31, 2019
Tactical Offensive Fixed Income Fund(Concluded)
sleeves remained within relative tracking expectations versus their respective benchmarks.
For the period, the Bloomberg Barclays U.S. Aggregate Bond Index returned 8.08%. From a sector perspective, U.S. investment-grade corporates and U.S. Treasurys were among the best performers as rates fell across the curve, as noted in the shareholder letter, while agency mortgage-backed securities were among the worst performers as mortgage rates fell and prepayments accelerated.
The Bloomberg Barclays U.S. High Yield Very Liquid Index returned 7.45% during the fiscal year, benefiting from the market’s general“risk-on” sentiment during the reporting period, as the Federal Reserve made a dovish pivot and spreads tightened. From a sector perspective, media and healthcare were among the best performers, while energy lagged.
The FTSE Emerging Markets USD Government Bond Index returned 11.92% during the period. The best-performing countries included Ecuador and Brazil; Brazil benefited after the election of rightwing president Jair Bolsonaro. Ukraine also outperformed as investors were encouraged that the country’s reform path would continue to accelerate after its new president, Volodymyr Zelensky, promised apro-reform, anti-corruption agenda. The worst performers included Venezuela and Argentina, as both countries struggled with high inflation and volatile currencies.
The Bloomberg Barclays Global Treasury G6 (G7ex-U.S.) Index (Hedged, USD) returned 8.40% during the period. For the fiscal period, rates fell in France, Germany, and Japan, as global banks attempted to counter slowing growth and weak productivity gains, as noted in the shareholder letter. European GDP growth remained slower than in the U.S., and global trade tensions helped drive yields lower across G7 countries.
The Fund used foreign-exchange currency forwards to hedge currency exposure to sovereign bonds. The associated derivatives did not have a material impact on overall Fund performance.
AVERAGE ANNUAL TOTAL RETURN1,2 | ||||||||||
| One Year Return | Annualized 3-Year Return | Annualized 5-Year Return | Annualized Inception to Date | |||||||
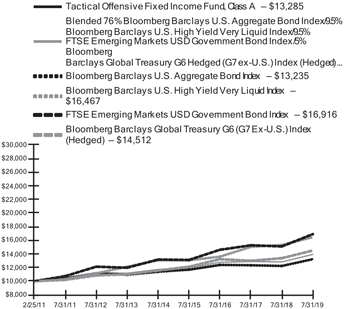
| Tactical Offensive Fixed Income Fund, Class A | 8.03% | 2.54% | 3.00% | 3.43% | ||||||
| Bloomberg Barclays U.S. Aggregate Bond Index | 8.08% | 2.17% | 3.05% | 3.38% | ||||||
Blended 76% Bloomberg Barclays U.S. Aggregate Bond Index/9.5% Bloomberg Barclays U.S. High Yield Very Liquid Index/9.5% FTSE Emerging Markets USD Government Bond Index/5% Bloomberg Barclays Global Treasury G6 Hedged (G7ex-U.S.) lndex(Hedged)
| 8.44% | 2.92% | 3.50% | 4.01% | ||||||
Comparison of Change in the Value of a $10,000 Investment in the Tactical Offensive Fixed Income Fund, Class A, versus the Bloomberg Barclays U.S. Aggregate Bond Index and a blended benchmark consisting of, 76% Bloomberg Barclays U.S. Aggregate Bond Index/9.5% Bloomberg Barclays U.S. High Yield Very Liquid Index/9.5% FTSE Emerging Markets USD Government Bond Index/5% Bloomberg Barclays Global Treasury G6 Hedged (G7ex-U.S.) Index (Hedged).
| 1 | For the year ended July 31, 2019. Past performance is no indication of future performance. Prior to October 1, 2014, the Fund’s investment approach was an “active” investment strategy where an investment manager would buy and sell securities based on its own economic, financial, and market analysis. On October 1, 2014, SIMC implemented a “passive” investment strategy which seeks to track an index return. Returns shown do not reflect the deduction of taxes that a shareholder would pay on fund distributions or the redemption of fund shares. Shares of the Fund were offered beginning February 25, 2011. |
| 2 | This table compares the Fund’s average annual total returns to those of a broad-based index and the Fund’s 76/9.5/9.5/5 Blended Benchmark, which consists of the Bloomberg Barclays U.S. Aggregate Bond Index, Bloomberg Barclays U.S. High Yield Bond Very Liquid Index, FTSE Emerging Markets USD Government Bond Index, and the Bloomberg Barclays Global G6 (G7ex-U.S.) Index (Hedged). The Fund’s blended benchmark encompasses additional countries, capitalization weights and sectors than the broad-based index, and therefore we believe that it more accurately reflects the overall investment strategy of the Fund. |
| 10 | Adviser Managed Trust / Annual Report / July 31, 2019 |
SUMMARY SCHEDULE OF INVESTMENTS
July 31, 2019
Tactical Offensive Equity Fund
†Percentages are based on total investments.
Description |
Percentage of |
Shares |
Market Value | |||||||
COMMON STOCK — 97.2% | ||||||||||
Argentina — 0.0% |
| |||||||||
Other Securities | 0.0% | $ | 668 | |||||||
Australia —1.4% |
| |||||||||
Other Securities‡ | 1.4 | 35,525 | ||||||||
Austria — 0.1% |
| |||||||||
Other Securities | 0.1 | 1,132 | ||||||||
Belgium — 0.2% |
| |||||||||
Other Securities | 0.2 | 5,152 | ||||||||
Bermuda — 0.0% |
| |||||||||
Other Securities | 0.0 | 60 | ||||||||
Brazil — 0.5% |
| |||||||||
Other Securities | 0.5 | 12,860 | ||||||||
Canada — 0.6% |
| |||||||||
Alibaba Group Holding ADR * | 0.4 | 64,400 | 11,148 | |||||||
Other Securities | 0.2 | 3,234 | ||||||||
| 14,382 | ||||||||||
Chile — 0.1% |
| |||||||||
Other Securities | 0.1 | 2,047 | ||||||||
China — 1.6% |
| |||||||||
Tencent Holdings | 0.5 | 258,500 | 12,159 | |||||||
Other Securities | 1.1 | 28,242 | ||||||||
| 40,401 | ||||||||||
Colombia — 0.0% |
| |||||||||
Other Securities | 0.0 | 662 | ||||||||
Czech Republic — 0.0% |
| |||||||||
Other Securities (A) | 0.0 | 438 | ||||||||
Description |
Percentage of |
Shares |
Market Value | |||||||
COMMON STOCK (continued) | ||||||||||
Denmark — 0.3% |
| |||||||||
Other Securities (A) | 0.3% | $ | 8,301 | |||||||
Finland — 0.2% |
| |||||||||
Other Securities | 0.2 | 4,920 | ||||||||
France — 2.0% |
| |||||||||
Other Securities‡(A) | 2.0 | 51,070 | ||||||||
Germany — 1.6% |
| |||||||||
Other Securities (A) | 1.6 | 39,778 | ||||||||
Greece — 0.0% |
| |||||||||
Other Securities (C) | 0.0 | 753 | ||||||||
Hong Kong — 1.6% |
| |||||||||
Other | 1.6 | 40,948 | ||||||||
Hungary — 0.0% |
| |||||||||
Other Securities | 0.0 | 725 | ||||||||
India — 0.8% |
| |||||||||
Other Securities (A) | 0.8 | 21,303 | ||||||||
Indonesia — 0.2% |
| |||||||||
Other Securities | 0.2 | 5,149 | ||||||||
Ireland — 0.6% |
| |||||||||
Accenture PLC, CI A | 0.3 | 34,800 | 6,702 | |||||||
Other Securities | 0.3 | 8,510 | ||||||||
| 15,212 | ||||||||||
Israel — 0.1% |
| |||||||||
Other Securities | 0.1 | 2,956 | ||||||||
ltaly — 0.4% |
| |||||||||
Other Securities (A) | 0.4 | 11,182 | ||||||||
Japan — 4.6% |
| |||||||||
Other Securities‡ | 4.6 | 117,902 | ||||||||
Luxembourg — 0.0% |
| |||||||||
Other Securities | 0.0 | 725 | ||||||||
Malaysia — 0.2% |
| |||||||||
Other Securities | 0.2 | 5,041 | ||||||||
Mexico — 0.2% |
| |||||||||
Other Securities‡ | 0.2 | 6,078 | ||||||||
Netherlands — 1.2% |
| |||||||||
Other Securities‡(A) | 1.2 | 31,515 | ||||||||
| ||||
| Adviser Managed Trust / Annual Report / July 31, 2019 | 11 | |||
SUMMARY SCHEDULE OF INVESTMENTS
July 31, 2019
Tactical Offensive Equity Fund(Continued)
| Description | Percentage of Net Assets (%) | Shares | Market Value ($ Thousands) | |||||||
COMMON STOCK (continued) | ||||||||||
New Zealand — 0.1% |
| |||||||||
Other Securities | 0.1% | $ | 1,297 | |||||||
|
| |||||||||
Norway — 0.1% |
| |||||||||
Other Securities | 0.1 | 3,285 | ||||||||
|
| |||||||||
Panama — 0.0% |
| |||||||||
Other Securities | 0.0 | 255 | ||||||||
|
| |||||||||
Peru — 0.0% |
| |||||||||
Other Securities | 0.0 | 836 | ||||||||
|
| |||||||||
Philippines — 0.1% |
| |||||||||
Other Securities | 0.1 | 2,705 | ||||||||
|
| |||||||||
Poland — 0.1% |
| |||||||||
Other Securities | 0.1 | 2,495 | ||||||||
|
| |||||||||
Portugal — 0.0% |
| |||||||||
Other Securities | 0.0 | 742 | ||||||||
|
| |||||||||
Qatar — 0.1% |
| |||||||||
Other Securities | 0.1 | 2,476 | ||||||||
|
| |||||||||
Russia — 0.4% |
| |||||||||
Other Securities | 0.4 | 9,159 | ||||||||
|
| |||||||||
Saudi Arabia — 0.1% |
| |||||||||
Other Securities | 0.1 | 3,626 | ||||||||
|
| |||||||||
Singapore — 0.3% |
| |||||||||
Other Securities‡ | 0.3 | 7,693 | ||||||||
|
| |||||||||
Slovak Republic — 0.0% |
| |||||||||
Other Securities | 0.0 | 582 | ||||||||
|
| |||||||||
South Africa — 0.6% |
| |||||||||
Other Securities‡ | 0.6 | 14,341 | ||||||||
|
| |||||||||
South Korea — 1.1% |
| |||||||||
Samsung Electronics Co Ltd | 0.3 | 216,216 | 8,288 | |||||||
Other Securities (A) | 0.8 |
| 18,641 |
| ||||||
|
| |||||||||
| 26,929 | ||||||||||
|
| |||||||||
Spain — 0.6% |
| |||||||||
Other Securities (A) | 0.6 | 14,188 | ||||||||
|
| |||||||||
Sweden — 0.5% |
| |||||||||
Other Securities | 0.5 | 12,613 | ||||||||
|
| |||||||||
Switzerland — 1.8% |
| |||||||||
Nestle SA | 0.5 | 109,123 | 11,651 | |||||||
Novartis AG | 0.3 | 77,248 | 7,136 | |||||||
| Description | Percentage of Net Assets (%) | Shares | Market Value ($ Thousands) | |||||||
COMMON STOCK (continued) | ||||||||||
Roche Holding AG | 0.3% | 25,033 | $ | 6,742 | ||||||
Other Securities | 0.7 | 20,941 | ||||||||
| 46,470 | ||||||||||
Taiwan — 1.1% |
| |||||||||
Taiwan Semiconductor Manufacturing | 0.4 | 1,115,000 | 9,305 | |||||||
Other Securities | 0.7 | 18,392 | ||||||||
| 27,697 | ||||||||||
Thailand — 0.3% |
| |||||||||
Other Securities | 0.3 | 7,598 | ||||||||
Turkey — 0.1% |
| |||||||||
Other Securities | 0.1 | 1,273 | ||||||||
United Arab Emirates — 0.1% |
| |||||||||
Other Securities | 0.1 | 1,908 | ||||||||
United Kingdom — 2.9% |
| |||||||||
Other Securities‡(A) | 2.9 | 74,874 | ||||||||
United States — 68.3% |
| |||||||||
Abbott Laboratories | 0.3 | 93,400 | 8,135 | |||||||
Adobe Inc * | 0.3 | 26,500 | 7,920 | |||||||
Alphabet Inc, CI A * | 0.8 | 16,300 | 19,857 | |||||||
Alphabet Inc, CI C * | 0.8 | 16,600 | 20,197 | |||||||
Amazon.com Inc * | 1.6 | 22,600 | 42,189 | |||||||
Apple | 2.1 | 251,000 | 53,473 | |||||||
AT&T Inc | 0.5 | 396,900 | 13,514 | |||||||
Bank of America Corp | 0.6 | 469,000 | 14,389 | |||||||
Berkshire Hathaway Inc, CI B * | 0.9 | 106,700 | 21,919 | |||||||
Boeing | 0.4 | 28,900 | 9,860 | |||||||
Chevron Corp | 0.5 | 104,000 | 12,803 | |||||||
Cisco Systems Inc | 0.5 | 240,200 | 13,307 | |||||||
Citigroup | 0.3 | 126,000 | 8,966 | |||||||
Coca-Cola | 0.4 | 208,900 | 10,994 | |||||||
Comcast Corp, CI A | 0.4 | 245,400 | 10,594 | |||||||
Exxon Mobil Corp | 0.7 | 230,800 | 17,162 | |||||||
Facebook Inc, | 1.0 | 130,300 | 25,308 | |||||||
Home Depot | 0.5 | 60,100 | 12,843 | |||||||
Honeywell International Inc | 0.3 | 39,700 | 6,847 | |||||||
Intel Corp | 0.5 | 244,300 | 12,349 | |||||||
International Business Machines Corp | 0.3 | 48,400 | 7,175 | |||||||
Johnson & Johnson | 0.7 | 144,800 | 18,856 | |||||||
JPMorgan Chase & Co | 0.8 | 175,900 | 20,404 | |||||||
Mastercard Inc, | 0.5 | 48,900 | 13,314 | |||||||
McDonald’s | 0.3 | 41,800 | 8,808 | |||||||
Medtronic PLC | 0.3 | 73,200 | 7,462 | |||||||
Merck & Co Inc | 0.4 | 140,400 | 11,652 | |||||||
Microsoft Corp | 2.2 | 412,400 | 56,198 | |||||||
Netflix Inc * | 0.3 | 22,800 | 7,364 | |||||||
Oracle Corp | 0.3 | 125,200 | 7,049 | |||||||
| 12 | Adviser Managed Trust / Annual Report / July 31, 2019 |
| Description | Percentage of Net Assets (%) | Shares | Market Value ($ Thousands) | |||||||
COMMON STOCK (continued) |
| |||||||||
PayPal Holdings * | 0.3% | 64,100 | $ | 7,077 | ||||||
PepsiCo Inc | 0.4 | 76,400 | 9,765 | |||||||
Pfizer Inc | 0.5 | 303,300 | 11,780 | |||||||
Philip Morris International | 0.3 | 84,800 | 7,090 | |||||||
Procter & Gamble Co/The | 0.6 | 134,800 | 15,912 | |||||||
Union Pacific Corp | 0.3 | 38,600 | 6,946 | |||||||
UnitedHealth Group Inc | 0.5 | 51,500 | 12,824 | |||||||
Verizon Communications Inc | 0.5 | 225,900 | 12,485 | |||||||
Visa Inc, CI A | 0.7 | 94,900 | 16,892 | |||||||
Walmart Inc | 0.3 | 76,700 | 8,466 | |||||||
Walt Disney Co/The | 0.5 | 95,300 | 13,629 | |||||||
Wells Fargo & Co | 0.4 | 220,800 | 10,689 | |||||||
Other Securities‡ | 43.5 | 1,113,296 | ||||||||
|
| |||||||||
| 1,747,759 | ||||||||||
|
| |||||||||
Total Common Stock |
| 2,487,686 | ||||||||
|
| |||||||||
PREFERRED STOCK — 0.4% |
| |||||||||
Brazil — 0.3% | ||||||||||
Other Securities | 0.3 | 6,918 | ||||||||
|
| |||||||||
Chile — 0.0% | ||||||||||
Other Securities | 0.0 | 195 | ||||||||
|
| |||||||||
Colombia — 0.0% | ||||||||||
Other Securities | 0.0 | 375 | ||||||||
|
| |||||||||
| Description | Percentage of Net Assets (%) | Shares | Market Value ($ Thousands) | |||||||
PREFERRED STOCK (continued) |
| |||||||||
Germany — O.1% | ||||||||||
Other Securities | 0.1% | $ | 2,583 | |||||||
|
| |||||||||
South Korea — 0.0% | ||||||||||
Other Securities | 0.0 | 1,463 | ||||||||
|
| |||||||||
Total Preferred Stock | 11,534 | |||||||||
|
| |||||||||
EXCHANGE TRADED FUND — 0.0% |
| |||||||||
Other Securities | 0.0 | 224 | ||||||||
|
| |||||||||
Total Exchange Traded Fund | 224 | |||||||||
|
| |||||||||
RIGHTS * — 0.0% |
| |||||||||
Hong Kong — 0.0% |
| |||||||||
Other Securities | 0.0 | — | ||||||||
|
| |||||||||
United States — 0.0% |
| |||||||||
Other Securities (C) | 0.0 | 11 | ||||||||
|
| |||||||||
Total Rights | 11 | |||||||||
|
| |||||||||
WARRANTS * — 0.0% |
| |||||||||
Thailand — 0.0% |
| |||||||||
Other Securities | 0.0 | — | ||||||||
|
| |||||||||
Total Warrants | — | |||||||||
|
| |||||||||
Total Investments – 97.6% | $ | 2,499,455 | ||||||||
|
| |||||||||
A list of the open futures contracts held by the Fund at July 31, 2019, is as follows:
Type of Contract | Number of Contracts Long | Expiration | Notional Amount (Thousands) | Value (Thousands) | Unrealized Appreciation (Thousands) | |||||||||||||||
MSCI EAFE Index | 155 | Sep-2019 | $ | 14,549 | $ | 14,609 | $ | 60 | ||||||||||||
MSCI Emerging Markets | 176 | Sep-2019 | 8,954 | 9,004 | 50 | |||||||||||||||
Russell 2000 Index E-MINI | 67 | Sep-2019 | 5,141 | 5,282 | 141 | |||||||||||||||
S&P 500 Index E-MINI | 198 | Sep-2019 | 28,770 | 29,525 | 755 | |||||||||||||||
S&P Mid Cap 400 Index E-MINI | 12 | Sep-2019 | 2,288 | 2,362 | 74 | |||||||||||||||
|
| |||||||||||||||||||
| $ | 59,702 | $ | 60,782 | $ | 1,080 | |||||||||||||||
|
| |||||||||||||||||||
Percentages are based on a Net Assets of $2,559,635 ($ Thousands).
| * | Non-income producing security. |
| ‡ | Real Estate Investment Trust. |
| (A) | Security exempt from registration under Rule 144A of the Securities Act of 1933. These securities may be resold in transactions exempt from registration normally to qualified institutions. On July 31, 2019, the value of these securities amounted to $6,929 ($ Thousands), representing 0.27% of the net assets of the Fund. |
| (B) | Security is a Master Limited Partnership. At July 31, 2019, such securities amounted to $296 ($ Thousands), or 0.01% of Net Assets (See Note 2). |
| (C) | Level 3 security in accordance with fair value hierarchy. |
ADR – American Depositary Receipt
CI – Class
EAFE – Europe, Australasia and Far East
MSCI – Morgan Stanley Capital International
S&P – Standard & Poor’s
| ||||
| Adviser Managed Trust / Annual Report / July 31, 2019 | 13 | |||
SUMMARY SCHEDULE OF INVESTMENTS
July 31, 2019
Tactical Offensive Equity Fund(Concluded)
The following is a list of the level of inputs used as of July 31, 2019, in valuing the Fund’s investments and other financial instruments carried at value ($ Thousands):
| Investments in Securities | Level 1 | Level 2 | Level 3(1) | Total | ||||||||||||
Common Stock | $ | 2,487,676 | $ | – | $ | 10 | $ | 2,487,686 | ||||||||
Preferred Stock | 11,534 | – | – | 11,534 | ||||||||||||
Exchange Traded Fund | 224 | – | – | 224 | ||||||||||||
Rights | 2 | – | 9 | 11 | ||||||||||||
Warrants | – | – | – | – | ||||||||||||
|
|
|
|
|
|
|
| |||||||||
Total Investments in Securities | $ | 2,499,436 | $ | – | $ | 19 | $ | 2,499,455 | ||||||||
|
|
|
|
|
|
|
| |||||||||
| Other Financial Instruments | Level 1 | Level 2 | Level 3 | Total | ||||||||||||
Futures Contracts * | $ | 1,080 | $ | – | $ | – | $ | 1,080 | ||||||||
|
|
|
|
|
|
|
| |||||||||
Total Other Financial Instruments | $ | 1,080 | $ | – | $ | – | $ | 1,080 | ||||||||
|
|
|
|
|
|
|
| |||||||||
* Futures contracts are valued at the unrealized appreciation on the instrument.
(1) A reconciliation of Level 3 investments is presented when the Fund has a significant amount of Level 3 investments at the beginning and/or end of the year in relation to net assets. Management has concluded that Level 3 investments are not material in relation to net assets.
For the year ended July 31, 2019, there were transfers between Level 1 and Level 2 assets and liabilities due to the availability of quoted prices in active markets to determine fair value. For the year ended July 31, 2019, there were no transfers between Level 2 and Level 3 assets and liabilities. All transfers, if any, are recognized by the Fund at the end of the year.
For more information on valuation inputs, see Note 2—Significant Accounting Policies in Notes to Financial Statements.
The following is a summary of the transactions the Fund had with affiliates for the year ended July 31, 2019 ($ Thousands):
| Security Description | Value 7/31/2018 | Purchases at Cost | Proceeds from Sales | Realized Loss | Change in Unrealized Depreciation | Value 7/31/2019 | Shares | Dividend Income | Capital Gains | |||||||||
| ||||||||||||||||||
SEI Investments Co | $ 462 | $ 188 | $ (541) | $ (19) | $(90) | $– | – | $ – | $– | |||||||||
SEI Daily Income Trust, Government Fund, CI F | – | 1,700,000 | (1,700,000) | – | – | – | – | 97 | – | |||||||||
|
|
|
|
|
|
|
|
| ||||||||||
Totals | $ 462 | $ 1,700,188 | $ (1,700,541) | $ (19) | $ (90) | $– | – | $ 97 | $– | |||||||||
|
|
|
|
|
|
|
|
| ||||||||||
Amounts designated as “–” are either $0 or have been rounded to $0.
The accompanying notes are an integral part of the financial statements.
| 14 | Adviser Managed Trust / Annual Report / July 31, 2019 |
SCHEDULE OF INVESTMENTS
July 31, 2019
Tactical Offensive Fixed Income Fund
 | ||||||||
†Percentages based on total investments.
| ||||||||
| Description | Face Amount (Thousands) | Market Value ($ Thousands) | ||||||
CORPORATE OBLIGATIONS — 30.6% |
| |||||||
Communication Services — 3.4% |
| |||||||
Acosta | ||||||||
7.750%, 10/01/2022 (A) | $ | 130 | $ | 21 | ||||
Activision Blizzard | ||||||||
3.400%, 09/15/2026 | 50 | 51 | ||||||
2.300%, 09/15/2021 | 30 | 30 | ||||||
Alphabet | ||||||||
3.625%, 05/19/2021 | 100 | 103 | ||||||
1.998%, 08/15/2026 | 50 | 49 | ||||||
Altice Financing | ||||||||
7.500%, 05/15/2026 (A) | 425 | 445 | ||||||
6.625%, 02/15/2023 (A) | 500 | 516 | ||||||
Altice France | ||||||||
8.125%, 02/01/2027 (A) | 200 | 217 | ||||||
7.375%, 05/01/2026 (A) | 1,200 | 1,279 | ||||||
Altice Luxembourg | ||||||||
10.500%, 05/15/2027 (A) | 350 | 371 | ||||||
7.625%, 02/15/2025 (A) | 250 | 245 | ||||||
AMC Entertainment Holdings |
| |||||||
5.750%, 06/15/2025 | 238 | 225 | ||||||
AMC Networks | ||||||||
5.000%, 04/01/2024 | 250 | 256 | ||||||
4.750%, 08/01/2025 | 105 | 107 | ||||||
America Movil SAB de CV | ||||||||
6.375%, 03/01/2035 | 100 | 132 | ||||||
6.125%, 03/30/2040 | 100 | 131 | ||||||
4.375%, 04/22/2049 | 200 | 219 | ||||||
3.625%, 04/22/2029 | 200 | 209 | ||||||
AT&T | ||||||||
6.250%, 03/29/2041 | 150 | 185 | ||||||
6.200%, 03/15/2040 | 275 | 334 | ||||||
6.000%, 08/15/2040 | 100 | 120 | ||||||
5.700%, 03/01/2057 | 250 | 301 | ||||||
5.650%, 02/15/2047 | 50 | 59 | ||||||
5.450%, 03/01/2047 | 100 | 115 | ||||||
5.250%, 03/01/2037 | 50 | 57 | ||||||
5.150%, 03/15/2042 | 150 | 167 | ||||||
5.150%, 02/15/2050 | 200 | 223 | ||||||
4.900%, 08/15/2037 | 100 | 109 | ||||||
4.850%, 03/01/2039 | 300 | 328 | ||||||
4.500%, 05/15/2035 | 150 | 160 | ||||||
4.500%, 03/09/2048 | 300 | 307 | ||||||
4.350%, 03/01/2029 | 300 | 324 | ||||||
| Description | Face Amount (Thousands) | Market Value ($ Thousands) | ||||||
CORPORATE OBLIGATIONS (continued) |
| |||||||
4.350%, 06/15/2045 | $ | 100 | $ | 101 | ||||
4.250%, 03/01/2027 | 150 | 161 | ||||||
4.100%, 02/15/2028 | 116 | 123 | ||||||
3.950%, 01/15/2025 | 100 | 106 | ||||||
3.800%, 03/01/2024 | 50 | 52 | ||||||
3.550%, 06/01/2024 | 100 | 104 | ||||||
3.400%, 05/15/2025 | 150 | 154 | ||||||
3.200%, 03/01/2022 | 90 | 92 | ||||||
2.950%, 07/15/2026 | 85 | 85 | ||||||
2.800%, 02/17/2021 | 400 | 402 | ||||||
Baidu | ||||||||
4.375%, 03/29/2028 | 100 | 106 | ||||||
3.875%, 09/29/2023 | 300 | 310 | ||||||
Bell Canada | ||||||||
4.464%, 04/01/2048 | 315 | 348 | ||||||
Block Communications | ||||||||
6.875%, 02/15/2025 (A) | 50 | 52 | ||||||
British Telecommunications | ||||||||
9.625%, 12/15/2030 | 150 | 226 | ||||||
5.125%, 12/04/2028 | 300 | 339 | ||||||
CBS | ||||||||
5.500%, 05/15/2033 | 75 | 88 | ||||||
4.200%, 06/01/2029 | 50 | 53 | ||||||
4.000%, 01/15/2026 | 35 | 37 | ||||||
3.500%, 01/15/2025 | 100 | 103 | ||||||
2.900%, 06/01/2023 | 200 | 201 | ||||||
CC0 Holdings | ||||||||
5.875%, 04/01/2024 (A) | 517 | 538 | ||||||
5.875%, 05/01/2027 (A) | 1,000 | 1,045 | ||||||
5.750%, 02/15/2026 (A) | 200 | 211 | ||||||
5.500%, 05/01/2026 (A) | 200 | 209 | ||||||
5.375%, 06/01/2029 (A) | 193 | 200 | ||||||
5.125%, 05/01/2027 (A) | 365 | 376 | ||||||
5.000%, 02/01/2028 (A) | 279 | 286 | ||||||
4.000%, 03/01/2023 (A) | 43 | 43 | ||||||
CenturyLink | ||||||||
7.500%, 04/01/2024 | 275 | 301 | ||||||
Charter Communications Operating | ||||||||
6.834%, 10/23/2055 | 35 | 42 | ||||||
6.484%, 10/23/2045 | 165 | 195 | ||||||
6.384%, 10/23/2035 | 50 | 59 | ||||||
5.750%, 04/01/2048 | 50 | 55 | ||||||
5.375%, 04/01/2038 | 400 | 436 | ||||||
5.375%, 05/01/2047 | 335 | 353 | ||||||
4.908%, 07/23/2025 | 150 | 162 | ||||||
4.500%, 02/01/2024 | 300 | 318 | ||||||
4.464%, 07/23/2022 | 50 | 52 | ||||||
3.750%, 02/15/2028 | 100 | 101 | ||||||
Cincinnati Bell | ||||||||
7.000%, 07/15/2024 (A) | 135 | 115 | ||||||
Clear Channel Worldwide Holdings | ||||||||
9.250%, 02/15/2024 (A) | 440 | 477 | ||||||
| Adviser Managed Trust / Annual Report / July 31, 2019 | 15 |
SCHEDULE OF INVESTMENTS
July 31, 2019
Tactical Offensive Fixed Income Fund(Continued)
| Description | Face Amount (Thousands) | Market Value ($ Thousands) | ||||||||
CORPORATE OBLIGATIONS (continued) |
| |||||||||
Comcast | ||||||||||
4.950%, 10/15/2058 | $ | 325 | $ | 395 | ||||||
4.700%, 10/15/2048 | 340 | 399 | ||||||||
4.600%, 10/15/2038 | 355 | 411 | ||||||||
4.600%, 08/15/2045 | 100 | 114 | ||||||||
4.400%, 08/15/2035 | 350 | 396 | ||||||||
4.250%, 10/15/2030 | 25 | 28 | ||||||||
4.250%, 01/15/2033 | 100 | 112 | ||||||||
4.200%, 08/15/2034 | 500 | 557 | ||||||||
4.150%, 10/15/2028 | 70 | 77 | ||||||||
3.900%, 03/01/2038 | 100 | 107 | ||||||||
3.700%, 04/15/2024 | 355 | 375 | ||||||||
3.450%, 10/01/2021 | 365 | 374 | ||||||||
3.400%, 07/15/2046 | 100 | 97 | ||||||||
3.375%, 02/15/2025 | 150 | 156 | ||||||||
3.375%, 08/15/2025 | 65 | 68 | ||||||||
3.300%, 02/01/2027 | 100 | 104 | ||||||||
3.200%, 07/15/2036 | 100 | 99 | ||||||||
2.750%, 03/01/2023 | 100 | 102 | ||||||||
Consolidated Communications | ||||||||||
6.500%, 10/01/2022 | 50 | 45 | ||||||||
CSC Holdings | ||||||||||
10.875%, 10/15/2025 (A) | 103 | 117 | ||||||||
7.750%, 07/15/2025 (A) | 500 | 537 | ||||||||
7.500%, 04/01/2028 (A) | 200 | 220 | ||||||||
6.625%, 10/15/2025 (A) | 250 | 266 | ||||||||
5.750%, 01/15/2030 (A) | 200 | 203 | ||||||||
5.500%, 05/15/2026 (A) | 78 | 82 | ||||||||
5.500%, 04/15/2027 (A) | 985 | 1,032 | ||||||||
5.375%, 07/15/2023 (A) | 150 | 154 | ||||||||
Cumulus Media New Holdings | ||||||||||
6.750%, 07/01/2026 (A) | 40 | 41 | ||||||||
Deutsche Telekom International Finance | ||||||||||
8.750%, 06/15/2030 | 100 | 146 | ||||||||
Diamond Sports Group | ||||||||||
6.625%, 08/15/2027 (A) | 352 | 360 | ||||||||
5.375%, 08/15/2026 (A) | 587 | 596 | ||||||||
Discovery Communications | ||||||||||
6.350%, 06/01/2040 | 100 | 118 | ||||||||
5.300%, 05/15/2049 | 40 | 43 | ||||||||
5.200%, 09/20/2047 | 60 | 64 | ||||||||
4.125%, 05/15/2029 | 45 | 47 | ||||||||
3.950%, 03/20/2028 | 60 | 62 | ||||||||
3.900%, 11/15/2024 | 300 | 312 | ||||||||
3.800%, 03/13/2024 | 100 | 104 | ||||||||
DISH DBS | ||||||||||
7.750%, 07/01/2026 | 397 | 389 | ||||||||
5.875%,11/15/2024 | 460 | 428 | ||||||||
Electronic Arts | ||||||||||
4.800%, 03/01/2026 | 50 | 56 | ||||||||
3.700%, 03/01/2021 | 50 | 51 | ||||||||
| Description | Face Amount (Thousands) | Market Value ($ Thousands) | ||||||||
CORPORATE OBLIGATIONS (continued) |
| |||||||||
Fox | ||||||||||
5.576%, 01/25/2049 (A) | $ | 45 | $ | 55 | ||||||
5.476%, 01/25/2039 (A) | 210 | 249 | ||||||||
4.709%, 01/25/2029 (A) | 240 | 269 | ||||||||
4.030%, 01/25/2024 (A) | 325 | 344 | ||||||||
Frontier Communications | ||||||||||
11.000%, 09/15/2025 | 970 | 564 | ||||||||
10.500%, 09/15/2022 | 210 | 131 | ||||||||
8.500%, 04/01/2026 (A) | 295 | 288 | ||||||||
8.000%, 04/01/2027 (A) | 347 | 363 | ||||||||
6.875%, 01/15/2025 | 100 | 55 | ||||||||
Gogo Intermediate Holdings | ||||||||||
9.875%, 05/01/2024 (A) | 194 | 200 | ||||||||
Gray Television | ||||||||||
7.000%, 05/15/2027 (A) | 35 | 38 | ||||||||
5.875%, 07/15/2026 (A) | 275 | 285 | ||||||||
5.125%, 10/15/2024 (A) | 100 | 103 | ||||||||
Grupo Televisa | ||||||||||
5.250%, 05/24/2049 | 300 | 313 | ||||||||
iHeartCommunications | ||||||||||
8.375%, 05/01/2027 | 250 | 263 | ||||||||
6.375%, 05/01/2026 | 100 | 106 | ||||||||
Intelsat Connect Finance | ||||||||||
9.500%, 02/15/2023 (A) | 245 | 220 | ||||||||
Intelsat Jackson Holdings | ||||||||||
9.750%, 07/15/2025 (A) | 214 | 221 | ||||||||
8.500%, 10/15/2024 (A) | 795 | 793 | ||||||||
8.000%, 02/15/2024 (A) | 200 | 208 | ||||||||
Interpublic Group of Cos | ||||||||||
3.750%, 10/01/2021 | 200 | 205 | ||||||||
Koninklijke | ||||||||||
8.375%, 10/01/2030 | 50 | 67 | ||||||||
Level 3 Financing | ||||||||||
5.625%, 02/01/2023 | 300 | 304 | ||||||||
5.375%, 08/15/2022 | 100 | 101 | ||||||||
5.375%, 05/01/2025 | 150 | 155 | ||||||||
5.250%, 03/15/2026 | 100 | 104 | ||||||||
5.125%, 05/01/2023 | 250 | 251 | ||||||||
Level 3 Parent | ||||||||||
5.750%, 12/01/2022 | 100 | 101 | ||||||||
Live Nation Entertainment | ||||||||||
4.875%, 11/01/2024 (A) | 115 | 118 | ||||||||
Meredith | ||||||||||
6.875%, 02/01/2026 | 250 | 265 | ||||||||
Midcontinent Communications | ||||||||||
6.875%, 08/15/2023 (A) | 75 | 78 | ||||||||
NBCUniversal Media | ||||||||||
5.950%, 04/01/2041 | 100 | 133 | ||||||||
Netflix | ||||||||||
6.375%, 05/15/2029 (A) | 200 | 224 | ||||||||
5.875%, 02/15/2025 | 138 | 150 | ||||||||
5.875%, 11/15/2028 | 420 | 461 | ||||||||
| 16 | Adviser Managed Trust / Annual Report / July 31, 2019 |
| Description | Face Amount (Thousands) | Market Value ($ Thousands) | ||||||||
CORPORATE OBLIGATIONS (continued) |
| |||||||||
5.375%, 11/15/2029 (A) | $ | 47 | $ | 50 | ||||||
4.375%, 11/15/2026 | 600 | 606 | ||||||||
Nexstar Broadcasting | ||||||||||
5.625%, 08/01/2024 (A) | 82 | 85 | ||||||||
Nexstar Escrow | ||||||||||
5.625%, 07/15/2027 (A) | 325 | 338 | ||||||||
Nokia | ||||||||||
4.375%, 06/12/2027 | 25 | 26 | ||||||||
3.375%, 06/12/2022 | 120 | 122 | ||||||||
Omnicom Group | ||||||||||
3.600%, 04/15/2026 | 100 | 103 | ||||||||
Orange | ||||||||||
9.000%, 03/01/2031 | 100 | 154 | ||||||||
5.500%, 02/06/2044 | 25 | 31 | ||||||||
Rogers Communications | ||||||||||
5.000%, 03/15/2044 | 100 | 116 | ||||||||
4.300%, 02/15/2048 | 340 | 367 | ||||||||
2.900%, 11/15/2026 | 100 | 101 | ||||||||
Scripps Escrow | ||||||||||
5.875%, 07/15/2027 (A) | 110 | 111 | ||||||||
Sinclair Television Group | ||||||||||
5.625%, 08/01/2024 (A) | 100 | 103 | ||||||||
Sirius XM Radio | ||||||||||
5.500%, 07/01/2029 (A) | 225 | 235 | ||||||||
5.375%, 07/15/2026 (A) | 707 | 739 | ||||||||
5.000%, 08/01/2027 (A) | 260 | 268 | ||||||||
4.625%, 07/15/2024 (A) | 90 | 93 | ||||||||
Sprint | ||||||||||
7.875%, 09/15/2023 | 1,000 | 1,115 | ||||||||
7.625%, 02/15/2025 | 200 | 221 | ||||||||
7.625%, 03/01/2026 | 200 | 224 | ||||||||
Telefonica Emisiones | ||||||||||
7.045%, 06/20/2036 | 100 | 135 | ||||||||
5.520%, 03/01/2049 | 150 | 178 | ||||||||
4.895%, 03/06/2048 | 150 | 164 | ||||||||
4.665%, 03/06/2038 | 350 | 373 | ||||||||
Telenet Finance Luxembourg Notes SARL | ||||||||||
5.500%, 03/01/2028 (A) | 200 | 202 | ||||||||
Telesat Canada | ||||||||||
8.875%, 11/15/2024 (A) | 120 | 130 | ||||||||
TELUS | ||||||||||
4.600%, 11/16/2048 | 225 | 254 | ||||||||
T-Mobile USA | ||||||||||
6.500%, 01/15/2026 | 350 | 373 | ||||||||
6.375%, 03/01/2025 | 1,100 | 1,140 | ||||||||
6.000%, 03/01/2023 | 200 | 203 | ||||||||
6.000%, 04/15/2024 | 500 | – | ||||||||
5.375%, 04/15/2027 | 200 | 106 | ||||||||
4.750%, 02/01/2028 | 100 | 103 | ||||||||
4.500%, 02/01/2026 | 160 | 163 | ||||||||
0.000%, 03/01/2023 (B) | 200 | – | ||||||||
0.000%, 01/15/2024 (B) | 150 | – | ||||||||
| Description | Face Amount (Thousands) | Market Value ($ Thousands) | ||||||||
CORPORATE OBLIGATIONS (continued) |
| |||||||||
0.000%, 03/01/2025 (B) | $ | 535 | $ | – | ||||||
0.000%, 01/15/2026 (B) | 610 | – | ||||||||
Tribune Media | ||||||||||
5.875%, 07/15/2022 | 250 | 254 | ||||||||
TWDC Enterprises 18 | ||||||||||
3.000%, 02/13/2026 | 100 | 104 | ||||||||
TWDC Enterprises 18 MTN | ||||||||||
4.125%, 06/01/2044 | 125 | 144 | ||||||||
3.000%, 07/30/2046 | 50 | 48 | ||||||||
2.350%, 12/01/2022 | 50 | 50 | ||||||||
2.300%, 02/12/2021 | 100 | 100 | ||||||||
Uber Technologies | ||||||||||
8.000%, 11/01/2026 (A) | 300 | 317 | ||||||||
7.500%, 11/01/2023 (A) | 100 | 106 | ||||||||
Unitymedia GmbH | ||||||||||
6.125%, 01/15/2025 (A) | 300 | 312 | ||||||||
UPC Holding BV | ||||||||||
5.500%, 01/15/2028 (A) | 200 | 204 | ||||||||
UPCB Finance IV | ||||||||||
5.375%, 01/15/2025 (A) | 200 | 205 | ||||||||
Verizon Communications | ||||||||||
5.250%, 03/16/2037 | 300 | 361 | ||||||||
5.150%, 09/15/2023 | 500 | 555 | ||||||||
4.812%, 03/15/2039 | 400 | 460 | ||||||||
4.600%, 04/01/2021 | 500 | 519 | ||||||||
4.522%, 09/15/2048 | 153 | 170 | ||||||||
4.500%, 08/10/2033 | 100 | 113 | ||||||||
4.400%, 11/01/2034 | 500 | 554 | ||||||||
4.329%, 09/21/2028 | 156 | 173 | ||||||||
4.125%, 08/15/2046 | 50 | 53 | ||||||||
3.875%, 02/08/2029 | 230 | 248 | ||||||||
3.376%, 02/15/2025 | 400 | 417 | ||||||||
3.125%, 03/16/2022 | 400 | 409 | ||||||||
2.625%, 08/15/2026 | 150 | 150 | ||||||||
Viacom | ||||||||||
6.250%, VAR ICE LIBOR USD 3 Month+3.899%, 02/28/2057 | 206 | 218 | ||||||||
5.875%, VAR ICE LIBOR USD 3 Month+3.895%, 02/28/2057 | 50 | 52 | ||||||||
5.850%, 09/01/2043 | 100 | 119 | ||||||||
4.250%, 09/01/2023 | 25 | 26 | ||||||||
Videotron | ||||||||||
5.125%, 04/15/2027 (A) | 100 | 105 | ||||||||
Virgin Media Secured Finance | ||||||||||
5.500%, 08/15/2026 (A) | 200 | 209 | ||||||||
5.500%, 05/15/2029 (A) | 200 | 205 | ||||||||
5.250%, 01/15/2026 (A) | 250 | 256 | ||||||||
Vodafone Group | ||||||||||
6.150%, 02/27/2037 | 100 | 123 | ||||||||
5.250%, 05/30/2048 | 75 | 84 | ||||||||
5.000%, 05/30/2038 | 340 | 377 | ||||||||
4.375%, 05/30/2028 | 70 | 76 | ||||||||
| ||||
| Adviser Managed Trust / Annual Report / July 31, 2019 | 17 | |||
SCHEDULE OF INVESTMENTS
July 31, 2019
Tactical Offensive Fixed Income Fund(Continued)
| Description | Face Amount (Thousands) | Market Value ($ Thousands) | ||||||||
CORPORATE OBLIGATIONS (continued) |
| |||||||||
4.125%, 05/30/2025 | $ | 325 | $ | 345 | ||||||
3.750%, 01/16/2024 | 245 | 255 | ||||||||
Walt Disney | ||||||||||
6.650%, 11/15/2037 (A) | 100 | 144 | ||||||||
6.150%, 02/15/2041 (A) | 50 | 70 | ||||||||
4.500%, 02/15/2021 (A) | 100 | 104 | ||||||||
3.000%, 09/15/2022 (A) | 100 | 102 | ||||||||
Wind Tre | ||||||||||
5.000%, 01/20/2026 (A) | 400 | 396 | ||||||||
WTT Investment | ||||||||||
5.500%, 11/21/2022 (A) | 200 | 205 | ||||||||
Zayo Group | ||||||||||
6.375%, 05/15/2025 | 600 | 615 | ||||||||
6.000%, 04/01/2023 | 70 | 72 | ||||||||
5.750%, 01/15/2027 (A) | 75 | 76 | ||||||||
Ziggo BV | ||||||||||
6.000%, 01/15/2027 (A) | 200 | 203 | ||||||||
5.500%, 01/15/2027 (A) | 300 | 307 | ||||||||
| 52,943 | ||||||||||
Consumer Discretionary — 2.8% |
| |||||||||
1011778 BC ULC / New Red Finance Inc | ||||||||||
5.000%, 10/15/2025 (A) | 450 | 459 | ||||||||
4.625%, 01/15/2022 (A) | 400 | 401 | ||||||||
4.250%, 05/15/2024 (A) | 150 | 153 | ||||||||
Adient Global Holdings | ||||||||||
4.875%, 08/15/2026 (A) | 200 | 153 | ||||||||
Adient US | ||||||||||
7.000%, 05/15/2026 (A) | 193 | 196 | ||||||||
Advance Auto Parts | ||||||||||
4.500%, 12/01/2023 | 100 | 107 | ||||||||
Albertsons | ||||||||||
7.500%, 03/15/2026 (A) | 25 | 28 | ||||||||
5.750%, 03/15/2025 | 615 | 627 | ||||||||
Alibaba Group Holding | ||||||||||
4.200%, 12/06/2047 | 60 | 64 | ||||||||
3.600%,11/28/2024 | 100 | 104 | ||||||||
3.400%, 12/06/2027 | 100 | 102 | ||||||||
Amazon.com | ||||||||||
5.200%, 12/03/2025 | 50 | 58 | ||||||||
4.950%, 12/05/2044 | 100 | 127 | ||||||||
4.800%, 12/05/2034 | 100 | 123 | ||||||||
4.250%, 08/22/2057 | 70 | 82 | ||||||||
4.050%, 08/22/2047 | 70 | 79 | ||||||||
3.875%, 08/22/2037 | 445 | 493 | ||||||||
3.150%, 08/22/2027 | 450 | 472 | ||||||||
2.800%, 08/22/2024 | 325 | 333 | ||||||||
2.500%, 11/29/2022 | 100 | 101 | ||||||||
2.400%, 02/22/2023 | 50 | 50 | ||||||||
1.900%, 08/21/2020 | 30 | 30 | ||||||||
American Axle & Manufacturing | ||||||||||
6.250%, 04/01/2025 | 130 | 130 | ||||||||
| Description | Face Amount (Thousands) | Market Value ($ Thousands) | ||||||||
CORPORATE OBLIGATIONS (continued) |
| |||||||||
American Honda Finance MTN | ||||||||||
3.550%, 01/12/2024 | $ | 100 | $ | 104 | ||||||
3.500%, 02/15/2028 | 50 | 53 | ||||||||
2.900%, 02/16/2024 | 250 | 255 | ||||||||
2.400%, 06/27/2024 | 100 | 100 | ||||||||
1.700%, 09/09/2021 | 75 | 74 | ||||||||
Aptiv | ||||||||||
4.350%, 03/15/2029 | 20 | 21 | ||||||||
APX Group | ||||||||||
7.875%, 12/01/2022 | 158 | 150 | ||||||||
Aramark Services | ||||||||||
5.125%, 01/15/2024 | 183 | 188 | ||||||||
5.000%, 04/01/2025 (A) | 100 | 103 | ||||||||
5.000%, 02/01/2028 (A) | 60 | 62 | ||||||||
4.750%, 06/01/2026 | 275 | 282 | ||||||||
Asbury Automotive Group | ||||||||||
6.000%, 12/15/2024 | 50 | 52 | ||||||||
Atento Luxco 1 | ||||||||||
6.125%, 08/10/2022 (A) | 100 | 102 | ||||||||
AutoNation | ||||||||||
4.500%, 10/01/2025 | 100 | 104 | ||||||||
AutoZone | ||||||||||
3.750%, 06/01/2027 | 100 | 105 | ||||||||
3.700%, 04/15/2022 | 80 | 83 | ||||||||
3.125%, 04/18/2024 | 50 | 51 | ||||||||
BAT Capital | ||||||||||
4.540%, 08/15/2047 | 60 | 57 | ||||||||
4.390%, 08/15/2037 | 70 | 67 | ||||||||
3.557%, 08/15/2027 | 50 | 50 | ||||||||
2.297%, 08/14/2020 | 100 | 100 | ||||||||
Beazer Homes USA | ||||||||||
8.750%, 03/15/2022 | 50 | 52 | ||||||||
Best Buy | ||||||||||
4.450%, 10/01/2028 | 250 | 266 | ||||||||
Block Financial | ||||||||||
4.125%, 10/01/2020 | 100 | 102 | ||||||||
Board of Trustees of The Leland Stanford Junior University | ||||||||||
3.647%, 05/01/2048 | 25 | 27 | ||||||||
Booking Holdings | ||||||||||
3.600%, 06/01/2026 | 50 | 52 | ||||||||
3.550%, 03/15/2028 | 50 | 53 | ||||||||
2.750%, 03/15/2023 | 50 | 51 | ||||||||
BorgWarner | ||||||||||
4.375%, 03/15/2045 | 50 | 50 | ||||||||
3.375%, 03/15/2025 | 100 | 103 | ||||||||
Boyd Gaming | ||||||||||
6.875%, 05/15/2023 | 62 | 64 | ||||||||
6.375%, 04/01/2026 | 268 | 283 | ||||||||
6.000%, 08/15/2026 | 100 | 104 | ||||||||
Caesars Resort Collection | ||||||||||
5.250%, 10/15/2025 (A) | 344 | 343 | ||||||||
| 18 | Adviser Managed Trust / Annual Report / July 31, 2019 |
| Description | Face Amount (Thousands) | Market Value ($ Thousands) | ||||||||
CORPORATE OBLIGATIONS (continued) |
| |||||||||
Carvana | ||||||||||
8.875%, 10/01/2023 (A) | $ | 118 | $ | 119 | ||||||
Cedar Fair | ||||||||||
5.375%, 04/15/2027 | 110 | 116 | ||||||||
5.250%, 07/15/2029 (A) | 40 | 41 | ||||||||
Cengage Learning | ||||||||||
9.500%, 06/15/2024 (A) | 161 | 151 | ||||||||
Century Communities | ||||||||||
6.750%, 06/01/2027 (A) | 100 | 103 | ||||||||
Churchill Downs | ||||||||||
5.500%, 04/01/2027 (A) | 81 | 85 | ||||||||
4.750%, 01/15/2028 (A) | 94 | 94 | ||||||||
Cirsa Finance International SARL |
| |||||||||
7.875%, 12/20/2023 (A) | 200 | 211 | ||||||||
Daimler Finance North America |
| |||||||||
8.500%, 01/18/2031 | 50 | 74 | ||||||||
Darden Restaurants | ||||||||||
4.550%, 02/15/2048 | 15 | 15 | ||||||||
3.850%, 05/01/2027 | 30 | 31 | ||||||||
Delphi Technologies | ||||||||||
5.000%, 10/01/2025 (A) | 105 | 92 | ||||||||
Diamond Resorts International |
| |||||||||
10.750%, 09/01/2024 (A) | 175 | 170 | ||||||||
7.750%, 09/01/2023 (A) | 150 | 153 | ||||||||
Dollar General | ||||||||||
3.250%, 04/15/2023 | 100 | 103 | ||||||||
Dollar Tree | ||||||||||
4.200%, 05/15/2028 | 345 | 359 | ||||||||
4.000%, 05/15/2025 | 100 | 104 | ||||||||
3.700%, 05/15/2023 | 345 | 356 | ||||||||
eBay | ||||||||||
3.450%, 08/01/2024 | 50 | 52 | ||||||||
2.600%, 07/15/2022 | 100 | 100 | ||||||||
eG Global Finance | ||||||||||
6.750%, 02/07/2025 (A) | 200 | 201 | ||||||||
Eldorado Resorts | ||||||||||
6.000%, 04/01/2025 | 200 | 211 | ||||||||
6.000%, 09/15/2026 | 75 | 81 | ||||||||
ESH Hospitality | ||||||||||
5.250%, 05/01/2025 (A) | 250 | 257 | ||||||||
Expedia Group | ||||||||||
5.000%, 02/15/2026 | 100 | 110 | ||||||||
4.500%, 08/15/2024 | 50 | 53 | ||||||||
Fiat Chrysler Automobiles | ||||||||||
5.250%, 04/15/2023 | 200 | 210 | ||||||||
Ford Motor | ||||||||||
7.450%, 07/16/2031 | 100 | 118 | ||||||||
5.291%, 12/08/2046 | 50 | 46 | ||||||||
4.750%, 01/15/2043 | 125 | 109 | ||||||||
Ford Motor Credit | ||||||||||
5.875%, 08/02/2021 | 100 | 105 | ||||||||
5.596%, 01/07/2022 | 200 | 211 | ||||||||
| Description | Face Amount (Thousands) | Market Value ($ Thousands) | ||||||||
CORPORATE OBLIGATIONS (continued) |
| |||||||||
5.113%, 05/03/2029 | $ | 200 | $ | 204 | ||||||
3.815%, 11/02/2027 | 300 | 287 | ||||||||
3.813%, 10/12/2021 | 500 | 507 | ||||||||
2.979%, 08/03/2022 | 400 | 395 | ||||||||
Garda World Security | ||||||||||
8.750%, 05/15/2025 (A) | 173 | 177 | ||||||||
General Motors | ||||||||||
6.600%, 04/01/2036 | 100 | 114 | ||||||||
5.400%, 04/01/2048 | 50 | 49 | ||||||||
5.150%, 04/01/2038 | 330 | 332 | ||||||||
5.000%, 04/01/2035 | 50 | 50 | ||||||||
4.200%, 10/01/2027 | 50 | 51 | ||||||||
General Motors Financial | ||||||||||
4.350%, 04/09/2025 | 75 | 77 | ||||||||
4.350%, 01/17/2027 | 70 | 72 | ||||||||
4.000%, 10/06/2026 | 50 | 50 | ||||||||
3.950%, 04/13/2024 | 250 | 256 | ||||||||
3.700%, 05/09/2023 | 35 | 36 | ||||||||
3.550%, 04/09/2021 | 260 | 264 | ||||||||
3.550%, 07/08/2022 | 50 | 51 | ||||||||
3.500%, 11/07/2024 | 100 | 100 | ||||||||
3.450%, 01/14/2022 | 100 | 102 | ||||||||
3.450%, 04/10/2022 | 50 | 51 | ||||||||
3.200%, 07/06/2021 | 50 | 50 | ||||||||
3.150%, 06/30/2022 | 370 | 373 | ||||||||
2.450%, 11/06/2020 | 100 | 100 | ||||||||
George Washington University |
| |||||||||
4.868%, 09/15/2045 | 50 | 62 | ||||||||
Golden Nugget | ||||||||||
8.750%, 10/01/2025 (A) | 105 | 110 | ||||||||
6.750%, 10/15/2024 (A) | 275 | 283 | ||||||||
Goodyear Tire & Rubber | ||||||||||
5.125%, 11/15/2023 | 200 | 203 | ||||||||
5.000%, 05/31/2026 | 250 | 249 | ||||||||
4.875%, 03/15/2027 | 55 | 52 | ||||||||
GrubHub Holdings | ||||||||||
5.500%, 07/01/2027 (A) | 44 | 45 | ||||||||
Guitar Center Escrow Issuer | ||||||||||
9.500%, 10/15/2021 (A) | 165 | 157 | ||||||||
Hanesbrands | ||||||||||
4.875%, 05/15/2026 (A) | 200 | 209 | ||||||||
4.625%, 05/15/2024 (A) | 176 | 183 | ||||||||
Hasbro | ||||||||||
3.500%, 09/15/2027 | 60 | 61 | ||||||||
HD Supply | ||||||||||
5.375%, 10/15/2026 (A) | 100 | 105 | ||||||||
Hilton Domestic Operating | ||||||||||
5.125%, 05/01/2026 | 300 | 312 | ||||||||
4.875%, 01/15/2030 (A) | 80 | 82 | ||||||||
4.250%, 09/01/2024 | 170 | 172 | ||||||||
Hilton Worldwide Finance | ||||||||||
4.875%, 04/01/2027 | 150 | 155 | ||||||||
| ||||
| Adviser Managed Trust / Annual Report / July 31, 2019 | 19 | |||
SCHEDULE OF INVESTMENTS
July 31, 2019
Tactical Offensive Fixed Income Fund(Continued)
| Description | Face Amount (Thousands) | Market Value ($ Thousands) | ||||||||
CORPORATE OBLIGATIONS (continued) |
| |||||||||
4.625%, 04/01/2025 | $ | 120 | $ | 123 | ||||||
Home Depot | ||||||||||
4.400%, 04/01/2021 | 100 | 103 | ||||||||
4.400%, 03/15/2045 | 50 | 58 | ||||||||
3.900%, 12/06/2028 | 440 | 487 | ||||||||
3.900%, 06/15/2047 | 50 | 54 | ||||||||
3.500%, 09/15/2056 | 100 | 100 | ||||||||
3.250%, 03/01/2022 | 500 | 515 | ||||||||
3.000%, 04/01/2026 | 100 | 103 | ||||||||
2.625%, 06/01/2022 | 75 | 76 | ||||||||
2.000%, 04/01/2021 | 50 | 50 | ||||||||
IAA | ||||||||||
5.500%, 06/15/2027 (A) | 99 | 104 | ||||||||
International Game Technology | ||||||||||
6.250%, 02/15/2022 (A) | 400 | 421 | ||||||||
6.250%, 01/15/2027 (A) | 250 | 271 | ||||||||
Jack Ohio Finance | ||||||||||
6.750%, 11/15/2021 (A) | 115 | 118 | ||||||||
Jaguar Holding II | ||||||||||
6.375%, 08/01/2023 (A) | 252 | 261 | ||||||||
Jaguar Land Rover Automotive |
| |||||||||
4.500%, 10/01/2027 (A) | 125 | 99 | ||||||||
JBS Investments GmbH | ||||||||||
7.250%, 04/03/2024 (A) | 200 | 208 | ||||||||
JBS Investments II GmbH | ||||||||||
7.000%, 01/15/2026 (A) | 200 | 214 | ||||||||
5.750%, 01/15/2028 (A) | 200 | 203 | ||||||||
JBS USA LUX | ||||||||||
6.750%, 02/15/2028 (A) | 95 | 102 | ||||||||
6.500%, 04/15/2029 (A) | 75 | 81 | ||||||||
5.875%, 07/15/2024 (A) | 78 | 80 | ||||||||
5.750%, 06/15/2025 (A) | 281 | 290 | ||||||||
5.500%, 01/15/2030 (A) | 319 | 319 | ||||||||
JC Penney | ||||||||||
5.875%, 07/01/2023 (A) | 130 | 108 | ||||||||
KFC Holding | ||||||||||
5.250%, 06/01/2026 (A) | 92 | 96 | ||||||||
5.000%, 06/01/2024 (A) | 350 | 361 | ||||||||
4.750%, 06/01/2027 (A) | 125 | 128 | ||||||||
L Brands | ||||||||||
7.500%, 06/15/2029 | 125 | 125 | ||||||||
5.250%, 02/01/2028 | 100 | 93 | ||||||||
Las Vegas Sands | ||||||||||
3.900%, 08/08/2029 | 40 | 41 | ||||||||
3.500%, 08/18/2026 | 30 | 30 | ||||||||
3.200%, 08/08/2024 | 45 | 45 | ||||||||
Laureate Education | ||||||||||
8.250%, 05/01/2025 (A) | 90 | 98 | ||||||||
Lear | ||||||||||
5.250%, 01/15/2025 | 70 | 73 | ||||||||
3.800%, 09/15/2027 | 100 | 99 | ||||||||
| Description | Face Amount (Thousands) | Market Value ($ Thousands) | ||||||||
CORPORATE OBLIGATIONS (continued) |
| |||||||||
Leggett & Platt | ||||||||||
3.500%, 11/15/2027 | $ | 250 | $ | 249 | ||||||
Lennar | ||||||||||
4.750%, 04/01/2021 | 100 | 102 | ||||||||
4.750%, 05/30/2025 | 100 | 105 | ||||||||
4.750%, 11/29/2027 | 100 | 105 | ||||||||
4.500%, 04/30/2024 | 300 | 313 | ||||||||
Lowe’s | ||||||||||
4.550%, 04/05/2049 | 50 | 54 | ||||||||
4.250%, 09/15/2044 | 50 | 51 | ||||||||
3.700%, 04/15/2046 | 150 | 143 | ||||||||
3.650%, 04/05/2029 | 100 | 105 | ||||||||
3.375%, 09/15/2025 | 100 | 104 | ||||||||
3.125%, 09/15/2024 | 100 | 103 | ||||||||
Macy’s Retail Holdings | ||||||||||
4.500%, 12/15/2034 | 12 | 11 | ||||||||
3.450%, 01/15/2021 | 50 | 51 | ||||||||
2.875%, 02/15/2023 | 75 | 74 | ||||||||
Magna International | ||||||||||
3.625%, 06/15/2024 | 100 | 104 | ||||||||
Marriott International | ||||||||||
3.600%, 04/15/2024 | 100 | 104 | ||||||||
3.125%, 10/15/2021 | 100 | 101 | ||||||||
3.125%, 06/15/2026 | 50 | 50 | ||||||||
2.300%, 01/15/2022 | 50 | 50 | ||||||||
Marriott Ownership Resorts | ||||||||||
6.500%, 09/15/2026 | 80 | 86 | ||||||||
Massachusetts Institute of Technology |
| |||||||||
5.600%, 07/01/2111 | 100 | 157 | ||||||||
Mattamy Group | ||||||||||
6.500%, 10/01/2025 (A) | 175 | 183 | ||||||||
Mattel | ||||||||||
6.750%, 12/31/2025 (A) | 300 | 315 | ||||||||
McDonald’s MTN | ||||||||||
6.300%, 10/15/2037 | 50 | 66 | ||||||||
4.875%, 12/09/2045 | 125 | 144 | ||||||||
4.700%, 12/09/2035 | 175 | 202 | ||||||||
4.450%, 03/01/2047 | 25 | 28 | ||||||||
3.800%, 04/01/2028 | 50 | 54 | ||||||||
3.700%, 01/30/2026 | 30 | 32 | ||||||||
3.350%, 04/01/2023 | 30 | 31 | ||||||||
2.750%, 12/09/2020 | 120 | 121 | ||||||||
MDC Partners | ||||||||||
6.500%, 05/01/2024 (A) | 250 | 226 | ||||||||
MGM China Holdings | ||||||||||
5.375%, 05/15/2024 (A) | 300 | 311 | ||||||||
MGM Resorts International | ||||||||||
6.000%, 03/15/2023 | 200 | 217 | ||||||||
5.750%, 06/15/2025 | 315 | 340 | ||||||||
5.500%, 04/15/2027 | 215 | 228 | ||||||||
Michaels Stores | ||||||||||
8.000%, 07/15/2027 (A) | 100 | 97 | ||||||||
| 20 | Adviser Managed Trust / Annual Report / July 31, 2019 |
| Description | Face Amount (Thousands) | Market Value ($ Thousands) | ||||||||
CORPORATE OBLIGATIONS (continued) |
| |||||||||
Mohegan Gaming & Entertainment |
| |||||||||
7.875%, 10/15/2024 (A) | $ | 100 | $ | 97 | ||||||
NCL | ||||||||||
4.750%, 12/15/2021 (A) | 72 | 73 | ||||||||
Neiman Marcus Group | ||||||||||
8.000%, 10/25/2024 (A) | 100 | 43 | ||||||||
Newell Brands | ||||||||||
5.375%, 04/01/2036 | 24 | 24 | ||||||||
4.200%, 04/01/2026 | 50 | 50 | ||||||||
3.850%, 04/01/2023 | 60 | 61 | ||||||||
Newell Rubbermaid | ||||||||||
4.000%, 12/01/2024 | 100 | 100 | ||||||||
NIKE | ||||||||||
3.875%, 11/01/2045 | 100 | 109 | ||||||||
Nordstrom | ||||||||||
5.000%, 01/15/2044 | 100 | 92 | ||||||||
4.000%, 03/15/2027 | 100 | 102 | ||||||||
Northwestern University | ||||||||||
3.662%, 12/01/2057 | 25 | 27 | ||||||||
O’Reilly Automotive | ||||||||||
4.350%, 06/01/2028 | 250 | 273 | ||||||||
3.600%, 09/01/2027 | 100 | 104 | ||||||||
3.550%, 03/15/2026 | 50 | 52 | ||||||||
Panther BF Aggregator 2 | ||||||||||
8.500%, 05/15/2027 (A) | 375 | 381 | ||||||||
6.250%, 05/15/2026 (A) | 224 | 232 | ||||||||
Party City Holdings | ||||||||||
6.625%, 08/01/2026 (A) | 70 | 67 | ||||||||
Penske Automotive Group | ||||||||||
5.500%, 05/15/2026 | 50 | 52 | ||||||||
PetSmart | ||||||||||
8.875%, 06/01/2025 (A) | 85 | 82 | ||||||||
7.125%, 03/15/2023 (A) | 408 | 380 | ||||||||
5.875%, 06/01/2025 (A) | 226 | 223 | ||||||||
President & Fellows of Harvard College |
| |||||||||
3.150%, 07/15/2046 | 100 | 102 | ||||||||
Prime Security Services Borrower |
| |||||||||
9.250%, 05/15/2023 (A) | 61 | 64 | ||||||||
5.750%, 04/15/2026 (A) | 175 | 182 | ||||||||
5.250%, 04/15/2024 (A) | 123 | 126 | ||||||||
PulteGroup | ||||||||||
5.500%, 03/01/2026 | 175 | 189 | ||||||||
5.000%, 01/15/2027 | 107 | 112 | ||||||||
QVC | ||||||||||
4.450%, 02/15/2025 | 100 | 102 | ||||||||
Refinitiv US Holdings | ||||||||||
8.250%, 11/15/2026 (A) | 350 | 387 | ||||||||
6.250%, 05/15/2026 (A) | 240 | 258 | ||||||||
RELX Capital | ||||||||||
3.500%, 03/16/2023 | 260 | 268 | ||||||||
Ritchie Bros Auctioneers | ||||||||||
5.375%, 01/15/2025 (A) | 25 | 26 | ||||||||
| Description | Face Amount (Thousands) | Market Value ($ Thousands) | ||||||||
CORPORATE OBLIGATIONS (continued) |
| |||||||||
Sabre | ||||||||||
5.375%, 04/15/2023 (A) | $ | 235 | $ | 240 | ||||||
Sally Holdings | ||||||||||
5.625%, 12/01/2025 | 175 | 174 | ||||||||
Scientific Games International |
| |||||||||
10.000%, 12/01/2022 | 218 | 227 | ||||||||
8.250%, 03/15/2026 (A) | 225 | 241 | ||||||||
5.000%, 10/15/2025 (A) | 250 | 256 | ||||||||
Service International | ||||||||||
5.125%, 06/01/2029 | 138 | 145 | ||||||||
4.625%, 12/15/2027 | 100 | 103 | ||||||||
ServiceMaster | ||||||||||
5.125%, 11/15/2024 (A) | 130 | 135 | ||||||||
Sigma Holdco BV | ||||||||||
7.875%, 05/15/2026 (A) | 200 | 186 | ||||||||
Simmons Foods | ||||||||||
5.750%, 11/01/2024 (A) | 74 | 68 | ||||||||
Six Flags Entertainment | ||||||||||
5.500%, 04/15/2027 (A) | 75 | 79 | ||||||||
4.875%, 07/31/2024 (A) | 200 | 204 | ||||||||
Star Merger | ||||||||||
10.250%, 02/15/2027 (A) | 150 | 161 | ||||||||
6.875%, 08/15/2026 (A) | 135 | 144 | ||||||||
Starbucks | ||||||||||
4.500%, 11/15/2048 | 30 | 33 | ||||||||
4.450%, 08/15/2049 | 150 | 165 | ||||||||
4.000%, 11/15/2028 | 50 | 55 | ||||||||
3.800%, 08/15/2025 | 50 | 53 | ||||||||
3.550%, 08/15/2029 | 150 | 158 | ||||||||
3.500%, 03/01/2028 | 50 | 53 | ||||||||
3.100%, 03/01/2023 | 50 | 51 | ||||||||
2.700%, 06/15/2022 | 50 | 50 | ||||||||
Stars Group Holdings BV | ||||||||||
7.000%, 07/15/2026 (A) | 175 | 184 | ||||||||
Station Casinos | ||||||||||
5.000%, 10/01/2025 (A) | 134 | 137 | ||||||||
Studio City | ||||||||||
7.250%, 11/30/2021 (A) | 200 | 206 | ||||||||
Summit Materials | ||||||||||
6.125%, 07/15/2023 | 125 | 127 | ||||||||
Tapestry | ||||||||||
4.125%, 07/15/2027 | 250 | 254 | ||||||||
Target | ||||||||||
3.900%, 11/15/2047 | 100 | 108 | ||||||||
3.500%, 07/01/2024 | 50 | 53 | ||||||||
3.375%, 04/15/2029 | 300 | 318 | ||||||||
Taylor Morrison Communities |
| |||||||||
5.875%, 06/15/2027 (A) | 107 | 112 | ||||||||
Tempur Sealy International | ||||||||||
5.500%, 06/15/2026 | 164 | 172 | ||||||||
Tenneco | ||||||||||
5.000%, 07/15/2026 | 105 | 81 | ||||||||
| ||||
| Adviser Managed Trust / Annual Report / July 31, 2019 | 21 | |||
SCHEDULE OF INVESTMENTS
July 31, 2019
Tactical Offensive Fixed Income Fund(Continued)
| Description | Face Amount (Thousands) | Market Value ($ Thousands) | ||||||
CORPORATE OBLIGATIONS (continued) |
| |||||||
Tesla | ||||||||
5.300%, 08/15/2025 (A) | $ | 344 | $ | 302 | ||||
Time Warner Cable | ||||||||
6.550%, 05/01/2037 | 400 | 468 | ||||||
5.875%, 11/15/2040 | 400 | 441 | ||||||
4.500%, 09/15/2042 | 100 | 95 | ||||||
4.000%, 09/01/2021 | 300 | 306 | ||||||
TJX | ||||||||
2.250%, 09/15/2026 | 150 | 147 | ||||||
Toyota Motor Credit MTN | ||||||||
3.650%, 01/08/2029 | 300 | 326 | ||||||
3.400%, 04/14/2025 | 100 | 105 | ||||||
3.300%, 01/12/2022 | 100 | 102 | ||||||
2.950%, 04/13/2021 | 250 | 253 | ||||||
2.900%, 04/17/2024 | 250 | 256 | ||||||
2.800%, 07/13/2022 | 50 | 51 | ||||||
2.600%, 01/11/2022 | 100 | 101 | ||||||
2.250%, 10/18/2023 | 50 | 50 | ||||||
1.900%, 04/08/2021 | 50 | 50 | ||||||
Under Armour | ||||||||
3.250%, 06/15/2026 | 100 | 97 | ||||||
University of Notre Dame du Lac |
| |||||||
3.394%, 02/15/2048 | 100 | 103 | ||||||
University of Southern California |
| |||||||
3.028%, 10/01/2039 | 150 | 149 | ||||||
Univision Communications |
| |||||||
6.750%, 09/15/2022 (A) | 48 | 49 | ||||||
5.125%, 02/15/2025 (A) | 247 | 240 | ||||||
Verscend Escrow | ||||||||
9.750%, 08/15/2026 (A) | 235 | 251 | ||||||
Viking Cruises | ||||||||
5.875%, 09/15/2027 (A) | 134 | 139 | ||||||
V0C Escrow | ||||||||
5.000%, 02/15/2028 (A) | 200 | 204 | ||||||
Whirlpool | ||||||||
3.700%, 05/01/2025 | 50 | 52 | ||||||
William Carter | ||||||||
5.625%, 03/15/2027 (A) | 118 | 124 | ||||||
WPP Finance | ||||||||
3.750%, 09/19/2024 | 100 | 103 | ||||||
Wyndham Hotels & Resorts | ||||||||
5.375%, 04/15/2026 (A) | 85 | 89 | ||||||
Wynn Las Vegas | ||||||||
5.500%, 03/01/2025 (A) | 300 | 315 | ||||||
5.250%, 05/15/2027 (A) | 255 | 261 | ||||||
Wynn Macau | ||||||||
5.500%, 10/01/2027 (A) | 300 | 302 | ||||||
|
| |||||||
| 43,872 | ||||||||
|
| |||||||
Consumer Staples — 1.7% |
| |||||||
Altria Group | ||||||||
6.200%, 02/14/2059 | 15 | 17 | ||||||
| Description | Face Amount (Thousands) | Market Value ($ Thousands) | ||||||
CORPORATE OBLIGATIONS (continued) |
| |||||||
5.950%, 02/14/2049 | $ | 340 | $ | 396 | ||||
5.800%, 02/14/2039 | 235 | 270 | ||||||
5.375%, 01/31/2044 | 100 | 110 | ||||||
4.800%, 02/14/2029 | 75 | 81 | ||||||
3.800%, 02/14/2024 | 320 | 333 | ||||||
3.490%, 02/14/2022 | 300 | 306 | ||||||
2.850%, 08/09/2022 | 100 | 101 | ||||||
Anheuser-Busch | ||||||||
4.900%, 02/01/2046 | 400 | 454 | ||||||
4.700%, 02/01/2036 | 350 | 390 | ||||||
Anheuser-Busch InBev Finance |
| |||||||
4.625%, 02/01/2044 | 100 | 109 | ||||||
3.300%, 02/01/2023 | 449 | 462 | ||||||
Anheuser-Busch InBev Worldwide |
| |||||||
8.200%, 01/15/2039 | 100 | 154 | ||||||
5.800%, 01/23/2059 | 195 | 250 | ||||||
5.550%, 01/23/2049 | 100 | 124 | ||||||
5.450%, 01/23/2039 | 465 | 563 | ||||||
4.900%, 01/23/2031 | 65 | 76 | ||||||
4.750%, 01/23/2029 | 85 | 97 | ||||||
4.600%, 04/15/2048 | 350 | 382 | ||||||
4.375%, 04/15/2038 | 35 | 38 | ||||||
4.150%, 01/23/2025 | 360 | 387 | ||||||
4.000%, 04/13/2028 | 60 | 65 | ||||||
3.750%, 07/15/2042 | 100 | 98 | ||||||
Archer-Daniels-Midland | ||||||||
4.500%, 03/15/2049 | 300 | 352 | ||||||
4.479%, 03/01/2021 | 50 | 52 | ||||||
4.016%, 04/16/2043 | 100 | 108 | ||||||
3.750%, 09/15/2047 | 100 | 104 | ||||||
2.500%, 08/11/2026 | 100 | 100 | ||||||
Avon International Operations |
| |||||||
7.875%, 08/15/2022 (A) | 70 | 73 | ||||||
B&G Foods | ||||||||
5.250%, 04/01/2025 | 100 | 100 | ||||||
4.625%, 06/01/2021 | 100 | 100 | ||||||
Brown-Forman | ||||||||
4.500%, 07/15/2045 | 35 | 42 | ||||||
Bunge Finance | ||||||||
3.750%, 09/25/2027 | 330 | 328 | ||||||
3.500%, 11/24/2020 | 50 | 50 | ||||||
3.000%, 09/25/2022 | 55 | 55 | ||||||
Campbell Soup | ||||||||
4.800%, 03/15/2048 | 240 | 254 | ||||||
4.150%, 03/15/2028 | 100 | 105 | ||||||
3.300%, 03/15/2021 | 65 | 66 | ||||||
Chobani | ||||||||
7.500%, 04/15/2025 (A) | 100 | 93 | ||||||
Clorox | ||||||||
3.900%, 05/15/2028 | 50 | 55 | ||||||
3.100%, 10/01/2027 | 50 | 51 | ||||||
| 22 | Adviser Managed Trust / Annual Report / July 31, 2019 |
| Description | Face Amount (Thousands) | Market Value ($ Thousands) | ||||||||
CORPORATE OBLIGATIONS (continued) |
| |||||||||
Coca-Cola | ||||||||||
2.875%, 10/27/2025 | $ | 100 | $ | 103 | ||||||
2.250%, 09/01/2026 | 50 | 50 | ||||||||
2.200%, 05/25/2022 | 300 | 300 | ||||||||
1.875%, 10/27/2020 | 300 | 299 | ||||||||
1.550%, 09/01/2021 | 50 | 50 | ||||||||
Coca-Cola European Partners |
| |||||||||
3.500%, 09/15/2020 | 100 | 101 | ||||||||
Colgate-Palmolive MTN | ||||||||||
4.000%, 08/15/2045 | 50 | 57 | ||||||||
3.250%, 03/15/2024 | 50 | 52 | ||||||||
2.300%, 05/03/2022 | 100 | 101 | ||||||||
Conagra Brands | ||||||||||
5.400%, 11/01/2048 | 220 | 247 | ||||||||
5.300%, 11/01/2038 | 315 | 350 | ||||||||
4.850%, 11/01/2028 | 25 | 28 | ||||||||
4.300%, 05/01/2024 | 310 | 329 | ||||||||
3.800%, 10/22/2021 | 10 | 10 | ||||||||
3.200%, 01/25/2023 | 118 | 120 | ||||||||
Constellation Brands | ||||||||||
4.500%, 05/09/2047 | 20 | 21 | ||||||||
4.250%, 05/01/2023 | 90 | 95 | ||||||||
4.100%, 02/15/2048 | 250 | 253 | ||||||||
3.750%, 05/01/2021 | 25 | 26 | ||||||||
3.600%, 02/15/2028 | 50 | 52 | ||||||||
3.500%, 05/09/2027 | 15 | 16 | ||||||||
3.200%, 02/15/2023 | 50 | 51 | ||||||||
2.700%, 05/09/2022 | 15 | 15 | ||||||||
2.650%, 11/07/2022 | 100 | 100 | ||||||||
Costco Wholesale | ||||||||||
3.000%, 05/18/2027 | 100 | 104 | ||||||||
Cott Holdings | ||||||||||
5.500%, 04/01/2025 (A) | 95 | 97 | ||||||||
Coty | ||||||||||
6.500%, 04/15/2026 (A) | 125 | 120 | ||||||||
Darling Ingredients | ||||||||||
5.250%, 04/15/2027 (A) | 106 | 111 | ||||||||
Dean Foods | ||||||||||
6.500%, 03/15/2023 (A) | 150 | 83 | ||||||||
Diageo Capital | ||||||||||
2.625%, 04/29/2023 | 50 | 50 | ||||||||
Diageo Investment | ||||||||||
4.250%, 05/11/2042 | 100 | 112 | ||||||||
2.875%, 05/11/2022 | 50 | 51 | ||||||||
Energizer Holdings | ||||||||||
7.750%, 01/15/2027 (A) | 10 | 11 | ||||||||
6.375%, 07/15/2026 (A) | 30 | 31 | ||||||||
5.500%, 06/15/2025 (A) | 313 | 318 | ||||||||
Estee Lauder | ||||||||||
4.375%, 06/15/2045 | 50 | 58 | ||||||||
4.150%, 03/15/2047 | 50 | 56 | ||||||||
3.150%, 03/15/2027 | 50 | 52 | ||||||||
| Description | Face Amount (Thousands) | Market Value ($ Thousands) | ||||||||
CORPORATE OBLIGATIONS (continued) |
| |||||||||
Fresh Market | ||||||||||
9.750%, 05/01/2023 (A) | $ | 100 | $ | 61 | ||||||
General Mills | ||||||||||
4.700%, 04/17/2048 | 220 | 246 | ||||||||
4.550%, 04/17/2038 | 115 | 125 | ||||||||
4.200%, 04/17/2028 | 25 | 27 | ||||||||
3.700%, 10/17/2023 | 40 | 42 | ||||||||
3.200%, 04/16/2021 | 10 | 10 | ||||||||
3.150%, 12/15/2021 | 100 | 102 | ||||||||
2.600%, 10/12/2022 | 100 | 100 | ||||||||
Hershey | ||||||||||
3.200%, 08/21/2025 | 100 | 104 | ||||||||
Ingredion | ||||||||||
3.200%, 10/01/2026 | 100 | 100 | ||||||||
JM Smucker | ||||||||||
4.375%, 03/15/2045 | 100 | 103 | ||||||||
4.250%, 03/15/2035 | 20 | 21 | ||||||||
3.500%, 03/15/2025 | 100 | 104 | ||||||||
Kellogg | ||||||||||
4.000%, 12/15/2020 | 100 | 102 | ||||||||
3.400%, 11/15/2027 | 100 | 102 | ||||||||
Keurig Dr Pepper | ||||||||||
5.085%, 05/25/2048 | 200 | 227 | ||||||||
4.597%, 05/25/2028 | 50 | 55 | ||||||||
4.500%, 11/15/2045 | 130 | 133 | ||||||||
3.551%, 05/25/2021 | 300 | 306 | ||||||||
2.550%, 09/15/2026 | 100 | 96 | ||||||||
Kimberly-Clark | ||||||||||
6.625%, 08/01/2037 | 50 | 71 | ||||||||
3.200%, 04/25/2029 | 100 | 106 | ||||||||
3.050%, 08/15/2025 | 50 | 52 | ||||||||
2.750%, 02/15/2026 | 50 | 51 | ||||||||
Kraft Foods Group | ||||||||||
5.000%, 06/04/2042 | 100 | 103 | ||||||||
Kraft Heinz Foods | ||||||||||
6.500%, 02/09/2040 | 100 | 118 | ||||||||
5.200%, 07/15/2045 | 100 | 105 | ||||||||
5.000%, 07/15/2035 | 500 | 531 | ||||||||
4.375%, 06/01/2046 | 60 | 58 | ||||||||
3.950%, 07/15/2025 | 100 | 104 | ||||||||
3.000%, 06/01/2026 | 55 | 54 | ||||||||
Kroger | ||||||||||
4.500%, 01/15/2029 | 50 | 55 | ||||||||
4.000%, 02/01/2024 | 100 | 105 | ||||||||
3.875%, 10/15/2046 | 100 | 90 | ||||||||
3.700%, 08/01/2027 | 35 | 36 | ||||||||
Kronos Acquisition Holdings |
| |||||||||
9.000%, 08/15/2023 (A) | 165 | 142 | ||||||||
Lamb Weston Holdings | ||||||||||
4.875%, 11/01/2026 (A) | 125 | 130 | ||||||||
4.625%, 11/01/2024 (A) | 200 | 208 | ||||||||
| ||||
| Adviser Managed Trust / Annual Report / July 31, 2019 | 23 | |||
SCHEDULE OF INVESTMENTS
July 31, 2019
Tactical Offensive Fixed Income Fund(Continued)
| Description | Face Amount (Thousands) | Market Value ($ Thousands) | ||||||
CORPORATE OBLIGATIONS (continued) |
| |||||||
McCormick | ||||||||
3.400%, 08/15/2027 | $ | 100 | $ | 103 | ||||
3.150%, 08/15/2024 | 300 | 307 | ||||||
Mead Johnson Nutrition | ||||||||
4.125%, 11/15/2025 | 30 | 33 | ||||||
3.000%, 11/15/2020 | 30 | 30 | ||||||
Molson Coors Brewing | ||||||||
5.000%, 05/01/2042 | 93 | 101 | ||||||
4.200%, 07/15/2046 | 40 | 39 | ||||||
3.000%, 07/15/2026 | 100 | 100 | ||||||
Mondelez International | ||||||||
4.125%, 05/07/2028 | 200 | 217 | ||||||
4.000%, 02/01/2024 | 100 | 105 | ||||||
NVA Holdings | ||||||||
6.875%, 04/01/2026 (A) | 50 | 53 | ||||||
PepsiCo | ||||||||
4.600%, 07/17/2045 | 45 | 54 | ||||||
4.250%, 10/22/2044 | 100 | 115 | ||||||
4.000%, 05/02/2047 | 335 | 374 | ||||||
3.600%, 03/01/2024 | 100 | 106 | ||||||
3.500%, 07/17/2025 | 100 | 106 | ||||||
3.000%, 10/15/2027 | 350 | 365 | ||||||
2.750%, 03/05/2022 | 50 | 51 | ||||||
2.625%, 07/29/2029 | 75 | 75 | ||||||
2.250%, 05/02/2022 | 50 | 50 | ||||||
Philip Morris International | ||||||||
6.375%, 05/16/2038 | 100 | 137 | ||||||
4.250%, 11/10/2044 | 50 | 53 | ||||||
4.125%, 03/04/2043 | 50 | 52 | ||||||
3.375%, 08/15/2029 | 150 | 155 | ||||||
3.125%, 08/17/2027 | 100 | 103 | ||||||
3.125%, 03/02/2028 | 50 | 51 | ||||||
2.875%, 05/01/2024 | 150 | 152 | ||||||
2.750%, 02/25/2026 | 50 | 51 | ||||||
2.625%, 02/18/2022 | 25 | 25 | ||||||
2.500%, 11/02/2022 | 50 | 50 | ||||||
2.375%, 08/17/2022 | 100 | 100 | ||||||
2.125%, 05/10/2023 | 25 | 25 | ||||||
1.875%, 02/25/2021 | 50 | 50 | ||||||
Pilgrim’s Pride | ||||||||
5.875%, 09/30/2027 (A) | 200 | 210 | ||||||
5.750%, 03/15/2025 (A) | 148 | 153 | ||||||
Post Holdings | ||||||||
5.750%, 03/01/2027 (A) | 405 | 420 | ||||||
5.625%, 01/15/2028 (A) | 208 | 214 | ||||||
5.500%, 03/01/2025 (A) | 245 | 255 | ||||||
5.500%, 12/15/2029 (A) | 205 | 207 | ||||||
Procter & Gamble | ||||||||
2.850%, 08/11/2027 | 100 | 103 | ||||||
2.450%, 11/03/2026 | 50 | 51 | ||||||
1.700%, 11/03/2021 | 100 | 99 | ||||||
| Description | Face Amount (Thousands) | Market Value ($ Thousands) | ||||||
CORPORATE OBLIGATIONS (continued) |
| |||||||
Reynolds American | ||||||||
5.850%, 08/15/2045 | $ | 100 | $ | 110 | ||||
5.700%, 08/15/2035 | 100 | 112 | ||||||
4.450%, 06/12/2025 | 100 | 106 | ||||||
Rite Aid | ||||||||
6.125%, 04/01/2023 (A) | 350 | 295 | ||||||
Skandinaviska Enskilda Banken | ||||||||
1.875%, 09/13/2021 | 150 | 148 | ||||||
Spectrum Brands | ||||||||
5.750%, 07/15/2025 | 200 | 207 | ||||||
Staples | ||||||||
10.750%, 04/15/2027 (A) | 215 | 223 | ||||||
7.500%, 04/15/2026 (A) | 400 | 409 | ||||||
Sysco | ||||||||
4.850%, 10/01/2045 | 15 | 17 | ||||||
4.450%, 03/15/2048 | 250 | 277 | ||||||
3.750%, 10/01/2025 | 25 | 27 | ||||||
3.550%, 03/15/2025 | 50 | 52 | ||||||
3.300%, 07/15/2026 | 100 | 103 | ||||||
2.600%, 10/01/2020 | 50 | 50 | ||||||
TreeHouse Foods | ||||||||
6.000%, 02/15/2024 (A) | 120 | 124 | ||||||
Tyson Foods | ||||||||
5.100%, 09/28/2048 | 300 | 343 | ||||||
4.500%, 06/15/2022 | 100 | 105 | ||||||
4.350%, 03/01/2029 | 300 | 330 | ||||||
3.950%, 08/15/2024 | 50 | 53 | ||||||
2.250%, 08/23/2021 | 35 | 35 | ||||||
Unilever Capital | ||||||||
5.900%, 11/15/2032 | 100 | 134 | ||||||
3.125%, 03/22/2023 | 100 | 103 | ||||||
1.375%, 07/28/2021 | 100 | 98 | ||||||
US Foods | ||||||||
5.875%, 06/15/2024 (A) | 115 | 118 | ||||||
Vector Group | ||||||||
6.125%, 02/01/2025 (A) | 205 | 194 | ||||||
Walgreens Boots Alliance | ||||||||
4.800%, 11/18/2044 | 100 | 102 | ||||||
3.800%, 11/18/2024 | 100 | 104 | ||||||
3.450%, 06/01/2026 | 30 | 31 | ||||||
3.300%, 11/18/2021 | 100 | 102 | ||||||
Walmart | ||||||||
4.050%, 06/29/2048 | 65 | 75 | ||||||
3.950%, 06/28/2038 | 415 | 468 | ||||||
3.700%, 06/26/2028 | 100 | 109 | ||||||
3.625%, 12/15/2047 | 325 | 350 | ||||||
3.550%, 06/26/2025 | 325 | 346 | ||||||
3.400%, 06/26/2023 | 100 | 104 | ||||||
3.250%, 07/08/2029 | 40 | 42 | ||||||
3.125%, 06/23/2021 | 100 | 102 | ||||||
2.650%, 12/15/2024 | 50 | 51 | ||||||
2.550%, 04/11/2023 | 50 | 51 | ||||||
| 24 | Adviser Managed Trust / Annual Report / July 31, 2019 |
| Description | Face Amount (Thousands) | Market Value ($ Thousands) | ||||||||
CORPORATE OBLIGATIONS (continued) |
| |||||||||
2.350%, 12/15/2022 | $ | 100 | $ | 101 | ||||||
1.900%, 12/15/2020 | 450 |
| 448
|
| ||||||
|
|
| ||||||||
| 27,175 | ||||||||||
|
|
| ||||||||
Energy — 3.1% | ||||||||||
Al Candelaria Spain SLU | ||||||||||
7.500%, 12/15/2028 (A) | 277 | 310 | ||||||||
Aker BP | ||||||||||
5.875%, 03/31/2025 (A) | 150 | 158 | ||||||||
Alta Mesa Holdings | ||||||||||
7.875%, 12/15/2024 | 80 | 28 | ||||||||
Anadarko Petroleum | ||||||||||
6.600%, 03/15/2046 | 50 | 64 | ||||||||
6.450%, 09/15/2036 | 25 | 30 | ||||||||
5.550%, 03/15/2026 | 300 | 337 | ||||||||
4.850%, 03/15/2021 | 340 | 351 | ||||||||
Andeavor Logistics | ||||||||||
5.200%, 12/01/2047 | 230 | 247 | ||||||||
4.250%, 12/01/2027 | 215 | 226 | ||||||||
3.500%, 12/01/2022 | 15 | 15 | ||||||||
Antero Midstream Partners |
| |||||||||
5.750%, 03/01/2027 (A) | 115 | 108 | ||||||||
5.750%, 01/15/2028 (A) | 148 | 138 | ||||||||
5.375%, 09/15/2024 | 150 | 144 | ||||||||
Antero Resources | ||||||||||
5.625%, 06/01/2023 | 44 | 41 | ||||||||
5.125%, 12/01/2022 | 375 | 358 | ||||||||
5.000%, 03/01/2025 | 50 | 45 | ||||||||
Apache | ||||||||||
5.350%, 07/01/2049 | 150 | 152 | ||||||||
5.100%, 09/01/2040 | 100 | 99 | ||||||||
4.375%, 10/15/2028 | 100 | 102 | ||||||||
4.250%, 01/15/2030 | 150 | 149 | ||||||||
Archrock Partners | ||||||||||
6.875%, 04/01/2027 (A) | 69 | 73 | ||||||||
Ascent Resources Utica Holdings |
| |||||||||
10.000%, 04/01/2022 (A) | 264 | 261 | ||||||||
7.000%, 11/01/2026 (A) | 55 | 44 | ||||||||
Baker Hughes a GE Co | ||||||||||
5.125%, 09/15/2040 | 100 | 111 | ||||||||
4.080%, 12/15/2047 | 50 | 49 | ||||||||
2.773%, 12/15/2022 | 50 | 50 | ||||||||
Blue Racer Midstream | ||||||||||
6.125%, 11/15/2022 (A) | 178 | 179 | ||||||||
Boardwalk Pipelines | ||||||||||
5.950%, 06/01/2026 | 100 | 111 | ||||||||
BP Capital Markets | ||||||||||
3.994%, 09/26/2023 | 38 | 41 | ||||||||
3.723%, 11/28/2028 | 30 | 32 | ||||||||
3.506%, 03/17/2025 | 100 | 105 | ||||||||
BP Capital Markets America |
| |||||||||
4.234%, 11/06/2028 | 100 | 111 | ||||||||
| Description | Face Amount (Thousands) | Market Value ($ Thousands) | ||||||||
CORPORATE OBLIGATIONS (continued) |
| |||||||||
3.588%, 04/14/2027 | $ | 100 | $ | 106 | ||||||
3.224%, 04/14/2024 | 100 | 103 | ||||||||
3.216%, 11/28/2023 | 50 | 52 | ||||||||
3.119%, 05/04/2026 | 100 | 103 | ||||||||
2.520%, 09/19/2022 | 100 | 100 | ||||||||
2.112%, 09/16/2021 | 350 | 349 | ||||||||
Brazos Valley Longhorn | ||||||||||
6.875%, 02/01/2025 | 150 | 139 | ||||||||
Bruin E&P Partners | ||||||||||
8.875%, 08/01/2023 (A) | 105 | 79 | ||||||||
Calfrac Holdings | ||||||||||
8.500%, 06/15/2026 (A) | 205 | 138 | ||||||||
California Resources | ||||||||||
8.000%, 12/15/2022 (A) | 398 | 279 | ||||||||
Callon Petroleum | ||||||||||
6.125%, 10/01/2024 | 131 | 128 | ||||||||
Canadian Natural Resources |
| |||||||||
6.250%, 03/15/2038 | 50 | 62 | ||||||||
3.900%, 02/01/2025 | 100 | 105 | ||||||||
3.850%, 06/01/2027 | 50 | 52 | ||||||||
2.950%, 01/15/2023 | 50 | 50 | ||||||||
Canadian Natural Resources MTN |
| |||||||||
4.950%, 06/01/2047 | 25 | 28 | ||||||||
Carrizo Oil & Gas | ||||||||||
6.250%, 04/15/2023 | 115 | 113 | ||||||||
Cenovus Energy | ||||||||||
5.400%, 06/15/2047 | 250 | 272 | ||||||||
5.250%, 06/15/2037 | 35 | 37 | ||||||||
4.250%, 04/15/2027 | 100 | 103 | ||||||||
3.000%, 08/15/2022 | 308 | 308 | ||||||||
Centennial Resource Production |
| |||||||||
6.875%, 04/01/2027 (A) | 76 | 74 | ||||||||
Cheniere Corpus Christi Holdings |
| |||||||||
7.000%, 06/30/2024 | 150 | 171 | ||||||||
5.875%, 03/31/2025 | 450 | 495 | ||||||||
5.125%, 06/30/2027 | 220 | 239 | ||||||||
Cheniere Energy Partners | ||||||||||
5.625%, 10/01/2026 | 310 | 328 | ||||||||
5.250%, 10/01/2025 | 218 | 226 | ||||||||
Chesapeake Energy | ||||||||||
8.000%, 01/15/2025 | 267 | 228 | ||||||||
8.000%, 03/15/2026 (A) | 65 | 52 | ||||||||
8.000%, 06/15/2027 | 398 | 319 | ||||||||
7.000%, 10/01/2024 | 125 | 102 | ||||||||
Chevron | ||||||||||
3.326%, 11/17/2025 | 50 | 53 | ||||||||
2.954%, 05/16/2026 | 100 | 103 | ||||||||
2.895%, 03/03/2024 | 50 | 52 | ||||||||
2.566%, 05/16/2023 | 100 | 101 | ||||||||
2.498%, 03/03/2022 | 350 | 353 | ||||||||
2.419%, 11/17/2020 | 50 | 50 | ||||||||
2.355%, 12/05/2022 | 100 | 101 | ||||||||
| ||||
| Adviser Managed Trust / Annual Report / July 31, 2019 | 25 | |||
SCHEDULE OF INVESTMENTS
July 31, 2019
Tactical Offensive Fixed Income Fund(Continued)
| Description | Face Amount (Thousands) | Market Value ($ Thousands) | ||||||||
CORPORATE OBLIGATIONS (continued) |
| |||||||||
Cimarex Energy | ||||||||||
4.375%, 03/15/2029 | $ | 50 | $ | 52 | ||||||
3.900%, 05/15/2027 | 55 | 56 | ||||||||
CNOOC Nexen Finance | ||||||||||
4.250%, 04/30/2024 | 100 | 107 | ||||||||
CNX Resources | ||||||||||
7.250%, 03/14/2027 (A) | 125 | 107 | ||||||||
Comstock Resources | ||||||||||
9.750%, 08/15/2026 | 150 | 112 | ||||||||
Concho Resources | ||||||||||
4.300%, 08/15/2028 | 50 | 54 | ||||||||
ConocoPhillips | ||||||||||
6.500%, 02/01/2039 | 75 | 106 | ||||||||
4.950%, 03/15/2026 | 450 | 513 | ||||||||
Continental Resources | ||||||||||
5.000%, 09/15/2022 | 92 | 92 | ||||||||
4.900%, 06/01/2044 | 40 | 42 | ||||||||
4.500%, 04/15/2023 | 85 | 89 | ||||||||
4.375%, 01/15/2028 | 55 | 57 | ||||||||
3.800%, 06/01/2024 | 55 | 56 | ||||||||
Covey Park Energy | ||||||||||
7.500%, 05/15/2025 (A) | 150 | 105 | ||||||||
Crestwood Midstream Partners |
| |||||||||
6.250%, 04/01/2023 | 150 | 153 | ||||||||
5.750%, 04/01/2025 | 105 | 106 | ||||||||
5.625%, 05/01/2027 (A) | 120 | 119 | ||||||||
CrownRock | ||||||||||
5.625%, 10/15/2025 (A) | 250 | 246 | ||||||||
DCP Midstream Operating | ||||||||||
5.375%, 07/15/2025 | 155 | 164 | ||||||||
5.125%, 05/15/2029 | 56 | 58 | ||||||||
Denbury Resources | ||||||||||
9.000%, 05/15/2021 (A) | 124 | 117 | ||||||||
Devon Energy | ||||||||||
5.600%, 07/15/2041 | 100 | 119 | ||||||||
5.000%, 06/15/2045 | 50 | 57 | ||||||||
Diamond Offshore Drilling | ||||||||||
7.875%, 08/15/2025 | 83 | 79 | ||||||||
Diamondback Energy | ||||||||||
5.375%, 05/31/2025 | 330 | 346 | ||||||||
4.750%, 11/01/2024 (A) | 60 | 62 | ||||||||
Ecopetrol | ||||||||||
5.875%, 09/18/2023 | 100 | 111 | ||||||||
5.875%, 05/28/2045 | 200 | 225 | ||||||||
4.125%, 01/16/2025 | 225 | 233 | ||||||||
Enable Midstream Partners | ||||||||||
4.950%, 05/15/2028 | 230 | 238 | ||||||||
Enbridge | ||||||||||
5.500%, 12/01/2046 | 50 | 62 | ||||||||
4.250%, 12/01/2026 | 100 | 109 | ||||||||
3.700%, 07/15/2027 | 50 | 52 | ||||||||
2.900%, 07/15/2022 | 50 | 51 | ||||||||
| Description | Face Amount (Thousands) | Market Value ($ Thousands) | ||||||||
CORPORATE OBLIGATIONS (continued) |
| |||||||||
Enbridge Energy Partners | ||||||||||
7.375%, 10/15/2045 | $ | 50 | $ | 73 | ||||||
5.500%, 09/15/2040 | 100 | 115 | ||||||||
Encana | ||||||||||
6.500%, 02/01/2038 | 100 | 122 | ||||||||
Endeavor Energy Resources | ||||||||||
5.750%, 01/30/2028 (A) | 50 | 53 | ||||||||
5.500%, 01/30/2026 (A) | 107 | 111 | ||||||||
Energy Transfer Operating | ||||||||||
6.250%, 04/15/2049 | 415 | 493 | ||||||||
6.125%, 12/15/2045 | 100 | 115 | ||||||||
5.250%, 04/15/2029 | 215 | 240 | ||||||||
5.200%, 02/01/2022 | 100 | 106 | ||||||||
4.950%, 06/15/2028 | 300 | 328 | ||||||||
4.900%, 03/15/2035 | 50 | 50 | ||||||||
4.750%, 01/15/2026 | 50 | 54 | ||||||||
4.200%, 04/15/2027 | 50 | 52 | ||||||||
3.600%, 02/01/2023 | 85 | 87 | ||||||||
EnLink Midstream | ||||||||||
5.375%, 06/01/2029 | 135 | 139 | ||||||||
EnLink Midstream Partners | ||||||||||
4.850%, 07/15/2026 | 125 | 127 | ||||||||
4.150%, 06/01/2025 | 100 | 98 | ||||||||
Ensign Drilling | ||||||||||
9.250%, 04/15/2024 (A) | 145 | 142 | ||||||||
Enterprise Products Operating |
| |||||||||
5.200%, 09/01/2020 | 100 | 103 | ||||||||
5.100%, 02/15/2045 | 25 | 29 | ||||||||
4.875%, VAR ICE LIBOR USD 3 Month+2.986%, 08/16/2077 | 100 | 96 | ||||||||
4.850%, 08/15/2042 | 100 | 111 | ||||||||
4.800%, 02/01/2049 | 325 | 362 | ||||||||
4.150%, 10/16/2028 | 225 | 244 | ||||||||
3.950%, 02/15/2027 | 220 | 236 | ||||||||
3.700%, 02/15/2026 | 100 | 105 | ||||||||
3.500%, 02/01/2022 | 250 | 256 | ||||||||
3.350%, 03/15/2023 | 100 | 103 | ||||||||
2.850%, 04/15/2021 | 230 | 231 | ||||||||
EOG Resources | ||||||||||
3.150%, 04/01/2025 | 100 | 103 | ||||||||
EP Energy | ||||||||||
9.375%, 05/01/2024 (A) | 200 | 42 | ||||||||
8.000%, 11/29/2024 (A) | 130 | 86 | ||||||||
8.000%, 02/15/2025 (A) | 200 | 37 | ||||||||
7.750%, 05/15/2026 (A) | 170 | 152 | ||||||||
EQM Midstream Partners | ||||||||||
4.750%, 07/15/2023 | 300 | 307 | ||||||||
EQT | ||||||||||
3.900%, 10/01/2027 | 50 | 45 | ||||||||
3.000%, 10/01/2022 | 35 | 34 | ||||||||
EQT Midstream Partners | ||||||||||
4.125%, 12/01/2026 | 35 | 34 | ||||||||
| 26 | Adviser Managed Trust / Annual Report / July 31, 2019 |
| Description | Face Amount (Thousands) | Market Value ($ Thousands) | ||||||||
CORPORATE OBLIGATIONS (continued) |
| |||||||||
Equinor | ||||||||||
4.800%, 11/08/2043 | $ | 100 | $ | 122 | ||||||
3.700%, 03/01/2024 | 200 | 212 | ||||||||
Extraction Oil & Gas | ||||||||||
5.625%, 02/01/2026 (A) | 155 | 114 | ||||||||
Exxon Mobil | ||||||||||
3.567%, 03/06/2045 | 50 | 52 | ||||||||
3.176%, 03/15/2024 | 300 | 312 | ||||||||
2.726%, 03/01/2023 | 100 | 102 | ||||||||
2.709%, 03/06/2025 | 100 | 102 | ||||||||
2.222%, 03/01/2021 | 340 | 341 | ||||||||
Genesis Energy | ||||||||||
6.750%, 08/01/2022 | 100 | 102 | ||||||||
6.500%, 10/01/2025 | 150 | 149 | ||||||||
Gulfport Energy | ||||||||||
6.375%, 05/15/2025 | 200 | 153 | ||||||||
6.000%, 10/15/2024 | 35 | 27 | ||||||||
Halcon Resources | ||||||||||
6.750%, 02/15/2025 | 100 | 17 | ||||||||
Halliburton | ||||||||||
7.450%, 09/15/2039 | 100 | 140 | ||||||||
5.000%, 11/15/2045 | 50 | 55 | ||||||||
3.800%, 11/15/2025 | 100 | 105 | ||||||||
Hess | ||||||||||
7.125%, 03/15/2033 | 100 | 122 | ||||||||
5.600%, 02/15/2041 | 50 | 53 | ||||||||
4.300%, 04/01/2027 | 50 | 51 | ||||||||
Hess Infrastructure Partners |
| |||||||||
5.625%, 02/15/2026 (A) | 145 | 151 | ||||||||
Hilcorp Energy I | ||||||||||
6.250%, 11/01/2028 (A) | 190 | 184 | ||||||||
5.750%, 10/01/2025 (A) | 117 | 114 | ||||||||
Holly Energy Partners | ||||||||||
6.000%, 08/01/2024 (A) | 66 | 69 | ||||||||
Husky Energy | ||||||||||
4.000%, 04/15/2024 | 100 | 105 | ||||||||
Indigo Natural Resources | ||||||||||
6.875%, 02/15/2026 (A) | 150 | 126 | ||||||||
Jonah Energy | ||||||||||
7.250%, 10/15/2025 (A) | 191 | 75 | ||||||||
Kinder Morgan | ||||||||||
5.300%, 12/01/2034 | 50 | 57 | ||||||||
5.050%, 02/15/2046 | 90 | 98 | ||||||||
4.300%, 06/01/2025 | 100 | 107 | ||||||||
4.300%, 03/01/2028 | 300 | 321 | ||||||||
3.150%, 01/15/2023 | 500 | 508 | ||||||||
Kinder Morgan Energy Partners |
| |||||||||
5.500%, 03/01/2044 | 50 | 57 | ||||||||
4.300%, 05/01/2024 | 100 | 106 | ||||||||
4.250%, 09/01/2024 | 50 | 53 | ||||||||
Magellan Midstream Partners |
| |||||||||
4.200%, 10/03/2047 | 100 | 102 | ||||||||
| Description | Face Amount (Thousands) | Market Value ($ Thousands) | ||||||||
CORPORATE OBLIGATIONS (continued) |
| |||||||||
Marathon Oil | ||||||||||
5.200%, 06/01/2045 | $ | 50 | $ | 55 | ||||||
4.400%, 07/15/2027 | 100 | 105 | ||||||||
2.800%, 11/01/2022 | 100 | 100 | ||||||||
Marathon Petroleum | ||||||||||
6.500%, 03/01/2041 | 50 | 63 | ||||||||
5.125%, 03/01/2021 | 50 | 52 | ||||||||
5.125%, 12/15/2026 | 50 | 55 | ||||||||
4.500%, 04/01/2048 | 25 | 25 | ||||||||
3.800%, 04/01/2028 | 130 | 133 | ||||||||
Matador Resources | ||||||||||
5.875%, 09/15/2026 | 215 | 212 | ||||||||
McDermott Technology Americas |
| |||||||||
10.625%, 05/01/2024 (A) | 250 | 206 | ||||||||
MEG Energy | ||||||||||
6.500%, 01/15/2025 (A) | 155 | 155 | ||||||||
Montage Resources | ||||||||||
8.875%, 07/15/2023 | 100 | 77 | ||||||||
Moss Creek Resources Holdings |
| |||||||||
10.500%, 05/15/2027 (A) | 80 | 71 | ||||||||
7.500%, 01/15/2026 (A) | 150 | 117 | ||||||||
MPLX | ||||||||||
5.200%, 03/01/2047 | 50 | 54 | ||||||||
4.900%, 04/15/2058 | 225 | 226 | ||||||||
4.875%, 06/01/2025 | 100 | 109 | ||||||||
4.700%, 04/15/2048 | 245 | 248 | ||||||||
4.500%, 07/15/2023 | 250 | 265 | ||||||||
4.500%, 04/15/2038 | 130 | 132 | ||||||||
4.125%, 03/01/2027 | 50 | 52 | ||||||||
4.000%, 03/15/2028 | 370 | 383 | ||||||||
3.375%, 03/15/2023 | 225 | 230 | ||||||||
Murphy Oil | ||||||||||
5.750%, 08/15/2025 | 102 | 105 | ||||||||
Nabors Industries | ||||||||||
5.750%, 02/01/2025 | 165 | 144 | ||||||||
5.500%, 01/15/2023 | 100 | 94 | ||||||||
National Oilwell Varco | ||||||||||
2.600%, 12/01/2022 | 100 | 100 | ||||||||
Neptune Energy Bondco | ||||||||||
6.625%, 05/15/2025 (A) | 200 | 202 | ||||||||
Nexen | ||||||||||
6.400%, 05/15/2037 | 200 | 265 | ||||||||
NGL Energy Partners | ||||||||||
7.500%, 11/01/2023 | 120 | 124 | ||||||||
Noble Energy | ||||||||||
5.250%, 11/15/2043 | 100 | 109 | ||||||||
5.050%, 11/15/2044 | 50 | 53 | ||||||||
4.150%, 12/15/2021 | 50 | 52 | ||||||||
3.900%, 11/15/2024 | 100 | 104 | ||||||||
3.850%, 01/15/2028 | 100 | 102 | ||||||||
Noble Holding International | ||||||||||
7.875%, 02/01/2026 (A) | 145 | 124 | ||||||||
| Adviser Managed Trust / Annual Report / July 31, 2019 | 27 |
SCHEDULE OF INVESTMENTS
July 31, 2019
Tactical Offensive Fixed Income Fund(Continued)
| Description | Face Amount (Thousands) | Market Value ($ Thousands) | ||||||||
CORPORATE OBLIGATIONS (continued) |
| |||||||||
NuStar Logistics |
| |||||||||
6.000%, 06/01/2026 | $ | 45 | $ | 47 | ||||||
5.625%, 04/28/2027 | 90 | 93 | ||||||||
Occidental Petroleum | ||||||||||
4.400%, 04/15/2046 | 50 | 51 | ||||||||
4.200%, 03/15/2048 | 100 | 99 | ||||||||
4.100%, 02/01/2021 | 100 | 102 | ||||||||
3.000%, 02/15/2027 | 100 | 100 | ||||||||
2.700%, 02/15/2023 | 100 | 100 | ||||||||
Oceaneering International | ||||||||||
4.650%, 11/15/2024 | 100 | 96 | ||||||||
ONEOK | ||||||||||
6.000%, 06/15/2035 | 100 | 114 | ||||||||
4.550%, 07/15/2028 | 250 | 270 | ||||||||
4.000%, 07/13/2027 | 55 | 57 | ||||||||
ONEOK Partners | ||||||||||
6.200%, 09/15/2043 | 50 | 60 | ||||||||
Pacific Drilling | ||||||||||
8.375%, 10/01/2023 (A) | 150 | 146 | ||||||||
Parkland Fuel | ||||||||||
6.000%, 04/01/2026 (A) | 95 | 98 | ||||||||
5.875%, 07/15/2027 (A) | 94 | 97 | ||||||||
Parsley Energy | ||||||||||
5.625%, 10/15/2027 (A) | 150 | 155 | ||||||||
5.375%, 01/15/2025 (A) | 100 | 101 | ||||||||
PBF Holding | ||||||||||
7.250%, 06/15/2025 | 150 | 157 | ||||||||
PBF Logistics | ||||||||||
6.875%, 05/15/2023 | 80 | 82 | ||||||||
PDC Energy | ||||||||||
5.750%, 05/15/2026 | 100 | 97 | ||||||||
Peabody Energy | ||||||||||
6.375%, 03/31/2025 (A) | 100 | 103 | ||||||||
6.000%, 03/31/2022 (A) | 50 | 51 | ||||||||
Petroleos Mexicanos | ||||||||||
6.625%, 06/15/2035 | 300 | 280 | ||||||||
6.500%, 03/13/2027 | 1,000 | 992 | ||||||||
6.500%, 06/02/2041 | 260 | 234 | ||||||||
6.350%, 02/12/2048 | 330 | 288 | ||||||||
5.625%, 01/23/2046 | 100 | 82 | ||||||||
5.375%, 03/13/2022 | 200 | 204 | ||||||||
5.350%, 02/12/2028 | 255 | 234 | ||||||||
3.500%, 01/30/2023 | 250 | 238 | ||||||||
2.378%, 04/15/2025 | 57 | 57 | ||||||||
Petroleos Mexicanos MTN | ||||||||||
6.875%, 08/04/2026 | 100 | 102 | ||||||||
6.750%, 09/21/2047 | 50 | 46 | ||||||||
4.625%, 09/21/2023 | 120 | 118 | ||||||||
Phillips 66 | ||||||||||
4.875%, 11/15/2044 | 100 | 113 | ||||||||
4.650%, 11/15/2034 | 150 | 167 | ||||||||
4.300%, 04/01/2022 | 50 | 52 | ||||||||
| Description | Face Amount (Thousands) | Market Value ($ Thousands) | ||||||||
CORPORATE OBLIGATIONS (continued) |
| |||||||||
Phillips 66 Partners | ||||||||||
4.900%, 10/01/2046 | $ | 225 | $ | 243 | ||||||
3.550%, 10/01/2026 | 225 | 230 | ||||||||
Pioneer Natural Resources | ||||||||||
3.950%, 07/15/2022 | 100 | 104 | ||||||||
Plains All American Pipeline | ||||||||||
4.700%, 06/15/2044 | 100 | 97 | ||||||||
4.650%, 10/15/2025 | 100 | 106 | ||||||||
4.500%, 12/15/2026 | 100 | 107 | ||||||||
3.600%,11/01/2024 | 100 | 102 | ||||||||
Puget Energy | ||||||||||
5.625%, 07/15/2022 | 100 | 107 | ||||||||
3.650%, 05/15/2025 | 50 | 51 | ||||||||
Puget Sound Energy | ||||||||||
4.300%, 05/20/2045 | 50 | 57 | ||||||||
Puma International Financing | ||||||||||
5.125%, 10/06/2024 (A) | 200 | 189 | ||||||||
QEP Resources | ||||||||||
5.625%, 03/01/2026 | 100 | 86 | ||||||||
Range Resources | ||||||||||
5.000%, 08/15/2022 | 100 | 92 | ||||||||
5.000%, 03/15/2023 | 250 | 220 | ||||||||
4.875%, 05/15/2025 | 38 | 32 | ||||||||
Sabine Pass Liquefaction | ||||||||||
5.750%, 05/15/2024 | 75 | 83 | ||||||||
5.625%, 02/01/2021 | 25 | 26 | ||||||||
5.625%, 03/01/2025 | 75 | 83 | ||||||||
4.200%, 03/15/2028 | 100 | 105 | ||||||||
Sable Permian Resources Land | ||||||||||
7.375%, 11/01/2021 (A) | 80 | 6 | ||||||||
Sanchez Energy | ||||||||||
7.250%, 02/15/2023 (A) | 45 | 37 | ||||||||
6.125%, 01/15/2023 | 200 | 12 | ||||||||
Schlumberger Investment | ||||||||||
3.650%, 12/01/2023 | 100 | 104 | ||||||||
SESI | ||||||||||
7.750%, 09/15/2024 | 170 | 102 | ||||||||
Seven Generations Energy | ||||||||||
5.375%, 09/30/2025 (A) | 146 | 139 | ||||||||
Shell International Finance BV | ||||||||||
4.550%, 08/12/2043 | 300 | 354 | ||||||||
4.125%, 05/11/2035 | 100 | 113 | ||||||||
4.000%, 05/10/2046 | 50 | 55 | ||||||||
3.750%, 09/12/2046 | 50 | 53 | ||||||||
3.500%, 11/13/2023 | 40 | 42 | ||||||||
2.875%, 05/10/2026 | 50 | 51 | ||||||||
2.500%, 09/12/2026 | 350 | 350 | ||||||||
2.250%,11/10/2020 | 370 | 370 | ||||||||
2.250%, 01/06/2023 | 100 | 100 | ||||||||
1.875%, 05/10/2021 | 250 | 249 | ||||||||
1.750%, 09/12/2021 | 50 | 50 | ||||||||
| 28 | Adviser Managed Trust / Annual Report / July 31, 2019 |
| Description | Face Amount (Thousands) | Market Value ($ Thousands) | ||||||||
CORPORATE OBLIGATIONS (continued) |
| |||||||||
SM Energy | ||||||||||
6.625%, 01/15/2027 | $ | 175 | $ | 153 | ||||||
5.625%, 06/01/2025 | 113 | 98 | ||||||||
Southwestern Energy | ||||||||||
7.750%, 10/01/2027 | 305 | 267 | ||||||||
6.200%, 01/23/2025 | 100 | 86 | ||||||||
Spectra Energy Partners | ||||||||||
4.750%, 03/15/2024 | 100 | 109 | ||||||||
3.500%, 03/15/2025 | 100 | 103 | ||||||||
SRC Energy | ||||||||||
6.250%, 12/01/2025 | 71 | 62 | ||||||||
Summit Midstream Holdings | ||||||||||
5.750%, 04/15/2025 | 90 | 77 | ||||||||
Suncor Energy | ||||||||||
6.850%, 06/01/2039 | 50 | 70 | ||||||||
6.500%, 06/15/2038 | 100 | 136 | ||||||||
4.000%, 11/15/2047 | 200 | 208 | ||||||||
3.600%, 12/01/2024 | 300 | 312 | ||||||||
Sunoco | ||||||||||
6.000%, 04/15/2027 | 109 | 115 | ||||||||
5.500%, 02/15/2026 | 375 | 389 | ||||||||
Sunoco Logistics Partners Operations | ||||||||||
5.400%, 10/01/2047 | 100 | 107 | ||||||||
5.350%, 05/15/2045 | 25 | 26 | ||||||||
4.000%, 10/01/2027 | 100 | 103 | ||||||||
3.900%, 07/15/2026 | 100 | 102 | ||||||||
Tallgrass Energy Partners | ||||||||||
5.500%, 09/15/2024 (A) | 145 | 147 | ||||||||
5.500%, 01/15/2028 (A) | 188 | 186 | ||||||||
4.750%, 10/01/2023 (A) | 50 | 51 | ||||||||
Targa Resources Partners | ||||||||||
6.875%, 01/15/2029 (A) | 40 | 44 | ||||||||
6.750%, 03/15/2024 | 100 | 103 | ||||||||
6.500%, 07/15/2027 (A) | 514 | 560 | ||||||||
5.875%, 04/15/2026 | 100 | 106 | ||||||||
5.375%, 02/01/2027 | 25 | 26 | ||||||||
5.125%, 02/01/2025 | 50 | 52 | ||||||||
5.000%, 01/15/2028 | 100 | 101 | ||||||||
TC PipeLines | ||||||||||
3.900%, 05/25/2027 | 220 | 226 | ||||||||
Teekay Offshore Partners | ||||||||||
8.500%, 07/15/2023 (A) | 175 | 174 | ||||||||
Total Capital | ||||||||||
3.883%, 10/11/2028 | 10 | 11 | ||||||||
Total Capital International | ||||||||||
3.750%, 04/10/2024 | 50 | 53 | ||||||||
3.461%, 07/12/2049 | 50 | 50 | ||||||||
3.455%, 02/19/2029 | 100 | 107 | ||||||||
2.875%, 02/17/2022 | 300 | 305 | ||||||||
2.829%, 01/10/2030 | 50 | 50 | ||||||||
2.700%, 01/25/2023 | 100 | 101 | ||||||||
2.434%, 01/10/2025 | 50 | 50 | ||||||||
| Description | Face Amount (Thousands) | Market Value ($ Thousands) | ||||||||
CORPORATE OBLIGATIONS (continued) |
| |||||||||
2.218%, 07/12/2021 | $ | 30 | $ | 30 | ||||||
TransCanada PipeLines | ||||||||||
6.200%, 10/15/2037 | 50 | 63 | ||||||||
5.100%, 03/15/2049 | 225 | 261 | ||||||||
4.875%, 01/15/2026 | 100 | 111 | ||||||||
4.750%, 05/15/2038 | 100 | 111 | ||||||||
4.250%, 05/15/2028 | 300 | 324 | ||||||||
2.500%, 08/01/2022 | 100 | 100 | ||||||||
Transocean | ||||||||||
9.000%, 07/15/2023 (A) | 250 | 263 | ||||||||
7.500%, 01/15/2026 (A) | 157 | 149 | ||||||||
7.250%, 11/01/2025 (A) | 90 | 84 | ||||||||
Transocean Guardian | ||||||||||
5.875%, 01/15/2024 (A) | 76 | 77 | ||||||||
Transocean Pontus | ||||||||||
6.125%, 08/01/2025 (A) | 19 | 19 | ||||||||
Transocean Poseidon | ||||||||||
6.875%, 02/01/2027 (A) | 270 | 288 | ||||||||
Transocean Sentry | ||||||||||
5.375%, 05/15/2023 (A) | 101 | 101 | ||||||||
USA Compression Partners | ||||||||||
6.875%, 04/01/2026 | 140 | 146 | ||||||||
6.875%, 09/01/2027 (A) | 165 | 171 | ||||||||
Valaris | ||||||||||
7.750%, 02/01/2026 | 260 | 190 | ||||||||
Valero Energy | ||||||||||
6.625%, 06/15/2037 | 100 | 128 | ||||||||
4.350%, 06/01/2028 | 70 | 75 | ||||||||
4.000%, 04/01/2029 | 65 | 68 | ||||||||
3.650%, 03/15/2025 | 90 | 93 | ||||||||
Valero Energy Partners | ||||||||||
4.375%, 12/15/2026 | 220 | 237 | ||||||||
Vine Oil & Gas | ||||||||||
8.750%, 04/15/2023 (A) | 100 | 59 | ||||||||
W&T Offshore | ||||||||||
9.750%, 11/01/2023 (A) | 145 | 139 | ||||||||
Western Midstream Operating | ||||||||||
5.450%, 04/01/2044 | 50 | 46 | ||||||||
4.650%, 07/01/2026 | 50 | 51 | ||||||||
3.950%, 06/01/2025 | 100 | 99 | ||||||||
Whiting Petroleum | ||||||||||
6.625%, 01/15/2026 | 183 | 172 | ||||||||
Williams | ||||||||||
6.300%, 04/15/2040 | 100 | 122 | ||||||||
5.750%, 06/24/2044 | 20 | 23 | ||||||||
4.900%, 01/15/2045 | 50 | 53 | ||||||||
4.550%, 06/24/2024 | 50 | 54 | ||||||||
4.300%, 03/04/2024 | 60 | 64 | ||||||||
3.900%, 01/15/2025 | 100 | 104 | ||||||||
3.750%, 06/15/2027 | 100 | 103 | ||||||||
3.700%, 01/15/2023 | 15 | 16 | ||||||||
3.600%, 03/15/2022 | 450 | 461 | ||||||||
| ||||
| Adviser Managed Trust / Annual Report / July 31, 2019 | 29 | |||
SCHEDULE OF INVESTMENTS
July 31, 2019
Tactical Offensive Fixed Income Fund(Continued)
| Description | Face Amount (Thousands) | Market Value ($ Thousands) | ||||||||
CORPORATE OBLIGATIONS (continued) |
| |||||||||
WPX Energy | ||||||||||
5.750%, 06/01/2026 | $ | 175 | $ | 180 | ||||||
5.250%, 09/15/2024 | 158 | 159 | ||||||||
|
|
| ||||||||
| 48,575 | ||||||||||
|
|
| ||||||||
Financials — 7.7% | ||||||||||
Acrisure | ||||||||||
8.125%, 02/15/2024 (A) | 130 | 139 | ||||||||
7.000%, 11/15/2025 (A) | 165 | 151 | ||||||||
Aflac | ||||||||||
3.625%, 11/15/2024 | 100 | 105 | ||||||||
African Development Bank | ||||||||||
2.625%, 03/22/2021 | 50 | 50 | ||||||||
1.250%, 07/26/2021 | 100 | 99 | ||||||||
African Development Bank MTN | ||||||||||
3.000%, 12/06/2021 | 60 | 61 | ||||||||
2.125%, 11/16/2022 | 100 | 101 | ||||||||
Algeco Global Finance | ||||||||||
8.000%, 02/15/2023 (A) | 145 | 149 | ||||||||
Alliant Holdings Intermediate | ||||||||||
8.250%, 08/01/2023 (A) | 100 | 102 | ||||||||
Allied Universal Holdco | ||||||||||
9.750%, 07/15/2027 (A) | 167 | 174 | ||||||||
6.625%, 07/15/2026 (A) | 188 | 197 | ||||||||
Allstate | ||||||||||
5.950%, 04/01/2036 | 100 | 130 | ||||||||
5.750%, VAR ICE LIBOR USD 3 Month+2.938%, | 100 | 106 | ||||||||
3.850%, 08/10/2049 | 50 | 53 | ||||||||
Ally Financial | ||||||||||
5.750%, 11/20/2025 | 200 | 223 | ||||||||
4.625%, 03/30/2025 | 200 | 213 | ||||||||
4.250%, 04/15/2021 | 300 | 305 | ||||||||
3.875%, 05/21/2024 | 46 | 48 | ||||||||
American Equity Investment Life Holding | ||||||||||
5.000%, 06/15/2027 | 55 | 57 | ||||||||
American Express | ||||||||||
4.050%, 12/03/2042 | 100 | 111 | ||||||||
3.700%, 11/05/2021 | 300 | 309 | ||||||||
3.400%, 02/27/2023 | 100 | 103 | ||||||||
3.000%, 02/22/2021 | 300 | 303 | ||||||||
2.650%, 12/02/2022 | 100 | 101 | ||||||||
2.500%, 08/01/2022 | 350 | 351 | ||||||||
2.200%, 10/30/2020 | 180 | 180 | ||||||||
American Express Credit MTN | ||||||||||
3.300%, 05/03/2027 | 130 | 137 | ||||||||
2.250%, 05/05/2021 | 150 | 150 | ||||||||
American Financial Group | ||||||||||
4.500%, 06/15/2047 | 50 | 51 | ||||||||
3.500%, 08/15/2026 | 85 | 86 | ||||||||
| Description | Face Amount (Thousands) | Market Value ($ Thousands) | ||||||||
CORPORATE OBLIGATIONS (continued) |
| |||||||||
American International Group | ||||||||||
5.750%, VAR ICE LIBOR USD 3 Month+2.868%, | $ | 200 | $ | 210 | ||||||
4.750%, 04/01/2048 | 300 | 336 | ||||||||
4.700%, 07/10/2035 | 300 | 333 | ||||||||
4.500%, 07/16/2044 | 100 | 107 | ||||||||
4.200%, 04/01/2028 | 50 | 54 | ||||||||
4.125%, 02/15/2024 | 100 | 106 | ||||||||
3.875%, 01/15/2035 | 100 | 102 | ||||||||
3.300%, 03/01/2021 | 50 | 51 | ||||||||
Ameriprise Financial | ||||||||||
3.700%, 10/15/2024 | 100 | 106 | ||||||||
Andina de Fomento | ||||||||||
4.375%, 06/15/2022 | 100 | 105 | ||||||||
3.250%, 02/11/2022 | 500 | 507 | ||||||||
Aon | ||||||||||
8.205%, 01/01/2027 | 100 | 123 | ||||||||
4.600%, 06/14/2044 | 100 | 111 | ||||||||
3.500%, 06/14/2024 | 100 | 104 | ||||||||
Arch Capital Group | ||||||||||
5.144%, 11/01/2043 | 50 | 60 | ||||||||
Ares Capital | ||||||||||
4.200%, 06/10/2024 | 65 | 66 | ||||||||
3.625%, 01/19/2022 | 100 | 101 | ||||||||
Asian Development Bank | ||||||||||
2.625%, 01/30/2024 | 300 | 309 | ||||||||
Asian Development Bank MTN | ||||||||||
3.125%, 09/26/2028 | 300 | 326 | ||||||||
2.875%, 11/27/2020 | 45 | 46 | ||||||||
2.625%, 01/12/2027 | 200 | 209 | ||||||||
2.250%, 01/20/2021 | 500 | 501 | ||||||||
2.000%, 02/16/2022 | 200 | 200 | ||||||||
2.000%, 01/22/2025 | 150 | 150 | ||||||||
2.000%, 04/24/2026 | 100 | 100 | ||||||||
1.875%, 08/10/2022 | 100 | 100 | ||||||||
1.750%, 09/13/2022 | 200 | 199 | ||||||||
1.750%, 08/14/2026 | 100 | 98 | ||||||||
1.625%, 08/26/2020 | 100 | 100 | ||||||||
1.625%, 03/16/2021 | 150 | 149 | ||||||||
ASP AMC Merger | ||||||||||
8.000%, 05/15/2025 (A) | 120 | 82 | ||||||||
Assurant | ||||||||||
4.900%, 03/27/2028 | 100 | 108 | ||||||||
AssuredPartners | ||||||||||
7.000%, 08/15/2025 (A) | 164 | 163 | ||||||||
Australia & New Zealand Banking Group NY | ||||||||||
2.550%, 11/23/2021 | 150 | 151 | ||||||||
Australia & New Zealand Banking Group NY MTN | ||||||||||
3.700%, 11/16/2025 | 50 | 53 | ||||||||
AXA Equitable Holdings | ||||||||||
4.350%, 04/20/2028 | 300 | 315 | ||||||||
| 30 | Adviser Managed Trust / Annual Report / July 31, 2019 |
| Description | Face Amount (Thousands) | Market Value ($ Thousands) | ||||||||
CORPORATE OBLIGATIONS (continued) |
| |||||||||
AXIS Specialty Finance | ||||||||||
4.000%, 12/06/2027 | $ | 50 | $ | 52 | ||||||
Banco Santander | ||||||||||
5.179%, 11/19/2025 | 100 | 108 | ||||||||
3.848%, 04/12/2023 | 300 | 311 | ||||||||
3.800%, 02/23/2028 | 200 | 206 | ||||||||
3.125%, 02/23/2023 | 100 | 101 | ||||||||
Bank of America | ||||||||||
7.750%, 05/14/2038 | 375 | 563 | ||||||||
6.110%, 01/29/2037 | 150 | 192 | ||||||||
3.946%, VAR ICE LIBOR USD 3 Month+1.190%, 01/23/2049 | 200 | 214 | ||||||||
3.419%, VAR ICE LIBOR USD 3 Month+1.040%, 12/20/2028 | 121 | 125 | ||||||||
3.366%, VAR ICE LIBOR USD 3 Month+0.810%, 01/23/2026 | 100 | 103 | ||||||||
3.004%, VAR ICE LIBOR USD 3 Month+0.790%, 12/20/2023 | 117 | 118 | ||||||||
2.738%, VAR ICE LIBOR USD 3 Month+0.370%, 01/23/2022 | 100 | 100 | ||||||||
Bank of America MTN | ||||||||||
5.000%, 01/21/2044 | 50 | 62 | ||||||||
4.750%, 04/21/2045 | 40 | 46 | ||||||||
4.330%, VAR ICE LIBOR USD 3 Month+1.520%, 03/15/2050 | 200 | 227 | ||||||||
4.271%, VAR ICE LIBOR USD 3 Month+1.310%, 07/23/2029 | 100 | 109 | ||||||||
4.244%, VAR ICE LIBOR USD 3 Month+1.814%, 04/24/2038 | 300 | 334 | ||||||||
4.183%, 11/25/2027 | 150 | 159 | ||||||||
4.100%, 07/24/2023 | 115 | 122 | ||||||||
4.000%, 04/01/2024 | 135 | 144 | ||||||||
4.000%, 01/22/2025 | 150 | 157 | ||||||||
3.974%, VAR ICE LIBOR USD 3 Month+1.210%, 02/07/2030 | 350 | 375 | ||||||||
3.970%, VAR ICE LIBOR USD 3 Month+1.070%, 03/05/2029 | 150 | 160 | ||||||||
3.875%, 08/01/2025 | 100 | 107 | ||||||||
3.864%, VAR ICE LIBOR USD 3 Month+0.940%, 07/23/2024 | 100 | 105 | ||||||||
3.824%, VAR ICE LIBOR USD 3 Month+1.575%, 01/20/2028 | 350 | 371 | ||||||||
3.705%, VAR ICE LIBOR USD 3 Month+1.512%, 04/24/2028 | 100 | 105 | ||||||||
3.559%, VAR ICE LIBOR USD 3 Month+1.060%, 04/23/2027 | 200 | 208 | ||||||||
3.550%, VAR ICE LIBOR USD 3 Month+0.780%, 03/05/2024 | 150 | 155 | ||||||||
3.499%, VAR ICE LIBOR USD 3 Month+0.630%, 05/17/2022 | 100 | 102 | ||||||||
3.458%, VAR ICE LIBOR USD 3 Month+0.970%, 03/15/2025 | 300 | 310 | ||||||||
| Description | Face Amount (Thousands) | Market Value ($ Thousands) | ||||||||
CORPORATE OBLIGATIONS (continued) |
| |||||||||
3.194%, VAR ICE LIBOR USD 3 Month+1.180%, 07/23/2030 | $ | 100 | $ | 101 | ||||||
3.124%, VAR ICE LIBOR USD 3 Month+1.160%, 01/20/2023 | 300 | 304 | ||||||||
2.881%, VAR ICE LIBOR USD 3 Month+1.021%, 04/24/2023 | 350 | 353 | ||||||||
2.816%, VAR ICE LIBOR USD 3 Month+0.930%, 07/21/2023 | 100 | 101 | ||||||||
2.625%, 10/19/2020 | 100 | 100 | ||||||||
2.625%, 04/19/2021 | 250 | 251 | ||||||||
2.328%, VAR ICE LIBOR USD 3 Month+0.630%, 10/01/2021 | 350 | 349 | ||||||||
2.151%, 11/09/2020 | 150 | 150 | ||||||||
Bank of Montreal MTN | ||||||||||
3.300%, 02/05/2024 | 200 | 207 | ||||||||
2.350%, 09/11/2022 | 150 | 150 | ||||||||
1.900%, 08/27/2021 | 350 | 348 | ||||||||
Bank of New York Mellon | ||||||||||
3.550%, 09/23/2021 | 100 | 102 | ||||||||
Bank of New York Mellon MTN | ||||||||||
3.000%, 02/24/2025 | 150 | 154 | ||||||||
3.000%, 10/30/2028 | 285 | 289 | ||||||||
2.800%, 05/04/2026 | 350 | 355 | ||||||||
2.661%, VAR ICE LIBOR USD 3 Month+0.634%, 05/16/2023 | 350 | 353 | ||||||||
2.600%, 08/17/2020 | 100 | 100 | ||||||||
2.600%, 02/07/2022 | 300 | 303 | ||||||||
2.450%, 11/27/2020 | 50 | 50 | ||||||||
2.050%, 05/03/2021 | 250 | 249 | ||||||||
Bank of Nova Scotia | ||||||||||
4.650%, VAR ICE LIBOR USD 3 Month+2.648%, 04/12/2168 | 150 | 146 | ||||||||
3.400%, 02/11/2024 | 400 | 414 | ||||||||
2.800%, 07/21/2021 | 50 | 50 | ||||||||
2.700%, 08/03/2026 | 100 | 100 | ||||||||
2.450%, 03/22/2021 | 150 | 150 | ||||||||
1.875%, 04/26/2021 | 300 | 299 | ||||||||
Barclays | ||||||||||
5.250%, 08/17/2045 | 100 | 107 | ||||||||
5.200%, 05/12/2026 | 200 | 209 | ||||||||
5.088%, VAR ICE LIBOR USD 3 Month+3.054%, 06/20/2030 | 200 | 202 | ||||||||
4.836%, 05/09/2028 | 550 | 559 | ||||||||
4.610%, VAR ICE LIBOR USD 3 Month+1.400%, 02/15/2023 | 520 | 535 | ||||||||
4.375%, 09/11/2024 | 400 | 411 | ||||||||
3.650%, 03/16/2025 | 150 | 150 | ||||||||
3.250%, 01/12/2021 | 50 | 50 | ||||||||
2.650%, 01/11/2021 | 100 | 100 | ||||||||
Barclays MTN | ||||||||||
4.338%, VAR ICE LIBOR USD 3 Month+1.356%, 05/16/2024 | 300 | 308 | ||||||||
| Adviser Managed Trust / Annual Report / July 31, 2019 | 31 |
SCHEDULE OF INVESTMENTS
July 31, 2019
Tactical Offensive Fixed Income Fund(Continued)
| Description | Face Amount (Thousands) | Market Value ($ Thousands) | ||||||
CORPORATE OBLIGATIONS (continued) |
| |||||||
BB&T MTN | ||||||||
2.500%, 08/01/2024 | $ | 100 | $ | 100 | ||||
2.150%, 02/01/2021 | 350 | 349 | ||||||
Berkshire Hathaway | ||||||||
4.500%, 02/11/2043 | 50 | 59 | ||||||
3.125%, 03/15/2026 | 35 | 36 | ||||||
2.750%, 03/15/2023 | 100 | 102 | ||||||
2.200%, 03/15/2021 | 35 | 35 | ||||||
Berkshire Hathaway Finance | ||||||||
4.250%, 01/15/2021 | 100 | 103 | ||||||
4.250%, 01/15/2049 | 300 | 340 | ||||||
BlackRock | ||||||||
3.500%, 03/18/2024 | 100 | 106 | ||||||
3.250%, 04/30/2029 | 90 | 94 | ||||||
BNP Paribas MTN | ||||||||
5.000%, 01/15/2021 | 150 | 156 | ||||||
Branch Banking & Trust | ||||||||
3.625%, 09/16/2025 | 150 | 157 | ||||||
2.625%, 01/15/2022 | 150 | 151 | ||||||
Brighthouse Financial | ||||||||
4.700%, 06/22/2047 | 250 | 218 | ||||||
3.700%, 06/22/2027 | 250 | 242 | ||||||
Brookfield Finance | ||||||||
4.700%, 09/20/2047 | 50 | 53 | ||||||
4.000%, 04/01/2024 | 50 | 52 | ||||||
Brown & Brown | ||||||||
4.500%, 03/15/2029 | 50 | 53 | ||||||
Canadian Imperial Bank of Commerce | ||||||||
2.606%, VAR ICE LIBOR USD 3 Month+0.785%, 07/22/2023 | 50 | 50 | ||||||
2.550%, 06/16/2022 | 300 | 302 | ||||||
2.100%, 10/05/2020 | 150 | 150 | ||||||
Capital One | ||||||||
2.650%, 08/08/2022 | 150 | 151 | ||||||
2.250%, 09/13/2021 | 150 | 149 | ||||||
Capital One Financial | ||||||||
4.250%, 04/30/2025 | 100 | 107 | ||||||
3.900%, 01/29/2024 | 300 | 316 | ||||||
3.750%, 07/28/2026 | 350 | 359 | ||||||
3.750%, 03/09/2027 | 350 | 364 | ||||||
3.450%, 04/30/2021 | 100 | 101 | ||||||
3.200%, 02/05/2025 | 100 | 102 | ||||||
Charles Schwab | ||||||||
3.850%, 05/21/2025 | 100 | 107 | ||||||
3.450%, 02/13/2026 | 70 | 73 | ||||||
3.250%, 05/22/2029 | 200 | 208 | ||||||
Chubb INA Holdings | ||||||||
3.350%, 05/15/2024 | 100 | 105 | ||||||
2.300%, 11/03/2020 | 100 | 100 | ||||||
CIT Group | ||||||||
5.250%, 03/07/2025 | 50 | 55 | ||||||
4.750%, 02/16/2024 | 210 | 223 | ||||||
| Description | Face Amount (Thousands) | Market Value ($ Thousands) | ||||||
CORPORATE OBLIGATIONS (continued) |
| |||||||
Citibank | ||||||||
3.650%, 01/23/2024 | $ | 250 | $ | 262 | ||||
3.165%, VAR ICE LIBOR USD 3 Month+0.530%, 02/19/2022 | 250 | 253 | ||||||
2.850%, 02/12/2021 | 200 | 201 | ||||||
2.125%, 10/20/2020 | 50 | 50 | ||||||
Citigroup | ||||||||
6.675%, 09/13/2043 | 90 | 127 | ||||||
6.125%, 08/25/2036 | 100 | 124 | ||||||
4.750%, 05/18/2046 | 150 | 170 | ||||||
4.650%, 07/30/2045 | 100 | 117 | ||||||
4.650%, 07/23/2048 | 200 | 235 | ||||||
4.600%, 03/09/2026 | 335 | 362 | ||||||
4.450%, 09/29/2027 | 100 | 108 | ||||||
4.044%, VAR ICE LIBOR USD 3 Month+1.023%, 06/01/2024 | 100 | 105 | ||||||
3.980%, VAR ICE LIBOR USD 3 Month+1.338%, 03/20/2030 | 300 | 321 | ||||||
3.878%, VAR ICE LIBOR USD 3 Month+1.168%, 01/24/2039 | 200 | 212 | ||||||
3.875%, 03/26/2025 | 100 | 104 | ||||||
3.668%, VAR ICE LIBOR USD 3 Month+1.390%, 07/24/2028 | 150 | 157 | ||||||
3.520%, VAR ICE LIBOR USD 3 Month+1.151%, 10/27/2028 | 350 | 361 | ||||||
3.400%, 05/01/2026 | 150 | 155 | ||||||
3.352%, VAR ICE LIBOR USD 3 Month+0.897%, 04/24/2025 | 150 | 154 | ||||||
3.300%, 04/27/2025 | 100 | 104 | ||||||
3.142%, VAR ICE LIBOR USD 3 Month+0.722%, 01/24/2023 | 150 | 152 | ||||||
2.900%, 12/08/2021 | 350 | 354 | ||||||
2.876%, VAR ICE LIBOR USD 3 Month+0.950%, 07/24/2023 | 150 | 151 | ||||||
2.750%, 04/25/2022 | 400 | 403 | ||||||
2.700%, 03/30/2021 | 50 | 50 | ||||||
2.650%, 10/26/2020 | 100 | 100 | ||||||
2.350%, 08/02/2021 | 350 | 350 | ||||||
Citizens Bank | ||||||||
3.750%, 02/18/2026 | 300 | 318 | ||||||
3.250%, 02/14/2022 | 300 | 305 | ||||||
Citizens Financial Group | ||||||||
2.375%, 07/28/2021 | 30 | 30 | ||||||
CME Group | ||||||||
3.000%, 03/15/2025 | 100 | 103 | ||||||
CNA Financial | ||||||||
4.500%, 03/01/2026 | 50 | 54 | ||||||
3.900%, 05/01/2029 | 40 | 42 | ||||||
3.450%, 08/15/2027 | 50 | 51 | ||||||
Comerica | ||||||||
4.000%, 02/01/2029 | 50 | 54 | ||||||
3.700%, 07/31/2023 | 225 | 234 | ||||||
| 32 | Adviser Managed Trust / Annual Report / July 31, 2019 |
| Description | Face Amount (Thousands) | Market Value ($ Thousands) | ||||||||
CORPORATE OBLIGATIONS (continued) |
| |||||||||
Cooperatieve Rabobank | ||||||||||
5.250%, 08/04/2045 | $ | 150 | $ | 181 | ||||||
4.625%, 12/01/2023 | 150 | 161 | ||||||||
3.750%, 07/21/2026 | 150 | 154 | ||||||||
Cooperatieve Rabobank MTN | ||||||||||
3.875%, 02/08/2022 | 150 | 156 | ||||||||
2.500%, 01/19/2021 | 150 | 150 | ||||||||
Council of Europe Development Bank | ||||||||||
2.625%, 02/13/2023 | 120 | 123 | ||||||||
2.500%, 02/27/2024 | 300 | 307 | ||||||||
Credit Suisse MTN | ||||||||||
3.625%, 09/09/2024 | 150 | 157 | ||||||||
Credit Suisse Group Funding Guernsey | ||||||||||
4.875%, 05/15/2045 | 50 | 59 | ||||||||
3.800%, 06/09/2023 | 150 | 156 | ||||||||
3.750%, 03/26/2025 | 150 | 156 | ||||||||
3.450%, 04/16/2021 | 150 | 152 | ||||||||
Curo Group Holdings | ||||||||||
8.250%, 09/01/2025 (A) | 190 | 168 | ||||||||
Deutsche Bank | ||||||||||
5.000%, 02/14/2022 | 300 | 311 | ||||||||
4.875%, VAR USD ICE Swap 11:00 NY 5 Yr+2.553%, 12/01/2032 | 300 | 272 | ||||||||
4.500%, 04/01/2025 | 200 | 191 | ||||||||
4.250%, 10/14/2021 | 300 | 303 | ||||||||
3.950%, 02/27/2023 | 100 | 101 | ||||||||
3.300%, 11/16/2022 | 100 | 99 | ||||||||
3.150%, 01/22/2021 | 100 | 99 | ||||||||
Deutsche Bank MTN | ||||||||||
3.700%, 05/30/2024 | 250 | 247 | ||||||||
3.375%, 05/12/2021 | 100 | 100 | ||||||||
Discover Bank | ||||||||||
4.200%, 08/08/2023 | 150 | 159 | ||||||||
Discover Financial Services | ||||||||||
4.500%, 01/30/2026 | 300 | 323 | ||||||||
4.100%, 02/09/2027 | 340 | 358 | ||||||||
3.850%, 11/21/2022 | 100 | 104 | ||||||||
E*TRADE Financial | ||||||||||
3.800%, 08/24/2027 | 100 | 103 | ||||||||
2.950%, 08/24/2022 | 25 | 25 | ||||||||
Enstar Group | ||||||||||
4.950%, 06/01/2029 | 50 | 51 | ||||||||
European Bank for Reconstruction & Development MTN | ||||||||||
2.750%, 04/26/2021 | 500 | 506 | ||||||||
2.750%, 03/07/2023 | 500 | 515 | ||||||||
2.000%, 02/01/2021 | 200 | 200 | ||||||||
European Investment Bank | ||||||||||
2.875%, 09/15/2020 | 125 | 126 | ||||||||
2.625%, 05/20/2022 | 600 | 612 | ||||||||
2.625%, 03/15/2024 | 885 | 913 | ||||||||
2.500%, 03/15/2023 | 180 | 184 | ||||||||
| Description | Face Amount (Thousands) | Market Value ($ Thousands) | ||||||||
CORPORATE OBLIGATIONS (continued) |
| |||||||||
2.375%, 06/15/2022 | $ | 500 | $ | 507 | ||||||
2.250%, 03/15/2022 | 200 | 202 | ||||||||
2.250%, 06/24/2024 | 200 | 203 | ||||||||
2.125%, 10/15/2021 | 150 | 150 | ||||||||
2.000%, 03/15/2021 | 150 | 150 | ||||||||
1.875%, 02/10/2025 | 200 | 199 | ||||||||
1.625%, 12/15/2020 | 250 | 249 | ||||||||
1.625%, 06/15/2021 | 150 | 149 | ||||||||
European Investment Bank MTN | ||||||||||
3.125%, 12/14/2023 | 150 | 158 | ||||||||
2.875%, 08/15/2023 | 500 | 519 | ||||||||
2.375%, 05/13/2021 | 200 | 201 | ||||||||
Fairfax Financial Holdings | ||||||||||
4.850%, 04/17/2028 | 200 | 213 | ||||||||
Fidelity & Guaranty Life Holdings | ||||||||||
5.500%, 05/01/2025 (A) | 120 | 125 | ||||||||
Fidelity National Financial | ||||||||||
4.500%, 08/15/2028 | 50 | 53 | ||||||||
Fifth Third Bancorp | ||||||||||
3.950%, 03/14/2028 | 250 | 271 | ||||||||
3.650%, 01/25/2024 | 350 | 366 | ||||||||
Fifth Third Bank | ||||||||||
2.200%, 10/30/2020 | 350 | 350 | ||||||||
First Republic Bank | ||||||||||
4.625%, 02/13/2047 | 50 | 54 | ||||||||
FMS Wertmanagement | ||||||||||
2.750%, 01/30/2024 | 500 | 518 | ||||||||
Franklin Resources | ||||||||||
2.850%, 03/30/2025 | 150 | 153 | ||||||||
Freedom Mortgage | ||||||||||
8.250%, 04/15/2025 (A) | 200 | 174 | ||||||||
FS Energy & Power Fund | ||||||||||
7.500%, 08/15/2023 (A) | 60 | 61 | ||||||||
Global Aircraft Leasing | ||||||||||
6.500% cash/7.250% PIK, 09/15/2024 (A) | 300 | 299 | ||||||||
Goldman Sachs Group | ||||||||||
6.750%, 10/01/2037 | 125 | 166 | ||||||||
6.250%, 02/01/2041 | 100 | 134 | ||||||||
5.750%, 01/24/2022 | 130 | 140 | ||||||||
4.750%, 10/21/2045 | 100 | 117 | ||||||||
4.411%, VAR ICE LIBOR USD 3 Month+1.430%, 04/23/2039 | 400 | 437 | ||||||||
4.223%, VAR ICE LIBOR USD 3 Month+1.301%, 05/01/2029 | 150 | 161 | ||||||||
4.017%, VAR ICE LIBOR USD 3 Month+1.373%, 10/31/2038 | 300 | 312 | ||||||||
3.814%, VAR ICE LIBOR USD 3 Month+1.158%, 04/23/2029 | 100 | 105 | ||||||||
3.750%, 05/22/2025 | 150 | 157 | ||||||||
3.750%, 02/25/2026 | 360 | 377 | ||||||||
3.625%, 02/20/2024 | 510 | 529 | ||||||||
| Adviser Managed Trust / Annual Report / July 31, 2019 | 33 |
SCHEDULE OF INVESTMENTS
July 31, 2019
Tactical Offensive Fixed Income Fund(Continued)
| Description | Face Amount (Thousands) | Market Value ($ Thousands) | ||||||||
CORPORATE OBLIGATIONS (continued) |
| |||||||||
3.500%, 01/23/2025 | $ | 100 | $ | 103 | ||||||
3.500%, 11/16/2026 | 100 | 103 | ||||||||
3.272%, VAR ICE LIBOR USD 3 Month+1.201%, 09/29/2025 | 145 | 148 | ||||||||
3.200%, 02/23/2023 | 255 | 260 | ||||||||
3.000%, 04/26/2022 | 385 | 388 | ||||||||
2.908%,VAR ICE LIBOR USD 3 Month+1.053%, 06/05/2023 | 150 | 151 | ||||||||
2.876%, VAR ICE LIBOR USD 3 Month+0.821%, 10/31/2022 | 100 | 101 | ||||||||
2.875%, 02/25/2021 | 50 | 50 | ||||||||
2.600%, 12/27/2020 | 50 | 50 | ||||||||
2.350%, 11/15/2021 | 350 | 349 | ||||||||
Goldman Sachs Group MTN | ||||||||||
4.800%, 07/08/2044 | 100 | 116 | ||||||||
3.850%, 07/08/2024 | 100 | 105 | ||||||||
Hartford Financial Services Group | ||||||||||
4.400%, 03/15/2048 | 200 | 222 | ||||||||
4.300%, 04/15/2043 | 100 | 106 | ||||||||
HSBC Holdings | ||||||||||
6.500%, 05/02/2036 | 100 | 130 | ||||||||
6.500%, 09/15/2037 | 325 | 428 | ||||||||
5.250%, 03/14/2044 | 100 | 118 | ||||||||
4.583%, VAR ICE LIBOR USD 3 Month+1.535%, 06/19/2029 | 100 | 109 | ||||||||
4.375%, 11/23/2026 | 250 | 266 | ||||||||
4.292%, VAR ICE LIBOR USD 3 Month+1.348%, 09/12/2026 | 300 | 318 | ||||||||
4.041%, VAR ICE LIBOR USD 3 Month+1.546%, 03/13/2028 | 350 | 366 | ||||||||
3.973%, VAR ICE LIBOR USD 3 Month+1.610%, 05/22/2030 | 290 | 304 | ||||||||
3.950%, VAR ICE LIBOR USD 3 Month+0.987%, 05/18/2024 | 100 | 104 | ||||||||
3.803%, VAR ICE LIBOR USD 3 Month+1.211%, 03/11/2025 | 220 | 228 | ||||||||
3.262%, VAR ICE LIBOR USD 3 Month+1.055%, 03/13/2023 | 300 | 304 | ||||||||
3.033%, VAR ICE LIBOR USD 3 Month+0.923%, 11/22/2023 | 100 | 101 | ||||||||
2.950%, 05/25/2021 | 150 | 151 | ||||||||
2.650%, 01/05/2022 | 350 | 350 | ||||||||
HUB International | ||||||||||
7.000%, 05/01/2026 (A) | 265 | 269 | ||||||||
Hunt | ||||||||||
6.250%, 02/15/2026 (A) | 100 | 94 | ||||||||
Huntington Bancshares | ||||||||||
2.300%, 01/14/2022 | 150 | 149 | ||||||||
Huntington National Bank | ||||||||||
3.125%, 04/01/2022 | 300 | 305 | ||||||||
2.500%, 08/07/2022 | 150 | 151 | ||||||||
Industrial & Commercial Bank of China | ||||||||||
2.452%, 10/20/2021 | 150 | 149 | ||||||||
| Description | Face Amount (Thousands) | Market Value ($ Thousands) | ||||||||
CORPORATE OBLIGATIONS (continued) |
| |||||||||
ING Groep | ||||||||||
4.100%, 10/02/2023 | $ | 100 | $ | 105 | ||||||
4.050%, 04/09/2029 | 200 | 216 | ||||||||
3.550%, 04/09/2024 | 200 | 207 | ||||||||
Inter-American Development Bank | ||||||||||
3.200%, 08/07/2042 | 100 | 109 | ||||||||
3.125%, 09/18/2028 | 400 | 434 | ||||||||
3.000%, 02/21/2024 | 300 | 314 | ||||||||
2.625%, 01/16/2024 | 750 | 771 | ||||||||
2.375%, 07/07/2027 | 200 | 205 | ||||||||
1.875%, 03/15/2021 | 100 | 100 | ||||||||
Inter-American Development Bank MTN | ||||||||||
3.000%, 09/26/2022 | 50 | 52 | ||||||||
2.625%, 04/19/2021 | 500 | 505 | ||||||||
1.750%, 09/14/2022 | 200 | 199 | ||||||||
Intercontinental Exchange | ||||||||||
4.250%, 09/21/2048 | 25 | 29 | ||||||||
3.750%, 12/01/2025 | 55 | 59 | ||||||||
3.750%, 09/21/2028 | 20 | 21 | ||||||||
3.450%, 09/21/2023 | 15 | 16 | ||||||||
2.750%, 12/01/2020 | 55 | 55 | ||||||||
International Bank for Reconstruction & Development | ||||||||||
3.000%, 09/27/2023 | 150 | 157 | ||||||||
2.750%, 07/23/2021 | 500 | 508 | ||||||||
2.500%, 03/19/2024 | 400 | 411 | ||||||||
2.500%, 11/25/2024 | 200 | 206 | ||||||||
2.500%, 07/29/2025 | 150 | 155 | ||||||||
2.125%, 11/01/2020 | 200 | 200 | ||||||||
2.125%, 07/01/2022 | 500 | 503 | ||||||||
2.000%, 01/26/2022 | 200 | 200 | ||||||||
1.875%, 06/19/2023 | 300 | 300 | ||||||||
1.750%, 04/19/2023 | 150 | 149 | ||||||||
1.625%, 02/10/2022 | 200 | 199 | ||||||||
International Bank for Reconstruction & Development MTN | ||||||||||
2.500%, 11/22/2027 | 500 | 518 | ||||||||
1.875%, 10/27/2026 | 200 | 199 | ||||||||
1.625%, 09/04/2020 | 200 | 199 | ||||||||
1.625%, 03/09/2021 | 150 | 149 | ||||||||
1.375%, 05/24/2021 | 250 | 247 | ||||||||
International Finance MTN | ||||||||||
2.000%, 10/24/2022 | 200 | 201 | ||||||||
1.125%, 07/20/2021 | 100 | 98 | ||||||||
Intesa Sanpaolo MTN | ||||||||||
5.710%, 01/15/2026 (A) | 200 | 206 | ||||||||
5.017%, 06/26/2024 (A) | 100 | 101 | ||||||||
Invesco Finance | ||||||||||
5.375%, 11/30/2043 | 150 | 173 | ||||||||
Jefferies Financial Group | ||||||||||
5.500%, 10/18/2023 | 100 | 108 | ||||||||
| 34 | Adviser Managed Trust / Annual Report / July 31, 2019 |
| Description | Face Amount (Thousands) | Market Value ($ Thousands) | ||||||||
CORPORATE OBLIGATIONS (continued) |
| |||||||||
Jefferies Group |
| |||||||||
6.875%, 04/15/2021 | $ | 100 | $ | 107 | ||||||
4.850%, 01/15/2027 | 35 | 37 | ||||||||
JPMorgan Chase | ||||||||||
6.400%, 05/15/2038 | 400 | 558 | ||||||||
5.625%, 08/16/2043 | 90 | 116 | ||||||||
4.950%, 06/01/2045 | 100 | 120 | ||||||||
4.625%, 05/10/2021 | 150 | 156 | ||||||||
4.350%, 08/15/2021 | 100 | 104 | ||||||||
4.250%, 10/01/2027 | 95 | 104 | ||||||||
4.032%, VAR ICE LIBOR USD 3 Month+1.460%, 07/24/2048 | 100 | 108 | ||||||||
4.023%, VAR ICE LIBOR USD 3 Month+1.000%, 12/05/2024 | 500 | 530 | ||||||||
4.005%, VAR ICE LIBOR USD 3 Month+1.120%, 04/23/2029 | 100 | 108 | ||||||||
3.964%, VAR ICE LIBOR USD 3 Month+1.380%, 11/15/2048 | 145 | 155 | ||||||||
3.960%, VAR ICE LIBOR USD 3 Month+1.245%, 01/29/2027 | 450 | 481 | ||||||||
3.900%, 07/15/2025 | 100 | 107 | ||||||||
3.897%, VAR ICE LIBOR USD 3 Month+1.220%, 01/23/2049 | 250 | 266 | ||||||||
3.882%, VAR ICE LIBOR USD 3 Month+1.360%, 07/24/2038 | 400 | 426 | ||||||||
3.875%, 02/01/2024 | 100 | 106 | ||||||||
3.797%, VAR ICE LIBOR USD 3 Month+0.890%, 07/23/2024 | 100 | 105 | ||||||||
3.702%, VAR ICE LIBOR USD 3 Month+1.160%, 05/06/2030 | 100 | 106 | ||||||||
3.625%, 05/13/2024 | 125 | 131 | ||||||||
3.559%, VAR ICE LIBOR USD 3 Month+0.730%, 04/23/2024 | 150 | 155 | ||||||||
3.540%, VAR ICE LIBOR USD 3 Month+1.380%, 05/01/2028 | 150 | 157 | ||||||||
3.514%, VAR ICE LIBOR USD 3 Month+0.610%, 06/18/2022 | 150 | 153 | ||||||||
3.509%, VAR ICE LIBOR USD 3 Month+0.945%, 01/23/2029 | 125 | 130 | ||||||||
3.300%, 04/01/2026 | 150 | 156 | ||||||||
3.250%, 09/23/2022 | 100 | 103 | ||||||||
3.207%, VAR ICE LIBOR USD 3 Month+0.695%, 04/01/2023 | 280 | 285 | ||||||||
3.125%, 01/23/2025 | 100 | 103 | ||||||||
2.950%, 10/01/2026 | 350 | 355 | ||||||||
2.776%, VAR ICE LIBOR USD 3 Month+0.935%, 04/25/2023 | 363 | 365 | ||||||||
2.700%, 05/18/2023 | 150 | 151 | ||||||||
2.550%, 10/29/2020 | 185 | 185 | ||||||||
2.550%, 03/01/2021 | 50 | 50 | ||||||||
Kemper | ||||||||||
4.350%, 02/15/2025 | 35 | 37 | ||||||||
| Description | Face Amount (Thousands) | Market Value ($ Thousands) | ||||||||
CORPORATE OBLIGATIONS (continued) |
| |||||||||
KeyBank |
| |||||||||
3.300%, 02/01/2022 | $ | 300 | $ | 307 | ||||||
2.300%, 09/14/2022 | 150 | 150 | ||||||||
KeyCorp MTN | ||||||||||
4.150%, 10/29/2025 | 230 | 248 | ||||||||
2.900%, 09/15/2020 | 100 | 101 | ||||||||
Kreditanstalt fuer Wiederaufbau | ||||||||||
3.127%, 04/18/2036 (C) | 200 | 131 | ||||||||
2.875%, 04/03/2028 | 500 | 532 | ||||||||
2.750%, 10/01/2020 | 200 | 202 | ||||||||
2.625%, 04/12/2021 | 100 | 101 | ||||||||
2.625%, 02/28/2024 | 315 | 325 | ||||||||
2.500%, 02/15/2022 | 700 | 710 | ||||||||
2.375%, 12/29/2022 | 1,000 | 1,016 | ||||||||
2.125%, 01/17/2023 | 150 | 151 | ||||||||
2.000%, 11/30/2021 | 50 | 50 | ||||||||
2.000%, 09/29/2022 | 100 | 100 | ||||||||
2.000%, 05/02/2025 | 250 | 251 | ||||||||
1.500%, 06/15/2021 | 300 | 298 | ||||||||
Kreditanstalt fuer Wiederaufbau MTN | ||||||||||
3.125%, 12/15/2021 | 500 | 514 | ||||||||
Ladder Capital Finance Holdings LLLP | ||||||||||
5.250%, 03/15/2022 (A) | 95 | 97 | ||||||||
Landwirtschaftliche Rentenbank | ||||||||||
2.500%, 11/15/2027 | 100 | 103 | ||||||||
2.375%, 06/10/2025 | 150 | 153 | ||||||||
2.250%, 10/01/2021 | 150 | 151 | ||||||||
2.000%, 01/13/2025 | 100 | 101 | ||||||||
Lazard Group | ||||||||||
4.375%, 03/11/2029 | 100 | 107 | ||||||||
3.750%, 02/13/2025 | 50 | 52 | ||||||||
Legg Mason | ||||||||||
4.750%, 03/15/2026 | 50 | 54 | ||||||||
Lincoln National | ||||||||||
4.350%, 03/01/2048 | 210 | 225 | ||||||||
4.000%, 09/01/2023 | 5 | 6 | ||||||||
3.800%, 03/01/2028 | 120 | 126 | ||||||||
3.625%, 12/12/2026 | 50 | 52 | ||||||||
3.350%, 03/09/2025 | 150 | 153 | ||||||||
Lions Gate Capital Holdings | ||||||||||
6.375%, 02/01/2024 (A) | 50 | 53 | ||||||||
5.875%, 11/01/2024 (A) | 105 | 109 | ||||||||
Lloyds Bank | ||||||||||
3.300%, 05/07/2021 | 100 | 101 | ||||||||
Lloyds Banking Group | ||||||||||
4.650%, 03/24/2026 | 350 | 364 | ||||||||
4.550%, 08/16/2028 | 200 | 215 | ||||||||
4.344%, 01/09/2048 | 100 | 95 | ||||||||
4.050%, 08/16/2023 | 100 | 104 | ||||||||
3.750%, 01/11/2027 | 350 | 355 | ||||||||
3.100%, 07/06/2021 | 150 | 152 | ||||||||
| Adviser Managed Trust / Annual Report / July 31, 2019 | 35 |
SCHEDULE OF INVESTMENTS
July 31, 2019
Tactical Offensive Fixed Income Fund(Continued)
| Description | Face Amount (Thousands) | Market Value ($ Thousands) | ||||||||
CORPORATE OBLIGATIONS (continued) |
| |||||||||
Loews | ||||||||||
2.625%, 05/15/2023 | $ | 100 | $ | 101 | ||||||
LPL Holdings | ||||||||||
5.750%, 09/15/2025 (A) | 200 | 207 | ||||||||
Manulife Financial | ||||||||||
4.061%, VAR USD Swap Semi 30/360 5 Yr Curr+1.647%, 02/24/2032 | 100 | 102 | ||||||||
Markel | ||||||||||
5.000%, 04/05/2046 | 50 | 56 | ||||||||
4.300%, 11/01/2047 | 200 | 200 | ||||||||
Marsh & McLennan | ||||||||||
4.375%, 03/15/2029 | 200 | 223 | ||||||||
4.350%, 01/30/2047 | 20 | 22 | ||||||||
4.200%, 03/01/2048 | 50 | 54 | ||||||||
3.875%, 03/15/2024 | 300 | 318 | ||||||||
3.750%, 03/14/2026 | 100 | 106 | ||||||||
2.750%, 01/30/2022 | 30 | 30 | ||||||||
MetLife | ||||||||||
4.875%, 11/13/2043 | 100 | 120 | ||||||||
4.600%, 05/13/2046 | 100 | 118 | ||||||||
4.368%, 09/15/2023 | 85 | 92 | ||||||||
4.050%, 03/01/2045 | 100 | 108 | ||||||||
3.600%, 04/10/2024 | 100 | 106 | ||||||||
3.600%,11/13/2025 | 100 | 106 | ||||||||
Mitsubishi UFJ Financial Group | ||||||||||
4.286%, 07/26/2038 | 235 | 262 | ||||||||
3.961%, 03/02/2028 | 100 | 108 | ||||||||
3.761%, 07/26/2023 | 150 | 157 | ||||||||
3.677%, 02/22/2027 | 350 | 370 | ||||||||
3.535%, 07/26/2021 | 260 | 265 | ||||||||
2.950%, 03/01/2021 | 50 | 50 | ||||||||
2.801%, 07/18/2024 | 200 | 201 | ||||||||
2.665%, 07/25/2022 | 350 | 351 | ||||||||
Mizuho Financial Group | ||||||||||
3.663%, 02/28/2027 | 350 | 370 | ||||||||
3.170%, 09/11/2027 | 150 | 154 | ||||||||
2.601%, 09/11/2022 | 100 | 100 | ||||||||
Moody’s | ||||||||||
4.875%, 12/17/2048 | 200 | 233 | ||||||||
3.250%, 01/15/2028 | 35 | 36 | ||||||||
2.750%, 12/15/2021 | 100 | 100 | ||||||||
2.625%, 01/15/2023 | 50 | 50 | ||||||||
Morgan Stanley | ||||||||||
5.750%, 01/25/2021 | 175 | 183 | ||||||||
4.457%, VAR ICE LIBOR USD 3 Month+1.431%, 04/22/2039 | 150 | 168 | ||||||||
3.737%, VAR ICE LIBOR USD 3 Month+0.847%, 04/24/2024 | 140 | 145 | ||||||||
3.625%, 01/20/2027 | 150 | 157 | ||||||||
Morgan Stanley MTN | ||||||||||
6.375%, 07/24/2042 | 150 | 212 | ||||||||
4.875%, 11/01/2022 | 65 | 69 | ||||||||
| Description | Face Amount (Thousands) | Market Value ($ Thousands) | ||||||||
CORPORATE OBLIGATIONS (continued) |
| |||||||||
4.431%, VAR ICE LIBOR USD 3 Month+1.628%, 01/23/2030 | $ | 350 | $ | 387 | ||||||
4.350%, 09/08/2026 | 65 | 70 | ||||||||
4.300%, 01/27/2045 | 100 | 111 | ||||||||
4.000%, 07/23/2025 | 155 | 165 | ||||||||
3.971%, VAR ICE LIBOR USD 3 Month+1.455%, 07/22/2038 | 300 | 318 | ||||||||
3.875%, 01/27/2026 | 150 | 159 | ||||||||
3.772%, VAR ICE LIBOR USD 3 Month+1.140%, 01/24/2029 | 100 | 105 | ||||||||
3.125%, 01/23/2023 | 100 | 102 | ||||||||
3.125%, 07/27/2026 | 250 | 254 | ||||||||
2.720%, VAR United States Secured Overnight Financing Rate+1.152%, 07/22/2025 | 315 | 315 | ||||||||
2.625%, 11/17/2021 | 150 | 151 | ||||||||
2.500%, 04/21/2021 | 260 | 261 | ||||||||
MSCI | ||||||||||
5.750%, 08/15/2025 (A) | 312 | 325 | ||||||||
5.375%, 05/15/2027 (A) | 60 | 64 | ||||||||
5.250%, 11/15/2024 (A) | 150 | 154 | ||||||||
National Australia Bank | ||||||||||
2.500%, 07/12/2026 | 150 | 149 | ||||||||
National Australia Bank MTN | ||||||||||
2.625%, 01/14/2021 | 50 | 50 | ||||||||
2.500%, 05/22/2022 | 150 | 151 | ||||||||
National Rural Utilities Cooperative Finance | ||||||||||
3.400%, 02/07/2028 | 100 | 106 | ||||||||
2.950%, 02/07/2024 | 230 | 235 | ||||||||
National Rural Utilities Cooperative Finance MTN | ||||||||||
3.250%, 11/01/2025 | 50 | 52 | ||||||||
2.900%, 03/15/2021 | 70 | 71 | ||||||||
2.300%, 09/15/2022 | 70 | 70 | ||||||||
Nationstar Mortgage Holdings | ||||||||||
9.125%, 07/15/2026 (A) | 265 | 277 | ||||||||
8.125%, 07/15/2023 (A) | 45 | 47 | ||||||||
Navient | ||||||||||
7.250%, 09/25/2023 | 500 | 546 | ||||||||
6.750%, 06/25/2025 | 105 | 110 | ||||||||
6.750%, 06/15/2026 | 40 | 42 | ||||||||
5.875%, 03/25/2021 | 115 | 119 | ||||||||
5.875%,10/25/2024 | 100 | 102 | ||||||||
5.000%, 10/26/2020 | 100 | 102 | ||||||||
NFP | ||||||||||
6.875%, 07/15/2025 (A) | 108 | 108 | ||||||||
Nordic Investment Bank | ||||||||||
2.250%, 05/21/2024 | 200 | 203 | ||||||||
1.625%, 11/20/2020 | 200 | 199 | ||||||||
Northern Trust | ||||||||||
3.375%, VAR ICE LIBOR USD 3 Month+1.131%, 05/08/2032 | 163 | 165 | ||||||||
3.150%, 05/03/2029 | 50 | 52 | ||||||||
| 36 | Adviser Managed Trust / Annual Report / July 31, 2019 |
| Description | Face Amount (Thousands) | Market Value ($ Thousands) | ||||||||
CORPORATE OBLIGATIONS (continued) |
| |||||||||
Oesterreichische Kontrollbank | ||||||||||
2.875%, 09/07/2021 | $ 300 | $ | 306 | |||||||
2.625%, 01/31/2022 | 450 | 457 | ||||||||
Oesterreichische Kontrollbank MTN | ||||||||||
2.875%, 03/13/2023 | 500 | 516 | ||||||||
Old Republic International | ||||||||||
3.875%, 08/26/2026 | 50 | 52 | ||||||||
ORIX | ||||||||||
3.700%, 07/18/2027 | 50 | 53 | ||||||||
2.900%, 07/18/2022 | 30 | 30 | ||||||||
PNC Bank | ||||||||||
3.300%, 10/30/2024 | 150 | 156 | ||||||||
3.100%, 10/25/2027 | 150 | 154 | ||||||||
2.625%, 02/17/2022 | 150 | 151 | ||||||||
2.450%, 11/05/2020 | 150 | 150 | ||||||||
2.450%, 07/28/2022 | 150 | 151 | ||||||||
2.150%, 04/29/2021 | 150 | 150 | ||||||||
PNC Financial Services Group | ||||||||||
3.500%, 01/23/2024 | 400 | 419 | ||||||||
Principal Financial Group | ||||||||||
3.700%, 05/15/2029 | 25 | 27 | ||||||||
3.400%, 05/15/2025 | 150 | 156 | ||||||||
Private Export Funding | ||||||||||
2.300%, 09/15/2020 | 150 | 150 | ||||||||
Progressive | ||||||||||
4.200%, 03/15/2048 | 250 | 284 | ||||||||
3.700%, 01/26/2045 | 50 | 52 | ||||||||
2.450%, 01/15/2027 | 50 | 49 | ||||||||
Prudential Financial | ||||||||||
5.875%, VAR ICE LIBOR USD | 100 | 107 | ||||||||
4.500%, VAR ICE LIBOR USD | 100 | 101 | ||||||||
3.935%, 12/07/2049 | 300 | 318 | ||||||||
Prudential Financial MTN | ||||||||||
5.700%, 12/14/2036 | 100 | 127 | ||||||||
4.600%, 05/15/2044 | 50 | 58 | ||||||||
3.500%, 05/15/2024 | 100 | 106 | ||||||||
Quicken Loans | ||||||||||
5.750%, 05/01/2025 (A) | 350 | 362 | ||||||||
5.250%, 01/15/2028 (A) | 100 | 101 | ||||||||
Raymond James Financial | ||||||||||
4.950%, 07/15/2046 | 50 | 57 | ||||||||
Regions Financial | ||||||||||
3.200%, 02/08/2021 | 150 | 152 | ||||||||
2.750%, 08/14/2022 | 350 | 352 | ||||||||
Reinsurance Group of America | ||||||||||
3.950%, 09/15/2026 | 30 | 32 | ||||||||
3.900%, 05/15/2029 | 50 | 52 | ||||||||
RenaissanceRe Finance | ||||||||||
3.450%, 07/01/2027 | 30 | 31 | ||||||||
| Description | Face Amount (Thousands) | Market Value ($ Thousands) | ||||||||
CORPORATE OBLIGATIONS (continued) |
| |||||||||
RenaissanceRe Holdings | ||||||||||
3.600%, 04/15/2029 | $ | 25 | $ | 26 | ||||||
Royal Bank of Canada | ||||||||||
2.300%, 03/22/2021 | 150 | 150 | ||||||||
2.100%, 10/14/2020 | 200 | 200 | ||||||||
Royal Bank of Canada MTN | ||||||||||
3.200%, 04/30/2021 | 275 | 279 | ||||||||
2.750%, 02/01/2022 | 300 | 304 | ||||||||
2.350%, 10/30/2020 | 150 | 150 | ||||||||
2.150%, 10/26/2020 | 340 | 340 | ||||||||
Royal Bank of Scotland Group | ||||||||||
6.125%, 12/15/2022 | 75 | 81 | ||||||||
6.100%, 06/10/2023 | 35 | 38 | ||||||||
6.000%, 12/19/2023 | 65 | 70 | ||||||||
5.125%, 05/28/2024 | 75 | 78 | ||||||||
4.800%, 04/05/2026 | 350 | 376 | ||||||||
4.519%, VAR ICE LIBOR USD 3 Month+1.550%, 06/25/2024 | 100 | 104 | ||||||||
4.445%, VAR ICE LIBOR USD 3 Month+1.871%, 05/08/2030 | 200 | 207 | ||||||||
3.498%, VAR ICE LIBOR USD 3 Month+1.480%, 05/15/2023 | 350 | 351 | ||||||||
S&P Global | ||||||||||
4.500%, 05/15/2048 | 250 | 289 | ||||||||
4.400%, 02/15/2026 | 100 | 111 | ||||||||
4.000%, 06/15/2025 | 50 | 54 | ||||||||
Santander Holdings USA | ||||||||||
4.450%, 12/03/2021 | 300 | 311 | ||||||||
4.400%, 07/13/2027 | 50 | 53 | ||||||||
3.700%, 03/28/2022 | 230 | 235 | ||||||||
3.400%, 01/18/2023 | 100 | 101 | ||||||||
Santander UK | ||||||||||
2.875%, 06/18/2024 | 200 | 200 | ||||||||
Santander UK Group Holdings | ||||||||||
3.823%, VAR ICE LIBOR USD 3 Month+1.400%, 11/03/2028 | 350 | 355 | ||||||||
2.875%, 10/16/2020 | 100 | 100 | ||||||||
Santander UK Group Holdings MTN | ||||||||||
3.125%, 01/08/2021 | 100 | 100 | ||||||||
Springleaf Finance | ||||||||||
7.750%, 10/01/2021 | 400 | 437 | ||||||||
7.125%, 03/15/2026 | 395 | 444 | ||||||||
6.875%, 03/15/2025 | 80 | 89 | ||||||||
6.625%, 01/15/2028 | 36 | 39 | ||||||||
6.125%, 03/15/2024 | 335 | 363 | ||||||||
5.625%, 03/15/2023 | 200 | 214 | ||||||||
Starwood Property Trust | ||||||||||
5.000%, 12/15/2021 | 155 | 160 | ||||||||
Stifel Financial | ||||||||||
4.250%, 07/18/2024 | 50 | 52 | ||||||||
Sumitomo Mitsui Financial Group | ||||||||||
3.944%, 07/19/2028 | 250 | 271 | ||||||||
| Adviser Managed Trust / Annual Report / July 31, 2019 | 37 |
SCHEDULE OF INVESTMENTS
July 31, 2019
Tactical Offensive Fixed Income Fund(Continued)
| Description | Face Amount (Thousands) | Market Value ($ Thousands) | ||||||||
CORPORATE OBLIGATIONS (continued) |
| |||||||||
3.784%, 03/09/2026 | $ | 50 | $ | 53 | ||||||
3.748%, 07/19/2023 | 250 | 261 | ||||||||
3.446%, 01/11/2027 | 150 | 156 | ||||||||
3.364%, 07/12/2027 | 350 | 364 | ||||||||
2.934%, 03/09/2021 | 50 | 50 | ||||||||
2.784%, 07/12/2022 | 350 | 353 | ||||||||
2.632%, 07/14/2026 | 50 | 50 | ||||||||
2.442%, 10/19/2021 | 150 | 150 | ||||||||
2.058%, 07/14/2021 | 150 | 149 | ||||||||
SunTrust Banks | ||||||||||
4.000%, 05/01/2025 | 100 | 106 | ||||||||
2.900%, 03/03/2021 | 150 | 151 | ||||||||
2.700%, 01/27/2022 | 350 | 352 | ||||||||
2.450%, 08/01/2022 | 350 | 350 | ||||||||
Svensk Exportkredit MTN | ||||||||||
2.875%, 05/22/2021 | 200 | 203 | ||||||||
2.875%, 03/14/2023 | 500 | 516 | ||||||||
Svenska Handelsbanken | ||||||||||
3.900%, 11/20/2023 | 150 | 159 | ||||||||
1.950%, 09/08/2020 | 300 | 299 | ||||||||
Synchrony Financial | ||||||||||
4.250%, 08/15/2024 | 100 | 105 | ||||||||
3.950%, 12/01/2027 | 350 | 355 | ||||||||
3.700%, 08/04/2026 | 350 | 353 | ||||||||
TD Ameritrade Holding | ||||||||||
2.950%, 04/01/2022 | 100 | 102 | ||||||||
Tempo Acquisition | ||||||||||
6.750%, 06/01/2025 (A) | 195 | 201 | ||||||||
Torchmark | ||||||||||
4.550%, 09/15/2028 | 200 | 219 | ||||||||
Toronto-Dominion Bank | ||||||||||
3.625%, VAR USD Swap Semi 30/360 5 Yr Curr+2.205%, 09/15/2031 | 150 | 152 | ||||||||
Toronto-Dominion Bank MTN | ||||||||||
2.650%, 06/12/2024 | 100 | 101 | ||||||||
2.500%, 12/14/2020 | 150 | 151 | ||||||||
2.125%, 04/07/2021 | 150 | 150 | ||||||||
1.850%, 09/11/2020 | 350 | 348 | ||||||||
Travelers | ||||||||||
4.100%, 03/04/2049 | 150 | 169 | ||||||||
4.050%, 03/07/2048 | 50 | 56 | ||||||||
4.000%, 05/30/2047 | 40 | 44 | ||||||||
3.750%, 05/15/2046 | 25 | 27 | ||||||||
Travelers MTN | ||||||||||
6.250%, 06/15/2037 | 100 | 138 | ||||||||
Trinity Acquisition | ||||||||||
4.400%, 03/15/2026 | 50 | 54 | ||||||||
UniCredit | ||||||||||
5.861%, VAR USD ICE Swap NY 5 Yr+3.703%, 06/19/2032 (A) | 200 | 201 | ||||||||
Unum Group | ||||||||||
4.000%, 06/15/2029 | 70 | 72 | ||||||||
| Description | Face Amount (Thousands) | Market Value ($ Thousands) | ||||||||
CORPORATE OBLIGATIONS (continued) |
| |||||||||
3.000%, 05/15/2021 | $ | 30 | $ | 30 | ||||||
US Bancorp | ||||||||||
3.375%, 02/05/2024 | 300 | 313 | ||||||||
US Bancorp MTN | ||||||||||
3.900%, 04/26/2028 | 100 | 110 | ||||||||
3.600%, 09/11/2024 | 150 | 157 | ||||||||
2.950%, 07/15/2022 | 100 | 102 | ||||||||
2.625%, 01/24/2022 | 300 | 302 | ||||||||
2.375%, 07/22/2026 | 150 | 149 | ||||||||
US Bank MTN | ||||||||||
2.050%, 10/23/2020 | 150 | 150 | ||||||||
USI | ||||||||||
6.875%, 05/01/2025 (A) | 170 | 169 | ||||||||
VFH Parent | ||||||||||
6.750%, 06/15/2022 (A) | 80 | 82 | ||||||||
VistaJet Malta Finance | ||||||||||
10.500%, 06/01/2024 (A) | 99 | 98 | ||||||||
Voya Financial | ||||||||||
3.125%, 07/15/2024 | 50 | 51 | ||||||||
Wells Fargo | ||||||||||
5.606%, 01/15/2044 | 150 | 190 | ||||||||
5.375%, 11/02/2043 | 180 | 221 | ||||||||
3.900%, 05/01/2045 | 150 | 163 | ||||||||
3.625%, 10/22/2021 | 500 | 513 | ||||||||
3.069%, 01/24/2023 | 300 | 304 | ||||||||
3.000%, 04/22/2026 | 150 | 152 | ||||||||
3.000%, 10/23/2026 | 150 | 152 | ||||||||
2.897%, VAR ICE LIBOR USD 3 Month+0.610%, 05/27/2022 | 495 | 499 | ||||||||
2.600%, 01/15/2021 | 100 | 100 | ||||||||
2.500%, 03/04/2021 | 150 | 150 | ||||||||
Wells Fargo MTN | ||||||||||
4.300%, 07/22/2027 | 100 | 108 | ||||||||
4.150%, 01/24/2029 | 150 | 164 | ||||||||
4.125%, 08/15/2023 | 150 | 158 | ||||||||
4.100%, 06/03/2026 | 135 | 143 | ||||||||
3.750%, 01/24/2024 | 350 | 367 | ||||||||
3.584%, VAR ICE LIBOR USD 3 Month+1.310%, 05/22/2028 | 375 | 392 | ||||||||
3.450%, 02/13/2023 | 100 | 103 | ||||||||
3.196%, VAR ICE LIBOR USD 3 Month+1.170%, 06/17/2027 | 185 | 188 | ||||||||
3.000%, 02/19/2025 | 100 | 102 | ||||||||
2.625%, 07/22/2022 | 290 | 291 | ||||||||
Wells Fargo Capital X | ||||||||||
5.950%, 12/15/2036 | 150 | 179 | ||||||||
Westpac Banking | ||||||||||
4.421%, 07/24/2039 | 25 | 26 | ||||||||
4.110%, VAR USD ICE Swap 11:00 NY 5 Yr+2.000%, 07/24/2034 | 30 | 31 | ||||||||
3.650%, 05/15/2023 | 100 | 105 | ||||||||
3.350%, 03/08/2027 | 350 | 368 | ||||||||
| 38 | Adviser Managed Trust / Annual Report / July 31, 2019 |
| Description | Face Amount (Thousands) | Market Value ($ Thousands) | ||||||
CORPORATE OBLIGATIONS (continued) |
| |||||||
3.300%, 02/26/2024 | $ | 300 | $ | 312 | ||||
2.850%, 05/13/2026 | 250 | 255 | ||||||
2.700%, 08/19/2026 | 250 | 252 | ||||||
2.600%, 11/23/2020 | 50 | 50 | ||||||
2.500%, 06/28/2022 | 50 | 50 | ||||||
2.100%, 05/13/2021 | 50 | 50 | ||||||
2.000%, 08/19/2021 | 350 | 348 | ||||||
Willis North America | ||||||||
3.600%, 05/15/2024 | 50 | 52 | ||||||
XLIT | ||||||||
5.500%, 03/31/2045 | 100 | 120 | ||||||
4.450%, 03/31/2025 | 100 | 108 | ||||||
| 120,516 | ||||||||
Health Care — 3.1% | ||||||||
Abbott Laboratories | ||||||||
4.900%, 11/30/2046 | 100 | 125 | ||||||
4.750%, 11/30/2036 | 50 | 60 | ||||||
4.750%, 04/15/2043 | 300 | 356 | ||||||
3.750%, 11/30/2026 | 28 | 30 | ||||||
3.400%, 11/30/2023 | 70 | 73 | ||||||
2.950%, 03/15/2025 | 100 | 102 | ||||||
AbbVie | ||||||||
4.700%, 05/14/2045 | 35 | 35 | ||||||
4.500%, 05/14/2035 | 140 | 146 | ||||||
4.450%, 05/14/2046 | 150 | 149 | ||||||
4.300%, 05/14/2036 | 350 | 357 | ||||||
3.750%, 11/14/2023 | 200 | 208 | ||||||
3.600%, 05/14/2025 | 100 | 103 | ||||||
3.375%, 11/14/2021 | 300 | 306 | ||||||
3.200%, 11/06/2022 | 45 | 46 | ||||||
3.200%, 05/14/2026 | 100 | 101 | ||||||
2.900%, 11/06/2022 | 100 | 101 | ||||||
2.850%, 05/14/2023 | 50 | 50 | ||||||
Acadia Healthcare | ||||||||
5.625%, 02/15/2023 | 100 | 101 | ||||||
Aetna | ||||||||
3.875%, 08/15/2047 | 45 | 41 | ||||||
2.800%, 06/15/2023 | 25 | 25 | ||||||
Agilent Technologies | ||||||||
3.050%, 09/22/2026 | 65 | 66 | ||||||
AHS Hospital | ||||||||
5.024%, 07/01/2045 | 25 | 31 | ||||||
Allergan Finance | ||||||||
3.250%, 10/01/2022 | 50 | 51 | ||||||
Allergan Funding SCS | ||||||||
4.850%, 06/15/2044 | 50 | 52 | ||||||
4.750%, 03/15/2045 | 100 | 103 | ||||||
4.550%, 03/15/2035 | 100 | 103 | ||||||
3.850%, 06/15/2024 | 100 | 104 | ||||||
3.800%, 03/15/2025 | 100 | 104 | ||||||
| Description | Face Amount (Thousands) | Market Value ($ Thousands) | ||||||
CORPORATE OBLIGATIONS (continued) |
| |||||||
AmerisourceBergen | ||||||||
4.250%, 03/01/2045 | $ | 25 | $ | 25 | ||||
3.450%, 12/15/2027 | 350 | 359 | ||||||
3.400%, 05/15/2024 | 100 | 103 | ||||||
Amgen | ||||||||
5.150%, 11/15/2041 | 100 | 116 | ||||||
4.663%, 06/15/2051 | 400 | 442 | ||||||
4.563%, 06/15/2048 | 100 | 109 | ||||||
4.400%, 05/01/2045 | 125 | 134 | ||||||
3.875%, 11/15/2021 | 100 | 103 | ||||||
3.125%, 05/01/2025 | 50 | 51 | ||||||
2.650%, 05/11/2022 | 250 | 251 | ||||||
2.600%, 08/19/2026 | 100 | 99 | ||||||
2.250%, 08/19/2023 | 100 | 99 | ||||||
1.850%, 08/19/2021 | 50 | 49 | ||||||
Anthem | ||||||||
5.100%, 01/15/2044 | 150 | 173 | ||||||
4.650%, 01/15/2043 | 50 | 55 | ||||||
4.550%, 03/01/2048 | 50 | 54 | ||||||
4.375%, 12/01/2047 | 300 | 314 | ||||||
4.101%, 03/01/2028 | 50 | 53 | ||||||
3.650%, 12/01/2027 | 300 | 311 | ||||||
3.500%, 08/15/2024 | 150 | 155 | ||||||
2.500%, 11/21/2020 | 300 | 300 | ||||||
Ascension Health | ||||||||
3.945%, 11/15/2046 | 60 | 66 | ||||||
AstraZeneca | ||||||||
6.450%, 09/15/2037 | 100 | 137 | ||||||
4.375%, 11/16/2045 | 100 | 113 | ||||||
3.500%, 08/17/2023 | 200 | 208 | ||||||
3.375%, 11/16/2025 | 100 | 104 | ||||||
2.375%, 11/16/2020 | 100 | 100 | ||||||
Avantor | ||||||||
9.000%, 10/01/2025 (A) | 411 | 455 | ||||||
6.000%, 10/01/2024 (A) | 300 | 321 | ||||||
Bausch Health | ||||||||
9.000%, 12/15/2025 (A) | 800 | 896 | ||||||
7.250%, 05/30/2029 (A) | 69 | 72 | ||||||
7.000%, 03/15/2024 (A) | 500 | 528 | ||||||
7.000%, 01/15/2028 (A) | 69 | 72 | ||||||
6.500%, 03/15/2022 (A) | 100 | 104 | ||||||
6.125%, 04/15/2025 (A) | 250 | 257 | ||||||
5.875%, 05/15/2023 (A) | 60 | 60 | ||||||
5.750%, 08/15/2027 (A) | 160 | 168 | ||||||
5.500%, 11/01/2025 (A) | 196 | 204 | ||||||
Bausch Health Americas | ||||||||
9.250%, 04/01/2026 (A) | 225 | 252 | ||||||
8.500%, 01/31/2027 (A) | 250 | 275 | ||||||
Baxalta | ||||||||
5.250%, 06/23/2045 | 15 | 19 | ||||||
Baxter International | ||||||||
3.500%, 08/15/2046 | 100 | 94 | ||||||
| Adviser Managed Trust / Annual Report / July 31, 2019 | 39 |
SCHEDULE OF INVESTMENTS
July 31, 2019
Tactical Offensive Fixed Income Fund(Continued)
| Description | Face Amount (Thousands) | Market Value ($ Thousands) | ||||||
CORPORATE OBLIGATIONS (continued) |
| |||||||
BCPE Cycle Merger Sub II | ||||||||
10.625%, 07/15/2027 (A) | $ | 125 | $ | 123 | ||||
Becton Dickinson | ||||||||
4.685%, 12/15/2044 | 40 | 44 | ||||||
4.669%, 06/06/2047 | 50 | 56 | ||||||
3.734%, 12/15/2024 | 50 | 52 | ||||||
3.700%, 06/06/2027 | 66 | 69 | ||||||
3.363%, 06/06/2024 | 350 | 362 | ||||||
3.125%, 11/08/2021 | 100 | 101 | ||||||
2.894%, 06/06/2022 | 65 | 66 | ||||||
Biogen | ||||||||
5.200%, 09/15/2045 | 100 | 114 | ||||||
3.625%, 09/15/2022 | 100 | 103 | ||||||
Boston Scientific | ||||||||
4.000%, 03/01/2028 | 100 | 108 | ||||||
3.850%, 05/15/2025 | 100 | 107 | ||||||
Bristol-Myers Squibb | ||||||||
4.500%, 03/01/2044 | 50 | 57 | ||||||
4.250%, 10/26/2049 (A) | 85 | 94 | ||||||
4.125%, 06/15/2039 (A) | 35 | 38 | ||||||
3.400%, 07/26/2029 (A) | 130 | 136 | ||||||
3.250%, 02/27/2027 | 100 | 104 | ||||||
3.250%, 08/01/2042 | 100 | 96 | ||||||
3.200%, 06/15/2026 (A) | 50 | 52 | ||||||
2.900%, 07/26/2024 (A) | 110 | 112 | ||||||
2.600%, 05/16/2022 (A) | 75 | 76 | ||||||
Cardinal Health | ||||||||
3.410%, 06/15/2027 | 400 | 391 | ||||||
2.616%, 06/15/2022 | 100 | 99 | ||||||
Catalent Pharma Solutions | ||||||||
5.000%, 07/15/2027 (A) | 70 | 72 | ||||||
Celgene | ||||||||
5.000%, 08/15/2045 | 50 | 60 | ||||||
4.550%, 02/20/2048 | 100 | 115 | ||||||
4.350%, 11/15/2047 | 50 | 56 | ||||||
3.900%, 02/20/2028 | 100 | 107 | ||||||
3.875%, 08/15/2025 | 50 | 53 | ||||||
3.625%, 05/15/2024 | 50 | 52 | ||||||
3.450%, 11/15/2027 | 50 | 52 | ||||||
3.250%, 02/20/2023 | 100 | 102 | ||||||
2.875%, 08/15/2020 | 100 | 100 | ||||||
2.875%, 02/19/2021 | 345 | 347 | ||||||
2.750%, 02/15/2023 | 250 | 252 | ||||||
Centene | ||||||||
6.125%, 02/15/2024 | 576 | 603 | ||||||
5.625%, 02/15/2021 | 54 | 55 | ||||||
5.375%, 06/01/2026 (A) | 325 | 343 | ||||||
4.750%, 01/15/2025 | 90 | 93 | ||||||
Change Healthcare Holdings | ||||||||
5.750%, 03/01/2025 (A) | 215 | 215 | ||||||
Charles River Laboratories International | ||||||||
5.500%, 04/01/2026 (A) | 100 | 106 | ||||||
| Description | Face Amount (Thousands) | Market Value ($ Thousands) | ||||||
CORPORATE OBLIGATIONS (continued) |
| |||||||
CHS | ||||||||
9.875%, 06/30/2023 (A)(D) | $ | 175 | $ | 147 | ||||
8.625%, 01/15/2024 (A) | 55 | 55 | ||||||
8.125%, 06/30/2024 (A) | 383 | 291 | ||||||
8.000%, 03/15/2026 (A) | 275 | 264 | ||||||
6.250%, 03/31/2023 | 840 | 804 | ||||||
Cigna | ||||||||
4.900%, 12/15/2048 (A) | 30 | 33 | ||||||
4.800%, 08/15/2038 (A) | 330 | 360 | ||||||
4.375%, 10/15/2028 (A) | 60 | 65 | ||||||
4.125%, 11/15/2025 (A) | 25 | 27 | ||||||
3.750%, 07/15/2023 (A) | 55 | 57 | ||||||
3.400%, 09/17/2021 (A) | 20 | 20 | ||||||
3.200%, 09/17/2020 (A) | 250 | 252 | ||||||
Cigna Holding | ||||||||
3.875%, 10/15/2047 | 50 | 47 | ||||||
3.250%, 04/15/2025 | 150 | 152 | ||||||
3.050%,10/15/2027 | 30 | 30 | ||||||
CommonSpirit Health | ||||||||
2.950%, 11/01/2022 | 100 | 101 | ||||||
CVS Health | ||||||||
5.300%, 12/05/2043 | 50 | 55 | ||||||
5.125%, 07/20/2045 | 55 | 60 | ||||||
5.050%, 03/25/2048 | 395 | 428 | ||||||
4.875%, 07/20/2035 | 100 | 109 | ||||||
4.780%, 03/25/2038 | 400 | 424 | ||||||
4.300%, 03/25/2028 | 110 | 117 | ||||||
4.100%, 03/25/2025 | 50 | 53 | ||||||
4.000%, 12/05/2023 | 100 | 105 | ||||||
3.875%, 07/20/2025 | 100 | 104 | ||||||
3.700%, 03/09/2023 | 385 | 397 | ||||||
3.350%, 03/09/2021 | 95 | 96 | ||||||
2.875%, 06/01/2026 | 100 | 99 | ||||||
2.750%, 12/01/2022 | 100 | 100 | ||||||
2.125%, 06/01/2021 | 50 | 50 | ||||||
Danaher | ||||||||
4.375%, 09/15/2045 | 20 | 23 | ||||||
3.350%, 09/15/2025 | 20 | 21 | ||||||
2.400%, 09/15/2020 | 100 | 100 | ||||||
DaVita | ||||||||
5.000%, 05/01/2025 | 295 | 289 | ||||||
Duke University Health System | ||||||||
3.920%, 06/01/2047 | 125 | 139 | ||||||
Eagle Holding II | ||||||||
7.750% cash/8.500% PIK, 05/15/2022 (A) | 57 | 57 | ||||||
7.625% cash/8.375% PIK, 05/15/2022 (A) | 80 | 81 | ||||||
Elanco Animal Health | ||||||||
4.900%, 08/28/2028 | 75 | 83 | ||||||
4.272%, 08/28/2023 | 310 | 326 | ||||||
3.912%, 08/27/2021 | 25 | 26 | ||||||
| 40 | Adviser Managed Trust / Annual Report / July 31, 2019 |
| Description | Face Amount (Thousands) | Market Value ($ Thousands) | ||||||||
CORPORATE OBLIGATIONS (continued) |
| |||||||||
Eli Lilly | ||||||||||
3.875%, 03/15/2039 | $ | 300 | $ | 329 | ||||||
3.700%, 03/01/2045 | 100 | 104 | ||||||||
3.375%, 03/15/2029 | 300 | 319 | ||||||||
3.100%, 05/15/2027 | 124 | 130 | ||||||||
Endo Dac | ||||||||||
6.000%, 07/15/2023 (A) | 246 | 156 | ||||||||
6.000%, 02/01/2025 (A) | 200 | 120 | ||||||||
Envision Healthcare | ||||||||||
8.750%, 10/15/2026 (A) | 325 | 225 | ||||||||
Express Scripts Holding | ||||||||||
4.800%, 07/15/2046 | 35 | 38 | ||||||||
4.750%, 11/15/2021 | 100 | 105 | ||||||||
4.500%, 02/25/2026 | 50 | 54 | ||||||||
3.500%, 06/15/2024 | 50 | 52 | ||||||||
3.400%, 03/01/2027 | 40 | 41 | ||||||||
3.000%, 07/15/2023 | 50 | 50 | ||||||||
Gilead Sciences | ||||||||||
5.650%, 12/01/2041 | 100 | 125 | ||||||||
4.600%, 09/01/2035 | 100 | 115 | ||||||||
4.150%, 03/01/2047 | 100 | 105 | ||||||||
3.700%, 04/01/2024 | 50 | 53 | ||||||||
3.650%, 03/01/2026 | 75 | 79 | ||||||||
2.950%, 03/01/2027 | 100 | 101 | ||||||||
1.950%, 03/01/2022 | 30 | 30 | ||||||||
GlaxoSmithKline Capital | ||||||||||
3.875%, 05/15/2028 | 50 | 55 | ||||||||
3.625%, 05/15/2025 | 85 | 90 | ||||||||
3.375%, 05/15/2023 | 250 | 259 | ||||||||
3.375%, 06/01/2029 | 165 | 175 | ||||||||
3.125%, 05/14/2021 | 105 | 106 | ||||||||
3.000%, 06/01/2024 | 70 | 72 | ||||||||
2.875%, 06/01/2022 | 100 | 101 | ||||||||
HCA | ||||||||||
5.875%, 02/15/2026 | 350 | 389 | ||||||||
5.875%, 02/01/2029 | 120 | 134 | ||||||||
5.625%, 09/01/2028 | 85 | 94 | ||||||||
5.500%, 06/15/2047 | 340 | 367 | ||||||||
5.375%, 02/01/2025 | 303 | 328 | ||||||||
5.375%, 09/01/2026 | 620 | 671 | ||||||||
5.250%, 04/15/2025 | 40 | 44 | ||||||||
5.250%, 06/15/2026 | 40 | 45 | ||||||||
5.250%, 06/15/2049 | 100 | 105 | ||||||||
5.125%, 06/15/2039 | 25 | 26 | ||||||||
5.000%, 03/15/2024 | 55 | 60 | ||||||||
4.750%, 05/01/2023 | 35 | 37 | ||||||||
4.500%, 02/15/2027 | 35 | 37 | ||||||||
4.125%, 06/15/2029 | 35 | 36 | ||||||||
Hologic | ||||||||||
4.375%, 10/15/2025 (A) | 185 | 186 | ||||||||
Horizon Pharma USA | ||||||||||
5.500%, 08/01/2027(A) | 219 | 225 | ||||||||
| Description | Face Amount (Thousands) | Market Value ($ Thousands) | ||||||||
CORPORATE OBLIGATIONS (continued) |
| |||||||||
Humana | ||||||||||
3.950%, 03/15/2027 | $ | 300 | $ | 315 | ||||||
3.850%, 10/01/2024 | 100 | 104 | ||||||||
2.900%, 12/15/2022 | 50 | 51 | ||||||||
2.500%, 12/15/2020 | 25 | 25 | ||||||||
IQVIA | ||||||||||
5.000%, 10/15/2026 (A) | 200 | 209 | ||||||||
5.000%, 05/15/2027 (A) | 200 | 209 | ||||||||
4.875%, 05/15/2023 (A) | 140 | 143 | ||||||||
Johnson & Johnson | ||||||||||
3.750%, 03/03/2047 | 300 | 325 | ||||||||
3.700%, 03/01/2046 | 100 | 108 | ||||||||
3.625%, 03/03/2037 | 332 | 353 | ||||||||
2.950%, 03/03/2027 | 50 | 52 | ||||||||
2.450%, 12/05/2021 | 50 | 51 | ||||||||
2.450%, 03/01/2026 | 50 | 50 | ||||||||
2.250%, 03/03/2022 | 250 | 251 | ||||||||
2.050%, 03/01/2023 | 50 | 50 | ||||||||
1.650%, 03/01/2021 | 50 | 50 | ||||||||
Kaiser Foundation Hospitals | ||||||||||
4.150%, 05/01/2047 | 320 | 362 | ||||||||
3.150%, 05/01/2027 | 25 | 26 | ||||||||
Kinetic Concepts | ||||||||||
7.875%, 02/15/2021 (A) | 44 | 45 | ||||||||
Laboratory Corp of America Holdings | ||||||||||
4.700%, 02/01/2045 | 50 | 53 | ||||||||
Mallinckrodt International Finance | ||||||||||
5.750%, 08/01/2022 (A) | 150 | 113 | ||||||||
5.625%, 10/15/2023 (A) | 200 | 126 | ||||||||
5.500%, 04/15/2025 (A) | 100 | 58 | ||||||||
McKesson | ||||||||||
4.750%, 05/30/2029 | 225 | 246 | ||||||||
3.796%, 03/15/2024 | 50 | 52 | ||||||||
MEDNAX | ||||||||||
6.250%, 01/15/2027 (A) | 160 | 158 | ||||||||
5.250%, 12/01/2023 (A) | 200 | 200 | ||||||||
Medtronic | ||||||||||
4.625%, 03/15/2045 | 82 | 102 | ||||||||
4.375%, 03/15/2035 | 394 | 459 | ||||||||
3.500%, 03/15/2025 | 45 | 48 | ||||||||
2.750%, 04/01/2023 | 100 | 102 | ||||||||
Memorial Sloan-Kettering Cancer Center | ||||||||||
4.200%, 07/01/2055 | 50 | 58 | ||||||||
Merck | ||||||||||
4.150%, 05/18/2043 | 100 | 113 | ||||||||
4.000%, 03/07/2049 | 65 | 73 | ||||||||
3.900%, 03/07/2039 | 150 | 167 | ||||||||
3.700%, 02/10/2045 | 50 | 53 | ||||||||
3.400%, 03/07/2029 | 200 | 213 | ||||||||
2.900%, 03/07/2024 | 45 | 46 | ||||||||
2.800%, 05/18/2023 | 100 | 102 | ||||||||
2.750%, 02/10/2025 | 100 | 102 | ||||||||
| Adviser Managed Trust / Annual Report / July 31, 2019 | 41 |
SCHEDULE OF INVESTMENTS
July 31, 2019
Tactical Offensive Fixed Income Fund(Continued)
| Description | Face Amount (Thousands) | Market Value ($ Thousands) | ||||||||
CORPORATE OBLIGATIONS (continued) |
| |||||||||
2.350%, 02/10/2022 | $ | 100 | $ | 101 | ||||||
Molina Healthcare | ||||||||||
5.375%, 11/15/2022 | 75 | 78 | ||||||||
Mount Sinai Hospitals Group | ||||||||||
3.981%, 07/01/2048 | 250 | 257 | ||||||||
MPH Acquisition Holdings | ||||||||||
7.125%, 06/01/2024 (A) | 290 | 281 | ||||||||
Mylan | ||||||||||
5.250%, 06/15/2046 | 365 | 375 | ||||||||
5.200%, 04/15/2048 | 50 | 51 | ||||||||
4.550%, 04/15/2028 | 250 | 263 | ||||||||
3.950%, 06/15/2026 | 100 | 102 | ||||||||
3.150%, 06/15/2021 | 400 | 403 | ||||||||
Northwell Healthcare | ||||||||||
4.260%, 11/01/2047 | 100 | 107 | ||||||||
Novartis Capital | ||||||||||
4.400%, 05/06/2044 | 50 | 59 | ||||||||
4.000%, 11/20/2045 | 100 | 112 | ||||||||
3.400%, 05/06/2024 | 100 | 105 | ||||||||
3.100%, 05/17/2027 | 230 | 241 | ||||||||
3.000%, 11/20/2025 | 100 | 103 | ||||||||
2.400%, 05/17/2022 | 250 | 251 | ||||||||
NYU Langone Hospitals | ||||||||||
4.368%, 07/01/2047 | 25 | 28 | ||||||||
Par Pharmaceutical | ||||||||||
7.500%, 04/01/2027 (A) | 295 | 268 | ||||||||
Partners Healthcare System | ||||||||||
3.765%, 07/01/2048 | 100 | 103 | ||||||||
Pfizer | ||||||||||
7.200%, 03/15/2039 | 50 | 77 | ||||||||
4.400%, 05/15/2044 | 50 | 58 | ||||||||
4.200%, 09/15/2048 | 400 | 450 | ||||||||
4.125%, 12/15/2046 | 65 | 72 | ||||||||
4.100%, 09/15/2038 | 300 | 333 | ||||||||
4.000%, 03/15/2049 | 100 | 109 | ||||||||
3.900%, 03/15/2039 | 25 | 27 | ||||||||
3.450%, 03/15/2029 | 100 | 106 | ||||||||
3.400%, 05/15/2024 | 50 | 53 | ||||||||
3.000%, 12/15/2026 | 100 | 103 | ||||||||
2.950%, 03/15/2024 | 100 | 103 | ||||||||
2.800%, 03/11/2022 | 65 | 66 | ||||||||
2.750%, 06/03/2026 | 50 | 51 | ||||||||
2.200%, 12/15/2021 | 100 | 100 | ||||||||
1.950%, 06/03/2021 | 50 | 50 | ||||||||
Polaris Intermediate | ||||||||||
8.500% cash/9.250% PIK, 12/01/2022 (A) | 250 | 231 | ||||||||
Prestige Brands | ||||||||||
6.375%, 03/01/2024 (A) | 115 | 119 | ||||||||
Providence St. Joseph Health Obligated Group | ||||||||||
3.930%, 10/01/2048 | 180 | 190 | ||||||||
| Description | Face Amount (Thousands) | Market Value ($ Thousands) | ||||||||
CORPORATE OBLIGATIONS (continued) |
| |||||||||
Quest Diagnostics | ||||||||||
4.200%, 06/30/2029 | $ | 50 | $ | 54 | ||||||
3.500%, 03/30/2025 | 100 | 104 | ||||||||
RegionalCare Hospital Partners Holdings | ||||||||||
9.750%, 12/01/2026 (A) | 275 | 292 | ||||||||
8.250%, 05/01/2023 (A) | 212 | 226 | ||||||||
Sanofi | ||||||||||
4.000%, 03/29/2021 | 50 | 51 | ||||||||
3.625%, 06/19/2028 | 100 | 108 | ||||||||
3.375%, 06/19/2023 | 200 | 208 | ||||||||
Select Medical | ||||||||||
6.250%, 08/15/2026 (A) | 168 | 171 | ||||||||
Shire Acquisitions Investments Ireland DAC | ||||||||||
3.200%, 09/23/2026 | 50 | 51 | ||||||||
2.400%, 09/23/2021 | 100 | 100 | ||||||||
SSM Health Care | ||||||||||
3.688%, 06/01/2023 | 50 | 52 | ||||||||
Stryker | ||||||||||
4.625%, 03/15/2046 | 30 | 35 | ||||||||
3.500%, 03/15/2026 | 25 | 26 | ||||||||
3.375%, 05/15/2024 | 100 | 104 | ||||||||
3.375%, 11/01/2025 | 100 | 106 | ||||||||
Takeda Pharmaceutical | ||||||||||
5.000%, 11/26/2028 (A) | 250 | 287 | ||||||||
4.400%, 11/26/2023 (A) | 250 | 267 | ||||||||
3.800%, 11/26/2020 (A) | 300 | 305 | ||||||||
Team Health Holdings | ||||||||||
6.375%, 02/01/2025 (A) | 210 | 171 | ||||||||
Teleflex | ||||||||||
4.625%, 11/15/2027 | 156 | 162 | ||||||||
Tenet Healthcare | ||||||||||
6.750%, 06/15/2023 | 366 | 376 | ||||||||
6.250%, 02/01/2027 (A) | 115 | 119 | ||||||||
5.125%, 05/01/2025 | 425 | 423 | ||||||||
4.625%, 07/15/2024 | 350 | 356 | ||||||||
Thermo Fisher Scientific | ||||||||||
4.150%, 02/01/2024 | 50 | 54 | ||||||||
4.100%, 08/15/2047 | 50 | 54 | ||||||||
3.600%, 08/15/2021 | 100 | 102 | ||||||||
3.200%, 08/15/2027 | 50 | 51 | ||||||||
3.150%, 01/15/2023 | 100 | 102 | ||||||||
2.950%, 09/19/2026 | 105 | 106 | ||||||||
Toledo Hospital | ||||||||||
6.015%, 11/15/2048 | 225 | 261 | ||||||||
5.750%, 11/15/2038 | 225 | 263 | ||||||||
UnitedHealth Group | ||||||||||
6.875%, 02/15/2038 | 100 | 145 | ||||||||
4.750%, 07/15/2045 | 50 | 59 | ||||||||
4.625%, 07/15/2035 | 100 | 117 | ||||||||
4.375%, 03/15/2042 | 50 | 56 | ||||||||
4.250%, 04/15/2047 | 31 | 34 | ||||||||
4.250%, 06/15/2048 | 300 | 331 | ||||||||
| 42 | Adviser Managed Trust / Annual Report / July 31, 2019 |
| Description | Face Amount (Thousands) | Market Value ($ Thousands) | ||||||||
CORPORATE OBLIGATIONS (continued) |
| |||||||||
4.200%, 01/15/2047 | $ | 25 | $ | 27 | ||||||
3.875%, 10/15/2020 | 100 | 102 | ||||||||
3.875%, 08/15/2059 | 100 | 101 | ||||||||
3.850%, 06/15/2028 | 300 | 325 | ||||||||
3.750%, 07/15/2025 | 50 | 53 | ||||||||
3.750%, 10/15/2047 | 50 | 51 | ||||||||
3.700%, 08/15/2049 | 65 | 66 | ||||||||
3.500%, 08/15/2039 | 60 | 60 | ||||||||
3.450%, 01/15/2027 | 50 | 53 | ||||||||
3.375%, 04/15/2027 | 50 | 52 | ||||||||
2.950%, 10/15/2027 | 50 | 51 | ||||||||
2.875%, 08/15/2029 | 75 | 75 | ||||||||
2.375%, 08/15/2024 | 70 | 70 | ||||||||
WellCare Health Plans | ||||||||||
5.375%, 08/15/2026 (A) | 250 | 264 | ||||||||
5.250%, 04/01/2025 | 160 | 166 | ||||||||
West Street | ||||||||||
6.375%, 09/01/2025 (A) | 207 | 190 | ||||||||
Wyeth | ||||||||||
5.950%, 04/01/2037 | 100 | 134 | ||||||||
Zimmer Biomet Holdings | ||||||||||
3.700%, 03/19/2023 | 55 | 57 | ||||||||
3.550%, 04/01/2025 | 100 | 103 | ||||||||
Zoetis | ||||||||||
4.500%, 11/13/2025 | 50 | 55 | ||||||||
3.950%, 09/12/2047 | 100 | 101 | ||||||||
3.450%, 11/13/2020 | 25 | 25 | ||||||||
3.000%, 09/12/2027 | 50 | 51 | ||||||||
| 47,482 | ||||||||||
Industrials — 2.6% |
| |||||||||
3M MTN | ||||||||||
4.000%, 09/14/2048 | 300 | 323 | ||||||||
3.375%, 03/01/2029 | 300 | 317 | ||||||||
3.125%, 09/19/2046 | 100 | 94 | ||||||||
3.000%, 08/07/2025 | 50 | 52 | ||||||||
2.750%, 03/01/2022 | 300 | 304 | ||||||||
2.250%, 03/15/2023 | 285 | 284 | ||||||||
ABB Finance USA | ||||||||||
3.800%, 04/03/2028 | 250 | 273 | ||||||||
3.375%, 04/03/2023 | 50 | 51 | ||||||||
2.875%, 05/08/2022 | 50 | 51 | ||||||||
ADT Security | ||||||||||
4.875%, 07/15/2032 (A) | 150 | 130 | ||||||||
AEC0M | ||||||||||
5.875%, 10/15/2024 | 150 | 162 | ||||||||
5.125%, 03/15/2027 | 200 | 209 | ||||||||
AerCap Ireland Capital | ||||||||||
4.625%, 10/30/2020 | 150 | 153 | ||||||||
4.500%, 05/15/2021 | 150 | 155 | ||||||||
3.950%, 02/01/2022 | 275 | 282 | ||||||||
3.500%, 01/15/2025 | 150 | 152 | ||||||||
| Description | Face Amount (Thousands) | Market Value ($ Thousands) | ||||||||
CORPORATE OBLIGATIONS (continued) |
| |||||||||
AerCap Ireland Capital DAC | ||||||||||
4.450%, 12/16/2021 | $ | 200 | $ | 207 | ||||||
4.450%, 10/01/2025 | 200 | 211 | ||||||||
Ahern Rentals | ||||||||||
7.375%, 05/15/2023 (A) | 138 | 119 | ||||||||
Air Lease | ||||||||||
3.750%, 02/01/2022 | 100 | 102 | ||||||||
3.375%, 06/01/2021 | 35 | 36 | ||||||||
2.750%, 01/15/2023 | 100 | 100 | ||||||||
Air Lease MTN | ||||||||||
3.750%, 06/01/2026 | 350 | 361 | ||||||||
Aircastle | ||||||||||
5.500%, 02/15/2022 | 30 | 32 | ||||||||
5.125%, 03/15/2021 | 30 | 31 | ||||||||
5.000%, 04/01/2023 | 30 | 32 | ||||||||
4.250%, 06/15/2026 | 35 | 35 | ||||||||
4.125%, 05/01/2024 | 30 | 31 | ||||||||
Allegion US Holding | ||||||||||
3.550%, 10/01/2027 | 50 | 50 | ||||||||
3.200%, 10/01/2024 | 50 | 51 | ||||||||
Allison Transmission | ||||||||||
5.875%, 06/01/2029 (A) | 34 | 36 | ||||||||
5.000%, 10/01/2024 (A) | 195 | 198 | ||||||||
American Airlines Group | ||||||||||
5.000%, 06/01/2022 (A) | 169 | 174 | ||||||||
American Airlines Pass-Through Trust, Ser 2015-2, CI AA | ||||||||||
3.600%, 09/22/2027 | 86 | 89 | ||||||||
American Airlines Pass-Through Trust, Ser 2016-3, CI AA | ||||||||||
3.000%, 10/15/2028 | 90 | 90 | ||||||||
American Builders & Contractors Supply | ||||||||||
5.875%, 05/15/2026 (A) | 100 | 106 | ||||||||
Aptim | ||||||||||
7.750%, 06/15/2025 (A) | 150 | 111 | ||||||||
Arconic | ||||||||||
5.125%, 10/01/2024 | 300 | 320 | ||||||||
ARD Finance | ||||||||||
7.125% cash/7.875% PIK, 09/15/2023 | 200 | 206 | ||||||||
Ardagh Packaging Finance | ||||||||||
6.000%, 02/15/2025 (A) | 350 | 361 | ||||||||
4.250%, 09/15/2022 (A) | 200 | 203 | ||||||||
BBA US Holdings | ||||||||||
5.375%, 05/01/2026 (A) | 40 | 42 | ||||||||
BCD Acquisition | ||||||||||
9.625%, 09/15/2023 (A) | 125 | 130 | ||||||||
Beacon Roofing Supply | ||||||||||
4.875%, 11/01/2025 (A) | 250 | 247 | ||||||||
Boeing | ||||||||||
3.750%, 02/01/2050 | 50 | 50 | ||||||||
3.625%, 03/01/2048 | 20 | 20 | ||||||||
3.550%, 03/01/2038 | 330 | 333 | ||||||||
| Adviser Managed Trust / Annual Report / July 31, 2019 | | 43 | |
SCHEDULE OF INVESTMENTS
July 31, 2019
Tactical Offensive Fixed Income Fund(Continued)
| Description | Face Amount (Thousands) | Market Value ($ Thousands) | ||||||
CORPORATE OBLIGATIONS (continued) |
| |||||||
3.500%, 03/01/2039 | $ | 325 | $ | 325 | ||||
3.250%, 03/01/2028 | 50 | 52 | ||||||
3.200%, 03/01/2029 | 225 | 231 | ||||||
2.950%, 02/01/2030 | 100 | 100 | ||||||
2.800%, 03/01/2023 | 50 | 51 | ||||||
2.800%, 03/01/2024 | 25 | 25 | ||||||
2.800%, 03/01/2027 | 50 | 50 | ||||||
2.300%, 08/01/2021 | 55 | 55 | ||||||
Bombardier | ||||||||
7.875%, 04/15/2027 (A) | 406 | 411 | ||||||
7.500%, 12/01/2024 (A) | 89 | 92 | ||||||
7.500%, 03/15/2025 (A) | 560 | 569 | ||||||
Brand Industrial Services | ||||||||
8.500%, 07/15/2025 (A) | 178 | 156 | ||||||
Brink’s | ||||||||
4.625%, 10/15/2027 (A) | 97 | 99 | ||||||
Builders FirstSource | ||||||||
5.625%, 09/01/2024 (A) | 130 | 135 | ||||||
Burlington Northern Santa Fe |
| |||||||
4.900%, 04/01/2044 | 50 | 60 | ||||||
4.550%, 09/01/2044 | 100 | 116 | ||||||
4.150%, 04/01/2045 | 50 | 55 | ||||||
4.150%, 12/15/2048 | 255 | 285 | ||||||
4.050%, 06/15/2048 | 265 | 290 | ||||||
3.550%, 02/15/2050 | 200 | 202 | ||||||
3.400%, 09/01/2024 | 50 | 52 | ||||||
3.000%, 04/01/2025 | 100 | 103 | ||||||
BWAY Holding | ||||||||
7.250%, 04/15/2025 (A) | 245 | 232 | ||||||
5.500%, 04/15/2024 (A) | 270 | 270 | ||||||
Canadian National Railway | ||||||||
3.200%, 08/02/2046 | 50 | 49 | ||||||
2.950%, 11/21/2024 | 50 | 51 | ||||||
Canadian Pacific Railway | ||||||||
6.125%, 09/15/2115 | 30 | 42 | ||||||
4.800%, 09/15/2035 | 20 | 23 | ||||||
Carlisle | ||||||||
3.750%, 12/01/2027 | 50 | 51 | ||||||
Caterpillar | ||||||||
4.300%, 05/15/2044 | 100 | 114 | ||||||
3.400%, 05/15/2024 | 350 | 367 | ||||||
Caterpillar Financial Services | ||||||||
1.700%, 08/09/2021 | 50 | 50 | ||||||
Caterpillar Financial Services MTN | ||||||||
3.350%, 12/07/2020 | 50 | 51 | ||||||
2.950%, 02/26/2022 | 300 | 305 | ||||||
2.400%, 06/06/2022 | 100 | 100 | ||||||
1.850%, 09/04/2020 | 100 | 100 | ||||||
Cintas No. 2 | ||||||||
3.700%, 04/01/2027 | 50 | 53 | ||||||
2.900%, 04/01/2022 | 50 | 51 | ||||||
| Description | Face Amount (Thousands) | Market Value ($ Thousands) | ||||||
CORPORATE OBLIGATIONS (continued) |
| |||||||
Clean Harbors | ||||||||
4.875%, 07/15/2027 (A) | $ | 120 | $ | 123 | ||||
Cloud Crane | ||||||||
10.125%, 08/01/2024 (A) | 145 | 155 | ||||||
CNH Industrial MTN | ||||||||
3.850%, 11/15/2027 | 35 | 36 | ||||||
CNH Industrial Capital | ||||||||
4.875%, 04/01/2021 | 25 | 26 | ||||||
4.375%, 11/06/2020 | 35 | 36 | ||||||
4.375%, 04/05/2022 | 25 | 26 | ||||||
3.875%, 10/15/2021 | 20 | 20 | ||||||
Colfax | ||||||||
6.000%, 02/15/2024 (A) | 120 | 127 | ||||||
Core & Main | ||||||||
6.125%, 08/15/2025 (A) | 95 | 98 | ||||||
CSX | ||||||||
4.650%, 03/01/2068 | 250 | 269 | ||||||
4.300%, 03/01/2048 | 250 | 272 | ||||||
4.250%, 11/01/2066 | 50 | 51 | ||||||
4.100%, 03/15/2044 | 75 | 79 | ||||||
3.800%, 03/01/2028 | 50 | 54 | ||||||
3.800%, 11/01/2046 | 50 | 51 | ||||||
3.400%, 08/01/2024 | 50 | 52 | ||||||
3.250%, 06/01/2027 | 50 | 51 | ||||||
2.600%, 11/01/2026 | 50 | 50 | ||||||
Deere | ||||||||
3.900%, 06/09/2042 | 100 | 111 | ||||||
2.600%, 06/08/2022 | 350 | 353 | ||||||
Delta Air Lines | ||||||||
4.375%, 04/19/2028 | 50 | 52 | ||||||
3.800%, 04/19/2023 | 30 | 31 | ||||||
3.625%, 03/15/2022 | 50 | 51 | ||||||
2.600%, 12/04/2020 | 45 | 45 | ||||||
Dover | ||||||||
5.375%, 03/01/2041 | 100 | 119 | ||||||
Eaton | ||||||||
4.000%, 11/02/2032 | 50 | 55 | ||||||
2.750%, 11/02/2022 | 50 | 51 | ||||||
Emerson Electric | ||||||||
2.625%, 02/15/2023 | 75 | 77 | ||||||
Equifax | ||||||||
2.300%, 06/01/2021 | 50 | 50 | ||||||
FedEx | ||||||||
5.100%, 01/15/2044 | 50 | 55 | ||||||
4.400%, 01/15/2047 | 50 | 51 | ||||||
4.200%, 10/17/2028 | 100 | 110 | ||||||
4.050%, 02/15/2048 | 50 | 49 | ||||||
3.900%, 02/01/2035 | 100 | 102 | ||||||
3.400%, 02/15/2028 | 50 | 52 | ||||||
3.100%, 08/05/2029 | 350 | 346 | ||||||
Flex Acquisition | ||||||||
7.875%, 07/15/2026 (A) | 80 | 73 | ||||||
| 44 | Adviser Managed Trust / Annual Report / July 31, 2019 |
| Description | Face Amount (Thousands) | Market Value ($ Thousands) | ||||||
CORPORATE OBLIGATIONS (continued) |
| |||||||
6.875%, 01/15/2025 (A) | $ | 60 | $ | 53 | ||||
Fluor | ||||||||
3.500%, 12/15/2024 | 100 | 102 | ||||||
Fortress Transportation & Infrastructure Investors | ||||||||
6.750%, 03/15/2022 (A) | 125 | 130 | ||||||
FXI Holdings | ||||||||
7.875%, 11/01/2024 (A) | 75 | 67 | ||||||
GATX | ||||||||
3.250%, 09/15/2026 | 100 | 100 | ||||||
GE Capital International Funding | ||||||||
4.418%, 11/15/2035 | 1,151 | 1,164 | ||||||
2.342%, 11/15/2020 | 350 | 348 | ||||||
General Dynamics | ||||||||
3.750%, 05/15/2028 | 200 | 219 | ||||||
3.500%, 05/15/2025 | 200 | 212 | ||||||
3.000%, 05/11/2021 | 250 | 254 | ||||||
2.375%, 11/15/2024 | 100 | 100 | ||||||
2.250%,11/15/2022 | 100 | 100 | ||||||
General Electric | ||||||||
6.750%, 03/15/2032 | 101 | 126 | ||||||
2.700%, 10/09/2022 | 75 | 75 | ||||||
General Electric MTN | ||||||||
6.875%, 01/10/2039 | 115 | 149 | ||||||
5.300%, 02/11/2021 | 125 | 130 | ||||||
GFL Environmental | ||||||||
8.500%, 05/01/2027(A) | 123 | 135 | ||||||
Grinding Media | ||||||||
7.375%, 12/15/2023 (A) | 200 | 191 | ||||||
H&E Equipment Services | ||||||||
5.625%, 09/01/2025 | 188 | 193 | ||||||
Harris | ||||||||
4.854%, 04/27/2035 | 35 | 40 | ||||||
4.400%, 06/15/2028 | 150 | 165 | ||||||
3.832%, 04/27/2025 | 50 | 53 | ||||||
Harsco | ||||||||
5.750%, 07/31/2027 (A) | 70 | 72 | ||||||
Herc Holdings | ||||||||
5.500%, 07/15/2027 (A) | 250 | 250 | ||||||
Hertz | ||||||||
7.625%, 06/01/2022 (A) | 250 | 259 | ||||||
7.125%, 08/01/2026 (A) | 85 | 87 | ||||||
5.500%, 10/15/2024 (A) | 140 | 138 | ||||||
Honeywell International | ||||||||
2.700%, 08/15/2029 | 60 | 60 | ||||||
2.300%, 08/15/2024 | 100 | 100 | ||||||
2.150%, 08/08/2022 | 45 | 45 | ||||||
1.850%, 11/01/2021 | 50 | 50 | ||||||
Hubbell | ||||||||
3.500%, 02/15/2028 | 200 | 204 | ||||||
3.350%, 03/01/2026 | 50 | 51 | ||||||
| Description | Face Amount (Thousands) | Market Value ($ Thousands) | ||||||
CORPORATE OBLIGATIONS (continued) |
| |||||||
Icahn Enterprises | ||||||||
6.375%, 12/15/2025 | $ | 175 | $ | 183 | ||||
6.250%, 02/01/2022 | 200 | 205 | ||||||
6.250%, 05/15/2026 (A) | 242 | 250 | ||||||
IHS Markit | ||||||||
4.125%, 08/01/2023 | 25 | 26 | ||||||
Illinois Tool Works | ||||||||
3.500%, 03/01/2024 | 100 | 105 | ||||||
Ingersoll-Rand Global Holding | ||||||||
5.750%, 06/15/2043 | 50 | 63 | ||||||
4.250%, 06/15/2023 | 50 | 53 | ||||||
3.750%, 08/21/2028 | 200 | 211 | ||||||
JB Hunt Transport Services | ||||||||
3.300%, 08/15/2022 | 50 | 51 | ||||||
John Deere Capital | ||||||||
2.550%, 01/08/2021 | 100 | 100 | ||||||
John Deere Capital MTN | ||||||||
3.450%, 01/10/2024 | 300 | 313 | ||||||
3.350%, 06/12/2024 | 100 | 104 | ||||||
2.800%, 03/06/2023 | 100 | 102 | ||||||
2.650%, 01/06/2022 | 100 | 101 | ||||||
2.650%, 06/24/2024 | 50 | 51 | ||||||
2.350%, 01/08/2021 | 300 | 301 | ||||||
Johnson Controls International | ||||||||
5.125%, 09/14/2045 | 28 | 31 | ||||||
4.950%, 07/02/2064 (D) | 18 | 18 | ||||||
4.625%, 07/02/2044 | 100 | 103 | ||||||
3.625%, 07/02/2024 (D) | 47 | 49 | ||||||
Kansas City Southern | ||||||||
4.950%, 08/15/2045 | 100 | 114 | ||||||
KAR Auction Services | ||||||||
5.125%, 06/01/2025 (A) | 200 | 206 | ||||||
L3Harris Technologies | ||||||||
4.950%, 02/15/2021 (A) | 100 | 103 | ||||||
3.850%, 06/15/2023 (A) | 200 | 209 | ||||||
LABL Escrow Issuer | ||||||||
10.500%, 07/15/2027 (A) | 225 | 227 | ||||||
6.750%, 07/15/2026 (A) | 115 | 117 | ||||||
Lockheed Martin | ||||||||
4.700%, 05/15/2046 | 100 | 121 | ||||||
4.500%, 05/15/2036 | 100 | 116 | ||||||
3.800%, 03/01/2045 | 100 | 106 | ||||||
3.550%, 01/15/2026 | 100 | 107 | ||||||
2.900%, 03/01/2025 | 25 | 26 | ||||||
2.500%, 11/23/2020 | 100 | 100 | ||||||
Masco | ||||||||
4.375%, 04/01/2026 | 50 | 53 | ||||||
3.500%, 04/01/2021 | 65 | 66 | ||||||
Masonite International | ||||||||
5.625%, 03/15/2023 (A) | 63 | 65 | ||||||
5.375%, 02/01/2028 (A) | 110 | 113 | ||||||
| Adviser Managed Trust / Annual Report / July 31, 2019 | | 45 | |
SCHEDULE OF INVESTMENTS
July 31, 2019
Tactical Offensive Fixed Income Fund(Continued)
| Description | Face Amount (Thousands) | Market Value ($ Thousands) | ||||||||
CORPORATE OBLIGATIONS (continued) |
| |||||||||
Navistar International | ||||||||||
6.625%, 11/01/2025 (A) | $ | 226 | $ | 232 | ||||||
NCI Building Systems | ||||||||||
8.000%, 04/15/2026 (A) | 155 | 151 | ||||||||
Nielsen Luxembourg SARL | ||||||||||
5.000%, 02/01/2025 (A) | 100 | 96 | ||||||||
Norfolk Southern | ||||||||||
5.100%, 08/01/2118 | 50 | 58 | ||||||||
4.450%, 06/15/2045 | 100 | 112 | ||||||||
4.100%, 05/15/2049 | 50 | 54 | ||||||||
3.950%, 10/01/2042 | 100 | 104 | ||||||||
3.942%, 11/01/2047 | 95 | 99 | ||||||||
3.800%, 08/01/2028 | 25 | 27 | ||||||||
3.250%, 12/01/2021 | 75 | 76 | ||||||||
2.900%, 06/15/2026 | 35 | 36 | ||||||||
Northrop Grumman | ||||||||||
4.750%, 06/01/2043 | 25 | 29 | ||||||||
4.030%, 10/15/2047 | 75 | 80 | ||||||||
3.850%, 04/15/2045 | 100 | 104 | ||||||||
3.250%, 08/01/2023 | 50 | 52 | ||||||||
3.250%, 01/15/2028 | 65 | 67 | ||||||||
2.080%, 10/15/2020 | 60 | 60 | ||||||||
Novelis | ||||||||||
6.250%, 08/15/2024 (A) | 242 | 254 | ||||||||
5.875%, 09/30/2026 (A) | 250 | 259 | ||||||||
Oshkosh | ||||||||||
4.600%, 05/15/2028 | 200 | 211 | ||||||||
Owens Corning | ||||||||||
4.300%, 07/15/2047 | 50 | 43 | ||||||||
4.200%, 12/01/2024 | 100 | 104 | ||||||||
PACCAR Financial MTN | ||||||||||
2.800%, 03/01/2021 | 35 | 35 | ||||||||
2.650%, 05/10/2022 | 100 | 101 | ||||||||
2.300%, 08/10/2022 | 50 | 50 | ||||||||
Parker-Hannifin | ||||||||||
4.000%, 06/14/2049 | 20 | 21 | ||||||||
3.250%, 06/14/2029 | 20 | 21 | ||||||||
2.700%, 06/14/2024 | 15 | 15 | ||||||||
Parker-Hannifin MTN | ||||||||||
4.200%, 11/21/2034 | 135 | 150 | ||||||||
Pitney Bowes | ||||||||||
3.875%, 10/01/2021 | 200 | 195 | ||||||||
Plastipak Holdings | ||||||||||
6.250%, 10/15/2025 (A) | 150 | 135 | ||||||||
Raytheon | ||||||||||
3.125%, 10/15/2020 | 100 | 101 | ||||||||
2.500%, 12/15/2022 | 100 | 101 | ||||||||
RBS Global | ||||||||||
4.875%, 12/15/2025 (A) | 87 | 88 | ||||||||
Republic Services | ||||||||||
3.550%, 06/01/2022 | 50 | 51 | ||||||||
2.900%, 07/01/2026 | 100 | 101 | ||||||||
| Description | Face Amount (Thousands) | Market Value ($ Thousands) | ||||||||
CORPORATE OBLIGATIONS (continued) |
| |||||||||
2.500%, 08/15/2024 | $ | 95 | $ | 95 | ||||||
Rockwell Automation | ||||||||||
3.500%, 03/01/2029 | 85 | 91 | ||||||||
Rockwell Collins | ||||||||||
4.350%, 04/15/2047 | 25 | 28 | ||||||||
3.200%, 03/15/2024 | 50 | 51 | ||||||||
2.800%, 03/15/2022 | 50 | 51 | ||||||||
Roper Technologies | ||||||||||
4.200%, 09/15/2028 | 200 | 217 | ||||||||
3.850%, 12/15/2025 | 25 | 26 | ||||||||
3.800%, 12/15/2026 | 150 | 158 | ||||||||
3.000%, 12/15/2020 | 100 | 101 | ||||||||
Ryder System MTN | ||||||||||
3.650%, 03/18/2024 | 100 | 105 | ||||||||
2.875%, 09/01/2020 | 50 | 50 | ||||||||
2.875%, 06/01/2022 | 40 | 40 | ||||||||
Sensata Technologies | ||||||||||
5.000%, 10/01/2025 (A) | 140 | 147 | ||||||||
Sensata Technologies UK Financing | ||||||||||
6.250%, 02/15/2026 (A) | 200 | 212 | ||||||||
Snap-on | ||||||||||
4.100%, 03/01/2048 | 40 | 44 | ||||||||
Spirit AeroSystems | ||||||||||
3.850%, 06/15/2026 | 25 | 25 | ||||||||
Stanley Black & Decker | ||||||||||
3.400%, 03/01/2026 | 70 | 73 | ||||||||
2.900%, 11/01/2022 | 100 | 102 | ||||||||
Stericycle | ||||||||||
5.375%, 07/15/2024 (A) | 61 | 64 | ||||||||
Terex | ||||||||||
5.625%, 02/01/2025 (A) | 105 | 105 | ||||||||
Tervita Escrow | ||||||||||
7.625%, 12/01/2021 (A) | 150 | 153 | ||||||||
Textron | ||||||||||
3.375%, 03/01/2028 | 100 | 101 | ||||||||
Timken | ||||||||||
4.500%, 12/15/2028 | 200 | 209 | ||||||||
Titan Acquisition | ||||||||||
7.750%, 04/15/2026 (A) | 103 | 93 | ||||||||
TransDigm | ||||||||||
7.500%, 03/15/2027 (A) | 265 | 280 | ||||||||
6.500%, 05/15/2025 | 25 | 26 | ||||||||
6.375%, 06/15/2026 | 100 | 102 | ||||||||
6.250%, 03/15/2026 (A) | 830 | 870 | ||||||||
Trivium Packaging Finance BV | ||||||||||
5.500%, 08/15/2026 (A) | 200 | 206 | ||||||||
Tutor Perini | ||||||||||
6.875%, 05/01/2025 (A) | 85 | 83 | ||||||||
Union Pacific | ||||||||||
4.500%, 09/10/2048 | 200 | 226 | ||||||||
4.300%, 03/01/2049 | 300 | 330 | ||||||||
4.163%, 07/15/2022 | 100 | 105 | ||||||||
| 46 | Adviser Managed Trust / Annual Report / July 31, 2019 |
| Description | Face Amount (Thousands) | Market Value ($ Thousands) | ||||||||
CORPORATE OBLIGATIONS (continued) |
| |||||||||
4.050%, 03/01/2046 | $ | 50 | $ | 52 | ||||||
4.000%, 04/15/2047 | 50 | 52 | ||||||||
3.950%, 09/10/2028 | 300 | 328 | ||||||||
3.875%, 02/01/2055 | 100 | 98 | ||||||||
3.799%, 10/01/2051 | 55 | 56 | ||||||||
3.700%, 03/01/2029 | 125 | 134 | ||||||||
3.600%, 09/15/2037 | 20 | 20 | ||||||||
3.000%, 04/15/2027 | 50 | 51 | ||||||||
United Airlines Pass-Through Trust, | ||||||||||
4.300%, 08/15/2025 | 39 | 41 | ||||||||
United Airlines Pass-Through Trust, Ser 2016-1, CI AA | ||||||||||
3.100%, 07/07/2028 | 45 | 45 | ||||||||
United Airlines Pass-Through Trust, Ser 2016-2, CI AA | ||||||||||
2.875%, 10/07/2028 | 92 | 92 | ||||||||
United Parcel Service | ||||||||||
6.200%, 01/15/2038 | 50 | 69 | ||||||||
4.250%, 03/15/2049 | 100 | 113 | ||||||||
3.750%, 11/15/2047 | 50 | 52 | ||||||||
3.400%, 03/15/2029 | 65 | 69 | ||||||||
3.400%, 11/15/2046 | 50 | 49 | ||||||||
3.125%, 01/15/2021 | 50 | 51 | ||||||||
3.050%, 11/15/2027 | 50 | 52 | ||||||||
2.800%, 11/15/2024 | 50 | 51 | ||||||||
2.500%, 04/01/2023 | 50 | 50 | ||||||||
2.400%, 11/15/2026 | 50 | 50 | ||||||||
2.350%, 05/16/2022 | 50 | 50 | ||||||||
2.050%, 04/01/2021 | 50 | 50 | ||||||||
United Rentals North America |
| |||||||||
6.500%, 12/15/2026 | 650 | 707 | ||||||||
5.500%, 07/15/2025 | 325 | 338 | ||||||||
5.500%, 05/15/2027 | 140 | 147 | ||||||||
5.250%, 01/15/2030 | 103 | 105 | ||||||||
4.875%, 01/15/2028 | 154 | 157 | ||||||||
4.625%, 07/15/2023 | 185 | 189 | ||||||||
United Technologies | ||||||||||
4.625%, 11/16/2048 | 25 | 30 | ||||||||
4.500%, 06/01/2042 | 100 | 115 | ||||||||
4.450%, 11/16/2038 | 420 | 482 | ||||||||
4.125%, 11/16/2028 | 30 | 33 | ||||||||
3.950%, 08/16/2025 | 15 | 16 | ||||||||
3.650%, 08/16/2023 | 320 | 335 | ||||||||
3.350%, 08/16/2021 | 310 | 316 | ||||||||
3.125%, 05/04/2027 | 100 | 103 | ||||||||
3.100%, 06/01/2022 | 75 | 77 | ||||||||
Verisk Analytics | ||||||||||
5.500%, 06/15/2045 | 100 | 118 | ||||||||
4.125%, 03/15/2029 | 25 | 27 | ||||||||
Vertiv Group | ||||||||||
9.250%, 10/15/2024 (A) | 140 | 132 | ||||||||
| Description | Face Amount (Thousands) | Market Value ($ Thousands) | ||||||||
CORPORATE OBLIGATIONS (continued) |
| |||||||||
Vertiv Intermediate Holding | ||||||||||
12.000% cash/13.000% PIK, 02/15/2022 (A) | $ | 90 | $ | 85 | ||||||
Voyager Aviation Holdings | ||||||||||
8.500%, 08/15/2021 (A) | 100 | 103 | ||||||||
Wabtec | ||||||||||
4.950%, 09/15/2028 | 300 | 324 | ||||||||
3.450%, 11/15/2026 | 100 | 100 | ||||||||
Waste Connections | ||||||||||
3.500%, 05/01/2029 | 50 | 52 | ||||||||
Waste Management | ||||||||||
4.150%, 07/15/2049 | 65 | 72 | ||||||||
4.100%, 03/01/2045 | 50 | 55 | ||||||||
4.000%, 07/15/2039 | 70 | 76 | ||||||||
3.450%, 06/15/2029 | 50 | 52 | ||||||||
3.150%, 11/15/2027 | 50 | 52 | ||||||||
3.125%, 03/01/2025 | 50 | 52 | ||||||||
2.950%, 06/15/2024 | 30 | 31 | ||||||||
Waste Pro USA | ||||||||||
5.500%, 02/15/2026 (A) | 100 | 102 | ||||||||
WW Grainger | ||||||||||
4.600%, 06/15/2045 | 50 | 57 | ||||||||
4.200%, 05/15/2047 | 50 | 53 | ||||||||
XPO Logistics | ||||||||||
6.750%, 08/15/2024 (A) | 200 | 213 | ||||||||
6.500%, 06/15/2022 (A) | 117 | 119 | ||||||||
6.125%, 09/01/2023 (A) | 200 | 206 | ||||||||
Xylem | ||||||||||
4.375%, 11/01/2046 | 50 | 53 | ||||||||
|
|
| ||||||||
| 40,630 | ||||||||||
|
|
| ||||||||
Information Technology — 2.4% |
| |||||||||
Adobe | ||||||||||
3.250%, 02/01/2025 | 50 | 52 | ||||||||
Amkor Technology | ||||||||||
6.625%, 09/15/2027 (A) | 100 | 104 | ||||||||
Amphenol | ||||||||||
3.200%, 04/01/2024 | 100 | 103 | ||||||||
Analog Devices | ||||||||||
3.900%, 12/15/2025 | 100 | 106 | ||||||||
3.500%, 12/05/2026 | 50 | 51 | ||||||||
Apple | ||||||||||
4.500%, 02/23/2036 | 100 | 118 | ||||||||
4.375%, 05/13/2045 | 50 | 57 | ||||||||
4.250%, 02/09/2047 | 250 | 283 | ||||||||
3.850%, 05/04/2043 | 100 | 107 | ||||||||
3.850%, 08/04/2046 | 95 | 102 | ||||||||
3.750%, 09/12/2047 | 100 | 106 | ||||||||
3.750%, 11/13/2047 | 350 | 371 | ||||||||
3.350%, 02/09/2027 | 350 | 368 | ||||||||
3.250%, 02/23/2026 | 150 | 157 | ||||||||
3.200%, 05/11/2027 | 100 | 104 | ||||||||
| Adviser Managed Trust / Annual Report / July 31, 2019 | 47 |
SCHEDULE OF INVESTMENTS
July 31, 2019
Tactical Offensive Fixed Income Fund(Continued)
| Description | Face Amount (Thousands) | Market Value ($ Thousands) | ||||||
CORPORATE OBLIGATIONS (continued) |
| |||||||
3.000%, 06/20/2027 | $ | 100 | $ | 103 | ||||
2.850%, 05/06/2021 | 75 | 76 | ||||||
2.850%, 05/11/2024 | 350 | 359 | ||||||
2.500%, 02/09/2022 | 300 | 303 | ||||||
2.500%, 02/09/2025 | 75 | 76 | ||||||
2.450%, 08/04/2026 | 50 | 50 | ||||||
2.400%, 01/13/2023 | 100 | 101 | ||||||
2.400%, 05/03/2023 | 300 | 302 | ||||||
2.300%, 05/11/2022 | 300 | 301 | ||||||
2.250%, 02/23/2021 | 390 | 391 | ||||||
1.550%, 08/04/2021 | 100 | 99 | ||||||
Applied Materials | ||||||||
5.100%, 10/01/2035 | 35 | 43 | ||||||
4.350%, 04/01/2047 | 245 | 280 | ||||||
3.900%, 10/01/2025 | 35 | 38 | ||||||
3.300%, 04/01/2027 | 355 | 371 | ||||||
2.625%, 10/01/2020 | 50 | 50 | ||||||
Arrow Electronics | ||||||||
4.000%, 04/01/2025 | 100 | 102 | ||||||
3.250%, 09/08/2024 | 100 | 100 | ||||||
Autodesk | ||||||||
4.375%, 06/15/2025 | 100 | 107 | ||||||
Automatic Data Processing | ||||||||
3.375%, 09/15/2025 | 25 | 27 | ||||||
2.250%, 09/15/2020 | 50 | 50 | ||||||
Avnet | ||||||||
4.625%, 04/15/2026 | 25 | 27 | ||||||
3.750%, 12/01/2021 | 25 | 25 | ||||||
Broadcom | ||||||||
4.750%, 04/15/2029 (A) | 200 | 204 | ||||||
3.875%, 01/15/2027 | 150 | 147 | ||||||
3.625%, 01/15/2024 | 300 | 303 | ||||||
3.500%, 01/15/2028 | 250 | 235 | ||||||
3.125%, 01/15/2025 | 335 | 325 | ||||||
3.000%, 01/15/2022 | 200 | 201 | ||||||
2.650%, 01/15/2023 | 250 | 246 | ||||||
2.200%, 01/15/2021 | 250 | 248 | ||||||
C&W Senior Financing DAC | ||||||||
6.875%, 09/15/2027 (A) | 275 | 288 | ||||||
CA | ||||||||
4.700%, 03/15/2027 | 350 | 357 | ||||||
3.600%, 08/01/2020 | 50 | 50 | ||||||
Camelot Finance | ||||||||
7.875%, 10/15/2024 (A) | 76 | 79 | ||||||
CDK Global | ||||||||
5.875%, 06/15/2026 | 225 | 239 | ||||||
5.250%, 05/15/2029 (A) | 129 | 134 | ||||||
5.000%, 10/15/2024 | 10 | 11 | ||||||
4.875%, 06/01/2027 | 70 | 72 | ||||||
CDW | ||||||||
5.000%, 09/01/2023 | 131 | 133 | ||||||
5.000%, 09/01/2025 | 195 | 203 | ||||||
| Description | Face Amount (Thousands) | Market Value ($ Thousands) | ||||||
CORPORATE OBLIGATIONS (continued) |
| |||||||
Cisco Systems | ||||||||
5.900%, 02/15/2039 | $ | 100 | $ | 139 | ||||
5.500%, 01/15/2040 | 100 | 134 | ||||||
2.950%, 02/28/2026 | 100 | 104 | ||||||
2.500%, 09/20/2026 | 50 | 51 | ||||||
2.200%, 02/28/2021 | 50 | 50 | ||||||
CommScope | ||||||||
8.250%, 03/01/2027 (A) | 468 | 461 | ||||||
6.000%, 03/01/2026 (A) | 475 | 480 | ||||||
5.500%, 03/01/2024 (A) | 60 | 61 | ||||||
CommScope Technologies | ||||||||
6.000%, 06/15/2025 (A) | 82 | 74 | ||||||
5.000%, 03/15/2027 (A) | 65 | 55 | ||||||
Corning | ||||||||
4.375%, 11/15/2057 | 100 | 100 | ||||||
Dell International | ||||||||
8.350%, 07/15/2046 (A) | 100 | 127 | ||||||
8.100%, 07/15/2036 (A) | 350 | 440 | ||||||
7.125%, 06/15/2024 (A) | 450 | 476 | ||||||
6.020%, 06/15/2026 (A) | 100 | 111 | ||||||
5.875%, 06/15/2021 (A) | 171 | 174 | ||||||
5.450%, 06/15/2023 (A) | 115 | 124 | ||||||
5.300%, 10/01/2029 (A) | 100 | 106 | ||||||
4.900%, 10/01/2026 (A) | 100 | 105 | ||||||
4.420%, 06/15/2021 (A) | 400 | 411 | ||||||
4.000%, 07/15/2024 (A) | 50 | 52 | ||||||
DXC Technology | ||||||||
4.750%, 04/15/2027 | 100 | 107 | ||||||
Entegris | ||||||||
4.625%, 02/10/2026 (A) | 50 | 51 | ||||||
Exela Intermediate | ||||||||
10.000%, 07/15/2023 (A) | 200 | 164 | ||||||
Fidelity National Information Services | ||||||||
4.750%, 05/15/2048 | 250 | 283 | ||||||
4.500%, 08/15/2046 | 25 | 27 | ||||||
4.250%, 05/15/2028 | 240 | 263 | ||||||
3.625%, 10/15/2020 | 112 | 113 | ||||||
3.500%, 04/15/2023 | 53 | 55 | ||||||
3.000%, 08/15/2026 | 50 | 51 | ||||||
2.250%, 08/15/2021 | 53 | 53 | ||||||
First Data | ||||||||
5.750%, 01/15/2024 (A) | 200 | 206 | ||||||
5.375%, 08/15/2023 (A) | 200 | 205 | ||||||
5.000%, 01/15/2024 (A) | 100 | 103 | ||||||
Fiserv | ||||||||
4.400%, 07/01/2049 | 60 | 64 | ||||||
4.200%, 10/01/2028 | 200 | 218 | ||||||
3.800%, 10/01/2023 | 300 | 314 | ||||||
3.500%, 07/01/2029 | 65 | 66 | ||||||
3.200%, 07/01/2026 | 25 | 26 | ||||||
2.750%, 07/01/2024 | 100 | 101 | ||||||
| 48 | Adviser Managed Trust / Annual Report / July 31, 2019 |
| Description | Face Amount (Thousands) | Market Value ($ Thousands) | ||
CORPORATE OBLIGATIONS (continued) | ||||
Flex | ||||
4.750%, 06/15/2025 | $ 50 | $ 53 | ||
FLIR Systems | ||||
3.125%, 06/15/2021 | 50 | 50 | ||
Gartner | ||||
5.125%, 04/01/2025 (A) | 200 | 206 | ||
Genesys Telecommunications Laboratories | ||||
10.000%, 11/30/2024 (A) | 115 | 125 | ||
Genpact Luxembourg SARL | ||||
3.700%, 04/01/2022 | 100 | 100 | ||
Go Daddy Operating | ||||
5.250%, 12/01/2027 (A) | 122 | 127 | ||
GTT Communications | ||||
7.875%, 12/31/2024 (A) | 84 | 65 | ||
Harland Clarke Holdings | ||||
8.375%, 08/15/2022 (A) | 50 | 42 | ||
Hewlett Packard Enterprise | ||||
6.350%, 10/15/2045 | 50 | 56 | ||
6.200%, 10/15/2035 | 50 | 57 | ||
4.900%, 10/15/2025 | 100 | 110 | ||
4.400%, 10/15/2022 | 50 | 53 | ||
3.600%, 10/15/2020 | 50 | 51 | ||
Hughes Satellite Systems | ||||
6.625%, 08/01/2026 | 127 | 137 | ||
5.250%, 08/01/2026 | 169 | 179 | ||
IBM Credit | ||||
3.600%,11/30/2021 | 100 | 103 | ||
3.450%, 11/30/2020 | 300 | 305 | ||
1.800%, 01/20/2021 | 100 | 99 | ||
Infor US | ||||
6.500%, 05/15/2022 | 351 | 357 | ||
Informatica | ||||
7.125%, 07/15/2023 (A) | 101 | 103 | ||
Ingram Micro | ||||
5.450%, 12/15/2024 | 80 | 82 | ||
Intel | ||||
4.100%, 05/11/2047 | 250 | 278 | ||
3.734%, 12/08/2047 | 197 | 208 | ||
3.700%, 07/29/2025 | 45 | 48 | ||
3.300%, 10/01/2021 | 100 | 102 | ||
3.150%, 05/11/2027 | 200 | 210 | ||
2.875%, 05/11/2024 | 350 | 359 | ||
2.700%, 12/15/2022 | 50 | 51 | ||
2.600%, 05/19/2026 | 50 | 51 | ||
International Business Machines | ||||
4.250%, 05/15/2049 | 150 | 163 | ||
4.150%, 05/15/2039 | 100 | 108 | ||
4.000%, 06/20/2042 | 100 | 105 | ||
3.625%, 02/12/2024 | 50 | 52 | ||
3.500%, 05/15/2029 | 255 | 267 | ||
3.300%, 05/15/2026 | 150 | 156 | ||
3.000%, 05/15/2024 | 250 | 256 | ||
| Description | Face Amount (Thousands) | Market Value ($ Thousands) | ||
CORPORATE OBLIGATIONS (continued) | ||||
2.875%, 11/09/2022 | $ 100 | $ 102 | ||
2.850%, 05/13/2022 | 150 | 152 | ||
2.500%, 01/27/2022 | 400 | 401 | ||
2.250%, 02/19/2021 | 100 | 100 | ||
j2 Cloud Services | ||||
6.000%, 07/15/2025 (A) | 195 | 206 | ||
Jabil | ||||
3.950%, 01/12/2028 | 255 | 253 | ||
Keysight Technologies | ||||
4.600%, 04/06/2027 | 365 | 391 | ||
KLA-Tencor | ||||
4.100%, 03/15/2029 | 65 | 70 | ||
Lam Research | ||||
4.875%, 03/15/2049 | 25 | 29 | ||
4.000%, 03/15/2029 | 30 | 32 | ||
3.750%, 03/15/2026 | 50 | 53 | ||
Mastercard | ||||
3.650%, 06/01/2049 | 75 | 80 | ||
3.375%, 04/01/2024 | 100 | 105 | ||
2.950%, 06/01/2029 | 75 | 77 | ||
2.000%, 11/21/2021 | 90 | 90 | ||
Micron Technology | ||||
5.327%, 02/06/2029 | 300 | 319 | ||
Microsoft | ||||
4.500%, 10/01/2040 | 100 | 121 | ||
4.500%, 02/06/2057 | 300 | 366 | ||
4.450%, 11/03/2045 | 100 | 121 | ||
4.250%, 02/06/2047 | 100 | 118 | ||
4.100%, 02/06/2037 | 400 | 457 | ||
3.950%, 08/08/2056 | 50 | 55 | ||
3.700%, 08/08/2046 | 100 | 108 | ||
3.500%, 02/12/2035 | 50 | 54 | ||
3.450%, 08/08/2036 | 400 | 424 | ||
3.300%, 02/06/2027 | 100 | 106 | ||
2.875%, 02/06/2024 | 335 | 345 | ||
2.700%, 02/12/2025 | 100 | 102 | ||
2.400%, 02/06/2022 | 300 | 302 | ||
2.400%, 08/08/2026 | 50 | 50 | ||
2.375%, 02/12/2022 | 100 | 101 | ||
2.000%, 11/03/2020 | 200 | 200 | ||
2.000%, 08/08/2023 | 100 | 100 | ||
1.550%, 08/08/2021 | 400 | 396 | ||
Motorola Solutions | ||||
4.600%, 05/23/2029 | 50 | 53 | ||
4.000%, 09/01/2024 | 100 | 104 | ||
3.500%, 03/01/2023 | 100 | 102 | ||
NetApp | ||||
3.375%, 06/15/2021 | 50 | 51 | ||
Nuance Communications | ||||
5.625%, 12/15/2026 | 115 | 121 | ||
NVIDIA | ||||
3.200%, 09/16/2026 | 50 | 51 | ||
| Adviser Managed Trust / Annual Report / July 31, 2019 | 49 |
SCHEDULE OF INVESTMENTS
July 31, 2019
Tactical Offensive Fixed Income Fund(Continued)
| Description | Face Amount (Thousands) | Market Value ($ Thousands) | ||||
CORPORATE OBLIGATIONS (continued) |
| |||||
2.200%, 09/16/2021 | $ 30 | $ | 30 | |||
NXP BV | ||||||
3.875%, 06/18/2026 (A) | 200 | 205 | ||||
Open Text | ||||||
5.875%, 06/01/2026 (A) | 285 | 304 | ||||
5.625%, 01/15/2023 (A) | 40 | 41 | ||||
Oracle | ||||||
5.375%, 07/15/2040 | 150 | 189 | ||||
4.375%, 05/15/2055 | 100 | 112 | ||||
4.300%, 07/08/2034 | 100 | 114 | ||||
4.125%, 05/15/2045 | 100 | 109 | ||||
4.000%, 07/15/2046 | 50 | 53 | ||||
4.000%, 11/15/2047 | 270 | 290 | ||||
3.850%, 07/15/2036 | 50 | 53 | ||||
3.800%, 11/15/2037 | 300 | 321 | ||||
3.400%, 07/08/2024 | 100 | 105 | ||||
3.250%, 11/15/2027 | 100 | 105 | ||||
2.950%, 11/15/2024 | 100 | 103 | ||||
2.800%, 07/08/2021 | 75 | 76 | ||||
2.650%, 07/15/2026 | 40 | 40 | ||||
2.625%, 02/15/2023 | 270 | 273 | ||||
2.400%, 09/15/2023 | 50 | 50 | ||||
1.900%, 09/15/2021 | 360 | 357 | ||||
Plantronics | ||||||
5.500%, 05/31/2023 (A) | 100 | 102 | ||||
PTC | ||||||
6.000%, 05/15/2024 | 98 | 103 | ||||
Qorvo | ||||||
5.500%, 07/15/2026 | 210 | 221 | ||||
QUALCOMM | ||||||
4.800%, 05/20/2045 | 100 | 114 | ||||
4.650%, 05/20/2035 | 100 | 114 | ||||
4.300%, 05/20/2047 | 130 | 139 | ||||
3.450%, 05/20/2025 | 100 | 104 | ||||
3.250%, 05/20/2027 | 350 | 358 | ||||
2.900%, 05/20/2024 | 350 | 356 | ||||
2.600%, 01/30/2023 | 100 | 100 | ||||
Rackspace Hosting | ||||||
8.625%, 11/15/2024 (A) | 250 | 229 | ||||
salesforce.com | ||||||
3.700%, 04/11/2028 | 250 | 271 | ||||
Seagate HDD Cayman | ||||||
4.750%, 01/01/2025 | 100 | 101 | ||||
Solera | ||||||
10.500%, 03/01/2024 (A) | 150 | 161 | ||||
SS&C Technologies | ||||||
5.500%, 09/30/2027 (A) | 418 | 435 | ||||
Symantec | ||||||
5.000%, 04/15/2025 (A) | 190 | 194 | ||||
Texas Instruments | ||||||
4.150%, 05/15/2048 | 300 | 347 | ||||
2.625%, 05/15/2024 | 100 | 101 | ||||
| Description | Face Amount (Thousands) | Market Value ($ Thousands) | ||||
CORPORATE OBLIGATIONS (continued) |
| |||||
1.850%, 05/15/2022 | $ 100 | $ | 99 | |||
TIBC0 Software | ||||||
11.375%, 12/01/2021 (A) | 100 | 106 | ||||
Total System Services | ||||||
4.450%, 06/01/2028 | 250 | 270 | ||||
3.750%, 06/01/2023 | 100 | 103 | ||||
Tyco Electronics Group | ||||||
3.125%, 08/15/2027 | 100 | 100 | ||||
VeriSign | ||||||
5.250%, 04/01/2025 | 100 | 108 | ||||
4.750%, 07/15/2027 | 100 | 105 | ||||
Veritas US | ||||||
10.500%, 02/01/2024 (A) | 120 | 106 | ||||
ViaSat | ||||||
5.625%, 09/15/2025 (A) | 148 | 147 | ||||
5.625%, 04/15/2027 (A) | 53 | 56 | ||||
Visa | ||||||
4.300%, 12/14/2045 | 100 | 119 | ||||
4.150%, 12/14/2035 | 130 | 151 | ||||
3.650%, 09/15/2047 | 100 | 109 | ||||
2.800%, 12/14/2022 | 100 | 102 | ||||
2.200%, 12/14/2020 | 100 | 100 | ||||
VMware | ||||||
3.900%, 08/21/2027 | 330 | 335 | ||||
2.950%, 08/21/2022 | 260 | 262 | ||||
2.300%, 08/21/2020 | 260 | 259 | ||||
West | ||||||
8.500%, 10/15/2025 (A) | 200 | 168 | ||||
Western Digital | ||||||
4.750%, 02/15/2026 | 450 | 445 | ||||
Western Union | ||||||
4.250%, 06/09/2023 | 50 | 52 | ||||
Xerox | ||||||
4.125%, 03/15/2023 | 200 | 200 | ||||
Xilinx | ||||||
3.000%, 03/15/2021 | 50 | 50 | ||||
|
| |||||
| 36,724 | ||||||
|
| |||||
Materials — 1.1% |
| |||||
Air Products & Chemicals | ||||||
3.350%, 07/31/2024 | 100 | 104 | ||||
Albemarle | ||||||
4.150%, 12/01/2024 | 100 | 105 | ||||
Alcoa Nederland Holding BV | ||||||
6.750%, 09/30/2024 (A) | 200 | 210 | ||||
6.125%, 05/15/2028 (A) | 200 | 210 | ||||
ArcelorMittal | ||||||
7.000%, 10/15/2039 | 24 | 29 | ||||
6.250%, 02/25/2022 | 20 | 21 | ||||
6.125%, 06/01/2025 | 15 | 17 | ||||
5.500%, 03/01/2021 | 25 | 26 | ||||
5.250%, 08/05/2020 | 30 | 31 | ||||
| 50 | Adviser Managed Trust / Annual Report / July 31, 2019 |
| Description | Face Amount (Thousands) | Market Value ($ Thousands) | ||
CORPORATE OBLIGATIONS (continued) | ||||
4.550%, 03/11/2026 | $ 150 | $ 157 | ||
Ardagh Packaging Finance Holdings | ||||
7.250%, 05/15/2024 (A) | 275 | 290 | ||
4.625%, 05/15/2023 (A) | 150 | 154 | ||
Axalta Coating Systems | ||||
4.875%, 08/15/2024 (A) | 150 | 154 | ||
Baffinland Iron Mines | ||||
8.750%, 07/15/2026 (A) | 175 | 181 | ||
Ball | ||||
5.250%, 07/01/2025 | 190 | 207 | ||
4.875%, 03/15/2026 | 300 | 318 | ||
4.375%, 12/15/2020 | 60 | 61 | ||
Barrick | ||||
5.250%, 04/01/2042 | 100 | 116 | ||
Berry Global | ||||
5.625%, 07/15/2027 (A) | 35 | 37 | ||
5.125%, 07/15/2023 | 150 | 153 | ||
4.875%, 07/15/2026 (A) | 202 | 210 | ||
4.500%, 02/15/2026 (A) | 100 | 100 | ||
BHP Billiton Finance USA | ||||
5.000%, 09/30/2043 | 100 | 125 | ||
2.875%, 02/24/2022 | 55 | 56 | ||
Big River Steel | ||||
7.250%, 09/01/2025 (A) | 110 | 117 | ||
Blue Cube Spinco | ||||
10.000%, 10/15/2025 | 100 | 113 | ||
Celanese US Holdings | ||||
5.875%, 06/15/2021 | 30 | 32 | ||
4.625%, 11/15/2022 | 30 | 31 | ||
Chemours | ||||
7.000%, 05/15/2025 | 250 | 245 | ||
6.625%, 05/15/2023 | 80 | 81 | ||
5.375%, 05/15/2027 | 75 | 66 | ||
Cleveland-Cliffs | ||||
5.875%, 06/01/2027 (A) | 100 | 101 | ||
Consolidated Energy Finance | ||||
6.875%, 06/15/2025 (A) | 150 | 153 | ||
Constellium | ||||
6.625%, 03/01/2025 (A) | 250 | 262 | ||
Crown Americas | ||||
4.750%, 02/01/2026 | 185 | 190 | ||
CVR Partners | ||||
9.250%, 06/15/2023 (A) | 85 | 88 | ||
Dow Chemical | ||||
5.550%, 11/30/2048 (A) | 200 | 237 | ||
4.800%, 05/15/2049 (A) | 65 | 69 | ||
4.375%, 11/15/2042 | 50 | 51 | ||
4.250%, 10/01/2034 | 100 | 106 | ||
3.625%, 05/15/2026 (A) | 100 | 103 | ||
3.500%, 10/01/2024 | 50 | 52 | ||
3.150%, 05/15/2024 (A) | 55 | 56 | ||
3.000%, 11/15/2022 | 50 | 50 | ||
| Description | Face Amount (Thousands) | Market Value ($ Thousands) | ||
CORPORATE OBLIGATIONS (continued) | ||||
DowDuPont | ||||
5.419%, 11/15/2048 | $ 75 | $ 91 | ||
5.319%, 11/15/2038 | 335 | 395 | ||
4.725%, 11/15/2028 | 100 | 113 | ||
4.205%, 11/15/2023 | 200 | 213 | ||
3.766%, 11/15/2020 | 320 | 325 | ||
Eastman Chemical | ||||
4.650%, 10/15/2044 | 50 | 53 | ||
3.800%, 03/15/2025 | 100 | 104 | ||
Ecolab | ||||
4.350%, 12/08/2021 | 82 | 86 | ||
3.950%, 12/01/2047 | 220 | 238 | ||
3.250%, 12/01/2027 | 35 | 37 | ||
2.700%, 11/01/2026 | 20 | 20 | ||
2.375%, 08/10/2022 | 350 | 350 | ||
Element Solutions | ||||
5.875%, 12/01/2025 (A) | 150 | 153 | ||
Fibria Overseas Finance | ||||
5.500%, 01/17/2027 | 50 | 54 | ||
4.000%, 01/14/2025 | 50 | 51 | ||
FMG Resources August 2006 Pty | ||||
5.125%, 03/15/2023 (A) | 250 | 260 | ||
4.750%, 05/15/2022 (A) | 125 | 128 | ||
Freeport-McMoRan | ||||
6.875%, 02/15/2023 | 225 | 237 | ||
4.550%, 11/14/2024 | 200 | 205 | ||
Georgia-Pacific | ||||
8.875%, 05/15/2031 | 100 | 156 | ||
Greif | ||||
6.500%, 03/01/2027 (A) | 60 | 63 | ||
Hudbay Minerals | ||||
7.625%, 01/15/2025 (A) | 150 | 155 | ||
Huntsman International | ||||
4.500%, 05/01/2029 | 45 | 46 | ||
INEOS Group Holdings | ||||
5.625%, 08/01/2024 (A) | 200 | 199 | ||
International Flavors & Fragrances | ||||
4.375%, 06/01/2047 | 230 | 234 | ||
International Paper | ||||
7.500%, 08/15/2021 | 68 | 75 | ||
5.150%, 05/15/2046 | 100 | 109 | ||
4.800%, 06/15/2044 | 100 | 105 | ||
4.750%, 02/15/2022 | 46 | 48 | ||
Joseph T Ryerson & Son | ||||
11.000%, 05/15/2022 (A) | 75 | 79 | ||
Kinross | ||||
4.500%, 07/15/2027 | 300 | 304 | ||
Koppers | ||||
6.000%, 02/15/2025 (A) | 100 | 94 | ||
Lubrizol | ||||
6.500%, 10/01/2034 | 100 | 138 | ||
| Adviser Managed Trust / Annual Report / July 31, 2019 | 51 |
SCHEDULE OF INVESTMENTS
July 31, 2019
Tactical Offensive Fixed Income Fund(Continued)
| Description | Face Amount (Thousands) | Market Value ($ Thousands) | ||||||
CORPORATE OBLIGATIONS (continued) |
| |||||||
LYB International Finance BV | ||||||||
4.875%, 03/15/2044 | $ | 50 | $ | 53 | ||||
LYB International Finance II BV | ||||||||
3.500%, 03/02/2027 | 64 | 65 | ||||||
LyondellBasell Industries | ||||||||
4.625%, 02/26/2055 | 100 | 101 | ||||||
Martin Marietta Materials | ||||||||
4.250%, 07/02/2024 | 50 | 53 | ||||||
Mineral Resources | ||||||||
8.125%, 05/01/2027 (A) | 150 | 157 | ||||||
Mosaic | ||||||||
4.250%, 11/15/2023 | 25 | 27 | ||||||
3.250%, 11/15/2022 | 200 | 203 | ||||||
Newmont Goldcorp | ||||||||
6.250%, 10/01/2039 | 50 | 65 | ||||||
4.875%, 03/15/2042 | 25 | 28 | ||||||
3.700%, 03/15/2023 (A) | 100 | 103 | ||||||
3.500%, 03/15/2022 | 100 | 102 | ||||||
Northwest Acquisitions ULC | ||||||||
7.125%, 11/01/2022 (A) | 86 | 58 | ||||||
Nucor | ||||||||
6.400%, 12/01/2037 | 100 | 134 | ||||||
4.000%, 08/01/2023 | 100 | 105 | ||||||
3.950%, 05/01/2028 | 300 | 327 | ||||||
Nutrien | ||||||||
5.250%, 01/15/2045 | 70 | 79 | ||||||
4.125%, 03/15/2035 | 200 | 201 | ||||||
4.000%, 12/15/2026 | 50 | 53 | ||||||
3.625%, 03/15/2024 | 250 | 258 | ||||||
3.000%, 04/01/2025 | 100 | 101 | ||||||
OCI | ||||||||
6.625%, 04/15/2023 (A) | 200 | 208 | ||||||
Olin | ||||||||
5.625%, 08/01/2029 | 158 | 162 | ||||||
5.125%, 09/15/2027 | 340 | 342 | ||||||
Owens-Brockway Glass Container | ||||||||
5.875%, 08/15/2023 (A) | 95 | 102 | ||||||
5.000%, 01/15/2022 (A) | 15 | 16 | ||||||
Packaging Corp of America | ||||||||
2.450%, 12/15/2020 | 35 | 35 | ||||||
PQ | ||||||||
6.750%, 11/15/2022 (A) | 50 | 52 | ||||||
Praxair | ||||||||
3.200%, 01/30/2026 | 100 | 105 | ||||||
Rain Cll Carbon | ||||||||
7.250%, 04/01/2025 (A) | 100 | 95 | ||||||
Reynolds Group Issuer | ||||||||
7.000%, 07/15/2024 (A) | 175 | 181 | ||||||
5.125%, 07/15/2023 (A) | 300 | 305 | ||||||
Rio Tinto Finance USA | ||||||||
3.750%, 06/15/2025 | 150 | 160 | ||||||
| Description | Face Amount (Thousands) | Market Value ($ Thousands) | ||||||
CORPORATE OBLIGATIONS (continued) |
| |||||||
RPM International | ||||||||
5.250%, 06/01/2045 | $ | 50 | $ | 52 | ||||
4.550%, 03/01/2029 | 50 | 53 | ||||||
SASOL Financing USA | ||||||||
5.875%, 03/27/2024 | 200 | 214 | ||||||
Sherwin-Williams | ||||||||
4.500%, 06/01/2047 | 129 | 138 | ||||||
3.125%, 06/01/2024 | 25 | 26 | ||||||
Sonoco Products | ||||||||
5.750%, 11/01/2040 | 100 | 120 | ||||||
Southern Copper | ||||||||
6.750%, 04/16/2040 | 100 | 128 | ||||||
3.875%, 04/23/2025 | 60 | 62 | ||||||
SPCM | ||||||||
4.875%, 09/15/2025 (A) | 75 | 76 | ||||||
Standard Industries | ||||||||
6.000%, 10/15/2025 (A) | 350 | 368 | ||||||
5.500%, 02/15/2023 (A) | 250 | 256 | ||||||
5.375%, 11/15/2024 (A) | 50 | 51 | ||||||
4.750%, 01/15/2028 (A) | 185 | 183 | ||||||
Starfruit Finco BV | ||||||||
8.000%, 10/01/2026 (A) | 150 | 149 | ||||||
Steel Dynamics | ||||||||
5.500%, 10/01/2024 | 100 | 103 | ||||||
SunCoke Energy Partners | ||||||||
7.500%, 06/15/2025 (A) | 147 | 146 | ||||||
TPC Group | ||||||||
10.500%, 08/01/2024 (A) | 85 | 90 | ||||||
Trinseo Materials Operating SCA | ||||||||
5.375%, 09/01/2025 (A) | 75 | 71 | ||||||
Tronox | ||||||||
6.500%, 04/15/2026 (A) | 100 | 96 | ||||||
United States Steel | ||||||||
6.875%, 08/15/2025 | 121 | 118 | ||||||
6.250%, 03/15/2026 | 150 | 137 | ||||||
US Concrete | ||||||||
6.375%, 06/01/2024 | 100 | 104 | ||||||
Vale Overseas | ||||||||
6.250%, 08/10/2026 | 100 | 113 | ||||||
4.375%, 01/11/2022 | 40 | 41 | ||||||
Vulcan Materials | ||||||||
4.700%, 03/01/2048 | 50 | 51 | ||||||
Westlake Chemical | ||||||||
5.000%, 08/15/2046 | 200 | 209 | ||||||
WR Grace & Company | ||||||||
5.125%, 10/01/2021 (A) | 100 | 104 | ||||||
WRKCo | ||||||||
4.900%, 03/15/2029 | 50 | 55 | ||||||
3.900%, 06/01/2028 | 100 | 103 | ||||||
3.000%, 09/15/2024 | 100 | 101 | ||||||
| 17,747 | ||||||||
| 52 | Adviser Managed Trust / Annual Report / July 31, 2019 |
| Description | Face Amount (Thousands) | Market Value ($ Thousands) | ||||||
CORPORATE OBLIGATIONS (continued) |
| |||||||
Real Estate – 0.9% | ||||||||
Alexandria Real Estate Equities | ||||||||
4.000%, 02/01/2050 | $ | 50 | $ | 51 | ||||
3.800%, 04/15/2026 | 150 | 157 | ||||||
American Campus Communities Operating Partnership | ||||||||
3.625%, 11/15/2027 | 80 | 82 | ||||||
3.350%, 10/01/2020 | 50 | 50 | ||||||
American Tower | ||||||||
4.000%, 06/01/2025 | 100 | 106 | ||||||
3.600%, 01/15/2028 | 200 | 206 | ||||||
3.450%, 09/15/2021 | 50 | 51 | ||||||
3.300%, 02/15/2021 | 100 | 101 | ||||||
3.125%, 01/15/2027 | 100 | 100 | ||||||
2.250%, 01/15/2022 | 200 | 199 | ||||||
AvalonBay Communities | ||||||||
3.300%, 06/01/2029 | 125 | 130 | ||||||
AvalonBay Communities MTN | ||||||||
3.500%, 11/15/2025 | 100 | 105 | ||||||
3.350%, 05/15/2027 | 50 | 53 | ||||||
Boston Properties | ||||||||
4.500%, 12/01/2028 | 20 | 23 | ||||||
3.400%, 06/21/2029 | 50 | 51 | ||||||
3.200%, 01/15/2025 | 50 | 51 | ||||||
3.125%, 09/01/2023 | 350 | 358 | ||||||
Brixmor Operating Partnership | ||||||||
4.125%, 06/15/2026 | 25 | 26 | ||||||
3.875%, 08/15/2022 | 30 | 31 | ||||||
3.650%, 06/15/2024 | 50 | 51 | ||||||
3.250%, 09/15/2023 | 350 | 356 | ||||||
Brookfield Property | ||||||||
5.750%, 05/15/2026 (A) | 201 | 209 | ||||||
Camden Property Trust | ||||||||
4.100%, 10/15/2028 | 20 | 22 | ||||||
3.150%, 07/01/2029 | 65 | 66 | ||||||
CBL & Associates | ||||||||
5.950%, 12/15/2026 | 175 | 124 | ||||||
Corporate Office Properties | ||||||||
5.000%, 07/01/2025 | 50 | 53 | ||||||
Crown Castle International | ||||||||
5.250%, 01/15/2023 | 50 | 54 | ||||||
4.750%, 05/15/2047 | 225 | 249 | ||||||
4.450%, 02/15/2026 | 365 | 397 | ||||||
4.000%, 03/01/2027 | 20 | 21 | ||||||
3.800%, 02/15/2028 | 50 | 52 | ||||||
3.650%, 09/01/2027 | 35 | 36 | ||||||
3.400%, 02/15/2021 | 55 | 56 | ||||||
3.200%, 09/01/2024 | 35 | 36 | ||||||
3.150%, 07/15/2023 | 330 | 337 | ||||||
2.250%, 09/01/2021 | 55 | 55 | ||||||
CubeSmart | ||||||||
3.125%, 09/01/2026 | 50 | 49 | ||||||
| Description | Face Amount (Thousands) | Market Value ($ Thousands) | ||||||
CORPORATE OBLIGATIONS (continued) |
| |||||||
CyrusOne | ||||||||
5.000%, 03/15/2024 | $ | 100 | $ | 103 | ||||
Digital Realty Trust | ||||||||
3.950%, 07/01/2022 | 100 | 104 | ||||||
3.700%, 08/15/2027 | 50 | 52 | ||||||
3.600%, 07/01/2029 | 65 | 66 | ||||||
2.750%, 02/01/2023 | 50 | 50 | ||||||
Duke Realty | ||||||||
3.875%, 10/15/2022 | 50 | 52 | ||||||
EPR Properties | ||||||||
4.750%, 12/15/2026 | 50 | 53 | ||||||
Equinix | ||||||||
5.875%, 01/15/2026 | 85 | 90 | ||||||
5.375%, 05/15/2027 | 65 | 70 | ||||||
ERP Operating | ||||||||
4.000%, 08/01/2047 | 50 | 54 | ||||||
3.375%, 06/01/2025 | 100 | 105 | ||||||
3.250%, 08/01/2027 | 50 | 52 | ||||||
3.000%, 07/01/2029 | 150 | 152 | ||||||
Essex Portfolio | ||||||||
4.500%, 03/15/2048 | 50 | 55 | ||||||
4.000%, 03/01/2029 | 100 | 107 | ||||||
3.375%, 04/15/2026 | 50 | 52 | ||||||
Federal Realty Investment Trust | ||||||||
4.500%, 12/01/2044 | 50 | 57 | ||||||
3.200%, 06/15/2029 | 50 | 51 | ||||||
Five Point Operating | ||||||||
7.875%, 11/15/2025 (A) | 130 | 130 | ||||||
GLP Capital | ||||||||
5.750%, 06/01/2028 | 15 | 17 | ||||||
5.375%, 11/01/2023 | 15 | 16 | ||||||
5.375%, 04/15/2026 | 30 | 32 | ||||||
5.250%, 06/01/2025 | 15 | 16 | ||||||
4.875%, 11/01/2020 | 40 | 41 | ||||||
Greystar Real Estate Partners | ||||||||
5.750%, 12/01/2025 (A) | 97 | 99 | ||||||
HCP | ||||||||
4.000%, 12/01/2022 | 17 | 18 | ||||||
4.000%, 06/01/2025 | 100 | 105 | ||||||
3.500%, 07/15/2029 | 115 | 117 | ||||||
Healthcare Trust of America Holdings | ||||||||
3.500%, 08/01/2026 | 40 | 41 | ||||||
Highwoods Realty | ||||||||
3.200%, 06/15/2021 | 100 | 101 | ||||||
Hospitality Properties Trust | ||||||||
4.950%, 02/15/2027 | 70 | 71 | ||||||
4.500%, 03/15/2025 | 50 | 50 | ||||||
4.375%, 02/15/2030 | 50 | 48 | ||||||
3.950%, 01/15/2028 | 30 | 28 | ||||||
Host Hotels & Resorts | ||||||||
4.000%, 06/15/2025 | 65 | 67 | ||||||
3.875%, 04/01/2024 | 50 | 52 | ||||||
| Adviser Managed Trust / Annual Report / July 31, 2019 | 53 |
SCHEDULE OF INVESTMENTS
July 31, 2019
Tactical Offensive Fixed Income Fund(Continued)
| Description | Face Amount (Thousands) | Market Value ($ Thousands) | ||||||
CORPORATE OBLIGATIONS (continued) |
| |||||||
Howard Hughes | ||||||||
5.375%, 03/15/2025 (A) | $ | 200 | $ | 205 | ||||
Hudson Pacific Properties | ||||||||
3.950%, 11/01/2027 | 50 | 51 | ||||||
Iron Mountain | ||||||||
6.000%, 08/15/2023 | 100 | 102 | ||||||
5.250%, 03/15/2028 (A) | 100 | 101 | ||||||
4.875%, 09/15/2027 (A) | 125 | 124 | ||||||
4.375%, 06/01/2021 (A) | 100 | 100 | ||||||
Kilroy Realty | ||||||||
4.375%, 10/01/2025 | 100 | 107 | ||||||
Kimco Realty | ||||||||
4.450%, 09/01/2047 | 50 | 53 | ||||||
3.200%, 05/01/2021 | 45 | 46 | ||||||
Lamar Media | ||||||||
5.750%, 02/01/2026 | 55 | 58 | ||||||
5.375%, 01/15/2024 | 100 | 103 | ||||||
Liberty Property | ||||||||
3.375%, 06/15/2023 | 95 | 97 | ||||||
Life Storage | ||||||||
3.875%, 12/15/2027 | 50 | 52 | ||||||
MGM Growth Properties Operating Partnership | ||||||||
5.750%, 02/01/2027 (A) | 75 | 81 | ||||||
5.625%, 05/01/2024 | 225 | 240 | ||||||
4.500%, 09/01/2026 | 110 | 113 | ||||||
Mid-America Apartments | ||||||||
4.000%, 11/15/2025 | 50 | 53 | ||||||
3.950%, 03/15/2029 | 50 | 53 | ||||||
3.600%, 06/01/2027 | 50 | 52 | ||||||
MPT Operating Partnership | ||||||||
6.375%, 03/01/2024 | 100 | 105 | ||||||
5.250%, 08/01/2026 | 100 | 104 | ||||||
5.000%, 10/15/2027 | 300 | 311 | ||||||
4.625%, 08/01/2029 | 164 | 166 | ||||||
National Retail Properties | ||||||||
4.000%, 11/15/2025 | 65 | 69 | ||||||
3.600%,12/15/2026 | 50 | 52 | ||||||
3.500%, 10/15/2027 | 50 | 51 | ||||||
Newmark Group | ||||||||
6.125%, 11/15/2023 | 105 | 113 | ||||||
Office Properties Income Trust | ||||||||
4.500%, 02/01/2025 | 100 | 102 | ||||||
Outfront Media Capital | ||||||||
5.000%, 08/15/2027 (A) | 75 | 76 | ||||||
Physicians Realty | ||||||||
3.950%, 01/15/2028 | 50 | 51 | ||||||
Prologis | ||||||||
3.750%, 11/01/2025 | 65 | 70 | ||||||
Public Storage | ||||||||
3.094%, 09/15/2027 | 30 | 31 | ||||||
2.370%, 09/15/2022 | 100 | 100 | ||||||
| Description | Face Amount (Thousands) | Market Value ($ Thousands) | ||||||
CORPORATE OBLIGATIONS (continued) |
| |||||||
Realogy Group | ||||||||
9.375%, 04/01/2027 (A) | $ | 99 | $ | 86 | ||||
5.250%, 12/01/2021 (A) | 200 | 192 | ||||||
4.875%, 06/01/2023 (A) | 50 | 42 | ||||||
Realty Income | ||||||||
4.650%, 08/01/2023 | 50 | 54 | ||||||
3.250%, 10/15/2022 | 60 | 61 | ||||||
3.250%, 06/15/2029 | 200 | 205 | ||||||
Regency Centers | ||||||||
4.650%, 03/15/2049 | 30 | 34 | ||||||
4.400%, 02/01/2047 | 35 | 39 | ||||||
3.600%, 02/01/2027 | 30 | 31 | ||||||
SBA Communications | ||||||||
4.875%, 09/01/2024 | 150 | 154 | ||||||
4.000%, 10/01/2022 | 200 | 203 | ||||||
Senior Housing Properties Trust | ||||||||
4.750%, 02/15/2028 | 100 | 98 | ||||||
Simon Property Group | ||||||||
4.250%, 11/30/2046 | 50 | 56 | ||||||
3.250%, 11/30/2026 | 50 | 52 | ||||||
2.750%, 06/01/2023 | 50 | 51 | ||||||
2.625%, 06/15/2022 | 50 | 50 | ||||||
2.500%, 09/01/2020 | 100 | 100 | ||||||
SITE Centers | ||||||||
4.700%, 06/01/2027 | 35 | 38 | ||||||
3.625%, 02/01/2025 | 87 | 88 | ||||||
STORE Capital | ||||||||
4.625%, 03/15/2029 | 50 | 53 | ||||||
Tanger Properties | ||||||||
3.125%, 09/01/2026 | 50 | 48 | ||||||
UDR MTN | ||||||||
3.750%, 07/01/2024 | 100 | 104 | ||||||
3.200%, 01/15/2030 | 50 | 51 | ||||||
Uniti Group | ||||||||
8.250%, 10/15/2023 | 210 | 189 | ||||||
7.125%, 12/15/2024 (A) | 100 | 86 | ||||||
6.000%, 04/15/2023 (A) | 133 | 127 | ||||||
Ventas Realty | ||||||||
4.000%, 03/01/2028 | 100 | 106 | ||||||
3.250%, 10/15/2026 | 50 | 51 | ||||||
2.650%, 01/15/2025 | 300 | 297 | ||||||
VEREIT Operating Partnership | ||||||||
4.875%, 06/01/2026 | 30 | 33 | ||||||
4.600%, 02/06/2024 | 325 | 346 | ||||||
4.125%, 06/01/2021 | 20 | 20 | ||||||
3.950%, 08/15/2027 | 40 | 42 | ||||||
Vornado Realty | ||||||||
3.500%, 01/15/2025 | 50 | 51 | ||||||
Washington Prime Group | ||||||||
5.950%, 08/15/2024 | 125 | 117 | ||||||
Welltower | ||||||||
6.500%, 03/15/2041 | 70 | 90 | ||||||
| 54 | Adviser Managed Trust / Annual Report / July 31, 2019 |
| Description | Face Amount (Thousands) | Market Value ($ Thousands) | ||||||||
CORPORATE OBLIGATIONS (continued) |
| |||||||||
4.950%, 01/15/2021 | $ | 45 | $ | 46 | ||||||
4.250%, 04/01/2026 | 50 | 54 | ||||||||
4.125%, 03/15/2029 | 50 | 54 | ||||||||
3.950%, 09/01/2023 | 300 | 315 | ||||||||
WeWork | ||||||||||
7.875%, 05/01/2025 (A) | 180 | 175 | ||||||||
Weyerhaeuser | ||||||||||
7.375%, 03/15/2032 | 100 | 139 | ||||||||
WP Carey | ||||||||||
4.600%, 04/01/2024 | 50 | 53 | ||||||||
|
|
| ||||||||
| 14,001 | ||||||||||
|
|
| ||||||||
Utilities — 1.8% | ||||||||||
AEP Texas | ||||||||||
3.800%, 10/01/2047 | 100 | 103 | ||||||||
AEP Transmission | ||||||||||
3.800%, 06/15/2049 | 25 | 27 | ||||||||
3.750%, 12/01/2047 | 250 | 260 | ||||||||
AES | ||||||||||
6.000%, 05/15/2026 | 100 | 106 | ||||||||
5.125%, 09/01/2027 | 250 | 265 | ||||||||
4.500%, 03/15/2023 | 145 | 149 | ||||||||
Alabama Power | ||||||||||
3.750%, 03/01/2045 | 100 | 104 | ||||||||
Ameren | ||||||||||
2.700%, 11/15/2020 | 100 | 100 | ||||||||
Ameren Illinois | ||||||||||
3.800%, 05/15/2028 | 25 | 27 | ||||||||
3.250%, 03/01/2025 | 100 | 104 | ||||||||
American Water Capital | ||||||||||
6.593%, 10/15/2037 | 100 | 136 | ||||||||
4.150%, 06/01/2049 | 150 | 164 | ||||||||
3.450%, 06/01/2029 | 150 | 158 | ||||||||
AmeriGas Partners | ||||||||||
5.750%, 05/20/2027 | 250 | 263 | ||||||||
5.625%, 05/20/2024 | 170 | 180 | ||||||||
5.500%, 05/20/2025 | 90 | 94 | ||||||||
Appalachian Power | ||||||||||
7.000%, 04/01/2038 | 100 | 142 | ||||||||
4.500%, 03/01/2049 | 150 | 173 | ||||||||
3.400%, 06/01/2025 | 50 | 52 | ||||||||
Arizona Public Service | ||||||||||
2.950%, 09/15/2027 | 300 | 302 | ||||||||
Atmos Energy | ||||||||||
4.125%, 10/15/2044 | 100 | 111 | ||||||||
4.125%, 03/15/2049 | 80 | 89 | ||||||||
Avangrid | ||||||||||
3.150%, 12/01/2024 | 250 | 256 | ||||||||
Baltimore Gas & Electric | ||||||||||
2.400%, 08/15/2026 | 250 | 245 | ||||||||
Banff Merger Sub | ||||||||||
9.750%, 09/01/2026 (A) | 295 | 263 | ||||||||
| Description | Face Amount (Thousands) | Market Value ($ Thousands) | ||||||||
CORPORATE OBLIGATIONS (continued) |
| |||||||||
Berkshire Hathaway Energy | ||||||||||
6.125%, 04/01/2036 | $ | 47 | $ | 64 | ||||||
3.800%, 07/15/2048 | 225 | 234 | ||||||||
3.250%, 04/15/2028 | 230 | 239 | ||||||||
2.800%, 01/15/2023 | 40 | 40 | ||||||||
2.375%, 01/15/2021 | 25 | 25 | ||||||||
Black Hills | ||||||||||
3.950%, 01/15/2026 | 209 | 219 | ||||||||
Calpine | ||||||||||
5.500%, 02/01/2024 | 370 | 370 | ||||||||
5.250%, 06/01/2026 (A) | 150 | 151 | ||||||||
CenterPoint Energy | ||||||||||
2.500%, 09/01/2022 | 150 | 150 | ||||||||
CenterPoint Energy Houston Electric | ||||||||||
4.500%, 04/01/2044 | 100 | 116 | ||||||||
4.250%, 02/01/2049 | 15 | 17 | ||||||||
CenterPoint Energy Resources | ||||||||||
4.500%, 01/15/2021 | 50 | 51 | ||||||||
Clearway Energy Operating | ||||||||||
5.750%, 10/15/2025 (A) | 50 | 52 | ||||||||
5.375%, 08/15/2024 | 200 | 205 | ||||||||
Cleco Corporate Holdings | ||||||||||
4.973%, 05/01/2046 | 35 | 38 | ||||||||
3.743%, 05/01/2026 | 50 | 51 | ||||||||
CMS Energy | ||||||||||
3.450%, 08/15/2027 | 250 | 258 | ||||||||
Commonwealth Edison | ||||||||||
4.000%, 03/01/2048 | 100 | 110 | ||||||||
4.000%, 03/01/2049 | 400 | 442 | ||||||||
3.700%, 03/01/2045 | 50 | 52 | ||||||||
2.950%, 08/15/2027 | 100 | 102 | ||||||||
Connecticut Light & Power | ||||||||||
4.300%, 04/15/2044 | 100 | 114 | ||||||||
4.150%, 06/01/2045 | 100 | 113 | ||||||||
4.000%, 04/01/2048 | 25 | 28 | ||||||||
Consolidated Edison | ||||||||||
2.000%, 05/15/2021 | 100 | 99 | ||||||||
Consolidated Edison of New York | ||||||||||
6.300%, 08/15/2037 | 100 | 136 | ||||||||
4.450%, 03/15/2044 | 100 | 113 | ||||||||
4.300%, 12/01/2056 | 100 | 110 | ||||||||
4.125%, 05/15/2049 | 300 | 331 | ||||||||
Consumers Energy | ||||||||||
3.950%, 05/15/2043 | 50 | 55 | ||||||||
2.850%, 05/15/2022 | 100 | 101 | ||||||||
Dayton Power & Light | ||||||||||
3.950%, 06/15/2049 (A) | 65 | 68 | ||||||||
Delmarva Power & Light | ||||||||||
4.150%, 05/15/2045 | 50 | 55 | ||||||||
Dominion Energy | ||||||||||
4.050%, 09/15/2042 | 100 | 104 | ||||||||
2.850%, 08/15/2026 | 230 | 229 | ||||||||
| Adviser Managed Trust / Annual Report / July 31, 2019 | 55 |
SCHEDULE OF INVESTMENTS
July 31, 2019
Tactical Offensive Fixed Income Fund(Continued)
| Description | Face Amount (Thousands) | Market Value ($ Thousands) | ||||||||
CORPORATE OBLIGATIONS (continued) |
| |||||||||
Dominion Energy Gas Holdings |
| |||||||||
4.600%, 12/15/2044 | $ | 25 | $ | 29 | ||||||
3.600%,12/15/2024 | 100 | 104 | ||||||||
DPL |
| |||||||||
4.350%, 04/15/2029 (A) | 45 | 44 | ||||||||
Drax Finco |
| |||||||||
6.625%, 11/01/2025 (A) | 250 | 260 | ||||||||
DTE Electric |
| |||||||||
3.950%, 03/01/2049 | 400 | 442 | ||||||||
3.750%, 08/15/2047 | 100 | 107 | ||||||||
3.700%, 03/15/2045 | 50 | 52 | ||||||||
3.700%, 06/01/2046 | 250 | 260 | ||||||||
DTE Energy |
| |||||||||
3.300%, 06/15/2022 | 50 | 51 | ||||||||
2.850%,10/01/2026 | 250 | 249 | ||||||||
Duke Energy |
| |||||||||
3.750%, 04/15/2024 | 100 | 105 | ||||||||
3.150%, 08/15/2027 | 300 | 307 | ||||||||
Duke Energy Carolinas |
| |||||||||
4.250%, 12/15/2041 | 100 | 111 | ||||||||
3.950%, 03/15/2048 | 50 | 54 | ||||||||
3.350%, 05/15/2022 | 100 | 103 | ||||||||
3.050%, 03/15/2023 | 50 | 51 | ||||||||
2.950%, 12/01/2026 | 100 | 103 | ||||||||
Duke Energy Florida |
| |||||||||
4.200%, 07/15/2048 | 100 | 112 | ||||||||
3.800%, 07/15/2028 | 100 | 109 | ||||||||
3.200%, 01/15/2027 | 250 | 260 | ||||||||
Duke Energy Indiana |
| |||||||||
3.750%, 05/15/2046 | 250 | 260 | ||||||||
Duke Energy Ohio |
| |||||||||
3.700%, 06/15/2046 | 214 | 221 | ||||||||
Duke Energy Progress |
| |||||||||
4.150%, 12/01/2044 | 50 | 55 | ||||||||
3.450%, 03/15/2029 | 240 | 255 | ||||||||
Edison International |
| |||||||||
4.125%, 03/15/2028 | 250 | 257 | ||||||||
2.950%, 03/15/2023 | 50 | 49 | ||||||||
2.400%, 09/15/2022 | 180 | 176 | ||||||||
El Paso Electric |
| |||||||||
5.000%, 12/01/2044 | 50 | 56 | ||||||||
Emera US Finance |
| |||||||||
4.750%, 06/15/2046 | 235 | 264 | ||||||||
3.550%, 06/15/2026 | 285 | 293 | ||||||||
Enel Chile |
| |||||||||
4.875%, 06/12/2028 | 200 | 219 | ||||||||
Entergy |
| |||||||||
5.125%, 09/15/2020 | 50 | 51 | ||||||||
4.000%, 07/15/2022 | 100 | 104 | ||||||||
2.950%, 09/01/2026 | 100 | 101 | ||||||||
Entergy Arkansas |
| |||||||||
3.700%, 06/01/2024 | 100 | 106 | ||||||||
| Description | Face Amount (Thousands) | Market Value ($ Thousands) | ||||||||
CORPORATE OBLIGATIONS (continued) |
| |||||||||
Entergy Mississippi |
| |||||||||
2.850%, 06/01/2028 | $ | 225 | $ | 227 | ||||||
Evergy |
| |||||||||
4.850%, 06/01/2021 | 55 | 57 | ||||||||
Eversource Energy |
| |||||||||
3.150%, 01/15/2025 | 100 | 103 | ||||||||
Exelon |
| |||||||||
5.625%, 06/15/2035 | 100 | 122 | ||||||||
5.100%, 06/15/2045 | 100 | 121 | ||||||||
3.950%, 06/15/2025 | 100 | 106 | ||||||||
Exelon Generation |
| |||||||||
5.600%, 06/15/2042 | 100 | 115 | ||||||||
FirstEnergy |
| |||||||||
7.375%, 11/15/2031 | 70 | 97 | ||||||||
4.250%, 03/15/2023 | 40 | 42 | ||||||||
3.900%, 07/15/2027 | 300 | 317 | ||||||||
Florida Power & Light |
| |||||||||
5.950%, 02/01/2038 | 100 | 136 | ||||||||
4.125%, 06/01/2048 | 250 | 285 | ||||||||
4.050%, 10/01/2044 | 100 | 111 | ||||||||
3.700%, 12/01/2047 | 200 | 212 | ||||||||
Fortis |
| |||||||||
3.055%, 10/04/2026 | 300 | 300 | ||||||||
Georgia Power |
| |||||||||
4.300%, 03/15/2042 | 25 | 27 | ||||||||
Interstate Power & Light |
| |||||||||
3.700%, 09/15/2046 | 250 | 252 | ||||||||
ITC Holdings |
| |||||||||
3.250%, 06/30/2026 | 30 | 31 | ||||||||
Kansas City Power & Light |
| |||||||||
4.200%, 06/15/2047 | 100 | 112 | ||||||||
4.125%, 04/01/2049 | 100 | 112 | ||||||||
Kentucky Utilities |
| |||||||||
5.125%, 11/01/2040 | 94 | 115 | ||||||||
MidAmerican Energy |
| |||||||||
4.250%, 07/15/2049 | 50 | 58 | ||||||||
3.950%, 08/01/2047 | 250 | 272 | ||||||||
3.650%, 04/15/2029 | 250 | 272 | ||||||||
3.650%, 08/01/2048 | 250 | 262 | ||||||||
3.100%, 05/01/2027 | 50 | 52 | ||||||||
National Fuel Gas |
| |||||||||
5.200%, 07/15/2025 | 100 | 108 | ||||||||
3.950%, 09/15/2027 | 100 | 101 | ||||||||
Nevada Power |
| |||||||||
3.700%, 05/01/2029 | 155 | 167 | ||||||||
NextEra Energy Capital Holdings |
| |||||||||
5.650%, VAR ICE LIBOR USD 3 Month+3.156%, 05/01/2079 | 100 | 105 | ||||||||
3.500%, 04/01/2029 | 100 | 105 | ||||||||
3.150%, 04/01/2024 | 100 | 103 | ||||||||
NextEra Energy Operating Partners |
| |||||||||
4.500%, 09/15/2027 (A) | 108 | 109 | ||||||||
| 56 | Adviser Managed Trust / Annual Report / July 31, 2019 |
| Description | Face Amount (Thousands) | Market Value ($ Thousands) | ||||||||
CORPORATE OBLIGATIONS (continued) |
| |||||||||
4.250%, 07/15/2024 (A) | $ | 50 | $ | 51 | ||||||
4.250%, 09/15/2024 (A) | 136 | 137 | ||||||||
NiSource | ||||||||||
5.950%, 06/15/2041 | 100 | 126 | ||||||||
5.650%, 02/01/2045 | 50 | 62 | ||||||||
3.950%, 03/30/2048 | 100 | 102 | ||||||||
3.490%, 05/15/2027 | 50 | 52 | ||||||||
Northern States Power | ||||||||||
4.125%, 05/15/2044 | 100 | 111 | ||||||||
2.200%, 08/15/2020 | 50 | 50 | ||||||||
NRG Energy | ||||||||||
6.625%, 01/15/2027 | 525 | 560 | ||||||||
5.750%, 01/15/2028 | 109 | 116 | ||||||||
5.250%, 06/15/2029 (A) | 61 | 64 | ||||||||
NSTAR Electric | ||||||||||
3.250%, 05/15/2029 | 50 | 52 | ||||||||
3.200%, 05/15/2027 | 100 | 103 | ||||||||
Ohio Edison | ||||||||||
6.875%, 07/15/2036 | 100 | 135 | ||||||||
Ohio Power | ||||||||||
4.000%, 06/01/2049 | 20 | 22 | ||||||||
Oklahoma Gas & Electric | ||||||||||
3.850%, 08/15/2047 | 250 | 255 | ||||||||
Oncor Electric Delivery | ||||||||||
4.100%, 11/15/2048 | 100 | 113 | ||||||||
3.800%, 06/01/2049 (A) | 100 | 108 | ||||||||
3.700%, 11/15/2028 (A) | 100 | 108 | ||||||||
2.950%, 04/01/2025 | 50 | 51 | ||||||||
2.750%, 06/01/2024 (A) | 100 | 102 | ||||||||
ONE Gas | ||||||||||
4.500%, 11/01/2048 | 45 | 53 | ||||||||
PacifiCorp | ||||||||||
3.600%, 04/01/2024 | 50 | 52 | ||||||||
Piedmont Natural Gas | ||||||||||
3.640%, 11/01/2046 | 25 | 25 | ||||||||
3.500%, 06/01/2029 | 150 | 157 | ||||||||
Pinnacle West Capital | ||||||||||
2.250%,11/30/2020 | 45 | 45 | ||||||||
Potomac Electric Power | ||||||||||
6.500%, 11/15/2037 | 100 | 139 | ||||||||
PPL Capital Funding | ||||||||||
4.000%, 09/15/2047 | 100 | 99 | ||||||||
3.400%, 06/01/2023 | 100 | 103 | ||||||||
PPL Electric Utilities | ||||||||||
4.150%, 10/01/2045 | 100 | 111 | ||||||||
Progress Energy | ||||||||||
4.400%, 01/15/2021 | 100 | 102 | ||||||||
PSEG Power | ||||||||||
8.625%, 04/15/2031 | 100 | 138 | ||||||||
Public Service Electric & Gas MTN | ||||||||||
3.850%, 05/01/2049 | 125 | 135 | ||||||||
3.200%, 05/15/2029 | 150 | 157 | ||||||||
| Description | Face Amount (Thousands) | Market Value ($ Thousands) | ||||||||
CORPORATE OBLIGATIONS (continued) |
| |||||||||
3.000%, 05/15/2027 | $ | 100 | $ | 102 | ||||||
Public Service Enterprise Group | ||||||||||
2.000%, 11/15/2021 | 100 | 99 | ||||||||
San Diego Gas & Electric | ||||||||||
4.100%, 06/15/2049 | 250 | 266 | ||||||||
3.750%, 06/01/2047 | 250 | 255 | ||||||||
Sempra Energy | ||||||||||
3.800%, 02/01/2038 | 100 | 100 | ||||||||
2.900%, 02/01/2023 | 15 | 15 | ||||||||
2.850%,11/15/2020 | 100 | 101 | ||||||||
South Carolina Electric & Gas | ||||||||||
5.100%, 06/01/2065 | 100 | 127 | ||||||||
4.250%, 08/15/2028 | 15 | 17 | ||||||||
Southern | ||||||||||
4.250%, 07/01/2036 | 230 | 243 | ||||||||
3.250%, 07/01/2026 | 250 | 255 | ||||||||
2.950%, 07/01/2023 | 100 | 102 | ||||||||
2.350%, 07/01/2021 | 50 | 50 | ||||||||
Southern California Edison | ||||||||||
4.875%, 03/01/2049 | 100 | 116 | ||||||||
4.650%, 10/01/2043 | 100 | 112 | ||||||||
3.700%, 08/01/2025 | 60 | 63 | ||||||||
3.500%, 10/01/2023 | 50 | 51 | ||||||||
Southern California Gas | ||||||||||
4.300%, 01/15/2049 | 25 | 28 | ||||||||
Southern Gas Capital | ||||||||||
3.500%, 09/15/2021 | 100 | 102 | ||||||||
Southern Power | ||||||||||
4.150%, 12/01/2025 | 50 | 53 | ||||||||
2.500%, 12/15/2021 | 50 | 50 | ||||||||
Southwest Gas | ||||||||||
4.150%, 06/01/2049 | 30 | 31 | ||||||||
Southwestern Electric Power | ||||||||||
3.900%, 04/01/2045 | 50 | 51 | ||||||||
Southwestern Public Service | ||||||||||
3.750%, 06/15/2049 | 100 | 104 | ||||||||
Talen Energy Supply | ||||||||||
10.500%, 01/15/2026 (A) | 100 | 94 | ||||||||
7.250%, 05/15/2027 (A) | 55 | 54 | ||||||||
6.500%, 06/01/2025 | 150 | 121 | ||||||||
TerraForm Power Operating | ||||||||||
5.000%, 01/31/2028 (A) | 147 | 149 | ||||||||
4.250%, 01/31/2023 (A) | 70 | 70 | ||||||||
Union Electric | ||||||||||
3.650%, 04/15/2045 | 100 | 104 | ||||||||
3.500%, 03/15/2029 | 100 | 107 | ||||||||
Virginia Electric & Power | ||||||||||
8.875%, 11/15/2038 | 50 | 83 | ||||||||
4.600%, 12/01/2048 | 260 | 309 | ||||||||
4.200%, 05/15/2045 | 25 | 28 | ||||||||
3.800%, 09/15/2047 | 250 | 262 | ||||||||
2.750%, 03/15/2023 | 50 | 50 | ||||||||
| ||||
| Adviser Managed Trust / Annual Report / July 31, 2019 | 57 | |||
SCHEDULE OF INVESTMENTS
July 31, 2019
Tactical Offensive Fixed Income Fund(Continued)
| Description | Face Amount (Thousands) | Market Value ($ Thousands) | ||||||||
CORPORATE OBLIGATIONS (continued) |
| |||||||||
Vistra Operations | ||||||||||
5.625%, 02/15/2027 (A) | $ | 415 | $ | 438 | ||||||
5.500%, 09/01/2026 (A) | 105 | 110 | ||||||||
5.000%, 07/31/2027 (A) | 181 | 185 | ||||||||
Washington Gas Light MTN | ||||||||||
3.796%, 09/15/2046 | 35 | 35 | ||||||||
WEC Energy Group | ||||||||||
3.550%, 06/15/2025 | 100 | 105 | ||||||||
3.100%, 03/08/2022 | 45 | 46 | ||||||||
Xcel Energy | ||||||||||
4.000%, 06/15/2028 | 250 | 271 | ||||||||
2.600%, 03/15/2022
|
| 250
|
|
| 251
|
| ||||
| 27,770 | ||||||||||
Total Corporate Obligations |
| 477,435 | ||||||||
U.S. TREASURY OBLIGATIONS — 28.9% |
| |||||||||
U.S. Treasury Bonds | ||||||||||
7.125%, 02/15/2023 | 2,000 | 2,358 | ||||||||
6.250%, 08/15/2023 | 2,500 | 2,925 | ||||||||
5.375%, 02/15/2031 | 500 | 670 | ||||||||
5.000%, 05/15/2037 | 1,250 | 1,760 | ||||||||
4.750%, 02/15/2037 | 750 | 1,026 | ||||||||
4.750%, 02/15/2041 | 510 | 713 | ||||||||
4.625%, 02/15/2040 | 3,000 | 4,113 | ||||||||
4.500%, 02/15/2036 | 650 | 857 | ||||||||
4.500%, 05/15/2038 | 150 | 201 | ||||||||
4.375%, 02/15/2038 | 1,000 | 1,320 | ||||||||
4.375%, 05/15/2040 | 750 | 998 | ||||||||
4.375%, 05/15/2041 | 3,000 | 4,002 | ||||||||
4.250%, 05/15/2039 | 250 | 327 | ||||||||
3.875%, 08/15/2040 | 1,225 | 1,528 | ||||||||
3.750%, 08/15/2041 | 1,000 | 1,227 | ||||||||
3.750%, 11/15/2043 | 6,000 | 7,384 | ||||||||
3.625%, 08/15/2043 | 500 | 603 | ||||||||
3.625%, 02/15/2044 | 180 | 217 | ||||||||
3.500%, 02/15/2039 | 300 | 356 | ||||||||
3.375%, 05/15/2044 | 1,055 | 1,225 | ||||||||
3.375%, 11/15/2048 | 300 | 353 | ||||||||
3.125%, 02/15/2042 | 1,000 | 1,118 | ||||||||
3.125%, 08/15/2044 | 800 | 892 | ||||||||
3.125%, 05/15/2048 | 4,500 | 5,045 | ||||||||
3.000%, 11/15/2044 | 2,525 | 2,757 | ||||||||
3.000%, 05/15/2045 | 8,700 | 9,507 | ||||||||
3.000%, 11/15/2045 | 1,500 | 1,640 | ||||||||
3.000%, 02/15/2047 | 2,350 | 2,575 | ||||||||
3.000%, 05/15/2047 | 1,500 | 1,642 | ||||||||
3.000%, 02/15/2048 | 1,000 | 1,095 | ||||||||
3.000%, 08/15/2048 | 3,800 | 4,165 | ||||||||
3.000%, 02/15/2049 | 2,000 | 2,195 | ||||||||
| Description | Face Amount (Thousands) | Market Value ($ Thousands) | ||||||||
U.S. TREASURY OBLIGATIONS (continued) |
| |||||||||
2.875%, 05/15/2043 | $ | 2,625 | $ | 2,807 | ||||||
2.875%, 08/15/2045 | 750 | 801 | ||||||||
2.875%, 11/15/2046 | 2,250 | 2,406 | ||||||||
2.875%, 05/15/2049 | 2,000 | 2,145 | ||||||||
2.750%, 08/15/2042 | 6,000 | 6,294 | ||||||||
2.750%, 08/15/2047 | 1,000 | 1,043 | ||||||||
2.750%, 11/15/2047 | 1,200 | 1,252 | ||||||||
2.500%, 02/15/2045 | 500 | 498 | ||||||||
2.500%, 02/15/2046 | 700 | 696 | ||||||||
2.500%, 05/15/2046 | 650 | 646 | ||||||||
2.250%, 02/15/2027 | 2,500 | 2,552 | ||||||||
2.250%, 08/15/2046 | 3,600 | 3,399 | ||||||||
U.S. Treasury Notes | ||||||||||
3.625%, 02/15/2021 | 2,500 | 2,562 | ||||||||
3.125%, 05/15/2021 | 2,250 | 2,296 | ||||||||
3.125%, 11/15/2028 | 10,400 | 11,375 | ||||||||
2.875%, 10/15/2021 | 2,000 | 2,042 | ||||||||
2.875%, 09/30/2023 | 2,000 | 2,081 | ||||||||
2.875%, 10/31/2023 | 19,500 | 20,308 | ||||||||
2.875%, 11/30/2023 | 1,500 | 1,563 | ||||||||
2.875%, 04/30/2025 | 2,000 | 2,107 | ||||||||
2.875%, 05/31/2025 | 2,000 | 2,108 | ||||||||
2.875%, 05/15/2028 | 500 | 535 | ||||||||
2.875%, 08/15/2028 | 2,500 | 2,679 | ||||||||
2.750%, 11/30/2020 | 4,000 | 4,039 | ||||||||
2.750%, 04/30/2023 | 7,000 | 7,226 | ||||||||
2.750%, 05/31/2023 | 20,000 | 20,659 | ||||||||
2.750%, 07/31/2023 | 5,000 | 5,172 | ||||||||
2.750%, 08/31/2023 | 4,000 | 4,141 | ||||||||
2.750%, 11/15/2023 | 1,000 | 1,037 | ||||||||
2.750%, 02/15/2024 | 2,750 | 2,857 | ||||||||
2.750%, 02/15/2028 | 2,500 | 2,650 | ||||||||
2.625%, 08/15/2020 | 10,500 | 10,562 | ||||||||
2.625%, 12/15/2021 | 5,000 | 5,088 | ||||||||
2.625%, 12/31/2023 | 5,500 | 5,679 | ||||||||
2.625%, 12/31/2025 | 2,500 | 2,606 | ||||||||
2.625%, 02/15/2029 | 7,000 | 7,365 | ||||||||
2.500%, 12/31/2020 | 5,000 | 5,035 | ||||||||
2.500%, 01/15/2022 | 5,000 | 5,074 | ||||||||
2.500%, 03/31/2023 | 2,500 | 2,557 | ||||||||
2.500%, 01/31/2024 | 7,000 | 7,194 | ||||||||
2.500%, 05/15/2024 | 2,450 | 2,522 | ||||||||
2.500%, 01/31/2025 | 1,500 | 1,548 | ||||||||
2.375%, 01/31/2023 | 3,000 | 3,052 | ||||||||
2.375%, 02/29/2024 | 5,000 | 5,116 | ||||||||
2.375%, 05/15/2027 | 5,800 | 5,975 | ||||||||
2.250%, 07/31/2021 | 4,000 | 4,026 | ||||||||
2.250%, 12/31/2023 | 1,000 | 1,016 | ||||||||
2.250%, 01/31/2024 | 1,000 | 1,017 | ||||||||
2.250%, 04/30/2024 | 6,000 | 6,108 | ||||||||
2.250%, 11/15/2024 | 6,000 | 6,113 | ||||||||
2.250%, 12/31/2024 | 2,000 | 2,038 | ||||||||
| 58 | Adviser Managed Trust / Annual Report / July 31, 2019 |
| Description | Face Amount (Thousands) | Market Value ($ Thousands) | ||||||||
U.S. TREASURY OBLIGATIONS (continued) |
| |||||||||
2.250%,11/15/2025 | $ | 3,500 | $ | 3,570 | ||||||
2.250%, 03/31/2026 | 3,000 | �� | 3,061 | |||||||
2.250%, 08/15/2027 | 2,000 | 2,041 | ||||||||
2.250%,11/15/2027 | 1,500 | 1,530 | ||||||||
2.125%, 08/31/2020 | 1,000 | 1,001 | ||||||||
2.125%, 01/31/2021 | 1,500 | 1,503 | ||||||||
2.125%, 05/31/2021 | 5,000 | 5,018 | ||||||||
2.125%, 09/30/2021 | 2,500 | 2,512 | ||||||||
2.125%, 12/31/2021 | 1,000 | 1,006 | ||||||||
2.125%, 05/15/2022 | 5,000 | 5,036 | ||||||||
2.125%, 12/31/2022 | 10,000 | 10,092 | ||||||||
2.125%, 11/30/2023 | 700 | 708 | ||||||||
2.125%, 02/29/2024 | 1,500 | 1,517 | ||||||||
2.125%, 03/31/2024 | 1,500 | 1,518 | ||||||||
2.125%, 05/15/2025 | 2,500 | 2,532 | ||||||||
2.125%, 05/31/2026 | 2,000 | 2,025 | ||||||||
2.000%, 10/31/2021 | 2,000 | 2,005 | ||||||||
2.000%, 11/15/2021 | 5,000 | 5,013 | ||||||||
2.000%, 02/15/2022 | 3,000 | 3,010 | ||||||||
2.000%, 10/31/2022 | 2,000 | 2,009 | ||||||||
2.000%, 11/30/2022 | 1,000 | 1,005 | ||||||||
2.000%, 05/31/2024 | 1,000 | 1,007 | ||||||||
2.000%, 02/15/2025 | 2,850 | 2,867 | ||||||||
2.000%, 08/15/2025 | 1,200 | 1,207 | ||||||||
2.000%, 11/15/2026 | 10,000 | 10,037 | ||||||||
1.875%, 01/31/2022 | 4,500 | 4,499 | ||||||||
1.875%, 02/28/2022 | 2,000 | 2,000 | ||||||||
1.875%, 03/31/2022 | 1,500 | 1,501 | ||||||||
1.875%, 04/30/2022 | 3,000 | 3,001 | ||||||||
1.875%, 05/31/2022 | 5,000 | 5,003 | ||||||||
1.875%, 07/31/2022 | 10,000 | 10,005 | ||||||||
1.875%, 08/31/2024 | 1,000 | 1,001 | ||||||||
1.750%, 12/31/2020 | 3,000 | 2,990 | ||||||||
1.750%, 11/30/2021 | 4,000 | 3,988 | ||||||||
1.750%, 05/31/2022 | 1,500 | 1,495 | ||||||||
1.750%, 01/31/2023 | 2,000 | 1,993 | ||||||||
1.750%, 05/15/2023 | 1,750 | 1,743 | ||||||||
1.750%, 06/30/2024 | 7,000 | 6,968 | ||||||||
1.625%, 10/15/2020 | 3,000 | 2,986 | ||||||||
1.625%, 06/30/2021 | 5,000 | 4,974 | ||||||||
1.625%, 08/31/2022 | 2,000 | 1,986 | ||||||||
1.625%, 05/31/2023 | 500 | 496 | ||||||||
1.625%, 02/15/2026 | 2,650 | 2,601 | ||||||||
1.625%, 05/15/2026 | 2,000 | 1,961 | ||||||||
1.500%, 02/28/2023 | 750 | 741 | ||||||||
1.500%, 03/31/2023 | 2,000 | 1,975 | ||||||||
1.500%, 08/15/2026 | 2,000 | 1,942 | ||||||||
1.375%, 01/31/2021 | 1,000 | 991 | ||||||||
1.375%, 04/30/2021 | 4,000 | 3,961 | ||||||||
1.375%, 05/31/2021 | 3,000 | 2,970 | ||||||||
1.375%, 08/31/2023 | 1,500 | 1,472 | ||||||||
1.375%, 09/30/2023 | 1,000 | 981 | ||||||||
| Description | Face Amount (Thousands) | Market Value ($ Thousands) | ||||||||
U.S. TREASURY OBLIGATIONS (continued) |
| |||||||||
1.250%, 03/31/2021 | $ | 5,000 | $ | 4,942 | ||||||
1.250%, 10/31/2021 | 3,000 | 2,958 | ||||||||
1.125%, 02/28/2021 | 3,500 | 3,454 | ||||||||
1.125%, 06/30/2021 | 5,000 | 4,926 | ||||||||
1.125%, 07/31/2021 | 5,500 | 5,416 | ||||||||
1.125%, 09/30/2021
|
| 1,500
|
|
| 1,476
|
| ||||
Total U.S. Treasury Obligations |
| 450,687 | ||||||||
MORTGAGE-BACKED SECURITIES — 21.7% |
| |||||||||
Agency Mortgage-Backed Obligations — 20.8% |
| |||||||||
FHLMC | ||||||||||
5.500%, 10/01/2038 to 06/01/2041 | 1,011 | 1,121 | ||||||||
5.000%, 09/01/2023 to 11/01/2041 | 1,698 | 1,840 | ||||||||
4.500%, 08/01/2040 to 02/01/2045 | 2,161 | 2,329 | ||||||||
4.000%, 12/01/2040 to 05/01/2048 | 7,387 | 7,808 | ||||||||
3.500%, 10/01/2020 to 12/01/2047 | 12,510 | 12,954 | ||||||||
3.000%, 09/01/2029 to 01/01/2047 | 11,184 | 11,368 | ||||||||
2.500%, 10/01/2029 to 06/01/2031 | 2,578 | 2,597 | ||||||||
FHLMC Multifamily Structured Pass-Through Certificates, Ser K030, CI A2 | ||||||||||
3.250%, 04/25/2023 (F) | 500 | 517 | ||||||||
FHLMC Multifamily Structured Pass-Through Certificates, Ser K048, CI A2 | ||||||||||
3.284%, 06/25/2025 (F) | 1,500 | 1,581 | ||||||||
FHLMC Multifamily Structured Pass-Through Certificates, Ser K054, CI A2 | ||||||||||
2.745%, 01/25/2026 | 400 | 411 | ||||||||
FHLMC Multifamily Structured Pass-Through Certificates, Ser K066, CI AM | ||||||||||
3.200%, 06/25/2027 | 900 | 946 | ||||||||
FHLMC Multifamily Structured Pass-Through Certificates, Ser K067, CI AM | ||||||||||
3.276%, 08/25/2027 | 200 | 211 | ||||||||
FHLMC Multifamily Structured Pass-Through Certificates, Ser K079, CI A2 | ||||||||||
3.926%, 06/25/2028 | 550 | 612 | ||||||||
FHLMC Multifamily Structured Pass-Through Certificates, Ser K088, CI A2 | ||||||||||
3.690%, 01/25/2029 | 409 | 449 | ||||||||
FHLMC Multifamily Structured Pass-Through Certificates, Ser K089, CI A2 | ||||||||||
3.563%, 01/25/2029 | 571 | 622 | ||||||||
FHLMC Multifamily Structured Pass-Through Certificates, Ser K090, CI A2 | ||||||||||
3.422%, 02/25/2029 | 262 | 283 | ||||||||
FHLMC Multifamily Structured Pass-Through Certificates, Ser K156, CI A1 | ||||||||||
3.700%, 05/25/2030 | 1,279 | 1,382 | ||||||||
FNMA | ||||||||||
6.000%, 07/01/2036 to 10/01/2039 | 596 | 676 | ||||||||
| ||||
| Adviser Managed Trust / Annual Report / July 31, 2019 | 59 | |||
SCHEDULE OF INVESTMENTS
July 31, 2019
Tactical Offensive Fixed Income Fund(Continued)
| Description | Face Amount (Thousands) | Market Value ($ Thousands) | ||||||
MORTGAGE-BACKED SECURITIES (continued) |
| |||||||
5.500%, 01/01/2035 to 09/01/2041 | $ | 1,800 | $ | 2,011 | ||||
5.000%, 07/01/2040 to 05/01/2042 | 2,639 | 2,883 | ||||||
4.500%, 11/01/2040 to 01/01/2049 | 30,150 | 31,873 | ||||||
4.000%, 04/01/2020 to 03/01/2049 | 42,931 | 44,785 | ||||||
3.500%, 01/01/2027 to 07/01/2048 | 63,170 | 65,264 | ||||||
3.000%, 08/01/2029 to 01/01/2047 | 30,363 | 30,870 | ||||||
2.500%, 07/01/2028 to 03/01/2043 | 3,817 | 3,840 | ||||||
FNMA, Ser2012-M2, CI A2 | ||||||||
2.717%, 02/25/2022 | 383 | 388 | ||||||
FNMA, Ser2014-M11, CI 2A | ||||||||
3.299%, 08/25/2026 (F) | 465 | 492 | ||||||
FNMA, Ser2015-M1, CI A2 | ||||||||
2.532%, 09/25/2024 | 350 | 353 | ||||||
FNMA, Ser2016-M1, CI A2 | ||||||||
2.939%, 01/25/2026 (F) | 275 | 283 | ||||||
FNMA, Ser2016-M5, CI A2 | ||||||||
2.469%, 04/25/2026 | 750 | 757 | ||||||
FNMA, Ser2018-M1,CI A2 | ||||||||
2.986%,12/25/2027(F) | 115 | 119 | ||||||
FNMA, Ser2019-M5, CI A2 | ||||||||
3.273%, 01/25/2029 | 275 | 291 | ||||||
GNMA | ||||||||
6.500%, 11/15/2038 | 80 | 92 | ||||||
5.500%, 01/15/2033 to 10/20/2043 | 871 | 971 | ||||||
5.000%, 10/15/2033 to 11/20/2046 | 1,045 | 1,125 | ||||||
4.500%, 04/15/2040 to 02/20/2049 | 13,266 | 13,926 | ||||||
4.000%, 04/15/2040 to 03/20/2049 | 30,972 | 32,349 | ||||||
3.500%, 06/20/2042 to 07/20/2047 | 29,995 | 31,165 | ||||||
3.000%, 05/15/2042 to 05/20/2047
|
| 12,035
|
|
| 12,362
|
| ||
| 323,906 | ||||||||
Non-Agency Mortgage-Backed Obligations — 0.9% |
| |||||||
BANK, Ser 2017-BNK7, CI A4 | ||||||||
3.175%, 09/15/2060 | 200 | 207 | ||||||
BANK, Ser 2019-BN17, CI A4 | ||||||||
3.714%, 04/15/2052 | 265 | 286 | ||||||
BANK, Ser 2019-BN18, CI A4 | ||||||||
3.584%, 05/15/2062 | 250 | 268 | ||||||
Barclays Commercial Mortgage Trust, Ser2019-C3, CI A4 | ||||||||
3.583%, 05/15/2052 | 200 | 213 | ||||||
BENCHMARK Mortgage Trust, Ser2018-B3, CI A5 | ||||||||
4.025%, 04/10/2051 | 200 | 220 | ||||||
BENCHMARK Mortgage Trust, Ser2018-B4, CI A5 | ||||||||
4.121%, 07/15/2051 (F) | 100 | 111 | ||||||
BENCHMARK Mortgage Trust, Ser2019-B10, CI A4 | ||||||||
3.717%, 03/15/2062 | 260 | 280 | ||||||
CD Mortgage Trust, Ser2017-CD6, CI A5 | ||||||||
3.456%, 11/13/2050 | 150 | 159 | ||||||
| Description | Face Amount (Thousands) | Market Value ($ Thousands) | ||||||
MORTGAGE-BACKED SECURITIES (continued) |
| |||||||
Citigroup Commercial Mortgage Trust, Ser2012-GC8, CI A4 | ||||||||
3.024%, 09/10/2045 | $ | 534 | $ | 543 | ||||
Citigroup Commercial Mortgage Trust, Ser 2014-GC21, CI A5 | ||||||||
3.855%, 05/10/2047 | 265 | 281 | ||||||
Citigroup Commercial Mortgage Trust, Ser 2014-GC23, CI AS | ||||||||
3.863%, 07/10/2047 | 1,000 | 1,052 | ||||||
C0MM Mortgage Trust, Ser2015-PC1, CI A4 | ||||||||
3.620%, 07/10/2050 | 240 | 252 | ||||||
C0MM Mortgage Trust, Ser 2017-C0R2, CI A3 | ||||||||
3.510%, 09/10/2050 | 300 | 317 | ||||||
C0MM Mortgage Trust, Ser 2018-C0R3, CI A3 | ||||||||
4.228%, 05/10/2051 | 1,000 | 1,111 | ||||||
Commercial Mortgage Trust, Ser 2014-UBS2, CI A5 | ||||||||
3.961%, 03/10/2047 | 270 | 287 | ||||||
Commercial Mortgage Trust, Ser 2014-UBS3, CI A3 | ||||||||
3.546%, 06/10/2047 | 193 | 202 | ||||||
CSAIL Commercial Mortgage Trust, Ser 2015- C3, CI A4 | ||||||||
3.718%, 08/15/2048 | 245 | 260 | ||||||
CSAIL Commercial Mortgage Trust, Ser 2017- CX10, CI A5 | ||||||||
3.458%, 11/15/2050 (F) | 325 | 342 | ||||||
CSMC Trust, Ser 2016-NXSR,CI A4 | ||||||||
3.795%, 12/15/2049 (F) | 350 | 373 | ||||||
GS Mortgage Securities Trust, Ser 2014- GC20, CI AS | ||||||||
4.258%, 04/10/2047 | 297 | 316 | ||||||
GS Mortgage Securities Trust, Ser 2014- GC20, CI A5 | ||||||||
3.998%, 04/10/2047 | 265 | 282 | ||||||
GS Mortgage Securities Trust, Ser2017-GS7, CI A4 | ||||||||
3.430%, 08/10/2050 | 500 | 526 | ||||||
GS Mortgage Securities Trust, Ser 2019- GC39, CI A4 | ||||||||
3.567%, 05/10/2052 | 175 | 187 | ||||||
JPMBB Commercial Mortgage Securities Trust, Ser2013-C14, CI AS | ||||||||
4.409%, 08/15/2046 (F) | 295 | 313 | ||||||
JPMBB Commercial Mortgage Securities Trust, Ser2014-C22, CI A4 | ||||||||
3.801%, 09/15/2047 | 500 | 531 | ||||||
JPMCC Commercial Mortgage Securities Trust, Ser 2019-C0R4, CI A5 | ||||||||
4.029%, 03/10/2052 | 300 | 329 | ||||||
JPMorgan Chase Commercial Mortgage Securities Trust, Ser2011-C5, CI A3 | ||||||||
4.171%, 08/15/2046 | 389 | 399 | ||||||
| 60 | Adviser Managed Trust / Annual Report / July 31, 2019 |
| Description | Face Amount (Thousands) | Market Value ($ Thousands) | ||||||
MORTGAGE-BACKED SECURITIES (continued) |
| |||||||
Morgan Stanley Bank of America Merrill Lynch Trust, Ser2015-C23, CI A4 | ||||||||
3.719%, 07/15/2050 | $ | 200 | $ | 213 | ||||
Morgan Stanley Bank of America Merrill Lynch Trust, Ser2016-C31, CI A5 | ||||||||
3.102%, 11/15/2049 | 579 | 596 | ||||||
Morgan Stanley Capital I Trust, Ser 2016- BNK2, CI A3 | ||||||||
2.791%, 11/15/2049 | 500 | 506 | ||||||
UBS Commercial Mortgage Trust, Ser 2018- C10, CI A4 | ||||||||
4.313%, 05/15/2051 | 200 | 224 | ||||||
UBS Commercial Mortgage Trust, Ser 2018- C12, CI ASB | ||||||||
4.195%, 08/15/2051 | 500 | 545 | ||||||
UBS-Barclays Commercial Mortgage Trust, | ||||||||
Ser2013-C5, CI A4 | ||||||||
3.185%, 03/10/2046 | 305 | 313 | ||||||
Wells Fargo Commercial Mortgage Trust, | ||||||||
Ser2015-C31, CI A4 | ||||||||
3.695%, 11/15/2048 | 500 | 532 | ||||||
Wells Fargo Commercial Mortgage Trust, | ||||||||
Ser 2015-LC22, CI B | ||||||||
4.543%, 09/15/2058 (F) | 800 | 869 | ||||||
Wells Fargo Commercial Mortgage Trust, | ||||||||
Ser2017-RC1, CI A4 | ||||||||
3.631%, 01/15/2060 | 300 | 319 | ||||||
Wells Fargo Commercial Mortgage Trust, | ||||||||
Ser2019-C50, CI A5 | ||||||||
3.729%, 05/15/2052 | 65 | 70 | ||||||
WFRBS Commercial Mortgage Trust, Ser2012-C9, CI AS | ||||||||
3.388%, 11/15/2045 | 210 | 215 | ||||||
WFRBS Commercial Mortgage Trust, Ser2014-C19, CI A5 | ||||||||
4.101%, 03/15/2047 | 250 | 268 | ||||||
WFRBS Commercial Mortgage Trust, Ser2014-C22, CI A4 | ||||||||
3.488%, 09/15/2057 | 300 | 314 | ||||||
| 14,631 | ||||||||
Total Mortgage-Backed Securities | 338,537 | |||||||
SOVEREIGN DEBT — 16.0% |
| |||||||
Angolan Government International Bond | ||||||||
9.500%, 11/12/2025 (A) | 300 | 347 | ||||||
8.250%, 05/09/2028 (A) | 600 | 638 | ||||||
Argentine Republic Government International | ||||||||
Bond | ||||||||
8.280%, 12/31/2033 | 210 | 182 | ||||||
| Description | Face Amount (Thousands) | Market Value ($ Thousands) | ||||||
SOVEREIGN DEBT (continued) |
| |||||||
7.625%, 04/22/2046 | $ | 500 | $ | 402 | ||||
7.500%, 04/22/2026 | 900 | 770 | ||||||
7.125%, 07/06/2036 | 450 | 353 | ||||||
7.125%, 06/28/2117 | 1,250 | 959 | ||||||
6.875%, 04/22/2021 | 500 | 449 | ||||||
6.875%, 01/26/2027 | 450 | 372 | ||||||
6.875%, 01/11/2048 | 200 | 151 | ||||||
6.625%, 07/06/2028 | 200 | 161 | ||||||
5.875%, 01/11/2028 | 1,900 | 1,496 | ||||||
5.625%, 01/26/2022 | 400 | 344 | ||||||
4.625%, 01/11/2023 | 1,550 | 1,290 | ||||||
3.750%, 5.250%, 03/31/2029, | 600 | 358 | ||||||
Armenia Government International Bond | ||||||||
7.150%, 03/26/2025 | 200 | 231 | ||||||
Azerbaijan Government International Bond | ||||||||
4.750%, 03/18/2024 (A) | 200 | 213 | ||||||
3.500%, 09/01/2032 (A) | 350 | 335 | ||||||
Bahamas Government International Bond | ||||||||
6.000%, 11/21/2028 (A) | 200 | 220 | ||||||
Bahrain Government International Bond | ||||||||
7.500%, 09/20/2047 (A) | 300 | 341 | ||||||
7.000%, 01/26/2026 (A) | 200 | 224 | ||||||
7.000%, 10/12/2028 (A) | 500 | 565 | ||||||
6.750%, 09/20/2029 (A) | 200 | 222 | ||||||
6.125%, 07/05/2022 (A) | 200 | 213 | ||||||
6.125%, 08/01/2023 (A) | 300 | 323 | ||||||
5.875%, 01/26/2021 (A) | 200 | 206 | ||||||
Belarus Government International Bond | ||||||||
6.875%, 02/28/2023 (A) | 200 | 213 | ||||||
6.200%, 02/28/2030 (A) | 300 | 317 | ||||||
Belize Government International Bond | ||||||||
4.938%, 02/20/2034 (D) | 100 | 61 | ||||||
Bolivian Government International Bond | ||||||||
5.950%, 08/22/2023 | 300 | 327 | ||||||
4.500%, 03/20/2028 (A) | 200 | 194 | ||||||
Brazilian Government International Bond | ||||||||
8.875%, 04/15/2024 | 100 | 127 | ||||||
8.250%, 01/20/2034 | 350 | 483 | ||||||
7.125%, 01/20/2037 | 200 | 256 | ||||||
6.000%, 04/07/2026 | 350 | 403 | ||||||
5.625%, 01/07/2041 | 250 | 278 | ||||||
5.625%, 02/21/2047 | 1,100 | 1,224 | ||||||
5.000%, 01/27/2045 | 550 | 567 | ||||||
4.875%, 01/22/2021 | 300 | 311 | ||||||
4.625%, 01/13/2028 | 1,200 | 1,271 | ||||||
4.500%, 05/30/2029 | 200 | 208 | ||||||
4.250%, 01/07/2025 | 950 | 1,000 | ||||||
2.625%, 01/05/2023 | 750 | 748 | ||||||
Bundesobligation | ||||||||
-0.483%, 04/08/2022 (C) (G) | EUR 687 | 782 | ||||||
-0.584%, 04/17/2020 (C) (G) | 131 | 146 | ||||||
| ||||
| Adviser Managed Trust / Annual Report / July 31, 2019 | 61 | |||
SCHEDULE OF INVESTMENTS
July 31, 2019
Tactical Offensive Fixed Income Fund(Continued)
| Description | Face Amount (Thousands) | Market Value ($ Thousands) | ||||||||||
SOVEREIGN DEBT (continued) |
| |||||||||||
Bundesrepublik Deutschland Bundesanleihe | ||||||||||||
4.750%, 07/04/2034 | EUR | 273 | $ | 536 | ||||||||
4.750%, 07/04/2040 | 7 | 16 | ||||||||||
4.250%, 07/04/2039 | 190 | 396 | ||||||||||
4.000%, 01/04/2037 | 37 | 72 | ||||||||||
2.500%, 07/04/2044 | 255 | 456 | ||||||||||
2.500%, 08/15/2046 | 153 | 280 | ||||||||||
2.000%, 01/04/2022 | 631 | 751 | ||||||||||
2.000%, 08/15/2023 | 530 | 658 | ||||||||||
1.750%, 02/15/2024 | 546 | 679 | ||||||||||
1.250%, 08/15/2048 | 87 | 128 | ||||||||||
1.000%, 08/15/2024 | 2 | 2 | ||||||||||
1.000%, 08/15/2025 | 29 | 36 | ||||||||||
0.500%, 02/15/2025 | 619 | 737 | ||||||||||
0.500%, 02/15/2026 | 37 | 44 | ||||||||||
0.500%, 02/15/2028 | 464 | 564 | ||||||||||
0.250%, 02/15/2027 | 15 | 18 | ||||||||||
-0.127%, 08/15/2026 (C) (G) |
| 20 | 23 | |||||||||
Bundesschatzanweisungen |
| |||||||||||
-0.568%, 12/11/2020 (C) (G) |
| 275 | 310 | |||||||||
-0.581%, 03/13/2020 (C) (G) |
| 104 | 116 | |||||||||
Cameroon Government International Bond | ||||||||||||
9.500%, 11/19/2025 (A) | $ | 200 | 217 | |||||||||
Canadian Government International Bond | ||||||||||||
4.000%, 06/01/2041 | CAD | 15 | 16 | |||||||||
3.500%, 12/01/2045 | 314 | 328 | ||||||||||
2.625%, 01/25/2022 | $ | 410 | 417 | |||||||||
2.250%, 06/01/2025 | CAD | 532 | 422 | |||||||||
2.000%, 11/15/2022 | $ | 300 | 301 | |||||||||
2.000%, 06/01/2028 | CAD | 560 | 444 | |||||||||
1.500%, 03/01/2020 | 833 | 633 | ||||||||||
Chile Government International Bond | ||||||||||||
3.875%, 08/05/2020 | $ | 150 | 153 | |||||||||
3.860%, 06/21/2047 | 300 | 326 | ||||||||||
3.240%, 02/06/2028 | 1,000 | 1,045 | ||||||||||
3.125%, 01/21/2026 | 200 | 208 | ||||||||||
China Government International Bond | ||||||||||||
4.000%, 10/19/2048 | 200 | 223 | ||||||||||
3.500%, 10/19/2028 | 200 | 217 | ||||||||||
3.250%, 10/19/2023 | 200 | 208 | ||||||||||
2.625%, 11/02/2027 | 200 | 203 | ||||||||||
2.125%, 11/02/2022 | 200 | 199 | ||||||||||
Colombia Government International Bond | ||||||||||||
7.375%, 09/18/2037 | 200 | 275 | ||||||||||
6.125%, 01/18/2041 | 1,250 | 1,558 | ||||||||||
5.625%, 02/26/2044 | 200 | 239 | ||||||||||
5.200%, 05/15/2049 | 1,000 | 1,149 | ||||||||||
5.000%, 06/15/2045 | 500 | 556 | ||||||||||
4.500%, 01/28/2026 | 200 | 215 | ||||||||||
4.500%, 03/15/2029 | 800 | 874 | ||||||||||
4.375%, 07/12/2021 | 550 | 569 | ||||||||||
4.000%, 02/26/2024 | 300 | 315 | ||||||||||
| Description | Face Amount (Thousands) | Market Value ($ Thousands) | ||||||||||
SOVEREIGN DEBT (continued) |
| |||||||||||
3.875%, 04/25/2027 | $ | 800 | $ | 835 | ||||||||
2.625%, 03/15/2023 | 600 | 598 | ||||||||||
Costa Rica Government International Bond | ||||||||||||
7.158%, 03/12/2045 | 400 | 414 | ||||||||||
7.000%, 04/04/2044 (A) | 200 | 204 | ||||||||||
4.375%, 04/30/2025 (A) | 200 | 194 | ||||||||||
Croatia Government International Bond | ||||||||||||
6.375%, 03/24/2021 | 450 | 477 | ||||||||||
6.000%, 01/26/2024 | 200 | 228 | ||||||||||
5.500%, 04/04/2023 | 250 | 275 | ||||||||||
Dominican Republic International Bond | ||||||||||||
7.500%, 05/06/2021 | 67 | 70 | ||||||||||
7.450%, 04/30/2044 | 150 | 177 | ||||||||||
6.875%, 01/29/2026 (A) | 200 | 227 | ||||||||||
6.850%, 01/27/2045 | 100 | 112 | ||||||||||
6.600%, 01/28/2024 | 100 | 111 | ||||||||||
6.500%, 02/15/2048 (A) | 200 | 214 | ||||||||||
6.400%, 06/05/2049 (A) | 350 | 373 | ||||||||||
6.000%, 07/19/2028 (A) | 600 | 656 | ||||||||||
5.950%, 01/25/2027 (A) | 200 | 218 | ||||||||||
5.875%, 04/18/2024 | 400 | 429 | ||||||||||
5.500%, 01/27/2025 | 500 | 531 | ||||||||||
Ecuador Government International Bond | ||||||||||||
10.750%, 03/28/2022 (A) | 700 | 774 | ||||||||||
9.650%, 12/13/2026 (A) | 500 | 539 | ||||||||||
9.625%, 06/02/2027 (A) | 200 | 214 | ||||||||||
8.875%, 10/23/2027 (A) | 200 | 206 | ||||||||||
8.750%, 06/02/2023 (A) | 200 | 215 | ||||||||||
7.950%, 06/20/2024 | 200 | 208 | ||||||||||
7.875%, 01/23/2028 (A) | 1,300 | 1,274 | ||||||||||
Egypt Government International Bond | ||||||||||||
8.500%, 01/31/2047 (A) | 200 | 218 | ||||||||||
7.903%, 02/21/2048 (A) | 600 | 623 | ||||||||||
7.600%, 03/01/2029 (A) | 200 | 214 | ||||||||||
7.500%, 01/31/2027 (A) | 400 | 436 | ||||||||||
6.875%, 04/30/2040 | 200 | 195 | ||||||||||
6.588%, 02/21/2028 (A) | 500 | 514 | ||||||||||
5.875%, 06/11/2025 | 200 | 208 | ||||||||||
5.577%, 02/21/2023 (A) | 1,050 | 1,087 | ||||||||||
El Salvador Government International Bond | ||||||||||||
8.625%, 02/28/2029 (A) | 600 | 702 | ||||||||||
7.650%, 06/15/2035 | 60 | 65 | ||||||||||
7.625%, 02/01/2041 (A) | 150 | 162 | ||||||||||
6.375%, 01/18/2027 | 100 | 103 | ||||||||||
5.875%, 01/30/2025 | 50 | 52 | ||||||||||
Ethiopia Government International Bond | ||||||||||||
6.625%, 12/11/2024 | 200 | 208 | ||||||||||
Export Development Canada | ||||||||||||
2.625%, 02/21/2024 | 500 | 516 | ||||||||||
2.500%, 01/24/2023 | 400 | 407 | ||||||||||
2.000%, 05/17/2022 | 200 | 200 | ||||||||||
1.375%, 10/21/2021 | 100 | 99 | ||||||||||
| 62 | Adviser Managed Trust / Annual Report / July 31, 2019 |
| Description | Face Amount | Market Value ($ Thousands) | ||||||||||
SOVEREIGN DEBT (continued) |
| |||||||||||
Export-Import Bank of Korea | ||||||||||||
3.500%, 11/27/2021 | $ | 500 | $ | 513 | ||||||||
2.875%, 01/21/2025 | 100 | 102 | ||||||||||
2.625%, 05/26/2026 | 200 | 199 | ||||||||||
French Republic Government Bond OAT | ||||||||||||
8.500%, 04/25/2023 | EUR | 1 | 1 | |||||||||
5.750%, 10/25/2032 | 29 | 57 | ||||||||||
5.500%, 04/25/2029 | 20 | 35 | ||||||||||
4.750%, 04/25/2035 | 263 | 501 | ||||||||||
4.500%, 04/25/2041 | 280 | 576 | ||||||||||
4.250%, 10/25/2023 | 428 | 578 | ||||||||||
4.000%, 10/25/2038 | 54 | 101 | ||||||||||
4.000%, 04/25/2055 | 9 | 20 | ||||||||||
4.000%, 04/25/2060 | 8 | 19 | ||||||||||
3.750%, 04/25/2021 | 700 | 840 | ||||||||||
3.500%, 04/25/2020 | 97 | 111 | ||||||||||
3.250%, 10/25/2021 | 107 | 130 | ||||||||||
3.250%, 05/25/2045 | 180 | 328 | ||||||||||
3.000%, 04/25/2022 | 263 | 323 | ||||||||||
2.750%, 10/25/2027 | 417 | 585 | ||||||||||
2.500%, 10/25/2020 | 1 | 1 | ||||||||||
2.500%, 05/25/2030 | 366 | 524 | ||||||||||
2.250%, 05/25/2024 | 150 | 191 | ||||||||||
2.000%, 05/25/2048 (A) | 245 | 366 | ||||||||||
1.750%, 05/25/2023 | 1 | 1 | ||||||||||
1.750%, 11/25/2024 | 385 | 483 | ||||||||||
1.750%, 05/25/2066 (A) | 125 | 182 | ||||||||||
1.500%, 05/25/2031 | 384 | 505 | ||||||||||
1.250%, 05/25/2034 | 126 | 162 | ||||||||||
1.250%, 05/25/2036 (A) | 332 | 428 | ||||||||||
1.000%, 11/25/2025 | 665 | 812 | ||||||||||
0.750%, 11/25/2028 | 375 | 456 | ||||||||||
0.500%, 05/25/2025 | 481 | 568 | ||||||||||
-0.445%, 05/25/2021 (C) (G) | 1 | 1 | ||||||||||
-0.530%, 05/25/2020 (C) (G) | 140 | 157 | ||||||||||
Gabon Government International Bond | ||||||||||||
6.950%, 06/16/2025 | $ | 300 | 300 | |||||||||
6.375%, 12/12/2024 | 200 | 198 | ||||||||||
Ghana Government International Bond | ||||||||||||
10.750%, 10/14/2030 | 300 | 380 | ||||||||||
8.950%, 03/26/2051 (A) | 200 | 207 | ||||||||||
8.125%, 01/18/2026 | 200 | 216 | ||||||||||
8.125%, 03/26/2032 (A) | 200 | 203 | ||||||||||
7.875%, 08/07/2023 | 200 | 219 | ||||||||||
7.875%, 03/26/2027 (A) | 200 | 211 | ||||||||||
7.625%, 05/16/2029 (A) | 300 | 306 | ||||||||||
Guatemala Government International Bond | ||||||||||||
5.750%, 06/06/2022 (A) | 200 | 213 | ||||||||||
4.875%, 02/13/2028 | 100 | 104 | ||||||||||
4.500%, 05/03/2026 (A) | 200 | 203 | ||||||||||
4.375%,06/05/2027(A) | 300 | 302 | ||||||||||
| Description | Face Amount | Market Value ($ Thousands) | ||||||||||
SOVEREIGN DEBT (continued) |
| |||||||||||
Honduras Government International Bond | ||||||||||||
7.500%, 03/15/2024 | $ | 200 | $ | 220 | ||||||||
6.250%, 01/19/2027 (A) | 150 | 162 | ||||||||||
Hungary Government International Bond | ||||||||||||
7.625%, 03/29/2041 | 300 | 475 | ||||||||||
6.375%, 03/29/2021 | 550 | 584 | ||||||||||
5.750%, 11/22/2023 | 200 | 225 | ||||||||||
5.375%, 02/21/2023 | 800 | 877 | ||||||||||
5.375%, 03/25/2024 | 450 | 504 | ||||||||||
Indonesia Government International Bond | ||||||||||||
8.500%, 10/12/2035 | 100 | 152 | ||||||||||
7.750%, 01/17/2038 | 300 | 438 | ||||||||||
6.750%, 01/15/2044 (A) | 275 | 380 | ||||||||||
6.625%, 02/17/2037 | 325 | 427 | ||||||||||
5.950%, 01/08/2046 (A) | 200 | 253 | ||||||||||
5.875%, 01/15/2024 (A) | 200 | 225 | ||||||||||
5.375%, 10/17/2023 (A) | 200 | 221 | ||||||||||
5.350%, 02/11/2049 | 800 | 967 | ||||||||||
5.250%, 01/17/2042 (A) | 950 | 1,098 | ||||||||||
5.250%, 01/08/2047 (A) | 200 | 234 | ||||||||||
5.125%, 01/15/2045 (A) | 200 | 230 | ||||||||||
4.875%, 05/05/2021 (A) | 500 | 518 | ||||||||||
4.750%, 01/08/2026 (A) | 200 | 220 | ||||||||||
4.750%, 02/11/2029 | 650 | 733 | ||||||||||
4.625%, 04/15/2043 (A) | 400 | 430 | ||||||||||
4.450%, 02/11/2024 | 550 | 588 | ||||||||||
4.350%, 01/08/2027 (A) | 200 | 216 | ||||||||||
4.350%, 01/11/2048 | 500 | 526 | ||||||||||
4.125%, 01/15/2025 (A) | 200 | 212 | ||||||||||
4.100%, 04/24/2028 | 600 | 641 | ||||||||||
3.850%, 07/18/2027 (A) | 200 | 209 | ||||||||||
3.750%, 04/25/2022 (A) | 450 | 463 | ||||||||||
3.700%, 01/08/2022 (A) | 200 | 205 | ||||||||||
3.500%, 01/11/2028 | 200 | 205 | ||||||||||
3.375%, 04/15/2023 (A) | 200 | 205 | ||||||||||
2.950%, 01/11/2023 | 200 | 202 | ||||||||||
Iraq Government AID Bond | ||||||||||||
2.149%, 01/18/2022 | 320 | 322 | ||||||||||
Iraq Government International Bond | ||||||||||||
6.752%, 03/09/2023 (A) | 400 | 414 | ||||||||||
5.800%, 01/15/2028 (A) | 250 | 248 | ||||||||||
Israel Government International Bond | ||||||||||||
4.500%, 01/30/2043 | 200 | 230 | ||||||||||
4.125%, 01/17/2048 | 200 | 219 | ||||||||||
3.250%, 01/17/2028 | 100 | 105 | ||||||||||
2.875%, 03/16/2026 | 300 | 310 | ||||||||||
Italy Buoni Poliennali Del Tesoro | ||||||||||||
6.500%, 11/01/2027 | EUR | 104 | 162 | |||||||||
6.000%, 05/01/2031 | 267 | 431 | ||||||||||
5.250%, 11/01/2029 | 15 | 22 | ||||||||||
5.000%, 08/01/2034 (A) | 330 | 509 | ||||||||||
5.000%, 08/01/2039 (A) | 211 | 333 | ||||||||||
| ||||
| Adviser Managed Trust / Annual Report / July 31, 2019 | 63 | |||
SCHEDULE OF INVESTMENTS
July 31, 2019
Tactical Offensive Fixed Income Fund(Continued)
| Description | Face Amount (Thousands) | Market Value ($ Thousands) | ||||||
SOVEREIGN DEBT (continued) |
| |||||||
5.000%, 09/01/2040 (A) | EUR 195 | $ | 308 | |||||
4.750%, 09/01/2028 (A) | 299 | 430 | ||||||
4.750%, 09/01/2044 (A) | 28 | 44 | ||||||
4.000%, 02/01/2037 (A) | 61 | 86 | ||||||
3.750%, 05/01/2021 (A) | 500 | 593 | ||||||
3.450%, 03/01/2048 (A) | 150 | 198 | ||||||
3.250%, 09/01/2046 (A) | 161 | 206 | ||||||
2.800%, 12/01/2028 | 274 | 341 | ||||||
2.800%, 03/01/2067(A) | 119 | 133 | ||||||
2.500%, 12/01/2024 | 368 | 444 | ||||||
2.500%, 11/15/2025 | 318 | 385 | ||||||
2.300%, 10/15/2021 | 519 | 605 | ||||||
2.050%, 08/01/2027 | 296 | 349 | ||||||
2.000%, 02/01/2028 | 302 | 355 | ||||||
1.650%, 03/01/2032 (A) | 93 | 102 | ||||||
1.450%, 05/15/2025 | 347 | 397 | ||||||
1.000%, 07/15/2022 | 821 | 931 | ||||||
0.650%, 11/01/2020 | 544 | 612 | ||||||
0.650%, 10/15/2023 | 382 | 427 | ||||||
Italy Government International Bond | ||||||||
6.875%, 09/27/2023 | $ | 100 | 114 | |||||
5.375%, 06/15/2033 | 150 | 167 | ||||||
Ivory Coast Government International Bond | ||||||||
6.375%, 03/03/2028 | 500 | 502 | ||||||
6.125%, 06/15/2033 (A) | 200 | 189 | ||||||
5.750%, 12/31/2032 | 13 | 13 | ||||||
5.375%, 07/23/2024 | 200 | 203 | ||||||
Jamaica Government International Bond | ||||||||
8.000%, 03/15/2039 | 100 | 126 | ||||||
7.875%, 07/28/2045 | 100 | 127 | ||||||
6.750%, 04/28/2028 | 800 | 925 | ||||||
Japan Bank for International Cooperation | ||||||||
3.375%, 10/31/2023 | 200 | 210 | ||||||
3.250%, 07/20/2023 | 500 | 521 | ||||||
3.125%, 07/20/2021 | 300 | 306 | ||||||
2.875%, 06/01/2027 | 100 | 104 | ||||||
2.500%, 06/01/2022 | 200 | 202 | ||||||
2.500%, 05/23/2024 | 200 | 203 | ||||||
2.375%, 07/21/2022 | 100 | 101 | ||||||
1.875%, 07/21/2026 | 200 | 195 | ||||||
Japan Finance Organization for Municipalities | ||||||||
4.000%, 01/13/2021 | 100 | 102 | ||||||
Japan Government Five Year Bond | ||||||||
0.100%, 06/20/2020 | JPY 185,600 | 1,714 | ||||||
0.100%, 09/20/2020 | 209,300 | 1,934 | ||||||
0.100%, 09/20/2021 | 97,700 | 906 | ||||||
0.100%, 12/20/2021 | 105,000 | 974 | ||||||
0.100%, 09/20/2022 | 119,000 | 1,107 | ||||||
0.100%, 03/20/2023 | 253,100 | 2,359 | ||||||
0.100%, 06/20/2023 | 182,000 | 1,699 | ||||||
| Description | Face Amount (Thousands) | Market Value ($ Thousands) | ||||||
SOVEREIGN DEBT (continued) |
| |||||||
Japan Government Forty Year Bond | ||||||||
0.900%, 03/20/2057 | JPY 77,200 | $ | 837 | |||||
Japan Government Ten Year Bond | ||||||||
0.800%, 06/20/2022 | 67,700 | 642 | ||||||
0.800%, 12/20/2022 | 115,800 | 1,104 | ||||||
0.800%, 09/20/2023 | 205,500 | 1,974 | ||||||
0.700%, 12/20/2022 | 102,250 | 971 | ||||||
0.400%, 09/20/2025 | 181,000 | 1,734 | ||||||
0.100%, 03/20/2026 | 108,250 | 1,020 | ||||||
0.100%, 06/20/2026 | 118,000 | 1,113 | ||||||
0.100%, 03/20/2027 | 120,000 | 1,135 | ||||||
0.100%, 09/20/2027 | 146,600 | 1,388 | ||||||
0.100%, 03/20/2028 | 162,600 | 1,539 | ||||||
0.100%, 06/20/2028 | 164,950 | 1,561 | ||||||
0.100%, 09/20/2028 | 170,200 | 1,610 | ||||||
0.100%, 12/20/2028 | 63,200 | 598 | ||||||
0.100%, 06/20/2029 | 41,400 | 391 | ||||||
Japan Government Thirty Year Bond | ||||||||
2.500%, 03/20/2036 | 127,700 | 1,641 | ||||||
2.300%, 03/20/2040 | 13,150 | 172 | ||||||
1.700%, 09/20/2044 | 66,650 | 822 | ||||||
1.400%, 09/20/2045 | 45,000 | 528 | ||||||
0.900%, 09/20/2048 | 43,000 | 456 | ||||||
0.800%, 06/20/2047 | 43,000 | 445 | ||||||
0.800%, 09/20/2047 | 38,000 | 394 | ||||||
0.800%, 03/20/2048 | 46,000 | 477 | ||||||
0.600%, 12/20/2046 | 45,000 | 444 | ||||||
0.300%, 06/20/2046 | 48,750 | 447 | ||||||
Japan Government Twenty Year Bond | ||||||||
1.700%, 09/20/2032 | 87,000 | 983 | ||||||
1.600%, 03/20/2033 | 130,250 | 1,462 | ||||||
1.500%, 03/20/2034 | 82,000 | 917 | ||||||
1.000%, 12/20/2035 | 98,800 | 1,044 | ||||||
0.700%, 09/20/2038 | 54,500 | 550 | ||||||
0.600%, 12/20/2036 | 81,000 | 806 | ||||||
0.600%, 09/20/2037 | 56,000 | 557 | ||||||
0.500%, 09/20/2036 | 118,300 | 1,159 | ||||||
0.500%, 03/20/2038 | 74,500 | 727 | ||||||
0.500%, 06/20/2038 | 23,500 | 229 | ||||||
0.400%, 03/20/2039 | 25,150 | 240 | ||||||
Jordan Government International Bond | ||||||||
7.375%, 10/10/2047 (A) | $ | 100 | 106 | |||||
6.125%, 01/29/2026 (A) | 300 | 315 | ||||||
5.750%, 01/31/2027 (A) | 200 | 205 | ||||||
Kazakhstan Government International Bond | ||||||||
6.500%, 07/21/2045 (A) | 500 | 694 | ||||||
5.125%, 07/21/2025 (A) | 500 | 563 | ||||||
4.875%, 10/14/2044 (A) | 200 | 230 | ||||||
Kenya Government International Bond | ||||||||
8.250%, 02/28/2048 (A) | 100 | 104 | ||||||
7.250%, 02/28/2028 (A) | 600 | 624 | ||||||
7.000%, 05/22/2027 (A) | 300 | 314 | ||||||
| 64 | Adviser Managed Trust / Annual Report / July 31, 2019 |
| Description | Face Amount (Thousands) | Market Value ($ Thousands) | ||||||
SOVEREIGN DEBT (continued) |
| |||||||
6.875%, 06/24/2024 | $ | 200 | $ | 215 | ||||
Korea Government International Bond | ||||||||
3.875%, 09/11/2023 | 200 | 214 | ||||||
3.500%, 09/20/2028 | 200 | 216 | ||||||
Kuwait Government International Bond | ||||||||
3.500%, 03/20/2027 (A) | 1,050 | 1,112 | ||||||
2.750%, 03/20/2022 (A) | 500 | 505 | ||||||
Lebanon Government International Bond | ||||||||
8.250%, 04/12/2021 | 400 | 373 | ||||||
7.250%, 03/23/2037 | 100 | 76 | ||||||
7.000%, 03/23/2032 | 100 | 77 | ||||||
6.850%, 03/23/2027 | 900 | 702 | ||||||
6.650%, 11/03/2028 | 50 | 38 | ||||||
6.650%, 02/26/2030 | 550 | 413 | ||||||
6.600%, 11/27/2026 | 450 | 348 | ||||||
6.250%, 05/27/2022 | 600 | 513 | ||||||
6.100%, 10/04/2022 | 400 | 339 | ||||||
6.000%, 01/27/2023 | 50 | 42 | ||||||
Mexico Government International Bond | ||||||||
6.750%, 09/27/2034 | 525 | 673 | ||||||
6.050%, 01/11/2040 | 900 | 1,079 | ||||||
5.750%, 10/12/2110 | 500 | 543 | ||||||
5.550%, 01/21/2045 | 850 | 982 | ||||||
4.750%, 03/08/2044 | 550 | 568 | ||||||
4.600%, 01/23/2046 | 600 | 605 | ||||||
4.600%, 02/10/2048 | 1,100 | 1,112 | ||||||
4.500%, 04/22/2029 | 1,700 | 1,811 | ||||||
4.500%, 01/31/2050 | 215 | 214 | ||||||
4.350%, 01/15/2047 | 550 | 535 | ||||||
4.150%, 03/28/2027 | 650 | 677 | ||||||
4.125%, 01/21/2026 | 550 | 576 | ||||||
4.000%, 10/02/2023 | 1,300 | 1,360 | ||||||
3.750%, 01/11/2028 | 600 | 607 | ||||||
3.625%, 03/15/2022 | 400 | 411 | ||||||
3.600%, 01/30/2025 | 400 | 409 | ||||||
Mongolia Government International Bond | ||||||||
8.750%, 03/09/2024 (A) | 200 | 227 | ||||||
5.625%, 05/01/2023 (A) | 400 | 408 | ||||||
Morocco Government International Bond | ||||||||
5.500%, 12/11/2042 (A) | 100 | 117 | ||||||
4.250%, 12/11/2022 (A) | 400 | 417 | ||||||
Namibia Government International Bond | ||||||||
5.500%, 11/03/2021 (A) | 200 | 208 | ||||||
Nigeria Government International Bond | ||||||||
9.248%, 01/21/2049 (A) | 250 | 286 | ||||||
8.747%, 01/21/2031 (A) | 500 | 564 | ||||||
7.875%, 02/16/2032 (A) | 200 | 212 | ||||||
7.696%, 02/23/2038 (A) | 300 | 309 | ||||||
7.625%, 11/21/2025 (A) | 200 | 222 | ||||||
7.625%, 11/28/2047 (A) | 100 | 101 | ||||||
7.143%, 02/23/2030 (A) | 300 | 310 | ||||||
6.500%, 11/28/2027 (A) | 200 | 205 | ||||||
| Description | Face Amount (Thousands) | Market Value ($ Thousands) | ||||||
SOVEREIGN DEBT (continued) |
| |||||||
Oman Government International Bond | ||||||||
6.750%, 01/17/2048 (A) | $ | 600 | $ | 565 | ||||
6.500%, 03/08/2047 (A) | 250 | 231 | ||||||
5.625%, 01/17/2028 (A) | 850 | 840 | ||||||
5.375%, 03/08/2027 (A) | 200 | 195 | ||||||
4.875%, 02/01/2025 (A) | 200 | 200 | ||||||
4.750%, 06/15/2026 (A) | 200 | 192 | ||||||
4.125%, 01/17/2023 (A) | 800 | 796 | ||||||
3.875%, 03/08/2022 (A) | 200 | 199 | ||||||
Pakistan Government International Bond | ||||||||
8.250%, 04/15/2024 | 400 | 448 | ||||||
8.250%, 09/30/2025 | 200 | 224 | ||||||
Panama Government International Bond | ||||||||
6.700%, 01/26/2036 | 200 | 275 | ||||||
4.500%, 05/15/2047 | 300 | 340 | ||||||
4.500%, 04/16/2050 | 500 | 560 | ||||||
4.300%, 04/29/2053 | 200 | 220 | ||||||
4.000%, 09/22/2024 | 200 | 212 | ||||||
3.875%, 03/17/2028 | 1,000 | 1,069 | ||||||
3.870%, 07/23/2060 | 200 | 201 | ||||||
3.750%, 03/16/2025 | 500 | 525 | ||||||
3.160%, 01/23/2030 | 200 | 202 | ||||||
Paraguay Government International Bond | ||||||||
6.100%, 08/11/2044 | 200 | 242 | ||||||
5.000%, 04/15/2026 (A) | 400 | 438 | ||||||
4.625%, 01/25/2023 | 200 | 210 | ||||||
Peruvian Government International Bond | ||||||||
8.750%, 11/21/2033 | 250 | 408 | ||||||
6.550%, 03/14/2037 | 250 | 354 | ||||||
5.625%, 11/18/2050 | 800 | 1,108 | ||||||
4.125%, 08/25/2027 | 800 | 890 | ||||||
2.844%, 06/20/2030 | 55 | 56 | ||||||
Philippine Government International Bond | ||||||||
9.500%, 02/02/2030 | 100 | 161 | ||||||
7.750%, 01/14/2031 | 200 | 296 | ||||||
6.375%, 01/15/2032 | 100 | 135 | ||||||
6.375%, 10/23/2034 | 250 | 350 | ||||||
5.500%, 03/30/2026 | 450 | 531 | ||||||
5.000%, 01/13/2037 | 200 | 251 | ||||||
4.200%, 01/21/2024 | 900 | 970 | ||||||
4.000%, 01/15/2021 | 400 | 409 | ||||||
3.950%, 01/20/2040 | 600 | 674 | ||||||
3.750%, 01/14/2029 | 1,200 | 1,314 | ||||||
3.700%, 03/01/2041 | 600 | 656 | ||||||
3.700%, 02/02/2042 | 300 | 329 | ||||||
3.000%, 02/01/2028 | 1,250 | 1,286 | ||||||
Poland Government International Bond | ||||||||
5.125%, 04/21/2021 | 450 | 471 | ||||||
5.000%, 03/23/2022 | 375 | 402 | ||||||
4.000%, 01/22/2024 | 300 | 322 | ||||||
3.250%, 04/06/2026 | 500 | 526 | ||||||
3.000%, 03/17/2023 | 1,200 | 1,231 | ||||||
| ||||
| Adviser Managed Trust / Annual Report / July 31, 2019 | 65 | |||
SCHEDULE OF INVESTMENTS
July 31, 2019
Tactical Offensive Fixed Income Fund(Continued)
| Description | Face Amount (Thousands) | Market Value ($ Thousands) | ||||||
SOVEREIGN DEBT (continued) |
| |||||||
Province of Alberta Canada | ||||||||
3.350%, 11/01/2023 | $ | 100 | $ | 105 | ||||
3.300%, 03/15/2028 | 100 | 107 | ||||||
2.950%, 01/23/2024 | 300 | 311 | ||||||
Province of British Columbia Canada | ||||||||
2.250%, 06/02/2026 | 100 | 101 | ||||||
2.000%, 10/23/2022 | 125 | 125 | ||||||
Province of Manitoba Canada | ||||||||
2.125%, 05/04/2022 | 500 | 501 | ||||||
2.125%, 06/22/2026 | 100 | 99 | ||||||
Province of New Brunswick Canada | ||||||||
3.625%, 02/24/2028 | 250 | 272 | ||||||
Province of Ontario Canada | ||||||||
3.400%, 10/17/2023 | 500 | 526 | ||||||
3.050%, 01/29/2024 | 500 | 521 | ||||||
2.550%, 02/12/2021 | 200 | 201 | ||||||
2.500%, 09/10/2021 | 200 | 202 | ||||||
2.500%, 04/27/2026 | 500 | 508 | ||||||
2.250%, 05/18/2022 | 100 | 101 | ||||||
2.200%, 10/03/2022 | 100 | 100 | ||||||
Province of Quebec Canada | ||||||||
2.750%, 04/12/2027 | 500 | 519 | ||||||
2.500%, 04/09/2024 | 135 | 138 | ||||||
2.375%, 01/31/2022 | 100 | 101 | ||||||
Qatar Government International Bond | ||||||||
9.750%, 06/15/2030 (A) | 200 | 324 | ||||||
5.750%, 01/20/2042 (A) | 200 | 264 | ||||||
5.103%, 04/23/2048 (A) | 1,600 | 1,923 | ||||||
4.817%, 03/14/2049 (A) | 1,400 | 1,621 | ||||||
4.625%, 06/02/2046 (A) | 200 | 231 | ||||||
4.500%, 04/23/2028 (A) | 1,100 | 1,240 | ||||||
4.000%, 03/14/2029 (A) | 600 | 654 | ||||||
3.875%, 04/23/2023 (A) | 1,100 | 1,159 | ||||||
3.375%, 03/14/2024 (A) | 250 | 260 | ||||||
3.250%, 06/02/2026 (A) | 300 | 311 | ||||||
2.375%, 06/02/2021 (A) | 600 | 599 | ||||||
Romanian Government International Bond | ||||||||
6.125%, 01/22/2044 (A) | 100 | 127 | ||||||
5.125%, 06/15/2048 (A) | 300 | 333 | ||||||
4.875%, 01/22/2024 (A) | 150 | 162 | ||||||
4.375%, 08/22/2023 (A) | 750 | 792 | ||||||
Russian Foreign Bond - Eurobond | ||||||||
12.750%, 06/24/2028 (A) | 375 | 620 | ||||||
7.500%, 03/31/2030 | 694 | 781 | ||||||
5.875%, 09/16/2043 (A) | 850 | 1,041 | ||||||
5.625%, 04/04/2042 (A) | 2,700 | 3,193 | ||||||
4.875%, 09/16/2023 (A) | 1,600 | 1,718 | ||||||
4.500%, 04/04/2022 (A) | 400 | 417 | ||||||
Saudi Government International Bond | ||||||||
5.250%, 01/16/2050 (A) | 1,050 | 1,232 | ||||||
5.000%, 04/17/2049 (A) | 400 | 454 | ||||||
4.625%, 10/04/2047 (A) | 750 | 804 | ||||||
| Description | Face Amount (Thousands) | Market Value ($ Thousands) | ||||||
SOVEREIGN DEBT (continued) |
| |||||||
4.500%, 04/17/2030 (A) | $ | 400 | $ | 445 | ||||
4.500%, 10/26/2046 (A) | 1,150 | 1,216 | ||||||
4.375%, 04/16/2029 (A) | 1,450 | 1,599 | ||||||
4.000%, 04/17/2025 (A) | 1,400 | 1,498 | ||||||
3.625%, 03/04/2028 (A) | 430 | 449 | ||||||
3.250%, 10/26/2026 (A) | 1,350 | 1,391 | ||||||
2.875%, 03/04/2023 (A) | 350 | 355 | ||||||
2.375%, 10/26/2021 (A) | 700 | 700 | ||||||
Senegal Government International Bond | ||||||||
6.750%, 03/13/2048 (A) | 400 | 384 | ||||||
6.250%, 07/30/2024 | 200 | 218 | ||||||
Serbia Government International Bond | ||||||||
7.250%, 09/28/2021 | 300 | 328 | ||||||
South Africa Government International Bond | ||||||||
6.250%, 03/08/2041 | 100 | 109 | ||||||
5.875%, 05/30/2022 | 100 | 106 | ||||||
5.875%, 09/16/2025 | 600 | 650 | ||||||
5.650%, 09/27/2047 | 250 | 251 | ||||||
5.375%, 07/24/2044 | 400 | 391 | ||||||
5.000%, 10/12/2046 | 200 | 189 | ||||||
4.875%, 04/14/2026 | 200 | 205 | ||||||
4.850%, 09/27/2027 | 700 | 707 | ||||||
4.300%, 10/12/2028 | 450 | 435 | ||||||
Sri Lanka Government International Bond | ||||||||
7.850%, 03/14/2029 (A) | 200 | 208 | ||||||
7.550%, 03/28/2030 (A) | 400 | 407 | ||||||
6.850%, 03/14/2024 (A) | 400 | 411 | ||||||
6.850%, 11/03/2025 (A) | 200 | 204 | ||||||
6.825%, 07/18/2026 (A) | 200 | 203 | ||||||
6.750%, 04/18/2028 (A) | 200 | 196 | ||||||
6.350%, 06/28/2024 (A) | 200 | 201 | ||||||
6.250%, 10/04/2020 (A) | 100 | 101 | ||||||
6.200%, 05/11/2027 (A) | 100 | 96 | ||||||
5.750%, 01/18/2022 (A) | 200 | 202 | ||||||
5.750%, 04/18/2023 (A) | 750 | 751 | ||||||
Trinidad & Tobago Government International Bond | ||||||||
4.500%, 08/04/2026 (A) | 200 | 200 | ||||||
Turkey Government International Bond | ||||||||
8.000%, 02/14/2034 | 100 | 108 | ||||||
7.625%, 04/26/2029 | 200 | 210 | ||||||
7.375%, 02/05/2025 | 200 | 210 | ||||||
7.250%, 12/23/2023 | 1,000 | 1,050 | ||||||
7.250%, 03/05/2038 | 200 | 203 | ||||||
6.875%, 03/17/2036 | 250 | 245 | ||||||
6.750%, 05/30/2040 | 200 | 191 | ||||||
6.625%, 02/17/2045 | 300 | 281 | ||||||
6.350%, 08/10/2024 | 200 | 202 | ||||||
6.250%, 09/26/2022 | 200 | 204 | ||||||
6.125%, 10/24/2028 | 200 | 193 | ||||||
6.000%, 03/25/2027 | 1,400 | 1,354 | ||||||
6.000%, 01/14/2041 | 1,500 | 1,316 | ||||||
| 66 | Adviser Managed Trust / Annual Report / July 31, 2019 |
| Description | Face Amount (Thousands) | Market Value ($ Thousands) | ||||||
SOVEREIGN DEBT (continued) |
| |||||||
5.750%, 03/22/2024 | $ | 600 | $ | 592 | ||||
5.750%, 05/11/2047 | 950 | 801 | ||||||
5.625%, 03/30/2021 | 300 | 305 | ||||||
5.125%, 03/25/2022 | 200 | 200 | ||||||
5.125%, 02/17/2028 | 1,350 | 1,232 | ||||||
4.875%, 10/09/2026 | 550 | 502 | ||||||
4.875%, 04/16/2043 | 275 | 216 | ||||||
4.250%, 04/14/2026 | 200 | 178 | ||||||
3.250%, 03/23/2023 | 200 | 185 | ||||||
Ukraine Government AID Bond | ||||||||
1.847%, 05/29/2020 | 263 | 263 | ||||||
Ukraine Government International Bond | ||||||||
8.994%, 02/01/2024 (A) | 200 | 222 | ||||||
7.750%, 09/01/2020 (A) | 200 | 206 | ||||||
7.750%, 09/01/2021 (A) | 250 | 262 | ||||||
7.750%, 09/01/2022 (A) | 600 | 636 | ||||||
7.750%, 09/01/2023 (A) | 200 | 214 | ||||||
7.750%, 09/01/2024 (A) | 400 | 427 | ||||||
7.750%, 09/01/2025 (A) | 200 | 211 | ||||||
7.750%, 09/01/2026 (A) | 200 | 211 | ||||||
7.750%, 09/01/2027 (A) | 200 | 211 | ||||||
7.375%, 09/25/2032 (A) | 750 | 762 | ||||||
United Kingdom Gilt | ||||||||
4.750%, 03/07/2020 | GBP 529 | 664 | ||||||
4.750%, 12/07/2038 | 260 | 517 | ||||||
4.500%, 09/07/2034 | 302 | 552 | ||||||
4.250%, 06/07/2032 | 354 | 612 | ||||||
4.250%, 03/07/2036 | 27 | 49 | ||||||
4.250%, 09/07/2039 | 187 | 354 | ||||||
4.250%, 12/07/2046 | 11 | 23 | ||||||
4.250%, 12/07/2049 | 4 | 8 | ||||||
4.250%, 12/07/2055 | 34 | 77 | ||||||
4.000%, 01/22/2060 | 155 | 354 | ||||||
3.750%, 09/07/2021 | 357 | 468 | ||||||
3.750%, 07/22/2052 | 325 | 660 | ||||||
3.500%, 01/22/2045 | 245 | 442 | ||||||
3.500%, 07/22/2068 | 153 | 339 | ||||||
3.250%, 01/22/2044 | 4 | 7 | ||||||
2.500%, 07/22/2065 | 2 | 3 | ||||||
2.250%, 09/07/2023 | 711 | 937 | ||||||
2.000%, 09/07/2025 | 342 | 459 | ||||||
1.750%, 09/07/2037 | 217 | 291 | ||||||
1.750%, 07/22/2057 | 139 | 194 | ||||||
1.625%, 10/22/2028 | 330 | 441 | ||||||
1.625%, 10/22/2071 | 54 | 76 | ||||||
1.500%, 01/22/2021 | 270 | 336 | ||||||
1.500%, 07/22/2026 | 329 | 432 | ||||||
1.500%, 07/22/2047 | 410 | 523 | ||||||
1.000%, 04/22/2024 | 39 | 49 | ||||||
0.750%, 07/22/2023 | 37 | 46 | ||||||
Uruguay Government International Bond | ||||||||
7.625%, 03/21/2036 | $ | 150 | 218 | |||||
| Description | Face Amount (Thousands) | Market Value ($ Thousands) | ||||||
SOVEREIGN DEBT (continued) |
| |||||||
5.100%, 06/18/2050 | $ | 455 | $ | 522 | ||||
4.975%, 04/20/2055 | 790 | 886 | ||||||
4.500%, 08/14/2024 | 250 | 268 | ||||||
4.375%, 10/27/2027 | 500 | 544 | ||||||
4.375%, 01/23/2031 | 1,100 | 1,202 | ||||||
4.125%, 11/20/2045 | 200 | 206 | ||||||
Uzbekistan Government International Bond MTN | ||||||||
4.750%, 02/20/2024 (A) | 200 | 211 | ||||||
Vietnam Government International Bond | ||||||||
4.800%, 11/19/2024 | 200 | 218 | ||||||
Zambia Government International Bond | ||||||||
8.970%, 07/30/2027 | 300 | 214 | ||||||
5.375%, 09/20/2022
|
| 200
|
|
| 140
|
| ||
Total Sovereign Debt | 249,078 | |||||||
U.S. GOVERNMENT AGENCY OBLIGATIONS — 0.9% |
| |||||||
FFCB | ||||||||
1.620%, 04/20/2021 | 250 | 249 | ||||||
FHLB | ||||||||
5.500%, 07/15/2036 | 225 | 313 | ||||||
3.250%, 11/16/2028 | 315 | 341 | ||||||
3.000%, 10/12/2021 | 1,000 | 1,023 | ||||||
2.500%, 02/13/2024 | 875 | 899 | ||||||
1.875%, 11/29/2021 | 500 | 499 | ||||||
1.125%, 07/14/2021 | 750 | 739 | ||||||
FHLMC | ||||||||
6.750%, 03/15/2031 | 500 | 722 | ||||||
6.250%, 07/15/2032 | 300 | 428 | ||||||
2.375%, 01/13/2022 | 375 | 379 | ||||||
FNMA | ||||||||
6.625%, 11/15/2030 | 475 | 677 | ||||||
2.875%, 10/30/2020 | 700 | 707 | ||||||
2.625%, 01/11/2022 | 1,500 | 1,524 | ||||||
2.625%, 09/06/2024 | 300 | 310 | ||||||
2.500%, 02/05/2024 | 2,500 | 2,564 | ||||||
2.250%, 04/12/2022 | 845 | 853 | ||||||
2.125%, 04/24/2026 | 205 | 206 | ||||||
1.875%, 12/28/2020 | 100 | 100 | ||||||
1.875%, 09/24/2026 | 300 | 297 | ||||||
Tennessee Valley Authority | ||||||||
5.250%, 09/15/2039 | 275 | 367 | ||||||
4.250%, 09/15/2065 | 200 | 251 | ||||||
3.500%, 12/15/2042 | 125 | 134 | ||||||
| ||||
| Adviser Managed Trust / Annual Report / July 31, 2019 | 67 | |||
SCHEDULE OF INVESTMENTS
July 31, 2019
Tactical Offensive Fixed Income Fund(Continued)
| Description | Face Amount (Thousands) | Market Value ($ Thousands) | ||||||
U.S. GOVERNMENT AGENCY OBLIGATIONS (continued) |
| |||||||
2.875%, 02/01/2027 | $ | 150 | $ | 156 | ||||
Total U.S. Government Agency Obligations (Cost $13,370) ($Thousands) | 13,738 | |||||||
MUNICIPAL BONDS — 0.5% |
| |||||||
California — 0.2% |
| |||||||
Bay Area, Toll Authority, RB | ||||||||
6.263%, 04/01/2049 | 100 | 151 | ||||||
California State University, Ser B, RB | ||||||||
Callable 05/01/2047 @ 100 | ||||||||
3.899%, 11/01/2047 | 100 | 108 | ||||||
California State, Build America Bonds, GO | ||||||||
7.600%, 11/01/2040 | 175 | 287 | ||||||
7.500%, 04/01/2034 | 500 | 750 | ||||||
California State, Department of Water Resources, Ser P, RB | ||||||||
2.000%, 05/01/2022 | 25 | 25 | ||||||
California State, East Bay Municipal Utility District, Water System Revenue, RB | ||||||||
5.874%, 06/01/2040 | 100 | 136 | ||||||
California State, GO | ||||||||
7.300%, 10/01/2039 | 500 | 760 | ||||||
3.500%, 04/01/2028 | 25 | 27 | ||||||
3.375%, 04/01/2025 | 200 | 212 | ||||||
California State, GO | ||||||||
Callable 04/01/2028 @ 100 | ||||||||
4.600%, 04/01/2038 | 30 | 34 | ||||||
4.500%, 04/01/2033 | 50 | 57 | ||||||
Los Angeles, Unified School District, GO | ||||||||
5.750%, 07/01/2034 | 100 | 128 | ||||||
University of California, Ser AJ, RB | ||||||||
4.601%, 05/15/2031 | 250 | 287 | ||||||
University of California, Ser AO, RB | ||||||||
4.767%, 05/15/2115 | 150 | 178 | ||||||
| 3,140 | ||||||||
Connecticut — 0.0% |
| |||||||
Connecticut State, Ser A, GO | ||||||||
5.850%, 03/15/2032 | 100 | 128 | ||||||
Georgia — 0.0% |
| |||||||
Georgia State, Municipal Electric Authority, RB | ||||||||
6.655%, 04/01/2057 | 98 | 133 | ||||||
6.637%, 04/01/2057 | 98 | 126 | ||||||
| 259 | ||||||||
| Description | Face Amount (Thousands) | Market Value ($ Thousands) | ||||||
MUNICIPAL BONDS (continued) |
| |||||||
Illinois — 0.1% | ||||||||
Chicago 0’Hare International Airport, Ser C, GO | ||||||||
4.472%, 01/01/2049 | $ | 50 | $ | 59 | ||||
Chicago 0’Hare International Airport, Ser C, RB | ||||||||
4.572%, 01/01/2054 | 200 | 238 | ||||||
Illinois State, GO | ||||||||
5.100%, 06/01/2033 | 700 | 723 | ||||||
4.950%, 06/01/2023 | 87 | 91 | ||||||
Sales Tax Securitization, Ser A, RB | ||||||||
4.787%, 01/01/2048 | 200 | 233 | ||||||
| 1,344 | ||||||||
New Jersey — 0.0% |
| |||||||
New Jersey State, Turnpike Authority, RB | ||||||||
7.102%, 01/01/2041 | 350 | 536 | ||||||
New York — 0.1% |
| |||||||
New York & New Jersey, Port Authority, RB | ||||||||
4.458%, 10/01/2062 | 100 | 121 | ||||||
4.031%, 09/01/2048 | 50 | 56 | ||||||
New York & New Jersey, Port Authority, Ser 20, RB | ||||||||
4.229%, 10/15/2057 | 65 | 76 | ||||||
New York City, Water & Sewer System, RB | ||||||||
5.750%, 06/15/2041 | 100 | 137 | ||||||
New York State, Dormitory Authority, RB | ||||||||
5.289%, 03/15/2033 | 100 | 121 | ||||||
New York State, Metropolitan Transportation Authority, RB | ||||||||
6.814%, 11/15/2040 | 150 | 213 | ||||||
New York State, Urban Development, RB Callable 09/15/2028 @ 100 | ||||||||
3.900%, 03/15/2033 | 50 | 54 | ||||||
| 778 | ||||||||
Ohio — 0.0% |
| |||||||
American Municipal Power, Hydroelectic Project, Ser B, RB | ||||||||
8.084%, 02/15/2050 | 100 | 174 | ||||||
South Carolina — 0.0% |
| |||||||
South Carolina State, Public Service Authority, Ser D, RB | ||||||||
2.388%, 12/01/2023 | 50 | 49 | ||||||
| 68 | Adviser Managed Trust / Annual Report / July 31, 2019 |
| Description | Face Amount (Thousands) | Market Value ($ Thousands) | ||||||
MUNICIPAL BONDS (continued) |
| |||||||
Tennessee — 0.0% |
| |||||||
Nashville & Davidson County, Metropolitan Government, Health & Educational Facilities Board, Ser B, RB | ||||||||
Callable 04/01/2026 @ 100 | ||||||||
4.053%, 07/01/2026 | $ | 100 | $ | 108 | ||||
Texas — 0.1% |
| |||||||
Houston, Ser A, GO | ||||||||
6.290%, 03/01/2032 | 80 | 98 | ||||||
Texas State, Build America Bonds, GO | ||||||||
5.517%, 04/01/2039 | 100 | 133 | ||||||
Texas State, Transportation Commission State Highway Fund, Ser B, RB | ||||||||
5.178%, 04/01/2030 | 200 | 241 | ||||||
University of Texas, Permanent University Fund, Ser S, RB Callable 01/01/2047 @ 100 | ||||||||
3.376%, 07/01/2047 | 20 | 21 | ||||||
University of Texas, Ser A, RB Callable 02/15/2047 @100 | ||||||||
3.354%, 08/15/2047 | 50 | 51 | ||||||
| 544 | ||||||||
Total Municipal Bonds | 7,060 | |||||||
ASSET-BACKED SECURITIES — 0.4% |
| |||||||
Ally Auto Receivables Trust, Ser2018-2, CI A3 | ||||||||
2.920%,11/15/2022 | 145 | 146 | ||||||
Ally Master Owner Trust, Ser2018-1, CI A2 | ||||||||
2.700%, 01/17/2023 | 100 | 100 | ||||||
Ally Master Owner Trust, Ser2018-2, CI A | ||||||||
3.290%, 05/15/2023 | 100 | 102 | ||||||
American Express Credit Account Master Trust, Ser2018-6, CI A | ||||||||
3.060%, 02/15/2024 | 500 | 509 | ||||||
American Express Credit Account Master Trust, Ser2018-8, CI A | ||||||||
3.180%, 04/15/2024 | 103 | 105 | ||||||
Americredit Automobile Receivables Trust, Ser2018-1, CI C | ||||||||
3.500%, 01/18/2024 | 125 | 128 | ||||||
Americredit Automobile Receivables Trust, Ser2019-1, CI A3 | ||||||||
2.970%, 11/20/2023 | 67 | 68 | ||||||
Capital One Multi-Asset Execution Trust, Ser2017-A4, CI A4 | ||||||||
1.990%, 07/17/2023 | 300 | 299 | ||||||
| Description | Face Amount (Thousands) | Market Value ($ Thousands) | ||||||
ASSET-BACKED SECURITIES (continued) |
| |||||||
Capital One Multi-Asset Execution Trust, Ser2017-A6, CI A6 | ||||||||
2.290%, 07/15/2025 | $ | 250 | $ | 251 | ||||
CarMax Auto Owner Trust, Ser2018-3, CI A3 | ||||||||
3.130%, 06/15/2023 | 550 | 558 | ||||||
Citibank Credit Card Issuance Trust, Ser2014-A1, CI A1 | ||||||||
2.880%, 01/23/2023 | 250 | 252 | ||||||
Citibank Credit Card Issuance Trust, Ser2014-A5, CI A5 | ||||||||
2.680%, 06/07/2023 | 470 | 474 | ||||||
Discover Card Execution Note Trust, Ser2019-A1, CI A1 | ||||||||
3.040%, 07/15/2024 | 300 | 306 | ||||||
Drive Auto Receivables Trust, Ser2018-4, CI D | ||||||||
4.090%, 01/15/2026 | 100 | 103 | ||||||
Ford Credit Auto Lease Trust, Ser2018-B, CI A3 | ||||||||
3.190%, 12/15/2021 | 40 | 40 | ||||||
Ford Credit Auto Owner Trust, Ser2018-B, CI A3 | ||||||||
3.240%, 04/15/2023 | 100 | 102 | ||||||
Ford Credit Floorplan Master Owner Trust, Ser2017-2, CI A1 | ||||||||
2.160%, 09/15/2022 | 250 | 250 | ||||||
GM Financial Consumer Automobile Receivables Trust, Ser2019-2, CI A3 | ||||||||
2.650%, 02/16/2024 | 250 | 252 | ||||||
Honda Auto Receivables Owner Trust, Ser2018-4, CI A3 | ||||||||
3.160%, 01/17/2023 | 100 | 102 | ||||||
Hyundai Auto Receivables Trust, Ser2018-A, CI A3 | ||||||||
2.790%, 07/15/2022 | 100 | 101 | ||||||
Nissan Auto Receivables Owner Trust, Ser2019-B, CI A3 | ||||||||
2.500%, 11/15/2023 | 200 | 202 | ||||||
Santander Drive Auto Receivables Trust, Ser2019-2, CI C | ||||||||
2.900%, 10/15/2024 | 150 | 151 | ||||||
Synchrony Credit Card Master Note Trust, Ser2016-2, CI A | ||||||||
2.210%, 05/15/2024 | 200 | 200 | ||||||
Synchrony Credit Card Master Note Trust, Ser2018-2, CI A | ||||||||
3.470%, 05/15/2026 | 100 | 105 | ||||||
Toyota Auto Receivables Owner Trust, Ser2018-B, CI A3 | ||||||||
2.960%, 09/15/2022 | 400 | 404 | ||||||
World Financial Network Credit Card Master Trust, Ser2015-B,CIA | ||||||||
2.550%, 06/17/2024 | 250 | 250 | ||||||
| Adviser Managed Trust / Annual Report / July 31, 2019 | 69 |
SCHEDULE OF INVESTMENTS
July 31, 2019
Tactical Offensive Fixed Income Fund(Concluded)
| Description | Face Amount (Thousands) | Market Value ($ Thousands) | ||||||||
ASSET-BACKED SECURITIES (continued) |
| |||||||||
World Omni Auto Receivables Trust, |
| |||||||||
2.240%, 06/15/2023 | $ | 300 | $ | 299 | ||||||
| Description | Face Amount (Thousands) | Market Value ($ Thousands) | ||||||||
ASSET-BACKED SECURITIES (continued) | ||||||||||
Total Asset-Backed Securities | 5,859 | |||||||||
Total Investments in Securities — 99.0% | $ 1,542,394 | |||||||||
A list of the open forward foreign currency contracts held by the Fund at July 31, 2019, is as follows:
| Counterparty | Settlement Date | Currency to Deliver (Thousands) | Currency to Receive (Thousands) | Unrealized Appreciation (Depreciation) (Thousands) | ||||||||||||||||||||
Brown Brothers Harriman | 08/06/19 | USD | 1,025 | EUR | 903 | $ | (20) | |||||||||||||||||
Brown Brothers Harriman | 08/06/19 | USD | 1,071 | JPY | 114,733 | (14) | ||||||||||||||||||
Brown Brothers Harriman | 09/03/19 | CAD | 2,433 | USD | 1,854 | 1 | ||||||||||||||||||
Brown Brothers Harriman | 08/06/19 | CAD | 2,419 | USD | 1,787 | (55) | ||||||||||||||||||
Brown Brothers Harriman | 08/06/19 | GBP | 7,169 | USD | 9,040 | 260 | ||||||||||||||||||
Brown Brothers Harriman | 09/03/19 | GBP | 7,291 | USD | 8,928 | (8) | ||||||||||||||||||
Brown Brothers Harriman | 08/06/19 - 09/03/19 | EUR | 43,671 | USD | 48,778 | 226 | ||||||||||||||||||
Brown Brothers Harriman | 08/06/19 - 09/03/19 | JPY | 9,348,972 | USD | 86,218 | 164 | ||||||||||||||||||
|
| |||||||||||||||||||||||
| $ | 554 | |||||||||||||||||||||||
|
| |||||||||||||||||||||||
Percentages are based on Net Assets of $1,557,559 ($ Thousands).
| (A) | Security exempt from registration under Rule 144A of the Securities Act of 1933. These securities may be resold in transactions exempt from registration normally to qualified institutions. On July 31, 2019, the value of these securities amounted to $170,332 ($ Thousands), representing 10.9% of the Net Assets of the Fund. |
| (B) | Level 3 security in accordance with fair value hierarchy. |
| (C) | Zero coupon security. The rate shown on the Schedule of Investments is the security’s effective yield at the time of purchase. |
| (D) | Step Bonds – Represents the final rate and maturity date. |
| (E) | Step Bonds – Represents the current rate, the step rate, the step date and the final maturity date. |
| (F) | Variable or floating rate security, the interest rate of which adjusts periodically based on changes in current interest rates and prepayments on the underlying pool of assets. |
| (G) | Rate is negative due to the decrease in value of the foreign currency against the U.S. Dollar. |
CAD — Canadian Dollar
CI — Class
DAC — Designated Activity Company
EUR — Euro
FFCB — Federal Farm Credit Bank
FHLB — Federal Home Loan Bank
FHLMC — Federal Home Loan Mortgage Corporation
FNMA — Federal National Mortgage Association
GBP — British Pound Sterling
GNMA — Government National Mortgage Association
GO — General Obligation
ICE — Intercontinental Exchange
JPY — Japanese Yen
LIBOR — London Interbank Offered Rate
LLLP — Limited Liability Limited Partnership
MTN — Medium Term Note
OAT — French Treasury Obligations (Obligations assimilables du Tresor)
PIK —Payment-in-Kind
Pty — Proprietary
RB — Revenue Bond
S&P — Standard & Poor’s
SARL — Private Limited Liability Company (Societe a responsabilite limitee)
Ser — Series
ULC — Unlimited Liability Company
USD — United States Dollar
VAR — Variable Rate
The following is a list of inputs used as of July 31, 2019 in valuing the Fund’s investments and other financial instruments carried at value ($ Thousands):
| Investments in Seairities | Level 1 | Level 2 | Level 3 | Total | ||||||||||||
Corporate Obligations | $ | – | $ | 477,435 | $ –† | $ | 477,435 | |||||||||
U.S. Treasury Obligations | – | 450,687 | – | 450,687 | ||||||||||||
Mortgage-Backed Securities | – | 338,537 | – | 338,537 | ||||||||||||
Sovereign Debt | – | 249,078 | – | 249,078 | ||||||||||||
U.S. Government Agency Obligations | – | 13,738 | – | 13,738 | ||||||||||||
Municipal Bonds | – | 7,060 | – | 7,060 | ||||||||||||
Asset-Backed Securities | – | 5,859 | – | 5,859 | ||||||||||||
|
|
|
|
|
|
|
| |||||||||
Total Investments in Securities | $ | – | $ | 1,542,394 | $ | – | $ | 1,542,394 | ||||||||
|
|
|
|
|
|
|
| |||||||||
| Other Financial Instruments | Level 1 | Level 2 | Level 3 | Total | ||||||||||||
Forwards Contracts * | ||||||||||||||||
Unrealized Appreciation | $ | — | $ | 651 | $ | — | $ | 651 | ||||||||
Unrealized Depreciation | — | (97) | — | (97) | ||||||||||||
|
|
|
|
|
|
|
| |||||||||
Total Other Financial Instruments | $ | $ | 554 | $ | — | $ | 554 | |||||||||
|
|
|
|
|
|
|
| |||||||||
† Represents securities in which the fair value is $0.
| * | Forwards contracts are valued at the unrealized appreciation/(depreciation) on the instruments. |
For the year ended July 31, 2019, there were no transfers between Level 1, Level 2, and/or Level 3 assets and liabilities. All transfers, if any, are recognized by the Fund at the end of the year.
| 70 | Adviser Managed Trust / Annual Report / July 31, 2019 |
For more information on valuation inputs, see Note 2 — Significant Accounting Policies in Notes to Financial Statements.
Amounts designated as “—” are either $0 or have been rounded to $0.
The accompanying notes are an integral part of the financial statements.
| Adviser Managed Trust / Annual Report / July 31, 2019 | 71 |
STATEMENTS OF ASSETS AND LIABILITIES ($ Thousands)
July 31, 2019
| Tactical Offensive Equity Fund | Tactical Offensive Fixed Income Fund | |||||||
Assets: | ||||||||
Investments, at value† | $ | 2,499,455 | $ | 1,542,394 | ||||
Cash | 58,426 | 8,721 | ||||||
Foreign currency, at value†† | 1,039 | 105 | ||||||
Dividends and interest receivable | 2,714 | 11,845 | ||||||
Cash pledged as collateral for futures contracts | 2,713 | — | ||||||
Receivable for fund shares sold | 643 | 480 | ||||||
Receivable for investment securities sold | 383 | 981 | ||||||
Foreign tax reclaim receivable | 142 | — | ||||||
Unrealized gain on forward foreign currency contracts | — | 651 | ||||||
Unrealized gain on foreign spot currency contracts | — | 33 | ||||||
Prepaid expenses | 109 | 78 | ||||||
Total Assets | 2,565,624 | 1,565,288 | ||||||
Liabilities: | ||||||||
Payable for fund shares redeemed | 2,145 | 1,238 | ||||||
Payable for investment securities purchased | 1,982 | 5,742 | ||||||
Payable for variation margin | 548 | — | ||||||
Shareholder servicing fees payable | 547 | 330 | ||||||
Administration fees payable | 337 | 5 | ||||||
Investment advisory fees payable | 95 | 73 | ||||||
Accrued foreign capital gains tax on appreciated securities | 76 | — | ||||||
Trustees fees payable | 14 | 10 | ||||||
Chief Compliance Officer fees payable | 3 | 2 | ||||||
Unrealized loss on forward foreign currency contracts | — | 97 | ||||||
Unrealized loss on foreign spot currency contracts | — | 28 | ||||||
Accrued expense payable | 242 | 204 | ||||||
Total Liabilities | 5,989 | 7,729 | ||||||
Net Assets | $ | 2,559,635 | $ | 1,557,559 | ||||
† Cost of investments | $ | 2,445,176 | $ | 1,497,354 | ||||
†† Cost of foreign currency | 1,039 | 107 | ||||||
Net Assets: | ||||||||
Paid-in Capital – (unlimited authorization – no par value) | $ | 2,492,582 | $ | 1,543,397 | ||||
Total Distributable Earnings | 67,053 | 14,162 | ||||||
Net Assets | $ | 2,559,635 | $ | 1,557,559 | ||||
Net Asset Value, Offering and Redemption Price Per Share | $ | 15.64 | $ | 10.34 | ||||
| | ($2,559,635,373 ÷ 163,671,628 shares) |
| | ($1,557,559,015 ÷ 150,572,321 shares) |
| |||
Amounts designated as “—” are $0 or have been rounded to $0.
The accompanying notes are an integral part of the financial statements.
| 72 | Adviser Managed Trust / Annual Report / July 31, 2019 |
STATEMENTS OF OPERATIONS ($ Thousands)
For the year ended July 31, 2019
| Tactical Offensive Equity Fund† | Tactical Offensive Fixed Income Fund | |||||||
Investment income: | ||||||||
Dividends | $ | 33,936 | $ | — | ||||
Dividends from affiliated investments(1) | 97 | — | ||||||
Interest income | 550 | 37,749 | ||||||
Less: foreign taxes withheld | (1,852 | ) | (32) | |||||
Total investment income | 32,731 | 37,717 | ||||||
Expenses: | ||||||||
Shareholder servicing fees | 3,920 | 2,826 | ||||||
Investment advisory fees | 3,136 | 1,696 | ||||||
Administration fees | 3,122 | 2,255 | ||||||
Trustee fees | 30 | 18 | ||||||
Chief Compliance Officer fees | 8 | 4 | ||||||
Custodian/wire agent fees | 257 | 53 | ||||||
Professional fees | 112 | 46 | ||||||
Registration fees | 98 | 66 | ||||||
Printing fees | 70 | 38 | ||||||
Other expenses | 167 | 423 | ||||||
Total expenses | 10,920 | 7,425 | ||||||
Less: | ||||||||
Waiver of investment advisory fees | (2,513 | ) | (1,108 | ) | ||||
Waiver of administration fees | (535 | ) | (2,003 | ) | ||||
Net expenses | 7,872 | 4,314 | ||||||
Net investment income | 24,859 | 33,403 | ||||||
Net realized gain/(loss) on: | ||||||||
Investments | 278,723 | (150 | ) | |||||
Affiliated investments(1) | (19 | ) | — | |||||
Futures contracts | (3,156 | ) | — | |||||
Forward foreign currency contracts | — | 1,755 | ||||||
Foreign currency transactions | (110 | ) | (54 | ) | ||||
Net change in unrealized appreciation/(depreciation) on: | ||||||||
Investments | (523,000 | ) | 64,812 | |||||
Affiliated investments(1) | (90 | ) | — | |||||
Futures contracts | 793 | — | ||||||
Accrued foreign capital gains tax on appreciated securities | (41 | ) | — | |||||
Forward foreign currency contracts | — | 281 | ||||||
Foreign currency and translation of other assets and liabilities denominated in foreign currency | 5 | 37 | ||||||
Net increase/(decrease) in net assets resulting from operations | $ | (222,036 | ) | $ | 100,084 | |||
| † | For the period December 18, 2018 through March 24, 2019, the Fund was not an active component of the Adviser Managed Strategy (see Note 1). |
(1) See Note 5 in the Notes to Financial Statements.
Amounts designated as “—” are $0 or have been rounded to $0.
The accompanying notes are an integral part of the financial statements.
| Adviser Managed Trust / Annual Report / July 31, 2019 | 73 |
STATEMENTS OF CHANGES IN NET ASSETS ($ Thousands)
For the years ended July 31,
| | Tactical Offensive Equity Fund | | Tactical Offensive Fixed Income Fund | |||||||||||||
| 2019 | † | 2018 | 2019 | 2018 | ||||||||||||
Operations: | ||||||||||||||||
Net investment income | $ | 24,859 | $ | 40,622 | $ | 33,403 | $ | 35,305 | ||||||||
Net realized gain/(loss) from investments, affiliated investments and futures contracts | 275,548 | 24,316 | (150 | ) | (19,085 | ) | ||||||||||
Net realized gain/(loss) on forward foreign currency contracts and foreign currency transactions | (110 | ) | 6 | 1,701 | 1,199 | |||||||||||
Net change in unrealized appreciation/(depreciation) on investments, affiliated investments and futures contracts | (522,297 | ) | 226,946 | 64,812 | (33,663 | ) | ||||||||||
Net change on accrued foreign capital gains tax on appreciated securities | (41 | ) | (35 | ) | — | — | ||||||||||
Net change in unrealized appreciation/(depreciation) on forward foreign currency contracts, foreign currency and translation of other assets and liabilities denominated in foreign currency | 5 | (85 | ) | 318 | 1,417 | |||||||||||
Net increase/(decrease) in net assets resulting from operations | (222,036 | ) | 291,770 | 100,084 | (14,827 | ) | ||||||||||
Distributions:(1) | (325,113 | ) | (56,127 | ) | (43,706 | ) | (37,118 | ) | ||||||||
Total distributions | (325,113 | ) | (56,127 | ) | (43,706 | ) | (37,118 | ) | ||||||||
Capital share transactions:(2) | ||||||||||||||||
Proceeds from shares issued | 2,752,180 | 412,886 | 908,943 | 297,964 | ||||||||||||
Reinvestment of dividends & distributions | 25,028 | 55,928 | 43,578 | 37,007 | ||||||||||||
Cost of shares redeemed | (2,282,883 | ) | (360,320 | ) | (260,476 | ) | (797,744 | ) | ||||||||
Net increase/(decrease) in net assets derived from capital share transactions | 494,325 | 108,494 | 692,045 | (462,773 | ) | |||||||||||
Net increase/(decrease) in net assets | (52,824 | ) | 344,137 | 748,423 | (514,718 | ) | ||||||||||
Net assets: | ||||||||||||||||
Beginning of year | 2,612,459 | 2,268,322 | 809,136 | 1,323,854 | ||||||||||||
End of year(3) | $ | 2,559,635 | $ | 2,612,459 | $ | 1,557,559 | $ | 809,136 | ||||||||
† For the period December 18, 2018 through March 24, 2019, the Fund was not an active component of the Adviser Managed Strategy (see Note 1).
(1) Current year presentation of distributions with S-X Disclosure Simplification. Prior year distributions have been consolidated to conform with S-X Disclosure Simplification (see Note 11).
(2) See Note 6 in the Notes to Financial Statements for additional information.
(3) Includes undistributed net investment income of $24,447 and $9,449, as of the year ended July 31, 2018. The SEC eliminated the requirement to disclose undistributed net investment income on November 5, 2018 (see Note 11).
Amount designated as “—” is $0 or has been rounded to $0.
The accompanying notes are an integral part of the financial statements. | ||||||||||||||||
| 74 | Adviser Managed Trust / Annual Report / July 31, 2019 |
For the years ended July 31,
For a share outstanding throughout the years
| | Net asset value, beginning of year | | | Net investment income(1) |
| | Net realized and unrealized gains/(losses) on securities(1) | | | Total from operations | | | Dividends from net investment income | | | Distributions from realized gains | | | Total dividends and distributions |
| | Net asset value, end of year | | | Total Return† |
| | Net assets, end of year ($ Thousands) |
| | Ratio of net expenses to average net assets | | | Ratio of expenses to average net assets (excluding fees |
| | Ratio of expenses to average (excluding fees paid |
| | Ratio of net investment income to average net assets |
| | Portfolio turnover |
| ||||||||||||||||
Tactical Offensive Equity Fund # |
| |||||||||||||||||||||||||||||||||||||||||||||||||||||||||||
2019 | $ | 17.35 | $ | 0.26 | $ | 0.11 | Ù | $ | 0.37 | $ | (0.25 | ) | $ | (1.83 | ) | $ (2.08) | $ 15.64 | 4.12 | % | $ | 2,559,635 | 0.50 | % | 0.50 | % | 0.69 | % | 1.58 | % | 148 | % | |||||||||||||||||||||||||||||
2018 | 15.74 | 0.27 | 1.72 | 1.99 | (0.26 | ) | (0.12 | ) | (0.38) | 17.35 | 12.77 | 2,612,459 | 0.50 | 0.50 | 0.68 | 1.64 | 7 | |||||||||||||||||||||||||||||||||||||||||||
2017 | 13.59 | 0.24 | 2.04 | 2.28 | (0.13 | ) | — | (0.13) | 15.74 | 16.87 | 2,268,322 | 0.50 | 0.50 | 0.69 | 1.68 | 8 | ||||||||||||||||||||||||||||||||||||||||||||
2016 | 13.93 | 0.20 | (0.28 | ) | (0.08 | ) | (0.15 | ) | (0.11 | ) | (0.26) | 13.59 | (0.42 | ) | 1,848,988 | 0.50 | 0.50 | 0.71 | 1.53 | 319 | ||||||||||||||||||||||||||||||||||||||||
2015 | 14.43 | 0.20 | 0.63 | 0.83 | (0.13 | ) | (1.20 | ) | (1.33) | 13.93 | 6.18 | 1,682,732 | 0.59 | 0.59 | 0.78 | 1.44 | 64 | |||||||||||||||||||||||||||||||||||||||||||
Tactical Offensive Fixed Income Fund |
| |||||||||||||||||||||||||||||||||||||||||||||||||||||||||||
2019 | $ | 9.99 | $ | 0.30 | $ | 0.48 | $ | 0.78 | $ | (0.43 | ) | $ | — | $ (0.43) | $ | 10.34 | 8.03 | % | $ | 1,557,559 | 0.38 | % | 0.38 | % | 0.66 | % | 2.95 | % | 61 | % | ||||||||||||||||||||||||||||||
2018 | 10.35 | 0.27 | (0.34 | ) | (0.07 | ) | (0.29 | ) | — | (0.29) | 9.99 | (0.71 | ) | 809,136 | 0.38 | 0.38 | 0.65 | 2.63 | 47 | |||||||||||||||||||||||||||||||||||||||||
2017 | 10.59 | 0.26 | (0.21 | ) | 0.05 | (0.29 | ) | — | (0.29) | 10.35 | 0.51 | 1,323,854 | 0.38 | 0.38 | 0.66 | 2.52 | 48 | |||||||||||||||||||||||||||||||||||||||||||
2016 | 10.19 | 0.25 | 0.36 | 0.61 | (0.21 | ) | — | (0.21) | 10.59 | 6.05 | 1,143,375 | 0.38 | 0.38 | 0.66 | 2.45 | 101 | ||||||||||||||||||||||||||||||||||||||||||||
2015 | 10.25 | 0.22 | (0.08 | ) | 0.14 | (0.20 | ) | — | (0.20) | 10.19 | 1.40 | 977,138 | 0.43 | 0.43 | 0.68 | 2.11 | 257 | |||||||||||||||||||||||||||||||||||||||||||
| # | For the period December 18, 2018 through March 24, 2019, the Fund was not an active component of the Adviser Managed Strategy (see Note 1). |
| † | Returns do not reflect the deduction of taxes the shareholder would pay on fund distributions or redemption of fund shares. Effective October 1, 2014, the Funds’ investment strategy was changed from “active” to “passive”. The Funds’ past performance is not necessarily indicative of how the Funds will perform in the future. |
| Ù | The amount shown for a share outstanding throughout the period does not accord with the aggregate net realized and unrealized losses for that period because of the sales and repurchases of fund shares in relation to fluctuating market value of the investments of the Fund. |
(1) Per share net investment income and net realized and unrealized gains/(losses) on securities calculated using average shares.
Amounts designated as “—” are $0 or have been rounded to $0.
The accompanying notes are an integral part of the financial statements.
| Adviser Managed Trust / Annual Report / July 31, 2019 | 75 |
July 31, 2019
1. ORGANIZATION
Adviser Managed Trust (the “Trust”) was established as a Delaware statutory trust under an Agreement and Declaration of Trust dated September 22, 2010. The Trust commenced operations on February 25, 2011.
The Trust is registered under the Investment Company Act of 1940, as amended, as anopen-end investment management company with two registered funds: Tactical Offensive Equity and Tactical Offensive Fixed Income (each a “Fund,” collectively, the “Funds”) each of which are diversified Funds. The assets of each Fund are segregated, and a shareholder’s interest is limited to the Fund in which shares are held. The Trust’s prospectus provides a description of each Fund’s investment objective and strategies.
Only persons who are clients of the Financial Adviser (as defined below) and who participate in the Adviser Managed Strategy should invest in the Funds. The Funds may not be purchased by any other investor. The Funds are designed to be a component of a broader strategy employed by a third party investment manager (“Financial Adviser”) for the benefit of its clients. The Financial Adviser seeks to take advantage of broad market changes by tactically shifting its clients’ assets among the Tactical Offensive Equity Fund, the Tactical Offensive Fixed Income Fund and a money market fund affiliated with the Funds, depending on the Financial Adviser’s evaluation of current market conditions (“Adviser Managed Strategy”). The Financial Adviser is not the adviser to the Funds, and is not affiliated with SEI Investments Management Corporation (“SIMC”), the adviser to the Funds. The Adviser Managed Strategy is based on models developed by the Financial Adviser and is not subject to the oversight of or input from SIMC.
When the Financial Adviser determines to reallocate its clients’ assets to one or more of the Funds that compose the Adviser Managed Strategy, the Financial Adviser may request the redemption of a substantial portion or all of the shares for which the Financial Adviser exercises investment discretion. In such an instance, the Financial Adviser’s redemption request will cause a Fund to liquidate a substantial portion or substantially all of its assets in order to fulfill the redemption request. If the Financial Adviser redeems all of the shares for which it exercises investment discretion, the Fund will no longer be an active component of the Adviser Managed Strategy.
When the Tactical Offensive Equity Fund is not an active component of the Adviser Managed Strategy, the Fund may invest up to 100% of its remaining assets in exchange traded funds (“ETF“s) that are designed to track the performance of the broad equity market. When
the Tactical Offensive Fixed Income Fund is not an active component of the Adviser Managed Strategy, the Fund may invest up to 100% of its remaining assets in cash, money market instruments, repurchase agreements and other short-term obligations that would not ordinarily be consistent with the Fund’s investment goal.
The Funds could be invested in these types of investments for extended periods of time. At such times, SIMC will manage the assets of the Funds. SIMC, the Financial Adviser or one or more of their affiliates will be the only investors in a Fund when the Fund is not an active component of the Adviser Managed Strategy.
During the period December 18, 2018 through March 24, 2019, the Tactical Offensive Equity Fund was not an active component of the Adviser Managed Strategy.
2. SIGNIFICANT ACCOUNTING POLICIES
The following are significant accounting policies, which are consistently followed in the preparation of its financial statements by the Funds. The Funds are investment companies that apply the accounting and reporting guidance issued in Topic 946 by the U.S. Financial Accounting Standards Board (“FASB”).
Use of Estimates— The preparation of financial statements, in conformity with U.S. generally accepted accounting principles (“U.S. GAAP”), requires management to make estimates and assumptions that affect the reported amount of assets and liabilities and disclosure of contingent assets and liabilities as of the date of the financial statements and the reported amounts of increases and decreases in net assets from operations during the reporting period. Actual results could differ from those estimates.
Security Valuation— Securities listed on a securities exchange, market or automated quotation system for which quotations are readily available (other than securities traded on National Association of Securities Dealers Automated Quotations (NASDAQ) or as otherwise noted below) at the last quoted sale price on an exchange or market (foreign or domestic) on which the securities are traded, or, if there is no such reported sale, at the most recent quoted bid price. The Funds value securities traded on NASDAQ at the NASDAQ Official Closing Price. If available, debt securities, swaps (which are not centrally cleared), bank loans or collateralized debt obligations (including collateralized loan obligations), such as those held by the Funds, are priced based upon valuations provided by independent, third-party pricing agents. Such values generally reflect the last reported sales price if the security is actively traded. The third-party pricing agents may also value debt securities at an evaluated bid price by employing methodologies that utilize actual market transactions,
| 76 | Adviser Managed Trust / Annual Report / July 31, 2019 |
broker supplied valuations or other methodologies designed to identify the market value for such securities. Redeemable securities issued byopen-end investment companies are valued at the investment company’s applicable net asset value, with the exception of ETFs, which are priced as equity securities. The prices of foreign securities are reported in local currency and converted to U.S. dollars using currency exchange rates. If a security’s price cannot be obtained, as noted above, the Funds will value the securities using a bid price from at least one independent broker. If such prices are not readily available or cannot be valued using the methodologies described above, the Funds will value the security using the Funds’ Fair Value Pricing Policies and Procedures (“Fair Value Procedures”), as described below.
On the first day a new debt security purchase is recorded, if a price is not available from a third-party pricing agent or an independent broker, the security may be valued at its purchase price. Each day thereafter, the debt security will be valued according to the Funds’ Fair Value Procedures until a price from an independent source can be secured. Securities held by a Fund with remaining maturities of 60 days or less may be valued by the amortized cost method, which involves valuing a security at its cost on the date of purchase and thereafter (absent unusual circumstances) assuming a constant amortization to maturity of any discount or premium, regardless of the impact of fluctuations in general market rates of interest on the value of the instrument. While this method provides certainty in valuation, it may result in periods during which value, as determined by this method, is higher or lower than the price a Fund would receive if it sold the instrument. Further, the value of securities in the Fund can be expected to vary inversely with changes in prevailing interest rates. Should existing credit, liquidity or interest rate conditions in the relevant markets and issuer specific circumstances suggest that amortized cost does not approximate fair value, then the amortized cost method may not be used.
Options and warrants are valued at the last quoted sales price. If there is no such reported sale on the valuation date, long positions are valued at the most recent bid price, and short positions are valued at the most recent ask price.
Futures and swaps cleared through a central clearing house (“centrally cleared swaps”) are valued at the settlement price established each day by the board of exchange on which they are traded. The daily settlement prices for financial futures and centrally cleared swaps are provided by an independent source. On days when there is excessive volume, market volatility or the future
or centrally cleared swap does not end trading by the time a Fund calculates its NAV, the settlement price may not be available at the time at which the Fund calculates its NAV. On such days, the best available price (which is typically the last sales price) may be used to value a Fund’s futures or centrally cleared swaps position.
Foreign currency forward contracts are valued at the current day’s interpolated foreign exchange rate, as calculated using the current day’s spot rate, and the thirty, sixty, ninety andone-hundred eighty day forward rates provided by an independent source.
Prices for most securities held by a Fund are provided daily by third-party independent pricing agents. SIMC or aSub-Adviser (“Sub Adviser”), as applicable, reasonably believes that prices provided by independent pricing agents are reliable. However, there can be no assurance that such pricing service’s prices will be reliable. SIMC or aSub-Adviser, as applicable, will continuously monitor the reliability of prices obtained from any pricing service and shall promptly notify the Funds’ administrator if it believes that a particular pricing service is no longer a reliable source of prices. The Funds’ administrator, in turn, will notify the Fair Value Pricing Committee (the “Committee”) if it receives such notification from SIMC or aSub-Adviser, as applicable, or if the Funds’ administrator reasonably believes that a particular pricing service is no longer a reliable source for prices.
The Funds’ Fair Value Procedures provide that any change in a primary pricing agent or a pricing methodology requires prior approval by the Board of Trustees (“Board”) or its designatedsub-committee. However, when the change would not materially affect valuation of a Fund’s net assets or involve a material departure in pricing methodology from that of the Fund’s existing pricing agent or pricing methodology, approval may be obtained at the next regularly scheduled meeting of the Board.
Securities for which market prices are not readily available, for which market prices are determined to be unreliable, or which cannot be valued using the methodologies described above are valued in accordance with the Fair Value Procedures established by the Board. The Funds’ Fair Value Procedures are implemented through the Committee designated by the Board. The Committee is currently composed of two members of the Board, as well as representatives from SIMC and its affiliates. Some of the more common reasons that may necessitate that a security be valued using Fair Value Procedures include: (i) the security’s trading has been halted or suspended, (ii) the security has been delisted from a national exchange, (iii) the security’s primary trading market is temporarily closed at a time when under normal conditions it would be
| Adviser Managed Trust / Annual Report / July 31, 2019 | 77 |
NOTES TO FINANCIAL STATEMENTS (Continued)
July 31, 2019
open, or (iv) the security’s primary pricing source is not able or willing to provide a price. When a security is valued in accordance with the Fair Value Procedures, the Committee will determine the value after taking into consideration relevant information reasonably available to the Committee. Examples of factors the Committee may consider include: (i) the facts giving rise to the need to fair value, (ii) the last trade price, (iii) the performance of the market or the issuer’s industry, (iv) the liquidity of the security, (v) the size of the holding in a Fund, or (vi) any other appropriate information.
The determination of a security’s fair value price often involves the consideration of a number of subjective factors, and is therefore subject to the unavoidable risk that the value assigned to a security may be higher or lower than the security’s value would be if a reliable market quotation for the security was readily available.
For securities that principally trade on a foreign market or exchange, a significant gap in time can exist between the time of a particular security’s last trade and the time at which a Fund calculates its Net Asset Value (“NAV”). The closing prices of such securities may no longer reflect their market value at the time a Fund calculates NAV if an event that could materially affect the value of those securities (a “Significant Event”), including substantial fluctuations in domestic or foreign markets or occurrences not tied directly to the securities markets, such as natural disasters, armed conflicts or significant governmental actions, has occurred between the time of the security’s last close and the time that the Fund calculates NAV. A Fund may invest in securities that are primarily listed on foreign exchanges that trade on weekends or other days when the Fund does not price its shares. As a result, the NAV of the Fund’s shares may change on days when shareholders will not be able to purchase or redeem Fund shares.
A Significant Event may relate to a single issuer or to an entire market sector. If SIMC or aSub-Adviser becomes aware of a Significant Event that has occurred with respect to a security or group of securities after the closing of the exchange or market on which the security or securities principally trade, but before the time at which the Funds calculate NAV, it may request that a Committee meeting be called. In addition, the Funds use several processes, with respect to certain securities to monitor the pricing data supplied by various sources, including price comparisons and price movements. Any identified discrepancies are researched and subject to the procedures described above.
In accordance with U.S. GAAP, fair value is defined as the price that a Fund would receive upon selling an investment in an orderly transaction to an independent buyer in the principal or most advantageous market
of the investment. A three tier hierarchy has been established to maximize the use of observable and minimize the use of unobservable inputs and to establish classification of fair value measurements for disclosure purposes. Inputs refer broadly to the assumptions that market participants would use in pricing an asset. Inputs may be observable or unobservable. Observable inputs are inputs that reflect the assumptions market participants would use in pricing the asset or liability based on market data obtained from sources independent of the reporting entity. Unobservable inputs are inputs that reflect the reporting entity’s own assumptions about the assumptions market participants would use in pricing the asset or liability based on the best information available in the circumstances.
The three-tier hierarchy of inputs is summarized in the three broad Levels listed below:
Level 1 — quoted prices in active markets for identical investments
Level 2 — other significant observable inputs (including quoted prices for similar investments, interest rates, prepayment speeds, credit risks, etc.)
Level 3 — significant unobservable inputs (including the Fund’s own assumptions in determining the fair value of investments)
Investments are classified within the level of the lowest significant input considered in determining fair value. Investments classified within Level 3 whose fair value measurement considers several inputs may include Level 1 or Level 2 inputs as components of the overall fair value measurement.
Debt securities are valued in accordance with the evaluated bid price supplied by the pricing service and generally categorized as Level 2 in the hierarchy. Other securities that are categorized as Level 2 in the hierarchy include, but are not limited to, preferred stocks, bank loans, warrants, swaps and forward contracts. The Fund may use a systematic fair valuation model provided by an independent pricing service to value foreign equity securities in order to adjust for stale pricing, which may occur between the close of certain foreign exchanges and the New York Stock Exchange. These are generally categorized as Level 2 in the hierarchy.
When independent prices are unavailable or unreliable, debt securities and swaps may be valued utilizing pricing matrices which consider similar factors that would be used by independent pricing services. These are generally categorized as Level 2 in the hierarchy but may be Level 3 depending on the circumstances. For certain collateralized debt obligations, corporate
| 78 | Adviser Managed Trust / Annual Report / July 31, 2019 |
obligations, mortgage backed securities, auction rate preferred securities and loan participations where observable inputs are limited, assumptions about market activity and risk are used and are categorized as Level 3 in the hierarchy.
The valuation techniques used by the Funds to measure fair value during the year ended July 31, 2019, maximized the use of observable inputs and minimized the use of unobservable inputs.
For the year ended July 31, 2019, there have been no significant changes to the Trust’s fair valuation methodologies.
For details of the investment classification, reference the Schedules of Investments.
Security Transactions and Investment Income—
Security transactions are recorded on the trade date. Cost used in determining realized capital gains and losses on the sale of securities is determined on the basis of specific identification. Dividend income and expense recognized on theex-dividend date, and interest income or expense recognized using the accrual basis of accounting.
Distributions received on securities that represent a return of capital or capital gains are recorded as a reduction of cost of investments and/or as a realized gain. The Trust estimates the components of distributions received that may be considered nontaxable distributions or capital gain distributions.
Amortization and accretion is calculated using the scientific interest method, which approximates the effective interest method over the holding period of the security. Amortization of premiums and discounts is included in interest income.
Repurchase Agreements— Securities pledged as collateral for repurchase agreements are held by each Fund’s custodian bank until the repurchase date of the repurchase agreement. The Funds also invest intri-party repurchase agreements. Securities held as collateral fortri-party repurchase agreements are maintained by the broker’s custodian bank in a segregated account until the repurchase date of the repurchase agreement. Provisions of the repurchase agreements and the Trust’s policies require that the market value of the collateral, including accrued interest thereon, is sufficient in the event of default by the counterparty. If the counterparty defaults and the value of the collateral declines, or if the counterparty enters into an insolvency proceeding, realization of the collateral by the Funds may be delayed
or limited. There were no outstanding repurchase agreements as of July 31, 2019.
Reverse Repurchase Agreements— To the extent consistent with its investment objective and strategies, a Fund may issue reverse repurchase agreements. A reverse repurchase agreement involves the sale of portfolio assets together with an agreement to repurchase the same assets later at a fixed price. Additional assets are maintained in a segregated account with the custodian. The segregated assets may consist of cash, U.S. Government securities, or other liquid securities at least equal in value to the obligations under the reverse repurchase agreements. In the event the buyer of securities under a reverse repurchase agreement files for bankruptcy or becomes insolvent, the Funds’ use of the proceeds under the reverse repurchase agreement may be restricted pending a determination by the other party, or its trustee or receiver, whether to enforce the obligation to repurchase the securities. There were no outstanding reverse repurchase agreements as of July 31, 2019.
Expenses— Expenses that are directly related to one of the Funds are charged directly to that Fund. Other operating expenses of the Funds are prorated to the Funds on the basis of relative net assets.
Foreign Currency Translation— The books and records of the Funds’ investments in international securities are maintained in U.S. dollars on the following basis:
(i) market value of investment securities, assets and liabilities at the current rate of exchange; and
(ii) purchases and sales of investment securities, income and expenses at the relevant rates of exchange prevailing on the respective dates of such transactions.
The Funds do not isolate that portion of gains and losses on investments in equity securities that is due to changes in the foreign exchange rates from that which is due to changes in market prices of equity securities.
The Funds report certain foreign-currency-related transactions as components of realized gains for financial reporting purposes, whereas such components are treated as ordinary income for Federal income tax purposes.
Forward Foreign Currency Contracts— To the extent consistent with its investment objective and strategies, a Fund may enter into forward foreign currency contracts for hedging or speculative purposes with respect to either specific transactions, fund positions or anticipated fund positions. All commitments aremarked-to-market daily at the applicable foreign exchange rate, and any resulting unrealized gains or losses are recorded currently. The Fund realizes gains and losses at the time
| Adviser Managed Trust / Annual Report / July 31, 2019 | 79 |
NOTES TO FINANCIAL STATEMENTS (Continued)
July 31, 2019
forward contracts are extinguished. Unrealized gains or losses on outstanding positions in forward foreign currency contracts held at the close of the period are recognized as ordinary income or loss for Federal income tax purposes. A Fund could be exposed to risk if the counterparties to the contracts are unable to meet the terms of the contract and from unanticipated movements in the value of a foreign currency relative to the U.S. dollar.
Finally, the risk exists that losses could exceed amounts disclosed on the Statements of Assets and Liabilities. Refer to each Fund’s Schedule of Investments for details regarding open forward foreign currency contracts as of July 31, 2019, if applicable.
Futures Contracts— To the extent consistent with its investment objective and strategies, a Fund may use futures contracts for tactical hedging purposes as well as to enhance the Fund’s returns. Initial margin deposits of cash or securities are made upon entering into futures contracts. The contracts are marked to market daily and the resulting changes in value are accounted for as unrealized gains and losses. Variation margin payments are paid or received, depending upon whether unrealized gains or losses are incurred. When the contract is closed, the Funds record a realized gain or loss equal to the difference between the proceeds from (or cost of) the closing transaction and the amount invested in the contract.
Risks of entering into futures contracts include the possibility that there will be an imperfect price correlation between the futures and the underlying securities. Second, it is possible that a lack of liquidity for futures contracts could exist in the secondary market, resulting in an inability to close a position prior to its maturity date. Third, the futures contract involves the risk that a Fund could lose more than the original margin deposit required to initiate a futures transaction.
Finally, the risk exists that losses could exceed amounts disclosed on the Statements of Assets and Liabilities. Refer to each Fund’s Schedule of Investments for details regarding open futures contracts as of July 31, 2019, if applicable.
Options/Swaptions Writing/Purchasing— To the extent consistent with its investment objective and strategies, a Fund may invest in financial options/swaptions contracts for the purpose of hedging its existing portfolio securities, or securities that a Fund intends to purchase, against fluctuations in fair market value caused by changes in prevailing market interest rates. A Fund may also invest in financial option/swaption contracts to enhance its returns. When the Fund writes or purchases an option/swaption, an amount equal to the premium received or paid by the Fund is recorded
as a liability or an asset and is subsequently adjusted to the current market value of the option/swaption written or purchased. Premiums received or paid from writing or purchasing options/swaptions which expire unexercised are treated by the Fund on the expiration date as realized gains or losses. The difference between the premium and the amount paid or received on effecting a closing purchase or sale transaction, including brokerage commissions, is also treated as a realized gain or loss. If an option/swaption is exercised, the premium paid or received is added to the cost of the purchase or proceeds from the sale in determining whether the Fund has realized a gain or a loss.
The risk in writing a call option/swaption is a Fund may give up the opportunity for profit if the market price of the security increases. The risk in writing a put option/swaption is a Fund may incur a loss if the market price of the security decreases and the option/swaption is exercised. The risk in purchasing an option/swaption is a Fund may pay a premium whether or not the option/swaption is exercised. The Funds also have the additional risk of being unable to enter into a closing transaction at an acceptable price if a liquid secondary market does not exist. Option/swaption contracts also involve the risk that they may not work as intended due to unanticipated developments in market conditions or other causes.
Finally, the risk exists that losses on written options could exceed amounts disclosed on the Statements of Assets and Liabilities. The Funds did not hold any option/swaption contracts as of July 31, 2019.
Swap Agreements— To the extent consistent with its investment objective and strategies, a Fund may invest in swap contracts for speculative or hedging purposes. Swaps may be used to synthetically obtain exposure to securities or baskets of securities. A swap agreement is atwo-party contract under which an agreement is made to exchange returns from predetermined investments or instruments, including a particular interest rate, foreign currency, or “basket” of securities representing a particular index. Interest rate swaps involve the exchange by a Fund with another party of their respective commitments to pay or receive interest (e.g., an exchange of floating rate payments for fixed rate payments) with respect to a notional amount of principal. Credit-default swaps involve periodic payments by a Fund or counterparty based on a specified rate multiplied by a notional amount assigned to an underlying debt instrument or group of debt instruments in exchange for the assumption of credit risk on the same instruments. In the event of a credit event, usually in the form of a credit rating downgrade, the party receiving periodic payments (i.e. floating rate
| 80 | Adviser Managed Trust / Annual Report / July 31, 2019 |
payer) must pay the other party (i.e. fixed rate payer) an amount equal to the recovery rate used to settle the contracts. The recovery rate is a function of how many credit default swap investors wish to deliver the security or receive the security. The recovery rate is determined through an auction process. Total return swaps allow an investor to benefit from the cash flow without ever actually owning the underlying security. The receiver must pay any decline in value to the payer at the end of the total return swap. However, the investor does not need to make a payment if there is no decline in price. Payments can be made on various indices, bonds (i.e. mortgage backed securities, bank debt and corporate), loans or commodities. The value of a total return swap is equal to the change in value of the underlying asset versus the accrued income payment based on LIBOR or some other form of indices on the notional amount. Interest rate swaps involve the exchange by a Fund with another party of their respective commitments to pay or receive interest (e.g., an exchange of floating rate payments for fixed rate payments) with respect to a notional amount of principal to manage a Fund’s exposure to interest rates. Payments received or made are recorded as realized gains or loss. A Fund could be exposed to credit or market risk due to unfavorable changes in the fluctuation of interest rates or if the counterparty defaults on its obligation to perform. Risk of loss may exceed amounts recognized on the statement of assets and liabilities. In connection with swap agreements securities may be set aside as collateral by a Fund’s custodian.
Swaps aremarked-to-market daily based upon quotations from market makers and the resulting changes in market values, if any, are recorded as unrealized gains or losses in the Statement of Operations. Net payments of interest are recorded as realized gains or losses.
Entering into swap agreements involves, to varying degrees, elements of credit and market risk in excess of the amounts recognized on the Statement of Assets and Liabilities. Such risks involve the possibility that there will be no liquid market for these agreements, that the counterparty to the agreement may default on its obligation to perform and that there may be unfavorable changes in the fluctuation of interest rates. Risks also arise from potential losses from adverse market movements.
These risks may be mitigated by having a master netting arrangement between a Fund and the counterparty and by having the counterparty post collateral to cover a Fund’s exposure to the counterparty. See Note 3 for further details. The Funds did not hold any swap contracts as of July 31, 2019.
Delayed Delivery Transactions— To the extent consistent with its investment objective and strategies, a Fund may purchase or sell securities on a when-issued or delayed delivery basis. These transactions involve a commitment by those Funds to purchase or sell securities for a predetermined price or yield, with payment and delivery taking place beyond the customary settlement period. When purchasing a security on a delayed delivery basis, that Fund assumes the rights and risks of ownership of the security, including the risk of price and yield fluctuations, and takes such fluctuations into account when determining its net asset value. Those Funds may dispose of or renegotiate a delayed delivery transaction after it is entered into, and may sell when-issued securities before they are delivered, which may result in a capital gain or loss. When those Funds have sold a security on a delayed delivery basis, that Fund does not participate in future gains and losses with respect to the security.
Loan Participations and Brady Bonds— To the extent consistent with its investment objective and strategies, a Fund may invest in U.S. dollar-denominated fixed - and floating-rate loans (“Loans”) arranged through private negotiations between a foreign sovereign entity and one or more financial institutions (“Lenders”). The Fund invests in such Loans in the form of participations in Loans (“Participations”) or assignments of all or a portion of Loans from third parties. Participations typically result in this Fund having a contractual relationship only with the Lenders, not with the sovereign borrowers. This Fund has the right to receive payments of principal, interest and any fees to which it is entitled from the Lender selling the Participation and only upon receipt by the Lender of the payments from the borrower. In connection with purchasing Participations, the Fund generally has no right to enforce compliance by the borrower with the terms of the loan agreement relating to the Loan, nor any rights ofset-off against the borrower, and the Fund will not benefit directly from any collateral supporting the Loan in which it has purchased the Participation. As a result, the Fund assumes the credit risk of both the borrower and the Lender that is selling the Participation.
Certain debt obligations, customarily referred to as “Brady Bonds,” are created through the exchange of existing commercial bank loans to foreign entities for new obligations in connection with debt restructuring under a plan introduced by former U.S. Secretary of the Treasury Nicholas F. Brady. Brady Bonds have only been issued since 1989, and, accordingly, do not have a long payment history. They are issued by governments that may have previously defaulted on the loans being restructured by the Brady Bonds, so they are subject to the risk of default by the issuer. They may be fully or
| Adviser Managed Trust / Annual Report / July 31, 2019 | 81 |
NOTES TO FINANCIAL STATEMENTS (Continued)
July 31, 2019
partially collateralized or uncollateralized and issued in various currencies. As of July 31, 2019, the Funds did not hold any loans.
Collateralized Debt Obligations— To the extent consistent with its investment objective and strategies, a Fund may invest in collateralized debt obligations (“CDOs”), which include collateralized loan obligations (“CLOs”) and other similarly structured securities. CLOs are a type of asset-backed security. A CLO is a trust, typically collateralized by a pool of loans, which may include, among others, domestic and foreign senior secured loans, senior unsecured loans and subordinate corporate loans, including loans that may be rated below investment grade or equivalent unrated loans. CDOs may charge management fees and administrative expenses.
For CDOs, the cash flows from the Trust are split into two or more portions, called tranches, varying in risk and yield. The riskiest portion is the “equity” tranche which bears the bulk of defaults from the bonds or loans in the trust and serves to protect the other, more senior tranches from default in all but the most severe circumstances. Since it is partially protected from defaults, a senior tranche from a CDO trust typically has a higher rating and lower yield than their underlying securities, and can be rated investment grade. Despite the protection from the equity tranche, CDO tranches can experience substantial losses due to actual defaults, increased sensitivity to defaults due to collateral default and disappearance of protecting tranches, market anticipation of defaults, as well as aversion to CDO securities as a class.
The risks of an investment in a CDO depend largely on the type of the collateral securities and the class of the CDO in which a Fund invests. Normally, CLOs and other CDOs are privately offered and sold, and thus, are not registered under the securities laws. As a result, investments in CDOs may be characterized by a Fund as illiquid securities; however, an active dealer market may exist for CDOs allowing a CDO to qualify for Rule 144A transactions. In addition to the normal risks associated with fixed income securities (e.g., interest rate risk and default risk), CDOs carry additional risks including, but not limited to: (i) the possibility that distributions from collateral securities will not be adequate to make interest or other payments; (ii) the quality of the collateral may decline CDOs that are subordinate structure of the investment and investment results. The Funds did not hold any CDOs or CLOs as of July 31, 2019.
Dividends and Distributions to Shareholders—
Dividends from net investment income are declared and paid to shareholders annually for the Tactical Offensive Equity Fund and declared and paid quarterly for the
Tactical Offensive Fixed Income Fund. Dividends and distributions are recorded on theex-dividend date. Any net realized capital gains will be distributed at least annually by the Funds.
Illiquid Securities— A security is considered illiquid if it cannot be sold or disposed of in the ordinary course of business within seven days or less for its approximate carrying value on the books of a Fund. Valuations of illiquid securities may differ significantly from the values that would have been used had an active market value for these securities existed. The Funds did not hold any illiquid securities as of July 31, 2019.
Investments in Real Estate Investment Trusts
(“REITs”)— Dividend income is recorded based on the income included in distributions received from the REIT investments using published REIT reclassifications including some management estimates when actual amounts are not available. Distributions received in excess of this estimated amount are recorded as a reduction of the cost of investments or reclassified to capital gains. The actual amounts of income, return of capital, and capital gains are only determined by each REIT after its fiscalyear-end, and may differ from the estimated amounts.
3. CREDIT DERIVATIVES
When a Fund seeks to take an active long or short position with respect to the likelihood of an event of default of a security or basket of securities, the Fund may use credit default swaps. The Fund may buy credit default swaps in an attempt to manage credit risk where the Fund has credit exposure to an issuer and the Fund may sell credit default swaps to more efficiently gain credit exposure to such security or basket of securities. The reference obligation of the swap can be a single issuer, a “basket” of issuers, or an index. The underlying referenced assets are corporate debt, sovereign debt and asset-backed securities.
The buyer of a credit default swap is generally obligated to pay the seller a periodic stream of payments over the term of the contract in return for a contingent payment upon the occurrence of a credit event with respect to an underlying reference obligation. Generally, a credit event for corporate or sovereign reference obligations means bankruptcy, failure to pay, obligation acceleration, repudiation/moratorium or restructuring. For credit default swaps on asset-backed securities, a credit event may be triggered by events such as failure to pay principal, maturity extension, rating downgrade or write-down.
If a Fund is a seller of protection, and a credit event occurs, as defined under the terms of that particular swap agreement, a Fund will generally either (i) pay
| 82 | Adviser Managed Trust / Annual Report / July 31, 2019 |
to the buyer an amount equal to the notional amount of the swap and take delivery of the referenced obligation, other deliverable obligations, or underlying securities comprising a referenced index or (ii) pay a net settlement amount in the form of cash or securities equal to the notional amount of the swap less the recovery value of the referenced obligation or underlying securities comprising a referenced index.
If a Fund is a buyer of protection and a credit event occurs, as defined under the terms of that particular swap agreement, a Fund will either (i) receive from the seller of protection an amount equal to the notional amount of the swap and deliver the referenced obligation, other deliverable obligations or underlying securities comprising the referenced index or (ii) receive a net settlement amount in the form of cash or securities equal to the notional amount of the swap less the recovery value of the referenced obligation or underlying securities comprising the referenced index. Recovery values are assumed by market makers considering either industry standard recovery rates or entity specific factors and considerations until a credit event occurs. If a credit event has occurred, the recovery value is determined by a facilitated auction whereby a minimum number of allowable broker bids, together with a specified valuation method, are used to calculate the settlement value.
The Funds are party to International Swap Dealers Association, Inc. Master Agreements (“ISDA Master Agreements”). These agreements are with select counterparties and they govern transactions, including certainover-the-counter derivative and foreign exchange contracts, entered into by the Funds and the counterparty.
There were no outstanding credit default swaps as of July 31, 2019.
4. DERIVATIVE TRANSACTIONS
A Fund is subject to various netting arrangements with select counterparties (“Master Agreements”). Master Agreements govern the terms of certain transactions, and reduce the counterparty risk associated with relevant transactions by specifying credit protection mechanisms and providing standardization that improves legal certainty. Since different types of transactions have different mechanics and are sometimes traded out of different legal entities of a particular counterparty organization, each type of transaction may be covered by a different Master Agreement, resulting in the need for multiple agreements with a single counterparty. As the Master Agreements are specific to unique operations of different asset types, they allow a Fund to close out and
net its total exposure to a specific counterparty entity in the event of a default with respect to all the transactions governed under a single agreement with a specific counterparty entity.
Master Agreements can also help limit counterparty risk by specifying collateral posting arrangements atpre-arranged exposure levels. Under the Master Agreements, collateral is routinely transferred if the total net exposure to certain transactions (net of existing collateral already in place) governed under the relevant Master Agreement with a counterparty in a given account exceeds a specified threshold, which typically ranges from zero to $250,000 depending on the counterparty and the type of Master Agreement. United States Treasury Securities and U.S. dollar cash are generally the preferred forms of collateral. Securities and cash pledged as collateral are reflected as assets on the Statements of Assets and Liabilities as either a component of investments at value (securities) or deposits due from counterparties (cash). Cash collateral received is not typically held in a segregated account and as such is reflected as a liability on the Statements of Assets and Liabilities as deposits due to counterparties. The market value of any securities received as collateral is not reflected as a component of net asset value. A Fund’s overall exposure to counterparty risk can change substantially within a short period, as it is affected by each transaction subject to the relevant Master Agreement.
Customer account agreements and related addendums govern exchange traded derivatives transactions such as futures, options on futures, and centrally cleared swaps. Exchange traded derivative transactions require posting of initial margin as determined by each relevant clearing agency which is segregated at a broker account registered with the Commodities Futures Trading Commission (“CFTC”), or the applicable regulator. In the US, counterparty risk is significantly reduced as creditors of the futures broker do not have claim to Fund assets in the segregated account. Additionally, portability of exposure in the event of default further reduces risk to the Funds. Variation margin, or changes in market value, are exchanged daily, but may not be netted between futures and cleared Over the Counter (“OTC”) derivatives.
| Adviser Managed Trust / Annual Report / July 31, 2019 | 83 |
NOTES TO FINANCIAL STATEMENTS (Continued)
July 31, 2019
The following is a summary of the variation margin of exchange-traded or centrally cleared financial derivative instruments as of July 31, 2019 ($ Thousands):
| Financial Derivative Assets | Financial Derivative Liabilities | |||||||||||||||||
| Variation Margin Asset | Variation Margin Liability | |||||||||||||||||
| Futures | Total | Futures | Total | |||||||||||||||
Tactical Offensive Equity Fund | $— | $— | $548 | $548 | ||||||||||||||
Total Exchange-Traded or Centrally Cleared | $— | $— | $— | $— | ||||||||||||||
The Tactical Offensive Equity Fund had cash with an aggregate market value of $2,713 ($ Thousands) pledged as collateral for exchange-traded and centrally cleared derivative instruments as of July 31, 2019.
International Swaps and Derivatives Association, Inc. Master Agreements and Credit Support Annexes (“ISDA Master Agreements”) govern OTC financial derivative transactions entered into by a Fund and select counterparties. ISDA Master Agreements maintain provisions for general obligations, representations, agreements, collateral and events of default or
termination. Events of termination include conditions that may entitle counterparties to elect to terminate early and cause settlement of all outstanding transactions under the applicable ISDA Master Agreement. Any election to terminate early could be material to the financial statements. In limited circumstances, the ISDA Master Agreement may contain additional provisions that add additional counterparty protection beyond coverage of existing daily exposure if the counterparty has a decline in credit quality below a predefined level. These amounts, if any, may be segregated with a third party custodian.
The following is a summary by counterparty of the market value of OTC financial derivative instruments and collateral (received)/pledged as of July 31, 2019 ($ Thousands):
| Financial Derivative Assets | Financial Derivative Liabilities | |||||||||||||||||||||||||||||||
| Tactical Offensive Fixed Income Fund | Forward Foreign Currency Contracts | Total Over the | Forward Foreign | Total Over the | Net Market Value of OTC Derivatives | Collateral (Received)/ Pledged | Net Exposures(1) | |||||||||||||||||||||||||
Brown Brothers Harriman | $651 | $651 | $97 | $97 | $554 | $— | $554 | |||||||||||||||||||||||||
Total Over the Counter | $651 | $651 | $97 | $97 | ||||||||||||||||||||||||||||
(1) Net Exposures represents the net receivable/(payable) that would be due from/to the counterparty in the event of default. Exposure to OTC financial derivative instruments can only be netted across transactions governed under the same master netting agreement with the same legal entity.
Securities with an aggregate market value of $0 have been pledged and $0 have been received as collateral for financial derivative instruments as governed by ISDA Master Agreements as of July 31, 2019.
The following table discloses the volume of the Fund’s futures contracts and forward foreign currency contracts activity during the year ended July 31, 2019 ($ Thousands):
| Tactical Offensive Equity Fund | Tactical Offensive Fixed Income Fund | |||||||
Futures Contracts: | ||||||||
Equity Contracts | ||||||||
Average Notional Balance Long | $ | 35,654 | $ | – | ||||
Ending Notional Balance Long | 59,702 | – | ||||||
Forward Foreign Currency Contracts: | ||||||||
Average Notional Balance Long | 3 | 138,151 | ||||||
Average Notional Balance Short | 3 | 138,083 | ||||||
Ending Notional Balance Long | – | 235,174 | ||||||
Ending Notional Balance Short | – | 234,770 | ||||||
| 84 | Adviser Managed Trust / Annual Report / July 31, 2019 |
5. INVESTMENT ADVISORY, ADMINISTRATION AND DISTRIBUTION AGREEMENTS, INVESTMENT
SUB-ADVISORY AGREEMENTS AND OTHER
TRANSACTIONS WITH AFFILIATES
Investment Advisory, Administration & Distribution Agreements— SIMC serves as investment adviser (the “Adviser”) to each Fund. In connection with serving as Adviser, SIMC is entitled to a fee that is calculated daily and paid monthly, based on the average daily net assets of each Fund.
The Trust and SEI Investments Global Funds Services (the “Administrator”) are parties to an Administration and Transfer Agency Agreement under which the Administrator provides administrative and transfer agency services for annual fees, based on the average daily net assets of each Fund.
SEI Investments Distribution Co. (the “Distributor”), serves as each Fund’s Distributor pursuant to a distribution agreement with the Trust. The Funds have adopted a shareholder services plan (the “Service Plan”) with respect to the Shares that allows such Shares to pay service providers a fee in connection with the ongoing servicing of shareholder accounts owning such Shares at an annual rate of average daily net assets of the Shares. The Funds’ Service Plan provides that shareholder servicing fees on the Shares will be paid to the Distributor, which may be used by the Distributor to compensate financial intermediaries for providing shareholder services with respect to the Shares.
The Funds’ administrator and/or its affiliates have contractually agreed to waive fees or reimburse expenses for each Fund until November 30, 2019, in
order to keep total fund operating expenses (exclusive of interest from borrowings, brokerage commissions, taxes and other extraordinary expenses not incurred in the ordinary course of the Fund’s business) from exceeding the levels specified in the table below. These contractual waivers and reimbursements will only apply if a Fund’s total operating costs exceed the applicable thresholds and will not affect the Fund’s total operating costs if they are less than the applicable thresholds. In other words, shareholders will pay the lower of a Fund’s actual total fund operating expenses or total fund operating expenses after contractual waivers and expense reimbursements. The contractual waiver and expense reimbursement are limited to the Fund’s direct operating expenses and, therefore, do not apply to indirect expenses incurred by the Fund, such as acquired fund fees and expenses (“AFFE”). The agreement may be amended or terminated only with the consent of the Board of Trustees.
The Funds’ adviser, the Funds’ administrator and/or the Funds’ distributor have voluntarily agreed to waive a portion of their fees in order to keep total direct operating expenses (exclusive of interest from borrowings, brokerage commissions, trustee fees, taxes and extraordinary expenses not incurred in the ordinary course of the Funds’ business) at the levels specified in the table below. The voluntary waivers of the Funds’ adviser, Funds’ administrator and Funds’ distributor are limited to the Funds’ direct operating expenses and therefore do not apply to indirect expenses incurred by the Funds, such as AFFE, if any. The Funds’ adviser, the Funds’ administrator and/or the Funds’ distributor may discontinue all or part of these waivers at any time.
The following is a summary of annual fees payable to the Adviser and Distributor and the expense limitations for each Fund:
| Advisory Fee | Shareholder Servicing Fee | Contractual Expense Limitation | Voluntary Expense Limitation | |||||||||||||
Tactical Offensive Equity Fund | 0.20% | 0.25% | 0.75% | 0.50% | ||||||||||||
Tactical Offensive Fixed Income Fund | 0.15 | 0.25 | 0.70 | 0.38 | ||||||||||||
The following is a summary of annual fees payable to the Administrator:
Contractual Fees | ||||||||||
| First $2.5 Billion | Next $500 Million | Over $3 Billion | ||||||||
Tactical Offensive Equity Fund | 0.200% | 0.1650% | 0.120% | |||||||
| First $1.5 Billion | Next $500 Million | Next $500 Million | Next $500 Million | Over $3 Billion | ||||||
Tactical Offensive Fixed Income Fund | 0.200% | 0.1775% | 0.1550% | 0.1325% | 0.110% | |||||
| Adviser Managed Trust / Annual Report / July 31, 2019 | 85 |
NOTES TO FINANCIAL STATEMENTS (Continued)
July 31, 2019
As of July 31, 2019, SIMC has entered into an investmentsub-advisory agreement with the following party and pays thesub-adviser out of the fee that it receives from the Funds:
InvestmentSub-Adviser
Tactical Offensive Equity Fund
SSgA Funds Management, Inc.
Tactical Offensive Fixed Income Fund
SSgA Funds Management, Inc.
Other— The Distribution Agreement between the Distributor and the Trust provides that the Distributor may receive compensation on Fund transactions effected for the Trust in accordance with Securities and Exchange Commission (“SEC”) rules. Accordingly, it is expected that Fund transactions may result in brokerage commissions being paid to the Distributor. The SEC rules require that such commissions not exceed usual and customary commissions.
There were no such commissions for the year ended July 31, 2019.
Payments to Affiliates— Certain officers and/or trustees of the Trust are also officers or directors of the Distributor or the Adviser. The Trust pays each unaffiliated Trustee an annual fee for attendance at quarterly, interim and committee meetings.
Compensation of officers and affiliated Trustees of the Trust is paid by the Adviser or Administrator.
A portion of the services provided by the Chief Compliance Officer (“CCO”) and his staff, whom are employees of the Administrator, are paid for by the Trust as incurred.
Fees Paid Indirectly— The Funds may direct certain fund trades to the Distributor who pays a portion of each
Fund’s expenses. Accordingly, the expenses reduced, which were used to pay third party expenses, can be found on the Statements of Operations and the effect on each Fund’s expense ratio, as a percentage of each Fund’s average daily net assets for the year ended July 31, 2019, can be found on the Financial Highlights, if applicable.
Investment in Affiliated Security— The Funds may invest in the SEI Daily Income Trust Government Fund, an affiliated money market fund to manage excess cash or to serve as margin or collateral for derivative positions. The Funds may also purchase securities of certain companies with which it is affiliated to the extent these companies are represented in an index that the adviser orsub-adviser is passively seeking to replicate in accordance with the Fund’s investment strategy.
Interfund Lending— The SEC has granted an exemption that permits the Trust to participate in an interfund lending program (“the Program”) with existing or future investment companies registered under the 1940 Act that are advised by SIMC (the “SEI Funds”). The Program allows the SEI Funds to lend money to and borrow money from each other for temporary or emergency purposes. Participation in the Program is voluntary for both borrowing and lending funds. Interfund loans may be made only when the rate of interest to be charged is more favorable to the lending fund than an investment in overnight repurchase agreements (“Repo Rate”), and more favorable to the borrowing fund than the rate of interest that would be charged by a bank for short-term borrowings (“Bank Loan Rate”). The Bank Loan Rate will be determined using a formula reviewed annually by the SEI Funds’ Board of Trustees. The interest rate imposed on interfund loans is the average of the Repo Rate and the Bank Loan Rate.
As of, and during the year ended July 31, 2019, the Trust had not participated in the Program.
6. CAPITAL SHARE TRANSACTIONS
Capital Share Transactions for the Funds were as follows (Thousands):
| Tactical Offensive Equity Fund | Tactical Offensive Fixed Income Fund | |||||||||||||||
| 2019† | 2018 | 2019 | 2018 | |||||||||||||
Shares Issued | 179,498 | 24,730 | 91,060 | 29,099 | ||||||||||||
Shares Issued in Lieu of Dividends and Distributions | 1,609 | 3,343 | 4,365 | 3,632 | ||||||||||||
Shares Redeemed | (168,023 | ) | (21,554 | ) | (25,829 | ) | (79,712 | ) | ||||||||
Increase/(Decrease) in capital share transactions | 13,084 | 6,519 | 69,596 | (46,981 | ) | |||||||||||
† For the period December 18, 2018 through March 24, 2019, the Fund was not an active component of the Adviser Managed Strategy (see Note 1).
| 86 | Adviser Managed Trust / Annual Report / July 31, 2019 |
7. INVESTMENT TRANSACTIONS
The cost of security purchases and the proceeds from the sale and maturities of securities other than temporary cash investments during the year ended July 31, 2019, were as follows:
| U.S. Gov’t ($ Thousands) | Other ($ Thousands) | Total ($ Thousands) | ||||||||||
Tactical Offensive Equity Fund |
| |||||||||||
Purchases | $ | — | $ | 2,616,490 | $ | 2,616,490 | ||||||
Sales | — | 2,432,609 | 2,432,609 | |||||||||
Tactical Offensive Fixed Income Fund |
| |||||||||||
Purchases | 923,445 | — | 923,445 | |||||||||
Sales | 559,007 | — | 559,007 | |||||||||
8. FEDERAL TAX INFORMATION
It is each Fund’s intention to continue to qualify as a regulated investment company, under Sub chapter M of the Internal Revenue Code, and to distribute all of its taxable income and net capital gains. Accordingly, no provision for Federal income taxes is required.
Dividends from net investment income and distributions from net realized capital gains are determined in accordance with U.S. Federal income tax regulations, which may differ from those amounts determined under U.S. GAAP. These book/tax differences are either temporary or permanent in nature. To the extent these differences are permanent, they are charged or credited to paid-in capital and distributable earnings (loss), as appropriate, in the period that the differences arise.
The tax character of dividends and distributions paid during the last two fiscal years were as follows:
Ordinary Income ($ Thousands) | Long-term ($ Thousands) | Return of Capital ($ Thousands) | Total ($ Thousands) | |||||||||||||||||
Tactical Offensive Equity Fund | ||||||||||||||||||||
| 2019 | $ 42,874 | $ 282,239 | $ — | $ 325,113 | ||||||||||||||||
| 2018 | 43,107 | 13,020 | — | 56,127 | ||||||||||||||||
Tactical Offensive Fixed Income Fund | ||||||||||||||||||||
| 2019 | 43,706 | — | — | 43,706 | ||||||||||||||||
| 2018 | 37,118 | — | — | 37,118 | ||||||||||||||||
As of July 31, 2019, the components of Distributable Earnings (Accumulated Losses) on a tax basis were as follows:
Undistributed Income ($ Thousands) | Undistributed Long-Term Capital Gain ($ Thousands) | Capital Loss | Unrealized Appreciation (Depreciation) ($ Thousands) | Other Temporary Differences ($ Thousands) | Total Distributable Earnings ($ Thousands) | |||||||||||||||||||
Tactical Offensive Equity Fund | $ 12,803 | $ 1,794 | $ — | $ 52,456 | $ — | $ 67,053 | ||||||||||||||||||
Tactical Offensive Fixed Income Fund | 5,491 | — | (31,748 | ) | 44,471 | (4,052 | ) | 14,162 | ||||||||||||||||
For Federal income tax purposes, capital loss carryforwards may be carried forward and applied against future capital gains as follows:
Short-Term ($ Thousands) | Long-Term ($ Thousands) | Total ($ Thousands) | ||||||||||
Tactical Offensive Fixed Income Fund | $ 8,858 | $ 22,890 | $ 31,748 | |||||||||
For Federal income tax purposes, the cost of securities owned at July 31, 2019, and the net realized gains or losses on securities sold for the period were not materially different from amounts reported for financial reporting purposes. These differences are primarily due to investments in passive foreign investment companies, partnership basis adjustments, mark-to-market of futures and forwards contracts, corporate actions, and wash sales which cannot be used for Federal income tax purposes in the current year and have been deferred for use in future years.
The aggregate gross unrealized appreciation and depreciation on total investments (including foreign
currency and derivatives, if applicable) held by the Funds at July 31, 2019, were as follows:
| Federal Tax Cost ($ Thousands) | Appreciated ($ Thousands) | Depreciated ($ Thousands) | Net Unrealized Appreciation (Depreciation) ($ Thousands) | |||||||||||||
Tactical Offensive Equity Fund | $ 2,446,990 | $ 112,969 | $ (60,513) | $ 52,456 | ||||||||||||
Tactical Offensive Fixed Income Fund | 1,497,923 | 52,672 | (8,201) | 44,471 | ||||||||||||
Management has analyzed the Funds’ tax positions taken on Federal income tax returns for all open tax years and has concluded that as of July 31, 2019, no provision for income tax would be required in the Funds’ financial statements. The Funds’ Federal and state income and Federal excise tax returns for tax years for which the applicable statutes of limitations have not expired are subject to examination by the Internal Revenue Service and state departments of revenue.
| Adviser Managed Trust / Annual Report / July 31, 2019 | 87 |
NOTES TO FINANCIAL STATEMENTS (Continued)
July 31, 2019
9. CONCENTRATION/RISKS
In the normal course of business, the Trust enters into contracts that provide general indemnifications by the Trust to the counterparty to the contract. The Trust’s maximum exposure under these arrangements is dependent on future claims that may be made against the Trust and, therefore, cannot be estimated; however, management believes that, based on experience, the risk of loss from such claims is considered remote.
The following is not intended to be a complete discussion of the risks associated with investing in a Fund. Please review each Fund’s prospectus for additional disclosures regarding the principal risks associated with investing in a Fund.
Adviser Managed Strategy Risk— The Funds are a component of a broader investment strategy employed by the Financial Adviser known as the Adviser Managed Strategy. Pursuant to the Adviser Managed Strategy, the Financial Adviser tactically shifts its clients’ assets among the Funds and a money market fund affiliated with the Funds. These asset shifts among the Funds in the Adviser Managed Strategy (i.e., an exchange of shares of one fund for shares of another fund) will be a taxable event to an investor unless the investor is investing in a Fund through atax-deferred arrangement. As part of the Adviser Managed Strategy, substantial portions or substantially all of the Funds’ shares may be periodically sold and repurchased at the direction of the Financial Adviser. These large redemptions and repurchases will have significant effects on the management of the Funds and are expected to result in increased portfolio turnover (and related transaction costs), disruption of portfolio management strategies and the realization of significant taxable gains. Accordingly, if notified of an upcoming redemption request, the Funds may begin to liquidate substantial portions or substantially all of its assets prior to the submission of the redemption request in an effort to raise the necessary cash, and the Funds will not be invested pursuant to its investment strategy during such time. When the Funds are required to rapidly liquidate a substantial portion of their portfolio to satisfy a large redemption order placed as part of the Adviser Managed Strategy, the Funds may be forced to sell securities at below current market values or the Funds’ selling activity may drive down the market value of securities being sold. The Funds may also be required to sell portfolio holdings at a time when the portfolio managers would otherwise not recommend doing so. For example, if a Fund were to experience a large redemption at a time of high market volatility or during a substantial market decline, the Fund would be forced to liquidate securities even though the portfolio managers may not otherwise choose to do so. When the
Funds receive a large purchase order as a result of the Adviser Managed Strategy, the Funds may be required to rapidly purchase portfolio securities. This may cause the Funds to incur higher than normal transaction costs or may require the Funds to purchase portfolio securities at above current market values. Further, the Funds’ purchasing activity may drive up the market value of securities being purchased or the Funds may be required to purchase portfolio securities at a time when the portfolio managers would not otherwise recommend doing so. When the Funds are not an active component of the Adviser Managed Strategy, the Funds may miss investment opportunities because the assets necessary to take advantage of such opportunities are tied up in other investments or have been allocated to another fund within the Adviser Managed Strategy.
Asset Allocation Risk— The risk that SIMC’s decisions regarding allocation of the Funds’ assets among Indexes will not anticipate market trends successfully.
Asset-Backed Securities Risk— Payment of principal and interest on asset-backed securities is dependent largely on the cash flows generated by the assets backing the securities. Securitization trusts generally do not have any assets or sources of funds other than the receivables and related property they own, and asset-backed securities are generally not insured or guaranteed by the related sponsor or any other entity. Asset-backed securities may be more illiquid than more conventional types of fixed income securities that the Fund may acquire.
Below Investment Grade Securities (Junk Bonds) Risk — The Tactical Offensive Fixed Income Fund may invest in fixed income securities rated below investment grade (also known as high yield securities or junk bonds) that involve greater risks of default or downgrade and are generally more volatile than investment grade securities because the prospect for repayment of principal and interest of many of these securities is speculative.
Corporate Fixed Income Securities Risk— The Tactical Offensive Fixed Income Fund may invest in corporate fixed income securities which respond to economic developments, especially changes in interest rates, as well as to perceptions of the creditworthiness and business prospects of individual issuers.
Credit Risk— The risk that the issuer of a security or the counterparty to a contract will default or otherwise become unable to honor a financial obligation.
Currency Risk— As a result of the Funds’ investments in securities denominated in and/or receiving revenues in foreign currencies, the Funds will be subject to currency risk. This is the risk that those currencies will decline in value relative to the U.S. dollar or, in the case of hedging positions, that the U.S. dollar will decline in value relative
| 88 | Adviser Managed Trust / Annual Report / July 31, 2019 |
to the currency hedged. In either event, the dollar value of an investment in the Funds would be adversely affected.
Derivatives Risk— The Funds’ use of futures contracts, forward contracts and swaps is subject to market risk, leverage risk, correlation risk and liquidity risk. Leverage risk and liquidity risk are described below. Manyover-the-counter (OTC) derivative instruments will not have liquidity beyond the counterparty to the instrument. Market risk is the risk that the market value of an investment may move up and down, sometimes rapidly and unpredictably. Correlation risk is the risk that changes in the value of the derivative may not correlate perfectly with the underlying asset, rate or index. The Funds’ use of forward contracts and swap agreements is also subject to credit risk and valuation risk. Valuation risk is the risk that the derivative may be difficult to value and/or valued incorrectly. Credit risk is described above. Each of these risks could cause the Funds to lose more than the principal amount invested in a derivative instrument. Some derivatives have the potential for unlimited loss, regardless of the size of the Funds’ initial investment. The other parties to certain derivative contracts present the same types of credit risk as issuers of fixed income securities. The Funds’ use of derivatives may also increase the amount of taxes payable by shareholders. Both U.S. andnon-U.S. regulators are in the process of adopting and implementing regulations governing derivatives markets, the ultimate impact of which remains unclear.
Equity Market Risk— As a result of the Tactical Offensive Equity Fund’s investments in equity securities, the Fund will be subject to the risk that stock prices will fall over short or extended periods of time.
Exchange Traded Funds (ETFs) Risk— The risks of owning shares of an ETF generally reflect the risks of owning the underlying securities the ETF is designed to track, although lack of liquidity in an ETF could result in its value being more volatile than the underlying portfolio securities.
Fixed Income Market Risk— The prices of the Tactical Offensive Fixed Income Fund’s fixed income securities respond to economic developments, particularly interest rate changes, as well as to perceptions about the creditworthiness of individual issuers, including governments and their agencies. Generally, the Fund’s fixed income securities will decrease in value if interest rates rise and vice versa. In a low interest rate environment, risks associated with rising rates are heightened. In the case of foreign securities, price fluctuations will reflect international economic and
political events as well as changes in currency valuations relative to the U.S. dollar.
Foreign Investment/Emerging Markets Risk— The risk thatnon-U.S. securities may be subject to additional risks due to, among other things, political, social and economic developments abroad, currency movements and different legal, regulatory and tax environments. These additional risks may be heightened with respect to emerging market countries because political turmoil and rapid changes in economic conditions are more likely to occur in these countries.
Foreign Sovereign Debt Securities Risk— The Tactical Offensive Fixed Income Fund may be subject to the risk that: (i) the governmental entity that controls the repayment of sovereign debt may not be willing or able to repay the principal and/or interest when it becomes due because of factors such as debt service burden, political constraints, cash flow problems and other national economic factors; (ii) governments may default on their debt securities, which may require holders of such securities to participate in debt rescheduling or additional lending to defaulting governments; and (iii) there is no bankruptcy proceeding by which defaulted sovereign debt may be collected in whole or in part.
Interest Rate Risk— The Tactical Offensive Fixed Income Fund may be subject to the risk that a rise in interest rates will cause a fall in the value of fixed income securities, including U.S. Government securities, in which the Fund invests. Although U.S. Government securities are considered to be among the safest investments, they are not guaranteed against price movements due to changing interest rates. A low interest rate environment may present greater interest rate risk, because there may be a greater likelihood of rates increasing and rates may increase more rapidly.
Investment Style Risk— The risk that the Tactical Offensive Equity Fund’s investment approach may underperform other segments of the equity markets or the equity markets as a whole and the risk that the Tactical Offensive Fixed Income Fund’s investment approach may underperform other segments of the fixed income markets or the fixed income markets as a whole.
Leverage Risk— The use of leverage can amplify the effects of market volatility on the Funds’ share price and may also cause the Funds to liquidate portfolio positions when it would not be advantageous to do so in order to satisfy its obligations.
Liquidity Risk— The risk that certain securities may be difficult or impossible to sell at the time and the price that the Funds would like. The Funds may have to lower the price, sell other securities instead or forego
| Adviser Managed Trust / Annual Report / July 31, 2019 | 89 |
NOTES TO FINANCIAL STATEMENTS (Concluded)
July 31, 2019
an investment opportunity, any of which could have a negative effect on Funds’ management or performance.
Mortgage-Backed Securities Risk— Mortgage-backed securities are affected significantly by the rate of prepayments and modifications of the mortgage loans backing those securities, as well as by other factors such as borrower defaults, delinquencies, realized or liquidation losses and other shortfalls. Mortgage-backed securities are particularly sensitive to prepayment risk, which is described below, given that the term to maturity for mortgage loans is generally substantially longer than the expected lives of those securities; however, the timing and amount of prepayments cannot be accurately predicted. The timing of changes in the rate of prepayments of the mortgage loans may significantly affect the Tactical Offensive Fixed Income Fund’s actual yield to maturity on any mortgage-backed securities, even if the average rate of principal payments is consistent with the Fund’s expectation. Along with prepayment risk, mortgage-backed securities are significantly affected by interest rate risk, which is described above. In a low interest rate environment, mortgage loan prepayments would generally be expected to increase due to factors such as refinancings and loan modifications at lower interest rates. In contrast, if prevailing interest rates rise, prepayments of mortgage loans would generally be expected to decline and therefore extend the weighted average lives of mortgage-backed securities held or acquired by the Fund.
Mortgage Dollar Rolls Risk— Mortgage dollar rolls are transactions in which the Tactical Offensive Fixed Income Fund sells securities (usually mortgage-backed securities) and simultaneously contracts to repurchase substantially similar, but not identical, securities on a specified future date. If the broker-dealer to whom a Fund sells the security becomes insolvent, the Fund’s right to repurchase the security may be restricted. Other risks involved in entering into mortgage dollar rolls include the risk that the value of the security may change adversely over the term of the mortgage dollar roll and that the security the Fund is required to repurchase may be worth less than the security that the Fund originally held.
Portfolio Turnover Risk— Due to their investment strategy, the Funds may buy and sell securities frequently. This may result in higher transaction costs and additional capital gains tax liabilities.
Prepayment Risk— The risk that, in a declining interest rate environment, fixed income securities with stated interest rates may have the principal paid earlier than expected, requiring the Tactical Offensive Fixed Income
Fund to invest the proceeds at generally lower interest rates.
Real Estate Investment Trust (REITs) Risk— REITs are trusts that invest primarily in commercial real estate or real estate-related loans. The Tactical Offensive Equity Fund’s investments in REITs will be subject to the risks associated with the direct ownership of real estate. Risks commonly associated with the direct ownership of real estate include fluctuations in the value of underlying properties, defaults by borrowers or tenants, changes in interest rates and risks related to general or local economic conditions. Some REITs may have limited diversification and may be subject to risks inherent in financing a limited number of properties.
Small and Medium Capitalization Risk— The risk that small and medium capitalization companies in which the Tactical Offensive Equity Fund may invest may be more vulnerable to adverse business or economic events than larger, more established companies. In particular, small and medium capitalization companies may have limited product lines, markets and financial resources and may depend upon a relatively small management group. Therefore, small capitalization and medium capitalization stocks may be more volatile than those of larger companies. Small capitalization and medium capitalization stocks may be tradedover-the-counter or listed on an exchange.
Tracking Error Risk— The risk that the Funds’ performance may vary substantially from the performance of the indexes they track as a result of cash flows, fund expenses, imperfect correlation between the Funds’ investments and the indexes’ components and other factors.
U.S. Government Securities Risk— The Tactical Offensive Fixed Income Fund may invest in U.S. Government securities, which are considered to be among the safest investments, they are not guaranteed against price movements due to changing interest rates. Obligations issued by some U.S. Government agencies are backed by the U.S. Treasury, while others are backed solely by the ability of the agency to borrow from the U.S. Treasury or by the agency’s own resources.
10. CONCENTRATION OF SHAREHOLDERS
SEI Private Trust Company (“SPTC”) and SIMC are subsidiaries of SEI Investments Company (“SEI”). As of July 31, 2019, SPTC held of record the following percentage of outstanding shares of each Fund:
Tactical Offensive Equity Fund | 93.31 | % | ||||
Tactical Offensive Fixed Income Fund | 92.77 | % |
| 90 | Adviser Managed Trust / Annual Report / July 31, 2019 |
SPTC is not a direct service provider to the Funds. However, SPTC performs a key role in the comprehensive investment solution that SEI provides to investors. SPTC holds the vast majority of shares in the Funds as custodian for shareholders that are clients of the Financial Adviser. SPTC maintains omnibus accounts at the Funds’ transfer agent.
11. REGULATORY MATTERS
On August 17, 2018, the SEC adopted amendments to RegulationS-X. These changes are effective for periods after November 5, 2018. The updates to Registered Investment Companies were mainly focused on simplifying the presentation of distributable earnings by eliminating the need to present the components of distributable earnings on a book basis in the Statements of Assets and Liabilities. The update also impacted the presentation of undistributed net investment income and distribution to shareholders on the Statements of Changes in Net Assets. The amounts presented in the current Statements of Changes in Net Assets represent the aggregated total distributions of net investment income and realized capital gains, except for distributions classified as return of capital which are still presented separately. The disaggregated amounts from the prior fiscal year are broken out below if there were both distributions from net investment income and realized capital gains. Otherwise, the amount on the current Statement of Changes for the prior fiscal year end represents distributions of net investment income.
Ordinary ($ Thousands) | Long-Term Capital Gain ($ Thousands) | Total ($ Thousands) | ||||||||||||||
Tactical Offensive Equity Fund | $ 38,352 | $ 17,725 | $ 56,127 | |||||||||||||
12. NEW ACCOUNTING PRONOUNCEMENT
In August 2018, The FASB issued Accounting Standards Update2018-13, Fair Value Measurement (Topic 820). The new guidance includes additions and modifications to disclosures requirements for fair value measurements. For public entities, the amendments are effective for financial statements issued for fiscal years beginning after December 15, 2019, and interim periods within those fiscal years. At this time, management is currently evaluating the impact of this new guidance on the financial statements and disclosures.
13. SUBSEQUENT EVENTS
Management has evaluated the need for disclosures and/or adjustments resulting from subsequent events through the date the financial statements were issued. Based on this evaluation, no disclosures and/or adjustments were required to the financial statements as of July 31, 2019.
| ||||
| Adviser Managed Trust / Annual Report / July 31, 2019 | 91 | |||
REPORT OF INDEPENDENT REGISTERED ACCOUNTING FIRM
To the Shareholders of the Funds and Board of Trustees
Adviser Managed Trust:
Opinion on the Financial Statements
We have audited the accompanying statement of assets and liabilities, including the summary schedule of investments, of the Tactical Offensive Equity Fund and the statement of assets and liabilities, including the schedule of investments, of the Tactical Offensive Fixed Income Fund (collectively, the Funds) comprising the Adviser Managed Trust, as of July 31, 2019, the related statement of operations for the year then ended, the statements of changes in net assets for each of the years in the two year period then ended, and the related notes (collectively, the financial statements) and the financial highlights for each of the years in the five year period then ended. In our opinion, the financial statements and financial highlights present fairly, in all material respects, the financial position of the Funds as of July 31, 2019, the results of their operations for the year then ended, the changes in their net assets for each of the years in the two year period then ended, and the financial highlights for each of the years in the five year period then ended, in conformity with U.S. generally accepted accounting principles.
Basis for Opinion
These financial statements and financial highlights are the responsibility of the Funds’ management. Our responsibility is to express an opinion on these financial statements and financial highlights based on our audits. We are a public accounting firm registered with the Public Company Accounting Oversight Board (United States) (PCAOB) and are required to be independent with respect to the Funds in accordance with the U.S. federal securities laws and the applicable rules and regulations of the Securities and Exchange Commission and the PCAOB.
We conducted our audits in accordance with the standards of the PCAOB. Those standards require that we plan and perform the audit to obtain reasonable assurance about whether the financial statements and financial highlights are free of material misstatement, whether due to error or fraud. Our audits included performing procedures to assess the risks of material misstatement of the financial statements and financial highlights, whether due to error or fraud, and performing procedures that respond to those risks. Such procedures included examining, on a test basis, evidence regarding the amounts and disclosures in the financial statements and financial highlights. Such procedures also included confirmation of securities owned as of July 31, 2019, by correspondence with custodians and brokers or by other appropriate auditing procedures when replies from brokers were not received. Our audits also included evaluating the accounting principles used and significant estimates made by management, as well as evaluating the overall presentation of the financial statements and financial highlights. We believe that our audits provide a reasonable basis for our opinion.

We have served as the auditor of one or more SEI Funds investment companies since 2005.
Philadelphia, Pennsylvania
September 27, 2019
| 92 | Adviser Managed Trust / Annual Report / July 31, 2019 |
TRUSTEES AND OFFICERS OF THE TRUST (Unaudited)
The following chart lists Trustees and Officers as of July 31, 2019:
Set forth below are the names, addresses, ages, position with the Trust, Term of Office and Length of Time Served, the principal occupations for the last five years, number of positions in fund complex overseen by trustee, and other directorships outside the fund complex of each of the persons currently serving as Trustees and Officers of the Trust. The Trust’s Statement of Additional Information (“SAI”) includes additional information about the Trustees and Officers. The SAI may be obtained without charge by calling1-800-342-5734.
Name, Address, and Age | Position(s) Held with Trusts | Term of Office and Time Served1 | Principal Occupation(s) During Past Five Years | Number of by Trustee2 | Other Directorships Held by Trustee | |||||
INTERESTED TRUSTEES | ||||||||||
Robert A. Nesher One Freedom Valley Drive, Oaks, PA 19456 | Chairman of the Board of Trustees* | since 1995 | Currently performs various services on behalf of SEI for which Mr. Nesher is compensated. | 99 | President and Director of SEI Structured Credit Fund, LP. Director of SEI Global Master Fund plc, SEI Global Assets Fund plc, SEI Global Investments Fund plc, SEI Investments—Global Funds Services, Limited, SEI Investments Global, Limited, SEI Investments (Europe) Ltd., SEI Multi-Strategy Funds PLC, SEI Global Nominee Ltd and SEI Investments—Unit Trust Management (UK) Limited. President, Director and Chief Executive Officer of SEI Alpha Strategy Portfolios, LP from 2007 to 2013. Trustee of SEI Liquid Asset Trust from 1989 to 2016. Vice Chairman of O’Connor EQUUS(closed-end investment company) from 2014 to 2016. Vice Chairman of Winton Series Trust from 2014 to 2017. Vice Chairman of The Advisors’ Inner Circle Fund III and Winton Diversified Opportunities Fund(closed-end investment company) from 2014 to 2018. Vice Chairman of Gallery Trust, Schroder Series Trust and Schroder Global Series Trust from 2015 to 2018. Trustee of The Advisors’ Inner Circle Fund, The Advisors’ Inner Circle Fund II, Bishop Street Funds, and the KP Funds. President, Chief Executive Officer and Trustee of SEI Asset Allocation Trust, SEI Daily Income Trust, SEI Institutional Managed Trust, SEI Institutional International Trust, SEI Institutional Investments Trust, SEI Tax Exempt Trust, SEI Insurance Products Trust, Adviser Managed Trust, The New Covenant Funds and SEI Catholic Values Trust. | |||||
William M. Doran One Freedom Valley Drive, Oaks, PA 19456 79 yrs. old | Trustee* | since1995 | Self-employed consultant since 2003.Partner, Morgan, Lewis & Bockius LLP (law firm) from 1976 to 2003, counsel to the Trust, SEI, SIMC, the Administrator and the Distributor. | 99 | Director of SEI since 1974; Secretary of SEI since 1978. Director of SEI Investments Distribution Co. since 2003. Director of SEI Investments—Global Funds Services, Limited, SEI Investments Global, Limited, SEI Investments (Europe), Limited, SEI Investments (Asia) Limited, SEI Global Nominee Ltd. and SEI Investments—Unit Trust Management (UK) Limited. Trustee of SEI Liquid Asset Trust from 1982 to 2016. Trustee of O’Connor EQUUS from 2014 to 2016. Director of SEI Alpha Strategy Portfolios, LP from 2007 to 2013. Trustee of The Advisors’ Inner Circle Fund, The Advisors’ Inner Circle Fund II, The Advisors’ Inner Circle Fund III, Winton Series Trust, Winton Diversified Opportunities Fund, Gallery Trust, Bishop Street Funds, SEI Asset Allocation Trust, SEI Daily Income Trust, SEI Institutional Managed Trust, SEI Institutional International Trust, SEI Institutional Investments Trust, SEI Tax Exempt Trust, SEI Insurance Products Trust, Adviser Managed Trust, New Covenant Funds, The KP Funds and SEI Catholic Values Trust. | |||||
TRUSTEES | ||||||||||
George J. Sullivan Jr. One Freedom Valley Drive, Oaks, PA 19456 76 yrs. old | Trustee | since 1996 | Retired since January 2012. Self-Employed Consultant, Newfound Consultants Inc. April 1997-December 2011. | 99 | Member of the independent review committee for SEI’s Canadian-registered mutual funds. Director of SEI Opportunity Fund, LP. to 2010. Director of SEI Alpha Strategy Portfolios, LP from 2007 to 2013. Trustee of SEI Liquid Asset Trust from 1996 to 2016. Trustee/Director of State Street Navigator Securities Lending Trust, The Advisors’ Inner Circle Fund, The Advisors’ Inner Circle Fund II, Bishop Street Funds, SEI Structured Credit Fund, LP, SEI Asset Allocation Trust, SEI Daily Income Trust, SEI Institutional Managed Trust, SEI Institutional International Trust, SEI Institutional Investments Trust, SEI Tax Exempt Trust, SEI Insurance Products Trust, Adviser Managed Trust, New Covenant Funds, The KP Funds and SEI Catholic Values Trust. | |||||
| * | Messrs. Nesher and Doran are Trustees who may be deemed as “interested” persons of the Trust as that term is defined in the 1940 Act by virtue of their affiliation with SIMC and the Trust’s Distributor. |
| 1 | Each trustee shall hold office during the lifetime of this Trust until the election and qualification of his or her successor, or until he or she sooner dies, resigns or is removed in accordance with the Trust’s Declaration of Trust. |
| 2 | The Fund Complex includes the following Trusts: SEI Asset Allocation Trust, SEI Daily Income Trust, SEI Institutional Investments Trust, Adviser Managed Trust, SEI Institutional International Trust, SEI Institutional Managed Trust, SEI Tax Exempt Trust, SEI Insurance Products Trust and New Covenant Funds. |
| ||||
| Adviser Managed Trust / Annual Report / July 31, 2019 | 93 | |||
TRUSTEES AND OFFICERS OF THE TRUST (Unaudited) (Concluded)
Name Address, and Age | Position(s) Held with Trusts | Term of Office and Length of Time Served1 | Principal Occupation(s) During Past Five Years | Number of by Trustee2 | Other Directorships Held by Trustee | |||||
TRUSTEES (continued) | ||||||||||
Nina Lesavoy One Freedom Valley Drive, Oaks, PA 19456 62 yrs. old | Trustee | since 2003 | Founder and Managing Director, Avec Capital (strategic fundraising firm) since 2008. Managing Director, Cue Capital (strategic fundraising firm) from March 2002-March 2008. | 99 | Director of SEI Alpha Strategy Portfolios, LP from 2007 to 2013. Trustee of SEI Liquid Asset Trust from 2003 to 2016. Trustee/Director of SEI Structured Credit Fund, LP., SEI Asset Allocation Trust, SEI Daily Income Trust, SEI Institutional Managed Trust, SEI Institutional International Trust, SEI Institutional Investments Trust, SEI Tax Exempt Trust, SEI Insurance Products Trust, New Covenant Funds, Adviser Managed Trust and SEI Catholic Values Trust. | |||||
James M. Williams One Freedom Valley Drive, Oaks, PA 19456 | Trustee | since 2004 | Vice President and Chief Investment Officer, J. Paul Getty Trust,Non-Profit Foundation for Visual Arts, since December 2002. President, Harbor Capital Advisors and Harbor Mutual Funds, 2000-2002. Director of SEI Alpha Strategy Portfolios, L.P. from 2007 to 2013. Manager, Pension Asset Management, Ford Motor Company, 1997-1999. | 99 | Director of SEI Alpha Strategy Portfolios, LP from 2007 to 2013, Trustee of SEI Liquid Asset Trust from 2004 to 2016. Trustee/Director of Ariel Mutual Funds, SEI Structured Credit Fund, LP, SEI Asset Allocation Trust, SEI Daily Income Trust, SEI Institutional Managed Trust, SEI Institutional International Trust, SEI Institutional Investments Trust, SEI Tax Exempt Trust, New Covenant Funds, SEI Insurance Products Trust, Adviser Managed Trust and SEI Catholic Values Trust. | |||||
Mitchell A. Johnson One Freedom Valley Drive, Oaks, PA 19456 77 yrs. old | Trustee | since 2007 | Retired Private Investor since 1994. | 99 | Director, Federal Agricultural Mortgage Corporation (Farmer Mac) since 1997. Director of SEI Alpha Strategy Portfolios, LP from 2007 to 2013. Trustee of SEI Liquid Asset Trust from 2007 to 2016. Trustee of the Advisors’ Inner Circle Fund, The Advisors’ Inner Circle Fund II, Bishop Street Funds, SEI Asset Allocation Trust, SEI Daily Income Trust, SEI Institutional Managed Trust, SEI Institutional International Trust, SEI Institutional Investments Trust, SEI Tax Exempt Trust, SEI Insurance Products Trust, Adviser Managed Trust, The KP Funds and SEI Catholic Values Trust. | |||||
Hubert L. Harris, Jr. One Freedom Valley Drive, Oaks, PA 19456 76 yrs. old | Trustee | since 2008 | Retired since December 2005. Owner of Harris Plantation, Inc. since 1995. Chief Executive Officer of Harris CAPM,a consulting asset and property management entity. Chief Executive Officer, INVESCO North America, August 2003-December 2005. Chief Executive Officer and Chair of the Board of Directors, AMVESCAP Retirement, Inc., January 1998- August 2003. | 99 | Director of AMVESCAP PLC from 1993-2004. Served as a director of a bank holding company, 2003-2009. Director, Aaron’s Inc., 2012-present. President and CEO of Oasis Ornamentals LLC since 2011. Member of the Board of Councilors of the Carter Center (nonprofit corporation) and served on the board of othernon-profit organizations. Director of SEI Alpha Strategy Portfolios, LP from 2008 to 2013. Trustee of Liquid Asset Trust from 2008 to 2016. Trustee of SEI Asset Allocation Trust, SEI Daily Income Trust, SEI Institutional Managed Trust, SEI Institutional International Trust, SEI Institutional Investments Trust, SEI Tax Exempt Trust, SEI Insurance Products Trust, New Covenant Funds, Adviser Managed Trust and SEI Catholic Values Trust. | |||||
Susan C. Cote One Freedom Valley Drive, Oaks, PA 19456 64 yrs. old | Trustee | since 2016 | Retired since July 2015. Americas Director of Asset Management, Ernst & Young LLP from 2006-2013. Global Asset Management Assurance Leader, Ernest & Young LLP from 2006-2015. Partner Ernest & Young LLP from 1997-2015. Prudential, 1983-1997.Member of the Ernst & Young LLP Retirement Investment Committee, Treasurer and Chair of Finance, Investment and Audit Committee of the New York Women’s Foundation. | 99 | Trustee of SEI Tax Exempt Trust, SEI Daily Income Trust, SEI Institutional International Trust, SEI Institutional Managed Trust, SEI Asset Allocation Trust, SEI Institutional Investments Trust, SEI Insurance Products Trust, New Covenant Funds, Adviser Managed Trust and SEI Catholic Values Trust. | |||||
James B. Taylor One Freedom Valley Drive, Oaks, PA 19456 68 yrs. old | Trustee | since 2018 | Retired since December 2017. Chief Investment Officer at Georgia Teach Foundation from 2008 to 2017. Chief Investment Officer at Delta Air Lines from 1983 to 2007. Member of the Investment Committee at the Institute of Electrical and Electronic Engineers from 1999 to 2004. President, Vice President and Treasurer at Southern Benefits Conference from 1998 to 2000. | 99 | Trustee of SEI Daily Income Trust, SEI Tax Exempt Trust, SEI Institutional Managed Trust, SEI Institutional International Trust, SEI Institutional Investments Trust, SEI Asset Allocation Trust, Adviser Managed Trust, New Covenant Funds, SEI Insurance Products Trust and SEI Catholic Values Trust. | |||||
| 1 | Each trustee shall hold office during the lifetime of this Trust until the election and qualification of his or her successor, or until he or she sooner dies, resigns or is removed in accordance with the Trust’s Declaration of Trust. |
| 2 | The Fund Complex includes the following Trusts: SEI Asset Allocation Trust, SEI Daily Income Trust, SEI Institutional Investments Trust, Adviser Managed Trust, SEI Institutional International Trust, SEI Institutional Managed Trust, SEI Tax Exempt Trust, SEI Insurance Products Trust and New Covenant Funds. |
| 94 | Adviser Managed Trust / Annual Report / July 31, 2019 |
Name Address, and Age | Position(s) Held with Trusts | Term of Office and | Principal Occupation(s) During Past Five Years | Number of by Trustee2 | Other Directorships Held by Trustee | |||||
OFFICERS | ||||||||||
Robert A. Nesher Oaks, PA 19456 72 yrs. old | President and CEO | since 2005 | Currently performs various services on behalf of SEI for which Mr. Nesher is compensated. | N/A | N/A | |||||
James J. Hoffmayer One Freedom Oaks, PA 19456 45 yrs. old | Controller and Chief Financial Officer | since 2016 | Senior Director, Funds Accounting and Fund Administration, SEI Investments Global Funds Services (since September 2016); Senior Director of Fund Administration, SEI Investments Global Funds Services (since October 2014). Director of Financial Reporting, SEI Investments Global Funds Services (November 2004-October 2014). | N/A | N/A | |||||
Glenn R. Kurdziel One Freedom Oaks, PA 19456 | Assistant Controller | since 2017 | Assistant Controller, Funds Accounting, SEI Investments Global Funds Services (March 2017); Senior Manager, Funds Accounting, SEI Investments Global Funds Services since 2005. | N/A | N/A | |||||
Russell Emery One Freedom Oaks, PA 19456 | Chief Compliance Officer | since 2006 | Chief Compliance Officer of SEI Daily Income Trust, SEI Institutional Investments Trust, SEI Institutional Managed Trust, SEI Asset Allocation Trust, SEI Institutional International Trust, SEI Tax Exempt Trust, The Advisors’ Inner Circle Fund, The Advisors’ Inner Circle Fund II and Bishop Street Funds since March 2006. Chief Compliance Officer of SEI Liquid Asset Trust from 2006 to 2016. Chief Compliance Officer of SEI Structured Credit Fund, LP June 2007. Chief Compliance Officer of Adviser Managed Trust since December 2010. Chief Compliance Officer of SEI Alpha Strategy Portfolios, LP from 2007 to 2013. Chief Compliance Officer of New Covenant Funds since February 2012.Chief Compliance Officer of SEI Insurance Products Trust and The KP Funds since 2013. Chief Compliance Officer of New Covenant Funds since February 2012. Chief Compliance Officer of O’Connor EQUUS from 2014 to 2016. Chief Compliance Officer of The Advisors’ Inner Circle Fund III, Winton Series Trust and Winton Diversified Opportunities Fund since 2014. Chief Compliance Officer of SEI Catholic Values Trust and Gallery Trust since 2015. | N/A | N/A | |||||
Timothy D Barto One Freedom Oaks, PA 19456 51 yrs. old | Vice President and Secretary | since 2002 | Vice President and Secretary of SEI Institutional Transfer Agent, Inc. since 2009. General Counsel and Secretary of SIMC and the Administrator since 2004. Vice President of SIMC and the Administrator since 1999. Vice President and Assistant Secretary of SEI since 2001. | N/A | N/A | |||||
Aaron Buser One Freedom Oaks, PA 19456 48 yrs. old | Vice President and Assistant Secretary | since 2008 | Vice President and Assistant Secretary of SEI Institutional Transfer Agent, Inc. since 2009. Vice President and Assistant Secretary of SIMC since 2007. Attorney Stark & Stark (law firm), March 2004-July 2007. | N/A | N/A | |||||
David F. McCann One Freedom Oaks, PA 19456 | Vice President and Assistant Secretary | since 2009 | Vice President and Assistant Secretary of SEI Institutional Transfer Agent, Inc. since 2009. Vice President and Assistant Secretary of SIMC since 2008. Attorney, Drinker Biddle & Reath, LLP (law firm), May 2005 - October 2008. | N/A | N/A | |||||
Stephen G. MacRae One Freedom Oaks, PA 19456 51 yrs. old | Vice President | since 2012 | Director of Global Investment Product Management from January 2004 - to present. | N/A | N/A | |||||
Bridget E. Sudall One Freedom Oaks, PA 19456 38 yrs. old | Anti-Money Laundering Compliance Officer and Privacy Officer | since 2015 | Anti-Money Laundering Compliance Officer and Privacy Officer (since 2015), Senior Associate and AML Officer, Morgan Stanley Alternative Investment Partners, April 2011-March 2015, Investor Services Team Lead, Morgan Stanley Alternative Investment Partners, July 2007-April 2011. | N/A | N/A | |||||
| 1 | Each trustee shall hold office during the lifetime of this Trust until the election and qualification of his or her successor, or until he or she sooner dies, resigns or is removed in accordance with the Trust’s Declaration of Trust. |
| 2 | The Fund Complex includes the following Trusts: SEI Asset Allocation Trust, SEI Daily Income Trust, SEI Institutional Investments Trust, Adviser Managed Trust, SEI Institutional International Trust, SEI Institutional Managed Trust, SEI Tax Exempt Trust, SEI Insurance Products Trust and New Covenant Funds. |
| ||||
| Adviser Managed Trust / Annual Report / July 31, 2019 | 95 | |||
DISCLOSURE OF FUND EXPENSES (Unaudited)
July 31, 2019
All mutual funds have operating expenses. As a shareholder of a fund, your investment is affected by these ongoing costs, which include (among others) costs for portfolio management, administrative services, and shareholder reports like this one. It is important for you to understand the impact of these costs on your investment returns.
Operating expenses such as these are deducted from the fund’s gross income and directly reduce your final investment return. These expenses are expressed as a percentage of the fund’s average net assets; this percentage is known as the fund’s expense ratio.
The following examples use the expense ratio and are intended to help you understand the ongoing costs (in dollars) of investing in your fund and to compare these costs with those of other mutual funds. The examples are based on an investment of $1,000 made at the beginning of the period shown and held for the entire period (February 1, 2019 through July 31, 2019).
The table on this page illustrates your fund’s costs in two ways:
Actual fund return:This section helps you to estimate the actual expenses after fee waivers that your Fund incurred over the period. The “Expenses Paid During Period” column shows the actual dollar expense cost incurred by a $1,000 investment in the Fund, and the “Ending Account Value” number is derived from deducting that expense cost from the Fund’s gross investment return.
You can use this information, together with the actual amount you invested in the Fund, to estimate the expenses you paid over that period. Simply divide your actual account value by $1,000 to arrive at a ratio (for example, an $8,600 account value divided by $1,000 = 8.6), then multiply that ratio by the number shown for your Fund under “Expenses Paid During Period.”
Hypothetical 5% return:This section helps you compare your Fund’s costs with those of other mutual funds. It assumes that the fund had an annual 5% return before expenses during the year, but that the expense ratio (Column 3) for the period is unchanged. This example is useful in making comparisons because the Securities and Exchange Commission requires all mutual funds to make this 5% calculation. You can assess your Fund’s comparative cost by comparing the hypothetical result for your Fund in the “Expense Paid During Period” column with those that appear in the same charts in the shareholder reports for other funds.
NOTE:Because the return is set at 5% for comparison purposes — NOT your Fund’s actual return — the account values shown may not apply to your specific investment.
| Beginning Account Value 2/1/19 | Ending Account Value 7/31/19 | Annualized Expense Ratios | Expenses Paid During Period* | |||||
Tactical Offensive Equity Fund | ||||||||
Actual Fund Return | ||||||||
Class A | $1,000.00 | $1,082.40 | 0.50% | $2.58 | ||||
Hypothetical 5% Return | ||||||||
Class A | $1,000.00 | $1,022.32 | 0.50% | $2.51 | ||||
| Beginning Account Value 2/1/19 | Ending Account Value 7/31/19 | Annualized Expense Ratios | Expenses Paid During Period* | |||||
Tactical Offensive Fixed Income Fund | ||||||||
Actual Fund Return | ||||||||
Class A | $1,000.00 | $1,055.10 | 0.38% | $1.94 | ||||
Hypothetical 5% Return | ||||||||
Class A | $1,000.00 | $1,022.91 | 0.38% | $1.91 | ||||
* Expenses are equal to the Fund’s annualized expense ratio multiplied by the average account value over the period, multiplied by 181/365 (to reflect theone-half year period shown).
| 96 | Adviser Managed Trust / Annual Report / July 31, 2019 |
BOARD OF TRUSTEES’ CONSIDERATIONS IN APPROVING THE ADVISORY ANDSUB-ADVISORY AGREEMENTS (Unaudited)
Adviser Managed Trust (the “Trust”) and SEI Investments Management Corporation (“SIMC”) have entered into an investment advisory agreement (the “Advisory Agreement”). Pursuant to the Advisory Agreement, SIMC is responsible for the investment advisory services provided to the series of the Trust (the “Funds”). Pursuant to asub-advisory agreement with SIMC (the“Sub-Advisory Agreement” and, together with the Advisory Agreement, the “Investment Advisory Agreements”), and under the supervision of SIMC and the Trust’s Board of Trustees (the “Board”), thesub-adviser (the“Sub-Adviser”) provides security selection and certain other advisory services with respect to all or a discrete portion of the assets of the Funds. TheSub-Adviser is also responsible for managing its employees who provide services to the Funds.Sub-Advisers are selected based primarily upon the research and recommendations of SIMC, which evaluates quantitatively and qualitatively theSub-Advisers’ skills and investment results in managing assets for specific asset classes, investment styles and strategies.
The Investment Company Act of 1940, as amended (the “1940 Act”), requires that the initial approval of, as well as the continuation of, the Funds’ Investment Advisory Agreements be specifically approved: (i) by the vote of the Board or by a vote of the shareholders of the Funds; and (ii) by the vote of a majority of the Trustees who are not parties to the Investment Advisory Agreements or “interested persons” of any party (the “Independent Trustees”), cast in person at a meeting called for the purpose of voting on such approval(s). In connection with their consideration of such approval(s), the Funds’ Trustees must request and evaluate, and SIMC and theSub-Adviser are required to furnish, such information as may be reasonably necessary to evaluate the terms of the Investment Advisory Agreements. In addition, the Securities and Exchange Commission takes the position that, as part of their fiduciary duties with respect to a mutual fund’s fees, mutual fund boards are required to evaluate the material factors applicable to a decision to approve an investment advisory agreement.
Consistent with these responsibilities, the Board calls and holds meetings each year to consider whether to approve new and/or renew existing Investment Advisory Agreements between the Trust and SIMC and SIMC and theSub-Adviser with respect to the Funds of the Trust. In preparation for these meetings, the Board requests and reviews a wide variety of materials provided by SIMC and theSub-Adviser, including information about SIMC’s and theSub-Adviser’s affiliates, personnel and operations and the services provided pursuant to the Investment Advisory Agreements. The Board also receives data from third parties. This information is provided in addition to the detailed information about the Funds that the Board reviews during the course of each year, including information that relates to Fund operations and Fund performance. The Trustees also receive a memorandum from counsel regarding the responsibilities of Trustees in connection with their consideration of whether to approve the Trust’s Investment Advisory Agreements. Finally, the Independent Trustees receive advice from independent counsel to the Independent Trustees, meet in executive sessions outside the presence of Fund management and participate in question and answer sessions with representatives of SIMC and theSub-Adviser.
Specifically, during the course of the Trust’s fiscal year, the Board requested and received written materials from SIMC and theSub-Adviser regarding: (i) the quality of SIMC’s and theSub-Adviser’s investment management and other services; (ii) SIMC’s and theSub-Adviser’s investment management personnel; (iii) SIMC’s and theSub-Adviser’s operations and financial condition; (iv) SIMC’s and theSub-Adviser’s brokerage practices (including any soft dollar arrangements) and investment strategies; (v) the level of the advisory fees that SIMC charges the Funds and the level of thesub-advisory fees that SIMC pays theSub-Adviser, compared with fees each charge to comparable accounts; (vi) the advisory fees charged by SIMC and the Funds’ overall fees and operating expenses compared with peer groups of mutual funds prepared by Broadridge, an independent provider of investment company data; (vii) the level of SIMC’s and theSub-Adviser’s profitability from their Fund-related operations; (viii) SIMC’s and theSub-Adviser’s compliance program, including a description of material compliance matters and material compliance violations; (ix) SIMC’s potential economies of scale; (x) SIMC’s and theSub-Adviser’s policies on and compliance procedures for personal securities transactions; (xi) SIMC’s and theSub-Adviser’s expertise and resources in domestic and/or international financial markets; and (xii) the Funds’ performance over various periods of time compared with peer groups of mutual funds prepared by Broadridge and the Funds’ benchmark indexes.
At the December4-5, 2018 meeting of the Board, the Trustees approved a brief extension of the Advisory Agreement and theSub-Advisory Agreement already in effect to accommodate a revised meeting schedule. Accordingly, at the April2-3, 2019 meeting of the Board, the Trustees, including a majority of the Independent Trustees, voted to renew the Advisory Agreement andSub-Advisory Agreement. In each case, the Board’s decision was based on its consideration and evaluation of the factors described above, as discussed at the meeting and
| Adviser Managed Trust / Annual Report / July 31, 2019 | 97 |
BOARD OF TRUSTEES’ CONSIDERATIONS IN APPROVING THE ADVISORY ANDSUB-ADVISORY AGREEMENTS (Unaudited) (Concluded)
at prior meetings. The following discusses some, but not all, of the factors that were considered by the Board in connection with its assessment of the Investment Advisory Agreements.
Nature, Extent and Quality of Services.The Board considered the nature, extent and quality of the services provided by SIMC and theSub-Adviser to the Funds and the resources of SIMC and theSub-Adviser and their affiliates dedicated to the Funds. In this regard, the Trustees evaluated, among other things, SIMC’s and theSub-Adviser’s personnel, experience, track record and compliance program. Following evaluation, the Board concluded that, within the context of its full deliberations, the nature, extent and quality of services provided by SIMC and theSub-Adviser to the Funds and the resources of SIMC and theSub-Adviser and their affiliates dedicated to the Funds were sufficient to support the renewal of the Investment Advisory Agreements. In addition to advisory services, the Board considered the nature and quality of certain administrative, transfer agency and othernon-investment advisory services provided to the Funds by SIMC and/or its affiliates.
Performance.In determining whether to renew SIMC’s Advisory Agreement, the Trustees considered the Funds’ performance relative to their peer groups and appropriate indexes/benchmarks. The Trustees reviewed performance information for each Fund, noting that they receive performance reports that permit them to monitor each Fund’s performance at board meetings throughout the year. As part of this review, the Trustees considered the composition of each peer group and selection criteria. In assessing Fund performance, the Trustees considered a report compiled by Broadridge, an independent third-party that was engaged to prepare an assessment of the Funds in connection with the renewal of the Advisory Agreement (the “Broadridge Report”). The Broadridge Report included metrics on net total return for the Funds and a universe of comparable funds. Based on the materials considered and discussed at the meeting, the Trustees found Fund performance satisfactory, or, where performance was materially below the benchmark and/or peer group, the Trustees were satisfied with the reasons provided to explain such performance. In connection with the renewal of theSub-Advisory Agreement, the Board considered the performance of theSub-Adviser relative to appropriate indexes/benchmarks. Following evaluation, the Board concluded that, within the context of its full deliberations, the performance of the Funds was sufficient to support renewal of SIMC’s Advisory Agreement, and the performance of theSub-Adviser was sufficient to support renewal of theSub-Advisory Agreement.
Fees.With respect to the Funds’ expenses under the Investment Advisory Agreements, the Trustees considered the rate of compensation called for by the Investment Advisory Agreements and the Funds’ net operating expense ratio in comparison to those of the Funds’ respective peer groups. In assessing Fund expenses, the Trustees considered the information in the Broadridge Report, which included various metrics related to fund expenses, including, but not limited to, contractual management fees at various asset levels, actual management fees (including transfer agent expenses), and actual total expenses for the Funds and a universe of comparable funds. Based on the materials considered and discussion at the meeting, the Trustees further determined that fees were either shown to be below the peer average in the comparative fee analysis, or that there was a reasonable basis for the fee level. The Trustees also considered the effects of SIMC’s and its affiliates’ waiver of management and other fees to prevent total Fund operating expenses from exceeding a specified cap and concluded that SIMC, through waivers, has maintained the Funds’ net operating expenses at competitive levels for its distribution channels. The Board also took into consideration compensation earned from the Funds by SIMC or its affiliates fornon-advisory services, such as administration, transfer agency, shareholder services or brokerage, and considered whether SIMC and its affiliates may have realized other benefits from their relationship with the Funds, such as any research and brokerage services received under soft dollar arrangements. When considering fees paid to theSub-Adviser, the Board took into account the fact that theSub-Adviser is compensated by SIMC and not by the Funds directly, and that such compensation with respect to any unaffiliatedSub-Adviser reflects an arms-length negotiation between theSub-Adviser and SIMC. Following evaluation, the Board concluded that, within the context of its full deliberations, the expenses of the Funds are reasonable and supported renewal of the Investment Advisory Agreements. The Board also considered whether theSub-Adviser and its affiliates may have realized other benefits from their relationship with the Funds, such as any research and brokerage services received under soft dollar arrangements.
Profitability.With regard to profitability, the Trustees considered compensation flowing to SIMC and theSub-Adviser and its affiliates, directly or indirectly. The Trustees considered whether the levels of compensation and profitability were reasonable. As with the fee levels, when considering the profitability of theSub-Adviser, the Board took into account the fact that compensation with respect to any unaffiliatedSub-Adviser reflects an arms-length negotiation between theSub-Adviser and SIMC. In connection with the renewal of theSub-Advisory Agreement, the Board
| 98 | Adviser Managed Trust / Annual Report / July 31, 2019 |
also took into consideration the impact that the fees paid to theSub-Adviser have on SIMC’s advisory fee margin and profitability. Based on this evaluation, the Board concluded that, within the context of its full deliberations, the profitability of each of SIMC and theSub-Adviser is reasonable and supported renewal of the Investment Advisory Agreements.
Economies of Scale.With respect to the Advisory Agreement, the Trustees considered whether any economies of scale were being realized by SIMC and its affiliates and, if so, whether the benefits of such economies of scale were passed along to the Funds’ shareholders through a graduated investment advisory fee schedule or other means, including any fee waivers by SIMC and its affiliates. The Trustees recognized that economies of scale are difficult to identify and quantify and are rarely identifiable on afund-by-fund basis. Based on this evaluation, the Board determined that the fees were reasonable in light of the information that was provided by SIMC with respect to economies of scale.
Based on the Trustees’ deliberation and their evaluation of the information described above, the Board, including all of the Independent Trustees, with the assistance of Fund counsel and Independent Trustees’ counsel, unanimously approved the renewal of the Investment Advisory Agreements and concluded that the compensation under the Investment Advisory Agreements is fair and reasonable in light of such services and expenses and such other matters as the Trustees considered to be relevant in the exercise of their reasonable judgment. In the course of its deliberations, the Board did not identify any particular factor (or conclusion with respect thereto) or single piece of information that wasall-important, controlling or determinative of its decision, but considered all of the factors together, and each Trustee may have attributed different weights to the various factors (and conclusions with respect thereto) and information.
| Adviser Managed Trust / Annual Report / July 31, 2019 | 99 |
NOTICE TO SHAREHOLDERS (Unaudited)
For shareholders that do not have a July 31, 2019 taxable year end, this notice is for informational purposes only. For shareholders with a July 31, 2019 year end, please consult your tax advisor as to the pertinence of this notice.
For the fiscal year ended July 31, 2019, the funds of the Adviser Managed Trust are designating the following items with regard to distributions paid during the year:
(A) Long-Term Capital Gains | (B) Ordinary Income (Tax Basis) | Total Distributions | (C) Dividends Received | |||||||||||||||||||||
Tactical Offensive Equity Fund | 86.81% | 13.19% | 100.00% | 63.97% | ||||||||||||||||||||
Tactical Offensive Fixed Income Fund | 0.00% | 100.00% | 100.00% | 0.00% | ||||||||||||||||||||
(D) Qualifying for QDI) (2) | Qualifying Business Income (3) | (F) U.S. Government | Interest Related Dividends (5) | Short-Term Capital Gain Dividends (6) | ||||||||||||||||||||
Tactical Offensive Equity Fund | 99.74% | 0.26% | 0.00% | 0.85% | 100.00% | |||||||||||||||||||
Tactical Offensive Fixed Income Fund | 0.00% | 0.00% | 18.19% | 70.87% | 0.00% | |||||||||||||||||||
| (1) | Qualifying dividends represent dividends which qualify for the corporate dividends received deduction. |
| (2) | The percentage in this column represents the amount of “Qualifying Dividend Income” is reflected as a percentage of “Ordinary Income Distributions.” It is the intention of each of the aforementioned funds to designate the maximum amount permitted by the law. The information reported herein may differ from the information and distributions taxable to the shareholders for the calendar year ending December 31, 2019. Complete information will be computed and reported in conjunction with your 2019 Form1099-DIV. |
| (3) | The percentage of this column represents the amount of ordinary dividend income that qualified for 20% Business Income Deduction. |
| (4) | “U.S. Government Interest” represents the amount of interest that was derived from direct U.S. Government obligations and distributed during the fiscal year. This amount is reflected as a percentage of total ordinary income distributions (the total of short term capital gain and net investment income distributions). Generally, interest from direct U.S. Government obligations is exempt from state income tax. However, for shareholders who are residents of California, Connecticut and New York, the statutory threshold requirements were not satisfied to permit exemption of these amounts from state income. |
| (5) | The percentage in this column represents the amount of “Interest Related Dividend” and is reflected as a percentage of net investment income distributions that is exempt from U.S. withholding tax when paid to foreign investors. |
| (6) | The percentage in this column represents the amount of “Short-Term Capital Gain” and is reflected as a percentage of short-term capital gain distributions that is exempt from U.S. withholding tax when paid to foreign investors. |
Items (A) and (B) are based on the percentage of the Funds total distribution.
Items (C) and (D) are based on the percentage of ordinary income distributions of each fund. Item (E) is based on the percentage of gross income of each fund.
Please consult your tax adviser for proper treatment of this information. This notification should be kept with your permanent tax records.
| 100 | Adviser Managed Trust / Annual Report / July 31, 2019 |
ADVISER MANAGED TRUST ANNUAL REPORT JULY 31, 2019
Robert A. Nesher, Chairman
Trustees
William M. Doran
George J. Sullivan, Jr.
Nina Lesavoy
James M. Williams
Mitchell A. Johnson
Hubert L. Harris, Jr.
Susan C. Cote
James B. Taylor
Officers
Robert A. Nesher
President and Chief Executive Officer
James J. Hoffmayer
Controller and Chief Financial Officer
Glenn R. Kurdziel
Assistant Controller
Russell Emery
Chief Compliance Officer
Timothy D. Barto
Vice President, Secretary
Aaron Buser
Vice President, Assistant Secretary
David F. McCann
Vice President, Assistant Secretary
Stephen G. MacRae
Vice President
Bridget E. Sudall
Anti-Money Laundering Compliance Officer
Privacy Officer
Investment Adviser
SEI Investments Management Corporation
Administrator
SEI Investments Global Funds Services
Distributor
SEI Investments Distribution Co.
Legal Counsel
Morgan, Lewis & Bockius LLP
Independent Registered Public Accounting Firm
KPMG LLP
This report and the financial statements contained herein are submitted for the general information of the shareholders of the Trust and must be preceded or accompanied by a current prospectus. Shares of the Funds are not deposits or obligations of, or guaranteed or endorsed by, any bank. The shares are not federally insured by the Federal Deposit Insurance Corporation (FDIC), the Federal Reserve Board, or any other government agency. Investment in the shares involves risk, including the possible loss of principal.
For more information call
1 800 DIAL SEI
(1 800 342 5734)

1 Freedom Valley Drive, P.O. Box 1100, Oaks, PA 19456
AMT (7/19)
| Item 2. | Code of Ethics. |
The Registrant has adopted a code of ethics that applies to the Registrant’s principal executive officer, principal financial officer, principal accounting officer or controller, or persons performing similar functions.
| Item 3. | Audit Committee Financial Expert. |
(a)(1) The Registrant’s Board of Trustees has determined that the Registrant has three audit committee financial experts serving on its audit committee.
(a) (2) The audit committee financial experts are Susan C. Cote, George J. Sullivan, Jr. and Hubert L. Harris Jr. Ms. Cote and Messrs. Sullivan and Harris are independent as defined in FormN-CSR Item 3 (a) (2).
| Item 4. | Principal Accountant Fees and Services. |
Fees billed by KPMG LLP (“KPMG”) related to the Registrant.
KPMG billed the Registrant aggregate fees for services rendered to the Registrant for the fiscal years 2019 and 2018 as follows:
| Fiscal Year 2019 | Fiscal Year 2018 | |||||||||||||||||||||||||
| All fees and services to the Registrant that were pre- approved | All fees and services to service affiliates that were pre- approved | All other fees and services to service affiliates that did not require pre- approval | All fees and services to the Registrant that were pre- approved | All fees and services to service affiliates that were pre- approved | All other fees and services to service affiliates that did not require pre- approval | |||||||||||||||||||||
(a) | Audit Fees(1) | $ | 80,790 | $ | 0 | N/A | $ | 79,890 | $ | 0 | N/A | |||||||||||||||
(b) | Audit-Related Fees | $ | 0 | $ | 0 | $ | 0 | $ | 0 | $ | 0 | $ | 0 | |||||||||||||
(c) | Tax Fees | $ | 0 | $ | 0 | $ | 0 | $ | 0 | $ | 0 | $ | 0 | |||||||||||||
(d) | All Other Fees(2) | $ | 0 | $ | 273,762 | $ | 0 | $ | 0 | $ | 425,536 | $ | 0 | |||||||||||||
Notes:
| (1) | Audit fees include amounts related to the audit of the Registrant’s annual financial statements and services normally provided by the accountant in connection with statutory and regulatory filings. |
| (2) | See Item 4 (g) for a description of the services comprising the fees disclosed under this category. |
(e)(1) The Registrant’s Audit Committee has adopted and the Board of Trustees has ratified an Audit andNon-Audit ServicesPre-Approval Policy (the “Policy”), which sets forth the procedures and the conditions pursuant to which services proposed to be performed by the independent auditor of the Registrant may bepre-approved. In any instance where services requirepre-approval, the Audit Committee will consider whether such services are consistent with SEC rules on auditor independence and whether the provision of such services would compromise the auditor’s independence.
The Policy provides that all requests or applications for proposed services to be provided by the independent auditor must be submitted to the Registrant’s Chief Financial Officer (“CFO”) and must include a detailed description of the services proposed to be rendered. The CFO will determine whether such services: (1) require specificpre-approval; (2) are included within the list of services that have received the generalpre-approval of the Audit Committee pursuant to the Policy; or (3) have been previouslypre-approved in connection with the independent auditor’s annual engagement letter for the applicable year or otherwise.
Requests or applications to provide services that require specificpre-approval by the Audit Committee will be submitted to the Audit Committee by the CFO. The Audit Committee has delegated specificpre-approval authority to either the Audit Committee Chair or financial experts, provided that the estimated fee for any such proposedpre-approved service does not exceed $100,000 and anypre-approval decisions are reported to the Audit Committee at its next regularly scheduled meeting.
Services that have received the generalpre-approval of the Audit Committee are identified and described in the Policy. In addition, the Policy sets forth a maximum fee per engagement with respect to each identified service that has received generalpre-approval. The Audit Committee will annually review andpre-approve the services that may be provided by the independent auditor during the following twelve months without obtaining specificpre-approval from the Audit Committee.
The Audit Committee will be informed by the CFO on a quarterly basis of all services rendered by the independent auditor.
All services to be provided by the independent auditor shall be provided pursuant to a signed written engagement letter with the Registrant, the investment advisor or applicable control affiliate (except that matters as to which an engagement letter would be impractical because of timing issues or because the matter is small may not be the subject of an engagement letter) that sets forth both the services to be provided by the independent auditor and the total fees (or the manner of their determination) to be paid to the independent auditor for those services.
In addition, the Audit Committee has determined to take additional measures on an annual basis to meet its responsibility to oversee the work of the independent auditor and to assure the auditor’s independence from the Registrant, such as reviewing a formal written statement from the independent auditor delineating all relationships between the independent auditor and the Registrant, and discussing with the independent auditor its methods and procedures for ensuring independence.
(e)(2) Percentage of fees billed applicable tonon-audit services pursuant to waiver ofpre-approval requirement were as follows:
| Fiscal Year 2019 | Fiscal Year 2018 | |||||||
Audit-Related Fees | 0 | % | 0 | % | ||||
Tax Fees | 0 | % | 0 | % | ||||
All Other Fees | 0 | % | 0 | % | ||||
(f) Not Applicable.
(g) The aggregatenon-audit fees billed by KPMG for the fiscal years 2019 and 2018 were $273,762 and $425,536, respectively.Non-audit fees consist of a review of fund accounting and administration operations and an attestation report in accordance with Rule17Ad-13.
(h) During the past fiscal year, Registrant’s principal accountant provided certainnon-audit services to Registrant’s investment adviser or to entities controlling, controlled by, or under common control with Registrant’s investment adviser that provide ongoing services to Registrant that were not subject topre-approval pursuant to paragraph (c)(7)(ii) of Rule2-01 of RegulationS-X. The Audit Committee of Registrant’s Board of Trustees reviewed and considered thesenon-audit services provided by Registrant’s principal accountant to Registrant’s affiliates, including whether the provision of thesenon-audit services is compatible with maintaining the principal accountant’s independence.
| Item 5. | Audit Committee of Listed Registrants. |
Not applicable.
| Item 6. | Investments |
(a) The Schedule of Investments in securities of unaffiliated issuers as of the close of the reporting period for the Tactical Offensive Equity Fund is listed below. The Schedule of Investments in securities of unaffiliated issuers as of the close of the reporting period for the Tactical Offensive Fixed Income Fund is included as part of the report to shareholders filed under Item 1 of this form.
SCHEDULE OF INVESTMENTS
July 31, 2019
Tactical Offensive Equity Fund(Continued)
| Description | Shares | Market Value ($ Thousands) | ||||||
COMMON STOCK — 97.2% | ||||||||
Argentina — 0.0% |
| |||||||
Banco BBVA Argentina ADR | 2,400 | $ | 28 | |||||
Banco Macro ADR | 2,300 | 159 | ||||||
Grupo Financiero Galicia ADR | 5,000 | 184 | ||||||
Pampa Energia ADR* | 2,000 | 66 | ||||||
Telecom Argentina ADR | 2,800 | 47 | ||||||
Transportadora de Gas del Sur ADR | 2,600 | 41 | ||||||
YPF ADR | 8,700 | 143 | ||||||
|
| |||||||
| 668 | ||||||||
|
| |||||||
Australia — 1.4% | ||||||||
AGL Energy | 23,538 | 340 | ||||||
Alumina Ltd | 88,649 | 143 | ||||||
AMP Ltd | 106,355 | 131 | ||||||
APA Group | 42,338 | 322 | ||||||
Aristocrat Leisure Ltd | 20,584 | 435 | ||||||
ASX Ltd | 6,939 | 425 | ||||||
Aurizon Holdings Ltd | 71,554 | 284 | ||||||
AusNet Services | 66,886 | 82 | ||||||
Australia & New Zealand Banking Group Ltd | 101,886 | 1,960 | ||||||
Bank of Queensland Ltd | 14,684 | 94 | ||||||
Bendigo & Adelaide Bank | 14,323 | 113 | ||||||
BHP Group | 105,013 | 2,950 | ||||||
BlueScope Steel Ltd | 19,305 | 174 | ||||||
Boral Ltd | 42,426 | 151 | ||||||
Brambles Ltd | 57,042 | 516 | ||||||
Caltex Australia Ltd | 9,027 | 168 | ||||||
Challenger Ltd | 20,149 | 98 | ||||||
CIMIC Group Ltd | 2,891 | 73 | ||||||
Coca-Cola Amatil Ltd | 14,995 | 110 | ||||||
Cochlear Ltd | 2,073 | 315 | ||||||
Coles Group Ltd* | 40,645 | 398 | ||||||
Commonwealth Bank of Australia | 63,096 | 3,579 | ||||||
Computershare Ltd | 17,617 | 192 | ||||||
Crown Resorts Ltd | 11,045 | 90 | ||||||
CSL | 16,151 | 2,556 | ||||||
Dexus‡ | 39,143 | 354 | ||||||
Domino’s Pizza Enterprises Ltd | 1,466 | 39 | ||||||
Flight Centre Travel Group Ltd | 1,386 | 44 | ||||||
Fortescue Metals Group Ltd | 49,759 | 286 | ||||||
Goodman Group‡ | 58,387 | 596 | ||||||
GPT Group‡ | 64,852 | 278 | ||||||
Harvey Norman Holdings Ltd | 14,691 | 44 | ||||||
Incitec Pivot Ltd | 47,783 | 115 | ||||||
Insurance Australia Group | 82,760 | 492 | ||||||
James Hardie Industries PLC | 15,944 | 219 | ||||||
Lendlease Group | 20,359 | 204 | ||||||
Macquarie Group Ltd | 11,546 | 1,025 | ||||||
Medibank Pvt Ltd | 99,142 | 247 | ||||||
Mirvac Group‡ | 140,280 | 311 | ||||||
National Australia Bank Ltd | 100,611 | 1,977 | ||||||
Newcrest Mining Ltd | 27,481 | 674 | ||||||
| Description | Shares | Market Value ($ Thousands) | ||||||
COMMON STOCK (continued) | ||||||||
Oil Search Ltd | 49,342 | $ | 242 | |||||
Orica | 13,706 | 206 | ||||||
Origin Energy Ltd | 63,176 | 346 | ||||||
QBE Insurance Group Ltd | 47,621 | 410 | ||||||
Ramsay Health Care | 5,088 | 255 | ||||||
REA Group | 1,557 | 105 | ||||||
Rio Tinto Ltd | 13,256 | 904 | ||||||
Santos Ltd | 63,571 | 317 | ||||||
Scentre Group‡ | 190,321 | 523 | ||||||
SEEK Ltd | 12,047 | 174 | ||||||
Sonic Healthcare | 16,161 | 312 | ||||||
South32 | 181,035 | 392 | ||||||
Stockland‡ | 86,485 | 272 | ||||||
Suncorp Group Ltd | 46,515 | 433 | ||||||
Sydney Airport | 39,844 | 230 | ||||||
Tabcorp Holdings | 72,561 | 225 | ||||||
Telstra Corp Ltd | 149,198 | 408 | ||||||
TPG Telecom Ltd | 9,104 | 44 | ||||||
Transurban Group | 95,529 | 1,024 | ||||||
Treasury Wine Estates Ltd | 25,831 | 315 | ||||||
Vicinity Centres‡ | 117,385 | 211 | ||||||
Washington H Soul Pattinson & Co Ltd | 2,651 | 42 | ||||||
Wesfarmers Ltd | 40,484 | 1,094 | ||||||
Westpac Banking | 122,922 | 2,427 | ||||||
Woodside Petroleum Ltd | 33,444 | 800 | ||||||
Woolworths Group Ltd | 44,941 | 1,103 | ||||||
WorleyParsons Ltd | 9,575 | 107 | ||||||
|
| |||||||
| 35,525 | ||||||||
|
| |||||||
Austria — 0.1% | ||||||||
ANDRITZ AG | 2,662 | 96 | ||||||
Erste Group Bank AG | 10,783 | 390 | ||||||
OMV | 5,298 | 267 | ||||||
Raiffeisen Bank International AG | 5,379 | 127 | ||||||
Verbund AG | 2,472 | 139 | ||||||
voestalpine AG | 4,220 | 113 | ||||||
|
| |||||||
| 1,132 | ||||||||
|
| |||||||
Belgium — 0.2% | ||||||||
Ageas | 6,558 | 355 | ||||||
Anheuser-Busch InBev SA/NV | 27,168 | 2,755 | ||||||
Colruyt SA | 1,632 | 86 | ||||||
Groupe Bruxelles Lambert SA | 2,899 | 276 | ||||||
KBC Group NV | 8,931 | 580 | ||||||
Proximus SADP | 5,502 | 158 | ||||||
Solvay SA | 2,664 | 275 | ||||||
Telenet Group Holding | 1,721 | 85 | ||||||
UCB SA | 4,534 | 357 | ||||||
Umicore SA | 7,100 | 225 | ||||||
|
| |||||||
| 5,152 | ||||||||
|
| |||||||
Bermuda — 0.0% | ||||||||
Bank of NT Butterfield & Son | 1,858 | 60 | ||||||
|
| |||||||
| Adviser Managed Trust / Annual Report / July 31, 2019 | 1 |
SCHEDULE OF INVESTMENTS
July 31, 2019
Tactical Offensive Equity Fund(Continued)
| Description | Shares | Market Value ($ Thousands) | ||||||
COMMON STOCK (continued) | ||||||||
Brazil — 0.5% | ||||||||
Ambev SA | 215,800 | $ | 1,159 | |||||
Atacadao | 13,700 | 84 | ||||||
B2W Cia Digital* | 9,700 | 97 | ||||||
B3 SA - Brasil Bolsa Balcao | 94,400 | 1,061 | ||||||
Banco Bradesco SA | 56,080 | 466 | ||||||
Banco BTG Pactual | 10,900 | 174 | ||||||
Banco do Brasil SA | 39,800 | 522 | ||||||
Banco Santander Brasil | 19,700 | 227 | ||||||
BB Seguridade Participacoes SA | 33,100 | 286 | ||||||
BR Malls Participacoes SA | 38,900 | 156 | ||||||
BRF SA* | 27,400 | 242 | ||||||
CCR SA | 58,200 | 232 | ||||||
Centrais Eletricas Brasileiras SA | 7,300 | 76 | ||||||
Cia de Saneamento Basico do Estado de Sao Paulo | 16,400 | 232 | ||||||
Cia Siderurgica Nacional SA | 21,600 | 95 | ||||||
Cielo | 42,300 | 81 | ||||||
Cosan SA | 5,600 | 76 | ||||||
Embraer | 34,400 | 176 | ||||||
Energisa | 5,900 | 78 | ||||||
Engie Brasil Energia SA | 7,100 | 91 | ||||||
Equatorial Energia SA | 8,300 | 209 | ||||||
Hypera SA | 18,800 | 152 | ||||||
IRB Brasil Resseguros S/A | 6,800 | 169 | ||||||
JBS SA | 51,600 | 342 | ||||||
Klabin SA | 34,700 | 148 | ||||||
Kroton Educacional SA | 71,400 | 236 | ||||||
Localiza Rent a Car SA | 27,300 | 318 | ||||||
Lojas Renner SA | 36,810 | 462 | ||||||
M Dias Branco SA | 2,300 | 24 | ||||||
Magazine Luiza SA | 3,700 | 259 | ||||||
Multiplan Empreendimentos Imobiliarios SA | 9,800 | 74 | ||||||
Natura Cosmeticos SA | 9,600 | 156 | ||||||
Notre Dame Intermedica Participacoes | 16,700 | 192 | ||||||
Petrobras Distribuidora | 16,000 | 112 | ||||||
Petroleo Brasileiro SA | 136,100 | 1,041 | ||||||
Porto Seguro SA | 5,300 | 73 | ||||||
Raia Drogasil SA | 11,100 | 243 | ||||||
Rumo SA* | 51,700 | 299 | ||||||
Sul America SA | 8,100 | 90 | ||||||
Suzano SA | 26,100 | 212 | ||||||
TIM Participacoes SA | 29,300 | 95 | ||||||
Ultrapar Participacoes SA | 35,000 | 185 | ||||||
Vale SA | 144,200 | 1,903 | ||||||
WEG SA | 40,200 | 255 | ||||||
|
| |||||||
| 12,860 | ||||||||
|
| |||||||
Canada — 0.6% | ||||||||
58.com Inc ADR* | 4,400 | 248 | ||||||
Alibaba Group Holding ADR* | 64,400 | 11,148 | ||||||
Atlantic Power* | 10,505 | 25 | ||||||
| Description | Shares | Market Value ($ Thousands) | ||||||
COMMON STOCK (continued) | ||||||||
Ctrip.com International ADR* | 18,800 | $ | 733 | |||||
IMAX Corp* | 6,763 | 149 | ||||||
JD.com Inc ADR* | 33,600 | 1,005 | ||||||
Masonite International* | 3,294 | 176 | ||||||
MDC Partners Inc, Cl A* | 8,179 | 20 | ||||||
Momo Inc ADR | 6,900 | 234 | ||||||
TAL Education Group ADR* | 16,400 | 528 | ||||||
Teekay Corp | 9,109 | 42 | ||||||
Weibo Corp ADR* | 1,900 | 74 | ||||||
|
| |||||||
| 14,382 | ||||||||
|
| |||||||
Chile — 0.1% | ||||||||
Aguas Andinas SA, Cl A | 90,490 | 51 | ||||||
Banco de Chile | 1,455,958 | 210 | ||||||
Banco de Credito e Inversiones SA | 2,429 | 154 | ||||||
Banco Santander Chile | 3,150,026 | 229 | ||||||
Cencosud SA | 71,007 | 141 | ||||||
Cia Cervecerias Unidas | 5,115 | 72 | ||||||
Colbun SA | 273,076 | 51 | ||||||
Empresa Nacional de Telecomunicaciones SA* | 5,226 | 48 | ||||||
Empresas CMPC SA | 55,524 | 131 | ||||||
Empresas COPEC | 18,820 | 173 | ||||||
Enel Americas SA | 1,819,695 | 302 | ||||||
Enel Chile | 970,790 | 88 | ||||||
Itau CorpBanca | 3,821,596 | 30 | ||||||
Latam Airlines Group | 15,041 | 144 | ||||||
SACI Falabella | 36,018 | 223 | ||||||
|
| |||||||
| 2,047 | ||||||||
|
| |||||||
China — 1.6% | ||||||||
51job Inc ADR* | 900 | 70 | ||||||
AAC Technologies Holdings | 35,000 | 191 | ||||||
Agricultural Bank of China Ltd, Cl H | 1,350,000 | 550 | ||||||
Air China, Cl H | 74,000 | 73 | ||||||
Aluminum Corp of China Ltd, Cl H* | 174,000 | 58 | ||||||
ANTA Sports Products Ltd | 50,000 | 376 | ||||||
Autohome Inc ADR* | 2,800 | 238 | ||||||
AviChina Industry & Technology Co Ltd, Cl H | 107,000 | 58 | ||||||
Baidu Inc ADR* | 12,600 | 1,407 | ||||||
Bank of China Ltd, Cl H | 3,621,000 | 1,480 | ||||||
Baozun Inc ADR* | 2,300 | 114 | ||||||
BBMG Corp, Cl H | 139,000 | 41 | ||||||
BeiGene Ltd ADR* | 1,300 | 179 | ||||||
Beijing Capital International Airport Co Ltd, Cl H | 72,000 | 57 | ||||||
CGN Power Co Ltd, Cl H (A) | 523,000 | 152 | ||||||
China Cinda Asset Management Co Ltd, Cl H | 732,000 | 161 | ||||||
China CITIC Bank Corp Ltd, Cl H | 425,000 | 237 | ||||||
China Coal Energy Co Ltd, Cl H | 83,000 | 32 | ||||||
China Communications Construction Co Ltd, Cl H | 267,000 | 226 | ||||||
| 2 | Adviser Managed Trust / Annual Report / July 31, 2019 |
SCHEDULE OF INVESTMENTS
July 31, 2019
Tactical Offensive Equity Fund(Continued)
| Description | Shares | Market Value ($ Thousands) | ||||||
COMMON STOCK (continued) |
| |||||||
China Communications Services Corp Ltd, Cl H | 82,000 | $ | 58 | |||||
China Construction Bank Corp, Cl H | 4,362,000 | 3,382 | ||||||
China Everbright Bank Co Ltd, Cl H | 128,000 | 58 | ||||||
China Galaxy Securities, Cl H | 210,000 | 113 | ||||||
China Longyuan Power Group Corp Ltd, Cl H | 110,000 | 68 | ||||||
China Lumena New Materials Corp* (D) | 1,226,772 | – | ||||||
China Merchants Bank Co Ltd, Cl H | 189,000 | 948 | ||||||
China National Building Material Co Ltd, Cl H | 190,000 | 169 | ||||||
China Oilfield Services, Cl H | 68,000 | 77 | ||||||
China Pacific Insurance Group Co Ltd, Cl H | 135,400 | 583 | ||||||
China Petroleum & Chemical Corp, Cl H | 1,172,000 | 758 | ||||||
China Railway Construction, Cl H | 108,000 | 126 | ||||||
China Railway Group Ltd, Cl H | 186,000 | 131 | ||||||
China Telecom Corp Ltd, Cl H | 652,000 | 293 | ||||||
China Vanke Co Ltd, Cl H | 71,000 | 269 | ||||||
China Zhongwang Holdings Ltd | 189,200 | 97 | ||||||
Chongqing Rural Commercial Bank Co Ltd, Cl H | 86,000 | 45 | ||||||
CITIC Securities Co Ltd, Cl H | 124,500 | 241 | ||||||
COSCO SHIPPING Holdings Co Ltd, Cl H* | 88,000 | 33 | ||||||
Country Garden Holdings | 351,000 | 479 | ||||||
CRRC Corp Ltd | 212,000 | 168 | ||||||
Datang International Power Generation Co Ltd, Cl H | 370,000 | 84 | ||||||
ENN Energy Holdings Ltd | 36,900 | 383 | ||||||
Fosun International Ltd | 125,500 | 166 | ||||||
GDS Holdings ADR* | 2,000 | 82 | ||||||
Great Wall Motor Co Ltd, Cl H | 107,500 | 74 | ||||||
Guangzhou R&F Properties Co Ltd | 35,200 | 64 | ||||||
Huadian Power International Corp Ltd, Cl H | 190,000 | 80 | ||||||
Huaneng Power International Inc, Cl H | 214,000 | 125 | ||||||
Huazhu Group Ltd ADR | 6,300 | 206 | ||||||
Industrial & Commercial Bank of China Ltd, Cl H | 3,025,000 | 2,048 | ||||||
Inner Mongolia Yitai Coal Co Ltd, Cl B | 631,300 | 640 | ||||||
iQIYI Inc ADR* | 4,300 | 80 | ||||||
Jiangsu Expressway Co Ltd, Cl H | 42,000 | 57 | ||||||
Jiangxi Copper Co Ltd, Cl H | 76,000 | 95 | ||||||
Kingsoft Corp Ltd | 32,000 | 70 | ||||||
NetEase Inc ADR | 3,200 | 739 | ||||||
New Oriental Education & Technology Group Inc ADR* | 6,600 | 688 | ||||||
NIO ADR* | 22,700 | 79 | ||||||
Noah Holdings Ltd ADR* | 1,000 | 32 | ||||||
PetroChina Co Ltd, Cl H | 976,000 | 519 | ||||||
PICC Property & Casualty Co Ltd, Cl H | 324,000 | 388 | ||||||
Pinduoduo Inc ADR* | 9,200 | 205 | ||||||
Ping An Insurance Group Co of China Ltd, Cl H | 270,500 | 3,227 | ||||||
| Description | Shares | Market Value ($ Thousands) | ||||||
COMMON STOCK (continued) | ||||||||
Shandong Weigao Group Medical Polymer Co Ltd, Cl H | 72,000 | $ | 69 | |||||
Shanghai Electric Group Co Ltd, Cl H | 216,000 | 75 | ||||||
Shanghai Fosun Pharmaceutical Group Co Ltd, Cl H | 20,500 | 61 | ||||||
Shanghai Lujiazui Finance & Trade Zone Development Co Ltd, Cl B | 571,300 | 673 | ||||||
Shanghai Pharmaceuticals Holding Co Ltd, Cl H | 31,400 | 61 | ||||||
Shenzhou International Group Holdings Ltd | 34,900 | 485 | ||||||
Shimao Property Holdings Ltd | 56,000 | 156 | ||||||
Sihuan Pharmaceutical Holdings Group Ltd | 396,000 | 82 | ||||||
SINA Corp/China* | 3,200 | 125 | ||||||
Sino-Ocean Group Holding Ltd | 134,000 | 54 | ||||||
Sinopec Engineering Group Co Ltd, Cl H | 58,500 | 46 | ||||||
Sinopec Shanghai Petrochemical Co Ltd, Cl H | 256,000 | 90 | ||||||
Sinopharm Group Co Ltd, Cl H | 57,200 | 213 | ||||||
Sinotrans Ltd, Cl H | 223,000 | 77 | ||||||
SOHO China Ltd | 103,500 | 33 | ||||||
Sun Art Retail Group Ltd | 138,000 | 140 | ||||||
Tencent Holdings | 258,500 | 12,159 | ||||||
Tencent Music Entertainment Group ADR* | 4,000 | 57 | ||||||
Tingyi Cayman Islands Holding Corp | 96,000 | 144 | ||||||
TravelSky Technology Ltd, Cl H | 32,000 | 63 | ||||||
Tsingtao Brewery Co Ltd, Cl H | 22,000 | 130 | ||||||
Uni-President China Holdings | 55,000 | 65 | ||||||
Vipshop Holdings Ltd ADR* | 21,200 | 161 | ||||||
Want Want China Holdings Ltd | 241,000 | 189 | ||||||
Weichai Power Co Ltd, Cl H | 95,000 | 148 | ||||||
Yanzhou Coal Mining Co Ltd, Cl H | 64,000 | 57 | ||||||
YY Inc ADR* | 2,400 | 154 | ||||||
Zhuzhou CRRC Times Electric, Cl H | 27,000 | 130 | ||||||
Zijin Mining Group Co Ltd, Cl H | 332,000 | 134 | ||||||
ZTE Corp, Cl H | 48,200 | 146 | ||||||
ZTO Express Cayman Inc ADR | 15,100 | 297 | ||||||
|
| |||||||
| 40,401 | ||||||||
|
| |||||||
Colombia — 0.0% | ||||||||
Bancolombia SA | 11,402 | 136 | ||||||
Cementos Argos SA | 13,055 | 30 | ||||||
Ecopetrol | 236,678 | 212 | ||||||
Grupo Argos SA/Colombia | 7,784 | 41 | ||||||
Grupo de Inversiones Suramericana SA | 11,773 | 123 | ||||||
Interconexion Electrica SA ESP | 22,145 | 120 | ||||||
|
| |||||||
| 662 | ||||||||
|
| |||||||
Czech Republic — 0.0% | ||||||||
Central European Media Enterprises Ltd, Cl A* | 11,668 | 55 | ||||||
CEZ AS | 7,811 | 176 | ||||||
Komercni banka as | 3,749 | 146 | ||||||
| Adviser Managed Trust / Annual Report / July 31, 2019 | 3 |
SCHEDULE OF INVESTMENTS
July 31, 2019
Tactical Offensive Equity Fund(Continued)
| Description | Shares | Market Value ($ Thousands) | ||||||
COMMON STOCK (continued) | ||||||||
Moneta Money Bank AS (A) | 17,683 | $ | 61 | |||||
|
| |||||||
| 438 | ||||||||
|
| |||||||
Denmark — 0.3% | ||||||||
AP Moller - Maersk A/S, Cl A | 136 | 147 | ||||||
AP Moller - Maersk A/S, Cl B | 235 | 266 | ||||||
Carlsberg A/S, Cl B | 3,829 | 526 | ||||||
Chr Hansen Holding A/S | 3,779 | 333 | ||||||
Coloplast A/S, Cl B | 4,253 | 500 | ||||||
Danske Bank A/S | 24,089 | 360 | ||||||
Demant A/S* | 3,300 | 98 | ||||||
DSV A/S | 6,387 | 614 | ||||||
Genmab A/S* | 2,204 | 411 | ||||||
H Lundbeck A/S | 2,545 | 99 | ||||||
ISS | 5,703 | 161 | ||||||
Novo Nordisk A/S, Cl B | 61,357 | 2,964 | ||||||
Novozymes A/S, Cl B | 7,850 | 367 | ||||||
Orsted A/S (A) | 6,767 | 622 | ||||||
Pandora A/S | 3,795 | 147 | ||||||
Tryg A/S | 3,525 | 108 | ||||||
Vestas Wind Systems A/S | 6,989 | 578 | ||||||
|
| |||||||
| 8,301 | ||||||||
|
| |||||||
Finland — 0.2% | ||||||||
Elisa OYJ | 5,118 | 242 | ||||||
Fortum OYJ | 15,934 | 369 | ||||||
Kone, Cl B | 12,114 | 696 | ||||||
Metso OYJ | 3,814 | 148 | ||||||
Neste Oyj | 15,144 | 506 | ||||||
Nokia OYJ | 201,233 | 1,093 | ||||||
Nokian Renkaat | 3,641 | 105 | ||||||
Orion Oyj, Cl B | 3,778 | 130 | ||||||
Sampo Oyj, Cl A | 15,843 | 665 | ||||||
Stora Enso OYJ, Cl R | 20,945 | 243 | ||||||
UPM-Kymmene OYJ | 19,103 | 520 | ||||||
Wartsila OYJ Abp | 15,972 | 203 | ||||||
|
| |||||||
| 4,920 | ||||||||
|
| |||||||
France — 2.0% | ||||||||
Accor SA | 6,603 | 296 | ||||||
Aeroports de Paris | 1,071 | 186 | ||||||
Air Liquide | 15,314 | 2,131 | ||||||
Alstom SA | 5,624 | 244 | ||||||
Amundi SA (A) | 2,191 | 152 | ||||||
Arkema SA | 2,479 | 226 | ||||||
Atos SE | 3,457 | 281 | ||||||
AXA SA | 69,191 | 1,764 | ||||||
BioMerieux | 1,223 | 104 | ||||||
BNP Paribas SA | 40,116 | 1,884 | ||||||
Bollore SA | 25,840 | 112 | ||||||
Bouygues SA | 8,007 | 289 | ||||||
Bureau Veritas | 10,334 | 260 | ||||||
Capgemini SE | 5,682 | 729 | ||||||
Carrefour SA | 21,706 | 421 | ||||||
| Description | Shares | Market Value ($ Thousands) | ||||||
COMMON STOCK (continued) | ||||||||
Casino Guichard Perrachon SA | 2,021 | $ | 75 | |||||
Cie de Saint-Gobain | 17,585 | 680 | ||||||
Cie Generale des Etablissements Michelin SCA | 6,105 | 683 | ||||||
CNP Assurances | 5,012 | 104 | ||||||
Covivio‡ | 1,647 | 169 | ||||||
Credit Agricole SA | 41,043 | 493 | ||||||
Danone SA | 21,990 | 1,920 | ||||||
Dassault Aviation SA | 74 | 102 | ||||||
Dassault Systemes SE | 4,673 | 718 | ||||||
Edenred | 8,586 | 434 | ||||||
Eiffage SA | 2,817 | 280 | ||||||
Electricite de France SA | 21,626 | 270 | ||||||
Engie SA | 65,218 | 1,011 | ||||||
EssilorLuxottica SA | 10,053 | 1,373 | ||||||
Eurazeo SE | 1,445 | 98 | ||||||
Eurofins Scientific | 414 | 178 | ||||||
Eutelsat Communications SA | 5,199 | 100 | ||||||
Faurecia SA | 2,259 | 108 | ||||||
Gecina SA‡ | 1,646 | 254 | ||||||
Getlink SE | 15,825 | 230 | ||||||
Hermes International | 1,132 | 802 | ||||||
ICADE‡ | 1,006 | 88 | ||||||
Iliad SA | 790 | 83 | ||||||
Imerys SA | 862 | 36 | ||||||
Ingenico Group SA | 2,192 | 210 | ||||||
Ipsen | 1,362 | 157 | ||||||
JCDecaux SA | 2,301 | 67 | ||||||
Kering | 2,703 | 1,413 | ||||||
Klepierre SA‡ | 7,350 | 228 | ||||||
Legrand | 9,538 | 678 | ||||||
L’Oreal SA | 8,990 | 2,422 | ||||||
LVMH Moet Hennessy Louis Vuitton | 9,899 | 4,136 | ||||||
Natixis SA | 34,218 | 139 | ||||||
Orange SA | 71,216 | 1,065 | ||||||
Pernod Ricard SA | 7,577 | 1,342 | ||||||
Peugeot SA | 21,051 | 501 | ||||||
Publicis Groupe | 7,930 | 395 | ||||||
Remy Cointreau SA | 684 | 102 | ||||||
Renault SA | 6,887 | 388 | ||||||
Safran SA | 11,674 | 1,688 | ||||||
Sanofi | 40,015 | 3,362 | ||||||
Sartorius Stedim Biotech | 1,001 | 161 | ||||||
Schneider Electric SE | 19,619 | 1,706 | ||||||
SCOR SE | 5,863 | 243 | ||||||
SEB SA | 658 | 106 | ||||||
Societe BIC | 934 | 65 | ||||||
Societe Generale SA | 27,437 | 678 | ||||||
Sodexo SA | 3,172 | 366 | ||||||
STMicroelectronics | 24,472 | 455 | ||||||
Suez | 12,346 | 183 | ||||||
Teleperformance | 2,070 | 437 | ||||||
| 4 | Adviser Managed Trust / Annual Report / July 31, 2019 |
SCHEDULE OF INVESTMENTS
July 31, 2019
Tactical Offensive Equity Fund(Continued)
| Description | Shares | Market Value ($ Thousands) | ||||||
COMMON STOCK (continued) | ||||||||
Thales SA | 3,816 | $ | 434 | |||||
TOTAL SA | 84,732 | 4,437 | ||||||
Ubisoft Entertainment SA* | 3,009 | 250 | ||||||
Valeo | 8,641 | 273 | ||||||
Veolia Environnement SA | 19,240 | 489 | ||||||
Vinci SA | 18,135 | 1,883 | ||||||
Vivendi SA | 32,657 | 916 | ||||||
Wendel SA | 814 | 113 | ||||||
Worldline*(A) | 2,962 | 214 | ||||||
|
| |||||||
| 51,070 | ||||||||
|
| |||||||
Germany — 1.6% | ||||||||
1&1 Drillisch AG | 1,263 | 38 | ||||||
adidas AG | 6,433 | 2,074 | ||||||
Affimed* | 8,361 | 25 | ||||||
Allianz | 15,129 | 3,544 | ||||||
Aroundtown SA | 29,291 | 236 | ||||||
Axel Springer SE | 1,473 | 102 | ||||||
BASF | 32,750 | 2,207 | ||||||
Bayer | 33,256 | 2,175 | ||||||
Bayerische Motoren Werke | 11,827 | 880 | ||||||
Beiersdorf AG | 3,611 | 422 | ||||||
Brenntag AG | 5,554 | 275 | ||||||
Carl Zeiss Meditec | 1,458 | 161 | ||||||
Commerzbank AG | 36,029 | 247 | ||||||
Continental AG | 3,935 | 549 | ||||||
Covestro (A) | 6,242 | 286 | ||||||
Daimler AG | 32,434 | 1,694 | ||||||
Delivery Hero*(A) | 4,065 | 197 | ||||||
Deutsche Bank AG | 70,272 | 551 | ||||||
Deutsche Boerse AG | 6,785 | 954 | ||||||
Deutsche Lufthansa AG | 8,609 | 138 | ||||||
Deutsche Post | 35,312 | 1,160 | ||||||
Deutsche Telekom AG | 118,857 | 1,969 | ||||||
Deutsche Wohnen SE | 13,027 | 482 | ||||||
E.ON SE | 78,620 | 793 | ||||||
Evonik Industries AG | 6,727 | 194 | ||||||
Fraport AG Frankfurt Airport Services Worldwide | 1,229 | 104 | ||||||
Fresenius Medical Care AG & Co KGaA | 7,707 | 540 | ||||||
Fresenius SE & Co KGaA | 14,904 | 756 | ||||||
GEA Group AG | 5,552 | 140 | ||||||
Hannover Rueck SE | 2,163 | 341 | ||||||
HeidelbergCement AG | 5,331 | 390 | ||||||
Henkel AG & Co KGaA | 3,728 | 353 | ||||||
HOCHTIEF AG | 735 | 84 | ||||||
HUGO BOSS AG | 1,848 | 118 | ||||||
Infineon Technologies | 40,658 | 771 | ||||||
Innogy SE (A) | 5,000 | 242 | ||||||
KION Group | 1,925 | 104 | ||||||
Knorr-Bremse | 1,745 | 178 | ||||||
LANXESS AG | 3,143 | 189 | ||||||
Merck KGaA | 4,627 | 476 | ||||||
| Description | Shares | Market Value ($ Thousands) | ||||||
COMMON STOCK (continued) | ||||||||
METRO AG | 5,394 | $ | 84 | |||||
MTU Aero Engines AG | 1,863 | 470 | ||||||
Muenchener Rueckversicherungs-Gesellschaft in Muenchen | 5,336 | 1,294 | ||||||
Puma SE | 2,995 | 211 | ||||||
QIAGEN* | 8,283 | 318 | ||||||
RWE AG | 19,577 | 533 | ||||||
SAP SE | 35,024 | 4,357 | ||||||
Siemens | 27,269 | 3,005 | ||||||
Siemens Healthineers AG (A) | 5,401 | 227 | ||||||
Symrise, Cl A | 4,607 | 429 | ||||||
Telefonica Deutschland Holding AG | 32,668 | 83 | ||||||
thyssenkrupp AG | 14,593 | 190 | ||||||
TUI AG | 15,970 | 160 | ||||||
Uniper SE | 7,252 | 226 | ||||||
United Internet AG | 4,454 | 134 | ||||||
Volkswagen AG | 1,171 | 202 | ||||||
Vonovia SE | 17,580 | 866 | ||||||
Wirecard | 4,196 | 708 | ||||||
Zalando* | 3,059 | 142 | ||||||
|
| |||||||
| 39,778 | ||||||||
|
| |||||||
Greece — 0.0% | ||||||||
Alpha Bank AE* | 48,077 | 94 | ||||||
Costamare Inc | 6,600 | 40 | ||||||
Eurobank Ergasias* | 89,848 | 88 | ||||||
FF Group*(D) | 1,785 | 10 | ||||||
Hellenic Telecommunications Organization | 11,717 | 162 | ||||||
JUMBO SA | 6,450 | 127 | ||||||
Motor Oil Hellas Corinth Refineries SA | 2,073 | 52 | ||||||
National Bank of Greece SA* | 18,992 | 56 | ||||||
OPAP SA | 8,163 | 92 | ||||||
Titan Cement Co SA | 1,463 | 32 | ||||||
|
| |||||||
| 753 | ||||||||
|
| |||||||
Hong Kong — 1.6% | ||||||||
3SBio Inc*(A) | 73,500 | 126 | ||||||
Agile Group Holdings | 84,000 | 109 | ||||||
AIA Group Ltd | 430,400 | 4,448 | ||||||
Alibaba Health Information Technology Ltd* | 172,000 | 156 | ||||||
Alibaba Pictures Group Ltd* | 690,000 | 140 | ||||||
Angang Steel Co Ltd, Cl H | 96,200 | 37 | ||||||
Anhui Conch Cement Co Ltd, Cl H | 58,000 | 339 | ||||||
ASM Pacific Technology Ltd | 9,000 | 106 | ||||||
BAIC Motor Corp Ltd, Cl H (A) | 60,000 | 38 | ||||||
Bank of Communications Co Ltd, Cl H | 472,000 | 345 | ||||||
Bank of East Asia | 37,400 | 108 | ||||||
Beijing Enterprises Holdings Ltd | 27,500 | 135 | ||||||
Beijing Enterprises Water Group | 270,000 | 143 | ||||||
BOC Aviation Ltd (A) | 13,300 | 115 | ||||||
BOC Hong Kong Holdings Ltd | 132,500 | 509 | ||||||
Brilliance China Automotive Holdings | 148,000 | 163 | ||||||
| Adviser Managed Trust / Annual Report / July 31, 2019 | 5 |
SCHEDULE OF INVESTMENTS
July 31, 2019
Tactical Offensive Equity Fund(Continued)
| Description | Shares | Market Value ($ Thousands) | ||||||
COMMON STOCK (continued) | ||||||||
BYD Co Ltd, Cl H | 31,000 | $ | 195 | |||||
BYD Electronic International Co Ltd | 68,000 | 108 | ||||||
China Agri-Industries Holdings Ltd | 254,000 | 78 | ||||||
China Aoyuan Group | 42,000 | 57 | ||||||
China Conch Venture Holdings Ltd | 77,000 | 266 | ||||||
China Eastern Airlines Corp Ltd, Cl H | 118,000 | 66 | ||||||
China Education Group Holdings | 21,000 | 33 | ||||||
China Everbright International Ltd | 180,000 | 160 | ||||||
China Everbright Ltd | 90,000 | 120 | ||||||
China Evergrande Group | 89,000 | 238 | ||||||
China First Capital Group Ltd* | 112,000 | 34 | ||||||
China Gas Holdings Ltd | 83,600 | 349 | ||||||
China Hongqiao Group Ltd | 74,000 | 54 | ||||||
China Huarong Asset Management, Cl H (A) | 691,000 | 117 | ||||||
China Huishan Dairy Holdings Co Ltd* | 228,000 | 12 | ||||||
China International Capital Corp Ltd, Cl H (A) | 66,800 | 128 | ||||||
China Jinmao Holdings Group Ltd | 256,000 | 167 | ||||||
China Life Insurance, Cl H | 342,000 | 880 | ||||||
China Literature Ltd*(A) | 10,800 | 44 | ||||||
China Medical System Holdings Ltd | 58,000 | 56 | ||||||
China Mengniu Dairy Co Ltd | 127,000 | 516 | ||||||
China Merchants Port Holdings Co Ltd | 46,000 | 76 | ||||||
China Minsheng Banking Corp Ltd, Cl H | 336,500 | 233 | ||||||
China Mobile Ltd | 279,000 | 2,379 | ||||||
China Molybdenum Co Ltd, Cl H | 129,000 | 37 | ||||||
China Oriental Group Co Ltd | 124,000 | 56 | ||||||
China Overseas Land & Investment Ltd | 176,000 | 605 | ||||||
China Power International Development Ltd | 180,000 | 45 | ||||||
China Railway Signal & Communication Corp Ltd, Cl H (A) | 50,000 | 34 | ||||||
China Reinsurance Group, Cl H | 526,000 | 93 | ||||||
China Resources Beer Holdings Co Ltd | 68,000 | 321 | ||||||
China Resources Cement Holdings Ltd | 138,000 | 128 | ||||||
China Resources Gas Group | 42,000 | 214 | ||||||
China Resources Land Ltd | 128,000 | 552 | ||||||
China Resources Pharmaceutical Group Ltd (A) | 54,500 | 60 | ||||||
China Resources Power Holdings Co Ltd | 96,000 | 139 | ||||||
China Shenhua Energy Co Ltd, Cl H | 159,500 | 318 | ||||||
China Southern Airlines Co Ltd, Cl H | 62,000 | 40 | ||||||
China State Construction International Holdings Ltd | 118,000 | 122 | ||||||
China Taiping Insurance Holdings Co Ltd | 77,800 | 218 | ||||||
China Tower Corp Ltd, Cl H (A) | 1,948,000 | 508 | ||||||
China Traditional Chinese Medicine Holdings Co Ltd | 94,000 | 43 | ||||||
China Unicom Hong Kong | 288,000 | 282 | ||||||
CIFI Holdings Group Co Ltd | 125,979 | 81 | ||||||
CITIC Ltd | 307,000 | 408 | ||||||
CK Asset Holdings Ltd | 92,500 | 701 | ||||||
| Description | Shares | Market Value ($ Thousands) | ||||||
COMMON STOCK (continued) | ||||||||
CK Hutchison Holdings Ltd | 96,500 | $ | 908 | |||||
CK Infrastructure Holdings Ltd | 24,000 | 187 | ||||||
CLP Holdings | 58,500 | 637 | ||||||
CNOOC Ltd | 815,000 | 1,347 | ||||||
COSCO SHIPPING Energy Transportation Co Ltd, Cl H | 166,000 | 95 | ||||||
COSCO SHIPPING Ports Ltd | 63,314 | 55 | ||||||
Country Garden Services Holdings | 42,000 | 102 | ||||||
CSPC Pharmaceutical Group Ltd | 220,000 | 387 | ||||||
Dali Foods Group (A) | 102,000 | 64 | ||||||
Dongfeng Motor Group, Cl H | 156,000 | 140 | ||||||
Far East Horizon Ltd | 124,000 | 116 | ||||||
Fullshare Holdings Ltd | 385,000 | 14 | ||||||
Future Land Development Holdings Ltd | 62,000 | 53 | ||||||
Fuyao Glass Industry Group Co Ltd, Cl H (A) | 28,400 | 87 | ||||||
Galaxy Entertainment Group Ltd | 77,000 | 531 | ||||||
Geely Automobile Holdings Ltd | 231,000 | 358 | ||||||
Genscript Biotech Corp* | 32,000 | 79 | ||||||
GF Securities Co Ltd, Cl H | 92,600 | 105 | ||||||
GOME Retail Holdings Ltd* | 869,000 | 93 | ||||||
Greentown Service Group Co Ltd | 98,000 | 83 | ||||||
Guangdong Investment Ltd | 140,000 | 295 | ||||||
Guangzhou Automobile Group, Cl H | 146,000 | 150 | ||||||
Guotai Junan Securities Co Ltd, Cl H (A) | 52,800 | 86 | ||||||
Haier Electronics Group Co Ltd | 62,000 | 147 | ||||||
Haitian International Holdings Ltd | 27,000 | 55 | ||||||
Haitong Securities, Cl H | 188,400 | 189 | ||||||
Hanergy Thin Film Power Group Ltd*(D) | 444,000 | — | ||||||
Hang Lung Properties Ltd | 73,000 | 173 | ||||||
Hang Seng Bank Ltd | 27,300 | 652 | ||||||
Henderson Land Development Co Ltd | 52,600 | 274 | ||||||
Hengan International Group Co Ltd | 34,000 | 257 | ||||||
HengTen Networks Group Ltd* | 2,392,000 | 46 | ||||||
HK Electric Investments & HK Electric Investments Ltd | 80,500 | 82 | ||||||
HKT Trust & HKT Ltd | 136,000 | 218 | ||||||
Hong Kong & China Gas | 362,800 | 804 | ||||||
Hong Kong Exchanges & Clearing Ltd | 42,400 | 1,439 | ||||||
Hua Hong Semiconductor Ltd (A) | 20,000 | 42 | ||||||
Huaneng Renewables Corp Ltd, Cl H | 198,000 | 54 | ||||||
Huatai Securities Co Ltd, Cl H (A) | 81,200 | 133 | ||||||
Hutchison China MediTech Ltd ADR* | 2,700 | 56 | ||||||
Hysan Development Co Ltd | 19,000 | 91 | ||||||
Kaisa Group Holdings Ltd | 100,000 | 42 | ||||||
Kerry Properties Ltd | 20,000 | 76 | ||||||
Kingboard Holdings Ltd | 26,500 | 66 | ||||||
Kingboard Laminates Holdings Ltd | 43,000 | 36 | ||||||
Kingdee International Software Group Co Ltd | 115,000 | 111 | ||||||
Kunlun Energy Co Ltd | 160,000 | 140 | ||||||
KWG Group Holdings | 61,500 | 58 | ||||||
Lee & Man Paper Manufacturing Ltd | 124,000 | 76 | ||||||
| 6 | Adviser Managed Trust / Annual Report / July 31, 2019 |
SCHEDULE OF INVESTMENTS
July 31, 2019
Tactical Offensive Equity Fund(Continued)
| Description | Shares | Market Value ($ Thousands) | ||||||
COMMON STOCK (continued) | ||||||||
Legend Holdings Corp, Cl H (A) | 19,200 | $ | 45 | |||||
Lenovo Group Ltd | 342,000 | 278 | ||||||
Li Ning | 95,500 | 237 | ||||||
Link‡ | 75,500 | 882 | ||||||
Logan Property Holdings Co Ltd | 48,000 | 73 | ||||||
Longfor Group Holdings Ltd (A) | 84,000 | 313 | ||||||
Luye Pharma Group Ltd (A) | 46,500 | 36 | ||||||
Maanshan Iron & Steel Co Ltd, Cl H | 150,000 | 57 | ||||||
Meitu Inc*(A) | 92,500 | 27 | ||||||
Meituan Dianping, Cl B* | 46,700 | 382 | ||||||
Melco Resorts & Entertainment ADR | 6,700 | 151 | ||||||
Metallurgical Corp of China Ltd, Cl H | 277,000 | 68 | ||||||
MGM China Holdings Ltd | 22,800 | 38 | ||||||
MMG Ltd* | 104,000 | 33 | ||||||
MTR Corp Ltd | 55,000 | 362 | ||||||
New China Life Insurance Co Ltd, Cl H | 40,100 | 201 | ||||||
New World Development | 220,000 | 312 | ||||||
Nexteer Automotive Group Ltd | 38,000 | 40 | ||||||
Nine Dragons Paper Holdings Ltd | 70,000 | 57 | ||||||
NWS Holdings Ltd | 46,000 | 86 | ||||||
PCCW Ltd | 130,000 | 74 | ||||||
People’s Insurance Co Group of China Ltd/ The, Cl H | 406,000 | 172 | ||||||
Postal Savings Bank of China Co Ltd, Cl H (A) | 380,000 | 222 | ||||||
Power Assets Holdings | 49,500 | 355 | ||||||
Sands China Ltd | 86,800 | 422 | ||||||
Semiconductor Manufacturing International Corp* | 148,000 | 176 | ||||||
Shanghai Industrial Holdings Ltd | 45,000 | 93 | ||||||
Shangri-La Asia | 32,000 | 39 | ||||||
Shenzhen International Holdings Ltd | 34,669 | 64 | ||||||
Shenzhen Investment Ltd | 156,000 | 56 | ||||||
Shui On Land Ltd | 153,000 | 33 | ||||||
Sino Biopharmaceutical Ltd | 326,000 | 403 | ||||||
Sino Land Co Ltd | 110,000 | 179 | ||||||
Sinotruk Hong Kong Ltd | 31,000 | 46 | ||||||
SJM Holdings Ltd | 73,000 | 80 | ||||||
SSY Group Ltd | 60,000 | 54 | ||||||
Sun Hung Kai Properties Ltd | 57,000 | 924 | ||||||
Sunac China Holdings Ltd | 112,000 | 512 | ||||||
Sunny Optical Technology Group Co Ltd | 33,400 | 394 | ||||||
Swire Pacific Ltd, Cl A | 18,000 | 206 | ||||||
Swire Properties Ltd | 42,200 | 153 | ||||||
Techtronic Industries Co Ltd | 49,000 | 368 | ||||||
Tong Ren Tang Technologies Co Ltd, Cl H | 45,000 | 54 | ||||||
Towngas China | 104,630 | 80 | ||||||
Vitasoy International Holdings | 22,000 | 104 | ||||||
WH Group Ltd | 342,000 | 337 | ||||||
Wharf Holdings Ltd/The | 36,000 | 88 | ||||||
Wharf Real Estate Investment Co Ltd | 44,000 | 279 | ||||||
Wheelock & Co Ltd | 30,000 | 190 | ||||||
| Description | Shares | Market Value ($ Thousands) | ||||||
COMMON STOCK (continued) | ||||||||
WuXi AppTec, Cl H | 11,060 | $ | 103 | |||||
Wuxi Biologics Cayman Inc*(A) | 26,500 | 286 | ||||||
Wynn Macau Ltd | 46,000 | 105 | ||||||
Xiaomi Corp, Cl B*(A) | 165,400 | 191 | ||||||
Xinjiang Goldwind Science & Technology Co Ltd, Cl H | 88,000 | 99 | ||||||
Xinyi Solar Holdings | 160,753 | 89 | ||||||
Yihai International Holding | 16,000 | 86 | ||||||
Yue Yuen Industrial Holdings Ltd | 27,000 | 76 | ||||||
Yuexiu Property Co Ltd | 242,000 | 55 | ||||||
Yuzhou Properties Co Ltd | 189,000 | 90 | ||||||
Zhaojin Mining Industry Co Ltd | 89,000 | 104 | ||||||
Zhejiang Expressway, Cl H | 56,000 | 55 | ||||||
ZhongAn Online P&C Insurance Co Ltd, Cl H*(A) | 13,900 | 31 | ||||||
Zhongsheng Group Holdings Ltd | 23,500 | 66 | ||||||
|
| |||||||
| 40,948 | ||||||||
|
| |||||||
Hungary — 0.0% | ||||||||
MOL Hungarian Oil & Gas PLC | 19,643 | 201 | ||||||
OTP Bank Nyrt | 10,422 | 438 | ||||||
Richter Gedeon Nyrt | 4,837 | 86 | ||||||
|
| |||||||
| 725 | ||||||||
|
| |||||||
India — 0.8% | ||||||||
Adani Ports & Special Economic Zone | 30,186 | 166 | ||||||
Ambuja Cements Ltd | 20,614 | 60 | ||||||
Ashok Leyland Ltd | 63,407 | 64 | ||||||
Asian Paints Ltd | 13,628 | 301 | ||||||
Aurobindo Pharma Ltd | 9,124 | 76 | ||||||
Avenue Supermarts Ltd*(A) | 4,319 | 93 | ||||||
Axis Bank Ltd | 87,114 | 854 | ||||||
Bajaj Auto | 4,097 | 150 | ||||||
Bajaj Finance | 8,081 | 382 | ||||||
Bajaj Finserv Ltd | 1,830 | 189 | ||||||
Bharat Forge Ltd | 11,440 | 70 | ||||||
Bharat Petroleum | 31,676 | 159 | ||||||
Bharti Airtel Ltd | 83,693 | 411 | ||||||
Bharti Infratel | 10,210 | 36 | ||||||
Bosch Ltd | 536 | 113 | ||||||
Britannia Industries Ltd | 1,996 | 76 | ||||||
Cipla Ltd/India | 11,989 | 91 | ||||||
Coal India Ltd | 59,049 | 175 | ||||||
Container Corp Of India Ltd | 10,406 | 77 | ||||||
Dabur India Ltd | 26,195 | 162 | ||||||
Divi’s Laboratories Ltd | 2,756 | 65 | ||||||
Dr Reddy’s Laboratories Ltd | 5,514 | 206 | ||||||
Eicher Motors Ltd | 648 | 154 | ||||||
GAIL India Ltd | 76,924 | 144 | ||||||
Glenmark Pharmaceuticals Ltd | 3,149 | 19 | ||||||
Godrej Consumer Products Ltd | 17,463 | 152 | ||||||
Grasim Industries Ltd | 14,348 | 164 | ||||||
Havells India Ltd | 12,402 | 116 | ||||||
| Adviser Managed Trust / Annual Report / July 31, 2019 | 7 |
SCHEDULE OF INVESTMENTS
July 31, 2019
Tactical Offensive Equity Fund(Continued)
| Description | Shares | Market Value ($ Thousands) | ||||||
COMMON STOCK (continued) | ||||||||
HCL Technologies | 25,314 | $ | 381 | |||||
Hero MotoCorp Ltd | 3,065 | 105 | ||||||
Hindalco Industries Ltd | 57,290 | 159 | ||||||
Hindustan Petroleum Corp Ltd | 21,093 | 82 | ||||||
Hindustan Unilever Ltd | 29,829 | 749 | ||||||
Housing Development Finance Corp Ltd | 74,322 | 2,293 | ||||||
ICICI Bank Ltd | 109,812 | 678 | ||||||
ICICI Lombard General Insurance (A) | 4,716 | 83 | ||||||
Indiabulls Housing Finance Ltd | 9,614 | 75 | ||||||
Indian Oil Corp Ltd | 90,660 | 184 | ||||||
Infosys | 159,131 | 1,836 | ||||||
InterGlobe Aviation Ltd (A) | 3,193 | 72 | ||||||
ITC Ltd | 158,175 | 621 | ||||||
JSW Steel Ltd | 41,531 | 143 | ||||||
Larsen & Toubro | 22,127 | 446 | ||||||
LIC Housing Finance Ltd | 10,304 | 78 | ||||||
Lupin | 7,672 | 85 | ||||||
Mahindra & Mahindra Financial Services Ltd | 15,887 | 70 | ||||||
Mahindra & Mahindra Ltd | 35,112 | 281 | ||||||
Marico Ltd | 15,635 | 83 | ||||||
Maruti Suzuki India Ltd | 4,913 | 391 | ||||||
Motherson Sumi Systems Ltd | 60,590 | 94 | ||||||
Nestle India Ltd | 1,120 | 190 | ||||||
NTPC | 113,708 | 209 | ||||||
Oil & Natural Gas Corp Ltd | 118,856 | 240 | ||||||
Page Industries Ltd | 189 | 50 | ||||||
Petronet LNG Ltd | 20,763 | 71 | ||||||
Pidilite Industries Ltd | 7,017 | 127 | ||||||
Piramal Enterprises Ltd | 2,866 | 75 | ||||||
Power Grid Corp of India Ltd | 94,040 | 288 | ||||||
REC Ltd | 36,763 | 75 | ||||||
Reliance Industries | 129,617 | 2,198 | ||||||
Shree Cement Ltd | 289 | 85 | ||||||
Shriram Transport Finance Co Ltd | 8,382 | 118 | ||||||
State Bank of India | 83,216 | 402 | ||||||
Sun Pharmaceutical Industries Ltd | 40,243 | 250 | ||||||
Tata Consultancy Services Ltd | 41,090 | 1,318 | ||||||
Tata Motors Ltd | 77,324 | 152 | ||||||
Tata Power Co Ltd/The | 35,868 | 32 | ||||||
Tech Mahindra Ltd | 22,502 | 208 | ||||||
Titan | 14,718 | 226 | ||||||
UltraTech Cement Ltd | 4,536 | 287 | ||||||
United Spirits* | 16,756 | 145 | ||||||
UPL Ltd | 25,528 | 221 | ||||||
Vedanta Ltd | 89,100 | 200 | ||||||
Vodafone Idea* | 248,593 | 25 | ||||||
Wipro Ltd | 57,464 | 222 | ||||||
Yes Bank Ltd | 59,251 | 79 | ||||||
Zee Entertainment Enterprises Ltd | 18,280 | 96 | ||||||
|
| |||||||
| 21,303 | ||||||||
|
| |||||||
| Description | Shares | Market Value ($ Thousands) | ||||||
COMMON STOCK (continued) | ||||||||
Indonesia — 0.2% | ||||||||
Adaro Energy Tbk PT | 788,200 | $ | 71 | |||||
Astra International Tbk PT | 938,000 | 468 | ||||||
Bank Central Asia | 451,700 | 997 | ||||||
Bank Mandiri Persero | 865,800 | 493 | ||||||
Bank Negara Indonesia Persero Tbk PT | 356,900 | 216 | ||||||
Bank Rakyat Indonesia Persero Tbk PT | 2,550,100 | 815 | ||||||
Bank Tabungan Negara Persero | 101,400 | 18 | ||||||
Barito Pacific | 184,700 | 51 | ||||||
Bukit Asam Tbk PT | 66,900 | 13 | ||||||
Bumi Serpong Damai* | 182,900 | 19 | ||||||
Charoen Pokphand Indonesia Tbk PT | 255,400 | 98 | ||||||
Gudang Garam Tbk PT | 16,600 | 89 | ||||||
Hanjaya Mandala Sampoerna Tbk PT | 322,000 | 70 | ||||||
Indah Kiat Pulp & Paper | 145,100 | 77 | ||||||
Indocement Tunggal Prakarsa Tbk PT | 63,700 | 102 | ||||||
Indofood CBP Sukses Makmur Tbk PT | 80,700 | 62 | ||||||
Indofood Sukses Makmur | 151,900 | 77 | ||||||
Jasa Marga Persero Tbk PT | 47,900 | 21 | ||||||
Kalbe Farma Tbk PT | 729,900 | 77 | ||||||
Pabrik Kertas Tjiwi Kimia Tbk PT | 32,400 | 28 | ||||||
Pakuwon Jati Tbk PT | 384,700 | 20 | ||||||
Perusahaan Gas Negara Persero Tbk | 578,200 | 85 | ||||||
Semen Indonesia Persero Tbk PT | 102,600 | 94 | ||||||
Surya Citra Media Tbk PT | 148,300 | 16 | ||||||
Telekomunikasi Indonesia Persero Tbk PT | 2,281,900 | 700 | ||||||
Unilever Indonesia Tbk PT | 72,800 | 226 | ||||||
United Tractors Tbk PT | 82,300 | 146 | ||||||
|
| |||||||
| 5,149 | ||||||||
|
| |||||||
Ireland — 0.6% | ||||||||
Accenture PLC, Cl A | 34,800 | 6,702 | ||||||
AIB Group PLC | 29,613 | 102 | ||||||
Alkermes PLC* | 8,400 | 194 | ||||||
Ardmore Shipping Corp* | 4,457 | 33 | ||||||
Bank of Ireland Group PLC | 35,050 | 156 | ||||||
CRH PLC | 28,975 | 968 | ||||||
Eaton Corp PLC | 23,000 | 1,890 | ||||||
Endo International PLC* | 28,474 | 90 | ||||||
Experian PLC | 32,497 | 995 | ||||||
Ingersoll-Rand PLC | 13,400 | 1,657 | ||||||
Jazz Pharmaceuticals PLC* | 3,200 | 446 | ||||||
Kerry Group PLC, Cl A | 5,672 | 666 | ||||||
Mallinckrodt* | 10,514 | 72 | ||||||
Paddy Power Betfair PLC | 2,827 | 225 | ||||||
Pentair PLC | 8,500 | 330 | ||||||
Perrigo | 7,000 | 378 | ||||||
Prothena Corp PLC* | 5,382 | 50 | ||||||
Smurfit Kappa Group | 8,116 | 258 | ||||||
|
| |||||||
| 15,212 | ||||||||
|
| |||||||
Israel — 0.1% | ||||||||
Azrieli Group | 1,550 | 110 | ||||||
| 8 | Adviser Managed Trust / Annual Report / July 31, 2019 |
SCHEDULE OF INVESTMENTS
July 31, 2019
Tactical Offensive Equity Fund(Continued)
| Description | Shares | Market Value ($ Thousands) | ||||||
COMMON STOCK (continued) | ||||||||
Bank Hapoalim BM* | 40,719 | $ | 311 | |||||
Bank LeumiLe-Israel | 53,557 | 393 | ||||||
Check Point Software Technologies* | 4,500 | 504 | ||||||
Elbit Systems Ltd | 853 | 138 | ||||||
Israel Chemicals Ltd | 20,565 | 112 | ||||||
Israel Discount Bank, Cl A | 42,077 | 184 | ||||||
Mizrahi Tefahot Bank Ltd* | 5,098 | 123 | ||||||
Nice Ltd* | 2,222 | 342 | ||||||
Stratasys Ltd* | 6,363 | 177 | ||||||
Teva Pharmaceutical Industries ADR* | 39,100 | 310 | ||||||
Wix.com Ltd* | 1,700 | 252 | ||||||
|
| |||||||
| 2,956 | ||||||||
|
| |||||||
Italy — 0.4% |
| |||||||
Assicurazioni Generali SpA | 39,155 | 734 | ||||||
Atlantia SpA | 17,739 | 459 | ||||||
CNH Industrial NV | 36,408 | 372 | ||||||
Davide Campari-Milano SpA | 20,938 | 196 | ||||||
Enel SpA | 290,050 | 2,002 | ||||||
Eni SpA | 90,764 | 1,435 | ||||||
EXOR NV | 3,899 | 273 | ||||||
Ferrari | 4,366 | 708 | ||||||
Fiat Chrysler Automobiles | 38,841 | 521 | ||||||
FinecoBank Banca Fineco | 18,667 | 187 | ||||||
Intesa Sanpaolo SpA | 531,256 | 1,160 | ||||||
Leonardo SpA | 14,615 | 180 | ||||||
Mediobanca Banca di Credito Finanziario | 22,365 | 226 | ||||||
Moncler SpA | 6,438 | 266 | ||||||
Pirelli & C (A) | 14,656 | 87 | ||||||
Poste Italiane (A) | 18,842 | 203 | ||||||
Prysmian SpA | 8,720 | 181 | ||||||
Recordati SpA | 3,784 | 171 | ||||||
Snam SpA | 74,592 | 369 | ||||||
Telecom Italia* | 308,562 | 175 | ||||||
Telecom Italia SpA/Milano | 219,453 | 117 | ||||||
Terna Rete Elettrica Nazionale | 50,483 | 309 | ||||||
UniCredit SpA | 71,697 | 851 | ||||||
|
| |||||||
| 11,182 | ||||||||
|
| |||||||
Japan — 4.6% | ||||||||
ABC-Mart Inc | 1,400 | 89 | ||||||
Acom | 10,900 | 39 | ||||||
Advantest | 7,200 | 283 | ||||||
Aeon Co Ltd | 23,400 | 408 | ||||||
AEON Financial Service Co Ltd | 4,200 | 68 | ||||||
Aeon Mall Co Ltd | 2,600 | 40 | ||||||
AGC Inc/Japan | 6,600 | 204 | ||||||
Air Water Inc | 5,500 | 91 | ||||||
Aisin Seiki Co Ltd | 5,800 | 189 | ||||||
Ajinomoto Co Inc | 15,800 | 285 | ||||||
Alfresa Holdings Corp | 6,800 | 165 | ||||||
Alps Alpine Co Ltd | 6,200 | 114 | ||||||
Amada Holdings | 13,700 | 152 | ||||||
| Description | Shares | Market Value ($ Thousands) | ||||||
COMMON STOCK (continued) | ||||||||
ANA Holdings Inc | 4,600 | $ | 155 | |||||
Aozora Bank | 3,600 | 83 | ||||||
Asahi Group Holdings | 13,000 | 567 | ||||||
Asahi Intecc Co Ltd | 7,000 | 185 | ||||||
Asahi Kasei | 45,200 | 463 | ||||||
Astellas Pharma Inc | 67,200 | 961 | ||||||
Bandai Namco Holdings Inc | 7,200 | 391 | ||||||
Bank of Kyoto Ltd/The | 2,000 | 78 | ||||||
Benesse Holdings | 1,700 | 40 | ||||||
Bridgestone Corp | 20,400 | 770 | ||||||
Brother Industries Ltd | 8,900 | 159 | ||||||
Calbee | 3,000 | 85 | ||||||
Canon Inc | 35,700 | 977 | ||||||
Casio Computer Co Ltd | 7,100 | 81 | ||||||
Central Japan Railway Co | 5,100 | 1,030 | ||||||
Chiba Bank Ltd/The | 18,100 | 90 | ||||||
Chubu Electric Power Co Inc | 23,100 | 327 | ||||||
Chugai Pharmaceutical Co Ltd | 8,000 | 575 | ||||||
Chugoku Electric Power Co Inc/The | 8,200 | 103 | ||||||
Coca-Cola Bottlers Japan Holdings Inc | 4,500 | 112 | ||||||
Concordia Financial Group Ltd | 42,900 | 152 | ||||||
Credit Saison Co Ltd | 3,800 | 47 | ||||||
CyberAgent | 3,700 | 151 | ||||||
Dai Nippon Printing | 8,800 | 186 | ||||||
Daicel Corp | 9,600 | 82 | ||||||
Daifuku Co Ltd | 3,700 | 205 | ||||||
Dai-ichi Life Holdings Inc | 38,600 | 571 | ||||||
Daiichi Sankyo Co Ltd | 20,200 | 1,237 | ||||||
Daikin Industries Ltd | 8,900 | 1,114 | ||||||
Daito Trust Construction Co Ltd | 2,600 | 337 | ||||||
Daiwa House Industry | 20,300 | 582 | ||||||
Daiwa House Investment Corp, Cl A‡ | 67 | 164 | ||||||
Daiwa Securities Group | 55,000 | 239 | ||||||
Denso Corp | 15,500 | 662 | ||||||
Dentsu Inc | 7,800 | 260 | ||||||
Disco Corp | 1,100 | 205 | ||||||
East Japan Railway Co | 10,900 | 1,004 | ||||||
Eisai Co Ltd | 9,000 | 490 | ||||||
Electric Power Development Co Ltd | 4,400 | 99 | ||||||
FamilyMart UNY Holdings Co Ltd | 9,100 | 195 | ||||||
FANUC | 6,900 | 1,241 | ||||||
Fast Retailing | 2,100 | 1,268 | ||||||
Fuji Electric Co Ltd | 4,600 | 143 | ||||||
FUJIFILM Holdings Corp | 12,900 | 616 | ||||||
Fujitsu Ltd | 7,000 | 551 | ||||||
Fukuoka Financial Group Inc | 5,100 | 94 | ||||||
GMO Payment Gateway | 1,200 | 88 | ||||||
Hakuhodo DY Holdings Inc | 9,300 | 147 | ||||||
Hamamatsu Photonics KK | 5,100 | 191 | ||||||
Hankyu Hanshin Holdings Inc | 8,200 | 290 | ||||||
Hikari Tsushin Inc | 800 | 178 | ||||||
Hino Motors Ltd | 10,500 | 85 | ||||||
| Adviser Managed Trust / Annual Report / July 31, 2019 | 9 |
SCHEDULE OF INVESTMENTS
July 31, 2019
Tactical Offensive Equity Fund(Continued)
| Description | Shares | Market Value ($ Thousands) | ||||||
COMMON STOCK (continued) | ||||||||
Hirose Electric | 1,200 | $ | 127 | |||||
Hisamitsu Pharmaceutical Co Inc | 1,900 | 77 | ||||||
Hitachi Chemical Co Ltd | 3,100 | 86 | ||||||
Hitachi Construction Machinery Co Ltd | 3,900 | 93 | ||||||
Hitachi High-Technologies | 2,100 | 107 | ||||||
Hitachi Ltd | 34,500 | 1,237 | ||||||
Hitachi Metals Ltd | 7,900 | 84 | ||||||
Honda Motor Co Ltd | 58,200 | 1,453 | ||||||
Hoshizaki | 2,200 | 156 | ||||||
Hoya | 13,600 | 1,053 | ||||||
Hulic Co Ltd | 9,800 | 85 | ||||||
Idemitsu Kosan | 7,056 | 196 | ||||||
IHI Corp | 4,400 | 106 | ||||||
Iida Group Holdings Co Ltd | 5,400 | 89 | ||||||
Inpex | 36,700 | 325 | ||||||
Isetan Mitsukoshi Holdings Ltd | 10,100 | 81 | ||||||
Isuzu Motors Ltd | 19,900 | 222 | ||||||
ITOCHU Corp | 48,100 | 922 | ||||||
Itochu Techno-Solutions | 2,900 | 75 | ||||||
J Front Retailing Co Ltd | 8,400 | 99 | ||||||
Japan Airlines | 3,400 | 107 | ||||||
Japan Airport Terminal Co Ltd | 1,900 | 79 | ||||||
Japan Exchange Group Inc | 18,300 | 270 | ||||||
Japan Post Bank Co Ltd | 14,700 | 143 | ||||||
Japan Post Holdings Co Ltd | 56,300 | 554 | ||||||
Japan Prime Realty Investment Corp‡ | 24 | 106 | ||||||
Japan Real Estate Investment‡ | 47 | 295 | ||||||
Japan Retail Fund Investment Corp‡ | 94 | 189 | ||||||
Japan Tobacco Inc | 42,800 | 954 | ||||||
JFE Holdings Inc | 17,700 | 236 | ||||||
JGC Corp | 6,300 | 83 | ||||||
JSR | 5,800 | 97 | ||||||
JTEKT Corp | 7,500 | 90 | ||||||
JXTG Holdings Inc | 115,100 | 546 | ||||||
Kajima Corp | 16,200 | 210 | ||||||
Kakaku.com | 4,100 | 86 | ||||||
Kamigumi Co Ltd | 3,900 | 90 | ||||||
Kaneka | 1,200 | 45 | ||||||
Kansai Electric Power Co Inc/The | 25,300 | 314 | ||||||
Kansai Paint Co Ltd | 5,300 | 105 | ||||||
Kao | 17,400 | 1,279 | ||||||
Kawasaki Heavy Industries Ltd | 4,200 | 92 | ||||||
KDDI Corp | 63,200 | 1,661 | ||||||
Keihan Holdings Co Ltd | 3,500 | 143 | ||||||
Keikyu Corp | 8,800 | 149 | ||||||
Keio Corp | 3,700 | 230 | ||||||
Keisei Electric Railway Co Ltd | 4,700 | 174 | ||||||
Keyence Corp | 3,300 | 1,919 | ||||||
Kikkoman Corp | 5,200 | 238 | ||||||
Kintetsu Group Holdings Co Ltd | 6,200 | 296 | ||||||
Kirin Holdings Co Ltd | 29,400 | 642 | ||||||
Kobayashi Pharmaceutical Co Ltd | 1,800 | 129 | ||||||
| Description | Shares | Market Value ($ Thousands) | ||||||
COMMON STOCK (continued) | ||||||||
Kobe Steel | 11,400 | $ | 74 | |||||
Koito Manufacturing Co Ltd | 3,800 | 192 | ||||||
Komatsu Ltd | 33,000 | 743 | ||||||
Konami Holdings Corp | 3,400 | 145 | ||||||
Konica Minolta Inc | 16,400 | 137 | ||||||
Kose Corp | 1,200 | 206 | ||||||
Kubota | 37,500 | 585 | ||||||
Kuraray Co Ltd | 12,800 | 153 | ||||||
Kurita Water Industries Ltd | 3,600 | 92 | ||||||
Kyocera Corp | 11,500 | 709 | ||||||
Kyowa Hakko Kirin Co Ltd | 8,800 | 146 | ||||||
Kyushu Electric Power Co Inc | 15,300 | 153 | ||||||
Kyushu Railway Co | 5,800 | 166 | ||||||
Lawson Inc | 1,800 | 90 | ||||||
LINE Corp* | 2,800 | 90 | ||||||
Lion Corp | 8,100 | 160 | ||||||
LIXIL Group Corp | 7,900 | 138 | ||||||
M3 Inc | 15,100 | 308 | ||||||
Makita Corp | 8,100 | 268 | ||||||
Marubeni Corp | 56,100 | 367 | ||||||
Marui Group | 6,900 | 150 | ||||||
Maruichi Steel Tube Ltd | 1,400 | 37 | ||||||
Mazda Motor | 20,500 | 204 | ||||||
McDonald’s Holdings Co Japan Ltd | 2,000 | 90 | ||||||
Mebuki Financial Group Inc | 32,500 | 81 | ||||||
Medipal Holdings Corp | 6,600 | 141 | ||||||
MEIJI Holdings Co Ltd | 4,100 | 286 | ||||||
Mercari* | 2,300 | 62 | ||||||
MINEBEA MITSUMI Inc | 13,100 | 227 | ||||||
MISUMI Group | 10,200 | 232 | ||||||
Mitsubishi Chemical Holdings Corp | 46,000 | 329 | ||||||
Mitsubishi Corp | 48,200 | 1,304 | ||||||
Mitsubishi Electric Corp | 65,200 | 860 | ||||||
Mitsubishi Estate Co Ltd | 42,200 | 782 | ||||||
Mitsubishi Gas Chemical | 6,000 | 81 | ||||||
Mitsubishi Heavy Industries Ltd | 11,500 | 477 | ||||||
Mitsubishi Materials Corp | 3,200 | 89 | ||||||
Mitsubishi Motors Corp | 20,000 | 89 | ||||||
Mitsubishi Tanabe Pharma Corp | 8,200 | 93 | ||||||
Mitsubishi UFJ Financial Group Inc | 438,700 | 2,118 | ||||||
Mitsubishi UFJ Lease & Finance Co Ltd | 17,600 | 94 | ||||||
Mitsui & Co Ltd | 59,100 | 968 | ||||||
Mitsui Chemicals Inc | 6,700 | 155 | ||||||
Mitsui Fudosan Co Ltd | 31,900 | 726 | ||||||
Mitsui OSK Lines Ltd | 3,500 | 87 | ||||||
Mizuho Financial Group Inc | 861,000 | 1,224 | ||||||
MonotaRO Co Ltd | 3,800 | 84 | ||||||
MS&AD Insurance Group Holdings Inc | 17,000 | 561 | ||||||
Murata Manufacturing Co Ltd | 20,500 | 914 | ||||||
Nabtesco Corp | 3,400 | 93 | ||||||
Nagoya Railroad Co Ltd | 6,600 | 183 | ||||||
NEC Corp | 8,900 | 367 | ||||||
| 10 | Adviser Managed Trust / Annual Report / July 31, 2019 |
SCHEDULE OF INVESTMENTS
July 31, 2019
Tactical Offensive Equity Fund(Continued)
| Description | Shares | Market Value ($ Thousands) | ||||||
COMMON STOCK (continued) | ||||||||
Nexon Co Ltd | 17,700 | $ | 282 | |||||
NGK Insulators Ltd | 10,600 | 159 | ||||||
NGK Spark Plug Co Ltd | 4,700 | 90 | ||||||
NH Foods Ltd | 3,100 | 116 | ||||||
Nidec | 8,000 | 1,084 | ||||||
Nikon Corp | 11,600 | 158 | ||||||
Nintendo Co Ltd | 4,000 | 1,477 | ||||||
Nippon Building Fund‡ | 48 | 338 | ||||||
Nippon Electric Glass Co Ltd | 2,900 | 66 | ||||||
Nippon Express Co Ltd | 2,900 | 165 | ||||||
Nippon Paint Holdings Co Ltd | 5,300 | 232 | ||||||
Nippon Prologis Inc‡ | 72 | 174 | ||||||
Nippon Steel Corp | 28,900 | 457 | ||||||
Nippon Telegraph & Telephone Corp | 23,000 | 1,043 | ||||||
Nippon Yusen | 5,600 | 94 | ||||||
Nissan Chemical | 4,600 | 203 | ||||||
Nissan Motor Co Ltd | 83,000 | 543 | ||||||
Nisshin Seifun Group Inc | 7,200 | 137 | ||||||
Nissin Foods Holdings Co Ltd | 2,300 | 144 | ||||||
Nitori Holdings Co Ltd | 2,900 | 393 | ||||||
Nitto Denko Corp | 5,600 | 278 | ||||||
Nomura Holdings Inc | 118,900 | 376 | ||||||
Nomura Real Estate Holdings Inc | 3,800 | 78 | ||||||
Nomura Real Estate Master Fund‡ | 140 | 223 | ||||||
Nomura Research Institute Ltd | 12,300 | 220 | ||||||
NSK Ltd | 10,700 | 91 | ||||||
NTT Data | 22,700 | 300 | ||||||
NTT DOCOMO Inc | 47,600 | 1,146 | ||||||
Obayashi Corp | 23,400 | 223 | ||||||
Obic Co Ltd | 2,300 | 247 | ||||||
Odakyu Electric Railway Co Ltd | 10,600 | 238 | ||||||
Oji Holdings Corp | 31,100 | 162 | ||||||
Olympus Corp | 41,700 | 458 | ||||||
Omron Corp | 6,900 | 333 | ||||||
Ono Pharmaceutical Co Ltd | 13,700 | 250 | ||||||
Oracle Corp Japan | 1,400 | 117 | ||||||
Oriental Land Co Ltd/Japan | 7,100 | 944 | ||||||
ORIX | 47,300 | 680 | ||||||
Osaka Gas Co Ltd | 13,500 | 249 | ||||||
Otsuka Corp | 3,800 | 151 | ||||||
Otsuka Holdings | 14,000 | 518 | ||||||
Pan Pacific International Holdings Corp | 4,000 | 256 | ||||||
Panasonic Corp | 78,900 | 672 | ||||||
Park24 Co Ltd | 4,200 | 92 | ||||||
PeptiDream* | 3,400 | 191 | ||||||
Persol Holdings Co Ltd | 7,100 | 174 | ||||||
Pigeon | 4,200 | 156 | ||||||
Pola Orbis Holdings Inc | 2,800 | 71 | ||||||
Rakuten Inc | 30,900 | 318 | ||||||
Recruit Holdings Co Ltd | 42,400 | 1,452 | ||||||
Renesas Electronics Corp* | 27,300 | 163 | ||||||
Resona Holdings Inc | 75,100 | 307 | ||||||
| Description | Shares | Market Value ($ Thousands) | ||||||
COMMON STOCK (continued) | ||||||||
Ricoh Co Ltd | 24,100 | $ | 222 | |||||
Rinnai Corp | 1,200 | 81 | ||||||
Rohm Co Ltd | 3,400 | 240 | ||||||
Ryohin Keikaku | 900 | 161 | ||||||
Sankyo Co Ltd | 1,100 | 38 | ||||||
Santen Pharmaceutical Co Ltd | 13,200 | 214 | ||||||
SBI Holdings Inc/Japan | 8,500 | 195 | ||||||
Secom | 7,500 | 591 | ||||||
Sega Sammy Holdings | 6,400 | 83 | ||||||
Seibu Holdings Inc | 7,500 | 119 | ||||||
Seiko Epson Corp | 10,100 | 150 | ||||||
Sekisui Chemical Co Ltd | 13,300 | 199 | ||||||
Sekisui House | 22,300 | 377 | ||||||
Seven & i Holdings Co Ltd | 26,900 | 924 | ||||||
Seven Bank Ltd | 15,300 | 42 | ||||||
SG Holdings Co Ltd | 5,200 | 138 | ||||||
Sharp Corp/Japan | 7,800 | 99 | ||||||
Shimadzu Corp | 8,000 | 194 | ||||||
Shimamura Co Ltd | 600 | 43 | ||||||
Shimano Inc | 2,700 | 384 | ||||||
Shimizu Corp | 21,400 | 174 | ||||||
Shin-Etsu Chemical | 13,000 | 1,336 | ||||||
Shinsei Bank Ltd | 5,700 | 87 | ||||||
Shionogi & Co Ltd | 9,600 | 536 | ||||||
Shiseido Co Ltd | 14,300 | 1,060 | ||||||
Shizuoka Bank Ltd/The | 16,800 | 116 | ||||||
Showa Denko KK | 5,400 | 147 | ||||||
SMC Corp/Japan | 2,000 | 734 | ||||||
Softbank Corp | 59,900 | 810 | ||||||
SoftBank Group Corp | 58,800 | 3,048 | ||||||
Sohgo Security Services Co Ltd | 2,100 | 103 | ||||||
Sompo Holdings Inc | 12,000 | 501 | ||||||
Sony Corp | 45,300 | 2,574 | ||||||
Sony Financial Holdings | 5,500 | 134 | ||||||
Stanley Electric Co Ltd | 3,900 | 97 | ||||||
Subaru Corp | 22,000 | 516 | ||||||
SUMCO Corp | 7,100 | 95 | ||||||
Sumitomo Chemical Co Ltd | 53,600 | 247 | ||||||
Sumitomo Corp | 42,500 | 635 | ||||||
Sumitomo Dainippon Pharma | 4,700 | 87 | ||||||
Sumitomo Electric Industries | 27,100 | 338 | ||||||
Sumitomo Heavy Industries Ltd | 3,300 | 107 | ||||||
Sumitomo Metal Mining Co Ltd | 8,400 | 241 | ||||||
Sumitomo Mitsui Financial Group Inc | 47,400 | 1,662 | ||||||
Sumitomo Mitsui Trust Holdings Inc | 11,900 | 409 | ||||||
Sumitomo Realty & Development | 11,900 | 436 | ||||||
Sumitomo Rubber Industries Ltd | 6,300 | 69 | ||||||
Sundrug Co Ltd | 1,700 | 47 | ||||||
Suntory Beverage & Food Ltd | 5,000 | 200 | ||||||
Suzuken | 2,600 | 144 | ||||||
Suzuki Motor Corp | 13,200 | 519 | ||||||
Sysmex Corp | 6,000 | 439 | ||||||
| Adviser Managed Trust / Annual Report / July 31, 2019 | 11 |
SCHEDULE OF INVESTMENTS
July 31, 2019
Tactical Offensive Equity Fund(Continued)
| Description | Shares | Market Value ($ Thousands) | ||||||
COMMON STOCK (continued) | ||||||||
T&D Holdings | 20,100 | $ | 227 | |||||
Taiheiyo Cement Corp | 4,900 | 139 | ||||||
Taisei | 7,300 | 253 | ||||||
Taisho Pharmaceutical Holdings | 1,100 | 84 | ||||||
Taiyo Nippon Sanso | 4,700 | 97 | ||||||
Takeda Pharmaceutical Co Ltd | 53,000 | 1,774 | ||||||
TDK Corp | 4,600 | 359 | ||||||
Teijin Ltd | 5,300 | 92 | ||||||
Terumo Corp | 23,100 | 677 | ||||||
THK Co Ltd | 3,700 | 95 | ||||||
Tobu Railway Co Ltd | 6,900 | 198 | ||||||
Toho Co Ltd/Tokyo | 4,100 | 160 | ||||||
Toho Gas Co Ltd | 2,200 | 84 | ||||||
Tohoku Electric Power Co Inc | 15,500 | 156 | ||||||
Tokio Marine Holdings Inc | 23,100 | 1,233 | ||||||
Tokyo Century Corp | 1,000 | 42 | ||||||
Tokyo Electric Power Holdings* | 54,900 | 265 | ||||||
Tokyo Electron Ltd | 5,600 | 964 | ||||||
Tokyo Gas | 13,800 | 346 | ||||||
Tokyu Corp | 17,900 | 315 | ||||||
Tokyu Fudosan Holdings | 18,000 | 105 | ||||||
Toppan Printing Co Ltd | 9,800 | 160 | ||||||
Toray Industries Inc | 49,700 | 345 | ||||||
Toshiba | 19,900 | 639 | ||||||
Tosoh Corp | 7,700 | 109 | ||||||
TOTO Ltd | 5,100 | 206 | ||||||
Toyo Seikan Group Holdings Ltd | 4,500 | 79 | ||||||
Toyo Suisan Kaisha Ltd | 3,600 | 146 | ||||||
Toyoda Gosei Co Ltd | 1,700 | 31 | ||||||
Toyota Industries Corp | 5,300 | 277 | ||||||
Toyota Motor Corp | 81,400 | 5,266 | ||||||
Toyota Tsusho Corp | 7,600 | 222 | ||||||
Trend Micro Inc/Japan | 4,600 | 202 | ||||||
Tsuruha Holdings Inc | 1,100 | 113 | ||||||
Unicharm Corp | 14,500 | 414 | ||||||
United Urban Investment Corp‡ | 105 | 178 | ||||||
USS Co Ltd | 7,900 | 158 | ||||||
Welcia Holdings | 1,200 | 56 | ||||||
West Japan Railway Co | 5,900 | 486 | ||||||
Yahoo Japan Corp | 101,800 | 301 | ||||||
Yakult Honsha Co Ltd | 4,300 | 244 | ||||||
Yamada Denki Co Ltd | 18,800 | 83 | ||||||
Yamaha | 5,200 | 247 | ||||||
Yamaha Motor Co Ltd | 10,100 | 178 | ||||||
Yamato Holdings Co Ltd | 11,100 | 219 | ||||||
Yamazaki Baking Co Ltd | 3,000 | 46 | ||||||
Yaskawa Electric Corp | 8,600 | 289 | ||||||
Yokogawa Electric Corp | 8,300 | 150 | ||||||
Yokohama Rubber Co Ltd/The | 4,400 | 81 | ||||||
ZOZO Inc | 6,000 | 114 | ||||||
|
| |||||||
| 117,902 | ||||||||
|
| |||||||
| Description | Shares | Market Value ($ Thousands) | ||||||
COMMON STOCK (continued) | ||||||||
Luxembourg — 0.0% | ||||||||
Altisource Portfolio Solutions SA* | 637 | $ | 13 | |||||
RTL Group SA | 1,427 | 71 | ||||||
SES, Cl A | 13,128 | 218 | ||||||
Tenaris SA | 17,018 | 216 | ||||||
Trinseo SA | 5,328 | 207 | ||||||
|
| |||||||
| 725 | ||||||||
|
| |||||||
Malaysia — 0.2% | ||||||||
AirAsia Group Bhd | 38,600 | 18 | ||||||
Alliance Bank Malaysia Bhd | 26,100 | 23 | ||||||
AMMB Holdings | 56,400 | 58 | ||||||
Axiata Group Bhd | 133,178 | 162 | ||||||
British American Tobacco Malaysia Bhd | 4,900 | 27 | ||||||
CIMB Group Holdings Bhd | 225,946 | 278 | ||||||
Dialog Group Bhd | 181,500 | 152 | ||||||
DiGi.Com Bhd | 150,900 | 183 | ||||||
Fraser & Neave Holdings Bhd | 11,100 | 93 | ||||||
Gamuda Bhd | 47,800 | 43 | ||||||
Genting Bhd | 104,100 | 173 | ||||||
Genting Malaysia Bhd | 102,700 | 96 | ||||||
Genting Plantations Bhd | 4,900 | 12 | ||||||
HAP Seng Consolidated Bhd | 60,100 | 144 | ||||||
Hartalega Holdings Bhd | 51,900 | 62 | ||||||
Hong Leong Bank Bhd | 32,100 | 140 | ||||||
Hong Leong Financial Group Bhd | 6,300 | 28 | ||||||
IHH Healthcare Bhd | 108,200 | 151 | ||||||
IJM | 92,800 | 52 | ||||||
IOI Corp Bhd | 65,200 | 66 | ||||||
Kuala Lumpur Kepong Bhd | 14,800 | 85 | ||||||
Malayan Banking Bhd | 180,518 | 378 | ||||||
Malaysia Airports Holdings Bhd | 34,400 | 70 | ||||||
Maxis Bhd | 115,100 | 158 | ||||||
MISC Bhd | 38,600 | 68 | ||||||
Nestle Malaysia Bhd | 2,400 | 86 | ||||||
Petronas Chemicals Group Bhd | 139,600 | 253 | ||||||
Petronas Dagangan Bhd | 8,600 | 49 | ||||||
Petronas Gas | 32,100 | 125 | ||||||
PPB Group Bhd | 19,700 | 89 | ||||||
Press Metal Aluminium Holdings Bhd | 47,200 | 52 | ||||||
Public Bank Bhd | 142,600 | 757 | ||||||
QL Resources | 22,100 | 37 | ||||||
RHB Bank Bhd | 34,100 | 46 | ||||||
Sime Darby Bhd | 92,500 | 49 | ||||||
Sime Darby Plantation Bhd | 71,500 | 80 | ||||||
Sime Darby Property Bhd | 70,400 | 17 | ||||||
SP Setia Group | 36,100 | 17 | ||||||
Telekom Malaysia Bhd | 28,200 | 28 | ||||||
Tenaga Nasional Bhd | 145,300 | 487 | ||||||
Top Glove Corp Bhd | 53,200 | 59 | ||||||
Westports Holdings Bhd | 23,700 | 23 | ||||||
| 12 | Adviser Managed Trust / Annual Report / July 31, 2019 |
SCHEDULE OF INVESTMENTS
July 31, 2019
Tactical Offensive Equity Fund(Continued)
| Description | Shares | Market Value ($ Thousands) | ||||||
COMMON STOCK (continued) | ||||||||
YTL | 269,700 | $ | 67 | |||||
|
| |||||||
| 5,041 | ||||||||
|
| |||||||
Mexico — 0.2% | ||||||||
Alfa SAB de CV, Cl A | 149,700 | 131 | ||||||
Alsea SAB de CV* | 18,500 | 38 | ||||||
America Movil SAB de CV | 1,538,100 | 1,088 | ||||||
Arca Continental SAB de CV | 15,300 | 82 | ||||||
Banco Santander Mexico SA Institucion de Banca Multiple Grupo Financiero Santand, Cl B | 90,800 | 130 | ||||||
Cemex SAB de CV | 714,100 | 257 | ||||||
Coca-Cola Femsa SAB de CV | 25,700 | 160 | ||||||
El Puerto de Liverpool SAB de CV | 6,400 | 31 | ||||||
Fibra Uno Administracion SA de CV‡ | 152,700 | 198 | ||||||
Fomento Economico Mexicano SAB de CV | 89,200 | 817 | ||||||
Gruma SAB de CV, Cl B | 7,315 | 68 | ||||||
Grupo Aeroportuario del Pacifico SAB de CV, Cl B | 17,300 | 175 | ||||||
Grupo Aeroportuario del Sureste SAB de CV, Cl B | 10,125 | 155 | ||||||
Grupo Bimbo SAB de CV, Ser A | 79,700 | 154 | ||||||
Grupo Carso SAB de CV | 15,500 | 50 | ||||||
Grupo Financiero Banorte SAB de CV, Cl O | 119,500 | 603 | ||||||
Grupo Financiero Inbursa SAB de CV, Cl O | 113,600 | 140 | ||||||
Grupo Mexico SAB de CV | 163,000 | 404 | ||||||
Grupo Televisa SAB | 115,400 | 221 | ||||||
Industrias Penoles SAB de CV | 4,735 | 44 | ||||||
Infraestructura Energetica Nova SAB de CV | 18,600 | 72 | ||||||
Kimberly-Clark de Mexico SAB de CV, Cl A | 75,300 | 158 | ||||||
Megacable Holdings | 10,200 | 44 | ||||||
Mexichem SAB de CV | 36,300 | 67 | ||||||
Promotora y Operadora de Infraestructura SAB de CV | 7,890 | 72 | ||||||
Wal-Mart de Mexico SAB de CV | 241,200 | 719 | ||||||
|
| |||||||
| 6,078 | ||||||||
|
| |||||||
Netherlands — 1.2% | ||||||||
ABN AMRO Group NV (A) | 15,180 | 304 | ||||||
Adyen NV *(A) | 372 | 284 | ||||||
Aegon NV | 65,075 | 324 | ||||||
AerCap Holdings NV* | 4,800 | 262 | ||||||
Airbus SE | 20,757 | 2,960 | ||||||
Akzo Nobel NV | 8,139 | 774 | ||||||
ArcelorMittal | 23,802 | 385 | ||||||
ASML Holding NV | 15,174 | 3,426 | ||||||
Cimpress NV* | 2,726 | 263 | ||||||
Coca-Cola European Partners | 3,801 | 212 | ||||||
Frank’s International* | 13,792 | 79 | ||||||
Heineken | 9,255 | 1,001 | ||||||
Heineken Holding NV | 4,128 | 421 | ||||||
ING Groep NV | 138,832 | 1,557 | ||||||
Koninklijke Ahold Delhaize | 42,268 | 963 | ||||||
| Description | Shares | Market Value ($ Thousands) | ||||||
COMMON STOCK (continued) | ||||||||
Koninklijke DSM NV | 6,482 | $ | 814 | |||||
Koninklijke KPN NV | 128,014 | �� | 368 | |||||
Koninklijke Philips NV | 33,047 | 1,563 | ||||||
Koninklijke Vopak NV | 2,559 | 127 | ||||||
NN Group NV | 11,284 | 427 | ||||||
NXP Semiconductors NV | 10,600 | 1,096 | ||||||
Randstad NV | 4,288 | 217 | ||||||
Royal Dutch Shell, Cl A | 157,763 | 5,011 | ||||||
Royal Dutch Shell PLC, Cl B | 133,483 | 4,254 | ||||||
Unibail-Rodamco-Westfield‡ | 4,942 | 666 | ||||||
Unilever | 51,954 | 3,027 | ||||||
Wolters Kluwer NV | 9,997 | 730 | ||||||
|
| |||||||
| 31,515 | ||||||||
|
| |||||||
New Zealand — 0.1% | ||||||||
a2 Milk Co Ltd* | 26,384 | 314 | ||||||
Auckland International Airport Ltd | 34,826 | 214 | ||||||
Fisher & Paykel Healthcare Corp Ltd | 20,677 | 225 | ||||||
Fletcher Building Ltd | 31,089 | 102 | ||||||
Meridian Energy Ltd | 46,460 | 144 | ||||||
Ryman Healthcare Ltd | 14,569 | 124 | ||||||
Spark New Zealand Ltd | 66,364 | 174 | ||||||
|
| |||||||
| 1,297 | ||||||||
|
| |||||||
Norway — 0.1% | ||||||||
Aker BP ASA | 3,940 | 113 | ||||||
DNB ASA | 34,425 | 622 | ||||||
Equinor | 35,802 | 648 | ||||||
Gjensidige Forsikring ASA | 7,246 | 142 | ||||||
Mowi ASA | 15,727 | 382 | ||||||
Nordic American Tankers | 18,592 | 38 | ||||||
Norsk Hydro ASA | 48,602 | 168 | ||||||
Orkla ASA | 27,501 | 236 | ||||||
Schibsted ASA, Cl B | 3,589 | 94 | ||||||
Telenor ASA | 26,320 | 540 | ||||||
Yara International ASA | 6,377 | 302 | ||||||
|
| |||||||
| 3,285 | ||||||||
|
| |||||||
Panama — 0.0% | ||||||||
Banco Latinoamericano de Comercio | 3,958 | 83 | ||||||
Copa Holdings SA, Cl A | 1,700 | 172 | ||||||
|
| |||||||
| 255 | ||||||||
|
| |||||||
Peru — 0.0% | ||||||||
Cia de Minas Buenaventura SAA ADR | 10,500 | 160 | ||||||
Credicorp Ltd | 3,100 | 676 | ||||||
|
| |||||||
| 836 | ||||||||
|
| |||||||
Philippines — 0.1% | ||||||||
Aboitiz Equity Ventures | 68,200 | 71 | ||||||
Aboitiz Power Corp | 37,100 | 26 | ||||||
Alliance Global Group Inc | 103,000 | 32 | ||||||
Ayala Corp | 13,540 | 255 | ||||||
Ayala Land Inc | 345,550 | 338 | ||||||
| Adviser Managed Trust / Annual Report / July 31, 2019 | 13 |
SCHEDULE OF INVESTMENTS
July 31, 2019
Tactical Offensive Equity Fund(Continued)
| Description | Shares | Market Value ($ Thousands) | ||||||
COMMON STOCK (continued) | ||||||||
Bank of the Philippine Islands | 23,310 | $ | 41 | |||||
BDO Unibank Inc | 93,560 | 270 | ||||||
DMCI Holdings Inc | 108,600 | 22 | ||||||
Globe Telecom | 1,785 | 75 | ||||||
GT Capital Holdings Inc | 5,130 | 93 | ||||||
International Container Terminal Services Inc | 49,820 | 132 | ||||||
JG Summit Holdings Inc | 139,270 | 179 | ||||||
Jollibee Foods Corp | 15,090 | 77 | ||||||
Manila Electric Co | 11,850 | 85 | ||||||
Megaworld Corp | 616,000 | 74 | ||||||
Metro Pacific Investments | 352,000 | 33 | ||||||
Metropolitan Bank & Trust | 55,090 | 82 | ||||||
PLDT Inc | 2,990 | 68 | ||||||
Robinsons Land Corp | 41,200 | 22 | ||||||
Security Bank | 7,510 | 27 | ||||||
SM Investments Corp | 11,540 | 227 | ||||||
SM Prime Holdings Inc | 473,500 | 340 | ||||||
Universal Robina Corp | 43,520 | 136 | ||||||
|
| |||||||
| 2,705 | ||||||||
|
| |||||||
Poland — 0.1% | ||||||||
Alior Bank SA* | 3,109 | 38 | ||||||
Bank Millennium* | 20,635 | 41 | ||||||
Bank Polska Kasa Opieki SA | 8,121 | 218 | ||||||
CCC SA | 980 | 38 | ||||||
CD Projekt | 3,267 | 195 | ||||||
Cyfrowy Polsat SA | 8,853 | 69 | ||||||
Dino Polska SA* | 1,696 | 64 | ||||||
Grupa Lotos SA | 3,199 | 73 | ||||||
Jastrzebska Spolka Weglowa SA* | 1,797 | 18 | ||||||
KGHM Polska Miedz SA | 6,783 | 166 | ||||||
LPP SA | 45 | 92 | ||||||
mBank SA* | 504 | 46 | ||||||
Orange Polska SA | 22,323 | 39 | ||||||
PGE Polska Grupa Energetyczna SA* | 29,116 | 67 | ||||||
Polski Koncern Naftowy ORLEN SA | 14,057 | 356 | ||||||
Polskie Gornictwo Naftowe i Gazownictwo SA | 59,987 | 88 | ||||||
Powszechna Kasa Oszczednosci Bank Polski SA | 40,643 | 431 | ||||||
Powszechny Zaklad Ubezpieczen | 28,395 | 308 | ||||||
Santander Bank Polska SA | 1,739 | 148 | ||||||
|
| |||||||
| 2,495 | ||||||||
|
| |||||||
Portugal — 0.0% | ||||||||
EDP - Energias de Portugal SA | 91,811 | 340 | ||||||
Galp Energia SGPS | 18,022 | 283 | ||||||
Jeronimo Martins SGPS SA | 7,342 | 119 | ||||||
|
| |||||||
| 742 | ||||||||
|
| |||||||
Qatar — 0.1% | ||||||||
Barwa Real Estate Co | 65,980 | 65 | ||||||
Commercial Bank PQSC/The | 68,630 | 90 | ||||||
| Description | Shares | Market Value ($ Thousands) | ||||||
COMMON STOCK (continued) | ||||||||
Industries Qatar QSC | 85,920 | $ | 265 | |||||
Masraf Al Rayan QSC | 178,254 | 188 | ||||||
Mesaieed Petrochemical Holding | 215,730 | 154 | ||||||
Ooredoo QPSC | 43,090 | 85 | ||||||
Qatar Electricity & Water Co QSC | 18,650 | 80 | ||||||
Qatar Fuel QSC | 24,106 | 140 | ||||||
Qatar Insurance Co SAQ | 54,070 | 52 | ||||||
Qatar Islamic Bank SAQ | 54,934 | 248 | ||||||
Qatar National Bank QPSC | 206,945 | 1,109 | ||||||
|
| |||||||
| 2,476 | ||||||||
|
| |||||||
Russia — 0.4% | ||||||||
Gazprom PJSC ADR | 242,484 | 1,777 | ||||||
LUKOIL PJSC ADR | 18,797 | 1,547 | ||||||
Magnit GDR* | 4,636 | 55 | ||||||
Magnit PJSC GDR | 12,343 | 179 | ||||||
MMC Norilsk Nickel PJSC ADR | 29,147 | 670 | ||||||
Mobile TeleSystems PJSC ADR | 24,000 | 196 | ||||||
Novatek PJSC GDR | 4,179 | 876 | ||||||
PhosAgro PJSC GDR | 4,415 | 55 | ||||||
Rosneft Oil Co PJSC GDR | 40,344 | 267 | ||||||
Rosneft Oil PJSC GDR | 14,280 | 93 | ||||||
Sberbank of Russia PJSC ADR | 122,799 | 1,834 | ||||||
Severstal GDR | 2,590 | 42 | ||||||
Severstal PJSC GDR | 7,602 | 122 | ||||||
Surgutneftegas PJSC ADR | 97,095 | 434 | ||||||
Tatneft PJSC ADR | 11,659 | 814 | ||||||
X5 Retail Group GDR | 5,903 | 198 | ||||||
|
| |||||||
| 9,159 | ||||||||
|
| |||||||
Saudi Arabia — 0.1% | ||||||||
Advanced Petrochemical | 2,835 | 44 | ||||||
Al Rajhi Bank | 28,338 | 520 | ||||||
Alinma Bank | 18,510 | 124 | ||||||
Almarai JSC | 6,499 | 88 | ||||||
Bank AlBilad | 10,010 | 77 | ||||||
BankAl-Jazira | 6,814 | 28 | ||||||
Banque Saudi Fransi | 13,356 | 144 | ||||||
Dar Al Arkan Real Estate Development* | 8,975 | 27 | ||||||
Etihad Etisalat* | 6,399 | 42 | ||||||
for Cooperative Insurance* | 1,600 | 32 | ||||||
Jarir Marketing | 2,006 | 89 | ||||||
National Commercial Bank | 27,907 | 408 | ||||||
National Industrialization* | 5,558 | 23 | ||||||
Riyad Bank | 28,895 | 200 | ||||||
Sahara International Petrochemical | 6,094 | 33 | ||||||
Samba Financial Group | 23,398 | 204 | ||||||
Saudi Arabian Fertilizer | 2,773 | 65 | ||||||
Saudi Arabian Mining* | 10,121 | 127 | ||||||
Saudi Basic Industries | 19,016 | 545 | ||||||
Saudi British Bank | 9,467 | 100 | ||||||
Saudi Cement | 1,271 | 24 | ||||||
Saudi Electricity | 30,051 | 157 | ||||||
| 14 | Adviser Managed Trust / Annual Report / July 31, 2019 |
SCHEDULE OF INVESTMENTS
July 31, 2019
Tactical Offensive Equity Fund(Continued)
| Description | Shares | Market Value ($ Thousands) | ||||||
COMMON STOCK (continued) | ||||||||
Saudi Industrial Investment Group | 3,740 | $ | 24 | |||||
Saudi Kayan Petrochemical* | 20,287 | 61 | ||||||
Saudi Telecom | 9,460 | 272 | ||||||
Savola Group* | 7,281 | 62 | ||||||
Yanbu National Petrochemical | 6,763 | 106 | ||||||
|
| |||||||
| 3,626 | ||||||||
|
| |||||||
Singapore — 0.3% | ||||||||
Ascendas Real Estate Investment Trust‡ | 89,800 | 201 | ||||||
CapitaLand Commercial Trust‡ | 95,100 | 143 | ||||||
CapitaLand Ltd | 92,300 | 244 | ||||||
CapitaLand Mall Trust‡ | 93,300 | 179 | ||||||
City Developments Ltd | 16,500 | 117 | ||||||
ComfortDelGro | 78,400 | 155 | ||||||
Dairy Farm International Holdings Ltd | 10,300 | 77 | ||||||
DBS Group Holdings Ltd | 64,100 | 1,237 | ||||||
Genting Singapore Ltd | 176,100 | 118 | ||||||
Golden Agri-Resources Ltd | 171,000 | 37 | ||||||
Hongkong Land Holdings Ltd | 41,900 | 257 | ||||||
Jardine Cycle & Carriage Ltd | 3,600 | 89 | ||||||
Jardine Matheson Holdings Ltd | 7,900 | 481 | ||||||
Jardine Strategic Holdings Ltd | 8,000 | 276 | ||||||
Keppel Corp Ltd | 52,300 | 245 | ||||||
Oversea-Chinese Banking Corp Ltd | 114,032 | 962 | ||||||
SATS Ltd | 24,700 | 87 | ||||||
Sembcorp Industries Ltd | 23,600 | 40 | ||||||
Singapore Airlines Ltd | 19,600 | 139 | ||||||
Singapore Exchange Ltd | 29,100 | 168 | ||||||
Singapore Press Holdings Ltd | 58,400 | 94 | ||||||
Singapore Technologies Engineering | 56,400 | 175 | ||||||
Singapore Telecommunications Ltd | 291,800 | 710 | ||||||
Suntec Real Estate Investment Trust‡ | 68,600 | 96 | ||||||
United Overseas Bank Ltd | 45,000 | 868 | ||||||
UOL Group Ltd | 17,000 | 91 | ||||||
Venture Corp Ltd | 10,000 | 114 | ||||||
Wilmar International Ltd | 69,400 | 202 | ||||||
Yangzijiang Shipbuilding Holdings Ltd | 87,200 | 91 | ||||||
|
| |||||||
| 7,693 | ||||||||
|
| |||||||
Slovak Republic — 0.0% | ||||||||
Celltrion Inc* | 4,038 | 582 | ||||||
|
| |||||||
South Africa — 0.6% | ||||||||
Absa Group Ltd | �� | 33,576 | 378 | |||||
Anglo American Platinum Ltd | 2,662 | 160 | ||||||
AngloGold Ashanti Ltd | 19,468 | 349 | ||||||
Aspen Pharmacare Holdings Ltd | 19,295 | 123 | ||||||
Bid Corp Ltd | 15,722 | 333 | ||||||
Bidvest Group Ltd/The | 13,878 | 181 | ||||||
Capitec Bank Holdings Ltd | 2,228 | 185 | ||||||
Clicks Group Ltd | 12,683 | 183 | ||||||
Discovery | 19,021 | 178 | ||||||
Exxaro Resources | 12,377 | 146 | ||||||
FirstRand Ltd | 154,710 | 674 | ||||||
| Description | Shares | Market Value ($ Thousands) | ||||||
COMMON STOCK (continued) | ||||||||
Fortress, Cl A‡ | 41,177 | $ | 62 | |||||
Foschini Group Ltd/The | 11,678 | 137 | ||||||
Gold Fields Ltd | 39,877 | 214 | ||||||
Growthpoint Properties Ltd‡ | 141,679 | 238 | ||||||
Investec Ltd | 14,922 | 86 | ||||||
Kumba Iron Ore Ltd | 2,229 | 75 | ||||||
Liberty Holdings Ltd | 3,342 | 26 | ||||||
Life Healthcare Group Holdings Ltd | 48,238 | 77 | ||||||
Momentum Metropolitan Holdings | 22,179 | 26 | ||||||
Mr Price Group | 12,497 | 156 | ||||||
MTN Group Ltd | 78,319 | 623 | ||||||
MultiChoice Group Ltd* | 21,205 | 201 | ||||||
Naspers Ltd, Cl N | 19,882 | 4,920 | ||||||
Nedbank Group Ltd | 17,395 | 296 | ||||||
NEPI Rockcastle PLC | 18,358 | 168 | ||||||
Netcare Ltd | 40,199 | 47 | ||||||
Old Mutual Ltd | 231,599 | 314 | ||||||
Pick n Pay Stores Ltd | 12,807 | 60 | ||||||
PSG Group Ltd | 5,218 | 84 | ||||||
Rand Merchant Investment Holdings Ltd | 26,504 | 58 | ||||||
Redefine Properties Ltd‡ | 267,178 | 166 | ||||||
Reinet Investments SCA | 5,085 | 91 | ||||||
Remgro Ltd | 24,858 | 314 | ||||||
RMB Holdings | 37,200 | 199 | ||||||
Sanlam Ltd | 82,925 | 437 | ||||||
Sappi Ltd | 18,318 | 67 | ||||||
Sasol Ltd | 25,911 | 568 | ||||||
Shoprite Holdings Ltd | 22,411 | 244 | ||||||
SPAR Group Ltd/The | 6,665 | 87 | ||||||
Standard Bank Group Ltd | 59,406 | 753 | ||||||
Telkom SA SOC Ltd | 9,728 | 59 | ||||||
Tiger Brands Ltd | 5,583 | 88 | ||||||
Truworths International Ltd | 15,321 | 68 | ||||||
Vodacom Group | 30,461 | 253 | ||||||
Woolworths Holdings Ltd/South Africa | 48,651 | 189 | ||||||
|
| |||||||
| 14,341 | ||||||||
|
| |||||||
South Korea — 1.1% | ||||||||
Amorepacific Corp | 1,538 | 182 | ||||||
AMOREPACIFIC Group | 993 | 48 | ||||||
BGF retail | 268 | 46 | ||||||
BNK Financial Group | 9,587 | 57 | ||||||
Celltrion Healthcare Co Ltd* | 1,736 | 68 | ||||||
Celltrion Pharm Inc* | 361 | 11 | ||||||
Cheil Worldwide Inc | 2,376 | 54 | ||||||
CJ CheilJedang | 287 | 69 | ||||||
CJ Corp | 502 | 40 | ||||||
CJ ENM Co Ltd | 372 | 52 | ||||||
CJ Logistics Corp* | 314 | 36 | ||||||
Daelim Industrial | 1,377 | 123 | ||||||
Daewoo Engineering & Construction* | 4,086 | 14 | ||||||
Daewoo Shipbuilding & Marine Engineering Co Ltd* | 884 | 22 | ||||||
| Adviser Managed Trust / Annual Report / July 31, 2019 | 15 |
SCHEDULE OF INVESTMENTS
July 31, 2019
Tactical Offensive Equity Fund(Continued)
| Description | Shares | Market Value ($ Thousands) | ||||||
COMMON STOCK (continued) | ||||||||
DB Insurance | 2,679 | $ | 127 | |||||
Doosan Bobcat Inc | 1,725 | 52 | ||||||
E-MART Inc | 723 | 75 | ||||||
Fila Korea Ltd | 2,385 | 136 | ||||||
GS Engineering & Construction Corp | 2,067 | 59 | ||||||
GS Holdings Corp | 1,768 | 75 | ||||||
GS Retail Co Ltd | 719 | 23 | ||||||
Hana Financial Group Inc | 13,961 | 410 | ||||||
Hankook Tire Co Ltd | 4,226 | 110 | ||||||
Hanmi Pharm | 221 | 54 | ||||||
Hanmi Science Co ltd | 323 | 13 | ||||||
Hanon Systems | 6,465 | 64 | ||||||
Hanwha Chemical | 3,669 | 58 | ||||||
Hanwha Corp | 886 | 18 | ||||||
Hanwha Life Insurance Co Ltd | 7,290 | 16 | ||||||
HDC Hyundai Development -Engineering & Construction, Cl E | 1,885 | 59 | ||||||
Helixmith Co Ltd* | 858 | 143 | ||||||
HLB Inc* | 1,152 | 26 | ||||||
Hotel Shilla Co Ltd | 1,560 | 104 | ||||||
Hyundai Department Store Co Ltd | 483 | 30 | ||||||
Hyundai Engineering & Construction | 3,782 | 138 | ||||||
Hyundai Glovis Co Ltd | 1,011 | 132 | ||||||
Hyundai Heavy Industries Co Ltd* | 1,881 | 173 | ||||||
Hyundai Heavy Industries Holdings Co Ltd | 486 | 134 | ||||||
Hyundai Marine & Fire Insurance Co Ltd | 2,100 | 50 | ||||||
Hyundai Mobis | 3,145 | 641 | ||||||
Hyundai Motor | 6,865 | 734 | ||||||
Hyundai Steel | 3,962 | 130 | ||||||
Industrial Bank of Korea | 12,420 | 138 | ||||||
Kakao Corp | 2,380 | 256 | ||||||
Kangwon Land Inc | 5,783 | 150 | ||||||
KB Financial Group Inc | 18,272 | 670 | ||||||
KCC Corp | 200 | 41 | ||||||
Kia Motors Corp | 12,252 | 453 | ||||||
Korea Aerospace Industries | 2,530 | 79 | ||||||
Korea Electric Power Corp | 12,173 | 287 | ||||||
Korea Gas Corp | 597 | 22 | ||||||
Korea Investment Holdings Co Ltd | 2,074 | 131 | ||||||
Korea Zinc Co Ltd | 415 | 155 | ||||||
Korean Air Lines | 1,632 | 35 | ||||||
KT&G Corp | 5,419 | 441 | ||||||
Kumho Petrochemical Co Ltd | 629 | 43 | ||||||
LG Chem Ltd | 2,116 | 604 | ||||||
LG Corp | 4,479 | 268 | ||||||
LG Display | 11,359 | 139 | ||||||
LG Electronics | 4,987 | 275 | ||||||
LG Household & Health Care Ltd | 434 | 461 | ||||||
LG Innotek | 489 | 47 | ||||||
LG Uplus Corp | 3,757 | 41 | ||||||
Lotte Chemical Corp | 831 | 164 | ||||||
Lotte Corp | 633 | 18 | ||||||
| Description | Shares | Market Value ($ Thousands) | ||||||
COMMON STOCK (continued) | ||||||||
Lotte Shopping Co Ltd | 392 | $ | 45 | |||||
Medy-Tox Inc | 290 | 102 | ||||||
Meritz Securities | 10,483 | 45 | ||||||
Mirae Asset Daewoo Co Ltd | 21,038 | 134 | ||||||
NAVER Corp | 6,464 | 754 | ||||||
NCSoft Corp | 775 | 315 | ||||||
Netmarble Corp (A) | 1,271 | 98 | ||||||
NH Investment & Securities Co Ltd | 8,913 | 99 | ||||||
OCI Co Ltd | 657 | 42 | ||||||
Orange Life Insurance | 776 | 19 | ||||||
Orion Corp/Republic of Korea | 821 | 56 | ||||||
Ottogi Corp | 30 | 16 | ||||||
Pan Ocean Co Ltd* | 9,200 | 37 | ||||||
Pearl Abyss Corp* | 165 | 24 | ||||||
POSCO | 3,607 | 688 | ||||||
POSCO Chemical Co Ltd | 531 | 22 | ||||||
Posco International Corp | 1,207 | 19 | ||||||
S-1, Cl 1 | 589 | 52 | ||||||
Samsung Biologics Co Ltd* (A) | 794 | 188 | ||||||
Samsung C&T Corp | 4,013 | 311 | ||||||
Samsung Card Co Ltd | 2,221 | 68 | ||||||
Samsung Electro-Mechanics Co Ltd | 2,683 | 209 | ||||||
Samsung Electronics Co Ltd | 216,216 | 8,288 | ||||||
Samsung Engineering* | 5,426 | 76 | ||||||
Samsung Fire & Marine Insurance Co Ltd | 1,445 | 321 | ||||||
Samsung Heavy Industries Co Ltd* | 21,737 | 130 | ||||||
Samsung Life Insurance Co Ltd | 3,337 | 215 | ||||||
Samsung SDI Co Ltd | 2,548 | 536 | ||||||
Samsung SDS | 1,641 | 289 | ||||||
Samsung Securities Co Ltd | 3,735 | 116 | ||||||
Shinhan Financial Group Co Ltd | 20,679 | 760 | ||||||
Shinsegae Inc | 256 | 55 | ||||||
SillaJen Inc* | 2,962 | 111 | ||||||
SK Holdings Co Ltd | 1,651 | 308 | ||||||
SK Hynix Inc | 24,898 | 1,618 | ||||||
SK Innovation Co Ltd | 2,599 | 376 | ||||||
SK Telecom Co Ltd | 967 | 203 | ||||||
S-Oil Corp | 2,214 | 176 | ||||||
Woongjin Coway Co Ltd | 2,516 | 178 | ||||||
Woori Financial Group Inc | 22,527 | 249 | ||||||
Yuhan Corp | 310 | 57 | ||||||
|
| |||||||
| 26,929 | ||||||||
|
| |||||||
Spain — 0.6% | ||||||||
ACS Actividades de Construccion y Servicios SA | 9,384 | 382 | ||||||
Aena SME SA | 2,417 | 442 | ||||||
Amadeus IT Group SA, Cl A | 15,662 | 1,244 | ||||||
Banco Bilbao Vizcaya Argentaria SA | 237,935 | 1,218 | ||||||
Banco de Sabadell SA | 202,729 | 179 | ||||||
Banco Santander SA | 578,857 | 2,490 | ||||||
Bankia | 44,986 | 90 | ||||||
Bankinter SA | 24,375 | 159 | ||||||
| 16 | Adviser Managed Trust / Annual Report / July 31, 2019 |
SCHEDULE OF INVESTMENTS
July 31, 2019
Tactical Offensive Equity Fund(Continued)
| Description | Shares | Market Value ($ Thousands) | ||||||
COMMON STOCK (continued) | ||||||||
CaixaBank SA | 128,695 | $ | 320 | |||||
Cellnex Telecom (A) | 6,982 | 263 | ||||||
Enagas SA | 8,167 | 179 | ||||||
Endesa SA | 11,406 | 284 | ||||||
Ferrovial SA | 17,442 | 457 | ||||||
Grifols | 10,713 | 350 | ||||||
Iberdrola | 214,134 | 2,043 | ||||||
Industria de Diseno Textil SA | 38,941 | 1,172 | ||||||
Mapfre SA | 39,194 | 109 | ||||||
Naturgy Energy Group | 10,780 | 275 | ||||||
Red Electrica Corp SA | 15,530 | 296 | ||||||
Repsol SA | 51,756 | 829 | ||||||
Siemens Gamesa Renewable Energy SA | 8,636 | 122 | ||||||
Telefonica SA | 166,739 | 1,285 | ||||||
|
| |||||||
| 14,188 | ||||||||
|
| |||||||
Sweden — 0.5% | ||||||||
Alfa Laval | 11,320 | 214 | ||||||
Assa Abloy AB, Cl B | 35,814 | 832 | ||||||
Atlas Copco AB, Cl B | 13,991 | 386 | ||||||
Atlas Copco AB, Cl A | 24,000 | 743 | ||||||
Boliden | 9,843 | 226 | ||||||
Electrolux AB | 8,133 | 190 | ||||||
Epiroc, Cl A | 23,719 | 262 | ||||||
Epiroc AB, Cl B | 14,147 | 148 | ||||||
Essity AB, Cl B | 21,682 | 651 | ||||||
Hennes & Mauritz AB, Cl B | 28,773 | 506 | ||||||
Hexagon, Cl B | 9,321 | 457 | ||||||
Husqvarna, Cl B | 15,147 | 136 | ||||||
ICA Gruppen AB | 2,653 | 119 | ||||||
Industrivarden AB, Cl C | 6,063 | 133 | ||||||
Investor AB, Cl B | 16,275 | 781 | ||||||
Kinnevik AB | 8,712 | 224 | ||||||
L E Lundbergforetagen AB, Cl B | 2,775 | 104 | ||||||
Lundin Petroleum | 6,754 | 215 | ||||||
Millicom International Cellular SA | 1,932 | 100 | ||||||
Nordea Bank Abp | 108,528 | 701 | ||||||
Sandvik AB | 40,352 | 627 | ||||||
Securitas AB, Cl B | 11,293 | 177 | ||||||
Skandinaviska Enskilda Banken AB, Cl A | 58,235 | 553 | ||||||
Skanska AB, Cl B | 12,256 | 231 | ||||||
SKF AB, Cl B | 13,674 | 226 | ||||||
Svenska Handelsbanken AB, Cl A | 54,645 | 497 | ||||||
Swedbank AB, Cl A | 32,422 | 447 | ||||||
Swedish Match AB | 6,324 | 244 | ||||||
Tele2 AB, Cl B | 17,957 | 259 | ||||||
Telefonaktiebolaget LM Ericsson, Cl B | 109,685 | 973 | ||||||
Telia Co AB | 100,812 | 453 | ||||||
Volvo AB, Cl B | 53,063 | 798 | ||||||
|
| |||||||
| 12,613 | ||||||||
|
| |||||||
Switzerland — 1.8% | ||||||||
ABB Ltd | 65,769 | 1,249 | ||||||
| Description | Shares | Market Value ($ Thousands) | ||||||
COMMON STOCK (continued) | ||||||||
Adecco Group AG | 5,678 | $ | 312 | |||||
Alcon Inc* | 15,486 | 907 | ||||||
Baloise Holding AG | 1,752 | 318 | ||||||
Barry Callebaut | 79 | 156 | ||||||
Chocoladefabriken Lindt & Spruengli AG | 43 | 621 | ||||||
Cie Financiere Richemont SA | 18,623 | 1,606 | ||||||
Clariant AG | 5,821 | 107 | ||||||
Coca-Cola HBC AG | 7,211 | 250 | ||||||
Credit Suisse Group AG | 91,248 | 1,109 | ||||||
Dufry AG | 1,565 | 139 | ||||||
EMS-Chemie Holding AG | 295 | 186 | ||||||
Geberit | 1,325 | 615 | ||||||
Givaudan | 330 | 882 | ||||||
Julius Baer Group Ltd | 8,029 | 346 | ||||||
Kuehne + Nagel International AG | 1,941 | 288 | ||||||
LafargeHolcim Ltd | 17,343 | 858 | ||||||
Lonza Group AG | 2,660 | 917 | ||||||
Nestle SA | 109,123 | 11,651 | ||||||
Novartis AG | 77,248 | 7,136 | ||||||
Pargesa Holding SA | 1,407 | 106 | ||||||
Partners Group Holding AG | 669 | 537 | ||||||
Roche Holding AG | 25,033 | 6,742 | ||||||
Schindler Holding | 1,461 | 340 | ||||||
Schindler Holding AG | 728 | 165 | ||||||
SGS SA | 191 | 475 | ||||||
Sika AG | 4,560 | 663 | ||||||
Sonova Holding AG | 1,988 | 461 | ||||||
Straumann Holding AG | 370 | 304 | ||||||
Swatch Group | 1,053 | 308 | ||||||
Swatch Group AG/The | 2,037 | 112 | ||||||
Swiss Life Holding AG | 1,224 | 595 | ||||||
Swiss Prime Site AG | 2,734 | 242 | ||||||
Swiss Re AG | 10,879 | 1,061 | ||||||
Swisscom AG | 927 | 452 | ||||||
Temenos AG | 2,291 | 408 | ||||||
Transocean* | 28,200 | 171 | ||||||
UBS Group | 137,554 | 1,542 | ||||||
Vifor Pharma AG | 1,638 | 244 | ||||||
Zurich Insurance Group AG | 5,398 | 1,889 | ||||||
|
| |||||||
| 46,470 | ||||||||
|
| |||||||
Taiwan — 1.1% | ||||||||
Acer Inc | 152,000 | 93 | ||||||
Advantech Co Ltd | 17,000 | 144 | ||||||
Airtac International Group | 3,000 | 31 | ||||||
ASE Technology Holding | 162,000 | 364 | ||||||
Asia Cement Corp | 107,000 | 144 | ||||||
Asustek Computer Inc | 34,000 | 243 | ||||||
AU Optronics Corp | 300,000 | 80 | ||||||
Catcher Technology Co Ltd | 31,000 | 230 | ||||||
Cathay Financial Holding Co Ltd | 350,000 | 459 | ||||||
Chailease Holding Co Ltd | 56,650 | 240 | ||||||
Chang Hwa Commercial Bank Ltd | 262,000 | 184 | ||||||
| Adviser Managed Trust / Annual Report / July 31, 2019 | 17 |
SCHEDULE OF INVESTMENTS
July 31, 2019
Tactical Offensive Equity Fund(Continued)
| Description | Shares | Market Value ($ Thousands) | ||||||
COMMON STOCK (continued) | ||||||||
Cheng Shin Rubber Industry | 111,000 | $ | 144 | |||||
Chicony Electronics Co Ltd | 31,000 | 79 | ||||||
China Airlines | 48,000 | 15 | ||||||
China Development Financial Holding Corp | 616,000 | 184 | ||||||
China Life Insurance Co Ltd/Taiwan | 134,471 | 111 | ||||||
China Steel Corp | 549,000 | 424 | ||||||
Chunghwa Telecom Co Ltd | 175,000 | 608 | ||||||
Compal Electronics | 145,000 | 89 | ||||||
CTBC Financial Holding Co Ltd | 855,000 | 558 | ||||||
Delta Electronics Inc | 91,000 | 443 | ||||||
E.Sun Financial Holding Co Ltd | 487,351 | 408 | ||||||
Eclat Textile Co Ltd | 7,000 | 93 | ||||||
Eva Airways Corp | 78,000 | 37 | ||||||
Evergreen Marine Corp Taiwan Ltd | 53,000 | 25 | ||||||
Far Eastern New Century Corp | 157,000 | 149 | ||||||
Far EasTone Telecommunications | 77,000 | 177 | ||||||
Feng TAY Enterprise Co Ltd | 11,000 | 74 | ||||||
First Financial Holding | 463,000 | 348 | ||||||
Formosa Chemicals & Fibre Corp | 162,000 | 495 | ||||||
Formosa Petrochemical | 59,000 | 201 | ||||||
Formosa Plastics | 205,000 | 663 | ||||||
Formosa Taffeta Co Ltd | 22,000 | 25 | ||||||
Foxconn Technology Co Ltd | 48,000 | 99 | ||||||
Fubon Financial Holding | 309,000 | 429 | ||||||
Giant Manufacturing Co Ltd | 15,000 | 115 | ||||||
Globalwafers | 8,000 | 87 | ||||||
Highwealth Construction Corp | 28,000 | 44 | ||||||
Hiwin Technologies | 8,000 | 72 | ||||||
Hon Hai Precision Industry Co Ltd | 569,000 | 1,438 | ||||||
Hotai Motor | 14,000 | 203 | ||||||
Hua Nan Financial Holdings Co Ltd | 358,000 | 253 | ||||||
Innolux Corp | 293,000 | 68 | ||||||
Inventec | 87,000 | 65 | ||||||
Largan Precision Co Ltd | 5,000 | 683 | ||||||
Lite-On Technology Corp | 104,000 | 148 | ||||||
MediaTek Inc | 70,000 | 708 | ||||||
Mega Financial Holding Co Ltd | 504,000 | 520 | ||||||
Micro-Star International Co Ltd | 35,000 | 99 | ||||||
Nan Ya Plastics Corp | 238,000 | 546 | ||||||
Nanya Technology | 43,000 | 102 | ||||||
Nien Made Enterprise Co Ltd | 11,000 | 85 | ||||||
Novatek Microelectronics Corp | 28,000 | 149 | ||||||
Pegatron Corp | 96,000 | 157 | ||||||
Phison Electronics Corp | 8,000 | 79 | ||||||
Pou Chen Corp | 110,000 | 136 | ||||||
Powertech Technology Inc | 26,000 | 72 | ||||||
President Chain Store Corp | 27,000 | 260 | ||||||
Quanta Computer Inc | 129,000 | 239 | ||||||
Realtek Semiconductor | 24,000 | 162 | ||||||
Ruentex Development Co Ltd | 7,000 | 9 | ||||||
Ruentex Industries Ltd | 10,000 | 21 | ||||||
| Description | Shares | Market Value ($ Thousands) | ||||||
COMMON STOCK (continued) | ||||||||
Shanghai Commercial & Savings Bank Ltd/The* | 146,000 | $ | 241 | |||||
Shin Kong Financial Holding Co Ltd | 514,000 | 149 | ||||||
SinoPac Financial Holdings Co Ltd | 514,000 | 205 | ||||||
Standard Foods Corp | 12,000 | 23 | ||||||
Synnex Technology International Corp | 70,000 | 86 | ||||||
TaiMed Biologics* | 5,000 | 27 | ||||||
Taishin Financial Holding | 452,000 | 212 | ||||||
Taiwan Business Bank | 133,000 | 57 | ||||||
Taiwan Cement | 216,000 | 311 | ||||||
Taiwan Cooperative Financial Holding Co Ltd | 416,000 | 281 | ||||||
Taiwan High Speed Rail* | 97,000 | 130 | ||||||
Taiwan Mobile | 76,000 | 268 | ||||||
Taiwan Semiconductor Manufacturing | 1,115,000 | 9,305 | ||||||
Tatung* | 44,000 | 29 | ||||||
Uni-President Enterprises Corp | 223,000 | 579 | ||||||
United Microelectronics Corp | 562,000 | 249 | ||||||
Vanguard International Semiconductor Corp | 31,000 | 63 | ||||||
Walsin Technology Corp | 11,000 | 63 | ||||||
Win Semiconductors Corp | 12,000 | 103 | ||||||
Winbond Electronics | 161,000 | 100 | ||||||
Wistron | 98,000 | 73 | ||||||
WPG Holdings Ltd | 78,000 | 103 | ||||||
Yageo* | 9,000 | 77 | ||||||
Yuanta Financial Holding Co Ltd | 470,000 | 265 | ||||||
Zhen Ding Technology Holding Ltd | 24,000 | 88 | ||||||
|
| |||||||
| 27,697 | ||||||||
|
| |||||||
Thailand — 0.3% | ||||||||
Advanced Info Service PCL NVDR | 55,700 | 386 | ||||||
Airports of Thailand PCL NVDR | 198,900 | 466 | ||||||
Bangkok Bank | 9,900 | 58 | ||||||
Bangkok Bank PCL NVDR | 13,600 | 80 | ||||||
Bangkok Dusit Medical Services PCL NVDR | 439,900 | 358 | ||||||
Bangkok Expressway & Metro PCL NVDR | 378,000 | 129 | ||||||
Banpu NVDR | 151,800 | 71 | ||||||
Berli Jucker PCL NVDR | 42,600 | 72 | ||||||
BTS Group Holdings PCL NVDR | 323,200 | 130 | ||||||
Bumrungrad Hospital NVDR | 15,300 | 85 | ||||||
Central Pattana NVDR | 106,500 | 254 | ||||||
Charoen Pokphand Foods PCL NVDR | 188,600 | 170 | ||||||
CP ALL PCL NVDR | 268,500 | 757 | ||||||
Electricity Generating PCL NVDR | 14,300 | 153 | ||||||
Energy Absolute PCL NVDR | 82,900 | 141 | ||||||
Fabrinet* | 4,477 | 240 | ||||||
Gulf Energy Development NVDR | 19,100 | 78 | ||||||
Home Product Center NVDR | 289,200 | 162 | ||||||
Indorama Ventures PCL NVDR | 84,100 | 112 | ||||||
Intouch Holdings NVDR | 100,700 | 209 | ||||||
IRPC PCL NVDR | 401,100 | 63 | ||||||
Kasikornbank PCL NVDR | 97,400 | 546 | ||||||
| 18 | Adviser Managed Trust / Annual Report / July 31, 2019 |
SCHEDULE OF INVESTMENTS
July 31, 2019
Tactical Offensive Equity Fund(Continued)
| Description | Shares | Market Value ($ Thousands) | ||||||
COMMON STOCK (continued) | ||||||||
Krung Thai Bank NVDR | 177,600 | $ | 113 | |||||
Land & Houses PCL NVDR | 412,700 | 152 | ||||||
Minor International PCL NVDR | 134,900 | 176 | ||||||
Muangthai Capital PCL NVDR | 16,500 | 32 | ||||||
PTT Exploration & Production NVDR | 65,700 | 289 | ||||||
PTT Global Chemical PCL NVDR | 108,000 | 212 | ||||||
PTT PCL NVDR | 524,500 | 806 | ||||||
Ratch Group NVDR | 26,300 | 58 | ||||||
Robinson NVDR | 12,000 | 25 | ||||||
Siam Cement PCL/The NVDR | 36,100 | 509 | ||||||
Siam Commercial Bank NVDR | 42,400 | 190 | ||||||
Thai Oil PCL NVDR | 39,200 | 88 | ||||||
Thai Union Group PCL NVDR | 118,200 | 73 | ||||||
TMB Bank NVDR | 289,100 | 18 | ||||||
Total Access Communication NVDR | 26,500 | 50 | ||||||
True Corp PCL NVDR | 414,900 | 87 | ||||||
|
| |||||||
| 7,598 | ||||||||
|
| |||||||
Turkey — 0.1% | ||||||||
Akbank T.A.S. | 140,184 | 190 | ||||||
Anadolu Efes Biracilik Ve Malt Sanayii | 6,106 | 24 | ||||||
Arcelik AS | 4,547 | 14 | ||||||
Aselsan Elektronik Sanayi Ve Ticaret AS | 8,833 | 30 | ||||||
BIM Birlesik Magazalar AS | 21,008 | 177 | ||||||
Eregli Demir ve Celik Fabrikalari TAS | 87,058 | 116 | ||||||
Ford Otomotiv Sanayi | 1,100 | 12 | ||||||
Haci Omer Sabanci Holding | 50,001 | 89 | ||||||
KOC Holding AS | 26,326 | 89 | ||||||
TAV Havalimanlari Holding AS | 5,106 | 23 | ||||||
Tupras Turkiye Petrol Rafinerileri AS | 4,333 | 109 | ||||||
Turk Hava Yollari AO* | 18,779 | 42 | ||||||
Turkcell Iletisim Hizmetleri AS | 38,065 | 89 | ||||||
Turkiye Garanti Bankasi AS* | 112,830 | 200 | ||||||
Turkiye Is Bankasi, Cl C | 53,580 | 60 | ||||||
Turkiye Sise ve Cam Fabrikalari AS | 10,094 | 9 | ||||||
|
| |||||||
| 1,273 | ||||||||
|
| |||||||
United Arab Emirates — 0.1% | �� | |||||||
Abu Dhabi Commercial Bank PJSC | 131,122 | 321 | ||||||
Aldar Properties PJSC | 133,321 | 84 | ||||||
DP World PLC | 8,231 | 127 | ||||||
Dubai Islamic Bank PJSC | 83,268 | 121 | ||||||
Emaar Development PJSC | 15,970 | 21 | ||||||
Emaar Malls PJSC | 90,071 | 52 | ||||||
Emaar Properties PJSC | 168,992 | 254 | ||||||
Emirates Telecommunications Group Co PJSC | 81,408 | 382 | ||||||
First Abu Dhabi Bank PJSC | 126,204 | 546 | ||||||
|
| |||||||
| 1,908 | ||||||||
|
| |||||||
United Kingdom — 2.9% | ||||||||
3i Group PLC | 34,842 | 475 | ||||||
Admiral Group PLC | 6,819 | 181 | ||||||
Anglo American PLC | 37,622 | 939 | ||||||
| Description | Shares | Market Value ($ Thousands) | ||||||
COMMON STOCK (continued) | ||||||||
Antofagasta PLC | 14,264 | $ | 164 | |||||
Aon PLC | 13,100 | 2,479 | ||||||
Ashtead Group PLC | 16,929 | 471 | ||||||
Associated British Foods PLC | 12,770 | 378 | ||||||
AstraZeneca | 45,162 | 3,905 | ||||||
Auto Trader Group PLC (A) | 33,622 | 223 | ||||||
Aviva PLC | 139,497 | 694 | ||||||
BAE Systems PLC | 114,253 | 767 | ||||||
Barclays | 611,568 | 1,154 | ||||||
Barratt Developments | 36,472 | 288 | ||||||
Berkeley Group Holdings PLC | 4,420 | 210 | ||||||
BHP Group PLC | 75,329 | 1,830 | ||||||
BP PLC | 721,964 | 4,824 | ||||||
British American Tobacco PLC | 81,769 | 2,956 | ||||||
British Land‡ | 32,630 | 203 | ||||||
BT Group, Cl A | 301,359 | 713 | ||||||
Bunzl PLC | 12,074 | 318 | ||||||
Burberry Group | 14,763 | 408 | ||||||
Carnival PLC | 5,908 | 268 | ||||||
Centrica PLC | 205,055 | 191 | ||||||
Compass Group | 56,595 | 1,443 | ||||||
Croda International PLC | 4,614 | 265 | ||||||
DCC PLC | 3,528 | 301 | ||||||
Diageo PLC | 86,180 | 3,634 | ||||||
Direct Line Insurance Group | 49,578 | 196 | ||||||
easyJet PLC | 5,883 | 69 | ||||||
Evraz | 18,281 | 146 | ||||||
Ferguson | 8,297 | 626 | ||||||
Fresnillo PLC | 8,110 | 60 | ||||||
G4S PLC | 56,171 | 132 | ||||||
GlaxoSmithKline PLC | 176,963 | 3,689 | ||||||
Glencore PLC | 397,001 | 1,295 | ||||||
GVC Holdings PLC | 21,034 | 152 | ||||||
Halma | 13,620 | 332 | ||||||
Hargreaves Lansdown PLC | 10,241 | 263 | ||||||
HSBC Holdings | 714,485 | 5,745 | ||||||
Imperial Brands PLC | 34,180 | 877 | ||||||
Informa | 44,829 | �� | 480 | |||||
InterContinental Hotels Group PLC | 6,166 | 432 | ||||||
Intertek Group PLC | 5,783 | 404 | ||||||
Investec PLC | 24,690 | 142 | ||||||
ITV | 130,824 | 178 | ||||||
J Sainsbury PLC | 63,755 | 153 | ||||||
John Wood Group PLC | 24,761 | 161 | ||||||
Johnson Matthey PLC | 6,956 | 274 | ||||||
Kingfisher PLC | 76,085 | 207 | ||||||
Kingspan Group PLC | 5,509 | 272 | ||||||
Land Securities Group PLC‡ | 25,322 | 247 | ||||||
Legal & General Group | 213,038 | 683 | ||||||
Lloyds Banking Group PLC | 2,544,641 | 1,662 | ||||||
London Stock Exchange Group PLC | 11,197 | 908 | ||||||
Magnitogorsk Iron & Steel Works PJSC GDR | 6,131 | 54 | ||||||
| Adviser Managed Trust / Annual Report / July 31, 2019 | 19 |
SCHEDULE OF INVESTMENTS
July 31, 2019
Tactical Offensive Equity Fund(Continued)
| Description | Shares | Market Value ($ Thousands) | ||||||
COMMON STOCK (continued) | ||||||||
Marks & Spencer Group | 70,371 | $ | 179 | |||||
Meggitt PLC | 28,044 | 205 | ||||||
Melrose Industries PLC | 174,156 | 399 | ||||||
Merlin Entertainments PLC (A) | 25,982 | 144 | ||||||
Micro Focus International | 6,081 | 129 | ||||||
Micro Focus International PLC ADR | 6,221 | 130 | ||||||
Mondi | 17,291 | 382 | ||||||
National Grid PLC | 121,695 | 1,258 | ||||||
Next PLC | 4,936 | 366 | ||||||
NMC Health PLC | 3,417 | 103 | ||||||
Novolipetsk Steel PJSC GDR | 5,872 | 139 | ||||||
Ocado Group* | 16,369 | 250 | ||||||
Pearson PLC | 28,069 | 299 | ||||||
Persimmon PLC | 11,412 | 281 | ||||||
Polymetal International | 7,309 | 89 | ||||||
Polyus PJSC GDR | 2,002 | 102 | ||||||
Prudential PLC | 92,479 | 1,923 | ||||||
Reckitt Benckiser Group PLC | 25,230 | 1,968 | ||||||
RELX PLC | 70,009 | 1,675 | ||||||
Rentokil Initial | 66,367 | 353 | ||||||
Rio Tinto PLC | 40,644 | 2,338 | ||||||
Rolls-Royce Holdings PLC | 60,987 | 644 | ||||||
Royal Bank of Scotland Group PLC | 172,536 | 458 | ||||||
RSA Insurance Group PLC | 36,918 | 253 | ||||||
Sage Group PLC/The | 38,922 | 343 | ||||||
Schroders PLC | 4,492 | 164 | ||||||
Seadrill* | 7,983 | 33 | ||||||
Segro PLC‡ | 38,895 | 364 | ||||||
Severn Trent PLC | 8,541 | 211 | ||||||
Smith & Nephew PLC | 31,277 | 712 | ||||||
Smiths Group PLC | 14,231 | 286 | ||||||
Spirax-Sarco Engineering | 2,644 | 291 | ||||||
SSE PLC | 36,738 | 495 | ||||||
St. James’s Place | 19,042 | 229 | ||||||
Standard Chartered PLC | 100,465 | 833 | ||||||
Standard Life Aberdeen PLC | 89,429 | 327 | ||||||
Tata Steel Ltd GDR | 12,084 | 75 | ||||||
Taylor Wimpey | 118,018 | 234 | ||||||
Tesco PLC | 349,654 | 956 | ||||||
Unilever PLC | 39,579 | 2,402 | ||||||
United Utilities Group PLC | 24,525 | 237 | ||||||
Vodafone Group PLC | 953,261 | 1,752 | ||||||
VTB Bank PJSC GDR | 54,743 | 73 | ||||||
Weir Group PLC/The | 9,373 | 172 | ||||||
Whitbread PLC | 6,471 | 358 | ||||||
Wm Morrison Supermarkets PLC | 85,331 | 203 | ||||||
WPP PLC | 45,141 | 536 | ||||||
|
| |||||||
| 74,874 | ||||||||
|
| |||||||
United States — 68.3% | ||||||||
Communication Services — 6.1% | ||||||||
Activision Blizzard Inc | 41,100 | 2,003 | ||||||
Alphabet Inc, Cl A* | 16,300 | 19,857 | ||||||
| Description | Shares | Market Value ($ Thousands) | ||||||
COMMON STOCK (continued) | ||||||||
Alphabet Inc, Cl C* | 16,600 | $ | 20,197 | |||||
Altice USA, Cl A* | 17,900 | 462 | ||||||
AMC Entertainment Holdings Inc, Cl A | 6,766 | 80 | ||||||
AMC Networks Inc, Cl A* | 2,400 | 128 | ||||||
AT&T Inc | 396,900 | 13,514 | ||||||
ATN International Inc | 1,352 | 76 | ||||||
Bandwidth, Cl A* | 2,041 | 152 | ||||||
Boingo Wireless Inc* | 5,229 | 79 | ||||||
Boston Omaha Corp, Cl A* | 1,358 | 29 | ||||||
Cable One Inc | 200 | 243 | ||||||
Cardlytics Inc* | 1,801 | 51 | ||||||
Care.com Inc* | 2,871 | 31 | ||||||
Cargurus, Cl A* | 9,338 | 348 | ||||||
Cars.com Inc* | 8,630 | 164 | ||||||
CBS Corp, Cl B | 17,700 | 912 | ||||||
CenturyLink | 59,300 | 717 | ||||||
Charter Communications Inc, Cl A* | 8,700 | 3,353 | ||||||
Cincinnati Bell Inc* | 6,675 | 25 | ||||||
Cinemark Holdings Inc | 5,800 | 232 | ||||||
Clear Channel Outdoor Holdings, Cl A* | 5,280 | 16 | ||||||
Cogent Communications Holdings Inc | 5,347 | 337 | ||||||
Comcast Corp, Cl A | 245,400 | 10,594 | ||||||
Consolidated Communications Holdings Inc | 9,345 | 44 | ||||||
Cumulus Media, Cl A* | 1,916 | 29 | ||||||
Daily Journal Corp* | 153 | 38 | ||||||
Discovery Inc, Cl A* | 8,400 | 255 | ||||||
Discovery Inc, Cl C* | 18,800 | 531 | ||||||
DISH Network Corp, Cl A* | 12,100 | 410 | ||||||
Electronic Arts Inc* | 16,200 | 1,499 | ||||||
Emerald Expositions Events Inc | 3,351 | 36 | ||||||
Entercom Communications, Cl A | 16,369 | 93 | ||||||
Entravision Communications Corp, Cl A | 8,406 | 27 | ||||||
Eros International PLC* | 3,324 | 6 | ||||||
Eventbrite, Cl A* | 4,716 | 83 | ||||||
EverQuote, Cl A* | 1,256 | 19 | ||||||
EW Scripps, Cl A | 7,005 | 107 | ||||||
Facebook Inc, Cl A* | 130,300 | 25,308 | ||||||
Fluent Inc* | 5,810 | 30 | ||||||
Fox Corp | 27,900 | 1,040 | ||||||
Frontier Communications* | 14,493 | 19 | ||||||
Gannett Co Inc | 14,354 | 147 | ||||||
GCI Liberty Inc* | 5,500 | 329 | ||||||
Glu Mobile* | 14,347 | 107 | ||||||
Gogo Inc* | 5,495 | 23 | ||||||
Gray Television Inc* | 11,528 | 205 | ||||||
Hemisphere Media Group Inc, Cl A* | 1,767 | 22 | ||||||
IAC/InterActiveCorp* | 4,100 | 980 | ||||||
IDT, Cl B* | 2,382 | 24 | ||||||
Intelsat SA* | 8,501 | 192 | ||||||
Interpublic Group of Cos Inc/The | 20,900 | 479 | ||||||
Iridium Communications* | 12,479 | 317 | ||||||
John Wiley & Sons Inc, Cl A | 2,400 | 109 | ||||||
| 20 | Adviser Managed Trust / Annual Report / July 31, 2019 |
SCHEDULE OF INVESTMENTS
July 31, 2019
Tactical Offensive Equity Fund(Continued)
| Description | Shares | Market Value ($ Thousands) | ||||||
COMMON STOCK (continued) | ||||||||
Liberty Broadband Corp, Cl C* | 5,700 | $ | 567 | |||||
Liberty Broadband Corp, Cl A* | 1,400 | 137 | ||||||
Liberty Latin America Ltd, Cl A* | 5,540 | 91 | ||||||
Liberty Latin America Ltd, Cl C* | 14,072 | 231 | ||||||
Liberty Media Corp-Liberty Braves, Cl A* | 1,344 | 39 | ||||||
Liberty Media Corp-Liberty Formula One, Cl C* | 10,800 | 425 | ||||||
Liberty Media Corp-Liberty Formula One, Cl A* | 1,400 | 52 | ||||||
Liberty Media Corp-Liberty SiriusXM, Cl A* | 4,600 | 191 | ||||||
Liberty Media -Liberty Braves, Cl C* | 4,513 | 130 | ||||||
Liberty Media -Liberty SiriusXM, Cl C* | 9,000 | 377 | ||||||
Liberty TripAdvisor Holdings Inc, Cl A* | 9,220 | 106 | ||||||
Lions Gate Entertainment, Cl A | 2,700 | 35 | ||||||
Lions Gate Entertainment Corp, Cl B | 5,400 | 66 | ||||||
Live Nation Entertainment Inc* | 7,500 | 540 | ||||||
LiveXLive Media Inc* | 3,080 | 9 | ||||||
Loral Space & Communications Inc* | 1,702 | 63 | ||||||
Madison Square Garden* | 1,000 | 290 | ||||||
Marcus Corp/The | 2,899 | 101 | ||||||
Match Group Inc | 2,900 | 218 | ||||||
Meet Group Inc/The* | 9,917 | 34 | ||||||
Meredith Corp | 5,075 | 278 | ||||||
MSG Networks Inc* | 7,418 | 141 | ||||||
National CineMedia Inc | 7,419 | 53 | ||||||
Netflix Inc* | 22,800 | 7,364 | ||||||
New Media Investment Group | 7,763 | 84 | ||||||
New York Times, Cl A | 8,800 | 314 | ||||||
News Corp, Cl A | 20,800 | 274 | ||||||
News Corp | 6,600 | 89 | ||||||
Nexstar Media Group Inc, Cl A | 2,400 | 244 | ||||||
Omnicom Group Inc | 12,100 | 971 | ||||||
Ooma* | 2,651 | 35 | ||||||
ORBCOMM Inc* | 9,574 | 56 | ||||||
Pareteum* | 14,399 | 50 | ||||||
pdvWireless Inc* | 1,196 | 53 | ||||||
QuinStreet Inc* | 5,717 | 93 | ||||||
Reading International Inc, Cl A* | 2,413 | 31 | ||||||
Rosetta Stone Inc* | 2,636 | 61 | ||||||
Saga Communications Inc, Cl A | 405 | 13 | ||||||
Scholastic Corp | 3,606 | 123 | ||||||
Shenandoah Telecommunications Co | 6,120 | 241 | ||||||
Sinclair Broadcast Group, Cl A | 3,300 | 166 | ||||||
Sirius XM Holdings | 77,100 | 483 | ||||||
Spok Holdings | 1,752 | 23 | ||||||
Spotify Technology* | 6,400 | 992 | ||||||
Sprint Corp* | 35,700 | 262 | ||||||
Take-Two Interactive Software Inc* | 6,100 | 747 | ||||||
TechTarget Inc* | 2,952 | 68 | ||||||
TEGNA Inc | 27,644 | 420 | ||||||
Telephone & Data Systems Inc | 5,400 | 175 | ||||||
T-Mobile US Inc* | 16,800 | 1,339 | ||||||
| Description | Shares | Market Value ($ Thousands) | ||||||
COMMON STOCK (continued) | ||||||||
Travelzoo* | 136 | $ | 2 | |||||
Tribune Media Co, Cl A | 4,800 | 223 | ||||||
Tribune Publishing Co | 2,526 | 21 | ||||||
TripAdvisor Inc* | 5,700 | 252 | ||||||
TrueCar Inc* | 12,379 | 63 | ||||||
Twitter Inc* | 39,000 | 1,650 | ||||||
United States Cellular Corp* | 700 | 34 | ||||||
Verizon Communications Inc | 225,900 | 12,485 | ||||||
Viacom, Cl B | 19,300 | 586 | ||||||
Viacom Inc, Cl A | 500 | 17 | ||||||
Vonage Holdings Corp* | 28,505 | 353 | ||||||
Walt Disney Co/The | 95,300 | 13,629 | ||||||
WideOpenWest* | 4,266 | 32 | ||||||
World Wrestling Entertainment Inc, Cl A | 2,400 | 175 | ||||||
Yelp, Cl A* | 9,333 | 327 | ||||||
Zayo Group Holdings Inc* | 12,400 | 418 | ||||||
Zillow Group Inc, Cl C* | 6,600 | 330 | ||||||
Zillow Group Inc, Cl A* | 3,100 | 155 | ||||||
Zynga, Cl A* | 41,700 | 266 | ||||||
|
| |||||||
| 156,071 | ||||||||
|
| |||||||
Consumer Discretionary — 7.2% | ||||||||
1-800-Flowers.com Inc, Cl A* | 3,475 | 68 | ||||||
Aaron’s Inc | 8,490 | 535 | ||||||
Abercrombie & Fitch Co, Cl A | 8,321 | 158 | ||||||
Acushnet Holdings Corp | 4,389 | 112 | ||||||
Adient | 11,068 | 263 | ||||||
Adtalem Global Education Inc* | 7,085 | 336 | ||||||
Advance Auto Parts Inc | 3,800 | 572 | ||||||
Amazon.com Inc* | 22,600 | 42,189 | ||||||
American Axle & Manufacturing Holdings Inc* | 13,951 | 168 | ||||||
American Eagle Outfitters Inc | 20,592 | 364 | ||||||
American Outdoor Brands Corp* | 7,051 | 68 | ||||||
American Public Education Inc* | 2,115 | 70 | ||||||
America’sCar-Mart Inc/TX* | 759 | 68 | ||||||
Aramark | 13,300 | 481 | ||||||
Asbury Automotive Group Inc* | 2,416 | 222 | ||||||
Ascena Retail Group Inc* | 11,397 | 5 | ||||||
At Home Group Inc* | 6,314 | 38 | ||||||
AutoNation Inc* | 3,000 | 146 | ||||||
AutoZone Inc* | 1,300 | 1,460 | ||||||
Barnes & Noble Education Inc* | 4,021 | 14 | ||||||
Barnes & Noble Inc | 7,711 | 50 | ||||||
Bassett Furniture Industries | 1,017 | 13 | ||||||
BBX Capital Corp, Cl A | 8,835 | 38 | ||||||
Beazer Homes USA Inc* | 3,978 | 47 | ||||||
Bed Bath & Beyond | 16,427 | 160 | ||||||
Best Buy Co Inc | 12,600 | 964 | ||||||
Big Lots Inc | 5,047 | 129 | ||||||
Biglari Holdings, Cl B* | 142 | 13 | ||||||
BJ’s Restaurants Inc | 2,655 | 105 | ||||||
Bloomin’ Brands | 11,614 | 198 | ||||||
| Adviser Managed Trust / Annual Report / July 31, 2019 | 21 |
SCHEDULE OF INVESTMENTS
July 31, 2019
Tactical Offensive Equity Fund(Continued)
| Description | Shares | Market Value ($ Thousands) | ||||||
COMMON STOCK (continued) | ||||||||
Bluegreen Vacations Corp | 218 | $ | 2 | |||||
Booking Holdings Inc* | 2,400 | 4,528 | ||||||
Boot Barn Holdings Inc* | 3,547 | 111 | ||||||
BorgWarner Inc | 11,400 | 431 | ||||||
Boyd Gaming Corp | 10,181 | 270 | ||||||
Bright Horizons Family Solutions Inc* | 3,100 | 471 | ||||||
Brinker International Inc | 4,688 | 187 | ||||||
Brunswick Corp/DE | 4,700 | 231 | ||||||
Buckle Inc/The | 3,786 | 77 | ||||||
Burlington Stores Inc* | 3,600 | 651 | ||||||
Caesars Entertainment* | 31,100 | 368 | ||||||
Caleres Inc | 5,382 | 101 | ||||||
Callaway Golf | 11,685 | 214 | ||||||
Camping World Holdings Inc, Cl A | 4,325 | 51 | ||||||
Capri Holdings Ltd* | 7,600 | 270 | ||||||
Career Education* | 8,513 | 161 | ||||||
CarMax Inc* | 9,300 | 816 | ||||||
Carnival Corp | 21,800 | 1,030 | ||||||
Carriage Services Inc, Cl A | 2,251 | 43 | ||||||
Carrols Restaurant Group Inc* | 4,625 | 43 | ||||||
Carter’s Inc | 2,500 | 233 | ||||||
Carvana Co, Cl A* | 2,200 | 140 | ||||||
Cato Corp/The, Cl A | 2,943 | 42 | ||||||
Cavco Industries Inc* | 1,069 | 190 | ||||||
Century Casinos Inc* | 3,684 | 36 | ||||||
Century Communities Inc* | 3,360 | 93 | ||||||
Cheesecake Factory Inc/The | 5,248 | 226 | ||||||
Chegg* | 14,561 | 654 | ||||||
Chico’s FAS Inc | 15,857 | 51 | ||||||
Children’s Place | 1,965 | 192 | ||||||
Chipotle Mexican Grill, Cl A* | 1,300 | 1,034 | ||||||
Choice Hotels International Inc | 1,900 | 163 | ||||||
Churchill Downs Inc | 4,462 | 534 | ||||||
Chuy’s Holdings Inc* | 2,210 | 52 | ||||||
Citi Trends Inc | 1,603 | 25 | ||||||
Clarus Corp | 3,103 | 45 | ||||||
Collectors Universe | 1,129 | 27 | ||||||
Columbia Sportswear Co | 1,600 | 170 | ||||||
Conn’s Inc* | 2,631 | 55 | ||||||
Container Store Group Inc/The* | 1,670 | 10 | ||||||
Cooper Tire & Rubber | 6,322 | 170 | ||||||
Cooper-Standard Holdings Inc* | 2,271 | 112 | ||||||
Core-Mark Holding Co Inc | 5,676 | 212 | ||||||
Cracker Barrel Old Country Store Inc | 2,448 | 425 | ||||||
Crocs* | 8,318 | 190 | ||||||
Culp | 1,511 | 27 | ||||||
Dana Inc | 18,043 | 301 | ||||||
Darden Restaurants Inc | 6,800 | 827 | ||||||
Dave & Buster’s Entertainment Inc | 4,833 | 196 | ||||||
Deckers Outdoor Corp* | 3,670 | 574 | ||||||
Del Frisco’s Restaurant Group Inc* | 4,738 | 38 | ||||||
Del Taco Restaurants Inc* | 3,794 | 46 | ||||||
| Description | Shares | Market Value ($ Thousands) | ||||||
COMMON STOCK (continued) | ||||||||
Delphi Automotive PLC | 14,200 | $ | 1,245 | |||||
Delta Apparel* | 877 | 17 | ||||||
Denny’s Corp* | 7,656 | 173 | ||||||
Designer Brands Inc, Cl A | 8,616 | 158 | ||||||
Dick’s Sporting Goods Inc | 3,900 | 145 | ||||||
Dillard’s Inc, Cl A | 1,434 | 104 | ||||||
Dine Brands Global Inc | 2,086 | 171 | ||||||
Dollar General Corp | 14,100 | 1,890 | ||||||
Dollar Tree Inc* | 12,800 | 1,302 | ||||||
Domino’s Pizza Inc | 2,300 | 562 | ||||||
Dorman Products Inc* | 3,319 | 239 | ||||||
DR Horton Inc | 18,600 | 854 | ||||||
Drive Shack Inc* | 8,093 | 42 | ||||||
Duluth Holdings Inc, Cl B* | 855 | 10 | ||||||
Dunkin’ Brands Group Inc | 4,500 | 361 | ||||||
eBay Inc | 45,000 | 1,854 | ||||||
El Pollo Loco Holdings Inc* | 2,132 | 21 | ||||||
Eldorado Resorts Inc* | 8,381 | 378 | ||||||
Empire Resorts Inc* | 108 | 1 | ||||||
Escalade Inc | 1,113 | 13 | ||||||
Ethan Allen Interiors Inc | 3,148 | 65 | ||||||
Etsy Inc* | 6,500 | 436 | ||||||
Everi Holdings Inc* | 8,493 | 102 | ||||||
Expedia Group Inc | 6,400 | 850 | ||||||
Express Inc* | 9,111 | 22 | ||||||
Extended Stay America | 10,300 | 172 | ||||||
Fiesta Restaurant Group* | 2,261 | 22 | ||||||
Five Below Inc* | 3,000 | 352 | ||||||
Flexsteel Industries | 755 | 14 | ||||||
Floor & Decor Holdings Inc, Cl A* | 3,200 | 125 | ||||||
Foot Locker Inc | 6,100 | 250 | ||||||
Ford Motor Co | 213,000 | 2,030 | ||||||
Fossil Group Inc* | 5,999 | 66 | ||||||
Fox Factory Holding* | 4,732 | 379 | ||||||
frontdoor Inc* | 4,600 | 210 | ||||||
Funko Inc, Cl A* | 2,227 | 56 | ||||||
Gaia Inc, Cl A* | 329 | 2 | ||||||
GameStop, Cl A | 13,076 | 53 | ||||||
Gap Inc/The | 11,800 | 230 | ||||||
Garmin Ltd | 7,900 | 621 | ||||||
General Motors Co | 67,600 | 2,727 | ||||||
Genesco Inc* | 2,507 | 99 | ||||||
Gentex Corp | 14,300 | 392 | ||||||
Gentherm Inc* | 4,351 | 178 | ||||||
Genuine Parts Co | 7,800 | 758 | ||||||
G-III Apparel Group Ltd* | 5,467 | 157 | ||||||
GNC Holdings Inc, Cl A* | 8,476 | 18 | ||||||
Golden Entertainment* | 1,809 | 25 | ||||||
Goodyear Tire & Rubber Co/The | 12,700 | 174 | ||||||
GoPro Inc, Cl A* | 14,804 | 78 | ||||||
Graham Holdings, Cl B | 200 | 149 | ||||||
Grand Canyon Education* | 2,600 | 283 | ||||||
| 22 | Adviser Managed Trust / Annual Report / July 31, 2019 |
SCHEDULE OF INVESTMENTS
July 31, 2019
Tactical Offensive Equity Fund(Continued)
| Description | Shares | Market Value ($ Thousands) | ||||||
COMMON STOCK (continued) | ||||||||
Green Brick Partners Inc* | 3,525 | $ | 33 | |||||
Group 1 Automotive Inc | 2,305 | 194 | ||||||
Groupon Inc, Cl A* | 55,574 | 175 | ||||||
GrubHub Inc* | 4,900 | 331 | ||||||
Guess? Inc | 7,334 | 124 | ||||||
H&R Block Inc | 11,200 | 310 | ||||||
Habit Restaurants Inc/The, Cl A* | 2,816 | 28 | ||||||
Hamilton Beach Brands Holding Co, Cl A | 674 | 11 | ||||||
Hanesbrands Inc | 19,600 | 315 | ||||||
Harley-Davidson Inc | 8,900 | 318 | ||||||
Hasbro Inc | 6,300 | 763 | ||||||
Haverty Furniture Cos Inc | 2,451 | 44 | ||||||
Helen of Troy Ltd* | 3,161 | 469 | ||||||
Hibbett Sports Inc* | 2,413 | 44 | ||||||
Hilton Grand Vacations Inc* | 5,300 | 173 | ||||||
Hilton Worldwide Holdings Inc | 15,000 | 1,448 | ||||||
Home Depot | 60,100 | 12,843 | ||||||
Hooker Furniture | 1,586 | 33 | ||||||
Houghton Mifflin Harcourt* | 13,486 | 79 | ||||||
Hudson Ltd, Cl A* | 5,192 | 66 | ||||||
Hyatt Hotels Corp, Cl A | 2,200 | 170 | ||||||
Inspired Entertainment* | 1,391 | 11 | ||||||
Installed Building Products Inc* | 2,727 | 145 | ||||||
International Game Technology | 5,400 | 72 | ||||||
International Speedway, Cl A | 2,963 | 134 | ||||||
iRobot Corp* | 3,502 | 256 | ||||||
J Alexander’s Holdings Inc* | 1,321 | 14 | ||||||
J. Jill Inc | 481 | 1 | ||||||
Jack in the Box Inc | 3,185 | 229 | ||||||
JC Penney Co Inc* | 41,985 | 33 | ||||||
Johnson Outdoors Inc, Cl A | 648 | 44 | ||||||
K12 Inc* | 4,705 | 140 | ||||||
KB Home | 10,630 | 279 | ||||||
Kohl’s Corp | 8,900 | 479 | ||||||
Kontoor Brands | 5,615 | 165 | ||||||
L Brands Inc | 12,500 | 324 | ||||||
Lands’ End Inc* | 1,063 | 12 | ||||||
Las Vegas Sands Corp | 18,500 | 1,118 | ||||||
Laureate Education Inc, Cl A* | 11,834 | 194 | ||||||
La-Z-Boy Inc, Cl Z | 5,830 | 192 | ||||||
LCI Industries | 3,022 | 277 | ||||||
Leaf Group Ltd* | 1,750 | 11 | ||||||
Lear Corp | 3,400 | 431 | ||||||
Lee Enterprises* | 7,797 | 17 | ||||||
Legacy Housing* | 136 | 2 | ||||||
Leggett & Platt | 7,100 | 284 | ||||||
Lennar Corp, Cl B | 900 | 34 | ||||||
Lennar Corp, Cl A | 15,400 | 733 | ||||||
LGI Homes Inc* | 2,537 | 178 | ||||||
Lifetime Brands Inc | 1,266 | 11 | ||||||
Lindblad Expeditions Holdings Inc* | 3,009 | 57 | ||||||
Liquidity Services* | 3,831 | 25 | ||||||
| Description | Shares | Market Value ($ Thousands) | ||||||
COMMON STOCK (continued) | ||||||||
Lithia Motors, Cl A | 2,742 | $ | 362 | |||||
LKQ Corp* | 17,300 | 466 | ||||||
Lovesac Co/The* | 804 | 17 | ||||||
Lowe’s | 43,900 | 4,451 | ||||||
Lululemon Athletica Inc* | 6,400 | 1,223 | ||||||
Lumber Liquidators Holdings* | 3,782 | 33 | ||||||
M/I Homes Inc* | 3,461 | 122 | ||||||
Macy’s Inc | 16,700 | 380 | ||||||
Malibu Boats Inc, Cl A* | 2,653 | 80 | ||||||
Marine Products Corp | 799 | 13 | ||||||
MarineMax* | 2,925 | 45 | ||||||
Marriott International Inc/MD, Cl A | 15,400 | 2,142 | ||||||
Marriott Vacations Worldwide Corp | 5,543 | 567 | ||||||
MasterCraft Boat Holdings Inc* | 2,418 | 40 | ||||||
Mattel Inc* | 18,800 | 274 | ||||||
McDonald’s | 41,800 | 8,808 | ||||||
MDC Holdings Inc | 6,096 | 220 | ||||||
Meritage Homes Corp* | 4,724 | 297 | ||||||
MGM Resorts International | 27,300 | 820 | ||||||
Michaels Cos Inc/The* | 10,962 | 75 | ||||||
Modine Manufacturing Co* | 6,377 | 87 | ||||||
Mohawk Industries Inc* | 3,400 | 424 | ||||||
Monarch Casino & Resort Inc* | 1,489 | 70 | ||||||
Monro Inc | 4,107 | 346 | ||||||
Motorcar Parts of America Inc* | 2,473 | 44 | ||||||
Movado Group Inc | 1,966 | 52 | ||||||
Murphy USA Inc* | 3,882 | 343 | ||||||
Nathan’s Famous Inc | 397 | 28 | ||||||
National Vision Holdings Inc* | 8,676 | 274 | ||||||
Newell Brands | 23,600 | 335 | ||||||
NIKE Inc, Cl B | 67,200 | 5,781 | ||||||
Noodles, Cl A* | 3,931 | 29 | ||||||
Nordstrom Inc | 6,400 | 212 | ||||||
Norwegian Cruise Line Holdings Ltd* | 12,000 | 593 | ||||||
NVR Inc* | 170 | 568 | ||||||
Office Depot Inc | 68,705 | 140 | ||||||
Ollie’s Bargain Outlet Holdings Inc* | 2,900 | 246 | ||||||
OneSpaWorld Holdings* | 5,833 | 91 | ||||||
O’Reilly Automotive Inc* | 4,200 | 1,599 | ||||||
Overstock.com Inc* | 3,580 | 81 | ||||||
Oxford Industries Inc | 2,098 | 154 | ||||||
Papa John’s International Inc | 2,802 | 124 | ||||||
Party City Holdco Inc* | 7,103 | 45 | ||||||
Penn National Gaming Inc* | 14,162 | 276 | ||||||
Penske Automotive Group Inc | 1,900 | 87 | ||||||
PetMed Express Inc | 2,667 | 46 | ||||||
Planet Fitness, Cl A* | 4,600 | 362 | ||||||
PlayAGS Inc* | 3,456 | 65 | ||||||
Polaris Industries Inc | 3,200 | 303 | ||||||
Pool Corp | 2,100 | 398 | ||||||
Potbelly* | 2,339 | 10 | ||||||
PulteGroup Inc | 13,700 | 432 | ||||||
| Adviser Managed Trust / Annual Report / July 31, 2019 | 23 |
SCHEDULE OF INVESTMENTS
July 31, 2019
Tactical Offensive Equity Fund(Continued)
| Description | Shares | Market Value ($ Thousands) | ||||||
COMMON STOCK (continued) | ||||||||
PVH Corp | 4,100 | $ | 365 | |||||
Quotient Technology Inc* | 10,139 | 107 | ||||||
Qurate Retail Inc, Cl A* | 22,600 | 320 | ||||||
Ralph Lauren Corp, Cl A | 2,900 | 302 | ||||||
RCI Hospitality Holdings Inc | 1,293 | 22 | ||||||
Red Lion Hotels* | 3,360 | 23 | ||||||
Red Robin Gourmet Burgers* | 1,696 | 56 | ||||||
Red Rock Resorts Inc, Cl A | 8,673 | 181 | ||||||
Regis Corp* | 4,028 | 74 | ||||||
Rent-A-Center Inc/TX, Cl A* | 6,185 | 167 | ||||||
RH* | 2,352 | 328 | ||||||
Rocky Brands Inc | 960 | 30 | ||||||
Roku Inc, Cl A* | 4,500 | 465 | ||||||
Ross Stores | 19,900 | 2,110 | ||||||
Royal Caribbean Cruises Ltd | 9,100 | 1,059 | ||||||
RTW RetailWinds* | 856 | 2 | ||||||
Rubicon Project* | 6,357 | 48 | ||||||
Ruth’s Hospitality Group Inc | 3,725 | 83 | ||||||
Sally Beauty Holdings Inc* | 14,976 | 206 | ||||||
Scientific Games, Cl A* | 6,993 | 143 | ||||||
SeaWorld Entertainment Inc* | 6,211 | 190 | ||||||
Select Interior Concepts, Cl A* | 2,904 | 33 | ||||||
Service Corp International/US | 9,500 | 438 | ||||||
ServiceMaster Global Holdings Inc* | 7,400 | 394 | ||||||
Shake Shack Inc, Cl A* | 3,559 | 266 | ||||||
Shoe Carnival Inc | 966 | 25 | ||||||
Shutterfly* | 4,381 | 222 | ||||||
Shutterstock Inc | 2,409 | 92 | ||||||
Signet Jewelers Ltd | 6,591 | 120 | ||||||
Six Flags Entertainment Corp | 3,900 | 206 | ||||||
Skechers U.S.A. Inc, Cl A* | 7,100 | 269 | ||||||
Skyline Champion* | 6,381 | 182 | ||||||
Sleep Number Corp* | 3,642 | 179 | ||||||
Sonic Automotive, Cl A | 3,130 | 86 | ||||||
Sonos Inc* | 8,932 | 97 | ||||||
Sotheby’s* | 4,138 | 247 | ||||||
Speedway Motorsports Inc | 1,551 | 31 | ||||||
Sportsman’s Warehouse Holdings Inc* | 3,764 | 17 | ||||||
Stamps.com* | 2,256 | 108 | ||||||
Standard Motor Products | 2,688 | 124 | ||||||
Starbucks | 65,900 | 6,240 | ||||||
Steven Madden Ltd | 10,737 | 371 | ||||||
Stitch Fix, Cl A* | 5,317 | 139 | ||||||
Stoneridge Inc* | 3,493 | 114 | ||||||
Strategic Education Inc | 2,678 | 477 | ||||||
Sturm Ruger & Co Inc | 2,136 | 121 | ||||||
Superior Group of Cos Inc | 921 | 16 | ||||||
Tailored Brands Inc | 6,654 | 32 | ||||||
Tapestry Inc | 15,700 | 486 | ||||||
Target Corp | 27,200 | 2,350 | ||||||
Target Hospitality* | 4,390 | 37 | ||||||
Taylor Morrison Home Corp, Cl A* | 13,257 | 299 | ||||||
| Description | Shares | Market Value ($ Thousands) | ||||||
COMMON STOCK (continued) | ||||||||
Tempur Sealy International Inc* | 2,500 | $ | 201 | |||||
Tenneco Inc, Cl A | 6,640 | 60 | ||||||
Tesla Inc* | 7,500 | 1,812 | ||||||
Texas Roadhouse Inc, Cl A | 8,566 | 473 | ||||||
Thor Industries | 2,700 | 161 | ||||||
Tiffany & Co | 6,600 | 620 | ||||||
Tile Shop Holdings Inc | 2,833 | 7 | ||||||
Tilly’s Inc, Cl A | 3,019 | 25 | ||||||
TJX Cos Inc/The | 66,200 | 3,612 | ||||||
Toll Brothers Inc | 7,400 | 266 | ||||||
TopBuild Corp* | 4,370 | 355 | ||||||
Tower International Inc | 2,625 | 81 | ||||||
Tractor Supply | 6,700 | 729 | ||||||
TRI Pointe Group Inc* | 17,614 | 241 | ||||||
Tupperware Brands Corp | 6,182 | 95 | ||||||
Twin River Worldwide Holdings | 2,699 | 71 | ||||||
Ulta Beauty Inc* | 3,100 | 1,083 | ||||||
Under Armour Inc, Cl C* | 10,400 | 212 | ||||||
Under Armour Inc, Cl A* | 10,100 | 233 | ||||||
Unifi Inc* | 1,494 | 28 | ||||||
Universal Electronics Inc* | 1,756 | 75 | ||||||
Urban Outfitters Inc* | 4,000 | 95 | ||||||
Vail Resorts Inc | 2,200 | 542 | ||||||
Vera Bradley Inc* | 2,160 | 25 | ||||||
VF | 16,800 | 1,468 | ||||||
Vista Outdoor* | 7,533 | 54 | ||||||
Visteon Corp* | 3,575 | 236 | ||||||
Waitr Holdings* | 6,970 | 32 | ||||||
Wayfair Inc, Cl A* | 3,100 | 407 | ||||||
Weight Watchers International* | 5,971 | 129 | ||||||
Wendy’s Co/The | 10,100 | 184 | ||||||
Weyco Group Inc | 860 | 24 | ||||||
Whirlpool Corp | 3,400 | 495 | ||||||
William Lyon Homes, Cl A* | 4,136 | 81 | ||||||
Williams-Sonoma Inc | 4,400 | 293 | ||||||
Wingstop Inc, Cl A | 3,734 | 357 | ||||||
Winmark Corp | 334 | 56 | ||||||
Winnebago Industries Inc | 3,925 | 158 | ||||||
Wolverine World Wide Inc | 10,806 | 293 | ||||||
Wyndham Destinations Inc | 5,200 | 245 | ||||||
Wyndham Hotels & Resorts Inc | 5,300 | 300 | ||||||
Wynn Resorts Ltd | 5,600 | 728 | ||||||
YETI Holdings Inc* | 3,950 | 137 | ||||||
Yum China Holdings Inc | 36,400 | 1,656 | ||||||
Yum! Brands Inc | 16,700 | 1,879 | ||||||
ZAGG Inc* | 3,873 | 26 | ||||||
Zumiez* | 2,449 | 61 | ||||||
|
| |||||||
| 185,288 | ||||||||
|
| |||||||
Consumer Staples — 4.3% | ||||||||
22nd Century Group Inc* | 15,693 | 25 | ||||||
Alico Inc | 586 | 19 | ||||||
Altria Group Inc | 102,000 | 4,801 | ||||||
| 24 | Adviser Managed Trust / Annual Report / July 31, 2019 |
SCHEDULE OF INVESTMENTS
July 31, 2019
Tactical Offensive Equity Fund(Continued)
| Description | Shares | Market Value ($ Thousands) | ||||||
COMMON STOCK (continued) | ||||||||
Andersons Inc/The | 4,024 | $ | 108 | |||||
Archer-Daniels-Midland Co | 30,500 | 1,253 | ||||||
B&G Foods Inc, Cl A | 8,209 | 150 | ||||||
Beyond Meat* | 500 | 98 | ||||||
BJ’s Wholesale Club Holdings Inc* | 14,262 | 336 | ||||||
Boston Beer Co Inc/The, Cl A* | 1,051 | 412 | ||||||
Bridgford Foods* | 291 | 10 | ||||||
Brown-Forman Corp, Cl B | 9,400 | 515 | ||||||
Brown-Forman Corp, Cl A | 2,800 | 149 | ||||||
Bunge | 7,700 | 450 | ||||||
Calavo Growers | 1,976 | 175 | ||||||
Cal-Maine Foods Inc | 3,910 | 156 | ||||||
Campbell Soup Co | 9,700 | 401 | ||||||
Casey’s General Stores | 2,000 | 324 | ||||||
Celsius Holdings Inc* | 3,791 | 19 | ||||||
Central Garden & Pet Co, Cl A* | 6,586 | 185 | ||||||
Chefs’ Warehouse Inc/The* | 3,121 | 114 | ||||||
Church & Dwight Co Inc | 13,300 | 1,003 | ||||||
Clorox Co/The | 7,000 | 1,138 | ||||||
Coca-Cola | 208,900 | 10,994 | ||||||
Coca-Cola Consolidated Inc | 587 | 172 | ||||||
Coca-Cola European Partners | 4,700 | 260 | ||||||
Colgate-Palmolive Co | 45,800 | 3,286 | ||||||
Conagra Brands Inc | 26,300 | 759 | ||||||
Constellation Brands Inc, Cl A | 8,500 | 1,673 | ||||||
Costco Wholesale Corp | 23,900 | 6,588 | ||||||
Coty Inc, Cl A | 17,204 | 188 | ||||||
Craft Brew Alliance Inc* | 1,641 | 26 | ||||||
Darling Ingredients Inc* | 20,878 | 424 | ||||||
Dean Foods Co | 9,373 | 14 | ||||||
Edgewell Personal Care Co* | 6,728 | 205 | ||||||
elf Beauty Inc* | 3,464 | 57 | ||||||
Energizer Holdings Inc | 3,400 | 143 | ||||||
Estee Lauder Cos Inc/The, Cl A | 11,700 | 2,155 | ||||||
Farmer Brothers Co* | 1,471 | 24 | ||||||
Flowers Foods Inc | 9,800 | 232 | ||||||
Fresh Del Monte Produce Inc | 3,878 | 118 | ||||||
Freshpet Inc* | 3,930 | 177 | ||||||
General Mills Inc | 32,400 | 1,721 | ||||||
Hain Celestial Group Inc/The* | 5,000 | 109 | ||||||
Herbalife Nutrition* | 5,900 | 242 | ||||||
Hershey Co/The | 7,700 | 1,168 | ||||||
HF Foods Group* | 1,041 | 24 | ||||||
Hormel Foods Corp | 14,800 | 607 | ||||||
Hostess Brands Inc, Cl A* | 12,348 | 174 | ||||||
Ingles Markets, Cl A | 1,825 | 57 | ||||||
Ingredion Inc | 3,600 | 278 | ||||||
Inter Parfums Inc | 2,188 | 152 | ||||||
J&J Snack Foods Corp | 1,926 | 358 | ||||||
JM Smucker | 6,000 | 667 | ||||||
John B Sanfilippo & Son Inc | 1,105 | 96 | ||||||
Kellogg Co | 13,500 | 786 | ||||||
| Description | Shares | Market Value ($ Thousands) | ||||||
COMMON STOCK (continued) | ||||||||
Keurig Dr Pepper Inc | 9,900 | $ | 279 | |||||
Kimberly-Clark | 18,700 | 2,537 | ||||||
Kraft Heinz Co/The | 32,900 | 1,053 | ||||||
Kroger | 43,300 | 916 | ||||||
Lamb Weston Holdings Inc | 8,000 | 537 | ||||||
Lancaster Colony Corp | 2,405 | 375 | ||||||
Landec* | 3,482 | 39 | ||||||
Lifevantage* | 1,960 | 23 | ||||||
Limoneira | 2,085 | 41 | ||||||
McCormick & Co Inc/MD | 6,700 | 1,062 | ||||||
Medifast Inc | 1,458 | 163 | ||||||
MGP Ingredients Inc | 1,682 | 84 | ||||||
Molson Coors Brewing, Cl B | 9,500 | 513 | ||||||
Mondelez International Inc, Cl A | 77,900 | 4,167 | ||||||
Monster Beverage Corp* | 21,000 | 1,354 | ||||||
National Beverage | 1,544 | 67 | ||||||
Natural Grocers by Vitamin Cottage Inc* | 1,418 | 13 | ||||||
Nature’s Sunshine Products Inc* | 1,374 | 12 | ||||||
New Age Beverages* | 9,579 | 36 | ||||||
Nu Skin Enterprises Inc, Cl A | 3,000 | 120 | ||||||
Oil-Dri Corp of America | 516 | 18 | ||||||
PepsiCo Inc | 76,400 | 9,765 | ||||||
Performance Food Group* | 12,924 | 567 | ||||||
Philip Morris International | 84,800 | 7,090 | ||||||
Pilgrim’s Pride Corp* | 2,900 | 78 | ||||||
Post Holdings Inc* | 3,500 | 375 | ||||||
PriceSmart Inc | 2,780 | 170 | ||||||
Primo Water Corp* | 4,574 | 68 | ||||||
Procter & Gamble Co/The | 134,800 | 15,912 | ||||||
Pyxus International Inc* | 851 | 12 | ||||||
Revlon Inc, Cl A* | 540 | 11 | ||||||
Rite Aid Corp* | 7,157 | 50 | ||||||
Sanderson Farms Inc | 2,533 | 332 | ||||||
Seaboard Corp | 14 | 57 | ||||||
Seneca Foods Corp, Cl A* | 715 | 23 | ||||||
Simply Good Foods Co/The* | 8,963 | 244 | ||||||
SpartanNash | 4,703 | 56 | ||||||
Spectrum Brands Holdings Inc | 2,200 | 110 | ||||||
Sprouts Farmers Market Inc* | 6,800 | 115 | ||||||
Sysco Corp | 25,600 | 1,755 | ||||||
Tootsie Roll Industries Inc | 2,179 | 81 | ||||||
TreeHouse Foods Inc* | 3,000 | 178 | ||||||
Turning Point Brands Inc | 1,085 | 40 | ||||||
Tyson Foods, Cl A | 15,900 | 1,264 | ||||||
United Natural Foods Inc* | 6,783 | 67 | ||||||
Universal Corp/VA | 3,085 | 184 | ||||||
US Foods Holding Corp* | 11,700 | 414 | ||||||
USANA Health Sciences Inc* | 1,608 | 109 | ||||||
Vector Group Ltd | 12,945 | 150 | ||||||
Village Super Market Inc, Cl A | 1,132 | 28 | ||||||
Walgreens Boots Alliance Inc | 42,100 | 2,294 | ||||||
Walmart Inc | 76,700 | 8,466 | ||||||
| Adviser Managed Trust / Annual Report / July 31, 2019 | 25 |
SCHEDULE OF INVESTMENTS
July 31, 2019
Tactical Offensive Equity Fund(Continued)
| Description | Shares | Market Value ($ Thousands) | ||||||
COMMON STOCK (continued) | ||||||||
WD-40 Co | 1,750 | $ | 318 | |||||
Weis Markets | 1,260 | 46 | ||||||
|
| |||||||
| 109,613 | ||||||||
|
| |||||||
Energy — 3.1% | ||||||||
Abraxas Petroleum* | 22,288 | 19 | ||||||
Altus Midstream, Cl A* | 6,937 | 22 | ||||||
Anadarko Petroleum Corp | 27,500 | 2,026 | ||||||
Antero Midstream | 12,300 | 112 | ||||||
Antero Resources Corp* | 13,200 | 61 | ||||||
Apache Corp | 20,800 | 508 | ||||||
Apergy Corp* | 4,200 | 137 | ||||||
Arch Coal Inc | 2,177 | 194 | ||||||
Archrock Inc | 15,956 | 175 | ||||||
Baker Hughes a GE Co, Cl A | 28,000 | 711 | ||||||
Berry Petroleum | 8,233 | 81 | ||||||
Bonanza Creek Energy Inc* | 2,492 | 54 | ||||||
Brigham Minerals, Cl A* | 2,125 | 46 | ||||||
C&J Energy Services* | 8,090 | 88 | ||||||
Cabot Oil & Gas Corp | 23,200 | 445 | ||||||
Cactus Inc, Cl A* | 5,962 | 175 | ||||||
California Resources Corp* | 5,745 | 88 | ||||||
Callon Petroleum Co* | 28,485 | 140 | ||||||
Carrizo Oil & Gas Inc* | 11,111 | 106 | ||||||
Centennial Resource Development, Cl A* | 10,000 | 59 | ||||||
Chaparral Energy, Cl A* | 4,526 | 16 | ||||||
Cheniere Energy* | 12,600 | 821 | ||||||
Chesapeake Energy Corp* | 56,900 | 103 | ||||||
Chevron Corp | 104,000 | 12,803 | ||||||
Cimarex Energy Co | 5,400 | 274 | ||||||
Clean Energy Fuels Corp* | 17,736 | 47 | ||||||
CNX Resources Corp* | 24,615 | 202 | ||||||
Comstock Resources* | 2,355 | 16 | ||||||
Concho Resources Inc | 10,600 | 1,035 | ||||||
ConocoPhillips | 62,200 | 3,675 | ||||||
CONSOL Energy* | 3,525 | 76 | ||||||
Continental Resources Inc/OK* | 4,800 | 178 | ||||||
Contura Energy* | 2,419 | 87 | ||||||
Covia Holdings Corp* | 909 | 2 | ||||||
CVR Energy Inc | 3,748 | 199 | ||||||
Delek US Holdings Inc | 9,489 | 409 | ||||||
Denbury Resources Inc* | 59,456 | 67 | ||||||
Devon Energy Corp | 22,500 | 607 | ||||||
DHT Holdings Inc | 10,298 | 58 | ||||||
Diamond Offshore Drilling Inc* | 8,454 | 76 | ||||||
Diamond S Shipping* | 2,955 | 35 | ||||||
Diamondback Energy Inc | 8,600 | 889 | ||||||
DMC Global Inc | 1,812 | 95 | ||||||
Dorian LPG Ltd* | 2,720 | 25 | ||||||
Dril-Quip Inc* | 4,448 | 234 | ||||||
Earthstone Energy Inc, Cl A* | 1,975 | 9 | ||||||
Energy Fuels Inc/Canada* | 8,300 | 15 | ||||||
EOG Resources | 31,600 | 2,713 | ||||||
| Description | Shares | Market Value ($ Thousands) | ||||||
COMMON STOCK (continued) | ||||||||
EQT Corp | 13,800 | $ | 209 | |||||
Equitrans Midstream Corp | 11,600 | 192 | ||||||
Era Group Inc* | 2,025 | 21 | ||||||
Evolution Petroleum | 3,743 | 23 | ||||||
Exterran Corp* | 4,137 | 56 | ||||||
Extraction Oil & Gas Inc* | 13,102 | 49 | ||||||
Exxon Mobil Corp | 230,800 | 17,162 | ||||||
Falcon Minerals | 5,132 | 41 | ||||||
Forum Energy Technologies Inc* | 7,622 | 20 | ||||||
FTS International Inc* | 3,442 | 14 | ||||||
GasLog Ltd | 5,318 | 76 | ||||||
Geospace Technologies* | 1,833 | 29 | ||||||
Golar LNG | 11,792 | 200 | ||||||
Goodrich Petroleum Corp* | 1,096 | 13 | ||||||
Green Plains Inc | 5,209 | 53 | ||||||
Gulfport Energy Corp* | 22,252 | 84 | ||||||
Hallador Energy Co | 2,989 | 16 | ||||||
Halliburton Co | 47,700 | 1,097 | ||||||
Helix Energy Solutions Group Inc* | 17,690 | 155 | ||||||
Helmerich & Payne Inc | 5,800 | 288 | ||||||
Hess Corp | 14,300 | 927 | ||||||
HighPoint Resources Corp* | 11,475 | 14 | ||||||
HollyFrontier | 8,700 | 433 | ||||||
Independence Contract Drilling* | 5,019 | 7 | ||||||
International Seaways Inc* | 3,287 | 56 | ||||||
Isramco Inc* | 114 | 14 | ||||||
Jagged Peak Energy Inc* | 8,395 | 62 | ||||||
Keane Group Inc* | 6,968 | 44 | ||||||
Kinder Morgan Inc/DE | 106,300 | 2,192 | ||||||
KLX Energy Services Holdings Inc* | 2,579 | 41 | ||||||
Kosmos Energy Ltd | 13,900 | 84 | ||||||
Laredo Petroleum Inc* | 23,550 | 78 | ||||||
Liberty Oilfield Services Inc, Cl A | 5,709 | 81 | ||||||
Magnolia Oil & Gas* | 12,840 | 144 | ||||||
Mammoth Energy Services Inc | 811 | 5 | ||||||
Marathon Oil Corp | 45,200 | 636 | ||||||
Marathon Petroleum Corp | 36,600 | 2,064 | ||||||
Matador Resources* | 14,007 | 247 | ||||||
Matrix Service Co* | 3,464 | 64 | ||||||
McDermott International Inc* | 22,397 | 144 | ||||||
Midstates Petroleum Co Inc* | 1,574 | 7 | ||||||
Montage Resources Corp* | 3,069 | 10 | ||||||
Murphy Oil Corp | 8,900 | 214 | ||||||
Nabors Industries Ltd | 44,999 | 133 | ||||||
NACCO Industries, Cl A | 510 | 27 | ||||||
National Energy Services Reunited* | 3,242 | 26 | ||||||
National Oilwell Varco Inc | 20,800 | 495 | ||||||
Natural Gas Services Group Inc* | 1,731 | 28 | ||||||
NCS Multistage Holdings* | 286 | 1 | ||||||
Newpark Resources Inc* | 11,548 | 88 | ||||||
NextDecade Corp* | 229 | 1 | ||||||
Nine Energy Service Inc* | 2,130 | 27 | ||||||
| 26 | Adviser Managed Trust / Annual Report / July 31, 2019 |
SCHEDULE OF INVESTMENTS
July 31, 2019
Tactical Offensive Equity Fund(Continued)
| Description | Shares | Market Value ($ Thousands) | ||||||
COMMON STOCK (continued) | ||||||||
Noble Corp plc* | 31,492 | $ | 70 | |||||
Noble Energy Inc | 26,200 | 578 | ||||||
Northern Oil and Gas Inc* | 36,162 | 59 | ||||||
Oasis Petroleum Inc* | 40,351 | 196 | ||||||
Occidental Petroleum Corp | 41,200 | 2,116 | ||||||
Oceaneering International Inc* | 12,266 | 190 | ||||||
Oil States International Inc* | 7,517 | 112 | ||||||
ONEOK Inc | 22,400 | 1,570 | ||||||
Overseas Shipholding Group Inc, Cl A* | 9,544 | 19 | ||||||
Pacific Drilling* | 3,915 | 37 | ||||||
Panhandle Oil and Gas Inc, Cl A | 2,115 | 25 | ||||||
Par Pacific Holdings Inc* | 4,114 | 95 | ||||||
Parker Drilling* | 1,297 | 22 | ||||||
Parsley Energy Inc, Cl A* | 14,400 | 239 | ||||||
Patterson-UTI Energy Inc | 11,700 | 136 | ||||||
PBF Energy Inc, Cl A | 6,500 | 182 | ||||||
PDC Energy Inc* | 8,191 | 235 | ||||||
Peabody Energy Corp | 8,719 | 184 | ||||||
Penn Virginia Corp* | 1,776 | 61 | ||||||
Phillips 66 | 24,700 | 2,533 | ||||||
Pioneer Natural Resources Co | 9,200 | 1,270 | ||||||
PrimeEnergy Resources* | 86 | 10 | ||||||
ProPetro Holding Corp* | 10,115 | 183 | ||||||
QEP Resources Inc* | 30,300 | 150 | ||||||
Range Resources Corp | 11,500 | 65 | ||||||
Renewable Energy Group Inc* | 4,790 | 65 | ||||||
REX American Resources Corp* | 737 | 55 | ||||||
RigNet Inc* | 1,730 | 15 | ||||||
Ring Energy Inc* | 6,038 | 15 | ||||||
RPC Inc | 7,602 | 47 | ||||||
SandRidge Energy Inc* | 3,204 | 22 | ||||||
Schlumberger Ltd | 75,700 | 3,026 | ||||||
Scorpio Tankers Inc | 5,739 | 150 | ||||||
SEACOR Holdings Inc* | 2,188 | 104 | ||||||
SEACOR Marine Holdings Inc* | 2,584 | 36 | ||||||
Select Energy Services, Cl A* | 7,612 | 77 | ||||||
SemGroup Corp, Cl A | 10,030 | 127 | ||||||
Ship Finance International Ltd | 10,259 | 135 | ||||||
SilverBow Resources Inc* | 866 | 9 | ||||||
SM Energy Co | 14,204 | 142 | ||||||
Smart Sand Inc* | 651 | 2 | ||||||
Solaris Oilfield Infrastructure, Cl A | 4,002 | 57 | ||||||
Southwestern Energy* | 66,976 | 147 | ||||||
SRC Energy Inc* | 30,423 | 124 | ||||||
Superior Energy Services Inc* | 14,554 | 13 | ||||||
Talos Energy Inc* | 2,658 | 55 | ||||||
Targa Resources Corp | 12,300 | 479 | ||||||
Teekay Tankers Ltd, Cl A* | 19,100 | 23 | ||||||
Tellurian Inc* | 10,950 | 68 | ||||||
TETRA Technologies Inc* | 12,862 | 20 | ||||||
Tidewater Inc* | 4,819 | 111 | ||||||
Unit Corp* | 6,909 | 45 | ||||||
| Description | Shares | Market Value ($ Thousands) | ||||||
COMMON STOCK (continued) | ||||||||
Uranium Energy Corp* | 24,860 | $ | 25 | |||||
US Silica Holdings Inc | 9,916 | 137 | ||||||
US Well Services* | 2,988 | 9 | ||||||
Valero Energy Corp | 23,100 | 1,969 | ||||||
W&T Offshore Inc* | 11,817 | 53 | ||||||
Whiting Petroleum Corp* | 11,510 | 203 | ||||||
Williams | 65,000 | 1,602 | ||||||
World Fuel Services Corp | 8,283 | 323 | ||||||
WPX Energy Inc* | 21,600 | 225 | ||||||
|
| |||||||
| 78,257 | ||||||||
|
| |||||||
Financials — 9.6% | ||||||||
1st Constitution Bancorp | 774 | 14 | ||||||
1st Source Corp | 1,648 | 77 | ||||||
ACNB Corp | 929 | 35 | ||||||
Affiliated Managers Group | 2,900 | 249 | ||||||
Aflac Inc | 40,700 | 2,142 | ||||||
AG Mortgage Investment Trust Inc‡ | 3,787 | 62 | ||||||
AGNC Investment Corp‡ | 29,200 | 500 | ||||||
Alleghany Corp* | 800 | 549 | ||||||
Allegiance Bancshares Inc* | 2,507 | 84 | ||||||
Allstate Corp/The | 18,100 | 1,944 | ||||||
Ally Financial Inc | 22,100 | 727 | ||||||
Amalgamated Bank, Cl A | 1,879 | 32 | ||||||
Ambac Financial Group Inc* | 5,798 | 106 | ||||||
Amerant Bancorp, Cl A* | 2,548 | 47 | ||||||
American Equity Investment Life Holding Co | 11,491 | 296 | ||||||
American Express Co | 37,300 | 4,639 | ||||||
American Financial Group Inc/OH | 3,900 | 399 | ||||||
American International Group Inc | 47,400 | 2,654 | ||||||
American National Bankshares Inc | 1,405 | 52 | ||||||
American National Insurance Co | 400 | 48 | ||||||
Ameriprise Financial Inc | 7,400 | 1,077 | ||||||
Ameris Bancorp | 8,219 | 327 | ||||||
AMERISAFE Inc | 2,398 | 156 | ||||||
Ames National Corp | 1,237 | 34 | ||||||
Annaly Capital Management Inc‡ | 75,400 | 720 | ||||||
Anworth Mortgage Asset Corp‡ | 12,848 | 49 | ||||||
Apollo Commercial Real Estate Finance‡ | 19,129 | 360 | ||||||
Arch Capital Group Ltd* | 21,100 | 816 | ||||||
Ares Commercial Real Estate‡ | 3,535 | 54 | ||||||
Ares Management | 8,135 | 238 | ||||||
Argo Group International Holdings | 4,163 | 285 | ||||||
Arlington Asset Investment Corp, Cl A‡ | 4,027 | 26 | ||||||
ARMOUR Residential Inc‡ | 7,570 | 135 | ||||||
Arrow Financial Corp | 1,621 | 54 | ||||||
Arthur J Gallagher & Co | 9,800 | 886 | ||||||
Artisan Partners Asset Management Inc, Cl A | 6,408 | 190 | ||||||
Associated Banc-Corp | 8,900 | 193 | ||||||
Associated Capital Group Inc | 68 | 3 | ||||||
Assurant Inc | 3,300 | 374 | ||||||
| Adviser Managed Trust / Annual Report / July 31, 2019 | 27 |
SCHEDULE OF INVESTMENTS
July 31, 2019
Tactical Offensive Equity Fund(Continued)
| Description | Shares | Market Value ($ Thousands) | ||||||
COMMON STOCK (continued) | ||||||||
Assured Guaranty Ltd | 5,700 | $ | 249 | |||||
Athene Holding Ltd, Cl A* | 8,700 | 355 | ||||||
Atlantic Capital Bancshares Inc* | 3,093 | 57 | ||||||
Atlantic Union Bankshares | 10,227 | 389 | ||||||
AXA Equitable Holdings | 15,200 | 342 | ||||||
Axis Capital Holdings Ltd | 4,500 | 287 | ||||||
Axos Financial Inc* | 7,216 | 212 | ||||||
B. Riley Financial | 2,643 | 50 | ||||||
Banc of California Inc | 5,584 | 87 | ||||||
BancFirst Corp | 2,277 | 133 | ||||||
Bancorp Inc/The* | 6,671 | 65 | ||||||
BancorpSouth Bank | 12,047 | 360 | ||||||
Bank First | 757 | 44 | ||||||
Bank of America Corp | 469,000 | 14,389 | ||||||
Bank of Commerce Holdings | 1,564 | 17 | ||||||
Bank of Hawaii Corp | 2,200 | 188 | ||||||
Bank of Marin Bancorp | 1,771 | 77 | ||||||
Bank of New York Mellon Corp/The | 46,400 | 2,177 | ||||||
Bank of NT Butterfield & Son Ltd/The | 5,071 | 159 | ||||||
Bank of Princeton/The | 584 | 16 | ||||||
Bank OZK | 6,600 | 202 | ||||||
Bank7* | 100 | 2 | ||||||
BankFinancial Corp | 1,922 | 26 | ||||||
BankUnited Inc | 5,300 | 182 | ||||||
Bankwell Financial Group Inc | 917 | 26 | ||||||
Banner | 4,362 | 258 | ||||||
Bar Harbor Bankshares | 2,005 | 51 | ||||||
Baycom* | 1,464 | 34 | ||||||
BB&T Corp | 42,000 | 2,164 | ||||||
BCB Bancorp | 1,377 | 18 | ||||||
Berkshire Hathaway Inc, Cl B* | 106,700 | 21,919 | ||||||
Berkshire Hills Bancorp Inc | 5,756 | 189 | ||||||
BGC Partners Inc, Cl A | 14,900 | 82 | ||||||
BlackRock Inc, Cl A | 6,500 | 3,040 | ||||||
Blackstone Mortgage Trust Inc, Cl A‡ | 15,827 | 562 | ||||||
Blucora Inc* | 5,938 | 178 | ||||||
BOK Financial Corp | 1,800 | 151 | ||||||
Boston Private Financial Holdings Inc | 10,563 | 122 | ||||||
Bridge Bancorp Inc | 2,189 | 64 | ||||||
Bridgewater Bancshares Inc* | 3,148 | 38 | ||||||
Brighthouse Financial Inc* | 6,500 | 255 | ||||||
Brightsphere Investment Group | 8,524 | 91 | ||||||
Brookline Bancorp Inc | 9,936 | 147 | ||||||
Brown & Brown Inc | 12,700 | 456 | ||||||
Bryn Mawr Bank Corp | 2,556 | 95 | ||||||
Business First Bancshares Inc | 1,655 | 41 | ||||||
Byline Bancorp Inc* | 3,043 | 58 | ||||||
C&F Financial Corp | 335 | 18 | ||||||
Cadence BanCorp, Cl A | 15,811 | 271 | ||||||
Cambridge Bancorp | 568 | 44 | ||||||
Camden National | 1,981 | 89 | ||||||
Cannae Holdings Inc* | 8,539 | 247 | ||||||
| Description | Shares | Market Value ($ Thousands) | ||||||
COMMON STOCK (continued) | ||||||||
Capital Bancorp Inc* | 1,200 | $ | 15 | |||||
Capital City Bank Group Inc | 1,777 | 46 | ||||||
Capital One Financial Corp | 25,400 | 2,347 | ||||||
Capitol Federal Financial Inc | 16,354 | 223 | ||||||
Capstar Financial Holdings Inc | 1,987 | 32 | ||||||
Capstead Mortgage Corp‡ | 10,917 | 92 | ||||||
Carolina Financial Corp | 2,692 | 95 | ||||||
Carter Bank & Trust* | 2,957 | 59 | ||||||
Cathay General Bancorp | 9,539 | 355 | ||||||
Cboe Global Markets Inc | 6,100 | 667 | ||||||
CBTX Inc | 2,348 | 71 | ||||||
CenterState Bank Corp | 15,838 | 385 | ||||||
Central Pacific Financial Corp | 3,615 | 107 | ||||||
Central Valley Community Bancorp | 1,508 | 31 | ||||||
Century Bancorp Inc/MA, Cl A | 279 | 23 | ||||||
Charles Schwab Corp/The | 65,600 | 2,835 | ||||||
Chemung Financial Corp | 338 | 15 | ||||||
Cherry Hill Mortgage Investment Corp‡ | 1,567 | 24 | ||||||
Chimera Investment Corp‡ | 10,200 | 197 | ||||||
Chubb | 25,000 | 3,821 | ||||||
Cincinnati Financial Corp | 8,400 | 902 | ||||||
CIT Group | 5,500 | 278 | ||||||
Citigroup | 126,000 | 8,966 | ||||||
Citizens & Northern | 1,595 | 41 | ||||||
Citizens Financial Group Inc | 25,500 | 950 | ||||||
Citizens Inc/TX, Cl A* | 6,525 | 49 | ||||||
City Holding | 1,992 | 154 | ||||||
Civista Bancshares Inc | 2,028 | 45 | ||||||
CME Group Inc, Cl A | 19,300 | 3,752 | ||||||
CNA Financial Corp | 1,500 | 72 | ||||||
CNB Financial Corp/PA | 1,907 | 54 | ||||||
CNO Financial Group Inc | 20,260 | 343 | ||||||
Coastal Financial Corp/WA* | 760 | 12 | ||||||
Codorus Valley Bancorp Inc | 1,258 | 29 | ||||||
Cohen & Steers | 2,808 | 147 | ||||||
Colony Bankcorp | 1,077 | 18 | ||||||
Colony Credit Real Estate Inc‡ | 10,521 | 170 | ||||||
Columbia Banking System Inc | 9,357 | 353 | ||||||
Columbia Financial Inc* | 6,366 | 97 | ||||||
Comerica | 8,800 | 644 | ||||||
Commerce Bancshares Inc/MO | 5,400 | 328 | ||||||
Community Bank System Inc | 6,392 | 422 | ||||||
Community Bankers Trust Corp | 2,167 | 17 | ||||||
Community Financial Corp/The | 493 | 16 | ||||||
Community Trust Bancorp Inc | 2,005 | 85 | ||||||
ConnectOne Bancorp Inc | 3,893 | 89 | ||||||
Cowen Inc, Cl A* | 3,668 | 64 | ||||||
Crawford, Cl A | 2,314 | 24 | ||||||
Credit Acceptance Corp* | 600 | 287 | ||||||
Cullen/Frost Bankers Inc | 3,100 | 294 | ||||||
Curo Group Holdings Corp* | 2,402 | 30 | ||||||
Customers Bancorp Inc* | 3,753 | 77 | ||||||
| 28 | Adviser Managed Trust / Annual Report / July 31, 2019 |
SCHEDULE OF INVESTMENTS
July 31, 2019
Tactical Offensive Equity Fund(Continued)
| Description | Shares | Market Value ($ Thousands) | ||||||
COMMON STOCK (continued) | ||||||||
CVB Financial Corp | 16,800 | $ | 370 | |||||
Diamond Hill Investment Group Inc | 432 | 61 | ||||||
Dime Community Bancshares | 4,092 | 83 | ||||||
Discover Financial Services | 18,000 | 1,615 | ||||||
DNB Financial | 490 | 22 | ||||||
Donegal Group Inc, Cl A | 963 | 14 | ||||||
Donnelley Financial Solutions* | 4,257 | 58 | ||||||
Dynex Capital‡ | 3,138 | 51 | ||||||
E*TRADE Financial Corp | 13,500 | 659 | ||||||
Eagle Bancorp Inc | 4,253 | 171 | ||||||
East West Bancorp | 7,900 | 379 | ||||||
Eaton Vance Corp | 6,100 | 271 | ||||||
eHealth Inc* | 2,848 | 295 | ||||||
Elevate Credit Inc* | 3,319 | 14 | ||||||
Ellington Financial | 3,504 | 61 | ||||||
EMC Insurance Group Inc | 1,246 | 45 | ||||||
Employers Holdings Inc | 4,032 | 177 | ||||||
Encore Capital Group Inc* | 3,933 | 142 | ||||||
Enova International* | 4,224 | 114 | ||||||
Enstar Group Ltd* | 1,467 | 260 | ||||||
Entegra Financial Corp* | 924 | 28 | ||||||
Enterprise Bancorp Inc/MA | 929 | 28 | ||||||
Enterprise Financial Services Corp | 3,138 | 131 | ||||||
Equity Bancshares Inc, Cl A* | 1,981 | 52 | ||||||
Erie Indemnity Co, Cl A | 1,300 | 290 | ||||||
Esquire Financial Holdings Inc* | 621 | 16 | ||||||
ESSA Bancorp Inc | 974 | 15 | ||||||
Essent Group Ltd* | 12,088 | 558 | ||||||
Evans Bancorp Inc | 470 | 17 | ||||||
Evercore Inc, Cl A | 2,200 | 190 | ||||||
Everest Re Group Ltd | 2,200 | 543 | ||||||
Exantas Capital Corp‡ | 4,028 | 45 | ||||||
EZCORP, Cl A* | 6,742 | 66 | ||||||
FactSet Research Systems Inc | 2,000 | 555 | ||||||
Farmers & Merchants Bancorp Inc/Archbold OH | 1,349 | 39 | ||||||
Farmers National Banc Corp | 3,375 | 49 | ||||||
FB Financial Corp | 2,126 | 81 | ||||||
FBL Financial Group Inc, Cl A | 1,279 | 80 | ||||||
Federal Agricultural Mortgage Corp, Cl C | 1,160 | 90 | ||||||
Federated Investors Inc, Cl B | 12,257 | 426 | ||||||
FedNat Holding Co | 1,153 | 14 | ||||||
FGL Holdings | 18,399 | 150 | ||||||
Fidelity D&D Bancorp Inc | 281 | 19 | ||||||
Fidelity National Financial Inc | 14,400 | 617 | ||||||
Fifth Third Bancorp | 39,900 | 1,185 | ||||||
Financial Institutions Inc | 2,022 | 62 | ||||||
First American Financial | 5,900 | 341 | ||||||
First Bancorp Inc/ME | 1,387 | 36 | ||||||
First BanCorp/Puerto Rico | 26,458 | 285 | ||||||
First Bancorp/Southern Pines NC | 3,692 | 136 | ||||||
First Bancshares | 2,155 | 72 | ||||||
| Description | Shares | Market Value ($ Thousands) | ||||||
COMMON STOCK (continued) | ||||||||
First Bank/Hamilton NJ | 2,288 | $ | 26 | |||||
First Busey Corp | 6,581 | 178 | ||||||
First Business Financial Services Inc | 1,149 | 27 | ||||||
First Capital | 455 | 26 | ||||||
First Choice Bancorp | 1,375 | 31 | ||||||
First Citizens BancShares, Cl A | 400 | 187 | ||||||
First Commonwealth Financial Corp | 12,293 | 169 | ||||||
First Community Bankshares | 2,044 | 68 | ||||||
First Defiance Financial Corp | 2,604 | 75 | ||||||
First Financial Bancorp | 12,309 | 314 | ||||||
First Financial Bankshares Inc | 16,336 | 535 | ||||||
First Financial Corp/IN | 1,574 | 68 | ||||||
First Financial Northwest Inc | 854 | 13 | ||||||
First Foundation Inc | 4,993 | 75 | ||||||
First Guaranty Bancshares Inc | 524 | 11 | ||||||
First Hawaiian Inc | 7,200 | 193 | ||||||
First Horizon National Corp | 17,200 | 282 | ||||||
First Internet Bancorp | 1,347 | 28 | ||||||
First Interstate BancSystem Inc, Cl A | 4,745 | 190 | ||||||
First Merchants Corp | 6,127 | 241 | ||||||
First Mid Bancshares Inc | 1,908 | 65 | ||||||
First Midwest Bancorp Inc/IL | 13,082 | 283 | ||||||
First Northwest Bancorp | 938 | 15 | ||||||
First of Long Island | 3,225 | 71 | ||||||
First Republic Bank/CA | 8,900 | 884 | ||||||
FirstCash Inc | 5,379 | 541 | ||||||
Flagstar Bancorp Inc | 3,742 | 129 | ||||||
Flushing Financial | 3,506 | 71 | ||||||
FNB Corp/PA | 17,600 | 212 | ||||||
FNCB Bancorp | 2,453 | 20 | ||||||
Focus Financial Partners, Cl A* | 3,876 | 108 | ||||||
Franklin Financial Network Inc | 1,728 | 51 | ||||||
Franklin Financial Services | 589 | 21 | ||||||
Franklin Resources Inc | 16,400 | 535 | ||||||
FS Bancorp Inc | 550 | 27 | ||||||
Fulton Financial Corp | 20,580 | 350 | ||||||
FVCBankcorp* | 1,645 | 30 | ||||||
GAIN Capital Holdings Inc | 2,871 | 12 | ||||||
GAMCO Investors, Cl A | 790 | 16 | ||||||
Genworth Financial Inc, Cl A* | 62,761 | 250 | ||||||
German American Bancorp Inc | 2,945 | 93 | ||||||
Glacier Bancorp Inc | 10,780 | 452 | ||||||
Global Indemnity | 820 | 23 | ||||||
Goldman Sachs Group Inc/The | 17,900 | 3,940 | ||||||
Goosehead Insurance Inc, Cl A | 1,468 | 66 | ||||||
Granite Point Mortgage Trust Inc‡ | 6,396 | 122 | ||||||
Great Ajax Corp‡ | 2,189 | 30 | ||||||
Great Southern Bancorp Inc | 1,426 | 86 | ||||||
Great Western Bancorp Inc | 7,100 | 240 | ||||||
Green Dot Corp, Cl A* | 6,251 | 317 | ||||||
Greene County Bancorp Inc | 497 | 14 | ||||||
Greenhill & Co Inc | 1,695 | 28 | ||||||
| Adviser Managed Trust / Annual Report / July 31, 2019 | 29 |
SCHEDULE OF INVESTMENTS
July 31, 2019
Tactical Offensive Equity Fund(Continued)
| Description | Shares | Market Value ($ Thousands) | ||||||
COMMON STOCK (continued) | ||||||||
Greenlight Capital Re, Cl A* | 3,967 | $ | 33 | |||||
Guaranty Bancshares Inc/TX | 1,088 | 34 | ||||||
Hallmark Financial Services Inc* | 1,321 | 20 | ||||||
Hamilton Lane Inc, Cl A | 2,767 | 162 | ||||||
Hancock Whitney Corp | 10,764 | 447 | ||||||
Hanmi Financial Corp | 3,921 | 84 | ||||||
Hanover Insurance Group Inc/The | 2,300 | 298 | ||||||
HarborOne Bancorp Inc* | 1,971 | 38 | ||||||
Hartford Financial Services Group Inc/The | 19,500 | 1,124 | ||||||
Hawthorn Bancshares | 799 | 20 | ||||||
HCI Group Inc | 692 | 28 | ||||||
Health Insurance Innovations Inc, Cl A* | 1,230 | 27 | ||||||
Heartland Financial USA Inc | 4,154 | 200 | ||||||
Heritage Commerce Corp | 5,262 | 65 | ||||||
Heritage Financial | 4,607 | 131 | ||||||
Heritage Insurance Holdings | 3,494 | 47 | ||||||
Hilltop Holdings Inc | 8,896 | 202 | ||||||
Hingham Institution for Savings | 188 | 36 | ||||||
Home Bancorp Inc | 1,051 | 39 | ||||||
Home BancShares Inc/AR | 19,323 | 380 | ||||||
HomeStreet Inc* | 3,189 | 93 | ||||||
HomeTrust Bancshares Inc | 2,113 | 55 | ||||||
Hope Bancorp | 15,111 | 223 | ||||||
Horace Mann Educators Corp | 5,117 | 222 | ||||||
Horizon Bancorp | 4,806 | 84 | ||||||
Houlihan Lokey Inc, Cl A | 4,219 | 194 | ||||||
Howard Bancorp* | 1,783 | 27 | ||||||
Huntington Bancshares Inc/OH | 56,800 | 809 | ||||||
IBERIABANK Corp | 6,810 | 535 | ||||||
Independence Holding Co | 685 | 26 | ||||||
Independent Bank Corp/MI | 2,838 | 62 | ||||||
Independent Bank Corp/Rockland MA | 4,229 | 329 | ||||||
Independent Bank Group Inc | 4,575 | 260 | ||||||
Interactive Brokers Group, Cl A | 4,000 | 205 | ||||||
Intercontinental Exchange Inc | 30,700 | 2,697 | ||||||
International Bancshares Corp | 6,849 | 258 | ||||||
INTL. FCStone Inc* | 2,018 | 82 | ||||||
Invesco Ltd | 22,100 | 424 | ||||||
Invesco Mortgage Capital Inc‡ | 15,910 | 262 | ||||||
Investar Holding | 1,269 | 31 | ||||||
Investors Bancorp Inc | 29,313 | 333 | ||||||
Investors Title | 197 | 32 | ||||||
James River Group Holdings Ltd | 3,753 | 180 | ||||||
Janus Henderson Group | 8,900 | 179 | ||||||
Jefferies Financial Group | 15,000 | 320 | ||||||
JPMorgan Chase & Co | 175,900 | 20,404 | ||||||
Kearny Financial | 10,017 | 134 | ||||||
Kemper Corp | 3,300 | 290 | ||||||
KeyCorp | 55,300 | 1,016 | ||||||
Kinsale Capital Group Inc | 2,426 | 218 | ||||||
KKR Real Estate Finance Trust Inc‡ | 3,319 | 66 | ||||||
Ladder Capital Corp, Cl A‡ | 13,011 | 219 | ||||||
| Description | Shares | Market Value ($ Thousands) | ||||||
COMMON STOCK (continued) | ||||||||
Ladenburg Thalmann Financial Services Inc | 15,547 | $ | 48 | |||||
Lakeland Bancorp Inc | 5,786 | 95 | ||||||
Lakeland Financial | 3,072 | 141 | ||||||
Lazard Ltd, Cl A (B) | 6,300 | 244 | ||||||
LCNB Corp | 1,691 | 30 | ||||||
LegacyTexas Financial Group Inc | 5,902 | 252 | ||||||
Legg Mason | 4,600 | 173 | ||||||
LendingClub* | 8,131 | 120 | ||||||
LendingTree Inc* | 400 | 129 | ||||||
Level One Bancorp Inc | 539 | 13 | ||||||
Lincoln National | 11,600 | 758 | ||||||
Live Oak Bancshares Inc | 3,295 | 64 | ||||||
Loews | 14,300 | 766 | ||||||
LPL Financial Holdings Inc | 4,600 | 386 | ||||||
Luther Burbank Corp | 2,736 | 31 | ||||||
M&T Bank Corp | 7,500 | 1,232 | ||||||
Macatawa Bank Corp | 3,521 | 36 | ||||||
Mackinac Financial | 1,306 | 20 | ||||||
MainStreet Bancshares* | 999 | 23 | ||||||
Malvern Bancorp Inc* | 769 | 16 | ||||||
Markel* | 740 | 824 | ||||||
MarketAxess Holdings Inc | 2,000 | 674 | ||||||
Marlin Business Services Corp | 1,199 | 28 | ||||||
Marsh & McLennan Cos Inc | 27,700 | 2,737 | ||||||
MBIA Inc* | 11,289 | 105 | ||||||
MBT Financial Corp | 2,477 | 27 | ||||||
Medallion Financial* | 2,955 | 15 | ||||||
Mercantile Bank Corp | 2,127 | 71 | ||||||
Merchants Bancorp/IN | 1,530 | 27 | ||||||
Mercury General | 1,500 | 85 | ||||||
Meridian Bancorp | 6,120 | 112 | ||||||
Meta Financial Group Inc | 4,682 | 145 | ||||||
MetLife | 44,400 | 2,194 | ||||||
Metropolitan Bank Holding Corp* | 933 | 39 | ||||||
MFA Financial Inc‡ | 24,400 | 175 | ||||||
MGIC Investment Corp | 19,300 | 248 | ||||||
Mid Penn Bancorp Inc | 999 | 26 | ||||||
Midland States Bancorp Inc | 2,749 | 75 | ||||||
MidSouth Bancorp Inc | 2,178 | 27 | ||||||
MidWestOne Financial Group Inc | 1,576 | 49 | ||||||
MMA Capital Holdings* | 684 | 22 | ||||||
Moelis & Co, Cl A | 6,004 | 219 | ||||||
Moody’s Corp | 9,100 | 1,950 | ||||||
Morgan Stanley | 66,200 | 2,950 | ||||||
Morningstar Inc | 1,000 | 152 | ||||||
Mr Cooper Group Inc* | 9,715 | 74 | ||||||
MSCI Inc, Cl A | 4,500 | 1,023 | ||||||
MutualFirst Financial Inc | 817 | 27 | ||||||
MVB Financial Corp | 885 | 15 | ||||||
Nasdaq Inc | 6,300 | 607 | ||||||
National Bank Holdings Corp, Cl A | 3,628 | 132 | ||||||
National Bankshares Inc | 656 | 24 | ||||||
| 30 | Adviser Managed Trust / Annual Report / July 31, 2019 |
SCHEDULE OF INVESTMENTS
July 31, 2019
Tactical Offensive Equity Fund(Continued)
| Description | Shares | Market Value ($ Thousands) | ||||||
COMMON STOCK (continued) |
| |||||||
National General Holdings Corp | 8,573 | $ | 212 | |||||
National Western Life Group, Cl A | 296 | 80 | ||||||
Navient | 13,300 | 188 | ||||||
NBT Bancorp Inc | 5,312 | 206 | ||||||
Nelnet Inc, Cl A | 2,344 | 147 | ||||||
New Residential Investment Corp‡ | 21,900 | 344 | ||||||
New York Community Bancorp Inc | 25,100 | 289 | ||||||
New York Mortgage Trust Inc‡ | 26,445 | 162 | ||||||
NI Holdings Inc* | 1,329 | 22 | ||||||
Nicolet Bankshares Inc* | 1,036 | 68 | ||||||
NMI Holdings Inc, Cl A* | 8,222 | 205 | ||||||
Northeast Bank | 764 | 17 | ||||||
Northern Trust Corp | 11,000 | 1,078 | ||||||
Northfield Bancorp Inc | 5,655 | 89 | ||||||
Northrim BanCorp Inc | 972 | 38 | ||||||
Northwest Bancshares Inc | 12,686 | 218 | ||||||
Norwood Financial | 797 | 28 | ||||||
Oak Valley Bancorp | 717 | 13 | ||||||
OceanFirst Financial Corp | 6,371 | 155 | ||||||
Och-Ziff Capital Management Group, Cl A (B) | 2,214 | 52 | ||||||
Ocwen Financial Corp* | 15,664 | 30 | ||||||
OFG Bancorp | 6,437 | 146 | ||||||
Ohio Valley Banc Corp | 416 | 15 | ||||||
Old Line Bancshares Inc | 2,001 | 57 | ||||||
Old National Bancorp/IN | 21,768 | 383 | ||||||
Old Republic International Corp | 15,400 | 351 | ||||||
Old Second Bancorp Inc | 3,820 | 50 | ||||||
On Deck Capital* | 7,444 | 27 | ||||||
OneMain Holdings, Cl A | 4,200 | 174 | ||||||
OP Bancorp | 1,304 | 13 | ||||||
Oppenheimer Holdings Inc, Cl A | 1,303 | 38 | ||||||
Opus Bank | 2,854 | 64 | ||||||
Orchid Island Capital Inc, Cl A‡ | 6,830 | 42 | ||||||
Origin Bancorp Inc | 2,267 | 79 | ||||||
Oritani Financial Corp | 4,986 | 90 | ||||||
Orrstown Financial Services | 1,392 | 32 | ||||||
Pacific Mercantile Bancorp* | 1,632 | 13 | ||||||
Pacific Premier Bancorp Inc | 7,754 | 245 | ||||||
PacWest Bancorp | 6,700 | 259 | ||||||
Palomar Holdings* | 809 | 23 | ||||||
Park National Corp | 1,719 | 163 | ||||||
Parke Bancorp Inc | 1,229 | 29 | ||||||
PCB Bancorp | 1,690 | 28 | ||||||
PCSB Financial Corp | 2,148 | 42 | ||||||
PDL Community Bancorp* | 921 | 13 | ||||||
Peapack Gladstone Financial Corp | 2,453 | 70 | ||||||
Penns Woods Bancorp | 632 | 29 | ||||||
PennyMac Financial Services Inc | 3,232 | 78 | ||||||
PennyMac Mortgage Investment Trust‡ | 9,532 | 210 | ||||||
Peoples Bancorp | 2,303 | 75 | ||||||
Peoples Bancorp of North Carolina | 485 | 13 | ||||||
| Description | Shares | Market Value ($ Thousands) | ||||||
COMMON STOCK (continued) |
| |||||||
Peoples Financial Services | 960 | $ | 46 | |||||
People’s United Financial Inc | 21,100 | 346 | ||||||
People’s Utah Bancorp | 1,941 | 59 | ||||||
Pinnacle Financial Partners Inc | 4,100 | 249 | ||||||
Piper Jaffray Cos | 1,807 | 140 | ||||||
PJT Partners Inc | 2,963 | 125 | ||||||
PNC Financial Services Group Inc/The | 24,900 | 3,558 | ||||||
Popular Inc | 5,400 | 311 | ||||||
PRA Group Inc* | 5,591 | 174 | ||||||
Preferred Bank/Los Angeles CA | 1,802 | 98 | ||||||
Premier Financial Bancorp Inc | 1,794 | 28 | ||||||
Primerica Inc | 2,300 | 282 | ||||||
Principal Financial Group Inc | 15,100 | 876 | ||||||
ProAssurance Corp | 6,580 | 257 | ||||||
Progressive Corp/The | 31,600 | 2,559 | ||||||
Prosperity Bancshares Inc | 3,600 | 250 | ||||||
Protective Insurance Corp | 961 | 16 | ||||||
Provident Bancorp* | 458 | 13 | ||||||
Provident Financial Holdings | 850 | 18 | ||||||
Provident Financial Services Inc | 7,667 | 185 | ||||||
Prudential Bancorp Inc | 893 | 16 | ||||||
Prudential Financial Inc | 22,500 | 2,279 | ||||||
Pzena Investment Management Inc, Cl A | 1,744 | 14 | ||||||
QCR Holdings Inc | 1,732 | 66 | ||||||
Radian Group Inc | 26,560 | 606 | ||||||
Raymond James Financial Inc | 6,900 | 557 | ||||||
RBB Bancorp | 2,155 | 43 | ||||||
Ready Capital Corp‡ | 3,911 | 60 | ||||||
Redwood Trust Inc‡ | 11,906 | 201 | ||||||
Regional Management* | 916 | 22 | ||||||
Regions Financial Corp | 56,400 | 898 | ||||||
Reinsurance Group of America Inc, Cl A | 3,400 | 530 | ||||||
Reliant Bancorp Inc | 1,445 | 36 | ||||||
RenaissanceRe Holdings Ltd | 2,200 | 399 | ||||||
Renasant Corp | 7,192 | 258 | ||||||
Republic Bancorp Inc/KY, Cl A | 1,200 | 57 | ||||||
Republic First Bancorp Inc* | 6,343 | 28 | ||||||
Riverview Bancorp Inc | 2,136 | 18 | ||||||
RLI Corp | 5,019 | 452 | ||||||
S&P Global Inc | 13,600 | 3,331 | ||||||
S&T Bancorp | 4,314 | 164 | ||||||
Safeguard Scientifics Inc* | 2,741 | 32 | ||||||
Safety Insurance Group Inc | 1,832 | 181 | ||||||
Sandy Spring Bancorp Inc | 4,355 | 159 | ||||||
Santander Consumer USA Holdings Inc | 6,300 | 170 | ||||||
SB One Bancorp | 720 | 16 | ||||||
Seacoast Banking Corp of Florida* | 6,410 | 173 | ||||||
Select Bancorp* | 2,260 | 26 | ||||||
Selective Insurance Group Inc | 7,346 | 552 | ||||||
ServisFirst Bancshares | 5,800 | 198 | ||||||
Shore Bancshares Inc | 1,737 | 28 | ||||||
Siebert Financial Corp* | 1,183 | 14 | ||||||
| Adviser Managed Trust / Annual Report / July 31, 2019 | 31 |
SCHEDULE OF INVESTMENTS
July 31, 2019
Tactical Offensive Equity Fund(Continued)
| Description | Shares | Market Value ($ Thousands) | ||||||
COMMON STOCK (continued) |
| |||||||
Sierra Bancorp | 1,864 | $ | 49 | |||||
Signature Bank/New York NY | 2,800 | 357 | ||||||
Silvercrest Asset Management Group, Cl A | 878 | 13 | ||||||
Simmons First National Corp, Cl A | 11,216 | 289 | ||||||
SLM Corp | 23,700 | 216 | ||||||
SmartFinancial Inc* | 1,613 | 35 | ||||||
South Plains Financial | 575 | 10 | ||||||
South State Corp | 4,391 | 352 | ||||||
Southern First Bancshares Inc* | 940 | 38 | ||||||
Southern Missouri Bancorp Inc | 1,019 | 36 | ||||||
Southern National Bancorp of Virginia Inc | 2,585 | 41 | ||||||
Southside Bancshares Inc | 4,034 | 140 | ||||||
Spirit of Texas Bancshares Inc* | 1,577 | 34 | ||||||
Starwood Property Trust Inc‡ | 14,600 | 339 | ||||||
State Auto Financial Corp | 2,171 | 75 | ||||||
State Street Corp | 20,500 | 1,191 | ||||||
Sterling Bancorp Inc/MI | 2,930 | 29 | ||||||
Sterling Bancorp/DE | 11,700 | 256 | ||||||
Stewart Information Services | 2,961 | 112 | ||||||
Stifel Financial Corp | 8,734 | 522 | ||||||
Stock Yards Bancorp Inc | 2,385 | 91 | ||||||
Summit Financial Group Inc | 1,492 | 40 | ||||||
SunTrust Banks Inc | 24,500 | 1,632 | ||||||
SVB Financial Group* | 2,900 | 673 | ||||||
Synchrony Financial | 37,500 | 1,345 | ||||||
Synovus Financial Corp | 8,700 | 332 | ||||||
T Rowe Price Group | 12,700 | 1,440 | ||||||
TCF Financial Corp | 8,800 | 188 | ||||||
TD Ameritrade Holding Corp | 15,200 | 777 | ||||||
Territorial Bancorp Inc | 1,060 | 30 | ||||||
Texas Capital Bancshares Inc* | 2,700 | 170 | ||||||
TFS Financial Corp | 2,700 | 48 | ||||||
Third Point Reinsurance Ltd* | 9,499 | 96 | ||||||
Timberland Bancorp Inc/WA | 1,018 | 28 | ||||||
Tiptree Inc | 2,675 | 18 | ||||||
Tompkins Financial Corp | 1,853 | 152 | ||||||
Torchmark | 5,600 | 511 | ||||||
Towne Bank/Portsmouth VA | 8,184 | 230 | ||||||
TPG RE Finance Trust Inc‡ | 6,319 | 125 | ||||||
Travelers Cos Inc/The | 14,400 | 2,111 | ||||||
TriCo Bancshares | 3,229 | 122 | ||||||
TriState Capital Holdings Inc* | 3,216 | 68 | ||||||
Triumph Bancorp* | 3,162 | 99 | ||||||
Trupanion Inc* | 3,624 | 117 | ||||||
TrustCo Bank Corp NY | 12,031 | 97 | ||||||
Trustmark Corp | 8,106 | 288 | ||||||
Two Harbors Investment Corp‡ | 13,400 | 180 | ||||||
UMB Financial Corp | 5,585 | 381 | ||||||
Umpqua Holdings | 11,900 | 208 | ||||||
Union Bankshares | 399 | 13 | ||||||
United Bankshares | 12,400 | 466 | ||||||
United Community Banks Inc/GA | 9,707 | 279 | ||||||
| Description | Shares | Market Value ($ Thousands) | ||||||
COMMON STOCK (continued) |
| |||||||
United Community Financial Corp/OH | 6,324 | $ | 64 | |||||
United Financial Bancorp Inc | 6,523 | 94 | ||||||
United Fire Group Inc | 2,657 | 139 | ||||||
United Insurance Holdings Corp | 1,981 | 22 | ||||||
United Security Bancshares/Fresno CA | 1,351 | 14 | ||||||
Unity Bancorp Inc | 780 | 16 | ||||||
Universal Insurance Holdings Inc | 4,019 | 100 | ||||||
Univest Financial Corp | 3,697 | 102 | ||||||
Unum Group | 11,100 | 355 | ||||||
US Bancorp | 78,800 | 4,503 | ||||||
Valley National Bancorp | 40,783 | 455 | ||||||
Veritex Holdings Inc | 6,668 | 171 | ||||||
Virtu Financial Inc, Cl A | 2,200 | 48 | ||||||
Virtus Investment Partners Inc | 864 | 93 | ||||||
Voya Financial Inc | 8,200 | 461 | ||||||
Waddell & Reed Financial Inc, Cl A | 9,396 | 164 | ||||||
Walker & Dunlop | 3,453 | 201 | ||||||
Washington Federal Inc | 9,994 | 366 | ||||||
Washington Trust Bancorp Inc | 1,927 | 97 | ||||||
Waterstone Financial Inc | 3,183 | 54 | ||||||
Watford Holdings* | 2,617 | 50 | ||||||
Webster Financial Corp | 5,000 | 255 | ||||||
Wells Fargo & Co | 220,800 | 10,689 | ||||||
WesBanco Inc | 6,485 | 237 | ||||||
West Bancorporation Inc | 2,116 | 45 | ||||||
Westamerica Bancorporation | 3,211 | 206 | ||||||
Western Alliance Bancorp* | 5,400 | 267 | ||||||
Western Asset Mortgage Capital Corp‡ | 6,180 | 63 | ||||||
Western New England Bancorp Inc | 3,652 | 34 | ||||||
Westwood Holdings Group Inc | 798 | 25 | ||||||
White Mountains Insurance Group Ltd | 200 | 215 | ||||||
Willis Towers Watson PLC | 7,100 | 1,386 | ||||||
Wintrust Financial Corp | 3,000 | 215 | ||||||
WisdomTree Investments | 17,050 | 106 | ||||||
World Acceptance Corp* | 858 | 109 | ||||||
WR Berkley Corp | 7,750 | 538 | ||||||
WSFS Financial Corp | 6,629 | 281 | ||||||
Zions Bancorp NA | 10,100 | 455 | ||||||
|
| |||||||
| 244,561 | ||||||||
|
| |||||||
Health Care — 9.5% | ||||||||
Abbott Laboratories | 93,400 | 8,135 | ||||||
AbbVie Inc | 80,600 | 5,370 | ||||||
Abeona Therapeutics Inc* | 3,338 | 9 | ||||||
ABIOMED Inc* | 2,300 | 641 | ||||||
Acadia Healthcare Co Inc* | 4,700 | 150 | ||||||
ACADIA Pharmaceuticals Inc* | 13,039 | 320 | ||||||
Accelerate Diagnostics Inc* | 3,413 | 64 | ||||||
Acceleron Pharma Inc* | 5,712 | 249 | ||||||
Accuray* | 11,485 | 48 | ||||||
AcelRx Pharmaceuticals* | 10,845 | 28 | ||||||
Acer Therapeutics* | 753 | 2 | ||||||
Achillion Pharmaceuticals* | 18,342 | 81 | ||||||
| 32 | Adviser Managed Trust / Annual Report / July 31, 2019 |
SCHEDULE OF INVESTMENTS
July 31, 2019
Tactical Offensive Equity Fund(Continued)
| Description | Shares | Market Value ($ Thousands) | ||||||
COMMON STOCK (continued) | ||||||||
Aclaris Therapeutics Inc* | 2,493 | $ | 3 | |||||
Acorda Therapeutics Inc* | 5,936 | 41 | ||||||
Adamas Pharmaceuticals Inc* | 2,663 | 17 | ||||||
Addus HomeCare Corp* | 1,244 | 100 | ||||||
ADMA Biologics Inc* | 2,516 | 9 | ||||||
Aduro Biotech Inc* | 4,159 | 5 | ||||||
Adverum Biotechnologies Inc* | 7,045 | 94 | ||||||
Aeglea BioTherapeutics Inc* | 3,577 | 32 | ||||||
Aerie Pharmaceuticals* | 5,354 | 116 | ||||||
Agenus Inc* | 13,882 | 33 | ||||||
AgeX Therapeutics* | 3,277 | 10 | ||||||
Agilent Technologies Inc | 17,400 | 1,208 | ||||||
Agios Pharmaceuticals* | 2,800 | 135 | ||||||
Aimmune Therapeutics Inc* | 5,561 | 107 | ||||||
Akcea Therapeutics* | 1,276 | 28 | ||||||
Akebia Therapeutics Inc* | 15,321 | 64 | ||||||
Akorn* | 12,389 | 46 | ||||||
Albireo Pharma Inc* | 1,368 | 35 | ||||||
Alder Biopharmaceuticals Inc* | 9,330 | 94 | ||||||
Aldeyra Therapeutics Inc* | 2,146 | 12 | ||||||
Alector* | 1,361 | 29 | ||||||
Alexion Pharmaceuticals Inc* | 11,700 | 1,325 | ||||||
Align Technology Inc* | 4,300 | 899 | ||||||
Allakos* | 2,226 | 77 | ||||||
Allergan PLC | 17,900 | 2,873 | ||||||
Allogene Therapeutics Inc* | 4,938 | 153 | ||||||
Allscripts Healthcare Solutions Inc* | 21,608 | 223 | ||||||
Alnylam Pharmaceuticals Inc* | 5,100 | 396 | ||||||
Alphatec Holdings* | 4,307 | 20 | ||||||
AMAG Pharmaceuticals Inc* | 4,446 | 37 | ||||||
Amedisys Inc* | 3,939 | 543 | ||||||
American Renal Associates Holdings Inc* | 2,640 | 20 | ||||||
AmerisourceBergen Corp, Cl A | 8,400 | 732 | ||||||
Amgen Inc | 33,200 | 6,194 | ||||||
Amicus Therapeutics Inc* | 29,134 | 361 | ||||||
AMN Healthcare Services Inc* | 5,709 | 305 | ||||||
Amneal Pharmaceuticals Inc* | 11,274 | 41 | ||||||
Amphastar Pharmaceuticals Inc* | 4,508 | 91 | ||||||
AnaptysBio* | 3,114 | 167 | ||||||
Anavex Life Sciences* | 6,118 | 16 | ||||||
AngioDynamics* | 4,681 | 95 | ||||||
ANI Pharmaceuticals* | 1,134 | 96 | ||||||
Anika Therapeutics* | 1,809 | 100 | ||||||
Antares Pharma* | 19,195 | 61 | ||||||
Anthem Inc | 14,000 | 4,125 | ||||||
Apellis Pharmaceuticals Inc* | 6,144 | 172 | ||||||
Apollo Medical Holdings Inc* | 941 | 14 | ||||||
Apyx Medical* | 4,551 | 33 | ||||||
Arcus Biosciences Inc* | 4,286 | 34 | ||||||
Ardelyx Inc* | 5,173 | 12 | ||||||
Arena Pharmaceuticals Inc* | 6,353 | 398 | ||||||
ArQule* | 13,647 | 138 | ||||||
| Description | Shares | Market Value ($ Thousands) | ||||||
COMMON STOCK (continued) | ||||||||
Arrowhead Pharmaceuticals Inc* | 11,552 | $ | 336 | |||||
Arvinas Inc* | 2,309 | 62 | ||||||
Assembly Biosciences Inc* | 3,015 | 38 | ||||||
Assertio Therapeutics Inc* | 8,716 | 30 | ||||||
Atara Biotherapeutics Inc* | 5,326 | 76 | ||||||
Athenex Inc* | 7,538 | 136 | ||||||
Athersys Inc* | 16,910 | 23 | ||||||
AtriCure Inc* | 4,641 | 149 | ||||||
Atrion Corp | 179 | 138 | ||||||
Audentes Therapeutics Inc* | 5,544 | 216 | ||||||
Avanos Medical Inc* | 5,807 | 236 | ||||||
Avedro* | 753 | 14 | ||||||
Avid Bioservices Inc* | 7,452 | 48 | ||||||
Avrobio Inc* | 1,917 | 41 | ||||||
Axogen Inc* | 4,369 | 79 | ||||||
Axonics Modulation Technologies Inc* | 1,996 | 73 | ||||||
Axsome Therapeutics* | 3,146 | 80 | ||||||
Baxter International Inc | 26,300 | 2,208 | ||||||
Becton Dickinson and Co | 14,500 | 3,666 | ||||||
Beyondspring* | 1,454 | 24 | ||||||
BioCryst Pharmaceuticals Inc* | 14,620 | 46 | ||||||
BioDelivery Sciences International* | 10,748 | 40 | ||||||
Biogen Inc* | 10,700 | 2,545 | ||||||
Biohaven Pharmaceutical Holding* | 4,221 | 182 | ||||||
BioLife Solutions* | 983 | 19 | ||||||
BioMarin Pharmaceutical Inc* | 9,600 | 761 | ||||||
Bio-Rad Laboratories Inc, Cl A* | 1,200 | 378 | ||||||
BioScrip* | 13,001 | 37 | ||||||
BioSig Technologies* | 2,228 | 17 | ||||||
BioSpecifics Technologies Corp* | 809 | 47 | ||||||
Bio-Techne Corp | 2,000 | 420 | ||||||
BioTelemetry Inc* | 4,100 | 192 | ||||||
BioTime Inc* | 13,360 | 15 | ||||||
Bioxcel Therapeutics* | 989 | 11 | ||||||
Bluebird Bio Inc* | 3,000 | 394 | ||||||
Blueprint Medicines Corp* | 6,127 | 614 | ||||||
Boston Scientific Corp* | 75,200 | 3,193 | ||||||
Bristol-Myers Squibb Co | 89,300 | 3,966 | ||||||
Brookdale Senior Living Inc, Cl A* | 23,453 | 183 | ||||||
Bruker Corp | 5,500 | 263 | ||||||
Calithera Biosciences Inc* | 4,954 | 21 | ||||||
Calyxt Inc* | 1,360 | 13 | ||||||
Cambrex Corp* | 4,183 | 183 | ||||||
Cantel Medical Corp | 2,000 | 185 | ||||||
Cara Therapeutics Inc* | 4,201 | 101 | ||||||
Cardinal Health | 16,300 | 745 | ||||||
Cardiovascular Systems Inc* | 4,228 | 194 | ||||||
CareDx* | 5,209 | 171 | ||||||
CASI Pharmaceuticals Inc* | 5,035 | 16 | ||||||
Castlight Health Inc, Cl B* | 13,395 | 22 | ||||||
Catalent Inc* | 7,900 | 446 | ||||||
Catalyst Pharmaceuticals Inc* | 12,726 | 63 | ||||||
| Adviser Managed Trust / Annual Report / July 31, 2019 | 33 |
SCHEDULE OF INVESTMENTS
July 31, 2019
Tactical Offensive Equity Fund(Continued)
| Description | Shares | Market Value ($ Thousands) | ||||||
COMMON STOCK (continued) | ||||||||
Catasys* | 1,012 | $ | 18 | |||||
Celcuity Inc* | 599 | 14 | ||||||
Celgene* | 38,300 | 3,518 | ||||||
Cellular Biomedicine Group Inc* | 1,674 | 23 | ||||||
CEL-SCI* | 3,574 | 26 | ||||||
Centene Corp* | 22,100 | 1,151 | ||||||
Cerecor* | 3,177 | 13 | ||||||
Cerner Corp | 16,900 | 1,211 | ||||||
Cerus Corp* | 17,338 | 101 | ||||||
Charles River Laboratories International Inc* | 2,600 | 350 | ||||||
Checkpoint Therapeutics* | 3,539 | 9 | ||||||
Chemed Corp | 800 | 324 | ||||||
ChemoCentryx Inc* | 5,376 | 43 | ||||||
Chiasma* | 3,570 | 20 | ||||||
Chimerix Inc* | 4,723 | 17 | ||||||
ChromaDex* | 5,313 | 25 | ||||||
Cigna Corp | 20,300 | 3,449 | ||||||
Clovis Oncology Inc* | 6,126 | 65 | ||||||
Codexis Inc* | 6,532 | 120 | ||||||
Coherus Biosciences Inc* | 7,847 | 132 | ||||||
Collegium Pharmaceutical Inc* | 4,212 | 46 | ||||||
Community Health Systems* | 8,777 | 18 | ||||||
Computer Programs & Systems | 1,676 | 43 | ||||||
Concert Pharmaceuticals Inc* | 3,035 | 31 | ||||||
ConforMIS* | 8,610 | 24 | ||||||
CONMED Corp | 3,432 | 300 | ||||||
Constellation Pharmaceuticals Inc* | 1,608 | 15 | ||||||
Cooper Cos Inc/The | 2,600 | 877 | ||||||
Corbus Pharmaceuticals Holdings* | 7,325 | 44 | ||||||
Corcept Therapeutics Inc* | 12,332 | 139 | ||||||
Corindus Vascular Robotics* | 12,231 | 31 | ||||||
CorMedix* | 3,258 | 32 | ||||||
Cortexyme* | 430 | 15 | ||||||
CorVel* | 1,147 | 98 | ||||||
Covetrus Inc* | 3,300 | 78 | ||||||
Crinetics Pharmaceuticals Inc* | 1,482 | 30 | ||||||
Cross Country Healthcare Inc* | 4,779 | 45 | ||||||
CryoLife* | 4,481 | 129 | ||||||
CryoPort Inc* | 3,597 | 74 | ||||||
Cue Biopharma Inc* | 1,840 | 15 | ||||||
Cutera Inc* | 1,894 | 48 | ||||||
CVS Health | 70,100 | 3,916 | ||||||
Cyclerion Therapeutics Inc* | 3,176 | 30 | ||||||
Cymabay Therapeutics Inc* | 7,972 | 49 | ||||||
Cytokinetics Inc* | 7,029 | 86 | ||||||
CytomX Therapeutics Inc* | 5,864 | 60 | ||||||
CytoSorbents Corp* | 4,202 | 29 | ||||||
Danaher Corp | 34,300 | 4,819 | ||||||
DaVita Inc* | 7,100 | 425 | ||||||
Deciphera Pharmaceuticals Inc* | 1,947 | 43 | ||||||
Denali Therapeutics* | 5,778 | 123 | ||||||
| Description | Shares | Market Value ($ Thousands) | ||||||
COMMON STOCK (continued) | ||||||||
DENTSPLY SIRONA Inc | 11,900 | $ | 648 | |||||
Dermira Inc* | 6,082 | 54 | ||||||
DexCom Inc* | 4,800 | 753 | ||||||
Dicerna Pharmaceuticals Inc* | 6,853 | 93 | ||||||
Diplomat Pharmacy Inc* | 7,639 | 40 | ||||||
Dova Pharmaceuticals Inc* | 1,407 | 22 | ||||||
Dynavax Technologies* | 5,875 | 16 | ||||||
Eagle Pharmaceuticals Inc/DE* | 1,373 | 75 | ||||||
Editas Medicine Inc* | 6,335 | 160 | ||||||
Edwards Lifesciences Corp* | 11,500 | 2,448 | ||||||
Eidos Therapeutics Inc* | 1,299 | 42 | ||||||
Eiger BioPharmaceuticals* | 3,158 | 35 | ||||||
Elanco Animal Health Inc* | 18,200 | 600 | ||||||
ElectroCore* | 356 | — | ||||||
Eli Lilly | 46,900 | 5,110 | ||||||
Eloxx Pharmaceuticals Inc* | 2,365 | 19 | ||||||
Emergent BioSolutions Inc* | 5,631 | 249 | ||||||
Enanta Pharmaceuticals Inc* | 2,090 | 157 | ||||||
Encompass Health Corp | 5,300 | 338 | ||||||
Ensign Group Inc/The | 6,365 | 384 | ||||||
Enzo Biochem* | 4,500 | 18 | ||||||
Epizyme Inc* | 9,863 | 131 | ||||||
Esperion Therapeutics Inc* | 3,165 | 126 | ||||||
Evelo Biosciences Inc* | 1,670 | 10 | ||||||
Evofem Biosciences* | 2,133 | 10 | ||||||
Evolent Health Inc, Cl A* | 8,906 | 61 | ||||||
Evolus Inc* | 1,563 | 28 | ||||||
Exact Sciences* | 6,500 | 748 | ||||||
Exelixis Inc* | 16,000 | 340 | ||||||
EyePoint Pharmaceuticals* | 9,317 | 13 | ||||||
Fate Therapeutics Inc* | 6,397 | 141 | ||||||
FibroGen Inc* | 9,754 | 461 | ||||||
Five Prime Therapeutics Inc* | 3,205 | 16 | ||||||
Flexion Therapeutics Inc* | 4,512 | 45 | ||||||
Fluidigm* | 8,836 | 104 | ||||||
Forty Seven Inc* | 2,293 | 20 | ||||||
G1 Therapeutics Inc* | 4,317 | 107 | ||||||
Galectin Therapeutics* | 4,622 | 17 | ||||||
Genesis Healthcare Inc, Cl A* | 12,164 | 14 | ||||||
GenMark Diagnostics Inc* | 7,181 | 45 | ||||||
Genomic Health Inc* | 3,411 | 249 | ||||||
Geron Corp* | 17,676 | 21 | ||||||
Gilead Sciences Inc | 69,700 | 4,567 | ||||||
Glaukos Corp* | 4,486 | 366 | ||||||
Global Blood Therapeutics Inc* | 6,840 | 375 | ||||||
Globus Medical Inc, Cl A* | 9,557 | 436 | ||||||
GlycoMimetics Inc* | 4,609 | 43 | ||||||
Gossamer Bio Inc* | 2,609 | 52 | ||||||
Gritstone Oncology Inc* | 3,363 | 35 | ||||||
Guardant Health* | 1,900 | 179 | ||||||
Haemonetics Corp* | 6,420 | 784 | ||||||
Halozyme Therapeutics Inc* | 18,035 | 306 | ||||||
| 34 | Adviser Managed Trust / Annual Report / July 31, 2019 |
SCHEDULE OF INVESTMENTS
July 31, 2019
Tactical Offensive Equity Fund(Continued)
| Description | Shares | Market Value ($ Thousands) | ||||||
COMMON STOCK (continued) | ||||||||
Hanger* | 4,661 | $ | 80 | |||||
Harpoon Therapeutics* | 933 | 14 | ||||||
HCA Healthcare Inc | 14,900 | 1,989 | ||||||
HealthEquity Inc* | 8,506 | 697 | ||||||
HealthStream Inc* | 3,340 | 94 | ||||||
Henry Schein Inc* | 8,300 | 552 | ||||||
Heron Therapeutics Inc* | 9,357 | 163 | ||||||
Heska Corp* | 882 | 71 | ||||||
Hill-Rom Holdings Inc | 3,600 | 384 | ||||||
HMS Holdings Corp* | 10,924 | 381 | ||||||
Hologic Inc* | 14,500 | 743 | ||||||
Homology Medicines Inc* | 3,170 | 56 | ||||||
Horizon Therapeutics* | 10,000 | 249 | ||||||
Humana | 7,400 | 2,196 | ||||||
ICU Medical Inc* | 800 | 204 | ||||||
IDEXX Laboratories* | 4,700 | 1,326 | ||||||
Illumina Inc* | 8,000 | 2,395 | ||||||
ImmunoGen* | 19,370 | 44 | ||||||
Immunomedics Inc * | 22,056 | 325 | ||||||
Incyte* | 9,600 | 815 | ||||||
Innoviva* | 8,716 | 104 | ||||||
Inogen* | 2,240 | 138 | ||||||
Inovalon Holdings Inc, Cl A* | 8,705 | 131 | ||||||
Inovio Pharmaceuticals* | 12,497 | 34 | ||||||
Insmed Inc* | 9,487 | 208 | ||||||
Inspire Medical Systems Inc* | 1,624 | 110 | ||||||
Insulet Corp* | 3,200 | 393 | ||||||
Integer Holdings Corp* | 4,090 | 358 | ||||||
Integra LifeSciences Holdings Corp* | 3,900 | 247 | ||||||
Intellia Therapeutics Inc* | 4,372 | 79 | ||||||
Intercept Pharmaceuticals Inc* | 3,124 | 196 | ||||||
Intersect ENT Inc* | 3,845 | 76 | ||||||
Intra-Cellular Therapies Inc, Cl A* | 5,824 | 49 | ||||||
Intrexon Corp* | 9,561 | 76 | ||||||
IntriCon* | 1,132 | 20 | ||||||
Intuitive Surgical Inc* | 6,200 | 3,221 | ||||||
Invacare Corp | 3,514 | 19 | ||||||
Invitae Corp* | 10,944 | 294 | ||||||
Ionis Pharmaceuticals Inc* | 6,800 | 448 | ||||||
Iovance Biotherapeutics Inc* | 14,441 | 355 | ||||||
IQVIA Holdings Inc* | 9,500 | 1,512 | ||||||
iRadimed Corp* | 665 | 16 | ||||||
iRhythm Technologies Inc* | 3,158 | 263 | ||||||
Ironwood Pharmaceuticals Inc, Cl A* | 19,437 | 207 | ||||||
Johnson & Johnson | 144,800 | 18,856 | ||||||
Joint* | 1,771 | 33 | ||||||
Jounce Therapeutics Inc* | 2,558 | 12 | ||||||
Kadmon Holdings Inc* | 17,699 | 46 | ||||||
Kala Pharmaceuticals Inc* | 2,057 | 12 | ||||||
KalVista Pharmaceuticals* | 1,573 | 26 | ||||||
Karyopharm Therapeutics Inc* | 7,600 | 67 | ||||||
Kezar Life Sciences Inc* | 1,335 | 8 | ||||||
| Description | Shares | Market Value ($ Thousands) | ||||||
COMMON STOCK (continued) | ||||||||
Kindred Biosciences Inc* | 3,626 | $ | 25 | |||||
Kiniksa Pharmaceuticals Ltd, Cl A* | 1,920 | 23 | ||||||
Kodiak Sciences Inc* | 3,158 | 39 | ||||||
Krystal Biotech* | 1,154 | 55 | ||||||
Kura Oncology Inc* | 3,698 | 71 | ||||||
La Jolla Pharmaceutical Co* | 2,552 | 21 | ||||||
Laboratory Corp of America Holdings* | 5,500 | 921 | ||||||
Lannett Co Inc* | 4,382 | 31 | ||||||
Lantheus Holdings* | 4,688 | 106 | ||||||
LeMaitre Vascular Inc | 2,119 | 70 | ||||||
Lexicon Pharmaceuticals Inc* | 4,482 | 6 | ||||||
LHC Group Inc* | 3,782 | 479 | ||||||
Ligand Pharmaceuticals* | 2,359 | 216 | ||||||
Liquidia Technologies Inc* | 1,969 | 14 | ||||||
LivaNova PLC* | 6,170 | 475 | ||||||
LogicBio Therapeutics Inc* | 946 | 12 | ||||||
Luminex Corp | 5,270 | 115 | ||||||
MacroGenics* | 6,105 | 88 | ||||||
Madrigal Pharmaceuticals* | 1,016 | 89 | ||||||
Magellan Health Inc* | 2,662 | 187 | ||||||
Magenta Therapeutics Inc* | 2,083 | 28 | ||||||
MannKind* | 24,139 | 27 | ||||||
Marinus Pharmaceuticals* | 6,909 | 8 | ||||||
Marker Therapeutics* | 3,703 | 17 | ||||||
Masimo* | 2,500 | 395 | ||||||
McKesson Corp | 10,500 | 1,459 | ||||||
Medicines Co/The* | 8,861 | 318 | ||||||
MediciNova Inc* | 5,344 | 51 | ||||||
Medidata Solutions Inc* | 3,300 | 302 | ||||||
MEDNAX Inc* | 4,800 | 118 | ||||||
Medpace Holdings* | 3,488 | 275 | ||||||
Medtronic PLC | 73,200 | 7,462 | ||||||
MEI Pharma* | 9,466 | 16 | ||||||
MeiraGTx Holdings plc* | 2,064 | 56 | ||||||
Menlo Therapeutics Inc* | 2,335 | 9 | ||||||
Merck & Co Inc | 140,400 | 11,652 | ||||||
Meridian Bioscience Inc | 5,470 | 65 | ||||||
Merit Medical Systems Inc* | 6,833 | 270 | ||||||
Mersana Therapeutics* | 5,090 | 18 | ||||||
Mesa Laboratories Inc | 430 | 108 | ||||||
Mettler-Toledo International Inc* | 1,300 | 984 | ||||||
Millendo Therapeutics* | 1,375 | 13 | ||||||
Minerva Neurosciences Inc* | 4,091 | 27 | ||||||
Mirati Therapeutics* | 3,146 | 333 | ||||||
Misonix* | 1,017 | 24 | ||||||
Moderna Inc* | 1,400 | 18 | ||||||
Molecular Templates Inc* | 1,576 | 10 | ||||||
Molina Healthcare Inc* | 3,400 | 451 | ||||||
Momenta Pharmaceuticals Inc* | 12,217 | 138 | ||||||
Mustang Bio Inc* | 4,166 | 13 | ||||||
Mylan NV* | 28,000 | 585 | ||||||
MyoKardia Inc* | 5,603 | 305 | ||||||
| Adviser Managed Trust / Annual Report / July 31, 2019 | 35 |
SCHEDULE OF INVESTMENTS
July 31, 2019
Tactical Offensive Equity Fund(Continued)
| Description | Shares | Market Value ($ Thousands) | ||||||
COMMON STOCK (continued) | ||||||||
Myriad Genetics Inc* | 8,951 | $ | 261 | |||||
NanoString Technologies Inc* | 4,223 | 139 | ||||||
Natera* | 7,089 | 196 | ||||||
National HealthCare Corp | 1,535 | 134 | ||||||
National Research Corp, Cl A | 1,430 | 96 | ||||||
Natus Medical Inc* | 4,170 | 130 | ||||||
Nektar Therapeutics, Cl A* | 8,500 | 242 | ||||||
Neogen Corp* | 6,446 | 460 | ||||||
NeoGenomics Inc* | 11,040 | 269 | ||||||
Neon Therapeutics Inc* | 428 | 1 | ||||||
Neurocrine Biosciences Inc* | 4,900 | 472 | ||||||
Neuronetics Inc* | 1,832 | 22 | ||||||
Nevro Corp* | 3,759 | 251 | ||||||
NextCure* | 485 | 11 | ||||||
NextGen Healthcare Inc* | 6,811 | 111 | ||||||
NGM Biopharmaceuticals* | 1,016 | 14 | ||||||
Novavax | 2,319 | 10 | ||||||
Novocure Ltd* | 10,629 | 885 | ||||||
NuVasive Inc* | 6,531 | 435 | ||||||
Ocular Therapeutix Inc* | 4,575 | 21 | ||||||
Odonate Therapeutics Inc* | 1,035 | 42 | ||||||
Omeros Corp* | 5,940 | 92 | ||||||
Omnicell Inc* | 5,150 | 387 | ||||||
Oncocyte* | 3,314 | 6 | ||||||
OPKO Health Inc* | 41,508 | 88 | ||||||
OptimizeRx* | 1,661 | 25 | ||||||
Optinose Inc* | 3,451 | 19 | ||||||
OraSure Technologies Inc* | 7,869 | 66 | ||||||
Organogenesis Holdings* | 1,654 | 8 | ||||||
Orthofix Medical* | 2,218 | 119 | ||||||
OrthoPediatrics Corp* | 1,158 | 41 | ||||||
Osmotica Pharmaceuticals PLC* | 285 | 1 | ||||||
Owens & Minor Inc | 8,533 | 23 | ||||||
Pacific Biosciences of California Inc* | 17,584 | 95 | ||||||
Pacira BioSciences Inc* | 4,959 | 218 | ||||||
Palatin Technologies* | 20,556 | 19 | ||||||
Paratek Pharmaceuticals Inc* | 3,303 | 11 | ||||||
Patterson | 10,174 | 201 | ||||||
PDL BioPharma Inc* | 14,056 | 40 | ||||||
Penumbra Inc* | 1,700 | 285 | ||||||
PerkinElmer Inc | 6,000 | 517 | ||||||
PetIQ Inc, Cl A* | 2,430 | 83 | ||||||
Pfenex Inc* | 4,180 | 25 | ||||||
Pfizer Inc | 303,300 | 11,780 | ||||||
PhaseBio Pharmaceuticals* | 1,923 | 15 | ||||||
Phibro Animal Health Corp, Cl A | 2,638 | 82 | ||||||
Pieris Pharmaceuticals Inc* | 7,475 | 41 | ||||||
PolarityTE Inc* | 297 | 1 | ||||||
Portola Pharmaceuticals Inc, Cl A* | 8,528 | 228 | ||||||
PRA Health Sciences* | 3,200 | 320 | ||||||
Precision BioSciences* | 1,329 | 17 | ||||||
Premier Inc, Cl A* | 2,800 | 108 | ||||||
| Description | Shares | Market Value ($ Thousands) | ||||||
COMMON STOCK (continued) | ||||||||
Prestige Consumer Healthcare Inc* | 6,476 | $ | 224 | |||||
Principia Biopharma* | 1,742 | 65 | ||||||
Progenics Pharmaceuticals Inc* | 11,239 | 60 | ||||||
Protagonist Therapeutics* | 2,101 | 23 | ||||||
Providence Service Corp/The* | 1,432 | 80 | ||||||
PTC Therapeutics Inc* | 7,212 | 347 | ||||||
Pulse Biosciences Inc* | 1,094 | 14 | ||||||
Puma Biotechnology Inc* | 3,895 | 38 | ||||||
QIAGEN NV* | 12,100 | 456 | ||||||
Quanterix Corp* | 1,262 | 39 | ||||||
Quest Diagnostics Inc | 7,400 | 755 | ||||||
Quidel Corp* | 4,465 | 264 | ||||||
R1 RCM Inc* | 12,910 | 162 | ||||||
Ra Pharmaceuticals Inc* | 4,005 | 136 | ||||||
Radius Health Inc* | 5,734 | 123 | ||||||
RadNet* | 5,251 | 77 | ||||||
Reata Pharmaceuticals Inc, Cl A* | 2,540 | 230 | ||||||
Recro Pharma Inc* | 1,840 | 18 | ||||||
Regeneron Pharmaceuticals Inc* | 4,400 | 1,341 | ||||||
REGENXBIO Inc* | 4,190 | 186 | ||||||
Repligen Corp* | 5,954 | 562 | ||||||
Replimune Group* | 1,659 | 21 | ||||||
ResMed | 7,700 | 991 | ||||||
resTORbio* | 2,110 | 23 | ||||||
Retrophin Inc* | 5,255 | 104 | ||||||
Revance Therapeutics Inc* | 5,067 | 64 | ||||||
Rhythm Pharmaceuticals Inc* | 2,986 | 57 | ||||||
Rigel Pharmaceuticals Inc* | 22,616 | 52 | ||||||
Rocket Pharmaceuticals Inc* | 3,175 | 39 | ||||||
Rockwell Medical Inc* | 7,793 | 21 | ||||||
RTI Surgical Holdings Inc* | 5,847 | 25 | ||||||
Rubius Therapeutics Inc* | 4,485 | 60 | ||||||
Sage Therapeutics* | 2,700 | 433 | ||||||
Sangamo Therapeutics Inc* | 14,606 | 175 | ||||||
Sarepta Therapeutics* | 3,600 | 536 | ||||||
Savara Inc* | 2,735 | 7 | ||||||
Scholar Rock Holding Corp* | 1,423 | 17 | ||||||
SeaSpine Holdings Corp* | 2,158 | 27 | ||||||
Seattle Genetics Inc* | 5,900 | 447 | ||||||
Select Medical Holdings Corp* | 13,491 | 226 | ||||||
Senseonics Holdings Inc* | 14,599 | 16 | ||||||
Seres Therapeutics Inc* | 2,665 | 7 | ||||||
Shockwave Medical* | 869 | 43 | ||||||
SI-BONE Inc* | 2,146 | 39 | ||||||
Sientra Inc* | 3,283 | 20 | ||||||
SIGA Technologies Inc* | 7,321 | 41 | ||||||
Silk Road Medical* | 921 | 40 | ||||||
Simulations Plus Inc | 1,578 | 61 | ||||||
Solid Biosciences Inc* | 2,373 | 14 | ||||||
Sorrento Therapeutics Inc* | 15,195 | 41 | ||||||
Spark Therapeutics Inc* | 1,867 | 187 | ||||||
Spectrum Pharmaceuticals* | 14,421 | 109 | ||||||
| 36 | Adviser Managed Trust / Annual Report / July 31, 2019 |
SCHEDULE OF INVESTMENTS
July 31, 2019
Tactical Offensive Equity Fund(Continued)
| Description | Shares | Market Value ($ Thousands) | ||||||
COMMON STOCK (continued) | ||||||||
Spero Therapeutics Inc* | 1,014 | $ | 11 | |||||
STAAR Surgical* | 5,507 | 161 | ||||||
Stemline Therapeutics Inc* | 4,958 | 66 | ||||||
STERIS PLC | 4,600 | 685 | ||||||
Strongbridge Biopharma* | 5,276 | 14 | ||||||
Stryker Corp | 18,600 | 3,902 | ||||||
Supernus Pharmaceuticals Inc* | 6,106 | 204 | ||||||
Surgery Partners Inc* | 3,302 | 25 | ||||||
Surmodics Inc* | 1,712 | 71 | ||||||
Sutro Biopharma Inc* | 1,568 | 18 | ||||||
Syndax Pharmaceuticals Inc* | 1,836 | 18 | ||||||
Syneos Health Inc, Cl A* | 7,920 | 405 | ||||||
Synlogic Inc* | 1,597 | 9 | ||||||
Synthorx* | 891 | 15 | ||||||
Syros Pharmaceuticals* | 4,706 | 35 | ||||||
Tabula Rasa HealthCare* | 2,485 | 150 | ||||||
Tactile Systems Technology Inc* | 2,223 | 128 | ||||||
Tandem Diabetes Care Inc* | 6,972 | 442 | ||||||
Teladoc Health Inc* | 8,963 | 612 | ||||||
Teleflex Inc | 2,500 | 849 | ||||||
Tenet Healthcare Corp* | 12,973 | 306 | ||||||
TG Therapeutics Inc* | 10,174 | 76 | ||||||
TherapeuticsMD Inc* | 24,298 | 52 | ||||||
Theravance Biopharma Inc* | 5,553 | 116 | ||||||
Thermo Fisher Scientific | 21,700 | 6,026 | ||||||
Tivity Health* | 6,055 | 106 | ||||||
Tocagen Inc* | 1,466 | 8 | ||||||
TransEnterix Inc* | 17,743 | 24 | ||||||
Translate Bio Inc* | 3,041 | 24 | ||||||
TransMedics Group* | 911 | 22 | ||||||
Tricida Inc* | 2,797 | 88 | ||||||
Triple-S Management Corp, Cl B* | 2,999 | 72 | ||||||
Turning Point Therapeutics* | 887 | 35 | ||||||
Twist Bioscience Corp* | 2,739 | 92 | ||||||
Tyme Technologies Inc* | 10,589 | 12 | ||||||
Ultragenyx Pharmaceutical Inc* | 6,867 | 414 | ||||||
United Therapeutics Corp* | 2,300 | 182 | ||||||
UnitedHealth Group Inc | 51,500 | 12,824 | ||||||
UNITY Biotechnology Inc* | 3,574 | 25 | ||||||
Universal Health Services Inc, Cl B | 4,600 | 694 | ||||||
UroGen Pharma* | 2,415 | 82 | ||||||
US Physical Therapy Inc | 1,556 | 201 | ||||||
Utah Medical Products Inc | 468 | 43 | ||||||
Vanda Pharmaceuticals Inc* | 6,585 | 82 | ||||||
Vapotherm Inc* | 695 | 11 | ||||||
Varex Imaging Corp* | 4,804 | 153 | ||||||
Varian Medical Systems Inc* | 5,000 | 587 | ||||||
VBI Vaccines* | 12,372 | 9 | ||||||
Veeva Systems Inc, Cl A* | 6,800 | 1,128 | ||||||
Veracyte Inc* | 5,909 | 168 | ||||||
Vericel Corp* | 5,571 | 107 | ||||||
Verrica Pharmaceuticals* | 1,387 | 17 | ||||||
| Description | Shares | Market Value ($ Thousands) | ||||||
COMMON STOCK (continued) | ||||||||
Vertex Pharmaceuticals Inc* | 13,900 | $ | 2,316 | |||||
ViewRay Inc* | 8,225 | 74 | ||||||
Viking Therapeutics Inc* | 8,038 | 62 | ||||||
Vocera Communications Inc* | 3,825 | 98 | ||||||
Voyager Therapeutics Inc* | 2,789 | 61 | ||||||
Waters Corp* | 3,700 | 779 | ||||||
WaVe Life Sciences Ltd* | 2,639 | 56 | ||||||
WellCare Health Plans Inc* | 2,700 | 776 | ||||||
West Pharmaceutical Services Inc | 4,000 | 549 | ||||||
Wright Medical Group NV* | 15,847 | 457 | ||||||
X4 Pharmaceuticals* | 1,036 | 12 | ||||||
XBiotech* | 2,419 | 17 | ||||||
Xencor Inc* | 5,815 | 256 | ||||||
Xeris Pharmaceuticals Inc* | 2,954 | 35 | ||||||
Y-mAbs Therapeutics Inc* | 2,655 | 59 | ||||||
Zimmer Biomet Holdings Inc | 11,100 | 1,500 | ||||||
ZIOPHARM Oncology Inc* | 20,500 | 142 | ||||||
Zoetis Inc, Cl A | 26,400 | 3,033 | ||||||
Zogenix* | 5,422 | 261 | ||||||
Zynerba Pharmaceuticals* | 2,785 | 29 | ||||||
Zynex | 2,153 | 18 | ||||||
|
| |||||||
| 243,166 | ||||||||
|
| |||||||
Industrials — 7.1% | ||||||||
3M | 30,500 | 5,329 | ||||||
AAON Inc | 5,112 | 260 | ||||||
AAR Corp | 4,138 | 173 | ||||||
ABM Industries Inc | 8,474 | 357 | ||||||
Acacia Research Corp* | 4,924 | 14 | ||||||
ACCO Brands Corp | 12,990 | 127 | ||||||
Actuant Corp, Cl A | 6,853 | 157 | ||||||
Acuity Brands Inc | 2,200 | 295 | ||||||
ADT Inc | 5,800 | 37 | ||||||
Advanced Disposal Services Inc* | 8,957 | 290 | ||||||
Advanced Drainage Systems | 4,552 | 150 | ||||||
AECOM* | 8,500 | 306 | ||||||
Aegion Corp, Cl A* | 4,189 | 79 | ||||||
Aerojet Rocketdyne Holdings Inc* | 9,218 | 394 | ||||||
Aerovironment Inc* | 2,652 | 145 | ||||||
AGCO | 3,600 | 277 | ||||||
Air Lease Corp, Cl A | 5,300 | 221 | ||||||
Air Transport Services Group Inc* | 7,300 | 170 | ||||||
Aircastle Ltd | 6,839 | 142 | ||||||
Alamo Group Inc | 1,219 | 119 | ||||||
Alaska Air Group Inc | 6,600 | 418 | ||||||
Albany International Corp, Cl A | 3,688 | 317 | ||||||
Allegiant Travel Co, Cl A | 1,602 | 240 | ||||||
Allegion PLC | 5,200 | 538 | ||||||
Allied Motion Technologies Inc | 955 | 38 | ||||||
Allison Transmission Holdings Inc | 6,200 | 285 | ||||||
Altra Industrial Motion Corp | 8,107 | 233 | ||||||
AMERCO | 400 | 155 | ||||||
Ameresco Inc, Cl A* | 2,914 | 42 | ||||||
| Adviser Managed Trust / Annual Report / July 31, 2019 | 37 |
SCHEDULE OF INVESTMENTS
July 31, 2019
Tactical Offensive Equity Fund(Continued)
| Description | Shares | Market Value ($ Thousands) | ||||||
COMMON STOCK (continued) | ||||||||
American Airlines Group Inc | 22,600 | $ | 690 | |||||
American Superconductor* | 2,918 | 26 | ||||||
American Woodmark* | 1,926 | 163 | ||||||
AMETEK Inc | 12,500 | 1,120 | ||||||
AO Smith | 7,700 | 350 | ||||||
Apogee Enterprises Inc | 3,370 | 137 | ||||||
Applied Industrial Technologies Inc | 4,719 | 287 | ||||||
ArcBest Corp | 3,303 | 99 | ||||||
Arconic Inc | 21,700 | 543 | ||||||
Arcosa Inc | 6,150 | 231 | ||||||
Argan Inc | 1,900 | 78 | ||||||
Armstrong Flooring Inc* | 2,085 | 17 | ||||||
Armstrong World Industries Inc | 2,300 | 225 | ||||||
ASGN Inc* | 6,449 | 407 | ||||||
Astec Industries | 2,907 | 95 | ||||||
Astronics Corp* | 3,089 | 114 | ||||||
Atkore International Group Inc* | 5,874 | 160 | ||||||
Atlas Air Worldwide Holdings Inc* | 2,995 | 137 | ||||||
Avis Budget Group Inc* | 7,303 | 266 | ||||||
Axon Enterprise Inc* | 7,322 | 514 | ||||||
AZZ Inc | 3,257 | 152 | ||||||
Barnes Group Inc | 5,897 | 307 | ||||||
Barrett Business Services Inc | 921 | 81 | ||||||
Beacon Roofing Supply* | 8,422 | 305 | ||||||
BG Staffing Inc | 842 | 14 | ||||||
Bloom Energy, Cl A* | 7,097 | 74 | ||||||
Blue Bird Corp* | 2,058 | 43 | ||||||
BlueLinx Holdings Inc* | 1,244 | 26 | ||||||
BMC Stock Holdings Inc* | 8,423 | 178 | ||||||
Boeing | 28,900 | 9,860 | ||||||
Brady Corp, Cl A | 5,890 | 305 | ||||||
Briggs & Stratton Corp | 5,341 | 51 | ||||||
BrightView Holdings* | 4,030 | 80 | ||||||
Brink’s Co/The | 6,336 | 571 | ||||||
Builders FirstSource Inc* | 14,042 | 241 | ||||||
BWX Technologies Inc, Cl W | 5,400 | 291 | ||||||
Caesarstone Ltd | 2,980 | 42 | ||||||
CAI International Inc* | 2,214 | 50 | ||||||
Carlisle Cos Inc | 3,200 | 461 | ||||||
Casella Waste Systems, Cl A* | 5,690 | 248 | ||||||
Caterpillar Inc | 30,200 | 3,976 | ||||||
CBIZ Inc* | 6,510 | 152 | ||||||
CECO Environmental* | 4,164 | 38 | ||||||
CH Robinson Worldwide Inc | 7,400 | 620 | ||||||
Charah Solutions Inc* | 250 | 1 | ||||||
Chart Industries Inc* | 4,465 | 337 | ||||||
Cintas Corp | 4,700 | 1,224 | ||||||
CIRCOR International Inc* | 2,492 | 95 | ||||||
Clean Harbors Inc* | 2,800 | 218 | ||||||
Colfax* | 4,600 | 127 | ||||||
Columbus McKinnon Corp/NY | 2,836 | 109 | ||||||
Comfort Systems USA Inc | 4,547 | 191 | ||||||
| Description | Shares | Market Value ($ Thousands) | ||||||
COMMON STOCK (continued) | ||||||||
Commercial Vehicle Group Inc* | 2,984 | $ | 24 | |||||
Construction Partners, Cl A* | 1,675 | 26 | ||||||
Continental Building Products* | 4,713 | 116 | ||||||
Copart* | 11,100 | 861 | ||||||
Cornerstone Building Brands* | 6,146 | 36 | ||||||
CoStar Group Inc* | 2,000 | 1,231 | ||||||
Covanta Holding Corp | 14,552 | 251 | ||||||
Covenant Transportation Group Inc, Cl A* | 1,757 | 30 | ||||||
CRA International Inc | 1,050 | 46 | ||||||
Crane Co | 2,700 | 226 | ||||||
CSW Industrials Inc | 1,882 | 133 | ||||||
CSX Corp | 42,400 | 2,985 | ||||||
Cubic Corp | 3,877 | 257 | ||||||
Cummins Inc | 8,100 | 1,328 | ||||||
Curtiss-Wright Corp | 2,400 | 305 | ||||||
Daseke Inc* | 6,382 | 24 | ||||||
Deere | 17,500 | 2,899 | ||||||
Delta Air Lines Inc | 31,700 | 1,935 | ||||||
Deluxe | 5,732 | 256 | ||||||
Donaldson Co Inc | 7,000 | 350 | ||||||
Douglas Dynamics Inc | 2,824 | 116 | ||||||
Dover Corp | 7,900 | 765 | ||||||
Ducommun Inc* | 1,402 | 59 | ||||||
DXP Enterprises Inc/TX* | 2,094 | 71 | ||||||
Dycom Industries* | 3,755 | 207 | ||||||
Eagle Bulk Shipping Inc* | 4,792 | 22 | ||||||
Eastern Co/The | 560 | 14 | ||||||
Echo Global Logistics* | 3,644 | 77 | ||||||
EMCOR Group Inc | 7,010 | 592 | ||||||
Emerson Electric | 33,400 | 2,167 | ||||||
Encore Wire Corp | 2,564 | 141 | ||||||
Energous Corp* | 2,542 | 10 | ||||||
Energy Recovery Inc* | 4,886 | 54 | ||||||
EnerSys | 5,502 | 375 | ||||||
Ennis Inc | 2,859 | 58 | ||||||
EnPro Industries Inc | 2,559 | 182 | ||||||
Equifax Inc | 6,500 | 904 | ||||||
ESCO Technologies Inc | 3,156 | 264 | ||||||
EVI Industries Inc | 394 | 14 | ||||||
Evoqua Water Technologies Corp* | 9,571 | 136 | ||||||
Expeditors International of Washington Inc | 9,400 | 718 | ||||||
Exponent Inc | 6,575 | 452 | ||||||
Fastenal Co | 31,300 | 964 | ||||||
Federal Signal | 7,404 | 231 | ||||||
FedEx Corp | 13,300 | 2,268 | ||||||
Flowserve Corp | 7,100 | 355 | ||||||
Fluor | 7,600 | 247 | ||||||
Forrester Research Inc | 1,370 | 65 | ||||||
Fortive Corp | 16,000 | 1,217 | ||||||
Fortune Brands Home & Security Inc | 7,700 | 423 | ||||||
Forward Air | 3,587 | 226 | ||||||
Foundation Building Materials* | 2,097 | 36 | ||||||
| 38 | Adviser Managed Trust / Annual Report / July 31, 2019 |
SCHEDULE OF INVESTMENTS
July 31, 2019
Tactical Offensive Equity Fund(Continued)
| Description | Shares | Market Value ($ Thousands) | ||||||
COMMON STOCK (continued) | ||||||||
Franklin Covey Co* | 1,289 | $ | 47 | |||||
Franklin Electric Co Inc | 5,739 | 269 | ||||||
FTI Consulting Inc* | 4,789 | 500 | ||||||
Gardner Denver Holdings Inc* | 6,900 | 227 | ||||||
Gates Industrial Corp PLC* | 2,400 | 26 | ||||||
GATX Corp | 4,630 | 356 | ||||||
Genco Shipping & Trading Ltd* | 2,216 | 21 | ||||||
Gencor Industries Inc* | 944 | 12 | ||||||
Generac Holdings* | 7,679 | 555 | ||||||
General Dynamics Corp | 13,800 | 2,566 | ||||||
General Electric Co | 470,700 | 4,919 | ||||||
General Finance* | 1,794 | 14 | ||||||
Genesee & Wyoming, Cl A* | 3,100 | 340 | ||||||
Gibraltar Industries* | 4,003 | 166 | ||||||
GMS Inc* | 4,217 | 95 | ||||||
Gorman-Rupp | 2,294 | 76 | ||||||
GP Strategies Corp* | 1,744 | 28 | ||||||
Graco Inc | 9,000 | 433 | ||||||
GrafTech International Ltd | 3,200 | 37 | ||||||
Graham Corp | 1,316 | 28 | ||||||
Granite Construction Inc | 5,915 | 210 | ||||||
Great Lakes Dredge & Dock Corp* | 7,391 | 79 | ||||||
Greenbrier Cos Inc/The | 4,016 | 116 | ||||||
Griffon Corp | 4,590 | 75 | ||||||
H&E Equipment Services Inc | 4,039 | 124 | ||||||
Harsco Corp* | 9,957 | 234 | ||||||
Hawaiian Holdings Inc | 6,148 | 160 | ||||||
HD Supply Holdings Inc* | 9,700 | 393 | ||||||
Healthcare Services Group Inc | 9,151 | 219 | ||||||
Heartland Express Inc | 5,950 | 118 | ||||||
HEICO Corp, Cl A | 4,100 | 432 | ||||||
HEICO Corp | 2,100 | 287 | ||||||
Heidrick & Struggles International Inc | 2,414 | 72 | ||||||
Helios Technologies | 3,620 | 170 | ||||||
Herc Holdings Inc* | 3,030 | 137 | ||||||
Heritage-Crystal Clean* | 1,971 | 55 | ||||||
Herman Miller Inc | 7,266 | 329 | ||||||
Hertz Global Holdings Inc* | 12,492 | 194 | ||||||
Hexcel Corp | 4,600 | 376 | ||||||
Hillenbrand Inc | 7,752 | 261 | ||||||
HNI Corp | 5,415 | 185 | ||||||
Honeywell International Inc | 39,700 | 6,847 | ||||||
Hub Group Inc, Cl A* | 4,088 | 185 | ||||||
Hubbell Inc, Cl B | 3,000 | 390 | ||||||
Huntington Ingalls Industries Inc | 2,300 | 525 | ||||||
Hurco Cos Inc | 632 | 22 | ||||||
Huron Consulting Group Inc* | 2,781 | 170 | ||||||
Hyster-Yale Materials Handling Inc, Cl A | 1,352 | 84 | ||||||
IAA* | 7,300 | 341 | ||||||
ICF International Inc | 2,263 | 193 | ||||||
IDEX | 4,200 | 707 | ||||||
IES Holdings Inc* | 844 | 15 | ||||||
| Description | Shares | Market Value ($ Thousands) | ||||||
COMMON STOCK (continued) | ||||||||
IHS Markit Ltd* | 21,100 | $ | 1,359 | |||||
Illinois Tool Works Inc | 17,700 | 2,730 | ||||||
InnerWorkings* | 4,353 | 16 | ||||||
Insperity Inc | 4,862 | 517 | ||||||
Insteel Industries Inc | 2,433 | 47 | ||||||
Interface Inc, Cl A | 7,490 | 104 | ||||||
ITT Inc | 4,800 | 300 | ||||||
Jacobs Engineering Group | 6,800 | 561 | ||||||
JB Hunt Transport Services Inc | 4,700 | 481 | ||||||
JELD-WEN Holding* | 8,489 | 186 | ||||||
JetBlue Airways Corp* | 16,600 | 319 | ||||||
John Bean Technologies Corp | 3,963 | 470 | ||||||
Johnson Controls International plc | 49,700 | 2,109 | ||||||
Kadant Inc | 1,383 | 129 | ||||||
Kaman Corp | 3,435 | 218 | ||||||
Kansas City Southern | 5,500 | 681 | ||||||
KAR Auction Services Inc | 7,300 | 195 | ||||||
Kelly Services, Cl A | 3,992 | 111 | ||||||
Kennametal Inc | 10,451 | 361 | ||||||
Kforce Inc | 2,934 | 100 | ||||||
Kimball International Inc, Cl B | 4,636 | 80 | ||||||
Kirby Corp* | 3,200 | 251 | ||||||
Knight-Swift Transportation Holdings | ||||||||
Inc, Cl A | 6,900 | 247 | ||||||
Knoll Inc | 6,109 | 148 | ||||||
Korn Ferry | 6,983 | 274 | ||||||
Kratos Defense & Security Solutions Inc* | 11,492 | 283 | ||||||
L3Harris Technologies* | 12,090 | 2,510 | ||||||
Landstar System Inc | 2,200 | 245 | ||||||
Lawson Products* | 652 | 27 | ||||||
LB Foster, Cl A* | 1,416 | 34 | ||||||
Lennox International Inc | 2,000 | 513 | ||||||
Lincoln Electric Holdings Inc | 3,400 | 287 | ||||||
Lindsay | 1,365 | 125 | ||||||
Lockheed Martin Corp | 13,400 | 4,853 | ||||||
LSC Communications | 2,311 | 2 | ||||||
Luxfer Holdings | 3,503 | 69 | ||||||
Lydall Inc* | 2,258 | 53 | ||||||
Lyft, Cl A* | 1,800 | 110 | ||||||
Macquarie Infrastructure Corp | 4,300 | 178 | ||||||
Manitowoc Co Inc/The* | 4,589 | 82 | ||||||
ManpowerGroup Inc | 3,400 | 311 | ||||||
Marten Transport Ltd | 5,024 | 101 | ||||||
Masco Corp | 16,000 | 652 | ||||||
MasTec* | 7,434 | 382 | ||||||
Matson Inc | 5,277 | 216 | ||||||
Matthews International Corp, Cl A | 3,932 | 134 | ||||||
Maxar Technologies Inc | 7,248 | 53 | ||||||
McGrath RentCorp | 3,008 | 205 | ||||||
Mercury Systems Inc* | 6,704 | 547 | ||||||
Meritor Inc* | 9,914 | 245 | ||||||
Mesa Air Group Inc* | 2,840 | 29 | ||||||
| Adviser Managed Trust / Annual Report / July 31, 2019 | 39 |
SCHEDULE OF INVESTMENTS
July 31, 2019
Tactical Offensive Equity Fund(Continued)
| Description | Shares | Market Value ($ Thousands) | ||||||
COMMON STOCK (continued) | ||||||||
Middleby Corp/The* | 3,000 | $ | 403 | |||||
Milacron Holdings Corp* | 8,794 | 148 | ||||||
Miller Industries Inc/TN | 1,461 | 46 | ||||||
Mistras Group Inc* | 2,443 | 37 | ||||||
Mobile Mini Inc | 5,561 | 189 | ||||||
Moog Inc, Cl A | 4,093 | 333 | ||||||
MRC Global Inc* | 10,515 | 164 | ||||||
MSA Safety Inc | 4,435 | 467 | ||||||
MSC Industrial Direct Co Inc, Cl A | 2,400 | 171 | ||||||
Mueller Industries Inc | 7,057 | 213 | ||||||
Mueller Water Products, Cl A | 19,273 | 196 | ||||||
MYR Group Inc* | 2,090 | 75 | ||||||
National Presto Industries Inc | 656 | 60 | ||||||
Navigant Consulting Inc | 5,344 | 130 | ||||||
Navistar International Corp* | 6,118 | 191 | ||||||
Nielsen Holdings PLC | 19,400 | 449 | ||||||
NN Inc | 5,512 | 45 | ||||||
Nordson Corp | 3,200 | 453 | ||||||
Norfolk Southern | 14,600 | 2,790 | ||||||
Northrop Grumman Corp | 8,600 | 2,972 | ||||||
Northwest Pipe Co* | 1,362 | 32 | ||||||
NOW* | 13,459 | 165 | ||||||
NRC Group Holdings* | 1,493 | 18 | ||||||
NV5 Global Inc* | 1,304 | 104 | ||||||
nVent Electric PLC | 8,800 | 218 | ||||||
Old Dominion Freight Line Inc | 3,600 | 601 | ||||||
Omega Flex | 284 | 22 | ||||||
Oshkosh Corp | 3,800 | 318 | ||||||
Owens Corning | 5,900 | 342 | ||||||
PACCAR Inc | 18,500 | 1,298 | ||||||
PAM Transportation Services Inc* | 291 | 17 | ||||||
Park Aerospace | 2,481 | 45 | ||||||
Parker-Hannifin Corp | 7,000 | 1,226 | ||||||
Park-Ohio Holdings Corp | 1,191 | 36 | ||||||
Parsons* | 2,400 | 88 | ||||||
Patrick Industries Inc* | 2,907 | 133 | ||||||
PGT Innovations Inc* | 7,184 | 116 | ||||||
PICO Holdings Inc* | 2,501 | 25 | ||||||
Pitney Bowes Inc | 24,077 | 98 | ||||||
Plug Power Inc* | 29,845 | 66 | ||||||
Powell Industries Inc | 1,180 | 44 | ||||||
Preformed Line Products Co | 311 | 18 | ||||||
Primoris Services | 5,333 | 112 | ||||||
Proto Labs Inc* | 3,339 | 348 | ||||||
Quad | 4,206 | 48 | ||||||
Quanex Building Products Corp | 4,327 | 81 | ||||||
Quanta Services Inc | 8,000 | 299 | ||||||
Radiant Logistics Inc* | 3,784 | 21 | ||||||
Raven Industries Inc | 4,497 | 163 | ||||||
Raytheon Co | 15,200 | 2,771 | ||||||
RBC Bearings Inc* | 3,045 | 495 | ||||||
Regal Beloit Corp | 2,400 | 191 | ||||||
| Description | Shares | Market Value ($ Thousands) | ||||||
COMMON STOCK (continued) | ||||||||
Republic Services Inc, Cl A | 11,900 | $ | 1,055 | |||||
Resideo Technologies Inc* | 6,700 | 126 | ||||||
Resources Connection Inc | 3,920 | 69 | ||||||
REV Group | 3,586 | 52 | ||||||
Rexnord Corp* | 13,267 | 389 | ||||||
Robert Half International Inc | 6,400 | 387 | ||||||
Rockwell Automation Inc | 6,600 | 1,061 | ||||||
Rollins Inc | 7,900 | 265 | ||||||
Roper Technologies | 5,500 | 2,000 | ||||||
RR Donnelley & Sons | 9,931 | 20 | ||||||
Rush Enterprises Inc, Cl B | 441 | 17 | ||||||
Rush Enterprises Inc, Cl A | 3,789 | 143 | ||||||
Ryder System Inc | 2,800 | 149 | ||||||
Safe Bulkers* | 7,588 | 15 | ||||||
Saia Inc* | 3,192 | 244 | ||||||
Schneider National Inc, Cl B | 2,600 | 50 | ||||||
Scorpio Bulkers Inc | 7,127 | 43 | ||||||
Sensata Technologies Holding PLC* | 8,800 | 417 | ||||||
Simpson Manufacturing Co Inc | 5,635 | 348 | ||||||
SiteOne Landscape Supply* | 5,201 | 384 | ||||||
SkyWest Inc | 6,272 | 381 | ||||||
Snap-on | 3,000 | 458 | ||||||
Southwest Airlines Co | 26,600 | 1,371 | ||||||
SP Plus Corp* | 2,902 | 100 | ||||||
Spartan Motors Inc | 4,528 | 54 | ||||||
Spirit AeroSystems Holdings Inc, Cl A | 5,800 | 446 | ||||||
Spirit Airlines Inc* | 8,728 | 370 | ||||||
SPX Corp* | 5,381 | 188 | ||||||
SPX FLOW Inc* | 5,244 | 213 | ||||||
Standex International Corp | 1,596 | 112 | ||||||
Stanley Black & Decker Inc | 8,300 | 1,225 | ||||||
Steelcase Inc, Cl A | 10,733 | 181 | ||||||
Stericycle Inc* | 4,500 | 207 | ||||||
Sterling Construction Co Inc* | 3,448 | 43 | ||||||
Sunrun* | 13,951 | 266 | ||||||
Systemax | 1,187 | 26 | ||||||
Team Inc* | 3,776 | 63 | ||||||
Teledyne Technologies* | 1,900 | 553 | ||||||
Tennant Co | 2,247 | 171 | ||||||
Terex Corp | 7,998 | 244 | ||||||
Tetra Tech | 6,798 | 538 | ||||||
Textainer Group Holdings Ltd | 3,751 | 37 | ||||||
Textron Inc | 13,300 | 656 | ||||||
Thermon Group Holdings Inc* | 4,130 | 105 | ||||||
Timken Co/The | 3,700 | 169 | ||||||
Titan International Inc | 4,956 | 19 | ||||||
Titan Machinery Inc* | 2,503 | 52 | ||||||
Toro | 5,600 | 408 | ||||||
TPI Composites Inc* | 3,707 | 95 | ||||||
Transcat* | 947 | 23 | ||||||
TransDigm Group* | 2,600 | 1,262 | ||||||
TransUnion | 10,000 | 828 | ||||||
| 40 | Adviser Managed Trust / Annual Report / July 31, 2019 |
SCHEDULE OF INVESTMENTS
July 31, 2019
Tactical Offensive Equity Fund(Continued)
| Description | Shares | Market Value ($ Thousands) | ||||||
COMMON STOCK (continued) | ||||||||
Trex Co Inc* | 7,463 | $ | 610 | |||||
TriMas* | 5,732 | 172 | ||||||
TriNet Group Inc* | 5,619 | 413 | ||||||
Trinity Industries | 7,900 | 155 | ||||||
Triton International Ltd/Bermuda | 7,175 | 237 | ||||||
Triumph Group Inc | 6,183 | 150 | ||||||
TrueBlue Inc* | 5,118 | 101 | ||||||
Tutor Perini Corp* | 5,166 | 67 | ||||||
Twin Disc Inc* | 990 | 12 | ||||||
Uber Technologies* | 9,800 | 413 | ||||||
UniFirst Corp/MA | 1,882 | 371 | ||||||
Union Pacific Corp | 38,600 | 6,946 | ||||||
United Continental Holdings Inc* | 13,300 | 1,222 | ||||||
United Parcel Service Inc, Cl B | 37,700 | 4,504 | ||||||
United Rentals Inc* | 4,300 | 544 | ||||||
United Technologies Corp | 44,200 | 5,905 | ||||||
Univar* | 6,800 | 150 | ||||||
Universal Forest Products Inc | 7,416 | 300 | ||||||
Universal Logistics Holdings Inc | 1,167 | 23 | ||||||
Upwork Inc* | 7,018 | 115 | ||||||
US Ecology Inc | 2,738 | 174 | ||||||
US Xpress Enterprises Inc, Cl A* | 2,341 | 12 | ||||||
Valmont Industries Inc | 1,200 | 165 | ||||||
Vectrus Inc* | 1,449 | 59 | ||||||
Verisk Analytics, Cl A | 8,700 | 1,320 | ||||||
Veritiv Corp* | 1,650 | 29 | ||||||
Viad Corp | 2,546 | 176 | ||||||
Vicor Corp* | 2,258 | 67 | ||||||
Vivint Solar* | 5,774 | 48 | ||||||
VSE | 847 | 25 | ||||||
Wabash National Corp | 6,944 | 110 | ||||||
WABCO Holdings Inc* | 2,800 | 371 | ||||||
Wabtec Corp | 8,400 | 653 | ||||||
WageWorks* | 4,915 | 252 | ||||||
Waste Management Inc | 23,300 | 2,726 | ||||||
Watsco Inc | 1,700 | 276 | ||||||
Watts Water Technologies Inc, Cl A | 3,429 | 318 | ||||||
Welbilt* | 16,378 | 269 | ||||||
Werner Enterprises | 5,821 | 193 | ||||||
Wesco Aircraft Holdings* | 7,074 | 74 | ||||||
WESCO International Inc* | 2,600 | 132 | ||||||
Willdan Group Inc* | 1,311 | 46 | ||||||
Willis Lease Finance Corp* | 305 | 19 | ||||||
WillScot Corp, Cl A* | 6,623 | 105 | ||||||
Woodward | 3,000 | 336 | ||||||
WW Grainger Inc | 2,500 | 728 | ||||||
XPO Logistics Inc* | 5,000 | 337 | ||||||
Xylem Inc/NY | 9,800 | 787 | ||||||
YRC Worldwide Inc* | 2,126 | 7 | ||||||
|
| |||||||
| 182,257 | ||||||||
|
| |||||||
Information Technology — 14.2% | ||||||||
2U Inc* | 3,000 | 38 | ||||||
| Description | Shares | Market Value ($ Thousands) | ||||||
COMMON STOCK (continued) | ||||||||
3D Systems Corp* | 13,847 | $ | 125 | |||||
8x8 Inc* | 11,619 | 281 | ||||||
A10 Networks Inc* | 7,339 | 56 | ||||||
Acacia Communications Inc* | 4,735 | 318 | ||||||
ACI Worldwide Inc* | 13,861 | 465 | ||||||
Adesto Technologies Corp* | 3,659 | 31 | ||||||
Adobe Inc* | 26,500 | 7,920 | ||||||
ADTRAN Inc | 6,118 | 68 | ||||||
Advanced Energy Industries* | 4,752 | 278 | ||||||
Advanced Micro Devices Inc* | 54,600 | 1,663 | ||||||
Aerohive Networks Inc* | 3,520 | 16 | ||||||
Agilysys* | 2,323 | 57 | ||||||
Airgain* | 1,336 | 17 | ||||||
Akamai Technologies Inc* | 8,600 | 758 | ||||||
Akoustis Technologies* | 3,528 | 21 | ||||||
Alarm.com Holdings Inc* | 4,637 | 231 | ||||||
Alliance Data Systems Corp | 2,600 | 408 | ||||||
Alpha & Omega Semiconductor Ltd* | 2,786 | 28 | ||||||
Altair Engineering Inc, Cl A* | 4,879 | 203 | ||||||
Alteryx Inc, Cl A* | 2,500 | 294 | ||||||
Ambarella Inc* | 3,878 | 194 | ||||||
Amdocs Ltd | 7,500 | 480 | ||||||
American Software, Cl A | 3,784 | 50 | ||||||
Amkor Technology* | 13,120 | 121 | ||||||
Amphenol Corp, Cl A | 16,100 | 1,502 | ||||||
Analog Devices Inc | 20,200 | 2,373 | ||||||
Anaplan Inc* | 4,500 | 256 | ||||||
Anixter International* | 3,865 | 249 | ||||||
ANSYS Inc* | 4,500 | 914 | ||||||
Appfolio, Cl A* | 1,942 | 188 | ||||||
Appian, Cl A* | 3,962 | 156 | ||||||
Apple | 251,000 | 53,473 | ||||||
Applied Materials Inc | 52,000 | 2,567 | ||||||
Applied Optoelectronics* | 2,642 | 26 | ||||||
Aquantia Corp* | 3,703 | 49 | ||||||
Arista Networks Inc* | 3,100 | 848 | ||||||
Arlo Technologies Inc* | 9,917 | 43 | ||||||
Arrow Electronics Inc* | 4,600 | 334 | ||||||
Aspen Technology Inc* | 3,800 | 501 | ||||||
AstroNova | 949 | 23 | ||||||
Atlassian Corp PLC, Cl A* | 5,500 | 771 | ||||||
Autodesk Inc* | 12,000 | 1,874 | ||||||
Automatic Data Processing Inc | 23,800 | 3,963 | ||||||
Avalara* | 2,300 | 187 | ||||||
Avaya Holdings Corp* | 14,236 | 171 | ||||||
Avid Technology Inc* | 3,919 | 40 | ||||||
Avnet Inc | 5,900 | 268 | ||||||
AVX Corp | 5,967 | 91 | ||||||
Axcelis Technologies Inc* | 4,282 | 69 | ||||||
AXT* | 5,406 | 23 | ||||||
Badger Meter Inc | 3,554 | 190 | ||||||
Bel Fuse Inc, Cl B | 1,375 | 23 | ||||||
| Adviser Managed Trust / Annual Report / July 31, 2019 | 41 |
SCHEDULE OF INVESTMENTS
July 31, 2019
Tactical Offensive Equity Fund(Continued)
| Description | Shares | Market Value ($ Thousands) | ||||||
COMMON STOCK (continued) | ||||||||
Belden Inc | 4,991 | $ | 227 | |||||
Benchmark Electronics Inc | 4,708 | 127 | ||||||
Benefitfocus* | 3,600 | 90 | ||||||
Black Knight Inc* | 7,700 | 488 | ||||||
Blackbaud Inc | 6,136 | 558 | ||||||
Blackline Inc* | 5,389 | 240 | ||||||
Booz Allen Hamilton Holding, Cl A | 7,500 | 516 | ||||||
Bottomline Technologies DE Inc* | 5,236 | 220 | ||||||
Box Inc, Cl A* | 18,040 | 298 | ||||||
Brightcove Inc* | 4,969 | 62 | ||||||
Broadcom Inc | 21,100 | 6,119 | ||||||
Broadridge Financial Solutions Inc | 6,300 | 801 | ||||||
Brooks Automation Inc | 8,931 | 347 | ||||||
Cabot Microelectronics Corp | 3,646 | 444 | ||||||
CACI International Inc, Cl A* | 1,300 | 280 | ||||||
Cadence Design Systems Inc* | 15,200 | 1,123 | ||||||
CalAmp Corp* | 4,324 | 48 | ||||||
Calix* | 6,090 | 38 | ||||||
Carbon Black Inc* | 7,125 | 133 | ||||||
Carbonite Inc* | 4,118 | 74 | ||||||
Cardtronics PLC* | 4,999 | 142 | ||||||
Casa Systems Inc* | 4,344 | 29 | ||||||
Cass Information Systems Inc | 1,850 | 94 | ||||||
CDK Global Inc | 6,800 | 353 | ||||||
CDW Corp/DE | 8,000 | 945 | ||||||
Ceridian HCM Holding Inc* | 3,100 | 165 | ||||||
CEVA Inc* | 2,845 | 79 | ||||||
ChannelAdvisor Corp* | 3,634 | 33 | ||||||
Ciena Corp* | 8,400 | 380 | ||||||
Cirrus Logic Inc* | 7,333 | 360 | ||||||
Cisco Systems Inc | 240,200 | 13,307 | ||||||
Cision Ltd* | 11,661 | 121 | ||||||
Citrix Systems | 6,800 | 641 | ||||||
Clearfield Inc* | 1,136 | 15 | ||||||
Cloudera Inc* | 29,936 | 179 | ||||||
Cognex Corp | 9,000 | 396 | ||||||
Cognizant Technology Solutions Corp, Cl A | 31,400 | 2,045 | ||||||
Coherent Inc* | 1,300 | 181 | ||||||
Cohu | 5,126 | 78 | ||||||
CommScope Holding Co Inc* | 10,300 | 147 | ||||||
CommVault Systems Inc* | 4,325 | 197 | ||||||
comScore* | 6,445 | 21 | ||||||
Comtech Telecommunications Corp | 3,001 | 89 | ||||||
Conduent* | 21,895 | 199 | ||||||
Control4* | 3,431 | 82 | ||||||
CoreLogic Inc/United States* | 4,400 | 201 | ||||||
Cornerstone OnDemand Inc* | 7,041 | 417 | ||||||
Corning | 43,000 | 1,322 | ||||||
Coupa Software Inc* | 3,300 | 448 | ||||||
Cray Inc* | 5,053 | 175 | ||||||
Cree* | 5,700 | 354 | ||||||
CSG Systems International Inc | 4,078 | 209 | ||||||
| Description | Shares | Market Value ($ Thousands) | ||||||
COMMON STOCK (continued) | ||||||||
CTS Corp | 4,148 | $ | 131 | |||||
CyberArk Software* | 1,300 | 181 | ||||||
Cypress Semiconductor Corp | 19,500 | 448 | ||||||
Daktronics Inc | 3,498 | 22 | ||||||
DASAN Zhone Solutions Inc* | 172 | 2 | ||||||
Dell Technologies Inc, Cl C* | 8,200 | 473 | ||||||
DHI Group* | 6,990 | 26 | ||||||
Diebold Nixdorf Inc* | 9,784 | 136 | ||||||
Digi International Inc* | 3,677 | 48 | ||||||
Digimarc Corp* | 1,469 | 66 | ||||||
Digital Turbine* | 10,191 | 55 | ||||||
Diodes Inc* | 5,026 | 214 | ||||||
DocuSign, Cl A* | 8,300 | 429 | ||||||
Dolby Laboratories Inc, Cl A | 3,400 | 232 | ||||||
Domo Inc, Cl B* | 2,199 | 61 | ||||||
Dropbox, Cl A* | 11,500 | 271 | ||||||
DSP Group* | 2,893 | 47 | ||||||
DXC Technology Co | 14,600 | 814 | ||||||
Ebix Inc | 3,028 | 139 | ||||||
EchoStar Corp, Cl A* | 2,600 | 118 | ||||||
eGain Corp* | 1,819 | 14 | ||||||
Elastic* | 2,000 | 198 | ||||||
Endurance International Group Holdings Inc* | 9,435 | 45 | ||||||
Enphase Energy Inc* | 11,614 | 327 | ||||||
Entegris Inc | 7,300 | 318 | ||||||
Envestnet* | 6,006 | 429 | ||||||
EPAM Systems Inc* | 2,800 | 543 | ||||||
ePlus Inc* | 1,695 | 129 | ||||||
Euronet Worldwide Inc* | 2,700 | 421 | ||||||
Everbridge Inc* | 4,102 | 420 | ||||||
EVERTEC Inc | 7,565 | 242 | ||||||
Evo Payments Inc, Cl A* | 3,986 | 124 | ||||||
Exela Technologies* | 4,875 | 13 | ||||||
ExlService Holdings Inc* | 4,130 | 284 | ||||||
Extreme Networks Inc* | 14,899 | 121 | ||||||
F5 Networks Inc* | 3,200 | 470 | ||||||
Fair Isaac Corp* | 1,600 | 556 | ||||||
FARO Technologies Inc* | 2,176 | 116 | ||||||
Fidelity National Information Services Inc | 32,938 | 4,389 | ||||||
Finisar Corp* | 7,021 | 165 | ||||||
FireEye Inc* | 10,500 | 158 | ||||||
First Solar* | 4,500 | 290 | ||||||
Fiserv Inc* | 30,699 | 3,237 | ||||||
Fitbit Inc, Cl A* | 27,069 | 114 | ||||||
Five9* | 7,400 | 365 | ||||||
FleetCor Technologies Inc* | 4,600 | 1,307 | ||||||
FLIR Systems Inc | 7,300 | 363 | ||||||
ForeScout Technologies Inc* | 5,146 | 192 | ||||||
FormFactor Inc* | 9,318 | 156 | ||||||
Fortinet Inc* | 7,700 | 618 | ||||||
Gartner Inc* | 4,800 | 669 | ||||||
| 42 | Adviser Managed Trust / Annual Report / July 31, 2019 |
SCHEDULE OF INVESTMENTS
July 31, 2019
Tactical Offensive Equity Fund(Continued)
| Description | Shares | Market Value ($ Thousands) | ||||||
COMMON STOCK (continued) | ||||||||
Genpact Ltd | 8,900 | $ | 353 | |||||
Global Payments | 8,700 | 1,461 | ||||||
Globant* | 1,700 | 180 | ||||||
GoDaddy Inc, Cl A* | 9,200 | 675 | ||||||
GSI Technology* | 2,189 | 18 | ||||||
GTT Communications Inc* | 4,005 | 48 | ||||||
GTY Technology Holdings* | 4,093 | 28 | ||||||
Guidewire Software Inc* | 4,400 | 449 | ||||||
Hackett Group Inc/The | 3,202 | 53 | ||||||
Harmonic* | 11,196 | 84 | ||||||
Hewlett Packard Enterprise Co | 76,300 | 1,096 | ||||||
HP Inc | 84,900 | 1,786 | ||||||
HubSpot Inc* | 2,200 | 393 | ||||||
I3 Verticals Inc, Cl A* | 1,296 | 37 | ||||||
Ichor Holdings Ltd* | 2,878 | 73 | ||||||
Ideanomics* | 7,694 | 15 | ||||||
II-VI Inc* | 7,773 | 309 | ||||||
Immersion* | 4,216 | 34 | ||||||
Impinj Inc* | 2,037 | 74 | ||||||
Infinera Corp* | 22,840 | 88 | ||||||
Information Services Group Inc* | 3,635 | 10 | ||||||
Inphi Corp* | 5,667 | 341 | ||||||
Inseego* | 6,108 | 32 | ||||||
Insight Enterprises Inc* | 4,354 | 240 | ||||||
Instructure* | 4,279 | 170 | ||||||
Intel Corp | 244,300 | 12,349 | ||||||
Intelligent Systems* | 944 | 46 | ||||||
InterDigital Inc | 3,927 | 253 | ||||||
International Business Machines Corp | 48,400 | 7,175 | ||||||
International Money Express* | 1,782 | 25 | ||||||
Intuit Inc | 13,500 | 3,744 | ||||||
IPG Photonics Corp* | 2,000 | 262 | ||||||
Iteris Inc* | 2,622 | 14 | ||||||
Itron Inc* | 4,374 | 271 | ||||||
j2 Global Inc | 5,921 | 528 | ||||||
Jabil Inc | 8,200 | 253 | ||||||
Jack Henry & Associates | 4,200 | 587 | ||||||
Juniper Networks Inc | 18,600 | 503 | ||||||
KBR Inc | 17,834 | 470 | ||||||
KEMET Corp | 7,125 | 143 | ||||||
Keysight Technologies* | 10,200 | 913 | ||||||
Kimball Electronics Inc* | 3,223 | 51 | ||||||
KLA | 8,900 | 1,213 | ||||||
Knowles Corp* | 10,899 | 222 | ||||||
KVH Industries Inc* | 1,649 | 17 | ||||||
Lam Research Corp | 8,300 | 1,731 | ||||||
Lattice Semiconductor Corp* | 15,755 | 305 | ||||||
Leidos Holdings Inc | 7,700 | 632 | ||||||
Limelight Networks* | 14,876 | 40 | ||||||
Littelfuse Inc | 1,300 | 220 | ||||||
LivePerson Inc* | 7,632 | 253 | ||||||
LiveRamp Holdings Inc* | 8,580 | 452 | ||||||
| Description | Shares | Market Value ($ Thousands) | ||||||
COMMON STOCK (continued) | ||||||||
LogMeIn Inc | 2,700 | $ | 205 | |||||
Lumentum Holdings* | 9,606 | 544 | ||||||
MACOM Technology Solutions Holdings Inc* | 5,899 | 116 | ||||||
Majesco* | 191 | 2 | ||||||
Manhattan Associates Inc* | 3,500 | 297 | ||||||
ManTech International Corp/VA, Cl A | 3,291 | 226 | ||||||
Marchex, Cl B* | 4,893 | 21 | ||||||
Marvell Technology Group Ltd | 35,700 | 937 | ||||||
Mastercard Inc, Cl A | 48,900 | 13,314 | ||||||
Maxim Integrated Products Inc | 14,800 | 876 | ||||||
MAXIMUS | 8,024 | 590 | ||||||
MaxLinear Inc, Cl A* | 7,901 | 174 | ||||||
Methode Electronics Inc | 4,561 | 137 | ||||||
Microchip Technology Inc | 12,700 | 1,199 | ||||||
Micron Technology Inc* | 61,100 | 2,743 | ||||||
Microsoft Corp | 412,400 | 56,198 | ||||||
MicroStrategy Inc, Cl A* | 1,081 | 148 | ||||||
Mitek Systems Inc* | 4,864 | 49 | ||||||
MKS Instruments Inc | 2,900 | 247 | ||||||
MobileIron Inc* | 12,369 | 85 | ||||||
Model N Inc* | 4,180 | 91 | ||||||
MongoDB, Cl A* | 1,300 | 186 | ||||||
Monolithic Power Systems Inc | 2,200 | 326 | ||||||
Monotype Imaging Holdings Inc | 5,236 | 105 | ||||||
Motorola Solutions Inc | 8,800 | 1,460 | ||||||
MTS Systems Corp | 2,259 | 130 | ||||||
Nanometrics* | 2,913 | 91 | ||||||
Napco Security Technologies Inc* | 1,526 | 44 | ||||||
National Instruments Corp | 6,000 | 251 | ||||||
NCR Corp* | 6,400 | 216 | ||||||
NeoPhotonics Corp* | 5,348 | 25 | ||||||
NetApp Inc | 13,800 | 807 | ||||||
NETGEAR Inc* | 3,975 | 135 | ||||||
NetScout Systems Inc* | 9,313 | 243 | ||||||
New Relic Inc* | 2,500 | 233 | ||||||
NIC Inc | 8,126 | 147 | ||||||
nLight Inc* | 4,183 | 69 | ||||||
Novanta Inc* | 4,234 | 356 | ||||||
Nuance Communications Inc* | 15,600 | 260 | ||||||
Nutanix Inc, Cl A* | 7,600 | 173 | ||||||
NVE Corp | 631 | 42 | ||||||
NVIDIA Corp | 31,800 | 5,365 | ||||||
Okta, Cl A* | 5,600 | 733 | ||||||
ON Semiconductor Corp* | 22,700 | 488 | ||||||
OneSpan Inc* | 4,170 | 61 | ||||||
Oracle Corp | 125,200 | 7,049 | ||||||
OSI Systems Inc* | 2,084 | 235 | ||||||
Palo Alto Networks Inc* | 5,000 | 1,133 | ||||||
PAR Technology Corp* | 1,532 | 40 | ||||||
Paychex Inc | 17,500 | 1,453 | ||||||
Paycom Software Inc* | 2,600 | 626 | ||||||
| Adviser Managed Trust / Annual Report / July 31, 2019 | 43 |
SCHEDULE OF INVESTMENTS
July 31, 2019
Tactical Offensive Equity Fund(Continued)
| �� | ||||||||
| Description | Shares | Market Value ($ Thousands) | ||||||
COMMON STOCK (continued) | ||||||||
Paylocity Holding Corp* | 1,800 | $ | 184 | |||||
PayPal Holdings* | 64,100 | 7,077 | ||||||
Paysign* | 3,922 | 55 | ||||||
PC Connection Inc | 1,478 | 48 | ||||||
PCM* | 1,252 | 44 | ||||||
PDF Solutions Inc* | 3,726 | 50 | ||||||
Pegasystems Inc | 2,100 | 159 | ||||||
Perficient Inc* | 4,072 | 139 | ||||||
Perspecta Inc | 17,977 | 419 | ||||||
Photronics Inc* | 8,503 | 82 | ||||||
Plantronics Inc | 4,155 | 160 | ||||||
Plexus Corp* | 3,812 | 228 | ||||||
Pluralsight Inc, Cl A* | 2,900 | 89 | ||||||
Power Integrations Inc | 3,546 | 323 | ||||||
Presidio Inc | 5,308 | 74 | ||||||
PRGX Global Inc* | 2,135 | 12 | ||||||
Progress Software Corp | 5,551 | 240 | ||||||
Proofpoint Inc* | 2,700 | 341 | ||||||
PROS Holdings* | 4,149 | 300 | ||||||
PTC Inc* | 5,700 | 386 | ||||||
Pure Storage Inc, Cl A* | 9,000 | 136 | ||||||
Q2 Holdings Inc* | 5,038 | 402 | ||||||
QAD Inc, Cl A | 1,370 | 59 | ||||||
Qorvo Inc* | 6,700 | 491 | ||||||
QUALCOMM Inc | 66,200 | 4,843 | ||||||
Qualys Inc* | 4,325 | 374 | ||||||
Rambus* | 13,365 | 167 | ||||||
Rapid7 Inc* | 6,054 | 367 | ||||||
RealPage Inc* | 3,900 | 244 | ||||||
Ribbon Communications* | 7,969 | 39 | ||||||
Rimini Street Inc* | 2,935 | 14 | ||||||
RingCentral, Cl A* | 3,700 | 525 | ||||||
Rogers Corp* | 2,359 | 374 | ||||||
Rudolph Technologies Inc* | 4,025 | 108 | ||||||
Sabre Corp | 15,000 | 353 | ||||||
SailPoint Technologies Holding* | 10,834 | 229 | ||||||
salesforce.com Inc* | 39,700 | 6,134 | ||||||
Sanmina Corp* | 8,401 | 267 | ||||||
ScanSource Inc* | 3,213 | 109 | ||||||
Science Applications International | 7,446 | 636 | ||||||
SecureWorks Corp, Cl A* | 875 | 10 | ||||||
Semtech Corp* | 8,287 | 438 | ||||||
ServiceNow Inc* | 10,000 | 2,774 | ||||||
SharpSpring* | 1,260 | 12 | ||||||
ShotSpotter Inc* | 1,057 | 40 | ||||||
Silicon Laboratories Inc* | 5,397 | 606 | ||||||
Skyworks Solutions Inc | 9,500 | 810 | ||||||
SMART Global Holdings Inc* | 1,677 | 51 | ||||||
Smartsheet, Cl A* | 4,600 | 230 | ||||||
SolarWinds Corp* | 2,200 | 39 | ||||||
Splunk* | 8,000 | 1,082 | ||||||
SPS Commerce Inc* | 2,268 | 254 | ||||||
| Description | Shares | Market Value ($ Thousands) | ||||||
COMMON STOCK (continued) | ||||||||
Square Inc, Cl A* | 18,100 | $ | 1,455 | |||||
SS&C Technologies Holdings | 11,700 | 561 | ||||||
StarTek* | 2,353 | 16 | ||||||
SunPower Corp, Cl A* | 7,956 | 93 | ||||||
SVMK Inc* | 10,628 | 180 | ||||||
Switch, Cl A | 2,000 | 27 | ||||||
Sykes Enterprises* | 4,985 | 141 | ||||||
Symantec Corp | 34,700 | 748 | ||||||
Synaptics Inc* | 4,384 | 141 | ||||||
Synchronoss Technologies* | 5,096 | 41 | ||||||
SYNNEX Corp | 2,200 | 217 | ||||||
Synopsys Inc* | 8,100 | 1,075 | ||||||
Tableau Software Inc, Cl A* | 3,900 | 661 | ||||||
Tech Data Corp* | 4,574 | 464 | ||||||
Telaria Inc* | 5,735 | 46 | ||||||
Telenav Inc* | 4,448 | 42 | ||||||
Tenable Holdings Inc* | 4,713 | 118 | ||||||
Teradata Corp* | 6,500 | 238 | ||||||
Teradyne Inc | 9,800 | 546 | ||||||
TESSCO Technologies | 904 | 13 | ||||||
Texas Instruments Inc | 51,100 | 6,388 | ||||||
TiVo Corp | 15,363 | 116 | ||||||
Total System Services | 9,800 | 1,330 | ||||||
Trade Desk Inc/The, Cl A* | 2,100 | 553 | ||||||
Trimble Inc* | 13,600 | 575 | ||||||
TTEC Holdings Inc | 1,828 | 86 | ||||||
TTM Technologies Inc* | 11,896 | 124 | ||||||
Tucows, Cl A* | 1,237 | 61 | ||||||
Twilio, Cl A* | 6,300 | 876 | ||||||
Tyler Technologies Inc* | 2,100 | 490 | ||||||
Ubiquiti Networks Inc | 800 | 103 | ||||||
Ultra Clean Holdings Inc* | 5,035 | 73 | ||||||
Unisys Corp* | 6,640 | 82 | ||||||
Universal Display Corp | 2,300 | 485 | ||||||
Upland Software Inc* | 2,860 | 126 | ||||||
USA Technologies* | 7,536 | 50 | ||||||
Varonis Systems Inc* | 3,745 | 269 | ||||||
Veeco Instruments Inc* | 6,199 | 74 | ||||||
Verint Systems Inc* | 8,220 | 476 | ||||||
VeriSign Inc* | 5,600 | 1,182 | ||||||
Verra Mobility, Cl A* | 12,493 | 173 | ||||||
Versum Materials Inc | 5,900 | 307 | ||||||
ViaSat Inc* | 3,000 | 245 | ||||||
Viavi Solutions Inc* | 28,908 | 424 | ||||||
VirnetX Holding Corp* | 7,974 | 58 | ||||||
Virtusa* | 3,564 | 159 | ||||||
Visa Inc, Cl A | 94,900 | 16,892 | ||||||
Vishay Intertechnology Inc | 16,408 | 279 | ||||||
Vishay Precision Group Inc* | 1,366 | 56 | ||||||
VMware, Cl A | 3,900 | 681 | ||||||
Western Digital Corp | 15,800 | 851 | ||||||
Western Union Co/The | 24,100 | 506 | ||||||
| 44 | Adviser Managed Trust / Annual Report / July 31, 2019 |
SCHEDULE OF INVESTMENTS
July 31, 2019
Tactical Offensive Equity Fund(Continued)
| Description | Shares | Market Value ($ Thousands) | ||||||
COMMON STOCK (continued) |
| |||||||
WEX Inc* | 2,200 | $ | 480 | |||||
Workday Inc, Cl A* | 8,700 | 1,740 | ||||||
Workiva Inc, Cl A* | 4,422 | 254 | ||||||
Xerox Corp | 11,000 | 353 | ||||||
Xilinx | 13,900 | 1,588 | ||||||
Xperi Corp | 6,128 | 131 | ||||||
Yext Inc* | 11,736 | 244 | ||||||
Zebra Technologies Corp, Cl A* | 2,900 | 612 | ||||||
Zendesk Inc* | 5,700 | 476 | ||||||
Zix Corp* | 6,842 | 62 | ||||||
Zscaler Inc* | 3,300 | 278 | ||||||
Zuora, Cl A* | 10,811 | 162 | ||||||
|
| |||||||
| 363,016 | ||||||||
|
| |||||||
Materials — 2.1% | ||||||||
Advanced Emissions Solutions | 1,854 | 24 | ||||||
AdvanSix Inc* | 3,833 | 98 | ||||||
Air Products & Chemicals Inc | 12,000 | 2,739 | ||||||
AK Steel Holding Corp* | 40,518 | 114 | ||||||
Albemarle Corp | 5,800 | 423 | ||||||
Alcoa Corp* | 10,200 | 229 | ||||||
Allegheny Technologies Inc* | 16,007 | 349 | ||||||
American Vanguard Corp | 3,714 | 53 | ||||||
Amyris Inc* | 3,402 | 11 | ||||||
AptarGroup Inc | 3,400 | 412 | ||||||
Ardagh Group SA, Cl A | 1,000 | 17 | ||||||
Ashland Global Holdings Inc | 3,400 | 270 | ||||||
Avery Dennison | 4,700 | 540 | ||||||
Axalta Coating Systems Ltd* | 11,300 | 335 | ||||||
Balchem Corp | 4,094 | 420 | ||||||
Ball | 18,200 | 1,301 | ||||||
Berry Global Group Inc* | 7,100 | 320 | ||||||
Boise Cascade Co | 4,918 | 133 | ||||||
Cabot Corp | 3,200 | 143 | ||||||
Carpenter Technology Corp | 6,006 | 270 | ||||||
Celanese Corp, Cl A | 7,000 | 785 | ||||||
Century Aluminum Co* | 6,640 | 48 | ||||||
CF Industries Holdings Inc | 12,600 | 625 | ||||||
Chase Corp | 926 | 96 | ||||||
Chemours Co/The | 9,300 | 177 | ||||||
Clearwater Paper Corp* | 2,154 | 42 | ||||||
Cleveland-Cliffs Inc | 36,029 | 384 | ||||||
Coeur Mining Inc* | 24,212 | 111 | ||||||
Commercial Metals Co | 15,041 | 263 | ||||||
Compass Minerals International | 4,227 | 236 | ||||||
Corteva | 41,333 | 1,219 | ||||||
Crown Holdings Inc* | 7,000 | 448 | ||||||
Domtar | 3,400 | 144 | ||||||
Dow Inc | 41,333 | 2,002 | ||||||
DuPont de Nemours | 41,333 | 2,983 | ||||||
Eagle Materials Inc | 2,400 | 199 | ||||||
Eastman Chemical Co | 7,600 | 573 | ||||||
Ecolab Inc | 13,900 | 2,804 | ||||||
| Description | Shares | Market Value ($ Thousands) | ||||||
COMMON STOCK (continued) | ||||||||
Element Solutions Inc* | 12,100 | $ | 121 | |||||
Ferro Corp* | 10,428 | 154 | ||||||
Flotek Industries Inc* | 7,436 | 23 | ||||||
FMC Corp | 7,300 | 631 | ||||||
Forterra Inc* | 2,652 | 17 | ||||||
Freeport-McMoRan | 78,900 | 873 | ||||||
FutureFuel Corp | 3,479 | 41 | ||||||
GCP Applied Technologies Inc* | 6,867 | 151 | ||||||
Gold Resource | 7,915 | 29 | ||||||
Graphic Packaging Holding Co | 16,300 | 242 | ||||||
Greif Inc, Cl A | 3,255 | 114 | ||||||
Greif Inc, Cl B | 845 | 36 | ||||||
Hawkins Inc | 1,279 | 56 | ||||||
Haynes International Inc | 1,633 | 49 | ||||||
HB Fuller | 6,487 | 310 | ||||||
Hecla Mining Co | 58,359 | 108 | ||||||
Huntsman Corp | 11,900 | 245 | ||||||
Ingevity Corp* | 5,339 | 526 | ||||||
Innophos Holdings Inc | 2,543 | 69 | ||||||
Innospec Inc | 3,000 | 280 | ||||||
International Flavors & Fragrances Inc | 5,500 | 792 | ||||||
International Paper Co | 22,300 | 979 | ||||||
Intrepid Potash* | 12,639 | 47 | ||||||
Kaiser Aluminum | 2,008 | 193 | ||||||
Koppers Holdings* | 2,605 | 71 | ||||||
Kraton Corp* | 3,941 | 121 | ||||||
Kronos Worldwide Inc | 2,996 | 40 | ||||||
Linde | 29,600 | 5,662 | ||||||
Livent* | 18,872 | 122 | ||||||
Louisiana-Pacific Corp | 15,611 | 408 | ||||||
LSB Industries Inc* | 3,475 | 17 | ||||||
LyondellBasell Industries NV, Cl A | 14,400 | 1,205 | ||||||
Marrone Bio Innovations Inc* | 1,596 | 2 | ||||||
Martin Marietta Materials | 3,400 | 842 | ||||||
Materion Corp | 2,517 | 156 | ||||||
Mayville Engineering* | 957 | 13 | ||||||
Minerals Technologies Inc | 4,382 | 233 | ||||||
Mosaic Co/The | 19,100 | 481 | ||||||
Myers Industries | 4,539 | 73 | ||||||
Neenah Inc | 2,105 | 138 | ||||||
NewMarket Corp | 400 | 169 | ||||||
Newmont Goldcorp | 44,600 | 1,629 | ||||||
Novagold Resources* | 29,356 | 181 | ||||||
Nucor Corp | 16,700 | 908 | ||||||
Olin Corp | 9,000 | 181 | ||||||
Olympic Steel Inc | 952 | 12 | ||||||
OMNOVA Solutions Inc* | 5,731 | 57 | ||||||
Orion Engineered Carbons | 7,565 | 147 | ||||||
Owens-Illinois Inc | 8,700 | 148 | ||||||
Packaging Corp of America | 5,100 | 515 | ||||||
PH Glatfelter Co | 5,584 | 91 | ||||||
PolyOne Corp | 9,868 | 323 | ||||||
| Adviser Managed Trust / Annual Report / July 31, 2019 | 45 |
SCHEDULE OF INVESTMENTS
July 31, 2019
Tactical Offensive Equity Fund(Continued)
| Description | Shares | Market Value ($ Thousands) | ||||||
COMMON STOCK (continued) | ||||||||
PPG Industries Inc | 13,200 | $ | 1,550 | |||||
PQ Group Holdings Inc* | 4,754 | 74 | ||||||
Quaker Chemical Corp | 1,672 | 313 | ||||||
Ramaco Resources Inc* | 175 | 1 | ||||||
Rayonier Advanced Materials Inc | 4,779 | 22 | ||||||
Reliance Steel & Aluminum Co | 3,700 | 370 | ||||||
Royal Gold Inc | 3,600 | 412 | ||||||
RPM International Inc | 7,000 | 475 | ||||||
Ryerson Holding Corp* | 1,609 | 13 | ||||||
Schnitzer Steel Industries Inc, Cl A | 3,383 | 90 | ||||||
Schweitzer-Mauduit International | 3,879 | 134 | ||||||
ScottsMiracle-Gro Co/The, Cl A | 2,200 | 247 | ||||||
Sealed Air Corp | 8,500 | 355 | ||||||
Sensient Technologies | 5,390 | 368 | ||||||
Sherwin-Williams Co/The | 4,500 | 2,309 | ||||||
Silgan Holdings | 4,200 | 126 | ||||||
Sonoco Products Co | 5,400 | 324 | ||||||
Southern Copper Corp | 8,700 | 311 | ||||||
Steel Dynamics | 12,000 | 378 | ||||||
Stepan Co | 2,516 | 250 | ||||||
Summit Materials Inc, Cl A* | 13,897 | 256 | ||||||
SunCoke Energy Inc* | 11,244 | 85 | ||||||
Synalloy Corp | 848 | 14 | ||||||
TimkenSteel Corp* | 5,338 | 37 | ||||||
Trecora Resources* | 2,930 | 28 | ||||||
Tredegar Corp | 3,406 | 57 | ||||||
Tronox Holdings PLC, Cl A | 11,810 | 131 | ||||||
UFP Technologies Inc* | 914 | 40 | ||||||
United States Lime & Minerals Inc | 202 | 16 | ||||||
United States Steel Corp | 9,600 | 144 | ||||||
US Concrete Inc* | 2,058 | 97 | ||||||
Valhi | 739 | 2 | ||||||
Valvoline Inc | 10,300 | 208 | ||||||
Verso Corp* | 4,448 | 72 | ||||||
Vulcan Materials | 7,200 | 996 | ||||||
Warrior Met Coal Inc | 6,553 | 162 | ||||||
Westlake Chemical | 2,000 | 135 | ||||||
Westrock | 13,700 | 494 | ||||||
Worthington Industries Inc | 5,086 | 205 | ||||||
WR Grace | 3,600 | 244 | ||||||
|
| |||||||
| 52,916 | ||||||||
|
| |||||||
Real Estate — 3.0% | ||||||||
Acadia Realty Trust‡ | 10,380 | 291 | ||||||
Agree Realty Corp‡ | 4,737 | 317 | ||||||
Alexander & Baldwin Inc‡ | 8,504 | 200 | ||||||
Alexander’s Inc‡ | 271 | 102 | ||||||
Alexandria Real Estate Equities Inc‡ | 6,100 | 893 | ||||||
American Assets Trust Inc‡ | 5,720 | 265 | ||||||
American Campus Communities Inc‡ | 7,400 | 346 | ||||||
American Finance Trust‡ | 13,587 | 159 | ||||||
American Homes 4 Rent, Cl A‡ | 14,100 | 341 | ||||||
American Tower, Cl A‡ | 23,900 | 5,058 | ||||||
| Description | Shares | Market Value ($ Thousands) | ||||||
COMMON STOCK (continued) | ||||||||
Americold Realty Trust‡ | 10,400 | $ | 349 | |||||
Apartment Investment & Management, Cl A‡ | 8,200 | 406 | ||||||
Apple Hospitality Inc‡ | 11,800 | 185 | ||||||
Armada Hoffler Properties‡ | 6,283 | 106 | ||||||
Ashford Hospitality Trust Inc‡ | 12,344 | 33 | ||||||
AvalonBay Communities Inc‡ | 7,500 | 1,566 | ||||||
Bluerock Residential Growth Inc, Cl A‡ | 2,314 | 27 | ||||||
Boston Properties Inc‡ | 8,400 | 1,117 | ||||||
Braemar Hotels & Resorts Inc‡ | 4,007 | 37 | ||||||
Brandywine Realty Trust‡ | 9,600 | 142 | ||||||
Brixmor Property Group Inc‡ | 16,400 | 311 | ||||||
Brookfield Property Inc, Cl A‡ | 6,800 | 131 | ||||||
BRT Apartments Corp‡ | 1,005 | 14 | ||||||
Camden Property Trust‡ | 4,800 | 498 | ||||||
CareTrust Inc‡ | 12,030 | 279 | ||||||
CatchMark Timber Trust Inc, Cl A‡ | 6,434 | 65 | ||||||
CBL & Associates Properties Inc‡ | 23,619 | 25 | ||||||
CBRE Group Inc, Cl A* | 17,300 | 917 | ||||||
Cedar Realty Trust‡ | 8,601 | 24 | ||||||
Chatham Lodging Trust‡ | 5,826 | 104 | ||||||
Chesapeake Lodging Trust‡ | 7,377 | 203 | ||||||
CIM Commercial Trust‡ | 630 | 13 | ||||||
City Office Inc‡ | 5,112 | 63 | ||||||
Clipper Realty Inc‡ | 2,000 | 23 | ||||||
Colony Capital‡ | 26,200 | 148 | ||||||
Columbia Property Trust Inc‡ | 6,400 | 140 | ||||||
Community Healthcare Trust Inc‡ | 2,283 | 94 | ||||||
Consolidated-Tomoka Land Co | 543 | 34 | ||||||
CoreCivic Inc‡ | 14,636 | 248 | ||||||
CorEnergy Infrastructure Trust Inc‡ | 1,568 | 63 | ||||||
CorePoint Lodging Inc‡ | 5,399 | 63 | ||||||
CoreSite Realty Corp‡ | 2,000 | 210 | ||||||
Corporate Office Properties Trust‡ | 5,600 | 156 | ||||||
Cousins Properties‡ | 7,900 | 278 | ||||||
Crown Castle International Corp‡ | 22,600 | 3,012 | ||||||
CubeSmart‡ | 10,100 | 343 | ||||||
Cushman & Wakefield* | 12,941 | 257 | ||||||
CyrusOne Inc‡ | 5,700 | 327 | ||||||
DiamondRock Hospitality Co‡ | 25,660 | 258 | ||||||
Digital Realty Trust Inc‡ | 11,200 | 1,281 | ||||||
Douglas Emmett Inc‡ | 8,800 | 359 | ||||||
Duke Realty Corp‡ | 19,500 | 650 | ||||||
Easterly Government Properties Inc‡ | 8,661 | 163 | ||||||
EastGroup Properties Inc‡ | 4,558 | 549 | ||||||
Empire State Realty Trust Inc, Cl A‡ | 7,700 | 108 | ||||||
EPR Properties‡ | 4,000 | 298 | ||||||
Equinix Inc‡ | 4,500 | 2,259 | ||||||
Equity Commonwealth‡ | 6,400 | 215 | ||||||
Equity LifeStyle Properties Inc‡ | 4,700 | 584 | ||||||
Equity Residential‡ | 19,600 | 1,546 | ||||||
Essential Properties Realty Trust Inc‡ | 9,008 | 190 | ||||||
| 46 | Adviser Managed Trust / Annual Report / July 31, 2019 |
SCHEDULE OF INVESTMENTS
July 31, 2019
Tactical Offensive Equity Fund(Continued)
| Description | Shares | Market Value ($ Thousands) | ||||||
COMMON STOCK (continued) | ||||||||
Essex Property Trust Inc‡ | 3,600 | $ | 1,088 | |||||
eXp World Holdings* | 2,211 | 23 | ||||||
Extra Space Storage Inc‡ | 6,700 | 753 | ||||||
Farmland Partners Inc‡ | 3,982 | 25 | ||||||
Federal Realty Investment Trust‡ | 4,000 | 528 | ||||||
First Industrial Realty Trust Inc‡ | 15,825 | 604 | ||||||
Forestar Group Inc* | 1,454 | 30 | ||||||
Four Corners Property Trust‡ | 8,401 | 226 | ||||||
Franklin Street Properties Corp‡ | 13,293 | 107 | ||||||
Front Yard Residential Corp‡ | 6,389 | 77 | ||||||
FRP Holdings* | 929 | 46 | ||||||
Gaming and Leisure Properties Inc‡ | 11,000 | 415 | ||||||
GEO Group Inc/The‡ | 14,808 | 264 | ||||||
Getty Realty Corp‡ | 4,134 | 124 | ||||||
Gladstone Commercial Corp‡ | 3,712 | 79 | ||||||
Gladstone Land Corp‡ | 2,252 | 26 | ||||||
Global Medical Inc‡ | 4,066 | 42 | ||||||
Global Net Lease Inc‡ | 10,670 | 208 | ||||||
Hannon Armstrong Sustainable Infrastructure Capital Inc‡ | 7,870 | 216 | ||||||
HCP Inc‡ | 26,100 | 833 | ||||||
Healthcare Realty Trust Inc‡ | 16,065 | 514 | ||||||
Healthcare Trust of America Inc, Cl A‡ | 11,200 | 302 | ||||||
Hersha Hospitality Trust, Cl A‡ | 4,616 | 72 | ||||||
Highwoods Properties Inc‡ | 5,500 | 249 | ||||||
Hospitality Properties Trust‡ | 8,900 | 220 | ||||||
Host Hotels & Resorts Inc‡ | 39,900 | 694 | ||||||
Howard Hughes Corp/The* | 2,100 | 284 | ||||||
Hudson Pacific Properties Inc‡ | 8,400 | 297 | ||||||
Independence Realty Trust‡ | 11,243 | 139 | ||||||
Industrial Logistics Properties Trust‡ | 8,091 | 173 | ||||||
Innovative Industrial Properties, Cl A‡ | 1,160 | 123 | ||||||
Investors Real Estate Trust‡ | 1,538 | 98 | ||||||
Invitation Homes Inc | 20,800 | 571 | ||||||
Iron Mountain‡ | 15,500 | 456 | ||||||
iStar‡ | 8,317 | 110 | ||||||
JBG SMITH Properties‡ | 6,200 | 243 | ||||||
Jernigan Capital‡ | 2,718 | 54 | ||||||
Jones Lang LaSalle Inc | 2,500 | 364 | ||||||
Kennedy-Wilson Holdings Inc | 15,455 | 333 | ||||||
Kilroy Realty Corp‡ | 5,400 | 429 | ||||||
Kimco Realty‡ | 22,200 | 426 | ||||||
Kite Realty Group Trust‡ | 10,367 | 165 | ||||||
Lamar Advertising Co, Cl A‡ | 4,600 | 372 | ||||||
Lexington Realty Trust‡ | 28,879 | 285 | ||||||
Liberty Property Trust‡ | 8,000 | 418 | ||||||
Life Storage Inc‡ | 2,500 | 244 | ||||||
LTC Properties Inc‡ | 4,884 | 225 | ||||||
Macerich Co/The‡ | 7,400 | 245 | ||||||
Mack-Cali Realty Corp‡ | 11,197 | 266 | ||||||
Marcus & Millichap Inc* | 2,950 | 98 | ||||||
Maui Land & Pineapple Co Inc* | 198 | 2 | ||||||
| Description | Shares | Market Value ($ Thousands) | ||||||
COMMON STOCK (continued) | ||||||||
Medical Properties Trust Inc‡ | 20,100 | $ | 352 | |||||
Mid-America Apartment Communities‡ | 6,200 | 731 | ||||||
Monmouth Real Estate Investment Corp‡ | 11,183 | 154 | ||||||
National Health Investors‡ | 5,261 | 418 | ||||||
National Retail Properties‡ | 8,600 | 449 | ||||||
National Storage Affiliates Trust‡ | 7,043 | 213 | ||||||
New Senior Investment Group Inc‡ | 9,768 | 70 | ||||||
Newmark Group, Cl A | 18,699 | 184 | ||||||
NexPoint Residential Trust Inc‡ | 2,391 | 103 | ||||||
NorthStar Realty Europe Corp‡ | 5,740 | 98 | ||||||
Office Properties Income Trust‡ | 5,976 | 168 | ||||||
Omega Healthcare Investors Inc‡ | 11,200 | 407 | ||||||
One Liberty Properties Inc‡ | 2,000 | 57 | ||||||
Outfront Media Inc‡ | 7,600 | 207 | ||||||
Paramount Group Inc‡ | 11,100 | 154 | ||||||
Park Hotels & Resorts‡ | 11,000 | 291 | ||||||
Pebblebrook Hotel Trust‡ | 16,342 | 457 | ||||||
Pennsylvania Real Estate Investment Trust‡ | 9,107 | 54 | ||||||
Physicians Realty Trust‡ | 23,340 | 402 | ||||||
Piedmont Office Realty Trust Inc, Cl A‡ | 15,567 | 324 | ||||||
PotlatchDeltic Corp‡ | 8,179 | 301 | ||||||
Preferred Apartment Communities Inc, Cl A‡ | 5,301 | 77 | ||||||
Prologis Inc‡ | 34,200 | 2,757 | ||||||
PS Business Parks Inc‡ | 2,515 | 440 | ||||||
Public Storage‡ | 8,100 | 1,966 | ||||||
QTS Realty Trust Inc, Cl A‡ | 6,891 | 319 | ||||||
Rafael Holdings, Cl B* | 1,418 | 29 | ||||||
Rayonier Inc‡ | 7,000 | 203 | ||||||
RE/MAX Holdings Inc, Cl A | 2,325 | 68 | ||||||
Realogy Holdings Corp | 14,583 | 76 | ||||||
Realty Income Corp‡ | 17,100 | 1,184 | ||||||
Redfin* | 11,162 | 201 | ||||||
Regency Centers Corp‡ | 8,300 | 554 | ||||||
Retail Opportunity Investments Corp‡ | 13,930 | 253 | ||||||
Retail Properties of America, Cl A‡ | 11,700 | 142 | ||||||
Retail Value Inc‡ | 1,935 | 73 | ||||||
Rexford Industrial Realty‡ | 13,037 | 540 | ||||||
RLJ Lodging Trust‡ | 21,396 | 370 | ||||||
RMR Group Inc/The, Cl A | 1,847 | 91 | ||||||
RPT Realty‡ | 10,027 | 123 | ||||||
Ryman Hospitality Properties‡ | 5,766 | 432 | ||||||
Sabra Health Care Inc‡ | 22,488 | 464 | ||||||
Safehold Inc‡ | 1,134 | 37 | ||||||
Saul Centers Inc‡ | 1,520 | 83 | ||||||
SBA Communications Corp, Cl A*‡ | 6,100 | 1,497 | ||||||
Senior Housing Properties Trust‡ | 29,882 | 245 | ||||||
Seritage Growth Properties‡ | 4,082 | 171 | ||||||
Simon Property Group Inc‡ | 16,800 | 2,725 | ||||||
SITE Centers Corp‡ | 8,300 | 118 | ||||||
SL Green Realty Corp‡ | 4,400 | 357 | ||||||
| Adviser Managed Trust / Annual Report / July 31, 2019 | 47 |
SCHEDULE OF INVESTMENTS
July 31, 2019
Tactical Offensive Equity Fund(Continued)
| Description | Shares | Market Value ($ Thousands) | ||||||
COMMON STOCK (continued) | ||||||||
Spirit MTA‡ | 5,667 | $ | 48 | |||||
Spirit Realty Capital Inc‡ | 4,700 | 207 | ||||||
St Joe Co/The* | 4,540 | 87 | ||||||
STAG Industrial Inc‡ | 15,885 | 472 | ||||||
STORE Capital Corp‡ | 10,400 | 356 | ||||||
Stratus Properties Inc* | 593 | 17 | ||||||
Summit Hotel Properties Inc‡ | 12,987 | 144 | ||||||
Sun Communities Inc‡ | 4,600 | 611 | ||||||
Sunstone Hotel Investors Inc‡ | 29,037 | 384 | ||||||
Tanger Factory Outlet Centers‡ | 11,470 | 182 | ||||||
Taubman Centers Inc‡ | 3,200 | 130 | ||||||
Tejon Ranch Co* | 2,769 | 51 | ||||||
Terreno Realty Corp‡ | 7,817 | 382 | ||||||
Transcontinental Realty Investors Inc* | 49 | 1 | ||||||
UDR Inc‡ | 14,900 | 686 | ||||||
UMH Properties Inc‡ | 4,472 | 59 | ||||||
Uniti Group Inc‡ | 23,351 | 197 | ||||||
Universal Health Realty Income Trust‡ | 1,611 | 149 | ||||||
Urban Edge Properties‡ | 14,522 | 243 | ||||||
Urstadt Biddle Properties Inc, Cl A‡ | 3,819 | 82 | ||||||
Ventas Inc‡ | 19,400 | 1,305 | ||||||
VEREIT Inc‡ | 52,900 | 482 | ||||||
VICI Properties Inc‡ | 22,100 | 472 | ||||||
Vornado Realty Trust‡ | 9,400 | 605 | ||||||
Washington Prime Group Inc‡ | 23,936 | 87 | ||||||
Washington Real Estate Investment Trust‡ | 9,895 | 267 | ||||||
Weingarten Realty Investors‡ | 6,500 | 181 | ||||||
Welltower‡ | 22,100 | 1,837 | ||||||
Weyerhaeuser Co‡ | 40,900 | 1,039 | ||||||
Whitestone, Cl B‡ | 5,020 | 64 | ||||||
WP Carey Inc‡ | 8,700 | 753 | ||||||
Xenia Hotels & Resorts Inc‡ | 14,443 | 310 | ||||||
|
| |||||||
| 75,707 | ||||||||
|
| |||||||
Utilities — 2.2% | ||||||||
AES Corp/VA | 36,100 | 606 | ||||||
ALLETE Inc | 6,507 | 566 | ||||||
Alliant Energy Corp | 12,900 | 639 | ||||||
Ameren Corp | 13,300 | 1,007 | ||||||
American Electric Power Co Inc | 26,900 | 2,362 | ||||||
American States Water Co | 4,667 | 362 | ||||||
American Water Works | 9,900 | 1,136 | ||||||
Aqua America Inc | 11,500 | 482 | ||||||
AquaVenture Holdings Ltd* | 1,612 | 28 | ||||||
Artesian Resources Corp, Cl A | 1,082 | 39 | ||||||
Atmos Energy Corp | 6,200 | 676 | ||||||
Avangrid Inc | 3,100 | 157 | ||||||
Avista Corp | 8,349 | 384 | ||||||
Black Hills Corp | 7,574 | 600 | ||||||
Cadiz Inc* | 1,362 | 15 | ||||||
California Water Service Group | 5,932 | 317 | ||||||
CenterPoint Energy | 27,300 | 792 | ||||||
Chesapeake Utilities Corp | 1,973 | 184 | ||||||
| Description | Shares | Market Value ($ Thousands) | ||||||
COMMON STOCK (continued) | ||||||||
Clearway Energy Inc, Cl C | 9,227 | $ | 166 | |||||
Clearway Energy Inc, Cl A | 4,536 | 78 | ||||||
CMS Energy Corp | 15,400 | 897 | ||||||
Connecticut Water Service Inc | 1,536 | 107 | ||||||
Consolidated Edison Inc | 17,800 | 1,512 | ||||||
Consolidated Water Co Ltd | 1,975 | 28 | ||||||
Dominion Energy Inc | 43,700 | 3,247 | ||||||
DTE Energy | 9,900 | 1,258 | ||||||
Duke Energy | 38,900 | 3,373 | ||||||
Edison International | 17,300 | 1,290 | ||||||
El Paso Electric Co | 5,168 | 342 | ||||||
Entergy Corp | 9,900 | 1,046 | ||||||
Evergy Inc | 13,300 | 805 | ||||||
Eversource Energy | 17,300 | 1,312 | ||||||
Exelon Corp | 52,700 | 2,375 | ||||||
FirstEnergy Corp | 28,900 | 1,271 | ||||||
Genie Energy, Cl B | 2,021 | 22 | ||||||
Global Water Resources Inc | 1,166 | 15 | ||||||
Hawaiian Electric Industries | 5,900 | 264 | ||||||
IDACORP Inc | 2,700 | 276 | ||||||
MDU Resources Group | 10,600 | 284 | ||||||
MGE Energy | 4,311 | 320 | ||||||
Middlesex Water Co | 2,015 | 126 | ||||||
National Fuel Gas | 4,400 | 210 | ||||||
New Jersey Resources Corp | 11,144 | 556 | ||||||
NextEra Energy | 26,100 | 5,407 | ||||||
NiSource Inc | 20,300 | 603 | ||||||
Northwest Natural Holding Co | 3,548 | 253 | ||||||
NorthWestern Corp | 6,407 | 448 | ||||||
NRG Energy Inc | 14,500 | 495 | ||||||
OGE Energy | 10,900 | 468 | ||||||
ONE Gas | 6,556 | 598 | ||||||
Ormat Technologies Inc | 4,913 | 322 | ||||||
Otter Tail Corp | 4,879 | 260 | ||||||
Pattern Energy Group Inc, Cl A | 11,140 | 255 | ||||||
PG&E* | 28,200 | 511 | ||||||
Pinnacle West Capital Corp | 6,100 | 557 | ||||||
PNM Resources Inc | 9,965 | 495 | ||||||
Portland General Electric | 11,264 | 618 | ||||||
PPL Corp | 39,400 | 1,167 | ||||||
Public Service Enterprise Group | 27,500 | 1,572 | ||||||
Pure Cycle Corp* | 1,716 | 19 | ||||||
RGC Resources Inc | 1,025 | 30 | ||||||
Sempra Energy | 14,900 | 2,018 | ||||||
SJW Group | 3,329 | 216 | ||||||
South Jersey Industries Inc | 11,781 | 401 | ||||||
Southern Co/The | 56,200 | 3,158 | ||||||
Southwest Gas Holdings Inc | 6,697 | 595 | ||||||
Spark Energy Inc, Cl A | 1,212 | 13 | ||||||
Spire Inc | 6,241 | 514 | ||||||
TerraForm Power, Cl A | 9,228 | 142 | ||||||
UGI Corp | 9,400 | 480 | ||||||
| 48 | Adviser Managed Trust / Annual Report / July 31, 2019 |
SCHEDULE OF INVESTMENTS
July 31, 2019
Tactical Offensive Equity Fund(Continued)
| Description | Shares | Market Value ($ Thousands) | ||||||
COMMON STOCK (continued) | ||||||||
Unitil Corp | 1,850 | $ | 108 | |||||
Vistra Energy Corp | 21,600 | 464 | ||||||
WEC Energy Group | 17,200 | 1,470 | ||||||
Xcel Energy Inc | 27,800 | 1,657 | ||||||
York Water Co/The | 1,706 | 61 | ||||||
|
| |||||||
| 56,907 | ||||||||
|
| |||||||
| 1,747,759 | ||||||||
|
| |||||||
Total Common Stock | 2,487,686 | |||||||
|
| |||||||
PREFERRED STOCK — 0.4% | ||||||||
Brazil — 0.3% | ||||||||
Banco Bradesco SA (C) | 183,520 | 1,689 | ||||||
Braskem SA* (C) | 6,600 | 60 | ||||||
Centrais Eletricas Brasileiras SA (C) | 8,300 | 87 | ||||||
Cia Brasileira de Distribuicao (C) | 7,700 | 191 | ||||||
Cia Energetica de Minas Gerais (C) | 45,000 | 169 | ||||||
Gerdau SA (C) | 52,400 | 192 | ||||||
Itau Unibanco Holding (C) | 220,400 | 2,045 | ||||||
Itausa - Investimentos Itau (C) | 203,500 | 677 | ||||||
Lojas Americanas (C) | 36,500 | 176 | ||||||
Petroleo Brasileiro SA (C) | 191,700 | 1,338 | ||||||
Telefonica Brasil SA (C) | 21,200 | 294 | ||||||
|
| |||||||
| 6,918 | ||||||||
|
| |||||||
Chile — 0.0% | ||||||||
Embotelladora Andina SA | 8,671 | 31 | ||||||
Sociedad Quimica y Minera de Chile, Cl B (C) | 5,564 | 164 | ||||||
|
| |||||||
| 195 | ||||||||
|
| |||||||
Colombia — 0.0% | ||||||||
Bancolombia SA (C) | 21,429 | 269 | ||||||
Grupo Aval Acciones y Valores SA (C) | 208,700 | 80 | ||||||
Grupo de Inversiones Suramericana SA | 2,697 | 26 | ||||||
|
| |||||||
| 375 | ||||||||
|
| |||||||
Germany — 0.1% | ||||||||
Bayerische Motoren Werke AG (C) | 1,635 | 98 | ||||||
FUCHS PETROLUB SE (C) | 2,090 | 81 | ||||||
Henkel AG & Co KGaA (C) | 6,371 | 662 | ||||||
Porsche Automobil Holding SE (C) | 5,492 | 365 | ||||||
Sartorius AG (C) | 1,279 | 264 | ||||||
Volkswagen AG (C) | 6,625 | 1,113 | ||||||
|
| |||||||
| 2,583 | ||||||||
|
| |||||||
South Korea — 0.0% | ||||||||
Amorepacific Corp (C) | 208 | 14 | ||||||
Hyundai Motor Co (C) | 2,736 | 185 | ||||||
LG Chem Ltd (C) | 265 | 40 | ||||||
LG Household & Health Care Ltd (C) | 72 | 49 | ||||||
| Description | Shares | Market Value ($ Thousands) | ||||||
PREFERRED STOCK (continued) | ||||||||
Samsung Electronics Co Ltd (C) | 37,590 | $ | 1,175 | |||||
|
| |||||||
| 1,463 | ||||||||
|
| |||||||
Total Preferred Stock | 11,534 | |||||||
|
| |||||||
EXCHANGE TRADED FUND — 0.0% | ||||||||
United States — 0.0% | ||||||||
SPDR S&P 500 Trust | 752 | 224 | ||||||
|
| |||||||
Total Exchange Traded Fund | 224 | |||||||
|
| |||||||
| Number of Rights | ||||||||
RIGHTS — 0.0% | ||||||||
Hong Kong — 0.0% | ||||||||
Haitong Securities*^ | 3 | — | ||||||
XINYI Solar Holdings*^ | 7 | — | ||||||
|
| |||||||
| — | ||||||||
|
| |||||||
United States — 0.0% | ||||||||
Corium International*^ | 4 | 2 | ||||||
Newstar Financial*^ (D) | 4 | 2 | ||||||
Schulman*^ (D) | 3 | 7 | ||||||
Tobira Therapeutics, Expires 12/31/2028* (D) | 1 | — | ||||||
|
| |||||||
| 11 | ||||||||
|
| |||||||
Total Rights | 11 | |||||||
|
| |||||||
| Number of Warrants | ||||||||
WARRANTS — 0.0% | ||||||||
Thailand — 0.0% | ||||||||
Minor International, Expires 09/30/2021* | 2 | — | ||||||
|
| |||||||
Total Warrants | — | |||||||
|
| |||||||
Total Investments — 97.6% | $ | 2,499,455 | ||||||
|
| |||||||
| Adviser Managed Trust / Annual Report / July 31, 2019 | 49 |
SCHEDULE OF INVESTMENTS
July 31, 2019
Tactical Offensive Equity Fund(Continued)
A list of the open futures contracts held by the Fund at July 31, 2019, is as follows:
| Type of Contract | Number of Contracts Long | Expiration Date | Notional Amount (Thousands) | Value (Thousands) | Unrealized Appreciation (Thousands) | |||||||||||||||
MSCI EAFE Index | 155 | Sep-2019 | $ | 14,549 | $ | 14,609 | $ | 60 | ||||||||||||
MSCI Emerging Markets | 176 | Sep-2019 | 8,954 | 9,004 | 50 | |||||||||||||||
Russell 2000 IndexE-MINI | 67 | Sep-2019 | 5,141 | 5,282 | 141 | |||||||||||||||
S&P 500 IndexE-MINI | 198 | Sep-2019 | 28,770 | 29,525 | 755 | |||||||||||||||
S&P Mid Cap 400 IndexE-MINI | 12 | Sep-2019 | 2,288 | 2,362 | 74 | |||||||||||||||
|
|
|
|
|
| |||||||||||||||
| $ | 59,702 | $ | 60,782 | $ | 1,080 | |||||||||||||||
|
|
|
|
|
| |||||||||||||||
Percentages are based on a Net Assets of $2,559,635 ($ Thousands).
| * | Non-income producing security. |
| ‡ | Real Estate Investment Trust. |
| ^ | Expiration date unavailable. |
| (A) | Security exempt from registration under Rule 144A of the Securities Act of 1933. These securities may be resold in transactions exempt from registration normally to qualified institutions. On July 31, 2019, the value of these securities amounted to $6,929 ($ Thousands), representing 0.27% of the net assets of the Fund. |
| (B) | Security is a Master Limited Partnership. At July 31, 2019, such securities amounted to $296 ($ Thousands), or 0.01% of Net Assets (See Note 2). |
| (C) | There is currently no rate available. |
| (D) | Level 3 security in accordance with fair value hierarchy. |
ADR — American Depositary Receipt
Cl — Class
EAFE — Europe, Australasia and Far East
GDR — Global Depositary Receipt
MSCI — Morgan Stanley Capital International
NVDR —Non-voting Depositary Receipt
PJSC — Public Joint-Stock Company
PLC — Public Limited Company
S&P— Standard & Poor’s
Ser — Series
SPDR — Standard & Poor’s Depository Receipt
The following is a list of the level of inputs used as of July 31, 2019, in valuing the Fund’s investments and other financial instruments carried at value ($ Thousands):
| Investments in Securities | Level 1 | Level 2 | Level 3‡ | Total | ||||||||||||
Common Stock | $ | 2,487,676 | $ | — | $ | 10 | $ | 2,487,686 | ||||||||
Preferred Stock | 11,534 | — | — | 11,534 | ||||||||||||
Exchange Traded Fund | 224 | — | — | 224 | ||||||||||||
Rights | 2 | — | 9 | 11 | ||||||||||||
Warrants | — | — | — | — | ||||||||||||
|
|
|
|
|
|
|
| |||||||||
Total Investments in Securities | $ | 2,499,436 | $ | — | $ | 19 | $ | 2,499,455 | ||||||||
|
|
|
|
|
|
|
| |||||||||
| Other Financial Instruments | Level 1 | Level 2 | Level 3 | Total | ||||||||||||
Futures Contracts* | ||||||||||||||||
Unrealized Appreciation | $ | 1,080 | $ | — | $ | — | $ | 1,080 | ||||||||
|
|
|
|
|
|
|
| |||||||||
Total Other Financial Instruments | $ | 1,080 | $ | — | $ | — | $ | 1,080 | ||||||||
|
|
|
|
|
|
|
| |||||||||
| * | Futures contracts are valued at the unrealized appreciation on the instrument. |
| ‡ | A reconciliation of Level 3 investments is presented when the Fund has a significant amount of Level 3 investments at the beginning and/or end of the year in relation to net assets. Management has concluded that Level 3 investments are not material in relation to net assets. |
For the year ended July 31, 2019, there were transfers between Level 1 and Level 2 assets and liabilities due to the availability of quoted prices in active markets to determine fair value. For the year ended July 31, 2019, there were no transfers between Level 2 and Level 3 assets and liabilities. All transfers, if any, are recognized by the Fund at the end of the year.
For more information on valuation inputs, see Note 2 — Significant Accounting Policies in Notes to Financial Statements.
The following is a summary of the transactions the Fund had with affiliates for the year ended July 31, 2019 ($ Thousands):
| Security Description | Value 7/31/2018 | Purchases at Cost | Proceeds from Sales | Realized Loss | Change in Unrealized Depreciation | Value 7/31/2019 | Shares | Dividend Income | Capital Gains | ||||||||||||||||||||||||||||||||||||
| SEI Investments Co | $ | 462 | $ | 188 | $ | (541) | $ | (19 | ) | $ | (90 | ) | $ | — | — | $ | — | $ | — | ||||||||||||||||||||||||||
| SEI Daily Income Trust, Government Fund, Cl F | — | 1,700,000 | (1,700,000) | — | — | — | — | 97 | — | ||||||||||||||||||||||||||||||||||||
|
|
|
|
|
|
|
|
|
|
|
|
|
|
|
|
|
| ||||||||||||||||||||||||||||
| Totals | $ | 462 | $ | 1,700,188 | $ | (1,700,541) | $ | (19 | ) | $ | (90 | ) | $ | — | — | $ | 97 | $ | — | ||||||||||||||||||||||||||
|
|
|
|
|
|
|
|
|
|
|
|
|
|
|
|
|
| ||||||||||||||||||||||||||||
Amounts designated as “—” are either $0 or have been rounded to $0.
The accompanying notes are an integral part of the financial statements.
| 50 | Adviser Managed Trust / Annual Report / July 31, 2019 |
Report of Independent Registered Public Accounting Firm
To the Shareholders of the Funds and Board of Trustees
Adviser Managed Trust:
Opinion on the Financial Statements
We have audited the accompanying statement of assets and liabilities, including the summary schedule of investments and the schedule of investments, of the Tactical Offensive Equity Fund and the statement of assets and liabilities, including the schedule of investments, of the Tactical Offensive Fixed Income Fund (collectively, the Funds) comprising the Adviser Managed Trust, as of July 31, 2019, the related statement of operations for the year then ended, the statements of changes in net assets for each of the years in thetwo-year period then ended, and the related notes (collectively, the financial statements) and the financial highlights for each of the years in thefive-year period then ended. The financial statements and financial highlights are included in Item 1 of this FormN-CSR, except for the schedule of investments of the Tactical Offensive Equity Fund as of July 31, 2019, which is included in Item 6 of this FormN-CSR. In our opinion, the financial statements and financial highlights present fairly, in all material respects, the financial position of the Funds as of July 31, 2019, the results of their operations for the year then ended, the changes in their net assets for each of the years in thetwo-year period then ended, and the financial highlights for each of the years in thefive-year period then ended, in conformity with U.S. generally accepted accounting principles.
Basis for Opinion
These financial statements and financial highlights are the responsibility of the Funds’ management. Our responsibility is to express an opinion on these financial statements and financial highlights based on our audits. We are a public accounting firm registered with the Public Company Accounting Oversight Board (United States) (PCAOB) and are required to be independent with respect to the Funds in accordance with the U.S. federal securities laws and the applicable rules and regulations of the Securities and Exchange Commission and the PCAOB.
We conducted our audits in accordance with the standards of the PCAOB. Those standards require that we plan and perform the audit to obtain reasonable assurance about whether the financial statements and financial highlights are free of material misstatement, whether due to error or fraud. Our audits included performing procedures to assess the risks of material misstatement of the financial statements and financial highlights, whether due to error or fraud, and performing procedures that respond to those risks. Such procedures included examining, on a test basis, evidence regarding the amounts and disclosures in the financial statements and financial highlights. Such procedures also included confirmation of securities owned as of July 31, 2019, by correspondence with custodians and brokers or by other appropriate auditing procedures when replies from brokers were not received. Our audits also included evaluating the accounting principles used and significant estimates made by management, as well as evaluating the overall presentation of the financial statements and financial highlights. We believe that our audits provide a reasonable basis for our opinion.
We have served as the auditor of one or more SEI Funds investment companies since 2005.
Philadelphia, Pennsylvania
September 27, 2019
| Item 7. | Disclosure of Proxy Voting Policies and Procedures forClosed-End Management Investment Companies. |
Not applicable.
| Item 8. | Portfolio Managers ofClosed-End Management Investment Companies |
Not applicable.
| Item 9. | Purchases of Equity Securities byClosed-End Management Company and Affiliated Purchasers. |
Not applicable.
| Item 10. | Submission of Matters to a Vote of Security Holders. |
There have been no material changes to the procedures by which shareholders may recommend nominees to the Registrant’s Board of Trustees (the ‘Board”). The Registrant has a standing Governance Committee (the “Committee”) currently consisting of the Independent Trustees. The Committee is responsible for evaluating and recommending nominees for election to the Board. Pursuant to the Committee’s Charter, adopted on June 18, 2004, as amended, the Committee will review all shareholder recommendations for nominations to fill vacancies on the Board if such recommendations are submitted in writing and addressed to the Committee at the Registrant’s office.
| Item 11. | Controls and Procedures. |
(a) The Registrant’s principal executive and principal financial officers, or persons performing similar functions, have concluded that the Registrant’s disclosure controls and procedures (as defined in Rule30a-3(c) under the Investment Company Act of 1940 (the “1940 Act”)) are effective, based on the evaluation of these controls and procedures required by Rule30a-3(b) under the 1940 Act and Rules13a-15(b) or15d-15(b) under the Securities Exchange Act of 1934 as of a date within 90 days of the filing date of this report.
(b) There were no changes in the Registrant’s internal control over financial reporting (as defined in Rule30a-3(d) under the 1940 Act) that occurred during the period covered by this report that have materially affected, or are reasonably likely to materially affect, the Registrant’s internal control over financial reporting.
| Item 12. | Disclosure of Securities Lending Activities forClosed-End Management Investment Companies. |
Not applicable.
| Item 13. | Exhibits. |
(a)(1) Code of Ethics attached hereto.
(a)(2) A separate certification for the principal executive officer and the principal financial officer of the Registrant, as required by Rule30a-2(a) under the Investment Company Act of 1940, are filed herewith.
(b) Officer certifications as required by Rule30a-2(b) under the Investment Company Act of 1940, as amended, also accompany this filing as an exhibit.
SIGNATURES
Pursuant to the requirements of the Securities Exchange Act of 1934 and the Investment Company Act of 1940, the Registrant has duly caused this report to be signed on its behalf by the undersigned, thereunto duly authorized.
| Adviser Managed Trust | ||||||
| By | /s/ Robert A. Nesher | |||||
| Robert A. Nesher | ||||||
| President & CEO | ||||||
Date: October 7, 2019
Pursuant to the requirements of the Securities Exchange Act of 1934 and the Investment Company Act of 1940, this report has been signed below by the following persons on behalf of the Registrant and in the capacities and on the dates indicated.
| By | /s/ Robert A. Nesher | |||||
| Robert A. Nesher | ||||||
| President & CEO |
Date: October 7, 2019
| By | /s/ James Hoffmayer | |||||
| James Hoffmayer | ||||||
| Controller & CFO |
Date: October 7, 2019