UNITED STATES
SECURITIES AND EXCHANGE COMMISSION
Washington, D.C. 20549
FORM N-CSR
CERTIFIED SHAREHOLDER REPORT OF REGISTERED MANAGEMENT
INVESTMENT COMPANIES
Investment Company Act file number 811-22480
Adviser Managed Trust
(Exact name of registrant as specified in charter)
SEI Investments
One Freedom Valley Drive
Oaks, PA 19456
(Address of principal executive offices) (Zip code)
Timothy D. Barto, Esq.
SEI Investments Co.
One Freedom Valley Drive
Oaks, PA 19456
(Name and address of agent for service)
Registrant’s telephone number, including area code: 1-610-676-1000
Date of fiscal year end: July 31, 2021
Date of reporting period: July 31, 2021
Item 1. Reports to Stockholders.
July 31, 2021 ANNUAL REPORT Adviser Managed Trust Tactical Offensive Equity Fund Tactical Offensive Core Fixed Income Fund Tactical Offensive Enhanced Fixed Income Fund
TABLE OF CONTENTS
The Trust files its complete schedule of portfolio holdings with the Securities and Exchange Commission for the first and third quarter of each fiscal year on Form N-PORT. The Trust’s Forms N-PORT are available on the Commission’s website at http://www.sec.gov.
A description of the policies and procedures that the Trust uses to determine how to vote proxies relating to portfolio securities, as well as information relating to how a Fund voted proxies relating to portfolio securities during the most recent 12-month period ended July 31, is available (i) without charge, upon request, by calling 1-800-DIAL-SEI; and (ii) on the Commission’s website at http://www.sec.gov.
LETTER TO SHAREHOLDERS (Unaudited)
JULY 31, 2021
To Our Shareholders:
The fiscal year ending July 31, 2021, began with markets continuing their remarkable rally from the March 2020 lows. The “risk-on” sentiment came amid a push by local governments to slowly reverse lockdowns of non-essential economic activity; the promising news of progress made in the race to develop COVID-19 vaccines; and the sustained extraordinary support of central banks. U.S. equity markets eclipsed their pre-pandemic peaks early in the period and finished the fiscal year near all-time highs.
Central banks aggressively pursued accommodative monetary policy, asset purchase programs and record fiscal stimulus measures during the reporting period. In September, the millionth victim of the COVID-19 outbreak was claimed globally, a figure that would climb to over 4 million by the end of July. Cases had seemed to abate for a time during late-summer 2020, but then once again began to rise in the fall as variant strains were identified and met with another round of lockdowns in Europe and more sporadically in the U.S. Fears of yet another wave of outbreaks kept markets in a more cautious stance.
Markets advanced once it became clearer that former Vice President Joe Biden would become the next U.S. president in what would likely be a split government. Expectations of further, but less expansive, fiscal stimulus from Congress and a less likely reversal of the corporate tax cuts under the Trump administration fueled this appreciation. Investor exuberance kicked off in earnest in November after a series of positive vaccine clinical trial results; the enthusiasm was sustained by subsequent emergency use authorizations by the FDA.
Financial markets anticipated increased volatility around the U.S. presidential election, but with Joe Biden winning a close election for U.S. president and the announcement of effective vaccines thereafter, markets advanced higher and volatility declined. Despite no sign of the Federal Reserve tightening in the near term, the U.S. Treasury yield curve steepened over the course of the fiscal year, especially as future expectations for a rebound in economic growth increased along with rising inflation expectations; long-term yields rose more than shorter-term yields.
Government-bond yields (which had been rising slowly since the fall) began to spike further in February. The specter of a sharp increase in borrowing costs sent chills through markets during the second half of February, leading to selloffs of varying intensity before markets resumed their climb again in March.
The Federal Reserve’s (Fed) federal-funds rate target continued to range between 0.0% and 0.25%, and the Federal Open Market Committee (FOMC)—the Fed’s monetary policymakers—remained committed to purchasing Treasurys and agency mortgage-backed securities (MBS) to support the flow of credit to households and businesses. Fed Chair Jerome Powell pledged to continue supporting the economy via monetary policy during his semi-annual congressional testimony on July 14, 2021.
Equities continued to roll along, although work-from-home and mega-cap stocks gave up ground to cyclical and “go-out” names before a slight reversal over the final months of the period. Market observers attributed this to the FOMC deciding to increase its projection for the federal-funds rate in 2023. Meanwhile, for the first time since April this year, the seven-day moving average of new COVID-19 cases reported in the U.S. stopped falling in mid-June after an impressive period of declines that brought cases to their lowest levels since March 2020.
Geopolitical Events
In the U.S. general election in November, Joe Biden was declared the winner of the presidential race in early November. Most candidates from the Republican Party performed better in their races for state- and national-level offices compared to President Trump’s quest for a second term; in January, a violent security breach of the U.S. Capitol by a mob of protesters delayed—but did not stop—the counting of electoral votes in the U.S. Congress. Trump was impeached by the House of Representatives for inciting an insurrection—the first president in U.S. history to be impeached twice. Two weeks later, Joe Biden was inaugurated as president under heavy security provided by 25,000 National Guard troops.
President Joe Biden’s administration proposed a $6 trillion budget for the 2022 fiscal year that would serve as a starting point from which Congress can decide how to appropriate the country’s economic funding. The president incorporated his two major economic initiatives into the budget, infrastructure and families programs.
| | |
| Adviser Managed Trust / Annual Report / July 31, 2021 | | 1 |
LETTER TO SHAREHOLDERS (Unaudited) (Continued)
JULY 31, 2021
At the end of July, the U.S. Senate voted to begin negotiations about a bipartisan infrastructure plan. Formally called the Infrastructure Investment and Jobs Act, the plan includes roughly $1 trillion with $550 billion in new spending over a five-year period. It is projected to add approximately two million jobs per year for a decade as the nation undertakes modernizing roads, railways, ports, public transit, airports and power grids; improving water quality and broadband access; and cleaning abandoned environmentally hazardous sites.
The United States-Mexico-Canada trade agreement was ratified by all three countries and officially replaced the North American Free Trade Agreement just prior to the start of the reporting period on July 1. The Trump administration announced in September that it would not pursue a 10% tariff on U.S. imports of Canadian aluminum previously announced in August, as trade is now expected to normalize following high import levels earlier in 2020. President Trump and France’s President Emmanuel Macron successfully walked back threats of tariffs that originated with French plans for a digital tax that would have targeted U.S.-based multi-national technology companies..
In a push to re-establish tourism ahead of the traditionally busy summer season, the EU approved a proposal made by the European Commission in May to ease travel restrictions within the bloc for vaccinated foreigners. Tensions between the EU and China—which have flared over the last six months as the EU condemned China’s record on human rights and China imposed retaliatory economic sanctions—remained unsettled. In May, the European Parliament suspended ratification of the Comprehensive Agreement on Investment that EU and Chinese leaders had finalized in December 2020. As for U.S.-EU trade relations, friction smoothed as the European Commission delayed an increase to tariffs on the U.S. that had been planned in response to the Trump administration’s tariffs on European metals; existing tariffs will remain as the two sides negotiate a long-term solution.
Toward the end of the period, finance ministers and central bank leaders from the Group of 20 (G-20), representing the world’s 20 largest economies, unanimously agreed to endorse the major components of a tax plan that would establish a global minimum corporate tax of at least 15%. Finalization of the plan requires approval from national leaders. In deference to this effort, EU officials postponed review of its digital levy proposal until autumn.
Economic Performance
U.S. gross domestic product (GDP) saw a record 33.4% rebound in the third quarter of 2020, fueled by over $3 trillion in pandemic relief. A 4.0% gain in the fourth quarter resulted in a decline of 3.5% for the full year, the worst figure since at least the end of World War II. The U.S. economy expanded at a robust annualized rate of 6.3% in the first quarter of 2021; consumer spending (which accounts for nearly 70% of U.S. economic activity) spiked by 11.3% as Americans put their stimulus payments to work, providing a much-needed boost to restaurants, hotels and airlines. Overall U.S. economic growth measured an annualized 6.5% during the second quarter, just above the first-quarter pace, as service-oriented businesses anticipated saw continued gains from the rise in vaccinations and re-openings.
After touching a 50-year low of 3.5% and then jumping as high as 14.8% prior to the start of the fiscal year, the U.S. unemployment rate remained over 6.0% through April, with the final figure settling at 5.4% in July 2021, down from 10.2% a year earlier. The labor-force participation rate ended at 61.7%, up from 61.5% a year earlier. Average hourly earnings gained 4.0% over the fiscal year, as the leisure and hospitality industry continued to reopen and looked to boost pay in order to fill vacant positions.
Two off-cycle moves before the start of the fiscal year brought the federal-funds rate to near zero and were designed to bolster the economy in response to the economic threat posed by the coronavirus outbreak; the emergency actions were the first since the global financial crisis. Additionally, the Fed committed to purchasing unlimited amounts of Treasurys and established or renewed multiple facilities designed to support the economy. The FOMC held the federal-funds rate near zero throughout the second quarter and continued its asset purchases apace ($80 billion in Treasurys and $40 billion in agency mortgage-backed securities per month). Its latest Summary of Economic Projections (SEP), released in mid-June, featured a projected increase in the federal-funds rate to 0.6% in 2023 (up from 0.1% in its March projection). The SEP also depicted significantly higher real gross domestic product (GDP) and inflation projections for 2021, although out-year projections were only modestly higher.
| | |
| 2 | | Adviser Managed Trust / Annual Report / July 31, 2021 |
Market Developments
The S&P 500 Index returned 36.45% during the fiscal year. Large-cap value stocks (as measured by the Russell 1000® Value Index) edged out large-cap growth stocks (as measured by the Russell 1000® Growth Index). At the sector level, financials, industrials and capital goods stocks led, while utilities, healthcare, consumer staples and consumer discretionary lagged. Overall, U.S. equities outpaced major developed markets during the fiscal year.
Small-cap stocks, which tend to be value-oriented and sensitive to the success or decline in a local economy, outperformed large caps overall. U.S. large-cap stocks (Russell 1000® Index) finished the reporting period up 37.97%, while small-cap stocks (Russell 2000® Index) finished the period ahead 51.97%. The reason for this difference in performance was a shift in investor preference toward companies with smaller market caps and lower valuation ratios. These companies were viewed as able to benefit from the post-pandemic economic recovery and primed for a rebound following a prolonged period of prior underperformance.
Developed markets, as measured by the MSCI World Index (Net), finished up 35.07% for the year, outperforming emerging markets. The MSCI Emerging Markets Index (Net) finished the reporting period up 20.64% in U.S. dollar terms. Emerging-market equities were on a tear in the first half of the fiscal year (after bottoming early in the pandemic) but gave up some ground over the final few months. The best-performing region was EM Latin America, which was lifted by strong performance from Brazil and Mexico, both of which benefited from the shift in market appetite for cyclical sectors like materials. China was a relative benchmark laggard as government regulations weighed on social media and ecommerce equity prices.
The MSCI Europe Index (Net) advanced 32.50% in U.S. dollar terms. The MSCI ACWI Index (Net), a proxy for global equities in both developed and emerging markets, rose 33.18% in U.S. dollar terms. The FTSE UK Series All-Share Index recorded a 34.15% gain in U.S. dollar terms over the full reporting period.
U.S. investment-grade corporate debt, as represented by the Bloomberg Barclays US Corporate Investment Grade Index, returned 1.42%, while the U.S. high-yield market, as measured by the ICE BofA US High Yield Constrained Index, benefited from a broad reopening of the U.S. economy and was up 10.75% during the reporting period. Within the high-yield market, the energy sector outperformed the broader market during the period. Lower-quality issues also outperformed, as CCC rated securities led, followed by B and BB rated. U.S. asset-backed securities managed gains during the fiscal year, benefiting from improving supply-and-demand dynamics; mortgage-backed securities were close to flat, as elevated supply and fast prepayment speeds offset the Fed adding around $40 billion of MBS to its balance sheet each month.
Global fixed income, as measured by the Bloomberg Barclays Global Aggregate Index, climbed 0.78%. Emerging-market debt (EMD) delivered positive performance due to an improving growth outlook in the region relative to developed markets. The J.P. Morgan Global Bond Index-Emerging Markets (GBI-EM) Global Diversified Index, which tracks local-currency-denominated EM bonds, gained 3.00% in U.S. dollar terms. The J.P. Morgan Emerging Markets Bond Index (EMBI) Global Diversified Index, which tracks EMD denominated in external currencies (such as the U.S. dollar), was up 4.11%.
After the U.S. dollar initially rebounded from its January low (relative to a trade-weighted basket of foreign currencies), it resumed an overall downward trend and neared its earlier low again in May before recovering some as the fiscal year closed. After hitting an all-time low before the start of the reporting period, the West Texas Intermediate crude-oil price reached a 40-month high in the final month of the fiscal year due to optimistic forecasts for global economic growth and increased demand for crude.
Our View
Equity markets have long anticipated the economic improvement we are watching unfold. There is increasing concern, however, that equity prices have risen so much that there is little appreciation potential left, even if the global economy continues to forge ahead into 2022.
Since mid-June, we have witnessed a partial unwinding of the rotation trade (from expensive technology-oriented stay-at-home companies to less-expensive cyclically-oriented companies) that began last autumn. So far, this appears to us as a temporary pause in a longer-term upswing. The global recovery and expansion have a long way to go, especially since many countries are still imposing lockdown measures to varying degrees.
| | |
| Adviser Managed Trust / Annual Report / July 31, 2021 | | 3 |
LETTER TO SHAREHOLDERS (Unaudited) (Continued)
JULY 31, 2021
We can’t rule out a choppier and more lackluster performance for U.S. equities in the months ahead given their strong outperformance since March 2009 and elevated stock-market valuations relative to much of the rest of the world. If stock-market volatility does increase, we don’t think there’s reason to be overly concerned; corrections that range from 5% to 10% can occur without any fundamental reason.
In today’s environment, with economies opening up around the globe and interest rates still at extraordinarily low levels, the dominant trend favors further price gains over the next year or two. Still, investors must take into account that the U.S. economy appears to have reached “peak growth.”
Growth slowdowns, not just recessions, can lead to equity underperformance versus bonds. The relative performance of equities versus bonds was phenomenal over the past 16 months; a major narrowing of the performance gap is inevitable. Yet, with interest rates still at exceptionally low levels, it is hard to see equities losing ground to fixed-income securities while economic growth remains robust. Not only should consumer demand remain strong as long as economies continue to reopen, but businesses have been in a spending mood—desperately seeking materials and workers.
In the meantime, companies are expected to enjoy a great deal of pricing power and will almost certainly pass along at least a portion of their increased costs to customers. Unfortunately, one person’s pricing power is another person’s inflation. The big question is whether the price pressures seen this year are transitory, as central bankers around the world say they are.
Investors in the bond market seem to agree with the central bankers. Although U.S. bond yields rose sharply in the first quarter, they have since fallen. There’s no telling how long bond investors will maintain such a calm perspective if inflation persists at a pace not seen in almost 30 years.
Fed Chairman Jerome Powell has continued to reiterate that the U.S. labor market has a long way to go before it reaches full employment. Job openings in the country are now soaring. If the rise in the Employment Cost Index accelerates as we expect, inflation could become a greater concern for investors.
The recent stumble in the rotation theme was exacerbated by the marginally hawkish shift in Fed expectations. It is clear, however, that the U.S. central bank intends to cautiously move away from its current policy stance. The first move will likely be the tapering of its bond-buying programme, which may be announced in late August at the annual Jackson Hole conference, with actual tapering beginning no earlier than the first quarter of 2022.
The path of U.S. fiscal policy is harder to decipher given strained bipartisanship and the narrowness of the Democratic majority in the Congress. A traditional infrastructure bill appears likely to get passed with bipartisan support, but the push for non-traditional forms of infrastructure—and the taxes to pay for all the added spending—will depend on whether the Democrats in the Senate can come to terms with each other.
The combination of above-average economic growth, significantly higher inflation than seen in the past decade, a fiscal policy that expands the size of federal government spending, and extreme monetary ease aimed at suppressing interest rates is the perfect backdrop for risk assets—and the creation of speculative bubbles.
The relative success of the U.S. vaccination effort and the country’s state-by-state response has resulted in a significantly stronger economy this year than in other major developed countries. Fortunately, injection rates have been accelerating in Europe and Japan. We anticipate other advanced economies will record strong economic results in the second half of the year and into 2022, exceeding the pace of growth in the U.S.
Although economists correctly point out that the U.S. has employed direct fiscal measures (emergency spending, income support and tax breaks) more aggressively than any other nation, other countries have used different tactics that far exceed the U.S. effort.
Several European nations and Japan have relied on equity injections, loans and guarantees. Italy (35% of gross domestic product), Japan and Germany (both at 28%) are the most notable, according to the International Monetary Fund. In the eurozone, some of these loan commitments have only just begun to flow. Italy and Spain are big beneficiaries of the eurozone’s €750 billion in loans and grants as part of the so-called NextGenerationEU program.
The ECB also seems dedicated to maintaining its pandemic-related monetary support at least through March 2022. As a percentage of gross domestic product (GDP), the ECB’s balance sheet has risen more than 25% since the
| | |
| 4 | | Adviser Managed Trust / Annual Report / July 31, 2021 |
beginning of the COVID-19 crisis, more than any other major central bank besides the BOJ (30%). The ECB’s actions have succeeded in keeping peripheral Europe’s sovereign bond yields well behaved through the crisis period.
While the U.S., the U.K. and Canada seem to be enduring a much sharper inflationary increase than Japan or the eurozone, the latter two are probably relieved to have a respite from the deflationary pressures that have afflicted their economies for many years. There seems little reason for the ECB or BOJ to join the Fed when it comes to discussing a near-term reduction in asset purchases, much less raising their policy rates ahead of the U.S.
We do not see much sign that the Fed’s shift toward an earlier lift-off in rates will lead to a 2013-style “taper tantrum” among emerging economies. A strong U.S. dollar would certainly threaten the bull market in commodity prices.
While we are still bullish on the outlook for commodities, we are watching price trends carefully. Commodity prices of all types have enjoyed a spectacular run since March 2020 and were already in the process of consolidating or correcting in the weeks before the Fed revised its views.
We remain optimistic that the more cyclical and value-oriented areas within emerging markets will bounce back from their recent stumble. But there are near-term challenges besides the shift in perceptions about Fed policy and the future course of the U.S. dollar and commodity prices. Credit growth has decelerated significantly in China, similar to the slowdowns recorded in 2013 and 2018—years when the performance of emerging markets was less than stellar.
Another potential source of market volatility could stem from the increasingly fraught relationship between China and the U.S. and its allies. If there is any consensus in Washington nowadays, it is focused on countering China’s growing economic and military strength; although market participants have mostly managed to look past political tensions to date.
Fundamentally, emerging markets continue to look relatively cheap versus most other regions. The forward price-to-earnings multiple of the MSCI Emerging Markets Index is still selling at a 36.4% discount to that of the MSCI USA Index. Outside the March-to-April 2020 low point, this is as cheap a relative multiple against the U.S. as seen at any time in the past 16 years.
We are counting on advanced economies to take up the slack while vaccines ramp up in developing countries. There has been a tremendous amount of excess savings and pent-up demand in North America and Europe. That said, as we’ve witnessed with the surge in new cases driven by the Delta variant, the possibility of regional spikes cannot be dismissed. If severe enough, markets could switch back to a decidedly risk-off position.
As vaccination rates slow in the developed world, more shots are becoming available to the rest of the world. We expect a rolling reopening of the global economy that will extend well into 2022. This wave of recovery could resemble a prolonged up-cycle that keeps the pressure on supply chains, leading to continued shortages of goods and labor. Investor faith in the “transitory inflation” narrative probably will be tested as we head into year end and enter 2022.
Sincerely,

|
| James Smigiel |
|
| Chief Investment Officer |
| | |
| Adviser Managed Trust / Annual Report / July 31, 2021 | | 5 |
LETTER TO SHAREHOLDERS (Unaudited) (Concluded)
JULY 31, 2021
Index Definitions
Bloomberg Global Aggregate Index: is a broad-based benchmark that is considered representative of global investment-grade, fixed-income markets.
Bloomberg US Corporate Investment Grade Index: is a broad-based benchmark that measures the investment-grade, fixed-rate, taxable corporate bond market.
Bloomberg US Aggregate Bond Index: The Bloomberg Barclays U.S. Aggregate Bond Index is a benchmark index composed of U.S. securities in Treasury, government-related, corporate and securitized sectors. It includes securities that are of investment-grade quality or better, have at least one year to maturity and have an outstanding par value of at least $250 million.
Dow Jones Industrial Average: The Index measures the stock performance of 30 large companies listed on stock exchanges in the United States.
FTSE UK Series All-Share Index: is a capitalization-weighted index, comprising around 600 of more than 2,000 companies traded on the London Stock Exchange.
ICE BofA US High Yield Constrained Index: tracks the performance of below-investment-grade, U.S. dollar-denominated corporate bonds publicly issued in the U.S. domestic market; exposure to individual issuers is capped at 2%.
JP Morgan EMBI Global Diversified Index: tracks the performance of external debt instruments (including U.S.-dollar-denominated and other external-currency-denominated Brady bonds, loans, eurobonds and local-market instruments) in emerging markets.
JP Morgan GBI-EM Global Diversified Composite Index: tracks the performance of debt instruments issued in local currencies by emerging-market governments.
MSCI Europe Index: is a free float-adjusted market-capitalization-weighted index designed to measure the performance of large- and mid-capitalization stocks across developed-market countries in Europe.
MSCI Emerging Markets Index: is a free float-adjusted market-capitalization-weighted index designed to measure the performance of global emerging-market equities.
MSCI World Index: is a free float-adjusted market-capitalization-weighted index that is designed to measure the equity-market performance of developed markets. The Index consists of 24 developed-market country indexes.
Russell 1000® Index: includes 1,000 of the largest U.S. stocks based on market cap and current index membership; it is used to measure the activity of the U.S. large-cap equity market.
Russell 2000® Index: The Russell 2000 Index measures the performance of the 2,000 smallest companies in the Russell 3000® Index, which represents approximately 8% of the total market capitalization of the Russell 3000® Index.
S&P 500 Index: is an unmanaged, market-weighted index that consists of 500 of the largest publicly-traded U.S. companies and is considered representative of the broad U.S. stock market.
| | |
| 6 | | Adviser Managed Trust / Annual Report / July 31, 2021 |
MANAGEMENT’S DISCUSSION AND ANALYSIS OF FUND PERFORMANCE (Unaudited)
JULY 31, 2021
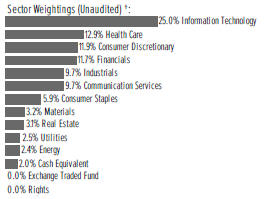
Tactical Offensive Equity Fund
I. Objective
The investment objective of the Tactical Offensive Equity Fund (the “Fund”) is capital appreciation.
II. Adviser Managed Strategy Component
Only persons who are clients of the Financial Adviser (as defined below) and who participate in the Adviser Managed Strategy should invest in the Fund. The Fund may not be purchased by any other investor. The Fund is designed to be a component of a broader strategy employed by a third party investment manager (Financial Adviser) for the benefit of its clients. The Financial Adviser seeks to take advantage of broad market changes by tactically shifting its clients’ assets among the Fund, the Tactical Offensive Core Fixed Income Fund, Tactical Offensive Enhanced Fixed Income Fund and a money market fund affiliated with the Fund, depending on the Financial Adviser’s evaluation of current market conditions (Adviser Managed Strategy). The Financial Adviser is not the adviser to the Fund and is not affiliated with SEI Investments Management Corporation (SIMC), the adviser to the Fund.
When the Financial Adviser determines to reallocate its clients’ assets to one or more of the other funds that compose the Adviser Managed Strategy, the Financial Adviser may request the redemption of a substantial portion of or all of the shares for which the Financial Adviser exercises investment discretion. In such an instance, the Financial Adviser’s notice of its intent to redeem or formal redemption request (collectively, “Redemption Request”) will cause the Fund to liquidate a substantial portion of or substantially all of its assets in order to fulfill the Redemption Request. If the Financial Adviser’s Redemption Request includes all of the shares for which it exercises investment discretion, the Fund will no longer be an active component of the Adviser Managed Strategy. When the Fund is not an active component of the Adviser Managed Strategy, the Fund may invest up to 100% of its remaining assets in cash, money market instruments, repurchase agreements and other short-term obligations pending the Financial Adviser’s formal redemption request; and exchange-traded funds (ETFs) that are designed to track the performance of the broad U.S. equity market. The Fund could be invested in these types of investments for extended periods of time. At such times, SIMC will manage the assets of the Fund. SIMC, the Financial Adviser or one or more of their affiliates will be the only investors in the Fund following the Financial Adviser’s redemption of all of its clients’ shares from the Fund. Due
to this strategy, the Fund may buy and sell securities and other instruments frequently.
III. Investment Approach
When the Fund is an active component of the Adviser Managed Strategy, the Fund employs a passive strategy designed to track, before fees and expenses, the performance of one or more indexes that represent broad exposure to the U.S. equity market and issuers located in developed and emerging-market countries outside the U.S. (each an Index, and collectively, the Indexes). The passive strategy is implemented by SSGA Funds Management, Inc., as sub-advisor under the general supervision of SIMC. SIMC may adjust the Fund’s allocation of assets among the Indexes over time on the basis of its long-term capital market assumptions.
IV. Return vs. Benchmark
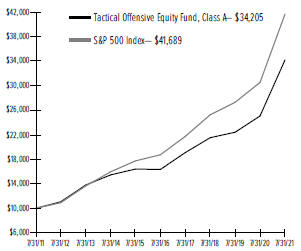
For the full year ended July 31, 2021, the Fund returned 36.45%. The Fund’s benchmark, the S&P 500 Index—which measures the performance of 500 of the largest U.S. companies and is considered representative of the broad U.S. equity market—returned 36.45%.
V. Performance Discussion
The Fund was an active part of the Adviser Managed Strategy for the full period from August 1, 2020, to July 31, 2021. While the benchmark of the Fund generally tracks large-cap U.S. equities, the Fund also seeks passive exposure to U.S. small caps, as well as stocks in developed- and emerging-market countries. During this period, the Fund’s allocation to U.S. small- and mid-cap stocks allowed it to match the S&P 500 Index.
U.S. large-cap stocks (as represented by the Russell 1000® Index) returned 37.97% during the fiscal year, which was slightly greater than the S&P 500 Index return during the same period. The reason for this was the strong performance of mid-cap stocks within the benchmark, which returned 42.58% (as represented by the Russell Midcap Index). Most of those stocks were not in the Fund’s S&P 500 Index benchmark, so the allocation to them was accretive to relative performance over the period.
The Fund’s exposure to small-cap stocks was beneficial during the period. Small caps (as represented by the Russell 2000® Index) returned 51.97% during the fiscal year, which was the greatest return out of all the market segments in which the Fund was invested. As noted in the shareholder letter, the reason for this strong performance was a shift in investor preference toward companies with smaller market caps and lower valuation
| | |
| Adviser Managed Trust / Annual Report / July 31, 2021 | | 7 |
MANAGEMENT’S DISCUSSION AND ANALYSIS OF FUND PERFORMANCE (Unaudited)
JULY 31, 2021
Tactical Offensive Equity Fund (Concluded)
ratios. These companies were viewed as able to benefit from the post-pandemic economic recovery and primed for a rebound following a prolonged period of underperformance.
The passive exposure to developed-market stocks outside the U.S. slightly detracted during the period, as the MSCI EAFE Index returned 30.31% during the fiscal year. Developed-market international stocks performed well at the end of 2020 due to their low valuations and initial signs of a strong economic recovery in Europe; however, they underperformed over the second half of the period. While the MSCI EAFE Index still had a positive return during this time frame, it underperformed the U.S. indexes as the recovery in Europe was hurt by new restrictions intended to combat the recent resurgence in COVID-19 cases within the region.
The Fund’s exposure to emerging-market equities was a headwind to performance, with these stocks (as represented by the MSCI Emerging Markets Index) returning 20.64% during the fiscal year. The primary reason for this was the underperformance of Asian and Latin American countries within the Index, as these regions were hit the hardest by the onset of new COVID-19 variants. This hampered their ability to participate in the recovery from the pandemic, and with vaccine distribution also being more challenging in those countries, many investors elected to shift their allocations to regions with greater short- and medium-term economic prospects.
Investing is subject to risk, including the possible loss of principal. Past performance is no indication of future results.
AVERAGE ANNUAL TOTAL RETURN1
| | | | | | | | | | | | | | | | | | | | |
| | | One Year Return | | | Annualized 3-Year Return | | | Annualized 5-Year Return | | | Annualized 10-Year Return | | | Annualized Inception to Date | |
| Tactical Offensive Equity Fund, Class A | | | 36.45% | | | | 16.68%4,5 | | | | 15.93%4,5 | | | | 13.09%2,3,4,5 | | | | 12.30%2,3,4,5 | |
| S&P 500 Index | | | 36.45% | | | | 18.16% | | | | 17.35% | | | | 15.35% | | | | 14.51% | |
Comparison of Change in the Value of a $10,000 Investment in the Tactical Offensive Equity Fund, Class A, versus the S&P 500 Index.
| 1 | For the year ended July 31, 2021. Past performance is no indication of future performance. Prior to October 1, 2014, the Fund’s investment approach was an “active” investment strategy where an investment manager would buy and sell securities based on its own economic, financial, and market analysis. On October 1, 2014, SIMC implemented a “passive” investment strategy which seeks to track an index return. Returns shown do not reflect the deduction of taxes that a shareholder would pay on fund distributions or the redemption of fund shares. Shares of the Fund were offered beginning February 25, 2011. |
| 2 | The Fund was not an active component of the Adviser Managed Strategy for the period of August 6, 2011 through January 25, 2012. |
| 3 | The Fund was not an active component of the Adviser Managed Strategy for the period of August 28, 2015 through April 14, 2016. |
| 4 | The Fund was not an active component of the Adviser Managed Strategy for the period of December 18, 2018 through March 24, 2019. |
| 5 | The Fund was not an active component of the Adviser Managed Strategy for the period of March 10, 2020 through June 3, 2020. |
| | |
| 8 | | Adviser Managed Trust / Annual Report / July 31, 2021 |
MANAGEMENT’S DISCUSSION AND ANALYSIS OF FUND PERFORMANCE (Unaudited)
JULY 31, 2021
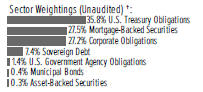
Tactical Offensive Core Fixed Income Fund
I. Objective
The investment objective of the Tactical Offensive Core Fixed Income Fund (the “Fund”) is total return.
II. Adviser Managed Strategy Component
Only persons who are clients of the Financial Adviser (as defined below) and who participate in the Adviser Managed Strategy should invest in the Fund. The Fund may not be purchased by any other investor. The Fund is designed to be a component of a broader strategy employed by a third party investment manager (Financial Adviser) for the benefit of its clients. The Financial Adviser seeks to take advantage of broad market changes by tactically shifting its clients’ assets among the Fund, the Tactical Offensive Equity Fund, the Tactical Offensive Enhanced Fixed Income Fund and a money market fund affiliated with the Fund, depending on the Financial Adviser’s evaluation of current market conditions (Adviser Managed Strategy). The Financial Adviser is not the adviser to the Fund and is not affiliated with SEI Investments Management Corporation (SIMC), the adviser to the Fund.
When the Financial Adviser determines to reallocate its clients’ assets to one or more of the other funds that compose the Adviser Managed Strategy, the Financial Adviser may request the redemption of a substantial portion of or all of the shares for which the Financial Adviser exercises investment discretion. In such an instance, the Financial Adviser’s notice of its intent to redeem or formal redemption request (collectively, “Redemption Request”) will cause the Fund to liquidate a substantial portion of or substantially all of its assets in order to fulfil the Redemption Request. If the Financial Adviser’s Redemption Request includes all of the shares for which it exercises investment discretion, the Fund will no longer be an active component of the Adviser Managed Strategy. When the Fund is not an active component of the Adviser Managed Strategy, the Fund may invest up to 100% of its remaining assets in cash, money market instruments, repurchase agreements and other short-term obligations that would not ordinarily be consistent with the Fund’s investment goal. The Fund could be invested in these types of investments for extended periods of time. At such times, SIMC will manage the assets of the Fund. SIMC, the Financial Adviser or one or more of their affiliates will be the only investors in the Fund following the Financial Adviser’s redemption of all of its clients’ shares from the Fund. Due to this strategy, the Fund may buy and sell securities and other instruments frequently.
III. Investment Approach
When the Fund is an active component of the Adviser Managed Strategy, the Fund employs a passive strategy designed to track, before fees and expenses, the performance of one or more U.S. Investment Grade Indexes (each an Index, and collectively, the Indexes) implemented by SSGA Funds Management, Inc., as sub-advisor under the general supervision of SEI Investments Management Corporation (SIMC). In addition, SIMC directly manages a portion of the Fund’s assets to invest in a portfolio of securities designed to track, before fees and expenses, the performance of one or more Foreign Sovereign Debt Indexes. Prior to a change in the Fund’s allocation and investment strategy during the reporting period, SSGA also implemented a strategy designed to track, before fees and expenses, the performance of High Yield and Emerging Market Fixed Income Indexes. SIMC may adjust the Fund’s allocation of assets among the Indexes over time on the basis of its long-term capital market assumptions.
IV. Return vs. Benchmark
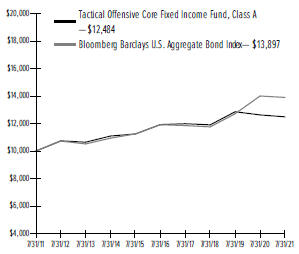
For the full year ended July 31, 2021, the Fund returned -1.13%. The Fund’s benchmark, the Bloomberg Barclays U.S. Aggregate Bond Index—which measures the performance of intermediate-term investment-grade bonds traded in the U.S.—returned -0.70%.
V. Performance Discussion
The Fund was an active part of the Adviser Managed Strategy for the full period from August 1, 2020, to July 31, 2021.
The Fund sought passive exposure to U.S. investment-grade fixed income—primarily a diversified mix of U.S. dollar-denominated fixed-income securities, which included U.S. government, corporate and securitized assets—that was in line with the Fund’s benchmark. The Fund’s passive exposure to G7 ex-U.S. debt, however, contributed to performance, as developed-market sovereign debt outperformed U.S. investment-grade debt. The U.S. investment-grade bond market (as represented by the Bloomberg Barclays US Aggregate Bond Index), generated a -0.70% return as U.S. Treasury yields rose on higher inflation expectations due to accommodative monetary policy, sizable fiscal stimulus and a fuller reopening of the U.S. economy. Spread sectors continued to outperform Treasurys. Early in the period, lending facilities launched by the Federal Reserve (Fed) provided support for both the corporate and securitized markets. Spreads continued to grind tighter during 2021 as the pace of vaccination improved
| | |
| Adviser Managed Trust / Annual Report / July 31, 2021 | | 9 |
MANAGEMENT’S DISCUSSION AND ANALYSIS OF FUND PERFORMANCE (Unaudited)
JULY 31, 2021
Tactical Offensive Core Fixed Income Fund (Concluded)
and the U.S. economy moved toward a broader reopening following health-related economic lockdowns in response to COVID-19. As noted in the shareholder letter, the Treasury curve steepened during the fiscal year; the Fed remained committed to a zero interest-rate policy, while longer-term rates rose significantly in the first quarter of 2021 as investors became increasingly concerned with the prospects of higher inflation, before yields declined again over the final three months of the period. The Fed also maintained the pace of its asset-purchase program, providing support for Treasury and agency mortgage-backed securities markets. Developed-market foreign sovereign bonds (as represented by the Bloomberg Barclays Global Aggregate ex-USD Index (Hedged)) outperformed investment-grade, U.S. dollar-denominated bonds (as represented by the Bloomberg Barclays US Aggregate Bond Index); foreign countries were slower to come out of health-related lockdowns and bonds in those countries generally rose less than similar bonds in the U.S.
The Tactical Offensive Enhanced Fixed Income Fund was launched in January and was funded from the Tactical Offensive Core Fixed Income Fund. The significant outgoing cash flows to the Tactical Offensive Enhanced Fixed Income Fund led to increased transaction costs for the Tactical Offensive Core Fixed Income Fund and detracted from its performance. Although over the course of a typical fiscal year, there will generally be some performance drag due to normal cash flows, this outflow led to the more notable performance deviation.
The Fund used foreign-exchange currency forwards to hedge currency exposure to sovereign bonds. The associated derivatives did not have a material impact on overall Fund performance.
Investing is subject to risk, including the possible loss of principal. Past performance is no indication of future results.
| | | | | | | | | | | | | | | | | | | | |
AVERAGE ANNUAL TOTAL RETURN1 | | | | | |
| | | One Year Return | | | Annualized 3-Year Return | | | Annualized 5-Year Return | | | Annualized 10-Year Return | | | Annualized Inception to Date | |
| Tactical Offensive Core Fixed Income Fund, Class A ‡ | | | (1.13)% | | | | 1.60%2 | | | | 0.92%2 | | | | 2.24%2 | | | | 2.47%2 | |
| Bloomberg Barclays U.S. Aggregate Bond Index | | | (0.70)% | | | | 5.73% | | | | 3.13% | | | | 3.35% | | | | 3.61% | |
Comparison of Change in the Value of a $10,000 Investment in the Tactical Offensive Core Fixed Income Fund, Class A, versus the Bloomberg Barclays U.S. Aggregate Bond Index.
| 1 | For the year ended July 31, 2021. Past performance is no indication of future performance. Prior to October 1, 2014, the Fund’s investment approach was an “active” investment strategy where an investment manager would buy and sell securities based on its own economic, financial, and market analysis. On October 1, 2014, SIMC implemented a “passive” investment strategy which seeks to track an index return. Returns shown do not reflect the deduction of taxes that a shareholder would pay on fund distributions or the redemption of fund shares. Shares of the Fund were offered beginning February 25, 2011. |
| 2 | The Fund was not an active component of the Adviser Managed Strategy for the period of March 19, 2020 through June 16, 2020. |
| ‡ | Prior to March 20, 2020, the Fund also materially invested in non-investment grade fixed income securities and fixed income securities of issuers located in emerging markets as part of its principal investment strategies. |
| | |
| 10 | | Adviser Managed Trust / Annual Report / July 31, 2021 |
MANAGEMENT’S DISCUSSION AND ANALYSIS OF FUND PERFORMANCE (Unaudited)
JULY 31, 2021
Tactical Offensive Enhanced Fixed Income Fund
I. Objective
The investment objective of the Tactical Offensive Enhanced Fixed Income Fund (the “Fund”) is total return.
II. Adviser Managed Strategy Component
Only persons who are clients of the Financial Adviser (as defined below) and who participate in the Adviser Managed Strategy should invest in the Fund. The Fund may not be purchased by any other investor. The Fund is designed to be a component of a broader strategy employed by a third party investment manager (Financial Adviser) for the benefit of its clients. The Financial Adviser seeks to take advantage of broad market changes by tactically shifting its clients’ assets among the Fund, the Tactical Offensive Equity Fund, the Tactical Offensive Core Fixed Income Fund and a money market fund affiliated with the Fund, depending on the Financial Adviser’s evaluation of current market conditions (Adviser Managed Strategy). The Financial Adviser is not the adviser to the Fund and is not affiliated with SEI Investments Management Corporation (SIMC), the adviser to the Fund.
When the Financial Adviser determines to reallocate its clients’ assets to one or more of the other funds that compose the Adviser Managed Strategy, the Financial Adviser may request the redemption of a substantial portion of or all of the shares for which the Financial Adviser exercises investment discretion. In such an instance, the Financial Adviser’s notice of its intent to redeem or formal redemption request (collectively, “Redemption Request”) will cause the Fund to liquidate a substantial portion of or substantially all of its assets in order to fulfill the Redemption Request. If the Financial Adviser’s Redemption Request includes all of the shares for which it exercises investment discretion, the Fund will no longer be an active component of the Adviser Managed Strategy. When the Fund is not an active component of the Adviser Managed Strategy, the Fund may invest up to 100% of its remaining assets in cash, money market instruments, repurchase agreements and other short-term obligations that would not ordinarily be consistent with the Fund’s investment goal. The Fund could be invested in these types of investments for extended periods of time. At such times, SIMC will manage the assets of the Fund. SIMC, the Financial Adviser or one or more of their affiliates will be the only investors in the Fund following the Financial Adviser’s redemption of all of its clients’ shares from the Fund. Due to this strategy, the Fund may buy and sell securities and other instruments frequently.
III. Investment Approach
When the Fund is an active component of the Adviser Managed Strategy, the Fund employs a passive strategy designed to track, before fees and expenses, the performance of one or more indexes that represent broad exposure to non-investment grade fixed income securities and issuers located in emerging market countries (each an Index, and collectively, the Indexes) implemented by SSGA Funds Management, Inc., as sub-advisor under the general supervision of SEI Investments Management Corporation (SIMC). SIMC may adjust the Fund’s allocation of assets among the Indexes over time on the basis of its long-term capital market assumptions.
IV. Return vs. Benchmark
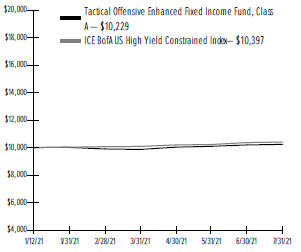
The Fund was incepted on January 12, 2021. For the period ended July 31, 2021, the Fund returned 2.29%. The Fund’s benchmark, the ICE BofA US High Yield Constrained Index—which measures performance of below-investment grade, U.S. dollar-denominated corporate bonds publicly issued in the U.S. domestic market—returned 3.97%.
V. Performance Discussion
The Fund was an active part of the Adviser Managed Strategy from its inception on January 12, 2021, through the end of its fiscal year on July 31, 2021. The Fund sought passive exposure to U.S. high-yield securities (as represented by the ICE BofA US High Yield Constrained Index) and dollar-denominated emerging-market debt (EMD) securities (as represented by the JPM EMBI Global Diversified Index). The Fund also experienced tracking error against the above mentioned indexes to which it seeks passive exposures. This was due to the implementation costs associated with reinvesting into the market over the course of the period. On a relative basis, the high-yield market outperformed dollar-denominated EMD during the Fund’s reporting period. Throughout the year, high-yield securities rallied as credit spreads continued to tighten and yields declined to record lows. As noted in the shareholder letter, the high-yield market benefited from a broader reopening of the U.S. economy; higher nominal yields relative to the rest of the U.S. bond market, as well as strong demand, also helped. Additionally, inflationary pressures and the reopening of the economy helped to push energy prices higher, providing support for the energy sub-sector. While dollar-denominated EMD underperformed high-yield securities from the Fund’s inception through the end of the period, absolute returns were still positive. The pace of vaccination within emerging-market
| | |
| Adviser Managed Trust / Annual Report / July 31, 2021 | | 11 |
MANAGEMENT’S DISCUSSION AND ANALYSIS OF FUND PERFORMANCE (Unaudited)
JULY 31, 2021
Tactical Offensive Enhanced Fixed Income Fund (Concluded)
countries lagged that of the developed world where the vaccine was more readily available. The rebound in China was beneficial for EMD, with first-quarter 2021 GDP increasing over 18% and growth moving above pre-pandemic levels. Additionally, with the uptick in growth and increasing prospect of inflation, several emerging-market central banks began the process of gradually raising rates, with Ukraine, Mexico and Russia each hiking during the period, while others indicated future rate hikes were probable.
Investing is subject to risk, including the possible loss of principal. Past performance is no indication of future results.
| | |
AVERAGE ANNUAL TOTAL RETURN1 |
| | | Cumulative Inception to Date |
Tactical Offensive Enhanced Fixed Income Fund, Class A | | 2.29% |
ICE BofA US High Yield Constrained Index | | 3.97% |
Comparison of Change in the Value of a $10,000 Investment in the Tactical Offensive Enhanced Fixed Income Fund, Class A, versus the ICE BofA US High Yield Constrained Index.
| 1 | For the period ended July 31, 2021. Past performance is no indication of future performance. Returns shown do not reflect the deduction of taxes that a shareholder would pay on fund distributions or the redemption of fund shares. Shares of the Fund were offered beginning January 12, 2021. |
| | |
| 12 | | Adviser Managed Trust / Annual Report / July 31, 2021 |
SUMMARY SCHEDULE OF INVESTMENTS
July 31, 2021
Tactical Offensive Equity Fund
†Percentages are based on total investments.
| | | | | | | | | | |
| | | | |
Description | | Percentage of Net Assets (%) | | Shares | | | Market Value ($ Thousands) |
| | |
COMMON STOCK — 90.5% | | | | | | | | |
| | |
Australia — 0.9% | | | | | | | | |
Other Securities ‡ | | 0.9% | | | | | | $ | 22,964 | |
| | | | | | | | | | |
| | |
Austria — 0.0% | | | | | | | | |
Other Securities | | 0.0 | | | | | | | 584 | |
| | | | | | | | | | |
| | |
Belgium — 0.1% | | | | | | | | |
Other Securities | | 0.1 | | | | | | | 3,067 | |
| | | | | | | | | | |
| | | |
China — 0.0% | | | | | | | | | | |
Other Securities | | 0.0 | | | | | | | 102 | |
| | | | | | | | | | |
| | |
Denmark — 0.3% | | | | | | | | |
Other Securities | | 0.3 | | | | | | | 8,687 | |
| | | | | | | | | | |
| | |
Finland — 0.1% | | | | | | | | |
Other Securities | | 0.1 | | | | | | | 3,628 | |
| | | | | | | | | | |
| | |
France — 1.3% | | | | | | | | |
Other Securities ‡ | | 1.3 | | | | | | | 35,997 | |
| | | | | | | | | | |
| | |
Germany — 1.1% | | | | | | | | |
Other Securities | | 1.1 | | | | | | | 28,478 | |
| | | | | | | | | | |
| | |
Greece — 0.0% | | | | | | | | |
Other Securities | | 0.0 | | | | | | | — | |
| | | | | | | | | | |
| | |
Hong Kong — 0.4% | | | | | | | | |
Other Securities ‡ | | 0.4 | | | | | | | 9,799 | |
| | | | | | | | | | |
| | |
Ireland — 0.7% | | | | | | | | |
Accenture PLC, Cl A | | 0.4 | | | 32,147 | | | | 10,212 | |
Other Securities | | 0.3 | | | | | | | 7,376 | |
| | | | | | | | | | |
| | | |
| | | | | | | | | 17,588 | |
| | | | | | | | | | |
| | | | | | | | | | |
| | | | |
Description | | Percentage of Net Assets (%) | | Shares | | | Market Value ($ Thousands) |
| | |
COMMON STOCK (continued) | | | | | | | | |
| | |
Israel — 0.1% | | | | | | | | |
Other Securities | | 0.1% | | | | | | $ | 2,747 | |
| | | | | | | | | | |
| | |
Italy — 0.3% | | | | | | | | |
Other Securities | | 0.3 | | | | | | | 7,556 | |
| | | | | | | | | | |
| | |
Japan — 2.7% | | | | | | | | |
Other Securities ‡ | | 2.7 | | | | | | | 74,036 | |
| | | | | | | | | | |
| | |
Luxembourg — 0.0% | | | | | | | | |
Other Securities | | 0.0 | | | | | | | 98 | |
| | | | | | | | | | |
| | |
Netherlands — 0.9% | | | | | | | | |
Other Securities ‡ | | 0.9 | | | | | | | 24,259 | |
| | | | | | | | | | |
| | |
New Zealand — 0.0% | | | | | | | | |
Other Securities | | 0.0 | | | | | | | 761 | |
| | | | | | | | | | |
| | |
Norway — 0.1% | | | | | | | | |
Other Securities | | 0.1 | | | | | | | 2,020 | |
| | | | | | | | | | |
| | |
Panama — 0.0% | | | | | | | | |
Other Securities | | 0.0 | | | | | | | 128 | |
| | | | | | | | | | |
| | |
Portugal — 0.0% | | | | | | | | |
Other Securities | | 0.0 | | | | | | | 613 | |
| | | | | | | | | | |
| | |
Singapore — 0.1% | | | | | | | | |
Other Securities ‡ | | 0.1 | | | | | | | 3,729 | |
| | | | | | | | | | |
| | |
South Korea — 0.0% | | | | | | | | |
Other Securities | | 0.0 | | | | | | | 1 | |
| | | | | | | | | | |
| | |
Spain — 0.3% | | | | | | | | |
Other Securities | | 0.3 | | | | | | | 7,834 | |
| | | | | | | | | | |
| | |
Sweden — 0.5% | | | | | | | | |
Other Securities | | 0.5 | | | | | | | 12,751 | |
| | | | | | | | | | |
| | |
Switzerland — 1.2% | | | | | | | | |
Other Securities | | 1.2 | | | | | | | 32,897 | |
| | | | | | | | | | |
| | |
Taiwan — 0.0% | | | | | | | | |
Other Securities | | 0.0 | | | | | | | 83 | |
| | | | | | | | | | |
| | |
United Kingdom — 1.6% | | | | | | | | |
Other Securities ‡ | | 1.6 | | | | | | | 41,982 | |
| | | | | | | | | | |
| | |
| Adviser Managed Trust / Annual Report / July 31, 2021 | | 13 |
SUMMARY SCHEDULE OF INVESTMENTS
July 31, 2021
Tactical Offensive Equity Fund (Continued)
| | | | | | | | | | |
| | | | |
Description | | Percentage of Net Assets (%) | | Shares | | | Market Value ($ Thousands) |
COMMON STOCK (continued) | | | | | | | | |
| | |
United States — 77.8% | | | | | | | | |
| | |
Communication Services — 8.4% | | | | | | | | |
Alphabet Inc, Cl A * | | 1.5% | | | 15,188 | | | $ | 40,924 | |
Alphabet Inc, Cl C * | | 1.5 | | | 14,359 | | | | 38,833 | |
AT&T Inc | | 0.4 | | | 361,066 | | | | 10,128 | |
Comcast Corp, Cl A | | 0.5 | | | 230,600 | | | | 13,566 | |
Facebook Inc, Cl A * | | 1.6 | | | 121,106 | | | | 43,150 | |
Netflix Inc * | | 0.4 | | | 21,900 | | | | 11,335 | |
Verizon Communications Inc | | 0.4 | | | 209,480 | | | | 11,685 | |
Walt Disney Co/The * | | 0.6 | | | 91,800 | | | | 16,159 | |
Other Securities | | 1.5 | | | | | | | 40,714 | |
| | | | | | | | | | |
| | | | | | | | | 226,494 | |
| | | | | | | | | | |
| | |
Consumer Discretionary — 9.5% | | | | | | | | |
Amazon.com Inc * | | 2.7 | | | 21,991 | | | | 73,177 | |
Home Depot | | 0.7 | | | 54,330 | | | | 17,831 | |
McDonald’s | | 0.4 | | | 37,747 | | | | 9,162 | |
NIKE Inc, Cl B | | 0.4 | | | 62,605 | | | | 10,487 | |
Tesla Inc * | | 1.0 | | | 39,190 | | | | 26,931 | |
Other Securities | | 4.3 | | | | | | | 119,140 | |
| | | | | | | | | | |
| | | | | | | | | 256,728 | |
| | | | | | | | | | |
| | |
Consumer Staples — 4.3% | | | | | | | | |
Coca-Cola | | 0.4 | | | 196,226 | | | | 11,191 | |
Costco Wholesale Corp | | 0.4 | | | 22,317 | | | | 9,590 | |
PepsiCo Inc | | 0.4 | | | 69,814 | | | | 10,957 | |
Philip Morris International | | 0.3 | | | 78,700 | | | | 7,877 | |
Procter & Gamble Co/The | | 0.7 | | | 123,124 | | | | 17,512 | |
Walmart Inc | | 0.4 | | | 72,531 | | | | 10,339 | |
Other Securities | | 1.7 | | | | | | | 49,500 | |
| | | | | | | | | | |
| | | | | | | | | 116,966 | |
| | | | | | | | | | |
| | |
Energy — 1.9% | | | | | | | | |
Chevron Corp | | 0.4 | | | 97,834 | | | | 9,961 | |
Exxon Mobil Corp | | 0.5 | | | 214,072 | | | | 12,324 | |
Other Securities | | 1.0 | | | | | | | 29,137 | |
| | | | | | | | | | |
| | | | | | | | | 51,422 | |
| | | | | | | | | | |
| | |
Financials — 8.7% | | | | | | | | |
Bank of America Corp | | 0.5 | | | 381,300 | | | | 14,627 | |
Berkshire Hathaway Inc, Cl B * | | 1.0 | | | 94,809 | | | | 26,384 | |
JPMorgan Chase & Co | | 0.9 | | | 152,070 | | | | 23,081 | |
Wells Fargo & Co | | 0.4 | | | 209,100 | | | | 9,606 | |
Other Securities ‡(A) | | 5.9 | | | | | | | 162,679 | |
| | | | | | | | | | |
| | | | | | | | | 236,377 | |
| | | | | | | | | | |
| | |
Health Care — 10.4% | | | | | | | | |
Abbott Laboratories | | 0.4 | | | 87,800 | | | | 10,622 | |
AbbVie Inc | | 0.4 | | | 89,300 | | | | 10,386 | |
Danaher Corp | | 0.4 | | | 32,164 | | | | 9,568 | |
Eli Lilly | | 0.4 | | | 42,800 | | | | 10,422 | |
Johnson & Johnson | | 0.8 | | | 133,223 | | | | 22,941 | |
| | | | | | | | | | | | |
| | | | |
Description | | Percentage of Net Assets (%) | | Shares | | | Market Value ($ Thousands) |
| | |
COMMON STOCK (continued) | | | | | | | | | |
| | |
Health Care (continued) | | | | | | | | | |
Medtronic PLC | | | 0.3 | % | | | 67,800 | | | $ | 8,903 | |
Merck & Co Inc | | | 0.4 | | | | 128,000 | | | | 9,839 | |
Pfizer Inc | | | 0.4 | | | | 282,167 | | | | 12,079 | |
Thermo Fisher Scientific | | | 0.4 | | | | 19,879 | | | | 10,735 | |
UnitedHealth Group Inc | | | 0.7 | | | | 47,561 | | | | 19,606 | |
Other Securities | | | 5.8 | | | | | | | | 156,750 | |
| | | | | | | | | | | | |
| | | | | | | | | | | 281,851 | |
| | | | | | | | | | | | |
| | |
Industrials — 6.9% | | | | | | | | | |
Honeywell International Inc | | | 0.3 | | | | 35,100 | | | | 8,206 | |
Other Securities | | | 6.6 | | | | | | | | 178,802 | |
| | | | | | | | | | | | |
| | | | | | | | | | | 187,008 | |
| | | | | | | | | | | | |
| | |
Information Technology — 21.4% | | | | | | | | | |
Adobe Inc * | | | 0.6 | | | | 24,107 | | | | 14,986 | |
Apple | | | 4.3 | | | | 795,164 | | | | 115,983 | |
Broadcom Inc | | | 0.4 | | | | 20,256 | | | | 9,832 | |
Cisco Systems Inc | | | 0.5 | | | | 213,647 | | | | 11,830 | |
Intel Corp | | | 0.4 | | | | 204,325 | | | | 10,976 | |
Mastercard Inc, Cl A | | | 0.6 | | | | 44,230 | | | | 17,070 | |
Microsoft Corp | | | 4.0 | | | | 381,692 | | | | 108,748 | |
NVIDIA Corp | | | 0.9 | | | | 120,800 | | | | 23,555 | |
PayPal Holdings * | | | 0.6 | | | | 59,451 | | | | 16,381 | |
QUALCOMM Inc | | | 0.3 | | | | 57,004 | | | | 8,539 | |
salesforce.com Inc * | | | 0.4 | | | | 46,743 | | | | 11,309 | |
Texas Instruments Inc | | | 0.3 | | | | 46,700 | | | | 8,902 | |
Visa Inc, Cl A | | | 0.8 | | | | 85,620 | | | | 21,096 | |
Other Securities | | | 7.3 | | | | | | | | 200,433 | |
| | | | | | | | | | | | |
| | | | | | | | | | | 579,640 | |
| | | | | | | | | | | | |
| | |
Materials — 1.9% | | | | | | | | | |
Other Securities | | | 1.9 | | | | | | | | 50,341 | |
| | | | | | | | | | | | |
| | |
Real Estate — 2.5% | | | | | | | | | |
Other Securities ‡ | | | 2.5 | | | | | | | | 67,811 | |
| | | | | | | | | | | | |
| | |
Utilities — 1.9% | | | | | | | | | |
Other Securities | | | 1.9 | | | | | | | | 50,867 | |
| | | | | | | | | | | | |
| | | |
| | | | | | | | | | | 2,105,505 | |
| | | | | | | | | | | | |
| | |
Total Common Stock
(Cost $1,831,900) ($ Thousands) | | | | | | | | 2,447,894 | |
| | | | | | | | | | | | |
| | |
| 14 | | Adviser Managed Trust / Annual Report / July 31, 2021 |
| | | | | | | | | | | | |
| | | | |
Description | | Percentage of Net Assets (%) | | Shares | | | Market Value ($ Thousands) |
| | |
PREFERRED STOCK — 0.1% | | | | | | | | | |
| | |
Germany — 0.1% | | | | | | | | | |
Other Securities (B) | | | 0.1 | % | | | | | | $ | 2,005 | |
| | | | | | | | | |
| | |
Total Preferred Stock
(Cost $1,431) ($ Thousands) | | | | | | | | 2,005 | |
| | | | | | | | | |
| |
EXCHANGE TRADED FUND — 0.0% | | | | | |
Other Securities | | | 0.0 | | | | | | | | 330 | |
| | | | | | | | | |
| | |
Total Exchange Traded Fund
(Cost $100) ($ Thousands) | | | | | | | | 330 | |
| | | | | | | | | |
| | |
RIGHTS — 0.0% | | | | | | | | | |
| | |
United States — 0.0% | | | | | | | | | |
Other Securities (C) | | | 0.0 | | | | | | | | — | |
| | | | | | | | | |
| | |
Total Rights
(Cost $–) ($ Thousands) | | | | | | | | — | |
| | | | | | | | | |
| | |
CASH EQUIVALENT — 1.9% | | | | | | | | | |
SEI Daily Income Trust,
Government Fund, Cl F
0.010% **† | | | 1.9 | | | | 50,776,582 | | | | 50,777 | |
| | | | | | | | | |
| | |
Total Cash Equivalent
(Cost $50,777) ($ Thousands) | | | | | | | | 50,777 | |
| | | | | | | | | |
| |
Total Investments in Securities — 92.5%
(Cost $1,884,208)($ Thousands) | | | $ | 2,501,006 | |
| | | | | | | | | |
A list of the open futures contracts held by the Fund at July 31, 2021, is as follows:
| | | | | | | | | | | | | | | | | | | | |
| |
| Type of Contract | | Number of Contracts | | | Expiration Date | | | Notional Amount (Thousands) | | | Value (Thousands) | | | Unrealized Appreciation/ (Depreciation) (Thousands) | |
| |
Long Contracts | | | | | | | | | | | | | | | | | | | | |
MSCI EAFE Index | | | 115 | | | | Sep-2021 | | | $ | 13,391 | | | $ | 13,337 | | | $ | (54) | |
MSCI Emerging Markets | | | 1,335 | | | | Sep-2021 | | | | 91,500 | | | | 85,286 | | | | (6,214) | |
NASDAQ 100 Index E-MINI | | | 8 | | | | Sep-2021 | | | | 2,248 | | | | 2,393 | | | | 145 | |
Russell 2000 Index E-MINI | | | 802 | | | | Sep-2021 | | | | 93,059 | | | | 89,086 | | | | (3,973) | |
S&P 500 Index E-MINI | | | 280 | | | | Sep-2021 | | | | 59,158 | | | | 61,453 | | | | 2,295 | |
S&P Mid Cap 400 Index E-MINI | | | 11 | | | | Sep-2021 | | | | 2,961 | | | | 2,969 | | | | 8 | |
| | | | | | | | | | | | | | | | | | | | |
| | | | | | | | | | $ | 262,317 | | | $ | 254,524 | | | $ | (7,793) | |
| | | | | | | | | | | | | | | | | | | | |
For the year ended July 31, 2021, the total amount of all open futures contracts, as presented in the table above, are representative of the volume of activity for this derivative type during the period.
| | Percentages are based on a Net Assets of $2,704,616 ($ Thousands). |
| * | Non-income producing security. |
| ‡ | Real Estate Investment Trust. |
| ** | The rate reported is the 7-day effective yield as of July 31, 2021. |
| † | Investment in Affiliated Security (see Note 6). |
| (A) | Security is a Master Limited Partnership. At July 31, 2021, such securities amounted to $4,232 ($ Thousands), or 0.2% of Net Assets (See Note 2). |
| (B) | There is currently no rate available. |
| (C) | Level 3 security in accordance with fair value hierarchy. |
Cl — Class
EAFE — Europe, Australasia and Far East
MSCI — Morgan Stanley Capital International
NASDAQ — National Association of Securities Dealers and Automated Quotations
PLC — Public Limited Company
S&P— Standard & Poor’s
The Summary Schedule of Investments does not reflect the complete portfolio holdings. It includes the Fund’s 50 largest holdings and each investment of any issuer that exceeds 1% of the Fund’s net assets. “Other Securities” represent all issues not required to be disclosed under the rules adopted by the U.S. Securities and Exchange Commission (“SEC”). In certain instances, securities for which footnotes listed above may otherwise apply are included in the Other Securities caption. The complete schedule of portfolio holdings is available (i) without charge, upon request, by calling (800) 342-5734; and (ii) on the SEC’s website at http://www.sec.gov.
| | |
| Adviser Managed Trust / Annual Report / July 31, 2021 | | 15 |
SUMMARY SCHEDULE OF INVESTMENTS
July 31, 2021
Tactical Offensive Equity Fund (Concluded)
The following is a list of the level of inputs used as of July 31, 2021, in valuing the Fund’s investments and other financial instruments carried at value ($ Thousands):
| | | | | | | | | | | | | | | | |
| | | | | |
Investments in Securities | | Level 1 ($) | | Level 2 ($) | | Level 3 ($)(1) | | Total ($) |
Common Stock | | | 2,447,839 | | | | 55 | | | | – | | | | 2,447,894 | |
Preferred Stock | | | 2,005 | | | | – | | | | – | | | | 2,005 | |
Exchange Traded Fund | | | 330 | | | | – | | | | – | | | | 330 | |
Rights | | | – | | | | – | | | | –(2) | | | | – | |
Cash Equivalent | | | 50,777 | | | | – | | | | – | | | | 50,777 | |
| | | | | | | | | | | | | | | | |
Total Investments in Securities | | | 2,500,951 | | | | 55 | | | | – | | | | 2,501,006 | |
| | | | | | | | | | | | | | | | |
| | | | | | | | | | | | | | | | |
Other Financial Instruments | | Level 1 ($) | | Level 2 ($) | | Level 3 ($) | | Total ($) |
Futures Contracts * | | | | | | | | | | | | | | | | |
Unrealized Appreciation | | | 2,448 | | | | — | | | | — | | | | 2,448 | |
Unrealized Depreciation | | | (10,241) | | | | — | | | | — | | | | (10,241) | |
| | | | | | | | | | | | | | | | |
Total Other Financial Instruments | | | (7,793) | | | | — | | | | — | | | | (7,793) | |
| | | | | | | | | | | | | | | | |
* Futures contracts are valued at the unrealized appreciation (depreciation) on the instrument.
(1) A reconciliation of Level 3 investments is presented when the Fund has a significant amount of Level 3 investments at the beginning and/or end of the period in relation to net assets. Management has concluded that Level 3 investments are not material in relation to net assets.
(2) This category includes securities with a value of $0.
For the year ended July 31, 2021, there were no transfers in or out of Level 3.
For more information on valuation inputs, see Note 2 — Significant Accounting Policies in Notes to Financial Statements.
The following is a summary of the transactions the Fund had with affiliates for the year ended July 31, 2021 ($ Thousands):
| | | | | | | | | | | | | | | | | | |
Security Description | | Value 7/31/2020 | | Purchases at Cost | | Proceeds from Sales | | Realized Gain (Loss) | | Change in Unrealized Appreciation (Depreciation) | | Value 7/31/2021 | | Shares | | Dividend Income | | Capital Gains |
SEI Daily Income Trust, Government Fund, Cl F | | $ — | | $ 140,042 | | $ (89,265) | | $ — | | $ — | | $ 50,777 | | 50,776,582 | | $ 1 | | $ — |
| | | | | | | | | | | | | | | | | | |
Amounts designated as “—” are either $0 or have been rounded to $0.
The accompanying notes are an integral part of the financial statements.
| | |
| 16 | | Adviser Managed Trust / Annual Report / July 31, 2021 |
SCHEDULE OF INVESTMENTS
July 31, 2021
Tactical Offensive Core Fixed Income Fund
†Percentages based on total investments.
| | | | | | | | |
| | | |
| Description | | Face Amount
(Thousands) | | Market Value
($ Thousands) |
| |
U.S. TREASURY OBLIGATIONS — 35.6% | | | | | |
U.S. Treasury Bonds | | | | | |
4.250%, 05/15/2039 | | $ | 1,000 | | | $ | 1,405 | |
3.625%, 02/15/2044 | | | 6,500 | | | | 8,654 | |
3.375%, 11/15/2048 | | | 3,000 | | | | 3,963 | |
3.125%, 05/15/2048 | | | 2,500 | | | | 3,155 | |
3.000%, 11/15/2044 | | | 2,000 | | | | 2,429 | |
3.000%, 02/15/2047 | | | 2,500 | | | | 3,072 | |
3.000%, 02/15/2048 | | | 5,000 | | | | 6,168 | |
3.000%, 02/15/2049 | | | 2,500 | | | | 3,099 | |
2.875%, 05/15/2043 | | | 2,500 | | | | 2,964 | |
2.750%, 08/15/2042 | | | 5,000 | | | | 5,810 | |
2.750%, 11/15/2042 | | | 2,000 | | | | 2,324 | |
2.500%, 02/15/2045 | | | 2,500 | | | | 2,797 | |
2.500%, 02/15/2046 | | | 3,000 | | | | 3,364 | |
2.375%, 05/15/2051 | | | 2,000 | | | | 2,219 | |
2.250%, 02/15/2027 | | | 5,000 | | | | 5,397 | |
2.250%, 08/15/2049 | | | 3,500 | | | | 3,763 | |
2.000%, 02/15/2050 | | | 1,800 | | | | 1,836 | |
1.875%, 02/15/2041 | | | 1,000 | | | | 1,011 | |
1.875%, 02/15/2051 | | | 2,000 | | | | 1,986 | |
1.625%, 11/15/2050 | | | 4,500 | | | | 4,207 | |
1.375%, 11/15/2040 | | | 7,000 | | | | 6,502 | |
1.375%, 08/15/2050 | | | 3,000 | | | | 2,635 | |
1.250%, 05/15/2050 | | | 6,000 | | | | 5,107 | |
1.125%, 05/15/2040 | | | 8,000 | | | | 7,148 | |
1.125%, 08/15/2040 | | | 4,000 | | | | 3,562 | |
U.S. Treasury Notes | | | | | |
3.125%, 11/15/2028 | | | 5,000 | | | | 5,737 | |
2.875%, 09/30/2023 | | | 10,000 | | | | 10,574 | |
2.750%, 11/15/2023 | | | 5,000 | | | | 5,287 | |
2.625%, 01/31/2026 | | | 5,000 | | | | 5,443 | |
2.625%, 02/15/2029 | | | 2,000 | | | | 2,227 | |
2.500%, 01/31/2024 | | | 10,000 | | | | 10,556 | |
2.500%, 05/15/2024 | | | 10,000 | | | | 10,610 | |
2.375%, 08/15/2024 | | | 5,000 | | | | 5,304 | |
2.375%, 05/15/2027 | | | 3,000 | | | | 3,264 | |
2.250%, 11/15/2024 | | | 5,000 | | | | 5,300 | |
2.250%, 11/15/2025 | | | 10,000 | | | | 10,703 | |
2.250%, 08/15/2027 | | | 2,000 | | | | 2,164 | |
2.125%, 03/31/2024 | | | 5,000 | | | | 5,243 | |
2.125%, 05/15/2025 | | | 5,000 | | | | 5,303 | |
2.000%, 10/31/2022 | | | 5,000 | | | | 5,118 | |
2.000%, 11/30/2022 | | | 5,000 | | | | 5,125 | |
| | | | | | | | |
| | | |
| Description | | Face Amount
(Thousands) | | Market Value
($ Thousands) |
| |
U.S. TREASURY OBLIGATIONS (continued) | | | | | |
2.000%, 02/15/2025 | | $ | 5,000 | | | $ | 5,270 | |
2.000%, 08/15/2025 | | | 10,000 | | | | 10,577 | |
2.000%, 11/15/2026 | | | 5,000 | | | | 5,324 | |
1.750%, 05/15/2023 | | | 7,500 | | | | 7,712 | |
1.625%, 08/15/2022 | | | 15,000 | | | | 15,237 | |
1.625%, 05/15/2026 | | | 5,000 | | | | 5,224 | |
1.625%, 11/30/2026 | | | 2,500 | | | | 2,614 | |
1.625%, 08/15/2029 | | | 5,000 | | | | 5,204 | |
1.625%, 05/15/2031 | | | 6,500 | | | | 6,739 | |
1.500%, 08/15/2022 | | | 2,000 | | | | 2,029 | |
1.500%, 01/15/2023 | | | 3,000 | | | | 3,060 | |
1.500%, 08/15/2026 | | | 3,000 | | | | 3,117 | |
1.500%, 01/31/2027 | | | 5,000 | | | | 5,196 | |
1.500%, 02/15/2030 | | | 3,900 | | | | 4,012 | |
1.375%, 02/15/2023 | | | 10,000 | | | | 10,191 | |
1.250%, 05/31/2028 | | | 5,000 | | | | 5,089 | |
1.125%, 02/28/2025 | | | 5,000 | | | | 5,116 | |
1.125%, 02/29/2028 | | | 2,000 | | | | 2,023 | |
1.125%, 02/15/2031 | | | 5,500 | | | | 5,452 | |
0.875%, 11/15/2030 | | | 5,000 | | | | 4,855 | |
0.750%, 04/30/2026 | | | 2,000 | | | | 2,008 | |
0.750%, 05/31/2026 | | | 4,000 | | | | 4,014 | |
0.750%, 01/31/2028 | | | 5,000 | | | | 4,940 | |
0.625%, 05/15/2030 | | | 5,000 | | | | 4,772 | |
0.625%, 08/15/2030 | | | 1,000 | | | | 952 | |
0.500%, 03/15/2023 | | | 8,000 | | | | 8,046 | |
0.500%, 05/31/2027 | | | 3,000 | | | | 2,942 | |
0.500%, 10/31/2027 | | | 5,000 | | | | 4,879 | |
0.375%, 04/15/2024 | | | 5,000 | | | | 5,010 | |
0.375%, 11/30/2025 | | | 2,000 | | | | 1,981 | |
0.375%, 12/31/2025 | | | 5,000 | | | | 4,948 | |
0.375%, 01/31/2026 | | | 5,000 | | | | 4,943 | |
0.375%, 09/30/2027 | | | 3,000 | | | | 2,908 | |
0.250%, 06/15/2023 | | | 3,000 | | | | 3,004 | |
0.250%, 11/15/2023 | | | 10,000 | | | | 10,005 | |
0.250%, 05/31/2025 | | | 10,000 | | | | 9,898 | |
0.250%, 06/30/2025 | | | 5,000 | | | | 4,945 | |
0.250%, 07/31/2025 | | | 7,000 | | | | 6,917 | |
0.250%, 08/31/2025 | | | 10,000 | | | | 9,872 | |
0.250%, 09/30/2025 | | | 10,000 | | | | 9,865 | |
0.250%, 10/31/2025 | | | 5,000 | | | | 4,928 | |
0.125%, 09/30/2022 | | | 5,000 | | | | 5,001 | |
0.125%, 10/31/2022 | | | 7,000 | | | | 7,002 | |
0.125%, 01/31/2023 | | | 3,000 | | | | 3,000 | |
0.125%, 12/15/2023 | | | 5,000 | | | | 4,986 | |
| | | | | | | | |
| |
Total U.S. Treasury Obligations
(Cost $445,760) ($ Thousands) | | | | 438,342 | |
| | | | | | | | |
| | |
| Adviser Managed Trust / Annual Report / July 31, 2021 | | 17 |
SCHEDULE OF INVESTMENTS
July 31, 2021
Tactical Offensive Core Fixed Income Fund (Continued)
| | | | | | | | |
| | | |
| Description | | Face Amount
(Thousands) | | Market Value
($ Thousands) |
|
MORTGAGE-BACKED SECURITIES — 27.4% | |
|
Agency Mortgage-Backed Obligations — 26.1% | |
FHLMC | | | | | | | | |
4.500%, 05/01/2048 to 10/01/2048 | | $ | 6,324 | | | $ | 6,831 | |
4.000%, 05/01/2050 | | | 5,699 | | | | 6,091 | |
3.500%, 11/01/2045 | | | 783 | | | | 844 | |
3.000%, 07/01/2033 to 08/01/2047 | | | 7,901 | | | | 8,358 | |
2.500%, 10/01/2040 | | | 4,246 | | | | 4,434 | |
2.000%, 06/01/2036 to 01/01/2051 | | | 18,335 | | | | 18,760 | |
FHLMC Multifamily Structured Pass-Through Certificates, Ser K073, Cl A2 | | | | | | | | |
3.350%, 01/25/2028 | | | 1,000 | | | | 1,134 | |
FHLMC Multifamily Structured Pass-Through Certificates, Ser K074, Cl A2 | | | | | | | | |
3.600%, 01/25/2028 | | | 815 | | | | 936 | |
FHLMC Multifamily Structured Pass-Through Certificates, Ser K091, Cl A2 | | | | | | | | |
3.505%, 03/25/2029 | | | 5,000 | | | | 5,773 | |
FHLMC Multifamily Structured Pass-Through Certificates, Ser K092, Cl A2 | | | | | | | | |
3.298%, 04/25/2029 | | | 315 | | | | 360 | |
FHLMC Multifamily Structured Pass-Through Certificates, Ser K722, Cl A2 | | | | | | | | |
2.406%, 03/25/2023 | | | 1,500 | | | | 1,540 | |
FNMA | | | | | | | | |
5.000%, 12/01/2048 | | | 2,922 | | | | 3,191 | |
4.500%, 05/01/2046 | | | 3,279 | | | | 3,647 | |
4.000%, 01/01/2048 to 01/01/2049 | | | 13,630 | | | | 14,626 | |
3.500%, 08/01/2030 to 06/01/2050 | | | 28,913 | | | | 30,849 | |
3.000%, 02/01/2034 to 07/01/2050 | | | 34,426 | | | | 36,292 | |
2.500%, 08/01/2031 to 11/01/2050 | | | 37,511 | | | | 39,177 | |
2.000%, 06/01/2036 to 07/01/2051 | | | 23,308 | | | | 23,841 | |
FNMA, Ser 2019-M7, Cl A2 | | | | | | | | |
3.143%, 04/25/2029 | | | 1,250 | | | | 1,410 | |
GNMA | | | | | | | | |
4.500%, 09/20/2046 to 01/20/2049 | | | 5,112 | | | | 5,534 | |
4.000%, 09/20/2047 to 05/20/2049 | | | 8,023 | | | | 8,509 | |
3.500%, 11/20/2041 to 07/20/2050 | | | 15,716 | | | | 16,634 | |
3.000%, 09/20/2046 to 07/20/2050 | | | 18,062 | | | | 18,994 | |
2.500%, 08/20/2050 to 07/20/2051 | | | 6,515 | | | | 6,776 | |
2.000%, 05/20/2051 to 06/20/2051 | | | 6,420 | | | | 6,581 | |
GNMA TBA | | | | | | | | |
2.500%, 08/01/2043 | | | 2,500 | | | | 2,599 | |
2.000%, 08/20/2169 | | | 3,550 | | | | 3,636 | |
UMBS TBA | | | | | | | | |
2.500%, 08/15/2051 | | | 7,000 | | | | 7,292 | |
2.000%, 08/15/2036 to 08/15/2051 | | | 23,225 | | | | 23,744 | |
1.500%, 08/15/2036 to 08/15/2051 | | | 13,000 | | | | 13,015 | |
| | | | | | | | |
| | |
| | | | | | | 321,408 | |
| | | | | | | | |
|
Non-Agency Mortgage-Backed Obligations — 1.3% | |
BANK, Ser 2019-BN21, Cl A5 | | | | | | | | |
2.851%, 10/17/2052 | | | 5,000 | | | | 5,404 | |
| | | | | | | | |
| | | |
| Description | | Face Amount
(Thousands) | | Market Value
($ Thousands) |
|
MORTGAGE-BACKED SECURITIES (continued) | |
BANK, Ser 2019-BN24, Cl A2 | | | | | | | | |
2.707%, 11/15/2062 | | $ | 500 | | | $ | 532 | |
BBCMS Mortgage Trust, Ser 2017-C1, Cl A4 | | | | | | | | |
3.674%, 02/15/2050 | | | 190 | | | | 213 | |
Benchmark Mortgage Trust, Ser 2020-B18, Cl A5 | | | | | | | | |
1.925%, 07/15/2053 | | | 396 | | | | 400 | |
Benchmark Mortgage Trust, Ser 2020-B21, Cl A5 | | | | | | | | |
1.978%, 12/17/2053 | | | 1,000 | | | | 1,009 | |
GS Mortgage Securities II, Ser 2013-GC10, Cl A5 | | | | | | | | |
2.943%, 02/10/2046 | | | 560 | | | | 577 | |
Wells Fargo Commercial Mortgage Trust, Ser 2014-LC16, Cl A5 | | | | | | | | |
3.817%, 08/15/2050 | | | 5,000 | | | | 5,378 | |
Wells Fargo Commercial Mortgage Trust, Ser 2018-C44, Cl A5 | | | | | | | | |
4.212%, 05/15/2051 | | | 1,500 | | | | 1,740 | |
| | | | | | | | |
| | |
| | | | | | | 15,253 | |
| | | | | | | | |
| | |
Total Mortgage-Backed Securities
(Cost $336,663) ($ Thousands) | | | | | | | 336,661 | |
| | | | | | | | |
| |
CORPORATE OBLIGATIONS — 27.0% | | | | | |
| |
Communication Services — 2.3% | | | | | |
Activision Blizzard | | | | | | | | |
1.350%, 09/15/2030 | | | 90 | | | | 86 | |
Alphabet | | | | | | | | |
2.050%, 08/15/2050 | | | 130 | | | | 118 | |
1.100%, 08/15/2030 | | | 130 | | | | 125 | |
0.450%, 08/15/2025 | | | 90 | | | | 89 | |
America Movil | | | | | | | | |
4.375%, 04/22/2049 | | | 500 | | | | 627 | |
2.875%, 05/07/2030 | | | 500 | | | | 531 | |
AT&T | | | | | | | | |
4.850%, 03/01/2039 | | | 1,000 | | | | 1,227 | |
3.650%, 06/01/2051 | | | 500 | | | | 530 | |
3.500%, 06/01/2041 | | | 600 | | | | 637 | |
3.500%, 02/01/2061 | | | 135 | | | | 135 | |
3.300%, 02/01/2052 | | | 120 | | | | 120 | |
3.100%, 02/01/2043 | | | 200 | | | | 200 | |
2.750%, 06/01/2031 | | | 500 | | | | 526 | |
2.300%, 06/01/2027 | | | 300 | | | | 314 | |
2.250%, 02/01/2032 | | | 165 | | | | 165 | |
1.700%, 03/25/2026 | | | 550 | | | | 559 | |
1.650%, 02/01/2028 | | | 35 | | | | 35 | |
0.900%, 03/25/2024 | | | 300 | | | | 301 | |
Baidu | | | | | | | | |
1.720%, 04/09/2026 | | | 200 | | | | 202 | |
| | |
| 18 | | Adviser Managed Trust / Annual Report / July 31, 2021 |
| | | | | | | | |
| | | |
| Description | | Face Amount
(Thousands) | | Market Value
($ Thousands) |
| |
CORPORATE OBLIGATIONS (continued) | | | | | |
Charter Communications Operating LLC | | | | | | | | |
4.908%, 07/23/2025 | | $ | 300 | | | $ | 341 | |
4.400%, 12/01/2061 | | | 50 | | | | 55 | |
3.900%, 06/01/2052 | | | 85 | | | | 88 | |
3.850%, 04/01/2061 | | | 135 | | | | 135 | |
3.700%, 04/01/2051 | | | 580 | | | | 587 | |
3.500%, 06/01/2041 | | | 660 | | | | 674 | |
2.800%, 04/01/2031 | | | 500 | | | | 519 | |
2.300%, 02/01/2032 | | | 100 | | | | 98 | |
Comcast | | | | | | | | |
3.950%, 10/15/2025 | | | 500 | | | | 561 | |
3.750%, 04/01/2040 | | | 800 | | | | 927 | |
3.250%, 11/01/2039 | | | 500 | | | | 546 | |
3.100%, 04/01/2025 | | | 500 | | | | 540 | |
2.800%, 01/15/2051 | | | 300 | | | | 297 | |
2.650%, 08/15/2062 | | | 150 | | | | 142 | |
2.450%, 08/15/2052 | | | 225 | | | | 209 | |
1.950%, 01/15/2031 | | | 200 | | | | 201 | |
1.500%, 02/15/2031 | | | 300 | | | | 290 | |
Discovery Communications | | | | | | | | |
4.650%, 05/15/2050 | | | 300 | | | | 356 | |
3.625%, 05/15/2030 | | | 300 | | | | 331 | |
Electronic Arts | | | | | | | | |
2.950%, 02/15/2051 | | | 40 | | | | 40 | |
1.850%, 02/15/2031 | | | 60 | | | | 60 | |
Fox | | | | | | | | |
5.576%, 01/25/2049 | | | 300 | | | | 414 | |
5.476%, 01/25/2039 | | | 500 | | | | 654 | |
Interpublic Group of Cos | | | | | | | | |
3.375%, 03/01/2041 | | | 370 | | | | 392 | |
2.400%, 03/01/2031 | | | 100 | | | | 102 | |
Rogers Communications | | | | | | | | |
4.350%, 05/01/2049 | | | 500 | | | | 593 | |
3.700%, 11/15/2049 | | | 500 | | | | 540 | |
Telefonica Emisiones | | | | | | | | |
5.520%, 03/01/2049 | | | 500 | | | | 659 | |
T-Mobile USA | | | | | | | | |
4.375%, 04/15/2040 | | | 500 | | | | 592 | |
3.600%, 11/15/2060 | | | 20 | | | | 21 | |
3.500%, 04/15/2025 | | | 300 | | | | 326 | |
3.300%, 02/15/2051 | | | 50 | | | | 51 | |
3.000%, 02/15/2041 | | | 220 | | | | 221 | |
2.550%, 02/15/2031 | | | 230 | | | | 235 | |
2.250%, 11/15/2031 | | | 50 | | | | 50 | |
2.050%, 02/15/2028 | | | 35 | | | | 36 | |
1.500%, 02/15/2026 | | | 550 | | | | 556 | |
Verizon Communications | | | | | | | | |
4.812%, 03/15/2039 | | | 1,000 | | | | 1,285 | |
4.672%, 03/15/2055 | | | 200 | | | | 261 | |
4.000%, 03/22/2050 | | | 500 | | | | 585 | |
3.700%, 03/22/2061 | | | 45 | | | | 50 | |
3.550%, 03/22/2051 | | | 55 | | | | 60 | |
| | | | | | | | |
| | | |
| Description | | Face Amount
(Thousands) | | Market Value
($ Thousands) |
| |
CORPORATE OBLIGATIONS (continued) | | | | | |
3.400%, 03/22/2041 | | $ | 380 | | | $ | 411 | |
3.000%, 03/22/2027 | | | 300 | | | | 326 | |
3.000%, 11/20/2060 | | | 90 | | | | 87 | |
2.875%, 11/20/2050 | | | 400 | | | | 389 | |
2.650%, 11/20/2040 | | | 400 | | | | 392 | |
2.550%, 03/21/2031 | | | 55 | | | | 57 | |
2.100%, 03/22/2028 | | | 60 | | | | 62 | |
1.750%, 01/20/2031 | | | 100 | | | | 97 | |
1.450%, 03/20/2026 | | | 540 | | | | 547 | |
0.850%, 11/20/2025 | | | 100 | | | | 99 | |
0.750%, 03/22/2024 | | | 35 | | | | 35 | |
ViacomCBS | | | | | | | | |
4.950%, 01/15/2031 | | | 300 | | | | 367 | |
4.950%, 05/19/2050 | | | 300 | | | | 386 | |
4.750%, 05/15/2025 | | | 300 | | | | 340 | |
4.200%, 05/19/2032 | | | 200 | | | | 234 | |
Vodafone Group | | | | | | | | |
5.000%, 05/30/2038 | | | 300 | | | | 384 | |
Walt Disney | | | | | | | | |
6.650%, 11/15/2037 | | | 500 | | | | 774 | |
4.700%, 03/23/2050 | | | 500 | | | | 682 | |
4.625%, 03/23/2040 | | | 200 | | | | 258 | |
3.500%, 05/13/2040 | | | 500 | | | | 565 | |
3.350%, 03/24/2025 | | | 200 | | | | 218 | |
| | | | | | | | |
| | | | | | | 27,917 | |
| | | | | | | | |
| |
Consumer Discretionary — 1.9% | | | | | |
Advance Auto Parts | | | | | | | | |
1.750%, 10/01/2027 | | | 40 | | | | 40 | |
Alibaba Group Holding | | | | | | | | |
2.700%, 02/09/2041 | | | 500 | | | | 480 | |
Amazon.com | | | | | | | | |
3.250%, 05/12/2061 | | | 100 | | | | 109 | |
3.100%, 05/12/2051 | | | 100 | | | | 108 | |
2.875%, 05/12/2041 | | | 100 | | | | 105 | |
2.100%, 05/12/2031 | | | 100 | | | | 103 | |
1.650%, 05/12/2028 | | | 100 | | | | 102 | |
1.500%, 06/03/2030 | | | 500 | | | | 495 | |
1.000%, 05/12/2026 | | | 100 | | | | 101 | |
0.800%, 06/03/2025 | | | 500 | | | | 502 | |
0.450%, 05/12/2024 | | | 45 | | | | 45 | |
0.400%, 06/03/2023 | | | 500 | | | | 501 | |
0.250%, 05/12/2023 | | | 40 | | | | 40 | |
American Honda Finance MTN | | | | | | | | |
1.200%, 07/08/2025 | | | 200 | | | | 202 | |
0.875%, 07/07/2023 | | | 635 | | | | 641 | |
0.400%, 10/21/2022 | | | 100 | | | | 100 | |
AutoNation | | | | | | | | |
2.400%, 08/01/2031 | | | 30 | | | | 30 | |
AutoZone | | | | | | | | |
3.625%, 04/15/2025 | | | 500 | | | | 547 | |
| | |
| Adviser Managed Trust / Annual Report / July 31, 2021 | | 19 |
SCHEDULE OF INVESTMENTS
July 31, 2021
Tactical Offensive Core Fixed Income Fund (Continued)
| | | | | | | | |
| | | |
| Description | | Face Amount
(Thousands) | | Market Value
($ Thousands) |
| |
CORPORATE OBLIGATIONS (continued) | | | | | |
BAT Capital | | | | | | | | |
4.700%, 04/02/2027 | | $ | 300 | | | $ | 341 | |
3.984%, 09/25/2050 | | | 150 | | | | 149 | |
3.734%, 09/25/2040 | | | 295 | | | | 296 | |
2.726%, 03/25/2031 | | | 300 | | | | 302 | |
2.259%, 03/25/2028 | | | 200 | | | | 201 | |
BAT International Finance | | | | | | | | |
1.668%, 03/25/2026 | | | 200 | | | | 202 | |
Best Buy | | | | | | | | |
1.950%, 10/01/2030 | | | 50 | | | | 49 | |
Choice Hotels International | | | | | | | | |
3.700%, 01/15/2031 | | | 605 | | | | 663 | |
Council of Europe Development Bank | | | | | | | | |
1.375%, 02/27/2025 | | | 500 | | | | 515 | |
Diageo Capital | | | | | | | | |
2.000%, 04/29/2030 | | | 200 | | | | 204 | |
1.375%, 09/29/2025 | | | 300 | | | | 306 | |
Dollar General | | | | | | | | |
4.125%, 04/03/2050 | | | 300 | | | | 361 | |
DR Horton | | | | | | | | |
2.600%, 10/15/2025 | | | 500 | | | | 529 | |
eBay | | | | | | | | |
3.650%, 05/10/2051 | | | 50 | | | | 55 | |
2.700%, 03/11/2030 | | | 200 | | | | 211 | |
2.600%, 05/10/2031 | | | 50 | | | | 52 | |
1.400%, 05/10/2026 | | | 50 | | | | 51 | |
Expedia Group | | | | | | | | |
4.625%, 08/01/2027 | | | 615 | | | | 702 | |
3.600%, 12/15/2023 | | | 565 | | | | 600 | |
General Motors | | | | | | | | |
6.800%, 10/01/2027 | | | 500 | | | | 636 | |
6.125%, 10/01/2025 | | | 500 | | | | 592 | |
5.400%, 10/02/2023 | | | 500 | | | | 548 | |
General Motors Financial | | | | | | | | |
3.600%, 06/21/2030 | | | 50 | | | | 55 | |
2.750%, 06/20/2025 | | | 550 | | | | 581 | |
1.500%, 06/10/2026 | | | 500 | | | | 502 | |
Home Depot | | | | | | | | |
3.300%, 04/15/2040 | | | 300 | | | | 335 | |
2.700%, 04/15/2030 | | | 500 | | | | 541 | |
2.375%, 03/15/2051 | | | 300 | | | | 284 | |
1.375%, 03/15/2031 | | | 300 | | | | 291 | |
0.900%, 03/15/2028 | | | 95 | | | | 93 | |
Lowe’s | | | | | | | | |
5.000%, 04/15/2040 | | | 300 | | | | 393 | |
3.500%, 04/01/2051 | | | 75 | | | | 82 | |
3.000%, 10/15/2050 | | | 15 | | | | 15 | |
2.625%, 04/01/2031 | | | 150 | | | | 158 | |
1.700%, 10/15/2030 | | | 20 | | | | 20 | |
1.300%, 04/15/2028 | | | 320 | | | | 316 | |
Marriott International | | | | | | | | |
4.625%, 06/15/2030 | | | 300 | | | | 347 | |
| | | | | | | | |
| | | |
| Description | | Face Amount
(Thousands) | | Market Value
($ Thousands) |
| |
CORPORATE OBLIGATIONS (continued) | | | | | |
3.500%, 10/15/2032 | | $ | 40 | | | $ | 43 | |
Massachusetts Institute of Technology | | | | | | | | |
2.989%, 07/01/2050 | | | 45 | | | | 50 | |
McDonald’s MTN | | | | | | | | |
4.200%, 04/01/2050 | | | 500 | | | | 617 | |
3.625%, 09/01/2049 | | | 100 | | | | 114 | |
3.600%, 07/01/2030 | | | 200 | | | | 227 | |
2.125%, 03/01/2030 | | | 500 | | | | 513 | |
NIKE | | | | | | | | |
2.850%, 03/27/2030 | | | 200 | | | | 220 | |
O’Reilly Automotive | | | | | | | | |
1.750%, 03/15/2031 | | | 135 | | | | 132 | |
RELX Capital | | | | | | | | |
3.000%, 05/22/2030 | | | 200 | | | | 216 | |
Rockefeller Foundation | | | | | | | | |
2.492%, 10/01/2050 | | | 30 | | | | 30 | |
Ross Stores | | | | | | | | |
0.875%, 04/15/2026 | | | 100 | | | | 99 | |
Sands China | | | | | | | | |
3.800%, 01/08/2026 | | | 500 | | | | 537 | |
Starbucks | | | | | | | | |
4.450%, 08/15/2049 | | | 100 | | | | 127 | |
3.500%, 11/15/2050 | | | 300 | | | | 332 | |
2.550%, 11/15/2030 | | | 200 | | | | 211 | |
2.250%, 03/12/2030 | | | 200 | | | | 206 | |
Target | | | | | | | | |
2.250%, 04/15/2025 | | | 500 | | | | 527 | |
TJX | | | | | | | | |
1.600%, 05/15/2031 | | | 250 | | | | 246 | |
1.150%, 05/15/2028 | | | 250 | | | | 245 | |
Toyota Motor Credit MTN | | | | | | | | |
3.375%, 04/01/2030 | | | 200 | | | | 228 | |
3.000%, 04/01/2025 | | | 300 | | | | 324 | |
1.800%, 02/13/2025 | | | 500 | | | | 518 | |
1.350%, 08/25/2023 | | | 300 | | | | 306 | |
1.125%, 06/18/2026 | | | 500 | | | | 502 | |
0.800%, 10/16/2025 | | | 50 | | | | 50 | |
0.350%, 10/14/2022 | | | 50 | | | | 50 | |
Trustees of the University of Pennsylvania | | | | | | | | |
2.396%, 10/01/2050 | | | 180 | | | | 178 | |
Unilever Capital | | | | | | | | |
1.375%, 09/14/2030 | | | 165 | | | | 162 | |
0.375%, 09/14/2023 | | | 100 | | | | 100 | |
VF | | | | | | | | |
2.800%, 04/23/2027 | | | 500 | | | | 538 | |
2.400%, 04/23/2025 | | | 500 | | | | 526 | |
Whirlpool | | | | | | | | |
2.400%, 05/15/2031 | | | 15 | | | | 15 | |
| | | | | | | | |
| | | | | | | 24,018 | |
| | | | | | | | |
| | |
| 20 | | Adviser Managed Trust / Annual Report / July 31, 2021 |
| | | | | | | | |
| | | |
| Description | | Face Amount
(Thousands) | | Market Value
($ Thousands) |
| |
CORPORATE OBLIGATIONS (continued) | | | | | |
| | |
Consumer Staples — 1.5% | | | | | | | | |
Altria Group | | | | | | | | |
5.800%, 02/14/2039 | | $ | 500 | | | $ | 628 | |
4.450%, 05/06/2050 | | | 300 | | | | 327 | |
4.000%, 02/04/2061 | | | 75 | | | | 74 | |
3.700%, 02/04/2051 | | | 200 | | | | 195 | |
3.400%, 02/04/2041 | | | 385 | | | | 372 | |
2.450%, 02/04/2032 | | | 200 | | | | 197 | |
Anheuser-Busch InBev Worldwide | | | | | | | | |
5.800%, 01/23/2059 | | | 500 | | | | 741 | |
5.450%, 01/23/2039 | | | 500 | | | | 666 | |
4.500%, 06/01/2050 | | | 500 | | | | 621 | |
4.350%, 06/01/2040 | | | 800 | | | | 969 | |
Bunge Finance | | | | | | | | |
2.750%, 05/14/2031 | | | 50 | | | | 51 | |
1.630%, 08/17/2025 | | | 125 | | | | 127 | |
Campbell Soup | | | | | | | | |
2.375%, 04/24/2030 | | | 500 | | | | 512 | |
Clorox | | | | | | | | |
1.800%, 05/15/2030 | | | 200 | | | | 200 | |
Coca-Cola | | | | | | | | |
3.000%, 03/05/2051 | | | 20 | | | | 22 | |
2.875%, 05/05/2041 | | | 350 | | | | 371 | |
2.250%, 01/05/2032 | | | 50 | | | | 52 | |
2.000%, 03/05/2031 | | | 65 | | | | 67 | |
1.650%, 06/01/2030 | | | 500 | | | | 500 | |
1.450%, 06/01/2027 | | | 500 | | | | 511 | |
Conagra Brands | | | | | | | | |
4.600%, 11/01/2025 | | | 500 | | | | 569 | |
Constellation Brands | | | | | | | | |
2.875%, 05/01/2030 | | | 200 | | | | 213 | |
2.250%, 08/01/2031 | | | 125 | | | | 126 | |
Costco Wholesale | | | | | | | | |
1.750%, 04/20/2032 | | | 500 | | | | 502 | |
1.600%, 04/20/2030 | | | 500 | | | | 498 | |
Estee Lauder | | | | | | | | |
2.600%, 04/15/2030 | | | 500 | | | | 536 | |
General Mills | | | | | | | | |
2.875%, 04/15/2030 | | | 200 | | | | 215 | |
Hershey | | | | | | | | |
2.650%, 06/01/2050 | | | 500 | | | | 506 | |
Hormel Foods | | | | | | | | |
1.800%, 06/11/2030 | | | 500 | | | | 503 | |
Ingredion | | | | | | | | |
3.900%, 06/01/2050 | | | 200 | | | | 231 | |
Keurig Dr Pepper | | | | | | | | |
3.350%, 03/15/2051 | | | 30 | | | | 32 | |
2.250%, 03/15/2031 | | | 40 | | | | 41 | |
0.750%, 03/15/2024 | | | 85 | | | | 85 | |
Kimberly-Clark | | | | | | | | |
1.050%, 09/15/2027 | | | 125 | | | | 124 | |
| | | | | | | | |
| | | |
| Description | | Face Amount
(Thousands) | | Market Value
($ Thousands) |
| |
CORPORATE OBLIGATIONS (continued) | | | | | |
Kroger | | | | | | | | |
3.950%, 01/15/2050 | | $ | 500 | | | $ | 579 | |
1.700%, 01/15/2031 | | | 65 | | | | 63 | |
McCormick | | | | | | | | |
2.500%, 04/15/2030 | | | 500 | | | | 519 | |
Mondelez International | | | | | | | | |
2.750%, 04/13/2030 | | | 200 | | | | 213 | |
2.625%, 09/04/2050 | | | 100 | | | | 96 | |
PepsiCo | | | | | | | | |
2.750%, 03/19/2030 | | | 200 | | | | 218 | |
2.250%, 03/19/2025 | | | 500 | | | | 528 | |
1.625%, 05/01/2030 | | | 200 | | | | 201 | |
1.400%, 02/25/2031 | | | 40 | | | | 39 | |
0.750%, 05/01/2023 | | | 500 | | | | 505 | |
0.400%, 10/07/2023 | | | 25 | | | | 25 | |
Philip Morris International | | | | | | | | |
1.750%, 11/01/2030 | | | 350 | | | | 344 | |
1.125%, 05/01/2023 | | | 500 | | | | 507 | |
0.875%, 05/01/2026 | | | 350 | | | | 347 | |
Procter & Gamble | | | | | | | | |
3.000%, 03/25/2030 | | | 200 | | | | 223 | |
1.950%, 04/23/2031 | | | 200 | | | | 206 | |
Sysco | | | | | | | | |
5.650%, 04/01/2025 | | | 300 | | | | 348 | |
Walgreens Boots Alliance | | | | | | | | |
4.100%, 04/15/2050 | | | 500 | | | | 570 | |
Walmart | | | | | | | | |
3.400%, 06/26/2023 | | | 300 | | | | 317 | |
3.050%, 07/08/2026 | | | 500 | | | | 550 | |
2.850%, 07/08/2024 | | | 500 | | | | 534 | |
| | | | | | | | |
| | | | | | | 18,316 | |
| | | | | | | | |
| | |
Energy — 1.9% | | | | | | | | |
Boardwalk Pipelines | | | | | | | | |
3.400%, 02/15/2031 | | | 85 | | | | 92 | |
BP Capital Markets America | | | | | | | | |
3.796%, 09/21/2025 | | | 500 | | | | 555 | |
3.633%, 04/06/2030 | | | 300 | | | | 340 | |
3.543%, 04/06/2027 | | | 500 | | | | 557 | |
3.194%, 04/06/2025 | | | 500 | | | | 539 | |
3.060%, 06/17/2041 | | | 500 | | | | 516 | |
Canadian Natural Resources | | | | | | | | |
2.950%, 07/15/2030 | | | 500 | | | | 523 | |
2.050%, 07/15/2025 | | | 500 | | | | 515 | |
Chevron | | | | | | | | |
2.978%, 05/11/2040 | | | 500 | | | | 532 | |
1.995%, 05/11/2027 | | | 500 | | | | 522 | |
1.554%, 05/11/2025 | | | 500 | | | | 514 | |
1.141%, 05/11/2023 | | | 500 | | | | 507 | |
ConocoPhillips | | | | | | | | |
4.875%, 10/01/2047 (A) | | | 500 | | | | 671 | |
2.400%, 02/15/2031 (A) | | | 190 | | | | 198 | |
| | |
| Adviser Managed Trust / Annual Report / July 31, 2021 | | 21 |
SCHEDULE OF INVESTMENTS
July 31, 2021
Tactical Offensive Core Fixed Income Fund (Continued)
| | | | | | | | |
| | | |
| Description | | Face Amount
(Thousands) | | Market Value
($ Thousands) |
| |
CORPORATE OBLIGATIONS (continued) | | | | | |
Diamondback Energy | | | | | | | | |
4.750%, 05/31/2025 | | $ | 500 | | | $ | 561 | |
Energy Transfer | | | | | | | | |
6.250%, 04/15/2049 | | | 500 | | | | 659 | |
4.750%, 01/15/2026 | | | 500 | | | | 564 | |
2.900%, 05/15/2025 | | | 500 | | | | 527 | |
Enterprise Products Operating LLC | | | | | | | | |
3.700%, 01/31/2051 | | | 500 | | | | 547 | |
2.800%, 01/31/2030 | | | 200 | | | | 214 | |
Equinor | | | | | | | | |
3.700%, 04/06/2050 | | | 500 | | | | 588 | |
3.625%, 04/06/2040 | | | 200 | | | | 230 | |
Exxon Mobil | | | | | | | | |
4.227%, 03/19/2040 | | | 500 | | | | 610 | |
3.482%, 03/19/2030 | | | 300 | | | | 341 | |
2.992%, 03/19/2025 | | | 500 | | | | 537 | |
2.610%, 10/15/2030 | | | 300 | | | | 322 | |
1.571%, 04/15/2023 | | | 500 | | | | 511 | |
Halliburton | | | | | | | | |
4.850%, 11/15/2035 | | | 300 | | | | 359 | |
HollyFrontier | | | | | | | | |
2.625%, 10/01/2023 | | | 250 | | | | 259 | |
Kinder Morgan | | | | | | | | |
5.550%, 06/01/2045 | | | 500 | | | | 657 | |
3.600%, 02/15/2051 | | | 250 | | | | 261 | |
3.250%, 08/01/2050 | | | 145 | | | | 143 | |
2.000%, 02/15/2031 | | | 140 | | | | 138 | |
Magellan Midstream Partners | | | | | | | | |
3.250%, 06/01/2030 | | | 200 | | | | 218 | |
Marathon Petroleum | | | | | | | | |
4.700%, 05/01/2025 | | | 500 | | | | 563 | |
MPLX | | | | | | | | |
5.200%, 12/01/2047 | | | 300 | | | | 366 | |
4.250%, 12/01/2027 | | | 500 | | | | 572 | |
2.650%, 08/15/2030 | | | 115 | | | | 118 | |
ONEOK | | | | | | | | |
7.150%, 01/15/2051 | | | 500 | | | | 747 | |
5.850%, 01/15/2026 | | | 300 | | | | 355 | |
2.200%, 09/15/2025 | | | 300 | | | | 310 | |
Phillips 66 | | | | | | | | |
3.850%, 04/09/2025 | | | 500 | | | | 550 | |
2.150%, 12/15/2030 | | | 500 | | | | 495 | |
Pioneer Natural Resources | | | | | | | | |
1.900%, 08/15/2030 | | | 200 | | | | 194 | |
0.550%, 05/15/2023 | | | 15 | | | | 15 | |
Sabine Pass Liquefaction | | | | | | | | |
4.500%, 05/15/2030 | | | 500 | | | | 585 | |
Shell International Finance BV | | | | | | | | |
3.250%, 04/06/2050 | | | 550 | | | | 598 | |
2.750%, 04/06/2030 | | | 510 | | | | 551 | |
2.375%, 04/06/2025 | | | 500 | | | | 527 | |
0.375%, 09/15/2023 | | | 250 | | | | 250 | |
| | | | | | | | |
| | | |
| Description | | Face Amount
(Thousands) | | Market Value
($ Thousands) |
| |
CORPORATE OBLIGATIONS (continued) | | | | | |
Suncor Energy | | | | | | | | |
3.100%, 05/15/2025 | | $ | 500 | | | $ | 536 | |
TotalEnergies Capital International | | | | | | | | |
3.127%, 05/29/2050 | | | 300 | | | | 313 | |
TransCanada PipeLines | | | | | | | | |
4.100%, 04/15/2030 | | | 300 | | | | 347 | |
Valero Energy | | | | | | | | |
2.700%, 04/15/2023 | | | 500 | | | | 518 | |
1.200%, 03/15/2024 | | | 250 | | | | 252 | |
Williams | | | | | | | | |
3.500%, 11/15/2030 | | | 200 | | | | 221 | |
| | | | | | | | |
| | | | | | | 23,810 | |
| | | | | | | | |
| | |
Financials — 8.4% | | | | | | | | |
Aflac | | | | | | | | |
1.125%, 03/15/2026 | | | 105 | | | | 106 | |
African Development Bank | | | | | | | | |
0.750%, 04/03/2023 | | | 500 | | | | 504 | |
African Development Bank MTN | | | | | | | | |
0.875%, 07/22/2026 | | | 116 | | | | 116 | |
Allstate | | | | | | | | |
1.450%, 12/15/2030 | | | 200 | | | | 195 | |
0.750%, 12/15/2025 | | | 125 | | | | 125 | |
Ally Financial | | | | | | | | |
1.450%, 10/02/2023 | | | 565 | | | | 574 | |
American Express | | | | | | | | |
3.700%, 08/03/2023 | | | 500 | | | | 532 | |
3.400%, 02/22/2024 | | | 500 | | | | 535 | |
2.500%, 07/30/2024 | | | 500 | | | | 528 | |
American Financial Group | | | | | | | | |
5.250%, 04/02/2030 | | | 300 | | | | 371 | |
American International Group | | | | | | | | |
4.375%, 06/30/2050 | | | 200 | | | | 252 | |
3.400%, 06/30/2030 | | | 500 | | | | 552 | |
2.500%, 06/30/2025 | | | 300 | | | | 317 | |
Andina de Fomento | | | | | | | | |
1.625%, 09/23/2025 | | | 500 | | | | 507 | |
Aon | | | | | | | | |
2.800%, 05/15/2030 | | | 200 | | | | 214 | |
2.200%, 11/15/2022 | | | 300 | | | | 307 | |
Arch Capital Group | | | | | | | | |
3.635%, 06/30/2050 | | | 35 | | | | 39 | |
Ares Capital | | | | | | | | |
3.875%, 01/15/2026 | | | 300 | | | | 324 | |
Asian Development Bank | | | | | | | | |
1.625%, 01/24/2023 | | | 500 | | | | 511 | |
0.625%, 04/29/2025 | | | 1,000 | | | | 999 | |
Asian Development Bank MTN | | | | | | | | |
1.875%, 01/24/2030 | | | 500 | | | | 527 | |
1.000%, 04/14/2026 | | | 100 | | | | 101 | |
0.500%, 02/04/2026 | | | 250 | | | | 248 | |
0.250%, 07/14/2023 | | | 45 | | | | 45 | |
| | |
| 22 | | Adviser Managed Trust / Annual Report / July 31, 2021 |
| | | | | | | | |
| | | |
| Description | | Face Amount
(Thousands) | | Market Value
($ Thousands) |
| |
CORPORATE OBLIGATIONS (continued) | | | | | |
Asian Infrastructure Investment Bank | | | | | | | | |
0.250%, 09/29/2023 | | $ | 335 | | | $ | 335 | |
Assurant | | | | | | | | |
2.650%, 01/15/2032 | | | 100 | | | | 101 | |
Assured Guaranty US Holdings | | | | | | | | |
3.150%, 06/15/2031 | | | 35 | | | | 37 | |
Athene Holding | | | | | | | | |
6.150%, 04/03/2030 | | | 300 | | | | 385 | |
3.500%, 01/15/2031 | | | 100 | | | | 109 | |
Banco Santander | | | | | | | | |
3.490%, 05/28/2030 | | | 500 | | | | 547 | |
2.746%, 05/28/2025 | | | 200 | | | | 211 | |
Bancolombia | | | | | | | | |
3.000%, 01/29/2025 | | | 140 | | | | 141 | |
Bank of America | | | | | | | | |
3.483%, VAR United States Secured Overnight Financing Rate+1.650%, 03/13/2052 | | | 200 | | | | 221 | |
3.311%, VAR United States Secured Overnight Financing Rate+1.580%, 04/22/2042 | | | 400 | | | | 430 | |
2.687%, VAR United States Secured Overnight Financing Rate+1.320%, 04/22/2032 | | | 100 | | | | 104 | |
2.651%, VAR United States Secured Overnight Financing Rate+1.220%, 03/11/2032 | | | 200 | | | | 208 | |
2.592%, VAR United States Secured Overnight Financing Rate+2.150%, 04/29/2031 | | | 200 | | | | 207 | |
1.734%, VAR United States Secured Overnight Financing Rate+0.960%, 07/22/2027 | | | 100 | | | | 102 | |
1.658%, VAR United States Secured Overnight Financing Rate+0.910%, 03/11/2027 | | | 200 | | | | 203 | |
0.976%, VAR United States Secured Overnight Financing Rate+0.690%, 04/22/2025 | | | 600 | | | | 603 | |
Bank of America MTN | | | | | | | | |
4.100%, 07/24/2023 | | | 500 | | | | 536 | |
4.083%, VAR ICE LIBOR USD 3 Month+3.150%, 03/20/2051 | | | 200 | | | | 242 | |
4.078%, VAR ICE LIBOR USD 3 Month+1.320%, 04/23/2040 | | | 700 | | | | 823 | |
2.884%, VAR ICE LIBOR USD 3 Month+1.190%, 10/22/2030 | | | 200 | | | | 212 | |
2.831%, VAR United States Secured Overnight Financing Rate+1.880%, 10/24/2051 | | | 50 | | | | 49 | |
2.676%, VAR United States Secured Overnight Financing Rate+1.930%, 06/19/2041 | | | 500 | | | | 493 | |
| | | | | | | | |
| | | |
| Description | | Face Amount
(Thousands) | | Market Value
($ Thousands) |
| |
CORPORATE OBLIGATIONS (continued) | | | | | |
2.015%, VAR ICE LIBOR USD 3 Month+0.640%, 02/13/2026 | | $ | 500 | | | $ | 516 | |
1.922%, VAR United States Secured Overnight Financing Rate+1.370%, 10/24/2031 | | | 200 | | | | 197 | |
1.898%, VAR United States Secured Overnight Financing Rate+1.530%, 07/23/2031 | | | 200 | | | | 197 | |
1.486%, VAR United States Secured Overnight Financing Rate+1.460%, 05/19/2024 | | | 300 | | | | 305 | |
1.319%, VAR United States Secured Overnight Financing Rate+1.150%, 06/19/2026 | | | 500 | | | | 503 | |
1.197%, VAR United States Secured Overnight Financing Rate+1.010%, 10/24/2026 | | | 200 | | | | 200 | |
0.810%, VAR United States Secured Overnight Financing Rate+0.740%, 10/24/2024 | | | 200 | | | | 201 | |
0.523%, VAR United States Secured Overnight Financing Rate+0.410%, 06/14/2024 | | | 300 | | | | 300 | |
Bank of Montreal MTN | | | | | | | | |
3.300%, 02/05/2024 | | | 500 | | | | 535 | |
1.850%, 05/01/2025 | | | 300 | | | | 311 | |
Bank of New York Mellon MTN | | | | | | | | |
2.100%, 10/24/2024 | | | 500 | | | | 524 | |
1.650%, 07/14/2028 | | | 100 | | | | 102 | |
1.650%, 01/28/2031 | | | 200 | | | | 200 | |
1.600%, 04/24/2025 | | | 300 | | | | 309 | |
Bank of Nova Scotia | | | | | | | | |
3.400%, 02/11/2024 | | | 500 | | | | 535 | |
2.200%, 02/03/2025 | | | 300 | | | | 315 | |
1.950%, 02/01/2023 | | | 300 | | | | 308 | |
1.625%, 05/01/2023 | | | 300 | | | | 307 | |
Barclays | | | | | | | | |
3.811%, VAR US Treas Yield Curve Rate T Note Const Mat 1 Yr+1.700%, 03/10/2042 | | | 200 | | | | 216 | |
2.852%, VAR United States Secured Overnight Financing Rate+2.714%, 05/07/2026 | | | 300 | | | | 318 | |
2.667%, VAR US Treas Yield Curve Rate T Note Const Mat 1 Yr+1.200%, 03/10/2032 | | | 200 | | | | 204 | |
2.645%, VAR US Treas Yield Curve Rate T Note Const Mat 1 Yr+1.900%, 06/24/2031 | | | 500 | | | | 511 | |
1.007%, VAR US Treas Yield Curve Rate T Note Const Mat 1 Yr+0.800%, 12/10/2024 | | | 290 | | | | 291 | |
| | |
| Adviser Managed Trust / Annual Report / July 31, 2021 | | 23 |
SCHEDULE OF INVESTMENTS
July 31, 2021
Tactical Offensive Core Fixed Income Fund (Continued)
| | | | | | | | |
| | | |
| Description | | Face Amount
(Thousands) | | Market Value
($ Thousands) |
| |
CORPORATE OBLIGATIONS (continued) | | | | | |
Berkshire Hathaway Finance | | | | | | | | |
2.850%, 10/15/2050 | | $ | 265 | | | $ | 272 | |
2.500%, 01/15/2051 | | | 280 | | | | 268 | |
1.450%, 10/15/2030 | | | 315 | | | | 312 | |
BlackRock | | | | | | | | |
1.900%, 01/28/2031 | | | 300 | | | | 306 | |
Blackstone Secured Lending Fund | | | | | | | | |
2.750%, 09/16/2026 | | | 100 | | | | 102 | |
Brighthouse Financial | | | | | | | | |
5.625%, 05/15/2030 | | | 300 | | | | 369 | |
4.700%, 06/22/2047 | | | 500 | | | | 562 | |
Brookfield Finance | | | | | | | | |
4.850%, 03/29/2029 | | | 200 | | | | 240 | |
3.500%, 03/30/2051 | | | 150 | | | | 160 | |
Brown & Brown | | | | | | | | |
2.375%, 03/15/2031 | | | 35 | | | | 35 | |
Canadian Imperial Bank of Commerce | | | | | | | | |
3.500%, 09/13/2023 | | | 500 | | | | 533 | |
0.950%, 06/23/2023 | | | 500 | | | | 505 | |
Capital One Financial | | | | | | | | |
3.800%, 01/31/2028 | | | 500 | | | | 565 | |
2.600%, 05/11/2023 | | | 300 | | | | 311 | |
2.359%, VAR United States Secured Overnight Financing Rate+1.337%, 07/29/2032 | | | 100 | | | | 101 | |
Cboe Global Markets | | | | | | | | |
1.625%, 12/15/2030 | | | 100 | | | | 98 | |
Charles Schwab | | | | | | | | |
4.200%, 03/24/2025 | | | 500 | | | | 560 | |
1.150%, 05/13/2026 | | | 25 | | | | 25 | |
Chubb INA Holdings | | | | | | | | |
1.375%, 09/15/2030 | | | 325 | | | | 314 | |
CI Financial | | | | | | | | |
3.200%, 12/17/2030 | | | 65 | | | | 68 | |
Citigroup | | | | | | | | |
8.125%, 07/15/2039 | | | 200 | | | | 349 | |
5.316%, VAR United States Secured Overnight Financing Rate+4.548%, 03/26/2041 | | | 700 | | | | 951 | |
4.412%, VAR United States Secured Overnight Financing Rate+3.914%, 03/31/2031 | | | 200 | | | | 235 | |
3.106%, VAR United States Secured Overnight Financing Rate+2.842%, 04/08/2026 | | | 300 | | | | 321 | |
2.976%, VAR United States Secured Overnight Financing Rate+1.422%, 11/05/2030 | | | 500 | | | | 535 | |
2.572%, VAR United States Secured Overnight Financing Rate+2.107%, 06/03/2031 | | | 200 | | | | 207 | |
| | | | | | | | |
| | | |
| Description | | Face Amount
(Thousands) | | Market Value
($ Thousands) |
| |
CORPORATE OBLIGATIONS (continued) | | | | | |
2.561%, VAR United States Secured Overnight Financing Rate+1.167%, 05/01/2032 | | $ | 165 | | | $ | 171 | |
1.678%, VAR United States Secured Overnight Financing Rate+1.667%, 05/15/2024 | | | 300 | | | | 306 | |
1.462%, VAR United States Secured Overnight Financing Rate+0.770%, 06/09/2027 | | | 500 | | | | 501 | |
0.981%, VAR United States Secured Overnight Financing Rate+0.669%, 05/01/2025 | | | 150 | | | | 151 | |
0.776%, VAR United States Secured Overnight Financing Rate+0.686%, 10/30/2024 | | | 150 | | | | 151 | |
Citizens Bank | | | | | | | | |
2.250%, 04/28/2025 | | | 500 | | | | 525 | |
Citizens Financial Group | | | | | | | | |
3.250%, 04/30/2030 | | | 500 | | | | 549 | |
CNA Financial | | | | | | | | |
2.050%, 08/15/2030 | | | 65 | | | | 65 | |
Cooperatieve Rabobank | | | | | | | | |
4.625%, 12/01/2023 | | | 500 | | | | 545 | |
Credit Suisse NY | | | | | | | | |
2.950%, 04/09/2025 | | | 300 | | | | 322 | |
1.000%, 05/05/2023 | | | 500 | | | | 505 | |
Deutsche Bank NY | | | | | | | | |
3.961%, VAR United States Secured Overnight Financing Rate+2.581%, 11/26/2025 | | | 500 | | | | 543 | |
2.222%, VAR United States Secured Overnight Financing Rate+2.159%, 09/18/2024 | | | 250 | | | | 257 | |
Equitable Holdings | | | | | | | | |
5.000%, 04/20/2048 | | | 500 | | | | 649 | |
4.350%, 04/20/2028 | | | 500 | | | | 578 | |
European Bank for Reconstruction & Development MTN | | | | | | | | |
0.250%, 07/10/2023 | | | 700 | | | | 700 | |
European Investment Bank | | | | | | | | |
1.625%, 05/13/2031 | | | 500 | | | | 515 | |
1.375%, 05/15/2023 | | | 500 | | | | 510 | |
1.250%, 02/14/2031 | | | 520 | | | | 517 | |
0.875%, 05/17/2030 | | | 500 | | | | 486 | |
0.625%, 07/25/2025 | | | 1,000 | | | | 1,001 | |
0.375%, 12/15/2025 | | | 200 | | | | 198 | |
Everest Reinsurance Holdings | | | | | | | | |
3.500%, 10/15/2050 | | | 100 | | | | 110 | |
Fairfax Financial Holdings | | | | | | | | |
4.625%, 04/29/2030 | | | 300 | | | | 348 | |
Fidelity National Financial | | | | | | | | |
2.450%, 03/15/2031 | | | 150 | | | | 151 | |
| | |
| 24 | | Adviser Managed Trust / Annual Report / July 31, 2021 |
| | | | | | | | |
| | | |
| Description | | Face Amount
(Thousands) | | Market Value
($ Thousands) |
|
CORPORATE OBLIGATIONS (continued) | |
Franklin Resources | | | | | | | | |
1.600%, 10/30/2030 | | $ | 100 | | | $ | 98 | |
FS KKR Capital | | | | | | | | |
3.400%, 01/15/2026 | | | 200 | | | | 209 | |
Globe Life | | | | | | | | |
2.150%, 08/15/2030 | | | 250 | | | | 251 | |
Goldman Sachs Group | | | | | | | | |
5.150%, 05/22/2045 | | | 500 | | | | 673 | |
3.625%, 02/20/2024 | | | 500 | | | | 535 | |
3.500%, 04/01/2025 | | | 500 | | | | 543 | |
3.210%, VAR United States Secured Overnight Financing Rate+1.513%, 04/22/2042 | | | 90 | | | | 95 | |
2.908%, VAR United States Secured Overnight Financing Rate+1.472%, 07/21/2042 | | | 115 | | | | 116 | |
2.615%, VAR United States Secured Overnight Financing Rate+1.281%, 04/22/2032 | | | 105 | | | | 109 | |
1.992%, VAR United States Secured Overnight Financing Rate+1.090%, 01/27/2032 | | | 225 | | | | 222 | |
1.542%, VAR United States Secured Overnight Financing Rate+0.818%, 09/10/2027 | | | 100 | | | | 101 | |
1.431%, VAR United States Secured Overnight Financing Rate+0.798%, 03/09/2027 | | | 200 | | | | 201 | |
1.093%, VAR United States Secured Overnight Financing Rate+0.789%, 12/09/2026 | | | 400 | | | | 397 | |
0.855%, VAR United States Secured Overnight Financing Rate+0.609%, 02/12/2026 | | | 165 | | | | 164 | |
0.673%, VAR United States Secured Overnight Financing Rate+0.572%, 03/08/2024 | | | 250 | | | | 250 | |
0.657%, VAR United States Secured Overnight Financing Rate+0.505%, 09/10/2024 | | | 100 | | | | 100 | |
0.627%, VAR United States Secured Overnight Financing Rate+0.538%, 11/17/2023 | | | 570 | | | | 570 | |
0.523%, 03/08/2023 | | | 155 | | | | 155 | |
0.481%, 01/27/2023 | | | 500 | | | | 500 | |
Goldman Sachs Group MTN | | | | | | | | |
2.383%, VAR United States Secured Overnight Financing Rate+1.248%, 07/21/2032 | | | 145 | | | | 147 | |
Hanover Insurance Group | | | | | | | | |
2.500%, 09/01/2030 | | | 15 | | | | 15 | |
HSBC Holdings | | | | | | | | |
4.950%, 03/31/2030 | | | 200 | | | | 243 | |
| | | | | | | | |
| | | |
| Description | | Face Amount
(Thousands) | | Market Value
($ Thousands) |
|
CORPORATE OBLIGATIONS (continued) | |
3.803%, VAR ICE LIBOR USD 3 Month+1.211%, 03/11/2025 | | $ | 500 | | | $ | 537 | |
2.848%, VAR United States Secured Overnight Financing Rate+2.387%, 06/04/2031 | | | 200 | | | | 211 | |
2.804%, VAR United States Secured Overnight Financing Rate+1.187%, 05/24/2032 | | | 200 | | | | 208 | |
2.099%, VAR United States Secured Overnight Financing Rate+1.929%, 06/04/2026 | | | 300 | | | | 310 | |
2.013%, VAR United States Secured Overnight Financing Rate+1.732%, 09/22/2028 | | | 200 | | | | 202 | |
1.589%, VAR United States Secured Overnight Financing Rate+1.290%, 05/24/2027 | | | 420 | | | | 423 | |
ING Groep | | | | | | | | |
3.550%, 04/09/2024 | | | 500 | | | | 538 | |
Inter-American Development Bank | | | | | | | | |
0.625%, 07/15/2025 | | | 1,000 | | | | 1,001 | |
0.625%, 09/16/2027 | | | 500 | | | | 489 | |
0.500%, 05/24/2023 | | | 400 | | | | 402 | |
0.250%, 11/15/2023 | | | 500 | | | | 500 | |
Intercontinental Exchange | | | | | | | | |
3.000%, 06/15/2050 | | | 200 | | | | 202 | |
3.000%, 09/15/2060 | | | 160 | | | | 159 | |
2.650%, 09/15/2040 | | | 165 | | | | 162 | |
1.850%, 09/15/2032 | | | 165 | | | | 159 | |
0.700%, 06/15/2023 | | | 110 | | | | 111 | |
International Bank for Reconstruction & Development | | | | | | | | |
2.500%, 07/29/2025 | | | 1,000 | | | | 1,074 | |
1.250%, 02/10/2031 | | | 500 | | | | 498 | |
0.875%, 05/14/2030 | | | 500 | | | | 486 | |
0.750%, 11/24/2027 | | | 230 | | | | 227 | |
0.500%, 10/28/2025 | | | 800 | | | | 795 | |
0.250%, 11/24/2023 | | | 125 | | | | 125 | |
International Bank for Reconstruction & Development MTN | | | | | | | | |
1.375%, 04/20/2028 | | | 650 | | | | 664 | |
International Finance MTN | | | | | | | | |
0.750%, 08/27/2030 | | | 500 | | | | 479 | |
0.375%, 07/16/2025 | | | 145 | | | | 144 | |
Jefferies Group | | | | | | | | |
5.125%, 01/20/2023 | | | 500 | | | | 533 | |
JPMorgan Chase | | | | | | | | |
4.493%, VAR United States Secured Overnight Financing Rate+3.790%, 03/24/2031 | | | 200 | | | | 239 | |
3.328%, VAR United States Secured Overnight Financing Rate+1.580%, 04/22/2052 | | | 70 | | | | 76 | |
| | |
| Adviser Managed Trust / Annual Report / July 31, 2021 | | 25 |
SCHEDULE OF INVESTMENTS
July 31, 2021
Tactical Offensive Core Fixed Income Fund (Continued)
| | | | | | | | |
| | | |
| Description | | Face Amount
(Thousands) | | Market Value
($ Thousands) |
|
CORPORATE OBLIGATIONS (continued) | |
3.157%, VAR United States Secured Overnight Financing Rate+1.460%, 04/22/2042 | | $ | 100 | | | $ | 106 | |
3.109%, VAR United States Secured Overnight Financing Rate+2.440%, 04/22/2051 | | | 800 | | | | 834 | |
3.109%, VAR United States Secured Overnight Financing Rate+2.460%, 04/22/2041 | | | 700 | | | | 743 | |
2.956%, VAR United States Secured Overnight Financing Rate+2.515%, 05/13/2031 | | | 300 | | | | 319 | |
2.580%, VAR United States Secured Overnight Financing Rate+1.250%, 04/22/2032 | | | 75 | | | | 78 | |
2.525%, VAR United States Secured Overnight Financing Rate+1.510%, 11/19/2041 | | | 750 | | | | 733 | |
2.522%, VAR United States Secured Overnight Financing Rate+2.040%, 04/22/2031 | | | 200 | | | | 208 | |
2.182%, VAR United States Secured Overnight Financing Rate+1.890%, 06/01/2028 | | | 300 | | | | 310 | |
2.005%, VAR United States Secured Overnight Financing Rate+1.585%, 03/13/2026 | | | 500 | | | | 518 | |
1.764%, VAR United States Secured Overnight Financing Rate+1.105%, 11/19/2031 | | | 450 | | | | 438 | |
1.578%, VAR United States Secured Overnight Financing Rate+0.885%, 04/22/2027 | | | 565 | | | | 572 | |
1.514%, VAR United States Secured Overnight Financing Rate+1.455%, 06/01/2024 | | | 300 | | | | 306 | |
1.045%, VAR United States Secured Overnight Financing Rate+0.800%, 11/19/2026 | | | 250 | | | | 248 | |
0.969%, VAR United States Secured Overnight Financing Rate+0.580%, 06/23/2025 | | | 300 | | | | 301 | |
0.824%, VAR United States Secured Overnight Financing Rate+0.540%, 06/01/2025 | | | 170 | | | | 170 | |
0.697%, VAR United States Secured Overnight Financing Rate+0.580%, 03/16/2024 | | | 200 | | | | 201 | |
Kemper | | | | | | | | |
2.400%, 09/30/2030 | | | 50 | | | | 51 | |
KeyBank | | | | | | | | |
1.250%, 03/10/2023 | | | 300 | | | | 304 | |
| | | | | | | | |
| | | |
| Description | | Face Amount
(Thousands) | | Market Value
($ Thousands) |
|
CORPORATE OBLIGATIONS (continued) | |
Korea Development Bank | | | | | | | | |
3.375%, 03/12/2023 | | $ | 260 | | | $ | 272 | |
0.500%, 10/27/2023 | | | 200 | | | | 200 | |
Kreditanstalt fuer Wiederaufbau | | | | | | | | |
2.625%, 02/28/2024 | | | 500 | | | | 529 | |
2.375%, 12/29/2022 | | | 500 | | | | 516 | |
0.625%, 01/22/2026 | | | 1,300 | | | | 1,298 | |
0.250%, 10/19/2023 | | | 750 | | | | 750 | |
0.250%, 03/08/2024 | | | 325 | | | | 324 | |
Landwirtschaftliche Rentenbank | | | | | | | | |
0.875%, 03/30/2026 | | | 40 | | | | 40 | |
0.500%, 05/27/2025 | | | 500 | | | | 499 | |
Lloyds Banking Group | | | | | | | | |
4.050%, 08/16/2023 | | | 500 | | | | 535 | |
3.900%, 03/12/2024 | | | 500 | | | | 541 | |
0.695%, VAR US Treas Yield Curve Rate T Note Const Mat 1 Yr+0.550%, 05/11/2024 | | | 200 | | | | 201 | |
Manulife Financial | | | | | | | | |
2.484%, 05/19/2027 | | | 300 | | | | 319 | |
Markel | | | | | | | | |
3.450%, 05/07/2052 | | | 70 | | | | 74 | |
Marsh & McLennan | | | | | | | | |
3.875%, 03/15/2024 | | | 500 | | | | 541 | |
2.250%, 11/15/2030 | | | 200 | | | | 206 | |
MetLife | | | | | | | | |
4.550%, 03/23/2030 | | | 200 | | | | 243 | |
Mitsubishi UFJ Financial Group | | | | | | | | |
3.751%, 07/18/2039 | | | 500 | | | | 577 | |
3.407%, 03/07/2024 | | | 500 | | | | 536 | |
2.801%, 07/18/2024 | | | 500 | | | | 529 | |
2.193%, 02/25/2025 | | | 500 | | | | 522 | |
Mizuho Financial Group | | | | | | | | |
2.260%, VAR US Treas Yield Curve Rate T Note Const Mat 1 Yr+0.900%, 07/09/2032 | | | 200 | | | | 201 | |
2.226%, VAR ICE LIBOR USD 3 Month+0.830%, 05/25/2026 | | | 300 | | | | 311 | |
1.241%, 07/10/2024 (D) | | | 500 | | | | 506 | |
Moody’s | | | | | | | | |
2.550%, 08/18/2060 | | | 250 | | | | 230 | |
Morgan Stanley | | | | | | | | |
3.217%, VAR United States Secured Overnight Financing Rate+1.485%, 04/22/2042 | | | 145 | | | | 156 | |
1.593%, VAR United States Secured Overnight Financing Rate+0.879%, 05/04/2027 | | | 245 | | | | 249 | |
0.985%, VAR United States Secured Overnight Financing Rate+0.720%, 12/10/2026 | | | 250 | | | | 247 | |
| | |
| 26 | | Adviser Managed Trust / Annual Report / July 31, 2021 |
| | | | | | | | |
| | | |
| Description | | Face Amount
(Thousands) | | Market Value
($ Thousands) |
| |
CORPORATE OBLIGATIONS (continued) | | | | | |
0.790%, VAR United States Secured Overnight Financing Rate+0.525%, 05/30/2025 | | $ | 200 | | | $ | 200 | |
0.731%, VAR United States Secured Overnight Financing Rate+0.616%, 04/05/2024 | | | 480 | | | | 482 | |
Morgan Stanley MTN | | | | | | | | |
5.597%, VAR United States Secured Overnight Financing Rate+4.840%, 03/24/2051 | | | 700 | | | | 1,062 | |
3.622%, VAR United States Secured Overnight Financing Rate+3.120%, 04/01/2031 | | | 200 | | | | 225 | |
2.720%, VAR United States Secured Overnight Financing Rate+1.152%, 07/22/2025 | | | 500 | | | | 526 | |
2.239%, VAR United States Secured Overnight Financing Rate+1.178%, 07/21/2032 | | | 150 | | | | 151 | |
2.188%, VAR United States Secured Overnight Financing Rate+1.990%, 04/28/2026 | | | 300 | | | | 311 | |
1.794%, VAR United States Secured Overnight Financing Rate+1.034%, 02/13/2032 | | | 375 | | | | 365 | |
1.512%, VAR United States Secured Overnight Financing Rate+0.858%, 07/20/2027 | | | 150 | | | | 151 | |
0.864%, VAR United States Secured Overnight Financing Rate+0.745%, 10/21/2025 | | | 345 | | | | 345 | |
0.791%, VAR United States Secured Overnight Financing Rate+0.509%, 01/22/2025 | | | 150 | | | | 150 | |
0.560%, VAR United States Secured Overnight Financing Rate+0.466%, 11/10/2023 | | | 450 | | | | 451 | |
MUFG Union Bank | | | | | | | | |
2.100%, 12/09/2022 | | | 300 | | | | 307 | |
Nasdaq | | | | | | | | |
0.445%, 12/21/2022 | | | 80 | | | | 80 | |
National Australia Bank | | | | | | | | |
1.875%, 12/13/2022 | | | 300 | | | | 307 | |
National Bank of Canada MTN | | | | | | | | |
2.100%, 02/01/2023 | | | 300 | | | | 308 | |
Natwest Group | | | | | | | | |
4.269%, VAR ICE LIBOR USD 3 Month+1.762%, 03/22/2025 | | | 500 | | | | 543 | |
3.875%, 09/12/2023 | | | 500 | | | | 533 | |
3.073%, VAR US Treas Yield Curve Rate T Note Const Mat 1 Yr+2.550%, 05/22/2028 | | | 300 | | | | 320 | |
| | | | | | | | |
| | | |
| Description | | Face Amount
(Thousands) | | Market Value
($ Thousands) |
| |
CORPORATE OBLIGATIONS (continued) | | | | | |
Nomura Holdings | | | | | | | | |
3.103%, 01/16/2030 | | $ | 200 | | | $ | 212 | |
2.648%, 01/16/2025 | | | 300 | | | | 316 | |
Nordic Investment Bank | | | | | | | | |
0.375%, 09/11/2025 | | | 500 | | | | 495 | |
Northern Trust | | | | | | | | |
1.950%, 05/01/2030 | | | 300 | | | | 308 | |
Oaktree Specialty Lending | | | | | | | | |
2.700%, 01/15/2027 | | | 50 | | | | 51 | |
Oesterreichische Kontrollbank | | | | | | | | |
1.500%, 02/12/2025 | | | 500 | | | | 516 | |
0.375%, 09/17/2025 | | | 90 | | | | 89 | |
Oesterreichische Kontrollbank MTN | | | | | | | | |
2.875%, 03/13/2023 | | | 500 | | | | 522 | |
Old Republic International | | | | | | | | |
3.850%, 06/11/2051 | | | 55 | | | | 60 | |
Owl Rock Capital | | | | | | | | |
4.250%, 01/15/2026 | | | 100 | | | | 108 | |
2.625%, 01/15/2027 | | | 100 | | | | 101 | |
PartnerRe Finance B | | | | | | | | |
4.500%, VAR US Treas Yield Curve Rate T Note Const Mat 5 Yr+3.815%, 10/01/2050 | | | 100 | | | | 105 | |
PNC Financial Services Group | | | | | | | | |
3.500%, 01/23/2024 | | | 500 | | | | 536 | |
2.307%, VAR United States Secured Overnight Financing Rate+0.979%, 04/23/2032 | | | 265 | | | | 275 | |
Progressive | | | | | | | | |
3.950%, 03/26/2050 | | | 200 | | | | 248 | |
Prudential | | | | | | | | |
3.125%, 04/14/2030 | | | 300 | | | | 330 | |
Prudential Financial MTN | | | | | | | | |
3.000%, 03/10/2040 | | | 1,000 | | | | 1,051 | |
1.500%, 03/10/2026 | | | 300 | | | | 307 | |
Regions Financial | | | | | | | | |
3.800%, 08/14/2023 | | | 500 | | | | 533 | |
Royal Bank of Canada MTN | | | | | | | | |
1.950%, 01/17/2023 | | | 300 | | | | 307 | |
1.600%, 04/17/2023 | | | 300 | | | | 307 | |
1.150%, 06/10/2025 | | | 500 | | | | 505 | |
0.500%, 10/26/2023 | | | 35 | | | | 35 | |
S&P Global | | | | | | | | |
2.300%, 08/15/2060 | | | 95 | | | | 84 | |
1.250%, 08/15/2030 | | | 75 | | | | 72 | |
Santander Holdings USA | | | | | | | | |
3.450%, 06/02/2025 | | | 500 | | | | 539 | |
Sumitomo Mitsui Financial Group | | | | | | | | |
2.696%, 07/16/2024 | | | 500 | | | | 528 | |
2.348%, 01/15/2025 | | | 300 | | | | 315 | |
2.130%, 07/08/2030 | | | 400 | | | | 406 | |
1.474%, 07/08/2025 | | | 500 | | | | 508 | |
| | |
| Adviser Managed Trust / Annual Report / July 31, 2021 | | 27 |
SCHEDULE OF INVESTMENTS
July 31, 2021
Tactical Offensive Core Fixed Income Fund (Continued)
| | | | | | | | |
| | | |
| Description | | Face Amount
(Thousands) | | Market Value
($ Thousands) |
| |
CORPORATE OBLIGATIONS (continued) | | | | | |
SVB Financial Group | | | | | | | | |
2.100%, 05/15/2028 | | $ | 40 | | | $ | 41 | |
1.800%, 02/02/2031 | | | 65 | | | | 63 | |
Toronto-Dominion Bank MTN | | | | | | | | |
1.200%, 06/03/2026 | | | 100 | | | | 101 | |
1.150%, 06/12/2025 | | | 500 | | | | 506 | |
0.550%, 03/04/2024 | | | 250 | | | | 250 | |
Travelers | | | | | | | | |
3.050%, 06/08/2051 | | | 400 | | | | 432 | |
Truist Bank | | | | | | | | |
3.200%, 04/01/2024 | | | 500 | | | | 535 | |
1.500%, 03/10/2025 | | | 300 | | | | 308 | |
1.250%, 03/09/2023 | | | 300 | | | | 304 | |
Truist Financial MTN | | | | | | | | |
3.750%, 12/06/2023 | | | 500 | | | | 538 | |
2.500%, 08/01/2024 | | | 500 | | | | 528 | |
US Bancorp | | | | | | | | |
2.400%, 07/30/2024 | | | 500 | | | | 527 | |
1.450%, 05/12/2025 | | | 300 | | | | 308 | |
US Bancorp MTN | | | | | | | | |
1.375%, 07/22/2030 | | | 50 | | | | 49 | |
US Bank | | | | | | | | |
2.050%, 01/21/2025 | | | 300 | | | | 313 | |
1.950%, 01/09/2023 | | | 300 | | | | 307 | |
W R Berkley | | | | | | | | |
4.000%, 05/12/2050 | | | 30 | | | | 35 | |
Wells Fargo | | | | | | | | |
3.068%, VAR United States Secured Overnight Financing Rate+2.530%, 04/30/2041 | | | 800 | | | | 838 | |
2.188%, VAR United States Secured Overnight Financing Rate+2.000%, 04/30/2026 | | | 300 | | | | 312 | |
Wells Fargo MTN | | | | | | | | |
5.013%, VAR United States Secured Overnight Financing Rate+4.502%, 04/04/2051 | | | 800 | | | | 1,114 | |
4.478%, VAR United States Secured Overnight Financing Rate+4.032%, 04/04/2031 | | | 300 | | | | 358 | |
3.750%, 01/24/2024 | | | 500 | | | | 538 | |
2.879%, VAR United States Secured Overnight Financing Rate+1.432%, 10/30/2030 | | | 200 | | | | 214 | |
2.393%, VAR United States Secured Overnight Financing Rate+2.100%, 06/02/2028 | | | 300 | | | | 314 | |
1.654%, VAR United States Secured Overnight Financing Rate+1.600%, 06/02/2024 | | | 500 | | | | 511 | |
0.805%, VAR United States Secured Overnight Financing Rate+0.510%, 05/19/2025 | | | 60 | | | | 60 | |
| | | | | | | | |
| | | |
| Description | | Face Amount
(Thousands) | | Market Value
($ Thousands) |
| |
CORPORATE OBLIGATIONS (continued) | | | | | |
Westpac Banking | | | | | | | | |
4.421%, 07/24/2039 | | $ | 200 | | | $ | 241 | |
3.300%, 02/26/2024 | | | 500 | | | | 536 | |
2.963%, 11/16/2040 | | | 530 | | | | 534 | |
2.668%, VAR US Treas Yield Curve Rate T Note Const Mat 5 Yr+1.750%, 11/15/2035 | | | 40 | | | | 40 | |
2.650%, 01/16/2030 | | | 500 | | | | 544 | |
| | | | | | | | |
| | | | | | | 103,016 | |
| | | | | | | | |
| | |
Health Care — 2.7% | | | | | | | | |
Abbott Laboratories | | | | | | | | |
1.400%, 06/30/2030 | | | 140 | | | | 139 | |
1.150%, 01/30/2028 | | | 45 | | | | 45 | |
AbbVie | | | | | | | | |
4.850%, 06/15/2044 | | | 500 | | | | 649 | |
4.550%, 03/15/2035 | | | 500 | | | | 614 | |
4.250%, 11/21/2049 | | | 500 | | | | 612 | |
4.050%, 11/21/2039 | | | 1,000 | | | | 1,179 | |
Agilent Technologies | | | | | | | | |
2.100%, 06/04/2030 | | | 300 | | | | 302 | |
AHS Hospital | | | | | | | | |
2.780%, 07/01/2051 | | | 40 | | | | 41 | |
AmerisourceBergen | | | | | | | | |
2.700%, 03/15/2031 | | | 200 | | | | 209 | |
0.737%, 03/15/2023 | | | 105 | | | | 105 | |
Amgen | | | | | | | | |
3.150%, 02/21/2040 | | | 500 | | | | 535 | |
2.300%, 02/25/2031 | | | 200 | | | | 206 | |
1.900%, 02/21/2025 | | | 500 | | | | 520 | |
Anthem | | | | | | | | |
3.600%, 03/15/2051 | | | 30 | | | | 34 | |
2.550%, 03/15/2031 | | | 50 | | | | 52 | |
1.500%, 03/15/2026 | | | 50 | | | | 51 | |
AstraZeneca | | | | | | | | |
2.125%, 08/06/2050 | | | 140 | | | | 127 | |
1.375%, 08/06/2030 | | | 300 | | | | 290 | |
0.700%, 04/08/2026 | | | 300 | | | | 296 | |
Astrazeneca Finance | | | | | | | | |
2.250%, 05/28/2031 | | | 20 | | | | 21 | |
Banner Health | | | | | | | | |
2.338%, 01/01/2030 | | | 200 | | | | 208 | |
1.897%, 01/01/2031 | | | 100 | | | | 101 | |
Baylor Scott & White Holdings | | | | | | | | |
1.777%, 11/15/2030 | | | 20 | | | | 20 | |
Becton Dickinson | | | | | | | | |
3.794%, 05/20/2050 | | | 300 | | | | 343 | |
2.823%, 05/20/2030 | | | 400 | | | | 425 | |
Biogen | | | | | | | | |
2.250%, 05/01/2030 | | | 200 | | | | 204 | |
Bon Secours Mercy Health | | | | | | | | |
2.095%, 06/01/2031 | | | 100 | | | | 102 | |
| | |
| 28 | | Adviser Managed Trust / Annual Report / July 31, 2021 |
| | | | | | | | |
| | | |
| Description | | Face Amount
(Thousands) | | Market Value
($ Thousands) |
| |
CORPORATE OBLIGATIONS (continued) | | | | | |
Boston Scientific | | | | | | | | |
2.650%, 06/01/2030 | | $ | 100 | | | $ | 105 | |
1.900%, 06/01/2025 | | | 300 | | | | 311 | |
Bristol-Myers Squibb | | | | | | | | |
4.550%, 02/20/2048 | | | 500 | | | | 668 | |
4.125%, 06/15/2039 | | | 800 | | | | 986 | |
2.900%, 07/26/2024 | | | 192 | | | | 205 | |
2.550%, 11/13/2050 | | | 230 | | | | 224 | |
2.350%, 11/13/2040 | | | 320 | | | | 314 | |
1.450%, 11/13/2030 | | | 30 | | | | 29 | |
0.750%, 11/13/2025 | | | 50 | | | | 50 | |
0.537%, 11/13/2023 | | | 335 | | | | 335 | |
Cigna | | | | | | | | |
4.800%, 08/15/2038 | | | 1,000 | | | | 1,267 | |
4.500%, 02/25/2026 | | | 300 | | | | 343 | |
3.400%, 03/15/2050 | | | 200 | | | | 216 | |
3.200%, 03/15/2040 | | | 500 | | | | 533 | |
2.375%, 03/15/2031 | | | 60 | | | | 62 | |
1.250%, 03/15/2026 | | | 65 | | | | 65 | |
CommonSpirit Health | | | | | | | | |
3.910%, 10/01/2050 | | | 75 | | | | 85 | |
2.782%, 10/01/2030 | | | 50 | | | | 53 | |
1.547%, 10/01/2025 | | | 35 | | | | 35 | |
CVS Health | | | | | | | | |
4.125%, 04/01/2040 | | | 500 | | | | 592 | |
3.625%, 04/01/2027 | | | 500 | | | | 557 | |
2.700%, 08/21/2040 | | | 500 | | | | 498 | |
1.875%, 02/28/2031 | | | 255 | | | | 252 | |
1.300%, 08/21/2027 | | | 400 | | | | 397 | |
Danaher | | | | | | | | |
2.600%, 10/01/2050 | | | 190 | | | | 187 | |
DENTSPLY SIRONA | | | | | | | | |
3.250%, 06/01/2030 | | | 200 | | | | 217 | |
Eli Lilly | | | | | | | | |
3.950%, 03/15/2049 | | | 200 | | | | 249 | |
2.250%, 05/15/2050 | | | 200 | | | | 186 | |
Gilead Sciences | | | | | | | | |
2.800%, 10/01/2050 | | | 200 | | | | 198 | |
2.600%, 10/01/2040 | | | 200 | | | | 199 | |
1.650%, 10/01/2030 | | | 95 | | | | 94 | |
1.200%, 10/01/2027 | | | 120 | | | | 119 | |
Hackensack Meridian Health | | | | | | | | |
2.675%, 09/01/2041 | | | 100 | | | | 101 | |
HCA | | | | | | | | |
5.125%, 06/15/2039 | | | 1,000 | | | | 1,275 | |
Humana | | | | | | | | |
4.500%, 04/01/2025 | | | 300 | | | | 337 | |
2.150%, 02/03/2032 | | | 15 | | | | 15 | |
1.350%, 02/03/2027 | | | 15 | | | | 15 | |
0.650%, 08/03/2023 | | | 5 | | | | 5 | |
Indiana University Health Obligated Group | | | | | | | | |
2.852%, 11/01/2051 | | | 15 | | | | 16 | |
| | | | | | | | |
| | | |
| Description | | Face Amount
(Thousands) | | Market Value
($ Thousands) |
| |
CORPORATE OBLIGATIONS (continued) | | | | | |
Integris Baptist Medical Center | | | | | | | | |
3.875%, 08/15/2050 | | $ | 100 | | | $ | 115 | |
Johnson & Johnson | | | | | | | | |
2.450%, 09/01/2060 | | | 165 | | | | 162 | |
2.250%, 09/01/2050 | | | 250 | | | | 242 | |
2.100%, 09/01/2040 | | | 165 | | | | 162 | |
1.300%, 09/01/2030 | | | 175 | | | | 173 | |
0.950%, 09/01/2027 | | | 155 | | | | 154 | |
0.550%, 09/01/2025 | | | 125 | | | | 124 | |
Kaiser Foundation Hospitals | | | | | | | | |
3.002%, 06/01/2051 | | | 100 | | | | 106 | |
2.810%, 06/01/2041 | | | 400 | | | | 419 | |
Laboratory Corp of America Holdings | | | | | | | | |
1.550%, 06/01/2026 | | | 145 | | | | 147 | |
McKesson | | | | | | | | |
0.900%, 12/03/2025 | | | 145 | | | | 144 | |
Merck | | | | | | | | |
3.900%, 03/07/2039 | | | 500 | | | | 604 | |
2.350%, 06/24/2040 | | | 500 | | | | 497 | |
1.450%, 06/24/2030 | | | 300 | | | | 298 | |
0.750%, 02/24/2026 | | | 300 | | | | 300 | |
New York and Presbyterian Hospital | | | | | | | | |
2.606%, 08/01/2060 | | | 40 | | | | 38 | |
Novartis Capital | | | | | | | | |
1.750%, 02/14/2025 | | | 500 | | | | 517 | |
Orlando Health Obligated Group | | | | | | | | |
3.327%, 10/01/2050 | | | 25 | | | | 27 | |
PeaceHealth Obligated Group | | | | | | | | |
1.375%, 11/15/2025 | | | 25 | | | | 25 | |
PerkinElmer | | | | | | | | |
3.625%, 03/15/2051 | | | 30 | | | | 33 | |
2.550%, 03/15/2031 | | | 85 | | | | 89 | |
Perrigo Finance Unlimited | | | | | | | | |
3.150%, 06/15/2030 | | | 200 | | | | 209 | |
Pfizer | | | | | | | | |
4.000%, 03/15/2049 | | | 200 | | | | 250 | |
2.700%, 05/28/2050 | | | 300 | | | | 306 | |
2.625%, 04/01/2030 | | | 200 | | | | 217 | |
2.550%, 05/28/2040 | | | 300 | | | | 309 | |
0.800%, 05/28/2025 | | | 500 | | | | 504 | |
Quest Diagnostics | | | | | | | | |
2.800%, 06/30/2031 | | | 200 | | | | 213 | |
Regeneron Pharmaceuticals | | | | | | | | |
1.750%, 09/15/2030 | | | 35 | | | | 34 | |
Royalty Pharma | | | | | | | | |
3.550%, 09/02/2050 (A) | | | 30 | | | | 30 | |
3.350%, 09/02/2051 | | | 60 | | | | 59 | |
3.300%, 09/02/2040 (A) | | | 30 | | | | 30 | |
2.200%, 09/02/2030 (A) | | | 40 | | | | 40 | |
2.150%, 09/02/2031 | | | 55 | | | | 54 | |
1.200%, 09/02/2025 (A) | | | 70 | | | | 70 | |
0.750%, 09/02/2023 (A) | | | 55 | | | | 55 | |
| | |
| Adviser Managed Trust / Annual Report / July 31, 2021 | | 29 |
SCHEDULE OF INVESTMENTS
July 31, 2021
Tactical Offensive Core Fixed Income Fund (Continued)
| | | | | | | | |
| | | |
| Description | | Face Amount
(Thousands) | | Market Value ($ Thousands) |
| |
CORPORATE OBLIGATIONS (continued) | | | | | |
Smith & Nephew | | | | | | | | |
2.032%, 10/14/2030 | | $ | 50 | | | $ | 50 | |
Stryker | | | | | | | | |
1.950%, 06/15/2030 | | | 400 | | | | 404 | |
1.150%, 06/15/2025 | | | 500 | | | | 505 | |
Sutter Health | | | | | | | | |
3.361%, 08/15/2050 | | | 55 | | | | 60 | |
2.294%, 08/15/2030 | | | 55 | | | | 57 | |
Takeda Pharmaceutical | | | | | | | | |
3.375%, 07/09/2060 | | | 100 | | | | 108 | |
3.025%, 07/09/2040 | | | 500 | | | | 522 | |
2.050%, 03/31/2030 | | | 200 | | | | 201 | |
Texas Health Resources | | | | | | | | |
2.328%, 11/15/2050 | | | 65 | | | | 59 | |
Thermo Fisher Scientific | | | | | | | | |
4.133%, 03/25/2025 | | | 300 | | | | 333 | |
Trinity Health | | | | | | | | |
2.632%, 12/01/2040 | | | 25 | | | | 25 | |
UnitedHealth Group | | | | | | | | |
3.500%, 08/15/2039 | | | 500 | | | | 569 | |
3.250%, 05/15/2051 | | | 50 | | | | 55 | |
3.125%, 05/15/2060 | | | 300 | | | | 321 | |
3.050%, 05/15/2041 | | | 50 | | | | 54 | |
2.750%, 05/15/2040 | | | 800 | | | | 830 | |
2.300%, 05/15/2031 | | | 50 | | | | 52 | |
1.250%, 01/15/2026 | | | 500 | | | | 508 | |
1.150%, 05/15/2026 | | | 100 | | | | 101 | |
Universal Health Services | | | | | | | | |
2.650%, 10/15/2030 (A) | | | 250 | | | | 254 | |
Viatris | | | | | | | | |
4.000%, 06/22/2050 (A) | | | 500 | | | | 541 | |
3.850%, 06/22/2040 (A) | | | 500 | | | | 545 | |
2.700%, 06/22/2030 (A) | | | 200 | | | | 205 | |
1.650%, 06/22/2025 (A) | | | 500 | | | | 509 | |
Zoetis | | | | | | | | |
2.000%, 05/15/2030 | | | 200 | | | | 203 | |
| | | | | | | | |
| | | | | | | 32,652 | |
| | | | | | | | |
| | |
Industrials — 2.2% | | | | | | | | |
3M | | | | | | | | |
3.050%, 04/15/2030 | | | 200 | | | | 223 | |
2.650%, 04/15/2025 | | | 300 | | | | 320 | |
AerCap Ireland Capital DAC | | | | | | | | |
4.875%, 01/16/2024 | | | 500 | | | | 544 | |
4.500%, 09/15/2023 | | | 650 | | | | 695 | |
Air Lease | | | | | | | | |
3.375%, 07/01/2025 | | | 25 | | | | 27 | |
Air Lease MTN | | | | | | | | |
2.875%, 01/15/2026 | | | 120 | | | | 127 | |
2.300%, 02/01/2025 | | | 500 | | | | 520 | |
Boeing | | | | | | | | |
5.705%, 05/01/2040 | | | 800 | | | | 1,040 | |
| | | | | | | | |
| | | |
| Description | | Face Amount
(Thousands) | | Market Value ($ Thousands) |
| |
CORPORATE OBLIGATIONS (continued) | | | | | |
5.040%, 05/01/2027 | | $ | 500 | | | $ | 578 | |
4.875%, 05/01/2025 | | | 500 | | | | 561 | |
4.508%, 05/01/2023 | | | 500 | | | | 531 | |
3.950%, 08/01/2059 | | | 200 | | | | 207 | |
3.625%, 02/01/2031 | | | 30 | | | | 33 | |
3.250%, 02/01/2028 | | | 50 | | | | 53 | |
2.750%, 02/01/2026 | | | 50 | | | | 52 | |
1.950%, 02/01/2024 | | | 30 | | | | 31 | |
Burlington Northern Santa Fe | | | | | | | | |
3.300%, 09/15/2051 | | | 100 | | | | 111 | |
Canadian Pacific Railway | | | | | | | | |
2.050%, 03/05/2030 | | | 200 | | | | 202 | |
Carrier Global | | | | | | | | |
3.577%, 04/05/2050 | | | 500 | | | | 556 | |
3.377%, 04/05/2040 | | | 500 | | | | 539 | |
2.242%, 02/15/2025 | | | 500 | | | | 523 | |
Caterpillar | | | | | | | | |
2.600%, 04/09/2030 | | | 200 | | | | 215 | |
Caterpillar Financial Services | | | | | | | | |
0.650%, 07/07/2023 | | | 600 | | | | 604 | |
Caterpillar Financial Services MTN | | | | | | | | |
1.450%, 05/15/2025 | | | 500 | | | | 514 | |
0.800%, 11/13/2025 | | | 330 | | | | 330 | |
0.450%, 05/17/2024 | | | 50 | | | | 50 | |
CNH Industrial Capital | | | | | | | | |
1.950%, 07/02/2023 | | | 515 | | | | 528 | |
CSX | | | | | | | | |
3.800%, 04/15/2050 | | | 500 | | | | 591 | |
2.500%, 05/15/2051 | | | 290 | | | | 271 | |
Cummins | | | | | | | | |
1.500%, 09/01/2030 | | | 250 | | | | 244 | |
Deere | | | | | | | | |
2.750%, 04/15/2025 | | | 300 | | | | 321 | |
Emerson Electric | | | | | | | | |
0.875%, 10/15/2026 | | | 165 | | | | 164 | |
Equifax | | | | | | | | |
3.100%, 05/15/2030 | | | 200 | | | | 218 | |
FedEx | | | | | | | | |
5.250%, 05/15/2050 | | | 300 | | | | 419 | |
3.250%, 05/15/2041 | | | 300 | | | | 317 | |
Flowserve | | | | | | | | |
3.500%, 10/01/2030 | | | 70 | | | | 74 | |
GATX | | | | | | | | |
1.900%, 06/01/2031 | | | 250 | | | | 242 | |
GE Capital Funding | | | | | | | | |
4.400%, 05/15/2030 | | | 200 | | | | 235 | |
3.450%, 05/15/2025 | | | 500 | | | | 545 | |
General Dynamics | | | | | | | | |
4.250%, 04/01/2040 | | | 500 | | | | 625 | |
3.250%, 04/01/2025 | | | 300 | | | | 326 | |
Honeywell International | | | | | | | | |
1.950%, 06/01/2030 | | | 300 | | | | 309 | |
| | |
| 30 | | Adviser Managed Trust / Annual Report / July 31, 2021 |
| | | | | | | | |
| | | |
| Description | | Face Amount
(Thousands) | | Market Value ($ Thousands) |
| |
CORPORATE OBLIGATIONS (continued) | | | | | |
1.350%, 06/01/2025 | | $ | 500 | | | $ | 511 | |
Hubbell | | | | | | | | |
2.300%, 03/15/2031 | | | 60 | | | | 61 | |
IDEX | | | | | | | | |
2.625%, 06/15/2031 | | | 50 | | | | 52 | |
JetBlue Pass-Through Trust, Ser 2020-1, Cl A | | | | | | | | |
4.000%, 11/15/2032 | | | 24 | | | | 27 | |
John Deere Capital | | | | | | | | |
1.450%, 01/15/2031 | | | 285 | | | | 279 | |
John Deere Capital MTN | | | | | | | | |
1.050%, 06/17/2026 | | | 500 | | | | 502 | |
0.700%, 01/15/2026 | | | 400 | | | | 398 | |
0.400%, 10/10/2023 | | | 290 | | | | 291 | |
Johnson Controls International | | | | | | | | |
1.750%, 09/15/2030 | | | 85 | | | | 84 | |
L3Harris Technologies | | | | | | | | |
3.850%, 12/15/2026 | | | 500 | | | | 564 | |
Leidos | | | | | | | | |
4.375%, 05/15/2030 | | | 300 | | | | 345 | |
Lockheed Martin | | | | | | | | |
1.850%, 06/15/2030 | | | 500 | | | | 508 | |
Masco | | | | | | | | |
2.000%, 10/01/2030 | | | 250 | | | | 249 | |
Norfolk Southern | | | | | | | | |
4.100%, 05/15/2121 | | | 15 | | | | 17 | |
3.155%, 05/15/2055 | | | 100 | | | | 104 | |
3.050%, 05/15/2050 | | | 200 | | | | 206 | |
2.300%, 05/15/2031 | | | 25 | | | | 26 | |
Northrop Grumman | | | | | | | | |
5.150%, 05/01/2040 | | | 500 | | | | 671 | |
Otis Worldwide | | | | | | | | |
3.112%, 02/15/2040 | | | 200 | | | | 211 | |
2.056%, 04/05/2025 | | | 250 | | | | 260 | |
PACCAR Financial MTN | | | | | | | | |
0.800%, 06/08/2023 | | | 500 | | | | 504 | |
Quanta Services | | | | | | | | |
2.900%, 10/01/2030 | | | 250 | | | | 263 | |
Raytheon Technologies | | | | | | | | |
4.500%, 06/01/2042 | | | 500 | | | | 637 | |
3.125%, 07/01/2050 | | | 300 | | | | 317 | |
2.250%, 07/01/2030 | | | 300 | | | | 310 | |
Republic Services | | | | | | | | |
1.750%, 02/15/2032 | | | 300 | | | | 293 | |
Roper Technologies | | | | | | | | |
2.000%, 06/30/2030 | | | 200 | | | | 201 | |
Southwest Airlines | | | | | | | | |
5.250%, 05/04/2025 | | | 300 | | | | 343 | |
4.750%, 05/04/2023 | | | 500 | | | | 536 | |
Stanley Black & Decker | | | | | | | | |
2.750%, 11/15/2050 | | | 350 | | | | 349 | |
| | | | | | | | |
| | | |
| Description | | Face Amount
(Thousands) | | Market Value ($ Thousands) |
| |
CORPORATE OBLIGATIONS (continued) | | | | | |
Union Pacific | | | | | | | | |
3.839%, 03/20/2060 | | $ | 500 | | | $ | 587 | |
3.799%, 04/06/2071 (A) | | | 500 | | | | 578 | |
2.973%, 09/16/2062 | | | 100 | | | | 99 | |
2.150%, 02/05/2027 | | | 500 | | | | 522 | |
United Airlines Pass-Through Trust, Ser 2020-1, Cl A | | | | | | | | |
5.875%, 10/15/2027 | | | 278 | | | | 310 | |
United Airlines Pass-Through Trust, Ser 2020-1, Cl B | | | | | | | | |
4.875%, 01/15/2026 | | | 47 | | | | 49 | |
United Parcel Service | | | | | | | | |
5.300%, 04/01/2050 | | | 500 | | | | 748 | |
5.200%, 04/01/2040 | | | 300 | | | | 415 | |
Waste Management | | | | | | | | |
2.000%, 06/01/2029 | | | 50 | | | | 51 | |
0.750%, 11/15/2025 | | | 300 | | | | 299 | |
Xylem | | | | | | | | |
2.250%, 01/30/2031 | | | 175 | | | | 179 | |
| | | | | | | | |
| | | | | | | 27,571 | |
| | | | | | | | |
| |
Information Technology — 2.4% | | | | | |
Amdocs | | | | | | | | |
2.538%, 06/15/2030 | | | 250 | | | | 254 | |
Apple | | | | | | | | |
3.850%, 05/04/2043 | | | 500 | | | | 601 | |
2.850%, 08/05/2061 | | | 50 | | | | 50 | |
2.800%, 02/08/2061 | | | 200 | | | | 198 | |
2.700%, 08/05/2051 | | | 100 | | | | 100 | |
2.650%, 05/11/2050 | | | 300 | | | | 296 | |
2.650%, 02/08/2051 | | | 200 | | | | 199 | |
2.375%, 02/08/2041 | | | 700 | | | | 689 | |
1.700%, 08/05/2031 | | | 100 | | | | 100 | |
1.650%, 05/11/2030 | | | 500 | | | | 502 | |
1.650%, 02/08/2031 | | | 200 | | | | 199 | |
1.400%, 08/05/2028 | | | 100 | | | | 100 | |
1.200%, 02/08/2028 | | | 200 | | | | 198 | |
1.125%, 05/11/2025 | | | 500 | | | | 507 | |
0.750%, 05/11/2023 | | | 500 | | | | 504 | |
0.700%, 02/08/2026 | | | 200 | | | | 199 | |
Automatic Data Processing | | | | | | | | |
3.375%, 09/15/2025 | | | 500 | | | | 550 | |
1.250%, 09/01/2030 | | | 40 | | | | 39 | |
Avnet | | | | | | | | |
3.000%, 05/15/2031 | | | 100 | | | | 101 | |
Broadcom | | | | | | | | |
4.150%, 11/15/2030 | | | 200 | | | | 227 | |
4.110%, 09/15/2028 | | | 300 | | | | 339 | |
3.459%, 09/15/2026 | | | 500 | | | | 546 | |
3.419%, 04/15/2033 (A) | | | 300 | | | | 320 | |
Citrix Systems | | | | | | | | |
1.250%, 03/01/2026 | | | 135 | | | | 134 | |
| | |
| Adviser Managed Trust / Annual Report / July 31, 2021 | | 31 |
SCHEDULE OF INVESTMENTS
July 31, 2021
Tactical Offensive Core Fixed Income Fund (Continued)
| | | | | | | | |
| | | |
| Description | | Face Amount
(Thousands) | | Market Value ($ Thousands) |
| |
CORPORATE OBLIGATIONS (continued) | | | | | |
Dell International | | | | | | | | |
5.850%, 07/15/2025 | | $ | 500 | | | $ | 588 | |
Fidelity National Information Services | | | | | | | | |
3.100%, 03/01/2041 | | | 315 | | | | 331 | |
2.250%, 03/01/2031 | | | 100 | | | | 102 | |
1.650%, 03/01/2028 | | | 35 | | | | 35 | |
1.150%, 03/01/2026 | | | 55 | | | | 55 | |
0.600%, 03/01/2024 | | | 35 | | | | 35 | |
0.375%, 03/01/2023 | | | 40 | | | | 40 | |
Fiserv | | | | | | | | |
4.400%, 07/01/2049 | | | 500 | | | | 616 | |
2.650%, 06/01/2030 | | | 300 | | | | 315 | |
Flex | | | | | | | | |
4.875%, 05/12/2030 | | | 415 | | | | 485 | |
Global Payments | | | | | | | | |
4.150%, 08/15/2049 | | | 500 | | | | 589 | |
2.900%, 05/15/2030 | | | 200 | | | | 212 | |
Hewlett Packard Enterprise | | | | | | | | |
4.650%, 10/01/2024 | | | 300 | | | | 333 | |
4.450%, 10/02/2023 | | | 300 | | | | 324 | |
1.750%, 04/01/2026 | | | 50 | | | | 51 | |
1.450%, 04/01/2024 | | | 550 | | | | 560 | |
HP | | | | | | | | |
2.200%, 06/17/2025 | | | 500 | | | | 520 | |
1.450%, 06/17/2026 (A) | | | 500 | | | | 500 | |
Intel | | | | | | | | |
4.600%, 03/25/2040 | | | 300 | | | | 383 | |
3.400%, 03/25/2025 | | | 500 | | | | 546 | |
3.100%, 02/15/2060 | | | 500 | | | | 516 | |
International Business Machines | | | | | | | | |
4.250%, 05/15/2049 | | | 500 | | | | 629 | |
4.150%, 05/15/2039 | | | 500 | | | | 604 | |
1.950%, 05/15/2030 | | | 200 | | | | 201 | |
1.700%, 05/15/2027 | | | 500 | | | | 512 | |
Intuit | | | | | | | | |
0.950%, 07/15/2025 | | | 500 | | | | 503 | |
Jabil | | | | | | | | |
1.700%, 04/15/2026 | | | 65 | | | | 66 | |
Juniper Networks | | | | | | | | |
2.000%, 12/10/2030 | | | 125 | | | | 122 | |
Lam Research | | | | | | | | |
2.875%, 06/15/2050 | | | 300 | | | | 311 | |
1.900%, 06/15/2030 | | | 500 | | | | 509 | |
Mastercard | | | | | | | | |
3.650%, 06/01/2049 | | | 500 | | | | 596 | |
Micron Technology | | | | | | | | |
2.497%, 04/24/2023 | | | 500 | | | | 515 | |
Microsoft | | | | | | | | |
3.041%, 03/17/2062 | | | 500 | | | | 548 | |
2.921%, 03/17/2052 | | | 500 | | | | 539 | |
2.875%, 02/06/2024 | | | 500 | | | | 530 | |
2.675%, 06/01/2060 | | | 200 | | | | 202 | |
| | | | | | | | |
| | | |
| Description | | Face Amount
(Thousands) | | Market Value ($ Thousands) |
| |
CORPORATE OBLIGATIONS (continued) | | | | | |
2.400%, 08/08/2026 | | $ | 200 | | | $ | 214 | |
Motorola Solutions | | | | | | | | |
2.750%, 05/24/2031 | | | 50 | | | | 52 | |
2.300%, 11/15/2030 | | | 250 | | | | 250 | |
NetApp | | | | | | | | |
2.700%, 06/22/2030 | | | 200 | | | | 211 | |
1.875%, 06/22/2025 | | | 500 | | | | 516 | |
NVIDIA | | | | | | | | |
3.500%, 04/01/2040 | | | 300 | | | | 344 | |
2.850%, 04/01/2030 | | | 200 | | | | 219 | |
2.000%, 06/15/2031 | | | 50 | | | | 51 | |
1.550%, 06/15/2028 | | | 50 | | | | 50 | |
0.584%, 06/14/2024 | | | 40 | | | | 40 | |
0.309%, 06/15/2023 | | | 40 | | | | 40 | |
NXP BV | | | | | | | | |
3.150%, 05/01/2027 (A) | | | 300 | | | | 324 | |
2.700%, 05/01/2025 (A) | | | 300 | | | | 317 | |
Oracle | | | | | | | | |
4.100%, 03/25/2061 | | | 95 | | | | 107 | |
3.950%, 03/25/2051 | | | 120 | | | | 133 | |
3.650%, 03/25/2041 | | | 620 | | | | 673 | |
3.600%, 04/01/2040 | | | 800 | | | | 856 | |
3.600%, 04/01/2050 | | | 500 | | | | 522 | |
2.950%, 04/01/2030 | | | 200 | | | | 214 | |
2.875%, 03/25/2031 | | | 75 | | | | 79 | |
2.500%, 04/01/2025 | | | 500 | | | | 526 | |
2.300%, 03/25/2028 | | | 105 | | | | 109 | |
1.650%, 03/25/2026 | | | 70 | | | | 71 | |
PayPal Holdings | | | | | | | | |
3.250%, 06/01/2050 | | | 300 | | | | 334 | |
1.650%, 06/01/2025 | | | 500 | | | | 514 | |
1.350%, 06/01/2023 | | | 500 | | | | 509 | |
QUALCOMM | | | | | | | | |
2.150%, 05/20/2030 | | | 200 | | | | 207 | |
salesforce.com | | | | | | | | |
3.050%, 07/15/2061 | | | 25 | | | | 26 | |
2.900%, 07/15/2051 | | | 50 | | | | 51 | |
2.700%, 07/15/2041 | | | 30 | | | | 31 | |
1.950%, 07/15/2031 | | | 80 | | | | 81 | |
0.625%, 07/15/2024 | | | 55 | | | | 55 | |
Texas Instruments | | | | | | | | |
1.375%, 03/12/2025 | | | 500 | | | | 512 | |
VeriSign | | | | | | | | |
2.700%, 06/15/2031 | | | 60 | | | | 62 | |
Visa | | | | | | | | |
2.050%, 04/15/2030 | | | 200 | | | | 208 | |
2.000%, 08/15/2050 | | | 100 | | | | 89 | |
1.100%, 02/15/2031 | | | 200 | | | | 192 | |
0.750%, 08/15/2027 | | | 95 | | | | 94 | |
Western Union | | | | | | | | |
2.750%, 03/15/2031 | | | 100 | | | | 102 | |
| | |
| 32 | | Adviser Managed Trust / Annual Report / July 31, 2021 |
| | | | | | | | |
| | | |
| Description | | Face Amount
(Thousands) | | Market Value ($ Thousands) |
| |
CORPORATE OBLIGATIONS (continued) | | | | | |
1.350%, 03/15/2026 | | $ | 100 | | | $ | 100 | |
| | | | | | | | |
| | | | | | | 29,560 | |
| | | | | | | | |
| | |
Materials — 0.5% | | | | | | | | |
Air Products and Chemicals | | | | | | | | |
2.700%, 05/15/2040 | | | 300 | | | | 315 | |
Amcor Flexibles North America | | | | | | | | |
2.690%, 05/25/2031 | | | 100 | | | | 104 | |
Berry Global | | | | | | | | |
1.650%, 01/15/2027 (A) | | | 100 | | | | 100 | |
Celanese US Holdings | | | | | | | | |
1.400%, 08/05/2026 | | | 50 | | | | 50 | |
Dow Chemical | | | | | | | | |
3.600%, 11/15/2050 | | | 500 | | | | 557 | |
2.100%, 11/15/2030 | | | 500 | | | | 506 | |
Ecolab | | | | | | | | |
2.125%, 08/15/2050 | | | 200 | | | | 185 | |
1.300%, 01/30/2031 | | | 160 | | | | 156 | |
EI du Pont de Nemours | | | | | | | | |
1.700%, 07/15/2025 | | | 200 | | | | 206 | |
Linde | | | | | | | | |
2.000%, 08/10/2050 | | | 95 | | | | 84 | |
1.100%, 08/10/2030 | | | 150 | | | | 144 | |
LYB International Finance III | | | | | | | | |
4.200%, 10/15/2049 | | | 500 | | | | 593 | |
4.200%, 05/01/2050 | | | 200 | | | | 237 | |
3.800%, 10/01/2060 | | | 30 | | | | 34 | |
3.625%, 04/01/2051 | | | 40 | | | | 44 | |
3.375%, 10/01/2040 | | | 30 | | | | 32 | |
2.875%, 05/01/2025 | | | 200 | | | | 213 | |
2.250%, 10/01/2030 | | | 25 | | | | 25 | |
1.250%, 10/01/2025 | | | 20 | | | | 20 | |
Martin Marietta Materials | | | | | | | | |
3.200%, 07/15/2051 | | | 35 | | | | 36 | |
2.400%, 07/15/2031 | | | 25 | | | | 26 | |
0.650%, 07/15/2023 | | | 15 | | | | 15 | |
Newmont | | | | | | | | |
2.250%, 10/01/2030 | | | 400 | | | | 407 | |
Nucor | | | | | | | | |
2.700%, 06/01/2030 | | | 400 | | | | 424 | |
2.000%, 06/01/2025 | | | 200 | | | | 208 | |
Nutrien | | | | | | | | |
3.950%, 05/13/2050 | | | 200 | | | | 236 | |
1.900%, 05/13/2023 | | | 300 | | | | 307 | |
PPG Industries | | | | | | | | |
2.550%, 06/15/2030 | | | 200 | | | | 210 | |
Reliance Steel & Aluminum | | | | | | | | |
1.300%, 08/15/2025 | | | 85 | | | | 85 | |
Sherwin-Williams | | | | | | | | |
3.300%, 05/15/2050 | | | 200 | | | | 219 | |
Steel Dynamics | | | | | | | | |
3.250%, 10/15/2050 | | | 65 | | | | 66 | |
| | | | | | | | |
| | | |
| Description | | Face Amount
(Thousands) | | Market Value ($ Thousands) |
| |
CORPORATE OBLIGATIONS (continued) | | | | | |
1.650%, 10/15/2027 | | $ | 40 | | | $ | 40 | |
Suzano Austria GmbH | | | | | | | | |
3.750%, 01/15/2031 | | | 250 | | | | 260 | |
Vale Overseas | | | | | | | | |
3.750%, 07/08/2030 | | | 225 | | | | 241 | |
| | | | | | | | |
| | | | | | | 6,385 | |
| | | | | | | | |
| | |
Real Estate — 0.9% | | | | | | | | |
Agree | | | | | | | | |
2.000%, 06/15/2028 | | | 65 | | | | 65 | |
Alexandria Real Estate Equities | | | | | | | | |
4.900%, 12/15/2030 | | | 300 | | | | 371 | |
3.000%, 05/18/2051 | | | 100 | | | | 101 | |
1.875%, 02/01/2033 | | | 70 | | | | 68 | |
American Tower | | | | | | | | |
3.100%, 06/15/2050 | | | 250 | | | | 252 | |
1.875%, 10/15/2030 | | | 250 | | | | 245 | |
1.300%, 09/15/2025 | | | 500 | | | | 504 | |
Boston Properties | | | | | | | | |
3.250%, 01/30/2031 | | | 400 | | | | 436 | |
2.900%, 03/15/2030 | | | 500 | | | | 530 | |
Brixmor Operating Partnership | | | | | | | | |
4.050%, 07/01/2030 | | | 150 | | | | 171 | |
Corporate Office Properties | | | | | | | | |
2.250%, 03/15/2026 | | | 285 | | | | 295 | |
Crown Castle International | | | | | | | | |
3.300%, 07/01/2030 | | | 200 | | | | 218 | |
2.900%, 04/01/2041 | | | 100 | | | | 99 | |
2.250%, 01/15/2031 | | | 200 | | | | 201 | |
1.350%, 07/15/2025 | | | 500 | | | | 506 | |
1.050%, 07/15/2026 | | | 100 | | | | 99 | |
CubeSmart | | | | | | | | |
2.000%, 02/15/2031 | | | 65 | | | | 65 | |
CyrusOne | | | | | | | | |
2.150%, 11/01/2030 | | | 50 | | | | 48 | |
Duke Realty | | | | | | | | |
1.750%, 02/01/2031 | | | 140 | | | | 137 | |
Equinix | | | | | | | | |
3.400%, 02/15/2052 | | | 15 | | | | 16 | |
2.500%, 05/15/2031 | | | 50 | | | | 52 | |
2.000%, 05/15/2028 | | | 15 | | | | 15 | |
1.450%, 05/15/2026 | | | 20 | | | | 20 | |
1.250%, 07/15/2025 | | | 500 | | | | 503 | |
1.000%, 09/15/2025 | | | 250 | | | | 250 | |
Essex Portfolio | | | | | | | | |
2.550%, 06/15/2031 | | | 65 | | | | 67 | |
1.700%, 03/01/2028 | | | 165 | | | | 165 | |
Federal Realty Investment Trust | | | | | | | | |
1.250%, 02/15/2026 | | | 250 | | | | 251 | |
GLP Capital | | | | | | | | |
4.000%, 01/15/2031 | | | 50 | | | | 55 | |
| | |
| Adviser Managed Trust / Annual Report / July 31, 2021 | | 33 |
SCHEDULE OF INVESTMENTS
July 31, 2021
Tactical Offensive Core Fixed Income Fund (Continued)
| | | | | | | | |
| | | |
| Description | | Face Amount
(Thousands) | | Market Value ($ Thousands) |
| |
CORPORATE OBLIGATIONS (continued) | | | | | |
Healthcare Realty Trust | | | | | | | | |
2.050%, 03/15/2031 | | $ | 65 | | | $ | 64 | |
Healthcare Trust of America Holdings | | | | | | | | |
2.000%, 03/15/2031 | | | 110 | | | | 109 | |
Highwoods Realty | | | | | | | | |
2.600%, 02/01/2031 | | | 65 | | | | 67 | |
Host Hotels & Resorts | | | | | | | | |
3.500%, 09/15/2030 | | | 145 | | | | 154 | |
Kilroy Realty | | | | | | | | |
2.500%, 11/15/2032 | | | 200 | | | | 201 | |
Kimco Realty | | | | | | | | |
2.700%, 10/01/2030 | | | 200 | | | | 209 | |
1.900%, 03/01/2028 | | | 100 | | | | 101 | |
Life Storage | | | | | | | | |
2.200%, 10/15/2030 | | | 45 | | | | 45 | |
National Retail Properties | | | | | | | | |
3.500%, 04/15/2051 | | | 70 | | | | 76 | |
Office Properties Income Trust | | | | | | | | |
4.500%, 02/01/2025 | | | 100 | | | | 108 | |
Omega Healthcare Investors | | | | | | | | |
3.375%, 02/01/2031 | | | 250 | | | | 260 | |
Piedmont Operating Partnership | | | | | | | | |
3.150%, 08/15/2030 | | | 100 | | | | 104 | |
Prologis | | | | | | | | |
2.250%, 04/15/2030 | | | 300 | | | | 312 | |
2.125%, 04/15/2027 | | | 300 | | | | 314 | |
Public Storage | | | | | | | | |
0.875%, 02/15/2026 | | | 50 | | | | 50 | |
Realty Income | | | | | | | | |
3.875%, 04/15/2025 | | | 500 | | | | 554 | |
3.250%, 01/15/2031 | | | 140 | | | | 155 | |
Retail Properties of America | | | | | | | | |
4.750%, 09/15/2030 | | | 250 | | | | 282 | |
Simon Property Group | | | | | | | | |
2.650%, 07/15/2030 | | | 250 | | | | 264 | |
2.200%, 02/01/2031 | | | 300 | | | | 302 | |
1.750%, 02/01/2028 | | | 300 | | | | 303 | |
Spirit Realty | | | | | | | | |
3.200%, 02/15/2031 | | | 200 | | | | 213 | |
STORE Capital | | | | | | | | |
2.750%, 11/18/2030 | | | 50 | | | | 51 | |
UDR MTN | | | | | | | | |
2.100%, 06/15/2033 | | | 200 | | | | 196 | |
VEREIT Operating Partnership | | | | | | | | |
3.400%, 01/15/2028 | | | 25 | | | | 28 | |
2.850%, 12/15/2032 | | | 65 | | | | 70 | |
2.200%, 06/15/2028 | | | 65 | | | | 67 | |
Welltower | | | | | | | | |
2.800%, 06/01/2031 | | | 400 | | | | 423 | |
2.050%, 01/15/2029 | | | 30 | | | | 30 | |
| | | | | | | | |
| | | |
| Description | | Face Amount
(Thousands) | | Market Value ($ Thousands) |
| |
CORPORATE OBLIGATIONS (continued) | | | | | |
WP Carey | | | | | | | | |
2.400%, 02/01/2031 | | $ | 150 | | | $ | 153 | |
| | | | | | | | |
| | | | | | | 11,070 | |
| | | | | | | | |
| | |
Utilities — 2.3% | | | | | | | | |
AEP Texas | | | | | | | | |
2.100%, 07/01/2030 | | | 300 | | | | 299 | |
AES | | | | | | | | |
2.450%, 01/15/2031 (A) | | | 150 | | | | 152 | |
1.375%, 01/15/2026 (A) | | | 115 | | | | 115 | |
Alabama Power | | | | | | | | |
1.450%, 09/15/2030 | | | 100 | | | | 97 | |
Ameren Illinois | | | | | | | | |
1.550%, 11/15/2030 | | | 375 | | | | 367 | |
American Electric Power | | | | | | | | |
1.000%, 11/01/2025 | | | 500 | | | | 499 | |
0.750%, 11/01/2023 | | | 145 | | | | 145 | |
American Water Capital | | | | | | | | |
3.250%, 06/01/2051 | | | 50 | | | | 54 | |
2.800%, 05/01/2030 | | | 300 | | | | 325 | |
2.300%, 06/01/2031 | | | 50 | | | | 52 | |
Arizona Public Service | | | | | | | | |
3.350%, 05/15/2050 | | | 300 | | | | 330 | |
Atmos Energy | | | | | | | | |
1.500%, 01/15/2031 | | | 300 | | | | 291 | |
Avangrid | | | | | | | | |
3.200%, 04/15/2025 | | | 500 | | | | 538 | |
Baltimore Gas and Electric | | | | | | | | |
2.900%, 06/15/2050 | | | 200 | | | | 205 | |
2.250%, 06/15/2031 | | | 350 | | | | 360 | |
Berkshire Hathaway Energy | | | | | | | | |
4.050%, 04/15/2025 | | | 500 | | | | 557 | |
3.700%, 07/15/2030 | | | 500 | | | | 574 | |
2.850%, 05/15/2051 | | | 50 | | | | 50 | |
1.650%, 05/15/2031 | | | 30 | | | | 29 | |
CenterPoint Energy Houston Electric LLC | | | | | | | | |
2.900%, 07/01/2050 | | | 200 | | | | 209 | |
CMS Energy | | | | | | | | |
4.750%, VAR US Treas Yield Curve Rate T Note Const Mat 5 Yr+4.116%, 06/01/2050 | | | 300 | | | | 337 | |
Commonwealth Edison | | | | | | | | |
3.000%, 03/01/2050 | | | 500 | | | | 525 | |
Connecticut Light and Power | | | | | | | | |
0.750%, 12/01/2025 | | | 400 | | | | 397 | |
Consolidated Edison | | | | | | | | |
0.650%, 12/01/2023 | | | 400 | | | | 400 | |
Consolidated Edison of New York | | | | | | | | |
3.000%, 12/01/2060 | | | 525 | | | | 507 | |
Consumers Energy Co | | | | | | | | |
3.500%, 08/01/2051 | | | 500 | | | | 582 | |
| | |
| 34 | | Adviser Managed Trust / Annual Report / July 31, 2021 |
| | | | | | | | |
| | | |
| Description | | Face Amount
(Thousands) | | Market Value ($ Thousands) |
| |
CORPORATE OBLIGATIONS (continued) | | | | | |
Dominion Energy | | | | | | | | |
3.375%, 04/01/2030 | | $ | 500 | | | $ | 555 | |
DTE Electric | | | | | | | | |
2.250%, 03/01/2030 | | | 300 | | | | 313 | |
DTE Energy | | | | | | | | |
1.050%, 06/01/2025 | | | 350 | | | | 351 | |
0.550%, 11/01/2022 | | | 55 | | | | 55 | |
Duke Energy | | | | | | | | |
2.450%, 06/01/2030 | | | 700 | | | | 725 | |
0.900%, 09/15/2025 | | | 155 | | | | 154 | |
Duke Energy Florida | | | | | | | | |
1.750%, 06/15/2030 | | | 200 | | | | 199 | |
Duke Energy Indiana | | | | | | | | |
2.750%, 04/01/2050 | | | 500 | | | | 496 | |
Duke Energy Progress | | | | | | | | |
2.500%, 08/15/2050 | | | 500 | | | | 481 | |
Entergy | | | | | | | | |
0.900%, 09/15/2025 | | | 475 | | | | 472 | |
Entergy Arkansas | | | | | | | | |
2.650%, 06/15/2051 | | | 255 | | | | 250 | |
Entergy Louisiana | | | | | | | | |
3.100%, 06/15/2041 | | | 300 | | | | 324 | |
2.900%, 03/15/2051 | | | 100 | | | | 102 | |
1.600%, 12/15/2030 | | | 100 | | | | 98 | |
0.620%, 11/17/2023 | | | 25 | | | | 25 | |
Essential Utilities | | | | | | | | |
3.351%, 04/15/2050 | | | 300 | | | | 321 | |
Evergy | | | | | | | | |
2.450%, 09/15/2024 | | | 500 | | | | 526 | |
Eversource Energy | | | | | | | | |
3.450%, 01/15/2050 | | | 125 | | | | 136 | |
1.650%, 08/15/2030 | | | 100 | | | | 98 | |
0.800%, 08/15/2025 | | | 60 | | | | 60 | |
Exelon Generation | | | | | | | | |
3.250%, 06/01/2025 | | | 300 | | | | 325 | |
Florida Power & Light | | | | | | | | |
2.850%, 04/01/2025 | | | 500 | | | | 536 | |
Georgia Power | | | | | | | | |
3.250%, 03/15/2051 | | | 70 | | | | 74 | |
2.100%, 07/30/2023 | | | 300 | | | | 310 | |
Kentucky Utilities | | | | | | | | |
3.300%, 06/01/2050 | | | 300 | | | | 328 | |
Mississippi Power | | | | | | | | |
3.100%, 07/30/2051 | | | 15 | | | | 16 | |
National Fuel Gas | | | | | | | | |
5.500%, 01/15/2026 | | | 500 | | | | 583 | |
National Rural Utilities Cooperative Finance | | | | | | | | |
1.350%, 03/15/2031 | | | 200 | | | | 189 | |
1.000%, 06/15/2026 | | | 250 | | | | 250 | |
NextEra Energy Capital Holdings | | | | | | | | |
2.750%, 05/01/2025 | | | 500 | | | | 533 | |
2.750%, 11/01/2029 | | | 500 | | | | 533 | |
| | | | | | | | |
| | | |
| Description | | Face Amount
(Thousands) | | Market Value ($ Thousands) |
| |
CORPORATE OBLIGATIONS (continued) | | | | | |
2.250%, 06/01/2030 | | $ | 500 | | | $ | 514 | |
NiSource | | | | | | | | |
3.600%, 05/01/2030 | | | 300 | | | | 336 | |
0.950%, 08/15/2025 | | | 175 | | | | 174 | |
Northern States Power Co | | | | | | | | |
2.600%, 06/01/2051 | | | 500 | | | | 498 | |
OGE Energy | | | | | | | | |
0.703%, 05/26/2023 | | | 40 | | | | 40 | |
Oglethorpe Power | | | | | | | | |
3.750%, 08/01/2050 | | | 125 | | | | 137 | |
Ohio Power | | | | | | | | |
1.625%, 01/15/2031 | | | 100 | | | | 98 | |
Oncor Electric Delivery Co LLC | | | | | | | | |
3.100%, 09/15/2049 | | | 500 | | | | 538 | |
ONE Gas | | | | | | | | |
1.100%, 03/11/2024 | | | 200 | | | | 200 | |
Pacific Gas and Electric | | | | | | | | |
4.950%, 07/01/2050 | | | 500 | | | | 517 | |
4.550%, 07/01/2030 | | | 500 | | | | 534 | |
4.500%, 07/01/2040 | | | 500 | | | | 505 | |
4.200%, 06/01/2041 | | | 300 | | | | 293 | |
3.150%, 01/01/2026 | | | 500 | | | | 513 | |
PacifiCorp | | | | | | | | |
3.300%, 03/15/2051 | | | 500 | | | | 545 | |
2.700%, 09/15/2030 | | | 300 | | | | 320 | |
Piedmont Natural Gas | | | | | | | | |
3.350%, 06/01/2050 | | | 300 | | | | 320 | |
Pinnacle West Capital | | | | | | | | |
1.300%, 06/15/2025 | | | 500 | | | | 506 | |
Public Service Electric and Gas MTN | | | | | | | | |
2.050%, 08/01/2050 | | | 450 | | | | 400 | |
San Diego Gas & Electric | | | | | | | | |
1.700%, 10/01/2030 | | | 465 | | | | 458 | |
Southern | | | | | | | | |
4.000%, VAR US Treas Yield Curve Rate T Note Const Mat 5 Yr+3.733%, 01/15/2051 | | | 250 | | | | 264 | |
3.700%, 04/30/2030 | | | 500 | | | | 563 | |
Southern California Edison | | | | | | | | |
4.875%, 03/01/2049 | | | 500 | | | | 600 | |
2.250%, 06/01/2030 | | | 125 | | | | 126 | |
1.200%, 02/01/2026 | | | 440 | | | | 442 | |
Southern Gas Capital | | | | | | | | |
1.750%, 01/15/2031 | | | 75 | | | | 73 | |
Southwestern Public Service | | | | | | | | |
3.150%, 05/01/2050 | | | 300 | | | | 325 | |
Tucson Electric Power | | | | | | | | |
3.250%, 05/01/2051 | | | 15 | | | | 16 | |
1.500%, 08/01/2030 | | | 90 | | | | 87 | |
Union Electric | | | | | | | | |
2.625%, 03/15/2051 | | | 155 | | | | 152 | |
| | |
| Adviser Managed Trust / Annual Report / July 31, 2021 | | 35 |
SCHEDULE OF INVESTMENTS
July 31, 2021
Tactical Offensive Core Fixed Income Fund (Continued)
| | | | | | | | |
| | | |
| Description | | Face Amount
(Thousands) | | Market Value ($ Thousands) |
| |
CORPORATE OBLIGATIONS (continued) | | | | | |
Virginia Electric and Power | | | | | | | | |
2.450%, 12/15/2050 | | $ | 125 | | | $ | 118 | |
Washington Gas Light MTN | | | | | | | | |
3.650%, 09/15/2049 | | | 40 | | | | 46 | |
WEC Energy Group | | | | | | | | |
0.550%, 09/15/2023 | | | 250 | | | | 250 | |
Xcel Energy | | | | | | | | |
0.500%, 10/15/2023 | | | 100 | | | | 100 | |
| | | | | | | | |
| | | | | | | 28,022 | |
| | | | | | | | |
| | |
Total Corporate Obligations
(Cost $329,618) ($ Thousands) | | | | | | | 332,337 | |
| | | | | | | | |
| | |
SOVEREIGN DEBT — 7.4% | | | | | | | | |
| | |
Bundesrepublik Deutschland Bundesanleihe | | | | | | | | |
5.625%, 01/04/2028 | | EUR | 600 | | | | 1,011 | |
2.500%, 07/04/2044 | | | 165 | | | | 315 | |
2.500%, 08/15/2046 | | | 500 | | | | 978 | |
1.750%, 02/15/2024 | | | 800 | | | | 1,012 | |
1.500%, 05/15/2024 | | | 800 | | | | 1,011 | |
-0.632%, 08/15/2026 (B)(C) | | | 800 | | | | 986 | |
Canada Government International Bond | | | | | | | | |
5.000%, 06/01/2037 | | CAD | 800 | | | | 956 | |
2.000%, 11/15/2022 | | $ | 200 | | | | 205 | |
1.625%, 01/22/2025 | | | 500 | | | | 520 | |
0.750%, 05/19/2026 | | | 500 | | | | 501 | |
0.250%, 08/01/2022 | | CAD | 1,150 | | | | 921 | |
Chile Government International Bond | | | | | | | | |
3.100%, 05/07/2041 | | $ | 500 | | | | 506 | |
2.450%, 01/31/2031 | | | 500 | | | | 511 | |
Export-Import Bank of Korea | | | | | | | | |
3.250%, 11/10/2025 | | | 500 | | | | 549 | |
1.875%, 02/12/2025 | | | 500 | | | | 519 | |
French Republic Government Bond OAT | | | | | | | | |
5.750%, 10/25/2032 | | EUR | 500 | | | | 986 | |
4.500%, 04/25/2041 | | | 500 | | | | 1,061 | |
2.500%, 05/25/2030 | | | 700 | | | | 1,036 | |
1.750%, 05/25/2023 | | | 1,600 | | | | 1,983 | |
1.750%, 06/25/2039 (A) | | | 439 | | | | 654 | |
1.500%, 05/25/2050 (A) | | | 800 | | | | 1,164 | |
1.000%, 05/25/2027 | | | 800 | | | | 1,034 | |
0.500%, 05/25/2026 | | | 800 | | | | 1,001 | |
0.149%, 11/25/2031 (B) | | | 887 | | | | 1,063 | |
Indonesia Government International Bond | | | | | | | | |
4.200%, 10/15/2050 | | $ | 300 | | | | 341 | |
3.050%, 03/12/2051 | | | 200 | | | | 196 | |
2.850%, 02/14/2030 | | | 500 | | | | 522 | |
Israel Government International Bond | | | | | | | | |
3.875%, 07/03/2050 | | | 300 | | | | 355 | |
| | | | | | | | |
| | | |
| Description | | Face Amount
(Thousands) | | Market Value ($ Thousands) |
| | |
SOVEREIGN DEBT (continued) | | | | | | | | |
Italy Buoni Poliennali Del Tesoro | | | | | | | | |
5.000%, 08/01/2034 (A) | | EUR | 600 | | | $ | 1,070 | |
4.750%, 08/01/2023 (A) | | | 700 | | | | 916 | |
3.850%, 09/01/2049 (A) | | | 575 | | | | 1,030 | |
2.450%, 09/01/2033 (A) | | | 700 | | | | 985 | |
1.850%, 07/01/2025 (A) | | | 800 | | | | 1,023 | |
1.650%, 03/01/2032 (A) | | | 800 | | | | 1,043 | |
0.500%, 02/01/2026 | | | 840 | | | | 1,022 | |
0.300%, 08/15/2023 (A) | | | 800 | | | | 962 | |
Italy Government International Bond | | | | | | | | |
4.000%, 10/17/2049 | | $ | 500 | | | | 576 | |
2.375%, 10/17/2024 | | | 500 | | | | 522 | |
Japan Bank for International Cooperation | | | | | | | | |
1.875%, 04/15/2031 | | | 400 | | | | 416 | |
1.250%, 01/21/2031 | | | 200 | | | | 197 | |
0.625%, 05/22/2023 | | | 500 | | | | 503 | |
0.625%, 07/15/2025 | | | 200 | | | | 199 | |
0.375%, 09/15/2023 | | | 420 | | | | 420 | |
Japan Government Five Year Bond | | | | | | | | |
0.100%, 03/20/2025 | | JPY | 189,000 | | | | 1,737 | |
Japan Government Forty Year Bond | | | | | | | | |
2.200%, 03/20/2050 | | | 145,000 | | | | 1,871 | |
Japan Government Ten Year Bond | | | | | | | | |
0.600%, 03/20/2024 | | | 330,000 | | | | 3,065 | |
0.100%, 09/20/2026 | | | 115,000 | | | | 1,060 | |
0.100%, 03/20/2030 | | | 209,000 | | | | 1,930 | |
0.100%, 06/20/2030 | | | 170,000 | | | | 1,568 | |
0.100%, 03/20/2031 | | | 152,000 | | | | 1,397 | |
Japan Government Thirty Year Bond | | | | | | | | |
2.400%, 02/20/2030 | | | 215,000 | | | | 2,371 | |
2.400%, 11/20/2031 | | | 210,000 | | | | 2,377 | |
2.300%, 03/20/2040 | | | 190,000 | | | | 2,337 | |
0.400%, 03/20/2050 | | | 180,000 | | | | 1,550 | |
0.300%, 06/20/2046 | | | 110,000 | | | | 952 | |
Japan Government Twenty Year Bond | | | | | | | | |
2.200%, 03/20/2028 | | | 200,000 | | | | 2,104 | |
2.100%, 03/20/2027 | | | 150,000 | | | | 1,539 | |
2.000%, 06/20/2025 | | | 315,000 | | | | 3,109 | |
0.500%, 12/20/2040 | | | 55,000 | | | | 512 | |
0.500%, 03/20/2041 | | | 40,000 | | | | 372 | |
0.400%, 03/20/2040 | | | 183,000 | | | | 1,681 | |
Japan Government Two Year Bond | | | | | | | | |
0.100%, 06/01/2022 | | | 219,000 | | | | 1,999 | |
Mexico Government International Bond | | | | | | | | |
6.050%, 01/11/2040 | | $ | 500 | | | | 631 | |
5.000%, 04/27/2051 | | | 300 | | | | 343 | |
3.900%, 04/27/2025 | | | 500 | | | | 555 | |
3.771%, 05/24/2061 | | | 225 | | | | 209 | |
3.750%, 04/19/2071 | | | 200 | | | | 184 | |
3.250%, 04/16/2030 | | | 500 | | | | 520 | |
2.659%, 05/24/2031 | | | 210 | | | | 207 | |
| | |
| 36 | | Adviser Managed Trust / Annual Report / July 31, 2021 |
| | | | | | | | |
| | | |
| Description | | Face Amount
(Thousands) | | Market Value ($ Thousands) |
| |
SOVEREIGN DEBT (continued) | | | | | |
Panama Government International Bond | | | | | | | | |
4.500%, 04/01/2056 | | $ | 500 | | | $ | 570 | |
3.160%, 01/23/2030 | | | 500 | | | | 527 | |
2.252%, 09/29/2032 | | | 200 | | | | 194 | |
Peruvian Government International Bond | | | | | | | | |
2.392%, 01/23/2026 | | | 500 | | | | 512 | |
Philippine Government International Bond | | | | | | | | |
3.950%, 01/20/2040 | | | 500 | | | | 559 | |
2.950%, 05/05/2045 | | | 300 | | | | 295 | |
2.457%, 05/05/2030 | | | 500 | | | | 519 | |
Province of Alberta Canada | | | | | | | | |
1.875%, 11/13/2024 | | | 500 | | | | 521 | |
1.300%, 07/22/2030 | | | 500 | | | | 489 | |
Province of British Columbia Canada | | | | | | | | |
1.300%, 01/29/2031 | | | 750 | | | | 742 | |
Province of Ontario Canada | | | | | | | | |
3.050%, 01/29/2024 | | | 500 | | | | 533 | |
2.000%, 10/02/2029 | | | 500 | | | | 527 | |
1.750%, 01/24/2023 | | | 1,000 | | | | 1,023 | |
1.050%, 05/21/2027 | | | 500 | | | | 501 | |
0.625%, 01/21/2026 | | | 1,000 | | | | 995 | |
Province of Quebec Canada | | | | | | | | |
1.500%, 02/11/2025 | | | 500 | | | | 517 | |
1.350%, 05/28/2030 | | | 500 | | | | 499 | |
0.600%, 07/23/2025 | | | 150 | | | | 149 | |
State of Israel | | | | | | | | |
2.500%, 01/15/2030 | | | 150 | | | | 158 | |
Svensk Exportkredit MTN | | | | | | | | |
0.750%, 04/06/2023 | | | 500 | | | | 505 | |
0.625%, 05/14/2025 | | | 500 | | | | 499 | |
United Kingdom Gilt | | | | | | | | |
5.000%, 03/07/2025 | | GBP | 700 | | | | 1,141 | |
4.750%, 12/07/2030 | | | 675 | | | | 1,295 | |
4.250%, 06/07/2032 | | | 500 | | | | 955 | |
4.250%, 12/07/2040 | | | 500 | | | | 1,101 | |
4.250%, 12/07/2046 | | | 241 | | | | 579 | |
3.500%, 07/22/2068 | | | 325 | | | | 912 | |
3.250%, 01/22/2044 | | | 600 | | | | 1,214 | |
1.625%, 10/22/2054 | | | 103 | | | | 170 | |
1.625%, 10/22/2071 | | | 75 | | | | 140 | |
1.500%, 07/22/2026 | | | 440 | | | | 649 | |
1.250%, 07/22/2027 | | | 700 | | | | 1,025 | |
0.625%, 10/22/2050 | | | 271 | | | | 341 | |
0.500%, 10/22/2061 | | | 145 | | | | 175 | |
Uruguay Government International Bond | | | | | | | | |
4.500%, 08/14/2024 | | $ | 1,000 | | | | 1,082 | |
4.375%, 10/27/2027 | | | 300 | | | | 345 | |
| | | | | | | | |
| | |
Total Sovereign Debt
(Cost $89,514) ($ Thousands) | | | | | | | 90,919 | |
| | | | | | | | |
| | | | | | | | |
| | | |
| Description | | Face Amount
(Thousands) | | Market Value ($ Thousands) |
|
U.S. GOVERNMENT AGENCY OBLIGATIONS — 1.3% | |
FHLB | | | | | | | | |
0.500%, 04/14/2025 | | $ | 2,000 | | | $ | 2,002 | |
0.125%, 03/17/2023 | | | 500 | | | | 500 | |
FHLMC | | | | | | | | |
0.375%, 04/20/2023 | | | 1,000 | | | | 1,004 | |
0.375%, 05/05/2023 | | | 1,000 | | | | 1,003 | |
0.375%, 09/23/2025 | | | 925 | | | | 917 | |
0.250%, 06/26/2023 | | | 1,000 | | | | 1,001 | |
0.125%, 10/16/2023 | | | 760 | | | | 758 | |
FNMA | | | | | | | | |
5.625%, 07/15/2037 | | | 2,500 | | | | 3,871 | |
0.750%, 10/08/2027 | | | 1,500 | | | | 1,484 | |
0.625%, 04/22/2025 | | | 1,000 | | | | 1,005 | |
0.500%, 06/17/2025 | | | 1,000 | | | | 999 | |
0.250%, 05/22/2023 | | | 1,000 | | | | 1,002 | |
Tennessee Valley Authority | | | | | | | | |
0.750%, 05/15/2025 | | | 1,000 | | | | 1,005 | |
| | | | | | | | |
| |
Total U.S. Government Agency Obligations
(Cost $16,620) ($ Thousands) | | | | 16,551 | |
| | | | | | | | |
| | |
MUNICIPAL BONDS — 0.4% | | | | | | | | |
| | |
California — 0.1% | | | | | | | | |
California State, GO | | | | | | | | |
2.500%, 10/01/2029 | | | 500 | | | | 536 | |
Los Angeles, Community College District, GO | | | | | | | | |
1.806%, 08/01/2030 | | | 50 | | | | 51 | |
1.606%, 08/01/2028 | | | 50 | | | | 51 | |
Los Angeles, Community College District, GO | | | | | | | | |
Callable 08/01/2030 @ 100 2.106%, 08/01/2032 | | | 50 | | | | 52 | |
Regents of the University of California, Medical Center Pooled Revenue, Ser N, RB | | | | | | | | |
Callable 11/15/2049 @ 100 3.006%, 05/15/2050 | | | 500 | | | | 524 | |
San Francisco, Public Utilities Commission Water Revenue, Ser E, RB | | | | | | | | |
Callable 11/01/2030 @ 100 2.825%, 11/01/2041 | | | 100 | | | | 103 | |
| | | | | | | | |
| | |
| | | | | | | 1,317 | |
| | | | | | | | |
| | |
| Adviser Managed Trust / Annual Report / July 31, 2021 | | 37 |
SCHEDULE OF INVESTMENTS
July 31, 2021
Tactical Offensive Core Fixed Income Fund (Continued)
| | | | | | | | |
| | | |
| Description | | Face Amount
(Thousands) | | Market Value ($ Thousands) |
| | |
MUNICIPAL BONDS (continued) | | | | | | | | |
Florida — 0.0% | | | | | | | | |
Florida State, Board of Administration Finance, Ser A, RB | | | | | | | | |
2.154%, 07/01/2030 | | $ | 50 | | | $ | 52 | |
1.705%, 07/01/2027 | | | 50 | | | | 51 | |
1.258%, 07/01/2025 | | | 50 | | | | 51 | |
| | | | | | | | |
| | |
| | | | | | | 154 | |
| | | | | | | | |
| | |
Maryland — 0.0% | | | | | | | | |
Maryland State, Health & Higher Educational Facilities Authority, RB | | | | | | | | |
3.197%, 07/01/2050 | | | 35 | | | | 37 | |
Maryland State, Health & Higher Educational Facilities Authority, RB | | | | | | | | |
Callable 01/01/2040 @ 100 | | | | | | | | |
3.052%, 07/01/2040 | | | 35 | | | | 38 | |
| | | | | | | | |
| | |
| | | | | | | 75 | |
| | | | | | | | |
| | |
Massachusetts — 0.0% | | | | | | | | |
Massachusetts State, School Building Authority, Ser C, RB | | | | | | | | |
Callable 05/15/2030 @ 100 | | | | | | | | |
2.950%, 05/15/2043 | | | 100 | | | | 104 | |
| | | | | | | | |
| | |
Michigan — 0.1% | | | | | | | | |
Great Lakes, Water Authority, Sewage Disposal System Revenue, Ser A, RB | | | | | | | | |
3.056%, 07/01/2039 | | | 500 | | | | 543 | |
| | | | | | | | |
| | |
New York — 0.1% | | | | | | | | |
New York & New Jersey, Port Authority, RB | | | | | | | | |
Callable 07/15/2031 @ 100 | | | | | | | | |
3.175%, 07/15/2060 | | | 660 | | | | 672 | |
New York & New Jersey, Port Authority, Ser AAA, RB | | | | | | | | |
1.086%, 07/01/2023 | | | 65 | | | | 66 | |
| | | | | | | | |
| | |
| | | | | | | 738 | |
| | | | | | | | |
| | |
Texas — 0.1% | | | | | | | | |
Grand Parkway, Transportation Corp, RB | | | | | | | | |
Callable 04/01/2030 @ 100 | | | | | | | | |
3.236%, 10/01/2052 | | | 500 | | | | 515 | |
Texas State, Transportation Commission, GO | | | | | | | | |
Callable 10/01/2030 @ 100 | | | | | | | | |
2.472%, 10/01/2044 | | | 1,200 | | | | 1,201 | |
| | | | | | | | |
| | |
| | | | | | | 1,716 | |
| | | | | | | | |
| | | | | | | | |
| | | |
| Description | | Face Amount
(Thousands) | | Market Value ($ Thousands) |
| |
MUNICIPAL BONDS (continued) | | | | | |
Virginia — 0.0% | | | | | | | | |
University of Virginia, RB | | | | | | | | |
Callable 03/01/2050 @ 100 | | | | | | | | |
2.256%, 09/01/2050 | | $ | 120 | | | $ | 115 | |
| | | | | | | | |
| | |
Total Municipal Bonds
(Cost $4,760) ($ Thousands) | | | | | | | 4,762 | |
| | | | | | | | |
| | |
ASSET-BACKED SECURITIES — 0.3% | | | | | | | | |
American Express Credit Account Master Trust, Ser 2017-7, Cl A | | | | | | | | |
2.350%, 05/15/2025 | | | 350 | | | | 359 | |
American Express Credit Account Master Trust, Ser 2019-3, Cl A | | | | | | | | |
2.000%, 04/15/2025 | | | 175 | | | | 179 | |
AmeriCredit Automobile Receivables Trust, Ser 2020-3, Cl A3 | | | | | | | | |
0.530%, 06/18/2025 | | | 69 | | | | 69 | |
AmeriCredit Automobile Receivables Trust, Ser 2021-1, Cl A3 | | | | | | | | |
0.370%, 08/18/2025 | | | 133 | | | | 133 | |
BA Credit Card Trust, Ser 2021-A1, Cl A1 | | | | | | | | |
0.440%, 09/15/2026 | | | 27 | | | | 27 | |
Capital One Multi-Asset Execution Trust, Ser 2021-A2, Cl A2 | | | | | | | | |
1.390%, 07/15/2030 | | | 100 | | | | 101 | |
CarMax Auto Owner Trust, Ser 2020-4, Cl A3 | | | | | | | | |
0.500%, 08/15/2025 | | | 250 | | | | 251 | |
Drive Auto Receivables Trust, Ser 2021-1, Cl A3 | | | | | | | | |
0.440%, 11/15/2024 | | | 120 | | | | 120 | |
Ford Credit Auto Owner Trust, Ser 2020-C, Cl A3 | | | | | | | | |
0.410%, 07/15/2025 | | | 350 | | | | 351 | |
Ford Credit Floorplan Master Owner Trust, Ser 2020-1, Cl A1 | | | | | | | | |
0.700%, 09/15/2025 | | | 350 | | | | 352 | |
GM Financial Consumer Automobile Receivables Trust, Ser 2020-3, Cl A3 | | | | | | | | |
0.450%, 04/16/2025 | | | 80 | | | | 80 | |
GM Financial Consumer Automobile Receivables Trust, Ser 2020-4, Cl A3 | | | | | | | | |
0.380%, 08/18/2025 | | | 100 | | | | 100 | |
Honda Auto Receivables Owner Trust, Ser 2020-3, Cl A3 | | | | | | | | |
0.370%, 10/18/2024 | | | 250 | | | | 251 | |
Hyundai Auto Receivables Trust, Ser 2020- C, Cl A3 | | | | | | | | |
0.380%, 05/15/2025 | | | 94 | | | | 94 | |
| | |
| 38 | | Adviser Managed Trust / Annual Report / July 31, 2021 |
| | | | | | | | |
| | | |
| Description | | Face Amount
(Thousands) | | Market Value ($ Thousands) |
| |
ASSET-BACKED SECURITIES (continued) | | | | | |
Santander Drive Auto Receivables Trust, Ser 2020-3, Cl C | | | | | | | | |
1.120%, 01/15/2026 | | $ | 150 | | | $ | 151 | |
Santander Drive Auto Receivables Trust, Ser 2021-2, Cl A3 | | | | | | | | |
0.340%, 02/18/2025 | | | 38 | | | | 38 | |
Toyota Auto Receivables Owner Trust, Ser 2020-C, Cl A3 | | | | | | | | |
0.440%, 10/15/2024 | | | 269 | | | | 270 | |
Verizon Owner Trust, Ser 2020-B, Cl A | | | | | | | | |
0.470%, 02/20/2025 | | | 350 | | | | 351 | |
Volkswagen Auto Lease Trust, Ser 2020-A, Cl A3 | | | | | | | | |
0.390%, 01/22/2024 | | | 100 | | | | 100 | |
World Omni Auto Receivables Trust, Ser 2020-C, Cl A3 | | | | | | | | |
0.480%, 11/17/2025 | | | 80 | | | | 81 | |
| | | | | | | | |
| | |
Total Asset-Backed Securities
(Cost $3,452) ($ Thousands) | | | | | | | 3,458 | |
| | | | | | | | |
| | |
Total Investments in Securities — 99.4%
(Cost $1,226,387) ($ Thousands) | | | | | | $ | 1,223,030 | |
| | | | | | | | |
A list of open forward foreign currency contracts held by the Fund at July 31, 2021, is as follows:
| | | | | | | | | | | | | | | | | | | | | | | | |
| Counterparty | | Settlement Date | | | | | | Currency to Deliver
(Thousands) | | | | | | Currency to Receive
(Thousands) | | | Unrealized
Appreciation
(Depreciation)
(Thousands) | |
| | | | | | |
Brown Brothers Harriman | | | 08/02/21 - 10/04/21 | | | | GBP | | | | 13,601 | | | | USD | | | | 19,122 | | | $ | 213 | |
| | | | | | |
Brown Brothers Harriman | | | 08/02/21 - 10/04/21 | | | | EUR | | | | 38,964 | | | | USD | | | | 46,924 | | | | 690 | |
| | | | | | |
Brown Brothers Harriman | | | 08/02/21 - 10/04/21 | | | | JPY | | | | 7,176,559 | | | | USD | | | | 65,442 | | | | 28 | |
| | | | | | |
Brown Brothers Harriman | | | 08/02/21 | | | | JPY | | | | 190,289 | | | | USD | | | | 1,717 | | | | (17) | |
| | | | | | |
Brown Brothers Harriman | | | 08/03/21 - 10/04/21 | | | | CAD | | | | 4,634 | | | | USD | | | | 3,781 | | | | 69 | |
| | | | | | | | | | | | | | | | | | | | | | | | |
| | | | | | |
| | | | | | | | | | | | | | | | | | | | | | $ | 983 | |
| | | | | | | | | | | | | | | | | | | | | | | | |
For the year ended July 31, 2021, the total amount of all open forward foreign currency contracts, as presented in the table above, are representative of the volume of activity for this derivative type during the period.
Percentages are based on Net Assets of $1,230,179 ($ Thousands).
| (A) | Security exempt from registration under Rule 144A of the Securities Act of 1933. These securities may be resold in transactions exempt from registration normally to qualified institutions. On July 31, 2021, the value of these securities amounted to $14,401 ($ Thousands), representing 1.2% of the Net Assets of the Fund. |
| (B) | Rate shown is the effective yield at the time of purchase. |
| (C) | Rate is negative due to the decrease in value of the foreign currency against the U.S. Dollar. |
| (D) | Variable of floating rate security, the interest rate of which adjusts periodically based on changes in current interest rates and prepayments on the underlying pool of assets. |
CAD — Canadian Dollar
Cl — Class
DAC — Designated Activity Company
EUR — Euro
FHLB — Federal Home Loan Bank
FHLMC — Federal Home Loan Mortgage Corporation
FNMA — Federal National Mortgage Association
GBP — British Pound Sterling
GNMA — Government National Mortgage Association
GO — General Obligation
ICE— Intercontinental Exchange
JPY — Japanese Yen
LIBOR — London Interbank Offered Rate
LLC — Limited Liability Company
MTN — Medium Term Note
OAT — French Treasury Obligations (Obligations assimilables du Tresor)
RB — Revenue Bond
Ser — Series
TBA — To Be Announced
UMBS — Uniform Mortgage-Backed Securities
| | |
| Adviser Managed Trust / Annual Report / July 31, 2021 | | 39 |
SCHEDULE OF INVESTMENTS
July 31, 2021
Tactical Offensive Core Fixed Income Fund (Concluded)
USD — United States Dollar
VAR — Variable Rate
The following is a list of inputs used as of July 31, 2021 in valuing the Fund’s investments and other financial instruments carried at value ($ Thousands):
| | | | | | | | | | | | | | | | |
| Investments in Securities | | Level 1
($) | | | Level 2 ($) | | | Level 3
($) | | | Total ($) | |
U.S. Treasury Obligations | | | – | | | | 438,342 | | | | – | | | | 438,342 | |
Mortgage-Backed Securities | | | – | | | | 336,661 | | | | – | | | | 336,661 | |
Corporate Obligations | | | – | | | | 332,337 | | | | – | | | | 332,337 | |
Sovereign Debt | | | – | | | | 90,919 | | | | – | | | | 90,919 | |
U.S. Government Agency Obligations | | | – | | | | 16,551 | | | | – | | | | 16,551 | |
Municipal Bonds | | | – | | | | 4,762 | | | | – | | | | 4,762 | |
Asset-Backed Securities | | | – | | | | 3,458 | | | | – | | | | 3,458 | |
| | | | | | | | | | | | | | | | |
Total Investments in Securities | | | – | | | | 1,223,030 | | | | – | | | | 1,223,030 | |
| | | | | | | | | | | | | | | | |
| | | | | | | | | | | | | | | | |
| Other Financial Instruments | | Level 1
($) | | | Level 2
($) | | | Level 3
($) | | | Total ($) | |
Forwards Contracts * | | | | | | | | | | | | | | | | |
Unrealized Appreciation | | | — | | | | 1,000 | | | | — | | | | 1,000 | |
Unrealized Depreciation | | | — | | | | (17) | | | | — | | | | (17) | |
| | | | | | | | | | | | | | | | |
Total Other Financial Instruments | | | — | | | | 983 | | | | — | | | | 983 | |
| | | | | | | | | | | | | | | | |
| * | Forwards contracts are valued at the unrealized appreciation (depreciation) on the instruments. |
For the year ended July 31, 2021, there were no transfers in or out of Level 3.
For more information on valuation inputs, see Note 2 — Significant Accounting Policies in Notes to Financial Statements.
Amounts designated as “—” are either $0 or have been rounded to $0.
The accompanying notes are an integral part of the financial statements.
| | |
| 40 | | Adviser Managed Trust / Annual Report / July 31, 2021 |
SCHEDULE OF INVESTMENTS
July 31, 2021
Tactical Offensive Enhanced Fixed Income Fund
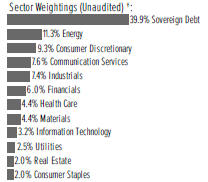
†Percentages based on total investments.
| | | | | | | | |
| | | |
| Description | | Face Amount
(Thousands) | | Market Value
($ Thousands) |
|
CORPORATE OBLIGATIONS — 59.2% | |
|
Communication Services — 7.5% | |
Acuris Finance US | | | | | | | | |
5.000%, 05/01/2028 (A) | | $ | 30 | | | $ | 30 | |
Advantage Sales & Marketing | | | | | | | | |
6.500%, 11/15/2028 (A) | | | 20 | | | | 21 | |
Altice Financing | | | | | | | | |
7.500%, 05/15/2026 (A) | | | 400 | | | | 416 | |
Altice France | | | | | | | | |
8.125%, 02/01/2027 (A) | | | 200 | | | | 216 | |
7.375%, 05/01/2026 (A) | | | 270 | | | | 281 | |
5.125%, 01/15/2029 (A) | | | 46 | | | | 46 | |
5.125%, 07/15/2029 (A) | | | 262 | | | | 264 | |
Altice France Holding | | | | | | | | |
10.500%, 05/15/2027 (A) | | | 160 | | | | 176 | |
6.000%, 02/15/2028 (A) | | | 200 | | | | 197 | |
AMC Entertainment Holdings | | | | | | | | |
12.000% cash/0% PIK, 06/15/2026 (A) | | | 106 | | | | 95 | |
10.500%, 04/15/2025 (A) | | | 100 | | | | 106 | |
AMC Networks | | | | | | | | |
4.250%, 02/15/2029 | | | 80 | | | | 80 | |
ANGI Group | | | | | | | | |
3.875%, 08/15/2028 (A) | | | 50 | | | | 50 | |
Arches Buyer | | | | | | | | |
6.125%, 12/01/2028 (A) | | | 100 | | | | 103 | |
Audacy Capital | | | | | | | | |
6.750%, 03/31/2029 (A) | | | 50 | | | | 51 | |
6.500%, 05/01/2027 (A) | | | 100 | | | | 103 | |
Banijay Entertainment SASU | | | | | | | | |
5.375%, 03/01/2025 (A) | | | 20 | | | | 21 | |
Beasley Mezzanine Holdings | | | | | | | | |
8.625%, 02/01/2026 (A) | | | 50 | | | | 50 | |
Block Communications | | | | | | | | |
4.875%, 03/01/2028 (A) | | | 50 | | | | 51 | |
| | | | | | | | |
| | | |
| Description | | Face Amount
(Thousands) | | Market Value
($ Thousands) |
|
CORPORATE OBLIGATIONS (continued) | |
C&W Senior Financing DAC | | | | | | | | |
6.875%, 09/15/2027 (A) | | $ | 200 | | | $ | 212 | |
Cablevision Lightpath | | | | | | | | |
3.875%, 09/15/2027 (A) | | | 200 | | | | 199 | |
Cars.com | | | | | | | | |
6.375%, 11/01/2028 (A) | | | 100 | | | | 107 | |
CCO Holdings | | | | | | | | |
5.750%, 02/15/2026 (A) | | | 124 | | | | 128 | |
5.375%, 06/01/2029 (A) | | | 160 | | | | 174 | |
5.125%, 05/01/2027 (A) | | | 400 | | | | 418 | |
5.000%, 02/01/2028 (A) | | | 438 | | | | 459 | |
4.750%, 03/01/2030 (A) | | | 330 | | | | 350 | |
4.500%, 08/15/2030 (A) | | | 100 | | | | 105 | |
4.500%, 05/01/2032 | | | 250 | | | | 262 | |
4.500%, 06/01/2033 (A) | | | 63 | | | | 66 | |
4.250%, 02/01/2031 (A) | | | 500 | | | | 516 | |
Cincinnati Bell | | | | | | | | |
7.000%, 07/15/2024 (A) | | | 150 | | | | 153 | |
Cinemark USA | | | | | | | | |
5.875%, 03/15/2026 (A) | | | 100 | | | | 98 | |
5.250%, 07/15/2028 (A) | | | 50 | | | | 47 | |
Clear Channel International BV | | | | | | | | |
6.625%, 08/01/2025 (A) | | | 50 | | | | 52 | |
Clear Channel Outdoor Holdings | | | | | | | | |
7.750%, 04/15/2028 (A) | | | 30 | | | | 31 | |
7.500%, 06/01/2029 (A) | | | 50 | | | | 52 | |
Clear Channel Worldwide Holdings | | | | | | | | |
5.125%, 08/15/2027 (A) | | | 251 | | | | 258 | |
Cogent Communications Group | | | | | | | | |
3.500%, 05/01/2026 (A) | | | 75 | | | | 77 | |
Connect Finco SARL | | | | | | | | |
6.750%, 10/01/2026 (A) | | | 200 | | | | 210 | |
Consolidated Communications | | | | | | | | |
6.500%, 10/01/2028 (A) | | | 100 | | | | 108 | |
5.000%, 10/01/2028 (A) | | | 50 | | | | 50 | |
CSC Holdings | | | | | | | | |
7.500%, 04/01/2028 (A) | | | 200 | | | | 218 | |
6.500%, 02/01/2029 (A) | | | 155 | | | | 171 | |
5.875%, 09/15/2022 | | | 100 | | | | 105 | |
5.750%, 01/15/2030 (A) | | | 150 | | | | 156 | |
5.500%, 04/15/2027 (A) | | | 484 | | | | 506 | |
5.375%, 02/01/2028 (A) | | | 200 | | | | 211 | |
4.500%, 11/15/2031 (A) | | | 250 | | | | 252 | |
4.125%, 12/01/2030 (A) | | | 100 | | | | 100 | |
Cumulus Media New Holdings | | | | | | | | |
6.750%, 07/01/2026 (A) | | | 20 | | | | 21 | |
Diamond Sports Group | | | | | | | | |
6.625%, 08/15/2027 (A) | | | 250 | | | | 99 | |
5.375%, 08/15/2026 (A) | | | 400 | | | | 232 | |
DIRECTV Holdings | | | | | | | | |
5.875%, 08/15/2027 (A) | | | 115 | | | | 119 | |
| | |
| Adviser Managed Trust / Annual Report / July 31, 2021 | | 41 |
SCHEDULE OF INVESTMENTS
July 31, 2021
Tactical Offensive Enhanced Fixed Income Fund (Continued)
| | | | | | | | |
| | | |
| Description | | Face Amount
(Thousands) | | Market Value
($ Thousands) |
|
CORPORATE OBLIGATIONS (continued) | |
DISH DBS | | | | | | | | |
7.750%, 07/01/2026 | | $ | 200 | | | $ | 228 | |
7.375%, 07/01/2028 | | | 200 | | | | 216 | |
5.875%, 07/15/2022 | | | 90 | | | | 93 | |
5.875%, 11/15/2024 | | | 250 | | | | 270 | |
5.125%, 06/01/2029 (A) | | | 122 | | | | 121 | |
5.000%, 03/15/2023 | | | 150 | | | | 156 | |
DKT Finance ApS | | | | | | | | |
9.375%, 06/17/2023 (A) | | | 100 | | | | 102 | |
Embarq | | | | | | | | |
7.995%, 06/01/2036 | | | 200 | | | | 224 | |
Frontier Communications Holdings | | | | | | | | |
5.875%, 10/15/2027 (A) | | | 200 | | | | 214 | |
5.000%, 05/01/2028 (A) | | | 200 | | | | 207 | |
GCI | | | | | | | | |
4.750%, 10/15/2028 (A) | | | 100 | | | | 104 | |
Getty Images | | | | | | | | |
9.750%, 03/01/2027 (A) | | | 32 | | | | 34 | |
Gray Television | | | | | | | | |
7.000%, 05/15/2027 (A) | | | 200 | | | | 214 | |
4.750%, 10/15/2030 (A) | | | 100 | | | | 99 | |
iHeartCommunications | | | | | | | | |
8.375%, 05/01/2027 | | | 264 | | | | 281 | |
5.250%, 08/15/2027 (A) | | | 80 | | | | 83 | |
LCPR Senior Secured Financing DAC | | | | | | | | |
6.750%, 10/15/2027 (A) | | | 200 | | | | 213 | |
Level 3 Financing | | | | | | | | |
4.625%, 09/15/2027 (A) | | | 331 | | | | 344 | |
3.625%, 01/15/2029 (A) | | | 254 | | | | 247 | |
Liberty Interactive | | | | | | | | |
8.500%, 07/15/2029 | | | 50 | | | | 57 | |
8.250%, 02/01/2030 | | | 50 | | | | 57 | |
Ligado Networks | | | | | | | | |
15.500% cash/0% PIK, 11/01/2023 (A) | | | 432 | | | | 425 | |
Live Nation Entertainment | | | | | | | | |
6.500%, 05/15/2027 (A) | | | 158 | | | | 174 | |
4.875%, 11/01/2024 (A) | | | 138 | | | | 140 | |
4.750%, 10/15/2027 (A) | | | 50 | | | | 51 | |
LogMeIn | | | | | | | | |
5.500%, 09/01/2027 (A) | | | 100 | | | | 104 | |
Lumen Technologies | | | | | | | | |
7.650%, 03/15/2042 | | | 150 | | | | 170 | |
7.500%, 04/01/2024 | | | 330 | | | | 371 | |
6.875%, 01/15/2028 | | | 34 | | | | 38 | |
6.750%, 12/01/2023 | | | 75 | | | | 83 | |
5.375%, 06/15/2029 (A) | | | 60 | | | | 62 | |
5.125%, 12/15/2026 (A) | | | 175 | | | | 182 | |
Match Group Holdings II | | | | | | | | |
5.625%, 02/15/2029 (A) | | | 50 | | | | 55 | |
5.000%, 12/15/2027 (A) | | | 50 | | | | 53 | |
4.625%, 06/01/2028 (A) | | | 50 | | | | 52 | |
4.125%, 08/01/2030 (A) | | | 50 | | | | 52 | |
| | | | | | | | |
| | | |
| Description | | Face Amount
(Thousands) | | Market Value
($ Thousands) |
|
CORPORATE OBLIGATIONS (continued) | |
Mav Acquisition | | | | | | | | |
8.000%, 08/01/2029 (A) | | $ | 50 | | | $ | 49 | |
5.750%, 08/01/2028 (A) | | | 75 | | | | 75 | |
Meredith | | | | | | | | |
6.875%, 02/01/2026 | | | 120 | | | | 125 | |
Millennium Escrow | | | | | | | | |
6.625%, 08/01/2026 (A) | | | 30 | | | | 31 | |
National CineMedia | | | | | | | | |
5.875%, 04/15/2028 (A) | | | 38 | | | | 36 | |
Netflix | | | | | | | | |
6.375%, 05/15/2029 | | | 100 | | | | 129 | |
5.875%, 02/15/2025 | | | 80 | | | | 92 | |
5.875%, 11/15/2028 | | | 400 | | | | 497 | |
4.875%, 04/15/2028 | | | 135 | | | | 158 | |
4.875%, 06/15/2030 (A) | | | 100 | | | | 120 | |
4.375%, 11/15/2026 | | | 38 | | | | 43 | |
3.625%, 06/15/2025 (A) | | | 50 | | | | 54 | |
News | | | | | | | | |
3.875%, 05/15/2029 (A) | | | 30 | | | | 31 | |
Nexstar Media | | | | | | | | |
5.625%, 07/15/2027 (A) | | | 201 | | | | 212 | |
4.750%, 11/01/2028 (A) | | | 100 | | | | 103 | |
Nokia | | | | | | | | |
6.625%, 05/15/2039 | | | 50 | | | | 69 | |
4.375%, 06/12/2027 | | | 20 | | | | 22 | |
Northwest Fiber | | | | | | | | |
6.000%, 02/15/2028 (A) | | | 100 | | | | 98 | |
Photo Holdings Merger Sub | | | | | | | | |
8.500%, 10/01/2026 (A) | | | 150 | | | | 164 | |
Playtika Holding | | | | | | | | |
4.250%, 03/15/2029 (A) | | | 55 | | | | 55 | |
Radiate Holdco | | | | | | | | |
6.500%, 09/15/2028 (A) | | | 100 | | | | 104 | |
Rakuten Group | | | | | | | | |
5.125%, VAR US Treas Yield Curve Rate T Note Const Mat 5 Yr+4.578%(A)(B) | | | 200 | | | | 201 | |
Sable International Finance | | | | | | | | |
5.750%, 09/07/2027 (A) | | | 100 | | | | 105 | |
Scripps Escrow II | | | | | | | | |
5.375%, 01/15/2031 (A) | | | 100 | | | | 100 | |
3.875%, 01/15/2029 (A) | | | 55 | | | | 55 | |
Sinclair Television Group | | | | | | | | |
5.875%, 03/15/2026 (A) | | | 50 | | | | 51 | |
5.125%, 02/15/2027 (A) | | | 267 | | | | 266 | |
Sirius XM Radio | | | | | | | | |
5.375%, 07/15/2026 (A) | | | 100 | | | | 103 | |
5.000%, 08/01/2027 (A) | | | 300 | | | | 313 | |
4.625%, 07/15/2024 (A) | | | 200 | | | | 205 | |
4.125%, 07/01/2030 (A) | | | 116 | | | | 120 | |
4.000%, 07/15/2028 (A) | | | 175 | | | | 181 | |
| | |
| 42 | | Adviser Managed Trust / Annual Report / July 31, 2021 |
| | | | | | | | |
| | | |
| Description | | Face Amount
(Thousands) | | Market Value
($ Thousands) |
|
CORPORATE OBLIGATIONS (continued) | |
TEGNA | | | | | | | | |
4.625%, 03/15/2028 | | $ | 91 | | | $ | 94 | |
Telecom Italia | | | | | | | | |
5.303%, 05/30/2024 (A) | | | 105 | | | | 114 | |
Telecom Italia Capital | | | | | | | | |
7.721%, 06/04/2038 | | | 200 | | | | 268 | |
7.200%, 07/18/2036 | | | 200 | | | | 256 | |
Telesat Canada | | | | | | | | |
6.500%, 10/15/2027 (A) | | | 200 | | | | 169 | |
5.625%, 12/06/2026 (A) | | | 27 | | | | 25 | |
4.875%, 06/01/2027 (A) | | | 50 | | | | 46 | |
Terrier Media Buyer | | | | | | | | |
8.875%, 12/15/2027 (A) | | | 200 | | | | 214 | |
T-Mobile USA | | | | | | | | |
4.750%, 02/01/2028 | | | 200 | | | | 213 | |
3.500%, 04/15/2031 | | | 268 | | | | 281 | |
3.375%, 04/15/2029 | | | 300 | | | | 312 | |
2.625%, 04/15/2026 | | | 95 | | | | 97 | |
2.625%, 02/15/2029 | | | 200 | | | | 200 | |
2.250%, 02/15/2026 (A) | | | 195 | | | | 197 | |
Townsquare Media | | | | | | | | |
6.875%, 02/01/2026 (A) | | | 50 | | | | 53 | |
Twitter | | | | | | | | |
3.875%, 12/15/2027 (A) | | | 100 | | | | 107 | |
Univision Communications | | | | | | | | |
9.500%, 05/01/2025 (A) | | | 100 | | | | 109 | |
6.625%, 06/01/2027 (A) | | | 200 | | | | 215 | |
4.500%, 05/01/2029 (A) | | | 86 | | | | 86 | |
UPC Broadband Finco BV | | | | | | | | |
4.875%, 07/15/2031 (A) | | | 200 | | | | 204 | |
UPC Holding BV | | | | | | | | |
5.500%, 01/15/2028 (A) | | | 50 | | | | 52 | |
Urban One | | | | | | | | |
7.375%, 02/01/2028 (A) | | | 100 | | | | 107 | |
ViacomCBS | | | | | | | | |
6.250%, VAR ICE LIBOR USD 3 Month+3.899%, 02/28/2057 | | | 142 | | | | 163 | |
Videotron | | | | | | | | |
5.375%, 06/15/2024 (A) | | | 100 | | | | 110 | |
5.125%, 04/15/2027 (A) | | | 100 | | | | 104 | |
3.625%, 06/15/2029 (A) | | | 20 | | | | 21 | |
Virgin Media Finance | | | | | | | | |
5.000%, 07/15/2030 (A) | | | 90 | | | | 92 | |
Virgin Media Secured Finance | | | | | | | | |
5.500%, 05/15/2029 (A) | | | 309 | | | | 330 | |
Vmed O2 UK Financing I | | | | | | | | |
4.750%, 07/15/2031 (A) | | | 200 | | | | 204 | |
Vodafone Group | | | | | | | | |
5.125%, VAR US Treas Yield Curve Rate T Note Const Mat 5 Yr+3.073%, 06/04/2081 | | | 150 | | | | 154 | |
| | | | | | | | |
| | | |
| Description | | Face Amount
(Thousands) | | Market Value
($ Thousands) |
|
CORPORATE OBLIGATIONS (continued) | |
4.125%, VAR US Treas Yield Curve Rate T Note Const Mat 5 Yr+2.767%, 06/04/2081 | | $ | 100 | | | $ | 101 | |
3.250%, VAR US Treas Yield Curve Rate T Note Const Mat 5 Yr+2.447%, 06/04/2081 | | | 15 | | | | 15 | |
Windstream Escrow | | | | | | | | |
7.750%, 08/15/2028 (A) | | | 259 | | | | 264 | |
WMG Acquisition | | | | | | | | |
3.875%, 07/15/2030 (A) | | | 100 | | | | 103 | |
Zayo Group Holdings | | | | | | | | |
4.000%, 03/01/2027 (A) | | | 100 | | | | 99 | |
Ziggo BV | | | | | | | | |
5.500%, 01/15/2027 (A) | | | 297 | | | | 308 | |
5.125%, 02/28/2030 (A) | | | 100 | | | | 103 | |
| | | | | | | | |
| | | | | | | 23,812 | |
| | | | | | | | |
|
Consumer Discretionary — 9.2% | |
1011778 BC ULC | | | | | | | | |
5.750%, 04/15/2025 (A) | | | 50 | | | | 53 | |
4.375%, 01/15/2028 (A) | | | 180 | | | | 182 | |
4.000%, 10/15/2030 (A) | | | 100 | | | | 100 | |
3.875%, 01/15/2028 (A) | | | 219 | | | | 221 | |
99 Escrow Issuer | | | | | | | | |
7.500%, 01/15/2026 (A) | | | 100 | | | | 94 | |
Adtalem Global Education | | | | | | | | |
5.500%, 03/01/2028 (A) | | | 100 | | | | 103 | |
Affinity Gaming | | | | | | | | |
6.875%, 12/15/2027 (A) | | | 122 | | | | 129 | |
Ambience Merger Sub | | | | | | | | |
7.125%, 07/15/2029 (A) | | | 15 | | | | 15 | |
4.875%, 07/15/2028 (A) | | | 30 | | | | 30 | |
American Axle & Manufacturing | | | | | | | | |
6.250%, 04/01/2025 | | | 86 | | | | 89 | |
6.250%, 03/15/2026 | | | 250 | | | | 258 | |
American Builders & Contractors Supply | | | | | | | | |
4.000%, 01/15/2028 (A) | | | 100 | | | | 102 | |
3.875%, 11/15/2029 (A) | | | 40 | | | | 40 | |
Aramark Services | | | | | | | | |
5.000%, 04/01/2025 (A) | | | 104 | | | | 107 | |
5.000%, 02/01/2028 (A) | | | 150 | | | | 156 | |
Asbury Automotive Group | | | | | | | | |
4.500%, 03/01/2028 | | | 100 | | | | 104 | |
Aston Martin Capital Holdings | | | | | | | | |
10.500%, 11/30/2025 (A) | | | 300 | | | | 333 | |
Bally’s | | | | | | | | |
6.750%, 06/01/2027 (A) | | | 50 | | | | 54 | |
Bath & Body Works | | | | | | | | |
6.950%, 03/01/2033 | | | 200 | | | | 244 | |
6.694%, 01/15/2027 | | | 200 | | | | 237 | |
6.625%, 10/01/2030 (A) | | | 100 | | | | 115 | |
5.625%, 10/15/2023 | | | 80 | | | | 88 | |
| | |
| Adviser Managed Trust / Annual Report / July 31, 2021 | | 43 |
SCHEDULE OF INVESTMENTS
July 31, 2021
Tactical Offensive Enhanced Fixed Income Fund (Continued)
| | | | | | | | |
| | | |
| Description | | Face Amount
(Thousands) | | Market Value
($ Thousands) |
|
CORPORATE OBLIGATIONS (continued) | |
5.250%, 02/01/2028 | | $ | 25 | | | $ | 28 | |
BCPE Empire Holdings | | | | | | | | |
7.625%, 05/01/2027 (A) | | | 60 | | | | 60 | |
Bed Bath & Beyond | | | | | | | | |
3.749%, 08/01/2024 | | | 96 | | | | 99 | |
Bidfair Holdings | | | | | | | | |
5.875%, 06/01/2029 (A) | | | 50 | | | | 52 | |
Bloomin’ Brands | | | | | | | | |
5.125%, 04/15/2029 (A) | | | 25 | | | | 26 | |
Boyd Gaming | | | | | | | | |
8.625%, 06/01/2025 (A) | | | 50 | | | | 54 | |
4.750%, 06/15/2031 (A) | | | 25 | | | | 26 | |
Boyne USA | | | | | | | | |
4.750%, 05/15/2029 (A) | | | 19 | | | | 20 | |
C&S Group Enterprises | | | | | | | | |
5.000%, 12/15/2028 (A) | | | 100 | | | | 99 | |
Caesars Entertainment | | | | | | | | |
8.125%, 07/01/2027 (A) | | | 200 | | | | 220 | |
6.250%, 07/01/2025 (A) | | | 300 | | | | 316 | |
Caesars Resort Collection | | | | | | | | |
5.750%, 07/01/2025 (A) | | | 293 | | | | 308 | |
5.250%, 10/15/2025 (A) | | | 100 | | | | 101 | |
Carnival | | | | | | | | |
11.500%, 04/01/2023 (A) | | | 350 | | | | 395 | |
9.875%, 08/01/2027 (A) | | | 230 | | | | 263 | |
7.625%, 03/01/2026 (A) | | | 200 | | | | 211 | |
5.750%, 03/01/2027 (A) | | | 262 | | | | 266 | |
4.000%, 08/01/2028 (A) | | | 70 | | | | 70 | |
Carriage Services | | | | | | | | |
4.250%, 05/15/2029 (A) | | | 50 | | | | 50 | |
Carrols Restaurant Group | | | | | | | | |
5.875%, 07/01/2029 (A) | | | 50 | | | | 48 | |
Carvana | | | | | | | | |
5.625%, 10/01/2025 (A) | | | 100 | | | | 104 | |
5.500%, 04/15/2027 (A) | | | 36 | | | | 37 | |
CCM Merger | | | | | | | | |
6.375%, 05/01/2026 (A) | | | 50 | | | | 52 | |
CD&R Smokey Buyer | | | | | | | | |
6.750%, 07/15/2025 (A) | | | 10 | | | | 11 | |
CEC Entertainment | | | | | | | | |
6.750%, 05/01/2026 (A) | | | 79 | | | | 79 | |
Cedar Fair | | | | | | | | |
5.375%, 06/01/2024 | | | 250 | | | | 251 | |
5.250%, 07/15/2029 | | | 50 | | | | 51 | |
Chobani | | | | | | | | |
4.625%, 11/15/2028 (A) | | | 100 | | | | 104 | |
Churchill Downs | | | | | | | | |
5.500%, 04/01/2027 (A) | | | 117 | | | | 122 | |
4.750%, 01/15/2028 (A) | | | 105 | | | | 109 | |
Cirsa Finance International Sarl | | | | | | | | |
7.875%, 12/20/2023 (A) | | | 200 | | | | 204 | |
| | | | | | | | |
| | | |
| Description | | Face Amount
(Thousands) | | Market Value
($ Thousands) |
|
CORPORATE OBLIGATIONS (continued) | |
Clarios Global | | | | | | | | |
8.500%, 05/15/2027 (A) | | $ | 190 | | | $ | 205 | |
6.250%, 05/15/2026 (A) | | | 270 | | | | 286 | |
Cooper-Standard Automotive | | | | | | | | |
5.625%, 11/15/2026 (A) | | | 50 | | | | 46 | |
Crocs | | | | | | | | |
4.250%, 03/15/2029 (A) | | | 75 | | | | 77 | |
CSC Holdings | | | | | | | | |
5.250%, 06/01/2024 | | | 50 | | | | 54 | |
Dana | | | | | | | | |
5.375%, 11/15/2027 | | | 153 | | | | 162 | |
4.250%, 09/01/2030 | | | 50 | | | | 52 | |
Dave & Buster’s | | | | | | | | |
7.625%, 11/01/2025 (A) | | | 100 | | | | 106 | |
Dealer Tire | | | | | | | | |
8.000%, 02/01/2028 (A) | | | 50 | | | | 54 | |
Diamond Resorts International | | | | | | | | |
10.750%, 09/01/2024 (A) | | | 100 | | | | 103 | |
Downstream Development Authority of the Quapaw Tribe of Oklahoma | | | | | | | | |
10.500%, 02/15/2023 (A) | | | 20 | | | | 21 | |
DP World Salaam | | | | | | | | |
6.000%, VAR US Treas Yield Curve Rate T Note Const Mat 5 Yr+5.750%(B) | | | 200 | | | | 218 | |
Eagle Intermediate Global Holding BV | | | | | | | | |
7.500%, 05/01/2025 (A) | | | 200 | | | | 187 | |
eG Global Finance | | | | | | | | |
8.500%, 10/30/2025 (A) | | | 200 | | | | 210 | |
Everi Holdings | | | | | | | | |
5.000%, 07/15/2029 (A) | | | 25 | | | | 26 | |
Ferrellgas | | | | | | | | |
5.875%, 04/01/2029 (A) | | | 70 | | | | 70 | |
5.375%, 04/01/2026 (A) | | | 100 | | | | 99 | |
Ford Motor | | | | | | | | |
9.625%, 04/22/2030 | | | 106 | | | | 153 | |
9.000%, 04/22/2025 | | | 230 | | | | 283 | |
8.500%, 04/21/2023 | | | 245 | | | | 272 | |
7.400%, 11/01/2046 | | | 200 | | | | 266 | |
5.291%, 12/08/2046 | | | 100 | | | | 114 | |
4.346%, 12/08/2026 | | | 50 | | | | 54 | |
Ford Motor Credit | | | | | | | | |
5.125%, 06/16/2025 | | | 218 | | | | 240 | |
5.113%, 05/03/2029 | | | 50 | | | | 57 | |
4.542%, 08/01/2026 | | | 150 | | | | 163 | |
4.375%, 08/06/2023 | | | 50 | | | | 52 | |
4.250%, 09/20/2022 | | | 92 | | | | 95 | |
4.134%, 08/04/2025 | | | 150 | | | | 160 | |
3.815%, 11/02/2027 | | | 200 | | | | 210 | |
3.664%, 09/08/2024 | | | 100 | | | | 104 | |
3.625%, 06/17/2031 | | | 200 | | | | 207 | |
3.375%, 11/13/2025 | | | 160 | | | | 167 | |
| | |
| 44 | | Adviser Managed Trust / Annual Report / July 31, 2021 |
| | | | | | | | |
| | | |
| Description | | Face Amount
(Thousands) | | Market Value
($ Thousands) |
|
CORPORATE OBLIGATIONS (continued) | |
3.350%, 11/01/2022 | | $ | 200 | | | $ | 205 | |
3.096%, 05/04/2023 | | | 100 | | | | 102 | |
3.087%, 01/09/2023 | | | 150 | | | | 153 | |
2.979%, 08/03/2022 | | | 100 | | | | 101 | |
2.900%, 02/16/2028 | | | 200 | | | | 200 | |
Foundation Building Materials | | | | | | | | |
6.000%, 03/01/2029 (A) | | | 75 | | | | 74 | |
Full House Resorts | | | | | | | | |
8.250%, 02/15/2028 (A) | | | 50 | | | | 54 | |
Gap | | | | | | | | |
8.875%, 05/15/2027 (A) | | | 50 | | | | 58 | |
8.375%, 05/15/2023 (A) | | | 50 | | | | 56 | |
Garda World Security | | | | | | | | |
9.500%, 11/01/2027 (A) | | | 100 | | | | 109 | |
6.000%, 06/01/2029 (A) | | | 50 | | | | 49 | |
Golden Nugget | | | | | | | | |
6.750%, 10/15/2024 (A) | | | 100 | | | | 100 | |
Goodyear Tire & Rubber | | | | | | | | |
5.625%, 04/30/2033 | | | 50 | | | | 53 | |
5.250%, 04/30/2031 | | | 100 | | | | 106 | |
5.250%, 07/15/2031 (A) | | | 230 | | | | 243 | |
5.000%, 07/15/2029 (A) | | | 80 | | | | 84 | |
Group 1 Automotive | | | | | | | | |
4.000%, 08/15/2028 (A) | | | 54 | | | | 55 | |
GrubHub Holdings | | | | | | | | |
5.500%, 07/01/2027 (A) | | | 50 | | | | 53 | |
Guitar Center | | | | | | | | |
8.500%, 01/15/2026 (A) | | | 100 | | | | 107 | |
Hanesbrands | | | | | | | | |
5.375%, 05/15/2025 (A) | | | 50 | | | | 53 | |
4.625%, 05/15/2024 (A) | | | 286 | | | | 302 | |
Hilton Domestic Operating | | | | | | | | |
5.750%, 05/01/2028 (A) | | | 100 | | | | 107 | |
4.875%, 01/15/2030 | | | 135 | | | | 145 | |
3.625%, 02/15/2032 (A) | | | 215 | | | | 214 | |
Hilton Grand Vacations Borrower Escrow | | | | | | | | |
5.000%, 06/01/2029 (A) | | | 90 | | | | 91 | |
4.875%, 07/01/2031 (A) | | | 31 | | | | 30 | |
Houghton Mifflin Harcourt Publishers | | | | | | | | |
9.000%, 02/15/2025 (A) | | | 100 | | | | 107 | |
IHO Verwaltungs GmbH | | | | | | | | |
6.000% cash/0% PIK, 05/15/2027 (A) | | | 200 | | | | 208 | |
International Game Technology | | | | | | | | |
6.500%, 02/15/2025 (A) | | | 200 | | | | 223 | |
6.250%, 01/15/2027 (A) | | | 150 | | | | 170 | |
IRB Holding | | | | | | | | |
6.750%, 02/15/2026 (A) | | | 150 | | | | 154 | |
Jaguar Land Rover Automotive | | | | | | | | |
7.750%, 10/15/2025 (A) | | | 200 | | | | 217 | |
5.500%, 07/15/2029 (A) | | | 200 | | | | 200 | |
4.500%, 10/01/2027 (A) | | | 100 | | | | 98 | |
| | | | | | | | |
| | | |
| Description | | Face Amount
(Thousands) | | Market Value
($ Thousands) |
|
CORPORATE OBLIGATIONS (continued) | |
JB Poindexter | | | | | | | | |
7.125%, 04/15/2026 (A) | | $ | 100 | | | $ | 105 | |
JBS USA LUX | | | | | | | | |
6.750%, 02/15/2028 (A) | | | 200 | | | | 219 | |
6.500%, 04/15/2029 (A) | | | 150 | | | | 168 | |
3.750%, 12/01/2031 (A) | | | 73 | | | | 75 | |
KB Home | | | | | | | | |
7.500%, 09/15/2022 | | | 50 | | | | 53 | |
4.000%, 06/15/2031 | | | 50 | | | | 52 | |
Kronos Acquisition Holdings | | | | | | | | |
7.000%, 12/31/2027 (A) | | | 76 | | | | 74 | |
5.000%, 12/31/2026 (A) | | | 47 | | | | 48 | |
LBM Acquisition | | | | | | | | |
6.250%, 01/15/2029 (A) | | | 117 | | | | 117 | |
LCM Investments Holdings II | | | | | | | | |
4.875%, 05/01/2029 (A) | | | 61 | | | | 62 | |
Legends Hospitality Holding | | | | | | | | |
5.000%, 02/01/2026 (A) | | | 80 | | | | 83 | |
Levi Strauss | | | | | | | | |
3.500%, 03/01/2031 (A) | | | 85 | | | | 87 | |
LGI Homes | | | | | | | | |
4.000%, 07/15/2029 (A) | | | 56 | | | | 57 | |
Life Time | | | | | | | | |
8.000%, 04/15/2026 (A) | | | 75 | | | | 79 | |
5.750%, 01/15/2026 (A) | | | 85 | | | | 86 | |
Lions Gate Capital Holdings | | | | | | | | |
5.500%, 04/15/2029 (A) | | | 110 | | | | 113 | |
Lithia Motors | | | | | | | | |
4.625%, 12/15/2027 (A) | | | 208 | | | | 221 | |
3.875%, 06/01/2029 (A) | | | 35 | | | | 37 | |
LSF9 Atlantis Holdings | | | | | | | | |
7.750%, 02/15/2026 (A) | | | 90 | | | | 94 | |
M/I Homes | | | | | | | | |
5.625%, 08/01/2025 | | | 100 | | | | 103 | |
Macy’s | | | | | | | | |
8.375%, 06/15/2025 (A) | | | 100 | | | | 109 | |
Macy’s Retail Holdings | | | | | | | | |
5.875%, 04/01/2029 (A) | | | 90 | | | | 95 | |
4.300%, 02/15/2043 | | | 25 | | | | 21 | |
3.625%, 06/01/2024 | | | 12 | | | | 12 | |
2.875%, 02/15/2023 | | | 53 | | | | 53 | |
MajorDrive Holdings IV | | | | | | | | |
6.375%, 06/01/2029 (A) | | | 65 | | | | 64 | |
Marriott Ownership Resorts | | | | | | | | |
6.125%, 09/15/2025 (A) | | | 116 | | | | 123 | |
4.750%, 01/15/2028 | | | 100 | | | | 101 | |
4.500%, 06/15/2029 (A) | | | 35 | | | | 35 | |
Mattamy Group | | | | | | | | |
5.250%, 12/15/2027 (A) | | | 100 | | | | 104 | |
Mattel | | | | | | | | |
5.875%, 12/15/2027 (A) | | | 135 | | | | 148 | |
3.750%, 04/01/2029 (A) | | | 55 | | | | 58 | |
| | |
| Adviser Managed Trust / Annual Report / July 31, 2021 | | 45 |
SCHEDULE OF INVESTMENTS
July 31, 2021
Tactical Offensive Enhanced Fixed Income Fund (Continued)
| | | | | | | | |
| | | |
| Description | | Face Amount
(Thousands) | | Market Value
($ Thousands) |
|
CORPORATE OBLIGATIONS (continued) | |
3.375%, 04/01/2026 (A) | | $ | 30 | | | $ | 31 | |
MDC Partners | | | | | | | | |
7.500%, 05/01/2024 (A) | | | 100 | | | | 102 | |
Meritage Homes | | | | | | | | |
3.875%, 04/15/2029 (A) | | | 50 | | | | 53 | |
Merlin Entertainments | | | | | | | | |
5.750%, 06/15/2026 (A) | | | 100 | | | | 104 | |
Metis Merger Sub | | | | | | | | |
6.500%, 05/15/2029 (A) | | | 40 | | | | 39 | |
MGM Resorts International | | | | | | | | |
6.000%, 03/15/2023 | | | 123 | | | | 130 | |
5.750%, 06/15/2025 | | | 29 | | | | 32 | |
5.500%, 04/15/2027 | | | 100 | | | | 109 | |
4.750%, 10/15/2028 | | | 80 | | | | 84 | |
4.625%, 09/01/2026 | | | 272 | | | | 284 | |
Michaels | | | | | | | | |
7.875%, 05/01/2029 (A) | | | 150 | | | | 156 | |
5.250%, 05/01/2028 (A) | | | 85 | | | | 88 | |
Midwest Gaming Borrower | | | | | | | | |
4.875%, 05/01/2029 (A) | | | 44 | | | | 44 | |
Mohegan Gaming & Entertainment | | | | | | | | |
8.000%, 02/01/2026 (A) | | | 90 | | | | 94 | |
7.875%, 10/15/2024 (A) | | | 100 | | | | 105 | |
Murphy Oil USA | | | | | | | | |
4.750%, 09/15/2029 | | | 80 | | | | 85 | |
3.750%, 02/15/2031 (A) | | | 65 | | | | 65 | |
NCL | | | | | | | | |
12.250%, 05/15/2024 (A) | | | 100 | | | | 118 | |
10.250%, 02/01/2026 (A) | | | 100 | | | | 114 | |
5.875%, 03/15/2026 (A) | | | 65 | | | | 65 | |
3.625%, 12/15/2024 (A) | | | 60 | | | | 57 | |
NCL Finance | | | | | | | | |
6.125%, 03/15/2028 (A) | | | 65 | | | | 66 | |
NESCO Holdings II | | | | | | | | |
5.500%, 04/15/2029 (A) | | | 100 | | | | 103 | |
New Home | | | | | | | | |
7.250%, 10/15/2025 (A) | | | 50 | | | | 53 | |
Newell Brands | | | | | | | | |
6.000%, 04/01/2046 | | | 30 | | | | 39 | |
4.700%, 04/01/2026 | | | 250 | | | | 279 | |
4.350%, 04/01/2023 | | | 224 | | | | 234 | |
Park River Holdings | | | | | | | | |
6.750%, 08/01/2029 (A) | | | 50 | | | | 50 | |
5.625%, 02/01/2029 (A) | | | 130 | | | | 127 | |
Party City Holdings | | | | | | | | |
8.750%, 02/15/2026 (A) | | | 90 | | | | 95 | |
Patrick Industries | | | | | | | | |
4.750%, 05/01/2029 (A) | | | 25 | | | | 26 | |
Peninsula Pacific Entertainment | | | | | | | | |
8.500%, 11/15/2027 (A) | | | 165 | | | | 178 | |
Penn National Gaming | | | | | | | | |
5.625%, 01/15/2027 (A) | | | 42 | | | | 43 | |
| | | | | | | | |
| | | |
| Description | | Face Amount
(Thousands) | | Market Value
($ Thousands) |
|
CORPORATE OBLIGATIONS (continued) | |
4.125%, 07/01/2029 (A) | | $ | 100 | | | $ | 99 | |
Penske Automotive Group | | | | | | | | |
3.750%, 06/15/2029 | | | 40 | | | | 41 | |
PetSmart | | | | | | | | |
7.750%, 02/15/2029 (A) | | | 150 | | | | 164 | |
PM General Purchaser | | | | | | | | |
9.500%, 10/01/2028 (A) | | | 100 | | | | 105 | |
Prime Security Services Borrower | | | | | | | | |
6.250%, 01/15/2028 (A) | | | 200 | | | | 209 | |
5.750%, 04/15/2026 (A) | | | 100 | | | | 109 | |
3.375%, 08/31/2027 (A) | | | 135 | | | | 131 | |
QVC | | | | | | | | |
5.950%, 03/15/2043 | | | 50 | | | | 52 | |
5.450%, 08/15/2034 | | | 50 | | | | 53 | |
4.750%, 02/15/2027 | | | 200 | | | | 214 | |
4.375%, 09/01/2028 | | | 50 | | | | 51 | |
Raptor Acquisition | | | | | | | | |
4.875%, 11/01/2026 (A) | | | 50 | | | | 51 | |
Real Hero Merger Sub 2 | | | | | | | | |
6.250%, 02/01/2029 (A) | | | 15 | | | | 16 | |
Rent-A-Center | | | | | | | | |
6.375%, 02/15/2029 (A) | | | 95 | | | | 102 | |
Royal Caribbean Cruises | | | | | | | | |
11.500%, 06/01/2025 (A) | | | 250 | | | | 286 | |
10.875%, 06/01/2023 (A) | | | 80 | | | | 91 | |
9.125%, 06/15/2023 (A) | | | 66 | | | | 72 | |
7.500%, 10/15/2027 | | | 50 | | | | 57 | |
5.500%, 04/01/2028 (A) | | | 160 | | | | 163 | |
5.250%, 11/15/2022 | | | 100 | | | | 103 | |
4.250%, 07/01/2026 (A) | | | 50 | | | | 49 | |
3.700%, 03/15/2028 | | | 42 | | | | 40 | |
Sally Holdings | | | | | | | | |
5.625%, 12/01/2025 | | | 100 | | | | 103 | |
Scientific Games International | | | | | | | | |
8.625%, 07/01/2025 (A) | | | 100 | | | | 108 | |
8.250%, 03/15/2026 (A) | | | 100 | | | | 106 | |
5.000%, 10/15/2025 (A) | | | 100 | | | | 103 | |
Service International | | | | | | | | |
4.000%, 05/15/2031 | | | 105 | | | | 108 | |
3.375%, 08/15/2030 | | | 100 | | | | 100 | |
Six Flags Entertainment | | | | | | | | |
5.500%, 04/15/2027 (A) | | | 34 | | | | 35 | |
4.875%, 07/31/2024 (A) | | | 205 | | | | 206 | |
Sizzling Platter | | | | | | | | |
8.500%, 11/28/2025 (A) | | | 100 | | | | 104 | |
Sotheby’s | | | | | | | | |
7.375%, 10/15/2027 (A) | | | 100 | | | | 107 | |
Specialty Building Products Holdings | | | | | | | | |
6.375%, 09/30/2026 (A) | | | 100 | | | | 105 | |
SRS Distribution | | | | | | | | |
6.125%, 07/01/2029 (A) | | | 33 | | | | 34 | |
4.625%, 07/01/2028 (A) | | | 20 | | | | 20 | |
| | |
| 46 | | Adviser Managed Trust / Annual Report / July 31, 2021 |
| | | | | | | | |
| | | |
| Description | | Face Amount
(Thousands) | | Market Value
($ Thousands) |
|
CORPORATE OBLIGATIONS (continued) | |
Station Casinos | | | | | | | | |
4.500%, 02/15/2028 (A) | | $ | 80 | | | $ | 80 | |
StoneMor | | | | | | | | |
8.500%, 05/15/2029 (A) | | | 33 | | | | 33 | |
Superior Plus | | | | | | | | |
4.500%, 03/15/2029 (A) | | | 40 | | | | 41 | |
Taylor Morrison Communities | | | | | | | | |
6.625%, 07/15/2027 (A) | | | 200 | | | | 213 | |
5.875%, 04/15/2023 (A) | | | 100 | | | | 106 | |
Tempur Sealy International | | | | | | | | |
4.000%, 04/15/2029 (A) | | | 100 | | | | 102 | |
Tenneco | | | | | | | | |
5.125%, 04/15/2029 (A) | | | 160 | | | | 164 | |
5.000%, 07/15/2026 | | | 50 | | | | 49 | |
Tesla | | | | | | | | |
5.300%, 08/15/2025 (A) | | | 250 | | | | 257 | |
Toll Brothers Finance | | | | | | | | |
4.875%, 03/15/2027 | | | 100 | | | | 114 | |
3.800%, 11/01/2029 | | | 50 | | | | 54 | |
TopBuild | | | | | | | | |
3.625%, 03/15/2029 (A) | | | 75 | | | | 75 | |
Travel + Leisure | | | | | | | | |
6.625%, 07/31/2026 (A) | | | 200 | | | | 223 | |
6.600%, 10/01/2025 | | | 40 | | | | 45 | |
6.000%, 04/01/2027 | | | 20 | | | | 22 | |
Tri Pointe Homes | | | | | | | | |
5.700%, 06/15/2028 | | | 100 | | | | 111 | |
5.250%, 06/01/2027 | | | 50 | | | | 54 | |
Triton Water Holdings | | | | | | | | |
6.250%, 04/01/2029 (A) | | | 105 | | | | 105 | |
Universal Entertainment | | | | | | | | |
8.500%, 12/11/2024 (A) | | | 100 | | | | 105 | |
US Foods | | | | | | | | |
4.750%, 02/15/2029 (A) | | | 90 | | | | 92 | |
Victoria’s Secret | | | | | | | | |
4.625%, 07/15/2029 (A) | | | 88 | | | | 88 | |
Viking Cruises | | | | | | | | |
13.000%, 05/15/2025 (A) | | | 200 | | | | 232 | |
7.000%, 02/15/2029 (A) | | | 50 | | | | 50 | |
5.875%, 09/15/2027 (A) | | | 84 | | | | 80 | |
Viking Ocean Cruises Ship VII | | | | | | | | |
5.625%, 02/15/2029 (A) | | | 50 | | | | 50 | |
Vista Outdoor | | | | | | | | |
4.500%, 03/15/2029 (A) | | | 50 | | | | 51 | |
WASH Multifamily Acquisition | | | | | | | | |
5.750%, 04/15/2026 (A) | | | 70 | | | | 73 | |
Wheel Pros | | | | | | | | |
6.500%, 05/15/2029 (A) | | | 50 | | | | 51 | |
White Capital Buyer | | | | | | | | |
6.875%, 10/15/2028 (A) | | | 100 | | | | 107 | |
William Carter | | | | | | | | |
5.625%, 03/15/2027 (A) | | | 100 | | | | 105 | |
| | | | | | | | |
| | | |
| Description | | Face Amount
(Thousands) | | Market Value
($ Thousands) |
|
CORPORATE OBLIGATIONS (continued) | |
Winnebago Industries | | | | | | | | |
6.250%, 07/15/2028 (A) | | $ | 4 | | | $ | 4 | |
WW International | | | | | | | | |
4.500%, 04/15/2029 (A) | | | 60 | | | | 61 | |
Wynn Las Vegas | | | | | | | | |
5.500%, 03/01/2025 (A) | | | 200 | | | | 211 | |
5.250%, 05/15/2027 (A) | | | 100 | | | | 105 | |
Wynn Resorts Finance | | | | | | | | |
5.125%, 10/01/2029 (A) | | | 200 | | | | 208 | |
Yum! Brands | | | | | | | | |
5.350%, 11/01/2043 | | | 100 | | | | 109 | |
4.750%, 01/15/2030 (A) | | | 188 | | | | 206 | |
4.625%, 01/31/2032 | | | 70 | | | | 75 | |
3.625%, 03/15/2031 | | | 100 | | | | 102 | |
ZF North America Capital | | | | | | | | |
4.750%, 04/29/2025 (A) | | | 45 | | | | 49 | |
| | | | | | | | |
| | | | | | | 29,211 | |
| | | | | | | | |
| | |
Consumer Staples — 2.0% | | | | | | | | |
Albertsons | | | | | | | | |
5.875%, 02/15/2028 (A) | | | 365 | | | | 391 | |
4.875%, 02/15/2030 (A) | | | 150 | | | | 162 | |
3.500%, 02/15/2023 (A) | | | 100 | | | | 102 | |
Avon Products | | | | | | | | |
6.500%, 03/15/2023 | | | 165 | | | | 176 | |
B&G Foods | | | | | | | | |
5.250%, 09/15/2027 | | | 82 | | | | 85 | |
Central Garden & Pet | | | | | | | | |
4.125%, 10/15/2030 | | | 50 | | | | 52 | |
4.125%, 04/30/2031 (A) | | | 100 | | | | 102 | |
Coty | | | | | | | | |
6.500%, 04/15/2026 (A) | | | 100 | | | | 100 | |
5.000%, 04/15/2026 (A) | | | 125 | | | | 126 | |
Edgewell Personal Care | | | | | | | | |
4.125%, 04/01/2029 (A) | | | 50 | | | | 50 | |
Energizer Holdings | | | | | | | | |
4.750%, 06/15/2028 (A) | | | 100 | | | | 103 | |
HLF Financing Sarl | | | | | | | | |
4.875%, 06/01/2029 (A) | | | 100 | | | | 101 | |
Ingles Markets | | | | | | | | |
4.000%, 06/15/2031 (A) | | | 19 | | | | 19 | |
Kraft Heinz Foods | | | | | | | | |
7.125%, 08/01/2039 (A) | | | 90 | | | | 134 | |
6.875%, 01/26/2039 | | | 288 | | | | 423 | |
6.750%, 03/15/2032 | | | 250 | | | | 343 | |
6.500%, 02/09/2040 | | | 24 | | | | 34 | |
5.200%, 07/15/2045 | | | 100 | | | | 127 | |
5.000%, 07/15/2035 | | | 68 | | | | 84 | |
5.000%, 06/04/2042 | | | 275 | | | | 345 | |
4.875%, 10/01/2049 | | | 110 | | | | 137 | |
4.375%, 06/01/2046 | | | 300 | | | | 346 | |
3.875%, 05/15/2027 | | | 200 | | | | 221 | |
| | |
| Adviser Managed Trust / Annual Report / July 31, 2021 | | 47 |
SCHEDULE OF INVESTMENTS
July 31, 2021
Tactical Offensive Enhanced Fixed Income Fund (Continued)
| | | | | | | | |
| | | |
| Description | | Face Amount
(Thousands) | | Market Value
($ Thousands) |
|
CORPORATE OBLIGATIONS (continued) | |
3.750%, 04/01/2030 | | $ | 100 | | | $ | 111 | |
Lamb Weston Holdings | | | | | | | | |
4.875%, 05/15/2028 (A) | | | 100 | | | | 111 | |
Performance Food Group | | | | | | | | |
5.500%, 10/15/2027 (A) | | | 100 | | | | 104 | |
4.250%, 08/01/2029 (A) | | | 104 | | | | 106 | |
Pilgrim’s Pride | | | | | | | | |
5.875%, 09/30/2027 (A) | | | 18 | | | | 19 | |
4.250%, 04/15/2031 (A) | | | 115 | | | | 122 | |
Post Holdings | | | | | | | | |
5.750%, 03/01/2027 (A) | | | 100 | | | | 104 | |
5.625%, 01/15/2028 (A) | | | 154 | | | | 162 | |
4.625%, 04/15/2030 (A) | | | 200 | | | | 204 | |
4.500%, 09/15/2031 (A) | | | 200 | | | | 202 | |
Primo Water Holdings | | | | | | | | |
4.375%, 04/30/2029 (A) | | | 38 | | | | 38 | |
Rite Aid | | | | | | | | |
8.000%, 11/15/2026 (A) | | | 40 | | | | 40 | |
7.700%, 02/15/2027 | | | 100 | | | | 93 | |
SEG Holding | | | | | | | | |
5.625%, 10/15/2028 (A) | | | 50 | | | | 53 | |
Simmons Foods | | | | | | | | |
4.625%, 03/01/2029 (A) | | | 90 | | | | 91 | |
Spectrum Brands | | | | | | | | |
3.875%, 03/15/2031 (A) | | | 50 | | | | 50 | |
Staples | | | | | | | | |
7.500%, 04/15/2026 (A) | | | 250 | | | | 254 | |
Stena | | | | | | | | |
7.000%, 02/01/2024 (A) | | | 100 | | | | 105 | |
TKC Holdings | | | | | | | | |
10.500%, 05/15/2029 (A) | | | 50 | | | | 54 | |
6.875%, 05/15/2028 (A) | | | 50 | | | | 52 | |
TreeHouse Foods | | | | | | | | |
4.000%, 09/01/2028 | | | 50 | | | | 50 | |
Turning Point Brands | | | | | | | | |
5.625%, 02/15/2026 (A) | | | 40 | | | | 42 | |
United Natural Foods | | | | | | | | |
6.750%, 10/15/2028 (A) | | | 50 | | | | 54 | |
Vector Group | | | | | | | | |
10.500%, 11/01/2026 (A) | | | 100 | | | | 106 | |
5.750%, 02/01/2029 (A) | | | 100 | | | | 101 | |
| | | | | | | | |
| | | | | | | 6,191 | |
| | | | | | | | |
| | |
Energy — 11.1% | | | | | | | | |
Abu Dhabi Crude Oil Pipeline | | | | | | | | |
4.600%, 11/02/2047 | | | 250 | | | | 298 | |
Aethon United BR | | | | | | | | |
8.250%, 02/15/2026 (A) | | | 95 | | | | 102 | |
Alliance Resource Operating Partners | | | | | | | | |
7.500%, 05/01/2025 (A) | | | 100 | | | | 101 | |
Altera Infrastructure | | | | | | | | |
8.500%, 07/15/2023 (A) | | | 100 | | | | 92 | |
| | | | | | | | |
| | | |
| Description | | Face Amount
(Thousands) | | Market Value
($ Thousands) |
|
CORPORATE OBLIGATIONS (continued) | |
Antero Midstream Partners | | | | | | | | |
7.875%, 05/15/2026 (A) | | $ | 100 | | | $ | 111 | |
5.750%, 03/01/2027 (A) | | | 150 | | | | 154 | |
5.750%, 01/15/2028 (A) | | | 40 | | | | 42 | |
5.375%, 06/15/2029 (A) | | | 50 | | | | 51 | |
Antero Resources | | | | | | | | |
5.375%, 03/01/2030 (A) | | | 35 | | | | 36 | |
5.000%, 03/01/2025 | | | 202 | | | | 206 | |
Apache | | | | | | | | |
6.000%, 01/15/2037 | | | 50 | | | | 57 | |
5.350%, 07/01/2049 | | | 100 | | | | 105 | |
5.100%, 09/01/2040 | | | 100 | | | | 107 | |
4.875%, 11/15/2027 | | | 50 | | | | 54 | |
4.750%, 04/15/2043 | | | 150 | | | | 154 | |
4.625%, 11/15/2025 | | | 100 | | | | 107 | |
4.375%, 10/15/2028 | | | 100 | | | | 106 | |
Archrock Partners | | | | | | | | |
6.875%, 04/01/2027 (A) | | | 200 | | | | 210 | |
Ascent Resources Utica Holdings | | | | | | | | |
8.250%, 12/31/2028 (A) | | | 50 | | | | 54 | |
7.000%, 11/01/2026 (A) | | | 150 | | | | 155 | |
5.875%, 06/30/2029 (A) | | | 90 | | | | 89 | |
Baytex Energy | | | | | | | | |
8.750%, 04/01/2027 (A) | | | 100 | | | | 100 | |
5.625%, 06/01/2024 (A) | | | 50 | | | | 50 | |
Berry Petroleum | | | | | | | | |
7.000%, 02/15/2026 (A) | | | 50 | | | | 49 | |
Blue Racer Midstream | | | | | | | | |
7.625%, 12/15/2025 (A) | | | 100 | | | | 108 | |
Bristow Group | | | | | | | | |
6.875%, 03/01/2028 (A) | | | 50 | | | | 51 | |
Buckeye Partners | | | | | | | | |
5.850%, 11/15/2043 | | | 150 | | | | 151 | |
5.600%, 10/15/2044 | | | 50 | | | | 49 | |
4.125%, 03/01/2025 (A) | | | 60 | | | | 62 | |
4.125%, 12/01/2027 | | | 40 | | | | 41 | |
3.950%, 12/01/2026 | | | 54 | | | | 55 | |
California Resources | | | | | | | | |
7.125%, 02/01/2026 (A) | | | 75 | | | | 77 | |
Callon Petroleum | | | | | | | | |
8.000%, 08/01/2028 (A) | | | 45 | | | | 42 | |
6.125%, 10/01/2024 | | | 50 | | | | 47 | |
Calumet Specialty Products Partners | | | | | | | | |
11.000%, 04/15/2025 (A) | | | 100 | | | | 111 | |
Centennial Resource Production | | | | | | | | |
5.375%, 01/15/2026 (A) | | | 100 | | | | 96 | |
CGG | | | | | | | | |
8.750%, 04/01/2027 (A) | | | 200 | | | | 200 | |
Cheniere Energy Partners | | | | | | | | |
5.625%, 10/01/2026 | | | 254 | | | | 262 | |
4.000%, 03/01/2031 (A) | | | 139 | | | | 147 | |
| | |
| 48 | | Adviser Managed Trust / Annual Report / July 31, 2021 |
| | | | | | | | |
| | | |
| Description | | Face Amount
(Thousands) | | Market Value
($ Thousands) |
|
CORPORATE OBLIGATIONS (continued) | |
Chesapeake Energy | | | | | | | | |
5.875%, 02/01/2029 (A) | | $ | 60 | | | $ | 64 | |
5.500%, 02/01/2026 (A) | | | 45 | | | | 47 | |
CNX Midstream Partners | | | | | | | | |
6.500%, 03/15/2026 (A) | | | 20 | | | | 21 | |
CNX Resources | | | | | | | | |
7.250%, 03/14/2027 (A) | | | 100 | | | | 106 | |
6.000%, 01/15/2029 (A) | | | 30 | | | | 32 | |
Colgate Energy Partners III | | | | | | | | |
7.750%, 02/15/2026 (A) | | | 25 | | | | 27 | |
5.875%, 07/01/2029 (A) | | | 30 | | | | 31 | |
Comstock Resources | | | | | | | | |
6.750%, 03/01/2029 (A) | | | 85 | | | | 89 | |
5.875%, 01/15/2030 (A) | | | 82 | | | | 82 | |
Continental Resources | | | | | | | | |
5.750%, 01/15/2031 (A) | | | 100 | | | | 121 | |
4.900%, 06/01/2044 | | | 100 | | | | 115 | |
4.500%, 04/15/2023 | | | 251 | | | | 261 | |
Coronado Finance Pty | | | | | | | | |
10.750%, 05/15/2026 (A) | | | 50 | | | | 55 | |
Crestwood Midstream Partners | | | | | | | | |
6.000%, 02/01/2029 (A) | | | 100 | | | | 104 | |
5.625%, 05/01/2027 (A) | | | 60 | | | | 61 | |
CrownRock | | | | | | | | |
5.625%, 10/15/2025 (A) | | | 150 | | | | 154 | |
5.000%, 05/01/2029 (A) | | | 13 | | | | 14 | |
CVR Energy | | | | | | | | |
5.250%, 02/15/2025 (A) | | | 150 | | | | 146 | |
DCP Midstream Operating | | | | | | | | |
8.125%, 08/16/2030 | | | 20 | | | | 27 | |
5.850%, VAR ICE LIBOR USD 3 | | | | | | | | |
Month+3.850%, 05/21/2043 (A) | | | 150 | | | | 139 | |
5.375%, 07/15/2025 | | | 300 | | | | 331 | |
DT Midstream | | | | | | | | |
4.375%, 06/15/2031 (A) | | | 30 | | | | 31 | |
4.125%, 06/15/2029 (A) | | | 125 | | | | 128 | |
Empresa Nacional del Petroleo | | | | | | | | |
5.250%, 11/06/2029 | | | 200 | | | | 226 | |
3.750%, 08/05/2026 | | | 200 | | | | 211 | |
Encino Acquisition Partners Holdings | | | | | | | | |
8.500%, 05/01/2028 (A) | | | 92 | | | | 92 | |
Endeavor Energy Resources | | | | | | | | |
6.625%, 07/15/2025 (A) | | | 100 | | | | 106 | |
5.750%, 01/30/2028 (A) | | | 100 | | | | 105 | |
Energy Ventures Gom | | | | | | | | |
11.750%, 04/15/2026 (A) | | | 25 | | | | 26 | |
EnLink Midstream | | | | | | | | |
5.625%, 01/15/2028 (A) | | | 50 | | | | 53 | |
EnLink Midstream Partners | | | | | | | | |
5.050%, 04/01/2045 | | | 100 | | | | 92 | |
4.850%, 07/15/2026 | | | 100 | | | | 105 | |
4.150%, 06/01/2025 | | | 100 | | | | 103 | |
| | | | | | | | |
| | | |
| Description | | Face Amount
(Thousands) | | Market Value
($ Thousands) |
|
CORPORATE OBLIGATIONS (continued) | |
Enviva Partners | | | | | | | | |
6.500%, 01/15/2026 (A) | | $ | 100 | | | $ | 104 | |
EQM Midstream Partners | | | | | | | | |
6.500%, 07/01/2027 (A) | | | 100 | | | | 112 | |
6.500%, 07/15/2048 | | | 50 | | | | 55 | |
6.000%, 07/01/2025 (A) | | | 100 | | | | 109 | |
5.500%, 07/15/2028 | | | 100 | | | | 108 | |
4.750%, 07/15/2023 | | | 150 | | | | 156 | |
4.500%, 01/15/2029 (A) | | | 100 | | | | 101 | |
4.000%, 08/01/2024 | | | 100 | | | | 102 | |
EQT Corp | | | | | | | | |
7.500%, 02/01/2030 | | | 100 | | | | 131 | |
5.000%, 01/15/2029 | | | 50 | | | | 57 | |
3.900%, 10/01/2027 | | | 100 | | | | 108 | |
3.000%, 10/01/2022 | | | 84 | | | | 85 | |
Equities | | | | | | | | |
3.625%, 05/15/2031 (A) | | | 25 | | | | 26 | |
3.125%, 05/15/2026 (A) | | | 54 | | | | 56 | |
Exterran Energy Solutions | | | | | | | | |
8.125%, 05/01/2025 | | | 50 | | | | 44 | |
Genesis Energy | | | | | | | | |
8.000%, 01/15/2027 | | | 25 | | | | 26 | |
7.750%, 02/01/2028 | | | 150 | | | | 152 | |
6.500%, 10/01/2025 | | | 150 | | | | 149 | |
Global Partners | | | | | | | | |
7.000%, 08/01/2027 | | | 100 | | | | 105 | |
Harvest Midstream I | | | | | | | | |
7.500%, 09/01/2028 (A) | | | 60 | | | | 64 | |
Hess Midstream Operations | | | | | | | | |
5.625%, 02/15/2026 (A) | | | 170 | | | | 177 | |
Hilcorp Energy I | | | | | | | | |
6.250%, 11/01/2028 (A) | | | 200 | | | | 209 | |
Independence Energy Finance | | | | | | | | |
7.250%, 05/01/2026 (A) | | | 65 | | | | 68 | |
Indigo Natural Resources | | | | | | | | |
5.375%, 02/01/2029 (A) | | | 110 | | | | 115 | |
ITT Holdings | | | | | | | | |
6.500%, 08/01/2029 (A) | | | 75 | | | | 75 | |
KazMunayGas National JSC | | | | | | | | |
6.375%, 10/24/2048 | | | 500 | | | | 657 | |
5.750%, 04/19/2047 | | | 200 | | | | 249 | |
5.375%, 04/24/2030 | | | 500 | | | | 595 | |
Laredo Petroleum | | | | | | | | |
10.125%, 01/15/2028 | | | 30 | | | | 32 | |
7.750%, 07/31/2029 (A) | | | 135 | | | | 131 | |
Magnolia Oil & Gas Operating | | | | | | | | |
6.000%, 08/01/2026 (A) | | | 50 | | | | 51 | |
Matador Resources | | | | | | | | |
5.875%, 09/15/2026 | | | 100 | | | | 102 | |
MEG Energy | | | | | | | | |
5.875%, 02/01/2029 (A) | | | 240 | | | | 248 | |
| | |
| Adviser Managed Trust / Annual Report / July 31, 2021 | | 49 |
SCHEDULE OF INVESTMENTS
July 31, 2021
Tactical Offensive Enhanced Fixed Income Fund (Continued)
| | | | | | | | |
| | | |
| Description | | Face Amount
(Thousands) | | Market Value
($ Thousands) |
|
CORPORATE OBLIGATIONS (continued) | |
Moss Creek Resources Holdings | | | | | | | | |
10.500%, 05/15/2027 (A) | | $ | 100 | | | $ | 96 | |
Murphy Oil | | | | | | | | |
6.375%, 07/15/2028 | | | 65 | | | | 69 | |
5.875%, 12/01/2027 | | | 202 | | | | 209 | |
Nabors Industries | | | | | | | | |
7.500%, 01/15/2028 (A) | | | 138 | | | | 125 | |
Neptune Energy Bondco | | | | | | | | |
6.625%, 05/15/2025 (A) | | | 200 | | | | 203 | |
New Fortress Energy | | | | | | | | |
6.750%, 09/15/2025 (A) | | | 150 | | | | 153 | |
6.500%, 09/30/2026 (A) | | | 125 | | | | 126 | |
NGL Energy Operating | | | | | | | | |
7.500%, 02/01/2026 (A) | | | 190 | | | | 195 | |
NGL Energy Partners | | | | | | | | |
7.500%, 11/01/2023 | | | 175 | | | | 167 | |
Northern Oil and Gas | | | | | | | | |
8.125%, 03/01/2028 (A) | | | 45 | | | | 47 | |
Northriver Midstream Finance | | | | | | | | |
5.625%, 02/15/2026 (A) | | | 55 | | | | 57 | |
NuStar Logistics | | | | | | | | |
6.000%, 06/01/2026 | | | 100 | | | | 108 | |
5.750%, 10/01/2025 | | | 100 | | | | 109 | |
5.625%, 04/28/2027 | | | 50 | | | | 54 | |
Oasis Midstream Partners | | | | | | | | |
8.000%, 04/01/2029 (A) | | | 50 | | | | 52 | |
Oasis Petroleum | | | | | | | | |
6.375%, 06/01/2026 (A) | | | 40 | | | | 41 | |
Occidental Petroleum | | | | | | | | |
8.500%, 07/15/2027 | | | 200 | | | | 249 | |
8.000%, 07/15/2025 | | | 50 | | | | 59 | |
7.950%, 06/15/2039 | | | 50 | | | | 65 | |
7.875%, 09/15/2031 | | | 50 | | | | 65 | |
7.500%, 05/01/2031 | | | 200 | | | | 254 | |
6.600%, 03/15/2046 | | | 100 | | | | 123 | |
6.450%, 09/15/2036 | | | 100 | | | | 121 | |
6.375%, 09/01/2028 | | | 2 | | | | 2 | |
6.125%, 01/01/2031 | | | 150 | | | | 177 | |
5.875%, 09/01/2025 | | | 100 | | | | 111 | |
5.500%, 12/01/2025 | | | 110 | | | | 121 | |
4.705%, 10/10/2036 (C) | | | 200 | | | | 104 | |
4.300%, 08/15/2039 | | | 100 | | | | 99 | |
4.200%, 03/15/2048 | | | 200 | | | | 191 | |
4.100%, 02/15/2047 | | | 200 | | | | 189 | |
3.500%, 06/15/2025 | | | 250 | | | | 255 | |
3.500%, 08/15/2029 | | | 150 | | | | 150 | |
3.400%, 04/15/2026 | | | 300 | | | | 303 | |
3.200%, 08/15/2026 | | | 300 | | | | 298 | |
3.000%, 02/15/2027 | | | 100 | | | | 99 | |
2.900%, 08/15/2024 | | | 100 | | | | 101 | |
Oceaneering International | | | | | | | | |
4.650%, 11/15/2024 | | | 50 | | | | 50 | |
| | | | | | | | |
| | | |
| Description | | Face Amount
(Thousands) | | Market Value
($ Thousands) |
|
CORPORATE OBLIGATIONS (continued) | |
Oil and Gas Holding BSCC | | | | | | | | |
7.500%, 10/25/2027 | | $ | 500 | | | $ | 554 | |
Ovintiv | | | | | | | | |
7.375%, 11/01/2031 | | | 84 | | | | 113 | |
6.625%, 08/15/2037 | | | 100 | | | | 136 | |
6.500%, 08/15/2034 | | | 100 | | | | 133 | |
Ovintiv Exploration | | | | | | | | |
5.375%, 01/01/2026 | | | 70 | | | | 79 | |
Par Petroleum | | | | | | | | |
7.750%, 12/15/2025 (A) | | | 100 | | | | 99 | |
Parkland | | | | | | | | |
5.875%, 07/15/2027 (A) | | | 50 | | | | 53 | |
4.500%, 10/01/2029 (A) | | | 55 | | | | 57 | |
PBF Holding | | | | | | | | |
6.000%, 02/15/2028 | | | 250 | | | | 131 | |
PDC Energy | | | | | | | | |
5.750%, 05/15/2026 | | | 128 | | | | 132 | |
Peabody Energy | | | | | | | | |
6.375%, 03/31/2025 (A) | | | 50 | | | | 39 | |
Penn Virginia Escrow | | | | | | | | |
9.250%, 08/15/2026 (A) | | | 25 | | | | 25 | |
Pertamina Persero MTN | | | | | | | | |
6.450%, 05/30/2044 | | | 300 | | | | 390 | |
4.300%, 05/20/2023 | | | 200 | | | | 212 | |
4.175%, 01/21/2050 | | | 500 | | | | 514 | |
Petroleos del Peru | | | | | | | | |
4.750%, 06/19/2032 | | | 500 | | | | 517 | |
Petroleos Mexicanos | | | | | | | | |
6.950%, 01/28/2060 | | | 500 | | | | 448 | |
6.875%, 10/16/2025 | | | 700 | | | | 771 | |
6.500%, 03/13/2027 | | | 1,250 | | | | 1,324 | |
Petroleos Mexicanos MTN | | | | | | | | |
6.750%, 09/21/2047 | | | 1,000 | | | | 894 | |
Petronas Capital MTN | | | | | | | | |
4.550%, 04/21/2050 | | | 1,250 | | | | 1,536 | |
3.500%, 03/18/2025 | | | 1,000 | | | | 1,084 | |
Precision Drilling | | | | | | | | |
6.875%, 01/15/2029 (A) | | | 25 | | | | 26 | |
Qatar Petroleum | | | | | | | | |
3.125%, 07/12/2041 | | | 400 | | | | 415 | |
Range Resources | | | | | | | | |
9.250%, 02/01/2026 | | | 100 | | | | 108 | |
5.000%, 03/15/2023 | | | 58 | | | | 60 | |
4.875%, 05/15/2025 | | | 149 | | | | 155 | |
Renewable Energy Group | | | | | | | | |
5.875%, 06/01/2028 (A) | | | 70 | | | | 73 | |
Rockies Express Pipeline | | | | | | | | |
4.950%, 07/15/2029 (A) | | | 50 | | | | 51 | |
4.800%, 05/15/2030 (A) | | | 50 | | | | 51 | |
3.600%, 05/15/2025 (A) | | | 100 | | | | 102 | |
Ruby Pipeline | | | | | | | | |
8.000%, 04/01/2022 (A) | | | 5 | | | | 4 | |
| | |
| 50 | | Adviser Managed Trust / Annual Report / July 31, 2021 |
| | | | | | | | |
| | | |
| Description | | Face Amount
(Thousands) | | Market Value
($ Thousands) |
|
CORPORATE OBLIGATIONS (continued) | |
Sinopec Group Overseas Development 2015 | | | | | | | | |
3.250%, 04/28/2025 | | $ | 1,000 | | | $ | 1,073 | |
Sinopec Group Overseas Development 2018 | | | | | | | | |
2.700%, 05/13/2030 | | | 1,000 | | | | 1,039 | |
2.300%, 01/08/2031 | | | 200 | | | | 201 | |
SM Energy | | | | | | | | |
10.000%, 01/15/2025 (A) | | | 150 | | | | 167 | |
6.625%, 01/15/2027 | | | 50 | | | | 50 | |
6.500%, 07/15/2028 | | | 50 | | | | 50 | |
5.625%, 06/01/2025 | | | 95 | | | | 93 | |
Southern Gas Corridor CJSC | | | | | | | | |
6.875%, 03/24/2026 | | | 750 | | | | 889 | |
Southwestern Energy | | | | | | | | |
7.500%, 04/01/2026 | | | 246 | | | | 259 | |
Strathcona Resources | | | | | | | | |
6.875%, 08/01/2026 (A) | | | 50 | | | | 49 | |
Summit Midstream Holdings | | | | | | | | |
5.750%, 04/15/2025 | | | 30 | | | | 28 | |
Sunoco | | | | | | | | |
6.000%, 04/15/2027 | | | 20 | | | | 21 | |
5.875%, 03/15/2028 | | | 100 | | | | 105 | |
5.500%, 02/15/2026 | | | 100 | | | | 103 | |
4.500%, 05/15/2029 | | | 50 | | | | 51 | |
Tallgrass Energy Partners | | | | | | | | |
7.500%, 10/01/2025 (A) | | | 100 | | | | 108 | |
5.500%, 09/15/2024 (A) | | | 200 | | | | 203 | |
Talos Production | | | | | | | | |
12.000%, 01/15/2026 | | | 100 | | | | 104 | |
Targa Resources Partners | | | | | | | | |
6.500%, 07/15/2027 | | | 70 | | | | 76 | |
5.875%, 04/15/2026 | | | 154 | | | | 161 | |
5.500%, 03/01/2030 | | | 100 | | | | 110 | |
5.375%, 02/01/2027 | | | 80 | | | | 83 | |
5.000%, 01/15/2028 | | | 154 | | | | 162 | |
4.000%, 01/15/2032 (A) | | | 90 | | | | 93 | |
TechnipFMC | | | | | | | | |
6.500%, 02/01/2026 (A) | | | 162 | | | | 174 | |
Teine Energy | | | | | | | | |
6.875%, 04/15/2029 (A) | | | 50 | | | | 51 | |
TransMontaigne Partners | | | | | | | | |
6.125%, 02/15/2026 | | | 100 | | | | 102 | |
Transocean | | | | | | | | |
7.500%, 04/15/2031 | | | 100 | | | | 63 | |
Transocean Pontus | | | | | | | | |
6.125%, 08/01/2025 (A) | | | 145 | | | | 143 | |
Transocean Poseidon | | | | | | | | |
6.875%, 02/01/2027 (A) | | | 100 | | | | 97 | |
Transocean Sentry | | | | | | | | |
5.375%, 05/15/2023 (A) | | | 276 | | | | 260 | |
Trinidad Petroleum Holdings | | | | | | | | |
9.750%, 06/15/2026 | | | 200 | | | | 224 | |
| | | | | | | | |
| | | |
| Description | | Face Amount
(Thousands) | | Market Value
($ Thousands) |
|
CORPORATE OBLIGATIONS (continued) | |
USA Compression Partners | | | | | | | | |
6.875%, 04/01/2026 | | $ | 200 | | | $ | 209 | |
Vantage Drilling International | | | | | | | | |
9.250%, 11/15/2023 (A) | | | 100 | | | | 88 | |
Venture Global Calcasieu Pass | | | | | | | | |
4.125%, 08/15/2031 (A) | | | 48 | | | | 50 | |
3.875%, 08/15/2029 (A) | | | 48 | | | | 49 | |
Vine Energy Holdings | | | | | | | | |
6.750%, 04/15/2029 (A) | | | 50 | | | | 52 | |
W&T Offshore | | | | | | | | |
9.750%, 11/01/2023 (A) | | | 100 | | | | 96 | |
Weatherford International | | | | | | | | |
11.000%, 12/01/2024 (A) | | | 280 | | | | 290 | |
Western Midstream Operating | | | | | | | | |
6.500%, 02/01/2050 | | | 274 | | | | 322 | |
5.500%, 08/15/2048 | | | 50 | | | | 56 | |
4.650%, 07/01/2026 | | | 50 | | | | 54 | |
4.500%, 03/01/2028 | | | 100 | | | | 107 | |
4.350%, 02/01/2025 | | | 102 | | | | 107 | |
3.950%, 06/01/2025 | | | 100 | | | | 103 | |
| | | | | | | | |
| | | | | | | 35,211 | |
| | | | | | | | |
| | |
Financials — 5.9% | | | | | | | | |
1MDB Global Investments | | | | | | | | |
4.400%, 03/09/2023 | | | 1,000 | | | | 1,004 | |
Acrisure | | | | | | | | |
7.000%, 11/15/2025 (A) | | | 30 | | | | 30 | |
6.000%, 08/01/2029 (A) | | | 65 | | | | 65 | |
4.250%, 02/15/2029 (A) | | | 55 | | | | 54 | |
Advisor Group Holdings | | | | | | | | |
10.750%, 08/01/2027 (A) | | | 100 | | | | 110 | |
Air Methods | | | | | | | | |
8.000%, 05/15/2025 (A) | | | 50 | | | | 47 | |
Alliant Holdings Intermediate | | | | | | | | |
6.750%, 10/15/2027 (A) | | | 26 | | | | 27 | |
Allied Universal Holdco | | | | | | | | |
9.750%, 07/15/2027 (A) | | | 100 | | | | 110 | |
6.625%, 07/15/2026 (A) | | | 200 | | | | 212 | |
6.000%, 06/01/2029 (A) | | | 53 | | | | 53 | |
4.625%, 06/01/2028 (A) | | | 291 | | | | 292 | |
Ally Financial | | | | | | | | |
5.750%, 11/20/2025 | | | 100 | | | | 114 | |
AmWINS Group | | | | | | | | |
4.875%, 06/30/2029 (A) | | | 35 | | | | 36 | |
Apollo Commercial Real Estate Finance | | | | | | | | |
4.625%, 06/15/2029 (A) | | | 40 | | | | 39 | |
Aretec Escrow Issuer | | | | | | | | |
7.500%, 04/01/2029 (A) | | | 100 | | | | 105 | |
AssuredPartners | | | | | | | | |
5.625%, 01/15/2029 (A) | | | 60 | | | | 60 | |
Banco Nacional de Panama | | | | | | | | |
2.500%, 08/11/2030 | | | 200 | | | | 193 | |
| | |
| Adviser Managed Trust / Annual Report / July 31, 2021 | | 51 |
SCHEDULE OF INVESTMENTS
July 31, 2021
Tactical Offensive Enhanced Fixed Income Fund (Continued)
| | | | | | | | |
| | | |
| Description | | Face Amount
(Thousands) | | Market Value
($ Thousands) |
|
CORPORATE OBLIGATIONS (continued) | |
Banque Centrale de Tunisie International Bond | | | | | | | | |
5.750%, 01/30/2025 | | $ | 200 | | | $ | 169 | |
BroadStreet Partners | | | | | | | | |
5.875%, 04/15/2029 (A) | | | 33 | | | | 33 | |
CBB International Sukuk Programme WLL | | | | | | | | |
6.250%, 11/14/2024 | | | 1,250 | | | | 1,358 | |
CIT Group | | | | | | | | |
5.250%, 03/07/2025 | | | 149 | | | | 168 | |
5.000%, 08/15/2022 | | | 100 | | | | 104 | |
5.000%, 08/01/2023 | | | 103 | | | | 111 | |
Compass Group Diversified Holdings | | | | | | | | |
5.250%, 04/15/2029 (A) | | | 150 | | | | 156 | |
Credit Acceptance | | | | | | | | |
5.125%, 12/31/2024 (A) | | | 100 | | | | 103 | |
Curo Group Holdings | | | | | | | | |
8.250%, 09/01/2025 (A) | | | 100 | | | | 105 | |
7.500%, 08/01/2028 (A) | | | 33 | | | | 34 | |
DAE Sukuk Difc MTN | | | | | | | | |
3.750%, 02/15/2026 | | | 200 | | | | 212 | |
Deutsche Bank | | | | | | | | |
4.500%, 04/01/2025 | | | 200 | | | | 216 | |
Deutsche Bank MTN | | | | | | | | |
4.296%, VAR USD Swap Semi 30/360 5 Yr Curr+2.248%, 05/24/2028 | | | 160 | | | | 166 | |
Deutsche Bank NY | | | | | | | | |
4.875%, VAR USD ICE Swap 11:00 NY 5 Yr+2.553%, 12/01/2032 | | | 200 | | | | 217 | |
Development Bank of Kazakhstan JSC | | | | | | | | |
4.125%, 12/10/2022 | | | 700 | | | | 728 | |
Enact Holdings | | | | | | | | |
6.500%, 08/15/2025 (A) | | | 289 | | | | 313 | |
Enova International | | | | | | | | |
8.500%, 09/15/2025 (A) | | | 100 | | | | 104 | |
Finance of America Funding | | | | | | | | |
7.875%, 11/15/2025 (A) | | | 100 | | | | 99 | |
FirstCash | | | | | | | | |
4.625%, 09/01/2028 (A) | | | 197 | | | | 205 | |
Freedom Mortgage | | | | | | | | |
7.625%, 05/01/2026 (A) | | | 200 | | | | 205 | |
6.625%, 01/15/2027 (A) | | | 30 | | | | 29 | |
FS Energy and Power Fund | | | | | | | | |
7.500%, 08/15/2023 (A) | | | 50 | | | | 52 | |
Genworth Holdings | | | | | | | | |
4.800%, 02/15/2024 | | | 40 | | | | 40 | |
Global Aircraft Leasing | | | | | | | | |
6.500% cash/0% PIK, 09/15/2024 (A) | | | 207 | | | | 208 | |
goeasy | | | | | | | | |
5.375%, 12/01/2024 (A) | | | 100 | | | | 104 | |
GTCR AP Finance | | | | | | | | |
8.000%, 05/15/2027 (A) | | | 100 | | | | 106 | |
| | | | | | | | |
| | | |
| Description | | Face Amount
(Thousands) | | Market Value
($ Thousands) |
|
CORPORATE OBLIGATIONS (continued) | |
Gtlk Europe Capital DAC | | | | | | | | |
4.800%, 02/26/2028 | | $ | 250 | | | $ | 262 | |
HAT Holdings I | | | | | | | | |
6.000%, 04/15/2025 (A) | | | 100 | | | | 105 | |
3.375%, 06/15/2026 (A) | | | 80 | | | | 81 | |
Hazine Mustesarligi Varlik Kiralama | | | | | | | | |
5.800%, 02/21/2022 | | | 500 | | | | 509 | |
Hightower Holding | | | | | | | | |
6.750%, 04/15/2029 (A) | | | 50 | | | | 51 | |
Home Point Capital | | | | | | | | |
5.000%, 02/01/2026 (A) | | | 135 | | | | 125 | |
HUB International | | | | | | | | |
7.000%, 05/01/2026 (A) | | | 26 | | | | 27 | |
Intesa Sanpaolo MTN | | | | | | | | |
5.710%, 01/15/2026 (A) | | | 200 | | | | 226 | |
5.017%, 06/26/2024 (A) | | | 236 | | | | 256 | |
Jefferson Capital Holdings | | | | | | | | |
6.000%, 08/15/2026 (A) | | | 20 | | | | 20 | |
Ladder Capital Finance Holdings LLLP | | | | | | | | |
4.750%, 06/15/2029 (A) | | | 50 | | | | 50 | |
4.250%, 02/01/2027 (A) | | | 100 | | | | 100 | |
LD Holdings Group | | | | | | | | |
6.125%, 04/01/2028 (A) | | | 149 | | | | 148 | |
Liberty Mutual Group | | | | | | | | |
7.800%, 03/15/2037 (A) | | | 100 | | | | 134 | |
LPL Holdings | | | | | | | | |
4.375%, 05/15/2031 (A) | | | 40 | | | | 41 | |
4.000%, 03/15/2029 (A) | | | 155 | | | | 157 | |
Malaysia Sukuk Global | | | | | | | | |
3.179%, 04/27/2026 | | | 500 | | | | 547 | |
Malaysia Wakala Sukuk | | | | | | | | |
2.070%, 04/28/2031 (A) | | | 250 | | | | 255 | |
MDGH - GMTN BV MTN | | | | | | | | |
3.950%, 05/21/2050 | | | 200 | | | | 229 | |
2.500%, 05/21/2026 | | | 500 | | | | 525 | |
MGIC Investment | | | | | | | | |
5.250%, 08/15/2028 | | | 50 | | | | 53 | |
Midcap Financial Issuer Trust | | | | | | | | |
6.500%, 05/01/2028 (A) | | | 200 | | | | 208 | |
Modulaire Global Finance | | | | | | | | |
8.000%, 02/15/2023 (A) | | | 200 | | | | 206 | |
MPH Acquisition Holdings | | | | | | | | |
5.750%, 11/01/2028 (A) | | | 165 | | | | 160 | |
MSCI | | | | | | | | |
4.000%, 11/15/2029 (A) | | | 70 | | | | 75 | |
3.875%, 02/15/2031 (A) | | | 135 | | | | 143 | |
3.625%, 09/01/2030 (A) | | | 70 | | | | 74 | |
3.625%, 11/01/2031 (A) | | | 55 | | | | 58 | |
Mumtalakat Sukuk Holding | | | | | | | | |
5.625%, 02/27/2024 | | | 200 | | | | 212 | |
Nationstar Mortgage Holdings | | | | | | | | |
5.500%, 08/15/2028 (A) | | | 200 | | | | 203 | |
| | |
| 52 | | Adviser Managed Trust / Annual Report / July 31, 2021 |
| | | | | | | | |
| | | |
| Description | | Face Amount
(Thousands) | | Market Value
($ Thousands) |
|
CORPORATE OBLIGATIONS (continued) | |
5.125%, 12/15/2030 (A) | | $ | 66 | | | $ | 66 | |
Navient | | | | | | | | |
6.750%, 06/25/2025 | | | 150 | | | | 167 | |
5.000%, 03/15/2027 | | | 100 | | | | 104 | |
4.875%, 03/15/2028 | | | 100 | | | | 101 | |
Navient MTN | | | | | | | | |
6.125%, 03/25/2024 | | | 224 | | | | 243 | |
New Residential Investment | | | | | | | | |
6.250%, 10/15/2025 (A) | | | 60 | | | | 60 | |
NFP | | | | | | | | |
6.875%, 08/15/2028 (A) | | | 200 | | | | 208 | |
4.875%, 08/15/2028 (A) | | | 13 | | | | 13 | |
Oman Sovereign Sukuk | | | | | | | | |
4.397%, 06/01/2024 | | | 500 | | | | 519 | |
OneMain Finance | | | | | | | | |
8.875%, 06/01/2025 | | | 64 | | | | 70 | |
7.125%, 03/15/2026 | | | 200 | | | | 235 | |
6.625%, 01/15/2028 | | | 100 | | | | 116 | |
6.125%, 03/15/2024 | | | 250 | | | | 269 | |
5.625%, 03/15/2023 | | | 100 | | | | 106 | |
5.375%, 11/15/2029 | | | 100 | | | | 110 | |
3.500%, 01/15/2027 | | | 20 | | | | 20 | |
PennyMac Financial Services | | | | | | | | |
5.375%, 10/15/2025 (A) | | | 50 | | | | 52 | |
4.250%, 02/15/2029 (A) | | | 85 | | | | 82 | |
PHH Mortgage | | | | | | | | |
7.875%, 03/15/2026 (A) | | | 30 | | | | 31 | |
Quicken Loans | | | | | | | | |
5.250%, 01/15/2028 (A) | | | 100 | | | | 105 | |
3.625%, 03/01/2029 (A) | | | 100 | | | | 100 | |
Radian Group | | | | | | | | |
6.625%, 03/15/2025 | | | 50 | | | | 56 | |
4.875%, 03/15/2027 | | | 117 | | | | 127 | |
Sabre GLBL | | | | | | | | |
9.250%, 04/15/2025 (A) | | | 100 | | | | 117 | |
7.375%, 09/01/2025 (A) | | | 90 | | | | 96 | |
Sharjah Sukuk Program | | | | | | | | |
2.942%, 06/10/2027 | | | 500 | | | | 511 | |
SLM | | | | | | | | |
4.200%, 10/29/2025 | | | 100 | | | | 108 | |
Starwood Property Trust | | | | | | | | |
4.750%, 03/15/2025 | | | 100 | | | | 106 | |
3.625%, 07/15/2026 (A) | | | 110 | | | | 112 | |
Stena International | | | | | | | | |
5.750%, 03/01/2024 (A) | | | 200 | | | | 206 | |
StoneX Group | | | | | | | | |
8.625%, 06/15/2025 (A) | | | 7 | | | | 8 | |
Tempo Acquisition | | | | | | | | |
5.750%, 06/01/2025 (A) | | | 50 | | | | 53 | |
Third Pakistan International Sukuk | | | | | | | | |
5.625%, 12/05/2022 | | | 500 | | | | 512 | |
| | | | | | | | |
| | | |
| Description | | Face Amount
(Thousands) | | Market Value
($ Thousands) |
|
CORPORATE OBLIGATIONS (continued) | |
TMX Finance | | | | | | | | |
11.125%, 04/01/2023 (A) | | $ | 100 | | | $ | 102 | |
UniCredit | | | | | | | | |
5.861%, VAR USD ICE Swap 11:00 NY 5 Yr+3.703%, 06/19/2032 (A) | | | 100 | | | | 111 | |
UniCredit MTN | | | | | | | | |
7.296%, VAR USD ICE Swap 11:00 NY 5 Yr+4.914%, 04/02/2034 (A) | | | 100 | | | | 121 | |
5.459%, VAR US Treas Yield Curve Rate T Note Const Mat 5 Yr+4.750%, 06/30/2035 (A) | | | 200 | | | | 221 | |
United Wholesale Mortgage | | | | | | | | |
5.500%, 04/15/2029 (A) | | | 100 | | | | 99 | |
USI | | | | | | | | |
6.875%, 05/01/2025 (A) | | | 50 | | | | 51 | |
| | | | | | | | |
| | | | | | | 18,630 | |
| | | | | | | | |
| | |
Health Care — 4.3% | | | | | | | | |
AdaptHealth | | | | | | | | |
6.125%, 08/01/2028 (A) | | | 61 | | | | 64 | |
4.625%, 08/01/2029 (A) | | | 50 | | | | 50 | |
AHP Health Partners | | | | | | | | |
5.750%, 07/15/2029 (A) | | | 50 | | | | 51 | |
Akumin | | | | | | | | |
7.000%, 11/01/2025 (A) | | | 140 | | | | 143 | |
Avantor Funding | | | | | | | | |
4.625%, 07/15/2028 (A) | | | 100 | | | | 105 | |
Bausch Health | | | | | | | | |
9.000%, 12/15/2025 (A) | | | 250 | | | | 267 | |
6.250%, 02/15/2029 (A) | | | 200 | | | | 199 | |
6.125%, 04/15/2025 (A) | | | 100 | | | | 102 | |
5.500%, 11/01/2025 (A) | | | 350 | | | | 357 | |
5.250%, 02/15/2031 (A) | | | 100 | | | | 94 | |
5.000%, 01/30/2028 (A) | | | 100 | | | | 95 | |
5.000%, 02/15/2029 (A) | | | 420 | | | | 397 | |
4.875%, 06/01/2028 (A) | | | 35 | | | | 36 | |
Bausch Health Americas | | | | | | | | |
8.500%, 01/31/2027 (A) | | | 450 | | | | 487 | |
Catalent Pharma Solutions | | | | | | | | |
3.125%, 02/15/2029 (A) | | | 117 | | | | 115 | |
Centene | | | | | | | | |
5.375%, 06/01/2026 (A) | | | 220 | | | | 229 | |
5.375%, 08/15/2026 (A) | | | 100 | | | | 104 | |
4.625%, 12/15/2029 | | | 500 | | | | 548 | |
4.250%, 12/15/2027 | | | 300 | | | | 317 | |
3.375%, 02/15/2030 | | | 50 | | | | 52 | |
3.000%, 10/15/2030 | | | 10 | | | | 10 | |
2.625%, 08/01/2031 | | | 65 | | | | 65 | |
2.500%, 03/01/2031 | | | 280 | | | | 280 | |
2.450%, 07/15/2028 | | | 80 | | | | 81 | |
Charles River Laboratories International | | | | | | | | |
4.250%, 05/01/2028 (A) | | | 50 | | | | 52 | |
| | |
| Adviser Managed Trust / Annual Report / July 31, 2021 | | 53 |
SCHEDULE OF INVESTMENTS
July 31, 2021
Tactical Offensive Enhanced Fixed Income Fund (Continued)
| | | | | | | | |
| | | |
| Description | | Face Amount
(Thousands) | | Market Value
($ Thousands) |
|
CORPORATE OBLIGATIONS (continued) | |
4.000%, 03/15/2031 (A) | | $ | 50 | | | $ | 53 | |
3.750%, 03/15/2029 (A) | | | 83 | | | | 85 | |
Cheplapharm Arzneimittel GmbH | | | | | | | | |
5.500%, 01/15/2028 (A) | | | 100 | | | | 102 | |
CHS | | | | | | | | |
8.000%, 03/15/2026 (A) | | | 200 | | | | 214 | |
6.875%, 04/01/2028 (A) | | | 200 | | | | 198 | |
6.875%, 04/15/2029 (A) | | | 185 | | | | 195 | |
6.625%, 02/15/2025 (A) | | | 100 | | | | 105 | |
6.125%, 04/01/2030 (A) | | | 137 | | | | 139 | |
6.000%, 01/15/2029 (A) | | | 50 | | | | 53 | |
5.625%, 03/15/2027 (A) | | | 200 | | | | 212 | |
4.750%, 02/15/2031 (A) | | | 90 | | | | 91 | |
DaVita | | | | | | | | |
4.625%, 06/01/2030 (A) | | | 425 | | | | 439 | |
Elanco Animal Health | | | | | | | | |
5.272%, 08/28/2023 | | | 100 | | | | 107 | |
Encompass Health | | | | | | | | |
4.750%, 02/01/2030 | | | 100 | | | | 107 | |
4.625%, 04/01/2031 | | | 40 | | | | 44 | |
4.500%, 02/01/2028 | | | 100 | | | | 104 | |
Endo DAC | | | | | | | | |
9.500%, 07/31/2027 (A) | | | 100 | | | | 100 | |
6.000%, 06/30/2028 (A) | | | 300 | | | | 203 | |
Endo Luxembourg Finance I Sarl | | | | | | | | |
6.125%, 04/01/2029 (A) | | | 90 | | | | 89 | |
Envision Healthcare | | | | | | | | |
8.750%, 10/15/2026 (A) | | | 200 | | | | 147 | |
Global Medical Response | | | | | | | | |
6.500%, 10/01/2025 (A) | | | 64 | | | | 66 | |
HCA | | | | | | | | |
7.500%, 11/06/2033 | | | 200 | | | | 283 | |
5.875%, 05/01/2023 | | | 30 | | | | 32 | |
5.875%, 02/15/2026 | | | 150 | | | | 174 | |
5.875%, 02/01/2029 | | | 100 | | | | 122 | |
5.625%, 09/01/2028 | | | 200 | | | | 241 | |
5.375%, 02/01/2025 | | | 350 | | | | 397 | |
3.500%, 09/01/2030 | | | 210 | | | | 228 | |
HCRX Investments Holdco | | | | | | | | |
4.500%, 08/01/2029 (A) | | | 20 | | | | 20 | |
Hologic | | | | | | | | |
4.625%, 02/01/2028 (A) | | | 50 | | | | 53 | |
Jaguar Holding II | | | | | | | | |
4.625%, 06/15/2025 (A) | | | 100 | | | | 105 | |
Jazz Securities DAC | | | | | | | | |
4.375%, 01/15/2029 (A) | | | 200 | | | | 208 | |
Lannett | | | | | | | | |
7.750%, 04/15/2026 (A) | | | 50 | | | | 49 | |
LifePoint Health | | | | | | | | |
5.375%, 01/15/2029 (A) | | | 125 | | | | 124 | |
MEDNAX | | | | | | | | |
6.250%, 01/15/2027 (A) | | | 135 | | | | 142 | |
| | | | | | | | |
| | | |
| Description | | Face Amount
(Thousands) | | Market Value
($ Thousands) |
|
CORPORATE OBLIGATIONS (continued) | |
ModivCare | | | | | | | | |
5.875%, 11/15/2025 (A) | | $ | 100 | | | $ | 106 | |
Molina Healthcare | | | | | | | | |
4.375%, 06/15/2028 (A) | | | 100 | | | | 105 | |
Organon | | | | | | | | |
5.125%, 04/30/2031 (A) | | | 200 | | | | 206 | |
4.125%, 04/30/2028 (A) | | | 200 | | | | 205 | |
Ortho-Clinical Diagnostics | | | | | | | | |
7.250%, 02/01/2028 (A) | | | 40 | | | | 44 | |
Owens & Minor | | | | | | | | |
4.500%, 03/31/2029 (A) | | | 65 | | | | 67 | |
P&L Development | | | | | | | | |
7.750%, 11/15/2025 (A) | | | 100 | | | | 105 | |
Par Pharmaceutical | | | | | | | | |
7.500%, 04/01/2027 (A) | | | 200 | | | | 204 | |
Prestige Brands | | | | | | | | |
3.750%, 04/01/2031 (A) | | | 150 | | | | 148 | |
Prime Healthcare Services | | | | | | | | |
7.250%, 11/01/2025 (A) | | | 231 | | | | 248 | |
Radiology Partners | | | | | | | | |
9.250%, 02/01/2028 (A) | | | 100 | | | | 108 | |
RegionalCare Hospital Partners Holdings | | | | | | | | |
9.750%, 12/01/2026 (A) | | | 135 | | | | 143 | |
RP Escrow Issuer | | | | | | | | |
5.250%, 12/15/2025 (A) | | | 150 | | | | 153 | |
Select Medical | | | | | | | | |
6.250%, 08/15/2026 (A) | | | 200 | | | | 211 | |
Surgery Center Holdings | | | | | | | | |
6.750%, 07/01/2025 (A) | | | 22 | | | | 22 | |
Syneos Health | | | | | | | | |
3.625%, 01/15/2029 (A) | | | 100 | | | | 99 | |
Team Health Holdings | | | | | | | | |
6.375%, 02/01/2025 (A) | | | 100 | | | | 93 | |
Teleflex | | | | | | | | |
4.625%, 11/15/2027 | | | 12 | | | | 13 | |
4.250%, 06/01/2028 (A) | | | 50 | | | | 52 | |
Tenet Healthcare | | | | | | | | |
7.500%, 04/01/2025 (A) | | | 300 | | | | 323 | |
6.875%, 11/15/2031 | | | 100 | | | | 114 | |
6.750%, 06/15/2023 | | | 50 | | | | 54 | |
6.250%, 02/01/2027 (A) | | | 150 | | | | 156 | |
6.125%, 10/01/2028 (A) | | | 300 | | | | 320 | |
5.125%, 11/01/2027 (A) | | | 200 | | | | 210 | |
4.875%, 01/01/2026 (A) | | | 200 | | | | 207 | |
4.625%, 06/15/2028 (A) | | | 50 | | | | 52 | |
4.250%, 06/01/2029 (A) | | | 200 | | | | 204 | |
US Acute Care Solutions | | | | | | | | |
6.375%, 03/01/2026 (A) | | | 70 | | | | 73 | |
US Renal Care | | | | | | | | |
10.625%, 07/15/2027 (A) | | | 100 | | | | 109 | |
Varex Imaging | | | | | | | | |
7.875%, 10/15/2027 (A) | | | 90 | | | | 100 | |
| | |
| 54 | | Adviser Managed Trust / Annual Report / July 31, 2021 |
| | | | | | | | |
| | | |
| Description | | Face Amount
(Thousands) | | Market Value
($ Thousands) |
|
CORPORATE OBLIGATIONS (continued) | |
Vizient | | | | | | | | |
6.250%, 05/15/2027 (A) | | $ | 200 | | | $ | 209 | |
| | | | | | | | |
| | | | | | | 13,794 | |
| | | | | | | | |
| | |
Industrials — 7.3% | | | | | | | | |
ACCO Brands | | | | | | | | |
4.250%, 03/15/2029 (A) | | | 85 | | | | 85 | |
ADT Security | | | | | | | | |
4.875%, 07/15/2032 (A) | | | 20 | | | | 21 | |
4.125%, 08/01/2029 (A) | | | 50 | | | | 50 | |
3.500%, 07/15/2022 | | | 200 | | | | 205 | |
Advanced Drainage Systems | | | | | | | | |
5.000%, 09/30/2027 (A) | | | 99 | | | | 103 | |
AECOM | | | | | | | | |
5.125%, 03/15/2027 | | | 100 | | | | 111 | |
AerCap Global Aviation Trust | | | | | | | | |
6.500%, VAR ICE LIBOR USD 3 | | | | | | | | |
Month+4.300%, 06/15/2045 (A) | | | 200 | | | | 214 | |
Aeropuerto Internacional de Tocumen | | | | | | | | |
6.000%, 11/18/2048 | | | 493 | | | | 575 | |
Ahern Rentals | | | | | | | | |
7.375%, 05/15/2023 (A) | | | 70 | | | | 63 | |
Air Canada | | | | | | | | |
3.875%, 08/15/2026 (A) | | | 60 | | | | 60 | |
Allison Transmission | | | | | | | | |
4.750%, 10/01/2027 (A) | | | 49 | | | | 51 | |
3.750%, 01/30/2031 (A) | | | 100 | | | | 100 | |
Alta Equipment Group | | | | | | | | |
5.625%, 04/15/2026 (A) | | | 40 | | | | 41 | |
American Airlines | | | | | | | | |
11.750%, 07/15/2025 (A) | | | 269 | | | | 336 | |
5.750%, 04/20/2029 (A) | | | 290 | | | | 313 | |
5.500%, 04/20/2026 (A) | | | 360 | | | | 377 | |
Amsted Industries | | | | | | | | |
4.625%, 05/15/2030 (A) | | | 50 | | | | 52 | |
Apex Tool Group | | | | | | | | |
9.000%, 02/15/2023 (A) | | | 151 | | | | 151 | |
APi Group DE | | | | | | | | |
4.125% cash/0% PIK, 07/15/2029 (A) | | | 50 | | | | 49 | |
Aptim | | | | | | | | |
7.750%, 06/15/2025 (A) | | | 100 | | | | 86 | |
APX Group | | | | | | | | |
6.750%, 02/15/2027 (A) | | | 140 | | | | 148 | |
5.750%, 07/15/2029 (A) | | | 90 | | | | 90 | |
Arcosa | | | | | | | | |
4.375%, 04/15/2029 (A) | | | 50 | | | | 51 | |
ARD Finance | | | | | | | | |
6.500% cash/0% PIK, 06/30/2027 (A) | | | 200 | | | | 211 | |
Ardagh Metal Packaging Finance USA | | | | | | | | |
3.250%, 09/01/2028 (A) | | | 50 | | | | 50 | |
Ardagh Packaging Finance | | | | | | | | |
5.250%, 04/30/2025 (A) | | | 250 | | | | 261 | |
| | | | | | | | |
| | | |
| Description | | Face Amount
(Thousands) | | Market Value
($ Thousands) |
|
CORPORATE OBLIGATIONS (continued) | |
5.250%, 08/15/2027 (A) | | $ | 200 | | | $ | 204 | |
ASGN | | | | | | | | |
4.625%, 05/15/2028 (A) | | | 100 | | | | 104 | |
Ashton Woods USA | | | | | | | | |
4.625%, 08/01/2029 (A) | | | 25 | | | | 25 | |
Atkore | | | | | | | | |
4.250%, 06/01/2031 (A) | | | 50 | | | | 51 | |
ATS Automation Tooling Systems | | | | | | | | |
4.125%, 12/15/2028 (A) | | | 100 | | | | 102 | |
Avis Budget Car Rental | | | | | | | | |
5.375%, 03/01/2029 (A) | | | 95 | | | | 99 | |
4.750%, 04/01/2028 (A) | | | 75 | | | | 76 | |
Beacon Roofing Supply | | | | | | | | |
4.125%, 05/15/2029 (A) | | | 50 | | | | 50 | |
Boise Cascade | | | | | | | | |
4.875%, 07/01/2030 (A) | | | 42 | | | | 44 | |
Bombardier | | | | | | | | |
7.875%, 04/15/2027 (A) | | | 275 | | | | 285 | |
7.500%, 12/01/2024 (A) | | | 200 | | | | 208 | |
7.125%, 06/15/2026 (A) | | | 116 | | | | 121 | |
Booz Allen Hamilton | | | | | | | | |
4.000%, 07/01/2029 (A) | | | 25 | | | | 26 | |
3.875%, 09/01/2028 (A) | | | 70 | | | | 71 | |
Brand Industrial Services | | | | | | | | |
8.500%, 07/15/2025 (A) | | | 100 | | | | 102 | |
Brightstar Escrow | | | | | | | | |
9.750%, 10/15/2025 (A) | | | 100 | | | | 107 | |
Brookfield Residential Properties | | | | | | | | |
5.000%, 06/15/2029 (A) | | | 50 | | | | 51 | |
4.875%, 02/15/2030 (A) | | | 100 | | | | 100 | |
Brundage-Bone Concrete Pumping Holdings | | | | | | | | |
6.000%, 02/01/2026 (A) | | | 35 | | | | 37 | |
Builders FirstSource | | | | | | | | |
5.000%, 03/01/2030 (A) | | | 70 | | | | 74 | |
4.250%, 02/01/2032 (A) | | | 40 | | | | 41 | |
BWX Technologies | | | | | | | | |
4.125%, 04/15/2029 (A) | | | 50 | | | | 51 | |
Cargo Aircraft Management | | | | | | | | |
4.750%, 02/01/2028 (A) | | | 165 | | | | 169 | |
Cascades | | | | | | | | |
5.375%, 01/15/2028 (A) | | | 100 | | | | 105 | |
China Minmetals | | | | | | | | |
3.750% B)(F) | | | 500 | | | | 511 | |
Clean Harbors | | | | | | | | |
4.875%, 07/15/2027 (A) | | | 50 | | | | 52 | |
Colfax | | | | | | | | |
6.375%, 02/15/2026 (A) | | | 100 | | | | 106 | |
CoreCivic | | | | | | | | |
8.250%, 04/15/2026 | | | 40 | | | | 42 | |
CoreLogic | | | | | | | | |
4.500%, 05/01/2028 (A) | | | 83 | | | | 83 | |
| | |
| Adviser Managed Trust / Annual Report / July 31, 2021 | | 55 |
SCHEDULE OF INVESTMENTS
July 31, 2021
Tactical Offensive Enhanced Fixed Income Fund (Continued)
| | | | | | | | |
| | | |
| Description | | Face Amount
(Thousands) | | Market Value
($ Thousands) |
|
CORPORATE OBLIGATIONS (continued) | |
Cornerstone Building Brands | | | | | | | | |
6.125%, 01/15/2029 (A) | | $ | 53 | | | $ | 56 | |
Covanta Holding | | | | | | | | |
5.875%, 07/01/2025 | | | 100 | | | | 104 | |
CP Atlas Buyer | | | | | | | | |
7.000%, 12/01/2028 (A) | | | 50 | | | | 52 | |
Danaos | | | | | | | | |
8.500%, 03/01/2028 (A) | | | 100 | | | | 108 | |
Delta Air Lines | | | | | | | | |
7.375%, 01/15/2026 | | | 351 | | | | 413 | |
Deluxe | | | | | | | | |
8.000%, 06/01/2029 (A) | | | 35 | | | | 38 | |
DP World Crescent | | | | | | | | |
3.908%, 05/31/2023 | | | 500 | | | | 524 | |
Dun & Bradstreet | | | | | | | | |
6.875%, 08/15/2026 (A) | | | 44 | | | | 47 | |
Dycom Industries | | | | | | | | |
4.500%, 04/15/2029 (A) | | | 35 | | | | 35 | |
Empire Communities | | | | | | | | |
7.000%, 12/15/2025 (A) | | | 150 | | | | 158 | |
Empresa de Transporte de Pasajeros Metro | | | | | | | | |
4.700%, 05/07/2050 | | | 250 | | | | 301 | |
EnPro Industries | | | | | | | | |
5.750%, 10/15/2026 | | | 4 | | | | 4 | |
First Student Bidco | | | | | | | | |
4.000%, 07/31/2029 (A) | | | 80 | | | | 80 | |
Flex Acquisition | | | | | | | | |
7.875%, 07/15/2026 (A) | | | 100 | | | | 104 | |
Fluor | | | | | | | | |
3.500%, 12/15/2024 | | | 50 | | | | 52 | |
Fortress Transportation and Infrastructure Investors | | | | | | | | |
9.750%, 08/01/2027 (A) | | | 100 | | | | 114 | |
6.500%, 10/01/2025 (A) | | | 100 | | | | 104 | |
5.500%, 05/01/2028 (A) | | | 20 | | | | 21 | |
FXI Holdings | | | | | | | | |
12.250%, 11/15/2026 (A) | | | 200 | | | | 228 | |
Georgian Railway JSC | | | | | | | | |
4.000%, 06/17/2028 | | | 250 | | | | 252 | |
GFL Environmental | | | | | | | | |
4.750%, 06/15/2029 (A) | | | 30 | | | | 31 | |
4.000%, 08/01/2028 (A) | | | 50 | | | | 49 | |
3.750%, 08/01/2025 (A) | | | 100 | | | | 103 | |
3.500%, 09/01/2028 (A) | | | 80 | | | | 80 | |
Global Infrastructure Solutions | | | | | | | | |
5.625%, 06/01/2029 (A) | | | 40 | | | | 41 | |
GrafTech Finance | | | | | | | | |
4.625%, 12/15/2028 (A) | | | 100 | | | | 103 | |
Graham Packaging | | | | | | | | |
7.125%, 08/15/2028 (A) | | | 100 | | | | 107 | |
Granite US Holdings | | | | | | | | |
11.000%, 10/01/2027 (A) | | | 20 | | | | 22 | |
| | | | | | | | |
| | | |
| Description | | Face Amount
(Thousands) | | Market Value
($ Thousands) |
|
CORPORATE OBLIGATIONS (continued) | |
Great Lakes Dredge & Dock | | | | | | | | |
5.250%, 06/01/2029 (A) | | $ | 15 | | | $ | 15 | |
Griffon | | | | | | | | |
5.750%, 03/01/2028 | | | 135 | | | | 142 | |
Grinding Media | | | | | | | | |
7.375%, 12/15/2023 (A) | | | 100 | | | | 101 | |
GYP Holdings III | | | | | | | | |
4.625%, 05/01/2029 (A) | | | 25 | | | | 25 | |
H&E Equipment Services | | | | | | | | |
3.875%, 12/15/2028 (A) | | | 20 | | | | 20 | |
Hawaiian Brand Intellectual Property | | | | | | | | |
5.750%, 01/20/2026 (A) | | | 175 | | | | 183 | |
Hillenbrand | | | | | | | | |
5.750%, 06/15/2025 | | | 100 | | | | 107 | |
3.750%, 03/01/2031 | | | 40 | | | | 41 | |
Howmet Aerospace | | | | | | | | |
6.875%, 05/01/2025 | | | 250 | | | | 291 | |
5.950%, 02/01/2037 | | | 100 | | | | 127 | |
5.900%, 02/01/2027 | | | 10 | | | | 12 | |
IAA | | | | | | | | |
5.500%, 06/15/2027 (A) | | | 100 | | | | 105 | |
Icahn Enterprises | | | | | | | | |
6.750%, 02/01/2024 | | | 28 | | | | 29 | |
6.375%, 12/15/2025 | | | 42 | | | | 43 | |
6.250%, 05/15/2026 | | | 132 | | | | 139 | |
5.250%, 05/15/2027 | | | 200 | | | | 210 | |
4.750%, 09/15/2024 | | | 165 | | | | 172 | |
Imola Merger | | | | | | | | |
4.750%, 05/15/2029 (A) | | | 225 | | | | 232 | |
Intelligent Packaging Finco | | | | | | | | |
6.000%, 09/15/2028 (A) | | | 135 | | | | 140 | |
Interface | | | | | | | | |
5.500%, 12/01/2028 (A) | | | 100 | | | | 104 | |
Intertape Polymer Group | | | | | | | | |
4.375%, 06/15/2029 (A) | | | 20 | | | | 20 | |
James Hardie International Finance DAC | | | | | | | | |
5.000%, 01/15/2028 (A) | | | 50 | | | | 53 | |
JELD-WEN | | | | | | | | |
4.625%, 12/15/2025 (A) | | | 200 | | | | 204 | |
KAR Auction Services | | | | | | | | |
5.125%, 06/01/2025 (A) | | | 100 | | | | 102 | |
Kratos Defense & Security Solutions | | | | | | | | |
6.500%, 11/30/2025 (A) | | | 50 | | | | 52 | |
LABL | | | | | | | | |
10.500%, 07/15/2027 (A) | | | 100 | | | | 110 | |
6.750%, 07/15/2026 (A) | | | 60 | | | | 64 | |
Madison IAQ | | | | | | | | |
5.875%, 06/30/2029 (A) | | | 60 | | | | 61 | |
4.125%, 06/30/2028 (A) | | | 35 | | | | 35 | |
Manitowoc | | | | | | | | |
9.000%, 04/01/2026 (A) | | | 100 | | | | 108 | |
| | |
| 56 | | Adviser Managed Trust / Annual Report / July 31, 2021 |
| | | | | | | | |
| | | |
| Description | | Face Amount
(Thousands) | | Market Value
($ Thousands) |
|
CORPORATE OBLIGATIONS (continued) | |
Masonite International | | | | | | | | |
3.500%, 02/15/2030 (A) | | $ | 100 | | | $ | 101 | |
Mauser Packaging Solutions Holding | | | | | | | | |
7.250%, 04/15/2025 (A) | | | 150 | | | | 146 | |
5.500%, 04/15/2024 (A) | | | 300 | | | | 302 | |
Meritor | | | | | | | | |
4.500%, 12/15/2028 (A) | | | 100 | | | | 102 | |
Mexico City Airport Trust | | | | | | | | |
5.500%, 07/31/2047 | | | 200 | | | | 202 | |
Moog | | | | | | | | |
4.250%, 12/15/2027 (A) | | | 50 | | | | 52 | |
Mueller Water Products | | | | | | | | |
4.000%, 06/15/2029 (A) | | | 15 | | | | 16 | |
Nielsen Finance | | | | | | | | |
5.625%, 10/01/2028 (A) | | | 100 | | | | 106 | |
4.750%, 07/15/2031 (A) | | | 21 | | | | 21 | |
4.500%, 07/15/2029 (A) | | | 27 | | | | 27 | |
Nielsen Luxembourg SARL | | | | | | | | |
5.000%, 02/01/2025 (A) | | | 292 | | | | 300 | |
Pactiv | | | | | | | | |
7.950%, 12/15/2025 | | | 200 | | | | 225 | |
Picasso Finance Sub | | | | | | | | |
6.125%, 06/15/2025 (A) | | | 82 | | | | 87 | |
Pitney Bowes | | | | | | | | |
7.250%, 03/15/2029 (A) | | | 40 | | | | 43 | |
6.875%, 03/15/2027 (A) | | | 97 | | | | 103 | |
Powerchina Roadbridge Group British Virgin Islands | | | | | | | | |
3.080% B)(F) | | | 200 | | | | 200 | |
PowerTeam Services | | | | | | | | |
9.033%, 12/04/2025 (A) | | | 150 | | | | 165 | |
RBS Global | | | | | | | | |
4.875%, 12/15/2025 (A) | | | 100 | | | | 102 | |
Resideo Funding | | | | | | | | |
6.125%, 11/01/2026 (A) | | | 9 | | | | 9 | |
Rolls-Royce | | | | | | | | |
5.750%, 10/15/2027 (A) | | | 138 | | | | 151 | |
3.625%, 10/14/2025 (A) | | | 60 | | | | 60 | |
RR Donnelley & Sons | | | | | | | | |
6.125%, 11/01/2026 (A) | | | 130 | | | | 137 | |
Science Applications International | | | | | | | | |
4.875%, 04/01/2028 (A) | | | 40 | | | | 42 | |
Seaspan | | | | | | | | |
5.500%, 08/01/2029 (A) | | | 48 | | | | 48 | |
Sensata Technologies | | | | | | | | |
3.750%, 02/15/2031 (A) | | | 50 | | | | 50 | |
Sensata Technologies BV | | | | | | | | |
5.625%, 11/01/2024 (A) | | | 200 | | | | 223 | |
4.000%, 04/15/2029 (A) | | | 135 | | | | 139 | |
Spirit AeroSystems | | | | | | | | |
7.500%, 04/15/2025 (A) | | | 200 | | | | 212 | |
5.500%, 01/15/2025 (A) | | | 150 | | | | 158 | |
| | | | | | | | |
| | | |
| Description | | Face Amount
(Thousands) | | Market Value
($ Thousands) |
|
CORPORATE OBLIGATIONS (continued) | |
Spirit Loyalty Cayman | | | | | | | | |
8.000%, 09/20/2025 (A) | | $ | 50 | | | $ | 56 | |
SRM Escrow Issuer | | | | | | | | |
6.000%, 11/01/2028 (A) | | | 225 | | | | 240 | |
SSL Robotics | | | | | | | | |
9.750%, 12/31/2023 (A) | | | 118 | | | | 130 | |
Standard Industries | | | | | | | | |
5.000%, 02/15/2027 (A) | | | 250 | | | | 258 | |
4.750%, 01/15/2028 (A) | | | 20 | | | | 21 | |
4.375%, 07/15/2030 (A) | | | 110 | | | | 113 | |
Summit Materials | | | | | | | | |
5.250%, 01/15/2029 (A) | | | 100 | | | | 106 | |
Terex | | | | | | | | |
5.000%, 05/15/2029 (A) | | | 63 | | | | 65 | |
Titan International | | | | | | | | |
7.000%, 04/30/2028 (A) | | | 100 | | | | 104 | |
TK Elevator US Newco | | | | | | | | |
5.250%, 07/15/2027 (A) | | | 159 | | | | 168 | |
TransDigm | | | | | | | | |
7.500%, 03/15/2027 | | | 75 | | | | 79 | |
6.375%, 06/15/2026 | | | 100 | | | | 103 | |
6.250%, 03/15/2026 (A) | | | 500 | | | | 524 | |
5.500%, 11/15/2027 | | | 170 | | | | 176 | |
4.875%, 05/01/2029 (A) | | | 150 | | | | 150 | |
4.625%, 01/15/2029 (A) | | | 115 | | | | 115 | |
TransDigm UK Holdings | | | | | | | | |
6.875%, 05/15/2026 | | | 160 | | | | 169 | |
Transnet SOC | | | | | | | | |
4.000%, 07/26/2022 | | | 200 | | | | 203 | |
TriMas | | | | | | | | |
4.125%, 04/15/2029 (A) | | | 55 | | | | 56 | |
TriNet Group | | | | | | | | |
3.500%, 03/01/2029 (A) | | | 55 | | | | 55 | |
Triumph Group | | | | | | | | |
8.875%, 06/01/2024 (A) | | | 166 | | | | 184 | |
Trivium Packaging Finance BV | | | | | | | | |
8.500%, 08/15/2027 (A) | | | 65 | | | | 70 | |
5.500%, 08/15/2026 (A) | | | 200 | | | | 209 | |
Tutor Perini | | | | | | | | |
6.875%, 05/01/2025 (A) | | | 250 | | | | 258 | |
Uber Technologies | | | | | | | | |
7.500%, 09/15/2027 (A) | | | 266 | | | | 291 | |
United Airlines | | | | | | | | |
4.625%, 04/15/2029 (A) | | | 184 | | | | 189 | |
4.375%, 04/15/2026 (A) | | | 182 | | | | 187 | |
United Airlines Holdings | | | | | | | | |
5.000%, 02/01/2024 | | | 100 | | | | 104 | |
4.875%, 01/15/2025 | | | 100 | | | | 103 | |
United Rentals North America | | | | | | | | |
5.500%, 05/15/2027 | | | 150 | | | | 158 | |
5.250%, 01/15/2030 | | | 100 | | | | 109 | |
4.875%, 01/15/2028 | | | 300 | | | | 317 | |
| | |
| Adviser Managed Trust / Annual Report / July 31, 2021 | | 57 |
SCHEDULE OF INVESTMENTS
July 31, 2021
Tactical Offensive Enhanced Fixed Income Fund (Continued)
| | | | | | | | |
| | | |
| Description | | Face Amount
(Thousands) | | Market Value
($ Thousands) |
|
CORPORATE OBLIGATIONS (continued) | |
3.750%, 01/15/2032 | | $ | 31 | | | $ | 31 | |
Vertical Holdco GmbH | | | | | | | | |
7.625%, 07/15/2028 (A) | | | 50 | | | | 54 | |
Victors Merger | | | | | | | | |
6.375%, 05/15/2029 (A) | | | 22 | | | | 22 | |
VM Consolidated | | | | | | | | |
5.500%, 04/15/2029 (A) | | | 50 | | | | 51 | |
Watco | | | | | | | | |
6.500%, 06/15/2027 (A) | | | 100 | | | | 107 | |
Weekley Homes | | | | | | | | |
4.875%, 09/15/2028 (A) | | | 100 | | | | 103 | |
Welbilt | | | | | | | | |
9.500%, 02/15/2024 | | | 100 | | | | 104 | |
WESCO Distribution | | | | | | | | |
7.250%, 06/15/2028 (A) | | | 150 | | | | 167 | |
7.125%, 06/15/2025 (A) | | | 200 | | | | 215 | |
Williams Scotsman International | | | | | | | | |
4.625%, 08/15/2028 (A) | | | 50 | | | | 52 | |
Wolverine Escrow | | | | | | | | |
9.000%, 11/15/2026 (A) | | | 100 | | | | 97 | |
8.500%, 11/15/2024 (A) | | | 100 | | | | 97 | |
XPO Logistics | | | | | | | | |
6.250%, 05/01/2025 (A) | | | 150 | | | | 159 | |
| | | | | | | | |
| | | | | | | 23,187 | |
| | | | | | | | |
| | |
Information Technology — 3.1% | | | | | | | | |
Ahead DB Holdings | | | | | | | | |
6.625%, 05/01/2028 (A) | | | 67 | | | | 69 | |
ams | | | | | | | | |
7.000%, 07/31/2025 (A) | | | 100 | | | | 107 | |
Austin BidCo | | | | | | | | |
7.125%, 12/15/2028 (A) | | | 100 | | | | 102 | |
Avaya | | | | | | | | |
6.125%, 09/15/2028 (A) | | | 125 | | | | 134 | |
Black Knight InfoServ | | | | | | | | |
3.625%, 09/01/2028 (A) | | | 135 | | | | 135 | |
CDK Global | | | | | | | | |
5.250%, 05/15/2029 (A) | | | 100 | | | | 109 | |
CDW | | | | | | | | |
4.250%, 04/01/2028 | | | 100 | | | | 104 | |
4.125%, 05/01/2025 | | | 100 | | | | 104 | |
3.250%, 02/15/2029 | | | 50 | | | | 50 | |
Clarivate Science Holdings | | | | | | | | |
4.875%, 06/30/2029 (A) | | | 35 | | | | 35 | |
3.875%, 06/30/2028 (A) | | | 140 | | | | 141 | |
CommScope | | | | | | | | |
6.000%, 03/01/2026 (A) | | | 500 | | | | 521 | |
CommScope Technologies | | | | | | | | |
6.000%, 06/15/2025 (A) | | | 200 | | | | 203 | |
CPI CG | | | | | | | | |
8.625%, 03/15/2026 (A) | | | 35 | | | | 37 | |
| | | | | | | | |
| | | |
| Description | | Face Amount
(Thousands) | | Market Value
($ Thousands) |
|
CORPORATE OBLIGATIONS (continued) | |
Crowdstrike Holdings | | | | | | | | |
3.000%, 02/15/2029 | | $ | 50 | | | $ | 51 | |
Dell | | | | | | | | |
6.500%, 04/15/2038 | | | 28 | | | | 37 | |
5.400%, 09/10/2040 | | | 30 | | | | 36 | |
Diebold Nixdorf | | | | | | | | |
8.500%, 04/15/2024 | | | 264 | | | | 269 | |
Elastic | | | | | | | | |
4.125%, 07/15/2029 (A) | | | 65 | | | | 65 | |
Endure Digital | | | | | | | | |
6.000%, 02/15/2029 (A) | | | 90 | | | | 87 | |
Entegris | | | | | | | | |
3.625%, 05/01/2029 (A) | | | 125 | | | | 128 | |
Fair Isaac | | | | | | | | |
4.000%, 06/15/2028 (A) | | | 80 | | | | 84 | |
Gartner | | | | | | | | |
4.500%, 07/01/2028 (A) | | | 50 | | | | 53 | |
3.625%, 06/15/2029 (A) | | | 40 | | | | 41 | |
Go Daddy Operating | | | | | | | | |
3.500%, 03/01/2029 (A) | | | 90 | | | | 90 | |
Granite Merger Sub 2 | | | | | | | | |
11.000%, 07/15/2027 (A) | | | 40 | | | | 45 | |
Helios Software Holdings | | | | | | | | |
4.625%, 05/01/2028 (A) | | | 30 | | | | 30 | |
Hughes Satellite Systems | | | | | | | | |
6.625%, 08/01/2026 | | | 127 | | | | 143 | |
5.250%, 08/01/2026 | | | 80 | | | | 89 | |
Intrado | | | | | | | | |
8.500%, 10/15/2025 (A) | | | 167 | | | | 162 | |
J2 Global | | | | | | | | |
4.625%, 10/15/2030 (A) | | | 100 | | | | 106 | |
MicroStrategy | | | | | | | | |
6.125%, 06/15/2028 (A) | | | 15 | | | | 15 | |
MoneyGram International | | | | | | | | |
5.375%, 08/01/2026 (A) | | | 20 | | | | 21 | |
NCR | | | | | | | | |
5.250%, 10/01/2030 (A) | | | 75 | | | | 79 | |
5.125%, 04/15/2029 (A) | | | 118 | | | | 123 | |
5.000%, 10/01/2028 (A) | | | 123 | | | | 127 | |
Nuance Communications | | | | | | | | |
5.625%, 12/15/2026 | | | 50 | | | | 52 | |
Open Text | | | | | | | | |
5.875%, 06/01/2026 (A) | | | 100 | | | | 103 | |
3.875%, 02/15/2028 (A) | | | 90 | | | | 93 | |
Open Text Holdings | | | | | | | | |
4.125%, 02/15/2030 (A) | | | 95 | | | | 98 | |
Paysafe Finance | | | | | | | | |
4.000%, 06/15/2029 (A) | | | 50 | | | | 49 | |
Plantronics | | | | | | | | |
4.750%, 03/01/2029 (A) | | | 150 | | | | 146 | |
Presidio Holdings | | | | | | | | |
8.250%, 02/01/2028 (A) | | | 44 | | | | 48 | |
| | |
| 58 | | Adviser Managed Trust / Annual Report / July 31, 2021 |
| | | | | | | | |
| | | |
| Description | | Face Amount
(Thousands) | | Market Value
($ Thousands) |
|
CORPORATE OBLIGATIONS (continued) | |
4.875%, 02/01/2027 (A) | | $ | 54 | | | $ | 56 | |
PTC | | | | | | | | |
3.625%, 02/15/2025 (A) | | | 100 | | | | 103 | |
Qorvo | | | | | | | | |
4.375%, 10/15/2029 | | | 80 | | | | 87 | |
3.375%, 04/01/2031 (A) | | | 50 | | | | 52 | |
Rackspace Technology Global | | | | | | | | |
5.375%, 12/01/2028 (A) | | | 50 | | | | 51 | |
3.500%, 02/15/2028 (A) | | | 125 | | | | 120 | |
Rocket Software | | | | | | | | |
6.500%, 02/15/2029 (A) | | | 110 | | | | 110 | |
Seagate HDD Cayman | | | | | | | | |
4.875%, 03/01/2024 | | | 50 | | | | 54 | |
4.875%, 06/01/2027 | | | 100 | | | | 112 | |
4.750%, 01/01/2025 | | | 100 | | | | 110 | |
4.125%, 01/15/2031 (A) | | | 50 | | | | 52 | |
4.091%, 06/01/2029 (A) | | | 100 | | | | 105 | |
3.125%, 07/15/2029 (A) | | | 100 | | | | 98 | |
Shift4 Payments | | | | | | | | |
4.625%, 11/01/2026 (A) | | | 100 | | | | 104 | |
Sprint | | | | | | | | |
7.875%, 09/15/2023 | | | 500 | | | | 566 | |
7.625%, 02/15/2025 | | | 245 | | | | 289 | |
7.625%, 03/01/2026 | | | 100 | | | | 122 | |
7.125%, 06/15/2024 | | | 230 | | | | 264 | |
Sprint Capital | | | | | | | | |
8.750%, 03/15/2032 | | | 100 | | | | 154 | |
6.875%, 11/15/2028 | | | 100 | | | | 129 | |
Sprint Communications | | | | | | | | |
6.000%, 11/15/2022 | | | 500 | | | | 529 | |
Square | | | | | | | | |
3.500%, 06/01/2031 (A) | | | 42 | | | | 44 | |
2.750%, 06/01/2026 (A) | | | 50 | | | | 51 | |
SS&C Technologies | | | | | | | | |
5.500%, 09/30/2027 (A) | | | 217 | | | | 230 | |
Switch | | | | | | | | |
4.125%, 06/15/2029 (A) | | | 40 | | | | 41 | |
3.750%, 09/15/2028 (A) | | | 123 | | | | 126 | |
Synaptics | | | | | | | | |
4.000%, 06/15/2029 (A) | | | 75 | | | | 76 | |
TTM Technologies | | | | | | | | |
4.000%, 03/01/2029 (A) | | | 45 | | | | 45 | |
Twilio | | | | | | | | |
3.875%, 03/15/2031 | | | 45 | | | | 47 | |
3.625%, 03/15/2029 | | | 90 | | | | 92 | |
Unisys | | | | | | | | |
6.875%, 11/01/2027 (A) | | | 100 | | | | 109 | |
Veritas US | | | | | | | | |
10.500%, 02/01/2024 (A) | | | 500 | | | | 509 | |
Viasat | | | | | | | | |
6.500%, 07/15/2028 (A) | | | 200 | | | | 212 | |
| | | | | | | | |
| | | |
| Description | | Face Amount
(Thousands) | | Market Value
($ Thousands) |
|
CORPORATE OBLIGATIONS (continued) | |
Western Digital | | | | | | | | |
4.750%, 02/15/2026 | | $ | 230 | | | $ | 255 | |
Xerox | | | | | | | | |
6.750%, 12/15/2039 | | | 40 | | | | 45 | |
4.375%, 03/15/2023 | | | 100 | | | | 105 | |
Xerox Holdings | | | | | | | | |
5.000%, 08/15/2025 (A) | | | 200 | | | | 213 | |
ZoomInfo Technologies | | | | | | | | |
3.875%, 02/01/2029 (A) | | | 117 | | | | 117 | |
| | | | | | | | |
| | | | | | | 9,905 | |
| | | | | | | | |
| | |
Materials — 4.3% | | | | | | | | |
Alcoa Nederland Holding BV | | | | | | | | |
6.125%, 05/15/2028 (A) | | | 120 | | | | 131 | |
4.125%, 03/31/2029 (A) | | | 200 | | | | 210 | |
Allegheny Technologies | | | | | | | | |
7.875%, 08/15/2023 | | | 100 | | | | 109 | |
ArcelorMittal | | | | | | | | |
7.000%, 03/01/2041 | | | 100 | | | | 144 | |
4.550%, 03/11/2026 | | | 81 | | | | 91 | |
3.600%, 07/16/2024 | | | 50 | | | | 53 | |
Arconic | | | | | | | | |
6.125%, 02/15/2028 (A) | | | 165 | | | | 176 | |
6.000%, 05/15/2025 (A) | | | 120 | | | | 127 | |
Ashland | | | | | | | | |
4.750%, 08/15/2022 | | | 2 | | | | 2 | |
Avient | | | | | | | | |
5.750%, 05/15/2025 (A) | | | 100 | | | | 105 | |
Axalta Coating Systems | | | | | | | | |
4.750%, 06/15/2027 (A) | | | 100 | | | | 105 | |
Baffinland Iron Mines | | | | | | | | |
8.750%, 07/15/2026 (A) | | | 100 | | | | 107 | |
Ball | | | | | | | | |
5.250%, 07/01/2025 | | | 135 | | | | 152 | |
2.875%, 08/15/2030 | | | 100 | | | | 99 | |
Berry Global | | | | | | | | |
5.625%, 07/15/2027 (A) | | | 100 | | | | 105 | |
4.875%, 07/15/2026 (A) | | | 85 | | | | 90 | |
4.500%, 02/15/2026 (A) | | | 50 | | | | 51 | |
Big River Steel | | | | | | | | |
6.625%, 01/31/2029 (A) | | | 100 | | | | 110 | |
Carpenter Technology | | | | | | | | |
4.450%, 03/01/2023 | | | 85 | | | | 89 | |
Century Aluminum | | | | | | | | |
7.500%, 04/01/2028 (A) | | | 50 | | | | 53 | |
CF Industries | | | | | | | | |
4.950%, 06/01/2043 | | | 200 | | | | 246 | |
Chemours | | | | | | | | |
7.000%, 05/15/2025 | | | 165 | | | | 170 | |
5.375%, 05/15/2027 | | | 51 | | | | 55 | |
Chinalco Capital Holdings | | | | | | | | |
2.125%, 06/03/2026 | | | 250 | | | | 249 | |
| | |
| Adviser Managed Trust / Annual Report / July 31, 2021 | | 59 |
SCHEDULE OF INVESTMENTS
July 31, 2021
Tactical Offensive Enhanced Fixed Income Fund (Continued)
| | | | | | | | |
| | | |
| Description | | Face Amount
(Thousands) | | Market Value
($ Thousands) |
|
CORPORATE OBLIGATIONS (continued) | |
Clearwater Paper | | | | | | | | |
4.750%, 08/15/2028 (A) | | $ | 100 | | | $ | 101 | |
Cleveland-Cliffs | | | | | | | | |
9.875%, 10/17/2025 (A) | | | 175 | | | | 205 | |
5.875%, 06/01/2027 | | | 50 | | | | 53 | |
4.875%, 03/01/2031 (A) | | | 105 | | | | 113 | |
4.625%, 03/01/2029 (A) | | | 45 | | | | 48 | |
CNAC HK Finbridge | | | | | | | | |
5.125%, 03/14/2028 | | | 500 | | | | 569 | |
3.500%, 07/19/2022 | | | 500 | | | | 510 | |
Coeur Mining | | | | | | | | |
5.125%, 02/15/2029 (A) | | | 100 | | | | 97 | |
Commercial Metals | | | | | | | | |
3.875%, 02/15/2031 | | | 35 | | | | 35 | |
Constellium | | | | | | | | |
5.625%, 06/15/2028 (A) | | | 50 | | | | 53 | |
3.750%, 04/15/2029 (A) | | | 50 | | | | 50 | |
Cornerstone Chemical | | | | | | | | |
6.750%, 08/15/2024 (A) | | | 100 | | | | 90 | |
Crown Americas | | | | | | | | |
4.750%, 02/01/2026 | | | 10 | | | | 10 | |
4.500%, 01/15/2023 | | | 3 | | | | 3 | |
CVR Partners | | | | | | | | |
6.125%, 06/15/2028 (A) | | | 15 | | | | 16 | |
Element Solutions | | | | | | | | |
3.875%, 09/01/2028 (A) | | | 100 | | | | 102 | |
FMG Resources August 2006 Pty | | | | | | | | |
4.375%, 04/01/2031 (A) | | | 162 | | | | 176 | |
Freeport-McMoRan | | | | | | | | |
5.450%, 03/15/2043 | | | 200 | | | | 257 | |
5.400%, 11/14/2034 | | | 100 | | | | 127 | |
5.000%, 09/01/2027 | | | 191 | | | | 202 | |
4.125%, 03/01/2028 | | | 147 | | | | 154 | |
3.875%, 03/15/2023 | | | 150 | | | | 156 | |
GPD | | | | | | | | |
10.125%, 04/01/2026 (A) | | | 100 | | | | 108 | |
Graphic Packaging International | | | | | | | | |
3.500%, 03/15/2028 (A) | | | 100 | | | | 101 | |
Greif | | | | | | | | |
6.500%, 03/01/2027 (A) | | | 50 | | | | 53 | |
HB Fuller | | | | | | | | |
4.250%, 10/15/2028 | | | 100 | | | | 102 | |
Hecla Mining | | | | | | | | |
7.250%, 02/15/2028 | | | 50 | | | | 54 | |
Herens Holdco Sarl | | | | | | | | |
4.750%, 05/15/2028 (A) | | | 176 | | | | 175 | |
Hudbay Minerals | | | | | | | | |
6.125%, 04/01/2029 (A) | | | 100 | | | | 108 | |
IAMGOLD | | | | | | | | |
5.750%, 10/15/2028 (A) | | | 100 | | | | 103 | |
Indonesia Asahan Aluminium Persero | | | | | | | | |
4.750%, 05/15/2025 | | | 350 | | | | 383 | |
| | | | | | | | |
| | | |
| Description | | Face Amount
(Thousands) | | Market Value
($ Thousands) |
|
CORPORATE OBLIGATIONS (continued) | |
INEOS Quattro Finance 2 | | | | | | | | |
3.375%, 01/15/2026 (A) | | $ | 50 | | | $ | 50 | |
Infrabuild Australia Pty | | | | | | | | |
12.000%, 10/01/2024 (A) | | | 50 | | | | 53 | |
Ingevity | | | | | | | | |
3.875%, 11/01/2028 (A) | | | 100 | | | | 100 | |
Innophos Holdings | | | | | | | | |
9.375%, 02/15/2028 (A) | | | 50 | | | | 54 | |
Joseph T Ryerson & Son | | | | | | | | |
8.500%, 08/01/2028 (A) | | | 32 | | | | 35 | |
Kaiser Aluminum | | | | | | | | |
4.625%, 03/01/2028 (A) | | | 100 | | | | 104 | |
4.500%, 06/01/2031 (A) | | | 15 | | | | 16 | |
Kraton Polymers | | | | | | | | |
4.250%, 12/15/2025 (A) | | | 50 | | | | 51 | |
Louisiana-Pacific | | | | | | | | |
3.625%, 03/15/2029 (A) | | | 100 | | | | 101 | |
LSB Industries | | | | | | | | |
9.625%, 05/01/2023 (A) | | | 50 | | | | 52 | |
Mercer International | | | | | | | | |
5.125%, 02/01/2029 | | | 200 | | | | 204 | |
Methanex | | | | | | | | |
5.250%, 12/15/2029 | | | 70 | | | | 77 | |
5.125%, 10/15/2027 | | | 203 | | | | 220 | |
Mineral Resources | | | | | | | | |
8.125%, 05/01/2027 (A) | | | 50 | | | | 55 | |
Nacional del Cobre de Chile | | | | | | | | |
4.375%, 02/05/2049 | | | 200 | | | | 234 | |
3.700%, 01/30/2050 | | | 1,000 | | | | 1,053 | |
3.150%, 01/14/2030 | | | 750 | | | | 790 | |
New | | | | | | | | |
7.500%, 07/15/2027 (A) | | | 42 | | | | 45 | |
NMG Holding | | | | | | | | |
7.125%, 04/01/2026 (A) | | | 85 | | | | 91 | |
NOVA Chemicals | | | | | | | | |
5.250%, 06/01/2027 (A) | | | 150 | | | | 162 | |
4.875%, 06/01/2024 (A) | | | 100 | | | | 106 | |
4.250%, 05/15/2029 (A) | | | 100 | | | | 101 | |
Novelis | | | | | | | | |
4.750%, 01/30/2030 (A) | | | 192 | | | | 205 | |
3.875%, 08/15/2031 (A) | | | 31 | | | | 31 | |
3.250%, 11/15/2026 (A) | | | 23 | | | | 23 | |
OCI | | | | | | | | |
4.625%, 10/15/2025 (A) | | | 167 | | | | 173 | |
OI European Group BV | | | | | | | | |
4.000%, 03/15/2023 (A) | | | 50 | | | | 52 | |
Olin | | | | | | | | |
9.500%, 06/01/2025 (A) | | | 70 | | | | 88 | |
5.000%, 02/01/2030 | | | 215 | | | | 230 | |
Owens-Brockway Glass Container | | | | | | | | |
6.625%, 05/13/2027 (A) | | | 100 | | | | 108 | |
| | |
| 60 | | Adviser Managed Trust / Annual Report / July 31, 2021 |
| | | | | | | | |
| | | |
| Description | | Face Amount
(Thousands) | | Market Value
($ Thousands) |
| |
CORPORATE OBLIGATIONS (continued) | | | | | |
Rayonier AM Products | | | | | | | | |
7.625%, 01/15/2026 (A) | | $ | 200 | | | $ | 206 | |
Resolute Forest Products | | | | | | | | |
4.875%, 03/01/2026 (A) | | | 40 | | | | 41 | |
SCIH Salt Holdings | | | | | | | | |
6.625%, 05/01/2029 (A) | | | 84 | | | | 83 | |
4.875%, 05/01/2028 (A) | | | 98 | | | | 98 | |
Scotts Miracle-Gro | | | | | | | | |
4.500%, 10/15/2029 | | | 107 | | | | 112 | |
4.000%, 04/01/2031 (A) | | | 75 | | | | 75 | |
Sealed Air | | | | | | | | |
5.500%, 09/15/2025 (A) | | | 184 | | | | 204 | |
SPCM | | | | | | | | |
4.875%, 09/15/2025 (A) | | | 100 | | | | 102 | |
SunCoke Energy | | | | | | | | |
4.875%, 06/30/2029 (A) | | | 47 | | | | 47 | |
Tacora Resources | | | | | | | | |
8.250%, 05/15/2026 (A) | | | 25 | | | | 26 | |
Taseko Mines | | | | | | | | |
7.000%, 02/15/2026 (A) | | | 75 | | | | 77 | |
TMS International | | | | | | | | |
6.250%, 04/15/2029 (A) | | | 15 | | | | 16 | |
TPC Group | | | | | | | | |
10.500%, 08/01/2024 (A) | | | 82 | | | | 81 | |
Trinseo Materials Operating SCA | | | | | | | | |
5.125%, 04/01/2029 (A) | | | 76 | | | | 77 | |
Tronox | | | | | | | | |
4.625%, 03/15/2029 (A) | | | 175 | | | | 178 | |
United States Steel | | | | | | | | |
6.875%, 08/15/2025 | | | 100 | | | | 102 | |
6.875%, 03/01/2029 | | | 80 | | | | 87 | |
US Concrete | | | | | | | | |
5.125%, 03/01/2029 (A) | | | 100 | | | | 109 | |
Venator Finance Sarl | | | | | | | | |
5.750%, 07/15/2025 (A) | | | 50 | | | | 48 | |
WR Grace & -Conn | | | | | | | | |
5.625%, 10/01/2024 (A) | | | 30 | | | | 33 | |
4.875%, 06/15/2027 (A) | | | 100 | | | | 106 | |
| | | | | | | | |
| | | | | | | 13,715 | |
| | | | | | | | |
| | |
Real Estate — 2.0% | | | | | | | | |
Brookfield Property | | | | | | | | |
5.750%, 05/15/2026 (A) | | | 150 | | | | 156 | |
CTR Partnership | | | | | | | | |
3.875%, 06/30/2028 (A) | | | 25 | | | | 26 | |
Diversified Healthcare Trust | | | | | | | | |
9.750%, 06/15/2025 | | | 378 | | | | 417 | |
4.750%, 02/15/2028 | | | 28 | | | | 28 | |
4.375%, 03/01/2031 | | | 55 | | | | 54 | |
EPR Properties | | | | | | | | |
5.250%, 07/15/2023 | | | 60 | | | | 63 | |
4.950%, 04/15/2028 | | | 10 | | | | 11 | |
| | | | | | | | |
| | | |
| Description | | Face Amount
(Thousands) | | Market Value
($ Thousands) |
|
CORPORATE OBLIGATIONS (continued) | |
4.750%, 12/15/2026 | | $ | 12 | | | $ | 13 | |
4.500%, 06/01/2027 | | | 10 | | | | 11 | |
3.750%, 08/15/2029 | | | 50 | | | | 51 | |
Forestar Group | | | | | | | | |
5.000%, 03/01/2028 (A) | | | 50 | | | | 52 | |
3.850%, 05/15/2026 (A) | | | 30 | | | | 30 | |
GEO Group | | | | | | | | |
5.125%, 04/01/2023 | | | 150 | | | | 141 | |
Global Net Lease | | | | | | | | |
3.750%, 12/15/2027 (A) | | | 100 | | | | 99 | |
Howard Hughes | | | | | | | | |
5.375%, 08/01/2028 (A) | | | 88 | | | | 93 | |
4.375%, 02/01/2031 (A) | | | 80 | | | | 80 | |
4.125%, 02/01/2029 (A) | | | 55 | | | | 54 | |
Hunt | | | | | | | | |
5.250%, 04/15/2029 (A) | | | 75 | | | | 73 | |
Iron Mountain | | | | | | | | |
5.625%, 07/15/2032 (A) | | | 26 | | | | 28 | |
5.250%, 03/15/2028 (A) | | | 100 | | | | 104 | |
5.250%, 07/15/2030 (A) | | | 100 | | | | 107 | |
5.000%, 07/15/2028 (A) | | | 50 | | | | 52 | |
4.875%, 09/15/2027 (A) | | | 49 | | | | 51 | |
4.875%, 09/15/2029 (A) | | | 100 | | | | 105 | |
4.500%, 02/15/2031 (A) | | | 100 | | | | 102 | |
iStar | | | | | | | | |
4.250%, 08/01/2025 | | | 222 | | | | 230 | |
Kennedy-Wilson | | | | | | | | |
5.000%, 03/01/2031 | | | 105 | | | | 108 | |
4.750%, 03/01/2029 | | | 105 | | | | 108 | |
Lamar Media | | | | | | | | |
4.000%, 02/15/2030 | | | 179 | | | | 182 | |
MGM Growth Properties Operating Partnership | | | | | | | | |
5.750%, 02/01/2027 | | | 100 | | | | 112 | |
5.625%, 05/01/2024 | | | 100 | | | | 108 | |
4.625%, 06/15/2025 (A) | | | 104 | | | | 110 | |
3.875%, 02/15/2029 (A) | | | 84 | | | | 86 | |
MPT Operating Partnership | | | | | | | | |
4.625%, 08/01/2029 | | | 135 | | | | 145 | |
3.500%, 03/15/2031 | | | 200 | | | | 205 | |
Outfront Media Capital | | | | | | | | |
5.000%, 08/15/2027 (A) | | | 153 | | | | 156 | |
4.625%, 03/15/2030 (A) | | | 100 | | | | 101 | |
Park Intermediate Holdings | | | | | | | | |
5.875%, 10/01/2028 (A) | | | 11 | | | | 12 | |
4.875%, 05/15/2029 (A) | | | 23 | | | | 24 | |
Realogy Group | | | | | | | | |
9.375%, 04/01/2027 (A) | | | 125 | | | | 138 | |
5.750%, 01/15/2029 (A) | | | 90 | | | | 94 | |
RHP Hotel Properties | | | | | | | | |
4.500%, 02/15/2029 (A) | | | 90 | | | | 91 | |
| | |
| Adviser Managed Trust / Annual Report / July 31, 2021 | | 61 |
SCHEDULE OF INVESTMENTS
July 31, 2021
Tactical Offensive Enhanced Fixed Income Fund (Continued)
| | | | | | | | |
| | | |
| Description | | Face Amount
(Thousands) | | Market Value
($ Thousands) |
|
CORPORATE OBLIGATIONS (continued) | |
RLJ Lodging Trust | | | | | | | | |
3.750%, 07/01/2026 (A) | | $ | 10 | | | $ | 10 | |
SBA Communications | | | | | | | | |
3.875%, 02/15/2027 | | | 50 | | | | 52 | |
3.125%, 02/01/2029 (A) | | | 155 | | | | 152 | |
Service Properties Trust | | | | | | | | |
5.500%, 12/15/2027 | | | 100 | | | | 107 | |
4.950%, 02/15/2027 | | | 50 | | | | 49 | |
4.500%, 06/15/2023 | | | 289 | | | | 296 | |
4.375%, 02/15/2030 | | | 100 | | | | 93 | |
3.950%, 01/15/2028 | | | 100 | | | | 94 | |
Uniti Group | | | | | | | | |
7.875%, 02/15/2025 (A) | | | 300 | | | | 319 | |
7.125%, 12/15/2024 (A) | | | 50 | | | | 51 | |
6.500%, 02/15/2029 (A) | | | 70 | | | | 71 | |
4.750%, 04/15/2028 (A) | | | 100 | | | | 100 | |
VICI Properties | | | | | | | | |
4.250%, 12/01/2026 (A) | | | 258 | | | | 268 | |
4.125%, 08/15/2030 (A) | | | 138 | | | | 145 | |
3.750%, 02/15/2027 (A) | | | 76 | | | | 78 | |
Washington Prime Group | | | | | | | | |
0.000%, 08/15/2024 (D) | | | 100 | | | | 61 | |
WeWork | | | | | | | | |
7.875%, 05/01/2025 (A) | | | 100 | | | | 102 | |
XHR | | | | | | | | |
6.375%, 08/15/2025 (A) | | | 100 | | | | 107 | |
4.875%, 06/01/2029 (A) | | | 25 | | | | 26 | |
| | | | | | | | |
| | | | | | | 6,192 | |
| | | | | | | | |
| | |
Utilities — 2.5% | | | | | | | | |
AES Andres BV | | | | | | | | |
5.700%, 05/04/2028 (A) | | | 200 | | | | 206 | |
AmeriGas Partners | | | | | | | | |
5.875%, 08/20/2026 | | | 242 | | | | 271 | |
5.500%, 05/20/2025 | | | 25 | | | | 27 | |
Atlantica Sustainable Infrastructure | | | | | | | | |
4.125%, 06/15/2028 (A) | | | 25 | | | | 26 | |
Banff Merger Sub | | | | | | | | |
9.750%, 09/01/2026 (A) | | | 300 | | | | 315 | |
Calpine | | | | | | | | |
5.125%, 03/15/2028 (A) | | | 100 | | | | 101 | |
5.000%, 02/01/2031 (A) | | | 100 | | | | 101 | |
4.625%, 02/01/2029 (A) | | | 100 | | | | 99 | |
4.500%, 02/15/2028 (A) | | | 265 | | | | 273 | |
3.750%, 03/01/2031 (A) | | | 100 | | | | 96 | |
Clearway Energy Operating | | | | | | | | |
4.750%, 03/15/2028 (A) | | | 158 | | | | 167 | |
3.750%, 02/15/2031 (A) | �� | | 60 | | | | 60 | |
Comision Federal de Electricidad | | | | | | | | |
3.348%, 02/09/2031 | | | 200 | | | | 198 | |
Eskom Holdings SOC | | | | | | | | |
7.125%, 02/11/2025 | | | 250 | | | | 263 | |
| | | | | | | | |
| | | |
| Description | | Face Amount
(Thousands) | | Market Value
($ Thousands) |
|
CORPORATE OBLIGATIONS (continued) | |
Eskom Holdings SOC MTN | | | | | | | | |
6.350%, 08/10/2028 | | $ | 250 | | | $ | 277 | |
FirstEnergy | | | | | | | | |
7.375%, 11/15/2031 | | | 100 | | | | 140 | |
5.350%, 07/15/2047 | | | 100 | | | | 126 | |
4.400%, 07/15/2027 | | | 200 | | | | 223 | |
3.350%, 07/15/2022 | | | 250 | | | | 253 | |
2.650%, 03/01/2030 | | | 50 | | | | 51 | |
2.250%, 09/01/2030 | | | 100 | | | | 99 | |
2.050%, 03/01/2025 | | | 100 | | | | 102 | |
InterGen | | | | | | | | |
7.000%, 06/30/2023 (A) | | | 200 | | | | 198 | |
LBC Tank Terminals Holding Netherlands BV | | | | | | | | |
6.875%, 05/15/2023 (A) | | | 50 | | | | 50 | |
Leeward Renewable Energy Operations | | | | | | | | |
4.250%, 07/01/2029 (A) | | | 30 | | | | 31 | |
Midland Cogeneration Venture | | | | | | | | |
6.000%, 03/15/2025 (A) | | | 12 | | | | 13 | |
NRG Energy | | | | | | | | |
7.250%, 05/15/2026 | | | 170 | | | | 177 | |
6.625%, 01/15/2027 | | | 177 | | | | 183 | |
5.250%, 06/15/2029 (A) | | | 50 | | | | 54 | |
3.625%, 02/15/2031 (A) | | | 100 | | | | 101 | |
Pattern Energy Operations | | | | | | | | |
4.500%, 08/15/2028 (A) | | | 50 | | | | 52 | |
Perusahaan Perseroan Persero Perusahaan Listrik Negara MTN | | | | | | | | |
4.125%, 05/15/2027 | | | 500 | | | | 543 | |
4.000%, 06/30/2050 | | | 200 | | | | 197 | |
PG&E | | | | | | | | |
5.000%, 07/01/2028 | | | 200 | | | | 195 | |
Solaris Midstream Holdings | | | | | | | | |
7.625%, 04/01/2026 (A) | | | 50 | | | | 52 | |
SPIC MTN | | | | | | | | |
1.625%, 07/27/2025 | | | 250 | | | | 250 | |
State Grid Overseas Investment 2016 MTN | | | | | | | | |
3.500%, 05/04/2027 | | | 200 | | | | 222 | |
1.625%, 08/05/2030 | | | 1,000 | | | | 965 | |
Suburban Propane Partners | | | | | | | | |
5.000%, 06/01/2031 (A) | | | 67 | | | | 69 | |
Talen Energy Supply | | | | | | | | |
7.625%, 06/01/2028 (A) | | | 78 | | | | 71 | |
6.500%, 06/01/2025 | | | 300 | | | | 177 | |
Terraform Global Operating | | | | | | | | |
6.125%, 03/01/2026 (A) | | | 150 | | | | 154 | |
TerraForm Power Operating | | | | | | | | |
5.000%, 01/31/2028 (A) | | | 200 | | | | 216 | |
TransAlta | | | | | | | | |
4.500%, 11/15/2022 | | | 10 | | | | 10 | |
Vistra Operations | | | | | | | | |
5.625%, 02/15/2027 (A) | | | 200 | | | | 207 | |
5.000%, 07/31/2027 (A) | | | 192 | | | | 198 | |
| | |
| 62 | | Adviser Managed Trust / Annual Report / July 31, 2021 |
| | | | | | | | |
| | | |
| Description | | Face Amount
(Thousands) | | Market Value
($ Thousands) |
| |
CORPORATE OBLIGATIONS (continued) | | | | | |
4.375%, 05/01/2029 (A) | | $ | 122 | | | $ | 125 | |
| | | | | | | | |
| | | | | | | 7,984 | |
| | | | | | | | |
| | |
Total Corporate Obligations
(Cost $186,676) ($ Thousands) | | | | | | | 187,832 | |
| | | | | | | | |
|
SOVEREIGN DEBT — 39.4% | |
| | |
Abu Dhabi Government International Bond | | | | | | | | |
3.125%, 10/11/2027 | | | 500 | | | | 551 | |
3.125%, 09/30/2049 | | | 1,500 | | | | 1,540 | |
2.500%, 09/30/2029 | | | 1,000 | | | | 1,052 | |
0.750%, 09/02/2023 | | | 250 | | | | 251 | |
Angolan Government International Bond | | | | | | | | |
9.500%, 11/12/2025 | | | 700 | | | | 772 | |
9.125%, 11/26/2049 | | | 500 | | | | 513 | |
8.000%, 11/26/2029 | | | 500 | | | | 517 | |
Argentine Republic Government International Bond | | | | | | | | |
2.500% , 3.500%, 07/09/2022, 07/09/2041 (E) | | | 1,000 | | | | 373 | |
1.125% , 1.500%, 07/09/2022, 07/09/2035 (E) | | | 2,250 | | | | 726 | |
0.500% , 0.750%, 07/09/2023, 07/09/2030 (E) | | | 1,750 | | | | 636 | |
Armenia Government International Bond | | | | | | | | |
3.600%, 02/02/2031 (A) | | | 200 | | | | 190 | |
Azerbaijan Government International Bond | | | | | | | | |
4.750%, 03/18/2024 | | | 500 | | | | 541 | |
Bahrain Government International Bond | | | | | | | | |
6.125%, 08/01/2023 | | | 1,000 | | | | 1,069 | |
6.000%, 09/19/2044 | | | 500 | | | | 468 | |
5.450%, 09/16/2032 | | | 500 | | | | 489 | |
Belarus Government International Bond | | | | | | | | |
6.875%, 02/28/2023 | | | 250 | | | | 250 | |
Belarus Ministry of Finance | | | | | | | | |
6.378%, 02/24/2031 | | | 500 | | | | 442 | |
Bolivian Government International Bond | | | | | | | | |
4.500%, 03/20/2028 | | | 500 | | | | 447 | |
Brazilian Government International Bond | | | | | | | | |
4.750%, 01/14/2050 | | | 1,000 | | | | 959 | |
4.625%, 01/13/2028 | | | 1,000 | | | | 1,085 | |
3.875%, 06/12/2030 | | | 1,700 | | | | 1,717 | |
3.750%, 09/12/2031 | | | 200 | | | | 197 | |
2.875%, 06/06/2025 | | | 1,000 | | | | 1,032 | |
Chile Government International Bond | | | | | | | | |
3.860%, 06/21/2047 | | | 250 | | | | 278 | |
3.500%, 01/25/2050 | | | 750 | | | | 791 | |
3.240%, 02/06/2028 | | | 650 | | | | 708 | |
3.100%, 05/07/2041 | | | 200 | | | | 202 | |
| | | | | | | | |
| | | |
| Description | | Face Amount
(Thousands) | | Market Value
($ Thousands) |
|
SOVEREIGN DEBT (continued) | |
Colombia Government International Bond | | | | | | | | |
5.000%, 06/15/2045 | | $ | 2,000 | | | $ | 2,091 | |
4.500%, 03/15/2029 | | | 1,000 | | | | 1,086 | |
4.000%, 02/26/2024 | | | 1,000 | | | | 1,048 | |
3.250%, 04/22/2032 | | | 200 | | | | 196 | |
Costa Rica Government International Bond | | | | | | | | |
7.158%, 03/12/2045 | | | 700 | | | | 742 | |
6.125%, 02/19/2031 | | | 300 | | | | 319 | |
4.250%, 01/26/2023 | | | 300 | | | | 306 | |
Croatia Government International Bond | | | | | | | | |
6.000%, 01/26/2024 | | | 750 | | | | 848 | |
Dominican Republic International Bond | | | | | | | | |
6.875%, 01/29/2026 | | | 1,000 | | | | 1,151 | |
6.850%, 01/27/2045 | | | 400 | | | | 455 | |
6.000%, 07/19/2028 | | | 200 | | | | 228 | |
5.875%, 01/30/2060 | | | 1,000 | | | | 1,009 | |
5.300%, 01/21/2041 | | | 200 | | | | 203 | |
4.875%, 09/23/2032 | | | 1,200 | | | | 1,245 | |
Ecuador Government International Bond | | | | | | | | |
5.000% , 5.500%, 07/31/2022, 07/31/2030 (E) | | | 1,200 | | | | 1,047 | |
1.000% , 2.500%, 07/31/2022, 07/31/2035 (E) | | | 1,750 | | | | 1,212 | |
0.500% , 1.500%, 07/31/2022, 07/31/2040 (E) | | | 500 | | | | 307 | |
Egypt Government International Bond | | | | | | | | |
8.875%, 05/29/2050 | | | 750 | | | | 798 | |
8.500%, 01/31/2047 | | | 750 | | | | 774 | |
7.500%, 01/31/2027 | | | 1,000 | | | | 1,108 | |
5.875%, 02/16/2031 (A) | | | 350 | | | | 337 | |
5.750%, 05/29/2024 | | | 1,200 | | | | 1,276 | |
El Salvador Government International Bond | | | | | | | | |
9.500%, 07/15/2052 | | | 500 | | | | 470 | |
7.650%, 06/15/2035 | | | 400 | | | | 349 | |
5.875%, 01/30/2025 | | | 700 | | | | 627 | |
Emirate of Dubai Government International Bond MTN | | | | | | | | |
3.900%, 09/09/2050 | | | 200 | | | | 187 | |
Ethiopia Government International Bond | | | | | | | | |
6.625%, 12/11/2024 | | | 200 | | | | 178 | |
Export-Import Bank of India MTN | | | | | | | | |
3.250%, 01/15/2030 | | | 1,250 | | | | 1,281 | |
Gabon Government International Bond | | | | | | | | |
6.625%, 02/06/2031 | | | 500 | | | | 501 | |
Ghana Government International Bond | | | | | | | | |
8.950%, 03/26/2051 | | | 200 | | | | 195 | |
7.875%, 02/11/2035 | | | 1,200 | | | | 1,151 | |
6.375%, 02/11/2027 | | | 1,400 | | | | 1,376 | |
Guatemala Government International Bond | | | | | | | | |
6.125%, 06/01/2050 | | | 500 | | | | 597 | |
4.500%, 05/03/2026 | | | 500 | | | | 545 | |
| | |
| Adviser Managed Trust / Annual Report / July 31, 2021 | | 63 |
SCHEDULE OF INVESTMENTS
July 31, 2021
Tactical Offensive Enhanced Fixed Income Fund (Concluded)
| | | | | | | | |
| | | |
| Description | | Face Amount
(Thousands) | | Market Value
($ Thousands) |
|
SOVEREIGN DEBT (continued) | |
Honduras Government International Bond | | | | | | | | |
5.625%, 06/24/2030 | | $ | 350 | | | $ | 365 | |
Hungary Government International Bond | | | | | | | | |
7.625%, 03/29/2041 | | | 450 | | | | 757 | |
5.375%, 03/25/2024 | | | 800 | | | | 900 | |
Indonesia Government International Bond | | | | | | | | |
6.750%, 01/15/2044 | | | 750 | | | | 1,113 | |
4.750%, 01/08/2026 | | | 1,250 | | | | 1,430 | |
4.350%, 01/11/2048 | | | 750 | | | | 857 | |
3.850%, 10/15/2030 | | | 250 | | | | 280 | |
Iraq Government International Bond | | | | | | | | |
5.800%, 01/15/2028 | | | 609 | | | | 582 | |
Ivory Coast Government International Bond | | | | | | | | |
6.125%, 06/15/2033 | | | 500 | | | | 541 | |
Jamaica Government International Bond | | | | | | | | |
7.875%, 07/28/2045 | | | 500 | | | | 698 | |
6.750%, 04/28/2028 | | | 500 | | | | 582 | |
Jordan Government International Bond | | | | | | | | |
6.125%, 01/29/2026 | | | 500 | | | | 542 | |
5.850%, 07/07/2030 | | | 500 | | | | 517 | |
Kazakhstan Government International Bond MTN | | | | | | | | |
6.500%, 07/21/2045 | | | 750 | | | | 1,106 | |
3.875%, 10/14/2024 | | | 750 | | | | 817 | |
Kenya Government International Bond | | | | | | | | |
8.000%, 05/22/2032 | | | 650 | | | | 734 | |
6.875%, 06/24/2024 | | | 500 | | | | 549 | |
6.300%, 01/23/2034 | | | 200 | | | | 202 | |
Kuwait International Government Bond | | | | | | | | |
3.500%, 03/20/2027 | | | 750 | | | | 838 | |
Lebanon Government International Bond MTN | | | | | | | | |
6.650%, 02/26/2030 (D) | | | 1,500 | | | | 180 | |
6.100%, 10/04/2022 (D) | | | 1,500 | | | | 180 | |
Mexico Government International Bond | | | | | | | | |
6.050%, 01/11/2040 | | | 1,250 | | | | 1,576 | |
5.000%, 04/27/2051 | | | 750 | | | | 859 | |
4.500%, 04/22/2029 | | | 750 | | | | 854 | |
4.150%, 03/28/2027 | | | 500 | | | | 569 | |
Mongolia Government International Bond | | | | | | | | |
5.625%, 05/01/2023 | | | 350 | | | | 368 | |
5.125%, 04/07/2026 | | | 300 | | | | 316 | |
Morocco Government International Bond | | | | | | | | |
4.250%, 12/11/2022 | | | 500 | | | | 524 | |
4.000%, 12/15/2050 | | | 350 | | | | 328 | |
3.000%, 12/15/2032 | | | 350 | | | | 340 | |
Mozambique Government International Bond | | | | | | | | |
5.000% , 9.000%, 09/15/2023, 09/15/2031 (E) | | | 200 | | | | 170 | |
Nigeria Government International Bond | | | | | | | | |
7.875%, 02/16/2032 | | | 750 | | | | 803 | |
| | | | | | | | |
| | | |
| Description | | Face Amount
(Thousands) | | Market Value
($ Thousands) |
|
SOVEREIGN DEBT (continued) | |
7.625%, 11/28/2047 | | $ | 500 | | | $ | 502 | |
6.500%, 11/28/2027 | | | 850 | | | | 902 | |
Oman Government International Bond | | | | | | | | |
7.375%, 10/28/2032 | | | 200 | | | | 229 | |
6.750%, 01/17/2048 | | | 750 | | | | 757 | |
6.000%, 08/01/2029 | | | 750 | | | | 798 | |
4.750%, 06/15/2026 | | | 2,000 | | | | 2,068 | |
Pakistan Government International Bond | | | | | | | | |
6.875%, 12/05/2027 | | | 800 | | | | 818 | |
6.000%, 04/08/2026 | | | 250 | | | | 252 | |
Panama Government International Bond | | | | | | | | |
4.500%, 04/16/2050 | | | 700 | | | | 797 | |
4.500%, 04/01/2056 | | | 1,000 | | | | 1,141 | |
4.000%, 09/22/2024 | | | 450 | | | | 489 | |
3.875%, 03/17/2028 | | | 1,000 | | | | 1,101 | |
2.252%, 09/29/2032 | | | 200 | | | | 194 | |
Paraguay Government International Bond | | | | | | | | |
5.400%, 03/30/2050 | | | 700 | | | | 823 | |
4.950%, 04/28/2031 | | | 700 | | | | 802 | |
Perusahaan Penerbit SBSN Indonesia III | | | | | | | | |
4.325%, 05/28/2025 | | | 500 | | | | 558 | |
4.150%, 03/29/2027 | | | 450 | | | | 504 | |
3.800%, 06/23/2050 | | | 200 | | | | 210 | |
Peruvian Government International Bond | | | | | | | | |
5.625%, 11/18/2050 | | | 250 | | | | 338 | |
2.783%, 01/23/2031 | | | 1,200 | | | | 1,205 | |
2.780%, 12/01/2060 | | | 1,250 | | | | 1,074 | |
2.392%, 01/23/2026 | | | 1,200 | | | | 1,228 | |
Philippine Government International Bond | | | | | | | | |
3.750%, 01/14/2029 | | | 2,500 | | | | 2,828 | |
3.700%, 02/02/2042 | | | 1,000 | | | | 1,088 | |
3.000%, 02/01/2028 | | | 250 | | | | 270 | |
2.650%, 12/10/2045 | | | 500 | | | | 468 | |
Poland Government International Bond | | | | | | | | |
5.000%, 03/23/2022 | | | 1,000 | | | | 1,030 | |
3.000%, 03/17/2023 | | | 500 | | | | 522 | |
Qatar Government International Bond | | | | | | | | |
5.103%, 04/23/2048 | | | 2,000 | | | | 2,680 | |
4.000%, 03/14/2029 | | | 1,000 | | | | 1,154 | |
3.875%, 04/23/2023 | | | 1,000 | | | | 1,059 | |
3.400%, 04/16/2025 | | | 500 | | | | 544 | |
Romanian Government International Bond | | | | | | | | |
4.000%, 02/14/2051 | | | 1,100 | | | | 1,163 | |
3.000%, 02/14/2031 | | | 500 | | | | 519 | |
Russian Foreign Bond - Eurobond | | | | | | | | |
5.250%, 06/23/2047 | | | 1,000 | | | | 1,270 | |
4.875%, 09/16/2023 | | | 1,000 | | | | 1,085 | |
4.500%, 04/04/2022 | | | 1,000 | | | | 1,026 | |
4.375%, 03/21/2029 | | | 1,400 | | | | 1,588 | |
Saudi Government International Bond | | | | | | | | |
5.250%, 01/16/2050 | | | 200 | | | | 263 | |
4.500%, 10/26/2046 | | | 1,250 | | | | 1,467 | |
| | |
| 64 | | Adviser Managed Trust / Annual Report / July 31, 2021 |
| | | | | | | | |
| | | |
| Description | | Face Amount
(Thousands) | | Market Value
($ Thousands) |
| | |
SOVEREIGN DEBT (continued) | | | | | | | | |
4.500%, 04/22/2060 | | $ | 500 | | | $ | 609 | |
3.250%, 10/26/2026 | | | 1,000 | | | | 1,089 | |
3.250%, 10/22/2030 | | | 1,450 | | | | 1,569 | |
2.875%, 03/04/2023 | | | 1,000 | | | | 1,034 | |
Senegal Government International Bond | | | | | | | | |
6.750%, 03/13/2048 | | | 250 | | | | 256 | |
6.250%, 05/23/2033 | | | 250 | | | | 265 | |
Serbia Government International Bond | | | | | | | | |
2.125%, 12/01/2030 | | | 200 | | | | 190 | |
South Africa Government International Bond | | | | | | | | |
5.875%, 09/16/2025 | | | 1,250 | | | | 1,414 | |
5.750%, 09/30/2049 | | | 1,000 | | | | 1,014 | |
4.850%, 09/30/2029 | | | 950 | | | | 1,003 | |
Sri Lanka Government International Bond | | | | | | | | |
7.550%, 03/28/2030 | | | 1,000 | | | | 612 | |
6.850%, 11/03/2025 | | | 1,000 | | | | 636 | |
5.750%, 04/18/2023 | | | 700 | | | | 507 | |
Trinidad & Tobago Government International Bond | | | | | | | | |
4.500%, 08/04/2026 | | | 400 | | | | 422 | |
Turkey Government International Bond | | | | | | | | |
7.625%, 04/26/2029 | | | 1,750 | | | | 1,927 | |
7.375%, 02/05/2025 | | | 100 | | | | 108 | |
6.350%, 08/10/2024 | | | 1,750 | | | | 1,840 | |
4.875%, 04/16/2043 | | | 1,250 | | | | 1,004 | |
4.750%, 01/26/2026 | | | 200 | | | | 198 | |
Ukraine Government International Bond | | | | | | | | |
7.750%, 09/01/2023 | | | 1,450 | | | | 1,553 | |
7.750%, 09/01/2026 | | | 1,000 | | | | 1,094 | |
7.375%, 09/25/2032 | | | 700 | | | | 728 | |
7.253%, 03/15/2033 | | | 500 | | | | 516 | |
Uruguay Government International Bond | | | | | | | | |
5.100%, 06/18/2050 | | | 1,700 | | | | 2,227 | |
4.375%, 01/23/2031 | | | 1,250 | | | | 1,461 | |
Uzbekistan Government International Bond | | | | | | | | |
3.900%, 10/19/2031 | | | 200 | | | | 200 | |
3.700%, 11/25/2030 | | | 250 | | | | 247 | |
Vietnam Government International Bond | | | | | | | | |
4.800%, 11/19/2024 | | | 250 | | | | 278 | |
Zambia Government International Bond | | | | | | | | |
8.970%, 07/30/2027 | | | 700 | | | | 452 | |
| | | | | | | | |
| | |
Total Sovereign Debt
(Cost $126,152) ($ Thousands) | | | | | | | 124,783 | |
| | | | | | | | |
| | |
Total Investments in Securities — 98.6%
(Cost $312,828) ($ Thousands) | | | | | | $ | 312,615 | |
| | | | | | | | |
Percentages are based on Net Assets of $316,957 ($ Thousands).
| (A) | Security exempt from registration under Rule 144A of the Securities Act of 1933. These securities may be resold in transactions exempt from registration normally to qualified institutions. On July 31, 2021, the value of these securities amounted to $106,017 ($ Thousands), representing 33.4% of the Net Assets of the Fund. |
| (B) | Perpetual security with no stated maturity date. |
| (C) | Rate shown is the effective yield at the time of purchase. |
| (D) | Security is in default on interest payment. |
| (E) | Step Bonds – Represents the current rate, the step rate, the step date and the final maturity date. |
| (F) | Variable of floating rate security, the interest rate of which adjusts periodically based on changes in current interest rates and prepayments on the underlying pool of assets. |
CJSC— Closed Joint-Stock Company
DAC — Designated Activity Company
ICE— Intercontinental Exchange
JSC— Joint-Stock Company
LIBOR — London Interbank Offered Rate
LLLP — Limited Liability Limited Partnership
MTN — Medium Term Note
PIK — Payment In-Kind
USD — United States Dollar
VAR — Variable Rate
As of July 31, 2021, all of the Fund’s investments were considered Level 2, in accordance with the authoritative guidance on fair value measurements and disclosure under U.S. GAAP.
For the year ended July 31, 2021, there were no transfers in or out of Level 3.
For more information on valuation inputs, see Note 2 — Significant Accounting Policies in Notes to Financial Statements.
The accompanying notes are an integral part of the financial statements.
| | |
| Adviser Managed Trust / Annual Report / July 31, 2021 | | 65 |
STATEMENTS OF ASSETS AND LIABILITIES ($ Thousands)
July 31, 2021
| | | | | | | | | | | | | | | |
| | | Tactical Offensive
Equity Fund | | Tactical Offensive Core
Fixed Income Fund | | Tactical Offensive
Enhanced Fixed
Income Fund |
Assets: | | | | | | | | | | | | | | | |
Investments, at value† | | | $ | 2,450,229 | | | | $ | 1,223,030 | | | | $ | 312,615 | |
Affiliated investments, at value†† | | | | 50,777 | | | | | — | | | | | — | |
Cash | | | | 190,002 | | | | | 50,730 | | | | | 1,075 | |
Foreign currency, at value ††† | | | | 244 | | | | | 125 | | | | | — | |
Cash pledged as collateral for futures contracts | | | | 15,182 | | | | | — | | | | | — | |
Dividends and interest receivable | | | | 1,770 | | | | | 5,280 | | | | | 4,277 | |
Receivable for fund shares sold | | | | 532 | | | | | 251 | | | | | 63 | |
Foreign tax reclaim receivable | | | | 385 | | | | | — | | | | | — | |
Receivable for investment securities sold | | | | — | | | | | 3,863 | | | | | 103 | |
Unrealized gain on forward foreign currency contracts | | | | — | | | | | 1,000 | | | | | — | |
Prepaid expenses | | | | 19 | | | | | 13 | | | | | — | |
Total Assets | | | | 2,709,140 | | | | | 1,284,292 | | | | | 318,133 | |
Liabilities: | | | | | | | | | | | | | | | |
Payable for variation margin | | | | 1,884 | | | | | — | | | | | — | |
Payable for fund shares redeemed | | | | 1,085 | | | | | 303 | | | | | 66 | |
Shareholder servicing fees payable | | | | 571 | | | | | 260 | | | | | 67 | |
Administration fees payable | | | | 395 | | | | | 8 | | | | | 32 | |
Payable to custodian | | | | 280 | | | | | 18 | | | | | 19 | |
Investment advisory fees payable | | | | 98 | | | | | 50 | | | | | 73 | |
Trustees fees payable | | | | 16 | | | | | 7 | | | | | 2 | |
Chief Compliance Officer fees payable | | | | 5 | | | | | 2 | | | | | 1 | |
Payable for investment securities purchased | | | | — | | | | | 53,270 | | | | | 884 | |
Unrealized loss on forward foreign currency contracts | | | | — | | | | | 17 | | | | | — | |
Unrealized loss on foreign spot currency contracts | | | | — | | | | | 85 | | | | | — | |
Accrued expense payable | | | | 190 | | | | | 93 | | | | | 32 | |
Total Liabilities | | | | 4,524 | | | | | 54,113 | | | | | 1,176 | |
Net Assets | | | $ | 2,704,616 | | | | $ | 1,230,179 | | | | $ | 316,957 | |
† Cost of investments | | | $ | 1,833,431 | | | | $ | 1,226,387 | | | | $ | 312,828 | |
†† Cost of affiliated investments | | | | 50,777 | | | | | — | | | | | — | |
††† Cost of foreign currency | | | | 243 | | | | | 126 | | | | | — | |
Net Assets: | | | | | | | | | | | | | | | |
Paid-in capital — (unlimited authorization — no par value) | | | $ | 1,993,619 | | | | $ | 1,253,031 | | | | $ | 315,879 | |
Total distributable earnings (accumulated losses) | | | | 710,997 | | | | | (22,852 | ) | | | | 1,078 | |
Net Assets | | | $ | 2,704,616 | | | | $ | 1,230,179 | | | | $ | 316,957 | |
Net Asset Value, Offering and Redemption Price Per Share | | | $ | 23.43 | | | | $ | 9.73 | | | | $ | 10.04 | |
| | | | ($2,704,615,690 ÷ | | | | | ($1,230,179,135 ÷ | | | | | ($316,956,822 ÷ | |
| | | | 115,415,452 shares) | | | | | 126,423,396 shares) | | | | | 31,580,487 shares) | |
Amounts designated as “—” are $0 or have been rounded to $0.
The accompanying notes are an integral part of the financial statements.
| | |
| 66 | | Adviser Managed Trust / Annual Report / July 31, 2021 |
STATEMENTS OF OPERATIONS ($ Thousands)
For the year or period ended July 31, 2021
| | | | | | | | | | | | |
| | | Tactical Offensive
Equity Fund | | | Tactical Offensive
Core Fixed Income
Fund | | | Tactical Offensive
Enhanced Fixed
Income Fund‡ |
Investment income: | | | | | | | | | | | | |
Dividends | | $ | 36,386 | | | $ | — | | | $ | — | |
Dividends from affiliated investments (1) | | | 1 | | | | — | | | | — | |
Interest income | | | 10 | | | | 10,996 | | | | 7,606 | |
Less: foreign taxes withheld | | | (473) | | | | — | | | | (29 | ) |
Total investment income | | | 35,924 | | | | 10,996 | | | | 7,577 | |
Expenses: | | | | | | | | | | | | |
Shareholder servicing fees | | | 6,012 | | | | 3,281 | | | | 419 | |
Investment advisory fees | | | 4,810 | | | | 1,968 | | | | 503 | |
Administration fees | | | 4,790 | | | | 2,625 | | | | 335 | |
Trustee fees | | | 55 | | | | 30 | | | | 5 | |
Chief Compliance Officer fees | | | 14 | | | | 8 | | | | 1 | |
Professional fees | | | 170 | | | | 96 | | | | 16 | |
Custodian/wire agent fees | | | 166 | | | | 51 | | | | 10 | |
Printing fees | | | 108 | | | | 63 | | | | 7 | |
Registration fees | | | 46 | | | | 31 | | | | — | |
Other expenses | | | 154 | | | | 93 | | | | 48 | |
Total expenses | | | 16,325 | | | | 8,246 | | | | 1,344 | |
Less: | | | | | | | | | | | | |
Waiver of investment advisory fees | | | (3,754) | | | | (1,215 | ) | | | (65 | ) |
Waiver of administration fees | | | (494) | | | | (2,518 | ) | | | (304 | ) |
Net expenses | | | 12,077 | | | | 4,513 | | | | 975 | |
Net investment income | | | 23,847 | | | | 6,483 | | | | 6,602 | |
Net realized gain/(loss) on: | | | | | | | | | | | | |
Investments | | | 44,977 | | | | (3,948 | ) | | | 444 | |
Futures contracts | | | 65,964 | | | | — | | | | — | |
Forward foreign currency contracts | | | — | | | | (3,452 | ) | | | — | |
Foreign currency transactions | | | 14 | | | | 1,204 | | | | — | |
Net change in unrealized appreciation/(depreciation) on: | | | | | | | | | | | | |
Investments | | | 593,922 | | | | (21,424 | ) | | | (213 | ) |
Futures contracts | | | (9,280) | | | | — | | | | — | |
Forward foreign currency contracts | | | — | | | | 3,640 | | | | — | |
Foreign currency and translation of other assets and liabilities denominated in foreign currency | | | 10 | | | | (42 | ) | | | — | |
Net increase/(decrease) in net assets resulting from operations | | $ | 719,454 | | | $ | (17,539 | ) | | $ | 6,833 | |
| ‡ | Commenced operations on January 12, 2021. |
| (1) | See Note 5 in the Notes to Financial Statements. |
Amounts designated as “—” are $0 or have been rounded to $0.
The accompanying notes are an integral part of the financial statements.
| | |
| Adviser Managed Trust / Annual Report / July 31, 2021 | | 67 |
STATEMENTS OF CHANGES IN NET ASSETS ($ Thousands)
For the years ended July 31,
| | | | | | | | | | | | | | | | |
| | | Tactical Offensive Equity Fund | | | Tactical Offensive Core Fixed Income Fund | |
| | | 2021 | | | 2020† | | | 2021 | | | 2020^ |
Operations: | | | | | | | | | | | | | | | | |
Net investment income | | $ | 23,847 | | | $ | 22,587 | | | $ | 6,483 | | | $ | 28,422 | |
Net realized gain/(loss) from investments and futures contracts | | | 110,941 | | | | (132,415 | ) | | | (3,948 | ) | | | (34,334 | ) |
Net realized gain/(loss) on forward foreign currency contracts and foreign currency transactions | | | 14 | | | | (1,834 | ) | | | (2,248 | ) | | | 2,800 | |
Net change in unrealized appreciation/(depreciation) on investments and futures contracts | | | 584,642 | | | | (30,996 | ) | | | (21,424 | ) | | | (26,973 | ) |
Net change on accrued foreign capital gains tax on appreciated securities | | | — | | | | 76 | | | | — | | | | — | |
Net change in unrealized appreciation/(depreciation) on forward foreign currency contracts, foreign currency and translation of other assets and liabilities denominated in foreign currency | | | 10 | | | | — | | | | 3,598 | | | | (3,258 | ) |
Net increase/(decrease) in net assets resulting from operations | | | 719,454 | | | | (142,582 | ) | | | (17,539 | ) | | | (33,343 | ) |
Distributions: | | | (10,009 | ) | | | (37,495 | ) | | | (11,845 | ) | | | (34,147 | ) |
Total distributions | | | (10,009 | ) | | | (37,495 | ) | | | (11,845 | ) | | | (34,147 | ) |
Capital share transactions:(1) | | | | | | | | | | | | | | | | |
Proceeds from shares issued | | | 2,029,388 | | | | 753,829 | | | | 289,389 | | | | 1,595,207 | |
Reinvestment of dividends & distributions | | | 9,978 | | | | 34,275 | | | | 11,807 | | | | 24,837 | |
Cost of shares redeemed | | | (652,451 | ) | | | (2,559,406 | ) | | | (523,938 | ) | | | (1,627,808 | ) |
Net increase/(decrease) in net assets derived from capital share transactions | | | 1,386,915 | | | | (1,771,302 | ) | | | (222,742 | ) | | | (7,764 | ) |
Net increase/(decrease) in net assets | | | 2,096,360 | | | | (1,951,379 | ) | | | (252,126 | ) | | | (75,254 | ) |
Net assets: | | | | | | | | | | | | | | | | |
Beginning of year | | | 608,256 | | | | 2,559,635 | | | | 1,482,305 | | | | 1,557,559 | |
End of year | | $ | 2,704,616 | | | $ | 608,256 | | | $ | 1,230,179 | | | $ | 1,482,305 | |
| † | For the period March 10, 2020 through June 3, 2020, the Fund was not an active component of the Adviser Managed Strategy (see Note 1). |
| ^ | For the period March 19, 2020 through June 16, 2020, the Fund was not an active component of the Adviser Managed Strategy (see Note 1). |
| (1) | See Note 6 in the Notes to Financial Statements for additional information. |
Amount designated as “—” is $0 or has been rounded to $0.
The accompanying notes are an integral part of the financial statements.
| | |
| 68 | | Adviser Managed Trust / Annual Report / July 31, 2021 |
STATEMENT OF CHANGES IN NET ASSETS ($ Thousands)
For the period ended July 31, 2021
| | | | |
| | | Tactical Offensive Enhanced
Fixed Income Fund | |
| | | 2021‡ | |
Operations: | | | | |
Net investment income | | $ | 6,602 | |
Net realized gain from investments | | | 444 | |
Net change in unrealized appreciation/(depreciation) on investments | | | (213 | ) |
Net increase in net assets resulting from operations | | | 6,833 | |
Distributions: | | | (5,755 | ) |
Total distributions | | | (5,755 | ) |
Capital share transactions:(1) | | | | |
Proceeds from shares issued | | | 338,151 | |
Reinvestment of dividends & distributions | | | 5,739 | |
Cost of shares redeemed | | | (28,011 | ) |
Net increase in net assets derived from capital share transactions | | | 315,879 | |
Net increase in net assets | | | 316,957 | |
Net assets: | | | | |
Beginning of period | | | — | |
End of period | | $ | 316,957 | |
| ‡ | Commenced operations on January 12, 2021. |
| (1) | See Note 6 in the Notes to Financial Statements for additional information. |
Amount designated as “—” is $0 or has been rounded to $0.
The accompanying notes are an integral part of the financial statements.
| | |
| Adviser Managed Trust / Annual Report / July 31, 2021 | | 69 |
FINANCIAL HIGHLIGHTS
For the years or period ended July 31,
For a share outstanding throughout the years or period
| | | | | | | | | | | | | | | | | | | | | | | | | | | | | | | | | | | | | | | | | | | | | | | | | | | | | | | | | | | | |
| | | Net asset
value,
beginning
of year or
period | | | Net
investment
income(1) | | | Net realized
and unrealized gains/(losses) on securities(1) | | | Total from
operations | | | Dividends from
net investment
income | | | Distributions
from realized
gains | | | Total
dividends
and distributions | | | Net asset
value,
end of year or
period | | | Total Return† | | | Net assets, end of year or period
($ Thousands) | | | Ratio of net expenses to average
net assets | | | Ratio of expenses
to average net assets
(excluding fees
paid indirectly
and including
waivers) | | | Ratio of
expenses to average
net assets
(excluding
fees paid
indirectly and
waivers) | | | Ratio of net investment income to average net assets | | | Portfolio
turnover† | |
Tactical Offensive Equity Fund | | | | | | | | | | | | | | | | | | | | | | | | | | | | | | | | | | | | | | | | | | | | | |
2021 | | $ | 17.24 | | | $ | 0.20 | | | $ | 6.07 | | | $ | 6.27 | | | $ | (0.08) | | | $ | – | | | $ | (0.08) | | | $ | 23.43 | | | | 36.45% | | | $ | 2,704,616 | | | | 0.50% | | | | 0.50% | | | | 0.68% | | | | 0.99% | | | | 18% | |
2020(2) | | | 15.64 | | | | 0.22 | | | | 1.61 | ^ | | | 1.83 | | | | (0.22) | | | | (0.01) | | | | (0.23) | | | | 17.24 | | | | 11.82 | | | | 608,256 | | | | 0.50 | | | | 0.50 | | | | 0.71 | | | | 1.35 | | | | 37 | |
2019(3) | | | 17.35 | | | | 0.26 | | | | 0.11 | ^ | | | 0.37 | | | | (0.25) | | | | (1.83) | | | | (2.08) | | | | 15.64 | | | | 4.12 | | | | 2,559,635 | | | | 0.50 | | | | 0.50 | | | | 0.69 | | | | 1.58 | | | | 148 | |
2018 | | | 15.74 | | | | 0.27 | | | | 1.72 | | | | 1.99 | | | | (0.26) | | | | (0.12) | | | | (0.38) | | | | 17.35 | | | | 12.77 | | | | 2,612,459 | | | | 0.50 | | | | 0.50 | | | | 0.68 | | | | 1.64 | | | | 7 | |
2017 | | | 13.59 | | | | 0.24 | | | | 2.04 | | | | 2.28 | | | | (0.13) | | | | – | | | | (0.13) | | | | 15.74 | | | | 16.87 | | | | 2,268,322 | | | | 0.50 | | | | 0.50 | | | | 0.69 | | | | 1.68 | | | | 8 | |
Tactical Offensive Core Fixed Income Fund | | | | | | | | | | | | | | | | | | | | | | | | | | | | | | | | | | | | | | | | | | | | | |
2021 | | $ | 9.93 | | | $ | 0.05 | | | $ | (0.16 | ) | | $ | (0.11) | | | $ | (0.09) | | | $ | – | | | $ | (0.09) | | | $ | 9.73 | | | | (1.13)% | | | $ | 1,230,179 | | | | 0.34% | | | | 0.34% | | | | 0.63% | | | | 0.49% | | | | 76% | |
2020(4) | | | 10.34 | | | | 0.24 | | | | (0.42 | ) | | | (0.18) | | | | (0.23) | | | | – | | | | (0.23) | | | | 9.93 | | | | (1.79) | | | | 1,482,305 | | | | 0.38 | | | | 0.38 | | | | 0.66 | | | | 2.34 | | | | 222 | |
2019 | | | 9.99 | | | | 0.30 | | | | 0.48 | | | | 0.78 | | | | (0.43) | | | | – | | | | (0.43) | | | | 10.34 | | | | 8.03 | | | | 1,557,559 | | | | 0.38 | | | | 0.38 | | | | 0.66 | | | | 2.95 | | | | 61 | |
2018 | | | 10.35 | | | | 0.27 | | | | (0.34 | ) | | | (0.07) | | | | (0.29) | | | | – | | | | (0.29) | | | | 9.99 | | | | (0.71) | | | | 809,136 | | | | 0.38 | | | | 0.38 | | | | 0.65 | | | | 2.63 | | | | 47 | |
2017 | | | 10.59 | | | | 0.26 | | | | (0.21 | ) | | | 0.05 | | | | (0.29) | | | | – | | | | (0.29) | | | | 10.35 | | | | 0.51 | | | | 1,323,854 | | | | 0.38 | | | | 0.38 | | | | 0.66 | | | | 2.52 | | | | 48 | |
Tactical Offensive Enhanced Fixed Income Fund | | | | | | | | | | | | | | | | | | | | | | | | | | | | | | | | | | | | | | | | | | | | | |
2021(5) | | $ | 10.00 | | | $ | 0.22 | | | $ | 0.01 | | | $ | 0.23 | | | $ | (0.19) | | | $ | – | | | $ | (0.19) | | | $ | 10.04 | | | | 2.29% | | | $ | 316,957 | | | | 0.58% | | | | 0.58% | | | | 0.80% | | | | 3.92% | | | | 30% | |
| (1) | Per share net investment income and net realized and unrealized gains/(losses) on securities calculated using average shares. |
| (2) | For the period March 10, 2020 through June 3, 2020, the Fund was not an active component of the Adviser Managed Strategy (see Note 1). |
| (3) | For the period December 18, 2018 through March 24, 2019, the Fund was not an active component of the Adviser Managed Strategy (see Note 1). |
| (4) | For the period March 19, 2020 through June 16, 2020, the Fund was not an active component of the Adviser Managed Strategy (see Note 1). |
| (5) | Commenced operations on January 12, 2021. |
|
† Returns and portfolio turnover rate are for the period indicated and have not been annualized. Returns do not reflect the deduction of taxes the shareholder would pay on fund distributions or redemption of fund shares. |
|
^ The amount shown for a share outstanding throughout the period does not accord with the aggregate net realized and unrealized losses for that period because of the sales and repurchases of fund shares in relation to fluctuating market value of the investments of the Fund. |
The accompanying notes are an integral part of the financial statements.
| | |
| 70 | | Adviser Managed Trust / Annual Report / July 31, 2021 |
NOTES TO FINANCIAL STATEMENTS
July 31, 2021
1. ORGANIZATION
Adviser Managed Trust (the “Trust”) was established as a Delaware statutory trust under an Agreement and Declaration of Trust dated September 22, 2010. The Trust commenced operations on February 25, 2011.
The Trust is registered under the Investment Company Act of 1940, as amended, as an open-end investment management company with three registered funds: Tactical Offensive Equity, Tactical Offensive Core Fixed Income and Tactical Offensive Enhanced Fixed Income (commenced operations (each a “Fund,” collectively, the “Funds”) each of which are diversified Funds. The Tactical Offensive Enhanced Fixed Income Fund commenced operations on January 12, 2021. The assets of each Fund are segregated, and a shareholder’s interest is limited to the Fund in which shares are held. The Trust’s prospectus provides a description of each Fund’s investment objective and strategies.
Only persons who are clients of the Financial Adviser (as defined below) and who participate in the Adviser Managed Strategy should invest in the Funds. The Funds may not be purchased by any other investor. The Funds are designed to be a component of a broader strategy employed by a third party investment manager (“Financial Adviser”) for the benefit of its clients. The Financial Adviser seeks to take advantage of broad market changes by tactically shifting its clients’ assets among the Tactical Offensive Equity Fund, the Tactical Offensive Core Fixed Income Fund, the Tactical Offensive Enhanced Fixed Income Fund and a money market fund affiliated with the Funds, depending on the Financial Adviser’s evaluation of current market conditions (“Adviser Managed Strategy”). The Financial Adviser is not the adviser to the Funds, and is not affiliated with SEI Investments Management Corporation (“SIMC”), the adviser to the Funds.
When the Financial Adviser determines to reallocate its clients’ assets to one or more of the Funds that compose the Adviser Managed Strategy, the Financial Adviser may request the redemption of a substantial portion of or all of the shares for which the Financial Adviser exercises investment discretion. In such an instance, the Financial Adviser’s notice of its intent to redeem or formal redemption request (collectively, “Redemption Request”) will cause a Fund to liquidate a substantial portion of or substantially all of its assets in order to fulfill the Redemption Request. If the Financial Adviser’s Redemption Request includes all of the shares for which it exercises investment discretion, the Fund will no longer be an active component of the Adviser Managed Strategy.
When the Tactical Offensive Equity Fund is not an active component of the Adviser Managed Strategy, the Fund may invest up to 100% of its remaining assets in cash, money market instruments, repurchase agreements and other short-term obligations pending the Financial Adviser’s formal redemption request; and exchange traded funds (“ETF”s) that are designed to track the performance of the broad equity market. When the Tactical Offensive Core Fixed Income and Tactical Offensive Enhanced Fixed Income Funds are not active components of the Adviser Managed Strategy, the Funds may invest up to 100% of their remaining assets in cash, money market instruments, repurchase agreements and other short-term obligations that would not ordinarily be consistent with the Funds’ investment goals.
The Funds could be invested in these types of investments for extended periods of time. At such times, SIMC will manage the assets of the Funds. SIMC, the Financial Adviser or one or more of their affiliates will be the only investors in a Fund when the Fund is not an active component of the Adviser Managed Strategy.
During the periods March 10, 2020 through June 3, 2020, and December 18, 2018 through March 24, 2019, the Tactical Offensive Equity Fund was not an active component of the Adviser Managed Strategy.
During the period March 19, 2020 through June 16, 2020, the Tactical Offensive Core Fixed Income Fund was not an active component of the Adviser Managed Strategy.
2. SIGNIFICANT ACCOUNTING POLICIES
The following are significant accounting policies, which are consistently followed in the preparation of its financial statements by the Funds. The Funds are investment companies that apply the accounting and reporting guidance issued in Topic 946 by the U.S. Financial Accounting Standards Board (“FASB”).
Use of Estimates — The preparation of financial statements, in conformity with U.S. generally accepted accounting principles (“U.S. GAAP”), requires management to make estimates and assumptions that affect the reported amount of assets and liabilities and disclosure of contingent assets and liabilities as of the date of the financial statements and the reported amounts of increases and decreases in net assets from operations during the reporting period. Actual results could differ from those estimates.
Security Valuation — Securities listed on a securities exchange, market or automated quotation system for which quotations are readily available (other than securities traded on National Association of Securities Dealers Automated Quotations (NASDAQ) or as
| | |
| Adviser Managed Trust / Annual Report / July 31, 2021 | | 71 |
NOTES TO FINANCIAL STATEMENTS (Continued)
July 31, 2021
otherwise noted below) at the last quoted sale price on an exchange or market (foreign or domestic) on which the securities are traded, or, if there is no such reported sale, at the most recent quoted bid price. The Funds value securities traded on NASDAQ at the NASDAQ Official Closing Price. If available, debt securities, swaps (which are not centrally cleared), bank loans or collateralized debt obligations (including collateralized loan obligations), such as those held by the Funds, are priced based upon valuations provided by independent, third-party pricing agents. Such values generally reflect the last reported sales price if the security is actively traded. The third-party pricing agents may also value debt securities at an evaluated bid price by employing methodologies that utilize actual market transactions, broker supplied valuations or other methodologies designed to identify the market value for such securities. Redeemable securities issued by open-end investment companies are valued at the investment company’s applicable net asset value, with the exception of ETFs, which are priced as equity securities. The prices of foreign securities are reported in local currency and converted to U.S. dollars using currency exchange rates. If a security’s price cannot be obtained, as noted above, the Funds will value the securities using a bid price from at least one independent broker. If such prices are not readily available or cannot be valued using the methodologies described above, the Funds will value the security using the Funds’ Fair Value Pricing Policies and Procedures (“Fair Value Procedures”), as described below.
On the first day a new debt security purchase is recorded, if a price is not available from a third-party pricing agent or an independent broker, the security may be valued at its purchase price. Each day thereafter, the debt security will be valued according to the Funds’ Fair Value Procedures until a price from an independent source can be secured. Securities held by a Fund with remaining maturities of 60 days or less may be valued by the amortized cost method, which involves valuing a security at its cost on the date of purchase and thereafter (absent unusual circumstances) assuming a constant amortization to maturity of any discount or premium, regardless of the impact of fluctuations in general market rates of interest on the value of the instrument. While this method provides certainty in valuation, it may result in periods during which value, as determined by this method, is higher or lower than the price a Fund would receive if it sold the instrument. Further, the value of securities in the Fund can be expected to vary inversely with changes in prevailing interest rates. Should existing credit, liquidity or interest rate conditions in the relevant markets and issuer specific circumstances suggest that amortized cost
does not approximate fair value, then the amortized cost method may not be used.
Options and warrants are valued at the last quoted sales price. If there is no such reported sale on the valuation date, long positions are valued at the most recent bid price, and short positions are valued at the most recent ask price.
Futures and swaps cleared through a central clearing house (“centrally cleared swaps”) are valued at the settlement price established each day by the board of exchange on which they are traded. The daily settlement prices for financial futures and centrally cleared swaps are provided by an independent source. On days when there is excessive volume, market volatility or the future or centrally cleared swap does not end trading by the time a Fund calculates its NAV, the settlement price may not be available at the time at which the Fund calculates its NAV. On such days, the best available price (which is typically the last sales price) may be used to value a Fund’s futures or centrally cleared swaps position.
Foreign currency forward contracts are valued at the current day’s interpolated foreign exchange rate, as calculated using the current day’s spot rate, and the thirty, sixty, ninety and one-hundred eighty day forward rates provided by an independent source.
Prices for most securities held by a Fund are provided daily by third-party independent pricing agents. SIMC or a Sub-Adviser (“Sub Adviser”), as applicable, reasonably believes that prices provided by independent pricing agents are reliable. However, there can be no assurance that such pricing service’s prices will be reliable. SIMC or a Sub-Adviser, as applicable, will continuously monitor the reliability of prices obtained from any pricing service and shall promptly notify the Funds’ administrator if it believes that a particular pricing service is no longer a reliable source of prices. The Funds’ administrator, in turn, will notify the Fair Value Pricing Committee (the “Committee”) if it receives such notification from SIMC or a Sub-Adviser, as applicable, or if the Funds’ administrator reasonably believes that a particular pricing service is no longer a reliable source for prices.
The Funds’ Fair Value Procedures provide that any change in a primary pricing agent or a pricing methodology requires prior approval by the Board of Trustees (“Board”) or its designated sub-committee. However, when the change would not materially affect valuation of a Fund’s net assets or involve a material departure in pricing methodology from that of the Fund’s existing pricing agent or pricing methodology, approval may be obtained at the next regularly scheduled meeting of the Board.
| | |
| 72 | | Adviser Managed Trust / Annual Report / July 31, 2021 |
Securities for which market prices are not readily available, for which market prices are determined to be unreliable, or which cannot be valued using the methodologies described above are valued in accordance with the Fair Value Procedures established by the Board. The Funds’ Fair Value Procedures are implemented through the Committee designated by the Board. The Committee is currently composed of two members of the Board, as well as representatives from SIMC and its affiliates. Some of the more common reasons that may necessitate that a security be valued using Fair Value Procedures include: (i) the security’s trading has been halted or suspended, (ii) the security has been delisted from a national exchange, (iii) the security’s primary trading market is temporarily closed at a time when under normal conditions it would be open, or (iv) the security’s primary pricing source is not able or willing to provide a price. When a security is valued in accordance with the Fair Value Procedures, the Committee will determine the value after taking into consideration relevant information reasonably available to the Committee. Examples of factors the Committee may consider include: (i) the facts giving rise to the need to fair value, (ii) the last trade price, (iii) the performance of the market or the issuer’s industry, (iv) the liquidity of the security, (v) the size of the holding in a Fund, or (vi) any other appropriate information.
The determination of a security’s fair value price often involves the consideration of a number of subjective factors, and is therefore subject to the unavoidable risk that the value assigned to a security may be higher or lower than the security’s value would be if a reliable market quotation for the security was readily available.
For securities that principally trade on a foreign market or exchange, a significant gap in time can exist between the time of a particular security’s last trade and the time at which a Fund calculates its Net Asset Value (“NAV”). The closing prices of such securities may no longer reflect their market value at the time a Fund calculates NAV if an event that could materially affect the value of those securities (a “Significant Event”), including substantial fluctuations in domestic or foreign markets or occurrences not tied directly to the securities markets, such as natural disasters, armed conflicts or significant governmental actions, has occurred between the time of the security’s last close and the time that the Fund calculates NAV. A Fund may invest in securities that are primarily listed on foreign exchanges that trade on weekends or other days when the Fund does not price its shares. As a result, the NAV of the Fund’s shares may change on days when shareholders will not be able to purchase or redeem Fund shares.
A Significant Event may relate to a single issuer or to an entire market sector. If SIMC or a Sub-Adviser becomes aware of a Significant Event that has occurred with respect to a security or group of securities after the closing of the exchange or market on which the security or securities principally trade, but before the time at which the Funds calculate NAV, it may request that a Committee meeting be called. In addition, the Funds use several processes, with respect to certain securities to monitor the pricing data supplied by various sources, including price comparisons and price movements. Any identified discrepancies are researched and subject to the procedures described above.
In accordance with U.S. GAAP, fair value is defined as the price that a Fund would receive upon selling an investment in an orderly transaction to an independent buyer in the principal or most advantageous market of the investment. A three tier hierarchy has been established to maximize the use of observable and minimize the use of unobservable inputs and to establish classification of fair value measurements for disclosure purposes. Inputs refer broadly to the assumptions that market participants would use in pricing an asset. Inputs may be observable or unobservable. Observable inputs are inputs that reflect the assumptions market participants would use in pricing the asset or liability based on market data obtained from sources independent of the reporting entity. Unobservable inputs are inputs that reflect the reporting entity’s own assumptions about the assumptions market participants would use in pricing the asset or liability based on the best information available in the circumstances.
The three-tier hierarchy of inputs is summarized in the three broad Levels listed below:
Level 1 — quoted prices in active markets for identical investments
Level 2 — other significant observable inputs (including quoted prices for similar investments, interest rates, prepayment speeds, credit risks, etc.)
Level 3 — significant unobservable inputs (including the Fund’s own assumptions in determining the fair value of investments)
Investments are classified within the level of the lowest significant input considered in determining fair value. Investments classified within Level 3 whose fair value measurement considers several inputs may include Level 1 or Level 2 inputs as components of the overall fair value measurement.
Debt securities are valued in accordance with the evaluated bid price supplied by the pricing service and generally categorized as Level 2 in the hierarchy.
| | |
| Adviser Managed Trust / Annual Report / July 31, 2021 | | 73 |
NOTES TO FINANCIAL STATEMENTS (Continued)
July 31, 2021
Other securities that are categorized as Level 2 in the hierarchy include, but are not limited to, preferred stocks, bank loans, warrants, swaps and forward contracts. The Fund may use a systematic fair valuation model provided by an independent pricing service to value foreign equity securities in order to adjust for stale pricing, which may occur between the close of certain foreign exchanges and the New York Stock Exchange. These are generally categorized as Level 2 in the hierarchy.
When independent prices are unavailable or unreliable, debt securities and swaps may be valued utilizing pricing matrices which consider similar factors that would be used by independent pricing services. These are generally categorized as Level 2 in the hierarchy but may be Level 3 depending on the circumstances. For certain collateralized debt obligations, corporate obligations, mortgage backed securities, auction rate preferred securities and loan participations where observable inputs are limited, assumptions about market activity and risk are used and are categorized as Level 3 in the hierarchy.
The valuation techniques used by the Funds to measure fair value during the year or period ended July 31, 2021, maximized the use of observable inputs and minimized the use of unobservable inputs.
For the year or period ended July 31, 2021, there have been no significant changes to the Trust’s fair valuation methodologies.
For details of the investment classification, reference the Schedules of Investments.
Security Transactions and Investment Income — Security transactions are recorded on the trade date. Cost used in determining realized capital gains and losses on the sale of securities is determined on the basis of specific identification. Dividend income and expense recognized on the ex-dividend date, and interest income or expense recognized using the accrual basis of accounting.
Distributions received on securities that represent a return of capital or capital gains are recorded as a reduction of cost of investments and/or as a realized gain. The Trust estimates the components of distributions received that may be considered nontaxable distributions or capital gain distributions.
Amortization and accretion is calculated using the scientific interest method, which approximates the effective interest method over the holding period of the security. Amortization of premiums and discounts is included in interest income.
Repurchase Agreements — Securities pledged as collateral for repurchase agreements are held by each Fund’s custodian bank until the repurchase date of the repurchase agreement. The Funds also invest in tri-party repurchase agreements. Securities held as collateral for tri-party repurchase agreements are maintained by the broker’s custodian bank in a segregated account until the repurchase date of the repurchase agreement. Provisions of the repurchase agreements and the Trust’s policies require that the market value of the collateral, including accrued interest thereon, is sufficient in the event of default by the counterparty. If the counterparty defaults and the value of the collateral declines, or if the counterparty enters into an insolvency proceeding, realization of the collateral by the Funds may be delayed or limited. There were no outstanding repurchase agreements as of July 31, 2021.
Reverse Repurchase Agreements — To the extent consistent with its investment objective and strategies, a Fund may issue reverse repurchase agreements. A reverse repurchase agreement involves the sale of portfolio assets together with an agreement to repurchase the same assets later at a fixed price. Additional assets are maintained in a segregated account with the custodian. The segregated assets may consist of cash, U.S. Government securities, or other liquid securities at least equal in value to the obligations under the reverse repurchase agreements. In the event the buyer of securities under a reverse repurchase agreement files for bankruptcy or becomes insolvent, the Funds’ use of the proceeds under the reverse repurchase agreement may be restricted pending a determination by the other party, or its trustee or receiver, whether to enforce the obligation to repurchase the securities. There were no outstanding reverse repurchase agreements as of July 31, 2021.
Expenses — Expenses that are directly related to one of the Funds are charged directly to that Fund. Other operating expenses of the Funds are prorated to the Funds on the basis of relative net assets.
Foreign Currency Translation — The books and records of the Funds’ investments in international securities are maintained in U.S. dollars on the following basis:
(i) market value of investment securities, assets and liabilities at the current rate of exchange; and
(ii) purchases and sales of investment securities, income and expenses at the relevant rates of exchange prevailing on the respective dates of such transactions.
The Funds do not isolate that portion of gains and losses on investments in equity securities that is due to changes in the foreign exchange rates from that which is due to changes in market prices of equity securities.
| | |
| 74 | | Adviser Managed Trust / Annual Report / July 31, 2021 |
The Funds report certain foreign-currency-related transactions as components of realized gains for financial reporting purposes, whereas such components are treated as ordinary income for Federal income tax purposes.
Forward Foreign Currency Contracts — To the extent consistent with its investment objective and strategies, a Fund may enter into forward foreign currency contracts for hedging or speculative purposes with respect to either specific transactions, fund positions or anticipated fund positions. All commitments are marked-to-market daily at the applicable foreign exchange rate, and any resulting unrealized gains or losses are recorded currently. The Fund realizes gains and losses at the time forward contracts are extinguished. Unrealized gains or losses on outstanding positions in forward foreign currency contracts held at the close of the period are recognized as ordinary income or loss for Federal income tax purposes. A Fund could be exposed to risk if the counterparties to the contracts are unable to meet the terms of the contract and from unanticipated movements in the value of a foreign currency relative to the U.S. dollar.
Finally, the risk exists that losses could exceed amounts disclosed on the Statements of Assets and Liabilities. Refer to each Fund’s Schedule of Investments for details regarding open forward foreign currency contracts as of July 31, 2021, if applicable.
Futures Contracts — To the extent consistent with its investment objective and strategies, a Fund may use futures contracts for tactical hedging purposes as well as to enhance the Fund’s returns. Initial margin deposits of cash or securities are made upon entering into futures contracts. The contracts are marked to market daily and the resulting changes in value are accounted for as unrealized gains and losses. Variation margin payments are paid or received, depending upon whether unrealized gains or losses are incurred. When the contract is closed, the Funds record a realized gain or loss equal to the difference between the proceeds from (or cost of) the closing transaction and the amount invested in the contract.
Risks of entering into futures contracts include the possibility that there will be an imperfect price correlation between the futures and the underlying securities. Second, it is possible that a lack of liquidity for futures contracts could exist in the secondary market, resulting in an inability to close a position prior to its maturity date. Third, the futures contract involves the risk that a Fund could lose more than the original margin deposit required to initiate a futures transaction.
Finally, the risk exists that losses could exceed amounts disclosed on the Statements of Assets and Liabilities.
Refer to each Fund’s Schedule of Investments for details regarding open futures contracts as of July 31, 2021, if applicable.
Options/Swaptions Writing/Purchasing — To the extent consistent with its investment objective and strategies, a Fund may invest in financial options/swaptions contracts for the purpose of hedging its existing portfolio securities, or securities that a Fund intends to purchase, against fluctuations in fair market value caused by changes in prevailing market interest rates. A Fund may also invest in financial option/swaption contracts to enhance its returns. When the Fund writes or purchases an option/swaption, an amount equal to the premium received or paid by the Fund is recorded as a liability or an asset and is subsequently adjusted to the current market value of the option/swaption written or purchased. Premiums received or paid from writing or purchasing options/swaptions which expire unexercised are treated by the Fund on the expiration date as realized gains or losses. The difference between the premium and the amount paid or received on effecting a closing purchase or sale transaction, including brokerage commissions, is also treated as a realized gain or loss. If an option/swaption is exercised, the premium paid or received is added to the cost of the purchase or proceeds from the sale in determining whether the Fund has realized a gain or a loss.
The risk in writing a call option/swaption is a Fund may give up the opportunity for profit if the market price of the security increases. The risk in writing a put option/swaption is a Fund may incur a loss if the market price of the security decreases and the option/swaption is exercised. The risk in purchasing an option/swaption is a Fund may pay a premium whether or not the option/swaption is exercised. The Funds also have the additional risk of being unable to enter into a closing transaction at an acceptable price if a liquid secondary market does not exist. Option/swaption contracts also involve the risk that they may not work as intended due to unanticipated developments in market conditions or other causes.
Finally, the risk exists that losses on written options could exceed amounts disclosed on the Statements of Assets and Liabilities. The Funds did not hold any option/swaption contracts as of July 31, 2021.
Swap Agreements — To the extent consistent with its investment objective and strategies, a Fund may invest in swap contracts for speculative or hedging purposes. Swaps may be used to synthetically obtain exposure to securities or baskets of securities. A swap agreement is a two-party contract under which an agreement is made to exchange returns from predetermined investments or instruments, including a
| | |
| Adviser Managed Trust / Annual Report / July 31, 2021 | | 75 |
NOTES TO FINANCIAL STATEMENTS (Continued)
July 31, 2021
particular interest rate, foreign currency, or “basket” of securities representing a particular index. Interest rate swaps involve the exchange by a Fund with another party of their respective commitments to pay or receive interest (e.g., an exchange of floating rate payments for fixed rate payments) with respect to a notional amount of principal. Credit-default swaps involve periodic payments by a Fund or counterparty based on a specified rate multiplied by a notional amount assigned to an underlying debt instrument or group of debt instruments in exchange for the assumption of credit risk on the same instruments. In the event of a credit event, usually in the form of a credit rating downgrade, the party receiving periodic payments (i.e. floating rate payer) must pay the other party (i.e. fixed rate payer) an amount equal to the recovery rate used to settle the contracts. The recovery rate is a function of how many credit default swap investors wish to deliver the security or receive the security. The recovery rate is determined through an auction process. Total return swaps allow an investor to benefit from the cash flow without ever actually owning the underlying security. The receiver must pay any decline in value to the payer at the end of the total return swap. However, the investor does not need to make a payment if there is no decline in price. Payments can be made on various indices, bonds (i.e. mortgage backed securities, bank debt and corporate), loans or commodities. The value of a total return swap is equal to the change in value of the underlying asset versus the accrued income payment based on LIBOR or some other form of indices on the notional amount. Interest rate swaps involve the exchange by a Fund with another party of their respective commitments to pay or receive interest (e.g., an exchange of floating rate payments for fixed rate payments) with respect to a notional amount of principal to manage a Fund’s exposure to interest rates. Payments received or made are recorded as realized gains or loss. A Fund could be exposed to credit or market risk due to unfavorable changes in the fluctuation of interest rates or if the counterparty defaults on its obligation to perform. Risk of loss may exceed amounts recognized on the statement of assets and liabilities. In connection with swap agreements securities may be set aside as collateral by a Fund’s custodian.
Swaps are marked-to-market daily based upon quotations from market makers and the resulting changes in market values, if any, are recorded as unrealized gains or losses in the Statement of Operations. Net payments of interest are recorded as realized gains or losses.
Entering into swap agreements involves, to varying degrees, elements of credit and market risk in excess of the amounts recognized on the Statement of Assets
and Liabilities. Such risks involve the possibility that there will be no liquid market for these agreements, that the counterparty to the agreement may default on its obligation to perform and that there may be unfavorable changes in the fluctuation of interest rates. Risks also arise from potential losses from adverse market movements.
These risks may be mitigated by having a master netting arrangement between a Fund and the counterparty and by having the counterparty post collateral to cover a Fund’s exposure to the counterparty. See Note 3 for further details. The Funds did not hold any swap contracts as of July 31, 2021.
Delayed Delivery Transactions — To the extent consistent with its investment objective and strategies, a Fund may purchase or sell securities on a when-issued or delayed delivery basis. These transactions involve a commitment by those Funds to purchase or sell securities for a predetermined price or yield, with payment and delivery taking place beyond the customary settlement period. When purchasing a security on a delayed delivery basis, that Fund assumes the rights and risks of ownership of the security, including the risk of price and yield fluctuations, and takes such fluctuations into account when determining its net asset value. Those Funds may dispose of or renegotiate a delayed delivery transaction after it is entered into, and may sell when-issued securities before they are delivered, which may result in a capital gain or loss. When those Funds have sold a security on a delayed delivery basis, that Fund does not participate in future gains and losses with respect to the security.
Loan Participations and Brady Bonds — To the extent consistent with its investment objective and strategies, a Fund may invest in U.S. dollar-denominated fixed - and floating-rate loans (“Loans”) arranged through private negotiations between a foreign sovereign entity and one or more financial institutions (“Lenders”). The Fund invests in such Loans in the form of participations in Loans (“Participations”) or assignments of all or a portion of Loans from third parties. Participations typically result in this Fund having a contractual relationship only with the Lenders, not with the sovereign borrowers. This Fund has the right to receive payments of principal, interest and any fees to which it is entitled from the Lender selling the Participation and only upon receipt by the Lender of the payments from the borrower. In connection with purchasing Participations, the Fund generally has no right to enforce compliance by the borrower with the terms of the loan agreement relating to the Loan, nor any rights of set-off against the borrower, and the Fund will not benefit directly from any collateral supporting the Loan in which it has purchased
| | |
| 76 | | Adviser Managed Trust / Annual Report / July 31, 2021 |
the Participation. As a result, the Fund assumes the credit risk of both the borrower and the Lender that is selling the Participation.
Certain debt obligations, customarily referred to as “Brady Bonds,” are created through the exchange of existing commercial bank loans to foreign entities for new obligations in connection with debt restructuring under a plan introduced by former U.S. Secretary of the Treasury Nicholas F. Brady. Brady Bonds have only been issued since 1989, and, accordingly, do not have a long payment history. They are issued by governments that may have previously defaulted on the loans being restructured by the Brady Bonds, so they are subject to the risk of default by the issuer. They may be fully or partially collateralized or uncollateralized and issued in various currencies. As of July 31, 2021, the Funds did not hold any loans.
Collateralized Debt Obligations — To the extent consistent with its investment objective and strategies, a Fund may invest in collateralized debt obligations (“CDOs”), which include collateralized loan obligations (“CLOs”) and other similarly structured securities. CLOs are a type of asset-backed security. A CLO is a trust, typically collateralized by a pool of loans, which may include, among others, domestic and foreign senior secured loans, senior unsecured loans and subordinate corporate loans, including loans that may be rated below investment grade or equivalent unrated loans. CDOs may charge management fees and administrative expenses.
For CDOs, the cash flows from the Trust are split into two or more portions, called tranches, varying in risk and yield. The riskiest portion is the “equity” tranche which bears the bulk of defaults from the bonds or loans in the trust and serves to protect the other, more senior tranches from default in all but the most severe circumstances. Since it is partially protected from defaults, a senior tranche from a CDO trust typically has a higher rating and lower yield than their underlying securities, and can be rated investment grade. Despite the protection from the equity tranche, CDO tranches can experience substantial losses due to actual defaults, increased sensitivity to defaults due to collateral default and disappearance of protecting tranches, market anticipation of defaults, as well as aversion to CDO securities as a class.
The risks of an investment in a CDO depend largely on the type of the collateral securities and the class of the CDO in which a Fund invests. Normally, CLOs and other CDOs are privately offered and sold, and thus, are not registered under the securities laws. As a result, investments in CDOs may be characterized by a Fund as illiquid securities; however, an active dealer market may
exist for CDOs allowing a CDO to qualify for Rule 144A transactions. In addition to the normal risks associated with fixed income securities (e.g., interest rate risk and default risk), CDOs carry additional risks including, but not limited to: (i) the possibility that distributions from collateral securities will not be adequate to make interest or other payments; (ii) the quality of the collateral may decline CDOs that are subordinate structure of the investment and investment results. The Funds did not hold any CDOs or CLOs as of July 31, 2021.
Dividends and Distributions to Shareholders — Dividends from net investment income are declared and paid to shareholders annually for the Tactical Offensive Equity Fund and declared and paid quarterly for the Tactical Offensive Core Fixed Income Fund and the Tactical Offensive Enhanced Fixed Income Fund. Dividends and distributions are recorded on the ex-dividend date. Any net realized capital gains will be distributed at least annually by the Funds.
Illiquid Securities — A security is considered illiquid if it cannot be sold or disposed of in the ordinary course of business within seven days or less for its approximate carrying value on the books of a Fund. Valuations of illiquid securities may differ significantly from the values that would have been used had an active market value for these securities existed. The Funds did not hold any illiquid securities as of July 31, 2021.
Investments in Real Estate Investment Trusts (“REITs”) — Dividend income is recorded based on the income included in distributions received from the REIT investments using published REIT reclassifications including some management estimates when actual amounts are not available. Distributions received in excess of this estimated amount are recorded as a reduction of the cost of investments or reclassified to capital gains. The actual amounts of income, return of capital, and capital gains are only determined by each REIT after its fiscal year-end, and may differ from the estimated amounts.
3. CREDIT DERIVATIVES
When a Fund seeks to take an active long or short position with respect to the likelihood of an event of default of a security or basket of securities, the Fund may use credit default swaps. The Fund may buy credit default swaps in an attempt to manage credit risk where the Fund has credit exposure to an issuer and the Fund may sell credit default swaps to more efficiently gain credit exposure to such security or basket of securities. The reference obligation of the swap can be a single issuer, a “basket” of issuers, or an index. The underlying referenced assets are corporate debt, sovereign debt and asset-backed securities.
| | |
| Adviser Managed Trust / Annual Report / July 31, 2021 | | 77 |
NOTES TO FINANCIAL STATEMENTS (Continued)
July 31, 2021
The buyer of a credit default swap is generally obligated to pay the seller a periodic stream of payments over the term of the contract in return for a contingent payment upon the occurrence of a credit event with respect to an underlying reference obligation. Generally, a credit event for corporate or sovereign reference obligations means bankruptcy, failure to pay, obligation acceleration, repudiation/moratorium or restructuring. For credit default swaps on asset-backed securities, a credit event may be triggered by events such as failure to pay principal, maturity extension, rating downgrade or write-down.
If a Fund is a seller of protection, and a credit event occurs, as defined under the terms of that particular swap agreement, a Fund will generally either (i) pay to the buyer an amount equal to the notional amount of the swap and take delivery of the referenced obligation, other deliverable obligations, or underlying securities comprising a referenced index or (ii) pay a net settlement amount in the form of cash or securities equal to the notional amount of the swap less the recovery value of the referenced obligation or underlying securities comprising a referenced index.
If a Fund is a buyer of protection and a credit event occurs, as defined under the terms of that particular swap agreement, a Fund will either (i) receive from the seller of protection an amount equal to the notional amount of the swap and deliver the referenced obligation, other deliverable obligations or underlying securities comprising the referenced index or (ii) receive a net settlement amount in the form of cash or securities equal to the notional amount of the swap less the recovery value of the referenced obligation or underlying securities comprising the referenced index. Recovery values are assumed by market makers considering either industry standard recovery rates or entity specific factors and considerations until a credit event occurs. If a credit event has occurred, the recovery value is determined by a facilitated auction whereby a minimum number of allowable broker bids, together with a specified valuation method, are used to calculate the settlement value.
The Funds are party to International Swap Dealers Association, Inc. Master Agreements (“ISDA Master Agreements”). These agreements are with select counterparties and they govern transactions, including certain over-the-counter derivative and foreign exchange contracts, entered into by the Funds and the counterparty.
There were no outstanding credit default swaps as of July 31, 2021.
4. DERIVATIVE TRANSACTIONS
A Fund is subject to various netting arrangements with select counterparties (“Master Agreements”). Master Agreements govern the terms of certain transactions, and reduce the counterparty risk associated with relevant transactions by specifying credit protection mechanisms and providing standardization that improves legal certainty. Since different types of transactions have different mechanics and are sometimes traded out of different legal entities of a particular counterparty organization, each type of transaction may be covered by a different Master Agreement, resulting in the need for multiple agreements with a single counterparty. As the Master Agreements are specific to unique operations of different asset types, they allow a Fund to close out and net its total exposure to a specific counterparty entity in the event of a default with respect to all the transactions governed under a single agreement with a specific counterparty entity.
Master Agreements can also help limit counterparty risk by specifying collateral posting arrangements at pre-arranged exposure levels. Under the Master Agreements, collateral is routinely transferred if the total net exposure to certain transactions (net of existing collateral already in place) governed under the relevant Master Agreement with a counterparty in a given account exceeds a specified threshold, which typically ranges from zero to $250,000 depending on the counterparty and the type of Master Agreement. United States Treasury Securities and U.S. dollar cash are generally the preferred forms of collateral. Securities and cash pledged as collateral are reflected as assets on the Statements of Assets and Liabilities as either a component of investments at value (securities) or deposits due from counterparties (cash). Cash collateral received is not typically held in a segregated account and as such is reflected as a liability on the Statements of Assets and Liabilities as deposits due to counterparties. The market value of any securities received as collateral is not reflected as a component of net asset value. A Fund’s overall exposure to counterparty risk can change substantially within a short period, as it is affected by each transaction subject to the relevant Master Agreement.
Customer account agreements and related addendums govern exchange traded derivatives transactions such as futures, options on futures, and centrally cleared swaps. Exchange traded derivative transactions require posting of initial margin as determined by each relevant clearing agency which is segregated at a broker account registered with the Commodities Futures Trading Commission (“CFTC”), or the applicable regulator. In the
| | |
| 78 | | Adviser Managed Trust / Annual Report / July 31, 2021 |
US, counterparty risk is significantly reduced as creditors of the futures broker do not have claim to Fund assets in the segregated account. Additionally, portability of exposure in the event of default further reduces risk
to the Funds. Variation margin, or changes in market value, are exchanged daily, but may not be netted between futures and cleared Over the Counter (“OTC”) derivatives.
The following is a summary of the variation margin of exchange-traded or centrally cleared financial derivative instruments as of July 31, 2021 ($ Thousands):
| | | | | | | | | | |
| | | Financial Derivative Assets | | | | Financial Derivative Liabilities |
| | | Variation Margin Asset | | | | Variation Margin Liability |
| | | Futures | | Total | | | | Futures | | Total |
| | | | |
Tactical Offensive Equity Fund | | $— | | $— | | | | $1,884 | | $1,884 |
| | | | | | |
Total Exchange-Traded or Centrally Cleared | | $— | | $— | | | | $1,884 | | $1,884 |
| | | | | | |
The Tactical Offensive Equity Fund had cash with an aggregate market value of $15,182 ($ Thousands) pledged as collateral for exchange-traded and centrally cleared derivative instruments as of July 31, 2021.
International Swaps and Derivatives Association, Inc. Master Agreements and Credit Support Annexes (“ISDA Master Agreements”) govern OTC financial derivative transactions entered into by a Fund and select counterparties. ISDA Master Agreements maintain provisions for general obligations, representations, agreements, collateral and events of default or
termination. Events of termination include conditions that may entitle counterparties to elect to terminate early and cause settlement of all outstanding transactions under the applicable ISDA Master Agreement. Any election to terminate early could be material to the financial statements. In limited circumstances, the ISDA Master Agreement may contain additional provisions that add additional counterparty protection beyond coverage of existing daily exposure if the counterparty has a decline in credit quality below a predefined level. These amounts, if any, may be segregated with a third party custodian.
The following is a summary by counterparty of the market value of OTC financial derivative instruments and collateral (received)/pledged as of July 31, 2021 ($ Thousands):
| | | | | | | | | | | | | | | | | | | | | | | | | | | | | | |
| | | Financial Derivative Assets | | | | | Financial Derivative Liabilities | | | | | | | | | | |
| Tactical Offensive Core Fixed Income Fund | | Forward Foreign Currency
Contracts | | | Total Over the
Counter | | | | | Forward Foreign Currency Contracts | | | Total Over the Counter | | | Net Market
Value of OTC
Derivatives | | | Collateral
(Received)/
Pledged | | | Net
Exposures(1) | |
Brown Brothers Harriman | | | $1,000 | | | | $1,000 | | | | | | $17 | | | | $17 | | | | $983 | | | | $— | | | | $983 | |
| | | | | | | | | | | | | | | | | | | | | | |
Total Over the Counter | | | $1,000 | | | | $1,000 | | | | | | 17 | | | | $17 | | | | | | | | | | | | | |
| | | | | | | | | | | | | | | | | | | | | | |
(1) Net Exposures represents the net receivable/(payable) that would be due from/to the counterparty in the event of default. Exposure to OTC financial derivative instruments can only be netted across transactions governed under the same master netting agreement with the same legal entity.
Securities with an aggregate market value of $0 have been pledged and $0 have been received as collateral for financial derivative instruments as governed by ISDA Master Agreements as of July 31, 2021.
5. INVESTMENT ADVISORY, ADMINISTRATION AND DISTRIBUTION AGREEMENTS, INVESTMENT SUB-ADVISORY AGREEMENTS AND OTHER TRANSACTIONS WITH AFFILIATES
Investment Advisory, Administration & Distribution Agreements — SIMC serves as investment adviser (the “Adviser”) to each Fund. In connection with serving as Adviser, SIMC is entitled to a fee that is calculated daily and paid monthly, based on the average daily net assets of each Fund.
The Trust and SEI Investments Global Funds Services (the “Administrator”) are parties to an Administration and Transfer Agency Agreement under which the Administrator provides administrative and transfer
agency services for annual fees, based on the average daily net assets of each Fund.
SEI Investments Distribution Co. (the “Distributor”), serves as each Fund’s Distributor pursuant to a distribution agreement with the Trust. The Funds have adopted a shareholder services plan (the “Service Plan”) with respect to the Shares that allows such Shares to pay service providers a fee in connection with the ongoing servicing of shareholder accounts owning such Shares at an annual rate of average daily net assets of the Shares. The Funds’ Service Plan provides that shareholder servicing fees on the Shares will be paid to the Distributor, which may be used by the Distributor to compensate financial intermediaries for providing shareholder services with respect to the Shares.
| | |
| Adviser Managed Trust / Annual Report / July 31, 2021 | | 79 |
NOTES TO FINANCIAL STATEMENTS (Continued)
July 31, 2021
The Funds’ administrator and/or its affiliates have contractually agreed to waive fees or reimburse expenses for each Fund until November 30, 2021, in order to keep total fund operating expenses (exclusive of interest from borrowings, brokerage commissions, taxes and other extraordinary expenses not incurred in the ordinary course of the Fund’s business) from exceeding the levels specified in the table below. These contractual waivers and reimbursements will only apply if a Fund’s total operating costs exceed the applicable thresholds and will not affect the Fund’s total operating costs if they are less than the applicable thresholds. In other words, shareholders will pay the lower of a Fund’s actual total fund operating expenses or total fund operating expenses after contractual waivers and expense reimbursements. The contractual waiver and expense reimbursement are limited to the Fund’s direct operating expenses and, therefore, do
not apply to indirect expenses incurred by the Fund, such as acquired fund fees and expenses (“AFFE”). The agreement may be amended or terminated only with the consent of the Board of Trustees.
The Funds’ adviser, the Funds’ administrator and/ or the Funds’ distributor have voluntarily agreed to waive a portion of their fees in order to keep total direct operating expenses (exclusive of interest from borrowings, brokerage commissions, trustee fees, taxes and extraordinary expenses not incurred in the ordinary course of the Funds’ business) at the levels specified in the table below. The voluntary waivers of the Funds’ adviser, Funds’ administrator and Funds’ distributor are limited to the Funds’ direct operating expenses and therefore do not apply to indirect expenses incurred by the Funds, such as AFFE, if any. The Funds’ adviser, the Funds’ administrator and/or the Funds’ distributor may discontinue all or part of these waivers at any time.
The following is a summary of annual fees payable to the Adviser and Distributor and the expense limitations for each Fund:
| | | | | | | | | | | | | | | | |
| | | Advisory
Fee | | | Shareholder
Servicing
Fee | | | Contractual
Expense
Limitation | | | Voluntary
Expense
Limitation | |
Tactical Offensive Equity Fund | | | 0.20% | | | | 0.25% | | | | 0.75% | | | | 0.50% | |
Tactical Offensive Core Fixed Income Fund | | | 0.15 | | | | 0.25 | | | | 0.70 | | | | 0.33(1) | |
Tactical Offensive Enhanced Fixed Income Fund | | | 0.30 | | | | 0.25 | | | | 0.90 | | | | 0.58 | |
| (1) | Prior to September 25, 2020, the voluntary expense limitation was 0.38%. |
The following is a summary of annual fees payable to the Administrator:
| | | | | | | | | | | | | | | | | | | | |
| | | | | | Contractual Fees | | | | | | | |
| | | First $2.5 Billion | | | Next $ 500 Million | | | Over $3 Billion | | | | | | | |
Tactical Offensive Equity Fund | | | 0.200 | % | | | 0.1650 | % | | | 0.120 | % | | | | | | | | |
| | | | | |
| | | First $1.5 Billion | | | Next $ 500 Million | | | Next $500 Million | | | Next $500 Million | | | Over $3 Billion | |
Tactical Offensive Core Fixed Income Fund | | | 0.200 | % | | | 0.1775 | % | | | 0.1550 | % | | | 0.1325 | % | | | 0.110 | % |
Tactical Offensive Enhanced Fixed Income Fund | | | 0.200 | % | | | 0.1775 | % | | | 0.1550 | % | | | 0.1325 | % | | | 0.110 | % |
As of July 31, 2021, SIMC has entered into an investment sub-advisory agreement with the following party and pays the sub-adviser out of the fee that it receives from the Funds:
Investment Sub-Adviser
Tactical Offensive Equity Fund
SSgA Funds Management, Inc.
Tactical Offensive Core Fixed Income Fund
SSgA Funds Management, Inc.
Tactical Offensive Enhanced Fixed Income Fund
SSgA Funds Management, Inc.
Other — The Distribution Agreement between the Distributor and the Trust provides that the Distributor
may receive compensation on Fund transactions effected for the Trust in accordance with Securities and Exchange Commission (“SEC”) rules. Accordingly, it is expected that Fund transactions may result in brokerage commissions being paid to the Distributor. The SEC rules require that such commissions not exceed usual and customary commissions.
There were no such commissions for the year or period ended July 31, 2021.
Payments to Affiliates — Certain officers and/or trustees of the Trust are also officers or directors of the Distributor or the Adviser. The Trust pays each
| | |
| 80 | | Adviser Managed Trust / Annual Report / July 31, 2021 |
unaffiliated Trustee an annual fee for attendance at quarterly, interim and committee meetings.
Compensation of officers and affiliated Trustees of the Trust is paid by the Adviser or Administrator.
A portion of the services provided by the Chief Compliance Officer (“CCO”) and his staff, whom are employees of the Administrator, are paid for by the Trust as incurred.
Fees Paid Indirectly — The Funds may direct certain fund trades to the Distributor who pays a portion of each Fund’s expenses. Accordingly, the expenses reduced, which were used to pay third party expenses, can be found on the Statements of Operations and the effect on each Fund’s expense ratio, as a percentage of each Fund’s average daily net assets for the year or period ended July 31, 2021, can be found on the Financial Highlights, if applicable.
Investment in Affiliated Security — The Funds may invest in the SEI Daily Income Trust Government Fund, an affiliated money market fund to manage excess cash or to serve as margin or collateral for derivative positions. The Funds may also purchase securities of certain companies with which it is affiliated to the extent
these companies are represented in an index that the adviser or sub-adviser is passively seeking to replicate in accordance with the Fund’s investment strategy.
Interfund Lending — The SEC has granted an exemption that permits the Trust to participate in an interfund lending program (“the Program”) with existing or future investment companies registered under the 1940 Act that are advised by SIMC (the “SEI Funds”). The Program allows the SEI Funds to lend money to and borrow money from each other for temporary or emergency purposes. Participation in the Program is voluntary for both borrowing and lending funds. Interfund loans may be made only when the rate of interest to be charged is more favorable to the lending fund than an investment in overnight repurchase agreements (“Repo Rate”), and more favorable to the borrowing fund than the rate of interest that would be charged by a bank for short-term borrowings (“Bank Loan Rate”). The Bank Loan Rate will be determined using a formula reviewed annually by the SEI Funds’ Board of Trustees. The interest rate imposed on interfund loans is the average of the Repo Rate and the Bank Loan Rate.
As of, and during the year or period ended July 31, 2021, the Trust had not participated in the Program.
6. CAPITAL SHARE TRANSACTIONS
Capital Share Transactions for the Funds were as follows (Thousands):
| | | | | | | | | | | | | | | | | | | | |
| | | Tactical Offensive Equity
Fund | | | Tactical Offensive Core
Fixed Income Fund | | | Tactical
Offensive
Enhanced
Fixed Income
Fund | |
| | | 2021 | | | 2020† | | | 2021 | | | 2020^ | | | 2021‡ | |
Shares Issued | | | 111,738 | | | | 45,819 | | | | 29,672 | | | | 161,611 | | | | 33,817 | |
Shares Issued in Lieu of Dividends and Distributions | | | 493 | | | | 2,053 | | | | 1,214 | | | | 2,381 | | | | 577 | |
Shares Redeemed | | | (32,099 | ) | | | (176,261 | ) | | | (53,700 | ) | | | (165,327 | ) | | | (2,814 | ) |
Increase/(Decrease) in capital share transactions | | | 80,132 | | | | (128,389 | ) | | | (22,814 | ) | | | (1,335 | ) | | | 31,580 | |
| | † | For the period March 10, 2020 through June 3, 2020, the Fund was not an active component of the Adviser Managed Strategy (see Note 1). |
| | ^ | For the period March 19, 2020 through June 16, 2020, the Fund was not an active component of the Adviser Managed Strategy (see Note 1). |
| | ‡ | Commenced operations on January 12, 2021. |
| | |
| Adviser Managed Trust / Annual Report / July 31, 2021 | | 81 |
NOTES TO FINANCIAL STATEMENTS (Continued)
July 31, 2021
7. INVESTMENT TRANSACTIONS
The cost of security purchases and the proceeds from the sale and maturities of securities other than temporary cash investments during the year or period ended July 31, 2021, were as follows:
| | | | | | | | | | | | |
| | | U.S. Gov’t ($ Thousands) | | Other ($ Thousands) | | Total ($ Thousands) |
Tactical Offensive Equity Fund | | | | | |
Purchases | | $ | — | | | $ | 1,631,478 | | | $ | 1,631,478 | |
Sales | | | — | | | | 391,250 | | | | 391,250 | |
Tactical Offensive Core Fixed Income Fund | | | | | |
Purchases | | | 870,897 | | | | 125,486 | | | | 996,383 | |
Sales | | | 973,653 | | | | 229,244 | | | | 1,202,897 | |
Tactical Offensive Enhanced Fixed Income Fund† | |
Purchases | | | 8,188 | | | | 389,378 | | | | 397,566 | |
Sales | | | 8,214 | | | | 79,921 | | | | 88,135 | |
| † | Commenced operations on January 11, 2021. |
8. FEDERAL TAX INFORMATION
It is each Fund’s intention to continue to qualify as a regulated investment company, under Sub chapter M of the Internal Revenue Code, and to distribute all of its taxable income and net capital gains. Accordingly, no provision for Federal income taxes is required.
Dividends from net investment income and distributions from net realized capital gains are determined in accordance with U.S. Federal income tax regulations, which may differ from those amounts determined under U.S. GAAP. These book/tax differences are either temporary or permanent in nature. To the extent these differences are permanent, they are charged or credited to paid-in capital and distributable earnings (loss), as appropriate, in the period that the differences arise.
The permanent differences primarily consist of foreign currency translation, reclassification of long term capital gain distribution on REITs, investments in publicly traded partnerships, write off of capital losses, investments in PFICs, paydown gain/loss on mortgage and asset-backed securities, and distribution reclassification. The permanent differences that are credited or charged to paid-in capital and distributable earnings (accumulated loss) as of July 31, 2021 are primarily related to a write off of capital losses.
| | | | | | | | |
| | | Distributable Earnings
(Accumulated Loss)
($ Thousands) | | Paid-in-
Capital ($ Thousands) |
Tactical Offensive Equity Fund | | | $ 37 | | | $ | (37 | ) |
These reclassifications have no impact on net assets or net asset value per share.
The tax character of dividends and distributions paid during the last two fiscal years were as follows:
| | | | | | | | | | | | | | | | | | | | |
| | | | | | Ordinary
Income ($ Thousands) | | | Long-Term
Capital Gain
($ Thousands) | | | Distributions
($ Thousands) | | | Total ($ Thousands) | |
Tactical Offensive Equity Fund | | | | | | | | | | | | | | | | | | | | |
| | | 2021 | | | $ | 10,009 | | | $ | — | | | $ | — | | | $ | 10,009 | |
| | | 2020 | | | | 36,673 | | | | 822 | | | | — | | | | 37,495 | |
Tactical Offensive Core Fixed Income Fund | | | | | | | | | | | | | | | | | | | | |
| | | 2021 | | | | 11,845 | | | | — | | | | — | | | | 11,845 | |
| | | 2020 | | | | 34,147 | | | | — | | | | — | | | | 34,147 | |
Tactical Offensive Enhanced Fixed Income Fund | | | | | | | | | | | | | | | | | | | | |
| | | 2021 | | | | 5,755 | | | | — | | | | — | | | | 5,755 | |
| | |
| 82 | | Adviser Managed Trust / Annual Report / July 31, 2021 |
As of July 31, 2021, the components of Distributable Earnings (Accumulated Losses) on a tax basis were as follows:
| | | | | | | | | | | | | | | | | | | | | | | | | | | | |
| | | | | | | | |
| | | Undistributed
Ordinary
Income ($ Thousands) | | | Undistributed
Long-Term
Capital Gain
($ Thousands) | | | Capital Loss
Carryforwards
($ Thousands) | | | Post- October
Losses ($ Thousands) | | | Unrealized
Appreciation
(Depreciation)
($ Thousands) | | | Other
Temporary
Differences ($ Thousands) | | | Total Distributable
Earnings (Accumulated Losses) ($ Thousands) | |
Tactical Offensive Equity Fund | | $ | 40,063 | | | $ | 56,497 | | | $ | — | | | $ | — | | | $ | 614,437 | | | $ | — | | | $ | 710,997 | |
Tactical Offensive Core Fixed Income Fund | | | 3,309 | | | | — | | | | (11,192 | ) | | | (9,167 | ) | | | (3,812 | ) | | | (1,990 | ) | | | (22,852 | ) |
Tactical Offensive Enhanced Fixed Income Fund | | | 1,331 | | | | — | | | | — | | | | — | | | | (228 | ) | | | (25 | ) | | | 1,078 | |
Post-October losses represent losses realized on investment transactions from November 1, 2020 through July 31, 2021 that, in accordance with Federal income tax regulations, the Funds may elect to defer and treat as having arisen in the following fiscal year. Other temporary differences are primarily consist mark to market of forward foreign currency contracts and PFICs, straddle loss deferrals, and defaulted bond and perpetual bond adjustments.
For Federal income tax purposes, capital loss carryforwards may be carried forward and applied against future capital gains as follows:
| | | | | | | | | | | | |
| | | Short-Term
Loss ($ Thousands) | | | Long-Term
Loss ($ Thousands) | | | Total ($ Thousands) | |
Tactical Offensive Core Fixed Income Fund | | $ | 2,163 | | | $ | 9,029 | | | $ | 11,192 | |
For Federal income tax purposes, the cost of securities owned at July 31, 2021, and the net realized gains or losses on securities sold for the period were not materially different from amounts reported for financial reporting purposes. These differences are primarily due to investments in passive foreign investment companies, partnership basis adjustments, mark-to-market of futures and forwards contracts, corporate actions, and wash sales which cannot be used for Federal income tax purposes in the current year and have been deferred for use in future years.
The aggregate gross unrealized appreciation and depreciation on total investments (including foreign currency and derivatives, if applicable) held by the Funds at July 31, 2021, were as follows:
| | | | | | | | | | | | | | | | |
| | | Federal Tax Cost
($ Thousands) | | | Appreciated
Securities
($ Thousands) | | | Depreciated
Securities
($ Thousands) | | | Net Unrealized
Appreciation
(Depreciation)
($ Thousands) | |
Tactical Offensive Equity Fund | | $ | 1,886,569 | | | $ | 631,108 | | | $ | (16,671 | ) | | $ | 614,437 | |
Tactical Offensive Core Fixed Income Fund | | | 1,226,754 | | | | 9,769 | | | | (13,581 | ) | | | (3,812 | ) |
| | | | | | | | | | | | | | | | |
| | | Federal Tax Cost
($ Thousands) | | | Appreciated
Securities
($ Thousands) | | | Depreciated
Securities
($ Thousands) | | | Net Unrealized
Appreciation
(Depreciation)
($ Thousands) | |
Tactical Offensive Enhanced Fixed Income Fund | | $ | 312,843 | | | $ | 3,959 | | | $ | (4,187 | ) | | $ | (228 | ) |
Management has analyzed the Funds’ tax positions taken on Federal income tax returns for all open tax years and has concluded that as of July 31, 2021, no provision for income tax would be required in the Funds’ financial statements. The Funds’ Federal and state income and Federal excise tax returns for tax years for which the applicable statutes of limitations have not expired are subject to examination by the Internal Revenue Service and state departments of revenue.
9. CONCENTRATION/RISKS
In the normal course of business, the Trust enters into contracts that provide general indemnifications by the Trust to the counterparty to the contract. The Trust’s maximum exposure under these arrangements is dependent on future claims that may be made against the Trust and, therefore, cannot be estimated; however, management believes that, based on experience, the risk of loss from such claims is considered remote. The following is not intended to be a complete discussion of the risks associated with investing in a Fund. Please review each Fund’s prospectus for additional disclosures regarding the principal risks associated with investing in a Fund.
Adviser Managed Strategy Risk — The Funds are a component of a broader investment strategy employed by the Financial Adviser known as the Adviser Managed Strategy. Pursuant to the Adviser Managed Strategy, the Financial Adviser tactically shifts its clients’ assets among the Funds and a money market fund affiliated with the Funds. These asset shifts among the Funds in the Adviser Managed Strategy (i.e., an exchange of shares of one fund for shares of another fund) will be a taxable event to an investor unless the investor is investing in a Fund through a tax-deferred arrangement. As part of the Adviser Managed Strategy, substantial portions or
| | |
| Adviser Managed Trust / Annual Report / July 31, 2021 | | 83 |
NOTES TO FINANCIAL STATEMENTS (Continued)
July 31, 2021
substantially all of the Funds’ shares may be periodically sold and repurchased at the direction of the Financial Adviser. These large redemptions and repurchases will have significant effects on the management of the Funds and are expected to result in increased portfolio turnover (and related transaction costs), disruption of portfolio management strategies and the realization of significant taxable gains. Accordingly, if notified of an upcoming redemption request, the Funds may begin to liquidate substantial portions or substantially all of its assets prior to the submission of the redemption request in an effort to raise the necessary cash, and the Funds will not be invested pursuant to its investment strategy during such time. When the Funds are required to rapidly liquidate a substantial portion of their portfolio to satisfy a large redemption order placed as part of the Adviser Managed Strategy, the Funds may be forced to sell securities at below current market values or the Funds’ selling activity may drive down the market value of securities being sold. The Funds may also be required to sell portfolio holdings at a time when the portfolio managers would otherwise not recommend doing so. For example, if a Fund were to experience a large redemption at a time of high market volatility or during a substantial market decline, the Fund would be forced to liquidate securities even though the portfolio managers may not otherwise choose to do so. When the Funds receive a large purchase order as a result of the Adviser Managed Strategy, the Funds may be required to rapidly purchase portfolio securities. This may cause the Funds to incur higher than normal transaction costs or may require the Funds to purchase portfolio securities at above current market values. Further, the Funds’ purchasing activity may drive up the market value of securities being purchased or the Funds may be required to purchase portfolio securities at a time when the portfolio managers would not otherwise recommend doing so. When the Funds are not an active component of the Adviser Managed Strategy, the Fund’s investments may not be consistent with the Fund’s investment goal, and the Funds may miss investment opportunities because the assets necessary to take advantage of such opportunities are tied up in other investments or have been allocated to another fund within the Adviser Managed Strategy.
Asset Allocation Risk — The risk that SIMC’s decisions regarding allocation of the Funds’ assets among Indexes and for direct management will not anticipate market trends successfully.
Asset-Backed Securities Risk — Payment of principal and interest on asset-backed securities is dependent largely on the cash flows generated by the assets backing the securities. Securitization trusts generally do not have any assets or sources of funds other than
the receivables and related property they own, and asset-backed securities are generally not insured or guaranteed by the related sponsor or any other entity. Asset-backed securities may be more illiquid than more conventional types of fixed income securities that the Fund may acquire.
Below Investment Grade Securities (Junk Bonds) Risk — The Tactical Offensive Core Fixed Income Fund and the Tactical Offensive Enhanced Fixed Income Fund may invest in fixed income securities rated below investment grade (also known as high yield securities or junk bonds) that involve greater risks of default or downgrade and are generally more volatile than investment grade securities because the prospect for repayment of principal and interest of many of these securities is speculative.
Corporate Fixed Income Securities Risk — The Tactical Offensive Core Fixed Income Fund and the Tactical Offensive Enhanced Fixed Income Fund may invest in corporate fixed income securities which respond to economic developments, especially changes in interest rates, as well as to perceptions of the creditworthiness and business prospects of individual issuers.
Credit Risk — The risk that the issuer of a security or the counterparty to a contract will default or otherwise become unable to honor a financial obligation.
Currency Risk — As a result of the Funds’ investments in securities denominated in and/or receiving revenues in foreign currencies, the Funds will be subject to currency risk. This is the risk that those currencies will decline in value relative to the U.S. dollar or, in the case of hedging positions, that the U.S. dollar will decline in value relative to the currency hedged. In either event, the dollar value of an investment in the Funds would be adversely affected.
Derivatives Risk — The Funds’ use of futures contracts, forward contracts and swaps is subject to market risk, leverage risk, correlation risk and liquidity risk. Leverage risk and liquidity risk are described below. Many over-the-counter (OTC) derivative instruments will not have liquidity beyond the counterparty to the instrument. Market risk is the risk that the market value of an investment may move up and down, sometimes rapidly and unpredictably. Correlation risk is the risk that changes in the value of the derivative may not correlate perfectly with the underlying asset, rate or index. The Funds’ use of forward contracts and swap agreements is also subject to credit risk and valuation risk. Valuation risk is the risk that the derivative may be difficult to value and/or valued incorrectly. Credit risk is described above. Each of these risks could cause the Funds to lose more than the principal amount invested in a derivative instrument. Some derivatives have the potential for
| | |
| 84 | | Adviser Managed Trust / Annual Report / July 31, 2021 |
unlimited loss, regardless of the size of the Funds’ initial investment. The other parties to certain derivative contracts present the same types of credit risk as issuers of fixed income securities. The Funds’ use of derivatives may also increase the amount of taxes payable by shareholders. Both U.S. and non-U.S. regulators are in the process of adopting and implementing regulations governing derivatives markets, the ultimate impact of which remains unclear.
Economic Risks of Global Health Events — Global health events and pandemics, such as COVID-19, have the ability to affect—quickly, drastically and substantially the economies of many nations, states, individual companies and the markets in general and can cause disruptions that cannot necessarily be foreseen. The spread of COVID-19 around the world in 2020 resulted in a substantial number of nations implementing social distancing measures, quarantines, and the shutdown of non-essential businesses and governmental services. Further, it has caused significant volatility in U.S. and international markets. The impact of the outbreak may be short term or may last for an extended period of time.
Exchange Traded Funds (ETFs) Risk — The risks of owning shares of an ETF generally reflect the risks of owning the underlying securities the ETF is designed to track, although lack of liquidity in an ETF could result in its value being more volatile than the underlying portfolio securities.
Foreign Investment/Emerging Markets Risk — The risk that non-U.S. securities may be subject to additional risks due to, among other things, political, social and economic developments abroad, currency movements and different legal, regulatory, tax, accounting and audit environments. These additional risks may be heightened with respect to emerging market countries because political turmoil and rapid changes in economic conditions are more likely to occur in these countries.
Foreign Sovereign Debt Securities Risk — The Tactical Offensive Core Fixed Income Fund and the Tactical Offensive Enhanced Fixed Income Fund may be subject to the risk that: (i) the governmental entity that controls the repayment of sovereign debt may not be willing or able to repay the principal and/ or interest when it becomes due because of factors such as debt service burden, political constraints, cash flow problems and other national economic factors; (ii) governments may default on their debt securities, which may require holders of such securities to participate in debt rescheduling or additional lending to defaulting governments; and (iii) there is no bankruptcy proceeding
by which defaulted sovereign debt may be collected in whole or in part.
Interest Rate Risk — The Tactical Offensive Core Fixed Income Fund and the Tactical Offensive Enhanced Fixed Income Fund may be subject to the risk that a rise in interest rates will cause a fall in the value of fixed income securities, including U.S. Government securities, in which the Fund invests. Although U.S. Government securities are considered to be among the safest investments, they are not guaranteed against price movements due to changing interest rates. A low interest rate environment may present greater interest rate risk, because there may be a greater likelihood of rates increasing and rates may increase more rapidly.
Investment Style Risk — The risk that the Tactical Offensive Equity Fund’s investment approach may underperform other segments of the equity markets or the equity markets as a whole and the risk that the Tactical Offensive Core Fixed Income Fund or the Tactical Offensive Enhanced Fixed Income Fund’s investment approach may underperform other segments of the fixed income markets or the fixed income markets as a whole.
Leverage Risk — The use of leverage can amplify the effects of market volatility on the Funds’ share price and may also cause the Funds to liquidate portfolio positions when it would not be advantageous to do so in order to satisfy its obligations.
Liquidity Risk — The risk that certain securities may be difficult or impossible to sell at the time and the price that the Funds would like. The Funds may have to lower the price, sell other securities instead or forego an investment opportunity, any of which could have a negative effect on Funds’ management or performance.
Market Risk — The risk that the market value of a security may move up and down, sometimes rapidly and unpredictably. Market risk may affect a single issuer, an industry, a sector or the equity or bond market as a whole. Equity markets may decline significantly in response to adverse issuer, political, regulatory, market, economic or other developments that may cause broad changes in market value, public perceptions concerning these developments, and adverse investor sentiment or publicity. Similarly, environmental and public health risks, such as natural disasters, epidemics, pandemics or widespread fear that such events may occur, may impact markets adversely and cause market volatility in both the short- and long-term. The prices of fixed income securities respond to economic developments, particularly interest rate changes, as well as to perceptions about the creditworthiness of individual issuers, including governments and their agencies. Generally, fixed income securities will decrease in value
| | |
| Adviser Managed Trust / Annual Report / July 31, 2021 | | 85 |
NOTES TO FINANCIAL STATEMENTS (Concluded)
July 31, 2021
if interest rates rise and vice versa. In a low interest rate environment, risks associates with rising rates are heightened. In the case of foreign securities, price fluctuations will reflect international economic and political events as well as changes in currency valuations relative to the U.S. dollar.
Mortgage-Backed Securities Risk — Mortgage-backed securities are affected significantly by the rate of prepayments and modifications of the mortgage loans backing those securities, as well as by other factors such as borrower defaults, delinquencies, realized or liquidation losses and other shortfalls. Mortgage-backed securities are particularly sensitive to prepayment risk, which is described below, given that the term to maturity for mortgage loans is generally substantially longer than the expected lives of those securities; however, the timing and amount of prepayments cannot be accurately predicted. The timing of changes in the rate of prepayments of the mortgage loans may significantly affect the Tactical Offensive Core Fixed Income Fund’s actual yield to maturity on any mortgage-backed securities, even if the average rate of principal payments is consistent with the Fund’s expectation. Along with prepayment risk, mortgage-backed securities are significantly affected by interest rate risk, which is described above. In a low interest rate environment, mortgage loan prepayments would generally be expected to increase due to factors such as re-financings and loan modifications at lower interest rates. In contrast, if prevailing interest rates rise, prepayments of mortgage loans would generally be expected to decline and therefore extend the weighted average lives of mortgage-backed securities held or acquired by the Fund.
Mortgage Dollar Rolls Risk — Mortgage dollar rolls are transactions in which the Tactical Offensive Core Fixed Income Fund sells securities (usually mortgage-backed securities) and simultaneously contracts to repurchase substantially similar, but not identical, securities on a specified future date. If the broker-dealer to whom a Fund sells the security becomes insolvent, the Fund’s right to repurchase the security may be restricted. Other risks involved in entering into mortgage dollar rolls include the risk that the value of the security may change adversely over the term of the mortgage dollar roll and that the security the Fund is required to repurchase may be worth less than the security that the Fund originally held.
Portfolio Turnover Risk — Due to their investment strategy, the Funds may buy and sell securities
frequently. This may result in higher transaction costs and additional capital gains tax liabilities.
Prepayment Risk — The risk that, in a declining interest rate environment, fixed income securities with stated interest rates may have the principal paid earlier than expected, requiring the Tactical Offensive Core Fixed Income Fund or the Tactical Offensive Enhanced Fixed Income Fund to invest the proceeds at generally lower interest rates.
Real Estate Investment Trust (REITs) Risk — REITs are trusts that invest primarily in commercial real estate or real estate-related loans. The Tactical Offensive Equity Fund’s investments in REITs will be subject to the risks associated with the direct ownership of real estate. Risks commonly associated with the direct ownership of real estate include fluctuations in the value of underlying properties, defaults by borrowers or tenants, changes in interest rates and risks related to general or local economic conditions. Some REITs may have limited diversification and may be subject to risks inherent in financing a limited number of properties.
Small and Medium Capitalization Risk — The risk that small and medium capitalization companies in which the Tactical Offensive Equity Fund may invest may be more vulnerable to adverse business or economic events than larger, more established companies. In particular, small and medium capitalization companies may have limited product lines, markets and financial resources and may depend upon a relatively small management group. Therefore, small capitalization and medium capitalization stocks may be more volatile than those of larger companies. Small capitalization and medium capitalization stocks may be traded over-the-counter or listed on an exchange.
Tracking Error Risk — The risk that the Funds’ performance may vary substantially from the performance of the indexes they track as a result of cash flows, fund expenses, imperfect correlation between the Funds’ investments and the indexes’ components and other factors.
U.S. Government Securities Risk — The Tactical Offensive Core Fixed Income Fund and the Tactical Offensive Enhanced Fixed Income Fund may invest in U.S. Government securities, which are considered to be among the safest investments, they are not guaranteed against price movements due to changing interest rates. Obligations issued by some U.S. Government agencies are backed by the U.S. Treasury, while others are backed solely by the ability of the agency to borrow from the U.S. Treasury or by the agency’s own resources.
| | |
| 86 | | Adviser Managed Trust / Annual Report / July 31, 2021 |
10. CONCENTRATION OF SHAREHOLDERS
SEI Private Trust Company (“SPTC”) and SIMC are subsidiaries of SEI Investments Company (“SEI”). As of July 31, 2021, SPTC held of record the following percentage of outstanding shares of each Fund:
| | | | |
Tactical Offensive Equity Fund | | | 99.99 | % |
Tactical Offensive Core Fixed Income Fund | | | 99.99 | % |
Tactical Offensive Enhanced Fixed Income Fund | | | 99.97 | % |
SPTC is not a direct service provider to the Funds. However, SPTC performs a key role in the comprehensive investment solution that SEI provides to investors. SPTC holds the vast majority of shares in the Funds as custodian for shareholders that are clients of the Financial Adviser. SPTC maintains omnibus accounts at the Funds’ transfer agent.
11. REGULATORY MATTERS
LIBOR Replacement — The elimination of the London Inter-Bank Offered Rate (LIBOR) may adversely affect the interest rates on, and value of, certain Fund investments for which the value is tied to LIBOR. Such investments may include bank loans, derivatives, floating rate securities, and other assets or liabilities tied to LIBOR. On July 27, 2017, the U.K. Financial Conduct Authority announced that it intends to stop compelling or inducing banks to submit LIBOR rates after 2021. However, it remains unclear if LIBOR will continue to exist in its current, or a modified, form. Actions by regulators have resulted in the establishment of alternative reference rates to LIBOR in most major currencies. The U.S. Federal Reserve, based on the recommendations of the New York Federal Reserve’s Alternative Reference Rate Committee (comprised of major derivative market participants and their regulators), has begun publishing a Secured Overnight Financing Rate, which is intended to replace U.S. dollar LIBOR. Alternative reference rates for other currencies have also been announced or have already begun publication. Markets are slowly developing in response to these new rates. Questions around liquidity impacted by these rates, and how to appropriately adjust these rates at the time of transition, remain a concern for the Funds. The effect of any changes to, or discontinuation of, LIBOR on the Funds will vary depending on, among other things, (1) existing fallback or termination provisions in individual contracts and (2) whether, how, and when industry participants develop and adopt new reference rates and fallbacks for both legacy and new products and instruments. Accordingly, it is difficult to predict the full impact of the transition away from LIBOR on the Funds until new reference rates and fallbacks for both legacy and new
products, instruments and contracts are commercially accepted.
12. SUBSEQUENT EVENTS
Management has evaluated the need for disclosures and/or adjustments resulting from subsequent events through the date the financial statements were issued. Based on this evaluation, no disclosures and/or adjustments were required to the financial statements as of July 31, 2021.
| | |
| Adviser Managed Trust / Annual Report / July 31, 2021 | | 87 |
REPORT OF INDEPENDENT REGISTERED PUBLIC ACCOUNTING FIRM
To the Shareholders of the Funds and Board of Trustees
Adviser Managed Trust:
Opinion on the Financial Statements
We have audited the accompanying statement of assets and liabilities, including the summary schedule of investments, of the Tactical Offensive Equity Fund and the statements of assets and liabilities, including the schedules of investments, of the Tactical Offensive Core Fixed Income Fund and the Tactical Offensive Enhanced Fixed Income Fund (collectively, the Funds) comprising the Adviser Managed Trust, as of July 31, 2021, the related statements of operations for the year then ended, except for the Tactical Offensive Enhanced Fixed Income Fund for which the date is the period from January 12, 2021 (commencement of operations) through July 31, 2021, the statements of changes in net assets for each of the years in the two-year period then ended, except for the Tactical Offensive Enhanced Fixed Income Fund for which the date is the period from January 12, 2021 (commencement of operations) through July 31, 2021, and the related notes (collectively, the financial statements) and the financial highlights for each of the years or periods in the five-year period then ended. In our opinion, the financial statements and financial highlights present fairly, in all material respects, the financial position of the Funds as of July 31, 2021, the results of their operations for the year or period then ended, the changes in their net assets for each of the years or periods in the two-year period then ended, and the financial highlights for each of the years or periods in the five-year period then ended, in conformity with U.S. generally accepted accounting principles.
Basis for Opinion
These financial statements and financial highlights are the responsibility of the Funds’ management. Our responsibility is to express an opinion on these financial statements and financial highlights based on our audits. We are a public accounting firm registered with the Public Company Accounting Oversight Board (United States) (PCAOB) and are required to be independent with respect to the Funds in accordance with the U.S. federal securities laws and the applicable rules and regulations of the Securities and Exchange Commission and the PCAOB.
We conducted our audits in accordance with the standards of the PCAOB. Those standards require that we plan and perform the audit to obtain reasonable assurance about whether the financial statements and financial highlights are free of material misstatement, whether due to error or fraud. Our audits included performing procedures to assess the risks of material misstatement of the financial statements and financial highlights, whether due to error or fraud, and performing procedures that respond to those risks. Such procedures included examining, on a test basis, evidence regarding the amounts and disclosures in the financial statements and financial highlights. Such procedures also included confirmation of securities owned as of July 31, 2021, by correspondence with the custodian, the transfer agent and brokers or by other appropriate auditing procedures when replies from brokers were not received. Our audits also included evaluating the accounting principles used and significant estimates made by management, as well as evaluating the overall presentation of the financial statements and financial highlights. We believe that our audits provide a reasonable basis for our opinion.

We have served as the auditor of one or more SEI Funds investment companies since 2005.
Philadelphia, Pennsylvania
September 29, 2021
| | |
| 88 | | Adviser Managed Trust / Annual Report / July 31, 2021 |
TRUSTEES AND OFFICERS OF THE TRUST (Unaudited)
The following chart lists Trustees and Officers as of July 31, 2021.
Set forth below are the names, addresses, ages, position with the Trust, Term of Office and Length of Time Served, the principal occupations for the last five years, number of positions in fund complex overseen by trustee, and other directorships outside the fund complex of each of the persons currently serving as Trustees and Officers of the Trust. The Trust’s Statement of Additional Information (“SAI”) includes additional information about the Trustees and Officers. The SAI may be obtained without charge by calling 1-800-342-5794.
| | | | | | | | | | | | |
Name, Address, and Age | | Position(s) Held with Trusts | | Term of Office and Length of Time Served1 | | Principal Occupation(s) During Past Five Years | | Number of Portfolios in Fund Complex Overseen by Trustee2 | | | Other Directorships Held by Trustee |
INTERESTED TRUSTEES | | | | | | | | | | |
| | | | | |
Robert A. Nesher One Freedom Valley Drive Oaks, PA 19456 74 yrs. old | | Chairman
of the
Board of
Trustees* | | since 2010 | | Currently performs various services on behalf of SEI for which Mr. Nesher is compensated. | | | 93 | | | President and Director of SEI Structured Credit Fund, LP. Director of SEI Global Master Fund plc, SEI Global Assets Fund plc, SEI Global Investments Fund plc, SEI Investments—Global Funds Services, Limited, SEI Investments Global, Limited, SEI Investments (Europe) Ltd., SEI Multi-Strategy Funds PLC, SEI Global Nominee Ltd and SEI Investments—Unit Trust Management (UK) Limited. President, Director and Chief Executive Officer of SEI Alpha Strategy Portfolios, LP from 2007 to 2013. Trustee of SEI Liquid Asset Trust from 1989 to 2016. Trustee of SEI Insurance Products Trust from 2013 to 2020. Vice Chairman of O’Connor EQUUS (closed-end investment company) from 2014 to 2016. Vice Chairman of Winton Series Trust from 2014 to 2017. Vice Chairman of The Advisors’ Inner Circle Fund III and Winton Diversified Opportunities Fund (closed-end investment company) from 2014 to 2018. Vice Chairman of Gallery Trust, Schroder Series Trust and Schroder Global Series Trust from 2015 to 2018. Trustee of The Advisors’ Inner Circle Fund, The Advisors’ Inner Circle Fund II, Bishop Street Funds, and the KP Funds. President, Chief Executive Officer and Trustee of SEI Asset Allocation Trust, SEI Daily Income Trust, SEI Institutional Managed Trust, SEI Institutional International Trust, SEI Institutional Investments Trust, SEI Tax Exempt Trust, Adviser Managed Trust, The New Covenant Funds and SEI Catholic Values Trust. |
| | | | | |
William M. Doran One Freedom Valley Drive Oaks, PA 19456 81 yrs. old | | Trustee* | | since 2010 | | Self-employed consultant since 2003.Partner, Morgan, Lewis & Bockius LLP (law firm) from 1976 to 2003. Counsel to the Trust, SEI, SIMC, the Administrator and the Distributor. | | | 93 | | | Director of SEI since 1974; Secretary of SEI since 1978. Director of SEI Investments Distribution Co. since 2003. Director of SEI Investments—Global Funds Services, Limited, SEI Investments Global, Limited, SEI Investments (Europe), Limited, SEI Investments (Asia) Limited, SEI Global Nominee Ltd. and SEI Investments—Unit Trust Management (UK) Limited. Trustee of SEI Liquid Asset Trust from 1982 to 2016. Trustee of O’Connor EQUUS from 2014 to 2016. Director of SEI Alpha Strategy Portfolios, LP from 2007 to 2013. Trustee of Winton Series Trust from 2014 to 2017. Trustee of The Advisors’ Inner Circle Fund, The Advisors’ Inner Circle Fund II and Bishop Street Funds from 1991 to 2018. Trustee of The KP Funds from 2013 to 2018. Trustee of Winton Diversified Opportunities Fund from 2014 to 2018. Trustee of SEI Insurance Products Trust from 2013 to 2020. Trustee of The Advisors’ Inner Circle Fund III, Gallery Trust, SEI Asset Allocation Trust, SEI Daily Income Trust, SEI Institutional Managed Trust, SEI Institutional International Trust, SEI Institutional Investments Trust, SEI Tax Exempt Trust, Adviser Managed Trust, New Covenant Funds, Schroder Series Trust, Schroder Global Series Trust and SEI Catholic Values Trust. |
TRUSTEES | | | | | | | | | | |
| | | | | |
George J. Sullivan Jr. One Freedom Valley Drive, Oaks, PA 19456 78 yrs. old | | Trustee | | since 2010 | | Retired since January 2012. Self-Employed Consultant, Newfound Consultants Inc. April 1997-December 2011. | | | 93 | | | Member of the independent review committee for SEI’s Canadian-registered mutual funds from 2011 to 2017. Director of SEI Alpha Strategy Portfolios, LP from 2007 to 2013. Trustee of SEI Liquid Asset Trust from 1996 to 2016. Trustee/Director of State Street Navigator Securities Lending Trust from 1996 to 2017. Trustee of SEI Insurance Products Trust from 2013 to 2020. Trustee/Director of The Advisors’ Inner Circle Fund, The Advisors’ Inner Circle Fund II, Bishop Street Funds, SEI Structured Credit Fund, LP, SEI Asset Allocation Trust, SEI Daily Income Trust, SEI Institutional Managed Trust, SEI Institutional International Trust, SEI Institutional Investments Trust, SEI Tax Exempt Trust, Adviser Managed Trust, New Covenant Funds, The KP Funds and SEI Catholic Values Trust. |
| * | Messrs. Nesher and Doran are Trustees who may be deemed as “interested” persons of the Trust as that term is defined in the 1940 Act by virtue of their affiliation with SIMC and the Trust’s Distributor. |
| 1 | Each trustee shall hold office during the lifetime of this Trust until the election and qualification of his or her successor, or until he or she sooner dies, resigns or is removed in accordance with the Trust’s Declaration of Trust. |
| 2 | The Fund Complex includes the following Trusts: SEI Asset Allocation Trust, SEI Daily Income Trust, SEI Institutional Investments Trust, Adviser Managed Trust, SEI Institutional International Trust, SEI Institutional Managed Trust, SEI Tax Exempt Trust, SEI Catholic Values Trust and New Covenant Funds. |
| | |
| Adviser Managed Trust / Annual Report / July 31, 2021 | | 89 |
TRUSTEES AND OFFICERS OF THE TRUST (Unaudited) (Concluded)
| | | | | | | | | | | | |
Name Address, and Age | | Position(s) Held with Trusts | | Term of Office and Length of Time Served1 | | Principal Occupation(s) During Past Five Years | | Number of Portfolios in Fund Complex Overseen by Trustee2 | | | Other Directorships Held by Trustee |
TRUSTEES (continued) | | | | | | | | |
| | | | | |
Nina Lesavoy One Freedom Valley Drive, Oaks, PA 19456 64 yrs. old | | Trustee | | since 2010 | | Founder and Managing Director, Avec Capital (strategic fundraising firm) since 2008. Managing Director, Cue Capital (strategic fundraising firm) from March 2002-March 2008. | | | 93 | | | Director of SEI Alpha Strategy Portfolios, LP from 2007 to 2013. Trustee of SEI Liquid Asset Trust from 2003 to 2016. Trustee of SEI Insurance Products Trust from 2013 to 2020. Trustee/Director of SEI Structured Credit Fund, L.P., SEI Asset Allocation Trust, SEI Daily Income Trust, SEI Institutional Managed Trust, SEI Institutional International Trust, SEI Institutional Investments Trust, SEI Tax Exempt Trust, New Covenant Funds, Adviser Managed Trust and SEI Catholic Values Trust. |
| | | | | |
James M. Williams One Freedom Valley Drive, Oaks, PA 19456 73 yrs. old | | Trustee | | since 2010 | | Vice President and Chief Investment Officer, J. Paul Getty Trust, Non-Profit Foundation for Visual Arts, since December 2002. President, Harbor Capital Advisors and Harbor Mutual Funds, 2000-2002. Manager, Pension Asset Management, Ford Motor Company, 1997-1999. | | | 93 | | | Director of SEI Alpha Strategy Portfolios, LP from 2007 to 2013, Trustee of SEI Liquid Asset Trust from 2004 to 2016. Trustee of SEI Insurance Products Trust from 2013 to 2020. Trustee/Director of Ariel Mutual Funds, SEI Structured Credit Fund, LP, SEI Asset Allocation Trust, SEI Daily Income Trust, SEI Institutional Managed Trust, SEI Institutional International Trust, SEI Institutional Investments Trust, SEI Tax Exempt Trust, New Covenant Funds, Adviser Managed Trust and SEI Catholic Values Trust. |
| | | | | |
Mitchell A. Johnson One Freedom Valley Drive, Oaks, PA 19456 79 yrs. old | | Trustee | | since 2010 | | Retired Private Investor since 1994. | | | 93 | | | Director, Federal Agricultural Mortgage Corporation (Farmer Mac) since 1997. Director of SEI Alpha Strategy Portfolios, LP from 2007 to 2013. Trustee of SEI Liquid Asset Trust from 2007 to 2016. Trustee of SEI Insurance Products Trust from 2013 to 2020. Trustee of the Advisors’ Inner Circle Fund, The Advisors’ Inner Circle Fund II, Bishop Street Funds, SEI Asset Allocation Trust, SEI Daily Income Trust, SEI Institutional Managed Trust, SEI Institutional International Trust, SEI Institutional Investments Trust, SEI Tax Exempt Trust, Adviser Managed Trust, The KP Funds, New Covenant Funds and SEI Catholic Values Trust. |
| | | | | |
Hubert L. Harris, Jr. One Freedom Valley Drive, Oaks, PA 19456 78 yrs. old | | Trustee | | since 2010 | | Retired since December 2005. Owner of Harris Plantation, Inc. since 1995. Chief Executive Officer of Harris CAPM, a consulting asset and property management entity. Chief Executive Officer, INVESCO North America, August 2003-December 2005. Chief Executive Officer and Chair of the Board of Directors, AMVESCAP Retirement, Inc., January 1998- August 2003. | | | 93 | | | Director of AMVESCAP PLC from 1993-2004. Served as a director of a bank holding company, 2003-2009. Director, Aaron’s Inc., 2012-present. President and CEO of Oasis Ornamentals LLC since 2011. Member of the Board of Councilors of the Carter Center (nonprofit corporation) and served on the board of other non-profit organizations. Director of SEI Alpha Strategy Portfolios, LP from 2008 to 2013. Trustee of SEI Liquid Asset Trust from 2008 to 2016. Trustee of SEI Insurance Products Trust from 2013 to 2020. Trustee of SEI Asset Allocation Trust, SEI Daily Income Trust, SEI Institutional Managed Trust, SEI Institutional International Trust, SEI Institutional Investments Trust, SEI Tax Exempt Trust, New Covenant Funds, Adviser Managed Trust and SEI Catholic Values Trust. |
| | | | | |
Susan C. Cote One Freedom Valley Drive Oaks, PA 19456 66 years old | | Trustee | | since 2015 | | Retired since July 2015. Treasurer and Chair of Finance, Investment and Audit Committee of the New York Women’s Foundation from 2009 to 2017. Americas Director of Asset Management, Ernst & Young LLP from 2006-2013. Global Asset Management Assurance Leader, Ernst & Young LLP from 2006- 2015. Partner Ernst & Young LLP from 1997-2015. Prudential, 1983-1997. Member of the Ernst & Young LLP Retirement Investment Committee. | | | 93 | | | Trustee of SEI Insurance Products Trust from 2015 to 2020. Trustee of SEI Structured Credit Fund, LP, SEI Tax Exempt Trust, SEI Daily Income Trust, SEI Institutional International Trust, SEI Institutional Managed Trust, SEI Asset Allocation Trust, SEI Institutional Investments Trust, New Covenant Funds, Adviser Managed Trust and SEI Catholic Values Trust. |
| | | | | |
James B. Taylor One Freedom Valley Drive Oaks, PA 19456 70 years old | | Trustee | | since 2018 | | Retired since December 2017. Chief Investment Officer at Georgia Tech Foundation from 2008 to 2017. Chief Investment Officer at Delta Air Lines from 1983 to 2007. Member of the Investment Committee at the Institute of Electrical and Electronic Engineers from 1999 to 2004. President, Vice President and Treasurer at Southern Benefits Conference from 1998 to 2000. | | | 93 | | | Trustee of SEI Insurance Products Trust from 2018 to 2020. Trustee of SEI Daily Income Trust, SEI Tax Exempt Trust, SEI Institutional Managed Trust, SEI Institutional International Trust, SEI Institutional Investments Trust, SEI Asset Allocation Trust, Adviser Managed Trust, New Covenant Funds and SEI Catholic Values Trust. |
| | | | | |
Christine Reynolds One Freedom Valley Drive Oaks, PA 19456 62 years old | | Trustee | | since 2019 | | Retired since December 2016. Executive Vice President, Fidelity Investments from 2014-2016. President, Fidelity Pricing and Cash Management Services and Chief Financial Officer of Fidelity Funds from 2008-2014. Chief Operating Officer, Fidelity Pricing and Cash Management Services from 2007-2008. President and Treasurer, Fidelity Funds from 2004-2007. Anti-Money Laundering Officer, Fidelity Funds in 2004. Executive Vice President, Fidelity Funds from 2002-2004. Audit Partner, PricewaterhouseCoopers from 1992-2002. | | | 93 | | | Trustee of SEI Insurance Products Trust from 2019 to 2020. Trustee of SEI Daily Income Trust, SEI Tax Exempt Trust, SEI Institutional Managed Trust, SEI Institutional International Trust, SEI Institutional Investments Trust, SEI Asset Allocation Trust, Adviser Managed Trust, New Covenant Funds and SEI Catholic Values Trust. |
| 1 | Each trustee shall hold office during the lifetime of this Trust until the election and qualification of his or her successor, or until he or she sooner dies, resigns or is removed in accordance with the Trust’s Declaration of Trust. |
| 2 | The Fund Complex includes the following Trusts: SEI Asset Allocation Trust, SEI Daily Income Trust, SEI Institutional Investments Trust, Adviser Managed Trust, SEI Institutional International Trust, SEI Institutional Managed Trust, SEI Tax Exempt Trust, Catholic Values Trust and New Covenant Funds. |
| | |
| 90 | | Adviser Managed Trust / Annual Report / July 31, 2021 |
| | | | | | | | | | | | |
Name Address, and Age | | Position(s) Held with Trusts | | Term of Office and Length of Time Served1 | | Principal Occupation(s) During Past Five Years | | Number of Portfolios in
Fund Complex Overseen by Trustee2 | | | Other Directorships Held by Trustee |
OFFICERS | | | | | | | | | | | | |
| | | | | |
Robert A. Nesher One Freedom Valley Drive, Oaks, PA 19456 74 yrs. Old | | President and CEO | | since 2010 | | Currently performs various services on behalf of SEI for which Mr. Nesher is compensated. | | | N/A | | | N/A |
| | | | | |
Peter A. Rodriguez One Freedom Valley Drive Oaks, PA 19456 59 yrs. old | | Controller and Chief Financial Officer | | since 2020 | | Director, Fund Accounting, SEI Investments Global Funds Services since April 2020 and previously from March 2011 to March 2015; Director, Financial Reporting from June 2017 to March 2020. Director, Centralized Operations from March 2015 to June 2017. | | | N/A | | | N/A |
| | | | | |
Glenn R. Kurdziel One Freedom Valley Drive Oaks, PA 19456 47 yrs. old | | Assistant Controller | | since 2017 | | Assistant Controller, Funds Accounting, SEI Investments Global Funds Services (March 2017); Senior Manager, Funds Accounting, SEI Investments Global Funds Services since 2005. | | | N/A | | | N/A |
| | | | | |
Russell Emery One Freedom Valley Drive Oaks, PA 19456 58 yrs. old | | Chief Compliance Officer | | since 2010 | | Chief Compliance Officer of SEI Daily Income Trust, SEI Institutional Investments Trust, SEI Institutional Managed Trust, SEI Asset Allocation Trust, SEI Institutional International Trust, SEI Tax Exempt Trust, The Advisors’ Inner Circle Fund, The Advisors’ Inner Circle Fund II and Bishop Street Funds since March 2006. Chief Compliance Officer of SEI Liquid Asset Trust from 2006 to 2016. Chief Compliance Officer of SEI Structured Credit Fund, LP since June 2007. Chief Compliance Officer of Adviser Managed Trust since December 2010. Chief Compliance Officer of SEI Alpha Strategy Portfolios, LP from 2007 to 2013. Chief Compliance Officer of New Covenant Funds since February 2012. Chief Compliance Officer of SEI Insurance Products Trust from 2013 to 2020. Chief Compliance Officer of The KP Funds from 2013 to 2020. Chief Compliance Officer of O’Connor EQUUS from 2014 to 2016. Chief Compliance Officer of The Advisors’ Inner Circle Fund III since 2014. Chief Compliance Officer of Winton Series Trust from 2014 to 2017. Chief Compliance Officer of Winton Diversified Opportunities Fund from 2014 to 2018. Chief Compliance Officer of SEI Catholic Values Trust and Gallery Trust since 2015. Chief Compliance Officer of Schroder Series Trust and Schroder Global Series Trust since 2017. | | | N/A | | | N/A |
| | | | | |
Timothy D Barto One Freedom Valley Drive Oaks, PA 19456 53 yrs. old | | Vice President and Secretary | | since 2010 | | Vice President and Secretary of SEI Institutional Transfer Agent, Inc. since 2009. General Counsel and Secretary of SIMC and the Administrator since 2004. Vice President of SIMC and the Administrator since 1999. Vice President and Assistant Secretary of SEI since 2001. | | | N/A | | | N/A |
| | | | | |
Aaron Buser One Freedom Valley Drive, Oaks, PA 19456 50 yrs. old | | Vice President and Assistant Secretary | | since 2010 | | Vice President and Assistant Secretary of SEI Institutional Transfer Agent, Inc. since 2009. Vice President and Assistant Secretary of SIMC since 2007. Attorney Stark & Stark (law firm), March 2004-July 2007 | | | N/A | | | N/A |
| | | | | |
David F. McCann One Freedom Valley Drive, Oaks, PA 19456 45 yrs. old | | Vice President and Assistant Secretary | | since 2010 | | Vice President and Assistant Secretary of SEI Institutional Transfer Agent, Inc. since 2009. Vice President and Assistant Secretary of SIMC since 2008. Attorney, Drinker Biddle & Reath, LLP (law firm), May 2005 - October 2008. | | | N/A | | | N/A |
| | | | | |
Stephen G. MacRae One Freedom Valley Drive, Oaks, PA 19456 53 yrs. old | | Vice President | | since 2012 | | Director of Global Investment Product Management since January 2004. | | | N/A | | | N/A |
| | | | | |
Bridget E. Sudall One Freedom Valley Drive Oaks, PA 19456 40 yrs. old | | Anti-Money Laundering Compliance Officer and Privacy Officer | | since 2015 | | Anti-Money Laundering Compliance Officer and Privacy Officer (since 2015), Senior Associate and AML Officer, Morgan Stanley Alternative Investment Partners, April 2011-March 2015, Investor Services Team Lead, Morgan Stanley Alternative Investment Partners, July 2007-April 2011. | | | N/A | | | N/A |
| 1 | Each trustee shall hold office during the lifetime of this Trust until the election and qualification of his or her successor, or until he or she sooner dies, resigns or is removed in accordance with the Trust’s Declaration of Trust. |
| 2 | The Fund Complex includes the following Trusts: SEI Asset Allocation Trust, SEI Daily Income Trust, SEI Institutional Investments Trust, Adviser Managed Trust, SEI Institutional International Trust, SEI Institutional Managed Trust, SEI Tax Exempt Trust, SEI Catholic Values Trust and New Covenant Funds. |
| | |
| Adviser Managed Trust / Annual Report / July 31, 2021 | | 91 |
DISCLOSURE OF FUND EXPENSES (Unaudited)
July 31, 2021
All mutual funds have operating expenses. As a shareholder of a fund, your investment is affected by these ongoing costs, which include (among others) costs for portfolio management, administrative services, and shareholder reports like this one. It is important for you to understand the impact of these costs on your investment returns.
Operating expenses such as these are deducted from the fund’s gross income and directly reduce your final investment return. These expenses are expressed as a percentage of the fund’s average net assets; this percentage is known as the fund’s expense ratio.
The following examples use the expense ratio and are intended to help you understand the ongoing costs (in dollars) of investing in your fund and to compare these costs with those of other mutual funds. The examples are based on an investment of $1,000 made at the beginning of the period shown and held for the entire period (February 1, 2021 through July 31, 2021).
The table on this page illustrates your fund’s costs in two ways:
Actual fund return: This section helps you to estimate the actual expenses after fee waivers that your Fund incurred over the period. The “Expenses Paid During Period” column shows the actual dollar expense cost incurred by a $1,000 investment in the Fund, and the “Ending Account Value” number is derived from deducting that expense cost from the Fund’s gross investment return.
You can use this information, together with the actual amount you invested in the Fund, to estimate the expenses you paid over that period. Simply divide your actual account value by $1,000 to arrive at a ratio (for example, an $8,600 account value divided by $1,000 = 8.6), then multiply that ratio by the number shown for your Fund under “Expenses Paid During Period.”
Hypothetical 5% return: This section helps you compare your Fund’s costs with those of other mutual funds. It assumes that the fund had an annual 5% return before expenses during the year, but that the expense ratio (Column 3) for the period is unchanged. This example is useful in making comparisons because the Securities and Exchange Commission requires all mutual funds to make this 5% calculation. You can assess your Fund’s comparative cost by comparing the hypothetical result for your Fund in the “Expenses Paid During Period” column with those that appear in the same charts in the shareholder reports for other funds.
NOTE: Because the return is set at 5% for comparison purposes — NOT your Fund’s actual return — the account values shown may not apply to your specific investment.
| | | | | | | | | | | | | | |
| | | Beginning
Account Value 2/1/21 | | Ending
Account
Value
7/31/21 | | | Annualized
Expense
Ratios | | | Expenses
Paid
During
Period * | |
Tactical Offensive Equity Fund | |
Actual Fund Return | |
Class A | | $1,000.00 | | | $1,159.90 | | | | 0.50% | | | | $2.68 | |
Hypothetical 5% Return | |
Class A | | $1,000.00 | | | $1,022.32 | | | | 0.50% | | | | $2.51 | |
| | | | | | | | | | | | | | |
| | | Beginning
Account Value 2/1/21 | | Ending
Account
Value
7/31/21 | | | Annualized
Expense
Ratios | | | Expenses
Paid
During
Period * | |
Tactical Offensive Core Fixed Income Fund | |
Actual Fund Return | |
Class A | | $1,000.00 | | | $999.80 | | | | 0.33% | | | | $1.64 | |
Hypothetical 5% Return | |
Class A | | $1,000.00 | | | $1,023.16 | | | | 0.33% | | | | $1.66 | |
| | | | | | | | | | | | | | |
| | | Beginning
Account Value 2/1/21 | | Ending
Account
Value
7/31/21 | | | Annualized
Expense
Ratios | | | Expenses
Paid
During
Period * | |
Tactical Offensive Enhanced Fixed Income Fund | |
Actual Fund Return | |
Class A | | $1,000.00 | | | $1,021.90 | | | | 0.58% | | | | $2.91 | |
Hypothetical 5% Return | |
Class A | | $1,000.00 | | | $1,021.92 | | | | 0.58% | | | | $2.91 | |
* Expenses are equal to the Fund’s annualized expense ratio multiplied by the average account value over the period, multiplied by 181/365 (to reflect the one-half year period shown).
| | |
| 92 | | Adviser Managed Trust / Annual Report / July 31, 2021 |
LIQUIDITY RISK MANAGEMENT PROGRAM (Unaudited)
July 31, 2021
Pursuant to Rule 22e-4 under the 1940 Act, the Trust, on behalf of the Funds, has adopted a liquidity risk management program (the “Program”) to govern the Trust’s approach to managing liquidity risk. The Program is overseen by the SIMC Liquidity Risk Oversight Committee, and the Program’s principal objectives include assessing, managing and periodically reviewing each Fund’s liquidity risk, based on factors specific to the circumstances of the Fund.
At a meeting of the Board held on March 23, 2021, the Trustees received a report from the SIMC Liquidity Risk Oversight Committee addressing the operations of the Program and assessing its adequacy and effectiveness of implementation. The SIMC Liquidity Risk Oversight Committee determined, and reported to the Board, that the Program is reasonably designed to assess and manage each Fund’s liquidity risk and has operated adequately and effectively to manage each Fund’s liquidity risk since the Program was implemented on December 1, 2018. The SIMC Liquidity Risk Oversight Committee reported that during the period covered by the report, there were no liquidity events that impacted the Funds or their ability to timely meet redemptions without dilution to existing shareholders. The SIMC Liquidity Risk Oversight Committee further noted that no material changes have been made to the Program since its implementation.
There can be no assurance that the Program will achieve its objectives in the future. Please refer to the prospectus for more information regarding a Fund’s exposure to liquidity risk and other principal risks to which an investment in the Funds may be subject.
| | |
| Adviser Managed Trust / Annual Report / July 31, 2021 | | 93 |
BOARD OF TRUSTEES’ CONSIDERATIONS IN APPROVING THE ADVISORY AND SUB-ADVISORY AGREEMENTS (Unaudited)
Adviser Managed Trust (the “Trust”) and SEI Investments Management Corporation (“SIMC”) have entered into an investment advisory agreement (the “Advisory Agreement”), pursuant to which SIMC provides investment advisory services to the series of the Trust (the “Funds”). Pursuant to a separate sub-advisory agreement with SIMC (the “Sub-Advisory Agreement” and, together with the Advisory Agreement, the “Investment Advisory Agreements”), and under the supervision of SIMC and the Trust’s Board of Trustees (each member, a “Trustee” and, collectively, the “Trustees” or the “Board”), the sub-adviser (the “Sub-Adviser”) provides security selection and certain other advisory services with respect to all or a discrete portion of the assets of the Funds. The Sub-Adviser is also responsible for managing its employees who provide services to the Funds. The Sub-Adviser is selected based primarily upon the research and recommendations of SIMC, which evaluates quantitatively and qualitatively the Sub-Adviser’s skills and investment results in managing assets for specific asset classes, investment styles and strategies.
The Investment Company Act of 1940, as amended (the “1940 Act”), requires that the initial approval of a Fund’s Investment Advisory Agreements be specifically approved by the vote of a majority of the outstanding shareholders of the Funds and the vote of a majority of the Trustees who are not parties to the Investment Advisory Agreements or “interested persons” of any party (the “Independent Trustees”) cast in person (or otherwise, as consistent with applicable laws, regulations and related guidance and relief) at a meeting called for such purpose. In addition, the 1940 Act requires that the continuation or renewal of any Investment Advisory Agreement be approved at least annually (after an initial period of up to two years), which also requires the vote of a majority of the Board, including a majority of the Independent Trustees. In the case of an initial approval of a Sub-Advisory Agreement, only the approval of a majority of the Board, including a majority of the Independent Trustees, is required pursuant to an exemptive order that has been granted to the Trust by the Securities and Exchange Commission. In connection with their consideration of such initial approvals and renewals, the Funds’ Trustees must request and evaluate, and SIMC and the Sub-Adviser are required to furnish, such information as may be reasonably necessary to evaluate the terms of the Investment Advisory Agreements. In addition, the Securities and Exchange Commission takes the position that, as part of their fiduciary duties with respect to a mutual fund’s fees, mutual fund boards are required to evaluate the material factors applicable to a decision to approve an Investment Advisory Agreement.
Consistent with these responsibilities, the Board calls and holds meetings each year to consider whether to approve new and/or renew existing Investment Advisory Agreements between the Trust and SIMC and SIMC and the Sub-Adviser with respect to the Funds of the Trust. In preparation for these meetings, the Board requests and reviews a wide variety of materials provided by SIMC and the Sub-Adviser, including information about SIMC’s and the Sub-Adviser’s affiliates, personnel and operations and the services provided pursuant to the Investment Advisory Agreements. The Board also receives data from third parties. This information is provided in addition to the detailed information about the Funds that the Board reviews during the course of each year, including information that relates to Fund operations and Fund performance. The Trustees also receive a memorandum from counsel regarding the responsibilities of Trustees in connection with their consideration of whether to approve the Trust’s Investment Advisory Agreements. Finally, the Independent Trustees receive advice from independent counsel to the Independent Trustees, meet in executive sessions outside the presence of Fund management and participate in question and answer sessions with representatives of SIMC and the Sub-Adviser.
Specifically, during the course of the Trust’s fiscal year, the Board requested and received written materials from SIMC and the Sub-Adviser regarding: (i) the quality of SIMC’s and the Sub-Adviser’s investment management and other services; (ii) SIMC’s and the Sub-Adviser’s investment management personnel; (iii) SIMC’s and the Sub-Adviser’s operations and financial condition; (iv) SIMC’s and the Sub-Adviser’s brokerage practices (including any soft dollar arrangements) and investment strategies; (v) the level of the advisory fees that SIMC charges the Funds and the level of the sub-advisory fees that SIMC pays the Sub-Adviser, compared with fees each charge to comparable accounts; (vi) the advisory fees charged by SIMC and the Funds’ overall fees and operating expenses compared with peer groups of mutual funds prepared by Broadridge, an independent provider of investment company data; (vii) the level of SIMC’s and the Sub-Adviser’s profitability from their Fund-related operations; (viii) SIMC’s and the Sub-Adviser’s compliance program, including a description of material compliance matters and material compliance violations; (ix) SIMC’s potential economies of scale; (x) SIMC’s and the Sub-Adviser’s policies on and compliance procedures for personal securities transactions; (xi) SIMC’s and the Sub-Adviser’s expertise and resources in domestic and/or international financial markets; and (xii) the Funds’ performance over various periods of time compared with peer groups of mutual funds prepared by Broadridge and the Funds’ benchmark indexes.
| | |
| 94 | | Adviser Managed Trust / Annual Report / July 31, 2021 |
At the March 22-24, 2021 meeting of the Board, the Trustees, including a majority of the Independent Trustees, approved the renewal of the Advisory Agreement. Also, the Sub-Advisory Agreement was renewed at a meeting of the Board held during the course of the Trust’s fiscal year on March 22-24, 2021. In connection with the Tactical Offensive Enhanced Fixed Income Fund, the Advisory Agreement and the Sub-Advisory Agreement were initially approved at a meeting of the Board held during the course of the Trust’s fiscal year on September 14-16, 2020. In each case, the Board’s decision was based on its consideration and evaluation of the factors described above, as discussed at the meeting and at prior meetings. The following discusses some, but not all, of the factors that were considered by the Board in connection with its assessment of the Investment Advisory Agreements.
Nature, Extent and Quality of Services. The Board considered the nature, extent and quality of the services provided by SIMC and the Sub-Adviser to the Funds and the resources of SIMC and the Sub-Adviser and their affiliates dedicated to the Funds. In this regard, the Trustees evaluated, among other things, SIMC’s and the Sub-Adviser’s personnel, experience, track record and compliance program. Following evaluation, the Board concluded that, within the context of its full deliberations, the nature, extent and quality of services provided by SIMC and the Sub-Adviser to the Funds and the resources of SIMC and the Sub-Adviser and their affiliates dedicated to the Funds were sufficient to support the approval or renewal, as applicable, of the Investment Advisory Agreements. In addition to advisory services, the Board considered the nature and quality of certain administrative, transfer agency and other non-investment advisory services provided to the Funds by SIMC and/or its affiliates.
Performance. In determining whether to renew SIMC’s Advisory Agreement, the Trustees considered the Funds’ performance relative to their peer groups and appropriate indexes/benchmarks. The Trustees reviewed performance information for each Fund, noting that they receive performance reports that permit them to monitor each Fund’s performance at board meetings throughout the year. As part of this review, the Trustees considered the composition of each peer group and selection criteria. In assessing Fund performance, the Trustees considered a report compiled by Broadridge, an independent third-party that was engaged to prepare an assessment of the Funds in connection with the renewal of the Advisory Agreement (the “Broadridge Report”). The Broadridge Report included metrics on net total return for the Tactical Offensive Equity Fund, the Tactical Offensive Core Fixed Income Fund and a universe of comparable funds. Based on the materials considered and discussed at the meeting, the Trustees found Fund performance satisfactory, or, where performance was materially below the benchmark and/or peer group, the Trustees were satisfied with the reasons provided to explain such performance. In connection with the renewal of the Sub-Advisory Agreement, the Board considered the performance of the Sub-Adviser relative to appropriate indexes/benchmarks. Following evaluation, the Board concluded that, within the context of its full deliberations, the performance of the Funds was sufficient to support renewal of SIMC’s Advisory Agreement, and the performance of the Sub-Adviser was sufficient to support renewal of the Sub-Advisory Agreement.
Fees. With respect to the Funds’ expenses under the Investment Advisory Agreements, the Trustees considered the rate of compensation called for by the Investment Advisory Agreements and the Funds’ net operating expense ratios in comparison to those of the Funds’ respective peer groups. In assessing Fund expenses, the Trustees considered the information in the Broadridge Report, which included various metrics related to fund expenses, including, but not limited to, contractual management fees at various asset levels, actual management fees (including transfer agent expenses), and actual total expenses for the Funds and a universe of comparable funds. Based on the materials considered and discussion at the meetings, the Trustees further determined that fees were either shown to be below the peer average in the comparative fee analysis, or that there was a reasonable basis for the fee level. The Trustees also considered the effects of SIMC’s and its affiliates’ contractual and voluntary waivers of management and other fees to prevent total Fund operating expenses from exceeding any applicable cap, and concluded that SIMC, through waivers, has maintained the Funds’ net operating expenses at competitive levels for its distribution channels. The Board also took into consideration compensation earned from the Funds by SIMC or its affiliates for non-advisory services, such as administration, transfer agency, shareholder services or brokerage, and considered whether SIMC and its affiliates may have realized other benefits from their relationship with the Funds, such as any research and brokerage services received under soft dollar arrangements. When considering fees paid to the Sub-Adviser, the Board took into account the fact that the Sub-Adviser is compensated by SIMC and not by the Funds directly, and that such compensation with respect to an unaffiliated Sub-Adviser reflects an arms-length negotiation between the Sub-Adviser and SIMC. Following evaluation, the Board concluded that, within the context of its full deliberations, the expenses of the Funds are reasonable and supported approval or renewal, as applicable, of the Investment Advisory Agreements. The Board also considered whether the Sub-Adviser and its affiliates may have
| | |
| Adviser Managed Trust / Annual Report / July 31, 2021 | | 95 |
BOARD OF TRUSTEES’ CONSIDERATIONS IN APPROVING THE ADVISORY AND SUB-ADVISORY AGREEMENTS (Unaudited) (Concluded)
realized other benefits from their relationship with the Funds, such as any research and brokerage services received under soft dollar arrangements.
Profitability. With regard to profitability, the Trustees considered compensation flowing to SIMC and the Sub-Adviser and their affiliates, directly or indirectly. The Trustees considered whether the levels of compensation and profitability were reasonable. As with the fee levels, when considering the profitability of the Sub-Adviser, the Board took into account the fact that compensation with respect to any unaffiliated Sub-Adviser reflects an arms-length negotiation between the Sub-Adviser and SIMC. In connection with the approval or renewal, as applicable, of the Sub-Advisory Agreement, the Board also took into consideration the impact that the fees paid to the Sub-Adviser have on SIMC’s advisory fee margin and profitability. Based on this evaluation, the Board concluded that, within the context of its full deliberations, the profitability of each of SIMC and the Sub-Adviser is reasonable and supported approval or renewal, as applicable, of the Investment Advisory Agreements.
Economies of Scale. With respect to the Advisory Agreement, the Trustees considered whether any economies of scale were being realized by SIMC and its affiliates and, if so, whether the benefits of such economies of scale were passed along to the Funds’ shareholders through a graduated investment advisory fee schedule or other means, including any fee waivers by SIMC and its affiliates. The Trustees recognized that economies of scale are difficult to identify and quantify and are rarely identifiable on a fund-by-fund basis. Based on this evaluation, the Board determined that the fees were reasonable in light of the information that was provided by SIMC with respect to economies of scale.
Based on the Trustees’ deliberation and their evaluation of the information described above, the Board, including all of the Independent Trustees, with the assistance of Fund counsel and Independent Trustees’ counsel, unanimously approved the approval or renewal, as applicable, of the Investment Advisory Agreements and concluded that the compensation under the Investment Advisory Agreements is fair and reasonable in light of such services and expenses and such other matters as the Trustees considered to be relevant in the exercise of their reasonable judgment. In the course of its deliberations, the Board did not identify any particular factor (or conclusion with respect thereto) or single piece of information that was all-important, controlling or determinative of its decision, but considered all of the factors together, and each Trustee may have attributed different weights to the various factors (and conclusions with respect thereto) and information.
| | |
| 96 | | Adviser Managed Trust / Annual Report / July 31, 2021 |
NOTICE TO SHAREHOLDERS (Unaudited)
For shareholders that do not have a July 31, 2021 taxable year end, this notice is for informational purposes only. For shareholders with a July 31, 2021 year end, please consult your tax advisor as to the pertinence of this notice.
For the fiscal year ended July 31, 2021, the funds of the Adviser Managed Trust are designating the following items with regard to distributions paid during the year:
| | | | | | | | | | | | | | | | | | | | | | | | | |
| | | (A) Long-Term Capital Gains Distributions | | (B) Ordinary Income Distributions (Tax Basis) | | Total Distributions | | (C) Dividends Qualifying for Corporate Dividends Received Deduction (1) |
Tactical Offensive Equity Fund | | | | 0.00% | | | | | 100.00 | % | | | | 100.00 | % | | | | 51.41 | % |
Tactical Offensive Core Fixed Income Fund | | | | 0.00% | | | | | 100.00 | % | | | | 100.00 | % | | | | 0.00 | % |
Tactical Offensive Enhabced Fixed Income Fund | | | | 0.00% | | | | | 100.00 | % | | | | 100.00 | % | | | | 0.00 | % |
| | | | | |
| | | (D) Qualifying Dividend Income (15% Tax Rate for QDI) (2) | | Qualifying Business Income (3) | | (F) U.S. Government Interest (4) | | Interest Related Dividends (5) | | Short-Term Capital Gain Dividends (6) |
Tactical Offensive Equity Fund | | | | 67.86 | % | | | | 0.00 | % | | | | 0.00 | % | | | | 0.02 | % | | | | 0.00 | % |
Tactical Offensive Core Fixed Income Fund | | | | 0.00 | % | | | | 0.00 | % | | | | 16.53 | % | | | | 87.06 | % | | | | 0.00 | % |
Tactical Offensive Enhanced Fixed Income Fund | | | | 0.00 | % | | | | 0.00 | % | | | | 0.00 | % | | | | 50.80 | % | | | | 0.00 | % |
| (1) | Qualifying dividends represent dividends which qualify for the corporate dividends received deduction. |
| (2) | The percentage in this column represents the amount of “Qualifying Dividend Income” is reflected as a percentage of “Ordinary Income Distributions.” It is the intention of each of the aforementioned funds to designate the maximum amount permitted by the law. The information reported herein may differ from the information and distributions taxable to the shareholders for the calendar year ending December 31, 2021. Complete information will be computed and reported in conjunction with your 2021 Form 1099-DIV. |
| (3) | The percentage of this column represents the amount of ordinary dividend income that qualified for 20% Business Income Deduction. |
| (4) | “U.S. Government Interest” represents the amount of interest that was derived from direct U.S. Government obligations and distributed during the fiscal year. This amount is reflected as a percentage of total ordinary income distributions (the total of short term capital gain and net investment income distributions). Generally, interest from direct U.S. Government obligations is exempt from state income tax. However, for shareholders who are residents of California, Connecticut and New York, the statutory threshold requirements were not satisfied to permit exemption of these amounts from state income. |
| (5) | The percentage in this column represents the amount of “Interest Related Dividend” and is reflected as a percentage of net investment income distributions that is exempt from U.S. withholding tax when paid to foreign investors. |
| (6) | The percentage in this column represents the amount of “Short-Term Capital Gain” and is reflected as a percentage of short-term capital gain distributions that is exempt from U.S. withholding tax when paid to foreign investors. |
Items (A) and (B) are based on the percentage of the Funds total distribution.
Items (C) and (D) are based on the percentage of ordinary income distributions of each fund. Item (E) is based on the percentage of gross income of each fund.
Please consult your tax adviser for proper treatment of this information. This notification should be kept with your permanent tax records.
| | |
| Adviser Managed Trust / Annual Report / July 31, 2021 | | 97 |
ADVISER MANAGED TRUST ANNUAL REPORT JULY 31, 2021
Robert A. Nesher, Chairman
Trustees
William M. Doran
George J. Sullivan, Jr.
Nina Lesavoy
James M. Williams
Mitchell A. Johnson
Hubert L. Harris, Jr.
Susan C. Cote
James B. Taylor
Christine Reynolds
Officers
Robert A. Nesher
President and Chief Executive Officer
Peter A. Rodriguez
Controller and Chief Financial Officer
Glenn R. Kurdziel
Assistant Controller
Russell Emery
Chief Compliance Officer
Timothy D. Barto
Vice President, Secretary
Aaron Buser
Vice President, Assistant Secretary
David F. McCann
Vice President, Assistant Secretary
Stephen G. MacRae
Vice President
Bridget E. Sudall
Anti-Money Laundering Compliance Officer
Privacy Officer
Investment Adviser
SEI Investments Management Corporation
Administrator
SEI Investments Global Funds Services
Distributor
SEI Investments Distribution Co.
Legal Counsel
Morgan, Lewis & Bockius LLP
Independent Registered Public Accounting Firm
KPMG LLP
This report and the financial statements contained herein are submitted for the general information of the shareholders of the Trust and must be preceded or accompanied by a current prospectus. Shares of the Funds are not deposits or obligations of, or guaranteed or endorsed by, any bank. The shares are not federally insured by the Federal Deposit Insurance Corporation (FDIC), the Federal Reserve Board, or any other government agency. Investment in the shares involves risk, including the possible loss of principal.
For more information call
1 800 DIAL SEI
(1 800 342 5734)

1 Freedom Valley Drive, P.O. Box 1100, Oaks, PA 19456
AMT (7/21)
Item 2. Code of Ethics.
The Registrant has adopted a code of ethics that applies to the Registrant’s principal executive officer, principal financial officer, principal accounting officer or controller, or persons performing similar functions.
Item 3. Audit Committee Financial Expert.
(a)(1) The Registrant’s Board of Trustees has determined that the Registrant has three audit committee financial experts serving on the audit committee.
(a) (2) The audit committee financial experts are Susan C. Cote, George J. Sullivan, Jr. and Hubert L. Harris, Jr. Ms. Cote and Messrs. Sullivan and Harris are independent as defined in Form N-CSR Item 3 (a) (2).
Item 4. Principal Accountant Fees and Services.
Fees billed by KPMG LLP (“KPMG”) related to the Registrant.
KPMG billed the Registrant aggregate fees for services rendered to the Registrant for the fiscal years 2021 and 2020 as follows:
| | | | | | | | | | | | | | |
| | | Fiscal Year 2021 | | Fiscal Year 2020 |
| | | | | All fees and services to the Registrant that were pre- approved | | All fees and services to service affiliates that were pre- approved | | All other fees and services to service affiliates that did not require pre- approval | | All fees and services to the Registrant that were pre- approved | | All fees and services to service affiliates that were pre- approved | | All other fees and services to service affiliates that did not require pre- approval |
| (a) | | Audit Fees(1) | | $123,455 | | $0 | | N/A | | $87,705 | | $0 | | N/A |
| (b) | | Audit-Related Fees | | $0 | | $0 | | $0 | | $0 | | $0 | | $0 |
| (c) | | Tax Fees | | $0 | | $0 | | $0 | | $0 | | $0 | | $0 |
(d) | | All Other Fees(2) | | $0 | | $331,000 | | $0 | | $0 | | $417,252 | | $0 |
Notes:
| | (1) | Audit fees include amounts related to the audit of the Registrant’s annual financial statements and services normally provided by the accountant in connection with statutory and regulatory filings. |
| | (2) | See Item 4(g) for a description of the services comprising the fees disclosed in this category. |
(e)(1) The Registrant’s Audit Committee has adopted and the Board of Trustees has ratified an Audit and Non-Audit Services Pre-Approval Policy (the “Policy”), which sets forth the procedures and the conditions pursuant to which services proposed to be performed by the independent auditor of the Registrant may be pre-approved. In any instance where services require pre-approval, the Audit Committee will consider whether such services are consistent with SEC’s rules on auditor independence and whether the provision of such services would compromise the auditor’s independence.
The Policy provides that all requests or applications for proposed services to be provided by the independent auditor must be submitted to the Registrant’s Chief Financial Officer (“CFO”) and must include a detailed description of the services proposed to be rendered. The CFO will determine whether such services: (1) require specific pre-approval; (2) are included within the list of services that have received the general pre-approval of the Audit Committee pursuant to the Policy; or (3) have been previously pre-approved in connection with the independent auditor’s annual engagement letter for the applicable year or otherwise.
Requests or applications to provide services that require specific pre-approval by the Audit Committee will be submitted to the Audit Committee by the CFO. The Audit Committee has delegated specific pre-approval authority to either the Audit Committee Chair or financial experts, provided that the estimated fee for any such proposed pre-approved service does not exceed $100,000 and any pre-approval decisions are reported to the Audit Committee at its next regularly scheduled meeting.
Services that have received the general pre-approval of the Audit Committee are identified and described in the Policy. In addition, the Policy sets forth a maximum fee per engagement with respect to each identified service that has received general pre-approval. The Audit Committee will annually review and pre-approve the services that may be provided by the independent auditor during the following twelve months without obtaining specific pre-approval from the Audit Committee.
The Audit Committee will be informed by the CFO on a quarterly basis of all services rendered by the independent auditor.
All services to be provided by the independent auditor shall be provided pursuant to a signed written engagement letter with the Registrant, the investment advisor or applicable control affiliate (except that matters as to which an engagement letter would be impractical because of timing issues or because the matter is small may not be the subject of an engagement letter) that sets forth both the services to be provided by the independent auditor and the total fees (or the manner of their determination) to be paid to the independent auditor for those services.
In addition, the Audit Committee has determined to take additional measures on an annual basis to meet its responsibility to oversee the work of the independent auditor and to assure the auditor’s independence from the Registrant, such as reviewing a formal written statement from the independent auditor delineating all relationships between the independent auditor and the Registrant, and discussing with the independent auditor its methods and procedures for ensuring independence.
(e)(2) Percentage of fees billed applicable to non-audit services pursuant to waiver of pre-approval requirement were as follows:
| | | | |
| | | Fiscal Year 2021 | | Fiscal Year 2020 |
| Audit-Related Fees | | 0% | | 0% |
| Tax Fees | | 0% | | 0% |
All Other Fees | | 0% | | 0% |
(g)(1) The aggregate non-audit fees billed by KPMG for the fiscal years 2021 and 2020 were $331,000 and $417,252, respectively. Non-audit fees consist of SSAE No. 16 review of fund accounting and administration operations and an attestation report in accordance with Rule 17 Ad-13.
(h) During the past fiscal year, Registrant’s principal accountant provided certain non-audit services to Registrant’s investment adviser or to entities controlling, controlled by, or under common control with Registrant’s investment adviser that provide ongoing services to Registrant that were not subject to pre-approval pursuant to paragraph (c)(7)(ii) of Rule 2-01 of Regulation S-X. The Audit Committee of Registrant’s Board of Trustees reviewed and considered these non-audit services provided by Registrant’s principal accountant to Registrant’s affiliates, including whether the provision of these non-audit services is compatible with maintaining the principal accountant’s independence.
Item 5. Audit Committee of Listed Registrants.
Not applicable.
Item 6. Investments
(a) The Schedule of Investments in securities of unaffiliated issuers as of the close of the reporting period for the Tactical Offensive Equity Fund is listed below. The Schedule of Investments in securities of unaffiliated issuers as of the close of the reporting period for the Tactical Offensive Fixed Income Fund and Tactical Offensive Enhanced Income Fund are included as part of the report to shareholders filed under Item 1 of this form.
SCHEDULE OF INVESTMENTS
July 31, 2021
Tactical Offensive Equity Fund
| | | | | | | | |
| | | |
| Description | | Shares | | | Market Value
($ Thousands) | |
| | |
COMMON STOCK — 90.5% | | | | | | | | |
Australia — 0.9% | | | | | | | | |
Afterpay * | | | 3,978 | | | $ | 283 | |
AGL Energy | | | 14,159 | | | | 75 | |
Ampol | | | 4,178 | | | | 87 | |
APA Group | | | 24,080 | | | | 169 | |
Aristocrat Leisure Ltd | | | 11,026 | | | | 337 | |
ASX Ltd | | | 3,989 | | | | 225 | |
Aurizon Holdings Ltd | | | 33,573 | | | | 95 | |
AusNet Services | | | 24,922 | | | | 33 | |
Australia & New Zealand Banking Group Ltd | | | 54,354 | | | | 1,107 | |
BHP Group | | | 56,266 | | | | 2,212 | |
BlueScope Steel Ltd | | | 8,718 | | | | 155 | |
Brambles Ltd | | | 26,670 | | | | 228 | |
Cochlear Ltd | | | 1,346 | | | | 243 | |
Coles Group Ltd | | | 24,977 | | | | 321 | |
Commonwealth Bank of Australia | | | 33,812 | | | | 2,477 | |
Computershare Ltd | | | 9,723 | | | | 112 | |
Crown Resorts Ltd | | | 4,725 | | | | 30 | |
CSL | | | 8,679 | | | | 1,843 | |
Dexus ‡ | | | 20,849 | | | | 158 | |
Domino’s Pizza Enterprises Ltd | | | 1,260 | | | | 108 | |
Endeavour Group * | | | 24,186 | | | | 118 | |
Evolution Mining | | | 36,613 | | | | 112 | |
Fortescue Metals Group Ltd | | | 31,064 | | | | 569 | |
Goodman Group ‡ | | | 32,679 | | | | 544 | |
GPT Group ‡ | | | 33,423 | | | | 115 | |
Insurance Australia Group | | | 43,426 | | | | 155 | |
James Hardie Industries PLC | | | 8,240 | | | | 277 | |
Lendlease | | | 14,991 | | | | 134 | |
Macquarie Group Ltd | | | 6,716 | | | | 775 | |
Magellan Financial Group | | | 2,899 | | | | 104 | |
Medibank Pvt Ltd | | | 49,771 | | | | 121 | |
Mirvac Group ‡ | | | 75,075 | | | | 158 | |
National Australia Bank Ltd | | | 63,065 | | | | 1,202 | |
Newcrest Mining Ltd | | | 15,179 | | | | 296 | |
Northern Star Resources | | | 21,074 | | | | 158 | |
Oil Search Ltd | | | 33,755 | | | | 95 | |
Orica | | | 9,230 | | | | 84 | |
Origin Energy Ltd | | | 30,429 | | | | 92 | |
Qantas Airways | | | 13,819 | | | | 47 | |
QBE Insurance Group Ltd | | | 30,004 | | | | 240 | |
Ramsay Health Care | | | 3,723 | | | | 176 | |
REA Group | | | 1,011 | | | | 120 | |
Reece | | | 6,058 | | | | 105 | |
Rio Tinto Ltd | | | 7,189 | | | | 705 | |
Santos Ltd | | | 33,907 | | | | 161 | |
Scentre Group ‡ | | | 98,587 | | | | 188 | |
SEEK Ltd | | | 5,823 | | | | 125 | |
Sonic Healthcare | | | 9,308 | | | | 274 | |
South32 | | | 93,173 | | | | 203 | |
Stockland ‡ | | | 45,640 | | | | 148 | |
| | | | | | | | |
| | | |
| Description | | Shares | | | Market Value
($ Thousands) | |
| | |
COMMON STOCK (continued) | | | | | | | | |
Suncorp Group Ltd | | | 23,543 | | | $ | 200 | |
Sydney Airport | | | 23,911 | | | | 137 | |
Tabcorp Holdings | | | 43,982 | | | | 160 | |
Telstra Corp Ltd | | | 78,738 | | | | 219 | |
Transurban Group | | | 53,146 | | | | 559 | |
Treasury Wine Estates Ltd | | | 13,058 | | | | 114 | |
Vicinity Centres ‡ | | | 88,352 | | | | 101 | |
Washington H Soul Pattinson & Co Ltd | | | 1,728 | | | | 41 | |
Wesfarmers Ltd | | | 21,773 | | | | 978 | |
Westpac Banking | | | 69,216 | | | | 1,247 | |
WiseTech Global | | | 3,378 | | | | 76 | |
Woodside Petroleum Ltd | | | 17,967 | | | | 289 | |
Woolworths Group Ltd | | | 24,186 | | | | 689 | |
Xero * | | | 2,473 | | | | 255 | |
| | | | | | | | |
| | | | | | | 22,964 | |
| | | | | | | | |
| | |
Austria — 0.0% | | | | | | | | |
Erste Group Bank AG | | | 5,354 | | | | 208 | |
OMV | | | 2,525 | | | | 136 | |
Raiffeisen Bank International AG | | | 1,878 | | | | 44 | |
Verbund AG | | | 1,159 | | | | 107 | |
voestalpine AG | | | 2,020 | | | | 89 | |
| | | | | | | | |
| | | | | | | 584 | |
| | | | | | | | |
| | |
Belgium — 0.1% | | | | | | | | |
Ageas | | | 3,588 | | | | 190 | |
Anheuser-Busch InBev SA/NV | | | 14,605 | | | | 925 | |
Argenx * | | | 883 | | | | 269 | |
Elia Group | | | 714 | | | | 84 | |
Etablissements Franz Colruyt | | | 1,276 | | | | 72 | |
Groupe Bruxelles Lambert SA | | | 2,156 | | | | 251 | |
KBC Group NV | | | 4,789 | | | | 386 | |
Proximus SADP | | | 3,526 | | | | 73 | |
Sofina | | | 275 | | | | 129 | |
Solvay SA | | | 1,425 | | | | 190 | |
UCB SA | | | 2,426 | | | | 262 | |
Umicore SA | | | 3,801 | | | | 236 | |
| | | | | | | | |
| | | | | | | 3,067 | |
| | | | | | | | |
| | |
China — 0.0% | | | | | | | | |
China Lumena New Materials Corp * | | | 30,699 | | | | – | |
Futu Holdings ADR * | | | 1,000 | | | | 102 | |
| | | | | | | | |
| | | | | | | 102 | |
| | | | | | | | |
| | |
Denmark — 0.3% | | | | | | | | |
Ambu, Cl B | | | 2,800 | | | | 104 | |
AP Moller - Maersk A/S, Cl A | | | 60 | | | | 160 | |
AP Moller - Maersk A/S, Cl B | | | 110 | | | | 305 | |
Carlsberg A/S, Cl B | | | 1,909 | | | | 353 | |
Chr Hansen Holding A/S | | | 2,080 | | | | 187 | |
Coloplast A/S, Cl B | | | 2,216 | | | | 405 | |
Danske Bank A/S | | | 13,200 | | | | 231 | |
Demant A/S * | | | 1,921 | | | | 117 | |
DSV PANALPINA | | | 3,967 | | | | 966 | |
| | |
| Adviser Managed Trust / Annual Report / July 31, 2021 | | 1 |
SCHEDULE OF INVESTMENTS
July 31, 2021
Tactical Offensive Equity Fund (Continued)
| | | | | | | | |
| Description | | Shares | | | Market Value
($ Thousands) | |
| | | |
COMMON STOCK (continued) | | | | | | | | |
Genmab A/S * | | | 1,280 | | | $ | 578 | |
GN Store Nord | | | 2,427 | | | | 213 | |
Novo Nordisk A/S, Cl B | | | 33,101 | | | | 3,061 | |
Novozymes A/S, Cl B | | | 3,686 | | | | 290 | |
Orsted A/S | | | 3,622 | | | | 538 | |
Pandora A/S | | | 1,892 | | | | 245 | |
ROCKWOOL International, Cl B | | | 164 | | | | 87 | |
Tryg A/S | | | 6,021 | | | | 149 | |
Vestas Wind Systems | | | 18,935 | | | | 698 | |
| | | | | | | | |
| | | | | | | 8,687 | |
| | | | | | | | |
| | |
Finland — 0.1% | | | | | | | | |
Elisa | | | 2,715 | | | | 174 | |
Fortum | | | 8,371 | | | | 231 | |
Kesko, Cl B | | | 5,563 | | | | 238 | |
Kone, Cl B | | | 6,602 | | | | 547 | |
Neste Oyj | | | 7,758 | | | | 477 | |
Nokia | | | 102,536 | | | | 629 | |
Orion Oyj, Cl B | | | 2,398 | | | | 102 | |
Sampo Oyj, Cl A | | | 9,348 | | | | 450 | |
Stora Enso, Cl R | | | 10,982 | | | | 217 | |
UPM-Kymmene | | | 10,023 | | | | 409 | |
Wartsila Abp | | | 10,203 | | | | 154 | |
| | | | | | | | |
| | | | | | | 3,628 | |
| | | | | | | | |
| | |
France — 1.3% | | | | | | | | |
Accor SA | | | 3,044 | | | | 108 | |
Aeroports de Paris | | | 686 | | | | 83 | |
Air Liquide | | | 9,044 | | | | 1,572 | |
Alstom SA | | | 4,947 | | | | 205 | |
Amundi SA | | | 1,069 | | | | 99 | |
Arkema SA | | | 1,322 | | | | 168 | |
Atos SE | | | 1,907 | | | | 91 | |
AXA SA | | | 37,181 | | | | 965 | |
BioMerieux | | | 940 | | | | 112 | |
BNP Paribas SA | | | 21,557 | | | | 1,315 | |
Bollore SA | | | 20,354 | | | | 114 | |
Bouygues SA | | | 4,293 | | | | 165 | |
Bureau Veritas | | | 5,606 | | | | 185 | |
Capgemini SE | | | 3,120 | | | | 674 | |
Carrefour SA | | | 11,530 | | | | 214 | |
Cie de Saint-Gobain | | | 9,455 | | | | 676 | |
Cie Generale des Etablissements Michelin SCA | | | 3,307 | | | | 540 | |
CNP Assurances | | | 2,178 | | | | 37 | |
Covivio ‡ | | | 1,193 | | | | 112 | |
Credit Agricole SA | | | 21,705 | | | | 303 | |
Danone SA | | | 12,591 | | | | 927 | |
Dassault Aviation SA | | | 32 | | | | 38 | |
Dassault Systemes | | | 12,810 | | | | 707 | |
Edenred | | | 4,480 | | | | 260 | |
Eiffage SA | | | 1,626 | | | | 166 | |
Electricite de France SA | | | 8,843 | | | | 108 | |
| | | | | | | | |
| Description | | Shares | | | Market Value
($ Thousands) | |
| | | |
COMMON STOCK (continued) | | | | | | | | |
Engie SA | | | 33,462 | | | $ | 446 | |
EssilorLuxottica SA | | | 5,461 | | | | 1,031 | |
Eurazeo SE | | | 596 | | | | 58 | |
Eurofins Scientific | | | 2,349 | | | | 281 | |
Faurecia | | | 344 | | | | 16 | |
Faurecia SA | | | 2,068 | | | | 92 | |
Gecina SA ‡ | | | 791 | | | | 125 | |
Getlink SE | | | 8,391 | | | | 134 | |
Hermes International | | | 607 | | | | 928 | |
Iliad SA | | | 188 | | | | 41 | |
Ipsen | | | 865 | | | | 92 | |
Kering | | | 1,452 | | | | 1,302 | |
Klepierre SA ‡ | | | 3,463 | | | | 84 | |
La Francaise des Jeux SAEM | | | 1,990 | | | | 106 | |
Legrand | | | 5,193 | | | | 584 | |
L’Oreal SA | | | 4,775 | | | | 2,185 | |
LVMH Moet Hennessy Louis Vuitton | | | 5,322 | | | | 4,253 | |
Orange SA | | | 36,334 | | | | 405 | |
Orpea | | | 891 | | | | 113 | |
Pernod Ricard SA | | | 4,014 | | | | 886 | |
Publicis Groupe | | | 4,589 | | | | 290 | |
Remy Cointreau SA | | | 518 | | | | 114 | |
Renault SA | | | 3,676 | | | | 140 | |
Safran SA | | | 6,595 | | | | 863 | |
Sanofi | | | 21,483 | | | | 2,213 | |
Sartorius Stedim Biotech | | | 545 | | | | 311 | |
Schneider Electric SE | | | 10,204 | | | | 1,710 | |
SCOR SE | | | 2,839 | | | | 79 | |
SEB SA | | | 572 | | | | 95 | |
Societe Generale SA | | | 16,021 | | | | 470 | |
Sodexo SA | | | 1,690 | | | | 144 | |
Stellantis | | | 18,994 | | | | 365 | |
STMicroelectronics | | | 13,291 | | | | 544 | |
Suez | | | 5,980 | | | | 139 | |
Teleperformance | | | 1,164 | | | | 491 | |
Thales SA | | | 2,016 | | | | 211 | |
TotalEnergies | | | 47,806 | | | | 2,080 | |
Ubisoft Entertainment SA * | | | 1,705 | | | | 108 | |
Valeo | | | 4,692 | | | | 136 | |
Veolia Environnement SA | | | 10,330 | | | | 339 | |
Vinci SA | | | 10,283 | | | | 1,088 | |
Vivendi SA | | | 13,533 | | | | 457 | |
Wendel SA | | | 582 | | | | 82 | |
Worldline * | | | 4,508 | | | | 422 | |
| | | | | | | | |
| | | | | | | 35,997 | |
| | | | | | | | |
| | |
Germany — 1.1% | | | | | | | | |
adidas AG | | | 3,637 | | | | 1,320 | |
Allianz | | | 7,852 | | | | 1,955 | |
Aroundtown SA | | | 18,825 | | | | 147 | |
BASF | | | 17,543 | | | | 1,378 | |
Bayer | | | 18,764 | | | | 1,119 | |
Bayerische Motoren Werke | | | 6,384 | | | | 635 | |
| | |
| 2 | | Adviser Managed Trust / Annual Report / July 31, 2021 |
| | | | | | | | |
| | | |
| | | | | | Market Value | |
| Description | | Shares | | | ($ Thousands) | |
| | |
COMMON STOCK (continued) | | | | | | | | |
Bechtle | | | 556 | | | $ | 115 | |
Beiersdorf AG | | | 1,987 | | | | 236 | |
Brenntag AG | | | 3,031 | | | | 303 | |
Carl Zeiss Meditec | | | 772 | | | | 172 | |
Commerzbank AG | | | 17,267 | | | | 111 | |
Continental AG | | | 1,976 | | | | 268 | |
Covestro | | | 3,842 | | | | 247 | |
Daimler AG | | | 16,402 | | | | 1,464 | |
Delivery Hero * | | | 3,069 | | | | 459 | |
Deutsche Bank AG * | | | 40,098 | | | | 507 | |
Deutsche Boerse AG | | | 3,678 | | | | 614 | |
Deutsche Lufthansa AG | | | 6,910 | | | | 78 | |
Deutsche Post | | | 18,956 | | | | 1,284 | |
Deutsche Telekom AG | | | 63,876 | | | | 1,326 | |
Deutsche Wohnen SE | | | 6,375 | | | | 398 | |
E.ON SE | | | 43,546 | | | | 536 | |
Evonik Industries AG | | | 3,621 | | | | 126 | |
Fresenius Medical Care AG & Co KGaA | | | 3,982 | | | | 314 | |
Fresenius SE & Co KGaA | | | 8,285 | | | | 435 | |
GEA Group AG | | | 2,756 | | | | 122 | |
Hannover Rueck SE | | | 1,150 | | | | 193 | |
HeidelbergCement AG | | | 2,835 | | | | 251 | |
HelloFresh * | | | 3,010 | | | | 282 | |
Henkel AG & Co KGaA | | | 1,974 | | | | 179 | |
Infineon Technologies | | | 25,027 | | | | 954 | |
KION Group | | | 1,324 | | | | 140 | |
Knorr-Bremse | | | 1,478 | | | | 168 | |
LANXESS AG | | | 1,419 | | | | 103 | |
LEG Immobilien | | | 1,518 | | | | 240 | |
Merck KGaA | | | 2,352 | | | | 482 | |
MTU Aero Engines AG | | | 1,023 | | | | 256 | |
Muenchener Rueckversicherungs- Gesellschaft in Muenchen | | | 2,686 | | | | 726 | |
Nemetschek | | | 1,320 | | | | 117 | |
Puma SE | | | 1,875 | | | | 230 | |
QIAGEN * | | | 4,505 | | | | 241 | |
Rational | | | 104 | | | | 113 | |
RWE AG | | | 11,763 | | | | 419 | |
SAP SE | | | 20,070 | | | | 2,876 | |
Scout24 | | | 1,770 | | | | 152 | |
Siemens | | | 14,510 | | | | 2,264 | |
Siemens Energy * | | | 7,425 | | | | 202 | |
Siemens Healthineers AG | | | 5,327 | | | | 352 | |
Symrise, Cl A | | | 2,394 | | | | 353 | |
TeamViewer * | | | 3,072 | | | | 103 | |
Telefonica Deutschland Holding AG | | | 13,210 | | | | 36 | |
Uniper SE | | | 1,740 | | | | 68 | |
United Internet AG | | | 1,652 | | | | 68 | |
Volkswagen AG | | | 648 | | | | 215 | |
Vonovia SE | | | 10,132 | | | | 675 | |
Zalando * | | | 3,155 | | | | 351 | |
| | | | | | | | |
| | | | | | | 28,478 | |
| | | | | | | | |
| | | | | | | | |
| | | |
| | | | | | Market Value | |
| Description | | Shares | | | ($ Thousands) | |
| | |
COMMON STOCK (continued) | | | | | | | | |
Greece — 0.0% | | | | | | | | |
FF Group * | | | 1,785 | | | $ | – | |
| | | | | | | | |
| | |
Hong Kong — 0.4% | | | | | | | | |
AIA Group Ltd | | | 231,000 | | | | 2,767 | |
Bank of East Asia | | | 16,600 | | | | 27 | |
BOC Hong Kong Holdings Ltd | | | 73,000 | | | | 235 | |
Budweiser Brewing APAC | | | 39,100 | | | | 109 | |
China Huishan Dairy Holdings Co Ltd * | | | 228,000 | | | | – | |
Chow Tai Fook Jewellery Group | | | 43,000 | | | | 90 | |
CK Asset Holdings Ltd | | | 39,737 | | | | 271 | |
CK Hutchison Holdings Ltd | | | 50,500 | | | | 369 | |
CK Infrastructure Holdings Ltd | | | 15,500 | | | | 94 | |
CLP Holdings | | | 30,500 | | | | 315 | |
ESR Cayman * | | | 34,200 | | | | 120 | |
Galaxy Entertainment Group Ltd | | | 43,000 | | | | 292 | |
Hanergy Thin Film Power Group Ltd * | | | 444,000 | | | | – | |
Hang Lung Properties Ltd | | | 46,000 | | | | 119 | |
Hang Seng Bank Ltd | | | 15,200 | | | | 292 | |
Henderson Land Development Co Ltd | | | 26,000 | | | | 116 | |
HK Electric Investments & HK Electric Investments Ltd | | | 33,500 | | | | 34 | |
HKT Trust & HKT Ltd | | | 86,000 | | | | 117 | |
Hong Kong & China Gas | | | 214,095 | | | | 349 | |
Hong Kong Exchanges & Clearing Ltd | | | 23,000 | | | | 1,468 | |
Link ‡ | | | 38,712 | | | | 370 | |
Melco Resorts & Entertainment ADR * | | | 4,900 | | | | 68 | |
MTR Corp Ltd | | | 29,500 | | | | 175 | |
New World Development | | | 29,500 | | | | 140 | |
Power Assets Holdings | | | 26,500 | | | | 171 | |
Sands China Ltd | | | 46,400 | | | | 158 | |
Sino Land Co Ltd | | | 55,170 | | | | 84 | |
SJM Holdings Ltd | | | 25,000 | | | | 22 | |
Sun Hung Kai Properties Ltd | | | 24,500 | | | | 351 | |
Swire Pacific Ltd, Cl A | | | 6,500 | | | | 40 | |
Swire Properties Ltd | | | 27,000 | | | | 77 | |
Techtronic Industries Co Ltd | | | 26,000 | | | | 465 | |
WH Group Ltd | | | 183,000 | | | | 152 | |
Wharf Real Estate Investment Co Ltd | | | 31,000 | | | | 175 | |
Wynn Macau Ltd | | | 19,600 | | | | 25 | |
Xinyi Glass Holdings | | | 38,000 | | | | 142 | |
| | | | | | | | |
| | | | | | | 9,799 | |
| | | | | | | | |
| | |
Ireland — 0.7% | | | | | | | | |
Accenture PLC, Cl A | | | 32,147 | | | | 10,212 | |
CRH PLC | | | 15,028 | | | | 753 | |
Eaton Corp PLC | | | 20,028 | | | | 3,165 | |
Experian PLC | | | 17,762 | | | | 782 | |
Jazz Pharmaceuticals PLC * | | | 2,800 | | | | 475 | |
Kerry Group PLC, Cl A | | | 2,888 | | | | 428 | |
Paddy Power Betfair PLC * | | | 3,108 | | | | 530 | |
Pentair PLC | | | 8,600 | | | | 634 | |
Perrigo PLC | | | 6,800 | | | | 327 | |
| | |
| Adviser Managed Trust / Annual Report / July 31, 2021 | | 3 |
SCHEDULE OF INVESTMENTS
July 31, 2021
Tactical Offensive Equity Fund (Continued)
| | | | | | | | |
| | | |
Description | | Shares | | | Market Value ($ Thousands) | |
|
|
COMMON STOCK (continued) | |
Smurfit Kappa Group PLC | | | 4,992 | | | $ | 282 | |
| | | | | | | | |
| | | | | | | 17,588 | |
| | | | | | | | |
| | |
Israel — 0.1% | | | | | | | | |
Azrieli Group | | | 626 | | | | 50 | |
Bank Hapoalim BM * | | | 21,628 | | | | 173 | |
Bank Leumi Le-Israel * | | | 27,853 | | | | 214 | |
Check Point Software Technologies * | | | 2,200 | | | | 279 | |
Elbit Systems Ltd | | | 611 | | | | 81 | |
ICL Group | | | 14,825 | | | | 108 | |
Israel Discount Bank, Cl A * | | | 20,807 | | | | 98 | |
Mizrahi Tefahot Bank Ltd * | | | 2,957 | | | | 90 | |
Nice Ltd * | | | 1,129 | | | | 317 | |
Teva Pharmaceutical Industries ADR * | | | 20,900 | | | | 202 | |
Wix.com Ltd * | | | 3,800 | | | | 1,135 | |
| | | | | | | | |
| | | | | | | 2,747 | |
| | | | | | | | |
| | |
Italy — 0.3% | | | | | | | | |
Amplifon | | | 2,536 | | | | 125 | |
Assicurazioni Generali SpA | | | 20,673 | | | | 413 | |
Atlantia SpA | | | 10,153 | | | | 184 | |
CNH Industrial NV | | | 19,496 | | | | 325 | |
Davide Campari-Milano | | | 9,720 | | | | 137 | |
DiaSorin | | | 576 | | | | 117 | |
Enel SpA | | | 154,036 | | | | 1,421 | |
Eni SpA | | | 46,501 | | | | 553 | |
EXOR NV | | | 2,071 | | | | 170 | |
Ferrari | | | 2,460 | | | | 536 | |
FinecoBank Banca Fineco | | | 11,458 | | | | 205 | |
Infrastrutture Wireless Italiane | | | 6,845 | | | | 78 | |
Intesa Sanpaolo SpA | | | 316,688 | | | | 876 | |
Mediobanca Banca di Credito Finanziario | | | 11,301 | | | | 133 | |
Moncler SpA | | | 3,653 | | | | 251 | |
Nexi * | | | 8,515 | | | | 183 | |
Poste Italiane | | | 9,467 | | | | 126 | |
Prysmian SpA | | | 4,613 | | | | 165 | |
Recordati Industria Chimica e Farmaceutica | | | 1,874 | | | | 116 | |
Snam SpA | | | 40,114 | | | | 243 | |
Stellantis | | | 20,210 | | | | 388 | |
Telecom Italia | | | 191,866 | | | | 84 | |
Telecom Italia SpA/Milano | | | 76,471 | | | | 36 | |
Terna - Rete Elettrica Nazionale | | | 26,837 | | | | 213 | |
UniCredit SpA | | | 39,905 | | | | 478 | |
| | | | | | | | |
| | | | | | | 7,556 | |
| | | | | | | | |
| | |
Japan — 2.7% | | | | | | | | |
ABC-Mart Inc | | | 500 | | | | 27 | |
Acom | | | 6,500 | | | | 27 | |
Advantest | | | 4,000 | | | | 350 | |
Aeon Co Ltd | | | 12,300 | | | | 335 | |
AGC Inc/Japan | | | 3,300 | | | | 140 | |
Aisin | | | 2,900 | | | | 117 | |
Ajinomoto Co Inc | | | 8,900 | | | | 226 | |
| | | | | | | | |
| | | |
Description | | Shares | | | Market Value ($ Thousands) | |
|
| | |
COMMON STOCK (continued) | | | | | | | | |
ANA Holdings Inc | | | 3,200 | | | $ | 75 | |
Asahi Group Holdings | | | 8,700 | | | | 389 | |
Asahi Intecc Co Ltd | | | 3,400 | | | | 92 | |
Asahi Kasei | | | 24,800 | | | | 268 | |
Astellas Pharma Inc | | | 36,200 | | | | 574 | |
Azbil | | | 2,500 | | | | 97 | |
Bandai Namco Holdings Inc | | | 3,800 | | | | 244 | |
Bridgestone Corp | | | 11,100 | | | | 485 | |
Brother Industries Ltd | | | 5,100 | | | | 103 | |
Canon Inc | | | 18,700 | | | | 425 | |
Capcom | | | 3,600 | | | | 99 | |
Casio Computer Co Ltd | | | 4,500 | | | | 73 | |
Central Japan Railway Co | | | 2,700 | | | | 390 | |
Chiba Bank Ltd/The | | | 6,700 | | | | 38 | |
Chubu Electric Power Co Inc | | | 12,300 | | | | 148 | |
Chugai Pharmaceutical Co Ltd | | | 12,900 | | | | 473 | |
Concordia Financial Group Ltd | | | 23,700 | | | | 85 | |
Cosmos Pharmaceutical | | | 300 | | | | 51 | |
CyberAgent | | | 7,600 | | | | 136 | |
Dai Nippon Printing | | | 4,000 | | | | 94 | |
Daifuku Co Ltd | | | 2,000 | | | | 178 | |
Dai-ichi Life Holdings Inc | | | 20,200 | | | | 370 | |
Daiichi Sankyo Co Ltd | | | 32,600 | | | | 641 | |
Daikin Industries Ltd | | | 4,800 | | | | 991 | |
Daito Trust Construction Co Ltd | | | 1,100 | | | | 129 | |
Daiwa House Industry | | | 10,900 | | | | 332 | |
Daiwa House Investment Corp, Cl A ‡ | | | 35 | | | | 104 | |
Daiwa Securities Group | | | 25,000 | | | | 131 | |
Denso Corp | | | 8,200 | | | | 559 | |
Dentsu Group | | | 4,100 | | | | 142 | |
Disco Corp | | | 600 | | | | 170 | |
East Japan Railway Co | | | 5,500 | | | | 365 | |
Eisai Co Ltd | | | 4,400 | | | | 360 | |
ENEOS Holdings | | | 60,400 | | | | 253 | |
FANUC | | | 3,700 | | | | 822 | |
Fast Retailing | | | 1,100 | | | | 741 | |
Fuji Electric Co Ltd | | | 2,200 | | | | 95 | |
FUJIFILM Holdings Corp | | | 6,800 | | | | 485 | |
Fujitsu Ltd | | | 3,800 | | | | 643 | |
GLP J-REIT ‡ | | | 83 | | | | 149 | |
GMO Payment Gateway | | | 900 | | | | 115 | |
Hakuhodo DY Holdings Inc | | | 4,800 | | | | 73 | |
Hamamatsu Photonics KK | | | 2,600 | | | | 144 | |
Hankyu Hanshin Holdings Inc | | | 4,300 | | | | 126 | |
Harmonic Drive Systems | | | 800 | | | | 44 | |
Hikari Tsushin Inc | | | 400 | | | | 69 | |
Hino Motors Ltd | | | 4,500 | | | | 39 | |
Hirose Electric | | | 700 | | | | 104 | |
Hisamitsu Pharmaceutical Co Inc | | | 1,100 | | | | 48 | |
Hitachi Construction Machinery Co Ltd | | | 2,500 | | | | 70 | |
Hitachi Ltd | | | 18,500 | | | | 1,055 | |
Hitachi Metals Ltd | | | 5,000 | | | | 97 | |
| | |
| 4 | | Adviser Managed Trust / Annual Report / July 31, 2021 |
| | | | | | | | |
| Description | | Shares | | | Market Value
($ Thousands) | |
| | |
COMMON STOCK (continued) | | | | | | | | |
Honda Motor Co Ltd | | | 31,300 | | | $ | 996 | |
Hoshizaki | | | 800 | | | | 67 | |
Hoya | | | 7,200 | | | | 1,011 | |
Hulic Co Ltd | | | 3,800 | | | | 43 | |
Ibiden | | | 2,200 | | | | 116 | |
Idemitsu Kosan | | | 4,400 | | | | 103 | |
Iida Group Holdings Co Ltd | | | 3,100 | | | | 74 | |
Inpex | | | 18,700 | | | | 132 | |
Isuzu Motors Ltd | | | 9,900 | | | | 131 | |
Ito En | | | 1,200 | | | | 71 | |
ITOCHU Corp | | | 22,600 | | | | 666 | |
Itochu Techno-Solutions | | | 2,200 | | | | 67 | |
Japan Airlines | | | 1,800 | | | | 37 | |
Japan Exchange Group Inc | | | 10,100 | | | | 228 | |
Japan Metropolitan Fund Invest ‡ | | | 120 | | | | 125 | |
Japan Post Bank Co Ltd | | | 9,400 | | | | 80 | |
Japan Post Holdings Co Ltd | | | 31,100 | | | | 263 | |
Japan Post Insurance | | | 5,200 | | | | 92 | |
Japan Real Estate Investment ‡ | | | 25 | | | | 156 | |
Japan Tobacco Inc | | | 22,700 | | | | 443 | |
JFE Holdings Inc | | | 8,900 | | | | 108 | |
JSR | | | 3,400 | | | | 113 | |
Kajima Corp | | | 8,100 | | | | 104 | |
Kakaku.com | | | 3,100 | | | | 84 | |
Kansai Electric Power Co Inc/The | | | 12,200 | | | | 115 | |
Kansai Paint Co Ltd | | | 4,100 | | | | 100 | |
Kao | | | 9,200 | | | | 551 | |
KDDI Corp | | | 30,900 | | | | 938 | |
Keio Corp | | | 1,800 | | | | 100 | |
Keisei Electric Railway Co Ltd | | | 3,000 | | | | 89 | |
Keyence Corp | | | 3,700 | | | | 2,048 | |
Kikkoman Corp | | | 2,700 | | | | 164 | |
Kintetsu Group Holdings Co Ltd | | | 3,300 | | | | 111 | �� |
Kirin Holdings Co Ltd | | | 15,800 | | | | 288 | |
Kobayashi Pharmaceutical Co Ltd | | | 1,100 | | | | 87 | |
Kobe Bussan | | | 2,800 | | | | 94 | |
Koei Tecmo Holdings | | | 1,170 | | | | 55 | |
Koito Manufacturing Co Ltd | | | 2,000 | | | | 121 | |
Komatsu Ltd | | | 16,600 | | | | 428 | |
Konami Holdings Corp | | | 1,700 | | | | 94 | |
Kose Corp | | | 600 | | | | 94 | |
Kubota | | | 19,600 | | | | 407 | |
Kurita Water Industries Ltd | | | 2,100 | | | | 101 | |
Kyocera Corp | | | 6,200 | | | | 381 | |
Kyowa Hakko Kirin Co Ltd | | | 5,100 | | | | 165 | |
Lasertec | | | 1,400 | | | | 261 | |
Lawson Inc | | | 600 | | | | 30 | |
Lion Corp | | | 5,100 | | | | 88 | |
Lixil | | | 5,000 | | | | 135 | |
M3 Inc | | | 8,500 | | | | 552 | |
Makita Corp | | | 4,300 | | | | 222 | |
Marubeni Corp | | | 31,200 | | | | 263 | |
| | | | | | | | |
| Description | | Shares | | | Market Value
($ Thousands) | |
| | |
COMMON STOCK (continued) | | | | | | | | |
Mazda Motor | | | 9,900 | | | $ | 97 | |
McDonald’s Holdings Co Japan Ltd | | | 1,500 | | | | 68 | |
Medipal Holdings Corp | | | 4,200 | | | | 79 | |
MEIJI Holdings Co Ltd | | | 2,100 | | | | 130 | |
Mercari * | | | 2,000 | | | | 104 | |
MINEBEA MITSUMI Inc | | | 6,900 | | | | 185 | |
MISUMI Group | | | 5,300 | | | | 184 | |
Mitsubishi Chemical Holdings Corp | | | 22,500 | | | | 188 | |
Mitsubishi Corp | | | 24,000 | | | | 670 | |
Mitsubishi Electric Corp | | | 34,700 | | | | 467 | |
Mitsubishi Estate Co Ltd | | | 22,700 | | | | 354 | |
Mitsubishi Gas Chemical | | | 3,300 | | | | 68 | |
Mitsubishi HC Capital | | | 13,800 | | | | 75 | |
Mitsubishi Heavy Industries Ltd | | | 5,800 | | | | 166 | |
Mitsubishi UFJ Financial Group Inc | | | 234,300 | | | | 1,235 | |
Mitsui & Co Ltd | | | 29,100 | | | | 663 | |
Mitsui Chemicals Inc | | | 3,300 | | | | 104 | |
Mitsui Fudosan Co Ltd | | | 17,200 | | | | 400 | |
Miura | | | 2,000 | | | | 88 | |
Mizuho Financial Group Inc | | | 46,190 | | | | 659 | |
MonotaRO Co Ltd | | | 4,800 | | | | 110 | |
MS&AD Insurance Group Holdings Inc | | | 8,800 | | | | 271 | |
Murata Manufacturing Co Ltd | | | 11,000 | | | | 906 | |
Nabtesco Corp | | | 1,800 | | | | 68 | |
NEC Corp | | | 4,900 | | | | 247 | |
Nexon Co Ltd | | | 9,700 | | | | 199 | |
NGK Insulators Ltd | | | 5,900 | | | | 94 | |
NH Foods Ltd | | | 1,900 | | | | 76 | |
Nidec | | | 8,600 | | | | 959 | |
Nihon M&A Center | | | 5,800 | | | | 161 | |
Nintendo Co Ltd | | | 2,100 | | | | 1,079 | |
Nippon Building Fund ‡ | | | 29 | | | | 187 | |
Nippon Express Co Ltd | | | 1,600 | | | | 116 | |
Nippon Paint Holdings Co Ltd | | | 13,000 | | | | 165 | |
Nippon Prologis Inc ‡ | | | 36 | | | | 120 | |
Nippon Sanso Holdings | | | 1,900 | | | | 42 | |
Nippon Shinyaku | | | 1,100 | | | | 82 | |
Nippon Steel Corp | | | 15,200 | | | | 262 | |
Nippon Telegraph & Telephone Corp | | | 24,700 | | | | 631 | |
Nippon Yusen | | | 3,100 | | | | 166 | |
Nissan Chemical | | | 2,400 | | | | 117 | |
Nissan Motor Co Ltd | | | 44,100 | | | | 254 | |
Nisshin Seifun Group Inc | | | 4,600 | | | | 74 | |
Nissin Foods Holdings Co Ltd | | | 1,400 | | | | 100 | |
Nitori Holdings Co Ltd | | | 1,600 | | | | 303 | |
Nitto Denko Corp | | | 3,100 | | | | 229 | |
Nomura Holdings Inc | | | 58,700 | | | | 293 | |
Nomura Real Estate Holdings Inc | | | 1,800 | | | | 44 | |
Nomura Real Estate Master Fund ‡ | | | 77 | | | | 122 | |
Nomura Research Institute Ltd | | | 6,300 | | | | 202 | |
NSK Ltd | | | 8,300 | | | | 68 | |
NTT Data | | | 12,100 | | | | 186 | |
| | |
| Adviser Managed Trust / Annual Report / July 31, 2021 | | 5 |
SCHEDULE OF INVESTMENTS
July 31, 2021
Tactical Offensive Equity Fund (Continued)
| | | | | | | | |
| | | |
Description | | Shares | | | Market Value ($ Thousands) | |
|
| |
COMMON STOCK (continued) | |
Obayashi Corp | | | 11,700 | | | $ | 95 | |
Obic Co Ltd | | | 1,400 | | | | 245 | |
Odakyu Electric Railway Co Ltd | | | 5,500 | | | | 130 | |
Oji Holdings Corp | | | 15,400 | | | | 88 | |
Olympus Corp | | | 22,800 | | | | 466 | |
Omron Corp | | | 3,500 | | | | 297 | |
Ono Pharmaceutical Co Ltd | | | 7,300 | | | | 165 | |
Oracle Corp Japan | | | 900 | | | | 67 | |
Oriental Land Co Ltd/Japan | | | 3,800 | | | | 518 | |
ORIX | | | 22,800 | | | | 397 | |
Orix JREIT ‡ | | | 60 | | | | 114 | |
Osaka Gas Co Ltd | | | 7,000 | | | | 131 | |
Otsuka Corp | | | 2,400 | | | | 124 | |
Otsuka Holdings | | | 7,800 | | | | 308 | |
Pan Pacific International Holdings Corp | | | 7,800 | | | | 162 | |
Panasonic Corp | | | 41,900 | | | | 498 | |
PeptiDream * | | | 1,800 | | | | 74 | |
Persol Holdings Co Ltd | | | 2,300 | | | | 46 | |
Pigeon | | | 2,600 | | | | 75 | |
Pola Orbis Holdings Inc | | | 1,500 | | | | 36 | |
Rakuten Group | | | 16,200 | | | | 178 | |
Recruit Holdings Co Ltd | | | 26,000 | | | | 1,333 | |
Renesas Electronics Corp * | | | 17,300 | | | | 186 | |
Resona Holdings Inc | | | 39,400 | | | | 148 | |
Ricoh Co Ltd | | | 12,200 | | | | 132 | |
Rinnai Corp | | | 700 | | | | 65 | |
Rohm Co Ltd | | | 1,700 | | | | 165 | |
Ryohin Keikaku | | | 3,900 | | | | 79 | |
Santen Pharmaceutical Co Ltd | | | 8,100 | | | | 109 | |
SBI Holdings Inc/Japan | | | 4,500 | | | | 107 | |
SCSK | | | 700 | | | | 42 | |
Secom | | | 4,000 | | | | 301 | |
Seiko Epson Corp | | | 4,900 | | | | 84 | |
Sekisui Chemical Co Ltd | | | 6,200 | | | | 106 | |
Sekisui House | | | 12,100 | | | | 238 | |
Seven & i Holdings Co Ltd | | | 14,300 | | | | 634 | |
SG Holdings Co Ltd | | | 6,200 | | | | 166 | |
Sharp Corp/Japan | | | 4,100 | | | | 62 | |
Shimadzu Corp | | | 4,200 | | | | 168 | |
Shimano Inc | | | 1,400 | | | | 357 | |
Shimizu Corp | | | 12,600 | | | | 92 | |
Shin-Etsu Chemical | | | 6,800 | | | | 1,100 | |
Shionogi & Co Ltd | | | 5,300 | | | | 278 | |
Shiseido Co Ltd | | | 7,600 | | | | 505 | |
Shizuoka Bank Ltd/The | | | 9,500 | | | | 68 | |
SMC Corp/Japan | | | 1,100 | | | | 649 | |
SoftBank | | | 55,000 | | | | 716 | |
SoftBank Group Corp | | | 23,800 | | | | 1,483 | |
Sohgo Security Services Co Ltd | | | 1,600 | | | | 75 | |
Sompo Holdings Inc | | | 5,800 | | | | 239 | |
Sony Group | | | 24,100 | | | | 2,498 | |
Square Enix Holdings | | | 1,500 | | | | 77 | |
| | | | | | | | |
| | | |
Description | | Shares | | | Market Value ($ Thousands) | |
|
| | | |
COMMON STOCK (continued) | | | | | | | | |
Stanley Electric Co Ltd | | | 3,000 | | | $ | 78 | |
Subaru Corp | | | 12,200 | | | | 238 | |
SUMCO Corp | | | 4,700 | | | | 108 | |
Sumitomo Chemical Co Ltd | | | 28,600 | | | | 148 | |
Sumitomo Corp | | | 21,800 | | | | 295 | |
Sumitomo Dainippon Pharma | | | 2,300 | | | | 40 | |
Sumitomo Electric Industries | | | 14,300 | | | | 202 | |
Sumitomo Metal Mining Co Ltd | | | 4,500 | | | | 181 | |
Sumitomo Mitsui Financial Group Inc | | | 25,100 | | | | 845 | |
Sumitomo Mitsui Trust Holdings Inc | | | 6,400 | | | | 210 | |
Sumitomo Realty & Development | | | 5,800 | | | | 188 | |
Suntory Beverage & Food Ltd | | | 2,500 | | | | 87 | |
Suzuki Motor Corp | | | 7,100 | | | | 287 | |
Sysmex Corp | | | 3,100 | | | | 367 | |
T&D Holdings | | | 9,300 | | | | 118 | |
Taisei | | | 3,500 | | | | 117 | |
Taisho Pharmaceutical Holdings | | | 400 | | | | 22 | |
Takeda Pharmaceutical Co Ltd | | | 30,200 | | | | 1,013 | |
TDK Corp | | | 2,400 | | | | 272 | |
Terumo Corp | | | 11,800 | | | | 456 | |
THK Co Ltd | | | 2,500 | | | | 71 | |
TIS | | | 3,900 | | | | 101 | |
Tobu Railway Co Ltd | | | 3,400 | | | | 88 | |
Toho Co Ltd/Tokyo | | | 2,600 | | | | 113 | |
Toho Gas Co Ltd | | | 1,700 | | | | 83 | |
Tohoku Electric Power Co Inc | | | 9,800 | | | | 74 | |
Tokio Marine Holdings Inc | | | 12,100 | | | | 574 | |
Tokyo Century Corp | | | 500 | | | | 27 | |
Tokyo Electric Power Holdings * | | | 25,800 | | | | 69 | |
Tokyo Electron Ltd | | | 2,800 | | | | 1,146 | |
Tokyo Gas | | | 7,100 | | | | 134 | |
Tokyu Corp | | | 8,400 | | | | 112 | |
TOPPAN Inc | | | 6,000 | | | | 101 | |
Toray Industries Inc | | | 26,500 | | | | 173 | |
Toshiba | | | 7,600 | | | | 325 | |
Tosoh Corp | | | 4,600 | | | | 80 | |
TOTO Ltd | | | 2,700 | | | | 139 | |
Toyo Suisan Kaisha Ltd | | | 2,000 | | | | 76 | |
Toyota Industries Corp | | | 2,900 | | | | 242 | |
Toyota Motor Corp | | | 40,500 | | | | 3,618 | |
Toyota Tsusho Corp | | | 4,100 | | | | 192 | |
Trend Micro Inc/Japan | | | 2,300 | | | | 119 | |
Tsuruha Holdings Inc | | | 800 | | | | 94 | |
Unicharm Corp | | | 7,700 | | | | 307 | |
United Urban Investment Corp ‡ | | | 68 | | | | 100 | |
USS Co Ltd | | | 5,000 | | | | 86 | |
Welcia Holdings | | | 2,200 | | | | 75 | |
West Japan Railway Co | | | 3,000 | | | | 162 | |
Yakult Honsha Co Ltd | | | 2,700 | | | | 159 | |
Yamada Holdings | | | 16,700 | | | | 79 | |
Yamaha | | | 2,400 | | | | 132 | |
Yamaha Motor Co Ltd | | | 4,600 | | | | 114 | |
| | |
| 6 | | Adviser Managed Trust / Annual Report / July 31, 2021 |
| | | | | | | | |
| | | |
| Description | | Shares | | | Market Value
($ Thousands) | |
| | |
COMMON STOCK (continued) | | | | | | | | |
Yamato Holdings Co Ltd | | | 5,700 | | | $ | 164 | |
Yaskawa Electric Corp | | | 4,600 | | | | 225 | |
Yokogawa Electric Corp | | | 5,200 | | | | 79 | |
Z Holdings | | | 50,900 | | | | 253 | |
ZOZO Inc | | | 2,600 | | | | 88 | |
| | | | | | | | |
| | | | | | | 74,036 | |
| | | | | | | | |
| | |
Luxembourg — 0.0% | | | | | | | | |
Tenaris SA | | | 9,677 | | | | 98 | |
| | | | | | | | |
| | |
Netherlands — 0.9% | | | | | | | | |
ABN AMRO Group NV | | | 7,563 | | | | 88 | |
Adyen NV * | | | 381 | | | | 1,034 | |
Aegon NV | | | 34,466 | | | | 147 | |
Airbus SE | | | 11,232 | | | | 1,541 | |
Akzo Nobel NV | | | 3,573 | | | | 441 | |
ArcelorMittal | | | 13,373 | | | | 466 | |
ASM International | | | 905 | | | | 321 | |
ASML Holding NV | | | 7,995 | | | | 6,058 | |
Heineken | | | 5,021 | | | | 584 | |
Heineken Holding NV | | | 2,203 | | | | 217 | |
ING Groep NV | | | 74,677 | | | | 960 | |
InPost * | | | 4,272 | | | | 84 | |
JDE Peet’s | | | 1,527 | | | | 51 | |
Just Eat Takeaway.com * | | | 3,435 | | | | 305 | |
Koninklijke Ahold Delhaize | | | 19,886 | | | | 618 | |
Koninklijke DSM NV | | | 3,375 | | | | 680 | |
Koninklijke KPN NV | | | 69,975 | | | | 230 | |
Koninklijke Philips NV | | | 17,234 | | | | 795 | |
Koninklijke Vopak NV | | | 1,613 | | | | 68 | |
NN Group NV | | | 5,190 | | | | 258 | |
NXP Semiconductors NV | | | 13,900 | | | | 2,869 | |
Prosus | | | 9,341 | | | | 829 | |
Randstad NV | | | 2,271 | | | | 165 | |
Royal Dutch Shell, Cl B | | | 70,788 | | | | 1,397 | |
Royal Dutch Shell, Cl A | | | 77,709 | | | | 1,559 | |
Unibail-Rodamco-Westfield ‡ | | | 2,583 | | | | 215 | |
Unilever | | | 29,727 | | | | 1,713 | |
Wolters Kluwer NV | | | 4,966 | | | | 566 | |
| | | | | | | | |
| | | | | | | 24,259 | |
| | | | | | | | |
| | |
New Zealand — 0.0% | | | | | | | | |
a2 Milk Co Ltd * | | | 16,639 | | | | 72 | |
Auckland International Airport Ltd | | | 21,699 | | | | 110 | |
Fisher & Paykel Healthcare Corp Ltd | | | 11,481 | | | | 253 | |
Mercury NZ | | | 10,297 | | | | 47 | |
Meridian Energy Ltd | | | 22,443 | | | | 82 | |
Ryman Healthcare Ltd | | | 9,192 | | | | 85 | |
Spark New Zealand Ltd | | | 33,914 | | | | 112 | |
| | | | | | | | |
| | | | | | | 761 | |
| | | | | | | | |
| | |
Norway — 0.1% | | | | | | | | |
Adevinta, Cl B * | | | 5,490 | | | | 106 | |
DNB Bank * | | | 17,731 | | | | 363 | |
| | | | | | | | |
| | | |
| Description | | Shares | | | Market Value
($ Thousands) | |
| | |
COMMON STOCK (continued) | | | | | | | | |
Equinor | | | 18,251 | | | $ | 356 | |
Gjensidige Forsikring ASA | | | 4,579 | | | | 105 | |
Mowi ASA | | | 8,257 | | | | 210 | |
Norsk Hydro ASA | | | 23,022 | | | | 153 | |
Orkla ASA | | | 13,111 | | | | 119 | |
Schibsted, Cl A | | | 1,540 | | | | 82 | |
Schibsted ASA, Cl B | | | 2,251 | | | | 104 | |
Telenor ASA | | | 14,262 | | | | 248 | |
Yara International ASA | | | 3,311 | | | | 174 | |
| | | | | | | | |
| | | | | | | 2,020 | |
| | | | | | | | |
| | |
Panama — 0.0% | | | | | | | | |
Copa Holdings SA, Cl A * | | | 1,800 | | | | 128 | |
| | | | | | | | |
| | |
Portugal — 0.0% | | | | | | | | |
EDP - Energias de Portugal SA | | | 51,969 | | | | 270 | |
EDP Renovaveis | | | 5,855 | | | | 138 | |
Galp Energia SGPS | | | 9,071 | | | | 88 | |
Jeronimo Martins SGPS SA | | | 5,764 | | | | 117 | |
| | | | | | | | |
| | | | | | | 613 | |
| | | | | | | | |
| | |
Singapore — 0.1% | | | | | | | | |
Ascendas Real Estate Investment Trust ‡ | | | 55,967 | | | | 129 | |
CapitaLand Integrated Commercial Trust ‡ | | | 82,528 | | | | 131 | |
CapitaLand Ltd | | | 47,399 | | | | 141 | |
City Developments Ltd | | | 5,800 | | | | 29 | |
DBS Group Holdings Ltd | | | 34,711 | | | | 780 | |
Genting Singapore Ltd | | | 140,000 | | | | 84 | |
Hongkong Land Holdings Ltd | | | 21,100 | | | | 96 | |
Jardine Matheson Holdings Ltd | | | 4,300 | | | | 256 | |
Keppel Corp Ltd | | | 26,100 | | | | 106 | |
Mapletree Commercial Trust ‡ | | | 49,800 | | | | 79 | |
Mapletree Logistics Trust ‡ | | | 62,159 | | | | 97 | |
Oversea-Chinese Banking Corp Ltd | | | 63,489 | | | | 577 | |
Singapore Airlines Ltd | | | 24,000 | | | | 90 | |
Singapore Exchange Ltd | | | 14,500 | | | | 127 | |
Singapore Technologies Engineering | | | 35,800 | | | | 106 | |
Singapore Telecommunications | | | 146,400 | | | | 245 | |
United Overseas Bank Ltd | | | 22,100 | | | | 429 | |
UOL Group Ltd | | | 5,900 | | | | 32 | |
Venture Corp Ltd | | | 6,300 | | | | 88 | |
Wilmar International Ltd | | | 33,400 | | | | 107 | |
| | | | | | | | |
| | | | | | | 3,729 | |
| | | | | | | | |
| | |
South Korea — 0.0% | | | | | | | | |
Medytox | | | 5 | | | | 1 | |
| | | | | | | | |
| | |
Spain — 0.3% | | | | | | | | |
ACS Actividades de Construccion y Servicios | | | 5,314 | | | | 140 | |
Aena SME SA * | | | 1,494 | | | | 238 | |
Amadeus IT Group SA, Cl A | | | 8,731 | | | | 572 | |
Banco Bilbao Vizcaya Argentaria SA | | | 127,926 | | | | 821 | |
Banco Santander SA | | | 332,326 | | | | 1,217 | |
CaixaBank SA | | | 87,627 | | | | 260 | |
| | |
| Adviser Managed Trust / Annual Report / July 31, 2021 | | 7 |
SCHEDULE OF INVESTMENTS
July 31, 2021
Tactical Offensive Equity Fund (Continued)
| | | | | | | | |
| | | | | | Market Value | |
| Description | | Shares | | | ($ Thousands) | |
| | |
COMMON STOCK (continued) | | | | | | | | |
Cellnex Telecom | | | 9,887 | | | $ | 644 | |
Enagas SA | | | 4,405 | | | | 101 | |
Endesa SA | | | 5,987 | | | | 146 | |
Ferrovial SA | | | 9,414 | | | | 279 | |
Grifols | | | 6,160 | | | | 157 | |
Iberdrola | | | 112,597 | | | | 1,357 | |
Industria de Diseno Textil SA | | | 20,884 | | | | 708 | |
Naturgy Energy Group | | | 5,129 | | | | 132 | |
Red Electrica Corp SA | | | 8,085 | | | | 160 | |
Repsol SA | | | 28,246 | | | | 309 | |
Siemens Gamesa Renewable Energy SA | | | 4,572 | | | | 127 | |
Telefonica SA | | | 101,757 | | | | 466 | |
| | | | | | | | |
| | | | | | | 7,834 | |
| | | | | | | | |
| | |
Sweden — 0.5% | | | | | | | | |
Alfa Laval | | | 6,026 | | | | 252 | |
Assa Abloy AB, Cl B | | | 19,441 | | | | 624 | |
Atlas Copco AB, Cl A | | | 12,850 | | | | 869 | |
Atlas Copco AB, Cl B | | | 7,712 | | | | 438 | |
Boliden | | | 5,112 | | | | 199 | |
Electrolux AB | | | 4,077 | | | | 107 | |
Embracer Group, Cl B * | | | 5,184 | | | | 134 | |
Epiroc, Cl B | | | 6,752 | | | | 136 | |
Epiroc, Cl A | | | 11,714 | | | | 274 | |
EQT AB | | | 4,571 | | | | 220 | |
Essity AB, Cl B | | | 11,967 | | | | 392 | |
Evolution | | | 3,298 | | | | 575 | |
Fastighets Balder, Cl B * | | | 2,063 | | | | 143 | |
H & M Hennes & Mauritz, Cl B | | | 13,889 | | | | 291 | |
Hexagon, Cl B | | | 38,408 | | | | 636 | |
Husqvarna, Cl B | | | 7,481 | | | | 105 | |
ICA Gruppen AB | | | 2,291 | | | | 113 | |
Industrivarden, Cl A | | | 2,176 | | | | 87 | |
Industrivarden AB, Cl C | | | 2,862 | | | | 110 | |
Investment Latour, Cl B | | | 3,417 | | | | 134 | |
Investor, Cl B | | | 34,776 | | | | 862 | |
Kinnevik | | | 4,289 | | | | 187 | |
L E Lundbergforetagen AB, Cl B | | | 1,749 | | | | 125 | |
Lundin Energy | | | 3,370 | | | | 105 | |
Nibe Industrier, Cl B | | | 25,856 | | | | 309 | |
Nordea Bank Abp * | | | 61,447 | | | | 721 | |
Sandvik AB | | | 21,908 | | | | 571 | |
Securitas AB, Cl B | | | 7,154 | | | | 126 | |
Sinch * | | | 9,210 | | | | 186 | |
Skandinaviska Enskilda Banken AB, Cl A | | | 30,284 | | | | 410 | |
Skanska AB, Cl B | | | 7,018 | | | | 198 | |
SKF AB, Cl B | | | 7,896 | | | | 210 | |
Svenska Cellulosa, Cl B | | | 12,583 | | | | 234 | |
Svenska Handelsbanken AB, Cl A | | | 28,873 | | | | 326 | |
Swedbank AB, Cl A | | | 16,815 | | | | 328 | |
Swedish Match | | | 31,120 | | | | 279 | |
Tele2 AB, Cl B | | | 8,605 | | | | 126 | |
Telefonaktiebolaget LM Ericsson, Cl B | | | 55,880 | | | | 642 | |
| | | | | | | | |
| | | | | | Market Value | |
| Description | | Shares | | | ($ Thousands) | |
| | |
COMMON STOCK (continued) | | | | | | | | |
Telia Co AB | | | 51,320 | | | $ | 225 | |
Volvo, Cl A | | | 4,139 | | | | 101 | |
Volvo AB, Cl B | | | 27,224 | | | | 641 | |
| | | | | | | | |
| | | | | | | 12,751 | |
| | | | | | | | |
| | |
Switzerland — 1.2% | | | | | | | | |
ABB Ltd | | | 32,986 | | | | 1,206 | |
Adecco Group AG | | | 2,921 | | | | 175 | |
Alcon Inc | | | 9,414 | | | | 686 | |
Baloise Holding AG | | | 888 | | | | 140 | |
Banque Cantonale Vaudoise | | | 697 | | | | 62 | |
Barry Callebaut | | | 72 | | | | 182 | |
Chocoladefabriken Lindt & Spruengli AG | | | 23 | | | | 467 | |
Cie Financiere Richemont SA, Cl A | | | 10,003 | | | | 1,280 | |
Clariant AG | | | 4,559 | | | | 95 | |
Coca-Cola HBC AG | | | 3,638 | | | | 137 | |
Credit Suisse Group AG | | | 44,943 | | | | 452 | |
EMS-Chemie Holding AG | | | 125 | | | | 138 | |
Geberit | | | 720 | | | | 591 | |
Givaudan | | | 177 | | | | 883 | |
Holcim | | | 10,154 | | | | 595 | |
Julius Baer Group Ltd | | | 4,395 | | | | 291 | |
Kuehne + Nagel International AG | | | 1,066 | | | | 359 | |
Logitech International | | | 3,384 | | | | 370 | |
Lonza Group AG | | | 1,427 | | | | 1,110 | |
Nestle SA | | | 54,922 | | | | 6,957 | |
Novartis AG | | | 42,574 | | | | 3,940 | |
Partners Group Holding AG | | | 440 | | | | 752 | |
Roche Holding | | | 612 | | | | 263 | |
Roche Holding AG | | | 13,388 | | | | 5,176 | |
Schindler Holding | | | 1,162 | | | | 371 | |
SGS SA | | | 113 | | | | 366 | |
Sika AG | | | 2,717 | | | | 957 | |
Sonova Holding AG | | | 1,008 | | | | 396 | |
Straumann Holding AG | | | 183 | | | | 339 | |
Swatch Group | | | 550 | | | | 184 | |
Swatch Group AG/The | | | 796 | | | | 52 | |
Swiss Life Holding AG | | | 628 | | | | 324 | |
Swiss Prime Site AG | | | 1,323 | | | | 141 | |
Swiss Re AG | | | 5,856 | | | | 530 | |
Swisscom AG | | | 496 | | | | 298 | |
Temenos AG | | | 1,284 | | | | 204 | |
UBS Group | | | 70,259 | | | | 1,158 | |
Vifor Pharma AG | | | 786 | | | | 110 | |
Zurich Insurance Group AG | | | 2,874 | | | | 1,160 | |
| | | | | | | | |
| | | | | | | 32,897 | |
| | | | | | | | |
| | |
Taiwan — 0.0% | | | | | | | | |
Sea Ltd ADR * | | | 300 | | | | 83 | |
| | | | | | | | |
| | |
United Kingdom — 1.6% | | | | | | | | |
3i Group PLC | | | 18,019 | | | | 321 | |
Abrdn PLC | | | 45,954 | | | | 181 | |
Admiral Group PLC | | | 3,639 | | | | 172 | |
| | |
| 8 | | Adviser Managed Trust / Annual Report / July 31, 2021 |
| | | | | | | | |
| Description | | Shares | | | Market Value ($ Thousands) | |
| | |
COMMON STOCK (continued) | | | | | | | | |
Anglo American PLC | | | 24,959 | | | $ | 1,107 | |
Antofagasta PLC | | | 6,957 | | | | 144 | |
Ashtead Group PLC | | | 8,459 | | | | 633 | |
Associated British Foods PLC | | | 7,329 | | | | 205 | |
AstraZeneca PLC | | | 29,485 | | | | 3,389 | |
Auto Trader Group PLC | | | 18,383 | | | | 167 | |
AVEVA Group PLC | | | 2,058 | | | | 112 | |
Aviva PLC | | | 77,638 | | | | 418 | |
BAE Systems PLC | | | 63,531 | | | | 509 | |
Barclays PLC | | | 331,489 | | | | 804 | |
Barratt Developments PLC | | | 19,037 | | | | 186 | |
Berkeley Group Holdings PLC | | | 2,409 | | | | 162 | |
BHP Group PLC | | | 40,477 | | | | 1,308 | |
BP PLC | | | 391,893 | | | | 1,576 | |
British American Tobacco PLC | | | 41,449 | | | | 1,545 | |
British Land PLC ‡ | | | 15,954 | | | | 113 | |
BT Group PLC, Cl A | | | 166,339 | | | | 401 | |
Bunzl PLC | | | 5,943 | | | | 220 | |
Burberry Group PLC | | | 8,306 | | | | 238 | |
Compass Group PLC | | | 34,053 | | | | 720 | |
Croda International PLC | | | 2,686 | | | | 314 | |
DCC PLC | | | 1,714 | | | | 144 | |
Diageo PLC | | | 44,327 | | | | 2,200 | |
Direct Line Insurance Group PLC | | | 24,675 | | | | 102 | |
Entain PLC | | | 11,947 | | | | 302 | |
Evraz PLC | | | 10,725 | | | | 92 | |
Ferguson PLC | | | 4,365 | | | | 612 | |
GlaxoSmithKline PLC | | | 96,874 | | | | 1,910 | |
Glencore PLC | | | 191,516 | | | | 862 | |
Halma PLC | | | 7,058 | | | | 284 | |
Hargreaves Lansdown PLC | | | 7,150 | | | | 162 | |
Hikma Pharmaceuticals PLC | | | 2,892 | | | | 106 | |
HSBC Holdings PLC | | | 386,350 | | | | 2,135 | |
Imperial Brands PLC | | | 18,137 | | | | 389 | |
Informa PLC * | | | 30,785 | | | | 212 | |
InterContinental Hotels Group PLC | | | 3,215 | | | | 212 | |
Intertek Group PLC | | | 3,000 | | | | 215 | |
J Sainsbury PLC | | | 29,618 | | | | 117 | |
JD Sports Fashion PLC | | | 10,024 | | | | 125 | |
Johnson Matthey PLC | | | 3,343 | | | | 138 | |
Kingfisher PLC | | | 43,292 | | | | 222 | |
Kingspan Group PLC | | | 2,731 | | | | 297 | |
Land Securities Group PLC ‡ | | | 12,813 | | | | 126 | |
Legal & General Group PLC | | | 112,433 | | | | 409 | |
Lloyds Banking Group PLC | | | 1,351,901 | | | | 858 | |
London Stock Exchange Group PLC | | | 6,058 | | | | 631 | |
M&G PLC | | | 44,894 | | | | 141 | |
Melrose Industries PLC | | | 99,658 | | | | 222 | |
Mondi PLC | | | 8,610 | | | | 239 | |
National Grid PLC | | | 67,503 | | | | 867 | |
Natwest Group PLC | | | 91,470 | | | | 257 | |
Next PLC | | | 2,551 | | | | 280 | |
| | | | | | | | |
| Description | | Shares | | | Market Value ($ Thousands) | |
| | |
COMMON STOCK (continued) | | | | | | | | |
NMC Health PLC * | | | 3,417 | | | $ | – | |
Ocado Group PLC * | | | 8,755 | | | | 226 | |
Pearson PLC | | | 12,995 | | | | 157 | |
Persimmon PLC | | | 5,636 | | | | 228 | |
Phoenix Group Holdings PLC | | | 11,193 | | | | 106 | |
Prudential PLC | | | 49,994 | | | | 943 | |
Reckitt Benckiser Group PLC | | | 13,630 | | | | 1,047 | |
RELX PLC | | | 37,018 | | | | 1,088 | |
Rentokil Initial PLC | | | 35,576 | | | | 280 | |
Rio Tinto PLC | | | 21,264 | | | | 1,804 | |
Rolls-Royce Holdings PLC | | | 159,417 | | | | 221 | |
Sage Group PLC/The | | | 22,718 | | | | 222 | |
Schroders PLC | | | 2,245 | | | | 114 | |
Segro PLC ‡ | | | 22,065 | | | | 374 | |
Severn Trent PLC | | | 4,169 | | | | 162 | |
Smith & Nephew PLC | | | 17,143 | | | | 348 | |
Smiths Group PLC | | | 7,582 | | | | 164 | |
Spirax-Sarco Engineering PLC | | | 1,303 | | | | 272 | |
SSE PLC | | | 20,482 | | | | 412 | |
St. James’s Place PLC | | | 10,248 | | | | 226 | |
Standard Chartered PLC | | | 50,154 | | | | 301 | |
Taylor Wimpey PLC | | | 69,788 | | | | 160 | |
Tesco PLC | | | 147,413 | | | | 478 | |
Unilever PLC | | | 20,712 | | | | 1,195 | |
United Utilities Group PLC | | | 12,707 | | | | 190 | |
Vodafone Group PLC | | | 515,418 | | | | 833 | |
Whitbread PLC * | | | 4,136 | | | | 175 | |
Wm Morrison Supermarkets PLC | | | 43,293 | | | | 161 | |
WPP PLC | | | 21,843 | | | | 282 | |
| | | | | | | | |
| | | | | | | 41,982 | |
| | | | | | | | |
|
United States — 77.8% | |
| |
Communication Services — 8.4% | | | | | |
Activision Blizzard Inc | | | 39,100 | | | | 3,270 | |
Alphabet Inc, Cl A * | | | 15,188 | | | | 40,924 | |
Alphabet Inc, Cl C * | | | 14,359 | | | | 38,833 | |
Altice USA, Cl A * | | | 11,800 | | | | 363 | |
AT&T Inc | | | 361,066 | | | | 10,128 | |
Cable One Inc | | | 237 | | | | 447 | |
Charter Communications Inc, Cl A * | | | 6,590 | | | | 4,903 | |
Comcast Corp, Cl A | | | 230,600 | | | | 13,566 | |
Discovery Inc, Cl A * | | | 8,200 | | | | 238 | |
Discovery Inc, Cl C * | | | 16,200 | | | | 439 | |
DISH Network Corp, Cl A * | | | 13,000 | | | | 545 | |
Electronic Arts Inc | | | 14,600 | | | | 2,102 | |
Facebook Inc, Cl A * | | | 121,106 | | | | 43,150 | |
Fox Corp | | | 24,305 | | | | 846 | |
IAC * | | | 4,049 | | | | 556 | |
Interpublic Group of Cos Inc/The | | | 20,245 | | | | 716 | |
Liberty Broadband Corp, Cl A * | | | 1,200 | | | | 206 | |
Liberty Broadband Corp, Cl C * | | | 7,564 | | | | 1,343 | |
Liberty Media Corp-Liberty Formula One, Cl C * | | | 10,300 | | | | 483 | |
| | |
| Adviser Managed Trust / Annual Report / July 31, 2021 | | 9 |
SCHEDULE OF INVESTMENTS
July 31, 2021
Tactical Offensive Equity Fund (Continued)
| | | | | | | | |
| Description | | Shares | | | Market Value
($ Thousands) | |
| | |
COMMON STOCK (continued) | | | | | | | | |
Liberty Media Corp-Liberty Formula One, Cl A * | | | 1,200 | | | $ | 50 | |
Liberty Media Corp-Liberty SiriusXM, Cl A * | | | 4,900 | | | | 229 | |
Liberty Media -Liberty SiriusXM, Cl C * | | | 8,000 | | | | 370 | |
Live Nation Entertainment Inc * | | | 6,652 | | | | 525 | |
Lumen Technologies | | | 57,500 | | | | 717 | |
Madison Square Garden Sports * | | | 1,139 | | | | 185 | |
Match Group * | | | 13,597 | | | | 2,166 | |
Netflix Inc * | | | 21,900 | | | | 11,335 | |
New York Times, Cl A | | | 8,600 | | | | 376 | |
News Corp | | | 7,100 | | | | 167 | |
News Corp, Cl A | | | 20,500 | | | | 505 | |
Nexstar Media Group Inc, Cl A | | | 2,230 | | | | 328 | |
Omnicom Group Inc | | | 10,800 | | | | 786 | |
Pinterest, Cl A * | | | 27,500 | | | | 1,620 | |
Playtika Holding * | | | 3,700 | | | | 82 | |
Roku Inc, Cl A * | | | 5,830 | | | | 2,497 | |
Sirius XM Holdings | | | 43,901 | | | | 284 | |
Skillz, Cl A * | | | 14,400 | | | | 203 | |
Spotify Technology * | | | 6,851 | | | | 1,567 | |
Take-Two Interactive Software Inc * | | | 5,800 | | | | 1,006 | |
T-Mobile US Inc * | | | 29,735 | | | | 4,282 | |
TripAdvisor Inc * | | | 5,900 | | | | 224 | |
Twitter Inc * | | | 39,900 | | | | 2,783 | |
Verizon Communications Inc | | | 209,480 | | | | 11,685 | |
ViacomCBS, Cl B | | | 29,000 | | | | 1,187 | |
ViacomCBS | | | 500 | | | | 22 | |
Vimeo * | | | 6,573 | | | | 294 | |
Walt Disney Co/The * | | | 91,800 | | | | 16,159 | |
World Wrestling Entertainment Inc, Cl A | | | 2,700 | | | | 133 | |
Zillow Group Inc, Cl A * | | | 3,100 | | | | 332 | |
Zillow Group Inc, Cl C * | | | 8,200 | | | | 871 | |
Zynga, Cl A * | | | 46,127 | | | | 466 | |
| | | | | | | | |
| | | | | | | 226,494 | |
| | | | | | | | |
|
Consumer Discretionary — 9.5% | |
Advance Auto Parts Inc | | | 3,400 | | | | 721 | |
Amazon.com Inc * | | | 21,991 | | | | 73,177 | |
Aramark | | | 12,100 | | | | 425 | |
AutoNation Inc * | | | 2,500 | | | | 303 | |
AutoZone Inc * | | | 1,070 | | | | 1,737 | |
Best Buy Co Inc | | | 12,500 | | | | 1,404 | |
Booking Holdings Inc * | | | 2,098 | | | | 4,570 | |
BorgWarner Inc | | | 12,200 | | | | 598 | |
Boyd Gaming Corp * | | | 4,000 | | | | 228 | |
Bright Horizons Family Solutions Inc * | | | 3,124 | | | | 467 | |
Brunswick Corp/DE | | | 4,100 | | | | 428 | |
Burlington Stores Inc * | | | 3,273 | | | | 1,096 | |
Caesars Entertainment * | | | 10,000 | | | | 874 | |
Capri Holdings Ltd * | | | 7,400 | | | | 417 | |
CarMax Inc * | | | 8,200 | | | | 1,098 | |
Carnival Corp * | | | 42,689 | | | | 924 | |
Carter’s Inc | | | 2,500 | | | | 244 | |
| | | | | | | | |
Description | | Shares | | | Market Value
($ Thousands) | |
| | |
COMMON STOCK (continued) | | | | | | | | |
Carvana Co, Cl A * | | | 3,900 | | | $ | 1,317 | |
Chegg * | | | 6,400 | | | | 567 | |
Chipotle Mexican Grill, Cl A * | | | 1,403 | | | | 2,614 | |
Choice Hotels International Inc | | | 2,000 | | | | 240 | |
Churchill Downs Inc | | | 1,800 | | | | 334 | |
Columbia Sportswear Co | | | 1,700 | | | | 169 | |
Darden Restaurants Inc | | | 6,500 | | | | 948 | |
Deckers Outdoor Corp * | | | 1,400 | | | | 575 | |
Delphi Automotive PLC * | | | 13,700 | | | | 2,286 | |
Dick’s Sporting Goods Inc | | | 3,100 | | | | 323 | |
Dollar General Corp | | | 12,100 | | | | 2,815 | |
Dollar Tree Inc * | | | 12,000 | | | | 1,198 | |
Domino’s Pizza Inc | | | 1,983 | | | | 1,042 | |
DoorDash, Cl A * | | | 4,200 | | | | 732 | |
DR Horton Inc | | | 16,906 | | | | 1,613 | |
DraftKings, Cl A * | | | 15,100 | | | | 732 | |
eBay Inc | | | 34,500 | | | | 2,353 | |
Etsy Inc * | | | 6,000 | | | | 1,101 | |
Expedia Group Inc * | | | 7,200 | | | | 1,158 | |
Five Below Inc * | | | 2,900 | | | | 564 | |
Floor & Decor Holdings Inc, Cl A * | | | 5,100 | | | | 622 | |
Foot Locker Inc | | | 5,100 | | | | 291 | |
Ford Motor Co * | | | 199,600 | | | | 2,784 | |
Frontdoor * | | | 5,000 | | | | 245 | |
GameStop, Cl A * | | | 2,900 | | | | 467 | |
Gap Inc/The | | | 9,100 | | | | 265 | |
Garmin Ltd | | | 7,600 | | | | 1,195 | |
General Motors Co * | | | 69,400 | | | | 3,945 | |
Gentex Corp | | | 12,800 | | | | 436 | |
Genuine Parts Co | | | 7,100 | | | | 901 | |
Grand Canyon Education * | | | 2,739 | | | | 253 | |
H&R Block Inc | | | 9,000 | | | | 221 | |
Hanesbrands Inc | | | 18,100 | | | | 331 | |
Harley-Davidson Inc | | | 7,600 | | | | 301 | |
Hasbro Inc | | | 6,731 | | | | 669 | |
Hilton Worldwide Holdings Inc * | | | 13,900 | | | | 1,827 | |
Home Depot | | | 54,330 | | | | 17,831 | |
Hyatt Hotels Corp, Cl A * | | | 2,100 | | | | 168 | |
Kohl’s Corp | | | 8,300 | | | | 422 | |
L Brands Inc | | | 12,000 | | | | 961 | |
Las Vegas Sands Corp * | | | 16,500 | | | | 699 | |
Lear Corp | | | 3,139 | | | | 549 | |
Leggett & Platt | | | 6,867 | | | | 330 | |
Lennar Corp, Cl B | | | 800 | | | | 69 | |
Lennar Corp, Cl A | | | 13,800 | | | | 1,451 | |
Leslie’s * | | | 3,600 | | | | 88 | |
Lithia Motors, Cl A | | | 1,400 | | | | 528 | |
LKQ Corp * | | | 13,900 | | | | 705 | |
Lowe’s | | | 36,300 | | | | 6,995 | |
Lululemon Athletica Inc * | | | 5,827 | | | | 2,332 | |
Marriott International Inc/MD, Cl A * | | | 13,700 | | | | 2,000 | |
Marriott Vacations Worldwide Corp * | | | 2,000 | | | | 295 | |
| | |
| 10 | | Adviser Managed Trust / Annual Report / July 31, 2021 |
| | | | | | | | |
| Description | | Shares | | | Market Value ($ Thousands) | |
| | |
COMMON STOCK (continued) | | | | | | | | |
Mattel Inc * | | | 18,000 | | | $ | 391 | |
McDonald’s | | | 37,747 | | | | 9,162 | |
MGM Resorts International | | | 20,400 | | | | 766 | |
Mohawk Industries Inc * | | | 3,035 | | | | 592 | |
Newell Brands | | | 20,000 | | | | 495 | |
NIKE Inc, Cl B | | | 62,605 | | | | 10,487 | |
Nordstrom Inc * | | | 6,400 | | | | 212 | |
Norwegian Cruise Line Holdings Ltd * | | | 19,132 | | | | 460 | |
NVR Inc * | | | 174 | | | | 909 | |
Ollie’s Bargain Outlet Holdings Inc * | | | 3,100 | | | | 289 | |
O’Reilly Automotive Inc * | | | 3,433 | | | | 2,073 | |
Peloton Interactive, Cl A * | | | 13,000 | | | | 1,535 | |
Penn National Gaming Inc * | | | 7,800 | | | | 533 | |
Penske Automotive Group Inc | | | 1,900 | | | | 168 | |
Planet Fitness, Cl A * | | | 4,100 | | | | 308 | |
Polaris | | | 3,024 | | | | 396 | |
Pool Corp | | | 1,982 | | | | 947 | |
PulteGroup Inc | | | 13,000 | | | | 713 | |
PVH Corp * | | | 3,700 | | | | 387 | |
QuantumScape, Cl A * | | | 5,500 | | | | 126 | |
Qurate Retail Inc, Cl A | | | 18,800 | | | | 223 | |
Ralph Lauren Corp, Cl A | | | 2,400 | | | | 272 | |
RH * | | | 900 | | | | 598 | |
Ross Stores | | | 17,843 | | | | 2,189 | |
Royal Caribbean Cruises Ltd * | | | 10,100 | | | | 776 | |
Service Corp International/US | | | 8,800 | | | | 550 | |
Six Flags Entertainment Corp * | | | 4,500 | | | | 187 | |
Skechers USA, Cl A * | | | 6,670 | | | | 358 | |
Starbucks | | | 59,500 | | | | 7,225 | |
Tapestry Inc * | | | 14,400 | | | | 609 | |
Target Corp | | | 25,100 | | | | 6,552 | |
Tempur Sealy International Inc | | | 9,440 | | | | 409 | |
Terminix Global Holdings * | | | 6,900 | | | | 362 | |
Tesla Inc * | | | 39,190 | | | | 26,931 | |
Thor Industries | | | 2,800 | | | | 331 | |
TJX Cos Inc/The | | | 61,500 | | | | 4,232 | |
Toll Brothers Inc | | | 6,000 | | | | 356 | |
TopBuild Corp * | | | 1,600 | | | | 324 | |
Tractor Supply | | | 5,900 | | | | 1,068 | |
Travel + Leisure | | | 4,100 | | | | 212 | |
Ulta Beauty Inc * | | | 2,700 | | | | 907 | |
Under Armour Inc, Cl A * | | | 11,100 | | | | 227 | |
Under Armour Inc, Cl C * | | | 11,200 | | | | 196 | |
Vail Resorts Inc | | | 2,100 | | | | 641 | |
VF | | | 16,400 | | | | 1,315 | |
Vroom * | | | 5,300 | | | | 196 | |
Wayfair Inc, Cl A * | | | 3,558 | | | | 859 | |
Wendy’s Co/The | | | 10,600 | | | | 246 | |
Whirlpool Corp | | | 3,247 | | | | 719 | |
Williams-Sonoma Inc | | | 3,700 | | | | 561 | |
Wyndham Hotels & Resorts Inc | | | 4,600 | | | | 332 | |
Wynn Resorts Ltd * | | | 5,600 | | | | 551 | |
| | | | | | | | |
| Description | | Shares | | | Market Value ($ Thousands) | |
| | |
COMMON STOCK (continued) | | | | | | | | |
YETI Holdings Inc * | | | 4,200 | | | $ | 405 | |
Yum China Holdings Inc | | | 20,400 | | | | 1,269 | |
Yum! Brands Inc | | | 15,400 | | | | 2,023 | |
| | | | | | | | |
| | | | | | | 256,728 | |
| | | | | | | | |
| | |
Consumer Staples — 4.3% | | | | | | | | |
Albertsons | | | 7,800 | | | | 168 | |
Altria Group Inc | | | 93,500 | | | | 4,492 | |
Archer-Daniels-Midland Co | | | 28,300 | | | | 1,690 | |
Beyond Meat * | | | 2,742 | | | | 336 | |
Boston Beer Co Inc/The, Cl A * | | | 463 | | | | 329 | |
Brown-Forman Corp, Cl A | | | 2,700 | | | | 181 | |
Brown-Forman Corp, Cl B | | | 9,600 | | | | 681 | |
Bunge | | | 6,800 | | | | 528 | |
Campbell Soup Co | | | 10,300 | | | | 450 | |
Casey’s General Stores | | | 1,968 | | | | 389 | |
Church & Dwight Co Inc | | | 12,600 | | | | 1,091 | |
Clorox Co/The | | | 6,400 | | | | 1,158 | |
Coca-Cola | | | 196,226 | | | | 11,191 | |
Coca-Cola Europacific Partners | | | 3,900 | | | | 242 | |
Colgate-Palmolive Co | | | 42,100 | | | | 3,347 | |
Conagra Brands Inc | | | 23,400 | | | | 784 | |
Constellation Brands Inc, Cl A | | | 8,261 | | | | 1,853 | |
Costco Wholesale Corp | | | 22,317 | | | | 9,590 | |
Coty Inc, Cl A * | | | 13,900 | | | | 121 | |
Darling Ingredients Inc * | | | 8,000 | | | | 553 | |
Estee Lauder Cos Inc/The, Cl A | | | 11,600 | | | | 3,872 | |
Flowers Foods Inc | | | 9,600 | | | | 226 | |
Freshpet Inc * | | | 2,000 | | | | 293 | |
General Mills Inc | | | 31,020 | | | | 1,826 | |
Grocery Outlet Holding * | | | 4,100 | | | | 136 | |
Hain Celestial Group Inc/The * | | | 4,800 | | | | 192 | |
Herbalife Nutrition * | | | 4,400 | | | | 224 | |
Hershey Co/The | | | 7,555 | | | | 1,351 | |
Hormel Foods Corp | | | 14,900 | | | | 691 | |
Ingredion Inc | | | 3,500 | | | | 307 | |
J M Smucker | | | 5,300 | | | | 695 | |
Kellogg Co | | | 13,300 | | | | 843 | |
Keurig Dr Pepper Inc | | | 35,685 | | | | 1,256 | |
Kimberly-Clark | | | 17,000 | | | | 2,307 | |
Kraft Heinz Co/The | | | 33,000 | | | | 1,270 | |
Kroger | | | 38,700 | | | | 1,575 | |
Lamb Weston Holdings Inc | | | 7,700 | | | | 514 | |
McCormick & Co Inc/MD | | | 12,600 | | | | 1,061 | |
Molson Coors Beverage, Cl B | | | 9,385 | | | | 459 | |
Mondelez International Inc, Cl A | | | 70,400 | | | | 4,453 | |
Monster Beverage Corp * | | | 18,900 | | | | 1,783 | |
PepsiCo Inc | | | 69,814 | | | | 10,957 | |
Philip Morris International | | | 78,700 | | | | 7,877 | |
Pilgrim’s Pride Corp * | | | 2,600 | | | | 58 | |
Post Holdings Inc * | | | 3,300 | | | | 338 | |
Procter & Gamble Co/The | | | 123,124 | | | | 17,512 | |
Reynolds Consumer Products | | | 2,900 | | | | 83 | |
| | |
| Adviser Managed Trust / Annual Report / July 31, 2021 | | 11 |
SCHEDULE OF INVESTMENTS
July 31, 2021
Tactical Offensive Equity Fund (Continued)
| | | | | | | | |
| Description | | Shares | | | Market Value
($ Thousands) | |
|
COMMON STOCK (continued) | |
Seaboard Corp | | | 12 | | | $ | 49 | |
Spectrum Brands Holdings Inc | | | 2,500 | | | | 218 | |
Sysco Corp | | | 24,800 | | | | 1,840 | |
Tyson Foods, Cl A | | | 14,600 | | | | 1,043 | |
US Foods Holding Corp * | | | 11,610 | | | | 399 | |
Walgreens Boots Alliance Inc | | | 37,000 | | | | 1,745 | |
Walmart Inc | | | 72,531 | | | | 10,339 | |
| | | | | | | | |
| | | | | | | 116,966 | |
| | | | | | | | |
| | |
Energy — 1.9% | | | | | | | | |
Antero Midstream | | | 16,900 | | | | 161 | |
APA | | | 19,874 | | | | 373 | |
Baker Hughes a GE Co, Cl A | | | 37,300 | | | | 792 | |
Cabot Oil & Gas Corp | | | 20,565 | | | | 329 | |
Cheniere Energy * | | | 11,800 | | | | 1,002 | |
Chevron Corp | | | 97,834 | | | | 9,961 | |
Cimarex Energy Co | | | 5,200 | | | | 339 | |
ConocoPhillips | | | 68,138 | | | | 3,820 | |
Continental Resources Inc/OK | | | 3,600 | | | | 123 | |
Devon Energy Corp | | | 34,141 | | | | 882 | |
Diamondback Energy Inc | | | 9,000 | | | | 694 | |
DT Midstream * | | | 4,900 | | | | 208 | |
EOG Resources | | | 29,800 | | | | 2,171 | |
EQT Corp * | | | 15,000 | | | | 276 | |
Exxon Mobil Corp | | | 214,072 | | | | 12,324 | |
Halliburton Co | | | 44,400 | | | | 918 | |
Hess Corp | | | 14,000 | | | | 1,070 | |
HollyFrontier | | | 7,400 | | | | 218 | |
Kinder Morgan Inc/DE | | | 99,366 | | | | 1,727 | |
Marathon Oil Corp | | | 41,522 | | | | 481 | |
Marathon Petroleum Corp | | | 33,100 | | | | 1,828 | |
NOV * | | | 20,300 | | | | 280 | |
Occidental Petroleum Corp | | | 42,700 | | | | 1,114 | |
ONEOK Inc | | | 22,600 | | | | 1,175 | |
Phillips 66 | | | 22,300 | | | | 1,637 | |
Pioneer Natural Resources Co | | | 10,916 | | | | 1,587 | |
Schlumberger Ltd | | | 71,000 | | | | 2,047 | |
Targa Resources Corp | | | 11,600 | | | | 488 | |
Texas Pacific Land | | | 300 | | | | 448 | |
Valero Energy Corp | | | 20,800 | | | | 1,393 | |
Williams | | | 62,100 | | | | 1,556 | |
| | | | | | | | |
| | | | | | | 51,422 | |
| | | | | | | | |
| | |
Financials — 8.7% | | | | | | | | |
Affiliated Managers Group | | | 2,300 | | | | 364 | |
Aflac Inc | | | 33,800 | | | | 1,859 | |
AGNC Investment Corp ‡ | | | 27,092 | | | | 430 | |
Alleghany Corp * | | | 700 | | | | 464 | |
Allstate Corp/The | | | 14,983 | | | | 1,949 | |
Ally Financial Inc | | | 18,566 | | | | 954 | |
American Express Co | | | 32,900 | | | | 5,610 | |
American Financial Group Inc/OH | | | 3,643 | | | | 461 | |
American International Group Inc | | | 44,100 | | | | 2,088 | |
| | | | | | | | |
| Description | | Shares | | | Market Value
($ Thousands) | |
| | |
COMMON STOCK (continued) | | | | | | | | |
Ameriprise Financial Inc | | | 6,000 | | | $ | 1,545 | |
Annaly Capital Management Inc ‡ | | | 74,849 | | | | 635 | |
Aon, Cl A | | | 11,363 | | | | 2,955 | |
Apollo Global Management, Cl A | | | 9,000 | | | | 530 | |
Arch Capital Group Ltd * | | | 19,400 | | | | 757 | |
Ares Management, Cl A | | | 5,800 | | | | 415 | |
Arthur J Gallagher & Co | | | 10,200 | | | | 1,421 | |
Assurant Inc | | | 3,035 | | | | 479 | |
Assured Guaranty Ltd | | | 3,800 | | | | 182 | |
Athene Holding Ltd, Cl A * | | | 5,940 | | | | 384 | |
Axis Capital Holdings Ltd | | | 3,700 | | | | 188 | |
Bank of America Corp | | | 381,300 | | | | 14,627 | |
Bank of Hawaii Corp | | | 2,300 | | | | 193 | |
Bank of New York Mellon Corp/The | | | 40,800 | | | | 2,094 | |
Bank OZK | | | 6,000 | | | | 244 | |
Berkshire Hathaway Inc, Cl B * | | | 94,809 | | | | 26,384 | |
BlackRock Inc, Cl A | | | 7,173 | | | | 6,220 | |
Blackstone Group (A) | | | 34,300 | | | | 3,954 | |
BOK Financial Corp | | | 1,800 | | | | 151 | |
Brighthouse Financial Inc * | | | 4,583 | | | | 197 | |
Brown & Brown Inc | | | 11,900 | | | | 647 | |
Capital One Financial Corp | | | 22,600 | | | | 3,654 | |
Carlyle Group | | | 8,000 | | | | 404 | |
Cboe Global Markets Inc | | | 5,700 | | | | 675 | |
Charles Schwab Corp/The | | | 79,180 | | | | 5,380 | |
Chubb | | | 22,600 | | | | 3,814 | |
Cincinnati Financial Corp | | | 7,600 | | | | 896 | |
Citigroup | | | 104,400 | | | | 7,060 | |
Citizens Financial Group Inc | | | 21,300 | | | | 898 | |
CME Group Inc, Cl A | | | 18,200 | | | | 3,861 | |
CNA Financial Corp | | | 1,400 | | | | 62 | |
Comerica | | | 7,200 | | | | 494 | |
Commerce Bancshares Inc/MO | | | 5,546 | | | | 392 | |
Credit Acceptance Corp * | | | 472 | | | | 229 | |
Cullen/Frost Bankers Inc | | | 2,900 | | | | 311 | |
Discover Financial Services | | | 15,600 | | | | 1,939 | |
East West Bancorp | | | 7,471 | | | | 532 | |
Equitable Holdings | | | 19,059 | | | | 588 | |
Erie Indemnity Co, Cl A | | | 1,300 | | | | 240 | |
Evercore Inc, Cl A | | | 1,900 | | | | 251 | |
Everest Re Group Ltd | | | 2,000 | | | | 506 | |
FactSet Research Systems Inc | | | 1,972 | | | | 705 | |
Fidelity National Financial Inc | | | 14,400 | | | | 642 | |
Fifth Third Bancorp | | | 36,300 | | | | 1,317 | |
First American Financial | | | 5,400 | | | | 363 | |
First Citizens BancShares, Cl A | | | 349 | | | | 273 | |
First Hawaiian Inc | | | 7,600 | | | | 209 | |
First Horizon National Corp | | | 28,900 | | | | 447 | |
First Republic Bank/CA | | | 8,841 | | | | 1,724 | |
FNB Corp/PA | | | 19,000 | | | | 218 | |
Franklin Resources Inc | | | 14,239 | | | | 421 | |
Globe Life | | | 5,400 | | | | 503 | |
| | |
| 12 | | Adviser Managed Trust / Annual Report / July 31, 2021 |
| | | | | | | | |
| Description | | Shares | | | Market Value ($ Thousands) | |
| | |
COMMON STOCK (continued) | | | | | | | | |
Goldman Sachs Group Inc/The | | | 16,714 | | | $ | 6,266 | |
Hanover Insurance Group Inc/The | | | 1,900 | | | | 258 | |
Hartford Financial Services Group Inc/The | | | 18,200 | | | | 1,158 | |
Huntington Bancshares Inc/OH | | | 74,322 | | | | 1,046 | |
Interactive Brokers Group, Cl A | | | 4,200 | | | | 260 | |
Intercontinental Exchange Inc | | | 28,435 | | | | 3,407 | |
Invesco Ltd | | | 16,500 | | | | 402 | |
Janus Henderson Group | | | 8,400 | | | | 351 | |
Jefferies Financial Group | | | 11,000 | | | | 365 | |
JPMorgan Chase & Co | | | 152,070 | | | | 23,081 | |
Kemper Corp | | | 3,600 | | | | 238 | |
KeyCorp | | | 49,400 | | | | 971 | |
KKR | | | 27,700 | | | | 1,766 | |
Lazard Ltd, Cl A (A) | | | 5,900 | | | | 278 | |
Lemonade * | | | 1,700 | | | | 148 | |
Lincoln National | | | 10,073 | | | | 621 | |
Loews | | | 11,043 | | | | 592 | |
LPL Financial Holdings Inc | | | 4,100 | | | | 578 | |
M&T Bank Corp | | | 6,500 | | | | 870 | |
Markel * | | | 670 | | | | 808 | |
MarketAxess Holdings Inc | | | 1,959 | | | | 931 | |
Marsh & McLennan Cos Inc | | | 25,924 | | | | 3,817 | |
Mercury General | | | 1,300 | | | | 79 | |
MetLife | | | 37,300 | | | | 2,152 | |
MGIC Investment Corp | | | 16,600 | | | | 230 | |
Moody’s Corp | | | 8,300 | | | | 3,121 | |
Morgan Stanley | | | 70,143 | | | | 6,732 | |
Morningstar Inc | | | 1,237 | | | | 313 | |
MSCI Inc, Cl A | | | 4,100 | | | | 2,443 | |
Nasdaq Inc | | | 5,734 | | | | 1,071 | |
New Residential Investment Corp ‡ | | | 24,400 | | | | 238 | |
New York Community Bancorp Inc | | | 22,200 | | | | 262 | |
Northern Trust Corp | | | 9,800 | | | | 1,106 | |
Old Republic International Corp | | | 14,800 | | | | 365 | |
OneMain Holdings, Cl A | | | 3,800 | | | | 232 | |
PacWest Bancorp | | | 5,700 | | | | 227 | |
People’s United Financial Inc | | | 22,200 | | | | 349 | |
Pinnacle Financial Partners Inc | | | 3,853 | | | | 345 | |
PNC Financial Services Group Inc/The | | | 21,400 | | | | 3,904 | |
Popular Inc | | | 4,300 | | | | 313 | |
Primerica Inc | | | 1,900 | | | | 278 | |
Principal Financial Group Inc | | | 13,400 | | | | 833 | |
Progressive Corp/The | | | 29,900 | | | | 2,845 | |
Prosperity Bancshares Inc | | | 4,700 | | | | 321 | |
Prudential Financial Inc | | | 20,200 | | | | 2,026 | |
Raymond James Financial Inc | | | 6,500 | | | | 842 | |
Regions Financial Corp | | | 48,100 | | | | 926 | |
Reinsurance Group of America Inc, Cl A | | | 3,600 | | | | 397 | |
RenaissanceRe Holdings Ltd | | | 2,562 | | | | 391 | |
Rocket, Cl A | | | 5,600 | | | | 97 | |
S&P Global Inc | | | 12,155 | | | | 5,211 | |
Santander Consumer USA Holdings Inc | | | 3,700 | | | | 152 | |
| | | | | | | | |
| Description | | Shares | | | Market Value ($Thousands) | |
| | |
COMMON STOCK (continued) | | | | | | | | |
Signature Bank/New York NY | | | 3,000 | | | $ | 681 | |
SLM Corp | | | 17,600 | | | | 331 | |
Starwood Property Trust Inc ‡ | | | 14,300 | | | | 372 | |
State Street Corp | | | 18,000 | | | | 1,569 | |
Sterling Bancorp/DE | | | 9,500 | | | | 206 | |
Stifel Financial Corp | | | 5,000 | | | | 333 | |
SVB Financial Group * | | | 2,774 | | | | 1,526 | |
Synchrony Financial | | | 29,700 | | | | 1,396 | |
Synovus Financial Corp | | | 7,700 | | | | 315 | |
T Rowe Price Group | | | 11,300 | | | | 2,307 | |
TFS Financial Corp | | | 2,400 | | | | 47 | |
Tradeweb Markets, Cl A | | | 5,300 | | | | 460 | |
Travelers Cos Inc/The | | | 12,900 | | | | 1,921 | |
Truist Financial | | | 67,800 | | | | 3,690 | |
Umpqua Holdings | | | 13,000 | | | | 245 | |
Unum Group | | | 10,100 | | | | 277 | |
Upstart Holdings * | | | 700 | | | | 85 | |
US Bancorp | | | 67,700 | | | | 3,760 | |
Virtu Financial Inc, Cl A | | | 3,700 | | | | 95 | |
Voya Financial Inc | | | 6,600 | | | | 425 | |
Webster Financial Corp | | | 4,374 | | | | 210 | |
Wells Fargo & Co | | | 209,100 | | | | 9,606 | |
Western Alliance Bancorp | | | 5,100 | | | | 473 | |
White Mountains Insurance Group Ltd | | | 122 | | | | 138 | |
Willis Towers Watson PLC | | | 6,469 | | | | 1,333 | |
Wintrust Financial Corp | | | 2,800 | | | | 200 | |
WR Berkley Corp | | | 7,261 | | | | 531 | |
Zions Bancorp NA | | | 8,501 | | | | 443 | |
| | | | | | | | |
| | | | | | | 236,377 | |
| | | | | | | | |
| | |
Health Care — 10.4% | | | | | | | | |
10X Genomics, Cl A * | | | 4,200 | | | | 770 | |
Abbott Laboratories | | | 87,800 | | | | 10,622 | |
AbbVie Inc | | | 89,300 | | | | 10,386 | |
ABIOMED Inc * | | | 2,327 | | | | 761 | |
Acadia Healthcare Co Inc * | | | 4,300 | | | | 265 | |
Acceleron Pharma Inc * | | | 2,900 | | | | 363 | |
Adaptive Biotechnologies * | | | 4,200 | | | | 154 | |
Agilent Technologies Inc | | | 15,600 | | | | 2,390 | |
agilon health * | | | 2,300 | | | | 85 | |
Align Technology Inc * | | | 3,970 | | | | 2,762 | |
Alnylam Pharmaceuticals Inc * | | | 6,100 | | | | 1,092 | |
Amedisys Inc * | | | 1,600 | | | | 417 | |
AmerisourceBergen Corp, Cl A | | | 7,700 | | | | 941 | |
Amgen Inc | | | 28,991 | | | | 7,002 | |
Anthem Inc | | | 12,339 | | | | 4,738 | |
Avantor * | | | 28,997 | | | | 1,090 | |
Baxter International Inc | | | 25,310 | | | | 1,958 | |
Becton Dickinson and Co | | | 14,767 | | | | 3,777 | |
Biogen Inc * | | | 7,576 | | | | 2,475 | |
BioMarin Pharmaceutical Inc * | | | 9,600 | | | | 737 | |
Bio-Rad Laboratories Inc, Cl A * | | | 1,057 | | | | 782 | |
Bio-Techne Corp | | | 1,975 | | | | 952 | |
| | |
| Adviser Managed Trust / Annual Report / July 31, 2021 | | 13 |
SCHEDULE OF INVESTMENTS
July 31, 2021
Tactical Offensive Equity Fund (Continued)
| | | | | | | | |
| Description | | Shares | | | Market Value ($ Thousands) | |
| | | |
COMMON STOCK (continued) | | | | | | | | |
Boston Scientific Corp * | | | 71,500 | | | $ | 3,260 | |
Bristol-Myers Squibb | | | 112,900 | | | | 7,663 | |
Bruker Corp | | | 5,400 | | | | 444 | |
Cardinal Health | | | 14,500 | | | | 861 | |
Catalent Inc * | | | 8,200 | | | | 982 | |
Centene Corp * | | | 29,400 | | | | 2,017 | |
Cerner Corp | | | 15,500 | | | | 1,246 | |
Change Healthcare * | | | 12,000 | | | | 261 | |
Charles River Laboratories International Inc * | | | 2,548 | | | | 1,037 | |
Chemed Corp | | | 815 | | | | 388 | |
Cigna Corp | | | 17,238 | | | | 3,956 | |
Cooper Cos Inc/The | | | 2,454 | | | | 1,035 | |
CureVac * | | | 2,500 | | | | 123 | |
CVS Health | | | 66,500 | | | | 5,477 | |
Danaher Corp | | | 32,164 | | | | 9,568 | |
DaVita Inc * | | | 3,443 | | | | 414 | |
DENTSPLY SIRONA Inc | | | 10,800 | | | | 713 | |
Dexcom * | | | 4,863 | | | | 2,507 | |
Edwards Lifesciences Corp * | | | 31,600 | | | | 3,548 | |
Elanco Animal Health Inc * | | | 22,726 | | | | 829 | |
Eli Lilly | | | 42,800 | | | | 10,422 | |
Encompass Health Corp | | | 4,900 | | | | 408 | |
Envista Holdings * | | | 8,300 | | | | 358 | |
Exact Sciences * | | | 8,582 | | | | 926 | |
Exelixis Inc * | | | 15,300 | | | | 258 | |
Gilead Sciences Inc | | | 63,400 | | | | 4,330 | |
Globus Medical Inc, Cl A * | | | 3,700 | | | | 308 | |
Guardant Health * | | | 4,343 | | | | 477 | |
HCA Healthcare Inc | | | 13,142 | | | | 3,262 | |
Henry Schein Inc * | | | 7,500 | | | | 601 | |
Hill-Rom Holdings Inc | | | 3,500 | | | | 485 | |
Hologic Inc * | | | 12,700 | | | | 953 | |
Horizon Therapeutics * | | | 10,372 | | | | 1,037 | |
Humana | | | 6,572 | | | | 2,799 | |
ICU Medical Inc * | | | 1,142 | | | | 232 | |
IDEXX Laboratories * | | | 4,300 | | | | 2,918 | |
Illumina Inc * | | | 7,378 | | | | 3,658 | |
Incyte * | | | 9,700 | | | | 750 | |
Insulet Corp * | | | 3,438 | | | | 962 | |
Integra LifeSciences Holdings Corp * | | | 3,500 | | | | 253 | |
Intuitive Surgical Inc * | | | 5,947 | | | | 5,896 | |
Ionis Pharmaceuticals Inc * | | | 7,644 | | | | 284 | |
Iovance Biotherapeutics Inc * | | | 8,000 | | | | 178 | |
IQVIA Holdings Inc * | | | 9,700 | | | | 2,403 | |
Johnson & Johnson | | | 133,223 | | | | 22,941 | |
Laboratory Corp of America Holdings * | | | 4,900 | | | | 1,451 | |
Maravai LifeSciences Holdings, Cl A * | | | 3,300 | | | | 145 | |
Masimo * | | | 2,542 | | | | 692 | |
McKesson Corp | | | 8,100 | | | | 1,651 | |
Medtronic PLC | | | 67,800 | | | | 8,903 | |
Merck & Co Inc | | | 128,000 | | | | 9,839 | |
| | | | | | | | |
| Description | | Shares | | | Market Value ($ Thousands) | |
| | | |
COMMON STOCK (continued) | | | | | | | | |
Mettler-Toledo International Inc * | | | 1,167 | | | $ | 1,720 | |
Mirati Therapeutics * | | | 1,900 | | | | 304 | |
Moderna Inc * | | | 17,100 | | | | 6,047 | |
Molina Healthcare Inc * | | | 2,839 | | | | 775 | |
Natera * | | | 3,900 | | | | 447 | |
Nektar Therapeutics, Cl A * | | | 10,200 | | | | 161 | |
Neurocrine Biosciences Inc * | | | 4,800 | | | | 447 | |
Novavax * | | | 3,700 | | | | 664 | |
Novocure Ltd * | | | 5,100 | | | | 785 | |
Oak Street Health * | | | 4,700 | | | | 296 | |
Organon * | | | 13,590 | | | | 394 | |
Penumbra Inc * | | | 1,732 | | | | 461 | |
PerkinElmer Inc | | | 5,900 | | | | 1,075 | |
Pfizer Inc | | | 282,167 | | | | 12,079 | |
PPD * | | | 7,200 | | | | 332 | |
Premier Inc, Cl A | | | 6,200 | | | | 221 | |
QIAGEN * | | | 11,800 | | | | 623 | |
Quest Diagnostics Inc | | | 6,500 | | | | 922 | |
Quidel Corp * | | | 2,170 | | | | 307 | |
Regeneron Pharmaceuticals Inc * | | | 5,105 | | | | 2,933 | |
Repligen Corp * | | | 2,800 | | | | 688 | |
ResMed | | | 7,338 | | | | 1,994 | |
Royalty Pharma, Cl A | | | 17,000 | | | | 649 | |
Sage Therapeutics * | | | 3,000 | | | | 131 | |
Sarepta Therapeutics * | | | 4,121 | | | | 279 | |
Seagen * | | | 6,450 | | | | 989 | |
Sotera Health * | | | 2,500 | | | | 59 | |
STERIS PLC | | | 4,600 | | | | 1,003 | |
Stryker Corp | | | 17,600 | | | | 4,769 | |
Syneos Health Inc, Cl A * | | | 5,000 | | | | 448 | |
Tandem Diabetes Care Inc * | | | 3,400 | | | | 370 | |
Teladoc Health Inc * | | | 7,331 | | | | 1,088 | |
Teleflex Inc | | | 2,441 | | | | 970 | |
Thermo Fisher Scientific | | | 19,879 | | | | 10,735 | |
Ultragenyx Pharmaceutical Inc * | | | 3,100 | | | | 247 | |
United Therapeutics Corp * | | | 2,200 | | | | 400 | |
UnitedHealth Group Inc | | | 47,561 | | | | 19,606 | |
Universal Health Services Inc, Cl B | | | 3,900 | | | | 626 | |
Veeva Systems Inc, Cl A * | | | 6,959 | | | | 2,315 | |
Vertex Pharmaceuticals Inc * | | | 13,300 | | | | 2,681 | |
Viatris, Cl W * | | | 61,266 | | | | 862 | |
Waters Corp * | | | 3,064 | | | | 1,194 | |
West Pharmaceutical Services Inc | | | 3,734 | | | | 1,537 | |
Zimmer Biomet Holdings Inc | | | 10,600 | | | | 1,732 | |
Zoetis Inc, Cl A | | | 23,964 | | | | 4,858 | |
| | | | | | | | |
| | | | | | | 281,851 | |
| | | | | | | | |
| | |
Industrials — 6.9% | | | | | | | | |
3M | | | 28,900 | | | | 5,720 | |
A O Smith | | | 7,000 | | | | 492 | |
Acuity Brands Inc | | | 1,900 | | | | 333 | |
ADT Inc | | | 5,400 | | | | 57 | |
Advanced Drainage Systems | | | 2,700 | | | | 330 | |
| | |
| 14 | | Adviser Managed Trust / Annual Report / July 31, 2021 |
| | | | | | | | |
| | | | | | Market Value | |
| Description | | Shares | | | ($ Thousands) | |
|
COMMON STOCK (continued) | |
AECOM * | | | 7,100 | | | $ | 447 | |
AGCO | | | 3,261 | | | | 431 | |
Air Lease Corp, Cl A | | | 5,279 | | | | 224 | |
Alaska Air Group Inc * | | | 6,300 | | | | 366 | |
Allegion PLC | | | 4,800 | | | | 656 | |
Allison Transmission Holdings Inc | | | 5,200 | | | | 208 | |
AMERCO | | | 462 | | | | 272 | |
American Airlines Group Inc * | | | 32,794 | | | | 668 | |
AMETEK Inc | | | 11,700 | | | | 1,627 | |
Armstrong World Industries Inc | | | 2,300 | | | | 249 | |
Axon Enterprise Inc * | | | 3,300 | | | | 614 | |
AZEK, Cl A * | | | 4,700 | | | | 171 | |
Boeing * | | | 27,100 | | | | 6,138 | |
Booz Allen Hamilton Holding, Cl A | | | 7,100 | | | | 609 | |
Builders FirstSource Inc * | | | 10,100 | | | | 449 | |
BWX Technologies Inc, Cl W | | | 4,700 | | | | 270 | |
CACI International Inc, Cl A * | | | 1,100 | | | | 294 | |
Carlisle Cos Inc | | | 2,700 | | | | 546 | |
Carrier Global | | | 44,421 | | | | 2,454 | |
Caterpillar Inc | | | 27,841 | | | | 5,756 | |
CH Robinson Worldwide Inc | | | 7,000 | | | | 624 | |
ChargePoint Holdings * | | | 6,000 | | | | 142 | |
Cintas Corp | | | 4,542 | | | | 1,790 | |
Clarivate * | | | 20,400 | | | | 465 | |
Clean Harbors Inc * | | | 2,400 | | | | 228 | |
Colfax * | | | 5,800 | | | | 266 | |
Copart * | | | 10,500 | | | | 1,543 | |
CoStar Group Inc * | | | 19,820 | | | | 1,761 | |
Crane Co | | | 2,900 | | | | 282 | |
CSX Corp | | | 114,300 | | | | 3,694 | |
Cummins Inc | | | 7,500 | | | | 1,741 | |
Curtiss-Wright Corp | | | 2,000 | | | | 237 | |
Deere | | | 14,255 | | | | 5,154 | |
Delta Air Lines Inc * | | | 32,500 | | | | 1,297 | |
Donaldson Co Inc | | | 6,700 | | | | 443 | |
Dover Corp | | | 7,346 | | | | 1,228 | |
Dun & Bradstreet Holdings * | | | 5,000 | | | | 105 | |
Emerson Electric | | | 30,500 | | | | 3,077 | |
Equifax Inc | | | 6,200 | | | | 1,616 | |
Expeditors International of Washington Inc | | | 8,600 | | | | 1,103 | |
Fastenal Co | | | 29,200 | | | | 1,599 | |
FedEx Corp | | | 12,360 | | | | 3,460 | |
Flowserve Corp | | | 6,400 | | | | 269 | |
Fortive Corp | | | 16,500 | | | | 1,199 | |
Fortune Brands Home & Security Inc | | | 7,300 | | | | 712 | |
FTI Consulting Inc * | | | 1,700 | | | | 248 | |
Gates Industrial Corp PLC * | | | 2,200 | | | | 40 | |
Generac Holdings * | | | 3,100 | | | | 1,300 | |
General Dynamics Corp | | | 12,648 | | | | 2,479 | |
General Electric Co | | | 441,239 | | | | 5,714 | |
Graco Inc | | | 8,700 | | | | 679 | |
HEICO Corp, Cl A | | | 4,100 | | | | 497 | |
| | | | | | | | |
| | | | | | Market Value | |
| Description | | Shares | | | ($ Thousands) | |
|
COMMON STOCK (continued) | |
HEICO Corp | | | 2,200 | | | $ | 298 | |
Hexcel Corp * | | | 4,100 | | | | 223 | |
Honeywell International Inc | | | 35,100 | | | | 8,206 | |
Howmet Aerospace | | | 20,700 | | | | 679 | |
Hubbell Inc, Cl B | | | 2,800 | | | | 561 | |
Huntington Ingalls Industries Inc | | | 2,100 | | | | 431 | |
IAA * | | | 6,979 | | | | 422 | |
IDEX | | | 3,849 | | | | 873 | |
IHS Markit Ltd | | | 18,800 | | | | 2,197 | |
Illinois Tool Works Inc | | | 15,894 | | | | 3,603 | |
Ingersoll Rand * | | | 18,400 | | | | 899 | |
ITT Inc | | | 4,547 | | | | 445 | |
Jacobs Engineering Group | | | 6,700 | | | | 906 | |
JB Hunt Transport Services Inc | | | 4,428 | | | | 746 | |
JetBlue Airways Corp * | | | 15,900 | | | | 235 | |
Johnson Controls International plc | | | 36,000 | | | | 2,571 | |
Kansas City Southern | | | 4,600 | | | | 1,232 | |
Kirby Corp * | | | 3,500 | | | | 203 | |
Knight-Swift Transportation Holdings Inc, Cl A | | | 6,200 | | | | 308 | |
L3Harris Technologies | | | 10,269 | | | | 2,328 | |
Landstar System Inc | | | 1,900 | | | | 298 | |
Leidos Holdings Inc | | | 6,800 | | | | 724 | |
Lennox International Inc | | | 1,753 | | | | 577 | |
Lincoln Electric Holdings Inc | | | 3,033 | | | | 423 | |
Lockheed Martin Corp | | | 12,504 | | | | 4,647 | |
Lyft, Cl A * | | | 13,100 | | | | 725 | |
ManpowerGroup Inc | | | 2,933 | | | | 348 | |
Masco Corp | | | 13,000 | | | | 776 | |
MasTec * | | | 2,700 | | | | 273 | |
Mercury Systems Inc * | | | 3,200 | | | | 211 | |
Middleby Corp/The * | | | 2,900 | | | | 555 | |
MSA Safety Inc | | | 1,800 | | | | 296 | |
MSC Industrial Direct Co Inc, Cl A | | | 2,600 | | | | 232 | |
Nielsen Holdings PLC | | | 18,800 | | | | 445 | |
Nordson Corp | | | 3,100 | | | | 701 | |
Norfolk Southern | | | 12,565 | | | | 3,240 | |
Northrop Grumman Corp | | | 7,638 | | | | 2,773 | |
nVent Electric PLC | | | 9,100 | | | | 288 | |
Old Dominion Freight Line Inc | | | 5,000 | | | | 1,346 | |
Oshkosh Corp | | | 3,600 | | | | 430 | |
Otis Worldwide | | | 20,800 | | | | 1,863 | |
Owens Corning | | | 5,600 | | | | 538 | |
PACCAR Inc | | | 17,300 | | | | 1,436 | |
Parker-Hannifin Corp | | | 6,536 | | | | 2,039 | |
Plug Power Inc * | | | 25,000 | | | | 682 | |
Quanta Services Inc | | | 7,200 | | | | 654 | |
Raytheon Technologies | | | 76,500 | | | | 6,652 | |
Regal Beloit Corp | | | 2,100 | | | | 309 | |
Republic Services Inc, Cl A | | | 10,728 | | | | 1,270 | |
Robert Half International Inc | | | 5,900 | | | | 579 | |
Rockwell Automation Inc | | | 5,942 | | | | 1,827 | |
| | |
| Adviser Managed Trust / Annual Report / July 31, 2021 | | 15 |
SCHEDULE OF INVESTMENTS
July 31, 2021
Tactical Offensive Equity Fund (Continued)
| | | | | | | | |
| Description | | Shares | | | Market Value
($ Thousands) | |
| | |
COMMON STOCK (continued) | | | | | | | | |
Rollins Inc | | | 11,550 | | | $ | 443 | |
Roper Technologies | | | 5,357 | | | | 2,632 | |
Ryder System Inc | | | 3,100 | | | | 236 | |
Schneider National Inc, Cl B | | | 3,500 | | | | 79 | |
Science Applications International | | | 2,900 | | | | 253 | |
Sensata Technologies Holding PLC * | | | 8,000 | | | | 469 | |
Shoals Technologies Group, Cl A * | | | 4,400 | | | | 128 | |
SiteOne Landscape Supply * | | | 2,200 | | | | 385 | |
Snap-on | | | 2,700 | | | | 588 | |
Southwest Airlines Co * | | | 30,100 | | | | 1,521 | |
Spirit AeroSystems Holdings Inc, Cl A | | | 5,200 | | | | 225 | |
Stanley Black & Decker Inc | | | 7,900 | | | | 1,557 | |
Stericycle Inc * | | | 4,558 | | | | 322 | |
Sunrun * | | | 9,900 | | | | 524 | |
Teledyne Technologies * | | | 2,339 | | | | 1,059 | |
Textron Inc | | | 11,200 | | | | 773 | |
Timken Co/The | | | 3,100 | | | | 246 | |
Toro | | | 5,600 | | | | 637 | |
Trane Technologies | | | 12,239 | | | | 2,492 | |
TransDigm Group * | | | 2,579 | | | | 1,653 | |
TransUnion | | | 9,700 | | | | 1,165 | |
Trex Co Inc * | | | 6,100 | | | | 592 | |
TuSimple Holdings, Cl A * | | | 1,600 | | | | 59 | |
Uber Technologies * | | | 81,400 | | | | 3,538 | |
Union Pacific Corp | | | 33,549 | | | | 7,339 | |
United Continental Holdings Inc * | | | 15,811 | | | | 739 | |
United Parcel Service Inc, Cl B | | | 36,535 | | | | 6,991 | |
United Rentals Inc * | | | 3,639 | | | | 1,199 | |
Univar Solutions * | | | 9,800 | | | | 240 | |
Valmont Industries Inc | | | 1,047 | | | | 248 | |
Verisk Analytics, Cl A | | | 8,054 | | | | 1,530 | |
Vertiv Holdings, Cl A | | | 12,900 | | | | 362 | |
Virgin Galactic Holdings * | | | 7,038 | | | | 211 | |
Waste Management Inc | | | 21,600 | | | | 3,202 | |
Watsco Inc | | | 1,639 | | | | 463 | |
Westinghouse Air Brake Technologies | | | 9,600 | | | | 815 | |
Woodward | | | 2,900 | | | | 353 | |
WW Grainger Inc | | | 2,324 | | | | 1,033 | |
XPO Logistics Inc * | | | 4,800 | | | | 666 | |
Xylem Inc/NY | | | 9,100 | | | | 1,145 | |
| | | | | | | | |
| | | | | | | 187,008 | |
| | | | | | | | |
|
Information Technology — 21.4% | |
Adobe Inc * | | | 24,107 | | | | 14,986 | |
Advanced Micro Devices Inc * | | | 48,600 | | | | 5,161 | |
Akamai Technologies Inc * | | | 8,100 | | | | 971 | |
Allegro MicroSystems * | | | 2,100 | | | | 58 | |
Alliance Data Systems Corp | | | 2,300 | | | | 214 | |
Alteryx Inc, Cl A * | | | 3,083 | | | | 239 | |
Amdocs Ltd | | | 6,800 | | | | 524 | |
Amphenol Corp, Cl A | | | 29,872 | | | | 2,165 | |
Analog Devices Inc | | | 12,227 | | | | 2,047 | |
Anaplan Inc * | | | 7,100 | | | | 406 | |
| | | | | | | | |
| Description | | Shares | | | Market Value
($ Thousands) | |
| | |
COMMON STOCK (continued) | | | | | | | | |
ANSYS Inc * | | | 4,324 | | | $ | 1,593 | |
Apple | | | 795,164 | | | | 115,983 | |
Applied Materials Inc | | | 46,200 | | | | 6,465 | |
Arista Networks Inc * | | | 2,938 | | | | 1,118 | |
Arrow Electronics Inc * | | | 3,900 | | | | 462 | |
Aspen Technology Inc * | | | 3,500 | | | | 512 | |
Atlassian Corp PLC, Cl A * | | | 6,700 | | | | 2,178 | |
Autodesk Inc * | | | 11,200 | | | | 3,597 | |
Automatic Data Processing Inc | | | 21,500 | | | | 4,507 | |
Avalara * | | | 4,335 | | | | 725 | |
Avnet Inc | | | 5,800 | | | | 240 | |
Bentley Systems, Cl B | | | 6,600 | | | | 401 | |
Bill.com Holdings * | | | 3,900 | | | | 807 | |
Black Knight Inc * | | | 7,600 | | | | 629 | |
Broadcom Inc | | | 20,256 | | | | 9,832 | |
Broadridge Financial Solutions Inc | | | 5,800 | | | | 1,006 | |
Brooks Automation Inc | | | 3,600 | | | | 320 | |
Cadence Design Systems Inc * | | | 14,035 | | | | 2,072 | |
CDK Global Inc | | | 6,400 | | | | 307 | |
CDW Corp/DE | | | 7,240 | | | | 1,327 | |
Ceridian HCM Holding Inc * | | | 6,200 | | | | 610 | |
Ciena Corp * | | | 8,100 | | | | 471 | |
Cirrus Logic Inc * | | | 3,400 | | | | 281 | |
Cisco Systems Inc | | | 213,647 | | | | 11,830 | |
Citrix Systems | | | 6,497 | | | | 655 | |
Cloudflare, Cl A * | | | 12,600 | | | | 1,495 | |
Cognex Corp | | | 8,500 | | | | 768 | |
Cognizant Technology Solutions Corp, Cl A | | | 26,500 | | | | 1,949 | |
Coherent Inc * | | | 1,200 | | | | 295 | |
CommScope Holding Co Inc * | | | 11,400 | | | | 241 | |
Concentrix * | | | 2,100 | | | | 344 | |
Corning | | | 38,200 | | | | 1,599 | |
Coupa Software Inc * | | | 3,563 | | | | 773 | |
Cree * | | | 5,800 | | | | 538 | |
Crowdstrike Holdings, Cl A * | | | 7,900 | | | | 2,004 | |
CyberArk Software * | | | 600 | | | | 85 | |
Datadog, Cl A * | | | 11,400 | | | | 1,262 | |
Dell Technologies Inc, Cl C * | | | 13,300 | | | | 1,285 | |
DocuSign, Cl A * | | | 9,556 | | | | 2,848 | |
Dolby Laboratories Inc, Cl A | | | 3,200 | | | | 311 | |
Dropbox, Cl A * | | | 12,785 | | | | 403 | |
Duck Creek Technologies * | | | 3,700 | | | | 163 | |
DXC Technology Co * | | | 13,300 | | | | 532 | |
Dynatrace * | | | 9,221 | | | | 589 | |
Elastic * | | | 3,200 | | | | 474 | |
Enphase Energy Inc * | | | 6,600 | | | | 1,251 | |
Entegris Inc | | | 6,800 | | | | 820 | |
EPAM Systems Inc * | | | 2,700 | | | | 1,511 | |
Euronet Worldwide Inc * | | | 2,600 | | | | 371 | |
Everbridge Inc * | | | 2,049 | | | | 289 | |
F5 Networks Inc * | | | 2,940 | | | | 607 | |
Fair Isaac Corp * | | | 1,400 | | | | 733 | |
| | |
| 16 | | Adviser Managed Trust / Annual Report / July 31, 2021 |
| | | | | | | | |
| | | | | | Market Value | |
| Description | | Shares | | | ($ Thousands) | |
|
COMMON STOCK (continued) | |
Fastly, Cl A * | | �� | 4,300 | | | $ | 207 | |
Fidelity National Information Services Inc | | | 31,300 | | | | 4,665 | |
FireEye Inc * | | | 12,900 | | | | 261 | |
First Solar * | | | 4,900 | | | | 422 | |
Fiserv Inc * | | | 30,200 | | | | 3,476 | |
Five9 * | | | 3,200 | | | | 644 | |
FleetCor Technologies Inc * | | | 4,200 | | | | 1,085 | |
Fortinet Inc * | | | 6,746 | | | | 1,837 | |
Gartner Inc * | | | 4,234 | | | | 1,121 | |
Genpact Ltd | | | 9,879 | | | | 492 | |
Global Payments | | | 14,769 | | | | 2,856 | |
Globant * | | | 1,963 | | | | 469 | |
GoDaddy Inc, Cl A * | | | 8,900 | | | | 746 | |
Guidewire Software Inc * | | | 4,400 | | | | 507 | |
Hewlett Packard Enterprise Co | | | 65,500 | | | | 950 | |
HP Inc | | | 62,700 | | | | 1,810 | |
HubSpot Inc * | | | 2,300 | | | | 1,371 | |
Intel Corp | | | 204,325 | | | | 10,976 | |
International Business Machines Corp | | | 45,127 | | | | 6,361 | |
Intuit Inc | | | 12,940 | | | | 6,858 | |
IPG Photonics Corp * | | | 1,754 | | | | 383 | |
Jabil Inc | | | 7,699 | | | | 458 | |
Jack Henry & Associates | | | 3,659 | | | | 637 | |
Jamf Holding * | | | 2,000 | | | | 66 | |
Juniper Networks Inc | | | 17,351 | | | | 488 | |
Keysight Technologies * | | | 9,500 | | | | 1,563 | |
KLA | | | 7,749 | | | | 2,698 | |
Lam Research Corp | | | 7,159 | | | | 4,563 | |
Littelfuse Inc | | | 1,171 | | | | 311 | |
Lumentum Holdings * | | | 4,000 | | | | 336 | |
Manhattan Associates Inc * | | | 3,300 | | | | 527 | |
Marvell Technology | | | 39,707 | | | | 2,403 | |
Mastercard Inc, Cl A | | | 44,230 | | | | 17,070 | |
Maxim Integrated Products Inc | | | 24,093 | | | | 2,407 | |
Medallia * | | | 4,800 | | | | 163 | |
Microchip Technology Inc | | | 12,800 | | | | 1,832 | |
Micron Technology Inc | | | 57,105 | | | | 4,430 | |
Microsoft Corp | | | 381,692 | | | | 108,748 | |
MKS Instruments Inc | | | 2,800 | | | | 438 | |
MongoDB, Cl A * | | | 2,713 | | | | 974 | |
Monolithic Power Systems Inc | | | 2,312 | | | | 1,039 | |
Motorola Solutions Inc | | | 8,352 | | | | 1,870 | |
N-Able * | | | 1,150 | | | | 16 | |
National Instruments Corp | | | 6,359 | | | | 280 | |
nCino * | | | 2,300 | | | | 146 | |
NCR Corp * | | | 6,400 | | | | 284 | |
NetApp Inc | | | 11,700 | | | | 931 | |
New Relic Inc * | | | 3,000 | | | | 207 | |
NortonLifeLock | | | 29,000 | | | | 720 | |
Nuance Communications Inc * | | | 14,809 | | | | 813 | |
Nutanix Inc, Cl A * | | | 10,500 | | | | 378 | |
NVIDIA Corp | | | 120,800 | | | | 23,555 | |
| | | | | | | | |
| | | | | | Market Value | |
| Description | | Shares | | | ($ Thousands) | |
| | |
COMMON STOCK (continued) | | | | | | | | |
Okta, Cl A * | | | 5,937 | | | $ | 1,471 | |
ON Semiconductor Corp * | | | 21,500 | | | | 840 | |
Oracle Corp | | | 87,967 | | | | 7,666 | |
Palantir Technologies, Cl A * | | | 81,700 | | | | 1,774 | |
Palo Alto Networks Inc * | | | 4,800 | | | | 1,915 | |
Paychex Inc | | | 16,336 | | | | 1,859 | |
Paycom Software Inc * | | | 2,459 | | | | 984 | |
Paylocity Holding Corp * | | | 2,045 | | | | 424 | |
PayPal Holdings * | | | 59,451 | | | | 16,381 | |
Paysafe * | | | 14,700 | | | | 159 | |
Pegasystems Inc | | | 1,900 | | | | 243 | |
Proofpoint Inc * | | | 2,800 | | | | 489 | |
PTC Inc * | | | 5,500 | | | | 745 | |
Pure Storage Inc, Cl A * | | | 14,200 | | | | 277 | |
Qorvo Inc * | | | 5,644 | | | | 1,070 | |
QUALCOMM Inc | | | 57,004 | | | | 8,539 | |
RingCentral, Cl A * | | | 4,049 | | | | 1,082 | |
Sabre Corp * | | | 16,200 | | | | 191 | |
salesforce.com Inc * | | | 46,743 | | | | 11,309 | |
ServiceNow Inc * | | | 9,970 | | | | 5,861 | |
Shift4 Payments, Cl A * | | | 2,100 | | | | 187 | |
Skyworks Solutions Inc | | | 8,443 | | | | 1,558 | |
Smartsheet, Cl A * | | | 5,704 | | | | 414 | |
Snowflake, Cl A * | | | 6,000 | | | | 1,594 | |
SolarWinds Corp * | | | 2,300 | | | | 26 | |
Splunk * | | | 8,541 | | | | 1,213 | |
Square Inc, Cl A * | | | 19,700 | | | | 4,871 | |
SS&C Technologies Holdings | | | 11,200 | | | | 878 | |
StoneCo, Cl A * | | | 10,500 | | | | 618 | |
Switch, Cl A | | | 4,300 | | | | 89 | |
SYNNEX Corp | | | 2,400 | | | | 287 | |
Synopsys Inc * | | | 7,700 | | | | 2,218 | |
Teradata Corp * | | | 5,300 | | | | 263 | |
Teradyne Inc | | | 8,400 | | | | 1,067 | |
Texas Instruments Inc | | | 46,700 | | | | 8,902 | |
Trade Desk Inc/The, Cl A * | | | 21,100 | | | | 1,728 | |
Trimble Inc * | | | 12,656 | | | | 1,082 | |
Twilio, Cl A * | | | 8,135 | | | | 3,039 | |
Tyler Technologies Inc * | | | 2,079 | | | | 1,024 | |
Ubiquiti | | | 457 | | | | 143 | |
Unity Software * | | | 7,300 | | | | 782 | |
Universal Display Corp | | | 2,215 | | | | 519 | |
VeriSign Inc * | | | 5,157 | | | | 1,116 | |
Viasat * | | | 3,400 | | | | 169 | |
Visa Inc, Cl A | | | 85,620 | | | | 21,096 | |
VMware, Cl A * | | | 3,958 | | | | 608 | |
Vontier | | | 7,000 | | | | 226 | |
Western Digital Corp * | | | 15,500 | | | | 1,006 | |
Western Union Co/The | | | 21,400 | | | | 497 | |
WEX Inc * | | | 2,217 | | | | 421 | |
Workday Inc, Cl A * | | | 9,149 | | | | 2,145 | |
Xerox Holdings | | | 8,700 | | | | 210 | |
| | |
| Adviser Managed Trust / Annual Report / July 31, 2021 | | 17 |
SCHEDULE OF INVESTMENTS
July 31, 2021
Tactical Offensive Equity Fund (Continued)
| | | | | | | | |
| | | | | | Market Value | |
| Description | | Shares | | | ($ Thousands) | |
| | |
COMMON STOCK (continued) | | | | | | | | |
Xilinx | | | 20,422 | | | $ | 3,060 | |
Zebra Technologies Corp, Cl A * | | | 2,700 | | | | 1,492 | |
Zendesk Inc * | | | 5,900 | | | | 770 | |
Zoom Video Communications, Cl A * | | | 10,800 | | | | 4,083 | |
Zscaler Inc * | | | 3,700 | | | | 873 | |
| | | | | | | | |
| | | | | | | 579,640 | |
| | | | | | | | |
| | |
Materials — 1.9% | | | | | | | | |
Air Products & Chemicals Inc | | | 11,300 | | | | 3,289 | |
Albemarle Corp | | | 5,900 | | | | 1,216 | |
Alcoa Corp * | | | 9,100 | | | | 365 | |
Amcor | | | 77,000 | | | | 890 | |
AptarGroup Inc | | | 3,300 | | | | 425 | |
Ardagh Group SA, Cl A | | | 900 | | | | 21 | |
Ashland Global Holdings Inc | | | 2,700 | | | | 230 | |
Avery Dennison | | | 4,100 | | | | 864 | |
Axalta Coating Systems Ltd * | | | 11,000 | | | | 331 | |
Ball | | | 16,222 | | | | 1,312 | |
Berry Global Group Inc * | | | 6,973 | | | | 448 | |
Celanese Corp, Cl A | | | 5,800 | | | | 903 | |
CF Industries Holdings Inc | | | 11,109 | | | | 525 | |
Chemours Co/The | | | 8,100 | | | | 269 | |
Cleveland-Cliffs Inc * | | | 22,500 | | | | 563 | |
Corteva | | | 37,100 | | | | 1,587 | |
Crown Holdings Inc | | | 6,800 | | | | 678 | |
Dow Inc | | | 38,000 | | | | 2,362 | |
DuPont de Nemours | | | 26,773 | | | | 2,009 | |
Eagle Materials Inc | | | 2,000 | | | | 283 | |
Eastman Chemical Co | | | 6,800 | | | | 766 | |
Ecolab Inc | | | 12,800 | | | | 2,827 | |
Element Solutions Inc | | | 10,700 | | | | 250 | |
FMC Corp | | | 6,542 | | | | 700 | |
Freeport-McMoRan | | | 74,200 | | | | 2,827 | |
Graphic Packaging Holding Co | | | 13,900 | | | | 266 | |
Huntsman Corp | | | 9,900 | | | | 261 | |
International Flavors & Fragrances Inc | | | 12,686 | | | | 1,911 | |
International Paper Co | | | 20,000 | | | | 1,155 | |
Louisiana-Pacific Corp | | | 5,000 | | | | 277 | |
LyondellBasell Industries NV, Cl A | | | 13,100 | | | | 1,301 | |
Martin Marietta Materials | | | 3,154 | | | | 1,146 | |
Mosaic Co/The | | | 18,000 | | | | 562 | |
NewMarket Corp | | | 348 | | | | 110 | |
Newmont | | | 41,100 | | | | 2,582 | |
Nucor Corp | | | 15,400 | | | | 1,602 | |
Olin Corp | | | 7,100 | | | | 334 | |
Packaging Corp of America | | | 4,700 | | | | 665 | |
PPG Industries Inc | | | 12,026 | | | | 1,966 | |
Reliance Steel & Aluminum Co | | | 3,300 | | | | 519 | |
Royal Gold Inc | | | 3,300 | | | | 401 | |
RPM International Inc | | | 6,742 | | | | 584 | |
Scotts Miracle-Gro Co/The, Cl A | | | 2,100 | | | | 372 | |
Sealed Air Corp | | | 8,100 | | | | 460 | |
Sherwin-Williams Co/The | | | 12,300 | | | | 3,580 | |
| | | | | | | | |
| | | | | | Market Value | |
| Description | | Shares | | | ($ Thousands) | |
| | |
COMMON STOCK (continued) | | | | | | | | |
Silgan Holdings | | | 4,673 | | | $ | 189 | |
Sonoco Products Co | | | 5,000 | | | | 319 | |
Southern Copper Corp | | | 4,300 | | | | 282 | |
Steel Dynamics | | | 10,419 | | | | 672 | |
United States Steel Corp | | | 13,100 | | | | 347 | |
Valvoline Inc | | | 9,000 | | | | 276 | |
Vulcan Materials | | | 6,700 | | | | 1,206 | |
W R Grace | | | 3,300 | | | | 230 | |
Westlake Chemical | | | 1,960 | | | | 163 | |
Westrock | | | 13,478 | | | | 663 | |
| | | | | | | | |
| | | | | | | 50,341 | |
| | | | | | | | |
| | |
Real Estate — 2.5% | | | | | | | | |
Alexandria Real Estate Equities Inc ‡ | | | 7,400 | | | | 1,490 | |
American Campus Communities Inc ‡ | | | 6,800 | | | | 342 | |
American Homes 4 Rent, Cl A ‡ | | | 13,696 | | | | 575 | |
American Tower, Cl A ‡ | | | 22,815 | | | | 6,452 | |
Americold Realty Trust ‡ | | | 11,800 | | | | 458 | |
Apartment Income ‡ | | | 7,675 | | | | 404 | |
AvalonBay Communities Inc ‡ | | | 7,200 | | | | 1,640 | |
Boston Properties Inc ‡ | | | 8,027 | | | | 942 | |
Brixmor Property Group Inc ‡ | | | 14,800 | | | | 341 | |
Camden Property Trust ‡ | | | 4,800 | | | | 717 | |
CBRE Group Inc, Cl A * | | | 17,000 | | | | 1,640 | |
CoreSite Realty Corp ‡ | | | 2,000 | | | | 276 | |
Cousins Properties ‡ | | | 7,374 | | | | 293 | |
Crown Castle International Corp ‡ | | | 21,848 | | | | 4,219 | |
CubeSmart ‡ | | | 10,100 | | | | 502 | |
CyrusOne Inc ‡ | | | 6,000 | | | | 428 | |
Digital Realty Trust Inc ‡ | | | 14,246 | | | | 2,196 | |
Douglas Emmett Inc ‡ | | | 8,200 | | | | 274 | |
Duke Realty Corp ‡ | | | 19,600 | | | | 997 | |
EPR Properties ‡ | | | 3,574 | | | | 180 | |
Equinix Inc ‡ | | | 4,545 | | | | 3,729 | |
Equity LifeStyle Properties Inc ‡ | | | 8,800 | | | | 737 | |
Equity Residential ‡ | | | 18,700 | | | | 1,573 | |
Essex Property Trust Inc ‡ | | | 3,275 | | | | 1,075 | |
Extra Space Storage Inc ‡ | | | 6,700 | | | | 1,167 | |
Federal Realty Investment Trust ‡ | | | 4,000 | | | | 470 | |
First Industrial Realty Trust Inc ‡ | | | 6,400 | | | | 351 | |
Gaming and Leisure Properties Inc ‡ | | | 10,942 | | | | 518 | |
Healthcare Trust of America Inc, Cl A ‡ | | | 10,800 | | | | 309 | |
Healthpeak Properties ‡ | | | 26,924 | | | | 995 | |
Highwoods Properties Inc ‡ | | | 5,100 | | | | 243 | |
Host Hotels & Resorts Inc *‡ | | | 36,547 | | | | 582 | |
Howard Hughes Corp/The * | | | 2,300 | | | | 213 | |
Hudson Pacific Properties Inc ‡ | | | 8,800 | | | | 240 | |
Invitation Homes Inc ‡ | | | 28,500 | | | | 1,159 | |
Iron Mountain ‡ | | | 15,203 | | | | 665 | |
JBG SMITH Properties ‡ | | | 7,200 | | | | 235 | |
Jones Lang LaSalle Inc * | | | 2,700 | | | | 601 | |
Kilroy Realty Corp ‡ | | | 6,000 | | | | 416 | |
Kimco Realty ‡ | | | 21,700 | | | | 463 | |
| | |
| 18 | | Adviser Managed Trust / Annual Report / July 31, 2021 |
| | | | | | | | |
| | | | | | Market Value | |
| Description | | Shares | | | ($ Thousands) | |
| | |
COMMON STOCK (continued) | | | | | | | | |
Lamar Advertising Co, Cl A ‡ | | | 4,500 | | | $ | 480 | |
Life Storage Inc ‡ | | | 4,095 | | | | 481 | |
Medical Properties Trust Inc ‡ | | | 30,587 | | | | 643 | |
Mid-America Apartment Communities ‡ | | | 5,700 | | | | 1,101 | |
National Retail Properties | | | 9,100 | | | | 445 | |
Omega Healthcare Investors Inc ‡ | | | 11,900 | | | | 432 | |
Opendoor Technologies * | | | 16,900 | | | | 250 | |
Park Hotels & Resorts *‡ | | | 12,200 | | | | 226 | |
Prologis Inc ‡ | | | 37,200 | | | | 4,763 | |
Public Storage ‡ | | | 7,700 | | | | 2,406 | |
Rayonier Inc ‡ | | | 6,500 | | | | 245 | |
Realty Income Corp ‡ | | | 19,100 | | | | 1,343 | |
Regency Centers Corp ‡ | | | 8,900 | | | | 582 | |
Rexford Industrial Realty ‡ | | | 6,800 | | | | 418 | |
SBA Communications Corp, Cl A ‡ | | | 5,400 | | | | 1,841 | |
Simon Property Group Inc ‡ | | | 16,700 | | | | 2,113 | |
SL Green Realty ‡ | | | 3,494 | | | | 260 | |
Spirit Realty Capital Inc ‡ | | | 6,100 | | | | 306 | |
STORE Capital Corp ‡ | | | 13,200 | | | | 478 | |
Sun Communities Inc ‡ | | | 5,400 | | | | 1,059 | |
UDR Inc ‡ | | | 14,800 | | | | 814 | |
Ventas Inc ‡ | | | 19,000 | | | | 1,136 | |
VEREIT ‡ | | | 11,516 | | | | 564 | |
VICI Properties Inc ‡ | | | 27,100 | | | | 845 | |
Vornado Realty Trust ‡ | | | 9,175 | | | | 399 | |
Weingarten Realty Investors ‡ | | | 7,100 | | | | 229 | |
Welltower | | | 21,300 | | | | 1,850 | |
Weyerhaeuser Co ‡ | | | 38,100 | | | | 1,285 | |
WP Carey Inc ‡ | | | 8,800 | | | | 710 | |
| | | | | | | | |
| | | | | | | 67,811 | |
| | | | | | | | |
| | |
Utilities — 1.9% | | | | | | | | |
AES Corp/VA | | | 32,997 | | | | 782 | |
Alliant Energy Corp | | | 13,200 | | | | 772 | |
Ameren Corp | | | 12,500 | | | | 1,049 | |
American Electric Power Co Inc | | | 25,427 | | | | 2,240 | |
American Water Works | | | 9,200 | | | | 1,565 | |
Atmos Energy Corp | | | 6,600 | | | | 651 | |
Avangrid Inc | | | 3,300 | | | | 172 | |
Brookfield Renewable, Cl A | | | 6,200 | | | | 263 | |
CenterPoint Energy | | | 28,908 | | | | 736 | |
CMS Energy Corp | | | 15,200 | | | | 939 | |
Consolidated Edison Inc | | | 17,200 | | | | 1,269 | |
Dominion Energy Inc | | | 40,600 | | | | 3,040 | |
DTE Energy | | | 9,800 | | | | 1,150 | |
Duke Energy | | | 38,800 | | | | 4,078 | |
Edison International | | | 18,200 | | | | 992 | |
Entergy Corp | | | 10,200 | | | | 1,050 | |
Essential Utilities | | | 11,700 | | | | 575 | |
Evergy Inc | | | 12,000 | | | | 783 | |
Eversource Energy | | | 17,500 | | | | 1,510 | |
Exelon Corp | | | 49,800 | | | | 2,331 | |
FirstEnergy Corp | | | 27,600 | | | | 1,058 | |
| | | | | | | | |
| | | | | | Market Value | |
| Description | | Shares | | | ($ Thousands) | |
| |
COMMON STOCK (continued) | | | | | |
Hawaiian Electric Industries | | | 5,100 | | | $ | 221 | |
IDACORP Inc | | | 2,500 | | | | 263 | |
MDU Resources Group | | | 9,900 | | | | 314 | |
National Fuel Gas | | | 4,900 | | | | 252 | |
NextEra Energy | | | 99,072 | | | | 7,718 | |
NiSource Inc | | | 19,852 | | | | 492 | |
NRG Energy Inc | | | 12,700 | | | | 524 | |
OGE Energy | | | 10,474 | | | | 353 | |
PG&E * | | | 76,412 | | | | 672 | |
Pinnacle West Capital Corp | | | 6,000 | | | | 501 | |
PPL Corp | | | 39,200 | | | | 1,112 | |
Public Service Enterprise Group | | | 25,800 | | | | 1,605 | |
Sempra Energy | | | 15,600 | | | | 2,038 | |
Southern Co/The | | | 54,100 | | | | 3,455 | |
UGI Corp | | | 11,000 | | | | 506 | |
Vistra | | | 25,550 | | | | 489 | |
WEC Energy Group | | | 16,100 | | | | 1,516 | |
Xcel Energy Inc | | | 26,826 | | | | 1,831 | |
| | | | | | | | |
| | |
| | | | | | | 50,867 | |
| | | | | | | | |
| | | | | | | 2,105,505 | |
| | | | | | | | |
Total Common Stock
(Cost $1,831,900) ($ Thousands) | | | | 2,447,894 | |
| | | | | | | | |
|
PREFERRED STOCK — 0.1% | |
Germany — 0.1% | | | | | | | | |
Bayerische Motoren Werke AG (B) | | | 996 | | | | 85 | |
FUCHS PETROLUB SE (B) | | | 1,607 | | | | 80 | |
Henkel AG & Co KGaA (B) | | | 3,530 | | | | 358 | |
Porsche Automobil Holding SE (B) | | | 2,908 | | | | 315 | |
Sartorius AG (B) | | | 498 | | | | 301 | |
Volkswagen AG (B) | | | 3,553 | | | | 866 | |
| | | | | | | | |
| |
Total Preferred Stock
(Cost $1,431) ($ Thousands) | | | | 2,005 | |
| | | | | | | | |
|
EXCHANGE TRADED FUND — 0.0% | |
United States — 0.0% | | | | | | | | |
SPDR S&P 500 Trust | | | 752 | | | | 330 | |
| | | | | | | | |
| | |
Total Exchange Traded Fund
(Cost $100) ($ Thousands) | | | | | | | 330 | |
| | | | | | | | |
| | |
| | | Number of
Rights | | | | |
RIGHTS — 0.0% | | | | | | | | |
United States — 0.0% | | | | | | | | |
Newstar Financial *^(C) | | | 4 | | | | – | |
| | |
| Adviser Managed Trust / Annual Report / July 31, 2021 | | 19 |
SCHEDULE OF INVESTMENTS
July 31, 2021
Tactical Offensive Equity Fund (Concluded)
| | | | | | | | |
| Description | | Number of
Rights | | | Market Value
($ Thousands) | |
| | |
RIGHTS (continued) | | | | | | | | |
Tobira Therapeutics, Expires 12/31/2028 *(C) | | | 1 | | | $ | – | |
| | | | | | | | |
| | | | | | | – | |
| | | | | | | | |
| | |
Total Rights
(Cost $—) ($ Thousands) | | | | | | | – | |
| | | | | | | | |
| | | | | | | | |
| | | | | | Market Value | |
| Description | | Shares | | | ($ Thousands) | |
|
CASH EQUIVALENT — 1.9% | |
SEI Daily Income Trust, Government Fund, Cl F | | | | | | | | |
0.010% **† | | | 50,776,582 | | | $ | 50,777 | |
| | | | | | | | |
Total Cash Equivalent
(Cost $50,777) ($ Thousands) | | | | | | | 50,777 | |
| | | | | | | | |
| | |
Total Investments — 92.5%
(Cost $1,884,208) ($ Thousands) | | | | | | $ | 2,501,006 | |
| | | | | | | | |
A list of the open futures contracts held by the Fund at July 31, 2021, is as follows:
| | | | | | | | | | | | | | | | | | | | |
| Type of Contract | | Number of Contracts | | | Expiration Date | | | Notional Amount (Thousands) | | | Value (Thousands) | | | Unrealized Appreciation/ (Depreciation) (Thousands) | |
Long Contracts | | | | | | | | | | | | | | | | | | | | |
MSCI EAFE Index | | | 115 | | | | Sep-2021 | | | $ | 13,391 | | | $ | 13,337 | | | $ | (54 | ) |
MSCI Emerging Markets | | | 1,335 | | | | Sep-2021 | | | | 91,500 | | | | 85,286 | | | | (6,214 | ) |
NASDAQ 100 Index E-MINI | | | 8 | | | | Sep-2021 | | | | 2,248 | | | | 2,393 | | | | 145 | |
Russell 2000 Index E-MINI | | | 802 | | | | Sep-2021 | | | | 93,059 | | | | 89,086 | | | | (3,973 | ) |
S&P 500 Index E-MINI | | | 280 | | | | Sep-2021 | | | | 59,158 | | | | 61,453 | | | | 2,295 | |
S&P Mid Cap 400 Index E-MINI | | | 11 | | | | Sep-2021 | | | | 2,961 | | | | 2,969 | | | | 8 | |
| | | | | | | | | | | | | | | | | | | | |
| | | | | | | | | | $ | 262,317 | | | $ | 254,524 | | | $ | (7,793 | ) |
| | | | | | | | | | | | | | | | | | | | |
For the year ended July 31, 2021, the total amount of all open futures contracts, as presented in the table above, are representative of the volume of activity for this derivative type during the period.
| | Percentages are based on a Net Assets of $2,704,616 ($ Thousands). |
| * | Non-income producing security. |
| ‡ | Real Estate Investment Trust. |
| ^ | Expiration date unavailable. |
| ** | Rate shown is the 7-day effective yield as of July 31, 2021. |
| † | Investment in Affiliated Security. |
| (A) | Security is a Master Limited Partnership. At July 31, 2021, such securities amounted to $4,232 ($ Thousands), or 0.2% of Net Assets. |
| (B) | There is currently no rate available. |
| (C) | Level 3 security in accordance with fair value hierarchy. |
ADR — American Depositary Receipt
Cl — Class
EAFE — Europe, Australasia and Far East
LTD — Limited
MSCI — Morgan Stanley Capital International
NASDAQ — National Association of Securities Dealers and Automated Quotations
PLC — Public Limited Company
S&P— Standard & Poor’s
SPDR— Standard & Poor’s Depository Receipt
The following is a list of the level of inputs used as of July 31, 2021, in valuing the Fund’s investments and other financial instruments carried at value ($ Thousands):
| | | | | | | | | | | | | | | | |
Investments in Securities | | Level 1 ($) | | | Level 2 ($) | | | Level 3 ($)(1) | | | Total ($) | |
Common Stock | | | 2,447,839 | | | | 55 | | | | �� | | | | 2,447,894 | |
Preferred Stock | | | 2,005 | | | | – | | | | – | | | | 2,005 | |
Exchange Traded Fund | | | 330 | | | | – | | | | – | | | | 330 | |
Rights | | | – | | | | – | | | | – | (2) | | | – | |
Cash Equivalent | | | 50,777 | | | | – | | | | – | | | | 50,777 | |
| | | | | | | | | | | | | | | | |
Total Investments in Securities | | | 2,500,951 | | | | 55 | | | | – | | | | 2,501,006 | |
| | | | | | | | | | | | | | | | |
| | | | | | | | | | | | | | | | |
| Other Financial Instruments | | Level 1
($) | | | Level 2 ($) | | | Level 3 ($) | | | Total ($) | |
Futures Contracts * | | | | | | | | | | | | | | | | |
Unrealized Appreciation | | | 2,448 | | | | — | | | | — | | | | 2,448 | |
Unrealized Depreciation | | | (10,241 | ) | | | — | | | | — | | | | (10,241 | ) |
| | | | | | | | | | | | | | | | |
Total Other Financial Instruments | | | (7,793 | ) | | | — | | | | — | | | | (7,793 | ) |
| | | | | | | | | | | | | | | | |
* Futures contracts are valued at the unrealized appreciation (depreciation) on the instrument.
(1) A reconciliation of Level 3 investments is presented when the Fund has a significant amount of Level 3 investments at the beginning and/or end of the period in relation to net assets. Management has concluded that Level 3 investments are not material in relation to net assets.
(2) This category includes securities with a value of $0.
For the year ended July 31, 2021, there were no transfers in or out of Level 3.
For more information on valuation inputs, see Note 2 — Significant Accounting Policies in Notes to Financial Statements.
| | |
| 20 | | Adviser Managed Trust / Annual Report / July 31, 2021 |
The following is a summary of the transactions the Fund had with affiliates for the year ended July 31, 2021 ($ Thousands):
| | | | | | | | | | | | | | | | | | |
| Security Description | | Value
7/31/2020 | | Purchases at Cost | | Proceeds from Sales | | Realized Gain (Loss) | | Change in Unrealized Appreciation (Depreciation) | | Value 7/31/2021 | | Shares | | Dividend Income | | Capital Gains |
SEI Daily Income Trust, Government Fund, Cl F | | $— | | $140,042 | | $(89,265) | | $— | | $— | | $50,777 | | 50,776,582 | | $1 | | $— |
| | | | | | | | | | | | | | | | | | |
Amounts designated as “—” are either $0 or have been rounded to $0.
The accompanying notes are an integral part of the financial statements.
| | |
| Adviser Managed Trust / Annual Report / July 31, 2021 | | 21 |

KPMG LLP
1601 Market Street
Philadelphia, PA 19103-2499
Report of Independent Registered Public Accounting Firm
To the Shareholders of the Funds and Board of Trustees
Adviser Managed Trust:
Opinion on the Financial Statements
We have audited the accompanying statement of assets and liabilities, including the summary schedule of investments, of the Tactical Offensive Equity Fund and the statements of assets and liabilities, including the schedules of investments, of the Tactical Offensive Core Fixed Income Fund and the Tactical Offensive Enhanced Fixed Income Fund (collectively, the Funds) comprising the Adviser Managed Trust, as of July 31, 2021, the related statements of operations for the year then ended, except for the Tactical Offensive Enhanced Fixed Income Fund for which the date is the period from January 12, 2021 (commencement of operations) through July 31, 2021, the statements of changes in net assets for each of the years in the two-year period then ended, except for the Tactical Offensive Enhanced Fixed Income Fund for which the date is the period from January 12, 2021 (commencement of operations) through July 31, 2021, and the related notes (collectively, the financial statements) and the financial highlights for each of the years or periods in the five-year period then ended. The financial statements and financial highlights are included in Item 1 of this Form N-CSR and the schedule of investments of the Tactical Offensive Equity Fund as of July 31, 2021 is included in Item 6 of this Form N-CSR. In our opinion, the financial statements and financial highlights present fairly, in all material respects, the financial position of the Funds as of July 31, 2021, the results of their operations for the year or period then ended, the changes in their net assets for each of the years or periods in the two-year period then ended, and the financial highlights for each of the years or periods in the five-year period then ended, in conformity with U.S. generally accepted accounting principles.
Basis for Opinion
These financial statements and financial highlights are the responsibility of the Funds’ management. Our responsibility is to express an opinion on these financial statements and financial highlights based on our audits. We are a public accounting firm registered with the Public Company Accounting Oversight Board (United States) (PCAOB) and are required to be independent with respect to the Funds in accordance with the U.S. federal securities laws and the applicable rules and regulations of the Securities and Exchange Commission and the PCAOB.
We conducted our audits in accordance with the standards of the PCAOB. Those standards require that we plan and perform the audit to obtain reasonable assurance about whether the financial statements and financial highlights are free of material misstatement, whether due to error or fraud. Our audits included performing procedures to assess the risks of material misstatement of the financial statements and financial highlights, whether due to error or fraud, and performing procedures that respond to those risks. Such procedures included examining, on a test basis, evidence regarding the amounts and disclosures in the financial statements and financial highlights. Such procedures also included confirmation of securities owned as of July 31, 2021, by correspondence with the custodian, the transfer agent, and brokers or by other appropriate auditing procedures when replies from brokers were not received. Our audits also included evaluating the accounting principles used and significant estimates made by management, as well as evaluating the overall presentation of the financial statements and financial highlights. We believe that our audits provide a reasonable basis for our opinion.

We have served as the auditor of one or more SEI Funds investment companies since 2005.
Philadelphia, Pennsylvania
September 29, 2021
KPMG LLP, a Delaware limited liability partnership and a member firm of
the KPMG global organization of independent member firms affiliated with
KPMG International Limited, a private English company limited by guarantee.
Item 7. Disclosure of Proxy Voting Policies and Procedures for Closed-End Management Investment Companies.
Not applicable.
Item 8. Portfolio Managers of Closed-End Management Investment Companies
Not applicable.
Item 9. Purchases of Equity Securities by Closed-End Management Company and Affiliated Purchasers.
Not applicable.
Item 10. Submission of Matters to a Vote of Security Holders.
There have been no material changes to the procedures by which shareholders may recommend nominees to the Registrant’s Board of Trustees (the “Board”). The Registrant has a standing Governance Committee (the “Committee”) currently consisting of the independent trustees. The Committee is responsible for evaluating and recommending nominees for election to the Board. Pursuant to the Committee’s Charter, adopted on June 18, 2004, as amended, the Committee will review all shareholder recommendations for nominations to fill vacancies on the Board if such recommendations are submitted in writing and addressed to the Committee at the Registrant’s office.
Item 11. Controls and Procedures.
(a) The Registrant’s principal executive and principal financial officers, or persons performing similar functions, have concluded that the Registrant’s disclosure controls and procedures (as defined in Rule 30a-3(c) under the Investment Company Act of 1940 (the “1940 Act”) are effective based on the evaluation of these controls and procedures required by Rule 30a-3(b) under the 1940 Act and Rules 13a-15(b) or 15d-15(b) under the Securities Exchange Act of 1934 as of a date within 90 days of the filing date of this report.
(b) There were no changes in the Registrant’s internal control over financial reporting (as defined in Rule 30a-3(d) under the 1940 Act that occurred during the period covered by this report that have materially affected, or are reasonably likely to materially affect, the Registrant’s internal control over financial reporting.
Item 12. Disclosure of Securities Lending Activities for Closed-End Management Investment Companies.
Not applicable.
Item 13. Exhibits.
(a)(1) Code of Ethics attached hereto.
(a)(2) A separate certification for the principal executive officer and the principal financial officer of the Registrant as required by Rule 30a-2(a) under the Investment Company Act of 1940 are filed herewith.
(b) Officer certifications as required by Rule 30a-2(b) under the Investment Company Act of 1940, as amended also accompany this filing as exhibits.
SIGNATURES
Pursuant to the requirements of the Securities Exchange Act of 1934 and the Investment Company Act of 1940, the Registrant has duly caused this report to be signed on its behalf by the undersigned, thereunto duly authorized.
| | | | |
| | | | Adviser Managed Trust |
| By | | | | /s/ Robert A. Nesher |
| | | | Robert A. Nesher |
| | | | President & CEO |
Date: October 8, 2021
Pursuant to the requirements of the Securities Exchange Act of 1934 and the Investment Company Act of 1940, this report has been signed below by the following persons on behalf of the Registrant and in the capacities and on the dates indicated.
| | | | |
|
| By | | | | /s/ Robert A. Nesher |
| | | | Robert A. Nesher |
| | | | President & CEO |
Date: October 8, 2021
| | | | |
| By | | | | /s/ Peter A. Rodriguez |
| | | | Peter A. Rodriguez |
| | | | Controller & CFO |
Date: October 8, 2021