united states
securities and exchange commission
washington, d.c. 20549
form n-csr
certified shareholder report of registered management
investment companies
Investment Company Act file number 811-22483
Copeland Trust
(Exact name of Registrant as specified in charter)
Eight Tower Bridge, 161 Washington St., Suite #1325 Conshohocken, PA 19428
(Address of principal executive offices) (Zip code)
Gemini Fund Services, LLC, 80 Arkay Drive Suite 10, Hauppauge, NY 11788
(Name and address of agent for service)
Registrant's telephone number, including area code: (631) 470-2619
Date of fiscal year end: 11/30
Date of reporting period: 11/30/20
Item 1. Reports to Stockholders.
| Copeland | ||
| Dividend Growth Fund | ||
| (formerly, Copeland Risk Managed Dividend Growth Fund) | ||
| Copeland | ||
| SMID Cap | ||
| Dividend Growth Fund | ||
| Annual Report | ||
| November 30, 2020 | ||
| Investor Information: 1-888-9-COPELAND | ||
| This report and the financial statements contained herein are submitted for the general information of shareholders and are not authorized for distribution to prospective investors unless preceded or accompanied by an effective prospectus. Nothing herein contained is to be considered an offer of sale or solicitation of an offer to buy shares of the Funds. Such offering is made only by prospectus, which includes details as to offering price and other material information. | ||
| Distributed by Northern Lights Distributors, LLC | ||
| Member FINRA | ||
Copeland Dividend Growth Fund
Annual Report
November 30, 2020
Dear Fellow Shareholders,
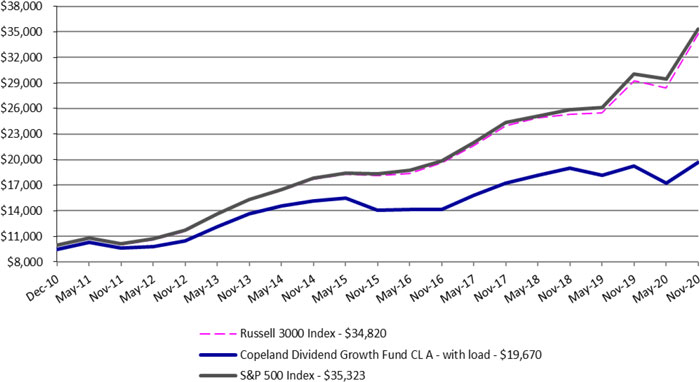
Copeland Capital Management is pleased to review the performance of the Copeland Dividend Growth Fund for the fiscal year beginning December 1, 2019 through November 30, 2020. Unless otherwise stated herein, all data and statistics that follow are as of November 30, 2020.
During the twelve-month period, the Class I shares of the Fund delivered a 2.4% return versus the 17.5% advance posted by the S&P 500 Index. The underperformance was wholly attributable to the average cash and cash equivalent position of 22% held by the Fund over the course of the measurement period. The defensive posture was triggered by the violent peak-to-trough market decline of 34% over the course of just 34 days in late February through March 23, 2020. The rapid downdraft, fueled by the U.S. outbreak of the Coronavirus, stands as the fastest 30% plus market decline in history.
All nine of our proprietary sector signals registered a negative reading as we moved into April, leading the Fund to rein in its overall equity exposure level to 50%. Defying all expectations, the market staged a sharp rally of over +60% from the market low through November 30, 2020. While the Fund added equity exposure over the balance of the year, the initial V-shaped nature of the recovery was a decided drag on performance. Perhaps most importantly, since November 16, 2020, the Fund no longer applies a sector rotation strategy and now maintains a substantially fully invested position under normal conditions and will continue to do so from this point onward, in an effort to reduce the impact of potential violent market whipsaws on the Fund, which have characterized the investment climate in recent years.
Our stock selection in the Financials sector of the market bolstered Fund returns while those in the Information Technology sector were a drag. Bucking the overall Fund trend, Information Technology holding Apple Inc. (AAPL, 2.4% of holdings) rose a sharp 79% during the period. This consumer electronics behemoth has posted strong growth amidst the backdrop of the global pandemic. Work-from-home trends bolstered sales of iPads and Mac computers, which rose 31% and 22%, respectively in the most recently reported quarter. In addition, highly valued services revenue, given its recurring nature, grew over 15% versus the prior year to top $13 billion. A second standout performer, Financials sector constituent MSCI Inc. (MSCI, 1.1% of holdings), advanced over 57% during the period despite a 6% downdraft in the broader Financials sector. This provider of index, portfolio construction and risk management tools has benefitted from an ongoing shift towards passive, index-based investing. A focus on Environmental, Social and Governance (ESG) investing has also proven to be a windfall to MSCI, as this area continues to attract outsized attention and client assets. The aforementioned tailwinds have fueled a steep five-year compound annual growth rate in revenues and earnings at MSCI of 10% and 28%, respectively. With 74% of revenues coming from recurring subscriptions and a customer retention rate of nearly 95%, the exemplary results posted by MSCI appear to us to be poised to continue for the foreseeable future.
On the downside, Fund holding Diamondback Energy (FANG, 0.0% of holdings) was the worst performer in the Fund, falling over 78% while we held a position in the company. This oil and gas exploration company was sharply impacted by an unfolding oil price war between Russia and Saudi Arabia which triggered a halving of the price of West Texas Intermediate (“WTI”) crude oil from $61 per barrel at the start of the year, to under $30 per barrel during the month of March. Amidst fears surrounding a potential dividend cut, we elected to exit our position in the shares. Healthcare sector constituent, U.S. Physical Therapy (USPH, 0.0% of holdings) was also a laggard as shares retreated over 40% during the period. The operator of outpatient physical therapy clinics suffered as the pandemic forced clinics to either close or experience sharply reduced patient volumes, by as much as 50%. The company took steps to weather the
1
downturn including lay-offs, salary reductions and lease renegotiations. Nevertheless, we elected to eliminate our position is the shares as the company reported that an upcoming suspension of the dividend was likely.
Looking back over the prior twelve-month period, it is striking that the market has climbed over 17% in the face of the Coronavirus pandemic. $2.2 trillion in economic stimulus in the form of the Coronavirus Aid, Relief, and Economic Stability (CARES) Act, coupled with aggressive monetary easing from the Federal Reserve, provided the initial fuel for the market recovery. More recently, news of forthcoming successful COVID-19 vaccines from both Pfizer and Moderna, propelled the equity markets to gain nearly 11% in the month of November. Looking forward, we believe that the equity market outlook is clouded by the crosscurrents of a potential end to the global pandemic, juxtaposed against the financial and human toll exacted by the virus.
Regardless of the future path taken by the equity market, we at Copeland remain intently focused on the long-term prospects of companies held in the Fund, with a particular emphasis on the capacity of each to continue to grow its dividend over time. We continue to favor companies that we believe retain noteworthy competitive advantages in their respective industries, generate steady and growing cash flows, and are overseen by managements with capital allocation discipline and an eye on the shareholder. With dividend growth equities having lagged the broader market indices of late, we find the present environment to be particularly attractive for the high quality, cash generative companies in which we invest. Longer term, we look forward to maintaining a substantially invested investment position under normal conditions, in an attempt to reap the potential rewards historically afforded by equity securities, in general and dividend growth securities in particular.
Thank you for the confidence you have placed in Copeland and for your investment in the Copeland Dividend Growth Fund.
The views and opinions expressed in this letter are subject to change and may not be relied upon for investment advice. No forecasts can be guaranteed. The Fund holdings discussed herein are for informational purposes only and should not be perceived as investment recommendations by Copeland Capital Management. Holdings are subject to change, may not represent current holdings and are subject to risk. Performance data quoted here represents past performance. Past performance is no guarantee of future results. The return quoted reflects fee waivers and expense reimbursements in effect and would have been lower in their absence. Current performance may be lower or higher than the performance quoted above. The risks of investing in the Copeland Funds vary from fund to fund; to see the risks of investing in an individual fund, please refer to that fund’s latest prospectus.
You cannot invest directly in any index. Index returns do not include a deduction for fees or expenses. The S&P 500® Index is a market-capitalization-weighted index of the stocks of 500 leading companies in major industries of the U.S. economy.
1017-NLD-1/21/2021
2
Copeland SMID Cap Dividend Growth Fund
Annual Report
November 30, 2020
Dear Fellow Shareholders,
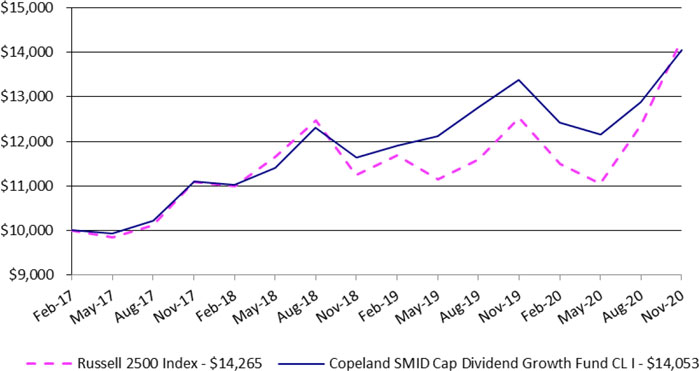
Copeland Capital Management is pleased to review the performance of the Copeland SMID Cap Dividend Growth Fund for the fiscal year beginning December 1, 2019 through November 30, 2020. Unless otherwise stated herein, all data and statistics that follow are as of November 30, 2020.
During the twelve-month period ended November 30, 2020, Class I shares of the Fund delivered a +5.0% return, versus the +13.9% advance posted by the Russell 2500 Index. The Fund outperformed the benchmark during the first half of the year, when the Covid-19 pandemic spread across the globe and led to a massive decline in equity markets, including a 40% decline among SMID cap equities from mid-February through the lows of mid-March. Unprecedented fiscal stimulus was quickly enacted that supported the unemployed as well as impaired businesses, while the Federal Reserve stepped in to ensure that the bond markets and banks kept the lending markets functioning. Meanwhile the health care industry was called to action and, far more quickly than expected, was able to deliver pharmaceuticals and start to develop vaccines that could target the virus, which engendered optimism in the markets. The result was a remarkable stock market rebound that continued through the period’s end. SMID Cap equities were more significantly impaired than their larger cap counterparts during the decline, and then led the accelerating rally that closed the period as investors grew more confident that massive stimulus would lead to a strong recovery in both the economy and corporate earnings. The Fund lagged the benchmark during the recovery, which is an unsurprising outcome given the typical preference of investors for higher risk, lower quality, speculative investments following a deep recession.
We believe our dividend growth strategy behaved as it was designed, delivering resiliency during the downdrafts while reasonably participating in the rebounds, aided in both instances by strong rates of dividend growth.
Our stock selection in the Financials sector most significantly aided Fund returns. MarketAxess Holdings (MKTX, 1.6%), which operates an innovative electronic trading platform for fixed income securities, rallied as market share gains were evident in the company’s rapidly expanding trading volumes. We believe that robust earnings growth, projected to reach 44% for the year, should enable the company to extend its 10-year streak of raising its dividend. Discover Financial Services (DFS, 0.0%), a leading provider or credit cards and lending to consumers and small businesses, provided significant appreciation from the Fund’s timely purchase of shares near the market low in March. Expectations for large credit losses proved overly pessimistic as the government supported consumers and the economy quickly rebounded. The Fund also benefited from stocks with exposure to activities that were enhanced by the changing spending habits of consumers during the pandemic, such as Pool Corporation (POOL, 1.5%). As the dominant distributor of pool supplies and equipment in the United States, the company’s sales and profits accelerated during the year as consumers were spending their leisure time at home.
The Fund’s selections within the Health Care sector were a drag on performance, despite appreciating as a group by over 13%. However, biotechnology stocks, which are a material weighting in the benchmark, returned on average 86% during the period as investors speculated on the winners of the Covid-19 vaccine arms race. Similarly, while the Fund’s Technology stocks rose as a group by nearly 18%, they lagged the average return of 39% among the Technology stocks in the benchmark. We believe that both of these examples reflect the market’s short-term preference for speculative investments to the detriment of resilient dividend growth companies. Finally, Ryman Hospitality Properties (RHP, 0.0%) declined significantly during March when hotels were closed, and conferences were cancelled as the pandemic worsened. As a result of our belief that the dividend was at risk, the stock was sold from the portfolio.
3
Looking forward, we believe that the equity market outlook is clouded by the crosscurrents of a potential end to the global pandemic, juxtaposed against the financial and human toll exacted by the virus and valuations in some corners of the market that have reached historically high levels. With dividend growth equities having lagged the broader market indices of late, we find the present environment to be particularly attractive for the high quality, cash generative companies in which we invest.
Regardless of the future path taken by the equity market, we at Copeland we remain intently focused on the long-term prospects of companies held in the Fund, with a particular emphasis on the capacity of each to continue to grow its dividend over time. We continue to favor companies that we believe retain noteworthy competitive advantages in their respective industries, are cash generative, and are overseen by managements with capital allocation discipline and an eye on the shareholder. By owning a diversified portfolio of such companies, we hope to deliver better than benchmark returns over time, but with less volatility than is typically found when owning SMID Cap stocks.
Thank you for the confidence you have placed in Copeland and for your investment in the Copeland SMID Cap Dividend Growth Fund.
The views and opinions expressed in this letter are subject to change and may not be relied upon for investment advice. No forecasts can be guaranteed. The Fund holdings discussed herein are for informational purposes only and should not be perceived as investment recommendations by Copeland Capital Management. Holdings are subject to change, may not represent current holdings and are subject to risk. Performance data quoted here represents past performance. Past performance is no guarantee of future results. The return quoted reflects fee waivers and expense reimbursements in effect and would have been lower in their absence. Current performance may be lower or higher than the performance quoted above. The risks of investing in the Copeland Funds vary from fund to fund; to see the risks of investing in an individual fund, please refer to that fund’s latest prospectus.
You cannot invest directly in any index. Index returns do not include a deduction for fees or expenses. The Russell 2500 Index is comprised of the bottom 2500 companies in the Russell 3000 Index. The Russell 3000 Index measures the performance of the 3000 largest U.S. companies based on total market capitalization, which represents approximately 98% of the investable U.S. equity market.
1017-NLD-1/21/2021
4
| Copeland Dividend Growth Fund |
| Portfolio Review (Unaudited) |
| December 28, 2010* through November 30, 2020 |
Performance of a $10,000 Investment (as of November 30, 2020)
| Average Annualized | Since | Since | Since | ||
| Total Returns as of | Inception | Inception | Inception | ||
| November 30, 2020 | One Year | Five Year | Class A * | Class C * | Class I * |
| Copeland Dividend Growth Fund: | |||||
| Class A | |||||
| Without sales charge | 2.24% | 6.91% | 7.70% | — | — |
| With sales charge + | -3.65% | 5.65% | 7.06% | — | — |
| Class C | 1.51% | 6.11% | — | 7.49% | — |
| Class I | 2.40% | 7.07% | — | — | 7.50% |
| S&P 500 Index | 17.46% | 13.99% | 13.56% | 14.72% | 14.17% |
| Russell 3000 Index | 19.02% | 13.95% | 13.40% | 14.68% | 14.03% |
| * | Class A shares commenced operations on December 28, 2010. Class C commenced operations on January 5, 2012. Class I commenced operations March 1, 2013. |
| + | Adjusted for initial maximum sales charge of 5.75%. |
The S&P 500 Index is an unmanaged market capitalization-weighted index which is comprised of 500 of the largest U.S. domiciled companies and includes the reinvestment of all dividends. Investors cannot invest directly in an index or benchmark.
The Russell 3000 Index measures the performance of the largest 3000 U.S. companies representing approximately 98% of the investable U.S. equity market and includes the reinvestment of all dividends. Investors cannot invest directly in an index or benchmark.
Past performance is not predictive of future results. The investment return and principal value of an investment will fluctuate. An investor’s shares, when redeemed, may be worth more or less than the original cost. The performance and returns do not reflect the deduction of taxes that a shareholder may pay on Fund distributions or redemption of Fund shares. Total return is calculated assuming reinvestment of all dividends and distributions. Total returns would have been lower had the adviser not waived its fees and reimbursed a portion of the Fund’s expenses. For performance information current to the most recent month-end please call toll-free 1-888-9-COPELAND (1-888-926-7352). Additional information can be found by visiting our website, www.copelandfunds.com. The Fund’s gross annual operating expense ratio, as stated in the current prospectus, is 1.49%, 2.24%, and 1.34%,for Class A, Class C, and Class I shares, respectively, and its net annual operating expense ratio is 1.20%, 1.95%, and 1.05%, for Class A, Class C, and Class I shares, respectively. These ratios can fluctuate and may differ from the expense ratios disclosed in the Financial Highlights section of this report. The Fund’s investment adviser has contractually agreed to reduce its fees and/or absorb expenses of the Fund, at least until December 31, 2021, to ensure that total annual fund operating expenses after fee deferral and/or reimbursement (exclusive of any taxes, leverage interest, borrowing interest, brokerage commissions, expenses incurred in connection with any merger or reorganization, dividend expense on securities sold short, acquired fund fees and expenses or extraordinary expenses such as litigation) will not exceed 1.20%, 1.95% and 1.05% of Class A, Class C and Class I shares, respectively, subject to possible recoupment from the Fund in future years on a rolling three year basis (within the three years after the fees have been deferred or reimbursed) if such recoupment can be achieved without exceeding the lesser of the expense limitation in effect at the time of the deferral and at the time of the repayment. Prior to November 16, 2020, the expense limitations were 1.45%, 2.20%, and 1.30% of Class A, Class C and Class I shares, respectively.
5
| Copeland SMID Cap Dividend Growth Fund |
| Portfolio Review (Unaudited) |
| February 27, 2017* through November 30, 2020 |
Performance of a $10,000 Investment (as of November 30, 2020)
| Since | Since | ||
| Total Returns as of | Inception | Inception | |
| November 30, 2020 | One Year | Class I * | Class A * |
| Copeland SMID Cap Dividend Growth Fund: | |||
| Class I | 4.98% | 9.48% | — |
| Class A | |||
| Without sales charge | 4.73% | — | 10.72% |
| With sales charge + | -1.31% | — | 7.12% |
| Russell 2500 Index | 13.86% | 9.92% | 13.65% |
| * | Class I shares commenced operations February 27, 2017. Class A commenced operations February 11, 2019 |
| + | Adjusted for initial maximum sales charge of 5.75%. |
The Russell 2500 Index is comprised of the smallest 2500 companies in the Russell 3000 Index. The Russell 3000 Index measures the performance of the 3,000 largest U.S. companies based on total market capitalization, which represents approximately 98% of the investable U.S. equity market. Investors cannot invest directly in an index or benchmark.
Past performance is not predictive of future results. The investment return and principal value of an investment will fluctuate. An investor’s shares, when redeemed, may be worth more or less than the original cost. The performance and returns do not reflect the deduction of taxes that a shareholder may pay on Fund distributions or redemption of Fund shares. Total return is calculated assuming reinvestment of all dividends and distributions. Total returns would have been lower had the adviser not waived its fees and reimbursed a portion of the Fund’s expenses. For performance information current to the most recent month-end please call toll-free 1-888-9-COPELAND (1-888-926-7352). Additional information can be found by visiting our website, www.copelandfunds.com. The Fund’s gross annual operating expense ratio, as stated in the current prospectus is 3.04% and 1.18% for Class A and Class C shares, respectively, and its net annual operating expense ratio is 1.20% and 0.95% for Class A and Class I shares, respectively. This ratio can fluctuate and may differ from the expense ratio disclosed in the Financial Highlights section of this report. The Fund’s adviser has contractually agreed to reduce its fees and/or absorb expenses of the Fund, until at least March 31, 2021, to ensure that total annual fund operating expenses after fee deferral and/or reimbursement (exclusive of any taxes, leverage interest, borrowing interest, brokerage commissions, expenses incurred in connection with any merger or reorganization, dividend expense on securities sold short, acquired fund fees and expenses or extraordinary expenses such as litigation) will not exceed 1.20% and 0.95% of Class A and Class I shares, respectively, subject to possible recoupment from the Fund in future years on a rolling three year basis (within the three years after the fees have been deferred or reimbursed) if such recoupment can be achieved without exceeding the lesser of the expense limitation in effect at the time of the deferral and at the time of the repayment.
6
| Copeland Dividend Growth Fund |
| PORTFOLIO OF INVESTMENTS |
| November 30, 2020 |
| Shares | Security | Market Value | ||||||
| COMMON STOCK - 98.8% | ||||||||
| AEROSPACE & DEFENSE - 2.4% | ||||||||
| 5,652 | Huntington Ingalls Industries, Inc. | $ | 905,394 | |||||
| 2,206 | Lockheed Martin Corporation | 805,190 | ||||||
| 1,710,584 | ||||||||
| ASSET MANAGEMENT - 2.6% | ||||||||
| 5,190 | Ameriprise Financial, Inc. | 961,396 | ||||||
| 1,229 | BlackRock, Inc. | 858,272 | ||||||
| 1,819,668 | ||||||||
| BANKING - 2.5% | ||||||||
| 8,468 | JPMorgan Chase & Company | 998,208 | ||||||
| 16,392 | Truist Financial Corporation | 760,917 | ||||||
| 1,759,125 | ||||||||
| BIOTECHNOLOGY & PHARMACEUTICALS - 1.5% | ||||||||
| 6,627 | Zoetis, Inc. | 1,062,838 | ||||||
| CABLE & SATELLITE - 4.0% | ||||||||
| 450 | Cable One, Inc. | 891,302 | ||||||
| 18,679 | Comcast Corporation | 938,433 | ||||||
| 149,538 | Sirius XM Holdings, Inc. | 970,502 | ||||||
| 2,800,237 | ||||||||
| CHEMICALS - 3.0% | ||||||||
| 1,790 | Air Products and Chemicals, Inc. | 501,451 | ||||||
| 2,537 | Ecolab, Inc. | 563,594 | ||||||
| 2,489 | Quaker Chemical Corporation | 614,783 | ||||||
| 568 | Sherwin-Williams Company (The) | 424,654 | ||||||
| 2,104,482 | ||||||||
| COMMERCIAL SUPPORT SERVICES - 2.4% | ||||||||
| 4,389 | UniFirst Corporation | 811,438 | ||||||
| 8,110 | Waste Connections, Inc. | 843,278 | ||||||
| 1,654,716 | ||||||||
| ELECTRIC UTILITIES - 1.9% | ||||||||
| 43,408 | Algonquin Power & Utilities Corporation | 680,637 | ||||||
| 9,160 | NextEra Energy, Inc. | 674,084 | ||||||
| 1,354,721 | ||||||||
| ELECTRICAL EQUIPMENT - 1.2% | ||||||||
| 13,061 | Otis Worldwide Corporation | 874,303 | ||||||
| ENGINEERING & CONSTRUCTION - 1.4% | ||||||||
| 8,254 | Tetra Tech, Inc. | 984,290 | ||||||
| FOOD - 2.8% | ||||||||
| 4,743 | J & J Snack Foods Corporation | 689,585 | ||||||
| 8,961 | Lamb Weston Holdings, Inc. | 648,597 | ||||||
| 3,290 | McCormick & Company, Inc. | 615,164 | ||||||
| 1,953,346 | ||||||||
| GAS & WATER UTILITIES - 1.0% | ||||||||
| 4,363 | American Water Works Company, Inc. | 669,197 | ||||||
| HEALTH CARE FACILITIES & SERVICES - 8.5% | ||||||||
| 2,236 | Chemed Corporation | 1,069,367 | ||||||
| 16,377 | Encompass Health Corporation | 1,319,659 | ||||||
| 18,515 | Ensign Group, Inc. (The) | 1,330,673 | ||||||
| 9,231 | Quest Diagnostics, Inc. | 1,144,459 | ||||||
| 3,400 | UnitedHealth Group, Inc. | 1,143,556 | ||||||
| 6,007,714 | ||||||||
| HOME CONSTRUCTION - 1.3% | ||||||||
| 12,372 | DR Horton, Inc. | 921,714 | ||||||
| HOUSEHOLD PRODUCTS - 0.9% | ||||||||
| 7,011 | Church & Dwight Company, Inc. | 615,355 | ||||||
| INDUSTRIAL SUPPORT SERVICES - 1.3% | ||||||||
| 18,417 | Fastenal Company | 910,721 | ||||||
| INSURANCE - 1.3% | ||||||||
| 8,954 | Allstate Corporation (The) | 916,442 | ||||||
The accompanying notes are an integral part of these financial statements.
7
| Copeland Dividend Growth Fund |
| PORTFOLIO OF INVESTMENTS (Continued) |
| November 30, 2020 |
| Shares | Security | Market Value | ||||||
| COMMON STOCK - 98.8% (Continued) | ||||||||
| LEISURE FACILITIES & SERVICES - 2.7% | ||||||||
| 2,173 | Domino’s Pizza, Inc. | $ | 853,055 | |||||
| 10,690 | Starbucks Corporation | 1,047,834 | ||||||
| 1,900,889 | ||||||||
| LEISURE PRODUCTS - 1.6% | ||||||||
| 14,666 | Brunswick Corporation | 1,094,670 | ||||||
| MEDICAL EQUIPMENT & DEVICES - 5.2% | ||||||||
| 10,345 | Medtronic plc | 1,176,227 | ||||||
| 6,376 | ResMed, Inc. | 1,336,410 | ||||||
| 5,915 | STERIS plc | 1,146,386 | ||||||
| 3,659,023 | ||||||||
| OIL & GAS PRODUCERS - 0.6% | ||||||||
| 24,239 | Cabot Oil & Gas Corporation | 424,667 | ||||||
| PUBLISHING & BROADCASTING - 1.4% | ||||||||
| 9,287 | Nexstar Media Group, Inc. | 977,457 | ||||||
| REITS - 3.6% | ||||||||
| 3,052 | Alexandria Real Estate Equities, Inc. | 499,704 | ||||||
| 1,894 | American Tower Corporation | 437,893 | ||||||
| 688 | Equinix, Inc. | 480,080 | ||||||
| 4,017 | Innovative Industrial Properties, Inc. | 617,252 | ||||||
| 11,254 | NexPoint Residential Trust, Inc. | 498,665 | ||||||
| 2,533,594 | ||||||||
| RETAIL - CONSUMER STAPLES - 3.2% | ||||||||
| 3,462 | Casey’s General Stores, Inc. | 628,976 | ||||||
| 1,761 | Costco Wholesale Corporation | 689,907 | ||||||
| 4,377 | Dollar General Corporation | 956,725 | ||||||
| 2,275,608 | ||||||||
| RETAIL - DISCRETIONARY - 3.9% | ||||||||
| 6,002 | Advance Auto Parts, Inc. | 886,495 | ||||||
| 3,361 | Home Depot, Inc. (The) | 932,375 | ||||||
| 6,566 | Tractor Supply Company | 924,558 | ||||||
| 2,743,428 | ||||||||
| SEMICONDUCTORS - 6.7% | ||||||||
| 3,192 | Broadcom, Inc. | 1,281,843 | ||||||
| 4,539 | CMC Materials, Inc. | 700,277 | ||||||
| 8,089 | Texas Instruments, Inc. | 1,304,351 | ||||||
| 6,243 | Universal Display Corporation | 1,429,897 | ||||||
| 4,716,368 | ||||||||
| SOFTWARE - 3.7% | ||||||||
| 3,571 | Intuit, Inc. | 1,257,063 | ||||||
| 6,229 | Microsoft Corporation | 1,333,442 | ||||||
| 2,590,505 | ||||||||
| SPECIALTY FINANCE - 3.0% | ||||||||
| 16,186 | Aaron’s Holdings Company, Inc. | 1,018,585 | ||||||
| 14,545 | Discover Financial Services | 1,107,893 | ||||||
| 2,126,478 | ||||||||
| TECHNOLOGY HARDWARE - 5.2% | ||||||||
| 14,028 | Apple, Inc. | 1,670,033 | ||||||
| 26,022 | AudioCodes Ltd. | 727,835 | ||||||
| 7,415 | Motorola Solutions, Inc. | 1,271,895 | ||||||
| 3,669,763 | ||||||||
| TECHNOLOGY SERVICES - 15.0% | ||||||||
| 5,275 | Accenture plc | 1,313,950 | ||||||
| 8,534 | Automatic Data Processing, Inc. | 1,483,892 | ||||||
| 14,146 | Booz Allen Hamilton Holding Corporation | 1,227,731 | ||||||
| 8,567 | Broadridge Financial Solutions, Inc. | 1,258,321 | ||||||
| 9,468 | CDW Corporation/DE | 1,235,479 | ||||||
| 3,615 | FactSet Research Systems, Inc. | 1,206,542 | ||||||
| 1,490 | MarketAxess Holdings, Inc. | 803,378 | ||||||
| 1,907 | MSCI, Inc. | 780,764 | ||||||
| 5,802 | Visa, Inc. | 1,220,451 | ||||||
| 10,530,508 | ||||||||
The accompanying notes are an integral part of these financial statements.
8
| Copeland Dividend Growth Fund |
| PORTFOLIO OF INVESTMENTS (Continued) |
| November 30, 2020 |
| Shares | Security | Market Value | ||||||
| COMMON STOCK - 98.8% (Continued) | ||||||||
| TELECOMMUNICATIONS - 0.9% | ||||||||
| 10,779 | Cogent Communications Holdings, Inc. | $ | 626,691 | |||||
| TRANSPORTATION & LOGISTICS - 1.2% | ||||||||
| 4,163 | Union Pacific Corporation | 849,585 | ||||||
| WHOLESALE - CONSUMER STAPLES - 0.9% | ||||||||
| 9,243 | Calavo Growers, Inc. | 662,076 | ||||||
| TOTAL COMMON STOCK (Cost - $60,043,955) | 69,500,763 | |||||||
| TOTAL INVESTMENTS - 98.8% (Cost - $60,043,955) | $ | 69,500,763 | ||||||
| OTHER ASSETS IN EXCESS OF LIABILITIES - 1.2% | 864,299 | |||||||
| NET ASSETS - 100.0% | $ | 70,365,062 | ||||||
plc - Public Limited Company
REITs - Real Estate Investment Trusts
| Portfolio Composition as of November 30, 2020 | ||||
| Sector | Percent of Net Assets | |||
| Technology | 30.6 | % | ||
| Health Care | 15.2 | % | ||
| Industrials | 9.9 | % | ||
| Consumer Discretionary | 9.5 | % | ||
| Financials | 9.4 | % | ||
| Consumer Staples | 7.8 | % | ||
| Communications | 6.3 | % | ||
| Real Estate | 3.6 | % | ||
| Materials | 3.0 | % | ||
| Utilities | 2.9 | % | ||
| Energy | 0.6 | % | ||
| Other Assets in Excess of Liabilities | 1.2 | % | ||
| Net Assets | 100.0 | % | ||
The accompanying notes are an integral part of these financial statements.
9
| Copeland SMID Cap Dividend Growth Fund |
| PORTFOLIO OF INVESTMENTS |
| November 30, 2020 |
| Shares | Security | Market Value | ||||||
| COMMON STOCK - 96.5% | ||||||||
| AEROSPACE & DEFENSE - 1.4% | ||||||||
| 1,982 | Huntington Ingalls Industries, Inc. | $ | 317,497 | |||||
| ASSET MANAGEMENT - 3.1% | ||||||||
| 5,872 | Cohen & Steers, Inc. | 415,561 | ||||||
| 16,805 | Kennedy-Wilson Holdings, Inc. | 268,544 | ||||||
| 684,105 | ||||||||
| BANKING - 4.6% | ||||||||
| 12,525 | Bank OZK | 350,199 | ||||||
| 18,301 | Home BancShares, Inc. | 338,752 | ||||||
| 5,145 | Prosperity Bancshares, Inc. | 323,260 | ||||||
| 1,012,211 | ||||||||
| CABLE & SATELITE - 1.5% | ||||||||
| 164 | Cable One, Inc. | 324,830 | ||||||
| CHEMICALS - 2.0% | ||||||||
| 1,774 | Quaker Chemical Corporation | 438,178 | ||||||
| COMMERCIAL SUPPORT SERVICES - 2.6% | ||||||||
| 7,418 | ABM Industries, Inc. | 285,593 | ||||||
| 1,556 | UniFirst Corporation | 287,673 | ||||||
| 573,266 | ||||||||
| ELECTRIC UTILITIES - 1.3% | ||||||||
| 18,485 | Algonquin Power & Utilities Corporation | 289,845 | ||||||
| ELECTRICAL EQUIPMENT - 6.2% | ||||||||
| 4,660 | Badger Meter, Inc. | 384,170 | ||||||
| 5,533 | BWX Technologies, Inc. | 314,717 | ||||||
| 4,386 | Cognex Corporation | 329,564 | ||||||
| 1,467 | Littelfuse, Inc. | 352,858 | ||||||
| 1,381,309 | ||||||||
| ENGINEERING & CONSTRUCTION - 2.6% | ||||||||
| 2,725 | Exponent, Inc. | 226,202 | ||||||
| 2,972 | Tetra Tech, Inc. | 354,411 | ||||||
| 580,613 | ||||||||
| FOOD - 2.9% | ||||||||
| 2,213 | J & J Snack Foods Corporation | 321,748 | ||||||
| 4,299 | Lamb Weston Holdings, Inc. | 311,162 | ||||||
| 632,910 | ||||||||
| GAS & WATER UTILITIES - 2.4% | ||||||||
| 3,242 | American States Water Company | 239,324 | ||||||
| 8,253 | UGI Corporation | 292,816 | ||||||
| 532,140 | ||||||||
| HEALTH CARE FACILITIES & SERVICES - 7.2% | ||||||||
| 735 | Chemed Corporation | 351,514 | ||||||
| 4,266 | Encompass Health Corporation | 343,754 | ||||||
| 8,008 | Ensign Group, Inc. (The) | 575,535 | ||||||
| 2,686 | Quest Diagnostics, Inc. | 333,010 | ||||||
| 1,603,813 | ||||||||
| HOME CONSTRUCTION - 0.7% | ||||||||
| 4,648 | KB Home | 163,610 | ||||||
| INDUSTRIAL SUPPORT SERVICES - 1.9% | ||||||||
| 5,042 | MSC Industrial Direct Company, Inc. | 420,099 | ||||||
| INSTITUTIONAL FINANCIAL SERVICES - 1.4% | ||||||||
| 8,480 | Lazard Ltd. | 316,474 | ||||||
| INSURANCE - 1.3% | ||||||||
| 3,013 | Globe Life, Inc. | 280,510 | ||||||
The accompanying notes are an integral part of these financial statements.
10
| Copeland SMID Cap Dividend Growth Fund |
| PORTFOLIO OF INVESTMENTS (Continued) |
| November 30, 2020 |
| Shares | Security | Market Value | ||||||
| COMMON STOCK - 96.5% (Continued) | ||||||||
| INTERNET MEDIA & SERVICES - 0.5% | ||||||||
| 1,588 | Shutterstock, Inc. | $ | 109,191 | |||||
| LEISURE FACILITIES & SERVICES - 2.0% | ||||||||
| 822 | Domino’s Pizza, Inc. | 322,693 | ||||||
| 852 | Wingstop, Inc. | 108,468 | ||||||
| 431,161 | ||||||||
| LEISURE PRODUCTS - 1.9% | ||||||||
| 5,541 | Brunswick Corporation | 413,580 | ||||||
| MACHINERY - 4.4% | ||||||||
| 1,374 | Nordson Corporation | 280,035 | ||||||
| 2,129 | Snap-on, Inc. | 374,385 | ||||||
| 3,624 | Toro Company (The) | 328,733 | ||||||
| 983,153 | ||||||||
| MEDICAL EQUIPMENT & DEVICES - 3.8% | ||||||||
| 2,910 | LeMaitre Vascular, Inc. | 114,625 | ||||||
| 12,447 | Luminex Corporation | 295,367 | ||||||
| 2,198 | STERIS plc | 425,994 | ||||||
| 835,986 | ||||||||
| OIL & GAS PRODUCERS - 1.8% | ||||||||
| 17,121 | Cabot Oil & Gas Corporation | 299,960 | ||||||
| 2,595 | Diamondback Energy, Inc. | 103,696 | ||||||
| 403,656 | ||||||||
| PUBLISHING & BROADCASTING - 1.6% | ||||||||
| 3,317 | Nexstar Media Group, Inc. | 349,114 | ||||||
| REITS - 6.9% | ||||||||
| 2,129 | Alexandria Real Estate Equities, Inc. | 348,581 | ||||||
| 8,490 | Americold Realty Trust | 289,764 | ||||||
| 2,082 | Innovative Industrial Properties, Inc. | 319,920 | ||||||
| 6,881 | NexPoint Residential Trust, Inc. | 304,897 | ||||||
| 4,631 | QTS Realty Trust, Inc. | 275,128 | ||||||
| 1,538,290 | ||||||||
| RETAIL - CONSUMER STAPLES - 1.5% | ||||||||
| 1,803 | Casey’s General Stores, Inc. | 327,569 | ||||||
| RETAIL - DISCRETIONARY - 4.4% | ||||||||
| 1,936 | Advance Auto Parts, Inc. | 285,947 | ||||||
| 6,819 | Monro, Inc. | 320,561 | ||||||
| 2,557 | Tractor Supply Company | 360,051 | ||||||
| 966,559 | ||||||||
| SEMICONDUCTORS - 5.3% | ||||||||
| 2,338 | CMC Materials, Inc. | 360,707 | ||||||
| 5,526 | Power Integrations, Inc. | 394,501 | ||||||
| 1,800 | Universal Display Corporation | 412,272 | ||||||
| 1,167,480 | ||||||||
| SPECIALTY FINANCE - 2.0% | ||||||||
| 7,164 | Aaron’s Holdings Company, Inc. | 450,831 | ||||||
| TECHNOLOGY HARDWARE - 1.1% | ||||||||
| 8,889 | AudioCodes Ltd. | 248,625 | ||||||
| TECHNOLOGY SERVICES - 9.4% | ||||||||
| 2,060 | Broadridge Financial Solutions, Inc. | 302,573 | ||||||
| 975 | FactSet Research Systems, Inc. | 325,416 | ||||||
| 1,762 | Jack Henry & Associates, Inc. | 283,435 | ||||||
| 4,018 | ManTech International Corporation | 309,266 | ||||||
| 647 | MarketAxess Holdings, Inc. | 348,850 | ||||||
| 3,877 | MAXIMUS, Inc. | 278,407 | ||||||
| 1,210 | Morningstar, Inc. | 242,121 | ||||||
| 2,090,068 | ||||||||
The accompanying notes are an integral part of these financial statements.
11
| Copeland SMID Cap Dividend Growth Fund |
| PORTFOLIO OF INVESTMENTS (Continued) |
| November 30, 2020 |
| Shares | Security | Market Value | ||||||
| COMMON STOCK - 96.5% (Continued) | ||||||||
| TELECOMMUNICATIONS - 1.3% | ||||||||
| 4,925 | Cogent Communications Holdings, Inc. | $ | 286,340 | |||||
| TRANSPORTATION & LOGISTICS - 1.1% | ||||||||
| 1,927 | Landstar System, Inc. | 253,246 | ||||||
| WHOLESALE - CONSUMER STAPLES - 2.9% | ||||||||
| 4,390 | Calavo Growers, Inc. | 314,456 | ||||||
| 10,830 | Core-Mark Holding Company, Inc. | 337,788 | ||||||
| 652,244 | ||||||||
| WHOLESALE - DISCRETIONARY - 1.5% | ||||||||
| 974 | Pool Corporation | 337,111 | ||||||
| TOTAL COMMON STOCK (Cost - $19,081,974) | 21,395,614 | |||||||
| TOTAL INVESTMENTS - 96.5% (Cost - $19,081,974) | $ | 21,395,614 | ||||||
| OTHER ASSETS IN EXCESS OF LIABILITIES - 3.5% | 768,237 | |||||||
| NET ASSETS - 100.00% | $ | 22,163,851 | ||||||
plc - Public Limited Company
REITs - Real Estate Investment Trusts
| Portfolio Composition as of November 30, 2020 | ||||
| Sector | Percent of Net Assets | |||
| Industrials | 20.4 | % | ||
| Technology | 15.8 | % | ||
| Financials | 12.4 | % | ||
| Health Care | 11.0 | % | ||
| Consumer Discretionary | 10.4 | % | ||
| Consumer Staples | 7.3 | % | ||
| Real Estate | 6.9 | % | ||
| Communications | 4.8 | % | ||
| Utilities | 3.7 | % | ||
| Materials | 2.0 | % | ||
| Energy | 1.8 | % | ||
| Other Assets in Excess of Liabilities | 3.5 | % | ||
| Net Assets | 100.0 | % | ||
The accompanying notes are an integral part of these financial statements.
12
| Copeland Trust |
| STATEMENTS OF ASSETS AND LIABILITIES |
| November 30, 2020 |
| Copeland SMID | ||||||||
| Copeland Dividend | Cap Dividend | |||||||
| Growth Fund | Growth Fund | |||||||
| Assets: | ||||||||
| Investments, at Cost | $ | 60,043,955 | $ | 19,081,974 | ||||
| Investments in Securities, at Market Value | $ | 69,500,763 | $ | 21,395,614 | ||||
| Cash | 807,831 | 622,401 | ||||||
| Dividends and Interest Receivable | 104,931 | 59,414 | ||||||
| Due from Investment Adviser | 39,086 | 92,233 | ||||||
| Receivable for Fund Shares Sold | 19,579 | 7,278 | ||||||
| Prepaid Expenses and Other Assets | 51,804 | 20,902 | ||||||
| Total Assets | 70,523,994 | 22,197,842 | ||||||
| Liabilities: | ||||||||
| Payable for Fund Shares Redeemed | 49,895 | — | ||||||
| Accrued Audit Fees | 15,289 | 6,466 | ||||||
| Accrued Distribution Fees | 16,301 | 21 | ||||||
| Payable to Related Parties | 27,450 | 11,330 | ||||||
| Other Accrued Expenses | 49,997 | 16,174 | ||||||
| Total Liabilities | 158,932 | 33,991 | ||||||
| Net Assets | $ | 70,365,062 | $ | 22,163,851 | ||||
| Composition of Net Assets: | ||||||||
| At November 30, 2020, Net Assets consisted of: | ||||||||
| Paid-in-Capital | $ | 62,738,773 | $ | 19,881,890 | ||||
| Accumulated Earnings (Loss) | 7,626,289 | 2,281,961 | ||||||
| Net Assets | $ | 70,365,062 | $ | 22,163,851 | ||||
| Class A Shares: | ||||||||
| Net Assets | $ | 18,799,786 | $ | 108,247 | ||||
| Shares Outstanding (no par value; unlimited number of shares authorized) | 1,568,609 | 8,239 | ||||||
| Net Asset Value and Redemption Price Per Share* | $ | 11.99 | $ | 13.14 | ||||
| Offering Price Per Share (NAV/$0.9425) Includes a Maximum Sales Charge of 5.75% | $ | 12.72 | $ | 13.94 | ||||
| Class C Shares: | ||||||||
| Net Assets | $ | 15,401,276 | ||||||
| Shares Outstanding (no par value; unlimited number of shares authorized) | 1,343,329 | |||||||
| Net Asset Value, Offering Price and Redemption Price Per Share* | $ | 11.47 | ||||||
| Class I Shares: | ||||||||
| Net Assets | $ | 36,164,000 | $ | 22,055,604 | ||||
| Shares Outstanding (no par value; unlimited number of shares authorized) | 3,052,318 | 1,672,736 | ||||||
| Net Asset Value, Offering Price and Redemption Price Per Share* | $ | 11.85 | $ | 13.19 | ||||
| * | The Funds charge a 1.00% fee on shares redeemed less than 30 days after purchase or if shares held less than 30 days are redeemed for the Funds’ minimum balance requirement. |
The accompanying notes are an integral part of these financial statements.
13
| Copeland Trust |
| STATEMENTS OF OPERATIONS |
| For the Year Ended November 30, 2020 |
| Copeland SMID | ||||||||
| Copeland Dividend | Cap Dividend | |||||||
| Growth Fund | Growth Fund | |||||||
| Investment Income: | ||||||||
| Dividend Income | $ | 1,291,470 | $ | 294,195 | ||||
| Interest Income | 74,037 | 4,419 | ||||||
| Less: Foreign Taxes Withholding | (27,457 | ) | (2,334 | ) | ||||
| Total Investment Income | 1,338,050 | 296,280 | ||||||
| Expenses: | ||||||||
| Investment Advisory Fees | 869,705 | 110,259 | ||||||
| Distribution Fees - Class C | 184,964 | — | ||||||
| Distribution Fees - Class A | 60,013 | 133 | ||||||
| Trustees’ Fees | 140,466 | 26,760 | ||||||
| Administration Fees | 88,051 | 22,003 | ||||||
| Legal Fees | 84,296 | 17,223 | ||||||
| Chief Compliance Officer Fees | 149,779 | 34,729 | ||||||
| Fund Accounting Fees | 51,631 | 33,139 | ||||||
| Registration & Filing Fees | 97,020 | 32,363 | ||||||
| Transfer Agent Fees | 41,390 | 24,818 | ||||||
| Non-Rule 12B-1 Shareholder Service Fees - Class A and Class C | 39,495 | 974 | ||||||
| Shareholder Service Fees- Class I | 36,116 | 2,111 | ||||||
| Printing Expenses | 30,543 | 5,260 | ||||||
| Custody Fees | 24,017 | 37,573 | ||||||
| Insurance Expense | 19,564 | 1,798 | ||||||
| Audit Fees | 15,916 | 6,992 | ||||||
| Miscellaneous Expenses | 9,752 | 7,642 | ||||||
| Total Expenses | 1,942,718 | 363,777 | ||||||
| Less: Fees Waived/Reimbursed by Adviser | (610,939 | ) | (223,713 | ) | ||||
| Net Expenses | 1,331,779 | 140,064 | ||||||
| Net Investment Income | 6,271 | 156,216 | ||||||
| Net Realized and Unrealized Gain (Loss) on Investments: | ||||||||
| Net Realized Loss on: | ||||||||
| Securities | (1,840,706 | ) | (177,079 | ) | ||||
| Net Change in Unrealized Appreciation (Depreciation) on Securities | (1,252,707 | ) | 1,606,726 | |||||
| Foreign Currency Transactions | (51 | ) | — | |||||
| (1,252,758 | ) | 1,606,726 | ||||||
| Net Realized and Unrealized Gain (Loss) on Investments | (3,093,464 | ) | 1,429,647 | |||||
| Net Increase (Decrease) in Net Assets Resulting From Operations | $ | (3,087,193 | ) | $ | 1,585,863 | |||
The accompanying notes are an integral part of these financial statements.
14
| Copeland Dividend Growth Fund |
| STATEMENTS OF CHANGES IN NET ASSETS |
| Year | Year | |||||||
| Ended | Ended | |||||||
| November 30, 2020 | November 30, 2019 | |||||||
| Operations: | ||||||||
| Net Investment Income | $ | 6,271 | $ | 888,564 | ||||
| Net Realized Gain (Loss) on Investments | (1,840,706 | ) | 25,079,273 | |||||
| Net Change in Unrealized Depreciation on investments and foreign currency transactions | (1,252,758 | ) | (25,884,106 | ) | ||||
| Net Increase (Decrease) in Net Assets Resulting From Operations | (3,087,193 | ) | 83,731 | |||||
| Distributions to Shareholders From: | ||||||||
| Total Distributions Paid | ||||||||
| Class A | (6,494,529 | ) | (3,753,431 | ) | ||||
| Class C | (4,425,567 | ) | (2,354,930 | ) | ||||
| Class I | (11,471,495 | ) | (6,061,800 | ) | ||||
| Total Distributions to Shareholders | (22,391,591 | ) | (12,170,161 | ) | ||||
| Beneficial Interest Transactions: | ||||||||
| Class A | ||||||||
| Proceeds from Shares Issued | 498,957 | 1,578,190 | ||||||
| Distributions Reinvested | 6,043,037 | 3,503,569 | ||||||
| Cost of Shares Redeemed | (17,118,388 | ) | (17,085,621 | ) | ||||
| Redemption Fees | 3 | 481 | ||||||
| Total Class A Shares | (10,576,391 | ) | (12,003,381 | ) | ||||
| Class C | ||||||||
| Proceeds from Shares Issued | 241,114 | 612,453 | ||||||
| Distributions Reinvested | 4,347,841 | 2,329,578 | ||||||
| Cost of Shares Redeemed | (9,389,864 | ) | (7,724,642 | ) | ||||
| Redemption Fees | 5 | 79 | ||||||
| Total Class C Shares | (4,800,904 | ) | (4,782,532 | ) | ||||
| Class I | ||||||||
| Proceeds from Shares Issued | 8,248,914 | 15,245,576 | ||||||
| Distributions Reinvested | 11,247,291 | 5,921,432 | ||||||
| Cost of Shares Redeemed | (37,065,774 | ) | (30,395,830 | ) | ||||
| Redemption Fees | 168 | 94 | ||||||
| Total Class I Shares | (17,569,401 | ) | (9,228,728 | ) | ||||
| Total Beneficial Interest Transactions | (32,946,696 | ) | (26,014,641 | ) | ||||
| Decrease in Net Assets | (58,425,480 | ) | (38,101,071 | ) | ||||
| Net Assets: | ||||||||
| Beginning of Year | 128,790,542 | 166,891,613 | ||||||
| End of Year | $ | 70,365,062 | $ | 128,790,542 | ||||
| Share Activity: | ||||||||
| Class A | ||||||||
| Shares Issued | 44,691 | 119,196 | ||||||
| Distributions Reinvested | 515,617 | 256,296 | ||||||
| Shares Redeemed | (1,579,723 | ) | (1,263,441 | ) | ||||
| Total Class A Shares | (1,019,415 | ) | (887,949 | ) | ||||
| Class C | ||||||||
| Shares Issued | 21,875 | 47,575 | ||||||
| Distributions Reinvested | 384,765 | 175,552 | ||||||
| Shares Redeemed | (903,727 | ) | (590,670 | ) | ||||
| Total Class C Shares | (497,087 | ) | (367,543 | ) | ||||
| Class I | ||||||||
| Shares Issued | 756,637 | 1,158,415 | ||||||
| Distributions Reinvested | 972,108 | 437,975 | ||||||
| Shares Redeemed | (3,395,792 | ) | (2,281,806 | ) | ||||
| Total Class I Shares | (1,667,047 | ) | (685,416 | ) | ||||
The accompanying notes are an integral part of these financial statements.
15
| Copeland SMID Cap Dividend Growth Fund |
| STATEMENTS OF CHANGES IN NET ASSETS |
| Year | For the Year/Period | |||||||
| Ended | Ended | |||||||
| November 30, 2020 | November 30, 2019 * | |||||||
| Operations: | ||||||||
| Net Investment Income | $ | 156,216 | $ | 47,797 | ||||
| Net Realized Gain (Loss) on Investments and Foreign Currency Transactions | (177,079 | ) | 130,998 | |||||
| Net Change in Unrealized Appreciation on Investments | 1,606,726 | 663,357 | ||||||
| Net Increase in Net Assets Resulting From Operations | 1,585,863 | 842,152 | ||||||
| Distributions to Shareholders From: | ||||||||
| Total Distributions Paid | ||||||||
| Class A | (646 | ) | — | |||||
| Class I | (187,956 | ) | (39,614 | ) | ||||
| Total Distributions to Shareholders | (188,602 | ) | (39,614 | ) | ||||
| Beneficial Interest Transactions: | ||||||||
| Class A * | ||||||||
| Proceeds from Shares Issued | 87,691 | 31,929 | ||||||
| Distributions Reinvested | 646 | — | ||||||
| Cost of Shares Redeemed | (19,121 | ) | — | |||||
| Redemption Fees | 3 | — | ||||||
| Total Class A Shares | 69,219 | 31,929.00 | ||||||
| Class I | ||||||||
| Proceeds from Shares Issued | 12,007,820 | 10,235,537 | ||||||
| Distributions Reinvested | 181,961 | 35,745 | ||||||
| Cost of Shares Redeemed | (3,430,600 | ) | (203,729 | ) | ||||
| Redemption Fees | 658 | 60 | ||||||
| Total Class I Shares | 8,759,839 | 10,067,613 | ||||||
| Total Beneficial Interest Transactions | 8,829,058 | 10,099,542 | ||||||
| Increase in Net Assets | 10,226,319 | 10,902,080 | ||||||
| Net Assets: | ||||||||
| Beginning of Year | 11,937,532 | 1,035,452 | ||||||
| End of Year | $ | 22,163,851 | $ | 11,937,532 | ||||
| Share Activity: | ||||||||
| Class A | ||||||||
| Shares Issued | 6,974 | 2,684 | ||||||
| Distributions Reinvested | 52 | — | ||||||
| Shares Redeemed | (1,471 | ) | — | |||||
| Total Class A Shares | 5,555 | 2,684 | ||||||
| Class I | ||||||||
| Shares Issued | 1,023,263 | 856,574 | ||||||
| Distributions Reinvested | 14,557 | 3,328 | ||||||
| Shares Redeemed | (298,189 | ) | (16,542 | ) | ||||
| Total Class I Shares | 739,631 | 843,360 | ||||||
| * | Class A commenced operations on February 11, 2019 |
The accompanying notes are an integral part of these financial statements.
16
| Copeland Dividend Growth Fund |
| FINANCIAL HIGHLIGHTS |
| Certain information in the table below reflects financial results for one share of beneficial interest outstanding throughout each year presented. |
| Class A | ||||||||||||||||||||
| Year | Year | Year | Year | Year | ||||||||||||||||
| Ended | Ended | Ended | Ended | Ended | ||||||||||||||||
| November 30, 2020 | November 30, 2019 | November 30, 2018 | November 30, 2017 | November 30, 2016 | ||||||||||||||||
| Net Asset Value, Beginning of Year | $ | 14.25 | $ | 15.18 | $ | 14.38 | $ | 12.27 | $ | 13.38 | ||||||||||
| Increase From Operations: | ||||||||||||||||||||
| Net investment income (a) | 0.01 | 0.10 | 0.04 | 0.06 | — | |||||||||||||||
| Net gain (loss) from securities (both realized and unrealized) | (0.48 | ) | 0.05 | 1.38 | 2.51 | 0.07 | ||||||||||||||
| Other capital changes | 0.73 | (d) | — | — | — | — | ||||||||||||||
| Total from operations | 0.26 | 0.15 | 1.42 | 2.57 | 0.07 | |||||||||||||||
| Distributions to shareholders from: | ||||||||||||||||||||
| Net investment income | (0.09 | ) | (0.01 | ) | (0.03 | ) | (0.09 | ) | (0.05 | ) | ||||||||||
| Net realized gains | (2.43 | ) | (1.07 | ) | (0.59 | ) | (0.37 | ) | (1.13 | ) | ||||||||||
| Total distributions | (2.52 | ) | (1.08 | ) | (0.62 | ) | (0.46 | ) | (1.18 | ) | ||||||||||
| Redemption fees (b) | 0.00 | 0.00 | 0.00 | 0.00 | 0.00 | |||||||||||||||
| Net Asset Value, End of Year | $ | 11.99 | $ | 14.25 | $ | 15.18 | $ | 14.38 | $ | 12.27 | ||||||||||
| Total Return (c) | 2.24 | % | 1.32 | % | 10.33 | % | 21.63 | % | 0.49 | % | ||||||||||
| Ratios/Supplemental Data | ||||||||||||||||||||
| Net assets, end of year (in 000’s) | $ | 18,800 | $ | 36,870 | $ | 52,779 | $ | 64,666 | $ | 82,165 | ||||||||||
| Ratio of expenses to average net assets: | ||||||||||||||||||||
| before reimbursement | 2.13 | % | 1.74 | % | 1.71 | % | 1.82 | % | 1.62 | % | ||||||||||
| net of reimbursement | 1.44 | % | 1.45 | % | 1.45 | % | 1.45 | % | 1.45 | % | ||||||||||
| Ratio of net investment income to average net assets | 0.10 | % | 0.70 | % | 0.28 | % | 0.47 | % | 0.01 | % | ||||||||||
| Portfolio turnover rate | 170 | % | 244 | % | 30 | % | 27 | % | 201 | % | ||||||||||
| (a) | Per share amounts are calculated using the average shares method, which more appropriately presents the per share data for the year. |
| (b) | Less than $0.01 per share. |
| (c) | Total returns are historical in nature and assume changes in share price, reinvestment of dividends and capital gains distributions, if any. Had the Adviser not absorbed a portion of fund expenses, the total return would have been lower. Sales loads are not reflected in total return. |
| (d) | As required by SEC standard per share data calculation methodology, this represents a balancing figure derived from the other amounts in the financial highlights tables that captures all other changes affecting net asset value per share. |
The accompanying notes are an integral part of these financial statements.
17
| Copeland Dividend Growth Fund |
| FINANCIAL HIGHLIGHTS |
| Certain information in the table below reflects financial results for one share of beneficial interest outstanding throughout each year presented. |
| Class C | ||||||||||||||||||||
| Year | Year | Year | Year | Year | ||||||||||||||||
| Ended | Ended | Ended | Ended | Ended | ||||||||||||||||
| November 30, 2020 | November 30, 2019 | November 30, 2018 | November 30, 2017 | November 30, 2016 | ||||||||||||||||
| Net Asset Value, Beginning of Year | $ | 13.73 | $ | 14.76 | $ | 14.06 | $ | 12.01 | $ | 13.17 | ||||||||||
| Increase From Operations: | ||||||||||||||||||||
| Net investment loss (a) | (0.07 | ) | (0.01 | ) | (0.07 | ) | (0.04 | ) | (0.09 | ) | ||||||||||
| Net gain (loss) from securities (both realized and unrealized) | (0.30 | ) | 0.05 | 1.36 | 2.46 | 0.06 | ||||||||||||||
| Other capital changes | 0.54 | (d) | — | — | — | — | ||||||||||||||
| Total from operations | 0.17 | 0.04 | 1.29 | 2.42 | (0.03 | ) | ||||||||||||||
| Distributions to shareholders from: | ||||||||||||||||||||
| Net investment income | — | — | — | — | — | |||||||||||||||
| Net realized gains | (2.43 | ) | (1.07 | ) | (0.59 | ) | (0.37 | ) | (1.13 | ) | ||||||||||
| Total distributions | (2.43 | ) | (1.07 | ) | (0.59 | ) | (0.37 | ) | (1.13 | ) | ||||||||||
| Redemption fees (b) | 0.00 | 0.00 | 0.00 | 0.00 | 0.00 | |||||||||||||||
| Net Asset Value, End of Year | $ | 11.47 | $ | 13.73 | $ | 14.76 | $ | 14.06 | $ | 12.01 | ||||||||||
| Total Return (c) | 1.51 | % | 0.54 | % | 9.55 | % | 20.68 | % | (0.30 | )% | ||||||||||
| Ratios/Supplemental Data | ||||||||||||||||||||
| Net assets, end of year (in 000’s) | $ | 15,401 | $ | 25,271 | $ | 32,597 | $ | 35,487 | $ | 43,859 | ||||||||||
| Ratio of expenses to average net assets: | ||||||||||||||||||||
| before reimbursement | 2.88 | % | 2.49 | % | 2.45 | % | 2.57 | % | 2.38 | % | ||||||||||
| net of reimbursement | 2.19 | % | 2.20 | % | 2.20 | % | 2.20 | % | 2.20 | % | ||||||||||
| Ratio of net investment loss to average net assets | (0.67 | )% | (0.05 | )% | (0.46 | )% | (0.28 | )% | (0.74 | )% | ||||||||||
| Portfolio turnover rate | 170 | % | 244 | % | 30 | % | 27 | % | 201 | % | ||||||||||
| (a) | Per share amounts are calculated using the average shares method, which more appropriately presents the per share data for the year. |
| (b) | Less than $0.01 per share. |
| (c) | Total returns are historical in nature and assume changes in share price, reinvestment of dividends and capital gains distributions, if any. Had the Adviser not absorbed a portion of fund expenses, the total return would have been lower. |
| (d) | As required by SEC standard per share data calculation methodology, this represents a balancing figure derived from the other amounts in the financial highlights tables that captures all other changes affecting net asset value per share. |
The accompanying notes are an integral part of these financial statements.
18
| Copeland Dividend Growth Fund |
| FINANCIAL HIGHLIGHTS |
| Certain information in the table below reflects financial results for one share of beneficial interest outstanding throughout each year presented. |
| Class I | ||||||||||||||||||||
| Year | Year | Year | Year | Year | ||||||||||||||||
| Ended | Ended | Ended | Ended | Ended | ||||||||||||||||
| November 30, 2020 | November 30, 2019 | November 30, 2018 | November 30, 2017 | November 30, 2016 | ||||||||||||||||
| Net Asset Value, Beginning of Year | $ | 14.12 | $ | 15.08 | $ | 14.30 | $ | 12.24 | $ | 13.38 | ||||||||||
| Increase From Operations: | ||||||||||||||||||||
| Net investment income (a) | 0.03 | 0.11 | 0.07 | 0.08 | 0.01 | |||||||||||||||
| Net gain (loss) from securities (both realized and unrealized) | (0.38 | ) | 0.06 | 1.37 | 2.49 | 0.08 | ||||||||||||||
| Other capital changes | 0.63 | (d) | — | — | — | — | ||||||||||||||
| Total from operations | 0.28 | 0.17 | 1.44 | 2.57 | 0.09 | |||||||||||||||
| Distributions to shareholders from: | ||||||||||||||||||||
| Net investment income | (0.12 | ) | (0.06 | ) | (0.07 | ) | (0.14 | ) | (0.10 | ) | ||||||||||
| Net realized gains | (2.43 | ) | (1.07 | ) | (0.59 | ) | (0.37 | ) | (1.13 | ) | ||||||||||
| Total distributions | (2.55 | ) | (1.13 | ) | (0.66 | ) | (0.51 | ) | (1.23 | ) | ||||||||||
| Redemption fees (b) | 0.00 | 0.00 | 0.00 | 0.00 | 0.00 | |||||||||||||||
| Net Asset Value, End of Year | $ | 11.85 | $ | 14.12 | $ | 15.08 | $ | 14.30 | $ | 12.24 | ||||||||||
| Total Return (c) | 2.40 | % | 1.43 | % | 10.56 | % | 21.72 | % | 0.67 | % | ||||||||||
| Ratios/Supplemental Data | ||||||||||||||||||||
| Net assets, end of year (in 000’s) | $ | 36,164 | $ | 66,649 | $ | 81,516 | $ | 75,097 | $ | 81,750 | ||||||||||
| Ratio of expenses to average net assets: | ||||||||||||||||||||
| before reimbursement | 1.98 | % | 1.58 | % | 1.53 | % | 1.57 | % | 1.37 | % | ||||||||||
| net of reimbursement | 1.29 | % | 1.30 | % | 1.30 | % | 1.30 | % | 1.30 | % | ||||||||||
| Ratio of net investment income to average net assets | 0.23 | % | 0.85 | % | 0.45 | % | 0.62 | % | 0.11 | % | ||||||||||
| Portfolio turnover rate | 170 | % | 244 | % | 30 | % | 27 | % | 201 | % | ||||||||||
| (a) | Per share amounts are calculated using the average shares method, which more appropriately presents the per share data for the year. |
| (b) | Less than $0.01 per share. |
| (c) | Total returns are historical in nature and assume changes in share price, reinvestment of dividends and capital gains distributions, if any. Had the Adviser not absorbed a portion of fund expenses, the total return would have been lower. |
| (d) | As required by SEC standard per share data calculation methodology, this represents a balancing figure derived from the other amounts in the financial highlights tables that captures all other changes affecting net asset value per share. |
The accompanying notes are an integral part of these financial statements.
19
| Copeland SMID Cap Dividend Growth Fund |
| FINANCIAL HIGHLIGHTS |
| Certain information in the table below reflects financial results for one share of beneficial interest outstanding throughout the year/period presented. |
| Class A | ||||||||
| Year | �� | Period | ||||||
| Ended | Ended | |||||||
| November 30, 2020 | November 30, 2019 * | |||||||
| Net Asset Value, Beginning of Year/Period | $ | 12.73 | $ | 11.10 | ||||
| Increase From Operations: | ||||||||
| Net investment income (a) | 0.10 | 0.10 | ||||||
| Net gain from securities (both realized and unrealized) | 0.50 | 1.53 | ||||||
| Total from operations | 0.60 | 1.63 | ||||||
| Distributions to shareholders from: | ||||||||
| Net investment income | (0.05 | ) | — | |||||
| Net realized gains | (0.14 | ) | — | |||||
| Total distributions | (0.19 | ) | — | |||||
| Redemption fees (b) | 0.00 | 0.00 | ||||||
| Net Asset Value, End of Year/Period | $ | 13.14 | $ | 12.73 | ||||
| Total Return (c) | 4.73 | % | 14.68 | % (e) | ||||
| Ratios/Supplemental Data | ||||||||
| Net assets, end of year/period (in 000’s) | $ | 108 | $ | 34 | ||||
| Ratio of expenses to average net assets: | ||||||||
| before reimbursement | 2.72 | % | 3.04 | % (d) | ||||
| net of reimbursement | 1.20 | % | 1.20 | % (d) | ||||
| Ratio of net investment income to average net assets | 0.87 | % | 0.82 | % (d) | ||||
| Portfolio turnover rate | 49 | % | 22 | % (e) | ||||
| * | Class A commenced operations on February 11, 2019. |
| (a) | Per share amounts are calculated using the average shares method, which more appropriately presents the per share data for the period/year. |
| (b) | Less than $0.01 per share. |
| (c) | Total returns are historical in nature and assume changes in share price, reinvestment of dividends and capital gains distributions, if any. Had the Adviser not absorbed a portion of fund expenses, the total return would have been lower. |
| (d) | Annualized. |
| (e) | Not annualized. |
The accompanying notes are an integral part of these financial statements.
20
| Copeland SMID Cap Dividend Growth Fund |
| FINANCIAL HIGHLIGHTS |
| Certain information in the table below reflects financial results for one share of beneficial interest outstanding throughout the year/period presented. |
| Class I | ||||||||||||||||
| Year | Year | Year | Period | |||||||||||||
| Ended | Ended | Ended | Ended | |||||||||||||
| November 30, 2020 | November 30, 2019 | November 30, 2018 | November 30, 2017* | |||||||||||||
| Net Asset Value, Beginning of Year/Period | $ | 12.76 | $ | 11.54 | $ | 11.10 | $ | 10.00 | ||||||||
| Increase From Operations: | ||||||||||||||||
| Net investment income (a) | 0.13 | 0.13 | 0.10 | 0.06 | ||||||||||||
| Net gain from securities (both realized and unrealized) | 0.50 | 1.53 | 0.42 | 1.04 | ||||||||||||
| Total from operations | 0.63 | 1.66 | 0.52 | 1.10 | ||||||||||||
| Distributions to shareholders from: | ||||||||||||||||
| Net investment income | (0.06 | ) | (0.08 | ) | (0.07 | ) | — | |||||||||
| Net realized gains | (0.14 | ) | (0.36 | ) | (0.01 | ) | — | |||||||||
| Total distributions | (0.20 | ) | (0.44 | ) | (0.08 | ) | — | |||||||||
| Redemption fees (b) | 0.00 | 0.00 | 0.00 | 0.00 | ||||||||||||
| Net Asset Value, End of Year/Period | $ | 13.19 | $ | 12.76 | $ | 11.54 | $ | 11.10 | ||||||||
| Total Return (c) | 4.98 | % | 15.12 | % | 4.76 | % | 11.00 | % (e) | ||||||||
| Ratios/Supplemental Data | ||||||||||||||||
| Net assets, end of year/period (in 000’s) | $ | 22,056 | $ | 11,903 | $ | 1,035 | $ | 616 | ||||||||
| Ratio of expenses to average net assets: | ||||||||||||||||
| before reimbursement | 2.47 | % | 3.18 | % | 10.14 | % | 12.96 | % (d) | ||||||||
| net of reimbursement | 0.95 | % | 0.95 | % | 0.95 | % | 0.95 | % (d) | ||||||||
| Ratio of net investment income to average net assets | 1.06 | % | 1.09 | % | 0.90 | % | 0.83 | % (d) | ||||||||
| Portfolio turnover rate | 49 | % | 22 | % | 26 | % | 21 | % (e) | ||||||||
| * | Class I commenced operations on February 27, 2017. |
| (a) | Per share amounts are calculated using the average shares method, which more appropriately presents the per share data for the period/year. |
| (b) | Less than $0.01 per share. |
| (c) | Total returns are historical in nature and assume changes in share price, reinvestment of dividends and capital gains distributions, if any. Had the Adviser not absorbed a portion of fund expenses, the total return would have been lower. |
| (d) | Annualized. |
| (e) | Not annualized. |
The accompanying notes are an integral part of these financial statements.
21
| Copeland Trust |
| NOTES TO FINANCIAL STATEMENTS |
| November 30, 2020 |
| 1. | ORGANIZATION |
Copeland Dividend Growth Fund (the “Dividend Growth Fund”), formerly, the Copeland Risk Managed Dividend Growth Fund, and Copeland SMID Cap Dividend Growth Fund (the “SMID Fund”) are diversified series of Copeland Trust (the “Trust”). The Trust is registered under the Investment Company Act of 1940, as amended (the “1940 Act”) as an open-end management investment company. The Trust was organized as a statutory trust on September 10, 2010, under the laws of the State of Delaware.
The Dividend Growth Fund currently offers Class A, Class C and Class I shares. The SMID Fund currently offers Class A and Class I shares. The Dividend Growth Fund’s Class A shares commenced operations on December 28, 2010, Class C shares commenced operations on January 5, 2012 and Class I shares commenced operations on March 1, 2013. The SMID Fund’s Class I shares commenced operations on February 27, 2017 and Class A shares commenced operations on February 11, 2019. Class A shares are offered at net asset value plus a maximum sales charge of 5.75%. Purchases of $1,000,000 or more may be subject to a maximum contingent deferred sales charge of 1.00% on shares redeemed within 18 months. Class C and Class I shares are offered at net asset value. Each class represents an interest in the same assets of the Funds and classes are identical except for differences in their sales charge structures and ongoing service and distribution charges. All classes of shares have equal voting privileges except that each class has exclusive voting rights with respect to its service and/or distribution plans. The Funds’ income, expenses (other than class specific distribution fees) and realized and unrealized gains and losses are allocated proportionately each day based upon the relative net assets of each class.
| 2. | SUMMARY OF SIGNIFICANT ACCOUNTING POLICIES |
The following is a summary of significant accounting policies followed by the Funds in preparation of their financial statements. These policies are in conformity with accounting principles generally accepted in the United States of America (“GAAP”). The preparation of financial statements requires management to make estimates and assumptions that affect the reported amounts of assets and liabilities and disclosure of contingent assets and liabilities at the date of the financial statements and the reported amounts of income and expenses for the period. Actual results could differ from those estimates. The Funds are investment companies and accordingly follow the investment company accounting and reporting guidance of the Financial Accounting Standards Board (FASB) Accounting Standard Codification Topic 946 “Financial Services – Investment Companies” including FASB Accounting Standard Update ASU 2013-08.
SECURITY VALUATION
The Funds’ securities are valued at the last sale price on the exchange in which such securities are primarily traded, as of the close of business on the day the securities are being valued. In the absence of a sale on the primary exchange, such securities shall be valued at the last mean on the primary exchange. NASDAQ traded securities are valued using the NASDAQ Official Closing Price (“NOCP”). Investments valued in currencies other than the U.S. dollar are converted to U.S. dollars using exchange rates obtained from pricing services. Short-term investments that mature in 60 days or less may be valued at amortized cost.
If market quotations are not readily available, securities will be valued at their fair market value as determined in good faith by the adviser in accordance with procedures approved by the Trust’s Board of Trustees (the “Board”) and evaluated by the Board as to the reliability of the fair value method used. The procedures consider, among others, the following factors to determine a security’s fair value: the nature and pricing history, if any, of the security; whether any dealer quotations for the security are available; and possible valuation methodologies that could be used to determine the fair value of the security.
The Funds utilize various methods to measure the fair value of their investments on a recurring basis. GAAP establishes a hierarchy that prioritizes inputs to valuation methods.
22
| Copeland Trust |
| NOTES TO FINANCIAL STATEMENTS (Continued) |
| November 30, 2020 |
The three levels of input are:
Level 1 – Unadjusted quoted prices in active markets for identical assets and liabilities that the Funds have the ability to access.
Level 2 – Observable inputs other than quoted prices included in Level 1 that are observable for the asset or liability, either directly or indirectly. These inputs may include quoted prices for the identical instrument on an inactive market, prices for similar instruments, interest rates, prepayment speeds, credit risk, yield curves, default rates and similar data.
Level 3 – Unobservable inputs for the asset or liability, to the extent relevant observable inputs are not available, representing the Funds’ own assumptions about the assumptions a market participant would use in valuing the asset or liability, and would be based on the best information available.
The availability of observable inputs can vary from security to security and is affected by a wide variety of factors, including, for example, the type of security, whether the security is new and not yet established in the marketplace, the liquidity of markets, and other characteristics particular to the security. To the extent that valuation is based on models or inputs that are less observable or unobservable in the market, the determination of fair value requires more judgment. Accordingly, the degree of judgment exercised in determining fair value is greatest for instruments categorized in Level 3.
The inputs used to measure fair value may fall into different levels of the fair value hierarchy. In such cases, for disclosure purposes, the level in the fair value hierarchy within which the fair value measurement falls in its entirety, is determined based on the lowest level input that is significant to the fair value measurement in its entirety.
The inputs or methodology used for valuing securities are not necessarily an indication of the risk associated with investing in those securities. The following tables summarize the inputs used as of November 30, 2020 for the Funds’ assets measured at fair value:
| Copeland Dividend Growth Fund | ||||||||||||||||
| Assets | Level 1 | Level 2 | Level 3 | Total | ||||||||||||
| Common Stock* | $ | 69,500,763 | $ | — | $ | — | $ | 69,500,763 | ||||||||
| Total | $ | 69,500,763 | $ | — | $ | — | $ | 69,500,763 | ||||||||
| Copeland SMID Cap Dividend Growth Fund | ||||||||||||||||
| Assets | Level 1 | Level 2 | Level 3 | Total | ||||||||||||
| Common Stock* | $ | 21,395,614 | $ | — | $ | — | $ | 21,395,614 | ||||||||
| Total | $ | 21,395,614 | $ | — | $ | — | $ | 21,395,614 | ||||||||
The Funds did not hold any Level 3 securities during the period.
| * | Please refer to the Portfolio of Investments for Industry Classification. |
SECURITY TRANSACTIONS AND INVESTMENT INCOME
Investment security transactions are accounted for on a trade date basis. Cost is determined and gains and losses are based upon the specific identification method for both financial statement and federal income tax purposes. Dividend income is recorded on the ex-dividend date and interest income is recorded on the accrual basis. Purchase discounts and premiums on securities are accreted and amortized over the life of the respective securities.
FEDERAL INCOME TAXES
The Funds intend to continue to comply with the requirements of Subchapter M of the Internal Revenue Code applicable to regulated investment companies and will distribute all of their taxable income, if any, to shareholders. Accordingly, no provision for Federal income taxes is required in the financial statements.
23
| Copeland Trust |
| NOTES TO FINANCIAL STATEMENTS (Continued) |
| November 30, 2020 |
The Funds recognize the tax benefits of uncertain tax positions only where the position is “more likely than not” to be sustained assuming examination by tax authorities. Management has analyzed the Funds’ tax positions, and has concluded that there are no significant uncertain tax positions taken or expected to be taken that would require recognition in the financial statements related to the open tax years (2017-2019) or expected to be taken in the Funds’ 2020 tax returns. The Funds identify their major tax jurisdictions as U.S. Federal and foreign jurisdictions where the Funds may make investments; however, the Funds are not aware of any tax positions for which it is reasonably possible that the total amounts of unrecognized tax benefits will change materially in the next twelve months.
DIVIDEND-PAYING STOCK RISK
The Fund’s emphasis on dividend-paying stocks could cause the Fund to underperform similar funds that invest without consideration of a company’s track record of paying dividends. Stocks of companies with a history of paying dividends may not participate in a broad market advance to the same degree as most other stocks, and a sharp rise in interest rates or economic downturn could cause a company to unexpectedly reduce or eliminate its dividend. If the amount a company pays out as a dividend exceeds its earnings and profits, the excess will be treated as a return of capital and the Fund’s tax basis in the stock will be reduced. A reduction in the Fund’s tax basis in such stock will increase the amount of gain (or decrease the amount of loss) recognized by the Fund on a subsequent sale of the stock.
MARKET RISK
Overall securities market risks may affect the value of individual securities in which the Fund invests. Factors such as foreign and domestic economic growth and market conditions, interest rate levels, and political events affect the securities markets.
REIT RISK
An equity REIT’s performance depends on the types and locations of the rental properties it owns and on how well it manages those properties. Real estate values rise and fall in response to a variety of factors, including local, regional and national economic conditions, changes in interest rates and property taxes.
SMALL AND MEDIUM CAPITALIZATION RISK
The value of a small or medium capitalization company securities may be subject to more abrupt or erratic market movements than those of larger, more established companies or the market averages in general.
FOREIGN CURRENCY
The accounting records of the Funds are maintained in U.S. dollars. Investment securities and other assets and liabilities denominated in a foreign currency, and income receipts and expense payments, if any, are translated into U.S. dollars using the prevailing exchange rate at the London market close. Purchases and sales of securities are translated into U.S. dollars at the contractual currency rates established at the approximate time of the trade. Net realized gains and losses on foreign currency transactions represent net gains and losses from currency realized between the trade and settlement dates on securities transactions and the difference between income accrued versus income received. The effects of changes in foreign currency exchange rates on investments in securities are included with the net realized and unrealized gain or loss on investment securities.
FORWARD CURRENCY CONTRACTS
If foreign securities are purchased, the Funds generally enter into forward currency exchange contracts in order to eliminate ongoing foreign currency exchange rate risks. If foreign securities are sold, the foreign currency proceeds are typically repatriated into US dollars. Any realized gains and losses between trade date and settlement date from contract transactions are included as a component of net realized gains (losses) from foreign currency transactions in the Statements of Operations. The Funds did not hold any forward currency contracts as of November 30, 2020.
CONCENTRATION OF RISK
Investing in securities of foreign issuers and currency transactions may involve certain considerations and risks not typically associated with investments in the United States. These risks include revaluation of currencies, adverse fluctuations in foreign currency values and possible adverse political, social and economic developments, including those particular to a specific industry, country or region. These conditions could cause the securities and their markets to be less liquid and prices more volatile than those of comparable U.S. companies and U.S. government securities.
24
| Copeland Trust |
| NOTES TO FINANCIAL STATEMENTS (Continued) |
| November 30, 2020 |
DISTRIBUTIONS TO SHAREHOLDERS
Distributions from investment income, if any, are declared and paid annually and are recorded on the ex-dividend date. The Funds will declare and pay net realized capital gains, if any, annually. The character of income and gains to be distributed is determined in accordance with income tax regulations, which may differ from GAAP. These “book/tax” differences are considered either temporary (i.e., deferred losses, capital loss carry forwards) or permanent in nature. To the extent these differences are permanent in nature, such amounts are reclassified within the composition of net assets based on their federal tax-basis treatment; temporary differences do not require classification.
EXPENSES
Expenses of the Trust that are directly identifiable to a specific Fund are charged to that Fund. Expenses, which are not readily identifiable to a specific Fund, are allocated in such a manner as deemed equitable, taking into consideration the nature and type of expense and the relative sizes of the Funds in the Trust.
INDEMNIFICATION
The Trust indemnifies their officers and trustees for certain liabilities that may arise from the performance of their duties to the Trust. Additionally, in the normal course of business, the Funds enter into contracts that contain a variety of representations and warranties and which provide general indemnities. The Funds’ maximum exposure under these arrangements is unknown, as this would involve future claims that may be made against the Funds that have not yet occurred. However, based on experience, the Funds expect the risk of loss due to these warranties and indemnities to be remote.
| 3. | INVESTMENT ADVISORY AGREEMENT AND TRANSACTIONS WITH RELATED PARTIES |
ADVISORY FEE
Subject to the authority of the Board, the adviser is responsible for management of the Funds’ investment portfolios. Pursuant to the Management Agreement (the “Management Agreement”), investment advisory services are provided to the Funds by Copeland Capital Management, LLC (the “Adviser”). Under the terms of the Management Agreement, the Adviser receives monthly fees calculated at an annual rate of 0.75% for each of the Dividend Growth Fund and SMID Fund, respectively, of the average daily net assets of each Fund. Prior to November 16, 2020, the Dividend Growth Fund paid the Advisor at an annual rate of 1.00% of that Fund’s average daily net assets. For the year ended November 30, 2020, the Adviser earned advisory fees of $869,705 and $110,259 for the Dividend Growth Fund and SMID Fund, respectively, before the effect of the Expense Limitation Agreement.
The Adviser, pursuant to an Expense Limitation Agreement (the “Agreement”) has contractually agreed to reduce its fees and/or absorb expenses of each Fund, at least until March 31, 2021 for the SMID Fund and December 31, 2021 for the Dividend Growth Fund, to ensure that Net Annual Operating Expenses (excluding any front-end or contingent deferred loads, brokerage fees and commissions, acquired fund fees and expenses, borrowing costs such as interest and dividend expense on securities sold short, taxes and extraordinary expenses such as litigation) will not exceed 1.20%, 1.95% and 1.05% (1.45%, 2.20% and 1.30% prior to November 16, 2020) of the Dividend Growth Fund’s average daily net assets for Class A, Class C and Class I shares, respectively and 1.20% and 0. 95% of the SMID Fund’s average daily net assets for Class A and Class I, respectively, subject to possible recoupment from the Fund in future years on a rolling three year basis (within the three years after the fees have been deferred or reimbursed) if such recoupment can be achieved without exceeding the lesser of the expense limitation in effect at the time of the deferral and at the time of the repayment. For the year ended November 30, 2020, the Adviser waived fees/reimbursed expenses of $610,939 and $223,713 for the Dividend Growth Fund and SMID Fund, respectively.
The expenses subject to recapture for the Dividend Growth Fund and the SMID Fund will expire on November 30 of the years indicated below:
| Copeland Dividend Growth Fund | ||||||||||||||
| 2021 | 2022 | 2023 | Total | |||||||||||
| $ | 420,780 | $ | 403,205 | $ | 610,939 | $ | 1,434,924 | |||||||
| Copeland SMID Cap Dividend Growth Fund | ||||||||||||||
| 2021 | 2022 | 2023 | Total | |||||||||||
| $ | 77,534 | $ | 97,581 | $ | 223,713 | $ | 398,828 | |||||||
25
| Copeland Trust |
| NOTES TO FINANCIAL STATEMENTS (Continued) |
| November 30, 2020 |
DISTRIBUTOR
The Board has adopted Distribution Plans and Agreements for each Fund (collectively the “Plan”) pursuant to Rule 12b-1 under the 1940 Act. The Plan provides that a monthly service and/or distribution fee is calculated by each Fund at an annual rate of 0.25% and 1. 00% (of which up to 0.75% is a distribution fee and up to 0.25% is a service fee) of the average daily net assets attributable to Class A shares and Class C shares, respectively and is paid to Northern Lights Distributors, LLC (the “Distributor” or “NLD”), to provide compensation for ongoing distribution-related activities or services and/or maintenance of the Funds’ shareholder accounts, not otherwise required to be provided by the Adviser. The Plan is a compensation plan, which means that compensation is provided regardless of 12b-1 expenses incurred. For the year ended November 30, 2020, the 12b-1 fees accrued amounted to $60,013 and $184,964 for the Dividend Growth Fund for Class A and Class C shares, respectively. The 12b-1 fees accrued for the SMID Cap Dividend Growth Fund Class A shares were $133.
The Distributor acts as the Funds’ principal underwriter in a continuous public offering of the Funds’ shares. For the year ended November 30, 2020, the Distributor received $1,292 in underwriting commissions for sales of Class A shares of the Dividend Growth Fund, of which $179 was retained by the principal underwriter or other affiliated broker-dealers and $3,558 in underwriting commissions for sales of Class A shares of the SMID Cap Dividend Growth Fund of which $500 was retained by the principal underwriter or other affiliated broker-dealers.
In addition, certain affiliates of the Distributor provide services to the Funds as follows:
GEMINI FUND SERVICES, LLC (“GFS”)
GFS, an affiliate of the Distributor, provides administration, fund accounting, and transfer agent services to the Trust. Pursuant to separate servicing agreements with GFS, the Fund pays GFS fees for providing administration, fund accounting, and transfer agency services to the Fund. These fees are disclosed in the Statement of Operations. An officer of the Fund is also an officer of GFS, and is not paid any fees directly by the Fund for servicing in such capacity.
BLU GIANT, LLC (“Blu Giant”)
Blu Giant, an affiliate of GFS and the Distributor, provides EDGAR conversion and filing services as well as print management services for the Funds on an ad-hoc basis. For the provision of these services, Blu Giant receives customary fees from the Funds.
SHAREHOLDER SERVICES
The Board has adopted non-Rule 12b-1 shareholder service plans (collectively, the “Shareholder Service Plan”) for the Class I shares of each Fund. The Shareholder Service Plan permits the Funds to pay brokers, financial intermediaries and others an annual fee of 0.10% of each Fund’s average daily net assets attributable to the Class I shares for shareholder support and/or administrative services, not otherwise provided by the Trust’s transfer agent. The fees incurred by the Funds for these services are included as Shareholder Service Fees – Class I in the Statement of Operations. For the year ended November 30, 2020, the Dividend Growth Fund accrued $36,116 and the SMID Cap Dividend Growth Fund accrued $2,111 in fees associated with the Shareholder Service Plan. The Funds’ Class A and Class C shares may also pay broker-dealers or other financial intermediaries for shareholder support services and/or administrative services based on the aggregate net asset value of the Class A and Class C shares, as applicable, owned of record or beneficially by the broker-dealers’ or financial intermediaries’ customers. The fees incurred by the Funds for these services are included as Non-Rule 12B-1 Shareholder Services Fees - Class A and Class C in the Statement of Operations.
CHIEF COMPLIANCE OFFICER
The Adviser is providing a Chief Compliance Officer to the Trust as well as related compliance services. The Trust reimburses the Adviser for an allocable portion of the chief Compliance Officer’s salary.
TRUSTEES
For the fiscal year ended November 30, 2020, each Trustee who is not affiliated with the Trust or Adviser received (i) a base annual retainer of $30,000, (ii) $17,000 for attendance at four regularly scheduled Board meetings, (iii) $2,000 for attendance at each regularly scheduled Audit Committee meeting, (iv) $750 and $2,500 per each additional special telephonic or in person meeting, respectively, and (v) reimbursement for any reasonable expenses incurred attending the meetings. For carrying out his additional responsibilities, the independent Chairman of the Board received an additional $11,000 per year. The foregoing compensation is paid in quarterly payments.
26
| Copeland Trust |
| NOTES TO FINANCIAL STATEMENTS (Continued) |
| November 30, 2020 |
Effective February 1, 2021, as compensation for services rendered to the Trust, each Trustee of the Trust who is not affiliated with the Trust or the Adviser shall receive: (1) an annual base retainer of $22,000; (2) $12,000 for attendance at four regularly scheduled Board meetings per year; (3) $1,500 for attendance at each regularly scheduled Audit Committee meeting; (4) $750 and $2,500 for each additional special telephonic or special in person meeting, respectively; and (5) the independent Chairman of the Board shall receive an additional $9,000 per year for carrying out his additional responsibilities.
The “interested persons” who serve as Trustees of the Trust receive no compensation for their services as Trustees. None of the executive officers receive compensation from the Trust except for the CCO, a portion of whose salary is paid by the Trust for compliance services.
| 4. | INVESTMENT TRANSACTIONS |
The cost of purchases and the proceeds from sales of investments, other than short-term investments, for the fiscal year ended November 30, 2020 were as follows:
| Fund | Purchases | Sale Proceeds | ||||||
| Dividend Growth Fund | $ | 147,872,351 | $ | 202,833,178 | ||||
| SMID Cap Dividend Growth Fund | 15,592,479 | 6,927,301 | ||||||
| 5. | AGGREGATE UNREALIZED APPRECIATION AND DEPRECIATION – TAX BASIS |
The identified cost of investments in securities owned by the Funds for federal income tax purposes, and their respective gross unrealized appreciation and depreciation at November 30, 2020, were as follows:
| Gross | Gross | Net Unrealized | ||||||||||||||
| Unrealized | Unrealized | Appreciation | ||||||||||||||
| Fund | Tax Cost | Appreciation | Depreciation | (Depreciation) | ||||||||||||
| Dividend Growth Fund | $ | 60,129,111 | $ | 10,195,581 | $ | (823,929 | ) | $ | 9,371,652 | |||||||
| SMID Cap Dividend Growth Fund | 19,145,279 | 2,751,850 | (501,515 | ) | 2,250,335 | |||||||||||
| 6. | DISTRIBUTIONS TO SHAREHOLDERS AND TAX COMPONENTS OF CAPITAL |
The tax character of fund distributions paid for the fiscal years ended November 30, 2020 and November 30, 2019 was as follows:
| For the year ended November 30, 2020: | ||||||||||||||||
| Ordinary | Long-Term | Return of | ||||||||||||||
| Income | Capital Gains | Capital | Total | |||||||||||||
| Dividend Growth Fund | $ | 1,782,928 | $ | 20,608,663 | $ | — | $ | 22,391,591 | ||||||||
| SMID Cap Dividend Growth Fund | 112,658 | 75,944 | — | 188,602 | ||||||||||||
| For the year ended November 30, 2019: | ||||||||||||||||
| Ordinary | Long-Term | Return of | ||||||||||||||
| Income | Capital Gains | Capital | Total | |||||||||||||
| Dividend Growth Fund | $ | 358,371 | $ | 11,811,791 | $ | — | $ | 12,170,162 | ||||||||
| SMID Cap Dividend Growth Fund | 11,638 | 27,976 | — | 39,614 | ||||||||||||
27
| Copeland Trust |
| NOTES TO FINANCIAL STATEMENTS (Continued) |
| November 30, 2020 |
As of November 30, 2020, the components of accumulated earnings/(deficit) on a tax basis were as follows:
| Post October Loss | Capital Loss | Other | Unrealized | Total | ||||||||||||||||||||||||
| Ordinary | Long-Term | and | Carry | Book/Tax | Appreciation/ | Accumulated | ||||||||||||||||||||||
| Income | Capital Gains | Late Year Loss | Forwards | Differences | (Depreciation) | Earnings/(Deficits) | ||||||||||||||||||||||
| Dividend Growth Fund | $ | — | $ | — | $ | (2,323 | ) | $ | (1,743,040 | ) | $ | — | $ | 9,371,652 | $ | 7,626,289 | ||||||||||||
| SMID Cap Dividend Growth Fund | 88,431 | — | — | (56,805 | ) | — | 2,250,335 | 2,281,961 | ||||||||||||||||||||
The difference between book basis and tax basis undistributed net investment income, accumulated net realized gain, and unrealized appreciation from investments is primarily attributable to the tax deferral of losses on wash sales, and adjustments for partnerships, and C-Corporation return of capital distributions.
Late year losses incurred after December 31 within the fiscal year are deemed to arise on the first business day of the following fiscal year for tax purposes. The Dividend Growth Fund incurred and elected to defer such late year losses of $2,323.
At November 30, 2020, the Funds had capital loss carry forwards for federal income tax purposes available to offset future capital gains as follows:
| Non-Expiring | ||||||||||||
| Short-Term | Long-Term | Total | ||||||||||
| Dividend Growth Fund | $ | 1,743,040 | $ | — | $ | 1,743,040 | ||||||
| SMID Cap Dividend Growth Fund | 56,805 | — | 56,805 | |||||||||
Permanent book and tax differences, primarily attributable to the book/tax basis treatment of Fund distributions, resulted in reclassification for the period ended November 30, 2020 as follows:
| Paid | ||||||||
| In | Accumulated | |||||||
| Capital | Earnings (Losses) | |||||||
| Dividend Growth Fund | $ | (43,493 | ) | $ | 43,493 | |||
| SMID Cap Dividend Growth Fund | — | — | ||||||
| 7. | REDEMPTION FEES |
The Funds may assess a short-term redemption fee of 1.00% of the total redemption amount if shareholders sell their shares after holding them for less than 30 days or if shares are redeemed for failure to maintain the Funds’ minimum account balance requirement. The redemption fee is paid directly to the Funds. For the year ended November 30, 2020, the Dividend Growth Fund assessed $3, $5, and $168 in redemption fees for Class A, Class C and Class I shares, respectively. The SMID Fund assessed $3 and $658 in redemption fees for Class A and Class I shares, respectively.
| 8. | SUBSEQUENT EVENTS |
Subsequent events after the date of the Statement of Assets and Liabilities have been evaluated through the date the financial statements were issued. Management has determined that no events or transactions occurred requiring adjustment or disclosure in the financial statements.
28
REPORT OF INDEPENDENT REGISTERED PUBLIC ACCOUNTING FIRM
To the Board of Trustees of
And Shareholders of Copeland Trust
Opinion on the Financial Statements
We have audited the accompanying statements of assets and liabilities of Copeland Dividend Growth Fund and Copeland SMID Cap Dividend Growth Fund (the “Funds”), each a series of shares of Copeland Trust (the “Trust”), including the portfolios of investments, as of November 30, 2020, the related statements of operations, the statements of changes in net assets, and the financial highlights for each of the periods indicated in the table below, and the related notes (collectively referred to as the “financial statements”). In our opinion, the financial statements present fairly, in all material respects, the financial position of the Funds as of November 30, 2020, the results of their operations, the changes in their net assets, and the financial highlights for the periods indicated in the table below, in conformity with accounting principles generally accepted in the United States of America.
| Individual Funds Constituting | Statement Of | Statements Of | |
| Copeland Trust | Operations | Changes In Net Assets | Financial Highlights |
| Copeland Dividend Growth Fund | For the year ended November 30, 2020 | For each of the two years in period ended November 30, 2020 | For each of the five years in the period ended November 30, 2020 |
| Copeland SMID Cap Dividend Growth Fund | For the year ended November 30, 2020 | For each of the two years in period ended November 30, 2020 | For each of the three years in the period ended November 30, 2020 and for the period February 27, 2017 (commencement of operations) to November 30, 2017 |
Basis for Opinion
These financial statements are the responsibility of the Funds’ management. Our responsibility is to express an opinion on the Funds’ financial statements based on our audits. We are a public accounting firm registered with the Public Company Accounting Oversight Board (United States) (“PCAOB”) and are required to be independent with respect to the Funds in accordance with the U.S. federal securities laws and the applicable rules and regulations of the Securities and Exchange Commission and the PCAOB. We have served as the auditor of one or more of the funds in the Trust since 2011.
We conducted our audits in accordance with the standards of the PCAOB. Those standards require that we plan and perform the audits to obtain reasonable assurance about whether the financial statements are free of material misstatement, whether due to error or fraud. The Funds are not required to have, nor were we engaged to perform, an audit of their internal control over financial reporting. As part of our audits we are required to obtain an understanding of internal control over financial reporting, but not for the purpose of expressing an opinion on the effectiveness of the Funds internal control over financial reporting. Accordingly, we express no such opinion.
Our audits included performing procedures to assess the risks of material misstatement of the financial statements, whether due to error or fraud, and performing procedures that respond to those risks. Such procedures included examining, on a test basis, evidence regarding the amounts and disclosures in the financial statements. Our audits also included evaluating the accounting principles used and significant estimates made by management, as well as evaluating the overall presentation of the financial statements. Our procedures included confirmation of securities owned as of November 30, 2020 by correspondence with the custodian. We believe that our audits provide a reasonable basis for our opinion.
��
 |
| TAIT, WELLER & BAKER LLP |
Philadelphia, Pennsylvania
January 29, 2021
29
| Copeland Trust |
| SUPPLEMENTAL INFORMATION (Unaudited) |
| November 30, 2020 |
Liquidity Risk Management Program Annual Report
The Trust has adopted a Liquidity Risk Management Program (the “Program”) for each of the Funds pursuant to Rule 22e-4 under the Investment Company Act of 1940 Act, as amended (the “Liquidity Rule”). The Program seeks to assess, manage and review each Fund’s Liquidity Risk. “Liquidity Risk” is defined as the risk that a Fund could not meet requests to redeem shares issued by the Fund without significant dilution of remaining investors’ interests in the Fund.
The Trust’s Board of Trustees has appointed the Adviser to be the administrator of the Program (the “Program Administrator”). Among other things, the Liquidity Rule requires that the Program Administrator provide a written report to the Board on an annual basis that addresses the operation of the Program and assesses the adequacy and effectiveness of its implementation, including the operation of the Highly Liquidity Investment Minimum (“HLIM”) established for each Fund, if any, and any material changes to the Program (the “Report”). On November 11, 2020, the Boards received the first annual Report concerning the operation of the Program for the period from June 1, 2019 through September 30, 2020 (the “Program Reporting Period”). The Report summarized the operation of the Program and the information and factors considered by the Program Administrator in assessing whether the Program had been adequately and effectively implemented with respect to each Fund. There were no material changes to the Program during the Program Reporting Period and none of the Funds were required to set a HLIM. The Report concluded that the Program is appropriately designed, implemented and is effectively operating to assess and manage each Fund’s liquidity risk within the compliance parameters of the Liquidity Rule during the Program Reporting Period.
30
| Copeland Trust |
| SUPPLEMENTAL INFORMATION (Unaudited) (Continued) |
| November 30, 2020 |
Considerations Regarding the Management Agreement
During a special meeting held on September 16, 2020, the Board of Trustees of Copeland Trust (the “Trust”), including all of Trustees who are not interested persons under the Investment Company Act of 1940, as amended (the “Independent Trustees”), considered an amendment to the Management Agreement between the Trust, on behalf of the Copeland Risk Managed Dividend Growth Fund (the “Dividend Growth Fund”) and Copeland Capital Management, LLC (“Copeland”), to reduce the management fee of the Dividend Growth Fund from 1.00% to 0.75% (the “Amendment”). Pursuant to relief granted by the U.S. Securities and Exchange Commission (the “SEC”) in light of the COVID-19 pandemic (the “Order”) and a determination by the Board that reliance on the Order was appropriate due to circumstances related to the current or potential effects of COVID-19, the meeting was held by video-conference.
In connection with the approval of the Amendment, the Board took into consideration the contract renewal materials that it had received at the May 13, 2020 Board meeting, to the extent that such information was relevant, and additional information provided by Copeland regarding the changes to the Dividend Growth Fund’s investment strategy, the proposed reduced management fee and expenses as compared to the Dividend Growth Fund’s new peer group and Copeland’s other similarly managed accounts and an analysis of the costs of the services to be provided and the profits to be realized by Copeland in connection with the reduced management fee. Also included in the materials was a memorandum from counsel on the responsibilities of the Board in considering approval of the Amendment. The Trustees discussed the written materials and Copeland’s oral presentation, together with other information provided to the Trustees over the course of the year. In their deliberations, the Trustees did not identify any single piece of information that was all-important or controlling.
The Trustees considered, among other things, the nature, extent and quality of services to be provided to the Dividend Growth Fund by Copeland after the changes to the Fund’s investment strategy go into effect. The Trustees also considered Copeland’s rationale for reducing the management fee, its financial condition and profitability. The Board, including the Independent Trustees concluded that, based on the information provided at the May 13, 2020 contract renewal meeting, and the information reviewed and discussed at the special meeting, the Dividend Growth Fund’s proposed management fee and expenses were reasonable as compared to the fees of Copeland’s similarly managed accounts and the fees and expenses of comparable funds, taking into account Copeland’s agreement to waive fees and reimburse expenses to limit the expenses of the Dividend Growth Fund. The Board based its decision on an evaluation of all these factors as a whole and did not consider any one factor as all-important or controlling.
Based upon the Trustees’ deliberations and evaluation of the information described above, the Trustees, and separately by all of the Independent Trustees, determined that the terms of the Amendment were reasonable and fair to the Fund and its shareholders, and voted to approve the Amendment with respect to the Dividend Growth Fund.
31
| Copeland Trust |
| DISCLOSURE OF FUND EXPENSES (Unaudited) |
| November 30, 2020 |
As a shareholder of the Copeland Dividend Growth Fund and the Copeland SMID Cap Dividend Growth Fund, you incur two types of costs (1) transaction costs, including sales charges (loads) on purchase payments and sales (for Class A shares only) and redemption fees; and (2) ongoing costs, including management fees, distribution and/or service (12b-1 fees for Class A and C shares only) fees, shareholder servicing fees and other Fund expenses. This example is intended to help you understand your ongoing costs (in dollars) of investing in the Funds and to compare these costs with the ongoing costs of investing in other mutual funds. Please note, the expenses shown in the tables are meant to highlight ongoing costs only and do not reflect any transactional costs. This example is based on an investment of $1,000 invested for the period of time as indicated in the table below.
Actual Expenses: The first line of the table provides information about actual account values and actual expenses. You may use the information in this line, together with the amount you invested, to estimate the expenses that you paid over the period. Simply divide your account value by $1,000 (for example, an $8,600 account value divided by $1,000 = 8.6), then multiply the result by the number in the first line under the heading entitled “Expenses Paid During the Period” to estimate the expenses you paid on your account during the period.
Hypothetical Examples for Comparison Purposes : The second line of the table below provides information about hypothetical account values and hypothetical expenses based on the Funds’ actual expense ratio and an assumed rate of return of 5% per year before expenses, which is not the Funds’ actual return. The hypothetical account values and expenses may not be used to estimate the actual ending account balance or expenses you paid for the period. You may use this information to compare the ongoing costs of investing in the Funds and other funds. To do so, compare this 5% hypothetical example with the 5% hypothetical examples that appear in the shareholder reports of the other funds.
Please note that the expenses shown in the table are meant to highlight your ongoing costs only and do not reflect any transactional costs, such as sales charges (loads) or redemption fees which may be applicable to your account. Therefore, the second line of the table is useful in comparing ongoing costs only, and will not help you determine the relative total costs of owning different funds. In addition, if these transactional costs were included, your costs would have been higher.
| Beginning | Ending | Expenses Paid | ||||||||||||
| Account Value | Account Value | Annualized | During the Period | |||||||||||
| 6/1/2020 | 11/30/2020 | Expense Ratio | 6/1/2020 - 11/30/2020 | |||||||||||
| Actual (a) | ||||||||||||||
| Copeland Dividend Growth Fund | ||||||||||||||
| Class A | $ | 1,000.00 | $ | 1,140.80 | 1.44% | $ | 7.71 | |||||||
| Class C | $ | 1,000.00 | $ | 1,135.60 | 2.19% | $ | 11.70 | |||||||
| Class I | $ | 1,000.00 | $ | 1,140.50 | 1.29% | $ | 6.91 | |||||||
| Copeland SMID Cap Dividend Growth Fund | ||||||||||||||
| Class A | $ | 1,000.00 | $ | 1,154.70 | 1.20% | $ | 6.46 | |||||||
| Class I | $ | 1,000.00 | $ | 1,156.00 | 0.95% | $ | 5.12 | |||||||
| Hypothetical (a) | ||||||||||||||
| (5% return before expenses) | ||||||||||||||
| Copeland Dividend Growth Fund | ||||||||||||||
| Class A | $ | 1,000.00 | $ | 1,017.79 | 1.44% | $ | 7.27 | |||||||
| Class C | $ | 1,000.00 | $ | 1,014.05 | 2.19% | $ | 11.03 | |||||||
| Class I | $ | 1,000.00 | $ | 1,018.54 | 1.29% | $ | 6.52 | |||||||
| Copeland SMID Cap Dividend Growth Fund | ||||||||||||||
| Class A | $ | 1,000.00 | $ | 1,019.00 | 1.20% | $ | 6.06 | |||||||
| Class I | $ | 1,000.00 | $ | 1,020.25 | 0.95% | $ | 4.80 | |||||||
| (a) | Expenses are equal to the average account value over the period, multiplied by the Fund’s annualized expense ratio, multiplied by the number of days in the six month period ended November 30, 2020 (183) divided by the number of days in the fiscal year (366). |
32
TRUSTEES AND OFFICERS
The names, year of birth, addresses, present position(s) with the Fund, term of office and length of time served, principal occupation(s) during the past five years and other directorships held outside the Fund complex of the Fund’s trustees and officers are set forth in the table below. The Board of Trustees is responsible for managing the business affairs of the Fund. Unless otherwise noted, the address of each Trustee and Officer is 4221 North 203rd Street, Suite 100, Elkhorn, Nebraska 68022. The Statement of Additional Information includes additional information about the Fund’s trustees and is available, without charge, upon request by calling toll-free 1-888-9-COPELAND (1-888-926-7352).
Independent Trustees
| Name, Address and Age | Position/Term of Office | Principal Occupation During the Past Five Years | Number of Portfolios in Fund Complex* Overseen by Trustee | Other Directorships held by Trustee During Past 5 Years |
| Thomas A. Leonard Year of Birth: 1949 | Chairman/Indefinite (since 2010) | Retired (since 2008); Partner and Financial Services Industry Leader, PricewaterhouseCoopers LLP (accounting firm) (1970–2008). | 2 | Trustee, Lincoln Variable Insurance Products Trust (92 portfolios) (2013 to Present) and Lincoln Advisors Trust (6 portfolios) (2013-2016) |
| Bruce M. Aronow Year of Birth: 1965 | Trustee/Indefinite (since 2010) | CEO, eLocalUSA LLC (online directory business) (since 2008); Managing Partner, Managers Investment Group LLC (2005–2008). | 2 | Trustee, PFM Multi-Manager Series Trust (3 portfolios) (since 2017) |
| Stephen M. Wynne Year of Birth: 1955 | Trustee/Indefinite (since 2010) | CEO, BNY Mellon, U.S. Funds Services (2010); CEO (2008–2010) and President (2005–2008), PNC Global Investment Servicing. | 2 | Trustee, Third Avenue Trust (3 portfolios) and Third Avenue Variable Series Trust (1 portfolio) (2019- Present); Trustee, Context Capital Funds (2 portfolios) (2014-2018); Trustee, Fund Vantage Trust (32 portfolios) (2009-Present) |
33
Interested Trustee and Officers
| Name, Address and Age | Position/Term of Office | Principal Occupation During the Past 5 Years | Number of Portfolios in Fund Complex* Overseen by Trustee | Other Directorships held by Trustee During Past 5 Years |
| Edward C. Rorer** Year of Birth: 1943 | Interested Trustee/Indefinite (since 2010) | Chairman, Copeland Capital Management, LLC (since 2009).; Chairman, Chief Executive Officer and Chief Investment Officer, Rorer Asset Management, LLC (1999–2009). | 2 | None. |
| Eric C. Brown Year of Birth: 1969 | President /Indefinite (since 2010); Principal Executive Officer (2010–2015) | Chief Executive Officer and Portfolio Manager, Copeland Capital Management, LLC (since 2005). | N/A | N/A |
| Mark W. Giovanniello Year of Birth: 1974 | Vice-President, Principal Executive Officer / Indefinite (since 2015); Vice President, Treasurer, Principal Financial Officer (2010–2015) | Chief Investment Officer, Partner and Portfolio Manager, Copeland Capital Management, LLC (since 2009); Portfolio Manager, Rorer Asset Management, LLC (2006–2009). | N/A | N/A |
| Steven J. Adams Year of Birth: 1963 | Vice-President, Treasurer, Principal Financial Officer / Indefinite (since 2015) | Chief Operating and Financial Officer, Partner, Copeland Capital Management, LLC (since 2015); Chief Financial Officer, AMG Funds (2008–2015). | N/A | N/A |
| Sofia A Rosala Year of Birth: 1974 | Vice President, Chief Compliance Officer, Secretary / Indefinite (since 2016) | General Counsel and Chief Compliance Officer, Copeland Capital Management, LLC (since 2016); U.S. Counsel and Deputy Funds Chief Compliance Officer, Aberdeen Asset Management Inc. (2012-2016). | N/A | N/A |
| James Colantino 80 Arkay Drive, Suite 110 Hauppauge, NY 11788 Year of Birth: 1969 | Assistant Secretary / Indefinite (since 2010) | Senior Vice President – Fund Administration (since 2012) and Vice President (2004-2012), Gemini Fund Services, LLC. | N/A | N/A |
| * | The term “Fund Complex” refers to the Copeland Trust. |
| ** | Mr. Rorer is an “interested person” of the Fund as defined in the 1940 Act, because of his relationship with Copeland Capital Management, LLC. Mr. Rorer is also the father-in-law of Eric Brown, the Trust’s President. |
34
| PRIVACY notice | |
| FACTS | WHAT DOES COPELAND TRUST DO WITH YOUR PERSONAL INFORMATION? |
| Why? | Financial companies choose how they share your personal information. Federal law gives consumers the right to limit some but not all sharing. Federal law also requires us to tell you how we collect, share, and protect your personal information. Please read this notice carefully to understand what we do. |
| What? | The types of personal information we collect and share depend on the product or service you have with us. This information can include:
■ Social Security number ■ Purchase History
■ Assets ■ Account Balances
■ Retirement Assets ■ Account Transactions
■ Transaction History ■ Wire Transfer Instructions
■ Checking Account Information
When you are no longer our customer, we continue to share your information as described in this notice. |
| How? | All financial companies need to share customers’ personal information to run their everyday business. In the section below, we list the reasons financial companies can share their customers’ personal information; the reasons Copeland Trust chooses to share; and whether you can limit this sharing. |
| Reasons we can share your personal information: | Does Copeland Trust share? | Can you limit this sharing? | |
For our everyday business purposes – such as to process your transactions, maintain your account(s), respond to court orders and legal investigations, or report to credit bureaus | Yes | No | |
For our marketing purposes – to offer our products and services to you | No | We don’t share | |
| For joint marketing with other financial companies | No | We don’t share | |
For our affiliates’ everyday business purposes – information about your transactions and experiences | No | We don’t share | |
For our affiliates’ everyday business purposes – information about your creditworthiness | No | We don’t share | |
| For nonaffiliates to market to you | No | We don’t share | |
| Questions? | Call 1-888-9-COPELAND (1-888-926-7352) |
35
| Who we are: | |
| Who is providing this notice? | Copeland Trust
|
| What we do: | |
| How does Copeland Trust protect my personal information? | To protect your personal information from unauthorized access and use, we use security measures that comply with federal law. These measures include computer safeguards and secured files and buildings.
Our service providers are held accountable for adhering to strict policies and procedures to prevent any misuse of your nonpublic personal information. |
| How does Copeland Trust collect my personal information? | We collect your personal information, for example, when you
■ Open an account
■ Provide account information
■ Give us your contact information
■ Make deposits or withdrawals from your account
■ Make a wire transfer
■ Tell us where to send the money
■ Tells us who receives the money
■ Show your government-issued ID
■ Show your driver’s license
We also collect your personal information from other companies. |
| Why can’t I limit all sharing? | Federal law gives you the right to limit only
■ Sharing for affiliates’ everyday business purposes – information about your creditworthiness
■ Affiliates from using your information to market to you
■ Sharing for nonaffiliates to market to you
State laws and individual companies may give you additional rights to limit sharing. |
| Definitions: | |
| Affiliates | Companies related by common ownership or control. They can be financial and nonfinancial companies.
■ Copeland Trust does not share with our affiliates. |
| Nonaffiliates | Companies not related by common ownership or control. They can be financial and nonfinancial companies ■ Copeland Trust does not share with nonaffiliates so they can market to you. |
| Joint marketing | A formal agreement between nonaffiliated financial companies that together market financial products or services to you. ■ Copeland Trust does not jointly market. |
36
| Investment Adviser |
| Copeland Capital Management, LLC |
| 161 Washington Street, Suite 1325 |
| Conshohocken, PA 19428 |
| Distributor |
| Northern Lights Distributors, LLC |
| 4221 North 203rd Street, Suite 100 |
| Elkhorn, NE 68022 |
| Legal Counsel |
| Faegre Drinker Biddle & Reath, LLP |
| One Logan Square, Suite 2000 |
| Philadelphia, PA 19103 |
| Independent Registered Public Accounting Firm |
| Tait, Weller & Baker LLP |
| Two Liberty Place |
| 50 South 16th Street, Suite 2900 |
| Philadelphia, PA 19102 |
| Transfer Agent |
| Gemini Fund Services, LLC |
| 4221 North 203rd Street, Suite 100 |
| Elkhorn, NE 68022 |
| Administrator |
| Gemini Fund Services, LLC |
| 80 Arkay Drive Suite 110 |
| Hauppauge, NY 11788 |
| Custodian |
| The Northern Trust Company |
| 50 South LaSalle Street |
| Chicago, Il 60603 |
How to Obtain Proxy Voting Information
Information regarding how the Funds vote proxies relating to portfolio securities for the 12 month period ended June 30 as well as a description of the policies and procedures that the Funds used to determine how to vote proxies is available without charge, upon request, by calling 1-888-9-COPELAND or by referring to the Securities and Exchange Commission’s (“SEC”) website at http://www.sec.gov.
How to Obtain 1st and 3rd Fiscal Quarter Portfolio Holdings
The Funds files their complete schedule of portfolio holdings with the SEC for the first and third quarters of each fiscal year on Form N-PORT. Form N-PORT is available on the SEC’s website at http://www.sec.gov and may be reviewed and copied at the SEC’s Public Reference Room in Washington, DC (1-800-SEC-0330). The information on Form N-PORT is available without charge, upon request, by calling 1-888-9-COPELAND.
Item 2. Code of Ethics.
The Registrant has adopted a code of ethics that applies to its principal executive officer and principal financial officer. For the fiscal year ended November 30, 2020, there were no amendments to a provision of its code of ethics, nor were there any waivers, including implicit waivers granted from a provision of the code of ethics. The Registrant will provide to any person without charge, upon request, a copy of such code of ethics, by calling the Registrant at 1-888-9-COPELAND.
Item 3. Audit Committee Financial Expert.
The Registrant’s Board has determined that Thomas A. Leonard is an “audit committee financial expert,” and he is “independent” for purposes of this item.
Item 4. Principal Accountant Fees and Services.
For the fiscal years ended November 30, 2020 and November 30, 2019, the aggregate audit, audit-related, tax and all other fees billed by Tait & Weller for professional services rendered for the audits of the financial statements, or services that are normally provided in connection with statutory and regulatory filings or engagements for that fiscal year, as appropriate, for the Registrant are shown below.
| (a) | Audit Fees |
| 2020 | $ 24,350 | |
| 2019 | $ 36,300 |
| (b) | Audit-Related Fees |
| 2020 | $ 0 | |
| 2019 | $ 0 |
| (c) | Tax Fees |
| 2020 | $ 4,650 | |
| 2019 | $ 7,400 |
| (d) | All Other Fees |
| 2020 | $ 0 | |
| 2019 | $ 0 |
The above “Tax Fees” were billed for professional services rendered for tax compliance and tax return preparation.
| (e) | (1) Audit Committee’s Pre-Approval Policies |
The Registrant’s audit committee pre-approves all audit and non-audit services to be performed by the Registrant’s accountant before the accountant is engaged by the Registrant to perform such services.
| (2) Percentages of Services Approved by the Audit Committee pursuant to paragraph (c) (7)(i)(C) of Rule 2-01 of Regulation S-X. |
| Registrant | Advisor | |||||||
| Audit-Related Services: | 0.00 | % | 0.00 | % | ||||
| Tax Services: | 0.00 | % | 0.00 | % | ||||
| All Other Services: | 0.00 | % | 0.00 | % | ||||
(f) During the audit of Registrant's financial statements for the most recent fiscal period, less than 50 percent of the hours expended on the principal accountant's engagement were attributed to work performed by persons other than the principal accountant's full-time, permanent employees.
| (g) | The aggregate non-audit fees billed by the registrant's accountant for services rendered to the registrant, and rendered to the registrant's investment adviser (not including any sub-adviser whose role is primarily portfolio management and is subcontracted with or overseen by another investment adviser), and any entity controlling, controlled by, or under common control with the adviser that provides ongoing services to the registrant: |
2020 - $4,650
2019 - $7,400
(h) Disclose whether the Registrant’s audit committee of the board of directors has considered whether the provision of non-audit services that were rendered to the Registrant’s investment adviser, and any entity controlling, controlled by, or under common control with the investment adviser that provides ongoing services to the Registrant that were not pre-approved pursuant to paragraph (c) (7)(ii) of Rule 2-01 of Regulation S-X is compatible with maintaining the principal accountant’s independence.
Not applicable
Item 5. Audit Committee of Listed Companies. Not applicable to open-end investment companies.
Item 6. Investments.
| (a) | The complete schedule of investments is included in Item 1 of this Form N-CSR. |
(b) Not applicable.
Item 7. Disclosure of Proxy Voting Policies and Procedures for Closed-End Funds. Not applicable to open-end investment companies.
Item 8. Portfolio Managers of Closed-End Funds. Not applicable to open-end investment companies.
Item 9. Purchases of Equity Securities by Closed-End Funds and Affiliated Purchasers. Not applicable to open-end investment companies.
Item 10. Submission of Matters to a Vote of Security Holders. None
Item 11. Controls and Procedures.
(a) Based on an evaluation of the Registrant’s disclosure controls and procedures (as defined in rule 30a-3(c) under the Investment Company Act of 1940) as of a date within 90 days prior to the filing date of this report, Registrant’s principal executive officer and principal financial officer concluded that such disclosure controls and procedures are effective.
(b) There were no changes in the Registrant’s internal control over financial reporting that occurred during the period covered by this report that have materially affected, or are reasonably likely to materially affect, the Registrant’s internal control over financial reporting.
Item 12. Disclosure of Securities Lending Activities for Closed-End Management Investment Companies. (a) Not applicable to open-end investment companies.
(b) Not applicable to open-end investment companies.
Item 13. Exhibits.
(a)(1) Not applicable
(a)(2) Certifications required by Section 302 of the Sarbanes-Oxley Act of 2002 is filed herewith.
(a)(3) Not applicable for open-end investment companies.
(a)(4) Not applicable.
(b) Certification required by Section 906 of the Sarbanes-Oxley Act of 2002 is filed herewith.
SIGNATURE
Pursuant to the requirements of the Securities Exchange Act of 1934 and the Investment Company Act of 1940, the Registrant has duly caused this report to be signed on its behalf by the undersigned, thereunto duly authorized.
Copeland Trust
By: /s/ Mark W. Giovanniello_____________
Mark W. Giovanniello, Principal Executive Officer
Date 2/8/2021
Pursuant to the requirements of the Securities Exchange Act of 1934 and the Investment Company Act of 1940, this report has been signed below by the following persons on behalf of the Registrant and in the capacities and on the dates indicated.
By: /s/ Mark W. Giovanniello _____________
Mark W. Giovanniello, Principal Executive Officer
Date 2/8/2021
By: /s/ Steven J. Adams__________________
Steven J. Adams, Principal Financial Officer
Date 2/8/2021