united states
securities and exchange commission
washington, d.c. 20549
form n-csr
certified shareholder report of registered management
investment companies
Investment Company Act file number 811-22483
Copeland Trust
(Exact name of Registrant as specified in charter)
Eight Tower Bridge, 161 Washington St., Suite #1325 Conshohocken, PA 19428
(Address of principal executive offices) (Zip code)
Ultimus Fund Solutions, LLC, 80 Arkay Drive Suite 10, Hauppauge, NY 11788
(Name and address of agent for service)
Registrant's telephone number, including area code: (631) 470-2619
Date of fiscal year end: 11/30
Date of reporting period: 11/30/22
Item 1. Reports to Stockholders.
| Copeland | ||
| Dividend Growth Fund | ||
| Class A Shares: CDGRX | ||
| Class C Shares: CDCRX | ||
| Class I Shares: CDIVX | ||
| Copeland | ||
| SMID Cap Dividend Growth Fund | ||
| Class A Shares: CSDGX | ||
| Class I Shares: CSMDX | ||
| Copeland | ||
| International Small Cap Fund | ||
| Class A Shares: CISAX | ||
| Class I Shares: CSIIX | ||
| Annual Report | ||
| November 30, 2022 | ||
| Investor Information: 1-888-9-COPELAND | ||
| This report and the financial statements contained herein are submitted for the general information of shareholders and are not authorized for distribution to prospective investors unless preceded or accompanied by an effective prospectus. Nothing herein contained is to be considered an offer of sale or solicitation of an offer to buy shares of the Funds. Such offering is made only by prospectus, which includes details as to offering price and other material information. | ||
Distributed by Northern Lights Distributors, LLC Member FINRA | ||
Copeland Dividend Growth Fund
Annual Report
November 30, 2022
Dear Fellow Shareholders,
Copeland Capital Management is pleased to review the performance of the Copeland Dividend Growth Fund for the fiscal year beginning December 1, 2021 through November 30, 2022. Unless otherwise stated herein, all data and statistics that follow are as of November 30, 2022.
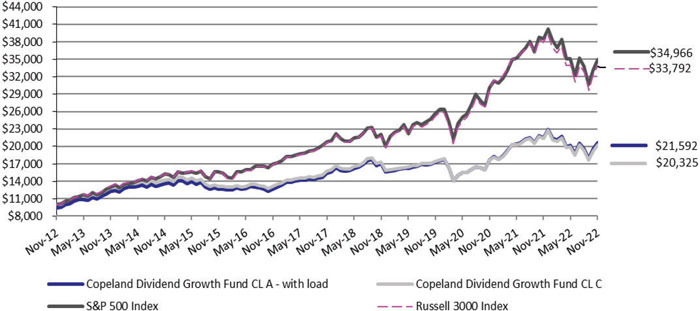
During the twelve-month period, the Class A shares of the Fund delivered a -3.9% return versus the -10.8% loss registered by the Russell 3000 Index and the -9.2% decline posted by the S&P 500 Index. As fears surrounding inflation and rising interest rates took center stage, we are pleased to have outpaced the benchmark indices, shielding shareholders from much of the market downdraft. Throughout 2022, US markets have been adversely impacted by the Federal Reserve’s (Fed) most aggressive monetary tightening campaign since the early 1980s, as the target interest rate has soared from 0.25% to 4.00%. The aggressive Fed posture comes in response to persistent inflation, with the November Core Consumer Price Index (CPI) rising 6% versus the prior year. While below the peak Core CPI reading of 6.6% in September 2022, the measure remains well above the 2% rate targeted by the Fed. This environment sparked a significant decline in many speculative stocks and a preference among investors for more profitable, reasonably valued investments, which favored Copeland’s Dividend Growth style of investing.
Our stock selection in the Consumer Discretionary sector bolstered Fund returns while those in the Real Estate sector were a drag. Amidst a broad-based surge in the Energy sector, Fund holding Diamondback Energy (FANG, 2.1% of holdings at period end) rose a sharp 45% during the period. The oil and gas exploration company has grown free cash flow by over 100% thus far in 2022. The company has rewarded shareholders with a 50% hike in the base dividend, versus the prior year, as well as the initiation of a variable dividend, which has translated into a more than five-fold increase in the overall shareholder payout thus far in 2022. Consistent with the broader industry, Diamondback is targeting a modest, two percent, production increase this year while demonstrating a heightened focus on profitability and shareholder return. A second standout performer, Materials sector constituent Reliance Steel & Aluminum (RS, 1.5% of holdings at period end), advanced 44% during the period. The largest value-added metals processing company in North America was bolstered by year-to-date average selling price, sales, and earnings growth of 27%, 2%, and 57%, respectively. With a network of over 300 locations in 40 states and 14 countries and a full line of over 100,000 metal products, Reliance benefits from broad product, end market, and geographic diversity. The company hiked its dividend by a robust 27% in March of 2022.
On the downside, Fund holding Cable One (CABO, 0.0% of holdings at period end) was the worst performer in the Fund, falling over 64% while we held a position in the company. The company provides high-speed internet, video, and voice services to residential and business customers, with a focus on rural markets. Shares came under pressure as the company reported lower than expected growth in both broadband subscriptions and average revenue per user. The recent spike in mortgage rates and attendant downturn in housing activity has limited the company’s ability to add new customers as they purchase a home. Fears surrounding heightened competition from fixed wireless players likely weighed on shares of Cable One as well. Information Technology sector constituent, eXp World Holdings (EXPI, 0.0% of holdings at period end) was also a laggard as shares of the cloud -based real estate brokerage firm retreated over 57% while we held a position in the company. Despite reporting strong earnings results, which included agent growth of over 50% year over year, the stock sold off due to the broader market sentiment shift away from high growth stocks and fears around the impact of higher interest rates on residential real
1
estate. With only 5% market share and the potential to dramatically expand via agent acquisition, we may look to reinitiate our position in shares of eXp Holdings in the future.
In recent months, the major U.S. equity indices have recouped a portion of the losses registered over the first three quarters of 2022. Incipient signs that inflation has peaked and an accompanying expectation that the Fed will be able to refrain from meaningful additional rate hikes in 2023, are likely responsible for the recent resurgence. Should the recent moderation in inflation continue, market attention will likely shift to the lagged impact of sharp monetary tightening on both the economy and corporate earnings. At present, the market appears to be pricing in a soft landing whereby the economy suffers a very mild recession or avoids an economic downturn altogether.
Regardless of the future path taken by the equity market, we at Copeland remain intently focused on the long-term prospects of companies held in the Fund, with a particular emphasis on the capacity of each to continue to grow its dividend over time. We continue to favor companies that we believe retain noteworthy competitive advantages in their respective industries, generate steady and growing cash flows, and are overseen by management teams with capital allocation discipline and an eye on the shareholder. Should a recession unfold in the year ahead, you may rest assured knowing that our Dividend Growth investment approach has historically provided significant downside protection during challenging economic environments.
Thank you for the confidence you have placed in Copeland and for your investment in the Copeland Dividend Growth Fund.
The views and opinions expressed in this letter are subject to change and may not be relied upon for investment advice. No forecasts can be guaranteed. The Fund holdings discussed herein are for informational purposes only and should not be perceived as investment recommendations by Copeland Capital Management. Holdings are subject to change, may not represent current holdings and are subject to risk. Performance data quoted here represents past performance. Past performance is no guarantee of future results. The return quoted reflects fee waivers and expense reimbursements in effect and would have been lower in their absence. Current performance may be lower or higher than the performance quoted above. The risks of investing in the Copeland Funds vary from fund to fund; to see the risks of investing in an individual fund, please refer to that fund’s latest prospectus.
You cannot invest directly in any index. Index returns do not include a deduction for fees or expenses. The S&P 500® Index is a market-capitalization-weighted index of the stocks of 500 leading companies in major industries of the U.S. economy. The Russell 3000 Index measures the performance of the 3000 largest U.S. companies based on total market capitalization, which represents approximately 98% of the investable U.S. equity market.
4003-NLD-01052023
2
Copeland SMID Cap Dividend Growth Fund
Annual Report
November 30, 2022
Dear Fellow Shareholders,
Copeland Capital Management is pleased to review the performance of the Copeland SMID Cap Dividend Growth Fund for the fiscal year beginning December 1, 2021 through November 30, 2022. Unless otherwise stated herein, all data and statistics that follow are as of November 30, 2022.
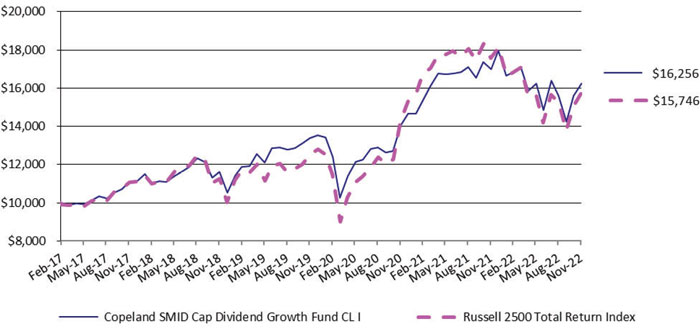
During the twelve-month period ended November 30, 2021, Class I shares of the Fund delivered a -4.3% return, versus the -10.4% decline of the Russell 2500 Index. As fears surrounding inflation and rising interest rates took center stage, we are pleased to have outpaced the benchmark indices, shielding shareholders from much of the market downdraft. Throughout 2022, US markets have been adversely impacted by the Federal Reserve’s (Fed) most aggressive monetary tightening campaign since the early 1980s, as the target interest rate has soared from 0.25% to 4.00%. The aggressive posture comes in response to persistent inflation, with the Core Consumer Price Index (CPI) rising 6% in November 2022 versus the prior year. While below the peak Core CPI reading of 6.6% in September, the measure remains well above the 2% rate targeted by the Fed. This environment sparked a significant decline in many speculative stocks and a preference among investors for more profitable, reasonably valued investments, which favored Copeland’s Dividend Growth style of investing.
Amidst a broad-based surge in oil and gas prices, Fund holding Northern Oil & Gas (NOG, 2.1% of holdings at period end) was the top performing stock during the period. The company acquires non-operating ownership interests in the wells of oil & gas producers, allowing others to perform the expensive drilling while NOG collects a share of the profits. This low capital intensity approach allows for high free cash flows and an ability to grow faster than peers even while rapidly growing its dividend, which rose over 200% during the period. Altra Industrial Motion (AIMC, 1.1%), a manufacturer of electromechanical power transmission products for a wide range of end markets and applications, was acquired for a substantial premium. The deal substantiated our belief that the company possessed a strong competitive position as a leader in specific niche markets and was unfairly punished in the market due to cyclical concerns, even though the company demonstrated its health and confidence with a 13% dividend raise in April. Meanwhile Healthcare stock selection was favorable during the period, as more speculative biotechnology stocks retreated while dividend growth stocks were more resilient. For example, the operations at Encompass Health (EHC, 1.4%), a provider of post-acute rehabilitation services, rebounded after a period of disruption during Covid. The company spun off its home health services unit and saw signs that labor costs were finally moderating, which will support strong growth going forward when combined with new facilities and rebounding volumes in 2023.
On the downside, Fund holding Cable One (CABO, 0.0% of holdings at period end), a rural market provider of high-speed internet, video, and voice services to residential and business customers, was the weakest performer during the period. Shares came under pressure as the company reported lower than expected growth in broadband internet subscriptions as consumers spent more time away from home when the Covid pandemic retreated and the housing market softened, although we believe these headwinds to be temporary and moderate, we sold out of the position. Innovative Industrial Properties (IIPR, 0.0%) was sold from the portfolio when the owner of industrial properties disclosed that a major tenant operating in California stopped paying rent on six properties. We felt that the impairment raises IIPR’s dividend payout ratio to uncomfortable levels and limits growth potential. Meanwhile, Algonquin Power and Utilities (AQN, 0.6%) struggled when an acquisition was delayed and earnings came up short of expectations. The company’s
3
focus on alternative energy expansion has been hampered by the rising cost of capital alongside interest rates.
In recent months, the major U.S. equity indices have recouped a portion of the losses registered over the first three quarters of 2022. Incipient signs that inflation has peaked and an accompanying expectation that the Fed will be able to refrain from meaningful additional rate hikes in 2023, are likely responsible for the recent resurgence. Should the recent moderation in inflation continue, market attention will likely shift to the lagged impact of sharp monetary tightening on both the economy and corporate earnings. At present, the market appears to be pricing in a soft landing whereby the economy suffers a very mild recession or avoids an economic downturn altogether.
Regardless of the future path taken by the equity market, we at Copeland remain intently focused on the long-term prospects of companies held in the Fund, with a particular emphasis on the capacity of each to continue to grow its dividend over time. We continue to favor companies that we believe retain noteworthy competitive advantages in their respective industries, are cash generative, and are overseen by management teams with capital allocation discipline and an eye on the shareholder. By owning a diversified portfolio of such companies, we hope to deliver better than benchmark returns over time, but with less volatility than is typically found when owning SMID Cap stocks. Should a recession unfold in the year ahead, you may rest assured knowing that our Dividend Growth investment approach has historically provided significant downside protection during challenging economic environments.
Thank you for the confidence you have placed in Copeland and for your investment in the Copeland SMID Cap Dividend Growth Fund.
The views and opinions expressed in this letter are subject to change and may not be relied upon for investment advice. No forecasts can be guaranteed. The Fund holdings discussed herein are for informational purposes only and should not be perceived as investment recommendations by Copeland Capital Management. Holdings are subject to change, may not represent current holdings and are subject to risk. Performance data quoted here represents past performance. Past performance is no guarantee of future results. The return quoted reflects fee waivers and expense reimbursements in effect and would have been lower in their absence. Current performance may be lower or higher than the performance quoted above. The risks of investing in the Copeland Funds vary from fund to fund; to see the risks of investing in an individual fund, please refer to that fund’s latest prospectus.
You cannot invest directly in any index. Index returns do not include a deduction for fees or expenses. The Russell 2500 Index is comprised of the bottom 2500 companies in the Russell 3000 Index. The Russell 3000 Index measures the performance of the 3000 largest U.S. companies based on total market capitalization, which represents approximately 98% of the investable U.S. equity market.
4003-NLD-01052023
4
Copeland International Small Cap Dividend Growth Fund
Annual Report
November 30, 2022
Dear Fellow Shareholders,
Copeland Capital Management is pleased to review the performance of the Copeland International Small Cap Dividend Growth Fund for the fiscal period from the Fund’s inception on December 27, 2021 through November 30, 2022. Unless otherwise stated herein, all data and statistics that follow are as of November 30, 2022. This constitutes 11 months of performance data since the Fund commenced operations.
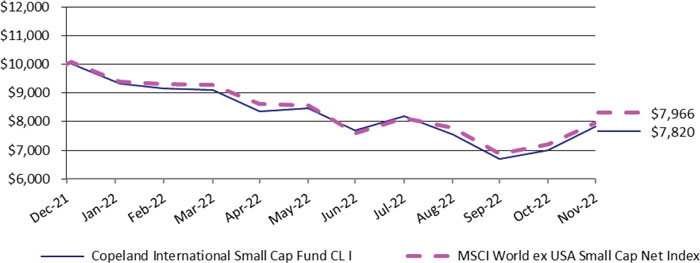
During the eleven-month period ended November 30, 2022, Class I shares of the Fund delivered a -21.8% return, versus the -21.1% of the MSCI World Ex USA Small Cap Index (the “benchmark”). International markets faced numerous headwinds, including rising interest rates and inflation across Europe, Canada and Australia. Germany’s 10-year government bond yield increased from -0.18% to 1.96% while the United Kingdom’s 10-year government bond yield increased from 0.97% to 3.18% during the period. Foreign currencies weakened materially relative to the US Dollar, reflecting more difficult economic conditions overseas. While inflation has been a concern in the United States, Consumer Price Indices accelerated across many European countries to an elevated level close to 10%. The Ukraine war exacerbated the inflationary backdrop due to a surge in energy costs. Meanwhile, China’s Covid lockdowns and a transition of government power led to increased volatility in Asian markets. In Japan, despite relatively stable JGB 10-year bond yields, the Yen weakened against the US Dollar by 24%. The Fund modestly lagged the benchmark during the period, which is unusual during a market downturn. However, given the rapid rise in inflation and interest rates, the market’s sell-off of speculative stocks also triggered a sell-off in the Fund’s more rapidly growing stock holdings. These tended to lag during the more value-oriented market climate of 2022.
Our stock selection in the Consumer Discretionary and Energy sectors most significantly aided Fund returns. The strategy invested in companies that have benefited due to the reopening from Covid lockdowns. For instance, Greek Organization of Football Prognostics SA (OPAP-GR, 2.2% of holdings at period end) is Greece’s leading gaming company and has grown as a result of its physical and online gaming assets. The top performing stock in the strategy was Tourmaline Oil Corp (TOU-CA, 1.6%), a leading natural gas producer in Western Canada. The company’s disciplined approach to new production spending in favor of free cash generation and shareholder returns resulted in a 34% increase in ordinary dividends as well as the payment of extraordinary dividends. Kongsberg Gruppen ASA (KOG-OSL, 1.a76%), a Norwegian-based Industrial company that delivers positioning, surveillance and navigation systems for the defense and maritime industries, performed well due to strong growth in shipping and defense spending in Europe. The company delivered double digit operating profit growth along with dividend growth of 10% in addition to a sizable special dividend.
The Fund’s selections within the Healthcare and Consumer Staples sectors were a drag on performance. Arjo AB Class B (ARJO.B-SE, 0.0%) Medical Distribution company posted record profits in 2021 driven by strong hospital bed rentals that benefited from elevated Covid-related demand. The stock sold off sharply this year as sales fell back to pre-pandemic levels. We decided to exit Arjo due to the reduced likelihood of dividend growth going forward given the decline in earnings expected this year. Hilton Foods (HFG-GB, 1.0%) is a leader in meat packaging for international food retailers. The core meats business fared well in spite of inflationary pressures due to the pass-through nature of costs built into their contracts. However, the recently acquired fish business had less protection against inflation, which led to weakness in the share price. We remain encouraged by the company’s leading market position in meat, attractive long-term
5
growth prospects, and strong balance sheet. Finally, shares of Future PLC (FUTR-GB, 0.0% of holdings at period end) came under pressure due to decelerating earnings growth after two years of strong results. The CEO who led the transformation of the company’s IT platform over the past few years unfortunately announced a sudden and unexpected resignation. As a result, we opted to exit the stock in favor of opportunities with more attractive dividend growth prospects.
In recent months, the major international equity indices have recouped a portion of the losses registered over the first three quarters of 2022. Incipient signs that inflation has peaked and an accompanying expectation that the Federal Reserve will be able to refrain from meaningful additional rate hikes in 2023, are likely responsible for the recent resurgence. Should the recent moderation in inflation continue, market attention will likely shift to the lagged impact of sharp monetary tightening on both the economy and corporate earnings. At present, the market appears to be pricing in a continued slowdown in Europe, which could result in a soft landing or mild recessionary scenario. In Asia, the GDP growth outlook is slowing but not necessarily entering recession territory, especially with hopes of a rebound in Chinese growth. We believe valuations are very attractive among many high-quality dividend growth stocks that were sold off indiscriminately along with speculative growth companies. As a result, we find the present environment to be particularly attractive for the types of companies in which we tend to invest.
Regardless of the future path taken by the equity market, we at Copeland remain intently focused on the long-term prospects of companies held in the Fund, with a particular emphasis on the capacity of each to continue to grow its dividend over time. We continue to favor companies that we believe retain noteworthy competitive advantages in their respective industries, are cash generative, and are overseen by management teams with capital allocation discipline and an eye on the shareholder returns. By owning a diversified portfolio of such companies, we hope to deliver better than benchmark returns over time, but with less volatility than is typically found when owning International Small Cap stocks.
Thank you for the confidence you have placed in Copeland and for your investment in the Copeland International Small Cap Dividend Growth Fund.
The views and opinions expressed in this letter are subject to change and may not be relied upon for investment advice. No forecasts can be guaranteed. The Fund holdings discussed herein are for informational purposes only and should not be perceived as investment recommendations by Copeland Capital Management. Holdings are subject to change, may not represent current holdings and are subject to risk. Performance data quoted here represents past performance. Past performance is no guarantee of future results. The return quoted reflects fee waivers and expense reimbursements in effect and would have been lower in their absence. Current performance may be lower or higher than the performance quoted above. The risks of investing in the Copeland Funds vary from fund to fund; to see the risks of investing in an individual fund, please refer to that fund’s latest prospectus.
You cannot invest directly in any index. Index returns do not include a deduction for fees or expenses. The MSCI World ex USA Small Cap Index captures small cap representation across 22 of 23 Developed Markets (DM) countries (excluding the United States). With 2,555 constituents, the index covers approximately 14% of the free float-adjusted market capitalization in each country. DM countries in this index include: Australia, Austria, Belgium, Canada, Denmark, Finland, France, Germany, Hong Kong, Ireland, Israel, Italy, Japan, Netherlands, New Zealand, Norway, Portugal, Singapore, Spain, Sweden, Switzerland and the UK.
4003-NLD-01052023
6
Copeland Dividend Growth Fund
Portfolio Review (Unaudited)
November 30, 2012 through November 30, 2022
Performance of a $10,000 Investment (as of November 30, 2022)
| Average Annualized | Since | |||
| Total Returns as of | Inception | |||
| November 30, 2022 | One Year | Five Year | Ten Year | Class I * |
| Copeland Dividend Growth Fund: | ||||
| Class A | ||||
| Without sales charge | (3.91)% | 5.97% | 8.16% | — |
| With sales charge + | (9.44)% | 4.72% | 7.52% | — |
| Class C | (4.63)% | 5.18% | 7.35% | — |
| Class I | (3.82)% | 6.14% | — | 7.67% |
| S&P 500 Index | (9.21)% | 10.98% | 13.34% | 12.82% |
| Russell 3000 Index | (10.80)% | 10.33% | 12.95% | 12.37% |
| * | Class A shares commenced operations on December 28, 2010. Class C commenced operations on January 5, 2012. Class I commenced operations March 1, 2013. |
| + | Adjusted for initial maximum sales charge of 5.75%. |
The S&P 500 Index is an unmanaged market capitalization-weighted index which is comprised of 500 of the largest U.S. domiciled companies and includes the reinvestment of all dividends. Investors cannot invest directly in an index or benchmark.
The Russell 3000 Index measures the performance of the largest 3000 U.S. companies representing approximately 98% of the investable U.S. equity market and includes the reinvestment of all dividends. Investors cannot invest directly in an index or benchmark.
Past performance is not predictive of future results. The investment return and principal value of an investment will fluctuate. An investor’s shares, when redeemed, may be worth more or less than the original cost. The performance and returns do not reflect the deduction of taxes that a shareholder may pay on Fund distributions or redemption of Fund shares. Total return is calculated assuming reinvestment of all dividends and distributions. Total returns would have been lower had the adviser not waived its fees and reimbursed a portion of the Fund’s expenses. For performance information current to the most recent month-end please call toll-free 1-888-9-COPELAND (1-888-926-7352). Additional information can be found by visiting our website, www.copelandfunds.com. The Fund’s gross annual operating expense ratio, as stated in the current prospectus, is 1.93%, 2.69%, and 1.75%, for Class A, Class C, and Class I shares, respectively, and its net annual operating expense ratio is 1.20%, 1.95%, and 1.05%, for Class A, Class C, and Class I shares, respectively. These ratios can fluctuate and may differ from the expense ratios disclosed in the Financial Highlights section of this report. The Fund’s investment adviser has contractually agreed to reduce its fees and/or absorb expenses of the Fund, until at least March 31, 2023, to ensure that total annual fund operating expenses after fee deferral and/or reimbursement (exclusive of any taxes, leverage interest, borrowing interest, brokerage commissions, expenses incurred in connection with any merger or reorganization, dividend expense on securities sold short, acquired fund fees and expenses or extraordinary expenses such as litigation) will not exceed 1.20%, 1.95% and 1.05% for Class A, Class C and Class I shares, respectively, subject to possible recoupment from the Fund in future years on a rolling three year basis (within the three years after the fees have been deferred or reimbursed) if such recoupment can be achieved without exceeding the lesser of the expense limitation in effect at the time of the deferral and at the time of the repayment.
7
Copeland SMID Cap Dividend Growth Fund
Portfolio Review (Unaudited)
February 27, 2017* through November 30, 2022
Performance of a $10,000 Investment (as of November 30, 2022)
| Since | Since | |||
| Total Returns as of | Inception | Inception | ||
| November 30, 2022 | One Year | Five Year | Class I * | Class A * |
| Copeland SMID Cap Dividend Growth Fund: | ||||
| Class I | (4.31)% | 7.93% | 8.81% | — |
| Class A | ||||
| Without sales charge | (4.50)% | — | — | 8.90% |
| With sales charge + | (9.97)% | — | — | 7.21% |
| Russell 2500 Total Return Index | (10.36)% | 7.27% | 8.21% | 9.05% |
| * | Class I shares commenced operations February 27, 2017. Class A commenced operations February 11, 2019 |
| + | Adjusted for initial maximum sales charge of 5.75%. |
The Russell 2500 Total Return Index is comprised of the smallest 2500 companies in the Russell 3000 Index. The Russell 3000 Index measures the performance of the 3,000 largest U.S. companies based on total market capitalization, which represents approximately 98% of the investable U.S. equity market. Investors cannot invest directly in an index or benchmark.
Past performance is not predictive of future results. The investment return and principal value of an investment will fluctuate. An investor’s shares, when redeemed, may be worth more or less than the original cost. The performance and returns do not reflect the deduction of taxes that a shareholder may pay on Fund distributions or redemption of Fund shares. Total return is calculated assuming reinvestment of all dividends and distributions. Total returns would have been lower had the adviser not waived its fees and reimbursed a portion of the Fund’s expenses. For performance information current to the most recent month-end please call toll-free 1-888-9-COPELAND (1-888-926-7352). Additional information can be found by visiting our website, www.copelandfunds.com. The Fund’s gross annual operating expense ratio, as stated in the current prospectus is 2.10% and 1.87% for Class A and Class I shares, respectively, and its net annual operating expense ratio is 1.20% and 0.95% for Class A and Class I shares, respectively. This ratio can fluctuate and may differ from the expense ratio disclosed in the Financial Highlights section of this report. The Fund’s adviser has contractually agreed to reduce its fees and/or absorb expenses of the Fund, until at least March 31, 2023, to ensure that total annual fund operating expenses after fee deferral and/or reimbursement (exclusive of any taxes, leverage interest, borrowing interest, brokerage commissions, expenses incurred in connection with any merger or reorganization, dividend expense on securities sold short, acquired fund fees and expenses or extraordinary expenses such as litigation) will not exceed 1.20% and 0.95% for Class A and Class I shares, respectively, subject to possible recoupment from the Fund in future years on a rolling three year basis (within the three years after the fees have been deferred or reimbursed) if such recoupment can be achieved without exceeding the lesser of the expense limitation in effect at the time of the deferral and at the time of the repayment.
8
Copeland International Small Cap Fund
Portfolio Review (Unaudited)
December 28, 2021* through November 30, 2022
Performance of a $10,000 Investment (as of November 30, 2022)
| Total Returns as of | Since | |
| November 30, 2022 | Inception* | |
| Copeland International Small Cap Fund: | (21.80)% | |
| Class I | ||
| Class A | (21.80)% | |
| Without sales charge | ||
| With sales charge + | (26.30)% | |
| MSCI World ex USA Small Cap Net Index | (20.34)% |
| * | The Fund commenced operations December 28, 2021. |
| + | Adjusted for initial maximum sales charge of 5.75%. |
The MSCI World ex USA Small Cap Net Index captures small cap representation across 22 of 23 Developed Markets (DM) countries (excluding the United States). With 2,555 constituents, the index covers approximately 14% of the free float-adjusted market capitalization in each country.
Past performance is not predictive of future results. The investment return and principal value of an investment will fluctuate. An investor’s shares, when redeemed, may be worth more or less than the original cost. The performance and returns do not reflect the deduction of taxes that a shareholder may pay on Fund distributions or redemption of Fund shares. Total return is calculated assuming reinvestment of all dividends and distributions. Total returns would have been lower had the adviser not waived its fees and reimbursed a portion of the Fund’s expenses. For performance information current to the most recent month-end please call toll-free 1-888-9-COPELAND (1-888-926-7352). Additional information can be found by visiting our website, www.copelandfunds.com. The Fund’s gross annual operating expense ratio, as stated in the current prospectus is 2.27% and 2.12% for Class A and Class I shares, respectively, and its net annual operating expense ratio is 1.23% and 0.98% for Class A and Class I shares, respectively. This ratio can fluctuate and may differ from the expense ratio disclosed in the Financial Highlights section of this report. The Fund’s adviser has contractually agreed to reduce its fees and/or absorb expenses of the Fund, until at least March 31, 2023, to ensure that total annual fund operating expenses after fee deferral and/or reimbursement (exclusive of any taxes, leverage interest, borrowing interest, brokerage commissions, expenses incurred in connection with any merger or reorganization, dividend expense on securities sold short, acquired fund fees and expenses or extraordinary expenses such as litigation) will not exceed 1.23% and 0.98% for Class A and Class I shares, respectively, subject to possible recoupment from the Fund in future years on a rolling three year basis (within the three years after the fees have been deferred or reimbursed) if such recoupment can be achieved without exceeding the lesser of the expense limitation in effect at the time of the deferral and at the time of the repayment.
9
| COPELAND DIVIDEND GROWTH FUND |
| SCHEDULE OF INVESTMENTS |
| November 30, 2022 |
| Shares | Fair Value | |||||||
| COMMON STOCKS — 99.3% | ||||||||
| AEROSPACE & DEFENSE - 1.7% | ||||||||
| 3,700 | Huntington Ingalls Industries, Inc. | $ | 858,252 | |||||
| ASSET MANAGEMENT - 4.9% | ||||||||
| 2,539 | Ameriprise Financial, Inc. | 842,822 | ||||||
| 870 | BlackRock, Inc. | 622,920 | ||||||
| 11,628 | Brookfield Infrastructure Corporation, Class A | 545,121 | ||||||
| 7,255 | Hamilton Lane, Inc., Class A | 535,999 | ||||||
| 2,546,862 | ||||||||
| BANKING - 1.1% | ||||||||
| 11,656 | Truist Financial Corporation | 545,617 | ||||||
| BEVERAGES - 1.5% | ||||||||
| 2,998 | Constellation Brands, Inc., Class A | 771,535 | ||||||
| BIOTECH & PHARMA - 1.2% | ||||||||
| 4,014 | Zoetis, Inc. | 618,718 | ||||||
| CHEMICALS - 2.7% | ||||||||
| 2,636 | Air Products and Chemicals, Inc. | 817,582 | ||||||
| 2,249 | Sherwin-Williams Company (The) | 560,406 | ||||||
| 1,377,988 | ||||||||
| COMMERCIAL SUPPORT SERVICES - 4.2% | ||||||||
| 21,474 | GFL Environmental, Inc. | 622,102 | ||||||
| 5,852 | Insperity, Inc. | 693,755 | ||||||
| 5,755 | Waste Connections, Inc. | 831,597 | ||||||
| 2,147,454 | ||||||||
| DATA CENTER REIT - 1.2% | ||||||||
| 895 | Equinix, Inc. | 618,132 | ||||||
| ELECTRIC UTILITIES - 1.7% | ||||||||
| 10,447 | NextEra Energy, Inc. | 884,861 | ||||||
The accompanying notes are an integral part of these financial statements.
10
| COPELAND DIVIDEND GROWTH FUND |
| SCHEDULE OF INVESTMENTS (Continued) |
| November 30, 2022 |
| Shares | Fair Value | |||||||
| COMMON STOCKS — 99.3% (Continued) | ||||||||
| ELECTRICAL EQUIPMENT - 1.3% | ||||||||
| 8,560 | Otis Worldwide Corporation | $ | 668,450 | |||||
| ENGINEERING & CONSTRUCTION - 1.4% | ||||||||
| 4,813 | Tetra Tech, Inc. | 744,042 | ||||||
| FOOD - 1.1% | ||||||||
| 30,196 | Utz Brands, Inc. | 575,536 | ||||||
| HEALTH CARE FACILITIES & SERVICES - 8.1% | ||||||||
| 1,475 | Chemed Corporation | 767,000 | ||||||
| 13,784 | Encompass Health Corporation | 806,088 | ||||||
| 9,407 | Ensign Group, Inc. (The) | 893,665 | ||||||
| 2,080 | UnitedHealth Group, Inc. | 1,139,341 | ||||||
| 6,698 | US Physical Therapy, Inc. | 578,774 | ||||||
| 4,184,868 | ||||||||
| HOUSEHOLD PRODUCTS - 1.6% | ||||||||
| 8,560 | Inter Parfums, Inc. | 815,682 | ||||||
| INSTITUTIONAL FINANCIAL SERVICES - 1.6% | ||||||||
| 8,778 | Morgan Stanley | 816,968 | ||||||
| INSURANCE - 1.6% | ||||||||
| 5,998 | Allstate Corporation (The) | 803,132 | ||||||
| LEISURE FACILITIES & SERVICES - 4.2% | ||||||||
| 3,700 | Churchill Downs, Inc. | 821,252 | ||||||
| 1,643 | Domino’s Pizza, Inc. | 638,683 | ||||||
| 6,675 | Starbucks Corporation | 682,185 | ||||||
| 2,142,120 | ||||||||
| LEISURE PRODUCTS - 1.0% | ||||||||
| 7,255 | Brunswick Corporation | 538,321 | ||||||
| MEDICAL EQUIPMENT & DEVICES - 5.3% | ||||||||
| 3,506 | ResMed, Inc. | 807,082 | ||||||
The accompanying notes are an integral part of these financial statements.
11
| COPELAND DIVIDEND GROWTH FUND |
| SCHEDULE OF INVESTMENTS (Continued) |
| November 30, 2022 |
| Shares | Fair Value | |||||||
| COMMON STOCKS — 99.3% (Continued) | ||||||||
| MEDICAL EQUIPMENT & DEVICES - 5.3% (Continued) | ||||||||
| 3,216 | STERIS plc | $ | 597,340 | |||||
| 3,362 | Stryker Corporation | 786,338 | ||||||
| 2,281 | West Pharmaceutical Services, Inc. | 535,259 | ||||||
| 2,726,019 | ||||||||
| OFFICE REIT - 1.3% | ||||||||
| 4,183 | Alexandria Real Estate Equities, Inc. | 650,917 | ||||||
| OIL & GAS PRODUCERS - 5.5% | ||||||||
| 7,303 | Diamondback Energy, Inc. | 1,080,990 | ||||||
| 20,240 | Northern Oil and Gas, Inc. | 736,534 | ||||||
| 4,208 | Pioneer Natural Resources Company | 993,046 | ||||||
| 2,810,570 | ||||||||
| PUBLISHING & BROADCASTING - 1.6% | ||||||||
| 4,305 | Nexstar Media Group, Inc. | 816,055 | ||||||
| RESIDENTIAL REIT - 1.2% | ||||||||
| 9,389 | Equity LifeStyle Properties, Inc. | 623,617 | ||||||
| RETAIL - CONSUMER STAPLES - 4.9% | ||||||||
| 3,652 | Casey’s General Stores, Inc. | 887,509 | ||||||
| 1,354 | Costco Wholesale Corporation | 730,145 | ||||||
| 3,506 | Dollar General Corporation | 896,414 | ||||||
| 2,514,068 | ||||||||
| RETAIL - DISCRETIONARY - 5.2% | ||||||||
| 3,713 | Advance Auto Parts, Inc. | 560,626 | ||||||
| 1,838 | Home Depot, Inc. (The) | 595,494 | ||||||
| 5,985 | Ross Stores, Inc. | 704,255 | ||||||
| 10,350 | TJX Companies, Inc. (The) | 828,517 | ||||||
| 2,688,892 | ||||||||
| SEMICONDUCTORS - 7.9% | ||||||||
| 1,620 | Broadcom, Inc. | 892,669 | ||||||
| 2,168 | Monolithic Power Systems, Inc. | 828,089 | ||||||
| 10,685 | Power Integrations, Inc. | 859,929 | ||||||
| 4,739 | Texas Instruments, Inc. | 855,200 | ||||||
The accompanying notes are an integral part of these financial statements.
12
| COPELAND DIVIDEND GROWTH FUND |
| SCHEDULE OF INVESTMENTS (Continued) |
| November 30, 2022 |
| Shares | Fair Value | |||||||
| COMMON STOCKS — 99.3% (Continued) | ||||||||
| SEMICONDUCTORS - 7.9% (Continued) | ||||||||
| 5,537 | Universal Display Corporation | $ | 623,577 | |||||
| 4,059,464 | ||||||||
| SOFTWARE - 2.8% | ||||||||
| 1,693 | Intuit, Inc. | 690,050 | ||||||
| 2,902 | Microsoft Corporation | 740,416 | ||||||
| 1,430,466 | ||||||||
| SPECIALTY FINANCE - 2.7% | ||||||||
| 17,895 | Air Lease Corporation | 691,105 | ||||||
| 6,457 | Discover Financial Services | 699,681 | ||||||
| 1,390,786 | ||||||||
| STEEL - 1.5% | ||||||||
| 3,749 | Reliance Steel & Aluminum Company | 792,126 | ||||||
| TECHNOLOGY HARDWARE - 3.6% | ||||||||
| 6,191 | Apple, Inc. | 916,454 | ||||||
| 3,482 | Motorola Solutions, Inc. | 947,800 | ||||||
| 1,864,254 | ||||||||
| TECHNOLOGY SERVICES - 11.0% | ||||||||
| 2,418 | Accenture plc, Class A | 727,649 | ||||||
| 8,633 | Booz Allen Hamilton Holding Corporation | 918,551 | ||||||
| 4,256 | Broadridge Financial Solutions, Inc. | 634,612 | ||||||
| 4,014 | CDW Corporation/DE | 757,201 | ||||||
| 1,303 | FactSet Research Systems, Inc. | 601,061 | ||||||
| 7,618 | Fidelity National Information Services, Inc. | 552,914 | ||||||
| 1,451 | MSCI, Inc. | 736,861 | ||||||
| 3,675 | Visa, Inc., Class A | 797,474 | ||||||
| 5,726,323 | ||||||||
| TELECOMMUNICATIONS - 1.2% | ||||||||
| 10,713 | Cogent Communications Holdings, Inc. | 621,890 | ||||||
The accompanying notes are an integral part of these financial statements.
13
| COPELAND DIVIDEND GROWTH FUND |
| SCHEDULE OF INVESTMENTS (Continued) |
| November 30, 2022 |
| Shares | Fair Value | |||||||
| COMMON STOCKS — 99.3% (Continued) | ||||||||
| TRANSPORTATION & LOGISTICS - 1.5% | ||||||||
| 3,555 | Union Pacific Corporation | $ | 772,964 | |||||
| TOTAL COMMON STOCKS (Cost $41,632,431) | 51,146,949 | |||||||
| TOTAL INVESTMENTS - 99.3% (Cost $41,632,431) | $ | 51,146,949 | ||||||
| OTHER ASSETS IN EXCESS OF LIABILITIES- 0.7% | 341,771 | |||||||
| NET ASSETS - 100.0% | $ | 51,488,720 | ||||||
| MSCI | - Morgan Stanley Capital International |
| PLC | - Public Limited Company |
| REIT | - Real Estate Investment Trust |
| Porfolio Composition as of November 30, 2022 (Unaudited) | ||||
| Sector | Percent of Net Assets | |||
| Technology | 25.4 | % | ||
| Health Care | 14.6 | % | ||
| Financials | 11.8 | % | ||
| Consumer Discretionary | 10.4 | % | ||
| Industrials | 10.1 | % | ||
| Consumer Staples | 9.1 | % | ||
| Energy | 5.5 | % | ||
| Materials | 4.2 | % | ||
| Real Estate | 3.7 | % | ||
| Communications | 2.8 | % | ||
| Utilities | 1.7 | % | ||
| Other Assets in Excess of Liabilities | 0.7 | % | ||
| Net Assets | 100.0 | % | ||
The accompanying notes are an integral part of these financial statements.
14
| COPELAND SMID CAP DIVIDEND GROWTH FUND |
| SCHEDULE OF INVESTMENTS |
| November 30, 2022 |
| Shares | Fair Value | |||||||
| COMMON STOCKS — 97.6% | ||||||||
| ASSET MANAGEMENT - 3.7% | ||||||||
| 10,770 | Brookfield Infrastructure Corporation, Class A | $ | 504,898 | |||||
| 9,405 | Cohen & Steers, Inc. | 623,081 | ||||||
| 9,256 | Hamilton Lane, Inc., Class A | 683,833 | ||||||
| 1,811,812 | ||||||||
| BANKING - 6.5% | ||||||||
| 20,480 | Bank OZK | 945,152 | ||||||
| 35,155 | Home BancShares, Inc. | 894,695 | ||||||
| 8,973 | Popular, Inc. | 655,208 | ||||||
| 9,926 | Prosperity Bancshares, Inc. | 750,108 | ||||||
| 3,245,163 | ||||||||
| BIOTECH & PHARMA - 1.0% | ||||||||
| 16,012 | Perrigo Company plc | 516,067 | ||||||
| CHEMICALS - 2.4% | ||||||||
| 30,346 | Element Solutions, Inc. | 593,568 | ||||||
| 2,970 | Quaker Houghton | 584,466 | ||||||
| 1,178,034 | ||||||||
| COMMERCIAL SUPPORT SERVICES - 6.3% | ||||||||
| 16,381 | ABM Industries, Inc. | 772,856 | ||||||
| 31,612 | GFL Environmental, Inc. | 915,800 | ||||||
| 7,535 | Insperity, Inc. | 893,274 | ||||||
| 2,997 | UniFirst Corporation | 580,699 | ||||||
| 3,162,629 | ||||||||
| CONSTRUCTION MATERIALS - 1.3% | ||||||||
| 2,421 | Carlisle Companies, Inc. | 636,989 | ||||||
| ELECTRIC UTILITIES - 0.6% | ||||||||
| 38,949 | Algonquin Power & Utilities Corporation | 294,065 | ||||||
| ELECTRICAL EQUIPMENT - 4.1% | ||||||||
| 10,612 | BWX Technologies, Inc. | 646,165 | ||||||
| 13,291 | Cognex Corporation | 661,626 | ||||||
| 2,818 | Littelfuse, Inc. | 694,637 | ||||||
| 2,002,428 | ||||||||
The accompanying notes are an integral part of these financial statements.
15
| COPELAND SMID CAP DIVIDEND GROWTH FUND |
| SCHEDULE OF INVESTMENTS (Continued) |
| November 30, 2022 |
| Shares | Fair Value | |||||||
| COMMON STOCKS — 97.6% (Continued) | ||||||||
| ENGINEERING & CONSTRUCTION - 1.7% | ||||||||
| 5,358 | Tetra Tech, Inc. | $ | 828,293 | |||||
| FORESTRY, PAPER & WOOD PRODUCTS - 1.2% | ||||||||
| 7,278 | UFP Industries, Inc. | 595,777 | ||||||
| GAS & WATER UTILITIES - 0.3% | ||||||||
| 1,093 | Chesapeake Utilities Corporation | 130,865 | ||||||
| HEALTH CARE FACILITIES & SERVICES - 7.8% | ||||||||
| 1,783 | Chemed Corporation | 927,160 | ||||||
| 11,442 | Encompass Health Corporation | 669,128 | ||||||
| 10,525 | Ensign Group, Inc. (The) | 999,874 | ||||||
| 5,148 | Quest Diagnostics, Inc. | 781,621 | ||||||
| 5,119 | US Physical Therapy, Inc. | 442,333 | ||||||
| 3,820,116 | ||||||||
| HOUSEHOLD PRODUCTS - 1.7% | ||||||||
| 8,628 | Inter Parfums, Inc. | 822,162 | ||||||
| INDUSTRIAL REIT - 1.7% | ||||||||
| 14,770 | Terreno Realty Corporation | 866,112 | ||||||
| INSURANCE - 1.4% | ||||||||
| 5,752 | Globe Life, Inc. | 690,010 | ||||||
| INTERNET MEDIA & SERVICES - 1.9% | ||||||||
| 17,707 | Shutterstock, Inc. | 952,991 | ||||||
| LEISURE FACILITIES & SERVICES - 6.7% | ||||||||
| 4,144 | Churchill Downs, Inc. | 919,802 | ||||||
| 1,580 | Domino’s Pizza, Inc. | 614,193 | ||||||
| 17,659 | Travel + Leisure Company | 686,405 | ||||||
| 6,219 | Wingstop, Inc. | 1,029,307 | ||||||
| 3,249,707 | ||||||||
The accompanying notes are an integral part of these financial statements.
16
| COPELAND SMID CAP DIVIDEND GROWTH FUND |
| SCHEDULE OF INVESTMENTS (Continued) |
| November 30, 2022 |
| Shares | Fair Value | |||||||
| COMMON STOCKS — 97.6% (Continued) | ||||||||
| LEISURE PRODUCTS - 1.5% | ||||||||
| 10,036 | Brunswick Corporation | $ | 744,671 | |||||
| MACHINERY - 3.8% | ||||||||
| 9,493 | Altra Industrial Motion Corporation | 556,480 | ||||||
| 2,623 | Nordson Corporation | 620,313 | ||||||
| 6,853 | Standex International Corporation | 719,908 | ||||||
| 1,896,701 | ||||||||
| MEDICAL EQUIPMENT & DEVICES - 3.0% | ||||||||
| 14,178 | LeMaitre Vascular, Inc. | 664,239 | ||||||
| 4,263 | STERIS plc | 791,810 | ||||||
| 1,456,049 | ||||||||
| OIL & GAS PRODUCERS - 7.9% | ||||||||
| 5,665 | Chord Energy Corporation | 864,082 | ||||||
| 8,551 | Civitas Resources, Inc. | 575,995 | ||||||
| 23,771 | Coterra Energy, Inc. | 663,449 | ||||||
| 5,364 | Diamondback Energy, Inc. | 793,979 | ||||||
| 27,786 | Northern Oil and Gas, Inc. | 1,011,133 | ||||||
| 3,908,638 | ||||||||
| PUBLISHING & BROADCASTING - 1.6% | ||||||||
| 4,190 | Nexstar Media Group, Inc. | 794,256 | ||||||
| RESIDENTIAL REIT - 1.7% | ||||||||
| 16,952 | NexPoint Residential Trust, Inc. | 815,222 | ||||||
| RETAIL - CONSUMER STAPLES - 1.7% | ||||||||
| 3,444 | Casey’s General Stores, Inc. | 836,961 | ||||||
| RETAIL - DISCRETIONARY - 2.3% | ||||||||
| 3,718 | Advance Auto Parts, Inc. | 561,381 | ||||||
| 13,085 | Monro, Inc. | 594,975 | ||||||
| 1,156,356 | ||||||||
| SEMICONDUCTORS - 6.3% | ||||||||
| 11,552 | Entegris, Inc. | 892,855 | ||||||
| 15,074 | Kulicke & Soffa Industries, Inc. | 722,798 | ||||||
The accompanying notes are an integral part of these financial statements.
17
| COPELAND SMID CAP DIVIDEND GROWTH FUND |
| SCHEDULE OF INVESTMENTS (Continued) |
| November 30, 2022 |
| Shares | Fair Value | |||||||
| COMMON STOCKS — 97.6% (Continued) | ||||||||
| SEMICONDUCTORS - 6.3% (Continued) | ||||||||
| 9,560 | Power Integrations, Inc. | $ | 769,389 | |||||
| 6,268 | Universal Display Corporation | 705,902 | ||||||
| 3,090,944 | ||||||||
| SPECIALTY FINANCE - 1.4% | ||||||||
| 17,529 | Air Lease Corporation | 676,970 | ||||||
| STEEL - 1.7% | ||||||||
| 3,937 | Reliance Steel & Aluminum Company | 831,849 | ||||||
| TECHNOLOGY HARDWARE - 0.5% | ||||||||
| 12,627 | AudioCodes Ltd. | 242,438 | ||||||
| TECHNOLOGY SERVICES - 7.2% | ||||||||
| 6,914 | Booz Allen Hamilton Holding Corporation | 735,650 | ||||||
| 3,969 | Broadridge Financial Solutions, Inc. | 591,818 | ||||||
| 1,726 | FactSet Research Systems, Inc. | 796,186 | ||||||
| 3,853 | Jack Henry & Associates, Inc. | 729,566 | ||||||
| 2,847 | Morningstar, Inc. | 697,885 | ||||||
| 3,551,105 | ||||||||
| TELECOMMUNICATIONS - 1.7% | ||||||||
| 14,119 | Cogent Communications Holdings, Inc. | 819,608 | ||||||
| TRANSPORTATION & LOGISTICS - 1.6% | ||||||||
| 4,486 | Landstar System, Inc. | 775,988 | ||||||
| TRANSPORTATION EQUIPMENT - 1.8% | ||||||||
| 20,084 | Allison Transmission Holdings, Inc. | 899,763 | ||||||
The accompanying notes are an integral part of these financial statements.
18
| COPELAND SMID CAP DIVIDEND GROWTH FUND |
| SCHEDULE OF INVESTMENTS (Continued) |
| November 30, 2022 |
| Shares | Fair Value | |||||||
| COMMON STOCKS — 97.6% (Continued) | ||||||||
| WHOLESALE - DISCRETIONARY - 1.6% | ||||||||
| 2,426 | Pool Corporation | $ | 799,149 | |||||
| TOTAL COMMON STOCKS (Cost $45,238,571) | 48,099,888 | |||||||
| TOTAL INVESTMENTS - 97.6% (Cost $45,238,571) | $ | 48,099,888 | ||||||
| OTHER ASSETS IN EXCESS OF LIABILITIES- 2.4% | 1,176,696 | |||||||
| NET ASSETS - 100.0% | $ | 49,276,584 | ||||||
| LTD | - Limited Company |
| PLC | - Public Limited Company |
| REIT | - Real Estate Investment Trust |
| Porfolio Composition as of November 30, 2022 (Unaudited) | ||||
| Sector | Percent of Net Assets | |||
| Industrials | 19.4 | % | ||
| Technology | 14.0 | % | ||
| Financials | 13.0 | % | ||
| Consumer Discretionary | 12.1 | % | ||
| Health Care | 11.8 | % | ||
| Energy | 7.9 | % | ||
| Materials | 6.6 | % | ||
| Communications | 5.2 | % | ||
| Real Estate | 3.4 | % | ||
| Consumer Staples | 3.3 | % | ||
| Utilities | 0.9 | % | ||
| Other Assets in Excess of Liabilities | 2.4 | % | ||
| Net Assets | 100.0 | % | ||
The accompanying notes are an integral part of these financial statements.
19
| COPELAND INTERNATIONAL SMALL CAP FUND |
| SCHEDULE OF INVESTMENTS |
| November 30, 2022 |
| Shares | Fair Value | |||||||
| COMMON STOCKS — 107.0% | ||||||||
| Australia - 2.4% | ||||||||
| 2,059 | Steadfast Group Ltd. | $ | 7,469 | |||||
| Austria - 1.4% | ||||||||
| 84 | BAWAG Group AG(a) | 4,406 | ||||||
| Canada - 13.3% | ||||||||
| 94 | Brookfield Infrastructure Corporation | 4,405 | ||||||
| 139 | Canadian Apartment Properties REIT | 4,516 | ||||||
| 335 | Freehold Royalties Ltd. | 4,119 | ||||||
| 430 | InterRent Real Estate Investment Trust | 4,005 | ||||||
| 124 | Stella-Jones, Inc. | 4,401 | ||||||
| 49 | TMX Group Ltd. | 5,138 | ||||||
| 64 | Toromont Industries Ltd. | 4,871 | ||||||
| 93 | Tourmaline Oil Corporation | 5,660 | ||||||
| 551 | Whitecap Resources, Inc. | 4,395 | ||||||
| 41,510 | ||||||||
| Cayman Islands - 1.4% | ||||||||
| 8,899 | Bosideng International Holdings, Ltd. | 4,434 | ||||||
| Denmark - 1.8% | ||||||||
| 152 | Sydbank A/S(a) | 5,686 | ||||||
| Finland - 1.5% | ||||||||
| 350 | Tokmanni Group Corporation Ord | 4,827 | ||||||
| France - 3.4% | ||||||||
| 61 | ARGAN S.A. | 4,917 | ||||||
| 98 | Ipsos | 5,614 | ||||||
| 10,531 | ||||||||
| Germany - 3.5% | ||||||||
| 159 | AIXTRON S.E. | 5,248 | ||||||
| 240 | Hensoldt A.G. | 5,616 | ||||||
| 10,864 | ||||||||
The accompanying notes are an integral part of these financial statements.
20
| COPELAND INTERNATIONAL SMALL CAP FUND |
| SCHEDULE OF INVESTMENTS (Continued) |
| November 30, 2022 |
| Shares | Fair Value | |||||||
| COMMON STOCKS — 107.0% (Continued) | ||||||||
| Greece - 2.5% | ||||||||
| 563 | OPAP S.A. | $ | 7,805 | |||||
| Hong Kong - 1.4% | ||||||||
| 13,482 | CITIC Telecom International Ho | 4,450 | ||||||
| Israel - 2.4% | ||||||||
| 1,882 | Bezeq The Israeli Telecommunication Corp Ltd.(a) | 3,475 | ||||||
| 91 | First International Bank Of Israel Ltd. | 3,951 | ||||||
| 7,426 | ||||||||
| Italy - 4.2% | ||||||||
| 90 | Interpump Group SpA | 4,044 | ||||||
| 2,087 | Iren SpA(a) | 3,469 | ||||||
| 128 | Recordati Industria Chimica e Farmaceutica SpA | 5,484 | ||||||
| 12,997 | ||||||||
| Japan - 32.9% | ||||||||
| 209 | Asics Corp. | 4,564 | ||||||
| 163 | BayCurrent Consulting, Inc.(a) | 5,418 | ||||||
| 40 | Cosmos Pharmaceutical Corporation | 4,078 | ||||||
| 93 | Digital Arts, Inc. | 4,478 | ||||||
| 534 | Elan Corporation | 4,028 | ||||||
| 116 | Fujimi, Inc. | 6,009 | ||||||
| 202 | Fullcast Holdings Company Ltd. | 4,574 | ||||||
| 100 | Hamamatsu Photonics K.K. | 5,281 | ||||||
| 181 | Information Services International-Dentsu Ltd. | 6,103 | ||||||
| 355 | Internet Initiative Japan, Inc. | 6,428 | ||||||
| 193 | MISUMI Group, Inc. | 4,798 | ||||||
| 1,138 | Mitsubishi UFJ Lease & Finance Co. Ltd. | 5,430 | ||||||
| 1 | Mitsui Fudosan Logistics Park, Inc. | 3,631 | ||||||
| 205 | Nakanishi, Inc. | 4,298 | ||||||
| 209 | NIPPON GAS CO. LTD. | 3,215 | ||||||
| 92 | Nissan Chemical Corporation | 4,567 | ||||||
| 163 | Okinawa Cellular Telephone Company | 3,262 | ||||||
| 280 | SCSK Corporation | 4,535 | ||||||
| 181 | Shoei Company, Ltd. | 7,366 | ||||||
The accompanying notes are an integral part of these financial statements.
21
| COPELAND INTERNATIONAL SMALL CAP FUND |
| SCHEDULE OF INVESTMENTS (Continued) |
| November 30, 2022 |
| Shares | Fair Value | |||||||
| COMMON STOCKS — 107.0% (Continued) | ||||||||
| Japan - 32.9% (Continued) | ||||||||
| 200 | Takeuchi Manufacturing Company, Ltd. | $ | 4,655 | |||||
| 634 | Zeon Corporation | 6,178 | ||||||
| 102,896 | ||||||||
| Netherlands - 1.6% | ||||||||
| 66 | Euronext N.V. | 5,055 | ||||||
| Norway - 1.8% | ||||||||
| 138 | Kongsberg Gruppen ASA | 5,724 | ||||||
| Puerto Rico - 1.4% | ||||||||
| 59 | Popular, Inc. | 4,308 | ||||||
| Singapore - 1.1% | ||||||||
| 2,217 | Frasers Centrepoint Trust | 3,324 | ||||||
| Sweden - 4.1% | ||||||||
| 423 | Bravida Holding A.B. | 4,288 | ||||||
| 343 | Hufvudstaden A.B.(a) | 4,858 | ||||||
| 163 | Sagax A.B. | 3,625 | ||||||
| 12,771 | ||||||||
| Switzerland - 2.9% | ||||||||
| 65 | Logitech International S.A.(a) | 3,941 | ||||||
| 235 | SIG Combibloc Group AG | 5,180 | ||||||
| 9,121 | ||||||||
| United Kingdom - 16.3% | ||||||||
| 1,274 | Advanced Medical Solutions Group plc | 4,215 | ||||||
| 949 | Bytes Technology Group plc | 4,753 | ||||||
| 1,222 | Chemring Group plc | 4,634 | ||||||
| 139 | Diploma PLC(a) | 4,755 | ||||||
| 433 | Electrocomponents plc | 4,818 | ||||||
| 180 | Halma plc(a) | 4,777 | ||||||
| 524 | Hilton Food Group plc | 3,440 | ||||||
| 1,151 | RWS Holdings plc | 4,591 | ||||||
| 542 | Treatt plc | 4,361 | ||||||
The accompanying notes are an integral part of these financial statements.
22
| COPELAND INTERNATIONAL SMALL CAP FUND |
| SCHEDULE OF INVESTMENTS (Continued) |
| November 30, 2022 |
| Shares | Fair Value | |||||||
| COMMON STOCKS — 107.0% (Continued) | ||||||||
| United Kingdom - 16.3% (Continued) | ||||||||
| 525 | UNITE Group plc (The) | $ | 5,881 | |||||
| 270 | WH Smith plc | 4,611 | ||||||
| 50,836 | ||||||||
| United States - 5.7% | ||||||||
| 206 | ICU Medical, Inc. | 3,154 | ||||||
| 110 | Inter Parfums, Inc. | 10,481 | ||||||
| 38 | Universal Display Corporation | 4,280 | ||||||
| 17,915 | ||||||||
| TOTAL COMMON STOCKS (Cost $357,665) | 334,355 | |||||||
| Shares | Fair Value | |||||||
| EXCHANGE-TRADED FUND — 1.6% | ||||||||
| United States - 1.6% | ||||||||
| 90 | iShares MSCI EAFE Small-Cap ETF, EQUITY | 5,130 | ||||||
| TOTAL EXCHANGE-TRADED FUND (Cost $4,943) | 5,130 | |||||||
| TOTAL INVESTMENTS - 108.6% (Cost $362,608) | $ | 339,485 | ||||||
| LIABILITIES IN EXCESS OF OTHER ASSETS - (8.6)% | (26,875 | ) | ||||||
| NET ASSETS - 100.0% | $ | 312,610 | ||||||
| A/S | - Anonim Sirketi |
| EAFE | - Europe, Australasia and Far East |
| ETF | - Exchange-Traded Fund |
| LTD | - Limited Company |
| MSCI | - Morgan Stanley Capital International |
| PLC | - Public Limited Company |
| REIT | - Real Estate Investment Trust |
| S/A | - Société Anonyme |
| (a) | The value of this security has been determined in good faith under policies of the Board of Trustees. |
The accompanying notes are an integral part of these financial statements.
23
| COPELAND INTERNATIONAL SMALL CAP FUND |
| SCHEDULE OF INVESTMENTS (Continued) |
| November 30, 2022 |
| Portfolio Composition * as of November 30, 2022 (Unaudited) | ||||
| Sector | Percent of Net Assets | |||
| Real Estate Investment Trust | 7.7 | % | ||
| Technology Services | 6.2 | % | ||
| Semiconductors | 6.0 | % | ||
| Banking | 5.4 | % | ||
| Chemicals | 4.5 | % | ||
| Industrial Support Services | 4.3 | % | ||
| Machinery | 4.2 | % | ||
| Oil & Gas Producers | 4.2 | % | ||
| Medical Equipment & Devices | 3.4 | % | ||
| Telecommunications | 3.3 | % | ||
| Household Products | 3.1 | % | ||
| Software | 3.1 | % | ||
| Institutional Financial Services | 3.0 | % | ||
| Commercial Support Services | 2.7 | % | ||
| Apparel & Textile Products | 2.6 | % | ||
| Retail - Consumer Staples | 2.6 | % | ||
| Leisure Facilities & Services | 2.3 | % | ||
| Automotive | 2.2 | % | ||
| Gas & Water Utilities | 2.2 | % | ||
| Insurance | 2.2 | % | ||
| Construction Materials | 1.8 | % | ||
| Advertising & Marketing | 1.7 | % | ||
| Biotech & Pharma | 1.6 | % | ||
| Specialty Finance | 1.6 | % | ||
| Containers & Packaging | 1.5 | % | ||
| Aerospace & Defense | 1.4 | % | ||
| Electrical Equipment | 1.4 | % | ||
| Industrial Intermediate Prod | 1.4 | % | ||
| Real Estate Services | 1.4 | % | ||
| Retail - Discretionary | 1.4 | % | ||
| Engineering & Construction | 1.3 | % | ||
| Forestry, Paper & Wood Products | 1.3 | % | ||
| Healthcare Facilities & Services | 1.2 | % | ||
| Technology Hardware | 1.1 | % | ||
| Real Estate Owners & Developers | 1.1 | % | ||
| Electric Utilities | 1.0 | % | ||
| Wholesale - Consumer Staples | 1.0 | % | ||
| Equity - Exchange Trade Fund | 1.6 | % | ||
| 100.0 | % | |||
| * | Based on total value of investments as of November 30, 2022. |
| Percentage may differ from Schedule of Investments which are based on Fund net assets. |
The accompanying notes are an integral part of these financial statements.
24
| Copeland Trust |
| STATEMENTS OF ASSETS AND LIABILITIES |
| November 30, 2022 |
| Copeland SMID | Copeland | |||||||||||
| Copeland Dividend | Cap Dividend | International | ||||||||||
| Growth Fund | Growth Fund | Small Cap Fund ** | ||||||||||
| Assets: | ||||||||||||
| Investments, at Cost | $ | 41,632,431 | $ | 45,238,571 | $ | 362,608 | ||||||
| Investments in Securities, at Market Value | $ | 51,146,949 | $ | 48,099,888 | $ | 339,485 | ||||||
| Cash | 315,142 | 868,207 | 8,698 | |||||||||
| Foreign Cash (Cost $0, $0, $14) | — | — | 16 | |||||||||
| Dividends and Interest Receivable | 103,609 | 62,343 | 1,318 | |||||||||
| Receivable for Securities Sold | — | 215,531 | — | |||||||||
| Receivable for Fund Shares Sold | — | 53,139 | — | |||||||||
| Due from Investment Adviser | — | 13,691 | — | |||||||||
| Prepaid Expenses and Other Assets | 47,075 | 30,378 | — | |||||||||
| Total Assets | 51,612,775 | 49,343,177 | 349,517 | |||||||||
| Liabilities: | ||||||||||||
| Payable for Fund Shares Redeemed | 10,573 | 5,354 | — | |||||||||
| Payable to Investment Adviser | 7,619 | — | 12,848 | |||||||||
| Accrued Audit Fees | 19,691 | 15,010 | 9,000 | |||||||||
| Accrued Distribution Fees | 11,450 | 333 | — | |||||||||
| Payable to Related Parties | 36,557 | 29,754 | 10,000 | |||||||||
| Other Accrued Expenses | 38,165 | 16,142 | 5,059 | |||||||||
| Total Liabilities | 124,055 | 66,593 | 36,907 | |||||||||
| Net Assets | $ | 51,488,720 | $ | 49,276,584 | $ | 312,610 | ||||||
| Composition of Net Assets: | ||||||||||||
| At November 30, 2022, Net Assets consisted of: | ||||||||||||
| Paid-in-Capital | $ | 40,828,432 | $ | 46,245,668 | $ | 399,992 | ||||||
| Accumulated Earnings/(Deficit) | 10,660,288 | 3,030,916 | (87,382 | ) | ||||||||
| Net Assets | $ | 51,488,720 | $ | 49,276,584 | $ | 312,610 | ||||||
| Class A Shares: | ||||||||||||
| Net Assets | $ | 15,441,210 | $ | 1,674,334 | $ | 8 | ||||||
| Shares Outstanding (no par value; unlimited number of shares authorized) | 1,236,377 | 118,317 | 1 | |||||||||
| Net Asset Value and Redemption Price Per Share* | $ | 12.49 | $ | 14.15 | $ | 7.82 | + | |||||
| Offering Price Per Share (NAV/$0.9425) Includes a Maximum Sales Charge of 5.75% | $ | 13.25 | $ | 15.01 | $ | 8.30 | ||||||
| Class C Shares: | ||||||||||||
| Net Assets | $ | 10,586,229 | ||||||||||
| Shares Outstanding (no par value; unlimited number of shares authorized) | 903,976 | |||||||||||
| Net Asset Value, Offering Price and Redemption Price Per Share* | $ | 11.71 | ||||||||||
| Class I Shares: | ||||||||||||
| Net Assets | $ | 25,461,281 | $ | 47,602,250 | $ | 312,602 | ||||||
| Shares Outstanding (no par value; unlimited number of shares authorized) | 2,063,071 | 3,345,329 | 39,999 | |||||||||
| Net Asset Value, Offering Price and Redemption Price Per Share* | $ | 12.34 | $ | 14.23 | $ | 7.82 | ||||||
| * | The Funds charge a 1.00% fee on shares redeemed less than 30 days after purchase or if shares held less than 30 days are redeemed for failure to maintain a balance that meets the minimum requirements listed in the Funds’ Prospectus. |
| ** | Fund commenced operations on December 28, 2021. |
| + | NAV may not recalculate due to rounding. |
The accompanying notes are an integral part of these financial statements.
25
| Copeland Trust |
| STATEMENTS OF OPERATIONS |
| For the Year or Period Ended November 30, 2022 |
| Copeland SMID | Copeland | |||||||||||
| Copeland Dividend | Cap Dividend | International | ||||||||||
| Growth Fund | Growth Fund | Small Cap Fund * | ||||||||||
| Investment Income: | ||||||||||||
| Dividend Income | $ | 1,072,951 | $ | 968,755 | $ | 10,029 | ||||||
| Interest Income | — | — | 103 | |||||||||
| Less: Foreign Taxes Withholding | (11,619 | ) | (11,888 | ) | (913 | ) | ||||||
| Total Investment Income | 1,061,332 | 956,867 | 9,219 | |||||||||
| Expenses: | ||||||||||||
| Investment Advisory Fees | 417,777 | 313,002 | 2,353 | |||||||||
| Distribution Fees - Class C | 114,677 | — | — | |||||||||
| Distribution Fees - Class A | 40,502 | 1,196 | — | |||||||||
| Chief Compliance Officer Fees | 113,879 | 85,451 | 605 | |||||||||
| Legal Fees | 77,016 | 53,624 | 339 | |||||||||
| Trustees’ Fees | 74,997 | 54,802 | 2,924 | |||||||||
| Administration Fees | 68,499 | 48,436 | 14,155 | |||||||||
| Registration & Filing Fees | 49,948 | 31,707 | 1,545 | |||||||||
| Fund Accounting Fees | 44,982 | 36,066 | 33,000 | |||||||||
| Transfer Agent Fees | 24,575 | 31,736 | 726 | |||||||||
| Custody Fees | 20,772 | 22,756 | 9,033 | |||||||||
| Audit Fees | 19,708 | 15,011 | 9,000 | |||||||||
| Non-Rule 12b-1 Shareholder Service Fees | 19,265 | 537 | 452 | |||||||||
| Insurance Expense | 17,891 | 10,175 | — | |||||||||
| Printing Expense | 15,686 | 10,683 | 8,301 | |||||||||
| Shareholder Service Fees - Class I | 6,423 | 7,251 | — | |||||||||
| Miscellaneous Expenses | 3,258 | 1,381 | 2,515 | |||||||||
| Total Expenses | 1,129,855 | 723,814 | 84,948 | |||||||||
| Less: Fees Waived by Adviser | (417,777 | ) | (313,002 | ) | (2,353 | ) | ||||||
| Less: Other Expenses Reimbursed by Adviser | (203 | ) | (12,818 | ) | (79,646 | ) | ||||||
| Net Expenses | 711,875 | 397,994 | 2,949 | |||||||||
| Net Investment Income | 349,457 | 558,873 | 6,270 | |||||||||
| Net Realized and Unrealized Gain (Loss) on Investments and Foreign Currency Transactions: | ||||||||||||
| Net Realized Gain (Loss) on: | ||||||||||||
| Securities | 906,824 | (309,069 | ) | (70,276 | ) | |||||||
| Foreign Currency Transactions | — | — | (291 | ) | ||||||||
| 906,824 | (309,069 | ) | (70,567 | ) | ||||||||
| Net Change in Unrealized Appreciation (Depreciation) on: | ||||||||||||
| Securities | (4,047,251 | ) | (2,066,348 | ) | (23,123 | ) | ||||||
| Foreign Currency Transactions | — | — | 30 | |||||||||
| (4,047,251 | ) | (2,066,348 | ) | (23,093 | ) | |||||||
| Net Realized and Unrealized Loss on Investments and | ||||||||||||
| Foreign Currency Transactions: | (3,140,427 | ) | (2,375,417 | ) | (93,660 | ) | ||||||
| Net Decrease in Net Assets Resulting From Operations | $ | (2,790,970 | ) | $ | (1,816,544 | ) | $ | (87,390 | ) | |||
| * | Fund commenced operations on December 28, 2021. |
The accompanying notes are an integral part of these financial statements.
26
| Copeland Dividend Growth Fund |
| STATEMENTS OF CHANGES IN NET ASSETS |
| For the | For the | |||||||
| Year Ended | Year Ended | |||||||
| November 30, 2022 | November 30, 2021 | |||||||
| Operations: | ||||||||
| Net Investment Income | $ | 349,457 | $ | 141,972 | ||||
| Net Realized Gain on Investments | 906,824 | 9,117,466 | ||||||
| Net Change in Unrealized Appreciation (Depreciation) on investments | (4,047,251 | ) | 4,104,961 | |||||
| Net Increase (Decrease) in Net Assets Resulting From Operations | (2,790,970 | ) | 13,364,399 | |||||
| Distributions to Shareholders From: | ||||||||
| Total Distributions Paid | ||||||||
| Class A | (2,057,408 | ) | — | |||||
| Class C | (1,592,846 | ) | — | |||||
| Class I | (3,889,176 | ) | — | |||||
| Total Distributions to Shareholders | (7,539,430 | ) | — | |||||
| Beneficial Interest Transactions: | ||||||||
| Class A | ||||||||
| Proceeds from Shares Issued | 925,192 | 627,282 | ||||||
| Distributions Reinvested | 1,889,194 | — | ||||||
| Cost of Shares Redeemed | (2,772,802 | ) | (4,967,290 | ) | ||||
| Total Class A Shares | 41,584 | (4,340,008 | ) | |||||
| Class C | ||||||||
| Proceeds from Shares Issued | 16,948 | 83,941 | ||||||
| Distributions Reinvested | 1,568,802 | — | ||||||
| Cost of Shares Redeemed | (2,288,082 | ) | (4,690,002 | ) | ||||
| Redemption Fees | 4 | 25 | ||||||
| Total Class C Shares | (702,328 | ) | (4,606,036 | ) | ||||
| Class I | ||||||||
| Proceeds from Shares Issued | 73,412 | 1,578,477 | ||||||
| Distributions Reinvested | 3,820,604 | — | ||||||
| Cost of Shares Redeemed | (6,614,708 | ) | (11,161,338 | ) | ||||
| Total Class I Shares | (2,720,692 | ) | (9,582,861 | ) | ||||
| Total Beneficial Interest Transactions | (3,381,436 | ) | (18,528,905 | ) | ||||
| Decrease in Net Assets | (13,711,836 | ) | (5,164,506 | ) | ||||
| Net Assets: | ||||||||
| Beginning of Year | 65,200,556 | 70,365,062 | ||||||
| End of Year | $ | 51,488,720 | $ | 65,200,556 | ||||
| Share Activity: | ||||||||
| Class A | ||||||||
| Shares Issued | 73,444 | 49,937 | ||||||
| Distributions Reinvested | 139,424 | — | ||||||
| Shares Redeemed | (224,571 | ) | (370,466 | ) | ||||
| Total Activity Class A Shares | (11,703 | ) | (320,529 | ) | ||||
| Class C | ||||||||
| Shares Issued | 1,472 | 6,508 | ||||||
| Distributions Reinvested | 122,563 | — | ||||||
| Shares Redeemed | (196,711 | ) | (373,185 | ) | ||||
| Total Activity Class C Shares | (72,676 | ) | (366,677 | ) | ||||
| Class I | ||||||||
| Shares Issued | 5,974 | 119,888 | ||||||
| Distributions Reinvested | 285,759 | — | ||||||
| Shares Redeemed | (544,731 | ) | (856,138 | ) | ||||
| Total Activity Class I Shares | (252,998 | ) | (736,250 | ) | ||||
The accompanying notes are an integral part of these financial statements.
27
| Copeland SMID Cap Dividend Growth Fund |
| STATEMENTS OF CHANGES IN NET ASSETS |
| For the | For the | |||||||
| Year Ended | Year Ended | |||||||
| November 30, 2022 | November 30, 2021 | |||||||
| Operations: | ||||||||
| Net Investment Income | $ | 558,873 | $ | 208,194 | ||||
| Net Realized Gain (Loss) on Investments | (309,069 | ) | 2,227,730 | |||||
| Net Change in Unrealized Appreciation (Depreciation) on Investments | (2,066,348 | ) | 2,614,025 | |||||
| Net Increase (Decrease) in Net Assets Resulting From Operations | (1,816,544 | ) | 5,049,949 | |||||
| Distributions to Shareholders From: | ||||||||
| Total Distributions Paid | ||||||||
| Class A | (13,327 | ) | (283 | ) | ||||
| Class I | (2,360,113 | ) | (95,606 | ) | ||||
| Total Distributions to Shareholders | (2,373,440 | ) | (95,889 | ) | ||||
| Beneficial Interest Transactions: | ||||||||
| Class A | ||||||||
| Proceeds from Shares Issued | 1,543,686 | 74,799 | ||||||
| Distributions Reinvested | 13,327 | 282 | ||||||
| Cost of Shares Redeemed | (127,520 | ) | — | |||||
| Redemption Fees | 19 | 10 | ||||||
| Total Class A Shares | 1,429,512 | 75,091 | ||||||
| Class I | ||||||||
| Proceeds from Shares Issued | 21,843,716 | 17,596,082 | ||||||
| Distributions Reinvested | 2,131,974 | 88,162 | ||||||
| Cost of Shares Redeemed | (7,747,664 | ) | (9,072,094 | ) | ||||
| Redemption Fees | 1,656 | 2,222 | ||||||
| Total Class I Shares | 16,229,682 | 8,614,372 | ||||||
| Total Beneficial Interest Transactions | 17,659,194 | 8,689,463 | ||||||
| Increase in Net Assets | 13,469,210 | 13,643,523 | ||||||
| Net Assets: | ||||||||
| Beginning of Year | 35,807,374 | 22,163,851 | ||||||
| End of Year | $ | 49,276,584 | $ | 35,807,374 | ||||
| Share Activity: | ||||||||
| Class A | ||||||||
| Shares Issued | 113,959 | 4,790 | ||||||
| Distributions Reinvested | 869 | 21 | ||||||
| Shares Redeemed | (9,561 | ) | — | |||||
| Total Activity Class A Shares | 105,267 | 4,811 | ||||||
| Class I | ||||||||
| Shares Issued | 1,540,114 | 1,162,033 | ||||||
| Distributions Reinvested | 138,530 | 6,492 | ||||||
| Shares Redeemed | (575,776 | ) | (598,801 | ) | ||||
| Total Activity Class I Shares | 1,102,868 | 569,724 | ||||||
The accompanying notes are an integral part of these financial statements.
28
| Copeland International Small Cap Fund |
| STATEMENT OF CHANGES IN NET ASSETS |
| For the | ||||
| Period Ended | ||||
| November 30, 2022 * | ||||
| Operations: | ||||
| Net Investment Income | $ | 6,270 | ||
| Net Realized Loss on Investments and Foreign Currency Transactions | (70,567 | ) | ||
| Net Change in Unrealized Depreciation on Investments and Foreign Currency Transactions | (23,093 | ) | ||
| Net Decrease in Net Assets Resulting From Operations | (87,390 | ) | ||
| Beneficial Interest Transactions: | ||||
| Class A | ||||
| Proceeds from Shares Issued | 10 | |||
| Total Class A Shares | 10 | |||
| Class I | ||||
| Proceeds from Shares Issued | 399,990 | |||
| Total Class I Shares | 399,990 | |||
| Total Beneficial Interest Transactions | 400,000 | |||
| Increase in Net Assets | 312,610 | |||
| Net Assets: | ||||
| Beginning of Period | — | |||
| End of Period | $ | 312,610 | ||
| Share Activity: | ||||
| Class A | ||||
| Shares Issued | 1 | |||
| Total Activity Class A Shares | 1 | |||
| Class I | ||||
| Shares Issued | 39,999 | |||
| Total Activity Class I Shares | 39,999 | |||
| * | Fund commenced operations on December 28, 2021. |
The accompanying notes are an integral part of these financial statements.
29
| Copeland Dividend Growth Fund |
| FINANCIAL HIGHLIGHTS |
Certain information in the table below reflects financial results for one share of beneficial interest outstanding throughout each year presented.
| Class A | ||||||||||||||||||||
| Year | Year | Year | Year | Year | ||||||||||||||||
| Ended | Ended | Ended | Ended | Ended | ||||||||||||||||
| November 30, 2022 | November 30, 2021 | November 30, 2020 | November 30, 2019 | November 30, 2018 | ||||||||||||||||
| Net Asset Value, Beginning of Year | $ | 14.59 | $ | 11.99 | $ | 14.25 | $ | 15.18 | $ | 14.38 | ||||||||||
| Increase (Decrease) From Operations: | ||||||||||||||||||||
| Net investment income (a) | 0.09 | 0.04 | 0.01 | 0.10 | 0.04 | |||||||||||||||
| Net gain (loss) from securities (both realized and unrealized) | (0.53 | ) | 2.56 | (0.48 | ) | 0.05 | 1.38 | |||||||||||||
| Other capital changes | — | — | 0.73 | (d) | — | — | ||||||||||||||
| Total from operations | (0.44 | ) | 2.60 | 0.26 | 0.15 | 1.42 | ||||||||||||||
| Distributions to shareholders from: | ||||||||||||||||||||
| Net investment income | (0.02 | ) | — | (0.09 | ) | (0.01 | ) | (0.03 | ) | |||||||||||
| Net realized gains | (1.64 | ) | — | (2.43 | ) | (1.07 | ) | (0.59 | ) | |||||||||||
| Total distributions | (1.66 | ) | — | (2.52 | ) | (1.08 | ) | (0.62 | ) | |||||||||||
| Redemption fees (b) | 0.00 | 0.00 | 0.00 | 0.00 | 0.00 | |||||||||||||||
| Net Asset Value, End of Year | $ | 12.49 | $ | 14.59 | $ | 11.99 | $ | 14.25 | $ | 15.18 | ||||||||||
| Total Return (c) | (3.91 | )% | 21.68 | % | 2.24 | % | 1.32 | % | 10.33 | % | ||||||||||
| Ratios/Supplemental Data | ||||||||||||||||||||
| Net assets, end of year (in 000’s) | $ | 15,441 | $ | 18,212 | $ | 18,800 | $ | 36,870 | $ | 52,779 | ||||||||||
| Ratio of expenses to average net assets: | ||||||||||||||||||||
| before reimbursement | 1.99 | % | 1.93 | % | 2.13 | % | 1.74 | % | 1.71 | % | ||||||||||
| net of reimbursement | 1.20 | % | 1.20 | % | 1.44 | % | 1.45 | % | 1.45 | % | ||||||||||
| Ratio of net investment income to average net assets | 0.72 | % | 0.29 | % | 0.10 | % | 0.70 | % | 0.28 | % | ||||||||||
| Portfolio turnover rate | 40 | % | 34 | % | 170 | % | 244 | % | 30 | % | ||||||||||
| (a) | Per share amounts are calculated using the average shares method, which more appropriately presents the per share data for the year/period. |
| (b) | Less than $0.01 per share. |
| (c) | Total returns are historical in nature and assume changes in share price, reinvestment of dividends and capital gains distributions, if any. Had the Adviser not absorbed a portion of fund expenses, the total return would have been lower. Sales loads are not reflected in total return. |
| (d) | As required by SEC standard per share data calculation methodology, this represents a balancing figure derived from the other amounts in the financial highlights tables that captures all other changes affecting net asset value per share. |
The accompanying notes are an integral part of these financial statements.
30
| Copeland Dividend Growth Fund |
| FINANCIAL HIGHLIGHTS |
Certain information in the table below reflects financial results for one share of beneficial interest outstanding throughout each year presented.
| Class C | ||||||||||||||||||||
| Year | Year | Year | Year | Year | ||||||||||||||||
| Ended | Ended | Ended | Ended | Ended | ||||||||||||||||
| November 30, 2022 | November 30, 2021 | November 30, 2020 | November 30, 2019 | November 30, 2018 | ||||||||||||||||
| Net Asset Value, Beginning of Year | $ | 13.85 | $ | 11.47 | $ | 13.73 | $ | 14.76 | $ | 14.06 | ||||||||||
| Increase (Decrease) From Operations: | ||||||||||||||||||||
| Net investment loss (a) | (0.01 | ) | (0.06 | ) | (0.07 | ) | (0.01 | ) | (0.07 | ) | ||||||||||
| Net gain (loss) from securities (both realized and unrealized) | (0.49 | ) | 2.44 | (0.30 | ) | 0.05 | 1.36 | |||||||||||||
| Other capital changes | — | — | 0.54 | (d) | — | — | ||||||||||||||
| Total from operations | (0.50 | ) | 2.38 | 0.17 | 0.04 | 1.29 | ||||||||||||||
| Distributions to shareholders from: | ||||||||||||||||||||
| Net investment income | — | — | — | — | — | |||||||||||||||
| Net realized gains | (1.64 | ) | — | (2.43 | ) | (1.07 | ) | (0.59 | ) | |||||||||||
| Total distributions | (1.64 | ) | — | (2.43 | ) | (1.07 | ) | (0.59 | ) | |||||||||||
| Redemption fees (b) | 0.00 | 0.00 | 0.00 | 0.00 | 0.00 | |||||||||||||||
| Net Asset Value, End of Year | $ | 11.71 | $ | 13.85 | $ | 11.47 | $ | 13.73 | $ | 14.76 | ||||||||||
| Total Return (c) | (4.63 | )% | 20.75 | % | 1.51 | % | 0.54 | % | 9.55 | % | ||||||||||
| Ratios/Supplemental Data | ||||||||||||||||||||
| Net assets, end of year (in 000’s) | $ | 10,586 | $ | 13,530 | $ | 15,401 | $ | 25,271 | $ | 32,597 | ||||||||||
| Ratio of expenses to average net assets: | ||||||||||||||||||||
| before reimbursement | 2.74 | % | 2.69 | % | 2.88 | % | 2.49 | % | 2.45 | % | ||||||||||
| net of reimbursement | 1.95 | % | 1.95 | % | 2.19 | % | 2.20 | % | 2.20 | % | ||||||||||
| Ratio of net investment loss to average net assets | (0.04 | )% | (0.46 | )% | (0.67 | )% | (0.05 | )% | (0.46 | )% | ||||||||||
| Portfolio turnover rate | 40 | % | 34 | % | 170 | % | 244 | % | 30 | % | ||||||||||
| (a) | Per share amounts are calculated using the average shares method, which more appropriately presents the per share data for the year/period. |
| (b) | Less than $0.01 per share. |
| (c) | Total returns are historical in nature and assume changes in share price, reinvestment of dividends and capital gains distributions, if any. Had the Adviser not absorbed a portion of fund expenses, the total return would have been lower. |
| (d) | As required by SEC standard per share data calculation methodology, this represents a balancing figure derived from the other amounts in the financial highlights tables that captures all other changes affecting net asset value per share. |
The accompanying notes are an integral part of these financial statements.
31
| Copeland Dividend Growth Fund |
| FINANCIAL HIGHLIGHTS |
Certain information in the table below reflects financial results for one share of beneficial interest outstanding throughout each year presented.
| Class I | ||||||||||||||||||||
| Year | Year | Year | Year | Year | ||||||||||||||||
| Ended | Ended | Ended | Ended | Ended | ||||||||||||||||
| November 30, 2022 | November 30, 2021 | November 30, 2020 | November 30, 2019 | November 30, 2018 | ||||||||||||||||
| Net Asset Value, Beginning of Year | $ | 14.45 | $ | 11.85 | $ | 14.12 | $ | 15.08 | $ | 14.30 | ||||||||||
| Increase (Decrease) From Operations: | ||||||||||||||||||||
| Net investment income (a) | 0.10 | 0.06 | 0.03 | 0.11 | 0.07 | |||||||||||||||
| Net gain (loss) from securities (both realized and unrealized) | (0.52 | ) | 2.54 | (0.38 | ) | 0.06 | 1.37 | |||||||||||||
| Other capital changes | — | — | 0.63 | (d) | — | — | ||||||||||||||
| Total from operations | (0.42 | ) | 2.60 | 0.28 | 0.17 | 1.44 | ||||||||||||||
| Distributions to shareholders from: | ||||||||||||||||||||
| Net investment income | (0.05 | ) | — | (0.12 | ) | (0.06 | ) | (0.07 | ) | |||||||||||
| Net realized gains | (1.64 | ) | — | (2.43 | ) | (1.07 | ) | (0.59 | ) | |||||||||||
| Total distributions | (1.69 | ) | — | (2.55 | ) | (1.13 | ) | (0.66 | ) | |||||||||||
| Redemption fees (b) | 0.00 | 0.00 | 0.00 | 0.00 | 0.00 | |||||||||||||||
| Net Asset Value, End of Year | $ | 12.34 | $ | 14.45 | $ | 11.85 | $ | 14.12 | $ | 15.08 | ||||||||||
| Total Return (c) | (3.82 | )% | 21.94 | % | 2.40 | % | 1.43 | % | 10.56 | % | ||||||||||
| Ratios/Supplemental Data | ||||||||||||||||||||
| Net assets, end of year (in 000’s) | $ | 25,461 | $ | 33,459 | $ | 36,164 | $ | 66,649 | $ | 81,516 | ||||||||||
| Ratio of expenses to average net assets: | ||||||||||||||||||||
| before reimbursement | 1.76 | % | 1.75 | % | 1.98 | % | 1.58 | % | 1.53 | % | ||||||||||
| net of reimbursement | 1.05 | % | 1.05 | % | 1.29 | % | 1.30 | % | 1.30 | % | ||||||||||
| Ratio of net investment income to average net assets | 0.85 | % | 0.44 | % | 0.23 | % | 0.85 | % | 0.45 | % | ||||||||||
| Portfolio turnover rate | 40 | % | 34 | % | 170 | % | 244 | % | 30 | % | ||||||||||
| (a) | Per share amounts are calculated using the average shares method, which more appropriately presents the per share data for the year/period. |
| (b) | Less than $0.01 per share. |
| (c) | Total returns are historical in nature and assume changes in share price, reinvestment of dividends and capital gains distributions, if any. Had the Adviser not absorbed a portion of fund expenses, the total return would have been lower. |
| (d) | As required by SEC standard per share data calculation methodology, this represents a balancing figure derived from the other amounts in the financial highlights tables that captures all other changes affecting net asset value per share. |
The accompanying notes are an integral part of these financial statements.
32
| Copeland SMID Cap Dividend Growth Fund |
| FINANCIAL HIGHLIGHTS |
Certain information in the table below reflects financial results for one share of beneficial interest outstanding throughout the year/period presented.
| Class A | ||||||||||||||||
| Year | Year | Year | Period | |||||||||||||
| Ended | Ended | Ended | Ended | |||||||||||||
| November 30, 2022 | November 30, 2021 | November 30, 2020 | November 30, 2019* | |||||||||||||
| Net Asset Value, Beginning of Year/Period | $ | 15.80 | $ | 13.14 | $ | 12.73 | $ | 11.10 | ||||||||
| Increase (Decrease) From Operations: | ||||||||||||||||
| Net investment income (a) | 0.13 | 0.06 | 0.10 | 0.10 | ||||||||||||
| Net gain (loss) from securities (both realized and unrealized) | (0.77 | ) | 2.63 | 0.50 | 1.53 | |||||||||||
| Total from operations | (0.64 | ) | 2.69 | 0.60 | 1.63 | |||||||||||
| Distributions to shareholders from: | ||||||||||||||||
| Net investment income | (0.04 | ) | (0.03 | ) | (0.05 | ) | — | |||||||||
| Net realized gains | (0.97 | ) | — | (0.14 | ) | — | ||||||||||
| Total distributions | (1.01 | ) | (0.03 | ) | (0.19 | ) | — | |||||||||
| Redemption fees (b) | 0.00 | 0.00 | 0.00 | 0.00 | ||||||||||||
| Net Asset Value, End of Year/Period | $ | 14.15 | $ | 15.80 | $ | 13.14 | $ | 12.73 | ||||||||
| Total Return (c) | (4.50 | )% | 20.55 | % | 4.73 | % | 14.68 | % (e) | ||||||||
| Ratios/Supplemental Data | ||||||||||||||||
| Net assets, end of year/period (in 000’s) | $ | 1,674 | $ | 206 | $ | 108 | $ | 34 | ||||||||
| Ratio of expenses to average net assets: | ||||||||||||||||
| before reimbursement | 2.03 | % | 2.10 | % | 2.72 | % | 3.04 | % (d) | ||||||||
| net of reimbursement | 1.20 | % | 1.20 | % | 1.20 | % | 1.20 | % (d) | ||||||||
| Ratio of net investment income to average net assets | 0.96 | % | 0.42 | % | 0.87 | % | 0.82 | % (d) | ||||||||
| Portfolio turnover rate | 40 | % | 35 | % | 49 | % | 22 | % (e) | ||||||||
| * | Class A commenced operations on February 11, 2019. |
| (a) | Per share amounts are calculated using the average shares method, which more appropriately presents the per share data for the period/year. |
| (b) | Less than $0.01 per share. |
| (c) | Total returns are historical in nature and assume changes in share price, reinvestment of dividends and capital gains distributions, if any. Had the Adviser not absorbed a portion of fund expenses, the total return would have been lower. Sales loads are not reflected in total return. |
| (d) | Annualized. |
| (e) | Not annualized. |
The accompanying notes are an integral part of these financial statements.
33
| Copeland SMID Cap Dividend Growth Fund |
| FINANCIAL HIGHLIGHTS |
Certain information in the table below reflects financial results for one share of beneficial interest outstanding throughout each year presented.
| Class I | ||||||||||||||||||||
| Year | Year | Year | Year | Year | ||||||||||||||||
| Ended | Ended | Ended | Ended | Ended | ||||||||||||||||
| November 30, 2022 | November 30, 2021 | November 30, 2020 | November 30, 2019 | November 30, 2018 | ||||||||||||||||
| Net Asset Value, Beginning of Year | $ | 15.88 | $ | 13.19 | $ | 12.76 | $ | 11.54 | $ | 11.10 | ||||||||||
| Increase (Decrease) From Operations: | ||||||||||||||||||||
| Net investment income (a) | 0.19 | 0.10 | 0.13 | 0.13 | 0.10 | |||||||||||||||
| Net gain (loss) from securities (both realized and unrealized) | (0.80 | ) | 2.65 | 0.50 | 1.53 | 0.42 | ||||||||||||||
| Total from operations | (0.61 | ) | 2.75 | 0.63 | 1.66 | 0.52 | ||||||||||||||
| Distributions to shareholders from: | ||||||||||||||||||||
| Net investment income | (0.07 | ) | (0.06 | ) | (0.06 | ) | (0.08 | ) | (0.07 | ) | ||||||||||
| Net realized gains | (0.97 | ) | — | (0.14 | ) | (0.36 | ) | (0.01 | ) | |||||||||||
| Total distributions | (1.04 | ) | (0.06 | ) | (0.20 | ) | (0.44 | ) | (0.08 | ) | ||||||||||
| Redemption fees (b) | 0.00 | 0.00 | 0.00 | 0.00 | 0.00 | |||||||||||||||
| Net Asset Value, End of Year | $ | 14.23 | $ | 15.88 | $ | 13.19 | $ | 12.76 | $ | 11.54 | ||||||||||
| Total Return (c) | (4.31 | )% | 20.89 | % | 4.98 | % | 15.12 | % | 4.76 | % | ||||||||||
| Ratios/Supplemental Data | ||||||||||||||||||||
| Net assets, end of year (in 000’s) | $ | 47,602 | $ | 35,601 | $ | 22,056 | $ | 11,903 | $ | 1,035 | ||||||||||
| Ratio of expenses to average net assets: | ||||||||||||||||||||
| before reimbursement | 1.73 | % | 1.87 | % | 2.47 | % | 3.18 | % | 10.14 | % | ||||||||||
| net of reimbursement | 0.95 | % | 0.95 | % | 0.95 | % | 0.95 | % | 0.95 | % | ||||||||||
| Ratio of net investment income to average net assets | 1.34 | % | 0.67 | % | 1.06 | % | 1.09 | % | 0.90 | % | ||||||||||
| Portfolio turnover rate | 40 | % | 35 | % | 49 | % | 22 | % | 26 | % | ||||||||||
| (a) | Per share amounts are calculated using the average shares method, which more appropriately presents the per share data for the period/year. |
| (b) | Less than $0.01 per share. |
| (c) | Total returns are historical in nature and assume changes in share price, reinvestment of dividends and capital gains distributions, if any. Had the Adviser not absorbed a portion of fund expenses, the total return would have been lower. |
The accompanying notes are an integral part of these financial statements.
34
| Copeland International Small Cap Fund |
| FINANCIAL HIGHLIGHTS |
Certain information in the table below reflects financial results for one share of beneficial interest outstanding throughout the period presented.
| Class A | ||||
| Period | ||||
| Ended | ||||
| November 30, 2022 * | ||||
| Net Asset Value, Beginning of Period | $ | 10.00 | ||
| Increase From Operations: | ||||
| Net investment income (a) | 0.10 | |||
| Net loss from securities (both realized and unrealized) | (2.28 | ) | ||
| Total from operations | (2.18 | ) | ||
| Net Asset Value, End of Period | $ | 7.82 | ||
| Total Return (b) | (21.80 | )% (c) | ||
| Ratios/Supplemental Data | ||||
| Net assets, end of period , actual (not truncated) | $ | 8 | ||
| Ratio of expenses to average net assets: | ||||
| before reimbursement | 34.90 | % (d) | ||
| net of reimbursement | 1.19 | % (d) | ||
| Ratio of net investment income to average net assets | 1.32 | % (d) | ||
| Portfolio turnover rate | 82 | % (c) | ||
| * | Class A commenced operations on December 28, 2021. |
| (a) | Per share amounts are calculated using the average shares method, which more appropriately presents the per share data for the period. |
| (b) | Total returns are historical in nature and assume changes in share price, reinvestment of dividends and capital gains distributions, if any. Had the Adviser not absorbed a portion of fund expenses, the total return would have been lower. Sales loads are not reflected in total return. |
| (c) | Not annualized. |
| (d) | Annualized. |
The accompanying notes are an integral part of these financial statements.
35
| Copeland International Small Cap Fund |
| FINANCIAL HIGHLIGHTS |
Certain information in the table below reflects financial results for one share of beneficial interest outstanding throughout the period presented.
| Class I | ||||
| Period | ||||
| Ended | ||||
| November 30, 2022 * | ||||
| Net Asset Value, Beginning of Period | $ | 10.00 | ||
| Increase From Operations: | ||||
| Net investment income (a) | 0.16 | |||
| Net loss from securities (both realized and unrealized) | (2.34 | ) | ||
| Total from operations | (2.18 | ) | ||
| Net Asset Value, End of Period | $ | 7.82 | ||
| Total Return (b) | (21.80 | )% (c) | ||
| Ratios/Supplemental Data | ||||
| Net assets, end of period (in 000’s) | $ | 313 | ||
| Ratio of expenses to average net assets: | ||||
| before reimbursement | 28.11 | % (d) | ||
| net of reimbursement | 0.98 | % (d) | ||
| Ratio of net investment income to average net assets | 2.07 | % (d) | ||
| Portfolio turnover rate | 82 | % (c) | ||
| * | Class I commenced operations on December 28, 2021. |
| (a) | Per share amounts are calculated using the average shares method, which more appropriately presents the per share data for the period. |
| (b) | Total returns are historical in nature and assume changes in share price, reinvestment of dividends and capital gains distributions, if any. Had the Adviser not absorbed a portion of fund expenses, the total return would have been lower. |
| (c) | Not annualized. |
| (d) | Annualized. |
The accompanying notes are an integral part of these financial statements.
36
| Copeland Trust |
| NOTES TO FINANCIAL STATEMENTS |
| November 30, 2022 |
| 1. | ORGANIZATION |
Copeland Dividend Growth Fund (the “Dividend Growth Fund”), formerly, the Copeland Risk Managed Dividend Growth Fund, Copeland SMID Cap Dividend Growth Fund (the “SMID Fund”), and Copeland International Small Cap Fund (the “International Fund”) are diversified series of Copeland Trust (the “Trust”). The Trust is registered under the Investment Company Act of 1940, as amended (the “1940 Act”) as an open-end management investment company. The Trust was organized as a statutory trust on September 10, 2010, under the laws of the State of Delaware.
The Dividend Growth Fund currently offers Class A, Class C and Class I shares. The SMID Fund and International Fund currently offer Class A and Class I shares. The Dividend Growth Fund’s Class A shares commenced operations on December 28, 2010, Class C shares commenced operations on January 5, 2012 and Class I shares commenced operations on March 1, 2013. The SMID Fund’s Class I shares commenced operations on February 27, 2017 and Class A shares commenced operations on February 11, 2019. The International Fund’s Class A and Class I shares commenced operations on December 28, 2021. Class A shares of each Fund are offered at net asset value plus a maximum sales charge of 5.75%. Purchases of $1,000,000 or more may be subject to a maximum contingent deferred sales charge of 1.00% on shares redeemed within 18 months. Class C and Class I shares are offered at net asset value. Each class represents an interest in the same assets of the applicable Fund and classes are identical except for differences in their sales charge structures and ongoing service and distribution charges. All classes of shares have equal voting privileges except that each class has exclusive voting rights with respect to its service and/or distribution plans. The Funds’ income, expenses (other than class specific distribution fees) and realized and unrealized gains and losses are allocated proportionately each day based upon the relative net assets of each class.
| 2. | SUMMARY OF SIGNIFICANT ACCOUNTING POLICIES |
The following is a summary of significant accounting policies followed by the Funds in preparation of their financial statements. These policies are in conformity with accounting principles generally accepted in the United States of America (“GAAP”). The preparation of financial statements requires management to make estimates and assumptions that affect the reported amounts of assets and liabilities and disclosure of contingent assets and liabilities at the date of the financial statements and the reported amounts of income and expenses for the period. Actual results could differ from those estimates. The Funds are investment companies and accordingly follow the investment company accounting and reporting guidance of the Financial Accounting Standards Board (FASB) Accounting Standard Codification Topic 946 “Financial Services – Investment Companies” including FASB Accounting Standard Update ASU 2013-08.
SECURITY VALUATION
Effective September 8, 2022, and pursuant to the requirements of the 1940 Act and Rule 2a-5 thereunder (the “Rule”), the Board of Trustees (the “Board”) has designated the Trust’s investment adviser, Copeland Capital Management, LLC (“Copeland”) as the Valuation Designee for the Funds pursuant to the Rule. The Valuation Designee has the responsibility for the fair value determination with respect to all Fund investments that do not have readily available market quotations or quotations that are no longer reliable. Copeland has appointed a Pricing Committee (the “Committee”) and has established a Valuation and Pricing Policy to implement the Rule and the Funds’ Valuation and Pricing Policy (together the “Policy”). Prior to September 8, 2022, fair-value determinations were performed in accordance with the Trust’s Fair Value Procedures established by the Funds’ Board of Trustees and were implemented through a Fair Value Committee designated by the Board. The valuation of investments with readily available market quotations has been delegated by the Board to the Funds’ administrator.
When valuing portfolio securities, a Fund values securities listed on a securities exchange, market or automated quotation system for which quotations are readily available (other than securities traded on National Association of Securities Dealers Automated Quotations (NASDAQ) or as otherwise noted below) at the last quoted sale price on an exchange or market (foreign or domestic) on which the securities are traded or, if there is no such reported sale, at the most recent quoted bid price. A Fund values securities traded on NASDAQ at the NASDAQ Official Closing Price. The prices of foreign securities are reported in local currency and converted to U.S. dollars using currency exchange rates. If a security’s price cannot be obtained, as noted above, a Fund will value the securities using a bid price from at least one independent broker.
37
| Copeland Trust |
| NOTES TO FINANCIAL STATEMENTS (Continued) |
| November 30, 2022 |
Prices for most securities held by a Fund are provided daily by third-party independent pricing agents. Copeland reasonably believes that prices provided by independent pricing agents are reliable. However, there can be no assurance that such pricing service’s prices will be reliable. Copeland will continuously monitor the reliability of prices obtained from any pricing service and shall promptly notify the Funds’ administrator if it believes that a particular pricing service is no longer a reliable source of prices. The Funds’ administrator, in turn, will notify Copeland, as Valuation Designee, if the Funds’ administrator reasonably believes that a particular pricing service is no longer a reliable source for prices.
The Valuation Designee must monitor for circumstances that may necessitate that a security be valued using Fair Value Procedures which can include: (i) the security’s trading has been halted or suspended, (ii) the security has been de-listed from a national exchange, (iii) the security’s primary trading market is temporarily closed at a time when under normal conditions it would be open, (iv) the security has not been traded for an extended period of time, (v) the security’s primary pricing source is not able or willing to provide a price, (vi) trading of the security is subject to local government-imposed restrictions; or (vii) a significant event (as defined below) has occurred. When a security is valued in accordance with the Fair Value Procedures, the Valuation Designee will determine the value after taking into consideration relevant information reasonably available to the Valuation Designee. Examples of factors the Valuation Designee may consider include: (i) the type of security or asset, (ii) the last trade price, (iii) evaluation of the forces that influence the market in which the security is purchased and sold, (iv) the liquidity of the security, (v) the size of the holding in a Fund or (vi) any other appropriate information.
The Valuation Designee is responsible for selecting and applying, in a consistent manner, the appropriate methodologies for determining and calculating the fair value of holdings of the Funds, including specifying the key inputs and assumptions specific to each asset class or holding.
The determination of a security’s fair value price often involves the consideration of a number of subjective factors and is therefore subject to the unavoidable risk that the value assigned to a security may be higher or lower than the security’s value would be if a reliable market quotation for the security was readily available.
The International Small Cap Fund use a third-party fair valuation vendor. The vendor provides a fair value for foreign securities held by the Fund based on certain factors and methodologies (involving, generally, tracking valuation correlations between the U.S. market and each non-U.S. security). Values from the vendor are applied in the event that there is a movement in the U.S. market that exceeds a specific threshold that has been established by the Committee.
For securities that principally trade on a foreign market or exchange, a significant gap in time can exist between the time of a particular security’s last trade and the time at which a Fund calculates its NAV. The closing prices of such securities may no longer reflect their market value at the time a Fund calculates NAV if an event that could materially affect the value of those securities (a “Significant Event”), including substantial fluctuations in domestic or foreign markets or occurrences not tied directly to the securities markets, such as natural disasters, armed conflicts or significant governmental actions, has occurred between the time of the security’s last close and the time that a Fund calculates NAV. A Fund may invest in securities that are primarily listed on foreign exchanges that trade on weekends or other days when the Fund does not price its shares. As a result, the NAV of the Fund’s shares may change on days when shareholders will not be able to purchase or redeem Fund shares.
A Significant Event may relate to a single issuer or to an entire market sector. If Copeland becomes aware of a Significant Event that has occurred with respect to a security or group of securities after the closing of the exchange or market on which the security or securities principally trade, but before the time at which a Fund calculates NAV, it may request that a Committee meeting be called. In addition, with respect to certain securities, the Funds’ administrator performs price comparisons and price movement review (among other processes), to monitor the pricing data supplied by various sources. Any identified discrepancies are researched and subject to the procedures described above.
The Funds utilize various methods to measure the fair value of their investments on a recurring basis. GAAP establishes a hierarchy that prioritizes inputs to valuation methods.
38
| Copeland Trust |
| NOTES TO FINANCIAL STATEMENTS (Continued) |
| November 30, 2022 |
The three levels of input are:
Level 1 – Unadjusted quoted prices in active markets for identical assets and liabilities that the Funds have the ability to access.
Level 2 – Observable inputs other than quoted prices included in Level 1 that are observable for the asset or liability, either directly or indirectly. These inputs may include quoted prices for the identical instrument on an inactive market, prices for similar instruments, interest rates, prepayment speeds, credit risk, yield curves, default rates and similar data.
Level 3 – Unobservable inputs for the asset or liability, to the extent relevant observable inputs are not available, representing the Funds’ own assumptions about the assumptions a market participant would use in valuing the asset or liability, and would be based on the best information available.
The availability of observable inputs can vary from security to security and is affected by a wide variety of factors, including, for example, the type of security, whether the security is new and not yet established in the marketplace, the liquidity of markets, and other characteristics particular to the security. To the extent that valuation is based on models or inputs that are less observable or unobservable in the market, the determination of fair value requires more judgment. Accordingly, the degree of judgment exercised in determining fair value is greatest for instruments categorized in Level 3.
The inputs used to measure fair value may fall into different levels of the fair value hierarchy. In such cases, for disclosure purposes, the level in the fair value hierarchy within which the fair value measurement falls in its entirety, is determined based on the lowest level input that is significant to the fair value measurement in its entirety.
The inputs or methodology used for valuing securities are not necessarily an indication of the risk associated with investing in those securities. The following tables summarize the inputs used as of November 30, 2022 for the Funds’ assets measured at fair value:
| Copeland Dividend Growth Fund | |||||||||||||||||
| Assets | Level 1 | Level 2 | Level 3 | Total | |||||||||||||
| Common Stocks* | $ | 51,146,949 | $ | — | $ | — | $ | 51,146,949 | |||||||||
| Total | $ | 51,146,949 | $ | — | $ | — | $ | 51,146,949 | |||||||||
| Copeland SMID Cap Dividend Growth Fund | |||||||||||||||||
| Assets | Level 1 | Level 2 | Level 3 | Total | |||||||||||||
| Common Stocks* | $ | 48,099,888 | $ | — | $ | — | $ | 48,099,888 | |||||||||
| Total | $ | 48,099,888 | $ | — | $ | — | $ | 48,099,888 | |||||||||
39
| Copeland Trust |
| NOTES TO FINANCIAL STATEMENTS (Continued) |
| November 30, 2022 |
| Copeland International Small Cap Fund | |||||||||||||||||
| Assets | Level 1 | Level 2 | Level 3 | Total | |||||||||||||
| Common Stocks* | |||||||||||||||||
| Advertising & Marketing | $ | — | $ | 5,613 | $ | — | $ | 5,613 | |||||||||
| Aerospace & Defense | — | 4,634 | — | 4,634 | |||||||||||||
| Apparel & Textile Products | — | 8,998 | — | 8,998 | |||||||||||||
| Automotive | — | 7,366 | — | 7,366 | |||||||||||||
| Banking | 8,259 | 10,092 | — | 18,351 | |||||||||||||
| Biotech & Pharma | — | 5,484 | — | 5,484 | |||||||||||||
| Chemicals | — | 15,108 | — | 15,108 | |||||||||||||
| Commercial Support Services | — | 9,165 | — | 9,165 | |||||||||||||
| Construction Materials | — | 6,009 | — | 6,009 | |||||||||||||
| Containers & Packaging | — | 5,181 | — | 5,181 | |||||||||||||
| Electric Utilities | — | 3,469 | — | 3,469 | |||||||||||||
| Electrical Equipment | — | 4,776 | — | 4,776 | |||||||||||||
| Engineering & Construction | — | 4,288 | — | 4,288 | |||||||||||||
| Forestry, Paper & Wood Product | 4,401 | — | — | 4,401 | |||||||||||||
| Gas & Water Utilities | 4,405 | 3,214 | — | 7,619 | |||||||||||||
| Health Care Facilities & Services | — | 4,028 | — | 4,028 | |||||||||||||
| Household Products | 10,482 | — | — | 10,482 | |||||||||||||
| Industrial Intermediate Products | — | 4,755 | — | 4,755 | |||||||||||||
| Industrial Support Services | 4,871 | 9,615 | — | 14,486 | |||||||||||||
| Institutional Financial Services | 5,138 | 5,055 | — | 10,193 | |||||||||||||
| Insurance | — | 7,469 | — | 7,469 | |||||||||||||
| Leisure Facilities & Services | — | 7,805 | — | 7,805 | |||||||||||||
| Machinery | — | 14,423 | — | 14,423 | |||||||||||||
| Medical Equipment & Devices | 3,154 | 8,513 | — | 11,667 | |||||||||||||
| Oil & Gas Producers | 14,174 | — | — | 14,174 | |||||||||||||
| Real Estate Owners & Developer | — | 3,625 | — | 3,625 | |||||||||||||
| Real Estate Services | — | 4,858 | — | 4,858 | |||||||||||||
| Real Estate Investment Trust | 8,521 | 17,753 | — | 26,274 | |||||||||||||
| Retail - Consumer Staples | — | 8,905 | — | 8,905 | |||||||||||||
| Retail - Discretionary | — | 4,611 | — | 4,611 | |||||||||||||
| Semiconductors | 4,280 | 16,144 | — | 20,424 | |||||||||||||
| Software | — | 10,582 | — | 10,582 | |||||||||||||
| Specialty Finance | — | 5,430 | — | 5,430 | |||||||||||||
| Technology Hardware | — | 3,941 | — | 3,941 | |||||||||||||
| Technology Services | — | 21,134 | — | 21,134 | |||||||||||||
| Telecommunications | 3,475 | 7,712 | — | 11,187 | |||||||||||||
| Wholesale - Consumer Staple | — | 3,440 | — | 3,440 | |||||||||||||
| Exchange Traded Fund | 5,130 | — | — | 5,130 | |||||||||||||
| Total | $ | 76,290 | $ | 263,195 | $ | — | $ | 339,485 | |||||||||
The Funds did not hold any Level 3 securities during the period.
| * | Please refer to the Portfolio of Investments for Industry/Country Classification. |
40
| Copeland Trust |
| NOTES TO FINANCIAL STATEMENTS (Continued) |
| November 30, 2022 |
SECURITY TRANSACTIONS AND INVESTMENT INCOME
Investment security transactions are accounted for on a trade date basis. Cost is determined and gains and losses are based upon the specific identification method for both financial statement and federal income tax purposes. Dividend income is recorded on the ex-dividend date and interest income is recorded on the accrual basis. Purchase discounts and premiums on securities are accreted and amortized over the life of the respective securities.
FEDERAL INCOME TAXES
The Funds intend to continue to comply with the requirements of Subchapter M of the Internal Revenue Code applicable to regulated investment companies and will distribute all of their taxable income, if any, to shareholders. Accordingly, no provision for Federal income taxes is required in the financial statements.
The Funds recognize the tax benefits of uncertain tax positions only where the position is “more likely than not” to be sustained assuming examination by tax authorities. Management has analyzed the Funds’ tax positions and has concluded that no liability for unrecognized tax benefits should be recorded related to uncertain tax positions related to the open tax years or expected to be taken in the Funds’ November 30, 2022 tax returns. The Funds identify their major tax jurisdictions as U.S. Federal and foreign jurisdictions where the Funds may make investments; however, the Funds are not aware of any tax positions for which it is reasonably possible that the total amounts of unrecognized tax benefits will change materially in the next twelve months.
DIVIDEND-PAYING STOCK RISK
The Funds’ emphasis on dividend-paying stocks could cause a Fund to underperform similar funds that invest without consideration of a company’s track record of paying dividends. Stocks of companies with a history of paying dividends may not participate in a broad market advance to the same degree as most other stocks, and a sharp rise in interest rates or economic downturn could cause a company to unexpectedly reduce or eliminate its dividend. If the amount a company pays out as a dividend exceeds its earnings and profits, the excess will be treated as a return of capital and the Fund’s tax basis in the stock will be reduced. A reduction in the Fund’s tax basis in such stock will increase the amount of gain (or decrease the amount of loss) recognized by the Fund on a subsequent sale of the stock.
MARKET RISK
Overall securities market risks may affect the value of individual securities in which the Fund invests. Factors such as foreign and domestic economic growth and market conditions, interest rate levels, and political events affect the securities markets.
REIT RISK
An equity REIT’s performance depends on the types and locations of the rental properties it owns and on how well it manages those properties. Real estate values rise and fall in response to a variety of factors, including local, regional and national economic conditions, changes in interest rates and property taxes.
SMALL AND MEDIUM CAPITALIZATION RISK
The value of a small or medium capitalization company securities may be subject to more abrupt or erratic market movements than those of larger, more established companies or the market averages in general.
FOREIGN INVESTING RISK
The International Fund invests significantly in foreign securities. Investments in foreign countries are subject to country-specific risks such as political, diplomatic, regional conflicts, terrorism, war, social and economic instability and policies that have the effect of decreasing the value of foreign securities. Foreign investments may experience greater volatility than U.S. investments. Currency hedging transactions may not perfectly offset the Fund’s foreign currency exposure and entail additional trading commissions and fees.
FOREIGN CURRENCY
The accounting records of the Funds are maintained in U.S. dollars. Investment securities and other assets and liabilities denominated in a foreign currency, and income receipts and expense payments, if any, are translated into U.S. dollars using the prevailing exchange rate at the London market close. Purchases and sales of securities are translated into U.S. dollars at the
41
| Copeland Trust |
| NOTES TO FINANCIAL STATEMENTS (Continued) |
| November 30, 2022 |
contractual currency rates established at the approximate time of the trade. Net realized gains and losses on foreign currency transactions represent net gains and losses from currency realized between the trade and settlement dates on securities transactions and the difference between income accrued versus income received. The effects of changes in foreign currency exchange rates on investments in securities are included with the net realized and unrealized gain or loss on investment securities.
FORWARD CURRENCY CONTRACTS
If foreign securities are purchased, the Funds generally enter into forward currency exchange contracts in order to eliminate ongoing foreign currency exchange rate risks. If foreign securities are sold, the foreign currency proceeds are typically repatriated into US dollars. Any realized gains and losses between trade date and settlement date from contract transactions are included as a component of net realized gains (losses) from foreign currency transactions in the Statements of Operations. The Funds did not hold any forward currency contracts as of November 30, 2022.
CONCENTRATION OF RISK
Investing in securities of foreign issuers and currency transactions may involve certain considerations and risks not typically associated with investments in the United States. These risks include revaluation of currencies, adverse fluctuations in foreign currency values and possible adverse political, social and economic developments, including those particular to a specific industry, country or region. These conditions could cause the securities and their markets to be less liquid and prices more volatile than those of comparable U.S. companies and U.S. government securities.
DISTRIBUTIONS TO SHAREHOLDERS
Distributions from investment income, if any, are declared and paid annually and are recorded on the ex-dividend date. The Funds will declare and pay net realized capital gains, if any, annually. The character of income and gains to be distributed is determined in accordance with income tax regulations, which may differ from GAAP. These “book/tax” differences are considered either temporary (i.e., deferred losses, capital loss carry forwards) or permanent in nature. To the extent these differences are permanent in nature, such amounts are reclassified within the composition of net assets based on their federal tax-basis treatment; temporary differences do not require classification.
EXPENSES
Expenses of the Trust that are directly identifiable to a specific Fund are charged to that Fund. Expenses, which are not readily identifiable to a specific Fund, are allocated in such a manner as deemed equitable, taking into consideration the nature and type of expense and the relative sizes of the Funds in the Trust.
INDEMNIFICATION
The Trust indemnifies their officers and trustees for certain liabilities that may arise from the performance of their duties to the Trust. Additionally, in the normal course of business, the Funds enter into contracts that contain a variety of representations and warranties and which provide general indemnities. The Funds’ maximum exposure under these arrangements is unknown, as this would involve future claims that may be made against the Funds that have not yet occurred. However, based on experience, the Funds expect the risk of loss due to these warranties and indemnities to be remote.
| 3. | INVESTMENT ADVISORY AGREEMENT AND TRANSACTIONS WITH RELATED PARTIES |
ADVISORY FEE
Subject to the authority of the Board, the adviser is responsible for management of the Funds’ investment portfolios. Pursuant to the Management Agreement (the “Management Agreement”), investment advisory services are provided to the Funds by Copeland Capital Management, LLC (the “Adviser”). Under the terms of the Management Agreement, the Adviser receives monthly fees calculated at an annual rate of 0.75% for each of the Dividend Growth Fund and SMID Fund and 0.78% for the International Fund, based on the average daily net assets of the respective Fund. For the year or period ended November 30, 2022, the Adviser earned advisory fees of $417,777, $313,002, and $2,353 for the Dividend Growth Fund, SMID Fund, and International Fund, respectively, before the effect of the Expense Limitation Agreement.
The Adviser, pursuant to an Expense Limitation Agreement (the “Agreement”) has contractually agreed to reduce its fees and/or absorb expenses of each Fund, at least until March 31, 2023 to ensure that Net Annual Operating Expenses (excluding any front-end
42
| Copeland Trust |
| NOTES TO FINANCIAL STATEMENTS (Continued) |
| November 30, 2022 |
or contingent deferred loads, brokerage fees and commissions, acquired fund fees and expenses, borrowing costs such as interest and dividend expense on securities sold short, taxes and extraordinary expenses such as litigation) will not exceed 1.20%, 1.95% and 1.05% of the Dividend Growth Fund’s average daily net assets for Class A, Class C and Class I shares, respectively, 1.20% and 0.95% of the SMID Fund’s average daily net assets for Class A and Class I, respectively, and 1.23% and 0.98% of the International Fund’s average daily net assets for Class A and Class I, respectively, subject to possible recoupment from the Fund in future years on a rolling three year basis (within the three years after the fees have been deferred or reimbursed) if such recoupment can be achieved without exceeding the lesser of the expense limitation in effect at the time of the deferral and at the time of the repayment. For the year or period ended November 30, 2022, the Adviser waived fees/reimbursed expenses of $417,980, $325,820, and $81,999 for the Dividend Growth Fund, SMID Fund, and International Fund, respectively.
The expenses subject to recapture for the Dividend Growth Fund, SMID Fund and International Small Cap Fund will expire on November 30 of the years indicated below:
| Copeland Dividend Growth Fund | ||||||||||||||
| 2023 | 2024 | 2025 | Total | |||||||||||
| $ | 610,939 | $ | 487,174 | $ | 417,980 | $ | 1,516,093 | |||||||
| Copeland SMID Cap Dividend Growth Fund | ||||||||||||||
| 2023 | 2024 | 2025 | Total | |||||||||||
| $ | 223,713 | $ | 288,151 | $ | 325,820 | $ | 837,684 | |||||||
| Copeland International Small Cap Fund | ||||||||||||||
| 2023 | 2024 | 2025 | Total | |||||||||||
| $ | 0 | $ | 0 | $ | 81,999 | $ | 81,999 | |||||||
DISTRIBUTOR
The Board has adopted Distribution Plans and Agreements for each Fund (collectively the “Plan”) pursuant to Rule 12b-1 under the 1940 Act. The Plan provides that a monthly service and/or distribution fee is calculated by each Fund at an annual rate of 0.25% and 1.00% (of which up to 0.75% is a distribution fee and up to 0.25% is a service fee) of the average daily net assets attributable to Class A shares and Class C shares, respectively and is paid to Northern Lights Distributors, LLC (the “Distributor” or “NLD”), to provide compensation for ongoing distribution-related activities or services and/or maintenance of the Funds’ shareholder accounts, not otherwise required to be provided by the Adviser. The Plan is a compensation plan, which means that compensation is provided regardless of 12b-1 expenses incurred. For the year or period ended November 30, 2022, the 12b-1 fees accrued amounted to $40,502 and $114,677 for the Dividend Growth Fund for Class A and Class C shares, respectively. The 12b-1 fees accrued for the SMID Cap Dividend Growth Fund Class A shares were $1,196. The International Fund did not accrue any 12b-1 fees for the period.
The Distributor acts as the Funds’ principal underwriter in a continuous public offering of the Funds’ shares. For the year or period ended November 30, 2022, the Distributor received $15,018 in underwriting commissions for sales of Class A shares of the Dividend Growth Fund, of which $2,290 was retained by the principal underwriter or other affiliated broker-dealers and $7,677 in underwriting commissions for sales of Class A shares of the SMID Cap Dividend Growth Fund of which $1,229 was retained by the principal underwriter or other affiliated broker-dealers. No underwriting commissions were generated by Class A Shares of the International Fund during the period ended November 30, 2022.
In addition, certain affiliates of the Distributor provide services to the Funds as follows:
ULTIMUS FUND SOLUTIONS, LLC (“UFS”)
UFS, an affiliate of the Distributor, provides administration, fund accounting, and transfer agent services to the Trust. Pursuant to separate servicing agreements with UFS, the Trust pays UFS fees for providing administration, fund accounting, and transfer agency services to the Funds. These fees are disclosed in the Statement of Operations. An officer of the Trust is also an officer of UFS and is not paid any fees directly by the Funds for servicing in such capacity.
BLU GIANT, LLC (“Blu Giant”)
Blu Giant, an affiliate of UFS and the Distributor, provides EDGAR conversion and filing services as well as print management services for the Funds on an ad-hoc basis. For the provision of these services, Blu Giant receives customary fees from the Funds.
43
| Copeland Trust |
| NOTES TO FINANCIAL STATEMENTS (Continued) |
| November 30, 2022 |
SHAREHOLDER SERVICES
The Board has adopted non-Rule 12b-1 shareholder service plans (collectively, the “Shareholder Service Plan”) for the Class I shares of each Fund. The Shareholder Service Plan permits the Funds to pay brokers, financial intermediaries and others an annual fee of 0.10% of each Fund’s average daily net assets attributable to the Class I shares for shareholder support and/or administrative services, not otherwise provided by the Trust’s transfer agent. The fees incurred by the Funds for these services are included as Shareholder Service Fees – Class I in the Statement of Operations. For the year or period ended November 30, 2022, the Dividend Growth Fund accrued $6,423 and the SMID Cap Dividend Growth Fund accrued $7,251 in fees associated with the Shareholder Service Plan. The International Fund did not accrue any Shareholder Service Fees for its Class I shares during the period. The Funds’ Class A and Class C shares may also pay broker-dealers or other financial intermediaries for shareholder support services and/or administrative services based on the aggregate net asset value of the Class A and Class C shares, as applicable, owned of record or beneficially by the broker-dealers’ or financial intermediaries’ customers. The fees incurred by the Funds for these services are included as Non-Rule 12b-1 Shareholder Services Fees - Class A and Class C in the Statement of Operations.
CHIEF COMPLIANCE OFFICER
The Adviser is providing a Chief Compliance Officer to the Trust as well as related compliance services. The Trust reimburses the Adviser for an allocable portion of the Chief Compliance Officer’s salary.
TRUSTEES
Effective February 1, 2021, as compensation for services rendered to the Trust, each Trustee of the Trust who is not affiliated with the Trust or the Adviser receives: (1) an annual base retainer of $22,000; (2) $12,000 for attendance at four regularly scheduled Board meetings per year; (3) $1,500 for attendance at each regularly scheduled Audit Committee meeting; (4) $750 and $2,500 for each additional special telephonic or special in person meeting, respectively; and (5) the independent Chairman of the Board receives an additional $9,000 per year for carrying out his additional responsibilities. The foregoing compensation is paid in quarterly payments.
The “interested persons” (as defined in the 1940 Act) who serve as Trustees of the Trust receive no compensation for their services as Trustees. None of the executive officers receive compensation from the Trust except for the CCO, a portion of whose salary is paid by the Trust for compliance services.
| 4. | INVESTMENT TRANSACTIONS |
The cost of purchases and the proceeds from sales of investments, other than short-term investments, for the year or period ended November 30, 2022 were as follows:
| Fund | Purchases | Sale Proceeds | ||||||
| Dividend Growth Fund | $ | 22,557,618 | $ | 33,058,547 | ||||
| SMID Cap Dividend Growth Fund | 31,501,944 | 16,338,831 | ||||||
| International Small Cap Fund | 705,152 | 272,268 | ||||||
| 5. | AGGREGATE UNREALIZED APPRECIATION AND DEPRECIATION – TAX BASIS |
The identified cost of investments in securities owned by the Funds for federal income tax purposes, and their respective gross unrealized appreciation and depreciation at November 30, 2022, were as follows:
| Gross | Gross | Net Unrealized | ||||||||||||||
| Unrealized | Unrealized | Appreciation/ | ||||||||||||||
| Fund | Tax Cost | Appreciation | Depreciation | (Depreciation) | ||||||||||||
| Dividend Growth Fund | $ | 42,032,004 | $ | 10,282,017 | $ | (1,167,072 | ) | $ | 9,114,945 | |||||||
| SMID Cap Dividend Growth Fund | 45,449,952 | 5,029,674 | (2,379,738 | ) | 2,649,936 | |||||||||||
| International Small Cap Fund | 363,850 | 17,487 | (41,852 | ) | (24,365 | ) | ||||||||||
44
| Copeland Trust |
| NOTES TO FINANCIAL STATEMENTS (Continued) |
| November 30, 2022 |
| 6. | DISTRIBUTIONS TO SHAREHOLDERS AND TAX COMPONENTS OF CAPITAL |
The tax character of fund distributions paid for the periods ended November 30, 2022 and November 30, 2021 was as follows:
| For the year ended November 30, 2022 | ||||||||||||
| Ordinary | Long-Term | |||||||||||
| Portfolio | Income | Capital Gains | Total | |||||||||
| Dividend Growth Fund | $ | 1,729,801 | $ | 5,809,629 | $ | 7,539,430 | ||||||
| SMID Cap Dividend Growth Fund | 621,556 | 1,751,884 | 2,373,440 | |||||||||
| International Small Cap Fund | — | — | — | |||||||||
| For the year ended November 30, 2021 | ||||||||||||
| Ordinary | Long-Term | |||||||||||
| Portfolio | Income | Capital Gains | Total | |||||||||
| Dividend Growth Fund | $ | — | $ | — | $ | — | ||||||
| SMID Cap Dividend Growth Fund | 95,889 | — | 95,889 | |||||||||
| International Small Cap Fund | — | — | — | |||||||||
As of November 30, 2022, the components of accumulated earnings/(deficit) on a tax basis were as follows:
| Undistributed | Undistributed | Undistributed | Post October Loss | Capital Loss | Other | Unrealized | Total | |||||||||||||||||||||||||
| Ordinary | Ordinary | Long-Term | and | Carry | Book/Tax | Appreciation/ | Accumulated | |||||||||||||||||||||||||
| Portfolio | Tax-Exempt Income | Income | Capital Gains | Late Year Loss | Forwards | Differences | (Depreciation) | Earnings/(Deficits) | ||||||||||||||||||||||||
| Dividend Growth Fund | $ | — | $ | 314,488 | $ | 2,869,741 | $ | (1,638,886 | ) | $ | — | $ | — | $ | 9,114,945 | $ | 10,660,288 | |||||||||||||||
| SMID Cap Dividend Growth Fund | — | 557,645 | 1,171,218 | (1,347,883 | ) | — | — | 2,649,936 | 3,030,916 | |||||||||||||||||||||||
| International Small Cap Fund | — | 8,272 | — | (1,678 | ) | (69,641 | ) | — | (24,335 | ) | (87,382 | ) | ||||||||||||||||||||
The difference between book basis and tax basis undistributed net investment income, accumulated net realized gains, and unrealized appreciation from investments is primarily attributable to the tax deferral of losses on wash sales, mark-to-market on passive foreign investment companies and C-Corporation return of capital distributions.
Capital losses incurred after October 31 within the fiscal year are deemed to arise on the first business day of the following fiscal year for tax purposes. The following Funds incurred and elected to defer such capital losses as follows:
| Post October | ||||
| Portfolio | Losses | |||
| Dividend Growth Fund | $ | 1,638,886 | ||
| SMID Cap Dividend Growth Fund | 1,347,883 | |||
| International Small Cap Fund | 1,678 | |||
At November 30, 2022, the Funds utilized capital loss carry forwards for federal income tax purposes as follows:
| Portfolio | Short-Term | Long-Term | Total | CLCF Utilized | ||||||||||||
| Dividend Growth Fund | $ | — | $ | — | $ | — | $ | — | ||||||||
| SMID Cap Dividend Growth Fund | — | — | — | — | ||||||||||||
| International Small Cap Fund | 69,641 | — | 69,641 | — | ||||||||||||
45
| Copeland Trust |
| NOTES TO FINANCIAL STATEMENTS (Continued) |
| November 30, 2022 |
Permanent book and tax differences, primarily attributable to the book/tax basis treatment of non-deductible expenses and adjustments for prior year tax returns, resulted in reclassifications for the Funds for the fiscal year ended November 30, 2022 as follows:
| Paid | ||||||||
| In | Accumulated | |||||||
| Portfolio | Capital | Earnings (Losses) | ||||||
| Dividend Growth Fund | $ | — | $ | — | ||||
| SMID Cap Dividend Growth Fund | 15,121 | (15,121 | ) | |||||
| International Small Cap Fund | (8 | ) | 8 | |||||
| 7. | REDEMPTION FEES |
The Funds may assess a short-term redemption fee of 1.00% of the total redemption amount if shareholders sell their shares after holding them for less than 30 days or if shares are redeemed for failure to maintain the Funds’ minimum account balance requirement. The redemption fee is paid directly to the Funds. For the year or period ended November 30, 2022, the Dividend Growth Fund assessed $0, $4, and $0 in redemption fees for Class A, Class C and Class I shares, respectively. The SMID Fund assessed $19 and $1,656 in redemption fees for Class A and Class I shares, respectively. The International Fund did not assess redemption fees for Class A or Class I shares.
| 8. | SUBSEQUENT EVENTS |
Subsequent events after the date of the Statement of Assets and Liabilities have been evaluated through the date the financial statements were issued. Management has determined that no events or transactions occurred requiring adjustment or disclosure in the financial statements.
46
 | taitweller.com |
REPORT OF INDEPENDENT REGISTERED PUBLIC ACCOUNTING FIRM
To the Board of Trustees of
And Shareholders of Copeland Trust
Opinion on the Financial Statements
We have audited the accompanying statements of assets and liabilities of Copeland Dividend Growth Fund, Copeland SMID Cap Dividend Growth Fund and Copeland International Small Cap Fund (the “Funds”), each a series of shares of Copeland Trust (the “Trust”), including the portfolios of investments, as of November 30, 2022, the related statements of operations, the statements of changes in net assets, and financial highlights for each of the periods indicated in the table below, and the related notes (collectively referred to as the “financial statements”). In our opinion, the financial statements present fairly, in all material respects, the financial position of the Funds as of November 30, 2022, the results of their operations, the changes in their net assets and their financial highlights for each of the periods indicated in the table below, in conformity with accounting principles generally accepted in the United States of America.
| Individual Funds | ||||||
| constituting Copeland Trust | Statement of operations | Statements of changes in net assets | Financial highlights | |||
| Copeland Dividend Growth Fund and Copeland SMID Cap Dividend Growth Fund | For the year ended November 30, 2022 | For each of the two years in the period ended November 30, 2022 | For each of the five years in the period ended November 30, 2022 | |||
| Copeland International Small Cap Fund | For the period December 28, 2021 (commencement of operations) through November 30, 2022 | For the period December 28, 2021 (commencement of operations) through November 30, 2022 | For the period December 28, 2021 (commencement of operations) through November 30, 2022 |
Basis for Opinion
These financial statements are the responsibility of the Funds’ management. Our responsibility is to express an opinion on the Funds’ financial statements based on our audits. We are a public accounting firm registered with the Public Company Accounting Oversight Board (United States) (“PCAOB”) and are required to be independent with respect to the Funds in accordance with the U.S. federal securities laws and the applicable rules and regulations of the Securities and Exchange Commission and the PCAOB. We have served as the auditor of one or more of the funds in the Trust since 2011.
We conducted our audits in accordance with the standards of the PCAOB. Those standards require that we plan and perform the audits to obtain reasonable assurance about whether the financial statements are free of material misstatement, whether due to error or fraud. The Funds are not required to have, nor were we engaged to perform, an audit of their internal control over financial reporting. As part of our audits we are required to obtain an understanding of internal control over financial reporting, but not for the purpose of expressing an opinion on the effectiveness of the Funds internal control over financial reporting. Accordingly, we express no such opinion.
Our audits included performing procedures to assess the risks of material misstatement of the financial statements, whether due to error or fraud, and performing procedures that respond to those risks. Such procedures included examining, on a test basis, evidence regarding the amounts and disclosures in the financial statements. Our audits also included evaluating the accounting principles used and significant estimates made by management, as well as evaluating the overall presentation of the financial statements. Our procedures included confirmation of securities owned as of November 30, 2022 by correspondence with the custodian. We believe that our audits provide a reasonable basis for our opinion.
 | |
| TAIT, WELLER & BAKER LLP |
Philadelphia, Pennsylvania
January 26, 2023
47
| Copeland Trust |
| SUPPLEMENTAL INFORMATION (Unaudited) |
| November 30, 2022 |
Liquidity Risk Management Program Annual Report
Pursuant to Rule 22e-4 under the 1940 Act, the Trust, on behalf of the Funds, has adopted a liquidity risk management program (the “Program”) to govern the Trust’s approach to managing liquidity risk. The Board of Trustees has appointed Copeland to be the program administrator of the Program (the “Program Administrator”), and the Program’s principal objectives include assessing, managing and periodically reviewing each Fund’s liquidity risk, based on factors specific to the circumstances of the Fund.
At a meeting of the Board held on November 9, 2022, the Trustees received a report from the Program Administrator addressing the operations of the Program and assessing its adequacy and effectiveness of implementation. The Program Administrator determined, and reported to the Board, that the Program remains appropriately designed and implemented and is effectively operating to assess and manage each Fund’s liquidity risk and that the Program adequately and effectively managed each Fund’s liquidity risk during the period from October 1, 2021 to September 30, 2022. The Program Administrator also reported that with respect to the Trust there were no reportable liquidity events during the period and none of the Funds were required to set a Highly Liquid Investment Minimum.
There can be no assurance that the Program will achieve its objectives in the future. Please refer to the prospectus for more information regarding a Fund’s exposure to liquidity risk and other principal risks to which an investment in the Funds may be subject.
48
| Copeland Trust |
| DISCLOSURE OF FUND EXPENSES (Unaudited) |
| November 30, 2022 |
As a shareholder of the Copeland Dividend Growth Fund and the Copeland SMID Cap Dividend Growth Fund, you incur two types of costs (1) transaction costs, including sales charges (loads) on purchase payments and sales (for Class A shares only) and redemption fees; and (2) ongoing costs, including management fees, distribution and/or service (12b-1 fees for Class A and C shares only) fees, shareholder servicing fees and other Fund expenses. This example is intended to help you understand your ongoing costs (in dollars) of investing in the Funds and to compare these costs with the ongoing costs of investing in other mutual funds. Please note, the expenses shown in the tables are meant to highlight ongoing costs only and do not reflect any transactional costs. This example is based on an investment of $1,000 invested for the period of time as indicated in the table below.
Actual Expenses: The first line of the table provides information about actual account values and actual expenses. You may use the information in this line, together with the amount you invested, to estimate the expenses that you paid over the period. Simply divide your account value by $1,000 (for example, an $8,600 account value divided by $1,000 = 8.6), then multiply the result by the number in the first line under the heading entitled “Expenses Paid During the Period” to estimate the expenses you paid on your account during the period.
Hypothetical Examples for Comparison Purposes: The second line of the table below provides information about hypothetical account values and hypothetical expenses based on the Funds’ actual expense ratio and an assumed rate of return of 5% per year before expenses, which is not the Funds’ actual return. The hypothetical account values and expenses may not be used to estimate the actual ending account balance or expenses you paid for the period. You may use this information to compare the ongoing costs of investing in the Funds and other funds. To do so, compare this 5% hypothetical example with the 5% hypothetical examples that appear in the shareholder reports of the other funds.
Please note that the expenses shown in the table are meant to highlight your ongoing costs only and do not reflect any transactional costs, such as sales charges (loads) or redemption fees which may be applicable to your account. Therefore, the second line of the table is useful in comparing ongoing costs only, and will not help you determine the relative total costs of owning different funds. In addition, if these transactional costs were included, your costs would have been higher.
| Beginning | Ending | Expenses Paid | ||||||||||||
| Account Value | Account Value | Annualized | During the Period | |||||||||||
| 6/1/2022 | 11/30/2022 | Expense Ratio | 6/1/2022 - 11/30/2022 | |||||||||||
| Actual (a) | ||||||||||||||
| Copeland Dividend Growth Fund | ||||||||||||||
| Class A | $ | 1,000.00 | $ | 1,024.60 | 1.20% | $ | 6.09 | |||||||
| Class C | $ | 1,000.00 | $ | 1,020.00 | 1.95% | $ | 9.87 | |||||||
| Class I | $ | 1,000.00 | $ | 1,024.90 | 1.05% | $ | 5.33 | |||||||
| Copeland SMID Cap Dividend Growth Fund | ||||||||||||||
| Class A | $ | 1,000.00 | $ | 1,000.70 | 1.20% | $ | 6.02 | |||||||
| Class I | $ | 1,000.00 | $ | 1,002.10 | 0.95% | $ | 4.77 | |||||||
| Copeland International Small Cap Fund | ||||||||||||||
| Class A | $ | 1,000.00 | $ | 923.30 | 1.19% | $ | 5.75 | |||||||
| Class I | $ | 1,000.00 | $ | 923.30 | 0.98% | $ | 4.71 | |||||||
| Hypothetical (a) | ||||||||||||||
| (5% return before expenses) | ||||||||||||||
| Copeland Dividend Growth Fund | ||||||||||||||
| Class A | $ | 1,000.00 | $ | 1,019.05 | 1.20% | $ | 6.07 | |||||||
| Class C | $ | 1,000.00 | $ | 1,015.29 | 1.95% | $ | 9.85 | |||||||
| Class I | $ | 1,000.00 | $ | 1,019.80 | 1.05% | $ | 5.32 | |||||||
| Copeland SMID Cap Dividend Growth Fund | ||||||||||||||
| Class A | $ | 1,000.00 | $ | 1,019.05 | 1.20% | $ | 6.03 | |||||||
| Class I | $ | 1,000.00 | $ | 1,020.17 | 0.95% | $ | 4.81 | |||||||
| Copeland International Small Cap Fund | ||||||||||||||
| Class A | $ | 1,000.00 | $ | 1,019.09 | 1.19% | $ | 6.03 | |||||||
| Class I | $ | 1,000.00 | $ | 1,020.17 | 0.98% | $ | 4.94 | |||||||
| (a) | Expenses are equal to the average account value over the period, multiplied by the Fund’s annualized expense ratio, multiplied by the number of days in the six month period ended November 30, 2022 (183) divided by the number of days in the fiscal year (365). |
49
Independent Trustees
| Name, Address and Age | Position/Term of Office | Principal Occupation During the Past Five Years | Number of Portfolios in Fund Complex* Overseen by Trustee | Other Directorships held by Trustee During Past 5 Years |
| Thomas A. Leonard Year of Birth: 1949 | Chairman/Indefinite (since 2010) | Retired (since 2008); Partner and Financial Services Industry Leader, PricewaterhouseCoopers LLP (accounting firm) (1970–2008). | 3 | Trustee, Lincoln Variable Insurance Products Trust (102 Portfolios) (2013 to Present) and Lincoln Advisors Trust (6 Portfolios) (2013-2016) |
| Bruce M. Aronow Year of Birth: 1965 | Trustee/Indefinite (since 2010) | Chairman, eLocalUSA LLC (online directory business) (since 2008); Managing Partner, Managers Investment Group LLC (2005–2008). | 3 | Trustee, PFM Multi-Manager Series Trust (3 Portfolios) (since 2017) |
| Stephen M. Wynne Year of Birth: 1955 | Trustee/Indefinite (since 2010) | CEO, BNY Mellon, U.S. Funds Services (2010); CEO (2008–2010) and President (2005–2008), PNC Global Investment Servicing. | 3 | Trustee, Third Avenue Trust (4 Portfolios) and Third Avenue Variable Series Trust (1 Portfolio) (2019-Present); Trustee, Context Capital Funds (2 portfolios) (2014-2018); Trustee, FundVantage Trust (30 Portfolios) (2009-Present) |
50
Interested Trustee and Officers
| Name, Address and Age | Position/Term of Office | Principal Occupation During the Past 5 Years | Number of Portfolios in Fund Complex* Overseen by Trustee | Other Directorships held by Trustee During Past 5 Years |
| Edward C. Rorer** Year of Birth: 1943 | Interested Trustee/Indefinite (since 2010) | Chairman, Copeland Capital Management, LLC (since 2009).; Chairman, Chief Executive Officer and Chief Investment Officer, Rorer Asset Management, LLC (1999–2009). | 3 | None. |
| Eric C. Brown Year of Birth: 1969 | President /Indefinite (since 2010); Principal Executive Officer (2010–2015) | Chief Executive Officer and Portfolio Manager, Copeland Capital Management, LLC (since 2005). | N/A | N/A |
| Mark W. Giovanniello Year of Birth: 1974 | Vice President, Principal Executive Officer / Indefinite (since 2015); Treasurer, Principal Financial Officer (2010–2015) | Chief Investment Officer, Partner and Portfolio Manager, Copeland Capital Management, LLC (since 2009); Portfolio Manager, Rorer Asset Management, LLC (2006–2009). | N/A | N/A |
| Steven J. Adams Year of Birth: 1963 | Vice-President, Treasurer, Principal Financial Officer / Indefinite (since 2015) | Chief Operating and Financial Officer, Partner, Copeland Capital Management, LLC (since 2015); Chief Financial Officer, AMG Funds (2008–2015). | N/A | N/A |
| Sofia A Rosala Year of Birth: 1974 | Vice President, Chief Compliance Officer, Secretary / Indefinite (since 2016) | General Counsel, Partner and Chief Compliance Officer, Copeland Capital Management, LLC (since 2016); U.S. Counsel and Deputy Funds Chief Compliance Officer, Aberdeen Asset Management Inc. (2012-2016). | N/A | N/A |
| James Colantino 4221 North 203rd Street, Suite 100 Elkhorn, NE 68022 Year of Birth: 1969 | Assistant Secretary / Indefinite (since 2010) | Senior Vice President – Fund Administration (since 2012) and Vice President (2004-2012), Gemini Fund Services, LLC. | N/A | N/A |
| * | The term “Fund Complex” refers to the Copeland Trust. |
| ** | Mr. Rorer is an “interested person” of the Funds as defined in the 1940 Act, because of his relationship with Copeland Capital Management, LLC. Mr. Rorer is also the father-in-law of Eric Brown, the Trust’s President. |
51
| PRIVACY notice | |
| FACTS | WHAT DOES COPELAND TRUST DO WITH YOUR PERSONAL INFORMATION? |
| Why? | Financial companies choose how they share your personal information. Federal law gives consumers the right to limit some but not all sharing. Federal law also requires us to tell you how we collect, share, and protect your personal information. Please read this notice carefully to understand what we do. |
| What? | The types of personal information we collect and share depend on the product or service you have with us. This information can include:
■ Social Security number ■ Purchase History
■ Assets ■ Account Balances
■ Retirement Assets ■ Account Transactions
■ Transaction History ■ Wire Transfer Instructions
■ Checking Account Information
When you are no longer our customer, we continue to share your information as described in this notice. |
| How? | All financial companies need to share customers’ personal information to run their everyday business. In the section below, we list the reasons financial companies can share their customers’ personal information; the reasons Copeland Trust chooses to share; and whether you can limit this sharing. |
| Reasons we can share your personal information: | Does Copeland Trust share? | Can you limit this sharing? | |
For our everyday business purposes – such as to process your transactions, maintain your account(s), respond to court orders and legal investigations, or report to credit bureaus | Yes | No | |
For our marketing purposes – to offer our products and services to you | No | We don’t share | |
| For joint marketing with other financial companies | No | We don’t share | |
For our affiliates’ everyday business purposes – information about your transactions and experiences | No | We don’t share | |
For our affiliates’ everyday business purposes – information about your creditworthiness | No | We don’t share | |
| For nonaffiliates to market to you | No | We don’t share | |
| Questions? | Call 1-888-9-COPELAND (1-888-926-7352) |
52
| Who we are: | |
| Who is providing this notice? | Copeland Trust
|
| What we do: | |
| How does Copeland Trust protect my personal information? | To protect your personal information from unauthorized access and use, we use security measures that comply with federal law. These measures include computer safeguards and secured files and buildings.
Our service providers are held accountable for adhering to strict policies and procedures to prevent any misuse of your nonpublic personal information. |
| How does Copeland Trust collect my personal information? | We collect your personal information, for example, when you
■ Open an account
■ Provide account information
■ Give us your contact information
■ Make deposits or withdrawals from your account
■ Make a wire transfer
■ Tell us where to send the money
■ Tells us who receives the money
■ Show your government-issued ID
■ Show your driver’s license
We also collect your personal information from other companies. |
| Why can’t I limit all sharing? | Federal law gives you the right to limit only
■ Sharing for affiliates’ everyday business purposes – information about your creditworthiness
■ Affiliates from using your information to market to you
■ Sharing for nonaffiliates to market to you
State laws and individual companies may give you additional rights to limit sharing. |
| Definitions: | |
| Affiliates | Companies related by common ownership or control. They can be financial and nonfinancial companies.
■ Copeland Trust does not share with our affiliates. |
| Nonaffiliates | Companies not related by common ownership or control. They can be financial and nonfinancial companies ■ Copeland Trust does not share with nonaffiliates so they can market to you. |
| Joint marketing | A formal agreement between nonaffiliated financial companies that together market financial products or services to you. ■ Copeland Trust does not jointly market. |
53
| Investment Adviser |
| Copeland Capital Management, LLC |
| 161 Washington Street, Suite 1325 |
| Conshohocken, PA 19428 |
| Distributor |
| Northern Lights Distributors, LLC |
| 4221 North 203rd Street, Suite 100 |
| Elkhorn, NE 68022 |
| Legal Counsel |
| Faegre Drinker Biddle & Reath, LLP |
| One Logan Square, Suite 2000 |
| Philadelphia, PA 19103 |
| Independent Registered Public Accounting Firm |
| Tait, Weller & Baker LLP |
| Two Liberty Place |
| 50 South 16th Street, Suite 2900 |
| Philadelphia, PA 19102 |
| Transfer Agent |
| Ultimus Fund Solutions, LLC |
| 4221 North 203rd Street, Suite 100 |
| Elkhorn, NE 68022 |
| Administrator |
| Ultimus Fund Solutions, LLC |
| 4221 North 203rd Street, Suite 100 |
| Elkhorn, NE 68022 |
| Custodian |
| The Northern Trust Company |
| 50 South LaSalle Street |
| Chicago, Il 60603 |
How to Obtain Proxy Voting Information
Information regarding how the Funds vote proxies relating to portfolio securities for the 12 month period ended June 30 as well as a description of the policies and procedures that the Funds used to determine how to vote proxies is available without charge, upon request, by calling 1-888-9-COPELAND or by referring to the Securities and Exchange Commission’s (“SEC”) website at http://www.sec.gov.
How to Obtain 1st and 3rd Fiscal Quarter Portfolio Holdings
The Funds files their complete schedule of portfolio holdings with the SEC for the first and third quarters of each fiscal year on Form N-PORT. Form N-PORT is available on the SEC’s website at http://www.sec.gov and may be reviewed and copied at the SEC’s Public Reference Room in Washington, DC (1-800-SEC-0330). The information on Form N-PORT is available without charge, upon request, by calling 1-888-9-COPELAND.
COPELAND-A22
Item 2. Code of Ethics.
The Registrant has adopted a code of ethics that applies to its principal executive officer and principal financial officer. For the fiscal year ended November 30, 2021, there were no amendments to a provision of its code of ethics, nor were there any waivers, including implicit waivers granted from a provision of the code of ethics. The Registrant will provide to any person without charge, upon request, a copy of such code of ethics, by calling the Registrant at 1-888-9-COPELAND.
Item 3. Audit Committee Financial Expert.
The Registrant’s Board has determined that Thomas A. Leonard is an “audit committee financial expert,” and he is “independent” for purposes of this item.
Item 4. Principal Accountant Fees and Services.
For the fiscal years ended November 30, 2022 and November 30, 2021, the aggregate audit, audit-related, tax and all other fees billed by Tait & Weller for professional services rendered for the audits of the financial statements, or services that are normally provided in connection with statutory and regulatory filings or engagements for that fiscal year, as appropriate, for the Registrant are shown below.
| (a) | Audit Fees |
2022 $ 37,000
2021 $ 29,000
| (b) | Audit-Related Fees |
2022 $ 0
2021 $ 0
| (c) | Tax Fees |
2022 $ 7,350
2021 $ 5,700
| (d) | All Other Fees |
2022 $ 0
2021 $ 0
The above “Tax Fees” were billed for professional services rendered for tax compliance and tax return preparation.
| (e) | (1) Audit Committee’s Pre-Approval Policies |
The Registrant’s audit committee pre-approves all audit and non-audit services to be performed by the Registrant’s accountant before the accountant is engaged by the Registrant to perform such services.
(2) Percentages of Services Approved by the Audit Committee pursuant to paragraph (c) (7)(i)(C) of Rule 2-01 of Regulation S-X.
Registrant Advisor
Audit-Related Services: 0.00% 0.00%
Tax Services: 0.00% 0.00%
All Other Services: 0.00% 0.00%
(f) During the audit of Registrant's financial statements for the most recent fiscal period, less than 50 percent of the hours expended on the principal accountant's engagement were attributed to work performed by persons other than the principal accountant's full-time, permanent employees.
| (g) | The aggregate non-audit fees billed by the registrant's accountant for services rendered to the registrant, and rendered to the registrant's investment adviser (not including any sub-adviser whose role is primarily portfolio management and is subcontracted with or overseen by another investment adviser), and any entity controlling, controlled by, or under common control with the adviser that provides ongoing services to the registrant: |
2022 - $7,350
2021 - $5,700
(h) Disclose whether the Registrant’s audit committee of the board of directors has considered whether the provision of non-audit services that were rendered to the Registrant’s investment adviser, and any entity controlling, controlled by, or under common control with the investment adviser that provides ongoing services to the Registrant that were not pre-approved pursuant to paragraph (c) (7)(ii) of Rule 2-01 of Regulation S-X is compatible with maintaining the principal accountant’s independence.
Not applicable
Item 5. Audit Committee of Listed Companies. Not applicable to open-end investment companies.
Item 6. Investments.
| (a) | The complete schedule of investments is included in Item 1 of this Form N-CSR. |
(b) Not applicable.
Item 7. Disclosure of Proxy Voting Policies and Procedures for Closed-End Funds. Not applicable to open-end investment companies.
Item 8. Portfolio Managers of Closed-End Funds. Not applicable to open-end investment companies.
Item 9. Purchases of Equity Securities by Closed-End Funds and Affiliated Purchasers. Not applicable to open-end investment companies.
Item 10. Submission of Matters to a Vote of Security Holders. None
Item 11. Controls and Procedures.
(a) Based on an evaluation of the Registrant’s disclosure controls and procedures (as defined in rule 30a-3(c) under the Investment Company Act of 1940) as of a date within 90 days prior to the filing date of this report, Registrant’s principal executive officer and principal financial officer concluded that such disclosure controls and procedures are effective.
(b) There were no significant changes in the Registrant’s internal control over financial reporting that occurred during the period covered by this report that have materially affected, or are reasonably likely to materially affect, the Registrant’s internal control over financial reporting.
Item 12. Disclosure of Securities Lending Activities for Closed-End Management Investment Companies. (a) Not applicable to open-end investment companies.
(b) Not applicable to open-end investment companies.
Item 13. Exhibits.
(a)(1) Not applicable
(a)(2) Certifications required by Section 302 of the Sarbanes-Oxley Act of 2002 is filed herewith.
(a)(3) Not applicable for open-end investment companies.
(a)(4) Not applicable.
(b) Certification required by Section 906 of the Sarbanes-Oxley Act of 2002 is filed herewith.
SIGNATURE
Pursuant to the requirements of the Securities Exchange Act of 1934 and the Investment Company Act of 1940, the Registrant has duly caused this report to be signed on its behalf by the undersigned, thereunto duly authorized.
Copeland Trust
By: /s/ Mark W. Giovanniello_____________
Mark W. Giovanniello, Principal Executive Officer
Date 2/7/2023
Pursuant to the requirements of the Securities Exchange Act of 1934 and the Investment Company Act of 1940, this report has been signed below by the following persons on behalf of the Registrant and in the capacities and on the dates indicated.
By: /s/ Mark W. Giovanniello _____________
Mark W. Giovanniello, Principal Executive Officer
Date 2/7/2023
By: /s/ Steven J. Adams__________________
Steven J. Adams, Principal Financial Officer
Date 2/7/2023