Exhibit 99.3

Q4 2016 % Change Y/Y Total Revenues $131.8 million +17% Sparkling Water Maker Units 941,000 +22% CO 2 Refill Units 7.4 million +10% Flavor Units 5.2 million - 6% Net Income $15.6 million +453% EPS (1) $0.71 +433% Net Income vs. 2015 Non - IFRS (2) $15.6 million +213% EPS vs. 2015 Non - IFRS (2) $0.71 +201% Financial Highlights Q4 2016 (1) Based on 22.0 million weighted shares outstanding in Q4 2016 and 21.2 million weighted shares outstanding in Q4 2015 (2) 2015 Non - IFRS excluding restructuring
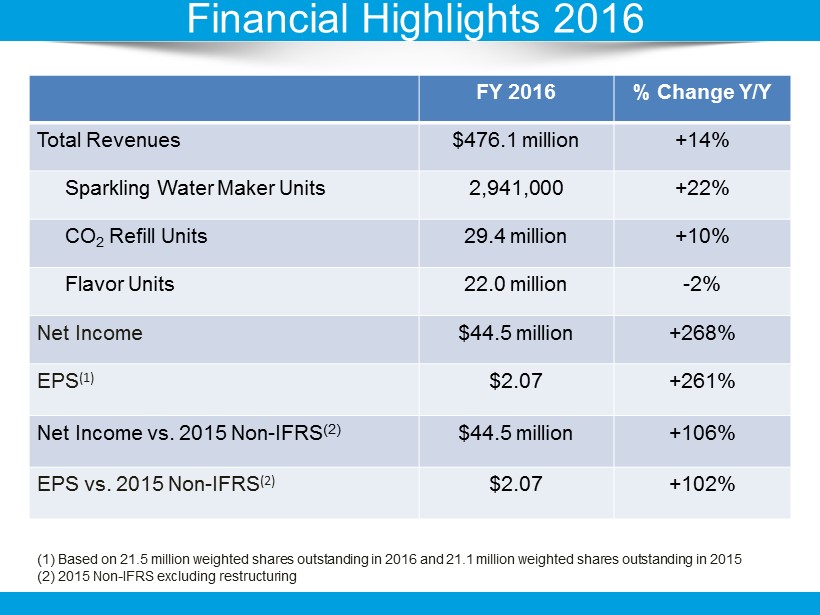
FY 2016 % Change Y/Y Total Revenues $476.1 million +14% Sparkling Water Maker Units 2,941,000 +22% CO 2 Refill Units 29.4 million +10% Flavor Units 22.0 million - 2% Net Income $44.5 million +268% EPS (1) $2.07 +261% Net Income vs. 2015 Non - IFRS (2) $44.5 million +106% EPS vs. 2015 Non - IFRS (2) $2.07 +102% Financial Highlights 2016 (1) Based on 21.5 million weighted shares outstanding in 2016 and 21.1 million weighted shares outstanding in 2015 (2) 2015 Non - IFRS excluding restructuring
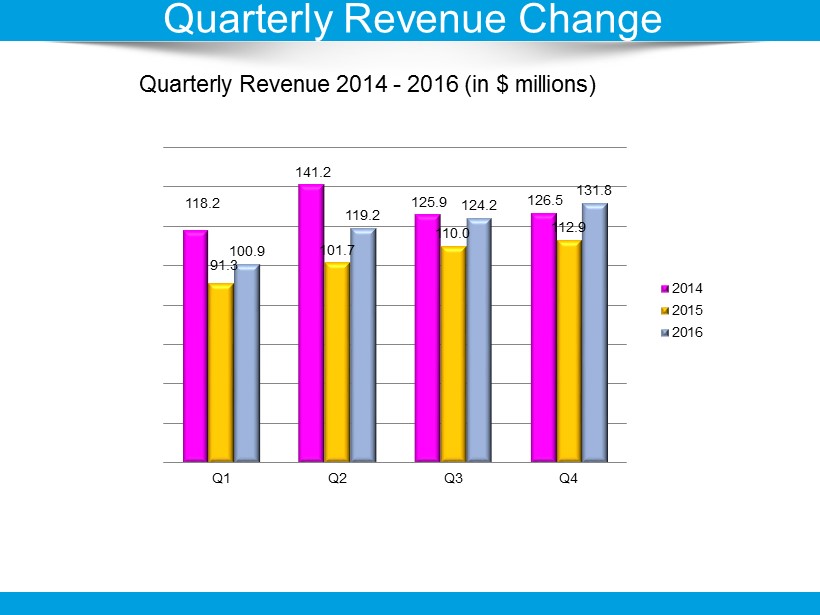
Quarterly Revenue 2014 - 2016 (in $ millions) Quarterly Revenue Change 118.2 141.2 125.9 126.5 91.3 101.7 110.0 112.9 100.9 119.2 124.2 131.8 Q1 Q2 Q3 Q4 2014 2015 2016
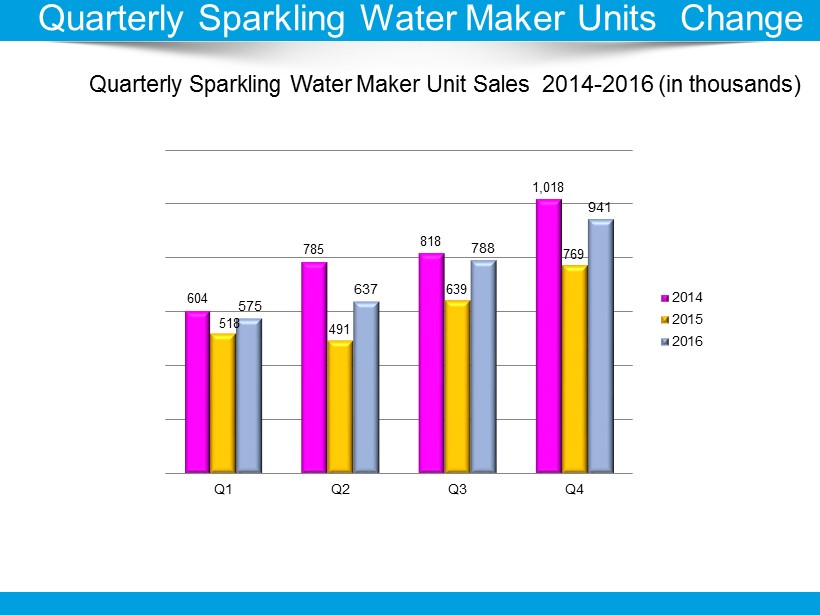
Quarterly Sparkling Water Maker Unit Sales 2014 - 2016 (in thousands ) Quarterly Sparkling Water Maker Units Change 604 785 818 1,018 518 491 639 769 575 637 788 941 Q1 Q2 Q3 Q4 2014 2015 2016
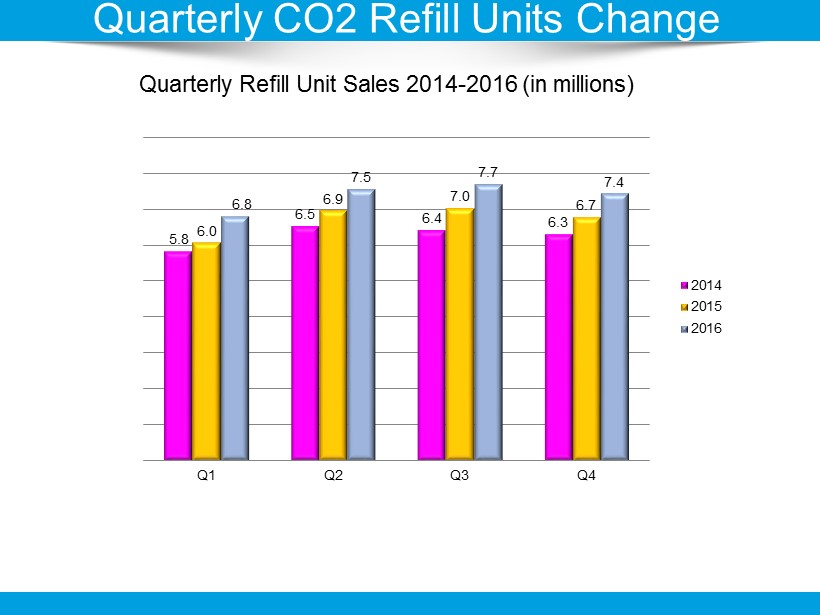
Quarterly Refill Unit Sales 2014 - 2016 (in millions) Quarterly CO 2 Refill Units Change 5.8 6.5 6.4 6.3 6.0 6.9 7.0 6.7 6.8 7.5 7.7 7.4 Q1 Q2 Q3 Q4 2014 2015 2016
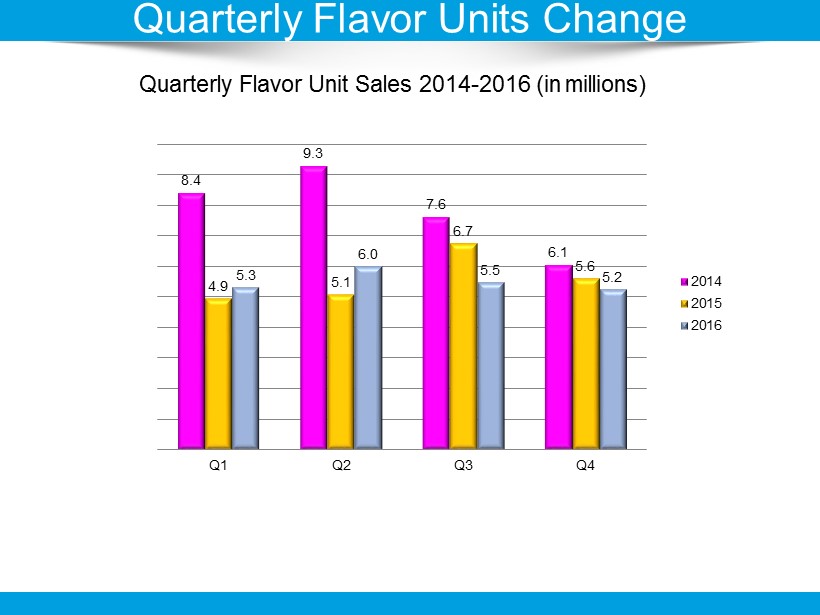
Quarterly Flavor Unit Sales 2014 - 2016 (in millions) Quarterly Flavor Units Change 8.4 9.3 7.6 6.1 4.9 5.1 6.7 5.6 5.3 6.0 5.5 5.2 Q1 Q2 Q3 Q4 2014 2015 2016
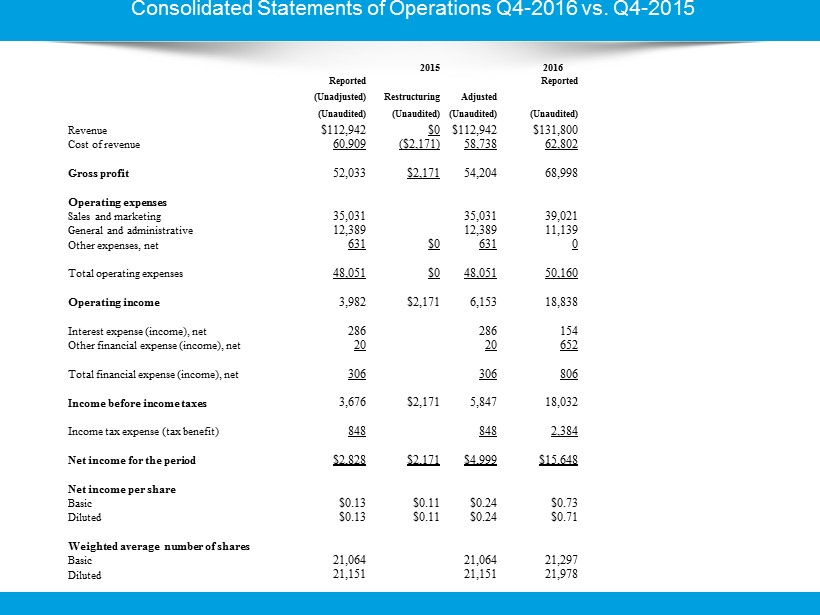
Consolidated Statements of Operations Q4 - 2016 vs. Q4 - 2015 2015 2016 Reported Reported (Unadjusted) Restructuring Adjusted (Unaudited ) (Unaudited ) (Unaudited ) (Unaudited) Revenue $112,942 $0 $112,942 $131,800 Cost of revenue 60,909 ($2,171) 58,738 62,802 Gross profit 52,033 $2,171 54,204 68,998 Operating expenses Sales and marketing 35,031 35,031 39,021 General and administrative 12,389 12,389 11,139 Other expenses, net 631 $0 631 0 Total operating expenses 48,051 $0 48,051 50,160 Operating income 3,982 $2,171 6,153 18,838 Interest expense (income), net 286 286 154 Other financial expense (income), net 20 20 652 Total financial expense (income), net 306 306 806 Income before income taxes 3,676 $2,171 5,847 18,032 Income tax expense (tax benefit) 848 848 2,384 Net income for the period $2,828 $2,171 $4,999 $15,648 Net income per share Basic $0.13 $ 0.11 $0.24 $0.73 Diluted $0.13 $ 0.11 $0.24 $0.71 Weighted average number of shares Basic 21,064 21,064 21,297 Diluted 21,151 21,151 21,978
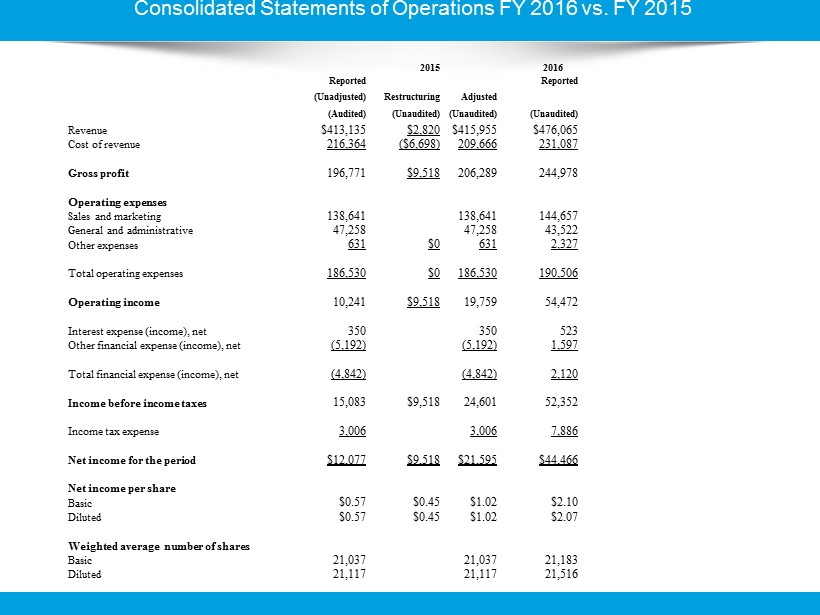
Consolidated Statements of Operations FY 2016 vs. FY 2015 2015 2016 Reported Reported (Unadjusted) Restructuring Adjusted (Audited ) (Unaudited ) (Unaudited ) (Unaudited) Revenue $413,135 $2,820 $415,955 $476,065 Cost of revenue 216,364 ($6,698) 209,666 231,087 Gross profit 196,771 $9,518 206,289 244,978 Operating expenses Sales and marketing 138,641 138,641 144,657 General and administrative 47,258 47,258 43,522 Other expenses 631 $0 631 2,327 Total operating expenses 186,530 $0 186,530 190,506 Operating income 10,241 $9,518 19,759 54,472 Interest expense (income), net 350 350 523 Other financial expense (income), net (5,192) (5,192) 1,597 Total financial expense (income), net (4,842) (4,842) 2,120 Income before income taxes 15,083 $9,518 24,601 52,352 Income tax expense 3,006 3,006 7,886 Net income for the period $12,077 $9,518 $21,595 $44,466 Net income per share Basic $0.57 $0.45 $ 1.02 $2.10 Diluted $0.57 $0.45 $1.02 $2.07 Weighted average number of shares Basic 21,037 21,037 21,183 Diluted 21,117 21,117 21,516