UNITED STATES
SECURITIES AND EXCHANGE COMMISSION
Washington, D.C. 20549
FORM N-CSR
CERTIFIED SHAREHOLDER REPORT OF REGISTERED MANAGEMENT
INVESTMENT COMPANIES
Investment Company Act file number 811-22487
DBX ETF Trust
(Exact name of registrant as specified in charter)
345 Park Avenue
New York, New York 10154
(Address of principal executive offices) (Zip code)
Freddi Klassen
DBX ETF Trust
345 Park Avenue
New York, New York 10154
(Name and address of agent for service)
Registrant’s telephone number, including area code: (212) 250-4352
Date of fiscal year end: August 31
Date of reporting period: August 31, 2017
Form N-CSR is to be used by management investment companies to file reports with the Commission not later than 10 days after the transmission to stockholders of any report that is required to be transmitted to stockholders under Rule 30e-1 under the Investment Company Act of 1940 (17 CFR 270.30e-1). The Commission may use the information provided on Form N-CSR in its regulatory, disclosure review, inspection, and policymaking roles.
A registrant is required to disclose the information specified by Form N-CSR, and the Commission will make this information public. A registrant is not required to respond to the collection of information contained in Form N-CSR unless the Form displays a currently valid Office of Management and Budget (“OMB”) control number. Please direct comments concerning the accuracy of the information collection burden estimate and any suggestions for reducing the burden to Secretary, Securities and Exchange Commission, 450 Fifth Street, NW, Washington, DC 20549-0609. The OMB has reviewed this collection of information under the clearance requirements of 44 U.S.C. § 3507.
Item 1. Reports to Stockholders.
The Report to Shareholders is attached herewith.

August 31, 2017
Annual Report
DBX ETF Trust
Deutsche X-trackers FTSE Developed ex US Comprehensive Factor ETF (DEEF)
Deutsche X-trackers FTSE Emerging Comprehensive Factor ETF (DEMG)
Deutsche X-trackers Russell 1000 Comprehensive Factor ETF (DEUS)
Deutsche X-trackers Russell 2000 Comprehensive Factor ETF (DESC)

DBX ETF Trust
| Page | ||||
| 1 | ||||
| 3 | ||||
Performance Summary | ||||
Deutsche X-trackers FTSE Developed ex US Comprehensive Factor ETF | 4 | |||
| 6 | ||||
| 8 | ||||
| 10 | ||||
| 12 | ||||
Schedules of Investments | ||||
Deutsche X-trackers FTSE Developed ex US Comprehensive Factor ETF | 13 | |||
| 25 | ||||
| 34 | ||||
| 43 | ||||
| 58 | ||||
| 59 | ||||
| 60 | ||||
| 62 | ||||
| 64 | ||||
| 73 | ||||
| 74 | ||||
| 77 | ||||
| 78 | ||||
To our Shareholders: (Unaudited)
Dear Shareholder,
We are pleased to provide this annual report for our four comprehensive factor equity ETFs for fiscal year ended August 31, 2017.
The global economy witnessed several positive trends during the reporting period — strong corporate earnings, increasing political stability in Europe, and overall positive investor sentiment. The U.S. economy has been upbeat, even as investors re-evaluated their optimism on Trump trades1. The Eurozone picked up momentum despite concerns related to the impact of the Brexit2 referendum, populist tides in the form of the Italian referendum, and the French and Dutch elections. Surprisingly, emerging markets powered ahead of developed markets, strengthened by the recent U.S. dollar weakness and rebounding commodity prices. In addition, strong economic data, foreign inflows, and corporate earnings growth boosted emerging market equities.
In the U.S., most macroeconomic indicators, such as gross domestic product (GDP) and consumer confidence, rebounded toward the end of the reporting period. Meanwhile, post-election optimism was slowly replaced by concerns over protectionism and policy implementation. However, U.S. equity indices reached new all-time highs on a robust earnings season and positive labor market developments. Meanwhile, the U.S. Federal Reserve Board continued to calibrate its interest rate strategy amid full employment and low inflation. U.S. dollar weakness also came under global spotlight amid rising tensions with North Korea and policy instability in the U.S.
As populist tides receded in Europe, aggregate growth figures across the Eurozone improved, consumer confidence reached new highs and the euro strengthened. European equities delivered robust returns following a relief rally after President Emmanuel Macron’s victory in the French presidential election. The European Central Bank has been considering slowly phasing out its stimulus program, while keeping an eye on euro volatility and inflation. In the U.K., a weak British pound and soft economic data added to its existing woes of a minority government after June’s snap elections3.
Japan’s economy powered ahead as increased consumption fueled higher-than-expected GDP growth. The labor market showed signs of a recovery toward the end of the reporting period. On the other side, the Japanese yen surged, as risks with North Korea re-emerged. Emerging markets continued to advance supported by reassuring growth in China, reflation trades and stimulating fiscal policy initiatives.
Improving economic activity led the synchronized recovery across the globe, and major central banks are looking at steadily tapering their monetary policies, albeit cautiously, weighing in inflation. In this environment of moderate growth, coupled with low inflation and low interest rates, diversifying factors may be a better positioning than pursuing a single-factor approach. Whether markets remain relatively calm or we do in fact witness some episodic volatility, our view is that retaining a diversified factor approach is right. It takes advantage of the relatively uncorrelated nature of their excess returns and mitigates the need to try and time a particular market cycle.
Our team appreciates your trust and looks forward to serving your investment needs through innovative index-driven strategies.
Sincerely,
/s/ Freddi Klassen
Freddi Klassen
President and Chief Executive Officer
1 The terms “Trump trade” or “Trump rally” describe the strong movements in various asset prices in the weeks and months following the U.S. elections of November 2016.
2 Brexit is a combination of the words “Britain” and “Exit” and describes the exit of the United Kingdom from the European Union.
3 A snap election is an election called earlier than expected. Generally it refers to an election in a parliamentary system called when not required (either by law or convention), usually to capitalize on a unique electoral opportunity or to decide a pressing issue.
Assumptions, estimates and opinions contained in this document constitute our judgment as of the date of the document and are subject to change without notice. Any projections are based on a number of assumptions as to market conditions and there can be no guarantee that any projected results will be achieved. Past performance is not a guarantee of future results.
1
This Page is Intentionally Left Blank
2
DBX ETF Trust
Deutsche X-trackers FTSE Developed Ex US Comprehensive Factor ETF (DEEF)
The Deutsche X-trackers FTSE Developed ex US Comprehensive Factor ETF (DEEF) seeks investment results that correspond generally to the performance, before fees and expenses, of the FTSE Developed ex US Comprehensive Factor Index (the DEEF Index). The DEEF index is designed to provide exposure to developed international equities (except the United States) based on five factors — value, momentum, quality, low volatility and size. For the 12-month period ended August 31, 2017, DEEF shares returned 15.16%, compared to the DEEF Index return of 15.99%.
All sectors contributed positively to performance, with the greatest contribution coming from Materials, Industrials and Financials. From a geographical perspective, Japan, Germany and France were the main positive contributors, while New Zealand contributed negatively to performance.
Deutsche X-trackers FTSE Emerging Comprehensive Factor ETF (DEMG)
The Deutsche X-trackers FTSE Emerging Comprehensive Factor ETF (DEMG) seeks investment results that correspond generally to the performance, before fees and expenses, of the FTSE Emerging Comprehensive Factor Index (the DEMG Index). The DEMG index is designed to provide exposure to emerging market equities based on five factors — value, momentum, quality, low volatility and size. For the 12-month period ended August 31, 2017, DEMG shares returned 16.56%, compared to the DEMG Index return of 18.54%.
All sectors contributed positively to performance, with the greatest contribution coming from Financials, Materials and Industrials. From a geographical perspective, China, Taiwan and South Africa were the main positive contributors, while Qatar and the Philippines contributed negatively to performance. The Fund invested in futures contracts during the period to gain exposure to the Indian markets, contributing positively to performance.
Deutsche X-trackers Russell 1000 Comprehensive Factor ETF (DEUS)
The Deutsche X-trackers Russell 1000 Comprehensive Factor ETF (DEUS) seeks investment results that correspond generally to the performance, before fees and expenses, of the Russell 1000 Comprehensive Factor Index (the DEUS Index). The DEUS index is designed to provide exposure to large-cap United States equities based on five factors — value, momentum, quality, low volatility and size. For the 12-month period ended August 31, 2017, DEUS shares returned 12.75%, compared to the DEUS Index return of 13.06%.
The majority of sectors contributed positively to performance with the greatest contribution coming from Information Technology, Industrials and Financials, while Consumer Staples, Real Estate and Telecommunication Services contributed negatively. The Fund invested in futures contracts during the period to to simulate investment in the Underlying Index, contributing positively to performance.
Deutsche X-trackers Russell 2000 Comprehensive Factor ETF (DESC)
The Deutsche X-trackers Russell 2000 Comprehensive Factor ETF (DESC) seeks investment results that correspond generally to the performance, before fees and expenses, of the Russell 2000 Comprehensive Factor Index (the DESC Index). The DESC index is designed to provide exposure to small-cap United States equities based on five factors — value, momentum, quality, low volatility and size. For the 12-month period ended August 31, 2017, DESC shares returned 13.72%, compared to the DESC Index return of 14.05%.
The majority of sectors contributed positively to performance during the period with the greatest contribution coming from Financials, Industrials and Information Technology sectors. The Energy sector was the only negative contributor to performance.
*************************
Performance data quoted represents past performance and does not guarantee future results. Investment returns and principal value of an investment will fluctuate so that an investor’s shares, when sold or redeemed, may be worth more or less than their original cost. Current performance may be lower or higher than the performance data quoted. To obtain the most recent month-end performance data visit www.Xtrackers.com. Returns assume that dividends and capital gains distributions have been reinvested. See pages 4-11 of this report for additional performance information, including performance data based on market value.
The views expressed in this report reflect those of the portfolio management team only through the end of the period of the report as stated on the cover. The management team’s views are subject to change at any time based on market and other conditions and should not be construed as a recommendation. Current and future portfolio holdings are subject to risk.
3
DBX ETF Trust
Deutsche X-trackers FTSE Developed ex US Comprehensive Factor ETF (DEEF)
Deutsche X-trackers FTSE Developed ex US Comprehensive Factor ETF (the “Fund”) seeks investment results that correspond generally to the performance, before fees and expenses, of the FTSE Developed ex US Comprehensive Factor Index (the “Underlying Index”). The Underlying Index is designed to track the equity market performance of companies in developed countries (except the United States) selected on the investment style criteria (“factors”) of value, momentum, quality, low volatility and size. The companies eligible for the Underlying Index are derived from its starting universe, the FTSE Developed ex US Index, which is comprised of large- and mid-cap equity securities from developed markets (except the United States). The Underlying Index consists of issuers from the following 23 developed market countries: Australia, Austria, Belgium, Canada, Denmark, Finland, France, Germany, Hong Kong, Ireland, Israel, Italy, Japan, the Netherlands, New Zealand, Norway, Portugal, Singapore, South Korea, Spain, Sweden, Switzerland and the United Kingdom. It is not possible to invest directly into an index.
Performance as of 8/31/17
| Average Annual Total Returns | ||||||||
| Net Asset Value | Market Value | FTSE Developed ex US Comprehensive Factor Index | FTSE Developed ex US Net Tax (US RIC) Index | |||||
One Year | 15.16% | 15.34% | 15.99% | 17.85% | ||||
Since Inception1 | 10.23% | 10.58% | 11.15% | 10.07% | ||||
| Cumulative Total Returns | ||||||||
| Net Asset Value | Market Value | FTSE Developed ex US Comprehensive Factor Index | FTSE Developed ex US Net Tax (US RIC) Index | |||||
One Year | 15.16% | 15.34% | 15.99% | 17.85% | ||||
Since Inception1 | 18.85% | 19.51% | 20.61% | 18.54% | ||||
1 Total returns are calculated based on the commencement of operations, 11/24/15 (“Inception”).
Past performance is no guarantee of future results. Current performance may be lower or higher than the performance data quoted. Performance data current to the most recent month-end is available at www.Xtrackers.com. Performance results assume reinvestment of all dividends and capital gain distributions and do not reflect the deduction of taxes that a shareholder would pay on fund distributions or on the sale of fund shares or redemption of fund creation units. The investment return and principal value of shares will vary with changes in market conditions. Shares may be worth more or less than their original cost when they are sold in the market or redeemed. The estimated operating expense ratio as disclosed in the most recent prospectus dated December 30, 2016, was 0.36%, and may differ from the expense ratio disclosed in the Financial Highlights table in this report.
The Fund’s net asset value or “NAV” is calculated by dividing the value of the Fund’s total assets less total liabilities by the number of share outstanding. The price used to calculate market return (“Market Price”) is determined by using the midpoint between the highest bid and the lowest offer on the primary stock exchange on which shares of a fund are listed for trading, as of the time that such fund’s NAV is calculated. Since shares of a fund may not have traded in the secondary market until after the fund’s inception, for the period from inception to the first day of secondary trading, the NAV of the fund is used as a proxy for the Market Price to calculate market returns. Market and NAV returns assume that dividends and capital gain distributions have been reinvested at Market Price and NAV, respectively.
An index is a statistical composite that tracks a specified financial market or sector. Unlike a fund, an index does not actually hold a portfolio of securities and therefore does not incur the expenses incurred by a fund. These expenses negatively impact fund performance. Also, market returns do not include brokerage commissions that may be payable on secondary market transactions. If brokerage commissions were included, market returns would be lower.
4
DBX ETF Trust
Performance Summary (Unaudited)
Deutsche X-trackers FTSE Developed ex US Comprehensive Factor ETF (DEEF) (Continued)
Growth of an Assumed $10,000 Investment
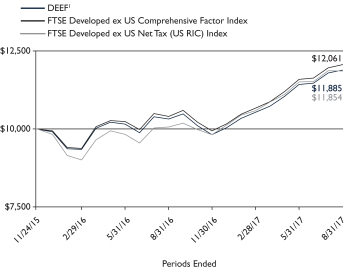
1 Based on Net Asset Value from commencement of operations, 11/24/15.
Sector Diversification* as of 8/31/17
Industrials | 20.1% | |||
Materials | 16.0% | |||
Consumer Discretionary | 15.8% | |||
Financials | 10.8% | |||
Real Estate | 9.8% | |||
Consumer Staples | 8.3% | |||
Information Technology | 5.8% | |||
Utilities | 4.7% | |||
Health Care | 4.2% | |||
Energy | 2.5% | |||
Telecommunication Services | 2.0% | |||
|
| |||
Total | 100.0% |
Ten Largest Equity Holdings as of 8/31/17 (7.9% of Net Assets)
| Description | % of Net Assets | |||
3i Group PLC (United Kingdom) | 1.2% | |||
Industrivarden AB (Sweden) | 1.1% | |||
Investor AB (Sweden) | 0.9% | |||
Dexus (Australia) | 0.8% | |||
Link (Hong Kong) | 0.8% | |||
Mirvac Group (Australia) | 0.7% | |||
Johnson Matthey PLC (United Kingdom) | 0.6% | |||
Asahi Kasei Corp. (Japan) | 0.6% | |||
Suzuki Motor Corp. (Japan) | 0.6% | |||
Cie Generale des Etablissements Michelin (France) | 0.6% | |||
Country Diversification* as of 8/31/17
Japan | 25.5% | |||
United Kingdom | 12.5% | |||
Australia | 9.6% | |||
Canada | 6.4% | |||
France | 5.7% | |||
Germany | 5.5% | |||
Sweden | 5.4% | |||
Hong Kong | 4.2% | |||
Switzerland | 4.1% | |||
South Korea | 3.0% | |||
Singapore | 2.3% | |||
Finland | 2.2% | |||
Other | 13.6% | |||
|
| |||
Total | 100.0% |
* As a percent of total investments excluding securities lending collateral.
Portfolio holdings and characteristics are subject to change. For more complete details about the Fund’s investment portfolio see page 13.
5
DBX ETF Trust
Deutsche X-trackers FTSE Emerging Comprehensive Factor ETF (DEMG)
Deutsche X-trackers FTSE Emerging Comprehensive Factor ETF (the “Fund”) seeks investment results that correspond generally to the performance, before fees and expenses, of the FTSE Emerging Comprehensive Factor Index (the “Underlying Index”). The Underlying Index is designed to track the equity market performance of companies in emerging market countries selected on the investment style criteria (“factors”) of value, momentum, quality, low volatility and size. The companies eligible for the Underlying Index are derived from its starting universe, the FTSE Emerging Index, which is comprised of large- and mid-cap equity securities from emerging markets. It is not possible to invest directly into an index.
Performance as of 8/31/17
| Average Annual Total Returns | ||||||||
| Net Asset Value | Market Value | FTSE Emerging Comprehensive Factor Index | FTSE Emerging Net Tax (US RIC) Index | |||||
One Year | 16.56% | 16.71% | 18.54% | 22.51% | ||||
Since Inception1 | 14.40% | 14.67% | 16.88% | 22.28% | ||||
| Cumulative Total Returns | ||||||||
| Net Asset Value | Market Value | FTSE Emerging Comprehensive Factor Index | FTSE Emerging Net Tax (US RIC) Index | |||||
One Year | 16.56% | 16.71% | 18.54% | 22.51% | ||||
Since Inception1 | 20.24% | 20.63% | 23.83% | 31.73% | ||||
1 Total returns are calculated based on the commencement of operations, 4/19/16 (“Inception”).
Past performance is no guarantee of future results. Current performance may be lower or higher than the performance data quoted. Performance data current to the most recent month-end is available at www.Xtrackers.com. Performance results assume reinvestment of all dividends and capital gain distributions and do not reflect the deduction of taxes that a shareholder would pay on fund distributions or on the sale of fund shares or redemption of fund creation units. The investment return and principal value of shares will vary with changes in market conditions. Shares may be worth more or less than their original cost when they are sold in the market or redeemed. The estimated operating expense ratio as disclosed in the most recent prospectus dated December 30, 2016, was 0.50%, and may differ from the expense ratio disclosed in the Financial Highlights table in this report.
The Fund’s net asset value or “NAV” is calculated by dividing the value of the Fund’s total assets less total liabilities by the number of share outstanding. The price used to calculate market return (“Market Price”) is determined by using the midpoint between the highest bid and the lowest offer on the primary stock exchange on which shares of a fund are listed for trading, as of the time that such fund’s NAV is calculated. Since shares of a fund may not have traded in the secondary market until after the fund’s inception, for the period from inception to the first day of secondary trading, the NAV of the fund is used as a proxy for the Market Price to calculate market returns. Market and NAV returns assume that dividends and capital gain distributions have been reinvested at Market Price and NAV, respectively.
An index is a statistical composite that tracks a specified financial market or sector. Unlike a fund, an index does not actually hold a portfolio of securities and therefore does not incur the expenses incurred by a fund. These expenses negatively impact fund performance. Also, market returns do not include brokerage commissions that may be payable on secondary market transactions. If brokerage commissions were included, market returns would be lower.
6
DBX ETF Trust
Performance Summary (Unaudited)
Deutsche X-trackers FTSE Emerging Comprehensive Factor ETF (DEMG) (Continued)
Growth of an Assumed $10,000 Investment
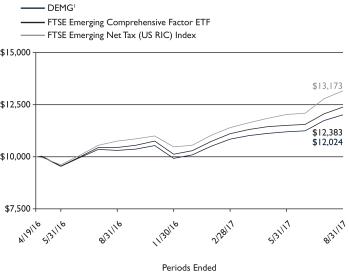
1 Based on Net Asset Value from commencement of operations, 4/19/16.
Sector Diversification* as of 8/31/17
Financials | 14.0% | |||
Industrials | 13.7% | |||
Materials | 13.0% | |||
Information Technology | 11.2% | |||
Consumer Staples | 9.8% | |||
Consumer Discretionary | 9.7% | |||
Utilities | 8.7% | |||
Energy | 7.4% | |||
Real Estate | 6.3% | |||
Telecommunication Services | 4.4% | |||
Health Care | 1.8% | |||
|
| |||
Total | 100.0% |
Ten Largest Equity Holdings as of 8/31/17 (9.2% of Net Assets)
| Description | % of Net Assets | |||
Lite-On Technology Corp. (Taiwan) | 1.2% | |||
Bidvest Group Ltd. (South Africa) | 1.2% | |||
Foxconn Technology Co. Ltd. (Taiwan) | 1.2% | |||
Barloworld Ltd. (South Africa) | 1.1% | |||
Equatorial Energia SA (Brazil) | 0.8% | |||
MOL Hungarian Oil & Gas PLC (Hungary) | 0.8% | |||
Clicks Group Ltd. (South Africa) | 0.8% | |||
Itausa — Investimentos Itau SA (Brazil) | 0.7% | |||
Sappi Ltd. (South Africa) | 0.7% | |||
Imperial Holdings Ltd. (South Africa) | 0.7% | |||
Country Diversification* as of 8/31/17
Taiwan | 20.4% | |||
South Africa | 14.7% | |||
China | 13.1% | |||
Brazil | 8.4% | |||
Mexico | 5.7% | |||
Malaysia | 5.3% | |||
Thailand | 4.9% | |||
Russia | 4.4% | |||
Hong Kong | 4.3% | |||
Chile | 3.7% | |||
Turkey | 3.2% | |||
Poland | 2.4% | |||
Other | 9.5% | |||
|
| |||
Total | 100.0% |
* As a percent of total investments excluding securities lending collateral.
Portfolio holdings and characteristics are subject to change. For more complete details about the Fund’s investment portfolio see page 25.
7
DBX ETF Trust
Deutsche X-trackers Russell 1000 Comprehensive Factor ETF (DEUS)
Deutsche X-trackers Russell 1000 Comprehensive Factor ETF (the “Fund”) seeks investment results that correspond generally to the performance, before fees and expenses, of the Russell 1000 Comprehensive Factor Index (the “Underlying Index”). The Underlying Index is designed to track the equity market performance of companies in the United States selected on the investment style factors of value, momentum, quality, low volatility and size. The companies eligible for the Underlying Index are derived from its starting universe, the Russell 1000 Index, which is comprised of large-cap equity securities from issuers in the United States. It is not possible to invest directly into an index.
Performance as of 8/31/17
| Average Annual Total Returns | ||||||||
| Net Asset Value | Market Value | Russell 1000 Comprehensive Factor Index | Russell 1000 Index Total Return | |||||
One Year | 12.75% | 12.66% | 13.06% | 16.16% | ||||
Since Inception1 | 11.79% | 11.78% | 12.08% | 12.28% | ||||
| Cumulative Total Returns | ||||||||
| Net Asset Value | Market Value | Russell 1000 Comprehensive Factor Index | Russell 1000 Index Total Return | |||||
One Year | 12.75% | 12.66% | 13.06% | 16.16% | ||||
Since Inception1 | 21.84% | 21.83% | 22.40% | 22.79% | ||||
1 Total returns are calculated based on the commencement of operations, 11/24/15 (“Inception”).
Past performance is no guarantee of future results. Current performance may be lower or higher than the performance data quoted. Performance data current to the most recent month-end is available at www.Xtrackers.com. Performance results assume reinvestment of all dividends and capital gain distributions and do not reflect the deduction of taxes that a shareholder would pay on fund distributions or on the sale of fund shares or redemption of fund creation units. The investment return and principal value of shares will vary with changes in market conditions. Shares may be worth more or less than their original cost when they are sold in the market or redeemed. Performance for certain funds may reflect a waiver of a portion of investment management fees. Without such waiver, performance would have been lower. The estimated operating expense ratio as disclosed in the most recent prospectus dated December 30, 2016, was 0.19%, and may differ from the expense ratio disclosed in the Financial Highlights table in this report.
The Fund’s net asset value or “NAV” is calculated by dividing the value of the Fund’s total assets less total liabilities by the number of share outstanding. The price used to calculate market return (“Market Price”) is determined by using the midpoint between the highest bid and the lowest offer on the primary stock exchange on which shares of a fund are listed for trading, as of the time that such fund’s NAV is calculated. Since shares of a fund may not have traded in the secondary market until after the fund’s inception, for the period from inception to the first day of secondary trading, the NAV of the fund is used as a proxy for the Market Price to calculate market returns. Market and NAV returns assume that dividends and capital gain distributions have been reinvested at Market Price and NAV, respectively.
An index is a statistical composite that tracks a specified financial market or sector. Unlike a fund, an index does not actually hold a portfolio of securities and therefore does not incur the expenses incurred by a fund. These expenses negatively impact fund performance. Also, market returns do not include brokerage commissions that may be payable on secondary market transactions. If brokerage commissions were included, market returns would be lower.
8
DBX ETF Trust
Performance Summary (Unaudited)
Deutsche X-trackers Russell 1000 Comprehensive Factor ETF (DEUS) (Continued)
Growth of an Assumed $10,000 Investment
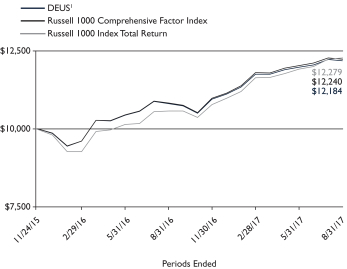
1 Based on Net Asset Value from commencement of operations, 11/24/15.
Sector Diversification* as of 8/31/17
Industrials | 18.2% | |||
Financials | 17.6% | |||
Consumer Discretionary | 17.0% | |||
Information Technology | 13.8% | |||
Health Care | 9.7% | |||
Utilities | 6.1% | |||
Materials | 5.8% | |||
Real Estate | 4.9% | |||
Consumer Staples | 4.2% | |||
Money Market Fund | 1.7% | |||
Energy | 0.7% | |||
Telecommunication Services | 0.3% | |||
|
| |||
Total | 100.0% |
Ten Largest Equity Holdings as of 8/31/17 (6.9% of Net Assets)
| Description | % of Net Assets | |||
Baxter International, Inc. | 1.0% | |||
Everest Re Group Ltd. | 0.8% | |||
Corning, Inc. | 0.8% | |||
Lear Corp. | 0.7% | |||
NVR, Inc. | 0.6% | |||
Equity Residential | 0.6% | |||
Delphi Automotive PLC | 0.6% | |||
Darden Restaurants, Inc. | 0.6% | |||
eBay, Inc. | 0.6% | |||
Progressive Corp. | 0.6% | |||
* As a percent of total investments excluding securities lending collateral.
Portfolio holdings and characteristics are subject to change. For more complete details about the Fund’s investment portfolio see page 34.
9
DBX ETF Trust
Deutsche X-trackers Russell 2000 Comprehensive Factor ETF (DESC)
Deutsche X-trackers Russell 2000 Comprehensive Factor ETF (the “Fund”) seeks investment results that correspond generally to the performance, before fees and expenses, of the Russell 2000 Comprehensive Factor Index (the “Underlying Index”). The Underlying Index is designed to track the equity market performance of companies in the United States selected on the investment style criteria (“factors”) of value, momentum, quality, low volatility and size. The companies eligible for the Underlying Index are derived from its starting universe, the Russell 2000 Index, which is comprised of small-cap equity securities from issuers in the United States. It is not possible to invest directly into an index.
Performance as of 8/31/17
| Average Annual Total Returns | ||||||||
| Net Asset Value | Market Value | Russell 2000 Comprehensive Factor Index | Russell 2000 Index Total Return | |||||
One Year | 13.72% | 13.94% | 14.05% | 14.91% | ||||
Since Inception1 | 22.12% | 22.32% | 22.47% | 25.85% | ||||
| Cumulative Total Returns | ||||||||
| Net Asset Value | Market Value | Russell 2000 Comprehensive Factor Index | Russell 2000 Index Total Return | |||||
One Year | 13.72% | 13.94% | 14.05% | 14.91% | ||||
Since Inception1 | 26.55% | 26.79% | 26.97% | 31.11% | ||||
1 Total returns are calculated based on the commencement of operations, 6/28/16 (“Inception”).
Past performance is no guarantee of future results. Current performance may be lower or higher than the performance data quoted. Performance data current to the most recent month-end is available at www.Xtrackers.com. Performance results assume reinvestment of all dividends and capital gain distributions and do not reflect the deduction of taxes that a shareholder would pay on fund distributions or on the sale of fund shares or redemption of fund creation units. The investment return and principal value of shares will vary with changes in market conditions. Shares may be worth more or less than their original cost when they are sold in the market or redeemed. The estimated operating expense ratio as disclosed in the most recent prospectus dated December 30, 2016, was 0.30%, and may differ from the expense ratio disclosed in the Financial Highlights table in this report.
The Fund’s net asset value or “NAV” is calculated by dividing the value of the Fund’s total assets less total liabilities by the number of share outstanding. The price used to calculate market return (“Market Price”) is determined by using the midpoint between the highest bid and the lowest offer on the primary stock exchange on which shares of a fund are listed for trading, as of the time that such fund’s NAV is calculated. Since shares of a fund may not have traded in the secondary market until after the fund’s inception, for the period from inception to the first day of secondary trading, the NAV of the fund is used as a proxy for the Market Price to calculate market returns. Market and NAV returns assume that dividends and capital gain distributions have been reinvested at Market Price and NAV, respectively.
An index is a statistical composite that tracks a specified financial market or sector. Unlike a fund, an index does not actually hold a portfolio of securities and therefore does not incur the expenses incurred by a fund. These expenses negatively impact fund performance. Also, market returns do not include brokerage commissions that may be payable on secondary market transactions. If brokerage commissions were included, market returns would be lower.
10
DBX ETF Trust
Performance Summary (Unaudited)
Deutsche X-trackers Russell 2000 Comprehensive Factor ETF (DESC) (Continued)
11
Growth of an Assumed $10,000 Investment
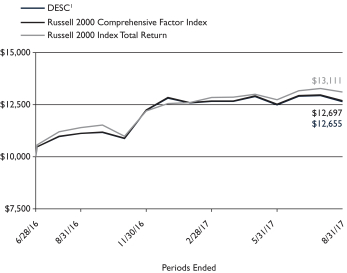
1 Based on Net Asset Value from commencement of operations, 6/28/16.
Sector Diversification* as of 8/31/17
Financials | 30.3% | |||
Industrials | 19.2% | |||
Consumer Discretionary | 15.7% | |||
Information Technology | 10.3% | |||
Health Care | 6.9% | |||
Real Estate | 6.0% | |||
Materials | 4.2% | |||
Consumer Staples | 2.6% | |||
Utilities | 1.9% | |||
Energy | 1.7% | |||
Telecommunication Services | 1.2% | |||
|
| |||
Total | 100.0% |
Ten Largest Equity Holdings as of 8/31/17 (3.2% of Net Assets)
| Description | % of Net Assets | |||
Argan, Inc. | 0.4% | |||
Bob Evans Farms, Inc. | 0.4% | |||
Walker & Dunlop, Inc. | 0.3% | |||
Hooker Furniture Corp. | 0.3% | |||
Wabash National Corp. | 0.3% | |||
John B Sanfilippo & Son, Inc. | 0.3% | |||
Benchmark Electronics, Inc. | 0.3% | |||
NMI Holdings, Inc. | 0.3% | |||
RPX Corp. | 0.3% | |||
Federal Agricultural Mortgage Corp. | 0.3% | |||
* As a percent of total investments excluding exchange-traded funds and securities lending collateral.
Portfolio holdings and characteristics are subject to change. For more complete details about the Fund’s investment portfolio see page 43.
DBX ETF Trust
As a shareholder of one or more of the funds, you incur two types of costs: (1) transaction costs, including brokerage commissions paid on purchases and sales of fund shares, and (2) ongoing costs, including management fees and other Fund expenses. The expense examples below are intended to help you understand your ongoing costs (in dollars) of investing in the Funds and to compare these costs with the ongoing costs of investing in other funds.
The examples in the table are based on an investment of $1,000 invested at the beginning of the six month period and held for the entire period (March 1, 2017 to August 31, 2017).
Actual expenses
The first line in the following tables provides information about actual account values and actual expenses. You may use the information in this line, together with the amount you invested, to estimate the expenses that you paid over the period. Simply divide your account value by $1,000 (for example, an $8,600 account value divided by $1,000 = 8.6), then multiply the result by the number in the first line under the heading “Expenses Paid During the Period” to estimate the expenses you paid on your account during this period.
Hypothetical example for comparison purposes
The second line in the following tables provides information about hypothetical account values and hypothetical expenses based on the Funds’ actual expense ratios and an assumed rate of return of 5% per year before expenses (which is not the Funds’ actual return). The hypothetical account values and expenses may not be used to estimate the actual ending account balance or expenses you paid for the period. You may use this information to compare the ongoing costs of investing in the Fund and other funds. To do so, compare this 5% hypothetical example with the 5% hypothetical examples that appear in the shareholder reports of the other funds.
Please note that the expenses shown in the tables are meant to highlight your ongoing costs only, and do not reflect any transactional costs. Therefore the second line in the table is useful in comparing ongoing costs only, and will not help you determine the relative total costs of owning different funds. In addition, if these transactional costs were included, your costs would have been higher.
| Beginning Account Value March 1, 2017 | Ending Account Value August 31, 2017 | Annualized Expense Ratio | Expenses Paid During the Period Per $1,000(1) | |||||||||||||
| Deutsche X-trackers FTSE Developed ex US Comprehensive Factor ETF | ||||||||||||||||
Actual | $ | 1,000.00 | $ | 1,128.80 | 0.35 | % | $ | 1.88 | ||||||||
Hypothetical (5% return before expenses) | $ | 1,000.00 | $ | 1,023.44 | 0.35 | % | $ | 1.79 | ||||||||
| Deutsche X-trackers FTSE Emerging Comprehensive Factor ETF | ||||||||||||||||
Actual | $ | 1,000.00 | $ | 1,107.70 | 0.50 | % | $ | 2.66 | ||||||||
Hypothetical (5% return before expenses) | $ | 1,000.00 | $ | 1,022.68 | 0.50 | % | $ | 2.55 | ||||||||
| Deutsche X-trackers Russell 1000 Comprehensive Factor ETF | ||||||||||||||||
Actual | $ | 1,000.00 | $ | 1,036.10 | 0.19 | % | $ | 0.98 | ||||||||
Hypothetical (5% return before expenses) | $ | 1,000.00 | $ | 1,024.25 | 0.19 | % | $ | 0.97 | ||||||||
| Deutsche X-trackers Russell 2000 Comprehensive Factor ETF | ||||||||||||||||
Actual | $ | 1,000.00 | $ | 999.50 | 0.30 | % | $ | 1.51 | ||||||||
Hypothetical (5% return before expenses) | $ | 1,000.00 | $ | 1,023.69 | 0.30 | % | $ | 1.53 | ||||||||
(1) Expenses are equal to each Fund’s annualized expense ratio, multiplied by the average account value over the period, multiplied by 184 (the number of days in the most recent six-month period), then divided by 365.
12
DBX ETF Trust
Deutsche X-trackers FTSE Developed ex US Comprehensive Factor ETF
August 31, 2017
Number | Value | |||||||
| COMMON STOCKS — 99.6% | ||||||||
| Australia — 9.6% | ||||||||
Adelaide Brighton Ltd. | 2,955 | $ | 13,477 | |||||
AGL Energy Ltd. | 1,384 | 26,334 | ||||||
Alumina Ltd. (a) | 1,483 | 2,494 | ||||||
Amcor Ltd. | 1,966 | 25,121 | ||||||
Ansell Ltd. | 1,603 | 27,742 | ||||||
APA Group (b) | 2,030 | 14,265 | ||||||
Aristocrat Leisure Ltd. | 3,604 | 60,515 | ||||||
ASX Ltd. | 692 | 30,012 | ||||||
Aurizon Holdings Ltd. | 6,425 | 25,276 | ||||||
AusNet Services | 10,910 | 15,057 | ||||||
Australia & New Zealand Banking Group Ltd. | 97 | 2,262 | ||||||
Bendigo & Adelaide Bank Ltd. | 218 | 2,066 | ||||||
BHP Billiton Ltd. | 75 | 1,629 | ||||||
BlueScope Steel Ltd. | 250 | 2,155 | ||||||
Boral Ltd. | 3,009 | 15,919 | ||||||
Brambles Ltd. | 1,450 | 10,707 | ||||||
Caltex Australia Ltd. | 1,439 | 38,109 | ||||||
Challenger Ltd. | 1,428 | 14,203 | ||||||
CIMIC Group Ltd. | 152 | 5,069 | ||||||
Coca-Cola Amatil Ltd. | 2,350 | 15,004 | ||||||
Cochlear Ltd. | 284 | 35,187 | ||||||
Computershare Ltd. | 1,856 | 20,683 | ||||||
Crown Resorts Ltd. | 909 | 8,363 | ||||||
CSL Ltd. | 185 | 18,858 | ||||||
CSR Ltd. | 8,197 | 26,266 | ||||||
Dexus REIT | 16,931 | 128,782 | ||||||
Downer EDI Ltd. | 4,020 | 22,702 | ||||||
DuluxGroup Ltd. | 1,791 | 9,432 | ||||||
Flight Centre Travel Group Ltd. (a) | 52 | 1,994 | ||||||
Goodman Group REIT | 11,743 | 77,213 | ||||||
GPT Group REIT | 15,268 | 60,549 | ||||||
Harvey Norman Holdings Ltd. (a) | 3,538 | 11,449 | ||||||
Healthscope Ltd. | 1,779 | 2,455 | ||||||
Incitec Pivot Ltd. | 4,559 | 12,041 | ||||||
Insurance Australia Group Ltd. | 988 | 5,023 | ||||||
IOOF Holdings Ltd. | 921 | 8,072 | ||||||
LendLease Group (b) | 2,558 | 33,639 | ||||||
Macquarie Atlas Roads Group (b) | 2,756 | 12,416 | ||||||
Macquarie Group Ltd. | 209 | 14,389 | ||||||
Magellan Financial Group Ltd. | 208 | 4,080 | ||||||
Medibank Pvt Ltd. | 11,305 | 27,258 | ||||||
Metcash Ltd. | 11,304 | 24,387 | ||||||
Mirvac Group REIT | 62,513 | 115,031 | ||||||
National Australia Bank Ltd. | 44 | 1,054 | ||||||
Newcrest Mining Ltd. | 129 | 2,338 | ||||||
Nufarm Ltd. | 329 | 2,325 | ||||||
Oil Search Ltd. | 393 | 2,092 | ||||||
Orica Ltd. | 2,317 | 37,361 | ||||||
Origin Energy Ltd.* | 560 | 3,398 | ||||||
Orora Ltd. | 13,513 | 33,225 | ||||||
OZ Minerals Ltd. | 307 | 1,975 | ||||||
Perpetual Ltd. | 385 | 16,777 | ||||||
Platinum Asset Management Ltd. | 229 | 1,083 | ||||||
Qantas Airways Ltd. | 909 | 4,124 | ||||||
QBE Insurance Group Ltd. | 1,031 | 8,537 | ||||||
Number | Value | |||||||
| Australia (Continued) | ||||||||
Ramsay Health Care Ltd. | 372 | $ | 20,155 | |||||
REA Group Ltd. | 108 | 5,679 | ||||||
Scentre Group REIT | 17,919 | 54,860 | ||||||
SEEK Ltd. | 878 | 11,664 | ||||||
Shopping Centres Australasia Property Group REIT | 8,523 | 15,075 | ||||||
Sonic Healthcare Ltd. | 1,986 | 34,497 | ||||||
Star Entertainment Group Ltd. | 1,042 | 4,298 | ||||||
Stockland REIT | 11,974 | 42,072 | ||||||
Suncorp Group Ltd. | 263 | 2,718 | ||||||
Sydney Airport (b) | 471 | 2,764 | ||||||
Tabcorp Holdings Ltd. | 5,614 | 18,301 | ||||||
Tatts Group Ltd. | 3,602 | 11,742 | ||||||
Telstra Corp. Ltd. | 1,351 | 3,933 | ||||||
Transurban Group (b) | 306 | 2,951 | ||||||
Treasury Wine Estates Ltd. | 648 | 7,442 | ||||||
Vicinity Centres REIT | 9,185 | 19,087 | ||||||
Wesfarmers Ltd. | 484 | 16,361 | ||||||
Westfield Corp. REIT | 3,176 | 18,716 | ||||||
Westpac Banking Corp. | 63 | 1,563 | ||||||
Woodside Petroleum Ltd. | 1,253 | 28,652 | ||||||
Woolworths Ltd. | 1,087 | 22,416 | ||||||
|
| |||||||
| 1,486,920 | ||||||||
|
| |||||||
| Austria — 0.4% | ||||||||
ANDRITZ AG | 174 | 9,456 | ||||||
Erste Group Bank AG* | 31 | 1,308 | ||||||
OMV AG | 404 | 23,194 | ||||||
Telekom Austria AG* | 757 | 7,276 | ||||||
Vienna Insurance Group AG Wiener Versicherung Gruppe | 63 | 1,858 | ||||||
voestalpine AG | 482 | 24,979 | ||||||
|
| |||||||
| 68,071 | ||||||||
|
| |||||||
| Belgium — 1.2% | ||||||||
Ackermans & van Haaren NV | 52 | 8,730 | ||||||
Ageas | 96 | 4,452 | ||||||
bpost SA | 371 | 10,343 | ||||||
Colruyt SA | 197 | 10,932 | ||||||
Groupe Bruxelles Lambert SA | 242 | 24,603 | ||||||
KBC Group NV | 30 | 2,462 | ||||||
Proximus SADP | 406 | 14,295 | ||||||
Sofina SA | 131 | 19,024 | ||||||
Solvay SA | 151 | 21,875 | ||||||
Telenet Group Holding NV* | 65 | 4,395 | ||||||
UCB SA | 44 | 3,028 | ||||||
Umicore SA | 735 | 54,834 | ||||||
|
| |||||||
| 178,973 | ||||||||
|
| |||||||
| Canada — 6.4% | ||||||||
Agnico Eagle Mines Ltd. | 22 | 1,123 | ||||||
Agrium, Inc. | 427 | 41,714 | ||||||
Alimentation Couche-Tard, Inc., Class B | 582 | 27,681 | ||||||
ARC Resources Ltd. | 909 | 11,890 | ||||||
Bank of Montreal | 77 | 5,503 | ||||||
Bank of Nova Scotia | 121 | 7,498 | ||||||
Barrick Gold Corp. | 43 | 771 | ||||||
BCE, Inc. | 151 | 7,159 | ||||||
| See Notes to Financial Statements. | 13 |
DBX ETF Trust
Schedule of Investments
Deutsche X-trackers FTSE Developed ex US Comprehensive Factor ETF (Continued)
August 31, 2017
Number | Value | |||||||
| Canada (Continued) | ||||||||
Brookfield Asset Management, Inc., Class A | 372 | $ | 14,654 | |||||
Canadian Imperial Bank of Commerce | 364 | 30,458 | ||||||
Canadian National Railway Co. | 207 | 16,712 | ||||||
Canadian Natural Resources Ltd. | 76 | 2,332 | ||||||
Canadian Pacific Railway Ltd. | 121 | 18,753 | ||||||
Canadian Tire Corp. Ltd., Class A | 526 | 62,008 | ||||||
Canadian Utilities Ltd., Class A | 550 | 17,074 | ||||||
Cenovus Energy, Inc. | 186 | 1,449 | ||||||
CGI Group, Inc., Class A* | 635 | 32,177 | ||||||
CI Financial Corp. | 1,196 | 26,081 | ||||||
Constellation Software, Inc. | 41 | 22,707 | ||||||
Enbridge, Inc. | 88 | 3,504 | ||||||
Fairfax Financial Holdings Ltd. | 1 | 518 | ||||||
Fortis, Inc. | 241 | 8,783 | ||||||
George Weston Ltd. | 163 | 14,110 | ||||||
Great-West Lifeco, Inc. (a) | 197 | 5,435 | ||||||
Husky Energy, Inc.* | 297 | 3,461 | ||||||
Hydro One Ltd., 144A | 373 | 6,893 | ||||||
IGM Financial, Inc. | 792 | 25,830 | ||||||
Imperial Oil Ltd. | 119 | 3,499 | ||||||
Intact Financial Corp. | 352 | 28,901 | ||||||
Inter Pipeline Ltd. | 943 | 17,202 | ||||||
Loblaw Cos. Ltd. | 187 | 10,102 | ||||||
Magna International, Inc. | 1,690 | 80,999 | ||||||
Manulife Financial Corp. | 1,503 | 29,407 | ||||||
Metro, Inc. | 1,022 | 33,601 | ||||||
National Bank of Canada | 77 | 3,530 | ||||||
Pembina Pipeline Corp. | 627 | 20,129 | ||||||
Potash Corp. of Saskatchewan, Inc. | 394 | 6,829 | ||||||
Power Corp. of Canada | 955 | 23,248 | ||||||
Power Financial Corp. | 362 | 9,733 | ||||||
Restaurant Brands International, Inc. | 646 | 39,278 | ||||||
RioCan Real Estate Investment Trust REIT | 1,887 | 35,821 | ||||||
Rogers Communications, Inc., Class B | 825 | 42,897 | ||||||
Royal Bank of Canada | 109 | 8,057 | ||||||
Saputo, Inc. | 725 | 24,380 | ||||||
Shaw Communications, Inc., Class B | 2,409 | 53,531 | ||||||
SNC-Lavalin Group, Inc. | 107 | 4,655 | ||||||
Sun Life Financial, Inc. (a) | 780 | 29,831 | ||||||
Suncor Energy, Inc. | 120 | 3,745 | ||||||
TELUS Corp. | 338 | 12,188 | ||||||
Thomson Reuters Corp. | 329 | 14,984 | ||||||
Toronto-Dominion Bank | 198 | 10,591 | ||||||
Tourmaline Oil Corp.* | 164 | 3,186 | ||||||
TransCanada Corp. | 119 | 6,019 | ||||||
Waste Connections, Inc. | 165 | 10,964 | ||||||
|
| |||||||
| 983,585 | ||||||||
|
| |||||||
| China — 0.5% | ||||||||
AAC Technologies Holdings, Inc. | 921 | 16,793 | ||||||
China Mengniu Dairy Co. Ltd.* | 7,778 | 18,167 | ||||||
FIH Mobile Ltd. | 2,601 | 801 | ||||||
Minth Group Ltd. | 1,352 | 6,228 | ||||||
Tingyi Cayman Islands Holding Corp. | 4,503 | 5,995 | ||||||
Uni-President China Holdings Ltd. | 4,997 | 4,271 | ||||||
Want Want China Holdings Ltd. | 12,809 | 8,478 | ||||||
Number | Value | |||||||
| China (Continued) | ||||||||
Yangzijiang Shipbuilding Holdings Ltd. | 12,900 | $ | 14,201 | |||||
|
| |||||||
| 74,934 | ||||||||
|
| |||||||
| Denmark — 1.1% | ||||||||
A.P. Moller — Maersk A/S, Class B | 1 | 2,059 | ||||||
Carlsberg A/S, Class B | 118 | 13,524 | ||||||
Chr Hansen Holding A/S | 65 | 5,585 | ||||||
Coloplast A/S, Class B | 99 | 8,094 | ||||||
Danske Bank A/S | 196 | 7,607 | ||||||
DONG Energy A/S, 144A | 152 | 7,901 | ||||||
DSV A/S | 120 | 8,498 | ||||||
Genmab A/S* | 11 | 2,564 | ||||||
H Lundbeck A/S | 87 | 5,533 | ||||||
ISS A/S | 768 | 29,844 | ||||||
Novozymes A/S, Class B | 209 | 10,617 | ||||||
Pandora A/S | 66 | 7,005 | ||||||
TDC A/S | 7,856 | 46,740 | ||||||
Tryg A/S | 451 | 10,410 | ||||||
Vestas Wind Systems A/S | 21 | 1,910 | ||||||
William Demant Holding A/S* | 241 | 6,368 | ||||||
|
| |||||||
| 174,259 | ||||||||
|
| |||||||
| Finland — 2.2% | ||||||||
Elisa OYJ | 438 | 19,111 | ||||||
Fortum OYJ | 305 | 5,468 | ||||||
Huhtamaki OYJ | 352 | 13,676 | ||||||
Kesko OYJ, Class B | 790 | 42,519 | ||||||
Kone OYJ, Class B | 275 | 14,902 | ||||||
Metso OYJ | 372 | 12,313 | ||||||
Neste OYJ | 614 | 27,039 | ||||||
Nokian Renkaat OYJ | 417 | 17,605 | ||||||
Orion OYJ, Class B | 758 | 35,849 | ||||||
Sampo OYJ, Class A | 197 | 10,385 | ||||||
Stora Enso OYJ, Class R | 2,525 | 33,142 | ||||||
UPM-Kymmene OYJ | 3,230 | 83,945 | ||||||
Wartsila OYJ Abp | 418 | 28,799 | ||||||
|
| |||||||
| 344,753 | ||||||||
|
| |||||||
| France — 5.7% | ||||||||
Aeroports de Paris | 32 | 5,701 | ||||||
Air Liquide SA | 44 | 5,365 | ||||||
Airbus SE | 66 | 5,541 | ||||||
Alstom SA | 372 | 13,213 | ||||||
Amundi SA, 144A | 52 | 3,998 | ||||||
Arkema SA | 274 | 29,735 | ||||||
Atos SE | 217 | 33,436 | ||||||
AXA SA | 42 | 1,217 | ||||||
BioMerieux | 74 | 18,093 | ||||||
BNP Paribas SA | 11 | 836 | ||||||
Bollore SA | 429 | 1,990 | ||||||
Bouygues SA | 319 | 14,448 | ||||||
Bureau Veritas SA | 404 | 9,594 | ||||||
Capgemini SE | 176 | 19,487 | ||||||
Carrefour SA | 539 | 10,855 | ||||||
Casino Guichard Perrachon SA | 308 | 17,491 | ||||||
Christian Dior SE | 44 | 13,567 | ||||||
Cie de Saint-Gobain | 461 | 25,253 | ||||||
Cie Generale des Etablissements Michelin | 647 | 88,075 | ||||||
| See Notes to Financial Statements. | 14 |
DBX ETF Trust
Schedule of Investments
Deutsche X-trackers FTSE Developed ex US Comprehensive Factor ETF (Continued)
August 31, 2017
Number | Value | |||||||
| France (Continued) | ||||||||
Cie Plastic Omnium SA | 98 | $ | 3,709 | |||||
Danone SA | 76 | 5,977 | ||||||
Dassault Aviation SA | 9 | 13,731 | ||||||
Dassault Systemes SE | 74 | 7,280 | ||||||
Edenred | 558 | 15,073 | ||||||
Eiffage SA | 196 | 20,226 | ||||||
Electricite de France SA | 110 | 1,164 | ||||||
Engie SA | 305 | 5,084 | ||||||
Essilor International SA | 54 | 6,808 | ||||||
Euler Hermes Group | 99 | 11,742 | ||||||
Eurazeo SA | 54 | 4,461 | ||||||
Faurecia | 153 | 8,887 | ||||||
Fonciere Des Regions REIT | 66 | 6,518 | ||||||
Gecina SA REIT | 162 | 25,212 | ||||||
Groupe Eurotunnel SE | 154 | 1,834 | ||||||
Hermes International | 19 | 10,036 | ||||||
Imerys SA | 107 | 9,401 | ||||||
Ingenico Group SA | 31 | 3,074 | ||||||
Ipsen SA | 196 | 26,297 | ||||||
JCDecaux SA | 42 | 1,373 | ||||||
Kering | 33 | 12,370 | ||||||
Klepierre SA REIT | 217 | 8,733 | ||||||
Lagardere SCA | 482 | 15,467 | ||||||
Legrand SA | 351 | 24,571 | ||||||
L’Oreal SA | 20 | 4,217 | ||||||
LVMH Moet Hennessy Louis Vuitton SE | 22 | 5,761 | ||||||
Orange SA | 822 | 13,951 | ||||||
Orpea | 66 | 7,988 | ||||||
Pernod Ricard SA | 32 | 4,368 | ||||||
Publicis Groupe SA | 65 | 4,382 | ||||||
Remy Cointreau SA | 44 | 5,018 | ||||||
Renault SA | 11 | 972 | ||||||
Rexel SA | 1,755 | 26,186 | ||||||
Safran SA | 186 | 18,042 | ||||||
Sanofi | 31 | 3,010 | ||||||
Sartorius Stedim Biotech | 42 | 3,073 | ||||||
Schneider Electric SE* | 197 | 15,863 | ||||||
SCOR SE | 263 | 11,006 | ||||||
SEB SA | 132 | 23,948 | ||||||
Societe BIC SA | 53 | 6,361 | ||||||
Societe Generale SA | 19 | 1,062 | ||||||
Sodexo SA | 195 | 22,727 | ||||||
Suez | 571 | 10,818 | ||||||
Teleperformance | 85 | 11,682 | ||||||
Thales SA | 218 | 24,104 | ||||||
TOTAL SA | 33 | 1,705 | ||||||
Unibail-Rodamco SE REIT | 65 | 16,503 | ||||||
Valeo SA | 538 | 35,934 | ||||||
Veolia Environnement SA | 319 | 7,475 | ||||||
Vinci SA | 187 | 17,197 | ||||||
Vivendi SA | 362 | 8,296 | ||||||
Zodiac Aerospace | 173 | 4,999 | ||||||
|
| |||||||
| 883,571 | ||||||||
|
| |||||||
| Germany — 5.3% | ||||||||
adidas AG | 109 | 24,434 | ||||||
Allianz SE | 20 | 4,274 | ||||||
Number | Value | |||||||
| Germany (Continued) | ||||||||
Axel Springer SE | 63 | $ | 3,895 | |||||
BASF SE | 65 | 6,288 | ||||||
Bayer AG | 32 | 4,090 | ||||||
Bayerische Motoren Werke AG | 21 | 1,947 | ||||||
Beiersdorf AG | 65 | 6,930 | ||||||
Brenntag AG | 284 | 15,030 | ||||||
CECONOMY AG | 845 | 9,245 | ||||||
Continental AG | 32 | 7,211 | ||||||
Covestro AG, 144A | 230 | 18,050 | ||||||
Daimler AG | 32 | 2,330 | ||||||
Deutsche Lufthansa AG | 514 | 12,876 | ||||||
Deutsche Post AG | 932 | 38,610 | ||||||
Deutsche Telekom AG | 228 | 4,109 | ||||||
Deutsche Wohnen AG | 1,876 | 79,580 | ||||||
E.ON SE | 2,602 | 29,373 | ||||||
Evonik Industries AG | 803 | 25,996 | ||||||
Fielmann AG | 66 | 5,472 | ||||||
Fraport AG Frankfurt Airport Services Worldwide | 132 | 13,008 | ||||||
Fresenius Medical Care AG & Co. KGaA | 65 | 6,066 | ||||||
Fresenius SE & Co. KGaA | 87 | 7,353 | ||||||
FUCHS PETROLUB SE | 162 | 7,847 | ||||||
GEA Group AG | 162 | 7,126 | ||||||
Hannover Rueck SE | 76 | 9,198 | ||||||
HeidelbergCement AG | 120 | 11,506 | ||||||
Hella KGaA Hueck & Co. | 120 | 6,620 | ||||||
Henkel AG & Co. KGaA | 33 | 3,990 | ||||||
HOCHTIEF AG | 107 | 18,834 | ||||||
HUGO BOSS AG | 294 | 24,856 | ||||||
Infineon Technologies AG | 1,000 | 23,029 | ||||||
Innogy SE, 144A | 229 | 10,080 | ||||||
K+S AG | 372 | 8,854 | ||||||
KION Group AG | 154 | 14,028 | ||||||
LANXESS AG | 340 | 25,325 | ||||||
LEG Immobilien AG | 52 | 5,249 | ||||||
Linde AG | 140 | 26,806 | ||||||
MAN SE | 33 | 3,700 | ||||||
Merck KGaA | 65 | 7,130 | ||||||
METRO AG* | 845 | 16,496 | ||||||
MTU Aero Engines AG | 361 | 50,473 | ||||||
Muenchener Rueckversicherungs-Gesellschaft AG in Muenchen | 32 | 6,597 | ||||||
OSRAM Licht AG | 140 | 11,482 | ||||||
ProSiebenSat.1 Media SE | 208 | 6,969 | ||||||
Rational AG | 1 | 649 | ||||||
RWE AG* | 1,416 | 35,277 | ||||||
SAP SE | 22 | 2,304 | ||||||
Siemens AG | 53 | 6,919 | ||||||
Suedzucker AG | 163 | 3,461 | ||||||
Symrise AG | 120 | 8,760 | ||||||
Talanx AG | 55 | 2,273 | ||||||
Telefonica Deutschland Holding AG | 286 | 1,546 | ||||||
thyssenkrupp AG | 395 | 11,830 | ||||||
TUI AG | 2,120 | 35,731 | ||||||
Uniper SE | 1,690 | 42,023 | ||||||
United Internet AG | 129 | 7,645 | ||||||
Vonovia SE | 261 | 11,017 | ||||||
| See Notes to Financial Statements. | 15 |
DBX ETF Trust
Schedule of Investments
Deutsche X-trackers FTSE Developed ex US Comprehensive Factor ETF (Continued)
August 31, 2017
Number | Value | |||||||
| Germany (Continued) | ||||||||
Wacker Chemie AG (a) | 41 | $ | 5,247 | |||||
Wirecard AG | 186 | 15,836 | ||||||
Zalando SE, 144A* | 22 | 1,041 | ||||||
|
| |||||||
| 823,921 | ||||||||
|
| |||||||
| Hong Kong — 4.2% | ||||||||
AIA Group Ltd. | 374 | 2,870 | ||||||
ASM Pacific Technology Ltd. | 187 | 2,313 | ||||||
Bank of East Asia Ltd. | 656 | 3,005 | ||||||
BOC Hong Kong Holdings Ltd. | 659 | 3,355 | ||||||
Cafe de Coral Holdings Ltd. | 4,120 | 13,108 | ||||||
Cathay Pacific Airways Ltd. | 810 | 1,203 | ||||||
Champion REIT | 27,213 | 20,028 | ||||||
Cheung Kong Property Holdings Ltd. | 1,558 | 13,676 | ||||||
China Travel International Investment Hong Kong Ltd. | 4,328 | 1,355 | ||||||
Chow Tai Fook Jewellery Group Ltd. | 7,084 | 7,313 | ||||||
CK Hutchison Holdings Ltd. | 383 | 5,011 | ||||||
CK Infrastructure Holdings Ltd. | 196 | 1,776 | ||||||
CLP Holdings Ltd. | 2,044 | 21,585 | ||||||
Dah Sing Financial Holdings Ltd. | 175 | 1,269 | ||||||
First Pacific Co. Ltd. | 6,818 | 5,479 | ||||||
Galaxy Entertainment Group Ltd. | 219 | 1,374 | ||||||
Great Eagle Holdings Ltd. | 1,810 | 9,898 | ||||||
Hang Lung Group Ltd. | 2,943 | 11,093 | ||||||
Hang Lung Properties Ltd. | 4,164 | 10,130 | ||||||
Hang Seng Bank Ltd. | 109 | 2,507 | ||||||
Henderson Land Development Co. Ltd. | 1,933 | 11,979 | ||||||
Hong Kong & China Gas Co. Ltd. | 6,283 | 11,881 | ||||||
Hong Kong Exchanges & Clearing Ltd. | 108 | 2,948 | ||||||
Hongkong Land Holdings Ltd. | 4,100 | 30,381 | ||||||
Hopewell Highway Infrastructure Ltd. | 11,612 | 7,122 | ||||||
Hopewell Holdings Ltd. | 6,450 | 25,342 | ||||||
Hysan Development Co. Ltd. | 1,075 | 4,972 | ||||||
I-CABLE Communications Ltd.* | 2,348 | 87 | ||||||
Johnson Electric Holdings Ltd. | 835 | 3,073 | ||||||
Kerry Logistics Network Ltd. | 2,019 | 2,879 | ||||||
Kerry Properties Ltd. | 5,121 | 20,284 | ||||||
Li & Fung Ltd. | 5,490 | 2,476 | ||||||
Lifestyle International Holdings Ltd. | 3,262 | 4,326 | ||||||
Link REIT | 15,063 | 124,331 | ||||||
MTR Corp. Ltd. | 989 | 5,781 | ||||||
New World Development Co. Ltd. | 6,790 | 9,283 | ||||||
NWS Holdings Ltd. | 10,412 | 20,009 | ||||||
Orient Overseas International Ltd. | 682 | 6,309 | ||||||
PCCW Ltd. | 9,227 | 5,140 | ||||||
Power Assets Holdings Ltd. | 1,163 | 10,253 | ||||||
Sa Sa International Holdings Ltd. | 9,183 | 3,356 | ||||||
Shangri-La Asia Ltd. | 2,448 | 4,097 | ||||||
Shun Tak Holdings Ltd.* | 1,390 | 600 | ||||||
Sino Land Co. Ltd. | 8,569 | 14,825 | ||||||
SJM Holdings Ltd. | 8,624 | 7,526 | ||||||
Sun Art Retail Group Ltd. | 16,706 | 15,390 | ||||||
Sun Hung Kai Properties Ltd. | 803 | 13,400 | ||||||
Swire Pacific Ltd., Class A | 1,415 | 14,400 | ||||||
Swire Properties Ltd. | 2,406 | 8,331 | ||||||
Techtronic Industries Co. Ltd. | 1,393 | 7,208 | ||||||
Number | Value | |||||||
| Hong Kong (Continued) | ||||||||
Television Broadcasts Ltd. | 1,526 | $ | 5,099 | |||||
Towngas China Co. Ltd.* | 4,491 | 3,041 | ||||||
VTech Holdings Ltd. | 977 | 13,732 | ||||||
WH Group Ltd., 144A | 7,284 | 7,613 | ||||||
Wharf Holdings Ltd. | 1,812 | 17,260 | ||||||
Wheelock & Co. Ltd. | 3,262 | 24,403 | ||||||
Xinyi Glass Holdings Ltd.* | 16,411 | 16,356 | ||||||
Yue Yuen Industrial Holdings Ltd. | 4,218 | 18,270 | ||||||
|
| |||||||
| 642,111 | ||||||||
|
| |||||||
| Ireland — 1.0% | ||||||||
CRH PLC | 1,209 | 42,296 | ||||||
DCC PLC | 239 | 21,696 | ||||||
Glanbia PLC | 297 | 5,547 | ||||||
James Hardie Industries PLC CDI | 901 | 12,642 | ||||||
Kerry Group PLC, Class A | 87 | 8,092 | ||||||
Kingspan Group PLC | 624 | 24,111 | ||||||
Paddy Power Betfair PLC | 66 | 5,796 | ||||||
Ryanair Holdings PLC* | 95 | 2,016 | ||||||
Smurfit Kappa Group PLC | 1,097 | 33,388 | ||||||
|
| |||||||
| 155,584 | ||||||||
|
| |||||||
| Israel — 1.2% | ||||||||
Airport City Ltd.* | 298 | 3,826 | ||||||
Alony Hetz Properties & Investments Ltd. | 866 | 8,982 | ||||||
Amot Investments Ltd. | 1,472 | 7,921 | ||||||
Azrieli Group Ltd. | 98 | 5,648 | ||||||
Bank Hapoalim BM | 2,075 | 13,960 | ||||||
Bank Leumi Le-Israel BM | 3,369 | 17,640 | ||||||
Bezeq The Israeli Telecommunication Corp. Ltd. | 3,463 | 5,098 | ||||||
Delek Automotive Systems Ltd. | 506 | 3,818 | ||||||
Elbit Systems Ltd. | 262 | 36,050 | ||||||
First International Bank of Israel Ltd. | 98 | 1,790 | ||||||
Frutarom Industries Ltd. | 42 | 3,223 | ||||||
Gazit-Globe Ltd. | 264 | 2,570 | ||||||
Harel Insurance Investments & Financial Services Ltd. | 613 | 3,770 | ||||||
Israel Chemicals Ltd. | 2,054 | 8,854 | ||||||
Israel Corp. Ltd.* | 20 | 3,816 | ||||||
Israel Discount Bank Ltd., Class A* | 2,844 | 7,087 | ||||||
Melisron Ltd. | 143 | 7,236 | ||||||
Mizrahi Tefahot Bank Ltd. | 954 | 16,991 | ||||||
Nice Ltd. | 253 | 19,582 | ||||||
Oil Refineries Ltd. | 2,460 | 1,143 | ||||||
Paz Oil Co. Ltd. | 33 | 5,246 | ||||||
Shikun & Binui Ltd. | 122 | 281 | ||||||
Strauss Group Ltd. | 253 | 4,672 | ||||||
Tower Semiconductor Ltd.* | 76 | 2,246 | ||||||
|
| |||||||
| 191,450 | ||||||||
|
| |||||||
| Italy — 1.1% | ||||||||
Assicurazioni Generali SpA | 184 | 3,290 | ||||||
Atlantia SpA | 184 | 5,906 | ||||||
Buzzi Unicem SpA | 87 | 2,127 | ||||||
Buzzi Unicem SpA-RSP | 142 | 1,920 | ||||||
Davide Campari-Milano SpA | 834 | 6,029 | ||||||
Enel SpA | 2,788 | 16,855 | ||||||
| See Notes to Financial Statements. | 16 |
DBX ETF Trust
Schedule of Investments
Deutsche X-trackers FTSE Developed ex US Comprehensive Factor ETF (Continued)
August 31, 2017
Number | Value | |||||||
| Italy (Continued) | ||||||||
Eni SpA | 131 | $ | 2,051 | |||||
Ferrari NV | 186 | 21,251 | ||||||
Italgas SpA | 2,175 | 12,267 | ||||||
Leonardo SpA | 164 | 2,771 | ||||||
Luxottica Group SpA | 31 | 1,782 | ||||||
Moncler SpA | 404 | 11,465 | ||||||
Parmalat SpA | 2,164 | 7,924 | ||||||
Poste Italiane SpA, 144A | 164 | 1,190 | ||||||
PRADA SpA | 493 | 1,792 | ||||||
Prysmian SpA | 1,286 | 40,394 | ||||||
Recordati SpA | 438 | 18,736 | ||||||
Salvatore Ferragamo SpA | 52 | 1,492 | ||||||
Snam SpA | 2,942 | 14,306 | ||||||
Terna Rete Elettrica Nazionale SpA | 305 | 1,799 | ||||||
|
| |||||||
| 175,347 | ||||||||
|
| |||||||
| Japan — 25.5% | ||||||||
Advantest Corp. | 100 | 1,665 | ||||||
Aeon Co. Ltd. (a) | 1,000 | 14,737 | ||||||
Aeon Mall Co. Ltd. | 100 | 1,795 | ||||||
Air Water, Inc. | 1,100 | 20,269 | ||||||
Aisin Seiki Co. Ltd. | 1,100 | 55,270 | ||||||
Ajinomoto Co., Inc. | 100 | 1,973 | ||||||
Alfresa Holdings Corp. | 700 | 13,159 | ||||||
Amada Holdings Co. Ltd. | 900 | 9,870 | ||||||
ANA Holdings, Inc. | 1,000 | 3,705 | ||||||
Aoyama Trading Co. Ltd. | 100 | 3,662 | ||||||
Aozora Bank Ltd. | 1,000 | 3,780 | ||||||
Asahi Glass Co. Ltd. | 200 | 7,796 | ||||||
Asahi Group Holdings Ltd. | 100 | 4,351 | ||||||
Asahi Kasei Corp. | 8,000 | 95,730 | ||||||
Asics Corp. | 100 | 1,506 | ||||||
Astellas Pharma, Inc. | 1,100 | 13,827 | ||||||
Autobacs Seven Co. Ltd. | 900 | 14,834 | ||||||
Azbil Corp. | 900 | 37,452 | ||||||
Bandai Namco Holdings, Inc. | 900 | 30,134 | ||||||
Benesse Holdings, Inc. | 100 | 3,843 | ||||||
Bic Camera, Inc. | 1,000 | 11,912 | ||||||
Bridgestone Corp. | 100 | 4,288 | ||||||
Canon Marketing Japan, Inc. | 900 | 20,631 | ||||||
Canon, Inc. | 100 | 3,502 | ||||||
Chubu Electric Power Co., Inc. | 900 | 11,751 | ||||||
Chugai Pharmaceutical Co. Ltd. | 100 | 4,061 | ||||||
Chugoku Bank Ltd. | 100 | 1,347 | ||||||
Citizen Watch Co. Ltd. | 900 | 6,370 | ||||||
Coca-Cola Bottlers Japan, Inc. | 175 | 5,994 | ||||||
COMSYS Holdings Corp. | 1,100 | 23,627 | ||||||
Concordia Financial Group Ltd. | 3,000 | 14,335 | ||||||
Cosmo Energy Holdings Co. Ltd. | 100 | 2,067 | ||||||
Dai Nippon Printing Co. Ltd. | 1,000 | 11,794 | ||||||
Daicel Corp. | 1,000 | 12,729 | ||||||
Daifuku Co. Ltd. | 100 | 4,348 | ||||||
Dai-ichi Life Holdings, Inc. | 100 | 1,608 | ||||||
Daiichi Sankyo Co. Ltd. | 600 | 14,169 | ||||||
Daikin Industries Ltd. | 100 | 9,990 | ||||||
Daikyo, Inc. | 1,000 | 1,953 | ||||||
Daito Trust Construction Co. Ltd. | 100 | 17,704 | ||||||
Number | Value | |||||||
| Japan (Continued) | ||||||||
Daiwa House Industry Co. Ltd. | 100 | $ | 3,495 | |||||
Denka Co. Ltd. | 2,000 | 12,702 | ||||||
Denso Corp. | 900 | 43,634 | ||||||
DIC Corp. | 900 | 31,769 | ||||||
Disco Corp. | 11 | 1,970 | ||||||
Don Quijote Holdings Co. Ltd. | 100 | 3,793 | ||||||
Ebara Corp. | 100 | 3,094 | ||||||
Electric Power Development Co. Ltd. | 100 | 2,735 | ||||||
Exedy Corp. | 900 | 26,944 | ||||||
Ezaki Glico Co. Ltd. | 100 | 5,306 | ||||||
FamilyMart UNY Holdings Co. Ltd. (a) | 369 | 19,982 | ||||||
FP Corp. | 100 | 5,170 | ||||||
Fuji Electric Co. Ltd. | 9,000 | 49,555 | ||||||
FUJIFILM Holdings Corp. | 100 | 3,927 | ||||||
Fujikura Ltd. | 2,100 | 17,058 | ||||||
Fujitsu Ltd. | 1,000 | 7,406 | ||||||
Furukawa Electric Co. Ltd. | 900 | 48,737 | ||||||
Glory Ltd. | 100 | 3,398 | ||||||
Gunma Bank Ltd. | 900 | 5,266 | ||||||
H2O Retailing Corp. | 100 | 1,803 | ||||||
Hachijuni Bank Ltd. | 900 | 5,479 | ||||||
Hakuhodo DY Holdings, Inc. | 2,200 | 29,924 | ||||||
Hamamatsu Photonics KK | 100 | 3,094 | ||||||
Hankyu Hanshin Holdings, Inc. | 100 | 3,807 | ||||||
Haseko Corp. | 100 | 1,237 | ||||||
Heiwa Corp. | 400 | 7,967 | ||||||
Hino Motors Ltd. | 900 | 10,328 | �� | |||||
Hirose Electric Co. Ltd. | 100 | 13,829 | ||||||
Hitachi Chemical Co. Ltd. | 1,100 | 29,744 | ||||||
Hitachi Construction Machinery Co. Ltd. | 900 | 25,391 | ||||||
Hitachi High-Technologies Corp. | 100 | 3,566 | ||||||
Hitachi Kokusai Electric, Inc. | 100 | 2,539 | ||||||
Hitachi Ltd. | 1,000 | 6,878 | ||||||
Hitachi Metals Ltd. | 1,100 | 14,682 | ||||||
Hitachi Transport System Ltd. | 100 | 2,414 | ||||||
Hokuhoku Financial Group, Inc. | 100 | 1,535 | ||||||
Honda Motor Co. Ltd. | 100 | 2,799 | ||||||
Horiba Ltd. | 100 | 6,124 | ||||||
House Foods Group, Inc. | 900 | 27,353 | ||||||
Hoya Corp. | 200 | 11,439 | ||||||
Ibiden Co. Ltd. | 900 | 14,891 | ||||||
Idemitsu Kosan Co. Ltd. | 600 | 14,643 | ||||||
Iida Group Holdings Co. Ltd. | 100 | 1,698 | ||||||
Inpex Corp. | 400 | 3,820 | ||||||
Isetan Mitsukoshi Holdings Ltd. | 900 | 9,257 | ||||||
Isuzu Motors Ltd. | 1,100 | 14,372 | ||||||
Ito En Ltd. | 100 | 3,680 | ||||||
ITOCHU Corp. | 1,100 | 17,950 | ||||||
Itochu Techno-Solutions Corp. | 800 | 29,729 | ||||||
Itoham Yonekyu Holdings, Inc. | 2,100 | 18,852 | ||||||
Iyo Bank Ltd. | 100 | 757 | ||||||
Izumi Co. Ltd. | 100 | 5,233 | ||||||
J. Front Retailing Co. Ltd. | 900 | 12,552 | ||||||
JFE Holdings, Inc. | 100 | 1,973 | ||||||
JSR Corp. | 1,600 | 31,139 | ||||||
JTEKT Corp. | 100 | 1,337 | ||||||
JXTG Holdings, Inc. | 11,050 | 53,453 | ||||||
| See Notes to Financial Statements. | 17 |
DBX ETF Trust
Schedule of Investments
Deutsche X-trackers FTSE Developed ex US Comprehensive Factor ETF (Continued)
August 31, 2017
Number | Value | |||||||
| Japan (Continued) | ||||||||
Kagome Co. Ltd. | 1,000 | $ | 31,528 | |||||
Kajima Corp. | 1,000 | 9,168 | ||||||
Kamigumi Co. Ltd. | 1,000 | 11,058 | ||||||
Kandenko Co. Ltd. | 8,000 | 85,626 | ||||||
Kansai Electric Power Co., Inc. | 900 | 12,593 | ||||||
Kansai Paint Co. Ltd. | 1,000 | 25,341 | ||||||
Kao Corp. | 100 | 6,235 | ||||||
Kawasaki Kisen Kaisha Ltd.* | 1,000 | 2,708 | ||||||
Keisei Electric Railway Co. Ltd. | 100 | 2,721 | ||||||
Kewpie Corp. | 200 | 4,788 | ||||||
Kinden Corp. | 1,000 | 16,318 | ||||||
Kintetsu Group Holdings Co. Ltd. | 1,000 | 3,771 | ||||||
Kirin Holdings Co. Ltd. | 1,100 | 24,951 | ||||||
Kissei Pharmaceutical Co. Ltd. | 100 | 2,532 | ||||||
Koito Manufacturing Co. Ltd. | 100 | 6,224 | ||||||
Komatsu Ltd. | 1,000 | 27,031 | ||||||
Komeri Co. Ltd. | 100 | 2,903 | ||||||
Konami Holdings Corp. | 800 | 41,650 | ||||||
Konica Minolta, Inc. | 100 | 798 | ||||||
K’s Holdings Corp. | 900 | 20,100 | ||||||
Kubota Corp. | 900 | 15,570 | ||||||
Kuraray Co. Ltd. | 4,300 | 81,577 | ||||||
Kurita Water Industries Ltd. | 900 | 25,881 | ||||||
Kyocera Corp. | 900 | 53,971 | ||||||
KYORIN Holdings, Inc. | 100 | 2,099 | ||||||
Kyushu Electric Power Co., Inc. | 100 | 1,174 | ||||||
Kyushu Financial Group, Inc. | 1,000 | 6,088 | ||||||
Kyushu Railway Co. | 26 | 813 | ||||||
Lintec Corp. | 900 | 24,058 | ||||||
Lion Corp. | 1,006 | 19,981 | ||||||
M3, Inc. | 100 | 2,596 | ||||||
Mabuchi Motor Co. Ltd. | 100 | 4,716 | ||||||
Makita Corp. | 800 | 32,092 | ||||||
Marubeni Corp. | 5,200 | 33,800 | ||||||
Maruichi Steel Tube Ltd. | 900 | 26,617 | ||||||
Mazda Motor Corp. | 100 | 1,471 | ||||||
Mebuki Financial Group, Inc. | 100 | 354 | ||||||
Medipal Holdings Corp. | 100 | 1,762 | ||||||
MINEBEA MITSUMI, Inc. | 100 | 1,642 | ||||||
MISUMI Group, Inc. | 1,000 | 25,631 | ||||||
Mitsubishi Chemical Holdings Corp. | 5,200 | 48,334 | ||||||
Mitsubishi Corp. | 900 | 20,799 | ||||||
Mitsubishi Electric Corp. | 1,100 | 16,261 | ||||||
Mitsubishi Gas Chemical Co., Inc. | 2,000 | 49,591 | ||||||
Mitsubishi Materials Corp. | 100 | 3,584 | ||||||
Mitsubishi Shokuhin Co. Ltd. | 100 | 2,998 | ||||||
Mitsubishi Tanabe Pharma Corp. | 900 | 22,079 | ||||||
Mitsubishi UFJ Financial Group, Inc. | 100 | 612 | ||||||
Mitsubishi UFJ Lease & Finance Co. Ltd. | 900 | 4,547 | ||||||
Mitsui & Co. Ltd. | 1,000 | 14,942 | ||||||
Mitsui Chemicals, Inc. | 1,000 | 5,979 | ||||||
Mitsui Engineering & Shipbuilding Co. Ltd. | 1,000 | 1,254 | ||||||
Mitsui OSK Lines Ltd. | 1,000 | 3,207 | ||||||
Miura Co. Ltd. | 100 | 2,253 | ||||||
Mizuho Financial Group, Inc. | 2,000 | 3,436 | ||||||
MS&AD Insurance Group Holdings, Inc. | 100 | 3,297 | ||||||
Number | Value | |||||||
| Japan (Continued) | ||||||||
Nabtesco Corp. | 100 | $ | 3,494 | |||||
Nagase & Co. Ltd. | 2,100 | 35,089 | ||||||
Nagoya Railroad Co. Ltd. | 1,000 | 4,470 | ||||||
NGK Insulators Ltd. | 100 | 1,865 | ||||||
NGK Spark Plug Co. Ltd. | 800 | 15,228 | ||||||
NHK Spring Co. Ltd. | 1,500 | 14,978 | ||||||
Nichirei Corp. | 100 | 2,641 | ||||||
Nihon Kohden Corp. | 100 | 2,317 | ||||||
Nihon M&A Center, Inc. | 900 | 41,623 | ||||||
Nikon Corp. | 900 | 14,826 | ||||||
Nippo Corp. | 1,000 | 19,807 | ||||||
Nippon Express Co. Ltd. | 1,000 | 6,896 | ||||||
Nippon Kayaku Co. Ltd. | 2,000 | 32,055 | ||||||
Nippon Paint Holdings Co. Ltd. | 100 | 3,407 | ||||||
Nippon Paper Industries Co. Ltd. | 100 | 1,913 | ||||||
Nippon Shokubai Co. Ltd. | 900 | 64,110 | ||||||
Nippon Steel & Sumitomo Metal Corp. | 900 | 21,461 | ||||||
Nippon Yusen KK* | 1,000 | 1,981 | ||||||
Nissan Chemical Industries Ltd. | 1,000 | 33,482 | ||||||
Nissan Motor Co. Ltd. | 400 | 3,972 | ||||||
Nisshin Seifun Group, Inc. | 900 | 15,627 | ||||||
Nisshinbo Holdings, Inc. | 100 | 1,059 | ||||||
Nissin Foods Holdings Co. Ltd. | 100 | 6,160 | ||||||
Nitori Holdings Co. Ltd. | 100 | 15,428 | ||||||
Nitto Denko Corp. | 100 | 8,812 | ||||||
NOK Corp. | 700 | 15,735 | ||||||
Nomura Holdings, Inc. | 300 | 1,670 | ||||||
Nomura Real Estate Holdings, Inc. | 100 | 2,063 | ||||||
Nomura Research Institute Ltd. | 810 | 31,499 | ||||||
NS Solutions Corp. | 100 | 2,145 | ||||||
NSK Ltd. | 1,000 | 11,857 | ||||||
NTT DOCOMO, Inc. | 100 | 2,320 | ||||||
Obayashi Corp. | 1,100 | 12,963 | ||||||
Oji Holdings Corp. | 8,000 | 41,941 | ||||||
Omron Corp. | 900 | 45,139 | ||||||
Oracle Corp. | 100 | 7,387 | ||||||
ORIX Corp. | 100 | 1,599 | ||||||
Osaka Gas Co. Ltd. | 11,000 | 42,987 | ||||||
OSG Corp. | 100 | 2,104 | ||||||
Otsuka Corp. | 100 | 6,615 | ||||||
Otsuka Holdings Co. Ltd. | 100 | 4,024 | ||||||
Panasonic Corp. | 900 | 11,984 | ||||||
Park24 Co. Ltd. | 200 | 4,803 | ||||||
Persol Holdings Co. Ltd. | 900 | 18,268 | ||||||
Pigeon Corp. | 100 | 3,866 | ||||||
Recruit Holdings Co. Ltd. | 900 | 17,917 | ||||||
Rengo Co. Ltd. | 1,000 | 5,770 | ||||||
Resona Holdings, Inc. | 2,100 | 10,468 | ||||||
Rohm Co. Ltd. | 100 | 7,778 | ||||||
Rohto Pharmaceutical Co. Ltd. | 100 | 2,319 | ||||||
San-In Godo Bank Ltd. | 100 | 830 | ||||||
Sankyo Co. Ltd. | 100 | 3,262 | ||||||
Santen Pharmaceutical Co. Ltd. | 900 | 13,951 | ||||||
Sanwa Holdings Corp. | 2,000 | 22,279 | ||||||
Sapporo Holdings Ltd. | 100 | 2,903 | ||||||
Secom Co. Ltd. | 100 | 7,416 | ||||||
Sega Sammy Holdings, Inc. | 100 | 1,436 | ||||||
| See Notes to Financial Statements. | 18 |
DBX ETF Trust
Schedule of Investments
Deutsche X-trackers FTSE Developed ex US Comprehensive Factor ETF (Continued)
August 31, 2017
Number | Value | |||||||
| Japan (Continued) | ||||||||
Seibu Holdings, Inc. | 100 | $ | 1,718 | |||||
Seiko Epson Corp. | 100 | 2,563 | ||||||
Seino Holdings Co. Ltd. | 1,000 | 13,583 | ||||||
Sekisui Chemical Co. Ltd. | 2,200 | 40,978 | ||||||
Sekisui House Ltd. | 100 | 1,730 | ||||||
Senshu Ikeda Holdings, Inc. | 900 | 3,353 | ||||||
Seven & i Holdings Co. Ltd. | 100 | 3,966 | ||||||
Shiga Bank Ltd. | 1,000 | 5,261 | ||||||
Shimachu Co. Ltd. | 900 | 23,183 | ||||||
Shimadzu Corp. | 100 | 1,836 | ||||||
Shimamura Co. Ltd. | 100 | 12,193 | ||||||
Shimizu Corp. | 2,200 | 22,708 | ||||||
Shin-Etsu Chemical Co. Ltd. | 100 | 8,835 | ||||||
Shinsei Bank Ltd. | 1,000 | 1,599 | ||||||
Shiseido Co. Ltd. | 100 | 4,142 | ||||||
Showa Denko KK | 900 | 23,886 | ||||||
Showa Shell Sekiyu KK | 900 | 9,854 | ||||||
Skylark Co. Ltd. | 100 | 1,466 | ||||||
Sojitz Corp. | 3,000 | 8,041 | ||||||
Sompo Holdings, Inc. | 100 | 3,757 | ||||||
Sony Corp. | 100 | 3,941 | ||||||
Sony Financial Holdings, Inc. | 100 | 1,583 | ||||||
Stanley Electric Co. Ltd. | 900 | 29,847 | ||||||
Subaru Corp. | 100 | 3,504 | ||||||
Sugi Holdings Co. Ltd. | 100 | 5,279 | ||||||
Sumitomo Chemical Co. Ltd. | 1,000 | 5,988 | ||||||
Sumitomo Corp. | 3,200 | 45,255 | ||||||
Sumitomo Dainippon Pharma Co. Ltd. | 100 | 1,357 | ||||||
Sumitomo Electric Industries Ltd. | 3,200 | 50,067 | ||||||
Sumitomo Forestry Co. Ltd. | 600 | 9,344 | ||||||
Sumitomo Heavy Industries Ltd. | 1,000 | 7,450 | ||||||
Sumitomo Mitsui Financial Group, Inc. | 100 | 3,738 | ||||||
Sumitomo Osaka Cement Co. Ltd. | 1,000 | 4,479 | ||||||
Sumitomo Rubber Industries Ltd. | 1,000 | 16,564 | ||||||
Suruga Bank Ltd. | 100 | 2,137 | ||||||
Suzuken Co. Ltd. | 800 | 29,111 | ||||||
Suzuki Motor Corp. | 1,900 | 95,397 | ||||||
T&D Holdings, Inc. | 100 | 1,371 | ||||||
Tadano Ltd. | 100 | 1,167 | ||||||
Taiheiyo Cement Corp. | 9,000 | 34,672 | ||||||
Taisei Corp. | 1,000 | 10,022 | ||||||
Taiyo Nippon Sanso Corp. | 400 | 4,663 | ||||||
Taiyo Yuden Co. Ltd. | 100 | 1,511 | ||||||
Takara Holdings, Inc. | 100 | 969 | ||||||
TDK Corp. | 100 | 6,696 | ||||||
Teijin Ltd. | 1,000 | 20,280 | ||||||
Terumo Corp. | 100 | 3,861 | ||||||
THK Co. Ltd. | 100 | 3,335 | ||||||
TIS, Inc. | 100 | 2,948 | ||||||
Tobu Railway Co. Ltd. | 1,000 | 5,524 | ||||||
Toho Co. Ltd. | 100 | 3,712 | ||||||
Toho Gas Co. Ltd. | 5,000 | 32,937 | ||||||
Tohoku Electric Power Co., Inc. | 900 | 12,299 | ||||||
Tokai Rika Co. Ltd. | 100 | 1,885 | ||||||
Tokyo Broadcasting System Holdings, Inc. | 100 | 1,917 | ||||||
Tokyo Electron Ltd. | 113 | 15,873 | ||||||
Number | Value | |||||||
| Japan (Continued) | ||||||||
Tokyo Gas Co. Ltd. | 10,000 | $ | 52,989 | |||||
Toppan Printing Co. Ltd. | 1,000 | 10,004 | ||||||
Toray Industries, Inc. | 2,200 | 20,929 | ||||||
Tosoh Corp. | 1,000 | 11,721 | ||||||
TOTO Ltd. | 100 | 3,802 | ||||||
Toyo Seikan Group Holdings Ltd. | 100 | 1,647 | ||||||
Toyo Suisan Kaisha Ltd. | 100 | 3,693 | ||||||
Toyobo Co. Ltd. | 1,000 | 1,808 | ||||||
Toyoda Gosei Co. Ltd. | 1,000 | 23,287 | ||||||
Toyota Boshoku Corp. | 100 | 1,976 | ||||||
Toyota Industries Corp. | 100 | 5,324 | ||||||
Toyota Tsusho Corp. | 900 | 27,680 | ||||||
TS Tech Co. Ltd. | 100 | 3,126 | ||||||
Tsumura & Co. | 100 | 3,766 | ||||||
TV Asahi Holdings Corp. | 100 | 2,016 | ||||||
Ube Industries Ltd. | 10,000 | 28,530 | ||||||
Unicharm Corp. | 100 | 2,351 | ||||||
Ushio, Inc. | 100 | 1,357 | ||||||
USS Co. Ltd. | 900 | 17,671 | ||||||
Wacoal Holdings Corp. | 1,000 | 14,247 | ||||||
Welcia Holdings Co. Ltd. | 100 | 3,921 | ||||||
West Japan Railway Co. | 100 | 7,261 | ||||||
Yahoo Japan Corp. | 100 | 458 | ||||||
Yakult Honsha Co. Ltd. | 100 | 6,923 | ||||||
Yamada Denki Co. Ltd. | 900 | 4,866 | ||||||
Yamaha Corp. | 100 | 3,480 | ||||||
Yamaha Motor Co. Ltd. | 100 | 2,826 | ||||||
Yamato Holdings Co. Ltd. | 100 | 2,130 | ||||||
Yamato Kogyo Co. Ltd. | 100 | 2,826 | ||||||
Yamazaki Baking Co. Ltd. | 200 | 3,787 | ||||||
Yaskawa Electric Corp. | 900 | 27,231 | ||||||
Yokogawa Electric Corp. | 1,100 | 17,121 | ||||||
Yokohama Rubber Co. Ltd. | 100 | 1,849 | ||||||
Zensho Holdings Co. Ltd. | 900 | 17,066 | ||||||
Zeon Corp. | 2,000 | 25,186 | ||||||
|
| |||||||
| 3,950,046 | ||||||||
|
| |||||||
| Jersey Island — 0.0% | ||||||||
Randgold Resources Ltd. | 32 | 3,262 | ||||||
|
| |||||||
| Jordan — 0.0% | ||||||||
Hikma Pharmaceuticals PLC | 109 | 1,758 | ||||||
|
| |||||||
| Luxembourg — 0.1% | ||||||||
Eurofins Scientific SE | 10 | 5,708 | ||||||
L’Occitane International SA | 1,867 | 4,322 | ||||||
RTL Group SA | 96 | 7,276 | ||||||
SES SA | 96 | 2,192 | ||||||
Tenaris SA | 196 | 2,617 | ||||||
|
| |||||||
| 22,115 | ||||||||
|
| |||||||
| Macau — 0.0% | ||||||||
MGM China Holdings Ltd. | 812 | 1,627 | ||||||
Sands China Ltd. | 154 | 689 | ||||||
|
| |||||||
| 2,316 | ||||||||
|
| |||||||
| Netherlands — 1.8% | ||||||||
ABN AMRO Group NV, 144A | 64 | 1,791 | ||||||
Aegon NV | 253 | 1,443 | ||||||
| See Notes to Financial Statements. | 19 |
DBX ETF Trust
Schedule of Investments
Deutsche X-trackers FTSE Developed ex US Comprehensive Factor ETF (Continued)
August 31, 2017
Number | Value | |||||||
| Netherlands (Continued) | ||||||||
Akzo Nobel NV | 374 | $ | 34,149 | |||||
ASML Holding NV | 33 | 5,120 | ||||||
Boskalis Westminster | 594 | 19,385 | ||||||
EXOR NV | 748 | 47,933 | ||||||
Gemalto NV | 44 | 2,375 | ||||||
GrandVision NV, 144A | 43 | 1,056 | ||||||
Heineken Holding NV | 99 | 9,762 | ||||||
Heineken NV | 22 | 2,305 | ||||||
ING Groep NV | 162 | 2,870 | ||||||
Koninklijke Ahold Delhaize NV | 2,307 | 41,416 | ||||||
Koninklijke DSM NV (a) | 463 | 35,081 | ||||||
Koninklijke Philips NV | 605 | 22,859 | ||||||
Koninklijke Vopak NV | 74 | 3,128 | ||||||
NN Group NV | 196 | 7,768 | ||||||
QIAGEN NV* | 319 | 10,223 | ||||||
Randstad Holding NV | 154 | 8,991 | ||||||
Wolters Kluwer NV | 462 | 20,155 | ||||||
|
| |||||||
| 277,810 | ||||||||
|
| |||||||
| New Zealand — 1.3% | ||||||||
Air New Zealand Ltd. | 2,295 | 5,868 | ||||||
Auckland International Airport Ltd. | 547 | 2,660 | ||||||
Contact Energy Ltd. | 1,878 | 7,505 | ||||||
Fisher & Paykel Healthcare Corp. Ltd. | 1,231 | 10,377 | ||||||
Fletcher Building Ltd. | 12,501 | 73,058 | ||||||
Kiwi Property Group Ltd. | 26,025 | 25,163 | ||||||
Mercury NZ Ltd. | 2,119 | 5,221 | ||||||
Meridian Energy Ltd. | 2,129 | 4,498 | ||||||
Ryman Healthcare Ltd. | 2,175 | 14,144 | ||||||
SKY Network Television Ltd. | 2,834 | 5,764 | ||||||
SKYCITY Entertainment Group Ltd. | 934 | 2,542 | ||||||
Spark New Zealand Ltd. | 12,686 | 35,571 | ||||||
Vector Ltd. | 1,735 | 4,063 | ||||||
|
| |||||||
| 196,434 | ||||||||
|
| |||||||
| Norway — 1.2% | ||||||||
DNB ASA | 330 | 6,426 | ||||||
Gjensidige Forsikring ASA | 228 | 3,980 | ||||||
Marine Harvest ASA* | 2,571 | 50,925 | ||||||
Norsk Hydro ASA | 7,417 | 53,388 | ||||||
Orkla ASA | 2,031 | 20,793 | ||||||
Schibsted ASA, Class A | 33 | 800 | ||||||
Statoil ASA | 44 | 832 | ||||||
Telenor ASA | 690 | 13,933 | ||||||
Yara International ASA | 659 | 26,877 | ||||||
|
| |||||||
| 177,954 | ||||||||
|
| |||||||
| Portugal — 0.3% | ||||||||
EDP — Energias de Portugal SA | 3,505 | 13,439 | ||||||
Galp Energia SGPS SA | 505 | 8,351 | ||||||
Jeronimo Martins SGPS SA | 922 | 18,372 | ||||||
|
| |||||||
| 40,162 | ||||||||
|
| |||||||
| Russia — 0.0% | ||||||||
Polymetal International PLC | 198 | 2,257 | ||||||
United Co. RUSAL PLC | 1,832 | 1,264 | ||||||
|
| |||||||
| 3,521 | ||||||||
|
| |||||||
Number | Value | |||||||
| Singapore — 2.3% | ||||||||
Ascendas Real Estate Investment Trust REIT | 5,400 | $ | 10,577 | |||||
BOC Aviation Ltd., 144A | 911 | 4,831 | ||||||
CapitaLand Commercial Trust REIT | 6,600 | 8,457 | ||||||
CapitaLand Ltd. | 6,300 | 17,536 | ||||||
CapitaLand Mall Trust REIT | 5,400 | 8,629 | ||||||
City Developments Ltd. | 3,200 | 27,593 | ||||||
ComfortDelGro Corp. Ltd. | 6,400 | 10,792 | ||||||
DBS Group Holdings Ltd. | 100 | 1,518 | ||||||
Genting Singapore PLC | 6,500 | 5,672 | ||||||
Global Logistic Properties Ltd. | 9,800 | 23,381 | ||||||
Golden Agri-Resources Ltd. | 52,700 | 15,329 | ||||||
Hutchison Port Holdings Trust, Class U | 6,400 | 2,912 | ||||||
Jardine Cycle & Carriage Ltd. | 93 | 2,735 | ||||||
Keppel Corp. Ltd. | 3,300 | 15,334 | ||||||
M1 Ltd. | 1,900 | 2,504 | ||||||
Oversea-Chinese Banking Corp. Ltd. | 163 | 1,341 | ||||||
SATS Ltd. | 6,500 | 23,119 | ||||||
Sembcorp Industries Ltd. | 3,200 | 7,022 | ||||||
Sembcorp Marine Ltd. (a) | 1,100 | 1,288 | ||||||
SIA Engineering Co. Ltd. | 1,100 | 2,851 | ||||||
Singapore Airlines Ltd. | 2,100 | 15,943 | ||||||
Singapore Exchange Ltd. | 3,100 | 17,121 | ||||||
Singapore Post Ltd. | 2,200 | 2,041 | ||||||
Singapore Press Holdings Ltd. | 2,100 | 4,268 | ||||||
Singapore Technologies Engineering Ltd. | 5,200 | 13,976 | ||||||
Singapore Telecommunications Ltd. | 3,000 | 8,174 | ||||||
StarHub Ltd. | 2,200 | 4,228 | ||||||
Suntec Real Estate Investment Trust REIT | 4,400 | 6,140 | ||||||
UOL Group Ltd. | 1,916 | 11,541 | ||||||
Venture Corp. Ltd. | 5,200 | 60,501 | ||||||
Wilmar International Ltd. | 6,400 | 15,647 | ||||||
Yanlord Land Group Ltd. | 6,500 | 8,281 | ||||||
|
| |||||||
| 361,282 | ||||||||
|
| |||||||
| South Africa — 0.3% | ||||||||
Investec PLC | 195 | 1,483 | ||||||
Mondi PLC | 1,701 | 46,313 | ||||||
|
| |||||||
| 47,796 | ||||||||
|
| |||||||
| South Korea — 3.0% | ||||||||
BNK Financial Group, Inc. | 97 | 848 | ||||||
Cheil Worldwide, Inc. | 241 | 4,061 | ||||||
CJ CheilJedang Corp. | 19 | 6,108 | ||||||
Coway Co. Ltd. | 52 | 4,556 | ||||||
Daelim Industrial Co. Ltd. | 30 | 2,230 | ||||||
Daewoo Engineering & Construction Co. Ltd.* | 349 | 2,176 | ||||||
DGB Financial Group, Inc. | 253 | 2,468 | ||||||
Dongbu Insurance Co. Ltd. | 41 | 2,734 | ||||||
Doosan Corp. | 21 | 2,384 | ||||||
E-MART, Inc. | 66 | 13,111 | ||||||
GS Holdings Corp. | 151 | 9,454 | ||||||
Hana Financial Group, Inc. | 297 | 12,906 | ||||||
Hankook Tire Co. Ltd. | 175 | 9,157 | ||||||
Hanon Systems | 153 | 1,567 | ||||||
Hanwha Chemical Corp. | 99 | 3,104 | ||||||
| See Notes to Financial Statements. | 20 |
DBX ETF Trust
Schedule of Investments
Deutsche X-trackers FTSE Developed ex US Comprehensive Factor ETF (Continued)
August 31, 2017
Number | Value | |||||||
| South Korea (Continued) | ||||||||
Hanwha Corp. | 152 | $ | 6,625 | |||||
Hyosung Corp. | 22 | 3,092 | ||||||
Hyundai Development Co.-Engineering & Construction | 44 | 1,469 | ||||||
Hyundai Engineering & Construction Co. Ltd. | 197 | 7,102 | ||||||
Hyundai Glovis Co. Ltd. | 1 | 138 | ||||||
Hyundai Heavy Industries Co. Ltd.* | 9 | 1,185 | ||||||
Hyundai Marine & Fire Insurance Co. Ltd. | 74 | 3,032 | ||||||
Hyundai Mobis Co. Ltd. | 152 | 31,813 | ||||||
Hyundai Motor Co. | 32 | 3,987 | ||||||
Hyundai Steel Co. | 132 | 6,755 | ||||||
Industrial Bank of Korea | 110 | 1,458 | ||||||
Kangwon Land, Inc. | 99 | 3,029 | ||||||
KB Financial Group, Inc. | 263 | 12,921 | ||||||
Kia Motors Corp. | 152 | 4,779 | ||||||
Korea Electric Power Corp. | 44 | 1,674 | ||||||
Korea Gas Corp.* | 54 | 2,169 | ||||||
Korea Zinc Co. Ltd. | 9 | 4,119 | ||||||
KT Corp. | 44 | 1,218 | ||||||
KT&G Corp. | 242 | 24,573 | ||||||
Kumho Petrochemical Co. Ltd. | 41 | 2,865 | ||||||
LG Chem Ltd. | 19 | 6,386 | ||||||
LG Corp. | 55 | 4,097 | ||||||
LG Display Co. Ltd. | 305 | 8,426 | ||||||
LG Electronics, Inc. | 184 | 13,299 | ||||||
LG Household & Health Care Ltd. | 1 | 851 | ||||||
LG Uplus Corp. | 1,118 | 13,683 | ||||||
Lotte Chemical Corp. | 10 | 3,543 | ||||||
LOTTE Fine Chemical Co. Ltd. | 53 | 2,047 | ||||||
LS Corp. | 108 | 8,093 | ||||||
Mando Corp. | 75 | 15,930 | ||||||
NCSoft Corp. | 2 | 682 | ||||||
NongShim Co. Ltd. | 9 | 2,654 | ||||||
POSCO | 174 | 53,006 | ||||||
Posco Daewoo Corp. | 163 | 3,057 | ||||||
S-1 Corp. | 55 | 4,375 | ||||||
Samsung Biologics Co. Ltd., 144A* | 2 | 502 | ||||||
Samsung Electro-Mechanics Co. Ltd. | 41 | 3,672 | ||||||
Samsung Electronics Co. Ltd. | 9 | 18,485 | ||||||
Samsung Fire & Marine Insurance Co. Ltd. | 21 | 5,149 | ||||||
Samsung Life Insurance Co. Ltd. | 22 | 2,254 | ||||||
Samsung SDI Co. Ltd. | 66 | 11,501 | ||||||
Shinhan Financial Group Co. Ltd. | 175 | 8,070 | ||||||
Shinsegae Inc. | 10 | 1,712 | ||||||
SK Hynix, Inc. | 439 | 26,708 | ||||||
SK Innovation Co. Ltd. | 53 | 8,860 | ||||||
SK Networks Co. Ltd. | 263 | 1,635 | ||||||
SK Telecom Co. Ltd. | 66 | 14,838 | ||||||
SKC Co. Ltd. | 30 | 982 | ||||||
S-Oil Corp. | 86 | 9,572 | ||||||
Woori Bank | 550 | 9,072 | ||||||
|
| |||||||
| 464,008 | ||||||||
|
| |||||||
| Spain — 1.6% | ||||||||
Abertis Infraestructuras SA | 594 | 12,005 | ||||||
Number | Value | |||||||
| Spain (Continued) | ||||||||
Acciona SA | 32 | $ | 2,731 | |||||
Acerinox SA | 152 | 2,165 | ||||||
ACS Actividades de Construccion y Servicios SA | 426 | 16,086 | ||||||
Aena SA, 144A | 63 | 12,287 | ||||||
Amadeus IT Group SA | 462 | 28,601 | ||||||
Banco Santander SA | 239 | 1,551 | ||||||
Bankinter SA | 153 | 1,457 | ||||||
CaixaBank SA | 371 | 1,913 | ||||||
Corp. Financiera Alba SA | 319 | 19,077 | ||||||
Distribuidora Internacional de Alimentacion SA | 3,371 | 21,305 | ||||||
Enagas SA | 427 | 12,567 | ||||||
Endesa SA | 802 | 19,323 | ||||||
Ferrovial SA | 316 | 7,193 | ||||||
Gas Natural SDG SA | 492 | 11,944 | ||||||
Grifols SA | 109 | 3,078 | ||||||
Iberdrola SA | 1,649 | 13,451 | ||||||
Industria de Diseno Textil SA | 30 | 1,138 | ||||||
Mapfre SA | 911 | 3,220 | ||||||
Mediaset Espana Comunicacion SA | 558 | 6,462 | ||||||
Merlin Properties Socimi SA REIT | 1,140 | 15,688 | ||||||
Red Electrica Corp. SA | 492 | 11,035 | ||||||
Repsol SA | 825 | 14,154 | ||||||
Siemens Gamesa Renewable Energy SA | 97 | 1,447 | ||||||
Telefonica SA | 843 | 9,079 | ||||||
Zardoya Otis SA | 164 | 1,688 | ||||||
|
| |||||||
| 250,645 | ||||||||
|
| |||||||
| Sweden — 5.4% | ||||||||
Alfa Laval AB | 802 | 18,142 | ||||||
Assa Abloy AB, Class B | 591 | 12,760 | ||||||
Atlas Copco AB, Class A | 473 | 18,510 | ||||||
Atlas Copco AB, Class B | 283 | 10,086 | ||||||
Boliden AB | 977 | 34,133 | ||||||
Electrolux AB, Series B | 1,744 | 63,318 | ||||||
Essity AB, Class B* | 383 | 10,618 | ||||||
Fastighets AB Balder, Class B* | 494 | 12,993 | ||||||
Getinge AB, Class B (a) | 54 | 1,002 | ||||||
Hennes & Mauritz AB, Class B | 209 | 5,279 | ||||||
Hexagon AB, Class B | 338 | 16,562 | ||||||
Husqvarna AB, Class B | 2,096 | 21,112 | ||||||
ICA Gruppen AB (a) | 657 | 26,157 | ||||||
Industrivarden AB, Class A | 3,854 | 96,188 | ||||||
Industrivarden AB, Class C | 3,009 | 71,166 | ||||||
Investment AB Latour, Class B | 748 | 9,485 | ||||||
Investor AB, Class B | 2,846 | 132,905 | ||||||
L E Lundbergforetagen AB, Class B | 481 | 37,205 | ||||||
Lundin Petroleum AB* | 86 | 1,843 | ||||||
Nordea Bank AB | 176 | 2,364 | ||||||
Sandvik AB | 1,779 | 29,354 | ||||||
Securitas AB, Class B | 569 | 9,339 | ||||||
Skandinaviska Enskilda Banken AB, Class A | 407 | 5,289 | ||||||
Skanska AB, Class B | 239 | 5,391 | ||||||
SKF AB, Class B | 1,582 | 31,571 | ||||||
Svenska Cellulosa AB SCA, Class B | 383 | 3,189 | ||||||
| See Notes to Financial Statements. | 21 |
DBX ETF Trust
Schedule of Investments
Deutsche X-trackers FTSE Developed ex US Comprehensive Factor ETF (Continued)
August 31, 2017
Number | Value | |||||||
| Sweden (Continued) | ||||||||
Svenska Handelsbanken AB, Class A | 153 | $ | 2,284 | |||||
Swedbank AB, Class A | 275 | 7,423 | ||||||
Swedish Match AB | 1,780 | 63,372 | ||||||
Tele2 AB, Class B | 450 | 5,231 | ||||||
Telefonaktiebolaget LM Ericsson, Class B | 108 | 632 | ||||||
Telia Co. AB | 1,526 | 7,268 | ||||||
Trelleborg AB, Class B | 1,054 | 25,074 | ||||||
Volvo AB, Class B | 1,823 | 31,088 | ||||||
|
| |||||||
| 828,333 | ||||||||
|
| |||||||
| Switzerland — 4.1% | ||||||||
ABB Ltd. | 956 | 22,085 | ||||||
Adecco Group AG | 460 | 33,267 | ||||||
Aryzta AG* | 33 | 1,038 | ||||||
Baloise Holding AG | 53 | 8,422 | ||||||
Barry Callebaut AG* | 11 | 15,796 | ||||||
Cie Financiere Richemont SA | 187 | 16,686 | ||||||
Clariant AG* | 703 | 16,928 | ||||||
Coca-Cola HBC AG* | 756 | 25,756 | ||||||
DKSH Holding AG | 273 | 22,329 | ||||||
Dufry AG* | 11 | 1,692 | ||||||
EMS-Chemie Holding AG | 16 | 10,914 | ||||||
Ferguson PLC | 879 | 52,135 | ||||||
Flughafen Zurich AG | 55 | 13,450 | ||||||
Geberit AG | 54 | 24,617 | ||||||
Givaudan SA | 9 | 18,356 | ||||||
Helvetia Holding AG | 1 | 572 | ||||||
Julius Baer Group Ltd.* | 74 | 4,127 | ||||||
Kuehne + Nagel International AG | 107 | 19,340 | ||||||
Lonza Group AG* | 78 | 19,707 | ||||||
Nestle SA | 30 | 2,540 | ||||||
Novartis AG | 19 | 1,599 | ||||||
Pargesa Holding SA | 129 | 10,430 | ||||||
Partners Group Holding AG | 63 | 40,776 | ||||||
PSP Swiss Property AG | 53 | 4,853 | ||||||
Roche Holding AG | 9 | 2,280 | ||||||
Schindler Holding AG | 31 | 6,500 | ||||||
Schindler Holding AG Participation Certificates | 63 | 13,465 | ||||||
SGS SA | 9 | 20,070 | ||||||
Sika AG | 9 | 63,684 | ||||||
Sonova Holding AG | 140 | 23,615 | ||||||
STMicroelectronics NV | 305 | 5,278 | ||||||
Straumann Holding AG | 33 | 21,101 | ||||||
Sulzer AG | 97 | 10,699 | ||||||
Swatch Group AG — Bearer | 31 | 12,348 | ||||||
Swatch Group AG — Registered | 42 | 3,249 | ||||||
Swiss Life Holding AG* | 22 | 7,857 | ||||||
Swiss Prime Site AG* | 108 | 9,755 | ||||||
Swiss Re AG | 187 | 16,900 | ||||||
Swisscom AG | 20 | 10,065 | ||||||
Temenos Group AG* | 66 | 6,497 | ||||||
Vifor Pharma AG | 36 | 3,630 | ||||||
Zurich Insurance Group AG | 41 | 12,240 | ||||||
|
| |||||||
| 636,648 | ||||||||
|
| |||||||
| United Kingdom — 12.5% | ||||||||
3i Group PLC | 14,403 | 179,929 | ||||||
Number | Value | |||||||
| United Kingdom (Continued) | ||||||||
Admiral Group PLC | 748 | $ | 18,612 | |||||
Aggreko PLC | 382 | 4,435 | ||||||
Ashmore Group PLC | 1,890 | 8,974 | ||||||
Ashtead Group PLC | 407 | 8,721 | ||||||
Associated British Foods PLC | 55 | 2,354 | ||||||
AstraZeneca PLC | 85 | 4,974 | ||||||
Auto Trader Group PLC, 144A | 1,087 | 4,950 | ||||||
Aviva PLC | 274 | 1,845 | ||||||
Babcock International Group PLC | 681 | 7,130 | ||||||
BAE Systems PLC | 3,966 | 31,046 | ||||||
Barratt Developments PLC | 1,734 | 13,954 | ||||||
Bellway PLC | 726 | 29,964 | ||||||
Booker Group PLC | 17,436 | 44,934 | ||||||
BP PLC | 395 | 2,266 | ||||||
British American Tobacco PLC | 63 | 3,922 | ||||||
British Land Co. PLC REIT | 4,021 | 31,683 | ||||||
Bunzl PLC | 550 | 16,371 | ||||||
Burberry Group PLC | 1,119 | 25,911 | ||||||
Centrica PLC | 15,158 | 39,044 | ||||||
CNH Industrial NV | 910 | 10,310 | ||||||
Compass Group PLC | 1,128 | 24,012 | ||||||
Croda International PLC | 681 | 33,714 | ||||||
Daily Mail & General Trust PLC, Class A | 1,198 | 9,625 | ||||||
Diageo PLC | 164 | 5,477 | ||||||
Direct Line Insurance Group PLC | 7,865 | 38,521 | ||||||
Dixons Carphone PLC | 591 | 1,320 | ||||||
DS Smith PLC | 1,800 | 11,546 | ||||||
Experian PLC | 1,788 | 35,803 | ||||||
Fiat Chrysler Automobiles NV* | 252 | 3,790 | ||||||
G4S PLC | 6,326 | 23,109 | ||||||
GKN PLC | 11,680 | 47,995 | ||||||
GlaxoSmithKline PLC | 264 | 5,217 | ||||||
Halma PLC | 955 | 13,450 | ||||||
Hammerson PLC REIT | 1,085 | 7,843 | ||||||
Hargreaves Lansdown PLC | 284 | 5,123 | ||||||
Howden Joinery Group PLC | 1,217 | 6,680 | ||||||
IMI PLC | 1,657 | 24,234 | ||||||
Imperial Brands PLC | 85 | 3,505 | ||||||
Inchcape PLC | 1,689 | 18,118 | ||||||
Informa PLC | 1,483 | 13,195 | ||||||
Inmarsat PLC | 143 | 1,349 | ||||||
InterContinental Hotels Group PLC | 1,243 | 61,760 | ||||||
International Consolidated Airlines Group SA | 901 | 7,099 | ||||||
Intertek Group PLC | 107 | 7,045 | ||||||
Intu Properties PLC REIT | 550 | 1,763 | ||||||
ITV PLC | 4,129 | 8,438 | ||||||
J Sainsbury PLC | 3,327 | 10,100 | ||||||
John Wood Group PLC | 602 | 4,391 | ||||||
Johnson Matthey PLC | 2,788 | 99,296 | ||||||
Kingfisher PLC | 7,381 | 28,428 | ||||||
Land Securities Group PLC REIT | 3,394 | 44,171 | ||||||
London Stock Exchange Group PLC | 31 | 1,578 | ||||||
Marks & Spencer Group PLC | 2,228 | 9,175 | ||||||
Meggitt PLC | 1,525 | 10,179 | ||||||
Melrose Industries PLC | 20,468 | 58,023 | ||||||
Merlin Entertainments PLC, 144A | 1,207 | 7,175 | ||||||
| See Notes to Financial Statements. | 22 |
DBX ETF Trust
Schedule of Investments
Deutsche X-trackers FTSE Developed ex US Comprehensive Factor ETF (Continued)
August 31, 2017
Number | Value | |||||||
| United Kingdom (Continued) | ||||||||
Micro Focus International PLC | 429 | $ | 12,565 | |||||
National Grid PLC | 1,087 | 13,652 | ||||||
Next PLC | 44 | 2,341 | ||||||
Old Mutual PLC | 2,372 | 6,342 | ||||||
Pennon Group PLC | 1,175 | 12,294 | ||||||
Persimmon PLC | 647 | 22,168 | ||||||
Petrofac Ltd. | 174 | 938 | ||||||
Provident Financial PLC (a) | 327 | 3,721 | ||||||
Prudential PLC | 22 | 515 | ||||||
Reckitt Benckiser Group PLC | 88 | 8,314 | ||||||
RELX NV | 2,503 | 52,479 | ||||||
RELX PLC | 2,614 | 56,957 | ||||||
Rentokil Initial PLC | 12,599 | 49,434 | ||||||
Rightmove PLC | 142 | 7,542 | ||||||
Rio Tinto Ltd. | 1,130 | 60,802 | ||||||
Rio Tinto PLC | 196 | 9,462 | ||||||
Royal Mail PLC | 2,626 | 13,339 | ||||||
RPC Group PLC | 306 | 3,655 | ||||||
RSA Insurance Group PLC | 341 | 2,929 | ||||||
Sage Group PLC | 1,151 | 10,271 | ||||||
Schroders PLC | 98 | 4,253 | ||||||
Segro PLC REIT | 8,742 | 60,603 | ||||||
Severn Trent PLC | 890 | 26,021 | ||||||
Sky PLC | 527 | 6,492 | ||||||
Smith & Nephew PLC | 1,349 | 24,283 | ||||||
Smiths Group PLC | 1,890 | 37,626 | ||||||
SSE PLC | 1,636 | 30,040 | ||||||
St James’s Place PLC | 241 | 3,581 | ||||||
Standard Chartered PLC* | 33 | 327 | ||||||
Standard Life Aberdeen PLC | 495 | 2,740 | ||||||
Tate & Lyle PLC | 2,360 | 20,785 | ||||||
Taylor Wimpey PLC | 5,186 | 13,398 | ||||||
TechnipFMC PLC* | 360 | 9,219 | ||||||
Tesco PLC* | 1,812 | 4,224 | ||||||
Travis Perkins PLC | 329 | 6,380 | ||||||
Unilever NV | 220 | 13,081 | ||||||
Unilever PLC | 460 | 26,786 | ||||||
United Utilities Group PLC | 1,922 | 22,537 | ||||||
Vodafone Group PLC | 932 | 2,659 | ||||||
Weir Group PLC | 65 | 1,503 | ||||||
Whitbread PLC | 330 | 15,980 | ||||||
William Hill PLC | 593 | 1,892 | ||||||
Number | Value | |||||||
| United Kingdom (Continued) | ||||||||
Wm Morrison Supermarkets PLC | 16,831 | $ | 53,351 | |||||
WPP PLC | 846 | 15,480 | ||||||
|
| |||||||
| 1,936,537 | ||||||||
|
| |||||||
| United States (c) — 0.3% | ||||||||
Carnival PLC | 615 | 42,595 | ||||||
Samsonite International SA | 2,129 | 8,732 | ||||||
Sims Metal Management Ltd. | 129 | 1,524 | ||||||
|
| |||||||
| 52,851 | ||||||||
|
| |||||||
TOTAL COMMON STOCKS | 15,436,957 | |||||||
|
| |||||||
| PREFERRED STOCKS — 0.2% | ||||||||
| Germany — 0.2% | ||||||||
FUCHS PETROLUB SE | 220 | 12,215 | ||||||
Henkel AG & Co. KGaA | 44 | 5,888 | ||||||
Porsche Automobil Holding SE | 31 | 1,755 | ||||||
Sartorius AG | 42 | 4,166 | ||||||
|
| |||||||
| 24,024 | ||||||||
|
| |||||||
| Spain — 0.0% | ||||||||
Grifols SA, Class B | 130 | 2,664 | ||||||
|
| |||||||
| Sweden — 0.0% | ||||||||
Fastighets AB Balder | 55 | 2,409 | ||||||
|
| |||||||
TOTAL PREFERRED STOCKS | 29,097 | |||||||
|
| |||||||
| RIGHTS — 0.0% | ||||||||
| Sweden — 0.0% | ||||||||
Getinge AB, expires 09/14/17* | 54 | 20 | ||||||
|
| |||||||
| SECURITIES LENDING COLLATERAL — 0.7% | ||||||||
Deutsche Government & Agency Securities Portfolio “Deutsche Government Cash Institutional Shares”, 0.93% (d)(e) | 115,119 | 115,119 | ||||||
|
| |||||||
TOTAL INVESTMENTS — 100.5% | $ | 15,581,193 | ||||||
Other assets and liabilities, net — (0.5%) | (85,409 | ) | ||||||
|
| |||||||
NET ASSETS — 100.0% | $ | 15,495,784 | ||||||
|
| |||||||
| * | Non-income producing security. |
| (a) | All or a portion of these securities were on loan. In addition, “Other assets and liabilities, net” may include pending sales that are also on loan. The value of securities loaned at August 31, 2017 amounted to $110,191, which is 0.7% of net assets. |
| (b) | Stapled Security — A security contractually bound to one or more other securities to form a single saleable unit which cannot be sold separately. |
| (c) | Securities are domiciled in the United States and trade on a non-U.S. securities exchange. |
| (d) | Affiliated fund managed by Deutsche Investment Management Americas Inc. The rate shown is the annualized seven-day yield at period end. |
| (e) | Represents collateral held in connection with securities lending. Income earned by the Fund is net of borrower rebates. |
| See Notes to Financial Statements. | 23 |
DBX ETF Trust
Schedule of Investments
Deutsche X-trackers FTSE Developed ex US Comprehensive Factor ETF (Continued)
August 31, 2017
| CDI: | Chess Depositary Interest |
| REIT: | Real Estate Investment Trust |
| RSP: | Risparmio (Convertible Savings Shares) |
| 144A: | Security exempt from registration under Rule 144A of the Securities Act of 1933. These securities may be resold in transactions exempt from registration, normally to qualified institutional buyers. |
Fair Value Measurements
Various inputs are used in determining the value of the Fund’s investments. These inputs are summarized in three broad levels. Level 1 includes quoted prices in active markets for identical securities. Level 2 includes other significant observable inputs (including quoted prices for similar securities, interest rates, prepayment speeds and credit risk). Level 3 includes significant unobservable inputs (including the Fund’s own assumptions in determining the fair value of investments). The level assigned to the securities valuations may not be an indication of the risk or liquidity associated with investing in those securities.
The following is a summary of the inputs used as of August 31, 2017 in valuing the Fund’s investments. For information on the Fund’s policy regarding the valuation of investments, please refer to the Security Valuation section of Note 2 in the accompanying Notes to Financial Statements.
Assets | Level 1 | Level 2 | Level 3 | Total | ||||||||||||
Common Stocks (f) | $ | 15,436,957 | $ | — | $ | — | $ | 15,436,957 | ||||||||
Preferred Stocks (f) | 29,097 | — | — | 29,097 | ||||||||||||
Rights | 20 | — | — | 20 | ||||||||||||
Short-Term Investments | 115,119 | — | — | 115,119 | ||||||||||||
|
|
|
|
|
|
|
| |||||||||
TOTAL | $ | 15,581,193 | $ | — | $ | — | $ | 15,581,193 | ||||||||
|
|
|
|
|
|
|
| |||||||||
| (f) | See Schedule of Investments for additional detailed categorizations. |
There have been no transfers between fair value measurement levels during the year ended August 31, 2017.
| See Notes to Financial Statements. | 24 |
DBX ETF Trust
Deutsche X-trackers FTSE Emerging Comprehensive Factor ETF
August 31, 2017
Number | Value | |||||||
| COMMON STOCKS — 88.0% | ||||||||
| Brazil — 5.6% | ||||||||
AES Tiete Energia SA | 3,310 | $ | 14,885 | |||||
B3 SA — Brasil Bolsa Balcao | 4,547 | 31,966 | ||||||
Banco Bradesco SA | 267 | 2,737 | ||||||
Banco BTG Pactual SA | 1,235 | 6,414 | ||||||
Banco do Brasil SA | 71 | 693 | ||||||
Banco Santander Brasil SA | 421 | 3,752 | ||||||
BB Seguridade Participacoes SA | 708 | 6,237 | ||||||
BR Malls Participacoes SA | 579 | 2,503 | ||||||
BTG Pactual Participations Ltd.* | 1,235 | 157 | ||||||
CCR SA | 1,203 | 6,676 | ||||||
Cia de Saneamento Basico do Estado de Sao Paulo | 1,629 | 16,645 | ||||||
Cia Energetica de Minas Gerais | 2,054 | 5,562 | ||||||
Cia Paranaense de Energia | 1,016 | 7,336 | ||||||
Cielo SA | 1,884 | 13,430 | ||||||
Cosan SA Industria e Comercio | 2,788 | 34,194 | ||||||
CPFL Energia SA | 2,162 | 18,614 | ||||||
EDP — Energias do Brasil SA | 8,345 | 40,419 | ||||||
Embraer SA | 1,422 | 8,103 | ||||||
Engie Brasil Energia SA | 1,318 | 15,122 | ||||||
Equatorial Energia SA | 5,300 | 102,953 | ||||||
Estacio Participacoes SA | 1,163 | 9,540 | ||||||
Fibria Celulose SA | 557 | 7,398 | ||||||
Gerdau SA | 795 | 2,974 | ||||||
Hypermarcas SA | 1,472 | 13,806 | ||||||
JBS SA | 509 | 1,402 | ||||||
Kroton Educacional SA | 980 | 5,597 | ||||||
Localiza Rent a Car SA | 892 | 16,882 | ||||||
Lojas Americanas SA | 666 | 3,056 | ||||||
Lojas Renner SA | 4,631 | 45,038 | ||||||
M Dias Branco SA | 1,554 | 24,250 | ||||||
Multiplan Empreendimentos Imobiliarios SA | 629 | 14,611 | ||||||
Multiplus SA | 1,316 | 15,688 | ||||||
Natura Cosmeticos SA | 368 | 3,450 | ||||||
Odontoprev SA | 2,436 | 11,474 | ||||||
Porto Seguro SA | 1,696 | 18,731 | ||||||
Raia Drogasil SA | 1,981 | 43,663 | ||||||
Sao Martinho SA | 2,287 | 12,684 | ||||||
Smiles SA | 845 | 18,667 | ||||||
Sul America SA | 9,234 | 52,767 | ||||||
TIM Participacoes SA | 6,452 | 23,130 | ||||||
Transmissora Alianca de Energia Eletrica SA | 1,550 | 11,084 | ||||||
Ultrapar Participacoes SA | 630 | 14,707 | ||||||
WEG SA | 2,734 | 17,778 | ||||||
|
| |||||||
| 726,775 | ||||||||
|
| |||||||
| Chile — 3.0% | ||||||||
AES Gener SA | 9,226 | 3,228 | ||||||
Aguas Andinas SA, Class A | 25,208 | 16,100 | ||||||
Banco de Chile | 23,353 | 3,402 | ||||||
Banco de Credito e Inversiones | 429 | 27,820 | ||||||
Banco Santander Chile | 57,261 | 4,187 | ||||||
Cencosud SA | 15,527 | 46,677 | ||||||
Cia Cervecerias Unidas SA | 1,783 | 24,306 | ||||||
Number | Value | |||||||
| Chile (Continued) | ||||||||
Colbun SA | 3,601 | $ | 867 | |||||
Empresa Nacional de Telecomunicaciones SA | 1,516 | 15,840 | ||||||
Empresas CMPC SA | 1,666 | 4,348 | ||||||
Empresas COPEC SA | 1,172 | 14,961 | ||||||
Enel Americas SA | 345,730 | 74,583 | ||||||
Enel Chile SA | 454,205 | 53,476 | ||||||
Enel Generacion Chile SA | 10,853 | 9,200 | ||||||
Itau CorpBanca | 439,766 | 4,202 | ||||||
Latam Airlines Group SA | 4,713 | 59,094 | ||||||
Parque Arauco SA | 10,808 | 29,440 | ||||||
SACI Falabella | 476 | 4,786 | ||||||
SONDA SA | 1,339 | 2,476 | ||||||
|
| |||||||
| 398,993 | ||||||||
|
| |||||||
| China — 12.0% | ||||||||
Agile Group Holdings Ltd. | 11,110 | 13,315 | ||||||
Agricultural Bank of China Ltd., Class H | 86,320 | 40,588 | ||||||
Air China Ltd., Class H | 16,877 | 15,009 | ||||||
Aluminum Corp. of China Ltd., Class H* | 33,357 | 24,678 | ||||||
Anhui Conch Cement Co. Ltd., Class H | 6,968 | 25,997 | ||||||
Anhui Expressway Co. Ltd., Class H | 6,000 | 4,538 | ||||||
Anhui Gujing Distillery Co. Ltd., Class B | 2,216 | 9,502 | ||||||
ANTA Sports Products Ltd. | 2,146 | 8,445 | ||||||
BAIC Motor Corp. Ltd., Class H, 144A | 675 | 601 | ||||||
Bank of China Ltd., Class H | 22,478 | 11,833 | ||||||
Bank of Communications Co. Ltd., Class H | 3,510 | 2,682 | ||||||
BBMG Corp., Class H | 270 | 139 | ||||||
Beijing Capital International Airport Co. Ltd., Class H | 2,862 | 4,630 | ||||||
Beijing Jingneng Clean Energy Co. Ltd., Class H | 4,911 | 1,324 | ||||||
BOE Technology Group Co. Ltd., Class B | 16,100 | 6,501 | ||||||
China BlueChemical Ltd., Class H | 22,638 | 6,971 | ||||||
China Cinda Asset Management Co. Ltd., Class H | 2,953 | 1,098 | ||||||
China CITIC Bank Corp. Ltd., Class H | 2,730 | 1,803 | ||||||
China Coal Energy Co. Ltd., Class H | 3,177 | 1,599 | ||||||
China Communications Construction Co. Ltd., Class H | 19,142 | 25,485 | ||||||
China Communications Services Corp. Ltd., Class H | 32,667 | 17,697 | ||||||
China Conch Venture Holdings Ltd. | 14,864 | 27,045 | ||||||
China Construction Bank Corp., Class H | 1,088 | 954 | ||||||
China Dongxiang Group Co. Ltd. | 36,646 | 6,555 | ||||||
China Eastern Airlines Corp. Ltd., Class H | 4,132 | 2,276 | ||||||
China Everbright Bank Co. Ltd., Class H | 22,288 | 10,708 | ||||||
China Evergrande Group* | 2,117 | 6,397 | ||||||
China Galaxy Securities Co. Ltd., Class H | 2,623 | 2,376 | ||||||
China Hongqiao Group Ltd.*(a) | 5,021 | 4,974 | ||||||
China Huarong Asset Management Co. Ltd., Class H, 144A | 9,965 | 4,253 | ||||||
China Life Insurance Co. Ltd., Class H | 4,165 | 13,357 | ||||||
China Longyuan Power Group Corp. Ltd., Class H | 6,174 | 4,623 | ||||||
China Medical System Holdings Ltd. | 2,905 | 5,345 | ||||||
| See Notes to Financial Statements. | 25 |
DBX ETF Trust
Schedule of Investments
Deutsche X-trackers FTSE Emerging Comprehensive Factor ETF (Continued)
August 31, 2017
Number | Value | |||||||
| China (Continued) | ||||||||
China Merchants Bank Co. Ltd., Class H | 8,000 | $ | 30,154 | |||||
China Minsheng Banking Corp. Ltd., Class H | 19,169 | 19,129 | ||||||
China Molybdenum Co. Ltd., Class H | 6,473 | 3,515 | ||||||
China National Accord Medicines Corp. Ltd., Class B | 429 | 2,263 | ||||||
China National Building Material Co. Ltd., Class H | 4,171 | 2,622 | ||||||
China National Materials Co. Ltd., Class H | 5,358 | 2,341 | ||||||
China Oilfield Services Ltd., Class H | 8,785 | 7,206 | ||||||
China Pacific Insurance Group Co. Ltd., Class H | 7,443 | 35,045 | ||||||
China Petroleum & Chemical Corp., Class H | 39,764 | 30,434 | ||||||
China Railway Construction Corp. Ltd., Class H | 10,883 | 14,267 | ||||||
China Railway Group Ltd., Class H | 30,444 | 24,351 | ||||||
China Railway Signal & Communication Corp. Ltd., Class H, 144A | 8,979 | 6,792 | ||||||
China Reinsurance Group Corp., Class H | 22,136 | 5,035 | ||||||
China Shenhua Energy Co. Ltd., Class H | 26,643 | 68,595 | ||||||
China Southern Airlines Co. Ltd., Class H | 5,645 | 4,407 | ||||||
China Telecom Corp. Ltd., Class H | 1,559 | 801 | ||||||
China Vanke Co. Ltd., Class H | 6,168 | 18,481 | ||||||
China Zhongwang Holdings Ltd. | 9,047 | 4,462 | ||||||
Chongqing Changan Automobile Co. Ltd., Class B | 3,613 | 4,727 | ||||||
Chongqing Rural Commercial Bank Co. Ltd., Class H | 8,381 | 5,836 | ||||||
CITIC Securities Co. Ltd., Class H | 3,465 | 7,686 | ||||||
CNOOC Ltd. | 3,295 | 3,941 | ||||||
Country Garden Holdings Co. Ltd. | 8,957 | 11,902 | ||||||
CSG Holding Co. Ltd., Class B | 5,107 | 3,132 | ||||||
CSPC Pharmaceutical Group Ltd. | 9,326 | 14,561 | ||||||
Dali Foods Group Co. Ltd., 144A | 6,931 | 4,614 | ||||||
Datang International Power Generation Co. Ltd., Class H* | 34,188 | 11,226 | ||||||
Dazhong Transportation Group Co. Ltd., Class B | 4,310 | 2,948 | ||||||
Dongfang Electric Corp. Ltd., Class H* | 4,631 | 4,970 | ||||||
Dongfeng Motor Group Co. Ltd., Class H | 4,843 | 6,287 | ||||||
ENN Energy Holdings Ltd. | 3,339 | 21,481 | ||||||
Everbright Securities Co. Ltd., Class H, 144A | 12,148 | 16,919 | ||||||
Fosun International Ltd. | 1,551 | 2,691 | ||||||
Fuyao Glass Industry Group Co. Ltd., Class H, 144A | 11,350 | 36,183 | ||||||
Geely Automobile Holdings Ltd. | 12,660 | 31,122 | ||||||
GF Securities Co. Ltd., Class H | 1,266 | 2,701 | ||||||
Golden Eagle Retail Group Ltd. | 8,081 | 10,325 | ||||||
Great Wall Motor Co. Ltd., Class H | 13,772 | 17,280 | ||||||
Guangdong Electric Power Development Co. Ltd., Class B | 14,400 | 6,532 | ||||||
Guangshen Railway Co. Ltd., Class H | 34,440 | 18,746 | ||||||
Guangzhou Automobile Group Co. Ltd., Class H | 35,724 | 70,476 | ||||||
Number | Value | |||||||
| China (Continued) | ||||||||
Guangzhou Baiyunshan Pharmaceutical Holdings Co. Ltd., Class H | 450 | $ | 1,137 | |||||
Guangzhou R&F Properties Co. Ltd., Class H | 1,800 | 4,204 | ||||||
Haitian International Holdings Ltd. | 5,240 | 15,734 | ||||||
Haitong Securities Co. Ltd., Class H | 1,585 | 2,657 | ||||||
Hengan International Group Co. Ltd. | 1,657 | 13,846 | ||||||
Huadian Energy Co. Ltd., Class B* | 8,900 | 4,370 | ||||||
Huadian Power International Corp. Ltd., Class H | 26 | 11 | ||||||
Huaneng Power International, Inc., Class H | 15,467 | 10,118 | ||||||
Industrial & Commercial Bank of China Ltd., Class H | 10,343 | 7,744 | ||||||
Inner Mongolia Yitai Coal Co. Ltd., Class B | 4,500 | 5,859 | ||||||
Jiangling Motors Corp. Ltd., Class B | 2,200 | 4,689 | ||||||
Jiangsu Expressway Co. Ltd., Class H | 11,829 | 18,137 | ||||||
Jiangxi Copper Co. Ltd., Class H | 20,137 | 34,941 | ||||||
KWG Property Holding Ltd. | 19,348 | 17,602 | ||||||
Lao Feng Xiang Co. Ltd., Class B | 3,600 | 13,889 | ||||||
Lenovo Group Ltd. | 3,312 | 1,811 | ||||||
Livzon Pharmaceutical Group, Inc., Class H | 648 | 3,527 | ||||||
Longfor Properties Co. Ltd. | 15,523 | 37,288 | ||||||
Maanshan Iron & Steel Co. Ltd., Class H* | 6,503 | 3,432 | ||||||
Metallurgical Corp. of China Ltd., Class H | 40,993 | 13,461 | ||||||
New China Life Insurance Co. Ltd., Class H | 5,273 | 33,754 | ||||||
Orient Securities Co. Ltd., Class H, 144A | 32,000 | 33,773 | ||||||
People’s Insurance Co. Group of China Ltd., Class H | 3,511 | 1,655 | ||||||
PetroChina Co. Ltd., Class H | 49,064 | 31,345 | ||||||
PICC Property & Casualty Co. Ltd., Class H | 4,921 | 9,243 | ||||||
Ping An Insurance Group Co. of China Ltd., Class H | 1,072 | 8,513 | ||||||
Red Star Macalline Group Corp. Ltd., Class H, 144A | 1,813 | 1,948 | ||||||
Shandong Chenming Paper Holdings Ltd., Class B | 28,300 | 41,294 | ||||||
Shandong Chenming Paper Holdings Ltd., Class H | 5,570 | 8,128 | ||||||
Shandong Weigao Group Medical Polymer Co. Ltd., Class H | 557 | 445 | ||||||
Shanghai Bailian Group Co. Ltd., Class B | 4,500 | 6,840 | ||||||
Shanghai Chlor-Alkali Chemical Co. Ltd., Class B* | 5,032 | 3,794 | ||||||
Shanghai Electric Group Co. Ltd., | 5,698 | 2,585 | ||||||
Shanghai Fosun Pharmaceutical Group Co. Ltd., Class H | 970 | 3,644 | ||||||
Shanghai Lujiazui Finance & Trade Zone Development Co. Ltd., Class B | 221 | 356 | ||||||
Shanghai Mechanical and Electrical Industry Co. Ltd., Class B | 3,662 | 7,423 | ||||||
| See Notes to Financial Statements. | 26 |
DBX ETF Trust
Schedule of Investments
Deutsche X-trackers FTSE Emerging Comprehensive Factor ETF (Continued)
August 31, 2017
Number | Value | |||||||
| China (Continued) | ||||||||
Shanghai Pharmaceuticals Holding Co. Ltd., Class H | 3,880 | $ | 9,548 | |||||
Shenzhen Chiwan Wharf Holdings Ltd., Class B | 2,700 | 4,771 | ||||||
Shenzhen Expressway Co. Ltd., Class H | 16,385 | 15,995 | ||||||
Shenzhou International Group Holdings Ltd. | 2,368 | 18,971 | ||||||
Sichuan Expressway Co. Ltd., Class H | 7,912 | 3,235 | ||||||
Sino-Ocean Group Holding Ltd. | 4,411 | 3,043 | ||||||
Sinopec Engineering Group Co. Ltd., Class H | 26,918 | 24,282 | ||||||
Sinopec Shanghai Petrochemical Co. Ltd., Class H | 16,815 | 10,485 | ||||||
Sinopharm Group Co. Ltd., Class H | 1,471 | 6,644 | ||||||
Sinotrans Ltd., Class H | 2,737 | 1,546 | ||||||
Sinotruk Hong Kong Ltd. | 6,107 | 6,757 | ||||||
Sunac China Holdings Ltd. | 5,322 | 15,980 | ||||||
Sunny Optical Technology Group Co. Ltd. | 429 | 6,150 | ||||||
Tencent Holdings Ltd. | 63 | 2,648 | ||||||
TravelSky Technology Ltd., Class H | 489 | 1,337 | ||||||
Tsingtao Brewery Co. Ltd., Class H | 6,564 | 27,216 | ||||||
Weichai Power Co. Ltd., Class H | 20,686 | 21,303 | ||||||
Weifu High-Technology Group Co. Ltd., Class B | 2,200 | 5,074 | ||||||
Xinhua Winshare Publishing and Media Co. Ltd., Class H | 7,778 | 6,380 | ||||||
Xinjiang Goldwind Science & Technology Co. Ltd., Class H | 2,836 | 3,113 | ||||||
Yantai Changyu Pioneer Wine Co. Ltd., Class B | 757 | 1,879 | ||||||
Yanzhou Coal Mining Co. Ltd., Class H | 3,592 | 3,607 | ||||||
Zhejiang Expressway Co. Ltd., Class H | 3,246 | 4,060 | ||||||
Zhongsheng Group Holdings Ltd. | 7,796 | 16,934 | ||||||
Zhuzhou CRRC Times Electric Co. Ltd., Class H | 215 | 1,125 | ||||||
Zijin Mining Group Co. Ltd., Class H | 55,176 | 20,233 | ||||||
ZTE Corp., Class H* | 1,369 | 3,735 | ||||||
|
| |||||||
| 1,564,732 | ||||||||
|
| |||||||
| Colombia — 0.6% | ||||||||
Almacenes Exito SA | 1,270 | 6,624 | ||||||
Cementos Argos SA | 1,013 | 4,114 | ||||||
Cemex Latam Holdings SA* | 946 | 3,598 | ||||||
Ecopetrol SA | 774 | 360 | ||||||
Grupo Argos SA | 881 | 6,277 | ||||||
Grupo de Inversiones Suramericana SA | 1,379 | 19,434 | ||||||
Interconexion Electrica SA ESP | 9,380 | 42,555 | ||||||
|
| |||||||
| 82,962 | ||||||||
|
| |||||||
| Czech Republic — 0.6% | ||||||||
CEZ AS | 1,792 | 33,934 | ||||||
Komercni banka AS | 172 | 7,567 | ||||||
Moneta Money Bank AS, 144A | 7,402 | 25,910 | ||||||
O2 Czech Republic AS | 520 | 6,509 | ||||||
|
| |||||||
| 73,920 | ||||||||
|
| |||||||
Number | Value | |||||||
| Greece — 0.1% | ||||||||
FF Group* | 36 | $ | 894 | |||||
JUMBO SA | 270 | 4,494 | ||||||
Motor Oil Hellas Corinth Refineries SA | 508 | 11,415 | ||||||
OPAP SA | 18 | 201 | ||||||
Titan Cement Co. SA | 27 | 766 | ||||||
|
| |||||||
| 17,770 | ||||||||
|
| |||||||
| Hong Kong — 4.0% | ||||||||
Beijing Enterprises Holdings Ltd. | 5,611 | 31,330 | ||||||
Beijing Enterprises Water Group Ltd.* | 2,648 | 2,250 | ||||||
Bosideng International Holdings Ltd. | 42,588 | 3,646 | ||||||
Brilliance China Automotive Holdings Ltd. | 3,597 | 9,307 | ||||||
China Agri-Industries Holdings Ltd. | 24,950 | 11,668 | ||||||
China Everbright International Ltd. | 5,289 | 6,988 | ||||||
China Everbright Ltd. | 6,356 | 14,521 | ||||||
China Foods Ltd. | 4,774 | 2,538 | ||||||
China Gas Holdings Ltd. | 2,290 | 5,782 | ||||||
China Jinmao Holdings Group Ltd. | 46,110 | 20,503 | ||||||
China Merchants Port Holdings Co. Ltd. | 3,820 | 12,495 | ||||||
China Mobile Ltd. | 500 | 5,302 | ||||||
China Overseas Land & Investment Ltd. | 1,479 | 5,168 | ||||||
China Power International Development Ltd. | 12,160 | 4,148 | ||||||
China Resources Beer Holdings Co. Ltd. | 1,566 | 3,930 | ||||||
China Resources Cement Holdings Ltd. | 21,411 | 11,764 | ||||||
China Resources Gas Group Ltd. | 2,821 | 9,948 | ||||||
China Resources Land Ltd. | 5,094 | 15,914 | ||||||
China Resources Power Holdings Co. Ltd. | 13,497 | 24,764 | ||||||
China State Construction International Holdings Ltd. | 5,967 | 8,646 | ||||||
China Taiping Insurance Holdings Co. Ltd. | 1,326 | 4,024 | ||||||
China Unicom Hong Kong Ltd.* | 2,422 | 3,528 | ||||||
COSCO SHIPPING Ports Ltd. | 18,665 | 22,060 | ||||||
Far East Horizon Ltd. | 3,366 | 3,075 | ||||||
Guangdong Investment Ltd. | 9,908 | 14,635 | ||||||
Haier Electronics Group Co. Ltd.* | 11,424 | 30,361 | ||||||
Kingboard Chemical Holdings Ltd. | 15,521 | 84,680 | ||||||
Kingboard Laminates Holdings Ltd. | 12,741 | 21,619 | ||||||
Kunlun Energy Co. Ltd. | 15,886 | 15,386 | ||||||
Lee & Man Paper Manufacturing Ltd. | 29,200 | 34,063 | ||||||
Nine Dragons Paper Holdings Ltd. | 3,709 | 6,189 | ||||||
Shanghai Industrial Holdings Ltd. | 5,996 | 18,234 | ||||||
Shenzhen International Holdings Ltd. | 4,321 | 7,939 | ||||||
Shenzhen Investment Ltd. | 25,619 | 11,686 | ||||||
Shimao Property Holdings Ltd. | 4,509 | 9,310 | ||||||
Sino Biopharmaceutical Ltd. | 7,176 | 6,299 | ||||||
Sinofert Holdings Ltd.* | 20,591 | 2,841 | ||||||
Yuexiu Property Co. Ltd. | 61,364 | 11,290 | ||||||
|
| |||||||
| 517,831 | ||||||||
|
| |||||||
| Hungary — 1.6% | ||||||||
Magyar Telekom Telecommunications PLC | 23,815 | 45,219 | ||||||
MOL Hungarian Oil & Gas PLC | 1,097 | 101,671 | ||||||
OTP Bank PLC | 247 | 10,038 | ||||||
| See Notes to Financial Statements. | 27 |
DBX ETF Trust
Schedule of Investments
Deutsche X-trackers FTSE Emerging Comprehensive Factor ETF (Continued)
August 31, 2017
Number | Value | |||||||
| Hungary (Continued) | ||||||||
Richter Gedeon Nyrt | 2,253 | $ | 58,584 | |||||
|
| |||||||
| 215,512 | ||||||||
|
| |||||||
| Indonesia — 1.6% | ||||||||
PT Adaro Energy Tbk | 63,632 | 8,704 | ||||||
PT Astra International Tbk | 6,907 | 4,077 | ||||||
PT Bank Central Asia Tbk | 7,211 | 10,242 | ||||||
PT Bank Danamon Indonesia Tbk | 11,847 | 4,839 | ||||||
PT Bank Mandiri Persero Tbk | 5,102 | 5,010 | ||||||
PT Bank Negara Indonesia Persero Tbk | 23,947 | 13,192 | ||||||
PT Bank Rakyat Indonesia Persero Tbk | 7,576 | 8,588 | ||||||
PT Bumi Serpong Damai Tbk | 27,465 | 3,777 | ||||||
PT Gudang Garam Tbk | 904 | 4,689 | ||||||
PT Indocement Tunggal Prakarsa Tbk | 3,178 | 4,716 | ||||||
PT Indofood CBP Sukses Makmur Tbk | 11,616 | 7,596 | ||||||
PT Indofood Sukses Makmur Tbk | 22,427 | 14,078 | ||||||
PT Jasa Marga Persero Tbk | 9,091 | 3,969 | ||||||
PT Kalbe Farma Tbk | 100,295 | 12,855 | ||||||
PT Perusahaan Gas Negara Persero Tbk | 46,284 | 7,354 | ||||||
PT Semen Indonesia Persero Tbk | 13,286 | 10,431 | ||||||
PT Surya Citra Media Tbk | 17,065 | 2,827 | ||||||
PT Tambang Batubara Bukit Asam Persero Tbk | 12,818 | 11,889 | ||||||
PT Telekomunikasi Indonesia Persero Tbk | 60,553 | 21,286 | ||||||
PT Tower Bersama Infrastructure Tbk | 3,798 | 1,829 | ||||||
PT Unilever Indonesia Tbk | 1,720 | 6,517 | ||||||
PT United Tractors Tbk | 17,298 | 39,284 | ||||||
|
| |||||||
| 207,749 | ||||||||
|
| |||||||
| Malaysia — 4.8% | ||||||||
AirAsia Bhd | 25,900 | 20,135 | ||||||
Alliance Financial Group Bhd | 11,700 | 10,521 | ||||||
AMMB Holdings Bhd | 12,700 | 12,728 | ||||||
Astro Malaysia Holdings Bhd | 26,000 | 16,317 | ||||||
Axiata Group Bhd | 2,435 | 2,811 | ||||||
Berjaya Sports Toto Bhd | 21,300 | 11,222 | ||||||
British American Tobacco Malaysia Bhd | 1,000 | 10,345 | ||||||
CIMB Group Holdings Bhd | 6,600 | 10,942 | ||||||
DiGi.Com Bhd | 17,600 | 19,947 | ||||||
Felda Global Ventures Holdings Bhd | 35,700 | 12,957 | ||||||
Gamuda Bhd | 14,800 | 18,507 | ||||||
Genting Bhd | 15,000 | 34,106 | ||||||
Genting Malaysia Bhd | 61,400 | 84,397 | ||||||
HAP Seng Consolidated Bhd | 6,300 | 13,395 | ||||||
Hong Leong Bank Bhd | 1,800 | 6,508 | ||||||
Hong Leong Financial Group Bhd | 1,900 | 7,519 | ||||||
IJM Corp. Bhd | 28,600 | 22,368 | ||||||
IOI Corp. Bhd | 900 | 957 | ||||||
IOI Properties Group Bhd | 28,000 | 13,048 | ||||||
KLCCP Stapled Group (b) | 11,600 | 21,187 | ||||||
Kuala Lumpur Kepong Bhd | 4,900 | 28,157 | ||||||
Malayan Banking Bhd | 1,129 | 2,501 | ||||||
Malaysia Airports Holdings Bhd | 3,500 | 7,376 | ||||||
Maxis Bhd | 6,300 | 8,527 | ||||||
MISC Bhd | 3,500 | 6,098 | ||||||
MMC Corp. Bhd | 32,800 | 17,896 | ||||||
Number | Value | |||||||
| Malaysia (Continued) | ||||||||
Petronas Chemicals Group Bhd | 14,300 | $ | 23,976 | |||||
Petronas Dagangan Bhd | 3,600 | 20,569 | ||||||
Petronas Gas Bhd | 2,100 | 9,048 | ||||||
PPB Group Bhd | 5,000 | 19,529 | ||||||
Public Bank Bhd | 1,300 | 6,271 | ||||||
RHB Bank Bhd | 5,221 | 6,174 | ||||||
Sapura Energy Bhd | 6,300 | 2,036 | ||||||
Sime Darby Bhd | 12,575 | 26,502 | ||||||
Telekom Malaysia Bhd | 7,100 | 10,690 | ||||||
Tenaga Nasional Bhd | 11,200 | 37,451 | ||||||
Westports Holdings Bhd | 13,300 | 11,679 | ||||||
YTL Corp. Bhd | 42,600 | 14,265 | ||||||
YTL Power International Bhd | 64,100 | 21,164 | ||||||
|
| |||||||
| 629,826 | ||||||||
|
| |||||||
| Mexico — 5.2% | ||||||||
Alfa SAB de CV, Class A | 1,838 | 2,581 | ||||||
Alpek SAB de CV | 1,266 | 1,404 | ||||||
Alsea SAB de CV | 3,230 | 11,789 | ||||||
America Movil SAB de CV, Series L | 18,226 | 16,996 | ||||||
Arca Continental SAB de CV | 377 | 2,767 | ||||||
Banregio Grupo Financiero SAB de CV | 2,275 | 14,723 | ||||||
Cemex SAB de CV, Series CPO* | 88,817 | 83,272 | ||||||
Coca-Cola Femsa SAB de CV, Series L | 1,892 | 15,555 | ||||||
Concentradora Fibra Danhos SA de CV REIT | 6,679 | 11,696 | ||||||
Controladora Vuela Cia de Aviacion SAB de CV, Class A* | 3,943 | 4,976 | ||||||
El Puerto de Liverpool SAB de CV, Class C1 | 529 | 4,754 | ||||||
Fibra Uno Administracion SA de CV REIT | 16,530 | 29,577 | ||||||
Fomento Economico Mexicano SAB de CV | 3,027 | 30,389 | ||||||
Gentera SAB de CV | 14,421 | 22,195 | ||||||
Gruma SAB de CV, Class B | 1,213 | 17,846 | ||||||
Grupo Aeromexico SAB de CV* | 9,430 | 19,116 | ||||||
Grupo Aeroportuario del Centro Norte SAB de CV | 1,991 | 12,080 | ||||||
Grupo Aeroportuario del Pacifico SAB de CV, Class B | 3,724 | 41,206 | ||||||
Grupo Aeroportuario del Sureste SAB de CV, Class B | 2,809 | 57,481 | ||||||
Grupo Bimbo SAB de CV, Series A | 2,190 | 5,326 | ||||||
Grupo Carso SAB de CV, Series A1 | 2,188 | 8,870 | ||||||
Grupo Comercial Chedraui SA de CV | 3,078 | 6,614 | ||||||
Grupo Financiero Banorte SAB de CV, Class O | 1,806 | 12,354 | ||||||
Grupo Lala SAB de CV | 1,050 | 1,870 | ||||||
Grupo Mexico SAB de CV, Series B | 7,047 | 23,305 | ||||||
Grupo Simec SAB de CV, Series B* | 5,833 | 21,093 | ||||||
Grupo Televisa SAB, Series CPO | 3,285 | 17,038 | ||||||
Industrias Bachoco SAB de CV, Series B | 5,909 | 31,460 | ||||||
Industrias CH SAB de CV, Series B* | 6,723 | 32,263 | ||||||
Industrias Penoles SAB de CV | 655 | 17,072 | ||||||
Infraestructura Energetica Nova SAB de CV | 1,739 | 9,479 | ||||||
| See Notes to Financial Statements. | 28 |
DBX ETF Trust
Schedule of Investments
Deutsche X-trackers FTSE Emerging Comprehensive Factor ETF (Continued)
August 31, 2017
Number | Value | |||||||
| Mexico (Continued) | ||||||||
Kimberly-Clark de Mexico SAB de CV, Class A | 4,265 | $ | 8,399 | |||||
Megacable Holdings SAB de CV, Series CPO | 4,236 | 18,398 | ||||||
Mexichem SAB de CV | 10,411 | 27,817 | ||||||
Nemak SAB de CV, 144A | 6,638 | 5,613 | ||||||
Organizacion Soriana SAB de CV, | 4,297 | 10,729 | ||||||
Promotora y Operadora de Infraestructura SAB de CV | 553 | 6,079 | ||||||
Promotora y Operadora de Infraestructura SAB de CV, Class L | 164 | 1,374 | ||||||
Telesites SAB de CV* | 3,798 | 3,032 | ||||||
Wal-Mart de Mexico SAB de CV | 3,101 | 7,567 | ||||||
|
| |||||||
| 676,155 | ||||||||
|
| |||||||
| Peru — 0.3% | ||||||||
Credicorp Ltd. | 198 | 40,160 | ||||||
|
| |||||||
| Philippines — 1.4% | ||||||||
Aboitiz Equity Ventures, Inc. | 10,760 | 15,655 | ||||||
Aboitiz Power Corp. | 9,800 | 7,565 | ||||||
Alliance Global Group, Inc.* | 8,100 | 2,200 | ||||||
Ayala Corp. | 620 | 11,147 | ||||||
Bank of the Philippine Islands | 3,050 | 6,312 | ||||||
BDO Unibank, Inc. | 1,790 | 4,446 | ||||||
DMCI Holdings, Inc. | 55,800 | 17,121 | ||||||
Energy Development Corp. | 107,100 | 14,191 | ||||||
Globe Telecom, Inc. | 45 | 1,759 | ||||||
GT Capital Holdings, Inc. | 205 | 4,479 | ||||||
International Container Terminal Services, Inc. | 1,260 | 2,571 | ||||||
JG Summit Holdings, Inc. | 5,040 | 7,072 | ||||||
Jollibee Foods Corp. | 1,990 | 9,264 | ||||||
Manila Electric Co. | 2,200 | 11,651 | ||||||
Megaworld Corp. | 72,900 | 7,038 | ||||||
Metro Pacific Investments Corp. | 73,700 | 9,146 | ||||||
Metropolitan Bank & Trust Co. | 2,880 | 4,930 | ||||||
Petron Corp. | 26,500 | 5,075 | ||||||
PLDT, Inc. | 95 | 3,212 | ||||||
Semirara Mining & Power Corp. | 4,570 | 15,504 | ||||||
SM Investments Corp. | 530 | 8,395 | ||||||
SM Prime Holdings, Inc. | 30,700 | 20,039 | ||||||
Universal Robina Corp. | 310 | 885 | ||||||
|
| |||||||
| 189,657 | ||||||||
|
| |||||||
| Poland — 2.2% | ||||||||
Alior Bank SA* | 78 | 1,441 | ||||||
Asseco Poland SA | 3,055 | 38,728 | ||||||
Bank Handlowy w Warszawie SA | 36 | 715 | ||||||
Bank Millennium SA* | 1,212 | 2,527 | ||||||
Bank Zachodni WBK SA | 19 | 1,965 | ||||||
Budimex SA | 347 | 22,058 | ||||||
CCC SA* | 288 | 21,132 | ||||||
Ciech SA* | 380 | 6,671 | ||||||
Cyfrowy Polsat SA | 514 | 3,855 | ||||||
Enea SA | 1,434 | 6,120 | ||||||
Eurocash SA | 516 | 5,652 | ||||||
Number | Value | |||||||
| Poland (Continued) | ||||||||
Grupa Azoty SA | 216 | $ | 4,165 | |||||
Grupa Lotos SA* | 647 | 10,657 | ||||||
KGHM Polska Miedz SA | 129 | 4,552 | ||||||
LPP SA | 4 | 9,775 | ||||||
mBank SA* | 16 | 1,961 | ||||||
Orange Polska SA* | 460 | 771 | ||||||
PGE Polska Grupa Energetyczna SA | 864 | 3,450 | ||||||
Polski Koncern Naftowy ORLEN SA | 848 | 27,979 | ||||||
Polskie Gornictwo Naftowe i Gazownictwo SA | 21,510 | 41,113 | ||||||
Powszechna Kasa Oszczednosci Bank Polski SA* | 937 | 9,618 | ||||||
Powszechny Zaklad Ubezpieczen SA | 1,968 | 26,711 | ||||||
Synthos SA | 11,841 | 15,839 | ||||||
Tauron Polska Energia SA* | 22,341 | 24,508 | ||||||
|
| |||||||
| 291,963 | ||||||||
|
| |||||||
| Qatar — 1.0% | ||||||||
Aamal Co. | 3,274 | 9,306 | ||||||
Al Meera Consumer Goods Co. QSC | 67 | 2,762 | ||||||
Barwa Real Estate Co. | 950 | 8,268 | ||||||
Commercial Bank QSC* | 61 | 499 | ||||||
Doha Bank QPSC | 467 | 3,868 | ||||||
Industries Qatar QSC | 275 | 6,873 | ||||||
Masraf Al Rayan QSC | 735 | 7,701 | ||||||
Ooredoo QSC | 859 | 20,663 | ||||||
Qatar Electricity & Water Co. QSC | 260 | 13,281 | ||||||
Qatar Gas Transport Co. Ltd. | 2,682 | 12,514 | ||||||
Qatar Insurance Co. SAQ | 993 | 17,999 | ||||||
Qatar International Islamic Bank QSC | 216 | 3,245 | ||||||
Qatar Islamic Bank SAQ | 115 | 2,937 | ||||||
Qatar Navigation QSC | 705 | 12,358 | ||||||
United Development Co. QSC | 1,845 | 7,687 | ||||||
|
| |||||||
| 129,961 | ||||||||
|
| |||||||
| Romania — 0.3% | ||||||||
NEPI Rockcastle PLC* | 2,971 | 43,088 | ||||||
|
| |||||||
| Russia — 3.7% | ||||||||
Acron PJSC | 216 | 13,129 | ||||||
Aeroflot PJSC | 18,385 | 60,719 | ||||||
Alrosa PJSC | 6,941 | 9,705 | ||||||
Bashneft PJSC* | 192 | 7,207 | ||||||
Federal Grid Co Unified Energy System PJSC | 1,291,117 | 3,935 | ||||||
Gazprom PJSC | 2,793 | 5,674 | ||||||
Inter RAO UES PJSC | 370,439 | 25,068 | ||||||
LSR Group PJSC, GDR | 261 | 744 | ||||||
LUKOIL PJSC | 1,206 | 61,063 | ||||||
Magnitogorsk Iron & Steel Works PJSC | 38,794 | 26,894 | ||||||
MegaFon PJSC, GDR | 435 | 4,289 | ||||||
MMC Norilsk Nickel PJSC | 61 | 10,283 | ||||||
Mobile TeleSystems PJSC | 12,010 | 55,836 | ||||||
Moscow Exchange MICEX-RTS PJSC | 801 | 1,454 | ||||||
Mosenergo PJSC | 162,117 | 9,109 | ||||||
Novatek PJSC | 1,357 | 14,003 | ||||||
Novolipetsk Steel PJSC | 8,453 | 20,366 | ||||||
PhosAgro PJSC, GDR | 740 | 10,286 | ||||||
| See Notes to Financial Statements. | 29 |
DBX ETF Trust
Schedule of Investments
Deutsche X-trackers FTSE Emerging Comprehensive Factor ETF (Continued)
August 31, 2017
Number | Value | |||||||
| Russia (Continued) | ||||||||
ROSSETI PJSC | 149,483 | $ | 2,625 | |||||
Rostelecom PJSC | 6,238 | 7,197 | ||||||
RusHydro PJSC | 1,420,876 | 20,324 | ||||||
Severstal PJSC | 2,515 | 39,408 | ||||||
Surgutneftegas OJSC | 9,714 | 4,516 | ||||||
Tatneft PJSC | 8,285 | 55,352 | ||||||
Unipro PJSC | 306,623 | 12,724 | ||||||
Uralkali PJSC* | 206 | 484 | ||||||
|
| |||||||
| 482,394 | ||||||||
|
| |||||||
| South Africa — 13.4% | ||||||||
AECI Ltd. | 3,300 | 27,167 | ||||||
Anglo American Platinum Ltd.* | 10 | 271 | ||||||
AngloGold Ashanti Ltd. | 198 | 2,006 | ||||||
Aspen Pharmacare Holdings Ltd. | 150 | 3,346 | ||||||
Attacq Ltd.* | 5,732 | 7,982 | ||||||
AVI Ltd. | 6,581 | 50,020 | ||||||
Barclays Africa Group Ltd. (c) | 390 | 4,452 | ||||||
Barloworld Ltd. | 14,289 | 141,268 | ||||||
Bid Corp. Ltd. | 2,652 | 60,281 | ||||||
Bidvest Group Ltd. (c) | 11,775 | 155,324 | ||||||
Capitec Bank Holdings Ltd. | 320 | 22,170 | ||||||
Clicks Group Ltd. | 8,561 | 98,009 | ||||||
Coronation Fund Managers Ltd. | 495 | 2,679 | ||||||
Discovery Ltd. | 675 | 7,821 | ||||||
Distell Group Ltd. | 495 | 5,263 | ||||||
EOH Holdings Ltd. | 483 | 4,143 | ||||||
Exxaro Resources Ltd. | 1,187 | 11,952 | ||||||
Famous Brands Ltd.* | 2,415 | 21,962 | ||||||
FirstRand Ltd. | 659 | 2,815 | ||||||
Foschini Group Ltd. | 2,007 | 23,667 | ||||||
Gold Fields Ltd. | 738 | 3,293 | ||||||
Grindrod Ltd.* | 4,716 | 4,902 | ||||||
Growthpoint Properties Ltd. REIT (c) | 16,859 | 32,622 | ||||||
Hyprop Investments Ltd. REIT | 5,857 | 51,430 | ||||||
Impala Platinum Holdings Ltd.* | 1,038 | 3,210 | ||||||
Imperial Holdings Ltd. | 5,784 | 92,838 | ||||||
JSE Ltd. | 1,034 | 10,721 | ||||||
KAP Industrial Holdings Ltd. | 50,426 | 32,783 | ||||||
Liberty Holdings Ltd. (c) | 534 | 4,256 | ||||||
Life Healthcare Group Holdings Ltd. | 10,280 | 20,857 | ||||||
Massmart Holdings Ltd. | 4,162 | 38,957 | ||||||
MMI Holdings Ltd. | 3,384 | 5,418 | ||||||
Mondi Ltd. | 855 | 23,334 | ||||||
Mr Price Group Ltd. | 1,396 | 19,467 | ||||||
MTN Group Ltd. (c) | 1,301 | 12,935 | ||||||
Nampak Ltd.* | 3,829 | 5,562 | ||||||
Nedbank Group Ltd. (c) | 590 | 9,981 | ||||||
Netcare Ltd. | 17,151 | 31,815 | ||||||
Oceana Group Ltd. | 514 | 3,705 | ||||||
Omnia Holdings Ltd. | 4,227 | 46,018 | ||||||
Pick n Pay Stores Ltd. | 9,505 | 46,788 | ||||||
Pioneer Foods Group Ltd. | 2,464 | 24,010 | ||||||
PSG Group Ltd. | 263 | 5,111 | ||||||
Rand Merchant Investment Holdings Ltd. | 6,097 | 19,528 | ||||||
Redefine Properties Ltd. REIT | 47,960 | 39,335 | ||||||
Remgro Ltd. | 373 | 6,237 | ||||||
Number | Value | |||||||
| South Africa (Continued) | ||||||||
Resilient REIT Ltd. REIT (c) | 2,677 | $ | 25,758 | |||||
Reunert Ltd. | 4,884 | 26,116 | ||||||
RMB Holdings Ltd. | 8,750 | 44,735 | ||||||
Sanlam Ltd. | 1,783 | 9,850 | ||||||
Santam Ltd. | 1,784 | 35,550 | ||||||
Sappi Ltd. | 13,816 | 92,904 | ||||||
Sasol Ltd. | 137 | 4,131 | ||||||
Shoprite Holdings Ltd. | 2,237 | 38,792 | ||||||
SPAR Group Ltd. | 1,597 | 20,771 | ||||||
Standard Bank Group Ltd. | 864 | 11,130 | ||||||
Sun International Ltd./South Africa | 955 | 4,262 | ||||||
Super Group Ltd./South Africa* | 4,025 | 12,793 | ||||||
Telkom SA SOC Ltd. | 10,891 | 52,589 | ||||||
Tiger Brands Ltd. | 2,033 | 63,035 | ||||||
Tongaat Hulett Ltd. | 1,046 | 9,546 | ||||||
Truworths International Ltd. | 2,199 | 14,048 | ||||||
Tsogo Sun Holdings Ltd. | 10,955 | 18,400 | ||||||
Vodacom Group Ltd. | 1,112 | 15,536 | ||||||
Woolworths Holdings Ltd. (c) | 1,811 | 8,268 | ||||||
|
| |||||||
| 1,755,925 | ||||||||
|
| |||||||
| Taiwan — 18.6% | ||||||||
Acer, Inc.* | 10,027 | 5,050 | ||||||
Advanced Semiconductor Engineering, Inc. | 28,364 | 34,211 | ||||||
Advantech Co. Ltd. | 2,426 | 17,886 | ||||||
Asia Cement Corp. | 16,420 | 14,881 | ||||||
Asustek Computer, Inc. | 575 | 4,763 | ||||||
AU Optronics Corp. | 61,093 | 25,102 | ||||||
Capital Securities Corp. | 24,070 | 7,864 | ||||||
Catcher Technology Co. Ltd. | 3,471 | 44,165 | ||||||
Cathay Real Estate Development Co. Ltd. | 24,900 | 13,655 | ||||||
Chang Hwa Commercial Bank Ltd. | 15,208 | 8,315 | ||||||
Cheng Shin Rubber Industry Co. Ltd. | 15,771 | 31,721 | ||||||
Cheng Uei Precision Industry Co. Ltd. | 7,444 | 10,162 | ||||||
Chicony Electronics Co. Ltd. | 17,059 | 42,847 | ||||||
China Airlines Ltd.* | 47,072 | 19,965 | ||||||
China Life Insurance Co. Ltd.* | 47,504 | 52,417 | ||||||
China Motor Corp. | 52,399 | 48,789 | ||||||
China Steel Corp. | 36,376 | 30,495 | ||||||
Chunghwa Telecom Co. Ltd. | 3,484 | 12,122 | ||||||
Compal Electronics, Inc. | 65,314 | 46,964 | ||||||
CTBC Financial Holding Co. Ltd. | 65,437 | 42,390 | ||||||
Delta Electronics, Inc. | 6,946 | 38,092 | ||||||
E.Sun Financial Holding Co. Ltd. | 25,155 | 15,504 | ||||||
Eclat Textile Co. Ltd. | 173 | 2,121 | ||||||
Eternal Materials Co. Ltd. | 58,080 | 61,392 | ||||||
Eva Airways Corp. | 26,708 | 13,894 | ||||||
Evergreen Marine Corp. Taiwan Ltd.* | 8,252 | 6,289 | ||||||
Far Eastern International Bank | 21,851 | 6,741 | ||||||
Far Eastern New Century Corp. | 44,281 | 35,435 | ||||||
Far EasTone Telecommunications Co. Ltd. | 10,239 | 24,835 | ||||||
Feng Hsin Steel Co. Ltd. | 31,766 | 55,366 | ||||||
Feng TAY Enterprise Co. Ltd. | 1,720 | 8,150 | ||||||
First Financial Holding Co. Ltd. | 19,915 | 12,934 | ||||||
Formosa Chemicals & Fibre Corp. | 18,266 | 57,439 | ||||||
| See Notes to Financial Statements. | 30 |
DBX ETF Trust
Schedule of Investments
Deutsche X-trackers FTSE Emerging Comprehensive Factor ETF (Continued)
August 31, 2017
Number | Value | |||||||
| Taiwan (Continued) | ||||||||
Formosa Petrochemical Corp. | 2,431 | $ | 8,579 | |||||
Formosa Plastics Corp. | 13,214 | 41,115 | ||||||
Formosa Taffeta Co. Ltd. | 8,749 | 8,697 | ||||||
Foxconn Technology Co. Ltd. | 48,457 | 153,822 | ||||||
Fubon Financial Holding Co. Ltd. | 20,827 | 33,471 | ||||||
Giant Manufacturing Co. Ltd. | 891 | 4,502 | ||||||
Hon Hai Precision Industry Co. Ltd. | 18,454 | 71,849 | ||||||
Hotai Motor Co. Ltd. | 817 | 9,624 | ||||||
Hua Nan Financial Holdings Co. Ltd. | 27,090 | 15,125 | ||||||
Innolux Corp. | 40,669 | 19,810 | ||||||
Inventec Corp. | 67,916 | 53,898 | ||||||
Largan Precision Co. Ltd. | 89 | 17,193 | ||||||
Lite-On Technology Corp. | 109,356 | 161,793 | ||||||
MediaTek, Inc. | 1,411 | 12,647 | ||||||
Mega Financial Holding Co. Ltd. | 16,959 | 13,627 | ||||||
Nan Ya Plastics Corp. | 18,173 | 45,886 | ||||||
Novatek Microelectronics Corp. | 9,244 | 35,991 | ||||||
Oriental Union Chemical Corp.* | 11,117 | 9,872 | ||||||
Pegatron Corp. | 23,529 | 74,067 | ||||||
Pou Chen Corp. | 56,861 | 73,764 | ||||||
President Chain Store Corp. | 5,959 | 49,857 | ||||||
Quanta Computer, Inc. | 16,139 | 36,739 | ||||||
Realtek Semiconductor Corp. | 4,875 | 18,900 | ||||||
Shin Kong Financial Holding Co. Ltd. | 70,122 | 20,377 | ||||||
Siliconware Precision Industries Co. Ltd. | 23,000 | 36,429 | ||||||
SinoPac Financial Holdings Co. Ltd.* | 70,452 | 22,644 | ||||||
Synnex Technology International Corp. | 9,320 | 10,407 | ||||||
Taishin Financial Holding Co. Ltd. | 22,605 | 10,037 | ||||||
Taiwan Business Bank | 31,403 | 8,678 | ||||||
Taiwan Cement Corp. | 44,872 | 51,817 | ||||||
Taiwan Fertilizer Co. Ltd. | 32,910 | 43,892 | ||||||
Taiwan Glass Industry Corp.* | 1,423 | 773 | ||||||
Taiwan Mobile Co. Ltd. | 5,074 | 18,158 | ||||||
Taiwan Secom Co. Ltd. | 5,120 | 15,133 | ||||||
Taiwan Semiconductor Manufacturing Co. Ltd. | 967 | 6,937 | ||||||
Teco Electric and Machinery Co. Ltd. | 30,727 | 28,712 | ||||||
Ton Yi Industrial Corp. | 31,336 | 14,848 | ||||||
Transcend Information, Inc. | 7,849 | 23,407 | ||||||
U-Ming Marine Transport Corp.* | 3,915 | 4,982 | ||||||
Unimicron Technology Corp. | 25,537 | 14,597 | ||||||
Uni-President Enterprises Corp. | 24,157 | 51,389 | ||||||
United Microelectronics Corp. | 69,293 | 34,556 | ||||||
Vanguard International Semiconductor Corp. | 7,830 | 14,140 | ||||||
Walsin Lihwa Corp. | 120,321 | 58,010 | ||||||
Wan Hai Lines Ltd. | 12,788 | 8,899 | ||||||
Wistron Corp. | 75,244 | 71,058 | ||||||
Yuanta Financial Holding Co. Ltd. | 75,559 | 32,798 | ||||||
Yulon Motor Co. Ltd. | 8,092 | 6,971 | ||||||
Yulon Nissan Motor Co. Ltd. | 63 | 520 | ||||||
|
| |||||||
| 2,432,953 | ||||||||
|
| |||||||
| Thailand — 4.5% | ||||||||
Advanced Info Service PCL, NVDR | 2,220 | 12,536 | ||||||
Airports of Thailand PCL, NVDR | 3,293 | 5,405 | ||||||
Bangkok Bank PCL | 900 | 5,001 | ||||||
Number | Value | |||||||
| Thailand (Continued) | ||||||||
Bangkok Expressway & Metro PCL, NVDR | 16,445 | $ | 3,863 | |||||
Bangkok Life Assurance PCL, NVDR | 9,998 | 13,775 | ||||||
Banpu PCL, NVDR | 56,868 | 30,142 | ||||||
BEC World PCL, NVDR | 1,640 | 854 | ||||||
BTS Group Holdings PCL, NVDR | 59,403 | 15,475 | ||||||
Bumrungrad Hospital PCL, NVDR | 800 | 5,252 | ||||||
Central Pattana PCL, NVDR | 17,571 | 38,100 | ||||||
Charoen Pokphand Foods PCL, NVDR | 14,899 | 12,227 | ||||||
CP ALL PCL, NVDR | 14,594 | 27,250 | ||||||
Delta Electronics Thailand PCL, NVDR | 3,627 | 9,721 | ||||||
Electricity Generating PCL, NVDR | 3,750 | 26,427 | ||||||
Glow Energy PCL, NVDR | 3,512 | 9,070 | ||||||
Home Product Center PCL, NVDR | 62,040 | 18,684 | ||||||
Indorama Ventures PCL, NVDR | 22,328 | 26,225 | ||||||
Intouch Holdings PCL, NVDR | 21,828 | 37,306 | ||||||
IRPC PCL, NVDR | 47,095 | 8,439 | ||||||
Kasikornbank PCL | 1,100 | 6,990 | ||||||
Krung Thai Bank PCL, NVDR | 24,978 | 14,067 | ||||||
Land & Houses PCL, NVDR | 167,252 | 48,858 | ||||||
Minor International PCL, NVDR | 8,308 | 9,946 | ||||||
PTT Exploration & Production PCL, NVDR | 7,400 | 19,500 | ||||||
PTT Global Chemical PCL, NVDR | 18,638 | 42,940 | ||||||
PTT PCL, NVDR | 1,930 | 23,191 | ||||||
Ratchaburi Electricity Generating Holding PCL, NVDR | 19,568 | 32,854 | ||||||
Siam Cement PCL | 500 | 7,529 | ||||||
Siam City Cement PCL, NVDR | 449 | 3,948 | ||||||
Siam Commercial Bank PCL, NVDR | 4,000 | 18,130 | ||||||
Thai Airways International PCL, NVDR* | 8,336 | 4,544 | ||||||
Thai Oil PCL, NVDR | 8,600 | 24,410 | ||||||
Thai Union Group PCL, NVDR | 14,018 | 8,359 | ||||||
TMB Bank PCL, NVDR | 101,924 | 7,244 | ||||||
Total Access Communication PCL, NVDR* | 3,596 | 5,929 | ||||||
|
| |||||||
| 584,191 | ||||||||
|
| |||||||
| Turkey — 2.9% | ||||||||
Akbank TAS | 754 | 2,258 | ||||||
Akcansa Cimento AS | 1,802 | 5,820 | ||||||
Anadolu Efes Biracilik Ve Malt Sanayii AS | 423 | 2,597 | ||||||
Arcelik AS | 1,755 | 12,200 | ||||||
Aselsan Elektronik Sanayi Ve Ticaret AS | 2,919 | 22,828 | ||||||
Aygaz AS | 5,601 | 25,405 | ||||||
BIM Birlesik Magazalar AS | 1,142 | 25,304 | ||||||
Coca-Cola Icecek AS | 90 | 1,046 | ||||||
Emlak Konut Gayrimenkul Yatirim Ortakligi AS REIT* | 51,894 | 44,190 | ||||||
Enka Insaat ve Sanayi AS | 4,935 | 7,647 | ||||||
Eregli Demir ve Celik Fabrikalari TAS | 15,081 | 35,906 | ||||||
Ford Otomotiv Sanayi AS | 1,215 | 16,730 | ||||||
Haci Omer Sabanci Holding AS | 226 | 694 | ||||||
KOC Holding AS | 2,169 | 11,333 | ||||||
Migros Ticaret AS* | 914 | 7,651 | ||||||
Petkim Petrokimya Holding AS | 26,741 | 48,331 | ||||||
TAV Havalimanlari Holding AS | 841 | 5,169 | ||||||
Tofas Turk Otomobil Fabrikasi AS | 2,618 | 23,962 | ||||||
Tupras Turkiye Petrol Rafinerileri AS | 603 | 20,487 | ||||||
Turk Hava Yollari AO* | 1,160 | 3,279 | ||||||
| See Notes to Financial Statements. | 31 |
DBX ETF Trust
Schedule of Investments
Deutsche X-trackers FTSE Emerging Comprehensive Factor ETF (Continued)
August 31, 2017
Number | Value | |||||||
| Turkey (Continued) | ||||||||
Turk Telekomunikasyon AS* | 1,800 | $ | 3,743 | |||||
Turk Traktor ve Ziraat Makineleri AS | 335 | 8,053 | ||||||
Turkcell Iletisim Hizmetleri AS | 874 | 3,344 | ||||||
Turkiye Garanti Bankasi AS | 1,349 | 4,196 | ||||||
Turkiye Is Bankasi, Class C | 6,323 | 13,717 | ||||||
Turkiye Sinai Kalkinma Bankasi AS | 9,011 | 3,967 | ||||||
Turkiye Sise ve Cam Fabrikalari AS | 9,917 | 12,753 | ||||||
Turkiye Vakiflar Bankasi TAO, Class D | 2,369 | 4,940 | ||||||
Ulker Biskuvi Sanayi AS | 295 | 1,764 | ||||||
|
| |||||||
| 379,314 | ||||||||
|
| |||||||
| United Arab Emirates — 0.6% | ||||||||
Abu Dhabi Commercial Bank PJSC | 2,015 | 4,005 | ||||||
Air Arabia PJSC | 33,531 | 10,224 | ||||||
Aldar Properties PJSC | 11,648 | 7,325 | ||||||
DAMAC Properties Dubai Co. PJSC | 7,152 | 7,866 | ||||||
DP World Ltd. | 152 | 3,487 | ||||||
Dubai Investments PJSC | 18,136 | 11,504 | ||||||
Dubai Islamic Bank PJSC | 3,369 | 5,586 | ||||||
Emaar Malls PJSC | 152 | 102 | ||||||
Emaar Properties PJSC | 7,962 | 18,425 | ||||||
Emirates Telecommunications Group Co. PJSC | 907 | 4,445 | ||||||
Union National Bank PJSC | 3,963 | 4,564 | ||||||
|
| |||||||
| 77,533 | ||||||||
|
| |||||||
TOTAL COMMON STOCKS | 11,519,364 | |||||||
|
| |||||||
| PREFERRED STOCKS — 3.3% | ||||||||
| Brazil — 2.1% | ||||||||
Banco Bradesco SA | 411 | 4,386 | ||||||
Braskem SA, Class A | 1,760 | 21,317 | ||||||
Cia de Gas de Sao Paulo — COMGAS, Class A | 1,711 | 29,365 | ||||||
Cia de Transmissao de Energia Eletrica Paulista | 2,207 | 49,626 | ||||||
Cia Energetica de Minas Gerais | 3,713 | 9,889 | ||||||
Cia Paranaense de Energia, Class B | 1,921 | 17,547 | ||||||
Itau Unibanco Holding SA | 947 | 12,144 | ||||||
Itausa — Investimentos Itau SA | 28,762 | 93,239 | ||||||
Suzano Papel e Celulose SA, Class A | 1,747 | 9,717 | ||||||
Number | Value | |||||||
| Brazil (Continued) | ||||||||
Telefonica Brasil SA | 1,402 | $ | 21,762 | |||||
Vale SA | 334 | 3,457 | ||||||
|
| |||||||
| 272,449 | ||||||||
|
| |||||||
| Chile — 0.4% | ||||||||
Embotelladora Andina SA, Class B | 5,535 | 26,082 | ||||||
Sociedad Quimica y Minera de Chile SA, Class B | 506 | 23,646 | ||||||
|
| |||||||
| 49,728 | ||||||||
|
| |||||||
| Colombia — 0.4% | ||||||||
Bancolombia SA | 2,504 | 28,570 | ||||||
Cementos Argos SA | 1,509 | 5,432 | ||||||
Grupo Aval Acciones y Valores SA | 30,625 | 13,728 | ||||||
Grupo de Inversiones Suramericana SA | 581 | 7,939 | ||||||
|
| |||||||
| 55,669 | ||||||||
|
| |||||||
| Russia — 0.4% | ||||||||
Bashneft PJSC | 43 | 957 | ||||||
Surgutneftegas OJSC | 19,038 | 9,507 | ||||||
Tatneft PJSC, Series 3 | 2,049 | 9,526 | ||||||
Transneft PJSC | 9 | 27,624 | ||||||
|
| |||||||
| 47,614 | ||||||||
|
| |||||||
TOTAL PREFERRED STOCKS | 425,460 | |||||||
|
| |||||||
| RIGHTS — 0.0% | ||||||||
| China — 0.0% | ||||||||
Sisram Medical, expires 12/31/17 (a) | 1 | 0 | ||||||
|
| |||||||
| SECURITIES LENDING COLLATERAL — 1.4% | ||||||||
Deutsche Government & Agency Securities Portfolio “Deutsche Government Cash Institutional Shares”, 0.93% (d)(e) | 184,866 | 184,866 | ||||||
|
| |||||||
TOTAL INVESTMENTS — 92.7% | $ | 12,129,690 | ||||||
Other assets and liabilities, net — 7.3% | 959,060 | |||||||
|
| |||||||
NET ASSETS — 100.0% | $ | 13,088,750 | ||||||
|
| |||||||
| * | Non-income producing security. |
| (a) | Investment was valued using significant unobservable inputs. |
| (b) | Stapled Security — A security contractually bound to one or more other securities to form a single saleable unit which cannot be sold separately. |
| (c) | All or a portion of these securities were on loan. In addition, “Other assets and liabilities, net” may include pending sales that are also on loan. The value of securities loaned at August 31, 2017 amounted to $175,873, which is 1.3% of net assets. |
| (d) | Affiliated fund managed by Deutsche Investment Management Americas Inc. The rate shown is the annualized seven-day yield at period end. |
| (e) | Represents collateral held in connection with securities lending. Income earned by the Fund is net of borrower rebates. |
| See Notes to Financial Statements. | 32 |
DBX ETF Trust
Schedule of Investments
Deutsche X-trackers FTSE Emerging Comprehensive Factor ETF (Continued)
August 31, 2017
| CPO: | Ordinary Participation Certificates |
| GDR: | Global Depositary Receipt |
| NVDR: | Non Voting Depositary Receipt |
| OJSC: | Open Joint Stock Company |
| PJSC: | Private Joint Stock Company |
| REIT: | Real Estate Investment Trust |
| 144A: | Security exempt from registration under Rule 144A of the Securities Act of 1933. These securities may be resold in transactions exempt from registration, normally to qualified institutional buyers. |
At August 31, 2017, open futures contract purchased was as follows:
Contract Description | Currency | Number of Contracts | Notional Amount | Contract Value | Expiration Date | Unrealized Appreciation (Depreciation) | ||||||||||||
SGX NIFTY 50 Futures | USD | 57 | $ | 1,136,124 | $1,132,932 | 9/28/2017 | $ | (3,192 | ) | |||||||||
Currency Abbreviations
| USD | U.S. Dollar |
For information on the Fund’s policy and additional disclosures regarding open futures contracts please refer to the Derivatives section of Note 2 in the accompanying Notes to Financial Statements.
Fair Value Measurements
Various inputs are used in determining the value of the Fund’s investments. These inputs are summarized in three broad levels. Level 1 includes quoted prices in active markets for identical securities. Level 2 includes other significant observable inputs (including quoted prices for similar securities, interest rates, prepayment speeds and credit risk). Level 3 includes significant unobservable inputs (including the Fund’s own assumptions in determining the fair value of investments). The level assigned to the securities valuations may not be an indication of the risk or liquidity associated with investing in those securities.
The following is a summary of the inputs used as of August 31, 2017 in valuing the Fund’s investments. For information on the Fund’s policy regarding the valuation of investments, please refer to the Security Valuation section of Note 2 in the accompanying Notes to Financial Statements.
Assets | Level 1 | Level 2 | Level 3 | Total | ||||||||||||
Common Stocks (f) | $ | 11,514,390 | $ | — | $ | 4,974 | $ | 11,519,364 | ||||||||
Preferred Stocks (f) | 425,460 | — | — | 425,460 | ||||||||||||
Rights | — | — | 0 | 0 | ||||||||||||
Short-Term Investments | 184,866 | — | — | 184,866 | ||||||||||||
|
|
|
|
|
|
|
| |||||||||
TOTAL | $ | 12,124,716 | $ | — | $ | 4,974 | $ | 12,129,690 | ||||||||
|
|
|
|
|
|
|
| |||||||||
Liabilities | Level 1 | Level 2 | Level 3 | Total | ||||||||||||
Derivatives (g) | ||||||||||||||||
Futures Contracts | $ | (3,192 | ) | $ | — | $ | — | $ | (3,192 | ) | ||||||
|
|
|
|
|
|
|
| |||||||||
TOTAL | $ | (3,192 | ) | $ | — | $ | — | $ | (3,192 | ) | ||||||
|
|
|
|
|
|
|
| |||||||||
| (f) | See Schedule of Investments for additional detailed categorizations. |
| (g) | Derivatives include unrealized appreciation (depreciation) on open futures contracts. |
During the period ended August 31, 2017, the amount of transfers between Level 1 and Level 3 was $2,128 and between Level 3 and Level 1 was $831. Investments were transferred from Level 1 to Level 3 as a result of a halt in trading on a securities exchange. Investments were transferred from Level 3 to Level 1 as a result of the resumption of trading on a securities exchange.
Transfers between price levels are recognized at the beginning of the reporting period.
| See Notes to Financial Statements. | 33 |
DBX ETF Trust
Deutsche X-trackers Russell 1000 Comprehensive Factor ETF
August 31, 2017
Number | Value | |||||||
| COMMON STOCKS — 98.8% | ||||||||
| Consumer Discretionary — 17.1% | ||||||||
Advance Auto Parts, Inc. | 595 | $ | 58,250 | |||||
Amazon.com, Inc.* | 14 | 13,728 | ||||||
AMC Networks, Inc., Class A* | 524 | 31,849 | ||||||
Aramark | 4,555 | 185,343 | ||||||
AutoNation, Inc.*(a) | 285 | 12,930 | ||||||
AutoZone, Inc.* | 242 | 127,882 | ||||||
Bed Bath & Beyond, Inc. | 1,667 | 45,993 | ||||||
Best Buy Co., Inc. | 1,487 | 80,685 | ||||||
BorgWarner, Inc. | 5,311 | 246,484 | ||||||
Bright Horizons Family Solutions, Inc.* | 702 | 56,111 | ||||||
Brunswick Corp. | 3,525 | 184,992 | ||||||
Burlington Stores, Inc.* | 2,243 | 195,433 | ||||||
Cabela’s, Inc.* | 291 | 15,627 | ||||||
Cable One, Inc. | 205 | 155,542 | ||||||
CalAtlantic Group, Inc. | 822 | 28,564 | ||||||
CarMax, Inc.* | 883 | 59,293 | ||||||
Carnival Corp. | 6,028 | 418,825 | ||||||
Carter’s, Inc. | 471 | 40,840 | ||||||
CBS Corp., Class B | 3,041 | 194,806 | ||||||
Charter Communications, Inc., Class A* | 16 | 6,377 | ||||||
Chipotle Mexican Grill, Inc.*(a) | 109 | 34,521 | ||||||
Choice Hotels International, Inc. | 871 | 54,046 | ||||||
Cinemark Holdings, Inc. | 3,718 | 123,772 | ||||||
Coach, Inc. | 2,929 | 122,139 | ||||||
Comcast Corp., Class A | 1,265 | 51,372 | ||||||
D.R. Horton, Inc. | 2,721 | 98,364 | ||||||
Darden Restaurants, Inc. | 7,028 | 576,929 | ||||||
Delphi Automotive PLC | 6,051 | 583,316 | ||||||
Dick’s Sporting Goods, Inc. | 2,585 | 68,141 | ||||||
Discovery Communications, Inc., | 1,979 | 43,954 | ||||||
Discovery Communications, Inc., | 2,926 | 61,475 | ||||||
DISH Network Corp., Class A* | 2,041 | 116,929 | ||||||
Dollar General Corp. | 958 | 69,512 | ||||||
Dollar Tree, Inc.* | 1,163 | 92,621 | ||||||
Domino’s Pizza, Inc. | 1,328 | 242,041 | ||||||
Dunkin’ Brands Group, Inc. | 1,259 | 64,914 | ||||||
Expedia, Inc. | 380 | 56,377 | ||||||
Extended Stay America, Inc. | 2,700 | 52,893 | ||||||
Floor & Decor Holdings, Inc., Class A* | 135 | 4,852 | ||||||
Foot Locker, Inc. | 6,771 | 238,542 | ||||||
Ford Motor Co. | 2,810 | 30,994 | ||||||
GameStop Corp., Class A (a) | 248 | 4,588 | ||||||
Gap, Inc. | 5,728 | 135,295 | ||||||
Garmin Ltd. | 4,342 | 223,613 | ||||||
General Motors Co. | 4,336 | 158,437 | ||||||
Gentex Corp. | 9,475 | 173,108 | ||||||
Genuine Parts Co. | 2,841 | 235,320 | ||||||
Goodyear Tire & Rubber Co. | 3,727 | 112,928 | ||||||
Graham Holdings Co., Class B | 252 | 147,974 | ||||||
H&R Block, Inc. | 8,840 | 236,382 | ||||||
Hanesbrands, Inc. | 579 | 14,047 | ||||||
Harley-Davidson, Inc. (a) | 4,569 | 214,789 | ||||||
Hasbro, Inc. | 2,693 | 264,587 | ||||||
Hilton Grand Vacations, Inc.* | 422 | 15,297 | ||||||
Number | Value | |||||||
| Consumer Discretionary (Continued) | ||||||||
Hilton Worldwide Holdings, Inc. | 1,051 | $ | 67,611 | |||||
Home Depot, Inc. | 610 | 91,421 | ||||||
Hyatt Hotels Corp., Class A* | 893 | 53,142 | ||||||
International Game Technology PLC | 1,511 | 30,779 | ||||||
Interpublic Group of Companies, Inc. | 5,482 | 110,407 | ||||||
John Wiley & Sons, Inc., Class A | 1,613 | 87,021 | ||||||
Kohl’s Corp. (a) | 2,877 | 114,447 | ||||||
L Brands, Inc. | 581 | 21,044 | ||||||
Las Vegas Sands Corp. | 734 | 45,662 | ||||||
Lear Corp. | 4,401 | 658,126 | ||||||
Leggett & Platt, Inc. | 3,624 | 166,595 | ||||||
Lennar Corp., Class A | 1,524 | 78,882 | ||||||
Liberty Broadband Corp., Class A* | 354 | 35,906 | ||||||
Liberty Broadband Corp., Class C* | 1,666 | 169,149 | ||||||
Liberty Interactive Corp., Class A* | 4,047 | 89,520 | ||||||
Liberty Media Corp.-Liberty Formula One, Class A* | 1,876 | 71,157 | ||||||
Liberty Media Corp.-Liberty Formula One, Class C* | 1,869 | 73,452 | ||||||
Liberty Media Corp-Liberty SiriusXM, Class A* | 1,284 | 57,395 | ||||||
Liberty Media Corp-Liberty SiriusXM, Class C* | 2,724 | 121,518 | ||||||
Liberty Ventures, Series A* | 6,829 | 420,393 | ||||||
Live Nation Entertainment, Inc.* | 4,163 | 166,353 | ||||||
LKQ Corp.* | 727 | 25,191 | ||||||
Lowe’s Cos., Inc. | 2,454 | 181,326 | ||||||
Macy’s, Inc. | 403 | 8,370 | ||||||
Madison Square Garden Co., Class A* | 86 | 18,276 | ||||||
Mattel, Inc. | 525 | 8,516 | ||||||
McDonald’s Corp. | 682 | 109,100 | ||||||
MGM Resorts International | 1,200 | 39,552 | ||||||
Michael Kors Holdings Ltd.* | 243 | 10,259 | ||||||
Michaels Cos., Inc.* | 274 | 6,151 | ||||||
Mohawk Industries, Inc.* | 1,130 | 286,026 | ||||||
Murphy USA, Inc.* | 566 | 36,484 | ||||||
News Corp., Class A | 15,786 | 211,059 | ||||||
News Corp., Class B | 5,215 | 71,446 | ||||||
NIKE, Inc., Class B | 1,379 | 72,825 | ||||||
Nordstrom, Inc. (a) | 4,773 | 212,971 | ||||||
Norwegian Cruise Line Holdings Ltd.* | 1,124 | 66,833 | ||||||
NVR, Inc.* | 222 | 604,029 | ||||||
Omnicom Group, Inc. | 3,469 | 251,086 | ||||||
O’Reilly Automotive, Inc.* | 651 | 127,681 | ||||||
Penske Automotive Group, Inc. | 492 | 20,841 | ||||||
Polaris Industries, Inc. (a) | 537 | 50,065 | ||||||
Pool Corp. | 2,277 | 226,994 | ||||||
Priceline Group, Inc.* | 37 | 68,527 | ||||||
PulteGroup, Inc. | 3,466 | 89,492 | ||||||
PVH Corp. | 695 | 87,494 | ||||||
Ralph Lauren Corp. | 207 | 18,193 | ||||||
Regal Entertainment Group, Class A (a) | 3,503 | 51,739 | ||||||
Ross Stores, Inc. | 5,976 | 349,297 | ||||||
Royal Caribbean Cruises Ltd. | 1,495 | 186,068 | ||||||
Scripps Networks Interactive, Inc., Class A | 2,498 | 213,954 | ||||||
Service Corp. International | 4,007 | 141,607 | ||||||
| See Notes to Financial Statements. | 34 |
DBX ETF Trust
Schedule of Investments
Deutsche X-trackers Russell 1000 Comprehensive Factor ETF (Continued)
August 31, 2017
Number | Value | |||||||
| Consumer Discretionary (Continued) | ||||||||
ServiceMaster Global Holdings, Inc.* | 549 | $ | 25,869 | |||||
Signet Jewelers Ltd. (a) | 196 | 12,362 | ||||||
Sirius XM Holdings, Inc. (a) | 18,418 | 105,904 | ||||||
Six Flags Entertainment Corp. (a) | 1,500 | 81,855 | ||||||
Staples, Inc. | 9,949 | 101,629 | ||||||
Starbucks Corp. | 1,478 | 81,083 | ||||||
Target Corp. | 2,471 | 134,744 | ||||||
TEGNA, Inc. | 3,131 | 39,513 | ||||||
Thor Industries, Inc. | 2,372 | 257,694 | ||||||
Tiffany & Co. | 4,118 | 376,385 | ||||||
Time Warner, Inc. | 1,305 | 131,936 | ||||||
TJX Cos., Inc. | 2,844 | 205,621 | ||||||
Toll Brothers, Inc. | 1,975 | 76,946 | ||||||
Tractor Supply Co. | 208 | 12,378 | ||||||
Tribune Media Co., Class A | 547 | 21,918 | ||||||
Tupperware Brands Corp. | 2,998 | 173,494 | ||||||
Twenty-First Century Fox, Inc., Class A | 934 | 25,769 | ||||||
Twenty-First Century Fox, Inc., Class B | 469 | 12,710 | ||||||
Ulta Beauty, Inc.* | 273 | 60,336 | ||||||
Vail Resorts, Inc. | 1,287 | 293,372 | ||||||
VF Corp. | 1,072 | 67,397 | ||||||
Viacom, Inc., Class B | 292 | 8,351 | ||||||
Visteon Corp.* | 873 | 100,779 | ||||||
Walt Disney Co. | 593 | 60,012 | ||||||
Wendy’s Co. | 3,305 | 49,311 | ||||||
Whirlpool Corp. | 725 | 124,425 | ||||||
Williams-Sonoma, Inc. (a) | 2,371 | 109,066 | ||||||
Wyndham Worldwide Corp. | 4,117 | 410,383 | ||||||
Yum China Holdings, Inc.* | 5,395 | 190,767 | ||||||
Yum! Brands, Inc. | 3,716 | 285,463 | ||||||
|
| |||||||
| 17,102,527 | ||||||||
|
| |||||||
| Consumer Staples — 4.3% | ||||||||
Altria Group, Inc. | 529 | 33,539 | ||||||
Archer-Daniels-Midland Co. | 2,372 | 98,011 | ||||||
Brown-Forman Corp., Class A | 404 | 22,470 | ||||||
Brown-Forman Corp., Class B | 1,767 | 93,722 | ||||||
Bunge Ltd. | 2,551 | 190,381 | ||||||
Campbell Soup Co. | 964 | 44,537 | ||||||
Casey’s General Stores, Inc. | 429 | 45,225 | ||||||
Church & Dwight Co., Inc. | 2,863 | 143,637 | ||||||
Clorox Co. | 881 | 122,045 | ||||||
Coca-Cola Co. | 242 | 11,023 | ||||||
Colgate-Palmolive Co. | 1,425 | 102,087 | ||||||
Conagra Brands, Inc. | 1,434 | 46,548 | ||||||
Constellation Brands, Inc., Class A | 383 | 76,638 | ||||||
Costco Wholesale Corp. | 1,487 | 233,072 | ||||||
CVS Health Corp. | 883 | 68,291 | ||||||
Dr Pepper Snapple Group, Inc. | 1,408 | 128,198 | ||||||
Edgewell Personal Care Co.* | 196 | 14,884 | ||||||
Energizer Holdings, Inc. | 194 | 8,565 | ||||||
Estee Lauder Cos., Inc., Class A | 1,575 | 168,509 | ||||||
Flowers Foods, Inc. | 4,505 | 78,252 | ||||||
General Mills, Inc. | 1,325 | 70,570 | ||||||
Hershey Co. | 1,899 | 199,243 | ||||||
Hormel Foods Corp. | 3,774 | 116,013 | ||||||
Ingredion, Inc. | 728 | 90,141 | ||||||
Number | Value | |||||||
| Consumer Staples (Continued) | ||||||||
JM Smucker Co. | 641 | $ | 67,151 | |||||
Kellogg Co. | 664 | 43,465 | ||||||
Kimberly-Clark Corp. | 982 | 121,071 | ||||||
Kraft Heinz Co. | 118 | 9,529 | ||||||
Kroger Co. | 2,198 | 48,070 | ||||||
Lamb Weston Holdings, Inc. | 4,345 | 197,611 | ||||||
McCormick & Co., Inc. | 1,458 | 138,700 | ||||||
Molson Coors Brewing Co., Class B | 144 | 12,924 | ||||||
Mondelez International, Inc., Class A | 702 | 28,543 | ||||||
Monster Beverage Corp.* | 203 | 11,331 | ||||||
Nu Skin Enterprises, Inc., Class A | 58 | 3,528 | ||||||
PepsiCo, Inc. | 308 | 35,645 | ||||||
Philip Morris International, Inc. | 275 | 32,156 | ||||||
Pilgrim’s Pride Corp.* | 267 | 7,863 | ||||||
Pinnacle Foods, Inc. | 2,542 | 150,766 | ||||||
Post Holdings, Inc.* | 607 | 51,674 | ||||||
Procter & Gamble Co. | 351 | 32,387 | ||||||
Seaboard Corp. | 15 | 64,435 | ||||||
Spectrum Brands Holdings, Inc. (a) | 423 | 46,513 | ||||||
Sprouts Farmers Market, Inc.* | 1,914 | 38,165 | ||||||
Sysco Corp. | 10,446 | 550,191 | ||||||
TreeHouse Foods, Inc.*(a) | 59 | 3,952 | ||||||
Tyson Foods, Inc., Class A | 1,939 | 122,739 | ||||||
US Foods Holding Corp.* | 3,971 | 109,004 | ||||||
Walgreens Boots Alliance, Inc. | 1,200 | 97,800 | ||||||
Wal-Mart Stores, Inc. | 525 | 40,987 | ||||||
|
| |||||||
| 4,271,801 | ||||||||
|
| |||||||
| Energy — 0.7% | ||||||||
Andeavor | 294 | 29,444 | ||||||
Baker Hughes a GE Co. | 2,179 | 73,868 | ||||||
Chevron Corp. | 95 | 10,224 | ||||||
Cimarex Energy Co. | 57 | 5,682 | ||||||
ConocoPhillips | 324 | 14,146 | ||||||
Energen Corp.* | 109 | 5,589 | ||||||
EOG Resources, Inc. | 126 | 10,709 | ||||||
Exxon Mobil Corp. | 80 | 6,106 | ||||||
Helmerich & Payne, Inc. (a) | 282 | 11,940 | ||||||
HollyFrontier Corp. | 597 | 18,692 | ||||||
Kinder Morgan, Inc. | 1,902 | 36,766 | ||||||
Marathon Petroleum Corp. | 2,358 | 123,677 | ||||||
Occidental Petroleum Corp. | 137 | 8,179 | ||||||
Oceaneering International, Inc. | 591 | 13,327 | ||||||
ONEOK, Inc. | 1,127 | 61,038 | ||||||
Phillips 66 | 323 | 27,071 | ||||||
Pioneer Natural Resources Co. | 76 | 9,853 | ||||||
Targa Resources Corp. | 123 | 5,482 | ||||||
Valero Energy Corp. | 3,467 | 236,103 | ||||||
Williams Cos., Inc. | 446 | 13,260 | ||||||
|
| |||||||
| 721,156 | ||||||||
|
| |||||||
| Financials — 17.7% | ||||||||
Affiliated Managers Group, Inc. | 790 | 139,585 | ||||||
Aflac, Inc. | 2,617 | 216,033 | ||||||
AGNC Investment Corp. REIT | 6,049 | 130,295 | ||||||
Alleghany Corp.* | 213 | 119,870 | ||||||
Allstate Corp. | 3,635 | 328,967 | ||||||
Ally Financial, Inc. | 4,725 | 106,785 | ||||||
| See Notes to Financial Statements. | 35 |
DBX ETF Trust
Schedule of Investments
Deutsche X-trackers Russell 1000 Comprehensive Factor ETF (Continued)
August 31, 2017
Number | Value | |||||||
| Financials (Continued) | ||||||||
American Express Co. | 2,281 | $ | 196,394 | |||||
American Financial Group, Inc. | 2,344 | 238,643 | ||||||
American International Group, Inc. | 285 | 17,237 | ||||||
American National Insurance Co. | 75 | 8,678 | ||||||
Ameriprise Financial, Inc. | 1,194 | 165,381 | ||||||
Annaly Capital Management, Inc. REIT | 23,838 | 297,975 | ||||||
Aon PLC | 2,091 | 290,984 | ||||||
Arch Capital Group Ltd.* | 2,978 | 289,879 | ||||||
Arthur J Gallagher & Co. | 4,640 | 268,656 | ||||||
Aspen Insurance Holdings Ltd. | 1,797 | 81,224 | ||||||
Associated Banc-Corp. | 4,036 | 88,388 | ||||||
Assurant, Inc. | 1,444 | 136,732 | ||||||
Assured Guaranty Ltd. | 5,255 | 223,548 | ||||||
Athene Holding, Ltd., Class A* | 318 | 17,016 | ||||||
Axis Capital Holdings Ltd. | 3,385 | 203,912 | ||||||
Bank of America Corp. | 649 | 15,505 | ||||||
Bank of Hawaii Corp. | 500 | 39,065 | ||||||
Bank of New York Mellon Corp. | 1,805 | 94,365 | ||||||
Bank of the Ozarks | 851 | 36,559 | ||||||
BankUnited, Inc. | 932 | 31,017 | ||||||
BB&T Corp. | 2,615 | 120,525 | ||||||
Berkshire Hathaway, Inc., Class B* | 334 | 60,507 | ||||||
BGC Partners, Inc., Class A | 2,421 | 31,449 | ||||||
BlackRock, Inc. | 58 | 24,303 | ||||||
BOK Financial Corp. | 132 | 10,623 | ||||||
Brighthouse Financial, Inc.* | 89 | 5,079 | ||||||
Brown & Brown, Inc. | 3,729 | 167,656 | ||||||
Capital One Financial Corp. | 2,217 | 176,495 | ||||||
CBOE Holdings, Inc. | 2,470 | 249,198 | ||||||
Charles Schwab Corp. | 668 | 26,653 | ||||||
Chimera Investment Corp. REIT | 15,323 | 292,210 | ||||||
Chubb Ltd. | 934 | 132,086 | ||||||
Cincinnati Financial Corp. | 1,736 | 133,394 | ||||||
CIT Group, Inc. | 887 | 39,782 | ||||||
Citigroup, Inc. | 612 | 41,634 | ||||||
Citizens Financial Group, Inc. | 3,049 | 101,013 | ||||||
CME Group, Inc. | 700 | 88,060 | ||||||
CNA Financial Corp. | 771 | 37,825 | ||||||
Comerica, Inc. | 905 | 61,766 | ||||||
Commerce Bancshares, Inc. | 1,145 | 62,964 | ||||||
Credit Acceptance Corp.*(a) | 249 | 67,803 | ||||||
Cullen/Frost Bankers, Inc. | 795 | 66,939 | ||||||
Discover Financial Services | 4,743 | 279,600 | ||||||
E*TRADE Financial Corp.* | 2,314 | 94,897 | ||||||
East West Bancorp, Inc. | 1,930 | 106,864 | ||||||
Eaton Vance Corp. | 5,846 | 278,153 | ||||||
Erie Indemnity Co., Class A | 1,419 | 171,401 | ||||||
Everest Re Group Ltd. | 3,227 | 814,753 | ||||||
FactSet Research Systems, Inc. | 954 | 149,950 | ||||||
Federated Investors, Inc., Class B | 2,086 | 56,969 | ||||||
Fifth Third Bancorp | 7,889 | 206,140 | ||||||
First American Financial Corp. | 4,352 | 213,509 | ||||||
First Hawaiian, Inc. | 366 | 9,915 | ||||||
First Horizon National Corp. | 2,351 | 40,461 | ||||||
First Republic Bank | 885 | 85,889 | ||||||
FNB Corp. | 1,751 | 22,220 | ||||||
FNF Group | 9,437 | 455,241 | ||||||
Number | Value | |||||||
| Financials (Continued) | ||||||||
Franklin Resources, Inc. | 7,958 | $ | 344,024 | |||||
Goldman Sachs Group, Inc. | 329 | 73,610 | ||||||
Hanover Insurance Group, Inc. | 567 | 55,668 | ||||||
Hartford Financial Services Group, Inc. | 1,755 | 94,893 | ||||||
Huntington Bancshares, Inc. | 8,089 | 101,841 | ||||||
Interactive Brokers Group, Inc., Class A | 145 | 6,080 | ||||||
Intercontinental Exchange, Inc. | 1,127 | 72,883 | ||||||
Invesco Ltd. | 2,900 | 95,062 | ||||||
JPMorgan Chase & Co. | 146 | 13,270 | ||||||
KeyCorp | 6,075 | 104,551 | ||||||
Lazard Ltd., Class A | 7,895 | 338,617 | ||||||
Legg Mason, Inc. | 3,093 | 118,122 | ||||||
Leucadia National Corp. | 5,577 | 132,063 | ||||||
Lincoln National Corp. | 1,733 | 117,601 | ||||||
Loews Corp. | 2,513 | 117,056 | ||||||
LPL Financial Holdings, Inc. | 3,532 | 165,439 | ||||||
M&T Bank Corp. | 640 | 94,630 | ||||||
Markel Corp.* | 51 | 53,651 | ||||||
MarketAxess Holdings, Inc. | 459 | 88,564 | ||||||
Marsh & McLennan Cos., Inc. | 4,256 | 332,308 | ||||||
Mercury General Corp. | 467 | 26,838 | ||||||
MetLife, Inc. | 999 | 46,783 | ||||||
MFA Financial, Inc. REIT | 9,552 | 83,867 | ||||||
Moody’s Corp. | 933 | 125,050 | ||||||
Morgan Stanley | 717 | 32,624 | ||||||
Morningstar, Inc. | 348 | 28,780 | ||||||
MSCI, Inc. | 2,459 | 281,826 | ||||||
Nasdaq, Inc. | 321 | 24,197 | ||||||
Navient Corp. | 1,225 | 16,170 | ||||||
New Residential Investment Corp. REIT | 12,607 | 207,763 | ||||||
New York Community Bancorp, Inc. | 2,036 | 24,534 | ||||||
Northern Trust Corp. | 940 | 83,190 | ||||||
Old Republic International Corp. | 6,928 | 132,256 | ||||||
PacWest Bancorp | 1,610 | 72,692 | ||||||
People’s United Financial, Inc. | 2,508 | 41,884 | ||||||
PNC Financial Services Group, Inc. | 851 | 106,724 | ||||||
Popular, Inc. | 1,266 | 50,526 | ||||||
Principal Financial Group, Inc. | 3,255 | 203,503 | ||||||
ProAssurance Corp. | 1,639 | 87,277 | ||||||
Progressive Corp. | 11,962 | 555,994 | ||||||
Prosperity Bancshares, Inc. | 850 | 50,788 | ||||||
Prudential Financial, Inc. | 1,488 | 151,895 | ||||||
Raymond James Financial, Inc. | 680 | 53,258 | ||||||
Regions Financial Corp. | 11,000 | 155,210 | ||||||
Reinsurance Group of America, Inc. | 2,122 | 285,303 | ||||||
RenaissanceRe Holdings Ltd. | 2,016 | 280,547 | ||||||
S&P Global, Inc. | 2,348 | 362,367 | ||||||
Santander Consumer USA Holdings, | 523 | 7,468 | ||||||
SEI Investments Co. | 2,421 | 141,532 | ||||||
Signature Bank* | 264 | 33,882 | ||||||
SLM Corp.* | 1,773 | 18,031 | ||||||
Starwood Property Trust, Inc. REIT | 2,450 | 54,415 | ||||||
State Street Corp. | 1,377 | 127,359 | ||||||
SunTrust Banks, Inc. | 924 | 50,912 | ||||||
SVB Financial Group* | 207 | 35,053 | ||||||
Synchrony Financial | 4,528 | 139,417 | ||||||
| See Notes to Financial Statements. | 36 |
DBX ETF Trust
Schedule of Investments
Deutsche X-trackers Russell 1000 Comprehensive Factor ETF (Continued)
August 31, 2017
Number | Value | |||||||
| Financials (Continued) | ||||||||
Synovus Financial Corp. | 1,533 | $ | 64,570 | |||||
T. Rowe Price Group, Inc. | 2,353 | 198,499 | ||||||
TCF Financial Corp. | 2,511 | 38,996 | ||||||
TD Ameritrade Holding Corp. | 1,525 | 66,063 | ||||||
Torchmark Corp. | 4,367 | 336,128 | ||||||
Travelers Cos., Inc. | 1,885 | 228,424 | ||||||
Two Harbors Investment Corp. REIT | 13,336 | 136,427 | ||||||
Unum Group | 5,770 | 277,999 | ||||||
US Bancorp | 1,161 | 59,501 | ||||||
Validus Holdings Ltd. | 3,652 | 183,148 | ||||||
Voya Financial, Inc. | 1,415 | 54,095 | ||||||
W.R. Berkley Corp. | 3,498 | 233,107 | ||||||
Webster Financial Corp. | 1,231 | 57,463 | ||||||
Wells Fargo & Co. | 226 | 11,542 | ||||||
Western Alliance Bancorp* | 957 | 46,156 | ||||||
Willis Towers Watson PLC | 420 | 62,357 | ||||||
XL Group Ltd. | 3,390 | 138,854 | ||||||
Zions Bancorporation | 1,819 | 79,418 | ||||||
|
| |||||||
| 17,739,214 | ||||||||
|
| |||||||
| Health Care — 9.7% | ||||||||
Abbott Laboratories | 1,706 | 86,904 | ||||||
AbbVie, Inc. | 568 | 42,770 | ||||||
Aetna, Inc. | 402 | 63,395 | ||||||
Agilent Technologies, Inc. | 3,116 | 201,668 | ||||||
Alexion Pharmaceuticals, Inc.* | 64 | 9,114 | ||||||
Align Technology, Inc.* | 534 | 94,379 | ||||||
Allergan PLC | 154 | 35,340 | ||||||
AmerisourceBergen Corp. | 2,102 | 168,685 | ||||||
Amgen, Inc. | 341 | 60,620 | ||||||
Anthem, Inc. | 2,054 | 402,666 | ||||||
Baxter International, Inc. | 15,958 | 990,034 | ||||||
Becton Dickinson and Co. | 610 | 121,658 | ||||||
Biogen, Inc.* | 357 | 113,012 | ||||||
Bio-Rad Laboratories, Inc., Class A* | 562 | 122,415 | ||||||
Bio-Techne Corp. | 488 | 60,405 | ||||||
Bioverativ, Inc.* | 3,632 | 205,898 | ||||||
Boston Scientific Corp.* | 1,641 | 45,210 | ||||||
Bristol-Myers Squibb Co. | 172 | 10,403 | ||||||
Bruker Corp. | 674 | 19,607 | ||||||
C.R. Bard, Inc. | 826 | 264,989 | ||||||
Cardinal Health, Inc. | 4,397 | 296,622 | ||||||
Celgene Corp.* | 261 | 36,261 | ||||||
Centene Corp.* | 215 | 19,103 | ||||||
Cerner Corp.* | 3,255 | 220,624 | ||||||
Charles River Laboratories International, Inc.* | 619 | 67,347 | ||||||
Cigna Corp. | 2,934 | 534,164 | ||||||
Cooper Cos., Inc. | 929 | 233,021 | ||||||
Danaher Corp. | 826 | 68,905 | ||||||
DaVita, Inc.* | 1,100 | 64,416 | ||||||
Edwards Lifesciences Corp.* | 523 | 59,444 | ||||||
Eli Lilly & Co. | 752 | 61,130 | ||||||
Express Scripts Holding Co.* | 1,201 | 75,447 | ||||||
Gilead Sciences, Inc. | 411 | 34,405 | ||||||
HCA Healthcare, Inc.* | 1,846 | 145,206 | ||||||
Henry Schein, Inc.* | 1,287 | 223,526 | ||||||
Number | Value | |||||||
| Health Care (Continued) | ||||||||
Hill-Rom Holdings, Inc. | 2,504 | $ | 192,708 | |||||
Hologic, Inc.* | 3,470 | 133,942 | ||||||
Humana, Inc. | 935 | 240,875 | ||||||
IDEXX Laboratories, Inc.* | 1,075 | 167,087 | ||||||
Illumina, Inc.* | 104 | 21,264 | ||||||
Intuitive Surgical, Inc.* | 111 | 111,518 | ||||||
Johnson & Johnson | 207 | 27,401 | ||||||
Laboratory Corp. of America Holdings* | 1,619 | 253,973 | ||||||
LifePoint Health, Inc.* | 689 | 39,928 | ||||||
McKesson Corp. | 513 | 76,596 | ||||||
MEDNAX, Inc.* | 378 | 16,953 | ||||||
Medtronic PLC | 353 | 28,459 | ||||||
Merck & Co., Inc. | 476 | 30,397 | ||||||
Mettler-Toledo International, Inc.* | 444 | 268,660 | ||||||
Mylan N.V.* | 152 | 4,785 | ||||||
Patterson Cos., Inc. | 1,102 | 42,427 | ||||||
PerkinElmer, Inc. | 1,477 | 98,944 | ||||||
Pfizer, Inc. | 525 | 17,808 | ||||||
Premier, Inc., Class A* | 261 | 8,743 | ||||||
QIAGEN NV* | 3,368 | 108,349 | ||||||
Quest Diagnostics, Inc. | 4,583 | 496,568 | ||||||
Regeneron Pharmaceuticals, Inc.* | 27 | 13,416 | ||||||
ResMed, Inc. | 1,631 | 126,533 | ||||||
STERIS PLC | 1,638 | 142,768 | ||||||
Stryker Corp. | 555 | 78,460 | ||||||
Teleflex, Inc. | 699 | 148,013 | ||||||
Thermo Fisher Scientific, Inc. | 396 | 74,107 | ||||||
United Therapeutics Corp.* | 1,108 | 144,926 | ||||||
UnitedHealth Group, Inc. | 548 | 108,997 | ||||||
Universal Health Services, Inc., Class B | 768 | 83,044 | ||||||
Varian Medical Systems, Inc.* | 3,520 | 374,000 | ||||||
VCA, Inc.* | 817 | 75,948 | ||||||
Veeva Systems, Inc., Class A* | 177 | 10,532 | ||||||
VWR Corp.* | 1,280 | 42,266 | ||||||
Waters Corp.* | 1,225 | 224,763 | ||||||
WellCare Health Plans, Inc.* | 728 | 127,167 | ||||||
West Pharmaceutical Services, Inc. | 2,051 | 178,519 | ||||||
Zimmer Biomet Holdings, Inc. | 490 | 55,992 | ||||||
Zoetis, Inc. | 1,495 | 93,737 | ||||||
|
| |||||||
| 9,749,366 | ||||||||
|
| |||||||
| Industrials — 18.3% | ||||||||
3M Co. | 408 | 83,363 | ||||||
AECOM* | 892 | 29,882 | ||||||
AGCO Corp. | 1,206 | 82,551 | ||||||
Air Lease Corp. | 2,822 | 114,686 | ||||||
Alaska Air Group, Inc. | 2,908 | 217,111 | ||||||
Allegion PLC | 1,546 | 121,686 | ||||||
Allison Transmission Holdings, Inc. | 3,538 | 122,875 | ||||||
AMERCO | 79 | 29,484 | ||||||
American Airlines Group, Inc. | 2,033 | 90,956 | ||||||
AMETEK, Inc. | 3,325 | 210,306 | ||||||
AO Smith Corp. | 3,664 | 204,048 | ||||||
Arconic, Inc. | 1,157 | 29,469 | ||||||
Armstrong World Industries, Inc.*(a) | 253 | 12,017 | ||||||
Boeing Co. | 1,372 | 328,814 | ||||||
BWX Technologies, Inc. | 3,735 | 204,379 | ||||||
| See Notes to Financial Statements. | 37 |
DBX ETF Trust
Schedule of Investments
Deutsche X-trackers Russell 1000 Comprehensive Factor ETF (Continued)
August 31, 2017
Number | Value | |||||||
| Industrials (Continued) | ||||||||
C.H. Robinson Worldwide, Inc. (a) | 991 | $ | 69,994 | |||||
Carlisle Cos., Inc. | 1,350 | 127,832 | ||||||
Caterpillar, Inc. | 551 | 64,737 | ||||||
Cintas Corp. | 2,317 | 312,818 | ||||||
Clean Harbors, Inc.* | 144 | 7,789 | ||||||
Colfax Corp.* | 670 | 26,720 | ||||||
Copa Holdings SA, Class A | 537 | 66,626 | ||||||
Copart, Inc.* | 5,665 | 185,189 | ||||||
Crane Co. | 1,840 | 136,583 | ||||||
CSX Corp. | �� | 1,867 | 93,723 | |||||
Cummins, Inc. | 2,758 | 439,570 | ||||||
Deere & Co. | 1,496 | 173,431 | ||||||
Delta Air Lines, Inc. | 7,369 | 347,743 | ||||||
Donaldson Co., Inc. | 3,869 | 182,810 | ||||||
Dover Corp. | 1,122 | 95,235 | ||||||
Dun & Bradstreet Corp. | 129 | 14,376 | ||||||
Eaton Corp. PLC | 2,814 | 201,933 | ||||||
Emerson Electric Co. | 1,447 | 85,431 | ||||||
Equifax, Inc. | 1,492 | 212,565 | ||||||
Expeditors International of Washington, Inc. | 3,918 | 219,800 | ||||||
Fastenal Co. | 2,104 | 89,778 | ||||||
FedEx Corp. | 659 | 141,276 | ||||||
Flowserve Corp. (a) | 365 | 14,337 | ||||||
Fluor Corp. | 546 | 21,059 | ||||||
Fortive Corp. | 2,728 | 177,238 | ||||||
Fortune Brands Home & Security, Inc. | 2,065 | 129,124 | ||||||
General Dynamics Corp. | 1,063 | 214,035 | ||||||
Genesee & Wyoming, Inc., Class A* | 174 | 11,929 | ||||||
Graco, Inc. | 1,464 | 169,107 | ||||||
HD Supply Holdings, Inc.* | 1,711 | 56,976 | ||||||
HEICO Corp. | 480 | 41,170 | ||||||
HEICO Corp., Class A | 1,280 | 92,992 | ||||||
Hexcel Corp. | 3,592 | 193,142 | ||||||
Honeywell International, Inc. | 617 | 85,313 | ||||||
Hubbell, Inc. | 1,414 | 159,485 | ||||||
Huntington Ingalls Industries, Inc. | 1,839 | 393,472 | ||||||
IDEX Corp. | 1,221 | 143,565 | ||||||
IHS Markit Ltd.* | 1,134 | 53,117 | ||||||
Illinois Tool Works, Inc. | 1,425 | 195,952 | ||||||
Ingersoll-Rand PLC | 4,063 | 346,940 | ||||||
ITT, Inc. | 2,646 | 106,793 | ||||||
Jacobs Engineering Group, Inc. | 3,670 | 199,978 | ||||||
JB Hunt Transport Services, Inc. | 2,425 | 239,808 | ||||||
JetBlue Airways Corp.* | 15,983 | 316,623 | ||||||
Kansas City Southern | 690 | 71,367 | ||||||
KAR Auction Services, Inc. | 2,235 | 100,776 | ||||||
Kirby Corp.* | 462 | 28,921 | ||||||
L3 Technologies, Inc. | 1,456 | 264,235 | ||||||
Landstar System, Inc. | 2,274 | 212,278 | ||||||
Lennox International, Inc. | 1,328 | 220,089 | ||||||
Lincoln Electric Holdings, Inc. | 1,839 | 159,699 | ||||||
Lockheed Martin Corp. | 637 | 194,533 | ||||||
Macquarie Infrastructure Corp. | 771 | 57,424 | ||||||
ManpowerGroup, Inc. | 4,456 | 496,889 | ||||||
Masco Corp. | 3,312 | 121,782 | ||||||
Middleby Corp.* | 451 | 54,887 | ||||||
Number | Value | |||||||
| Industrials (Continued) | ||||||||
MSC Industrial Direct Co., Inc., Class A | 2,573 | $ | 177,228 | |||||
Nielsen Holdings PLC | 521 | 20,241 | ||||||
Nordson Corp. | 1,341 | 146,571 | ||||||
Norfolk Southern Corp. | 1,374 | 165,594 | ||||||
Northrop Grumman Corp. | 791 | 215,318 | ||||||
Old Dominion Freight Line, Inc. | 2,845 | 284,216 | ||||||
Orbital ATK, Inc. | 1,028 | 114,704 | ||||||
Oshkosh Corp. | 2,499 | 186,425 | ||||||
Owens Corning | 3,312 | 245,519 | ||||||
PACCAR, Inc. | 2,302 | 152,692 | ||||||
Parker-Hannifin Corp. | 1,841 | 296,198 | ||||||
Pentair PLC | 722 | 44,800 | ||||||
Pitney Bowes, Inc. | 681 | 8,751 | ||||||
Quanta Services, Inc.* | 7,836 | 281,547 | ||||||
Raytheon Co. | 1,551 | 282,298 | ||||||
Regal Beloit Corp. | 1,819 | 137,153 | ||||||
Republic Services, Inc. | 2,606 | 170,015 | ||||||
Robert Half International, Inc. | 7,158 | 324,257 | ||||||
Rockwell Automation, Inc. | 1,473 | 241,660 | ||||||
Rockwell Collins, Inc. | 1,541 | 201,948 | ||||||
Rollins, Inc. | 3,117 | 138,426 | ||||||
Roper Technologies, Inc. | 316 | 72,889 | ||||||
Ryder System, Inc. | 827 | 64,175 | ||||||
Sensata Technologies Holding NV* | 1,503 | 67,124 | ||||||
Snap-on, Inc. | 1,943 | 286,729 | ||||||
Southwest Airlines Co. | 8,744 | 455,912 | ||||||
Spirit AeroSystems Holdings, Inc., Class A | 4,537 | 338,007 | ||||||
Spirit Airlines, Inc.* | 647 | 22,030 | ||||||
Stanley Black & Decker, Inc. | 2,608 | 375,552 | ||||||
Stericycle, Inc.* | 204 | 14,666 | ||||||
Teledyne Technologies, Inc.* | 1,133 | 170,018 | ||||||
Textron, Inc. | 3,786 | 185,855 | ||||||
Timken Co. | 3,190 | 143,072 | ||||||
Toro Co. | 5,771 | 355,955 | ||||||
TransDigm Group, Inc. | 186 | 48,483 | ||||||
TransUnion* | 765 | 36,613 | ||||||
Trinity Industries, Inc. | 403 | 11,623 | ||||||
Union Pacific Corp. | 1,100 | 115,830 | ||||||
United Continental Holdings, Inc.* | 2,042 | 126,522 | ||||||
United Parcel Service, Inc., Class B | 879 | 100,522 | ||||||
United Rentals, Inc.* | 390 | 46,043 | ||||||
United Technologies Corp. | 536 | 64,170 | ||||||
Univar, Inc.* | 711 | 20,057 | ||||||
USG Corp.*(a) | 509 | 15,270 | ||||||
Valmont Industries, Inc. | 531 | 76,225 | ||||||
Verisk Analytics, Inc.* | 894 | 72,459 | ||||||
W.W. Grainger, Inc. (a) | 311 | 50,559 | ||||||
WABCO Holdings, Inc.* | 947 | 136,008 | ||||||
Wabtec Corp. (a) | 54 | 3,811 | ||||||
Waste Management, Inc. | 2,789 | 215,060 | ||||||
Watsco, Inc. | 1,101 | 162,243 | ||||||
Welbilt, Inc.* | 1,552 | 30,885 | ||||||
WESCO International, Inc.* | 431 | 21,744 | ||||||
XPO Logistics, Inc.* | 146 | 8,935 | ||||||
Xylem, Inc. | 438 | 27,187 | ||||||
|
| |||||||
| 18,300,415 | ||||||||
|
| |||||||
| See Notes to Financial Statements. | 38 |
DBX ETF Trust
Schedule of Investments
Deutsche X-trackers Russell 1000 Comprehensive Factor ETF (Continued)
August 31, 2017
Number | Value | |||||||
| Information Technology — 13.9% | ||||||||
Accenture PLC, Class A | 869 | $ | 113,630 | |||||
Activision Blizzard, Inc. | 2,118 | 138,856 | ||||||
Adobe Systems, Inc.* | 823 | 127,697 | ||||||
Akamai Technologies, Inc.* | 490 | 23,104 | ||||||
Alliance Data Systems Corp. | 474 | 106,887 | ||||||
Alphabet, Inc., Class A* | 17 | 16,239 | ||||||
Alphabet, Inc., Class C* | 24 | 22,544 | ||||||
Amdocs Ltd. | 5,581 | 361,593 | ||||||
Amphenol Corp., Class A | 1,890 | 152,977 | ||||||
Analog Devices, Inc. | 2,979 | 249,253 | ||||||
ANSYS, Inc.* | 2,064 | 265,884 | ||||||
Apple, Inc. | 652 | 106,928 | ||||||
Applied Materials, Inc. | 5,117 | 230,879 | ||||||
Arista Networks, Inc.* | 52 | 9,160 | ||||||
Arrow Electronics, Inc.* | 1,038 | 82,448 | ||||||
Autodesk, Inc.* | 47 | 5,380 | ||||||
Automatic Data Processing, Inc. | 1,434 | 152,678 | ||||||
Avnet, Inc. | 295 | 11,378 | ||||||
Booz Allen Hamilton Holding Corp. | 2,440 | 83,228 | ||||||
Broadridge Financial Solutions, Inc. | 2,276 | 177,824 | ||||||
Brocade Communications Systems, Inc. | 2,025 | 25,070 | ||||||
CA, Inc. | 1,828 | 60,653 | ||||||
Cadence Design Systems, Inc.* | 7,546 | 296,482 | ||||||
CDK Global, Inc. | 953 | 61,469 | ||||||
CDW Corp. | 7,009 | 444,511 | ||||||
Cisco Systems, Inc. | 1,290 | 41,551 | ||||||
Citrix Systems, Inc.* | 2,501 | 195,603 | ||||||
Cognex Corp. | 857 | 93,387 | ||||||
Cognizant Technology Solutions Corp., Class A | 1,717 | 121,512 | ||||||
Coherent, Inc.* | 227 | 52,964 | ||||||
CommScope Holding Co., Inc.* | 636 | 21,026 | ||||||
Conduent, Inc.* | 1,636 | 27,010 | ||||||
CoreLogic, Inc.* | 1,308 | 61,437 | ||||||
Corning, Inc. | 26,639 | 766,138 | ||||||
CoStar Group, Inc.* | 185 | 53,025 | ||||||
CSRA, Inc. | 2,336 | 73,607 | ||||||
Dell Technologies, Inc., Class V* | 1,334 | 99,957 | ||||||
Dolby Laboratories, Inc., Class A | 1,565 | 78,970 | ||||||
DST Systems, Inc. | 606 | 31,106 | ||||||
DXC Technology Co. | 223 | 18,955 | ||||||
eBay, Inc.* | 15,929 | 575,515 | ||||||
EchoStar Corp., Class A* | 2,694 | 162,448 | ||||||
Electronic Arts, Inc.* | 727 | 88,331 | ||||||
Euronet Worldwide, Inc.* | 74 | 7,272 | ||||||
F5 Networks, Inc.* | 890 | 106,248 | ||||||
Fidelity National Information Services, Inc. | 1,279 | 118,845 | ||||||
Fiserv, Inc.* | 1,227 | 151,792 | ||||||
FleetCor Technologies, Inc.* | 104 | 14,952 | ||||||
FLIR Systems, Inc. | 3,039 | 115,482 | ||||||
Fortinet, Inc.* | 787 | 30,063 | ||||||
Gartner, Inc.* | 832 | 100,331 | ||||||
Genpact Ltd. | 2,119 | 60,286 | ||||||
Global Payments, Inc. | 126 | 12,032 | ||||||
GoDaddy, Inc., Class A* | 218 | 9,771 | ||||||
Guidewire Software, Inc.* | 181 | 13,704 | ||||||
Number | Value | |||||||
| Information Technology (Continued) | ||||||||
Harris Corp. | 2,994 | $ | 367,963 | |||||
Hewlett Packard Enterprise Co. | 9,089 | 164,147 | ||||||
HP, Inc. | 26,928 | 513,786 | ||||||
IAC/InterActiveCorp* | 338 | 38,366 | ||||||
Intel Corp. | 2,031 | 71,227 | ||||||
International Business Machines Corp. | 284 | 40,621 | ||||||
Intuit, Inc. | 1,357 | 191,948 | ||||||
IPG Photonics Corp.* | 415 | 72,953 | ||||||
Jabil, Inc. | 6,259 | 196,220 | ||||||
Jack Henry & Associates, Inc. | 2,104 | 216,859 | ||||||
Juniper Networks, Inc. | 6,332 | 175,586 | ||||||
Keysight Technologies, Inc.* | 3,598 | 147,014 | ||||||
KLA-Tencor Corp. | 2,216 | 207,617 | ||||||
Lam Research Corp. | 2,019 | 335,114 | ||||||
Mastercard, Inc., Class A | 533 | 71,049 | ||||||
Maxim Integrated Products, Inc. | 4,432 | 206,797 | ||||||
Microchip Technology, Inc. | 365 | 31,682 | ||||||
Microsoft Corp. | 468 | 34,992 | ||||||
Motorola Solutions, Inc. | 2,695 | 237,483 | ||||||
National Instruments Corp. | 2,905 | 117,333 | ||||||
NCR Corp.* | 2,581 | 94,284 | ||||||
NetApp, Inc. | 14,044 | 542,941 | ||||||
Nuance Communications, Inc.* | 1,382 | 22,209 | ||||||
NVIDIA Corp. | 217 | 36,768 | ||||||
NXP Semiconductors NV* | 263 | 29,708 | ||||||
ON Semiconductor Corp.* | 731 | 12,485 | ||||||
Oracle Corp. | 416 | 20,937 | ||||||
Paychex, Inc. | 2,547 | 145,255 | ||||||
PayPal Holdings, Inc.* | 1,194 | 73,646 | ||||||
PTC, Inc.* | 293 | 16,408 | ||||||
Qorvo, Inc.* | 313 | 22,918 | ||||||
QUALCOMM, Inc. | 1,806 | 94,400 | ||||||
Red Hat, Inc.* | 1,226 | 131,795 | ||||||
Sabre Corp. | 949 | 17,500 | ||||||
salesforce.com, Inc.* | 180 | 17,188 | ||||||
Skyworks Solutions, Inc. | 1,617 | 170,367 | ||||||
SS&C Technologies Holdings, Inc. | 1,031 | 39,910 | ||||||
Synopsys, Inc.* | 5,048 | 405,960 | ||||||
Take-Two Interactive Software, Inc.* | 1,287 | 125,856 | ||||||
Teradata Corp.* | 1,910 | 60,967 | ||||||
Teradyne, Inc. | 5,436 | 193,576 | ||||||
Texas Instruments, Inc. | 2,707 | 224,194 | ||||||
Total System Services, Inc. | 1,100 | 76,032 | ||||||
Trimble, Inc.* | 1,973 | 76,316 | ||||||
Tyler Technologies, Inc.* | 384 | 66,355 | ||||||
Ultimate Software Group, Inc.*(a) | 127 | 25,514 | ||||||
Vantiv, Inc., Class A* | 763 | 53,936 | ||||||
VeriSign, Inc.*(a) | 1,304 | 135,290 | ||||||
Versum Materials, Inc. | 4,811 | 177,670 | ||||||
Visa, Inc., Class A | 346 | 35,818 | ||||||
VMware, Inc., Class A*(a) | 1,070 | 115,667 | ||||||
Western Union Co. | 3,771 | 71,347 | ||||||
Workday, Inc., Class A* | 70 | 7,678 | ||||||
Xerox Corp. | 2,277 | 73,479 | ||||||
Xilinx, Inc. | 5,884 | 388,697 | ||||||
Zebra Technologies Corp., Class A* | 321 | 33,092 | ||||||
|
| |||||||
| 13,904,992 | ||||||||
|
| |||||||
| See Notes to Financial Statements. | 39 |
DBX ETF Trust
Schedule of Investments
Deutsche X-trackers Russell 1000 Comprehensive Factor ETF (Continued)
August 31, 2017
Number | Value | |||||||
| Materials — 5.8% | ||||||||
Air Products & Chemicals, Inc. | 1,229 | $ | 178,660 | |||||
Albemarle Corp. | 2,284 | 265,538 | ||||||
Alcoa Corp.* | 411 | 18,035 | ||||||
AptarGroup, Inc. | 1,097 | 91,720 | ||||||
Ashland Global Holdings, Inc. | 2,111 | 130,988 | ||||||
Avery Dennison Corp. | 3,296 | 310,681 | ||||||
Axalta Coating Systems Ltd.* | 2,425 | 71,586 | ||||||
Bemis Co., Inc. | 868 | 36,985 | ||||||
Berry Global Group, Inc.* | 2,007 | 112,874 | ||||||
Cabot Corp. | 1,852 | 97,563 | ||||||
Celanese Corp., Series A | 2,839 | 275,440 | ||||||
Crown Holdings, Inc.* | 2,157 | 127,328 | ||||||
Domtar Corp. | 1,854 | 74,976 | ||||||
Dow Chemical Co. | 1,085 | 72,315 | ||||||
E.I. du Pont de Nemours & Co. | 1,307 | 109,696 | ||||||
Eagle Materials, Inc. | 485 | 47,166 | ||||||
Eastman Chemical Co. | 2,044 | 176,193 | ||||||
Ecolab, Inc. | 853 | 113,705 | ||||||
FMC Corp. | 1,892 | 163,128 | ||||||
Graphic Packaging Holding Co. | 8,017 | 104,622 | ||||||
Huntsman Corp. | 1,884 | 50,058 | ||||||
International Flavors & Fragrances, Inc. | 1,245 | 170,378 | ||||||
International Paper Co. | 4,728 | 254,697 | ||||||
LyondellBasell Industries NV, Class A | 1,810 | 163,968 | ||||||
Martin Marietta Materials, Inc. | 338 | 71,653 | ||||||
Monsanto Co. | 689 | 80,751 | ||||||
Mosaic Co. | 1,357 | 27,113 | ||||||
NewMarket Corp. | 276 | 115,509 | ||||||
Nucor Corp. | 3,341 | 184,122 | ||||||
Olin Corp. | 6,859 | 221,066 | ||||||
Owens-Illinois, Inc.* | 3,263 | 80,400 | ||||||
Packaging Corp. of America | 2,290 | 257,419 | ||||||
PPG Industries, Inc. | 1,004 | 104,737 | ||||||
Praxair, Inc. | 1,504 | 197,836 | ||||||
Reliance Steel & Aluminum Co. | 565 | 40,917 | ||||||
RPM International, Inc. | 3,291 | 161,160 | ||||||
Scotts Miracle-Gro Co. | 1,351 | 129,142 | ||||||
Sealed Air Corp. | 1,020 | 45,268 | ||||||
Sherwin-Williams Co. | 445 | 150,975 | ||||||
Silgan Holdings, Inc. | 3,939 | 118,524 | ||||||
Sonoco Products Co. | 3,488 | 168,331 | ||||||
Southern Copper Corp. | 142 | 5,779 | ||||||
Steel Dynamics, Inc. | 4,257 | 146,654 | ||||||
Valvoline, Inc. | 3,448 | 73,408 | ||||||
Vulcan Materials Co. | 322 | 39,046 | ||||||
Westlake Chemical Corp. | 184 | 14,151 | ||||||
WestRock Co. | 3,402 | 193,608 | ||||||
|
| |||||||
| 5,845,869 | ||||||||
|
| |||||||
| Real Estate — 4.9% | ||||||||
Alexandria Real Estate Equities, Inc. REIT | 59 | 7,157 | ||||||
American Campus Communities, Inc. REIT | 347 | 16,514 | ||||||
American Homes 4 Rent, Class A REIT | 584 | 12,941 | ||||||
American Tower Corp. REIT | 525 | 77,726 | ||||||
Apartment Investment & Management Co., Class A REIT | 345 | 15,639 | ||||||
Number | Value | |||||||
| Real Estate (Continued) | ||||||||
Apple Hospitality REIT, Inc. REIT | 3,429 | $ | 62,339 | |||||
AvalonBay Communities, Inc. REIT | 858 | 161,072 | ||||||
Boston Properties, Inc. REIT | 341 | 41,125 | ||||||
Brandywine Realty Trust REIT | 793 | 13,624 | ||||||
Brixmor Property Group, Inc. REIT | 476 | 8,911 | ||||||
Camden Property Trust REIT | 2,268 | 202,941 | ||||||
CBRE Group, Inc., Class A* | 5,518 | 199,089 | ||||||
Colony NorthStar, Inc., Class A REIT | 2,013 | 26,390 | ||||||
Columbia Property Trust, Inc. REIT | 411 | 8,631 | ||||||
CoreCivic, Inc. REIT | 963 | 25,808 | ||||||
CoreSite Realty Corp. REIT | 411 | 48,810 | ||||||
Corporate Office Properties Trust REIT | 478 | 15,946 | ||||||
Crown Castle International Corp. REIT | 265 | 28,737 | ||||||
CubeSmart REIT | 266 | 6,557 | ||||||
CyrusOne, Inc. REIT | 118 | 7,438 | ||||||
DCT Industrial Trust, Inc. REIT | 809 | 47,205 | ||||||
Digital Realty Trust, Inc. REIT | 583 | 68,992 | ||||||
Douglas Emmett, Inc. REIT | 680 | 26,493 | ||||||
Duke Realty Corp. REIT | 3,659 | 108,746 | ||||||
DuPont Fabros Technology, Inc. REIT | 1,582 | 101,818 | ||||||
Empire State Realty Trust, Inc., Class A REIT | 872 | 17,745 | ||||||
EPR Properties REIT | 723 | 50,364 | ||||||
Equinix, Inc. REIT | 45 | 21,078 | ||||||
Equity Commonwealth REIT* | 1,854 | 57,363 | ||||||
Equity LifeStyle Properties, Inc. REIT | 1,331 | 118,659 | ||||||
Equity Residential REIT | 8,747 | 587,361 | ||||||
Essex Property Trust, Inc. REIT | 403 | 107,186 | ||||||
Extra Space Storage, Inc. REIT | 482 | 37,418 | ||||||
Federal Realty Investment Trust REIT | 137 | 17,389 | ||||||
Gaming and Leisure Properties, Inc. REIT | 3,474 | 136,146 | ||||||
GGP, Inc. REIT | 1,412 | 29,299 | ||||||
HCP, Inc. REIT | 2,493 | 74,316 | ||||||
Healthcare Trust of America, Inc., Class A REIT | 467 | 14,510 | ||||||
Highwoods Properties, Inc. REIT | 755 | 39,434 | ||||||
Hospitality Properties Trust REIT | 4,257 | 116,472 | ||||||
Host Hotels & Resorts, Inc. REIT | 18,790 | 340,475 | ||||||
Howard Hughes Corp.* | 252 | 29,572 | ||||||
Hudson Pacific Properties, Inc. REIT | 431 | 14,223 | ||||||
Iron Mountain, Inc. REIT | 340 | 13,403 | ||||||
JBG SMITH Properties REIT* | 417 | 13,648 | ||||||
Jones Lang LaSalle, Inc. | 722 | 88,019 | ||||||
Kilroy Realty Corp. REIT | 1,609 | 111,391 | ||||||
Lamar Advertising Co., Class A REIT | 3,152 | 209,797 | ||||||
Liberty Property Trust REIT | 3,734 | 159,068 | ||||||
Macerich Co. REIT | 302 | 15,937 | ||||||
Medical Properties Trust, Inc. REIT | 1,633 | 21,490 | ||||||
Mid-America Apartment Communities, Inc. REIT | 292 | 31,086 | ||||||
National Retail Properties, Inc. REIT | 388 | 16,230 | ||||||
Omega Healthcare Investors, Inc. REIT (a) | 3,843 | 122,476 | ||||||
Outfront Media, Inc. REIT | 1,336 | 29,392 | ||||||
Park Hotels & Resorts, Inc. REIT | 899 | 23,994 | ||||||
Piedmont Office Realty Trust, Inc., Class A REIT | 1,773 | 35,903 | ||||||
| See Notes to Financial Statements. | 40 |
DBX ETF Trust
Schedule of Investments
Deutsche X-trackers Russell 1000 Comprehensive Factor ETF (Continued)
August 31, 2017
Number | Value | |||||||
| Real Estate (Continued) | ||||||||
Prologis, Inc. REIT | 2,055 | $ | 130,205 | |||||
Public Storage REIT | 241 | 49,487 | ||||||
Rayonier, Inc. REIT | 4,301 | 124,772 | ||||||
Realogy Holdings Corp. | 1,548 | 52,477 | ||||||
Realty Income Corp. REIT | 279 | 16,059 | ||||||
Regency Centers Corp. REIT | 114 | 7,333 | ||||||
Retail Properties of America, Inc., Class A REIT | 1,235 | 16,463 | ||||||
SBA Communications Corp. REIT* | 292 | 44,837 | ||||||
Senior Housing Properties Trust REIT | 2,609 | 51,449 | ||||||
Simon Property Group, Inc. REIT | 150 | 23,528 | ||||||
SL Green Realty Corp. REIT | 331 | 31,902 | ||||||
STORE Capital Corp. REIT | 248 | 6,294 | ||||||
Sun Communities, Inc. REIT | 202 | 18,243 | ||||||
Tanger Factory Outlet Centers, Inc. REIT (a) | 483 | 11,302 | ||||||
Taubman Centers, Inc. REIT | 216 | 11,284 | ||||||
UDR, Inc. REIT | 704 | 27,329 | ||||||
Ventas, Inc. REIT | 493 | 33,741 | ||||||
Vornado Realty Trust REIT | 835 | 62,199 | ||||||
Weingarten Realty Investors REIT | 663 | 21,243 | ||||||
Welltower, Inc. REIT | 656 | 48,032 | ||||||
Weyerhaeuser Co. REIT | 1,833 | 59,774 | ||||||
WP Carey, Inc. REIT | 764 | 52,601 | ||||||
|
| |||||||
| 4,942,047 | ||||||||
|
| |||||||
| Telecommunication Services — 0.3% | ||||||||
AT&T, Inc. | 733 | 27,458 | ||||||
CenturyLink, Inc. (a) | 5,024 | 99,073 | ||||||
Level 3 Communications, Inc.* | 1,206 | 65,643 | ||||||
Telephone & Data Systems, Inc. | 1,646 | 48,244 | ||||||
T-Mobile US, Inc.* | 539 | 34,879 | ||||||
United States Cellular Corp.* | 265 | 10,250 | ||||||
Verizon Communications, Inc. | 317 | 15,207 | ||||||
Zayo Group Holdings, Inc.* | 1,072 | 36,630 | ||||||
|
| |||||||
| 337,384 | ||||||||
|
| |||||||
| Utilities — 6.1% | ||||||||
AES Corp. | 10,211 | 112,729 | ||||||
Alliant Energy Corp. | 3,330 | 142,324 | ||||||
Ameren Corp. | 5,252 | 315,067 | ||||||
American Electric Power Co., Inc. | 2,209 | 162,649 | ||||||
American Water Works Co., Inc. | 1,279 | 103,471 | ||||||
Aqua America, Inc. (a) | 1,507 | 50,334 | ||||||
Atmos Energy Corp. | 1,468 | 129,243 | ||||||
Avangrid, Inc. (a) | 800 | 39,056 | ||||||
Calpine Corp.* | 2,661 | 39,117 | ||||||
CenterPoint Energy, Inc. | 17,305 | 512,574 | ||||||
Number | Value | |||||||
| Utilities (Continued) | ||||||||
CMS Energy Corp. | 4,268 | $ | 207,169 | |||||
Consolidated Edison, Inc. | 2,786 | 234,776 | ||||||
Dominion Energy, Inc. | 878 | 69,160 | ||||||
DTE Energy Co. | 2,471 | 277,543 | ||||||
Duke Energy Corp. | 1,108 | 96,728 | ||||||
Edison International | 3,082 | 247,115 | ||||||
Entergy Corp. | 1,941 | 153,669 | ||||||
Eversource Energy | 3,476 | 218,988 | ||||||
Exelon Corp. | 5,876 | 222,524 | ||||||
FirstEnergy Corp. | 1,745 | 56,852 | ||||||
Great Plains Energy, Inc. | 3,108 | 95,385 | ||||||
Hawaiian Electric Industries, Inc. | 2,769 | 92,540 | ||||||
MDU Resources Group, Inc. | 3,218 | 87,015 | ||||||
National Fuel Gas Co. | 595 | 34,498 | ||||||
NextEra Energy, Inc. | 795 | 119,655 | ||||||
NiSource, Inc. | 3,274 | 87,972 | ||||||
NRG Energy, Inc. | 1,347 | 33,554 | ||||||
OGE Energy Corp. | 4,512 | 161,169 | ||||||
PG&E Corp. | 3,040 | 213,955 | ||||||
Pinnacle West Capital Corp. | 2,450 | 220,426 | ||||||
PPL Corp. | 4,037 | 158,412 | ||||||
Public Service Enterprise Group, Inc. | 3,677 | 172,231 | ||||||
SCANA Corp. | 1,093 | 65,995 | ||||||
Sempra Energy | 854 | 100,712 | ||||||
Southern Co. | 1,508 | 72,776 | ||||||
UGI Corp. | 4,116 | 203,372 | ||||||
Vectren Corp. | 3,649 | 239,411 | ||||||
Vistra Energy Corp. | 5,094 | 90,164 | ||||||
WEC Energy Group, Inc. | 2,639 | 172,116 | ||||||
Westar Energy, Inc. | 1,553 | 79,684 | ||||||
Xcel Energy, Inc. | 5,063 | 250,618 | ||||||
|
| |||||||
| 6,142,748 | ||||||||
|
| |||||||
TOTAL COMMON STOCKS | 99,057,519 | |||||||
|
| |||||||
| SECURITIES LENDING COLLATERAL — 1.7% | ||||||||
Deutsche Government & Agency Securities Portfolio “Deutsche Government Cash Institutional Shares”, 0.93% (b)(c) | 1,722,761 | 1,722,761 | ||||||
|
| |||||||
TOTAL INVESTMENTS — 100.5% | $ | 100,780,280 | ||||||
Other assets and liabilities, net — (0.5%) | (568,157 | ) | ||||||
|
| |||||||
NET ASSETS — 100.0% | $ | 100,212,123 | ||||||
|
| |||||||
| * | Non-income producing security. |
| (a) | All or a portion of these securities were on loan. In addition, “Other assets and liabilities, net” may include pending sales that are also on loan. The value of securities loaned at August 31, 2017 amounted to $1,682,630, which is 1.7% of net assets. |
| (b) | Affiliated fund managed by Deutsche Investment Management Americas Inc. The rate shown is the annualized seven-day yield at period end. |
| (c) | Represents collateral held in connection with securities lending. Income earned by the Fund is net of borrower rebates. |
| REIT: | Real Estate Investment Trust |
| See Notes to Financial Statements. | 41 |
DBX ETF Trust
Schedule of Investments
Deutsche X-trackers Russell 1000 Comprehensive Factor ETF (Continued)
August 31, 2017
At August 31, 2017, open futures contracts purchased were as follows:
Contract Description | Currency | Number of Contracts | Notional Amount | Contract Value | Expiration Date | Unrealized Appreciation (Depreciation) | ||||||||||||||
E-Mini S&P 500 futures | USD | 4 | $ | 490,687 | $ | 494,000 | 9/15/2017 | $ | 3,313 | |||||||||||
E-Mini S&P MidCap 400 futures | USD | 3 | 521,530 | 519,120 | 9/15/2017 | (2,410 | ) | |||||||||||||
|
| |||||||||||||||||||
Total net unrealized appreciation | $ | 903 | ||||||||||||||||||
|
| |||||||||||||||||||
Currency Abbreviations
| USD | U.S. Dollar |
For information on the Fund’s policy and additional disclosures regarding open futures contracts please refer to the Derivatives section of Note 2 in the accompanying Notes to Financial Statements.
Fair Value Measurements
Various inputs are used in determining the value of the Fund’s investments. These inputs are summarized in three broad levels. Level 1 includes quoted prices in active markets for identical securities. Level 2 includes other significant observable inputs (including quoted prices for similar securities, interest rates, prepayment speeds and credit risk). Level 3 includes significant unobservable inputs (including the Fund’s own assumptions in determining the fair value of investments). The level assigned to the securities valuations may not be an indication of the risk or liquidity associated with investing in those securities.
The following is a summary of the inputs used as of August 31, 2017 in valuing the Fund’s investments. For information on the Fund’s policy regarding the valuation of investments, please refer to the Security Valuation section of Note 2 in the accompanying Notes to Financial Statements.
Assets | Level 1 | Level 2 | Level 3 | Total | ||||||||||||
Common Stocks (d) | $ | 99,057,519 | $ | — | $ | — | $ | 99,057,519 | ||||||||
Short-Term Investments | 1,722,761 | — | — | 1,722,761 | ||||||||||||
Derivatives (e) | ||||||||||||||||
Futures Contracts | 3,313 | — | — | 3,313 | ||||||||||||
|
|
|
|
|
|
|
| |||||||||
TOTAL | $ | 100,783,593 | $ | — | $ | — | $ | 100,783,593 | ||||||||
|
|
|
|
|
|
|
| |||||||||
Liabilities | Level 1 | Level 2 | Level 3 | Total | ||||||||||||
Derivatives (e) | ||||||||||||||||
Futures Contracts | $ | (2,410 | ) | $ | — | $ | — | $ | (2,410 | ) | ||||||
|
|
|
|
|
|
|
| |||||||||
TOTAL | $ | (2,410 | ) | $ | — | $ | — | $ | (2,410 | ) | ||||||
|
|
|
|
|
|
|
| |||||||||
| (d) | See Schedule of Investments for additional detailed categorizations. |
| (e) | Derivatives include unrealized appreciation (depreciation) on open futures contracts. |
There have been no transfers between fair value measurement levels during the year ended August 31, 2017.
| See Notes to Financial Statements. | 42 |
DBX ETF Trust
Deutsche X-trackers Russell 2000 Comprehensive Factor ETF
August 31, 2017
Number | Value | |||||||
| COMMON STOCKS — 98.8% | ||||||||
| Consumer Discretionary — 15.5% | ||||||||
1-800-Flowers.com, Inc., Class A* | 331 | $ | 2,979 | |||||
Aaron’s, Inc. | 258 | 11,422 | ||||||
Abercrombie & Fitch Co., Class A (a) | 134 | 1,707 | ||||||
Acushnet Holdings Corp. (a) | 27 | 444 | ||||||
Adtalem Global Education, Inc. | 169 | 5,780 | ||||||
AMC Entertainment Holdings, Inc., Class A (a) | 33 | 442 | ||||||
American Axle & Manufacturing Holdings, Inc.* | 110 | 1,607 | ||||||
American Eagle Outfitters, Inc. | 115 | 1,374 | ||||||
American Outdoor Brands Corp.*(a) | 159 | 2,595 | ||||||
American Public Education, Inc.* | 66 | 1,218 | ||||||
America’s Car-Mart, Inc.*(a) | 126 | 4,838 | ||||||
Asbury Automotive Group, Inc.* | 59 | 3,177 | ||||||
Ascent Capital Group, Inc., Class A* | 17 | 169 | ||||||
AV Homes, Inc.*(a) | 389 | 6,010 | ||||||
Barnes & Noble Education, Inc.* | 254 | 1,316 | ||||||
Barnes & Noble, Inc. | 139 | 1,077 | ||||||
Bassett Furniture Industries, Inc. | 99 | 3,549 | ||||||
Beazer Homes USA, Inc.* | 552 | 8,230 | ||||||
Belmond Ltd., Class A* | 200 | 2,550 | ||||||
Big 5 Sporting Goods Corp. (a) | 451 | 3,450 | ||||||
Big Lots, Inc. (a) | 87 | 4,141 | ||||||
Biglari Holdings, Inc.* | 4 | 1,191 | ||||||
BJ’s Restaurants, Inc.* | 133 | 4,003 | ||||||
Bloomin’ Brands, Inc. | 330 | 5,613 | ||||||
Bob Evans Farms, Inc. | 261 | 17,952 | ||||||
Bojangles’, Inc.*(a) | 81 | 1,081 | ||||||
Boyd Gaming Corp. | 65 | 1,719 | ||||||
Bridgepoint Education, Inc.* | 178 | 1,572 | ||||||
Brinker International, Inc. (a) | 133 | 4,152 | ||||||
Buckle, Inc. (a) | 81 | 1,146 | ||||||
Buffalo Wild Wings, Inc.* | 34 | 3,494 | ||||||
Build-A-Bear Workshop, Inc.* | 44 | 405 | ||||||
Caesars Acquisition Co., Class A* | 80 | 1,492 | ||||||
Caleres, Inc. | 88 | 2,374 | ||||||
Callaway Golf Co. | 748 | 10,427 | ||||||
Cambium Learning Group, Inc.* | 143 | 838 | ||||||
Camping World Holdings, Inc., Class A | 82 | 3,014 | ||||||
Capella Education Co. | 128 | 8,621 | ||||||
Career Education Corp.* | 126 | 1,211 | ||||||
Carriage Services, Inc. | 113 | 2,767 | ||||||
Carrols Restaurant Group, Inc.* | 279 | 3,041 | ||||||
Cato Corp., Class A | 53 | 697 | ||||||
Cavco Industries, Inc.* | 59 | 7,938 | ||||||
Century Casinos, Inc.* | 396 | 2,713 | ||||||
Century Communities, Inc.* | 282 | 6,359 | ||||||
Cheesecake Factory, Inc. | 93 | 3,853 | ||||||
Chegg, Inc.*(a) | 172 | 2,441 | ||||||
Chico’s FAS, Inc. | 804 | 6,175 | ||||||
Children’s Place, Inc. | 103 | 10,933 | ||||||
Churchill Downs, Inc. | 23 | 4,494 | ||||||
Chuy’s Holdings, Inc.* | 36 | 677 | ||||||
Citi Trends, Inc. | 213 | 3,862 | ||||||
Clarus Corp.* | 113 | 819 | ||||||
Number | Value | |||||||
| Consumer Discretionary (Continued) | ||||||||
Clear Channel Outdoor Holdings, Inc., Class A | 180 | $ | 693 | |||||
ClubCorp Holdings, Inc. | 241 | 4,097 | ||||||
Collectors Universe, Inc. | 183 | 4,398 | ||||||
Columbia Sportswear Co. | 5 | 286 | ||||||
Conn’s, Inc.*(a) | 41 | 711 | ||||||
Cooper Tire & Rubber Co. (a) | 151 | 5,074 | ||||||
Cooper-Standard Holdings, Inc.* | 67 | 6,739 | ||||||
Cracker Barrel Old Country Store, Inc. (a) | 10 | 1,487 | ||||||
Crocs, Inc.* | 55 | 491 | ||||||
CSS Industries, Inc. | 125 | 3,348 | ||||||
Culp, Inc. | 155 | 4,495 | ||||||
Dana, Inc. | 221 | 5,319 | ||||||
Dave & Buster’s Entertainment, Inc.* | 64 | 3,741 | ||||||
Deckers Outdoor Corp.* | 33 | 2,109 | ||||||
Del Frisco’s Restaurant Group, Inc.* | 363 | 5,082 | ||||||
Del Taco Restaurants, Inc.* | 551 | 7,758 | ||||||
Delta Apparel, Inc.* | 10 | 196 | ||||||
Denny’s Corp.* | 292 | 3,492 | ||||||
Dillard’s, Inc., Class A (a) | 37 | 2,250 | ||||||
DineEquity, Inc. (a) | 15 | 596 | ||||||
Dorman Products, Inc.* | 50 | 3,321 | ||||||
Drive Shack, Inc. | 382 | 1,031 | ||||||
DSW, Inc., Class A | 206 | 3,817 | ||||||
El Pollo Loco Holdings, Inc.*(a) | 100 | 1,135 | ||||||
Eldorado Resorts, Inc.*(a) | 114 | 2,622 | ||||||
Emerald Expositions Events, Inc. (a) | 34 | 739 | ||||||
Entercom Communications Corp., Class A (a) | 79 | 814 | ||||||
Entravision Communications Corp., Class A | 113 | 627 | ||||||
Eros International PLC*(a) | 46 | 449 | ||||||
Escalade, Inc. | 183 | 2,205 | ||||||
Ethan Allen Interiors, Inc. | 112 | 3,276 | ||||||
EW Scripps Co., Class A* | 167 | 2,986 | ||||||
Express, Inc.* | 71 | 452 | ||||||
Fiesta Restaurant Group, Inc.* | 148 | 2,575 | ||||||
Finish Line, Inc., Class A | 264 | 2,199 | ||||||
Five Below, Inc.* | 31 | 1,475 | ||||||
Flexsteel Industries, Inc. | 146 | 6,643 | ||||||
Fogo De Chao, Inc.* | 93 | 1,176 | ||||||
Fox Factory Holding Corp.* | 198 | 7,920 | ||||||
Francesca’s Holdings Corp.* | 489 | 3,550 | ||||||
Fred’s, Inc., Class A | 25 | 148 | ||||||
FTD Cos, Inc.* | 32 | 428 | ||||||
Gaia, Inc.* | 244 | 2,721 | ||||||
Gannett Co., Inc. | 72 | 611 | ||||||
Genesco, Inc.* | 56 | 1,184 | ||||||
Gentherm, Inc.* | 25 | 779 | ||||||
Golden Entertainment, Inc.* | 351 | 7,975 | ||||||
Grand Canyon Education, Inc.* | 48 | 3,938 | ||||||
Gray Television, Inc.* | 113 | 1,616 | ||||||
Group 1 Automotive, Inc. | 130 | 7,803 | ||||||
Guess?, Inc. | 76 | 1,184 | ||||||
Habit Restaurants, Inc., Class A*(a) | 203 | 2,639 | ||||||
Haverty Furniture Cos., Inc. | 521 | 12,217 | ||||||
Helen of Troy Ltd.* | 15 | 1,355 | ||||||
| See Notes to Financial Statements. | 43 |
DBX ETF Trust
Schedule of Investments
Deutsche X-trackers Russell 2000 Comprehensive Factor ETF (Continued)
August 31, 2017
Number | Value | |||||||
| Consumer Discretionary (Continued) | ||||||||
Hemisphere Media Group, Inc.*(a) | 80 | $ | 1,036 | |||||
Hibbett Sports, Inc.*(a) | 91 | 1,119 | ||||||
Hooker Furniture Corp. | 363 | 14,611 | ||||||
Houghton Mifflin Harcourt Co.* | 56 | 571 | ||||||
Hovnanian Enterprises, Inc., Class A* | 2,113 | 3,846 | ||||||
HSN, Inc. | 28 | 1,028 | ||||||
Iconix Brand Group, Inc.* | 98 | 548 | ||||||
IMAX Corp.* | 64 | 1,194 | ||||||
Inspired Entertainment, Inc.* | 60 | 666 | ||||||
Installed Building Products, Inc.* | 69 | 3,981 | ||||||
International Speedway Corp., Class A | 190 | 6,774 | ||||||
iRobot Corp.* | 67 | 6,393 | ||||||
J Alexander’s Holdings, Inc.* | 102 | 1,010 | ||||||
J. Jill, Inc.* | 134 | 1,301 | ||||||
Jack in the Box, Inc. | 33 | 3,089 | ||||||
Johnson Outdoors, Inc., Class A | 137 | 8,741 | ||||||
K12, Inc.* | 201 | 3,602 | ||||||
KB Home | 240 | 5,136 | ||||||
Kirkland’s, Inc.* | 46 | 530 | ||||||
La Quinta Holdings, Inc.* | 225 | 3,555 | ||||||
Lands’ End, Inc.*(a) | 43 | 522 | ||||||
Laureate Education, Inc., Class A* | 309 | 4,524 | ||||||
La-Z-Boy, Inc. | 223 | 5,319 | ||||||
LCI Industries | 53 | 5,236 | ||||||
LGI Homes, Inc.*(a) | 19 | 808 | ||||||
Liberty Media Corp.-Liberty Braves, Class A* | 13 | 317 | ||||||
Liberty Media Corp.-Liberty Braves, Class C*(a) | 81 | 1,982 | ||||||
Liberty Tax, Inc. | 147 | 1,977 | ||||||
Liberty TripAdvisor Holdings, Inc., Class A* | 22 | 294 | ||||||
Lifetime Brands, Inc. | 109 | 1,897 | ||||||
Lindblad Expeditions Holdings, Inc.* | 125 | 1,390 | ||||||
Lithia Motors, Inc., Class A (a) | 22 | 2,376 | ||||||
Loral Space & Communications, Inc.* | 12 | 545 | ||||||
M/I Homes, Inc.* | 298 | 7,331 | ||||||
Malibu Boats, Inc., Class A* | 94 | 2,535 | ||||||
Marcus Corp. | 170 | 4,233 | ||||||
Marine Products Corp. | 140 | 2,181 | ||||||
MarineMax, Inc.* | 186 | 3,004 | ||||||
Marriott Vacations Worldwide Corp. | 28 | 3,258 | ||||||
MCBC Holdings, Inc.* | 389 | 6,667 | ||||||
MDC Holdings, Inc. | 215 | 6,719 | ||||||
Meredith Corp. | 56 | 3,044 | ||||||
Meritage Homes Corp.* | 43 | 1,750 | ||||||
Monarch Casino & Resort, Inc.* | 125 | 4,446 | ||||||
Monro, Inc. (a) | 24 | 1,145 | ||||||
Motorcar Parts of America, Inc.* | 47 | 1,235 | ||||||
Movado Group, Inc. | 127 | 3,524 | ||||||
MSG Networks, Inc., Class A* | 351 | 7,529 | ||||||
NACCO Industries, Inc., Class A | 23 | 1,668 | ||||||
Nathan’s Famous, Inc.* | 61 | 3,572 | ||||||
National CineMedia, Inc. | 72 | 390 | ||||||
Nautilus, Inc.* | 104 | 1,700 | ||||||
New Home Co, Inc.* | 141 | 1,455 | ||||||
New Media Investment Group, Inc. | 84 | 1,158 | ||||||
New York Times Co., Class A | 168 | 3,133 | ||||||
Number | Value | |||||||
| Consumer Discretionary (Continued) | ||||||||
Nexstar Media Group, Inc., Class A | 15 | $ | 903 | |||||
Nutrisystem, Inc. | 133 | 7,222 | ||||||
Office Depot, Inc. | 509 | 2,184 | ||||||
Ollie’s Bargain Outlet Holdings, Inc.* | 75 | 3,139 | ||||||
Overstock.com, Inc.* | 13 | 285 | ||||||
Oxford Industries, Inc. | 49 | 2,833 | ||||||
Papa John’s International, Inc. | 33 | 2,468 | ||||||
Party City Holdco, Inc.*(a) | 18 | 251 | ||||||
Penn National Gaming, Inc.* | 323 | 7,167 | ||||||
Perry Ellis International, Inc.* | 72 | 1,572 | ||||||
PetMed Express, Inc. (a) | 282 | 10,228 | ||||||
PICO Holdings, Inc.* | 104 | 1,690 | ||||||
Pier 1 Imports, Inc. | 346 | 1,450 | ||||||
Pinnacle Entertainment, Inc.* | 280 | 5,460 | ||||||
Planet Fitness, Inc., Class A | 174 | 4,414 | ||||||
Potbelly Corp.* | 177 | 2,124 | ||||||
RCI Hospitality Holdings, Inc. | 241 | 5,615 | ||||||
Reading International, Inc., Class A* | 156 | 2,459 | ||||||
Red Lion Hotels Corp.* | 90 | 630 | ||||||
Red Robin Gourmet Burgers, Inc.* | 70 | 3,990 | ||||||
Red Rock Resorts, Inc., Class A | 98 | 2,215 | ||||||
Regis Corp.* | 177 | 2,351 | ||||||
Rent-A-Center, Inc. (a) | 273 | 3,303 | ||||||
RH*(a) | 26 | 1,217 | ||||||
Ruth’s Hospitality Group, Inc. | 394 | 7,703 | ||||||
Saga Communications, Inc., Class A | 56 | 2,288 | ||||||
Salem Media Group, Inc. | 125 | 756 | ||||||
Scientific Games Corp., Class A* | 32 | 1,126 | ||||||
SeaWorld Entertainment, Inc. (a) | 140 | 1,817 | ||||||
Select Comfort Corp.* | 286 | 8,446 | ||||||
Shake Shack, Inc., Class A*(a) | 19 | 587 | ||||||
Shiloh Industries, Inc.* | 92 | 806 | ||||||
Shoe Carnival, Inc. | 93 | 1,869 | ||||||
Shutterfly, Inc.* | 63 | 2,872 | ||||||
Sinclair Broadcast Group, Inc., Class A (a) | 78 | 2,360 | ||||||
Sonic Automotive, Inc., Class A | 186 | 3,367 | ||||||
Sonic Corp. (a) | 105 | 2,458 | ||||||
Sotheby’s* | 61 | 2,737 | ||||||
Speedway Motorsports, Inc. | 79 | 1,644 | ||||||
Standard Motor Products, Inc. | 164 | 7,232 | ||||||
Steven Madden Ltd.* | 84 | 3,562 | ||||||
Stoneridge, Inc.* | 224 | 3,709 | ||||||
Strayer Education, Inc. | 39 | 3,120 | ||||||
Sturm Ruger & Co., Inc. | 93 | 4,259 | ||||||
Superior Industries International, Inc. | 109 | 1,597 | ||||||
Superior Uniform Group, Inc. | 22 | 484 | ||||||
Tailored Brands, Inc. (a) | 97 | 1,147 | ||||||
Taylor Morrison Home Corp., Class A* | 220 | 4,448 | ||||||
Tenneco, Inc. | 33 | 1,789 | ||||||
Texas Roadhouse, Inc. | 49 | 2,325 | ||||||
Tile Shop Holdings, Inc. | 90 | 1,355 | ||||||
Tilly’s, Inc., Class A | 231 | 2,543 | ||||||
Time, Inc. | 113 | 1,486 | ||||||
TopBuild Corp.* | 97 | 5,757 | ||||||
Tower International, Inc. | 129 | 2,896 | ||||||
Townsquare Media, Inc., Class A* | 132 | 1,317 | ||||||
TRI Pointe Group, Inc.* | 71 | 905 | ||||||
| See Notes to Financial Statements. | 44 |
DBX ETF Trust
Schedule of Investments
Deutsche X-trackers Russell 2000 Comprehensive Factor ETF (Continued)
August 31, 2017
Number | Value | |||||||
| Consumer Discretionary (Continued) | ||||||||
Unifi, Inc.* | 57 | $ | 1,772 | |||||
Universal Electronics, Inc.* | 34 | 1,991 | ||||||
VOXX International Corp.* | 100 | 810 | ||||||
West Marine, Inc. | 375 | 4,864 | ||||||
Weyco Group, Inc. | 97 | 2,672 | ||||||
William Lyon Homes, Class A* | 155 | 3,718 | ||||||
Wingstop, Inc. (a) | 166 | 5,380 | ||||||
Winmark Corp. (a) | 23 | 3,033 | ||||||
Winnebago Industries, Inc. (a) | 190 | 6,869 | ||||||
Wolverine World Wide, Inc. | 131 | 3,445 | ||||||
World Wrestling Entertainment, Inc., Class A | 35 | 763 | ||||||
ZAGG, Inc.* | 144 | 1,814 | ||||||
Zumiez, Inc.* | 172 | 2,141 | ||||||
|
| |||||||
| 723,925 | ||||||||
|
| |||||||
| Consumer Staples — 2.5% | ||||||||
Alico, Inc. | 22 | 704 | ||||||
Andersons, Inc. | 76 | 2,421 | ||||||
B&G Foods, Inc. (a) | 41 | 1,250 | ||||||
Boston Beer Co, Inc., Class A*(a) | 19 | 2,831 | ||||||
Calavo Growers, Inc. (a) | 30 | 2,014 | ||||||
Cal-Maine Foods, Inc.*(a) | 109 | 3,973 | ||||||
Central Garden & Pet Co.*(a) | 44 | 1,551 | ||||||
Central Garden & Pet Co., Class A* | 140 | 4,773 | ||||||
Chefs’ Warehouse, Inc.* | 114 | 1,966 | ||||||
Coca-Cola Bottling Co. Consolidated | 19 | 4,058 | ||||||
Craft Brew Alliance, Inc.* | 44 | 766 | ||||||
Darling Ingredients, Inc.* | 149 | 2,593 | ||||||
Dean Foods Co. | 63 | 693 | ||||||
Farmer Brothers Co.* | 42 | 1,367 | ||||||
Fresh Del Monte Produce, Inc. | 50 | 2,349 | ||||||
Freshpet, Inc.*(a) | 74 | 1,173 | ||||||
Hostess Brands, Inc.* | 143 | 1,908 | ||||||
HRG Group, Inc.* | 51 | 805 | ||||||
Ingles Markets, Inc., Class A | 121 | 2,656 | ||||||
Inter Parfums, Inc. | 80 | 3,156 | ||||||
J&J Snack Foods Corp. | 24 | 3,060 | ||||||
John B Sanfilippo & Son, Inc. | 227 | 14,088 | ||||||
Lancaster Colony Corp. | 12 | 1,398 | ||||||
Landec Corp.* | 270 | 3,510 | ||||||
Lifeway Foods, Inc.* | 27 | 235 | ||||||
Limoneira Co. | 33 | 739 | ||||||
Medifast, Inc. | 161 | 9,116 | ||||||
MGP Ingredients, Inc. | 19 | 1,068 | ||||||
National Beverage Corp. | 2 | 232 | ||||||
Nature’s Sunshine Products, Inc. | 96 | 1,013 | ||||||
Oil-Dri Corp. of America | 59 | 2,401 | ||||||
Omega Protein Corp. | 143 | 2,259 | ||||||
Performance Food Group Co.* | 89 | 2,474 | ||||||
PriceSmart, Inc. | 16 | 1,300 | ||||||
Sanderson Farms, Inc. (a) | 37 | 5,458 | ||||||
Seneca Foods Corp., Class A* | 26 | 775 | ||||||
Smart & Final Stores, Inc.* | 54 | 381 | ||||||
SpartanNash Co. | 293 | 7,220 | ||||||
Tootsie Roll Industries, Inc. (a) | 40 | 1,494 | ||||||
United Natural Foods, Inc.* | 35 | 1,216 | ||||||
Number | Value | |||||||
| Consumer Staples (Continued) | ||||||||
Universal Corp. | 111 | $ | 6,349 | |||||
USANA Health Sciences, Inc.* | 30 | 1,776 | ||||||
Vector Group Ltd. (a) | 66 | 1,426 | ||||||
Village Super Market, Inc., Class A | 111 | 2,567 | ||||||
WD-40 Co. | 22 | 2,397 | ||||||
Weis Markets, Inc. | 56 | 2,476 | ||||||
|
| |||||||
| 119,435 | ||||||||
|
| |||||||
| Energy — 1.7% | ||||||||
Adams Resources & Energy, Inc. | 6 | 208 | ||||||
Archrock, Inc. | 400 | 4,080 | ||||||
Ardmore Shipping Corp.* | 128 | 1,037 | ||||||
Atwood Oceanics, Inc.*(a) | 114 | 749 | ||||||
Bristow Group, Inc. | 21 | 173 | ||||||
Cloud Peak Energy, Inc.* | 330 | 1,036 | ||||||
Delek US Holdings, Inc. | 275 | 6,798 | ||||||
DHT Holdings, Inc. | 457 | 1,714 | ||||||
Dorian LPG Ltd.* | 158 | 1,084 | ||||||
Dril-Quip, Inc.* | 40 | 1,502 | ||||||
Ensco PLC, Class A (a) | 138 | 586 | ||||||
Era Group, Inc.* | 71 | 626 | ||||||
Evolution Petroleum Corp. | 553 | 3,843 | ||||||
Exterran Corp.* | 78 | 2,164 | ||||||
Forum Energy Technologies, Inc.* | 15 | 174 | ||||||
GasLog Ltd. (a) | 86 | 1,445 | ||||||
Green Plains, Inc. | 72 | 1,336 | ||||||
Gulf Island Fabrication, Inc. | 328 | 3,674 | ||||||
Hallador Energy Co. | 295 | 1,711 | ||||||
International Seaways, Inc* | 173 | 3,190 | ||||||
Isramco, Inc.*(a) | 6 | 676 | ||||||
Matrix Service Co.* | 39 | 462 | ||||||
McDermott International, Inc.* | 338 | 2,075 | ||||||
Midstates Petroleum Co., Inc.* | 104 | 1,507 | ||||||
Natural Gas Services Group, Inc.* | 106 | 2,502 | ||||||
Navios Maritime Acquisition Corp. | 543 | 684 | ||||||
Newpark Resources, Inc.* | 109 | 877 | ||||||
Nordic American Tankers Ltd. (a) | 16 | 76 | ||||||
Oil States International, Inc.* | 53 | 1,153 | ||||||
Overseas Shipholding Group, Inc., Class A* | 319 | 721 | ||||||
Panhandle Oil and Gas, Inc., Class A | 41 | 865 | ||||||
Renewable Energy Group, Inc.* | 500 | 6,050 | ||||||
REX American Resources Corp.* | 110 | 9,528 | ||||||
RigNet, Inc.* | 56 | 896 | ||||||
Ring Energy, Inc.* | 27 | 322 | ||||||
Rowan Cos. PLC, Class A* | 126 | 1,228 | ||||||
Scorpio Tankers, Inc. | 362 | 1,473 | ||||||
SEACOR Holdings, Inc.* | 14 | 537 | ||||||
SEACOR Marine Holdings, Inc.* | 105 | 1,345 | ||||||
Select Energy Services, Inc., Class A* | 59 | 832 | ||||||
SemGroup Corp., Class A (a) | 31 | 797 | ||||||
Ship Finance International Ltd. (a) | 202 | 2,636 | ||||||
SilverBow Resources, Inc.* | 79 | 1,710 | ||||||
Smart Sand, Inc.* | 35 | 209 | ||||||
Solaris Oilfield Infrastructure, Inc., Class A* | 96 | 1,359 | ||||||
Teekay Corp. (a) | 56 | 516 | ||||||
Unit Corp.* | 25 | 398 | ||||||
|
| |||||||
| 78,564 | ||||||||
|
| |||||||
| See Notes to Financial Statements. | 45 |
DBX ETF Trust
Schedule of Investments
Deutsche X-trackers Russell 2000 Comprehensive Factor ETF (Continued)
August 31, 2017
Number | Value | |||||||
| Financials — 29.9% | ||||||||
1st Source Corp. | 96 | $ | 4,480 | |||||
Access National Corp. (a) | 114 | 2,928 | ||||||
ACNB Corp. | 84 | 2,197 | ||||||
AG Mortgage Investment Trust, Inc. REIT | 464 | 8,941 | ||||||
Allegiance Bancshares, Inc.* | 111 | 3,780 | ||||||
Ambac Financial Group, Inc.* | 143 | 2,601 | ||||||
American Equity Investment Life Holding Co. | 315 | 8,744 | ||||||
American National Bankshares, Inc. | 107 | 3,905 | ||||||
Ameris Bancorp | 90 | 3,964 | ||||||
AMERISAFE, Inc. | 59 | 3,174 | ||||||
Ames National Corp. (a) | 94 | 2,547 | ||||||
Anworth Mortgage Asset Corp. REIT | 1,072 | 6,496 | ||||||
Apollo Commercial Real Estate Finance, Inc. REIT | 279 | 5,047 | ||||||
Ares Commercial Real Estate Corp. REIT | 240 | 3,166 | ||||||
Argo Group International Holdings Ltd. | 93 | 5,599 | ||||||
Arlington Asset Investment Corp., Class A (a) | 162 | 2,093 | ||||||
ARMOUR Residential REIT, Inc. REIT (a) | 11 | 291 | ||||||
Arrow Financial Corp. | 101 | 3,262 | ||||||
Artisan Partners Asset Management, Inc., Class A | 113 | 3,469 | ||||||
ASB Bancorp, Inc.* | 43 | 1,907 | ||||||
Associated Capital Group, Inc., Class A | 49 | 1,683 | ||||||
Astoria Financial Corp. | 173 | 3,389 | ||||||
Atlantic Capital Bancshares, Inc.* | 310 | 5,564 | ||||||
Atlas Financial Holdings, Inc.* | 31 | 522 | ||||||
Baldwin & Lyons, Inc., Class B | 106 | 2,321 | ||||||
Banc of California, Inc. (a) | 121 | 2,245 | ||||||
BancFirst Corp. | 76 | 3,830 | ||||||
Banco Latinoamericano de Comercio Exterior SA, Class E | 203 | 5,473 | ||||||
BancorpSouth, Inc. | 130 | 3,776 | ||||||
Bank Mutual Corp. | 321 | 2,937 | ||||||
Bank of Commerce Holdings (a) | 293 | 3,091 | ||||||
Bank of Marin Bancorp | 68 | 4,451 | ||||||
Bank of NT Butterfield & Son Ltd. | 75 | 2,466 | ||||||
BankFinancial Corp. | 131 | 2,101 | ||||||
Bankwell Financial Group, Inc. | 93 | 3,153 | ||||||
Banner Corp. | 55 | 3,032 | ||||||
Bar Harbor Bankshares | 129 | 3,388 | ||||||
BCB Bancorp, Inc. | 174 | 2,471 | ||||||
Bear State Financial, Inc. (a) | 65 | 668 | ||||||
Beneficial Bancorp, Inc. | 166 | 2,482 | ||||||
Berkshire Hills Bancorp, Inc. | 139 | 4,698 | ||||||
Blue Capital Reinsurance Holdings Ltd. | 146 | 2,745 | ||||||
Blue Hills Bancorp, Inc. | 137 | 2,562 | ||||||
BofI Holding, Inc.*(a) | 187 | 4,957 | ||||||
Boston Private Financial Holdings, Inc. | 371 | 5,454 | ||||||
Bridge Bancorp, Inc. | 122 | 3,770 | ||||||
Brookline Bancorp, Inc. | 386 | 5,539 | ||||||
Bryn Mawr Bank Corp. | 175 | 7,166 | ||||||
BSB Bancorp, Inc.* | 84 | 2,394 | ||||||
C&F Financial Corp. | 51 | 2,389 | ||||||
California First National Bancorp | 28 | 452 | ||||||
Camden National Corp. | 180 | 7,020 | ||||||
Number | Value | |||||||
| Financials (Continued) | ||||||||
Capital Bank Financial Corp., Class A | 81 | $ | 3,046 | |||||
Capital City Bank Group, Inc. | 101 | 2,090 | ||||||
Capitol Federal Financial, Inc. | 174 | 2,387 | ||||||
Capstar Financial Holdings, Inc.*(a) | 53 | 919 | ||||||
Capstead Mortgage Corp. REIT | 571 | 5,522 | ||||||
Carolina Financial Corp. | 157 | 5,343 | ||||||
Cathay General Bancorp | 102 | 3,598 | ||||||
CenterState Banks, Inc. | 228 | 5,579 | ||||||
Central Pacific Financial Corp. | 182 | 5,278 | ||||||
Central Valley Community Bancorp | 147 | 2,891 | ||||||
Century Bancorp, Inc., Class A | 53 | 3,540 | ||||||
Charter Financial Corp. | 181 | 2,943 | ||||||
Chemical Financial Corp. | 50 | 2,270 | ||||||
Chemung Financial Corp. | 51 | 2,060 | ||||||
Cherry Hill Mortgage Investment Corp. REIT | 279 | 5,156 | ||||||
Citizens & Northern Corp. | 113 | 2,536 | ||||||
Citizens, Inc.*(a) | 106 | 798 | ||||||
City Holding Co. | 106 | 6,713 | ||||||
Civista Bancshares, Inc. | 252 | 5,093 | ||||||
Clifton Bancorp, Inc. | 109 | 1,717 | ||||||
CNB Financial Corp. | 186 | 4,494 | ||||||
CNO Financial Group, Inc. | 139 | 3,107 | ||||||
CoBiz Financial, Inc. | 304 | 5,183 | ||||||
Codorus Valley Bancorp, Inc. | 131 | 3,282 | ||||||
Cohen & Steers, Inc. | 36 | 1,362 | ||||||
Columbia Banking System, Inc. | 118 | 4,386 | ||||||
Commerce Union Bancshares, Inc. | 195 | 4,678 | ||||||
Community Bank System, Inc. | 63 | 3,242 | ||||||
Community Bankers Trust Corp.* | 444 | 3,730 | ||||||
Community Trust Bancorp, Inc. | 119 | 5,063 | ||||||
ConnectOne Bancorp, Inc. | 260 | 5,928 | ||||||
County Bancorp, Inc. | 41 | 1,229 | ||||||
Crawford & Co., Class B | 137 | 1,359 | ||||||
CU Bancorp* | 167 | 5,954 | ||||||
Customers Bancorp, Inc.* | 58 | 1,634 | ||||||
CVB Financial Corp. | 162 | 3,353 | ||||||
CYS Investments, Inc. REIT | 352 | 3,094 | ||||||
Diamond Hill Investment Group, Inc. | 22 | 4,319 | ||||||
Dime Community Bancshares, Inc. | 215 | 4,074 | ||||||
DNB Financial Corp. (a) | 41 | 1,335 | ||||||
Donegal Group, Inc., Class A | 98 | 1,502 | ||||||
Donnelley Financial Solutions, Inc.* | 287 | 6,145 | ||||||
Dynex Capital, Inc. REIT | 703 | 5,026 | ||||||
Eagle Bancorp, Inc.* | 50 | 3,110 | ||||||
Elevate Credit, Inc.* | 91 | 576 | ||||||
Ellington Residential Mortgage REIT | 117 | 1,712 | ||||||
EMC Insurance Group, Inc. | 67 | 1,868 | ||||||
Employers Holdings, Inc. | 205 | 8,641 | ||||||
Encore Capital Group, Inc.*(a) | 235 | 9,482 | ||||||
Enova International, Inc.* | 477 | 5,676 | ||||||
Enstar Group Ltd.* | 8 | 1,660 | ||||||
Entegra Financial Corp.* | 110 | 2,552 | ||||||
Enterprise Bancorp, Inc. | 87 | 2,783 | ||||||
Enterprise Financial Services Corp. | 187 | 7,143 | ||||||
Equity Bancshares, Inc., Class A* | 91 | 3,108 | ||||||
ESSA Bancorp, Inc. | 111 | 1,676 | ||||||
| See Notes to Financial Statements. | 46 |
DBX ETF Trust
Schedule of Investments
Deutsche X-trackers Russell 2000 Comprehensive Factor ETF (Continued)
August 31, 2017
Number | Value | |||||||
| Financials (Continued) | ||||||||
Essent Group Ltd.* | 131 | $ | 5,119 | |||||
Evans Bancorp, Inc. | 91 | 3,758 | ||||||
Evercore, Inc., Class A | 99 | 7,470 | ||||||
EZCORP, Inc., Class A* | 32 | 290 | ||||||
Farmers Capital Bank Corp. | 63 | 2,359 | ||||||
Farmers National Banc Corp. | 380 | 5,206 | ||||||
FBL Financial Group, Inc., Class A (a) | 32 | 2,176 | ||||||
FCB Financial Holdings, Inc., Class A* | 74 | 3,226 | ||||||
Federal Agricultural Mortgage Corp., Class C | 184 | 12,534 | ||||||
Federated National Holding Co. | 25 | 388 | ||||||
Fidelity & Guaranty Life (a) | 33 | 1,031 | ||||||
Fidelity Southern Corp. | 173 | 3,782 | ||||||
Financial Engines, Inc. | 77 | 2,545 | ||||||
Financial Institutions, Inc. | 161 | 4,379 | ||||||
First BanCorp* | 607 | 3,448 | ||||||
First Bancorp, Inc. | 128 | 3,332 | ||||||
First Bancorp/Southern Pines NC | 213 | 6,590 | ||||||
First Bancshares, Inc. | 137 | 3,863 | ||||||
First Busey Corp. | 246 | 7,097 | ||||||
First Business Financial Services, Inc. | 63 | 1,343 | ||||||
First Citizens BancShares, Inc., Class A | 6 | 2,043 | ||||||
First Commonwealth Financial Corp. | 535 | 6,746 | ||||||
First Community Bancshares, Inc. | 160 | 4,118 | ||||||
First Connecticut Bancorp, Inc. | 209 | 5,173 | ||||||
First Defiance Financial Corp. | 101 | 4,945 | ||||||
First Financial Bancorp | 139 | 3,329 | ||||||
First Financial Bankshares, Inc. (a) | 65 | 2,603 | ||||||
First Financial Corp. | 104 | 4,514 | ||||||
First Financial Northwest, Inc. | 122 | 1,952 | ||||||
First Foundation, Inc.* | 316 | 5,356 | ||||||
First Guaranty Bancshares, Inc. (a) | 89 | 2,331 | ||||||
First Internet Bancorp | 58 | 1,844 | ||||||
First Interstate BancSystem, Inc., Class A | 111 | 3,907 | ||||||
First Merchants Corp. | 177 | 6,951 | ||||||
First Midwest Bancorp, Inc. | 121 | 2,551 | ||||||
First Northwest Bancorp* | 93 | 1,475 | ||||||
First of Long Island Corp. | 177 | 4,735 | ||||||
FirstCash, Inc. | 45 | 2,641 | ||||||
Flagstar Bancorp, Inc.* | 9 | 295 | ||||||
Flushing Financial Corp. | 237 | 6,480 | ||||||
FNB Bancorp | 110 | 3,294 | ||||||
FNFV Group* | 238 | 4,010 | ||||||
Franklin Financial Network, Inc.* | 74 | 2,420 | ||||||
Fulton Financial Corp. | 154 | 2,687 | ||||||
GAIN Capital Holdings, Inc. | 111 | 699 | ||||||
GAMCO Investors, Inc., Class A | 28 | 825 | ||||||
Genworth Financial, Inc., Class A* | 448 | 1,537 | ||||||
German American Bancorp, Inc. | 190 | 6,183 | ||||||
Glacier Bancorp, Inc. | 116 | 3,852 | ||||||
Global Indemnity Ltd.* | 81 | 3,274 | ||||||
Great Ajax Corp. REIT | 180 | 2,552 | ||||||
Great Southern Bancorp, Inc. | 104 | 5,179 | ||||||
Great Western Bancorp, Inc. | 83 | 2,981 | ||||||
Green Bancorp, Inc.* | 144 | 2,887 | ||||||
Green Dot Corp., Class A* | 78 | 3,758 | ||||||
Greene County Bancorp, Inc. (a) | 51 | 1,191 | ||||||
Number | Value | |||||||
| Financials (Continued) | ||||||||
Greenhill & Co., Inc. | 337 | $ | 5,072 | |||||
Greenlight Capital Re Ltd., Class A* | 100 | 2,225 | ||||||
Guaranty Bancorp | 207 | 5,341 | ||||||
Guaranty Bancshares, Inc. | 23 | 696 | ||||||
Hallmark Financial Services, Inc.* | 117 | 1,199 | ||||||
Hamilton Lane, Inc., Class A | 149 | 3,493 | ||||||
Hancock Holding Co. | 67 | 2,945 | ||||||
Hanmi Financial Corp. | 175 | 4,673 | ||||||
Hannon Armstrong Sustainable Infrastructure Capital, Inc. REIT | 99 | 2,297 | ||||||
HarborOne Bancorp, Inc.* | 60 | 1,031 | ||||||
HCI Group, Inc. | 156 | 6,082 | ||||||
Health Insurance Innovations, Inc., Class A* | 30 | 1,010 | ||||||
Heartland Financial USA, Inc. | 128 | 5,824 | ||||||
Heritage Commerce Corp. | 354 | 4,744 | ||||||
Heritage Financial Corp. | 279 | 7,296 | ||||||
Heritage Insurance Holdings, Inc. (a) | 211 | 2,401 | ||||||
Hilltop Holdings, Inc. | 59 | 1,397 | ||||||
Hingham Institution for Savings | 20 | 3,680 | ||||||
Home Bancorp, Inc. | 114 | 4,603 | ||||||
Home BancShares, Inc. | 83 | 1,935 | ||||||
HomeStreet, Inc.* | 165 | 4,166 | ||||||
HomeTrust Bancshares, Inc.* | 163 | 3,782 | ||||||
Hope Bancorp, Inc. | 167 | 2,695 | ||||||
Horace Mann Educators Corp. | 123 | 4,323 | ||||||
Horizon Bancorp | 231 | 6,045 | ||||||
Houlihan Lokey, Inc. | 234 | 8,436 | ||||||
Howard Bancorp, Inc.* | 89 | 1,758 | ||||||
IBERIABANK Corp. | 26 | 1,992 | ||||||
Independence Holding Co. | 96 | 2,083 | ||||||
Independent Bank Corp. | 182 | 3,713 | ||||||
Independent Bank Corp./Rockland MA | 87 | 6,029 | ||||||
Independent Bank Group, Inc. | 47 | 2,616 | ||||||
Infinity Property & Casualty Corp. | 84 | 7,430 | ||||||
International Bancshares Corp. | 91 | 3,271 | ||||||
INTL. FCStone, Inc.* | 201 | 7,133 | ||||||
Invesco Mortgage Capital, Inc. REIT | 409 | 6,945 | ||||||
Investar Holding Corp. | 193 | 4,246 | ||||||
Investment Technology Group, Inc. | 92 | 1,848 | ||||||
Investors Bancorp, Inc. | 95 | 1,244 | ||||||
Investors Title Co. | 44 | 7,738 | ||||||
James River Group Holdings Ltd. | 119 | 4,746 | ||||||
Kearny Financial Corp. | 160 | 2,264 | ||||||
Kemper Corp. | 87 | 4,167 | ||||||
Kingstone Cos., Inc. (a) | 296 | 4,455 | ||||||
Kinsale Capital Group, Inc. | 75 | 2,839 | ||||||
KKR Real Estate Finance Trust, Inc. | 33 | 685 | ||||||
Ladder Capital Corp. REIT | 428 | 5,872 | ||||||
Lakeland Bancorp, Inc. | 389 | 7,197 | ||||||
Lakeland Financial Corp. | 139 | 6,041 | ||||||
LCNB Corp. (a) | 126 | 2,325 | ||||||
LegacyTexas Financial Group, Inc. | 146 | 5,255 | ||||||
LendingTree, Inc.* | 8 | 1,848 | ||||||
Live Oak Bancshares, Inc. | 18 | 402 | ||||||
Macatawa Bank Corp. | 321 | 3,072 | ||||||
Maiden Holdings Ltd. | 266 | 1,929 | ||||||
| See Notes to Financial Statements. | 47 |
DBX ETF Trust
Schedule of Investments
Deutsche X-trackers Russell 2000 Comprehensive Factor ETF (Continued)
August 31, 2017
Number | Value | |||||||
| Financials (Continued) | ||||||||
MainSource Financial Group, Inc. | 188 | $ | 6,153 | |||||
Malvern Bancorp, Inc.* | 128 | 3,046 | ||||||
Marlin Business Services Corp. | 160 | 4,176 | ||||||
MB Financial, Inc. | 43 | 1,710 | ||||||
MBT Financial Corp. | 251 | 2,548 | ||||||
Mercantile Bank Corp. | 146 | 4,437 | ||||||
Meridian Bancorp, Inc. | 190 | 3,344 | ||||||
Meta Financial Group, Inc. | 90 | 6,327 | ||||||
MGIC Investment Corp.* | 35 | 401 | ||||||
Middlefield Banc Corp. (a) | 46 | 2,068 | ||||||
Midland States Bancorp, Inc. | 150 | 4,581 | ||||||
MidSouth Bancorp, Inc. (a) | 170 | 2,015 | ||||||
Moelis & Co., Class A | 242 | 9,535 | ||||||
MTGE Investment Corp. REIT | 285 | 5,472 | ||||||
MutualFirst Financial, Inc. | 83 | 2,922 | ||||||
National Bank Holdings Corp., Class A | 159 | 5,117 | ||||||
National Bankshares, Inc. (a) | 78 | 3,073 | ||||||
National Commerce Corp.* | 126 | 5,009 | ||||||
National General Holdings Corp. | 87 | 1,494 | ||||||
National Western Life Group, Inc., Class A | 26 | 8,695 | ||||||
Nationstar Mortgage Holdings, Inc.* | 68 | 1,171 | ||||||
Navigators Group, Inc. | 74 | 4,129 | ||||||
NBT Bancorp, Inc. | 133 | 4,366 | ||||||
Nelnet, Inc., Class A | 116 | 5,502 | ||||||
New York Mortgage Trust, Inc. REIT (a) | 609 | 3,812 | ||||||
NewStar Financial, Inc. | 89 | 954 | ||||||
NI Holdings, Inc.*(a) | 49 | 809 | ||||||
Nicolet Bankshares, Inc.* | 73 | 3,989 | ||||||
NMI Holdings, Inc., Class A* | 1,242 | 13,476 | ||||||
Northeast Bancorp | 158 | 3,413 | ||||||
Northfield Bancorp, Inc. | 173 | 2,787 | ||||||
Northrim BanCorp, Inc. | 86 | 2,567 | ||||||
Northwest Bancshares, Inc. | 186 | 2,870 | ||||||
Norwood Financial Corp. (a) | 66 | 2,907 | ||||||
OceanFirst Financial Corp. | 198 | 4,942 | ||||||
Oconee Federal Financial Corp. (a) | 25 | 703 | ||||||
OFG Bancorp | 394 | 3,428 | ||||||
Ohio Valley Banc Corp. | 91 | 2,994 | ||||||
Old Line Bancshares, Inc. (a) | 144 | 3,960 | ||||||
Old National Bancorp | 106 | 1,733 | ||||||
Old Point Financial Corp. (a) | 65 | 1,998 | ||||||
Old Second Bancorp, Inc. | 224 | 2,565 | ||||||
OM Asset Management PLC | 161 | 2,275 | ||||||
OneBeacon Insurance Group Ltd., Class A | 407 | 7,416 | ||||||
Oppenheimer Holdings, Inc., Class A | 48 | 780 | ||||||
Orchid Island Capital, Inc. REIT (a) | 205 | 1,982 | ||||||
Oritani Financial Corp. | 205 | 3,290 | ||||||
Orrstown Financial Services, Inc. | 72 | 1,760 | ||||||
Owens Realty Mortgage, Inc. REIT | 117 | 2,030 | ||||||
Pacific Continental Corp. | 240 | 5,700 | ||||||
Pacific Premier Bancorp, Inc.* | 135 | 4,779 | ||||||
Paragon Commercial Corp.* | 36 | 1,867 | ||||||
Park National Corp. | 33 | 3,187 | ||||||
Park Sterling Corp. | 556 | 6,322 | ||||||
Parke Bancorp, Inc. | 177 | 3,443 | ||||||
PCSB Financial Corp.* | 99 | 1,675 | ||||||
Peapack Gladstone Financial Corp. | 209 | 6,368 | ||||||
Number | Value | |||||||
| Financials (Continued) | ||||||||
Penns Woods Bancorp, Inc. (a) | 31 | $ | 1,330 | |||||
PennyMac Financial Services, Inc., Class A* | 230 | 3,910 | ||||||
PennyMac Mortgage Investment Trust REIT | 59 | 1,020 | ||||||
Peoples Bancorp of North Carolina, Inc. (a) | 89 | 2,704 | ||||||
Peoples Bancorp, Inc. | 216 | 6,709 | ||||||
Peoples Financial Services Corp. | 53 | 2,202 | ||||||
People’s Utah Bancorp | 194 | 5,306 | ||||||
PHH Corp.* | 38 | 540 | ||||||
Piper Jaffray Cos. | 60 | 3,327 | ||||||
PJT Partners, Inc., Class A | 131 | 5,064 | ||||||
PRA Group, Inc.* | 159 | 4,595 | ||||||
Preferred Bank | 136 | 7,317 | ||||||
Premier Financial Bancorp, Inc. | 129 | 2,438 | ||||||
Primerica, Inc. | 52 | 3,981 | ||||||
Provident Bancorp, Inc.* | 60 | 1,224 | ||||||
Provident Financial Holdings, Inc. | 83 | 1,572 | ||||||
Provident Financial Services, Inc. | 183 | 4,548 | ||||||
Prudential Bancorp, Inc. (a) | 70 | 1,292 | ||||||
Pzena Investment Management, Inc., Class A | 139 | 1,376 | ||||||
QCR Holdings, Inc. | 167 | 7,298 | ||||||
Radian Group, Inc. | 216 | 3,780 | ||||||
Redwood Trust, Inc. REIT | 66 | 1,101 | ||||||
Regional Management Corp.* | 261 | 5,729 | ||||||
Renasant Corp. | 117 | 4,660 | ||||||
Republic Bancorp, Inc., Class A | 80 | 2,846 | ||||||
Republic First Bancorp, Inc.*(a) | 367 | 3,101 | ||||||
Resource Capital Corp. REIT | 25 | 259 | ||||||
Riverview Bancorp, Inc. | 311 | 2,497 | ||||||
RLI Corp. | 24 | 1,284 | ||||||
S&T Bancorp, Inc. | 176 | 6,325 | ||||||
Safety Insurance Group, Inc. | 67 | 4,784 | ||||||
Sandy Spring Bancorp, Inc. | 188 | 7,251 | ||||||
Seacoast Banking Corp. of Florida* | 255 | 5,832 | ||||||
Selective Insurance Group, Inc. | 96 | 4,838 | ||||||
ServisFirst Bancshares, Inc. | 117 | 3,991 | ||||||
Shore Bancshares, Inc. | 216 | 3,562 | ||||||
SI Financial Group, Inc. | 164 | 2,394 | ||||||
Sierra Bancorp | 166 | 4,201 | ||||||
Silvercrest Asset Management Group, Inc., Class A | 58 | 711 | ||||||
Simmons First National Corp., Class A | 60 | 3,132 | ||||||
SmartFinancial, Inc.*(a) | 60 | 1,385 | ||||||
South State Corp. | 38 | 3,126 | ||||||
Southern First Bancshares, Inc.* | 100 | 3,535 | ||||||
Southern Missouri Bancorp, Inc. | 93 | 3,019 | ||||||
Southern National Bancorp of Virginia, Inc. | 193 | 3,233 | ||||||
Southside Bancshares, Inc. (a) | 118 | 3,855 | ||||||
Southwest Bancorp, Inc. | 205 | 5,176 | ||||||
State Auto Financial Corp. | 87 | 2,152 | ||||||
State Bank Financial Corp. | 164 | 4,407 | ||||||
State National Cos., Inc. | 331 | 6,875 | ||||||
Sterling Bancorp | 159 | 3,570 | ||||||
Stewart Information Services Corp. | 115 | 4,149 | ||||||
Stifel Financial Corp. | 28 | 1,337 | ||||||
| See Notes to Financial Statements. | 48 |
DBX ETF Trust
Schedule of Investments
Deutsche X-trackers Russell 2000 Comprehensive Factor ETF (Continued)
August 31, 2017
Number | Value | |||||||
| Financials (Continued) | ||||||||
Stock Yards Bancorp, Inc. | 166 | $ | 5,777 | |||||
Stonegate Bank | 126 | 6,074 | ||||||
Summit Financial Group, Inc. | 138 | 3,021 | ||||||
Sun Bancorp, Inc. | 96 | 2,242 | ||||||
Sunshine Bancorp, Inc.*(a) | 75 | 1,620 | ||||||
Sutherland Asset Management Corp. REIT | 167 | 2,547 | ||||||
Territorial Bancorp, Inc. | 84 | 2,539 | ||||||
Texas Capital Bancshares, Inc.* | 10 | 743 | ||||||
Third Point Reinsurance Ltd.* | 133 | 1,869 | ||||||
Timberland Bancorp, Inc. | 121 | 3,353 | ||||||
Tiptree, Inc. | 415 | 2,656 | ||||||
Tompkins Financial Corp. | 57 | 4,327 | ||||||
Towne Bank | 182 | 5,587 | ||||||
TriCo Bancshares | 141 | 5,017 | ||||||
TriState Capital Holdings, Inc.* | 231 | 4,828 | ||||||
Triumph Bancorp, Inc.* | 145 | 4,089 | ||||||
Trupanion, Inc.* | 129 | 2,823 | ||||||
TrustCo Bank Corp. | 659 | 5,206 | ||||||
Trustmark Corp. | 140 | 4,147 | ||||||
Two River Bancorp (a) | 178 | 3,243 | ||||||
UMB Financial Corp. | 29 | 1,946 | ||||||
Umpqua Holdings Corp. | 126 | 2,205 | ||||||
Union Bankshares Corp. | 134 | 4,198 | ||||||
Union Bankshares, Inc. | 47 | 2,028 | ||||||
United Bankshares, Inc. | 24 | 805 | ||||||
United Community Banks, Inc. | 197 | 5,144 | ||||||
United Community Financial Corp. | 389 | 3,536 | ||||||
United Financial Bancorp, Inc. | 288 | 4,988 | ||||||
United Fire Group, Inc. | 95 | 3,996 | ||||||
United Insurance Holdings Corp. | 42 | 661 | ||||||
United Security Bancshares | 244 | 2,257 | ||||||
Unity Bancorp, Inc. | 148 | 2,568 | ||||||
Universal Insurance Holdings, Inc. (a) | 285 | 6,113 | ||||||
Univest Corp. of Pennsylvania | 186 | 5,422 | ||||||
Valley National Bancorp | 319 | 3,570 | ||||||
Veritex Holdings, Inc.* | 165 | 4,358 | ||||||
Virtu Financial, Inc., Class A (a) | 73 | 1,310 | ||||||
Virtus Investment Partners, Inc. | 65 | 6,890 | ||||||
Waddell & Reed Financial, Inc., Class A (a) | 276 | 5,136 | ||||||
Walker & Dunlop, Inc.* | 312 | 15,035 | ||||||
Washington Federal, Inc. | 106 | 3,313 | ||||||
Washington Trust Bancorp, Inc. | 103 | 5,279 | ||||||
WashingtonFirst Bankshares, Inc. (a) | 148 | 5,013 | ||||||
Waterstone Financial, Inc. | 153 | 2,700 | ||||||
WesBanco, Inc. | 105 | 3,988 | ||||||
West Bancorporation, Inc. | 142 | 3,117 | ||||||
Westamerica Bancorporation (a) | 61 | 3,145 | ||||||
Western Asset Mortgage Capital Corp. REIT | 111 | 1,167 | ||||||
Western New England Bancorp, Inc. | 251 | 2,497 | ||||||
Westwood Holdings Group, Inc. | 60 | 3,668 | ||||||
Wintrust Financial Corp. | 41 | 2,985 | ||||||
WisdomTree Investments, Inc. (a) | 97 | 889 | ||||||
World Acceptance Corp.* | 60 | 4,489 | ||||||
WSFS Financial Corp. | 113 | 5,051 | ||||||
Xenith Bankshares, Inc.* | 50 | 1,433 | ||||||
|
| |||||||
| 1,398,043 | ||||||||
|
| |||||||
Number | Value | |||||||
| Health Care — 6.8% | ||||||||
Abaxis, Inc. | 61 | $ | 2,819 | |||||
Accuray, Inc.* | 239 | 992 | ||||||
Aceto Corp. | 30 | 318 | ||||||
Addus HomeCare Corp.* | 50 | 1,702 | ||||||
Albany Molecular Research, Inc.*(a) | 22 | 478 | ||||||
Almost Family, Inc.* | 33 | 1,607 | ||||||
AMAG Pharmaceuticals, Inc.* | 74 | 1,236 | ||||||
Amedisys, Inc.* | 33 | 1,724 | ||||||
AMN Healthcare Services, Inc.* | 50 | 1,867 | ||||||
Amphastar Pharmaceuticals, Inc.* | 135 | 2,161 | ||||||
Analogic Corp. | 33 | 2,361 | ||||||
AngioDynamics, Inc.* | 216 | 3,678 | ||||||
Anika Therapeutics, Inc.* | 38 | 2,041 | ||||||
Antares Pharma, Inc.*(a) | 663 | 1,996 | ||||||
Array BioPharma, Inc.*(a) | 78 | 755 | ||||||
AtriCure, Inc.* | 47 | 1,054 | ||||||
Atrion Corp. | 8 | 4,977 | ||||||
BioSpecifics Technologies Corp.* | 53 | 2,499 | ||||||
BioTelemetry, Inc.* | 114 | 4,235 | ||||||
Cambrex Corp.* | 47 | 2,449 | ||||||
Cantel Medical Corp. | 15 | 1,219 | ||||||
Capital Senior Living Corp.* | 41 | 510 | ||||||
Cardiovascular Systems, Inc.* | 66 | 1,938 | ||||||
Catalent, Inc.* | 57 | 2,354 | ||||||
Chemed Corp. | 26 | 5,130 | ||||||
Civitas Solutions, Inc.* | 21 | 401 | ||||||
Community Health Systems, Inc.*(a) | 100 | 764 | ||||||
CONMED Corp. | 41 | 2,034 | ||||||
Corcept Therapeutics, Inc.* | 136 | 2,267 | ||||||
CorVel Corp.* | 60 | 3,114 | ||||||
Cotiviti Holdings, Inc.* | 19 | 679 | ||||||
Cross Country Healthcare, Inc.* | 122 | 1,510 | ||||||
CryoLife, Inc.* | 37 | 770 | ||||||
Cutera, Inc.* | 229 | 8,507 | ||||||
Cytokinetics, Inc.* | 49 | 728 | ||||||
Emergent BioSolutions, Inc.* | 31 | 1,157 | ||||||
Enanta Pharmaceuticals, Inc.* | 38 | 1,629 | ||||||
Ensign Group, Inc. | 173 | 3,553 | ||||||
Enzo Biochem, Inc.* | 772 | 8,685 | ||||||
Exactech, Inc.* | 119 | 3,635 | ||||||
FibroGen, Inc.* | 22 | 1,060 | ||||||
FONAR Corp.* | 25 | 740 | ||||||
Genesis Healthcare, Inc.* | 480 | 499 | ||||||
Genomic Health, Inc.* | 51 | 1,617 | ||||||
Glaukos Corp.*(a) | 30 | 1,133 | ||||||
Globus Medical, Inc., Class A* | 144 | 4,353 | ||||||
Haemonetics Corp.* | 117 | 5,033 | ||||||
Halyard Health, Inc.* | 107 | 4,846 | ||||||
HealthEquity, Inc.* | 44 | 1,882 | ||||||
HealthSouth Corp. | 70 | 3,203 | ||||||
HealthStream, Inc.* | 85 | 1,997 | ||||||
Heska Corp.* | 54 | 5,493 | ||||||
HMS Holdings Corp.* | 93 | 1,648 | ||||||
ICU Medical, Inc.* | 22 | 3,836 | ||||||
INC Research Holdings, Inc., Class A* | 47 | 2,759 | ||||||
Innoviva, Inc.* | 54 | 758 | ||||||
Inogen, Inc.* | 40 | 3,832 | ||||||
| See Notes to Financial Statements. | 49 |
DBX ETF Trust
Schedule of Investments
Deutsche X-trackers Russell 2000 Comprehensive Factor ETF (Continued)
August 31, 2017
Number | Value | |||||||
| Health Care (Continued) | ||||||||
Inovalon Holdings, Inc., Class A*(a) | 55 | $ | 745 | |||||
Integer Holdings Corp.* | 157 | 7,214 | ||||||
Integra LifeSciences Holdings Corp.* | 24 | 1,224 | ||||||
Intersect ENT, Inc.* | 26 | 803 | ||||||
Invacare Corp. | 36 | 486 | ||||||
Ironwood Pharmaceuticals, Inc.* | 21 | 335 | ||||||
Jounce Therapeutics, Inc.* | 69 | 1,172 | ||||||
K2M Group Holdings, Inc.* | 43 | 1,005 | ||||||
Kindred Healthcare, Inc. | 200 | 1,620 | ||||||
Landauer, Inc. | 100 | 6,205 | ||||||
LeMaitre Vascular, Inc. | 232 | 8,445 | ||||||
LHC Group, Inc.* | 133 | 8,678 | ||||||
LivaNova PLC* | 42 | 2,628 | ||||||
Luminex Corp. | 138 | 2,668 | ||||||
Magellan Health, Inc.* | 29 | 2,346 | ||||||
Masimo Corp.* | 44 | 3,713 | ||||||
Medidata Solutions, Inc.* | 10 | 750 | ||||||
Medpace Holdings, Inc.* | 10 | 326 | ||||||
Meridian Bioscience, Inc. | 58 | 806 | ||||||
Merit Medical Systems, Inc.* | 108 | 4,460 | ||||||
MiMedx Group, Inc.*(a) | 123 | 2,001 | ||||||
Molina Healthcare, Inc.*(a) | 66 | 4,224 | ||||||
Momenta Pharmaceuticals, Inc.* | 253 | 4,263 | ||||||
Myriad Genetics, Inc.* | 45 | 1,372 | ||||||
National HealthCare Corp. | 78 | 4,863 | ||||||
National Research Corp., Class A | 153 | 4,942 | ||||||
Natus Medical, Inc.* | 65 | 2,184 | ||||||
Neogen Corp.* | 39 | 2,687 | ||||||
NeoGenomics, Inc.*(a) | 83 | 839 | ||||||
NuVasive, Inc.* | 13 | 812 | ||||||
NxStage Medical, Inc.* | 67 | 1,876 | ||||||
Omnicell, Inc.* | 50 | 2,565 | ||||||
OraSure Technologies, Inc.* | 354 | 7,225 | ||||||
Orthofix International NV* | 74 | 3,642 | ||||||
Owens & Minor, Inc. | 130 | 3,632 | ||||||
Oxford Immunotec Global PLC* | 87 | 1,376 | ||||||
Pacira Pharmaceuticals, Inc.* | 16 | 610 | ||||||
PAREXEL International Corp.* | 38 | 3,340 | ||||||
PDL BioPharma, Inc.* | 143 | 446 | ||||||
Penumbra, Inc.* | 24 | 2,064 | ||||||
PharMerica Corp.* | 72 | 2,117 | ||||||
Phibro Animal Health Corp., Class A | 63 | 2,237 | ||||||
PRA Health Sciences, Inc.* | 20 | 1,548 | ||||||
Prestige Brands Holdings, Inc.* | 24 | 1,217 | ||||||
Providence Service Corp.* | 105 | 5,442 | ||||||
Quality Systems, Inc.* | 279 | 4,394 | ||||||
Quidel Corp.* | 104 | 3,634 | ||||||
R1 RCM, Inc.*(a) | 992 | 3,274 | ||||||
RadNet, Inc.* | 707 | 7,247 | ||||||
Repligen Corp.* | 44 | 1,921 | ||||||
RTI Surgical, Inc.* | 295 | 1,328 | ||||||
SciClone Pharmaceuticals, Inc.* | 65 | 715 | ||||||
Select Medical Holdings Corp.* | 381 | 7,087 | ||||||
Simulations Plus, Inc. (a) | 161 | 2,335 | ||||||
STAAR Surgical Co.* | 75 | 896 | ||||||
Supernus Pharmaceuticals, Inc.* | 89 | 4,076 | ||||||
Surgery Partners, Inc.*(a) | 56 | 546 | ||||||
Number | Value | |||||||
| Health Care (Continued) | ||||||||
Surmodics, Inc.* | 43 | $ | 1,118 | |||||
Teligent, Inc.*(a) | 76 | 525 | ||||||
Tenet Healthcare Corp.*(a) | 40 | 687 | ||||||
Tivity Health, Inc.*(a) | 40 | 1,568 | ||||||
Triple-S Management Corp., Class B* | 56 | 1,384 | ||||||
US Physical Therapy, Inc. | 65 | 3,894 | ||||||
Utah Medical Products, Inc. | 34 | 2,453 | ||||||
Varex Imaging Corp.* | 143 | 4,366 | ||||||
Vocera Communications, Inc.* | 124 | 3,453 | ||||||
Wright Medical Group NV*(a) | 30 | 888 | ||||||
Xencor, Inc.* | 70 | 1,513 | ||||||
|
| |||||||
| 318,677 | ||||||||
|
| |||||||
| Industrials — 19.0% | ||||||||
AAON, Inc. | 132 | 4,303 | ||||||
AAR Corp. | 214 | 7,717 | ||||||
ABM Industries, Inc. | 114 | 5,065 | ||||||
Acacia Research Corp.* | 169 | 549 | ||||||
ACCO Brands Corp.* | 216 | 2,365 | ||||||
Actuant Corp., Class A | 60 | 1,443 | ||||||
Advanced Disposal Services, Inc.* | 22 | 524 | ||||||
Advanced Drainage Systems, Inc. | 126 | 2,451 | ||||||
Advisory Board Co.* | 62 | 3,301 | ||||||
Aegion Corp.* | 213 | 4,616 | ||||||
Aerojet Rocketdyne Holdings, Inc.* | 128 | 3,793 | ||||||
Aerovironment, Inc.* | 53 | 2,598 | ||||||
Air Transport Services Group, Inc.* | 312 | 7,164 | ||||||
Aircastle Ltd. | 110 | 2,466 | ||||||
Alamo Group, Inc. | 96 | 8,809 | ||||||
Albany International Corp., Class A | 57 | 3,055 | ||||||
Allegiant Travel Co. (a) | 13 | 1,534 | ||||||
Allied Motion Technologies, Inc. | 21 | 531 | ||||||
Altra Industrial Motion Corp. | 30 | 1,381 | ||||||
Ameresco, Inc., Class A* | 103 | 747 | ||||||
American Railcar Industries, Inc. (a) | 18 | 648 | ||||||
American Woodmark Corp.* | 55 | 4,554 | ||||||
Apogee Enterprises, Inc. | 100 | 4,370 | ||||||
Applied Industrial Technologies, Inc. | 95 | 5,415 | ||||||
ARC Document Solutions, Inc.* | 248 | 875 | ||||||
ArcBest Corp. | 111 | 3,297 | ||||||
Argan, Inc. | 306 | 19,385 | ||||||
Armstrong Flooring, Inc.* | 172 | 2,566 | ||||||
Astec Industries, Inc. | 92 | 4,571 | ||||||
Astronics Corp.* | 37 | 973 | ||||||
Atkore International Group, Inc.* | 66 | 1,100 | ||||||
Atlas Air Worldwide Holdings, Inc.* | 46 | 3,073 | ||||||
Avis Budget Group, Inc.*(a) | 32 | 1,159 | ||||||
Axon Enterprise, Inc.*(a) | 58 | 1,259 | ||||||
AZZ, Inc. | 34 | 1,663 | ||||||
Barnes Group, Inc. | 91 | 5,689 | ||||||
Barrett Business Services, Inc. | 77 | 3,972 | ||||||
BG Staffing, Inc. | 114 | 1,843 | ||||||
Blue Bird Corp.* | 61 | 1,110 | ||||||
BMC Stock Holdings, Inc.* | 397 | 8,059 | ||||||
Brady Corp., Class A | 178 | 5,936 | ||||||
Briggs & Stratton Corp. | 262 | 5,486 | ||||||
Brink’s Co. | 44 | 3,452 | ||||||
| See Notes to Financial Statements. | 50 |
DBX ETF Trust
Schedule of Investments
Deutsche X-trackers Russell 2000 Comprehensive Factor ETF (Continued)
August 31, 2017
Number | Value | |||||||
| Industrials (Continued) | ||||||||
Builders FirstSource, Inc.* | 166 | $ | 2,702 | |||||
Caesarstone Ltd.*(a) | 53 | 1,536 | ||||||
CAI International, Inc.* | 156 | 4,834 | ||||||
Casella Waste Systems, Inc., Class A* | 624 | 10,489 | ||||||
CBIZ, Inc.* | 530 | 8,029 | ||||||
CECO Environmental Corp. | 303 | 2,263 | ||||||
Chart Industries, Inc.* | 165 | 5,567 | ||||||
CIRCOR International, Inc. | 11 | 528 | ||||||
Columbus McKinnon Corp. | 80 | 2,642 | ||||||
Comfort Systems USA, Inc. | 180 | 6,129 | ||||||
Commercial Vehicle Group, Inc.* | 143 | 849 | ||||||
Continental Building Products, Inc.* | 186 | 4,529 | ||||||
Costamare, Inc. | 108 | 677 | ||||||
Covanta Holding Corp. (a) | 115 | 1,650 | ||||||
Covenant Transportation Group, Inc., Class A* | 2 | 48 | ||||||
CRA International, Inc. | 247 | 9,270 | ||||||
CSW Industrials, Inc.* | 67 | 2,804 | ||||||
Cubic Corp. | 42 | 1,804 | ||||||
Curtiss-Wright Corp. | 14 | 1,355 | ||||||
Daseke, Inc.* | 91 | 1,192 | ||||||
Deluxe Corp. | 24 | 1,664 | ||||||
DigitalGlobe, Inc.* | 143 | 4,919 | ||||||
DMC Global, Inc. | 172 | 2,227 | ||||||
Douglas Dynamics, Inc. | 95 | 3,315 | ||||||
Ducommun, Inc.* | 93 | 2,557 | ||||||
DXP Enterprises, Inc.* | 10 | 271 | ||||||
Dycom Industries, Inc.*(a) | 21 | 1,694 | ||||||
Eastern Co. | 233 | 6,093 | ||||||
Echo Global Logistics, Inc.* | 117 | 1,778 | ||||||
EMCOR Group, Inc. | 89 | 5,878 | ||||||
Encore Wire Corp. | 91 | 3,904 | ||||||
EnerSys | 41 | 2,628 | ||||||
Engility Holdings, Inc.* | 52 | 1,616 | ||||||
Ennis, Inc. | 345 | 6,589 | ||||||
EnPro Industries, Inc. | 54 | 3,805 | ||||||
EnviroStar, Inc. (a) | 24 | 793 | ||||||
ESCO Technologies, Inc. | 114 | 6,207 | ||||||
Essendant, Inc. | 53 | 629 | ||||||
Esterline Technologies Corp.* | 33 | 2,818 | ||||||
Exponent, Inc. | 66 | 4,495 | ||||||
Federal Signal Corp. | 253 | 4,729 | ||||||
Forward Air Corp. | 116 | 6,029 | ||||||
Foundation Building Materials, Inc.* | 59 | 771 | ||||||
Franklin Covey Co.* | 242 | 4,550 | ||||||
Franklin Electric Co., Inc. | 97 | 3,739 | ||||||
FreightCar America, Inc. | 42 | 763 | ||||||
FTI Consulting, Inc.* | 78 | 2,645 | ||||||
GATX Corp. (a) | 95 | 5,755 | ||||||
Gencor Industries, Inc.* | 252 | 3,881 | ||||||
Generac Holdings, Inc.* | 49 | 1,979 | ||||||
General Cable Corp. | 195 | 3,305 | ||||||
Gibraltar Industries, Inc.* | 109 | 3,188 | ||||||
Global Brass & Copper Holdings, Inc. | 29 | 866 | ||||||
GMS, Inc.* | 142 | 4,570 | ||||||
Gorman-Rupp Co. | 74 | 2,253 | ||||||
GP Strategies Corp.* | 66 | 1,888 | ||||||
Number | Value | |||||||
| Industrials (Continued) | ||||||||
Graham Corp. | 154 | $ | 3,085 | |||||
Granite Construction, Inc. | 53 | 2,927 | ||||||
Great Lakes Dredge & Dock Corp.* | 183 | 741 | ||||||
Greenbrier Cos., Inc. (a) | 183 | 7,851 | ||||||
Griffon Corp. | 164 | 3,042 | ||||||
H&E Equipment Services, Inc. | 62 | 1,459 | ||||||
Hardinge, Inc. | 277 | 3,792 | ||||||
Harsco Corp.* | 386 | 6,601 | ||||||
Hawaiian Holdings, Inc.* | 102 | 4,371 | ||||||
HC2 Holdings, Inc.* | 826 | 3,767 | ||||||
Healthcare Services Group, Inc. | 55 | 2,816 | ||||||
Heartland Express, Inc. | 125 | 2,771 | ||||||
Heidrick & Struggles International, Inc. | 338 | 6,168 | ||||||
Herc Holdings, Inc.* | 114 | 4,813 | ||||||
Heritage-Crystal Clean, Inc.* | 160 | 3,120 | ||||||
Herman Miller, Inc. | 166 | 5,586 | ||||||
Hertz Global Holdings, Inc.*(a) | 382 | 8,305 | ||||||
Hillenbrand, Inc. | 113 | 4,040 | ||||||
HNI Corp. | 56 | 2,052 | ||||||
Hub Group, Inc., Class A* | 78 | 2,999 | ||||||
Hudson Technologies, Inc.* | 198 | 1,762 | ||||||
Huron Consulting Group, Inc.* | 28 | 847 | ||||||
ICF International, Inc.* | 128 | 6,150 | ||||||
IES Holdings, Inc.* | 72 | 1,188 | ||||||
InnerWorkings, Inc.* | 464 | 4,858 | ||||||
Insperity, Inc. | 76 | 6,103 | ||||||
Insteel Industries, Inc. | 126 | 3,159 | ||||||
Interface, Inc. | 149 | 2,831 | ||||||
JELD-WEN Holding, Inc.* | 20 | 610 | ||||||
John Bean Technologies Corp. | 17 | 1,508 | ||||||
Kadant, Inc. | 133 | 11,551 | ||||||
Kaman Corp. | 136 | 6,669 | ||||||
KBR, Inc. | 54 | 879 | ||||||
Kelly Services, Inc., Class A | 289 | 6,251 | ||||||
Kennametal, Inc. | 62 | 2,170 | ||||||
Kforce, Inc. | 164 | 2,952 | ||||||
Kimball International, Inc., Class B | 704 | 11,940 | ||||||
KLX, Inc.* | 54 | 2,589 | ||||||
Knight Transportation, Inc. (a) | 108 | 4,217 | ||||||
Knoll, Inc. | 166 | 2,996 | ||||||
Korn/Ferry International | 52 | 1,733 | ||||||
Kratos Defense & Security Solutions, | 94 | 1,258 | ||||||
Lawson Products, Inc.* | 31 | 739 | ||||||
Layne Christensen Co.*(a) | 107 | 1,149 | ||||||
LB Foster Co., Class A | 40 | 764 | ||||||
Lindsay Corp. | 52 | 4,502 | ||||||
LSC Communications, Inc. | 554 | 8,925 | ||||||
LSI Industries, Inc. | 120 | 683 | ||||||
Lydall, Inc.* | 31 | 1,457 | ||||||
Manitowoc Co, Inc.* | 448 | 3,687 | ||||||
Marten Transport Ltd. | 445 | 7,632 | ||||||
Masonite International Corp.* | 64 | 4,051 | ||||||
MasTec, Inc.* | 74 | 3,019 | ||||||
Matson, Inc. | 48 | 1,238 | ||||||
Matthews International Corp., Class A | 59 | 3,555 | ||||||
McGrath RentCorp | 248 | 10,012 | ||||||
| See Notes to Financial Statements. | 51 |
DBX ETF Trust
Schedule of Investments
Deutsche X-trackers Russell 2000 Comprehensive Factor ETF (Continued)
August 31, 2017
Number | Value | |||||||
| Industrials (Continued) | ||||||||
Meritor, Inc.* | 509 | $ | 10,109 | |||||
Milacron Holdings Corp.* | 77 | 1,228 | ||||||
Miller Industries, Inc. | 222 | 5,572 | ||||||
Mistras Group, Inc.* | 63 | 1,191 | ||||||
Mobile Mini, Inc. | 38 | 1,150 | ||||||
Moog, Inc., Class A* | 58 | 4,452 | ||||||
MRC Global, Inc.* | 136 | 2,145 | ||||||
MSA Safety, Inc. | 39 | 2,842 | ||||||
Mueller Industries, Inc. | 177 | 5,280 | ||||||
Mueller Water Products, Inc., Class A | 210 | 2,518 | ||||||
Multi-Color Corp. | 46 | 3,671 | ||||||
MYR Group, Inc.* | 273 | 7,046 | ||||||
National Presto Industries, Inc. (a) | 27 | 2,689 | ||||||
Navigant Consulting, Inc.* | 509 | 7,803 | ||||||
Navistar International Corp.* | 30 | 1,025 | ||||||
NCI Building Systems, Inc.* | 140 | 2,352 | ||||||
Neff Corp., Class A* | 63 | 1,572 | ||||||
Nexeo Solutions, Inc.* | 255 | 1,828 | ||||||
NN, Inc. | 195 | 4,973 | ||||||
Northwest Pipe Co.* | 80 | 1,467 | ||||||
NOW, Inc.* | 50 | 583 | ||||||
Omega Flex, Inc. | 29 | 1,682 | ||||||
On Assignment, Inc.* | 99 | 4,722 | ||||||
Orion Group Holdings, Inc.* | 679 | 4,101 | ||||||
Park-Ohio Holdings Corp. | 31 | 1,235 | ||||||
Patrick Industries, Inc.* | 38 | 2,812 | ||||||
PGT Innovations, Inc.* | 114 | 1,505 | ||||||
Ply Gem Holdings, Inc.* | 105 | 1,633 | ||||||
Powell Industries, Inc. | 59 | 1,680 | ||||||
Preformed Line Products Co. | 27 | 1,411 | ||||||
Primoris Services Corp. | 69 | 1,974 | ||||||
Proto Labs, Inc.* | 26 | 1,867 | ||||||
Quad/Graphics, Inc. | 189 | 3,602 | ||||||
Quanex Building Products Corp. | 206 | 4,038 | ||||||
Radiant Logistics, Inc.* | 1,190 | 6,010 | ||||||
Raven Industries, Inc. | 259 | 7,252 | ||||||
RBC Bearings, Inc.* | 32 | 3,529 | ||||||
Resources Connection, Inc. | 312 | 3,978 | ||||||
Rexnord Corp.* | 54 | 1,290 | ||||||
Roadrunner Transportation Systems, Inc.* | 58 | 433 | ||||||
RPX Corp.* | 1,006 | 13,138 | ||||||
RR Donnelley & Sons Co. | 59 | 545 | ||||||
Rush Enterprises, Inc., Class A* | 223 | 9,141 | ||||||
Rush Enterprises, Inc., Class B* | 35 | 1,348 | ||||||
Saia, Inc.* | 189 | 10,688 | ||||||
Schneider National, Inc., Class B | 68 | 1,513 | ||||||
Simpson Manufacturing Co., Inc. | 90 | 3,940 | ||||||
SiteOne Landscape Supply, Inc.* | 41 | 2,060 | ||||||
SkyWest, Inc. | 101 | 3,505 | ||||||
SP Plus Corp.* | 154 | 5,683 | ||||||
Spartan Motors, Inc. | 967 | 8,896 | ||||||
Sparton Corp.* | 96 | 2,224 | ||||||
SPX Corp.* | 210 | 5,061 | ||||||
SPX FLOW, Inc.* | 8 | 268 | ||||||
Standex International Corp. | 56 | 5,345 | ||||||
Steelcase, Inc., Class A | 278 | 3,670 | ||||||
Sterling Construction Co., Inc.* | 602 | 7,092 | ||||||
Number | Value | |||||||
| Industrials (Continued) | ||||||||
Sun Hydraulics Corp. | 18 | $ | 862 | |||||
Supreme Industries, Inc., Class A | 337 | 7,057 | ||||||
Swift Transportation Co.* | 266 | 7,461 | ||||||
Team, Inc.*(a) | 25 | 309 | ||||||
Tennant Co. | 62 | 3,779 | ||||||
Tetra Tech, Inc. | 113 | 4,814 | ||||||
Textainer Group Holdings Ltd.*(a) | 72 | 1,278 | ||||||
Thermon Group Holdings, Inc.* | 81 | 1,338 | ||||||
Titan International, Inc. | 60 | 515 | ||||||
Titan Machinery, Inc.* | 322 | 4,154 | ||||||
Trex Co., Inc.* | 82 | 6,232 | ||||||
TriMas Corp.* | 170 | 4,114 | ||||||
TriNet Group, Inc.* | 144 | 5,145 | ||||||
Triton International Ltd/Bermuda* | 31 | 1,145 | ||||||
Triumph Group, Inc. | 223 | 5,865 | ||||||
TrueBlue, Inc.* | 555 | 11,350 | ||||||
Tutor Perini Corp.* | 101 | 2,641 | ||||||
Twin Disc, Inc.* | 45 | 781 | ||||||
UniFirst Corp. | 36 | 5,170 | ||||||
Universal Forest Products, Inc. | 44 | 3,837 | ||||||
US Ecology, Inc. | 44 | 2,262 | ||||||
Vectrus, Inc.* | 64 | 1,829 | ||||||
Veritiv Corp.* | 42 | 1,176 | ||||||
Viad Corp. | 94 | 5,165 | ||||||
Vicor Corp.* | 81 | 1,575 | ||||||
VSE Corp. | 121 | 6,310 | ||||||
Wabash National Corp. | 689 | 14,483 | ||||||
WageWorks, Inc.* | 27 | 1,592 | ||||||
Watts Water Technologies, Inc., Class A | 40 | 2,468 | ||||||
Werner Enterprises, Inc. | 102 | 3,376 | ||||||
Wesco Aircraft Holdings, Inc.* | 61 | 512 | ||||||
West Corp. | 41 | 958 | ||||||
Willdan Group, Inc.* | 66 | 2,047 | ||||||
Willis Lease Finance Corp.* | 43 | 1,023 | ||||||
Woodward, Inc. | 27 | 1,896 | ||||||
|
| |||||||
| 889,381 | ||||||||
|
| |||||||
| Information Technology — 10.2% | ||||||||
2U, Inc.* | 25 | 1,253 | ||||||
3D Systems Corp.*(a) | 42 | 528 | ||||||
8x8, Inc.* | 117 | 1,656 | ||||||
ACI Worldwide, Inc.* | 27 | 615 | ||||||
Acxiom Corp.* | 90 | 2,096 | ||||||
ADTRAN, Inc. | 186 | 4,111 | ||||||
Advanced Energy Industries, Inc.* | 59 | 4,339 | ||||||
Agilysys, Inc.* | 62 | 638 | ||||||
Alarm.com Holdings, Inc.* | 29 | 1,303 | ||||||
Alpha & Omega Semiconductor Ltd.* | 189 | 3,001 | ||||||
Ambarella, Inc*(a) | 15 | 816 | ||||||
American Software, Inc., Class A | 277 | 3,050 | ||||||
Amkor Technology, Inc.* | 249 | 2,186 | ||||||
Anixter International, Inc.* | 118 | 8,708 | ||||||
Appfolio, Inc., Class A* | 81 | 3,475 | ||||||
Applied Optoelectronics, Inc.*(a) | 11 | 650 | ||||||
Aspen Technology, Inc.* | 43 | 2,720 | ||||||
Avid Technology, Inc.* | 136 | 600 | ||||||
AVX Corp. | 89 | 1,553 | ||||||
| See Notes to Financial Statements. | 52 |
DBX ETF Trust
Schedule of Investments
Deutsche X-trackers Russell 2000 Comprehensive Factor ETF (Continued)
August 31, 2017
Number | Value | |||||||
| Information Technology (Continued) | ||||||||
Axcelis Technologies, Inc.* | 48 | $ | 1,003 | |||||
AXT, Inc.*(a) | 513 | 4,001 | ||||||
Badger Meter, Inc. | 123 | 5,646 | ||||||
Bankrate, Inc.* | 121 | 1,676 | ||||||
Barracuda Networks, Inc.* | 10 | 242 | ||||||
Bazaarvoice, Inc.* | 440 | 2,090 | ||||||
Bel Fuse, Inc., Class B | 105 | 2,677 | ||||||
Belden, Inc. | 17 | 1,310 | ||||||
Benchmark Electronics, Inc.* | 425 | 13,812 | ||||||
Blackbaud, Inc. | 9 | 760 | ||||||
Blackhawk Network Holdings, Inc.* | 57 | 2,554 | ||||||
Blucora, Inc.* | 205 | 4,674 | ||||||
Bottomline Technologies de, Inc.* | 57 | 1,728 | ||||||
Box, Inc., Class A* | 37 | 726 | ||||||
Brooks Automation, Inc. | 141 | 3,676 | ||||||
Cabot Microelectronics Corp. | 34 | 2,435 | ||||||
CACI International, Inc., Class A* | 6 | 779 | ||||||
CalAmp Corp.* | 58 | 1,075 | ||||||
Calix, Inc.* | 83 | 407 | ||||||
Callidus Software, Inc.* | 22 | 566 | ||||||
Carbonite, Inc.* | 243 | 4,860 | ||||||
Cardtronics PLC, Class A* | 78 | 2,026 | ||||||
Care.com, Inc.* | 103 | 1,542 | ||||||
Cars.com, Inc.*(a) | 201 | 5,198 | ||||||
Cass Information Systems, Inc. | 50 | 3,061 | ||||||
CEVA, Inc.* | 72 | 2,920 | ||||||
Ciena Corp.* | 27 | 583 | ||||||
Cimpress NV* | 16 | 1,479 | ||||||
Cirrus Logic, Inc.* | 33 | 1,913 | ||||||
Cohu, Inc. | 269 | 5,046 | ||||||
CommerceHub, Inc., Series C* | 40 | 849 | ||||||
CommVault Systems, Inc.* | 23 | 1,404 | ||||||
Control4 Corp.* | 143 | 3,541 | ||||||
Convergys Corp. | 150 | 3,525 | ||||||
Cree, Inc.* | 39 | 949 | ||||||
CSG Systems International, Inc. | 44 | 1,703 | ||||||
CTS Corp. | 167 | 3,757 | ||||||
CyberOptics Corp.*(a) | 115 | 1,742 | ||||||
Daktronics, Inc. | 659 | 6,346 | ||||||
Digi International, Inc.* | 71 | 653 | ||||||
Diodes, Inc.* | 126 | 3,546 | ||||||
DSP Group, Inc.* | 170 | 2,023 | ||||||
Ebix, Inc. (a) | 12 | 692 | ||||||
Electro Scientific Industries, Inc.* | 36 | 444 | ||||||
Electronics For Imaging, Inc.* | 29 | 1,031 | ||||||
Ellie Mae, Inc.* | 4 | 332 | ||||||
EMCORE Corp.* | 340 | 3,094 | ||||||
Entegris, Inc.* | 84 | 2,138 | ||||||
Envestnet, Inc.* | 23 | 1,022 | ||||||
EPAM Systems, Inc.* | 18 | 1,464 | ||||||
ePlus, Inc.* | 67 | 5,608 | ||||||
Etsy, Inc.* | 49 | 802 | ||||||
Everi Holdings, Inc.* | 441 | 3,400 | ||||||
EVERTEC, Inc. | 265 | 4,876 | ||||||
Exa Corp.* | 75 | 1,076 | ||||||
ExlService Holdings, Inc.* | 60 | 3,377 | ||||||
Extreme Networks, Inc.* | 294 | 3,360 | ||||||
Number | Value | |||||||
| Information Technology (Continued) | ||||||||
Fabrinet* | 54 | $ | 2,097 | |||||
Fair Isaac Corp. | 8 | 1,126 | ||||||
FARO Technologies, Inc.* | 48 | 1,654 | ||||||
Finisar Corp.* | 45 | 1,087 | ||||||
Five9, Inc.* | 31 | 666 | ||||||
Forrester Research, Inc. | 80 | 3,260 | ||||||
Gigamon, Inc.* | 7 | 301 | ||||||
GrubHub, Inc.*(a) | 36 | 2,055 | ||||||
GSI Technology, Inc.* | 167 | 1,109 | ||||||
GTT Communications, Inc.* | 54 | 1,714 | ||||||
Hackett Group, Inc. | 213 | 2,910 | ||||||
HubSpot, Inc.* | 13 | 954 | ||||||
II-VI, Inc.* | 189 | 6,776 | ||||||
Imperva, Inc.* | 14 | 625 | ||||||
Insight Enterprises, Inc.* | 141 | 5,651 | ||||||
Instructure, Inc.* | 26 | 770 | ||||||
Integrated Device Technology, Inc.* | 25 | 618 | ||||||
InterDigital, Inc. | 68 | 4,852 | ||||||
Intevac, Inc.* | 265 | 2,411 | ||||||
Iteris, Inc.* | 567 | 3,640 | ||||||
Itron, Inc.* | 76 | 5,518 | ||||||
IXYS Corp.* | 48 | 1,104 | ||||||
j2 Global, Inc. | 9 | 678 | ||||||
KEMET Corp.* | 273 | 6,527 | ||||||
Kimball Electronics, Inc.* | 535 | 10,192 | ||||||
Knowles Corp.* | 59 | 866 | ||||||
KVH Industries, Inc.* | 62 | 732 | ||||||
Lattice Semiconductor Corp.* | 105 | 593 | ||||||
Leaf Group Ltd.* | 87 | 618 | ||||||
Liquidity Services, Inc.* | 16 | 91 | ||||||
Littelfuse, Inc. | 11 | 2,048 | ||||||
LivePerson, Inc.* | 236 | 3,162 | ||||||
MACOM Technology Solutions Holdings, Inc.* | 11 | 501 | ||||||
ManTech International Corp., Class A | 160 | 6,435 | ||||||
MAXIMUS, Inc. | 36 | 2,188 | ||||||
MaxLinear, Inc.* | 84 | 1,814 | ||||||
Mesa Laboratories, Inc. (a) | 11 | 1,502 | ||||||
Methode Electronics, Inc. | 95 | 3,885 | ||||||
MicroStrategy, Inc., Class A* | 8 | 1,032 | ||||||
MINDBODY, Inc., Class A* | 51 | 1,206 | ||||||
MKS Instruments, Inc. | 25 | 2,059 | ||||||
MoneyGram International, Inc.* | 216 | 3,404 | ||||||
Monolithic Power Systems, Inc. | 14 | 1,418 | ||||||
Monotype Imaging Holdings, Inc. | 19 | 347 | ||||||
MuleSoft, Inc., Class A*(a) | 68 | 1,482 | ||||||
Nanometrics, Inc.* | 210 | 5,416 | ||||||
Napco Security Technologies, Inc.* | 274 | 2,151 | ||||||
NeoPhotonics Corp.*(a) | 28 | 164 | ||||||
NETGEAR, Inc.* | 42 | 2,016 | ||||||
NetScout Systems, Inc.* | 58 | 1,899 | ||||||
New Relic, Inc.* | 19 | 910 | ||||||
NIC, Inc. | 150 | 2,452 | ||||||
Novanta, Inc.* | 278 | 10,870 | ||||||
NVE Corp. | 85 | 6,446 | ||||||
OSI Systems, Inc.* | 52 | 4,319 | ||||||
Park Electrochemical Corp. | 59 | 1,071 | ||||||
| See Notes to Financial Statements. | 53 |
DBX ETF Trust
Schedule of Investments
Deutsche X-trackers Russell 2000 Comprehensive Factor ETF (Continued)
August 31, 2017
Number | Value | |||||||
| Information Technology (Continued) | ||||||||
Paycom Software, Inc.* | 13 | $ | 970 | |||||
Paylocity Holding Corp.* | 9 | 442 | ||||||
PC Connection, Inc. | 71 | 1,811 | ||||||
PCM, Inc.*(a) | 479 | 6,299 | ||||||
PDF Solutions, Inc.*(a) | 60 | 911 | ||||||
Pegasystems, Inc. | 12 | 691 | ||||||
Perficient, Inc.* | 74 | 1,354 | ||||||
Photronics, Inc.* | 543 | 4,290 | ||||||
Planet Payment, Inc.* | 211 | 836 | ||||||
Plantronics, Inc. | 39 | 1,663 | ||||||
Plexus Corp.* | 79 | 4,114 | ||||||
Power Integrations, Inc. | 30 | 2,185 | ||||||
Progress Software Corp. | 92 | 3,089 | ||||||
Proofpoint, Inc.*(a) | 3 | 275 | ||||||
Q2 Holdings, Inc.* | 32 | 1,299 | ||||||
QAD, Inc., Class A | 77 | 2,595 | ||||||
Qualys, Inc.* | 30 | 1,425 | ||||||
Quantum Corp.* | 100 | 551 | ||||||
QuinStreet, Inc.* | 175 | 936 | ||||||
Radisys Corp.* | 48 | 75 | ||||||
Rambus, Inc.* | 77 | 999 | ||||||
RealPage, Inc.* | 29 | 1,250 | ||||||
Reis, Inc. | 20 | 342 | ||||||
RingCentral, Inc., Class A* | 3 | 127 | ||||||
Rogers Corp.* | 45 | 5,335 | ||||||
Rosetta Stone, Inc.* | 65 | 598 | ||||||
Rudolph Technologies, Inc.* | 365 | 8,103 | ||||||
Sanmina Corp.* | 176 | 6,591 | ||||||
ScanSource, Inc.* | 153 | 6,005 | ||||||
Science Applications International Corp. | 43 | 3,177 | ||||||
Semtech Corp.* | 54 | 2,030 | ||||||
ShoreTel, Inc.* | 136 | 1,013 | ||||||
Shutterstock, Inc.* | 3 | 101 | ||||||
Sigma Designs, Inc.* | 40 | 250 | ||||||
Silicon Laboratories, Inc.* | 39 | 2,960 | ||||||
Sonus Networks, Inc.* | 44 | 304 | ||||||
SPS Commerce, Inc.* | 26 | 1,584 | ||||||
Stamps.com, Inc.* | 19 | 3,634 | ||||||
StarTek, Inc.* | 343 | 4,082 | ||||||
Stratasys Ltd.* | 32 | 716 | ||||||
Super Micro Computer, Inc.* | 64 | 1,704 | ||||||
Sykes Enterprises, Inc.* | 107 | 2,853 | ||||||
Synaptics, Inc.*(a) | 43 | 1,788 | ||||||
Systemax, Inc. | 127 | 3,104 | ||||||
Tech Data Corp.* | 4 | 441 | ||||||
TechTarget, Inc.* | 175 | 1,740 | ||||||
Telenav, Inc.* | 149 | 969 | ||||||
TeleTech Holdings, Inc. | 49 | 1,945 | ||||||
Trade Desk, Inc., Class A* | 9 | 477 | ||||||
Travelport Worldwide Ltd. | 143 | 2,165 | ||||||
TTM Technologies, Inc.* | 756 | 10,765 | ||||||
Tucows, Inc., Class A* | 66 | 3,488 | ||||||
Ubiquiti Networks, Inc.*(a) | 4 | 238 | ||||||
Unisys Corp.*(a) | 560 | 4,340 | ||||||
USA Technologies, Inc.* | 81 | 441 | ||||||
Varonis Systems, Inc.* | 32 | 1,242 | ||||||
VeriFone Systems, Inc.* | 41 | 811 | ||||||
Number | Value | |||||||
| Information Technology (Continued) | ||||||||
Verint Systems, Inc.* | 18 | $ | 715 | |||||
Viavi Solutions, Inc.* | 16 | 161 | ||||||
Virtusa Corp.* | 33 | 1,199 | ||||||
Vishay Intertechnology, Inc. | 357 | 6,319 | ||||||
Vishay Precision Group, Inc.* | 136 | 2,972 | ||||||
Web.com Group, Inc.* | 45 | 1,139 | ||||||
WebMD Health Corp.* | 8 | 532 | ||||||
Xcerra Corp.* | 65 | 638 | ||||||
XO Group, Inc.* | 200 | 3,724 | ||||||
Xperi Corp. | 15 | 409 | ||||||
Yelp, Inc.* | 24 | 1,022 | ||||||
Zix Corp.* | 922 | 4,896 | ||||||
|
| |||||||
| 475,158 | ||||||||
|
| |||||||
| Materials — 4.2% | ||||||||
A Schulman, Inc. | 217 | 6,597 | ||||||
Advanced Emissions Solutions, Inc. (a) | 94 | 976 | ||||||
AdvanSix, Inc.* | 212 | 6,769 | ||||||
American Vanguard Corp. | 223 | 4,516 | ||||||
Balchem Corp. | 30 | 2,249 | ||||||
Boise Cascade Co.* | 109 | 3,270 | ||||||
Calgon Carbon Corp. | 125 | 1,525 | ||||||
Carpenter Technology Corp. | 77 | 3,121 | ||||||
Chase Corp. | 77 | 7,199 | ||||||
Clearwater Paper Corp.* | 31 | 1,441 | ||||||
Codexis, Inc.* | 86 | 477 | ||||||
Commercial Metals Co. | 118 | 2,229 | ||||||
Compass Minerals International, Inc. (a) | 14 | 935 | ||||||
Core Molding Technologies, Inc. | 184 | 3,785 | ||||||
Deltic Timber Corp. | 38 | 2,966 | ||||||
Ferro Corp.* | 114 | 2,197 | ||||||
Forterra, Inc.*(a) | 41 | 136 | ||||||
FutureFuel Corp. | 487 | 6,565 | ||||||
GCP Applied Technologies, Inc.* | 118 | 3,333 | ||||||
Greif, Inc., Class A | 32 | 1,934 | ||||||
Greif, Inc., Class B | 7 | 442 | ||||||
Handy & Harman Ltd.* | 25 | 817 | ||||||
Hawkins, Inc. | 160 | 5,704 | ||||||
Haynes International, Inc. | 20 | 611 | ||||||
HB Fuller Co. | 58 | 2,911 | ||||||
Hecla Mining Co. | 265 | 1,399 | ||||||
Ingevity Corp.* | 94 | 5,919 | ||||||
Innophos Holdings, Inc. | 148 | 6,758 | ||||||
Innospec, Inc. | 50 | 2,775 | ||||||
Kaiser Aluminum Corp. | 26 | 2,504 | ||||||
KapStone Paper and Packaging Corp. | 206 | 4,608 | ||||||
KMG Chemicals, Inc. | 140 | 6,723 | ||||||
Koppers Holdings, Inc.* | 99 | 3,881 | ||||||
Kraton Corp.* | 56 | 1,838 | ||||||
Kronos Worldwide, Inc. | 31 | 649 | ||||||
Louisiana-Pacific Corp.* | 226 | 5,758 | ||||||
Materion Corp. | 277 | 10,581 | ||||||
Minerals Technologies, Inc. | 44 | 2,816 | ||||||
Myers Industries, Inc. | 162 | 3,046 | ||||||
Neenah Paper, Inc. | 76 | 5,871 | ||||||
OMNOVA Solutions, Inc.* | 345 | 3,001 | ||||||
PH Glatfelter Co. | 137 | 2,373 | ||||||
| See Notes to Financial Statements. | 54 |
DBX ETF Trust
Schedule of Investments
Deutsche X-trackers Russell 2000 Comprehensive Factor ETF (Continued)
August 31, 2017
Number | Value | |||||||
| Materials (Continued) | ||||||||
PolyOne Corp. | 40 | $ | 1,446 | |||||
Quaker Chemical Corp. | 62 | 8,632 | ||||||
Rayonier Advanced Materials, Inc. (a) | 41 | 563 | ||||||
Schnitzer Steel Industries, Inc., Class A | 49 | 1,318 | ||||||
Schweitzer-Mauduit International, Inc. | 146 | 5,538 | ||||||
Sensient Technologies Corp. | 31 | 2,237 | ||||||
Stepan Co. | 71 | 5,493 | ||||||
Summit Materials, Inc., Class A* | 68 | 2,009 | ||||||
SunCoke Energy, Inc.* | 376 | 3,504 | ||||||
Trecora Resources* | 59 | 717 | ||||||
Tredegar Corp. | 95 | 1,549 | ||||||
Trinseo SA | 51 | 3,412 | ||||||
Tronox Ltd., Class A | 77 | 1,593 | ||||||
UFP Technologies, Inc.* | 136 | 3,618 | ||||||
United States Lime & Minerals, Inc. | 40 | 3,198 | ||||||
US Concrete, Inc.*(a) | 25 | 2,001 | ||||||
Verso Corp., Class A*(a) | 839 | 4,463 | ||||||
Worthington Industries, Inc. | 30 | 1,499 | ||||||
|
| |||||||
| 195,995 | ||||||||
|
| |||||||
| Real Estate — 5.9% | ||||||||
Acadia Realty Trust REIT | 36 | 1,033 | ||||||
Agree Realty Corp. REIT | 74 | 3,709 | ||||||
Alexander & Baldwin, Inc. | 40 | 1,736 | ||||||
Alexander’s, Inc. REIT | 5 | 2,093 | ||||||
American Assets Trust, Inc. REIT | 43 | 1,747 | ||||||
Armada Hoffler Properties, Inc. REIT | 334 | 4,466 | ||||||
Ashford Hospitality Prime, Inc. REIT | 63 | 606 | ||||||
Ashford Hospitality Trust, Inc. REIT | 583 | 3,620 | ||||||
Bluerock Residential Growth REIT, Inc. REIT | 119 | 1,205 | ||||||
CareTrust REIT, Inc. REIT | 225 | 4,340 | ||||||
CatchMark Timber Trust, Inc., Class A REIT | 89 | 1,026 | ||||||
CBL & Associates Properties, Inc. REIT (a) | 421 | 3,368 | ||||||
Cedar Realty Trust, Inc. REIT | 139 | 701 | ||||||
Chatham Lodging Trust REIT | 145 | 2,941 | ||||||
Chesapeake Lodging Trust REIT | 184 | 4,709 | ||||||
City Office REIT, Inc. REIT | 166 | 2,123 | ||||||
Clipper Realty, Inc. REIT (a) | 72 | 804 | ||||||
Community Healthcare Trust, Inc. REIT | 110 | 2,922 | ||||||
Consolidated-Tomoka Land Co. | 40 | 2,216 | ||||||
CorEnergy Infrastructure Trust, Inc. | 120 | 3,916 | ||||||
Cousins Properties, Inc. REIT | 185 | 1,730 | ||||||
DiamondRock Hospitality Co. REIT | 435 | 4,781 | ||||||
Easterly Government Properties, Inc. | 140 | 2,808 | ||||||
EastGroup Properties, Inc. REIT | 39 | 3,466 | ||||||
Education Realty Trust, Inc. REIT | 20 | 773 | ||||||
Farmland Partners, Inc. REIT (a) | 83 | 735 | ||||||
FelCor Lodging Trust, Inc. REIT | 484 | 3,533 | ||||||
First Industrial Realty Trust, Inc. REIT | 61 | 1,890 | ||||||
First Potomac Realty Trust REIT | 285 | 3,172 | ||||||
Forestar Group, Inc.* | 374 | 6,433 | ||||||
Four Corners Property Trust, Inc. REIT | 268 | 6,810 | ||||||
Franklin Street Properties Corp. REIT | 185 | 1,844 | ||||||
FRP Holdings, Inc.* | 39 | 1,712 | ||||||
GEO Group, Inc. REIT | 91 | 2,515 | ||||||
Number | Value | |||||||
| Real Estate (Continued) | ||||||||
Getty Realty Corp. REIT | 181 | $ | 4,988 | |||||
Gladstone Commercial Corp. REIT | 176 | 3,766 | ||||||
Global Net Lease, Inc. REIT | 78 | 1,689 | ||||||
Government Properties Income Trust REIT | 188 | 3,487 | ||||||
Gramercy Property Trust REIT | 27 | 822 | ||||||
Healthcare Realty Trust, Inc. REIT | 30 | 998 | ||||||
Hersha Hospitality Trust REIT | 363 | 6,730 | ||||||
HFF, Inc., Class A | 120 | 4,576 | ||||||
Independence Realty Trust, Inc. REIT (a) | 231 | 2,377 | ||||||
InfraREIT, Inc. REIT | 249 | 5,600 | ||||||
Investors Real Estate Trust REIT | 490 | 3,077 | ||||||
iStar, Inc. REIT* | 351 | 4,075 | ||||||
Jernigan Capital, Inc. REIT (a) | 137 | 2,663 | ||||||
Kennedy-Wilson Holdings, Inc. | 62 | 1,197 | ||||||
Kite Realty Group Trust REIT | 40 | 805 | ||||||
LaSalle Hotel Properties REIT | 156 | 4,427 | ||||||
Lexington Realty Trust REIT | 231 | 2,278 | ||||||
LTC Properties, Inc. REIT | 59 | 2,869 | ||||||
Mack-Cali Realty Corp. REIT | 24 | 549 | ||||||
Marcus & Millichap, Inc.* | 64 | 1,685 | ||||||
Maui Land & Pineapple Co., Inc.* | 130 | 1,677 | ||||||
MedEquities Realty Trust, Inc. REIT | 134 | 1,537 | ||||||
Monmouth Real Estate Investment Corp. REIT | 271 | 4,404 | ||||||
Monogram Residential Trust, Inc. REIT | 183 | 2,196 | ||||||
National Health Investors, Inc. REIT | 32 | 2,566 | ||||||
National Storage Affiliates Trust REIT | 152 | 3,393 | ||||||
New Senior Investment Group, Inc. REIT | 107 | 988 | ||||||
NexPoint Residential Trust, Inc. REIT | 221 | 5,149 | ||||||
NorthStar Realty Europe Corp. REIT | 64 | 796 | ||||||
One Liberty Properties, Inc. REIT | 105 | 2,521 | ||||||
Parkway, Inc. REIT | 54 | 1,240 | ||||||
Pebblebrook Hotel Trust REIT (a) | 136 | 4,568 | ||||||
Physicians Realty Trust REIT | 55 | 1,030 | ||||||
Potlatch Corp. REIT | 83 | 3,967 | ||||||
Preferred Apartment Communities, Inc., Class A REIT | 123 | 2,237 | ||||||
PS Business Parks, Inc. REIT | 14 | 1,892 | ||||||
QTS Realty Trust, Inc., Class A REIT | 20 | 1,084 | ||||||
Quality Care Properties, Inc. REIT* | 291 | 3,993 | ||||||
RAIT Financial Trust REIT | 195 | 161 | ||||||
Ramco-Gershenson Properties Trust REIT | 117 | 1,539 | ||||||
RE/MAX Holdings, Inc., Class A | 126 | 7,717 | ||||||
Retail Opportunity Investments Corp. REIT | 75 | 1,488 | ||||||
Rexford Industrial Realty, Inc. REIT | 120 | 3,606 | ||||||
RLJ Lodging Trust REIT | 156 | 3,148 | ||||||
RMR Group, Inc., Class A | 89 | 4,597 | ||||||
Ryman Hospitality Properties, Inc. REIT | 56 | 3,328 | ||||||
Sabra Health Care REIT, Inc. REIT | 324 | 7,079 | ||||||
Saul Centers, Inc. REIT | 29 | 1,757 | ||||||
Select Income REIT | 84 | 1,950 | ||||||
Seritage Growth Properties, Class A | 9 | 433 | ||||||
St Joe Co.* | 54 | 1,018 | ||||||
STAG Industrial, Inc. REIT | 90 | 2,519 | ||||||
Starwood Waypoint Homes REIT | 10 | 372 | ||||||
Stratus Properties, Inc. | 35 | 1,036 | ||||||
| See Notes to Financial Statements. | 55 |
DBX ETF Trust
Schedule of Investments
Deutsche X-trackers Russell 2000 Comprehensive Factor ETF (Continued)
August 31, 2017
Number | Value | |||||||
| Real Estate (Continued) | ||||||||
Summit Hotel Properties, Inc. REIT | 410 | $ | 6,084 | |||||
Sunstone Hotel Investors, Inc. REIT | 224 | 3,539 | ||||||
Tejon Ranch Co.* | 24 | 480 | ||||||
Terreno Realty Corp. REIT | 98 | 3,553 | ||||||
Tier REIT, Inc. REIT | 25 | 460 | ||||||
UMH Properties, Inc. REIT | 322 | 5,094 | ||||||
Universal Health Realty Income Trust REIT | 75 | 5,678 | ||||||
Urban Edge Properties REIT | 43 | 1,081 | ||||||
Urstadt Biddle Properties, Inc., Class A REIT | 89 | 1,841 | ||||||
Washington Prime Group, Inc. REIT | 204 | 1,703 | ||||||
Washington Real Estate Investment Trust REIT | 87 | 2,859 | ||||||
Whitestone REIT (a) | 93 | 1,166 | ||||||
Xenia Hotels & Resorts, Inc. REIT | 260 | 5,190 | ||||||
|
| |||||||
| 275,855 | ||||||||
|
| |||||||
| Telecommunication Services — 1.2% | ||||||||
ATN International, Inc. | 27 | 1,635 | ||||||
Boingo Wireless, Inc.* | 294 | 6,053 | ||||||
Cincinnati Bell, Inc.* | 71 | 1,495 | ||||||
Cogent Communications Holdings, Inc. | 21 | 979 | ||||||
Consolidated Communications Holdings, Inc. (a) | 269 | 4,963 | ||||||
General Communication, Inc., Class A* | 138 | 5,952 | ||||||
Hawaiian Telcom Holdco, Inc.* | 128 | 3,894 | ||||||
IDT Corp., Class B | 411 | 6,046 | ||||||
Intelsat SA* | 228 | 880 | ||||||
Iridium Communications, Inc.*(a) | 483 | 5,361 | ||||||
Lumos Networks Corp.* | 318 | 5,718 | ||||||
Ooma, Inc.* | 86 | 843 | ||||||
ORBCOMM, Inc.*(a) | 137 | 1,515 | ||||||
Shenandoah Telecommunications Co. | 20 | 721 | ||||||
Spok Holdings, Inc. | 259 | 4,338 | ||||||
Vonage Holdings Corp.* | 170 | 1,411 | ||||||
Windstream Holdings, Inc. (a) | 1,239 | 2,565 | ||||||
|
| |||||||
| 54,369 | ||||||||
|
| |||||||
| Utilities — 1.9% | ||||||||
ALLETE, Inc. | 27 | 2,088 | ||||||
American States Water Co. | 63 | 3,106 | ||||||
Artesian Resources Corp., Class A | 104 | 3,857 | ||||||
Atlantic Power Corp.* | 476 | 1,166 | ||||||
Avista Corp. | 50 | 2,570 | ||||||
Black Hills Corp. | 18 | 1,267 | ||||||
California Water Service Group | 102 | 3,820 | ||||||
Chesapeake Utilities Corp. | 53 | 4,211 | ||||||
Connecticut Water Service, Inc. (a) | 52 | 2,820 | ||||||
Consolidated Water Co. Ltd. | 111 | 1,326 | ||||||
Delta Natural Gas Co., Inc. | 74 | 2,267 | ||||||
El Paso Electric Co. | 67 | 3,722 | ||||||
Number | Value | |||||||
| Utilities (Continued) | ||||||||
Global Water Resources, Inc. | 57 | $ | 546 | |||||
IDACORP, Inc. | 16 | 1,424 | ||||||
MGE Energy, Inc. | 53 | 3,371 | ||||||
Middlesex Water Co. | 53 | 2,013 | ||||||
New Jersey Resources Corp. | 11 | 480 | ||||||
Northwest Natural Gas Co. | 48 | 3,182 | ||||||
NorthWestern Corp. | 27 | 1,629 | ||||||
NRG Yield, Inc., Class A | 84 | 1,528 | ||||||
NRG Yield, Inc., Class C (a) | 153 | 2,830 | ||||||
ONE Gas, Inc. | 23 | 1,731 | ||||||
Ormat Technologies, Inc. | 35 | 2,010 | ||||||
Otter Tail Corp. | 121 | 5,058 | ||||||
Pattern Energy Group, Inc. | 60 | 1,507 | ||||||
PNM Resources, Inc. | 57 | 2,417 | ||||||
Portland General Electric Co. | 38 | 1,805 | ||||||
Pure Cycle Corp.* | 167 | 1,211 | ||||||
RGC Resources, Inc. | 122 | 3,361 | ||||||
SJW Group | 119 | 6,605 | ||||||
South Jersey Industries, Inc. | 71 | 2,547 | ||||||
Southwest Gas Holdings, Inc. | 27 | 2,147 | ||||||
Spark Energy, Inc., Class A | 23 | 365 | ||||||
Spire, Inc. | 16 | 1,224 | ||||||
Unitil Corp. | 89 | 4,438 | ||||||
WGL Holdings, Inc. | 16 | 1,348 | ||||||
York Water Co. | 79 | 2,599 | ||||||
|
| |||||||
| 89,596 | ||||||||
|
| |||||||
TOTAL COMMON STOCKS | 4,618,998 | |||||||
|
| |||||||
| EXCHANGE-TRADED FUNDS — 1.1% | ||||||||
iShares Core S&P Small-Cap ETF | 120 | 8,288 | ||||||
iShares Russell 2000 ETF (a) | 80 | 11,179 | ||||||
SPDR Russell 2000 ETF | 140 | 11,588 | ||||||
Vanguard Russell 2000 ETF | 90 | 10,103 | ||||||
Vanguard Small-Cap ETF | 75 | 10,190 | ||||||
|
| |||||||
TOTAL EXCHANGE-TRADED FUNDS | 51,348 | |||||||
|
| |||||||
| SECURITIES LENDING COLLATERAL — 8.0% | ||||||||
Deutsche Government & Agency Securities Portfolio “Deutsche Government Cash Institutional Shares”, 0.93% (b)(c) | 371,772 | 371,772 | ||||||
|
| |||||||
TOTAL INVESTMENTS — 107.9% | ||||||||
(Cost $4,555,474) | $ | 5,042,118 | ||||||
Other assets and liabilities, net — (7.9%) | (367,534 | ) | ||||||
|
| |||||||
NET ASSETS — 100.0% | $ | 4,674,584 | ||||||
|
| |||||||
| * | Non-income producing security. |
| (a) | All or a portion of these securities were on loan. In addition, “Other assets and liabilities, net” may include pending sales that are also on loan. The value of securities loaned at August 31, 2017 amounted to $361,318, which is 7.7% of net assets. |
| (b) | Affiliated fund managed by Deutsche Investment Management Americas Inc. The rate shown is the annualized seven-day yield at period end. |
| (c) | Represents collateral held in connection with securities lending. Income earned by the Fund is net of borrower rebates. |
| See Notes to Financial Statements. | 56 |
DBX ETF Trust
Schedule of Investments
Deutsche X-trackers Russell 2000 Comprehensive Factor ETF (Continued)
August 31, 2017
| REIT: | Real Estate Investment Trust |
Fair Value Measurements
Various inputs are used in determining the value of the Fund’s investments. These inputs are summarized in three broad levels. Level 1 includes quoted prices in active markets for identical securities. Level 2 includes other significant observable inputs (including quoted prices for similar securities, interest rates, prepayment speeds and credit risk). Level 3 includes significant unobservable inputs (including the Fund’s own assumptions in determining the fair value of investments). The level assigned to the securities valuations may not be an indication of the risk or liquidity associated with investing in those securities.
The following is a summary of the inputs used as of August 31, 2017 in valuing the Fund’s investments. For information on the Fund’s policy regarding the valuation of investments, please refer to the Security Valuation section of Note 2 in the accompanying Notes to Financial Statements.
Assets | Level 1 | Level 2 | Level 3 | Total | ||||||||||||
Common Stocks (d) | $ | 4,618,998 | $ | — | $ | — | $ | 4,618,998 | ||||||||
Exchange-Traded Funds | 51,348 | — | — | 51,348 | ||||||||||||
Short-Term Investments | 371,772 | — | — | 371,772 | ||||||||||||
|
|
|
|
|
|
|
| |||||||||
TOTAL | $ | 5,042,118 | $ | — | $ | — | $ | 5,042,118 | ||||||||
|
|
|
|
|
|
|
| |||||||||
| (d) | See Schedule of Investments for additional detailed categorizations. |
There have been no transfers between fair value measurement levels during the year ended August 31, 2017.
| See Notes to Financial Statements. | 57 |
DBX ETF Trust
August 31, 2017
| Deutsche X-trackers FTSE Developed ex US Comprehensive Factor ETF | Deutsche X-trackers FTSE Emerging Comprehensive Factor ETF | Deutsche X-trackers Russell 1000 Comprehensive Factor ETF | Deutsche X-trackers Russell 2000 Comprehensive Factor ETF | |||||||||||||
Assets | ||||||||||||||||
Investments in non-affiliated securities at value | $ | 15,466,074 | $ | 11,944,824 | $ | 99,057,519 | $ | 4,670,346 | ||||||||
Investment in Deutsche Government & Agency Securities Portfolio* | 115,119 | 184,866 | 1,722,761 | 371,772 | ||||||||||||
Cash | 429 | 976,567 | 975,599 | 9,478 | ||||||||||||
Foreign currency at value | 13,682 | 86,519 | — | — | ||||||||||||
Deposit with broker for futures contracts | — | 43,890 | 33,300 | — | ||||||||||||
| Receivables: | ||||||||||||||||
Investment securities sold | — | — | — | 14 | ||||||||||||
Variation margin on futures contracts | — | 3,192 | 7,775 | — | ||||||||||||
Dividends | 19,347 | 39,106 | 152,766 | 3,815 | ||||||||||||
Securities lending income | 44 | 34 | 769 | 411 | ||||||||||||
Foreign tax reclaim | 144 | 63 | — | — | ||||||||||||
|
|
|
|
|
|
|
| |||||||||
Total Assets | $ | 15,614,839 | $ | 13,279,061 | $ | 101,950,489 | $ | 5,055,836 | ||||||||
|
|
|
|
|
|
|
| |||||||||
Liabilities | ||||||||||||||||
Payable upon return of securities loaned | $ | 115,119 | $ | 184,866 | $ | 1,722,761 | $ | 371,772 | ||||||||
| Payables: | ||||||||||||||||
Investment securities purchased | — | — | — | 8,296 | ||||||||||||
Investment advisory fees | 3,936 | 5,445 | 15,605 | 1,184 | ||||||||||||
|
|
|
|
|
|
|
| |||||||||
Total Liabilities | 119,055 | 190,311 | 1,738,366 | 381,252 | ||||||||||||
|
|
|
|
|
|
|
| |||||||||
Net Assets, at value | $ | 15,495,784 | $ | 13,088,750 | $ | 100,212,123 | $ | 4,674,584 | ||||||||
|
|
|
|
|
|
|
| |||||||||
Net Assets Consist of | ||||||||||||||||
Paid-in capital | $ | 14,963,651 | $ | 11,438,417 | $ | 96,805,943 | $ | 4,068,782 | ||||||||
Undistributed net investment income | 141,041 | 199,229 | 327,015 | 12,922 | ||||||||||||
Accumulated net realized gain (loss) | (291,850 | ) | 139,107 | (1,383,421 | ) | 106,236 | ||||||||||
Net unrealized appreciation (depreciation) | 682,942 | 1,311,997 | 4,462,586 | 486,644 | ||||||||||||
|
|
|
|
|
|
|
| |||||||||
Net Assets, at value | $ | 15,495,784 | $ | 13,088,750 | $ | 100,212,123 | $ | 4,674,584 | ||||||||
|
|
|
|
|
|
|
| |||||||||
Number of Common Shares outstanding | 550,001 | 450,001 | 3,400,001 | 150,001 | ||||||||||||
|
|
|
|
|
|
|
| |||||||||
Net Asset Value | $ | 28.17 | $ | 29.09 | $ | 29.47 | $ | 31.16 | ||||||||
|
|
|
|
|
|
|
| |||||||||
Investments in non-affiliated securities at cost | $ | 14,783,202 | $ | 10,632,018 | $ | 94,595,836 | $ | 4,183,702 | ||||||||
|
|
|
|
|
|
|
| |||||||||
Value of securities loaned | $ | 110,191 | $ | 175,873 | $ | 1,682,630 | $ | 361,318 | ||||||||
|
|
|
|
|
|
|
| |||||||||
Investment in Deutsche Government & Agency Securities Portfolio at cost* | $ | 115,119 | $ | 184,866 | $ | 1,722,761 | $ | 371,772 | ||||||||
|
|
|
|
|
|
|
| |||||||||
Foreign currency at cost | $ | 13,625 | $ | 84,264 | $ | — | $ | — | ||||||||
|
|
|
|
|
|
|
| |||||||||
| * | Represents collateral on securities loaned. |
| See Notes to Financial Statements. | 58 |
DBX ETF Trust
For the Year Ended August 31, 2017
| Deutsche X-trackers FTSE Developed ex US Comprehensive Factor ETF | Deutsche X-trackers FTSE Emerging Comprehensive Factor ETF | Deutsche X-trackers Russell 1000 Comprehensive Factor ETF | Deutsche X-trackers Russell 2000 Comprehensive Factor ETF | |||||||||||||
Investment Income | ||||||||||||||||
Unaffiliated dividend income* | $ | 199,709 | $ | 318,540 | $ | 1,341,537 | $ | 66,395 | ||||||||
Securities lending income, net of borrower rebates | 1,204 | 514 | 6,377 | 3,252 | ||||||||||||
|
|
|
|
|
|
|
| |||||||||
Total Investment Income | 200,913 | 319,054 | 1,347,914 | 69,647 | ||||||||||||
|
|
|
|
|
|
|
| |||||||||
Expenses | ||||||||||||||||
Investment advisory fees | 28,718 | 42,210 | 150,105 | 11,546 | ||||||||||||
|
|
|
|
|
|
|
| |||||||||
Total Expenses | 28,718 | 42,210 | 150,105 | 11,546 | ||||||||||||
|
|
|
|
|
|
|
| |||||||||
Less fees waived (See Note 3): | ||||||||||||||||
Waiver | — | — | (8,268 | ) | — | |||||||||||
|
|
|
|
|
|
|
| |||||||||
Net Expenses | 28,718 | 42,210 | 141,837 | 11,546 | ||||||||||||
|
|
|
|
|
|
|
| |||||||||
Net Investment income (loss) | 172,195 | 276,844 | 1,206,077 | 58,101 | ||||||||||||
|
|
|
|
|
|
|
| |||||||||
Realized and Unrealized Gain (Loss) | ||||||||||||||||
Net realized gain (loss) from: | ||||||||||||||||
Investments | (175,641 | ) | 65,930 | (1,522,976 | ) | 106,736 | ||||||||||
In-kind redemptions | (878,423 | ) | — | 6,128,871 | — | |||||||||||
Futures contracts | — | 126,353 | 23,357 | — | ||||||||||||
Foreign currency transactions | (445 | ) | (21,625 | ) | — | — | ||||||||||
|
|
|
|
|
|
|
| |||||||||
Net realized gain (loss) | (1,054,509 | ) | 170,658 | 4,629,252 | 106,736 | |||||||||||
Net change in unrealized appreciation (depreciation) on: | ||||||||||||||||
Investments | 601,281 | 1,288,821 | 3,652,627 | 215,038 | ||||||||||||
Futures contracts | — | (6,840 | ) | 903 | — | |||||||||||
Foreign currency translations | 260 | 2,380 | — | — | ||||||||||||
|
|
|
|
|
|
|
| |||||||||
Net change in unrealized appreciation (depreciation) | 601,541 | 1,284,361 | 3,653,530 | 215,038 | ||||||||||||
|
|
|
|
|
|
|
| |||||||||
Net realized and unrealized gain (loss) on investments, futures and foreign currency transactions | (452,968 | ) | 1,455,019 | 8,282,782 | 321,774 | |||||||||||
|
|
|
|
|
|
|
| |||||||||
Net Increase (Decrease) in Net Assets Resulting from Operations | $ | (280,773 | ) | $ | 1,731,863 | $ | 9,488,859 | $ | 379,875 | |||||||
|
|
|
|
|
|
|
| |||||||||
* Unaffiliated foreign tax withheld | $ | 21,708 | $ | 44,615 | $ | 357 | $ | 19 | ||||||||
| See Notes to Financial Statements. | 59 |
DBX ETF Trust
| Deutsche X-trackers FTSE Developed ex US Comprehensive Factor ETF | Deutsche X-trackers FTSE Emerging Comprehensive Factor ETF | |||||||||||||||
| Year Ended August 31, 2017 | For the Period November 24, 2015(1) to August 31, 2016 | Year Ended August 31, 2017 | For the Period April 19, 2016(1) to August 31, 2016 | |||||||||||||
Increase (Decrease) in Net Assets from Operations | ||||||||||||||||
Net investment income (loss) | $ | 172,195 | $ | 52,395 | $ | 276,844 | $ | 38,174 | ||||||||
Net realized gain (loss) | (1,054,509 | ) | (58,909 | ) | 170,658 | 8,262 | ||||||||||
Net change in net unrealized appreciation (depreciation) | 601,541 | 81,401 | 1,284,361 | 27,636 | ||||||||||||
|
|
|
|
|
|
|
| |||||||||
Net increase (decrease) in net assets resulting from operations | (280,773 | ) | 74,887 | 1,731,863 | 74,072 | |||||||||||
|
|
|
|
|
|
|
| |||||||||
Distributions to Shareholders from | ||||||||||||||||
Net investment income | (163,100 | ) | (38,272 | ) | (132,417 | ) | (5,652 | ) | ||||||||
Net realized gains | — | — | (17,533 | ) | — | |||||||||||
|
|
|
|
|
|
|
| |||||||||
Total distributions | (163,100 | ) | (38,272 | ) | (149,950 | ) | (5,652 | ) | ||||||||
|
|
|
|
|
|
|
| |||||||||
Fund Shares Transactions | ||||||||||||||||
Proceeds from shares sold | 40,231,926 | 2,504,591 | 8,933,809 | 2,504,583 | ||||||||||||
Value of shares redeemed | (26,833,500 | ) | — | — | — | |||||||||||
|
|
|
|
|
|
|
| |||||||||
Net increase (decrease) in net assets resulting from fund share transactions | 13,398,426 | 2,504,591 | 8,933,809 | 2,504,583 | ||||||||||||
|
|
|
|
|
|
|
| |||||||||
Total net increase (decrease) in Net Assets | 12,954,553 | 2,541,206 | 10,515,722 | 2,573,003 | ||||||||||||
Net Assets | ||||||||||||||||
Beginning of period | 2,541,231 | 25 | 2,573,028 | 25 | ||||||||||||
|
|
|
|
|
|
|
| |||||||||
End of period | $ | 15,495,784 | $ | 2,541,231 | $ | 13,088,750 | $ | 2,573,028 | ||||||||
|
|
|
|
|
|
|
| |||||||||
Undistributed net investment income | $ | 141,041 | $ | 44,061 | $ | 199,229 | $ | 26,664 | ||||||||
|
|
|
|
|
|
|
| |||||||||
Changes in Shares Outstanding | ||||||||||||||||
Shares outstanding, beginning of period | 100,001 | 1 | 100,001 | 1 | ||||||||||||
Shares sold | 1,550,000 | 100,000 | 350,000 | 100,000 | ||||||||||||
Shares redeemed | (1,100,000 | ) | — | — | — | |||||||||||
|
|
|
|
|
|
|
| |||||||||
Shares outstanding, end of period | 550,001 | 100,001 | 450,001 | 100,001 | ||||||||||||
|
|
|
|
|
|
|
| |||||||||
| (1) | Commencement of Operations. |
| See Notes to Financial Statements. | 60 |
DBX ETF Trust
Statements of Changes in Net Assets (Continued)
| Deutsche X-trackers Russell 1000 Comprehensive Factor ETF | Deutsche X-trackers Russell 2000 Comprehensive Factor ETF | |||||||||||||||
| Year Ended August 31, 2017 | For the Period November 24, 2015(1) to August 31, 2016 | Year Ended August 31, 2017 | For the Period June 28, 2016(1) to August 31, 2016 | |||||||||||||
Increase (Decrease) in Net Assets from Operations | ||||||||||||||||
Net investment income (loss) | $ | 1,206,077 | $ | 113,784 | $ | 58,101 | $ | 8,620 | ||||||||
Net realized gain (loss) | 4,629,252 | (183,600 | ) | 106,736 | 732 | |||||||||||
Net change in net unrealized appreciation (depreciation) | 3,653,530 | 809,056 | 215,038 | 271,606 | ||||||||||||
|
|
|
|
|
|
|
| |||||||||
Net increase (decrease) in net assets resulting from operations | 9,488,859 | 739,240 | 379,875 | 280,958 | ||||||||||||
|
|
|
|
|
|
|
| |||||||||
Distributions to Shareholders from | ||||||||||||||||
Net investment income | (964,811 | ) | (39,260 | ) | (54,188 | ) | — | |||||||||
Net realized gains | — | — | (843 | ) | — | |||||||||||
|
|
|
|
|
|
|
| |||||||||
Total distributions | (964,811 | ) | (39,260 | ) | (55,031 | ) | — | |||||||||
|
|
|
|
|
|
|
| |||||||||
Fund Shares Transactions | ||||||||||||||||
Proceeds from shares sold | 146,512,353 | 20,705,428 | 1,567,483 | 2,501,274 | ||||||||||||
Value of shares redeemed | (76,229,711 | ) | — | — | — | |||||||||||
|
|
|
|
|
|
|
| |||||||||
Net increase (decrease) in net assets resulting from fund share transactions | 70,282,642 | 20,705,428 | 1,567,483 | 2,501,274 | ||||||||||||
|
|
|
|
|
|
|
| |||||||||
Total net increase (decrease) in Net Assets | 78,806,690 | 21,405,408 | 1,892,327 | 2,782,232 | ||||||||||||
Net Assets | ||||||||||||||||
Beginning of period | 21,405,433 | 25 | 2,782,257 | 25 | ||||||||||||
|
|
|
|
|
|
|
| |||||||||
End of period | $ | 100,212,123 | $ | 21,405,433 | $ | 4,674,584 | $ | 2,782,257 | ||||||||
|
|
|
|
|
|
|
| |||||||||
Undistributed net investment income | $ | 327,015 | $ | 74,790 | $ | 12,922 | $ | 8,813 | ||||||||
|
|
|
|
|
|
|
| |||||||||
Changes in Shares Outstanding | ||||||||||||||||
Shares outstanding, beginning of period | 800,001 | 1 | 100,001 | 1 | ||||||||||||
Shares sold | 5,350,000 | 800,000 | 50,000 | 100,000 | ||||||||||||
Shares redeemed | (2,750,000 | ) | — | — | — | |||||||||||
|
|
|
|
|
|
|
| |||||||||
Shares outstanding, end of period | 3,400,001 | 800,001 | 150,001 | 100,001 | ||||||||||||
|
|
|
|
|
|
|
| |||||||||
| (1) | Commencement of Operations. |
| See Notes to Financial Statements. | 61 |
DBX ETF Trust
| Deutsche X-trackers FTSE Developed ex US Comprehensive Factor ETF Selected Per Share Data | Year Ended 8/31/2017 | Period Ended 8/31/2016(a) | ||||||
Net Asset Value, beginning of period | $ | 25.41 | $ | 25.00 | ||||
|
|
|
| |||||
| Income (loss) from investment operations: | ||||||||
Net investment income (loss)(c) | 0.54 | 0.52 | ||||||
Net realized and unrealized gain (loss) | 3.19 | (d) | 0.27 | |||||
|
|
|
| |||||
Total from investment operations | 3.73 | 0.79 | ||||||
|
|
|
| |||||
| Less distributions from: | ||||||||
Net investment income | (0.97 | ) | (0.38 | ) | ||||
|
|
|
| |||||
Total distributions | (0.97 | ) | (0.38 | ) | ||||
|
|
|
| |||||
Net Asset Value, end of period | $ | 28.17 | $ | 25.41 | ||||
|
|
|
| |||||
Total Return (%) | 15.16 | 3.21 | ** | |||||
Ratios to Average Net Assets and Supplemental Data | ||||||||
Net Assets, end of period ($ millions) | 15 | 3 | ||||||
Ratio of expenses (%) | 0.35 | 0.36 | * | |||||
Ratio of net investment income (loss) (%) | 2.10 | 2.77 | * | |||||
Portfolio turnover rate (%)(e) | 45 | 35 | ** | |||||
| Deutsche X-trackers FTSE Emerging Comprehensive Factor ETF Selected Per Share Data | Year Ended 8/31/2017 | Period Ended 8/31/2016(b) | ||||||
Net Asset Value, beginning of period | $ | 25.73 | $ | 25.00 | ||||
|
|
|
| |||||
| Income (loss) from investment operations: | ||||||||
Net investment income (loss)(c) | 0.88 | 0.38 | ||||||
Net realized and unrealized gain (loss) | 3.27 | 0.41 | ||||||
|
|
|
| |||||
Total from investment operations | 4.15 | 0.79 | ||||||
|
|
|
| |||||
| Less distributions from: | ||||||||
Net investment income | (0.61 | ) | (0.06 | ) | ||||
Net realized gains | (0.18 | ) | — | |||||
|
|
|
| |||||
Total distributions | (0.79 | ) | (0.06 | ) | ||||
|
|
|
| |||||
Net Asset Value, end of period | $ | 29.09 | $ | 25.73 | ||||
|
|
|
| |||||
Total Return (%) | 16.56 | 3.16 | ** | |||||
Ratios to Average Net Assets and Supplemental Data | ||||||||
Net Assets, end of period ($ millions) | 13 | 3 | ||||||
Ratio of expenses (%) | 0.50 | 0.50 | * | |||||
Ratio of net investment income (loss) (%) | 3.28 | 4.14 | * | |||||
Portfolio turnover rate (%)(e) | 48 | 1 | ** | |||||
| (a) | For the period November 24, 2015 (commencement of operations) through August 31, 2016. |
| (b) | For the period April 19, 2016 (commencement of operations) through August 31, 2016. |
| (c) | Based on average shares outstanding during the period. |
| (d) | Because of the timing of subscriptions and redemptions in relation to fluctuating markets at value, the amount shown may not agree with the change in aggregate gains and losses. |
| (e) | Portfolio turnover rate does not include securities received or delivered from processing creations or redemptions. |
| * | Annualized. |
| ** | Not Annualized. |
| See Notes to Financial Statements. | 62 |
DBX ETF Trust
Financial Highlights (Continued)
| Deutsche X-trackers Russell 1000 Comprehensive Factor ETF Selected Per Share Data | Year Ended 8/31/2017 | Period Ended 8/31/2016(a) | ||||||
Net Asset Value, beginning of period | $ | 26.76 | $ | 25.00 | ||||
|
|
|
| |||||
| Income (loss) from investment operations: | ||||||||
Net investment income (loss)(c) | 0.51 | 0.40 | ||||||
Net realized and unrealized gain (loss) | 2.85 | 1.60 | ||||||
|
|
|
| |||||
Total from investment operations | 3.36 | 2.00 | ||||||
|
|
|
| |||||
| Less distributions from: | ||||||||
Net investment income | (0.65 | ) | (0.24 | ) | ||||
|
|
|
| |||||
Total distributions | (0.65 | ) | (0.24 | ) | ||||
|
|
|
| |||||
Net Asset Value, end of period | $ | 29.47 | $ | 26.76 | ||||
|
|
|
| |||||
Total Return (%) | 12.75 | (d) | 8.06 | ** | ||||
Ratios to Average Net Assets and Supplemental Data | ||||||||
Net Assets, end of period ($ millions) | 100 | 21 | ||||||
Ratio of expenses before fee waiver (%) | 0.23 | 0.25 | * | |||||
Ratio of expenses after fee waiver (%) | 0.21 | 0.25 | * | |||||
Ratio of net investment income (loss) (%) | 1.83 | 2.01 | * | |||||
Portfolio turnover rate (%)(e) | 67 | 64 | ** | |||||
| Deutsche X-trackers Russell 2000 Comprehensive Factor ETF Selected Per Share Data | Year Ended 8/31/2017 | Period Ended 8/31/2016(b) | ||||||
Net Asset Value, beginning of period | $ | 27.82 | $ | 25.00 | ||||
|
|
|
| |||||
| Income (loss) from investment operations: | ||||||||
Net investment income (loss)(c) | 0.46 | 0.09 | ||||||
Net realized and unrealized gain (loss) | 3.35 | 2.73 | ||||||
|
|
|
| |||||
Total from investment operations | 3.81 | 2.82 | ||||||
|
|
|
| |||||
| Less distributions from: | ||||||||
Net investment income | (0.46 | ) | — | |||||
Net realized gains | (0.01 | ) | — | |||||
|
|
|
| |||||
Total distributions | (0.47 | ) | — | |||||
|
|
|
| |||||
Net Asset Value, end of period | $ | 31.16 | $ | 27.82 | ||||
|
|
|
| |||||
Total Return (%) | 13.72 | 11.28 | ** | |||||
Ratios to Average Net Assets and Supplemental Data | ||||||||
Net Assets, end of period ($ millions) | 5 | 3 | ||||||
Ratio of expenses (%) | 0.30 | 0.30 | * | |||||
Ratio of net investment income (loss) (%) | 1.51 | 1.79 | * | |||||
Portfolio turnover rate (%)(e) | 53 | 2 | ** | |||||
| (a) | For the period November 24, 2015 (commencement of operations) through August 31, 2016. |
| (b) | For the period June 28, 2016 (commencement of operations) through August 31, 2016. |
| (c) | Based on average shares outstanding during the period. |
| (d) | The Total Return would have been lower if certain fees had not been reimbursed by the Advisor. |
| (e) | Portfolio turnover rate does not include securities received or delivered from processing creations or redemptions. |
| * | Annualized. |
| ** | Not Annualized. |
| See Notes to Financial Statements. | 63 |
DBX ETF Trust
1. Organization
DBX ETF Trust (the “Trust”) is registered under the Investment Company Act of 1940, as amended (the “Act”), as an open-end registered management investment company organized as a Delaware statutory trust.
As of August 31, 2017, the Trust consists of thirty-five investment series of exchange-traded funds (“ETFs”) (each a “Fund” and collectively, the “Funds”) in operation and trading. These financial statements report on the Funds listed below:
| Deutsche X-trackers FTSE Developed ex US Comprehensive Factor ETF |
| Deutsche X-trackers FTSE Emerging Comprehensive Factor ETF |
| Deutsche X-trackers Russell 1000 Comprehensive Factor ETF |
| Deutsche X-trackers Russell 2000 Comprehensive Factor ETF |
DBX Advisors LLC (“DBX” or the “Advisor”), an indirect, wholly owned subsidiary of Deutsche Bank AG, serves as investment advisor to the Funds and has overall responsibility for the general management and administration of the Funds, subject to the supervision of the Funds’ Board of Trustees (“Board”).
Each Fund offers shares that are listed and traded on the NYSE Arca, Inc. (“NYSE Arca”). Unlike conventional mutual funds, each Fund issues and redeems shares on a continuous basis, at net asset value, only in large specified lots consisting of 50,000 shares, each called a “Creation Unit”, to authorized participants who have entered into agreements with the Funds’ distributor. Shares are not individually redeemable securities of the Funds, and owners of the shares may acquire those shares from the Funds, or tender such shares for redemption to the Funds, in Creation Units only.
The investment objective of each Fund is to track the performance, before fees and expenses, of a particular index (the “Underlying Index”). The underlying indices for the Funds are:
Fund | Underlying Index | |
| Deutsche X-trackers FTSE Developed ex US Comprehensive Factor ETF | FTSE Developed ex US Comprehensive Factor Index | |
Deutsche X-trackers FTSE Emerging Comprehensive Factor ETF Deutsche X-trackers Russell 1000 Comprehensive Factor ETF Deutsche X-trackers Russell 2000 Comprehensive Factor ETF | FTSE Emerging Comprehensive Factor Index Russell 1000 Comprehensive Factor Index Russell 2000 Comprehensive Factor Index |
The FTSE Developed ex US Comprehensive Factor Index is designed to track the equity market performance of companies in developed countries (except the United States) selected on the investment style criteria (“factors”) of value, momentum, quality, low volatility and size. The companies eligible for the Underlying Index are derived from its starting universe, the FTSE Developed ex US Index, which is comprised of large- and mid-capitalization equity securities from developed markets (except the United States). The Underlying Index is rebalanced semiannually in March and September after the close of business on the third Friday of the review month.
The FTSE Emerging Comprehensive Factor Index is designed to track the equity market performance of companies in emerging market countries selected on the investment style criteria (“factors”) of value, momentum, quality, low volatility and size. The companies eligible for the Underlying Index are derived from its starting universe, the FTSE Emerging Index, which is comprised of large- and mid-cap equity securities from emerging markets. The Underlying Index is rebalanced semiannually in March and September after the close of business on the third Friday of the review month.
The Russell 1000 Comprehensive Factor Index is designed to track the equity market performance of companies in the United States selected on the investment style criteria (“factors”) of value, momentum, quality, low volatility and size. The companies eligible for the Underlying Index are derived from its starting universe, the Russell 1000 Index, which is comprised of large-cap equity securities from issuers in the United States. The Underlying Index is rebalanced semiannually in June and December after the close of business on the third Friday of the review month.
The Russell 2000 Comprehensive Factor Index is designed to track the equity market performance of companies in
the United States selected on the investment style criteria (“factors”) of value, momentum, quality, low volatility and size. The companies eligible for the Underlying Index are derived from its starting universe, the Russell 2000 Index, which is comprised of small-cap equity securities from issuers in the United States. The Underlying Index is rebalanced semiannually in June and December after the close of business on the third Friday of the review month.
64
DBX ETF Trust
Notes to Financial Statements (Continued)
Each Fund is entitled to use its respective Underlying Index pursuant to a licensing agreement between each Index Provider and DBX. There is no charge to the Funds in connection with these licensing agreements.
Each Fund is non-diversified and is not limited by the Act with regard to the percentage of its assets that may be invested in the securities of a single issuer. The securities of a particular issuer (or securities of issuers in particular industries) may dominate the underlying index of such a fund and, consequently, the fund’s investment portfolio. This may adversely affect the fund’s performance or subject the fund’s shares to greater price volatility than that experienced by more diversified investment companies.
Pursuant to the Trust’s organizational documents, the Trust’s officers and trustees are indemnified against certain liabilities that may arise out of the performance of their duties to the Funds. Additionally, in the normal course of business the Trust enters into contracts that contain a variety of representations that provide indemnification for certain liabilities. The Trust’s maximum exposure under these arrangements is unknown, as this would involve future claims that may be made against the Funds that have not yet occurred. However, the Trust expects the risk of loss to be remote.
2. Significant Accounting Policies
The financial statements have been prepared in conformity with U.S. generally accepted accounting principles (“U.S. GAAP”), which require management to make certain estimates and assumptions that affect the reported amounts and disclosures in the financial statements. Actual results could differ from those estimates. Each Fund qualifies as an investment company under Topic 946 of Accounting Standards Codification of U.S. GAAP. The following is a summary of significant accounting policies followed by the Funds.
Security Valuation The Net Asset Value (“NAV”), of each Fund’s shares is calculated each business day as of the close of regular trading on the New York Stock Exchange, generally 4:00 p.m. Eastern Time. NAV per share is calculated by dividing a Fund’s net assets by the number of Fund shares outstanding.
Various inputs are used in determining the value of the Funds’ investments. These inputs are summarized in three broad levels. Level 1 includes quoted prices in active markets for identical securities. Level 2 includes other significant observable inputs (including quoted prices for similar securities, interest rates, prepayment speeds, and credit risk). Level 3 includes significant unobservable inputs (including the Fund’s own assumptions in determining the fair value of investments). The level assigned to the securities valuations may not be an indication of the risk or liquidity associated with investing in those securities.
Equity securities and ETFs are valued at the most recent sale price or official closing price reported on the exchange (U.S. or foreign) or over-the-counter market on which they trade. Securities for which no sales are reported are valued at the calculated mean between the most recent bid and asked quotations on the relevant market or, if a mean cannot be determined, at the most recent bid quotation. Equity securities are generally categorized as Level 1.
Investments in open-end investment companies are valued at their net asset value each business day and are categorized as Level 1.
Futures contracts are generally valued at the settlement prices established each day on the exchange on which they are traded and are categorized as Level 1.
Securities and other assets for which market quotations are not readily available or for which the above valuation procedures are deemed not to reflect fair value are valued in a manner that is intended to reflect their fair value as determined in accordance with procedures approved by the Board and are generally categorized as Level 3. In accordance with the Fund’s valuation procedures, factors considered in determining value may include, but are not limited to, the type of the security; the size of the holding; the initial cost of the security; the existence of any contractual restrictions on the security’s disposition; the price and extent of public trading in similar securities of the issuer or of comparable companies; quotations or evaluated prices from broker-dealers and/or pricing services; information obtained from the issuer, analysts, and/or the appropriate stock exchange (for exchange-traded securities); an analysis of the company’s or issuer’s financial statements; an evaluation of the forces that influence the issuer and the market(s) in which the security is purchased and sold; and with respect to debt securities, the maturity, coupon, creditworthiness, currency denomination and the movement of the market in which the security is normally traded. The value determined under these procedures may differ from published values for the same securities.
65
DBX ETF Trust
Notes to Financial Statements (Continued)
Fair value pricing could result in a difference between the prices used to calculate a Fund’s net asset value and the prices used by the Fund’s underlying index, which in turn could result in a difference between the Fund’s performance and the performance of the Fund’s Underlying Index.
Disclosure about the classification of the fair value measurements is included in a table following the Fund’s Schedule of Investments.
Cash Cash consists of cash held at banks and is on deposit with major financial institutions.
Investment Transactions and Investment Income Investment transactions are recorded as of the date that the securities are purchased or sold (trade date). Realized gains and losses from the sale or disposition of securities are calculated on the identified cost-method. Dividend income is net of any foreign taxes withheld at source. Certain dividends from foreign securities may be recorded subsequent to the ex-dividend date as soon as the fund is informed of such dividends. Interest income is recorded on the accrual basis. Distributions received from foreign domiciled corporations, generally determined to be passive foreign investment companies for tax reporting purposes, are included in dividend income.
Tax Information and Dividends and Distributions to Shareholders It is each Fund’s policy to comply with all requirements of the Internal Revenue Code of 1986, as amended (“the Code”). Each fund intends to qualify for and to elect treatment as a separate Regulated Investment Company (“RIC”) under Subchapter M of the Code. It is the policy of each Fund to pay out dividends from its net investment income, if any, to investors quarterly. Taxable net realized gains from investment transactions, reduced by capital loss carryforwards, if any, are declared and distributed to shareholders at least annually. The capital loss carryforward amount, if any, is available to offset future net capital gains. The Funds may occasionally be required to make supplemental distributions at some other time during the year. The Funds reserve the right to declare special distributions if, in their reasonable discretion, such action is necessary or advisable to preserve the status of each Fund as a RIC or to avoid imposition of income or excise taxes on undistributed income. Dividends and distributions to shareholders, if any, are recorded on the ex-dividend date. The amount of dividends and distributions from net investment income and net realized capital gains are determined in accordance with Federal income tax regulations which may differ from U.S. GAAP. These “book/tax” differences are either considered temporary or permanent in nature. To the extent these differences are permanent in nature, such amounts are reclassified at the end of the year within the components of net assets based on their federal tax treatment; temporary differences do not require reclassification. Dividends and distributions, which exceed earnings and profits for the full year for tax purposes, are reported as a tax return of capital.
In accordance with U.S. GAAP requirements regarding accounting for uncertainties in income taxes, management has analyzed the Funds’ tax positions taken or expected to be taken on foreign, federal and state income tax returns for all open tax years and has concluded that no provision for income tax is required in the Funds’ financial statements.
The Funds recognize interest and penalties, if any, related to uncertain tax positions as income tax expense on the Statements of Operations. For the year ended August 31, 2017, the Funds did not incur any interest or penalties.
As of August 31, 2017, the components of accumulated earnings (losses) on a tax basis were as follows:
| Undistributed Ordinary Income* | Undistributed Long-Term Capital Gains | Capital and Other Gains (Losses) | Unrealized Appreciation (Depreciation) | Total Accumulated Earnings (Losses) | ||||||||||||||||
Deutsche X-trackers FTSE Developed ex US Comprehensive Factor ETF | $ | 141,041 | $ | — | $ | (152,563 | ) | $ | 543,655 | $ | 532,133 | |||||||||
Deutsche X-trackers FTSE Emerging Comprehensive Factor ETF | 384,637 | 2,622 | — | 1,263,074 | 1,650,333 | |||||||||||||||
Deutsche X-trackers Russell 1000 Comprehensive Factor ETF | 329,662 | — | (915,010 | ) | 3,991,528 | 3,406,180 | ||||||||||||||
Deutsche X-trackers Russell 2000 Comprehensive Factor ETF | 116,622 | 4,764 | — | 484,416 | 605,802 | |||||||||||||||
66
DBX ETF Trust
Notes to Financial Statements (Continued)
The tax character of dividends and distributions declared for the periods ended August 31, 2017 and August 31, 2016 were as follows:
| Year Ended August 31, 2017 | ||||||||
| Ordinary Income* | Long Term Capital Gains | |||||||
Deutsche X-trackers FTSE Developed ex US Comprehensive Factor ETF | $ | 163,100 | $ | — | ||||
Deutsche X-trackers FTSE Emerging Comprehensive Factor ETF | 149,950 | — | ||||||
Deutsche X-trackers Russell 1000 Comprehensive Factor ETF | 964,811 | — | ||||||
Deutsche X-trackers Russell 2000 Comprehensive Factor ETF | 54,712 | 319 | ||||||
| Year Ended August 31, 2016 | ||||
| Ordinary Income* | ||||
Deutsche X-trackers FTSE Developed ex US Comprehensive Factor ETF | $ | 38,272 | ||
Deutsche X-trackers FTSE Emerging Comprehensive Factor ETF | 5,652 | |||
Deutsche X-trackers Russell 1000 Comprehensive Factor ETF | 39,260 | |||
| * | For tax purposes short-term capital gain distributions are considered ordinary income distributions. |
At August 31, 2017, for Federal income tax purposes, the Funds have capital loss carryforwards available as shown in the table below, to the extent provided by regulations, to offset future capital gains for an unlimited period. To the extent that these loss carryforwards are used to offset future capital gains, it is probable that the capital gains so offset will not be distributed to shareholders.
| Short-Term | ||||
Deutsche X-trackers FTSE Developed ex US Comprehensive Factor ETF | $ | 50,651 | ||
Deutsche X-trackers Russell 1000 Comprehensive Factor ETF | 76,567 | |||
Capital losses incurred after October 31 (“post-October losses”) within the taxable year are deemed to arise on the first business day of each Fund’s next taxable year. During the Year ended August 31, 2017, the Funds incurred and will elect to defer net capital losses as follows:
| Post-October Losses on Capital | ||||
Deutsche X-trackers FTSE Developed ex US Comprehensive Factor ETF | $ | 101,912 | ||
Deutsche X-trackers Russell 1000 Comprehensive Factor ETF | 838,443 | |||
In order to present paid-in capital accumulated net realized gains or losses on the Statements of Assets and Liabilities that more closely represent their tax character, certain adjustments have been made to additional paid-in capital, undistributed net investment income or loss and accumulated net realized gains or losses on investments. These differences are primarily due to investments in futures, redemptions-in-kind, Foreign currency and Passive foreign investment companies (“PFICs”). For the year ended August 31, 2017, the adjustments were as follows:
| Undistributed Net Investment Income (Loss) | Undistributed Capital Gains (Accumulated Losses) | Paid-In Capital | ||||||||||
Deutsche X-trackers FTSE Developed ex US Comprehensive Factor ETF | $ | 87,885 | $ | 851,317 | $ | (939,202 | ) | |||||
Deutsche X-trackers FTSE Emerging Comprehensive Factor ETF | 28,138 | (28,138 | ) | — | ||||||||
Deutsche X-trackers Russell 1000 Comprehensive Factor ETF | 10,959 | (5,829,073 | ) | 5,818,114 | ||||||||
Deutsche X-trackers Russell 2000 Comprehensive Factor ETF | 196 | (196 | ) | — | ||||||||
67
DBX ETF Trust
Notes to Financial Statements (Continued)
As of August 31, 2017, the aggregate cost of investments for federal income tax purposes, the net unrealized appreciation or depreciation and the aggregated gross unrealized appreciation (depreciation) on investments were as follows:
| Aggregate Tax Cost | Net Unrealized Appreciation (Depreciation) | Aggregate Gross Unrealized Appreciation | Aggregate Gross Unrealized (Depreciation) | |||||||||||||
Deutsche X-trackers FTSE Developed ex US Comprehensive Factor ETF | $ | 15,037,608 | $ | 543,585 | $ | 810,707 | $ | (267,122 | ) | |||||||
Deutsche X-trackers FTSE Emerging Comprehensive Factor ETF | 10,865,807 | 1,263,883 | 1,493,901 | (230,018 | ) | |||||||||||
Deutsche X-trackers Russell 1000 Comprehensive Factor ETF | 96,788,752 | 3,991,528 | 6,497,344 | (2,505,816 | ) | |||||||||||
Deutsche X-trackers Russell 2000 Comprehensive Factor ETF | 4,557,702 | 484,416 | 649,314 | (164,898 | ) | |||||||||||
Foreign Taxes Foreign Taxes The Funds may be subject to foreign taxes (a portion of which may be reclaimable) on income, capital gains on investments, certain foreign currency transactions or other corporate events. All foreign taxes are recorded in accordance with the applicable foreign tax regulations and rates that exist in the foreign jurisdictions in which the Funds invest. These foreign taxes, if any, are paid by the Funds and are reflected in their Statements of Operations as follows: foreign taxes withheld at source are presented as a reduction of income, and foreign taxes on capital gains from sales of investments and foreign currency transactions are included in their respective net realized gain (loss) categories. Foreign taxes payable as of August 31, 2017, if any, are disclosed in the Funds’ Statements of Assets and Liabilities.
Foreign Currency Translations The books and records of the Funds are maintained in U.S. dollars. Investment securities and other assets and liabilities denominated in a foreign currency are translated into U.S. dollars at the prevailing exchange rates at year end. Purchases and sales of investment securities, income and expenses are translated into U.S. dollars at the prevailing exchange rates on the respective dates of the transactions.
Net realized and unrealized gains and losses on foreign currency transactions represent net gains and losses between trade and settlement dates on securities transactions, the acquisition and disposition of foreign currencies, and the difference between the amount of net investment income accrued and the U.S. dollar amount actually received. The portion of both realized and unrealized gains and losses on investments that results from fluctuations in foreign currency exchange rates is not separately disclosed, but is included with net realized and unrealized gain/appreciation and loss/depreciation on investments.
Securities Lending The Funds may lend securities to certain financial institutions under the terms of their securities lending agreement. During the term of the loans, the Funds continue to receive interest and dividends generated by the securities and to participate in any changes in their market value. The Funds require the borrowers of the securities to maintain collateral with the Funds consisting of cash having a value at least equal to the value of the securities loaned. When the collateral falls below specified amounts, the lending agent will use its best effort to obtain additional collateral on the next business day to meet required amounts under the securities lending agreement. During the year ended August 31, 2017, the Funds invested the cash collateral into a joint trading account in affiliated money market funds managed by Deutsche Investment Management Americas Inc. As of August 31, 2017 the Funds invested the cash collateral in Deutsche Government & Agency Securities Portfolio. Deutsche Investment Management Americas Inc. receives a management/administration fee (0.12% annualized effective rate as of August 31, 2017) on the cash collateral invested in Deutsche Government & Agency Securities Portfolio. The Funds receive compensation for lending its securities either in the form of fees or by earning interest on invested cash collateral net of borrower rebates and fees paid to a lending agent. Either the Fund or the borrower may terminate the loan at any time and the borrower, after notice, is required to return borrowed securities within a standard time period. There may be risks of delay and costs in recovery of securities or even loss of rights in the collateral should the borrower of the securities fail financially. If the Funds are not able to recover securities lent, the Funds may sell the collateral and purchase a replacement investment in the market, incurring the risk that the value of the replacement security is greater than the value of the collateral. The Funds are also subject to all investment risks associated with the reinvestment of any cash collateral received, including, but not limited to, interest rate, credit and liquidity risk associated with such investments.
68
DBX ETF Trust
Notes to Financial Statements (Continued)
As of August 31, 2017, the Funds listed below had securities on loan, which were classified as Common Stocks in the Schedule of Investments. The value of the related collateral exceeded the value of the securities loaned at year end. As of year end, the remaining contractual maturity of the collateral agreements were overnight and continuous.
Deutsche X-trackers FTSE Developed ex US Comprehensive Factor ETF
Deutsche X-trackers FTSE Emerging Comprehensive Factor ETF
Deutsche X-trackers Russell 1000 Comprehensive Factor ETF
As of August 31, 2017, Deutsche X-trackers Russell 2000 Comprehensive Factor ETF had securities on loan, which were classified as Common Stocks and Exchange-Traded Funds in the Schedule of Investments. The value of the related collateral exceeded the value of the securities loaned at year end.
Remaining Contractual Maturity of the Agreements, as of August 31, 2017 | ||||||||||||||||||||
| Overnight and Continuous | <30 Days | Between 30 & 90 days | >90 days | Total | ||||||||||||||||
Securities Lending Transactions | ||||||||||||||||||||
Common Stocks | $ | 350,699 | $ | — | $ | — | $ | — | $ | 350,699 | ||||||||||
Exchange Traded Fund | 10,619 | — | — | — | 10,619 | |||||||||||||||
|
|
|
|
|
|
|
|
|
| |||||||||||
Total Borrowings | $ | 361,318 | $ | — | $ | — | $ | — | $ | 361,318 | ||||||||||
|
|
|
|
|
|
|
|
|
| |||||||||||
Gross amount of recognized liabilities for securities lending transactions |
| $ | 361,318 | |||||||||||||||||
Derivatives
Futures Contracts Each Fund may enter into futures contracts. These futures contracts will be used to simulate investment in the respective Underlying Index, to facilitate trading or to reduce transaction costs. Each Fund will enter into futures contracts that are traded on a U.S. or non-U.S. exchange. No Fund will use futures for speculative purposes. Futures contracts provide for the future sale by one party and purchase by another party of a specified amount of a specific instrument or index at a specified future time and at a specified price. For the year ended August 31, 2017, Deutsche X-trackers FTSE Emerging Comprehensive Factor ETF and Deutsche X-trackers Russell 1000 Comprehensive Factor ETF utilized futures in order to simulate investment in the Underlying Index. To the extent required by law, liquid assets committed to futures contracts will be maintained.
At the time each Fund enters into a futures contract, each Fund deposits and maintains as collateral an initial margin with the broker, as required by the exchange on which the transaction is affected. Pursuant to the contract, each Fund agrees to receive from or pay to the broker an amount of cash equal to the daily fluctuation in the value of the contract. Such receipts or payments are known as variation margin and are recorded by each Fund as unrealized gains or losses. Risks may arise from the potential inability of a counterparty to meet the terms of the contract. The credit/counterparty risk for exchange-traded futures contracts is generally less than privately negotiated futures contracts, since the clearinghouse, which is the issuer or counterparty to each exchange-traded future, provides a guarantee of performance. The guarantee is supported by a daily payment system (i.e., margin requirements).
Use of long futures contracts subjects each Fund to risk of loss in excess of the amounts shown on the statement of assets and liabilities, up to the notional value of the futures contracts. Use of short futures contracts subjects each Fund to unlimited risk of loss. Under some circumstances, futures exchanges may establish daily limits on the amount that the price of a futures contract can vary from the previous day’s settlement price, which could effectively prevent liquidation of unfavorable positions.
A summary of the open futures contracts as of August 31, 2017 is included in a table following the Funds’ Schedule of Investments.
69
DBX ETF Trust
Notes to Financial Statements (Continued)
The following tables summarize the value of the Funds’ derivative instruments held as of August 31, 2017 and the related location in the accompanying Statement of Assets and Liabilities, presented by primary underlying risk exposure:
Asset Derivatives | Liability Derivatives | |||||||||||||
| Deutsche X-trackers FTSE Emerging Comprehensive Factor ETF | ||||||||||||||
| Equity contracts | Unrealized appreciation on futures contracts* | $ | — | Unrealized depreciation on futures contracts* | $ | 3,192 | ||||||||
| Deutsche X-trackers Russell 1000 Comprehensive Factor ETF | ||||||||||||||
| Equity contracts | Unrealized appreciation on futures contracts* | $ | 3,313 | Unrealized depreciation on futures contracts* | $ | 2,410 | ||||||||
| * | Includes cumulative appreciation or cumulative depreciation of futures contracts as disclosed in the Schedule of Investments. Unsettled variation margin is disclosed separately within the Statement of Assets and Liabilities. |
Additionally, the amount of realized and unrealized gains and losses on derivative instruments recognized in the Funds’ earnings during the year ended August 31, 2017 and the related location in the accompanying Statement of Operations is summarized in the following tables by primary underlying risk exposure:
Net Realized Gain (Loss) from: | ||||
| Futures Contracts — Equity Contracts | ||||
Deutsche X-trackers FTSE Emerging Comprehensive Factor ETF | $ | 126,353 | ||
Deutsche X-trackers Russell 1000 Comprehensive Factor ETF | 23,357 | |||
Net Change in Unrealized Appreciation (Depreciation) on: | ||||
| Futures Contracts — Equity Contracts | ||||
Deutsche X-trackers FTSE Emerging Comprehensive Factor ETF | $ | (6,840 | ) | |
Deutsche X-trackers Russell 1000 Comprehensive Factor ETF | 903 | |||
For the year ended August 31, 2017 the average monthly volume of derivatives was as follows:
| Futures Contracts (Contract Value) | ||||
Deutsche X-trackers FTSE Emerging Comprehensive Factor ETF | $ | 736,357 | ||
Deutsche X-trackers Russell 1000 Comprehensive Factor ETF | 241,804 | |||
3. Investment Advisory and Other Agreements
The Advisor has overall responsibility for the general management and administration of the Funds, subject to the supervision of the Funds’ Board of Trustees. Under an investment advisory agreement between the Trust, on behalf of the Funds, and the Advisor (the “Investment Advisory Agreement”), the Advisor is responsible for arranging sub-advisory, transfer agency, custody, fund administration, and all other non-distribution related services for the Funds to operate.
For its investment advisory services to the Funds below, the Advisor is entitled to receive a unitary management fee from each Fund based on each Fund’s average daily net assets, computed and accrued daily and payable monthly, at an annual rate equal to:
| Unitary Management Fee | ||||
Deutsche X-trackers FTSE Developed ex US Comprehensive Factor ETF | 0.35 | % | ||
Deutsche X-trackers FTSE Emerging Comprehensive Factor ETF | 0.50 | % | ||
Deutsche X-trackers Russell 2000 Comprehensive Factor ETF | 0.30 | % | ||
For its investment advisory services to Deutsche X-trackers Russell 1000 Comprehensive Factor ETF for the period from September 1, 2016 through May 23, 2017, the Advisor received a unitary management fee based on the Fund’s average daily net assets, computed and accrued daily and payable monthly, at an annual rate equal to 0.25%.
70
DBX ETF Trust
Notes to Financial Statements (Continued)
Effective March 9, 2017 the Adviser had agreed, until March 9, 2018, to waive a portion of its unitary management fee to the extent necessary to prevent the operating expenses of Deutsche X-trackers Russell 1000 Comprehensive Factor ETF from exceeding 0.19% of the Fund’s average daily net assets. For the period March 9, 2017 through May 23, 2017, the Advisor waived $ 8,268 of expenses to the Fund.
Effective May 24, 2017 the Board of Trustees approved a reduction in Deutsche X-trackers Russell 1000 Comprehensive Factor ETF’s unitary management fee to 0.19% and accordingly terminated the Adviser’s voluntary expense limitation.
Out of the unitary management fee, the Advisor pays substantially all expenses of each Fund, including the cost of transfer agency, custody, fund administration, legal, audit and other services, and expenses of the Independent Trustees. Each Fund is responsible for the payment of interest expense, taxes, brokerage expenses, distribution fees or expenses, if any, litigation expenses and extraordinary expenses.
The Bank of New York Mellon, a wholly-owned subsidiary of The Bank of New York Mellon Corporation, serves as Administrator, Custodian, Accounting Agent, Lending Agent and Transfer Agent for each Fund.
ALPS Distributors, Inc. (the “Distributor”) serves as the distributor of Creation Units for each Fund on an agency basis. The Distributor does not maintain a secondary market in shares of the Funds.
The Board of Trustees is currently comprised of four Trustees, including three Independent Trustees. The Advisor paid retainer fees and attendance fees to each Independent Trustee; retainer fees to the Chairman of the Audit Committee and Lead Independent Trustee (Chairman of the Board of Trustees effective November 16, 2016); and attendance fees to each member of the Audit Committee (which is comprised of all of the Funds’ Independent Trustees).
4. Investment Portfolio Transactions
For the year ended August 31, 2017, the cost of investments purchased and proceeds from sale of investments (excluding in-kind transactions and short-term investments) were as follows:
| Purchases | Sales | |||||||
Deutsche X-trackers FTSE Developed ex US Comprehensive Factor ETF | $ | 5,896,056 | $ | 3,608,614 | ||||
Deutsche X-trackers FTSE Emerging Comprehensive Factor ETF | 7,576,312 | 3,753,765 | ||||||
Deutsche X-trackers Russell 1000 Comprehensive Factor ETF | 43,082,290 | 43,982,207 | ||||||
Deutsche X-trackers Russell 2000 Comprehensive Factor ETF | 2,093,068 | 2,078,710 | ||||||
For the year ended August 31, 2017, the cost of in-kind purchases and proceeds from in-kind sales were as follows:
| Purchases | Sales | |||||||
Deutsche X-trackers FTSE Developed ex US Comprehensive Factor ETF | $ | 36,818,458 | $ | 25,715,744 | ||||
Deutsche X-trackers FTSE Emerging Comprehensive Factor ETF | 4,401,940 | — | ||||||
Deutsche X-trackers Russell 1000 Comprehensive Factor ETF | 146,495,053 | 76,115,228 | ||||||
Deutsche X-trackers Russell 2000 Comprehensive Factor ETF | 1,566,821 | — | ||||||
5. Fund Share Transactions
As of August 31, 2017, there were unlimited Fund shares authorized by the Trust. Fund shares are issued and redeemed by each Fund only in Creation Units or multiples thereof. Except when aggregated in Creation Units, shares of each Fund are not redeemable. Transactions in capital shares for each Fund are disclosed in detail in the Statements of Changes in Net Assets. The consideration for the purchase of Creation Units of a Fund generally consists of the in-kind contribution of a designated portfolio of securities constituting a portfolio sampling representation of the securities included in the respective Fund’s underlying index and an amount of cash, which under certain circumstances may include cash in lieu of portfolio securities. Investors purchasing and redeeming Creation Units pay a purchase transaction fee and a redemption transaction fee to offset transfer and other transaction costs associated with the issuance and redemption of Creation Units.
71
DBX ETF Trust
Notes to Financial Statements (Continued)
6. Concentration of Ownership
From time to time, the Funds may have a concentration of several shareholder accounts holding a significant percentage of shares outstanding. Investment activities of these shareholders could have a material impact on the Fund. At August 31, 2017, there was one affiliated shareholder account for each fund listed below holding a significant percentage of the shares outstanding:
| Approximate Percent of Outstanding Shares Held | ||||
Deutsche X-trackers FTSE Developed ex US Comprehensive Factor ETF | 11 | % | ||
Deutsche X-trackers FTSE Emerging Comprehensive Factor ETF | 16 | % | ||
Deutsche X-trackers Russell 2000 Comprehensive Factor ETF | 17 | % | ||
7. Investing in Emerging Markets
The securities of issuers located in emerging markets tend to be more volatile and less liquid than securities of issuers located in more mature economies, and emerging markets generally have less diverse and less mature economic structures and less stable political systems than those of developed countries. The securities of issuers located or doing substantial business in emerging markets are often subject to rapid and large changes in price.
8. Line of Credit
The Trust has entered into a senior unsecured credit facility with a syndication of banks which allows the Deutsche X-trackers FTSE Emerging Comprehensive Factor ETF and certain other funds managed by the Advisor to borrow up to $105 million. The Fund may borrow money under this credit facility to the extent necessary for temporary or emergency purposes, including the funding of shareholder redemption requests, trade settlements, and as necessary to distribute to shareholders any income necessary to maintain the Fund’s status as a regulated investment company. Borrowings are charged an interest rate of 1.25% per annum plus the greater of the Federal Funds Effective Rate or the one-month LIBOR Rate. The Fund may borrow up to the lesser of a pro-rata share of the credit facility at the amount listed below or 33 percent of its net assets as permitted by the Act. The Fund had no outstanding loans at August 31, 2017.
| Pro-rata Share | ||||
Deutsche X-trackers FTSE Emerging Comprehensive Factor ETF | $ | 525,000 | ||
9. Fund Name Change
Effective October 2, 2017, the “Deutsche X-trackers” ETFs were renamed “Xtrackers” ETFs. As a result, the Funds were renamed as follows:
Old Fund Name | New Fund Name | |
| Deutsche X-trackers FTSE Developed ex US Comprehensive Factor ETF | Xtrackers FTSE Developed ex US Comprehensive Factor ETF | |
| Deutsche X-trackers FTSE Emerging Comprehensive Factor ETF | Xtrackers FTSE Emerging Comprehensive Factor ETF | |
| Deutsche X-trackers Russell 1000 Comprehensive Factor ETF | Xtrackers Russell 1000 Comprehensive Factor ETF | |
| Deutsche X-trackers Russell 2000 Comprehensive Factor ETF | Xtrackers Russell 2000 Comprehensive Factor ETF |
72
DBX ETF Trust
To Board of Trustees and Shareholders of
DBX ETF Trust:
We have audited the accompanying statements of assets and liabilities, including the schedules of investments, of Xtrackers FTSE Developed ex US Comprehensive Factor ETF (formerly Deutsche X-trackers FTSE Developed ex US Comprehensive Factor ETF), Xtrackers FTSE Emerging Comprehensive Factor ETF (formerly Deutsche X-trackers FTSE Emerging Comprehensive Factor ETF), Xtrackers Russell 1000 Comprehensive Factor ETF (formerly Deutsche X-trackers Russell 1000 Comprehensive Factor ETF), and Xtrackers Russell 2000 Comprehensive Factor ETF (formerly Deutsche X-trackers Russell 2000 Comprehensive Factor ETF) (four of the portfolios constituting the DBX ETF Trust (collectively, the “Funds”)) as of August 31, 2017, and the related statements of operations for the year then ended, and the statements of changes in net assets and the financial highlights for each of the periods indicated therein. These financial statements and financial highlights are the responsibility of the Funds’ management. Our responsibility is to express an opinion on these financial statements and financial highlights based on our audits.
We conducted our audits in accordance with the standards of the Public Company Accounting Oversight Board (United States). Those standards require that we plan and perform the audit to obtain reasonable assurance about whether the financial statements and financial highlights are free of material misstatement. We were not engaged to perform an audit of the Funds’ internal control over financial reporting. Our audits included consideration of internal control over financial reporting as a basis for designing audit procedures that are appropriate in the circumstances, but not for the purpose of expressing an opinion on the effectiveness of the Funds’ internal control over financial reporting. Accordingly, we express no such opinion. An audit also includes examining, on a test basis, evidence supporting the amounts and disclosures in the financial statements and financial highlights, assessing the accounting principles used and significant estimates made by management, and evaluating the overall financial statement presentation. Our procedures included confirmation of securities owned as of August 31, 2017 by correspondence with the custodian and brokers or by other appropriate auditing procedures where replies from brokers were not received. We believe that our audits provide a reasonable basis for our opinion.
In our opinion, the financial statements and financial highlights referred to above present fairly, in all material respects, the financial position of Xtrackers FTSE Developed ex US Comprehensive Factor ETF, Xtrackers FTSE Emerging Comprehensive Factor ETF, Xtrackers Russell 1000 Comprehensive Factor ETF, and Xtrackers Russell 2000 Comprehensive Factor ETF at August 31, 2017, the results of their operations for the year then ended, and statements of changes in their net assets and the financial highlights for each of the periods indicated therein in conformity with U.S. generally accepted accounting principles.

New York, New York
October 26, 2017
73
DBX ETF Trust
| Name, Year of Birth and Address | Position(s) Held with Fund | Terms of Office and Length of Time Served | Principal Occupation(s) During Past 5 Years | Number of Portfolios in Fund Complex Overseen by Trustee | Other Directorships held by Trustee | |||||
Independent Trustees | ||||||||||
Stephen R. Byers (1953) 345 Park Avenue New York, New York 10154 | Trustee, Chairman of the Board and Member of the Audit and Nominating Committees; formerly, Lead Independent Trustee | Trustee since 2011 (Chairman of the Board since 2016; formerly, Lead Independent Trustee, 2015-2016) | Independent Director (2011-present); Independent Consultant (2014-present); formerly, Director of Investment Management, the Dreyfus Corporation (2000-2006) and Vice Chairman and Chief Investment Officer (2002-2006). | 35 | The Arbitrage Funds; Sierra Income Corporation; Mutual Fund Directors Forum. | |||||
George O. Elston (1964) 345 Park Avenue New York, New York 10154 | Trustee, Chairman of the Audit Committee and Member of the Nominating Committee | Trustee since 2011 (Chairman of the Audit Committee since 2015) | Chief Executive Officer, 2X Oncology, Inc. (2017-present); Senior Vice President and Chief Financial Officer, Juniper Pharmaceuticals, Inc. (2014-2016); Senior Vice President and Chief Financial Officer, KBI BioPharma Inc. (2013-2014); Managing Partner, Chatham Street Partners (2010-2013). | 35 | . | |||||
J. David Officer (1948) 345 Park Avenue New York, New York 10154 | Trustee, Chairman of the Nominating Committee and Member of the Audit Committee | Trustee since 2011 (Chairman of the Nominating Committee since 2015) | Independent Director (2010-present); formerly, Vice Chairman, the Dreyfus Corporation (2006-2009); President, The Dreyfus Family of Funds, Inc. (2006-2009). | 35 | Ilex Partners (Asia), LLC; Old Westbury Funds. | |||||
74
DBX ETF Trust
Trustees and Officers (Unaudited) (Continued)
| Name, Year of Birth and Address | Position(s) Held with Fund | Terms of Office and Length of Time Served | Principal Occupation(s) During Past 5 Years | Number of Portfolios in Fund Complex Overseen by Trustee | Other Directorships held by Trustee | |||||
Interested Trustee | ||||||||||
Michael Gilligan (1966) 345 Park Avenue New York, New York 10154 | Trustee Treasurer, Chief Financial Officer and Controller | Trustee since 2016; Treasurer, Chief Financial Officer and Controller since 2010 | Director in the Finance Division at Deutsche Bank AG (2008-present); Manager, Treasurer and Chief Financial Officer of the Adviser (2010-present); Chief Financial Officer of Global Passive Asset Management Platform (2012-present). | 35 | The Adviser, DBX Strategic Advisors LLC and DB Commodity Services LLC | |||||
| Name, Year of Birth and Address | Position(s) Held with Fund | Terms of Office and Length of Time Served | Principal Occupation(s) During Past 5 Years | |||||||
Officers | ||||||||||
Freddi Klassen (1975) 345 Park Avenue New York, New York 10154 | President and Chief Executive Officer | Since 2016 | Director in the Deutsche Asset Management Division at Deutsche Bank AG and Chief Operating Officer in the Americas for the Passive Asset Management Department (2014-present) and Trading and Product Development teams (2016-present); Manager and Chief Operating Officer of the Adviser (2016-present); Global Chief Operating Officer for Equities Technology in the Investment Bank Division at Deutsche Bank AG (2013-2014); Chief Operating Officer for Exchange Traded Funds and Systematic Funds in Europe (2008-2013). | |||||||
Fiona Bassett (1974) 345 Park Avenue New York, New York 10154 | Chief Operating Officer | Since 2014 | Managing Director in the Deutsche Asset Management Passive Asset Management Group at Deutsche Bank AG and Head of Passive Americas Asset Management Platform (2014-present); Manager and Chief Executive Officer and Chief Investment Officer of the Adviser (2014-present); Managing Director, COO Global Key Projects and Integration at Deutsche Asset Management (2012-2014); Managing Director at Deutsche Bank AG (2004-2012). | |||||||
Frank Gecsedi (1967) 60 Wall Street New York, New York 10005 | Chief Compliance Officer | Since 2010 | Director in the Deutsche Asset Management Compliance Department (2016-present), Vice President in the Deutsche Asset Management Compliance Department at Deutsche Bank AG (2013-2016) and Chief Compliance Officer of the Adviser (2010-present); Vice President in Deutsche Bank’s Global Markets Legal, Risk and Capital Division (2010-2012). | |||||||
75
DBX ETF Trust
Trustees and Officers (Unaudited) (Continued)
| Name, Year of Birth and Address | Position(s) Held with Fund | Terms of Office and Length of Time Served | Principal Occupation(s) During Past 5 Years | |||||||
Bryan Richards (1978) 345 Park Avenue New York New York 10154 | Vice President | Since 2016 | Director in the Deutsche Asset Management Division at Deutsche Bank A.G. and has served as a Portfolio Manager in the Passive Asset Management business since 2011. Also at Deutsche Bank, Mr. Richards served as the primary portfolio manager for the PowerShares DB Commodity ETFs until their sale in 2015. | |||||||
Leslie Lowenbraun (1953) 60 Wall Street New York, New York 10005 | Secretary | Since 2016 | Vice President in U.S. Retail Passive Legal of Deutsche Asset Management at Deutsche Bank AG (2014-present) and Chief Legal Officer of the Adviser (2017 to present); Counsel at Skadden, Arps, Slate, Meagher & Flom LLP (2005-2014). | |||||||
Each Trustee serves until his or her successor is duly elected or appointed and qualified. Each officer serves until he or she resigns, is
removed, dies, retires or becomes disqualified.
The Funds’ SAI includes additional information about the Funds’ Trustees and is available by calling 855-329-3837, or on the Company’s
website at www.Xtrackers.com
76
DBX ETF Trust
Proxy Voting Policies and Procedures
The Funds’ policies and procedures for voting proxies for portfolio securities and information about how each Fund voted proxies related to its portfolio securities during the most recent 12-month period ended June 30 are available on our Web site — www.Xtrackers.com (click on “Resources” and “Proxy Voting” at the top of the page) — or on the SEC’s Web site — www.sec.gov. To obtain a written copy of the Funds’ policies and procedures without charge, upon request, call us toll free at (855) 329-3837.
Quarterly Portfolio Disclosure
The Funds are required to file their complete schedule of portfolio holdings with the SEC for their first and third fiscal quarters on Form N-Q. Copies of the filings are available without charge, upon request on the SEC’s website at www.sec.gov and are available by calling the Trust at 855-329-3837. You can also obtain copies of Form N-Q by (i) visiting the SEC’s Public Reference Room in Washington, DC (information on the operation of the Public Reference Room may be obtained by calling 800-SEC-0330); (ii) sending your request and a duplicating fee to the SEC’s Public Reference Room, Washington, DC 20549-0102; or (iii) sending your request electronically to publicinfo@sec.gov.
Information about each Fund’s portfolio holdings is available daily at www.Xtrackers.com.
Discount & Premium Information
Information regarding how often shares of each Fund traded on NYSE Arca at a price above (i.e.,at a premium) or below (i.e., at a discount) the Net Asset Value of the Fund can be found at www.Xtrackers.com.
Tax Information
Form 1099-DIV and other year-end tax information provide shareholders with actual calendar year amounts that should be included in their tax returns. Shareholders should consult their tax advisors.
Each Fund designates the following amounts or, if subsequently determined to be different, the maximum allowable for its period ended August 31, 2017.
| Qualified Dividend Income* | Dividends Received Deduction* | |||||||
Deutsche X-trackers FTSE Developed ex US Comprehensive Factor ETF | 63% | 0% | ||||||
Deutsche X-trackers FTSE Emerging Comprehensive Factor ETF | 44% | 0% | ||||||
Deutsche X-trackers Russell 1000 Comprehensive Factor ETF | 100% | 88% | ||||||
Deutsche X-trackers Russell 2000 Comprehensive Factor ETF | 42% | 40% | ||||||
* The above percentage is based on ordinary income dividends paid to shareholders during each Fund’s fiscal year.
Each Fund intends to elect to pass through to shareholders the credit for taxes paid to foreign countries. The gross foreign source income and foreign taxes paid are as follows:
| Gross Foreign Income | Foreign Taxes Income | |||||||
Deutsche X-trackers FTSE Developed ex US Comprehensive Factor ETF | $221,609 | $18,159 | ||||||
Deutsche X-trackers FTSE Emerging Comprehensive Factor ETF | 363,144 | 42,209 | ||||||
77
DBX ETF Trust
DBX Advisors LLC (“Advisors”) collects non-public information about you from the following sources: (i) information received from you on applications or other forms; and (ii) information about your transactions with the Advisors, Advisors’ affiliates and third-party service providers and vendors. Advisors does not disclose any non-public personal information about you to anyone, other than as set forth below, as permitted by applicable law and regulation. Advisors may disclose non-public personal information about you to the funds in which you invest, to Advisors’ affiliates, and to non-affiliated companies that work with Advisors to service your account(s), or to provide services or process transactions that you have requested. Advisors may disclose non-public personal information in situations that may include, but are not limited to, in response to legal and/or regulatory inquiries and the proposed or actual sale, assignment merger or other transfer of all or a portion of Advisors’ business to another business entity. Advisors may also disclose non-public personal information about you to parties representing you, such as your investment representative, your accountant, your tax adviser, or to other third parties at your direction/consent. Advisors will not sell, rent, license or trade your personal and financial information to or with third parties for their own direct marketing use unless you give us general or specific consent to do so. If you decide to close your account(s) or become an inactive customer, Advisors will adhere to the privacy policies and practices as described in this notice. Advisors restricts access to your personal and account information to those employees who need to know that information to provide products and services to you. Advisors maintains reasonable and customary physical, electronic and procedural safeguards to guard your non-public personal information.
Advisors reserves the right, at their discretion, to change, modify, add, or remove portions of this Privacy Policy Notice, and any of the policies described herein, at any time. Advisors will indicate any such changes to the Privacy Policy Notice at the privacy link which can be found at www.Xtrackers.com. At all times, you are bound by the then-current version of the Privacy Policy and all applicable laws. Advisors highly recommends that you review this Privacy Policy Notice from time to time to ensure that you are familiar with the most recent version. The examples contained in this Privacy Policy Notice are illustrations; they are not intended to be exclusive.
78
DBX ETF Trust
This report is intended for the shareholders of the DBX ETF Trust.
Carefully consider the Fund’s investment objectives, risk factors and charges and expenses before investing. This and other information can be found in the Fund’s prospectus, which may be obtained by calling 1-855-DBX-ETFS (1-855-329-3837), or by viewing or downloading a prospectus at www.Xtrackers.com. Read the prospectus carefully before investing.
Investing involves risk, including the possible loss of principal. Stocks may decline in value. With respect to DEEF and DEMG, foreign investing involves greater and different risks than investing in U.S. companies, including currency fluctuations, less liquidity, less developed or less efficient trading markets, lack of comprehensive company information, political instability and differing auditing and legal standards. Further, with respect to DEMG only, emerging markets tend to be more volatile and less liquid than the markets of more mature economies, and generally have less diverse and less mature economic structures and less stable political systems than those of developed countries. Funds concentrating in a single industry (or groups of industries), country or in a limited geographic region to the extent the Underlying Indexes are so concentrated, generally are more volatile than more diversified funds. Additionally, with respect to DESC only, small company stocks tend to be more volatile and less liquid than medium-sized or large company stocks. Because the Funds seek to provide exposure to stocks based on the following multifactors — value, momentum, quality, low volatility and size — it is expected, exposure to such investment factors will detract from performance in some market environments, as more fully explained in the Funds’ prospectus. These funds are non-diversified and can take larger positions in fewer issues, increasing their potential risk. Performance of a Fund may diverge from that of its Underlying Index due to operating expenses, transaction costs, cash flows, use of sampling strategies or operational inefficiencies. An investment in any Fund should be considered only as a supplement to a complete investment program for those investors willing to accept the risks associated with that Fund. Please read the prospectus for more information.
Shares of the Fund are bought and sold at market price (not NAV) throughout the day on the New York Stock Exchange. Transactions in Fund shares may result in brokerage commissions and may generate tax consequences. There can be no assurance that an active trading market for shares of a fund will develop or be maintained.
DBX ETF Trust Funds are distributed by ALPS Distributors, Inc. The Fund is managed by DBX Advisors LLC which is not affiliated with ALPS.
Deutsche Asset Management represents the asset management activities conducted by Deutsche Bank AG or any of its subsidiaries.
The Funds are not in any way sponsored, endorsed, sold or promoted by the London Stock Exchange Group companies, which include FTSE International Limited (“FTSE”), Frank Russell Company (“Russell”), MTS Next Limited (“MTS”) and FTSE TX Global Debt Capital Markets Inc (“FTSE TMX”) (together “LSEG”). LSEG makes no claim, prediction, warranty or representation whatsoever, expressly or impliedly, either as to (i) the results to be obtained from the use of each Fund’s Index, (ii) the figure at which each Fund’s Index is said to stand at any particular time on any particular day or otherwise, or (iii) the suitability of each Fund’s Index for the purpose to which it is being put in connection with each Fund. LSEG has not provided nor will it provide any financial or investment advice or recommendation in relation to each Fund’s Index, to the advisor or to its clients. Each Fund’s Index is calculated by FTSE or its agent. LSEG shall not be (a) liable (whether in negligence or otherwise) to any person for any error in each Fund’s Index or (b) under any obligation to advise any person of any error therein.
All rights in each Fund’s Index vest in FTSE. FTSE®”, “Russell®”, “MTS®”, “FTSE TMX®” and “FTSE Russell”, and other service marks and trademarks related to the FTSE or Russell indexes are trademarks of the London Stock Exchange Group companies and are used by FTSE, MTS, FTSE TMX and Russell under license.
Copyright © 2017 Deutsche Bank AG. All rights reserved. Deutsche X-trackers® is a registered trademark of Deutsche Bank AG. All other trademarks, servicemarks or registered trademarks are the property of their respective owners.
Not FDIC Insured | No Bank Guarantee | May Lose Value
DBX ETF Trust
Investment advisor DBX Advisors LLC 345 Park Avenue New York, NY 10154 | Administrator, custodian, fund accounting agent, lending agent & transfer agent The Bank of New York Mellon 101 Barclay Street New York, NY 10286 | Distributor ALPS Distributors, Inc. 1290 Broadway Suite 1100 Denver, CO 80203 | ||
Independent registered public accounting firm Ernst & Young LLP 5 Times Square New York, NY 10036 | Legal counsel Dechert LLP 1095 Avenue of the Americas New York, NY 10036 | |||
R-047731-2 (10/17) DBX002887 (10/18)

August 31, 2017
Annual Report
DBX ETF Trust
Deutsche X-trackers Barclays International Corporate Bond Hedged ETF (IFIX)
Deutsche X-trackers Barclays International Treasury Bond Hedged ETF (IGVT)
Deutsche X-trackers USD High Yield Corporate Bond ETF (HYLB)

DBX ETF Trust
| Page | ||||
| 1 | ||||
| 3 | ||||
Performance Summary | ||||
Deutsche X-trackers Barclays International Corporate Bond Hedged ETF | 4 | |||
Deutsche X-trackers Barclays International Treasury Bond Hedged ETF | 6 | |||
| 8 | ||||
| 10 | ||||
Schedules of Investments | ||||
Deutsche X-trackers Barclays International Corporate Bond Hedged ETF | 11 | |||
Deutsche X-trackers Barclays International Treasury Bond Hedged ETF | 14 | |||
| 18 | ||||
| 34 | ||||
| 35 | ||||
| 36 | ||||
| 37 | ||||
| 39 | ||||
| 48 | ||||
| 49 | ||||
| 52 | ||||
| 53 | ||||
To our Shareholders: (Unaudited)
Dear Shareholder,
We are pleased to provide this annual report for our three ETFs tracking the fixed income markets for the fiscal period ended August 31, 2017.
Global growth gained momentum supported by improving corporate earnings, robust labor markets, and a synchronized expansion in economic activity across the globe. The upbeat macro backdrop, coupled with political stability, helped calm markets as uncertainty abated with favorable election outcomes in Europe and a relatively muted impact of Brexit1. Global equities performed strongly in this ‘Goldilocks economy’2, with the MSCI ACWI Index3 performing positively over the reporting period. While the Bank of Japan (BoJ) continued to tackle deflationary pressures by adding yield curve control to its monetary easing measures, the European Central Bank (ECB) and the U.S. Federal Reserve Bank (FRB) acknowledged the need to gradually tighten monetary policy as key indicators continued to improve. China also showed signs of a rebound, while energy prices gathered momentum as the Organization of the Petroleum Exporting Countries agreed to extend production cuts into 2018.
The U.S. economy continued to gather steam as macroeconomic signals remained healthy, with unemployment and inflation trends moving in the right direction. With the economy recovering steadily, the FRB hiked base rates three times since December 2016. Fixed income performance was mixed, with the asset class recovering strongly after the sell-off following President Donald Trump’s electoral victory. Treasury yields moved higher on diverging monetary policies, expectations of higher inflation and gross domestic product growth from President Trump’s pro-business reforms. However, the yield curve flattened toward the end of the reporting period as investors bid for safe havens given heightened tensions over North Korea’s military actions. U.S. high yields continued to perform well amid strong corporate earnings coupled with low default rates and a resilient economy.
The Eurozone recovery gathered pace as the outlook remained encouraging and deflation seemed less of a threat. Growth in the region was fuelled by domestic demand and favorable labor market conditions. Initial headwinds, in the form of political risk, turned into tailwinds as the likelihood of a Eurozone breakup started to fade. With firm signs of a recovery and reduced political tension, yield spreads4 between Germany and other European nations narrowed, signaling increasing investor confidence. In contrast, soft economic data in the U.K., pushed Gilt yields5 lower as uncertainty about the future of the economy increased with Prime Minister Theresa May’s surprising loss of her overall majority.
With a global economic recovery firmly in place, the FRB is likely to continue to tighten monetary policy, and the expectation is that the ECB will soon announce a further reduction in the scope of its bond buying program. On the contrary, the BoJ is expected to keep its monetary stimulus intact despite the improving outlook on its economy. Even as a robust backdrop supports global economic growth, investors are likely to closely monitor political risks. In this scenario, fixed income investments could deliver the necessary diversification6 benefits and income potential that the asset class has historically helped provide.
Sincerely,
/s/ Freddi Klassen
Freddi Klassen
President and Chief Executive Officer
1 Brexit is a combination of the words “Britain” and “Exit” and describes the exit of the United Kingdom from the European Union.
2 The term Goldilocks economy refers to a state of the economy, where there is neither a threat of inflation due to an overheating economy, nor a threat of a recession.
3 MSCI ACWI Index captures large- and mid-cap representation across 23 developed markets and 24 emerging markets. With 2,494 constituents, the index covers approximately 85% of the global investable equity opportunity set.
4 The yield spread is the difference between the quoted rates of return on two different investments, usually of different credit quality.
5 Gilt yields is the income return on bonds that are issued by the British Government referring to the interest received from the bond and is usually expressed annually as a percentage based on the investment’s cost, its current market value or its face value.
6 Diversification does not guarantee against loss.
Assumptions, estimates and opinions contained in this document constitute our judgment as of the date of the document and are subject to change without notice. Any projections are based on a number of assumptions as to market conditions and there can be no guarantee that any projected results will be achieved. Past performance is not a guarantee of future results.
1
This Page is Intentionally Left Blank
2
DBX ETF Trust
Deutsche X-trackers Barclays International Corporate Bond Hedged ETF (IFIX)
The Deutsche X-trackers Barclays International Corporate Bond Hedged ETF (IFIX) seeks investment results that correspond generally to the performance, before fees and expenses, of the Barclays Global Aggregate Corporate Ex USD Bond Index (USD Hedged) (the IFIX Index). The IFIX Index is designed to track the performance of investment grade corporate debt publicly issued in developed and emerging markets (excluding all securities denominated in U.S. dollars) in the industrial, utility and financial sectors, while mitigating exposure to fluctuations between the value of the U.S. dollar and the currencies of the countries included in the Underlying Index. For the period October 25, 2016 (commencement of operations) to August 31, 2017, IFIX shares returned 2.72%, compared to the IFIX Index return of 2.95%.
European corporate bonds formed a significant part of the portfolio. All the regions contributed positively to performance during the period, with the greatest contribution coming from European corporate bonds. The Fund entered into forward foreign currency exchange contracts1 during the period to hedge against changes in the value of the U.S. dollar against specified non-U.S. currencies. The currency hedging strategy contributed negatively to performance.
Deutsche X-trackers Barclays International Treasury Bond Hedged ETF (IGVT)
The Deutsche X-trackers Barclays International Treasury Bond Hedged ETF (IGVT) seeks investment results that correspond generally to the performance, before fees and expenses, of the Barclays Global Aggregate Treasury Ex USD Issuer Diversified Bond Index (USD Hedged) (the IGVT Index). The IGVT Index is designed to track the performance of investment grade sovereign debt publicly issued in the developed and emerging markets and denominated in the issuer’s own domestic currency (excluding all securities denominated in U.S. dollars), while mitigating exposure to fluctuations between the value of the U.S. dollar and the currencies of the countries included in the Underlying Index. For the period October 25, 2016 (commencement of operations) to August 31, 2017, IGVT shares returned -0.27%, compared to the IGVT Index return of -0.07%.
Japanese and European sovereign bonds formed a significant part of the portfolio. The majority of regions contributed positively to performance during the period, with the greatest contribution coming from European sovereign bonds, while Japanese and South Korean sovereign bonds contributed negatively. The Fund entered into forward foreign currency exchange contracts1 during the period to hedge against changes in the value of the U.S. dollar against specified non-U.S. currencies. The currency hedging strategy contributed negatively to performance.
Deutsche X-trackers USD High Yield Corporate Bond ETF (HYLB)
The Deutsche X-trackers USD High Yield Corporate Bond ETF (HYLB) seeks investment results that correspond generally to the performance, before fees and expenses, of the Solactive USD High Yield Corporates Total Market Index (the HYLB Index). The HYLB Index is designed to track the performance of a basket of U.S. dollar denominated high yield liquid corporate bonds. For the period December 7, 2016 (commencement of operations) to August 31, 2017, HYLB shares returned 6.43%, compared to the HYLB Index return of 6.84%.
High Yield spreads tightened over the period with financial, utility and industrial sectors all contributing positive returns. The communications sector had the largest contribution to total returns. Additionally, consumer non-cyclical sector, specifically the pharmaceutical and healthcare sub-sectors, rallied after the Republican lead congress failed to pass healthcare reform.
*************************
1 Forward Foreign Currency Exchange Contracts is an agreement to buy a certain amount of foreign currency on a specific future date at a predetermined exchange rate.
Performance data quoted represents past performance and does not guarantee future results. Investment returns and principal value of an investment will fluctuate so that an investor’s shares, when sold or redeemed, may be worth more or less than their original cost. Current performance may be lower or higher than the performance data quoted. To obtain the most recent month-end performance data visit www.Xtrackers.com. Returns assume that dividends and capital gains distributions have been reinvested. See pages 4-9 of this report for additional performance information, including performance data based on market value.
The views expressed in this report reflect those of the portfolio management team only through the end of the period of the report as stated on the cover. The management team’s views are subject to change at any time based on market and other conditions and should not be construed as a recommendation. Current and future portfolio holdings are subject to risk.
3
DBX ETF Trust
Performance Summary (Unaudited)
Deutsche X-trackers Barclays International Corporate Bond Hedged ETF (IFIX)
The Deutsche X-trackers Barclays International Corporate Bond Hedged ETF (the “Fund”) seeks investment results that correspond generally to the performance, before fees and expenses, of the Barclays Global Aggregate Corporate Ex USD Bond Index (USD Hedged) (the “Underlying Index”). The Underlying Index is designed to track the performance of investment grade corporate debt publicly issued in developed and emerging markets (excluding all securities denominated in U.S. dollars) in the industrial, utility and financial sectors while mitigating exposure to fluctuations between the value of the U.S. dollar and the currencies of the countries included in the Underlying Index. It is not possible to invest directly into an index.
Performance as of 8/31/17
| Cumulative Total Returns | ||||||||
| Net Asset Value | Market Value | Barclays Global Aggregate Corporate Ex USD Bond Index (USD Hedged) | Bloomberg Barclays Global Aggregate Bond Index | |||||
Since Inception1 | 2.72% | 2.92% | 2.95% | 2.15% | ||||
1 Total returns are calculated based on the commencement of operations, 10/25/16 (“Inception”).
Past performance is no guarantee of future results. Current performance may be lower or higher than the performance data quoted. Performance data current to the most recent month-end is available at www.Xtrackers.com. Performance results assume reinvestment of all dividends and capital gain distributions and do not reflect the deduction of taxes that a shareholder would pay on fund distributions or on the sale of fund shares or redemption of fund creation units. The investment return and principal value of shares will vary with changes in market conditions. Shares may be worth more or less than their original cost when they are sold in the market or redeemed. The estimated operating expense ratio as disclosed in the most recent prospectus dated October 12, 2016, was 0.30%, and may differ from the expense ratio disclosed in the Financial Highlights table in this report.
The Fund’s net asset value or “NAV” is calculated by dividing the value of the Fund’s total assets less total liabilities by the number of share outstanding. The price used to calculate market return (“Market Price”) is determined by using the midpoint between the highest bid and the lowest offer on the primary stock exchange on which shares of a fund are listed for trading, as of the time that such fund’s NAV is calculated. Since shares of a fund may not have traded in the secondary market until after the fund’s inception, for the period from inception to the first day of secondary trading, the NAV of the fund is used as a proxy for the Market Price to calculate market returns. Market and NAV returns assume that dividends and capital gain distributions have been reinvested at Market Price and NAV, respectively.
An index is a statistical composite that tracks a specified financial market or sector. Unlike a fund, an index does not actually hold a portfolio of securities and therefore does not incur the expenses incurred by a fund. These expenses negatively impact fund performance. Also, market returns do not include brokerage commissions that may be payable on secondary market transactions. If brokerage commissions were included, market returns would be lower.
4
DBX ETF Trust
Performance Summary (Unaudited)
Deutsche X-trackers Barclays International Corporate Bond Hedged ETF (IFIX) (Continued)
Growth of an Assumed $10,000 Investment
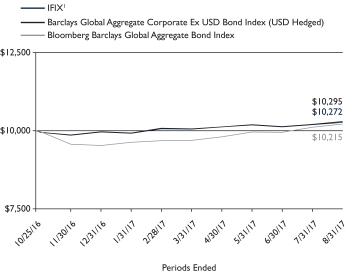
1 Based on Net Asset Value from commencement of operations, 10/25/16.
Sector Diversification* as of 8/31/17
Financial | 43.6% | |||
Consumer, Non-cyclical | 14.7% | |||
Communications | 9.3% | |||
Utilities | 7.2% | |||
Industrial | 7.0% | |||
Energy | 6.9% | |||
Consumer, Cyclical | 5.7% | |||
Basic Materials | 2.7% | |||
Technology | 2.5% | |||
Government | 0.4% | |||
|
| |||
Total | 100.0% |
Modified duration as of 8/31/17: 5.7 years
Modified duration is an approximate measure of a fund’s sensitivity to
movements in interest rates based on the current rate environment.
Quality* as of 8/31/17
| Description | % of Market Value | |||
AA | 25.6% | |||
A | 33.7% | |||
BBB | 40.7% | |||
|
| |||
Total | 100.0% | |||
The quality ratings represent the higher of Moody’s Investor Services, Inc. (“Moody’s”), Fitch Ratings, Inc. (“Fitch”) or Standard & Poor’s Corporation (“S&P”) credit ratings. The ratings of Moody’s, Fitch and S&P represent their opinions as to the quality of the securities they rate. Credit quality measures a bond issuer’s ability to repay interest and principal in a timely manner and is measured on a scale that ranges from AAA (highest) to D (lowest). Ratings are relative and subjective and are not absolute standards of quality. Credit quality does not remove market risk and is subject to change.
Country Diversification* as of 8/31/17
United States | 16.7% | |||
United Kingdom | 16.7% | |||
Netherlands | 14.2% | |||
France | 13.2% | |||
Canada | 8.7% | |||
Germany | 5.6% | |||
Italy | 4.2% | |||
Australia | 4.2% | |||
Japan | 4.1% | |||
Spain | 3.8% | |||
Ireland | 3.0% | |||
Belgium | 2.4% | |||
Other | 3.2% | |||
|
| |||
Total | 100.0% |
* As a percent of total investments.
Portfolio holdings and characteristics are subject to change. For more complete details about the Fund’s investment portfolio see page 11.
5
DBX ETF Trust
Performance Summary (Unaudited)
Deutsche X-trackers Barclays International Treasury Bond Hedged ETF (IGVT)
The Deutsche X-trackers Barclays International Treasury Bond Hedged ETF (the “Fund”) seeks investment results that correspond generally to the performance, before fees and expenses, of the Barclays Global Aggregate Treasury Ex USD Issuer Diversified Bond Index (USD Hedged) (the “Underlying Index”). The Underlying Index is designed to track the performance of investment grade sovereign debt publicly issued in the developed and emerging markets and denominated in the issuer’s own domestic currency (excluding all securities denominated in U.S. dollars) while at the same time mitigating exposure to fluctuations between the value of the U.S. dollar and the currencies of the countries included in the Underlying Index. It is not possible to invest directly into an index.
Performance as of 8/31/17
| Cumulative Total Returns | ||||||||
| Net Asset Value | Market Value | Barclays Global Aggregate Treasury Ex USD Issuer Diversified Bond Index (USD Hedged) | Bloomberg Barclays Global Aggregate Bond Index | |||||
Since Inception1 | -0.27% | -0.05% | -0.07% | 2.15% | ||||
1 Total returns are calculated based on the commencement of operations, 10/25/16 (“Inception”).
Past performance is no guarantee of future results. Current performance may be lower or higher than the performance data quoted. Performance data current to the most recent month-end is available at www.Xtrackers.com. Performance results assume reinvestment of all dividends and capital gain distributions and do not reflect the deduction of taxes that a shareholder would pay on fund distributions or on the sale of fund shares or redemption of fund creation units. The investment return and principal value of shares will vary with changes in market conditions. Shares may be worth more or less than their original cost when they are sold in the market or redeemed. The estimated operating expense ratio as disclosed in the most recent prospectus dated October 12, 2016, was 0.25%, and may differ from the expense ratio disclosed in the Financial Highlights table in this report.
The Fund’s net asset value or “NAV” is calculated by dividing the value of the Fund’s total assets less total liabilities by the number of share outstanding. The price used to calculate market return (“Market Price”) is determined by using the midpoint between the highest bid and the lowest offer on the primary stock exchange on which shares of a fund are listed for trading, as of the time that such fund’s NAV is calculated. Since shares of a fund may not have traded in the secondary market until after the fund’s inception, for the period from inception to the first day of secondary trading, the NAV of the fund is used as a proxy for the Market Price to calculate market returns. Market and NAV returns assume that dividends and capital gain distributions have been reinvested at Market Price and NAV, respectively.
An index is a statistical composite that tracks a specified financial market or sector. Unlike a fund, an index does not actually hold a portfolio of securities and therefore does not incur the expenses incurred by a fund. These expenses negatively impact fund performance. Also, market returns do not include brokerage commissions that may be payable on secondary market transactions. If brokerage commissions were included, market returns would be lower.
6
DBX ETF Trust
Performance Summary (Unaudited)
Deutsche X-trackers Barclays International Treasury Bond Hedged ETF (IGVT) (Continued)
Growth of an Assumed $10,000 Investment
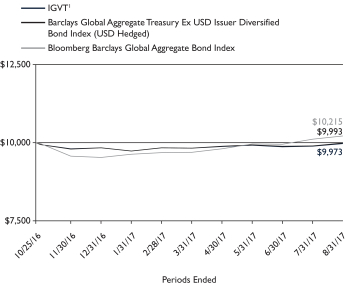
1 Based on Net Asset Value from commencement of operations, 10/25/16.
Country Diversification* as of 8/31/17
Japan | 22.9% | |||
United Kingdom | 7.0% | |||
Italy | 6.9% | |||
France | 6.7% | |||
Germany | 4.9% | |||
Canada | 4.7% | |||
Netherlands | 4.7% | |||
Australia | 4.5% | |||
South Korea | 4.5% | |||
Belgium | 4.3% | |||
Spain | 4.2% | |||
Austria | 3.4% | |||
Mexico | 2.3% | |||
Other | 19.0% | |||
|
| |||
Total | 100.0% |
Modified duration as of 8/31/17: 7.9 years
Modified duration is an approximate measure of a fund’s sensitivity to movements in interest rates based on the current rate environment.
Quality* as of 8/31/17
| Description | % of Market Value | |||
AAA | 20.8% | |||
AA | 28.3% | |||
A | 34.8% | |||
BBB | 16.1% | |||
|
| |||
Total | 100.0% | |||
The quality ratings represent the higher of Moody’s Investor Services, Inc. (“Moody’s”), Fitch Ratings, Inc. (“Fitch”) or Standard & Poor’s Corporation (“S&P”) credit ratings. The ratings of Moody’s, Fitch and S&P represent their opinions as to the quality of the securities they rate. Credit quality measures a bond issuer’s ability to repay interest and principal in a timely manner and is measured on a scale that ranges from AAA (highest) to D (lowest). Ratings are relative and subjective and are not absolute standards of quality. Credit quality does not remove market risk and is subject to change.
* As a percent of total investments.
Portfolio holdings and characteristics are subject to change. For more complete details about the Fund’s investment portfolio see page 14.
7
DBX ETF Trust
Performance Summary (Unaudited)
Deutsche X-trackers USD High Yield Corporate Bond ETF (HYLB)
The Deutsche X-trackers USD High Yield Corporate Bond ETF (the “Fund”) seeks investment results that correspond generally to the performance, before fees and expenses, of the Solactive USD High Yield Corporates Total Market Index (the “Underlying Index”). The Underlying Index is designed to track the performance of a basket of U.S. dollar-denominated high yield liquid corporate bonds. It is not possible to invest directly into an index.
Performance as of 8/31/17
| Cumulative Total Returns | ||||||||
| Net Asset Value | Market Value | Solactive USD High Yield Corporates Total Market Index | iBoxx USD Liquid High Yield Index | |||||
Since Inception1 | 6.43% | 6.52% | 6.84% | 6.30% | ||||
1 Total returns are calculated based on the commencement of operations, 12/07/16 (“Inception”).
Past performance is no guarantee of future results. Current performance may be lower or higher than the performance data quoted. Performance data current to the most recent month-end is available at www.Xtrackers.com. Performance results assume reinvestment of all dividends and capital gain distributions and do not reflect the deduction of taxes that a shareholder would pay on fund distributions or on the sale of fund shares or redemption of fund creation units. The investment return and principal value of shares will vary with changes in market conditions. Shares may be worth more or less than their original cost when they are sold in the market or redeemed. The estimated operating expense ratio as disclosed in the most recent prospectus dated December 2, 2016, was 0.25%, and may differ from the expense ratio disclosed in the Financial Highlights table in this report.
The Fund’s net asset value or “NAV” is calculated by dividing the value of the Fund’s total assets less total liabilities by the number of share outstanding. The price used to calculate market return (“Market Price”) is determined by using the midpoint between the highest bid and the lowest offer on the primary stock exchange on which shares of a fund are listed for trading, as of the time that such fund’s NAV is calculated. Since shares of a fund may not have traded in the secondary market until after the fund’s inception, for the period from inception to the first day of secondary trading, the NAV of the fund is used as a proxy for the Market Price to calculate market returns. Market and NAV returns assume that dividends and capital gain distributions have been reinvested at Market Price and NAV, respectively.
An index is a statistical composite that tracks a specified financial market or sector. Unlike a fund, an index does not actually hold a portfolio of securities and therefore does not incur the expenses incurred by a fund. These expenses negatively impact fund performance. Also, market returns do not include brokerage commissions that may be payable on secondary market transactions. If brokerage commissions were included, market returns would be lower.
8
DBX ETF Trust
Performance Summary (Unaudited)
Deutsche X-trackers USD High Yield Corporate Bond ETF (HYLB) (Continued)
Growth of an Assumed $10,000 Investment
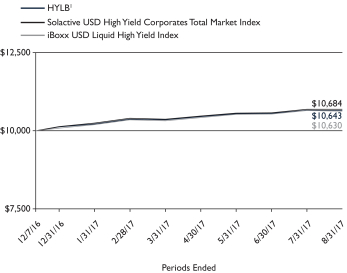
1 Based on Net Asset Value from commencement of operations, 12/7/16.
Sector Diversification* as of 8/31/17
Communications | 24.1% | |||
Consumer, Non-cyclical | 17.9% | |||
Consumer, Cyclical | 13.5% | |||
Energy | 12.0% | |||
Financial | 9.5% | |||
Industrial | 8.5% | |||
Technology | 5.8% | |||
Basic Materials | 5.8% | |||
Utilities | 2.7% | |||
Diversified | 0.2% | |||
|
| |||
Total | 100.0% |
Modified duration as of 8/31/17: 4.6 years
Modified duration is an approximate measure of a fund’s sensitivity to movements in interest rates based on the current rate environment.
Quality* as of 8/31/17
| Description | % of Market Value | |||
BBB | 7.8% | |||
BB | 53.5% | |||
B | 31.5% | |||
CCC | 7.1% | |||
CC | 0.1% | |||
|
| |||
Total | 100.0% | |||
The quality ratings represent the higher of Moody’s Investor Services, Inc. (“Moody’s”), Fitch Ratings, Inc. (“Fitch”) or Standard & Poor’s Corporation (“S&P”) credit ratings. The ratings of Moody’s, Fitch and S&P represent their opinions as to the quality of the securities they rate. Credit quality measures a bond issuer���s ability to repay interest and principal in a timely manner and is measured on a scale that ranges from AAA (highest) to D (lowest). Ratings are relative and subjective and are not absolute standards of quality. Credit quality does not remove market risk and is subject to change.
Country Diversification* as of 8/31/17
United States | 83.3% | |||
Luxembourg | 4.2% | |||
Canada | 3.8% | |||
United Kingdom | 2.7% | |||
Other | 6.0% | |||
|
| |||
Total | 100.0% |
* As a percent of total investments excluding securities lending collateral.
Portfolio holdings and characteristics are subject to change. For more complete details about the Fund’s investment portfolio see page 18.
9
DBX ETF Trust
As a shareholder of one or more of the funds, you incur two types of costs: (1) transaction costs, including brokerage commissions paid on purchases and sales of fund shares, and (2) ongoing costs, including management fees and other Fund expenses. The expense examples below are intended to help you understand your ongoing costs (in dollars) of investing in the Funds and to compare these costs with the ongoing costs of investing in other funds.
The examples in the table are based on an investment of $1,000 invested at the beginning of the six month period and held for the entire period (March 1, 2017 to August 31, 2017).
Actual expenses
The first line in the following tables provides information about actual account values and actual expenses. You may use the information in this line, together with the amount you invested, to estimate the expenses that you paid over the period. Simply divide your account value by $1,000 (for example, an $8,600 account value divided by $1,000 = 8.6), then multiply the result by the number in the first line under the heading “Expenses Paid During the Period” to estimate the expenses you paid on your account during this period.
Hypothetical example for comparison purposes
The second line in the following tables provides information about hypothetical account values and hypothetical expenses based on the Funds’ actual expense ratios and an assumed rate of return of 5% per year before expenses (which is not the Funds’ actual return). The hypothetical account values and expenses may not be used to estimate the actual ending account balance or expenses you paid for the period. You may use this information to compare the ongoing costs of investing in the Fund and other funds. To do so, compare this 5% hypothetical example with the 5% hypothetical examples that appear in the shareholder reports of the other funds.
Please note that the expenses shown in the tables are meant to highlight your ongoing costs only, and do not reflect any transactional costs. Therefore the second line in the table is useful in comparing ongoing costs only, and will not help you determine the relative total costs of owning different funds. In addition, if these transactional costs were included, your costs would have been higher.
| Beginning Account Value March 1, 2017 | Ending Account Value August 31, 2017 | Annualized Expense Ratio | Expenses Paid During the Period Per $1,000(1) | |||||||||||||
| Deutsche X-trackers Barclays International Corporate Bond Hedged ETF | ||||||||||||||||
Actual | $ | 1,000.00 | $ | 1,019.00 | 0.30 | % | $ | 1.53 | ||||||||
Hypothetical (5% return before expenses) | $ | 1,000.00 | $ | 1,023.69 | 0.30 | % | $ | 1.53 | ||||||||
| Deutsche X-trackers Barclays International Treasury Bond Hedged ETF | ||||||||||||||||
Actual | $ | 1,000.00 | $ | 1,014.30 | 0.25 | % | $ | 1.27 | ||||||||
Hypothetical (5% return before expenses) | $ | 1,000.00 | $ | 1,023.95 | 0.25 | % | $ | 1.28 | ||||||||
| Deutsche X-trackers USD High Yield Corporate Bond ETF | ||||||||||||||||
Actual | $ | 1,000.00 | $ | 1,026.30 | 0.25 | % | $ | 1.28 | ||||||||
Hypothetical (5% return before expenses) | $ | 1,000.00 | $ | 1,023.95 | 0.25 | % | $ | 1.28 | ||||||||
(1) Expenses are equal to each Fund’s annualized expense ratio, multiplied by the average account value over the period, multiplied by 184 (the number of days in the most recent six-month period), then divided by 365.
10
DBX ETF Trust
Schedule of Investments
Deutsche X-trackers Barclays International Corporate Bond Hedged ETF
August 31, 2017
Principal | Value | |||||||||||
| CORPORATE BONDS — 98.6% | ||||||||||||
| Australia — 4.1% | ||||||||||||
BHP Billiton Finance Ltd. Series MTN, | AUD | $ | 50,000 | $ | 40,059 | |||||||
QPH Finance Co. Pty Ltd. Series MTN, | AUD | 50,000 | 42,616 | |||||||||
Wesfarmers Ltd. Series EMTN, | EUR | 100,000 | 124,792 | |||||||||
|
| |||||||||||
| 207,467 | ||||||||||||
|
| |||||||||||
| Austria — 1.4% | ||||||||||||
OMV AG | EUR | 50,000 | 71,090 | |||||||||
|
| |||||||||||
| Belgium — 2.4% | ||||||||||||
Anheuser-Busch InBev SA/NV Series EMTN, | EUR | 100,000 | 121,256 | |||||||||
|
| |||||||||||
| Canada — 8.7% | ||||||||||||
CU, Inc. | CAD | 20,000 | 18,328 | |||||||||
Granite REIT Holdings LP Series 3, | CAD | 60,000 | 48,370 | |||||||||
Inter Pipeline Ltd. Series MTN, | CAD | 100,000 | 80,368 | |||||||||
Metro, Inc. Series MTN, | CAD | 150,000 | 123,603 | |||||||||
Royal Bank of Canada Series DPNT, | CAD | 50,000 | 40,601 | |||||||||
Suncor Energy, Inc. Series MTN, | CAD | 50,000 | 41,312 | |||||||||
Toronto-Dominion Bank Series DPNT, | CAD | 100,000 | 83,613 | |||||||||
|
| |||||||||||
| 436,195 | ||||||||||||
|
| |||||||||||
| France — 13.0% | ||||||||||||
Bouygues SA | EUR | 50,000 | 64,280 | |||||||||
BPCE SA Series EMTN, | EUR | 100,000 | 121,621 | |||||||||
Carrefour SA Series EMTN, | EUR | 100,000 | 122,833 | |||||||||
Orange SA Series EMTN, | EUR | 100,000 | 137,985 | |||||||||
Suez Series EMTN, | EUR | 50,000 | 79,387 | |||||||||
Total Capital International SA Series EMTN, | EUR | 100,000 | 131,089 | |||||||||
|
| |||||||||||
| 657,195 | ||||||||||||
|
| |||||||||||
| Germany — 5.5% | ||||||||||||
BASF SE Series EMTN, | EUR | 50,000 | 63,540 | |||||||||
Commerzbank AG Series EMTN, | EUR | 150,000 | 180,640 | |||||||||
Daimler AG Series EMTN, | EUR | 30,000 | 35,614 | |||||||||
|
| |||||||||||
| 279,794 | ||||||||||||
|
| |||||||||||
Principal | Value | |||||||||||
| Ireland — 3.0% | ||||||||||||
GE Capital UK Funding Unlimited Co. Series EMTN, | GBP | $ | 100,000 | $ | 150,935 | |||||||
|
| |||||||||||
| Italy — 4.1% | ||||||||||||
Assicurazioni Generali SpA Series EMTN, | EUR | 50,000 | 77,100 | |||||||||
UniCredit SpA Series EMTN, | EUR | 100,000 | 130,748 | |||||||||
|
| |||||||||||
| 207,848 | ||||||||||||
|
| |||||||||||
| Japan — 3.6% | ||||||||||||
Aozora Bank Ltd. Series 615, | JPY | 10,000,000 | 91,368 | |||||||||
Shinkin Central Bank Series 323, | JPY | 10,000,000 | 90,992 | |||||||||
|
| |||||||||||
| 182,360 | ||||||||||||
|
| |||||||||||
| Luxembourg — 0.7% | ||||||||||||
HeidelbergCement Finance Luxembourg SA | EUR | 25,000 | 35,239 | |||||||||
|
| |||||||||||
| Netherlands — 14.1% | ||||||||||||
Allianz Finance II BV Series 61, | EUR | 100,000 | 144,570 | |||||||||
BMW Finance NV Series EMTN, | EUR | 75,000 | 89,993 | |||||||||
Cooperatieve Rabobank UA Series EMTN, | EUR | 100,000 | 144,845 | |||||||||
Gas Natural Fenosa Finance BV Series EMTN, | EUR | 100,000 | 138,701 | |||||||||
Linde Finance BV Series EMTN, | EUR | 25,000 | 30,827 | |||||||||
Shell International Finance BV Series EMTN, | CHF | 25,000 | 27,432 | |||||||||
Siemens Financieringsmaatschappij NV Series EMTN, | EUR | 50,000 | 71,672 | |||||||||
Volkswagen International Finance NV | EUR | 50,000 | 62,777 | |||||||||
|
| |||||||||||
| 710,817 | ||||||||||||
|
| |||||||||||
| Spain — 3.7% | ||||||||||||
Santander Issuances SAU Series EMTN, | EUR | 100,000 | 123,123 | |||||||||
Telefonica Emisiones SAU Series EMTN, | EUR | 50,000 | 65,740 | |||||||||
|
| |||||||||||
| 188,863 | ||||||||||||
|
| |||||||||||
| Switzerland — 1.1% | ||||||||||||
Credit Suisse AG | CHF | 50,000 | 53,131 | |||||||||
|
| |||||||||||
| See Notes to Financial Statements. | 11 |
DBX ETF Trust
Schedule of Investments
Deutsche X-trackers Barclays International Corporate Bond Hedged ETF (Continued)
August 31, 2017
Principal | Value | |||||||||||
| United Kingdom — 16.6% | ||||||||||||
Barclays Bank PLC Series EMTN, | EUR | $ | 50,000 | $ | 74,200 | |||||||
Credit Agricole SA Series EMTN, | EUR | 100,000 | 141,752 | |||||||||
Daily Mail & General Trust PLC | GBP | 50,000 | 78,143 | |||||||||
Eastern Power Networks PLC Series EMTN, | GBP | 60,000 | 120,482 | |||||||||
Heathrow Funding Ltd. Series REGS, | GBP | 50,000 | 77,019 | |||||||||
HSBC Bank PLC Series EMTN, | GBP | 50,000 | 85,123 | |||||||||
Lloyds Bank PLC Series EMTN, | EUR | 100,000 | 123,232 | |||||||||
Prudential PLC | GBP | 50,000 | 83,151 | |||||||||
Vodafone Group PLC Series EMTN, | GBP | 30,000 | 51,532 | |||||||||
|
| |||||||||||
| 834,634 | ||||||||||||
|
| |||||||||||
| United States — 16.6% | ||||||||||||
Apple, Inc. Series EMTN, | EUR | 100,000 | 124,242 | |||||||||
AT&T, Inc. | EUR | 100,000 | 132,083 | |||||||||
Bank of America Corp. Series EMTN, | EUR | 50,000 | 62,405 | |||||||||
Principal | Value | |||||||||||
| United States (Continued) | ||||||||||||
Bristol-Myers Squibb Co. | EUR | $ | 100,000 | $ | 118,807 | |||||||
FedEx Corp. | EUR | 50,000 | 60,714 | |||||||||
Kraft Heinz Foods Co. | EUR | 100,000 | 120,730 | |||||||||
Prologis LP | EUR | 100,000 | 123,557 | |||||||||
Wal-Mart Stores, Inc. | GBP | 50,000 | 92,876 | |||||||||
|
| |||||||||||
| 835,414 | ||||||||||||
|
| |||||||||||
TOTAL CORPORATE BONDS | 4,972,238 | |||||||||||
|
| |||||||||||
| SOVEREIGN BOND — 0.4% | ||||||||||||
| Japan — 0.4% | ||||||||||||
Japan Government Ten Year Bond Series 345, | JPY | 2,000,000 | 18,381 | |||||||||
|
| |||||||||||
TOTAL SOVEREIGN BOND | 18,381 | |||||||||||
|
| |||||||||||
TOTAL INVESTMENTS — 99.0% | ||||||||||||
(Cost $4,641,428) | $ | 4,990,619 | ||||||||||
Other assets and liabilities, net — 1.0% | 50,931 | |||||||||||
|
| |||||||||||
NET ASSETS — 100.0% | $ | 5,041,550 | ||||||||||
|
| |||||||||||
| DPNT: | Deposit Note |
| EMTN: | Euro Medium Term Note |
| MTN: | Medium Term Note |
| REIT: | Real Estate Investment Trust |
As of August 31, 2017, the Fund had the following forward foreign currency exchange contracts outstanding:
Counterparty | Settlement Date | Currency To Deliver | Currency To Receive | Unrealized Appreciation | Unrealized Depreciation | |||||||||||||||||
The Bank of Nova Scotia | 9/5/2017 | AUD | 106,300 | USD | 84,830 | $ | 331 | $ | – | |||||||||||||
The Bank of Nova Scotia | 9/5/2017 | CAD | 551,598 | USD | 441,300 | — | (444 | ) | ||||||||||||||
The Bank of Nova Scotia | 9/5/2017 | CHF | 77,600 | USD | 80,592 | — | (358 | ) | ||||||||||||||
The Bank of Nova Scotia | 9/5/2017 | EUR | 2,947,351 | USD | 3,480,792 | — | (28,831 | ) | ||||||||||||||
The Bank of Nova Scotia | 9/5/2017 | GBP | 630,110 | USD | 831,585 | 16,650 | — | |||||||||||||||
The Bank of Nova Scotia | 9/5/2017 | JPY | 22,020,000 | USD | 199,559 | — | (789 | ) | ||||||||||||||
The Bank of Nova Scotia | 9/5/2017 | USD | 1,080 | AUD | 1,361 | 2 | — | |||||||||||||||
The Bank of Nova Scotia | 9/5/2017 | USD | 83,232 | AUD | 104,939 | 184 | — | |||||||||||||||
The Bank of Nova Scotia | 9/5/2017 | USD | 434,792 | CAD | 545,120 | 1,764 | — | |||||||||||||||
The Bank of Nova Scotia | 9/5/2017 | USD | 5,183 | CAD | 6,478 | 5 | — | |||||||||||||||
The Bank of Nova Scotia | 9/5/2017 | USD | 80,749 | CHF | 77,600 | 200 | — | |||||||||||||||
The Bank of Nova Scotia | 9/5/2017 | USD | 41,002 | EUR | 34,716 | 337 | — | |||||||||||||||
The Bank of Nova Scotia | 9/5/2017 | USD | 3,462,832 | EUR | 2,912,635 | 5,452 | — | |||||||||||||||
The Bank of Nova Scotia | 9/5/2017 | USD | 42,995 | GBP | 32,500 | — | (962 | ) | ||||||||||||||
The Bank of Nova Scotia | 9/5/2017 | USD | 741,956 | GBP | 575,807 | 2,747 | — | |||||||||||||||
The Bank of Nova Scotia | 9/5/2017 | USD | 28,776 | GBP | 21,803 | — | (577 | ) | ||||||||||||||
The Bank of Nova Scotia | 9/5/2017 | USD | 200,073 | JPY | 22,020,000 | 275 | — | |||||||||||||||
| See Notes to Financial Statements. | 12 |
DBX ETF Trust
Schedule of Investments
Deutsche X-trackers Barclays International Corporate Bond Hedged ETF (Continued)
August 31, 2017
Counterparty | Settlement Date | Currency To Deliver | Currency To Receive | Unrealized Appreciation | Unrealized Depreciation | |||||||||||||||||||||||
The Bank of Nova Scotia | 10/4/2017 | AUD | 104,939 | USD | 83,204 | $ | — | $ | (184 | ) | ||||||||||||||||||
The Bank of Nova Scotia | 10/4/2017 | CAD | 3,800 | USD | 3,032 | — | (12 | ) | ||||||||||||||||||||
The Bank of Nova Scotia | 10/4/2017 | CAD | 545,120 | USD | 434,920 | — | (1,767 | ) | ||||||||||||||||||||
The Bank of Nova Scotia | 10/4/2017 | CHF | 77,600 | USD | 80,903 | — | (204 | ) | ||||||||||||||||||||
The Bank of Nova Scotia | 10/4/2017 | EUR | 2,912,635 | USD | 3,468,147 | — | (5,620 | ) | ||||||||||||||||||||
The Bank of Nova Scotia | 10/4/2017 | EUR | 17,830 | USD | 21,231 | — | (34 | ) | ||||||||||||||||||||
The Bank of Nova Scotia | 10/4/2017 | GBP | 575,807 | USD | 742,696 | — | (2,765 | ) | ||||||||||||||||||||
The Bank of Nova Scotia | 10/4/2017 | GBP | 10,375 | USD | 13,382 | — | (50 | ) | ||||||||||||||||||||
The Bank of Nova Scotia | 10/4/2017 | JPY | 22,020,000 | USD | 200,344 | — | (279 | ) | ||||||||||||||||||||
|
|
|
| |||||||||||||||||||||||||
Total unrealized appreciation (depreciation) | $ | 27,947 | $ | (42,876 | ) | |||||||||||||||||||||||
|
|
|
| |||||||||||||||||||||||||
Currency Abbreviations
| AUD | Australian Dollar |
| CAD | Canadian Dollar |
| CHF | Swiss Franc |
| EUR | Euro |
| GBP | Pound Sterling |
| JPY | Japanese Yen |
| USD | U.S. Dollar |
For information on the Fund’s policy and additional disclosures regarding forward foreign currency exchange contracts, please refer to the Derivatives section of Note 2 in the accompanying Notes to Financial Statements.
Fair Value Measurements
Various inputs are used in determining the value of the Fund’s investments. These inputs are summarized in three broad levels. Level 1 includes quoted prices in active markets for identical securities. Level 2 includes other significant observable inputs (including quoted prices for similar securities, interest rates, prepayment speeds and credit risk). Level 3 includes significant unobservable inputs (including the Fund’s own assumptions in determining the fair value of investments). The level assigned to the securities valuations may not be an indication of the risk or liquidity associated with investing in those securities.
The following is a summary of the inputs used as of August 31, 2017 in valuing the Fund’s investments. For information on the Fund’s policy regarding the valuation of investments, please refer to the Security Valuation section of Note 2 in the accompanying Notes to Financial Statements.
Assets | Level 1 | Level 2 | Level 3 | Total | ||||||||||||
Corporate Bonds (a) | $ | — | $ | 4,972,238 | $ | — | $ | 4,972,238 | ||||||||
Sovereign Bond | — | 18,381 | — | 18,381 | ||||||||||||
Derivatives (b) | ||||||||||||||||
Forward Foreign Currency Exchange Contracts | — | 27,947 | — | 27,947 | ||||||||||||
|
|
|
|
|
|
|
| |||||||||
TOTAL | $ | — | $ | 5,018,566 | $ | — | $ | 5,018,566 | ||||||||
|
|
|
|
|
|
|
| |||||||||
Liabilities | Level 1 | Level 2 | Level 3 | Total | ||||||||||||
Derivatives (b) | ||||||||||||||||
Forward Foreign Currency Exchange Contracts | $ | — | $ | (42,876 | ) | $ | — | $ | (42,876 | ) | ||||||
|
|
|
|
|
|
|
| |||||||||
TOTAL | $ | — | $ | (42,876 | ) | $ | — | $ | (42,876 | ) | ||||||
|
|
|
|
|
|
|
| |||||||||
| (a) | See Schedule of Investments for additional detailed categorizations. |
| (b) | Derivatives include unrealized appreciation (depreciation) on forward foreign currency exchange contracts. |
There have been no transfers between fair value measurement levels during the period ended August 31, 2017.
| See Notes to Financial Statements. | 13 |
DBX ETF Trust
Schedule of Investments
Deutsche X-trackers Barclays International Treasury Bond Hedged ETF
August 31, 2017
Principal | Value | |||||||||||
| SOVEREIGN BONDS — 98.3% | ||||||||||||
| Australia — 4.4% | ||||||||||||
Australia Government Bond | AUD | $ | 75,000 | $ | 63,477 | |||||||
5.75%, 7/15/22 | AUD | 40,000 | 36,919 | |||||||||
3.25%, 4/21/25 | AUD | 50,000 | 41,680 | |||||||||
4.75%, 4/21/27 | AUD | 25,000 | 23,379 | |||||||||
2.75%, 11/21/27 | AUD | 25,000 | 19,938 | |||||||||
4.50%, 4/21/33 | AUD | 25,000 | 23,545 | |||||||||
3.25%, 6/21/39 | AUD | 10,000 | 7,839 | |||||||||
|
| |||||||||||
| 216,777 | ||||||||||||
|
| |||||||||||
| Austria — 3.4% | ||||||||||||
Republic of Austria Government Bond | EUR | 50,000 | 67,119 | |||||||||
1.65%, 10/21/24, 144A | EUR | 20,000 | 26,359 | |||||||||
2.40%, 5/23/34, 144A | EUR | 50,000 | 71,965 | |||||||||
|
| |||||||||||
| 165,443 | ||||||||||||
|
| |||||||||||
| Belgium — 4.2% | ||||||||||||
Kingdom of Belgium Government Bond | EUR | 25,000 | 31,921 | |||||||||
4.00%, 3/28/22 | EUR | 25,000 | 35,701 | |||||||||
0.80%, 6/22/25, 144A | EUR | 25,000 | 30,822 | |||||||||
1.00%, 6/22/26, 144A | EUR | 25,000 | 31,066 | |||||||||
1.00%, 6/22/31, 144A | EUR | 25,000 | 29,605 | |||||||||
4.25%, 3/28/41, 144A | EUR | 25,000 | 46,270 | |||||||||
|
| |||||||||||
| 205,385 | ||||||||||||
|
| |||||||||||
| Canada — 4.7% | ||||||||||||
Canadian Government Bond | CAD | 50,000 | 39,642 | |||||||||
3.50%, 6/01/20 | CAD | 75,000 | 63,562 | |||||||||
1.50%, 6/01/23 | CAD | 50,000 | 39,846 | |||||||||
8.00%, 6/01/27 | CAD | 25,000 | 30,961 | |||||||||
5.75%, 6/01/33 | CAD | 23,000 | 27,379 | |||||||||
3.50%, 12/01/45 | CAD | 27,000 | 27,046 | |||||||||
|
| |||||||||||
| 228,436 | ||||||||||||
|
| |||||||||||
| Czech Republic — 0.9% | ||||||||||||
Czech Republic Government Bond | CZK | 800,000 | 42,288 | |||||||||
|
| |||||||||||
| Denmark — 1.8% | ||||||||||||
Denmark Government Bond | DKK | 400,000 | 70,390 | |||||||||
0.50%, 11/15/27 | DKK | 100,000 | 16,010 | |||||||||
|
| |||||||||||
| 86,400 | ||||||||||||
|
| |||||||||||
| Finland — 1.3% | ||||||||||||
Finland Government Bond | EUR | 25,000 | 32,529 | |||||||||
0.75%, 4/15/31, 144A | EUR | 25,000 | 29,455 | |||||||||
|
| |||||||||||
| 61,984 | ||||||||||||
|
| |||||||||||
Principal | Value | |||||||||||
| France — 6.6% | ||||||||||||
French Republic Government Bond OAT | EUR | $ | 50,000 | $ | 68,697 | |||||||
2.25%, 5/25/24 | EUR | 125,000 | 170,265 | |||||||||
2.50%, 5/25/30 | EUR | 25,000 | 35,243 | |||||||||
3.25%, 5/25/45 | EUR | 30,000 | 48,471 | |||||||||
|
| |||||||||||
| 322,676 | ||||||||||||
|
| |||||||||||
| Germany — 4.8% | ||||||||||||
Bundesrepublik Deutschland | EUR | 15,000 | 18,945 | |||||||||
3.00%, 7/04/20 | EUR | 20,000 | 26,326 | |||||||||
2.00%, 1/04/22 | EUR | 25,000 | 33,005 | |||||||||
1.75%, 2/15/24 | EUR | 75,000 | 100,464 | |||||||||
0.25%, 2/15/27 | EUR | 20,000 | 23,726 | |||||||||
3.25%, 7/04/42 | EUR | 20,000 | 35,421 | |||||||||
|
| |||||||||||
| 237,887 | ||||||||||||
|
| |||||||||||
| Ireland — 1.7% | ||||||||||||
Ireland Government Bond | EUR | 50,000 | 81,286 | |||||||||
|
| |||||||||||
| Israel — 0.9% | ||||||||||||
Israel Government Bond—Fixed | ILS | 125,000 | 43,474 | |||||||||
|
| |||||||||||
| Italy — 6.8% | ||||||||||||
Italy Buoni Poliennali Del Tesoro | EUR | 50,000 | 62,308 | |||||||||
4.50%, 2/01/20 | EUR | 25,000 | 32,956 | |||||||||
3.75%, 8/01/21 | EUR | 35,000 | 46,998 | |||||||||
0.95%, 3/15/23 | EUR | 30,000 | 35,633 | |||||||||
7.25%, 11/01/26 | EUR | 50,000 | 86,477 | |||||||||
5.00%, 8/01/34 | EUR | 20,000 | 31,280 | |||||||||
4.75%, 9/01/44, 144A | EUR | 25,000 | 38,192 | |||||||||
|
| |||||||||||
| 333,844 | ||||||||||||
|
| |||||||||||
| Japan — 22.5% | ||||||||||||
Japan Government Five Year Bond | JPY | 3,000,000 | 27,489 | |||||||||
Japan Government Forty Year Bond | JPY | 5,000,000 | 51,457 | |||||||||
Japan Government Ten Year Bond | JPY | 10,000,000 | 93,686 | |||||||||
1.20%, 12/20/20 | JPY | 20,000,000 | 190,032 | |||||||||
0.90%, 6/20/22 | JPY | 5,000,000 | 47,752 | |||||||||
0.60%, 3/20/23 | JPY | 2,000,000 | 18,927 | |||||||||
0.60%, 12/20/23 | JPY | 2,000,000 | 19,013 | |||||||||
0.40%, 3/20/25 | JPY | 3,000,000 | 28,279 | |||||||||
Japan Government Thirty Year Bond | JPY | 9,000,000 | 112,302 | |||||||||
2.00%, 9/20/41 | JPY | 4,000,000 | 46,973 | |||||||||
1.90%, 9/20/42 | JPY | 1,000,000 | 11,568 | |||||||||
Japan Government Twenty Year Bond | JPY | 25,000,000 | 266,912 | |||||||||
1.70%, 9/20/32 | JPY | 12,000,000 | 132,162 | |||||||||
1.70%, 6/20/33 | JPY | 5,000,000 | 55,174 | |||||||||
|
| |||||||||||
| 1,101,726 | ||||||||||||
|
| |||||||||||
| See Notes to Financial Statements. | 14 |
DBX ETF Trust
Schedule of Investments
Deutsche X-trackers Barclays International Treasury Bond Hedged ETF (Continued)
August 31, 2017
Principal | Value | |||||||||||
| Malaysia — 1.3% | ||||||||||||
Malaysia Government Bond | MYR | $ | 250,000 | $ | 63,388 | |||||||
|
| |||||||||||
| Mexico — 2.3% | ||||||||||||
Mexican Bonos | MXN | 500,000 | 27,794 | |||||||||
6.50%, 6/09/22 | MXN | 1,000,000 | 55,474 | |||||||||
7.50%, 6/03/27 | MXN | 500,000 | 29,352 | |||||||||
|
| |||||||||||
| 112,620 | ||||||||||||
|
| |||||||||||
| Netherlands — 4.6% | ||||||||||||
Netherlands Government Bond | EUR | 50,000 | 61,143 | |||||||||
7.50%, 1/15/23, 144A | EUR | 50,000 | 84,387 | |||||||||
2.50%, 1/15/33, 144A | EUR | 25,000 | 37,073 | |||||||||
2.75%, 1/15/47, 144A | EUR | 25,000 | 41,343 | |||||||||
|
| |||||||||||
| 223,946 | ||||||||||||
|
| |||||||||||
| New Zealand — 0.4% | ||||||||||||
New Zealand Government Bond | NZD | 30,000 | 21,547 | |||||||||
|
| |||||||||||
| Norway — 0.9% | ||||||||||||
Norway Government Bond | NOK | 300,000 | 42,741 | |||||||||
|
| |||||||||||
| Poland — 1.4% | ||||||||||||
Republic of Poland Government Bond | PLN | 100,000 | 28,853 | |||||||||
3.25%, 7/25/25 | PLN | 150,000 | 42,590 | |||||||||
|
| |||||||||||
| 71,443 | ||||||||||||
|
| |||||||||||
| Russia — 0.9% | ||||||||||||
Russian Federal Bond—OFZ | RUB | 2,500,000 | 43,154 | |||||||||
|
| |||||||||||
| Singapore — 0.9% | ||||||||||||
Singapore Government Bond | SGD | 60,000 | 46,719 | |||||||||
|
| |||||||||||
| Slovak Republic — 0.6% | ||||||||||||
Slovakia Government Bond | EUR | 20,000 | 28,055 | |||||||||
|
| |||||||||||
| Slovenia — 0.4% | ||||||||||||
Slovenia Government Bond | EUR | 15,000 | 18,318 | |||||||||
|
| |||||||||||
Principal | Value | |||||||||||
| South Africa — 1.4% | ||||||||||||
Republic of South Africa Government Bond | ZAR | $ | 800,000 | $ | 69,046 | |||||||
|
| |||||||||||
| South Korea — 4.4% | ||||||||||||
Korea International Bond | 200,000 | 215,542 | ||||||||||
|
| |||||||||||
| Spain — 4.1% | ||||||||||||
Spain Government Bond | EUR | 25,000 | 33,097 | |||||||||
0.75%, 7/30/21 | EUR | 25,000 | 30,627 | |||||||||
5.90%, 7/30/26, 144A | EUR | 50,000 | 82,590 | |||||||||
4.20%, 1/31/37, 144A | EUR | 35,000 | 53,745 | |||||||||
|
| |||||||||||
| 200,059 | ||||||||||||
|
| |||||||||||
| Sweden — 1.0% | ||||||||||||
Sweden Government Bond | SEK | 350,000 | 51,064 | |||||||||
|
| |||||||||||
| Switzerland — 1.0% | ||||||||||||
Swiss Confederation Government Bond | CHF | 25,000 | 29,815 | |||||||||
4.00%, 1/06/49 | CHF | 10,000 | 22,027 | |||||||||
|
| |||||||||||
| 51,842 | ||||||||||||
|
| |||||||||||
| Thailand — 1.8% | ||||||||||||
Thailand Government Bond | THB | 3,000,000 | 88,863 | |||||||||
|
| |||||||||||
| United Kingdom — 6.9% | ||||||||||||
United Kingdom Gilt | GBP | 15,000 | 19,974 | |||||||||
3.75%, 9/07/20 | GBP | 40,000 | 57,288 | |||||||||
1.75%, 9/07/22 | GBP | 25,000 | 34,449 | |||||||||
1.50%, 7/22/26 | GBP | 25,000 | 33,889 | |||||||||
4.25%, 6/07/32 | GBP | 25,000 | 44,517 | |||||||||
4.75%, 12/07/38 | GBP | 10,000 | 20,122 | |||||||||
4.50%, 12/07/42 | GBP | 5,000 | 10,164 | |||||||||
4.25%, 12/07/46 | GBP | 57,000 | 116,651 | |||||||||
|
| |||||||||||
| 337,054 | ||||||||||||
|
| |||||||||||
TOTAL SOVEREIGN BONDS | 4,813,007 | |||||||||||
|
| |||||||||||
TOTAL INVESTMENTS — 98.3% | ||||||||||||
(Cost $4,670,969) | $ | 4,813,007 | ||||||||||
Other assets and liabilities, net — 1.7% | 84,152 | |||||||||||
|
| |||||||||||
NET ASSETS — 100.0% | $ | 4,897,159 | ||||||||||
|
| |||||||||||
| OFZ: | Obligatsyi Federal’novo Zaima “Federal Loan Obligation” |
| 144A: | Security exempt from registration under Rule 144A of the Securities Act of 1933. These securities may be resold in transactions exempt from registration, normally to qualified institutional buyers. |
| See Notes to Financial Statements. | 15 |
DBX ETF Trust
Schedule of Investments
Deutsche X-trackers Barclays International Treasury Bond Hedged ETF (Continued)
August 31, 2017
As of August 31, 2017, the Fund had the following forward foreign currency exchange contracts outstanding:
Counterparty | Settlement Date | Currency To Deliver | Currency To Receive | Unrealized Appreciation | Unrealized Depreciation | |||||||||||||||||
The Bank of Nova Scotia | 9/5/2017 | AUD | 277,060 | USD | 221,099 | $ | 863 | $ | — | |||||||||||||
The Bank of Nova Scotia | 9/5/2017 | CAD | 289,147 | USD | 231,329 | — | (233 | ) | ||||||||||||||
The Bank of Nova Scotia | 9/5/2017 | CHF | 80,351 | USD | 83,449 | — | (370 | ) | ||||||||||||||
The Bank of Nova Scotia | 9/5/2017 | CZK | 1,210,000 | USD | 54,835 | — | (364 | ) | ||||||||||||||
The Bank of Nova Scotia | 9/5/2017 | DKK | 542,000 | USD | 86,078 | — | (704 | ) | ||||||||||||||
The Bank of Nova Scotia | 9/5/2017 | EUR | 1,663,082 | USD | 1,964,083 | — | (16,268 | ) | ||||||||||||||
The Bank of Nova Scotia | 9/5/2017 | GBP | 262,215 | USD | 346,057 | 6,929 | — | |||||||||||||||
The Bank of Nova Scotia | 9/5/2017 | ILS | 157,500 | USD | 44,297 | 344 | — | |||||||||||||||
The Bank of Nova Scotia | 9/5/2017 | JPY | 124,364,808 | USD | 1,127,070 | — | (4,456 | ) | ||||||||||||||
The Bank of Nova Scotia | 9/5/2017 | NOK | 342,000 | USD | 43,314 | — | (775 | ) | ||||||||||||||
The Bank of Nova Scotia | 9/5/2017 | NZD | 29,400 | USD | 22,029 | 922 | — | |||||||||||||||
The Bank of Nova Scotia | 9/5/2017 | PLN | 258,800 | USD | 71,686 | — | (864 | ) | ||||||||||||||
The Bank of Nova Scotia | 9/5/2017 | RUB | 2,520,000 | USD | 41,590 | — | (1,812 | ) | ||||||||||||||
The Bank of Nova Scotia | 9/5/2017 | SEK | 417,550 | USD | 51,712 | — | (853 | ) | ||||||||||||||
The Bank of Nova Scotia | 9/5/2017 | SGD | 63,300 | USD | 46,658 | — | (26 | ) | ||||||||||||||
The Bank of Nova Scotia | 9/5/2017 | THB | 2,894,000 | USD | 87,017 | — | (142 | ) | ||||||||||||||
The Bank of Nova Scotia | 9/5/2017 | USD | 219,750 | AUD | 277,060 | 486 | — | |||||||||||||||
The Bank of Nova Scotia | 9/5/2017 | USD | 4,000 | CAD | 5,000 | 4 | — | |||||||||||||||
The Bank of Nova Scotia | 9/5/2017 | USD | 226,638 | CAD | 284,147 | 919 | — | |||||||||||||||
The Bank of Nova Scotia | 9/5/2017 | USD | 26,493 | CHF | 25,500 | 107 | — | |||||||||||||||
The Bank of Nova Scotia | 9/5/2017 | USD | 57,077 | CHF | 54,851 | 141 | — | |||||||||||||||
The Bank of Nova Scotia | 9/5/2017 | USD | 43,244 | CZK | 950,000 | 95 | — | |||||||||||||||
The Bank of Nova Scotia | 9/5/2017 | USD | 11,789 | CZK | 260,000 | 72 | — | |||||||||||||||
The Bank of Nova Scotia | 9/5/2017 | USD | 86,638 | DKK | 542,000 | 144 | — | |||||||||||||||
The Bank of Nova Scotia | 9/5/2017 | USD | 1,904,715 | EUR | 1,602,082 | 2,999 | — | |||||||||||||||
The Bank of Nova Scotia | 9/5/2017 | USD | 72,045 | EUR | 61,000 | 592 | — | |||||||||||||||
The Bank of Nova Scotia | 9/5/2017 | USD | 337,877 | GBP | 262,215 | 1,251 | — | |||||||||||||||
The Bank of Nova Scotia | 9/5/2017 | USD | 43,913 | ILS | 157,500 | 40 | — | |||||||||||||||
The Bank of Nova Scotia | 9/5/2017 | USD | 18,164 | JPY | 2,000,000 | 32 | — | |||||||||||||||
The Bank of Nova Scotia | 9/5/2017 | USD | 1,111,801 | JPY | 122,364,808 | 1,528 | — | |||||||||||||||
The Bank of Nova Scotia | 9/5/2017 | USD | 43,960 | NOK | 342,000 | 129 | — | |||||||||||||||
The Bank of Nova Scotia | 9/5/2017 | USD | 21,056 | NZD | 29,400 | 51 | — | |||||||||||||||
The Bank of Nova Scotia | 9/5/2017 | USD | 72,424 | PLN | 258,800 | 126 | — | |||||||||||||||
The Bank of Nova Scotia | 9/5/2017 | USD | 43,392 | RUB | 2,520,000 | 10 | — | |||||||||||||||
The Bank of Nova Scotia | 9/5/2017 | USD | 52,474 | SEK | 417,550 | 92 | — | |||||||||||||||
The Bank of Nova Scotia | 9/5/2017 | USD | 46,613 | SGD | 63,300 | 72 | — | |||||||||||||||
The Bank of Nova Scotia | 9/5/2017 | USD | 87,171 | THB | 2,894,000 | — | (13 | ) | ||||||||||||||
The Bank of Nova Scotia | 9/5/2017 | USD | 71,244 | ZAR | 926,000 | — | (120 | ) | ||||||||||||||
The Bank of Nova Scotia | 9/5/2017 | ZAR | 926,000 | USD | 69,802 | — | (1,323 | ) | ||||||||||||||
The Bank of Nova Scotia | 9/6/2017 | MXN | 2,037,489 | USD | 113,525 | — | (323 | ) | ||||||||||||||
The Bank of Nova Scotia | 9/6/2017 | MYR | 278,000 | USD | 64,704 | — | (378 | ) | ||||||||||||||
The Bank of Nova Scotia | 9/6/2017 | USD | 114,320 | MXN | 2,037,489 | — | (472 | ) | ||||||||||||||
The Bank of Nova Scotia | 9/6/2017 | USD | 65,105 | MYR | 278,000 | — | (23 | ) | ||||||||||||||
The Bank of Nova Scotia | 10/4/2017 | AUD | 277,060 | USD | 219,675 | — | (485 | ) | ||||||||||||||
The Bank of Nova Scotia | 10/4/2017 | CAD | 3,170 | USD | 2,529 | — | (10 | ) | ||||||||||||||
The Bank of Nova Scotia | 10/4/2017 | CAD | 284,147 | USD | 226,705 | — | (921 | ) | ||||||||||||||
The Bank of Nova Scotia | 10/4/2017 | CHF | 54,851 | USD | 57,186 | — | (145 | ) | ||||||||||||||
The Bank of Nova Scotia | 10/4/2017 | CZK | 950,000 | USD | 43,344 | — | (102 | ) | ||||||||||||||
The Bank of Nova Scotia | 10/4/2017 | DKK | 542,000 | USD | 86,773 | — | (151 | ) | ||||||||||||||
The Bank of Nova Scotia | 10/4/2017 | EUR | 1,602,082 | USD | 1,907,639 | — | (3,091 | ) | ||||||||||||||
The Bank of Nova Scotia | 10/4/2017 | GBP | 262,215 | USD | 338,214 | — | (1,259 | ) | ||||||||||||||
The Bank of Nova Scotia | 10/4/2017 | ILS | 157,500 | USD | 43,955 | — | (46 | ) | ||||||||||||||
The Bank of Nova Scotia | 10/4/2017 | JPY | 550,930 | USD | 5,013 | — | (7 | ) | ||||||||||||||
The Bank of Nova Scotia | 10/4/2017 | JPY | 122,364,808 | USD | 1,113,308 | — | (1,553 | ) | ||||||||||||||
The Bank of Nova Scotia | 10/4/2017 | MXN | 2,037,489 | USD | 113,796 | 465 | — | |||||||||||||||
The Bank of Nova Scotia | 10/4/2017 | MYR | 278,000 | USD | 65,105 | 97 | — | |||||||||||||||
| See Notes to Financial Statements. | 16 |
DBX ETF Trust
Schedule of Investments
Deutsche X-trackers Barclays International Treasury Bond Hedged ETF (Continued)
August 31, 2017
Counterparty | Settlement Date | Currency To Deliver | Currency To Receive | Unrealized Appreciation | Unrealized Depreciation | |||||||||||||||||||||||
The Bank of Nova Scotia | 10/4/2017 | NOK | 342,000 | USD | 43,988 | $ | — | $ | (129 | ) | ||||||||||||||||||
The Bank of Nova Scotia | 10/4/2017 | NZD | 29,400 | USD | 21,044 | — | (52 | ) | ||||||||||||||||||||
The Bank of Nova Scotia | 10/4/2017 | PLN | 258,800 | USD | 72,433 | — | (128 | ) | ||||||||||||||||||||
The Bank of Nova Scotia | 10/4/2017 | RUB | 2,520,000 | USD | 43,140 | — | (21 | ) | ||||||||||||||||||||
The Bank of Nova Scotia | 10/4/2017 | SEK | 417,550 | USD | 52,559 | — | (93 | ) | ||||||||||||||||||||
The Bank of Nova Scotia | 10/4/2017 | SGD | 63,300 | USD | 46,623 | — | (70 | ) | ||||||||||||||||||||
The Bank of Nova Scotia | 10/4/2017 | THB | 2,894,000 | USD | 87,145 | — | (30 | ) | ||||||||||||||||||||
The Bank of Nova Scotia | 10/4/2017 | THB | 60,700 | USD | 1,827 | — | (1 | ) | ||||||||||||||||||||
The Bank of Nova Scotia | 10/4/2017 | USD | 5,291 | CHF | 5,075 | 13 | — | |||||||||||||||||||||
The Bank of Nova Scotia | 10/4/2017 | USD | 10,121 | EUR | 8,500 | 16 | — | |||||||||||||||||||||
The Bank of Nova Scotia | 10/4/2017 | ZAR | 926,000 | USD | 70,906 | 117 | — | |||||||||||||||||||||
|
|
|
| |||||||||||||||||||||||||
Total unrealized appreciation (depreciation) | $ | 18,656 | $ | (37,813 | ) | |||||||||||||||||||||||
|
|
|
| |||||||||||||||||||||||||
Currency Abbreviations
| AUD | Australian Dollar |
| CAD | Canadian Dollar |
| CHF | Swiss Franc |
| CZK | Czech Koruna |
| DKK | Danish Krone |
| EUR | Euro |
| GBP | Pound Sterling |
| ILS | Israeli Shekel |
| JPY | Japanese Yen |
| MXN | Mexican Peso |
| MYR | Malaysian Ringgit |
| NOK | Norwegian Krone |
| NZD | New Zealand Dollar |
| PLN | Polish Zloty |
| RUB | Russian Ruble |
| SEK | Swedish Krona |
| SGD | Singapore Dollar |
| THB | Thai Baht |
| USD | U.S. Dollar |
| ZAR | South African Rand |
For information on the Fund’s policy and additional disclosures regarding forward foreign currency exchange contracts, please refer to the Derivatives section of Note 2 in the accompanying Notes to Financial Statements.
Fair Value Measurements
Various inputs are used in determining the value of the Fund’s investments. These inputs are summarized in three broad levels. Level 1 includes quoted prices in active markets for identical securities. Level 2 includes other significant observable inputs (including quoted prices for similar securities, interest rates, prepayment speeds and credit risk). Level 3 includes significant unobservable inputs (including the Fund’s own assumptions in determining the fair value of investments). The level assigned to the securities valuations may not be an indication of the risk or liquidity associated with investing in those securities.
The following is a summary of the inputs used as of August 31, 2017 in valuing the Fund’s investments. For information on the Fund’s policy regarding the valuation of investments, please refer to the Security Valuation section of Note 2 in the accompanying Notes to Financial Statements.
Assets | Level 1 | Level 2 | Level 3 | Total | ||||||||||||
Sovereign Bonds (a) | $ | — | $ | 4,813,007 | $ | — | $ | 4,813,007 | ||||||||
Derivatives (b) | ||||||||||||||||
Forward Foreign Currency Exchange Contracts | — | 18,656 | — | 18,656 | ||||||||||||
|
|
|
|
|
|
|
| |||||||||
TOTAL | $ | — | $ | 4,831,663 | $ | — | $ | 4,831,663 | ||||||||
|
|
|
|
|
|
|
| |||||||||
Liabilities | Level 1 | Level 2 | Level 3 | Total | ||||||||||||
Derivatives (b) | ||||||||||||||||
Forward Foreign Currency Exchange Contracts | $ | — | $ | (37,813 | ) | $ | — | $ | (37,813 | ) | ||||||
|
|
|
|
|
|
|
| |||||||||
TOTAL | $ | — | $ | (37,813 | ) | $ | — | $ | (37,813 | ) | ||||||
|
|
|
|
|
|
|
| |||||||||
| (a) | See Schedule of Investments for additional detailed categorizations. |
| (b) | Derivatives include unrealized appreciation (depreciation) on forward foreign currency exchange contracts. |
There have been no transfers between fair value measurement levels during the period ended August 31, 2017.
| See Notes to Financial Statements. | 17 |
DBX ETF Trust
Schedule of Investments
Deutsche X-trackers USD High Yield Corporate Bond ETF
August 31, 2017
Principal | Value | |||||||
| CORPORATE BONDS — 98.1% | ||||||||
| Basic Materials — 5.6% | ||||||||
| Chemicals — 2.2% | ||||||||
Ashland LLC | $ | 366,000 | $ | 383,385 | ||||
Blue Cube Spinco, Inc. | 405,000 | 493,087 | ||||||
10.00%, 10/15/25 | 30,000 | 37,125 | ||||||
CF Industries, Inc. | 100,000 | 110,500 | ||||||
3.45%, 6/01/23 (a) | 200,000 | 195,000 | ||||||
Chemours Co. | 305,000 | 325,206 | ||||||
7.00%, 5/15/25 | 400,000 | 443,000 | ||||||
Hexion, Inc. | 400,000 | 366,000 | ||||||
10.375%, 2/01/22, 144A (a) | 160,000 | 156,800 | ||||||
Huntsman International LLC | 210,000 | 221,288 | ||||||
5.125%, 11/15/22 | 100,000 | 106,250 | ||||||
INEOS Group Holdings SA, 144A | 50,000 | 51,625 | ||||||
Momentive Performance Materials, Inc. | 210,000 | 211,050 | ||||||
NOVA Chemicals Corp. | 240,000 | 249,000 | ||||||
4.875%, 6/01/24, 144A | 200,000 | 200,250 | ||||||
5.00%, 5/01/25, 144A | 45,000 | 45,000 | ||||||
5.25%, 6/01/27, 144A | 150,000 | 150,000 | ||||||
Olin Corp. | 60,000 | 62,250 | ||||||
Platform Specialty Products Corp. | 200,000 | 219,750 | ||||||
6.50%, 2/01/22, 144A (a) | 300,000 | 312,750 | ||||||
PolyOne Corp. | 119,000 | 125,545 | ||||||
Tronox Finance LLC, 144A | 100,000 | 105,250 | ||||||
Valvoline, Inc., 144A | 100,000 | 101,000 | ||||||
WR Grace & Co.-Conn, 144A | 180,000 | 196,200 | ||||||
|
| |||||||
| 4,867,311 | ||||||||
|
| |||||||
| Forest Products & Paper — 0.1% | ||||||||
Cascades, Inc., 144A | 210,000 | 218,400 | ||||||
|
| |||||||
| Iron/Steel — 1.2% | ||||||||
AK Steel Corp. | 20,000 | 20,900 | ||||||
7.00%, 3/15/27 (a) | 60,000 | 61,350 | ||||||
Allegheny Technologies, Inc. | 140,000 | 143,150 | ||||||
7.875%, 8/15/23 | 139,000 | 149,599 | ||||||
ArcelorMittal | 195,000 | 211,575 | ||||||
6.00%, 3/01/21 | 260,000 | 285,350 | ||||||
6.75%, 2/25/22 | 250,000 | 282,500 | ||||||
Principal | Value | |||||||
| Iron/Steel (Continued) | ||||||||
6.125%, 6/01/25 (a) | $ | 120,000 | $ | 138,300 | ||||
Cleveland-Cliffs, Inc., 144A | 310,000 | 304,311 | ||||||
Steel Dynamics, Inc. | 350,000 | 360,045 | ||||||
United States Steel Corp. | 148,000 | 162,245 | ||||||
8.375%, 7/01/21, 144A | 225,000 | 249,188 | ||||||
6.875%, 8/15/25 | 200,000 | 204,000 | ||||||
|
| |||||||
| 2,572,513 | ||||||||
|
| |||||||
| Mining — 2.1% | ||||||||
Alcoa Nederland Holding BV, 144A | 200,000 | 224,500 | ||||||
Aleris International, Inc. | 300,000 | 297,315 | ||||||
Constellium NV, 144A | 400,000 | 421,000 | ||||||
FMG Resources (August 2006) Pty Ltd., 144A | 375,000 | 388,594 | ||||||
Freeport-McMoRan, Inc. | 350,000 | 351,312 | ||||||
6.50%, 11/15/20 | 200,000 | 205,000 | ||||||
4.00%, 11/14/21 (a) | 60,000 | 60,330 | ||||||
6.75%, 2/01/22 | 60,000 | 63,150 | ||||||
3.55%, 3/01/22 | 360,000 | 355,050 | ||||||
3.875%, 3/15/23 (a) | 500,000 | 497,500 | ||||||
4.55%, 11/14/24 (a) | 240,000 | 240,600 | ||||||
Hudbay Minerals, Inc., 144A | 200,000 | 221,500 | ||||||
Kinross Gold Corp. | 180,000 | 198,900 | ||||||
4.50%, 7/15/27, 144A | 200,000 | 200,500 | ||||||
Polyus Finance PLC | 250,000 | 264,220 | ||||||
5.25%, 2/07/23, 144A | 200,000 | 207,804 | ||||||
Teck Resources Ltd. | 233,000 | 245,232 | ||||||
3.75%, 2/01/23 (a) | 165,000 | 166,766 | ||||||
8.50%, 6/01/24, 144A | 120,000 | 138,600 | ||||||
|
| |||||||
| 4,747,873 | ||||||||
|
| |||||||
| Communications — 23.6% | ||||||||
| Advertising — 0.4% | ||||||||
Acosta, Inc., 144A | 175,000 | 131,688 | ||||||
Lamar Media Corp. | 240,000 | 249,600 | ||||||
5.375%, 1/15/24 | 60,000 | 63,225 | ||||||
5.75%, 2/01/26 | 60,000 | 64,950 | ||||||
Outfront Media Capital LLC / Outfront Media Capital Corp. | 120,000 | 124,350 | ||||||
5.625%, 2/15/24 | 210,000 | 218,925 | ||||||
5.875%, 3/15/25 | 80,000 | 83,740 | ||||||
|
| |||||||
| 936,478 | ||||||||
|
| |||||||
| See Notes to Financial Statements. | 18 |
DBX ETF Trust
Schedule of Investments
Deutsche X-trackers USD High Yield Corporate Bond ETF (Continued)
August 31, 2017
Principal | Value | |||||||
| Internet — 1.4% | ||||||||
Netflix, Inc. | $ | 120,000 | $ | 129,150 | ||||
5.50%, 2/15/22 | 245,000 | 264,600 | ||||||
5.875%, 2/15/25 | 205,000 | 222,425 | ||||||
4.375%, 11/15/26, 144A | 220,000 | 215,050 | ||||||
Symantec Corp., 144A | 600,000 | 629,820 | ||||||
TIBCO Software, Inc., 144A | 200,000 | 219,500 | ||||||
VeriSign, Inc. | 225,000 | 232,594 | ||||||
5.25%, 4/01/25 | 220,000 | 236,500 | ||||||
Zayo Group LLC / Zayo Capital, Inc. | 250,000 | 265,862 | ||||||
6.375%, 5/15/25 | 405,000 | 436,768 | ||||||
5.75%, 1/15/27, 144A | 260,000 | 276,570 | ||||||
|
| |||||||
| 3,128,839 | ||||||||
|
| |||||||
| Media — 11.7% | ||||||||
Altice Financing SA | 1,000,000 | 1,060,000 | ||||||
7.50%, 5/15/26, 144A | 550,000 | 603,735 | ||||||
Altice Luxembourg SA | 792,000 | 841,500 | ||||||
7.625%, 2/15/25, 144A (a) | 625,000 | 678,719 | ||||||
Altice US Finance I Corp., 144A | 300,000 | 318,187 | ||||||
AMC Networks, Inc. | 150,000 | 155,062 | ||||||
5.00%, 4/01/24 | 250,000 | 258,437 | ||||||
4.75%, 8/01/25 | 115,000 | 115,719 | ||||||
Cablevision Systems Corp. | 250,000 | 277,187 | ||||||
5.875%, 9/15/22 | 60,000 | 62,850 | ||||||
CBS Radio, Inc., 144A | 120,000 | 126,900 | ||||||
CCO Holdings LLC / CCO Holdings Capital Corp. | 120,000 | 123,375 | ||||||
5.25%, 9/30/22 | 320,000 | 330,400 | ||||||
5.125%, 2/15/23 | 305,000 | 316,056 | ||||||
5.125%, 5/01/23, 144A | 235,000 | 246,428 | ||||||
5.75%, 1/15/24 | 120,000 | 126,186 | ||||||
5.875%, 4/01/24, 144A | 380,000 | 404,700 | ||||||
5.375%, 5/01/25, 144A | 285,000 | 297,825 | ||||||
5.75%, 2/15/26, 144A | 650,000 | 688,798 | ||||||
5.50%, 5/01/26, 144A | 300,000 | 313,875 | ||||||
5.125%, 5/01/27, 144A | 660,000 | 681,450 | ||||||
5.875%, 5/01/27, 144A | 240,000 | 255,600 | ||||||
5.00%, 2/01/28, 144A | 300,000 | 306,564 | ||||||
Cengage Learning, Inc., 144A | 150,000 | 129,375 | ||||||
Cequel Communications Holdings I LLC / Cequel Capital Corp. | 218,000 | 223,515 | ||||||
5.125%, 12/15/21, 144A | 235,000 | 240,287 | ||||||
7.75%, 7/15/25, 144A | 250,000 | 277,187 | ||||||
Principal | Value | |||||||
| Media (Continued) | ||||||||
Clear Channel Worldwide Holdings, Inc. | $ | 350,000 | $ | 350,000 | ||||
Series B, 6.50%, 11/15/22 | 580,000 | 600,300 | ||||||
CSC Holdings LLC | 515,000 | 570,517 | ||||||
10.125%, 1/15/23, 144A | 480,000 | 557,256 | ||||||
5.25%, 6/01/24 | 200,000 | 205,750 | ||||||
10.875%, 10/15/25, 144A | 200,000 | 246,500 | ||||||
5.50%, 4/15/27, 144A | 394,000 | 412,222 | ||||||
DISH DBS Corp. | 220,000 | 242,275 | ||||||
5.125%, 5/01/20 | 305,000 | 321,775 | ||||||
6.75%, 6/01/21 | 550,000 | 608,438 | ||||||
5.875%, 7/15/22 | 465,000 | 503,944 | ||||||
5.00%, 3/15/23 | 440,000 | 455,532 | ||||||
5.875%, 11/15/24 | 400,000 | 433,000 | ||||||
7.75%, 7/01/26 | 370,000 | 435,213 | ||||||
Gray Television, Inc. | 150,000 | 152,438 | ||||||
5.875%, 7/15/26, 144A | 95,000 | 98,088 | ||||||
iHeartCommunications, Inc. | 330,000 | 263,587 | ||||||
9.00%, 3/01/21 | 400,000 | 292,500 | ||||||
11.25%, 3/01/21 | 150,000 | 112,125 | ||||||
9.00%, 9/15/22 | 250,000 | 182,188 | ||||||
10.625%, 3/15/23 | 300,000 | 221,250 | ||||||
Nexstar Broadcasting, Inc., 144A | 260,000 | 269,750 | ||||||
Quebecor Media, Inc. | 180,000 | 193,275 | ||||||
SFR Group SA | 500,000 | 527,490 | ||||||
6.25%, 5/15/24, 144A | 400,000 | 422,500 | ||||||
7.375%, 5/01/26, 144A | 970,000 | 1,051,257 | ||||||
Sinclair Television Group, Inc. | 185,000 | 190,088 | ||||||
6.125%, 10/01/22 | 150,000 | 155,438 | ||||||
5.625%, 8/01/24, 144A | 125,000 | 128,163 | ||||||
5.125%, 2/15/27, 144A | 60,000 | 58,500 | ||||||
Sirius XM Radio, Inc. | 300,000 | 309,750 | ||||||
6.00%, 7/15/24, 144A | 180,000 | 194,900 | ||||||
5.375%, 4/15/25, 144A | 365,000 | 386,754 | ||||||
5.375%, 7/15/26, 144A | 325,000 | 342,063 | ||||||
5.00%, 8/01/27, 144A | 250,000 | 258,125 | ||||||
TEGNA, Inc. | 100,000 | 101,625 | ||||||
5.125%, 7/15/20 | 120,000 | 123,185 | ||||||
6.375%, 10/15/23 | 180,000 | 191,700 | ||||||
Tribune Media Co. | 300,000 | 312,750 | ||||||
Unitymedia Hessen GmbH & Co. KG / Unitymedia NRW GmbH | 450,000 | 466,875 | ||||||
5.00%, 1/15/25, 144A | 120,000 | 127,200 | ||||||
Univision Communications, Inc. | 120,000 | 124,620 | ||||||
| See Notes to Financial Statements. | 19 |
DBX ETF Trust
Schedule of Investments
Deutsche X-trackers USD High Yield Corporate Bond ETF (Continued)
August 31, 2017
Principal | Value | |||||||
| Media (Continued) | ||||||||
5.125%, 5/15/23, 144A | $ | 425,000 | $ | 433,500 | ||||
5.125%, 2/15/25, 144A | 200,000 | 201,500 | ||||||
UPCB Finance IV Ltd., 144A | 200,000 | 208,500 | ||||||
Videotron Ltd. | 160,000 | 171,800 | ||||||
5.375%, 6/15/24, 144A | 220,000 | 235,400 | ||||||
5.125%, 4/15/27, 144A | 100,000 | 103,250 | ||||||
Virgin Media Finance PLC | 120,000 | 126,300 | ||||||
6.00%, 10/15/24, 144A | 320,000 | 335,600 | ||||||
Virgin Media Secured Finance PLC | 120,000 | 125,700 | ||||||
5.25%, 1/15/26, 144A | 250,000 | 260,938 | ||||||
5.50%, 8/15/26, 144A | 200,000 | 212,000 | ||||||
Ziggo Bond Finance BV | 120,000 | 124,950 | ||||||
6.00%, 1/15/27, 144A | 60,000 | 61,725 | ||||||
Ziggo Secured Finance BV, 144A | 460,000 | 475,525 | ||||||
|
| |||||||
| 25,737,511 | ||||||||
|
| |||||||
| Telecommunications — 10.1% | ||||||||
Anixter, Inc. | 100,000 | 107,030 | ||||||
CenturyLink, Inc. | 180,000 | 187,650 | ||||||
Series S, 6.45%, 6/15/21 | 170,000 | 178,712 | ||||||
Series T, 5.80%, 3/15/22 | 430,000 | 428,925 | ||||||
Series W, 6.75%, 12/01/23 | 60,000 | 61,500 | ||||||
Series Y, 7.50%, 4/01/24 (a) | 280,000 | 294,000 | ||||||
Cincinnati Bell, Inc., 144A | 230,000 | 228,275 | ||||||
CommScope Technologies LLC | 180,000 | 192,150 | ||||||
5.00%, 3/15/27, 144A | 160,000 | 159,848 | ||||||
CommScope, Inc. | 60,000 | 61,800 | ||||||
5.50%, 6/15/24, 144A | 395,000 | 413,269 | ||||||
Consolidated Communications, Inc. | 150,000 | 145,594 | ||||||
Frontier Communications Corp. | 100,000 | 102,625 | ||||||
9.25%, 7/01/21 | 180,000 | 165,600 | ||||||
6.25%, 9/15/21 | 60,000 | 51,300 | ||||||
8.75%, 4/15/22 (a) | 180,000 | 153,000 | ||||||
10.50%, 9/15/22 | 580,000 | 523,450 | ||||||
7.125%, 1/15/23 | 240,000 | 189,600 | ||||||
7.625%, 4/15/24 | 350,000 | 278,250 | ||||||
6.875%, 1/15/25 | 120,000 | 91,800 | ||||||
11.00%, 9/15/25 | 700,000 | 613,375 | ||||||
GTH Finance BV, 144A | 200,000 | 226,623 | ||||||
Hughes Satellite Systems Corp. | 250,000 | 268,750 | ||||||
7.625%, 6/15/21 | 329,000 | 375,882 | ||||||
5.25%, 8/01/26 | 250,000 | 263,125 | ||||||
Principal | Value | |||||||
| Telecommunications (Continued) | ||||||||
Inmarsat Finance PLC, 144A | $ | 250,000 | $ | 255,625 | ||||
Intelsat Jackson Holdings SA | 490,000 | 468,869 | ||||||
7.50%, 4/01/21 | 240,000 | 226,272 | ||||||
9.50%, 9/30/22, 144A | 100,000 | 119,250 | ||||||
5.50%, 8/01/23 | 540,000 | 453,600 | ||||||
8.00%, 2/15/24, 144A | 280,000 | 302,134 | ||||||
9.75%, 7/15/25, 144A | 300,000 | 306,000 | ||||||
Intelsat Luxembourg SA | 650,000 | 413,562 | ||||||
8.125%, 6/01/23 | 100,000 | 61,550 | ||||||
Level 3 Communications, Inc. | 200,000 | 206,000 | ||||||
Level 3 Financing, Inc. | 250,000 | 256,280 | ||||||
5.375%, 8/15/22 | 550,000 | 567,215 | ||||||
5.125%, 5/01/23 | 60,000 | 61,125 | ||||||
5.375%, 1/15/24 | 211,000 | 216,212 | ||||||
5.375%, 5/01/25 | 405,000 | 417,150 | ||||||
Millicom International Cellular SA, 144A | 250,000 | 268,487 | ||||||
Nokia OYJ | 57,000 | 60,366 | ||||||
3.375%, 6/12/22 | 150,000 | 151,875 | ||||||
4.375%, 6/12/27 | 150,000 | 154,453 | ||||||
Sable International Finance Ltd., 144A | 325,000 | 351,406 | ||||||
SoftBank Group Corp., 144A | 500,000 | 518,125 | ||||||
Sprint Communications, Inc. | 371,000 | 401,144 | ||||||
7.00%, 3/01/20, 144A | 150,000 | 164,625 | ||||||
7.00%, 8/15/20 | 220,000 | 241,725 | ||||||
11.50%, 11/15/21 | 30,000 | 38,175 | ||||||
6.00%, 11/15/22 | 800,000 | 853,000 | ||||||
Sprint Corp. | 720,000 | 795,600 | ||||||
7.875%, 9/15/23 | 889,000 | 1,018,021 | ||||||
7.125%, 6/15/24 | 710,000 | 782,775 | ||||||
7.625%, 2/15/25 | 270,000 | 305,775 | ||||||
Telecom Italia SpA, 144A | 400,000 | 434,500 | ||||||
Telefonaktiebolaget LM Ericsson | 200,000 | 203,304 | ||||||
T-Mobile USA, Inc. | 305,000 | 318,725 | ||||||
4.00%, 4/15/22 | 20,000 | 20,650 | ||||||
6.00%, 3/01/23 | 230,000 | 242,937 | ||||||
6.625%, 4/01/23 | 330,000 | 348,562 | ||||||
6.836%, 4/28/23 | 245,000 | 259,700 | ||||||
6.50%, 1/15/24 | 180,000 | 192,600 | ||||||
6.00%, 4/15/24 | 280,000 | 298,550 | ||||||
6.375%, 3/01/25 | 430,000 | 464,131 | ||||||
5.125%, 4/15/25 | 410,000 | 431,648 | ||||||
6.50%, 1/15/26 | 270,000 | 299,700 | ||||||
5.375%, 4/15/27 | 60,000 | 64,518 | ||||||
| See Notes to Financial Statements. | 20 |
DBX ETF Trust
Schedule of Investments
Deutsche X-trackers USD High Yield Corporate Bond ETF (Continued)
August 31, 2017
Principal | Value | |||||||
| Telecommunications (Continued) | ||||||||
VimpelCom Holdings BV | $ | 250,000 | $ | 258,773 | ||||
7.504%, 3/01/22, 144A | 20,000 | 23,034 | ||||||
5.95%, 2/13/23, 144A | 200,000 | 216,602 | ||||||
4.95%, 6/16/24, 144A | 350,000 | 358,019 | ||||||
West Corp., 144A | 300,000 | 304,125 | ||||||
Wind Acquisition Finance SA | 250,000 | 253,750 | ||||||
7.375%, 4/23/21, 144A | 570,000 | 592,997 | ||||||
Windstream Services LLC | 200,000 | 179,124 | ||||||
7.75%, 10/01/21 (a) | 250,000 | 199,375 | ||||||
6.375%, 8/01/23 (a) | 45,000 | 34,988 | ||||||
|
| |||||||
| 22,198,841 | ||||||||
|
| |||||||
| Consumer, Cyclical — 13.2% | ||||||||
| Airlines — 0.3% | ||||||||
Air Canada, 144A | 150,000 | 172,365 | ||||||
American Airlines Group, Inc. | 280,000 | 293,300 | ||||||
4.625%, 3/01/20, 144A | 100,000 | 103,125 | ||||||
|
| |||||||
| 568,790 | ||||||||
|
| |||||||
| Apparel — 0.3% | ||||||||
Hanesbrands, Inc. | 300,000 | 313,500 | ||||||
4.875%, 5/15/26, 144A | 185,000 | 193,325 | ||||||
Levi Strauss & Co. | 150,000 | 157,500 | ||||||
|
| |||||||
| 664,325 | ||||||||
|
| |||||||
| Auto Manufacturers — 0.9% | ||||||||
Fiat Chrysler Automobiles NV | 420,000 | 439,215 | ||||||
5.25%, 4/15/23 (a) | 250,000 | 265,937 | ||||||
Jaguar Land Rover Automotive PLC | 250,000 | 254,688 | ||||||
4.25%, 11/15/19, 144A | 375,000 | 386,719 | ||||||
Navistar International Corp. | 240,000 | 242,400 | ||||||
Tesla, Inc., 144A | 400,000 | 394,980 | ||||||
|
| |||||||
| 1,983,939 | ||||||||
|
| |||||||
| Auto Parts & Equipment — 1.2% | ||||||||
Adient Global Holdings Ltd., 144A | 225,000 | 231,536 | ||||||
Allison Transmission, Inc., 144A | 285,000 | 294,262 | ||||||
American Axle & Manufacturing, Inc. | 120,000 | 124,086 | ||||||
6.625%, 10/15/22 (a) | 155,000 | 160,619 | ||||||
6.25%, 4/01/25, 144A (a) | 60,000 | 59,850 | ||||||
6.50%, 4/01/27, 144A (a) | 260,000 | 256,750 | ||||||
Goodyear Tire & Rubber Co. | 300,000 | 314,622 | ||||||
Principal | Value | |||||||
| Auto Parts & Equipment (Continued) | ||||||||
5.00%, 5/31/26 | $ | 100,000 | $ | 104,750 | ||||
4.875%, 3/15/27 | 154,000 | 157,080 | ||||||
Tenneco, Inc. | 200,000 | 202,500 | ||||||
ZF North America Capital, Inc. | 360,000 | 371,250 | ||||||
4.50%, 4/29/22, 144A | 240,000 | 253,680 | ||||||
4.75%, 4/29/25, 144A | 200,000 | 210,500 | ||||||
|
| |||||||
| 2,741,485 | ||||||||
|
| |||||||
| Distribution/Wholesale — 0.5% | ||||||||
American Tire Distributors, Inc., 144A | 275,000 | 285,312 | ||||||
HD Supply, Inc. | 380,000 | 400,425 | ||||||
5.75%, 4/15/24, 144A | 180,000 | 193,500 | ||||||
LKQ Corp. | 165,000 | 169,950 | ||||||
|
| |||||||
| 1,049,187 | ||||||||
|
| |||||||
| Entertainment — 1.9% | ||||||||
AMC Entertainment Holdings, Inc. | 260,000 | 248,300 | ||||||
5.875%, 11/15/26 | 180,000 | 169,875 | ||||||
Cinemark USA, Inc. | 200,000 | 200,500 | ||||||
GLP Capital LP / GLP Financing II, Inc. | 120,000 | 122,400 | ||||||
4.875%, 11/01/20 | 100,000 | 106,000 | ||||||
4.375%, 4/15/21 | 120,000 | 125,100 | ||||||
5.375%, 11/01/23 | 60,000 | 65,175 | ||||||
5.375%, 4/15/26 | 300,000 | 326,250 | ||||||
International Game Technology PLC | 20,000 | 21,250 | ||||||
6.25%, 2/15/22, 144A | 270,000 | 299,025 | ||||||
6.50%, 2/15/25, 144A | 250,000 | 281,875 | ||||||
Mohegan Gaming & Entertainment, 144A | 225,000 | 237,094 | ||||||
Penn National Gaming, Inc., 144A | 100,000 | 104,000 | ||||||
Regal Entertainment Group | 245,000 | 254,800 | ||||||
Scientific Games International, Inc. | 530,000 | 567,100 | ||||||
10.00%, 12/01/22 | 520,000 | 580,450 | ||||||
Six Flags Entertainment Corp., 144A | 250,000 | 256,250 | ||||||
WMG Acquisition Corp., 144A | 200,000 | 210,500 | ||||||
|
| |||||||
| 4,175,944 | ||||||||
|
| |||||||
| Food Service — 0.2% | ||||||||
Aramark Services, Inc. | 310,000 | 330,150 | ||||||
4.75%, 6/01/26 | 160,000 | 168,048 | ||||||
|
| |||||||
| 498,198 | ||||||||
|
| |||||||
| See Notes to Financial Statements. | 21 |
DBX ETF Trust
Schedule of Investments
Deutsche X-trackers USD High Yield Corporate Bond ETF (Continued)
August 31, 2017
Principal | Value | |||||||
| Home Builders — 1.4% | ||||||||
Beazer Homes USA, Inc. | $ | 150,000 | $ | 166,125 | ||||
CalAtlantic Group, Inc. | 30,000 | 35,062 | ||||||
5.875%, 11/15/24 | 150,000 | 163,313 | ||||||
5.25%, 6/01/26 | 100,000 | 103,375 | ||||||
K Hovnanian Enterprises, Inc. | 100,000 | 103,000 | ||||||
10.50%, 7/15/24, 144A | 100,000 | 105,000 | ||||||
KB Home | 20,000 | 20,600 | ||||||
7.00%, 12/15/21 | 150,000 | 168,375 | ||||||
Lennar Corp. | 20,000 | 20,700 | ||||||
4.75%, 4/01/21 | 260,000 | 275,275 | ||||||
4.125%, 1/15/22 | 60,000 | 62,025 | ||||||
4.75%, 11/15/22 | 148,000 | 155,215 | ||||||
4.875%, 12/15/23 | 450,000 | 477,562 | ||||||
4.75%, 5/30/25 | 60,000 | 62,925 | ||||||
Mattamy Group Corp., 144A | 100,000 | 102,250 | ||||||
PulteGroup, Inc. | 300,000 | 312,420 | ||||||
5.50%, 3/01/26 | 60,000 | 64,725 | ||||||
5.00%, 1/15/27 | 200,000 | 206,750 | ||||||
Taylor Morrison Communities, Inc. / Taylor Morrison Holdings II, Inc., 144A | 180,000 | 184,419 | ||||||
Toll Brothers Finance Corp. | 250,000 | 277,593 | ||||||
|
| |||||||
| 3,066,709 | ||||||||
|
| |||||||
| Home Furnishings — 0.1% | ||||||||
Tempur Sealy International, Inc. | 60,000 | 62,775 | ||||||
5.50%, 6/15/26 | 150,000 | 155,198 | ||||||
|
| |||||||
| 217,973 | ||||||||
|
| |||||||
| Leisure Time — 0.4% | ||||||||
24 Hour Fitness Worldwide, Inc., 144A | 175,000 | 164,115 | ||||||
NCL Corp. Ltd., 144A | 270,000 | 277,425 | ||||||
Sabre GLBL, Inc. | 76,000 | 78,565 | ||||||
5.25%, 11/15/23, 144A | 260,000 | 267,800 | ||||||
Viking Cruises Ltd., 144A | 100,000 | 105,000 | ||||||
|
| |||||||
| 892,905 | ||||||||
|
| |||||||
| Lodging — 2.3% | ||||||||
Boyd Gaming Corp. | 150,000 | 161,812 | ||||||
6.375%, 4/01/26 | 180,000 | 195,975 | ||||||
Caesars Entertainment Resort Properties LLC / Caesars Entertainment Resort Prope | 220,000 | 226,050 | ||||||
Principal | Value | |||||||
| Lodging (Continued) | ||||||||
11.00%, 10/01/21 | $ | 386,000 | $ | 411,090 | ||||
Diamond Resorts International, Inc. | 140,000 | 150,500 | ||||||
10.75%, 9/01/24, 144A | 110,000 | 117,425 | ||||||
Hilton Domestic Operating Co., Inc. | 185,000 | 189,455 | ||||||
Hilton Worldwide Finance LLC / Hilton Worldwide Finance Corp. | 385,000 | 403,249 | ||||||
Jack Ohio Finance LLC / Jack Ohio Finance 1 Corp., 144A | 235,000 | 244,987 | ||||||
Melco Resorts Finance Ltd., 144A | 200,000 | 201,297 | ||||||
MGM Resorts International | 270,000 | 295,988 | ||||||
5.25%, 3/31/20 | 220,000 | 232,650 | ||||||
6.75%, 10/01/20 | 305,000 | 339,313 | ||||||
6.625%, 12/15/21 | 300,000 | 337,500 | ||||||
7.75%, 3/15/22 | 30,000 | 35,175 | ||||||
6.00%, 3/15/23 | 438,000 | 485,085 | ||||||
Studio City Co. Ltd., 144A | 300,000 | 322,845 | ||||||
Wynn Las Vegas LLC / Wynn Las Vegas Capital Corp. | 160,000 | 164,200 | ||||||
5.50%, 3/01/25, 144A | 325,000 | 339,625 | ||||||
5.25%, 5/15/27, 144A | 300,000 | 303,375 | ||||||
|
| |||||||
| 5,157,596 | ||||||||
|
| |||||||
| Retail — 3.5% | ||||||||
1011778 BC ULC / New Red Finance, Inc. | 370,000 | 379,139 | ||||||
6.00%, 4/01/22, 144A | 420,000 | 434,123 | ||||||
4.25%, 5/15/24, 144A | 350,000 | 355,250 | ||||||
5.00%, 10/15/25, 144A | 250,000 | 257,813 | ||||||
Arch Merger Sub, Inc., 144A | 250,000 | 242,812 | ||||||
Asbury Automotive Group, Inc. | 150,000 | 155,250 | ||||||
Claire’s Stores, Inc., 144A | 200,000 | 107,500 | ||||||
Dollar Tree, Inc. | 200,000 | 205,750 | ||||||
5.75%, 3/01/23 | 410,000 | 434,600 | ||||||
Ferrellgas LP / Ferrellgas Finance Corp. | 60,000 | 57,450 | ||||||
6.75%, 1/15/22 (a) | 255,000 | 244,162 | ||||||
Group 1 Automotive, Inc. | 100,000 | 102,750 | ||||||
Guitar Center, Inc., 144A | 100,000 | 88,000 | ||||||
JC Penney Corp., Inc., 144A | 160,000 | 161,200 | ||||||
KFC Holding Co./Pizza Hut Holdings LLC/Taco Bell of America LLC | 400,000 | 419,120 | ||||||
| See Notes to Financial Statements. | 22 |
DBX ETF Trust
Schedule of Investments
Deutsche X-trackers USD High Yield Corporate Bond ETF (Continued)
August 31, 2017
Principal | Value | |||||||
| Retail (Continued) | ||||||||
5.25%, 6/01/26, 144A | $ | 90,000 | $ | 95,062 | ||||
4.75%, 6/01/27, 144A | 200,000 | 205,750 | ||||||
L Brands, Inc. | 30,000 | 33,075 | ||||||
6.625%, 4/01/21 | 180,000 | 197,100 | ||||||
5.625%, 2/15/22 | 140,000 | 148,575 | ||||||
5.625%, 10/15/23 | 328,000 | 346,040 | ||||||
Landry’s, Inc., 144A | 125,000 | 126,875 | ||||||
Men’s Wearhouse, Inc. | 150,000 | 133,875 | ||||||
Neiman Marcus Group Ltd. LLC, 144A | 260,000 | 134,550 | ||||||
Penske Automotive Group, Inc. | 120,000 | 123,750 | ||||||
5.50%, 5/15/26 | 100,000 | 101,250 | ||||||
PetSmart, Inc. | 300,000 | 269,250 | ||||||
8.875%, 6/01/25, 144A | 500,000 | 417,500 | ||||||
PVH Corp. | 200,000 | 206,200 | ||||||
QVC, Inc. | 390,000 | 404,237 | ||||||
4.85%, 4/01/24 | 60,000 | 62,679 | ||||||
Rite Aid Corp. | 250,000 | 259,063 | ||||||
6.75%, 6/15/21 | 150,000 | 156,000 | ||||||
6.125%, 4/01/23, 144A (a) | 300,000 | 295,500 | ||||||
Sears Holdings Corp. | 150,000 | 130,491 | ||||||
Suburban Propane Partners LP/Suburban Energy Finance Corp. | 140,000 | 138,600 | ||||||
|
| |||||||
| 7,630,341 | ||||||||
|
| |||||||
| Storage/Warehousing — 0.2% | ||||||||
Algeco Scotsman Global Finance PLC, 144A | 450,000 | 434,250 | ||||||
|
| |||||||
| Consumer, Non-cyclical — 17.6% | ||||||||
| Agriculture — 0.1% | ||||||||
Vector Group Ltd., 144A | 198,000 | 203,445 | ||||||
|
| |||||||
| Beverages — 0.1% | ||||||||
Cott Holdings, Inc., 144A | 250,000 | 261,875 | ||||||
|
| |||||||
| Biotechnology — 0.0% | ||||||||
Concordia International Corp. | 300,000 | 55,500 | ||||||
7.00%, 4/15/23, 144A | 100,000 | 17,000 | ||||||
|
| |||||||
| 72,500 | ||||||||
|
| |||||||
| Commercial Services — 4.2% | ||||||||
ADT Corp. | 240,000 | 240,432 | ||||||
Principal | Value | |||||||
| Commercial Services (Continued) | ||||||||
4.125%, 6/15/23 | $ | 240,000 | $ | 243,600 | ||||
Ahern Rentals, Inc., 144A | 175,000 | 158,375 | ||||||
APX Group, Inc. | 360,000 | 371,700 | ||||||
7.875%, 12/01/22 | 120,000 | 130,500 | ||||||
Ashtead Capital, Inc. | 200,000 | 215,224 | ||||||
4.125%, 8/15/25, 144A | 200,000 | 205,316 | ||||||
Avis Budget Car Rental LLC / Avis Budget Finance, Inc. | 110,000 | 110,687 | ||||||
5.50%, 4/01/23 (a) | 180,000 | 182,196 | ||||||
Brand Energy & Infrastructure Services, Inc., 144A | 150,000 | 162,000 | ||||||
Cenveo Corp., 144A | 300,000 | 249,000 | ||||||
Ceridian HCM Holding, Inc., 144A | 200,000 | 212,000 | ||||||
Gartner, Inc., 144A | 175,000 | 184,844 | ||||||
Herc Rentals, Inc. | 112,000 | 123,200 | ||||||
7.75%, 6/01/24, 144A | 110,000 | 121,000 | ||||||
Hertz Corp. | 80,000 | 77,200 | ||||||
7.375%, 1/15/21 (a) | 280,000 | 277,550 | ||||||
7.625%, 6/01/22, 144A | 225,000 | 227,531 | ||||||
5.50%, 10/15/24, 144A (a) | 340,000 | 290,700 | ||||||
Jaguar Holding Co. II / Pharmaceutical Product Development LLC, 144A | 305,000 | 320,616 | ||||||
KAR Auction Services, Inc., 144A | 325,000 | 336,927 | ||||||
Laureate Education, Inc., 144A | 200,000 | 218,000 | ||||||
Live Nation Entertainment, Inc., 144A | 185,000 | 189,163 | ||||||
Monitronics International, Inc. | 100,000 | 84,625 | ||||||
Nielsen Co. Luxembourg SARL | 130,000 | 133,900 | ||||||
5.00%, 2/01/25, 144A | 100,000 | 103,500 | ||||||
Nielsen Finance LLC / Nielsen Finance Co. | 375,000 | 381,563 | ||||||
5.00%, 4/15/22, 144A | 500,000 | 518,750 | ||||||
Prime Security Services Borrower LLC / Prime Finance, Inc., 144A | 770,000 | 852,775 | ||||||
RR Donnelley & Sons Co. | 150,000 | 159,750 | ||||||
Service Corp. International | 485,000 | 517,738 | ||||||
ServiceMaster Co. LLC, 144A | 260,000 | 267,800 | ||||||
| See Notes to Financial Statements. | 23 |
DBX ETF Trust
Schedule of Investments
Deutsche X-trackers USD High Yield Corporate Bond ETF (Continued)
August 31, 2017
Principal | Value | |||||||
| Commercial Services (Continued) | ||||||||
Team Health Holdings, Inc., 144A | $ | 275,000 | $ | 266,104 | ||||
United Rentals North America, Inc. | 120,000 | 125,738 | ||||||
5.75%, 11/15/24 | 120,000 | 128,886 | ||||||
5.50%, 7/15/25 | 260,000 | 279,175 | ||||||
5.875%, 9/15/26 | 305,000 | 333,136 | ||||||
5.50%, 5/15/27 | 310,000 | 329,375 | ||||||
|
| |||||||
| 9,330,576 | ||||||||
|
| |||||||
| Cosmetics/Personal Care — 0.5% | ||||||||
Avon Products, Inc. | 170,000 | 173,026 | ||||||
7.00%, 3/15/23 | 160,000 | 143,200 | ||||||
Edgewell Personal Care Co. | 300,000 | 323,991 | ||||||
First Quality Finance Co., Inc., 144A | 200,000 | 204,000 | ||||||
Revlon Consumer Products Corp. | 100,000 | 89,962 | ||||||
6.25%, 8/01/24 | 100,000 | 81,243 | ||||||
|
| |||||||
| 1,015,422 | ||||||||
|
| |||||||
| Food — 1.3% | ||||||||
Albertsons Cos. LLC / Safeway, Inc. / New Albertson’s, Inc. / Albertson’s LLC | 230,000 | 220,685 | ||||||
5.75%, 3/15/25 | 300,000 | 271,875 | ||||||
B&G Foods, Inc. | 230,000 | 236,900 | ||||||
Lamb Weston Holdings, Inc. | 385,000 | 398,956 | ||||||
4.875%, 11/01/26, 144A | 60,000 | 62,409 | ||||||
Post Holdings, Inc. | 150,000 | 158,437 | ||||||
5.50%, 3/01/25, 144A | 210,000 | 218,925 | ||||||
5.00%, 8/15/26, 144A | 320,000 | 320,800 | ||||||
5.75%, 3/01/27, 144A | 400,000 | 416,000 | ||||||
TreeHouse Foods, Inc. | 100,000 | 103,750 | ||||||
6.00%, 2/15/24, 144A | 300,000 | 318,750 | ||||||
US Foods, Inc., 144A | 223,000 | 233,314 | ||||||
|
| |||||||
| 2,960,801 | ||||||||
|
| |||||||
| Healthcare-Products — 1.1% | ||||||||
Alere, Inc., 144A | 270,000 | 289,575 | ||||||
DJO Finco, Inc. / DJO Finance LLC / DJO Finance Corp., 144A | 235,000 | 224,495 | ||||||
Hologic, Inc., 144A | 150,000 | 158,482 | ||||||
Kinetic Concepts, Inc. / KCI USA, Inc. | 245,000 | 257,863 | ||||||
12.50%, 11/01/21, 144A | 100,000 | 112,000 | ||||||
Mallinckrodt International Finance SA | 60,000 | 52,650 | ||||||
Principal | Value | |||||||
| Healthcare-Products (Continued) | ||||||||
Mallinckrodt International Finance SA / Mallinckrodt CB LLC | $ | 330,000 | $ | 329,175 | ||||
5.75%, 8/01/22, 144A (a) | 275,000 | 272,250 | ||||||
5.625%, 10/15/23, 144A (a) | 200,000 | 192,500 | ||||||
5.50%, 4/15/25, 144A | 60,000 | 56,250 | ||||||
Ortho-Clinical Diagnostics, Inc. / Ortho-Clinical Diagnostics SA, 144A | 390,000 | 384,150 | ||||||
|
| |||||||
| 2,329,390 | ||||||||
|
| |||||||
| Healthcare-Services — 7.5% | ||||||||
Acadia Healthcare Co., Inc. | 145,000 | 151,887 | ||||||
Centene Corp. | 330,000 | 344,025 | ||||||
4.75%, 5/15/22 | 317,000 | 334,276 | ||||||
6.125%, 2/15/24 | 235,000 | 253,506 | ||||||
4.75%, 1/15/25 | 250,000 | 258,750 | ||||||
CHS/Community Health Systems, Inc. | 340,000 | 338,300 | ||||||
7.125%, 7/15/20 (a) | 310,000 | 292,756 | ||||||
5.125%, 8/01/21 (a) | 240,000 | 240,900 | ||||||
6.875%, 2/01/22 (a) | 740,000 | 616,050 | ||||||
6.25%, 3/31/23 | 560,000 | 566,300 | ||||||
DaVita, Inc. | 230,000 | 237,331 | ||||||
5.125%, 7/15/24 | 510,000 | 521,475 | ||||||
5.00%, 5/01/25 | 300,000 | 304,890 | ||||||
Envision Healthcare Corp. | 235,000 | 245,281 | ||||||
5.625%, 7/15/22 | 180,000 | 187,312 | ||||||
6.25%, 12/01/24, 144A | 75,000 | 81,000 | ||||||
HCA Healthcare, Inc. | 60,000 | 64,950 | ||||||
HCA, Inc. | 320,000 | 326,400 | ||||||
6.50%, 2/15/20 | 740,000 | 807,695 | ||||||
7.50%, 2/15/22 | 350,000 | 404,250 | ||||||
5.875%, 3/15/22 | 500,000 | 555,200 | ||||||
4.75%, 5/01/23 | 240,000 | 253,752 | ||||||
5.875%, 5/01/23 | 320,000 | 350,880 | ||||||
5.00%, 3/15/24 | 400,000 | 426,000 | ||||||
5.375%, 2/01/25 | 540,000 | 571,050 | ||||||
5.25%, 4/15/25 | 250,000 | 270,312 | ||||||
5.875%, 2/15/26 | 600,000 | 648,750 | ||||||
5.25%, 6/15/26 | 330,000 | 355,988 | ||||||
4.50%, 2/15/27 | 260,000 | 264,225 | ||||||
HealthSouth Corp. | 415,000 | 428,488 | ||||||
Kindred Healthcare, Inc. | 220,000 | 219,450 | ||||||
6.375%, 4/15/22 | 270,000 | 247,050 | ||||||
8.75%, 1/15/23 (a) | 60,000 | 58,350 | ||||||
LifePoint Health, Inc. | 160,000 | 166,180 | ||||||
5.875%, 12/01/23 | 425,000 | 448,775 | ||||||
| See Notes to Financial Statements. | 24 |
DBX ETF Trust
Schedule of Investments
Deutsche X-trackers USD High Yield Corporate Bond ETF (Continued)
August 31, 2017
Principal | Value | |||||||
| Healthcare-Services (Continued) | ||||||||
MEDNAX, Inc., 144A | $ | 135,000 | $ | 140,063 | ||||
Molina Healthcare, Inc. | 100,000 | 104,750 | ||||||
MPH Acquisition Holdings LLC, 144A | 355,000 | 381,625 | ||||||
RegionalCare Hospital Partners Holdings, Inc., 144A | 150,000 | 159,938 | ||||||
Select Medical Corp. | 250,000 | 258,365 | ||||||
Tenet Healthcare Corp. | 175,000 | 181,125 | ||||||
4.75%, 6/01/20 | 120,000 | 124,350 | ||||||
6.00%, 10/01/20 | 400,000 | 426,876 | ||||||
4.50%, 4/01/21 | 150,000 | 153,750 | ||||||
4.375%, 10/01/21 | 240,000 | 245,100 | ||||||
7.50%, 1/01/22, 144A | 150,000 | 162,000 | ||||||
8.125%, 4/01/22 | 650,000 | 684,125 | ||||||
6.75%, 6/15/23 (a) | 450,000 | 447,570 | ||||||
4.625%, 7/15/24, 144A | 372,000 | 372,856 | ||||||
5.125%, 5/01/25, 144A | 320,000 | 322,784 | ||||||
7.00%, 8/01/25, 144A (a) | 100,000 | 98,219 | ||||||
WellCare Health Plans, Inc. | 285,000 | 299,250 | ||||||
|
| |||||||
| 16,404,530 | ||||||||
|
| |||||||
| Household Products/Wares — 0.3% | ||||||||
Spectrum Brands, Inc. | 370,000 | 385,263 | ||||||
5.75%, 7/15/25 | 256,000 | 273,600 | ||||||
|
| |||||||
| 658,863 | ||||||||
|
| |||||||
| Pharmaceuticals — 2.5% | ||||||||
Endo Dac / Endo Finance LLC / Endo Finco, Inc., 144A | 650,000 | 549,250 | ||||||
Endo Finance LLC, 144A | 215,000 | 193,500 | ||||||
Endo Finance LLC / Endo Finco, Inc., 144A | 210,000 | 176,925 | ||||||
Nature’s Bounty Co., 144A | 250,000 | 267,500 | ||||||
Valeant Pharmaceuticals International | 230,000 | 230,575 | ||||||
6.375%, 10/15/20, 144A (a) | 650,000 | 646,945 | ||||||
7.25%, 7/15/22, 144A | 21,000 | 20,055 | ||||||
Valeant Pharmaceuticals International, Inc. | 400,000 | 396,500 | ||||||
7.50%, 7/15/21, 144A | 325,000 | 320,125 | ||||||
5.625%, 12/01/21, 144A | 290,000 | 267,525 | ||||||
5.50%, 3/01/23, 144A | 540,000 | 456,300 | ||||||
5.875%, 5/15/23, 144A | 600,000 | 514,500 | ||||||
7.00%, 3/15/24, 144A | 560,000 | 595,700 | ||||||
6.125%, 4/15/25, 144A | 650,000 | 550,875 | ||||||
Principal | Value | |||||||
| Pharmaceuticals (Continued) | ||||||||
Vizient, Inc., 144A | $ | 275,000 | $ | 316,938 | ||||
|
| |||||||
| 5,503,213 | ||||||||
|
| |||||||
| Diversified — 0.3% | ||||||||
| Holding Companies-Diversified — 0.3% | ||||||||
HRG Group, Inc. | 60,000 | 61,140 | ||||||
7.75%, 1/15/22 | 190,000 | 199,975 | ||||||
Leucadia National Corp. | 150,000 | 161,584 | ||||||
Noble Group Ltd., 144A | 250,000 | 101,875 | ||||||
|
| |||||||
| 524,574 | ||||||||
|
| |||||||
| Energy — 11.8% | ||||||||
| Coal — 0.4% | ||||||||
CONSOL Energy, Inc. | 440,000 | 442,200 | ||||||
8.00%, 4/01/23 | 180,000 | 190,800 | ||||||
Murray Energy Corp., 144A | 240,000 | 140,400 | ||||||
Peabody Energy Corp., 144A | 200,000 | 205,750 | ||||||
|
| |||||||
| 979,150 | ||||||||
|
| |||||||
| Energy-Alternate Sources — 0.2% | ||||||||
TerraForm Power Operating LLC, 144A | 335,000 | 348,400 | ||||||
|
| |||||||
| Oil & Gas — 7.8% | ||||||||
Antero Resources Corp. | 230,000 | 234,887 | ||||||
5.125%, 12/01/22 | 60,000 | 60,450 | ||||||
5.625%, 6/01/23 | 420,000 | 429,450 | ||||||
Ascent Resources Utica Holdings LLC / ARU Finance Corp., 144A | 250,000 | 255,625 | ||||||
Atwood Oceanics, Inc. | 100,000 | 98,125 | ||||||
Baytex Energy Corp., 144A | 150,000 | 127,875 | ||||||
California Resources Corp., 144A | 480,000 | 266,400 | ||||||
Calumet Specialty Products Partners LP / Calumet Finance Corp. | 120,000 | 139,800 | ||||||
6.50%, 4/15/21 (a) | 245,000 | 236,119 | ||||||
Carrizo Oil & Gas, Inc. | 330,000 | 335,775 | ||||||
6.25%, 4/15/23 (a) | 120,000 | 117,000 | ||||||
Chesapeake Energy Corp. | 200,000 | 201,000 | ||||||
8.00%, 12/15/22, 144A (a) | 308,000 | 319,550 | ||||||
8.00%, 1/15/25, 144A (a) | 487,000 | 471,172 | ||||||
8.00%, 6/15/27, 144A | 100,000 | 95,500 | ||||||
Citgo Holding, Inc., 144A | 230,000 | 246,675 | ||||||
| See Notes to Financial Statements. | 25 |
DBX ETF Trust
Schedule of Investments
Deutsche X-trackers USD High Yield Corporate Bond ETF (Continued)
August 31, 2017
Principal | Value | |||||||
| Oil & Gas (Continued) | ||||||||
CITGO Petroleum Corp., 144A | $ | 200,000 | $ | 203,000 | ||||
Concho Resources, Inc. | 120,000 | 123,675 | ||||||
5.50%, 4/01/23 | 120,000 | 123,675 | ||||||
4.375%, 1/15/25 | 350,000 | 365,750 | ||||||
Continental Resources, Inc. | 380,000 | 383,325 | ||||||
4.50%, 4/15/23 (a) | 300,000 | 296,250 | ||||||
3.80%, 6/01/24 (a) | 215,000 | 201,025 | ||||||
Denbury Resources, Inc. | 235,000 | 211,500 | ||||||
5.50%, 5/01/22 | 145,000 | 67,062 | ||||||
4.625%, 7/15/23 | 120,000 | 53,400 | ||||||
Diamond Offshore Drilling, Inc. | 125,000 | 125,469 | ||||||
Diamondback Energy, Inc. | 270,000 | 278,775 | ||||||
Ensco PLC | 341,000 | 250,635 | ||||||
EP Energy LLC / Everest Acquisition Finance, Inc. | 320,000 | 237,200 | ||||||
6.375%, 6/15/23 | 100,000 | 57,500 | ||||||
8.00%, 11/29/24, 144A (a) | 100,000 | 98,250 | ||||||
8.00%, 2/15/25, 144A | 230,000 | 152,950 | ||||||
Gulfport Energy Corp. | 175,000 | 172,375 | ||||||
6.375%, 5/15/25, 144A | 100,000 | 98,750 | ||||||
Hilcorp Energy I LP / Hilcorp Finance Co. | 172,000 | 163,400 | ||||||
5.75%, 10/01/25, 144A | 78,000 | 75,660 | ||||||
Jupiter Resources, Inc., 144A | 245,000 | 160,475 | ||||||
Laredo Petroleum, Inc. | 120,000 | 120,150 | ||||||
7.375%, 5/01/22 | 84,000 | 86,625 | ||||||
MEG Energy Corp. | 155,000 | 124,581 | ||||||
7.00%, 3/31/24, 144A | 365,000 | 292,000 | ||||||
Murphy Oil Corp. | 160,000 | 157,843 | ||||||
4.70%, 12/01/22 | 156,000 | 153,847 | ||||||
6.875%, 8/15/24 | 109,000 | 115,404 | ||||||
Nabors Industries, Inc. | 320,000 | 320,800 | ||||||
4.625%, 9/15/21 | 200,000 | 190,876 | ||||||
5.50%, 1/15/23 (a) | 60,000 | 56,336 | ||||||
Newfield Exploration Co. | 270,000 | 286,200 | ||||||
5.625%, 7/01/24 | 60,000 | 64,200 | ||||||
5.375%, 1/01/26 | 180,000 | 189,000 | ||||||
Noble Holding International Ltd. | 325,000 | 252,681 | ||||||
Oasis Petroleum, Inc. | 230,000 | 224,825 | ||||||
Principal | Value | |||||||
| Oil & Gas (Continued) | ||||||||
Pacific Drilling SA, 144A | $ | 250,000 | $ | 91,250 | ||||
Parsley Energy LLC / Parsley Finance Corp. | 160,000 | 161,600 | ||||||
5.25%, 8/15/25, 144A | 210,000 | 211,050 | ||||||
PBF Holding Co. LLC / PBF Finance Corp. | 120,000 | 120,900 | ||||||
7.25%, 6/15/25, 144A | 100,000 | 99,250 | ||||||
PDC Energy, Inc. | 100,000 | 104,125 | ||||||
6.125%, 9/15/24, 144A | 100,000 | 103,000 | ||||||
Permian Resources LLC, 144A | 125,000 | 145,000 | ||||||
Permian Resources LLC / AEPB Finance Corp., 144A | 250,000 | 206,250 | ||||||
QEP Resources, Inc. | 155,000 | 149,962 | ||||||
5.25%, 5/01/23 | 140,000 | 133,700 | ||||||
Range Resources Corp. | 465,000 | 461,512 | ||||||
4.875%, 5/15/25 | 150,000 | 144,375 | ||||||
Rice Energy, Inc. | 100,000 | 104,125 | ||||||
Rowan Cos., Inc. | 110,000 | 100,375 | ||||||
7.375%, 6/15/25 | 175,000 | 159,250 | ||||||
RSP Permian, Inc. | 150,000 | 156,562 | ||||||
5.25%, 1/15/25, 144A | 150,000 | 151,125 | ||||||
Sanchez Energy Corp. | 100,000 | 87,000 | ||||||
6.125%, 1/15/23 (a) | 240,000 | 184,200 | ||||||
Seven Generations Energy Ltd. | 100,000 | 104,500 | ||||||
6.75%, 5/01/23, 144A | 160,000 | 167,400 | ||||||
6.875%, 6/30/23, 144A | 160,000 | 167,200 | ||||||
SM Energy Co. | 285,000 | 270,750 | ||||||
5.00%, 1/15/24 | 100,000 | 89,500 | ||||||
6.75%, 9/15/26 (a) | 245,000 | 232,138 | ||||||
Southwestern Energy Co. | 230,000 | 237,475 | ||||||
4.10%, 3/15/22 (a) | 365,000 | 338,538 | ||||||
6.70%, 1/23/25 | 120,000 | 117,600 | ||||||
Sunoco LP / Sunoco Finance Corp. | 285,000 | 293,707 | ||||||
6.25%, 4/15/21 | 155,000 | 161,588 | ||||||
6.375%, 4/01/23 | 185,000 | 195,869 | ||||||
Transocean, Inc. | 200,000 | 190,500 | ||||||
9.00%, 7/15/23, 144A | 203,000 | 216,703 | ||||||
Ultra Resources, Inc. | 100,000 | 98,500 | ||||||
7.125%, 4/15/25, 144A | 200,000 | 195,250 | ||||||
| See Notes to Financial Statements. | 26 |
DBX ETF Trust
Schedule of Investments
Deutsche X-trackers USD High Yield Corporate Bond ETF (Continued)
August 31, 2017
Principal | Value | |||||||
| Oil & Gas (Continued) | ||||||||
Whiting Petroleum Corp. | $ | 165,000 | $ | 164,175 | ||||
5.75%, 3/15/21 (a) | 220,000 | 207,350 | ||||||
6.25%, 4/01/23 (a) | 30,000 | 27,975 | ||||||
WPX Energy, Inc. | 120,000 | 124,350 | ||||||
8.25%, 8/01/23 (a) | 207,000 | 228,218 | ||||||
5.25%, 9/15/24 | 100,000 | 98,500 | ||||||
|
| |||||||
| 17,173,269 | ||||||||
|
| |||||||
| Oil & Gas Services — 0.6% | ||||||||
Bristow Group, Inc. | 100,000 | 62,750 | ||||||
CGG SA | 250,000 | 93,750 | ||||||
SESI LLC | 264,000 | 266,640 | ||||||
Weatherford International Ltd. | 100,000 | 107,500 | ||||||
7.75%, 6/15/21 | 310,000 | 311,162 | ||||||
4.50%, 4/15/22 | 5,000 | 4,488 | ||||||
8.25%, 6/15/23 | 355,000 | 348,787 | ||||||
9.875%, 2/15/24, 144A | 30,000 | 30,825 | ||||||
|
| |||||||
| 1,225,902 | ||||||||
|
| |||||||
| Pipelines — 2.8% | ||||||||
Andeavor Logistics LP / Tesoro Logistics Finance Corp. | 120,000 | 122,250 | ||||||
6.25%, 10/15/22 | 380,000 | 403,750 | ||||||
6.375%, 5/01/24 | 220,000 | 240,350 | ||||||
5.25%, 1/15/25 | 170,000 | 180,838 | ||||||
Cheniere Corpus Christi Holdings LLC | 450,000 | 514,125 | ||||||
5.875%, 3/31/25 | 236,000 | 254,585 | ||||||
5.125%, 6/30/27, 144A | 250,000 | 259,375 | ||||||
Crestwood Midstream Partners LP / Crestwood Midstream Finance Corp. | 65,000 | 67,437 | ||||||
5.75%, 4/01/25 | 185,000 | 188,006 | ||||||
DCP Midstream Operating LP | 451,000 | 476,932 | ||||||
3.875%, 3/15/23 | 160,000 | 156,600 | ||||||
Energy Transfer Equity LP | 220,000 | 249,425 | ||||||
5.875%, 1/15/24 | 211,000 | 228,408 | ||||||
5.50%, 6/01/27 | 285,000 | 304,950 | ||||||
Genesis Energy LP / Genesis Energy Finance Corp. | 245,000 | 249,288 | ||||||
6.50%, 10/01/25 | 125,000 | 123,125 | ||||||
NGPL PipeCo LLC | 150,000 | 154,500 | ||||||
4.875%, 8/15/27, 144A | 150,000 | 154,875 | ||||||
NuStar Logistics LP | 150,000 | 159,375 | ||||||
Rockies Express Pipeline LLC | 120,000 | 124,650 | ||||||
Principal | Value | |||||||
| Pipelines (Continued) | ||||||||
5.625%, 4/15/20, 144A | $ | 220,000 | $ | 232,650 | ||||
Targa Resources Partners LP / Targa Resources Partners Finance Corp. | 200,000 | 202,500 | ||||||
5.25%, 5/01/23 | 85,000 | 87,125 | ||||||
4.25%, 11/15/23 | 240,000 | 239,400 | ||||||
6.75%, 3/15/24 | 210,000 | 228,375 | ||||||
5.125%, 2/01/25, 144A | 60,000 | 61,875 | ||||||
5.375%, 2/01/27, 144A | 75,000 | 78,000 | ||||||
Williams Cos., Inc. | 120,000 | 119,700 | ||||||
4.55%, 6/24/24 | 330,000 | 339,075 | ||||||
|
| |||||||
| 6,201,544 | ||||||||
|
| |||||||
| Financial — 9.3% | ||||||||
| Banks — 1.6% | ||||||||
CIT Group, Inc. | 134,000 | 140,533 | ||||||
3.875%, 2/19/19 | 160,000 | 164,000 | ||||||
5.375%, 5/15/20 | 120,000 | 129,150 | ||||||
5.00%, 8/15/22 | 349,000 | 378,630 | ||||||
5.00%, 8/01/23 | 120,000 | 130,650 | ||||||
Intesa Sanpaolo SpA | 650,000 | 666,208 | ||||||
5.71%, 1/15/26, 144A | 250,000 | 264,647 | ||||||
Royal Bank of Scotland Group PLC | 410,000 | 452,009 | ||||||
6.10%, 6/10/23 | 355,000 | 392,771 | ||||||
6.00%, 12/19/23 | 420,000 | 466,017 | ||||||
5.125%, 5/28/24 | 400,000 | 422,520 | ||||||
|
| |||||||
| 3,607,135 | ||||||||
|
| |||||||
| Diversified Financial Services — 3.8% | ||||||||
Aircastle Ltd. | 150,000 | 162,000 | ||||||
5.125%, 3/15/21 | 135,000 | 143,606 | ||||||
5.50%, 2/15/22 | 60,000 | 65,700 | ||||||
5.00%, 4/01/23 | 300,000 | 319,800 | ||||||
Ally Financial, Inc. | 150,000 | 160,875 | ||||||
3.50%, 1/27/19 | 210,000 | 213,150 | ||||||
3.75%, 11/18/19 | 300,000 | 307,125 | ||||||
8.00%, 3/15/20 | 140,000 | 158,200 | ||||||
4.125%, 3/30/20 | 295,000 | 304,219 | ||||||
7.50%, 9/15/20 | 120,000 | 135,450 | ||||||
4.25%, 4/15/21 | 50,000 | 51,750 | ||||||
4.125%, 2/13/22 | 350,000 | 360,062 | ||||||
4.625%, 5/19/22 | 60,000 | 62,550 | ||||||
5.125%, 9/30/24 (a) | 85,000 | 91,800 | ||||||
4.625%, 3/30/25 | 60,000 | 62,775 | ||||||
5.75%, 11/20/25 (a) | 200,000 | 216,690 | ||||||
ASP AMC Merger Sub, Inc., 144A | 100,000 | 95,500 | ||||||
Intelsat Connect Finance SA, 144A | 150,000 | 143,625 | ||||||
Jefferies Finance LLC / JFIN Co-Issuer Corp., 144A | 470,000 | 486,450 | ||||||
| See Notes to Financial Statements. | 27 |
DBX ETF Trust
Schedule of Investments
Deutsche X-trackers USD High Yield Corporate Bond ETF (Continued)
August 31, 2017
Principal | Value | |||||||
| Diversified Financial Services (Continued) | ||||||||
LPL Holdings, Inc., 144A | $ | 450,000 | $ | 472,500 | ||||
Nationstar Mortgage LLC / Nationstar Capital Corp. | 60,000 | 61,425 | ||||||
6.50%, 7/01/21 | 240,000 | 246,086 | ||||||
Navient Corp. | 405,000 | 420,309 | ||||||
Series MTN, 4.875%, 6/17/19 | 170,000 | 176,163 | ||||||
Series MTN, 8.00%, 3/25/20 | 300,000 | 331,875 | ||||||
5.00%, 10/26/20 | 185,000 | 190,319 | ||||||
6.625%, 7/26/21 | 280,000 | 299,250 | ||||||
Series MTN, 7.25%, 1/25/22 | 120,000 | 131,550 | ||||||
5.50%, 1/25/23 | 450,000 | 456,188 | ||||||
7.25%, 9/25/23 | 100,000 | 108,960 | ||||||
Series MTN, 6.125%, 3/25/24 | 160,000 | 164,000 | ||||||
5.875%, 10/25/24 | 285,000 | 289,417 | ||||||
OneMain Financial Holdings LLC | 200,000 | 209,500 | ||||||
7.25%, 12/15/21, 144A | 145,000 | 152,431 | ||||||
Quicken Loans, Inc., 144A | 260,000 | 273,650 | ||||||
Springleaf Finance Corp. | 150,000 | 156,000 | ||||||
8.25%, 12/15/20 | 565,000 | 637,038 | ||||||
7.75%, 10/01/21 | 20,000 | 22,575 | ||||||
Walter Investment Management Corp. | 100,000 | 56,000 | ||||||
|
| |||||||
| 8,396,563 | ||||||||
|
| |||||||
| Insurance — 0.6% | ||||||||
Alliant Holdings Intermediate LLC, 144A | 208,000 | 218,920 | ||||||
AssuredPartners, Inc., 144A | 125,000 | 126,237 | ||||||
Genworth Holdings, Inc. | 250,000 | 251,250 | ||||||
7.625%, 9/24/21 | 165,000 | 161,997 | ||||||
4.90%, 8/15/23 | 30,000 | 25,650 | ||||||
4.80%, 2/15/24 | 100,000 | 84,000 | ||||||
HUB International Ltd., 144A | 390,000 | 406,458 | ||||||
|
| |||||||
| 1,274,512 | ||||||||
|
| |||||||
| Real Estate — 0.3% | ||||||||
Howard Hughes Corp., 144A | 200,000 | 200,632 | ||||||
Realogy Group LLC / Realogy Co.-Issuer Corp. | 300,000 | 313,500 | ||||||
4.875%, 6/01/23, 144A | 145,000 | 148,625 | ||||||
|
| |||||||
| 662,757 | ||||||||
|
| |||||||
| Real Estate Investment Trusts — 2.3% | ||||||||
Equinix, Inc. | 60,000 | 61,594 | ||||||
5.375%, 1/01/22 | 396,000 | 415,800 | ||||||
5.375%, 4/01/23 | 180,000 | 188,550 | ||||||
Principal | Value | |||||||
| Real Estate Investment Trusts (Continued) | ||||||||
5.75%, 1/01/25 | $ | 185,000 | $ | 199,800 | ||||
5.875%, 1/15/26 | 180,000 | 198,000 | ||||||
5.375%, 5/15/27 | 250,000 | 269,687 | ||||||
ESH Hospitality, Inc., 144A | 350,000 | 361,375 | ||||||
FelCor Lodging LP | 365,000 | 380,512 | ||||||
Iron Mountain, Inc. | 340,000 | 352,750 | ||||||
6.00%, 8/15/23 | 160,000 | 170,600 | ||||||
5.75%, 8/15/24 | 300,000 | 307,515 | ||||||
iStar, Inc. | 325,000 | 329,805 | ||||||
MGM Growth Properties Operating Partnership LP / MGP Finance Co-Issuer, Inc. | 280,000 | 305,900 | ||||||
MPT Operating Partnership LP / MPT Finance Corp. | 120,000 | 130,950 | ||||||
5.25%, 8/01/26 | 250,000 | 260,625 | ||||||
SBA Communications Corp. | 305,000 | 316,438 | ||||||
4.875%, 9/01/24 | 225,000 | 232,875 | ||||||
Uniti Group LP / Uniti Fiber Holdings, Inc. / CSL Capital LLC, 144A | 14,000 | 13,060 | ||||||
Uniti Group LP / Uniti Group Finance, Inc. / CSL Capital LLC | 270,000 | 271,350 | ||||||
8.25%, 10/15/23 | 270,000 | 265,167 | ||||||
|
| |||||||
| 5,032,353 | ||||||||
|
| |||||||
| Venture Capital — 0.7% | ||||||||
Icahn Enterprises LP / Icahn Enterprises Finance Corp. | 625,000 | 632,031 | ||||||
6.00%, 8/01/20 | 230,000 | 237,332 | ||||||
5.875%, 2/01/22 | 665,000 | 687,244 | ||||||
6.75%, 2/01/24 | 10,000 | 10,553 | ||||||
|
| |||||||
| 1,567,160 | ||||||||
|
| |||||||
| Industrial — 8.3% | ||||||||
| Aerospace/Defense — 1.3% | ||||||||
Arconic, Inc. | 150,000 | 157,551 | ||||||
6.15%, 8/15/20 | 270,000 | 296,460 | ||||||
5.40%, 4/15/21 | 300,000 | 322,875 | ||||||
5.87%, 2/23/22 | 60,000 | 65,850 | ||||||
5.125%, 10/01/24 | 330,000 | 351,450 | ||||||
KLX, Inc., 144A | 390,000 | 410,475 | ||||||
TransDigm, Inc. | 100,000 | 101,655 | ||||||
6.00%, 7/15/22 | 283,000 | 293,612 | ||||||
6.50%, 7/15/24 | 120,000 | 124,950 | ||||||
6.50%, 5/15/25 | 180,000 | 185,850 | ||||||
6.375%, 6/15/26 | 350,000 | 360,938 | ||||||
| See Notes to Financial Statements. | 28 |
DBX ETF Trust
Schedule of Investments
Deutsche X-trackers USD High Yield Corporate Bond ETF (Continued)
August 31, 2017
Principal | Value | |||||||
| Aerospace/Defense (Continued) | ||||||||
Triumph Group, Inc., 144A | $ | 100,000 | $ | 103,150 | ||||
|
| |||||||
| 2,774,816 | ||||||||
|
| |||||||
| Building Materials — 0.5% | ||||||||
Builders FirstSource, Inc., 144A | 200,000 | 209,750 | ||||||
Standard Industries, Inc. | 120,000 | 126,750 | ||||||
5.375%, 11/15/24, 144A | 397,000 | 416,850 | ||||||
6.00%, 10/15/25, 144A | 120,000 | 129,600 | ||||||
Standard Industries, Inc./NJ | 110,000 | 114,125 | ||||||
5.00%, 2/15/27, 144A | 60,000 | 61,650 | ||||||
USG Corp., 144A | 150,000 | 154,125 | ||||||
|
| |||||||
| 1,212,850 | ||||||||
|
| |||||||
| Electrical Components & Equipment — 0.1% | ||||||||
Energizer Holdings, Inc., 144A | 150,000 | 157,875 | ||||||
General Cable Corp. | 150,000 | 154,125 | ||||||
|
| |||||||
| 312,000 | ||||||||
|
| |||||||
| Electronics — 0.1% | ||||||||
Ingram Micro, Inc. | 125,000 | 127,388 | ||||||
|
| |||||||
| Engineering & Construction — 0.3% | ||||||||
AECOM | 120,000 | 126,013 | ||||||
5.875%, 10/15/24 | 483,000 | 530,696 | ||||||
|
| |||||||
| 656,709 | ||||||||
|
| |||||||
| Environmental Control — 0.6% | ||||||||
CD&R Waterworks Merger Sub LLC, 144A | 125,000 | 127,813 | ||||||
Clean Harbors, Inc. | 500,000 | 510,000 | ||||||
Covanta Holding Corp. | 200,000 | 200,500 | ||||||
5.875%, 7/01/25 | 60,000 | 59,700 | ||||||
GFL Environmental, Inc., 144A | 300,000 | 324,000 | ||||||
|
| |||||||
| 1,222,013 | ||||||||
|
| |||||||
| Machinery-Construction & Mining — 0.3% | ||||||||
BlueLine Rental Finance Corp. / BlueLine Rental LLC, 144A | 335,000 | 366,624 | ||||||
Vertiv Group Corp., 144A | 210,000 | 234,675 | ||||||
|
| |||||||
| 601,299 | ||||||||
|
| |||||||
| Machinery-Diversified — 0.5% | ||||||||
CNH Industrial Capital LLC | 240,000 | 250,800 | ||||||
Principal | Value | |||||||
| Machinery-Diversified (Continued) | ||||||||
4.875%, 4/01/21 | $ | 60,000 | $ | 63,654 | ||||
3.875%, 10/15/21 | 430,000 | 440,750 | ||||||
4.375%, 4/05/22 | 110,000 | 115,223 | ||||||
Welbilt, Inc. | 200,000 | 231,500 | ||||||
|
| |||||||
| 1,101,927 | ||||||||
|
| |||||||
| Metal Fabricate/Hardware — 0.3% | ||||||||
Novelis Corp. | 180,000 | 190,575 | ||||||
5.875%, 9/30/26, 144A | 350,000 | 365,750 | ||||||
|
| |||||||
| 556,325 | ||||||||
|
| |||||||
| Miscellaneous Manufacturing — 1.0% | ||||||||
Amsted Industries, Inc., 144A | 125,000 | 130,000 | ||||||
Bombardier, Inc. | 120,000 | 123,000 | ||||||
7.75%, 3/15/20, 144A | 490,000 | 537,922 | ||||||
8.75%, 12/01/21, 144A | 280,000 | 318,760 | ||||||
5.75%, 3/15/22, 144A | 60,000 | 61,425 | ||||||
6.00%, 10/15/22, 144A | 60,000 | 61,125 | ||||||
6.125%, 1/15/23, 144A | 270,000 | 277,679 | ||||||
7.50%, 3/15/25, 144A | 390,000 | 416,081 | ||||||
Gates Global LLC / Gates Global Co., 144A | 365,000 | 375,877 | ||||||
|
| |||||||
| 2,301,869 | ||||||||
|
| |||||||
| Packaging & Containers — 2.6% | ||||||||
Ardagh Packaging Finance PLC / Ardagh Holdings USA, Inc. | 50,000 | 51,525 | ||||||
4.625%, 5/15/23, 144A | 350,000 | 360,937 | ||||||
7.25%, 5/15/24, 144A | 250,000 | 276,712 | ||||||
6.00%, 2/15/25, 144A | 400,000 | 427,000 | ||||||
Ball Corp. | 60,000 | 64,425 | ||||||
5.25%, 7/01/25 | 605,000 | 661,719 | ||||||
Berry Plastics Corp. | 350,000 | 366,188 | ||||||
BWAY Holding Co. | 400,000 | 418,500 | ||||||
7.25%, 4/15/25, 144A | 255,000 | 261,056 | ||||||
Coveris Holdings SA, 144A | 275,000 | 267,438 | ||||||
Crown Americas LLC / Crown Americas Capital Corp. IV | 100,000 | 105,000 | ||||||
Flex Acquisition Co., Inc., 144A | 207,000 | 215,668 | ||||||
Owens-Brockway Glass Container, Inc. | 200,000 | 210,750 | ||||||
5.875%, 8/15/23, 144A | 120,000 | 131,925 | ||||||
Reynolds Group Issuer, Inc. / Reynolds Group Issuer LLC / Reynolds Group Issuer Lu | 400,000 | 407,956 | ||||||
6.875%, 2/15/21 | 155,552 | 159,830 | ||||||
| See Notes to Financial Statements. | 29 |
DBX ETF Trust
Schedule of Investments
Deutsche X-trackers USD High Yield Corporate Bond ETF (Continued)
August 31, 2017
Principal | Value | |||||||
| Packaging & Containers (Continued) | ||||||||
5.125%, 7/15/23, 144A | $ | 430,000 | $ | 448,679 | ||||
7.00%, 7/15/24, 144A | 310,000 | 332,669 | ||||||
Sealed Air Corp. | 160,000 | 169,000 | ||||||
5.25%, 4/01/23, 144A | 250,000 | 268,750 | ||||||
5.125%, 12/01/24, 144A | 60,000 | 64,050 | ||||||
5.50%, 9/15/25, 144A | 50,000 | 54,500 | ||||||
|
| |||||||
| 5,724,277 | ||||||||
|
| |||||||
| Shipbuilding — 0.1% | ||||||||
Huntington Ingalls Industries, Inc. | 170,000 | 175,525 | ||||||
5.00%, 11/15/25, 144A | 100,000 | 108,500 | ||||||
|
| |||||||
| 284,025 | ||||||||
|
| |||||||
| Transportation — 0.3% | ||||||||
Hornbeck Offshore Services, Inc. | 100,000 | 46,500 | ||||||
XPO Logistics, Inc. | 490,000 | 517,367 | ||||||
6.125%, 9/01/23, 144A | 160,000 | 167,600 | ||||||
|
| |||||||
| 731,467 | ||||||||
|
| |||||||
| Trucking & Leasing — 0.3% | ||||||||
Park Aerospace Holdings Ltd. | 660,000 | 690,525 | ||||||
5.50%, 2/15/24, 144A | 60,000 | 62,550 | ||||||
|
| |||||||
| 753,075 | ||||||||
|
| |||||||
| Technology — 5.7% | ||||||||
| Computers — 1.5% | ||||||||
Dell International LLC / EMC Corp. | 388,000 | 407,768 | ||||||
7.125%, 6/15/24, 144A (a) | 370,000 | 410,042 | ||||||
Dell, Inc. | 240,000 | 249,300 | ||||||
EMC Corp. | 279,000 | 275,383 | ||||||
3.375%, 6/01/23 | 275,000 | 265,840 | ||||||
Exela Intermediate LLC / Exela Finance, Inc., 144A | 200,000 | 197,000 | ||||||
Harland Clarke Holdings Corp., 144A | 78,000 | 79,297 | ||||||
NCR Corp. | 300,000 | 307,500 | ||||||
6.375%, 12/15/23 | 195,000 | 208,894 | ||||||
Riverbed Technology, Inc., 144A | 175,000 | 171,719 | ||||||
Sungard Availability Services Capital, Inc., 144A | 100,000 | 70,500 | ||||||
Western Digital Corp. | 620,000 | 737,800 | ||||||
|
| |||||||
| 3,381,043 | ||||||||
|
| |||||||
| Office/Business Equipment — 0.1% | ||||||||
CDW LLC / CDW Finance Corp. | 255,000 | 280,819 | ||||||
|
| |||||||
Principal | Value | |||||||
| Semiconductors — 1.2% | ||||||||
Amkor Technology, Inc. | $ | 264,000 | $ | 273,570 | ||||
Micron Technology, Inc. | 245,000 | 256,331 | ||||||
5.25%, 1/15/24, 144A | 240,000 | 250,800 | ||||||
NXP BV / NXP Funding LLC | 550,000 | 576,675 | ||||||
3.875%, 9/01/22, 144A | 375,000 | 389,062 | ||||||
Qorvo, Inc. | 280,000 | 305,900 | ||||||
7.00%, 12/01/25 | 30,000 | 34,125 | ||||||
Sensata Technologies BV | 295,000 | 308,644 | ||||||
5.00%, 10/01/25, 144A | 140,000 | 147,350 | ||||||
|
| |||||||
| 2,542,457 | ||||||||
|
| |||||||
| Software — 2.9% | ||||||||
BMC Software Finance, Inc., 144A | 300,000 | 311,250 | ||||||
CDK Global, Inc., 144A | 300,000 | 305,250 | ||||||
Change Healthcare Holdings LLC / Change Healthcare Finance, Inc., 144A | 200,000 | 206,500 | ||||||
First Data Corp. | 910,000 | 982,800 | ||||||
5.00%, 1/15/24, 144A | 420,000 | 438,896 | ||||||
5.75%, 1/15/24, 144A | 650,000 | 686,562 | ||||||
Infor US, Inc. | 150,000 | 154,125 | ||||||
6.50%, 5/15/22 | 280,000 | 287,000 | ||||||
Informatica LLC, 144A | 150,000 | 151,500 | ||||||
MSCI, Inc. | 60,000 | 64,200 | ||||||
5.75%, 8/15/25, 144A | 120,000 | 131,088 | ||||||
4.75%, 8/01/26, 144A | 300,000 | 312,000 | ||||||
Nuance Communications, Inc. | 260,000 | 264,550 | ||||||
5.625%, 12/15/26, 144A | 100,000 | 104,875 | ||||||
Open Text Corp. | 195,000 | 206,456 | ||||||
5.875%, 6/01/26, 144A | 230,000 | 249,838 | ||||||
Quintiles IMS, Inc. | 235,000 | 245,575 | ||||||
5.00%, 10/15/26, 144A | 250,000 | 262,500 | ||||||
Rackspace Hosting, Inc., 144A | 255,000 | 271,256 | ||||||
Solera LLC / Solera Finance, Inc., 144A | 270,000 | 308,813 | ||||||
SS&C Technologies Holdings, Inc. | 100,000 | 105,500 | ||||||
Veritas US, Inc. / Veritas Bermuda Ltd., 144A | 250,000 | 269,375 | ||||||
|
| |||||||
| 6,319,909 | ||||||||
|
| |||||||
| See Notes to Financial Statements. | 30 |
DBX ETF Trust
Schedule of Investments
Deutsche X-trackers USD High Yield Corporate Bond ETF (Continued)
August 31, 2017
Principal | Value | |||||||
| Utilities — 2.7% | ||||||||
| Electric — 2.3% | ||||||||
AES Corp. | $ | 48,000 | $ | 55,080 | ||||
7.375%, 7/01/21 | 300,000 | 341,250 | ||||||
5.50%, 3/15/24 | 200,000 | 208,500 | ||||||
5.50%, 4/15/25 | 150,000 | 157,125 | ||||||
Calpine Corp. | 100,000 | 103,500 | ||||||
5.375%, 1/15/23 (a) | 225,000 | 214,875 | ||||||
5.50%, 2/01/24 | 265,000 | 246,781 | ||||||
5.75%, 1/15/25 (a) | 300,000 | 276,660 | ||||||
5.25%, 6/01/26, 144A | 225,000 | 221,625 | ||||||
DPL, Inc. | 270,000 | 294,637 | ||||||
Dynegy, Inc. | 400,000 | 415,000 | ||||||
7.625%, 11/01/24 (a) | 170,000 | 176,162 | ||||||
8.00%, 1/15/25, 144A (a) | 450,000 | 465,188 | ||||||
8.125%, 1/30/26, 144A | 150,000 | 155,063 | ||||||
IPALCO Enterprises, Inc. | 100,000 | 101,500 | ||||||
NRG Energy, Inc. | 560,000 | 581,000 | ||||||
6.25%, 5/01/24 (a) | 60,000 | 62,400 | ||||||
7.25%, 5/15/26 | 260,000 | 280,150 | ||||||
6.625%, 1/15/27 | 300,000 | 316,500 | ||||||
NRG Yield Operating LLC | 200,000 | 210,000 | ||||||
Talen Energy Supply LLC | 20,000 | 18,050 | ||||||
6.50%, 6/01/25 | 300,000 | 219,750 | ||||||
|
| |||||||
| 5,120,796 | ||||||||
|
| |||||||
Principal | Value | |||||||
| Gas — 0.4% | ||||||||
AmeriGas Partners LP / AmeriGas Finance Corp. | $ | 150,000 | $ | 156,375 | ||||
5.50%, 5/20/25 | 135,000 | 137,363 | ||||||
5.875%, 8/20/26 | 140,000 | 143,500 | ||||||
5.75%, 5/20/27 | 136,000 | 138,040 | ||||||
NGL Energy Partners LP / NGL Energy Finance Corp. | 200,000 | 193,500 | ||||||
|
| |||||||
| 768,778 | ||||||||
|
| |||||||
TOTAL CORPORATE BONDS | 215,997,184 | |||||||
|
| |||||||
Number | ||||||||
| SECURITIES LENDING COLLATERAL — 8.1% | ||||||||
Deutsche Government & Agency Securities Portfolio “Deutsche Government Cash Institutional Shares”, 0.93% (b)(c) | 17,754,544 | 17,754,544 | ||||||
|
| |||||||
TOTAL INVESTMENTS — 106.2% | ||||||||
(Cost $231,630,320) | $ | 233,751,728 | ||||||
Other assets and liabilities, net — (6.2%) | (13,540,212 | ) | ||||||
|
| |||||||
NET ASSETS — 100.0% | $ | 220,211,516 | ||||||
|
| |||||||
| (a) | All or a portion of these securities were on loan. In addition, “Other assets and liabilities, net” may include pending sales that are also on loan. The value of securities loaned at August 31, 2017 amounted to $17,136,475, which is 7.8% of net assets. |
| (b) | Affiliated fund managed by Deutsche Investment Management Americas Inc. The rate shown is the annualized seven-day yield at period end. |
| (c) | Represents collateral held in connection with securities lending. Income earned by the Fund is net of borrower rebates. |
| MTN: | Medium Term Note |
| 144A: | Security exempt from registration under Rule 144A of the Securities Act of 1933. These securities may be resold in transactions exempt from registration, normally to qualified institutional buyers. |
| See Notes to Financial Statements. | 31 |
DBX ETF Trust
Schedule of Investments
Deutsche X-trackers USD High Yield Corporate Bond ETF (Continued)
August 31, 2017
Fair Value Measurements
Various inputs are used in determining the value of the Fund’s investments. These inputs are summarized in three broad levels. Level 1 includes quoted prices in active markets for identical securities. Level 2 includes other significant observable inputs (including quoted prices for similar securities, interest rates, prepayment speeds and credit risk). Level 3 includes significant unobservable inputs (including the Fund’s own assumptions in determining the fair value of investments). The level assigned to the securities valuations may not be an indication of the risk or liquidity associated with investing in those securities.
The following is a summary of the inputs used as of August 31, 2017 in valuing the Fund’s investments. For information on the Fund’s policy regarding the valuation of investments, please refer to the Security Valuation section of Note 2 in the accompanying Notes to Financial Statements.
Assets | Level 1 | Level 2 | Level 3 | Total | ||||||||||||
Corporate Bonds (d) | $ | — | $ | 215,997,184 | $ | — | $ | 215,997,184 | ||||||||
Short-Term Investments | 17,754,544 | — | — | 17,754,544 | ||||||||||||
|
|
|
|
|
|
|
| |||||||||
TOTAL | $ | 17,754,544 | $ | 215,997,184 | $ | — | $ | 233,751,728 | ||||||||
|
|
|
|
|
|
|
| |||||||||
| (d) | See Schedule of Investments for additional detailed categorizations. |
There have been no transfers between fair value measurement levels during the period ended August 31, 2017.
| See Notes to Financial Statements. | 32 |
This Page is Intentionally Left Blank
33
DBX ETF Trust
August 31, 2017
| Deutsche X-trackers Barclays International Corporate Bond Hedged ETF | Deutsche X-trackers Barclays International Treasury Bond Hedged ETF | Deutsche X-trackers USD High Yield Corporate Bond ETF | ||||||||||
Assets | ||||||||||||
Investments in non-affiliated securities at value | $ | 4,990,619 | $ | 4,813,007 | $ | 215,997,184 | ||||||
Investment in Deutsche Government & Agency Securities Portfolio* | — | — | 17,754,544 | |||||||||
Cash | 672 | 1,648 | 2,661,440 | |||||||||
Foreign currency at value | 1,326 | 1,714 | — | |||||||||
Unrealized appreciation on forward foreign currency exchange contracts | 27,947 | 18,656 | — | |||||||||
| Receivables: | ||||||||||||
Investment securities sold | — | 55,785 | 2,621,680 | |||||||||
Interest | 65,144 | 44,359 | 3,656,843 | |||||||||
Securities lending income | — | — | 15,641 | |||||||||
Foreign tax reclaim | — | 839 | — | |||||||||
|
|
|
|
|
| |||||||
Total Assets | $ | 5,085,708 | $ | 4,936,008 | $ | 242,707,332 | ||||||
|
|
|
|
|
| |||||||
Liabilities | ||||||||||||
Payable upon return of securities loaned | $ | — | $ | — | $ | 17,754,544 | ||||||
Unrealized depreciation on forward foreign currency exchange contracts | 42,876 | 37,813 | — | |||||||||
| Payables: | ||||||||||||
Investment securities purchased | — | — | 4,697,375 | |||||||||
Investment advisory fees | 1,282 | 1,036 | 43,897 | |||||||||
|
|
|
|
|
| |||||||
Total Liabilities | 44,158 | 38,849 | 22,495,816 | |||||||||
|
|
|
|
|
| |||||||
Net Assets, at value | $ | 5,041,550 | $ | 4,897,159 | $ | 220,211,516 | ||||||
|
|
|
|
|
| |||||||
Net Assets Consist of | ||||||||||||
Paid-in capital | $ | 5,009,594 | $ | 5,001,290 | $ | 217,738,925 | ||||||
Distributions in excess of net investment income | — | (20,509 | ) | — | ||||||||
Undistributed net investment income | 13,177 | — | 1,090,326 | |||||||||
Accumulated net realized gain (loss) | (318,361 | ) | (207,838 | ) | (739,143 | ) | ||||||
Net unrealized appreciation (depreciation) | 337,140 | 124,216 | 2,121,408 | |||||||||
|
|
|
|
|
| |||||||
Net Assets, at value | $ | 5,041,550 | $ | 4,897,159 | $ | 220,211,516 | ||||||
|
|
|
|
|
| |||||||
Number of Common Shares outstanding | 100,001 | 100,001 | 4,300,001 | |||||||||
|
|
|
|
|
| |||||||
Net Asset Value | $ | 50.42 | $ | 48.97 | $ | 51.21 | ||||||
|
|
|
|
|
| |||||||
Investments in non-affiliated securities at cost | $ | 4,641,428 | $ | 4,670,969 | $ | 213,875,776 | ||||||
|
|
|
|
|
| |||||||
Value of securities loaned | $ | — | $ | — | $ | 17,136,475 | ||||||
|
|
|
|
|
| |||||||
Investment in Deutsche Government & Agency Securities Portfolio at cost* | $ | — | $ | — | $ | 17,754,544 | ||||||
|
|
|
|
|
| |||||||
Foreign currency at cost | $ | 1,330 | $ | 1,720 | $ | — | ||||||
|
|
|
|
|
| |||||||
| * | Represents collateral on securities loaned. |
| See Notes to Financial Statements. | 34 |
DBX ETF Trust
For the Period Ended August 31, 2017
| Deutsche X-trackers Barclays International Corporate Bond Hedged ETF(1) | Deutsche X-trackers Barclays International Treasury Bond Hedged ETF(1) | Deutsche X-trackers USD High Yield Corporate Bond ETF(2) | ||||||||||
Investment Income | ||||||||||||
Unaffiliated interest income* | $ | 55,807 | $ | 35,462 | $ | 6,903,223 | ||||||
Securities lending income, net of borrower rebates | — | — | 70,820 | |||||||||
|
|
|
|
|
| |||||||
Total Investment Income | 55,807 | 35,462 | 6,974,043 | |||||||||
|
|
|
|
|
| |||||||
Expenses | ||||||||||||
Investment advisory fees | 12,738 | 10,398 | 299,608 | |||||||||
Other expense | — | — | 1,454 | |||||||||
|
|
|
|
|
| |||||||
Total Expenses | 12,738 | 10,398 | 301,062 | |||||||||
|
|
|
|
|
| |||||||
Net Investment income (loss) | 43,069 | 25,064 | 6,672,981 | |||||||||
|
|
|
|
|
| |||||||
Realized and Unrealized Gain (Loss) | ||||||||||||
Net realized gain (loss) from: | ||||||||||||
Investments | 55,301 | (9,817 | ) | (18,875 | ) | |||||||
In-kind redemptions | — | — | 517,327 | |||||||||
Foreign currency transactions | (1,138 | ) | 3,154 | — | ||||||||
Forward foreign currency exchange contracts | (310,613 | ) | (159,978 | ) | — | |||||||
Payments by Affiliates (See note 9) | — | 1,507 | — | |||||||||
|
|
|
|
|
| |||||||
Net realized gain (loss) | (256,450 | ) | (165,134 | ) | 498,452 | |||||||
Net change in unrealized appreciation (depreciation) on: | ||||||||||||
Investments | 349,191 | 142,038 | 2,121,408 | |||||||||
Foreign currency translations | 2,878 | 1,335 | — | |||||||||
Forward foreign currency exchange contracts | (14,929 | ) | (19,157 | ) | — | |||||||
|
|
|
|
|
| |||||||
Net change in unrealized appreciation (depreciation) | 337,140 | 124,216 | 2,121,408 | |||||||||
|
|
|
|
|
| |||||||
Net realized and unrealized gain (loss) on investments and foreign currency transactions | 80,690 | (40,918 | ) | 2,619,860 | ||||||||
|
|
|
|
|
| |||||||
Net Increase (Decrease) in Net Assets Resulting from Operations | $ | 123,759 | $ | (15,854 | ) | $ | 9,292,841 | |||||
|
|
|
|
|
| |||||||
* Unaffiliated foreign tax withheld | $ | 177 | $ | 40 | $ | — | ||||||
| (1) | For the period October 25, 2016 (commencement of operations) through August 31, 2017. |
| (2) | For the period December 7, 2016 (commencement of operations) through August 31, 2017. |
| See Notes to Financial Statements. | 35 |
DBX ETF Trust
| Deutsche X-trackers Barclays International Corporate Bond Hedged ETF | Deutsche X-trackers Barclays International Treasury Bond Hedged ETF | Deutsche X-trackers USD High Yield Corporate Bond ETF | ||||||||||
| For the Period October 25, 2016(1) to August 31, 2017 | For the Period October 25, 2016(1) to August 31, 2017 | For the Period December 7, 2016(1) to August 31, 2017 | ||||||||||
Increase (Decrease) in Net Assets from Operations | ||||||||||||
Net investment income (loss) | $ | 43,069 | $ | 25,064 | $ | 6,672,981 | ||||||
Net realized gain (loss) | (256,450 | ) | (165,134 | ) | 498,452 | |||||||
Net change in net unrealized appreciation (depreciation) | 337,140 | 124,216 | 2,121,408 | |||||||||
|
|
|
|
|
| |||||||
Net increase (decrease) in net assets resulting from operations | 123,759 | (15,854 | ) | 9,292,841 | ||||||||
|
|
|
|
|
| |||||||
Distributions to Shareholders from | ||||||||||||
Net investment income | (91,803 | ) | (88,277 | ) | (6,310,827 | ) | ||||||
|
|
|
|
|
| |||||||
Total distributions | (91,803 | ) | (88,277 | ) | (6,310,827 | ) | ||||||
|
|
|
|
|
| |||||||
Fund Shares Transactions | ||||||||||||
Proceeds from shares sold | 5,009,544 | 5,001,240 | 275,645,051 | |||||||||
Value of shares redeemed | — | — | (58,415,599 | ) | ||||||||
|
|
|
|
|
| |||||||
Net increase (decrease) in net assets resulting from fund share transactions | 5,009,544 | 5,001,240 | 217,229,452 | |||||||||
|
|
|
|
|
| |||||||
Total net increase (decrease) in Net Assets | 5,041,500 | 4,897,109 | 220,211,466 | |||||||||
Net Assets | ||||||||||||
Beginning of period | 50 | 50 | 50 | |||||||||
|
|
|
|
|
| |||||||
End of period | $ | 5,041,550 | $ | 4,897,159 | $ | 220,211,516 | ||||||
|
|
|
|
|
| |||||||
Distributions in excess of net investment income | $ | — | $ | (20,509 | ) | $ | — | |||||
|
|
|
|
|
| |||||||
Undistributed net investment income | $ | 13,177 | $ | — | $ | 1,090,326 | ||||||
|
|
|
|
|
| |||||||
Changes in Shares Outstanding | ||||||||||||
Shares outstanding, beginning of period | 1 | 1 | 1 | |||||||||
Shares sold | 100,000 | 100,000 | 5,450,000 | |||||||||
Shares redeemed | — | — | (1,150,000 | ) | ||||||||
|
|
|
|
|
| |||||||
Shares outstanding, end of period | 100,001 | 100,001 | 4,300,001 | |||||||||
|
|
|
|
|
| |||||||
| (1) | Commencement of Operations. |
| See Notes to Financial Statements. | 36 |
DBX ETF Trust
| Deutsche X-trackers Barclays International Corporate Bond Hedged ETF Selected Per Share Data | Period Ended 8/31/2017(a) | |||
Net Asset Value, beginning of period | $ | 50.00 | ||
|
| |||
| Income (loss) from investment operations: | ||||
Net investment income (loss)(b) | 0.43 | |||
Net realized and unrealized gain (loss) | 0.91 | |||
|
| |||
Total from investment operations | 1.34 | |||
|
| |||
Less distributions from: | ||||
Net investment income | (0.92 | ) | ||
|
| |||
Total distributions | (0.92 | ) | ||
|
| |||
Net Asset Value, end of period | $ | 50.42 | ||
|
| |||
Total Return (%) | 2.72 | ** | ||
Ratios to Average Net Assets and Supplemental Data | ||||
Net Assets, end of period ($ millions) | 5 | |||
Ratio of expenses (%) | 0.30 | * | ||
Ratio of net investment income (loss) (%) | 1.01 | * | ||
Portfolio turnover rate (%)(c) | 36 | ** | ||
| Deutsche X-trackers Barclays International Treasury Bond Hedged ETF Selected Per Share Data | Period Ended 8/31/2017(a) | |||
Net Asset Value, beginning of period | $ | 50.00 | ||
|
| |||
| Income (loss) from investment operations: | ||||
Net investment income (loss)(b) | 0.25 | |||
Net realized and unrealized gain (loss) | (0.40 | ) | ||
|
| |||
Total from investment operations | (0.15 | ) | ||
|
| |||
Less distributions from: | ||||
Net investment income | (0.88 | ) | ||
|
| |||
Total distributions | (0.88 | ) | ||
|
| |||
Net Asset Value, end of period | $ | 48.97 | ||
|
| |||
Total Return (%) | (0.27 | )(d)** | ||
Ratios to Average Net Assets and Supplemental Data | ||||
Net Assets, end of period ($ millions) | 5 | |||
Ratio of expenses (%) | 0.25 | * | ||
Ratio of net investment income (loss) (%) | 0.60 | * | ||
Portfolio turnover rate (%)(c) | 44 | ** | ||
| (a) | For the period October 25, 2016 (commencement of operations) through August 31, 2017. |
| (b) | Based on average shares outstanding during the period. |
| (c) | Portfolio turnover rate does not include securities received or delivered from processing creations or redemptions. |
| (d) | The Fund’s total return includes a reimbursement by the Advisor for a realized loss on a trade executed incorrectly, which otherwise would have reduced total return by 0.03%. |
| * | Annualized. |
| ** | Not Annualized. |
| See Notes to Financial Statements. | 37 |
DBX ETF Trust
Financial Highlights (Continued)
| Deutsche X-trackers USD High Yield Corporate Bond ETF Selected Per Share Data | Period Ended 8/31/2017(a) | |||
Net Asset Value, beginning of period | $ | 50.00 | ||
|
| |||
| Income (loss) from investment operations: | ||||
Net investment income (loss)(b) | 2.07 | |||
Net realized and unrealized gain (loss) | 1.11 | |||
|
| |||
Total from investment operations | 3.18 | |||
|
| |||
Less distributions from: | ||||
Net investment income | (1.97 | ) | ||
|
| |||
Total distributions | (1.97 | ) | ||
|
| |||
Net Asset Value, end of period | $ | 51.21 | ||
|
| |||
Total Return (%) | 6.43 | ** | ||
Ratios to Average Net Assets and Supplemental Data | ||||
Net Assets, end of period ($ millions) | 220 | |||
Ratio of expenses (%) | 0.25 | * | ||
Ratio of net investment income (loss) (%) | 5.57 | * | ||
Portfolio turnover rate (%)(c) | 36 | ** | ||
| (a) | For the period December 7, 2016 (commencement of operations) through August 31, 2017. |
| (b) | Based on average shares outstanding during the period. |
| (c) | Portfolio turnover rate does not include securities received or delivered from processing creations or redemptions. |
| * | Annualized. |
| ** | Not Annualized. |
| See Notes to Financial Statements. | 38 |
DBX ETF Trust
1. Organization
DBX ETF Trust (the “Trust”) is registered under the Investment Company Act of 1940, as amended (the “Act”), as an open-end registered management investment company organized as a Delaware statutory trust.
As of August 31, 2017, the Trust consists of thirty-five investment series of exchange-traded funds (“ETFs”) (each a “Fund” and collectively, the “Funds”) in operation and trading. These financial statements report on the Funds listed below:
| Deutsche X-trackers Barclays International Corporate Bond Hedged ETF |
| Deutsche X-trackers Barclays International Treasury Bond Hedged ETF |
| Deutsche X-trackers USD High Yield Corporate Bond ETF |
DBX Advisors LLC (“DBX” or the “Advisor”), an indirect, wholly owned subsidiary of Deutsche Bank AG, serves as investment advisor to the Funds and has overall responsibility for the general management and administration of the Funds, subject to the supervision of the Funds’ Board of Trustees (“Board”).
Deutsche X-trackers Barclays International Corporate Bond Hedged ETF and Deutsche X-trackers Barclays International Treasury Bond Hedged ETF offer shares that are listed and traded on the Bats BZX Exchange (“Bats BZX”). Deutsche X-trackers USD High Yield Corporate Bond ETF offers shares that are listed and traded on the NYSE Arca, Inc. (“NYSE Arca”). Unlike conventional mutual funds, each Fund issues and redeems shares on a continuous basis, at net asset value, only in large specified lots consisting of 50,000 shares, each called a “Creation Unit”, to authorized participants who have entered into agreements with the Funds’ distributor. Shares are not individually redeemable securities of the Funds, and owners of shares may acquire those shares from the Funds, or tender such shares for redemption to the Funds, in Creation Units only.
The investment objective of each Fund is to track the performance, before fees and expenses, of a particular index (the “Underlying Index”). The underlying indices for the Funds are:
Fund | Underlying Index | |
| Deutsche X-trackers Barclays International Corporate Bond Hedged ETF | Barclays Global Aggregate Corporate Ex USD Bond Index (USD Hedged) | |
| Deutsche X-trackers Barclays International Treasury Bond Hedged ETF | Barclays Global Aggregate Treasury Ex USD Issuer Diversified Bond Index (USD Hedged) | |
| Deutsche X-trackers USD High Yield Corporate Bond ETF | Solactive USD High Yield Corporates Total Market Index |
The Barclays Global Aggregate Corporate Ex USD Bond US Dollar Hedged Index is designed to track the performance of investment grade corporate debt publicly issued in developed and emerging markets (excluding all securities denominated in U.S. dollars) in the industrial, utility and financial sectors while mitigating exposure to fluctuations between the value of the U.S. dollar and the currencies of the countries included in the Underlying Index. The Barclays Global Aggregate Treasury Ex USD Issuer Diversified Bond US Dollar Hedged Index is designed to track the performance of investment grade sovereign debt publicly issued in the developed and emerging markets and denominated in the issuer’s own domestic currency (excluding all securities denominated in U.S. dollars) while mitigating exposure to fluctuations between the value of the U.S. dollar and the currencies of the countries included in the Underlying Index. The Barclays Hedged Indices are rebalanced monthly on the last trading day of the month, when the index will reflect the effect of rolling into new 1-month forward contracts based on the newly determined weights of currency to be sold for the next month’s index calculation. The currency weights are determined as of the last calendar day of the preceding month. This means that no changes in the weights are made during the month to account for changes in the Underlying Index due to price movement of constituent securities. With respect to the bond components of the Underlying Index, the Underlying Index is rebalanced on the last calendar day of the month. No changes are made to constituent holdings other than on month end rebalancing dates.
The Solactive USD High Yield Corporates Total Market Index is designed to track the performance of a basket of U.S. dollar denominated high yield liquid corporate bonds. The Underlying Index is rebalanced on the last business day of each month.
Each Fund is entitled to use its respective Underlying Index pursuant to a licensing agreement between each Index Provider and DBX. There is no charge to the Funds in connection with these licensing agreements.
39
DBX ETF Trust
Notes to Financial Statements (Continued)
Each Fund is non-diversified and is not limited by the Act with regard to the percentage of its assets that may be invested in the securities of a single issuer. The securities of a particular issuer (or securities of issuers in particular industries) may dominate the underlying index of such a Fund and, consequently, the Fund’s investment portfolio. This may adversely affect the Fund’s performance or subject the Fund’s shares to greater price volatility than that experienced by more diversified investment companies.
Pursuant to the Trust’s organizational documents, the Trust’s officers and trustees are indemnified against certain liabilities that may arise out of the performance of their duties to the Funds. Additionally, in the normal course of business the Trust enters into contracts that contain a variety of representations that provide indemnification for certain liabilities. The Trust’s maximum exposure under these arrangements is unknown, as this would involve future claims that may be made against the Funds that have not yet occurred. However, the Trust expects the risk of loss to be remote.
2. Significant Accounting Policies
The financial statements have been prepared in conformity with U.S. generally accepted accounting principles (“U.S. GAAP”), which require management to make certain estimates and assumptions that affect the reported amounts and disclosures in the financial statements. Actual results could differ from those estimates. Each Fund qualifies as an investment company under Topic 946 of Accounting Standards Codification of U.S. GAAP. The following is a summary of significant accounting policies followed by the Funds.
Security Valuation The Net Asset Value (“NAV”), of each Fund’s shares is calculated each business day as of the close of regular trading on the New York Stock Exchange, generally 4:00 p.m. Eastern Time. NAV per share is calculated by dividing a Fund’s net assets by the number of Fund shares outstanding.
Various inputs are used in determining the value of the Funds’ investments. These inputs are summarized in three broad levels. Level 1 includes quoted prices in active markets for identical securities. Level 2 includes other significant observable inputs (including quoted prices for similar securities, interest rates, prepayment speeds, and credit risk). Level 3 includes significant unobservable inputs (including the Fund’s own assumptions in determining the fair value of investments). The level assigned to the securities valuations may not be an indication of the risk or liquidity associated with investing in those securities.
Corporate and sovereign debt securities are valued at prices supplied by independent pricing services approved by the Funds’ Board. Such services may use various pricing techniques which take into account appropriate factors such as yield, quality, coupon rate, maturity, type of issue, trading characteristics and other data, as well as broker quotes. If the pricing services are unable to provide valuations, securities are valued at the mean between the bid and ask quotations or evaluated prices, as applicable, obtained from broker dealers. These securities are generally categorized as Level 2.
Investments in open-end investment companies are valued as their net asset value each business day and are categorized as Level 1.
Forward currency contracts are valued at the prevailing forward exchange rate of the underlying currencies and are categorized as Level 2.
Securities and other assets for which market quotations are not readily available or for which the above valuation procedures are deemed not to reflect fair value are valued in a manner that is intended to reflect their fair value as determined in accordance with procedures approved by the Board and are generally categorized as Level 3. In accordance with the Fund’s valuation procedures, factors considered in determining value may include, but are not limited to, the type of the security; the size of the holding; the initial cost of the security; the existence of any contractual restrictions on the security’s disposition; the price and extent of public trading in similar securities of the issuer or of comparable companies; quotations or evaluated prices from broker-dealers and/or pricing services; information obtained from the issuer, analysts, and/or the appropriate stock exchange (for exchange-traded securities); an analysis of the company’s or issuer’s financial statements; an evaluation of the forces that influence the issuer and the market(s) in which the security is purchased and sold; length of time of a halt in trading of the security; movement in the security’s proxy index; and with respect to debt securities, the maturity, coupon, creditworthiness, currency denomination and the movement of the market in which the security is normally traded. The value determined under these procedures may differ from published values for the same securities.
40
DBX ETF Trust
Notes to Financial Statements (Continued)
Fair value pricing could result in a difference between the prices used to calculate a Fund’s NAV and the prices used by the Fund’s underlying index, which in turn could result in a difference between the Fund’s performance and the performance of the Fund’s underlying index.
Disclosure about the classification of the fair value measurements is included in a table following each Fund’s Schedule of Investments.
Cash Cash consists of cash held at banks and is on deposit with major financial institutions.
Investment Transactions and Investment Income Investment transactions are recorded as of the date that the securities are purchased or sold (trade date). Realized gains and losses from the sale or disposition of securities are calculated on the identified cost-method. Interest income is recorded on the accrual basis. All premiums and discounts are amortized/accreted over the lives of the respective security for financial reporting purposes.
Tax Information and Dividends and Distributions to Shareholders It is each Fund’s policy to comply with all requirements of the Internal Revenue Code of 1986, as amended (“the Code”). Each fund intends to qualify for and to elect treatment as a separate Regulated Investment Company (“RIC”) under Subchapter M of the Code. It is the policy of each Fund to pay out dividends from its net investment income, if any, to investors monthly. Taxable net realized gains from investment transactions, reduced by capital loss carryforwards, if any, are declared and distributed to shareholders at least annually. The capital loss carryforward amount, if any, is available to offset future net capital gains. The Funds may occasionally be required to make supplemental distributions at some other time during the year. The Funds reserve the right to declare special distributions if, in their reasonable discretion, such action is necessary or advisable to preserve the status of each Fund as a RIC or to avoid imposition of income or excise taxes on undistributed income. Dividends and distributions to shareholders, if any, are recorded on the ex-dividend date. The amount of dividends and distributions from net investment income and net realized capital gains are determined in accordance with Federal income tax regulations which may differ from U.S. GAAP. These “book/tax” differences are either considered temporary or permanent in nature. To the extent these differences are permanent in nature, such amounts are reclassified at the end of the year within the components of net assets based on their federal tax treatment; temporary differences do not require reclassification. Dividends and distributions, which exceed earnings and profits for the full year for tax purposes, are reported as a tax return of capital.
In accordance with U.S. GAAP requirements regarding accounting for uncertainties in income taxes, management has analyzed the Funds’ tax positions taken or expected to be taken on foreign, federal and state income tax returns for all open tax years and has concluded that no provision for income tax is required in the Funds’ financial statements.
The Funds’ recognize interest and penalties, if any, related to uncertain tax positions as income tax expense on the Statements of Operations. For the period ended August 31, 2017, the Funds did not incur any interest or penalties.
As of August 31, 2017, the components of accumulated earnings (losses) on a tax basis were as follows:
| Undistributed Ordinary Income | Capital and Other Gains (Losses) | Unrealized Appreciation (Depreciation) | Total Accumulated Earnings (Losses) | |||||||||||||
Deutsche X-trackers Barclays International Corporate Bond Hedged ETF | $ | 13,177 | $ | (296,760 | ) | $ | 315,539 | $ | 31,956 | |||||||
Deutsche X-trackers Barclays International Treasury Bond Hedged ETF | 6,380 | (208,708 | ) | 98,197 | (104,131 | ) | ||||||||||
Deutsche X-trackers USD High Yield Corporate Bond ETF | 1,090,326 | (84,013 | ) | 1,466,278 | 2,472,591 | |||||||||||
The tax character of dividends and distributions declared for the period ended August 31, 2017 are as follows:
| Period Ended August 31, 2017 | ||||
| Ordinary Income* | ||||
Deutsche X-trackers Barclays International Corporate Bond Hedged ETF | $ | 91,803 | ||
Deutsche X-trackers Barclays International Treasury Bond Hedged ETF | 88,277 | |||
Deutsche X-trackers USD High Yield Corporate Bond ETF | 6,310,827 | |||
| * | For tax purposes short-term capital gain distributions are considered ordinary income distributions. |
41
DBX ETF Trust
Notes to Financial Statements (Continued)
At August 31, 2017, for Federal income tax purposes, the Funds have capital loss carryforwards available as shown in the table below, to the extent provided by regulations, to offset future capital gains for an unlimited period. To the extent that these loss carryforwards are used to offset future capital gains, it is probable that the capital gains so offset will not be distributed to shareholders.
| Short-Term | Long-Term | Total Amount | ||||||||||
Deutsche X-trackers Barclays International Corporate Bond Hedged ETF | $ | 10,951 | $ | 16,426 | $ | 27,377 | ||||||
Deutsche X-trackers Barclays International Treasury Bond Hedged ETF | 4,130 | 6,196 | 10,326 | |||||||||
Capital losses incurred after October 31 (“post-October losses”) within the taxable year are deemed to arise on the first business day of each Fund’s next taxable year. During the period ended August 31, 2017, the Funds incurred and will elect to defer net capital losses as follows:
| Post-October Losses on Capital | Late Year Ordinary Losses | |||||||
Deutsche X-trackers Barclays International Corporate Bond Hedged ETF | $ | 269,383 | $ | — | ||||
Deutsche X-trackers Barclays International Treasury Bond Hedged ETF | 171,493 | 26,889 | ||||||
Deutsche X-trackers USD High Yield Corporate Bond ETF | 84,013 | — | ||||||
In order to present paid-in capital accumulated net realized gains or losses on the Statements of Assets and Liabilities that more closely represent their tax character, certain adjustments have been made to additional paid-in capital, undistributed net investment income or loss and accumulated net realized gains or losses on investments. These differences are primarily due to premium amortization on debt securities, redemptions-in-kind, foreign currency, excise tax paid and tax equalization utilized. For the period ended August 31, 2017, the adjustments were as follows:
| Undistributed Net Investment Income (Loss) | Undistributed Capital Gains (Accumulated Losses) | Paid-In Capital | ||||||||||
Deutsche X-trackers Barclays International Corporate Bond Hedged ETF | $ | 61,911 | $ | (61,911 | ) | $ | — | |||||
Deutsche X-trackers Barclays International Treasury Bond Hedged ETF | 42,704 | (42,704 | ) | — | ||||||||
Deutsche X-trackers USD High Yield Corporate Bond ETF | 728,172 | (1,237,595 | ) | 509,423 | ||||||||
As of August 31, 2017, the aggregate cost of investments for federal income tax purposes, the net unrealized appreciation or depreciation and the aggregated gross unrealized appreciation (depreciation) on investments were as follows:
| Aggregate Tax Cost | Net Unrealized Appreciation (Depreciation) | Aggregate Gross Unrealized Appreciation | Aggregate Gross Unrealized (Depreciation) | |||||||||||||
Deutsche X-trackers Barclays International Corporate Bond Hedged ETF | $ | 4,688,581 | $ | 312,661 | $ | 342,990 | $ | (30,329 | ) | |||||||
Deutsche X-trackers Barclays International Treasury Bond Hedged ETF | 4,722,667 | 96,862 | 184,929 | (88,067 | ) | |||||||||||
Deutsche X-trackers USD High Yield Corporate Bond ETF | 232,285,450 | 1,466,278 | 3,683,818 | (2,217,540 | ) | |||||||||||
Foreign Taxes The Funds may be subject to foreign taxes (a portion of which may be reclaimable) on income, capital gains on investments, certain foreign currency transactions or other corporate events. All foreign taxes are recorded in accordance with the applicable foreign tax regulations and rates that exist in the foreign jurisdictions in which the Funds invest. These foreign taxes, if any, are paid by the Funds and are reflected in their Statements of Operations as follows: foreign taxes withheld at source are presented as a reduction of income, and foreign taxes on capital gains from sales of investments and foreign currency transactions are included in their respective net realized gain (loss) categories. Foreign taxes payable as of August 31, 2017, if any, are disclosed in the Funds’ Statements of Assets and Liabilities.
42
DBX ETF Trust
Notes to Financial Statements (Continued)
Foreign Currency Translations The books and records of the Fund are maintained in U.S. dollars. Investment securities and other assets and liabilities denominated in a foreign currency are translated into U.S. dollars at the prevailing exchange rates at year end. Purchases and sales of investment securities, income and expenses are translated into U.S. dollars at the prevailing exchange rates on the respective dates of the transactions.
Net realized and unrealized gains and losses on foreign currency transactions represent net gains and losses between trade and settlement dates on securities transactions, the acquisition and disposition of foreign currencies, and the difference between the amount of net investment income accrued and the U.S. dollar amount actually received. The portion of both realized and unrealized gains and losses on investments that results from fluctuations in foreign currency exchange rates is not separately disclosed, but is included with net realized and unrealized gain/appreciation and loss/depreciation on investments.
Securities Lending The Funds may lend securities to certain financial institutions under the terms of their securities lending agreement. During the term of the loans the Funds continue to receive interest and dividends generated by the securities and to participate in any changes in their market value. The Funds require the borrowers of the securities to maintain collateral with the Funds consisting of cash having a value at least equal to the value of the securities loaned. When the collateral falls below specified amounts, the lending agent will use its best effort to obtain additional collateral on the next business day to meet required amounts under the securities lending agreement. During the period ended August 31, 2017, the Funds invested the cash collateral into a joint trading account in affiliated money market funds managed by Deutsche Investment Management Americas Inc. As of August 31, 2017 the Funds invested the cash collateral in Deutsche Government & Agency Securities Portfolio. Deutsche Investment Management Americas Inc. receives a management/administration fee (0.12% annualized effective rate as of August 31, 2017) on the cash collateral invested in Deutsche Government & Agency Securities Portfolio. The Funds receive compensation for lending its securities either in the form of fees or by earning interest on invested cash collateral net of borrower rebates and fees paid to a lending agent. Either the Fund or the borrower may terminate the loan at any time and the borrower, after notice, is required to return borrowed securities within a standard time period. There may be risks of delay and costs in recovery of securities or even loss of rights in the collateral should the borrower of the securities fail financially. If the Funds are not able to recover securities lent, the Funds may sell the collateral and purchase a replacement investment in the market, incurring the risk that the value of the replacement security is greater than the value of the collateral. The Funds are also subject to all investment risks associated with the reinvestment of any cash collateral received, including, but not limited to, interest rate, credit and liquidity risk associated with such investments.
As of August 31, 2017, Deutsche X-trackers USD High Yield Corporate Bond ETF had securities on loan, which were classified as bonds in the Schedule of Investments. The value of the related collateral exceeded the value of the securities loaned at period end. As of period end, the remaining contractual maturity of the collateral agreements were overnight and continuous.
As of August 31, 2017, Deutsche X-trackers Barclays International Corporate Bond Hedged ETF and Deutsche X-trackers Barclays International Treasury Bond Hedged ETF had no securities on loan.
Derivatives
Forward Foreign Currency Exchange Contracts Deutsche X-trackers Barclays International Corporate Bond Hedged ETF and Deutsche X-trackers Barclays International Treasury Bond Hedged ETF enter into forward foreign currency exchange contracts (“forward currency contracts”) designed to offset the Fund’s exposure to non-U.S. currencies. In addition, the Funds may enter into forward currency contracts to facilitate local securities settlements or to protect against currency exposure in connection with distributions to Shareholders.
A forward currency contract is a commitment to purchase or sell a foreign currency at a future date at a negotiated forward rate. For the period ended August 31, 2017, the Funds invested in forward currency contracts to hedge against changes in the value of the U.S. dollar against specified non-U.S. currencies
The gain or loss arising from the difference between the original contract and the closing of such contract would be included in net realized gain or loss on foreign currency transactions. Risks may arise from the potential inability of a counterparty to meet the terms of a contract and from unanticipated movements in the value of a
43
DBX ETF Trust
Notes to Financial Statements (Continued)
foreign currency relative to the U.S. dollar. The face or contract amount, in U.S. dollars reflects the total exposure the Fund has in that particular currency contract
A summary of the open forward currency contracts as of August 31, 2017 is included in a table following the Fund’s Schedule of Investments. The investment in forward currency contracts short vs. U.S. dollars had a contract value generally indicative of a range of the total exposure the respective Funds had to the value of non U.S currencies during the period ended August 31, 2017.
The following tables summarize the value of the Funds’ derivative instruments held as of August 31, 2017 and the related location in the accompanying Statement of Assets and Liabilities, presented by primary underlying risk exposure:
Asset Derivatives | Liability Derivatives | |||||||||||
| Deutsche X-trackers Barclays International Corporate Bond Hedged ETF | ||||||||||||
| Foreign exchange contracts | Unrealized appreciation on forward foreign currency exchange contracts | $27,947 | Unrealized depreciation on forward foreign currency exchange contracts | $ | 42,876 | |||||||
| Deutsche X-trackers Barclays International Treasury Bond Hedged ETF | ||||||||||||
| Foreign exchange contracts | Unrealized appreciation on forward foreign currency exchange contracts | $18,656 | Unrealized depreciation on forward foreign currency exchange contracts | $ | 37,813 | |||||||
Additionally, the amount of realized and unrealized gains and losses on derivative instruments recognized in the Funds’ earnings during the period ended August 31, 2017 and the related location in the accompanying Statement of Operations is summarized in the following tables by primary underlying risk exposure:
Net Realized Gain (Loss) from: | ||||
| Forward Foreign Currency Exchange Contracts — Foreign Exchange Contracts | ||||
Deutsche X-trackers Barclays International Corporate Bond Hedged ETF | $ | (310,613 | ) | |
Deutsche X-trackers Barclays International Treasury Bond Hedged ETF | (159,978 | ) | ||
Net Change in Unrealized Appreciation (Depreciation) on: | ||||
| Forward Foreign Currency Exchange Contracts — Foreign Exchange Contracts | ||||
Deutsche X-trackers Barclays International Corporate Bond Hedged ETF | $ | (14,929 | ) | |
Deutsche X-trackers Barclays International Treasury Bond Hedged ETF | (19,157 | ) | ||
For the period ended August 31, 2017 the average monthly volume of derivatives was as follows:
| Forward Foreign Currency Exchange Contracts (Contract Value) | ||||
Deutsche X-trackers Barclays International Corporate Bond Hedged ETF | $ | (4,958,732 | ) | |
Deutsche X-trackers Barclays International Treasury Bond Hedged ETF | (4,738,254 | ) | ||
As of August 31, 2017, the Funds have transactions subject to enforceable master netting agreements which govern the terms of certain transactions, and reduce the counterparty risk associated with such transactions. Master netting agreements allow a Fund to close out and net total exposure to a counterparty in the event of a default with respect to all of the transactions with a counterparty. For financial reporting purposes the Statement of Assets and Liabilities generally shows derivatives assets and liabilities on a gross basis, which reflects the full risks and exposures prior to
44
DBX ETF Trust
Notes to Financial Statements (Continued)
netting. A reconciliation of the gross amounts on the Statement of Assets and Liabilities to the net amounts by counterparty, including any collateral exposure, is included in the following tables:
Fund | Gross Amounts of Assets Presented in the Statement of Assets and Liabilities | Financial Instruments and Derivatives Available for Offset | Collateral Received | Net Amount of Derivatives Assets | Gross Amounts of Liabilities Presented in the Statement of Assets and Liabilities | Financial Instruments and Derivatives Available for Offset | Collateral Pledged | Net Amount of Derivatives Liabilities | ||||||||||||||||||||||||
| Deutsche X-trackers Barclays International Corporate Bond Hedged ETF | ||||||||||||||||||||||||||||||||
The Bank of Nova Scotia | $ | 27,947 | $ | (27,947 | ) | $ | — | $ | — | $ | 42,876 | $ | (27,947 | ) | $ | — | $ | 14,929 | ||||||||||||||
|
|
|
|
|
|
|
|
|
|
|
|
|
|
|
| |||||||||||||||||
| $ | 27,947 | $ | (27,947 | ) | $ | — | $ | — | $ | 42,876 | $ | (27,947 | ) | $ | — | $ | 14,929 | |||||||||||||||
|
|
|
|
|
|
|
|
|
|
|
|
|
|
|
| |||||||||||||||||
| Deutsche X-trackers Barclays International Treasury Bond Hedged ETF | ||||||||||||||||||||||||||||||||
The Bank of Nova Scotia | $ | 18,656 | $ | (18,656 | ) | $ | — | $ | — | $ | 37,813 | $ | (18,656 | ) | $ | — | $ | 19,157 | ||||||||||||||
|
|
|
|
|
|
|
|
|
|
|
|
|
|
|
| |||||||||||||||||
| $ | 18,656 | $ | (18,656 | ) | $ | — | $ | — | $ | 37,813 | $ | (18,656 | ) | $ | — | $ | 19,157 | |||||||||||||||
|
|
|
|
|
|
|
|
|
|
|
|
|
|
|
| |||||||||||||||||
3. Investment Advisory and Other Agreements
The Advisor has overall responsibility for the general management and administration of the Funds, subject to the supervision of the Funds’ Board of Trustees. Under an investment advisory agreement between the Trust, on behalf of the Funds, and the Advisor (the “Investment Advisory Agreement”), the Advisor is responsible for arranging sub-advisory, transfer agency, custody, fund administration, and all other non-distribution related services for the Funds to operate.
For its investment advisory services to the Funds below, the Advisor is entitled to receive a unitary management fee from each Fund based on each Fund’s average daily net assets, computed and accrued daily and payable monthly, at an annual rate equal to:
| Unitary Management Fee | ||||
Deutsche X-trackers Barclays International Corporate Bond Hedged ETF | 0.30 | % | ||
Deutsche X-trackers Barclays International Treasury Bond Hedged ETF | 0.25 | % | ||
Deutsche X-trackers USD High Yield Corporate Bond ETF | 0.25 | % | ||
Out of the unitary management fee, the Advisor pays substantially all expenses of each Fund, including the cost of transfer agency, custody, fund administration, legal, audit and other services, and expenses of the Independent Trustees. Each Fund is responsible for the payment of interest expense, taxes, brokerage expenses, distribution fees or expenses, if any, litigation expenses and extraordinary expenses.
The Bank of New York Mellon, a wholly-owned subsidiary of The Bank of New York Mellon Corporation, serves as Administrator, Custodian, Accounting Agent, Lending Agent and Transfer Agent for each Fund.
ALPS Distributors, Inc. (the “Distributor”) serves as the distributor of Creation Units for each Fund on an agency basis. The Distributor does not maintain a secondary market in shares of the Funds.
The Board of Trustees is currently comprised of four Trustees, including three Independent Trustees. The Advisor paid the Independent Trustees the following types of fees: annual retainer fees and meeting fees to each Independent Trustee; retainer fees to the Independent Chairman of the Board and the Chairman of the Audit Committee; and meeting fees to each member of the Audit Committee (which is comprised of all of the Funds’ Independent Trustees).
45
DBX ETF Trust
Notes to Financial Statements (Continued)
4. Investment Portfolio Transactions
For the period ended August 31, 2017, the cost of investments purchased and proceeds from sale of investments (excluding in-kind transactions and short-term investments) were as follows:
| Purchases | Sales | |||||||
Deutsche X-trackers Barclays International Corporate Bond Hedged ETF | $ | 6,372,112 | $ | 1,726,622 | ||||
Deutsche X-trackers Barclays International Treasury Bond Hedged ETF | 6,864,987 | 2,110,721 | ||||||
Deutsche X-trackers USD High Yield Corporate Bond ETF | 58,593,582 | 53,007,728 | ||||||
For the period ended August 31, 2017, the cost of in-kind purchases and proceeds from in-kind sales were as follows:
| Purchases | Sales | |||||||
Deutsche X-trackers USD High Yield Corporate Bond ETF | $ | 263,999,076 | $ | 55,915,192 | ||||
5. Fund Share Transactions
As of August 31, 2017, there were unlimited Fund shares, no par value authorized by the Trust. Fund shares are issued and redeemed by each Fund only in Creation Units or multiples thereof. Except when aggregated in Creation Units, shares of each Fund are not redeemable. Transactions in capital shares for each Fund are disclosed in detail in the Statements of Changes in Net Assets. The consideration for the purchase of Creation Units of a Fund generally consists of the in-kind contribution of a designated portfolio of securities constituting a portfolio sampling representation of the securities included in the respective Fund’s Underlying Index and an amount of cash, which under certain circumstances may include cash in lieu of portfolio securities. Investors purchasing and redeeming Creation Units pay a purchase transaction fee and a redemption transaction fee to offset transfer and other transaction costs associated with the issuance and redemption of Creation Units.
6. Concentration of Ownership
From time to time, the Funds may have a concentration of several shareholder accounts holding a significant percentage of shares outstanding. Investment activities of these shareholders could have a material impact on the Fund. At August 31, 2017, there was one affiliated shareholder account for each of the funds listed below holding a significant percentage of the shares outstanding:
| Approximate Percent of Outstanding Shares Held | ||||
Deutsche X-trackers Barclays International Corporate Bond Hedged ETF | 95 | % | ||
Deutsche X-trackers Barclays International Treasury Bond Hedged ETF | 95 | % | ||
7. Line of Credit
The Trust has entered into a senior unsecured credit facility with a syndication of banks which allows the Deutsche X-trackers Barclays International Corporate Bond Hedged ETF, Deutsche X-trackers Barclays International Treasury Bond Hedged ETF, Deutsche X-trackers USD High Yield Corporate Bond ETF and certain other funds managed by the Advisor to borrow up to $105 million. Each Fund may borrow money under this credit facility to the extent necessary for temporary or emergency purposes, including the funding of shareholder redemption requests, trade settlements, and as necessary to distribute to shareholders any income necessary to maintain each Fund’s status as a regulated investment company. Borrowings are charged an interest rate of 1.25% per annum plus the greater of the Federal Funds Effective Rate or the one-month LIBOR Rate. Each Fund may borrow up to the lesser of a pro-rata share of the credit facility at the amount listed below or 33 percent of its net assets as permitted by the Act. The Funds’ had no outstanding loans at August 31, 2017.
| Pro-rata Share | ||||
Deutsche X-trackers Barclays International Corporate Bond Hedged ETF | $ | 1,050,000 | ||
Deutsche X-trackers Barclays International Treasury Bond Hedged ETF | 1,050,000 | |||
Deutsche X-trackers USD High Yield Corporate Bond ETF | 18,900,000 | |||
46
DBX ETF Trust
Notes to Financial Statements (Continued)
8. Investing in High-Yield Debt Securities
High-yield debt securities or junk bonds are generally regarded as speculative with respect to the issuer’s continuing ability to meet principal and interest payments. A fund’s performance could be hurt if an issuer of a debt security suffers an adverse change in financial condition that results in the issuer not making timely payments of interest or principal, a security downgrade or an inability to meet a financial obligation. High-yield debt securities’ total return and yield may generally be expected to fluctuate more than the total return and yield of investment-grade debt securities. A real or perceived economic downturn or an increase in market interest rates could cause a decline in the value of high-yield debt securities, result in increased redemptions and/or result in increased portfolio turnover, which could result in a decline in net asset value of a fund, reduce liquidity for certain investments and/or increase costs. High-yield debt securities are often thinly traded and can be more difficult to sell and value accurately than investment-grade debt securities as there may be no established secondary market. Investments in high-yield debt securities could increase liquidity risk for a fund. In addition, the market for high-yield debt securities can experience sudden and sharp volatility which is generally associated more with investments in stocks.
9. Payments by Affiliates
During the period ended August 31, 2017, the Advisor agreed to reimburse the Deutsche X-trackers Barclays International Treasury Bond Hedged ETF $1,507 for a loss incurred on trades executed incorrectly. The amount of the loss was 0.03% of the Fund’s average net assets.
10. Fund Name Change
Effective October 2, 2017, the “Deutsche X-trackers” ETFs were renamed “Xtrackers” ETFs. As a result, the Funds were renamed as follows:
Old Fund Name | New Fund Name | |
| Deutsche X-trackers Barclays International Corporate Bond Hedged ETF | Xtrackers Barclays International Corporate Bond Hedged ETF | |
| Deutsche X-trackers Barclays International Treasury Bond Hedged ETF | Xtrackers Barclays International Treasury Bond Hedged ETF | |
| Deutsche X-trackers USD High Yield Corporate Bond ETF | Xtrackers USD High Yield Corporate Bond ETF |
47
DBX ETF Trust
To Board of Trustees and Shareholders of
DBX ETF Trust:
We have audited the accompanying statements of assets and liabilities, including the schedules of investments, of Xtrackers Barclays International Corporate Bond Hedged ETF (formerly Deutsche X-trackers Barclays International Corporate Bond Hedged ETF), Xtrackers Barclays International Treasury Bond Hedged ETF (formerly Deutsche X-trackers Barclays International Treasury Bond Hedged ETF) and Xtrackers USD High Yield Corporate Bond ETF (formerly Deutsche X-trackers USD High Yield Corporate Bond ETF) (three of the portfolios constituting the DBX ETF Trust (collectively, the “Funds”)) as of August 31, 2017, and the related statements of operations, the statements of changes in net assets and the financial highlights for each of the periods indicated therein. These financial statements and financial highlights are the responsibility of the Funds’ management. Our responsibility is to express an opinion on these financial statements and financial highlights based on our audits.
We conducted our audits in accordance with the standards of the Public Company Accounting Oversight Board (United States). Those standards require that we plan and perform the audit to obtain reasonable assurance about whether the financial statements and financial highlights are free of material misstatement. We were not engaged to perform an audit of the Funds’ internal control over financial reporting. Our audits included consideration of internal control over financial reporting as a basis for designing audit procedures that are appropriate in the circumstances, but not for the purpose of expressing an opinion on the effectiveness of the Funds’ internal control over financial reporting. Accordingly, we express no such opinion. An audit also includes examining, on a test basis, evidence supporting the amounts and disclosures in the financial statements and financial highlights, assessing the accounting principles used and significant estimates made by management, and evaluating the overall financial statement presentation. Our procedures included confirmation of securities owned as of August 31, 2017 by correspondence with the custodian and brokers or by other appropriate auditing procedures where replies from brokers were not received. We believe that our audits provide a reasonable basis for our opinion.
In our opinion, the financial statements and financial highlights referred to above present fairly, in all material respects, the financial position of Xtrackers Barclays International Corporate Bond Hedged ETF, Xtrackers Barclays International Treasury Bond Hedged ETF and Xtrackers USD High Yield Corporate Bond ETF at August 31, 2017, the results of their operations, changes in their net assets and the financial highlights for each of the periods indicated therein in conformity with U.S. generally accepted accounting principles.

New York, New York
October 26, 2017
48
DBX ETF Trust
| Name, Year of Birth and Address | Position(s) Held with Fund | Terms of Office and Length of Time Served | Principal Occupation(s) During Past 5 Years | Number of Portfolios in Fund Complex Overseen by Trustee | Other Directorships held by Trustee | |||||
Independent Trustees | ||||||||||
Stephen R. Byers (1953) 345 Park Avenue New York, New York 10154 | Trustee, Chairman of the Board and Member of the Audit and Nominating Committees; formerly, Lead Independent Trustee | Trustee since 2011 (Chairman of the Board since 2016; formerly, Lead Independent Trustee, 2015-2016) | Independent Director (2011-present); Independent Consultant (2014-present); formerly, Director of Investment Management, the Dreyfus Corporation (2000-2006) and Vice Chairman and Chief Investment Officer (2002-2006). | 35 | The Arbitrage Funds; Sierra Income Corporation; Mutual Fund Directors Forum. | |||||
George O. Elston (1964) 345 Park Avenue New York, New York 10154 | Trustee, Chairman of the Audit Committee and Member of the Nominating Committee | Trustee since 2011 (Chairman of the Audit Committee since 2015) | Chief Executive Officer, 2X Oncology, Inc. (2017-present); Senior Vice President and Chief Financial Officer, Juniper Pharmaceuticals, Inc. (2014-2016); Senior Vice President and Chief Financial Officer, KBI BioPharma Inc. (2013-2014); Managing Partner, Chatham Street Partners (2010-2013). | 35 | ||||||
J. David Officer (1948) 345 Park Avenue New York, New York 10154 | Trustee, Chairman of the Nominating Committee and Member of the Audit Committee | Trustee since 2011 (Chairman of the Nominating Committee since 2015) | Independent Director (2010-present); formerly, Vice Chairman, the Dreyfus Corporation (2006-2009); President, The Dreyfus Family of Funds, Inc. (2006-2009). | 35 | Ilex Partners (Asia), LLC; Old Westbury Funds. | |||||
49
DBX ETF Trust
Trustees and Officers (Unaudited) (Continued)
| Name, Year of Birth and Address | Position(s) Held with Fund | Terms of Office and Length of Time Served | Principal Occupation(s) During Past 5 Years | Number of Portfolios in Fund Complex Overseen by Trustee | Other Directorships held by Trustee | |||||
Interested Trustee | ||||||||||
Michael Gilligan (1966) 345 Park Avenue New York, New York 10154 | Trustee Treasurer, Chief Financial Officer and Controller | Trustee since 2016; Treasurer, Chief Financial Officer and Controller since 2010 | Director in the Finance Division at Deutsche Bank AG (2008-present); Manager, Treasurer and Chief Financial Officer of the Adviser (2010-present); Chief Financial Officer of Global Passive Asset Management Platform (2012-present). | 35 | The Adviser, DBX Strategic Advisors LLC and DB Commodity Services LLC | |||||
| Name, Year of Birth and Address | Position(s) Held with Fund | Terms of Office and Length of Time Served | Principal Occupation(s) During Past 5 Years | |||||||
Officers | ||||||||||
Freddi Klassen (1975) 345 Park Avenue New York, New York 10154 | President and Chief Executive Officer | Since 2016 | Director in the Deutsche Asset Management Division at Deutsche Bank AG and Chief Operating Officer in the Americas for the Passive Asset Management Department (2014-present) and Trading and Product Development teams (2016-present); Manager and Chief Operating Officer of the Adviser (2016-present); Global Chief Operating Officer for Equities Technology in the Investment Bank Division at Deutsche Bank AG (2013-2014); Chief Operating Officer for Exchange Traded Funds and Systematic Funds in Europe (2008-2013). | |||||||
Fiona Bassett (1974) 345 Park Avenue New York, New York 10154 | Chief Operating Officer | Since 2014 | Managing Director in the Deutsche Asset Management Passive Asset Management Group at Deutsche Bank AG and Head of Passive Americas Asset Management Platform (2014-present); Manager and Chief Executive Officer and Chief Investment Officer of the Adviser (2014-present); Managing Director, COO Global Key Projects and Integration at Deutsche Asset Management (2012-2014); Managing Director at Deutsche Bank AG (2004-2012). | |||||||
50
DBX ETF Trust
Trustees and Officers (Unaudited) (Continued)
| Name, Year of Birth and Address | Position(s) Held with Fund | Terms of Office and Length of Time Served | Principal Occupation(s) During Past 5 Years | |||||||
Frank Gecsedi (1967) 60 Wall Street New York, New York 10005 | Chief Compliance Officer | Since 2010 | Director in the Deutsche Asset Management Compliance Department (2016-present), Vice President in the Deutsche Asset Management Compliance Department at Deutsche Bank AG (2013-2016) and Chief Compliance Officer of the Adviser (2010-present); Vice President in Deutsche Bank’s Global Markets Legal, Risk and Capital Division (2010-2012). | |||||||
Bryan Richards (1978) 345 Park Avenue New York New York 10154 | Vice President | Since 2016 | Director in the Deutsche Asset Management Division at Deutsche Bank A.G. and has served as a Portfolio Manager in the Passive Asset Management business since 2011. Also at Deutsche Bank, Mr. Richards served as the primary portfolio manager for the PowerShares DB Commodity ETFs until their sale in 2015. | |||||||
Leslie Lowenbraun (1953) 60 Wall Street New York, New York 10005 | Secretary | Since 2016 | Vice President in U.S. Retail Passive Legal of Deutsche Asset Management at Deutsche Bank AG (2014-present) and Chief Legal Officer of the Adviser (2017 to present); Counsel at Skadden, Arps, Slate, Meagher & Flom LLP (2005-2014). | |||||||
Each Trustee serves until his or her successor is duly elected or appointed and qualified. Each officer serves until he or she resigns, is removed, dies, retires or becomes disqualified.
The Funds’ SAI includes additional information about the Funds’ Trustees and is available by calling 855-329-3837, or on the Company’s website at www.Xtrackers.com
51
DBX ETF Trust
Proxy Voting Policies and Procedures
The Funds’ policies and procedures for voting proxies for portfolio securities and information about how each Fund voted proxies related to its portfolio securities during the most recent 12-month period ended June 30 are available on our Web site — www.Xtrackers.com (click on “Resources” and “Proxy Voting” at the top of the page) — or on the SEC’s Web site — www.sec.gov. To obtain a written copy of the Funds’ policies and procedures without charge, upon request, call us toll free at 855-329-3837.
Quarterly Portfolio Disclosure
The Funds are required to file their complete schedule of portfolio holdings with the SEC for their first and third fiscal quarters on Form N-Q. Copies of the filings are available without charge, upon request on the SEC’s website at www.sec.gov and are available by calling the Trust at 855-329-3837. You can also obtain copies of Form N-Q by (i) visiting the SEC’s Public Reference Room in Washington, DC (information on the operation of the Public Reference Room may be obtained by calling 800-SEC-0330); (ii) sending your request and a duplicating fee to the SEC’s Public Reference Room, Washington, DC 20549-0102; or (iii) sending your request electronically to publicinfo@sec.gov.
Information about each Fund’s portfolio holdings is available daily at www.deutsche-etfs.com.
Discount/Premium Information
Information regarding how often shares of each Fund traded on NYSE Arca or Bats BZX, as applicable, at a price above (i.e., at a premium) or below (i.e., at a discount) the Net Asset Value of the Fund can be found at www.Xtrackers.com.
Tax Information
Form 1099-DIV and other year-end tax information provide shareholders with actual calendar year amounts that should be included in their tax returns. Shareholders should consult their tax advisors.
52
DBX ETF Trust
DBX Advisors LLC (“Advisors”) collects non-public information about you from the following sources: (i) information received from you on applications or other forms; and (ii) information about your transactions with the Advisors, Advisors’ affiliates and third-party service providers and vendors. Advisors does not disclose any non-public personal information about you to anyone, other than as set forth below, as permitted by applicable law and regulation. Advisors may disclose non-public personal information about you to the funds in which you invest, to Advisors’ affiliates, and to non-affiliated companies that work with Advisors to service your account(s), or to provide services or process transactions that you have requested. Advisors may disclose non-public personal information in situations that may include, but are not limited to, in response to legal and/or regulatory inquiries and the proposed or actual sale, assignment merger or other transfer of all or a portion of Advisors’ business to another business entity. Advisors may also disclose non-public personal information about you to parties representing you, such as your investment representative, your accountant, your tax adviser, or to other third parties at your direction/consent. Advisors will not sell, rent, license or trade your personal and financial information to or with third parties for their own direct marketing use unless you give us general or specific consent to do so. If you decide to close your account(s) or become an inactive customer, Advisors will adhere to the privacy policies and practices as described in this notice. Advisors restricts access to your personal and account information to those employees who need to know that information to provide products and services to you. Advisors maintains reasonable and customary physical, electronic and procedural safeguards to guard your non-public personal information.
Advisors reserves the right, at their discretion, to change, modify, add, or remove portions of this Privacy Policy Notice, and any of the policies described herein, at any time. Advisors will indicate any such changes to the Privacy Policy Notice at the privacy link which can be found at www.Xtrackers.com. At all times, you are bound by the then-current version of the Privacy Policy and all applicable laws. Advisors highly recommends that you review this Privacy Policy Notice from time to time to ensure that you are familiar with the most recent version. The examples contained in this Privacy Policy Notice are illustrations; they are not intended to be exclusive.
53
DBX ETF Trust
This report is intended for the shareholders of the DBX ETF Trust.
Carefully consider the Fund’s investment objectives, risk factors and charges and expenses before investing. This and other information can be found in the Fund’s prospectus, which may be obtained by calling 1-855-DBX-ETFS (1-855-329-3837), or by viewing or downloading a prospectus at www.Xtrackers.com. Read the prospectus carefully before investing.
Investing involves risk, including the possible loss of principal. Bond investments are subject to interest rate, credit, liquidity and market risks to varying degrees. When interest rates rise, bond prices generally fall. Foreign investing involves greater and different risks than investing in U.S. companies, including currency fluctuations, less liquidity, less developed or less efficient trading markets, lack of comprehensive company information, political instability and differing auditing and legal standards. Emerging markets tend to be more volatile and less liquid than the markets of more mature economies, and generally have less diverse and less mature economic structures and less stable political systems than those of developed countries. Funds investing in a single industry, or group of industries, country or in a limited geographic region generally are more volatile than more diversified funds. Investments in lower-quality (“junk bonds”) and non-rated securities present greater risk of loss than investments in higher-quality securities. These funds are non-diversified and can take larger positions in fewer issues, increasing their potential risk. Credit risk refers to the ability of an issuer to make timely payments of principal and interest. Investing in derivatives entails special risks relating to liquidity, leverage and credit that may reduce returns and/or increase volatility. A Fund’s use of forward currency contracts may not be successful in hedging currency exchange rates changes and could eliminate some or all of the benefit of an increase in the value of a foreign currency versus the U.S. dollar. Performance of the Funds may diverge from that of the Underlying Index due to operating expenses, transaction costs, cash flows, use of sampling strategies or operational inefficiencies. An investment in these Funds should be considered only as a supplement to a complete investment program for those investors willing to accept the risks associated with the Funds. Please read the prospectus for more information.
Shares of the Funds are bought and sold at market price (not NAV) throughout the day on the New York Stock Exchange or Bats BZX Exchange, Inc., as applicable. Transactions in Fund shares may result in brokerage commissions and may generate tax consequences. There can be no assurance that an active trading market for shares of a fund will develop or be maintained.
DBX ETF Trust Funds are distributed by ALPS Distributors, Inc. The Funds are managed by DBX Advisors LLC which is not affiliated with ALPS.
Deutsche Asset Management represents the asset management activities conducted by Deutsche Bank AG or any of its subsidiaries.
Deutsche X-trackers USD High Yield Corporate Bond ETF is not sponsored, promoted, sold or supported in any other manner by Solactive AG (the “Licensor”) nor does the trademark or the Index Price at any time or in any other respect.
Barclays Bank PLC and its affiliates (“Barclays”) are not the issuer or producer of Deutsche X-trackers Barclays International Treasury Bond Hedged ETF or Deutsche X-trackers Barclays International Corporate Bond Hedged ETF (the “Funds”) and Barclays has no responsibilities, obligations or duties to investors in the Funds.
Copyright © 2017 Deutsche Bank AG. All rights reserved. Deutsche X-trackers® is a registered trademark of Deutsche Bank AG. All other trademarks, servicemarks or registered trademarks are the property of their respective owners.
Not FDIC Insured | No Bank Guarantee | May Lose Value
DBX ETF Trust
Investment advisor DBX Advisors LLC 345 Park Avenue New York, NY 10154 | Administrator, custodian, fund accounting agent, lending agent & transfer agent The Bank of New York Mellon 101 Barclay Street New York, NY 10286 | Distributor ALPS Distributors, Inc. 1290 Broadway Suite 1100 Denver, CO 80203 | ||
Independent registered public accounting firm Ernst & Young LLP 5 Times Square New York, NY 10036 | Legal counsel Dechert LLP 1095 Avenue of the Americas New York, NY 10036 | |||
R-052201-1 (10/17) DBX002886 (10/18)
Item 2. Code of Ethics.
| (a) | The registrant, as of the end of the period covered by this report, has adopted a code of ethics that applies to the registrant’s principal executive officer, principal financial officer, principal accounting officer or controller, or persons performing similar functions, regardless of whether these individuals are employed by the registrant or a third party. |
| (c) | There have been no amendments, during the period covered by this report, to a provision of the code of ethics that applies to the registrant’s principal executive officer, principal financial officer, principal accounting officer or controller, or persons performing similar functions, regardless of whether these individuals are employed by the registrant or a third party, and that relates to any element of the code of ethics description. |
| (d) | The registrant has not granted any waivers, including an implicit waiver, from a provision of the code of ethics that applies to the registrant’s principal executive officer, principal financial officer, principal accounting officer or controller, or persons performing similar functions, regardless of whether these individuals are employed by the registrant or a third party, that relates to one or more of the items set forth in paragraph (b) of this item’s instructions. |
Item 3. Audit Committee Financial Expert.
Stephen R. Byers, George O. Elston, and J. David Officer are the designated financial experts on the Audit Committee of DBX ETF Trust. With respect to DBX ETF Trust, Stephen Byers, George O. Elston, and J. David Officer are not “interested persons” as such terms are defined by Section 2(a)(19) of the Act (15 U.S.C. 80a-2(a)(19)).
Item 4. Principal Accountant Fees and Services.
Audit Fees
| (a) | The aggregate fees billed for each of the last two fiscal years for professional services rendered by the principal accountant for the audit of the registrant’s annual financial statements or services that are normally provided by the accountant in connection with statutory and regulatory filings or engagements for those fiscal years are $168,680 for 2017 and $92,000 for 2016. |
Audit-Related Fees
| (b) | The aggregate fees billed in each of the last two fiscal years for assurance and related services by the principal accountant that are reasonably related to the performance of the audit of the |
registrant’s financial statements and are not reported under paragraph (a) of this Item are $25,000 for 2017 and $0 for 2016. These services consisted of security counts related to Rule 17f-2 under the Investment Company Act of 1940. |
Tax Fees
| (c) | The aggregate fees billed in each of the last two fiscal years for professional services rendered by the principal accountant for tax compliance, tax advice, and tax planning are $123,242 for 2017 and $166,985 for 2016. |
All Other Fees
| (d) | The aggregate fees billed in each of the last two fiscal years for products and services provided by the principal accountant, other than the services reported in paragraphs (a) through (c) of this Item are $0 for 2017 and $0 for 2016. |
| (e)(1) | Disclose the audit committee’s pre-approval policies and procedures described in paragraph (c)(7) of Rule 2-01 of Regulation S-X. |
In accordance with Rule 2-01(c)(7)(A), the Audit Committee pre-approves all of the audit and permissible non-audit services of the Registrant.
| (e)(2) | All of the services described in paragraphs (b) through (d) above were approved by the Audit Committee in accordance with paragraph (c) (7) (i) (c) of Rule 2-01 of Regulation S-X. |
| (f) | Not Applicable. |
| (g) | The aggregate non-audit fees billed by the registrant’s accountant for services rendered to the registrant, and rendered to the registrant’s investment adviser (not including any sub-adviser whose role is primarily portfolio management and is subcontracted with or overseen by another investment adviser), and any entity controlling, controlled by, or under common control with the adviser that provides ongoing services to the registrant for each of the last two fiscal years of the registrant was $0 for 2017 and $72,043 for 2016. |
| (h) | The registrant’s audit committee of the board of directors has considered whether the provision of non-audit services that were rendered to the registrant’s investment adviser (not including any sub-adviser whose role is primarily portfolio management and is subcontracted with or overseen by another investment adviser), and any entity controlling, controlled by, or under common control with the investment adviser that provides ongoing services to the registrant that were not pre-approved pursuant to paragraph (c)(7)(ii) of Rule 2-01 of Regulation S-X is compatible with maintaining the principal accountant’s independence. |
Item 5. Audit Committee of Listed Registrants.
The Registrant is a listed issuer as defined in Rule 10A-3 under the Exchange Act and has a separately-designated standing audit committee established in accordance with Section 3(a)(58)(A) of the Exchange Act. The Registrant’s audit committee members are Stephen R. Byers, George O. Elston, and J. David Officer.
Item 6. Investments.
| (a) | Schedule of Investments in securities of unaffiliated issuers as of the close of the reporting period is included as part of the report to shareholders filed under Item 1 of this form. |
| (b) | Not applicable. |
| Item 7. | Disclosure of Proxy Voting Policies and Procedures for Closed-End Management Investment Companies. |
Not applicable.
Item 8. Portfolio Managers of Closed-End Management Investment Companies.
Not applicable.
| Item 9. | Purchases of Equity Securities by Closed-End Management Investment Company and Affiliated Purchasers. |
Not applicable.
Item 10. Submission of Matters to a Vote of Security Holders.
There were no material changes to the procedures by which shareholders may recommend nominees to the Registrant’s Board of Trustees.
Item 11. Controls and Procedures.
| (a) | The Chief Executive and Financial Officers concluded that the Registrant’s Disclosure Controls and Procedures are effective based on the evaluation of the Disclosure Controls and Procedures as of a date within 90 days of the filing date of this report. |
| (b) | There have been no changes in the registrant’s internal control over financial reporting that occurred during the last fiscal quarter that has materially affected, or is reasonably likely to materially affect, the registrant’s internal controls over financial reporting. |
Item 12. Disclosure of Securities Lending Activities for Closed End Management Investment Companies.
Not applicable.
Item 13. Exhibits.
| (a)(1) | Code of ethics, or any amendment thereto, that is the subject of disclosure required by Item 2 is attached hereto. |
| (a)(2) | Certifications pursuant to Rule 30a-2(a) under the 1940 Act and Section 302 of the Sarbanes-Oxley Act of 2002 are attached hereto. |
| (a)(3) | Not applicable. |
| (a)(4) | Not applicable. |
| (b) | Certifications pursuant to Rule 30a-2(b) under the 1940 Act and Section 906 of the Sarbanes-Oxley Act of 2002 are attached hereto. |
SIGNATURES
Pursuant to the requirements of the Securities Exchange Act of 1934 and the Investment Company Act of 1940, the registrant has duly caused this report to be signed on its behalf by the undersigned, thereunto duly authorized.
(Registrant) DBX ETF Trust
By (Signature and Title)* /s/ Freddi Klassen
Freddi Klassen
President and Chief Executive Officer
Date 10/31/2017
Pursuant to the requirements of the Securities Exchange Act of 1934 and the Investment Company Act of 1940, this report has been signed below by the following persons on behalf of the registrant and in the capacities and on the dates indicated.
By (Signature and Title)* /s/ Freddi Klassen
Freddi Klassen
President and Chief Executive Officer
Date 10/31/2017
By (Signature and Title)* /s/ Michael Gilligan
Michael Gilligan
Treasurer, Chief Financial Officer and Controller
Date 10/31/2017
* Print the name and title of each signing officer under his or her signature.