UNITED STATES
SECURITIES AND EXCHANGE COMMISSION
Washington, D.C. 20549
FORM N-CSR
CERTIFIED SHAREHOLDER REPORT OF REGISTERED MANAGEMENT
INVESTMENT COMPANIES
Investment Company Act file number 811-22487
DBX ETF Trust |
(Exact name of registrant as specified in charter)
345 Park Avenue New York, New York 10154 |
(Address of principal executive offices) (Zip code)
Alex Depetris DBX ETF Trust 345 Park Avenue New York, New York 10154 |
(Name and address of agent for service)
Registrant’s telephone number, including area code: (212) 250-4352
Date of fiscal year end: May 31
Date of reporting period: May 31, 2016
Form N-CSR is to be used by management investment companies to file reports with the Commission not later than 10 days after the transmission to stockholders of any report that is required to be transmitted to stockholders under Rule 30e-1 under the Investment Company Act of 1940 (17 CFR 270.30e-1). The Commission may use the information provided on Form N-CSR in its regulatory, disclosure review, inspection, and policymaking roles.
A registrant is required to disclose the information specified by Form N-CSR, and the Commission will make this information public. A registrant is not required to respond to the collection of information contained in Form N-CSR unless the Form displays a currently valid Office of Management and Budget (“OMB”) control number. Please direct comments concerning the accuracy of the information collection burden estimate and any suggestions for reducing the burden to Secretary, Securities and Exchange Commission, 100 F Street, NE, Washington, DC 20549. The OMB has reviewed this collection of information under the clearance requirements of 44 U.S.C. § 3507.
Item 1. Reports to Stockholders.
The Report to Shareholders is attached herewith.

May 31, 2016
Annual Report
DBX ETF Trust
Deutsche X-trackers MSCI All World ex US Hedged Equity ETF (DBAW)
Deutsche X-trackers MSCI Asia Pacific ex Japan Hedged Equity ETF (DBAP)
Deutsche X-trackers MSCI Brazil Hedged Equity ETF (DBBR)
Deutsche X-trackers MSCI Emerging Markets Hedged Equity ETF (DBEM)
Deutsche X-trackers MSCI Europe Hedged Equity ETF (DBEU)
Deutsche X-trackers MSCI Eurozone Hedged Equity ETF (DBEZ)
Deutsche X-trackers MSCI Germany Hedged Equity ETF (DBGR)
Deutsche X-trackers MSCI Japan Hedged Equity ETF (DBJP)
Deutsche X-trackers MSCI Mexico Hedged Equity ETF (DBMX)
Deutsche X-trackers MSCI South Korea Hedged Equity ETF (DBKO)
Deutsche X-trackers MSCI United Kingdom Hedged Equity ETF (DBUK)

DBX ETF Trust
| Page | ||||
| 1 | ||||
| 3 | ||||
| 6 | ||||
Deutsche X-trackers MSCI Asia Pacific ex Japan Hedged Equity ETF | 8 | |||
| 10 | ||||
| 12 | ||||
| 14 | ||||
| 16 | ||||
| 18 | ||||
| 20 | ||||
| 22 | ||||
| 24 | ||||
| 26 | ||||
| 28 | ||||
| 30 | ||||
Deutsche X-trackers MSCI Asia Pacific ex Japan Hedged Equity ETF | 57 | |||
| 66 | ||||
| 69 | ||||
| 84 | ||||
| 95 | ||||
| 103 | ||||
| 106 | ||||
| 111 | ||||
| 113 | ||||
| 116 | ||||
| 120 | ||||
| 124 | ||||
| 128 | ||||
| 134 | ||||
| 140 | ||||
| 156 | ||||
| 157 | ||||
Board Considerations in Approval of Investment Advisory and Sub-Advisory Contracts (Unaudited) | 160 | |||
| 163 | ||||
| 165 | ||||
To our shareholders: (Unaudited)
Dear Shareholder,
We are pleased to provide this annual report for eleven of our currency-hedged equity ETFs for the period ended May 31, 2016.
The global recovery has remained subdued in the past 12 months, in part due to unstable commodity prices, weakening momentum in developed economies and concerns over the slowdown in China. Capital markets remained under the spell of central banks, as global monetary policy drove equity markets. The US economy has remained on a moderate expansion path, despite mixed macroeconomic data. The housing sector has continued its recovery, while productivity gains have been anemic. Inflation has remained below target. The US Federal Reserve (FRB) increased the range of the federal funds rate from 0.25% to 0.5% in December 2015, citing an improving US labor market and strong macroeconomic growth. Divergent global monetary policies and low oil prices have supported the USD.
Growth in the Eurozone continued at a moderate pace, supported by accommodative monetary policy from the European Central Bank (ECB) and low oil prices. Equity markets were subject to periods of volatility, with markets reacting negatively to the devaluation of the Renminbi (RMB) and concerns over growth in the US and China. Greece secured a bailout package and received approval for additional loans from its creditors easing concerns of its exit from the Euro currency. Germany continued to grow steadily, fueled by booming construction activity, a buoyant labor market, the ECB’s monetary stimulus and low commodity prices. Growth prospects in France are improving, with the economy picking up steam in the first quarter of this year, supported by steady private consumption and investment. France’s attempt to deal with unemployment through its recent labor reforms has created some unease in markets. The recovery in the UK remained fragile due to global headwinds and Britain’s anticipated departure from the EU. The service sector and consumer demand contributed positively, while the slowdown was led by a weak external sector.
Japan continued to grow at a subdued rate despite introducing a ‘Quantitative and Qualitative Easing’ (QQE) program to help spur wage growth, consumer spending and investment. The QQE involves pursuing monetary easing via negative interest rates, JPY 80 trillion of purchases and buying a broader mix of assets. Markets reacted negatively to this unconventional move and were further weighed down by the slowdown in China’s economy and a strengthening JPY. Australia continued to grow at a modest pace, with growth accelerating in the latter half of 2015. The Reserve Bank of Australia cut cash rates to a record low on the back of unexpectedly weak inflation data and a challenging external environment.
The world economy remained on a moderate growth path, despite the challenging macroeconomic backdrop and political uncertainties. While Japanese and European equities are expected to be supported by further monetary policy initiatives, US equities could face headwinds from a strong USD as the FRB continues to lift rates at a cautious pace to offset the softer pace of global economic growth. In the current market environment, hedging currency exposure plays a significant role in managing investments in international equities.
Our team appreciates your trust and looks forward to serving your investment needs through innovative index-driven strategies.
Sincerely,
/s/ Alex N. Depetris
Alex N. Depetris
Chairman, President and Chief Executive Officer
Assumptions, estimates and opinions contained in this document constitute our judgment as of the date of the document and are subject to change without notice. Any projections are based on a number of assumptions as to market conditions and there can be no guarantee that any projected results will be achieved. Past performance is not a guarantee of future results.
1
This Page is Intentionally Left Blank
2
DBX ETF Trust
Management’s discussion of fund performance (Unaudited)
Deutsche X-trackers MSCI All World ex US Hedged Equity ETF
The Deutsche X-trackers MSCI All World ex US Hedged Equity ETF (DBAW) seeks investment results that correspond generally to the performance, before fees and expenses, of the MSCI ACWI ex USA US Dollar Hedged Index (the DBAW Index). The DBAW Index is designed to provide exposure to equity securities in developed and emerging stock markets (excluding the US), while at the same time mitigating exposure to fluctuations between the value of the US dollar and selected non-US currencies. For the 12-month period ended May 31, 2016, the DBAW shares returned
-11.17% compared to the DBAW Index return of -10.67%.
Nine out of the ten sectors in the DBAW Index contributed negatively to Index performance. Financials, Consumer Discretionary and Materials sectors were the primary negative contributors. China, Japan and Switzerland were the primary negative contributors, while Denmark, Belgium and New Zealand were the top three positive contributors to the Index performance.
Deutsche X-trackers MSCI Asia Pacific ex Japan Hedged Equity ETF
The Deutsche X-trackers MSCI Asia Pacific ex Japan Hedged Equity ETF (DBAP) seeks investment results that correspond generally to the performance, before fees and expenses, of the MSCI Asia Pacific ex Japan US Dollar Hedged Index (the DBAP Index). The DBAP Index is designed to provide exposure to equity securities in developed and emerging stock markets in the Asia Pacific region (excluding Japan), while at the same time mitigating exposure to fluctuations between the value of the US dollar and selected non-US currencies. For the 12-month period ended May 31, 2016, DBAP shares returned -12.98%, compared to the DBAP Index return of -12.76%.
Financials and Information Technology contributed negatively to performance. Healthcare was the only contributor to positive performance. Australia, South Korea, China, and Hong Kong were the significant negative contributors, while New Zealand contributed positively to performance.
Deutsche X-trackers MSCI Brazil Hedged Equity ETF
The Deutsche X-trackers MSCI Brazil Hedged Equity ETF (DBBR) seeks investment results that correspond generally to the performance, before fees and expenses, of the MSCI Brazil US Dollar Hedged Index (the DBBR Index). The DBBR Index is designed to provide exposure to Brazil’s equity market, while at the same time mitigating exposure to fluctuations between the value of the US dollar and the Brazilian real. For the 12-month period ended May 31, 2016, DBBR shares returned -15.83%, compared to the DBBR Index return of -15.28%.
Political uncertainty posed a major challenge to the Brazilian economy. All sectors represented in the DBBR Index delivered negative returns during the period, particularly Financials, Energy, Materials, and Consumer Staples.
Deutsche X-trackers MSCI Emerging Markets Hedged Equity ETF
The Deutsche X-trackers MSCI Emerging Markets Hedged ETF (DBEM) seeks investment results that correspond generally to the performance, before fees and expenses, of the MSCI EM US Dollar Hedged Index (the DBEM Index). The DBEM Index is designed to provide exposure to equity securities in global emerging markets, while at the same time mitigating exposure to fluctuations between the values of the US dollar and selected emerging market currencies. For the 12-month period ended May 31, 2016, DBEM shares returned -14.32% compared to the DBEM Index return of -12.99%.
Emerging markets faced significant headwinds due to hard landing fears in China, volatile commodity markets, and political turmoil. All sectors in the DBEM Index contributed to negative returns. Financials and Information Technology were the main contributors to negative performance. South Korea, Taiwan and China were the main contributors to negative performance.
Deutsche X-trackers MSCI Europe Hedged Equity ETF
The Deutsche X-trackers MSCI Europe Hedged Equity ETF (DBEU) seeks investment results that correspond generally to the performance, before fees and expenses, of the MSCI Europe US Dollar Hedged Index (the DBEU Index). The DBEU Index is designed to provide exposure to equity securities in 15 developed European stock
3
DBX ETF Trust
Management’s discussion of fund performance (Unaudited) (Continued)
markets, while at the same time mitigating exposure to fluctuations between the value of the US dollar and selected non-US currencies. For the 12-month period ended May 31, 2016, DBEU shares returned -8.46% compared to the DBEU Index return of -8.20%.
Global growth concerns and the China slowdown weighed heavily on the Eurozone economies, in particular the financial sector. Consumer Staples was the only significant positive contributor to Index performance. France, Germany and Switzerland contributed negatively to performance, while Denmark, Belgium, and Ireland delivered positive contributions.
Deutsche X-trackers MSCI Eurozone Hedged Equity ETF
The Deutsche X-trackers MSCI Eurozone Hedged Equity ETF (DBEZ) seeks investment results that correspond generally to the performance, before fees and expenses, of the MSCI EMU IMI US Dollar Hedged Index (the DBEZ Index). DBEZ Index offers investors access to Eurozone equities while seeking to mitigate exposure to currency fluctuations between the US dollar and the euro. For the 12-month period ended May 31, 2016, DBEZ shares returned
-8.45%, compared with the DBEZ Index return of -8.41%.
Consumer Discretionary and Financials were the primary negative contributors, while Consumer Staples, Information Technology and Industrial sectors contributed positively. From country perspective, Belgium and Ireland were the significant positive contributors and. Germany, Spain and France were the major negative contributors.
Deutsche X-trackers MSCI Germany Hedged Equity ETF
The Deutsche X-trackers MSCI Germany Hedged Equity ETF (DBGR) seeks investment results that correspond generally to the performance, before fees and expenses, of the MSCI Germany US Dollar Hedged Index (the DBGR Index). The DBGR Index is designed to provide exposure to Germany’s equity market, while at the same time mitigating exposure to fluctuations between the value of the US dollar and the euro. For the 12-month period ended May 31, 2016, the fund returned -9.99% compared to the DBGR Index return of -9.77%.
Four of the nine sectors in the DBGR Index contributed positively to Index performance. Industrials and information technology were the main contributors to positive performance. Consumer Discretionary, Healthcare and Materials contributed to the negative performance.
Deutsche X-trackers MSCI Japan Hedged Equity ETF
The Deutsche X-trackers MSCI Japan Hedged Equity ETF (DBJP) seeks investment results that correspond generally to the performance, before fees and expenses, of the MSCI Japan US Dollar Hedged Index (the DBJP Index). The DBJP Index is designed to provide exposure to Japan’s equity market, while at the same time mitigating exposure to fluctuations between the value of the US dollar and Japanese yen. For the 12-month period ended May 31, 2016, DBJP shares returned -18.65%, compared to the DBJP Index return of -18.13%.
Japan’s move to pursue monetary easing via negative interest rates resulted in a challenging year for equity markets. The Consumer Discretionary, Industrial, and Financial sectors contributed significant negative returns to the DBJP Index, while Telecom Services, Healthcare and Consumer Staples were the positive contributors to performance.
Deutsche X-trackers MSCI Mexico Hedged Equity ETF
The Deutsche X-trackers MSCI Mexico Hedged Equity ETF (DBMX) seeks investment results that correspond generally to the performance, before fees and expenses, of the MSCI Mexico IMI 25/50 US Dollar Hedged Index (the DBMX Index). The DBMX Index is designed to provide exposure to the Mexican equity markets, while at the same time mitigating exposure to fluctuations between the value of the US dollar and Mexican peso. For the 12-month period ended May 31, 2016, DBMX shares returned 2.09%, compared to the DBMX Index return of 2.32%.
The DBMX Index calculated in US dollar terms performed positively owing to the currency hedging. The Materials, Telecom Services and Consumer Discretionary sectors contributed significantly to the negative returns for the twelve months ended May 31, 2016. Industrials and Consumer staples sectors were the only positive contributors. The currency-hedging strategy by DBMX delivered a significant positive contribution of 14.70% to the fund’s returns.
4
DBX ETF Trust
Management’s discussion of fund performance (Unaudited) (Continued)
Deutsche X-trackers MSCI South Korea Hedged Equity ETF
The Deutsche X-trackers MSCI South Korea Hedged Equity ETF (DBKO) seeks investment results that correspond generally to the performance, before fees and expenses, of the MSCI Korea 25/50 US Dollar Hedged Index (the DBKO Index). The DBKO Index is designed to provide exposure to South Korean equity markets, while at the same time mitigating exposure to fluctuations between the value of the US dollar and the South Korean won. For the 12-month period ended May 31, 2016, DBKO shares returned -5.55%, compared to the DBKO Index return of -4.49%.
The Information Technology and Industrial sectors, contributed negatively to the performance. Only four of the ten sectors in the DBKO Index performed positively, with Energy sector being the significant positive contributor.
Deutsche X-trackers MSCI United Kingdom Hedged Equity ETF
The Deutsche X-trackers MSCI United Kingdom Hedged Equity ETF (DBUK) seeks investment results that correspond generally to the performance, before fees and expenses, of the MSCI United Kingdom US Dollar Hedged Index (the DBUK Index). The DBUK Index is designed to provide exposure to the equity market of the United Kingdom, while at the same time mitigating exposure to fluctuations between the value of the US dollar and British pound sterling. For the 12-month period ended May 31, 2016, DBUK shares returned -8.25%, compared to the DBUK Index return of -7.74%.
Nine out of the ten sectors in the DBUK Index contributed negatively to Index performance. Financials, Materials and Energy sectors were the primary contributors to the negative performance. Consumer Staples was the sole positive contributor.
*************************
Performance data quoted represents past performance and does not guarantee future results. Investment returns and principal value of an investment will fluctuate so that an investor’s shares, when sold or redeemed, may be worth more or less than their original cost. Current performance may be lower or higher than the performance data quoted. To obtain the most recent month-end performance data visit www.deutsche-etfs.com. Returns assume that dividends and capital gains distributions have been reinvested. See pages 6-27 of this report for additional performance information, including performance data based on market value.
The views expressed in this report reflect those of the portfolio management team only through the end of the period of the report as stated on the cover. The management team’s views are subject to change at any time based on market and other conditions and should not be construed as a recommendation. Current and future portfolio holdings are subject to risk.
5
DBX ETF Trust
Performance summary (Unaudited)
Deutsche X-trackers MSCI All World ex US Hedged Equity ETF (DBAW)
The Deutsche X-trackers MSCI All World ex US Hedged Equity ETF seeks investment results that correspond generally to the performance, before fees and expenses, of the MSCI ACWI ex USA US Dollar Hedged Index (the “Underlying Index”). The Underlying Index is designed to provide exposure to equity securities in developed and emerging stock markets (excluding the United States), while at the same time mitigating exposure to fluctuations between the value of the US dollar and selected non-US currencies. It is not possible to invest directly into an index.
Performance as of 5/31/16
| Average Annual Total Return | ||||||||
| Net Asset Value | Market Value | MSCI ACWI ex USA US Dollar Hedged Index | MSCI ACWI ex USA Index | |||||
One Year | -11.17% | -12.05% | -10.67% | -11.39% | ||||
Since Inception1 | 1.19% | 0.95% | 1.66% | -3.73% | ||||
| Cumulative Total Returns | ||||||||
| Net Asset Value | Market Value | MSCI ACWI ex USA US Dollar Hedged Index | MSCI ACWI ex USA Index | |||||
One Year | -11.17% | -12.05% | -10.67% | -11.39% | ||||
Since Inception1 | 2.83% | 2.26% | 3.96% | -8.56% | ||||
1 Total returns are calculated based on the commencement of operations, 1/23/14 (“Inception”).
Past performance is no guarantee of future results. Current performance may be lower or higher than the performance data quoted. Performance data current to the most recent month-end is available at www.deutsche-etfs.com. Performance results assume reinvestment of all dividends and capital gain distributions and do not reflect the deduction of taxes that a shareholder would pay on fund distributions or on the sale of fund shares or redemption of fund creation units. The investment return and principal value of shares will vary with changes in market conditions. Shares may be worth more or less than their original cost when they are sold in the market or redeemed. The estimated operating expense ratio as disclosed in the most recent prospectus dated September 30, 2015, was 0.40%.
Net asset value or “NAV” is the value of one share of a fund as calculated in accordance with the standard formula for valuing mutual fund shares. The price used to calculate market return (“Market Price”) is determined by using the midpoint between the highest bid and the lowest offer on the primary stock exchange on which shares of a fund are listed for trading, as of the time that such fund’s NAV is calculated. Since shares of a fund may not have traded in the secondary market until after the fund’s inception, for the period from inception to the first day of secondary trading, the NAV of the fund is used as a proxy for the Market Price to calculate market returns. Market and NAV returns assume that dividends and capital gain distributions have been reinvested at Market Price and NAV, respectively.
An index is a statistical composite that tracks a specified financial market or sector. Unlike a fund, an index does not actually hold a portfolio of securities and therefore does not incur the expenses incurred by a fund. These expenses negatively impact fund performance. Also, market returns do not include brokerage commissions that may be payable on secondary market transactions. If brokerage commissions were included, market returns would be lower.
6
DBX ETF Trust
Performance summary (Unaudited)
Deutsche X-trackers MSCI All World ex US Hedged Equity ETF (DBAW) (Continued)
Growth of an Assumed $10,000 Investment
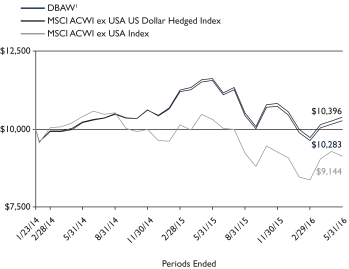
1 Based on Net Asset Value from commencement of operations, 1/23/14.
Sector Diversification* as of 5/31/16
Financials | 25.8% | |||
Consumer Discretionary | 11.8% | |||
Industrials | 11.5% | |||
Consumer Staples | 11.3% | |||
Health Care | 9.0% | |||
Information Technology | 8.3% | |||
Materials | 7.1% | |||
Energy | 6.5% | |||
Telecommunication Services | 5.3% | |||
Utilities | 3.4% | |||
|
| |||
Total | 100.0% |
Ten Largest Equity Holdings as of 5/31/16 (9.3% of Net Assets)
| Description | % of Net Assets | |||
Nestle SA (Switzerland) | 1.4% | |||
Royal Dutch Shell PLC (Netherlands) | 1.1% | |||
Roche Holding AG (Switzerland) | 1.1% | |||
Novartis AG (Switzerland) | 1.1% | |||
Toyota Motor Corp. (Japan) | 0.9% | |||
Samsung Electronics Co. Ltd. (South Korea) | 0.8% | |||
HSBC Holdings PLC (United Kingdom) | 0.8% | |||
Taiwan Semiconductor Manufacturing Co. Ltd. (Taiwan) | 0.7% | |||
Tencent Holdings Ltd. (China) | 0.7% | |||
British American Tobacco PLC (United Kingdom) | 0.7% | |||
Country Diversification* as of 5/31/16
Japan | 16.7% | |||
United Kingdom | 12.6% | |||
France | 7.0% | |||
Switzerland | 6.9% | |||
Canada | 6.6% | |||
Germany | 6.4% | |||
Australia | 5.2% | |||
China | 4.3% | |||
South Korea | 3.3% | |||
Hong Kong | 3.2% | |||
Netherlands | 2.9% | |||
Taiwan | 2.7% | |||
Spain | 2.2% | |||
Sweden | 2.0% | |||
Other | 18.0% | |||
|
| |||
Total | 100.0% |
* As a percent of total investments excluding securities lending collateral.
Portfolio holdings and characteristics are subject to change. For more complete details about the Fund’s investment portfolio see page 30.
7
DBX ETF Trust
Performance summary (Unaudited)
Deutsche X-trackers MSCI Asia Pacific ex Japan Hedged Equity ETF (DBAP)
The Deutsche X-trackers MSCI Asia Pacific ex Japan Hedged Equity ETF seeks investment results that correspond generally to the performance, before fees and expenses, of the MSCI Asia Pacific ex Japan US Dollar Hedged Index (the “Underlying Index”). The Underlying Index is designed to provide exposure to equity securities in developed and emerging stock markets in the Asia Pacific region (excluding Japan) while at the same time mitigating exposure to fluctuations between the value of the US dollar and selected non-US currencies. It is not possible to invest directly into an index.
Performance as of 5/31/16
| Average Annual Total Return | ||||||||
| Net Asset Value | Market Value | MSCI Asia Pacific ex Japan US Dollar Hedged Index | MSCI Asia Pacific ex Japan Index | |||||
One Year | -12.98% | -13.76% | -12.76% | -15.57% | ||||
Since Inception1 | 0.79% | 0.58% | 1.18% | -1.70% | ||||
| Cumulative Total Returns | ||||||||
| Net Asset Value | Market Value | MSCI Asia Pacific ex Japan US Dollar Hedged Index | MSCI Asia Pacific ex Japan Index | |||||
One Year | -12.98% | -13.76% | -12.76% | -15.57% | ||||
Since Inception1 | 2.13% | 1.56% | 3.18% | -4.46% | ||||
1 Total returns are calculated based on the commencement of operations, 10/1/13 (“Inception”).
Past performance is no guarantee of future results. Current performance may be lower or higher than the performance data quoted. Performance data current to the most recent month-end is available at www.deutsche-etfs.com. Performance results assume reinvestment of all dividends and capital gain distributions and do not reflect the deduction of taxes that a shareholder would pay on fund distributions or on the sale of fund shares or redemption of fund creation units. The investment return and principal value of shares will vary with changes in market conditions. Shares may be worth more or less than their original cost when they are sold in the market or redeemed. The estimated operating expense ratio as disclosed in the most recent prospectus dated September 30, 2015, was 0.60%.
Net asset value or “NAV” is the value of one share of a fund as calculated in accordance with the standard formula for valuing mutual fund shares. The price used to calculate market return (“Market Price”) is determined by using the midpoint between the highest bid and the lowest offer on the primary stock exchange on which shares of a fund are listed for trading, as of the time that such fund’s NAV is calculated. Since shares of a fund may not have traded in the secondary market until after the fund’s inception, for the period from inception to the first day of secondary trading, the NAV of the fund is used as a proxy for the Market Price to calculate market returns. Market and NAV returns assume that dividends and capital gain distributions have been reinvested at Market Price and NAV, respectively.
An index is a statistical composite that tracks a specified financial market or sector. Unlike a fund, an index does not actually hold a portfolio of securities and therefore does not incur the expenses incurred by a fund. These expenses negatively impact fund performance. Also, market returns do not include brokerage commissions that may be payable on secondary market transactions. If brokerage commissions were included, market returns would be lower.
8
DBX ETF Trust
Performance summary (Unaudited)
Deutsche X-trackers MSCI Asia Pacific ex Japan Hedged Equity ETF (DBAP) (Continued)
Growth of an Assumed $10,000 Investment
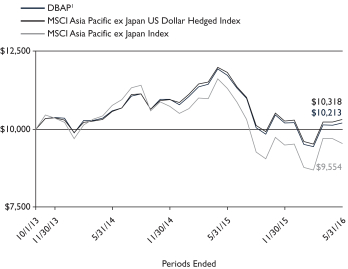
1 Based on Net Asset Value from commencement of operations, 10/1/13.
Sector Diversification* as of 5/31/16
Financials | 35.1% | |||
Information Technology | 18.8% | |||
Industrials | 8.6% | |||
Consumer Discretionary | 7.6% | |||
Materials | 6.6% | |||
Consumer Staples | 5.8% | |||
Telecommunication Services | 5.6% | |||
Energy | 4.4% | |||
Utilities | 4.0% | |||
Health Care | 3.5% | |||
|
| |||
Total | 100.0% |
Ten Largest Equity Holdings as of 5/31/16 (21.3% of Net Assets)
| Description | % of Net Assets | |||
Samsung Electronics Co. Ltd. (South Korea) | 3.3% | |||
Tencent Holdings Ltd. (China) | 3.2% | |||
Taiwan Semiconductor Manufacturing Co. Ltd. (Taiwan) | 3.0% | |||
Commonwealth Bank of Australia (Australia) | 2.4% | |||
Westpac Banking Corp. (Australia) | 1.9% | |||
China Mobile Ltd. (Hong Kong) | 1.8% | |||
AIA Group Ltd. (Hong Kong) | 1.8% | |||
Australia & New Zealand Banking Group Ltd. (Australia) | 1.4% | |||
National Australia Bank Ltd. (Australia) | 1.3% | |||
China Construction Bank Corp. (China) | 1.2% | |||
Country Diversification* as of 5/31/16
Australia | 21.5% | |||
China | 18.6% | |||
Hong Kong | 14.0% | |||
South Korea | 14.0% | |||
Taiwan | 11.5% | |||
India | 5.5% | |||
Singapore | 3.9% | |||
Malaysia | 3.0% | |||
Indonesia | 2.7% | |||
Other | 5.3% | |||
|
| |||
Total | 100.0% |
* As a percent of total investments excluding securities lending collateral.
Portfolio holdings and characteristics are subject to change. For more complete details about the Fund’s investment portfolio see page 57.
9
DBX ETF Trust
Performance summary (Unaudited)
Deutsche X-trackers MSCI Brazil Hedged Equity ETF (DBBR)
The Deutsche X-trackers MSCI Brazil Hedged Equity ETF seeks investment results that correspond generally to the performance, before fees and expenses, of the MSCI Brazil US Dollar Hedged Index (the “Underlying Index”). The Underlying Index is designed to provide exposure to Brazilian equity markets, while at the same time mitigating exposure to fluctuations between the value of the US dollar and Brazilian real. It is not possible to invest directly into an index.
Performance as of 5/31/16
| Average Annual Total Return | ||||||||
| Net Asset Value | Market Value | MSCI Brazil US Dollar Hedged Index | MSCI Brazil Index | |||||
One Year | -15.83% | -14.59% | -15.28% | -18.39% | ||||
Since Inception1 | -9.34% | -9.07% | -7.99% | -16.01% | ||||
| Cumulative Total Returns | ||||||||
| Net Asset Value | Market Value | MSCI Brazil US Dollar Hedged Index | MSCI Brazil Index | |||||
One Year | -15.83% | -14.59% | -15.28% | -18.39% | ||||
Since Inception1 | -38.63% | -37.75% | -33.96% | -58.09% | ||||
1 Total returns are calculated based on the commencement of operations, 6/9/11 (“Inception”).
Past performance is no guarantee of future results. Current performance may be lower or higher than the performance data quoted. Performance data current to the most recent month-end is available at www.deutsche-etfs.com. Performance results assume reinvestment of all dividends and capital gain distributions and do not reflect the deduction of taxes that a shareholder would pay on fund distributions or on the sale of fund shares or redemption of fund creation units. The investment return and principal value of shares will vary with changes in market conditions. Shares may be worth more or less than their original cost when they are sold in the market or redeemed. Performance for certain funds may reflect a waiver of a portion of investment management fees. Without such waiver, performance would have been lower. The estimated operating expense ratio as disclosed in the most recent prospectus dated September 30, 2015, was 0.60%.
Net asset value or “NAV” is the value of one share of a fund as calculated in accordance with the standard formula for valuing mutual fund shares. The price used to calculate market return (“Market Price”) is determined by using the midpoint between the highest bid and the lowest offer on the primary stock exchange on which shares of a fund are listed for trading, as of the time that such fund’s NAV is calculated. Since shares of a fund may not have traded in the secondary market until after the fund’s inception, for the period from inception to the first day of secondary trading, the NAV of the fund is used as a proxy for the Market Price to calculate market returns. Market and NAV returns assume that dividends and capital gain distributions have been reinvested at Market Price and NAV, respectively.
An index is a statistical composite that tracks a specified financial market or sector. Unlike a fund, an index does not actually hold a portfolio of securities and therefore does not incur the expenses incurred by a fund. These expenses negatively impact fund performance. Also, market returns do not include brokerage commissions that may be payable on secondary market transactions. If brokerage commissions were included, market returns would be lower.
10
DBX ETF Trust
Performance summary (Unaudited)
Deutsche X-trackers MSCI Brazil Hedged Equity ETF (DBBR) (Continued)
Growth of an Assumed $10,000 Investment
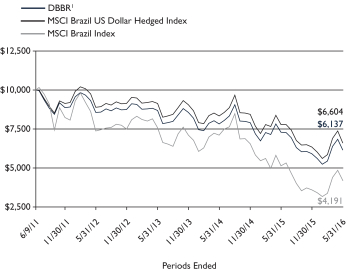
1 Based on Net Asset Value from commencement of operations, 6/9/11.
Sector Diversification* as of 5/31/16
Financials | 35.4% | |||
Consumer Staples | 19.8% | |||
Energy | 11.1% | |||
Materials | 9.7% | |||
Utilities | 5.7% | |||
Industrials | 5.3% | |||
Consumer Discretionary | 4.8% | |||
Information Technology | 4.4% | |||
Telecommunication Services | 3.0% | |||
Health Care | 0.8% | |||
|
| |||
Total | 100.0% |
Ten Largest Equity Holdings as of 5/31/16 (60.8% of Net Assets)
| Description | % of Net Assets | |||
Ambev SA | 10.9% | |||
Banco Bradesco SA | 10.2% | |||
Itau Unibanco Holding SA | 10.2% | |||
Petroleo Brasileiro SA | 7.5% | |||
Vale SA | 4.9% | |||
Cielo SA | 4.0% | |||
Itausa — Investimentos Itau SA | 3.4% | |||
BRF SA | 3.4% | |||
BM&FBovespa SA — Bolsa de Valores Mercadorias e Futuros | 3.3% | |||
Ultrapar Participacoes SA | 3.0% | |||
* As a percent of total investments.
Portfolio holdings and characteristics are subject to change. For more complete details about the Fund’s investment portfolio see page 66.
11
DBX ETF Trust
Performance summary (Unaudited)
Deutsche X-trackers MSCI Emerging Markets Hedged Equity ETF (DBEM)
The Deutsche X-trackers MSCI Emerging Markets Hedged Equity ETF seeks investment results that correspond generally to the performance, before fees and expenses, of the MSCI EM US Dollar Hedged Index (the “Underlying Index”). The Underlying Index is designed to provide exposure to equity securities in the global emerging markets, while at the same time mitigating exposure to fluctuations between the value of the US dollar and selected emerging market currencies. The Index includes securities from the following 23 countries: Brazil, Chile, China, Colombia, Czech Republic, Egypt, Greece, Hungary, India, Indonesia, South Korea, Malaysia, Mexico, Peru, Philippines, Poland, Qatar, Russia, South Africa, Taiwan, Thailand, Turkey and United Arab Emirates. It is not possible to invest directly into an index.
Performance as of 5/31/16
| Average Annual Total Return | ||||||||
| Net Asset Value | Market Value | MSCI EM US Dollar Hedged Index | MSCI Emerging Markets Index | |||||
One Year | -14.32% | -14.54% | -12.99% | -17.63% | ||||
Since Inception1 | -3.19% | -3.16% | -0.78% | -4.50% | ||||
| Cumulative Total Returns | ||||||||
| Net Asset Value | Market Value | MSCI EM US Dollar Hedged Index | MSCI Emerging Markets Index | |||||
One Year | -14.32% | -14.54% | -12.99% | -17.63% | ||||
Since Inception1 | -14.93% | -14.80% | -3.85% | -20.49% | ||||
1 Total returns are calculated based on the commencement of operations, 6/9/11 (“Inception”).
Past performance is no guarantee of future results. Current performance may be lower or higher than the performance data quoted. Performance data current to the most recent month-end is available at www.deutsche-etfs.com. Performance results assume reinvestment of all dividends and capital gain distributions and do not reflect the deduction of taxes that a shareholder would pay on fund distributions or on the sale of fund shares or redemption of fund creation units. The investment return and principal value of shares will vary with changes in market conditions. Shares may be worth more or less than their original cost when they are sold in the market or redeemed. Performance for certain funds may reflect a waiver of a portion of investment management fees. Without such waiver, performance would have been lower. The estimated operating expense ratio as disclosed in the most recent prospectus dated September 30, 2015, was 0.65%.
Net asset value or “NAV” is the value of one share of a fund as calculated in accordance with the standard formula for valuing mutual fund shares. The price used to calculate market return (“Market Price”) is determined by using the midpoint between the highest bid and the lowest offer on the primary stock exchange on which shares of a fund are listed for trading, as of the time that such fund’s NAV is calculated. Since shares of a fund may not have traded in the secondary market until after the fund’s inception, for the period from inception to the first day of secondary trading, the NAV of the fund is used as a proxy for the Market Price to calculate market returns. Market and NAV returns assume that dividends and capital gain distributions have been reinvested at Market Price and NAV, respectively.
An index is a statistical composite that tracks a specified financial market or sector. Unlike a fund, an index does not actually hold a portfolio of securities and therefore does not incur the expenses incurred by a fund. These expenses negatively impact fund performance. Also, market returns do not include brokerage commissions that may be payable on secondary market transactions. If brokerage commissions were included, market returns would be lower.
12
DBX ETF Trust
Performance summary (Unaudited)
Deutsche X-trackers MSCI Emerging Markets Hedged Equity ETF (DBEM) (Continued)
Growth of an Assumed $10,000 Investment
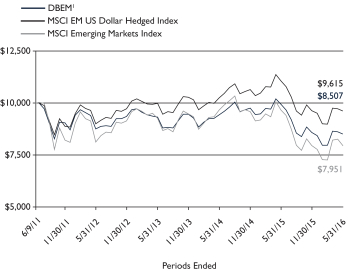
1 Based on Net Asset Value from commencement of operations, 6/9/11.
Sector Diversification* as of 5/31/16
Financials | 26.6% | |||
Information Technology | 20.9% | |||
Consumer Discretionary | 10.3% | |||
Consumer Staples | 8.5% | |||
Energy | 8.0% | |||
Telecommunication Services | 6.9% | |||
Industrials | 6.6% | |||
Materials | 6.6% | |||
Utilities | 3.1% | |||
Health Care | 2.5% | |||
|
| |||
Total | 100.0% |
Ten Largest Equity Holdings as of 5/31/16 (20.2% of Net Assets)
| Description | % of Net Assets | |||
Samsung Electronics Co. Ltd. (South Korea) | 3.6% | |||
Tencent Holdings Ltd. (China) | 3.5% | |||
Taiwan Semiconductor Manufacturing Co. Ltd. (Taiwan) | 3.4% | |||
China Mobile Ltd. (Hong Kong) | 2.0% | |||
Naspers Ltd. (South Africa) | 1.8% | |||
China Construction Bank Corp. (China) | 1.4% | |||
ICICI Bank Ltd. (India) | 1.2% | |||
Alibaba Group Holding Ltd. (China) | 1.2% | |||
Hon Hai Precision Industry Co. Ltd. (Taiwan) | 1.1% | |||
Reliance Industries Ltd., (India) | 1.0% | |||
Country Diversification* as of 5/31/16
China | 20.6% | |||
South Korea | 15.7% | |||
Taiwan | 12.8% | |||
South Africa | 6.6% | |||
Brazil | 6.4% | |||
India | 6.1% | |||
Hong Kong | 5.0% | |||
Mexico | 4.8% | |||
Russia | 3.6% | |||
Malaysia | 3.3% | |||
Indonesia | 3.0% | |||
Philippines | 2.1% | |||
Thailand | 2.0% | |||
Other | 8.0% | |||
|
| |||
Total | 100.0% |
* As a percent of total investments excluding securities lending collateral.
Portfolio holdings and characteristics are subject to change. For more complete details about the Fund’s investment portfolio see page 69.
13
DBX ETF Trust
Performance summary (Unaudited)
Deutsche X-trackers MSCI Europe Hedged Equity ETF (DBEU)
The Deutsche X-trackers MSCI Europe Hedged Equity ETF seeks investment results that correspond generally to the performance, before fees and expenses, of the MSCI Europe US Dollar Hedged Index (the “Underlying Index”). The Underlying Index is designed to provide exposure to equity securities in developed stock markets in Europe, while at the same time mitigating exposure to fluctuations between the value of the US dollar and selected non-US currencies. It is not possible to invest directly into an index.
Performance as of 5/31/16
| Average Annual Total Return | ||||||||
| Net Asset Value | Market Value | MSCI Europe US Dollar Hedged Index | MSCI Europe Index | |||||
One Year | -8.46% | -8.84% | -8.20% | -9.94% | ||||
Since Inception1 | 4.94% | 4.90% | 5.26% | -0.89% | ||||
| Cumulative Total Returns | ||||||||
| Net Asset Value | Market Value | MSCI Europe US Dollar Hedged Index | MSCI Europe Index | |||||
One Year | -8.46% | -8.84% | -8.20% | -9.94% | ||||
Since Inception1 | 13.73% | 13.60% | 14.67% | -2.37% | ||||
1 Total returns are calculated based on the commencement of operations, 10/1/13 (“Inception”).
Past performance is no guarantee of future results. Current performance may be lower or higher than the performance data quoted. Performance data current to the most recent month-end is available at www.deutsche-etfs.com. Performance results assume reinvestment of all dividends and capital gain distributions and do not reflect the deduction of taxes that a shareholder would pay on fund distributions or on the sale of fund shares or redemption of fund creation units. The investment return and principal value of shares will vary with changes in market conditions. Shares may be worth more or less than their original cost when they are sold in the market or redeemed. The estimated operating expense ratio as disclosed in the most recent prospectus dated September 30, 2015, was 0.45%.
Net asset value or “NAV” is the value of one share of a fund as calculated in accordance with the standard formula for valuing mutual fund shares. The price used to calculate market return (“Market Price”) is determined by using the midpoint between the highest bid and the lowest offer on the primary stock exchange on which shares of a fund are listed for trading, as of the time that such fund’s NAV is calculated. Since shares of a fund may not have traded in the secondary market until after the fund’s inception, for the period from inception to the first day of secondary trading, the NAV of the fund is used as a proxy for the Market Price to calculate market returns. Market and NAV returns assume that dividends and capital gain distributions have been reinvested at Market Price and NAV, respectively.
An index is a statistical composite that tracks a specified financial market or sector. Unlike a fund, an index does not actually hold a portfolio of securities and therefore does not incur the expenses incurred by a fund. These expenses negatively impact fund performance. Also, market returns do not include brokerage commissions that may be payable on secondary market transactions. If brokerage commissions were included, market returns would be lower.
14
DBX ETF Trust
Performance summary (Unaudited)
Deutsche X-trackers MSCI Europe Hedged Equity ETF (DBEU) (Continued)
Growth of an Assumed $10,000 Investment
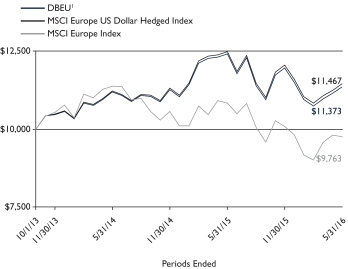
1 Based on Net Asset Value from commencement of operations, 10/1/13.
Sector Diversification* as of 5/31/16
Financials | 20.9% | |||
Consumer Staples | 15.7% | |||
Health Care | 13.6% | |||
Industrials | 11.8% | |||
Consumer Discretionary | 11.4% | |||
Materials | 6.9% | |||
Energy | 6.5% | |||
Telecommunication Services | 4.9% | |||
Information Technology | 4.2% | |||
Utilities | 4.1% | |||
|
| |||
Total | 100.0% |
Ten Largest Equity Holdings as of 5/31/16 (18.5% of Net Assets)
| Description | % of Net Assets | |||
Nestle SA (Switzerland) | 3.0% | |||
Royal Dutch Shell PLC (Netherlands) | 2.4% | |||
Roche Holding AG (Switzerland) | 2.4% | |||
Novartis AG (Switzerland) | 2.3% | |||
HSBC Holdings PLC (United Kingdom) | 1.6% | |||
British American Tobacco PLC (United Kingdom) | 1.5% | |||
Total SA (France) | 1.4% | |||
Novo Nordisk A/S (Denmark) | 1.3% | |||
GlaxoSmithKline PLC (United Kingdom) | 1.3% | |||
Anheuser-Busch InBev NV (Belgium) | 1.3% | |||
Country Diversification* as of 5/31/16
United Kingdom | 26.9% | |||
France | 15.2% | |||
Switzerland | 14.6% | |||
Germany | 13.9% | |||
Netherlands | 6.1% | |||
Spain | 4.8% | |||
Sweden | 4.3% | |||
Denmark | 3.1% | |||
Italy | 3.0% | |||
Belgium | 2.3% | |||
Other | 5.8% | |||
|
| |||
Total | 100.0% |
* As a percent of total investments excluding securities lending collateral.
Portfolio holdings and characteristics are subject to change. For more complete details about the Fund’s investment portfolio see page 84.
15
DBX ETF Trust
Performance summary (Unaudited)
Deutsche X-trackers MSCI Eurozone Hedged Equity ETF (DBEZ)
The Deutsche X-trackers MSCI Eurozone Hedged Equity ETF seeks investment results that correspond generally to the performance, before fees and expenses, of the MSCI EMU IMI US Dollar Hedged Index (the “Underlying Index”). The Underlying Index is designed to provide exposure to equities in countries in the EMU, or the “Eurozone,” that have adopted the euro as their common currency and sole legal tender, while at the same time mitigating exposure to fluctuations between the value of the US dollar and the euro. It is not possible to invest directly into an index.
Performance as of 5/31/16
| Average Annual Total Return | ||||||||
| Net Asset Value | Market Value | MSCI EMU IMI US Dollar Hedged Index | MSCI EMU IMI Net Total Return | |||||
One Year | -8.45% | -9.08% | -8.41% | -8.40% | ||||
Since Inception1 | 4.89% | 4.83% | 5.05% | -3.52% | ||||
| Cumulative Total Returns | ||||||||
| Net Asset Value | Market Value | MSCI EMU IMI | MSCI EMU IMI Net Total Return | |||||
One Year | -8.45% | -9.08% | -8.41% | -8.40% | ||||
Since Inception1 | 7.30% | 7.21% | 7.54% | -5.16% | ||||
1 Total returns are calculated based on the commencement of operations, 12/10/14 (“Inception”).
Past performance is no guarantee of future results. Current performance may be lower or higher than the performance data quoted. Performance data current to the most recent month-end is available at www.deutsche-etfs.com. Performance results assume reinvestment of all dividends and capital gain distributions and do not reflect the deduction of taxes that a shareholder would pay on fund distributions or on the sale of fund shares or redemption of fund creation units. The investment return and principal value of shares will vary with changes in market conditions. Shares may be worth more or less than their original cost when they are sold in the market or redeemed. The estimated operating expense ratio as disclosed in the most recent prospectus dated September 30, 2015, was 0.45%.
Net asset value or “NAV” is the value of one share of a fund as calculated in accordance with the standard formula for valuing mutual fund shares. The price used to calculate market return (“Market Price”) is determined by using the midpoint between the highest bid and the lowest offer on the primary stock exchange on which shares of a fund are listed for trading, as of the time that such fund’s NAV is calculated. Since shares of a fund may not have traded in the secondary market until after the fund’s inception, for the period from inception to the first day of secondary trading, the NAV of the fund is used as a proxy for the Market Price to calculate market returns. Market and NAV returns assume that dividends and capital gain distributions have been reinvested at Market Price and NAV, respectively.
An index is a statistical composite that tracks a specified financial market or sector. Unlike a fund, an index does not actually hold a portfolio of securities and therefore does not incur the expenses incurred by a fund. These expenses negatively impact fund performance. Also, market returns do not include brokerage commissions that may be payable on secondary market transactions. If brokerage commissions were included, market returns would be lower.
16
DBX ETF Trust
Performance summary (Unaudited)
Deutsche X-trackers MSCI Eurozone Hedged Equity ETF (DBEZ) (Continued)
Growth of an Assumed $10,000 Investment
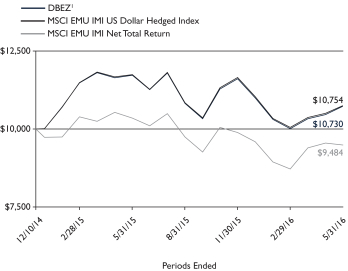
1 Based on Net Asset Value from commencement of operations, 12/10/14.
Sector Diversification* as of 5/31/16
Financials | 21.4% | |||
Industrials | 15.0% | |||
Consumer Discretionary | 14.1% | |||
Consumer Staples | 11.1% | |||
Health Care | 8.1% | |||
Materials | 7.8% | |||
Information Technology | 7.5% | |||
Utilities | 5.3% | |||
Energy | 4.9% | |||
Telecommunication Services | 4.8% | |||
|
| |||
Total | 100.0% |
Ten Largest Equity Holdings as of 5/31/16 (20.0% of Net Assets)
| Description | % of Net Assets | |
Total SA (France) | 2.6% | |
Anheuser-Busch InBev NV (Belgium) | 2.4% | |
Sanofi (France) | 2.3% | |
Siemens AG (Germany) | 2.0% | |
SAP SE (Germany) | 1.9% | |
Bayer AG (Germany) | 1.9% | |
Allianz SE (Germany) | 1.8% | |
Unilever NV (United Kingdom) | 1.8% | |
BASF SE (Germany) | 1.7% | |
Banco Santander SA (Spain) | 1.6% | |
Country Diversification* as of 5/31/16
France | 30.2% | |||
Germany | 28.4% | |||
Spain | 10.2% | |||
Netherlands | 8.0% | |||
Italy | 7.4% | |||
Belgium | 5.1% | |||
Finland | 3.5% | |||
United Kingdom | 2.7% | |||
Ireland | 2.1% | |||
Other | 2.4% | |||
|
| |||
Total | 100.0% |
* As a percent of total investments excluding securities lending collateral.
Portfolio holdings and characteristics are subject to change. For more complete details about the Fund’s investment portfolio see page 95.
17
DBX ETF Trust
Performance summary (Unaudited)
Deutsche X-trackers MSCI Germany Hedged Equity ETF (DBGR)
The Deutsche X-trackers MSCI Germany Hedged Equity ETF seeks investment results that correspond generally to the performance, before fees and expenses, of the MSCI Germany US Dollar Hedged Index (the “Underlying Index”). The Underlying Index is designed to provide exposure to Germany’s equity markets, while at the same time mitigating exposure to fluctuations between the value of the US dollar and euro. It is not possible to invest directly into an index.
Performance as of 5/31/16
| Average Annual Total Return | ||||||||
| Net Asset Value | Market Value | MSCI Germany US Dollar Hedged Index2 | MSCI Germany Index2 | |||||
One Year | -9.99% | -10.04% | -9.77% | -8.76% | ||||
Since Inception1 | 3.66% | 3.64% | 3.98% | -0.24% | ||||
| Cumulative Total Returns | ||||||||
| Net Asset Value | Market Value | MSCI Germany US Dollar Hedged Index2 | MSCI Germany Index2 | |||||
One Year | -9.99% | -10.04% | -9.77% | -8.76% | ||||
Since Inception1 | 19.62% | 19.49% | 21.50% | -1.18% | ||||
1 Total returns are calculated based on the commencement of operations, 6/9/11 (“Inception”).
2 Prior to 5/31/13, this fund was known as dbx-trackers MSCI Canada Hedged Equity Fund (DBCN) and had a different investment strategy. Returns reflect performance for DBCN and its underlying hedged and unhedged indices through 5/31/13.
Past performance is no guarantee of future results. Current performance may be lower or higher than the performance data quoted. Performance data current to the most recent month-end is available at www.deutsche-etfs.com. Performance results assume reinvestment of all dividends and capital gain distributions and do not reflect the deduction of taxes that a shareholder would pay on fund distributions or on the sale of fund shares or redemption of fund creation units. The investment return and principal value of shares will vary with changes in market conditions. Shares may be worth more or less than their original cost when they are sold in the market or redeemed. Performance for certain funds may reflect a waiver of a portion of investment management fees. Without such waiver, performance would have been lower. The estimated operating expense ratio as disclosed in the most recent prospectus dated September 30, 2015, was 0.45%.
Net asset value or “NAV” is the value of one share of a fund as calculated in accordance with the standard formula for valuing mutual fund shares. The price used to calculate market return (“Market Price”) is determined by using the midpoint between the highest bid and the lowest offer on the primary stock exchange on which shares of a fund are listed for trading, as of the time that such fund’s NAV is calculated. Since shares of a fund may not have traded in the secondary market until after the fund’s inception, for the period from inception to the first day of secondary trading, the NAV of the fund is used as a proxy for the Market Price to calculate market returns. Market and NAV returns assume that dividends and capital gain distributions have been reinvested at Market Price and NAV, respectively.
An index is a statistical composite that tracks a specified financial market or sector. Unlike a fund, an index does not actually hold a portfolio of securities and therefore does not incur the expenses incurred by a fund. These expenses negatively impact fund performance. Also, market returns do not include brokerage commissions that may be payable on secondary market transactions. If brokerage commissions were included, market returns would be lower.
18
DBX ETF Trust
Performance summary (Unaudited)
Deutsche X-trackers MSCI Germany Hedged Equity ETF (DBGR) (Continued)
Growth of an Assumed $10,000 Investment
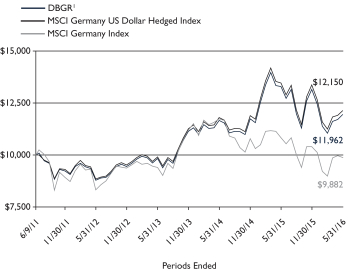
1 Based on Net Asset Value from commencement of operations, 6/9/11.
Sector Diversification* as of 5/31/16
Consumer Discretionary | 19.8% | |||
Financials | 17.7% | |||
Materials | 13.6% | |||
Health Care | 13.6% | |||
Industrials | 13.4% | |||
Information Technology | 9.6% | |||
Telecommunication Services | 5.6% | |||
Consumer Staples | 4.3% | |||
Utilities | 2.4% | |||
|
| |||
Total | 100.0% |
Ten Largest Equity Holdings as of 5/31/16 (55.8% of Net Assets)
| Description | % of Net Assets | |||
Siemens AG | 7.6% | |||
SAP SE | 7.4% | |||
Bayer AG | 7.3% | |||
Allianz SE | 6.9% | |||
BASF SE | 6.5% | |||
Daimler AG | 6.1% | |||
Deutsche Telekom AG | 5.2% | |||
Volkswagen AG | 3.0% | |||
Bayerische Motoren Werke AG | 2.9% | |||
Henkel AG & Co. KGaA | 2.9% | |||
* As a percent of total investments excluding securities lending collateral.
Portfolio holdings and characteristics are subject to change. For more complete details about the Fund’s investment portfolio see page 103.
19
DBX ETF Trust
Performance summary (Unaudited)
Deutsche X-trackers MSCI Japan Hedged Equity ETF (DBJP)
The Deutsche X-trackers MSCI Japan Hedged Equity ETF seeks investment results that correspond generally to the performance, before fees and expenses, of the MSCI Japan US Dollar Hedged Index (the “Underlying Index”). The Underlying Index is designed to provide exposure to Japanese equity markets, while at the same time mitigating exposure to fluctuations between the value of the US dollar and Japanese yen. It is not possible to invest directly into an index.
Performance as of 5/31/16
| Average Annual Total Return | ||||||||
| Net Asset Value | Market Value | MSCI Japan US Dollar Hedged Index | MSCI Japan Index | |||||
One Year | -18.65% | -18.98% | -18.13% | -8.24% | ||||
Since Inception1 | 10.95% | 10.71% | 11.74% | 5.36% | ||||
| Cumulative Total Returns | ||||||||
| Net Asset Value | Market Value | MSCI Japan US Dollar Hedged Index | MSCI Japan Index | |||||
One Year | -18.65% | -18.98% | -18.13% | -8.24% | ||||
Since Inception1 | 67.78% | 66.07% | 73.85% | 29.70% | ||||
1 Total returns are calculated based on the commencement of operations, 6/9/11 (“Inception”).
Past performance is no guarantee of future results. Current performance may be lower or higher than the performance data quoted. Performance data current to the most recent month-end is available at www.deutsche-etfs.com. Performance results assume reinvestment of all dividends and capital gain distributions and do not reflect the deduction of taxes that a shareholder would pay on fund distributions or on the sale of fund shares or redemption of fund creation units. The investment return and principal value of shares will vary with changes in market conditions. Shares may be worth more or less than their original cost when they are sold in the market or redeemed. Performance for certain funds may reflect a waiver of a portion of investment management fees. Without such waiver, performance would have been lower. The estimated operating expense ratio as disclosed in the most recent prospectus dated September 30, 2015, was 0.45%.
Net asset value or “NAV” is the value of one share of a fund as calculated in accordance with the standard formula for valuing mutual fund shares. The price used to calculate market return (“Market Price”) is determined by using the midpoint between the highest bid and the lowest offer on the primary stock exchange on which shares of a fund are listed for trading, as of the time that such fund’s NAV is calculated. Since shares of a fund may not have traded in the secondary market until after the fund’s inception, for the period from inception to the first day of secondary trading, the NAV of the fund is used as a proxy for the Market Price to calculate market returns. Market and NAV returns assume that dividends and capital gain distributions have been reinvested at Market Price and NAV, respectively.
An index is a statistical composite that tracks a specified financial market or sector. Unlike a fund, an index does not actually hold a portfolio of securities and therefore does not incur the expenses incurred by a fund. These expenses negatively impact fund performance. Also, market returns do not include brokerage commissions that may be payable on secondary market transactions. If brokerage commissions were included, market returns would be lower.
20
DBX ETF Trust
Performance summary (Unaudited)
Deutsche X-trackers MSCI Japan Hedged Equity ETF (DBJP) (Continued)
Growth of an Assumed $10,000 Investment
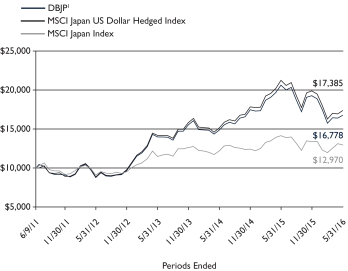
1 Based on Net Asset Value from commencement of operations, 6/9/11.
Sector Diversification* as of 5/31/16
Consumer Discretionary | 20.6% | |||
Industrials | 19.8% | |||
Financials | 17.4% | |||
Information Technology | 10.1% | |||
Health Care | 8.7% | |||
Consumer Staples | 8.6% | |||
Telecommunication Services | 6.3% | |||
Materials | 5.5% | |||
Utilities | 2.2% | |||
Energy | 0.8% | |||
|
| |||
Total | 100.0% |
Ten Largest Equity Holdings as of 5/31/16 (19.3% of Net Assets)
| Description | % of Net Assets | |||
Toyota Motor Corp. | 4.9% | |||
Mitsubishi UFJ Financial Group, Inc. | 2.2% | |||
KDDI Corp. | 1.9% | |||
SoftBank Group Corp. | 1.9% | |||
Honda Motor Co. Ltd. | 1.6% | |||
Sumitomo Mitsui Financial Group, Inc. | 1.5% | |||
Japan Tobacco, Inc. | 1.5% | |||
Mizuho Financial Group, Inc. | 1.3% | |||
NTT DOCOMO, Inc. | 1.3% | |||
Sony Corp. | 1.2% | |||
* As a percent of total investments excluding securities lending collateral.
Portfolio holdings and characteristics are subject to change. For more complete details about the Fund’s investment portfolio see page 106.
21
DBX ETF Trust
Performance summary (Unaudited)
Deutsche X-trackers MSCI Mexico Hedged Equity ETF (DBMX)
The Deutsche X-trackers MSCI Mexico Hedged Equity ETF seeks investment results that correspond generally to the performance, before fees and expenses, of the MSCI Mexico IMI 25/50 US Dollar Hedged Index (the “Underlying Index”). The Underlying Index is designed to provide exposure to the Mexican equity markets, while at the same time mitigating exposure to fluctuations between the value of the US dollar and Mexican peso. It is not possible to invest directly into an index.
Performance as of 5/31/16
| Average Annual Total Return | ||||||||
| Net Asset Value | Market Value | MSCI Mexico IMI 25/50 US Dollar Hedged Index | MSCI Mexico IMI 25/50 Index | |||||
One Year | 2.09% | 1.88% | 2.32% | -12.38% | ||||
Since Inception1 | 1.74% | 1.83% | 2.10% | -8.88% | ||||
| Cumulative Total Returns | ||||||||
| Net Asset Value | Market Value | MSCI Mexico IMI 25/50 US Dollar Hedged Index | MSCI Mexico IMI 25/50 Index | |||||
One Year | 2.09% | 1.88% | 2.32% | -12.38% | ||||
Since Inception1 | 4.13% | 4.37% | 5.02% | -19.68% | ||||
1 Total returns are calculated based on the commencement of operations, 1/23/14 (“Inception”).
Past performance is no guarantee of future results. Current performance may be lower or higher than the performance data quoted. Performance data current to the most recent month-end is available at www.deutsche-etfs.com. Performance results assume reinvestment of all dividends and capital gain distributions and do not reflect the deduction of taxes that a shareholder would pay on fund distributions or on the sale of fund shares or redemption of fund creation units. The investment return and principal value of shares will vary with changes in market conditions. Shares may be worth more or less than their original cost when they are sold in the market or redeemed. The estimated operating expense ratio as disclosed in the most recent prospectus dated September 30, 2015, was 0.50%.
Net asset value or “NAV” is the value of one share of a fund as calculated in accordance with the standard formula for valuing mutual fund shares. The price used to calculate market return (“Market Price”) is determined by using the midpoint between the highest bid and the lowest offer on the primary stock exchange on which shares of a fund are listed for trading, as of the time that such fund’s NAV is calculated. Since shares of a fund may not have traded in the secondary market until after the fund’s inception, for the period from inception to the first day of secondary trading, the NAV of the fund is used as a proxy for the Market Price to calculate market returns. Market and NAV returns assume that dividends and capital gain distributions have been reinvested at Market Price and NAV, respectively.
An index is a statistical composite that tracks a specified financial market or sector. Unlike a fund, an index does not actually hold a portfolio of securities and therefore does not incur the expenses incurred by a fund. These expenses negatively impact fund performance. Also, market returns do not include brokerage commissions that may be payable on secondary market transactions. If brokerage commissions were included, market returns would be lower.
22
DBX ETF Trust
Performance summary (Unaudited)
Deutsche X-trackers MSCI Mexico Hedged Equity ETF (DBMX) (Continued)
Growth of an Assumed $10,000 Investment
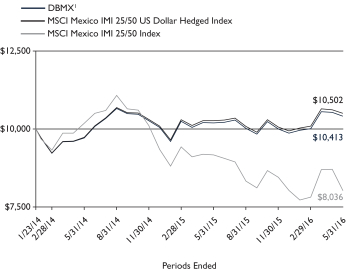
1 Based on Net Asset Value from commencement of operations, 1/23/14.
Sector Diversification* as of 5/31/16
Consumer Staples | 29.2% | |||
Financials | 21.3% | |||
Industrials | 13.6% | |||
Materials | 12.9% | |||
Telecommunication Services | 11.9% | |||
Consumer Discretionary | 10.5% | |||
Health Care | 0.6% | |||
|
| |||
Total | 100.0% |
Ten Largest Equity Holdings as of 5/31/16 (59.3% of Net Assets)
| Description | % of Net Assets | |||
America Movil SAB de CV | 11.1% | |||
Fomento Economico Mexicano SAB de CV | 9.3% | |||
Grupo Financiero Banorte SAB de CV | 7.1% | |||
Grupo Televisa SAB | 7.1% | |||
Wal-Mart de Mexico SAB de CV | 6.6% | |||
Grupo Mexico SAB de CV | 4.5% | |||
Cemex SAB de CV | 4.5% | |||
Fibra Uno Administracion SA de CV | 3.1% | |||
Alfa SAB de CV | 3.0% | |||
Grupo Bimbo SAB de CV | 3.0% | |||
* As a percent of total investments.
Portfolio holdings and characteristics are subject to change. For more complete details about the Fund’s investment portfolio see page 111.
23
DBX ETF Trust
Performance summary (Unaudited)
Deutsche X-trackers MSCI South Korea Hedged Equity ETF (DBKO)
The Deutsche X-trackers MSCI South Korea Hedged Equity ETF seeks investment results that correspond generally to the performance, before fees and expenses, of the MSCI Korea 25/50 US Dollar Hedged Index (the “Underlying Index”). The Underlying Index is designed to provide exposure to South Korean equity markets, while at the same time mitigating exposure to fluctuations between the value of the US dollar and the South Korean won. It is not possible to invest directly into an index.
Performance as of 5/31/16
| Average Annual Total Return | ||||||||
| Net Asset Value | Market Value | MSCI Korea 25/50 US Dollar Hedged Index | MSCI Korea 25/50 Index | |||||
One Year | -5.55% | -5.91% | -4.49% | -11.20% | ||||
Since Inception1 | -3.53% | -3.91% | -2.23% | -5.87% | ||||
| Cumulative Total Returns | ||||||||
| Net Asset Value | Market Value | MSCI Korea 25/50 US Dollar Hedged Index | MSCI Korea 25/50 Index | |||||
One Year | -5.55% | -5.91% | -4.49% | -11.20% | ||||
Since Inception1 | -8.12% | -8.96% | -5.18% | -13.29% | ||||
1 Total returns are calculated based on the commencement of operations, 1/23/14 (“Inception”).
Past performance is no guarantee of future results. Current performance may be lower or higher than the performance data quoted. Performance data current to the most recent month-end is available at www.deutsche-etfs.com. Performance results assume reinvestment of all dividends and capital gain distributions and do not reflect the deduction of taxes that a shareholder would pay on fund distributions or on the sale of fund shares or redemption of fund creation units. The investment return and principal value of shares will vary with changes in market conditions. Shares may be worth more or less than their original cost when they are sold in the market or redeemed. The estimated operating expense ratio as disclosed in the most recent prospectus dated September 30, 2015, was 0.58%.
Net asset value or “NAV” is the value of one share of a fund as calculated in accordance with the standard formula for valuing mutual fund shares. The price used to calculate market return (“Market Price”) is determined by using the midpoint between the highest bid and the lowest offer on the primary stock exchange on which shares of a fund are listed for trading, as of the time that such fund’s NAV is calculated. Since shares of a fund may not have traded in the secondary market until after the fund’s inception, for the period from inception to the first day of secondary trading, the NAV of the fund is used as a proxy for the Market Price to calculate market returns. Market and NAV returns assume that dividends and capital gain distributions have been reinvested at Market Price and NAV, respectively.
An index is a statistical composite that tracks a specified financial market or sector. Unlike a fund, an index does not actually hold a portfolio of securities and therefore does not incur the expenses incurred by a fund. These expenses negatively impact fund performance. Also, market returns do not include brokerage commissions that may be payable on secondary market transactions. If brokerage commissions were included, market returns would be lower.
24
DBX ETF Trust
Performance summary (Unaudited)
Deutsche X-trackers MSCI South Korea Hedged Equity ETF (DBKO) (Continued)
Growth of an Assumed $10,000 Investment
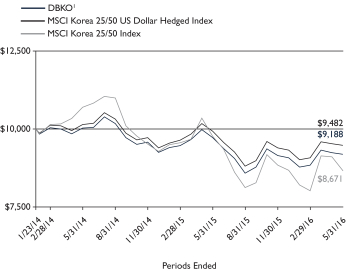
1 Based on Net Asset Value from commencement of operations, 1/23/14.
Sector Diversification* as of 5/31/16
Information Technology | 32.9% | |||
Consumer Discretionary | 15.4% | |||
Financials | 13.4% | |||
Industrials | 10.7% | |||
Consumer Staples | 10.4% | |||
Materials | 7.9% | �� | ||
Energy | 2.8% | |||
Utilities | 2.8% | |||
Health Care | 2.4% | |||
Telecommunication Services | 1.3% | |||
|
| |||
Total | 100.0% |
Ten Largest Equity Holdings as of 5/31/16 (47.3% of Net Assets)
| Description | % of Net Assets | |||
Samsung Electronics Co. Ltd. | 22.0% | |||
Hyundai Motor Co. | 4.4% | |||
NAVER Corp. | 3.2% | |||
Hyundai Mobis Co. Ltd. | 2.7% | |||
Shinhan Financial Group Co. Ltd. | 2.7% | |||
SK Hynix, Inc. | 2.6% | |||
Korea Electric Power Corp. | 2.6% | |||
Amorepacific Corp. | 2.5% | |||
KT&G Corp. | 2.3% | |||
POSCO | 2.3% | |||
* As a percent of total investments.
Portfolio holdings and characteristics are subject to change. For more complete details about the Fund’s investment portfolio see page 113.
25
DBX ETF Trust
Performance summary (Unaudited)
Deutsche X-trackers MSCI United Kingdom Hedged Equity ETF (DBUK)
The Deutsche X-trackers MSCI United Kingdom Hedged Equity ETF seeks investment results that correspond generally to the performance, before fees and expenses, of the MSCI United Kingdom US Dollar Hedged Index (the “Underlying Index”). The Underlying Index is designed to provide exposure to the United Kingdom equity markets, while at the same time mitigating exposure to fluctuations between the value of the US dollar and British pound sterling. It is not possible to invest directly into an index.
Performance as of 5/31/16
| Average Annual Total Return | ||||||||
| Net Asset Value | Market Value | MSCI United Kingdom US Dollar Hedged Index | MSCI United Kingdom Index | |||||
One Year | -8.25% | -8.79% | -7.74% | -12.12% | ||||
Since Inception1 | 1.20% | 1.14% | 1.83% | -2.11% | ||||
| Cumulative Total Returns | ||||||||
| Net Asset Value | Market Value | MSCI United Kingdom US Dollar Hedged Index | MSCI United Kingdom Index | |||||
One Year | -8.25% | -8.79% | -7.74% | -12.12% | ||||
Since Inception1 | 3.23% | 3.08% | 4.95% | -5.54% | ||||
1 Total returns are calculated based on the commencement of operations, 10/1/13 (“Inception”).
Past performance is no guarantee of future results. Current performance may be lower or higher than the performance data quoted. Performance data current to the most recent month-end is available at www.deutsche-etfs.com. Performance results assume reinvestment of all dividends and capital gain distributions and do not reflect the deduction of taxes that a shareholder would pay on fund distributions or on the sale of fund shares or redemption of fund creation units. The investment return and principal value of shares will vary with changes in market conditions. Shares may be worth more or less than their original cost when they are sold in the market or redeemed. The estimated operating expense ratio as disclosed in the most recent prospectus dated September 30, 2015, was 0.45%.
Net asset value or “NAV” is the value of one share of a fund as calculated in accordance with the standard formula for valuing mutual fund shares. The price used to calculate market return (“Market Price”) is determined by using the midpoint between the highest bid and the lowest offer on the primary stock exchange on which shares of a fund are listed for trading, as of the time that such fund’s NAV is calculated. Since shares of a fund may not have traded in the secondary market until after the fund’s inception, for the period from inception to the first day of secondary trading, the NAV of the fund is used as a proxy for the Market Price to calculate market returns. Market and NAV returns assume that dividends and capital gain distributions have been reinvested at Market Price and NAV, respectively.
An index is a statistical composite that tracks a specified financial market or sector. Unlike a fund, an index does not actually hold a portfolio of securities and therefore does not incur the expenses incurred by a fund. These expenses negatively impact fund performance. Also, market returns do not include brokerage commissions that may be payable on secondary market transactions. If brokerage commissions were included, market returns would be lower.
26
DBX ETF Trust
Performance summary (Unaudited)
Deutsche X-trackers MSCI United Kingdom Hedged Equity ETF (DBUK) (Continued)
Growth of an Assumed $10,000 Investment
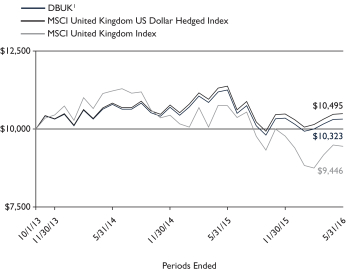
1 Based on Net Asset Value from commencement of operations, 10/1/13.
Sector Diversification* as of 5/31/16
Financials | 21.7% | |||
Consumer Staples | 20.0% | |||
Energy | 12.3% | |||
Consumer Discretionary | 10.5% | |||
Health Care | 10.0% | |||
Industrials | 7.0% | |||
Telecommunication Services | 6.3% | |||
Materials | 5.8% | |||
Utilities | 4.7% | |||
Information Technology | 1.7% | |||
|
| |||
Total | 100.0% |
Ten Largest Equity Holdings as of 5/31/16 (41.5% of Net Assets)
| Description | % of Net Assets | |||
Royal Dutch Shell PLC | 8.0% | |||
HSBC Holdings PLC | 5.3% | |||
British American Tobacco PLC | 4.7% | |||
GlaxoSmithKline PLC | 4.3% | |||
BP PLC | 4.0% | |||
Vodafone Group PLC | 3.7% | |||
AstraZeneca PLC | 3.1% | |||
Diageo PLC | 2.9% | |||
Lloyds Banking Group PLC | 2.8% | |||
Reckitt Benckiser Group PLC | 2.7% | |||
* As a percent of total investments excluding securities lending collateral.
Portfolio holdings and characteristics are subject to change. For more complete details about the Fund’s investment portfolio see page 116.
27
DBX ETF Trust
As a shareholder of one or more of the funds, you incur two types of costs: (1) transaction costs, including brokerage commissions paid on purchases and sales of fund shares, and (2) ongoing costs, including management fees and other Fund expenses. The expense examples below are intended to help you understand your ongoing costs (in dollars) of investing in the Funds and to compare these costs with the ongoing costs of investing in other funds.
The examples in the table are based on an investment of $1,000 invested at the beginning of the six month period and held for the entire period (December 1, 2015 to May 31, 2016).
Actual expenses
The first line in the following tables provides information about actual account values and actual expenses. You may use the information in this line, together with the amount you invested, to estimate the expenses that you paid over the period. Simply divide your account value by $1,000 (for example, an $8,600 account value divided by $1,000 = 8.6), then multiply the result by the number in the first line under the heading “Expenses Paid During the Period” to estimate the expenses you paid on your account during this period.
Hypothetical example for comparison purposes
The second line in the following tables provides information about hypothetical account values and hypothetical expenses based on the Funds’ actual expense ratios and an assumed rate of return of 5% per year before expenses (which is not the Funds’ actual return). The hypothetical account values and expenses may not be used to estimate the actual ending account balance or expenses you paid for the period. You may use this information to compare the ongoing costs of investing in the Fund and other funds. To do so, compare this 5% hypothetical example with the 5% hypothetical examples that appear in the shareholder reports of the other funds.
Please note that the expenses shown in the tables are meant to highlight your ongoing costs only, and do not reflect any transactional costs. Therefore the second line in the table is useful in comparing ongoing costs only, and will not help you determine the relative total costs of owning different funds. In addition, if these transactional costs were included, your costs would have been higher.
| Beginning Account Value December 1, 2015 | Ending Account Value May 31, 2016 | Annualized Expense Ratio | Expenses Paid During the Period Per $1,000(1) | |||||||||||||
| Deutsche X-trackers MSCI All World ex US Hedged Equity ETF | ||||||||||||||||
Actual | $ | 1,000.00 | $ | 957.30 | 0.40 | % | $ | 1.96 | ||||||||
Hypothetical (5% return before expenses) | $ | 1,000.00 | $ | 1,023.00 | 0.40 | % | $ | 2.02 | ||||||||
| Deutsche X-trackers MSCI Asia Pacific ex Japan Hedged ETF | ||||||||||||||||
Actual | $ | 1,000.00 | $ | 1,000.10 | 0.60 | % | $ | 3.00 | ||||||||
Hypothetical (5% return before expenses) | $ | 1,000.00 | $ | 1,022.00 | 0.60 | % | $ | 3.03 | ||||||||
| Deutsche X-trackers MSCI Brazil Hedged Equity ETF | ||||||||||||||||
Actual | $ | 1,000.00 | $ | 1,035.50 | 0.60 | % | $ | 3.05 | ||||||||
Hypothetical (5% return before expenses) | $ | 1,000.00 | $ | 1,022.00 | 0.60 | % | $ | 3.03 | ||||||||
| Deutsche X-trackers MSCI Emerging Markets Hedged Equity ETF | ||||||||||||||||
Actual | $ | 1,000.00 | $ | 991.00 | 0.65 | % | $ | 3.24 | ||||||||
Hypothetical (5% return before expenses) | $ | 1,000.00 | $ | 1,021.75 | 0.65 | % | $ | 3.29 | ||||||||
| Deutsche X-trackers MSCI Europe Hedged Equity ETF | ||||||||||||||||
Actual | $ | 1,000.00 | $ | 950.10 | 0.45 | % | $ | 2.19 | ||||||||
Hypothetical (5% return before expenses) | $ | 1,000.00 | $ | 1,022.75 | 0.45 | % | $ | 2.28 | ||||||||
28
DBX ETF Trust
Fees and expenses (Unaudited) (Continued)
| Beginning Account Value December 1, 2015 | Ending Account Value May 31, 2016 | Annualized Expense Ratio | Expenses Paid During the Period Per $1,000(1) | |||||||||||||
| Deutsche X-trackers MSCI Eurozone Hedged Equity ETF | ||||||||||||||||
Actual | $ | 1,000.00 | $ | 924.00 | 0.45 | % | $ | 2.16 | ||||||||
Hypothetical (5% return before expenses) | $ | 1,000.00 | $ | 1,022.75 | 0.45 | % | $ | 2.28 | ||||||||
| Deutsche X-trackers MSCI Germany Hedged Equity ETF | ||||||||||||||||
Actual | $ | 1,000.00 | $ | 909.40 | 0.45 | % | $ | 2.15 | ||||||||
Hypothetical (5% return before expenses) | $ | 1,000.00 | $ | 1,022.75 | 0.45 | % | $ | 2.28 | ||||||||
| Deutsche X-trackers MSCI Japan Hedged Equity ETF | ||||||||||||||||
Actual | $ | 1,000.00 | $ | 870.60 | 0.45 | % | $ | 2.10 | ||||||||
Hypothetical (5% return before expenses) | $ | 1,000.00 | $ | 1,022.75 | 0.45 | % | $ | 2.28 | ||||||||
| Deutsche X-trackers MSCI Mexico Hedged Equity ETF | ||||||||||||||||
Actual | $ | 1,000.00 | $ | 1,041.30 | 0.51 | % | $ | 2.60 | ||||||||
Hypothetical (5% return before expenses) | $ | 1,000.00 | $ | 1,022.45 | 0.51 | % | $ | 2.58 | ||||||||
| Deutsche X-trackers MSCI South Korea Hedged Equity ETF | ||||||||||||||||
Actual | $ | 1,000.00 | $ | 1,004.40 | 0.58 | % | $ | 2.91 | ||||||||
Hypothetical (5% return before expenses) | $ | 1,000.00 | $ | 1,022.10 | 0.58 | % | $ | 2.93 | ||||||||
| Deutsche X-trackers MSCI United Kingdom Hedged Equity ETF | ||||||||||||||||
Actual | $ | 1,000.00 | $ | 997.60 | 0.45 | % | $ | 2.25 | ||||||||
Hypothetical (5% return before expenses) | $ | 1,000.00 | $ | 1,022.75 | 0.45 | % | $ | 2.28 | ||||||||
(1) Expenses are equal to each Fund’s annualized expense ratio, multiplied by the average account value over the period, multiplied by 183 (the number of days in the most recent six-month period), then divided by 366.
29
DBX ETF Trust
Deutsche X-trackers MSCI All World ex US Hedged Equity ETF
May 31, 2016
Number | Value | |||||||
| COMMON STOCKS — 98.0% | ||||||||
| Australia — 5.1% | ||||||||
AGL Energy Ltd. | 1,950 | $ | 26,200 | |||||
Alumina Ltd. (a) | 14,692 | 15,025 | ||||||
Amcor Ltd. | 5,647 | 66,445 | ||||||
AMP Ltd. | 10,346 | 42,174 | ||||||
APA Group (b) | 6,178 | 39,159 | ||||||
Aristocrat Leisure Ltd. | 2,458 | 22,846 | ||||||
Asciano Ltd. | 4,494 | 28,875 | ||||||
ASX Ltd. | 843 | 27,119 | ||||||
Aurizon Holdings Ltd. | 9,473 | 30,878 | ||||||
AusNet Services | 18,311 | 20,844 | ||||||
Australia & New Zealand Banking Group Ltd. | 10,232 | 188,430 | ||||||
Bank of Queensland Ltd. | 1,925 | 16,181 | ||||||
Bendigo and Adelaide Bank Ltd. | 1,624 | 12,019 | ||||||
BHP Billiton Ltd. | 12,533 | 172,831 | ||||||
BHP Billiton PLC | 8,265 | 98,518 | ||||||
Boral Ltd. | 3,425 | 16,833 | ||||||
Brambles Ltd. | 7,755 | 72,024 | ||||||
Caltex Australia Ltd. | 1,158 | 27,385 | ||||||
Challenger Ltd. | 1,693 | 11,710 | ||||||
CIMIC Group Ltd. | 559 | 15,110 | ||||||
Coca-Cola Amatil Ltd. | 3,482 | 22,348 | ||||||
Cochlear Ltd. | 309 | 26,949 | ||||||
Commonwealth Bank of Australia | 6,506 | 364,093 | ||||||
Computershare Ltd. | 2,678 | 20,788 | ||||||
Crown Resorts Ltd. | 1,808 | 15,733 | ||||||
CSL Ltd. | 1,977 | 165,407 | ||||||
Dexus Property Group REIT | 5,100 | 31,921 | ||||||
Domino’s Pizza Enterprises Ltd. | 209 | 10,403 | ||||||
DUET Group (b) | 7,314 | 12,423 | ||||||
Flight Centre Travel Group Ltd. | 300 | 6,854 | ||||||
Fortescue Metals Group Ltd. (a) | 5,667 | 12,206 | ||||||
Goodman Group REIT | 9,910 | 50,925 | ||||||
GPT Group REIT | 9,632 | 37,453 | ||||||
Harvey Norman Holdings Ltd. | 4,545 | 14,979 | ||||||
Healthscope Ltd. | 4,235 | 9,183 | ||||||
Incitec Pivot Ltd. | 7,953 | 19,831 | ||||||
Insurance Australia Group Ltd. | 8,797 | 37,385 | ||||||
LendLease Group (b) | 3,132 | 30,401 | ||||||
Macquarie Group Ltd. | 980 | 53,030 | ||||||
Medibank Pvt Ltd. | 8,391 | 19,407 | ||||||
Mirvac Group REIT | 22,627 | 31,808 | ||||||
National Australia Bank Ltd. | 9,081 | 178,194 | ||||||
Newcrest Mining Ltd.* | 3,335 | 45,966 | ||||||
Oil Search Ltd. | 4,503 | 22,098 | ||||||
Orica Ltd. | 1,746 | 17,162 | ||||||
Origin Energy Ltd. | 6,329 | 26,119 | ||||||
Platinum Asset Management Ltd. | 719 | 3,419 | ||||||
Qantas Airways Ltd.* | 4,597 | 10,233 | ||||||
QBE Insurance Group Ltd. | 4,209 | 37,843 | ||||||
Ramsay Health Care Ltd. | 724 | 38,068 | ||||||
REA Group Ltd. | 178 | 7,203 | ||||||
Santos Ltd. | 5,744 | 18,806 | ||||||
Scentre Group REIT | 22,979 | 77,394 | ||||||
Seek Ltd. | 1,671 | 19,686 | ||||||
Sonic Healthcare Ltd. | 2,157 | 33,362 | ||||||
Number | Value | |||||||
| Australia (Continued) | ||||||||
South32 Ltd.* | 20,693 | $ | 23,331 | |||||
Stockland REIT | 12,493 | 40,903 | ||||||
Suncorp Group Ltd. | 3,064 | 28,744 | ||||||
Sydney Airport (b) | 7,700 | 39,402 | ||||||
Tabcorp Holdings Ltd. | 4,922 | 15,724 | ||||||
Tatts Group Ltd. | 7,661 | 21,816 | ||||||
Telstra Corp. Ltd. | 16,572 | 66,954 | ||||||
TPG Telecom Ltd. | 2,006 | 17,862 | ||||||
Transurban Group (b) | 9,830 | 85,611 | ||||||
Treasury Wine Estates Ltd. | 3,553 | 26,553 | ||||||
Vicinity Centres REIT | 11,377 | 26,806 | ||||||
Vocus Communications Ltd. | 1,586 | 10,787 | ||||||
Wesfarmers Ltd. | 4,441 | 130,412 | ||||||
Westfield Corp. REIT | 9,173 | 71,072 | ||||||
Westpac Banking Corp. | 12,598 | 279,531 | ||||||
Woodside Petroleum Ltd. | 2,560 | 50,697 | ||||||
Woolworths Ltd. | 5,029 | 80,400 | ||||||
|
| |||||||
| 3,496,291 | ||||||||
|
| |||||||
| Austria — 0.1% | ||||||||
ANDRITZ AG | 357 | 18,183 | ||||||
Erste Group Bank AG* | 1,095 | 29,301 | ||||||
OMV AG (a) | 574 | 15,999 | ||||||
Raiffeisen Bank International AG* | 375 | 5,017 | ||||||
voestalpine AG | 484 | 16,578 | ||||||
|
| |||||||
| 85,078 | ||||||||
|
| |||||||
| Belgium — 1.0% | ||||||||
Ageas | 771 | 31,187 | ||||||
Anheuser-Busch InBev NV | 3,228 | 408,905 | ||||||
Colruyt SA | 126 | 7,486 | ||||||
Delhaize Group (a) | 382 | 40,051 | ||||||
Groupe Bruxelles Lambert SA | 315 | 26,780 | ||||||
KBC Groep NV* | 1,001 | 59,263 | ||||||
Proximus SA | 744 | 24,172 | ||||||
Solvay SA | 278 | 28,210 | ||||||
Telenet Group Holding NV* | 239 | 11,379 | ||||||
UCB SA | 505 | 36,495 | ||||||
Umicore SA | 410 | 20,665 | ||||||
|
| |||||||
| 694,593 | ||||||||
|
| |||||||
| Brazil — 0.9% | ||||||||
Ambev SA | 19,466 | 102,943 | ||||||
Banco Bradesco SA | 3,563 | 24,167 | ||||||
Banco do Brasil SA | 3,328 | 15,168 | ||||||
Banco Santander Brasil SA | 2,165 | 10,413 | ||||||
BB Seguridade Participacoes SA | 3,217 | 24,268 | ||||||
BM&FBovespa SA | 7,302 | 32,170 | ||||||
BR Malls Participacoes SA* | 3,076 | 9,832 | ||||||
BRF SA | 2,915 | 36,841 | ||||||
CCR SA | 2,723 | 11,491 | ||||||
CETIP SA — Mercados Organizados | 1,285 | 15,109 | ||||||
Cia de Saneamento Basico do Estado de Sao Paulo | 1,507 | 10,672 | ||||||
Cia Siderurgica Nacional SA* | 2,842 | 5,144 | ||||||
Cielo SA | 3,590 | 31,543 | ||||||
Cosan SA Industria e Comercio | 518 | 4,706 | ||||||
Duratex SA | 1,777 | 3,565 | ||||||
| See Notes to Financial Statements. | 30 |
DBX ETF Trust
Schedule of investments
Deutsche X-trackers MSCI All World ex US Hedged Equity ETF (Continued)
May 31, 2016
Number | Value | |||||||
| Brazil (Continued) | ||||||||
Embraer SA | 1,632 | $ | 8,491 | |||||
Equatorial Energia SA | 681 | 8,594 | ||||||
Fibria Celulose SA | 1,173 | 10,842 | ||||||
Hypermarcas SA | 1,507 | 11,885 | ||||||
JBS SA | 3,120 | 8,634 | ||||||
Klabin SA | 2,227 | 11,186 | ||||||
Kroton Educacional SA | 5,176 | 15,871 | ||||||
Localiza Rent a Car SA | 592 | 5,447 | ||||||
Lojas Americanas SA | 1,171 | 3,493 | ||||||
Lojas Renner SA | 2,668 | 15,431 | ||||||
Natura Cosmeticos SA | 892 | 5,559 | ||||||
Odontoprev SA | 3,306 | 10,256 | ||||||
Petroleo Brasileiro SA* | 12,030 | 33,890 | ||||||
Qualicorp SA | 1,292 | 5,452 | ||||||
Raia Drogasil SA | 1,025 | 16,378 | ||||||
Rumo Logistica Operadora Multimodal | 3,276 | 4,297 | ||||||
Sul America SA | 1,537 | 6,372 | ||||||
TIM Participacoes SA | 3,159 | 6,224 | ||||||
Totvs SA | 721 | 5,910 | ||||||
Ultrapar Participacoes SA | 1,451 | 27,405 | ||||||
Vale SA | 4,960 | 19,518 | ||||||
WEG SA | 1,835 | 7,307 | ||||||
|
| |||||||
| 586,474 | ||||||||
|
| |||||||
| Canada — 6.6% | ||||||||
Agnico Eagle Mines Ltd. | 932 | 41,833 | ||||||
Agrium, Inc. | 458 | 41,335 | ||||||
Alimentation Couche-Tard, Inc., | 1,899 | 83,557 | ||||||
AltaGas Ltd. (a) | 450 | 10,401 | ||||||
ARC Resources Ltd. (a) | 1,507 | 24,788 | ||||||
Bank of Montreal | 2,799 | 175,665 | ||||||
Bank of Nova Scotia | 4,895 | 239,421 | ||||||
Barrick Gold Corp. | 4,793 | 80,118 | ||||||
BCE, Inc. | 740 | 34,112 | ||||||
BlackBerry Ltd.* | 2,178 | 15,845 | ||||||
Bombardier, Inc., Class B* | 8,100 | 12,168 | ||||||
Brookfield Asset Management, Inc., Class A | 3,952 | 138,690 | ||||||
CAE, Inc. | 2,403 | 30,034 | ||||||
Cameco Corp. | 1,621 | 18,888 | ||||||
Canadian Imperial Bank of Commerce | 1,767 | 137,105 | ||||||
Canadian National Railway Co. | 3,280 | 194,471 | ||||||
Canadian Natural Resources Ltd. | 4,284 | 127,310 | ||||||
Canadian Pacific Railway Ltd. | 578 | 74,807 | ||||||
Canadian Tire Corp. Ltd., Class A | 175 | 19,110 | ||||||
Canadian Utilities Ltd., Class A | 888 | 24,547 | ||||||
CCL Industries, Inc., Class B | 50 | 8,900 | ||||||
Cenovus Energy, Inc. | 3,350 | 50,505 | ||||||
CGI Group, Inc., Class A* | 1,064 | 49,762 | ||||||
CI Financial Corp. | 1,847 | 40,423 | ||||||
Constellation Software, Inc. | 114 | 46,335 | ||||||
Crescent Point Energy Corp. | 1,969 | 33,333 | ||||||
Dollarama, Inc. | 658 | 45,310 | ||||||
Eldorado Gold Corp. | 2,920 | 12,425 | ||||||
Element Financial Corp. | 970 | 11,377 | ||||||
Empire Co. Ltd., Class A | 500 | 8,568 | ||||||
Enbridge, Inc. | 3,467 | 138,220 | ||||||
Number | Value | |||||||
| Canada (Continued) | ||||||||
Encana Corp. | 3,454 | $ | 27,419 | |||||
Fairfax Financial Holdings Ltd. | 100 | 51,387 | ||||||
Finning International, Inc. | 796 | 13,409 | ||||||
First Capital Realty, Inc. | 1,283 | 20,566 | ||||||
First Quantum Minerals Ltd. | 2,066 | 13,549 | ||||||
Fortis, Inc. | 1,410 | 44,106 | ||||||
Franco-Nevada Corp. | 650 | 41,111 | ||||||
George Weston Ltd. | 100 | 8,645 | ||||||
Gildan Activewear, Inc. | 723 | 21,541 | ||||||
Goldcorp, Inc. | 3,387 | 56,951 | ||||||
Great-West Lifeco, Inc. | 1,507 | 40,613 | ||||||
H&R Real Estate Investment Trust REIT | 1,005 | 16,263 | ||||||
Husky Energy, Inc. | 1,545 | 17,838 | ||||||
Hydro One Ltd., 144A | 600 | 11,182 | ||||||
Imperial Oil Ltd. | 1,184 | 37,732 | ||||||
Industrial Alliance Insurance and Financial Services, Inc. | 200 | 6,496 | ||||||
Intact Financial Corp. | 300 | 20,978 | ||||||
Inter Pipeline Ltd. | 1,507 | 30,626 | ||||||
Keyera Corp. | 525 | 15,662 | ||||||
Kinross Gold Corp.* | 5,303 | 22,727 | ||||||
Linamar Corp. | 175 | 7,318 | ||||||
Loblaw Cos. Ltd. | 1,087 | 58,911 | ||||||
Magna International, Inc. | 1,380 | 56,038 | ||||||
Manulife Financial Corp. | 7,523 | 111,983 | ||||||
Methanex Corp. | 275 | 9,047 | ||||||
Metro, Inc. | 450 | 15,246 | ||||||
National Bank of Canada | 800 | 26,550 | ||||||
Onex Corp. | 300 | 18,215 | ||||||
Open Text Corp. | 391 | 22,905 | ||||||
Pembina Pipeline Corp. (a) | 1,507 | 44,210 | ||||||
Peyto Exploration & Development Corp. | 840 | 22,023 | ||||||
Potash Corp. of Saskatchewan, Inc. | 3,419 | 55,795 | ||||||
Power Corp. of Canada | 1,507 | 33,993 | ||||||
Power Financial Corp. | 1,507 | 36,476 | ||||||
PrairieSky Royalty Ltd. (a) | 698 | 13,509 | ||||||
Restaurant Brands International, Inc. | 978 | 40,832 | ||||||
Rogers Communications, Inc., | 1,507 | 57,460 | ||||||
Royal Bank of Canada | 6,165 | 370,600 | ||||||
Saputo, Inc. | 680 | 20,716 | ||||||
Seven Generations Energy Ltd., Class A* | 788 | 15,864 | ||||||
Shaw Communications, Inc., Class B | 1,786 | 34,158 | ||||||
Silver Wheaton Corp. | 1,682 | 31,361 | ||||||
SNC-Lavalin Group, Inc. | 649 | 26,136 | ||||||
Sun Life Financial, Inc. | 2,706 | 93,725 | ||||||
Suncor Energy, Inc. | 6,162 | 170,197 | ||||||
Teck Resources Ltd., Class B | 2,177 | 20,934 | ||||||
TELUS Corp. | 916 | 29,037 | ||||||
Toronto-Dominion Bank | 7,377 | 321,272 | ||||||
Tourmaline Oil Corp.* | 788 | 18,856 | ||||||
TransCanada Corp. | 2,877 | 119,218 | ||||||
Turquoise Hill Resources Ltd.* | 8,660 | 24,500 | ||||||
Veresen, Inc. | 1,048 | 8,200 | ||||||
Vermilion Energy, Inc. | 403 | 13,334 | ||||||
West Fraser Timber Co. Ltd. | 228 | 7,789 | ||||||
Yamana Gold, Inc. | 3,764 | 15,873 | ||||||
|
| |||||||
| 4,460,445 | ||||||||
|
| |||||||
| See Notes to Financial Statements. | 31 |
DBX ETF Trust
Schedule of investments
Deutsche X-trackers MSCI All World ex US Hedged Equity ETF (Continued)
May 31, 2016
Number | Value | |||||||
| Chile — 0.3% | ||||||||
Aguas Andinas SA, Class A | 5,909 | $ | 3,239 | |||||
Antofagasta PLC (a) | 1,625 | 10,097 | ||||||
Banco de Chile | 404,132 | 40,683 | ||||||
Banco de Credito e Inversiones | 244 | 9,865 | ||||||
Banco Santander Chile | 614,086 | 27,608 | ||||||
Cencosud SA | 6,864 | 18,155 | ||||||
Cia Cervecerias Unidas SA | 1,143 | 12,401 | ||||||
Colbun SA | 26,289 | 6,345 | ||||||
Empresa Nacional de Electricidad SA | 9,996 | 8,680 | ||||||
Empresas CMPC SA | 5,757 | 11,984 | ||||||
Empresas Copec SA | 1,492 | 12,722 | ||||||
Endesa Americas SA | 9,996 | 4,177 | ||||||
Enersis Americas SA | 66,511 | 10,080 | ||||||
Enersis Chile SA | 66,511 | 7,612 | ||||||
Itau CorpBanca | 1,089,169 | 8,653 | ||||||
LATAM Airlines Group SA* | 842 | 5,108 | ||||||
|
| |||||||
| 197,409 | ||||||||
|
| |||||||
| China — 4.3% | ||||||||
3SBio, Inc., 144A* | 5,800 | 5,650 | ||||||
58.com, Inc., ADR*(a) | 165 | 8,918 | ||||||
AAC Technologies Holdings, Inc. | 3,546 | 28,703 | ||||||
Agricultural Bank of China Ltd., Class H | 100,326 | 36,667 | ||||||
Air China Ltd., Class H | 11,192 | 7,403 | ||||||
Alibaba Group Holding Ltd., ADR*(a) | 2,014 | 165,148 | ||||||
Aluminum Corp. of China Ltd., Class H* | 24,405 | 7,381 | ||||||
Anhui Conch Cement Co. Ltd., Class H | 7,018 | 16,979 | ||||||
Anta Sports Products Ltd. | 5,520 | 12,005 | ||||||
AviChina Industry & Technology Co. Ltd., | 10,700 | 7,518 | ||||||
Baidu, Inc., ADR* | 552 | 98,554 | ||||||
Bank of China Ltd., Class H | 326,843 | 132,912 | ||||||
Bank of Communications Co. Ltd., | 44,895 | 27,790 | ||||||
Beijing Capital International Airport Co. Ltd., Class H | 14,415 | 15,527 | ||||||
Belle International Holdings Ltd. | 25,286 | 14,838 | ||||||
Byd Co. Ltd., Class H* | 2,523 | 14,594 | ||||||
CGN Power Co. Ltd., Class H, 144A | 34,098 | 10,356 | ||||||
China Cinda Asset Management Co. Ltd., Class H | 32,291 | 10,555 | ||||||
China CITIC Bank Corp. Ltd., Class H | 37,959 | 22,275 | ||||||
China Communications Construction Co. Ltd., Class H | 19,810 | 22,434 | ||||||
China Communications Services Corp. Ltd., Class H | 26,709 | 12,546 | ||||||
China Conch Venture Holdings Ltd.* | 4,723 | 9,518 | ||||||
China Construction Bank Corp., Class H | 282,886 | 182,384 | ||||||
China Everbright Bank Co. Ltd., | 22,867 | 9,829 | ||||||
China Galaxy Securities Co. Ltd., Class H (a) | 10,570 | 9,318 | ||||||
China Huishan Dairy Holdings Co. | 32,065 | 12,627 | ||||||
China Life Insurance Co. Ltd., Class H | 22,720 | 50,815 | ||||||
China Longyuan Power Group Corp. Ltd., Class H | 13,362 | 9,182 | ||||||
China Medical System Holdings Ltd. | 7,541 | 10,791 | ||||||
China Mengniu Dairy Co. Ltd. | 13,805 | 22,846 | ||||||
Number | Value | |||||||
| China (Continued) | ||||||||
China Merchants Bank Co. Ltd., Class H | 18,836 | $ | 38,638 | |||||
China Minsheng Banking Corp. Ltd., Class H | 28,148 | 26,515 | ||||||
China Pacific Insurance Group Co. Ltd., Class H* | 11,361 | 38,817 | ||||||
China Petroleum & Chemical Corp., Class H | 102,077 | 69,621 | ||||||
China Railway Construction Corp. Ltd., Class H | 8,738 | 10,919 | ||||||
China Railway Group Ltd., Class H | 11,009 | 8,458 | ||||||
China Shenhua Energy Co. Ltd., Class H | 11,959 | 18,991 | ||||||
China Southern Airlines Co. Ltd., | 6,785 | 3,982 | ||||||
China Telecom Corp. Ltd., Class H | 57,861 | 26,955 | ||||||
China Vanke Co. Ltd., Class H | 6,597 | 15,723 | ||||||
Chongqing Rural Commercial Bank Co. Ltd., Class H | 13,497 | 6,913 | ||||||
CITIC Securities Co. Ltd., Class H | 6,216 | 13,471 | ||||||
CNOOC Ltd. | 64,579 | 77,122 | ||||||
Country Garden Holdings Co. Ltd. | 30,728 | 12,298 | ||||||
CRRC Corp. Ltd., Class H | 15,091 | 14,352 | ||||||
CSPC Pharmaceutical Group Ltd.* | 21,474 | 19,565 | ||||||
Ctrip.com International, Ltd., ADR*(a) | 716 | 32,764 | ||||||
Dalian Wanda Commercial Properties Co. Ltd., Class H, 144A | 696 | 4,411 | ||||||
Dongfeng Motor Group Co. Ltd., Class H | 11,316 | 12,611 | ||||||
ENN Energy Holdings Ltd. | 3,090 | 15,329 | ||||||
Evergrande Real Estate Group Ltd. | 10,567 | 7,071 | ||||||
Fosun International Ltd. | 12,313 | 17,493 | ||||||
Geely Automobile Holdings Ltd. | 22,254 | 11,770 | ||||||
GF Securities Co. Ltd., Class H* | 3,590 | 8,316 | ||||||
GOME Electrical Appliances Holding Ltd. | 50,217 | 6,010 | ||||||
Great Wall Motor Co. Ltd., Class H | 11,233 | 8,644 | ||||||
Guangzhou Automobile Group Co. Ltd., Class H | 17,402 | 19,909 | ||||||
Guangzhou R&F Properties Co. Ltd., Class H | 8,294 | 11,015 | ||||||
Haitian International Holdings Ltd. | 2,396 | 3,848 | ||||||
Haitong Securities Co. Ltd., Class H (a) | 9,647 | 15,766 | ||||||
Hengan International Group Co. Ltd. | 3,991 | 36,003 | ||||||
Huadian Power International Corp. Ltd., Class H* | 14,375 | 7,622 | ||||||
Huaneng Power International, Inc., | 26,722 | 18,260 | ||||||
Huaneng Renewables Corp. Ltd., | 15,223 | 4,623 | ||||||
Huatai Securities Co. Ltd., Class H, 144A*(a) | 4,488 | 9,414 | ||||||
Industrial & Commercial Bank of China Ltd., Class H | 267,977 | 142,080 | ||||||
JD.com, Inc., ADR*(a) | 1,373 | 33,790 | ||||||
Jiangsu Expressway Co. Ltd., Class H | 7,565 | 10,358 | ||||||
Jiangxi Copper Co. Ltd., Class H | 4,893 | 5,258 | ||||||
Kingsoft Corp. Ltd. | 2,689 | 5,135 | ||||||
Lenovo Group Ltd. (a) | 30,412 | 18,668 | ||||||
Longfor Properties Co. Ltd. | 9,946 | 13,439 | ||||||
Luye Pharma Group Ltd.* | 9,290 | 5,738 | ||||||
NetEase, Inc., ADR | 193 | 34,323 | ||||||
New China Life Insurance Co. Ltd., Class H | 2,806 | 9,605 | ||||||
New Oriental Education & Technology Group, Inc., ADR | 464 | 19,604 | ||||||
| See Notes to Financial Statements. | 32 |
DBX ETF Trust
Schedule of investments
Deutsche X-trackers MSCI All World ex US Hedged Equity ETF (Continued)
May 31, 2016
Number | Value | |||||||
| China (Continued) | ||||||||
People’s Insurance Co. (Group) of China Ltd., Class H | 26,709 | $ | 10,689 | |||||
PetroChina Co. Ltd., Class H | 77,816 | 53,475 | ||||||
PICC Property & Casualty Co. Ltd., Class H | 18,713 | 34,147 | ||||||
Ping An Insurance Group Co. of China Ltd., Class H | 18,647 | 83,268 | ||||||
Qihoo 360 Technology Co. Ltd., ADR* | 221 | 16,420 | ||||||
Qunar Cayman Islands Ltd., ADR* | 169 | 5,489 | ||||||
Semiconductor Manufacturing International Corp.* | 103,593 | 8,665 | ||||||
Shandong Weigao Group Medical Polymer Co. Ltd., Class H | 16,462 | 9,448 | ||||||
Shanghai Electric Group Co. Ltd., | 11,857 | 5,096 | ||||||
Shanghai Fosun Pharmaceutical Group Co. Ltd., Class H | 2,776 | 7,216 | ||||||
Shanghai Pharmaceuticals Holding Co. Ltd., Class H | 4,157 | 8,977 | ||||||
Shenzhou International Group Holdings Ltd. | 3,007 | 15,130 | ||||||
Sino-Ocean Land Holdings Ltd. | 10,593 | 4,294 | ||||||
Sinopec Engineering Group Co. Ltd., Class H | 14,145 | 12,414 | ||||||
Sinopec Shanghai Petrochemical Co. Ltd., Class H* | 22,459 | 10,983 | ||||||
Sinopharm Group Co. Ltd., Class H | 5,718 | 26,490 | ||||||
Soho China Ltd. | 16,560 | 7,267 | ||||||
SouFun Holdings Ltd., ADR*(a) | 740 | 4,018 | ||||||
TAL Education Group, ADR*(a) | 201 | 10,737 | ||||||
Tencent Holdings Ltd. | 22,588 | 503,748 | ||||||
Tingyi Cayman Islands Holding Corp. | 8,580 | 7,795 | ||||||
TravelSky Technology Ltd., Class H | 3,877 | 7,344 | ||||||
Tsingtao Brewery Co. Ltd., Class H | 2,679 | 9,636 | ||||||
Vipshop Holdings Ltd., ADR* | 908 | 10,596 | ||||||
Want Want China Holdings Ltd. (a) | 35,280 | 24,971 | ||||||
Weichai Power Co. Ltd., Class H | 6,104 | 7,132 | ||||||
YY, Inc., ADR* | 114 | 4,953 | ||||||
Zhejiang Expressway Co. Ltd., Class H | 10,730 | 10,052 | ||||||
Zhuzhou CRRC Times Electric Co. Ltd. | 2,621 | 14,672 | ||||||
Zijin Mining Group Co. Ltd., Class H | 43,895 | 12,653 | ||||||
ZTE Corp., Class H | 4,802 | 6,303 | ||||||
|
| |||||||
| 2,901,358 | ||||||||
|
| |||||||
| Colombia — 0.0% | ||||||||
Ecopetrol SA | 11,583 | 5,021 | ||||||
Grupo Argos SA | 603 | 3,371 | ||||||
Grupo de Inversiones Suramericana SA | 1,018 | 12,252 | ||||||
|
| |||||||
| 20,644 | ||||||||
|
| |||||||
| Czech Republic — 0.1% | ||||||||
CEZ AS | 371 | 6,738 | ||||||
Komercni Banka AS | 805 | 31,656 | ||||||
O2 Czech Republic AS | 1,280 | 12,386 | ||||||
|
| |||||||
| 50,780 | ||||||||
|
| |||||||
| Denmark — 1.5% | ||||||||
A.P. Moeller — Maersk A/S, Class A | 22 | 27,431 | ||||||
A.P. Moeller — Maersk A/S, Class B | 32 | 41,216 | ||||||
Number | Value | |||||||
| Denmark (Continued) | ||||||||
Carlsberg A/S, Class B | 419 | $ | 40,429 | |||||
Chr Hansen Holding A/S | 265 | 16,797 | ||||||
Coloplast A/S, Class B | 478 | 36,182 | ||||||
Danske Bank A/S | 2,822 | 81,434 | ||||||
DSV A/S | 783 | 35,714 | ||||||
Genmab A/S* | 198 | 35,781 | ||||||
ISS A/S | 518 | 20,884 | ||||||
Novo Nordisk A/S, Class B | 7,807 | 434,222 | ||||||
Novozymes A/S, Class B | 964 | 45,859 | ||||||
Pandora A/S | 513 | 76,243 | ||||||
TDC A/S | 3,301 | 16,523 | ||||||
Tryg A/S | 300 | 5,915 | ||||||
Vestas Wind Systems A/S | 987 | 70,725 | ||||||
William Demant Holding A/S*(a) | 595 | 12,550 | ||||||
|
| |||||||
| 997,905 | ||||||||
|
| |||||||
| Egypt — 0.1% | ||||||||
Commercial International Bank Egypt SAE | 7,593 | 36,409 | ||||||
Talaat Moustafa Group | 12,325 | 8,092 | ||||||
|
| |||||||
| 44,501 | ||||||||
|
| |||||||
| Finland — 0.7% | ||||||||
Elisa OYJ | 717 | 27,315 | ||||||
Fortum OYJ (a) | 1,873 | 28,092 | ||||||
Kone OYJ, Class B | 1,158 | 54,733 | ||||||
Metso OYJ | 557 | 13,083 | ||||||
Neste OYJ | 597 | 20,120 | ||||||
Nokia OYJ* | 22,156 | 126,710 | ||||||
Nokian Renkaat OYJ (a) | 536 | 18,923 | ||||||
Orion OYJ, Class B | 417 | 14,963 | ||||||
Sampo OYJ, Class A | 1,602 | 71,423 | ||||||
Stora Enso OYJ, Class R | 2,345 | 20,104 | ||||||
UPM-Kymmene OYJ | 2,198 | 42,284 | ||||||
Wartsila OYJ Abp | 558 | 23,127 | ||||||
|
| |||||||
| 460,877 | ||||||||
|
| |||||||
| France — 6.9% | ||||||||
Accor SA | 730 | 31,762 | ||||||
Aeroports de Paris | 177 | 21,082 | ||||||
Air Liquide SA (a) | 1,319 | 141,665 | ||||||
Airbus Group SE | 2,359 | 147,037 | ||||||
Alstom SA* | 733 | 18,407 | ||||||
Arkema SA (a) | 315 | 25,845 | ||||||
Atos SE | 360 | 33,270 | ||||||
AXA SA | 8,017 | 201,415 | ||||||
BNP Paribas SA* | 4,264 | 236,101 | ||||||
Bollore SA (a) | 2,447 | 8,846 | ||||||
Bouygues SA | 717 | 23,295 | ||||||
Bureau Veritas SA (a) | 964 | 20,722 | ||||||
Capgemini SA (a) | 658 | 62,743 | ||||||
Carrefour SA (a) | 2,186 | 59,225 | ||||||
Casino Guichard-Perrachon SA | 196 | 11,661 | ||||||
Christian Dior SE | 214 | 34,894 | ||||||
Cie de Saint-Gobain | 1,778 | 79,369 | ||||||
Cie Generale des Etablissements Michelin | 727 | 73,884 | ||||||
CNP Assurances | 650 | 11,029 | ||||||
Credit Agricole SA (a) | 4,183 | 42,004 | ||||||
Danone SA | 2,363 | 165,849 | ||||||
| See Notes to Financial Statements. | 33 |
DBX ETF Trust
Schedule of investments
Deutsche X-trackers MSCI All World ex US Hedged Equity ETF (Continued)
May 31, 2016
Number | Value | |||||||
| France (Continued) | ||||||||
Dassault Systemes SA | 513 | $ | 40,845 | |||||
Edenred | 826 | 15,302 | ||||||
Eiffage SA | 156 | 11,508 | ||||||
Electricite de France (a) | 1,018 | 13,564 | ||||||
Engie | 5,920 | 91,195 | ||||||
Essilor International SA (a) | 779 | 101,713 | ||||||
Eurazeo SA | 191 | 12,434 | ||||||
Eutelsat Communications SA | 718 | 14,316 | ||||||
Fonciere des Regions REIT | 118 | 10,545 | ||||||
Gecina SA REIT | 177 | 25,001 | ||||||
Groupe Eurotunnel SE | 1,983 | 25,583 | ||||||
Hermes International | 79 | 28,563 | ||||||
ICADE REIT (a) | 180 | 13,000 | ||||||
Iliad SA | 120 | 26,296 | ||||||
Imerys SA | 173 | 12,198 | ||||||
Ingenico Group | 229 | 27,900 | ||||||
JCDecaux SA | 359 | 14,817 | ||||||
Kering | 299 | 48,289 | ||||||
Klepierre REIT | 608 | 27,810 | ||||||
Lagardere SCA | 724 | 17,138 | ||||||
Legrand SA | 1,035 | 56,929 | ||||||
L’Oreal SA | 1,031 | 193,751 | ||||||
LVMH Moet Hennessy Louis Vuitton SE | 1,078 | 172,778 | ||||||
Natixis SA | 3,994 | 19,278 | ||||||
Numericable-SFR SA | 517 | 16,069 | ||||||
Orange SA | 7,848 | 136,351 | ||||||
Pernod Ricard SA | 848 | 92,380 | ||||||
Peugeot SA*(a) | 1,868 | 29,399 | ||||||
Publicis Groupe SA (a) | 787 | 56,970 | ||||||
Remy Cointreau SA | 104 | 8,637 | ||||||
Renault SA | 781 | 73,289 | ||||||
Rexel SA | 1,203 | 18,398 | ||||||
Safran SA (a) | 1,156 | 81,032 | ||||||
Sanofi | 4,760 | 390,276 | ||||||
Schneider Electric SE | 2,190 | 141,596 | ||||||
SCOR SE | 590 | 19,727 | ||||||
Societe BIC SA | 108 | 14,414 | ||||||
Societe Generale SA | 3,070 | 126,351 | ||||||
Sodexo SA | 354 | 37,233 | ||||||
Suez | 1,322 | 22,218 | ||||||
Technip SA | 419 | 23,000 | ||||||
Thales SA | 412 | 35,692 | ||||||
Total SA (a) | 8,832 | 429,189 | ||||||
Unibail-Rodamco SE REIT | 457 | 123,001 | ||||||
Valeo SA* | 326 | 49,203 | ||||||
Veolia Environnement SA | 1,685 | 37,834 | ||||||
Vinci SA | 1,859 | 139,804 | ||||||
Vivendi SA | 4,913 | 97,466 | ||||||
Wendel SA | 177 | 20,432 | ||||||
Zodiac Aerospace | 717 | 16,745 | ||||||
|
| |||||||
| 4,707,564 | ||||||||
|
| |||||||
| Germany — 6.1% | ||||||||
adidas AG | 883 | 113,131 | ||||||
Allianz SE | 1,874 | 305,883 | ||||||
Axel Springer SE | 237 | 13,480 | ||||||
BASF SE | 3,670 | 283,511 | ||||||
Number | Value | |||||||
| Germany (Continued) | ||||||||
Bayer AG | 3,355 | $ | 319,650 | |||||
Bayerische Motoren Werke AG | 1,344 | 113,485 | ||||||
Beiersdorf AG | 385 | 34,989 | ||||||
Brenntag AG | 599 | 32,064 | ||||||
Commerzbank AG | 4,098 | 35,109 | ||||||
Continental AG | 450 | 96,533 | ||||||
Covestro AG, 144A | 200 | 8,481 | ||||||
Daimler AG | 3,902 | 266,527 | ||||||
Deutsche Bank AG*(c) | 5,568 | 99,464 | ||||||
Deutsche Boerse AG | 783 | 68,607 | ||||||
Deutsche Lufthansa AG | 1,025 | 14,364 | ||||||
Deutsche Post AG | 4,173 | 121,718 | ||||||
Deutsche Telekom AG | 13,157 | 232,322 | ||||||
Deutsche Wohnen AG | 1,083 | 34,782 | ||||||
E.ON SE* | 8,119 | 79,811 | ||||||
Evonik Industries AG | 464 | 13,681 | ||||||
Fraport AG Frankfurt Airport Services Worldwide | 179 | 10,247 | ||||||
Fresenius Medical Care AG & Co. KGaA | 826 | 71,685 | ||||||
Fresenius SE & Co. KGaA | 1,588 | 119,847 | ||||||
GEA Group AG | 777 | 36,020 | ||||||
Hannover Rueck SE | 237 | 26,726 | ||||||
HeidelbergCement AG | 597 | 51,074 | ||||||
Henkel AG & Co. KGaA | 408 | 42,786 | ||||||
HOCHTIEF AG | 100 | 12,651 | ||||||
Hugo Boss AG | 231 | 14,195 | ||||||
Infineon Technologies AG | 4,707 | 70,598 | ||||||
K+S AG (a) | 725 | 17,892 | ||||||
LANXESS AG | 472 | 22,551 | ||||||
Linde AG | 741 | 110,891 | ||||||
MAN SE* | 59 | 6,253 | ||||||
Merck KGaA | 503 | 50,341 | ||||||
Metro AG | 674 | 22,145 | ||||||
Muenchener Rueckversicherungs-Gesellschaft AG | 670 | 125,873 | ||||||
OSRAM Licht AG | 417 | 22,192 | ||||||
ProSiebenSat.1 Media SE* | 1,023 | 51,431 | ||||||
RWE AG* | 1,980 | 25,919 | ||||||
SAP SE | 3,891 | 315,866 | ||||||
Siemens AG | 3,100 | 333,848 | ||||||
Symrise AG | 538 | 33,755 | ||||||
Telefonica Deutschland Holding AG | 2,044 | 9,140 | ||||||
thyssenkrupp AG | 1,629 | 35,860 | ||||||
TUI AG | 2,459 | 37,645 | ||||||
United Internet AG | 538 | 25,375 | ||||||
Volkswagen AG*(a) | 155 | 23,929 | ||||||
Vonovia SE | 1,693 | 58,028 | ||||||
Zalando SE, 144A*(a) | 338 | 9,908 | ||||||
|
| |||||||
| 4,082,263 | ||||||||
|
| |||||||
| Hong Kong — 3.2% | ||||||||
AIA Group Ltd. | 44,705 | 261,473 | ||||||
Alibaba Health Information Technology | 10,759 | 7,850 | ||||||
Alibaba Pictures Group Ltd.* | 41,053 | 9,668 | ||||||
ASM Pacific Technology Ltd. | 1,347 | 9,898 | ||||||
Bank of East Asia Ltd. | 4,012 | 14,792 | ||||||
| See Notes to Financial Statements. | 34 |
DBX ETF Trust
Schedule of investments
Deutsche X-trackers MSCI All World ex US Hedged Equity ETF (Continued)
May 31, 2016
Number | Value | |||||||
| Hong Kong (Continued) | ||||||||
Beijing Enterprises Holdings Ltd. | 3,771 | $ | 19,605 | |||||
Beijing Enterprises Water Group Ltd. | 20,015 | 12,853 | ||||||
BOC Hong Kong (Holdings) Ltd. | 12,030 | 37,000 | ||||||
Brilliance China Automotive Holdings Ltd. | 14,407 | 13,998 | ||||||
Cathay Pacific Airways Ltd. | 4,857 | 7,600 | ||||||
Cheung Kong Infrastructure Holdings Ltd. | 1,078 | 10,085 | ||||||
Cheung Kong Property Holdings Ltd. | 10,473 | 65,568 | ||||||
China Everbright International Ltd. | 13,362 | 14,324 | ||||||
China Gas Holdings Ltd. | 7,405 | 10,482 | ||||||
China Jinmao Holdings Group Ltd. | 32,231 | 9,291 | ||||||
China Merchants Holdings International Co. Ltd. | 4,825 | 13,784 | ||||||
China Mobile Ltd. | 26,615 | 303,457 | ||||||
China Overseas Land & Investment Ltd. | 17,399 | 52,282 | ||||||
China Power International Development Ltd. | 11,671 | 4,926 | ||||||
China Resources Beer Holdings Co. Ltd. | 6,025 | 13,057 | ||||||
China Resources Gas Group Ltd. | 5,279 | 14,776 | ||||||
China Resources Land Ltd. | 6,459 | 15,444 | ||||||
China Resources Power Holdings Co. Ltd. | 12,615 | 19,805 | ||||||
China State Construction International Holdings Ltd. | 6,764 | 8,661 | ||||||
China Taiping Insurance Holdings Co. | 6,204 | 12,008 | ||||||
China Unicom (Hong Kong) Ltd. | 26,731 | 28,861 | ||||||
CITIC Ltd. | 12,138 | 17,619 | ||||||
CK Hutchison Holdings Ltd. | 11,155 | 129,483 | ||||||
CLP Holdings Ltd. | 6,666 | 62,879 | ||||||
COSCO Pacific Ltd. | 6,658 | 6,734 | ||||||
Far East Horizon Ltd. | 13,362 | 10,128 | ||||||
First Pacific Co. Ltd. | 7,070 | 4,640 | ||||||
Galaxy Entertainment Group Ltd. | 9,653 | 32,422 | ||||||
GCL-Poly Energy Holdings Ltd. | 63,282 | 9,039 | ||||||
Guangdong Investment Ltd. | 22,386 | 31,574 | ||||||
Haier Electronics Group Co. Ltd. | 4,358 | 7,044 | ||||||
Hanergy Thin Film Power Group Ltd.* | 36,104 | 0 | ||||||
Hang Lung Properties Ltd. | 10,889 | 20,795 | ||||||
Hang Seng Bank Ltd. | 2,680 | 47,559 | ||||||
Henderson Land Development Co. Ltd. | 5,412 | 32,838 | ||||||
HKT Trust and HKT Ltd. (b) | 7,136 | 10,340 | ||||||
Hong Kong and China Gas Co. Ltd. | 31,117 | 59,745 | ||||||
Hong Kong Exchanges & Clearing Ltd. | 4,636 | 110,967 | ||||||
Hongkong Land Holdings Ltd. | 3,800 | 22,952 | ||||||
Hysan Development Co. Ltd. | 1,976 | 8,519 | ||||||
Jardine Matheson Holdings Ltd. | 700 | 39,900 | ||||||
Kerry Properties Ltd. | 2,680 | 6,698 | ||||||
Kunlun Energy Co. Ltd. | 22,972 | 18,802 | ||||||
Li & Fung Ltd. | 28,345 | 14,445 | ||||||
Link REIT | 9,750 | 59,912 | ||||||
Melco Crown Entertainment Ltd., ADR | 343 | 4,963 | ||||||
MTR Corp. Ltd. | 4,085 | 19,372 | ||||||
New World Development Co. Ltd. | 22,456 | 21,211 | ||||||
Nine Dragons Paper Holdings Ltd. | 9,344 | 6,758 | ||||||
Noble Group Ltd.* | 30,700 | 6,576 | ||||||
NWS Holdings Ltd. | 10,662 | 16,822 | ||||||
PCCW Ltd. | 18,829 | 12,285 | ||||||
Power Assets Holdings Ltd. | 5,337 | 51,751 | ||||||
Number | Value | |||||||
| Hong Kong (Continued) | ||||||||
Shimao Property Holdings Ltd. | 6,844 | $ | 8,666 | |||||
Sino Biopharmaceutical Ltd. | 25,118 | 17,035 | ||||||
Sino Land Co. Ltd. | 17,693 | 27,095 | ||||||
SJM Holdings Ltd. | 13,362 | 8,563 | ||||||
Sun Art Retail Group Ltd. | 19,149 | 12,050 | ||||||
Sun Hung Kai Properties Ltd. | 6,477 | 76,183 | ||||||
Swire Pacific Ltd., Class A | 3,264 | 35,199 | ||||||
Swire Properties Ltd. | 3,900 | 10,665 | ||||||
Techtronic Industries Co. Ltd. | 5,818 | 23,397 | ||||||
WH Group Ltd., 144A | 20,129 | 15,490 | ||||||
Wharf Holdings Ltd. | 5,542 | 29,990 | ||||||
Wheelock & Co. Ltd. | 1,011 | 4,554 | ||||||
Yue Yuen Industrial (Holdings) Ltd. | 2,735 | 10,312 | ||||||
|
| |||||||
| 2,175,519 | ||||||||
|
| |||||||
| Hungary — 0.1% | ||||||||
MOL Hungarian Oil and Gas PLC | 314 | 17,269 | ||||||
OTP Bank PLC | 980 | 23,684 | ||||||
Richter Gedeon Nyrt | 984 | 19,727 | ||||||
|
| |||||||
| 60,680 | ||||||||
|
| |||||||
| India — 1.2% | ||||||||
Axis Bank Ltd. GDR | 3,703 | 143,491 | ||||||
Dr. Reddy’s Laboratories Ltd., ADR | 798 | 37,634 | ||||||
ICICI Bank Ltd., ADR | 23,242 | 167,110 | ||||||
Infosys Ltd., ADR (a) | 3,760 | 73,095 | ||||||
Larsen & Toubro Ltd., GDR | 5,503 | 119,965 | ||||||
Reliance Industries Ltd., GDR, 144A | 5,088 | 144,499 | ||||||
Tata Motors Ltd., ADR*(a) | 2,551 | 85,433 | ||||||
Wipro Ltd., ADR | 5,192 | 62,356 | ||||||
|
| |||||||
| 833,583 | ||||||||
|
| |||||||
| Indonesia — 0.6% | ||||||||
PT Astra International Tbk | 82,426 | 39,825 | ||||||
PT Bank Central Asia Tbk | 53,562 | 50,974 | ||||||
PT Bank Danamon Indonesia Tbk | 16,349 | 3,926 | ||||||
PT Bank Mandiri Persero Tbk | 33,057 | 21,840 | ||||||
PT Bank Negara Indonesia Persero Tbk | 27,106 | 9,525 | ||||||
PT Bank Rakyat Indonesia Persero Tbk | 43,603 | 33,037 | ||||||
PT Bumi Serpong Damai Tbk | 52,464 | 7,028 | ||||||
PT Charoen Pokphand Indonesia Tbk | 38,138 | 9,772 | ||||||
PT Gudang Garam Tbk | 3,002 | 15,208 | ||||||
PT Hanjaya Mandala Sampoerna Tbk | 1,503 | 10,453 | ||||||
PT Indocement Tunggal Prakarsa Tbk | 7,535 | 9,184 | ||||||
PT Indofood CBP Sukses Makmur Tbk* | 7,535 | 8,936 | ||||||
PT Indofood Sukses Makmur Tbk* | 15,063 | 7,636 | ||||||
PT Jasa Marga Persero Tbk | 15,738 | 6,221 | ||||||
PT Kalbe Farma Tbk* | 117,549 | 12,306 | ||||||
PT Lippo Karawaci Tbk | 131,378 | 9,185 | ||||||
PT Matahari Department Store Tbk | 12,341 | 17,143 | ||||||
PT Media Nusantara Citra Tbk | 25,596 | 3,935 | ||||||
PT Perusahaan Gas Negara Persero Tbk | 49,348 | 8,959 | ||||||
PT Semen Indonesia Persero Tbk | 15,065 | 9,926 | ||||||
PT Summarecon Agung Tbk | 31,685 | 3,711 | ||||||
PT Surya Citra Media Tbk | 31,646 | 7,761 | ||||||
PT Telekomunikasi Indonesia Persero Tbk | 204,894 | 55,498 | ||||||
PT Tower Bersama Infrastructure Tbk | 16,582 | 8,073 | ||||||
PT Unilever Indonesia Tbk | 9,135 | 28,823 | ||||||
| See Notes to Financial Statements. | 35 |
DBX ETF Trust
Schedule of investments
Deutsche X-trackers MSCI All World ex US Hedged Equity ETF (Continued)
May 31, 2016
Number | Value | |||||||
| Indonesia (Continued) | ||||||||
PT United Tractors Tbk | 6,381 | $ | 6,633 | |||||
PT XL Axiata Tbk* | 25,596 | 6,615 | ||||||
|
| |||||||
| 412,133 | ||||||||
|
| |||||||
| Ireland — 0.5% | ||||||||
AerCap Holdings NV* | 300 | 11,727 | ||||||
Bank of Ireland* | 110,264 | 33,616 | ||||||
CRH PLC | 3,068 | 92,969 | ||||||
DCC PLC | 325 | 29,608 | ||||||
Experian PLC | 3,668 | 69,382 | ||||||
James Hardie Industries PLC CDI | 2,164 | 32,970 | ||||||
Kerry Group PLC, Class A | 543 | 48,998 | ||||||
Paddy Power Betfair PLC | 295 | 39,814 | ||||||
|
| |||||||
| 359,084 | ||||||||
|
| |||||||
| Israel — 0.6% | ||||||||
Azrieli Group | 338 | 14,344 | ||||||
Bank Hapoalim BM | 5,905 | 30,501 | ||||||
Bank Leumi Le-Israel BM* | 9,277 | 34,048 | ||||||
Bezeq The Israeli Telecommunication Corp. Ltd. | 6,227 | 12,041 | ||||||
Check Point Software Technologies | 391 | 33,223 | ||||||
Israel Chemicals Ltd. | 3,551 | 14,609 | ||||||
Mizrahi Tefahot Bank Ltd. | 1,085 | 12,774 | ||||||
Mobileye NV*(a) | 259 | 9,834 | ||||||
NICE Systems Ltd. | 299 | 19,193 | ||||||
Teva Pharmaceutical Industries Ltd. | 3,796 | 197,155 | ||||||
|
| |||||||
| 377,722 | ||||||||
|
| |||||||
| Italy — 1.4% | ||||||||
Assicurazioni Generali SpA | 4,227 | 61,282 | ||||||
Atlantia SpA | 1,865 | 50,300 | ||||||
Enel SpA (a) | 29,523 | 133,825 | ||||||
Eni SpA | 9,850 | 150,474 | ||||||
EXOR SpA (a) | 357 | 13,541 | ||||||
Ferrari NV* | 423 | 17,932 | ||||||
Intesa Sanpaolo SpA | 62,337 | 160,080 | ||||||
Intesa Sanpaolo SpA-RSP (a) | 4,337 | 10,520 | ||||||
Leonardo-Finmeccanica SpA*(a) | 2,183 | 25,843 | ||||||
Luxottica Group SpA | 598 | 32,396 | ||||||
Mediobanca SpA | 3,857 | 29,911 | ||||||
Poste Italiane SpA, 144A* | 1,400 | 10,717 | ||||||
Prysmian SpA | 843 | 20,626 | ||||||
Saipem SpA* | 19,196 | 7,858 | ||||||
Snam SpA | 8,732 | 49,987 | ||||||
Telecom Italia SpA* | 41,597 | 39,387 | ||||||
Telecom Italia SpA-RSP | 25,828 | 19,929 | ||||||
Terna Rete Elettrica Nazionale SpA (a) | 6,988 | 38,751 | ||||||
UniCredit SpA | 18,291 | 58,531 | ||||||
Unione di Banche Italiane SpA (a) | 2,365 | 8,789 | ||||||
UnipolSai SpA (a) | 4,201 | 8,400 | ||||||
|
| |||||||
| 949,079 | ||||||||
|
| |||||||
| Japan — 16.5% | ||||||||
ABC-Mart, Inc. | 100 | 6,484 | ||||||
Acom Co. Ltd.*(a) | 3,100 | 17,105 | ||||||
Aeon Co. Ltd. | 3,500 | 53,210 | ||||||
Number | Value | |||||||
| Japan (Continued) | ||||||||
AEON Financial Service Co. Ltd. | 400 | $ | 8,839 | |||||
AIR WATER, Inc. | 1,000 | 15,668 | ||||||
AISIN SEIKI Co. Ltd. | 600 | 24,789 | ||||||
Ajinomoto Co., Inc. | 2,100 | 50,739 | ||||||
Alfresa Holdings Corp. | 500 | 10,552 | ||||||
Alps Electric Co. Ltd. | 600 | 12,148 | ||||||
Amada Holdings Co. Ltd. | 1,100 | 12,129 | ||||||
ANA Holdings, Inc. | 3,000 | 8,775 | ||||||
Aozora Bank Ltd. | 4,000 | 13,618 | ||||||
Asahi Glass Co. Ltd. | 3,000 | 18,206 | ||||||
Asahi Group Holdings Ltd. | 2,100 | 71,571 | ||||||
Asahi Kasei Corp. | 5,000 | 33,544 | ||||||
ASICS Corp. | 600 | 13,660 | ||||||
Astellas Pharma, Inc. | 9,700 | 132,884 | ||||||
Bandai Namco Holdings, Inc. | 700 | 17,359 | ||||||
Bank of Kyoto Ltd. | 1,000 | 6,610 | ||||||
Benesse Holdings, Inc. | 200 | 4,425 | ||||||
Bridgestone Corp. | 3,500 | 120,928 | ||||||
Brother Industries Ltd. | 300 | 3,600 | ||||||
Calbee, Inc. | 300 | 11,081 | ||||||
Canon, Inc. | 5,400 | 156,633 | ||||||
Casio Computer Co. Ltd. | 700 | 10,904 | ||||||
Central Japan Railway Co. | 500 | 88,635 | ||||||
Chiba Bank Ltd. | 2,000 | 10,512 | ||||||
Chubu Electric Power Co., Inc. | 4,000 | 54,707 | ||||||
Chugai Pharmaceutical Co. Ltd. | 800 | 28,139 | ||||||
Chugoku Electric Power Co., Inc. | 400 | 5,017 | ||||||
Concordia Financial Group Ltd.* | 3,100 | 14,454 | ||||||
Credit Saison Co. Ltd. | 500 | 9,536 | ||||||
CYBERDYNE, Inc.* | 400 | 9,392 | ||||||
Dai Nippon Printing Co. Ltd. | 2,000 | 20,517 | ||||||
Daicel Corp. | 1,000 | 12,498 | ||||||
Daihatsu Motor Co. Ltd. | 300 | 4,113 | ||||||
Dai-ichi Life Insurance Co. Ltd. | 5,700 | 75,178 | ||||||
Daiichi Sankyo Co. Ltd. | 3,000 | 69,802 | ||||||
Daikin Industries Ltd. | 900 | 77,179 | ||||||
Daito Trust Construction Co. Ltd. | 300 | 43,604 | ||||||
Daiwa House Industry Co. Ltd. | 1,300 | 37,767 | ||||||
Daiwa Securities Group, Inc. | 2,000 | 11,671 | ||||||
DENSO Corp. | 1,400 | 55,236 | ||||||
Dentsu, Inc. | 600 | 30,397 | ||||||
Don Quijote Holdings Co. Ltd. | 300 | 9,645 | ||||||
East Japan Railway Co. | 1,100 | 100,677 | ||||||
Eisai Co. Ltd. | 900 | 55,901 | ||||||
Electric Power Development Co. Ltd. | 400 | 10,371 | ||||||
FamilyMart Co. Ltd. | 200 | 10,512 | ||||||
FANUC Corp. | 700 | 107,337 | ||||||
Fast Retailing Co. Ltd. | 100 | 26,988 | ||||||
Fuji Electric Co. Ltd. | 1,000 | 4,046 | ||||||
Fuji Heavy Industries Ltd. | 2,700 | 101,188 | ||||||
FUJIFILM Holdings Corp. | 1,400 | 56,918 | ||||||
Fujitsu Ltd. | 5,000 | 20,228 | ||||||
Fukuoka Financial Group, Inc. | 2,000 | 7,297 | ||||||
Hamamatsu Photonics KK | 500 | 13,636 | ||||||
Hankyu Hanshin Holdings, Inc. | 4,000 | 27,489 | ||||||
Hikari Tsushin, Inc. | 100 | 8,164 | ||||||
Hino Motors Ltd. | 300 | 3,078 | ||||||
| See Notes to Financial Statements. | 36 |
DBX ETF Trust
Schedule of investments
Deutsche X-trackers MSCI All World ex US Hedged Equity ETF (Continued)
May 31, 2016
Number | Value | |||||||
| Japan (Continued) | ||||||||
Hirose Electric Co. Ltd. | 100 | $ | 12,426 | |||||
Hiroshima Bank Ltd. | 1,000 | 3,775 | ||||||
Hisamitsu Pharmaceutical Co., Inc. | 200 | 10,710 | ||||||
Hitachi Chemical Co. Ltd. | 400 | 7,495 | ||||||
Hitachi Construction Machinery Co. Ltd. | 400 | 6,184 | ||||||
Hitachi High-Technologies Corp. | 200 | 5,834 | ||||||
Hitachi Ltd. | 23,200 | 107,269 | ||||||
Hitachi Metals Ltd. | 700 | 7,522 | ||||||
Honda Motor Co. Ltd. | 6,000 | 170,732 | ||||||
Hoshizaki Electric Co. Ltd. | 200 | 19,163 | ||||||
Hoya Corp. | 1,900 | 67,037 | ||||||
Hulic Co. Ltd. | 3,700 | 36,721 | ||||||
Idemitsu Kosan Co. Ltd. | 300 | 6,009 | ||||||
IHI Corp. | 5,000 | 12,914 | ||||||
Iida Group Holdings Co. Ltd. | 500 | 10,484 | ||||||
INPEX Corp. | 4,900 | 40,382 | ||||||
Isetan Mitsukoshi Holdings Ltd. | 2,800 | 27,384 | ||||||
Isuzu Motors Ltd. | 1,500 | 18,097 | ||||||
ITOCHU Corp. | 5,700 | 71,626 | ||||||
Iyo Bank Ltd. | 4,500 | 29,991 | ||||||
J. Front Retailing Co. Ltd. | 400 | 4,797 | ||||||
Japan Airlines Co. Ltd. | 100 | 3,433 | ||||||
Japan Airport Terminal Co. Ltd. | 100 | 3,459 | ||||||
Japan Exchange Group, Inc. | 2,200 | 30,000 | ||||||
Japan Post Holdings Co. Ltd. | 1,200 | 15,529 | ||||||
Japan Prime Realty Investment Corp. REIT | 1 | 4,285 | ||||||
Japan Real Estate Investment Corp. REIT | 2 | 11,722 | ||||||
Japan Retail Fund Investment Corp. REIT | 3 | 6,982 | ||||||
Japan Tobacco, Inc. | 4,800 | 190,812 | ||||||
JFE Holdings, Inc. | 2,700 | 36,367 | ||||||
JGC Corp. | 1,000 | 15,469 | ||||||
Joyo Bank Ltd. | 1,000 | 3,703 | ||||||
JSR Corp. | 600 | 8,832 | ||||||
JTEKT Corp. | 1,600 | 22,179 | ||||||
JX Holdings, Inc. | 11,200 | 43,795 | ||||||
Kajima Corp. | 3,000 | 20,454 | ||||||
Kakaku.com, Inc. | 400 | 7,586 | ||||||
Kamigumi Co. Ltd. | 1,000 | 9,157 | ||||||
Kaneka Corp. | 1,000 | 7,965 | ||||||
Kansai Electric Power Co., Inc.* | 4,000 | 38,795 | ||||||
Kansai Paint Co. Ltd. | 800 | 16,204 | ||||||
Kao Corp. | 2,300 | 126,720 | ||||||
Kawasaki Heavy Industries Ltd. | 4,000 | 12,462 | ||||||
KDDI Corp. | 8,500 | 248,472 | ||||||
Keihan Holdings Co. Ltd. | 3,000 | 20,265 | ||||||
Keikyu Corp. | 1,000 | 9,482 | ||||||
Keio Corp. | 2,000 | 17,158 | ||||||
Keisei Electric Railway Co. Ltd. | 1,000 | 13,437 | ||||||
Keyence Corp. | 100 | 63,575 | ||||||
Kikkoman Corp. | 1,000 | 35,942 | ||||||
Kintetsu Group Holdings Co. Ltd. | 7,000 | 28,193 | ||||||
Kirin Holdings Co. Ltd. | 3,100 | 52,182 | ||||||
Kobe Steel Ltd. | 11,000 | 9,934 | ||||||
Koito Manufacturing Co. Ltd. | 400 | 18,892 | ||||||
Komatsu Ltd. | 4,800 | 82,901 | ||||||
Konami Holdings Corp. | 300 | 11,379 | ||||||
Konica Minolta, Inc. | 3,400 | 29,353 | ||||||
Number | Value | |||||||
| Japan (Continued) | ||||||||
Kose Corp. | 100 | $ | 8,994 | |||||
Kubota Corp. | 4,300 | 63,315 | ||||||
Kuraray Co. Ltd. | 2,800 | 37,220 | ||||||
Kurita Water Industries Ltd. | 400 | 9,381 | ||||||
Kyocera Corp. | 1,100 | 55,032 | ||||||
Kyowa Hakko Kirin Co. Ltd. | 1,000 | 18,242 | ||||||
Kyushu Electric Power Co., Inc.* | 2,800 | 28,446 | ||||||
Lawson, Inc. | 100 | 7,920 | ||||||
LIXIL Group Corp. | 900 | 16,271 | ||||||
M3, Inc. | 700 | 20,134 | ||||||
Mabuchi Motor Co. Ltd. | 100 | 4,732 | ||||||
Makita Corp. | 400 | 25,936 | ||||||
Marubeni Corp. | 10,700 | 51,493 | ||||||
Marui Group Co. Ltd. | 1,500 | 22,039 | ||||||
Maruichi Steel Tube Ltd. | 200 | 6,683 | ||||||
Mazda Motor Corp. | 2,700 | 46,595 | ||||||
Medipal Holdings Corp. | 300 | 5,215 | ||||||
MEIJI Holdings Co. Ltd. | 400 | 36,158 | ||||||
Minebea Co. Ltd. | 1,100 | 8,831 | ||||||
Miraca Holdings, Inc. | 200 | 8,462 | ||||||
Mitsubishi Chemical Holdings Corp. | 7,900 | 40,265 | ||||||
Mitsubishi Corp. | 6,000 | 106,579 | ||||||
Mitsubishi Electric Corp. | 7,000 | 84,675 | ||||||
Mitsubishi Estate Co. Ltd. | 2,000 | 38,642 | ||||||
Mitsubishi Gas Chemical Co., Inc. | 1,000 | 5,680 | ||||||
Mitsubishi Heavy Industries Ltd. | 10,000 | 40,610 | ||||||
Mitsubishi Logistics Corp. | 1,000 | 14,097 | ||||||
Mitsubishi Materials Corp. | 3,000 | 8,669 | ||||||
Mitsubishi Motors Corp. | 4,000 | 20,915 | ||||||
Mitsubishi Tanabe Pharma Corp. | 600 | 10,094 | ||||||
Mitsubishi UFJ Financial Group, Inc. | 55,400 | 277,063 | ||||||
Mitsubishi UFJ Lease & Finance Co. Ltd. | 6,900 | 29,722 | ||||||
Mitsui & Co. Ltd. | 9,300 | 112,119 | ||||||
Mitsui Chemicals, Inc. | 4,000 | 15,063 | ||||||
Mitsui Fudosan Co. Ltd. | 2,000 | 49,153 | ||||||
Mitsui OSK Lines Ltd. | 3,000 | 6,827 | ||||||
Mixi, Inc. | 300 | 11,595 | ||||||
Mizuho Financial Group, Inc. | 111,300 | 175,290 | ||||||
MS&AD Insurance Group Holdings, Inc. | 3,100 | 88,519 | ||||||
Murata Manufacturing Co. Ltd. | 700 | 81,862 | ||||||
Nabtesco Corp. | 300 | 7,637 | ||||||
Nagoya Railroad Co. Ltd. | 3,000 | 15,117 | ||||||
NEC Corp. | 8,000 | 18,856 | ||||||
Nexon Co. Ltd. | 1,400 | 23,048 | ||||||
NGK Insulators Ltd. | 1,000 | 22,026 | ||||||
NGK Spark Plug Co. Ltd. | 500 | 9,703 | ||||||
NH Foods Ltd. | 1,000 | 23,371 | ||||||
Nidec Corp. | 900 | 69,547 | ||||||
Nikon Corp. | 1,100 | 15,467 | ||||||
Nintendo Co. Ltd. | 400 | 59,421 | ||||||
Nippon Building Fund, Inc. REIT | 3 | 17,853 | ||||||
Nippon Electric Glass Co. Ltd. | 2,000 | 9,645 | ||||||
Nippon Express Co. Ltd. | 3,000 | 12,950 | ||||||
Nippon Paint Holdings Co. Ltd. | 600 | 17,122 | ||||||
Nippon Prologis REIT, Inc. REIT | 2 | 4,342 | ||||||
Nippon Steel & Sumitomo Metal Corp. | 4,010 | 82,927 | ||||||
Nippon Telegraph & Telephone Corp. | 2,100 | 92,071 | ||||||
| See Notes to Financial Statements. | 37 |
DBX ETF Trust
Schedule of investments
Deutsche X-trackers MSCI All World ex US Hedged Equity ETF (Continued)
May 31, 2016
Number | Value | |||||||
| Japan (Continued) | ||||||||
Nippon Yusen KK | 3,000 | $ | 5,689 | |||||
Nissan Motor Co. Ltd. | 11,900 | 120,897 | ||||||
Nisshin Seifun Group, Inc. | 1,550 | 26,413 | ||||||
Nissin Foods Holdings Co. Ltd. | 200 | 10,042 | ||||||
Nitori Holdings Co. Ltd. | 300 | 30,505 | ||||||
Nitto Denko Corp. | 600 | 39,494 | ||||||
Nomura Holdings, Inc. | 17,100 | 74,185 | ||||||
Nomura Real Estate Master Fund, Inc. REIT | 6 | 9,482 | ||||||
Nomura Research Institute Ltd. | 820 | 30,990 | ||||||
NSK Ltd. | 2,700 | 24,017 | ||||||
NTT Data Corp. | 500 | 25,827 | ||||||
NTT DOCOMO, Inc. | 5,800 | 145,556 | ||||||
NTT Urban Development Corp. | 4,100 | 41,098 | ||||||
Obayashi Corp. | 2,300 | 24,239 | ||||||
Obic Co. Ltd. | 200 | 10,891 | ||||||
Odakyu Electric Railway Co. Ltd. | 2,000 | 21,746 | ||||||
Oji Holdings Corp. | 3,000 | 12,354 | ||||||
Olympus Corp. | 1,000 | 42,399 | ||||||
Omron Corp. | 700 | �� | 22,567 | |||||
Ono Pharmaceutical Co. Ltd. | 1,600 | 71,146 | ||||||
Oracle Corp. Japan | 100 | 5,319 | ||||||
Oriental Land Co. Ltd. | 700 | 46,096 | ||||||
ORIX Corp. | 5,700 | 79,270 | ||||||
Osaka Gas Co. Ltd. | 3,000 | 11,270 | ||||||
OTSUKA Corp. | 100 | 4,741 | ||||||
Otsuka Holdings Co. Ltd. | 1,400 | 57,272 | ||||||
Panasonic Corp. | 10,200 | 95,013 | ||||||
Park24 Co. Ltd. | 300 | 8,588 | ||||||
Pola Orbis Holdings, Inc. | 100 | 8,669 | ||||||
Rakuten, Inc. | 4,600 | 49,620 | ||||||
Recruit Holdings Co. Ltd. | 900 | 30,681 | ||||||
Resona Holdings, Inc. | 12,000 | 45,666 | ||||||
Ricoh Co. Ltd. | 5,400 | 47,107 | ||||||
Rinnai Corp. | 100 | 8,724 | ||||||
Rohm Co. Ltd. | 200 | 8,552 | ||||||
Ryohin Keikaku Co. Ltd. | 100 | 23,055 | ||||||
Sankyo Co. Ltd. | 200 | 7,468 | ||||||
Santen Pharmaceutical Co. Ltd. | 1,400 | 20,633 | ||||||
Secom Co. Ltd. | 700 | 54,901 | ||||||
Sega Sammy Holdings, Inc. | 600 | 7,326 | ||||||
Seibu Holdings, Inc. | 500 | 9,432 | ||||||
Seiko Epson Corp. | 900 | 16,222 | ||||||
Sekisui Chemical Co. Ltd. | 1,200 | 15,670 | ||||||
Sekisui House Ltd. | 3,500 | 62,771 | ||||||
Seven & i Holdings Co. Ltd. | 3,400 | 145,659 | ||||||
Seven Bank Ltd. | 9,300 | 34,266 | ||||||
Shikoku Electric Power Co., Inc. | 300 | 3,579 | ||||||
Shimadzu Corp. | 1,000 | 15,262 | ||||||
Shimamura Co. Ltd. | 100 | 13,004 | ||||||
Shimano, Inc. | 200 | 31,228 | ||||||
Shimizu Corp. | 1,000 | 8,958 | ||||||
Shin-Etsu Chemical Co. Ltd. | 1,900 | 110,978 | ||||||
Shionogi & Co. Ltd. | 1,100 | 61,956 | ||||||
Shiseido Co. Ltd. | 1,900 | 50,179 | ||||||
Shizuoka Bank Ltd. | 2,000 | 14,973 | ||||||
Showa Shell Sekiyu KK | 800 | 8,120 | ||||||
Number | Value | |||||||
| Japan (Continued) | ||||||||
SMC Corp. | 100 | $ | 25,511 | |||||
SoftBank Group Corp. | 4,100 | 230,594 | ||||||
Sohgo Security Services Co. Ltd. | 200 | 9,861 | ||||||
Sompo Japan Nipponkoa Holdings, Inc. | 700 | 19,761 | ||||||
Sony Corp. | 5,300 | 148,372 | ||||||
Stanley Electric Co. Ltd. | 400 | 8,492 | ||||||
Start Today Co. Ltd. | 200 | 9,139 | ||||||
Sumitomo Chemical Co. Ltd. | 6,000 | 27,525 | ||||||
Sumitomo Corp. | 5,600 | 57,525 | ||||||
Sumitomo Dainippon Pharma Co. Ltd. | 500 | 7,324 | ||||||
Sumitomo Electric Industries Ltd. | 4,800 | 68,033 | ||||||
Sumitomo Heavy Industries Ltd. | 1,000 | 4,867 | ||||||
Sumitomo Metal Mining Co. Ltd. | 2,000 | 20,644 | ||||||
Sumitomo Mitsui Financial Group, Inc. | 6,400 | 209,047 | ||||||
Sumitomo Mitsui Trust Holdings, Inc. | 20,100 | 70,010 | ||||||
Sumitomo Realty & Development Co. Ltd. | 1,000 | 27,977 | ||||||
Sundrug Co. Ltd. | 100 | 8,281 | ||||||
Suntory Beverage & Food Ltd. | 500 | 23,615 | ||||||
Suruga Bank Ltd. | 600 | 13,443 | ||||||
Suzuken Co. Ltd. | 200 | 6,466 | ||||||
Suzuki Motor Corp. | 1,000 | 25,728 | ||||||
Sysmex Corp. | 500 | 36,574 | ||||||
T&D Holdings, Inc. | 4,200 | 41,968 | ||||||
Taiheiyo Cement Corp. | 4,000 | 10,548 | ||||||
Taisei Corp. | 4,000 | 29,693 | ||||||
Taisho Pharmaceutical Holdings Co. Ltd. | 100 | 9,329 | ||||||
Taiyo Nippon Sanso Corp. | 500 | 4,502 | ||||||
Takashimaya Co. Ltd. | 1,000 | 7,080 | ||||||
Takeda Pharmaceutical Co. Ltd. | 3,300 | 142,955 | ||||||
TDK Corp. | 400 | 23,407 | ||||||
Teijin Ltd. | 3,000 | 10,566 | ||||||
Terumo Corp. | 1,800 | 75,748 | ||||||
THK Co. Ltd. | 300 | 5,681 | ||||||
Tobu Railway Co. Ltd. | 4,000 | 20,337 | ||||||
Toho Gas Co. Ltd. | 1,000 | 7,423 | ||||||
Tohoku Electric Power Co., Inc. | 3,400 | 43,907 | ||||||
Tokio Marine Holdings, Inc. | 4,500 | 156,008 | ||||||
Tokyo Electric Power Co. Holdings, Inc.* | 6,900 | 32,464 | ||||||
Tokyo Electron Ltd. | 500 | 37,125 | ||||||
Tokyo Gas Co. Ltd. | 4,000 | 16,179 | ||||||
Tokyo Tatemono Co. Ltd. | 300 | 3,831 | ||||||
Tokyu Corp. | 3,000 | 25,737 | ||||||
Tokyu Fudosan Holdings Corp. | 6,800 | 44,951 | ||||||
TonenGeneral Sekiyu KK | 1,000 | 9,527 | ||||||
Toppan Printing Co. Ltd. | 2,000 | 18,097 | ||||||
Toray Industries, Inc. | 6,000 | 51,967 | ||||||
Toshiba Corp.*(a) | 20,100 | 49,662 | ||||||
TOTO Ltd. | 500 | 19,009 | ||||||
Toyo Seikan Group Holdings Ltd. | 600 | 12,684 | ||||||
Toyo Suisan Kaisha Ltd. | 300 | 11,636 | ||||||
Toyota Industries Corp. | 100 | 4,339 | ||||||
Toyota Motor Corp. | 11,800 | 616,241 | ||||||
Toyota Tsusho Corp. | 700 | 16,562 | ||||||
Trend Micro, Inc. | 400 | 14,521 | ||||||
TSURUHA HOLDINGS, Inc. | 100 | 10,412 | ||||||
Unicharm Corp. | 1,300 | 25,458 | ||||||
United Urban Investment Corp. REIT | 34 | 53,732 | ||||||
| See Notes to Financial Statements. | 38 |
DBX ETF Trust
Schedule of investments
Deutsche X-trackers MSCI All World ex US Hedged Equity ETF (Continued)
May 31, 2016
Number | Value | |||||||
| Japan (Continued) | ||||||||
USS Co. Ltd. | 2,000 | $ | 31,697 | |||||
West Japan Railway Co. | 500 | 31,309 | ||||||
Yahoo Japan Corp. | 6,000 | 26,983 | ||||||
Yakult Honsha Co. Ltd. | 300 | 14,738 | ||||||
Yamada Denki Co. Ltd. | 5,600 | 26,398 | ||||||
Yamaha Corp. | 600 | 18,206 | ||||||
Yamaha Motor Co. Ltd. | 900 | 15,946 | ||||||
Yamato Holdings Co. Ltd. | 2,400 | 48,798 | ||||||
Yamazaki Baking Co. Ltd. | 1,000 | 24,572 | ||||||
Yaskawa Electric Corp. | 800 | 10,143 | ||||||
Yokogawa Electric Corp. | 800 | 9,247 | ||||||
|
| |||||||
| 11,202,435 | ||||||||
|
| |||||||
| Jersey Island — 0.0% | ||||||||
Randgold Resources Ltd. | 409 | 34,358 | ||||||
|
| |||||||
| Jordan — 0.0% | ||||||||
Hikma Pharmaceuticals PLC | 561 | 18,672 | ||||||
|
| |||||||
| Luxembourg — 0.2% | ||||||||
ArcelorMittal* | 7,136 | 35,094 | ||||||
Millicom International Cellular SA SDR | 240 | 13,983 | ||||||
RTL Group SA | 180 | 16,144 | ||||||
SES SA FDR | 1,267 | 28,378 | ||||||
Tenaris SA | 1,805 | 23,919 | ||||||
|
| |||||||
| 117,518 | ||||||||
|
| |||||||
| Macau — 0.1% | ||||||||
MGM China Holdings Ltd. | 4,523 | 6,507 | ||||||
Sands China Ltd. | 9,867 | 37,839 | ||||||
Wynn Macau Ltd. | 6,900 | �� | 10,798 | |||||
|
| |||||||
| 55,144 | ||||||||
|
| |||||||
| Malaysia — 0.7% | ||||||||
Alliance Financial Group Bhd | 7,400 | 7,258 | ||||||
AMMB Holdings Bhd | 10,500 | 10,960 | ||||||
Astro Malaysia Holdings Bhd | 17,100 | 11,430 | ||||||
Berjaya Sports Toto Bhd | 11,525 | 8,513 | ||||||
Dialog Group Bhd | 23,810 | 8,938 | ||||||
DiGi.Com Bhd | 19,500 | 21,158 | ||||||
Genting Bhd | 3,000 | 6,074 | ||||||
Genting Malaysia Bhd | 20,500 | 21,895 | ||||||
Genting Plantations Bhd | 4,500 | 11,335 | ||||||
Hartalega Holdings Bhd | 3,600 | 3,636 | ||||||
Hong Leong Bank Bhd | 4,700 | 15,208 | ||||||
Hong Leong Financial Group Bhd | 2,000 | 7,208 | ||||||
IHH Healthcare Bhd | 16,500 | 25,815 | ||||||
IJM Corp. Bhd | 11,800 | 9,974 | ||||||
IOI Corp. Bhd | 17,700 | 17,747 | ||||||
Kuala Lumpur Kepong Bhd | 3,800 | 21,204 | ||||||
Lafarge Malaysia Bhd | 4,900 | 9,423 | ||||||
Malayan Banking Bhd | 19,000 | 37,549 | ||||||
Malaysia Airports Holdings Bhd | 5,800 | 8,976 | ||||||
Maxis Bhd | 12,500 | 16,651 | ||||||
MISC Bhd | 5,800 | 10,844 | ||||||
Petronas Chemicals Group Bhd | 11,900 | 18,964 | ||||||
Petronas Dagangan Bhd | 1,800 | 10,218 | ||||||
Petronas Gas Bhd | 5,100 | 26,729 | ||||||
Public Bank Bhd | 11,800 | 54,642 | ||||||
Number | Value | |||||||
| Malaysia (Continued) | ||||||||
Sime Darby Bhd | 11,800 | $ | 21,177 | |||||
Telekom Malaysia Bhd | 9,000 | 14,669 | ||||||
Tenaga Nasional Bhd | 6,400 | 21,669 | ||||||
UMW Holdings Bhd | 4,800 | 5,789 | ||||||
Westports Holdings Bhd | 3,600 | 3,784 | ||||||
YTL Corp. Bhd | 13,200 | 5,211 | ||||||
YTL Power International Bhd | 17,365 | 6,098 | ||||||
|
| |||||||
| 480,746 | ||||||||
|
| |||||||
| Malta — 0.0% | ||||||||
Brait SE*(a) | 1,882 | 19,102 | ||||||
|
| |||||||
| Mexico — 1.0% | ||||||||
Alfa SAB de CV, Class A | 11,435 | 20,049 | ||||||
America Movil SAB de CV, Series L | 138,164 | 84,515 | ||||||
Arca Continental SAB de CV | 1,507 | 10,016 | ||||||
Cemex SAB de CV, Series CPO* | 60,464 | 38,427 | ||||||
Coca-Cola Femsa SAB de CV, Series L | 1,902 | 15,243 | ||||||
El Puerto de Liverpool SAB de CV, Class C1 | 1,507 | 16,203 | ||||||
Fibra Uno Administracion SA de CV REIT | 9,037 | 19,566 | ||||||
Fomento Economico Mexicano SAB de CV | 8,388 | 75,778 | ||||||
Fresnillo PLC | 1,138 | 16,631 | ||||||
Gentera SAB de CV | 4,507 | 8,207 | ||||||
Gruma SAB de CV, Class B | 812 | 11,673 | ||||||
Grupo Aeroportuario del Pacifico SAB de CV, Class B | 925 | 9,351 | ||||||
Grupo Aeroportuario del Sureste SAB de CV, Class B* | 638 | 10,060 | ||||||
Grupo Bimbo SAB de CV, Series A | 6,030 | 17,776 | ||||||
Grupo Carso SAB de CV, Series A1 | 1,504 | 6,364 | ||||||
Grupo Comercial Chedraui SA de CV | 1,510 | 3,771 | ||||||
Grupo Financiero Banorte SAB de CV, Class O | 11,065 | 57,859 | ||||||
Grupo Financiero Inbursa SAB de CV, Class O | 13,559 | 22,612 | ||||||
Grupo Financiero Santander Mexico SAB de CV, Class B | 8,070 | 14,582 | ||||||
Grupo Mexico SAB de CV, Series B | 16,582 | 36,737 | ||||||
Grupo Televisa SAB, Series CPO | 11,372 | 60,678 | ||||||
Industrias Penoles SAB de CV | 1,120 | 17,864 | ||||||
Kimberly-Clark de Mexico SAB de CV, Class A | 6,030 | 14,323 | ||||||
Mexichem SAB de CV | 5,138 | 10,809 | ||||||
OHL Mexico SAB de CV* | 3,038 | 3,824 | ||||||
Promotora y Operadora de Infraestructura SAB de CV | 803 | 9,594 | ||||||
Wal-Mart de Mexico SAB de CV | 22,597 | 52,450 | ||||||
|
| |||||||
| 664,962 | ||||||||
|
| |||||||
| Netherlands — 2.9% | ||||||||
ABN AMRO Group NV, 144A | 900 | 18,330 | ||||||
Aegon NV (a) | 7,399 | 38,034 | ||||||
Akzo Nobel NV | 952 | 64,613 | ||||||
Altice NV, Class A*(a) | 1,260 | 21,716 | ||||||
Altice NV, Class B* | 420 | 7,262 | ||||||
ASML Holding NV | 1,451 | 144,332 | ||||||
Gemalto NV (a) | 354 | 21,636 | ||||||
| See Notes to Financial Statements. | 39 |
DBX ETF Trust
Schedule of investments
Deutsche X-trackers MSCI All World ex US Hedged Equity ETF (Continued)
May 31, 2016
Number | Value | |||||||
| Netherlands (Continued) | ||||||||
Heineken Holding NV | 399 | $ | 32,737 | |||||
Heineken NV | 933 | 86,650 | ||||||
ING Groep NV | 15,629 | 194,676 | ||||||
Koninklijke Ahold NV | 3,216 | 71,243 | ||||||
Koninklijke Boskalis Westminster | 360 | 13,038 | ||||||
Koninklijke DSM NV (a) | 717 | 42,672 | ||||||
Koninklijke KPN NV (a) | 13,363 | 53,035 | ||||||
Koninklijke Philips NV | 3,708 | 99,924 | ||||||
Koninklijke Vopak NV | 289 | 15,058 | ||||||
NN Group NV | 1,200 | 40,075 | ||||||
NXP Semiconductors NV* | 579 | 54,710 | ||||||
OCI NV*(a) | 465 | 6,690 | ||||||
QIAGEN NV* | 934 | 20,026 | ||||||
Randstad Holding NV | 488 | 26,358 | ||||||
Royal Dutch Shell PLC, Class A | 16,769 | 402,564 | ||||||
Royal Dutch Shell PLC, Class B | 15,388 | 370,080 | ||||||
Steinhoff International Holdings NV | 11,628 | 68,238 | ||||||
Wolters Kluwer NV | 1,387 | 55,286 | ||||||
|
| |||||||
| 1,968,983 | ||||||||
|
| |||||||
| New Zealand — 0.2% | ||||||||
Auckland International Airport Ltd. | 9,295 | 39,243 | ||||||
Contact Energy Ltd. | 7,134 | 26,017 | ||||||
Fletcher Building Ltd. | 3,541 | 21,443 | ||||||
Meridian Energy Ltd. | 9,274 | 16,816 | ||||||
Ryman Healthcare Ltd. | 3,927 | 25,507 | ||||||
Spark New Zealand Ltd. | 5,220 | 13,068 | ||||||
|
| |||||||
| 142,094 | ||||||||
|
| |||||||
| Norway — 0.5% | ||||||||
DNB ASA | 4,144 | 53,152 | ||||||
Gjensidige Forsikring ASA | 909 | 15,680 | ||||||
Marine Harvest ASA* | 1,602 | 26,752 | ||||||
Norsk Hydro ASA | 5,529 | 22,042 | ||||||
Orkla ASA | 3,640 | 32,938 | ||||||
Schibsted ASA, Class A | 237 | 7,366 | ||||||
Schibsted ASA, Class B | 258 | 7,649 | ||||||
Statoil ASA | 4,557 | 72,667 | ||||||
Telenor ASA (a) | 3,076 | 51,257 | ||||||
Yara International ASA (a) | 737 | 26,579 | ||||||
|
| |||||||
| 316,082 | ||||||||
|
| |||||||
| Peru — 0.1% | ||||||||
Cia de Minas Buenaventura SAA, ADR* | 779 | 7,447 | ||||||
Credicorp Ltd. | 183 | 25,657 | ||||||
Southern Copper Corp. (a) | 193 | 5,028 | ||||||
|
| |||||||
| 38,132 | ||||||||
|
| |||||||
| Philippines — 0.4% | ||||||||
Aboitiz Equity Ventures, Inc. | 15,640 | 26,421 | ||||||
Aboitiz Power Corp. | 17,800 | 17,509 | ||||||
Alliance Global Group, Inc. | 11,700 | 3,808 | ||||||
Ayala Corp. | 1,200 | 21,721 | ||||||
Ayala Land, Inc. | 29,900 | 22,825 | ||||||
Bank of the Philippine Islands | 7,770 | 15,327 | ||||||
BDO Unibank, Inc. | 7,180 | 15,507 | ||||||
DMCI Holdings Inc. | 15,400 | 4,182 | ||||||
Energy Development Corp. | 30,000 | 3,625 | ||||||
Number | Value | |||||||
| Philippines (Continued) | ||||||||
Globe Telecom, Inc. | 200 | $ | 10,307 | |||||
GT Capital Holdings, Inc. | 200 | 5,966 | ||||||
International Container Terminal Services, Inc. | 5,990 | 7,243 | ||||||
JG Summit Holdings, Inc. | 9,190 | 16,232 | ||||||
Jollibee Foods Corp. | 2,990 | 15,051 | ||||||
Metro Pacific Investments Corp. | 51,900 | 6,692 | ||||||
Metropolitan Bank & Trust Co. | 4,800 | 8,940 | ||||||
Philippine Long Distance Telephone Co. | 325 | 13,204 | ||||||
Security Bank Corp. | 1,100 | 4,775 | ||||||
SM Investments Corp. | 1,170 | 23,518 | ||||||
SM Prime Holdings, Inc. | 47,800 | 24,531 | ||||||
Universal Robina Corp. | 5,980 | 24,935 | ||||||
|
| |||||||
| 292,319 | ||||||||
|
| |||||||
| Poland — 0.3% | ||||||||
Alior Bank SA* | 783 | 10,257 | ||||||
Bank Pekao SA | 904 | 34,190 | ||||||
Bank Zachodni WBK SA | 477 | 31,207 | ||||||
CCC SA | 343 | 14,829 | ||||||
Cyfrowy Polsat SA* | 5,272 | 29,945 | ||||||
Polski Koncern Naftowy Orlen SA | 1,167 | 20,472 | ||||||
Polskie Gornictwo Naftowe i Gazownictwo SA | 9,991 | 13,402 | ||||||
Powszechny Zaklad Ubezpieczen SA | 3,580 | 28,342 | ||||||
|
| |||||||
| 182,644 | ||||||||
|
| |||||||
| Portugal — 0.1% | ||||||||
EDP — Energias de Portugal SA | 10,371 | 34,560 | ||||||
Galp Energia SGPS SA | 1,595 | 20,906 | ||||||
Jeronimo Martins SGPS SA | 1,407 | 22,793 | ||||||
|
| |||||||
| 78,259 | ||||||||
|
| |||||||
| Qatar — 0.2% | ||||||||
Barwa Real Estate Co. | 964 | 8,023 | ||||||
Ezdan Holding Group QSC | 4,018 | 18,664 | ||||||
Industries Qatar QSC | 416 | 10,970 | ||||||
Masraf Al Rayan QSC | 1,507 | 13,598 | ||||||
Qatar Electricity & Water Co. QSC | 250 | 13,700 | ||||||
Qatar Gas Transport Co. Ltd. | 2,709 | 17,398 | ||||||
Qatar Insurance Co. SAQ | 333 | 6,586 | ||||||
Qatar National Bank SAQ | 790 | 28,970 | ||||||
|
| |||||||
| 117,909 | ||||||||
|
| |||||||
| Romania — 0.0% | ||||||||
New Europe Property Investments PLC | 495 | 5,795 | ||||||
|
| |||||||
| Russia — 0.7% | ||||||||
Gazprom PAO, ADR | 9,992 | 43,685 | ||||||
Lukoil PJSC, ADR | 1,410 | 53,932 | ||||||
Magnit PJSC, GDR | 1,886 | 66,764 | ||||||
MegaFon PJSC, GDR | 2,259 | 25,301 | ||||||
Mobile TeleSystems PJSC, ADR | 4,793 | 41,987 | ||||||
NovaTek OAO, GDR | 793 | 79,617 | ||||||
PhosAgro OAO GDR | 1,300 | 19,500 | ||||||
Rosneft Oil Co. OJSC, GDR | 11,242 | 54,389 | ||||||
Severstal PAO, GDR | 3,026 | 31,622 | ||||||
Sistema JSFC, GDR | 2,160 | 16,092 | ||||||
| See Notes to Financial Statements. | 40 |
DBX ETF Trust
Schedule of investments
Deutsche X-trackers MSCI All World ex US Hedged Equity ETF (Continued)
May 31, 2016
Number | Value | |||||||
| Russia (Continued) | ||||||||
Surgutneftegas OJSC, ADR | 7,882 | $ | 39,962 | |||||
VTB Bank PJSC, GDR | 13,896 | 28,250 | ||||||
|
| |||||||
| 501,101 | ||||||||
|
| |||||||
| Singapore — 0.9% | ||||||||
Ascendas Real Estate Investment Trust REIT | 15,100 | 25,110 | ||||||
CapitaLand Commercial Trust REIT | 21,300 | 21,499 | ||||||
CapitaLand Ltd. | 13,200 | 28,660 | ||||||
CapitaLand Mall Trust REIT | 16,700 | 24,618 | ||||||
ComfortDelGro Corp. Ltd. | 14,400 | 28,651 | ||||||
DBS Group Holdings Ltd. | 8,100 | 91,170 | ||||||
Genting Singapore PLC | 27,700 | 14,885 | ||||||
Global Logistic Properties Ltd. | 11,800 | 15,509 | ||||||
Golden Agri-Resources Ltd. | 11,800 | 3,342 | ||||||
Hutchison Port Holdings Trust, Class U | 30,000 | 12,900 | ||||||
Jardine Cycle & Carriage Ltd. | 200 | 4,909 | ||||||
Keppel Corp. Ltd. | 6,100 | 23,831 | ||||||
Oversea-Chinese Banking Corp. Ltd. | 11,300 | 70,733 | ||||||
Sembcorp Industries Ltd. | 2,500 | 5,065 | ||||||
Sembcorp Marine Ltd. (a) | 3,300 | 3,714 | ||||||
Singapore Airlines Ltd. | 1,400 | 10,858 | ||||||
Singapore Exchange Ltd. | 1,800 | 10,130 | ||||||
Singapore Press Holdings Ltd. (a) | 1,800 | 5,045 | ||||||
Singapore Technologies Engineering Ltd. | 9,800 | 22,986 | ||||||
Singapore Telecommunications Ltd. | 34,100 | 95,830 | ||||||
United Overseas Bank Ltd. | 4,400 | 58,215 | ||||||
Wilmar International Ltd. | 10,000 | 24,109 | ||||||
|
| |||||||
| 601,769 | ||||||||
|
| |||||||
| South Africa — 1.4% | ||||||||
Anglo American Platinum Ltd.* | 328 | 7,332 | ||||||
AngloGold Ashanti Ltd.* | 1,964 | 26,255 | ||||||
Aspen Pharmacare Holdings Ltd.* | 1,203 | 24,647 | ||||||
Barclays Africa Group Ltd. | 1,600 | 14,858 | ||||||
Bid Corp. Ltd.* | 979 | 18,850 | ||||||
Bidvest Group Ltd. | 1,239 | 9,885 | ||||||
Capitec Bank Holdings Ltd. | 178 | 6,739 | ||||||
Discovery Ltd. | 1,059 | 8,100 | ||||||
Exxaro Resources Ltd. | 1,680 | 6,687 | ||||||
FirstRand Ltd. | 13,066 | 35,333 | ||||||
Fortress Income Fund Ltd. | 4,294 | 9,973 | ||||||
Fortress Income Fund Ltd., Class A | 4,977 | 4,994 | ||||||
Foschini Group Ltd. (a) | 680 | 6,057 | ||||||
Gold Fields Ltd. | 4,273 | 14,850 | ||||||
Growthpoint Properties Ltd. REIT | 8,171 | 12,218 | ||||||
Hyprop Investments Ltd. REIT | 905 | 6,791 | ||||||
Impala Platinum Holdings Ltd.* | 3,116 | 8,922 | ||||||
Imperial Holdings Ltd. | 559 | 4,980 | ||||||
Investec Ltd. | 640 | 4,321 | ||||||
Investec PLC | 2,280 | 15,481 | ||||||
Life Healthcare Group Holdings Ltd. | 2,934 | 7,169 | ||||||
Mediclinic International PLC | 1,349 | 16,930 | ||||||
Mondi Ltd. | 498 | 9,649 | ||||||
Mondi PLC | 1,438 | 28,034 | ||||||
Mr Price Group Ltd. | 843 | 9,896 | ||||||
MTN Group Ltd. | 6,408 | 49,947 | ||||||
Naspers Ltd., Class N | 1,750 | 257,393 | ||||||
Number | Value | |||||||
| South Africa (Continued) | ||||||||
Nedbank Group Ltd. | 629 | $ | 7,084 | |||||
PSG Group Ltd. | 311 | 3,716 | ||||||
Rand Merchant Investment Holdings Ltd. | 1,928 | 5,016 | ||||||
Redefine Properties Ltd. REIT | 19,199 | 13,377 | ||||||
Remgro Ltd. | 1,862 | 28,801 | ||||||
Resilient REIT Ltd. | 1,299 | 10,754 | ||||||
RMB Holdings Ltd. | 2,088 | 7,025 | ||||||
Sanlam Ltd. | 5,869 | 23,239 | ||||||
Sappi Ltd.* | 2,285 | 10,720 | ||||||
Sasol Ltd. | 2,445 | 74,208 | ||||||
Shoprite Holdings Ltd. | 1,395 | 14,638 | ||||||
Sibanye Gold Ltd. | 4,420 | 12,656 | ||||||
SPAR Group Ltd. | 436 | 5,613 | ||||||
Standard Bank Group Ltd. | 5,201 | 41,039 | ||||||
Tiger Brands Ltd. (a) | 550 | 12,161 | ||||||
Truworths International Ltd. | 1,211 | 7,245 | ||||||
Vodacom Group Ltd. (a) | 1,442 | 15,084 | ||||||
Woolworths Holdings Ltd. | 3,474 | 18,391 | ||||||
|
| |||||||
| 937,058 | ||||||||
|
| |||||||
| South Korea — 3.1% | ||||||||
Amorepacific Corp. | 122 | 42,738 | ||||||
AMOREPACIFIC Group | 110 | 15,414 | ||||||
BGF Retail Co. Ltd. | 42 | 7,735 | ||||||
BNK Financial Group, Inc. | 1,069 | 7,848 | ||||||
Celltrion, Inc.* | 325 | 27,024 | ||||||
Cheil Worldwide, Inc. | 558 | 7,608 | ||||||
CJ CheilJedang Corp. | 52 | 16,689 | ||||||
CJ Corp. | 67 | 12,199 | ||||||
CJ E&M Corp. | 114 | 7,203 | ||||||
Coway Co. Ltd. | 308 | 26,619 | ||||||
Daelim Industrial Co. Ltd. | 119 | 8,118 | ||||||
DGB Financial Group, Inc. | 1,131 | 8,797 | ||||||
Dongbu Insurance Co. Ltd. | 292 | 17,861 | ||||||
E-MART, Inc. | 120 | 18,325 | ||||||
GS Engineering & Construction Corp.* | 297 | 7,376 | ||||||
GS Holdings | 120 | 5,276 | ||||||
GS Retail Co. Ltd. | 132 | 5,859 | ||||||
Hana Financial Group, Inc. | 1,186 | 25,724 | ||||||
Hankook Tire Co. Ltd. | 420 | 18,043 | ||||||
Hanmi Pharm. Co. Ltd. | 21 | 11,154 | ||||||
Hanmi Science Co. Ltd. | 52 | 6,719 | ||||||
Hanon Systems | 1,398 | 14,487 | ||||||
Hanssem Co. Ltd. | 36 | 5,573 | ||||||
Hanwha Chemical Corp. | 414 | 8,285 | ||||||
Hanwha Corp. | 332 | 10,725 | ||||||
Hanwha Life Insurance Co. Ltd. | 1,778 | 9,533 | ||||||
Hotel Shilla Co. Ltd. | 104 | 5,751 | ||||||
Hyosung Corp. | 132 | 13,014 | ||||||
Hyundai Department Store Co. Ltd. | 115 | 12,785 | ||||||
Hyundai Development Co.-Engineering & Construction | 241 | 9,059 | ||||||
Hyundai Engineering & Construction Co. Ltd. | 238 | 6,830 | ||||||
Hyundai Glovis Co. Ltd. | 97 | 14,813 | ||||||
Hyundai Heavy Industries Co. Ltd.* | 120 | 11,025 | ||||||
Hyundai Marine & Fire Insurance Co. Ltd. | 489 | 12,966 | ||||||
| See Notes to Financial Statements. | 41 |
DBX ETF Trust
Schedule of investments
Deutsche X-trackers MSCI All World ex US Hedged Equity ETF (Continued)
May 31, 2016
Number | Value | |||||||
| South Korea (Continued) | ||||||||
Hyundai Mobis Co. Ltd. | 300 | $ | 64,189 | |||||
Hyundai Motor Co. | 578 | 67,655 | ||||||
Hyundai Steel Co. | 346 | 14,196 | ||||||
Hyundai Wia Corp. | 106 | 8,236 | ||||||
Kakao Corp. | 99 | 8,539 | ||||||
Kangwon Land, Inc. | 600 | 21,421 | ||||||
KB Financial Group, Inc. | 1,331 | 38,083 | ||||||
KCC Corp. | 34 | 11,540 | ||||||
KEPCO Plant Service & Engineering Co. Ltd. | 71 | 4,188 | ||||||
Kia Motors Corp. | 1,025 | 40,121 | ||||||
Korea Aerospace Industries Ltd. | 292 | 16,391 | ||||||
Korea Electric Power Corp. | 878 | 46,338 | ||||||
Korea Gas Corp. | 99 | 3,302 | ||||||
Korea Investment Holdings Co. Ltd. | 179 | 6,706 | ||||||
Korea Zinc Co. Ltd. | 53 | 20,879 | ||||||
KT Corp. | 175 | 4,713 | ||||||
KT&G Corp. | 550 | 58,840 | ||||||
Kumho Petrochemical Co. Ltd. | 127 | 6,799 | ||||||
LG Chem Ltd. | 212 | 48,206 | ||||||
LG Corp. | 267 | 14,764 | ||||||
LG Display Co. Ltd. | 783 | 16,950 | ||||||
LG Electronics, Inc. | 417 | 19,629 | ||||||
LG Household & Health Care Ltd. | 47 | 41,645 | ||||||
LG Innotek Co. Ltd. | 59 | 4,302 | ||||||
LG Uplus Corp. | 1,554 | 15,060 | ||||||
Lotte Chemical Corp. | 85 | 20,255 | ||||||
Lotte Chilsung Beverage Co. Ltd. | 2 | 3,259 | ||||||
Lotte Shopping Co. Ltd. | 60 | 11,504 | ||||||
Mirae Asset Securities Co. Ltd. | 226 | 4,447 | ||||||
NAVER Corp. | 114 | 68,871 | ||||||
NCSoft Corp. | 93 | 18,767 | ||||||
OCI Co. Ltd.* | 113 | 9,282 | ||||||
Orion Corp. | 19 | 15,464 | ||||||
Ottogi Corp. | 5 | 3,558 | ||||||
POSCO | 341 | 59,513 | ||||||
Posco Daewoo Corp. | 178 | 3,525 | ||||||
S-1 Corp. | 161 | 13,509 | ||||||
Samsung C&T Corp. | 305 | 30,710 | ||||||
Samsung Card Co. Ltd. | 291 | 9,364 | ||||||
Samsung Electro-Mechanics Co. Ltd. | 240 | 10,512 | ||||||
Samsung Electronics Co. Ltd. | 415 | 449,891 | ||||||
Samsung Fire & Marine Insurance Co. Ltd. | 162 | 37,788 | ||||||
Samsung Heavy Industries Co. Ltd.* | 478 | 3,826 | ||||||
Samsung Life Insurance Co. Ltd. | 368 | 32,113 | ||||||
Samsung SDI Co. Ltd. | 222 | 20,956 | ||||||
Samsung SDS Co. Ltd. | 113 | 17,351 | ||||||
Samsung Securities Co. Ltd. | 180 | 5,384 | ||||||
Shinhan Financial Group Co. Ltd. | 1,685 | 55,917 | ||||||
Shinsegae Co. Ltd. | 57 | 9,924 | ||||||
SK Holdings Co. Ltd. | 163 | 31,320 | ||||||
SK Hynix, Inc. | 2,221 | 53,484 | ||||||
SK Innovation Co. Ltd. | 217 | 29,770 | ||||||
SK Telecom Co. Ltd. | 63 | 11,735 | ||||||
S-Oil Corp. | 119 | 8,577 | ||||||
Yuhan Corp. | 58 | 15,427 | ||||||
|
| |||||||
| 2,107,870 | ||||||||
|
| |||||||
Number | Value | |||||||
| Spain — 2.2% | ||||||||
Abertis Infraestructuras SA | 1,867 | $ | 28,584 | |||||
ACS Actividades de Construccion y Servicios SA | 860 | 28,371 | ||||||
Aena SA, 144A* | 300 | 40,506 | ||||||
Amadeus IT Holding SA, Class A | 1,630 | 75,510 | ||||||
Banco Bilbao Vizcaya Argentaria SA | 26,129 | 173,300 | ||||||
Banco de Sabadell SA | 20,300 | 34,693 | ||||||
Banco Popular Espanol SA | 7,738 | 12,742 | ||||||
Banco Santander SA | 57,415 | 274,120 | ||||||
Bankia SA | 22,267 | 19,349 | ||||||
Bankinter SA | 3,843 | 29,230 | ||||||
CaixaBank SA | 9,747 | 26,646 | ||||||
Distribuidora Internacional de Alimentacion SA* | 1,985 | 11,871 | ||||||
Enagas SA | 1,025 | 30,724 | ||||||
Endesa SA | 851 | 17,498 | ||||||
Ferrovial SA | 1,686 | 35,699 | ||||||
Gas Natural SDG SA | 1,550 | 30,681 | ||||||
Grifols SA | 1,194 | 27,055 | ||||||
Iberdrola SA | 21,211 | 143,867 | ||||||
Industria de Diseno Textil SA | 4,445 | 150,152 | ||||||
Mapfre SA | 5,080 | 12,876 | ||||||
Red Electrica Corp. SA | 514 | 45,775 | ||||||
Repsol SA | 4,331 | 55,778 | ||||||
Telefonica SA (a) | 18,241 | 190,597 | ||||||
Zardoya Otis SA | 477 | 4,946 | ||||||
|
| |||||||
| 1,500,570 | ||||||||
|
| |||||||
| Sweden — 2.0% | ||||||||
Alfa Laval AB | 1,021 | 15,435 | ||||||
Assa Abloy AB, Class B | 3,885 | 80,761 | ||||||
Atlas Copco AB, Class A | 2,618 | 67,636 | ||||||
Atlas Copco AB, Class B | 1,417 | 33,789 | ||||||
Boliden AB | 1,150 | 20,349 | ||||||
Electrolux AB, Series B | 992 | 26,616 | ||||||
Getinge AB, Class B | 788 | 16,816 | ||||||
Hennes & Mauritz AB, Class B | 3,997 | 122,670 | ||||||
Hexagon AB, Class B | 968 | 37,588 | ||||||
Husqvarna AB, Class B | 1,832 | 14,539 | ||||||
ICA Gruppen AB (a) | 287 | 10,105 | ||||||
Industrivarden AB, Class C | 802 | 13,557 | ||||||
Investor AB, Class B | 1,875 | 65,232 | ||||||
Kinnevik AB* | 955 | 2,049 | ||||||
Kinnevik AB, Class B | 955 | 23,241 | ||||||
Lundin Petroleum AB* | 897 | 16,088 | ||||||
Nordea Bank AB | 12,486 | 121,172 | ||||||
Sandvik AB | 4,110 | 40,182 | ||||||
Securitas AB, Class B | 1,213 | 19,123 | ||||||
Skandinaviska Enskilda Banken AB, Class A | 6,018 | 57,681 | ||||||
Skanska AB, Class B | 1,327 | 29,145 | ||||||
SKF AB, Class B | 1,482 | 26,082 | ||||||
Svenska Cellulosa AB SCA, Class B | 2,442 | 78,167 | ||||||
Svenska Handelsbanken AB, Class A | 5,857 | 74,991 | ||||||
Swedbank AB, Class A | 3,556 | 78,271 | ||||||
Swedish Match AB | 697 | 23,781 | ||||||
Tele2 AB, Class B (a) | 1,144 | 10,039 | ||||||
| See Notes to Financial Statements. | 42 |
DBX ETF Trust
Schedule of investments
Deutsche X-trackers MSCI All World ex US Hedged Equity ETF (Continued)
May 31, 2016
Number | Value | |||||||
| Sweden (Continued) | ||||||||
Telefonaktiebolaget LM Ericsson, Class B | 12,157 | $ | 93,713 | |||||
Telia Co. AB | 9,778 | 45,823 | ||||||
Volvo AB, Class B | 6,071 | 67,578 | ||||||
|
| |||||||
| 1,332,219 | ||||||||
|
| |||||||
| Switzerland — 6.8% | ||||||||
ABB Ltd.* | 8,708 | 181,168 | ||||||
Actelion Ltd.* | 419 | 68,751 | ||||||
Adecco Group AG | 651 | 39,460 | ||||||
Aryzta AG* | 357 | 14,208 | ||||||
Baloise Holding AG | 240 | 29,650 | ||||||
Barry Callebaut AG* | 10 | 11,821 | ||||||
Chocoladefabriken Lindt & Spruengli AG Participation Certificates | 4 | 24,648 | ||||||
Cie Financiere Richemont SA | 2,120 | 124,875 | ||||||
Coca-Cola HBC AG CDI* | 964 | 18,751 | ||||||
Credit Suisse Group AG* | 7,043 | 96,505 | ||||||
Dufry AG* | 91 | 12,222 | ||||||
EMS-Chemie Holding AG | 46 | 22,803 | ||||||
Galenica AG | 7 | 9,246 | ||||||
Geberit AG | 175 | 66,901 | ||||||
Givaudan SA | 40 | 76,660 | ||||||
Glencore PLC* | 48,675 | 92,424 | ||||||
Julius Baer Group Ltd.* | 783 | 34,841 | ||||||
Kuehne + Nagel International AG | 359 | 50,491 | ||||||
LafargeHolcim Ltd.* | 1,725 | 77,573 | ||||||
Lonza Group AG* | 179 | 30,902 | ||||||
Nestle SA | 12,819 | 946,594 | ||||||
Novartis AG | 9,066 | 719,625 | ||||||
Pargesa Holding SA | 177 | 11,690 | ||||||
Partners Group Holding AG | 108 | 45,525 | ||||||
Roche Holding AG | 2,783 | 730,468 | ||||||
Schindler Holding AG | 120 | 22,117 | ||||||
Schindler Holding AG Participation Certificates | 235 | 43,525 | ||||||
SGS SA | 24 | 51,211 | ||||||
Sika AG | 6 | 25,956 | ||||||
Sonova Holding AG | 273 | 36,446 | ||||||
STMicroelectronics NV | 2,769 | 16,566 | ||||||
Swatch Group AG — Bearer | 131 | 38,615 | ||||||
Swatch Group AG — Registered | 180 | 10,440 | ||||||
Swiss Life Holding AG* | 105 | 27,222 | ||||||
Swiss Prime Site AG* | 538 | 46,114 | ||||||
Swiss Re AG | 1,491 | 133,950 | ||||||
Swisscom AG | 136 | 64,798 | ||||||
Syngenta AG | 381 | 149,679 | ||||||
UBS Group AG | 14,596 | 225,548 | ||||||
Wolseley PLC | 966 | 56,678 | ||||||
Zurich Insurance Group AG* | 571 | 138,154 | ||||||
|
| |||||||
| 4,624,821 | ||||||||
|
| |||||||
| Taiwan — 2.6% | ||||||||
Acer, Inc.* | 34,311 | 13,467 | ||||||
Advanced Semiconductor Engineering, Inc. | 30,484 | 34,492 | ||||||
Advantech Co. Ltd. | 1,670 | 12,341 | ||||||
Asia Cement Corp. | 7,242 | 5,518 | ||||||
Asustek Computer, Inc. | 2,576 | 22,117 | ||||||
Number | Value | |||||||
| Taiwan (Continued) | ||||||||
AU Optronics Corp. | 68,822 | $ | 19,119 | |||||
Casetek Holdings Ltd. | 1,195 | 4,544 | ||||||
Catcher Technology Co. Ltd. | 3,229 | 24,555 | ||||||
Cathay Financial Holding Co. Ltd. | 44,823 | 51,815 | ||||||
Chang Hwa Commercial Bank Ltd. | 7,945 | 4,032 | ||||||
Cheng Shin Rubber Industry Co. Ltd. | 7,818 | 16,061 | ||||||
Chicony Electronics Co. Ltd. | 1,892 | 4,560 | ||||||
China Development Financial Holding Corp. | 49,112 | 12,379 | ||||||
China Life Insurance Co. Ltd. | 10,939 | 8,352 | ||||||
China Steel Corp. | 47,786 | 29,672 | ||||||
Chunghwa Telecom Co. Ltd. | 16,113 | 54,348 | ||||||
Compal Electronics, Inc. | 18,392 | 10,828 | ||||||
CTBC Financial Holding Co. Ltd. | 67,752 | 35,525 | ||||||
Delta Electronics, Inc. | 9,653 | 44,399 | ||||||
E.Sun Financial Holding Co. Ltd. | 20,528 | 11,487 | ||||||
Eclat Textile Co. Ltd. | 1,003 | 10,764 | ||||||
Far EasTone Telecommunications Co. Ltd. | 6,832 | 15,733 | ||||||
Feng Tay Enterprise Co. Ltd. | 2,309 | 9,664 | ||||||
First Financial Holding Co. Ltd. | 14,492 | 7,332 | ||||||
Formosa Chemicals & Fibre Corp. | 11,416 | 28,774 | ||||||
Formosa Petrochemical Corp. | 2,188 | 5,971 | ||||||
Formosa Plastics Corp. | 15,893 | 38,499 | ||||||
Foxconn Technology Co. Ltd. | 5,514 | 12,596 | ||||||
Fubon Financial Holding Co. Ltd. | 32,519 | 38,390 | ||||||
Giant Manufacturing Co. Ltd. | 1,194 | 7,121 | ||||||
Hermes Microvision, Inc. | 183 | 6,481 | ||||||
Hiwin Technologies Corp. | 1,212 | 5,129 | ||||||
Hon Hai Precision Industry Co. Ltd. | 66,861 | 164,218 | ||||||
Hotai Motor Co. Ltd. | 942 | 8,997 | ||||||
HTC Corp. | 1,766 | 4,603 | ||||||
Hua Nan Financial Holdings Co. Ltd. | 9,276 | 4,622 | ||||||
Innolux Corp. | 34,014 | 10,086 | ||||||
Inotera Memories, Inc.* | 16,040 | 14,337 | ||||||
Inventec Corp. | 11,921 | 7,932 | ||||||
Largan Precision Co. Ltd. | 508 | 42,369 | ||||||
Lite-On Technology Corp. | 7,890 | 10,161 | ||||||
MediaTek, Inc. | 6,597 | 44,503 | ||||||
Mega Financial Holding Co. Ltd. | 29,405 | 21,549 | ||||||
Nan Ya Plastics Corp. | 25,480 | 48,597 | ||||||
Nien Made Enterprise Co. Ltd.* | 900 | 8,251 | ||||||
Novatek Microelectronics Corp. | 2,218 | 7,379 | ||||||
OBI Pharma, Inc.* | 534 | 9,955 | ||||||
Pegatron Corp. | 8,262 | 17,202 | ||||||
Phison Electronics Corp. | 651 | 5,350 | ||||||
Pou Chen Corp. | 9,266 | 12,430 | ||||||
Powertech Technology, Inc. | 3,379 | 7,284 | ||||||
President Chain Store Corp. | 2,525 | 19,162 | ||||||
Quanta Computer, Inc. | 10,189 | 18,121 | ||||||
Realtek Semiconductor Corp. | 1,384 | 3,751 | ||||||
Siliconware Precision Industries Co. Ltd. | 13,055 | 21,216 | ||||||
Synnex Technology International Corp. | 3,640 | 3,616 | ||||||
TaiMed Biologics, Inc.* | 800 | 6,366 | ||||||
Taiwan Cement Corp. | 11,726 | 10,805 | ||||||
Taiwan Cooperative Financial Holding Co. Ltd. | 20,828 | 9,133 | ||||||
Taiwan Mobile Co. Ltd. | 7,154 | 24,459 | ||||||
| See Notes to Financial Statements. | 43 |
DBX ETF Trust
Schedule of investments
Deutsche X-trackers MSCI All World ex US Hedged Equity ETF (Continued)
May 31, 2016
Number | Value | |||||||
| Taiwan (Continued) | ||||||||
Taiwan Semiconductor Manufacturing Co. Ltd. | 105,034 | $ | 504,034 | |||||
Teco Electric & Machinery Co. Ltd. | 6,416 | 5,145 | ||||||
Uni-President Enterprises Corp. | 21,051 | 40,085 | ||||||
United Microelectronics Corp. | 59,121 | 22,116 | ||||||
Vanguard International Semiconductor Corp. | 4,144 | 6,798 | ||||||
Wistron Corp. | 6,996 | 4,494 | ||||||
WPG Holdings Ltd. | 5,700 | 6,266 | ||||||
Yuanta Financial Holding Co. Ltd. | 48,381 | 16,319 | ||||||
Zhen Ding Technology Holding Ltd. | 1,841 | 3,466 | ||||||
|
| |||||||
| 1,781,242 | ||||||||
|
| |||||||
| Thailand — 0.4% | ||||||||
Indorama Ventures PCL, NVDR | 34,900 | 32,482 | ||||||
IRPC PCL, NVDR | 155,090 | 21,619 | ||||||
Kasikornbank PCL, NVDR | 10,400 | 50,654 | ||||||
Krung Thai Bank PCL, NVDR | 65,100 | 31,161 | ||||||
PTT Exploration & Production PCL, NVDR | 20,100 | 43,745 | ||||||
PTT PCL, NVDR | 6,600 | 55,608 | ||||||
Siam Commercial Bank PCL, NVDR | 11,800 | 44,260 | ||||||
Thai Oil PCL, NVDR | 8,100 | 14,397 | ||||||
|
| |||||||
| 293,926 | ||||||||
|
| |||||||
| Turkey — 0.3% | ||||||||
Akbank TAS | 7,892 | 21,307 | ||||||
Anadolu Efes Biracilik Ve Malt Sanayii AS | 535 | 3,389 | ||||||
Arcelik AS | 1,115 | 7,407 | ||||||
BIM Birlesik Magazalar AS | 903 | 17,711 | ||||||
Emlak Konut Gayrimenkul Yatirim Ortakligi AS REIT | 12,282 | 11,233 | ||||||
Eregli Demir ve Celik Fabrikalari TAS | 10,193 | 14,225 | ||||||
Ford Otomotiv Sanayi AS | 737 | 8,733 | ||||||
Haci Omer Sabanci Holding AS | 4,800 | 14,943 | ||||||
KOC Holding AS | 3,398 | 15,090 | ||||||
TAV Havalimanlari Holding AS | 1,987 | 10,190 | ||||||
Tofas Turk Otomobil Fabrikasi AS | 1,198 | 8,985 | ||||||
Tupras Turkiye Petrol Rafinerileri AS | 665 | 15,003 | ||||||
Turk Hava Yollari Anonim Ortakligi* | 2,881 | 6,070 | ||||||
Turkcell Iletisim Hizmetleri AS* | 3,785 | 13,796 | ||||||
Turkiye Garanti Bankasi AS | 10,771 | 27,583 | ||||||
Turkiye Halk Bankasi AS | 2,400 | 7,227 | ||||||
Turkiye Is Bankasi, Class C | 6,651 | 10,161 | ||||||
Turkiye Sise ve Cam Fabrikalari AS | 8,086 | 9,641 | ||||||
|
| |||||||
| 222,694 | ||||||||
|
| |||||||
| United Arab Emirates — 0.2% | ||||||||
Abu Dhabi Commercial Bank PJSC | 6,030 | 9,784 | ||||||
Aldar Properties PJSC | 13,560 | 9,709 | ||||||
DP World Ltd. | 1,392 | 23,942 | ||||||
Dubai Islamic Bank PJSC | 3,024 | 4,199 | ||||||
Emaar Malls Group PJSC | 19,707 | 14,647 | ||||||
Emaar Properties PJSC | 14,688 | 24,993 | ||||||
Emirates Telecommunications Group Co. PJSC | 3,183 | 15,338 | ||||||
First Gulf Bank PJSC | 9,385 | 30,278 | ||||||
National Bank of Abu Dhabi PJSC | 4,563 | 9,690 | ||||||
|
| |||||||
| 142,580 | ||||||||
|
| |||||||
Number | Value | |||||||
| United Kingdom — 12.5% | ||||||||
3i Group PLC | 4,141 | $ | 33,677 | |||||
Aberdeen Asset Management PLC (a) | 3,906 | 15,789 | ||||||
Admiral Group PLC | 902 | 25,710 | ||||||
Aggreko PLC | 1,113 | 18,119 | ||||||
Anglo American PLC | 6,007 | 52,210 | ||||||
ARM Holdings PLC | 5,791 | 82,784 | ||||||
Ashtead Group PLC | 1,715 | 24,243 | ||||||
Associated British Foods PLC | 1,490 | 63,533 | ||||||
AstraZeneca PLC | 5,028 | 293,332 | ||||||
Auto Trader Group PLC, 144A | 3,057 | 17,401 | ||||||
Aviva PLC | 15,775 | 102,769 | ||||||
Babcock International Group PLC | 994 | 14,929 | ||||||
BAE Systems PLC | 11,892 | 83,294 | ||||||
Barclays PLC | 66,915 | 176,776 | ||||||
Barratt Developments PLC | 4,004 | 34,331 | ||||||
Berkeley Group Holdings PLC | 441 | 20,918 | ||||||
BP PLC | 73,814 | 381,931 | ||||||
British American Tobacco PLC | 7,466 | 453,946 | ||||||
British Land Co. PLC REIT | 4,205 | 45,068 | ||||||
BT Group PLC | 34,218 | 219,450 | ||||||
Bunzl PLC | 1,339 | 39,640 | ||||||
Burberry Group PLC | 1,807 | 28,108 | ||||||
Capita PLC | 2,507 | 38,634 | ||||||
Centrica PLC | 20,588 | 60,770 | ||||||
CNH Industrial NV | 3,845 | 27,123 | ||||||
Cobham PLC (a) | 4,380 | 10,340 | ||||||
Compass Group PLC | 6,359 | 118,534 | ||||||
Croda International PLC | 605 | 25,762 | ||||||
Diageo PLC | 9,902 | 268,259 | ||||||
Direct Line Insurance Group PLC | 5,305 | 28,836 | ||||||
Dixons Carphone PLC | 3,842 | 24,484 | ||||||
easyJet PLC | 777 | 17,252 | ||||||
Fiat Chrysler Automobiles NV | 4,032 | 28,779 | ||||||
G4S PLC | 6,015 | 16,282 | ||||||
GKN PLC | 6,717 | 26,744 | ||||||
GlaxoSmithKline PLC | 19,451 | 407,084 | ||||||
Hammerson PLC REIT | 2,873 | 24,093 | ||||||
Hargreaves Lansdown PLC | 1,025 | 20,027 | ||||||
HSBC Holdings PLC | 78,900 | 508,581 | ||||||
ICAP PLC | 2,405 | 15,048 | ||||||
IMI PLC | 1,142 | 16,623 | ||||||
Imperial Brands PLC | 3,866 | 210,591 | ||||||
Inmarsat PLC | 1,924 | 20,050 | ||||||
InterContinental Hotels Group PLC | 754 | 29,060 | ||||||
International Consolidated Airlines Group SA | 4,325 | 33,806 | ||||||
Intertek Group PLC | 674 | 30,623 | ||||||
Intu Properties PLC REIT | 3,486 | 15,132 | ||||||
ITV PLC | 17,017 | 52,941 | ||||||
J Sainsbury PLC | 4,662 | 18,130 | ||||||
Johnson Matthey PLC | 815 | 34,043 | ||||||
Kingfisher PLC | 10,132 | 53,885 | ||||||
Land Securities Group PLC REIT | 3,425 | 57,841 | ||||||
Legal & General Group PLC | 22,956 | 79,597 | ||||||
Lloyds Banking Group PLC | 252,872 | 263,772 | ||||||
London Stock Exchange Group PLC | 1,076 | 42,623 | ||||||
Marks & Spencer Group PLC | 6,988 | 38,430 | ||||||
| See Notes to Financial Statements. | 44 |
DBX ETF Trust
Schedule of investments
Deutsche X-trackers MSCI All World ex US Hedged Equity ETF (Continued)
May 31, 2016
Number | Value | |||||||
| United Kingdom (Continued) | ||||||||
Meggitt PLC | 3,185 | $ | 17,898 | |||||
Merlin Entertainments PLC, 144A | 2,113 | 12,933 | ||||||
National Grid PLC | 14,891 | 217,184 | ||||||
Next PLC | 637 | 50,189 | ||||||
Old Mutual PLC | 19,750 | 50,945 | ||||||
Pearson PLC | 3,604 | 43,769 | ||||||
Persimmon PLC | 1,266 | 38,543 | ||||||
Petrofac Ltd. (a) | 1,225 | 13,804 | ||||||
Provident Financial PLC | 443 | 18,684 | ||||||
Prudential PLC | 10,251 | 204,889 | ||||||
Reckitt Benckiser Group PLC | 2,625 | 261,382 | ||||||
RELX NV | 4,493 | 77,911 | ||||||
RELX PLC | 4,618 | 83,606 | ||||||
Rexam PLC (a) | 2,941 | 26,772 | ||||||
Rio Tinto Ltd. | 1,786 | 57,687 | ||||||
Rio Tinto PLC | 4,981 | 140,137 | ||||||
Rolls-Royce Holdings PLC* | 7,202 | 64,568 | ||||||
Rolls-Royce Holdings PLC, Class C* | 613,581 | 889 | ||||||
Rolls-Royce Holdings PLC — Entitlement* | 548,049 | 794 | ||||||
Royal Bank of Scotland Group PLC* | 13,079 | 46,694 | ||||||
Royal Mail PLC | 2,820 | 22,096 | ||||||
RSA Insurance Group PLC | 3,721 | 26,408 | ||||||
SABMiller PLC | 4,370 | 271,812 | ||||||
Sage Group PLC | 4,746 | 42,137 | ||||||
Schroders PLC | 538 | 21,117 | ||||||
Segro PLC REIT | 2,523 | 16,002 | ||||||
Severn Trent PLC | 1,166 | 38,707 | ||||||
Sky PLC | 4,323 | 60,327 | ||||||
Smith & Nephew PLC | 3,776 | 64,096 | ||||||
Smiths Group PLC | 1,625 | 26,407 | ||||||
SSE PLC | 4,107 | 91,129 | ||||||
St James’s Place PLC | 1,642 | 22,058 | ||||||
Standard Chartered PLC | 13,136 | 100,702 | ||||||
Standard Life PLC | 7,836 | 38,485 | ||||||
Tate & Lyle PLC | 2,285 | 20,800 | ||||||
Taylor Wimpey PLC | 13,431 | 39,956 | ||||||
Tesco PLC* | 31,859 | 76,182 | ||||||
Travis Perkins PLC | 943 | 26,264 | ||||||
Unilever NV | 6,626 | 297,586 | ||||||
Unilever PLC | 5,293 | 241,176 | ||||||
United Utilities Group PLC | 3,120 | 43,833 | ||||||
Vodafone Group PLC | 105,678 | 353,337 | ||||||
Weir Group PLC | 903 | 15,681 | ||||||
Whitbread PLC | 717 | 43,740 | ||||||
William Hill PLC | 3,425 | 15,432 | ||||||
Wm Morrison Supermarkets PLC (a) | 8,924 | 25,618 | ||||||
Worldpay Group PLC, 144A* | 4,640 | 18,622 | ||||||
WPP PLC | 5,283 | 121,814 | ||||||
|
| |||||||
| 8,502,539 | ||||||||
|
| |||||||
| United States(d) — 0.4% | ||||||||
Carnival PLC | 725 | 35,796 | ||||||
Shire PLC | 2,371 | 146,290 | ||||||
Thomson Reuters Corp. | 1,507 | 63,286 | ||||||
Number | Value | |||||||
| United States(d) (Continued) | ||||||||
Valeant Pharmaceuticals International, | 1,254 | $ | 35,784 | |||||
|
| |||||||
| 281,156 | ||||||||
|
| |||||||
TOTAL COMMON STOCKS | 66,518,681 | |||||||
|
| |||||||
| PREFERRED STOCKS — 1.1% | ||||||||
| Brazil — 0.5% | ||||||||
Banco Bradesco SA | 11,199 | 70,660 | ||||||
Braskem SA, Class A | 885 | 5,143 | ||||||
Cia Brasileira de Distribuicao | 633 | 7,086 | ||||||
Cia Energetica de Minas Gerais | 3,402 | 5,300 | ||||||
Gerdau SA | 3,746 | 5,774 | ||||||
Itau Unibanco Holding SA | 12,126 | 97,482 | ||||||
Itausa — Investimentos Itau SA | 16,646 | 32,890 | ||||||
Lojas Americanas SA | 1,972 | 8,388 | ||||||
Petroleo Brasileiro SA* | 15,952 | 35,492 | ||||||
Suzano Papel e Celulose SA, Class A | 1,507 | 6,114 | ||||||
Telefonica Brasil SA | 1,221 | 14,154 | ||||||
Vale SA | 7,816 | 24,311 | ||||||
|
| |||||||
| 312,794 | ||||||||
|
| |||||||
| Chile — 0.0% | ||||||||
Embotelladora Andina SA, Class B | 2,520 | 7,926 | ||||||
Sociedad Quimica y Minera de Chile SA, Class B | 478 | 10,470 | ||||||
|
| |||||||
| 18,396 | ||||||||
|
| |||||||
| Colombia — 0.0% | ||||||||
Bancolombia SA | 2,142 | 17,519 | ||||||
Grupo Aval Acciones y Valores SA | 16,003 | 5,876 | ||||||
|
| |||||||
| 23,395 | ||||||||
|
| |||||||
| Germany — 0.4% | ||||||||
Bayerische Motoren Werke AG | 238 | 17,504 | ||||||
FUCHS PETROLUB SE | 300 | 12,212 | ||||||
Henkel AG & Co. KGaA | 707 | 82,400 | ||||||
Porsche Automobil Holding SE* | 627 | 34,526 | ||||||
Schaeffler AG | 600 | 9,680 | ||||||
Volkswagen AG* | 748 | 111,814 | ||||||
|
| |||||||
| 268,136 | ||||||||
|
| |||||||
| South Korea — 0.2% | ||||||||
Amorepacific Corp. | 31 | 6,503 | ||||||
Hyundai Motor Co. | 103 | 8,565 | ||||||
Hyundai Motor Co. — 2nd Preferred | 161 | 14,184 | ||||||
LG Chem Ltd. | 59 | 9,703 | ||||||
Samsung Electronics Co. Ltd. | 79 | 70,396 | ||||||
|
| |||||||
| 109,351 | ||||||||
|
| |||||||
TOTAL PREFERRED STOCKS | 732,072 | |||||||
|
| |||||||
| RIGHTS — 0.0% | ||||||||
| Poland — 0.0% | ||||||||
Alior Bank SA*, expires 07/30/16 | 822 | 2,069 | ||||||
|
| |||||||
| See Notes to Financial Statements. | 45 |
DBX ETF Trust
Schedule of investments
Deutsche X-trackers MSCI All World ex US Hedged Equity ETF (Continued)
May 31, 2016
Number | Value | |||||||
| Spain — 0.0% | ||||||||
Abertis Infraestructuras SA*, expires 06/30/16 | 1,867 | $ | 1,431 | |||||
Banco Popular Espanol SA*, expires 06/30/16 | 7,738 | 1,929 | ||||||
Ferrovial SA*, expires 07/30/16 | 1,686 | 602 | ||||||
|
| |||||||
| 3,962 | ||||||||
|
| |||||||
| United Arab Emirates — 0.0% | ||||||||
Dubai Islamic Bank PJSC*, expires 07/31/16 | 756 | 383 | ||||||
|
| |||||||
TOTAL RIGHTS | 6,414 | |||||||
|
| |||||||
| SECURITIES LENDING COLLATERAL — 3.9% | ||||||||
Daily Assets Fund “Capital Shares”, 0.48% (e)(f) | 2,639,988 | 2,639,988 | ||||||
|
| |||||||
TOTAL INVESTMENTS — 103.0% | ||||||||
(Cost $73,980,725)† | $ | 69,897,155 | ||||||
Other assets and liabilities, net — (3.0%) | (2,024,001 | ) | ||||||
|
| |||||||
NET ASSETS — 100.0% | $ | 67,873,154 | ||||||
|
| |||||||
| * | Non-income producing security. |
| † | The cost for federal income tax purposes was $74,619,326. At May 31, 2016, net unrealized depreciation for all securities based on tax cost was $4,722,171. This consisted of aggregate gross unrealized appreciation for all securities in which there was an excess of value over tax cost of $2,488,983 and aggregate gross unrealized depreciation for all securities in which there was an excess of tax cost over value of $7,211,154. |
| (a) | All or a portion of these securities were on loan. In addition, “Other Assets and Liabilities, Net” may include pending sales that are also on loan. The value of securities loaned at May 31, 2016 amounted to $2,255,373, which is 3.3% of net assets. |
| (b) | Stapled Security — A security contractually bound to one or more other securities to form a single saleable unit which cannot be sold separately. |
| (c) | Affiliated issuer. This security is owned in proportion with its representation in the index. |
| (d) | Securities are domiciled in the United States and trade on a non-US securities exchange. |
| (e) | Affiliated fund managed by Deutsche Investment Management Americas Inc. The rate shown is the annualized seven-day yield at period end. |
| (f) | Represents collateral held in connection with securities lending. Income earned by the Fund is net of borrower rebates. |
| ADR: | American Depositary Receipt |
| CDI: | Chess Depositary Interest |
| CPO: | Ordinary Participation Certificates |
| FDR: | Fiduciary Depositary Receipt |
| GDR: | Global Depositary Receipt |
| NVDR: | Non Voting Depositary Receipt |
| OJSC: | Open Joint Stock Company |
| PJSC: | Private Joint Stock Company |
| REIT: | Real Estate Investment Trust |
| RSP: | Risparmio (Convertible Savings Shares) |
| SDR: | Swedish Depositary Receipt |
| 144A: | Security exempt from registration under Rule 144A of the Securities Act of 1933. These securities may be resold in transactions exempt from registration, normally to qualified institutional buyers. |
| See Notes to Financial Statements. | 46 |
DBX ETF Trust
Schedule of investments
Deutsche X-trackers MSCI All World ex US Hedged Equity ETF (Continued)
May 31, 2016
As of May 31, 2016, the Fund had the following forward foreign currency exchange contracts outstanding:
Counterparty | Settlement Date | Currency To Deliver | Currency To Receive | Unrealized Appreciation (Depreciation) | ||||||||||||||
JP Morgan & Chase Co. | 6/2/2016 | AED | 50,000 | USD | 13,612 | $ | 0 | |||||||||||
State Street Bank & Trust Co. | 6/2/2016 | AED | 30,000 | USD | 8,166 | (2 | ) | |||||||||||
State Street Bank & Trust Co. | 6/2/2016 | AED | 80,000 | USD | 21,778 | (2 | ) | |||||||||||
The Bank of New York Mellon | 6/2/2016 | AED | 7,600 | USD | 2,069 | 0 | ||||||||||||
The Bank of New York Mellon | 6/2/2016 | AED | 367,200 | USD | 99,958 | (12 | ) | |||||||||||
Bank of Montreal | 6/2/2016 | AUD | 103,800 | USD | 79,114 | 4,093 | ||||||||||||
JP Morgan & Chase Co. | 6/2/2016 | AUD | 2,528,107 | USD | 1,926,544 | 99,349 | ||||||||||||
State Street Bank & Trust Co. | 6/2/2016 | AUD | 1,828,000 | USD | 1,393,292 | 72,101 | ||||||||||||
State Street Bank & Trust Co. | 6/2/2016 | AUD | 35,900 | USD | 26,008 | 61 | ||||||||||||
State Street Bank & Trust Co. | 6/2/2016 | AUD | 202,000 | USD | 153,958 | 7,962 | ||||||||||||
The Bank of New York Mellon | 6/2/2016 | AUD | 2,800 | USD | 2,055 | 31 | ||||||||||||
The Bank of Nova Scotia | 6/2/2016 | AUD | 452,300 | USD | 344,734 | 17,833 | ||||||||||||
Bank of Montreal | 6/2/2016 | CHF | 98,800 | USD | 103,203 | 3,807 | ||||||||||||
State Street Bank & Trust Co. | 6/2/2016 | CHF | 85,500 | USD | 85,999 | (17 | ) | |||||||||||
State Street Bank & Trust Co. | 6/2/2016 | CHF | 2,026,774 | USD | 2,117,149 | 78,141 | ||||||||||||
State Street Bank & Trust Co. | 6/2/2016 | CHF | 162,000 | USD | 169,216 | 6,238 | ||||||||||||
State Street Bank & Trust Co. | 6/2/2016 | CHF | 52,000 | USD | 54,229 | 1,915 | ||||||||||||
The Bank of Nova Scotia | 6/2/2016 | CHF | 2,523,596 | USD | 2,636,023 | 97,193 | ||||||||||||
Bank of Montreal | 6/2/2016 | CZK | 23,100 | USD | 979 | 28 | ||||||||||||
JP Morgan & Chase Co. | 6/2/2016 | CZK | 682,000 | USD | 28,896 | 814 | ||||||||||||
State Street Bank & Trust Co. | 6/2/2016 | CZK | 557,000 | USD | 23,600 | 665 | ||||||||||||
The Bank of New York Mellon | 6/2/2016 | CZK | 69,700 | USD | 2,953 | 83 | ||||||||||||
The Bank of New York Mellon | 6/2/2016 | CZK | 15,600 | USD | 655 | 12 | ||||||||||||
The Bank of New York Mellon | 6/2/2016 | CZK | 11,500 | USD | 475 | 1 | ||||||||||||
Bank of Montreal | 6/2/2016 | DKK | 184,000 | USD | 28,338 | 812 | ||||||||||||
State Street Bank & Trust Co. | 6/2/2016 | DKK | 96,000 | USD | 14,785 | 423 | ||||||||||||
State Street Bank & Trust Co. | 6/2/2016 | DKK | 77,800 | USD | 11,644 | 5 | ||||||||||||
State Street Bank & Trust Co. | 6/2/2016 | DKK | 2,607,000 | USD | 401,516 | 11,521 | ||||||||||||
State Street Bank & Trust Co. | 6/2/2016 | DKK | 81,000 | USD | 12,459 | 341 | ||||||||||||
The Bank of New York Mellon | 6/2/2016 | DKK | 22,500 | USD | 3,414 | 48 | ||||||||||||
The Bank of Nova Scotia | 6/2/2016 | DKK | 4,003,400 | USD | 616,572 | 17,682 | ||||||||||||
Bank of Montreal | 6/2/2016 | EUR | 367,500 | USD | 421,269 | 12,372 | ||||||||||||
State Street Bank & Trust Co. | 6/2/2016 | EUR | 296,000 | USD | 339,296 | 9,953 | ||||||||||||
State Street Bank & Trust Co. | 6/2/2016 | EUR | 340,700 | USD | 379,284 | 206 | ||||||||||||
State Street Bank & Trust Co. | 6/2/2016 | EUR | 6,040,854 | USD | 6,924,752 | 203,431 | ||||||||||||
State Street Bank & Trust Co. | 6/2/2016 | EUR | 169,000 | USD | 193,485 | 5,448 | ||||||||||||
The Bank of Nova Scotia | 6/2/2016 | EUR | 7,541,626 | USD | 8,645,079 | 253,933 | ||||||||||||
Bank of Montreal | 6/2/2016 | GBP | 51,300 | USD | 75,153 | 853 | ||||||||||||
JP Morgan & Chase Co. | 6/2/2016 | GBP | 3,670,736 | USD | 5,377,463 | 60,946 | ||||||||||||
State Street Bank & Trust Co. | 6/2/2016 | GBP | 34,000 | USD | 49,721 | 477 | ||||||||||||
State Street Bank & Trust Co. | 6/2/2016 | GBP | 193,000 | USD | 282,730 | 3,198 | ||||||||||||
State Street Bank & Trust Co. | 6/2/2016 | GBP | 3,322,353 | USD | 4,867,211 | 55,275 | ||||||||||||
State Street Bank & Trust Co. | 6/2/2016 | GBP | 126,900 | USD | 184,703 | 907 | ||||||||||||
Bank of Montreal | 6/2/2016 | HKD | 1,020,000 | USD | 131,524 | 262 | ||||||||||||
JP Morgan & Chase Co. | 6/2/2016 | HKD | 22,141,796 | USD | 2,855,053 | 5,676 | ||||||||||||
State Street Bank & Trust Co. | 6/2/2016 | HKD | 8,460,200 | USD | 1,090,923 | 2,199 | ||||||||||||
State Street Bank & Trust Co. | 6/2/2016 | HKD | 668,000 | USD | 86,133 | 169 | ||||||||||||
The Bank of New York Mellon | 6/2/2016 | HKD | 4,600 | USD | 593 | 1 | ||||||||||||
The Bank of New York Mellon | 6/2/2016 | HKD | 5,782,700 | USD | 745,656 | 1,494 | ||||||||||||
Bank of Montreal | 6/2/2016 | HUF | 583,500 | USD | 2,144 | 73 | ||||||||||||
JP Morgan & Chase Co. | 6/2/2016 | HUF | 10,222,000 | USD | 37,553 | 1,283 | ||||||||||||
State Street Bank & Trust Co. | 6/2/2016 | HUF | 8,612,100 | USD | 31,638 | 1,080 | ||||||||||||
The Bank of Nova Scotia | 6/2/2016 | HUF | 741,900 | USD | 2,725 | 93 | ||||||||||||
Bank of Montreal | 6/2/2016 | ILS | 34,700 | USD | 9,300 | 293 | ||||||||||||
JP Morgan & Chase Co. | 6/2/2016 | ILS | 738,698 | USD | 197,980 | 6,245 | ||||||||||||
State Street Bank & Trust Co. | 6/2/2016 | ILS | 22,000 | USD | 5,713 | 3 | ||||||||||||
| See Notes to Financial Statements. | 47 |
DBX ETF Trust
Schedule of investments
Deutsche X-trackers MSCI All World ex US Hedged Equity ETF (Continued)
May 31, 2016
Counterparty | Settlement Date | Currency To Deliver | Currency To Receive | Unrealized Appreciation (Depreciation) | ||||||||||||||
State Street Bank & Trust Co. | 6/2/2016 | ILS | 21,000 | USD | 5,627 | $ | 177 | |||||||||||
State Street Bank & Trust Co. | 6/2/2016 | ILS | 710,500 | USD | 190,411 | 5,995 | ||||||||||||
The Bank of Nova Scotia | 6/2/2016 | ILS | 5,000 | USD | 1,340 | 42 | ||||||||||||
Bank of Montreal | 6/2/2016 | NOK | 60,500 | USD | 7,512 | 280 | ||||||||||||
JP Morgan & Chase Co. | 6/2/2016 | NOK | 1,468,000 | USD | 182,279 | 6,798 | ||||||||||||
State Street Bank & Trust Co. | 6/2/2016 | NOK | 96,000 | USD | 11,920 | 444 | ||||||||||||
State Street Bank & Trust Co. | 6/2/2016 | NOK | 50,700 | USD | 6,062 | 2 | ||||||||||||
State Street Bank & Trust Co. | 6/2/2016 | NOK | 925,100 | USD | 114,869 | 4,285 | ||||||||||||
Bank of Montreal | 6/2/2016 | NZD | 1,500 | USD | 1,047 | 32 | ||||||||||||
JP Morgan & Chase Co. | 6/2/2016 | NZD | 76,116 | USD | 53,133 | 1,633 | ||||||||||||
State Street Bank & Trust Co. | 6/2/2016 | NZD | 162,700 | USD | 113,582 | 3,499 | ||||||||||||
State Street Bank & Trust Co. | 6/2/2016 | NZD | 7,700 | USD | 5,209 | 0 | ||||||||||||
The Bank of Nova Scotia | 6/2/2016 | NZD | 13,500 | USD | 9,424 | 290 | ||||||||||||
JP Morgan & Chase Co. | 6/2/2016 | PLN | 864,392 | USD | 226,127 | 6,938 | ||||||||||||
JP Morgan & Chase Co. | 6/2/2016 | PLN | 9,300 | USD | 2,358 | 0 | ||||||||||||
JP Morgan & Chase Co. | 6/2/2016 | PLN | 5,500 | USD | 1,394 | 0 | ||||||||||||
State Street Bank & Trust Co. | 6/2/2016 | PLN | 117,700 | USD | 30,792 | 946 | ||||||||||||
Bank of Montreal | 6/2/2016 | SEK | 271,000 | USD | 33,813 | 1,324 | ||||||||||||
JP Morgan & Chase Co. | 6/2/2016 | SEK | 6,362,000 | USD | 793,795 | 31,089 | ||||||||||||
State Street Bank & Trust Co. | 6/2/2016 | SEK | 107,000 | USD | 13,321 | 494 | ||||||||||||
State Street Bank & Trust Co. | 6/2/2016 | SEK | 276,700 | USD | 33,125 | (47 | ) | |||||||||||
State Street Bank & Trust Co. | 6/2/2016 | SEK | 170,000 | USD | 21,211 | 831 | ||||||||||||
State Street Bank & Trust Co. | 6/2/2016 | SEK | 5,230,900 | USD | 652,709 | 25,604 | ||||||||||||
Bank of Montreal | 6/2/2016 | TRY | 23,000 | USD | 8,164 | 373 | ||||||||||||
JP Morgan & Chase Co. | 6/2/2016 | TRY | 366,646 | USD | 130,116 | 5,917 | ||||||||||||
State Street Bank & Trust Co. | 6/2/2016 | TRY | 428,800 | USD | 152,170 | 6,918 | ||||||||||||
State Street Bank & Trust Co. | 6/2/2016 | TRY | 31,000 | USD | 11,000 | 499 | ||||||||||||
State Street Bank & Trust Co. | 6/2/2016 | TRY | 16,500 | USD | 5,589 | (1 | ) | |||||||||||
The Bank of Nova Scotia | 6/2/2016 | TRY | 23,700 | USD | 8,412 | 384 | ||||||||||||
Bank of Montreal | 6/2/2016 | USD | 75,198 | AUD | 103,800 | (176 | ) | |||||||||||
Bank of Montreal | 6/2/2016 | USD | 99,376 | CHF | 98,800 | 20 | ||||||||||||
Bank of Montreal | 6/2/2016 | USD | 952 | CZK | 23,100 | 0 | ||||||||||||
Bank of Montreal | 6/2/2016 | USD | 27,538 | DKK | 184,000 | (12 | ) | |||||||||||
Bank of Montreal | 6/2/2016 | USD | 409,119 | EUR | 367,500 | (223 | ) | |||||||||||
Bank of Montreal | 6/2/2016 | USD | 74,667 | GBP | 51,300 | (367 | ) | |||||||||||
Bank of Montreal | 6/2/2016 | USD | 131,305 | HKD | 1,020,000 | (44 | ) | |||||||||||
Bank of Montreal | 6/2/2016 | USD | 2,071 | HUF | 583,500 | (1 | ) | |||||||||||
Bank of Montreal | 6/2/2016 | USD | 9,011 | ILS | 34,700 | (4 | ) | |||||||||||
Bank of Montreal | 6/2/2016 | USD | 7,234 | NOK | 60,500 | (2 | ) | |||||||||||
Bank of Montreal | 6/2/2016 | USD | 1,015 | NZD | 1,500 | 0 | ||||||||||||
Bank of Montreal | 6/2/2016 | USD | 32,442 | SEK | 271,000 | 46 | ||||||||||||
Bank of Montreal | 6/2/2016 | USD | 7,790 | TRY | 23,000 | 1 | ||||||||||||
JP Morgan & Chase Co. | 6/2/2016 | USD | 13,613 | AED | 50,000 | (1 | ) | |||||||||||
JP Morgan & Chase Co. | 6/2/2016 | USD | 1,831,487 | AUD | 2,528,107 | (4,292 | ) | |||||||||||
JP Morgan & Chase Co. | 6/2/2016 | USD | 28,095 | CZK | 682,000 | (13 | ) | |||||||||||
JP Morgan & Chase Co. | 6/2/2016 | USD | 5,342,756 | GBP | 3,670,736 | (26,239 | ) | |||||||||||
JP Morgan & Chase Co. | 6/2/2016 | USD | 2,850,331 | HKD | 22,141,796 | (954 | ) | |||||||||||
JP Morgan & Chase Co. | 6/2/2016 | USD | 36,288 | HUF | 10,222,000 | (18 | ) | |||||||||||
JP Morgan & Chase Co. | 6/2/2016 | USD | 191,827 | ILS | 738,698 | (92 | ) | |||||||||||
JP Morgan & Chase Co. | 6/2/2016 | USD | 175,532 | NOK | 1,468,000 | (51 | ) | |||||||||||
JP Morgan & Chase Co. | 6/2/2016 | USD | 51,497 | NZD | 76,116 | 4 | ||||||||||||
JP Morgan & Chase Co. | 6/2/2016 | USD | 219,158 | PLN | 864,392 | 31 | ||||||||||||
JP Morgan & Chase Co. | 6/2/2016 | USD | 761,620 | SEK | 6,362,000 | 1,086 | ||||||||||||
JP Morgan & Chase Co. | 6/2/2016 | USD | 124,183 | TRY | 366,646 | 15 | ||||||||||||
State Street Bank & Trust Co. | 6/2/2016 | USD | 29,949 | AED | 110,000 | (2 | ) | |||||||||||
State Street Bank & Trust Co. | 6/2/2016 | USD | 1,145,138 | AUD | 1,580,700 | (2,684 | ) | |||||||||||
State Street Bank & Trust Co. | 6/2/2016 | USD | 160,290 | AUD | 210,300 | (8,295 | ) | |||||||||||
| See Notes to Financial Statements. | 48 |
DBX ETF Trust
Schedule of investments
Deutsche X-trackers MSCI All World ex US Hedged Equity ETF (Continued)
May 31, 2016
Counterparty | Settlement Date | Currency To Deliver | Currency To Receive | Unrealized Appreciation (Depreciation) | ||||||||||||||
State Street Bank & Trust Co. | 6/2/2016 | USD | 172,602 | AUD | 239,000 | $ | 136 | |||||||||||
State Street Bank & Trust Co. | 6/2/2016 | USD | 1,828,077 | CHF | 1,817,474 | 368 | ||||||||||||
State Street Bank & Trust Co. | 6/2/2016 | USD | 212,365 | CHF | 203,300 | (7,838 | ) | |||||||||||
State Street Bank & Trust Co. | 6/2/2016 | USD | 222,088 | CHF | 220,000 | (760 | ) | |||||||||||
State Street Bank & Trust Co. | 6/2/2016 | USD | 2,532 | CZK | 61,000 | (20 | ) | |||||||||||
State Street Bank & Trust Co. | 6/2/2016 | USD | 20,433 | CZK | 496,000 | (10 | ) | |||||||||||
State Street Bank & Trust Co. | 6/2/2016 | USD | 17,819 | DKK | 115,700 | (511 | ) | |||||||||||
State Street Bank & Trust Co. | 6/2/2016 | USD | 49,038 | DKK | 325,000 | (420 | ) | |||||||||||
State Street Bank & Trust Co. | 6/2/2016 | USD | 350,702 | DKK | 2,343,300 | (155 | ) | |||||||||||
State Street Bank & Trust Co. | 6/2/2016 | USD | 6,058,680 | EUR | 5,442,336 | (3,298 | ) | |||||||||||
State Street Bank & Trust Co. | 6/2/2016 | USD | 120,000 | EUR | 104,018 | (4,265 | ) | |||||||||||
State Street Bank & Trust Co. | 6/2/2016 | USD | 381,151 | EUR | 332,500 | (11,197 | ) | |||||||||||
State Street Bank & Trust Co. | 6/2/2016 | USD | 703,515 | EUR | 627,000 | (5,888 | ) | |||||||||||
State Street Bank & Trust Co. | 6/2/2016 | USD | 432,611 | GBP | 295,300 | (4,913 | ) | |||||||||||
State Street Bank & Trust Co. | 6/2/2016 | USD | 457,917 | GBP | 316,000 | (238 | ) | |||||||||||
State Street Bank & Trust Co. | 6/2/2016 | USD | 4,276,336 | GBP | 2,938,053 | (21,002 | ) | |||||||||||
State Street Bank & Trust Co. | 6/2/2016 | USD | 961,258 | HKD | 7,467,200 | (322 | ) | |||||||||||
State Street Bank & Trust Co. | 6/2/2016 | USD | 213,858 | HKD | 1,661,000 | (108 | ) | |||||||||||
State Street Bank & Trust Co. | 6/2/2016 | USD | 22,461 | HUF | 6,326,900 | (11 | ) | |||||||||||
State Street Bank & Trust Co. | 6/2/2016 | USD | 3,122 | HUF | 881,000 | 4 | ||||||||||||
State Street Bank & Trust Co. | 6/2/2016 | USD | 5,159 | HUF | 1,404,200 | (176 | ) | |||||||||||
State Street Bank & Trust Co. | 6/2/2016 | USD | 12,247 | ILS | 45,700 | (386 | ) | |||||||||||
State Street Bank & Trust Co. | 6/2/2016 | USD | 15,957 | ILS | 62,000 | 135 | ||||||||||||
State Street Bank & Trust Co. | 6/2/2016 | USD | 161,990 | ILS | 623,800 | (78 | ) | |||||||||||
State Street Bank & Trust Co. | 6/2/2016 | USD | 13,456 | NOK | 112,000 | (68 | ) | |||||||||||
State Street Bank & Trust Co. | 6/2/2016 | USD | 9,797 | NOK | 78,900 | (365 | ) | |||||||||||
State Street Bank & Trust Co. | 6/2/2016 | USD | 99,269 | NOK | 830,200 | (29 | ) | |||||||||||
State Street Bank & Trust Co. | 6/2/2016 | USD | 94,582 | NZD | 139,800 | 7 | ||||||||||||
State Street Bank & Trust Co. | 6/2/2016 | USD | 7,609 | NZD | 10,900 | (234 | ) | |||||||||||
State Street Bank & Trust Co. | 6/2/2016 | USD | 8,118 | NZD | 12,000 | 2 | ||||||||||||
State Street Bank & Trust Co. | 6/2/2016 | USD | 8,634 | PLN | 33,000 | (266 | ) | |||||||||||
State Street Bank & Trust Co. | 6/2/2016 | USD | 10,160 | PLN | 40,000 | (17 | ) | |||||||||||
State Street Bank & Trust Co. | 6/2/2016 | USD | 14,127 | PLN | 54,000 | (434 | ) | |||||||||||
State Street Bank & Trust Co. | 6/2/2016 | USD | 62,528 | SEK | 520,000 | (188 | ) | |||||||||||
State Street Bank & Trust Co. | 6/2/2016 | USD | 530,488 | SEK | 4,431,300 | 757 | ||||||||||||
State Street Bank & Trust Co. | 6/2/2016 | USD | 69,452 | SEK | 556,600 | (2,724 | ) | |||||||||||
State Street Bank & Trust Co. | 6/2/2016 | USD | 5,572 | TRY | 15,700 | (253 | ) | |||||||||||
State Street Bank & Trust Co. | 6/2/2016 | USD | 12,051 | TRY | 36,000 | 143 | ||||||||||||
State Street Bank & Trust Co. | 6/2/2016 | USD | 138,225 | TRY | 408,100 | 16 | ||||||||||||
The Bank of New York Mellon | 6/2/2016 | USD | 93,741 | AED | 344,300 | (5 | ) | |||||||||||
The Bank of New York Mellon | 6/2/2016 | USD | 2,314 | AED | 8,500 | 0 | ||||||||||||
The Bank of New York Mellon | 6/2/2016 | USD | 5,990 | AED | 22,000 | 0 | ||||||||||||
The Bank of New York Mellon | 6/2/2016 | USD | 28,464 | AUD | 38,700 | (494 | ) | |||||||||||
The Bank of New York Mellon | 6/2/2016 | USD | 5,037 | CHF | 5,000 | (7 | ) | |||||||||||
The Bank of New York Mellon | 6/2/2016 | USD | 68,037 | CHF | 64,800 | (2,846 | ) | |||||||||||
The Bank of New York Mellon | 6/2/2016 | USD | 16,091 | CHF | 15,700 | (297 | ) | |||||||||||
The Bank of New York Mellon | 6/2/2016 | USD | 1,821 | CZK | 44,200 | (1 | ) | |||||||||||
The Bank of New York Mellon | 6/2/2016 | USD | 2,171 | CZK | 52,600 | (5 | ) | |||||||||||
The Bank of New York Mellon | 6/2/2016 | USD | 15,294 | DKK | 100,300 | (290 | ) | |||||||||||
The Bank of New York Mellon | 6/2/2016 | USD | 136,259 | EUR | 118,300 | (4,633 | ) | |||||||||||
The Bank of New York Mellon | 6/2/2016 | USD | 66,534 | EUR | 59,700 | (109 | ) | |||||||||||
The Bank of New York Mellon | 6/2/2016 | USD | 110,181 | EUR | 95,600 | (3,813 | ) | |||||||||||
The Bank of New York Mellon | 6/2/2016 | USD | 11,383 | EUR | 10,000 | (257 | ) | |||||||||||
The Bank of New York Mellon | 6/2/2016 | USD | 29,366 | EUR | 25,900 | (548 | ) | |||||||||||
The Bank of New York Mellon | 6/2/2016 | USD | 35,666 | EUR | 31,200 | (952 | ) | |||||||||||
The Bank of New York Mellon | 6/2/2016 | USD | 13,320 | GBP | 9,200 | 5 | ||||||||||||
The Bank of New York Mellon | 6/2/2016 | USD | 7,894 | GBP | 5,400 | (73 | ) | |||||||||||
| See Notes to Financial Statements. | 49 |
DBX ETF Trust
Schedule of investments
Deutsche X-trackers MSCI All World ex US Hedged Equity ETF (Continued)
May 31, 2016
Counterparty | Settlement Date | Currency To Deliver | Currency To Receive | Unrealized Appreciation (Depreciation) | ||||||||||||||
The Bank of New York Mellon | 6/2/2016 | USD | 151,870 | GBP | 105,100 | $ | 352 | |||||||||||
The Bank of New York Mellon | 6/2/2016 | USD | 10,507 | GBP | 7,200 | (78 | ) | |||||||||||
The Bank of New York Mellon | 6/2/2016 | USD | 39,923 | HKD | 309,700 | (69 | ) | |||||||||||
The Bank of New York Mellon | 6/2/2016 | USD | 40,735 | HKD | 316,100 | (57 | ) | |||||||||||
The Bank of New York Mellon | 6/2/2016 | USD | 664,444 | HKD | 5,161,500 | (222 | ) | |||||||||||
The Bank of New York Mellon | 6/2/2016 | USD | 5,717 | ILS | 22,000 | (6 | ) | |||||||||||
The Bank of New York Mellon | 6/2/2016 | USD | 6,065 | NOK | 50,700 | (4 | ) | |||||||||||
The Bank of New York Mellon | 6/2/2016 | USD | 5,266 | NZD | 7,700 | (56 | ) | |||||||||||
The Bank of New York Mellon | 6/2/2016 | USD | 1,387 | PLN | 5,500 | 8 | ||||||||||||
The Bank of New York Mellon | 6/2/2016 | USD | 6,982 | SEK | 57,400 | (101 | ) | |||||||||||
The Bank of New York Mellon | 6/2/2016 | USD | 27,032 | SEK | 219,300 | (741 | ) | |||||||||||
The Bank of New York Mellon | 6/2/2016 | USD | 5,589 | TRY | 16,500 | 0 | ||||||||||||
The Bank of Nova Scotia | 6/2/2016 | USD | 327,669 | AUD | 452,300 | (768 | ) | |||||||||||
The Bank of Nova Scotia | 6/2/2016 | USD | 2,538,319 | CHF | 2,523,596 | 511 | ||||||||||||
The Bank of Nova Scotia | 6/2/2016 | USD | 599,154 | DKK | 4,003,400 | (264 | ) | |||||||||||
The Bank of Nova Scotia | 6/2/2016 | USD | 8,395,715 | EUR | 7,541,626 | (4,570 | ) | |||||||||||
The Bank of Nova Scotia | 6/2/2016 | USD | 2,634 | HUF | 741,900 | (1 | ) | |||||||||||
The Bank of Nova Scotia | 6/2/2016 | USD | 1,298 | ILS | 5,000 | (1 | ) | |||||||||||
The Bank of Nova Scotia | 6/2/2016 | USD | 9,133 | NZD | 13,500 | 1 | ||||||||||||
The Bank of Nova Scotia | 6/2/2016 | USD | 8,029 | TRY | 23,700 | (1 | ) | |||||||||||
JP Morgan & Chase Co. | 6/3/2016 | BRL | 651,530 | USD | 186,711 | 6,580 | ||||||||||||
State Street Bank & Trust Co. | 6/3/2016 | BRL | 158,000 | USD | 45,311 | 1,628 | ||||||||||||
State Street Bank & Trust Co. | 6/3/2016 | BRL | 458,000 | USD | 131,345 | 4,720 | ||||||||||||
State Street Bank & Trust Co. | 6/3/2016 | BRL | 35,000 | USD | 10,049 | 372 | ||||||||||||
The Bank of New York Mellon | 6/3/2016 | BRL | 2,524,480 | USD | 723,554 | 25,601 | ||||||||||||
Bank of Montreal | 6/3/2016 | CAD | 154,000 | USD | 122,947 | 5,511 | ||||||||||||
JP Morgan & Chase Co. | 6/3/2016 | CAD | 95,000 | USD | 75,843 | 3,399 | ||||||||||||
State Street Bank & Trust Co. | 6/3/2016 | CAD | 117,600 | USD | 89,900 | 222 | ||||||||||||
State Street Bank & Trust Co. | 6/3/2016 | CAD | 2,073,200 | USD | 1,655,137 | 74,175 | ||||||||||||
State Street Bank & Trust Co. | 6/3/2016 | CAD | 173,000 | USD | 138,104 | 6,179 | ||||||||||||
State Street Bank & Trust Co. | 6/3/2016 | CAD | 7,000 | USD | 5,579 | 241 | ||||||||||||
The Bank of Nova Scotia | 6/3/2016 | CAD | 3,826,788 | USD | 3,055,125 | 136,926 | ||||||||||||
Bank of Montreal | 6/3/2016 | CLP | 4,126,000 | USD | 6,250 | 297 | ||||||||||||
JP Morgan & Chase Co. | 6/3/2016 | CLP | 95,944,000 | USD | 145,086 | 6,654 | ||||||||||||
State Street Bank & Trust Co. | 6/3/2016 | CLP | 67,067,280 | USD | 101,295 | 4,527 | ||||||||||||
Bank of Montreal | 6/3/2016 | COP | 4,457,000 | USD | 1,561 | 120 | ||||||||||||
JP Morgan & Chase Co. | 6/3/2016 | COP | 124,064,000 | USD | 43,139 | 3,027 | ||||||||||||
State Street Bank & Trust Co. | 6/3/2016 | COP | 21,604,780 | USD | 7,541 | 556 | ||||||||||||
Bank of Montreal | 6/3/2016 | IDR | 137,191,500 | USD | 10,361 | 324 | ||||||||||||
JP Morgan & Chase Co. | 6/3/2016 | IDR | 2,917,359,000 | USD | 219,548 | 6,109 | ||||||||||||
State Street Bank & Trust Co. | 6/3/2016 | IDR | 3,177,571,500 | USD | 239,998 | 7,520 | ||||||||||||
Bank of Montreal | 6/3/2016 | INR | 1,292,500 | USD | 19,459 | 260 | ||||||||||||
JP Morgan & Chase Co. | 6/3/2016 | INR | 23,679,246 | USD | 354,825 | 3,099 | ||||||||||||
State Street Bank & Trust Co. | 6/3/2016 | INR | 26,381,991 | USD | 395,295 | 3,423 | ||||||||||||
State Street Bank & Trust Co. | 6/3/2016 | INR | 1,071,000 | USD | 16,047 | 139 | ||||||||||||
Bank of Montreal | 6/3/2016 | JPY | 24,861,600 | USD | 232,497 | 7,956 | ||||||||||||
JP Morgan & Chase Co. | 6/3/2016 | JPY | 700,391,722 | USD | 6,549,145 | 223,464 | ||||||||||||
State Street Bank & Trust Co. | 6/3/2016 | JPY | 17,934,000 | USD | 167,939 | 5,966 | ||||||||||||
State Street Bank & Trust Co. | 6/3/2016 | JPY | 463,644,473 | USD | 4,335,995 | 148,528 | ||||||||||||
State Street Bank & Trust Co. | 6/3/2016 | JPY | 4,528,200 | USD | 40,830 | (67 | ) | |||||||||||
The Bank of New York Mellon | 6/3/2016 | JPY | 4,400,300 | USD | 40,365 | 624 | ||||||||||||
The Bank of New York Mellon | 6/3/2016 | JPY | 8,618,200 | USD | 80,593 | 2,756 | ||||||||||||
The Bank of Nova Scotia | 6/3/2016 | JPY | 60,474,000 | USD | 565,505 | 19,326 | ||||||||||||
Bank of Montreal | 6/3/2016 | KRW | 68,934,500 | USD | 60,331 | 2,494 | ||||||||||||
JP Morgan & Chase Co. | 6/3/2016 | KRW | 1,553,631,000 | USD | 1,355,462 | 51,944 | ||||||||||||
State Street Bank & Trust Co. | 6/3/2016 | KRW | 1,292,105,011 | USD | 1,130,747 | 46,653 | ||||||||||||
Bank of Montreal | 6/3/2016 | MXN | 82,000 | USD | 4,772 | 331 | ||||||||||||
| See Notes to Financial Statements. | 50 |
DBX ETF Trust
Schedule of investments
Deutsche X-trackers MSCI All World ex US Hedged Equity ETF (Continued)
May 31, 2016
Counterparty | Settlement Date | Currency To Deliver | Currency To Receive | Unrealized Appreciation (Depreciation) | ||||||||||||||
JP Morgan & Chase Co. | 6/3/2016 | MXN | 5,615,493 | USD | 326,803 | $ | 22,661 | |||||||||||
State Street Bank & Trust Co. | 6/3/2016 | MXN | 6,610,500 | USD | 384,717 | 26,684 | ||||||||||||
The Bank of New York Mellon | 6/3/2016 | MXN | 141,500 | USD | 8,236 | 572 | ||||||||||||
Bank of Montreal | 6/3/2016 | MYR | 59,000 | USD | 15,085 | 799 | ||||||||||||
JP Morgan & Chase Co. | 6/3/2016 | MYR | 1,419,000 | USD | 362,406 | 18,816 | ||||||||||||
State Street Bank & Trust Co. | 6/3/2016 | MYR | 996,423 | USD | 254,840 | 13,571 | ||||||||||||
Bank of Montreal | 6/3/2016 | PHP | 303,500 | USD | 6,459 | (30 | ) | |||||||||||
JP Morgan & Chase Co. | 6/3/2016 | PHP | 5,613,000 | USD | 119,280 | (726 | ) | |||||||||||
State Street Bank & Trust Co. | 6/3/2016 | PHP | 7,137,500 | USD | 151,862 | (738 | ) | |||||||||||
JP Morgan & Chase Co. | 6/3/2016 | RUB | 6,778,000 | USD | 103,894 | 2,337 | ||||||||||||
State Street Bank & Trust Co. | 6/3/2016 | RUB | 11,815,076 | USD | 181,435 | 4,405 | ||||||||||||
Bank of Montreal | 6/3/2016 | SGD | 18,200 | USD | 13,530 | 314 | ||||||||||||
JP Morgan & Chase Co. | 6/3/2016 | SGD | 511,707 | USD | 380,367 | 8,803 | ||||||||||||
State Street Bank & Trust Co. | 6/3/2016 | SGD | 26,000 | USD | 18,885 | 6 | ||||||||||||
State Street Bank & Trust Co. | 6/3/2016 | SGD | 271,000 | USD | 201,458 | 4,678 | ||||||||||||
The Bank of Nova Scotia | 6/3/2016 | SGD | 145,000 | USD | 107,787 | 2,498 | ||||||||||||
Bank of Montreal | 6/3/2016 | THB | 293,000 | USD | 8,388 | 187 | ||||||||||||
JP Morgan & Chase Co. | 6/3/2016 | THB | 7,352,000 | USD | 210,255 | 4,472 | ||||||||||||
State Street Bank & Trust Co. | 6/3/2016 | THB | 3,160,931 | USD | 90,537 | 2,062 | ||||||||||||
Bank of Montreal | 6/3/2016 | TWD | 1,310,500 | USD | 40,635 | 448 | ||||||||||||
JP Morgan & Chase Co. | 6/3/2016 | TWD | 22,001,297 | USD | 681,260 | 6,588 | ||||||||||||
State Street Bank & Trust Co. | 6/3/2016 | TWD | 36,751,650 | USD | 1,140,116 | 13,123 | ||||||||||||
Bank of Montreal | 6/3/2016 | USD | 117,727 | CAD | 154,000 | (291 | ) | |||||||||||
Bank of Montreal | 6/3/2016 | USD | 5,972 | CLP | 4,126,000 | (19 | ) | |||||||||||
Bank of Montreal | 6/3/2016 | USD | 1,441 | COP | 4,457,000 | 0 | ||||||||||||
Bank of Montreal | 6/3/2016 | USD | 10,058 | IDR | 137,191,500 | (21 | ) | |||||||||||
Bank of Montreal | 6/3/2016 | USD | 19,251 | INR | 1,292,500 | (52 | ) | |||||||||||
Bank of Montreal | 6/3/2016 | USD | 224,175 | JPY | 24,861,600 | 366 | ||||||||||||
Bank of Montreal | 6/3/2016 | USD | 57,904 | KRW | 68,934,500 | (67 | ) | |||||||||||
Bank of Montreal | 6/3/2016 | USD | 4,453 | MXN | 82,000 | (11 | ) | |||||||||||
Bank of Montreal | 6/3/2016 | USD | 14,352 | MYR | 59,000 | (66 | ) | |||||||||||
Bank of Montreal | 6/3/2016 | USD | 6,492 | PHP | 303,500 | (3 | ) | |||||||||||
Bank of Montreal | 6/3/2016 | USD | 13,220 | SGD | 18,200 | (4 | ) | |||||||||||
Bank of Montreal | 6/3/2016 | USD | 8,202 | THB | 293,000 | 0 | ||||||||||||
Bank of Montreal | 6/3/2016 | USD | 40,423 | TWD | 1,310,500 | (236 | ) | |||||||||||
JP Morgan & Chase Co. | 6/3/2016 | USD | 180,880 | BRL | 651,530 | (749 | ) | |||||||||||
JP Morgan & Chase Co. | 6/3/2016 | USD | 72,624 | CAD | 95,000 | (179 | ) | |||||||||||
JP Morgan & Chase Co. | 6/3/2016 | USD | 139,184 | CLP | 95,944,000 | (752 | ) | |||||||||||
JP Morgan & Chase Co. | 6/3/2016 | USD | 40,175 | COP | 124,064,000 | (63 | ) | |||||||||||
JP Morgan & Chase Co. | 6/3/2016 | USD | 214,212 | IDR | 2,917,359,000 | (773 | ) | |||||||||||
JP Morgan & Chase Co. | 6/3/2016 | USD | 352,501 | INR | 23,679,246 | (775 | ) | |||||||||||
JP Morgan & Chase Co. | 6/3/2016 | USD | 6,315,240 | JPY | 700,391,722 | 10,441 | ||||||||||||
JP Morgan & Chase Co. | 6/3/2016 | USD | 1,305,572 | KRW | 1,553,631,000 | (2,054 | ) | |||||||||||
JP Morgan & Chase Co. | 6/3/2016 | USD | 305,107 | MXN | 5,615,493 | (964 | ) | |||||||||||
JP Morgan & Chase Co. | 6/3/2016 | USD | 344,995 | MYR | 1,419,000 | (1,406 | ) | |||||||||||
JP Morgan & Chase Co. | 6/3/2016 | USD | 120,172 | PHP | 5,613,000 | (167 | ) | |||||||||||
JP Morgan & Chase Co. | 6/3/2016 | USD | 102,791 | RUB | 6,778,000 | (1,233 | ) | |||||||||||
JP Morgan & Chase Co. | 6/3/2016 | USD | 371,678 | SGD | 511,707 | (114 | ) | |||||||||||
JP Morgan & Chase Co. | 6/3/2016 | USD | 206,151 | THB | 7,352,000 | (368 | ) | |||||||||||
JP Morgan & Chase Co. | 6/3/2016 | USD | 675,073 | TWD | 22,001,297 | (401 | ) | |||||||||||
JP Morgan & Chase Co. | 6/3/2016 | USD | 103,281 | ZAR | 1,624,732 | 29 | ||||||||||||
State Street Bank & Trust Co. | 6/3/2016 | USD | 180,663 | BRL | 651,000 | (678 | ) | |||||||||||
State Street Bank & Trust Co. | 6/3/2016 | USD | 221,723 | CAD | 291,000 | 186 | ||||||||||||
State Street Bank & Trust Co. | 6/3/2016 | USD | 1,385,887 | CAD | 1,812,900 | (3,422 | ) | |||||||||||
State Street Bank & Trust Co. | 6/3/2016 | USD | 119,194 | CAD | 149,300 | (5,342 | ) | |||||||||||
State Street Bank & Trust Co. | 6/3/2016 | USD | 10,455 | CLP | 7,235,000 | (16 | ) | |||||||||||
State Street Bank & Trust Co. | 6/3/2016 | USD | 70,161 | CLP | 48,396,280 | (333 | ) | |||||||||||
| See Notes to Financial Statements. | 51 |
DBX ETF Trust
Schedule of investments
Deutsche X-trackers MSCI All World ex US Hedged Equity ETF (Continued)
May 31, 2016
Counterparty | Settlement Date | Currency To Deliver | Currency To Receive | Unrealized Appreciation (Depreciation) | ||||||||||||||
State Street Bank & Trust Co. | 6/3/2016 | USD | 17,272 | CLP | 11,436,000 | $ | (772 | ) | ||||||||||
State Street Bank & Trust Co. | 6/3/2016 | USD | 4,665 | COP | 14,418,780 | (3 | ) | |||||||||||
State Street Bank & Trust Co. | 6/3/2016 | USD | 2,349 | COP | 7,186,000 | (26 | ) | |||||||||||
State Street Bank & Trust Co. | 6/3/2016 | USD | 204,728 | IDR | 2,786,758,500 | (843 | ) | |||||||||||
State Street Bank & Trust Co. | 6/3/2016 | USD | 8,719 | IDR | 115,444,000 | (273 | ) | |||||||||||
State Street Bank & Trust Co. | 6/3/2016 | USD | 20,199 | IDR | 275,369,000 | (52 | ) | |||||||||||
State Street Bank & Trust Co. | 6/3/2016 | USD | 34,894 | INR | 2,355,000 | 87 | ||||||||||||
State Street Bank & Trust Co. | 6/3/2016 | USD | 373,816 | INR | 25,097,991 | (1,016 | ) | |||||||||||
State Street Bank & Trust Co. | 6/3/2016 | USD | 106,734 | JPY | 11,412,000 | (3,665 | ) | |||||||||||
State Street Bank & Trust Co. | 6/3/2016 | USD | 3,741,298 | JPY | 414,920,473 | 6,111 | ||||||||||||
State Street Bank & Trust Co. | 6/3/2016 | USD | 501,665 | JPY | 55,246,000 | (2,703 | ) | |||||||||||
State Street Bank & Trust Co. | 6/3/2016 | USD | 927,312 | KRW | 1,103,075,011 | (1,817 | ) | |||||||||||
State Street Bank & Trust Co. | 6/3/2016 | USD | 116,123 | KRW | 137,652,000 | (631 | ) | |||||||||||
State Street Bank & Trust Co. | 6/3/2016 | USD | 44,962 | KRW | 51,378,000 | (1,855 | ) | |||||||||||
State Street Bank & Trust Co. | 6/3/2016 | USD | 31,225 | MXN | 573,000 | (190 | ) | |||||||||||
State Street Bank & Trust Co. | 6/3/2016 | USD | 318,094 | MXN | 5,854,500 | (1,007 | ) | |||||||||||
State Street Bank & Trust Co. | 6/3/2016 | USD | 10,652 | MXN | 183,000 | (741 | ) | |||||||||||
State Street Bank & Trust Co. | 6/3/2016 | USD | 29,206 | MYR | 119,000 | (392 | ) | |||||||||||
State Street Bank & Trust Co. | 6/3/2016 | USD | 43,478 | MYR | 170,000 | (2,315 | ) | |||||||||||
State Street Bank & Trust Co. | 6/3/2016 | USD | 172,164 | MYR | 707,423 | (872 | ) | |||||||||||
State Street Bank & Trust Co. | 6/3/2016 | USD | 134,971 | PHP | 6,304,500 | (181 | ) | |||||||||||
State Street Bank & Trust Co. | 6/3/2016 | USD | 13,458 | PHP | 628,000 | (31 | ) | |||||||||||
State Street Bank & Trust Co. | 6/3/2016 | USD | 4,362 | PHP | 205,000 | 21 | ||||||||||||
State Street Bank & Trust Co. | 6/3/2016 | USD | 155,448 | RUB | 10,278,076 | (1,448 | ) | |||||||||||
State Street Bank & Trust Co. | 6/3/2016 | USD | 22,961 | RUB | 1,537,000 | 69 | ||||||||||||
State Street Bank & Trust Co. | 6/3/2016 | USD | 30,384 | SGD | 42,000 | 113 | ||||||||||||
State Street Bank & Trust Co. | 6/3/2016 | USD | 166,333 | SGD | 229,000 | (50 | ) | |||||||||||
State Street Bank & Trust Co. | 6/3/2016 | USD | 14,318 | THB | 511,000 | (15 | ) | |||||||||||
State Street Bank & Trust Co. | 6/3/2016 | USD | 74,276 | THB | 2,649,931 | (104 | ) | |||||||||||
State Street Bank & Trust Co. | 6/3/2016 | USD | 929,025 | TWD | 30,267,650 | (865 | ) | |||||||||||
State Street Bank & Trust Co. | 6/3/2016 | USD | 78,885 | TWD | 2,579,000 | 200 | ||||||||||||
State Street Bank & Trust Co. | 6/3/2016 | USD | 121,142 | TWD | 3,905,000 | (1,394 | ) | |||||||||||
State Street Bank & Trust Co. | 6/3/2016 | USD | 40,671 | ZAR | 637,000 | (167 | ) | |||||||||||
State Street Bank & Trust Co. | 6/3/2016 | USD | 202,719 | ZAR | 3,189,000 | 57 | ||||||||||||
The Bank of New York Mellon | 6/3/2016 | USD | 9,745 | BRL | 35,000 | (69 | ) | |||||||||||
The Bank of New York Mellon | 6/3/2016 | USD | 646,059 | BRL | 2,326,457 | (2,854 | ) | |||||||||||
The Bank of New York Mellon | 6/3/2016 | USD | 45,614 | BRL | 163,023 | (542 | ) | |||||||||||
The Bank of New York Mellon | 6/3/2016 | USD | 86,582 | CAD | 111,900 | (1,250 | ) | |||||||||||
The Bank of New York Mellon | 6/3/2016 | USD | 4,332 | CAD | 5,700 | 15 | ||||||||||||
The Bank of New York Mellon | 6/3/2016 | USD | 164,605 | JPY | 17,546,700 | (6,130 | ) | |||||||||||
The Bank of New York Mellon | 6/3/2016 | USD | 4,167 | MXN | 76,700 | (13 | ) | |||||||||||
The Bank of New York Mellon | 6/3/2016 | USD | 3,501 | MXN | 64,800 | 8 | ||||||||||||
The Bank of New York Mellon | 6/3/2016 | USD | 15,444 | SGD | 21,000 | (196 | ) | |||||||||||
The Bank of New York Mellon | 6/3/2016 | USD | 3,617 | SGD | 5,000 | 14 | ||||||||||||
The Bank of New York Mellon | 6/3/2016 | USD | 530,740 | ZAR | 8,349,140 | 151 | ||||||||||||
The Bank of Nova Scotia | 6/3/2016 | USD | 2,925,456 | CAD | 3,826,788 | (7,257 | ) | |||||||||||
The Bank of Nova Scotia | 6/3/2016 | USD | 545,277 | JPY | 60,474,000 | 901 | ||||||||||||
The Bank of Nova Scotia | 6/3/2016 | USD | 84,039 | SGD | 115,700 | (26 | ) | |||||||||||
The Bank of Nova Scotia | 6/3/2016 | USD | 21,780 | SGD | 29,300 | (505 | ) | |||||||||||
JP Morgan & Chase Co. | 6/3/2016 | ZAR | 1,624,732 | USD | 113,885 | 10,574 | ||||||||||||
State Street Bank & Trust Co. | 6/3/2016 | ZAR | 3,736,000 | USD | 261,868 | 24,310 | ||||||||||||
State Street Bank & Trust Co. | 6/3/2016 | ZAR | 90,000 | USD | 6,275 | 553 | ||||||||||||
The Bank of New York Mellon | 6/3/2016 | ZAR | 8,187,140 | USD | 573,824 | 53,234 | ||||||||||||
The Bank of New York Mellon | 6/3/2016 | ZAR | 162,000 | USD | 10,166 | (135 | ) | |||||||||||
JP Morgan & Chase Co. | 6/6/2016 | EGP | 484,000 | USD | 53,481 | (679 | ) | |||||||||||
The Bank of Nova Scotia | 6/6/2016 | EGP | 78,000 | USD | 8,590 | (138 | ) | |||||||||||
The Bank of Nova Scotia | 6/6/2016 | EGP | 297,000 | USD | 32,709 | (525 | ) | |||||||||||
| See Notes to Financial Statements. | 52 |
DBX ETF Trust
Schedule of investments
Deutsche X-trackers MSCI All World ex US Hedged Equity ETF (Continued)
May 31, 2016
Counterparty | Settlement Date | Currency To Deliver | Currency To Receive | Unrealized Appreciation (Depreciation) | ||||||||||||||
State Street Bank & Trust Co. | 6/6/2016 | QAR | 50,000 | USD | 13,726 | $ | (6 | ) | ||||||||||
The Bank of New York Mellon | 6/6/2016 | QAR | 459,000 | USD | 125,981 | (84 | ) | |||||||||||
JP Morgan & Chase Co. | 6/6/2016 | USD | 3,051 | EGP | 27,000 | (30 | ) | |||||||||||
JP Morgan & Chase Co. | 6/6/2016 | USD | 52,050 | EGP | 457,000 | (911 | ) | |||||||||||
State Street Bank & Trust Co. | 6/6/2016 | USD | 13,733 | QAR | 50,000 | (1 | ) | |||||||||||
The Bank of New York Mellon | 6/6/2016 | USD | 6,041 | QAR | 22,000 | 1 | ||||||||||||
The Bank of New York Mellon | 6/6/2016 | USD | 120,024 | QAR | 437,000 | 0 | ||||||||||||
The Bank of Nova Scotia | 6/6/2016 | USD | 42,469 | EGP | 375,000 | (506 | ) | |||||||||||
Bank of Montreal | 7/5/2016 | AUD | 103,800 | USD | 75,104 | 186 | ||||||||||||
JP Morgan & Chase Co. | 7/5/2016 | AUD | 2,528,107 | USD | 1,829,262 | 4,573 | ||||||||||||
State Street Bank & Trust Co. | 7/5/2016 | AUD | 199,000 | USD | 143,984 | 354 | ||||||||||||
State Street Bank & Trust Co. | 7/5/2016 | AUD | 1,580,700 | USD | 1,143,747 | 2,859 | ||||||||||||
State Street Bank & Trust Co. | 7/5/2016 | AUD | 42,000 | USD | 30,380 | 66 | ||||||||||||
The Bank of Nova Scotia | 7/5/2016 | AUD | 452,300 | USD | 327,264 | 811 | ||||||||||||
Bank of Montreal | 7/5/2016 | CHF | 98,800 | USD | 99,528 | (38 | ) | |||||||||||
State Street Bank & Trust Co. | 7/5/2016 | CHF | 69,000 | USD | 69,507 | (28 | ) | |||||||||||
State Street Bank & Trust Co. | 7/5/2016 | CHF | 1,817,474 | USD | 1,830,923 | (637 | ) | |||||||||||
The Bank of Nova Scotia | 7/5/2016 | CHF | 2,523,596 | USD | 2,542,205 | (949 | ) | |||||||||||
Bank of Montreal | 7/5/2016 | DKK | 184,000 | USD | 27,568 | 7 | ||||||||||||
State Street Bank & Trust Co. | 7/5/2016 | DKK | 2,343,300 | USD | 351,101 | 93 | ||||||||||||
State Street Bank & Trust Co. | 7/5/2016 | DKK | 125,000 | USD | 18,728 | 4 | ||||||||||||
The Bank of Nova Scotia | 7/5/2016 | DKK | 4,003,400 | USD | 599,837 | 160 | ||||||||||||
Bank of Montreal | 7/5/2016 | EUR | 367,500 | USD | 409,581 | 143 | ||||||||||||
State Street Bank & Trust Co. | 7/5/2016 | EUR | 5,442,336 | USD | 6,065,641 | 2,252 | ||||||||||||
The Bank of Nova Scotia | 7/5/2016 | EUR | 7,541,626 | USD | 8,405,218 | 2,977 | ||||||||||||
Bank of Montreal | 7/5/2016 | GBP | 51,300 | USD | 74,683 | 362 | ||||||||||||
JP Morgan & Chase Co. | 7/5/2016 | GBP | 3,670,736 | USD | 5,343,868 | 25,914 | ||||||||||||
State Street Bank & Trust Co. | 7/5/2016 | GBP | 2,938,053 | USD | 4,277,277 | 20,791 | ||||||||||||
Bank of Montreal | 7/5/2016 | HKD | 1,020,000 | USD | 131,361 | 31 | ||||||||||||
JP Morgan & Chase Co. | 7/5/2016 | HKD | 22,141,796 | USD | 2,851,505 | 655 | ||||||||||||
State Street Bank & Trust Co. | 7/5/2016 | HKD | 7,467,200 | USD | 961,679 | 246 | ||||||||||||
The Bank of New York Mellon | 7/5/2016 | HKD | 5,161,500 | USD | 664,735 | 170 | ||||||||||||
Bank of Montreal | 7/5/2016 | HUF | 583,500 | USD | 2,070 | 1 | ||||||||||||
JP Morgan & Chase Co. | 7/5/2016 | HUF | 10,222,000 | USD | 36,271 | 18 | ||||||||||||
State Street Bank & Trust Co. | 7/5/2016 | HUF | 6,326,900 | USD | 22,449 | 10 | ||||||||||||
The Bank of Nova Scotia | 7/5/2016 | HUF | 741,900 | USD | 2,632 | 1 | ||||||||||||
Bank of Montreal | 7/5/2016 | ILS | 34,700 | USD | 9,015 | 3 | ||||||||||||
JP Morgan & Chase Co. | 7/5/2016 | ILS | 738,698 | USD | 191,917 | 57 | ||||||||||||
State Street Bank & Trust Co. | 7/5/2016 | ILS | 623,800 | USD | 162,034 | 16 | ||||||||||||
The Bank of Nova Scotia | 7/5/2016 | ILS | 5,000 | USD | 1,299 | 0 | ||||||||||||
Bank of Montreal | 7/5/2016 | JPY | 24,861,600 | USD | 224,423 | (387 | ) | |||||||||||
JP Morgan & Chase Co. | 7/5/2016 | JPY | 700,391,722 | USD | 6,322,109 | (11,155 | ) | |||||||||||
State Street Bank & Trust Co. | 7/5/2016 | JPY | 414,920,473 | USD | 3,745,611 | (6,290 | ) | |||||||||||
State Street Bank & Trust Co. | 7/5/2016 | JPY | 9,498,000 | USD | 85,737 | (148 | ) | |||||||||||
State Street Bank & Trust Co. | 7/5/2016 | JPY | 1,897,000 | USD | 17,158 | 4 | ||||||||||||
The Bank of Nova Scotia | 7/5/2016 | JPY | 60,474,000 | USD | 545,895 | (939 | ) | |||||||||||
Bank of Montreal | 7/5/2016 | MXN | 82,000 | USD | 4,437 | 12 | ||||||||||||
JP Morgan & Chase Co. | 7/5/2016 | MXN | 5,615,493 | USD | 304,034 | 1,020 | ||||||||||||
State Street Bank & Trust Co. | 7/5/2016 | MXN | 5,854,500 | USD | 316,964 | 1,053 | ||||||||||||
The Bank of New York Mellon | 7/5/2016 | MXN | 76,700 | USD | 4,152 | 14 | ||||||||||||
Bank of Montreal | 7/5/2016 | NOK | 60,500 | USD | 7,233 | 2 | ||||||||||||
JP Morgan & Chase Co. | 7/5/2016 | NOK | 1,468,000 | USD | 175,518 | 55 | ||||||||||||
State Street Bank & Trust Co. | 7/5/2016 | NOK | 830,200 | USD | 99,260 | 30 | ||||||||||||
Bank of Montreal | 7/5/2016 | NZD | 1,500 | USD | 1,013 | 0 | ||||||||||||
JP Morgan & Chase Co. | 7/5/2016 | NZD | 76,116 | USD | 51,409 | 5 | ||||||||||||
State Street Bank & Trust Co. | 7/5/2016 | NZD | 15,000 | USD | 10,130 | 0 | ||||||||||||
State Street Bank & Trust Co. | 7/5/2016 | NZD | 139,800 | USD | 94,420 | 8 | ||||||||||||
| See Notes to Financial Statements. | 53 |
DBX ETF Trust
Schedule of investments
Deutsche X-trackers MSCI All World ex US Hedged Equity ETF (Continued)
May 31, 2016
Counterparty | Settlement Date | Currency To Deliver | Currency To Receive | Unrealized Appreciation (Depreciation) | ||||||||||||||
The Bank of Nova Scotia | 7/5/2016 | NZD | 13,500 | USD | 9,118 | $ | 1 | |||||||||||
JP Morgan & Chase Co. | 7/5/2016 | PLN | 864,392 | USD | 218,972 | (16 | ) | |||||||||||
Bank of Montreal | 7/5/2016 | SEK | 271,000 | USD | 32,485 | (53 | ) | |||||||||||
JP Morgan & Chase Co. | 7/5/2016 | SEK | 6,362,000 | USD | 762,624 | (1,251 | ) | |||||||||||
State Street Bank & Trust Co. | 7/5/2016 | SEK | 4,431,300 | USD | 531,200 | (859 | ) | |||||||||||
Bank of Montreal | 7/5/2016 | SGD | 18,200 | USD | 13,212 | 4 | ||||||||||||
JP Morgan & Chase Co. | 7/5/2016 | SGD | 511,707 | USD | 371,489 | 132 | ||||||||||||
State Street Bank & Trust Co. | 7/5/2016 | SGD | 229,000 | USD | 166,246 | 56 | ||||||||||||
The Bank of Nova Scotia | 7/5/2016 | SGD | 115,700 | USD | 83,987 | 21 | ||||||||||||
JP Morgan & Chase Co. | 7/5/2016 | USD | 1,393 | PLN | 5,500 | 0 | ||||||||||||
JP Morgan & Chase Co. | 7/5/2016 | USD | 2,356 | PLN | 9,300 | 0 | ||||||||||||
State Street Bank & Trust Co. | 7/5/2016 | USD | 25,976 | AUD | 35,900 | (65 | ) | |||||||||||
State Street Bank & Trust Co. | 7/5/2016 | USD | 9,080 | CHF | 9,000 | (10 | ) | |||||||||||
State Street Bank & Trust Co. | 7/5/2016 | USD | 86,133 | CHF | 85,500 | 30 | ||||||||||||
State Street Bank & Trust Co. | 7/5/2016 | USD | 11,657 | DKK | 77,800 | (3 | ) | |||||||||||
State Street Bank & Trust Co. | 7/5/2016 | USD | 379,720 | EUR | 340,700 | (141 | ) | |||||||||||
State Street Bank & Trust Co. | 7/5/2016 | USD | 82,480 | EUR | 74,000 | (35 | ) | |||||||||||
State Street Bank & Trust Co. | 7/5/2016 | USD | 7,811 | EUR | 7,000 | (12 | ) | |||||||||||
State Street Bank & Trust Co. | 7/5/2016 | USD | 184,744 | GBP | 126,900 | (898 | ) | |||||||||||
State Street Bank & Trust Co. | 7/5/2016 | USD | 43,552 | GBP | 30,000 | (90 | ) | |||||||||||
State Street Bank & Trust Co. | 7/5/2016 | USD | 94,635 | GBP | 65,000 | (466 | ) | |||||||||||
State Street Bank & Trust Co. | 7/5/2016 | USD | 176,712 | HKD | 1,372,000 | (61 | ) | |||||||||||
State Street Bank & Trust Co. | 7/5/2016 | USD | 13,256 | ILS | 51,000 | (10 | ) | |||||||||||
State Street Bank & Trust Co. | 7/5/2016 | USD | 5,715 | ILS | 22,000 | (1 | ) | |||||||||||
State Street Bank & Trust Co. | 7/5/2016 | USD | 40,877 | JPY | 4,528,200 | 69 | ||||||||||||
State Street Bank & Trust Co. | 7/5/2016 | USD | 6,062 | NOK | 50,700 | (2 | ) | |||||||||||
State Street Bank & Trust Co. | 7/5/2016 | USD | 5,201 | NZD | 7,700 | 0 | ||||||||||||
State Street Bank & Trust Co. | 7/5/2016 | USD | 6,587 | PLN | 26,000 | 0 | ||||||||||||
State Street Bank & Trust Co. | 7/5/2016 | USD | 21,819 | SEK | 182,000 | 34 | ||||||||||||
State Street Bank & Trust Co. | 7/5/2016 | USD | 33,169 | SEK | 276,700 | 54 | ||||||||||||
State Street Bank & Trust Co. | 7/5/2016 | USD | 18,875 | SGD | 26,000 | (6 | ) | |||||||||||
State Street Bank & Trust Co. | 7/5/2016 | USD | 14,522 | SGD | 20,000 | (7 | ) | |||||||||||
State Street Bank & Trust Co. | 7/5/2016 | USD | 4,296 | ZAR | 68,000 | (1 | ) | |||||||||||
JP Morgan & Chase Co. | 7/5/2016 | ZAR | 1,624,732 | USD | 102,614 | 14 | ||||||||||||
State Street Bank & Trust Co. | 7/5/2016 | ZAR | 124,000 | USD | 7,851 | 21 | ||||||||||||
State Street Bank & Trust Co. | 7/5/2016 | ZAR | 3,189,000 | USD | 201,415 | 34 | ||||||||||||
The Bank of New York Mellon | 7/5/2016 | ZAR | 8,349,140 | USD | 527,242 | 7 | ||||||||||||
JP Morgan & Chase Co. | 7/6/2016 | BRL | 651,530 | USD | 179,203 | 886 | ||||||||||||
State Street Bank & Trust Co. | 7/6/2016 | BRL | 651,000 | USD | 178,920 | 747 | ||||||||||||
The Bank of New York Mellon | 7/6/2016 | BRL | 2,326,457 | USD | 639,752 | 3,022 | ||||||||||||
Bank of Montreal | 7/6/2016 | CAD | 154,000 | USD | 117,728 | 294 | ||||||||||||
JP Morgan & Chase Co. | 7/6/2016 | CAD | 95,000 | USD | 72,625 | 182 | ||||||||||||
State Street Bank & Trust Co. | 7/6/2016 | CAD | 1,812,900 | USD | 1,385,885 | 3,438 | ||||||||||||
State Street Bank & Trust Co. | 7/6/2016 | CAD | 91,000 | USD | 69,568 | 175 | ||||||||||||
The Bank of Nova Scotia | 7/6/2016 | CAD | 3,826,788 | USD | 2,925,456 | 7,295 | ||||||||||||
Bank of Montreal | 7/6/2016 | CLP | 4,126,000 | USD | 5,953 | 19 | ||||||||||||
JP Morgan & Chase Co. | 7/6/2016 | CLP | 95,944,000 | USD | 138,694 | 688 | ||||||||||||
State Street Bank & Trust Co. | 7/6/2016 | CLP | 48,396,280 | USD | 69,967 | 354 | ||||||||||||
Bank of Montreal | 7/6/2016 | COP | 4,457,000 | USD | 1,433 | 2 | ||||||||||||
JP Morgan & Chase Co. | 7/6/2016 | COP | 124,064,000 | USD | 39,900 | 58 | ||||||||||||
State Street Bank & Trust Co. | 7/6/2016 | COP | 14,418,780 | USD | 4,638 | 7 | ||||||||||||
Bank of Montreal | 7/6/2016 | KRW | 68,934,500 | USD | 57,855 | 57 | ||||||||||||
JP Morgan & Chase Co. | 7/6/2016 | KRW | 1,553,631,000 | USD | 1,304,312 | 1,662 | ||||||||||||
State Street Bank & Trust Co. | 7/6/2016 | KRW | 1,103,075,011 | USD | 926,627 | 1,748 | ||||||||||||
JP Morgan & Chase Co. | 7/6/2016 | RUB | 6,778,000 | USD | 101,849 | 1,219 | ||||||||||||
State Street Bank & Trust Co. | 7/6/2016 | RUB | 10,278,076 | USD | 154,025 | 1,431 | ||||||||||||
Bank of Montreal | 7/6/2016 | TWD | 1,310,500 | USD | 40,398 | 182 | ||||||||||||
| See Notes to Financial Statements. | 54 |
DBX ETF Trust
Schedule of investments
Deutsche X-trackers MSCI All World ex US Hedged Equity ETF (Continued)
May 31, 2016
Counterparty | Settlement Date | Currency To Deliver | Currency To Receive | Unrealized Appreciation (Depreciation) | ||||||||||||||
JP Morgan & Chase Co. | 7/6/2016 | TWD | 22,001,297 | USD | 674,473 | $ | (681 | ) | ||||||||||
State Street Bank & Trust Co. | 7/6/2016 | TWD | 354,000 | USD | 10,854 | (9 | ) | |||||||||||
State Street Bank & Trust Co. | 7/6/2016 | TWD | 30,267,650 | USD | 928,029 | (795 | ) | |||||||||||
State Street Bank & Trust Co. | 7/6/2016 | USD | 103,311 | BRL | 376,000 | (403 | ) | |||||||||||
State Street Bank & Trust Co. | 7/6/2016 | USD | 89,900 | CAD | 117,600 | (223 | ) | |||||||||||
State Street Bank & Trust Co. | 7/6/2016 | USD | 7,129 | CLP | 4,931,000 | (36 | ) | |||||||||||
State Street Bank & Trust Co. | 7/6/2016 | USD | 85,214 | KRW | 101,440,000 | (161 | ) | |||||||||||
State Street Bank & Trust Co. | 7/6/2016 | USD | 4,601 | RUB | 307,000 | (43 | ) | |||||||||||
Bank of Montreal | 7/7/2016 | CZK | 23,100 | USD | 952 | 0 | ||||||||||||
JP Morgan & Chase Co. | 7/7/2016 | CZK | 682,000 | USD | 28,121 | 7 | ||||||||||||
State Street Bank & Trust Co. | 7/7/2016 | CZK | 496,000 | USD | 20,449 | 4 | ||||||||||||
The Bank of New York Mellon | 7/7/2016 | CZK | 44,200 | USD | 1,822 | 0 | ||||||||||||
Bank of Montreal | 7/7/2016 | INR | 1,292,500 | USD | 19,147 | 67 | ||||||||||||
JP Morgan & Chase Co. | 7/7/2016 | INR | 23,679,246 | USD | 350,471 | 918 | ||||||||||||
State Street Bank & Trust Co. | 7/7/2016 | INR | 5,540,740 | USD | 82,000 | 208 | ||||||||||||
State Street Bank & Trust Co. | 7/7/2016 | INR | 25,097,991 | USD | 371,767 | 1,271 | ||||||||||||
Bank of Montreal | 7/7/2016 | PHP | 303,500 | USD | 6,483 | 6 | ||||||||||||
JP Morgan & Chase Co. | 7/7/2016 | PHP | 5,613,000 | USD | 119,951 | 171 | ||||||||||||
State Street Bank & Trust Co. | 7/7/2016 | PHP | 475,000 | USD | 10,150 | 13 | ||||||||||||
State Street Bank & Trust Co. | 7/7/2016 | PHP | 6,304,500 | USD | 134,712 | 175 | ||||||||||||
Bank of Montreal | 7/7/2016 | THB | 293,000 | USD | 8,201 | 5 | ||||||||||||
JP Morgan & Chase Co. | 7/7/2016 | THB | 7,352,000 | USD | 205,896 | 231 | ||||||||||||
State Street Bank & Trust Co. | 7/7/2016 | THB | 2,649,931 | USD | 74,213 | 84 | ||||||||||||
State Street Bank & Trust Co. | 7/7/2016 | THB | 308,000 | USD | 8,620 | 4 | ||||||||||||
Bank of Montreal | 7/8/2016 | MYR | 59,000 | USD | 14,341 | 89 | ||||||||||||
JP Morgan & Chase Co. | 7/8/2016 | MYR | 1,419,000 | USD | 344,551 | 1,801 | ||||||||||||
State Street Bank & Trust Co. | 7/8/2016 | MYR | 707,423 | USD | 171,997 | 1,124 | ||||||||||||
Bank of Montreal | 7/8/2016 | TRY | 23,000 | USD | 7,717 | 4 | ||||||||||||
JP Morgan & Chase Co. | 7/8/2016 | TRY | 366,646 | USD | 123,001 | 45 | ||||||||||||
State Street Bank & Trust Co. | 7/8/2016 | TRY | 408,100 | USD | 136,904 | 46 | ||||||||||||
The Bank of Nova Scotia | 7/8/2016 | TRY | 23,700 | USD | 7,955 | 7 | ||||||||||||
State Street Bank & Trust Co. | 7/8/2016 | USD | 19,937 | MYR | 82,000 | (130 | ) | |||||||||||
State Street Bank & Trust Co. | 7/8/2016 | USD | 23,154 | TRY | 69,000 | (15 | ) | |||||||||||
State Street Bank & Trust Co. | 7/8/2016 | USD | 5,535 | TRY | 16,500 | (2 | ) | |||||||||||
JP Morgan & Chase Co. | 7/11/2016 | AED | 50,000 | USD | 13,610 | (1 | ) | |||||||||||
State Street Bank & Trust Co. | 7/11/2016 | AED | 110,000 | USD | 29,943 | (1 | ) | |||||||||||
The Bank of New York Mellon | 7/11/2016 | AED | 344,300 | USD | 93,725 | 1 | ||||||||||||
State Street Bank & Trust Co. | 7/11/2016 | QAR | 50,000 | USD | 13,724 | 2 | ||||||||||||
The Bank of New York Mellon | 7/11/2016 | QAR | 437,000 | USD | 119,882 | (48 | ) | |||||||||||
State Street Bank & Trust Co. | 7/11/2016 | USD | 13,614 | AED | 50,000 | (3 | ) | |||||||||||
State Street Bank & Trust Co. | 7/11/2016 | USD | 7,686 | QAR | 28,000 | (2 | ) | |||||||||||
JP Morgan & Chase Co. | 7/12/2016 | EGP | 457,000 | USD | 49,877 | 611 | ||||||||||||
The Bank of Nova Scotia | 7/12/2016 | EGP | 375,000 | USD | 41,574 | 1,148 | ||||||||||||
Bank of Montreal | 7/12/2016 | IDR | 137,191,500 | USD | 10,016 | 48 | ||||||||||||
JP Morgan & Chase Co. | 7/12/2016 | IDR | 2,917,359,000 | USD | 212,977 | 1,007 | ||||||||||||
State Street Bank & Trust Co. | 7/12/2016 | IDR | 2,786,758,500 | USD | 203,562 | 1,081 | ||||||||||||
State Street Bank & Trust Co. | 7/12/2016 | USD | 12,985 | IDR | 177,766,000 | (69 | ) | |||||||||||
|
| |||||||||||||||||
Total net unrealized appreciation | $ | 2,081,092 | ||||||||||||||||
|
| |||||||||||||||||
| See Notes to Financial Statements. | 55 |
DBX ETF Trust
Schedule of investments
Deutsche X-trackers MSCI All World ex US Hedged Equity ETF (Continued)
May 31, 2016
Currency Abbreviations
| AED | Arab Emirates Dirham |
| AUD | Australian Dollar |
| BRL | Brazilian Real |
| CAD | Canadian Dollar |
| CHF | Swiss Franc |
| CLP | Chilean Peso |
| COP | Colombian Peso |
| CZK | Czech Kronua |
| DKK | Danish Krone |
| EGP | Egyptian Pound |
| EUR | Euro |
| GBP | Pound Sterling |
| HKD | Hong Kong Dollar |
| HUF | Hungarian Forint |
| IDR | Indonesian Rupiah |
| ILS | Israeli New Sheqel |
| INR | Indian Rupee |
| JPY | Japanese Yen |
| KRW | South Korean Won |
| MXN | Mexican Peso |
| MYR | Malaysian Ringgit |
| NOK | Norwegian Krone |
| NZD | New Zealand Dollar |
| PHP | Phillippine Peso |
| PLN | Polish Zloty |
| QAR | Qatari Rial |
| RUB | Russian Ruble |
| SEK | Swedish Krona |
| SGD | Singapore Dollar |
| THB | Thai Baht |
| TRY | Turkish New Lira |
| TWD | New Taiwan Dollar |
| USD | U.S. Dollar |
| ZAR | South African Rand |
For information on the Fund’s policy and additional disclosures regarding forward foreign currency exchange contracts, please refer to the Derivatives section of Note 2 in the accompanying Notes to Financial Statements.
Fair Value Measurements
Various inputs are used in determining the value of the Fund’s investments. These inputs are summarized in three broad levels. Level 1 includes quoted prices in active markets for identical securities. Level 2 includes other significant observable inputs (including quoted prices for similar securities, interest rates, prepayment speeds and credit risk). Level 3 includes significant unobservable inputs (including the Fund’s own assumptions in determining the fair value of investments). The level assigned to the securities valuations may not be an indication of the risk or liquidity associated with investing in those securities.
The following is a summary of the inputs used as of May 31, 2016 in valuing the Fund’s investments. For information on Fund’s policy regarding the valuation of investments, please refer to the Security Valuation section of Note 2 in the accompanying Notes to Financial Statements.
Assets | Level 1 | Level 2 | Level 3 | Total | ||||||||||||
Common Stocks (g) | $ | 66,518,681 | $ | — | $ | 0 | $ | 66,518,681 | ||||||||
Preferred Stocks (g) | 732,072 | — | — | 732,072 | ||||||||||||
Rights (g) | 6,414 | — | — | 6,414 | ||||||||||||
Short-Term Investments | 2,639,988 | — | — | 2,639,988 | ||||||||||||
Derivatives (h) | — | 2,306,671 | — | 2,306,671 | ||||||||||||
|
|
|
|
|
|
|
| |||||||||
TOTAL | $ | 69,897,155 | $ | 2,306,671 | $ | 0 | $ | 72,203,826 | ||||||||
|
|
|
|
|
|
|
| |||||||||
Liabilities | Level 1 | Level 2 | Level 3 | Total | ||||||||||||
Derivatives (h) | $ | — | $ | (225,579 | ) | $ | — | $ | (225,579 | ) | ||||||
|
|
|
|
|
|
|
| |||||||||
TOTAL | $ | — | $ | (225,579 | ) | $ | — | $ | (225,579 | ) | ||||||
|
|
|
|
|
|
|
| |||||||||
| (g) | See Schedule of investments for additional detailed categorizations. |
| (h) | Derivatives include unrealized appreciation (depreciation) on forward foreign currency exchange contracts. |
During the year ended May 31, 2016, the amount of transfers between Level 3 and Level 1 was $ 10,895. Investments were transferred from Level 3 to Level 1 as a result of the resumption of trading on a securities exchange.
Transfers between price levels are recognized at the beginning of the reporting period.
| See Notes to Financial Statements. | 56 |
DBX ETF Trust
Schedule of investments
Deutsche X-trackers MSCI Asia Pacific ex Japan Hedged Equity ETF
May 31, 2016
Number | Value | |||||||
| COMMON STOCKS — 98.9% | ||||||||
| Australia — 21.4% | ||||||||
AGL Energy Ltd. | 895 | $ | 12,025 | |||||
Alumina Ltd. (a) | 3,413 | 3,490 | ||||||
Amcor Ltd. | 1,372 | 16,143 | ||||||
AMP Ltd. | 3,401 | 13,864 | ||||||
APA Group (b) | 1,416 | 8,975 | ||||||
Aristocrat Leisure Ltd. | 532 | 4,945 | ||||||
Asciano Ltd. | 879 | 5,648 | ||||||
ASX Ltd. | 229 | 7,367 | ||||||
Aurizon Holdings Ltd. | 2,765 | 9,013 | ||||||
AusNet Services | 3,161 | 3,598 | ||||||
Australia & New Zealand Banking Group Ltd. | 3,282 | 60,440 | ||||||
Bank of Queensland Ltd. | 432 | 3,631 | ||||||
Bendigo and Adelaide Bank Ltd. | 518 | 3,834 | ||||||
BHP Billiton Ltd. | 3,654 | 50,389 | ||||||
Boral Ltd. | 843 | 4,143 | ||||||
Brambles Ltd. | 1,808 | 16,792 | ||||||
Caltex Australia Ltd. | 262 | 6,196 | ||||||
Challenger Ltd. | 564 | 3,901 | ||||||
CIMIC Group Ltd. | 140 | 3,784 | ||||||
Coca-Cola Amatil Ltd. | 843 | 5,410 | ||||||
Cochlear Ltd. | 66 | 5,756 | ||||||
Commonwealth Bank of Australia | 1,936 | 108,344 | ||||||
Computershare Ltd. | 573 | 4,448 | ||||||
Crown Resorts Ltd. | 336 | 2,924 | ||||||
CSL Ltd. | 522 | 43,674 | ||||||
Dexus Property Group REIT | 1,160 | 7,260 | ||||||
Domino’s Pizza Enterprises Ltd. | 66 | 3,285 | ||||||
DUET Group (b) | 2,108 | 3,580 | ||||||
Flight Centre Travel Group Ltd. (a) | 46 | 1,051 | ||||||
Fortescue Metals Group Ltd. (a) | 1,930 | 4,157 | ||||||
Goodman Group REIT | 1,924 | 9,887 | ||||||
GPT Group REIT | 2,295 | 8,924 | ||||||
Harvey Norman Holdings Ltd. | 958 | 3,157 | ||||||
Healthscope Ltd. | 2,210 | 4,792 | ||||||
Incitec Pivot Ltd. | 1,934 | 4,822 | ||||||
Insurance Australia Group Ltd. | 2,905 | 12,346 | ||||||
LendLease Group (b) | 516 | 5,009 | ||||||
Macquarie Group Ltd. | 345 | 18,669 | ||||||
Medibank Pvt Ltd. | 4,168 | 9,640 | ||||||
Mirvac Group REIT | 4,045 | 5,686 | ||||||
National Australia Bank Ltd. | 2,965 | 58,181 | ||||||
Newcrest Mining Ltd.* | 908 | 12,515 | ||||||
Oil Search Ltd. | 1,321 | 6,483 | ||||||
Orica Ltd. | 431 | 4,236 | ||||||
Origin Energy Ltd. | 1,842 | 7,602 | ||||||
Platinum Asset Management Ltd. (a) | 139 | 661 | ||||||
Qantas Airways Ltd.* | 698 | 1,554 | ||||||
QBE Insurance Group Ltd. | 1,729 | 15,545 | ||||||
Ramsay Health Care Ltd. | 171 | 8,991 | ||||||
REA Group Ltd. | 37 | 1,497 | ||||||
Santos Ltd. | 1,729 | 5,661 | ||||||
Scentre Group REIT | 6,145 | 20,696 | ||||||
Seek Ltd. | 353 | 4,159 | ||||||
Sonic Healthcare Ltd. | 548 | 8,476 | ||||||
South32 Ltd.* | 6,289 | 7,091 | ||||||
Number | Value | |||||||
| Australia (Continued) | ||||||||
Stockland REIT | 2,732 | $ | 8,945 | |||||
Suncorp Group Ltd. | 1,567 | 14,701 | ||||||
Sydney Airport (b) | 1,486 | 7,604 | ||||||
Tabcorp Holdings Ltd. | 621 | 1,984 | ||||||
Tatts Group Ltd. | 1,459 | 4,155 | ||||||
Telstra Corp. Ltd. | 4,743 | 19,163 | ||||||
TPG Telecom Ltd. | 377 | 3,357 | ||||||
Transurban Group (b) | 2,492 | 21,703 | ||||||
Treasury Wine Estates Ltd. | 995 | 7,436 | ||||||
Vicinity Centres REIT | 4,310 | 10,155 | ||||||
Vocus Communications Ltd. | 439 | 2,986 | ||||||
Wesfarmers Ltd. | 1,247 | 36,619 | ||||||
Westfield Corp. REIT | 2,458 | 19,044 | ||||||
Westpac Banking Corp. | 3,774 | 83,739 | ||||||
Woodside Petroleum Ltd. | 755 | 14,952 | ||||||
Woolworths Ltd. | 1,433 | 22,910 | ||||||
|
| |||||||
| 953,800 | ||||||||
|
| |||||||
| China — 18.5% | ||||||||
3SBio, Inc., 144A* | 1,700 | 1,656 | ||||||
58.com, Inc., ADR* | 46 | 2,486 | ||||||
AAC Technologies Holdings, Inc. | 1,041 | 8,426 | ||||||
Agricultural Bank of China Ltd., Class H | 25,380 | 9,276 | ||||||
Air China Ltd., Class H | 1,467 | 970 | ||||||
Alibaba Group Holding Ltd., ADR*(a) | 562 | 46,084 | ||||||
Aluminum Corp. of China Ltd., Class H* | 6,222 | 1,882 | ||||||
Anhui Conch Cement Co. Ltd., Class H | 1,689 | 4,086 | ||||||
Anta Sports Products Ltd. | 1,935 | 4,208 | ||||||
AviChina Industry & Technology Co. Ltd., Class H | 3,428 | 2,409 | ||||||
Baidu, Inc., ADR* | 154 | 27,495 | ||||||
Bank of China Ltd., Class H | 79,629 | 32,381 | ||||||
Bank of Communications Co. Ltd., Class H* | 5,494 | 3,401 | ||||||
Beijing Capital International Airport Co. Ltd., Class H | 3,515 | 3,786 | ||||||
Belle International Holdings Ltd. | 8,337 | 4,892 | ||||||
BYD Co. Ltd., Class H* | 737 | 4,263 | ||||||
CGN Power Co. Ltd., Class H, 144A | 9,850 | 2,991 | ||||||
China Cinda Asset Management Co. Ltd., Class H | 8,594 | 2,809 | ||||||
China CITIC Bank Corp. Ltd., Class H | 4,994 | 2,931 | ||||||
China Communications Construction Co. Ltd., Class H | 5,832 | 6,604 | ||||||
China Communications Services Corp. Ltd., Class H | 3,204 | 1,505 | ||||||
China Conch Venture Holdings Ltd.* | 1,420 | 2,862 | ||||||
China Construction Bank Corp., Class H | 85,183 | 54,920 | ||||||
China COSCO Holdings Co. Ltd., Class H* | 3,703 | 1,330 | ||||||
China Everbright Bank Co. Ltd., Class H* | 5,450 | 2,343 | ||||||
China Galaxy Securities Co. Ltd., Class H (a) | 3,090 | 2,724 | ||||||
China Huishan Dairy Holdings Co. Ltd. (a) | 10,899 | 4,292 | ||||||
China Life Insurance Co. Ltd., Class H | 7,345 | 16,428 | ||||||
China Longyuan Power Group Corp. Ltd., Class H | 5,412 | 3,719 | ||||||
China Medical System Holdings Ltd. | 2,248 | 3,217 | ||||||
China Mengniu Dairy Co. Ltd. (a) | 3,986 | 6,597 | ||||||
China Merchants Bank Co. Ltd., Class H | 4,369 | 8,962 | ||||||
| See Notes to Financial Statements. | 57 |
DBX ETF Trust
Schedule of investments
Deutsche X-trackers MSCI Asia Pacific ex Japan Hedged Equity ETF (Continued)
May 31, 2016
Number | Value | |||||||
| China (Continued) | ||||||||
China Minsheng Banking Corp. Ltd., Class H | 7,064 | $ | 6,654 | |||||
China National Building Material Co. Ltd., Class H | 1,811 | 823 | ||||||
China Oilfield Services Ltd., Class H | 2,283 | 1,736 | ||||||
China Pacific Insurance Group Co. Ltd., Class H* | 2,899 | 9,905 | ||||||
China Petroleum & Chemical Corp., Class H | 31,267 | 21,326 | ||||||
China Railway Construction Corp. Ltd., Class H | 2,892 | 3,614 | ||||||
China Railway Group Ltd., Class H | 3,185 | 2,447 | ||||||
China Shenhua Energy Co. Ltd., Class H | 3,984 | 6,327 | ||||||
China Shipping Container Lines Co. Ltd., Class H* | 2,124 | 462 | ||||||
China Southern Airlines Co. Ltd., Class H | 1,598 | 938 | ||||||
China Telecom Corp. Ltd., Class H | 16,419 | 7,649 | ||||||
China Vanke Co. Ltd., Class H | 1,932 | 4,605 | ||||||
Chongqing Rural Commercial Bank Co. Ltd., Class H | 1,152 | 590 | ||||||
CITIC Securities Co. Ltd., Class H (a) | 1,904 | 4,126 | ||||||
CNOOC Ltd. | 17,713 | 21,153 | ||||||
Country Garden Holdings Co. Ltd. | 7,878 | 3,153 | ||||||
CRRC Corp. Ltd., Class H (a) | 4,123 | 3,921 | ||||||
CSPC Pharmaceutical Group Ltd.* | 6,259 | 5,703 | ||||||
Ctrip.com International, Ltd., ADR*(a) | 203 | 9,289 | ||||||
Dalian Wanda Commercial Properties Co. Ltd., Class H, 144A | 448 | 2,839 | ||||||
Dongfeng Motor Group Co. Ltd., Class H | 3,989 | 4,446 | ||||||
ENN Energy Holdings Ltd. | 1,149 | 5,700 | ||||||
Evergrande Real Estate Group Ltd. | 5,015 | 3,356 | ||||||
Fosun International Ltd. | 3,307 | 4,698 | ||||||
Geely Automobile Holdings Ltd. | 7,634 | 4,038 | ||||||
GF Securities Co. Ltd., Class H* | 1,262 | 2,923 | ||||||
GOME Electrical Appliances Holding Ltd. (a) | 10,737 | 1,285 | ||||||
Great Wall Motor Co. Ltd., Class H | 3,605 | 2,774 | ||||||
Guangzhou Automobile Group Co. Ltd., Class H | 3,989 | 4,564 | ||||||
Guangzhou R&F Properties Co. Ltd., Class H | 1,831 | 2,432 | ||||||
Haitian International Holdings Ltd. | 797 | 1,280 | ||||||
Haitong Securities Co. Ltd., Class H (a) | 2,948 | 4,818 | ||||||
Hengan International Group Co. Ltd. | 1,051 | 9,481 | ||||||
Huadian Power International Corp. Ltd., Class H* | 3,194 | 1,693 | ||||||
Huaneng Power International, Inc., Class H | 5,188 | 3,545 | ||||||
Huaneng Renewables Corp. Ltd., Class H | 3,599 | 1,093 | ||||||
Huatai Securities Co. Ltd., Class H, 144A*(a) | 1,478 | 3,100 | ||||||
Industrial & Commercial Bank of China Ltd., Class H | 81,212 | 43,058 | ||||||
JD.com, Inc., ADR*(a) | 436 | 10,730 | ||||||
Jiangsu Expressway Co. Ltd., Class H | 2,916 | 3,993 | ||||||
Jiangxi Copper Co. Ltd., Class H | 1,722 | 1,850 | ||||||
Kingsoft Corp. Ltd. | 871 | 1,663 | ||||||
Lenovo Group Ltd. (a) | 8,633 | 5,299 | ||||||
Longfor Properties Co. Ltd. | 2,280 | 3,081 | ||||||
Luye Pharma Group Ltd.* | 2,966 | 1,832 | ||||||
NetEase, Inc., ADR | 51 | 9,070 | ||||||
Number | Value | |||||||
| China (Continued) | ||||||||
New China Life Insurance Co. Ltd., Class H | 722 | $ | 2,471 | |||||
New Oriental Education & Technology Group, Inc., ADR | 100 | 4,225 | ||||||
People’s Insurance Co. (Group) of China Ltd., Class H | 7,207 | 2,884 | ||||||
PetroChina Co. Ltd., Class H | 23,225 | 15,960 | ||||||
PICC Property & Casualty Co. Ltd., Class H | 4,729 | 8,629 | ||||||
Ping An Insurance Group Co. of China Ltd., Class H | 5,429 | 24,243 | ||||||
Qihoo 360 Technology Co. Ltd., ADR* | 61 | 4,532 | ||||||
Qunar Cayman Islands Ltd., ADR* | 23 | 747 | ||||||
Semiconductor Manufacturing International Corp.* | 31,072 | 2,599 | ||||||
Shandong Weigao Group Medical Polymer Co. Ltd., Class H | 4,184 | 2,401 | ||||||
Shanghai Electric Group Co. Ltd., Class H*(a) | 4,999 | 2,149 | ||||||
Shanghai Fosun Pharmaceutical Group Co. Ltd., Class H | 831 | 2,160 | ||||||
Shanghai Pharmaceuticals Holding Co. Ltd., Class H | 1,294 | 2,794 | ||||||
Shenzhou International Group Holdings Ltd. | 1,095 | 5,510 | ||||||
Sino-Ocean Land Holdings Ltd. | 2,154 | 873 | ||||||
Sinopec Engineering Group Co. Ltd., Class H | 3,324 | 2,917 | ||||||
Sinopec Shanghai Petrochemical Co. Ltd., Class H* | 6,532 | 3,194 | ||||||
Sinopharm Group Co. Ltd., Class H | 1,653 | 7,658 | ||||||
Sinotrans Ltd., Class H | 2,332 | 1,005 | ||||||
Soho China Ltd. | 4,738 | 2,079 | ||||||
SouFun Holdings Ltd., ADR* | 148 | 804 | ||||||
Sunac China Holdings Ltd. | 2,320 | 1,442 | ||||||
TAL Education Group, ADR* | 35 | 1,870 | ||||||
Tencent Holdings Ltd. | 6,446 | 143,756 | ||||||
Tingyi Cayman Islands Holding Corp. (a) | 2,687 | 2,441 | ||||||
TravelSky Technology Ltd., Class H | 1,055 | 1,999 | ||||||
Tsingtao Brewery Co. Ltd., Class H | 1,114 | 4,007 | ||||||
Vipshop Holdings Ltd., ADR* | 248 | 2,894 | ||||||
Want Want China Holdings Ltd. (a) | 9,263 | 6,556 | ||||||
Weichai Power Co. Ltd., Class H | 1,995 | 2,331 | ||||||
Yangzijiang Shipbuilding Holdings Ltd. | 3,202 | 2,128 | ||||||
Yanzhou Coal Mining Co. Ltd., Class H | 315 | 169 | ||||||
YY, Inc., ADR* | 19 | 826 | ||||||
Zhejiang Expressway Co. Ltd., Class H | 2,697 | 2,527 | ||||||
Zhuzhou CRRC Times Electric Co. Ltd. | 696 | 3,896 | ||||||
Zijin Mining Group Co. Ltd., Class H | 11,877 | 3,424 | ||||||
ZTE Corp., Class H | 1,127 | 1,479 | ||||||
|
| |||||||
| 822,576 | ||||||||
|
| |||||||
| Hong Kong — 13.9% | ||||||||
AIA Group Ltd. | 13,711 | 80,194 | ||||||
Alibaba Health Information Technology Ltd.* | 3,285 | 2,397 | ||||||
Alibaba Pictures Group Ltd.*(a) | 12,967 | 3,054 | ||||||
ASM Pacific Technology Ltd. | 420 | 3,086 | ||||||
Bank of East Asia Ltd. | 1,148 | 4,233 | ||||||
| See Notes to Financial Statements. | 58 |
DBX ETF Trust
Schedule of investments
Deutsche X-trackers MSCI Asia Pacific ex Japan Hedged Equity ETF (Continued)
May 31, 2016
Number | Value | |||||||
| Hong Kong (Continued) | ||||||||
Beijing Enterprises Holdings Ltd. | 992 | $ | 5,157 | |||||
Beijing Enterprises Water Group Ltd. | 7,105 | 4,563 | ||||||
BOC Hong Kong (Holdings) Ltd. | 3,985 | 12,256 | ||||||
Brilliance China Automotive Holdings Ltd. (a) | 3,941 | 3,829 | ||||||
Cathay Pacific Airways Ltd. | 1,088 | 1,703 | ||||||
Cheung Kong Infrastructure Holdings Ltd. | 670 | 6,268 | ||||||
Cheung Kong Property Holdings Ltd. | 3,029 | 18,964 | ||||||
China Everbright International Ltd. | 3,534 | 3,788 | ||||||
China Everbright Ltd. | 1,132 | 2,173 | ||||||
China Gas Holdings Ltd. | 3,086 | 4,368 | ||||||
China Jinmao Holdings Group Ltd. | 7,239 | 2,087 | ||||||
China Merchants Holdings International Co. Ltd. | 1,911 | 5,459 | ||||||
China Mobile Ltd. | 7,174 | 81,796 | ||||||
China Overseas Land & Investment Ltd. | 4,557 | 13,693 | ||||||
China Power International Development Ltd. | 2,179 | 920 | ||||||
China Resources Beer Holdings Co. Ltd. | 1,970 | 4,269 | ||||||
China Resources Gas Group Ltd. | 1,734 | 4,853 | ||||||
China Resources Land Ltd. | 2,392 | 5,719 | ||||||
China Resources Power Holdings Co. Ltd. | 3,394 | 5,329 | ||||||
China State Construction International Holdings Ltd. | 2,715 | 3,476 | ||||||
China Taiping Insurance Holdings Co. Ltd.* | 1,485 | 2,874 | ||||||
China Unicom Ltd. | 6,809 | 7,352 | ||||||
CITIC Ltd. (a) | 3,995 | 5,799 | ||||||
CK Hutchison Holdings Ltd. | 3,123 | 36,251 | ||||||
CLP Holdings Ltd. | 1,894 | 17,866 | ||||||
COSCO Pacific Ltd. | 1,596 | 1,614 | ||||||
Far East Horizon Ltd. | 2,992 | 2,268 | ||||||
First Pacific Co. Ltd. | 1,995 | 1,309 | ||||||
Galaxy Entertainment Group Ltd. (a) | 2,592 | 8,706 | ||||||
GCL-Poly Energy Holdings Ltd. | 11,663 | 1,666 | ||||||
Guangdong Investment Ltd. | 5,234 | 7,382 | ||||||
Haier Electronics Group Co. Ltd. | 1,586 | 2,563 | ||||||
Hanergy Thin Film Power Group Ltd.* | 36,273 | 0 | ||||||
Hang Lung Properties Ltd. | 2,786 | 5,321 | ||||||
Hang Seng Bank Ltd. | 919 | 16,309 | ||||||
Henderson Land Development Co. Ltd. | 1,313 | 7,967 | ||||||
HKT Trust and HKT Ltd. (b) | 2,822 | 4,089 | ||||||
Hong Kong and China Gas Co. Ltd. | 7,590 | 14,573 | ||||||
Hong Kong Exchanges & Clearing Ltd. | 1,293 | 30,949 | ||||||
Hongkong Land Holdings Ltd. | 300 | 1,812 | ||||||
Hysan Development Co. Ltd. | 842 | 3,630 | ||||||
Jardine Matheson Holdings Ltd. | 200 | 11,400 | ||||||
Kerry Properties Ltd. | 848 | 2,119 | ||||||
Kunlun Energy Co. Ltd. | 4,817 | 3,943 | ||||||
Li & Fung Ltd. | 7,063 | 3,599 | ||||||
Link REIT | 2,701 | 16,597 | ||||||
Melco Crown Entertainment Ltd., ADR | 111 | 1,606 | ||||||
MTR Corp. Ltd. | 1,587 | 7,526 | ||||||
New World Development Co. Ltd. | 6,296 | 5,947 | ||||||
Nine Dragons Paper Holdings Ltd. | 1,997 | 1,444 | ||||||
Noble Group Ltd.* | 6,852 | 1,468 | ||||||
NWS Holdings Ltd. | 1,208 | 1,906 | ||||||
PCCW Ltd. | 3,018 | 1,969 | ||||||
Number | Value | |||||||
| Hong Kong (Continued) | ||||||||
Power Assets Holdings Ltd. | 1,606 | $ | 15,573 | |||||
Shanghai Industrial Holdings Ltd. | 336 | 758 | ||||||
Shangri-La Asia Ltd. | 792 | 904 | ||||||
Shimao Property Holdings Ltd. | 1,407 | 1,782 | ||||||
Sino Biopharmaceutical Ltd. | 8,185 | 5,551 | ||||||
Sino Land Co. Ltd. | 3,678 | 5,632 | ||||||
SJM Holdings Ltd. | 3,040 | 1,948 | ||||||
Sun Art Retail Group Ltd. | 5,048 | 3,177 | ||||||
Sun Hung Kai Properties Ltd. | 1,757 | 20,666 | ||||||
Swire Pacific Ltd., Class A | 598 | 6,449 | ||||||
Swire Properties Ltd. | 1,236 | 3,380 | ||||||
Techtronic Industries Co. Ltd. | 1,639 | 6,591 | ||||||
WH Group Ltd., 144A | 7,712 | 5,935 | ||||||
Wharf Holdings Ltd. | 1,607 | 8,696 | ||||||
Wheelock & Co. Ltd. | 1,088 | 4,900 | ||||||
Yue Yuen Industrial (Holdings) Ltd. | 912 | 3,439 | ||||||
|
| |||||||
| 618,839 | ||||||||
|
| |||||||
| India — 5.4% | ||||||||
Axis Bank Ltd. GDR | 1,000 | 38,750 | ||||||
Dr. Reddy’s Laboratories Ltd., ADR | 219 | 10,328 | ||||||
ICICI Bank Ltd., ADR | 7,276 | 52,314 | ||||||
Infosys Ltd., ADR (a) | 1,193 | 23,192 | ||||||
Larsen & Toubro Ltd., GDR | 1,512 | 32,961 | ||||||
Reliance Industries Ltd., GDR, 144A | 1,374 | 39,022 | ||||||
Tata Motors Ltd., ADR*(a) | 769 | 25,754 | ||||||
Wipro Ltd., ADR | 1,687 | 20,261 | ||||||
|
| |||||||
| 242,582 | ||||||||
|
| |||||||
| Indonesia — 2.6% | ||||||||
PT Adaro Energy Tbk | 234 | 12 | ||||||
PT AKR Corporindo Tbk | 1,439 | 674 | ||||||
PT Astra International Tbk | 24,446 | 11,811 | ||||||
PT Bank Central Asia Tbk | 14,275 | 13,585 | ||||||
PT Bank Danamon Indonesia Tbk | 3,768 | 905 | ||||||
PT Bank Mandiri Persero Tbk | 9,668 | 6,388 | ||||||
PT Bank Negara Indonesia Persero Tbk | 7,269 | 2,554 | ||||||
PT Bank Rakyat Indonesia Persero Tbk | 11,584 | 8,777 | ||||||
PT Bumi Serpong Damai Tbk | 8,508 | 1,140 | ||||||
PT Charoen Pokphand Indonesia Tbk | 7,063 | 1,810 | ||||||
PT Global Mediacom Tbk | 13,964 | 1,017 | ||||||
PT Gudang Garam Tbk | 628 | 3,181 | ||||||
PT Hanjaya Mandala Sampoerna Tbk | 443 | 3,081 | ||||||
PT Indocement Tunggal Prakarsa Tbk | 2,877 | 3,507 | ||||||
PT Indofood CBP Sukses Makmur Tbk* | 2,630 | 3,119 | ||||||
PT Indofood Sukses Makmur Tbk* | 4,467 | 2,265 | ||||||
PT Jasa Marga Persero Tbk | 4,658 | 1,841 | ||||||
PT Kalbe Farma Tbk* | 30,802 | 3,224 | ||||||
PT Lippo Karawaci Tbk | 29,202 | 2,042 | ||||||
PT Matahari Department Store Tbk | 3,690 | 5,126 | ||||||
PT Media Nusantara Citra Tbk | 4,923 | 757 | ||||||
PT Perusahaan Gas Negara Persero Tbk | 15,646 | 2,841 | ||||||
PT Semen Indonesia Persero Tbk | 5,035 | 3,317 | ||||||
PT Summarecon Agung Tbk | 7,040 | 825 | ||||||
PT Surya Citra Media Tbk | 8,257 | 2,025 | ||||||
PT Telekomunikasi Indonesia Persero Tbk | 65,233 | 17,669 | ||||||
PT Tower Bersama Infrastructure Tbk | 3,933 | 1,915 | ||||||
PT Unilever Indonesia Tbk | 2,611 | 8,238 | ||||||
| See Notes to Financial Statements. | 59 |
DBX ETF Trust
Schedule of investments
Deutsche X-trackers MSCI Asia Pacific ex Japan Hedged Equity ETF (Continued)
May 31, 2016
Number | Value | |||||||
| Indonesia (Continued) | ||||||||
PT United Tractors Tbk | 1,322 | $ | 1,374 | |||||
PT Waskita Karya Persero Tbk | 3,800 | 698 | ||||||
PT XL Axiata Tbk* | 7,701 | 1,990 | ||||||
|
| |||||||
| 117,708 | ||||||||
|
| |||||||
| Ireland — 0.2% | ||||||||
James Hardie Industries PLC CDI (c) | 522 | 7,953 | ||||||
|
| |||||||
| Macau — 0.3% | ||||||||
MGM China Holdings Ltd. | 1,045 | 1,504 | ||||||
Sands China Ltd. | 2,681 | 10,281 | ||||||
Wynn Macau Ltd. | 1,695 | 2,652 | ||||||
|
| |||||||
| 14,437 | ||||||||
|
| |||||||
| Malaysia — 3.0% | ||||||||
Alliance Financial Group Bhd | 1,976 | 1,938 | ||||||
AMMB Holdings Bhd | 3,100 | 3,236 | ||||||
Astro Malaysia Holdings Bhd | 1,400 | 936 | ||||||
Axiata Group Bhd | 1,600 | 2,023 | ||||||
Berjaya Sports Toto Bhd | 2,995 | 2,212 | ||||||
British American Tobacco Malaysia Bhd | 350 | 4,243 | ||||||
CIMB Group Holdings Bhd | 1,050 | 1,116 | ||||||
Dialog Group Bhd | 1,000 | 375 | ||||||
DiGi.Com Bhd | 5,502 | 5,970 | ||||||
Felda Global Ventures Holdings Bhd | 1,727 | 573 | ||||||
Gamuda Bhd | 400 | 465 | ||||||
Genting Bhd | 1,800 | 3,644 | ||||||
Genting Malaysia Bhd | 5,953 | 6,358 | ||||||
Genting Plantations Bhd | 100 | 252 | ||||||
Hap Seng Consolidated Bhd | 400 | 754 | ||||||
Hartalega Holdings Bhd | 1,500 | 1,515 | ||||||
Hong Leong Bank Bhd | 1,351 | 4,371 | ||||||
Hong Leong Financial Group Bhd | 625 | 2,252 | ||||||
IHH Healthcare Bhd | 4,676 | 7,316 | ||||||
IJM Corp. Bhd | 1,900 | 1,606 | ||||||
IOI Corp. Bhd | 1,900 | 1,905 | ||||||
IOI Properties Group Bhd | 2,300 | 1,354 | ||||||
Kuala Lumpur Kepong Bhd | 800 | 4,464 | ||||||
Lafarge Malaysia Bhd | 1,200 | 2,308 | ||||||
Malayan Banking Bhd | 5,327 | 10,528 | ||||||
Malaysia Airports Holdings Bhd | 1,325 | 2,051 | ||||||
Maxis Bhd | 3,401 | 4,530 | ||||||
MISC Bhd | 1,725 | 3,225 | ||||||
Petronas Chemicals Group Bhd | 2,500 | 3,984 | ||||||
Petronas Dagangan Bhd | 300 | 1,703 | ||||||
Petronas Gas Bhd | 1,175 | 6,158 | ||||||
PPB Group Bhd | 400 | 1,581 | ||||||
Public Bank Bhd | 3,626 | 16,791 | ||||||
Sime Darby Bhd | 4,228 | 7,588 | ||||||
Telekom Malaysia Bhd | 2,251 | 3,669 | ||||||
Tenaga Nasional Bhd | 1,000 | 3,386 | ||||||
UMW Holdings Bhd | 1,876 | 2,263 | ||||||
Westports Holdings Bhd | 1,300 | 1,366 | ||||||
YTL Power International Bhd | 6,131 | 2,153 | ||||||
|
| |||||||
| 132,162 | ||||||||
|
| |||||||
| New Zealand — 0.8% | ||||||||
Auckland International Airport Ltd. | 1,834 | 7,743 | ||||||
Contact Energy Ltd. | 1,846 | 6,732 | ||||||
Number | Value | |||||||
| New Zealand (Continued) | ||||||||
Fletcher Building Ltd. | 990 | $ | 5,995 | |||||
Mighty River Power Ltd. | 1,992 | 4,003 | ||||||
Ryman Healthcare Ltd. | 865 | 5,619 | ||||||
Spark New Zealand Ltd. | 1,751 | 4,383 | ||||||
|
| |||||||
| 34,475 | ||||||||
|
| |||||||
| Philippines — 1.9% | ||||||||
Aboitiz Equity Ventures, Inc. | 5,037 | 8,509 | ||||||
Aboitiz Power Corp. | 3,950 | 3,885 | ||||||
Ayala Corp. | 245 | 4,435 | ||||||
Ayala Land, Inc. | 6,426 | 4,906 | ||||||
Bank of the Philippine Islands | 2,698 | 5,322 | ||||||
BDO Unibank, Inc. | 1,350 | 2,916 | ||||||
DMCI Holdings Inc. | 6,600 | 1,792 | ||||||
Energy Development Corp. | 18,100 | 2,187 | ||||||
Globe Telecom, Inc. | 55 | 2,834 | ||||||
GT Capital Holdings, Inc. | 100 | 2,983 | ||||||
International Container Terminal Services, Inc. | 2,083 | 2,519 | ||||||
JG Summit Holdings, Inc. | 2,860 | 5,052 | ||||||
Jollibee Foods Corp. | 1,268 | 6,383 | ||||||
Metro Pacific Investments Corp. | 16,600 | 2,140 | ||||||
Metropolitan Bank & Trust Co. | 310 | 577 | ||||||
Philippine Long Distance Telephone Co. | 155 | 6,297 | ||||||
Robinsons Land Corp. | 1,200 | 744 | ||||||
Security Bank Corp. | 400 | 1,736 | ||||||
SM Investments Corp. | 125 | 2,513 | ||||||
SM Prime Holdings, Inc. | 18,357 | 9,421 | ||||||
Universal Robina Corp. | 1,890 | 7,881 | ||||||
|
| |||||||
| 85,032 | ||||||||
|
| |||||||
| Singapore — 3.9% | ||||||||
Ascendas Real Estate Investment Trust REIT | 2,650 | 4,407 | ||||||
CapitaLand Commercial Trust REIT | 2,850 | 2,877 | ||||||
CapitaLand Ltd. | 3,451 | 7,493 | ||||||
CapitaLand Mall Trust REIT | 2,901 | 4,276 | ||||||
City Developments Ltd. | 650 | 3,866 | ||||||
ComfortDelGro Corp. Ltd. | 1,800 | 3,581 | ||||||
DBS Group Holdings Ltd. | 1,900 | 21,385 | ||||||
Genting Singapore PLC | 5,803 | 3,118 | ||||||
Global Logistic Properties Ltd. | 4,101 | 5,390 | ||||||
Golden Agri-Resources Ltd. | 10,303 | 2,918 | ||||||
Hutchison Port Holdings Trust, Class U | 6,852 | 2,946 | ||||||
Jardine Cycle & Carriage Ltd. | 200 | 4,909 | ||||||
Keppel Corp. Ltd. | 2,000 | 7,814 | ||||||
Oversea-Chinese Banking Corp. Ltd. | 3,050 | 19,092 | ||||||
Sembcorp Industries Ltd. | 950 | 1,925 | ||||||
Sembcorp Marine Ltd. (a) | 950 | 1,069 | ||||||
Singapore Airlines Ltd. | 300 | 2,327 | ||||||
Singapore Exchange Ltd. | 1,050 | 5,909 | ||||||
Singapore Press Holdings Ltd. (a) | 1,050 | 2,943 | ||||||
Singapore Technologies Engineering Ltd. | 2,150 | 5,043 | ||||||
Singapore Telecommunications Ltd. | 8,803 | 24,739 | ||||||
StarHub Ltd. | 500 | 1,282 | ||||||
Suntec Real Estate Investment Trust REIT | 800 | 967 | ||||||
United Overseas Bank Ltd. | 1,600 | 21,169 | ||||||
UOL Group Ltd. | 850 | 3,506 | ||||||
| See Notes to Financial Statements. | 60 |
DBX ETF Trust
Schedule of investments
Deutsche X-trackers MSCI Asia Pacific ex Japan Hedged Equity ETF (Continued)
May 31, 2016
Number | Value | |||||||
| Singapore (Continued) | ||||||||
Wilmar International Ltd. | 2,850 | $ | 6,871 | |||||
|
| |||||||
| 171,822 | ||||||||
|
| |||||||
| South Korea — 13.4% | ||||||||
Amorepacific Corp. | 42 | 14,713 | ||||||
AMOREPACIFIC Group | 41 | 5,745 | ||||||
BGF Retail Co. Ltd. | 14 | 2,578 | ||||||
BNK Financial Group, Inc. | 321 | 2,357 | ||||||
Celltrion, Inc.* | 94 | 7,816 | ||||||
Cheil Worldwide, Inc. | 150 | 2,045 | ||||||
CJ CheilJedang Corp. | 8 | 2,568 | ||||||
CJ Corp. | 20 | 3,642 | ||||||
CJ E&M Corp. | 25 | 1,580 | ||||||
CJ Korea Express Corp.* | 5 | 898 | ||||||
Coway Co. Ltd. | 69 | 5,963 | ||||||
Daelim Industrial Co. Ltd. | 19 | 1,296 | ||||||
Daewoo Engineering & Construction Co. Ltd.* | 20 | 98 | ||||||
DGB Financial Group, Inc. | 235 | 1,828 | ||||||
Dongbu Insurance Co. Ltd. | 74 | 4,526 | ||||||
Dongsuh Cos., Inc. | 48 | 1,341 | ||||||
Doosan Heavy Industries & Construction Co. Ltd. | 33 | 671 | ||||||
E-MART, Inc. | 31 | 4,734 | ||||||
GS Engineering & Construction Corp.* | 79 | 1,962 | ||||||
GS Holdings | 27 | 1,187 | ||||||
GS Retail Co. Ltd. | 33 | 1,465 | ||||||
Hana Financial Group, Inc. | 346 | 7,505 | ||||||
Hankook Tire Co. Ltd. | 82 | 3,523 | ||||||
Hanmi Pharm. Co. Ltd. | 7 | 3,718 | ||||||
Hanmi Science Co. Ltd. | 16 | 2,067 | ||||||
Hanon Systems | 229 | 2,373 | ||||||
Hanssem Co. Ltd. | 13 | 2,013 | ||||||
Hanwha Chemical Corp. | 185 | 3,702 | ||||||
Hanwha Corp. | 68 | 2,197 | ||||||
Hanwha Life Insurance Co. Ltd. | 260 | 1,394 | ||||||
Hotel Shilla Co. Ltd. | 38 | 2,101 | ||||||
Hyosung Corp. | 34 | 3,352 | ||||||
Hyundai Department Store Co. Ltd. | 17 | 1,890 | ||||||
Hyundai Development Co.-Engineering & Construction | 41 | 1,541 | ||||||
Hyundai Engineering & Construction Co. Ltd. | 42 | 1,205 | ||||||
Hyundai Glovis Co. Ltd. | 23 | 3,512 | ||||||
Hyundai Heavy Industries Co. Ltd.* | 36 | 3,308 | ||||||
Hyundai Marine & Fire Insurance Co. Ltd. | 105 | 2,784 | ||||||
Hyundai Mobis Co. Ltd. | 77 | 16,475 | ||||||
Hyundai Motor Co. | 161 | 18,845 | ||||||
Hyundai Steel Co. | 127 | 5,211 | ||||||
Hyundai Wia Corp. | 18 | 1,399 | ||||||
Industrial Bank of Korea | 331 | 3,166 | ||||||
Kakao Corp. | 32 | 2,760 | ||||||
Kangwon Land, Inc. | 139 | 4,963 | ||||||
KB Financial Group, Inc. | 445 | 12,732 | ||||||
KCC Corp. | 3 | 1,018 | ||||||
KEPCO Plant Service & Engineering Co. Ltd. | 34 | 2,006 | ||||||
Kia Motors Corp. | 316 | 12,369 | ||||||
Number | Value | |||||||
| South Korea (Continued) | ||||||||
Korea Aerospace Industries Ltd. | 75 | $ | 4,210 | |||||
Korea Electric Power Corp. | 334 | 17,628 | ||||||
Korea Investment Holdings Co. Ltd. | 44 | 1,648 | ||||||
Korea Zinc Co. Ltd. | 14 | 5,515 | ||||||
Korean Air Lines Co. Ltd.* | 22 | 511 | ||||||
KT Corp. | 80 | 2,155 | ||||||
KT&G Corp. | 149 | 15,940 | ||||||
Kumho Petrochemical Co. Ltd. | 28 | 1,499 | ||||||
LG Chem Ltd. | 60 | 13,643 | ||||||
LG Corp. | 83 | 4,589 | ||||||
LG Display Co. Ltd. | 222 | 4,806 | ||||||
LG Electronics, Inc. | 116 | 5,460 | ||||||
LG Household & Health Care Ltd. | 13 | 11,519 | ||||||
LG Innotek Co. Ltd. | 12 | 875 | ||||||
LG Uplus Corp. | 353 | 3,421 | ||||||
Lotte Chemical Corp. | 24 | 5,719 | ||||||
Lotte Chilsung Beverage Co. Ltd. | 1 | 1,630 | ||||||
Lotte Confectionery Co. Ltd. | 3 | 546 | ||||||
Lotte Shopping Co. Ltd. | 12 | 2,301 | ||||||
MIRAE ASSET DAEWOO Co. Ltd. | 164 | 1,091 | ||||||
Mirae Asset Securities Co. Ltd. | 72 | 1,417 | ||||||
NAVER Corp. | 33 | 19,936 | ||||||
NCSoft Corp. | 24 | 4,843 | ||||||
NH Investment & Securities Co. Ltd. | 114 | 869 | ||||||
OCI Co. Ltd.* | 17 | 1,396 | ||||||
Orion Corp. | 5 | 4,069 | ||||||
Ottogi Corp. | 2 | 1,423 | ||||||
Paradise Co. Ltd. | 97 | 1,408 | ||||||
POSCO | 93 | 16,231 | ||||||
POSCO Daewoo Corp. | 31 | 614 | ||||||
S-1 Corp. | 33 | 2,769 | ||||||
Samsung C&T Corp. | 95 | 9,565 | ||||||
Samsung Card Co. Ltd. | 60 | 1,931 | ||||||
Samsung Electro-Mechanics Co. Ltd. | 57 | 2,497 | ||||||
Samsung Electronics Co. Ltd. | 117 | 126,837 | ||||||
Samsung Fire & Marine Insurance Co. Ltd. | 43 | 10,030 | ||||||
Samsung Heavy Industries Co. Ltd.* | 15 | 120 | ||||||
Samsung Life Insurance Co. Ltd. | 96 | 8,377 | ||||||
Samsung SDI Co. Ltd. | 49 | 4,625 | ||||||
Samsung SDS Co. Ltd. | 35 | 5,374 | ||||||
Samsung Securities Co. Ltd. | 61 | 1,825 | ||||||
Shinhan Financial Group Co. Ltd. | 515 | 17,090 | ||||||
Shinsegae Co. Ltd. | 8 | 1,393 | ||||||
SK Holdings Co. Ltd. | 49 | 9,415 | ||||||
SK Hynix, Inc. | 673 | 16,207 | ||||||
SK Innovation Co. Ltd. | 68 | 9,329 | ||||||
SK Networks Co. Ltd. | 72 | 373 | ||||||
SK Telecom Co. Ltd. | 23 | 4,284 | ||||||
S-Oil Corp. | 36 | 2,595 | ||||||
Woori Bank | 395 | 3,298 | ||||||
Yuhan Corp. | 10 | 2,660 | ||||||
|
| |||||||
| 595,648 | ||||||||
|
| |||||||
| Taiwan — 11.5% | ||||||||
Acer, Inc.* | 5,015 | 1,968 | ||||||
Advanced Semiconductor Engineering, Inc. | 9,133 | 10,334 | ||||||
Advantech Co. Ltd. | 465 | 3,436 | ||||||
Asia Cement Corp. | 2,581 | 1,967 | ||||||
| See Notes to Financial Statements. | 61 |
DBX ETF Trust
Schedule of investments
Deutsche X-trackers MSCI Asia Pacific ex Japan Hedged Equity ETF (Continued)
May 31, 2016
Number | Value | |||||||
| Taiwan (Continued) | ||||||||
Asia Pacific Telecom Co. Ltd.* | 4,563 | $ | 1,469 | |||||
Asustek Computer, Inc. | 891 | 7,650 | ||||||
AU Optronics Corp. | 12,655 | 3,516 | ||||||
Catcher Technology Co. Ltd. | 895 | 6,806 | ||||||
Cathay Financial Holding Co. Ltd. | 9,039 | 10,449 | ||||||
Chailease Holding Co. Ltd. | 219 | 335 | ||||||
Chang Hwa Commercial Bank Ltd. | 3,196 | 1,622 | ||||||
Cheng Shin Rubber Industry Co. Ltd. | 2,625 | 5,393 | ||||||
Chicony Electronics Co. Ltd. | 673 | 1,622 | ||||||
China Airlines Ltd.* | 2,446 | 776 | ||||||
China Life Insurance Co. Ltd. | 2,018 | 1,541 | ||||||
China Steel Corp. | 15,684 | 9,739 | ||||||
Chunghwa Telecom Co. Ltd. | 4,757 | 16,045 | ||||||
Compal Electronics, Inc. | 6,712 | 3,952 | ||||||
CTBC Financial Holding Co. Ltd. | 17,368 | 9,107 | ||||||
Delta Electronics, Inc. | 2,419 | 11,126 | ||||||
E.Sun Financial Holding Co. Ltd. | 4,477 | 2,505 | ||||||
Eclat Textile Co. Ltd. | 267 | 2,865 | ||||||
EVA Airways Corp.* | 1,709 | 776 | ||||||
Far Eastern New Century Corp. | 2,308 | 1,628 | ||||||
Far EasTone Telecommunications Co. Ltd. | 2,136 | 4,919 | ||||||
Feng Tay Enterprise Co. Ltd. | 489 | 2,047 | ||||||
First Financial Holding Co. Ltd. | 5,457 | 2,761 | ||||||
Formosa Chemicals & Fibre Corp. | 4,670 | 11,771 | ||||||
Formosa Petrochemical Corp. | 1,004 | 2,740 | ||||||
Formosa Plastics Corp. | 5,494 | 13,309 | ||||||
Formosa Taffeta Co. Ltd. | 1,184 | 1,133 | ||||||
Foxconn Technology Co. Ltd. | 1,480 | 3,381 | ||||||
Fubon Financial Holding Co. Ltd. | 7,092 | 8,372 | ||||||
Giant Manufacturing Co. Ltd. | 463 | 2,761 | ||||||
Hermes Microvision, Inc. | 45 | 1,594 | ||||||
Highwealth Construction Corp. | 154 | 232 | ||||||
Hiwin Technologies Corp. | 11 | 47 | ||||||
Hon Hai Precision Industry Co. Ltd. | 17,740 | 43,571 | ||||||
Hotai Motor Co. Ltd. | 319 | 3,047 | ||||||
HTC Corp. | 803 | 2,093 | ||||||
Hua Nan Financial Holdings Co. Ltd. | 6,111 | 3,045 | ||||||
Innolux Corp. | 9,982 | 2,960 | ||||||
Inotera Memories, Inc.* | 2,720 | 2,431 | ||||||
Inventec Corp. | 3,804 | 2,531 | ||||||
Largan Precision Co. Ltd. | 131 | 10,926 | ||||||
Lite-On Technology Corp. | 2,413 | 3,108 | ||||||
MediaTek, Inc. | 1,777 | 11,987 | ||||||
Mega Financial Holding Co. Ltd. | 7,497 | 5,494 | ||||||
Merida Industry Co. Ltd. | 338 | 1,425 | ||||||
Nan Ya Plastics Corp. | 7,578 | 14,453 | ||||||
Nanya Technology Corp. | 500 | 609 | ||||||
Nien Made Enterprise Co. Ltd.* | 300 | 2,750 | ||||||
Novatek Microelectronics Corp. | 644 | 2,142 | ||||||
OBI Pharma, Inc.* | 155 | 2,890 | ||||||
Pegatron Corp. | 2,694 | 5,609 | ||||||
Phison Electronics Corp. | 168 | 1,381 | ||||||
Pou Chen Corp. | 3,199 | 4,291 | ||||||
Powertech Technology, Inc. | 1,409 | 3,037 | ||||||
President Chain Store Corp. | 777 | 5,897 | ||||||
Quanta Computer, Inc. | 3,630 | 6,456 | ||||||
Realtek Semiconductor Corp. | 468 | 1,269 | ||||||
Ruentex Industries Ltd. | 537 | 789 | ||||||
Number | Value | |||||||
| Taiwan (Continued) | ||||||||
Siliconware Precision Industries Co. Ltd. | 3,614 | $ | 5,873 | |||||
Simplo Technology Co. Ltd. | 392 | 1,316 | ||||||
SinoPac Financial Holdings Co. Ltd. | 1,183 | 347 | ||||||
Standard Foods Corp. | 489 | 1,165 | ||||||
Synnex Technology International Corp. | 1,507 | 1,497 | ||||||
TaiMed Biologics, Inc.* | 200 | 1,591 | ||||||
Taishin Financial Holding Co. Ltd. | 1,929 | 727 | ||||||
Taiwan Business Bank* | 731 | 185 | ||||||
Taiwan Cement Corp. | 4,075 | 3,755 | ||||||
Taiwan Cooperative Financial Holding Co. Ltd. | 7,170 | 3,144 | ||||||
Taiwan Fertilizer Co. Ltd. | 692 | 911 | ||||||
Taiwan Mobile Co. Ltd. | 2,213 | 7,566 | ||||||
Taiwan Semiconductor Manufacturing Co. Ltd. | 28,230 | 135,469 | ||||||
Teco Electric & Machinery Co. Ltd. | 1,831 | 1,468 | ||||||
Transcend Information, Inc. | 266 | 760 | ||||||
Uni-President Enterprises Corp. | 6,187 | 11,781 | ||||||
United Microelectronics Corp. | 19,375 | 7,248 | ||||||
Vanguard International Semiconductor Corp. | 1,070 | 1,755 | ||||||
Wistron Corp. | 4,492 | 2,886 | ||||||
WPG Holdings Ltd. | 2,379 | 2,615 | ||||||
Yuanta Financial Holding Co. Ltd. | 4,384 | 1,479 | ||||||
Yulon Motor Co. Ltd. | 1,013 | 853 | ||||||
Zhen Ding Technology Holding Ltd. | 498 | 938 | ||||||
|
| |||||||
| 511,214 | ||||||||
|
| |||||||
| Thailand — 1.8% | ||||||||
Indorama Ventures PCL, NVDR | 8,926 | 8,308 | ||||||
IRPC PCL, NVDR | 23,183 | 3,232 | ||||||
Kasikornbank PCL, NVDR | 2,700 | 13,150 | ||||||
Krung Thai Bank PCL, NVDR | 34,504 | 16,515 | ||||||
PTT Exploration & Production PCL, NVDR | 3,600 | 7,835 | ||||||
PTT PCL, NVDR | 1,225 | 10,321 | ||||||
Siam Commercial Bank PCL, NVDR | 4,200 | 15,754 | ||||||
Thai Oil PCL, NVDR | 2,751 | 4,890 | ||||||
|
| |||||||
| 80,005 | ||||||||
|
| |||||||
| United Kingdom — 0.3% | ||||||||
Rio Tinto Ltd. | 480 | 15,504 | ||||||
|
| |||||||
TOTAL COMMON STOCKS | 4,403,757 | |||||||
|
| |||||||
| PREFERRED STOCKS — 0.6% | ||||||||
| South Korea — 0.6% | ||||||||
Amorepacific Corp. | 9 | 1,888 | ||||||
Hyundai Motor Co. | 15 | 1,247 | ||||||
Hyundai Motor Co. — 2nd Preferred | 34 | 2,995 | ||||||
LG Chem Ltd. | 15 | 2,467 | ||||||
Samsung Electronics Co. Ltd. | 22 | 19,604 | ||||||
|
| |||||||
| 28,201 | ||||||||
|
| |||||||
TOTAL PREFERRED STOCKS | 28,201 | |||||||
|
| |||||||
| See Notes to Financial Statements. | 62 |
DBX ETF Trust
Schedule of investments
Deutsche X-trackers MSCI Asia Pacific ex Japan Hedged Equity ETF (Continued)
May 31, 2016
Number | Value | |||||||
| SECURITIES LENDING COLLATERAL — 4.0% | ||||||||
Daily Assets Fund “Capital Shares”, 0.48% (d)(e) | 178,089 | $ | 178,089 | |||||
|
| |||||||
TOTAL INVESTMENTS — 103.5% (Cost $5,106,953)† | $ | 4,610,047 | ||||||
Other assets and liabilities, net — (3.5%) | (155,718 | ) | ||||||
|
| |||||||
NET ASSETS — 100.0% | $ | 4,454,329 | ||||||
|
| |||||||
| * | Non-income producing security. |
| † | The cost for federal income tax purposes was $5,157,549. At May 31, 2016, net unrealized depreciation for all securities based on tax cost was $547,502. This consisted of aggregate gross unrealized appreciation for all securities in which there was an excess of value over tax cost of $284,758 and aggregate gross unrealized depreciation for all securities in which there was an excess of tax cost over value of $832,260. |
| (a) | All or a portion of these securities were on loan. In addition, “Other Assets and Liabilities, Net” may include pending sales that are also on loan. The value of securities loaned at May 31, 2016 amounted to $174,144, which is 3.9% of net assets. |
| (b) | Stapled Security — A security contractually bound to one or more other securities to form a single saleable unit which cannot be sold separately. |
| (c) | Security is listed in country of domicile. Significant business activities of company are in Australia, New Zealand and the United States. |
| (d) | Affiliated fund managed by Deutsche Investment Management Americas Inc. The rate shown is the annualized seven-day yield at period end. |
| (e) | Represents collateral held in connection with securities lending. Income earned by the Fund is net of borrower rebates. |
| ADR: | American Depositary Receipt |
| CDI: | Chess Depositary Interest |
| GDR: | Global Depositary Receipt |
| NVDR: | Non Voting Depositary Receipt |
| REIT: | Real Estate Investment Trust |
| 144A: | Security exempt from registration under Rule 144A of the Securities Act of 1933. These securities may be resold in transactions exempt from registration, normally to qualified institutional buyers. |
As of May 31, 2016, the Fund had the following forward foreign currency exchange contracts outstanding:
Counterparty | Settlement Date | Currency To Deliver | Currency To Receive | Unrealized Appreciation (Depreciation) | ||||||||||||||
JP Morgan & Chase Co. | 6/2/2016 | AUD | 1,253,609 | USD | 955,312 | $ | 49,264 | |||||||||||
State Street Bank & Trust Co. | 6/2/2016 | AUD | 36,000 | USD | 27,439 | 1,420 | ||||||||||||
State Street Bank & Trust Co. | 6/2/2016 | AUD | 57,000 | USD | 43,444 | 2,247 | ||||||||||||
JP Morgan & Chase Co. | 6/2/2016 | HKD | 9,609,625 | USD | 1,239,104 | 2,464 | ||||||||||||
State Street Bank & Trust Co. | 6/2/2016 | HKD | 185,000 | USD | 23,854 | 47 | ||||||||||||
State Street Bank & Trust Co. | 6/2/2016 | HKD | 876,000 | USD | 112,958 | 228 | ||||||||||||
The Bank of New York Mellon | 6/2/2016 | HKD | 11,300 | USD | 1,456 | 2 | ||||||||||||
JP Morgan & Chase Co. | 6/2/2016 | NZD | 49,932 | USD | 34,855 | 1,071 | ||||||||||||
JP Morgan & Chase Co. | 6/2/2016 | USD | 46,028 | AUD | 60,400 | (2,374 | ) | |||||||||||
JP Morgan & Chase Co. | 6/2/2016 | USD | 864,420 | AUD | 1,193,209 | (2,026 | ) | |||||||||||
JP Morgan & Chase Co. | 6/2/2016 | USD | 46,085 | HKD | 357,400 | (92 | ) | |||||||||||
JP Morgan & Chase Co. | 6/2/2016 | USD | 1,191,046 | HKD | 9,252,225 | (398 | ) | |||||||||||
JP Morgan & Chase Co. | 6/2/2016 | USD | 32,158 | NZD | 47,532 | 2 | ||||||||||||
JP Morgan & Chase Co. | 6/2/2016 | USD | 1,675 | NZD | 2,400 | (51 | ) | |||||||||||
State Street Bank & Trust Co. | 6/2/2016 | USD | 67,374 | AUD | 93,000 | (158 | ) | |||||||||||
State Street Bank & Trust Co. | 6/2/2016 | USD | 136,583 | HKD | 1,061,000 | (46 | ) | |||||||||||
The Bank of New York Mellon | 6/2/2016 | USD | 1,455 | HKD | 11,300 | 0 | ||||||||||||
JP Morgan & Chase Co. | 6/3/2016 | IDR | 2,543,408,000 | USD | 191,406 | 5,326 | ||||||||||||
State Street Bank & Trust Co. | 6/3/2016 | IDR | 950,238,000 | USD | 69,809 | 288 | ||||||||||||
JP Morgan & Chase Co. | 6/3/2016 | INR | 27,675,572 | USD | 414,709 | 3,622 | ||||||||||||
State Street Bank & Trust Co. | 6/3/2016 | INR | 544,000 | USD | 8,151 | 71 | ||||||||||||
State Street Bank & Trust Co. | 6/3/2016 | INR | 13,173,034 | USD | 196,202 | 533 | ||||||||||||
| See Notes to Financial Statements. | 63 |
DBX ETF Trust
Schedule of investments
Deutsche X-trackers MSCI Asia Pacific ex Japan Hedged Equity ETF (Continued)
May 31, 2016
Counterparty | Settlement Date | Currency To Deliver | Currency To Receive | Unrealized Appreciation (Depreciation) | ||||||||||||||
JP Morgan & Chase Co. | 6/3/2016 | KRW | 1,272,775,880 | USD | 1,110,431 | $ | 42,554 | |||||||||||
State Street Bank & Trust Co. | 6/3/2016 | KRW | 524,557,590 | USD | 440,975 | 864 | ||||||||||||
JP Morgan & Chase Co. | 6/3/2016 | MYR | 1,185,000 | USD | 302,643 | 15,713 | ||||||||||||
State Street Bank & Trust Co. | 6/3/2016 | MYR | 590,443 | USD | 143,695 | 728 | ||||||||||||
JP Morgan & Chase Co. | 6/3/2016 | PHP | 5,459,000 | USD | 116,007 | (706 | ) | |||||||||||
State Street Bank & Trust Co. | 6/3/2016 | PHP | 1,803,933 | USD | 38,620 | 52 | ||||||||||||
JP Morgan & Chase Co. | 6/3/2016 | SGD | 235,779 | USD | 175,262 | 4,056 | ||||||||||||
State Street Bank & Trust Co. | 6/3/2016 | SGD | 22,000 | USD | 16,355 | 380 | ||||||||||||
JP Morgan & Chase Co. | 6/3/2016 | THB | 4,918,000 | USD | 140,647 | 2,991 | ||||||||||||
State Street Bank & Trust Co. | 6/3/2016 | THB | 2,388,887 | USD | 66,959 | 93 | ||||||||||||
Bank of Montreal | 6/3/2016 | TWD | 386,160 | USD | 11,974 | 132 | ||||||||||||
JP Morgan & Chase Co. | 6/3/2016 | TWD | 22,260,983 | USD | 689,301 | 6,666 | ||||||||||||
State Street Bank & Trust Co. | 6/3/2016 | TWD | 7,057,635 | USD | 216,625 | 202 | ||||||||||||
Bank of Montreal | 6/3/2016 | USD | 11,911 | TWD | 386,160 | (70 | ) | |||||||||||
JP Morgan & Chase Co. | 6/3/2016 | USD | 186,754 | IDR | 2,543,408,000 | (674 | ) | |||||||||||
JP Morgan & Chase Co. | 6/3/2016 | USD | 411,992 | INR | 27,675,572 | (905 | ) | |||||||||||
JP Morgan & Chase Co. | 6/3/2016 | USD | 1,069,560 | KRW | 1,272,775,880 | (1,683 | ) | |||||||||||
JP Morgan & Chase Co. | 6/3/2016 | USD | 288,104 | MYR | 1,185,000 | (1,174 | ) | |||||||||||
JP Morgan & Chase Co. | 6/3/2016 | USD | 116,875 | PHP | 5,459,000 | (162 | ) | |||||||||||
JP Morgan & Chase Co. | 6/3/2016 | USD | 165,810 | SGD | 228,279 | (51 | ) | |||||||||||
JP Morgan & Chase Co. | 6/3/2016 | USD | 5,575 | SGD | 7,500 | (129 | ) | |||||||||||
JP Morgan & Chase Co. | 6/3/2016 | USD | 137,902 | THB | 4,918,000 | (246 | ) | |||||||||||
JP Morgan & Chase Co. | 6/3/2016 | USD | 683,041 | TWD | 22,260,983 | (405 | ) | |||||||||||
State Street Bank & Trust Co. | 6/3/2016 | USD | 71,770 | IDR | 950,238,000 | (2,249 | ) | |||||||||||
State Street Bank & Trust Co. | 6/3/2016 | USD | 200,520 | INR | 13,382,734 | (1,736 | ) | |||||||||||
State Street Bank & Trust Co. | 6/3/2016 | USD | 5,000 | INR | 334,300 | (34 | ) | |||||||||||
State Street Bank & Trust Co. | 6/3/2016 | USD | 442,348 | KRW | 505,471,590 | (18,251 | ) | |||||||||||
State Street Bank & Trust Co. | 6/3/2016 | USD | 16,703 | KRW | 19,086,000 | (689 | ) | |||||||||||
State Street Bank & Trust Co. | 6/3/2016 | USD | 144,870 | MYR | 566,443 | (7,715 | ) | |||||||||||
State Street Bank & Trust Co. | 6/3/2016 | USD | 6,138 | MYR | 24,000 | (327 | ) | |||||||||||
State Street Bank & Trust Co. | 6/3/2016 | USD | 38,382 | PHP | 1,803,933 | 186 | ||||||||||||
State Street Bank & Trust Co. | 6/3/2016 | USD | 15,980 | SGD | 22,000 | (5 | ) | |||||||||||
State Street Bank & Trust Co. | 6/3/2016 | USD | 68,424 | THB | 2,388,887 | (1,558 | ) | |||||||||||
State Street Bank & Trust Co. | 6/3/2016 | USD | 19,544 | TWD | 630,000 | (225 | ) | |||||||||||
State Street Bank & Trust Co. | 6/3/2016 | USD | 199,399 | TWD | 6,427,635 | (2,295 | ) | |||||||||||
JP Morgan & Chase Co. | 7/5/2016 | AUD | 1,193,209 | USD | 863,370 | 2,158 | ||||||||||||
State Street Bank & Trust Co. | 7/5/2016 | AUD | 93,000 | USD | 67,292 | 168 | ||||||||||||
State Street Bank & Trust Co. | 7/5/2016 | AUD | 12,000 | USD | 8,680 | 19 | ||||||||||||
State Street Bank & Trust Co. | 7/5/2016 | AUD | 52,000 | USD | 37,624 | 93 | ||||||||||||
JP Morgan & Chase Co. | 7/5/2016 | HKD | 9,252,225 | USD | 1,191,537 | 274 | ||||||||||||
State Street Bank & Trust Co. | 7/5/2016 | HKD | 1,061,000 | USD | 136,643 | 35 | ||||||||||||
The Bank of New York Mellon | 7/5/2016 | HKD | 11,300 | USD | 1,455 | 0 | ||||||||||||
JP Morgan & Chase Co. | 7/5/2016 | NZD | 47,532 | USD | 32,103 | 3 | ||||||||||||
State Street Bank & Trust Co. | 7/5/2016 | NZD | 6,000 | USD | 4,052 | 0 | ||||||||||||
JP Morgan & Chase Co. | 7/5/2016 | SGD | 228,279 | USD | 165,726 | 59 | ||||||||||||
State Street Bank & Trust Co. | 7/5/2016 | SGD | 22,000 | USD | 15,971 | 5 | ||||||||||||
State Street Bank & Trust Co. | 7/5/2016 | USD | 46,754 | HKD | 363,000 | (16 | ) | |||||||||||
State Street Bank & Trust Co. | 7/5/2016 | USD | 5,083 | SGD | 7,000 | (3 | ) | |||||||||||
JP Morgan & Chase Co. | 7/6/2016 | KRW | 1,272,775,880 | USD | 1,068,527 | 1,362 | ||||||||||||
Bank of Montreal | 7/6/2016 | TWD | 386,160 | USD | 11,904 | 54 | ||||||||||||
JP Morgan & Chase Co. | 7/6/2016 | TWD | 22,260,983 | USD | 682,434 | (689 | ) | |||||||||||
State Street Bank & Trust Co. | 7/6/2016 | TWD | 165,000 | USD | 5,059 | (4 | ) | |||||||||||
State Street Bank & Trust Co. | 7/6/2016 | USD | 13,413 | KRW | 15,967,000 | (25 | ) | |||||||||||
State Street Bank & Trust Co. | 7/6/2016 | USD | 440,649 | KRW | 524,557,590 | (831 | ) | |||||||||||
State Street Bank & Trust Co. | 7/6/2016 | USD | 216,392 | TWD | 7,057,635 | 185 | ||||||||||||
JP Morgan & Chase Co. | 7/7/2016 | INR | 27,675,572 | USD | 409,620 | 1,073 | ||||||||||||
State Street Bank & Trust Co. | 7/7/2016 | INR | 945,980 | USD | 14,000 | 35 | ||||||||||||
| See Notes to Financial Statements. | 64 |
DBX ETF Trust
Schedule of investments
Deutsche X-trackers MSCI Asia Pacific ex Japan Hedged Equity ETF (Continued)
May 31, 2016
Counterparty | Settlement Date | Currency To Deliver | Currency To Receive | Unrealized Appreciation (Depreciation) | ||||||||||||||
State Street Bank & Trust Co. | 7/7/2016 | INR | 684,000 | USD | 10,132 | $ | 35 | |||||||||||
JP Morgan & Chase Co. | 7/7/2016 | PHP | 5,459,000 | USD | 116,660 | 167 | ||||||||||||
JP Morgan & Chase Co. | 7/7/2016 | THB | 4,918,000 | USD | 137,731 | 154 | ||||||||||||
State Street Bank & Trust Co. | 7/7/2016 | USD | 195,127 | INR | 13,173,034 | (667 | ) | |||||||||||
State Street Bank & Trust Co. | 7/7/2016 | USD | 38,546 | PHP | 1,803,933 | (50 | ) | |||||||||||
State Street Bank & Trust Co. | 7/7/2016 | USD | 66,902 | THB | 2,388,887 | (75 | ) | |||||||||||
JP Morgan & Chase Co. | 7/8/2016 | MYR | 1,185,000 | USD | 287,733 | 1,504 | ||||||||||||
State Street Bank & Trust Co. | 7/8/2016 | USD | 4,133 | MYR | 17,000 | (27 | ) | |||||||||||
State Street Bank & Trust Co. | 7/8/2016 | USD | 143,555 | MYR | 590,443 | (938 | ) | |||||||||||
JP Morgan & Chase Co. | 7/12/2016 | IDR | 2,543,408,000 | USD | 185,677 | 878 | ||||||||||||
State Street Bank & Trust Co. | 7/12/2016 | USD | 69,411 | IDR | 950,238,000 | (369 | ) | |||||||||||
|
| |||||||||||||||||
Total net unrealized appreciation | $ | 99,335 | ||||||||||||||||
|
| |||||||||||||||||
Currency Abbreviations
| AUD | Australian Dollar |
| HKD | Hong Kong Dollar |
| IDR | Indonesian Rupiah |
| INR | Indian Rupee |
| KRW | South Korean Won |
| MYR | Malaysian Ringgit |
| NZD | New Zealand Dollar |
| PHP | Phillippine Peso |
| SGD | Singapore Dollar |
| THB | Thai Baht |
| TWD | New Taiwan Dollar |
| USD | U.S. Dollar |
For information on the Fund’s policy and additional disclosures regarding forward foreign currency exchange contracts, please refer to the Derivatives section of Note 2 in the accompanying Notes to Financial Statements.
Fair Value Measurements
Various inputs are used in determining the value of the Fund’s investments. These inputs are summarized in three broad levels. Level 1 includes quoted prices in active markets for identical securities. Level 2 includes other significant observable inputs (including quoted prices for similar securities, interest rates, prepayment speeds and credit risk). Level 3 includes significant unobservable inputs (including the Fund’s own assumptions in determining the fair value of investments). The level assigned to the securities valuations may not be an indication of the risk or liquidity associated with investing in those securities.
The following is a summary of the inputs used as of May 31, 2016 in valuing the Fund’s investments. For information on Fund’s policy regarding the valuation of investments, please refer to the Security Valuation section of Note 2 in the accompanying Notes to Financial Statements.
Assets | Level 1 | Level 2 | Level 3 | Total | ||||||||||||
Common Stocks (f) | $ | 4,403,757 | $ | — | $ | 0 | $ | 4,403,757 | ||||||||
Preferred Stocks | 28,201 | — | — | 28,201 | ||||||||||||
Short-Term Investments | 178,089 | — | — | 178,089 | ||||||||||||
Derivatives (g) | ||||||||||||||||
Forward Foreign Currency Exchange Contracts | — | 149,463 | — | 149,463 | ||||||||||||
|
|
|
|
|
|
|
| |||||||||
TOTAL | $ | 4,610,047 | $ | 149,463 | $ | 0 | $ | 4,759,510 | ||||||||
|
|
|
|
|
|
|
| |||||||||
Liabilities | Level 1 | Level 2 | Level 3 | Total | ||||||||||||
Derivatives (g) | ||||||||||||||||
Forward Foreign Currency Exchange Contracts | $ | — | $ | (50,128 | ) | $ | — | $ | (50,128 | ) | ||||||
|
|
|
|
|
|
|
| |||||||||
TOTAL | $ | — | $ | (50,128 | ) | $ | — | $ | (50,128 | ) | ||||||
|
|
|
|
|
|
|
| |||||||||
| (f) | See Schedule of investments for additional detailed categorizations. |
| (g) | Derivatives include unrealized appreciation (depreciation) on forward foreign currency exchange contracts. |
During the year ended May 31, 2016, the amount of transfers between Level 3 and Level 1 was $19,633. Investments were transferred from Level 3 to Level 1 as a result of the resumption of trading on a securities exchange.
Transfers between price levels are recognized at the beginning of the reporting period.
| See Notes to Financial Statements. | 65 |
DBX ETF Trust
Schedule of investments
Deutsche X-trackers MSCI Brazil Hedged Equity ETF
May 31, 2016
Number | Value | |||||||
| COMMON STOCKS — 64.3% | ||||||||
| Consumer Discretionary — 3.7% | ||||||||
Kroton Educacional SA | 19,290 | $ | 59,147 | |||||
Lojas Americanas SA | 2,547 | 7,598 | ||||||
Lojas Renner SA | 8,925 | 51,620 | ||||||
|
| |||||||
| 118,365 | ||||||||
|
| |||||||
| Consumer Staples — 18.8% | ||||||||
Ambev SA | 65,688 | 347,381 | ||||||
BRF SA | 8,432 | 106,567 | ||||||
Hypermarcas SA | 4,832 | 38,109 | ||||||
JBS SA | 9,950 | 27,535 | ||||||
M Dias Branco SA | 470 | 11,915 | ||||||
Natura Cosmeticos SA | 2,349 | 14,639 | ||||||
Raia Drogasil SA | 3,224 | 51,515 | ||||||
|
| |||||||
| 597,661 | ||||||||
|
| |||||||
| Energy — 7.2% | ||||||||
Cosan SA Industria e Comercio | 1,668 | 15,154 | ||||||
Petroleo Brasileiro SA* | 41,502 | 116,917 | ||||||
Ultrapar Participacoes SA | 5,038 | 95,152 | ||||||
|
| |||||||
| 227,223 | ||||||||
|
| |||||||
| Financials — 13.9% | ||||||||
Banco Bradesco SA | 11,652 | 79,032 | ||||||
Banco do Brasil SA | 11,979 | 54,598 | ||||||
Banco Santander Brasil SA | 5,710 | 27,463 | ||||||
BB Seguridade Participacoes SA | 9,766 | 73,672 | ||||||
BM&F Bovespa SA | 24,038 | 105,901 | ||||||
BR Malls Participacoes SA* | 7,970 | 25,474 | ||||||
CETIP SA — Mercados Organizados | 3,127 | 36,768 | ||||||
Multiplan Empreendimentos Imobiliarios SA | 1,148 | 17,362 | ||||||
Porto Seguro SA | 1,536 | 11,222 | ||||||
Sul America SA | 2,458 | 10,189 | ||||||
|
| |||||||
| 441,681 | ||||||||
|
| |||||||
| Health Care — 0.8% | ||||||||
Odontoprev SA | 3,711 | 11,512 | ||||||
Qualicorp SA | 3,073 | 12,969 | ||||||
|
| |||||||
| 24,481 | ||||||||
|
| |||||||
| Industrials — 5.3% | ||||||||
CCR SA | 12,349 | 52,115 | ||||||
Embraer SA | 9,317 | 48,473 | ||||||
Localiza Rent a Car SA | 2,246 | 20,666 | ||||||
Rumo Logistica Operadora Multimodal SA* | 11,100 | 14,560 | ||||||
WEG SA | 7,838 | 31,212 | ||||||
|
| |||||||
| 167,026 | ||||||||
|
| |||||||
| Information Technology — 4.4% | ||||||||
Cielo SA | 14,262 | 125,310 | ||||||
Totvs SA | 1,708 | 14,000 | ||||||
|
| |||||||
| 139,310 | ||||||||
|
| |||||||
| Materials — 5.2% | ||||||||
Cia Siderurgica Nacional SA* | 8,672 | 15,695 | ||||||
Duratex SA | 4,280 | 8,587 | ||||||
Fibria Celulose SA | 3,482 | 32,183 | ||||||
Number | Value | |||||||
| Materials (Continued) | ||||||||
Klabin SA | 7,745 | $ | 38,901 | |||||
Vale SA | 17,934 | 70,573 | ||||||
|
| |||||||
| 165,939 | ||||||||
|
| |||||||
| Telecommunication Services — 0.7% | ||||||||
Tim Participacoes SA | 11,772 | 23,195 | ||||||
|
| |||||||
| Utilities — 4.3% | ||||||||
AES Tiete Energia SA | 2,700 | 10,617 | ||||||
Cia de Saneamento Basico do Estado de Sao Paulo | 4,740 | 33,567 | ||||||
CPFL Energia SA | 2,841 | 14,372 | ||||||
EDP — Energias do Brasil SA | 4,147 | 14,012 | ||||||
Equatorial Energia SA | 2,770 | 34,955 | ||||||
Tractebel Energia SA | 2,206 | 21,659 | ||||||
Transmissora Alianca de Energia Eletrica SA | 1,277 | 6,661 | ||||||
|
| |||||||
| 135,843 | ||||||||
|
| |||||||
TOTAL COMMON STOCKS | 2,040,724 | |||||||
|
| |||||||
| PREFERRED STOCKS — 35.0% | ||||||||
| Consumer Discretionary — 1.1% | ||||||||
Lojas Americanas SA | 8,190 | 34,835 | ||||||
|
| |||||||
| Consumer Staples — 0.8% | ||||||||
Cia Brasileira de Distribuicao | 2,222 | 24,873 | ||||||
|
| |||||||
| Energy — 3.8% | ||||||||
Petroleo Brasileiro SA* | 54,701 | 121,706 | ||||||
|
| |||||||
| Financials — 21.2% | ||||||||
Banco Bradesco SA | 38,739 | 244,423 | ||||||
Itau Unibanco Holding SA | 40,122 | 322,544 | ||||||
Itausa — Investimentos Itau SA | 54,257 | 107,205 | ||||||
|
| |||||||
| 674,172 | ||||||||
|
| |||||||
| Materials — 4.4% | ||||||||
Braskem SA, Class A | 2,148 | 12,483 | ||||||
Gerdau SA | 12,784 | 19,705 | ||||||
Suzano Papel e Celulose SA, Class A | 5,674 | 23,019 | ||||||
Vale SA | 26,864 | 83,560 | ||||||
|
| |||||||
| 138,767 | ||||||||
|
| |||||||
| Telecommunication Services — 2.3% | ||||||||
Telefonica Brasil SA | 6,244 | 72,382 | ||||||
|
| |||||||
| Utilities — 1.4% | ||||||||
Centrais Eletricas Brasileiras SA, | 3,167 | 10,955 | ||||||
Cia Energetica de Minas Gerais | 10,480 | 16,328 | ||||||
Cia Energetica de Sao Paulo, | 2,546 | 8,532 | ||||||
| See Notes to Financial Statements. | 66 |
DBX ETF Trust
Schedule of investments
Deutsche X-trackers MSCI Brazil Hedged Equity ETF (Continued)
May 31, 2016
Number | Value | |||||||
| Utilities (Continued) | ||||||||
Cia Paranaense de Energia, | 1,385 | $ | 9,076 | |||||
|
| |||||||
| 44,891 | ||||||||
|
| |||||||
TOTAL PREFERRED STOCKS | 1,111,626 | |||||||
|
| |||||||
| TOTAL INVESTMENTS — 99.3% (Cost $3,620,969)† | $ | 3,152,350 | ||||||
Other assets and liabilities, net — 0.7% | 22,336 | |||||||
|
| |||||||
NET ASSETS — 100.0% | $ | 3,174,686 | ||||||
|
| |||||||
| * | Non-income producing security. |
| † | The cost for federal income tax purposes was $4,599,880. At May 31, 2016, net unrealized depreciation for all securities based on tax cost was $1,447,530. This consisted of aggregate gross unrealized appreciation for all securities in which there was an excess of value over tax cost of $63,008 and aggregate gross unrealized depreciation for all securities in which there was an excess of tax cost over value of $1,510,538. |
As of May 31, 2016, the Fund had the following forward foreign currency exchange contracts outstanding:
Counterparty | Settlement Date | Currency To Deliver | Currency To Receive | Unrealized Appreciation (Depreciation) | ||||||||||||||
JP Morgan & Chase Co. | 6/3/2016 | BRL | 9,301,086 | USD | 2,665,449 | $ | 93,941 | |||||||||||
State Street Bank & Trust Co. | 6/3/2016 | BRL | 476,000 | USD | 136,507 | 4,906 | ||||||||||||
State Street Bank & Trust Co. | 6/3/2016 | BRL | 123,000 | USD | 35,314 | 1,308 | ||||||||||||
State Street Bank & Trust Co. | 6/3/2016 | BRL | 6,019,455 | USD | 1,726,256 | 62,033 | ||||||||||||
The Bank of New York Mellon | 6/3/2016 | BRL | 3,475,730 | USD | 965,212 | 4,263 | ||||||||||||
JP Morgan & Chase Co. | 6/3/2016 | USD | 2,582,200 | BRL | 9,301,086 | (10,692 | ) | |||||||||||
State Street Bank & Trust Co. | 6/3/2016 | USD | 1,836,725 | BRL | 6,618,455 | (6,894 | ) | |||||||||||
The Bank of New York Mellon | 6/3/2016 | USD | 883,414 | BRL | 3,082,230 | (31,257 | ) | |||||||||||
The Bank of New York Mellon | 6/3/2016 | USD | 1,724 | BRL | 6,000 | (65 | ) | |||||||||||
The Bank of New York Mellon | 6/3/2016 | USD | 702 | BRL | 2,500 | (11 | ) | |||||||||||
The Bank of New York Mellon | 6/3/2016 | USD | 107,019 | BRL | 385,000 | (576 | ) | |||||||||||
JP Morgan & Chase Co. | 7/6/2016 | BRL | 9,301,086 | USD | 2,558,265 | 12,644 | ||||||||||||
State Street Bank & Trust Co. | 7/6/2016 | BRL | 6,618,455 | USD | 1,819,006 | 7,597 | ||||||||||||
State Street Bank & Trust Co. | 7/6/2016 | USD | 5,776 | BRL | 21,000 | (29 | ) | |||||||||||
The Bank of New York Mellon | 7/6/2016 | USD | 359,609 | BRL | 1,307,000 | (1,895 | ) | |||||||||||
The Bank of New York Mellon | 7/6/2016 | USD | 955,790 | BRL | 3,475,730 | (4,515 | ) | |||||||||||
|
| |||||||||||||||||
Total net unrealized appreciation | $ | 130,758 | ||||||||||||||||
|
| |||||||||||||||||
Currency Abbreviations
| BRL | Brazilian Real |
| USD | U.S. Dollar |
For information on the Fund’s policy and additional disclosures regarding forward foreign currency exchange contracts, please refer to the Derivatives section of Note 2 in the accompanying Notes to Financial Statements.
Fair Value Measurements
Various inputs are used in determining the value of the Fund’s investments. These inputs are summarized in three broad levels. Level 1 includes quoted prices in active markets for identical securities. Level 2 includes other significant observable inputs (including quoted prices for similar securities, interest rates, prepayment speeds and credit risk). Level 3 includes significant unobservable inputs (including the Fund’s own assumptions in determining the fair value of investments). The level assigned to the securities valuations may not be an indication of the risk or liquidity associated with investing in those securities.
| See Notes to Financial Statements. | 67 |
DBX ETF Trust
Schedule of investments
Deutsche X-trackers MSCI Brazil Hedged Equity ETF (Continued)
May 31, 2016
The following is a summary of the inputs used as of May 31, 2016 in valuing the Fund’s investments. For information on Fund’s policy regarding the valuation of investments, please refer to the security Valuation section of Note 2 in the accompanying Notes to Financial Statements.
Assets | Level 1 | Level 2 | Level 3 | Total | ||||||||||||
Common Stocks (a) | $ | 2,040,724 | $ | — | $ | — | $ | 2,040,724 | ||||||||
Preferred Stocks (a) | 1,111,626 | — | — | 1,111,626 | ||||||||||||
Derivatives (b) | ||||||||||||||||
Forward Foreign Currency Exchange Contracts | — | 186,692 | — | 186,692 | ||||||||||||
|
|
|
|
|
|
|
| |||||||||
TOTAL | $ | 3,152,350 | $ | 186,692 | $ | — | $ | 3,339,042 | ||||||||
|
|
|
|
|
|
|
| |||||||||
Liabilities | Level 1 | Level 2 | Level 3 | Total | ||||||||||||
Derivatives (b) | ||||||||||||||||
Forward Foreign Currency Exchange Contracts | $ | — | $ | (55,934 | ) | $ | — | $ | (55,934 | ) | ||||||
|
|
|
|
|
|
|
| |||||||||
TOTAL | $ | — | $ | (55,934 | ) | $ | — | $ | (55,934 | ) | ||||||
|
|
|
|
|
|
|
| |||||||||
| (a) | See Schedule of Investments for additional detailed categorizations. |
| (b) | Derivatives include unrealized appreciation (depreciation) on forward foreign currency exchange contracts. |
There have been no transfers between fair value measurement levels during the year ended May 31, 2016.
| See Notes to Financial Statements. | 68 |
DBX ETF Trust
Schedule of investments
Deutsche X-trackers MSCI Emerging Markets Hedged Equity ETF
May 31, 2016
Number | Value | |||||||
| COMMON STOCKS — 95.6% | ||||||||
| Brazil — 4.1% | ||||||||
AES Tiete Energia SA | 5,900 | $ | 23,201 | |||||
Ambev SA | 142,482 | 753,495 | ||||||
Banco Bradesco SA | 30,631 | 207,761 | ||||||
Banco do Brasil SA | 30,723 | 140,029 | ||||||
Banco Santander Brasil SA | 21,823 | 104,960 | ||||||
BB Seguridade Participacoes SA | 24,006 | 181,095 | ||||||
BM&F Bovespa SA | 67,870 | 299,007 | ||||||
BR Malls Participacoes SA* | 24,036 | 76,825 | ||||||
BRF SA | 25,621 | 323,808 | ||||||
CCR SA | 32,822 | 138,514 | ||||||
CETIP SA — Mercados Organizados | 5,163 | 60,708 | ||||||
Cia de Saneamento Basico do Estado de Sao Paulo | 16,211 | 114,800 | ||||||
Cia Siderurgica Nacional SA* | 25,188 | 45,586 | ||||||
Cielo SA | 33,842 | 297,344 | ||||||
Cosan SA Industria e Comercio | 5,686 | 51,658 | ||||||
CPFL Energia SA | 11,444 | 57,891 | ||||||
Duratex SA | 18,121 | 36,356 | ||||||
EDP — Energias do Brasil SA | 10,590 | 35,783 | ||||||
Embraer SA | 30,127 | 156,738 | ||||||
Equatorial Energia SA | 4,491 | 56,672 | ||||||
Fibria Celulose SA | 7,903 | 73,046 | ||||||
Hypermarcas SA | 10,004 | 78,900 | ||||||
JBS SA | 28,104 | 77,773 | ||||||
Klabin SA | 23,167 | 116,361 | ||||||
Kroton Educacional SA | 49,760 | 152,574 | ||||||
Localiza Rent a Car SA | 6,869 | 63,204 | ||||||
Lojas Americanas SA | 6,420 | 19,152 | ||||||
Lojas Renner SA | 22,118 | 127,924 | ||||||
Multiplan Empreendimentos Imobiliarios SA | 3,508 | 53,053 | ||||||
Natura Cosmeticos SA | 8,494 | 52,935 | ||||||
Odontoprev SA | 31,276 | 97,024 | ||||||
Petroleo Brasileiro SA* | 106,536 | 300,126 | ||||||
Porto Seguro SA | 2,165 | 15,817 | ||||||
Qualicorp SA | 14,578 | 61,522 | ||||||
Raia Drogasil SA | 5,990 | 95,711 | ||||||
Rumo Logistica Operadora Multimodal SA* | 26,631 | 34,932 | ||||||
Sul America SA | 4,089 | 16,951 | ||||||
Tim Participacoes SA | 35,347 | 69,645 | ||||||
Totvs SA | 8,785 | 72,009 | ||||||
Tractebel Energia SA | 7,134 | 70,045 | ||||||
Ultrapar Participacoes SA | 17,843 | 337,000 | ||||||
Vale SA | 47,484 | 186,856 | ||||||
WEG SA | 11,036 | 43,947 | ||||||
|
| |||||||
| 5,378,738 | ||||||||
|
| |||||||
| Chile — 1.4% | ||||||||
AES Gener SA | 198,884 | 89,447 | ||||||
Banco de Chile | 2,413,747 | 242,984 | ||||||
Banco de Credito e Inversiones | 3,837 | 155,140 | ||||||
Banco Santander Chile | 3,597,265 | 161,723 | ||||||
Cencosud SA | 60,301 | 159,490 | ||||||
Cia Cervecerias Unidas SA | 9,578 | 103,915 | ||||||
Colbun SA | 371,388 | 89,636 | ||||||
Number | Value | |||||||
| Chile (Continued) | ||||||||
Empresa Nacional de Electricidad SA | 160,806 | $ | 139,642 | |||||
Empresa Nacional de Telecomunicaciones SA* | 3,669 | 31,284 | ||||||
Empresas CMPC SA | 62,350 | 129,788 | ||||||
Empresas Copec SA | 18,030 | 153,735 | ||||||
Endesa Americas SA | 160,806 | 67,195 | ||||||
Enersis Americas SA | 624,621 | 94,665 | ||||||
Enersis Chile SA | 624,621 | 71,488 | ||||||
Itau CorpBanca | 9,930,073 | 78,896 | ||||||
LATAM Airlines Group SA* | 8,905 | 54,023 | ||||||
|
| |||||||
| 1,823,051 | ||||||||
|
| |||||||
| China — 20.3% | ||||||||
3SBio, Inc., 144A* | 53,300 | 51,923 | ||||||
58.com, Inc., ADR*(a) | 940 | 50,807 | ||||||
AAC Technologies Holdings, Inc. | 34,273 | 277,421 | ||||||
Agricultural Bank of China Ltd., Class H | 700,402 | 255,978 | ||||||
Air China Ltd., Class H | 139,350 | 92,174 | ||||||
Alibaba Group Holding Ltd., ADR* | 18,488 | 1,516,016 | ||||||
Aluminum Corp. of China Ltd., Class H*(a) | 171,201 | 51,774 | ||||||
Anhui Conch Cement Co. Ltd., Class H | 72,162 | 174,584 | ||||||
Anta Sports Products Ltd. | 78,194 | 170,058 | ||||||
AviChina Industry & Technology Co. Ltd., Class H | 60,467 | 42,486 | ||||||
Baidu, Inc., ADR* | 5,137 | 917,160 | ||||||
Bank of China Ltd., Class H | 2,899,485 | 1,179,085 | ||||||
Bank of Communications Co. Ltd., Class H* | 384,700 | 238,125 | ||||||
Beijing Capital International Airport Co. Ltd., Class H | 62,605 | 67,433 | ||||||
Belle International Holdings Ltd. | 233,163 | 136,824 | ||||||
BYD Co. Ltd., Class H* | 31,443 | 181,882 | ||||||
CGN Power Co. Ltd., Class H, 144A | 273,318 | 83,007 | ||||||
China Cinda Asset Management Co. Ltd., Class H | 190,570 | 62,291 | ||||||
China CITIC Bank Corp. Ltd., Class H | 352,661 | 206,947 | ||||||
China Communications Construction Co. Ltd., Class H | 202,752 | 229,607 | ||||||
China Communications Services Corp. Ltd., Class H | 202,162 | 94,958 | ||||||
China Conch Venture Holdings Ltd.* | 40,918 | 82,460 | ||||||
China Construction Bank Corp., Class H | 2,854,517 | 1,840,380 | ||||||
China COSCO Holdings Co. Ltd., Class H* | 77,503 | 27,827 | ||||||
China Everbright Bank Co. Ltd., Class H* | 125,838 | 54,087 | ||||||
China Galaxy Securities Co. Ltd., Class H (a) | 67,330 | 59,352 | ||||||
China Huishan Dairy Holdings Co. Ltd. (a) | 219,688 | 86,510 | ||||||
China Life Insurance Co. Ltd., Class H | 205,936 | 460,595 | ||||||
China Longyuan Power Group Corp. Ltd., Class H | 190,195 | 130,701 | ||||||
China Medical System Holdings Ltd. | 69,576 | 99,564 | ||||||
China Mengniu Dairy Co. Ltd. (a) | 129,212 | 213,836 | ||||||
China Merchants Bank Co. Ltd., Class H | 156,462 | 320,948 | ||||||
China Minsheng Banking Corp. Ltd., Class H | 271,660 | 255,902 | ||||||
| See Notes to Financial Statements. | 69 |
DBX ETF Trust
Schedule of investments
Deutsche X-trackers MSCI Emerging Markets Hedged Equity ETF (Continued)
May 31, 2016
Number | Value | |||||||
| China (Continued) | ||||||||
China National Building Material Co. Ltd., Class H | 125,542 | $ | 57,030 | |||||
China Oilfield Services Ltd., Class H | 73,286 | 55,737 | ||||||
China Pacific Insurance Group Co. Ltd., Class H* | 87,625 | 299,385 | ||||||
China Petroleum & Chemical Corp., Class H | 1,016,603 | 693,369 | ||||||
China Railway Construction Corp. Ltd., Class H | 45,437 | 56,776 | ||||||
China Railway Group Ltd., Class H | 116,320 | 89,365 | ||||||
China Shenhua Energy Co. Ltd., Class H | 144,787 | 229,923 | ||||||
China Shipping Container Lines Co. Ltd., Class H* | 176,690 | 38,427 | ||||||
China Southern Airlines Co. Ltd., Class H | 78,680 | 46,171 | ||||||
China Telecom Corp. Ltd., Class H | 656,348 | 305,759 | ||||||
China Vanke Co. Ltd., Class H | 77,852 | 185,544 | ||||||
Chongqing Rural Commercial Bank Co. Ltd., Class H | 40,830 | 20,912 | ||||||
CITIC Securities Co. Ltd., Class H | 50,659 | 109,783 | ||||||
CNOOC Ltd. | 670,654 | 800,910 | ||||||
Country Garden Holdings Co. Ltd. | 283,481 | 113,454 | ||||||
CRRC Corp. Ltd., Class H (a) | 132,802 | 126,295 | ||||||
CSPC Pharmaceutical Group Ltd.* | 198,862 | 181,185 | ||||||
Ctrip.com International, Ltd., ADR*(a) | 6,544 | 299,453 | ||||||
Dalian Wanda Commercial Properties Co. Ltd., Class H, 144A | 17,819 | 112,934 | ||||||
Dongfeng Motor Group Co. Ltd., Class H | 173,267 | 193,095 | ||||||
ENN Energy Holdings Ltd. | 27,556 | 136,703 | ||||||
Evergrande Real Estate Group Ltd. | 136,457 | 91,314 | ||||||
Fosun International Ltd. | 126,121 | 179,182 | ||||||
Geely Automobile Holdings Ltd. | 194,372 | 102,805 | ||||||
GF Securities Co. Ltd., Class H* | 32,779 | 75,929 | ||||||
GOME Electrical Appliances Holding Ltd. (a) | 315,499 | 37,759 | ||||||
Great Wall Motor Co. Ltd., Class H | 141,369 | 108,791 | ||||||
Guangzhou Automobile Group Co. Ltd., Class H | 91,052 | 104,167 | ||||||
Guangzhou R&F Properties Co. Ltd., Class H | 80,178 | 106,481 | ||||||
Haitian International Holdings Ltd. | 18,149 | 29,148 | ||||||
Haitong Securities Co. Ltd., Class H (a) | 79,808 | 130,433 | ||||||
Hengan International Group Co. Ltd. (a) | 28,013 | 252,705 | ||||||
Huadian Power International Corp. Ltd., Class H* | 34,781 | 18,441 | ||||||
Huaneng Power International, Inc., Class H | 94,381 | 64,493 | ||||||
Huaneng Renewables Corp. Ltd., Class H | 72,235 | 21,938 | ||||||
Huatai Securities Co. Ltd., Class H, 144A*(a) | 40,699 | 85,371 | ||||||
Industrial & Commercial Bank of China Ltd., Class H | 2,488,509 | 1,319,391 | ||||||
JD.com, Inc., ADR* | 12,808 | 315,205 | ||||||
Jiangsu Expressway Co. Ltd., Class H | 41,139 | 56,329 | ||||||
Jiangxi Copper Co. Ltd., Class H | 51,144 | 54,956 | ||||||
Kingsoft Corp. Ltd. | 31,206 | 59,595 | ||||||
Lenovo Group Ltd. (a) | 285,516 | 175,261 | ||||||
Longfor Properties Co. Ltd. | 102,612 | 138,651 | ||||||
Number | Value | |||||||
| China (Continued) | ||||||||
Luye Pharma Group Ltd.* | 89,005 | $ | 54,978 | |||||
NetEase, Inc., ADR | 1,464 | 260,358 | ||||||
New China Life Insurance Co. Ltd., Class H | 15,520 | 53,126 | ||||||
New Oriental Education & Technology Group, Inc., ADR | 3,054 | 129,031 | ||||||
People’s Insurance Co. (Group) of China Ltd., Class H | 96,496 | 38,619 | ||||||
PetroChina Co. Ltd., Class H | 842,363 | 578,865 | ||||||
PICC Property & Casualty Co. Ltd., Class H | 179,671 | 327,862 | ||||||
Ping An Insurance Group Co. of China Ltd., Class H | 178,199 | 795,741 | ||||||
Qihoo 360 Technology Co. Ltd., ADR* | 1,559 | 115,834 | ||||||
Qunar Cayman Islands Ltd., ADR* | 740 | 24,035 | ||||||
Semiconductor Manufacturing International Corp.* | 800,833 | 66,987 | ||||||
Shandong Weigao Group Medical Polymer Co. Ltd., Class H | 127,243 | 73,031 | ||||||
Shanghai Electric Group Co. Ltd., Class H* | 108,591 | 46,674 | ||||||
Shanghai Fosun Pharmaceutical Group Co. Ltd., Class H | 25,957 | 67,475 | ||||||
Shanghai Pharmaceuticals Holding Co. Ltd., Class H | 37,880 | 81,797 | ||||||
Shenzhou International Group Holdings Ltd. | 26,360 | 132,635 | ||||||
Sinopec Engineering Group Co. Ltd., Class H | 120,632 | 105,873 | ||||||
Sinopec Shanghai Petrochemical Co. Ltd., Class H* | 230,326 | 112,632 | ||||||
Sinopharm Group Co. Ltd., Class H | 52,122 | 241,469 | ||||||
Sinotrans Ltd., Class H | 53,920 | 23,245 | ||||||
Soho China Ltd. | 268,640 | 117,886 | ||||||
SouFun Holdings Ltd., ADR*(a) | 7,997 | 43,424 | ||||||
Sunac China Holdings Ltd. | 35,230 | 21,898 | ||||||
TAL Education Group, ADR* | 1,098 | 58,655 | ||||||
Tencent Holdings Ltd. | 204,956 | 4,570,843 | ||||||
Tingyi Cayman Islands Holding Corp. | 107,096 | 97,300 | ||||||
TravelSky Technology Ltd., Class H | 31,591 | 59,842 | ||||||
Tsingtao Brewery Co. Ltd., Class H | 22,404 | 80,583 | ||||||
Vipshop Holdings Ltd., ADR* | 7,569 | 88,330 | ||||||
Want Want China Holdings Ltd. (a) | 307,912 | 217,935 | ||||||
Weichai Power Co. Ltd., Class H | 28,454 | 33,248 | ||||||
Yanzhou Coal Mining Co. Ltd., Class H | 52,309 | 28,138 | ||||||
YY, Inc., ADR* | 449 | 19,509 | ||||||
Zhejiang Expressway Co. Ltd., Class H | 45,049 | 42,204 | ||||||
Zhuzhou CRRC Times Electric Co. Ltd. | 17,744 | 99,329 | ||||||
Zijin Mining Group Co. Ltd., Class H | 474,961 | 136,912 | ||||||
ZTE Corp., Class H | 22,464 | 29,487 | ||||||
|
| |||||||
| 26,469,047 | ||||||||
|
| |||||||
| Colombia — 0.0% | ||||||||
Ecopetrol SA | 108,977 | 47,243 | ||||||
Grupo Argos SA | 3,158 | 17,655 | ||||||
|
| |||||||
| 64,898 | ||||||||
|
| |||||||
| See Notes to Financial Statements. | 70 |
DBX ETF Trust
Schedule of investments
Deutsche X-trackers MSCI Emerging Markets Hedged Equity ETF (Continued)
May 31, 2016
Number | Value | |||||||
| Czech Republic — 0.2% | ||||||||
CEZ AS | 7,286 | $ | 132,335 | |||||
O2 Czech Republic AS | 15,687 | 151,795 | ||||||
|
| |||||||
| 284,130 | ||||||||
|
| |||||||
| Egypt — 0.3% | ||||||||
Commercial International Bank Egypt SAE | 69,267 | 332,140 | ||||||
Talaat Moustafa Group | 73,781 | 48,440 | ||||||
|
| |||||||
| 380,580 | ||||||||
|
| |||||||
| Hong Kong — 4.9% | ||||||||
Alibaba Health Information Technology Ltd.* | 94,007 | 68,593 | ||||||
Alibaba Pictures Group Ltd.*(a) | 394,803 | 92,976 | ||||||
Beijing Enterprises Holdings Ltd. | 28,417 | 147,740 | ||||||
Beijing Enterprises Water Group Ltd. | 264,910 | 170,112 | ||||||
Brilliance China Automotive Holdings Ltd. | 109,196 | 106,094 | ||||||
China Everbright International Ltd. | 154,574 | 165,699 | ||||||
China Everbright Ltd. | 12,974 | 24,910 | ||||||
China Gas Holdings Ltd. | 114,100 | 161,516 | ||||||
China Merchants Holdings International Co. Ltd. | 40,215 | 114,889 | ||||||
China Mobile Ltd. | 232,860 | 2,655,007 | ||||||
China Overseas Land & Investment Ltd. | 162,206 | 487,406 | ||||||
China Power International Development Ltd. | 54,431 | 22,975 | ||||||
China Resources Beer (Holdings) Co. Ltd. | 60,749 | 131,649 | ||||||
China Resources Gas Group Ltd. | 45,030 | 126,037 | ||||||
China Resources Land Ltd. | 63,378 | 151,538 | ||||||
China Resources Power Holdings Co. Ltd. | 107,187 | 168,283 | ||||||
China State Construction International Holdings Ltd. | 105,378 | 134,931 | ||||||
China Taiping Insurance Holdings Co. Ltd.* | 39,864 | 77,155 | ||||||
China Unicom Ltd. | 176,482 | 190,546 | ||||||
CITIC Ltd. | 63,476 | 92,142 | ||||||
COSCO Pacific Ltd. | 47,317 | 47,860 | ||||||
GCL-Poly Energy Holdings Ltd. | 355,263 | 50,747 | ||||||
Guangdong Investment Ltd. | 170,263 | 240,142 | ||||||
Haier Electronics Group Co. Ltd. | 43,705 | 70,641 | ||||||
Hanergy Thin Film Power Group Ltd.* | 792,724 | 0 | ||||||
Kunlun Energy Co. Ltd. | 168,136 | 137,612 | ||||||
Nine Dragons Paper Holdings Ltd. | 173,060 | 125,161 | ||||||
Shanghai Industrial Holdings Ltd. | 54,072 | 121,911 | ||||||
Shimao Property Holdings Ltd. | 54,266 | 68,716 | ||||||
Sino Biopharmaceutical Ltd. | 313,157 | 212,378 | ||||||
Sun Art Retail Group Ltd. | 90,645 | 57,041 | ||||||
|
| |||||||
| 6,422,407 | ||||||||
|
| |||||||
| Hungary — 0.4% | ||||||||
MOL Hungarian Oil and Gas PLC | 2,897 | 159,330 | ||||||
OTP Bank PLC | 10,527 | 254,409 | ||||||
Richter Gedeon Nyrt | 7,473 | 149,817 | ||||||
|
| |||||||
| 563,556 | ||||||||
|
| |||||||
Number | Value | |||||||
| India — 6.1% | ||||||||
Axis Bank Ltd. GDR | 33,678 | $ | 1,305,022 | |||||
Dr. Reddy’s Laboratories Ltd., ADR | 9,254 | 436,419 | ||||||
ICICI Bank Ltd., ADR | 219,172 | 1,575,847 | ||||||
Infosys Ltd., ADR (a) | 37,535 | 729,680 | ||||||
Larsen & Toubro Ltd., GDR | 49,379 | 1,076,462 | ||||||
Reliance Industries Ltd., GDR, 144A | 46,860 | 1,330,824 | ||||||
Tata Motors Ltd., ADR*(a) | 24,773 | 829,648 | ||||||
Wipro Ltd., ADR | 52,007 | 624,604 | ||||||
|
| |||||||
| 7,908,506 | ||||||||
|
| |||||||
| Indonesia — 2.9% | ||||||||
PT AKR Corporindo Tbk | 38,226 | 17,910 | ||||||
PT Astra International Tbk | 874,164 | 422,363 | ||||||
PT Bank Central Asia Tbk | 494,194 | 470,317 | ||||||
PT Bank Danamon Indonesia Tbk | 182,816 | 43,897 | ||||||
PT Bank Mandiri Persero Tbk | 295,928 | 195,516 | ||||||
PT Bank Negara Indonesia Persero Tbk | 265,194 | 93,187 | ||||||
PT Bank Rakyat Indonesia Persero Tbk | 353,467 | 267,817 | ||||||
PT Bumi Serpong Damai Tbk | 259,644 | 34,784 | ||||||
PT Charoen Pokphand Indonesia Tbk | 156,444 | 40,085 | ||||||
PT Global Mediacom Tbk | 217,111 | 15,815 | ||||||
PT Gudang Garam Tbk | 31,165 | 157,878 | ||||||
PT Hanjaya Mandala Sampoerna Tbk | 13,101 | 91,112 | ||||||
PT Indocement Tunggal Prakarsa Tbk | 99,662 | 121,477 | ||||||
PT Indofood CBP Sukses Makmur Tbk* | 25,816 | 30,616 | ||||||
PT Indofood Sukses Makmur Tbk* | 120,856 | 61,269 | ||||||
PT Jasa Marga Persero Tbk | 55,210 | 21,825 | ||||||
PT Kalbe Farma Tbk* | 921,089 | 96,424 | ||||||
PT Lippo Karawaci Tbk | 1,125,450 | 78,683 | ||||||
PT Matahari Department Store Tbk | 124,613 | 173,099 | ||||||
PT Media Nusantara Citra Tbk | 119,767 | 18,412 | ||||||
PT Perusahaan Gas Negara Persero Tbk | 480,076 | 87,159 | ||||||
PT Semen Indonesia Persero Tbk | 141,210 | 93,037 | ||||||
PT Summarecon Agung Tbk | 310,706 | 36,393 | ||||||
PT Surya Citra Media Tbk | 233,575 | 57,282 | ||||||
PT Telekomunikasi Indonesia Persero Tbk | 2,086,315 | 565,107 | ||||||
PT Tower Bersama Infrastructure Tbk | 144,804 | 70,494 | ||||||
PT Unilever Indonesia Tbk | 82,824 | 261,326 | ||||||
PT United Tractors Tbk | 109,511 | 113,840 | ||||||
PT Waskita Karya Persero Tbk | 100,800 | 18,522 | ||||||
PT XL Axiata Tbk* | 231,038 | 59,705 | ||||||
|
| |||||||
| 3,815,351 | ||||||||
|
| |||||||
| Malaysia — 3.2% | ||||||||
Alliance Financial Group Bhd | 42,300 | 41,491 | ||||||
AMMB Holdings Bhd | 78,800 | 82,254 | ||||||
Astro Malaysia Holdings Bhd | 28,700 | 19,184 | ||||||
Axiata Group Bhd | 14,800 | 18,711 | ||||||
Berjaya Sports Toto Bhd | 27,116 | 20,030 | ||||||
British American Tobacco Malaysia Bhd | 10,400 | 126,090 | ||||||
CIMB Group Holdings Bhd | 59,600 | 63,367 | ||||||
DiGi.Com Bhd | 170,600 | 185,102 | ||||||
Genting Bhd | 11,800 | 23,892 | ||||||
Genting Malaysia Bhd | 139,300 | 148,780 | ||||||
Hap Seng Consolidated Bhd | 9,400 | 17,712 | ||||||
Hartalega Holdings Bhd | 35,800 | 36,155 | ||||||
Hong Leong Bank Bhd | 45,600 | 147,546 | ||||||
| See Notes to Financial Statements. | 71 |
DBX ETF Trust
Schedule of investments
Deutsche X-trackers MSCI Emerging Markets Hedged Equity ETF (Continued)
May 31, 2016
Number | Value | |||||||
| Malaysia (Continued) | ||||||||
IHH Healthcare Bhd | 130,300 | $ | 203,860 | |||||
IJM Corp. Bhd | 41,000 | 34,655 | ||||||
IOI Corp. Bhd | 171,400 | 171,857 | ||||||
IOI Properties Group Bhd | 75,966 | 44,708 | ||||||
Kuala Lumpur Kepong Bhd | 27,600 | 154,009 | ||||||
Lafarge Malaysia Bhd | 57,000 | 109,610 | ||||||
Malayan Banking Bhd | 169,900 | 335,768 | ||||||
Maxis Bhd | 106,700 | 142,129 | ||||||
Petronas Chemicals Group Bhd | 151,700 | 241,750 | ||||||
Petronas Dagangan Bhd | 12,500 | 70,961 | ||||||
Petronas Gas Bhd | 28,800 | 150,940 | ||||||
PPB Group Bhd | 10,400 | 41,106 | ||||||
Public Bank Bhd | 122,800 | 568,645 | ||||||
RHB Capital Bhd | 19,600 | 28,956 | ||||||
Sime Darby Bhd | 112,100 | 201,177 | ||||||
Telekom Malaysia Bhd | 75,400 | 122,897 | ||||||
Tenaga Nasional Bhd | 103,200 | 349,415 | ||||||
UMW Holdings Bhd | 78,900 | 95,162 | ||||||
Westports Holdings Bhd | 42,300 | 44,462 | ||||||
YTL Corp. Bhd | 224,293 | 88,544 | ||||||
YTL Power International Bhd | 160,370 | 56,318 | ||||||
|
| |||||||
| 4,187,243 | ||||||||
|
| |||||||
| Malta — 0.2% | ||||||||
Brait SE* | 21,390 | 217,109 | ||||||
|
| |||||||
| Mexico — 4.7% | ||||||||
Alfa SAB de CV, Class A | 118,230 | 207,291 | ||||||
America Movil SAB de CV, Series L | 1,163,579 | 711,762 | ||||||
Arca Continental SAB de CV | 34,647 | 230,276 | ||||||
Cemex SAB de CV, Series CPO* | 540,438 | 343,470 | ||||||
Coca-Cola Femsa SAB de CV, Series L | 17,046 | 136,614 | ||||||
El Puerto de Liverpool SAB de CV, Class C1 | 4,668 | 50,189 | ||||||
Fibra Uno Administracion SA de CV REIT | 102,848 | 222,672 | ||||||
Fomento Economico Mexicano SAB de CV | 83,712 | 756,262 | ||||||
Gentera SAB de CV | 38,889 | 70,817 | ||||||
Gruma SAB de CV, Class B | 5,404 | 77,684 | ||||||
Grupo Aeroportuario del Pacifico SAB de CV, Class B | 3,027 | 30,602 | ||||||
Grupo Aeroportuario del Sureste SAB de CV, Class B* | 3,814 | 60,142 | ||||||
Grupo Bimbo SAB de CV, Series A | 77,183 | 227,533 | ||||||
Grupo Carso SAB de CV, Series A1 | 26,666 | 112,837 | ||||||
Grupo Comercial Chedraui SA de CV | 10,493 | 26,209 | ||||||
Grupo Financiero Banorte SAB de CV, Class O | 106,126 | 554,931 | ||||||
Grupo Financiero Inbursa SAB de CV, Class O | 146,266 | 243,925 | ||||||
Grupo Financiero Santander Mexico SAB de CV, Class B | 88,188 | 159,349 | ||||||
Grupo Lala SAB de CV | 8,908 | 21,415 | ||||||
Grupo Mexico SAB de CV, Series B | 169,359 | 375,206 | ||||||
Grupo Televisa SAB, Series CPO | 88,110 | 470,130 | ||||||
Industrias Penoles SAB de CV | 7,797 | 124,360 | ||||||
Kimberly-Clark de Mexico SAB de CV, Class A | 54,558 | 129,591 | ||||||
Number | Value | |||||||
| Mexico (Continued) | ||||||||
Mexichem SAB de CV | 56,864 | $ | 119,633 | |||||
OHL Mexico SAB de CV* | 33,410 | 42,050 | ||||||
Promotora y Operadora de Infraestructura SAB de CV | 7,304 | 87,268 | ||||||
Wal-Mart de Mexico SAB de CV | 232,554 | 539,781 | ||||||
|
| |||||||
| 6,131,999 | ||||||||
|
| |||||||
| Netherlands — 0.5% | ||||||||
Steinhoff International Holdings NV | 105,773 | 620,723 | ||||||
|
| |||||||
| Peru — 0.2% | ||||||||
Cia de Minas Buenaventura SAA, ADR* | 5,461 | 52,207 | ||||||
Credicorp Ltd. | 1,292 | 181,139 | ||||||
|
| |||||||
| 233,346 | ||||||||
|
| |||||||
| Philippines — 2.1% | ||||||||
Aboitiz Equity Ventures, Inc. | 90,520 | 152,915 | ||||||
Aboitiz Power Corp. | 167,700 | 164,957 | ||||||
Ayala Corp. | 4,960 | 89,782 | ||||||
Ayala Land, Inc. | 390,400 | 298,028 | ||||||
Bank of the Philippine Islands | 86,920 | 171,461 | ||||||
BDO Unibank, Inc. | 86,019 | 185,778 | ||||||
DMCI Holdings Inc. | 145,800 | 39,595 | ||||||
Energy Development Corp. | 714,300 | 86,299 | ||||||
Globe Telecom, Inc. | 2,525 | 130,124 | ||||||
GT Capital Holdings, Inc. | 2,430 | 72,487 | ||||||
International Container Terminal Services, Inc. | 41,110 | 49,712 | ||||||
JG Summit Holdings, Inc. | 78,950 | 139,447 | ||||||
Jollibee Foods Corp. | 27,550 | 138,678 | ||||||
Metro Pacific Investments Corp. | 446,400 | 57,560 | ||||||
Metropolitan Bank & Trust Co. | 76,579 | 142,629 | ||||||
Philippine Long Distance Telephone Co. | 4,640 | 188,517 | ||||||
Robinsons Land Corp. | 26,200 | 16,247 | ||||||
Security Bank Corp. | 10,600 | 46,013 | �� | |||||
SM Investments Corp. | 8,460 | 170,050 | ||||||
SM Prime Holdings, Inc. | 225,900 | 115,933 | ||||||
Universal Robina Corp. | 65,730 | 274,080 | ||||||
|
| |||||||
| 2,730,292 | ||||||||
|
| |||||||
| Poland — 1.3% | ||||||||
Bank Pekao SA | 8,183 | 309,487 | ||||||
Bank Zachodni WBK SA | 2,232 | 146,023 | ||||||
CCC SA | 1,966 | 84,999 | ||||||
Cyfrowy Polsat SA* | 33,862 | 192,339 | ||||||
Eurocash SA | 6,469 | 80,362 | ||||||
Grupa Azoty SA* | 2,785 | 48,121 | ||||||
LPP SA | 41 | 56,142 | ||||||
PGE Polska Grupa Energetyczna SA | 38,274 | 122,384 | ||||||
Polski Koncern Naftowy Orlen SA | 7,343 | 128,814 | ||||||
Polskie Gornictwo Naftowe i Gazownictwo SA | 96,873 | 129,947 | ||||||
Powszechna Kasa Oszczednosci Bank Polski SA* | 17,359 | 108,989 | ||||||
Powszechny Zaklad Ubezpieczen SA | 39,224 | 310,522 | ||||||
|
| |||||||
| 1,718,129 | ||||||||
|
| |||||||
| See Notes to Financial Statements. | 72 |
DBX ETF Trust
Schedule of investments
Deutsche X-trackers MSCI Emerging Markets Hedged Equity ETF (Continued)
May 31, 2016
Number | Value | |||||||
| Qatar — 0.6% | ||||||||
Barwa Real Estate Co. | 3,777 | $ | 31,436 | |||||
Ezdan Holding Group QSC | 34,110 | 158,440 | ||||||
Industries Qatar QSC | 5,925 | 156,242 | ||||||
Masraf Al Rayan QSC | 9,106 | 82,168 | ||||||
Qatar Gas Transport Co. Ltd. | 5,462 | 35,078 | ||||||
Qatar National Bank SAQ | 10,451 | 383,246 | ||||||
|
| |||||||
| 846,610 | ||||||||
|
| |||||||
| Romania — 0.0% | ||||||||
New Europe Property Investments PLC | 2,541 | 29,749 | ||||||
|
| |||||||
| Russia — 3.6% | ||||||||
Gazprom PAO, ADR | 102,604 | 448,585 | ||||||
Lukoil PJSC, ADR | 12,616 | 482,562 | ||||||
Magnit PJSC, GDR | 17,520 | 620,208 | ||||||
MegaFon PJSC, GDR | 20,534 | 229,981 | ||||||
Mobile TeleSystems PJSC, ADR | 44,462 | 389,487 | ||||||
NovaTek OAO, GDR | 7,532 | 756,213 | ||||||
PhosAgro OAO GDR | 11,300 | 169,500 | ||||||
Rosneft Oil Co. OJSC, GDR | 112,366 | 543,627 | ||||||
Severstal PAO, GDR | 25,303 | 264,416 | ||||||
Sistema JSFC, GDR | 23,238 | 173,123 | ||||||
Surgutneftegas OJSC, ADR | 66,534 | 337,327 | ||||||
VTB Bank PJSC, GDR | 118,586 | 241,085 | ||||||
|
| |||||||
| 4,656,114 | ||||||||
|
| |||||||
| South Africa — 6.6% | ||||||||
Anglo American Platinum Ltd.* | 2,960 | 66,171 | ||||||
AngloGold Ashanti Ltd.* | 18,477 | 247,007 | ||||||
Aspen Pharmacare Holdings Ltd.* | 11,590 | 237,460 | ||||||
Barclays Africa Group Ltd. | 12,823 | 119,082 | ||||||
Bid Corp. Ltd.* | 9,932 | 191,230 | ||||||
Bidvest Group Ltd. | 11,916 | 95,070 | ||||||
Capitec Bank Holdings Ltd. | 3,174 | 120,162 | ||||||
Coronation Fund Managers Ltd. (a) | 5,040 | 21,768 | ||||||
Discovery Ltd. | 10,634 | 81,337 | ||||||
Exxaro Resources Ltd. | 10,101 | 40,208 | ||||||
FirstRand Ltd. | 126,367 | 341,723 | ||||||
Fortress Income Fund Ltd. | 52,870 | 122,787 | ||||||
Fortress Income Fund Ltd., Class A | 41,717 | 41,860 | ||||||
Foschini Group Ltd. (a) | 6,905 | 61,510 | ||||||
Gold Fields Ltd. | 42,079 | 146,241 | ||||||
Growthpoint Properties Ltd. REIT | 74,357 | 111,184 | ||||||
Hyprop Investments Ltd. REIT | 7,719 | 57,926 | ||||||
Impala Platinum Holdings Ltd.* | 24,522 | 70,213 | ||||||
Imperial Holdings Ltd. | 4,611 | 41,075 | ||||||
Investec Ltd. | 7,042 | 47,545 | ||||||
Liberty Holdings Ltd. | 2,562 | 19,407 | ||||||
Life Healthcare Group Holdings Ltd. | 27,720 | 67,729 | ||||||
MMI Holdings Ltd. | 34,679 | 49,648 | ||||||
Mondi Ltd. | 4,847 | 93,916 | ||||||
Mr Price Group Ltd. | 7,392 | 86,778 | ||||||
MTN Group Ltd. | 59,253 | 461,846 | ||||||
Naspers Ltd., Class N | 16,040 | 2,359,188 | ||||||
Nedbank Group Ltd. | 5,824 | 65,591 | ||||||
Netcare Ltd. (a) | 33,736 | 70,128 | ||||||
Pioneer Foods Group Ltd. | 1,563 | 16,248 | ||||||
PSG Group Ltd. | 5,916 | 70,685 | ||||||
Number | Value | |||||||
| South Africa (Continued) | ||||||||
Rand Merchant Investment Holdings Ltd. | 17,634 | $ | 45,880 | |||||
Redefine Properties Ltd. REIT | 183,496 | 127,847 | ||||||
Remgro Ltd. | 16,936 | 261,967 | ||||||
Resilient REIT Ltd. | 14,643 | 121,225 | ||||||
RMB Holdings Ltd. | 23,134 | 77,838 | ||||||
Sanlam Ltd. | 59,879 | 237,097 | ||||||
Sappi Ltd.* | 29,385 | 137,855 | ||||||
Sasol Ltd. | 22,295 | 676,670 | ||||||
Shoprite Holdings Ltd. | 14,589 | 153,082 | ||||||
Sibanye Gold Ltd. | 35,659 | 102,102 | ||||||
SPAR Group Ltd. | 3,830 | 49,307 | ||||||
Standard Bank Group Ltd. | 45,310 | 357,521 | ||||||
Telkom SA SOC Ltd. | 7,277 | 26,841 | ||||||
Tiger Brands Ltd. (a) | 4,553 | 100,671 | ||||||
Truworths International Ltd. | 13,291 | 79,511 | ||||||
Vodacom Group Ltd. (a) | 16,997 | 177,797 | ||||||
Woolworths Holdings Ltd. | 34,504 | 182,660 | ||||||
|
| |||||||
| 8,538,594 | ||||||||
|
| |||||||
| South Korea — 14.7% | ||||||||
Amorepacific Corp. | 1,250 | 437,888 | ||||||
AMOREPACIFIC Group | 959 | 134,379 | ||||||
BGF Retail Co. Ltd. | 626 | 115,294 | ||||||
BNK Financial Group, Inc. | 6,583 | 48,331 | ||||||
Celltrion, Inc.* | 3,339 | 277,643 | ||||||
Cheil Worldwide, Inc. | 2,864 | 39,050 | ||||||
CJ CheilJedang Corp. | 283 | 90,827 | ||||||
CJ Corp. | 518 | 94,316 | ||||||
CJ E&M Corp. | 796 | 50,293 | ||||||
CJ Korea Express Corp.* | 222 | 39,862 | ||||||
Coway Co. Ltd. | 2,965 | 256,247 | ||||||
Daelim Industrial Co. Ltd. | 488 | 33,289 | ||||||
Daewoo Engineering & Construction Co. Ltd.* | 10,906 | 53,350 | ||||||
DGB Financial Group, Inc. | 7,298 | 56,765 | ||||||
Dongbu Insurance Co. Ltd. | 2,222 | 135,915 | ||||||
Dongsuh Cos., Inc. | 1,383 | 38,642 | ||||||
Doosan Heavy Industries & Construction Co. Ltd. | 3,223 | 65,580 | ||||||
E-MART, Inc. | 1,146 | 175,006 | ||||||
GS Engineering & Construction Corp.* | 1,671 | 41,502 | ||||||
GS Holdings | 703 | 30,909 | ||||||
GS Retail Co. Ltd. | 1,128 | 50,068 | ||||||
Hana Financial Group, Inc. | 9,856 | 213,775 | ||||||
Hankook Tire Co. Ltd. | 2,686 | 115,391 | ||||||
Hanmi Pharm. Co. Ltd. | 222 | 117,911 | ||||||
Hanmi Science Co. Ltd. | 540 | 69,777 | ||||||
Hanon Systems | 8,173 | 84,693 | ||||||
Hanssem Co. Ltd. | 526 | 81,429 | ||||||
Hanwha Chemical Corp. | 5,321 | 106,483 | ||||||
Hanwha Corp. | 3,342 | 107,960 | ||||||
Hanwha Life Insurance Co. Ltd. | 18,194 | 97,550 | ||||||
Hotel Shilla Co. Ltd. | 1,297 | 71,717 | ||||||
Hyosung Corp. | 807 | 79,562 | ||||||
Hyundai Department Store Co. Ltd. | 600 | 66,706 | ||||||
Hyundai Development Co.-Engineering & Construction | 1,643 | 61,761 | ||||||
| See Notes to Financial Statements. | 73 |
DBX ETF Trust
Schedule of investments
Deutsche X-trackers MSCI Emerging Markets Hedged Equity ETF (Continued)
May 31, 2016
Number | Value | |||||||
| South Korea (Continued) | ||||||||
Hyundai Engineering & Construction Co. Ltd. | 4,082 | $ | 117,137 | |||||
Hyundai Glovis Co. Ltd. | 611 | 93,306 | ||||||
Hyundai Heavy Industries Co. Ltd.* | 1,025 | 94,175 | ||||||
Hyundai Marine & Fire Insurance Co. Ltd. | 3,880 | 102,876 | ||||||
Hyundai Mobis Co. Ltd. | 2,834 | 606,369 | ||||||
Hyundai Motor Co. | 5,910 | 691,765 | ||||||
Hyundai Steel Co. | 2,850 | 116,937 | ||||||
Hyundai Wia Corp. | 840 | 65,266 | ||||||
Industrial Bank of Korea | 1,870 | 17,887 | ||||||
Kakao Corp. | 1,004 | 86,601 | ||||||
Kangwon Land, Inc. | 4,629 | 165,266 | ||||||
KB Financial Group, Inc. | 8,674 | 248,182 | ||||||
KCC Corp. | 126 | 42,765 | ||||||
KEPCO Plant Service & Engineering Co. Ltd. | 865 | 51,023 | ||||||
Kia Motors Corp. | 12,164 | 476,129 | ||||||
Korea Aerospace Industries Ltd. | 2,224 | 124,841 | ||||||
Korea Electric Power Corp. | 6,573 | 346,905 | ||||||
Korea Investment Holdings Co. Ltd. | 1,017 | 38,101 | ||||||
Korea Zinc Co. Ltd. | 310 | 122,122 | ||||||
Korean Air Lines Co. Ltd.* | 1,389 | 32,283 | ||||||
KT&G Corp. | 5,181 | 554,269 | ||||||
Kumho Petrochemical Co. Ltd. | 1,105 | 59,153 | ||||||
LG Chem Ltd. | 2,040 | 463,870 | ||||||
LG Corp. | 4,714 | 260,658 | ||||||
LG Display Co. Ltd. | 6,501 | 140,733 | ||||||
LG Electronics, Inc. | 4,125 | 194,171 | ||||||
LG Household & Health Care Ltd. | 435 | 385,434 | ||||||
LG Innotek Co. Ltd. | 349 | 25,447 | ||||||
LG Uplus Corp. | 12,997 | 125,957 | ||||||
Lotte Chemical Corp. | 851 | 202,789 | ||||||
Lotte Chilsung Beverage Co. Ltd. | 22 | 35,848 | ||||||
Lotte Confectionery Co. Ltd. | 154 | 28,040 | ||||||
Lotte Shopping Co. Ltd. | 834 | 159,900 | ||||||
NAVER Corp. | 970 | 586,004 | ||||||
NCSoft Corp. | 716 | 144,486 | ||||||
Neo Holdings Co. Ltd.* | 26 | 0 | ||||||
OCI Co. Ltd.* | 978 | 80,337 | ||||||
Orion Corp. | 119 | 96,853 | ||||||
Ottogi Corp. | 47 | 33,442 | ||||||
Paradise Co. Ltd. | 2,136 | 31,006 | ||||||
POSCO | 2,504 | 437,013 | ||||||
Posco Daewoo Corp. | 3,223 | 63,822 | ||||||
S-1 Corp. | 701 | 58,819 | ||||||
Samsung C&T Corp. | 3,179 | 320,087 | ||||||
Samsung Card Co. Ltd. | 2,858 | 91,965 | ||||||
Samsung Electro-Mechanics Co. Ltd. | 1,874 | 82,080 | ||||||
Samsung Electronics Co. Ltd. | 3,768 | 4,084,793 | ||||||
Samsung Fire & Marine Insurance Co. Ltd. | 1,541 | 359,455 | ||||||
Samsung Heavy Industries Co. Ltd.* | 8,371 | 67,007 | ||||||
Samsung Life Insurance Co. Ltd. | 3,559 | 310,569 | ||||||
Samsung SDI Co. Ltd. | 2,279 | 215,126 | ||||||
Samsung SDS Co. Ltd. | 1,123 | 172,436 | ||||||
Samsung Securities Co. Ltd. | 1,180 | 35,297 | ||||||
Number | Value | |||||||
| South Korea (Continued) | ||||||||
Shinhan Financial Group Co. Ltd. | 15,466 | $ | 513,241 | |||||
Shinsegae Co. Ltd. | 231 | 40,219 | ||||||
SK Holdings Co. Ltd. | 1,909 | 366,807 | ||||||
SK Hynix, Inc. | 20,571 | 495,375 | ||||||
SK Innovation Co. Ltd. | 1,980 | 271,631 | ||||||
SK Networks Co. Ltd. | 10,906 | 56,461 | ||||||
SK Telecom Co. Ltd. | 588 | 109,528 | ||||||
S-Oil Corp. | 1,536 | 110,708 | ||||||
Woori Bank | 8,701 | 72,642 | ||||||
Yuhan Corp. | 388 | 103,202 | ||||||
|
| |||||||
| 19,226,487 | ||||||||
|
| |||||||
| Taiwan — 12.7% | ||||||||
Acer, Inc.* | 189,935 | 74,547 | ||||||
Advanced Semiconductor Engineering, Inc. | 283,772 | 321,079 | ||||||
Advantech Co. Ltd. | 19,549 | 144,463 | ||||||
Asia Cement Corp. | 57,640 | 43,920 | ||||||
Asia Pacific Telecom Co. Ltd.* | 87,038 | 28,023 | ||||||
Asustek Computer, Inc. | 30,227 | 259,519 | ||||||
AU Optronics Corp. | 476,619 | 132,408 | ||||||
Catcher Technology Co. Ltd. | 29,418 | 223,708 | ||||||
Cathay Financial Holding Co. Ltd. | 290,940 | 336,326 | ||||||
Chailease Holding Co. Ltd. | 46,003 | 70,389 | ||||||
Cheng Shin Rubber Industry Co. Ltd. | 72,761 | 149,482 | ||||||
Chicony Electronics Co. Ltd. | 26,683 | 64,309 | ||||||
China Airlines Ltd.* | 134,447 | 42,668 | ||||||
China Life Insurance Co. Ltd. | 139,636 | 106,614 | ||||||
China Steel Corp. | 473,301 | 293,886 | ||||||
Chunghwa Telecom Co. Ltd. | 159,932 | 539,441 | ||||||
Compal Electronics, Inc. | 182,300 | 107,326 | ||||||
CTBC Financial Holding Co. Ltd. | 583,259 | 305,825 | ||||||
Delta Electronics, Inc. | 85,366 | 392,638 | ||||||
E.Sun Financial Holding Co. Ltd. | 248,911 | 139,291 | ||||||
Eclat Textile Co. Ltd. | 9,003 | 96,621 | ||||||
EVA Airways Corp.* | 109,531 | 49,707 | ||||||
Evergreen Marine Corp. (Taiwan) Ltd. | 86,663 | 30,560 | ||||||
Far Eastern New Century Corp. | 78,326 | 55,239 | ||||||
Far EasTone Telecommunications Co. Ltd. | 74,153 | 170,759 | ||||||
Feng Tay Enterprise Co. Ltd. | 20,037 | 83,865 | ||||||
First Financial Holding Co. Ltd. | 212,107 | 107,314 | ||||||
Formosa Chemicals & Fibre Corp. | 119,153 | 300,326 | ||||||
Formosa Petrochemical Corp. | 19,666 | 53,669 | ||||||
Formosa Plastics Corp. | 159,462 | 386,278 | ||||||
Formosa Taffeta Co. Ltd. | 26,172 | 25,038 | ||||||
Foxconn Technology Co. Ltd. | 50,687 | 115,789 | ||||||
Fubon Financial Holding Co. Ltd. | 265,400 | 313,312 | ||||||
Giant Manufacturing Co. Ltd. | 12,816 | 76,434 | ||||||
Hermes Microvision, Inc. | 2,246 | 79,544 | ||||||
Highwealth Construction Corp. | 37,693 | 56,807 | ||||||
Hiwin Technologies Corp. | 12,767 | 54,024 | ||||||
Hon Hai Precision Industry Co. Ltd. | 565,949 | 1,390,035 | ||||||
Hotai Motor Co. Ltd. | 9,353 | 89,336 | ||||||
HTC Corp. | 22,066 | 57,512 | ||||||
Hua Nan Financial Holdings Co. Ltd. | 123,476 | 61,525 | ||||||
Innolux Corp. | 174,032 | 51,603 | ||||||
Inotera Memories, Inc.* | 129,605 | 115,845 | ||||||
| See Notes to Financial Statements. | 74 |
DBX ETF Trust
Schedule of investments
Deutsche X-trackers MSCI Emerging Markets Hedged Equity ETF (Continued)
May 31, 2016
Number | Value | |||||||
| Taiwan (Continued) | ||||||||
Inventec Corp. | 107,569 | $ | 71,575 | |||||
Largan Precision Co. Ltd. | 3,202 | 267,058 | ||||||
Lite-On Technology Corp. | 82,665 | 106,460 | ||||||
MediaTek, Inc. | 54,774 | 369,499 | ||||||
Mega Financial Holding Co. Ltd. | 295,795 | 216,773 | ||||||
Merida Industry Co. Ltd. | 8,804 | 37,119 | ||||||
Nan Ya Plastics Corp. | 175,035 | 333,834 | ||||||
Nien Made Enterprise Co. Ltd.* | 7,600 | 69,679 | ||||||
Novatek Microelectronics Corp. | 24,811 | 82,545 | ||||||
OBI Pharma, Inc.* | 4,469 | 83,316 | ||||||
Pegatron Corp. | 90,969 | 189,400 | ||||||
Phison Electronics Corp. | 7,344 | 60,351 | ||||||
Pou Chen Corp. | 101,356 | 135,970 | ||||||
Powertech Technology, Inc. | 34,204 | 73,731 | ||||||
President Chain Store Corp. | 22,536 | 171,028 | ||||||
Quanta Computer, Inc. | 113,970 | 202,691 | ||||||
Realtek Semiconductor Corp. | 23,376 | 63,363 | ||||||
Siliconware Precision Industries Co. Ltd. | 123,032 | 199,945 | ||||||
Simplo Technology Co. Ltd. | 14,344 | 48,162 | ||||||
SinoPac Financial Holdings Co. Ltd. | 280,850 | 82,500 | ||||||
Standard Foods Corp. | 11,788 | 28,085 | ||||||
Synnex Technology International Corp. | 61,825 | 61,422 | ||||||
TaiMed Biologics, Inc.* | 7,200 | 57,291 | ||||||
Taishin Financial Holding Co. Ltd. | 156,331 | 58,961 | ||||||
Taiwan Business Bank* | 72,021 | 18,241 | ||||||
Taiwan Cement Corp. | 112,554 | 103,710 | ||||||
Taiwan Cooperative Financial Holding Co. Ltd. | 161,227 | 70,695 | ||||||
Taiwan Fertilizer Co. Ltd. | 19,618 | 25,837 | ||||||
Taiwan Mobile Co. Ltd. | 72,323 | 247,268 | ||||||
Taiwan Semiconductor Manufacturing Co. Ltd. | 931,795 | 4,471,473 | ||||||
Teco Electric & Machinery Co. Ltd. | 38,957 | 31,237 | ||||||
Transcend Information, Inc. | 15,802 | 45,159 | ||||||
Uni-President Enterprises Corp. | 188,687 | 359,294 | ||||||
United Microelectronics Corp. | 531,422 | 198,799 | ||||||
Vanguard International Semiconductor Corp. | 50,908 | 83,513 | ||||||
Wistron Corp. | 90,195 | 57,941 | ||||||
WPG Holdings Ltd. | 74,935 | 82,374 | ||||||
Zhen Ding Technology Holding Ltd. | 19,748 | 37,180 | ||||||
|
| |||||||
| 16,500,483 | ||||||||
|
| |||||||
| Thailand — 2.0% | ||||||||
Indorama Ventures PCL, NVDR | 498,500 | 463,964 | ||||||
IRPC PCL, NVDR | 1,565,448 | 218,221 | ||||||
Kasikornbank PCL, NVDR | 87,500 | 426,172 | ||||||
Krung Thai Bank PCL, NVDR | 962,900 | 460,898 | ||||||
PTT Exploration & Production PCL, NVDR | 62,800 | 136,675 | ||||||
PTT PCL, NVDR | 20,200 | 170,195 | ||||||
Siam Commercial Bank PCL, NVDR | 134,500 | 504,493 | ||||||
Thai Oil PCL, NVDR | 130,100 | 231,248 | ||||||
|
| |||||||
| 2,611,866 | ||||||||
|
| |||||||
| Turkey — 1.6% | ||||||||
Akbank TAS | 77,466 | 209,141 | ||||||
Anadolu Efes Biracilik Ve Malt Sanayii AS | 7,202 | 45,621 | ||||||
Number | Value | |||||||
| Turkey (Continued) | ||||||||
Arcelik AS | 9,956 | $ | 66,135 | |||||
BIM Birlesik Magazalar AS | 13,608 | 266,896 | ||||||
Emlak Konut Gayrimenkul Yatirim Ortakligi AS REIT | 60,043 | 54,915 | ||||||
Eregli Demir ve Celik Fabrikalari TAS | 82,907 | 115,706 | ||||||
Ford Otomotiv Sanayi AS | 7,140 | 84,603 | ||||||
Haci Omer Sabanci Holding AS | 41,245 | 128,397 | ||||||
KOC Holding AS | 26,064 | 115,748 | ||||||
Petkim Petrokimya Holding AS* | 12,275 | 17,672 | ||||||
TAV Havalimanlari Holding AS | 7,365 | 37,772 | ||||||
Tofas Turk Otomobil Fabrikasi AS | 7,173 | 53,796 | ||||||
Tupras Turkiye Petrol Rafinerileri AS | 6,324 | 142,671 | ||||||
Turk Hava Yollari Anonim Ortakligi* | 29,203 | 61,530 | ||||||
Turkcell Iletisim Hizmetleri AS* | 28,946 | 105,504 | ||||||
Turkiye Garanti Bankasi AS | 90,705 | 232,285 | ||||||
Turkiye Halk Bankasi AS | 20,541 | 61,857 | ||||||
Turkiye Is Bankasi, Class C | 72,304 | 110,461 | ||||||
Turkiye Sise ve Cam Fabrikalari AS | 16,679 | 19,888 | ||||||
Turkiye Vakiflar Bankasi TAO, Class D | 40,891 | 61,778 | ||||||
Ulker Biskuvi Sanayi AS | 5,366 | 38,789 | ||||||
|
| |||||||
| 2,031,165 | ||||||||
|
| |||||||
| United Arab Emirates — 1.0% | ||||||||
Abu Dhabi Commercial Bank PJSC | 82,365 | 133,646 | ||||||
Aldar Properties PJSC | 128,782 | 92,210 | ||||||
Arabtec Holding PJSC* | 80,191 | 29,910 | ||||||
DP World Ltd. | 8,402 | 144,515 | ||||||
Dubai Financial Market PJSC | 124,601 | 41,725 | ||||||
Dubai Islamic Bank PJSC | 64,273 | 89,241 | ||||||
Emaar Malls Group PJSC | 21,853 | 16,242 | ||||||
Emaar Properties PJSC | 154,413 | 262,743 | ||||||
Emirates Telecommunications Group Co. PJSC | 33,964 | 163,666 | ||||||
First Gulf Bank PJSC | 62,138 | 200,467 | ||||||
National Bank of Abu Dhabi PJSC | 46,568 | 98,889 | ||||||
|
| |||||||
| 1,273,254 | ||||||||
|
| |||||||
TOTAL COMMON STOCKS | 124,663,427 | |||||||
|
| |||||||
| PREFERRED STOCKS — 3.2% | ||||||||
| Brazil — 2.2% | ||||||||
Banco Bradesco SA | 100,972 | 637,083 | ||||||
Braskem SA, Class A | 9,080 | 52,767 | ||||||
Centrais Eletricas Brasileiras SA, | 7,946 | 27,486 | ||||||
Cia Brasileira de Distribuicao | 6,017 | 67,353 | ||||||
Cia Energetica de Minas Gerais | 27,422 | 42,724 | ||||||
Gerdau SA | 35,147 | 54,176 | ||||||
Itau Unibanco Holding SA | 109,024 | 876,452 | ||||||
Itausa — Investimentos Itau SA | 145,725 | 287,933 | ||||||
Lojas Americanas SA | 16,486 | 70,121 | ||||||
Petroleo Brasileiro SA* | 141,854 | 315,615 | ||||||
Suzano Papel e Celulose SA, Class A | 11,129 | 45,149 | ||||||
Telefonica Brasil SA | 15,797 | 183,124 | ||||||
Vale SA | 71,374 | 222,007 | ||||||
|
| |||||||
| 2,881,990 | ||||||||
|
| |||||||
| See Notes to Financial Statements. | 75 |
DBX ETF Trust
Schedule of investments
Deutsche X-trackers MSCI Emerging Markets Hedged Equity ETF (Continued)
May 31, 2016
Number | Value | |||||||
| Chile — 0.1% | ||||||||
Embotelladora Andina SA, Class B | 12,803 | $ | 40,269 | |||||
Sociedad Quimica y Minera de Chile SA, Class B | 3,547 | 77,694 | ||||||
|
| |||||||
| 117,963 | ||||||||
|
| |||||||
| Colombia — 0.1% | ||||||||
Bancolombia SA | 13,731 | 112,300 | ||||||
|
| |||||||
| South Korea — 0.8% | ||||||||
Amorepacific Corp. | 317 | 66,496 | ||||||
Hyundai Motor Co. | 703 | 58,455 | ||||||
Hyundai Motor Co. — 2nd Preferred | 1,129 | 99,467 | ||||||
LG Chem Ltd. | 437 | 71,868 | ||||||
LG Household & Health Care Ltd. | 100 | 50,764 | ||||||
Samsung Electronics Co. Ltd. | 714 | 636,238 | ||||||
|
| |||||||
| 983,288 | ||||||||
|
| |||||||
TOTAL PREFERRED STOCKS | 4,095,541 | |||||||
|
| |||||||
Number | Value | |||||||
| RIGHTS — 0.0% | ||||||||
| United Arab Emirates — 0.0% | ||||||||
Dubai Islamic Bank PJSC*, | 16,068 | $ | 8,137 | |||||
|
| |||||||
| SECURITIES LENDING COLLATERAL — 1.8% | ||||||||
Daily Assets Fund “Capital Shares”, 0.48% (b)(c) | 2,403,639 | 2,403,639 | ||||||
|
| |||||||
TOTAL INVESTMENTS — 100.6% | ||||||||
(Cost $149,608,657)† | $ | 131,170,744 | ||||||
Other assets and liabilities, net — (0.6%) | (818,269 | ) | ||||||
|
| |||||||
NET ASSETS — 100.0% | $ | 130,352,475 | ||||||
|
| |||||||
| * | Non-income producing security. |
| † | The cost for federal income tax purposes was $153,036,254. At May 31, 2016, net unrealized depreciation for all securities based on tax cost was $21,865,510. This consisted of aggregate gross unrealized appreciation for all securities in which there was an excess of value over tax cost of $3,940,743 and aggregate gross unrealized depreciation for all securities in which there was an excess of tax cost over value of $25,806,253. |
| (a) | All or a portion of these securities were on loan. In addition, “Other Assets and Liabilities, Net” may include pending sales that are also on loan. The value of securities loaned at May 31, 2016 amounted to $2,341,141, which is 1.8% of net assets. |
| (b) | Affiliated fund managed by Deutsche Investment Management Americas Inc. The rate shown is the annualized seven-day yield at period end. |
| (c) | Represents collateral held in connection with securities lending. Income earned by the Fund is net of borrower rebates. |
| ADR: | American Depositary Receipt |
| CPO: | Ordinary Participation Certificates |
| GDR: | Global Depositary Receipt |
| NVDR: | Non Voting Depositary Receipt |
| OJSC: | Open Joint Stock Company |
| PJSC: | Private Joint Stock Company |
| REIT: | Real Estate Investment Trust |
| 144A: | Security exempt from registration under Rule 144A of the Securities Act of 1933. These securities may be resold in transactions exempt from registration, normally to qualified institutional buyers. |
At May 31, 2016, open future contract purchased was as follows:
Contract Description | Currency | Number of Contracts | Contract Value | Expiration Date | Unrealized Appreciation (Depreciation) | |||||||||||||||
E-mini MSCI Emerging Markets Index Futures | EUR | 12 | $ | 483,360 | 6/17/2016 | $ | (18,180 | ) | ||||||||||||
As of May 31, 2016, the Fund had the following forward foreign currency exchange contracts outstanding:
Counterparty | Settlement Date | Currency To Deliver | Currency To Receive | Unrealized Appreciation (Depreciation) | ||||||||||||||
Bank of Montreal | 6/2/2016 | AED | 1,520,000 | USD | 413,772 | $ | (47 | ) | ||||||||||
JP Morgan & Chase Co. | 6/2/2016 | AED | 2,137,000 | USD | 581,783 | (15 | ) | |||||||||||
State Street Bank & Trust Co. | 6/2/2016 | AED | 852,000 | USD | 231,933 | (24 | ) | |||||||||||
State Street Bank & Trust Co. | 6/2/2016 | AED | 311,000 | USD | 84,653 | (17 | ) | |||||||||||
The Bank of New York Mellon | 6/2/2016 | AED | 430,000 | USD | 117,074 | 7 | ||||||||||||
The Bank of New York Mellon | 6/2/2016 | AED | 331,179 | USD | 90,168 | 5 | ||||||||||||
JP Morgan & Chase Co. | 6/2/2016 | CZK | 1,131,500 | USD | 47,942 | 1,351 | ||||||||||||
| See Notes to Financial Statements. | 76 |
DBX ETF Trust
Schedule of investments
Deutsche X-trackers MSCI Emerging Markets Hedged Equity ETF (Continued)
May 31, 2016
Counterparty | Settlement Date | Currency To Deliver | Currency To Receive | Unrealized Appreciation (Depreciation) | ||||||||||||||
JP Morgan & Chase Co. | 6/2/2016 | CZK | 336,500 | USD | 13,961 | $ | 105 | |||||||||||
State Street Bank & Trust Co. | 6/2/2016 | CZK | 336,500 | USD | 13,961 | 105 | ||||||||||||
State Street Bank & Trust Co. | �� | 6/2/2016 | CZK | 262,000 | USD | 11,100 | 312 | |||||||||||
State Street Bank & Trust Co. | 6/2/2016 | CZK | 185,000 | USD | 7,838 | 221 | ||||||||||||
The Bank of New York Mellon | 6/2/2016 | CZK | 4,993,100 | USD | 211,555 | 5,957 | ||||||||||||
State Street Bank & Trust Co. | 6/2/2016 | EUR | 6,000 | USD | 6,869 | 193 | ||||||||||||
State Street Bank & Trust Co. | 6/2/2016 | EUR | 1,076 | USD | 1,234 | 36 | ||||||||||||
JP Morgan & Chase Co. | 6/2/2016 | HKD | 216,811,363 | USD | 27,956,541 | 55,584 | ||||||||||||
State Street Bank & Trust Co. | 6/2/2016 | HKD | 5,021,000 | USD | 647,414 | 1,273 | ||||||||||||
State Street Bank & Trust Co. | 6/2/2016 | HKD | 12,602,000 | USD | 1,624,999 | 3,276 | ||||||||||||
The Bank of New York Mellon | 6/2/2016 | HKD | 22,345,000 | USD | 2,876,763 | 1,237 | ||||||||||||
JP Morgan & Chase Co. | 6/2/2016 | HUF | 11,040,500 | USD | 39,014 | (161 | ) | |||||||||||
JP Morgan & Chase Co. | 6/2/2016 | HUF | 180,655,400 | USD | 663,687 | 22,673 | ||||||||||||
State Street Bank & Trust Co. | 6/2/2016 | HUF | 28,542,700 | USD | 104,856 | 3,579 | ||||||||||||
State Street Bank & Trust Co. | 6/2/2016 | HUF | 3,938,000 | USD | 14,465 | 492 | ||||||||||||
State Street Bank & Trust Co. | 6/2/2016 | HUF | 11,040,500 | USD | 39,015 | (160 | ) | |||||||||||
JP Morgan & Chase Co. | 6/2/2016 | PLN | 403,000 | USD | 101,660 | (531 | ) | |||||||||||
JP Morgan & Chase Co. | 6/2/2016 | PLN | 8,243,800 | USD | 2,156,595 | 66,170 | ||||||||||||
State Street Bank & Trust Co. | 6/2/2016 | PLN | 401,500 | USD | 105,037 | 3,226 | ||||||||||||
State Street Bank & Trust Co. | 6/2/2016 | PLN | 113,000 | USD | 29,519 | 865 | ||||||||||||
State Street Bank & Trust Co. | 6/2/2016 | PLN | 403,000 | USD | 101,661 | (530 | ) | |||||||||||
JP Morgan & Chase Co. | 6/2/2016 | TRY | 13,500 | USD | 4,572 | (1 | ) | |||||||||||
JP Morgan & Chase Co. | 6/2/2016 | TRY | 343,500 | USD | 114,478 | (1,880 | ) | |||||||||||
JP Morgan & Chase Co. | 6/2/2016 | TRY | 6,759,872 | USD | 2,398,949 | 109,097 | ||||||||||||
State Street Bank & Trust Co. | 6/2/2016 | TRY | 38,000 | USD | 13,470 | 598 | ||||||||||||
State Street Bank & Trust Co. | 6/2/2016 | TRY | 236,000 | USD | 83,742 | 3,799 | ||||||||||||
State Street Bank & Trust Co. | 6/2/2016 | TRY | 343,500 | USD | 114,470 | (1,888 | ) | |||||||||||
State Street Bank & Trust Co. | 6/2/2016 | TRY | 540,500 | USD | 191,810 | 8,720 | ||||||||||||
JP Morgan & Chase Co. | 6/2/2016 | USD | 581,829 | AED | 2,137,000 | (32 | ) | |||||||||||
JP Morgan & Chase Co. | 6/2/2016 | USD | 10,701 | CZK | 251,500 | (345 | ) | |||||||||||
JP Morgan & Chase Co. | 6/2/2016 | USD | 50,115 | CZK | 1,216,500 | (23 | ) | |||||||||||
JP Morgan & Chase Co. | 6/2/2016 | USD | 25,301,888 | HKD | 196,548,863 | (8,466 | ) | |||||||||||
JP Morgan & Chase Co. | 6/2/2016 | USD | 1,099,132 | HKD | 8,529,000 | (1,554 | ) | |||||||||||
JP Morgan & Chase Co. | 6/2/2016 | USD | 1,512,965 | HKD | 11,733,500 | (3,008 | ) | |||||||||||
JP Morgan & Chase Co. | 6/2/2016 | USD | 622,301 | HUF | 175,295,400 | (305 | ) | |||||||||||
JP Morgan & Chase Co. | 6/2/2016 | USD | 29,504 | HUF | 8,040,000 | (976 | ) | |||||||||||
JP Morgan & Chase Co. | 6/2/2016 | USD | 30,715 | HUF | 8,360,500 | (1,049 | ) | |||||||||||
JP Morgan & Chase Co. | 6/2/2016 | USD | 1,923,989 | PLN | 7,588,500 | 268 | ||||||||||||
JP Morgan & Chase Co. | 6/2/2016 | USD | 79,244 | PLN | 303,500 | (2,284 | ) | |||||||||||
JP Morgan & Chase Co. | 6/2/2016 | USD | 197,457 | PLN | 754,800 | (6,058 | ) | |||||||||||
JP Morgan & Chase Co. | 6/2/2016 | USD | 87,734 | TRY | 261,000 | 677 | ||||||||||||
JP Morgan & Chase Co. | 6/2/2016 | USD | 193,658 | TRY | 545,700 | (8,807 | ) | |||||||||||
JP Morgan & Chase Co. | 6/2/2016 | USD | 2,132,684 | TRY | 6,296,672 | 262 | ||||||||||||
State Street Bank & Trust Co. | 6/2/2016 | USD | 316,644 | AED | 1,163,000 | (17 | ) | |||||||||||
State Street Bank & Trust Co. | 6/2/2016 | USD | 10,701 | CZK | 251,500 | (345 | ) | |||||||||||
State Street Bank & Trust Co. | 6/2/2016 | USD | 21,916 | CZK | 532,000 | (10 | ) | |||||||||||
State Street Bank & Trust Co. | 6/2/2016 | USD | 7,878 | EUR | 7,076 | (4 | ) | |||||||||||
State Street Bank & Trust Co. | 6/2/2016 | USD | 1,170,678 | HKD | 9,094,000 | (392 | ) | |||||||||||
State Street Bank & Trust Co. | 6/2/2016 | USD | 1,099,125 | HKD | 8,529,000 | (1,548 | ) | |||||||||||
State Street Bank & Trust Co. | 6/2/2016 | USD | 29,504 | HUF | 8,040,000 | (976 | ) | |||||||||||
State Street Bank & Trust Co. | 6/2/2016 | USD | 125,959 | HUF | 35,481,200 | (62 | ) | |||||||||||
State Street Bank & Trust Co. | 6/2/2016 | USD | 115,908 | PLN | 443,000 | (3,574 | ) | |||||||||||
State Street Bank & Trust Co. | 6/2/2016 | USD | 43,355 | PLN | 171,000 | 6 | ||||||||||||
State Street Bank & Trust Co. | 6/2/2016 | USD | 79,243 | PLN | 303,500 | (2,283 | ) | |||||||||||
State Street Bank & Trust Co. | 6/2/2016 | USD | 87,762 | TRY | 261,000 | 650 | ||||||||||||
State Street Bank & Trust Co. | 6/2/2016 | USD | 303,817 | TRY | 897,000 | 35 | ||||||||||||
The Bank of New York Mellon | 6/2/2016 | USD | 413,842 | AED | 1,520,000 | (23 | ) | |||||||||||
| See Notes to Financial Statements. | 77 |
DBX ETF Trust
Schedule of investments
Deutsche X-trackers MSCI Emerging Markets Hedged Equity ETF (Continued)
May 31, 2016
Counterparty | Settlement Date | Currency To Deliver | Currency To Receive | Unrealized Appreciation (Depreciation) | ||||||||||||||
The Bank of New York Mellon | 6/2/2016 | USD | 3,213 | AED | 11,800 | $ | 0 | |||||||||||
The Bank of New York Mellon | 6/2/2016 | USD | 89,851 | AED | 330,000 | (8 | ) | |||||||||||
The Bank of New York Mellon | 6/2/2016 | USD | 23,596 | AED | 86,679 | 3 | ||||||||||||
The Bank of New York Mellon | 6/2/2016 | USD | 90,566 | AED | 332,700 | 11 | ||||||||||||
The Bank of New York Mellon | 6/2/2016 | USD | 205,694 | CZK | 4,993,100 | (96 | ) | |||||||||||
The Bank of New York Mellon | 6/2/2016 | USD | 2,419,122 | HKD | 18,792,100 | (809 | ) | |||||||||||
The Bank of New York Mellon | 6/2/2016 | USD | 66,479 | HKD | 516,000 | (76 | ) | |||||||||||
The Bank of New York Mellon | 6/2/2016 | USD | 391,373 | HKD | 3,036,900 | (561 | ) | |||||||||||
The Bank of New York Mellon | 6/2/2016 | USD | 4,562 | TRY | 13,500 | 11 | ||||||||||||
JP Morgan & Chase Co. | 6/3/2016 | BRL | 18,292,797 | USD | 5,242,240 | 184,757 | ||||||||||||
State Street Bank & Trust Co. | 6/3/2016 | BRL | 1,304,000 | USD | 373,960 | 13,438 | ||||||||||||
State Street Bank & Trust Co. | 6/3/2016 | BRL | 7,405,055 | USD | 2,123,618 | 76,312 | ||||||||||||
State Street Bank & Trust Co. | 6/3/2016 | BRL | 293,000 | USD | 84,123 | 3,116 | ||||||||||||
The Bank of New York Mellon | 6/3/2016 | BRL | 5,493,280 | USD | 1,574,457 | 55,708 | ||||||||||||
The Bank of New York Mellon | 6/3/2016 | BRL | 3,207,787 | USD | 902,204 | 15,334 | ||||||||||||
Bank of Montreal | 6/3/2016 | CLP | 139,820,000 | USD | 202,388 | 650 | ||||||||||||
JP Morgan & Chase Co. | 6/3/2016 | CLP | 1,944,188,800 | USD | 2,939,994 | 134,829 | ||||||||||||
JP Morgan & Chase Co. | 6/3/2016 | CLP | 72,476,500 | USD | 104,208 | (365 | ) | |||||||||||
State Street Bank & Trust Co. | 6/3/2016 | CLP | 2,804,000 | USD | 4,236 | 190 | ||||||||||||
State Street Bank & Trust Co. | 6/3/2016 | CLP | 72,476,500 | USD | 104,230 | (342 | ) | |||||||||||
State Street Bank & Trust Co. | 6/3/2016 | CLP | 416,096,500 | USD | 603,222 | 2,859 | ||||||||||||
Bank of Montreal | 6/3/2016 | COP | 49,081,500 | USD | 15,873 | 4 | ||||||||||||
JP Morgan & Chase Co. | 6/3/2016 | COP | 1,918,880,100 | USD | 667,228 | 46,821 | ||||||||||||
JP Morgan & Chase Co. | 6/3/2016 | COP | 20,546,500 | USD | 6,695 | 52 | ||||||||||||
State Street Bank & Trust Co. | 6/3/2016 | COP | 20,546,500 | USD | 6,697 | 54 | ||||||||||||
State Street Bank & Trust Co. | 6/3/2016 | COP | 1,448,557,000 | USD | 468,683 | 339 | ||||||||||||
State Street Bank & Trust Co. | 6/3/2016 | COP | 26,023,000 | USD | 9,083 | 669 | ||||||||||||
State Street Bank & Trust Co. | 6/3/2016 | COP | 18,916,000 | USD | 6,609 | 494 | ||||||||||||
Bank of Montreal | 6/3/2016 | IDR | 4,761,989,500 | USD | 349,119 | 723 | ||||||||||||
JP Morgan & Chase Co. | 6/3/2016 | IDR | 54,743,239,500 | USD | 4,119,750 | 114,625 | ||||||||||||
JP Morgan & Chase Co. | 6/3/2016 | IDR | 2,692,646,500 | USD | 197,567 | 568 | ||||||||||||
State Street Bank & Trust Co. | 6/3/2016 | IDR | 2,692,646,500 | USD | 197,611 | 612 | ||||||||||||
State Street Bank & Trust Co. | 6/3/2016 | IDR | 2,301,701,000 | USD | 173,844 | 5,447 | ||||||||||||
Bank of Montreal | 6/3/2016 | INR | 43,290,500 | USD | 644,780 | 1,752 | ||||||||||||
JP Morgan & Chase Co. | 6/3/2016 | INR | 628,161,144 | USD | 9,412,769 | 82,202 | ||||||||||||
JP Morgan & Chase Co. | 6/3/2016 | INR | 23,635,000 | USD | 349,723 | (1,346 | ) | |||||||||||
State Street Bank & Trust Co. | 6/3/2016 | INR | 140,495,406 | USD | 2,092,574 | 5,686 | ||||||||||||
State Street Bank & Trust Co. | 6/3/2016 | INR | 23,635,000 | USD | 349,501 | (1,568 | ) | |||||||||||
State Street Bank & Trust Co. | 6/3/2016 | INR | 10,316,000 | USD | 154,570 | 1,338 | ||||||||||||
State Street Bank & Trust Co. | 6/3/2016 | INR | 2,039,000 | USD | 30,519 | 233 | ||||||||||||
Bank of Montreal | 6/3/2016 | KRW | 2,194,755,000 | USD | 1,843,557 | 2,127 | ||||||||||||
JP Morgan & Chase Co. | 6/3/2016 | KRW | 1,276,015,500 | USD | 1,077,470 | 6,875 | ||||||||||||
JP Morgan & Chase Co. | 6/3/2016 | KRW | 25,248,111,500 | USD | 22,027,667 | 844,148 | ||||||||||||
State Street Bank & Trust Co. | 6/3/2016 | KRW | 1,405,900,900 | USD | 1,230,332 | 50,762 | ||||||||||||
State Street Bank & Trust Co. | 6/3/2016 | KRW | 1,276,015,500 | USD | 1,076,570 | 5,975 | ||||||||||||
JP Morgan & Chase Co. | 6/3/2016 | MXN | 6,221,000 | USD | 335,631 | (1,307 | ) | |||||||||||
JP Morgan & Chase Co. | 6/3/2016 | MXN | 463,000 | USD | 25,156 | 80 | ||||||||||||
JP Morgan & Chase Co. | 6/3/2016 | MXN | 113,066,662 | USD | 6,580,109 | 456,269 | ||||||||||||
State Street Bank & Trust Co. | 6/3/2016 | MXN | 6,221,000 | USD | 335,624 | (1,313 | ) | |||||||||||
State Street Bank & Trust Co. | 6/3/2016 | MXN | 7,239,500 | USD | 421,324 | 29,223 | ||||||||||||
State Street Bank & Trust Co. | 6/3/2016 | MXN | 363,000 | USD | 21,070 | 1,409 | ||||||||||||
Bank of Montreal | 6/3/2016 | MYR | 1,777,000 | USD | 432,255 | 1,981 | ||||||||||||
JP Morgan & Chase Co. | 6/3/2016 | MYR | 22,152,832 | USD | 5,657,727 | 293,752 | ||||||||||||
JP Morgan & Chase Co. | 6/3/2016 | MYR | 982,000 | USD | 240,110 | 2,333 | ||||||||||||
State Street Bank & Trust Co. | 6/3/2016 | MYR | 1,958,141 | USD | 476,549 | 2,415 | ||||||||||||
State Street Bank & Trust Co. | 6/3/2016 | MYR | 982,000 | USD | 239,893 | 2,116 | ||||||||||||
Bank of Montreal | 6/3/2016 | PHP | 9,947,000 | USD | 212,770 | 104 | ||||||||||||
| See Notes to Financial Statements. | 78 |
DBX ETF Trust
Schedule of investments
Deutsche X-trackers MSCI Emerging Markets Hedged Equity ETF (Continued)
May 31, 2016
Counterparty | Settlement Date | Currency To Deliver | Currency To Receive | Unrealized Appreciation (Depreciation) | ||||||||||||||
JP Morgan & Chase Co. | 6/3/2016 | PHP | 89,428,000 | USD | 1,900,398 | $ | (11,568 | ) | ||||||||||
JP Morgan & Chase Co. | 6/3/2016 | PHP | 6,342,500 | USD | 135,718 | 116 | ||||||||||||
State Street Bank & Trust Co. | 6/3/2016 | PHP | 6,342,500 | USD | 135,639 | 37 | ||||||||||||
State Street Bank & Trust Co. | 6/3/2016 | PHP | 42,257,216 | USD | 899,090 | (4,368 | ) | |||||||||||
JP Morgan & Chase Co. | 6/3/2016 | RUB | 87,176,155 | USD | 1,336,252 | 30,056 | ||||||||||||
JP Morgan & Chase Co. | 6/3/2016 | RUB | 15,563,000 | USD | 232,124 | (1,063 | ) | |||||||||||
State Street Bank & Trust Co. | 6/3/2016 | RUB | 69,672,198 | USD | 1,069,905 | 25,978 | ||||||||||||
State Street Bank & Trust Co. | 6/3/2016 | RUB | 11,300,000 | USD | 173,526 | 4,213 | ||||||||||||
State Street Bank & Trust Co. | 6/3/2016 | RUB | 15,563,000 | USD | 232,110 | (1,076 | ) | |||||||||||
The Bank of New York Mellon | 6/3/2016 | RUB | 6,878,000 | USD | 103,918 | 862 | ||||||||||||
Bank of Montreal | 6/3/2016 | THB | 6,907,500 | USD | 193,352 | 10 | ||||||||||||
JP Morgan & Chase Co. | 6/3/2016 | THB | 4,318,500 | USD | 120,958 | 82 | ||||||||||||
JP Morgan & Chase Co. | 6/3/2016 | THB | 116,965,500 | USD | 3,345,025 | 71,143 | ||||||||||||
State Street Bank & Trust Co. | 6/3/2016 | THB | 25,924,710 | USD | 726,651 | 1,014 | ||||||||||||
State Street Bank & Trust Co. | 6/3/2016 | THB | 257,000 | USD | 7,349 | 156 | ||||||||||||
State Street Bank & Trust Co. | 6/3/2016 | THB | 4,318,500 | USD | 120,931 | 55 | ||||||||||||
Bank of Montreal | 6/3/2016 | TWD | 46,861,500 | USD | 1,445,450 | 8,437 | ||||||||||||
JP Morgan & Chase Co. | 6/3/2016 | TWD | 27,125,000 | USD | 831,673 | (119 | ) | |||||||||||
JP Morgan & Chase Co. | 6/3/2016 | TWD | 469,013,884 | USD | 14,522,802 | 140,439 | ||||||||||||
State Street Bank & Trust Co. | 6/3/2016 | TWD | 99,900,906 | USD | 3,099,144 | 35,672 | ||||||||||||
State Street Bank & Trust Co. | 6/3/2016 | TWD | 27,125,000 | USD | 831,545 | (246 | ) | |||||||||||
Bank of Montreal | 6/3/2016 | USD | 211,796 | CLP | 139,820,000 | (10,057 | ) | |||||||||||
Bank of Montreal | 6/3/2016 | USD | 17,191 | COP | 49,081,500 | (1,322 | ) | |||||||||||
Bank of Montreal | 6/3/2016 | USD | 359,640 | IDR | 4,761,989,500 | (11,243 | ) | |||||||||||
Bank of Montreal | 6/3/2016 | USD | 651,741 | INR | 43,290,500 | (8,713 | ) | |||||||||||
Bank of Montreal | 6/3/2016 | USD | 1,920,843 | KRW | 2,194,755,000 | (79,413 | ) | |||||||||||
Bank of Montreal | 6/3/2016 | USD | 454,348 | MYR | 1,777,000 | (24,074 | ) | |||||||||||
Bank of Montreal | 6/3/2016 | USD | 211,689 | PHP | 9,947,000 | 977 | ||||||||||||
Bank of Montreal | 6/3/2016 | USD | 197,752 | THB | 6,907,500 | (4,410 | ) | |||||||||||
Bank of Montreal | 6/3/2016 | USD | 1,453,029 | TWD | 46,861,500 | (16,016 | ) | |||||||||||
Bank of Montreal | 6/3/2016 | USD | 418,685 | ZAR | 6,586,330 | 115 | ||||||||||||
Bank of Montreal | 6/3/2016 | USD | 253,432 | ZAR | 3,615,900 | (23,510 | ) | |||||||||||
JP Morgan & Chase Co. | 6/3/2016 | USD | 5,078,511 | BRL | 18,292,797 | (21,028 | ) | |||||||||||
JP Morgan & Chase Co. | 6/3/2016 | USD | 2,846,578 | CLP | 1,962,231,300 | (15,380 | ) | |||||||||||
JP Morgan & Chase Co. | 6/3/2016 | USD | 80,782 | CLP | 54,434,000 | (2,242 | ) | |||||||||||
JP Morgan & Chase Co. | 6/3/2016 | USD | 4,985 | COP | 14,811,500 | (196 | ) | |||||||||||
JP Morgan & Chase Co. | 6/3/2016 | USD | 623,234 | COP | 1,924,615,100 | (973 | ) | |||||||||||
JP Morgan & Chase Co. | 6/3/2016 | USD | 150,501 | IDR | 2,018,215,000 | (2,844 | ) | |||||||||||
JP Morgan & Chase Co. | 6/3/2016 | USD | 4,069,144 | IDR | 55,417,671,000 | (14,676 | ) | |||||||||||
JP Morgan & Chase Co. | 6/3/2016 | USD | 253,545 | INR | 16,988,000 | (1,209 | ) | |||||||||||
JP Morgan & Chase Co. | 6/3/2016 | USD | 9,450,065 | INR | 634,808,144 | (20,765 | ) | |||||||||||
JP Morgan & Chase Co. | 6/3/2016 | USD | 817,846 | KRW | 954,484,000 | (17,021 | ) | |||||||||||
JP Morgan & Chase Co. | 6/3/2016 | USD | 21,487,095 | KRW | 25,569,643,000 | (33,806 | ) | |||||||||||
JP Morgan & Chase Co. | 6/3/2016 | USD | 6,055,640 | MXN | 111,454,062 | (19,140 | ) | |||||||||||
JP Morgan & Chase Co. | 6/3/2016 | USD | 257,187 | MXN | 4,588,500 | (8,668 | ) | |||||||||||
JP Morgan & Chase Co. | 6/3/2016 | USD | 188,854 | MXN | 3,245,100 | (13,095 | ) | |||||||||||
JP Morgan & Chase Co. | 6/3/2016 | USD | 5,450,228 | MYR | 22,417,332 | (22,208 | ) | |||||||||||
JP Morgan & Chase Co. | 6/3/2016 | USD | 178,305 | MYR | 717,500 | (4,573 | ) | |||||||||||
JP Morgan & Chase Co. | 6/3/2016 | USD | 1,952,471 | PHP | 91,196,000 | (2,705 | ) | |||||||||||
JP Morgan & Chase Co. | 6/3/2016 | USD | 96,494 | PHP | 4,574,500 | 1,308 | ||||||||||||
JP Morgan & Chase Co. | 6/3/2016 | USD | 1,461,153 | RUB | 96,348,155 | (17,529 | ) | |||||||||||
JP Morgan & Chase Co. | 6/3/2016 | USD | 95,162 | RUB | 6,391,000 | 597 | ||||||||||||
JP Morgan & Chase Co. | 6/3/2016 | USD | 89,861 | THB | 3,158,000 | (1,468 | ) | |||||||||||
JP Morgan & Chase Co. | 6/3/2016 | USD | 3,312,275 | THB | 118,126,000 | (5,910 | ) | |||||||||||
JP Morgan & Chase Co. | 6/3/2016 | USD | 595,933 | TWD | 19,313,000 | (3,698 | ) | |||||||||||
JP Morgan & Chase Co. | 6/3/2016 | USD | 14,630,600 | TWD | 476,825,884 | (8,681 | ) | |||||||||||
JP Morgan & Chase Co. | 6/3/2016 | USD | 7,885,679 | ZAR | 124,050,616 | 2,241 | ||||||||||||
| See Notes to Financial Statements. | 79 |
DBX ETF Trust
Schedule of investments
Deutsche X-trackers MSCI Emerging Markets Hedged Equity ETF (Continued)
May 31, 2016
Counterparty | Settlement Date | Currency To Deliver | Currency To Receive | Unrealized Appreciation (Depreciation) | ||||||||||||||
JP Morgan & Chase Co. | 6/3/2016 | USD | 358,369 | ZAR | 5,428,500 | $ | (13,190 | ) | ||||||||||
State Street Bank & Trust Co. | 6/3/2016 | USD | 2,498,211 | BRL | 9,002,055 | (9,377 | ) | |||||||||||
State Street Bank & Trust Co. | 6/3/2016 | USD | 80,883 | CLP | 54,434,000 | (2,343 | ) | |||||||||||
State Street Bank & Trust Co. | 6/3/2016 | USD | 51,683 | CLP | 34,219,000 | (2,310 | ) | |||||||||||
State Street Bank & Trust Co. | 6/3/2016 | USD | 608,253 | CLP | 402,724,000 | (27,184 | ) | |||||||||||
State Street Bank & Trust Co. | 6/3/2016 | USD | 523,292 | COP | 1,499,231,000 | (38,565 | ) | |||||||||||
State Street Bank & Trust Co. | 6/3/2016 | USD | 4,987 | COP | 14,811,500 | (198 | ) | |||||||||||
State Street Bank & Trust Co. | 6/3/2016 | USD | 63,943 | IDR | 846,605,000 | (2,004 | ) | |||||||||||
State Street Bank & Trust Co. | 6/3/2016 | USD | 156,445 | IDR | 2,129,527,500 | (644 | ) | |||||||||||
State Street Bank & Trust Co. | 6/3/2016 | USD | 150,647 | IDR | 2,018,215,000 | (2,990 | ) | |||||||||||
State Street Bank & Trust Co. | 6/3/2016 | USD | 200,000 | INR | 13,372,000 | (1,375 | ) | |||||||||||
State Street Bank & Trust Co. | 6/3/2016 | USD | 1,899,690 | INR | 126,785,306 | (16,449 | ) | |||||||||||
State Street Bank & Trust Co. | 6/3/2016 | USD | 290,000 | INR | 19,340,100 | (2,726 | ) | |||||||||||
State Street Bank & Trust Co. | 6/3/2016 | USD | 253,590 | INR | 16,988,000 | (1,254 | ) | |||||||||||
State Street Bank & Trust Co. | 6/3/2016 | USD | 22,784 | KRW | 26,115,000 | (873 | ) | |||||||||||
State Street Bank & Trust Co. | 6/3/2016 | USD | 937,590 | KRW | 1,115,300,400 | (1,837 | ) | |||||||||||
State Street Bank & Trust Co. | 6/3/2016 | USD | 818,036 | KRW | 954,484,000 | (17,210 | ) | |||||||||||
State Street Bank & Trust Co. | 6/3/2016 | USD | 512,835 | KRW | 586,017,000 | (21,159 | ) | |||||||||||
State Street Bank & Trust Co. | 6/3/2016 | USD | 412,933 | MXN | 7,600,000 | (1,307 | ) | |||||||||||
State Street Bank & Trust Co. | 6/3/2016 | USD | 95,171 | MXN | 1,635,000 | (6,618 | ) | |||||||||||
State Street Bank & Trust Co. | 6/3/2016 | USD | 257,195 | MXN | 4,588,500 | (8,676 | ) | |||||||||||
State Street Bank & Trust Co. | 6/3/2016 | USD | 10,982 | MYR | 43,000 | (570 | ) | |||||||||||
State Street Bank & Trust Co. | 6/3/2016 | USD | 141,176 | MYR | 552,000 | (7,518 | ) | |||||||||||
State Street Bank & Trust Co. | 6/3/2016 | USD | 178,172 | MYR | 717,500 | (4,440 | ) | |||||||||||
State Street Bank & Trust Co. | 6/3/2016 | USD | 416,276 | MYR | 1,627,641 | (22,168 | ) | |||||||||||
State Street Bank & Trust Co. | 6/3/2016 | USD | 161,234 | PHP | 7,578,000 | 783 | ||||||||||||
State Street Bank & Trust Co. | 6/3/2016 | USD | 775,320 | PHP | 36,215,216 | (1,041 | ) | |||||||||||
State Street Bank & Trust Co. | 6/3/2016 | USD | 4,936 | PHP | 232,000 | 24 | ||||||||||||
State Street Bank & Trust Co. | 6/3/2016 | USD | 96,498 | PHP | 4,574,500 | 1,304 | ||||||||||||
State Street Bank & Trust Co. | 6/3/2016 | USD | 95,189 | RUB | 6,391,000 | 570 | ||||||||||||
State Street Bank & Trust Co. | 6/3/2016 | USD | 1,354,667 | RUB | 89,569,198 | (12,615 | ) | |||||||||||
State Street Bank & Trust Co. | 6/3/2016 | USD | 8,827 | RUB | 575,000 | (212 | ) | |||||||||||
State Street Bank & Trust Co. | 6/3/2016 | USD | 774,470 | THB | 27,039,210 | (17,638 | ) | |||||||||||
State Street Bank & Trust Co. | 6/3/2016 | USD | 8,679 | THB | 303,000 | (198 | ) | |||||||||||
State Street Bank & Trust Co. | 6/3/2016 | USD | 89,869 | THB | 3,158,000 | (1,476 | ) | |||||||||||
State Street Bank & Trust Co. | 6/3/2016 | USD | 2,583,392 | TWD | 84,166,906 | (2,404 | ) | |||||||||||
State Street Bank & Trust Co. | 6/3/2016 | USD | 595,841 | TWD | 19,313,000 | (3,606 | ) | |||||||||||
State Street Bank & Trust Co. | 6/3/2016 | USD | 724,740 | TWD | 23,362,000 | (8,342 | ) | |||||||||||
State Street Bank & Trust Co. | 6/3/2016 | USD | 5,700 | TWD | 184,000 | (58 | ) | |||||||||||
State Street Bank & Trust Co. | 6/3/2016 | USD | 358,396 | ZAR | 5,428,500 | (13,218 | ) | |||||||||||
State Street Bank & Trust Co. | 6/3/2016 | USD | 935,090 | ZAR | 14,710,000 | 264 | ||||||||||||
The Bank of New York Mellon | 6/3/2016 | USD | 703,822 | BRL | 2,509,479 | (10,017 | ) | |||||||||||
The Bank of New York Mellon | 6/3/2016 | USD | 1,719,408 | BRL | 6,191,588 | (7,595 | ) | |||||||||||
The Bank of New York Mellon | 6/3/2016 | USD | 25,844 | MXN | 463,000 | (767 | ) | |||||||||||
The Bank of New York Mellon | 6/3/2016 | USD | 105,669 | RUB | 6,878,000 | (2,613 | ) | |||||||||||
The Bank of New York Mellon | 6/3/2016 | USD | 20,183 | ZAR | 301,800 | (993 | ) | |||||||||||
The Bank of New York Mellon | 6/3/2016 | USD | 22,901 | ZAR | 349,000 | (709 | ) | |||||||||||
Bank of Montreal | 6/3/2016 | ZAR | 10,202,230 | USD | 715,055 | 66,333 | ||||||||||||
JP Morgan & Chase Co. | 6/3/2016 | ZAR | 122,027,116 | USD | 8,553,433 | 794,180 | ||||||||||||
JP Morgan & Chase Co. | 6/3/2016 | ZAR | 7,452,000 | USD | 473,043 | (802 | ) | |||||||||||
JP Morgan & Chase Co. | 6/3/2016 | ZAR | 650,800 | USD | 41,370 | (12 | ) | |||||||||||
State Street Bank & Trust Co. | 6/3/2016 | ZAR | 7,452,000 | USD | 473,038 | (808 | ) | |||||||||||
State Street Bank & Trust Co. | 6/3/2016 | ZAR | 902,000 | USD | 63,218 | 5,863 | ||||||||||||
State Street Bank & Trust Co. | 6/3/2016 | ZAR | 11,039,500 | USD | 773,793 | 71,832 | ||||||||||||
State Street Bank & Trust Co. | 6/3/2016 | ZAR | 745,000 | USD | 51,946 | 4,574 | ||||||||||||
JP Morgan & Chase Co. | 6/6/2016 | EGP | 470,000 | USD | 52,455 | (138 | ) | |||||||||||
JP Morgan & Chase Co. | 6/6/2016 | EGP | 10,338,001 | USD | 1,142,321 | (14,512 | ) | |||||||||||
| See Notes to Financial Statements. | 80 |
DBX ETF Trust
Schedule of investments
Deutsche X-trackers MSCI Emerging Markets Hedged Equity ETF (Continued)
May 31, 2016
Counterparty | Settlement Date | Currency To Deliver | Currency To Receive | Unrealized Appreciation (Depreciation) | ||||||||||||||
The Bank of Nova Scotia | 6/6/2016 | EGP | 4,694,000 | USD | 531,597 | $ | 6,334 | |||||||||||
The Bank of Nova Scotia | 6/6/2016 | EGP | 886,000 | USD | 97,577 | (1,567 | ) | |||||||||||
JP Morgan & Chase Co. | 6/6/2016 | QAR | 1,199,000 | USD | 329,207 | (102 | ) | |||||||||||
State Street Bank & Trust Co. | 6/6/2016 | QAR | 372,000 | USD | 102,125 | (46 | ) | |||||||||||
State Street Bank & Trust Co. | 6/6/2016 | QAR | 30,000 | USD | 8,234 | (5 | ) | |||||||||||
The Bank of New York Mellon | 6/6/2016 | QAR | 319,000 | USD | 87,604 | (11 | ) | |||||||||||
The Bank of New York Mellon | 6/6/2016 | QAR | 1,522,380 | USD | 417,846 | (280 | ) | |||||||||||
JP Morgan & Chase Co. | 6/6/2016 | USD | 21,517 | EGP | 191,501 | (88 | ) | |||||||||||
JP Morgan & Chase Co. | 6/6/2016 | USD | 1,187,358 | EGP | 10,425,000 | (20,790 | ) | |||||||||||
JP Morgan & Chase Co. | 6/6/2016 | USD | 21,517 | EGP | 191,500 | (88 | ) | |||||||||||
JP Morgan & Chase Co. | 6/6/2016 | USD | 329,318 | QAR | 1,199,000 | (9 | ) | |||||||||||
State Street Bank & Trust Co. | 6/6/2016 | USD | 110,417 | QAR | 402,000 | (6 | ) | |||||||||||
The Bank of New York Mellon | 6/6/2016 | USD | 4,890 | QAR | 17,800 | (1 | ) | |||||||||||
The Bank of New York Mellon | 6/6/2016 | USD | 65,659 | QAR | 239,000 | (17 | ) | |||||||||||
The Bank of New York Mellon | 6/6/2016 | USD | 435,211 | QAR | 1,584,580 | (1 | ) | |||||||||||
The Bank of Nova Scotia | 6/6/2016 | USD | 614,537 | EGP | 5,580,000 | 9,870 | ||||||||||||
State Street Bank & Trust Co. | 7/5/2016 | EUR | 7,076 | USD | 7,887 | 3 | ||||||||||||
JP Morgan & Chase Co. | 7/5/2016 | HKD | 196,548,863 | USD | 25,312,315 | 5,812 | ||||||||||||
State Street Bank & Trust Co. | 7/5/2016 | HKD | 9,094,000 | USD | 1,171,190 | 299 | ||||||||||||
The Bank of New York Mellon | 7/5/2016 | HKD | 18,792,100 | USD | 2,420,181 | 618 | ||||||||||||
JP Morgan & Chase Co. | 7/5/2016 | HUF | 175,295,400 | USD | 622,003 | 303 | ||||||||||||
State Street Bank & Trust Co. | 7/5/2016 | HUF | 35,481,200 | USD | 125,895 | 57 | ||||||||||||
State Street Bank & Trust Co. | 7/5/2016 | HUF | 4,033,000 | USD | 14,308 | 5 | ||||||||||||
JP Morgan & Chase Co. | 7/5/2016 | MXN | 111,454,062 | USD | 6,034,346 | 20,238 | ||||||||||||
State Street Bank & Trust Co. | 7/5/2016 | MXN | 7,600,000 | USD | 411,466 | 1,367 | ||||||||||||
State Street Bank & Trust Co. | 7/5/2016 | MXN | 408,000 | USD | 22,087 | 71 | ||||||||||||
State Street Bank & Trust Co. | 7/5/2016 | MXN | 452,000 | USD | 24,459 | 69 | ||||||||||||
JP Morgan & Chase Co. | 7/5/2016 | PLN | 7,588,500 | USD | 1,922,360 | (142 | ) | |||||||||||
State Street Bank & Trust Co. | 7/5/2016 | PLN | 171,000 | USD | 43,319 | (3 | ) | |||||||||||
JP Morgan & Chase Co. | 7/5/2016 | USD | 25,068 | MXN | 463,000 | (84 | ) | |||||||||||
JP Morgan & Chase Co. | 7/5/2016 | USD | 41,103 | ZAR | 650,800 | (6 | ) | |||||||||||
State Street Bank & Trust Co. | 7/5/2016 | USD | 5,573 | EUR | 5,000 | (2 | ) | |||||||||||
State Street Bank & Trust Co. | 7/5/2016 | USD | 928,895 | HKD | 7,212,000 | (319 | ) | |||||||||||
State Street Bank & Trust Co. | 7/5/2016 | USD | 77,022 | PLN | 304,000 | (5 | ) | |||||||||||
State Street Bank & Trust Co. | 7/5/2016 | USD | 90,143 | ZAR | 1,427,000 | (30 | ) | |||||||||||
Bank of Montreal | 7/5/2016 | ZAR | 6,586,330 | USD | 415,993 | 77 | ||||||||||||
JP Morgan & Chase Co. | 7/5/2016 | ZAR | 124,050,616 | USD | 7,834,693 | 1,095 | ||||||||||||
State Street Bank & Trust Co. | 7/5/2016 | ZAR | 14,710,000 | USD | 929,072 | 159 | ||||||||||||
State Street Bank & Trust Co. | 7/5/2016 | ZAR | 1,106,000 | USD | 70,028 | 186 | ||||||||||||
JP Morgan & Chase Co. | 7/6/2016 | BRL | 18,292,797 | USD | 5,031,438 | 24,868 | ||||||||||||
State Street Bank & Trust Co. | 7/6/2016 | BRL | 9,002,055 | USD | 2,474,112 | 10,332 | ||||||||||||
The Bank of New York Mellon | 7/6/2016 | BRL | 6,191,588 | USD | 1,702,623 | 8,043 | ||||||||||||
JP Morgan & Chase Co. | 7/6/2016 | CLP | 1,962,231,300 | USD | 2,836,537 | 14,073 | ||||||||||||
JP Morgan & Chase Co. | 7/6/2016 | COP | 1,924,615,100 | USD | 618,971 | 896 | ||||||||||||
JP Morgan & Chase Co. | 7/6/2016 | KRW | 25,569,643,000 | USD | 21,466,350 | 27,355 | ||||||||||||
State Street Bank & Trust Co. | 7/6/2016 | KRW | 1,115,300,400 | USD | 936,897 | 1,767 | ||||||||||||
JP Morgan & Chase Co. | 7/6/2016 | RUB | 96,348,155 | USD | 1,447,768 | 17,331 | ||||||||||||
State Street Bank & Trust Co. | 7/6/2016 | RUB | 12,313,600 | USD | 185,000 | 2,186 | ||||||||||||
State Street Bank & Trust Co. | 7/6/2016 | RUB | 89,569,198 | USD | 1,342,263 | 12,470 | ||||||||||||
JP Morgan & Chase Co. | 7/6/2016 | TWD | 476,825,884 | USD | 14,617,593 | (14,759 | ) | |||||||||||
State Street Bank & Trust Co. | 7/6/2016 | TWD | 84,166,906 | USD | 2,580,620 | (2,210 | ) | |||||||||||
State Street Bank & Trust Co. | 7/6/2016 | TWD | 403,000 | USD | 12,354 | (12 | ) | |||||||||||
State Street Bank & Trust Co. | 7/6/2016 | TWD | 401,000 | USD | 12,295 | (11 | ) | |||||||||||
Bank of Montreal | 7/6/2016 | USD | 201,746 | CLP | 139,820,000 | (629 | ) | |||||||||||
Bank of Montreal | 7/6/2016 | USD | 15,781 | COP | 49,081,500 | (19 | ) | |||||||||||
Bank of Montreal | 7/6/2016 | USD | 1,842,010 | KRW | 2,194,755,000 | (1,807 | ) | |||||||||||
Bank of Montreal | 7/6/2016 | USD | 1,444,559 | TWD | 46,861,500 | (6,521 | ) | |||||||||||
| See Notes to Financial Statements. | 81 |
DBX ETF Trust
Schedule of investments
Deutsche X-trackers MSCI Emerging Markets Hedged Equity ETF (Continued)
May 31, 2016
Counterparty | Settlement Date | Currency To Deliver | Currency To Receive | Unrealized Appreciation (Depreciation) | ||||||||||||||
State Street Bank & Trust Co. | 7/6/2016 | USD | 16,779 | BRL | 61,000 | $ | (83 | ) | ||||||||||
State Street Bank & Trust Co. | 7/6/2016 | USD | 878,967 | BRL | �� | 3,199,000 | (3,430 | ) | ||||||||||
State Street Bank & Trust Co. | 7/6/2016 | USD | 72,559 | CLP | 50,189,000 | (367 | ) | |||||||||||
State Street Bank & Trust Co. | 7/6/2016 | USD | 601,556 | CLP | 416,096,500 | (3,045 | ) | |||||||||||
State Street Bank & Trust Co. | 7/6/2016 | USD | 4,493 | COP | 13,961,000 | (10 | ) | |||||||||||
State Street Bank & Trust Co. | 7/6/2016 | USD | 17,546 | COP | 54,550,000 | (28 | ) | |||||||||||
State Street Bank & Trust Co. | 7/6/2016 | USD | 465,924 | COP | 1,448,557,000 | (731 | ) | |||||||||||
State Street Bank & Trust Co. | 7/6/2016 | USD | 559,466 | KRW | 665,999,000 | (1,055 | ) | |||||||||||
State Street Bank & Trust Co. | 7/6/2016 | USD | 331,740 | RUB | 22,137,000 | (3,082 | ) | |||||||||||
State Street Bank & Trust Co. | 7/6/2016 | USD | 8,746 | RUB | 583,000 | (90 | ) | |||||||||||
The Bank of New York Mellon | 7/6/2016 | USD | 102,964 | RUB | 6,878,000 | (850 | ) | |||||||||||
JP Morgan & Chase Co. | 7/7/2016 | CZK | 1,216,500 | USD | 50,159 | 13 | ||||||||||||
State Street Bank & Trust Co. | 7/7/2016 | CZK | 532,000 | USD | 21,934 | 4 | ||||||||||||
The Bank of New York Mellon | 7/7/2016 | CZK | 4,993,100 | USD | 205,821 | (2 | ) | |||||||||||
JP Morgan & Chase Co. | 7/7/2016 | INR | 634,808,144 | USD | 9,395,657 | 24,621 | ||||||||||||
State Street Bank & Trust Co. | 7/7/2016 | INR | 56,420,950 | USD | 835,000 | 2,114 | ||||||||||||
State Street Bank & Trust Co. | 7/7/2016 | INR | 21,616,000 | USD | 320,190 | 1,094 | ||||||||||||
JP Morgan & Chase Co. | 7/7/2016 | PHP | 91,196,000 | USD | 1,948,882 | 2,784 | ||||||||||||
State Street Bank & Trust Co. | 7/7/2016 | PHP | 36,215,216 | USD | 773,829 | 1,006 | ||||||||||||
State Street Bank & Trust Co. | 7/7/2016 | PHP | 3,166,000 | USD | 67,650 | 88 | ||||||||||||
JP Morgan & Chase Co. | 7/7/2016 | THB | 118,126,000 | USD | 3,308,175 | 3,706 | ||||||||||||
State Street Bank & Trust Co. | 7/7/2016 | THB | 1,831,000 | USD | 51,247 | 26 | ||||||||||||
Bank of Montreal | 7/7/2016 | USD | 641,297 | INR | 43,290,500 | (2,243 | ) | |||||||||||
Bank of Montreal | 7/7/2016 | USD | 212,465 | PHP | 9,947,000 | (198 | ) | |||||||||||
Bank of Montreal | 7/7/2016 | USD | 193,351 | THB | 6,907,500 | (120 | ) | |||||||||||
State Street Bank & Trust Co. | 7/7/2016 | USD | 9,196 | CZK | 223,000 | (4 | ) | |||||||||||
State Street Bank & Trust Co. | 7/7/2016 | USD | 2,081,105 | INR | 140,495,406 | (7,112 | ) | |||||||||||
State Street Bank & Trust Co. | 7/7/2016 | USD | 10,928 | INR | 738,000 | (34 | ) | |||||||||||
State Street Bank & Trust Co. | 7/7/2016 | USD | 726,040 | THB | 25,924,710 | (819 | ) | |||||||||||
JP Morgan & Chase Co. | 7/8/2016 | MYR | 22,417,332 | USD | 5,443,214 | 28,458 | ||||||||||||
JP Morgan & Chase Co. | 7/8/2016 | TRY | 6,296,672 | USD | 2,112,384 | 771 | ||||||||||||
State Street Bank & Trust Co. | 7/8/2016 | TRY | 897,000 | USD | 300,913 | 101 | ||||||||||||
Bank of Montreal | 7/8/2016 | USD | 431,919 | MYR | 1,777,000 | (2,696 | ) | |||||||||||
JP Morgan & Chase Co. | 7/8/2016 | USD | 4,529 | TRY | 13,500 | (2 | ) | |||||||||||
State Street Bank & Trust Co. | 7/8/2016 | USD | 96,523 | MYR | 397,000 | (631 | ) | |||||||||||
State Street Bank & Trust Co. | 7/8/2016 | USD | 476,086 | MYR | 1,958,141 | (3,110 | ) | |||||||||||
State Street Bank & Trust Co. | 7/8/2016 | USD | 12,886 | MYR | 53,000 | (84 | ) | |||||||||||
State Street Bank & Trust Co. | 7/8/2016 | USD | 198,320 | TRY | 591,000 | (126 | ) | |||||||||||
JP Morgan & Chase Co. | 7/11/2016 | AED | 2,137,000 | USD | 581,675 | (55 | ) | |||||||||||
State Street Bank & Trust Co. | 7/11/2016 | AED | 1,163,000 | USD | 316,583 | (6 | ) | |||||||||||
The Bank of New York Mellon | 7/11/2016 | AED | 1,520,000 | USD | 413,775 | 4 | ||||||||||||
JP Morgan & Chase Co. | 7/11/2016 | QAR | 1,199,000 | USD | 328,934 | (119 | ) | |||||||||||
State Street Bank & Trust Co. | 7/11/2016 | QAR | 402,000 | USD | 110,344 | 19 | ||||||||||||
The Bank of New York Mellon | 7/11/2016 | QAR | 1,584,580 | USD | 434,697 | (174 | ) | |||||||||||
State Street Bank & Trust Co. | 7/11/2016 | USD | 79,233 | AED | 291,000 | (18 | ) | |||||||||||
State Street Bank & Trust Co. | 7/11/2016 | USD | 49,412 | QAR | 180,000 | (13 | ) | |||||||||||
The Bank of New York Mellon | 7/11/2016 | USD | 90,154 | AED | 331,179 | (1 | ) | |||||||||||
JP Morgan & Chase Co. | 7/12/2016 | EGP | 10,425,000 | USD | 1,137,790 | 13,931 | ||||||||||||
JP Morgan & Chase Co. | 7/12/2016 | IDR | 55,417,671,000 | USD | 4,045,676 | 19,139 | ||||||||||||
State Street Bank & Trust Co. | 7/12/2016 | IDR | 2,129,527,500 | USD | 155,554 | 826 | ||||||||||||
Bank of Montreal | 7/12/2016 | USD | 347,667 | IDR | 4,761,989,500 | (1,670 | ) | |||||||||||
State Street Bank & Trust Co. | 7/12/2016 | USD | 85,512 | IDR | 1,170,661,000 | (454 | ) | |||||||||||
The Bank of Nova Scotia | 7/12/2016 | USD | 34,778 | EGP | 313,000 | (1,035 | ) | |||||||||||
The Bank of Nova Scotia | 7/12/2016 | USD | 520,399 | EGP | 4,694,000 | (14,366 | ) | |||||||||||
|
| |||||||||||||||||
Total net unrealized appreciation | $ | 3,372,618 | ||||||||||||||||
|
| |||||||||||||||||
| See Notes to Financial Statements. | 82 |
DBX ETF Trust
Schedule of investments
Deutsche X-trackers MSCI Emerging Markets Hedged Equity ETF (Continued)
May 31, 2016
Currency Abbreviations
| AED | Arab Emirates Dirham |
| BRL | Brazilian Real |
| CLP | Chilean Peso |
| COP | Colombian Peso |
| CZK | Czech Koruna |
| EGP | Egyptian Pound |
| EUR | Euro |
| HKD | Hong Kong Dollar |
| HUF | Hungarian Forint |
| IDR | Indonesian Rupiah |
| INR | Indian Rupee |
| KRW | South Korean Won |
| MXN | Mexican Peso |
| MYR | Malaysian Ringgit |
| PHP | Phillippine Peso |
| PLN | Polish Zloty |
| QAR | Qatari Rial |
| RUB | Russian Ruble |
| THB | Thai Baht |
| TRY | Turkish New Lira |
| TWD | New Taiwan Dollar |
| USD | U.S. Dollar |
| ZAR | South African Rand |
For information on the Fund’s policy and additional disclosures regarding open futures contracts and forward foreign currency exchange contracts, please refer to the Derivatives section of Note 2 in the accompanying Notes to Financial Statements.
Fair Value Measurements
Various inputs are used in determining the value of the Fund’s investments. These inputs are summarized in three broad levels. Level 1 includes quoted prices in active markets for identical securities. Level 2 includes other significant observable inputs (including quoted prices for similar securities, interest rates, prepayment speeds and credit risk). Level 3 includes significant unobservable inputs (including the Fund’s own assumptions in determining the fair value of investments). The level assigned to the securities valuations may not be an indication of the risk or liquidity associated with investing in those securities.
The following is a summary of the inputs used as of May 31, 2016 in valuing the Fund’s investments. For information on Fund’s policy regarding the valuation of investments, please refer to the Security Valuation section of Note 2 in the accompanying Notes to Financial Statements.
Assets | Level 1 | Level 2 | Level 3 | Total | ||||||||||||
Common Stocks (d) | $ | 124,634,471 | $ | — | $ | 28,956 | $ | 124,663,427 | ||||||||
Preferred Stocks (d) | 4,095,541 | — | — | 4,095,541 | ||||||||||||
Rights | 8,137 | — | — | 8,137 | ||||||||||||
Short-Term Investments | 2,403,639 | — | — | 2,403,639 | ||||||||||||
Derivatives (e) | ||||||||||||||||
Forward Foreign Currency Exchange Contracts | — | 4,273,009 | — | 4,273,009 | ||||||||||||
|
|
|
|
|
|
|
| |||||||||
TOTAL | $ | 131,141,788 | $ | 4,273,009 | $ | 28,956 | $ | 135,443,753 | ||||||||
|
|
|
|
|
|
|
| |||||||||
Liabilities | Level 1 | Level 2 | Level 3 | Total | ||||||||||||
Derivatives (e) | ||||||||||||||||
Futures Contracts | $ | (18,180 | ) | $ | — | $ | — | $ | (18,180 | ) | ||||||
Forward Foreign Currency Exchange Contracts | $ | — | $ | (900,391 | ) | $ | — | $ | (900,391 | ) | ||||||
|
|
|
|
|
|
|
| |||||||||
TOTAL | $ | (18,180 | ) | $ | (900,391 | ) | $ | — | $ | (918,571 | ) | |||||
|
|
|
|
|
|
|
| |||||||||
| (d) | See Schedule of investments for additional detailed categorizations. |
| (e) | Derivatives include unrealized appreciation (depreciation) on open futures contracts and forward foreign currency exchange contracts. |
During the period ended May 31, 2016, the amount of transfers between Level 1 and Level 3 was $57,550 and between Level 3 and Level 1 was $399,271. Investments were transferred from Level 1 to Level 3 as a result of a halt in trading on a securities exchange. Investments were transferred from Level 3 to Level 1 as a result of the resumption of trading on a securities exchange.
Transfers between price levels are recognized at the beginning of the reporting period.
| See Notes to Financial Statements. | 83 |
DBX ETF Trust
Schedule of investments
Deutsche X-trackers MSCI Europe Hedged Equity ETF
May 31, 2016
Number | Value | |||||||
| COMMON STOCKS — 98.5% | ||||||||
| Australia — 0.3% | ||||||||
BHP Billiton PLC | 893,345 | $ | 10,648,614 | |||||
|
| |||||||
| Austria — 0.3% | ||||||||
ANDRITZ AG | 32,403 | 1,650,326 | ||||||
Erste Group Bank AG | 118,166 | 3,162,015 | ||||||
OMV AG (a) | 61,265 | 1,707,562 | ||||||
Raiffeisen Bank International AG*(a) | 48,824 | 653,243 | ||||||
voestalpine AG | 47,277 | 1,619,367 | ||||||
|
| |||||||
| 8,792,513 | ||||||||
|
| |||||||
| Belgium — 2.2% | ||||||||
Ageas | 85,187 | 3,445,829 | ||||||
Anheuser-Busch InBev NV | 340,120 | 43,084,541 | ||||||
Colruyt SA | 29,169 | 1,733,082 | ||||||
Delhaize Group (a) | 44,097 | 4,623,326 | ||||||
Groupe Bruxelles Lambert SA | 34,125 | 2,901,210 | ||||||
KBC Groep NV* | 106,104 | 6,281,759 | ||||||
Proximus SA | 63,198 | 2,053,253 | ||||||
Solvay SA | 31,348 | 3,180,980 | ||||||
Telenet Group Holding NV* | 21,971 | 1,046,040 | ||||||
UCB SA | 53,476 | 3,864,509 | ||||||
Umicore SA | 39,536 | 1,992,724 | ||||||
|
| |||||||
| 74,207,253 | ||||||||
|
| |||||||
| Chile — 0.0% | ||||||||
Antofagasta PLC (c) | 163,860 | 1,018,133 | ||||||
|
| |||||||
| Denmark — 3.1% | ||||||||
A.P. Moeller — Maersk A/S, Class A | 1,583 | 1,973,807 | ||||||
A.P. Moeller — Maersk A/S, Class B | 2,872 | 3,699,182 | ||||||
Carlsberg A/S, Class B | 45,246 | 4,365,741 | ||||||
Chr Hansen Holding A/S | 41,828 | 2,651,207 | ||||||
Coloplast A/S, Class B | 51,265 | 3,880,517 | ||||||
Danske Bank A/S | 298,632 | 8,617,606 | ||||||
DSV A/S | 81,422 | 3,713,789 | ||||||
Genmab A/S* | 23,980 | 4,333,454 | ||||||
ISS A/S | 70,680 | 2,849,531 | ||||||
Novo Nordisk A/S, Class B | 785,165 | 43,670,523 | ||||||
Novozymes A/S, Class B (a) | 98,693 | 4,694,956 | ||||||
Pandora A/S | 49,142 | 7,303,630 | ||||||
TDC A/S | 338,225 | 1,692,972 | ||||||
Tryg A/S | 48,134 | 949,042 | ||||||
Vestas Wind Systems A/S | 94,778 | 6,791,429 | ||||||
William Demant Holding A/S*(a) | 50,870 | 1,072,998 | ||||||
|
| |||||||
| 102,260,384 | ||||||||
|
| |||||||
| Finland — 1.5% | ||||||||
Elisa OYJ | 59,030 | 2,248,862 | ||||||
Fortum OYJ (a) | 187,877 | 2,817,862 | ||||||
Kone OYJ, Class B (a) | 142,499 | 6,735,233 | ||||||
Metso OYJ | 46,889 | 1,101,325 | ||||||
Neste OYJ (a) | 53,328 | 1,797,260 | ||||||
Nokia OYJ* | 2,440,308 | 13,956,099 | ||||||
Nokian Renkaat OYJ | 47,602 | 1,680,550 | ||||||
Orion OYJ, Class B | 42,440 | 1,522,865 | ||||||
Sampo OYJ, Class A (a) | 189,085 | 8,430,099 | ||||||
Stora Enso OYJ, Class R (a) | 228,694 | 1,960,576 | ||||||
Number | Value | |||||||
| Finland (Continued) | ||||||||
UPM-Kymmene OYJ | 225,755 | $ | 4,342,988 | |||||
Wartsila OYJ Abp | 62,571 | 2,593,317 | ||||||
|
| |||||||
| 49,187,036 | ||||||||
|
| |||||||
| France — 15.1% | ||||||||
Accor SA | 87,733 | 3,817,258 | ||||||
Aeroports de Paris | 12,338 | 1,469,561 | ||||||
Air Liquide SA (a) | 145,597 | 15,637,632 | ||||||
Airbus Group SE | 249,137 | 15,528,789 | ||||||
Alstom SA* | 63,850 | 1,603,425 | ||||||
Arkema SA (a) | 28,350 | 2,326,015 | ||||||
Atos SE | 37,220 | 3,439,732 | ||||||
AXA SA | 821,058 | 20,627,854 | ||||||
BNP Paribas SA* | 448,107 | 24,812,013 | ||||||
Bollore SA (a) | 360,700 | 1,303,924 | ||||||
Bouygues SA | 87,590 | 2,845,730 | ||||||
Bureau Veritas SA (a) | 112,042 | 2,408,487 | ||||||
Capgemini SA (a) | 69,187 | 6,597,229 | ||||||
Carrefour SA (a) | 234,264 | 6,346,887 | ||||||
Casino Guichard-Perrachon SA | 23,534 | 1,400,110 | ||||||
Christian Dior SE | 23,060 | 3,760,117 | ||||||
Cie de Saint-Gobain | 201,674 | 9,002,582 | ||||||
Cie Generale des Etablissements Michelin | 77,354 | 7,861,403 | ||||||
CNP Assurances | 71,312 | 1,210,009 | ||||||
Credit Agricole SA (a) | 446,544 | 4,484,022 | ||||||
Danone SA | 249,323 | 17,498,882 | ||||||
Dassault Systemes SA | 54,294 | 4,322,932 | ||||||
Edenred (a) | 86,393 | 1,600,476 | ||||||
Eiffage SA | 24,300 | 1,792,570 | ||||||
Electricite de France (a) | 105,582 | 1,406,765 | ||||||
Engie | 618,033 | 9,520,525 | ||||||
Essilor International SA (a) | 86,978 | 11,356,612 | ||||||
Eurazeo SA | 17,437 | 1,135,163 | ||||||
Eutelsat Communications SA | 73,843 | 1,472,325 | ||||||
Fonciere des Regions REIT | 14,098 | 1,259,904 | ||||||
Gecina SA REIT | 17,393 | 2,456,764 | ||||||
Groupe Eurotunnel SE | 197,739 | 2,551,052 | ||||||
Hermes International | 11,164 | 4,036,385 | ||||||
ICADE REIT (a) | 15,674 | 1,132,003 | ||||||
Iliad SA | 11,170 | 2,447,741 | ||||||
Imerys SA | 14,928 | 1,052,547 | ||||||
Ingenico Group | 23,218 | 2,828,754 | ||||||
JCDecaux SA | 30,988 | 1,278,984 | ||||||
Kering | 32,045 | 5,175,277 | ||||||
Klepierre REIT | 93,075 | 4,257,325 | ||||||
Lagardere SCA | 49,058 | 1,161,277 | ||||||
Legrand SA | 112,906 | 6,210,232 | ||||||
L’Oreal SA | 107,157 | 20,137,542 | ||||||
LVMH Moet Hennessy Louis Vuitton SE | 117,941 | 18,903,157 | ||||||
Natixis SA | 389,506 | 1,880,009 | ||||||
Numericable-SFR SA | 45,620 | 1,417,948 | ||||||
Orange SA | 840,302 | 14,599,354 | ||||||
Pernod Ricard SA | 89,813 | 9,784,137 | ||||||
Peugeot SA*(a) | 205,213 | 3,229,714 | ||||||
Publicis Groupe SA (a) | 80,010 | 5,791,814 | ||||||
| See Notes to Financial Statements. | 84 |
DBX ETF Trust
Schedule of investments
Deutsche X-trackers MSCI Europe Hedged Equity ETF (Continued)
May 31, 2016
Number | Value | |||||||
| France (Continued) | ||||||||
Remy Cointreau SA (a) | 10,132 | $ | 841,440 | |||||
Renault SA | 81,304 | 7,629,600 | ||||||
Rexel SA | 125,348 | 1,916,984 | ||||||
Safran SA (a) | 132,294 | 9,273,357 | ||||||
Sanofi | 497,045 | 40,753,089 | ||||||
Schneider Electric SE | 236,111 | 15,265,933 | ||||||
SCOR SE | 69,022 | 2,307,747 | ||||||
Societe BIC SA | 11,959 | 1,596,068 | ||||||
Societe Generale SA | 323,966 | 13,333,373 | ||||||
Sodexo SA | 39,878 | 4,194,298 | ||||||
Suez | 137,714 | 2,314,489 | ||||||
Technip SA | 45,310 | 2,487,170 | ||||||
Thales SA | 44,616 | 3,865,105 | ||||||
Total SA (a) | 934,175 | 45,395,982 | ||||||
Unibail-Rodamco SE REIT | 41,723 | 11,229,687 | ||||||
Valeo SA | 33,611 | 5,072,914 | ||||||
Veolia Environnement SA | 190,630 | 4,280,245 | ||||||
Vinci SA | 211,880 | 15,934,142 | ||||||
Vivendi SA | 491,982 | 9,760,157 | ||||||
Wendel SA | 11,943 | 1,378,662 | ||||||
Zodiac Aerospace | 84,063 | 1,963,241 | ||||||
|
| |||||||
| 498,974,632 | ||||||||
|
| |||||||
| Germany — 12.9% | ||||||||
adidas AG | 79,644 | 10,204,066 | ||||||
Allianz SE | 193,298 | 31,551,044 | ||||||
Axel Springer SE | 18,536 | 1,054,297 | ||||||
BASF SE | 388,490 | 30,011,194 | ||||||
Bayer AG | 349,775 | 33,325,063 | ||||||
Bayerische Motoren Werke AG | 140,045 | 11,825,198 | ||||||
Beiersdorf AG | 42,636 | 3,874,793 | ||||||
Brenntag AG | 65,350 | 3,498,140 | ||||||
Commerzbank AG | 450,255 | 3,857,496 | ||||||
Continental AG | 46,529 | 9,981,298 | ||||||
Covestro AG, 144A | 30,000 | 1,272,086 | ||||||
Daimler AG | 407,260 | 27,817,984 | ||||||
Deutsche Bank AG*(b) | 583,393 | 10,421,441 | ||||||
Deutsche Boerse AG | 81,634 | 7,152,830 | ||||||
Deutsche Lufthansa AG | 96,783 | 1,356,293 | ||||||
Deutsche Post AG | 410,368 | 11,969,599 | ||||||
Deutsche Telekom AG | 1,363,936 | 24,083,920 | ||||||
Deutsche Wohnen AG | 142,717 | 4,583,567 | ||||||
E.ON SE* | 846,365 | 8,319,946 | ||||||
Evonik Industries AG | 58,025 | 1,710,871 | ||||||
Fraport AG Frankfurt Airport Services Worldwide | 17,247 | 987,314 | ||||||
Fresenius Medical Care AG & Co. KGaA | 92,633 | 8,039,270 | ||||||
Fresenius SE & Co. KGaA | 173,124 | 13,065,781 | ||||||
GEA Group AG | 77,349 | 3,585,769 | ||||||
Hannover Rueck SE | 25,505 | 2,876,109 | ||||||
HeidelbergCement AG | 59,613 | 5,099,964 | ||||||
Henkel AG & Co. KGaA | 43,955 | 4,609,416 | ||||||
HOCHTIEF AG | 8,800 | 1,113,267 | ||||||
Hugo Boss AG | 27,800 | 1,708,347 | ||||||
Infineon Technologies AG | 478,374 | 7,174,865 | ||||||
K+S AG (a) | 79,499 | 1,961,912 | ||||||
LANXESS AG | 38,019 | 1,816,431 | ||||||
Linde AG | 78,560 | 11,756,554 | ||||||
Number | Value | |||||||
| Germany (Continued) | ||||||||
MAN SE | 14,634 | $ | 1,550,902 | |||||
Merck KGaA | 54,666 | 5,471,101 | ||||||
Metro AG | 75,399 | 2,477,338 | ||||||
Muenchener Rueckversicherungs-Gesellschaft AG | 70,571 | 13,258,171 | ||||||
OSRAM Licht AG | 36,966 | 1,967,248 | ||||||
ProSiebenSat.1 Media SE* | 92,545 | 4,652,684 | ||||||
RWE AG* | 206,996 | 2,709,631 | ||||||
SAP SE | 415,698 | 33,745,745 | ||||||
Siemens AG | 328,729 | 35,401,753 | ||||||
Symrise AG | 52,162 | 3,272,748 | ||||||
Telefonica Deutschland Holding AG | 309,077 | 1,382,105 | ||||||
thyssenkrupp AG | 155,594 | 3,425,194 | ||||||
TUI AG | 210,964 | 3,229,664 | ||||||
United Internet AG | 52,026 | 2,453,805 | ||||||
Volkswagen AG*(a) | 14,681 | 2,266,444 | ||||||
Vonovia SE | 197,105 | 6,755,774 | ||||||
Zalando SE, 144A*(a) | 35,895 | 1,052,176 | ||||||
|
| |||||||
| 426,738,608 | ||||||||
|
| |||||||
| Ireland — 1.1% | ||||||||
AerCap Holdings NV* | 37,089 | 1,449,809 | ||||||
Bank of Ireland | 11,635,416 | 3,547,225 | ||||||
CRH PLC | 348,156 | 10,550,123 | ||||||
DCC PLC | 37,500 | 3,416,300 | ||||||
Experian PLC | 405,965 | 7,679,020 | ||||||
Kerry Group PLC, Class A | 66,955 | 6,041,714 | ||||||
Paddy Power Betfair PLC | 33,574 | 4,531,272 | ||||||
|
| |||||||
| 37,215,463 | ||||||||
|
| |||||||
| Italy — 3.0% | ||||||||
Assicurazioni Generali SpA | 493,885 | 7,160,222 | ||||||
Atlantia SpA | 174,642 | 4,710,181 | ||||||
Enel SpA (a) | 3,225,158 | 14,619,357 | ||||||
Eni SpA | 1,076,009 | 16,437,763 | ||||||
EXOR SpA (a) | 46,033 | 1,746,033 | ||||||
Ferrari NV* | 52,349 | 2,219,165 | ||||||
Intesa Sanpaolo SpA | 5,366,512 | 13,781,109 | ||||||
Intesa Sanpaolo SpA-RSP (a) | 387,730 | 940,464 | ||||||
Leonardo-Finmeccanica SpA* | 168,134 | 1,990,460 | ||||||
Luxottica Group SpA (a) | 71,602 | 3,879,013 | ||||||
Mediobanca SpA | 234,277 | 1,816,848 | ||||||
Poste Italiane SpA, 144A* | 221,000 | 1,691,753 | ||||||
Prysmian SpA | 80,970 | 1,981,097 | ||||||
Saipem SpA* | 2,531,249 | 1,036,146 | ||||||
Snam SpA | 1,036,468 | 5,933,317 | ||||||
Telecom Italia SpA* | 4,760,893 | 4,507,900 | ||||||
Telecom Italia SpA-RSP | 2,502,052 | 1,930,630 | ||||||
Terna Rete Elettrica Nazionale SpA (a) | 637,627 | 3,535,908 | ||||||
UniCredit SpA | 2,145,352 | 6,865,050 | ||||||
Unione di Banche Italiane SpA (a) | 374,956 | 1,393,423 | ||||||
UnipolSai SpA (a) | 462,294 | 924,321 | ||||||
|
| |||||||
| 99,100,160 | ||||||||
|
| |||||||
| Jersey Island — 0.1% | ||||||||
Randgold Resources Ltd. | 39,542 | 3,321,702 | ||||||
|
| |||||||
| See Notes to Financial Statements. | 85 |
DBX ETF Trust
Schedule of investments
Deutsche X-trackers MSCI Europe Hedged Equity ETF (Continued)
May 31, 2016
Number | Value | |||||||
| Jordan — 0.1% | ||||||||
Hikma Pharmaceuticals PLC | 60,800 | $ | 2,023,614 | |||||
|
| |||||||
| Luxembourg — 0.4% | ||||||||
ArcelorMittal* | 778,024 | 3,826,234 | ||||||
Millicom International Cellular SA SDR | 27,502 | 1,602,375 | ||||||
RTL Group SA | 16,111 | 1,445,000 | ||||||
SES SA FDR | 138,067 | 3,092,359 | ||||||
Tenaris SA | 199,734 | 2,646,793 | ||||||
|
| |||||||
| 12,612,761 | ||||||||
|
| |||||||
| Mexico — 0.0% | ||||||||
Fresnillo PLC (c) | 91,846 | 1,342,226 | ||||||
|
| |||||||
| Netherlands — 6.1% | ||||||||
ABN AMRO Group NV, 144A | 99,400 | 2,024,475 | ||||||
Aegon NV | 771,915 | 3,967,964 | ||||||
Akzo Nobel NV | 104,734 | 7,108,432 | ||||||
Altice NV, Class A*(a) | 156,307 | 2,693,929 | ||||||
Altice NV, Class B* | 45,501 | 786,735 | ||||||
ASML Holding NV | 155,794 | 15,496,889 | ||||||
Gemalto NV (a) | 33,883 | 2,070,846 | ||||||
Heineken Holding NV | 42,640 | 3,498,457 | ||||||
Heineken NV | 97,453 | 9,050,694 | ||||||
ING Groep NV | 1,636,808 | 20,388,163 | ||||||
Koninklijke Ahold NV | 352,916 | 7,818,058 | ||||||
Koninklijke Boskalis Westminster NV | 36,692 | 1,328,858 | ||||||
Koninklijke DSM NV | 76,738 | 4,567,088 | ||||||
Koninklijke KPN NV (a) | 1,444,955 | 5,734,739 | ||||||
Koninklijke Philips NV (a) | 394,894 | 10,641,698 | ||||||
Koninklijke Vopak NV | 29,261 | 1,524,648 | ||||||
NN Group NV | 134,030 | 4,476,068 | ||||||
NXP Semiconductors NV* | 62,273 | 5,884,176 | ||||||
OCI NV*(a) | 40,107 | 576,999 | ||||||
QIAGEN NV* | 91,848 | 1,969,281 | ||||||
Randstad Holding NV | 53,094 | 2,867,782 | ||||||
Royal Dutch Shell PLC, Class A | 1,780,560 | 42,744,890 | ||||||
Royal Dutch Shell PLC, Class B | 1,584,233 | 38,100,615 | ||||||
Wolters Kluwer NV | 127,694 | 5,089,943 | ||||||
|
| |||||||
| 200,411,427 | ||||||||
|
| |||||||
| Norway — 1.0% | ||||||||
DNB ASA | 413,361 | 5,301,907 | ||||||
Gjensidige Forsikring ASA | 83,156 | 1,434,375 | ||||||
Marine Harvest ASA* | 161,900 | 2,703,623 | ||||||
Norsk Hydro ASA | 558,341 | 2,225,862 | ||||||
Orkla ASA | 344,783 | 3,119,929 | ||||||
Schibsted ASA, Class A | 31,489 | 978,668 | ||||||
Schibsted ASA, Class B | 37,074 | 1,099,067 | ||||||
Statoil ASA | 472,047 | 7,527,382 | ||||||
Telenor ASA (a) | 317,537 | 5,291,271 | ||||||
Yara International ASA (a) | 75,629 | 2,727,511 | ||||||
|
| |||||||
| 32,409,595 | ||||||||
|
| |||||||
| Portugal — 0.2% | ||||||||
EDP — Energias de Portugal SA | 979,519 | 3,264,119 | ||||||
Galp Energia SGPS SA | 195,710 | 2,565,161 | ||||||
Jeronimo Martins SGPS SA | 104,785 | 1,697,527 | ||||||
|
| |||||||
| 7,526,807 | ||||||||
|
| |||||||
Number | Value | |||||||
| South Africa — 0.2% | ||||||||
Investec PLC | 261,151 | $ | 1,773,182 | |||||
Mediclinic International PLC | 153,014 | 1,920,321 | ||||||
Mondi PLC | 155,333 | 3,028,188 | ||||||
|
| |||||||
| 6,721,691 | ||||||||
|
| |||||||
| Spain — 4.8% | ||||||||
Abertis Infraestructuras SA | 219,426 | 3,359,408 | ||||||
ACS Actividades de Construccion y Servicios SA | 81,283 | 2,681,518 | ||||||
Aena SA, 144A* | 28,551 | 3,854,938 | ||||||
Amadeus IT Holding SA, Class A | 185,610 | 8,598,371 | ||||||
Banco Bilbao Vizcaya Argentaria SA | 2,751,463 | 18,249,000 | ||||||
Banco de Sabadell SA (a) | 2,249,894 | 3,845,117 | ||||||
Banco Popular Espanol SA (a) | 719,126 | 1,184,194 | ||||||
Banco Santander SA | 6,105,371 | 29,149,213 | ||||||
Bankia SA (a) | 1,914,692 | 1,663,820 | ||||||
Bankinter SA | 280,043 | 2,130,017 | ||||||
CaixaBank SA | 1,126,116 | 3,078,538 | ||||||
Distribuidora Internacional de Alimentacion SA* | 263,282 | 1,574,548 | ||||||
Enagas SA | 95,929 | 2,875,436 | ||||||
Endesa SA | 134,347 | 2,762,398 | ||||||
Ferrovial SA | 201,308 | 4,262,418 | ||||||
Gas Natural SDG SA | 148,142 | 2,932,314 | ||||||
Grifols SA (a) | 126,169 | 2,858,863 | ||||||
Iberdrola SA | 2,299,955 | 15,599,855 | ||||||
Industria de Diseno Textil SA | 461,389 | 15,585,663 | ||||||
Mapfre SA | 447,973 | 1,135,434 | ||||||
Red Electrica Corp. SA | 45,773 | 4,076,362 | ||||||
Repsol SA | 455,225 | 5,862,777 | ||||||
Telefonica SA | 1,893,929 | 19,789,362 | ||||||
Zardoya Otis SA (a) | 75,408 | 781,969 | ||||||
|
| |||||||
| 157,891,533 | ||||||||
|
| |||||||
| Sweden — 4.3% | ||||||||
Alfa Laval AB | 121,920 | 1,843,120 | ||||||
Assa Abloy AB, Class B | 423,943 | 8,812,928 | ||||||
Atlas Copco AB, Class A | 284,032 | 7,338,008 | ||||||
Atlas Copco AB, Class B | 165,052 | 3,935,675 | ||||||
Boliden AB | 113,530 | 2,008,911 | ||||||
Electrolux AB, Series B | 101,760 | 2,730,240 | ||||||
Getinge AB, Class B | 83,327 | 1,778,154 | ||||||
Hennes & Mauritz AB, Class B | 401,585 | 12,324,835 | ||||||
Hexagon AB, Class B | 109,313 | 4,244,694 | ||||||
Husqvarna AB, Class B | 173,082 | 1,373,642 | ||||||
ICA Gruppen AB (a) | 33,439 | 1,177,391 | ||||||
Industrivarden AB, Class C | 68,183 | 1,152,548 | ||||||
Investor AB, Class B | 192,657 | 6,702,639 | ||||||
Kinnevik AB* | 97,602 | 209,448 | ||||||
Kinnevik AB, Class B (a) | 97,602 | 2,375,300 | ||||||
Lundin Petroleum AB* | 90,523 | 1,623,507 | ||||||
Nordea Bank AB | 1,284,759 | 12,468,155 | ||||||
Sandvik AB (a) | 450,984 | 4,409,088 | ||||||
Securitas AB, Class B | 130,101 | 2,051,021 | ||||||
Skandinaviska Enskilda Banken AB, Class A | 642,499 | 6,158,211 | ||||||
Skanska AB, Class B | 157,480 | 3,458,713 | ||||||
SKF AB, Class B | 168,385 | 2,963,419 | ||||||
| See Notes to Financial Statements. | 86 |
DBX ETF Trust
Schedule of investments
Deutsche X-trackers MSCI Europe Hedged Equity ETF (Continued)
May 31, 2016
Number | Value | |||||||
| Sweden (Continued) | ||||||||
Svenska Cellulosa AB SCA, Class B | 256,251 | $ | 8,202,391 | |||||
Svenska Handelsbanken AB, Class A | 633,372 | 8,109,494 | ||||||
Swedbank AB, Class A | 383,045 | 8,431,137 | ||||||
Swedish Match AB | 83,114 | 2,835,781 | ||||||
Tele2 AB, Class B (a) | 132,637 | 1,163,964 | ||||||
Telefonaktiebolaget LM Ericsson, Class B | 1,287,226 | 9,922,690 | ||||||
Telia Co. AB | 1,098,900 | 5,149,766 | ||||||
Volvo AB, Class B | 652,133 | 7,259,083 | ||||||
|
| |||||||
| 142,213,953 | ||||||||
|
| |||||||
| Switzerland — 14.5% | ||||||||
ABB Ltd.* | 832,209 | 17,313,966 | ||||||
Actelion Ltd.* | 43,446 | 7,128,816 | ||||||
Adecco Group AG | 70,108 | 4,249,504 | ||||||
Aryzta AG* | 36,394 | 1,448,437 | ||||||
Baloise Holding AG | 21,149 | 2,612,774 | ||||||
Barry Callebaut AG | 942 | 1,113,531 | ||||||
Chocoladefabriken Lindt & Spruengli AG | 44 | 3,253,521 | ||||||
Chocoladefabriken Lindt & Spruengli AG Participation Certificates | 422 | 2,600,352 | ||||||
Cie Financiere Richemont SA | 220,791 | 13,005,345 | ||||||
Coca-Cola HBC AG CDI*(a) | 83,116 | 1,616,720 | ||||||
Credit Suisse Group AG* | 786,519 | 10,777,051 | ||||||
Dufry AG* | 16,696 | 2,242,370 | ||||||
EMS-Chemie Holding AG | 3,403 | 1,686,950 | ||||||
Galenica AG | 1,650 | 2,179,527 | ||||||
Geberit AG | 15,988 | 6,112,113 | ||||||
Givaudan SA | 3,906 | 7,485,845 | ||||||
Glencore PLC* | 5,175,274 | 9,826,754 | ||||||
Julius Baer Group Ltd.* | 94,665 | 4,212,307 | ||||||
Kuehne + Nagel International AG | 22,841 | 3,212,446 | ||||||
Lafarge Holcim Ltd.* | 192,529 | 8,657,994 | ||||||
Lonza Group AG* | 22,384 | 3,864,280 | ||||||
Nestle SA | 1,348,601 | 99,584,822 | ||||||
Novartis AG | 962,447 | 76,395,441 | ||||||
Pargesa Holding SA | 14,697 | 970,682 | ||||||
Partners Group Holding AG | 7,341 | 3,094,446 | ||||||
Roche Holding AG | 297,164 | 77,998,076 | ||||||
Schindler Holding AG | 8,519 | 1,570,101 | ||||||
Schindler Holding AG Participation Certificates | 18,711 | 3,465,488 | ||||||
SGS SA | 2,316 | 4,941,887 | ||||||
Sika AG | 923 | 3,992,857 | ||||||
Sonova Holding AG | 22,545 | 3,009,780 | ||||||
STMicroelectronics NV | 264,903 | 1,584,832 | ||||||
Swatch Group AG — Bearer | 13,045 | 3,845,257 | ||||||
Swatch Group AG — Registered | 20,702 | 1,200,674 | ||||||
Swiss Life Holding AG* | 13,570 | 3,518,098 | ||||||
Swiss Prime Site AG* | 29,461 | 2,525,229 | ||||||
Swiss Re AG | 146,007 | 13,117,128 | ||||||
Swisscom AG | 10,956 | 5,220,082 | ||||||
Syngenta AG | 39,314 | 15,444,786 | ||||||
UBS Group AG | 1,546,942 | 23,904,456 | ||||||
Wolseley PLC | 107,964 | 6,334,543 | ||||||
Zurich Insurance Group AG* | 63,621 | 15,393,210 | ||||||
|
| |||||||
| 481,712,478 | ||||||||
|
| |||||||
Number | Value | |||||||
| United Kingdom — 26.7% | ||||||||
3i Group PLC | 411,398 | $ | 3,345,692 | |||||
Aberdeen Asset Management PLC (a) | 384,188 | 1,553,022 | ||||||
Admiral Group PLC | 89,328 | 2,546,166 | ||||||
Aggreko PLC (a) | 106,446 | 1,732,885 | ||||||
Anglo American PLC | 592,952 | 5,153,677 | ||||||
ARM Holdings PLC | 595,722 | 8,515,984 | ||||||
Ashtead Group PLC | 212,900 | 3,009,536 | ||||||
Associated British Foods PLC | 150,685 | 6,425,129 | ||||||
AstraZeneca PLC | 534,734 | 31,196,173 | ||||||
Auto Trader Group PLC, 144A | 423,416 | 2,410,093 | ||||||
Aviva PLC | 1,712,506 | 11,156,439 | ||||||
Babcock International Group PLC | 104,744 | 1,573,193 | ||||||
BAE Systems PLC | 1,339,421 | 9,381,612 | ||||||
Barclays PLC | 7,108,871 | 18,780,170 | ||||||
Barratt Developments PLC | 423,938 | 3,634,947 | ||||||
Berkeley Group Holdings PLC | 54,912 | 2,604,669 | ||||||
BP PLC | 7,818,991 | 40,457,310 | ||||||
British American Tobacco PLC | 788,513 | 47,943,016 | ||||||
British Land Co. PLC REIT | 413,585 | 4,432,723 | ||||||
BT Group PLC | 3,581,595 | 22,969,849 | ||||||
Bunzl PLC | 141,777 | 4,197,210 | ||||||
Burberry Group PLC | 188,226 | 2,927,912 | ||||||
Capita PLC | 281,095 | 4,331,804 | ||||||
Centrica PLC | 2,294,848 | 6,773,797 | ||||||
CNH Industrial NV | 429,950 | 3,032,938 | ||||||
Cobham PLC (a) | 473,240 | 1,117,231 | ||||||
Compass Group PLC | 695,450 | 12,963,388 | ||||||
Croda International PLC | 55,514 | 2,363,872 | ||||||
Diageo PLC | 1,064,396 | 28,835,999 | ||||||
Direct Line Insurance Group PLC | 581,586 | 3,161,306 | ||||||
Dixons Carphone PLC | 413,980 | 2,638,190 | ||||||
easyJet PLC | 65,997 | 1,465,347 | ||||||
Fiat Chrysler Automobiles NV | 380,439 | 2,715,426 | ||||||
G4S PLC | 645,850 | 1,748,296 | ||||||
GKN PLC | 724,965 | 2,886,462 | ||||||
GlaxoSmithKline PLC | 2,059,907 | 43,111,141 | ||||||
Hammerson PLC REIT | 331,793 | 2,782,402 | ||||||
Hargreaves Lansdown PLC | 108,370 | 2,117,362 | ||||||
HSBC Holdings PLC | 8,326,756 | 53,673,350 | ||||||
ICAP PLC | 230,715 | 1,443,556 | ||||||
IMI PLC | 113,302 | 1,649,217 | ||||||
Imperial Brands PLC | 405,507 | 22,088,984 | ||||||
Inmarsat PLC | 186,706 | 1,945,643 | ||||||
InterContinental Hotels Group PLC | 81,530 | 3,142,218 | ||||||
International Consolidated Airlines Group SA | 342,263 | 2,675,239 | ||||||
Intertek Group PLC | 68,262 | 3,101,470 | ||||||
Intu Properties PLC REIT | 391,219 | 1,698,168 | ||||||
ITV PLC | 1,588,780 | 4,942,789 | ||||||
J Sainsbury PLC (a) | 559,212 | 2,174,677 | ||||||
Johnson Matthey PLC | 81,860 | 3,419,330 | ||||||
Kingfisher PLC | 964,753 | 5,130,892 | ||||||
Land Securities Group PLC REIT | 334,427 | 5,647,730 | ||||||
Legal & General Group PLC | 2,516,200 | 8,724,557 | ||||||
Lloyds Banking Group PLC | 27,170,116 | 28,341,228 | ||||||
London Stock Exchange Group PLC | 132,618 | 5,253,320 | ||||||
Marks & Spencer Group PLC | 686,135 | 3,773,325 | ||||||
| See Notes to Financial Statements. | 87 |
DBX ETF Trust
Schedule of investments
Deutsche X-trackers MSCI Europe Hedged Equity ETF (Continued)
May 31, 2016
Number | Value | |||||||
| United Kingdom (Continued) | ||||||||
Meggitt PLC | 321,889 | $ | 1,808,889 | |||||
Merlin Entertainments PLC, 144A | 295,201 | 1,806,847 | ||||||
National Grid PLC | 1,584,332 | 23,107,328 | ||||||
Next PLC | 60,262 | 4,748,063 | ||||||
Old Mutual PLC | 2,084,673 | 5,377,444 | ||||||
Pearson PLC | 347,522 | 4,220,456 | ||||||
Persimmon PLC | 130,096 | 3,960,689 | ||||||
Petrofac Ltd. (a) | 108,234 | 1,219,600 | ||||||
Provident Financial PLC | 62,259 | 2,625,836 | ||||||
Prudential PLC | 1,088,118 | 21,748,491 | ||||||
Reckitt Benckiser Group PLC | 268,943 | 26,779,780 | ||||||
RELX NV | 420,789 | 7,296,716 | ||||||
RELX PLC | 468,314 | 8,478,543 | ||||||
Rexam PLC (a) | 298,373 | 2,716,057 | ||||||
Rio Tinto PLC | 523,068 | 14,716,117 | ||||||
Rolls-Royce Holdings PLC* | 777,714 | 6,972,437 | ||||||
Rolls-Royce Holdings PLC, Class C* | 75,008,575 | 108,639 | ||||||
Rolls-Royce Holdings PLC — Entitlement* | 56,376,414 | 81,653 | ||||||
Royal Bank of Scotland Group PLC* | 1,475,135 | 5,266,508 | ||||||
Royal Mail PLC | 380,674 | 2,982,803 | ||||||
RSA Insurance Group PLC | 430,191 | 3,053,033 | ||||||
SABMiller PLC | 411,359 | 25,586,311 | ||||||
Sage Group PLC | 456,517 | 4,053,139 | ||||||
Schroders PLC | 57,361 | 2,251,438 | ||||||
Segro PLC REIT | 310,700 | 1,970,563 | ||||||
Severn Trent PLC | 99,486 | 3,302,559 | ||||||
Sky PLC | 436,716 | 6,094,315 | ||||||
Smith & Nephew PLC | 378,766 | 6,429,433 | ||||||
Smiths Group PLC | 167,117 | 2,715,736 | ||||||
SSE PLC | 425,601 | 9,443,554 | ||||||
St James’s Place PLC | 221,923 | 2,981,194 | ||||||
Standard Chartered PLC | 1,386,571 | 10,629,628 | ||||||
Standard Life PLC | 833,251 | 4,092,396 | ||||||
Tate & Lyle PLC | 194,256 | 1,768,291 | ||||||
Taylor Wimpey PLC | 1,378,575 | 4,101,143 | ||||||
Tesco PLC* | 3,443,433 | 8,234,036 | ||||||
Travis Perkins PLC | 105,700 | 2,943,936 | ||||||
Unilever NV | 689,016 | 30,945,003 | ||||||
Unilever PLC | 542,866 | 24,735,769 | ||||||
United Utilities Group PLC | 288,419 | 4,052,002 | ||||||
Vodafone Group PLC | 11,232,475 | 37,556,006 | ||||||
Weir Group PLC | 88,921 | 1,544,179 | ||||||
Whitbread PLC | 77,182 | 4,708,455 | ||||||
William Hill PLC | 367,496 | 1,655,872 | ||||||
Wm Morrison Supermarkets PLC (a) | 938,318 | 2,693,567 | ||||||
Number | Value | |||||||
| United Kingdom (Continued) | ||||||||
Worldpay Group PLC, 144A* | 592,160 | $ | 2,376,565 | |||||
WPP PLC | 547,641 | 12,627,375 | ||||||
|
| |||||||
| 885,386,455 | ||||||||
|
| |||||||
| United States(d) — 0.6% | ||||||||
Carnival PLC | 80,174 | 3,958,536 | ||||||
Shire PLC | 250,647 | 15,464,866 | ||||||
|
| |||||||
| 19,423,402 | ||||||||
|
| |||||||
TOTAL COMMON STOCKS | 3,261,140,440 | |||||||
|
| |||||||
| PREFERRED STOCKS — 0.9% | ||||||||
| Germany — 0.9% | ||||||||
Bayerische Motoren Werke AG | 22,653 | 1,666,032 | ||||||
FUCHS PETROLUB SE | 28,910 | 1,176,813 | ||||||
Henkel AG & Co. KGaA | 75,358 | 8,782,935 | ||||||
Porsche Automobil Holding SE* | 64,768 | 3,566,434 | ||||||
Schaeffler AG | 70,300 | 1,134,174 | ||||||
Volkswagen AG* | 78,498 | 11,734,174 | ||||||
|
| |||||||
| 28,060,562 | ||||||||
|
| |||||||
TOTAL PREFERRED STOCKS | 28,060,562 | |||||||
|
| |||||||
| RIGHTS — 0.0% | ||||||||
| Spain — 0.0% | ||||||||
Abertis Infraestructuras SA*, | 214,970 | 164,799 | ||||||
Banco Popular Espanol SA*, | 719,126 | 179,229 | ||||||
Ferrovial SA*, expires 07/30/16 | 197,550 | 70,557 | ||||||
|
| |||||||
| 414,585 | ||||||||
|
| |||||||
TOTAL RIGHTS | 414,585 | |||||||
|
| |||||||
| SECURITIES LENDING COLLATERAL — 5.8% | ||||||||
Daily Assets Fund “Capital Shares”, 0.48% (e)(f) | 193,320,226 | 193,320,226 | ||||||
|
| |||||||
| TOTAL INVESTMENTS — 105.2% (Cost $3,798,690,473)† | $ | 3,482,935,813 | ||||||
Other assets and liabilities, net — (5.2%) | (172,688,226 | ) | ||||||
|
| |||||||
NET ASSETS — 100.0% | $ | 3,310,247,587 | ||||||
|
| |||||||
| * | Non-income producing security. |
| † | The cost for federal income tax purposes was $3,852,135,567. At May 31, 2016, net unrealized depreciation for all securities based on tax cost was $369,199,754. This consisted of aggregate gross unrealized appreciation for all securities in which there was an excess of value over tax cost of $86,948,695 and aggregate gross unrealized depreciation for all securities in which there was an excess of tax cost over value of $456,148,449. |
| (a) | All or a portion of these securities were on loan. In addition, “Other Assets and Liabilities, Net” may include pending sales that are also on loan. The value of securities loaned at May 31, 2016 amounted to $169,842,726, which is 5.1% of net assets. |
| (b) | Affiliated issuer. This security is owned in proportion with its representation in the index. |
| (c) | Listed on London Stock Exchange. |
| (d) | Securities are domiciled in United States and trade on a non-US securities exchange. |
| (e) | Affiliated fund managed by Deutsche Investment Management Americas Inc. The rate shown is the annualized seven-day yield at period end. |
| (f) | Represents collateral held in connection with securities lending. Income earned by the Fund is net of borrower rebates. |
| See Notes to Financial Statements. | 88 |
DBX ETF Trust
Schedule of investments
Deutsche X-trackers MSCI Europe Hedged Equity ETF (Continued)
May 31, 2016
| CDI: | Chess Depositary Interest |
| FDR: | Fiduciary Depositary Receipt |
| REIT: | Real Estate Investment Trust |
| RSP: | Risparmio (Convertible Savings Shares) |
| SDR: | Swedish Depositary Receipt |
| 144A: | Security exempt from registration under Rule 144A of the Securities Act of 1933. These securities may be resold in transactions exempt from registration, normally to qualified institutional buyers. |
As of May 31, 2016, the Fund had the following forward foreign currency exchange contracts outstanding:
Counterparty | Settlement Date | Currency To Deliver | Currency To Receive | Unrealized Appreciation (Depreciation) | ||||||||||||||
Bank of Montreal | 6/2/2016 | CHF | 84,109,940 | USD | 87,858,419 | $ | 3,240,774 | |||||||||||
Canadian Imperial Bank of Commerce | 6/2/2016 | CHF | 54,743,500 | USD | 57,182,924 | 2,108,980 | ||||||||||||
JP Morgan & Chase Co. | 6/2/2016 | CHF | 80,202,991 | USD | 83,772,539 | 3,085,425 | ||||||||||||
RBC Capital Markets | 6/2/2016 | CHF | 88,501,200 | USD | 92,443,548 | 3,408,135 | ||||||||||||
State Street Bank & Trust Co. | 6/2/2016 | CHF | 80,402,814 | USD | 83,988,010 | 3,099,867 | ||||||||||||
The Bank of New York Mellon | 6/2/2016 | CHF | 532,200 | USD | 548,792 | 13,379 | ||||||||||||
The Bank of New York Mellon | 6/2/2016 | CHF | 790,400 | USD | 799,018 | 3,847 | ||||||||||||
The Bank of New York Mellon | 6/2/2016 | CHF | 612,100 | USD | 631,578 | 15,783 | ||||||||||||
The Bank of New York Mellon | 6/2/2016 | CHF | 5,637,500 | USD | 5,888,651 | 217,122 | ||||||||||||
The Bank of Nova Scotia | 6/2/2016 | CHF | 15,004,000 | USD | 15,671,611 | 577,043 | ||||||||||||
The Bank of Nova Scotia | 6/2/2016 | CHF | 57,468,994 | USD | 60,029,242 | 2,213,352 | ||||||||||||
The Bank of Nova Scotia | 6/2/2016 | CHF | 5,423,000 | USD | 5,653,316 | 197,582 | ||||||||||||
Bank of Montreal | 6/2/2016 | DKK | 93,705,800 | USD | 14,431,597 | 413,645 | ||||||||||||
Canadian Imperial Bank of Commerce | 6/2/2016 | DKK | 76,295,200 | USD | 11,750,504 | 337,097 | ||||||||||||
JP Morgan & Chase Co. | 6/2/2016 | DKK | 125,748,387 | USD | 19,365,867 | 554,494 | ||||||||||||
RBC Capital Markets | 6/2/2016 | DKK | 44,368,000 | USD | 6,833,100 | 195,854 | ||||||||||||
State Street Bank & Trust Co. | 6/2/2016 | DKK | 96,074,856 | USD | 14,796,924 | 424,572 | ||||||||||||
The Bank of New York Mellon | 6/2/2016 | DKK | 42,178,200 | USD | 6,495,850 | 186,188 | ||||||||||||
The Bank of New York Mellon | 6/2/2016 | DKK | 837,700 | USD | 128,161 | 2,845 | ||||||||||||
The Bank of New York Mellon | 6/2/2016 | DKK | 971,700 | USD | 148,715 | 3,353 | ||||||||||||
The Bank of New York Mellon | 6/2/2016 | DKK | 1,168,500 | USD | 175,809 | 1,007 | ||||||||||||
The Bank of New York Mellon | 6/2/2016 | DKK | 861,000 | USD | 129,773 | 971 | ||||||||||||
The Bank of New York Mellon | 6/2/2016 | DKK | 849,000 | USD | 128,811 | 1,805 | ||||||||||||
The Bank of Nova Scotia | 6/2/2016 | DKK | 7,898,000 | USD | 1,216,327 | 34,823 | ||||||||||||
The Bank of Nova Scotia | 6/2/2016 | DKK | 196,164,500 | USD | 30,211,690 | 866,394 | ||||||||||||
The Bank of Nova Scotia | 6/2/2016 | DKK | 8,467,000 | USD | 1,301,976 | 35,353 | ||||||||||||
Bank of Montreal | 6/2/2016 | EUR | 247,485,013 | USD | 283,694,545 | 8,331,809 | ||||||||||||
Canadian Imperial Bank of Commerce | 6/2/2016 | EUR | 164,772,270 | USD | 188,879,277 | 5,546,385 | ||||||||||||
JP Morgan & Chase Co. | 6/2/2016 | EUR | 241,448,685 | USD | 276,767,074 | 8,120,623 | ||||||||||||
RBC Capital Markets | 6/2/2016 | EUR | 273,218,191 | USD | 313,192,744 | 9,198,140 | ||||||||||||
State Street Bank & Trust Co. | 6/2/2016 | EUR | 248,328,392 | USD | 284,663,802 | 8,362,685 | ||||||||||||
The Bank of New York Mellon | 6/2/2016 | EUR | 18,618,879 | USD | 21,342,932 | 626,747 | ||||||||||||
The Bank of Nova Scotia | 6/2/2016 | EUR | 17,582,000 | USD | 20,123,742 | 561,233 | ||||||||||||
The Bank of Nova Scotia | 6/2/2016 | EUR | 206,835,500 | USD | 237,098,636 | 6,964,340 | ||||||||||||
The Bank of Nova Scotia | 6/2/2016 | EUR | 165,721 | USD | 184,489 | 100 | ||||||||||||
The Bank of Nova Scotia | 6/2/2016 | EUR | 36,955,000 | USD | 42,359,854 | 1,242,091 | ||||||||||||
Bank of Montreal | 6/2/2016 | GBP | 121,557,508 | USD | 178,078,710 | 2,020,678 | ||||||||||||
Canadian Imperial Bank of Commerce | 6/2/2016 | GBP | 149,234,300 | USD | 218,593,926 | 2,450,162 | ||||||||||||
JP Morgan & Chase Co. | 6/2/2016 | GBP | 110,206,150 | USD | 161,447,051 | 1,829,777 | ||||||||||||
RBC Capital Markets | 6/2/2016 | GBP | 137,566,721 | USD | 201,532,219 | 2,287,215 | ||||||||||||
State Street Bank & Trust Co. | 6/2/2016 | GBP | 126,417,325 | USD | 185,199,991 | 2,103,233 | ||||||||||||
The Bank of New York Mellon | 6/2/2016 | GBP | 2,763,300 | USD | 4,019,737 | 17,506 | ||||||||||||
The Bank of New York Mellon | 6/2/2016 | GBP | 349,400 | USD | 505,878 | (176 | ) | |||||||||||
The Bank of New York Mellon | 6/2/2016 | GBP | 502,200 | USD | 725,752 | (1,610 | ) | |||||||||||
The Bank of New York Mellon | 6/2/2016 | GBP | 76,200 | USD | 111,695 | 1,330 | ||||||||||||
The Bank of New York Mellon | 6/2/2016 | GBP | 3,432,382 | USD | 5,028,399 | 57,102 | ||||||||||||
The Bank of Nova Scotia | 6/2/2016 | GBP | 17,371,000 | USD | 25,446,865 | 287,546 | ||||||||||||
The Bank of Nova Scotia | 6/2/2016 | GBP | 3,565,000 | USD | 5,213,064 | 49,690 | ||||||||||||
| See Notes to Financial Statements. | 89 |
DBX ETF Trust
Schedule of investments
Deutsche X-trackers MSCI Europe Hedged Equity ETF (Continued)
May 31, 2016
Counterparty | Settlement Date | Currency To Deliver | Currency To Receive | Unrealized Appreciation (Depreciation) | ||||||||||||||
The Bank of Nova Scotia | 6/2/2016 | GBP | 46,370,483 | USD | 67,931,598 | $ | 770,827 | |||||||||||
Bank of Montreal | 6/2/2016 | NOK | 40,578,200 | USD | 5,038,517 | 187,914 | ||||||||||||
Canadian Imperial Bank of Commerce | 6/2/2016 | NOK | 41,110,300 | USD | 5,106,362 | 192,154 | ||||||||||||
JP Morgan & Chase Co. | 6/2/2016 | NOK | 46,249,592 | USD | 5,742,731 | 214,186 | ||||||||||||
RBC Capital Markets | 6/2/2016 | NOK | 18,217,500 | USD | 2,262,009 | 84,341 | ||||||||||||
State Street Bank & Trust Co. | 6/2/2016 | NOK | 47,044,000 | USD | 5,841,396 | 217,890 | ||||||||||||
The Bank of New York Mellon | 6/2/2016 | NOK | 6,841,600 | USD | 849,507 | 31,682 | ||||||||||||
The Bank of New York Mellon | 6/2/2016 | NOK | 259,800 | USD | 31,045 | (11 | ) | |||||||||||
The Bank of New York Mellon | 6/2/2016 | NOK | 16,300 | USD | 2,003 | 54 | ||||||||||||
The Bank of New York Mellon | 6/2/2016 | NOK | 223,200 | USD | 27,162 | 481 | ||||||||||||
The Bank of Nova Scotia | 6/2/2016 | NOK | 9,163,000 | USD | 1,137,688 | 42,370 | ||||||||||||
The Bank of Nova Scotia | 6/2/2016 | NOK | 3,200,000 | USD | 396,269 | 13,750 | ||||||||||||
The Bank of Nova Scotia | 6/2/2016 | NOK | 51,273,000 | USD | 6,366,430 | 237,402 | ||||||||||||
Bank of Montreal | 6/2/2016 | SEK | 230,891,200 | USD | 28,808,644 | 1,128,329 | ||||||||||||
Canadian Imperial Bank of Commerce | 6/2/2016 | SEK | 220,111,500 | USD | 27,472,814 | 1,084,819 | ||||||||||||
JP Morgan & Chase Co. | 6/2/2016 | SEK | 215,910,891 | USD | 26,939,495 | 1,055,089 | ||||||||||||
RBC Capital Markets | 6/2/2016 | SEK | 247,489,200 | USD | 30,880,912 | 1,210,750 | ||||||||||||
State Street Bank & Trust Co. | 6/2/2016 | SEK | 241,264,445 | USD | 30,104,845 | 1,180,937 | ||||||||||||
The Bank of New York Mellon | 6/2/2016 | SEK | 2,271,250 | USD | 283,403 | 11,114 | ||||||||||||
The Bank of Nova Scotia | 6/2/2016 | SEK | 13,929,000 | USD | 1,737,899 | 68,025 | ||||||||||||
The Bank of Nova Scotia | 6/2/2016 | SEK | 11,165,000 | USD | 1,390,342 | 51,829 | ||||||||||||
The Bank of Nova Scotia | 6/2/2016 | SEK | 10,429,550 | USD | 1,248,562 | (1,781 | ) | |||||||||||
The Bank of Nova Scotia | 6/2/2016 | SEK | 82,826,000 | USD | 10,334,583 | 405,015 | ||||||||||||
Bank of Montreal | 6/2/2016 | USD | 1,685,975 | CHF | 1,670,000 | (5,894 | ) | |||||||||||
Bank of Montreal | 6/2/2016 | USD | 81,650,010 | CHF | 81,176,440 | 16,429 | ||||||||||||
Bank of Montreal | 6/2/2016 | USD | 1,318,858 | CHF | 1,263,500 | (47,731 | ) | |||||||||||
Bank of Montreal | 6/2/2016 | USD | 385,138 | DKK | 2,557,000 | (2,622 | ) | |||||||||||
Bank of Montreal | 6/2/2016 | USD | 295,451 | DKK | 1,918,500 | (8,452 | ) | |||||||||||
Bank of Montreal | 6/2/2016 | USD | 13,354,331 | DKK | 89,230,300 | (5,893 | ) | |||||||||||
Bank of Montreal | 6/2/2016 | USD | 4,495,644 | EUR | 3,922,500 | (131,298 | ) | |||||||||||
Bank of Montreal | 6/2/2016 | USD | 265,553,556 | EUR | 238,539,013 | (144,534 | ) | |||||||||||
Bank of Montreal | 6/2/2016 | USD | 5,626,541 | EUR | 5,023,500 | (37,173 | ) | |||||||||||
Bank of Montreal | 6/2/2016 | USD | 170,417,229 | GBP | 117,085,008 | (836,950 | ) | |||||||||||
Bank of Montreal | 6/2/2016 | USD | 3,670,952 | GBP | 2,515,000 | (28,347 | ) | |||||||||||
Bank of Montreal | 6/2/2016 | USD | 2,860,559 | GBP | 1,957,500 | (25,411 | ) | |||||||||||
Bank of Montreal | 6/2/2016 | USD | 4,656,882 | NOK | 38,946,200 | (1,364 | ) | |||||||||||
Bank of Montreal | 6/2/2016 | USD | 88,734 | NOK | 714,500 | (3,325 | ) | |||||||||||
Bank of Montreal | 6/2/2016 | USD | 109,721 | NOK | 917,500 | (46 | ) | |||||||||||
Bank of Montreal | 6/2/2016 | USD | 26,704,241 | SEK | 223,067,200 | 38,097 | ||||||||||||
Bank of Montreal | 6/2/2016 | USD | 425,857 | SEK | 3,416,000 | (16,331 | ) | |||||||||||
Bank of Montreal | 6/2/2016 | USD | 527,537 | SEK | 4,408,000 | 915 | ||||||||||||
Canadian Imperial Bank of Commerce | 6/2/2016 | USD | 2,396,558 | CHF | 2,336,500 | (45,954 | ) | |||||||||||
Canadian Imperial Bank of Commerce | 6/2/2016 | USD | 1,318,907 | CHF | 1,263,500 | (47,781 | ) | |||||||||||
Canadian Imperial Bank of Commerce | 6/2/2016 | USD | 51,441,863 | CHF | 51,143,500 | 10,350 | ||||||||||||
Canadian Imperial Bank of Commerce | 6/2/2016 | USD | 10,596,505 | DKK | 70,803,200 | (4,676 | ) | |||||||||||
Canadian Imperial Bank of Commerce | 6/2/2016 | USD | 295,480 | DKK | 1,918,500 | (8,481 | ) | |||||||||||
Canadian Imperial Bank of Commerce | 6/2/2016 | USD | 546,513 | DKK | 3,573,500 | (11,934 | ) | |||||||||||
Canadian Imperial Bank of Commerce | 6/2/2016 | USD | 8,143,736 | EUR | 7,157,000 | (180,542 | ) | |||||||||||
Canadian Imperial Bank of Commerce | 6/2/2016 | USD | 171,098,477 | EUR | 153,692,770 | (93,124 | ) | |||||||||||
Canadian Imperial Bank of Commerce | 6/2/2016 | USD | 4,495,832 | EUR | 3,922,500 | (131,486 | ) | |||||||||||
Canadian Imperial Bank of Commerce | 6/2/2016 | USD | 2,860,700 | GBP | 1,957,500 | (25,552 | ) | |||||||||||
Canadian Imperial Bank of Commerce | 6/2/2016 | USD | 209,170,342 | GBP | 143,710,300 | (1,027,273 | ) | |||||||||||
Canadian Imperial Bank of Commerce | 6/2/2016 | USD | 5,151,952 | GBP | 3,566,500 | 13,595 | ||||||||||||
Canadian Imperial Bank of Commerce | 6/2/2016 | USD | 4,675,846 | NOK | 39,104,800 | (1,369 | ) | |||||||||||
Canadian Imperial Bank of Commerce | 6/2/2016 | USD | 88,737 | NOK | 714,500 | (3,328 | ) | |||||||||||
Canadian Imperial Bank of Commerce | 6/2/2016 | USD | 157,300 | NOK | 1,291,000 | (2,977 | ) | |||||||||||
Canadian Imperial Bank of Commerce | 6/2/2016 | USD | 425,877 | SEK | 3,416,000 | (16,351 | ) | |||||||||||
| See Notes to Financial Statements. | 90 |
DBX ETF Trust
Schedule of investments
Deutsche X-trackers MSCI Europe Hedged Equity ETF (Continued)
May 31, 2016
Counterparty | Settlement Date | Currency To Deliver | Currency To Receive | Unrealized Appreciation (Depreciation) | ||||||||||||||
Canadian Imperial Bank of Commerce | 6/2/2016 | USD | 25,200,072 | SEK | 210,502,500 | $ | 35,951 | |||||||||||
Canadian Imperial Bank of Commerce | 6/2/2016 | USD | 759,573 | SEK | 6,193,000 | (17,128 | ) | |||||||||||
JP Morgan & Chase Co. | 6/2/2016 | USD | 80,670,882 | CHF | 80,202,991 | 16,232 | ||||||||||||
JP Morgan & Chase Co. | 6/2/2016 | USD | 18,819,678 | DKK | 125,748,387 | (8,305 | ) | |||||||||||
JP Morgan & Chase Co. | 6/2/2016 | USD | 268,792,748 | EUR | 241,448,685 | (146,297 | ) | |||||||||||
JP Morgan & Chase Co. | 6/2/2016 | USD | 160,405,052 | GBP | 110,206,150 | (787,778 | ) | |||||||||||
JP Morgan & Chase Co. | 6/2/2016 | USD | 5,530,164 | NOK | 46,249,592 | (1,620 | ) | |||||||||||
JP Morgan & Chase Co. | 6/2/2016 | USD | 25,847,531 | SEK | 215,910,891 | 36,875 | ||||||||||||
RBC Capital Markets | 6/2/2016 | USD | 82,713,438 | CHF | 82,233,700 | 16,643 | ||||||||||||
RBC Capital Markets | 6/2/2016 | USD | 920,795 | CHF | 894,000 | (21,399 | ) | |||||||||||
RBC Capital Markets | 6/2/2016 | USD | 3,065,756 | CHF | 3,037,000 | (10,424 | ) | |||||||||||
RBC Capital Markets | 6/2/2016 | USD | 2,396,334 | CHF | 2,336,500 | (45,730 | ) | |||||||||||
RBC Capital Markets | 6/2/2016 | USD | 546,496 | DKK | 3,573,500 | (11,918 | ) | |||||||||||
RBC Capital Markets | 6/2/2016 | USD | 210,425 | DKK | 1,371,500 | (5,255 | ) | |||||||||||
RBC Capital Markets | 6/2/2016 | USD | 5,204,550 | DKK | 34,775,500 | (2,297 | ) | |||||||||||
RBC Capital Markets | 6/2/2016 | USD | 701,261 | DKK | 4,647,500 | (6,016 | ) | |||||||||||
RBC Capital Markets | 6/2/2016 | USD | 282,919,898 | EUR | 254,138,691 | (153,986 | ) | |||||||||||
RBC Capital Markets | 6/2/2016 | USD | 8,143,056 | EUR | 7,157,000 | (179,862 | ) | |||||||||||
RBC Capital Markets | 6/2/2016 | USD | 10,266,953 | EUR | 9,150,500 | (85,703 | ) | |||||||||||
RBC Capital Markets | 6/2/2016 | USD | 3,163,570 | EUR | 2,772,000 | (79,321 | ) | |||||||||||
RBC Capital Markets | 6/2/2016 | USD | 2,012,098 | GBP | 1,394,500 | 7,629 | ||||||||||||
RBC Capital Markets | 6/2/2016 | USD | 6,665,002 | GBP | 4,599,500 | (3,308 | ) | |||||||||||
RBC Capital Markets | 6/2/2016 | USD | 186,313,054 | GBP | 128,006,221 | (915,017 | ) | |||||||||||
RBC Capital Markets | 6/2/2016 | USD | 5,151,535 | GBP | 3,566,500 | 14,012 | ||||||||||||
RBC Capital Markets | 6/2/2016 | USD | 61,855 | NOK | 507,500 | (1,190 | ) | |||||||||||
RBC Capital Markets | 6/2/2016 | USD | 200,884 | NOK | 1,672,000 | (1,018 | ) | |||||||||||
RBC Capital Markets | 6/2/2016 | USD | 157,290 | NOK | 1,291,000 | (2,968 | ) | |||||||||||
RBC Capital Markets | 6/2/2016 | USD | 1,763,331 | NOK | 14,747,000 | (516 | ) | |||||||||||
RBC Capital Markets | 6/2/2016 | USD | 759,532 | SEK | 6,193,000 | (17,086 | ) | |||||||||||
RBC Capital Markets | 6/2/2016 | USD | 968,586 | SEK | 8,055,000 | (2,915 | ) | |||||||||||
RBC Capital Markets | 6/2/2016 | USD | 293,818 | SEK | 2,391,000 | (7,173 | ) | |||||||||||
RBC Capital Markets | 6/2/2016 | USD | 27,635,974 | SEK | 230,850,200 | 39,426 | ||||||||||||
State Street Bank & Trust Co. | 6/2/2016 | USD | 3,065,828 | CHF | 3,037,000 | (10,496 | ) | |||||||||||
State Street Bank & Trust Co. | 6/2/2016 | USD | 76,917,938 | CHF | 76,471,814 | 15,476 | ||||||||||||
State Street Bank & Trust Co. | 6/2/2016 | USD | 920,808 | CHF | 894,000 | (21,412 | ) | |||||||||||
State Street Bank & Trust Co. | 6/2/2016 | USD | 701,247 | DKK | 4,647,500 | (6,002 | ) | |||||||||||
State Street Bank & Trust Co. | 6/2/2016 | USD | 13,477,885 | DKK | 90,055,856 | (5,948 | ) | |||||||||||
State Street Bank & Trust Co. | 6/2/2016 | USD | 210,413 | DKK | 1,371,500 | (5,243 | ) | |||||||||||
State Street Bank & Trust Co. | 6/2/2016 | USD | 8,000,000 | EUR | 6,934,548 | (284,316 | ) | |||||||||||
State Street Bank & Trust Co. | 6/2/2016 | USD | 3,163,631 | EUR | 2,772,000 | (79,382 | ) | |||||||||||
State Street Bank & Trust Co. | 6/2/2016 | USD | 255,458,973 | EUR | 229,471,343 | (139,040 | ) | |||||||||||
State Street Bank & Trust Co. | 6/2/2016 | USD | 10,267,172 | EUR | 9,150,500 | (85,922 | ) | |||||||||||
State Street Bank & Trust Co. | 6/2/2016 | USD | 2,012,145 | GBP | 1,394,500 | 7,582 | ||||||||||||
State Street Bank & Trust Co. | 6/2/2016 | USD | 175,276,150 | GBP | 120,423,325 | (860,813 | ) | |||||||||||
State Street Bank & Trust Co. | 6/2/2016 | USD | 6,665,154 | GBP | 4,599,500 | (3,460 | ) | |||||||||||
State Street Bank & Trust Co. | 6/2/2016 | USD | 5,364,546 | NOK | 44,864,500 | (1,571 | ) | |||||||||||
State Street Bank & Trust Co. | 6/2/2016 | USD | 61,854 | NOK | 507,500 | (1,189 | ) | |||||||||||
State Street Bank & Trust Co. | 6/2/2016 | USD | 200,885 | NOK | 1,672,000 | (1,019 | ) | |||||||||||
State Street Bank & Trust Co. | 6/2/2016 | USD | 293,814 | SEK | 2,391,000 | (7,170 | ) | |||||||||||
State Street Bank & Trust Co. | 6/2/2016 | USD | 27,632,173 | SEK | 230,818,445 | 39,421 | ||||||||||||
State Street Bank & Trust Co. | 6/2/2016 | USD | 968,586 | SEK | 8,055,000 | (2,915 | ) | |||||||||||
The Bank of New York Mellon | 6/2/2016 | USD | 3,108,429 | CHF | 3,090,400 | 625 | ||||||||||||
The Bank of New York Mellon | 6/2/2016 | USD | 575,512 | CHF | 570,000 | (2,072 | ) | |||||||||||
The Bank of New York Mellon | 6/2/2016 | USD | 4,107,200 | CHF | 3,911,800 | (171,788 | ) | |||||||||||
The Bank of New York Mellon | 6/2/2016 | USD | 6,428,945 | DKK | 42,956,600 | (2,837 | ) | |||||||||||
The Bank of New York Mellon | 6/2/2016 | USD | 605,379 | DKK | 3,909,500 | (20,536 | ) | |||||||||||
The Bank of New York Mellon | 6/2/2016 | USD | 1,121,208 | EUR | 1,000,000 | (8,564 | ) | |||||||||||
| See Notes to Financial Statements. | 91 |
DBX ETF Trust
Schedule of investments
Deutsche X-trackers MSCI Europe Hedged Equity ETF (Continued)
May 31, 2016
Counterparty | Settlement Date | Currency To Deliver | Currency To Receive | Unrealized Appreciation (Depreciation) | ||||||||||||||
The Bank of New York Mellon | 6/2/2016 | USD | 14,405,410 | EUR | 12,499,000 | $ | (498,472 | ) | ||||||||||
The Bank of New York Mellon | 6/2/2016 | USD | 1,677,840 | EUR | 1,500,000 | (8,874 | ) | |||||||||||
The Bank of New York Mellon | 6/2/2016 | USD | 566,904 | EUR | 500,000 | (10,581 | ) | |||||||||||
The Bank of New York Mellon | 6/2/2016 | USD | 3,419,094 | EUR | 3,000,000 | (81,162 | ) | |||||||||||
The Bank of New York Mellon | 6/2/2016 | USD | 328,957 | EUR | 285,600 | (11,186 | ) | |||||||||||
The Bank of New York Mellon | 6/2/2016 | USD | 146,184 | GBP | 100,000 | (1,349 | ) | |||||||||||
The Bank of New York Mellon | 6/2/2016 | USD | 9,423,759 | GBP | 6,500,000 | (9,472 | ) | |||||||||||
The Bank of New York Mellon | 6/2/2016 | USD | 431,239 | GBP | 296,282 | (2,118 | ) | |||||||||||
The Bank of New York Mellon | 6/2/2016 | USD | 333,147 | GBP | 227,200 | (4,081 | ) | |||||||||||
The Bank of New York Mellon | 6/2/2016 | USD | 444,143 | NOK | 3,591,700 | (14,801 | ) | |||||||||||
The Bank of New York Mellon | 6/2/2016 | USD | 22,984 | NOK | 184,500 | (930 | ) | |||||||||||
The Bank of New York Mellon | 6/2/2016 | USD | 426,239 | NOK | 3,564,700 | (125 | ) | |||||||||||
The Bank of New York Mellon | 6/2/2016 | USD | 1,501,494 | SEK | 12,045,500 | (57,423 | ) | |||||||||||
The Bank of New York Mellon | 6/2/2016 | USD | 82,182 | SEK | 655,300 | (3,622 | ) | |||||||||||
The Bank of Nova Scotia | 6/2/2016 | USD | 1,686,051 | CHF | 1,670,000 | (5,971 | ) | |||||||||||
The Bank of Nova Scotia | 6/2/2016 | USD | 76,670,684 | CHF | 76,225,994 | 15,427 | ||||||||||||
The Bank of Nova Scotia | 6/2/2016 | USD | 385,146 | DKK | 2,557,000 | (2,631 | ) | |||||||||||
The Bank of Nova Scotia | 6/2/2016 | USD | 31,424,776 | DKK | 209,972,500 | (13,868 | ) | |||||||||||
The Bank of Nova Scotia | 6/2/2016 | USD | 5,626,822 | EUR | 5,023,500 | (37,455 | ) | |||||||||||
The Bank of Nova Scotia | 6/2/2016 | USD | 285,380,524 | EUR | 256,349,000 | (155,325 | ) | |||||||||||
The Bank of Nova Scotia | 6/2/2016 | USD | 94,304,003 | GBP | 64,791,483 | (463,144 | ) | |||||||||||
The Bank of Nova Scotia | 6/2/2016 | USD | 3,671,133 | GBP | 2,515,000 | (28,528 | ) | |||||||||||
The Bank of Nova Scotia | 6/2/2016 | USD | 7,499,387 | NOK | 62,718,500 | (2,196 | ) | |||||||||||
The Bank of Nova Scotia | 6/2/2016 | USD | 109,726 | NOK | 917,500 | (51 | ) | |||||||||||
The Bank of Nova Scotia | 6/2/2016 | USD | 527,564 | SEK | 4,408,000 | 888 | ||||||||||||
The Bank of Nova Scotia | 6/2/2016 | USD | 12,391,824 | SEK | 103,512,000 | 17,679 | ||||||||||||
Bank of Montreal | 7/5/2016 | CHF | 81,176,440 | USD | 81,774,209 | (31,335 | ) | |||||||||||
Canadian Imperial Bank of Commerce | 7/5/2016 | CHF | 51,143,500 | USD | 51,520,112 | (19,742 | ) | |||||||||||
JP Morgan & Chase Co. | 7/5/2016 | CHF | 80,202,991 | USD | 80,789,930 | (34,622 | ) | |||||||||||
RBC Capital Markets | 7/5/2016 | CHF | 82,233,700 | USD | 82,838,838 | (32,160 | ) | |||||||||||
State Street Bank & Trust Co. | 7/5/2016 | CHF | 76,471,814 | USD | 77,037,656 | (26,803 | ) | |||||||||||
The Bank of New York Mellon | 7/5/2016 | CHF | 3,090,400 | USD | 3,113,220 | (1,130 | ) | |||||||||||
The Bank of Nova Scotia | 7/5/2016 | CHF | 76,225,994 | USD | 76,788,083 | (28,651 | ) | |||||||||||
The Bank of Nova Scotia | 7/5/2016 | CHF | 7,194,000 | USD | 7,246,756 | (2,996 | ) | |||||||||||
Bank of Montreal | 7/5/2016 | DKK | 89,230,300 | USD | 13,369,237 | 3,259 | ||||||||||||
Canadian Imperial Bank of Commerce | 7/5/2016 | DKK | 70,803,200 | USD | 10,608,333 | 2,586 | ||||||||||||
JP Morgan & Chase Co. | 7/5/2016 | DKK | 125,748,387 | USD | 18,840,827 | 4,734 | ||||||||||||
RBC Capital Markets | 7/5/2016 | DKK | 34,775,500 | USD | 5,210,304 | 1,215 | ||||||||||||
State Street Bank & Trust Co. | 7/5/2016 | DKK | 90,055,856 | USD | 13,493,232 | 3,592 | ||||||||||||
The Bank of New York Mellon | 7/5/2016 | DKK | 42,956,600 | USD | 6,436,072 | 1,521 | ||||||||||||
The Bank of Nova Scotia | 7/5/2016 | DKK | 14,417,000 | USD | 2,160,018 | 468 | ||||||||||||
The Bank of Nova Scotia | 7/5/2016 | DKK | 209,972,500 | USD | 31,460,561 | 8,376 | ||||||||||||
Bank of Montreal | 7/5/2016 | EUR | 238,539,013 | USD | 265,852,923 | 92,977 | ||||||||||||
Canadian Imperial Bank of Commerce | 7/5/2016 | EUR | 153,692,770 | USD | 171,292,130 | 60,674 | ||||||||||||
JP Morgan & Chase Co. | 7/5/2016 | EUR | 241,448,685 | USD | 269,086,108 | 84,453 | ||||||||||||
RBC Capital Markets | 7/5/2016 | EUR | 254,138,691 | USD | 283,237,571 | 97,786 | ||||||||||||
State Street Bank & Trust Co. | 7/5/2016 | EUR | 229,471,343 | USD | 255,752,467 | 94,950 | ||||||||||||
The Bank of Nova Scotia | 7/5/2016 | EUR | 256,349,000 | USD | 285,703,524 | 101,200 | ||||||||||||
Bank of Montreal | 7/5/2016 | GBP | 117,085,008 | USD | 170,452,940 | 826,801 | ||||||||||||
Canadian Imperial Bank of Commerce | 7/5/2016 | GBP | 143,710,300 | USD | 209,214,892 | 1,015,535 | ||||||||||||
JP Morgan & Chase Co. | 7/5/2016 | GBP | 110,206,150 | USD | 160,438,444 | 778,005 | ||||||||||||
RBC Capital Markets | 7/5/2016 | GBP | 128,006,221 | USD | 186,352,736 | 904,561 | ||||||||||||
State Street Bank & Trust Co. | 7/5/2016 | GBP | 120,423,325 | USD | 175,314,685 | 852,181 | ||||||||||||
The Bank of New York Mellon | 7/5/2016 | GBP | 296,282 | USD | 431,335 | 2,097 | ||||||||||||
The Bank of Nova Scotia | 7/5/2016 | GBP | 64,791,483 | USD | 94,324,413 | 458,176 | ||||||||||||
Bank of Montreal | 7/5/2016 | NOK | 38,946,200 | USD | 4,656,408 | 1,365 | ||||||||||||
Canadian Imperial Bank of Commerce | 7/5/2016 | NOK | 39,104,800 | USD | 4,675,343 | 1,343 | ||||||||||||
| See Notes to Financial Statements. | 92 |
DBX ETF Trust
Schedule of investments
Deutsche X-trackers MSCI Europe Hedged Equity ETF (Continued)
May 31, 2016
Counterparty | Settlement Date | Currency To Deliver | Currency To Receive | Unrealized Appreciation (Depreciation) | ||||||||||||||
JP Morgan & Chase Co. | 7/5/2016 | NOK | 46,249,592 | USD | 5,529,714 | $ | 1,734 | |||||||||||
RBC Capital Markets | 7/5/2016 | NOK | 14,747,000 | USD | 1,763,160 | 525 | ||||||||||||
State Street Bank & Trust Co. | 7/5/2016 | NOK | 44,864,500 | USD | 5,364,049 | 1,621 | ||||||||||||
The Bank of New York Mellon | 7/5/2016 | NOK | 3,564,700 | USD | 426,191 | 121 | ||||||||||||
The Bank of Nova Scotia | 7/5/2016 | NOK | 62,718,500 | USD | 7,500,432 | 4,006 | ||||||||||||
Bank of Montreal | 7/5/2016 | SEK | 223,067,200 | USD | 26,739,613 | (43,695 | ) | |||||||||||
Canadian Imperial Bank of Commerce | 7/5/2016 | SEK | 210,502,500 | USD | 25,233,694 | (40,992 | ) | |||||||||||
JP Morgan & Chase Co. | 7/5/2016 | SEK | 215,910,891 | USD | 25,881,614 | (42,448 | ) | |||||||||||
RBC Capital Markets | 7/5/2016 | SEK | 230,850,200 | USD | 27,672,912 | (44,888 | ) | |||||||||||
State Street Bank & Trust Co. | 7/5/2016 | SEK | 230,818,445 | USD | 27,669,271 | (44,716 | ) | |||||||||||
The Bank of Nova Scotia | 7/5/2016 | SEK | 103,512,000 | USD | 12,408,312 | (20,202 | ) | |||||||||||
The Bank of Nova Scotia | 7/5/2016 | USD | 919,023 | CHF | 911,000 | (963 | ) | |||||||||||
The Bank of Nova Scotia | 7/5/2016 | USD | 67,357 | DKK | 449,000 | (100 | ) | |||||||||||
The Bank of Nova Scotia | 7/5/2016 | USD | 778,880 | EUR | 698,000 | (1,228 | ) | |||||||||||
The Bank of Nova Scotia | 7/5/2016 | USD | 11,637,372 | EUR | 10,441,000 | (4,894 | ) | |||||||||||
The Bank of Nova Scotia | 7/5/2016 | USD | 184,698 | EUR | 165,721 | (65 | ) | |||||||||||
The Bank of Nova Scotia | 7/5/2016 | USD | 9,490,980 | GBP | 6,519,000 | (46,621 | ) | |||||||||||
The Bank of Nova Scotia | 7/5/2016 | USD | 4,681,652 | GBP | 3,226,000 | (8,005 | ) | |||||||||||
The Bank of Nova Scotia | 7/5/2016 | USD | 318,175 | NOK | 2,661,000 | (119 | ) | |||||||||||
The Bank of Nova Scotia | 7/5/2016 | USD | 61,048 | NOK | 510,000 | (90 | ) | |||||||||||
The Bank of Nova Scotia | 7/5/2016 | USD | 1,250,223 | SEK | 10,429,550 | 2,035 | ||||||||||||
The Bank of Nova Scotia | 7/5/2016 | USD | 2,176,605 | SEK | 18,156,000 | 3,356 | ||||||||||||
The Bank of Nova Scotia | 7/5/2016 | USD | 266,367 | SEK | 2,215,000 | (415 | ) | |||||||||||
|
| |||||||||||||||||
Total net unrealized appreciation | $ | 86,215,598 | ||||||||||||||||
|
| |||||||||||||||||
Currency Abbreviations
| CHF | Swiss Franc |
| DKK | Danish Krone |
| EUR | Euro |
| GBP | Pound Sterling |
| NOK | Norwegian Krone |
| SEK | Swedish Krona |
| USD | U.S. Dollar |
For information on the Fund’s policy and additional disclosures regarding forward foreign currency exchange contracts, please refer to the Derivatives section of Note 2 in the accompanying Notes to Financial Statements.
Fair Value Measurements
Various inputs are used in determining the value of the Fund’s investments. These inputs are summarized in three broad levels. Level 1 includes quoted prices in active markets for identical securities. Level 2 includes other significant observable inputs (including quoted prices for similar securities, interest rates, prepayment speeds and credit risk). Level 3 includes significant unobservable inputs (including the Fund’s own assumptions in determining the fair value of investments). The level assigned to the securities valuations may not be an indication of the risk or liquidity associated with investing in those securities.
The following is a summary of the inputs used as of May 31, 2016 in valuing the Fund’s investments. For information on Fund’s policy regarding the valuation of investments, please refer to the security Valuation section of Note 2 in the accompanying Notes to Financial Statements.
Assets | Level 1 | Level 2 | Level 3 | Total | ||||||||||||
Common Stocks (g) | $ | 3,261,140,440 | $ | — | $ | — | $ | 3,261,140,440 | ||||||||
Preferred Stocks | 28,060,562 | — | — | 28,060,562 | ||||||||||||
Rights | 414,585 | — | — | 414,585 | ||||||||||||
Short-Term Investments | 193,320,226 | — | — | 193,320,226 | ||||||||||||
Derivatives (h) | ||||||||||||||||
Forward Foreign Currency Exchange Contracts | — | 95,241,545 | — | 95,241,545 | ||||||||||||
|
|
|
|
|
|
|
| |||||||||
TOTAL | $ | 3,482,935,813 | $ | 95,241,545 | $ | — | $ | 3,578,177,358 | ||||||||
|
|
|
|
|
|
|
| |||||||||
| See Notes to Financial Statements. | 93 |
DBX ETF Trust
Schedule of investments
Deutsche X-trackers MSCI Europe Hedged Equity ETF (Continued)
May 31, 2016
Liabilities | Level 1 | Level 2 | Level 3 | Total | ||||||||||||
Derivatives (h) | ||||||||||||||||
Forward Foreign Currency Exchange Contracts | $ | — | $ | (9,025,947 | ) | $ | — | $ | (9,025,947 | ) | ||||||
|
|
|
|
|
|
|
| |||||||||
TOTAL | $ | — | $ | (9,025,947 | ) | $ | — | $ | (9,025,947 | ) | ||||||
|
|
|
|
|
|
|
| |||||||||
| (g) | See Schedule of Investments for additional detailed categorizations. |
| (h) | Derivatives include unrealized appreciation (depreciation) on forward foreign currency exchange contracts. |
There have been no transfers between fair value measurement levels during the year ended May 31, 2016.
| See Notes to Financial Statements. | 94 |
DBX ETF Trust
Schedule of investments
Deutsche X-trackers MSCI Eurozone Hedged Equity ETF
May 31, 2016
Number | Value | |||||||
| COMMON STOCKS — 98.0% | ||||||||
| Austria — 0.9% | ||||||||
ANDRITZ AG | 1,464 | $ | 74,563 | |||||
Austria Technologie & Systemtechnik AG | 568 | 7,135 | ||||||
BUWOG AG* | 1,480 | 31,864 | ||||||
CA Immobilien Anlagen AG* | 1,473 | 26,206 | ||||||
Conwert Immobilien Invest SE* | 1,237 | 20,095 | ||||||
DO & CO AG | 135 | 13,963 | ||||||
Erste Group Bank AG* | 5,488 | 146,854 | ||||||
EVN AG | 880 | 10,232 | ||||||
Immofinanz AG* | 15,816 | 36,673 | ||||||
Lenzing AG | 164 | 15,045 | ||||||
Oesterreichische Post AG* | 696 | 24,932 | ||||||
OMV AG (a) | 2,932 | 81,720 | ||||||
Palfinger AG | 302 | 8,737 | ||||||
Raiffeisen Bank International AG* | 2,359 | 31,562 | ||||||
RHI AG | 579 | 11,387 | ||||||
S IMMO AG* | 1,034 | 9,946 | ||||||
Schoeller-Bleckmann Oilfield Equipment AG | 239 | 14,570 | ||||||
Semperit AG Holding | 239 | 8,252 | ||||||
UNIQA Insurance Group AG | 2,610 | 18,774 | ||||||
Vienna Insurance Group AG Wiener Versicherung Gruppe | 800 | 17,709 | ||||||
Voestalpine AG | 2,284 | 78,233 | ||||||
Wienerberger AG | 2,395 | 43,076 | ||||||
Zumtobel Group AG | 635 | 9,153 | ||||||
|
| |||||||
| 740,681 | ||||||||
|
| |||||||
| Belgium — 5.1% | ||||||||
Ablynx NV* | 1,052 | 16,767 | ||||||
Ackermans & van Haaren NV | 473 | 61,364 | ||||||
Aedifica SA REIT | 285 | 21,246 | ||||||
Ageas | 4,028 | 162,933 | ||||||
Agfa Gevaert NV* | 3,648 | 13,330 | ||||||
Anheuser-Busch InBev NV | 15,983 | 2,024,639 | ||||||
Barco NV | 214 | 14,696 | ||||||
Befimmo SA REIT | 383 | 25,428 | ||||||
Bekaert SA | 744 | 33,112 | ||||||
bpost SA | 2,007 | 52,902 | ||||||
Celyad SA* | 100 | 5,419 | ||||||
Cofinimmo SA/NV REIT | 409 | 49,830 | ||||||
Colruyt SA | 1,325 | 78,725 | ||||||
Compagnie d’Entreprises CFE SA | 167 | 15,865 | ||||||
Delhaize Group (a) | 2,077 | 217,762 | ||||||
D’ieteren SA | 541 | 25,561 | ||||||
Econocom Group SA* | 1,298 | 15,475 | ||||||
Elia System Operator SA (a) | 634 | 32,008 | ||||||
Euronav NV | 2,644 | 27,318 | ||||||
EVS Broadcast Equipment SA | 284 | 9,748 | ||||||
Galapagos NV* | 791 | 45,572 | ||||||
Gimv NV | 403 | 23,200 | ||||||
Groupe Bruxelles Lambert SA | 1,606 | 136,538 | ||||||
Intervest Offices & Warehouses NV REIT | 300 | 8,340 | ||||||
Ion Beam Applications | 426 | 18,689 | ||||||
KBC Ancora | 730 | 28,355 | ||||||
KBC Groep NV* | 4,979 | 294,776 | ||||||
Kinepolis Group NV | 316 | 14,667 | ||||||
Number | Value | |||||||
| Belgium (Continued) | ||||||||
Melexis NV | 425 | $ | 25,715 | |||||
Nyrstar NV* | 15,170 | 11,646 | ||||||
Ontex Group NV* | 1,480 | 48,158 | ||||||
Orange Belgium SA* | 631 | 15,144 | ||||||
Proximus SA | 3,028 | 98,377 | ||||||
Sofina SA | 300 | 41,073 | ||||||
Solvay SA | 1,484 | 150,586 | ||||||
Telenet Group Holding NV* | 1,072 | 51,038 | ||||||
Tessenderlo Chemie NV* | 626 | 22,243 | ||||||
UCB SA | 2,522 | 182,255 | ||||||
Umicore SA | 1,913 | 96,421 | ||||||
Van de Velde NV | 100 | 7,179 | ||||||
Warehouses De Pauw Comm. VA REIT | 282 | 26,799 | ||||||
|
| |||||||
| 4,250,899 | ||||||||
|
| |||||||
| Finland — 3.5% | ||||||||
Amer Sports OYJ | 2,402 | 71,572 | ||||||
Cargotec OYJ, Class B | 738 | 28,584 | ||||||
Caverion Corp. | 2,101 | 14,400 | ||||||
Citycon OYJ | 8,091 | 19,355 | ||||||
Cramo OYJ | 815 | 17,592 | ||||||
Elisa OYJ | 2,816 | 107,281 | ||||||
Fortum OYJ (a) | 8,819 | 132,271 | ||||||
F-Secure OYJ | 2,033 | 6,809 | ||||||
Huhtamaki OYJ | 1,839 | 76,874 | ||||||
Kemira OYJ | 2,116 | 25,521 | ||||||
Kesko OYJ, Class B | 1,301 | 52,155 | ||||||
Kone OYJ, Class B (a) | 6,662 | 314,880 | ||||||
Konecranes OYJ | 1,059 | 29,292 | ||||||
Metsa Board OYJ | 3,992 | 22,297 | ||||||
Metso OYJ | 2,284 | 53,646 | ||||||
Neste OYJ | 2,537 | 85,502 | ||||||
Nokia OYJ* | 114,379 | 654,132 | ||||||
Nokian Renkaat OYJ (a) | 2,285 | 80,670 | ||||||
Oriola-KD OYJ | 2,607 | 12,067 | ||||||
Orion OYJ, Class B | 2,056 | 73,775 | ||||||
Outokumpu OYJ* | 6,009 | 25,139 | ||||||
Outotec OYJ* | 3,357 | 13,081 | ||||||
PKC Group OYJ (a) | 504 | 9,842 | ||||||
Ramirent OYJ | 1,580 | 11,515 | ||||||
Sampo OYJ, Class A | 8,795 | 392,113 | ||||||
Sanoma OYJ | 1,633 | 9,130 | ||||||
Sponda OYJ | 4,510 | 19,099 | ||||||
Stora Enso OYJ, Class R | 11,058 | 94,799 | ||||||
Technopolis OYJ | 2,376 | 9,411 | ||||||
Tieto OYJ | 1,113 | 30,526 | ||||||
UPM-Kymmene OYJ | 10,641 | 204,708 | ||||||
Uponor OYJ (a) | 1,160 | 19,037 | ||||||
Valmet OYJ | 2,492 | 30,777 | ||||||
Wartsila OYJ Abp | 2,951 | 122,307 | ||||||
YIT OYJ (a) | 2,423 | 16,728 | ||||||
|
| |||||||
| 2,886,887 | ||||||||
|
| |||||||
| France — 30.1% | ||||||||
AB Science SA* | 346 | 6,310 | ||||||
Accor SA | 3,543 | 154,156 | ||||||
Aeroports de Paris (a) | 588 | 70,036 | ||||||
| See Notes to Financial Statements. | 95 |
DBX ETF Trust
Schedule of investments
Deutsche X-trackers MSCI Eurozone Hedged Equity ETF (Continued)
May 31, 2016
Number | Value | |||||||
| France (Continued) | ||||||||
Air France-KLM* | 2,814 | $ | 22,668 | |||||
Air Liquide SA (a) | 6,850 | 735,714 | ||||||
Airbus Group SE | 11,729 | 731,072 | ||||||
Akka Technologies | 241 | 8,581 | ||||||
Albioma SA | 647 | 10,366 | ||||||
Alstom SA* | 3,137 | 78,778 | ||||||
Altamir | 600 | 7,330 | ||||||
Alten SA | 587 | 37,979 | ||||||
Altran Technologies SA* | 2,707 | 40,194 | ||||||
Arkema SA (a) | 1,349 | 110,681 | ||||||
Atos SE | 1,750 | 161,728 | ||||||
AXA SA | 38,541 | 968,285 | ||||||
Beneteau SA | 900 | 9,914 | ||||||
BNP Paribas SA*(a) | 21,029 | 1,164,391 | ||||||
Boiron SA | 151 | 12,826 | ||||||
Bollore SA (a) | 17,507 | 63,287 | ||||||
Bonduelle SCA | 350 | 9,035 | ||||||
Bourbon SA | 610 | 8,212 | ||||||
Bouygues SA | 4,159 | 135,123 | ||||||
Bureau Veritas SA (a) | 5,345 | 114,898 | ||||||
Capgemini SA (a) | 3,254 | 310,281 | ||||||
Carrefour SA (a) | 11,002 | 298,076 | ||||||
Casino Guichard-Perrachon SA | 1,142 | 67,941 | ||||||
Cegid Group SA | 111 | 7,626 | ||||||
Cellectis SA* | 525 | 16,899 | ||||||
CGG* | 14,246 | 11,096 | ||||||
Christian Dior SE | 1,091 | 177,896 | ||||||
Cie de Saint-Gobain | 9,508 | 424,430 | ||||||
Cie Generale des Etablissements Michelin (a) | 3,622 | 368,100 | ||||||
CNP Assurances | 3,460 | 58,709 | ||||||
Coface SA | 2,063 | 15,707 | ||||||
Credit Agricole SA (a) | 21,056 | 211,436 | ||||||
Danone SA | 11,713 | 822,084 | ||||||
Dassault Systemes SA | 2,544 | 202,555 | ||||||
DBV Technologies SA* | 350 | 23,393 | ||||||
Edenred | 4,216 | 78,104 | ||||||
Eiffage SA | 1,161 | 85,645 | ||||||
Electricite de France (a) | 5,032 | 67,046 | ||||||
Elior Participations SCA, 144A | 2,164 | 48,553 | ||||||
Elis SA | 1,805 | 34,342 | ||||||
Engie | 29,078 | 447,934 | ||||||
Essilor International SA (a) | 4,087 | 533,635 | ||||||
Etablissements Maurel et Prom* | 2,786 | 10,353 | ||||||
Euler Hermes Group | 292 | 25,098 | ||||||
Eurazeo SA | 826 | 53,773 | ||||||
Europcar Groupe SA, 144A* | 1,749 | 18,014 | ||||||
Eutelsat Communications SA | 3,533 | 70,443 | ||||||
Faiveley Transport SA | 160 | 16,063 | ||||||
Faurecia | 1,390 | 55,290 | ||||||
FFP | 148 | 11,168 | ||||||
Fonciere des Regions REIT | 663 | 59,251 | ||||||
Gameloft SE* | 1,037 | 9,496 | ||||||
Gaztransport Et Technigaz SA | 481 | 16,315 | ||||||
Gecina SA REIT | 803 | 113,424 | ||||||
Genfit* | 482 | 15,212 | ||||||
Groupe Eurotunnel SE | 9,373 | 120,922 | ||||||
Number | Value | |||||||
| France (Continued) | ||||||||
Groupe Fnac SA* | 234 | $ | 13,591 | |||||
Guerbet | 124 | 8,464 | ||||||
Havas SA | 3,550 | 29,909 | ||||||
Hermes International | 525 | 189,816 | ||||||
ICADE REIT (a) | 741 | 53,516 | ||||||
ID Logistics Group* | 50 | 6,481 | ||||||
Iliad SA | 527 | 115,484 | ||||||
Imerys SA | 737 | 51,965 | ||||||
Ingenico Group | 1,098 | 133,774 | ||||||
Innate Pharma SA* | 931 | 13,549 | ||||||
Ipsen SA* | 760 | 47,938 | ||||||
Ipsos | 714 | 22,443 | ||||||
JCDecaux SA | 1,496 | 61,745 | ||||||
Kering | 1,516 | 244,834 | ||||||
Klepierre REIT | 4,300 | 196,685 | ||||||
Korian SA | 914 | 29,766 | ||||||
Lagardere SCA | 2,428 | 57,474 | ||||||
Legrand SA | 5,329 | 293,114 | ||||||
LISI | 383 | 10,632 | ||||||
L’Oreal SA | 5,039 | 946,957 | ||||||
LVMH Moet Hennessy Louis Vuitton SE | 5,540 | 887,931 | ||||||
Marie Brizard Wine & Spirits SA* | 430 | 8,650 | ||||||
Mercialys SA REIT | 1,047 | 22,780 | ||||||
Metropole Television SA | 1,250 | 22,941 | ||||||
Natixis SA | 18,794 | 90,712 | ||||||
Naturex* | 131 | 11,010 | ||||||
Neopost SA | 736 | 17,770 | ||||||
Nexans SA* | 539 | 27,737 | ||||||
Nexity SA* | 832 | 44,842 | ||||||
Numericable-SFR SA | 2,198 | 68,318 | ||||||
Orange SA | 39,478 | 685,888 | ||||||
Orpea | 853 | 71,257 | ||||||
Parrot SA* | 409 | 7,172 | ||||||
Pernod Ricard SA | 4,235 | 461,357 | ||||||
Peugeot SA*(a) | 9,708 | 152,788 | ||||||
Plastic Omnium SA | 1,248 | 41,616 | ||||||
Publicis Groupe SA (a) | 3,770 | 272,905 | ||||||
Rallye SA | 505 | 9,052 | ||||||
Remy Cointreau SA | 459 | 38,119 | ||||||
Renault SA | 3,832 | 359,596 | ||||||
Rexel SA | 6,117 | 93,549 | ||||||
Rubis SCA | 800 | 60,635 | ||||||
Safran SA (a) | 6,225 | 436,351 | ||||||
Saft Groupe SA | 542 | 22,102 | ||||||
Sanofi | 23,371 | 1,916,206 | ||||||
Sartorius Stedim Biotech | 561 | 36,852 | ||||||
Schneider Electric SE | 11,120 | 718,972 | ||||||
SCOR SE | 3,282 | 109,734 | ||||||
SEB SA | 462 | 56,827 | ||||||
Societe BIC SA | 586 | 78,209 | ||||||
Societe Generale SA | 15,246 | 627,475 | ||||||
Societe Television Francaise 1 (a) | 2,469 | 31,180 | ||||||
Sodexo SA | 1,883 | 198,051 | ||||||
Sopra Steria Group | 291 | 38,076 | ||||||
SPIE SA | 1,628 | 32,614 | ||||||
Suez | 6,568 | 110,385 | ||||||
Tarkett SA | 396 | 13,309 | ||||||
| See Notes to Financial Statements. | 96 |
DBX ETF Trust
Schedule of investments
Deutsche X-trackers MSCI Eurozone Hedged Equity ETF (Continued)
May 31, 2016
Number | Value | |||||||
| France (Continued) | ||||||||
Technicolor SA | 7,204 | $ | 47,844 | |||||
Technip SA | 2,151 | 118,073 | ||||||
Teleperformance | 1,162 | 101,337 | ||||||
Thales SA | 2,090 | 181,058 | ||||||
Total SA (a) | 43,915 | 2,134,038 | ||||||
Trigano SA | 193 | 11,609 | ||||||
Ubisoft Entertainment SA* | 1,786 | 65,875 | ||||||
Unibail-Rodamco SE REIT | 1,951 | 525,109 | ||||||
Valeo SA* | 1,586 | 239,375 | ||||||
Vallourec SA | 6,257 | 24,325 | ||||||
Veolia Environnement SA | 9,000 | 202,078 | ||||||
Vicat SA | 383 | 25,117 | ||||||
Vilmorin & Cie SA | 167 | 11,242 | ||||||
Vinci SA | 9,930 | 746,772 | ||||||
Virbac SA | 90 | 15,516 | ||||||
Vivendi SA | 23,039 | 457,058 | ||||||
Wendel SA | 587 | 67,761 | ||||||
Worldline SA, 144A* | 800 | 24,549 | ||||||
Zodiac Aerospace | 4,073 | 95,123 | ||||||
|
| |||||||
| 25,072,838 | ||||||||
|
| |||||||
| Germany — 26.6% | ||||||||
Aareal Bank AG | 1,215 | 44,598 | ||||||
adidas AG | 3,745 | 479,813 | ||||||
ADLER Real Estate AG* | 490 | 6,769 | ||||||
ADO Properties SA, 144A | 510 | 18,425 | ||||||
ADVA Optical Networking SE* | 906 | 9,092 | ||||||
AIXTRON SE* | 2,283 | 14,365 | ||||||
Allianz SE | 9,068 | 1,480,123 | ||||||
alstria office REIT-AG* | 2,337 | 30,540 | ||||||
Amadeus Fire AG | 122 | 8,689 | ||||||
AURELIUS SE & Co. KGaA | 485 | 29,140 | ||||||
Aurubis AG | 692 | 36,153 | ||||||
Axel Springer SE (a) | 868 | 49,370 | ||||||
BASF SE | 18,274 | 1,411,683 | ||||||
Bayer AG | 16,443 | 1,566,619 | ||||||
Bayerische Motoren Werke AG | 6,584 | 555,944 | ||||||
BayWa AG* | 291 | 9,875 | ||||||
Bechtle AG | 296 | 32,868 | ||||||
Beiersdorf AG | 2,013 | 182,943 | ||||||
Bertrandt AG | 120 | 13,130 | ||||||
Bilfinger SE* | 716 | 30,404 | ||||||
Borussia Dortmund GmbH & Co. KGaA | 1,608 | 7,446 | ||||||
Brenntag AG | 3,089 | 165,352 | ||||||
CANCOM SE | 341 | 19,187 | ||||||
Capital Stage AG | 1,010 | 6,811 | ||||||
Carl Zeiss Meditec AG (a) | 667 | 25,789 | ||||||
Cewe Stiftung & Co. KGaA | 121 | 8,122 | ||||||
comdirect bank AG | 645 | 7,126 | ||||||
Commerzbank AG | 21,232 | 181,902 | ||||||
CompuGroup Medical SE | 494 | 21,552 | ||||||
Continental AG | 2,182 | 468,078 | ||||||
Covestro AG, 144A | 1,400 | 59,364 | ||||||
CTS Eventim AG & Co. KGaA | 981 | 33,837 | ||||||
Daimler AG | 19,157 | 1,308,523 | ||||||
Deutsche Bank AG*(b) | 27,486 | 490,996 | ||||||
Deutsche Beteiligungs AG | 271 | 8,468 | ||||||
Number | Value | |||||||
| Germany (Continued) | ||||||||
Deutsche Boerse AG | 3,824 | $ | 335,062 | |||||
Deutsche Euroshop AG | 924 | 42,337 | ||||||
Deutsche Lufthansa AG | 4,648 | 65,136 | ||||||
Deutsche Pfandbriefbank AG, 144A | 2,224 | 25,389 | ||||||
Deutsche Post AG | 19,236 | 561,075 | ||||||
Deutsche Telekom AG | 64,035 | 1,130,708 | ||||||
Deutsche Wohnen AG | 6,614 | 212,418 | ||||||
Deutz AG | 2,005 | 9,722 | ||||||
DIC Asset AG | 1,024 | 9,854 | ||||||
DMG Mori AG*(a) | 804 | 36,986 | ||||||
Drillisch AG | 892 | 36,528 | ||||||
Duerr AG | 527 | 40,922 | ||||||
E.ON SE* | 39,900 | 392,225 | ||||||
ElringKlinger AG* | 603 | 13,687 | ||||||
Evonik Industries AG | 2,799 | 82,529 | ||||||
Evotec AG* | 2,541 | 11,337 | ||||||
Fraport AG Frankfurt Airport Services Worldwide | 837 | 47,915 | ||||||
Freenet AG | 2,572 | 70,899 | ||||||
Fresenius Medical Care AG & Co. KGaA | 4,352 | 377,694 | ||||||
Fresenius SE & Co. KGaA | 8,126 | 613,275 | ||||||
GEA Group AG | 3,653 | 169,347 | ||||||
Gerresheimer AG | 637 | 50,704 | ||||||
Gerry Weber International AG | 595 | 7,809 | ||||||
GFT Technologies Se | 330 | 7,896 | ||||||
Grammer AG | 230 | 9,507 | ||||||
GRENKE AG | 177 | 35,557 | ||||||
Hamborner REIT AG REIT | 1,328 | 14,480 | ||||||
Hamburger Hafen Und Logistik AG | 531 | 9,025 | ||||||
Hannover Rueck SE | 1,195 | 134,756 | ||||||
HeidelbergCement AG | 2,811 | 240,484 | ||||||
Heidelberger Druckmaschinen AG* | 5,350 | 15,530 | ||||||
Henkel AG & Co. KGaA | 2,073 | 217,389 | ||||||
HOCHTIEF AG | 400 | 50,603 | ||||||
Hugo Boss AG (a) | 1,352 | 83,082 | ||||||
Hypoport AG* | 100 | 9,708 | ||||||
Indus Holding AG | 395 | 20,705 | ||||||
Infineon Technologies AG | 22,553 | 338,260 | ||||||
Jenoptik AG | 1,078 | 17,182 | ||||||
K+S AG (a) | 3,839 | 94,741 | ||||||
KION Group AG | 1,294 | 71,607 | ||||||
Kloeckner & Co. SE* | 1,597 | 19,688 | ||||||
Koenig & Bauer AG* | 300 | 14,977 | ||||||
Krones AG | 292 | 34,796 | ||||||
KUKA AG | 465 | 54,842 | ||||||
KWS Saat SE | 43 | 14,492 | ||||||
LANXESS AG (a) | 1,842 | 88,005 | ||||||
LEG Immobilien AG* | 1,230 | 109,758 | ||||||
Leoni AG | 680 | 22,668 | ||||||
Linde AG | 3,698 | 553,408 | ||||||
MAN SE* | 695 | 73,656 | ||||||
Merck KGaA | 2,577 | 257,912 | ||||||
Metro AG | 3,551 | 116,673 | ||||||
MorphoSys AG*(a) | 520 | 29,160 | ||||||
MTU Aero Engines AG | 1,046 | 98,797 | ||||||
Muenchener Rueckversicherungs-Gesellschaft AG | 3,312 | 622,225 | ||||||
| See Notes to Financial Statements. | 97 |
DBX ETF Trust
Schedule of investments
Deutsche X-trackers MSCI Eurozone Hedged Equity ETF (Continued)
May 31, 2016
Number | Value | |||||||
| Germany (Continued) | ||||||||
Nemetschek SE | 312 | $ | 18,107 | |||||
Nordex SE*(a) | 1,315 | 37,383 | ||||||
Norma Group SE* | 663 | 32,930 | ||||||
OSRAM Licht AG | 1,785 | 94,994 | ||||||
PATRIZIA Immobilien AG* | 772 | 21,461 | ||||||
Pfeiffer Vacuum Technology AG | 151 | 14,363 | ||||||
ProSiebenSat.1 Media SE* | 4,340 | 218,193 | ||||||
Rational AG | 69 | 32,582 | ||||||
Rheinmetall AG | 795 | 54,586 | ||||||
Rhoen-Klinikum AG | 709 | 21,757 | ||||||
RIB Software AG (a) | 789 | 8,235 | ||||||
RWE AG* | 9,798 | 128,258 | ||||||
SAF-Holland SA | 974 | 12,311 | ||||||
Salzgitter AG* | 808 | 25,793 | ||||||
SAP SE | 19,518 | 1,584,442 | ||||||
SGL Carbon SE* | 812 | 10,602 | ||||||
Siemens AG | 15,199 | 1,636,823 | ||||||
Sixt SE | 254 | 14,885 | ||||||
SLM Solutions Group AG* | 288 | 8,123 | ||||||
SMA Solar Technology AG*(a) | 255 | 14,050 | ||||||
Software AG* | 1,035 | 40,190 | ||||||
STADA Arzneimittel AG | 1,256 | 66,883 | ||||||
STRATEC Biomedical AG* | 115 | 6,398 | ||||||
Stroeer SE & Co. KGaA | 566 | 30,783 | ||||||
Suedzucker AG | 1,466 | 28,733 | ||||||
Symrise AG | 2,464 | 154,596 | ||||||
TAG Immobilien AG (a) | 2,494 | 34,076 | ||||||
Takkt AG | 775 | 17,220 | ||||||
Telefonica Deutschland Holding AG | 14,827 | 66,302 | ||||||
thyssenkrupp AG | 7,350 | 161,800 | ||||||
TLG Immobilien AG | 1,365 | 29,828 | ||||||
United Internet AG | 2,443 | 115,224 | ||||||
Volkswagen AG*(a) | 646 | 99,729 | ||||||
Vonovia SE | 9,203 | 315,433 | ||||||
Vossloh AG* | 183 | 11,779 | ||||||
VTG AG | 238 | 7,784 | ||||||
Wacker Chemie AG | 322 | 30,238 | ||||||
Wacker Neuson SE* | 634 | 11,142 | ||||||
WCM Beteiligungs & Grundbesitz-AG* | 2,200 | 7,613 | ||||||
Wincor Nixdorf AG* | 602 | 34,268 | ||||||
Wirecard AG (a) | 2,346 | 104,306 | ||||||
Wuestenrot & Wuerttembergische AG | 500 | 10,453 | ||||||
XING AG | 60 | 12,057 | ||||||
Zalando SE, 144A*(a) | 1,759 | 51,561 | ||||||
zooplus AG* | 122 | 17,782 | ||||||
|
| |||||||
| 22,104,279 | ||||||||
|
| |||||||
| Ireland — 2.1% | ||||||||
AerCap Holdings NV* | 3,405 | 133,102 | ||||||
Bank of Ireland* | 546,906 | 166,732 | ||||||
C&C Group PLC | 6,775 | 31,155 | ||||||
CRH PLC | 16,363 | 495,846 | ||||||
Glanbia PLC | 3,888 | 72,244 | ||||||
Green REIT PLC REIT | 13,200 | 21,325 | ||||||
Hibernia REIT PLC REIT | 14,208 | 20,551 | ||||||
Irish Continental Group PLC | 3,297 | 19,809 | ||||||
Irish Residential Properties REIT PLC REIT | 8,100 | 10,400 | ||||||
Number | Value | |||||||
| Ireland (Continued) | ||||||||
Kerry Group PLC, Class A | 3,139 | $ | 283,249 | |||||
Kingspan Group PLC | 3,018 | 84,805 | ||||||
Origin Enterprises PLC | 2,747 | 19,204 | ||||||
Paddy Power Betfair PLC | 1,585 | 213,918 | ||||||
Permanent TSB Group Holdings PLC* | 3,048 | 7,383 | ||||||
Ryanair Holdings PLC | 2,385 | 37,430 | ||||||
Smurfit Kappa Group PLC | 4,692 | 128,007 | ||||||
|
| |||||||
| 1,745,160 | ||||||||
|
| |||||||
| Italy — 7.4% | ||||||||
A2A SpA | 32,935 | 46,942 | ||||||
ACEA SpA | 1,225 | 17,923 | ||||||
Amplifon SpA | 1,939 | 18,985 | ||||||
Anima Holding SpA, 144A | 4,662 | 28,607 | ||||||
Ansaldo STS SpA | 2,305 | 26,313 | ||||||
Assicurazioni Generali SpA | 23,242 | 336,957 | ||||||
ASTM SpA | 780 | 10,197 | ||||||
Atlantia SpA | 8,132 | 219,324 | ||||||
Autogrill SpA* | 2,705 | 23,190 | ||||||
Azimut Holding SpA | 2,340 | 51,447 | ||||||
Banca Carige SpA*(a) | 15,450 | 9,627 | ||||||
Banca Generali SpA | 1,214 | 31,797 | ||||||
Banca IFIS SpA | 472 | 12,494 | ||||||
Banca Mediolanum SpA | 5,268 | 44,166 | ||||||
Banca Monte dei Paschi di Siena SpA* | 54,349 | 37,674 | ||||||
Banca Popolare dell’Emilia Romagna SC | 9,863 | 49,910 | ||||||
Banca Popolare di Milano Scarl | 89,678 | 51,686 | ||||||
Banca Popolare di Sondrio Scarl | 9,540 | 31,249 | ||||||
Banco Popolare SC (a) | 7,492 | 37,078 | ||||||
Beni Stabili SpA SIIQ REIT*(a) | 23,453 | 17,327 | ||||||
Brembo SpA | 610 | 35,191 | ||||||
Brunello Cucinelli SpA | 640 | 12,625 | ||||||
Buzzi Unicem SpA | 1,384 | 27,503 | ||||||
Buzzi Unicem SpA-RSP | 886 | 10,302 | ||||||
Cerved Information Solutions SpA | 4,088 | 34,023 | ||||||
Compagnie Industriali Riunite SpA | 8,537 | 10,031 | ||||||
Credito Emiliano SpA | 1,941 | 13,735 | ||||||
Credito Valtellinese SC | 24,245 | 15,134 | ||||||
Danieli & C Officine Meccaniche Spa-RSP | 856 | 12,001 | ||||||
Datalogic SpA | 467 | 8,412 | ||||||
Davide Campari-Milano SpA | 5,910 | 57,110 | ||||||
De’ Longhi | 1,261 | 33,827 | ||||||
DiaSorin SpA | 465 | 28,145 | ||||||
EI Towers SpA* | 366 | 21,074 | ||||||
Enel SpA (a) | 149,471 | 677,539 | ||||||
Engineering SpA* | 96 | 7,050 | ||||||
Eni SpA | 50,569 | 772,523 | ||||||
ERG SpA | 1,255 | 15,304 | ||||||
EXOR SpA (a) | 2,230 | 84,584 | ||||||
Ferrari NV* | 2,450 | 103,860 | ||||||
FinecoBank Banca Fineco SpA | 4,291 | 31,320 | ||||||
Hera SpA | 13,955 | 40,370 | ||||||
Immobiliare Grande Distribuzione SIIQ SpA REIT | 9,795 | 8,828 | ||||||
Industria Macchine Automatiche SpA | 309 | 19,631 | ||||||
Infrastrutture Wireless Italiane SpA, 144A | 5,139 | 24,873 | ||||||
Interpump Group SpA | 1,518 | 24,186 | ||||||
| See Notes to Financial Statements. | 98 |
DBX ETF Trust
Schedule of investments
Deutsche X-trackers MSCI Eurozone Hedged Equity ETF (Continued)
May 31, 2016
Number | Value | |||||||
| Italy (Continued) | ||||||||
Intesa Sanpaolo SpA | 250,980 | $ | 644,512 | |||||
Intesa Sanpaolo SpA-RSP (a) | 19,642 | 47,643 | ||||||
Iren SpA | 12,661 | 23,244 | ||||||
Italcementi SpA* | 3,897 | 45,441 | ||||||
Italmobiliare SpA-RSP | 366 | 10,995 | ||||||
Leonardo-Finmeccanica SpA*(a) | 8,169 | 96,709 | ||||||
Luxottica Group SpA | 3,375 | 182,839 | ||||||
Maire Tecnimont SpA | 2,539 | 7,289 | ||||||
MARR SpA | 725 | 14,343 | ||||||
Mediaset SpA | 15,558 | 69,415 | ||||||
Mediobanca SpA | 11,496 | 89,153 | ||||||
Moncler SpA | 2,844 | 47,434 | ||||||
OVS SpA, 144A* | 2,426 | 16,628 | ||||||
Piaggio & C SpA (a) | 3,898 | 7,620 | ||||||
Poste Italiane SpA, 144A* | 10,500 | 80,377 | ||||||
Prysmian SpA | 3,949 | 96,620 | ||||||
RAI Way SpA, 144A | 2,109 | 9,973 | ||||||
Recordati SpA | 2,109 | 62,278 | ||||||
Reply SpA | 87 | 12,681 | ||||||
Saipem SpA* | 123,587 | 50,589 | ||||||
Salini Impregilo SpA | 4,233 | 14,553 | ||||||
Salvatore Ferragamo SpA | 1,074 | 22,980 | ||||||
Saras SpA | 7,115 | 12,461 | ||||||
Snam SpA | 47,938 | 274,424 | ||||||
Societa Cattolica DI Assicurazioni Scrl | 2,968 | 20,375 | ||||||
Societa Iniziative Autostradali e Servizi SpA | 1,563 | 15,269 | ||||||
Telecom Italia SpA* | 202,233 | 191,486 | ||||||
Telecom Italia SpA-RSP | 121,468 | 93,727 | ||||||
Terna Rete Elettrica Nazionale SpA (a) | 29,579 | 164,028 | ||||||
Tod’s SpA (a) | 296 | 17,817 | ||||||
UniCredit SpA | 101,280 | 324,092 | ||||||
Unione di Banche Italiane SpA (a) | 18,406 | 68,401 | ||||||
Unipol Gruppo Finanziario SpA | 9,070 | 33,504 | ||||||
UnipolSai SpA (a) | 23,409 | 46,804 | ||||||
Yoox Net-A-Porter Group SpA* | 1,156 | 32,451 | ||||||
|
| |||||||
| 6,180,229 | ||||||||
|
| |||||||
| Luxembourg — 0.8% | ||||||||
APERAM SA | 961 | 38,301 | ||||||
ArcelorMittal* | 36,823 | 181,091 | ||||||
BRAAS Monier Building Group SA | 505 | 14,123 | ||||||
Eurofins Scientific SE | 186 | 72,123 | ||||||
Grand City Properties SA | 2,283 | 48,047 | ||||||
RTL Group SA | 764 | 68,523 | ||||||
SES SA FDR | 6,523 | 146,099 | ||||||
Tenaris SA | 9,428 | 124,936 | ||||||
|
| |||||||
| 693,243 | ||||||||
|
| |||||||
| Netherlands — 8.0% | ||||||||
Aalberts Industries NV (a) | 1,995 | 70,387 | ||||||
ABN AMRO Group NV, 144A | 4,700 | 95,725 | ||||||
Accell Group | 469 | 9,850 | ||||||
Aegon NV | 36,303 | 186,612 | ||||||
Akzo Nobel NV | 4,917 | 333,723 | ||||||
Altice NV, Class A*(a) | 7,357 | 126,797 | ||||||
Altice NV, Class B* | 2,199 | 38,022 | ||||||
Amsterdam Commodities NV | 378 | 9,671 | ||||||
Number | Value | |||||||
| Netherlands (Continued) | ||||||||
Arcadis NV | 1,389 | $ | 23,151 | |||||
ASM International NV (a) | 966 | 38,994 | ||||||
ASML Holding NV | 7,324 | 728,521 | ||||||
BE Semiconductor Industries NV | 705 | 19,885 | ||||||
BinckBank NV | 1,464 | 8,974 | ||||||
Brunel International NV | 522 | 10,239 | ||||||
Corbion NV | 1,173 | 29,170 | ||||||
Delta Lloyd NV (a) | 9,252 | 46,591 | ||||||
Eurocommercial Properties NV | 966 | 45,443 | ||||||
Euronext NV, 144A | 1,193 | 50,115 | ||||||
Flow Traders, 144A | 570 | 19,613 | ||||||
Fugro NV* | 1,208 | 21,525 | ||||||
Gemalto NV (a) | 1,601 | 97,849 | ||||||
Heineken Holding NV | 1,978 | 162,288 | ||||||
Heineken NV | 4,536 | 421,269 | ||||||
IMCD Group NV (a) | 1,021 | 42,333 | ||||||
ING Groep NV | 76,830 | 956,998 | ||||||
Intertrust NV, 144A* | 700 | 13,825 | ||||||
InterXion Holding NV* | 1,395 | 52,257 | ||||||
Kendrion NV | 264 | 7,211 | ||||||
Koninklijke Ahold NV (a) | 16,492 | 365,343 | ||||||
Koninklijke BAM Groep NV | 4,744 | 22,312 | ||||||
Koninklijke Boskalis Westminster NV (a) | 1,772 | 64,176 | ||||||
Koninklijke DSM NV (a) | 3,614 | 215,088 | ||||||
Koninklijke KPN NV (a) | 67,693 | 268,660 | ||||||
Koninklijke Philips NV | 18,490 | 498,273 | ||||||
Koninklijke Vopak NV | 1,404 | 73,156 | ||||||
NN Group NV | 6,303 | 210,495 | ||||||
NSI NV REIT | 3,071 | 13,555 | ||||||
NXP Semiconductors NV* | 5,857 | 553,428 | ||||||
OCI NV*(a) | 1,935 | 27,838 | ||||||
PostNL NV* | 8,475 | 37,323 | ||||||
QIAGEN NV* | 4,441 | 95,218 | ||||||
Randstad Holding NV | 2,375 | 128,282 | ||||||
Refresco Group NV, 144A | 1,025 | 16,765 | ||||||
SBM Offshore NV (a) | 3,632 | 42,917 | ||||||
TKH Group NV | 831 | 32,246 | ||||||
TomTom NV* | 2,154 | 19,120 | ||||||
USG People NV* | 1,344 | 26,125 | ||||||
Vastned Retail NV REIT | 403 | 17,815 | ||||||
Wereldhave NV REIT | 820 | 41,754 | ||||||
Wessanen NV | 1,627 | 17,082 | ||||||
Wolters Kluwer NV | 5,964 | 237,728 | ||||||
|
| |||||||
| 6,691,737 | ||||||||
|
| |||||||
| Portugal — 0.6% | ||||||||
Banco BPI SA* | 8,035 | 10,415 | ||||||
Banco Comercial Portugues SA, Class R*(a) | 910,327 | 30,994 | ||||||
CTT-Correios de Portugal SA | 2,993 | 26,917 | ||||||
EDP — Energias de Portugal SA | 46,452 | 154,795 | ||||||
Galp Energia SGPS SA | 9,254 | 121,292 | ||||||
Jeronimo Martins SGPS SA | 5,027 | 81,438 | ||||||
Navigator Co. SA | 5,048 | 16,344 | ||||||
NOS SGPS SA | 4,798 | 35,640 | ||||||
REN — Redes Energeticas Nacionais SGPS SA | 3,717 | 10,968 | ||||||
| See Notes to Financial Statements. | 99 |
DBX ETF Trust
Schedule of investments
Deutsche X-trackers MSCI Eurozone Hedged Equity ETF (Continued)
May 31, 2016
Number | Value | |||||||
| Portugal (Continued) | ||||||||
Semapa-Sociedade de Investimento e Gestao | 621 | $ | 7,656 | |||||
Sonae SGPS SA | 17,140 | 17,640 | ||||||
|
| |||||||
| 514,099 | ||||||||
|
| |||||||
| Spain — 10.1% | ||||||||
Abertis Infraestructuras SA | 10,191 | 156,024 | ||||||
Acciona SA | 586 | 44,578 | ||||||
Acerinox SA | 3,266 | 37,792 | ||||||
ACS Actividades de Construccion y Servicios SA | 3,844 | 126,813 | ||||||
Aena SA, 144A* | 1,334 | 180,116 | ||||||
Almirall SA | 1,272 | 20,097 | ||||||
Amadeus IT Holding SA, Class A | 8,715 | 403,722 | ||||||
Applus Services SA | 2,296 | 19,620 | ||||||
Atresmedia Corp. de Medios de Comunicacion SA | 1,890 | 24,646 | ||||||
Axiare Patrimonio SOCIMI SA REIT | 1,506 | 21,968 | ||||||
Banco Bilbao Vizcaya Argentaria SA | 129,113 | 856,338 | ||||||
Banco de Sabadell SA | 105,750 | 180,729 | ||||||
Banco Popular Espanol SA | 34,992 | 57,622 | ||||||
Banco Santander SA | 286,801 | 1,369,290 | ||||||
Bankia SA | 91,598 | 79,596 | ||||||
Bankinter SA | 13,345 | 101,503 | ||||||
Bolsas y Mercados Espanoles SHMSF SA | 1,531 | 48,651 | ||||||
CaixaBank SA | 52,711 | 144,100 | ||||||
Cellnex Telecom SAU, 144A | 3,036 | 48,981 | ||||||
Cia de Distribucion Integral Logista Holdings SA | 827 | 18,670 | ||||||
CIE Automotive SA | 938 | 17,429 | ||||||
Construcciones y Auxiliar de Ferrocarriles SA | 40 | 12,987 | ||||||
Corp. Financiera Alba SA | 318 | 13,505 | ||||||
Distribuidora Internacional de Alimentacion SA* | 12,502 | 74,768 | ||||||
Ebro Foods SA | 1,464 | 34,313 | ||||||
Enagas SA | 4,529 | 135,755 | ||||||
Ence Energia y Celulosa S.A | 3,125 | 8,762 | ||||||
Endesa SA | 6,207 | 127,626 | ||||||
Euskaltel SA, 144A* | 2,059 | 20,733 | ||||||
Faes Farma SA | 5,533 | 19,115 | ||||||
Ferrovial SA | 9,478 | 200,684 | ||||||
Fomento de Construcciones y Contratas SA* | 3,916 | 32,983 | ||||||
Gamesa Corp. Tecnologica SA | 4,488 | 89,409 | ||||||
Gas Natural SDG SA | 6,949 | 137,548 | ||||||
Grifols SA | 5,959 | 135,025 | ||||||
Grupo Catalana Occidente SA | 870 | 27,152 | ||||||
Hispania Activos Inmobiliarios SA* | 2,260 | 29,999 | ||||||
Iberdrola SA | 107,468 | 728,921 | ||||||
Indra Sistemas SA* | 2,184 | 24,908 | ||||||
Industria de Diseno Textil SA | 21,718 | 733,631 | ||||||
Inmobiliaria Colonial SA* | 44,541 | 35,137 | ||||||
Lar Espana Real Estate Socimi SA REIT | 1,286 | 12,463 | ||||||
Liberbank SA* | 9,102 | 9,560 | ||||||
Mapfre SA | 21,738 | 55,097 | ||||||
Mediaset Espana Comunicacion SA | 4,077 | 54,390 | ||||||
Number | Value | |||||||
| Spain (Continued) | ||||||||
Melia Hotels International SA | 1,895 | $ | 23,130 | |||||
Merlin Properties Socimi SA REIT | 6,410 | 70,564 | ||||||
Miquel y Costas & Miquel SA | 167 | 6,791 | ||||||
NH Hotel Group SA* | 4,102 | 20,858 | ||||||
Obrascon Huarte Lain SA | 2,612 | 15,255 | ||||||
Pharma Mar SA* | 3,932 | 10,915 | ||||||
Promotora de Informaciones SA, Class A* | 1,236 | 8,788 | ||||||
Prosegur Compania de Seguridad SA | 5,913 | 35,790 | ||||||
Red Electrica Corp. SA | 2,140 | 190,580 | ||||||
Repsol SA | 21,561 | 277,681 | ||||||
Sacyr SA | 7,212 | 14,661 | ||||||
Saeta Yield SA | 1,123 | 11,175 | ||||||
Talgo SA, 144A* | 2,127 | 10,243 | ||||||
Tecnicas Reunidas SA | 702 | 22,077 | ||||||
Telefonica SA | 88,999 | 929,936 | ||||||
Viscofan SA | 871 | 48,669 | ||||||
Zardoya Otis SA | 3,709 | 38,462 | ||||||
|
| |||||||
| 8,448,331 | ||||||||
|
| |||||||
| Switzerland — 0.1% | ||||||||
STMicroelectronics NV | 12,915 | 77,266 | ||||||
|
| |||||||
| United Kingdom — 2.7% | ||||||||
CNH Industrial NV | 20,300 | 143,199 | ||||||
Dialog Semiconductor PLC* | 1,576 | 50,028 | ||||||
Fiat Chrysler Automobiles NV | 18,012 | 128,563 | ||||||
International Consolidated Airlines Group SA | 16,064 | 125,561 | ||||||
RELX NV | 19,599 | 339,858 | ||||||
Unilever NV | 32,396 | 1,454,965 | ||||||
VTTI Energy Partners LP | 403 | 8,181 | ||||||
Zeal Network SE | 154 | 6,383 | ||||||
|
| |||||||
| 2,256,738 | ||||||||
|
| |||||||
TOTAL COMMON STOCKS | 81,662,387 | |||||||
|
| |||||||
| PREFERRED STOCKS — 1.8% | ||||||||
| Germany — 1.8% | ||||||||
Bayerische Motoren Werke AG | 1,093 | 80,386 | ||||||
Biotest AG | 450 | 8,011 | ||||||
Draegerwerk AG & Co. KGaA | 171 | 11,456 | ||||||
FUCHS PETROLUB SE (a) | 1,412 | 57,477 | ||||||
Henkel AG & Co. KGaA | 3,553 | 414,100 | ||||||
Jungheinrich AG | 334 | 31,822 | ||||||
Porsche Automobil Holding SE* | 3,058 | 168,388 | ||||||
Sartorius AG | 180 | 49,719 | ||||||
Schaeffler AG | 3,300 | 53,240 | ||||||
Sixt SE | 349 | 15,336 | ||||||
STO SE & Co. KGaA | 58 | 6,889 | ||||||
Volkswagen AG* | 3,697 | 552,641 | ||||||
|
| |||||||
| 1,449,465 | ||||||||
|
| |||||||
TOTAL PREFERRED STOCKS | 1,449,465 | |||||||
|
| |||||||
| See Notes to Financial Statements. | 100 |
DBX ETF Trust
Schedule of investments
Deutsche X-trackers MSCI Eurozone Hedged Equity ETF (Continued)
May 31, 2016
Number | Value | |||||||
| RIGHTS — 0.0% | ||||||||
| Spain — 0.0% | ||||||||
Abertis Infraestructuras SA*, | 10,316 | $ | 7,908 | |||||
Banco Popular Espanol SA*, | 34,657 | 8,638 | ||||||
Ferrovial SA*, expires 07/30/16 | 9,267 | 3,310 | ||||||
|
| |||||||
| 19,856 | ||||||||
|
| |||||||
TOTAL RIGHTS | 19,856 | |||||||
|
| |||||||
Number | Value | |||||||
| SECURITIES LENDING COLLATERAL — 10.3% | ||||||||
Daily Assets Fund “Capital Shares”, 0.48% (c)(d) | 8,622,595 | $ | 8,622,595 | |||||
|
| |||||||
TOTAL INVESTMENTS — 110.1% | ||||||||
(Cost $95,142,006)† | $ | 91,754,303 | ||||||
Other assets and liabilities, net — (10.1%) | (8,436,179 | ) | ||||||
|
| |||||||
NET ASSETS — 100.0% | $ | 83,318,124 | ||||||
|
| |||||||
| * | Non-income producing security. |
| † | The cost for federal income tax purposes was $95,759,628. At May 31, 2016, net unrealized depreciation for all securities based on tax cost was $4,005,325. This consisted of aggregate gross unrealized appreciation for all securities in which there was an excess of value over tax cost of $2,402,928 and aggregate gross unrealized depreciation for all securities in which there was an excess of tax cost over value of $6,408,253. |
| (a) | All or a portion of these securities were on loan. In addition, “Other Assets and Liabilities, Net” may include pending sales that are also on loan. The value of securities loaned at May 31, 2016 amounted to $7,315,939, which is 8.8% of net assets. |
| (b) | Affiliated issuer. This security is owned in proportion with its representation in the index. |
| (c) | Affiliated fund managed by Deutsche Investment Management Americas Inc. The rate shown is the annualized seven-day yield at period end. |
| (d) | Represents collateral held in connection with securities lending. Income earned by the Fund is net of borrower rebates. |
| FDR: | Fiduciary Depositary Receipt |
| REIT: | Real Estate Investment Trust |
| RSP: | Risparmio (Convertible Savings Shares) |
| 144A: | Security exempt from registration under Rule 144A of the Securities Act of 1933. These securities may be resold in transactions exempt from registration, normally to qualified institutional buyers. |
As of May 31, 2016, the Fund had the following forward foreign currency exchange contracts outstanding:
Counterparty | Settlement Date | Currency To Deliver | Currency To Receive | Unrealized Appreciation (Depreciation) | ||||||||||||||
Bank of Montreal | 6/2/2016 | EUR | 2,183,000 | USD | 2,442,847 | $ | 13,945 | |||||||||||
Bank of Montreal | 6/2/2016 | EUR | 21,219,916 | USD | 24,324,602 | 714,388 | ||||||||||||
Canadian Imperial Bank of Commerce | 6/2/2016 | EUR | 25,862,909 | USD | 29,646,782 | 870,569 | ||||||||||||
JP Morgan & Chase Co. | 6/2/2016 | EUR | 2,183,000 | USD | 2,442,814 | 13,912 | ||||||||||||
JP Morgan & Chase Co. | 6/2/2016 | EUR | 7,232,873 | USD | 8,290,876 | 243,262 | ||||||||||||
RBC Capital Markets | 6/2/2016 | EUR | 985,000 | USD | 1,127,490 | 31,536 | ||||||||||||
RBC Capital Markets | 6/2/2016 | EUR | 24,163,180 | USD | 27,698,494 | 813,475 | ||||||||||||
RBC Capital Markets | 6/2/2016 | EUR | 1,646,000 | USD | 1,886,779 | 55,366 | ||||||||||||
Bank of Montreal | 6/2/2016 | USD | 3,040,564 | EUR | 2,643,500 | (99,290 | ) | |||||||||||
Bank of Montreal | 6/2/2016 | USD | 3,774,736 | EUR | 3,293,500 | (110,243 | ) | |||||||||||
Bank of Montreal | 6/2/2016 | USD | 125,000 | EUR | 108,379 | (4,413 | ) | |||||||||||
Bank of Montreal | 6/2/2016 | USD | 19,827,148 | EUR | 17,810,148 | (10,791 | ) | |||||||||||
Canadian Imperial Bank of Commerce | 6/2/2016 | USD | 25,808,317 | EUR | 23,182,858 | (14,047 | ) | |||||||||||
Canadian Imperial Bank of Commerce | 6/2/2016 | USD | 3,774,894 | EUR | 3,293,500 | (110,401 | ) | |||||||||||
Canadian Imperial Bank of Commerce | 6/2/2016 | USD | 63,571 | EUR | 55,457 | (1,867 | ) | |||||||||||
JP Morgan & Chase Co. | 6/2/2016 | USD | 10,733,691 | EUR | 9,641,761 | (5,842 | ) | |||||||||||
RBC Capital Markets | 6/2/2016 | USD | 27,372,204 | EUR | 24,587,652 | (14,898 | ) | |||||||||||
RBC Capital Markets | 6/2/2016 | USD | 300,000 | EUR | 262,787 | (7,611 | ) | |||||||||||
RBC Capital Markets | 6/2/2016 | USD | 3,040,559 | EUR | 2,643,500 | (99,284 | ) | |||||||||||
Bank of Montreal | 7/5/2016 | EUR | 17,790,093 | USD | 19,827,148 | 6,934 | ||||||||||||
Canadian Imperial Bank of Commerce | 7/5/2016 | EUR | 23,156,649 | USD | 25,808,317 | 9,142 | ||||||||||||
JP Morgan & Chase Co. | 7/5/2016 | EUR | 9,631,250 | USD | 10,733,691 | 3,369 | ||||||||||||
RBC Capital Markets | 7/5/2016 | EUR | 24,560,075 | USD | 27,372,204 | 9,450 | ||||||||||||
| See Notes to Financial Statements. | 101 |
DBX ETF Trust
Schedule of investments
Deutsche X-trackers MSCI Eurozone Hedged Equity ETF (Continued)
May 31, 2016
Counterparty | Settlement Date | Currency To Deliver | Currency To Receive | Unrealized Appreciation (Depreciation) | ||||||||||||||
RBC Capital Markets | 7/5/2016 | USD | 41,285 | EUR | 37,000 | $ | (63 | ) | ||||||||||
RBC Capital Markets | 7/5/2016 | USD | 582,919 | EUR | 523,000 | (236 | ) | |||||||||||
|
| |||||||||||||||||
Total net unrealized appreciation | $ | 2,306,362 | ||||||||||||||||
|
| |||||||||||||||||
Currency Abbreviations
| EUR | Euro |
| USD | U.S. Dollar |
For information on the Fund’s policy and additional disclosures regarding forward foreign currency exchange contracts, please refer to the Derivatives section of Note 2 in the accompanying Notes to Financial Statements.
Fair Value Measurements
Various inputs are used in determining the value of the Fund’s investments. These inputs are summarized in three broad levels. Level 1 includes quoted prices in active markets for identical securities. Level 2 includes other significant observable inputs (including quoted prices for similar securities, interest rates, prepayment speeds and credit risk). Level 3 includes significant unobservable inputs (including the Fund’s own assumptions in determining the fair value of investments). The level assigned to the securities valuations may not be an indication of the risk or liquidity associated with investing in those securities.
The following is a summary of the inputs used as of May 31, 2016 in valuing the Fund’s investments. For information on Fund’s policy regarding the valuation of investments, please refer to the Security Valuation section of Note 2 in the accompanying Notes to Financial Statements.
Assets | Level 1 | Level 2 | Level 3 | Total | ||||||||||||
Common Stocks (e) | $ | 81,662,387 | $ | — | $ | — | $ | 81,662,387 | ||||||||
Preferred Stocks | 1,449,465 | — | — | 1,449,465 | ||||||||||||
Rights (e) | 19,856 | — | — | 19,856 | ||||||||||||
Short-Term Investments | 8,622,595 | — | — | 8,622,595 | ||||||||||||
Derivatives (f) | ||||||||||||||||
Forward Foreign Currency Exchange Contracts | — | 2,785,348 | — | 2,785,348 | ||||||||||||
|
|
|
|
|
|
|
| |||||||||
TOTAL | $ | 91,754,303 | $ | 2,785,348 | $ | — | $ | 94,539,651 | ||||||||
|
|
|
|
|
|
|
| |||||||||
Liabilities | Level 1 | Level 2 | Level 3 | Total | ||||||||||||
Derivatives (f) | ||||||||||||||||
Forward Foreign Currency Exchange Contracts | $ | — | $ | (478,986 | ) | $ | — | $ | (478,986 | ) | ||||||
|
|
|
|
|
|
|
| |||||||||
TOTAL | $ | — | $ | (478,986 | ) | $ | — | $ | (478,986 | )�� | ||||||
|
|
|
|
|
|
|
| |||||||||
| (e) | See Schedule of investments for additional detailed categorizations. |
| (f) | Derivatives include unrealized appreciation (depreciation) on forward foreign currency exchange contracts. |
There have been no transfers between fair value measurement levels during the year ended May 31, 2016.
| See Notes to Financial Statements. | 102 |
DBX ETF Trust
Schedule of investments
Deutsche X-trackers MSCI Germany Hedged Equity ETF
May 31, 2016
Number | Value | |||||||
| COMMON STOCKS — 92.9% | ||||||||
| Consumer Discretionary — 15.6% | ||||||||
adidas AG | 19,076 | $ | 2,444,036 | |||||
Axel Springer SE | 4,371 | 248,615 | ||||||
Bayerische Motoren Werke AG | 33,543 | 2,832,323 | ||||||
Continental AG | 11,144 | 2,390,586 | ||||||
Daimler AG | 97,543 | 6,662,696 | ||||||
Hugo Boss AG | 6,776 | 416,394 | ||||||
ProSiebenSat.1 Media SE* | 22,166 | 1,114,392 | ||||||
RTL Group SA (Luxembourg) | 3,809 | 341,630 | ||||||
Volkswagen AG*(a) | 3,289 | 507,754 | ||||||
Zalando SE, 144A* | 8,506 | 249,333 | ||||||
|
| |||||||
| 17,207,759 | ||||||||
|
| |||||||
| Consumer Staples — 2.4% | ||||||||
Beiersdorf AG | 10,212 | 928,074 | ||||||
Henkel AG & Co. KGaA | 10,528 | 1,104,037 | ||||||
Metro AG | 18,059 | 593,353 | ||||||
|
| |||||||
| 2,625,464 | ||||||||
|
| |||||||
| Financials — 17.6% | ||||||||
Allianz SE | 46,297 | 7,556,823 | ||||||
Commerzbank AG | 107,841 | 923,913 | ||||||
Deutsche Bank AG*(b) | 139,729 | 2,496,049 | ||||||
Deutsche Boerse AG | 19,553 | 1,713,248 | ||||||
Deutsche Wohnen AG | 34,183 | 1,097,837 | ||||||
Hannover Rueck SE | 6,109 | 688,890 | ||||||
Muenchener Rueckversicherungs-Gesellschaft AG | 16,903 | 3,175,566 | ||||||
Vonovia SE | 47,209 | 1,618,088 | ||||||
|
| |||||||
| 19,270,414 | ||||||||
|
| |||||||
| Health Care — 13.5% | ||||||||
Bayer AG | 83,775 | 7,981,723 | ||||||
Fresenius Medical Care AG & Co. KGaA | 22,187 | 1,925,526 | ||||||
Fresenius SE & Co. KGaA | 41,465 | 3,129,391 | ||||||
Merck KGaA | 13,093 | 1,310,378 | ||||||
QIAGEN NV (Netherlands)* | 22,401 | 480,292 | ||||||
|
| |||||||
| 14,827,310 | ||||||||
|
| |||||||
| Industrials — 13.3% | ||||||||
Brenntag AG | 15,652 | 837,841 | ||||||
Deutsche Lufthansa AG | 22,982 | 322,064 | ||||||
Deutsche Post AG | 98,288 | 2,866,861 | ||||||
Fraport AG Frankfurt Airport Services Worldwide | 4,120 | 235,852 | ||||||
GEA Group AG | 18,526 | 858,834 | ||||||
HOCHTIEF AG | 2,200 | 278,317 | ||||||
MAN SE* | 3,571 | 378,452 | ||||||
OSRAM Licht AG | 9,015 | 479,758 | ||||||
Siemens AG | 77,499 | 8,346,086 | ||||||
|
| |||||||
| 14,604,065 | ||||||||
|
| |||||||
| Information Technology — 9.4% | ||||||||
Infineon Technologies AG | 114,576 | 1,718,462 | ||||||
SAP SE | 99,564 | 8,082,457 | ||||||
Number | Value | |||||||
| Information Technology (Continued) | ||||||||
United Internet AG | 12,461 | $ | 587,723 | |||||
|
| |||||||
| 10,388,642 | ||||||||
|
| |||||||
| Materials — 13.2% | ||||||||
BASF SE | 93,048 | 7,188,040 | ||||||
Covestro AG, 144A | 7,200 | 305,301 | ||||||
Evonik Industries AG | 14,163 | 417,597 | ||||||
HeidelbergCement AG | 14,278 | 1,221,500 | ||||||
K+S AG (a) | 19,390 | 478,515 | ||||||
LANXESS AG | 9,272 | 442,988 | ||||||
Linde AG | 18,816 | 2,815,826 | ||||||
Symrise AG | 12,494 | 783,898 | ||||||
ThyssenKrupp AG | 37,267 | 820,383 | ||||||
|
| |||||||
| 14,474,048 | ||||||||
|
| |||||||
| Telecommunication Services — 5.5% | ||||||||
Deutsche Telekom AG | 326,677 | 5,768,352 | ||||||
Telefonica Deutschland Holding AG | 75,335 | 336,877 | ||||||
|
| |||||||
| 6,105,229 | ||||||||
|
| |||||||
| Utilities — 2.4% | ||||||||
E.ON SE* | 202,713 | 1,992,711 | ||||||
RWE AG* | 49,578 | 648,989 | ||||||
|
| |||||||
| 2,641,700 | ||||||||
|
| |||||||
TOTAL COMMON STOCKS | 102,144,631 | |||||||
|
| |||||||
| PREFERRED STOCKS — 6.1% | ||||||||
| Consumer Discretionary — 3.9% | ||||||||
Bayerische Motoren Werke AG | 5,522 | 406,120 | ||||||
Porsche Automobil Holding SE* | 15,513 | 854,219 | ||||||
Schaeffler AG | 16,900 | 272,653 | ||||||
Volkswagen AG* | 18,801 | 2,810,444 | ||||||
|
| |||||||
| 4,343,436 | ||||||||
|
| |||||||
| Consumer Staples — 1.9% | ||||||||
Henkel AG & Co. KGaA | 18,049 | 2,103,601 | ||||||
|
| |||||||
| Materials — 0.3% | ||||||||
FUCHS PETROLUB SE | 7,041 | 286,612 | ||||||
|
| |||||||
TOTAL PREFERRED STOCKS | 6,733,649 | |||||||
|
| |||||||
| SECURITIES LENDING COLLATERAL — 0.8% | ||||||||
Daily Assets Fund “Capital Shares”, 0.48% (c)(d) | 934,762 | 934,762 | ||||||
|
| |||||||
TOTAL INVESTMENTS — 99.8% (Cost $127,749,917)† | $ | 109,813,042 | ||||||
Other assets and liabilities, net — 0.2% | 173,880 | |||||||
|
| |||||||
NET ASSETS — 100.0% | $ | 109,986,922 | ||||||
|
| |||||||
| See Notes to Financial Statements. | 103 |
DBX ETF Trust
Schedule of investments
Deutsche X-trackers MSCI Germany Hedged Equity ETF (Continued)
May 31, 2016
| * | Non-income producing security. |
| † | The cost for federal income tax purposes was $128,857,087. At May 31, 2016, net unrealized depreciation for all securities based on tax cost was $19,044,045. This consisted of aggregate gross unrealized appreciation for all securities in which there was an excess of value over tax cost of $3,094,434 and aggregate gross unrealized depreciation for all securities in which there was an excess of tax cost over value of $22,138,479 |
| (a) | All or a portion of these securities were on loan. In addition, “Other Assets and Liabilities, Net” may include pending sales that are also on loan. The value of securities loaned at May 31, 2016 amounted to $875,509, which is 0.8% of net assets. |
| (b) | Affiliated issuer. This security is owned in proportion with its representation in the index. |
| (c) | Affiliated fund managed by Deutsche Investment Management Americas Inc. The rate shown is the annualized seven-day yield at period end. |
| (d) | Represents collateral held in connection with securities lending. Income earned by the Fund is net of borrower rebates. |
| 144A: | Security exempt from registration under Rule 144A of the Securities Act of 1933. These securities may be resold in transactions exempt from registration, normally to qualified institutional buyers. |
At May 31, 2016, open future contract purchased was as follows:
Contract Description | Currency | Number of Contracts | Contract Value | Expiration Date | Unrealized Appreciation (Depreciation) | |||||||||||||||
DAX Index Future | EUR | 3 | $ | 856,472 | 6/17/2016 | $ | 6,684 | |||||||||||||
As of May 31, 2016, the Fund had the following forward foreign currency exchange contracts outstanding:
Counterparty | Settlement Date | Currency To Deliver | Currency To Receive | Unrealized Appreciation (Depreciation) | ||||||||||||||
Bank of Montreal | 6/2/2016 | EUR | 17,490,558 | USD | 20,049,601 | $ | 588,836 | |||||||||||
Canadian Imperial Bank of Commerce | 6/2/2016 | EUR | 22,563,624 | USD | 25,864,795 | 759,512 | ||||||||||||
JP Morgan & Chase Co. | 6/2/2016 | EUR | 23,486,180 | USD | 26,921,669 | 789,909 | ||||||||||||
RBC Capital Markets | 6/2/2016 | EUR | 1,269,000 | USD | 1,452,574 | 40,628 | ||||||||||||
RBC Capital Markets | 6/2/2016 | EUR | 18,805,434 | USD | 21,556,857 | 633,102 | ||||||||||||
RBC Capital Markets | 6/2/2016 | EUR | 2,134,000 | USD | 2,446,164 | 71,781 | ||||||||||||
State Street Bank & Trust Co. | 6/2/2016 | EUR | 18,081,717 | USD | 20,727,434 | 608,918 | ||||||||||||
The Bank of New York Mellon | 6/2/2016 | EUR | 520,036 | USD | 596,121 | 17,506 | ||||||||||||
The Bank of New York Mellon | 6/2/2016 | EUR | 7,000 | USD | 7,849 | 61 | ||||||||||||
Bank of Montreal | 6/2/2016 | USD | 20,049,601 | EUR | 18,009,972 | (10,912 | ) | |||||||||||
Canadian Imperial Bank of Commerce | 6/2/2016 | USD | 23,040,032 | EUR | 20,696,189 | (12,540 | ) | |||||||||||
Canadian Imperial Bank of Commerce | 6/2/2016 | USD | 2,824,762 | EUR | 2,482,500 | (62,623 | ) | |||||||||||
JP Morgan & Chase Co. | 6/2/2016 | USD | 26,921,669 | EUR | 24,182,949 | (14,653 | ) | |||||||||||
RBC Capital Markets | 6/2/2016 | USD | 22,631,068 | EUR | 20,328,828 | (12,317 | ) | |||||||||||
RBC Capital Markets | 6/2/2016 | USD | 2,824,526 | EUR | 2,482,500 | (62,388 | ) | |||||||||||
State Street Bank & Trust Co. | 6/2/2016 | USD | 200,000 | EUR | 179,206 | (608 | ) | |||||||||||
State Street Bank & Trust Co. | 6/2/2016 | USD | 2,194,699 | EUR | 1,956,000 | (18,367 | ) | |||||||||||
State Street Bank & Trust Co. | 6/2/2016 | USD | 18,332,735 | EUR | 16,467,761 | (9,978 | ) | |||||||||||
The Bank of New York Mellon | 6/2/2016 | USD | 355,438 | EUR | 319,280 | (193 | ) | |||||||||||
The Bank of New York Mellon | 6/2/2016 | USD | 109,969 | EUR | 97,000 | (2,043 | ) | |||||||||||
The Bank of New York Mellon | 6/2/2016 | USD | 24,184 | EUR | 21,700 | (40 | ) | |||||||||||
The Bank of New York Mellon | 6/2/2016 | USD | 114,378 | EUR | 100,000 | (3,114 | ) | |||||||||||
Bank of Montreal | 7/5/2016 | EUR | 17,989,691 | USD | 20,049,601 | 7,012 | ||||||||||||
Canadian Imperial Bank of Commerce | 7/5/2016 | EUR | 20,672,791 | USD | 23,040,032 | 8,161 | ||||||||||||
JP Morgan & Chase Co. | 7/5/2016 | EUR | 24,156,585 | USD | 26,921,669 | 8,450 | ||||||||||||
RBC Capital Markets | 7/5/2016 | EUR | 20,306,028 | USD | 22,631,068 | 7,813 | ||||||||||||
State Street Bank & Trust Co. | 7/5/2016 | EUR | 16,448,863 | USD | 18,332,735 | 6,806 | ||||||||||||
The Bank of New York Mellon | 7/5/2016 | EUR | 318,914 | USD | 355,438 | 131 | ||||||||||||
RBC Capital Markets | 7/5/2016 | USD | 54,675 | EUR | 49,000 | (83 | ) | |||||||||||
RBC Capital Markets | 7/5/2016 | USD | 1,452,281 | EUR | 1,303,000 | (589 | ) | |||||||||||
|
| |||||||||||||||||
Total net unrealized appreciation | $ | 3,338,178 | ||||||||||||||||
|
| |||||||||||||||||
Currency Abbreviations
| EUR | Euro |
| USD | U.S. Dollar |
| See Notes to Financial Statements. | 104 |
DBX ETF Trust
Schedule of investments
Deutsche X-trackers MSCI Germany Hedged Equity ETF (Continued)
May 31, 2016
For information on the Fund’s policy and additional disclosures regarding open futures contracts and forward foreign exchange currency contracts, please refer to the Derivatives section of Note 2 in the accompanying Notes to Financial Statements.
Fair Value Measurements
Various inputs are used in determining the value of the Fund’s investments. These inputs are summarized in three broad levels. Level 1 includes quoted prices in active markets for identical securities. Level 2 includes other significant observable inputs (including quoted prices for similar securities, interest rates, prepayment speeds and credit risk). Level 3 includes significant unobservable inputs (including the Fund’s own assumptions in determining the fair value of investments). The level assigned to the securities valuations may not be an indication of the risk or liquidity associated with investing in those securities.
The following is a summary of the inputs used as of May 31, 2016 in valuing the Fund’s investments. For information on Fund’s policy regarding the valuation of investments, please refer to the Security Valuation section of Note 2 in the accompanying Notes to Financial Statements.
Assets | Level 1 | Level 2 | Level 3 | Total | ||||||||||||
Common Stocks (e) | $ | 102,144,631 | $ | — | $ | — | $ | 102,144,631 | ||||||||
Preferred Stocks (e) | 6,733,649 | — | — | 6,733,649 | ||||||||||||
Short-Term Investments | 934,762 | — | — | 934,762 | ||||||||||||
Derivatives (f) | ||||||||||||||||
Forward Foreign Currency Exchange Contracts | — | 3,548,626 | — | 3,548,626 | ||||||||||||
Futures Contracts | 6,684 | — | — | 6,684 | ||||||||||||
|
|
|
|
|
|
|
| |||||||||
TOTAL | $ | 109,819,726 | $ | 3,548,626 | $ | — | $ | 113,368,352 | ||||||||
|
|
|
|
|
|
|
| |||||||||
Liabilities | Level 1 | Level 2 | Level 3 | Total | ||||||||||||
Derivatives (f) | ||||||||||||||||
Forward Foreign Currency Exchange Contracts | $ | — | $ | (210,448 | ) | $ | — | $ | (210,448 | ) | ||||||
|
|
|
|
|
|
|
| |||||||||
TOTAL | $ | — | $ | (210,448 | ) | $ | — | $ | (210,448 | ) | ||||||
|
|
|
|
|
|
|
| |||||||||
| (e) | See Schedule of investments for additional detailed categorizations. |
| (f) | Derivatives include unrealized appreciation (depreciation) on open futures contracts and forward currency exchange contracts. |
There have been no transfers between fair value measurement levels during the period ended May 31, 2016.
| See Notes to Financial Statements. | 105 |
DBX ETF Trust
Schedule of investments
Deutsche X-trackers MSCI Japan Hedged Equity ETF
May 31, 2016
Number of Shares | Value | |||||||
| COMMON STOCKS — 98.2% | ||||||||
| Consumer Discretionary — 20.2% | ||||||||
ABC-Mart, Inc. | 10,600 | $ | 687,298 | |||||
AISIN SEIKI Co. Ltd. | 68,100 | 2,813,541 | ||||||
ASICS Corp. | 56,300 | 1,281,729 | ||||||
Bandai Namco Holdings, Inc. | 71,900 | 1,782,972 | ||||||
Benesse Holdings, Inc. | 22,400 | 495,598 | ||||||
Bridgestone Corp. | 233,900 | 8,081,468 | ||||||
Casio Computer Co. Ltd. | 82,200 | 1,280,489 | ||||||
Daihatsu Motor Co. Ltd. | 68,300 | 936,284 | ||||||
DENSO Corp. | 174,900 | 6,900,601 | ||||||
Dentsu, Inc. | 77,400 | 3,921,199 | ||||||
Don Quijote Holdings Co. Ltd. | 40,700 | 1,308,457 | ||||||
Fast Retailing Co. Ltd. | 19,019 | 5,132,820 | ||||||
Fuji Heavy Industries Ltd. | 211,205 | 7,915,300 | ||||||
Hakuhodo DY Holdings, Inc. | 82,800 | 1,040,842 | ||||||
Hikari Tsushin, Inc. | 7,100 | 579,618 | ||||||
Honda Motor Co. Ltd. | 586,300 | 16,683,355 | ||||||
Iida Group Holdings Co. Ltd. | 54,000 | 1,132,325 | ||||||
Isetan Mitsukoshi Holdings Ltd. | 125,900 | 1,231,315 | ||||||
Isuzu Motors Ltd. | 207,900 | 2,508,280 | ||||||
J. Front Retailing Co. Ltd. | 82,900 | 994,186 | ||||||
Koito Manufacturing Co. Ltd. | 40,500 | 1,912,810 | ||||||
Marui Group Co. Ltd. | 79,900 | 1,173,950 | ||||||
Mazda Motor Corp. | 204,900 | 3,536,045 | ||||||
McDonald’s Holdings Co. Japan Ltd. | 22,400 | 588,851 | ||||||
Mitsubishi Motors Corp. | 247,600 | 1,294,626 | ||||||
NGK Spark Plug Co. Ltd. | 63,300 | 1,228,444 | ||||||
NHK Spring Co. Ltd. | 74,600 | 642,691 | ||||||
Nikon Corp. | 120,400 | 1,692,896 | ||||||
Nissan Motor Co. Ltd. | 894,100 | 9,083,510 | ||||||
Nitori Holdings Co. Ltd. | 28,800 | 2,928,505 | ||||||
NOK Corp. | 29,700 | 533,197 | ||||||
Oriental Land Co. Ltd. | 78,500 | 5,169,296 | ||||||
Panasonic Corp. | 793,900 | 7,395,203 | ||||||
Rakuten, Inc. | 326,500 | 3,521,960 | ||||||
Rinnai Corp. | 13,600 | 1,186,400 | ||||||
Ryohin Keikaku Co. Ltd. | 8,900 | 2,051,899 | ||||||
Sankyo Co. Ltd. | 18,400 | 687,082 | ||||||
Sega Sammy Holdings, Inc. | 66,200 | 808,258 | ||||||
Sekisui Chemical Co. Ltd. | 145,100 | 1,894,745 | ||||||
Sekisui House Ltd. | 216,900 | 3,890,038 | ||||||
Shimamura Co. Ltd. | 8,200 | 1,066,330 | ||||||
Shimano, Inc. | 26,663 | 4,163,122 | ||||||
Sony Corp. | 454,000 | 12,709,622 | ||||||
Stanley Electric Co. Ltd. | 51,800 | 1,099,759 | ||||||
Start Today Co. Ltd. | 21,300 | 973,297 | ||||||
Sumitomo Electric Industries Ltd. | 271,200 | 3,843,847 | ||||||
Sumitomo Rubber Industries Ltd. | 60,300 | 887,606 | ||||||
Suzuki Motor Corp. | 129,300 | 3,326,642 | ||||||
Takashimaya Co. Ltd. | 106,000 | 750,476 | ||||||
Toho Co. Ltd. | 39,300 | 1,075,351 | ||||||
Toyoda Gosei Co. Ltd. | 21,600 | 424,256 | ||||||
Toyota Industries Corp. | 57,400 | 2,490,694 | ||||||
Toyota Motor Corp. | 960,300 | 50,150,494 | ||||||
USS Co. Ltd. | 78,500 | 1,244,119 | ||||||
Yamada Denki Co. Ltd. | 238,600 | 1,124,750 | ||||||
Yamaha Corp. | 59,100 | 1,793,254 | ||||||
Number of Shares | Value | |||||||
| Consumer Discretionary (Continued) | ||||||||
Yamaha Motor Co. Ltd. | 100,600 | $ | 1,782,428 | |||||
Yokohama Rubber Co. Ltd. | 39,000 | 599,783 | ||||||
|
| |||||||
| 207,433,913 | ||||||||
|
| |||||||
| Consumer Staples — 8.4% | ||||||||
Aeon Co. Ltd. | 230,500 | 3,504,283 | ||||||
Ajinomoto Co., Inc. | 200,700 | 4,849,170 | ||||||
Asahi Group Holdings Ltd. | 137,700 | 4,693,004 | ||||||
Calbee, Inc. | 28,900 | 1,067,422 | ||||||
FamilyMart Co. Ltd. | 22,500 | 1,182,553 | ||||||
Japan Tobacco, Inc. | 395,600 | 15,726,114 | ||||||
Kao Corp. | 181,200 | 9,983,304 | ||||||
Kikkoman Corp. | 55,000 | 1,976,791 | ||||||
Kirin Holdings Co. Ltd. | 295,800 | 4,979,195 | ||||||
Kose Corp. | 11,900 | 1,070,339 | ||||||
Lawson, Inc. | 24,400 | 1,932,433 | ||||||
MEIJI Holdings Co. Ltd. | 42,000 | 3,796,632 | ||||||
NH Foods Ltd. | 64,600 | 1,509,774 | ||||||
Nisshin Seifun Group, Inc. | 76,185 | 1,298,244 | ||||||
Nissin Foods Holdings Co. Ltd. | 24,300 | 1,220,102 | ||||||
Pola Orbis Holdings, Inc. | 8,300 | 719,556 | ||||||
Seven & i Holdings Co. Ltd. | 271,000 | 11,609,916 | ||||||
Shiseido Co. Ltd. | 136,700 | 3,610,233 | ||||||
Sundrug Co. Ltd. | 13,300 | 1,101,377 | ||||||
Suntory Beverage & Food Ltd. | 48,400 | 2,285,926 | ||||||
Toyo Suisan Kaisha Ltd. | 31,900 | 1,237,283 | ||||||
TSURUHA HOLDINGS, Inc. | 13,200 | 1,374,416 | ||||||
Unicharm Corp. | 145,100 | 2,841,463 | ||||||
Yakult Honsha Co. Ltd. | 31,600 | 1,552,391 | ||||||
Yamazaki Baking Co. Ltd. | 47,400 | 1,164,721 | ||||||
|
| |||||||
| 86,286,642 | ||||||||
|
| |||||||
| Energy — 0.8% | ||||||||
Idemitsu Kosan Co. Ltd. (a) | 28,600 | 572,852 | ||||||
INPEX Corp. | 334,300 | 2,755,066 | ||||||
JX Holdings, Inc. | 791,600 | 3,095,343 | ||||||
Showa Shell Sekiyu KK | 67,700 | 687,179 | ||||||
TonenGeneral Sekiyu KK | 111,000 | 1,057,525 | ||||||
|
| |||||||
| 8,167,965 | ||||||||
|
| |||||||
| Financials — 17.1% | ||||||||
Acom Co. Ltd.*(a) | 139,500 | 769,716 | ||||||
AEON Financial Service Co. Ltd. | 36,600 | 808,780 | ||||||
AEON Mall Co. Ltd. | 39,850 | 526,487 | ||||||
Aozora Bank Ltd. | 425,500 | 1,448,625 | ||||||
Bank of Kyoto Ltd. | 134,000 | 885,790 | ||||||
Chiba Bank Ltd. | 251,600 | 1,322,357 | ||||||
Chugoku Bank Ltd. | 56,400 | 641,239 | ||||||
Concordia Financial Group Ltd.* | 409,100 | 1,907,422 | ||||||
Credit Saison Co. Ltd. | 54,500 | 1,039,455 | ||||||
Dai-ichi Life Insurance Co. Ltd. | 381,200 | 5,027,702 | ||||||
Daito Trust Construction Co. Ltd. | 25,700 | 3,735,418 | ||||||
Daiwa House Industry Co. Ltd. | 210,100 | 6,103,686 | ||||||
Daiwa Securities Group, Inc. | 586,320 | 3,421,502 | ||||||
Fukuoka Financial Group, Inc. | 278,000 | 1,014,241 | ||||||
Hachijuni Bank Ltd. | 142,200 | 629,232 | ||||||
Hiroshima Bank Ltd. | 187,100 | 706,261 | ||||||
| See Notes to Financial Statements. | 106 |
DBX ETF Trust
Schedule of investments
Deutsche X-trackers MSCI Japan Hedged Equity ETF (Continued)
May 31, 2016
Number | Value | |||||||
| Financials (Continued) | ||||||||
Hulic Co. Ltd. | 109,600 | $ | 1,087,736 | |||||
Iyo Bank Ltd. | 86,300 | 575,151 | ||||||
Japan Exchange Group, Inc. | 194,840 | 2,656,869 | ||||||
Japan Post Bank Co. Ltd. | 143,225 | 1,715,053 | ||||||
Japan Post Holdings Co. Ltd. | 157,642 | 2,040,014 | ||||||
Japan Prime Realty Investment Corp. REIT | 298 | 1,276,931 | ||||||
Japan Real Estate Investment Corp. REIT | 471 | 2,760,455 | ||||||
Japan Retail Fund Investment Corp. REIT | 888 | 2,066,534 | ||||||
Joyo Bank Ltd. | 229,000 | 847,880 | ||||||
Kyushu Financial Group, Inc. | 122,900 | 663,694 | ||||||
Mitsubishi Estate Co. Ltd. | 450,600 | 8,705,998 | ||||||
Mitsubishi UFJ Financial Group, Inc. | 4,585,800 | 22,934,177 | ||||||
Mitsubishi UFJ Lease & Finance Co. Ltd. | 173,400 | 746,935 | ||||||
Mitsui Fudosan Co. Ltd. | 320,800 | 7,884,203 | ||||||
Mizuho Financial Group, Inc. | 8,503,340 | 13,392,175 | ||||||
MS&AD Insurance Group Holdings, Inc. | 182,200 | 5,202,659 | ||||||
Nippon Building Fund, Inc. REIT | 507 | 3,017,230 | ||||||
Nippon Prologis REIT, Inc. REIT | 539 | 1,170,141 | ||||||
Nomura Holdings, Inc. | 1,305,900 | 5,665,367 | ||||||
Nomura Real Estate Holdings, Inc. | 44,600 | 801,902 | ||||||
Nomura Real Estate Master Fund, Inc. REIT | 1,252 | 1,978,598 | ||||||
NTT Urban Development Corp. | 41,100 | 411,984 | ||||||
ORIX Corp. | 476,160 | 6,621,993 | ||||||
Resona Holdings, Inc. | 780,100 | 2,968,656 | ||||||
SBI Holdings, Inc. | 76,228 | 796,458 | ||||||
Seven Bank Ltd. | 218,900 | 806,531 | ||||||
Shinsei Bank Ltd. | 633,000 | 1,017,510 | ||||||
Shizuoka Bank Ltd. | 199,000 | 1,489,782 | ||||||
Sompo Japan Nipponkoa Holdings, Inc. | 126,950 | 3,583,742 | ||||||
Sony Financial Holdings, Inc. | 65,800 | 805,156 | ||||||
Sumitomo Mitsui Financial Group, Inc. | 483,100 | 15,779,769 | ||||||
Sumitomo Mitsui Trust Holdings, Inc. | 1,169,900 | 4,074,867 | ||||||
Sumitomo Realty & Development Co. Ltd. | 125,000 | 3,497,088 | ||||||
Suruga Bank Ltd. | 64,000 | 1,433,910 | ||||||
T&D Holdings, Inc. | 202,400 | 2,022,446 | ||||||
Tokio Marine Holdings, Inc. | 245,200 | 8,500,680 | ||||||
Tokyo Tatemono Co. Ltd. | 72,800 | 929,599 | ||||||
Tokyu Fudosan Holdings Corp. | 181,200 | 1,197,800 | ||||||
United Urban Investment Corp. REIT | 956 | 1,510,814 | ||||||
Yamaguchi Financial Group, Inc. | 73,500 | 718,174 | ||||||
|
| |||||||
| 175,344,574 | ||||||||
|
| |||||||
| Health Care — 8.5% | ||||||||
Alfresa Holdings Corp. | 67,600 | 1,426,660 | ||||||
Astellas Pharma, Inc. | 759,100 | 10,399,194 | ||||||
Chugai Pharmaceutical Co. Ltd. | 80,200 | 2,820,960 | ||||||
CYBERDYNE, Inc.* | 36,200 | 849,957 | ||||||
Daiichi Sankyo Co. Ltd. | 224,500 | 5,223,500 | ||||||
Eisai Co. Ltd. (a) | 90,700 | 5,633,581 | ||||||
Hisamitsu Pharmaceutical Co., Inc. | 22,300 | 1,194,193 | ||||||
Hoya Corp. | 145,000 | 5,115,952 | ||||||
Kyowa Hakko Kirin Co. Ltd. | 93,300 | 1,701,955 | ||||||
M3, Inc. | 69,100 | 1,987,479 | ||||||
Number | Value | |||||||
| Health Care (Continued) | ||||||||
Medipal Holdings Corp. | 61,600 | $ | 1,070,845 | |||||
Miraca Holdings, Inc. | 20,300 | 858,857 | ||||||
Mitsubishi Tanabe Pharma Corp. | 83,000 | 1,396,388 | ||||||
Olympus Corp. | 104,800 | 4,443,365 | ||||||
Ono Pharmaceutical Co. Ltd. | 148,300 | 6,594,385 | ||||||
Otsuka Holdings Co. Ltd. | 139,000 | 5,686,278 | ||||||
Santen Pharmaceutical Co. Ltd. | 132,300 | 1,949,822 | ||||||
Shionogi & Co. Ltd. | 107,300 | 6,043,528 | ||||||
Sumitomo Dainippon Pharma Co. Ltd. | 56,000 | 820,265 | ||||||
Suzuken Co. Ltd. | 27,850 | 900,375 | ||||||
Sysmex Corp. | 56,200 | 4,110,895 | ||||||
Taisho Pharmaceutical Holdings Co. Ltd. | 12,400 | 1,156,744 | ||||||
Takeda Pharmaceutical Co. Ltd. | 255,700 | 11,076,831 | ||||||
Terumo Corp. | 122,900 | 5,171,933 | ||||||
|
| |||||||
| 87,633,942 | ||||||||
|
| |||||||
| Industrials — 19.5% | ||||||||
Amada Holdings Co. Ltd. | 120,200 | 1,325,364 | ||||||
ANA Holdings, Inc. | 410,000 | 1,199,250 | ||||||
Asahi Glass Co. Ltd. | 363,000 | 2,202,881 | ||||||
Central Japan Railway Co. | 51,898 | 9,199,962 | ||||||
Dai Nippon Printing Co. Ltd. | 191,000 | 1,959,417 | ||||||
Daikin Industries Ltd. | 84,300 | 7,229,086 | ||||||
East Japan Railway Co. | 120,000 | 10,982,977 | ||||||
FANUC Corp. | 70,320 | 10,782,802 | ||||||
Fuji Electric Co. Ltd. | 220,000 | 890,053 | ||||||
Hankyu Hanshin Holdings, Inc. | 434,200 | 2,983,936 | ||||||
Hino Motors Ltd. | 92,100 | 944,829 | ||||||
Hitachi Construction Machinery Co. Ltd. | 37,000 | 572,032 | ||||||
Hoshizaki Electric Co. Ltd. | 18,300 | 1,753,402 | ||||||
IHI Corp. | 504,000 | 1,301,702 | ||||||
ITOCHU Corp. | 538,100 | 6,761,784 | ||||||
Japan Airlines Co. Ltd. | 41,778 | 1,434,038 | ||||||
Japan Airport Terminal Co. Ltd. (a) | 15,800 | 546,476 | ||||||
JGC Corp. | 77,000 | 1,191,141 | ||||||
JTEKT Corp. | 80,200 | 1,111,726 | ||||||
Kajima Corp. | 323,000 | 2,202,240 | ||||||
Kamigumi Co. Ltd. | 87,000 | 796,659 | ||||||
Kawasaki Heavy Industries Ltd. | 494,000 | 1,539,080 | ||||||
Keihan Holdings Co. Ltd. | 190,800 | 1,288,828 | ||||||
Keikyu Corp. | 175,000 | 1,659,367 | ||||||
Keio Corp. | 216,000 | 1,853,073 | ||||||
Keisei Electric Railway Co. Ltd. | 103,000 | 1,384,061 | ||||||
Kintetsu Group Holdings Co. Ltd. | 642,000 | 2,585,741 | ||||||
Komatsu Ltd. | 332,000 | 5,733,959 | ||||||
Kubota Corp. | 380,500 | 5,602,612 | ||||||
Kurita Water Industries Ltd. | 36,300 | 851,322 | ||||||
LIXIL Group Corp. | 92,400 | 1,670,518 | ||||||
Mabuchi Motor Co. Ltd. | 19,500 | 922,743 | ||||||
Makita Corp. | 41,500 | 2,690,838 | ||||||
Marubeni Corp. | 582,300 | 2,802,255 | ||||||
Minebea Co. Ltd. | 118,100 | 948,128 | ||||||
Mitsubishi Corp. | 543,300 | 9,650,708 | ||||||
Mitsubishi Electric Corp. | 695,000 | 8,407,030 | ||||||
Mitsubishi Heavy Industries Ltd. | 1,153,100 | 4,682,793 | ||||||
Mitsubishi Logistics Corp. | 42,000 | 592,062 | ||||||
| See Notes to Financial Statements. | 107 |
DBX ETF Trust
Schedule of investments
Deutsche X-trackers MSCI Japan Hedged Equity ETF (Continued)
May 31, 2016
Number | Value | |||||||
| Industrials (Continued) | ||||||||
Mitsui & Co. Ltd. | 613,700 | $ | 7,398,650 | |||||
Mitsui OSK Lines Ltd. | 407,000 | 926,211 | ||||||
Nabtesco Corp. | 43,400 | 1,104,841 | ||||||
Nagoya Railroad Co. Ltd. | 330,600 | 1,665,912 | ||||||
NGK Insulators Ltd. | 96,000 | 2,114,453 | ||||||
Nidec Corp. | 85,800 | 6,630,158 | ||||||
Nippon Express Co. Ltd. | 299,000 | 1,290,667 | ||||||
Nippon Yusen KK | 569,000 | 1,079,063 | ||||||
NSK Ltd. | 164,600 | 1,464,135 | ||||||
Obayashi Corp. | 228,700 | 2,410,195 | ||||||
Odakyu Electric Railway Co. Ltd. | 220,000 | 2,392,017 | ||||||
Park24 Co. Ltd. | 36,700 | 1,050,607 | ||||||
Recruit Holdings Co. Ltd. | 101,700 | 3,466,993 | ||||||
Secom Co. Ltd. | 75,000 | 5,882,287 | ||||||
Seibu Holdings, Inc. | 61,500 | 1,160,189 | ||||||
Shimizu Corp. | 197,700 | 1,771,061 | ||||||
SMC Corp. | 20,600 | 5,255,339 | ||||||
Sohgo Security Services Co. Ltd. | 25,700 | 1,267,187 | ||||||
Sumitomo Corp. | 427,300 | 4,389,342 | ||||||
Sumitomo Heavy Industries Ltd. | 218,000 | 1,061,110 | ||||||
Taisei Corp. | 379,000 | 2,813,365 | ||||||
THK Co. Ltd. | 42,800 | 810,508 | ||||||
Tobu Railway Co. Ltd. | 341,000 | 1,733,716 | ||||||
Tokyu Corp. | 387,000 | 3,320,088 | ||||||
Toppan Printing Co. Ltd. | 196,000 | 1,773,531 | ||||||
Toshiba Corp.*(a) | 1,436,000 | 3,548,016 | ||||||
TOTO Ltd. | 49,350 | 1,876,223 | ||||||
Toyota Tsusho Corp. | 75,900 | 1,795,801 | ||||||
West Japan Railway Co. | 58,000 | 3,631,842 | ||||||
Yamato Holdings Co. Ltd. (a) | 130,000 | 2,643,202 | ||||||
|
| |||||||
| 199,963,584 | ||||||||
|
| |||||||
| Information Technology — 9.9% | ||||||||
Alps Electric Co. Ltd. | 65,600 | 1,328,173 | ||||||
Brother Industries Ltd. | 84,500 | 1,014,137 | ||||||
Canon, Inc. | 383,700 | 11,129,674 | ||||||
FUJIFILM Holdings Corp. | 157,300 | 6,395,129 | ||||||
Fujitsu Ltd. | 661,000 | 2,674,204 | ||||||
GungHo Online Entertainment, Inc. (a) | 147,330 | 428,412 | ||||||
Hamamatsu Photonics KK | 49,600 | 1,352,707 | ||||||
Hirose Electric Co. Ltd. | 11,210 | 1,392,962 | ||||||
Hitachi High-Technologies Corp. | 21,800 | 635,878 | ||||||
Hitachi Ltd. | 1,738,000 | 8,035,906 | ||||||
Kakaku.com, Inc. | 52,600 | 997,517 | ||||||
Keyence Corp. | 16,460 | 10,464,478 | ||||||
Konami Holdings Corp. | 31,300 | 1,187,159 | ||||||
Konica Minolta, Inc. | 158,600 | 1,369,229 | ||||||
Kyocera Corp. | 115,400 | 5,773,387 | ||||||
Mixi, Inc. | 15,800 | 610,683 | ||||||
Murata Manufacturing Co. Ltd. | 68,800 | 8,045,875 | ||||||
NEC Corp. | 937,000 | 2,208,489 | ||||||
Nexon Co. Ltd. | 62,500 | 1,028,920 | ||||||
Nintendo Co. Ltd. | 40,841 | 6,067,047 | ||||||
Nippon Electric Glass Co. Ltd. | 149,000 | 718,526 | ||||||
Nomura Research Institute Ltd. | 43,620 | 1,648,528 | ||||||
NTT Data Corp. | 45,400 | 2,345,130 | ||||||
Obic Co. Ltd. | 23,200 | 1,263,340 | ||||||
Number | Value | |||||||
| Information Technology (Continued) | ||||||||
Omron Corp. | 69,600 | $ | 2,243,843 | |||||
Oracle Corp. Japan | 14,300 | 760,618 | ||||||
OTSUKA Corp. | 19,600 | 929,245 | ||||||
Ricoh Co. Ltd. | 250,600 | 2,186,116 | ||||||
Rohm Co. Ltd. | 32,400 | 1,385,416 | ||||||
Seiko Epson Corp. | 97,500 | 1,757,439 | ||||||
Shimadzu Corp. | 94,000 | 1,434,596 | ||||||
TDK Corp. | 43,300 | 2,533,833 | ||||||
Tokyo Electron Ltd. | 56,400 | 4,187,662 | ||||||
Trend Micro, Inc. | 40,400 | 1,466,637 | ||||||
Yahoo Japan Corp. (a) | 500,700 | 2,251,760 | ||||||
Yaskawa Electric Corp. | 85,000 | 1,077,708 | ||||||
Yokogawa Electric Corp. | 82,600 | 954,784 | ||||||
|
| |||||||
| 101,285,147 | ||||||||
|
| |||||||
| Materials — 5.5% | ||||||||
AIR WATER, Inc. | 62,500 | 979,252 | ||||||
Asahi Kasei Corp. | 453,300 | 3,041,103 | ||||||
Daicel Corp. | 101,900 | 1,273,577 | ||||||
Hitachi Chemical Co. Ltd. | 34,400 | 644,602 | ||||||
Hitachi Metals Ltd. | 76,700 | 824,247 | ||||||
JFE Holdings, Inc. | 187,800 | 2,529,496 | ||||||
JSR Corp. | 64,100 | 943,541 | ||||||
Kaneka Corp. | 110,000 | 876,146 | ||||||
Kansai Paint Co. Ltd. | 83,000 | 1,681,212 | ||||||
Kobe Steel Ltd. | 1,087,000 | 981,623 | ||||||
Kuraray Co. Ltd. | 125,700 | 1,670,930 | ||||||
Maruichi Steel Tube Ltd. | 17,600 | 588,071 | ||||||
Mitsubishi Chemical Holdings Corp. | 478,900 | 2,440,883 | ||||||
Mitsubishi Gas Chemical Co., Inc. | 145,000 | 823,633 | ||||||
Mitsubishi Materials Corp. | 384,000 | 1,109,676 | ||||||
Mitsui Chemicals, Inc. | 331,000 | 1,246,462 | ||||||
Nippon Paint Holdings Co. Ltd. (a) | 58,500 | 1,669,391 | ||||||
Nippon Steel & Sumitomo Metal Corp. | 290,514 | 6,007,830 | ||||||
Nitto Denko Corp. | 58,200 | 3,830,946 | ||||||
Oji Holdings Corp. | 306,000 | 1,260,089 | ||||||
Shin-Etsu Chemical Co. Ltd. | 142,800 | 8,340,908 | ||||||
Sumitomo Chemical Co. Ltd. | 566,000 | 2,596,541 | ||||||
Sumitomo Metal Mining Co. Ltd. | 185,000 | 1,909,559 | ||||||
Taiheiyo Cement Corp. | 420,000 | 1,107,509 | ||||||
Taiyo Nippon Sanso Corp. | 58,500 | 526,703 | ||||||
Teijin Ltd. | 336,000 | 1,183,366 | ||||||
Toray Industries, Inc. | 528,000 | 4,573,123 | ||||||
Toyo Seikan Group Holdings Ltd. | 57,500 | 1,215,582 | ||||||
|
| |||||||
| 55,876,001 | ||||||||
|
| |||||||
| Telecommunication Services — 6.1% | ||||||||
KDDI Corp. | 677,452 | 19,803,243 | ||||||
Nippon Telegraph & Telephone Corp. | 248,800 | 10,908,241 | ||||||
NTT DOCOMO, Inc. | 514,300 | 12,906,847 | ||||||
SoftBank Group Corp. | 345,400 | 19,426,118 | ||||||
|
| |||||||
| 63,044,449 | ||||||||
|
| |||||||
| Utilities — 2.2% | ||||||||
Chubu Electric Power Co., Inc. | 226,800 | 3,101,897 | ||||||
Chugoku Electric Power Co., Inc. | 103,900 | 1,303,266 | ||||||
Electric Power Development Co. Ltd. | 51,200 | 1,327,450 | ||||||
Hokuriku Electric Power Co. | 63,200 | 790,464 | ||||||
| See Notes to Financial Statements. | 108 |
DBX ETF Trust
Schedule of investments
Deutsche X-trackers MSCI Japan Hedged Equity ETF (Continued)
May 31, 2016
Number of Shares | Value | |||||||
| Utilities (Continued) | ||||||||
Kansai Electric Power Co., Inc.* | 249,300 | $ | 2,417,918 | |||||
Kyushu Electric Power Co., Inc.* | 148,900 | 1,512,733 | ||||||
Osaka Gas Co. Ltd. | 666,000 | 2,501,973 | ||||||
Shikoku Electric Power Co., Inc. | 63,100 | 752,744 | ||||||
Toho Gas Co. Ltd. | 152,000 | 1,128,315 | ||||||
Tohoku Electric Power Co., Inc. | 158,600 | 2,048,115 | ||||||
Tokyo Electric Power Co. Holdings, Inc.* | 509,200 | 2,395,748 | ||||||
Tokyo Gas Co. Ltd. | 732,000 | 2,960,788 | ||||||
|
| |||||||
| 22,241,411 | ||||||||
|
| |||||||
TOTAL COMMON STOCKS | 1,007,277,628 | |||||||
|
| |||||||
Number | Value | |||||||
| SECURITIES LENDING COLLATERAL — 1.1% | ||||||||
Daily Assets Fund “Capital Shares”, 0.48% (b)(c) | 11,076,100 | $ | 11,076,100 | |||||
|
| |||||||
TOTAL INVESTMENTS — 99.3% (Cost $1,073,046,456)† | $ | 1,018,353,728 | ||||||
Other assets and liabilities, | 7,808,147 | |||||||
|
| |||||||
NET ASSETS — 100.0% | $ | 1,026,161,875 | ||||||
|
| |||||||
| * | Non-income producing security. |
| † | The cost for federal income tax purposes was $1,099,204,830. At May 31, 2016, net unrealized depreciation for all securities based on tax cost was $80,851,102. This consisted of aggregate gross unrealized appreciation for all securities in which there was an excess of value over tax cost of $48,146,191 and aggregate gross unrealized depreciation for all securities in which there was an excess of tax cost over value of $128,997,293 |
| (a) | All or a portion of these securities were on loan. In addition, “Other Assets and Liabilities, Net” may include pending sales that are also on loan. The value of securities loaned at May 31, 2016 amounted to $10,567,555, which is 1.0% of net assets. |
| (b) | Affiliated fund managed by Deutsche Investment Management Americas Inc. The rate shown is the annualized seven-day yield at period end. |
| (c) | Represents collateral held in connection with securities lending. Income earned by the Fund is net of borrower rebates. |
| REIT: | Real Estate Investment Trust |
At May 31, 2016, open future contract purchased was as follows:
Contract Description | Currency | Number of Contracts | Contract Value | Expiration Date | Unrealized Appreciation (Depreciation) | |||||||||
TOPIX Index Futures | JPY | 17 | $ | 2,113,966 | 6/09/2016 | $ | (9,271 | ) | ||||||
As of May 31, 2016, the Fund had the following forward foreign currency exchange contracts outstanding:
Counterparty | Settlement Date | Currency To Deliver | Currency To Receive | Unrealized Appreciation (Depreciation) | ||||||||||||||
Bank of Montreal | 6/3/2016 | JPY | 10,323,491,276 | USD | 96,541,678 | $ | 3,303,694 | |||||||||||
Canadian Imperial Bank of Commerce | 6/3/2016 | JPY | 1,665,730,000 | USD | 15,579,218 | 534,956 | ||||||||||||
Canadian Imperial Bank of Commerce | 6/3/2016 | JPY | 20,591,496,359 | USD | 192,579,777 | 6,604,939 | ||||||||||||
JP Morgan & Chase Co. | 6/3/2016 | JPY | 31,742,397,155 | USD | 296,813,259 | 10,127,577 | ||||||||||||
RBC Capital Markets | 6/3/2016 | JPY | 6,083,149,527 | USD | 56,888,018 | 1,947,244 | ||||||||||||
State Street Bank & Trust Co. | 6/3/2016 | JPY | 27,920,699,440 | USD | 261,113,891 | 8,944,380 | ||||||||||||
The Bank of New York Mellon | 6/3/2016 | JPY | 1,081,161,418 | USD | 10,110,464 | 345,811 | ||||||||||||
The Bank of Nova Scotia | 6/3/2016 | JPY | 18,006,601,957 | USD | 168,383,568 | 5,754,547 | ||||||||||||
Bank of Montreal | 6/3/2016 | USD | 96,541,678 | JPY | 10,706,713,468 | 157,429 | ||||||||||||
Canadian Imperial Bank of Commerce | 6/3/2016 | USD | 198,618,751 | JPY | 22,027,812,524 | 328,368 | ||||||||||||
Canadian Imperial Bank of Commerce | 6/3/2016 | USD | 9,540,245 | JPY | 1,020,046,000 | (327,563 | ) | |||||||||||
JP Morgan & Chase Co. | 6/3/2016 | USD | 5,152,828 | JPY | 556,171,000 | (129,696 | ) | |||||||||||
JP Morgan & Chase Co. | 6/3/2016 | USD | 291,660,431 | JPY | 32,346,600,090 | 482,190 | ||||||||||||
RBC Capital Markets | 6/3/2016 | USD | 33,665,681 | JPY | 3,733,692,303 | 55,658 | ||||||||||||
RBC Capital Markets | 6/3/2016 | USD | 1,594,706 | JPY | 170,735,500 | (52,686 | ) | |||||||||||
RBC Capital Markets | 6/3/2016 | USD | 21,627,631 | JPY | 2,381,811,000 | (115,988 | ) | |||||||||||
State Street Bank & Trust Co. | 6/3/2016 | USD | 1,500,000 | JPY | 165,178,800 | (8,166 | ) | |||||||||||
State Street Bank & Trust Co. | 6/3/2016 | USD | 5,152,561 | JPY | 556,171,000 | (129,428 | ) | |||||||||||
State Street Bank & Trust Co. | 6/3/2016 | USD | 21,628,192 | JPY | 2,381,811,000 | (116,549 | ) | |||||||||||
State Street Bank & Trust Co. | 6/3/2016 | USD | 1,594,745 | JPY | 170,735,500 | (52,724 | ) | |||||||||||
State Street Bank & Trust Co. | 6/3/2016 | USD | 6,344,760 | JPY | 687,286,500 | (137,441 | ) | |||||||||||
| See Notes to Financial Statements. | 109 |
DBX ETF Trust
Schedule of investments
Deutsche X-trackers MSCI Japan Hedged Equity ETF (Continued)
May 31, 2016
Counterparty | Settlement Date | Currency To Deliver | Currency To Receive | Unrealized Appreciation (Depreciation) | ||||||||||||||
State Street Bank & Trust Co. | 6/3/2016 | USD | 224,893,633 | JPY | 24,941,333,601 | $ | 367,339 | |||||||||||
The Bank of New York Mellon | 6/3/2016 | USD | 11,797 | JPY | 1,286,000 | (182 | ) | |||||||||||
The Bank of New York Mellon | 6/3/2016 | USD | 1,700,000 | JPY | 187,637,500 | (5,327 | ) | |||||||||||
The Bank of New York Mellon | 6/3/2016 | USD | 314,604 | JPY | 34,241,000 | (5,352 | ) | |||||||||||
The Bank of New York Mellon | 6/3/2016 | USD | 160,610 | JPY | 17,673,000 | (994 | ) | |||||||||||
The Bank of New York Mellon | 6/3/2016 | USD | 7,426,365 | JPY | 823,596,458 | 12,056 | ||||||||||||
The Bank of New York Mellon | 6/3/2016 | USD | 457,840 | JPY | 50,000,000 | (6,259 | ) | |||||||||||
The Bank of New York Mellon | 6/3/2016 | USD | 39,248 | JPY | 4,186,000 | (1,441 | ) | |||||||||||
The Bank of Nova Scotia | 6/3/2016 | USD | 6,345,089 | JPY | 687,286,500 | (137,770 | ) | |||||||||||
The Bank of Nova Scotia | 6/3/2016 | USD | 162,038,478 | JPY | 17,970,877,436 | 267,891 | ||||||||||||
Bank of Montreal | 7/5/2016 | JPY | 10,694,887,112 | USD | 96,541,678 | (166,411 | ) | |||||||||||
Canadian Imperial Bank of Commerce | 7/5/2016 | JPY | 170,724,000 | USD | 1,544,657 | 892 | ||||||||||||
Canadian Imperial Bank of Commerce | 7/5/2016 | JPY | 22,002,985,180 | USD | 198,618,751 | (342,363 | ) | |||||||||||
Canadian Imperial Bank of Commerce | 7/5/2016 | JPY | 20,416,000 | USD | 184,291 | (320 | ) | |||||||||||
JP Morgan & Chase Co. | 7/5/2016 | JPY | 32,311,455,008 | USD | 291,660,431 | (514,609 | ) | |||||||||||
RBC Capital Markets | 7/5/2016 | JPY | 3,729,534,591 | USD | 33,665,681 | (58,487 | ) | |||||||||||
State Street Bank & Trust Co. | 7/5/2016 | JPY | 24,912,614,684 | USD | 224,893,633 | (377,689 | ) | |||||||||||
The Bank of New York Mellon | 7/5/2016 | JPY | 822,674,104 | USD | 7,426,365 | (12,633 | ) | |||||||||||
The Bank of Nova Scotia | 7/5/2016 | JPY | 17,950,541,607 | USD | 162,038,478 | (278,576 | ) | |||||||||||
|
| |||||||||||||||||
Total net unrealized appreciation | $ | 36,256,317 | ||||||||||||||||
|
| |||||||||||||||||
Currency Abbreviations
| JPY | Japanese Yen |
| USD | U.S. Dollar |
For information on the Fund’s policy and additional disclosures regarding open futures contracts and forward foreign currency exchange contracts, please refer to the Derivatives section of Note 2 in the accompanying Notes to Financial Statements.
Fair Value Measurements
Various inputs are used in determining the value of the Fund’s investments. These inputs are summarized in three broad levels. Level 1 includes quoted prices in active markets for identical securities. Level 2 includes other significant observable inputs (including quoted prices for similar securities, interest rates, prepayment speeds and credit risk). Level 3 includes significant unobservable inputs (including the Fund’s own assumptions in determining the fair value of investments). The level assigned to the securities valuations may not be an indication of the risk or liquidity associated with investing in those securities.
The following is a summary of the inputs used as of May 31, 2016 in valuing the Fund’s investments. For information on Fund’s policy regarding the valuation of investments, please refer to the Security Valuation section of Note 2 in the accompanying Notes to Financial Statements.
Assets | Level 1 | Level 2 | Level 3 | Total | ||||||||||||
Common Stocks (d) | $ | 1,007,277,628 | $ | — | $ | — | $ | 1,007,277,628 | ||||||||
Short-Term Investments | 11,076,100 | — | — | 11,076,100 | ||||||||||||
Derivatives (e) | ||||||||||||||||
Forward Foreign Currency Exchange Contracts | — | 39,234,971 | — | 39,234,971 | ||||||||||||
|
|
|
|
|
|
|
| |||||||||
TOTAL | $ | 1,018,353,728 | $ | 39,234,971 | $ | — | $ | 1,057,588,699 | ||||||||
|
|
|
|
|
|
|
| |||||||||
Liabilities | Level 1 | Level 2 | Level 3 | Total | ||||||||||||
Derivatives (e) | ||||||||||||||||
Futures Contracts | $ | (9,271 | ) | $ | — | $ | — | $ | (9,271 | ) | ||||||
Forward Foreign Currency Exchange Contracts | — | (2,978,654 | ) | — | (2,978,654 | ) | ||||||||||
|
|
|
|
|
|
|
| |||||||||
TOTAL | $ | (9,271 | ) | $ | (2,978,654 | ) | $ | — | $ | (2,987,925 | ) | |||||
|
|
|
|
|
|
|
| |||||||||
| (d) | See Schedule of investments for additional detailed categorizations. |
| (e) | Derivatives include unrealized appreciation (depreciation) on open futures contracts and forward foreign currency exchange contracts. |
There have been no transfers between fair value measurement levels during the period ended May 31, 2016.
| See Notes to Financial Statements. | 110 |
DBX ETF Trust
Schedule of investments
Deutsche X-trackers MSCI Mexico Hedged Equity ETF
May 31, 2016
Number | Value | |||||||
| COMMON STOCKS — 99.6% | ||||||||
| Consumer Discretionary — 10.5% | ||||||||
Alsea SAB de CV | 13,960 | $ | 53,021 | |||||
Consorcio ARA SAB de CV | 29,102 | 10,012 | ||||||
Corpovael SA de CV | 2,600 | 2,175 | ||||||
El Puerto de Liverpool SAB de CV, Class C1 | 5,181 | 55,704 | ||||||
Grupo Famsa SAB de CV, Class A* | 11,020 | 4,580 | ||||||
Grupo Televisa SAB, Series CPO | 57,663 | 307,673 | ||||||
Hoteles City Express SAB de CV* | 9,600 | 10,455 | ||||||
Rassini SAB de CV, Class Series CP | 500 | 2,159 | ||||||
TV Azteca SAB de CV | 53,401 | 6,047 | ||||||
|
| |||||||
| 451,826 | ||||||||
|
| |||||||
| Consumer Staples — 29.1% | ||||||||
Arca Continental SAB de CV | 10,932 | 72,658 | ||||||
Coca-Cola Femsa SAB de CV, Series L | 10,070 | 80,705 | ||||||
Fomento Economico Mexicano SAB de CV | 44,120 | 398,584 | ||||||
Gruma SAB de CV, Class B | 5,213 | 74,938 | ||||||
Grupo Bimbo SAB de CV, Series A | 43,186 | 127,311 | ||||||
Grupo Comercial Chedraui SA de CV | 9,486 | 23,694 | ||||||
Grupo Herdez SAB de CV | 7,700 | 16,229 | ||||||
Grupo Lala SAB de CV | 17,449 | 41,947 | ||||||
Industrias Bachoco SAB de CV, Series B | 5,620 | 23,130 | ||||||
Kimberly-Clark de Mexico SAB de CV, Class A | 40,559 | 96,339 | ||||||
La Comer SAB de CV* | 12,557 | 13,076 | ||||||
Wal-Mart de Mexico SAB de CV | 123,038 | 285,584 | ||||||
|
| |||||||
| 1,254,195 | ||||||||
|
| |||||||
| Financials — 21.2% | ||||||||
Banregio Grupo Financiero SAB de CV | 6,640 | 36,307 | ||||||
Bolsa Mexicana de Valores SAB de CV | 12,640 | 19,792 | ||||||
Concentradora Fibra Hotelera Mexicana SA de CV REIT | 14,840 | 11,691 | ||||||
Corp. Inmobiliaria Vesta SAB de CV | 16,820 | 24,596 | ||||||
Credito Real SAB de CV, SOFOM, ER | 6,652 | 13,858 | ||||||
Fibra Shop Portafolios Inmobiliarios SAPI de CV REIT | 12,740 | 11,148 | ||||||
Fibra Uno Administracion SA de CV REIT | 62,553 | 135,431 | ||||||
Gentera SAB de CV | 29,147 | 53,077 | ||||||
Grupo Financiero Banorte SAB de CV, Class O | 58,879 | 307,877 | ||||||
Grupo Financiero Inbursa SAB de CV, Class O | 61,547 | 102,641 | ||||||
Grupo Financiero Interacciones SA de CV, Class O | 2,700 | 13,884 | ||||||
Grupo Financiero Santander Mexico SAB de CV, Class B | 48,883 | 88,328 | ||||||
Grupo GICSA SA de CV* | 4,700 | 3,384 | ||||||
Macquarie Mexico Real Estate Management SA de CV REIT* | 23,921 | 30,172 | ||||||
PLA Administradora Industrial S de RL de CV REIT* | 17,940 | 29,860 | ||||||
Number | Value | |||||||
| Financials (Continued) | ||||||||
Prologis Property Mexico SA de CV REIT* | 11,640 | $ | 17,526 | |||||
Qualitas Controladora SAB de CV | 8,060 | 11,088 | ||||||
Unifin Financiera SAB de CV SOFOM ENR | 1,500 | 4,027 | ||||||
|
| |||||||
| 914,687 | ||||||||
|
| |||||||
| Health Care — 0.6% | ||||||||
Genomma Lab Internacional SAB de CV, Class B* | 26,552 | 27,003 | ||||||
|
| |||||||
| Industrials — 13.5% | ||||||||
Alfa SAB de CV, Class A | 73,710 | 129,235 | ||||||
Controladora Vuela Cia de Aviacion SAB de CV, Class A* | 13,280 | 25,744 | ||||||
Elementia SAB de CV, 144A* | 4,000 | 4,891 | ||||||
Empresas ICA SAB de CV* | 26,441 | 3,696 | ||||||
Grupo Aeromexico SAB de CV* | 11,820 | 24,394 | ||||||
Grupo Aeroportuario del Centro Norte SAB de CV | 6,380 | 36,603 | ||||||
Grupo Aeroportuario del Pacifico SAB de CV, Class B | 8,370 | 84,617 | ||||||
Grupo Aeroportuario del Sureste SAB de CV, Class B* | 5,640 | 88,936 | ||||||
Grupo Carso SAB de CV, Series A1 | 15,427 | 65,280 | ||||||
Grupo Rotoplas SAB de CV | 6,880 | 12,324 | ||||||
OHL Mexico SAB de CV* | 21,732 | 27,352 | ||||||
Promotora y Operadora de Infraestructura SAB de CV | 6,691 | 79,944 | ||||||
|
| |||||||
| 583,016 | ||||||||
|
| |||||||
| Materials — 12.8% | ||||||||
Cemex SAB de CV, Series CPO* | 301,631 | 191,699 | ||||||
Grupo Mexico SAB de CV, Series B | 86,896 | 192,514 | ||||||
Grupo Simec SAB de CV, Series B* | 4,040 | 11,798 | ||||||
Industrias CH SAB de CV, Series B* | 4,738 | 19,333 | ||||||
Industrias Penoles SAB de CV | 3,890 | 62,044 | ||||||
Mexichem SAB de CV | 28,693 | 60,365 | ||||||
Minera Frisco SAB de CV, Class A1* | 23,949 | 14,066 | ||||||
|
| |||||||
| 551,819 | ||||||||
|
| |||||||
| Telecommunication Services — 11.9% | ||||||||
America Movil SAB de CV, Series L | 779,503 | 476,822 | ||||||
Axtel SAB de CV* | 27,361 | 9,562 | ||||||
Telesites SAB de CV* | 38,985 | 25,135 | ||||||
|
| |||||||
| 511,519 | ||||||||
|
| |||||||
TOTAL COMMON STOCKS | 4,294,065 | |||||||
|
| |||||||
| TOTAL INVESTMENTS — 99.6% (Cost $5,185,243)† | $ | 4,294,065 | ||||||
Other assets and liabilities, net — 0.4% | 16,380 | |||||||
|
| |||||||
NET ASSETS — 100.0% | $ | 4,310,445 | ||||||
|
| |||||||
| * | Non-income producing security. |
| † | The cost for federal income tax purposes was $5,306,208. At May 31, 2016, net unrealized depreciation for all securities based on tax cost was $1,012,143. This consisted of aggregate gross unrealized appreciation for all securities in which there was an excess of value over tax cost of $129,551 and aggregate gross unrealized depreciation for all securities in which there was an excess of tax cost over value of $1,141,694. |
| See Notes to Financial Statements. | 111 |
DBX ETF Trust
Schedule of investments
Deutsche X-trackers MSCI Mexico Hedged Equity ETF (Continued)
May 31, 2016
| CPO: | Ordinary Participation Certificates |
| REIT: | Real Estate Investment Trust |
| 144A: | Security exempt from registration under Rule 144A of the Securities Act of 1933. These securities may be resold in transactions exempt from registration, normally to qualified institutional buyers. |
As of May 31, 2016, the Fund had the following forward foreign currency exchange contracts outstanding:
Counterparty | Settlement Date | Currency To Deliver | Currency To Receive | Unrealized Appreciation (Depreciation) | ||||||||||||||
Bank of Montreal | 6/3/2016 | MXN | 51,173 | USD | 2,779 | $ | 7 | |||||||||||
Bank of Montreal | 6/3/2016 | MXN | 30,564,798 | USD | 1,778,652 | 123,222 | ||||||||||||
Bank of Montreal | 6/3/2016 | MXN | 269,000 | USD | 15,614 | 1,045 | ||||||||||||
JP Morgan & Chase Co. | 6/3/2016 | MXN | 45,190,647 | USD | 2,629,948 | 182,362 | ||||||||||||
Bank of Montreal | 6/3/2016 | USD | 1,713,917 | MXN | 31,564,281 | (4,353 | ) | |||||||||||
Bank of Montreal | 6/3/2016 | USD | 6,786 | MXN | 116,621 | (470 | ) | |||||||||||
Bank of Montreal | 6/3/2016 | USD | 63,563 | MXN | 1,092,000 | (4,418 | ) | |||||||||||
Bank of Montreal | 6/3/2016 | USD | 10,000 | MXN | 176,060 | (464 | ) | |||||||||||
JP Morgan & Chase Co. | 6/3/2016 | USD | 2,629,948 | MXN | 48,404,185 | (8,313 | ) | |||||||||||
The Bank of New York Mellon | 6/3/2016 | USD | 2,779 | MXN | 50,000 | (71 | ) | |||||||||||
Bank of Montreal | 7/5/2016 | MXN | 31,676,268 | USD | 1,713,917 | 4,652 | ||||||||||||
Bank of Montreal | 7/5/2016 | MXN | 337,000 | USD | 18,236 | 51 | ||||||||||||
Bank of Montreal | 7/5/2016 | MXN | 295,000 | USD | 15,971 | 53 | ||||||||||||
JP Morgan & Chase Co. | 7/5/2016 | MXN | 48,575,000 | USD | 2,629,948 | 8,820 | ||||||||||||
Bank of Montreal | 7/5/2016 | USD | 2,779 | MXN | 51,354 | (8 | ) | |||||||||||
|
| |||||||||||||||||
Total net unrealized appreciation | $ | 302,115 | ||||||||||||||||
|
| |||||||||||||||||
Currency Abbreviations
| MXN | Mexican Peso |
| USD | U.S. Dollar |
For information on the Fund’s policy and additional disclosures regarding forward foreign currency exchange contracts, please refer to the Derivatives section of Note 2 in the accompanying Notes to Financial Statements.
Fair Value Measurements
Various inputs are used in determining the value of the Fund’s investments. These inputs are summarized in three broad levels. Level 1 includes quoted prices in active markets for identical securities. Level 2 includes other significant observable inputs (including quoted prices for similar securities, interest rates, prepayment speeds and credit risk). Level 3 includes significant unobservable inputs (including the Fund’s own assumptions in determining the fair value of investments). The level assigned to the securities valuations may not be an indication of the risk or liquidity associated with investing in those securities.
The following is a summary of the inputs used as of May 31, 2016 in valuing the Fund’s investments. For information on Fund’s policy regarding the valuation of investments, please refer to the Security Valuation section of Note 2 in the accompanying Notes to Financial Statements.
Assets | Level 1 | Level 2 | Level 3 | Total | ||||||||||||
Common Stocks (a) | $ | 4,290,369 | $ | — | $ | 3,696 | $ | 4,294,065 | ||||||||
Derivatives (b) | ||||||||||||||||
Forward Foreign Currency Exchange Contracts | — | 320,212 | — | 320,212 | ||||||||||||
|
|
|
|
|
|
|
| |||||||||
TOTAL | $ | 4,290,369 | $ | 320,212 | $ | 3,696 | $ | 4,614,277 | ||||||||
|
|
|
|
|
|
|
| |||||||||
Liabilities | Level 1 | Level 2 | Level 3 | Total | ||||||||||||
Derivatives (b) | ||||||||||||||||
Forward Foreign Currency Exchange Contracts | $ | — | $ | (18,097 | ) | $ | — | $ | (18,097 | ) | ||||||
|
|
|
|
|
|
|
| |||||||||
TOTAL | $ | — | $ | (18,097 | ) | $ | — | $ | (18,097 | ) | ||||||
|
|
|
|
|
|
|
| |||||||||
| (a) | See Schedule of investments for additional detailed categorizations. |
| (b) | Derivatives include unrealized appreciation (depreciation) on forward foreign currency exchange contracts. |
During the year ended May 31, 2016, the amount of transfers between Level 1 and Level 3 was $23,595. Investments were transferred from Level 1 to Level 3 as a result of a halt in trading on a securities exchange.
Transfers between price levels are recognized at the beginning of the reporting period.
| See Notes to Financial Statements. | 112 |
DBX ETF Trust
Schedule of investments
Deutsche X-trackers MSCI South Korea Hedged Equity ETF
May 31, 2016
Number | Value | |||||||
| COMMON STOCKS — 95.0% | ||||||||
| Consumer Discretionary — 14.2% | ||||||||
Cheil Worldwide, Inc. | 19,964 | $ | 272,206 | |||||
CJ E&M Corp. | 4,112 | 259,803 | ||||||
Coway Co. Ltd. | 12,214 | 1,055,581 | ||||||
Hankook Tire Co. Ltd. | 17,024 | 731,355 | ||||||
Hanon Systems | 45,326 | 469,690 | ||||||
Hanssem Co. Ltd. | 2,306 | 356,987 | ||||||
Hotel Shilla Co. Ltd. | 7,753 | 428,698 | ||||||
Hyundai Department Store Co. Ltd. | 3,633 | 403,904 | ||||||
Hyundai Mobis Co. Ltd. | 15,117 | 3,234,465 | ||||||
Hyundai Motor Co. | 33,937 | 3,972,320 | ||||||
Hyundai Wia Corp. | 3,934 | 305,662 | ||||||
Kangwon Land, Inc. | 26,686 | 952,752 | ||||||
Kia Motors Corp. | 58,408 | 2,286,234 | ||||||
LG Electronics, Inc. | 23,882 | 1,124,165 | ||||||
Lotte Shopping Co. Ltd. | 2,582 | 495,039 | ||||||
Paradise Co. Ltd. | 11,780 | 170,997 | ||||||
Shinsegae Co. Ltd. | 1,701 | 296,155 | ||||||
|
| |||||||
| 16,816,013 | ||||||||
|
| |||||||
| Consumer Staples — 9.8% | ||||||||
Amorepacific Corp. | 7,133 | 2,498,764 | ||||||
AMOREPACIFIC Group | 6,399 | 896,655 | ||||||
BGF Retail Co. Ltd. | 2,166 | 398,923 | ||||||
CJ CheilJedang Corp. | 1,837 | 589,573 | ||||||
Dongsuh Cos., Inc. | 7,507 | 209,753 | ||||||
E-MART, Inc. | 4,815 | 735,300 | ||||||
GS Retail Co. Ltd. | 5,837 | 259,085 | ||||||
KT&G Corp. | 25,882 | 2,768,883 | ||||||
LG Household & Health Care Ltd. | 2,095 | 1,856,285 | ||||||
Lotte Chilsung Beverage Co. Ltd. | 133 | 216,719 | ||||||
Lotte Confectionery Co. Ltd. | 1,409 | 256,547 | ||||||
Orion Corp. | 828 | 673,905 | ||||||
Ottogi Corp. | 258 | 183,574 | ||||||
|
| |||||||
| 11,543,966 | ||||||||
|
| |||||||
| Energy — 2.7% | ||||||||
GS Holdings | 11,941 | 525,011 | ||||||
SK Innovation Co. Ltd. | 14,337 | 1,966,857 | ||||||
S-Oil Corp. | 10,341 | 745,336 | ||||||
|
| |||||||
| 3,237,204 | ||||||||
|
| |||||||
| Financials — 13.2% | ||||||||
BNK Financial Group, Inc. | 62,523 | 459,034 | ||||||
DGB Financial Group, Inc. | 40,911 | 318,212 | ||||||
Dongbu Insurance Co. Ltd. | 10,909 | 667,282 | ||||||
Hana Financial Group, Inc. | 66,499 | 1,442,356 | ||||||
Hanwha Life Insurance Co. Ltd. | 53,545 | 287,089 | ||||||
Hyundai Marine & Fire Insurance Co. Ltd. | 14,960 | 396,657 | ||||||
Industrial Bank of Korea | 60,130 | 575,165 | ||||||
KB Financial Group, Inc. | 85,713 | 2,452,436 | ||||||
Korea Investment Holdings Co. Ltd. | 9,295 | 348,231 | ||||||
Mirae Asset Daewoo Co. Ltd. | 43,164 | 287,205 | ||||||
Mirae Asset Securities Co. Ltd. | 16,177 | 318,301 | ||||||
NH Investment & Securities Co. Ltd. | 35,111 | 267,501 | ||||||
Samsung Card Co. Ltd. | 8,698 | 279,886 | ||||||
Samsung Fire & Marine Insurance Co. Ltd. | 7,783 | 1,815,467 | ||||||
Number | Value | |||||||
| Financials (Continued) | ||||||||
Samsung Life Insurance Co. Ltd. | 17,851 | $ | 1,557,731 | |||||
Samsung Securities Co. Ltd. | 13,590 | 406,514 | ||||||
Shinhan Financial Group Co. Ltd. | 94,686 | 3,142,164 | ||||||
Woori Bank | 73,430 | 613,046 | ||||||
|
| |||||||
| 15,634,277 | ||||||||
|
| |||||||
| Health Care — 2.4% | ||||||||
Celltrion, Inc.* | 16,654 | 1,384,806 | ||||||
Hanmi Pharm. Co. Ltd. | 1,147 | 609,205 | ||||||
Hanmi Science Co. Ltd. | 2,537 | 327,822 | ||||||
Yuhan Corp. | 1,856 | 493,667 | ||||||
|
| |||||||
| 2,815,500 | ||||||||
|
| |||||||
| Industrials — 10.6% | ||||||||
CJ Corp. | 3,361 | 611,963 | ||||||
CJ Korea Express Corp.* | 1,697 | 304,714 | ||||||
Daelim Industrial Co. Ltd. | 6,580 | 448,862 | ||||||
Daewoo Engineering & Construction Co. Ltd.* | 28,967 | 141,700 | ||||||
Doosan Heavy Industries & Construction Co. Ltd. | 12,855 | 261,565 | ||||||
GS Engineering & Construction Corp.* | 12,503 | 310,529 | ||||||
Hanwha Corp. | 10,975 | 354,537 | ||||||
Hyundai Development Co.-Engineering & Construction | 13,284 | 499,348 | ||||||
Hyundai Engineering & Construction Co. Ltd. | 17,463 | 501,120 | ||||||
Hyundai Glovis Co. Ltd. | 4,123 | 629,624 | ||||||
Hyundai Heavy Industries Co. Ltd.* | 9,527 | 875,320 | ||||||
KCC Corp. | 1,360 | 461,588 | ||||||
KEPCO Plant Service & Engineering Co. Ltd. | 5,189 | 306,080 | ||||||
Korea Aerospace Industries Ltd. | 13,335 | 748,541 | ||||||
Korean Air Lines Co. Ltd.* | 8,793 | 204,368 | ||||||
LG Corp. | 21,289 | 1,177,165 | ||||||
Posco Daewoo Corp. | 11,855 | 234,752 | ||||||
S-1 Corp. | 4,578 | 384,125 | ||||||
Samsung C&T Corp. | 16,801 | 1,691,660 | ||||||
Samsung Heavy Industries Co. Ltd.* | 36,531 | 292,420 | ||||||
SK Holdings Co. Ltd. | 10,133 | 1,947,019 | ||||||
SK Networks Co. Ltd. | 29,722 | 153,872 | ||||||
|
| |||||||
| 12,540,872 | ||||||||
|
| |||||||
| Information Technology — 30.4% | ||||||||
Kakao Corp. | 6,652 | 573,775 | ||||||
LG Display Co. Ltd. | 52,550 | 1,137,599 | ||||||
LG Innotek Co. Ltd. | 3,377 | 246,234 | ||||||
NAVER Corp. | 6,218 | 3,756,469 | ||||||
NCSoft Corp. | 3,866 | 780,142 | ||||||
Samsung Electro-Mechanics Co. Ltd. | 13,781 | 603,598 | ||||||
Samsung Electronics Co. Ltd. | 21,579 | 23,393,244 | ||||||
Samsung SDI Co. Ltd. | 12,438 | 1,174,085 | ||||||
Samsung SDS Co. Ltd. | 7,698 | 1,182,022 | ||||||
SK Hynix, Inc. | 129,188 | 3,111,005 | ||||||
|
| |||||||
| 35,958,173 | ||||||||
|
| |||||||
| See Notes to Financial Statements. | 113 |
DBX ETF Trust
Schedule of investments
Deutsche X-trackers MSCI South Korea Hedged Equity ETF (Continued)
May 31, 2016
Number | Value | |||||||
| Materials — 7.6% | ||||||||
Hanwha Chemical Corp. | 24,589 | $ | 492,069 | |||||
Hyosung Corp. | 5,308 | 523,318 | ||||||
Hyundai Steel Co. | 18,224 | 747,737 | ||||||
Korea Zinc Co. Ltd. | 1,944 | 765,823 | ||||||
Kumho Petrochemical Co. Ltd. | 3,931 | 210,436 | ||||||
LG Chem Ltd. | 10,285 | 2,338,677 | ||||||
Lotte Chemical Corp. | 3,501 | 834,271 | ||||||
OCI Co. Ltd.* | 4,119 | 338,354 | ||||||
POSCO | 15,469 | 2,699,741 | ||||||
|
| |||||||
| 8,950,426 | ||||||||
|
| |||||||
| Telecommunication Services — 1.3% | ||||||||
KT Corp. | 7,998 | 215,419 | ||||||
LG Uplus Corp. | 50,851 | 492,808 | ||||||
SK Telecom Co. Ltd. | 4,451 | 829,100 | ||||||
|
| |||||||
| 1,537,327 | ||||||||
|
| |||||||
| Utilities — 2.8% | ||||||||
Korea Electric Power Corp. | 56,961 | 3,006,249 | ||||||
Korea Gas Corp. | 7,147 | 238,373 | ||||||
|
| |||||||
| 3,244,622 | ||||||||
|
| |||||||
TOTAL COMMON STOCKS | 112,278,380 | |||||||
|
| |||||||
Number | Value | |||||||
| PREFERRED STOCKS — 4.0% | ||||||||
| Consumer Discretionary — 1.0% | ||||||||
Hyundai Motor Co. | 5,604 | $ | 465,981 | |||||
Hyundai Motor Co. — 2nd Preferred | 8,592 | 756,973 | ||||||
|
| |||||||
| 1,222,954 | ||||||||
|
| |||||||
| Consumer Staples — 0.6% | ||||||||
Amorepacific Corp. | 1,961 | 411,352 | ||||||
LG Household & Health Care Ltd. | 500 | 253,818 | ||||||
|
| |||||||
| 665,170 | ||||||||
|
| |||||||
| Information Technology — 2.2% | ||||||||
Samsung Electronics Co. Ltd. | 2,873 | 2,560,099 | ||||||
|
| |||||||
| Materials — 0.2% | ||||||||
LG Chem Ltd. | 1,860 | 305,890 | ||||||
|
| |||||||
TOTAL PREFERRED STOCKS | 4,754,113 | |||||||
|
| |||||||
| TOTAL INVESTMENTS — 99.0% (Cost $107,546,273)† | $ | 117,032,493 | ||||||
Other assets and liabilities, net — 1.0% | 1,128,772 | |||||||
|
| |||||||
NET ASSETS — 100.0% | $ | 118,161,265 | ||||||
|
| |||||||
| * | Non-income producing security. |
| † | The cost for federal income tax purposes was $129,612,302. At May 31, 2016, net unrealized depreciation for all securities based on tax cost was $12,579,809. This consisted of aggregate gross unrealized appreciation for all securities in which there was an excess of value over tax cost of $5,760,577 and aggregate gross unrealized depreciation for all securities in which there was an excess of tax cost over value of $18,340,386. |
As of May 31, 2016, the Fund had the following forward foreign currency exchange contracts outstanding:
Counterparty | Settlement Date | Currency To Deliver | Currency To Receive | Unrealized Appreciation (Depreciation) | ||||||||||||||
Bank of Montreal | 6/3/2016 | KRW | 11,581,211,000 | USD | 9,728,023 | $ | 11,224 | |||||||||||
JP Morgan & Chase Co. | 6/3/2016 | KRW | 83,833,949,340 | USD | 73,140,769 | 2,802,912 | ||||||||||||
RBC Capital Markets | 6/3/2016 | KRW | 5,157,037,500 | USD | 4,513,423 | 186,597 | ||||||||||||
State Street Bank & Trust Co. | 6/3/2016 | KRW | 60,451,489,500 | USD | 52,902,327 | 2,182,681 | ||||||||||||
Bank of Montreal | 6/3/2016 | USD | 10,135,840 | KRW | 11,581,211,000 | (419,042 | ) | |||||||||||
JP Morgan & Chase Co. | 6/3/2016 | USD | 70,448,697 | KRW | 83,833,949,340 | (110,840 | ) | |||||||||||
RBC Capital Markets | 6/3/2016 | USD | 4,335,211 | KRW | 5,157,037,500 | (8,385 | ) | |||||||||||
State Street Bank & Trust Co. | 6/3/2016 | USD | 49,190,075 | KRW | 58,513,561,500 | (96,377 | ) | |||||||||||
State Street Bank & Trust Co. | 6/3/2016 | USD | 135,450 | KRW | 155,253,000 | (5,191 | ) | |||||||||||
State Street Bank & Trust Co. | 6/3/2016 | USD | 1,560,055 | KRW | 1,782,675,000 | (64,366 | ) | |||||||||||
JP Morgan & Chase Co. | 7/6/2016 | KRW | 83,833,949,340 | USD | 70,380,682 | 89,688 | ||||||||||||
RBC Capital Markets | 7/6/2016 | KRW | 5,157,037,500 | USD | 4,325,793 | 1,849 | ||||||||||||
State Street Bank & Trust Co. | 7/6/2016 | KRW | 58,513,561,500 | USD | 49,153,712 | 92,724 | ||||||||||||
Bank of Montreal | 7/6/2016 | USD | 9,719,858 | KRW | 11,581,211,000 | (9,534 | ) | |||||||||||
State Street Bank & Trust Co. | 7/6/2016 | USD | 1,936,195 | KRW | 2,304,885,000 | (3,652 | ) | |||||||||||
|
| |||||||||||||||||
Total net unrealized appreciation | $ | 4,650,288 | ||||||||||||||||
|
| |||||||||||||||||
Currency Abbreviations
| KRW | South Korean Won |
| USD | U.S. Dollar |
| See Notes to Financial Statements. | 114 |
DBX ETF Trust
Schedule of investments
Deutsche X-trackers MSCI South Korea Hedged Equity ETF (Continued)
May 31, 2016
For information on the Fund’s policy and additional disclosures regarding forward foreign currency exchange contracts, please refer to the Derivatives section of Note 2 in the accompanying Notes to Financial Statements.
Fair Value Measurements
Various inputs are used in determining the value of the Fund’s investments. These inputs are summarized in three broad levels. Level 1 includes quoted prices in active markets for identical securities. Level 2 includes other significant observable inputs (including quoted prices for similar securities, interest rates, prepayment speeds and credit risk). Level 3 includes significant unobservable inputs (including the Fund’s own assumptions in determining the fair value of investments). The level assigned to the securities valuations may not be an indication of the risk or liquidity associated with investing in those securities.
The following is a summary of the inputs used as of May 31, 2016 in valuing the Fund’s investments. For information on Fund’s policy regarding the valuation of investments, please refer to the Security Valuation section of Note 2 in the accompanying Notes to Financial Statements.
Assets | Level 1 | Level 2 | Level 3 | Total | ||||||||||||
Common Stocks (a) | $ | 112,278,380 | $ | — | $ | — | $ | 112,278,380 | ||||||||
Preferred Stocks (a) | 4,754,113 | — | — | 4,754,113 | ||||||||||||
Derivatives (b) | ||||||||||||||||
Forward Foreign Currency Exchange Contracts | — | 5,367,675 | — | 5,367,675 | ||||||||||||
|
|
|
|
|
|
|
| |||||||||
TOTAL | $ | 117,032,493 | $ | 5,367,675 | $ | — | $ | 122,400,168 | ||||||||
|
|
|
|
|
|
|
| |||||||||
Liabilities | Level 1 | Level 2 | Level 3 | Total | ||||||||||||
Derivatives (b) | ||||||||||||||||
Forward Foreign Currency Exchange Contracts | $ | — | $ | (717,387 | ) | $ | — | $ | (717,387 | ) | ||||||
|
|
|
|
|
|
|
| |||||||||
TOTAL | $ | — | $ | (717,387 | ) | $ | — | $ | (717,387 | ) | ||||||
|
|
|
|
|
|
|
| |||||||||
| (a) | See Schedule of investments for additional detailed categorizations. |
| (b) | Derivatives include unrealized appreciation (depreciation) on forward foreign currency exchange contracts. |
There have been no transfers between fair value measurement levels during the year ended May 31, 2016.
| See Notes to Financial Statements. | 115 |
DBX ETF Trust
Schedule of investments
Deutsche X-trackers MSCI United Kingdom Hedged Equity ETF
May 31, 2016
Number | Value | |||||||
| COMMON STOCKS — 98.5% | ||||||||
| Consumer Discretionary — 10.3% | ||||||||
Barratt Developments PLC | 2,334 | $ | 20,012 | |||||
Berkeley Group Holdings PLC | 304 | 14,420 | ||||||
Burberry Group PLC | 1,035 | 16,100 | ||||||
Carnival PLC | 442 | 21,823 | ||||||
Compass Group PLC | 3,825 | 71,299 | ||||||
Dixons Carphone PLC | 2,279 | 14,523 | ||||||
GKN PLC | 3,992 | 15,894 | ||||||
InterContinental Hotels Group PLC | 434 | 16,727 | ||||||
ITV PLC | 8,443 | 26,267 | ||||||
Kingfisher PLC | 5,307 | 28,224 | ||||||
Marks & Spencer Group PLC | 3,774 | 20,755 | ||||||
Merlin Entertainments PLC, 144A | 1,661 | 10,166 | ||||||
Next PLC | 333 | 26,237 | ||||||
Pearson PLC | 1,912 | 23,220 | ||||||
Persimmon PLC | 717 | 21,829 | ||||||
RELX PLC | 2,576 | 46,637 | ||||||
Sky PLC | 2,402 | 33,520 | ||||||
Taylor Wimpey PLC | 7,580 | 22,550 | ||||||
TUI AG | 1,161 | 17,774 | ||||||
Whitbread PLC | 424 | 25,866 | ||||||
William Hill PLC | 2,070 | 9,327 | ||||||
WPP PLC | 3,012 | 69,450 | ||||||
|
| |||||||
| 572,620 | ||||||||
|
| |||||||
| Consumer Staples — 19.7% | ||||||||
Associated British Foods PLC | 828 | 35,305 | ||||||
British American Tobacco PLC | 4,337 | 263,697 | ||||||
Coca-Cola HBC AG CDI | 420 | 8,170 | ||||||
Diageo PLC | 5,855 | 158,620 | ||||||
Imperial Brands PLC | 2,230 | 121,474 | ||||||
J Sainsbury PLC | 3,136 | 12,195 | ||||||
Reckitt Benckiser Group PLC | 1,479 | 147,270 | ||||||
SABMiller PLC | 2,262 | 140,695 | ||||||
Tate & Lyle PLC | 1,092 | 9,940 | ||||||
Tesco PLC* | 18,942 | 45,295 | ||||||
Unilever PLC | 2,986 | 136,058 | ||||||
Wm Morrison Supermarkets PLC (a) | 5,167 | 14,833 | ||||||
|
| |||||||
| 1,093,552 | ||||||||
|
| |||||||
| Energy — 12.1% | ||||||||
BP PLC | 43,012 | 222,554 | ||||||
Petrofac Ltd. (a) | 607 | 6,840 | ||||||
Royal Dutch Shell PLC, Class A | 9,795 | 235,143 | ||||||
Royal Dutch Shell PLC, Class B | 8,714 | 209,571 | ||||||
|
| |||||||
| 674,108 | ||||||||
|
| |||||||
| Financials — 21.4% | ||||||||
3i Group PLC | 2,266 | 18,428 | ||||||
Aberdeen Asset Management PLC (a) | 2,169 | 8,768 | ||||||
Admiral Group PLC | 491 | 13,995 | ||||||
Aviva PLC | 9,420 | 61,368 | ||||||
Barclays PLC | 39,106 | 103,310 | ||||||
British Land Co. PLC REIT | 2,275 | 24,383 | ||||||
Direct Line Insurance Group PLC | 3,203 | 17,410 | ||||||
Hammerson PLC REIT | 1,827 | 15,321 | ||||||
Hargreaves Lansdown PLC | 609 | 11,899 | ||||||
Number | Value | |||||||
| Financials (Continued) | ||||||||
HSBC Holdings PLC | 45,806 | $ | 295,260 | |||||
ICAP PLC | 1,302 | 8,147 | ||||||
Intu Properties PLC REIT | 2,213 | 9,606 | ||||||
Investec PLC | 1,436 | 9,750 | ||||||
Land Securities Group PLC REIT | 1,839 | 31,057 | ||||||
Legal & General Group PLC | 13,841 | 47,992 | ||||||
Lloyds Banking Group PLC | 149,465 | 155,907 | ||||||
London Stock Exchange Group PLC | 729 | 28,878 | ||||||
Old Mutual PLC | 11,482 | 29,618 | ||||||
Provident Financial PLC | 342 | 14,424 | ||||||
Prudential PLC | 5,985 | 119,624 | ||||||
Royal Bank of Scotland Group PLC* | 8,091 | 28,886 | ||||||
RSA Insurance Group PLC | 2,369 | 16,813 | ||||||
Schroders PLC | 315 | 12,364 | ||||||
Segro PLC REIT | 1,750 | 11,099 | ||||||
St James’s Place PLC | 1,222 | 16,416 | ||||||
Standard Chartered PLC | 7,627 | 58,470 | ||||||
Standard Life PLC | 4,589 | 22,538 | ||||||
|
| |||||||
| 1,191,731 | ||||||||
|
| |||||||
| Health Care — 9.9% | ||||||||
AstraZeneca PLC | 2,941 | 171,577 | ||||||
GlaxoSmithKline PLC | 11,331 | 237,143 | ||||||
Hikma Pharmaceuticals PLC | 300 | 9,985 | ||||||
Mediclinic International PLC | 863 | 10,831 | ||||||
Shire PLC | 1,378 | 85,022 | ||||||
Smith & Nephew PLC | 2,083 | 35,358 | ||||||
|
| |||||||
| 549,916 | ||||||||
|
| |||||||
| Industrials — 6.9% | ||||||||
Aggreko PLC | 602 | 9,800 | ||||||
Ashtead Group PLC | 1,172 | 16,567 | ||||||
Babcock International Group PLC | 586 | 8,801 | ||||||
BAE Systems PLC | 7,368 | 51,607 | ||||||
Bunzl PLC | 784 | 23,210 | ||||||
Capita PLC | 1,553 | 23,933 | ||||||
Cobham PLC (a) | 2,677 | 6,320 | ||||||
DCC PLC | 200 | 18,220 | ||||||
easyJet PLC | 373 | 8,282 | ||||||
Experian PLC | 2,233 | 42,238 | ||||||
G4S PLC | 3,632 | 9,832 | ||||||
IMI PLC | 639 | 9,301 | ||||||
Intertek Group PLC | 378 | 17,174 | ||||||
Meggitt PLC | 1,814 | 10,194 | ||||||
Rolls-Royce Holdings PLC* | 4,278 | 38,354 | ||||||
Rolls-Royce Holdings PLC, Class C* | 305,353 | 442 | ||||||
Rolls-Royce Holdings PLC — Entitlement* | 309,844 | 449 | ||||||
Royal Mail PLC | 2,096 | 16,423 | ||||||
Smiths Group PLC | 920 | 14,951 | ||||||
Travis Perkins PLC | 579 | 16,126 | ||||||
Weir Group PLC | 500 | 8,683 | ||||||
Wolseley PLC | 593 | 34,793 | ||||||
|
| |||||||
| 385,700 | ||||||||
|
| |||||||
| Information Technology — 1.7% | ||||||||
ARM Holdings PLC | 3,284 | 46,946 | ||||||
Auto Trader Group PLC, 144A | 2,329 | 13,257 | ||||||
| See Notes to Financial Statements. | 116 |
DBX ETF Trust
Schedule of investments
Deutsche X-trackers MSCI United Kingdom Hedged Equity ETF (Continued)
May 31, 2016
Number | Value | |||||||
| Information Technology (Continued) | ||||||||
Sage Group PLC | 2,512 | $ | 22,302 | |||||
Worldpay Group PLC, 144A* | 3,261 | 13,088 | ||||||
|
| |||||||
| 95,593 | ||||||||
|
| |||||||
| Materials — 5.7% | ||||||||
Anglo American PLC | 3,261 | 28,343 | ||||||
Antofagasta PLC (a) | 923 | 5,735 | ||||||
BHP Billiton PLC | 4,914 | 58,574 | ||||||
Croda International PLC | 306 | 13,030 | ||||||
Fresnillo PLC (b) | 517 | 7,555 | ||||||
Glencore PLC* | 28,469 | 54,057 | ||||||
Johnson Matthey PLC | 453 | 18,922 | ||||||
Mondi PLC | 854 | 16,649 | ||||||
Randgold Resources Ltd. | 218 | 18,313 | ||||||
Rexam PLC (a) | 1,641 | 14,938 | ||||||
Rio Tinto PLC | 2,877 | 80,942 | ||||||
|
| |||||||
| 317,058 | ||||||||
|
| |||||||
| Telecommunication Services — 6.2% | ||||||||
BT Group PLC | 19,702 | 126,355 | ||||||
Inmarsat PLC | 1,046 | 10,900 | ||||||
Vodafone Group PLC | 61,790 | 206,596 | ||||||
|
| |||||||
| 343,851 | ||||||||
|
| |||||||
Number | Value | |||||||
| Utilities — 4.6% | ||||||||
Centrica PLC | 12,624 | $ | 37,263 | |||||
National Grid PLC | 8,715 | 127,107 | ||||||
Severn Trent PLC | 547 | 18,158 | ||||||
SSE PLC | 2,341 | 51,944 | ||||||
United Utilities Group PLC | 1,588 | 22,310 | ||||||
|
| |||||||
| 256,782 | ||||||||
|
| |||||||
TOTAL COMMON STOCKS | 5,480,911 | |||||||
|
| |||||||
| SECURITIES LENDING COLLATERAL — 1.0% | ||||||||
Daily Assets Fund “Capital Shares”, | 58,288 | 58,288 | ||||||
|
| |||||||
| TOTAL INVESTMENTS — 99.5% (Cost $6,079,442)† | $ | 5,539,199 | ||||||
Other assets and liabilities, net — 0.5% | 24,145 | |||||||
|
| |||||||
NET ASSETS — 100.0% | $ | 5,563,344 | ||||||
|
| |||||||
| * | Non-income producing security. |
| † | The cost for federal income tax purposes was $6,255,363. At May 31, 2016, net unrealized depreciation for all securities based on tax cost was $716,164. This consisted of aggregate gross unrealized appreciation for all securities in which there was an excess of value over tax cost of $309,052 and aggregate gross unrealized depreciation for all securities in which there was an excess of tax cost over value of $1,025,216. |
| (a) | All or a portion of these securities were on loan. In addition, “Other Assets and Liabilities, Net” may include pending sales that are also on loan. The value of securities loaned at May 31, 2016 amounted to $46,362, which is 0.8% of net assets. |
| (b) | Listed on London Stock Exchange. |
| (c) | Affiliated fund managed by Deutsche Investment Management Americas Inc. The rate shown is the annualized seven-day yield at period end. |
| (d) | Represents collateral held in connection with securities lending. Income earned by the Fund is net of borrower rebates. |
| CDI: | Chess Depositary Interest |
| REIT: | Real Estate Investment Trust |
| 144A: | Security exempt from registration under Rule 144A of the Securities Act of 1933. These securities may be resold in transactions exempt from registration, normally to qualified institutional buyers. |
As of May 31, 2016, the Fund had the following forward foreign currency exchange contracts outstanding:
Counterparty | Settlement Date | Currency To Deliver | Currency To Receive | Unrealized Appreciation (Depreciation) | ||||||||||||||
Bank of Montreal | 6/2/2016 | GBP | 1,927,563 | USD | 2,823,832 | $ | 32,042 | |||||||||||
Bank of Montreal | 6/2/2016 | GBP | 1,236 | USD | 1,799 | 9 | ||||||||||||
Bank of Montreal | 6/2/2016 | GBP | 20,000 | USD | 29,246 | 279 | ||||||||||||
Bank of Montreal | 6/2/2016 | GBP | 109,000 | USD | 159,678 | 1,808 | ||||||||||||
JP Morgan & Chase Co. | 6/2/2016 | GBP | 1,807,780 | USD | 2,648,316 | 30,015 | ||||||||||||
The Bank of New York Mellon | 6/2/2016 | GBP | 17,200 | USD | 25,021 | 109 | ||||||||||||
Bank of Montreal | 6/2/2016 | USD | 1,411 | GBP | 963 | (16 | ) | |||||||||||
Bank of Montreal | 6/2/2016 | USD | 3,011,345 | GBP | 2,068,942 | (14,789 | ) | |||||||||||
JP Morgan & Chase Co. | 6/2/2016 | USD | 2,648,316 | GBP | 1,819,524 | (13,006 | ) | |||||||||||
The Bank of New York Mellon | 6/2/2016 | USD | 723 | GBP | 500 | 2 | ||||||||||||
The Bank of New York Mellon | 6/2/2016 | USD | 26,097 | GBP | 18,000 | (26 | ) | |||||||||||
| See Notes to Financial Statements. | 117 |
DBX ETF Trust
Schedule of investments
Deutsche X-trackers MSCI United Kingdom Hedged Equity ETF (Continued)
May 31, 2016
Counterparty | Settlement Date | Currency To Deliver | Currency To Receive | Unrealized Appreciation (Depreciation) | ||||||||||||||
Bank of Montreal | 7/5/2016 | GBP | 2,068,509 | USD | 3,011,345 | $ | 14,607 | |||||||||||
JP Morgan & Chase Co. | 7/5/2016 | GBP | 1,819,145 | USD | 2,648,316 | 12,842 | ||||||||||||
Bank of Montreal | 7/5/2016 | USD | 55,322 | GBP | 38,000 | (270 | ) | |||||||||||
Bank of Montreal | 7/5/2016 | USD | 1,799 | GBP | 1,235 | (9 | ) | |||||||||||
Bank of Montreal | 7/5/2016 | USD | 26,127 | GBP | 18,000 | (50 | ) | |||||||||||
|
| |||||||||||||||||
Total net unrealized appreciation | $ | 63,547 | ||||||||||||||||
|
| |||||||||||||||||
Currency Abbreviations
| GBP | Pound Sterling |
| USD | U.S. Dollar |
For information on the Fund’s policy and additional disclosures regarding forward foreign currency exchange contracts, please refer to the Derivatives section of Note 2 in the accompanying Notes to Financial Statements.
Fair Value Measurements
Various inputs are used in determining the value of the Fund’s investments. These inputs are summarized in three broad levels. Level 1 includes quoted prices in active markets for identical securities. Level 2 includes other significant observable inputs (including quoted prices for similar securities, interest rates, prepayment speeds and credit risk). Level 3 includes significant unobservable inputs (including the Fund’s own assumptions in determining the fair value of investments). The level assigned to the securities valuations may not be an indication of the risk or liquidity associated with investing in those securities.
The following is a summary of the inputs used as of May 31, 2016 in valuing the Fund’s investments. For information on Fund’s policy regarding the valuation of investments, please refer to the Security Valuation section of Note 2 in the accompanying Notes to Financial Statements.
Assets | Level 1 | Level 2 | Level 3 | Total | ||||||||||||
Common Stocks (e) | $ | 5,480,911 | $ | — | $ | — | $ | 5,480,911 | ||||||||
Short-Term Investments | 58,288 | — | — | 58,288 | ||||||||||||
Derivatives (f) | ||||||||||||||||
Forward Foreign Currency Exchange Contracts | — | 91,713 | — | 91,713 | ||||||||||||
|
|
|
|
|
|
|
| |||||||||
TOTAL | $ | 5,539,199 | $ | 91,713 | $ | — | $ | 5,630,912 | ||||||||
|
|
|
|
|
|
|
| |||||||||
Liabilities | Level 1 | Level 2 | Level 3 | Total | ||||||||||||
Derivatives (f) | ||||||||||||||||
Forward Foreign Currency Exchange Contracts | $ | — | $ | (28,166 | ) | $ | — | $ | (28,166 | ) | ||||||
|
|
|
|
|
|
|
| |||||||||
TOTAL | $ | — | $ | (28,166 | ) | $ | — | $ | (28,166 | ) | ||||||
|
|
|
|
|
|
|
| |||||||||
| (e) | See Schedule of investments for additional detailed categorizations. |
| (f) | Derivatives include unrealized appreciation (depreciation) on forward foreign currency exchange contracts. |
There have been no transfers between fair value measurement levels during the year ended May 31, 2016.
| See Notes to Financial Statements. | 118 |
This Page is Intentionally Left Blank
119
DBX ETF Trust
Statements of assets and liabilities
May 31, 2016
| Deutsche X-trackers MSCI All World ex US Hedged Equity ETF | Deutsche X-trackers MSCI Asia Pacific ex Japan Hedged Equity ETF | Deutsche X-trackers MSCI Brazil Hedged Equity ETF | ||||||||||
Assets | ||||||||||||
Investments in non-affiliated securities at value | $ | 67,157,703 | $ | 4,431,958 | $ | 3,152,350 | ||||||
Investment in affiliated securities at value (See Note 4) | 99,464 | — | — | |||||||||
Investment in Daily Assets Fund* | 2,639,988 | 178,089 | — | |||||||||
Cash | 22,458 | 9,519 | 244 | |||||||||
Foreign currency at value | 79,686 | 6,832 | 4,419 | |||||||||
Unrealized appreciation on forward foreign currency exchange contracts | 2,306,671 | 149,463 | 186,692 | |||||||||
| Receivables: | ||||||||||||
Investment securities sold | 1,803,308 | 81,369 | 21,887 | |||||||||
Capital shares | 1,367 | — | — | |||||||||
Dividends | 246,284 | 14,181 | 10,996 | |||||||||
Securities lending income | 5,991 | 142 | — | |||||||||
Foreign tax reclaim | 66,310 | — | — | |||||||||
|
|
|
|
|
| |||||||
Total Assets | $ | 74,429,230 | $ | 4,871,553 | $ | 3,376,588 | ||||||
|
|
|
|
|
| |||||||
Liabilities | ||||||||||||
Payable upon return of securities loaned | $ | 2,639,988 | $ | 178,089 | $ | — | ||||||
Unrealized depreciation on forward foreign currency exchange contracts | 225,579 | 50,128 | 55,934 | |||||||||
| Payables: | ||||||||||||
Investment securities purchased | 3,667,191 | 186,792 | 144,260 | |||||||||
Investment advisory fees | 23,318 | 2,215 | 1,708 | |||||||||
|
|
|
|
|
| |||||||
Total Liabilities | 6,556,076 | 417,224 | 201,902 | |||||||||
|
|
|
|
|
| |||||||
Net Assets, at value | $ | 67,873,154 | $ | 4,454,329 | $ | 3,174,686 | ||||||
|
|
|
|
|
| |||||||
Net Assets Consist of | ||||||||||||
Paid-in capital | $ | 74,240,159 | $ | 5,814,515 | $ | 9,467,552 | ||||||
Undistributed net investment income | 767,934 | 9,022 | — | |||||||||
Accumulated net realized gain (loss) on investments and foreign currency transactions | (5,132,365 | ) | (971,431 | ) | (5,954,465 | ) | ||||||
Net unrealized appreciation (depreciation) on investments and foreign currency translations | (2,002,574 | ) | (397,777 | ) | (338,401 | ) | ||||||
|
|
|
|
|
| |||||||
Net Assets, at value | $ | 67,873,154 | $ | 4,454,329 | $ | 3,174,686 | ||||||
|
|
|
|
|
| |||||||
Number of Common Shares outstanding | 3,000,001 | 200,001 | 350,800 | |||||||||
|
|
|
|
|
| |||||||
Net Asset Value | $ | 22.62 | $ | 22.27 | $ | 9.05 | ||||||
|
|
|
|
|
| |||||||
Investments in non-affiliated securities at cost | $ | 71,185,970 | $ | 4,928,864 | $ | 3,620,969 | ||||||
|
|
|
|
|
| |||||||
Investments in affiliated securities at cost | $ | 154,767 | $ | — | $ | — | ||||||
|
|
|
|
|
| |||||||
Value of securities loaned | $ | 2,255,373 | $ | 174,144 | $ | — | ||||||
|
|
|
|
|
| |||||||
Investment in Daily Assets Fund at cost* | $ | 2,639,988 | $ | 178,089 | $ | — | ||||||
|
|
|
|
|
| |||||||
Foreign currency at cost | $ | 79,854 | $ | 6,898 | $ | 4,432 | ||||||
|
|
|
|
|
| |||||||
| * | Represents collateral on securities loaned. |
| See Notes to Financial Statements. | 120 |
DBX ETF Trust
Statements of assets and liabilities (Continued)
May 31, 2016
| Deutsche X-trackers MSCI Emerging Markets Hedged Equity ETF | Deutsche X-trackers MSCI Europe Hedged Equity ETF | Deutsche X-trackers MSCI Eurozone Hedged Equity ETF | ||||||||||
Assets | ||||||||||||
Investments in non-affiliated securities at value | $ | 128,767,105 | $ | 3,279,194,146 | $ | 82,640,712 | ||||||
Investment in affiliated securities at value (See Note 4) | — | 10,421,441 | 490,996 | |||||||||
Investment in Daily Assets Fund* | 2,403,639 | 193,320,226 | 8,622,595 | |||||||||
Cash | 833,853 | 638,950 | 264,947 | |||||||||
Foreign currency at value | 219,862 | 1,135,046 | 81,028 | |||||||||
Unrealized appreciation on forward foreign currency exchange contracts | 4,273,009 | 95,241,545 | 2,785,348 | |||||||||
Deposit with broker for futures contracts | 45,000 | — | — | |||||||||
| Receivables: | ||||||||||||
Investment securities sold | 3,704,346 | 7,848,500 | 763,367 | |||||||||
Capital shares | — | 90,200 | 128,920 | |||||||||
Dividends | 161,588 | 8,896,034 | 143,293 | |||||||||
Securities lending income | 2,071 | 702,032 | 18,571 | |||||||||
Foreign tax reclaim | 5,641 | 6,742,699 | 90,085 | |||||||||
|
|
|
|
|
| |||||||
Total Assets | $ | 140,416,114 | $ | 3,604,230,819 | $ | 96,029,862 | ||||||
|
|
|
|
|
| |||||||
Liabilities | ||||||||||||
Payable upon return of securities loaned | $ | 2,403,639 | $ | 193,320,226 | $ | 8,622,595 | ||||||
Unrealized depreciation on forward foreign currency exchange contracts | 900,391 | 9,025,947 | 478,986 | |||||||||
Unrealized depreciation on futures contracts | 18,180 | — | — | |||||||||
| Payables: | ||||||||||||
Investment securities purchased | 6,675,593 | 90,379,421 | 3,580,604 | |||||||||
Investment advisory fees | 65,836 | 1,257,638 | 29,553 | |||||||||
|
|
|
|
|
| |||||||
Total Liabilities | 10,063,639 | 293,983,232 | 12,711,738 | |||||||||
|
|
|
|
|
| |||||||
Net Assets, at value | $ | 130,352,475 | $ | 3,310,247,587 | $ | 83,318,124 | ||||||
|
|
|
|
|
| |||||||
Net Assets Consist of | ||||||||||||
Paid-in capital | $ | 162,379,977 | $ | 3,585,781,924 | $ | 87,967,668 | ||||||
Undistributed net investment income | 549,614 | 79,275,760 | 1,737,099 | |||||||||
Accumulated net realized gain (loss) on investments, futures and foreign currency transactions | (17,491,097 | ) | (125,125,526 | ) | (5,302,582 | ) | ||||||
Net unrealized appreciation (depreciation) on investments, futures and foreign currency translations | (15,086,019 | ) | (229,684,571 | ) | (1,084,061 | ) | ||||||
|
|
|
|
|
| |||||||
Net Assets, at value | $ | 130,352,475 | $ | 3,310,247,587 | $ | 83,318,124 | ||||||
|
|
|
|
|
| |||||||
Number of Common Shares outstanding | 7,000,800 | 129,050,001 | 3,250,001 | |||||||||
|
|
|
|
|
| |||||||
Net Asset Value | $ | 18.62 | $ | 25.65 | $ | 25.64 | ||||||
|
|
|
|
|
| |||||||
Investments in non-affiliated securities at cost | $ | 147,205,018 | $ | 3,587,517,366 | $ | 85,787,173 | ||||||
|
|
|
|
|
| |||||||
Investments in affiliated securities at cost | $ | — | $ | 17,852,881 | $ | 732,238 | ||||||
|
|
|
|
|
| |||||||
Value of securities loaned | $ | 2,341,141 | $ | 169,842,726 | $ | 7,315,939 | ||||||
|
|
|
|
|
| |||||||
Investment in Daily Assets Fund at cost* | $ | 2,403,639 | $ | 193,320,226 | $ | 8,622,595 | ||||||
|
|
|
|
|
| |||||||
Foreign currency at cost | $ | 220,115 | $ | 1,135,924 | $ | 80,884 | ||||||
|
|
|
|
|
| |||||||
| * | Represents collateral on securities loaned. |
| See Notes to Financial Statements. | 121 |
DBX ETF Trust
Statements of assets and liabilities (Continued)
May 31, 2016
| Deutsche X-trackers MSCI Germany Hedged Equity ETF | Deutsche X-trackers MSCI Japan Hedged Equity ETF | Deutsche X-trackers MSCI Mexico Hedged Equity ETF | ||||||||||
Assets | ||||||||||||
Investments in non-affiliated securities at value | $ | 106,382,231 | $ | 1,007,277,628 | $ | 4,294,065 | ||||||
Investment in affiliated securities at value (See Note 4) | 2,496,049 | — | — | |||||||||
Investment in Daily Assets Fund* | 934,762 | 11,076,100 | — | |||||||||
Cash | — | 81,141 | 1,357 | |||||||||
Foreign currency at value | 1,372 | 897,075 | 13,432 | |||||||||
Unrealized appreciation on forward foreign currency exchange contracts | 3,548,626 | 39,234,971 | 320,212 | |||||||||
Deposit with broker for futures contracts | 75,740 | 118,130 | — | |||||||||
Unrealized appreciation on future contracts | 6,684 | — | — | |||||||||
| Receivables: | ||||||||||||
Investment securities sold | 307,036 | 5,304,130 | 9,572 | |||||||||
Dividends | 193,322 | 8,823,476 | 111 | |||||||||
Securities lending income | 3,171 | 7,775 | 8 | |||||||||
Foreign tax reclaim | 831,580 | 2,427,129 | — | |||||||||
|
|
|
|
|
| |||||||
Total Assets | $ | 114,780,573 | $ | 1,075,247,555 | $ | 4,638,757 | ||||||
|
|
|
|
|
| |||||||
Liabilities | ||||||||||||
Due to custodian | $ | 19,949 | $ | — | $ | — | ||||||
Payable upon return of securities loaned | 934,762 | 11,076,100 | — | |||||||||
Unrealized depreciation on forward foreign currency exchange contracts | 210,448 | 2,978,654 | 18,097 | |||||||||
Unrealized depreciation on future contracts | — | 9,271 | — | |||||||||
| Payables: | ||||||||||||
Investment securities purchased | 3,586,217 | 34,629,942 | 308,381 | |||||||||
Investment advisory fees | 42,275 | 391,713 | 1,834 | |||||||||
|
|
|
|
|
| |||||||
Total Liabilities | 4,793,651 | 49,085,680 | 328,312 | |||||||||
|
|
|
|
|
| |||||||
Net Assets, at value | $ | 109,986,922 | $ | 1,026,161,875 | $ | 4,310,445 | ||||||
|
|
|
|
|
| |||||||
Net Assets Consist of | ||||||||||||
Paid-in capital | $ | 133,152,045 | $ | 1,279,481,180 | $ | 4,928,630 | ||||||
Undistributed net investment income | 2,512,500 | 14,091,038 | 61,484 | |||||||||
Accumulated net realized gain (loss) on investments, futures and foreign currency transactions | (11,057,613 | ) | (249,227,630 | ) | (90,467 | ) | ||||||
Net unrealized appreciation (depreciation) on investments, futures and foreign currency translations | (14,620,010 | ) | (18,182,713 | ) | (589,202 | ) | ||||||
|
|
|
|
|
| |||||||
Net Assets, at value | $ | 109,986,922 | $ | 1,026,161,875 | $ | 4,310,445 | ||||||
|
|
|
|
|
| |||||||
Number of Common Shares outstanding | 4,700,800 | 29,900,800 | 200,001 | |||||||||
|
|
|
|
|
| |||||||
Net Asset Value | $ | 23.40 | $ | 34.32 | $ | 21.55 | ||||||
|
|
|
|
|
| |||||||
Investments in non-affiliated securities at cost | $ | 122,199,289 | $ | 1,061,970,356 | $ | 5,185,243 | ||||||
|
|
|
|
|
| |||||||
Investments in affiliated securities at cost | $ | 4,615,866 | $ | — | $ | — | ||||||
|
|
|
|
|
| |||||||
Value of securities loaned | $ | 875,509 | $ | 10,567,555 | $ | — | ||||||
|
|
|
|
|
| |||||||
Investment in Daily Assets Fund at cost* | $ | 934,762 | $ | 11,076,100 | $ | — | ||||||
|
|
|
|
|
| |||||||
Foreign currency at cost | $ | 1,372 | $ | 899,139 | $ | 13,571 | ||||||
|
|
|
|
|
| |||||||
| * | Represents collateral on securities loaned. |
| See Notes to Financial Statements. | 122 |
DBX ETF Trust
Statements of assets and liabilities (Continued)
May 31, 2016
| Deutsche X-trackers MSCI South Korea Hedged Equity ETF | Deutsche X-trackers MSCI United Kingdom Hedged Equity ETF | |||||||
Assets | ||||||||
Investments in non-affiliated securities at value | $ | 117,032,493 | $ | 5,480,911 | ||||
Investment in Daily Assets Fund* | — | 58,288 | ||||||
Cash | 461,449 | 604 | ||||||
Foreign currency at value | — | 14,950 | ||||||
Unrealized appreciation on forward foreign currency exchange contracts | 5,367,675 | 91,713 | ||||||
| Receivables: | ||||||||
Investment securities sold | 993,862 | 36,601 | ||||||
Dividends | — | 31,971 | ||||||
Securities lending income | — | 213 | ||||||
|
|
|
| |||||
Total Assets | $ | 123,855,479 | $ | 5,715,251 | ||||
|
|
|
| |||||
Liabilities | ||||||||
Payable upon return of securities loaned | $ | — | $ | 58,288 | ||||
Unrealized depreciation on forward foreign currency exchange contracts | 717,387 | 28,166 | ||||||
| Payables: | ||||||||
Investment securities purchased | 4,919,248 | 63,356 | ||||||
Investment advisory fees | 57,579 | 2,097 | ||||||
|
|
|
| |||||
Total Liabilities | 5,694,214 | 151,907 | ||||||
|
|
|
| |||||
Net Assets, at value | $ | 118,161,265 | $ | 5,563,344 | ||||
|
|
|
| |||||
Net Assets Consist of | ||||||||
Paid-in capital | $ | 129,279,931 | $ | 6,113,246 | ||||
Undistributed net investment income | 430,429 | 121,600 | ||||||
Accumulated net realized gain (loss) on investments and foreign currency transactions | (25,685,603 | ) | (194,666 | ) | ||||
Net unrealized appreciation (depreciation) on investments and foreign currency translations | 14,136,508 | (476,836 | ) | |||||
|
|
|
| |||||
Net Assets, at value | $ | 118,161,265 | $ | 5,563,344 | ||||
|
|
|
| |||||
Number of Common Shares outstanding | 5,150,001 | 250,001 | ||||||
|
|
|
| |||||
Net Asset Value | $ | 22.94 | $ | 22.25 | ||||
|
|
|
| |||||
Investments in non-affiliated securities at cost | $ | 107,546,273 | $ | 6,021,154 | ||||
|
|
|
| |||||
Value of securities loaned | $ | — | $ | 46,362 | ||||
|
|
|
| |||||
Investment in Daily Assets Fund at cost* | $ | — | $ | 58,288 | ||||
|
|
|
| |||||
Foreign currency at cost | $ | — | $ | 14,977 | ||||
|
|
|
| |||||
| * | Represents collateral on securities loaned. |
| See Notes to Financial Statements. | 123 |
DBX ETF Trust
For the Year Ended May 31, 2016
| Deutsche X-trackers MSCI All World ex US Hedged Equity ETF | Deutsche X-trackers MSCI Asia Pacific ex Japan Hedged Equity ETF | Deutsche X-trackers MSCI Brazil Hedged Equity ETF | ||||||||||
Investment Income | ||||||||||||
Unaffiliated dividend income* | $ | 1,910,730 | $ | 243,259 | $ | 112,614 | ||||||
Securities lending income, including income from Daily Assets Fund, net of borrower rebates | 44,426 | 2,226 | — | |||||||||
|
|
|
|
|
| |||||||
Total Investment Income | 1,955,156 | 245,485 | 112,614 | |||||||||
|
|
|
|
|
| |||||||
Expenses | ||||||||||||
Investment advisory fees | 247,752 | 45,396 | 21,350 | |||||||||
|
|
|
|
|
| |||||||
Net Investment income (loss) | 1,707,404 | 200,089 | 91,264 | |||||||||
|
|
|
|
|
| |||||||
Realized and Unrealized Gain (Loss) | ||||||||||||
Net realized gain (loss) from: | ||||||||||||
Investments | (2,608,957 | ) | (871,687 | ) | (1,887,800 | ) | ||||||
Investments in affiliates | (16,051 | ) | — | — | ||||||||
In-kind redemptions | 210,531 | (288,237 | ) | — | ||||||||
In-kind redemptions in affiliates | (1,957 | ) | — | — | ||||||||
Foreign currency transactions | (834,037 | ) | 413,374 | 280,513 | ||||||||
|
|
|
|
|
| |||||||
Net realized gain (loss) | (3,250,471 | ) | (746,550 | ) | (1,607,287 | ) | ||||||
Net change in unrealized appreciation (depreciation) on: | ||||||||||||
Investments | (5,711,114 | ) | (1,075,045 | ) | 842,203 | |||||||
Foreign currency translations | 1,212,394 | (67,774 | ) | (174,330 | ) | |||||||
|
|
|
|
|
| |||||||
Net change in unrealized appreciation (depreciation) | (4,498,720 | ) | (1,142,819 | ) | 667,873 | |||||||
|
|
|
|
|
| |||||||
Net realized and unrealized gain (loss) on investments and foreign currency transactions | (7,749,191 | ) | (1,889,369 | ) | (939,414 | ) | ||||||
|
|
|
|
|
| |||||||
Net increase (decrease) in Net Assets Resulting from Operations | $ | (6,041,787 | ) | $ | (1,689,280 | ) | $ | (848,150 | ) | |||
|
|
|
|
|
| |||||||
* Unaffiliated foreign tax withheld | $ | 202,717 | $ | 20,010 | $ | 9,262 | ||||||
| See Notes to Financial Statements. | 124 |
DBX ETF Trust
Statements of operations (Continued)
For the Year Ended May 31, 2016
| Deutsche X-trackers MSCI Emerging Markets Hedged Equity ETF | Deutsche X-trackers MSCI Europe Hedged Equity ETF | Deutsche X-trackers MSCI Eurozone Hedged Equity ETF | ||||||||||
Investment Income | ||||||||||||
Unaffiliated dividend income* | $ | 4,532,126 | $ | 111,878,076 | $ | 1,961,678 | ||||||
Securities lending income, including income from Daily Assets Fund, net of borrower rebates | 49,196 | 3,695,310 | 89,927 | |||||||||
|
|
|
|
|
| |||||||
Total Investment Income | 4,581,322 | 115,573,386 | 2,051,605 | |||||||||
|
|
|
|
|
| |||||||
Expenses | ||||||||||||
Investment advisory fees | 1,044,369 | 14,740,930 | 259,618 | |||||||||
|
|
|
|
|
| |||||||
Net Investment income (loss) | 3,536,953 | 100,832,456 | 1,791,987 | |||||||||
|
|
|
|
|
| |||||||
Realized and Unrealized Gain (Loss) | ||||||||||||
Net realized gain (loss) from: | ||||||||||||
Investments | (21,868,855 | ) | (102,331,130 | ) | (1,800,920 | ) | ||||||
Investments in affiliates | — | (991,698 | ) | (42,750 | ) | |||||||
In-kind redemptions | (961,593 | ) | 9,070,438 | 1,326,566 | ||||||||
In-kind redemptions in affiliates | — | (538,009 | ) | (3,728 | ) | |||||||
Futures contracts | (21,900 | ) | — | — | ||||||||
Foreign currency transactions | 8,785,274 | 33,330,697 | (2,369,114 | ) | ||||||||
|
|
|
|
|
| |||||||
Net realized gain (loss) | (14,067,074 | ) | (61,459,702 | ) | (2,889,946 | ) | ||||||
Net change in unrealized appreciation (depreciation) on: | ||||||||||||
Investments | (21,905,911 | ) | (361,833,015 | ) | (3,468,843 | ) | ||||||
Futures contracts | (30,040 | ) | — | — | ||||||||
Foreign currency translations | (134,908 | ) | 52,703,559 | 1,865,112 | ||||||||
|
|
|
|
|
| |||||||
Net change in unrealized appreciation (depreciation) | (22,070,859 | ) | (309,129,456 | ) | (1,603,731 | ) | ||||||
|
|
|
|
|
| |||||||
Net realized and unrealized gain (loss) on investments, futures and foreign currency transactions | (36,137,933 | ) | (370,589,158 | ) | (4,493,677 | ) | ||||||
|
|
|
|
|
| |||||||
Net increase (decrease) in Net Assets Resulting from Operations | $ | (32,600,980 | ) | $ | (269,756,702 | ) | $ | (2,701,690 | ) | |||
|
|
|
|
|
| |||||||
* Unaffiliated foreign tax withheld | $ | 625,972 | $ | 11,170,460 | $ | 303,641 | ||||||
| See Notes to Financial Statements. | 125 |
DBX ETF Trust
Statements of operations (Continued)
For the Year Ended May 31, 2016
| Deutsche X-trackers MSCI Germany Hedged Equity ETF | Deutsche X-trackers MSCI Japan Hedged Equity ETF | Deutsche X-trackers MSCI Mexico Hedged Equity ETF | ||||||||||
Investment Income | ||||||||||||
Unaffiliated dividend income* | 2,802,836 | 23,715,631 | 131,675 | |||||||||
Securities lending income, including income from Daily Assets Fund, net of borrower rebates | 8,375 | 158,551 | 610 | |||||||||
|
|
|
|
|
| |||||||
Total Investment Income | 2,811,211 | 23,874,182 | 132,285 | |||||||||
|
|
|
|
|
| |||||||
Expenses | ||||||||||||
Investment advisory fees | 695,688 | 6,175,043 | 22,728 | |||||||||
Other expenses | — | — | 343 | |||||||||
|
|
|
|
|
| |||||||
Total Expenses | 695,688 | 6,175,043 | 23,071 | |||||||||
|
|
|
|
|
| |||||||
Net Investment income (loss) | 2,115,523 | 17,699,139 | 109,214 | |||||||||
|
|
|
|
|
| |||||||
Realized and Unrealized Gain (Loss) | ||||||||||||
Net realized gain (loss) from: | ||||||||||||
Investments | (4,694,452 | ) | (65,935,077 | ) | (315,885 | ) | ||||||
Investments in affiliates | (587,697 | ) | — | — | ||||||||
In-kind redemptions | (2,426,547 | ) | 55,403,602 | (49,927 | ) | |||||||
In-kind redemptions in affiliates | (506,732 | ) | — | — | ||||||||
Futures contracts | (42,472 | ) | (180,300 | ) | — | |||||||
Foreign currency transactions | (1,374,530 | ) | (142,945,005 | ) | 427,897 | |||||||
|
|
|
|
|
| |||||||
Net realized gain (loss) | (9,632,430 | ) | (153,656,780 | ) | 62,085 | |||||||
| Net change in unrealized appreciation (depreciation) on: | ||||||||||||
Investments | (11,622,216 | ) | (149,819,576 | ) | (414,294 | ) | ||||||
Futures contracts | 23,035 | (217,334 | ) | — | ||||||||
Foreign currency translations | (1,378,131 | ) | (4,402,100 | ) | 299,323 | |||||||
|
|
|
|
|
| |||||||
Net change in unrealized appreciation (depreciation) | (12,977,312 | ) | (154,439,010 | ) | (114,971 | ) | ||||||
|
|
|
|
|
| |||||||
Net realized and unrealized gain (loss) on investments, futures and foreign currency transactions | (22,609,742 | ) | (308,095,790 | ) | (52,886 | ) | ||||||
|
|
|
|
|
| |||||||
Net increase (decrease) in Net Assets Resulting from Operations | $ | (20,494,219 | ) | $ | (290,396,651 | ) | $ | 56,328 | ||||
|
|
|
|
|
| |||||||
* Unaffiliated foreign tax withheld | $ | 530,441 | $ | 2,637,452 | $ | 1,296 | ||||||
| See Notes to Financial Statements. | 126 |
DBX ETF Trust
Statements of operations (Continued)
For the Year Ended May 31, 2016
| Deutsche X-trackers MSCI South Korea Hedged Equity ETF | Deutsche X-trackers MSCI United Kingdom Hedged Equity ETF | |||||||
Investment Income | ||||||||
Unaffiliated dividend income* | 1,609,643 | 207,352 | ||||||
Securities lending income, including income from Daily Assets Fund, net of borrower rebates | — | 2,032 | ||||||
|
|
|
| |||||
Total Investment Income | 1,609,643 | 209,384 | ||||||
|
|
|
| |||||
Expenses | ||||||||
Investment advisory fees | 716,110 | 21,005 | ||||||
|
|
|
| |||||
Net Investment income (loss) | 893,533 | 188,379 | ||||||
|
|
|
| |||||
Realized and Unrealized Gain (Loss) | ||||||||
| Net realized gain (loss) from: | ||||||||
Investments | (23,867,463 | ) | (256,601 | ) | ||||
Foreign currency transactions | 8,710,340 | 147,251 | ||||||
|
|
|
| |||||
Net realized gain (loss) | (15,157,123 | ) | (109,350 | ) | ||||
Net change in unrealized appreciation (depreciation) on: | ||||||||
Investments | 2,715,726 | (501,928 | ) | |||||
Foreign currency translations | (538,941 | ) | 37,340 | |||||
|
|
|
| |||||
Net change in unrealized appreciation (depreciation) | 2,176,785 | (464,588 | ) | |||||
|
|
|
| |||||
Net realized and unrealized gain (loss) on investments and foreign currency transactions | (12,980,338 | ) | (573,938 | ) | ||||
|
|
|
| |||||
Net increase (decrease) in Net Assets Resulting from Operations | $ | (12,086,805 | ) | $ | (385,559 | ) | ||
|
|
|
| |||||
* Unaffiliated foreign tax withheld | $ | 462,361 | $ | 2,820 | ||||
| See Notes to Financial Statements. | 127 |
DBX ETF Trust
Statements of changes in net assets
| Deutsche X-trackers MSCI All World ex US Hedged Equity ETF | Deutsche X-trackers MSCI Asia Pacific ex Japan Hedged Equity ETF | |||||||||||||||
| Year Ended May 31, | Year Ended May 31, | |||||||||||||||
| 2016 | 2015 | 2016 | 2015 | |||||||||||||
Increase (Decrease) in Net Assets from Operations | ||||||||||||||||
Net investment income (loss) | $ | 1,707,404 | $ | 614,758 | $ | 200,089 | $ | 189,378 | ||||||||
Net realized gain (loss) | (3,250,471 | ) | (31,374 | ) | (746,550 | ) | 169,540 | |||||||||
Net change in unrealized appreciation (depreciation) | (4,498,720 | ) | 2,363,949 | (1,142,819 | ) | 388,805 | ||||||||||
|
|
|
|
|
|
|
| |||||||||
Net increase (decrease) in net assets resulting from operations | (6,041,787 | ) | 2,947,333 | (1,689,280 | ) | 747,723 | ||||||||||
|
|
|
|
|
|
|
| |||||||||
Distributions to Shareholders from |
| |||||||||||||||
Net investment income | (1,777,313 | ) | (363,724 | ) | (417,566 | ) | (323,116 | ) | ||||||||
Net realized gains | (1,089,202 | ) | (7,810 | ) | (344,439 | ) | — | |||||||||
|
|
|
|
|
|
|
| |||||||||
Total distributions | (2,866,515 | ) | (371,534 | ) | (762,005 | ) | (323,116 | ) | ||||||||
|
|
|
|
|
|
|
| |||||||||
Fund Shares Transactions |
| |||||||||||||||
Proceeds from shares sold | 39,978,605 | 39,333,293 | — | 4,120,508 | ||||||||||||
Value of shares redeemed | (10,227,798 | ) | — | (4,255,798 | ) | — | ||||||||||
|
|
|
|
|
|
|
| |||||||||
Net increase (decrease) in net assets resulting from fund share transactions | 29,750,807 | 39,333,293 | (4,255,798 | ) | 4,120,508 | |||||||||||
|
|
|
|
|
|
|
| |||||||||
Total net increase (decrease) in Net Assets | 20,842,505 | 41,909,092 | (6,707,083 | ) | 4,545,115 | |||||||||||
Net Assets |
| |||||||||||||||
Beginning of year | 47,030,649 | 5,121,557 | 11,161,412 | 6,616,297 | ||||||||||||
|
|
|
|
|
|
|
| |||||||||
End of year | $ | 67,873,154 | $ | 47,030,649 | $ | 4,454,329 | $ | 11,161,412 | ||||||||
|
|
|
|
|
|
|
| |||||||||
Undistributed net investment income | $ | 767,934 | $ | 1,334,726 | $ | 9,022 | $ | 285,031 | ||||||||
|
|
|
|
|
|
|
| |||||||||
Changes in Shares Outstanding |
| |||||||||||||||
Shares outstanding, beginning of year | 1,750,001 | 200,001 | 400,001 | 250,001 | ||||||||||||
Shares sold | 1,700,000 | 1,550,000 | — | 150,000 | ||||||||||||
Shares redeemed | (450,000 | ) | — | (200,000 | ) | — | ||||||||||
|
|
|
|
|
|
|
| |||||||||
Shares outstanding, end of year | 3,000,001 | 1,750,001 | 200,001 | 400,001 | ||||||||||||
|
|
|
|
|
|
|
| |||||||||
| See Notes to Financial Statements. | 128 |
DBX ETF Trust
Statements of changes in net assets (Continued)
| Deutsche X-trackers MSCI Brazil Hedged Equity ETF | Deutsche X-trackers MSCI Emerging Markets Hedged Equity ETF | |||||||||||||||
| Year Ended May 31, | Year Ended May 31, | |||||||||||||||
| 2016 | 2015 | 2016 | 2015 | |||||||||||||
Increase (Decrease) in Net Assets from Operations | ||||||||||||||||
Net investment income (loss) | $ | 91,264 | $ | 202,521 | $ | 3,536,953 | $ | 1,374,039 | ||||||||
Net realized gain (loss) | (1,607,287 | ) | (532,624 | ) | (14,067,074 | ) | (1,307,463 | ) | ||||||||
Net change in unrealized appreciation (depreciation) | 667,873 | (811,160 | ) | (22,070,859 | ) | 5,663,153 | ||||||||||
|
|
|
|
|
|
|
| |||||||||
Net increase (decrease) in net assets resulting from operations | (848,150 | ) | (1,141,263 | ) | (32,600,980 | ) | 5,729,729 | |||||||||
|
|
|
|
|
|
|
| |||||||||
Distributions to Shareholders from |
| |||||||||||||||
Net investment income | (1,037,444 | ) | (243,907 | ) | (6,061,629 | ) | (956,998 | ) | ||||||||
Return of capital | (3,755 | ) | — | — | — | |||||||||||
|
|
|
|
|
|
|
| |||||||||
Total distributions | (1,041,199 | ) | (243,907 | ) | (6,061,629 | ) | (956,998 | ) | ||||||||
|
|
|
|
|
|
|
| |||||||||
Fund Shares Transactions |
| |||||||||||||||
Proceeds from shares sold | 1,581,261 | 10,339,307 | 18,231,512 | 210,396,502 | ||||||||||||
Value of shares redeemed | (3,043,710 | ) | (8,221,419 | ) | (93,758,507 | ) | — | |||||||||
|
|
|
|
|
|
|
| |||||||||
Net increase (decrease) in net assets resulting from fund share transactions | (1,462,449 | ) | 2,117,888 | (75,526,995 | ) | 210,396,502 | ||||||||||
|
|
|
|
|
|
|
| |||||||||
Total net increase (decrease) in Net Assets | (3,351,798 | ) | 732,718 | (114,189,604 | ) | 215,169,233 | ||||||||||
Net Assets |
| |||||||||||||||
Beginning of year | 6,526,484 | 5,793,766 | 244,542,079 | 29,372,846 | ||||||||||||
|
|
|
|
|
|
|
| |||||||||
End of year | $ | 3,174,686 | $ | 6,526,484 | $ | 130,352,475 | $ | 244,542,079 | ||||||||
|
|
|
|
|
|
|
| |||||||||
Undistributed net investment income | $ | — | $ | 1,037,444 | $ | 549,614 | $ | 3,233,625 | ||||||||
|
|
|
|
|
|
|
| |||||||||
Changes in Shares Outstanding |
| |||||||||||||||
Shares outstanding, beginning of year | 500,800 | 400,800 | 10,900,800 | 1,350,800 | ||||||||||||
Shares sold | 150,000 | 700,000 | 1,000,000 | 9,550,000 | ||||||||||||
Shares redeemed | (300,000 | ) | (600,000 | ) | (4,900,000 | ) | — | |||||||||
|
|
|
|
|
|
|
| |||||||||
Shares outstanding, end of year | 350,800 | 500,800 | 7,000,800 | 10,900,800 | ||||||||||||
|
|
|
|
|
|
|
| |||||||||
| See Notes to Financial Statements. | 129 |
DBX ETF Trust
Statements of changes in net assets (Continued)
| Deutsche X-trackers MSCI Europe Hedged Equity ETF | Deutsche X-trackers MSCI Eurozone Hedged Equity ETF | |||||||||||||||
| Year Ended May 31, | Year Ended May 31, 2016 | For the Period December 10, 2014(1) to May 31, 2015 | ||||||||||||||
| 2016 | 2015 | |||||||||||||||
Increase (Decrease) in Net Assets from Operations | ||||||||||||||||
Net investment income (loss) | $ | 100,832,456 | $ | 43,275,210 | $ | 1,791,987 | $ | 318,178 | ||||||||
Net realized gain (loss) | (61,459,702 | ) | 28,985,989 | (2,889,946 | ) | (291,227 | ) | |||||||||
Net change in unrealized appreciation (depreciation) | (309,129,456 | ) | 75,976,111 | (1,603,731 | ) | 519,670 | ||||||||||
|
|
|
|
|
|
|
| |||||||||
Net increase (decrease) in net assets resulting from operations | (269,756,702 | ) | 148,237,310 | (2,701,690 | ) | 546,621 | ||||||||||
|
|
|
|
|
|
|
| |||||||||
Distributions to Shareholders from |
| |||||||||||||||
Net investment income | (120,694,283 | ) | (24,329,020 | ) | (1,359,253 | ) | — | |||||||||
Net realized gains | (21,395,440 | ) | (65,401 | ) | — | — | ||||||||||
|
|
|
|
|
|
|
| |||||||||
Total distributions | (142,089,723 | ) | (24,394,421 | ) | (1,359,253 | ) | — | |||||||||
|
|
|
|
|
|
|
| |||||||||
Fund Shares Transactions |
| |||||||||||||||
Proceeds from shares sold | 1,634,503,636 | 2,387,879,956 | 82,581,476 | 21,430,076 | ||||||||||||
Value of shares redeemed | (580,661,063 | ) | (7,202,324 | ) | (17,179,131 | ) | — | |||||||||
|
|
|
|
|
|
|
| |||||||||
Net increase (decrease) in net assets resulting from fund share transactions | 1,053,842,573 | 2,380,677,632 | 65,402,345 | 21,430,076 | ||||||||||||
|
|
|
|
|
|
|
| |||||||||
Total net increase (decrease) in Net Assets | 641,996,148 | 2,504,520,521 | 61,341,402 | 21,976,697 | ||||||||||||
Net Assets |
| |||||||||||||||
Beginning of year | 2,668,251,439 | 163,730,918 | 21,976,722 | 25 | ||||||||||||
|
|
|
|
|
|
|
| |||||||||
End of year | $ | 3,310,247,587 | $ | 2,668,251,439 | $ | 83,318,124 | $ | 21,976,722 | ||||||||
|
|
|
|
|
|
|
| |||||||||
Undistributed net investment income | $ | 79,275,760 | $ | 102,860,945 | $ | 1,737,099 | $ | 920,255 | ||||||||
|
|
|
|
|
|
|
| |||||||||
Changes in Shares Outstanding |
| |||||||||||||||
Shares outstanding, beginning of year | 90,550,001 | 5,900,001 | 750,001 | 1 | ||||||||||||
Shares sold | 62,500,000 | 84,900,000 | 3,200,000 | 750,000 | ||||||||||||
Shares redeemed | (24,000,000 | ) | (250,000 | ) | (700,000 | ) | — | |||||||||
|
|
|
|
|
|
|
| |||||||||
Shares outstanding, end of year | 129,050,001 | 90,550,001 | 3,250,001 | 750,001 | ||||||||||||
|
|
|
|
|
|
|
| |||||||||
| (1) | Commencement of operations. |
| See Notes to Financial Statements. | 130 |
DBX ETF Trust
Statements of changes in net assets (Continued)
| Deutsche X-trackers MSCI Germany Hedged Equity ETF | Deutsche X-trackers MSCI Japan Hedged Equity ETF | |||||||||||||||
| Year Ended May 31, | Year Ended May 31, | |||||||||||||||
| 2016 | 2015 | 2016 | 2015 | |||||||||||||
Increase (Decrease) in Net Assets from Operations | ||||||||||||||||
Net investment income (loss) | $ | 2,115,523 | $ | 4,266,017 | $ | 17,699,139 | $ | 8,953,553 | ||||||||
Net realized gain (loss) | (9,632,430 | ) | 2,718,383 | (153,656,780 | ) | 80,877,064 | ||||||||||
Net change in unrealized appreciation (depreciation) | (12,977,312 | ) | (5,155,413 | ) | (154,439,010 | ) | 147,043,634 | |||||||||
|
|
|
|
|
|
|
| |||||||||
Net increase (decrease) in net assets resulting from operations | (20,494,219 | ) | 1,828,987 | (290,396,651 | ) | 236,874,251 | ||||||||||
|
|
|
|
|
|
|
| |||||||||
Distributions to Shareholders from |
| |||||||||||||||
Net investment income | (10,562,800 | ) | (4,112,744 | ) | (44,182,466 | ) | (62,464,849 | ) | ||||||||
Net realized gains | — | — | (38,800,971 | ) | — | |||||||||||
|
|
|
|
|
|
|
| |||||||||
Total distributions | (10,562,800 | ) | (4,112,744 | ) | (82,983,437 | ) | (62,464,849 | ) | ||||||||
|
|
|
|
|
|
|
| |||||||||
Fund Shares Transactions |
| |||||||||||||||
Proceeds from shares sold | 20,164,894 | 192,112,959 | 927,313,581 | 697,274,666 | ||||||||||||
Value of shares redeemed | (112,914,893 | ) | (1,130,265 | ) | (790,640,177 | ) | (49,970,009 | ) | ||||||||
|
|
|
|
|
|
|
| |||||||||
Net increase (decrease) in net assets resulting from fund share transactions | (92,749,999 | ) | 190,982,694 | 136,673,404 | 647,304,657 | |||||||||||
|
|
|
|
|
|
|
| |||||||||
Total net increase (decrease) in Net Assets | (123,807,018 | ) | 188,698,937 | (236,706,684 | ) | 821,714,059 | ||||||||||
Net Assets |
| |||||||||||||||
Beginning of year | 233,793,940 | 45,095,003 | 1,262,868,559 | 441,154,500 | ||||||||||||
|
|
|
|
|
|
|
| |||||||||
End of year | $ | 109,986,922 | $ | 233,793,940 | $ | 1,026,161,875 | $ | 1,262,868,559 | ||||||||
|
|
|
|
|
|
|
| |||||||||
Undistributed net investment income | $ | 2,512,500 | $ | 9,876,983 | $ | 14,091,038 | $ | 42,626,377 | ||||||||
|
|
|
|
|
|
|
| |||||||||
Changes in Shares Outstanding |
| |||||||||||||||
Shares outstanding, beginning of year | 8,550,800 | 1,700,800 | 28,350,800 | 12,450,800 | ||||||||||||
Shares sold | 850,000 | 6,900,000 | 24,450,000 | 17,200,000 | ||||||||||||
Shares redeemed | (4,700,000 | ) | (50,000 | ) | (22,900,000 | ) | (1,300,000 | ) | ||||||||
|
|
|
|
|
|
|
| |||||||||
Shares outstanding, end of year | 4,700,800 | 8,550,800 | 29,900,800 | 28,350,800 | ||||||||||||
|
|
|
|
|
|
|
| |||||||||
| See Notes to Financial Statements. | 131 |
DBX ETF Trust
Statements of changes in net assets (Continued)
| Deutsche X-trackers MSCI Mexico Hedged Equity ETF | Deutsche X-trackers MSCI South Korea Hedged Equity ETF | |||||||||||||||
| Year Ended May 31, | Year Ended May 31, | |||||||||||||||
| 2016 | 2015 | 2016 | 2015 | |||||||||||||
Increase (Decrease) in Net Assets from Operations | ||||||||||||||||
Net investment income (loss) | $ | 109,214 | $ | 52,836 | $ | 893,533 | $ | (190,237 | ) | |||||||
Net realized gain (loss) | 62,085 | 628,796 | (15,157,123 | ) | (10,413,006 | ) | ||||||||||
Net change in unrealized appreciation (depreciation) | (114,971 | ) | (440,876 | ) | 2,176,785 | 11,756,072 | ||||||||||
|
|
|
|
|
|
|
| |||||||||
Net increase (decrease) in net assets resulting from operations | 56,328 | 240,756 | (12,086,805 | ) | 1,152,829 | |||||||||||
|
|
|
|
|
|
|
| |||||||||
Distributions to Shareholders from | ||||||||||||||||
Net investment income | (558,149 | ) | (36,482 | ) | (154,180 | ) | — | |||||||||
Net realized gains | (264,905 | ) | (14,040 | ) | — | — | ||||||||||
|
|
|
|
|
|
|
| |||||||||
Total distributions | (823,054 | ) | (50,522 | ) | (154,180 | ) | — | |||||||||
|
|
|
|
|
|
|
| |||||||||
Fund Shares Transactions | ||||||||||||||||
Proceeds from shares sold | 1,145,870 | — | 124,679,916 | 249,685,690 | ||||||||||||
Value of shares redeemed | (1,116,660 | ) | — | (131,675,567 | ) | (118,455,955 | ) | |||||||||
|
|
|
|
|
|
|
| |||||||||
Net increase (decrease) in net assets resulting from fund share transactions | 29,210 | — | (6,995,651 | ) | 131,229,735 | |||||||||||
|
|
|
|
|
|
|
| |||||||||
Total net increase (decrease) in Net Assets | (737,516 | ) | 190,234 | (19,236,636 | ) | 132,382,564 | ||||||||||
Net Assets | ||||||||||||||||
Beginning of year | 5,047,961 | 4,857,727 | 137,397,901 | 5,015,337 | ||||||||||||
|
|
|
|
|
|
|
| |||||||||
End of year | $ | 4,310,445 | $ | 5,047,961 | $ | 118,161,265 | $ | 137,397,901 | ||||||||
|
|
|
|
|
|
|
| |||||||||
Net investment loss | $ | — | $ | — | $ | — | $ | (789,801 | ) | |||||||
|
|
|
|
|
|
|
| |||||||||
Undistributed net investment income | $ | 61,484 | $ | 505,631 | $ | 430,429 | $ | — | ||||||||
|
|
|
|
|
|
|
| |||||||||
Changes in Shares Outstanding | ||||||||||||||||
Shares outstanding, beginning of year | 200,001 | 200,001 | 5,650,001 | 200,001 | ||||||||||||
Shares sold | 50,000 | — | 5,550,000 | 10,350,000 | ||||||||||||
Shares redeemed | (50,000 | ) | — | (6,050,000 | ) | (4,900,000 | ) | |||||||||
|
|
|
|
|
|
|
| |||||||||
Shares outstanding, end of year | 200,001 | 200,001 | 5,150,001 | 5,650,001 | ||||||||||||
|
|
|
|
|
|
|
| |||||||||
| See Notes to Financial Statements. | 132 |
DBX ETF Trust
Statements of changes in net assets (Continued)
| Deutsche X-trackers MSCI United Kingdom Hedged Equity ETF | ||||||||
| Year Ended May 31, | ||||||||
| 2016 | 2015 | |||||||
Increase (Decrease) in Net Assets from Operations | ||||||||
Net investment income (loss) | $ | 188,379 | $ | 183,195 | ||||
Net realized gain (loss) | (109,350 | ) | 356,306 | |||||
Net change in unrealized appreciation (depreciation) | (464,588 | ) | (337,065 | ) | ||||
|
|
|
| |||||
Net increase (decrease) in net assets resulting from operations | (385,559 | ) | 202,436 | |||||
|
|
|
| |||||
Distributions to Shareholders from | ||||||||
Net investment income | (302,668 | ) | (316,148 | ) | ||||
Net realized gains | (22,960 | ) | (4,896 | ) | ||||
|
|
|
| |||||
Total distributions | (325,628 | ) | (321,044 | ) | ||||
|
|
|
| |||||
Fund Shares Transactions | ||||||||
Proceeds from shares sold | 1,087,925 | — | ||||||
|
|
|
| |||||
Net increase (decrease) in net assets resulting from fund share transactions | 1,087,925 | — | ||||||
|
|
|
| |||||
Total net increase (decrease) in Net Assets | 376,738 | (118,608 | ) | |||||
Net Assets | ||||||||
Beginning of year | 5,186,606 | 5,305,214 | ||||||
|
|
|
| |||||
End of year | $ | 5,563,344 | $ | 5,186,606 | ||||
|
|
|
| |||||
Undistributed net investment income | $ | 121,600 | $ | 256,438 | ||||
|
|
|
| |||||
Changes in Shares Outstanding | ||||||||
Shares outstanding, beginning of year | 200,001 | 200,001 | ||||||
Shares sold | 50,000 | — | ||||||
Shares redeemed | — | — | ||||||
|
|
|
| |||||
Shares outstanding, end of year | 250,001 | 200,001 | ||||||
|
|
|
| |||||
| See Notes to Financial Statements. | 133 |
DBX ETF Trust
| Deutsche X-trackers MSCI All World ex US Hedged Equity ETF | Year Ended 5/31/2016 | Year Ended 5/31/2015 | Period Ended 5/31/2014(a) | |||||||||
Selected Per Share Data | ||||||||||||
Net Asset Value, beginning of period | $ | 26.87 | $ | 25.61 | $ | 25.00 | ||||||
|
|
|
|
|
| |||||||
| Income (loss) from investment operations: | ||||||||||||
Net investment income (loss) (c) | 0.64 | 0.96 | 0.45 | |||||||||
Net realized and unrealized gain (loss) | (3.57 | ) | 2.16 | 0.16 | ||||||||
|
|
|
|
|
| |||||||
Total from investment operations | (2.93 | ) | 3.12 | 0.61 | ||||||||
|
|
|
|
|
| |||||||
| Less distributions from: | ||||||||||||
Net investment income | (0.86 | ) | (1.82 | ) | — | |||||||
Net realized gains | (0.46 | ) | (0.04 | ) | — | |||||||
|
|
|
|
|
| |||||||
Total distributions | (1.32 | ) | (1.86 | ) | — | |||||||
|
|
|
|
|
| |||||||
Net Asset Value, end of period | $ | 22.62 | $ | 26.87 | $ | 25.61 | ||||||
|
|
|
|
|
| |||||||
Total Return (%) | (11.17 | ) | 13.01 | 2.44 | ** | |||||||
Ratios to Average Net Assets and Supplemental Data | ||||||||||||
Net assets, end of period ($ millions) | 68 | 47 | 5 | |||||||||
Ratio of expenses (%) | 0.40 | 0.40 | 0.40 | * | ||||||||
Ratio of net investment income (loss) (%) | 2.76 | 3.70 | 5.18 | * | ||||||||
Portfolio turnover rate (%) (d) | 24 | 24 | 3 | ** | ||||||||
| Deutsche X-trackers MSCI Asia Pacific ex Japan Hedged Equity ETF | Year Ended 5/31/2016 | Year Ended 5/31/2015 | Period Ended 5/31/2014(b) | |||||||||
Selected Per Share Data | ||||||||||||
Net Asset Value, beginning of period | $ | 27.90 | $ | 26.47 | $ | 25.00 | ||||||
|
|
|
|
|
| |||||||
| Income (loss) from investment operations: | ||||||||||||
Net investment income (loss) (c) | 0.63 | 0.68 | 0.40 | |||||||||
Net realized and unrealized gain (loss) | (4.19 | ) | 2.04 | 1.08 | ||||||||
|
|
|
|
|
| |||||||
Total from investment operations | (3.56 | ) | 2.72 | 1.48 | ||||||||
|
|
|
|
|
| |||||||
Less distributions from: | ||||||||||||
Net investment income | (1.09 | ) | (1.29 | ) | (0.01 | ) | ||||||
Net realized gains | (0.98 | ) | — | — | ||||||||
|
|
|
|
|
| |||||||
Total distributions | (2.07 | ) | (1.29 | ) | (0.01 | ) | ||||||
|
|
|
|
|
| |||||||
Net Asset Value, end of period | $ | 22.27 | $ | 27.90 | $ | 26.47 | ||||||
|
|
|
|
|
| |||||||
Total Return (%) | (12.98 | ) | 10.78 | 5.94 | ** | |||||||
Ratios to Average Net Assets and Supplemental Data | ||||||||||||
Net assets, end of period ($ millions) | 4 | 11 | 7 | |||||||||
Ratio of expenses (%) | 0.60 | 0.60 | 0.60 | * | ||||||||
Ratio of net investment income (loss) (%) | 2.64 | 2.51 | 2.33 | * | ||||||||
Portfolio turnover rate (%) (d) | 34 | 19 | 20 | ** | ||||||||
| (a) | For the period January 23, 2014 (commencement of operations) through May 31, 2014. |
| (b) | For the period October 1, 2013 (commencement of operations) through May 31, 2014. |
| (c) | Based on average shares outstanding during the period. |
| (d) | Portfolio turnover rate does not include securities received or delivered from processing creations or redemptions. |
| * | Annualized. |
| ** | Not Annualized. |
| See Notes to Financial Statements. | 134 |
DBX ETF Trust
Financial highlights (Continued)
| Deutsche X-trackers MSCI Brazil Hedged Equity ETF | Year Ended 5/31/2016 | Year Ended 5/31/2015 | Year Ended 5/31/2014 | Year Ended 5/31/2013 | Period Ended 5/31/2012(a) | |||||||||||||||
Selected Per Share Data |
| |||||||||||||||||||
Net Asset Value, beginning of period | $ | 13.03 | $ | 14.46 | $ | 19.28 | $ | 20.74 | $ | 25.00 | ||||||||||
|
|
|
|
|
|
|
|
|
| |||||||||||
| Income (loss) from investment operations: | ||||||||||||||||||||
Net investment income (loss) (b) | 0.24 | 0.42 | 0.47 | 0.54 | 0.64 | |||||||||||||||
Net realized and unrealized gain (loss) | (1.91 | ) | (1.44 | ) | (2.30 | ) | (0.15 | ) | (4.18 | ) | ||||||||||
|
|
|
|
|
|
|
|
|
| |||||||||||
Total from investment operations | (1.67 | ) | (1.02 | ) | (1.83 | ) | 0.39 | (3.54 | ) | |||||||||||
|
|
|
|
|
|
|
|
|
| |||||||||||
| Less distributions from: | ||||||||||||||||||||
Net investment income | (2.30 | ) | (0.41 | ) | (2.95 | ) | (0.54 | ) | (0.29 | ) | ||||||||||
Net realized gains | — | — | — | (1.31 | ) | (0.43 | ) | |||||||||||||
Return of capital | (0.01 | ) | — | (0.04 | ) | — | — | |||||||||||||
|
|
|
|
|
|
|
|
|
| |||||||||||
Total distributions | (2.31 | ) | (0.41 | ) | (2.99 | ) | (1.85 | ) | (0.72 | ) | ||||||||||
|
|
|
|
|
|
|
|
|
| |||||||||||
Net Asset Value, end of period | $ | 9.05 | $ | 13.03 | $ | 14.46 | $ | 19.28 | $ | 20.74 | ||||||||||
|
|
|
|
|
|
|
|
|
| |||||||||||
Total Return (%) | (15.83 | ) | (6.96 | ) | (9.83 | )(c) | 1.43 | (c) | (14.28 | )** | ||||||||||
Ratios to Average Net Assets and Supplemental Data | ||||||||||||||||||||
Net assets, end of period ($ millions) | 3 | 7 | 6 | 8 | 4 | |||||||||||||||
| Ratio of expenses before fee waiver (%) | 0.60 | 0.60 | 0.63 | 0.92 | 1.13 | * | ||||||||||||||
Ratio of expenses after fee waiver (%) | 0.60 | 0.60 | 0.60 | 0.68 | 1.13 | * | ||||||||||||||
Ratio of net investment income (loss) (%) | 2.56 | 2.97 | 2.93 | 2.66 | 2.89 | * | ||||||||||||||
Portfolio turnover rate (%) (d) | 59 | 141 | 89 | 25 | 34 | ** | ||||||||||||||
| Deutsche X-trackers MSCI Emerging Markets Hedged Equity ETF | Year Ended 5/31/2016 | Year Ended 5/31/2015 | Year Ended 5/31/2014 | Year Ended 5/31/2013 | Period Ended 5/31/2012(a) | |||||||||||||||
Selected Per Share Data | ||||||||||||||||||||
| Net Asset Value, beginning of period | $ | 22.43 | $ | 21.74 | $ | 21.96 | $ | 21.22 | $ | 25.00 | ||||||||||
|
|
|
|
|
|
|
|
|
| |||||||||||
| Income (loss) from investment operations: | ||||||||||||||||||||
Net investment income (loss) (b) | 0.43 | 0.36 | 0.38 | 0.38 | 0.21 | |||||||||||||||
Net realized and unrealized gain (loss) | (3.60 | ) | 0.77 | (0.17 | ) | 1.01 | (3.34 | ) | ||||||||||||
|
|
|
|
|
|
|
|
|
| |||||||||||
Total from investment operations | (3.17 | ) | 1.13 | 0.21 | 1.39 | (3.13 | ) | |||||||||||||
|
|
|
|
|
|
|
|
|
| |||||||||||
| Less distributions from: | ||||||||||||||||||||
Net investment income | (0.64 | ) | (0.44 | ) | (0.43 | ) | (0.40 | ) | (0.06 | ) | ||||||||||
Net realized gains | — | — | — | (0.25 | ) | (0.59 | ) | |||||||||||||
|
|
|
|
|
|
|
|
|
| |||||||||||
Total distributions | (0.64 | ) | (0.44 | ) | (0.43 | ) | (0.65 | ) | (0.65 | ) | ||||||||||
|
|
|
|
|
|
|
|
|
| |||||||||||
Net Asset Value, end of period | $ | 18.62 | $ | 22.43 | $ | 21.74 | $ | 21.96 | $ | 21.22 | ||||||||||
|
|
|
|
|
|
|
|
|
| |||||||||||
Total Return (%) | (14.32 | ) | 5.35 | 1.17 | (c) | 6.54 | (c) | (12.52 | )** | |||||||||||
Ratios to Average Net Assets and Supplemental Data | ||||||||||||||||||||
Net assets, end of period ($ millions) | 130 | 245 | 29 | 9 | 4 | |||||||||||||||
Ratio of expenses before fee waiver (%) | 0.65 | 0.65 | 0.66 | 0.94 | 1.19 | * | ||||||||||||||
Ratio of expenses after fee waiver (%) | 0.65 | 0.65 | 0.65 | 0.72 | 1.19 | * | ||||||||||||||
Ratio of net investment income (loss) (%) | 2.20 | 1.64 | 1.81 | 1.72 | 0.97 | * | ||||||||||||||
Portfolio turnover rate (%) (d) | 32 | 58 | 16 | 15 | 19 | ** | ||||||||||||||
| (a) | For the period June 9, 2011 (commencement of operations) through May 31, 2012. |
| (b) | Based on average shares outstanding during the period. |
| (c) | The Total Return would have been lower if certain fees had not been reimbursed by the Advisor. |
| (d) | Portfolio turnover rate does not include securities received or delivered from processing creations or redemptions. |
| * | Annualized. |
| ** | Not Annualized. |
| See Notes to Financial Statements. | 135 |
DBX ETF Trust
Financial highlights (Continued)
| Deutsche X-trackers MSCI Europe Hedged Equity ETF | Year Ended 5/31/2016 | Year Ended 5/31/2015 | Period Ended 5/31/2014(a) | |||||||||
Selected Per Share Data | ||||||||||||
Net Asset Value, beginning of period | $ | 29.47 | $ | 27.75 | $ | 25.00 | ||||||
|
|
|
|
|
| |||||||
| Income (loss) from investment operations: | ||||||||||||
Net investment income (loss) (c) | 0.79 | 1.33 | 1.27 | |||||||||
Net realized and unrealized gain (loss) | (3.19 | ) | 1.54 | 1.72 | ||||||||
|
|
|
|
|
| |||||||
Total from investment operations | (2.40 | ) | 2.87 | 2.99 | ||||||||
|
|
|
|
|
| |||||||
| Less distributions from: | ||||||||||||
Net investment income | (1.28 | ) | (1.15 | ) | (0.24 | ) | ||||||
Net realized gains | (0.14 | ) | (0.00 | )(d) | — | |||||||
|
|
|
|
|
| |||||||
Total distributions | (1.42 | ) | (1.15 | ) | (0.24 | ) | ||||||
|
|
|
|
|
| |||||||
Net Asset Value, end of period | $ | 25.65 | $ | 29.47 | $ | 27.75 | ||||||
|
|
|
|
|
| |||||||
Total Return (%) | (8.46 | ) | 10.88 | 12.05 | ** | |||||||
Ratios to Average Net Assets and Supplemental Data | ||||||||||||
Net assets, end of period ($ millions) | 3,310 | 2,668 | 164 | |||||||||
Ratio of expenses (%) | 0.45 | 0.45 | 0.45 | * | ||||||||
Ratio of net investment income (loss) (%) | 3.08 | 4.74 | 7.30 | * | ||||||||
Portfolio turnover rate (%) (e) | 18 | 13 | 4 | ** | ||||||||
| Deutsche X-trackers MSCI Eurozone Hedged Equity ETF | Year Ended 5/31/2016 | Period Ended 5/31/2015(b) | ||||||||||
Selected Per Share Data | ||||||||||||
Net Asset Value, beginning of period | $ | 29.30 | $ | 25.00 | ||||||||
|
|
|
| |||||||||
| Income (loss) from investment operations: | ||||||||||||
Net investment income (loss) (c) | 0.78 | 0.81 | ||||||||||
Net realized and unrealized gain (loss) | (3.15 | ) | 3.49 | |||||||||
|
|
|
| |||||||||
Total from investment operations | (2.37 | ) | 4.30 | |||||||||
|
|
|
| |||||||||
Less distributions from: | ||||||||||||
Net investment income | (1.29 | ) | — | |||||||||
|
|
|
| |||||||||
Total distributions | (1.29 | ) | — | |||||||||
|
|
|
| |||||||||
Net Asset Value, end of period | $ | 25.64 | $ | 29.30 | ||||||||
|
|
|
| |||||||||
Total Return (%) | (8.45 | ) | 17.20 | ** | ||||||||
Ratios to Average Net Assets and Supplemental Data | ||||||||||||
Net assets, end of period ($ millions) | 83 | 22 | ||||||||||
Ratio of expenses (%) | 0.45 | 0.45 | * | |||||||||
Ratio of net investment income (loss) (%) | 3.11 | 6.04 | * | |||||||||
Portfolio turnover rate (%) (e) | 22 | 8 | ** | |||||||||
| (a) | For the period October 1, 2013 (commencement of operations) through May 31, 2014. |
| (b) | For the period December 10, 2014 (commencement of operations) through May 31, 2015. |
| (c) | Based on average shares outstanding during the period. |
| (d) | Amount represents less than $0.005. |
| (e) | Portfolio turnover rate does not include securities received or delivered from processing creations or redemptions. |
| * | Annualized. |
| ** | Not Annualized. |
| See Notes to Financial Statements. | 136 |
DBX ETF Trust
Financial highlights (Continued)
| Deutsche X-trackers MSCI Germany Hedged Equity ETF | Year Ended 5/31/2016 | Year Ended 5/31/2015 | Year Ended 5/31/2014 | Year Ended 5/31/2013 | Period Ended 5/31/2012(a) | |||||||||||||||
Selected Per Share Data | ||||||||||||||||||||
Net Asset Value, beginning of period | $ | 27.34 | $ | 26.51 | $ | 23.22 | $ | 21.57 | $ | 25.00 | ||||||||||
|
|
|
|
|
|
|
|
|
| |||||||||||
| Income (loss) from investment operations: | ||||||||||||||||||||
Net investment income (loss) (b) | 0.33 | 1.38 | 1.03 | 0.44 | 0.27 | |||||||||||||||
Net realized and unrealized gain (loss) | (2.93 | ) | 1.93 | (e) | 3.11 | 2.08 | (3.30 | ) | ||||||||||||
|
|
|
|
|
|
|
|
|
| |||||||||||
Total from investment operations | (2.60 | ) | 3.31 | 4.14 | 2.52 | (3.03 | ) | |||||||||||||
|
|
|
|
|
|
|
|
|
| |||||||||||
| Less distributions from: | ||||||||||||||||||||
Net investment income | (1.34 | ) | (2.48 | ) | (0.85 | ) | (0.44 | ) | (0.12 | ) | ||||||||||
Net realized gains | — | — | — | (0.43 | ) | (0.28 | ) | |||||||||||||
|
|
|
|
|
|
|
|
|
| |||||||||||
Total distributions | (1.34 | ) | (2.48 | ) | (0.85 | ) | (0.87 | ) | (0.40 | ) | ||||||||||
|
|
|
|
|
|
|
|
|
| |||||||||||
Net Asset Value, end of period | $ | 23.40 | $ | 27.34 | $ | 26.51 | $ | 23.22 | $ | 21.57 | ||||||||||
|
|
|
|
|
|
|
|
|
| |||||||||||
Total Return (%) | (9.99 | ) | 13.92 | 18.70 | (c) | 11.86 | (c) | (12.14 | )** | |||||||||||
Ratios to Average Net Assets and Supplemental Data | ||||||||||||||||||||
Net assets, end of period ($ millions) | 110 | 234 | 45 | 5 | 4 | |||||||||||||||
Ratio of expenses before fee waiver (%) | 0.45 | 0.45 | 0.47 | 0.82 | 1.04 | * | ||||||||||||||
Ratio of expenses after fee waiver (%) | 0.45 | 0.45 | 0.47 | 0.58 | 1.04 | * | ||||||||||||||
Ratio of net investment income (loss) (%) | 1.37 | 5.14 | 4.15 | 1.93 | 1.20 | * | ||||||||||||||
Portfolio turnover rate (%) (d) | 16 | 20 | 12 | 108 | 17 | ** | ||||||||||||||
| Deutsche X-trackers MSCI Japan Hedged Equity ETF | Year Ended 5/31/2016 | Year Ended 5/31/2015 | Year Ended 5/31/2014 | Year Ended 5/31/2013 | Period Ended 5/31/2012(a) | |||||||||||||||
Selected Per Share Data | ||||||||||||||||||||
Net Asset Value, beginning of period | $ | 44.54 | $ | 35.43 | $ | 34.08 | $ | 21.79 | $ | 25.00 | ||||||||||
|
|
|
|
|
|
|
|
|
| |||||||||||
| Income (loss) from investment operations: | ||||||||||||||||||||
Net investment income (loss) (b) | 0.48 | 0.52 | 0.55 | 0.39 | 0.27 | |||||||||||||||
Net realized and unrealized gain (loss) | (8.44 | ) | 12.49 | 1.51 | 12.31 | (3.31 | ) | |||||||||||||
|
|
|
|
|
|
|
|
|
| |||||||||||
Total from investment operations | (7.96 | ) | 13.01 | 2.06 | 12.70 | (3.04 | ) | |||||||||||||
|
|
|
|
|
|
|
|
|
| |||||||||||
| Less distributions from: | ||||||||||||||||||||
Net investment income | (1.39 | ) | (3.90 | ) | (0.71 | ) | (0.41 | ) | (0.17 | ) | ||||||||||
Net realized gains | (0.87 | ) | — | — | — | — | ||||||||||||||
|
|
|
|
|
|
|
|
|
| |||||||||||
Total distributions | (2.26 | ) | (3.90 | ) | (0.71 | ) | (0.41 | ) | (0.17 | ) | ||||||||||
|
|
|
|
|
|
|
|
|
| |||||||||||
Net Asset Value, end of period | $ | 34.32 | $ | 44.54 | $ | 35.43 | $ | 34.08 | $ | 21.79 | ||||||||||
|
|
|
|
|
|
|
|
|
| |||||||||||
Total Return (%) | (18.65 | ) | 39.00 | 6.21 | (c) | 59.04 | (c) | (12.16 | )** | |||||||||||
Ratios to Average Net Assets and Supplemental Data | ||||||||||||||||||||
Net assets, end of period ($ millions) | 1,026 | 1,263 | 441 | 109 | 4 | |||||||||||||||
Ratio of expenses before fee waiver (%) | 0.45 | 0.45 | 0.48 | 0.66 | 1.03 | * | ||||||||||||||
Ratio of expenses after fee waiver (%) | 0.45 | 0.45 | 0.48 | 0.52 | 1.03 | * | ||||||||||||||
Ratio of net investment income (loss) (%) | 1.29 | 1.32 | 1.56 | 1.27 | 1.15 | * | ||||||||||||||
Portfolio turnover rate (%) (d) | 15 | 14 | 13 | 12 | 16 | ** | ||||||||||||||
| (a) | For the period June 9, 2011 (commencement of operations) through May 31, 2012. |
| (b) | Based on average shares outstanding during the period. |
| (c) | The Total Return would have been lower if certain fees had not been reimbursed by the Advisor. |
| (d) | Portfolio turnover rate does not include securities received or delivered from processing creations or redemptions. |
| (e) | Because of the timing of subscriptions and redemptions in relation to fluctuating markets at value, the amount shown may not agree with the change in aggregate gains and losses. |
| * | Annualized. |
| ** | Not Annualized. |
| See Notes to Financial Statements. | 137 |
DBX ETF Trust
Financial highlights (Continued)
| Deutsche X-trackers MSCI Mexico Hedged Equity ETF | Year Ended 5/31/2016 | Year Ended 5/31/2015 | Period Ended 5/31/2014(a) | |||||||||
Selected Per Share Data | ||||||||||||
Net Asset Value, beginning of period | $ | 25.24 | $ | 24.29 | $ | 25.00 | ||||||
|
|
|
|
|
| |||||||
| Income (loss) from investment operations: | ||||||||||||
Net investment income (loss) (b) | 0.53 | 0.26 | 0.07 | |||||||||
Net realized and unrealized gain (loss) | (0.11 | ) | 0.94 | (0.78 | ) | |||||||
|
|
|
|
|
| |||||||
Total from investment operations | 0.42 | 1.20 | (0.71 | ) | ||||||||
|
|
|
|
|
| |||||||
| Less distributions from: | ||||||||||||
Net investment income | (2.79 | ) | (0.18 | ) | — | |||||||
Net realized gains | (1.32 | ) | (0.07 | ) | — | |||||||
|
|
|
|
|
| |||||||
Total distributions | (4.11 | ) | (0.25 | ) | — | |||||||
|
|
|
|
|
| |||||||
Net Asset Value, end of period | $ | 21.55 | $ | 25.24 | $ | 24.29 | ||||||
|
|
|
|
|
| |||||||
Total Return (%) | 2.09 | 4.99 | (2.84 | )** | ||||||||
Ratios to Average Net Assets and Supplemental Data | ||||||||||||
Net assets, end of period ($ millions) | 4 | 5 | 5 | |||||||||
Ratio of expenses (%) | 0.51 | 0.50 | 0.50 | * | ||||||||
Ratio of net investment income (loss) (%) | 2.40 | 1.04 | 0.79 | * | ||||||||
Portfolio turnover rate (%) (c) | 34 | 22 | 7 | ** | ||||||||
| Deutsche X-trackers MSCI South Korea Hedged Equity ETF | Year Ended 5/31/2016 | Year Ended 5/31/2015 | Period Ended 5/31/2014(a) | |||||||||
Selected Per Share Data | ||||||||||||
Net Asset Value, beginning of period | $ | 24.32 | $ | 25.08 | $ | 25.00 | ||||||
|
|
|
|
|
| |||||||
| Income (loss) from investment operations: | ||||||||||||
Net investment income (loss) (b) | 0.16 | (0.11 | ) | (0.02 | ) | |||||||
Net realized and unrealized gain (loss) | (1.51 | ) | (0.65 | )(d) | 0.10 | (d) | ||||||
|
|
|
|
|
| |||||||
Total from investment operations | (1.35 | ) | (0.76 | ) | 0.08 | |||||||
|
|
|
|
|
| |||||||
Less distributions from: | ||||||||||||
Net investment income | (0.03 | ) | — | — | ||||||||
|
|
|
|
|
| |||||||
Total distributions | (0.03 | ) | — | — | ||||||||
|
|
|
|
|
| |||||||
Net Asset Value, end of period | $ | 22.94 | $ | 24.32 | $ | 25.08 | ||||||
|
|
|
|
|
| |||||||
Total Return (%) | (5.55 | ) | (3.07 | ) | 0.32 | ** | ||||||
Ratios to Average Net Assets and Supplemental Data | ||||||||||||
Net assets, end of period ($ millions) | 118 | 137 | 5 | |||||||||
Ratio of expenses (%) | 0.58 | 0.58 | 0.58 | * | ||||||||
Ratio of net investment income (loss) (%) | 0.72 | (0.47 | ) | (0.26 | )* | |||||||
Portfolio turnover rate (%) (c) | 124 | 287 | 8 | ** | ||||||||
| (a) | For the period January 23, 2014 (commencement of operations) through May 31, 2014. |
| (b) | Based on average shares outstanding during the period. |
| (c) | Portfolio turnover rate does not include securities received or delivered from processing creations or redemptions. |
| (d) | Because of the timing of subscriptions and redemptions in relation to fluctuating markets at value, the amount shown may not agree with the change in aggregate gains and losses. |
| * | Annualized. |
| ** | Not Annualized. |
| See Notes to Financial Statements. | 138 |
DBX ETF Trust
Financial highlights (Continued)
| Deutsche X-trackers MSCI United Kingdom Hedged Equity ETF | Year Ended 5/31/2016 | Year Ended 5/31/2015 | Period Ended 5/31/2014(a) | |||||||||
Selected Per Share Data | ||||||||||||
Net Asset Value, beginning of period | $ | 25.93 | $ | 26.53 | $ | 25.00 | ||||||
|
|
|
|
|
| |||||||
| Income (loss) from investment operations: | ||||||||||||
Net investment income (loss) (b) | 0.89 | 0.92 | 1.32 | |||||||||
Net realized and unrealized gain (loss) | (2.95 | ) | 0.08 | 0.63 | ||||||||
|
|
|
|
|
| |||||||
Total from investment operations | (2.06 | ) | 1.00 | 1.95 | ||||||||
|
|
|
|
|
| |||||||
| Less distributions from: | ||||||||||||
Net investment income | (1.51 | ) | (1.58 | ) | (0.42 | ) | ||||||
Net realized gains | (0.11 | ) | (0.02 | ) | — | |||||||
|
|
|
|
|
| |||||||
Total distributions | (1.62 | ) | (1.60 | ) | (0.42 | ) | ||||||
|
|
|
|
|
| |||||||
Net Asset Value, end of period | $ | 22.25 | $ | 25.93 | $ | 26.53 | ||||||
|
|
|
|
|
| |||||||
Total Return (%) | (8.25 | ) | 4.27 | 7.90 | ** | |||||||
Ratios to Average Net Assets and Supplemental Data | ||||||||||||
Net assets, end of period ($ millions) | 6 | 5 | 5 | |||||||||
Ratio of expenses (%) | 0.45 | 0.45 | 0.45 | * | ||||||||
Ratio of net investment income (loss) (%) | 4.04 | 3.57 | 7.70 | * | ||||||||
Portfolio turnover rate (%) (c) | 24 | 19 | 11 | ** | ||||||||
| (a) | For the period October 1, 2013 (commencement of operations) through May 31, 2014. |
| (b) | Based on average shares outstanding during the period. |
| (c) | Portfolio turnover rate does not include securities received or delivered from processing creations or redemptions. |
| * | Annualized. |
| ** | Not Annualized. |
| See Notes to Financial Statements. | 139 |
DBX ETF Trust
1. Organization
DBX ETF Trust (the “Trust”) is registered under the Investment Company Act of 1940, as amended (the “Act”), as an open-end registered management investment company organized as a Delaware statutory trust.
As of May 31, 2016, the Trust consists of thirty-six investment series of exchange-traded funds (“ETFs”) (each a “Fund” and collectively, the “Funds”) in operation and trading. These financial statements report on the Funds listed below:
| Deutsche X-trackers MSCI All World ex US Hedged Equity ETF |
| Deutsche X-trackers MSCI Asia Pacific ex Japan Hedged Equity ETF |
| Deutsche X-trackers MSCI Brazil Hedged Equity ETF |
| Deutsche X-trackers MSCI Emerging Markets Hedged Equity ETF |
| Deutsche X-trackers MSCI Europe Hedged Equity ETF |
| Deutsche X-trackers MSCI Eurozone Hedged Equity ETF |
| Deutsche X-trackers MSCI Germany Hedged Equity ETF |
| Deutsche X-trackers MSCI Japan Hedged Equity ETF |
| Deutsche X-trackers MSCI Mexico Hedged Equity ETF |
| Deutsche X-trackers MSCI South Korea Hedged Equity ETF |
| Deutsche X-trackers MSCI United Kingdom Hedged Equity ETF |
DBX Advisors LLC (“DBX” or the “Advisor”), an indirect wholly owned subsidiary of Deutsche Bank AG, serves as investment advisor to the Funds and has overall responsibility for the general management and administration of the Funds, subject to the supervision of the Funds’ Board of Trustees.
Each Fund offers shares that are listed and traded on the NYSE Arca, Inc. (“NYSE Arca”). Unlike conventional mutual funds, each Fund issues and redeems shares on a continuous basis, at net asset value, only in large specified lots consisting of 50,000 shares, each called a “Creation Unit”, to authorized participants who have entered into agreements with the Funds’ distributor. Shares are not individually redeemable securities of the Funds, and owners of the shares may acquire those shares from the Funds, or tender such shares for redemption to the Funds, in Creation Units only.
The investment objective of each Fund is to track the performance, before fees and expenses, of a particular index (the “Underlying Index”). The underlying indices for the Funds are:
Fund | Underlying Index | |
| Deutsche X-trackers MSCI All World ex US Hedged Equity ETF | MSCI ACWI ex USA US Dollar Hedged Index | |
| Deutsche X-trackers MSCI Asia Pacific ex Japan Hedged Equity ETF | MSCI Asia Pacific ex Japan US Dollar Hedged Index | |
| Deutsche X-trackers MSCI Brazil Hedged Equity ETF | MSCI Brazil US Dollar Hedged Index | |
| Deutsche X-trackers MSCI Emerging Markets Hedged Equity ETF | MSCI EM US Dollar Hedged Index | |
| Deutsche X-trackers MSCI Europe Hedged Equity ETF | MSCI Europe US Dollar Hedged Index | |
| Deutsche X-trackers MSCI Eurozone Hedged Equity ETF | MSCI EMU IMI US Dollar Hedged Index | |
| Deutsche X-trackers MSCI Germany Hedged Equity ETF | MSCI Germany US Dollar Hedged Index | |
| Deutsche X-trackers MSCI Japan Hedged Equity ETF | MSCI Japan US Dollar Hedged Index | |
| Deutsche X-trackers MSCI Mexico Hedged Equity ETF | MSCI Mexico IMI 25/50 US Dollar Hedged Index | |
| Deutsche X-trackers MSCI South Korea Hedged Equity ETF | MSCI Korea 25/50 US Dollar Hedged Index | |
| Deutsche X-trackers MSCI United Kingdom Hedged Equity ETF | MSCI United Kingdom US Dollar Hedged Index |
MSCI, Inc. (“MSCI”) is the creator of each MSCI Hedged Underlying Index. Each MSCI Hedged Underlying Index is comprised of securities listed in countries in the MSCI Global Index Series. All listed equity securities and listed securities that exhibit characteristics of equity securities, except mutual funds, exchange traded funds, equity derivatives, limited partnerships and most investment trusts, are eligible for inclusion in the equity universe. Real Estate Investment Trusts (“REITs”) in some countries and certain income trusts in Canada are also eligible for inclusion. Each company and its securities (i.e., share classes) are classified in only one country, which allows for a distinctive sorting of each company by its respective country.
140
DBX ETF Trust
Notes to financial statements (Continued)
The MSCI Hedged Underlying Indices are rebalanced monthly on the last trading day of the month, when the index will take into account the effect of rolling into new 1-month forward contracts based on the newly determined weights of currency to be sold for the next month’s index calculation. The currency weights are determined as of the close of two business days before the first calendar day of following month and remain constant intra month. This means that no changes in the weights are made during the month to account for changes in the indexes due to price movement of securities, corporate events, additions, deletions or any other changes. The daily calculation of MSCI Hedged Indices marks to market the one-month forward contracts on a daily basis by using an equal and offsetting forward position.
Each Fund is entitled to use its respective Underlying Index pursuant to a licensing agreement between each Index Provider and DBX. There is no charge to the Funds in connection with these licensing agreements.
Each Fund, except Deutsche X-trackers MSCI Emerging Markets Hedged Equity ETF and Deutsche X-trackers MSCI Japan Hedged Equity ETF, is non-diversified and is not limited by the Act with regard to the percentage of its assets that may be invested in the securities of a single issuer. The securities of a particular issuer (or securities of issuers in particular industries) may dominate the underlying index of such a fund and, consequently, the fund’s investment portfolio. This may adversely affect the Fund’s performance or subject the fund’s shares to greater price volatility than that experienced by more diversified investment companies.
Pursuant to the Trust’s organizational documents, the Trust’s officers and trustees are indemnified against certain liabilities that may arise out of the performance of their duties to the Funds. Additionally, in the normal course of business the Trust enters into contracts that contain a variety of representations that provide indemnification for certain liabilities. The Trust’s maximum exposure under these arrangements is unknown, as this would involve future claims that may be made against the Funds that have not yet occurred. However, the Trust expects the risk of loss to be remote.
2. Significant Accounting Policies
The financial statements have been prepared in conformity with U.S. generally accepted accounting principles (“U.S. GAAP”), which require management to make certain estimates and assumptions that affect the reported amounts and disclosures in the financial statements. Actual results could differ from those estimates. The following is a summary of significant accounting policies followed by the Funds.
Security Valuation The Net Asset Value (“NAV”), of each Fund’s shares is calculated each business day as of the close of regular trading on the New York Stock Exchange, generally 4:00 p.m. Eastern Time. NAV per share is calculated by dividing a Fund’s net assets by the number of Fund shares outstanding.
Various inputs are used in determining the value of the Funds’ investments. These inputs are summarized in three broad levels. Level 1 includes quoted prices in active markets for identical securities. Level 2 includes other significant observable inputs (including quoted prices for similar securities, interest rates, prepayment speeds, and credit risk). Level 3 includes significant unobservable inputs (including the Fund’s own assumptions in determining the fair value of investments). The level assigned to the securities valuations may not be an indication of the risk or liquidity associated with investing in those securities.
Equity securities are valued at the most recent sale price or official closing price reported on the exchange (U.S. or foreign) or over-the-counter market on which they trade. Securities for which no sales are reported are valued at the calculated mean between the most recent bid and asked quotations on the relevant market or, if a mean cannot be determined, at the most recent bid quotation. Equity securities are generally categorized as Level 1.
Futures contracts are generally valued at the settlement prices established each day on the exchange on which they are traded and are categorized as Level 1.
Forward currency contracts are valued at the prevailing forward exchange rate of the underlying currencies and are categorized as Level 2.
Securities and other assets for which market quotations are not readily available or for which the above valuation procedures are deemed not to reflect fair value are valued in a manner that is intended to reflect their fair value as determined in accordance with procedures approved by the Board and are generally categorized as Level 3. In
141
DBX ETF Trust
Notes to financial statements (Continued)
accordance with the Fund’s valuation procedures, factors considered in determining value may include, but are not limited to, the type of the security; the size of the holding; the initial cost of the security; the existence of any contractual restrictions on the security’s disposition; the price and extent of public trading in similar securities of the issuer or of comparable companies; quotations or evaluated prices from broker-dealers and/or pricing services; information obtained from the issuer, analysts, and/or the appropriate stock exchange (for exchange- traded securities); an analysis of the company’s or issuer’s financial statements; an evaluation of the forces that influence the issuer and the market(s) in which the security is purchased and sold; and with respect to debt securities, the maturity, coupon, creditworthiness, currency denomination and the movement of the market in which the security is normally traded. The value determined under these procedures may differ from published values for the same securities.
Fair value pricing could result in a difference between the prices used to calculate a Fund’s net asset value and the prices used by the Fund’s underlying index, which in turn could result in a difference between the Fund’s performance and the performance of the Fund’s Underlying Index.
Disclosure about classification of the fair value measurements is included in a table following the Fund’s Schedule of Investments.
Cash Cash consists of cash held at banks and is on deposit with major financial institutions.
Investment Transactions and Investment Income Investment transactions are recorded as of the date that the securities are purchased or sold (trade date). Realized gains and losses from the sale or disposition of securities are calculated on the identified cost-method. Dividend income is net of any foreign taxes withheld at source. Certain dividends from foreign securities may be recorded subsequent to the ex-dividend date as soon as the fund is informed of such dividends. Interest income is recorded on the accrual basis.
Tax Information and Dividends and Distributions to Shareholders It is each Fund’s policy to comply with all requirements of the Internal Revenue Code of 1986, as amended (“the Code”). Each fund intends to qualify for and to elect treatment as a separate Regulated Investment Company (“RIC”) under Subchapter M of the Code. It is the policy of each Fund to pay out dividends from its net investment income, if any, to investors semi-annually sufficient to relieve it from all, or substantially all, Federal income and excise taxes. Taxable net realized gains from investment transactions, reduced by capital loss carryforwards, if any, are declared and distributed to shareholders at least annually. The capital loss carryforward amount, if any, is available to offset future net capital gains. The Funds may occasionally be required to make supplemental distributions at some other time during the year. The Funds reserve the right to declare special distributions if, in their reasonable discretion, such action is necessary or advisable to preserve the status of each Fund as a RIC or to avoid imposition of income or excise taxes on undistributed income. Dividends and distributions to shareholders, if any, are recorded on the ex- dividend date. The amount of dividends and distributions from net investment income and net realized capital gains are determined in accordance with Federal income tax regulations which may differ from U.S. GAAP. These “book/tax” differences are either considered temporary or permanent in nature. To the extent these differences are permanent in nature, such amounts are reclassified at the end of the year within the components of net assets based on their federal tax treatment; temporary differences do not require reclassification. Dividends and distributions, which exceed earnings and profits for the full year for tax purposes, are reported as a tax return of capital.
In accordance with U.S. GAAP requirements regarding accounting for uncertainties in income taxes, management has analyzed the Funds’ tax positions taken or expected to be taken on foreign, federal and state income tax returns for all open tax years and has concluded that no provision for income tax is required in the Funds’ financial statements. The Advisor does not believe that the unrecognized tax benefits will change significantly in the next 12 months.
The Funds recognize interest and penalties, if any, related to uncertain tax provisions as income tax expense on the Statements of Operations. For the year ended May 31, 2016, the Funds did not incur any interest or penalties.
142
DBX ETF Trust
Notes to financial statements (Continued)
As of May 31, 2016, the components of accumulated earnings (losses) were as follows:
| Undistributed Net Investment Income | Undistributed Long-Term Capital Gains | Capital and Other Gains (Losses) | Unrealized Appreciation (Depreciation) | Total Accumulated Earnings (Losses) | ||||||||||||||||
Deutsche X-trackers MSCI All World ex US Hedged Equity ETF | $ | 767,934 | $ | — | $ | (2,527,578 | ) | $ | (4,607,361 | ) | $ | (6,367,005 | ) | |||||||
Deutsche X-trackers MSCI Asia Pacific ex Japan Hedged ETF | 9,022 | — | (843,723 | ) | (525,485 | ) | (1,360,186 | ) | ||||||||||||
Deutsche X-trackers MSCI Brazil Hedged Equity ETF | — | — | (4,845,276 | ) | (1,447,590 | ) | (6,292,866 | ) | ||||||||||||
Deutsche X-trackers MSCI Emerging Markets Hedged Equity ETF | 549,614 | — | (11,234,378 | ) | (21,342,738 | ) | (32,027,502 | ) | ||||||||||||
Deutsche X-trackers MSCI Europe Hedged Equity ETF | 79,275,760 | 13,415,685 | (1,299,467 | ) | (366,926,315 | ) | (275,534,337 | ) | ||||||||||||
Deutsche X-trackers MSCI Eurozone Hedged Equity ETF | 1,737,099 | — | (2,389,472 | ) | (3,997,171 | ) | (4,649,544 | ) | ||||||||||||
Deutsche X-trackers MSCI Germany Hedged Equity ETF | 2,512,500 | — | (6,582,081 | ) | (19,095,542 | ) | (23,165,123 | ) | ||||||||||||
Deutsche X-trackers MSCI Japan Hedged Equity ETF | 14,091,038 | — | (186,720,182 | ) | (80,690,161 | ) | (253,319,305 | ) | ||||||||||||
Deutsche X-trackers MSCI Mexico Hedged Equity ETF | 214,584 | 178,603 | — | (1,011,372 | ) | (618,185 | ) | |||||||||||||
Deutsche X-trackers MSCI South Korea Hedged Equity ETF | 430,429 | 1,064,017 | — | (12,613,112 | ) | (11,118,666 | ) | |||||||||||||
Deutsche X-trackers MSCI United Kingdom Hedged Equity ETF | 167,068 | — | — | (716,970 | ) | (549,902 | ) | |||||||||||||
The tax character of dividends and distributions declared for the years ended May 31, 2016 and May 31, 2015 were as follows:
| Year Ended May 31, 2016 | ||||||||||||
| Ordinary Income* | Long Term Capital Gains | Return of Capital | ||||||||||
Deutsche X-trackers MSCI All World ex US Hedged Equity ETF | $ | 2,321,724 | $ | 544,791 | $ | — | ||||||
Deutsche X-trackers MSCI Asia Pacific ex Japan Hedged ETF | 606,913 | 155,092 | — | |||||||||
Deutsche X-trackers MSCI Brazil Hedged Equity ETF | 1,037,444 | — | 3,755 | |||||||||
Deutsche X-trackers MSCI Emerging Markets Hedged Equity ETF | 6,061,629 | — | — | |||||||||
Deutsche X-trackers MSCI Europe Hedged Equity ETF | 123,776,401 | 18,313,322 | — | |||||||||
Deutsche X-trackers MSCI Eurozone Hedged Equity ETF | 1,359,253 | — | — | |||||||||
Deutsche X-trackers MSCI Germany Hedged Equity ETF | 10,562,800 | — | — | |||||||||
Deutsche X-trackers MSCI Japan Hedged Equity ETF | 59,783,319 | 23,200,118 | — | |||||||||
Deutsche X-trackers MSCI Mexico Hedged Equity ETF | 670,959 | 152,095 | — | |||||||||
Deutsche X-trackers MSCI South Korea Hedged Equity ETF | 154,180 | — | — | |||||||||
Deutsche X-trackers MSCI United Kingdom Hedged Equity ETF | 313,158 | 12,470 | — | |||||||||
143
DBX ETF Trust
Notes to financial statements (Continued)
| Year Ended May 31, 2015 | ||||
| Ordinary Income* | ||||
Deutsche X-trackers MSCI All World ex US Hedged Equity ETF | $ | 371,534 | ||
Deutsche X-trackers MSCI Asia Pacific ex Japan Hedged ETF | 323,116 | |||
Deutsche X-trackers MSCI Brazil Hedged Equity ETF | 243,907 | |||
Deutsche X-trackers MSCI Emerging Markets Hedged Equity ETF | 956,998 | |||
Deutsche X-trackers MSCI Europe Hedged Equity ETF | 24,394,421 | |||
Deutsche X-trackers MSCI Germany Hedged Equity ETF | 4,112,744 | |||
Deutsche X-trackers MSCI Japan Hedged Equity ETF | 62,464,849 | |||
Deutsche X-trackers MSCI Mexico Hedged Equity ETF | 50,522 | |||
Deutsche X-trackers MSCI United Kingdom Hedged Equity ETF | 321,044 | |||
| * | For tax purposes short-term capital gain distributions are considered ordinary income distributions. |
At May 31, 2016 for Federal income tax purposes, the Funds have capital loss carryforwards available as shown in the table below, as provided by regulations, to offset future capital gains for an unlimited period. To the extent that these loss carryforwards are used to offset future capital gains, it is probable that the capital gains so offset will not be distributed to shareholders.
| Short-Term | Long-Term | Total Amount | ||||||||||
Deutsche X-trackers MSCI Brazil Hedged Equity ETF | $ | 2,079,570 | $ | 1,684,928 | $ | 3,764,498 | ||||||
Deutsche X-trackers MSCI Emerging Markets Hedged Equity ETF | 502,271 | — | 502,271 | |||||||||
Deutsche X-trackers MSCI Eurozone Hedged Equity ETF | 33,309 | 85,724 | 119,033 | |||||||||
Deutsche X-trackers MSCI Germany Hedged Equity ETF | 1,851,136 | 2,925,397 | 4,776,533 | |||||||||
Deutsche X-trackers MSCI Japan Hedged Equity ETF | 11,799,790 | 18,520,568 | 30,320,358 | |||||||||
Capital losses incurred after October 31 (“post-October losses”) within the taxable year are deemed to arise on the first business day of the Fund’s next taxable year.
During the fiscal year ended May 31, 2016, the Fund incurred and elected to defer net capital losses as follows:
| Post-October Losses on Capital | ||||
Deutsche X-trackers MSCI All World ex US Hedged Equity ETF | $ | 2,527,578 | ||
Deutsche X-trackers MSCI Asia Pacific ex Japan Hedged ETF | 843,723 | |||
Deutsche X-trackers MSCI Brazil Hedged Equity ETF | 1,080,778 | |||
Deutsche X-trackers MSCI Emerging Markets Hedged Equity ETF | 10,732,107 | |||
Deutsche X-trackers MSCI Europe Hedged Equity ETF | 1,299,467 | |||
Deutsche X-trackers MSCI Eurozone Hedged Equity ETF | 2,270,439 | |||
Deutsche X-trackers MSCI Germany Hedged Equity ETF | 1,805,548 | |||
Deutsche X-trackers MSCI Japan Hedged Equity ETF | 156,399,824 | |||
In order to present paid-in capital and accumulated net realized gains or losses on the Statement of Assets and Liabilities that more closely represent their tax character, certain adjustments have been made to additional paid-in capital, undistributed net investment income or loss and accumulated net realized gains or losses on investments. These differences are primarily due to recognition of certain foreign currency gains (losses) as ordinary income (loss), net ordinary loss, distribution re-class, nondeductible excise tax, investments in futures,
144
DBX ETF Trust
Notes to financial statements (Continued)
Passive Foreign Investment Companies (“PFICs”) and redemptions-in-kind. For the fiscal year ended May 31, 2016, the adjustments were as follows:
| Undistributed Net Investment Income (Loss) | Undistributed Capital Gains (Accumulated Losses) | Paid-In Capital | ||||||||||
Deutsche X-trackers MSCI All World ex US Hedged Equity ETF | $ | (496,883 | ) | $ | 350,273 | $ | 146,610 | |||||
Deutsche X-trackers MSCI Asia Pacific ex Japan Hedged ETF | (58,532 | ) | 377,079 | (318,547 | ) | |||||||
Deutsche X-trackers MSCI Brazil Hedged Equity ETF | (91,264 | ) | 101,447 | (10,183 | ) | |||||||
Deutsche X-trackers MSCI Emerging Markets Hedged Equity ETF | (159,335 | ) | 1,990,795 | (1,831,460 | ) | |||||||
Deutsche X-trackers MSCI Europe Hedged Equity ETF | (3,723,358 | ) | 13,107,357 | (9,383,999 | ) | |||||||
Deutsche X-trackers MSCI Eurozone Hedged Equity ETF | 384,110 | (1,519,664 | ) | 1,135,554 | ||||||||
Deutsche X-trackers MSCI Germany Hedged Equity ETF | 1,082,794 | 6,197,062 | (7,279,856 | ) | ||||||||
Deutsche X-trackers MSCI Japan Hedged Equity ETF | (2,052,012 | ) | (38,277,758 | ) | 40,329,770 | |||||||
Deutsche X-trackers MSCI Mexico Hedged Equity ETF | 4,788 | 99,712 | (104,500 | ) | ||||||||
Deutsche X-trackers MSCI South Korea Hedged Equity ETF | 480,877 | (480,877 | ) | — | ||||||||
Deutsche X-trackers MSCI United Kingdom Hedged Equity ETF | (20,550 | ) | 20,550 | — | ||||||||
Foreign Taxes The Funds may be subject to foreign taxes (a portion of which may be reclaimable) on income, capital gains on investments, certain foreign currency transactions or other corporate events. All foreign taxes are recorded in accordance with the applicable foreign tax regulations and rates that exist in the foreign jurisdictions in which the Funds invest. These foreign taxes, if any, are paid by the Funds and are reflected in their Statements of Operations as follows: foreign taxes withheld at source are presented as a reduction of income and foreign taxes on capital gains from sales of investments and foreign currency transactions are included in their respective net realized gain (loss) categories. Foreign taxes payable as of May 31, 2016, if any, are disclosed in the Funds’ Statements of Assets and Liabilities.
Foreign Currency Translations The books and records of the Funds are maintained in U.S. dollars. Investment securities and other assets and liabilities denominated in a foreign currency are translated into U.S. dollars at the prevailing exchange rates at year end. Purchases and sales of investment securities, income and expenses are translated into U.S. dollars at the prevailing exchange rates on the respective dates of the transactions.
Net realized and unrealized gains and losses on foreign currency transactions represent net gains and losses between trade and settlement dates on securities transactions, the acquisition and disposition of foreign currencies, and the difference between the amount of net investment income accrued and the U.S. dollar amount actually received. The portion of both realized and unrealized gains and losses on investments that results from fluctuations in foreign currency exchange rates is not separately disclosed, but is included with net realized and unrealized gain/appreciation and loss/depreciation on investments.
Securities Lending The Funds may lend securities to certain financial institutions under the terms of their securities lending agreement. The Funds retain benefits of owning the securities they have loaned and continue to receive interest and dividends generated by the securities and to participate in any changes in their market value. The Funds require the borrowers of the securities to maintain collateral with the Funds consisting of either cash or liquid, unencumbered assets having a value at least equal to the value of the securities loaned. When the collateral falls below specified amounts, the lending agent will use its best effort to obtain additional collateral on the next business day to meet required amounts under the securities lending agreement. As of year end, any
145
DBX ETF Trust
Notes to financial statements (Continued)
securities on loan were collateralized by cash. The Funds may invest the cash collateral into a joint trading account in an affiliated money market fund. During the year ended May 31, 2016 the Funds invested the cash collateral in Daily Assets Fund, an affiliated money market fund managed by Deutsche Investment Management Americas Inc. Deutsche Investment Management Americas Inc. receives a management/administration fee (0.09% annualized effective rate as of May 31, 2016) on the cash collateral Invested in Daily Assets Fund. The Funds receive compensation for lending their securities either in the form of fees or by earning interest on invested cash collateral net of borrower rebates and fees paid to a lending agent. Either the Fund or the borrower may terminate the loan at any time and the borrower, after notice, is required to return borrowed securities within a standard time period. There may be risks of delay and costs in recovery of securities or even loss of rights in the collateral should the borrower of the securities fail financially. If the Funds are not able to recover securities lent, the Funds may sell the collateral and purchase a replacement investment in the market, incurring the risk that the value of the replacement security is greater than the value of the collateral. The Funds are also subject to all investment risks associated with the reinvestment of any cash collateral received, including, but not limited to, interest rate, credit and liquidity risk associated with such investments.
As of May 31, 2016, the funds listed below had securities on loan, which were classified as common stocks in the Schedule of Investments. The value of the related collateral exceeded the value of the securities loaned at year end.
| Deutsche X-trackers MSCI All World ex US Hedged Equity ETF |
| Deutsche X-trackers MSCI Asia Pacific ex Japan Hedged Equity ETF |
| Deutsche X-trackers MSCI Emerging Markets Hedged Equity ETF |
| Deutsche X-trackers MSCI Europe Hedged Equity ETF |
| Deutsche X-trackers MSCI Eurozone Hedged Equity ETF |
| Deutsche X-trackers MSCI Germany Hedged Equity ETF |
| Deutsche X-trackers MSCI Japan Hedged Equity ETF |
| Deutsche X-trackers MSCI United Kingdom Hedged Equity ETF |
As of May 31, 2016, the funds listed below had no securities on loan.
| Deutsche X-trackers MSCI Brazil Hedged Equity ETF |
| Deutsche X-trackers MSCI Mexico Hedged Equity ETF |
| Deutsche X-trackers MSCI South Korea Hedged Equity ETF |
Derivatives
Forward Foreign Currency Exchange Contracts Each Fund may enter into forward foreign currency exchange contracts (“forward currency contracts”) designed to offset a Fund’s exposure to non-U.S. currencies. In addition, the Funds may enter into forward currency contracts and foreign currency futures contracts to facilitate local securities settlements or to protect against currency exposure in connection with distributions to Shareholders.
A forward currency contract is a commitment to purchase or sell a foreign currency at a future date at a negotiated forward rate. For the year ended May 31, 2016, The Deutsche X-trackers MSCI Emerging Markets Hedged Equity ETF, Deutsche X-trackers MSCI Asia Pacific ex Japan Hedged Equity ETF, Deutsche X-trackers MSCI Europe Hedged Equity ETF, Deutsche X-trackers MSCI Eurozone Hedged Equity ETF and Deutsche X-trackers MSCI All World ex US Hedged Equity ETF invested in forward currency contracts to hedge against changes in the value of the U.S. dollar against specified non-U.S. currencies. Similarly, the Deutsche X-trackers MSCI Brazil Hedged Equity ETF, Deutsche X-trackers MSCI Germany Hedged Equity ETF, Deutsche X-trackers MSCI Japan Hedged Equity ETF, Deutsche X-trackers MSCI South Korea Hedged Equity ETF, Deutsche X-trackers MSCI United Kingdom ETF and Deutsche X-trackers MSCI Mexico Hedged Equity ETF each invested in forward currency contracts to hedge against changes in the value of the U.S. dollar against the Brazilian real, the euro, the Japanese yen, the South Korean won, the British Pound sterling and the Mexican peso, respectively.
The gain or loss arising from the difference between the original contract and the closing of such contract would be included in net realized gain or loss on foreign currency transactions. Risks may arise from the potential inability of a counterparty to meet the terms of a contract and from unanticipated movements in the value of a foreign currency relative to the U.S. dollar. The face or contract amount, in U.S. dollars reflects the total exposure the respective Fund has in that particular currency contract.
146
DBX ETF Trust
Notes to financial statements (Continued)
A summary of the open forward currency contracts as of May 31, 2016 is included in a table following the Funds’ Schedule of Investments. The investment in forward currency contracts short vs. U.S. dollars had a contract value generally indicative of a range of the total exposure the respective Fund had to the value of non U.S currencies during the year ended May 31, 2016.
Futures Contracts Each Fund may enter into futures contracts. These futures contracts will be used to simulate investment in the respective Underlying Index, to facilitate trading or to reduce transaction costs. Each Fund will enter into futures contracts that are traded on a U.S. or non-U.S. exchange. No Fund will use futures for speculative purposes. Futures contracts provide for the future sale by one party and purchase by another party of a specified amount of a specific instrument or index at a specified future time and at a specified price. Each Fund may enter into futures contracts in seeking performance that corresponds to its Underlying Index. To the extent required by law, liquid assets committed to futures contracts will be maintained.
At the time each Fund enters into a futures contract, each Fund deposits and maintains as collateral an initial margin with the broker, as required by the exchange on which the transaction is affected. Pursuant to the contract, each Fund agrees to receive from or pay to the broker an amount of cash equal to the daily fluctuation in the value of the contract. Such receipts or payments are known as variation margin and are recorded by each Fund as unrealized gains or losses. Risks may arise from the potential inability of a counterparty to meet the terms of the contract. The credit/counterparty risk for exchange-traded futures contracts is generally less than privately negotiated futures contracts, since the clearinghouse, which is the issuer or counterparty to each exchange-traded future, provides a guarantee of performance. The guarantee is supported by a daily payment system (i.e., margin requirements).
Use of long futures contracts subjects each Fund to risk of loss in excess of the amounts shown on the statement of assets and liabilities, up to the notional value of the futures contracts. Use of short futures contracts subjects each Fund to unlimited risk of loss. Under some circumstances, futures exchanges may establish daily limits on the amount that the price of a futures contract can vary from the previous day’s settlement price, which could effectively prevent liquidation of unfavorable positions.
A summary of the open futures contracts as of May 31, 2016 is included in a table following the Funds’ Schedule of Investments.
The following tables summarize the value of the Funds’ derivative instruments held as of May 31, 2016 and the related location in the accompanying Statement of Assets and Liabilities, presented by primary underlying risk exposure:
Asset Derivatives | Liability Derivatives | |||||||||||||
Risk Type | Statement of Asset and | Fair Value | Statement of Asset and | Fair Value | ||||||||||
| Deutsche X-trackers MSCI All World ex US Hedged Equity ETF | ||||||||||||||
| Foreign exchange contracts | Unrealized appreciation on forward foreign currency exchange contracts | $ | 2,306,671 | Unrealized depreciation on forward foreign currency exchange contracts | $ | 225,579 | ||||||||
|
|
|
| |||||||||||
| Total | $ | 2,306,671 | Total | $ | 225,579 | |||||||||
|
|
|
| |||||||||||
| Deutsche X-trackers MSCI Asia Pacific ex Japan Hedged ETF | ||||||||||||||
| Foreign exchange contracts | Unrealized appreciation on forward foreign currency exchange contracts | $ | 149,463 | Unrealized depreciation on forward foreign currency exchange contracts | $ | 50,128 | ||||||||
|
|
|
| |||||||||||
| Total | $ | 149,463 | Total | $ | 50,128 | |||||||||
|
|
|
| |||||||||||
| Deutsche X-trackers MSCI Brazil Hedged Equity ETF | ||||||||||||||
| Foreign exchange contracts | Unrealized appreciation on forward foreign currency exchange contracts | $ | 186,692 | Unrealized depreciation on forward foreign currency exchange contracts | $ | 55,934 | ||||||||
|
|
|
| |||||||||||
| Total | $ | 186,692 | Total | $ | 55,934 | |||||||||
|
|
|
| |||||||||||
147
DBX ETF Trust
Notes to financial statements (Continued)
Asset Derivatives | Liability Derivatives | |||||||||||||
Risk Type | Statement of Asset and | Fair Value | Statement of Asset and | Fair Value | ||||||||||
| Deutsche X-trackers MSCI Emerging Markets Hedged Equity ETF | ||||||||||||||
| Equity contracts | Unrealized appreciation on futures contracts | $ | — | Unrealized depreciation on futures contracts | $ | 18,180 | ||||||||
| Foreign exchange contracts | Unrealized appreciation on forward foreign currency exchange contracts | 4,273,009 | Unrealized depreciation on forward foreign currency exchange contracts | 900,391 | ||||||||||
|
|
|
| |||||||||||
| Total | $ | 4,273,009 | Total | $ | 918,571 | |||||||||
|
|
|
| |||||||||||
| Deutsche X-trackers MSCI Europe Hedged Equity ETF | ||||||||||||||
| Foreign exchange contracts | Unrealized appreciation on forward foreign currency exchange contracts | $ | 95,241,545 | Unrealized depreciation on forward foreign currency exchange contracts | $ | 9,025,947 | ||||||||
|
|
|
| |||||||||||
| Total | $ | 95,241,545 | Total | $ | 9,025,947 | |||||||||
|
|
|
| |||||||||||
| Deutsche X-trackers MSCI Eurozone Hedged Equity ETF | ||||||||||||||
| Foreign exchange contracts | Unrealized appreciation on forward foreign currency exchange contracts | $ | 2,785,348 | Unrealized depreciation on forward foreign currency exchange contracts | $ | 478,986 | ||||||||
|
|
|
| |||||||||||
| Total | $ | 2,785,348 | Total | $ | 478,986 | |||||||||
|
|
|
| |||||||||||
| Deutsche X-trackers MSCI Germany Hedged Equity ETF | ||||||||||||||
| Equity contracts | Unrealized appreciation on futures contracts | $ | 6,684 | Unrealized depreciation on futures contracts | $ | — | ||||||||
| Foreign exchange contracts | Unrealized appreciation on forward foreign currency exchange contracts | 3,548,626 | Unrealized depreciation on forward foreign currency exchange contracts | 210,448 | ||||||||||
|
|
|
| |||||||||||
| Total | $ | 3,465,310 | Total | $ | 210,448 | |||||||||
|
|
|
| |||||||||||
| Deutsche X-trackers MSCI Japan Hedged Equity ETF | ||||||||||||||
| Equity contracts | Unrealized appreciation on futures contracts | $ | — | Unrealized depreciation on futures contracts | $ | 9,271 | ||||||||
| Foreign exchange contracts | Unrealized appreciation on forward foreign currency exchange contracts | 39,234,971 | Unrealized depreciation on forward foreign currency exchange contracts | 2,978,654 | ||||||||||
|
|
|
| |||||||||||
| Total | $ | 39,234,971 | Total | $ | 2,987,925 | |||||||||
|
|
|
| |||||||||||
| Deutsche X-trackers MSCI Mexico Hedged Equity ETF | ||||||||||||||
| Foreign exchange contracts | Unrealized appreciation on forward foreign currency exchange contracts | $ | 320,212 | Unrealized depreciation on forward foreign currency exchange contracts | $ | 18,097 | ||||||||
|
|
|
| |||||||||||
| Total | $ | 320,212 | Total | $ | 18,097 | |||||||||
|
|
|
| |||||||||||
148
DBX ETF Trust
Notes to financial statements (Continued)
Asset Derivatives | Liability Derivatives | |||||||||||||
Risk Type | Statement of Asset and | Fair Value | Statement of Asset and | Fair Value | ||||||||||
| Deutsche X-trackers MSCI South Korea Hedged Equity ETF | ||||||||||||||
| Foreign exchange contracts | Unrealized appreciation on forward foreign currency exchange contracts | $ | 5,367,675 | Unrealized depreciation on forward foreign currency exchange contracts | $ | 717,387 | ||||||||
|
|
|
| |||||||||||
| Total | $ | 5,367,675 | Total | $ | 717,387 | |||||||||
|
|
|
| |||||||||||
| Deutsche X-trackers MSCI United Kingdom Hedged Equity ETF | ||||||||||||||
| Foreign exchange contracts | Unrealized appreciation on forward foreign currency exchange contracts | $ | 91,713 | Unrealized depreciation on forward foreign currency exchange contracts | $ | 28,166 | ||||||||
|
|
|
| |||||||||||
| Total | $ | 91,713 | Total | $ | 28,166 | |||||||||
|
|
|
| |||||||||||
Additionally, the amount of realized and unrealized gains and losses on derivative instruments recognized in the Funds’ earnings during the year ended May 31, 2016 and the related location in the accompanying Statement of Operations is summarized in the following tables by primary underlying risk exposure:
Net Realized Gain (Loss) on: | ||||||||||||
| Equity Contracts | Foreign Exchange Contracts | Total | ||||||||||
Deutsche X-trackers MSCI All World | $ | — | $ | (340,374 | ) | $ | (340,374 | ) | ||||
Deutsche X-trackers MSCI Asia Pacific | — | 431,981 | 431,981 | |||||||||
Deutsche X-trackers MSCI Brazil Hedged Equity ETF | — | 389,626 | 389,626 | |||||||||
Deutsche X-trackers MSCI Emerging Markets Hedged Equity ETF | (21,900 | ) | 8,587,332 | 8,565,432 | ||||||||
Deutsche X-trackers MSCI Europe Hedged Equity ETF | — | 34,547,427 | 34,547,427 | |||||||||
Deutsche X-trackers MSCI Eurozone Hedged Equity ETF | — | (2,479,541 | ) | (2,479,541 | ) | |||||||
Deutsche X-trackers MSCI Germany Hedged Equity ETF | (42,472 | ) | (1,154,050 | ) | (1,196,522 | ) | ||||||
Deutsche X-trackers MSCI Japan Hedged Equity ETF | (180,300 | ) | (147,705,512 | ) | (147,885,812 | ) | ||||||
Deutsche X-trackers MSCI Mexico Hedged Equity ETF | — | 433,974 | 433,974 | |||||||||
Deutsche X-trackers MSCI South Korea Hedged Equity ETF | — | 8,726,018 | 8,726,018 | |||||||||
Deutsche X-trackers MSCI United Kingdom Hedged Equity ETF | — | 150,036 | 150,036 | |||||||||
149
DBX ETF Trust
Notes to financial statements (Continued)
Net Change in Unrealized Appreciation (Depreciation) on: | ||||||||||||
| Equity Contracts | Foreign Exchange Contracts | Total | ||||||||||
Deutsche X-trackers MSCI All World | $ | — | $ | 1,208,167 | $ | 1,208,167 | ||||||
Deutsche X-trackers MSCI Asia Pacific | — | (68,655 | ) | (68,655 | ) | |||||||
Deutsche X-trackers MSCI Brazil Hedged Equity ETF | — | (175,970 | ) | (175,970 | ) | |||||||
Deutsche X-trackers MSCI Emerging Markets Hedged Equity ETF | (30,040 | ) | (136,161 | ) | (166,201 | ) | ||||||
Deutsche X-trackers MSCI Europe Hedged Equity ETF | — | 52,755,700 | 52,755,700 | |||||||||
Deutsche X-trackers MSCI Eurozone Hedged Equity ETF | — | 1,867,295 | 1,867,295 | |||||||||
Deutsche X-trackers MSCI Germany Hedged Equity ETF | 23,035 | (1,388,274 | ) | (1,365,239 | ) | |||||||
Deutsche X-trackers MSCI Japan Hedged Equity ETF | (217,334 | ) | (5,059,459 | ) | (5,276,793 | ) | ||||||
Deutsche X-trackers MSCI Mexico Hedged Equity ETF | — | 299,441 | 299,441 | |||||||||
Deutsche X-trackers MSCI South Korea Hedged Equity ETF | — | (538,941 | ) | (538,941 | ) | |||||||
Deutsche X-trackers MSCI United Kingdom Hedged Equity ETF | — | 37,101 | 37,101 | |||||||||
For the year ended May 31, 2016 the average monthly volume of derivatives was as follows:
| Futures Contracts (Contract Value) | Forward Foreign Currency Exchange Contracts (Market Value) | |||||||
Deutsche X-trackers MSCI All World ex US Hedged Equity ETF | $ | — | $ | (61,511,519 | ) | |||
Deutsche X-trackers MSCI Asia Pacific ex Japan Hedged Equity ETF | — | (7,518,694 | ) | |||||
Deutsche X-trackers MSCI Brazil Hedged Equity ETF | — | (3,551,530 | ) | |||||
Deutsche X-trackers MSCI Emerging Markets Hedged Equity ETF | 218,029 | (156,574,257 | ) | |||||
Deutsche X-trackers MSCI Europe Hedged Equity ETF | — | (3,269,016,711 | ) | |||||
Deutsche X-trackers MSCI Eurozone Hedged Equity ETF | — | (59,007,168 | ) | |||||
Deutsche X-trackers MSCI Germany Hedged Equity ETF | 355,259 | (157,703,257 | ) | |||||
Deutsche X-trackers MSCI Japan Hedged Equity ETF | 2,137,045 | (1,368,702,889 | ) | |||||
Deutsche X-trackers MSCI Mexico Hedged Equity ETF | — | (4,420,456 | ) | |||||
Deutsche X-trackers MSCI South Korea Hedged Equity ETF | — | (125,304,521 | ) | |||||
Deutsche X-trackers MSCI United Kingdom Hedged Equity ETF | — | (4,739,601 | ) | |||||
150
DBX ETF Trust
Notes to financial statements (Continued)
As of May 31, 2016, the Funds have transactions subject to enforceable master netting agreements which govern the terms of certain transactions, and reduce the counterparty risk associated with such transactions. Master netting agreements allow a Fund to close out and net total exposure to a counterparty in the event of a default with respect to all of the transactions with a counterparty. For financial reporting purposes the Statement of Assets and Liabilities generally shows derivatives assets and liabilities on a gross basis, which reflects the full risks and exposures prior to netting. A reconciliation of the gross amounts on the Statement of Assets and Liabilities to the net amounts by counterparty, including any collateral exposure, is included in the following tables:
| Gross Amounts of Assets Presented in the Statement of Assets and Liabilities | Financial Instruments and Derivatives Available for Offset | Collateral Received | Net Amount of Derivatives Assets | Gross Amounts of Liabilities Presented in the Statement of Assets and Liabilities | Financial Instruments and Derivatives Available for Offset | Collateral Pledged | Net Amount of Derivatives Liabilities | |||||||||||||||||||||||||
Deutsche X-trackers MSCI All World ex US Hedged Equity ETF |
| |||||||||||||||||||||||||||||||
JP Morgan & Chase Co. | $ | 658,750 | $ | (57,108 | ) | $ | — | $ | 601,642 | $ | 57,108 | $ | (57,108 | ) | $ | — | $ | — | ||||||||||||||
State Street Bank & Trust Co. | 954,062 | (122,917 | ) | — | 831,145 | 122,917 | (122,917 | ) | — | — | ||||||||||||||||||||||
The Bank of New York Mellon | 88,225 | (26,997 | ) | — | 61,228 | 26,997 | (26,997 | ) | — | — | ||||||||||||||||||||||
Bank of Montreal | 45,600 | (2,107 | ) | — | 43,493 | 2,107 | (2,107 | ) | — | — | ||||||||||||||||||||||
The Bank of Nova Scotia | 560,034 | (16,450 | ) | — | 543,584 | 16,450 | (16,450 | ) | — | — | ||||||||||||||||||||||
|
|
|
|
|
|
|
|
|
|
|
|
|
|
|
| |||||||||||||||||
| $ | 2,306,671 | $ | (225,579 | ) | $ | — | $ | 2,081,092 | $ | 225,579 | $ | (225,579 | ) | $ | — | $ | — | |||||||||||||||
|
|
|
|
|
|
|
|
|
|
|
|
|
|
|
| |||||||||||||||||
Deutsche X-trackers MSCI Asia Pacific ex Japan Hedged ETF |
| |||||||||||||||||||||||||||||||
JP Morgan & Chase Co. | $ | 141,361 | $ | (11,765 | ) | $ | — | $ | 129,596 | $ | 11,765 | $ | (11,765 | ) | $ | — | $ | — | ||||||||||||||
State Street Bank & Trust Co. | 7,914 | (7,914 | ) | — | — | 38,293 | (7,914 | ) | — | 30,379 | ||||||||||||||||||||||
The Bank of New York Mellon | 2 | — | — | 2 | — | — | — | — | ||||||||||||||||||||||||
Bank of Montreal | 186 | (70 | ) | — | 116 | 70 | (70 | ) | — | — | ||||||||||||||||||||||
|
|
|
|
|
|
|
|
|
|
|
|
|
|
|
| |||||||||||||||||
| $ | 149,463 | $ | (19,749 | ) | $ | — | $ | 129,714 | $ | 50,128 | $ | (19,749 | ) | $ | — | $ | 30,379 | |||||||||||||||
|
|
|
|
|
|
|
|
|
|
|
|
|
|
|
| |||||||||||||||||
Deutsche X-trackers MSCI Brazil Hedged Equity ETF |
| |||||||||||||||||||||||||||||||
JP Morgan & Chase Co. | $ | 106,585 | $ | (10,692 | ) | $ | — | $ | 95,893 | $ | 10,692 | $ | (10,692 | ) | $ | — | $ | — | ||||||||||||||
The Bank of New York Mellon | 4,263 | (4,263 | ) | — | — | 38,319 | (4,263 | ) | — | 34,056 | ||||||||||||||||||||||
State Street Bank & Trust Co. | 75,844 | (6,923 | ) | — | 68,921 | 6,923 | (6,923 | ) | — | — | ||||||||||||||||||||||
|
|
|
|
|
|
|
|
|
|
|
|
|
|
|
| |||||||||||||||||
| $ | 186,692 | $ | (21,878 | ) | $ | — | $ | 164,814 | $ | 55,934 | $ | (21,878 | ) | $ | — | $ | 34,056 | |||||||||||||||
|
|
|
|
|
|
|
|
|
|
|
|
|
|
|
| |||||||||||||||||
Deutsche X-trackers MSCI Emerging Markets Hedged Equity ETF |
| |||||||||||||||||||||||||||||||
Bank of Montreal | $ | 83,290 | $ | (83,290 | ) | $ | — | $ | — | $ | 194,708 | $ | (83,290 | ) | $ | — | $ | 111,418 | ||||||||||||||
JP Morgan & Chase Co. | 3,669,054 | (353,976 | ) | — | 3,315,078 | 353,976 | (353,976 | ) | — | — | ||||||||||||||||||||||
State Street Bank & Trust Co. | 416,661 | (309,135 | ) | — | 107,526 | 309,135 | (309,135 | ) | — | — | ||||||||||||||||||||||
The Bank of New York Mellon | 87,800 | (25,604 | ) | — | 62,196 | 25,604 | (25,604 | ) | — | — | ||||||||||||||||||||||
The Bank of Nova Scotia | 16,204 | (16,204 | ) | — | — | 16,968 | (16,204 | ) | — | 764 | ||||||||||||||||||||||
|
|
|
|
|
|
|
|
|
|
|
|
|
|
|
| |||||||||||||||||
| $ | 4,273,009 | $ | (788,209 | ) | $ | — | $ | 3,484,800 | $ | 900,391 | $ | (788,209 | ) | $ | — | $ | 112,182 | |||||||||||||||
|
|
|
|
|
|
|
|
|
|
|
|
|
|
|
| |||||||||||||||||
151
DBX ETF Trust
Notes to financial statements (Continued)
| Gross Amounts of Assets Presented in the Statement of Assets and Liabilities | Financial Instruments and Derivatives Available for Offset | Collateral Received | Net Amount of Derivatives Assets | Gross Amounts of Liabilities Presented in the Statement of Assets and Liabilities | Financial Instruments and Derivatives Available for Offset | Collateral Pledged | Net Amount of Derivatives Liabilities | |||||||||||||||||||||||||
Deutsche X-trackers MSCI Europe Hedged Equity ETF |
| |||||||||||||||||||||||||||||||
Canadian Imperial Bank of Commerce | $ | 12,859,631 | $ | (1,678,690 | ) | $ | — | $ | 11,180,941 | $ | 1,678,690 | $ | (1,678,690 | ) | $ | — | $ | — | ||||||||||||||
RBC Capital Markets | 17,466,232 | (1,630,150 | ) | — | 15,836,082 | 1,630,150 | (1,630,150 | ) | — | — | ||||||||||||||||||||||
The Bank of New York Mellon | 1,196,680 | (912,920 | ) | — | 283,760 | 912,920 | (912,920 | ) | — | — | ||||||||||||||||||||||
Bank of Montreal | 16,302,992 | (1,370,401 | ) | — | 14,932,591 | 1,370,401 | (1,370,401 | ) | — | — | ||||||||||||||||||||||
JP Morgan & Chase Co. | 15,781,627 | (1,021,070 | ) | — | 14,760,557 | 1,021,070 | (1,021,070 | ) | — | — | ||||||||||||||||||||||
State Street Bank & Trust Co. | 16,404,007 | (1,587,417 | ) | — | 14,816,590 | 1,587,417 | (1,587,417 | ) | — | — | ||||||||||||||||||||||
The Bank of Nova Scotia | 15,230,376 | (825,299 | ) | — | 14,405,077 | 825,299 | (825,299 | ) | — | — | ||||||||||||||||||||||
|
|
|
|
|
|
|
|
|
|
|
|
|
|
|
| |||||||||||||||||
| $ | 95,241,545 | $ | (9,025,947 | ) | $ | — | $ | 86,215,598 | $ | 9,025,947 | $ | (9,025,947 | ) | $ | — | $ | — | |||||||||||||||
|
|
|
|
|
|
|
|
|
|
|
|
|
|
|
| |||||||||||||||||
Deutsche X-trackers MSCI Eurozone Hedged Equity ETF |
| |||||||||||||||||||||||||||||||
Bank of Montreal | $ | 735,267 | $ | (224,737 | ) | $ | — | $ | 510,530 | $ | 224,737 | $ | (224,737 | ) | $ | — | $ | — | ||||||||||||||
Canadian Imperial Bank of Commerce | 879,711 | (126,315 | ) | — | 753,396 | 126,315 | (126,315 | ) | — | — | ||||||||||||||||||||||
JP Morgan & Chase Co. | 260,543 | (5,842 | ) | — | 254,701 | 5,842 | (5,842 | ) | — | — | ||||||||||||||||||||||
RBC Capital Markets | 909,827 | (122,092 | ) | — | 787,735 | 122,092 | (122,092 | ) | — | — | ||||||||||||||||||||||
|
|
|
|
|
|
|
|
|
|
|
|
|
|
|
| |||||||||||||||||
| $ | 2,785,348 | $ | (478,986 | ) | $ | — | $ | 2,306,362 | $ | 478,986 | $ | (478,986 | ) | $ | — | $ | — | |||||||||||||||
|
|
|
|
|
|
|
|
|
|
|
|
|
|
|
| |||||||||||||||||
Deutsche X-trackers MSCI Germany Hedged Equity ETF |
| |||||||||||||||||||||||||||||||
Canadian Imperial Bank of Commerce | $ | 767,673 | $ | (75,163 | ) | $ | — | $ | 692,510 | $ | 75,163 | $ | (75,163 | ) | $ | — | $ | — | ||||||||||||||
RBC Capital Markets | 753,324 | (75,376 | ) | — | 677,948 | 75,376 | (75,376 | ) | — | — | ||||||||||||||||||||||
The Bank of New York Mellon | 17,698 | (5,391 | ) | — | 12,307 | 5,391 | (5,391 | ) | — | — | ||||||||||||||||||||||
Bank of Montreal | 595,848 | (10,912 | ) | — | 584,936 | 10,912 | (10,912 | ) | — | — | ||||||||||||||||||||||
JP Morgan & Chase Co. | 798,359 | (14,653 | ) | — | 783,706 | 14,653 | (14,653 | ) | — | — | ||||||||||||||||||||||
State Street Bank & Trust Co. | 615,724 | (28,953 | ) | — | 586,771 | 28,953 | (28,953 | ) | — | — | ||||||||||||||||||||||
|
|
|
|
|
|
|
|
|
|
|
|
|
|
|
| |||||||||||||||||
| $ | 3,548,626 | $ | (210,448 | ) | $ | — | $ | 3,338,178 | $ | 210,448 | $ | (210,448 | ) | $ | — | $ | — | |||||||||||||||
|
|
|
|
|
|
|
|
|
|
|
|
|
|
|
| |||||||||||||||||
Deutsche X-trackers MSCI Japan Hedged Equity ETF |
| |||||||||||||||||||||||||||||||
Bank of Montreal | $ | 3,461,123 | $ | (166,411 | ) | $ | — | $ | 3,294,712 | $ | 166,411 | $ | (166,411 | ) | $ | — | $ | — | ||||||||||||||
Canadian Imperial Bank of Commerce | 7,469,155 | (670,246 | ) | — | 6,798,909 | 670,246 | (670,246 | ) | — | — | ||||||||||||||||||||||
JP Morgan & Chase Co. | 10,609,767 | (644,305 | ) | — | 9,965,462 | 644,305 | (644,305 | ) | — | — | ||||||||||||||||||||||
RBC Capital Markets | 2,002,902 | (227,161 | ) | — | 1,775,741 | 227,161 | (227,161 | ) | — | — | ||||||||||||||||||||||
State Street Bank & Trust Co. | 9,311,719 | (821,997 | ) | — | 8,489,722 | 821,997 | (821,997 | ) | — | — | ||||||||||||||||||||||
The Bank of New York Mellon | 357,867 | (32,188 | ) | — | 325,679 | 32,188 | (32,188 | ) | — | — | ||||||||||||||||||||||
The Bank of Nova Scotia | 6,022,438 | (416,346 | ) | — | 5,606,092 | 416,346 | (416,346 | ) | — | — | ||||||||||||||||||||||
|
|
|
|
|
|
|
|
|
|
|
|
|
|
|
| |||||||||||||||||
| $ | 39,234,971 | $ | (2,978,654 | ) | $ | — | $ | 36,256,317 | $ | 2,978,654 | $ | (2,978,654 | ) | $ | — | $ | — | |||||||||||||||
|
|
|
|
|
|
|
|
|
|
|
|
|
|
|
| |||||||||||||||||
Deutsche X-trackers MSCI Mexico Hedged Equity ETF |
| |||||||||||||||||||||||||||||||
Bank of Montreal | $ | 129,030 | $ | (9,714 | ) | $ | — | $ | 119,316 | $ | 9,714 | $ | (9,714 | ) | $ | — | $ | — | ||||||||||||||
JP Morgan & Chase Co. | 191,182 | (8,313 | ) | — | 182,869 | 8,313 | (8,313 | ) | — | — | ||||||||||||||||||||||
The Bank of New York Mellon | — | — | — | — | 70 | — | — | 70 | ||||||||||||||||||||||||
|
|
|
|
|
|
|
|
|
|
|
|
|
|
|
| |||||||||||||||||
| $ | 320,212 | $ | (18,027 | ) | $ | — | $ | 302,185 | $ | 18,097 | $ | (18,027 | ) | $ | — | $ | 70 | |||||||||||||||
|
|
|
|
|
|
|
|
|
|
|
|
|
|
|
| |||||||||||||||||
152
DBX ETF Trust
Notes to financial statements (Continued)
| Gross Amounts of Assets Presented in the Statement of Assets and Liabilities | Financial Instruments and Derivatives Available for Offset | Collateral Received | Net Amount of Derivatives Assets | Gross Amounts of Liabilities Presented in the Statement of Assets and Liabilities | Financial Instruments and Derivatives Available for Offset | Collateral Pledged | Net Amount of Derivatives Liabilities | |||||||||||||||||||||||||
Deutsche X-trackers MSCI South Korea Hedged Equity ETF |
| |||||||||||||||||||||||||||||||
RBC Capital Markets | $ | 188,446 | $ | (8,385 | ) | $ | — | $ | 180,061 | $ | 8,385 | $ | (8,385 | ) | $ | — | $ | — | ||||||||||||||
Bank of Montreal | 11,224 | (11,224 | ) | — | — | 428,576 | (11,224 | ) | — | 417,352 | ||||||||||||||||||||||
JP Morgan & Chase Co. | 2,892,600 | (110,840 | ) | — | 2,781,760 | 110,840 | (110,840 | ) | — | — | ||||||||||||||||||||||
State Street Bank & Trust Co. | 2,275,405 | (169,586 | ) | — | 2,105,819 | 169,586 | (169,586 | ) | — | — | ||||||||||||||||||||||
|
|
|
|
|
|
|
|
|
|
|
|
|
|
|
| |||||||||||||||||
| $ | 5,367,675 | $ | (300,035 | ) | $ | — | $ | 5,067,640 | $ | 717,387 | $ | (300,035 | ) | $ | — | $ | 417,352 | |||||||||||||||
|
|
|
|
|
|
|
|
|
|
|
|
|
|
|
| |||||||||||||||||
Deutsche X-trackers MSCI United Kingdom Hedged Equity ETF |
| |||||||||||||||||||||||||||||||
The Bank of New York Mellon | $ | 111 | $ | (26 | ) | $ | — | $ | 85 | $ | 26 | $ | (26 | ) | $ | — | $ | — | ||||||||||||||
Bank of Montreal | 48,745 | (15,134 | ) | — | 33,611 | 15,134 | (15,134 | ) | — | — | ||||||||||||||||||||||
JP Morgan & Chase Co. | 42,857 | (13,006 | ) | — | 29,851 | 13,006 | (13,006 | ) | — | — | ||||||||||||||||||||||
|
|
|
|
|
|
|
|
|
|
|
|
|
|
|
| |||||||||||||||||
| $ | 91,713 | $ | (28,166 | ) | $ | — | $ | 63,547 | $ | 28,166 | $ | (28,166 | ) | $ | — | $ | — | |||||||||||||||
|
|
|
|
|
|
|
|
|
|
|
|
|
|
|
| |||||||||||||||||
3. Investment Advisory and Other Agreements
The Advisor has overall responsibility for the general management and administration of the Funds, subject to the supervision of the Funds’ Board of Trustees. Under an investment advisory agreement between the Trust, on behalf of the Funds, and the Advisor (the “Investment Advisory Agreement”), the Advisor is responsible for arranging subadvisory, transfer agency, custody, fund administration, and all other non-distribution related services for the Funds to operate.
TDAM USA Inc. (“TDAM”) serves as investment sub-advisor to each Fund. TDAM is responsible for day-to-day management of the Funds, subject to the replication strategy for each Fund with regard to its underlying index and for general administration, compliance and management services as may be agreed between the Advisor and TDAM from time to time.
For its investment advisory services to the Funds below, the Advisor is entitled to receive a unitary management fee from each Fund based on each Fund’s average daily net assets at an annual rate equal to:
Fund | Unitary Management Fee | |||
Deutsche X-trackers MSCI All World ex US Hedged Equity ETF | 0.40 | % | ||
Deutsche X-trackers MSCI Asia Pacific ex Japan Hedged Equity ETF | 0.60 | % | ||
Deutsche X-trackers MSCI Brazil Hedged Equity ETF | 0.60 | % | ||
Deutsche X-trackers MSCI Emerging Markets Hedged Equity ETF | 0.65 | % | ||
Deutsche X-trackers MSCI Europe Hedged Equity ETF | 0.45 | % | ||
Deutsche X-trackers MSCI Eurozone Hedged Equity ETF | 0.45 | % | ||
Deutsche X-trackers MSCI Germany Hedged Equity ETF | 0.45 | % | ||
Deutsche X-trackers MSCI Japan Hedged Equity ETF | 0.45 | % | ||
Deutsche X-trackers MSCI Mexico Hedged Equity ETF | 0.50 | % | ||
Deutsche X-trackers MSCI South Korea Hedged Equity ETF | 0.58 | % | ||
Deutsche X-trackers MSCI United Kingdom Hedged Equity ETF | 0.45 | % | ||
Out of the unitary management fee, the Advisor pays substantially all expenses of each Fund, including the payments to the sub-advisor, the cost of transfer agency, custody, fund administration, legal, audit and other services, and expenses of the Independent Trustees. Each Fund is responsible for the payment of interest expense, taxes, brokerage expenses and extraordinary expenses.
The Bank of New York Mellon, a wholly-owned subsidiary of The Bank of New York Mellon Corporation, serves as Administrator, Custodian, Accounting Agent, Lending Agent and Transfer Agent for each Fund.
ALPS Distributors, Inc. (the “Distributor”) serves as the distributor of Creation Units for each Fund on an agency basis. The Distributor does not maintain a secondary market in shares of the Funds.
153
DBX ETF Trust
Notes to financial statements (Continued)
The Board of Trustees is currently comprised of four Trustees, including three Independent Trustees. The Advisor paid retainer fees and attendance fees to each Independent Trustee and attendance fees to each member of the Audit Committee (which is comprised of all of the Funds’ Independent Trustees).
4. Transactions with Affiliates
The Advisor is an indirect wholly-owned subsidiary of Deutsche Bank AG. Therefore, Deutsche Bank AG is considered to be affiliated with the Funds. The table below shows the transactions in and earnings from investments in Deutsche Bank AG securities for the six months ended May 31, 2016.
| Value at 5/31/15 | Purchases Cost | Sales Proceeds | Realized Gain/(Loss) | Income | Value at 5/31/16 | |||||||||||||||||||
Deutsche X-trackers MSCI All World ex US Hedged Equity ETF | ||||||||||||||||||||||||
Deutsche Bank AG (Common Stock) | $ | 98,068 | $ | 136,266 | $ | (68,391 | ) | $ | (18,008 | ) | $ | — | $ | 99,464 | ||||||||||
Deutsche X-trackers MSCI Europe Hedged Equity ETF | ||||||||||||||||||||||||
Deutsche Bank AG (Common Stock) | 12,693,883 | 9,832,081 | (4,077,002 | ) | (1,529,707 | ) | — | 10,421,441 | ||||||||||||||||
Deutsche X-trackers MSCI Eurozone Hedged Equity ETF | ||||||||||||||||||||||||
Deutsche Bank AG (Common Stock) | 205,048 | 738,144 | (183,975 | ) | (46,478 | ) | — | 490,996 | ||||||||||||||||
Deutsche X-trackers MSCI Germany Hedged Equity ETF | ||||||||||||||||||||||||
Deutsche Bank AG (Common Stock) | 8,184,755 | 1,294,589 | (4,817,505 | ) | (1,094,429 | ) | — | 2,496,049 | ||||||||||||||||
5. Investment Portfolio Transactions
For the year ended May 31, 2016, the cost of investments purchased and proceeds from sale of investments (excluding in-kind transactions and short-term investments) were as follows:
| Purchases | Sales | |||||||
Deutsche X-trackers MSCI All World ex US Hedged Equity ETF | $ | 16,672,399 | $ | 14,582,736 | ||||
Deutsche X-trackers MSCI Asia Pacific ex Japan Hedged Equity ETF | 2,559,898 | 4,968,682 | ||||||
Deutsche X-trackers MSCI Brazil Hedged Equity ETF | 2,141,199 | 4,450,725 | ||||||
Deutsche X-trackers MSCI Emerging Markets Hedged Equity ETF | 51,264,089 | 83,879,157 | ||||||
Deutsche X-trackers MSCI Europe Hedged Equity ETF | 610,607,249 | 584,855,565 | ||||||
Deutsche X-trackers MSCI Eurozone Hedged Equity ETF | 12,933,787 | 14,162,405 | ||||||
Deutsche X-trackers MSCI Germany Hedged Equity ETF | 24,640,507 | 36,821,797 | ||||||
Deutsche X-trackers MSCI Japan Hedged Equity ETF | 198,246,423 | 398,110,095 | ||||||
Deutsche X-trackers MSCI Mexico Hedged Equity ETF | 1,553,001 | 1,528,583 | ||||||
Deutsche X-trackers MSCI South Korea Hedged Equity ETF | 157,152,052 | 155,537,426 | ||||||
Deutsche X-trackers MSCI United Kingdom Hedged Equity ETF | 1,143,597 | 1,137,179 | ||||||
For the year ended May 31, 2016, the cost of in-kind purchases and proceeds from in-kind sales were as follows:
| Purchases | Sales | |||||||
Deutsche X-trackers MSCI All World ex US Hedged Equity ETF | $ | 35,053,016 | $ | 8,756,564 | ||||
Deutsche X-trackers MSCI Asia Pacific ex Japan Hedged Equity ETF | — | 2,049,349 | ||||||
Deutsche X-trackers MSCI Emerging Markets Hedged Equity ETF | 6,103,989 | 42,623,678 | ||||||
Deutsche X-trackers MSCI Europe Hedged Equity ETF | 1,631,184,151 | 583,963,833 | ||||||
Deutsche X-trackers MSCI Eurozone Hedged Equity ETF | 83,593,621 | 17,241,228 | ||||||
Deutsche X-trackers MSCI Germany Hedged Equity ETF | 20,210,791 | 113,517,383 | ||||||
Deutsche X-trackers MSCI Japan Hedged Equity ETF | 918,433,843 | 801,424,201 | ||||||
Deutsche X-trackers MSCI Mexico Hedged Equity ETF | 1,143,226 | 1,119,565 | ||||||
Deutsche X-trackers MSCI United Kingdom Hedged Equity ETF | 1,094,033 | — | ||||||
154
DBX ETF Trust
Notes to financial statements (Continued)
6. Fund Share Transactions
As of May 31, 2016, there were unlimited Fund shares, no par value authorized by the Trust. Fund shares are issued and redeemed by each Fund only in Creation Units or multiples thereof. Except when aggregated in Creation Units, shares of each Fund are not redeemable. Transactions in capital shares for each Fund are disclosed in detail in the Statements of Changes in Net Assets. The consideration for the purchase of Creation Units of a Fund generally consists of the in-kind contribution of a designated portfolio of securities constituting a portfolio sampling representation of the securities included in the respective Fund’s Underlying Index and an amount of cash, which under certain circumstances may include cash in lieu of portfolio securities. The purchase of Creation Units for Deutsche X-trackers MSCI Brazil Hedged Equity ETF and Deutsche X-trackers MSCI South Korea Hedged Equity ETF are generally issued in exchange for a specific amount of cash totaling the NAV of the Creation Units. Investors purchasing and redeeming Creation Units pay a purchase transaction fee and a redemption transaction fee to offset transfer and other transaction costs associated with the issuance and redemption of Creation Units.
7. Investing in Emerging Markets
Investment in emerging markets subjects a Fund to a greater risk of loss than investments in a developed market. This is due to, among other things, (i) greater market volatility, (ii) lower trading volume, (iii) political and economic instability, (iv) high levels of inflations, deflation or currency devaluation, (v) greater risk of market shut down, (vi) more governmental limitations on foreign investments and limitations on repatriation of invested capital than those typically found in a developed market, and (vii) the risk that companies may be held to lower disclosure, corporate governance, auditing and financial reporting standards than companies in more developed markets.
The financial stability of issuers (including governments) in emerging market countries may be more precarious than in other countries. As a result, there will tend to be an increased risk of price volatility in a Fund’s investments in emerging market countries, which may be magnified by currency fluctuations relative to the U.S. dollar.
Settlement practices for transactions in foreign markets may differ from those in U.S. markets. Such differences include delays beyond periods customary in the United States and practices, such as delivery of securities prior to receipt of payment, which increase the likelihood of a “failed settlement.” Failed settlements can result in losses to a Fund. Low trading volumes and volatile prices in less developed markets make trades harder to complete and settle, and governments or trade groups may compel local agents to hold securities in designated depositories that are not subject to independent evaluation. Local agents are held only to the standards of care of their local markets.
8. Line of Credit
The Trust has entered into a senior unsecured credit facility with a syndication of banks which allows the Deutsche X-trackers MSCI All World ex US Hedged Equity ETF, Deutsche X-trackers MSCI Asia Pacific ex Japan Hedged Equity ETF, Deutsche X-trackers MSCI Emerging Markets Hedged Equity ETF and certain other funds managed by the Advisor to borrow up to $130 million. Each Fund may borrow money under this credit facility to the extent necessary for temporary or emergency purposes, including the funding of shareholder redemption requests, trade settlements, and as necessary to distribute to shareholders any income necessary to maintain each Fund’s status as a regulated investment company. Borrowings are charged an interest rate of 1.25% per annum plus the greater of the Federal Funds Effective Rate or the one-month LIBOR Rate. Each Fund may borrow up to a maximum of 33 percent of its net assets as permitted by the Act. The Funds had no outstanding loans at May 31, 2016.
155
DBX ETF Trust
Report of Independent Registered Public Accounting Firm
To Board of Trustees and Shareholders of
DBX ETF Trust:
We have audited the accompanying statements of assets and liabilities of Deutsche X-trackers MSCI All World ex US Hedged Equity ETF, Deutsche X-trackers MSCI Asia Pacific ex Japan Hedged Equity ETF, Deutsche X-trackers MSCI Brazil Hedged Equity ETF, Deutsche X-trackers MSCI Emerging Markets Hedged Equity ETF, Deutsche X-trackers MSCI Europe Hedged Equity ETF, Deutsche X-trackers MSCI Eurozone Hedged Equity ETF, Deutsche X-trackers MSCI Germany Hedged Equity ETF, Deutsche X-trackers MSCI Japan Hedged Equity ETF, Deutsche X-trackers MSCI Mexico Hedged Equity ETF, Deutsche X-trackers MSCI South Korea Hedged Equity ETF and Deutsche X-trackers MSCI United Kingdom Hedged Equity ETF (the “Funds” within DBX ETF Trust), including the schedules of investments, as of May 31, 2016, and the related statements of operations for the year then ended and changes in net assets and the financial highlights for each of the periods indicated therein. These financial statements and financial highlights are the responsibility of the Funds’ management. Our responsibility is to express an opinion on these financial statements and financial highlights based on our audits.
We conducted our audits in accordance with the standards of the Public Company Accounting Oversight Board (United States). Those standards require that we plan and perform the audit to obtain reasonable assurance about whether the financial statements and financial highlights are free of material misstatement. We were not engaged to perform an audit of the Funds’ internal control over financial reporting. Our audits included consideration of internal control over financial reporting as a basis for designing audit procedures that are appropriate in the circumstances, but not for the purpose of expressing an opinion on the effectiveness of the Funds’ internal control over financial reporting. Accordingly, we express no such opinion. An audit also includes examining, on a test basis, evidence supporting the amounts and disclosures in the financial statements and financial highlights, assessing the accounting principles used and significant estimates made by management, and evaluating the overall financial statement presentation. Our procedures included confirmation of securities owned as of May 31, 2016 by correspondence with the custodian and brokers or by other appropriate auditing procedures where replies from brokers were not received. We believe that our audits provide a reasonable basis for our opinion.
In our opinion, the financial statements and financial highlights referred to above present fairly, in all material respects, the financial position of Deutsche X-trackers MSCI All World ex US Hedged Equity ETF, Deutsche X-trackers MSCI Asia Pacific ex Japan Hedged Equity ETF, Deutsche X-trackers MSCI Brazil Hedged Equity ETF, Deutsche X-trackers MSCI Emerging Markets Hedged Equity ETF, Deutsche X-trackers MSCI Europe Hedged Equity ETF, Deutsche X-trackers MSCI Eurozone Hedged Equity ETF, Deutsche X-trackers MSCI Germany Hedged Equity ETF, Deutsche X-trackers MSCI Japan Hedged Equity ETF, Deutsche X-trackers MSCI Mexico Hedged Equity ETF, Deutsche X-trackers MSCI South Korea Hedged Equity ETF and Deutsche X-trackers MSCI United Kingdom Hedged Equity ETF at May 31, 2016, the results of their operations for the year then ended and changes in their net assets and the financial highlights for each of the periods indicated therein in conformity with U.S. generally accepted accounting principles.

New York, New York
July 26, 2016
156
DBX ETF Trust
Trustees and officers (Unaudited)
| Name, Year of Birth and Address | Position(s) Held with Fund | Terms of Office Time Served | Principal Occupation(s) During Past 5 Years | Number of Portfolios in Fund Complex Overseen by Trustee | Other Directorships held by Trustee During Past 5 Years | |||||
Independent Trustees | ||||||||||
J. David Officer (1948) 345 Park Avenue New York, New York 10154 | Trustee, Chairman of the Nominating Committee and Member of the Audit Committee | Since 2011 (Chairman | Independent Director (2010-present); formerly, Vice Chairman, the Dreyfus Corporation (2006-2009); President, The Dreyfus Family of Funds, Inc. (2006-2009). | 36 | Ilex Partners (Asia), LLC; Old Westbury Funds; MAN Long/Short Fund; GLG Investment Series Trust. | |||||
Stephen R. Byers (1953) 345 Park Avenue New York, New York 10154 | Lead Independent Trustee, Member of the Audit and Nominating Committees | Since 2011 (Trustee and Member of Committees) (Lead | Independent Consultant (2014-present). | 36 | The Arbitrage Funds; Sierra Income Corporation; College of William and Mary, Graduate School of Business; Lighthouse Growth Advisors LLC; Founders Asset Management, LLC. | |||||
George O. Elston (1964) 345 Park Avenue New York, New York 10154 | Trustee, Chairman of the Audit Committee and Member of the Nominating Committee | Since 2011 (Chairman | Senior Vice President and Chief Financial Officer, Juniper Pharmaceuticals, Inc. (2014-present); Senior Vice President and Chief Financial Officer, KBI BioPharma Inc. (2013-2014); Managing Partner, Chatham Street Partners (2010-2013). | 36 | Celldex Therapeutics, Inc. | |||||
157
DBX ETF Trust
Trustees and officers (Unaudited) (Continued)
| Name, Year of Birth and Address | Position(s) Held with Fund | Terms of Office Time Served | Principal Occupation(s) During Past 5 Years | Number of Portfolios in Fund Complex Overseen by Trustee | Other Directorships held by Trustee During Past 5 Years | |||||
Interested Trustee | ||||||||||
Alex Depetris (1980) 345 Park Avenue New York, New York 10154 | Trustee, Chairman of the Board, President and Chief Executive Officer | Since 2010 | Director in the Deutsche Asset Management Passive Asset Management Group at Deutsche Bank AG (2008-present); Manager and Chief Operating Officer of the Adviser (2012-present); Associate, Arnold & Porter (2006-2008). | 36 | Director, Chairman of the Board of db-X Exchange Traded Funds Inc. | |||||
| Name, Year of Birth and Address | Position(s) Held with Fund | Terms of Office Time Served | Principal Occupation(s) During Past 5 Years | |||||||
Officers | ||||||||||
Michael Gilligan (1966) 60 Wall Street New York, New York 10005 | Treasurer, Chief Financial Officer and Controller | Since 2010 | Director in the Finance Division at Deutsche Bank AG (2008-present); Manager and Chief Financial Officer of the Adviser (2010-present); Chief Financial Officer of Global Passive Asset Management Platform (2012-present). | |||||||
Fiona Bassett (1974) 345 Park Avenue New York, New York 10154 | Chief Operating Officer | Since 2014 | Managing Director in the Deutsche Asset Management Passive Asset Management Group at Deutsche Bank AG and Head of Passive Americas Asset Management Platform (2014-present); Manager and Chief Executive Officer and Chief Investment Officer of the Adviser (2014-present); Managing Director, COO Global Key Projects and Integration at Deutsche Asset Management, (2012-2014); Managing Director at Deutsche Bank AG (2004-2012). | |||||||
Frank Gecsedi (1967) 60 Wall Street New York, New York 10005 | Chief Compliance Officer | Since 2010 | Director in the Deutsche Asset Management Compliance Department (2016-present), Vice President in the Deutsche Asset Management Compliance Department (2013-2016) and Chief Compliance Officer of the Adviser (2010-present); Vice President in Deutsche Bank’s Global Markets Legal, Risk and Capital Division (2010-2012). | |||||||
158
DBX ETF Trust
Trustees and officers (Unaudited) (Continued)
| Name, Year of Birth and Address | Position(s) Held with Fund | Terms of Office Time Served | Principal Occupation(s) During Past 5 Years | |||||||
Leslie Lowenbraun (1953) 60 Wall Street New York, New York 10005 | Secretary | Since 2016 | Vice President in U.S. Retail Passive Legal of Deutsche Asset Management (2014-present); Counsel at Skadden, Arps, Slate, Meagher & Flom LLP (2005-2014). | |||||||
Each Trustee serves until his or her successor is duly elected or appointed and qualified. Each officer serves until he or she resigns, is removed, dies, retires or becomes disqualified.
The Funds’ SAI includes additional information about the Funds’ Trustees and is available by calling 855-329-3837, or on the Company’s website at www.dbxus.com.
159
DBX ETF Trust
Board considerations in approval of investment advisory and sub-advisory contracts (Unaudited)
Deutsche X-trackers MSCI Brazil Hedged Equity ETF, Deutsche X-trackers MSCI Emerging Markets Hedged Equity ETF, Deutsche X-trackers MSCI Germany Hedged Equity ETF, Deutsche X-trackers MSCI Japan Hedged Equity ETF, Deutsche X-trackers MSCI Asia Pacific ex-Japan Hedged Equity ETF, Deutsche X-trackers MSCI Europe Hedged Equity ETF, Deutsche X-trackers MSCI United Kingdom Hedged Equity ETF, Deutsche X-trackers MSCI All World ex US Hedged Equity ETF, Deutsche X-trackers MSCI South Korea Hedged Equity ETF, Deutsche X-trackers MSCI Mexico Hedged Equity ETF and Deutsche X-trackers MSCI Eurozone Hedged Equity ETF
After discussions at meetings of the Board of Trustees (“Board” or “Trustees”) held on February 25, 2016 and February 28, 2016, at the February 28 meeting the Trustees, including the Independent Trustees (those not affiliated with DBX ETF Trust (the “Trust”) or its service providers), unanimously approved the continuance of the Investment Advisory Agreement and the Sub-Advisory Agreement with respect to Deutsche X-trackers MSCI Emerging Markets Hedged Equity ETF, Deutsche X-trackers MSCI Brazil Hedged Equity ETF, Deutsche X-trackers MSCI Germany Hedged Equity ETF, Deutsche X-trackers MSCI Japan Hedged Equity ETF, Deutsche X-trackers MSCI Asia Pacific ex Japan Hedged Equity ETF, Deutsche X-trackers MSCI Europe Hedged Equity ETF, Deutsche X-trackers MSCI United Kingdom Hedged Equity ETF, Deutsche X-trackers MSCI All World ex US Hedged Equity ETF, Deutsche X-trackers MSCI South Korea Hedged Equity ETF, Deutsche X-trackers MSCI Mexico Hedged Equity ETF and Deutsche X-trackers MSCI Eurozone Hedged Equity ETF (the “Funds”). The Independent Trustees were advised throughout the review and meetings by Independent Trustee Counsel.
In reaching this decision with respect to the Investment Advisory Agreement, the Board considered all factors it believed relevant, including (1) the nature, extent and quality of the services provided to the Funds and their shareholders; (2) the financial resources of DBX Advisors LLC (“DBX” or the “Adviser”) and its resulting ability to perform its obligations under the Investment Advisory Agreement; (3) the competitiveness of the advisory fee; (4) the total cost of the services provided by and the profits realized by the Adviser from its relationship with the Funds; and (5) the extent to which economies of scale have been realized, and if the Funds’ shareholders have benefitted from those economies.
In reaching this decision with respect to the Sub-Advisory Agreement, the Board considered all factors it believed relevant, including (1) the nature, extent and quality of the services provided to the Funds and their shareholders; (2) the performance of TDAM USA Inc. (“TDAM” or “Sub-Adviser”) with respect to its management of the Funds, as well as TDAM’s financial resources and its resulting ability to perform its obligations under the Sub-Advisory Agreement; (3) the total cost of the services provided by and the profits realized by TDAM from its relationship with the Funds; and (4) the extent to which economies of scale have been realized, and if the Funds’ shareholders have benefitted from those economies.
The Board reached a determination, with the assistance of Trust Counsel and through the exercise of its business judgment, that approval of the Investment Advisory Agreement and the Sub-Advisory Agreement and the compensation to be received thereunder is in the best interests of each Fund and its shareholders as well as consistent with the Board’s duties under state and federal law. The Board reached this conclusion based on multiple factors.
The Board considered the following in determining whether to approve the Investment Advisory Agreement:
Nature, Extent and Quality of Services. The Board reviewed in detail the nature, extent and quality of services provided by the Adviser under the Investment Advisory Agreement. The Board noted that these services include, among other things, furnishing a continuous investment program for the Funds, including arranging for, or implementing, the purchase and sale of portfolio securities, the provision of general corporate services such as portfolio management compliance services and the preparation and filing of certain reports on behalf of the Trust. The Board also considered, among other things, the professional experience and qualifications of the senior management and key professional personnel of the Adviser, including those individuals responsible for portfolio management. The Board considered that the Adviser provides, at its own expense, office facilities and equipment for use by the Funds and supervisory persons responsible for supervising and monitoring the Trust’s service providers. The Board also considered that the Adviser pays for the compensation of officers of the Trust who are also officers or employees of the Adviser, except as may otherwise be determined by the Board. The Board also considered that the Adviser arranges for the provision of transfer agency, custody, fund administration and
160
DBX ETF Trust
Board considerations in approval of investment advisory and sub-advisory contracts (Unaudited) (Continued)
accounting, and other non-distribution services necessary for the Funds’ operation. The Board also considered the role played by the Adviser in working with TDAM to manage the Funds’ portfolios, noting that the Adviser provides oversight of day-to-day operations, including monitoring tracking error, providing services in connection with the creation and redemption of creation units and assistance in meeting legal and regulatory requirements applicable to the Funds.
Based on its review, the Board concluded that the nature, extent, and quality of services provided by the Adviser under the Investment Advisory Agreement are reasonable and appropriate in relation to the fees paid to the Adviser, taking special consideration of the fact that the advisory fee is a unitary fee and, as a result, a portion of the unitary advisory fee will be used to compensate the Funds’ service providers. The Board considered the staffing of the Adviser, including the training, qualifications and experience of investment personnel in managing the Funds. The Board also considered the expertise of the Adviser in supervising third party service providers to the Funds, such as the administrator and custodian. The Board further considered the compliance program of the Adviser which supports the Funds’ compliance program.
Adviser’s Financial Resources. In connection with the assessment of the ability of the Adviser to perform its duties under the Investment Advisory Agreement, the Board considered the Adviser’s financial condition and whether it had the resources necessary to carry out its functions. The Board concluded that the Adviser had the financial resources necessary to perform its obligations under the Investment Advisory Agreement.
Reasonableness of Advisory Fee. The Board compared each Fund’s advisory fee to that of other exchange-traded funds (“ETFs”), and noted that each Fund’s fee is competitive with the fees of its respective peer group. The Board noted that the fee for the Funds is a unitary fee pursuant to which the Adviser pays all of the Funds’ costs. The Board also noted that the Funds’ portfolios are managed on a day-to-day basis by the Sub-Adviser, which receives a fee from the Adviser. The Board considered the allocation of responsibilities between the Adviser and Sub-Adviser and noted that the Adviser provides oversight of day-to-day operations, including monitoring tracking error, providing services in connection with creation and redemption units and assistance in meeting legal and regulatory requirements applicable to the Funds. Based on its review, the Board concluded that the advisory fee is reasonable in light of the services provided.
Costs of Services and Profitability. The Board considered the expenses of the Adviser in developing and rendering services to the Funds, and the information provided by the Adviser to the Board regarding the Funds’ profitability. The Board noted that the Adviser had provided extensive information about the Adviser’s profitability and the Adviser’s methodology in determining profitability. The Board also noted that while the Adviser had provided information about the Adviser’s expenses relating to marketing the Funds, the Board considered the Adviser’s profitability without accounting for such expenses. The Board determined that the Adviser’s profitability with respect to each Fund was not excessive. The Board also noted that since the fee paid by the Adviser to the Sub-Adviser under the Sub-Advisory Agreement contained breakpoints, the Adviser could experience increased profitability as the Funds’ assets increased. The Board considered whether the Adviser would benefit in other ways from its relationships with the Funds, and concluded that there were no material fall-out benefits likely to accrue to the Adviser related to the operation of the Funds.
Economies of Scale. The Board noted that while certain Funds had experienced dramatic asset inflows during 2015, it was too early to determine whether those Funds were realizing economies of scale. The Board also noted that most of the Funds were not experiencing economies of scale at this time and determined to evaluate economies of scale on an ongoing basis as a result of asset growth of the Funds.
Given all the information available to it and considering all material factors, the Board concluded that the Investment Advisory Agreement was fair and reasonable and it was unanimously approved.
The Board considered the following in determining whether to approve the Sub-Advisory Agreement:
Nature, Extent and Quality of Services. In considering the nature, extent and quality of services that TDAM provides to the Funds, the Board reviewed in detail the nature, extent and quality of services provided by TDAM under the Sub-Advisory Agreement. The Board noted that these services include, among other things, furnishing
161
DBX ETF Trust
Board considerations in approval of investment advisory and sub-advisory contracts (Unaudited) (Continued)
a continuous investment program for the Funds, including arranging for, or implementing, the purchase and sale of portfolio securities.
The Board also considered TDAM’s operational capabilities and resources. The Board considered the professional experience and qualifications of TDAM’s senior management and key professional personnel, as well as TDAM’s depth and breadth of experience in managing investment portfolios consisting of U.S. and non-U.S. equity securities. The Board gave special consideration to TDAM’s experience and capabilities in implementing currency hedging strategies, and their techniques for implementing such strategies while minimizing index tracking error. In addition, the Board considered TDAM’s operational capabilities and resources, and TDAM’s experience in managing index funds covering various asset classes.
Based on its review, the Board concluded that the nature, extent, and quality of services provided by TDAM under the Sub-Advisory Agreement are reasonable and appropriate in relation to the fees paid to TDAM, taking special consideration of the fact that the fees paid to TDAM are payable by the Adviser and not the Funds.
Performance of TDAM; TDAM’s Financial Resources. The Board considered TDAM’s performance in managing the Funds and its ability to minimize tracking error. The Board concluded that, given TDAM’s capabilities and experience in managing the Funds, TDAM had generally been able to keep the Funds’ tracking error within acceptable ranges.
The Board also considered TDAM’s financial condition and whether it had the resources necessary to carry out its functions. The Board concluded that TDAM had the financial resources necessary to perform its obligations under the Sub-Advisory Agreement.
Reasonableness of Sub-Advisory Fee. The Board noted that the fee paid to TDAM in respect of the Funds would be paid by the Adviser and not the Funds. The Board further noted that the fee for the Funds was a unitary fee pursuant to which the Adviser would pay all of the Funds’ costs, and thus was not directly affected by the amount of the sub-advisory fee paid to TDAM. Based on its review, the Board concluded that the sub-advisory fee was reasonable in light of the services provided.
Costs of Services and Profitability. The Board noted that the fees paid by the Adviser to TDAM under the Sub-Advisory Agreement contain breakpoints. The Board further noted that specific information about TDAM’s profitability with respect to its services provided to the Funds was not available because TDAM does not calculate the profitability of its sub-advisory services on a per-Fund level. The Board also noted that the overall fees paid by each Fund remained reasonable.
The Board also considered whether TDAM would benefit in other ways from its relationship with the Funds. The Board discussed TDAM’s practices regarding the selection and compensation of brokers and dealers that execute portfolio transactions for the Funds and the brokers’ and dealers’ provision of brokerage services to TDAM. The Board discussed the potential benefits TDAM might derive from the Funds’ soft dollar arrangements, whereby brokers provide brokerage services to the Funds or TDAM in return for allocating fund brokerage.
Economies of Scale. The Board noted that while certain Funds had experienced dramatic asset inflows during 2015, it was too early to determine whether those Funds were realizing economies of scale. The Board also noted that most of the Funds were not experiencing economies of scale at this time and determined to evaluate economies of scale on an ongoing basis as a result of asset growth of the Funds.
Given all the information available to it and considering all material factors, the Board concluded that the Sub-Advisory Agreement was fair and reasonable and it was unanimously approved.
162
DBX ETF Trust
Additional information (Unaudited)
Proxy Voting Policies and Procedures
The Funds’ policies and procedures for voting proxies for portfolio securities and information about how each Fund voted proxies related to its portfolio securities during the 12-month period ended May 31 are available on our Web site — www.deutsche-etfs.com (click on “proxy voting” at the bottom of the page) — or on the SEC’s Web site — www.sec.gov. To obtain a written copy of the Funds’ policies and procedures without charge, upon request, call us toll free at (855) 329-3837.
Quarterly Portfolio Disclosure
The Funds are required to file their complete schedule of portfolio holdings with the SEC for their first and third fiscal quarters on Form N-Q. Copies of the filings are available without charge, upon request on the SEC’s website at www.sec.gov and are available by calling the Company at 855-329-3837. You can also obtain copies of Form N-Q by (i) visiting the SEC’s Public Reference Room in Washington, DC (information on the operation of the Public Reference Room may be obtained by calling 800-SEC-0330); (ii) sending your request and a duplicating fee to the SEC’s Public Reference Room, Washington, DC 20549-0102; or (iii) sending your request electronically to publicinfo@sec.gov.
Information about each Fund’s portfolio holdings is available daily at www.deutsche-etfs.com.
Discount & Premium Information
Information regarding how often shares of each Fund traded on NYSE Arca at a price above (i.e., at a premium) or below (i.e., at a discount) the Net Asset Value of the Fund can be found at www.deutsche-etfs.com.
Tax Information
Form 1099-DIV and other year-end tax information provide shareholders with actual calendar year amounts that should be included in their tax returns. Shareholders should consult their tax advisors.
Each Fund designates the following amounts or, if subsequently determined to be different, the maximum amount allowable for its fiscal year ended May 31, 2016.
| Qualified Dividend Income* | ||||
Deutsche X-trackers MSCI All World ex US Hedged Equity ETF | 55% | |||
Deutsche X-trackers MSCI Asia Pacific ex Japan Hedged ETF | 43% | |||
Deutsche X-trackers MSCI Brazil Hedged Equity ETF | 1% | |||
Deutsche X-trackers MSCI Emerging Markets Hedged Equity ETF | 51% | |||
Deutsche X-trackers MSCI Europe Hedged Equity ETF | 41% | |||
Deutsche X-trackers MSCI Eurozone Hedged Equity ETF | 43% | |||
Deutsche X-trackers MSCI Germany Hedged Equity ETF | 35% | |||
Deutsche X-trackers MSCI Japan Hedged Equity ETF | 14% | |||
Deutsche X-trackers MSCI Mexico Hedged Equity ETF | 19% | |||
Deutsche X-trackers MSCI South Korea Hedged Equity ETF | 100% | |||
Deutsche X-trackers MSCI United Kingdom Hedged Equity ETF | 39% | |||
* The above percentage is based on ordinary income dividends paid to shareholders during each Fund’s fiscal year.
163
DBX ETF Trust
Additional information (Unaudited) (Continued)
Each Fund intends to elect to pass through to shareholders the credit for taxes paid to foreign countries. The gross foreign source income and foreign taxes paid are as follows:
| Gross Foreign Income | Foreign Taxes Paid | |||||||
Deutsche X-trackers MSCI All World ex US Hedged Equity ETF | $ 2,113,515 | $ 147,818 | ||||||
Deutsche X-trackers MSCI Asia Pacific ex Japan Hedged ETF | 263,346 | 19,809 | ||||||
Deutsche X-trackers MSCI Emerging Markets Hedged Equity ETF | 5,158,876 | 610,883 | ||||||
Deutsche X-trackers MSCI Europe Hedged Equity ETF | 123,062,288 | 5,017,919 | ||||||
Deutsche X-trackers MSCI Eurozone Hedged Equity ETF | 2,265,444 | 169,471 | ||||||
Deutsche X-trackers MSCI Germany Hedged Equity ETF | 3,333,497 | 513,813 | ||||||
Deutsche X-trackers MSCI Japan Hedged Equity ETF | 26,357,873 | 2,614,539 | ||||||
Deutsche X-trackers MSCI Mexico Hedged Equity ETF | 133,073 | 1,009 | ||||||
Deutsche X-trackers MSCI South Korea Hedged Equity ETF | 2,083,658 | 462,361 | ||||||
Deutsche X-trackers MSCI United Kingdom Hedged Equity ETF | 209,883 | 1,253 | ||||||
164
DBX ETF Trust
Privacy policy notice (Unaudited)
DBX Advisors LLC (“Advisors”) collects non-public information about you from the following sources: (i) information received from you on applications or other forms; and (ii) information about your transactions with the Advisors, Advisors’ affiliates and third-party service providers and vendors. Advisors does not disclose any non-public personal information about you to anyone, other than as set forth below, as permitted by applicable law and regulation. Advisors may disclose non-public personal information about you to the funds in which you invest, to Advisors’ affiliates, and to non-affiliated companies that work with Advisors to service your account(s), or to provide services or process transactions that you have requested. Advisors may disclose non-public personal information in situations that may include, but are not limited to, in response to legal and/or regulatory inquiries and the proposed or actual sale, assignment merger or other transfer of all or a portion of Advisors’ business to another business entity. Advisors may also disclose non-public personal information about you to parties representing you, such as your investment representative, your accountant, your tax adviser, or to other third parties at your direction/consent. Advisors will not sell, rent, license or trade your personal and financial information to or with third parties for their own direct marketing use unless you give us general or specific consent to do so. If you decide to close your account(s) or become an inactive customer, Advisors will adhere to the privacy policies and practices as described in this notice. Advisors restricts access to your personal and account information to those employees who need to know that information to provide products and services to you. Advisors maintains reasonable and customary physical, electronic and procedural safeguards to guard your non-public personal information.
Advisors reserves the right, at their discretion, to change, modify, add, or remove portions of this Privacy Policy Notice, and any of the policies described herein, at any time. Advisors will indicate any such changes to the Privacy Policy Notice at the privacy link which can be found at www.deutsche-etfs.com. At all times, you are bound by the then-current version of the Privacy Policy and all applicable laws. Advisors highly recommends that you review this Privacy Policy Notice from time to time to ensure that you are familiar with the most recent version. The examples contained in this Privacy Policy Notice are illustrations; they are not intended to be exclusive.
165
DBX ETF Trust
This report is intended for the shareholders of DBX ETF Trust.
Carefully consider a Fund’s investment objectives, risk factors and charges and expenses before investing. This and other information can be found in the Fund’s prospectus, which may be obtained by calling 1-855-DBX-ETFS (1-855-329-3837), or by viewing or downloading a prospectus at www.deutsche-etfs.com. Read the prospectus carefully before investing.
Investing involves risk, including the possible loss of principal. Stocks may decline in value. Foreign investing involves greater and different risks than investing in US companies, including currency fluctuations, less liquidity, less developed or less efficient trading markets, lack of comprehensive company information, political instability and differing auditing and legal standards. Emerging markets tend to be more volatile and less liquid than the markets of more mature economies, and generally have less diverse and less mature economic structures and less stable political systems than those of developed countries. The Funds’ use of forward currency contracts may not be successful in hedging currency exchange rates changes and could eliminate some or all of the benefit of an increase in the value of a foreign currency versus the US dollar. Funds investing in a single industry, country or in a limited geographic region generally are more volatile than more diversified funds. Investing in derivatives entails special risks relating to liquidity, leverage and credit that may reduce returns and/or increase volatility. Performance of the Funds may diverge from that of the Underlying Index due to operating expenses, transaction costs, cash flows, use of sampling strategies or operational inefficiencies. An investment in these Funds should be considered only as a supplement to a complete investment program for those investors willing to accept the risks associated with the Funds. See the prospectus for details.
In June 2016, the United Kingdom approved a referendum to leave the EU, creating economic and political uncertainty in its wake. Significant uncertainty exists regarding the timing of the United Kingdom’s anticipated withdrawal from the EU and the effects such withdrawal will have on the United Kingdom’s economy and on markets in the United Kingdom and throughout the world.
Shares of the Funds are bought and sold at market price (not NAV) throughout the day on the New York Stock Exchange. Transactions in Fund shares may result in brokerage commissions and may generate tax consequences. There can be no assurance that an active trading market for shares of a fund will develop or be maintained.
DBX ETF Trust Funds are distributed by ALPS Distributors, Inc. The Funds are managed by DBX Advisors LLC which is not affiliated with ALPS.
Deutsche Asset Management is the brand name for the asset management activities conducted by Deutsche Bank AG or any of its subsidiaries. Clients will be provided Deutsche Asset Management products or services by one or more legal entities that will be identified to clients pursuant to the contracts, agreements, offering materials or other documentation relevant to such products or services.
The funds or securities referred to herein are not sponsored, endorsed, or promoted by MSCI, and MSCI bears no liability with respect to any such funds or securities or any index on which such funds or securities are based. The prospectus contains a more detailed description of the limited relationship MSCI has with DBX and any related funds.
Copyright © 2016 Deutsche Bank AG. All rights reserved. Deutsche X-trackers® is a registered trademark of Deutsche Bank AG. All other trademarks, servicemarks or registered trademarks are the property of their respective owners.
Not FDIC Insured | No Bank Guarantee | May Lose Value
DBX ETF Trust
Investment advisor DBX Advisors LLC 345 Park Ave. New York, NY 10154 | Investment sub-advisor TDAM USA Inc. 161 Bay Street, 35th Floor TD Canada Trust Tower Toronto, Ontario Canada M5J 2T2 | Administrator, custodian, fund accountant, lending agent & transfer agent The Bank of New York Mellon 101 Barclay Street New York, NY 10286 | ||
Distributor ALPS Distributors, Inc. 1290 Broadway Suite 1100 Denver, CO 80203 | Independent registered public accounting firm Ernst & Young LLP 5 Times Square New York, NY 10036 | Legal counsel Dechert LLP 1095 Avenue of the Americas New York, NY 10036 | ||
R-35361-3 (7/16) DBX 002025 (7/17)

May 31, 2016
Annual Report
DBX ETF Trust
Deutsche X-trackers MSCI EAFE Hedged Equity ETF (DBEF)

DBX ETF Trust
| Page | ||||
| 1 | ||||
| 3 | ||||
| 4 | ||||
| 6 | ||||
| 7 | ||||
| 26 | ||||
| 27 | ||||
| 28 | ||||
| 29 | ||||
| 30 | ||||
| 37 | ||||
| 38 | ||||
Board Considerations in Approval of Investment Advisory and Sub-Advisory Contracts (Unaudited) | 40 | |||
| 43 | ||||
| 44 | ||||
To our shareholders: (Unaudited)
Dear Shareholder,
We are pleased to provide this annual report for Deutsche X-trackers MSCI EAFE Hedged Equity ETF for the period ended May 31, 2016.
Global growth fell short of expectations over the reporting period with markets reacting to China’s slowing growth, falling commodity prices and divergent central bank policies. The Federal Reserve Board (FRB) hiked rates in December on the back of improving labor market conditions and strong macroeconomic growth, while the European Central Bank (ECB) further eased monetary policy in March 2016 and cut bank deposit rates by 10 basis points (100 basis points equals one percentage point) to -0.4%. In addition, the ECB raised the volume of monthly asset purchases from EUR 60 billion to EUR 80 billion. China lowered its reserve ratio and cut interest rates to foster liquidity and growth. The increasing divergence in monetary policies between the US and other major economies has played a role in strengthening the USD.
Growth in the Eurozone continued at a moderate pace, supported by accommodative monetary policy from the ECB and low oil prices. Equity markets were subject to periods of volatility, with markets reacting negatively to the devaluation of the Renminbi (RMB) and concerns over growth in the US and China. Greece secured a bailout package and received approval for additional loans from its creditors easing concerns of its exit from the Euro currency. Germany continued to grow steadily, fueled by booming construction activity, a buoyant labor market, the ECB’s monetary stimulus and low commodity prices. Growth prospects in France are improving, with the economy picking up steam in the first quarter of this year, supported by steady private consumption and investment. France’s attempt to deal with unemployment through its recent labor reforms has created some unease in markets. The recovery in the UK remained fragile due to global headwinds and Britain’s anticipated departure from the EU. The service sector and consumer demand contributed positively, while the slowdown was led by a weak external sector.
Japan continued to grow at a subdued rate despite introducing a ‘Quantitative and Qualitative Easing’ (QQE) program to help spur wage growth, consumer spending and investment. The QQE involves pursuing monetary easing via negative interest rates, JPY 80 trillion of purchases and buying a broader mix of assets. Markets reacted negatively to this unconventional move and were further weighed down by the slowdown in China’s economy and a strengthening JPY. Australia continued to grow at a modest pace, with growth accelerating in the latter half of 2015. The Reserve Bank of Australia cut cash rates to a record low on the back of unexpectedly weak inflation data and a challenging external environment.
The world economy remained on a moderate growth path, despite the challenging macroeconomic backdrop and political uncertainties. While Japanese and European equities are expected to be supported by further monetary policy initiatives, US equities could face headwinds from a strong USD as the FRB continues to lift rates at a cautious pace to offset the softer pace of global economic growth. In the current market environment, hedging currency exposure plays a significant role in managing investments in international equities. In the backdrop of a strengthening USD, our currency-hedged strategy has made a positive contribution to the funds’ overall performance.
Our team appreciates your trust and looks forward to serving your investment needs through innovative index-driven strategies.
Sincerely,
/s/ Alex N. Depetris
Alex N. Depetris
Chairman, President and Chief Executive Officer
Assumptions, estimates and opinions contained in this document constitute our judgment as of the date of the document and are subject to change without notice. Any projections are based on a number of assumptions as to market conditions and there can be no guarantee that any projected results will be achieved. Past performance is not a guarantee of future results
1
This Page is Intentionally Left Blank
2
DBX ETF Trust
Management’s discussion of fund performance (Unaudited)
The Deutsche X-trackers MSCI EAFE Hedged Equity ETF (DBEF) seeks investment results that correspond generally to the performance, before fees and expenses, of the MSCI EAFE US Dollar Hedged Index (the DBEF Index). The DBEF Index is designed to provide exposure to equity securities in developed international stock markets, while at the same time mitigating exposure to fluctuations between the value of the US dollar and select non-US currencies. The DBEF Index included, among others, securities from the following 21 developed market countries: Australia, Austria, Belgium, Denmark, Finland, France, Germany, Hong Kong, Ireland, Israel, Italy, Japan, Netherlands, New Zealand, Norway, Portugal, Singapore, Spain, Sweden, Switzerland and the United Kingdom. For the 12-month period ended May 31, 2016, DBEF shares returned -10.90%, compared with the DBEF Index return of -10.52%.
Consumer Staples was the only sector that contributed positively to the DBEF Index, while Financials, Consumer Discretionary and Materials were the main contributors to negative performance. In terms of contribution by region, UK, Japan and Switzerland contributed negatively to performance.
*************************
Performance data quoted represents past performance and does not guarantee future results. Investment returns and principal value of an investment will fluctuate so that an investor’s shares, when sold or redeemed, may be worth more or less than their original cost. Current performance may be lower or higher than the performance data quoted. To obtain the most recent month-end performance data visit www.deutsche-etfs.com. Returns assume that dividends and capital gains distributions have been reinvested. See pages 4-5 of this report for additional performance information, including performance data based on market value.
The views expressed in this report reflect those of the portfolio management team only through the end of the period of the report as stated on the cover. The management team’s views are subject to change at any time based on market and other conditions and should not be construed as a recommendation. Current and future portfolio holdings are subject to risk.
3
DBX ETF Trust
Performance summary (Unaudited)
Deutsche X-trackers MSCI EAFE Hedged Equity ETF (DBEF)
The Deutsche X-trackers MSCI EAFE Hedged Equity ETF seeks investment results that correspond generally to the performance, before fees and expenses, of the MSCI EAFE US Dollar Hedged Index (the “Underlying Index”). The Underlying Index is designed to provide exposure to equity securities in developed international stock markets, while at the same time mitigating exposure to fluctuations between the value of the U.S. dollar and select non-U.S. currencies. As of May 31, 2016, the Index included securities from the following 21 countries: Australia, Austria, Belgium, Denmark, Finland, France, Germany, Hong Kong, Ireland, Israel, Italy, Japan, Netherlands, New Zealand, Norway, Portugal, Singapore, Spain, Sweden, Switzerland and the United Kingdom. It is not possible to invest directly into and index.
Performance as of 5/31/16
| Average Annual Total Return | ||||||||
| Net Asset Value | Market Value | MSCI EAFE US Dollar Hedged Index | MSCI EAFE Index | |||||
One Year | -10.90% | -11.29% | -10.52% | -9.68% | ||||
Since Inception1 | 7.09% | 7.04% | 7.55% | 2.66% | ||||
| Cumulative Total Returns | ||||||||
| Net Asset Value | Market Value | MSCI EAFE US Dollar Hedged Index | MSCI EAFE Index | |||||
One Year | -10.90% | -11.29% | -10.52% | -9.68% | ||||
Since Inception1 | 40.69% | 40.38% | 43.69% | 13.95% | ||||
1 Total returns are calculated based on the commencement of operations, 6/9/11 (“Inception”).
Past performance is no guarantee of future results. Current performance may be lower or higher than the performance data quoted. Performance data current to the most recent month-end is available at www.deutsche-etfs.com. Performance results assume reinvestment of all dividends and capital gain distributions and do not reflect the deduction of taxes that a shareholder would pay on fund distributions or on the sale of fund shares or redemption of creation units. The investment return and principal value of shares will vary with changes in market conditions. Shares may be worth more or less than their original cost when they are sold in the market or redeemed. The estimated operating expense ratio as disclosed in the most recent prospectus dated September 30, 2015, was 0.35%.
Net asset value or “NAV” is the value of one share of a fund as calculated in accordance with the standard formula for valuing mutual fund shares. The price used to calculate market return (“Market Price”) is determined by using the midpoint between the highest bid and the lowest offer on the primary stock exchange on which shares of a fund are listed for trading, as of the time that such fund’s NAV is calculated. Since shares of a fund may not have traded in the secondary market until after the fund’s inception, for the period from inception to the first day of secondary trading, the NAV of the fund is used as a proxy for the Market Price to calculate market returns. Market and NAV returns assume that dividends and capital gain distributions have been reinvested at Market Price and NAV, respectively.
An index is a statistical composite that tracks a specified financial market or sector. Unlike a fund, an index does not actually hold a portfolio of securities and therefore does not incur the expenses incurred by a fund. These expenses negatively impact fund performance. Also, market returns do not include brokerage commissions that may be payable on secondary market transactions. If brokerage commissions were included, market returns would be lower.
4
DBX ETF Trust
Performance summary (Unaudited)
Deutsche X-trackers MSCI EAFE Hedged Equity ETF (DBEF) (Continued)
Growth of an Assumed $10,000 Investment
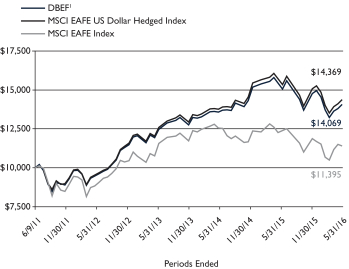
1 Based on Net Asset Value from commencement of operations, 6/9/11.
Sector Diversification* as of 5/31/16
Financials | 23.9% | |||
Industrials | 13.4% | |||
Consumer Staples | 12.7% | |||
Consumer Discretionary | 12.7% | |||
Health Care | 11.7% | |||
Materials | 6.7% | |||
Information Technology | 5.2% | |||
Telecommunication Services | 5.2% | |||
Energy | 4.7% | |||
Utilities | 3.8% | |||
|
| |||
Total | 100.0% |
Ten Largest Equity Holdings as of 5/31/16 (12.2% of Net Assets)
| Description | % of Net Assets | |||
Nestle SA (Switzerland) | 1.9% | |||
Royal Dutch Shell PLC (Netherlands) | 1.6% | |||
Roche Holding AG (Switzerland) | 1.5% | |||
Novartis AG (Switzerland) | 1.5% | |||
Toyota Motor Corp. (Japan) | 1.2% | |||
HSBC Holdings PLC (United Kingdom) | 1.0% | |||
British American Tobacco PLC (United Kingdom) | 0.9% | |||
Total SA (France) | 0.9% | |||
Novo Nordisk A/S (Denmark) | 0.9% | |||
GlaxoSmithKline PLC (United Kingdom) | 0.8% | |||
Country Diversification* as of 5/31/16
Japan | 23.3% | |||
United Kingdom | 17.5% | |||
France | 9.8% | |||
Switzerland | 9.4% | |||
Germany | 9.0% | |||
Australia | 7.1% | |||
Netherlands | 3.9% | |||
Spain | 3.1% | |||
Hong Kong | 3.1% | |||
Sweden | 2.8% | |||
Denmark | 2.0% | |||
Other | 9.0% | |||
|
| |||
Total | 100.0% |
* As a percent of total investments excluding securities lending collateral.
Portfolio holdings and characteristics are subject to change. For more complete details about the Fund’s investment portfolio see page 7.
5
DBX ETF Trust
As a shareholder of the Fund, you incur two types of costs: (1) transaction costs, including brokerage commissions paid on purchases and sales of fund shares, and (2) ongoing costs, including management fees and other Fund expenses. The expense examples below are intended to help you understand your ongoing costs (in dollars) of investing in the Fund and to compare these costs with the ongoing costs of investing in other funds.
The examples in the table are based on an investment of $1,000 invested at the beginning of the six month period and held for the entire period (December 1, 2015 to May 31, 2016).
Actual expenses
The first line in the following tables provides information about actual account values and actual expenses. You may use the information in this line, together with the amount you invested, to estimate the expenses that you paid over the period. Simply divide your account value by $1,000 (for example, an $8,600 account value divided by $1,000 = 8.6), then multiply the result by the number in the first line under the heading “Expenses Paid During the Period” to estimate the expenses you paid on your account during this period.
Hypothetical example for comparison purposes
The second line in the following tables provides information about hypothetical account values and hypothetical expenses based on the Funds’ actual expense ratios and an assumed rate of return of 5% per year before expenses (which is not the Funds’ actual return). The hypothetical account values and expenses may not be used to estimate the actual ending account balance or expenses you paid for the period. You may use this information to compare the ongoing costs of investing in the Fund and other funds. To do so, compare this 5% hypothetical example with the 5% hypothetical examples that appear in the shareholder reports of the other funds.
Please note that the expenses shown in the tables are meant to highlight your ongoing costs only, and do not reflect any transactional costs. Therefore the second line in the table is useful in comparing ongoing costs only, and will not help you determine the relative total costs of owning different funds. In addition, if these transactional costs were included, your costs would have been higher.
| Beginning Account Value December 1, 2015 | Ending Account Value May 31, 2016 | Annualized Expense Ratio | Expenses Paid During the Period Per $1,000(1) | |||||||||||||
| Deutsche X-trackers MSCI EAFE Hedged Equity ETF | ||||||||||||||||
Actual | $ | 1,000.00 | $ | 940.80 | 0.35 | % | $ | 1.70 | ||||||||
Hypothetical (5% return before expenses) | $ | 1,000.00 | $ | 1,023.25 | 0.35 | % | $ | 1.77 | ||||||||
(1) Expenses are equal to each Fund’s annualized expense ratio, multiplied by the average account value over the period, multiplied by 183 (the number of days in the most recent six-month period), then divided by 366.
6
DBX ETF Trust
Deutsche X-trackers MSCI EAFE Hedged Equity ETF
May 31, 2016
Number | Value | |||||||
| COMMON STOCKS — 98.5% | ||||||||
| Australia — 7.0% | ||||||||
AGL Energy Ltd. | 664,154 | $ | 8,923,549 | |||||
Alumina Ltd. (a) | 2,506,216 | 2,563,093 | ||||||
Amcor Ltd. | 1,140,018 | 13,413,915 | ||||||
AMP Ltd. | 2,911,453 | 11,868,022 | ||||||
APA Group (b) | 1,096,870 | 6,952,551 | ||||||
Aristocrat Leisure Ltd. | 522,646 | 4,857,782 | ||||||
Asciano Ltd. | 607,192 | 3,901,371 | ||||||
ASX Ltd. | 190,566 | 6,130,451 | ||||||
Aurizon Holdings Ltd. | 2,060,592 | 6,716,732 | ||||||
AusNet Services | 1,680,194 | 1,912,623 | ||||||
Australia & New Zealand Banking Group Ltd. | 2,871,904 | 52,888,200 | ||||||
Bank of Queensland Ltd. | 364,173 | 3,061,096 | ||||||
Bendigo and Adelaide Bank Ltd. | 442,566 | 3,275,423 | ||||||
BHP Billiton Ltd. | 3,161,432 | 43,596,504 | ||||||
BHP Billiton PLC | 2,079,020 | 24,781,784 | ||||||
Boral Ltd. | 720,573 | 3,541,411 | ||||||
Brambles Ltd. | 1,554,253 | 14,434,917 | ||||||
Caltex Australia Ltd. | 265,775 | 6,285,168 | ||||||
Challenger Ltd. | 552,949 | 3,824,604 | ||||||
CIMIC Group Ltd. | 98,346 | 2,658,384 | ||||||
Coca-Cola Amatil Ltd. | 555,007 | 3,562,057 | ||||||
Cochlear Ltd. | 54,767 | 4,776,477 | ||||||
Commonwealth Bank of Australia | 1,680,824 | 94,063,459 | ||||||
Computershare Ltd. | 454,633 | 3,529,025 | ||||||
Crown Resorts Ltd. | 352,936 | 3,071,227 | ||||||
CSL Ltd. | 455,616 | 38,119,477 | ||||||
Dexus Property Group REIT | 952,801 | 5,963,614 | ||||||
Domino’s Pizza Enterprises Ltd. | 60,400 | 3,006,467 | ||||||
DUET Group (b) | 2,244,528 | 3,812,258 | ||||||
Flight Centre Travel Group Ltd. (a) | 53,634 | 1,225,333 | ||||||
Fortescue Metals Group Ltd. (a) | 1,508,498 | 3,249,006 | ||||||
Goodman Group REIT | 1,750,490 | 8,995,363 | ||||||
GPT Group REIT | 1,768,800 | 6,877,814 | ||||||
Harvey Norman Holdings Ltd. | 532,190 | 1,753,965 | ||||||
Healthscope Ltd. | 1,681,470 | 3,645,859 | ||||||
Incitec Pivot Ltd. | 1,634,927 | 4,076,683 | ||||||
Insurance Australia Group Ltd. | 2,393,336 | 10,171,159 | ||||||
LendLease Group (b) | 528,807 | 5,132,898 | ||||||
Macquarie Group Ltd. | 301,480 | 16,313,825 | ||||||
Medibank Pvt Ltd. | 2,710,906 | 6,269,803 | ||||||
Mirvac Group REIT | 3,544,740 | 4,983,029 | ||||||
National Australia Bank Ltd. | 2,596,611 | 50,952,579 | ||||||
Newcrest Mining Ltd.* | 754,516 | 10,399,407 | ||||||
Oil Search Ltd. | 1,348,978 | 6,620,093 | ||||||
Orica Ltd. (a) | 354,466 | 3,484,199 | ||||||
Origin Energy Ltd. | 1,722,519 | 7,108,690 | ||||||
Platinum Asset Management Ltd. (a) | 224,762 | 1,068,903 | ||||||
Qantas Airways Ltd.* | 493,805 | 1,099,248 | ||||||
QBE Insurance Group Ltd. | 1,349,812 | 12,136,211 | ||||||
Ramsay Health Care Ltd. | 139,244 | 7,321,481 | ||||||
REA Group Ltd. | 51,001 | 2,063,852 | ||||||
Santos Ltd. | 1,606,248 | 5,258,965 | ||||||
Scentre Group REIT | 5,240,977 | 17,651,744 | ||||||
Seek Ltd. | 317,084 | 3,735,523 | ||||||
Sonic Healthcare Ltd. | 386,546 | 5,978,668 | ||||||
Number | Value | |||||||
| Australia (Continued) | ||||||||
South32 Ltd.* | 5,240,451 | $ | 5,908,574 | |||||
Stockland REIT | 2,354,610 | 7,709,152 | ||||||
Suncorp Group Ltd. | 1,266,467 | 11,881,137 | ||||||
Sydney Airport (b) | 1,075,344 | 5,502,628 | ||||||
Tabcorp Holdings Ltd. | 803,978 | 2,568,360 | ||||||
Tatts Group Ltd. | 1,402,617 | 3,994,154 | ||||||
Telstra Corp. Ltd. | 4,212,018 | 17,017,332 | ||||||
TPG Telecom Ltd. | 334,079 | 2,974,742 | ||||||
Transurban Group (b) | 2,003,679 | 17,450,370 | ||||||
Treasury Wine Estates Ltd. | 726,584 | 5,429,950 | ||||||
Vicinity Centres REIT | 3,312,197 | 7,804,107 | ||||||
Vocus Communications Ltd. | 437,800 | 2,977,521 | ||||||
Wesfarmers Ltd. | 1,108,509 | 32,551,836 | ||||||
Westfield Corp. REIT | 1,943,292 | 15,056,440 | ||||||
Westpac Banking Corp. | 3,283,574 | 72,857,561 | ||||||
Woodside Petroleum Ltd. | 729,916 | 14,454,827 | ||||||
Woolworths Ltd. | 1,251,049 | 20,000,870 | ||||||
|
| |||||||
| 839,205,502 | ||||||||
|
| |||||||
| Austria — 0.2% | ||||||||
ANDRITZ AG | 74,706 | 3,804,872 | ||||||
Erste Group Bank AG* | 274,999 | 7,358,723 | ||||||
OMV AG (a) | 141,055 | 3,931,448 | ||||||
Raiffeisen Bank International AG*(a) | 112,227 | 1,501,546 | ||||||
Voestalpine AG | 108,909 | 3,730,433 | ||||||
|
| |||||||
| 20,327,022 | ||||||||
|
| |||||||
| Belgium — 1.4% | ||||||||
Ageas | 198,249 | 8,019,207 | ||||||
Anheuser-Busch InBev NV | 791,538 | 100,267,704 | ||||||
Colruyt SA | 68,305 | 4,058,355 | ||||||
Delhaize Group (a) | 102,622 | 10,759,347 | ||||||
Groupe Bruxelles Lambert SA | 79,417 | 6,751,806 | ||||||
KBC Groep NV* | 246,927 | 14,619,015 | ||||||
Proximus SA | 145,674 | 4,732,833 | ||||||
Solvay SA | 72,954 | 7,402,871 | ||||||
Telenet Group Holding NV* | 51,044 | 2,430,207 | ||||||
UCB SA | 124,451 | 8,993,605 | ||||||
Umicore SA | 91,180 | 4,595,725 | ||||||
|
| |||||||
| 172,630,675 | ||||||||
|
| |||||||
| Chile — 0.0% | ||||||||
Antofagasta PLC (a) | 382,110 | 2,374,213 | ||||||
|
| |||||||
| China — 0.0% | ||||||||
Yangzijiang Shipbuilding Holdings Ltd. | 1,837,900 | 1,221,174 | ||||||
|
| |||||||
| Denmark — 2.0% | ||||||||
A.P. Moeller — Maersk A/S, Class A | 3,651 | 4,552,349 | ||||||
A.P. Moeller — Maersk A/S, Class B | 6,661 | 8,579,474 | ||||||
Carlsberg A/S, Class B | 105,298 | 10,160,098 | ||||||
Chr Hansen Holding A/S | 97,342 | 6,169,881 | ||||||
Coloplast A/S, Class B | 119,304 | 9,030,745 | ||||||
Danske Bank A/S | 694,986 | 20,055,171 | ||||||
DSV A/S | 189,488 | 8,642,855 | ||||||
Genmab A/S*(a) | 55,807 | 10,084,949 | ||||||
ISS A/S | 164,487 | 6,631,449 | ||||||
Novo Nordisk A/S, Class B | 1,827,259 | 101,631,322 | ||||||
| See Notes to Financial Statements. | 7 |
DBX ETF Trust
Schedule of investments
Deutsche X-trackers MSCI EAFE Hedged Equity ETF (Continued)
May 31, 2016
Number | Value | |||||||
| Denmark (Continued) | ||||||||
Novozymes A/S, Class B (a) | 229,680 | $ | 10,926,181 | |||||
Pandora A/S | 114,365 | 16,997,266 | ||||||
TDC A/S | 786,891 | 3,938,752 | ||||||
Tryg A/S (a) | 111,983 | 2,207,931 | ||||||
Vestas Wind Systems A/S | 220,568 | 15,805,058 | ||||||
William Demant Holding A/S*(a) | 118,385 | 2,497,088 | ||||||
|
| |||||||
| 237,910,569 | ||||||||
|
| |||||||
| Finland — 1.0% | ||||||||
Elisa OYJ | 136,225 | 5,189,755 | ||||||
Fortum OYJ (a) | 437,233 | 6,557,814 | ||||||
Kone OYJ, Class B | 331,626 | 15,674,343 | ||||||
Metso OYJ (a) | 109,278 | 2,566,712 | ||||||
Neste OYJ (a) | 124,217 | 4,186,360 | ||||||
Nokia OYJ* | 5,679,158 | 32,479,051 | ||||||
Nokian Renkaat OYJ | 109,638 | 3,870,681 | ||||||
Orion OYJ, Class B | 99,023 | 3,553,220 | ||||||
Sampo OYJ, Class A | 440,045 | 19,618,812 | ||||||
Stora Enso OYJ, Class R (a) | 527,556 | 4,522,697 | ||||||
UPM-Kymmene OYJ | 525,384 | 10,107,136 | ||||||
Wartsila OYJ Abp | 145,616 | 6,035,200 | ||||||
|
| |||||||
| 114,361,781 | ||||||||
|
| |||||||
| France — 9.7% | ||||||||
Accor SA | 173,753 | 7,559,984 | ||||||
Aeroports de Paris (a) | 28,745 | 3,423,775 | ||||||
Air Liquide SA (a) | 338,836 | 36,392,184 | ||||||
Airbus Group SE | 579,800 | 36,139,121 | ||||||
Alstom SA* | 148,617 | 3,732,126 | ||||||
Arkema SA (a) | 65,977 | 5,413,174 | ||||||
Atos SE | 86,619 | 8,005,000 | ||||||
AXA SA | 1,910,790 | 48,005,739 | ||||||
BNP Paribas SA*(a) | 1,042,849 | 57,743,314 | ||||||
Bollore SA (a) | 840,953 | 3,040,029 | ||||||
Bouygues SA | 203,841 | 6,622,632 | ||||||
Bureau Veritas SA (a) | 253,999 | 5,460,035 | ||||||
Capgemini SA (a) | 161,013 | 15,353,169 | ||||||
Carrefour SA (a) | 545,186 | 14,770,661 | ||||||
Casino Guichard-Perrachon SA | 54,857 | 3,263,612 | ||||||
Christian Dior SE | 53,665 | 8,750,507 | ||||||
Cie de Saint-Gobain | 469,341 | 20,951,045 | ||||||
Cie Generale des Etablissements Michelin (a) | 179,637 | 18,256,313 | ||||||
CNP Assurances | 165,981 | 2,816,336 | ||||||
Credit Agricole SA (a) | 1,039,210 | 10,435,345 | ||||||
Danone SA | 580,232 | 40,723,925 | ||||||
Dassault Systemes SA | 126,355 | 10,060,488 | ||||||
Edenred (a) | 199,005 | 3,686,672 | ||||||
Eiffage SA | 56,400 | 4,160,532 | ||||||
Electricite de France (a) | 245,712 | 3,273,845 | ||||||
Engie | 1,438,306 | 22,156,467 | ||||||
Essilor International SA (a) | 202,416 | 26,429,211 | ||||||
Eurazeo SA | 40,646 | 2,646,087 | ||||||
Eutelsat Communications SA | 171,849 | 3,426,425 | ||||||
Fonciere des Regions REIT | 32,810 | 2,932,150 | ||||||
Gecina SA REIT | 40,476 | 5,717,242 | ||||||
Groupe Eurotunnel SE | 460,185 | 5,936,896 | ||||||
Hermes International | 25,980 | 9,393,165 | ||||||
Number | Value | |||||||
| France (Continued) | ||||||||
ICADE REIT (a) | 36,476 | $ | 2,634,360 | |||||
Iliad SA | 25,995 | 5,696,421 | ||||||
Imerys SA | 34,784 | 2,452,559 | ||||||
Ingenico Group | 54,033 | 6,583,085 | ||||||
JCDecaux SA | 71,942 | 2,969,300 | ||||||
Kering | 74,575 | 12,043,884 | ||||||
Klepierre REIT | 216,606 | 9,907,731 | ||||||
Lagardere SCA | 114,334 | 2,706,458 | ||||||
Legrand SA | 262,757 | 14,452,571 | ||||||
L’Oreal SA | 249,378 | 46,864,507 | ||||||
LVMH Moet Hennessy Louis Vuitton SE | 274,476 | 43,992,020 | ||||||
Natixis SA | 898,774 | 4,338,068 | ||||||
Numericable-SFR SA | 106,157 | 3,299,541 | ||||||
Orange SA | 1,955,575 | 33,976,038 | ||||||
Pernod Ricard SA | 209,015 | 22,769,881 | ||||||
Peugeot SA*(a) | 477,577 | 7,516,274 | ||||||
Publicis Groupe SA (a) | 186,200 | 13,478,762 | ||||||
Remy Cointreau SA (a) | 23,552 | 1,955,941 | ||||||
Renault SA | 189,212 | 17,755,730 | ||||||
Rexel SA | 289,097 | 4,421,245 | ||||||
Safran SA (a) | 307,878 | 21,581,194 | ||||||
Sanofi (a) | 1,156,738 | 94,841,808 | ||||||
Schneider Electric SE | 549,485 | 35,527,364 | ||||||
SCOR SE | 160,630 | 5,370,657 | ||||||
Societe BIC SA | 27,650 | 3,690,215 | ||||||
Societe Generale SA (a) | 753,942 | 31,029,768 | ||||||
Sodexo SA | 92,804 | 9,760,962 | ||||||
Suez | 320,491 | 5,386,328 | ||||||
Technip SA | 105,446 | 5,788,173 | ||||||
Thales SA | 103,831 | 8,994,928 | ||||||
Total SA (a) | 2,174,041 | 105,646,937 | ||||||
Unibail-Rodamco SE REIT | 97,098 | 26,133,791 | ||||||
Valeo SA*(a) | 78,220 | 11,805,758 | ||||||
Veolia Environnement SA | 443,639 | 9,961,096 | ||||||
Vinci SA | 493,092 | 37,082,300 | ||||||
Vivendi SA | 1,144,954 | 22,714,106 | ||||||
Wendel SA | 27,890 | 3,219,533 | ||||||
Zodiac Aerospace | 194,008 | 4,530,940 | ||||||
|
| |||||||
| 1,159,557,440 | ||||||||
|
| |||||||
| Germany — 8.3% | ||||||||
adidas AG | 185,348 | 23,746,965 | ||||||
Allianz SE | 449,849 | 73,426,552 | ||||||
Axel Springer SE (a) | 43,147 | 2,454,131 | ||||||
BASF SE | 904,106 | 69,842,983 | ||||||
Bayer AG | 814,007 | 77,555,097 | ||||||
Bayerische Motoren Werke AG | 325,916 | 27,519,878 | ||||||
Beiersdorf AG | 99,223 | 9,017,463 | ||||||
Brenntag AG | 152,083 | 8,140,898 | ||||||
Commerzbank AG | 1,047,846 | 8,977,273 | ||||||
Continental AG | 108,282 | 23,228,414 | ||||||
Covestro AG, 144A | 69,800 | 2,959,720 | ||||||
Daimler AG | 947,786 | 64,738,732 | ||||||
Deutsche Bank AG*(c) | 1,357,689 | 24,253,079 | ||||||
Deutsche Boerse AG | 189,980 | 16,646,185 | ||||||
Deutsche Lufthansa AG (a) | 225,014 | 3,153,290 | ||||||
| See Notes to Financial Statements. | 8 |
DBX ETF Trust
Schedule of investments
Deutsche X-trackers MSCI EAFE Hedged Equity ETF (Continued)
May 31, 2016
Number | Value | |||||||
| Germany (Continued) | ||||||||
Deutsche Post AG | 955,021 | $ | 27,856,019 | |||||
Deutsche Telekom AG | 3,174,194 | 56,048,844 | ||||||
Deutsche Wohnen AG | 332,134 | 10,666,972 | ||||||
E.ON SE* | 1,969,687 | 19,362,438 | ||||||
Evonik Industries AG | 133,892 | 3,947,815 | ||||||
Fraport AG Frankfurt Airport Services Worldwide | 40,192 | 2,300,813 | ||||||
Fresenius Medical Care AG & Co. KGaA | 215,577 | 18,709,117 | ||||||
Fresenius SE & Co. KGaA | 402,900 | 30,407,124 | ||||||
GEA Group AG | 180,009 | 8,344,914 | ||||||
Hannover Rueck SE | 59,355 | 6,693,254 | ||||||
HeidelbergCement AG | 138,732 | 11,868,690 | ||||||
Henkel AG & Co. KGaA | 102,293 | 10,727,130 | ||||||
HOCHTIEF AG | 20,500 | 2,593,406 | ||||||
Hugo Boss AG | 64,767 | 3,980,018 | ||||||
Infineon Technologies AG | 1,113,287 | 16,697,571 | ||||||
K+S AG (a) | 183,307 | 4,523,732 | ||||||
LANXESS AG (a) | 87,648 | 4,187,553 | ||||||
Linde AG | 182,827 | 27,360,176 | ||||||
MAN SE* | 34,154 | 3,619,619 | ||||||
Merck KGaA | 127,220 | 12,732,475 | ||||||
Metro AG | 175,471 | 5,765,342 | ||||||
Muenchener Rueckversicherungs-Gesellschaft AG | 164,234 | 30,854,634 | ||||||
OSRAM Licht AG | 85,215 | 4,534,952 | ||||||
ProSiebenSat.1 Media SE* | 215,374 | 10,827,890 | ||||||
RWE AG* | 481,726 | 6,305,917 | ||||||
SAP SE | 967,424 | 78,534,041 | ||||||
Siemens AG | 763,401 | 82,212,807 | ||||||
Symrise AG | 121,393 | 7,616,440 | ||||||
Telefonica Deutschland Holding AG | 712,201 | 3,184,761 | ||||||
thyssenkrupp AG | 362,104 | 7,971,236 | ||||||
TUI AG | 490,962 | 7,516,176 | ||||||
United Internet AG | 121,076 | 5,710,547 | ||||||
Volkswagen AG*(a) | 33,914 | 5,235,622 | ||||||
Vonovia SE | 458,709 | 15,722,251 | ||||||
Zalando SE, 144A*(a) | 83,697 | 2,453,377 | ||||||
|
| |||||||
| 992,734,333 | ||||||||
|
| |||||||
| Hong Kong — 3.0% | ||||||||
AIA Group Ltd. | 11,859,886 | 69,366,769 | ||||||
ASM Pacific Technology Ltd. | 233,909 | 1,718,779 | ||||||
Bank of East Asia Ltd. (a) | 1,138,184 | 4,196,374 | ||||||
BOC Hong Kong (Holdings) Ltd. | 3,642,609 | 11,203,340 | ||||||
Cathay Pacific Airways Ltd. | 1,128,322 | 1,765,646 | ||||||
Cheung Kong Infrastructure Holdings Ltd. | 652,459 | 6,104,143 | ||||||
Cheung Kong Property Holdings Ltd. | 2,659,512 | 16,650,292 | ||||||
CK Hutchison Holdings Ltd. | 2,659,842 | 30,874,465 | ||||||
CLP Holdings Ltd. | 1,616,739 | 15,250,390 | ||||||
First Pacific Co. Ltd. | 2,247,161 | 1,474,828 | ||||||
Galaxy Entertainment Group Ltd. (a) | 2,307,579 | 7,750,579 | ||||||
Hang Lung Properties Ltd. | 2,153,463 | 4,112,523 | ||||||
Hang Seng Bank Ltd. | 752,836 | 13,359,854 | ||||||
Henderson Land Development Co. Ltd. | 1,108,282 | 6,724,640 | ||||||
Number | Value | |||||||
| Hong Kong (Continued) | ||||||||
HK Electric Investments & HK Electric Investments Ltd., 144A (b) | 2,568,160 | $ | 2,263,861 | |||||
HKT Trust and HKT Ltd. (b) | 2,567,410 | 3,720,238 | ||||||
Hong Kong and China Gas Co. Ltd. | 6,828,156 | 13,110,200 | ||||||
Hong Kong Exchanges & Clearing Ltd. (a) | 1,130,161 | 27,051,436 | ||||||
Hongkong Land Holdings Ltd. | 563,900 | 3,405,956 | ||||||
Hysan Development Co. Ltd. | 616,354 | 2,657,126 | ||||||
Jardine Matheson Holdings Ltd. | 242,000 | 13,794,000 | ||||||
Kerry Properties Ltd. | 622,807 | 1,556,466 | ||||||
Li & Fung Ltd. | 5,708,539 | 2,909,090 | ||||||
Link REIT | 2,214,321 | 13,606,644 | ||||||
Melco Crown Entertainment Ltd., ADR (a) | 91,025 | 1,317,132 | ||||||
MTR Corp. Ltd. | 1,442,253 | 6,839,369 | ||||||
New World Development Co. Ltd. | 5,473,572 | 5,170,160 | ||||||
Noble Group Ltd.*(a) | 4,518,200 | 967,881 | ||||||
NWS Holdings Ltd. | 1,459,791 | 2,303,129 | ||||||
PCCW Ltd. | 4,052,499 | 2,644,039 | ||||||
Power Assets Holdings Ltd. | 1,365,615 | 13,241,848 | ||||||
Shangri-La Asia Ltd. | 1,199,734 | 1,369,448 | ||||||
Sino Land Co. Ltd. | 2,913,135 | 4,461,128 | ||||||
SJM Holdings Ltd. | 1,895,772 | 1,214,934 | ||||||
Sun Hung Kai Properties Ltd. | 1,424,286 | 16,752,532 | ||||||
Swire Pacific Ltd., Class A | 563,455 | 6,076,316 | ||||||
Swire Properties Ltd. | 1,133,566 | 3,099,865 | ||||||
Techtronic Industries Co. Ltd. | 1,316,760 | 5,295,338 | ||||||
WH Group Ltd., 144A | 5,611,630 | 4,318,444 | ||||||
Wharf Holdings Ltd. | 1,343,290 | 7,268,969 | ||||||
Wheelock & Co. Ltd. | 885,223 | 3,987,106 | ||||||
Yue Yuen Industrial (Holdings) Ltd. | 717,391 | 2,704,959 | ||||||
|
| |||||||
| 363,660,236 | ||||||||
|
| |||||||
| Ireland — 0.8% | ||||||||
AerCap Holdings NV* | 85,109 | 3,326,911 | ||||||
Bank of Ireland* | 27,078,299 | 8,255,212 | ||||||
CRH PLC | 810,239 | 24,552,560 | ||||||
DCC PLC | 87,200 | 7,944,036 | ||||||
Experian PLC | 944,774 | 17,870,848 | ||||||
James Hardie Industries PLC CDI | 438,523 | 6,681,169 | ||||||
Kerry Group PLC, Class A | 155,819 | 14,060,395 | ||||||
Paddy Power Betfair PLC | 77,901 | 10,513,809 | ||||||
|
| |||||||
| 93,204,940 | ||||||||
|
| |||||||
| Israel — 0.7% | ||||||||
Azrieli Group (a) | 41,782 | 1,773,135 | ||||||
Bank Hapoalim BM | 1,047,859 | 5,412,411 | ||||||
Bank Leumi Le-Israel BM* | 1,340,912 | 4,921,353 | ||||||
Bezeq The Israeli Telecommunication Corp. Ltd. | 2,041,626 | 3,947,910 | ||||||
Check Point Software Technologies Ltd.* | 64,889 | 5,513,618 | ||||||
Israel Chemicals Ltd. | 494,127 | 2,032,837 | ||||||
Mizrahi Tefahot Bank Ltd. | 133,225 | 1,568,533 | ||||||
Mobileye NV*(a) | 86,394 | 3,280,380 | ||||||
NICE Systems Ltd. | 59,726 | 3,833,737 | ||||||
Taro Pharmaceutical Industries Ltd.* | 7,516 | 1,098,238 | ||||||
| See Notes to Financial Statements. | 9 |
DBX ETF Trust
Schedule of investments
Deutsche X-trackers MSCI EAFE Hedged Equity ETF (Continued)
May 31, 2016
Number | Value | |||||||
| Israel (Continued) | ||||||||
Teva Pharmaceutical Industries Ltd. | 904,909 | $ | 46,998,804 | |||||
|
| |||||||
| 80,380,956 | ||||||||
|
| |||||||
| Italy — 1.9% | ||||||||
Assicurazioni Generali SpA | 1,149,383 | 16,663,470 | ||||||
Atlantia SpA | 406,431 | 10,961,644 | ||||||
Enel SpA (a) | 7,505,687 | 34,022,619 | ||||||
Eni SpA | 2,504,120 | 38,254,448 | ||||||
EXOR SpA (a) | 106,120 | 4,025,135 | ||||||
Ferrari NV* | 120,730 | 5,117,955 | ||||||
Intesa Sanpaolo SpA | 12,489,112 | 32,071,822 | ||||||
Intesa Sanpaolo SpA-RSP (a) | 901,666 | 2,187,049 | ||||||
Leonardo-Finmeccanica SpA*(a) | 387,605 | 4,588,674 | ||||||
Luxottica Group SpA | 166,633 | 9,027,283 | ||||||
Mediobanca SpA | 539,955 | 4,187,421 | ||||||
Poste Italiane SpA, 144A* | 514,300 | 3,936,962 | ||||||
Prysmian SpA | 186,794 | 4,570,297 | ||||||
Saipem SpA*(a) | 5,900,597 | 2,415,361 | ||||||
Snam SpA | 2,412,100 | 13,808,196 | ||||||
Telecom Italia SpA*(a) | 11,047,999 | 10,460,910 | ||||||
Telecom Italia SpA-RSP | 5,772,994 | 4,454,550 | ||||||
Terna Rete Elettrica Nazionale SpA (a) | 1,483,904 | 8,228,868 | ||||||
UniCredit SpA | 4,992,728 | 15,976,552 | ||||||
Unione di Banche Italiane SpA (a) | 873,884 | 3,247,555 | ||||||
UnipolSai SpA (a) | 1,077,615 | 2,154,606 | ||||||
|
| |||||||
| 230,361,377 | ||||||||
|
| |||||||
| Japan — 23.1% | ||||||||
ABC-Mart, Inc. | 32,400 | 2,100,799 | ||||||
Acom Co. Ltd.*(a) | 383,000 | 2,113,270 | ||||||
Aeon Co. Ltd. | 643,800 | 9,787,667 | ||||||
AEON Financial Service Co. Ltd. | 99,600 | 2,200,941 | ||||||
AEON Mall Co. Ltd. | 108,100 | 1,428,187 | ||||||
AIR WATER, Inc. (a) | 156,000 | 2,444,214 | ||||||
AISIN SEIKI Co. Ltd. | 188,600 | 7,791,981 | ||||||
Ajinomoto Co., Inc. | 543,800 | 13,138,907 | ||||||
Alfresa Holdings Corp. | 185,100 | 3,906,432 | ||||||
Alps Electric Co. Ltd. | 176,100 | 3,565,415 | ||||||
Amada Holdings Co. Ltd. | 327,700 | 3,613,326 | ||||||
ANA Holdings, Inc. | 1,109,000 | 3,243,826 | ||||||
Aozora Bank Ltd. | 1,165,000 | 3,966,271 | ||||||
Asahi Glass Co. Ltd. | 993,000 | 6,026,062 | ||||||
Asahi Group Holdings Ltd. | 380,900 | 12,981,592 | ||||||
Asahi Kasei Corp. | 1,242,800 | 8,337,708 | ||||||
ASICS Corp. | 153,300 | 3,490,037 | ||||||
Astellas Pharma, Inc. | 2,077,800 | 28,464,556 | ||||||
Bandai Namco Holdings, Inc. | 196,700 | 4,877,755 | ||||||
Bank of Kyoto Ltd. | 335,000 | 2,214,476 | ||||||
Benesse Holdings, Inc. (a) | 65,400 | 1,446,968 | ||||||
Bridgestone Corp. | 640,400 | 22,126,432 | ||||||
Brother Industries Ltd. | 228,100 | 2,737,571 | ||||||
Calbee, Inc. | 79,000 | 2,917,867 | ||||||
Canon, Inc. | 1,050,400 | 30,468,098 | ||||||
Casio Computer Co. Ltd. (a) | 225,100 | 3,506,547 | ||||||
Central Japan Railway Co. | 142,004 | 25,173,057 | ||||||
Chiba Bank Ltd. | 688,000 | 3,615,984 | ||||||
Chubu Electric Power Co., Inc. | 634,300 | 8,675,192 | ||||||
Number | Value | |||||||
| Japan (Continued) | ||||||||
Chugai Pharmaceutical Co. Ltd. | 220,400 | $ | 7,752,364 | |||||
Chugoku Bank Ltd. | 167,600 | 1,905,526 | ||||||
Chugoku Electric Power Co., Inc. (a) | 285,200 | 3,577,395 | ||||||
Concordia Financial Group Ltd.* | 1,134,500 | 5,289,586 | ||||||
Credit Saison Co. Ltd. | 142,700 | 2,721,654 | ||||||
CYBERDYNE, Inc.* | 98,900 | 2,322,120 | ||||||
Dai Nippon Printing Co. Ltd. | 534,000 | 5,478,160 | ||||||
Daicel Corp. | 280,400 | 3,504,525 | ||||||
Daihatsu Motor Co. Ltd. | 184,000 | 2,522,346 | ||||||
Dai-ichi Life Insurance Co. Ltd. | 1,061,404 | 13,999,011 | ||||||
Daiichi Sankyo Co. Ltd. | 614,400 | 14,295,404 | ||||||
Daikin Industries Ltd. | 230,900 | 19,800,663 | ||||||
Daito Trust Construction Co. Ltd. | 69,400 | 10,087,082 | ||||||
Daiwa House Industry Co. Ltd. | 577,400 | 16,774,243 | ||||||
Daiwa Securities Group, Inc. | 1,636,064 | 9,547,339 | ||||||
DENSO Corp. | 478,700 | 18,886,895 | ||||||
Dentsu, Inc. | 213,000 | 10,790,897 | ||||||
Don Quijote Holdings Co. Ltd. | 113,400 | 3,645,677 | ||||||
East Japan Railway Co. | 328,500 | 30,065,901 | ||||||
Eisai Co. Ltd. (a) | 248,200 | 15,416,260 | ||||||
Electric Power Development Co. Ltd. | 141,000 | 3,655,673 | ||||||
FamilyMart Co. Ltd. (a) | 57,500 | 3,022,080 | ||||||
FANUC Corp. | 192,596 | 29,532,488 | ||||||
Fast Retailing Co. Ltd. | 52,300 | 14,114,648 | ||||||
Fuji Electric Co. Ltd. | 549,000 | 2,221,086 | ||||||
Fuji Heavy Industries Ltd. | 578,020 | 21,662,374 | ||||||
FUJIFILM Holdings Corp. | 446,000 | 18,132,406 | ||||||
Fujitsu Ltd. | 1,834,600 | 7,422,231 | ||||||
Fukuoka Financial Group, Inc. (a) | 760,000 | 2,772,746 | ||||||
GungHo Online Entertainment, Inc. (a) | 404,532 | 1,176,316 | ||||||
Hachijuni Bank Ltd. | 398,000 | 1,761,141 | ||||||
Hakuhodo DY Holdings, Inc. | 226,000 | 2,840,945 | ||||||
Hamamatsu Photonics KK | 136,300 | 3,717,217 | ||||||
Hankyu Hanshin Holdings, Inc. | 1,189,700 | 8,175,931 | ||||||
Hikari Tsushin, Inc. | 21,200 | 1,730,690 | ||||||
Hino Motors Ltd. | 252,000 | 2,585,199 | ||||||
Hirose Electric Co. Ltd. | 31,520 | 3,916,695 | ||||||
Hiroshima Bank Ltd. | 491,000 | 1,853,416 | ||||||
Hisamitsu Pharmaceutical Co., Inc. | 60,900 | 3,261,272 | ||||||
Hitachi Chemical Co. Ltd. | 100,400 | 1,881,338 | ||||||
Hitachi Construction Machinery Co. Ltd. | 103,600 | 1,601,690 | ||||||
Hitachi High-Technologies Corp. | 67,600 | 1,971,807 | ||||||
Hitachi Ltd. | 4,758,000 | 21,999,332 | ||||||
Hitachi Metals Ltd. | 206,800 | 2,222,351 | ||||||
Hokuriku Electric Power Co. | 160,100 | 2,002,425 | ||||||
Honda Motor Co. Ltd. | 1,604,800 | 45,665,100 | ||||||
Hoshizaki Electric Co. Ltd. | 49,900 | 4,781,135 | ||||||
Hoya Corp. (a) | 400,900 | 14,144,727 | ||||||
Hulic Co. Ltd. | 286,400 | 2,842,404 | ||||||
Idemitsu Kosan Co. Ltd. (a) | 86,400 | 1,730,575 | ||||||
IHI Corp. | 1,447,000 | 3,737,228 | ||||||
Iida Group Holdings Co. Ltd. (a) | 141,800 | 2,973,401 | ||||||
INPEX Corp. | 935,704 | 7,711,414 | ||||||
Isetan Mitsukoshi Holdings Ltd. (a) | 338,400 | 3,309,588 | ||||||
Isuzu Motors Ltd. | 584,700 | 7,054,312 | ||||||
| See Notes to Financial Statements. | 10 |
DBX ETF Trust
Schedule of investments
Deutsche X-trackers MSCI EAFE Hedged Equity ETF (Continued)
May 31, 2016
Number | Value | |||||||
| Japan (Continued) | ||||||||
ITOCHU Corp. | 1,521,000 | $ | 19,112,941 | |||||
Iyo Bank Ltd. | 234,900 | 1,565,505 | ||||||
J. Front Retailing Co. Ltd. | 233,400 | 2,799,072 | ||||||
Japan Airlines Co. Ltd. | 114,500 | 3,930,234 | ||||||
Japan Airport Terminal Co. Ltd. (a) | 45,800 | 1,584,088 | ||||||
Japan Exchange Group, Inc. | 527,000 | 7,186,255 | ||||||
Japan Post Bank Co. Ltd. | 389,158 | 4,659,986 | ||||||
Japan Post Holdings Co. Ltd. | 442,998 | 5,732,751 | ||||||
Japan Prime Realty Investment Corp. REIT (a) | 814 | 3,487,994 | ||||||
Japan Real Estate Investment Corp. REIT | 1,289 | 7,554,621 | ||||||
Japan Retail Fund Investment Corp. REIT | 2,513 | 5,848,197 | ||||||
Japan Tobacco, Inc. | 1,082,800 | 43,044,075 | ||||||
JFE Holdings, Inc. | 514,100 | 6,924,461 | ||||||
JGC Corp. | 202,700 | 3,135,640 | ||||||
Joyo Bank Ltd. | 602,000 | 2,228,925 | ||||||
JSR Corp. | 189,200 | 2,784,991 | ||||||
JTEKT Corp. | 219,700 | 3,045,464 | ||||||
JX Holdings, Inc. | 2,162,400 | 8,455,495 | ||||||
Kajima Corp. | 885,000 | 6,034,000 | ||||||
Kakaku.com, Inc. (a) | 139,000 | 2,636,023 | ||||||
Kamigumi Co. Ltd. | 229,000 | 2,096,952 | ||||||
Kaneka Corp. (a) | 275,000 | 2,190,364 | ||||||
Kansai Electric Power Co., Inc.* | 693,100 | 6,722,259 | ||||||
Kansai Paint Co. Ltd. | 224,500 | 4,547,374 | ||||||
Kao Corp. | 496,200 | 27,338,386 | ||||||
Kawasaki Heavy Industries Ltd. (a) | 1,358,000 | 4,230,912 | ||||||
KDDI Corp. | 1,854,230 | 54,202,759 | ||||||
Keihan Holdings Co. Ltd. | 500,000 | 3,377,433 | ||||||
Keikyu Corp. | 460,500 | 4,366,506 | ||||||
Keio Corp. | 567,800 | 4,871,179 | ||||||
Keisei Electric Railway Co. Ltd. | 270,000 | 3,628,121 | ||||||
Keyence Corp. | 44,910 | 28,551,623 | ||||||
Kikkoman Corp. | 144,000 | 5,175,599 | ||||||
Kintetsu Group Holdings Co. Ltd. | 1,783,400 | 7,182,882 | ||||||
Kirin Holdings Co. Ltd. | 809,800 | 13,631,347 | ||||||
Kobe Steel Ltd. | 3,016,000 | 2,723,619 | ||||||
Koito Manufacturing Co. Ltd. | 110,800 | 5,233,070 | ||||||
Komatsu Ltd. | 909,000 | 15,699,305 | ||||||
Konami Holdings Corp. | 90,700 | 3,440,105 | ||||||
Konica Minolta, Inc. | 437,700 | 3,778,762 | ||||||
Kose Corp. | 29,700 | 2,671,350 | ||||||
Kubota Corp. | 1,079,900 | 15,900,817 | ||||||
Kuraray Co. Ltd. | 341,700 | 4,542,217 | ||||||
Kurita Water Industries Ltd. | 102,500 | 2,403,870 | ||||||
Kyocera Corp. | 316,000 | 15,809,274 | ||||||
Kyowa Hakko Kirin Co. Ltd. (a) | 255,400 | 4,658,942 | ||||||
Kyushu Electric Power Co., Inc.* | 411,400 | 4,179,573 | ||||||
Kyushu Financial Group, Inc. | 337,700 | 1,823,674 | ||||||
Lawson, Inc. | 64,000 | 5,068,677 | ||||||
LIXIL Group Corp. | 255,300 | 4,615,619 | ||||||
M3, Inc. | 191,210 | 5,499,651 | ||||||
Mabuchi Motor Co. Ltd. | 48,700 | 2,304,493 | ||||||
Makita Corp. | 114,600 | 7,430,605 | ||||||
Marubeni Corp. | 1,625,300 | 7,821,577 | ||||||
Number | Value | |||||||
| Japan (Continued) | ||||||||
Marui Group Co. Ltd. | 215,500 | $ | 3,166,284 | |||||
Maruichi Steel Tube Ltd. | 55,600 | 1,857,768 | ||||||
Mazda Motor Corp. | 561,000 | 9,681,411 | ||||||
McDonald’s Holdings Co. Japan Ltd. | 64,600 | 1,698,204 | ||||||
Medipal Holdings Corp. | 168,500 | 2,929,178 | ||||||
MEIJI Holdings Co. Ltd. | 117,700 | 10,639,608 | ||||||
Minebea Co. Ltd. | 334,000 | 2,681,411 | ||||||
Miraca Holdings, Inc. | 53,400 | 2,259,259 | ||||||
Mitsubishi Chemical Holdings Corp. | 1,334,500 | 6,801,750 | ||||||
Mitsubishi Corp. | 1,487,000 | 26,413,772 | ||||||
Mitsubishi Electric Corp. | 1,903,000 | 23,019,538 | ||||||
Mitsubishi Estate Co. Ltd. | 1,232,000 | 23,803,350 | ||||||
Mitsubishi Gas Chemical Co., Inc. | 379,000 | 2,152,806 | ||||||
Mitsubishi Heavy Industries Ltd. | 3,155,200 | 12,813,414 | ||||||
Mitsubishi Logistics Corp. | 111,000 | 1,564,736 | ||||||
Mitsubishi Materials Corp. | 1,068,000 | 3,086,287 | ||||||
Mitsubishi Motors Corp. | 677,800 | 3,544,012 | ||||||
Mitsubishi Tanabe Pharma Corp. | 217,200 | 3,654,162 | ||||||
Mitsubishi UFJ Financial Group, Inc. | 12,552,500 | 62,776,669 | ||||||
Mitsubishi UFJ Lease & Finance Co. Ltd. | 479,100 | 2,063,762 | ||||||
Mitsui & Co. Ltd. | 1,680,000 | 20,253,759 | ||||||
Mitsui Chemicals, Inc. | 906,000 | 3,411,767 | ||||||
Mitsui Fudosan Co. Ltd. | 916,000 | 22,512,250 | ||||||
Mitsui OSK Lines Ltd. (a) | 1,095,000 | 2,491,895 | ||||||
Mixi, Inc. | 45,700 | 1,766,343 | ||||||
Mizuho Financial Group, Inc. | 23,275,800 | 36,657,782 | ||||||
MS&AD Insurance Group Holdings, Inc. | 498,800 | 14,243,063 | ||||||
Murata Manufacturing Co. Ltd. (a) | 195,200 | 22,827,832 | ||||||
Nabtesco Corp. | 116,500 | 2,965,761 | ||||||
Nagoya Railroad Co. Ltd. | 905,700 | 4,563,874 | ||||||
NEC Corp. | 2,516,000 | 5,930,158 | ||||||
Nexon Co. Ltd. | 171,000 | 2,815,126 | ||||||
NGK Insulators Ltd. | 257,000 | 5,660,568 | ||||||
NGK Spark Plug Co. Ltd. | 170,300 | 3,304,960 | ||||||
NH Foods Ltd. | 170,000 | 3,973,089 | ||||||
NHK Spring Co. Ltd. | 204,300 | 1,760,078 | ||||||
Nidec Corp. | 234,800 | 18,144,070 | ||||||
Nikon Corp. | 326,600 | 4,592,190 | ||||||
Nintendo Co. Ltd. | 111,600 | 16,578,498 | ||||||
Nippon Building Fund, Inc. REIT | 1,390 | 8,272,091 | ||||||
Nippon Electric Glass Co. Ltd. | 391,000 | 1,885,528 | ||||||
Nippon Express Co. Ltd. | 815,000 | 3,518,039 | ||||||
Nippon Paint Holdings Co. Ltd. (a) | 160,200 | 4,571,563 | ||||||
Nippon Prologis REIT, Inc. REIT | 1,504 | 3,265,107 | ||||||
Nippon Steel & Sumitomo Metal Corp. | 795,200 | 16,444,737 | ||||||
Nippon Telegraph & Telephone Corp. | 681,000 | 29,857,362 | ||||||
Nippon Yusen KK | 1,556,000 | 2,950,828 | ||||||
Nissan Motor Co. Ltd. | 2,447,500 | 24,865,106 | ||||||
Nisshin Seifun Group, Inc. | 205,400 | 3,500,156 | ||||||
Nissin Foods Holdings Co. Ltd. | 63,400 | 3,183,311 | ||||||
Nitori Holdings Co. Ltd. | 78,900 | 8,022,883 | ||||||
Nitto Denko Corp. | 162,500 | 10,696,370 | ||||||
NOK Corp. (a) | 92,600 | 1,662,426 | ||||||
Nomura Holdings, Inc. | 3,574,700 | 15,508,068 | ||||||
| See Notes to Financial Statements. | 11 |
DBX ETF Trust
Schedule of investments
Deutsche X-trackers MSCI EAFE Hedged Equity ETF (Continued)
May 31, 2016
Number | Value | |||||||
| Japan (Continued) | ||||||||
Nomura Real Estate Holdings, Inc. | 120,000 | $ | 2,157,583 | |||||
Nomura Real Estate Master Fund, Inc. REIT | 3,390 | 5,357,385 | ||||||
Nomura Research Institute Ltd. | 118,410 | 4,475,061 | ||||||
NSK Ltd. | 448,700 | 3,991,236 | ||||||
NTT Data Corp. | 121,600 | 6,281,230 | ||||||
NTT DOCOMO, Inc. | 1,407,692 | 35,327,368 | ||||||
NTT Urban Development Corp. | 109,100 | 1,093,611 | ||||||
Obayashi Corp. | 639,200 | 6,736,320 | ||||||
Obic Co. Ltd. | 63,500 | 3,457,850 | ||||||
Odakyu Electric Railway Co. Ltd. | 609,500 | 6,626,974 | ||||||
Oji Holdings Corp. | 838,600 | 3,453,304 | ||||||
Olympus Corp. | 286,800 | 12,159,895 | ||||||
Omron Corp. | 187,500 | 6,044,837 | ||||||
Ono Pharmaceutical Co. Ltd. | 406,100 | 18,057,853 | ||||||
Oracle Corp. Japan | 37,500 | 1,994,627 | ||||||
Oriental Land Co. Ltd. (a) | 214,800 | 14,144,774 | ||||||
ORIX Corp. | 1,303,400 | 18,126,482 | ||||||
Osaka Gas Co. Ltd. | 1,806,000 | 6,784,630 | ||||||
OTSUKA Corp. | 51,300 | 2,432,158 | ||||||
Otsuka Holdings Co. Ltd. | 384,400 | 15,725,218 | ||||||
Panasonic Corp. | 2,173,200 | 20,243,426 | ||||||
Park24 Co. Ltd. | 100,600 | 2,879,866 | ||||||
Pola Orbis Holdings, Inc. | 22,600 | 1,959,272 | ||||||
Rakuten, Inc. | 915,400 | 9,874,433 | ||||||
Recruit Holdings Co. Ltd. | 278,300 | 9,487,357 | ||||||
Resona Holdings, Inc. | 2,173,400 | 8,270,834 | ||||||
Ricoh Co. Ltd. (a) | 677,700 | 5,911,936 | ||||||
Rinnai Corp. | 35,900 | 3,131,747 | ||||||
Rohm Co. Ltd. (a) | 94,600 | 4,045,072 | ||||||
Ryohin Keikaku Co. Ltd. | 23,400 | 5,394,880 | ||||||
Sankyo Co. Ltd. | 48,400 | 1,807,324 | ||||||
Santen Pharmaceutical Co. Ltd. | 358,600 | 5,285,007 | ||||||
SBI Holdings, Inc. (a) | 205,600 | 2,148,184 | ||||||
Secom Co. Ltd. | 206,700 | 16,211,582 | ||||||
Sega Sammy Holdings, Inc. | 177,700 | 2,169,598 | ||||||
Seibu Holdings, Inc. | 168,400 | 3,176,842 | ||||||
Seiko Epson Corp. | 268,500 | 4,839,716 | ||||||
Sekisui Chemical Co. Ltd. | 400,800 | 5,233,727 | ||||||
Sekisui House Ltd. | 593,800 | 10,649,630 | ||||||
Seven & i Holdings Co. Ltd. | 741,700 | 31,775,182 | ||||||
Seven Bank Ltd. | 568,600 | 2,094,991 | ||||||
Shikoku Electric Power Co., Inc. | 170,000 | 2,027,995 | ||||||
Shimadzu Corp. | 247,000 | 3,769,630 | ||||||
Shimamura Co. Ltd. (a) | 21,700 | 2,821,872 | ||||||
Shimano, Inc. | 76,600 | 11,960,211 | ||||||
Shimizu Corp. | 580,000 | 5,195,828 | ||||||
Shin-Etsu Chemical Co. Ltd. | 395,300 | 23,089,361 | ||||||
Shinsei Bank Ltd. | 1,702,000 | 2,735,865 | ||||||
Shionogi & Co. Ltd. (a) | 293,800 | 16,547,890 | ||||||
Shiseido Co. Ltd. | 374,100 | 9,879,943 | ||||||
Shizuoka Bank Ltd. | 522,000 | 3,907,870 | ||||||
Showa Shell Sekiyu KK | 181,500 | 1,842,290 | ||||||
SMC Corp. | 56,400 | 14,388,405 | ||||||
SoftBank Group Corp. | 945,500 | 53,177,171 | ||||||
Sohgo Security Services Co. Ltd. | 70,400 | 3,471,206 | ||||||
Sompo Japan Nipponkoa Holdings, Inc. | 347,600 | 9,812,594 | ||||||
Number | Value | |||||||
| Japan (Continued) | ||||||||
Sony Corp. | 1,242,700 | $ | 34,789,091 | |||||
Sony Financial Holdings, Inc. | 169,400 | 2,072,850 | ||||||
Stanley Electric Co. Ltd. | 148,800 | 3,159,153 | ||||||
Start Today Co. Ltd. | 58,200 | 2,659,430 | ||||||
Sumitomo Chemical Co. Ltd. | 1,549,000 | 7,106,082 | ||||||
Sumitomo Corp. | 1,169,500 | 12,013,422 | ||||||
Sumitomo Dainippon Pharma Co. Ltd. (a) | 152,700 | 2,236,686 | ||||||
Sumitomo Electric Industries Ltd. | 742,500 | 10,523,807 | ||||||
Sumitomo Heavy Industries Ltd. | 543,000 | 2,643,040 | ||||||
Sumitomo Metal Mining Co. Ltd. (a) | 485,000 | 5,006,141 | ||||||
Sumitomo Mitsui Financial Group, Inc. | 1,322,400 | 43,194,300 | ||||||
Sumitomo Mitsui Trust Holdings, Inc. | 3,267,000 | 11,379,256 | ||||||
Sumitomo Realty & Development Co. Ltd. | 347,100 | 9,710,713 | ||||||
Sumitomo Rubber Industries Ltd. (a) | 162,700 | 2,394,916 | ||||||
Sundrug Co. Ltd. | 36,400 | 3,014,295 | ||||||
Suntory Beverage & Food Ltd. | 136,900 | 6,465,770 | ||||||
Suruga Bank Ltd. (a) | 174,000 | 3,898,442 | ||||||
Suzuken Co. Ltd. | 76,110 | 2,460,593 | ||||||
Suzuki Motor Corp. | 359,000 | 9,236,384 | ||||||
Sysmex Corp. | 153,800 | 11,250,102 | ||||||
T&D Holdings, Inc. | 570,200 | 5,697,623 | ||||||
Taiheiyo Cement Corp. | 1,124,000 | 2,963,905 | ||||||
Taisei Corp. | 1,038,000 | 7,705,206 | ||||||
Taisho Pharmaceutical Holdings Co. Ltd. | 35,534 | 3,314,817 | ||||||
Taiyo Nippon Sanso Corp. | 148,400 | 1,336,116 | ||||||
Takashimaya Co. Ltd. | 279,000 | 1,975,310 | ||||||
Takeda Pharmaceutical Co. Ltd. (a) | 700,100 | 30,328,078 | ||||||
TDK Corp. (a) | 118,600 | 6,940,245 | ||||||
Teijin Ltd. | 919,000 | 3,236,646 | ||||||
Terumo Corp. | 336,500 | 14,160,744 | ||||||
THK Co. Ltd. | 115,400 | 2,185,342 | ||||||
Tobu Railway Co. Ltd. | 984,000 | 5,002,863 | ||||||
Toho Co. Ltd. | 108,400 | 2,966,108 | ||||||
Toho Gas Co. Ltd. | 398,000 | 2,954,405 | ||||||
Tohoku Electric Power Co., Inc. | 445,600 | 5,754,350 | ||||||
Tokio Marine Holdings, Inc. | 671,200 | 23,269,398 | ||||||
Tokyo Electric Power Co. Holdings, Inc.* | 1,423,700 | 6,698,403 | ||||||
Tokyo Electron Ltd. (a) | 165,200 | 12,265,990 | ||||||
Tokyo Gas Co. Ltd. | 2,192,400 | 8,867,801 | ||||||
Tokyo Tatemono Co. Ltd. | 197,400 | 2,520,645 | ||||||
Tokyu Corp. | 1,083,600 | 9,296,248 | ||||||
Tokyu Fudosan Holdings Corp. | 491,600 | 3,249,661 | ||||||
TonenGeneral Sekiyu KK | 277,000 | 2,639,048 | ||||||
Toppan Printing Co. Ltd. | 515,000 | 4,660,044 | ||||||
Toray Industries, Inc. | 1,446,200 | 12,525,854 | ||||||
Toshiba Corp.* | 3,963,000 | 9,791,636 | ||||||
TOTO Ltd. | 135,600 | 5,155,335 | ||||||
Toyo Seikan Group Holdings Ltd. | 156,500 | 3,308,498 | ||||||
Toyo Suisan Kaisha Ltd. | 87,100 | 3,378,286 | ||||||
Toyoda Gosei Co. Ltd. | 63,200 | 1,241,342 | ||||||
Toyota Industries Corp. | 156,900 | 6,808,186 | ||||||
Toyota Motor Corp. | 2,628,700 | 137,280,644 | ||||||
| See Notes to Financial Statements. | 12 |
DBX ETF Trust
Schedule of investments
Deutsche X-trackers MSCI EAFE Hedged Equity ETF (Continued)
May 31, 2016
Number | Value | |||||||
| Japan (Continued) | ||||||||
Toyota Tsusho Corp. | 204,700 | $ | 4,843,220 | |||||
Trend Micro, Inc. | 110,500 | 4,011,469 | ||||||
TSURUHA HOLDINGS, Inc. | 36,000 | 3,748,408 | ||||||
Unicharm Corp. | 397,300 | 7,780,242 | ||||||
United Urban Investment Corp. REIT | 2,641 | 4,173,703 | ||||||
USS Co. Ltd. | 211,700 | 3,355,159 | ||||||
West Japan Railway Co. | 162,100 | 10,150,372 | ||||||
Yahoo Japan Corp. (a) | 1,401,600 | 6,303,308 | ||||||
Yakult Honsha Co. Ltd. (a) | 86,400 | 4,244,512 | ||||||
Yamada Denki Co. Ltd. | 654,500 | 3,085,285 | ||||||
Yamaguchi Financial Group, Inc. (a) | 194,400 | 1,899,497 | ||||||
Yamaha Corp. | 160,700 | 4,876,073 | ||||||
Yamaha Motor Co. Ltd. | 275,600 | 4,883,074 | ||||||
Yamato Holdings Co. Ltd. (a) | 355,800 | 7,234,241 | ||||||
Yamazaki Baking Co. Ltd. | 131,000 | 3,218,955 | ||||||
Yaskawa Electric Corp. | 249,400 | 3,162,122 | ||||||
Yokogawa Electric Corp. | 221,000 | 2,554,567 | ||||||
Yokohama Rubber Co. Ltd. | 98,900 | 1,520,989 | ||||||
|
| |||||||
| 2,764,046,779 | ||||||||
|
| |||||||
| Jersey Island — 0.1% | ||||||||
Randgold Resources Ltd. | 92,023 | 7,730,337 | ||||||
|
| |||||||
| Jordan — 0.0% | ||||||||
Hikma Pharmaceuticals PLC | 141,400 | 4,706,234 | ||||||
|
| |||||||
| Luxembourg — 0.2% | ||||||||
ArcelorMittal* | 1,810,642 | 8,904,532 | ||||||
Millicom International Cellular SA SDR (a) | 63,312 | 3,688,807 | ||||||
RTL Group SA | 37,440 | 3,358,003 | ||||||
SES SA FDR | 321,312 | 7,196,594 | ||||||
Tenaris SA | 464,826 | 6,159,684 | ||||||
|
| |||||||
| 29,307,620 | ||||||||
|
| |||||||
| Macau — 0.1% | ||||||||
MGM China Holdings Ltd. (a) | 909,782 | 1,308,929 | ||||||
Sands China Ltd. | 2,382,921 | 9,138,249 | ||||||
Wynn Macau Ltd. (a) | 1,491,383 | 2,333,780 | ||||||
|
| |||||||
| 12,780,958 | ||||||||
|
| |||||||
| Mexico — 0.0% | ||||||||
Fresnillo PLC | 213,749 | 3,123,700 | ||||||
|
| |||||||
| Netherlands — 3.9% | ||||||||
ABN AMRO Group NV, 144A | 231,400 | 4,712,912 | ||||||
Aegon NV (a) | 1,796,423 | 9,234,361 | ||||||
Akzo Nobel NV | 243,740 | 16,542,948 | ||||||
Altice NV, Class A*(a) | 363,762 | 6,269,386 | ||||||
Altice NV, Class B* | 105,825 | 1,829,766 | ||||||
ASML Holding NV | 362,569 | 36,064,877 | ||||||
Gemalto NV (a) | 76,720 | 4,688,938 | ||||||
Heineken Holding NV | 99,233 | 8,141,708 | ||||||
Heineken NV | 226,796 | 21,063,089 | ||||||
ING Groep NV | 3,809,231 | 47,447,974 | ||||||
Koninklijke Ahold NV | 821,316 | 18,194,403 | ||||||
Koninklijke Boskalis Westminster NV | 85,186 | 3,085,144 | ||||||
Koninklijke DSM NV (a) | 178,586 | 10,628,605 | ||||||
Koninklijke KPN NV | 3,362,744 | 13,346,063 | ||||||
Koninklijke Philips NV | 917,054 | 24,712,991 | ||||||
Number | Value | |||||||
| Netherlands (Continued) | ||||||||
Koninklijke Vopak NV | 68,144 | $ | 3,550,651 | |||||
NN Group NV | 311,917 | 10,416,784 | ||||||
NXP Semiconductors NV* | 144,842 | 13,686,121 | ||||||
OCI NV*(a) | 93,337 | 1,342,792 | ||||||
QIAGEN NV* | 211,753 | 4,540,122 | ||||||
Randstad Holding NV | 122,701 | 6,627,487 | ||||||
Royal Dutch Shell PLC, Class A | 4,143,774 | 99,477,223 | ||||||
Royal Dutch Shell PLC, Class B | 3,686,874 | 88,668,882 | ||||||
Wolters Kluwer NV | 297,173 | 11,845,457 | ||||||
|
| |||||||
| 466,118,684 | ||||||||
|
| |||||||
| New Zealand — 0.2% | ||||||||
Auckland International Airport Ltd. | 923,123 | 3,897,405 | ||||||
Contact Energy Ltd. | 704,739 | 2,570,091 | ||||||
Fletcher Building Ltd. | 661,412 | 4,005,221 | ||||||
Meridian Energy Ltd. | 1,245,111 | 2,257,742 | ||||||
Mighty River Power Ltd. | 670,419 | 1,347,207 | ||||||
Ryman Healthcare Ltd. | 363,315 | 2,359,859 | ||||||
Spark New Zealand Ltd. | 1,752,269 | 4,386,660 | ||||||
|
| |||||||
| 20,824,185 | ||||||||
|
| |||||||
| Norway — 0.6% | ||||||||
DNB ASA | 961,986 | 12,338,756 | ||||||
Gjensidige Forsikring ASA | 193,766 | 3,342,311 | ||||||
Marine Harvest ASA* | 376,600 | 6,288,972 | ||||||
Norsk Hydro ASA | 1,288,004 | 5,134,710 | ||||||
Orkla ASA | 802,389 | 7,260,788 | ||||||
Schibsted ASA, Class A (a) | 73,238 | 2,276,212 | ||||||
Schibsted ASA, Class B | 86,344 | 2,559,686 | ||||||
Statoil ASA | 1,098,562 | 17,517,951 | ||||||
Telenor ASA (a) | 738,981 | 12,313,994 | ||||||
Yara International ASA | 176,007 | 6,347,580 | ||||||
|
| |||||||
| 75,380,960 | ||||||||
|
| |||||||
| Portugal — 0.1% | ||||||||
EDP — Energias de Portugal SA (a) | 2,279,565 | 7,596,352 | ||||||
Galp Energia SGPS SA | 455,462 | 5,969,716 | ||||||
Jeronimo Martins SGPS SA | 243,926 | 3,951,625 | ||||||
|
| |||||||
| 17,517,693 | ||||||||
|
| |||||||
| Singapore — 1.2% | ||||||||
Ascendas Real Estate Investment Trust REIT | 2,149,800 | 3,574,934 | ||||||
CapitaLand Commercial Trust REIT | 1,998,200 | 2,016,918 | ||||||
CapitaLand Ltd. | 2,524,500 | 5,481,269 | ||||||
CapitaLand Mall Trust REIT | 2,398,100 | 3,535,069 | ||||||
City Developments Ltd. | 390,900 | 2,324,792 | ||||||
ComfortDelGro Corp. Ltd. | 2,059,500 | 4,097,763 | ||||||
DBS Group Holdings Ltd. | 1,732,800 | 19,503,595 | ||||||
Genting Singapore PLC | 5,857,500 | 3,147,593 | ||||||
Global Logistic Properties Ltd. | 3,046,000 | 4,003,529 | ||||||
Golden Agri-Resources Ltd. | 6,842,900 | 1,937,936 | ||||||
Hutchison Port Holdings Trust, Class U | 5,475,109 | 2,354,297 | ||||||
Jardine Cycle & Carriage Ltd. | 113,400 | 2,783,327 | ||||||
Keppel Corp. Ltd. | 1,431,600 | 5,592,918 | ||||||
Oversea-Chinese Banking Corp. Ltd. | 3,042,800 | 19,046,501 | ||||||
Sembcorp Industries Ltd. | 953,900 | 1,932,598 | ||||||
| See Notes to Financial Statements. | 13 |
DBX ETF Trust
Schedule of investments
Deutsche X-trackers MSCI EAFE Hedged Equity ETF (Continued)
May 31, 2016
Number | Value | |||||||
| Singapore (Continued) | ||||||||
Sembcorp Marine Ltd. (a) | 806,700 | $ | 907,984 | |||||
Singapore Airlines Ltd. | 518,100 | 4,018,087 | ||||||
Singapore Exchange Ltd. | 773,000 | 4,350,265 | ||||||
Singapore Press Holdings Ltd. (a) | 1,532,200 | 4,294,744 | ||||||
Singapore Technologies Engineering Ltd. | 1,509,500 | 3,540,545 | ||||||
Singapore Telecommunications Ltd. | 7,847,100 | 22,052,340 | ||||||
StarHub Ltd. | 578,200 | 1,482,133 | ||||||
Suntec Real Estate Investment Trust REIT | 2,318,700 | 2,803,453 | ||||||
United Overseas Bank Ltd. | 1,275,400 | 16,874,438 | ||||||
UOL Group Ltd. | 463,700 | 1,912,582 | ||||||
Wilmar International Ltd. | 1,840,300 | 4,436,712 | ||||||
|
| |||||||
| 148,006,322 | ||||||||
|
| |||||||
| South Africa — 0.1% | ||||||||
Investec PLC | 607,757 | 4,126,593 | ||||||
Mediclinic International PLC | 353,036 | 4,430,590 | ||||||
Mondi PLC | 361,494 | 7,047,259 | ||||||
|
| |||||||
| 15,604,442 | ||||||||
|
| |||||||
| Spain — 3.1% | ||||||||
Abertis Infraestructuras SA | 510,653 | 7,818,089 | ||||||
ACS Actividades de Construccion y Servicios SA | 189,163 | 6,240,468 | ||||||
Aena SA, 144A* | 66,444 | 8,971,226 | ||||||
Amadeus IT Holding SA, Class A | 431,956 | 20,010,334 | ||||||
Banco Bilbao Vizcaya Argentaria SA | 6,403,288 | 42,469,625 | ||||||
Banco de Sabadell SA | 5,236,021 | 8,948,472 | ||||||
Banco Popular Espanol SA (a) | 1,657,324 | 2,729,137 | ||||||
Banco Santander SA | 14,208,607 | 67,836,945 | ||||||
Bankia SA | 4,412,191 | 3,834,084 | ||||||
Bankinter SA | 645,645 | 4,910,798 | ||||||
CaixaBank SA (a) | 2,620,732 | 7,164,469 | ||||||
Distribuidora Internacional de Alimentacion SA* | 612,716 | 3,664,325 | ||||||
Enagas SA | 223,249 | 6,691,807 | ||||||
Endesa SA | 312,656 | 6,428,727 | ||||||
Ferrovial SA | 468,490 | 9,919,628 | ||||||
Gas Natural SDG SA | 344,761 | 6,824,178 | ||||||
Grifols SA | 293,623 | 6,653,203 | ||||||
Iberdrola SA | 5,352,525 | 36,304,455 | ||||||
Industria de Diseno Textil SA | 1,073,758 | 36,271,410 | ||||||
Mapfre SA | 1,044,321 | 2,646,939 | ||||||
Red Electrica Corp. SA | 106,523 | 9,486,516 | ||||||
Repsol SA | 1,057,159 | 13,614,998 | ||||||
Telefonica SA | 4,407,608 | 46,054,394 | ||||||
Zardoya Otis SA (a) | 174,978 | 1,814,494 | ||||||
|
| |||||||
| 367,308,721 | ||||||||
|
| |||||||
| Sweden — 2.8% | ||||||||
Alfa Laval AB (a) | 281,210 | 4,251,180 | ||||||
Assa Abloy AB, Class B | 986,613 | 20,509,713 | ||||||
Atlas Copco AB, Class A | 661,007 | 17,077,213 | ||||||
Atlas Copco AB, Class B | 384,113 | 9,159,198 | ||||||
Boliden AB | 261,942 | 4,635,058 | ||||||
Electrolux AB, Series B | 236,818 | 6,353,872 | ||||||
Getinge AB, Class B | 191,672 | 4,090,179 | ||||||
Number | Value | |||||||
| Sweden (Continued) | ||||||||
Hennes & Mauritz AB, Class B | 934,580 | $ | 28,682,705 | |||||
Hexagon AB, Class B (a) | 254,397 | 9,878,400 | ||||||
Husqvarna AB, Class B | 403,474 | 3,202,117 | ||||||
ICA Gruppen AB (a) | 78,208 | 2,753,714 | ||||||
Industrivarden AB, Class C | 159,100 | 2,689,385 | ||||||
Investor AB, Class B (a) | 448,357 | 15,598,578 | ||||||
Kinnevik AB* | 225,434 | 483,767 | ||||||
Kinnevik AB, Class B (a) | 225,434 | 5,486,294 | ||||||
Lundin Petroleum AB* | 211,053 | 3,785,182 | ||||||
Nordea Bank AB | 2,989,931 | 29,016,276 | ||||||
Sandvik AB (a) | 1,049,543 | 10,260,957 | ||||||
Securitas AB, Class B | 299,880 | 4,727,558 | ||||||
Skandinaviska Enskilda Banken AB, Class A | 1,495,243 | 14,331,574 | ||||||
Skanska AB, Class B | 365,880 | 8,035,775 | ||||||
SKF AB, Class B | 391,871 | 6,896,565 | ||||||
Svenska Cellulosa AB SCA, Class B | 596,355 | 19,088,851 | ||||||
Svenska Handelsbanken AB, Class A | 1,474,003 | 18,872,667 | ||||||
Swedbank AB, Class A | 891,433 | 19,621,176 | ||||||
Swedish Match AB | 193,425 | 6,599,502 | ||||||
Tele2 AB, Class B (a) | 308,584 | 2,707,997 | ||||||
Telefonaktiebolaget LM Ericsson, Class B | 2,995,672 | 23,092,390 | ||||||
Telia Co. AB | 2,557,394 | 11,984,694 | ||||||
Volvo AB, Class B | 1,517,664 | 16,893,561 | ||||||
|
| |||||||
| 330,766,098 | ||||||||
|
| |||||||
| Switzerland — 9.3% | ||||||||
ABB Ltd.* | 1,936,742 | 40,293,586 | ||||||
Actelion Ltd.* | 101,109 | 16,590,420 | ||||||
Adecco Group AG | 163,158 | 9,889,607 | ||||||
Aryzta AG* | 84,528 | 3,364,112 | ||||||
Baloise Holding AG | 49,218 | 6,080,453 | ||||||
Barry Callebaut AG* | 2,120 | 2,506,036 | ||||||
Chocoladefabriken Lindt & Spruengli AG | 99 | 7,320,423 | ||||||
Chocoladefabriken Lindt & Spruengli AG Participation Certificates (a) | 958 | 5,903,169 | ||||||
Cie Financiere Richemont SA | 513,832 | 30,266,462 | ||||||
Coca-Cola HBC AG CDI* | 193,284 | 3,759,638 | ||||||
Credit Suisse Group AG* | 1,830,411 | 25,080,682 | ||||||
Dufry AG* | 38,700 | 5,197,636 | ||||||
EMS-Chemie Holding AG | 7,871 | 3,901,846 | ||||||
Galenica AG | 3,737 | 4,936,299 | ||||||
Geberit AG | 37,207 | 14,224,004 | ||||||
Givaudan SA | 9,090 | 17,420,976 | ||||||
Glencore PLC* | 12,044,057 | 22,869,125 | ||||||
Julius Baer Group Ltd.* | 220,308 | 9,803,041 | ||||||
Kuehne + Nagel International AG | 53,155 | 7,475,925 | ||||||
LafargeHolcim Ltd.* | 448,059 | 20,149,132 | ||||||
Lonza Group AG* | 52,092 | 8,992,945 | ||||||
Nestle SA | 3,138,505 | 231,756,808 | ||||||
Novartis AG | 2,239,836 | 177,789,799 | ||||||
Pargesa Holding SA | 34,203 | 2,258,981 | ||||||
Partners Group Holding AG | 17,084 | 7,201,404 | ||||||
Roche Holding AG | 691,569 | 181,519,469 | ||||||
Schindler Holding AG | 19,762 | 3,642,252 | ||||||
| See Notes to Financial Statements. | 14 |
DBX ETF Trust
Schedule of investments
Deutsche X-trackers MSCI EAFE Hedged Equity ETF (Continued)
May 31, 2016
Number | Value | |||||||
| Switzerland (Continued) | ||||||||
Schindler Holding AG Participation Certificates | 43,545 | $ | 8,065,025 | |||||
SGS SA | 5,390 | 11,501,197 | ||||||
Sika AG | 2,118 | 9,162,374 | ||||||
Sonova Holding AG | 52,467 | 7,004,397 | ||||||
STMicroelectronics NV | 617,584 | 3,694,812 | ||||||
Swatch Group AG — Bearer (a) | 30,358 | 8,948,586 | ||||||
Swatch Group AG — Registered | 48,102 | 2,789,819 | ||||||
Swiss Life Holding AG* | 31,580 | 8,187,290 | ||||||
Swiss Prime Site AG* | 68,562 | 5,876,743 | ||||||
Swiss Re AG | 339,069 | 30,461,632 | ||||||
Swisscom AG | 25,496 | 12,147,792 | ||||||
Syngenta AG | 91,492 | 35,943,286 | ||||||
UBS Group AG | 3,600,091 | 55,631,185 | ||||||
Wolseley PLC | 251,258 | 14,741,993 | ||||||
Zurich Insurance Group AG* | 148,060 | 35,823,370 | ||||||
|
| |||||||
| 1,120,173,731 | ||||||||
|
| |||||||
| United Kingdom — 17.3% | ||||||||
3i Group PLC | 957,417 | 7,786,189 | ||||||
Aberdeen Asset Management PLC | 894,035 | 3,614,002 | ||||||
Admiral Group PLC | 207,887 | 5,925,520 | ||||||
Aggreko PLC (a) | 245,286 | 3,993,127 | ||||||
Anglo American PLC | 1,379,936 | 11,993,795 | ||||||
ARM Holdings PLC | 1,386,381 | 19,818,638 | ||||||
Ashtead Group PLC | 495,468 | 7,003,893 | ||||||
Associated British Foods PLC | 350,679 | 14,952,769 | ||||||
AstraZeneca PLC | 1,244,450 | 72,600,727 | ||||||
Auto Trader Group PLC, 144A | 985,387 | 5,608,845 | ||||||
Aviva PLC | 3,985,397 | 25,963,611 | ||||||
Babcock International Group PLC | 244,290 | 3,669,091 | ||||||
BAE Systems PLC | 3,117,142 | 21,833,177 | ||||||
Barclays PLC | 16,543,982 | 43,705,786 | ||||||
Barratt Developments PLC | 986,602 | 8,459,365 | ||||||
Berkeley Group Holdings PLC | 127,793 | 6,061,672 | ||||||
BP PLC | 18,196,596 | 94,153,495 | ||||||
British American Tobacco PLC | 1,835,052 | 111,574,479 | ||||||
British Land Co. PLC REIT | 962,507 | 10,315,961 | ||||||
BT Group PLC | 8,335,198 | 53,456,139 | ||||||
Bunzl PLC | 329,946 | 9,767,824 | ||||||
Burberry Group PLC | 438,046 | 6,813,936 | ||||||
Capita PLC | 654,172 | 10,081,093 | ||||||
Centrica PLC | 5,340,641 | 15,764,189 | ||||||
CNH Industrial NV | 1,000,593 | 7,058,347 | ||||||
Cobham PLC (a) | 1,103,347 | 2,604,796 | ||||||
Compass Group PLC | 1,618,472 | 30,168,783 | ||||||
Croda International PLC | 129,194 | 5,501,280 | ||||||
Diageo PLC | 2,477,095 | 67,108,021 | ||||||
Direct Line Insurance Group PLC | 1,353,483 | 7,357,079 | ||||||
Dixons Carphone PLC | 963,426 | 6,139,671 | ||||||
easyJet PLC | 153,981 | 3,418,876 | ||||||
Fiat Chrysler Automobiles NV | 885,369 | 6,319,420 | ||||||
G4S PLC | 1,486,005 | 4,022,570 | ||||||
GKN PLC | 1,687,159 | 6,717,456 | ||||||
GlaxoSmithKline PLC | 4,793,878 | 100,329,554 | ||||||
Hammerson PLC REIT | 772,158 | 6,475,284 | ||||||
Hargreaves Lansdown PLC | 249,833 | 4,881,304 | ||||||
HSBC Holdings PLC | 19,378,285 | 124,910,285 | ||||||
Number | Value | |||||||
| United Kingdom (Continued) | ||||||||
ICAP PLC | 536,601 | $ | 3,357,448 | |||||
IMI PLC | 263,486 | 3,835,285 | ||||||
Imperial Brands PLC | 943,708 | 51,406,144 | ||||||
Inmarsat PLC | 430,592 | 4,487,152 | ||||||
InterContinental Hotels Group PLC | 189,444 | 7,301,293 | ||||||
International Consolidated Airlines Group SA | 796,525 | 6,225,898 | ||||||
Intertek Group PLC | 158,862 | 7,217,862 | ||||||
Intu Properties PLC REIT | 901,466 | 3,913,003 | ||||||
ITV PLC | 3,687,807 | 11,472,987 | ||||||
J Sainsbury PLC (a) | 1,289,687 | 5,015,366 | ||||||
Johnson Matthey PLC | 190,505 | 7,957,483 | ||||||
Kingfisher PLC | 2,245,201 | 11,940,760 | ||||||
Land Securities Group PLC REIT | 778,287 | 13,143,541 | ||||||
Legal & General Group PLC | 5,855,777 | 20,304,053 | ||||||
Lloyds Banking Group PLC | 63,231,129 | 65,956,577 | ||||||
London Stock Exchange Group PLC | 308,632 | 12,225,661 | ||||||
Marks & Spencer Group PLC | 1,573,306 | 8,652,226 | ||||||
Meggitt PLC | 742,400 | 4,171,995 | ||||||
Merlin Entertainments PLC, 144A | 679,616 | 4,159,749 | ||||||
National Grid PLC | 3,687,106 | 53,776,081 | ||||||
Next PLC | 139,827 | 11,017,016 | ||||||
Old Mutual PLC | 4,851,515 | 12,514,553 | ||||||
Pearson PLC | 808,762 | 9,821,953 | ||||||
Persimmon PLC | 302,762 | 9,217,394 | ||||||
Petrofac Ltd. (a) | 251,421 | 2,833,056 | ||||||
Provident Financial PLC | 144,891 | 6,110,923 | ||||||
Prudential PLC | 2,532,302 | 50,613,765 | ||||||
Reckitt Benckiser Group PLC | 625,892 | 62,322,686 | ||||||
RELX NV | 979,272 | 16,981,123 | ||||||
RELX PLC | 1,089,874 | 19,731,512 | ||||||
Rexam PLC (a) | 694,382 | 6,320,884 | ||||||
Rio Tinto Ltd. | 417,555 | 13,486,942 | ||||||
Rio Tinto PLC | 1,217,299 | 34,247,774 | ||||||
Rolls-Royce Holdings PLC* | 1,809,920 | 16,226,471 | ||||||
Rolls-Royce Holdings PLC, Class C* | 198,656,285 | 287,724 | ||||||
Rolls-Royce Holdings PLC — Entitlement* | 128,526,898 | 186,152 | ||||||
Royal Bank of Scotland Group PLC* | 3,432,980 | 12,256,381 | ||||||
Royal Mail PLC | 885,916 | 6,941,668 | ||||||
RSA Insurance Group PLC | 1,001,153 | 7,105,106 | ||||||
SABMiller PLC | 957,328 | 59,545,291 | ||||||
Sage Group PLC | 1,062,420 | 9,432,586 | ||||||
Schroders PLC | 133,491 | 5,239,566 | ||||||
Segro PLC REIT | 716,090 | 4,541,681 | ||||||
Severn Trent PLC | 227,319 | 7,546,132 | ||||||
Sky PLC | 1,016,338 | 14,182,864 | ||||||
Smith & Nephew PLC | 881,476 | 14,962,776 | ||||||
Smiths Group PLC | 388,919 | 6,320,131 | ||||||
SSE PLC | 990,471 | 21,977,313 | ||||||
St James’s Place PLC | 516,465 | 6,937,913 | ||||||
Standard Chartered PLC | 3,226,869 | 24,737,584 | ||||||
Standard Life PLC | 1,939,168 | 9,523,954 | ||||||
Tate & Lyle PLC | 451,999 | 4,114,498 | ||||||
Taylor Wimpey PLC | 3,208,260 | 9,544,299 | ||||||
Tesco PLC* | 8,013,662 | 19,162,499 | ||||||
Travis Perkins PLC | 245,988 | 6,851,210 | ||||||
Unilever NV | 1,603,500 | 72,016,197 | ||||||
| See Notes to Financial Statements. | 15 |
DBX ETF Trust
Schedule of investments
Deutsche X-trackers MSCI EAFE Hedged Equity ETF (Continued)
May 31, 2016
Number | Value | |||||||
| United Kingdom (Continued) | ||||||||
Unilever PLC | 1,263,375 | $ | 57,565,867 | |||||
United Utilities Group PLC | 671,218 | 9,429,950 | ||||||
Vodafone Group PLC | 26,140,562 | 87,401,494 | ||||||
Weir Group PLC | 207,274 | 3,599,466 | ||||||
Whitbread PLC | 179,619 | 10,957,581 | ||||||
William Hill PLC | 856,820 | 3,860,679 | ||||||
Wm Morrison Supermarkets PLC (a) | 2,183,681 | 6,268,547 | ||||||
Worldpay Group PLC, 144A* | 1,378,092 | 5,530,811 | ||||||
WPP PLC | 1,274,485 | 29,386,770 | ||||||
|
| |||||||
| 2,073,311,355 | ||||||||
|
| |||||||
| United States — 0.4% | ||||||||
Carnival PLC | 186,583 | 9,212,407 | ||||||
Shire PLC | 583,313 | 35,990,287 | ||||||
|
| |||||||
| 45,202,694 | ||||||||
|
| |||||||
TOTAL COMMON STOCKS | 11,809,840,731 | |||||||
|
| |||||||
| PREFERRED STOCKS — 0.6% | ||||||||
| Germany — 0.6% | ||||||||
Bayerische Motoren Werke AG | 52,200 | 3,839,089 | ||||||
FUCHS PETROLUB SE | 67,323 | 2,740,456 | ||||||
Henkel AG & Co. KGaA | 175,375 | 20,439,863 | ||||||
Porsche Automobil Holding SE* | 150,729 | 8,299,855 | ||||||
Schaeffler AG | 163,500 | 2,637,801 | ||||||
Volkswagen AG* | 182,681 | 27,307,838 | ||||||
|
| |||||||
| 65,264,902 | ||||||||
|
| |||||||
TOTAL PREFERRED STOCKS | 65,264,902 | |||||||
|
| |||||||
Number | Value | |||||||
| RIGHTS — 0.0% | ||||||||
| Spain — 0.0% | ||||||||
Abertis Infraestructuras SA*, expires 06/30/16 | 499,471 | $ | 382,900 | |||||
Banco Popular Espanol SA*(a), expires 06/30/16 | 1,657,324 | 413,059 | ||||||
Ferrovial SA*, expires 07/30/16 | 458,230 | 163,661 | ||||||
|
| |||||||
| 959,620 | ||||||||
|
| |||||||
TOTAL RIGHTS | 959,620 | |||||||
|
| |||||||
| SECURITIES LENDING COLLATERAL — 4.5% | ||||||||
Daily Assets Fund “Capital Shares”, 0.48% (d)(e) | 541,008,659 | 541,008,659 | ||||||
|
| |||||||
TOTAL INVESTMENTS — 103.6% | $ | 12,417,073,912 | ||||||
Other assets and liabilities, | (433,026,073 | ) | ||||||
|
| |||||||
NET ASSETS — 100.0% | $ | 11,984,047,839 | ||||||
|
| |||||||
| * | Non-income producing security. |
| † | The cost for federal income tax purposes was $13,826,496,011. At May 31, 2016, net unrealized depreciation for all securities based on tax cost was $1,409,422,099. This consisted of aggregate gross unrealized appreciation for all securities in which there was an excess of value over tax cost of $392,578,722 and aggregate gross unrealized depreciation for all securities in which there was an excess of tax cost over value of $1,802,000,821. |
| (a) | All or a portion of these securities were on loan. In addition, “Other Assets and Liabilities, Net” may include pending sales that are also on loan. The value of securities loaned at May 31, 2016 amounted to $467,557,716, which is 3.9% of net assets. |
| (b) | Stapled Security — A security contractually bound to one or more other securities to form a single saleable unit which cannot be sold separately. |
| (c) | Affiliated issuer. This security is owned in proportion with its representation in the index. |
| (d) | Affiliated fund managed by Deutsche Investment Management Americas Inc. The rate shown is the annualized seven-day yield at period end. |
| (e) | Represents collateral held in connection with securities lending. Income earned by the Fund is net of borrower rebates. |
| ADR: | American Depositary Receipt |
| CDI: | Chess Depositary Interest |
| FDR: | Fiduciary Depositary Receipt |
| REIT: | Real Estate Investment Trust |
| RSP: | Risparmio (Convertible Savings Shares) |
| SDR: | Swedish Depositary Receipt |
| 144A: | Security exempt from registration under Rule 144A of the Securities Act of 1933. These securities may be resold in transactions exempt from registration, normally to qualified institutional buyers. |
| See Notes to Financial Statements. | 16 |
DBX ETF Trust
Schedule of investments
Deutsche X-trackers MSCI EAFE Hedged Equity ETF (Continued)
May 31, 2016
At May 31, 2016, open future contract purchased was as follows:
Contract Description | Number of Contracts | Contract Value | Expiration Date | Unrealized Appreciation (Depreciation) | ||||||
E-mini MSCI EAFE Index | 120 | $9,963,000 | 6/17/2016 | $(157,800) | ||||||
As of May 31, 2016, the Fund had the following forward foreign currency exchange contracts outstanding:
Counterparty | Settlement Date | Currency To Deliver | Currency To Receive | Unrealized Appreciation (Depreciation) | ||||||||||||||
Bank of Montreal | 6/2/2016 | AUD | 52,283,000 | USD | 39,848,058 | $ | 2,060,403 | |||||||||||
Bank of Montreal | 6/2/2016 | AUD | 1,224,500 | USD | 887,089 | 2,079 | ||||||||||||
Bank of Montreal | 6/2/2016 | AUD | 819,000 | USD | 621,806 | 29,872 | ||||||||||||
Bank of Montreal | 6/2/2016 | AUD | 116,120,100 | USD | 88,504,418 | 4,578,355 | ||||||||||||
Canadian Imperial Bank of Commerce | 6/2/2016 | AUD | 172,520,200 | USD | 131,492,309 | 6,802,948 | ||||||||||||
Canadian Imperial Bank of Commerce | 6/2/2016 | AUD | 10,145,900 | USD | 7,350,197 | 17,225 | ||||||||||||
JP Morgan & Chase Co. | 6/2/2016 | AUD | 236,673,679 | USD | 180,357,177 | 9,300,745 | ||||||||||||
State Street Bank & Trust Co. | 6/2/2016 | AUD | 316,282,679 | USD | 241,069,077 | 12,475,062 | ||||||||||||
The Bank of New York Mellon | 6/2/2016 | AUD | 3,059,000 | USD | 2,207,405 | (3,494 | ) | |||||||||||
The Bank of New York Mellon | 6/2/2016 | AUD | 1,424,300 | USD | 1,041,427 | 12,011 | ||||||||||||
The Bank of Nova Scotia | 6/2/2016 | AUD | 274,792,500 | USD | 209,441,348 | 10,834,453 | ||||||||||||
Bank of Montreal | 6/2/2016 | CHF | 12,304,000 | USD | 12,827,624 | 449,354 | ||||||||||||
Bank of Montreal | 6/2/2016 | CHF | 35,399,000 | USD | 36,975,680 | 1,363,004 | ||||||||||||
Bank of Montreal | 6/2/2016 | CHF | 168,368,800 | USD | 175,872,396 | 6,487,285 | ||||||||||||
Canadian Imperial Bank of Commerce | 6/2/2016 | CHF | 15,723,600 | USD | 15,815,329 | (3,182 | ) | |||||||||||
Canadian Imperial Bank of Commerce | 6/2/2016 | CHF | 179,150,700 | USD | 187,133,829 | 6,901,737 | ||||||||||||
JP Morgan & Chase Co. | 6/2/2016 | CHF | 249,163,563 | USD | 260,252,941 | 9,585,372 | ||||||||||||
RBC Capital Markets | 6/2/2016 | CHF | 91,132,400 | USD | 95,191,956 | 3,509,461 | ||||||||||||
State Street Bank & Trust Co. | 6/2/2016 | CHF | 280,742,482 | USD | 293,260,910 | 10,823,806 | ||||||||||||
The Bank of New York Mellon | 6/2/2016 | CHF | 1,689,700 | USD | 1,743,469 | 43,569 | ||||||||||||
The Bank of Nova Scotia | 6/2/2016 | CHF | 105,550,500 | USD | 110,252,781 | 4,065,155 | ||||||||||||
Bank of Montreal | 6/2/2016 | DKK | 19,227,000 | USD | 2,956,476 | 80,207 | ||||||||||||
Bank of Montreal | 6/2/2016 | DKK | 428,042,900 | USD | 65,922,733 | 1,889,508 | ||||||||||||
Bank of Montreal | 6/2/2016 | DKK | 17,859,000 | USD | 2,750,389 | 78,766 | ||||||||||||
Canadian Imperial Bank of Commerce | 6/2/2016 | DKK | 221,701,600 | USD | 34,145,078 | 979,551 | ||||||||||||
JP Morgan & Chase Co. | 6/2/2016 | DKK | 381,226,396 | USD | 58,710,732 | 1,681,038 | ||||||||||||
RBC Capital Markets | 6/2/2016 | DKK | 116,933,600 | USD | 18,008,902 | 516,180 | ||||||||||||
State Street Bank & Trust Co. | 6/2/2016 | DKK | 291,034,896 | USD | 44,823,602 | 1,286,136 | ||||||||||||
The Bank of New York Mellon | 6/2/2016 | DKK | 1,475,900 | USD | 225,881 | 5,093 | ||||||||||||
The Bank of New York Mellon | 6/2/2016 | DKK | 78,841,700 | USD | 12,142,384 | 348,033 | ||||||||||||
The Bank of New York Mellon | 6/2/2016 | DKK | 3,968,300 | USD | 597,057 | 3,418 | ||||||||||||
The Bank of Nova Scotia | 6/2/2016 | DKK | 24,796,300 | USD | 3,818,928 | 109,517 | ||||||||||||
Bank of Montreal | 6/2/2016 | EUR | 160,065,048 | USD | 183,484,165 | 5,388,736 | ||||||||||||
Bank of Montreal | 6/2/2016 | EUR | 39,906,000 | USD | 45,679,321 | 1,278,146 | ||||||||||||
Canadian Imperial Bank of Commerce | 6/2/2016 | EUR | 75,862,900 | USD | 84,454,373 | 45,966 | ||||||||||||
Canadian Imperial Bank of Commerce | 6/2/2016 | EUR | 1,046,130,104 | USD | 1,199,184,169 | 35,213,694 | ||||||||||||
JP Morgan & Chase Co. | 6/2/2016 | EUR | 755,424,170 | USD | 865,925,351 | 25,407,115 | ||||||||||||
RBC Capital Markets | 6/2/2016 | EUR | 85,277,000 | USD | 97,751,405 | 2,868,455 | ||||||||||||
RBC Capital Markets | 6/2/2016 | EUR | 182,167,000 | USD | 208,819,854 | 6,132,818 | ||||||||||||
State Street Bank & Trust Co. | 6/2/2016 | EUR | 890,858,895 | USD | 1,021,209,368 | 30,000,486 | ||||||||||||
The Bank of Nova Scotia | 6/2/2016 | EUR | 279,731,000 | USD | 320,659,841 | 9,418,798 | ||||||||||||
Bank of Montreal | 6/2/2016 | GBP | 8,094,000 | USD | 11,835,905 | 112,945 | ||||||||||||
Bank of Montreal | 6/2/2016 | GBP | 128,098,327 | USD | 187,660,847 | 2,129,407 | ||||||||||||
Canadian Imperial Bank of Commerce | 6/2/2016 | GBP | 26,262,900 | USD | 38,225,651 | 187,733 | ||||||||||||
Canadian Imperial Bank of Commerce | 6/2/2016 | GBP | 322,748,000 | USD | 472,751,588 | 5,298,949 | ||||||||||||
JP Morgan & Chase Co. | 6/2/2016 | GBP | 353,024,849 | USD | 517,165,518 | 5,861,351 | ||||||||||||
RBC Capital Markets | 6/2/2016 | GBP | 131,929,192 | USD | 193,273,364 | 2,193,484 | ||||||||||||
State Street Bank & Trust Co. | 6/2/2016 | GBP | 361,492,037 | USD | 529,581,858 | 6,014,224 | ||||||||||||
State Street Bank & Trust Co. | 6/2/2016 | GBP | 42,780,000 | USD | 62,669,278 | 708,789 | ||||||||||||
The Bank of New York Mellon | 6/2/2016 | GBP | 16,900 | USD | 24,334 | (143 | ) | |||||||||||
The Bank of New York Mellon | 6/2/2016 | GBP | 2,113,500 | USD | 3,054,314 | (6,778 | ) | |||||||||||
The Bank of Nova Scotia | 6/2/2016 | GBP | 344,303,800 | USD | 504,396,459 | 5,723,439 | ||||||||||||
| See Notes to Financial Statements. | 17 |
DBX ETF Trust
Schedule of investments
Deutsche X-trackers MSCI EAFE Hedged Equity ETF (Continued)
May 31, 2016
Counterparty | Settlement Date | Currency To Deliver | Currency To Receive | Unrealized Appreciation (Depreciation) | ||||||||||||||
Bank of Montreal | 6/2/2016 | HKD | 160,000 | USD | 20,629 | $ | 39 | |||||||||||
Bank of Montreal | 6/2/2016 | HKD | 66,572,000 | USD | 8,583,906 | 16,908 | ||||||||||||
Bank of Montreal | 6/2/2016 | HKD | 518,984,200 | USD | 66,920,370 | 133,483 | ||||||||||||
Canadian Imperial Bank of Commerce | 6/2/2016 | HKD | 768,024,448 | USD | 99,034,247 | 198,941 | ||||||||||||
JP Morgan & Chase Co. | 6/2/2016 | HKD | 657,191,570 | USD | 84,740,960 | 168,484 | ||||||||||||
RBC Capital Markets | 6/2/2016 | HKD | 13,152,000 | USD | 1,695,912 | 3,411 | ||||||||||||
State Street Bank & Trust Co. | 6/2/2016 | HKD | 468,520,870 | USD | 60,414,674 | 121,797 | ||||||||||||
The Bank of New York Mellon | 6/2/2016 | HKD | 3,117,900 | USD | 401,895 | 659 | ||||||||||||
The Bank of New York Mellon | 6/2/2016 | HKD | 363,789,900 | USD | 46,909,279 | 93,991 | ||||||||||||
The Bank of Nova Scotia | 6/2/2016 | HKD | 84,450,700 | USD | 10,889,137 | 21,370 | ||||||||||||
Bank of Montreal | 6/2/2016 | ILS | 66,186,000 | USD | 17,738,054 | 558,933 | ||||||||||||
Bank of Montreal | 6/2/2016 | ILS | 2,109,000 | USD | 564,274 | 16,866 | ||||||||||||
Bank of Montreal | 6/2/2016 | ILS | 1,807,000 | USD | 484,257 | 15,236 | ||||||||||||
Canadian Imperial Bank of Commerce | 6/2/2016 | ILS | 355,000 | USD | 92,187 | 44 | ||||||||||||
Canadian Imperial Bank of Commerce | 6/2/2016 | ILS | 46,532,300 | USD | 12,472,472 | 394,631 | ||||||||||||
JP Morgan & Chase Co. | 6/2/2016 | ILS | 59,317,918 | USD | 15,897,928 | 501,474 | ||||||||||||
RBC Capital Markets | 6/2/2016 | ILS | 23,151,200 | USD | 6,204,342 | 195,258 | ||||||||||||
State Street Bank & Trust Co. | 6/2/2016 | ILS | 61,216,518 | USD | 16,405,804 | 516,553 | ||||||||||||
The Bank of New York Mellon | 6/2/2016 | ILS | 25,671,400 | USD | 6,880,236 | 217,013 | ||||||||||||
The Bank of New York Mellon | 6/2/2016 | ILS | 515,200 | USD | 134,421 | 696 | ||||||||||||
The Bank of New York Mellon | 6/2/2016 | ILS | 376,000 | USD | 98,558 | 964 | ||||||||||||
Bank of Montreal | 6/2/2016 | NOK | 33,817,100 | USD | 4,199,004 | 156,604 | ||||||||||||
Bank of Montreal | 6/2/2016 | NOK | 7,306,000 | USD | 904,734 | 31,395 | ||||||||||||
Bank of Montreal | 6/2/2016 | NOK | 21,341,000 | USD | 2,649,805 | 98,762 | ||||||||||||
Canadian Imperial Bank of Commerce | 6/2/2016 | NOK | 91,288,000 | USD | 11,338,997 | 426,690 | ||||||||||||
Canadian Imperial Bank of Commerce | 6/2/2016 | NOK | 12,087,500 | USD | 1,445,329 | 423 | ||||||||||||
JP Morgan & Chase Co. | 6/2/2016 | NOK | 141,706,619 | USD | 17,595,462 | 656,256 | ||||||||||||
RBC Capital Markets | 6/2/2016 | NOK | 128,245,800 | USD | 15,923,876 | 593,738 | ||||||||||||
State Street Bank & Trust Co. | 6/2/2016 | NOK | 172,799,419 | USD | 21,456,291 | 800,340 | ||||||||||||
The Bank of Nova Scotia | 6/2/2016 | NOK | 25,189,100 | USD | 3,127,663 | 116,629 | ||||||||||||
Bank of Montreal | 6/2/2016 | NZD | 118,000 | USD | 82,169 | 2,330 | ||||||||||||
Bank of Montreal | 6/2/2016 | NZD | 10,562,600 | USD | 7,373,751 | 227,105 | ||||||||||||
Bank of Montreal | 6/2/2016 | NZD | 615,000 | USD | 429,318 | 13,209 | ||||||||||||
Canadian Imperial Bank of Commerce | 6/2/2016 | NZD | 4,494,600 | USD | 3,136,602 | 95,559 | ||||||||||||
JP Morgan & Chase Co. | 6/2/2016 | NZD | 3,827,680 | USD | 2,671,912 | 82,107 | ||||||||||||
RBC Capital Markets | 6/2/2016 | NZD | 2,116,500 | USD | 1,477,543 | 45,521 | ||||||||||||
State Street Bank & Trust Co. | 6/2/2016 | NZD | 6,796,480 | USD | 4,744,663 | 146,171 | ||||||||||||
The Bank of Nova Scotia | 6/2/2016 | NZD | 3,119,500 | USD | 2,177,754 | 67,103 | ||||||||||||
Bank of Montreal | 6/2/2016 | SEK | 172,527,900 | USD | 21,526,567 | 843,116 | ||||||||||||
Bank of Montreal | 6/2/2016 | SEK | 25,329,000 | USD | 3,154,414 | 117,855 | ||||||||||||
Bank of Montreal | 6/2/2016 | SEK | 41,592,000 | USD | 5,189,367 | 203,124 | ||||||||||||
Canadian Imperial Bank of Commerce | 6/2/2016 | SEK | 638,321,600 | USD | 79,670,943 | 3,145,968 | ||||||||||||
Canadian Imperial Bank of Commerce | 6/2/2016 | SEK | 78,041,900 | USD | 9,342,699 | (13,329 | ) | |||||||||||
JP Morgan & Chase Co. | 6/2/2016 | SEK | 705,782,358 | USD | 88,061,422 | 3,448,936 | ||||||||||||
RBC Capital Markets | 6/2/2016 | SEK | 273,762,300 | USD | 34,159,185 | 1,339,282 | ||||||||||||
State Street Bank & Trust Co. | 6/2/2016 | SEK | 872,479,258 | USD | 108,867,484 | 4,270,595 | ||||||||||||
The Bank of Nova Scotia | 6/2/2016 | SEK | 299,219,400 | USD | 37,334,989 | 1,463,169 | ||||||||||||
Bank of Montreal | 6/2/2016 | USD | 122,592,950 | AUD | 169,222,100 | (287,298 | ) | |||||||||||
Bank of Montreal | 6/2/2016 | USD | 217,332,328 | CHF | 216,071,800 | 43,729 | ||||||||||||
Bank of Montreal | 6/2/2016 | USD | 69,611,838 | DKK | 465,128,900 | (30,720 | ) | |||||||||||
Bank of Montreal | 6/2/2016 | USD | 222,617,769 | EUR | 199,971,048 | (121,165 | ) | |||||||||||
Bank of Montreal | 6/2/2016 | USD | 198,227,932 | GBP | 136,192,327 | (973,533 | ) | |||||||||||
Bank of Montreal | 6/2/2016 | USD | 75,399,703 | HKD | 585,716,200 | (25,228 | ) | |||||||||||
Bank of Montreal | 6/2/2016 | USD | 18,204,293 | ILS | 70,102,000 | (8,741 | ) | |||||||||||
Bank of Montreal | 6/2/2016 | USD | 7,468,968 | NOK | 62,464,100 | (2,187 | ) | |||||||||||
Bank of Montreal | 6/2/2016 | USD | 7,642,038 | NZD | 11,295,600 | 555 | ||||||||||||
Bank of Montreal | 6/2/2016 | USD | 28,665,358 | SEK | 239,448,900 | 40,895 | ||||||||||||
Canadian Imperial Bank of Commerce | 6/2/2016 | USD | 121,043,424 | AUD | 167,083,200 | (283,667 | ) | |||||||||||
Canadian Imperial Bank of Commerce | 6/2/2016 | USD | 1,097,851 | AUD | 1,489,500 | (21,311 | ) | |||||||||||
Canadian Imperial Bank of Commerce | 6/2/2016 | USD | 2,158,507 | AUD | 2,954,500 | (23,136 | ) | |||||||||||
| See Notes to Financial Statements. | 18 |
DBX ETF Trust
Schedule of investments
Deutsche X-trackers MSCI EAFE Hedged Equity ETF (Continued)
May 31, 2016
Counterparty | Settlement Date | Currency To Deliver | Currency To Receive | Unrealized Appreciation (Depreciation) | ||||||||||||||
Canadian Imperial Bank of Commerce | 6/2/2016 | USD | 717,155 | AUD | 993,000 | $ | 538 | |||||||||||
Canadian Imperial Bank of Commerce | 6/2/2016 | USD | 2,705,224 | CHF | 2,624,500 | (64,882 | ) | |||||||||||
Canadian Imperial Bank of Commerce | 6/2/2016 | USD | 175,323,074 | CHF | 174,306,200 | 35,276 | ||||||||||||
Canadian Imperial Bank of Commerce | 6/2/2016 | USD | 1,369,679 | CHF | 1,329,000 | (32,657 | ) | |||||||||||
Canadian Imperial Bank of Commerce | 6/2/2016 | USD | 902,800 | CHF | 891,000 | (6,421 | ) | |||||||||||
Canadian Imperial Bank of Commerce | 6/2/2016 | USD | 203,555 | DKK | 1,348,500 | (1,826 | ) | |||||||||||
Canadian Imperial Bank of Commerce | 6/2/2016 | USD | 308,642 | DKK | 2,009,000 | (8,105 | ) | |||||||||||
Canadian Imperial Bank of Commerce | 6/2/2016 | USD | 32,079,934 | DKK | 214,350,100 | (14,157 | ) | |||||||||||
Canadian Imperial Bank of Commerce | 6/2/2016 | USD | 611,463 | DKK | 3,994,000 | (13,979 | ) | |||||||||||
Canadian Imperial Bank of Commerce | 6/2/2016 | USD | 4,602,000 | EUR | 4,026,000 | (122,495 | ) | |||||||||||
Canadian Imperial Bank of Commerce | 6/2/2016 | USD | 9,164,889 | EUR | 8,047,000 | (211,442 | ) | |||||||||||
Canadian Imperial Bank of Commerce | 6/2/2016 | USD | 1,148,177,221 | EUR | 1,031,374,104 | (624,923 | ) | |||||||||||
Canadian Imperial Bank of Commerce | 6/2/2016 | USD | 3,011,372 | EUR | 2,683,000 | (26,148 | ) | |||||||||||
Canadian Imperial Bank of Commerce | 6/2/2016 | USD | 5,792,897 | GBP | 4,020,500 | 30,201 | ||||||||||||
Canadian Imperial Bank of Commerce | 6/2/2016 | USD | 2,924,728 | GBP | 2,025,000 | 8,185 | ||||||||||||
Canadian Imperial Bank of Commerce | 6/2/2016 | USD | 1,974,311 | GBP | 1,353,000 | (14,691 | ) | |||||||||||
Canadian Imperial Bank of Commerce | 6/2/2016 | USD | 458,991,197 | GBP | 315,349,500 | (2,254,189 | ) | |||||||||||
Canadian Imperial Bank of Commerce | 6/2/2016 | USD | 303,489 | HKD | 2,356,000 | (301 | ) | |||||||||||
Canadian Imperial Bank of Commerce | 6/2/2016 | USD | 97,170,748 | HKD | 754,836,948 | (32,512 | ) | |||||||||||
Canadian Imperial Bank of Commerce | 6/2/2016 | USD | 464,393 | HKD | 3,602,500 | (795 | ) | |||||||||||
Canadian Imperial Bank of Commerce | 6/2/2016 | USD | 931,430 | HKD | 7,229,000 | (1,147 | ) | |||||||||||
Canadian Imperial Bank of Commerce | 6/2/2016 | USD | 61,018 | ILS | 234,500 | (152 | ) | |||||||||||
Canadian Imperial Bank of Commerce | 6/2/2016 | USD | 179,329 | ILS | 678,000 | (3,349 | ) | |||||||||||
Canadian Imperial Bank of Commerce | 6/2/2016 | USD | 94,543 | ILS | 355,000 | (2,400 | ) | |||||||||||
Canadian Imperial Bank of Commerce | 6/2/2016 | USD | 11,754,496 | ILS | 45,264,800 | (5,644 | ) | |||||||||||
Canadian Imperial Bank of Commerce | 6/2/2016 | USD | 10,593,616 | NOK | 88,596,000 | (3,103 | ) | |||||||||||
Canadian Imperial Bank of Commerce | 6/2/2016 | USD | 89,951 | NOK | 734,500 | (2,151 | ) | |||||||||||
Canadian Imperial Bank of Commerce | 6/2/2016 | USD | 177,917 | NOK | 1,464,000 | (2,914 | ) | |||||||||||
Canadian Imperial Bank of Commerce | 6/2/2016 | USD | 59,356 | NOK | 493,500 | (364 | ) | |||||||||||
Canadian Imperial Bank of Commerce | 6/2/2016 | USD | 18,506 | NZD | 27,500 | 100 | ||||||||||||
Canadian Imperial Bank of Commerce | 6/2/2016 | USD | 2,939,677 | NZD | 4,345,100 | 214 | ||||||||||||
Canadian Imperial Bank of Commerce | 6/2/2016 | USD | 27,964 | NZD | 41,000 | (223 | ) | |||||||||||
Canadian Imperial Bank of Commerce | 6/2/2016 | USD | 54,771 | NZD | 81,000 | 33 | ||||||||||||
Canadian Imperial Bank of Commerce | 6/2/2016 | USD | 859,684 | SEK | 7,013,500 | (18,873 | ) | |||||||||||
Canadian Imperial Bank of Commerce | 6/2/2016 | USD | 429,588 | SEK | 3,492,500 | (10,891 | ) | |||||||||||
Canadian Imperial Bank of Commerce | 6/2/2016 | USD | 282,376 | SEK | 2,357,000 | 192 | ||||||||||||
Canadian Imperial Bank of Commerce | 6/2/2016 | USD | 74,876,078 | SEK | 625,458,600 | 106,820 | ||||||||||||
JP Morgan & Chase Co. | 6/2/2016 | USD | 140,993,748 | AUD | 194,621,779 | (330,421 | ) | |||||||||||
JP Morgan & Chase Co. | 6/2/2016 | USD | 30,328,752 | AUD | 39,798,900 | (1,564,008 | ) | |||||||||||
JP Morgan & Chase Co. | 6/2/2016 | USD | 1,685,321 | AUD | 2,253,000 | (56,960 | ) | |||||||||||
JP Morgan & Chase Co. | 6/2/2016 | USD | 2,087,379 | CHF | 1,989,500 | (85,870 | ) | |||||||||||
JP Morgan & Chase Co. | 6/2/2016 | USD | 204,720,794 | CHF | 203,533,413 | 41,191 | ||||||||||||
JP Morgan & Chase Co. | 6/2/2016 | USD | 45,582,939 | CHF | 43,640,650 | (1,678,865 | ) | |||||||||||
JP Morgan & Chase Co. | 6/2/2016 | USD | 461,831 | DKK | 2,984,500 | (15,363 | ) | |||||||||||
JP Morgan & Chase Co. | 6/2/2016 | USD | 56,608,208 | DKK | 378,241,896 | (24,982 | ) | |||||||||||
JP Morgan & Chase Co. | 6/2/2016 | USD | 7,054,463 | EUR | 6,125,000 | (239,518 | ) | |||||||||||
JP Morgan & Chase Co. | 6/2/2016 | USD | 710,461,644 | EUR | 638,186,970 | (386,686 | ) | |||||||||||
JP Morgan & Chase Co. | 6/2/2016 | USD | 127,365,359 | EUR | 111,112,200 | (3,737,027 | ) | |||||||||||
JP Morgan & Chase Co. | 6/2/2016 | USD | 76,234,207 | GBP | 52,038,600 | (864,009 | ) | |||||||||||
JP Morgan & Chase Co. | 6/2/2016 | USD | 4,484,043 | GBP | 3,084,000 | (17,327 | ) | |||||||||||
JP Morgan & Chase Co. | 6/2/2016 | USD | 433,596,724 | GBP | 297,902,249 | (2,129,472 | ) | |||||||||||
JP Morgan & Chase Co. | 6/2/2016 | USD | 714,336 | HKD | 5,543,500 | (956 | ) | |||||||||||
JP Morgan & Chase Co. | 6/2/2016 | USD | 83,887,164 | HKD | 651,648,070 | (28,068 | ) | |||||||||||
JP Morgan & Chase Co. | 6/2/2016 | USD | 146,968 | ILS | 555,500 | (2,783 | ) | |||||||||||
JP Morgan & Chase Co. | 6/2/2016 | USD | 15,259,597 | ILS | 58,762,418 | (7,327 | ) | |||||||||||
JP Morgan & Chase Co. | 6/2/2016 | USD | 136,988 | NOK | 1,111,500 | (4,122 | ) | |||||||||||
JP Morgan & Chase Co. | 6/2/2016 | USD | 14,445,026 | NOK | 120,805,919 | (4,230 | ) | |||||||||||
JP Morgan & Chase Co. | 6/2/2016 | USD | 2,457,190 | NOK | 19,789,200 | (91,646 | ) | |||||||||||
JP Morgan & Chase Co. | 6/2/2016 | USD | 41,096 | NZD | 59,500 | (838 | ) | |||||||||||
JP Morgan & Chase Co. | 6/2/2016 | USD | 532,473 | NZD | 762,800 | (16,363 | ) | |||||||||||
| See Notes to Financial Statements. | 19 |
DBX ETF Trust
Schedule of investments
Deutsche X-trackers MSCI EAFE Hedged Equity ETF (Continued)
May 31, 2016
Counterparty | Settlement Date | Currency To Deliver | Currency To Receive | Unrealized Appreciation (Depreciation) | ||||||||||||||
JP Morgan & Chase Co. | 6/2/2016 | USD | 2,033,290 | NZD | 3,005,380 | $ | 148 | |||||||||||
JP Morgan & Chase Co. | 6/2/2016 | USD | 662,671 | SEK | 5,329,500 | (23,745 | ) | |||||||||||
JP Morgan & Chase Co. | 6/2/2016 | USD | 14,110,393 | SEK | 113,090,000 | (552,635 | ) | |||||||||||
JP Morgan & Chase Co. | 6/2/2016 | USD | 70,315,489 | SEK | 587,362,858 | 100,314 | ||||||||||||
RBC Capital Markets | 6/2/2016 | USD | 901,328 | AUD | 1,224,500 | (16,317 | ) | |||||||||||
RBC Capital Markets | 6/2/2016 | USD | 1,114,430 | CHF | 1,082,000 | (25,899 | ) | |||||||||||
RBC Capital Markets | 6/2/2016 | USD | 90,575,739 | CHF | 90,050,400 | 18,224 | ||||||||||||
RBC Capital Markets | 6/2/2016 | USD | 251,850 | DKK | 1,641,500 | (6,290 | ) | |||||||||||
RBC Capital Markets | 6/2/2016 | USD | 17,254,776 | DKK | 115,292,100 | (7,615 | ) | |||||||||||
RBC Capital Markets | 6/2/2016 | USD | 3,807,811 | EUR | 3,336,500 | (95,474 | ) | |||||||||||
RBC Capital Markets | 6/2/2016 | USD | 294,017,674 | EUR | 264,107,500 | (160,026 | ) | |||||||||||
RBC Capital Markets | 6/2/2016 | USD | 2,424,762 | GBP | 1,680,500 | 9,194 | ||||||||||||
RBC Capital Markets | 6/2/2016 | USD | 189,576,971 | GBP | 130,248,692 | (931,047 | ) | |||||||||||
RBC Capital Markets | 6/2/2016 | USD | 387,977 | HKD | 3,010,000 | (627 | ) | |||||||||||
RBC Capital Markets | 6/2/2016 | USD | 1,305,588 | HKD | 10,142,000 | (437 | ) | |||||||||||
RBC Capital Markets | 6/2/2016 | USD | 5,937,702 | ILS | 22,865,200 | (2,851 | ) | |||||||||||
RBC Capital Markets | 6/2/2016 | USD | 75,486 | ILS | 286,000 | (1,253 | ) | |||||||||||
RBC Capital Markets | 6/2/2016 | USD | 15,261,331 | NOK | 127,632,800 | (4,470 | ) | |||||||||||
RBC Capital Markets | 6/2/2016 | USD | 74,714 | NOK | 613,000 | (1,437 | ) | |||||||||||
RBC Capital Markets | 6/2/2016 | USD | 22,890 | NZD | 33,500 | (224 | ) | |||||||||||
RBC Capital Markets | 6/2/2016 | USD | 1,409,254 | NZD | 2,083,000 | 102 | ||||||||||||
RBC Capital Markets | 6/2/2016 | USD | 32,428,193 | SEK | 270,880,800 | 46,263 | ||||||||||||
RBC Capital Markets | 6/2/2016 | USD | 354,093 | SEK | 2,881,500 | (8,645 | ) | |||||||||||
State Street Bank & Trust Co. | 6/2/2016 | USD | 223,751,946 | AUD | 308,857,679 | (524,366 | ) | |||||||||||
State Street Bank & Trust Co. | 6/2/2016 | USD | 901,350 | AUD | 1,224,500 | (16,339 | ) | |||||||||||
State Street Bank & Trust Co. | 6/2/2016 | USD | 717,058 | AUD | 993,000 | 635 | ||||||||||||
State Street Bank & Trust Co. | 6/2/2016 | USD | 1,685,323 | AUD | 2,253,000 | (56,962 | ) | |||||||||||
State Street Bank & Trust Co. | 6/2/2016 | USD | 2,158,333 | AUD | 2,954,500 | (22,962 | ) | |||||||||||
State Street Bank & Trust Co. | 6/2/2016 | USD | 2,087,331 | CHF | 1,989,500 | (85,822 | ) | |||||||||||
State Street Bank & Trust Co. | 6/2/2016 | USD | 275,754,860 | CHF | 274,155,482 | 55,484 | ||||||||||||
State Street Bank & Trust Co. | 6/2/2016 | USD | 1,114,446 | CHF | 1,082,000 | (25,915 | ) | |||||||||||
State Street Bank & Trust Co. | 6/2/2016 | USD | 902,743 | CHF | 891,000 | (6,365 | ) | |||||||||||
State Street Bank & Trust Co. | 6/2/2016 | USD | 2,704,909 | CHF | 2,624,500 | (64,567 | ) | |||||||||||
State Street Bank & Trust Co. | 6/2/2016 | USD | 251,836 | DKK | 1,641,500 | (6,276 | ) | |||||||||||
State Street Bank & Trust Co. | 6/2/2016 | USD | 203,535 | DKK | 1,348,500 | (1,806 | ) | |||||||||||
State Street Bank & Trust Co. | 6/2/2016 | USD | 611,417 | DKK | 3,994,000 | (13,933 | ) | |||||||||||
State Street Bank & Trust Co. | 6/2/2016 | USD | 461,802 | DKK | 2,984,500 | (15,335 | ) | |||||||||||
State Street Bank & Trust Co. | 6/2/2016 | USD | 42,064,788 | DKK | 281,066,396 | (18,563 | ) | |||||||||||
State Street Bank & Trust Co. | 6/2/2016 | USD | 9,164,302 | EUR | 8,047,000 | (210,855 | ) | |||||||||||
State Street Bank & Trust Co. | 6/2/2016 | USD | 3,011,203 | EUR | 2,683,000 | (25,979 | ) | |||||||||||
State Street Bank & Trust Co. | 6/2/2016 | USD | 20,000,000 | EUR | 17,336,371 | (710,790 | ) | |||||||||||
State Street Bank & Trust Co. | 6/2/2016 | USD | 7,054,481 | EUR | 6,125,000 | (239,536 | ) | |||||||||||
State Street Bank & Trust Co. | 6/2/2016 | USD | 3,807,884 | EUR | 3,336,500 | (95,547 | ) | |||||||||||
State Street Bank & Trust Co. | 6/2/2016 | USD | 949,970,763 | EUR | 853,331,024 | (517,044 | ) | |||||||||||
State Street Bank & Trust Co. | 6/2/2016 | USD | 4,484,053 | GBP | 3,084,000 | (17,336 | ) | |||||||||||
State Street Bank & Trust Co. | 6/2/2016 | USD | 2,424,819 | GBP | 1,680,500 | 9,137 | ||||||||||||
State Street Bank & Trust Co. | 6/2/2016 | USD | 5,792,576 | GBP | 4,020,500 | 30,523 | ||||||||||||
State Street Bank & Trust Co. | 6/2/2016 | USD | 573,662,091 | GBP | 394,134,037 | (2,817,359 | ) | |||||||||||
State Street Bank & Trust Co. | 6/2/2016 | USD | 1,974,022 | GBP | 1,353,000 | (14,402 | ) | |||||||||||
State Street Bank & Trust Co. | 6/2/2016 | USD | 57,978,073 | HKD | 450,382,370 | (19,399 | ) | |||||||||||
State Street Bank & Trust Co. | 6/2/2016 | USD | 387,957 | HKD | 3,010,000 | (607 | ) | |||||||||||
State Street Bank & Trust Co. | 6/2/2016 | USD | 714,328 | HKD | 5,543,500 | (947 | ) | |||||||||||
State Street Bank & Trust Co. | 6/2/2016 | USD | 303,473 | HKD | 2,356,000 | (285 | ) | |||||||||||
State Street Bank & Trust Co. | 6/2/2016 | USD | 931,383 | HKD | 7,229,000 | (1,099 | ) | |||||||||||
State Street Bank & Trust Co. | 6/2/2016 | USD | 146,971 | ILS | 555,500 | (2,786 | ) | |||||||||||
State Street Bank & Trust Co. | 6/2/2016 | USD | 15,441,401 | ILS | 59,462,518 | (7,415 | ) | |||||||||||
State Street Bank & Trust Co. | 6/2/2016 | USD | 75,471 | ILS | 286,000 | (1,238 | ) | |||||||||||
State Street Bank & Trust Co. | 6/2/2016 | USD | 61,022 | ILS | 234,500 | (156 | ) | |||||||||||
State Street Bank & Trust Co. | 6/2/2016 | USD | 179,328 | ILS | 678,000 | (3,348 | ) | |||||||||||
State Street Bank & Trust Co. | 6/2/2016 | USD | 136,981 | NOK | 1,111,500 | (4,115 | ) | |||||||||||
| See Notes to Financial Statements. | 20 |
DBX ETF Trust
Schedule of investments
Deutsche X-trackers MSCI EAFE Hedged Equity ETF (Continued)
May 31, 2016
Counterparty | Settlement Date | Currency To Deliver | Currency To Receive | Unrealized Appreciation (Depreciation) | ||||||||||||||
State Street Bank & Trust Co. | 6/2/2016 | USD | 20,221,737 | NOK | 169,117,419 | $ | (5,922 | ) | ||||||||||
State Street Bank & Trust Co. | 6/2/2016 | USD | 59,352 | NOK | 493,500 | (360 | ) | |||||||||||
State Street Bank & Trust Co. | 6/2/2016 | USD | 177,904 | NOK | 1,464,000 | (2,902 | ) | |||||||||||
State Street Bank & Trust Co. | 6/2/2016 | USD | 74,713 | NOK | 613,000 | (1,437 | ) | |||||||||||
State Street Bank & Trust Co. | 6/2/2016 | USD | 41,095 | NZD | 59,500 | (837 | ) | |||||||||||
State Street Bank & Trust Co. | 6/2/2016 | USD | 22,891 | NZD | 33,500 | (225 | ) | |||||||||||
State Street Bank & Trust Co. | 6/2/2016 | USD | 18,509 | NZD | 27,500 | 97 | ||||||||||||
State Street Bank & Trust Co. | 6/2/2016 | USD | 54,773 | NZD | 81,000 | 32 | ||||||||||||
State Street Bank & Trust Co. | 6/2/2016 | USD | 4,461,834 | NZD | 6,594,980 | 324 | ||||||||||||
State Street Bank & Trust Co. | 6/2/2016 | USD | 662,636 | SEK | 5,329,500 | (23,710 | ) | |||||||||||
State Street Bank & Trust Co. | 6/2/2016 | USD | 859,628 | SEK | 7,013,500 | (18,817 | ) | |||||||||||
State Street Bank & Trust Co. | 6/2/2016 | USD | 102,343,131 | SEK | 854,897,758 | 146,006 | ||||||||||||
State Street Bank & Trust Co. | 6/2/2016 | USD | 354,088 | SEK | 2,881,500 | (8,641 | ) | |||||||||||
State Street Bank & Trust Co. | 6/2/2016 | USD | 282,361 | SEK | 2,357,000 | 208 | ||||||||||||
The Bank of New York Mellon | 6/2/2016 | USD | 10,759,923 | AUD | 14,629,200 | (186,636 | ) | |||||||||||
The Bank of New York Mellon | 6/2/2016 | USD | 17,993,036 | CHF | 17,413,300 | (474,625 | ) | |||||||||||
The Bank of New York Mellon | 6/2/2016 | USD | 9,497,183 | DKK | 63,457,800 | (4,191 | ) | |||||||||||
The Bank of New York Mellon | 6/2/2016 | USD | 3,201,909 | DKK | 20,828,100 | (86,123 | ) | |||||||||||
The Bank of New York Mellon | 6/2/2016 | USD | 9,192,774 | EUR | 8,218,400 | (48,619 | ) | |||||||||||
The Bank of New York Mellon | 6/2/2016 | USD | 1,121,208 | EUR | 1,000,000 | (8,564 | ) | |||||||||||
The Bank of New York Mellon | 6/2/2016 | USD | 10,810,655 | EUR | 9,456,900 | (288,491 | ) | |||||||||||
The Bank of New York Mellon | 6/2/2016 | USD | 28,741,115 | EUR | 24,953,000 | (977,307 | ) | |||||||||||
The Bank of New York Mellon | 6/2/2016 | USD | 37,151,182 | EUR | 32,234,600 | (1,285,545 | ) | |||||||||||
The Bank of New York Mellon | 6/2/2016 | USD | 41,028,460 | GBP | 28,393,300 | 95,026 | ||||||||||||
The Bank of New York Mellon | 6/2/2016 | USD | 5,711,205 | HKD | 44,304,100 | (9,812 | ) | |||||||||||
The Bank of New York Mellon | 6/2/2016 | USD | 41,529,026 | HKD | 322,603,700 | (13,895 | ) | |||||||||||
The Bank of New York Mellon | 6/2/2016 | USD | 544,948 | ILS | 2,033,300 | (17,188 | ) | |||||||||||
The Bank of New York Mellon | 6/2/2016 | USD | 5,366,581 | ILS | 20,665,900 | (2,577 | ) | |||||||||||
The Bank of New York Mellon | 6/2/2016 | USD | 1,021,415 | ILS | 3,863,400 | (18,638 | ) | |||||||||||
The Bank of New York Mellon | 6/2/2016 | USD | 1,477,354 | NOK | 12,087,500 | (32,448 | ) | |||||||||||
The Bank of New York Mellon | 6/2/2016 | USD | 9,619,886 | SEK | 78,041,900 | (263,858 | ) | |||||||||||
The Bank of Nova Scotia | 6/2/2016 | USD | 1,097,866 | AUD | 1,489,500 | (21,326 | ) | |||||||||||
The Bank of Nova Scotia | 6/2/2016 | USD | 197,994,358 | AUD | 273,303,000 | (464,003 | ) | |||||||||||
The Bank of Nova Scotia | 6/2/2016 | USD | 104,829,511 | CHF | 104,221,500 | 21,092 | ||||||||||||
The Bank of Nova Scotia | 6/2/2016 | USD | 1,369,637 | CHF | 1,329,000 | (32,615 | ) | |||||||||||
The Bank of Nova Scotia | 6/2/2016 | USD | 308,636 | DKK | 2,009,000 | (8,099 | ) | |||||||||||
The Bank of Nova Scotia | 6/2/2016 | USD | 3,410,379 | DKK | 22,787,300 | (1,505 | ) | |||||||||||
The Bank of Nova Scotia | 6/2/2016 | USD | 306,928,591 | EUR | 275,705,000 | (167,053 | ) | |||||||||||
The Bank of Nova Scotia | 6/2/2016 | USD | 4,601,919 | EUR | 4,026,000 | (122,414 | ) | |||||||||||
The Bank of Nova Scotia | 6/2/2016 | USD | 2,924,657 | GBP | 2,025,000 | 8,255 | ||||||||||||
The Bank of Nova Scotia | 6/2/2016 | USD | 498,186,793 | GBP | 342,278,800 | (2,446,686 | ) | |||||||||||
The Bank of Nova Scotia | 6/2/2016 | USD | 10,407,652 | HKD | 80,848,200 | (3,482 | ) | |||||||||||
The Bank of Nova Scotia | 6/2/2016 | USD | 464,381 | HKD | 3,602,500 | (783 | ) | |||||||||||
The Bank of Nova Scotia | 6/2/2016 | USD | 94,540 | ILS | 355,000 | (2,397 | ) | |||||||||||
The Bank of Nova Scotia | 6/2/2016 | USD | 2,924,090 | NOK | 24,454,600 | (856 | ) | |||||||||||
The Bank of Nova Scotia | 6/2/2016 | USD | 89,948 | NOK | 734,500 | (2,148 | ) | |||||||||||
The Bank of Nova Scotia | 6/2/2016 | USD | 27,963 | NZD | 41,000 | (223 | ) | |||||||||||
The Bank of Nova Scotia | 6/2/2016 | USD | 2,082,759 | NZD | 3,078,500 | 151 | ||||||||||||
The Bank of Nova Scotia | 6/2/2016 | USD | 429,578 | SEK | 3,492,500 | (10,880 | ) | |||||||||||
The Bank of Nova Scotia | 6/2/2016 | USD | 35,402,616 | SEK | 295,726,900 | 50,506 | ||||||||||||
Bank of Montreal | 6/3/2016 | JPY | 19,976,052,600 | USD | 186,809,054 | 6,392,678 | ||||||||||||
Bank of Montreal | 6/3/2016 | JPY | 4,258,852,000 | USD | 39,831,205 | 1,366,817 | ||||||||||||
Canadian Imperial Bank of Commerce | 6/3/2016 | JPY | 9,437,523,000 | USD | 88,263,429 | 3,027,185 | ||||||||||||
JP Morgan & Chase Co. | 6/3/2016 | JPY | 82,156,313,427 | USD | 768,218,071 | 26,212,400 | ||||||||||||
RBC Capital Markets | 6/3/2016 | JPY | 41,992,789,500 | USD | 392,705,547 | 13,442,083 | ||||||||||||
State Street Bank & Trust Co. | 6/3/2016 | JPY | 82,078,613,900 | USD | 767,597,755 | 26,293,837 | ||||||||||||
The Bank of New York Mellon | 6/3/2016 | JPY | 665,225,400 | USD | 6,064,595 | 56,523 | ||||||||||||
The Bank of New York Mellon | 6/3/2016 | JPY | 38,851,371,500 | USD | 363,317,977 | 12,426,648 | ||||||||||||
The Bank of Nova Scotia | 6/3/2016 | JPY | 27,922,837,467 | USD | 261,112,397 | 8,923,576 | ||||||||||||
Bank of Montreal | 6/3/2016 | SGD | 650,000 | USD | 482,482 | 10,501 | ||||||||||||
| See Notes to Financial Statements. | 21 |
DBX ETF Trust
Schedule of investments
Deutsche X-trackers MSCI EAFE Hedged Equity ETF (Continued)
May 31, 2016
Counterparty | Settlement Date | Currency To Deliver | Currency To Receive | Unrealized Appreciation (Depreciation) | ||||||||||||||
Bank of Montreal | 6/3/2016 | SGD | 155,000 | USD | 115,222 | $ | 2,673 | |||||||||||
Bank of Montreal | 6/3/2016 | SGD | 32,705,500 | USD | 24,313,465 | 565,177 | ||||||||||||
Canadian Imperial Bank of Commerce | 6/3/2016 | SGD | 37,734,900 | USD | 28,058,191 | 657,929 | ||||||||||||
JP Morgan & Chase Co. | 6/3/2016 | SGD | 42,843,416 | USD | 31,846,737 | 737,053 | ||||||||||||
RBC Capital Markets | 6/3/2016 | SGD | 17,317,900 | USD | 12,873,809 | 298,846 | ||||||||||||
State Street Bank & Trust Co. | 6/3/2016 | SGD | 61,384,868 | USD | 45,632,725 | 1,059,625 | ||||||||||||
The Bank of New York Mellon | 6/3/2016 | SGD | 15,770,500 | USD | 11,723,797 | 272,439 | ||||||||||||
The Bank of Nova Scotia | 6/3/2016 | SGD | 7,245,500 | USD | 5,385,988 | 124,848 | ||||||||||||
Bank of Montreal | 6/3/2016 | USD | 218,524,421 | JPY | 24,234,904,600 | 356,343 | ||||||||||||
Bank of Montreal | 6/3/2016 | USD | 24,340,895 | SGD | 33,510,500 | (8,077 | ) | |||||||||||
Canadian Imperial Bank of Commerce | 6/3/2016 | USD | 3,483,966 | JPY | 377,655,000 | (73,125 | ) | |||||||||||
Canadian Imperial Bank of Commerce | 6/3/2016 | USD | 46,591,646 | JPY | 5,167,246,500 | 77,028 | ||||||||||||
Canadian Imperial Bank of Commerce | 6/3/2016 | USD | 2,298,340 | JPY | 253,249,500 | (11,084 | ) | |||||||||||
Canadian Imperial Bank of Commerce | 6/3/2016 | USD | 6,839,661 | JPY | 740,831,000 | (148,747 | ) | |||||||||||
Canadian Imperial Bank of Commerce | 6/3/2016 | USD | 27,109,356 | JPY | 2,898,541,000 | (930,797 | ) | |||||||||||
Canadian Imperial Bank of Commerce | 6/3/2016 | USD | 132,030 | SGD | 182,500 | 488 | ||||||||||||
Canadian Imperial Bank of Commerce | 6/3/2016 | USD | 404,463 | SGD | 554,500 | (1,827 | ) | |||||||||||
Canadian Imperial Bank of Commerce | 6/3/2016 | USD | 199,824 | SGD | 273,000 | (1,592 | ) | |||||||||||
Canadian Imperial Bank of Commerce | 6/3/2016 | USD | 26,675,068 | SGD | 36,724,900 | (8,193 | ) | |||||||||||
JP Morgan & Chase Co. | 6/3/2016 | USD | 735,714,467 | JPY | 81,594,412,927 | 1,216,326 | ||||||||||||
JP Morgan & Chase Co. | 6/3/2016 | USD | 5,281,660 | JPY | 561,900,500 | (206,781 | ) | |||||||||||
JP Morgan & Chase Co. | 6/3/2016 | USD | 30,810,907 | SGD | 42,418,916 | (9,463 | ) | |||||||||||
JP Morgan & Chase Co. | 6/3/2016 | USD | 313,545 | SGD | 424,500 | (5,305 | ) | |||||||||||
RBC Capital Markets | 6/3/2016 | USD | 375,876,525 | JPY | 41,686,586,000 | 621,421 | ||||||||||||
RBC Capital Markets | 6/3/2016 | USD | 2,860,006 | JPY | 306,203,500 | (94,489 | ) | |||||||||||
RBC Capital Markets | 6/3/2016 | USD | 167,788 | SGD | 228,500 | (1,868 | ) | |||||||||||
RBC Capital Markets | 6/3/2016 | USD | 12,413,082 | SGD | 17,089,400 | (4,038 | ) | |||||||||||
State Street Bank & Trust Co. | 6/3/2016 | USD | 6,839,062 | JPY | 740,831,000 | (148,148 | ) | |||||||||||
State Street Bank & Trust Co. | 6/3/2016 | USD | 2,298,238 | JPY | 253,249,500 | (10,982 | ) | |||||||||||
State Street Bank & Trust Co. | 6/3/2016 | USD | 5,281,711 | JPY | 561,900,500 | (206,832 | ) | |||||||||||
State Street Bank & Trust Co. | 6/3/2016 | USD | 2,860,075 | JPY | 306,203,500 | (94,558 | ) | |||||||||||
State Street Bank & Trust Co. | 6/3/2016 | USD | 723,303,915 | JPY | 80,216,429,400 | 1,181,436 | ||||||||||||
State Street Bank & Trust Co. | 6/3/2016 | USD | 43,576,948 | SGD | 59,994,868 | (13,162 | ) | |||||||||||
State Street Bank & Trust Co. | 6/3/2016 | USD | 404,445 | SGD | 554,500 | (1,808 | ) | |||||||||||
State Street Bank & Trust Co. | 6/3/2016 | USD | 167,760 | SGD | 228,500 | (1,840 | ) | |||||||||||
State Street Bank & Trust Co. | 6/3/2016 | USD | 132,040 | SGD | 182,500 | 478 | ||||||||||||
State Street Bank & Trust Co. | 6/3/2016 | USD | 313,552 | SGD | 424,500 | (5,311 | ) | |||||||||||
The Bank of New York Mellon | 6/3/2016 | USD | 314,822 | JPY | 33,559,600 | (11,724 | ) | |||||||||||
The Bank of New York Mellon | 6/3/2016 | USD | 25,843,132 | JPY | 2,800,000,000 | (554,560 | ) | |||||||||||
The Bank of New York Mellon | 6/3/2016 | USD | 325,486,781 | JPY | 36,097,037,300 | 528,413 | ||||||||||||
The Bank of New York Mellon | 6/3/2016 | USD | 5,384,124 | JPY | 586,000,000 | (91,587 | ) | |||||||||||
The Bank of New York Mellon | 6/3/2016 | USD | 2,404,210 | SGD | 3,269,100 | (30,434 | ) | |||||||||||
The Bank of New York Mellon | 6/3/2016 | USD | 9,080,337 | SGD | 12,501,400 | (2,756 | ) | |||||||||||
The Bank of Nova Scotia | 6/3/2016 | USD | 248,367,364 | JPY | 27,545,182,467 | 410,615 | ||||||||||||
The Bank of Nova Scotia | 6/3/2016 | USD | 3,483,906 | JPY | 377,655,000 | (73,065 | ) | |||||||||||
The Bank of Nova Scotia | 6/3/2016 | USD | 5,064,463 | SGD | 6,972,500 | (1,555 | ) | |||||||||||
The Bank of Nova Scotia | 6/3/2016 | USD | 199,819 | SGD | 273,000 | (1,587 | ) | |||||||||||
Bank of Montreal | 7/5/2016 | AUD | 169,222,100 | USD | 122,440,650 | 302,705 | ||||||||||||
Bank of Montreal | 7/5/2016 | AUD | 43,619,000 | USD | 31,559,738 | 77,236 | ||||||||||||
Bank of Montreal | 7/5/2016 | AUD | 10,247,000 | USD | 7,409,585 | 13,698 | ||||||||||||
Canadian Imperial Bank of Commerce | 7/5/2016 | AUD | 167,083,200 | USD | 120,893,049 | 298,879 | ||||||||||||
JP Morgan & Chase Co. | 7/5/2016 | AUD | 194,621,779 | USD | 140,822,481 | 352,033 | ||||||||||||
State Street Bank & Trust Co. | 7/5/2016 | AUD | 308,857,679 | USD | 223,480,151 | 558,663 | ||||||||||||
The Bank of Nova Scotia | 7/5/2016 | AUD | 273,303,000 | USD | 197,749,752 | 490,252 | ||||||||||||
Bank of Montreal | 7/5/2016 | CHF | 216,071,800 | USD | 217,662,916 | (83,406 | ) | |||||||||||
Bank of Montreal | 7/5/2016 | CHF | 17,038,000 | USD | 17,163,034 | (7,007 | ) | |||||||||||
Canadian Imperial Bank of Commerce | 7/5/2016 | CHF | 174,306,200 | USD | 175,589,761 | (67,284 | ) | |||||||||||
JP Morgan & Chase Co. | 7/5/2016 | CHF | 203,533,413 | USD | 205,022,905 | (87,860 | ) | |||||||||||
RBC Capital Markets | 7/5/2016 | CHF | 90,050,400 | USD | 90,713,059 | (35,217 | ) | |||||||||||
State Street Bank & Trust Co. | 7/5/2016 | CHF | 274,155,482 | USD | 276,184,054 | (96,090 | ) | |||||||||||
| See Notes to Financial Statements. | 22 |
DBX ETF Trust
Schedule of investments
Deutsche X-trackers MSCI EAFE Hedged Equity ETF (Continued)
May 31, 2016
Counterparty | Settlement Date | Currency To Deliver | Currency To Receive | Unrealized Appreciation (Depreciation) | ||||||||||||||
The Bank of Nova Scotia | 7/5/2016 | CHF | 104,221,500 | USD | 104,990,027 | $ | (39,173 | ) | ||||||||||
Bank of Montreal | 7/5/2016 | DKK | 465,128,900 | USD | 69,689,540 | 16,988 | ||||||||||||
Bank of Montreal | 7/5/2016 | DKK | 35,076,000 | USD | 5,255,259 | 1,157 | ||||||||||||
Canadian Imperial Bank of Commerce | 7/5/2016 | DKK | 214,350,100 | USD | 32,115,742 | 7,829 | ||||||||||||
JP Morgan & Chase Co. | 7/5/2016 | DKK | 378,241,896 | USD | 56,671,820 | 14,239 | ||||||||||||
RBC Capital Markets | 7/5/2016 | DKK | 115,292,100 | USD | 17,273,855 | 4,030 | ||||||||||||
State Street Bank & Trust Co. | 7/5/2016 | DKK | 281,066,396 | USD | 42,112,688 | 11,212 | ||||||||||||
The Bank of New York Mellon | 7/5/2016 | DKK | 63,457,800 | USD | 9,507,712 | 2,246 | ||||||||||||
The Bank of Nova Scotia | 7/5/2016 | DKK | 22,787,300 | USD | 3,414,262 | 909 | ||||||||||||
Bank of Montreal | 7/5/2016 | EUR | 199,971,048 | USD | 222,868,733 | 77,944 | ||||||||||||
Canadian Imperial Bank of Commerce | 7/5/2016 | EUR | 1,031,374,104 | USD | 1,149,476,753 | 407,161 | ||||||||||||
JP Morgan & Chase Co. | 7/5/2016 | EUR | 638,186,970 | USD | 711,237,041 | 223,222 | ||||||||||||
RBC Capital Markets | 7/5/2016 | EUR | 264,107,500 | USD | 294,347,809 | 101,622 | ||||||||||||
State Street Bank & Trust Co. | 7/5/2016 | EUR | 853,331,024 | USD | 951,062,173 | 353,087 | ||||||||||||
The Bank of Nova Scotia | 7/5/2016 | EUR | 275,705,000 | USD | 307,275,980 | 108,841 | ||||||||||||
Bank of Montreal | 7/5/2016 | GBP | 136,192,327 | USD | 198,269,471 | 961,728 | ||||||||||||
Canadian Imperial Bank of Commerce | 7/5/2016 | GBP | 315,349,500 | USD | 459,088,956 | 2,228,430 | ||||||||||||
JP Morgan & Chase Co. | 7/5/2016 | GBP | 297,902,249 | USD | 433,686,988 | 2,103,053 | ||||||||||||
RBC Capital Markets | 7/5/2016 | GBP | 130,248,692 | USD | 189,617,348 | 920,408 | ||||||||||||
State Street Bank & Trust Co. | 7/5/2016 | GBP | 394,134,037 | USD | 573,788,214 | 2,789,106 | ||||||||||||
The Bank of Nova Scotia | 7/5/2016 | GBP | 342,278,800 | USD | 498,294,611 | 2,420,438 | ||||||||||||
Bank of Montreal | 7/5/2016 | HKD | 350,000 | USD | 45,069 | 5 | ||||||||||||
Bank of Montreal | 7/5/2016 | HKD | 585,716,200 | USD | 75,431,553 | 18,096 | ||||||||||||
Canadian Imperial Bank of Commerce | 7/5/2016 | HKD | 754,836,948 | USD | 97,213,047 | 24,572 | ||||||||||||
JP Morgan & Chase Co. | 7/5/2016 | HKD | 651,648,070 | USD | 83,921,734 | 19,268 | ||||||||||||
RBC Capital Markets | 7/5/2016 | HKD | 10,142,000 | USD | 1,306,172 | 347 | ||||||||||||
State Street Bank & Trust Co. | 7/5/2016 | HKD | 450,382,370 | USD | 58,003,461 | 14,811 | ||||||||||||
The Bank of New York Mellon | 7/5/2016 | HKD | 322,603,700 | USD | 41,547,210 | 10,609 | ||||||||||||
The Bank of Nova Scotia | 7/5/2016 | HKD | 80,848,200 | USD | 10,411,941 | 2,391 | ||||||||||||
Bank of Montreal | 7/5/2016 | ILS | 70,102,000 | USD | 18,212,616 | 5,210 | ||||||||||||
Canadian Imperial Bank of Commerce | 7/5/2016 | ILS | 45,264,800 | USD | 11,759,076 | 2,570 | ||||||||||||
JP Morgan & Chase Co. | 7/5/2016 | ILS | 58,762,418 | USD | 15,266,733 | 4,526 | ||||||||||||
RBC Capital Markets | 7/5/2016 | ILS | 22,865,200 | USD | 5,939,943 | 1,225 | ||||||||||||
State Street Bank & Trust Co. | 7/5/2016 | ILS | 59,462,518 | USD | 15,445,532 | 1,490 | ||||||||||||
The Bank of New York Mellon | 7/5/2016 | ILS | 20,665,900 | USD | 5,369,030 | 1,530 | ||||||||||||
Bank of Montreal | 7/5/2016 | JPY | 24,234,904,600 | USD | 218,766,064 | (377,091 | ) | |||||||||||
Bank of Montreal | 7/5/2016 | JPY | 466,852,000 | USD | 4,222,421 | 931 | ||||||||||||
Canadian Imperial Bank of Commerce | 7/5/2016 | JPY | 5,167,246,500 | USD | 46,644,218 | (80,402 | ) | |||||||||||
Canadian Imperial Bank of Commerce | 7/5/2016 | JPY | 1,561,283,000 | USD | 14,093,355 | (24,484 | ) | |||||||||||
JP Morgan & Chase Co. | 7/5/2016 | JPY | 81,594,412,927 | USD | 736,514,701 | (1,299,514 | ) | |||||||||||
RBC Capital Markets | 7/5/2016 | JPY | 41,686,586,000 | USD | 376,295,555 | (653,732 | ) | |||||||||||
State Street Bank & Trust Co. | 7/5/2016 | JPY | 80,216,429,400 | USD | 724,137,730 | (1,216,125 | ) | |||||||||||
The Bank of New York Mellon | 7/5/2016 | JPY | 36,097,037,300 | USD | 325,851,705 | (554,310 | ) | |||||||||||
The Bank of Nova Scotia | 7/5/2016 | JPY | 27,545,182,467 | USD | 248,648,734 | (427,476 | ) | |||||||||||
Bank of Montreal | 7/5/2016 | NOK | 62,464,100 | USD | 7,468,209 | 2,190 | ||||||||||||
Canadian Imperial Bank of Commerce | 7/5/2016 | NOK | 88,596,000 | USD | 10,592,476 | 3,043 | ||||||||||||
JP Morgan & Chase Co. | 7/5/2016 | NOK | 120,805,919 | USD | 14,443,852 | 4,529 | ||||||||||||
RBC Capital Markets | 7/5/2016 | NOK | 127,632,800 | USD | 15,259,853 | 4,548 | ||||||||||||
State Street Bank & Trust Co. | 7/5/2016 | NOK | 169,117,419 | USD | 20,219,863 | 6,110 | ||||||||||||
The Bank of Nova Scotia | 7/5/2016 | NOK | 24,454,600 | USD | 2,924,497 | 1,562 | ||||||||||||
Bank of Montreal | 7/5/2016 | NZD | 1,122,000 | USD | 757,769 | 37 | ||||||||||||
Bank of Montreal | 7/5/2016 | NZD | 302,000 | USD | 204,104 | 151 | ||||||||||||
Bank of Montreal | 7/5/2016 | NZD | 11,295,600 | USD | 7,628,800 | 424 | ||||||||||||
Canadian Imperial Bank of Commerce | 7/5/2016 | NZD | 4,345,100 | USD | 2,934,594 | 172 | ||||||||||||
JP Morgan & Chase Co. | 7/5/2016 | NZD | 3,005,380 | USD | 2,029,837 | 182 | ||||||||||||
RBC Capital Markets | 7/5/2016 | NZD | 2,083,000 | USD | 1,406,848 | 114 | ||||||||||||
State Street Bank & Trust Co. | 7/5/2016 | NZD | 6,594,980 | USD | 4,454,217 | 360 | ||||||||||||
The Bank of Nova Scotia | 7/5/2016 | NZD | 3,078,500 | USD | 2,079,173 | 137 | ||||||||||||
Bank of Montreal | 7/5/2016 | SEK | 239,448,900 | USD | 28,703,328 | (46,904 | ) | |||||||||||
Canadian Imperial Bank of Commerce | 7/5/2016 | SEK | 625,458,600 | USD | 74,975,977 | (121,798 | ) | |||||||||||
| See Notes to Financial Statements. | 23 |
DBX ETF Trust
Schedule of investments
Deutsche X-trackers MSCI EAFE Hedged Equity ETF (Continued)
May 31, 2016
Counterparty | Settlement Date | Currency To Deliver | Currency To Receive | Unrealized Appreciation (Depreciation) | ||||||||||||||
JP Morgan & Chase Co. | 7/5/2016 | SEK | 587,362,858 | USD | 70,408,206 | $ | (115,477 | ) | ||||||||||
RBC Capital Markets | 7/5/2016 | SEK | 270,880,800 | USD | 32,471,536 | (52,672 | ) | |||||||||||
State Street Bank & Trust Co. | 7/5/2016 | SEK | 854,897,758 | USD | 102,480,536 | (165,617 | ) | |||||||||||
The Bank of Nova Scotia | 7/5/2016 | SEK | 295,726,900 | USD | 35,449,722 | (57,715 | ) | |||||||||||
Bank of Montreal | 7/5/2016 | SGD | 33,510,500 | USD | 24,325,806 | 6,561 | ||||||||||||
Bank of Montreal | 7/5/2016 | SGD | 748,000 | USD | 542,751 | (87 | ) | |||||||||||
Canadian Imperial Bank of Commerce | 7/5/2016 | SGD | 36,724,900 | USD | 26,660,544 | 8,545 | ||||||||||||
JP Morgan & Chase Co. | 7/5/2016 | SGD | 42,418,916 | USD | 30,795,249 | 10,987 | ||||||||||||
RBC Capital Markets | 7/5/2016 | SGD | 17,089,400 | USD | 12,405,954 | 3,832 | ||||||||||||
State Street Bank & Trust Co. | 7/5/2016 | SGD | 59,994,868 | USD | 43,554,234 | 14,749 | ||||||||||||
The Bank of New York Mellon | 7/5/2016 | SGD | 12,501,400 | USD | 9,075,295 | 2,777 | ||||||||||||
The Bank of Nova Scotia | 7/5/2016 | SGD | 6,972,500 | USD | 5,061,339 | 1,255 | ||||||||||||
Bank of Montreal | 7/5/2016 | USD | 885,987 | AUD | 1,224,500 | (2,190 | ) | |||||||||||
Bank of Montreal | 7/5/2016 | USD | 2,130,350 | CHF | 2,111,000 | (2,990 | ) | |||||||||||
Bank of Montreal | 7/5/2016 | USD | 156,340 | DKK | 1,042,000 | (257 | ) | |||||||||||
Bank of Montreal | 7/5/2016 | USD | 1,805,453 | EUR | 1,618,000 | (2,815 | ) | |||||||||||
Bank of Montreal | 7/5/2016 | USD | 10,845,645 | GBP | 7,472,000 | (20,634 | ) | |||||||||||
Bank of Montreal | 7/5/2016 | USD | 12,535,520 | HKD | 97,334,000 | (3,353 | ) | |||||||||||
Bank of Montreal | 7/5/2016 | USD | 3,636,111 | ILS | 13,995,000 | (1,227 | ) | |||||||||||
Bank of Montreal | 7/5/2016 | USD | 107,051 | ILS | 412,000 | (43 | ) | |||||||||||
Bank of Montreal | 7/5/2016 | USD | 141,774 | NOK | 1,184,000 | (257 | ) | |||||||||||
Bank of Montreal | 7/5/2016 | USD | 696,698 | NOK | 5,827,000 | (226 | ) | |||||||||||
Bank of Montreal | 7/5/2016 | USD | 4,803,736 | SEK | 40,072,000 | 7,643 | ||||||||||||
Bank of Montreal | 7/5/2016 | USD | 617,353 | SEK | 5,133,000 | (1,042 | ) | |||||||||||
Bank of Montreal | 7/5/2016 | USD | 4,522,682 | SGD | 6,230,000 | (1,446 | ) | |||||||||||
Canadian Imperial Bank of Commerce | 7/5/2016 | USD | 7,341,066 | AUD | 10,145,900 | (18,149 | ) | |||||||||||
Canadian Imperial Bank of Commerce | 7/5/2016 | USD | 15,839,386 | CHF | 15,723,600 | 6,070 | ||||||||||||
Canadian Imperial Bank of Commerce | 7/5/2016 | USD | 84,549,961 | EUR | 75,862,900 | (29,949 | ) | |||||||||||
Canadian Imperial Bank of Commerce | 7/5/2016 | USD | 38,233,792 | GBP | 26,262,900 | (185,588 | ) | |||||||||||
Canadian Imperial Bank of Commerce | 7/5/2016 | USD | 92,223 | ILS | 355,000 | (20 | ) | |||||||||||
Canadian Imperial Bank of Commerce | 7/5/2016 | USD | 1,445,173 | NOK | 12,087,500 | (415 | ) | |||||||||||
Canadian Imperial Bank of Commerce | 7/5/2016 | USD | 9,355,164 | SEK | 78,041,900 | 15,197 | ||||||||||||
RBC Capital Markets | 7/5/2016 | USD | 22,377,162 | EUR | 20,077,000 | (9,070 | ) | |||||||||||
State Street Bank & Trust Co. | 7/5/2016 | USD | 20,666,728 | GBP | 14,195,000 | (101,814 | ) | |||||||||||
|
| |||||||||||||||||
Total net unrealized appreciation | $ | 344,319,532 | ||||||||||||||||
|
| |||||||||||||||||
Currency Abbreviations
| AUD | Australian Dollar |
| CHF | Swiss Franc |
| DKK | Danish Krone |
| EUR | Euro |
| GBP | Pound Sterling |
| HKD | Hong Kong Dollar |
| ILS | Israeli New Sheqel |
| JPY | Japanese Yen |
| NOK | Norwegian Krone |
| NZD | New Zealand Dollar |
| SEK | Swedish Krona |
| SGD | Singapore Dollar |
| USD | U.S. Dollar |
For information on the Fund’s policy and additional disclosures regarding futures contracts and forward foreign currency exchange contracts, please refer to the Derivatives section of Note 2 in the accompanying Notes to Financial Statements.
| See Notes to Financial Statements. | 24 |
DBX ETF Trust
Schedule of investments
Deutsche X-trackers MSCI EAFE Hedged Equity ETF (Continued)
May 31, 2016
Fair Value Measurements
Various inputs are used in determining the value of the Fund’s investments. These inputs are summarized in three broad levels. Level 1 includes quoted prices in active markets for identical securities. Level 2 includes other significant observable inputs (including quoted prices for similar securities, interest rates, prepayment speeds and credit risk). Level 3 includes significant unobservable inputs (including the Fund’s own assumptions in determining the fair value of investments). The level assigned to the securities valuations may not be an indication of the risk or liquidity associated with investing in those securities.
The following is a summary of the inputs used as of May 31, 2016 in valuing the Fund’s investments. For information on Fund’s policy regarding the valuation of investments, please refer to the Security Valuation section of Note 2 in the accompanying Notes to Financial Statements.
Assets | Level 1 | Level 2 | Level 3 | Total | ||||||||||||
Common Stocks (f) | $ | 11,809,840,731 | $ | — | $ | — | $ | 11,809,840,731 | ||||||||
Preferred Stocks | 65,264,902 | — | — | 65,264,902 | ||||||||||||
Rights | 959,620 | — | — | 959,620 | ||||||||||||
Short-Term Investments | 541,008,659 | — | — | 541,008,659 | ||||||||||||
Derivatives (g) | ||||||||||||||||
Forward Foreign Currency Exchange Contracts | — | 384,091,524 | — | 384,091,524 | ||||||||||||
|
|
|
|
|
|
|
| |||||||||
Total | $ | 12,417,073,912 | $ | 384,091,524 | $ | — | $ | 12,801,165,436 | ||||||||
|
|
|
|
|
|
|
| |||||||||
Liabilities | Level 1 | Level 2 | Level 3 | Total | ||||||||||||
Derivatives (g) | ||||||||||||||||
Futures Contracts | $ | (157,800 | ) | $ | — | $ | — | $ | (157,800 | ) | ||||||
Forward Foreign Currency Exchange Contracts | — | (39,771,992 | ) | — | (39,771,992 | ) | ||||||||||
|
|
|
|
|
|
|
| |||||||||
Total | $ | (157,800 | ) | $ | (39,771,992 | ) | $ | — | $ | (39,929,792 | ) | |||||
|
|
|
|
|
|
|
| |||||||||
| (f) | See Schedule of investments for additional detailed categorizations. |
| (g) | Derivatives include unrealized appreciation (depreciation) on open futures contracts and forward foreign currency exchange contracts. |
There have been no transfers between fair value measurement levels during the year ended May 31, 2016.
| See Notes to Financial Statements. | 25 |
DBX ETF Trust
Statement of assets and liabilities
May 31, 2016
| Deutsche X-trackers MSCI EAFE Hedged Equity ETF | ||||
Assets | ||||
Investments in non-affiliated securities at value | $ | 11,851,812,174 | ||
Investment in affiliated securities at value (See Note 4) | 24,253,079 | |||
Investment in Daily Assets Fund* | 541,008,659 | |||
Cash | 1,254,095 | |||
Foreign currency at value | 6,054,257 | |||
Unrealized appreciation on forward foreign currency exchange contracts | 384,091,524 | |||
Deposit with broker for futures contracts | 555,500 | |||
| Receivables: | ||||
Investment securities sold | 35,712,942 | |||
Dividends | 53,489,532 | |||
Securities lending income | 1,703,561 | |||
Foreign tax reclaim | 19,812,989 | |||
|
| |||
Total Assets | $ | 12,919,748,312 | ||
|
| |||
Liabilities | ||||
Payable upon return of securities loaned | $ | 541,008,659 | ||
Unrealized depreciation on forward foreign currency exchange contracts | 39,771,992 | |||
Unrealized depreciation on future contracts | 157,800 | |||
| Payables: | ||||
Investment securities purchased | 351,282,039 | |||
Investment advisory fees | 3,479,983 | |||
|
| |||
Total Liabilities | 935,700,473 | |||
|
| |||
Net Assets, at value | $ | 11,984,047,839 | ||
|
| |||
Net Assets Consist of | ||||
Paid-in capital | $ | 13,505,844,265 | ||
Undistributed net investment income | 240,133,461 | |||
Accumulated net realized gain (loss) on investments, futures and foreign currency transactions | (788,203,806 | ) | ||
Net unrealized appreciation (depreciation) on investments, futures and foreign currency translations | (973,726,081 | ) | ||
|
| |||
Net Assets, at value | $ | 11,984,047,839 | ||
|
| |||
Number of Common Shares outstanding | 452,550,800 | |||
|
| |||
Net Asset Value | $ | 26.48 | ||
|
| |||
Investments in non-affiliated securities at cost | $ | 13,150,014,045 | ||
|
| |||
Investments in affiliated securities at cost | $ | 44,126,684 | ||
|
| |||
Value of securities loaned* | $ | 467,557,716 | ||
|
| |||
Investment in Daily Assets Fund at cost | $ | 541,008,659 | ||
|
| |||
Foreign currency at cost | $ | 6,062,075 | ||
|
| |||
| * | Represents collateral on securities loaned. |
| See Notes to Financial Statements. | 26 |
DBX ETF Trust
For the Year Ended May 31, 2016
| Deutsche X-trackers MSCI EAFE Hedged Equity ETF | ||||
Investment Income | ||||
Unaffiliated dividend income* | $ | 398,501,750 | ||
Securities lending income, including income from Daily Assets Fund, net of borrower rebates | 9,672,547 | |||
|
| |||
Total Investment Income | 408,174,297 | |||
|
| |||
Expenses | ||||
Investment advisory fees | 45,000,724 | |||
|
| |||
Net Investment income (loss) | 363,173,573 | |||
|
| |||
Realized and Unrealized Gain (Loss) | ||||
Net realized gain (loss) from: | ||||
Investments | (378,170,545 | ) | ||
Investments in affiliates | (2,883,230 | ) | ||
In-kind redemptions | 78,877,856 | |||
In-kind redemptions in affiliates | (685,830 | ) | ||
Futures contracts | (33,795 | ) | ||
Foreign currency transactions | (211,061,556 | ) | ||
|
| |||
Net realized gain (loss) | (513,957,100 | ) | ||
Net change in unrealized appreciation (depreciation) on: | ||||
Investments | (1,570,286,797 | ) | ||
Futures contracts | (238,100 | ) | ||
Foreign currency translations | 117,793,118 | |||
|
| |||
Net change in unrealized appreciation (depreciation) | (1,452,731,779 | ) | ||
|
| |||
Net realized and unrealized gain (loss) on investments, futures and foreign currency transactions | (1,966,688,879 | ) | ||
|
| |||
Net increase (decrease) in Net Assets Resulting from Operations | $ | (1,603,515,306 | ) | |
|
| |||
* Unaffiliated foreign tax withheld | $ | 34,295,742 | ||
| See Notes to Financial Statements. | 27 |
DBX ETF Trust
Statement of changes in net assets
| Deutsche X-trackers MSCI EAFE Hedged Equity ETF | ||||||||
| Year Ended May 31, | ||||||||
| 2016 | 2015 | |||||||
Increase (Decrease) in Net Assets from Operations | ||||||||
Net investment income (loss) | $ | 363,173,573 | $ | 156,253,508 | ||||
Net realized gain (loss) | (513,957,100 | ) | 10,994,476 | |||||
Net change in unrealized appreciation (depreciation) | (1,452,731,779 | ) | 444,128,055 | |||||
|
|
|
| |||||
Net increase (decrease) in net assets resulting from operations | (1,603,515,306 | ) | 611,376,039 | |||||
|
|
|
| |||||
Distributions to Shareholders from | ||||||||
Net investment income | (382,099,530 | ) | (60,786,308 | ) | ||||
Net realized gains | (58,292,903 | ) | (18,620 | ) | ||||
|
|
|
| |||||
Total distributions | (440,392,433 | ) | (60,804,928 | ) | ||||
|
|
|
| |||||
Fund Shares Transactions | ||||||||
Proceeds from shares sold | 3,817,716,917 | 11,584,742,012 | ||||||
Value of shares redeemed | (2,057,792,137 | ) | (430,415,811 | ) | ||||
|
|
|
| |||||
Net increase (decrease) in net assets resulting from fund share transactions | 1,759,924,780 | 11,154,326,201 | ||||||
|
|
|
| |||||
Total net increase (decrease) in Net Assets | (283,982,959 | ) | 11,704,897,312 | |||||
Net Assets | ||||||||
Beginning of year | 12,268,030,798 | 563,133,486 | ||||||
|
|
|
| |||||
End of year | $ | 11,984,047,839 | $ | 12,268,030,798 | ||||
|
|
|
| |||||
Undistributed net investment income | $ | 240,133,461 | $ | 309,538,780 | ||||
|
|
|
| |||||
Changes in Shares Outstanding | ||||||||
Shares outstanding, beginning of year | 398,950,800 | 20,250,800 | ||||||
Shares sold | 132,200,000 | 392,850,000 | ||||||
Shares redeemed | (78,600,000 | ) | (14,150,000 | ) | ||||
|
|
|
| |||||
Shares outstanding, end of year | 452,550,800 | 398,950,800 | ||||||
|
|
|
| |||||
| See Notes to Financial Statements. | 28 |
DBX ETF Trust
| Deutsche X-trackers MSCI EAFE Hedged Equity ETF Selected Per Share Data | Year Ended 5/31/2016 | Year Ended 5/31/2015 | Year Ended 5/31/2014 | Year Ended 5/31/2013 | Period Ended 5/31/2012(a) | |||||||||||||||
Net Asset Value, beginning of period | $ | 30.75 | $ | 27.81 | $ | 25.09 | $ | 22.12 | $ | 25.00 | ||||||||||
|
|
|
|
|
|
|
|
|
| |||||||||||
| Income (loss) from investment operations: | ||||||||||||||||||||
Net investment income (loss)(b) | 0.76 | 1.41 | 1.18 | 0.79 | 0.70 | |||||||||||||||
Net realized and unrealized gain (loss) | (4.03 | ) | 2.90 | 1.95 | 6.26 | (3.48 | ) | |||||||||||||
|
|
|
|
|
|
|
|
|
| |||||||||||
Total from investment operations | (3.27 | ) | 4.31 | 3.13 | 7.05 | (2.78 | ) | |||||||||||||
|
|
|
|
|
|
|
|
|
| |||||||||||
| Less distributions from: | ||||||||||||||||||||
Net investment income | (0.88 | ) | (1.37 | ) | (0.41 | ) | (1.68 | ) | (0.10 | ) | ||||||||||
Net realized gains | (0.12 | ) | (0.00 | )(c) | — | (2.40 | ) | — | ||||||||||||
|
|
|
|
|
|
|
|
|
| |||||||||||
Total distributions | (1.00 | ) | (1.37 | ) | (0.41 | ) | (4.08 | ) | (0.10 | ) | ||||||||||
|
|
|
|
|
|
|
|
|
| |||||||||||
Net Asset Value, end of period | $ | 26.48 | $ | 30.75 | $ | 27.81 | $ | 25.09 | $ | 22.12 | ||||||||||
|
|
|
|
|
|
|
|
|
| |||||||||||
Total Return (%) | (10.90 | ) | 16.22 | 12.74 | (d) | 35.60 | (d) | (11.14 | )** | |||||||||||
Ratios to Average Net Assets and Supplemental Data | ||||||||||||||||||||
Net assets, end of period ($ millions) | 11,984 | 12,268 | 563 | 75 | 31 | |||||||||||||||
Ratio of expenses before fee waiver (%) | 0.35 | 0.35 | 0.36 | 0.64 | 0.57 | * | ||||||||||||||
Ratio of expenses after fee waiver (%) | 0.35 | 0.35 | 0.35 | 0.48 | 0.57 | * | ||||||||||||||
Ratio of net investment income (loss) (%) | 2.82 | 4.81 | 4.48 | 3.35 | 3.04 | * | ||||||||||||||
Portfolio turnover rate (%)(e) | 15 | 12 | 10 | 14 | 14 | ** | ||||||||||||||
| (a) | For the period June 9, 2011 (commencement of operations) through May 31, 2012. |
| (b) | Based on average shares outstanding during the period. |
| (c) | Amount represents less than $0.005. |
| (d) | The Total Return would have been lower if certain fees had not been reimbursed by the Advisor. |
| (e) | Portfolio turnover rate does not include securities received or delivered from processing creations or redemptions. |
| * | Annualized. |
| ** | Not Annualized. |
| See Notes to Financial Statements. | 29 |
DBX ETF Trust
1. Organization
DBX ETF Trust (the “Trust”) is registered under the Investment Company Act of 1940, as amended (the “Act”), as an open-end registered management investment company organized as a Delaware statutory trust.
As of May 31, 2016, the Trust consists of thirty-six investment series of exchange-traded funds (“ETFs”) in operation and trading. These financial statements report on Deutsche X-trackers MSCI EAFE Hedged Equity ETF (the “Fund”), a diversified series of the Trust.
DBX Advisors LLC (“DBX” or the “Advisor”), an indirect, wholly owned subsidiary of Deutsche Bank AG, serves as investment advisor to the Fund and has overall responsibility for the general management and administration of the Fund, subject to the supervision of the Fund’s Board of Trustees.
The Fund offers shares that are listed and traded on the NYSE Arca, Inc. (“NYSE Arca”). Unlike conventional mutual funds, the Fund issues and redeems shares on a continuous basis, at net asset value, only in large specified lots consisting of 200,000 shares, each called a “Creation Unit”, to authorized participants who have entered into agreements with the Fund’s distributor. Shares are not individually redeemable securities of the Fund, and owners of shares may acquire those shares from the Fund, or tender such shares for redemption to the Fund, in Creation Units only.
The investment objective of the Fund is to track the performance, before fees and expenses, of the MSCI EAFE US Dollar Hedged Index (the “Underlying Index”).
MSCI, Inc. (“MSCI”) is the creator of the Underlying Index. The Underlying Index is comprised of securities listed in countries in the MSCI Global Index Series. All listed equity securities and listed securities that exhibit characteristics of equity securities, except mutual funds, ETFs, equity derivatives, limited partnerships and most investment trusts, are eligible for inclusion in the equity universe. Real Estate Investment Trusts (“REITs”) in some countries and certain income trusts in Canada are also eligible for inclusion. Each company and its securities (i.e., share classes) are classified in only one country, which allows for a distinctive sorting of each company by its respective country.
The Underlying Index is rebalanced monthly on the last trading day of the month, when the index will take into account the effect of rolling into new 1-month forward contracts based on the newly determined weights of currency to be sold for the next month’s index calculation. The currency weights are determined as of the close of two business days before the first calendar day of following month and remain constant intra month. This means that no changes in the weights are made during the month to account for changes in the indexes due to price movement of securities, corporate events, additions, deletions or any other changes. The daily calculation of the Underlying Index marks to market the one-month forward contracts on a daily basis by using an equal and offsetting forward position.
The Fund is entitled to use its Underlying Index pursuant to a licensing agreement between the Index Provider and DBX. There is no charge to the Fund in connection with the licensing agreement.
Pursuant to the Trust’s organizational documents, the Trust’s officers and trustees are indemnified against certain liabilities that may arise out of the performance of their duties to the Fund. Additionally, in the normal course of business the Trust enters into contracts that contain a variety of representations that provide indemnification for certain liabilities. The Trust’s maximum exposure under these arrangements is unknown, as this would involve future claims that may be made against the Fund that have not yet occurred. However, the Trust expects the risk of loss to be remote.
2. Significant Accounting Policies
The financial statements have been prepared in conformity with U.S. generally accepted accounting principles (“U.S. GAAP”), which require management to make certain estimates and assumptions that affect the reported amounts and disclosures in the financial statements. Actual results could differ from those estimates. The following is a summary of significant accounting policies followed by the Fund.
Security Valuation The Net Asset Value (“NAV”), of the Fund’s shares is calculated each business day as of the close of regular trading on the New York Stock Exchange, generally 4:00 p.m. Eastern Time. NAV per share is calculated by dividing a Fund’s net assets by the number of Fund shares outstanding.
30
DBX ETF Trust
Notes to financial statements (Continued)
Various inputs are used in determining the value of the Fund’s investments. These inputs are summarized in three broad levels. Level 1 includes quoted prices in active markets for identical securities. Level 2 includes other significant observable inputs (including quoted prices for similar securities, interest rates, prepayment speeds, and credit risk). Level 3 includes significant unobservable inputs (including the Fund’s own assumptions in determining the fair value of investments). The level assigned to the securities valuations may not be an indication of the risk or liquidity associated with investing in those securities.
Equity securities are valued at the most recent sale price or official closing price reported on the exchange (U.S. or foreign) or over-the-counter market on which they trade. Securities for which no sales are reported are valued at the calculated mean between the most recent bid and asked quotations on the relevant market or, if a mean cannot be determined, at the most recent bid quotation. Equity securities are generally categorized as Level 1.
Futures contracts are generally valued at the settlement prices established each day on the exchange on which they are traded and are categorized as Level 1.
Forward currency contracts are valued at the prevailing forward exchange rate of the underlying currencies and are categorized as Level 2.
Securities and other assets for which market quotations are not readily available or for which the above valuation procedures are deemed not to reflect fair value are valued in a manner that is intended to reflect their fair value as determined in accordance with procedures approved by the Board and are generally categorized as Level 3. In accordance with the Fund’s valuation procedures, factors considered in determining value may include, but are not limited to, the type of the security; the size of the holding; the initial cost of the security; the existence of any contractual restrictions on the security’s disposition; the price and extent of public trading in similar securities of the issuer or of comparable companies; quotations or evaluated prices from broker-dealers and/or pricing services; information obtained from the issuer, analysts, and/or the appropriate stock exchange (for exchange-traded securities); an analysis of the company’s or issuer’s financial statements; an evaluation of the forces that influence the issuer and the market(s) in which the security is purchased and sold; and with respect to debt securities, the maturity, coupon, creditworthiness, currency denomination and the movement of the market in which the security is normally traded. The value determined under these procedures may differ from published values for the same securities.
Fair value pricing could result in a difference between the prices used to calculate a Fund’s net asset value and the prices used by the Fund’s underlying index, which in turn could result in a difference between the Fund’s performance and the performance of the Fund’s underlying index.
Disclosure about the classification of the fair value measurements is included in a table following the Fund’s Schedule of Investments.
Cash Cash consists of cash held at banks and is on deposit with major financial institutions.
Investment Transactions and Investment Income Investment transactions are recorded as of the date that the securities are purchased or sold (trade date). Realized gains and losses from the sale or disposition of securities are calculated on the identified cost-method. Dividend income is net of any foreign taxes withheld at source. Certain dividends from foreign securities may be recorded subsequent to the ex-dividend date as soon as the fund is informed of such dividends. Interest income is recorded on the accrual basis.
Tax Information and Dividends and Distributions to Shareholders It is the Fund’s policy to comply with all requirements of the Internal Revenue Code of 1986, as amended (“the Code”). The Fund intends to qualify for and to elect treatment as a separate Regulated Investment Company (“RIC”) under Subchapter M of the Code. It is the policy of the Fund to pay out dividends from its net investment income, if any, to investors semi-annually sufficient to relieve it from all, or substantially all, Federal income and excise taxes. Taxable net realized gains from investment transactions, reduced by capital loss carryforwards, if any, are declared and distributed to shareholders at least annually. The capital loss carryforward amount, if any, is available to offset future net capital gains. The Fund may occasionally be required to make supplemental distributions at some other time during the year. The Fund reserves the right to declare special distributions if, in their reasonable discretion, such action is necessary or advisable to preserve the status of the Fund as a RIC or to avoid imposition of income or excise taxes on undistributed income. Dividends and distributions to shareholders, if any, are recorded on the ex-dividend date.
31
DBX ETF Trust
Notes to financial statements (Continued)
The amount of dividends and distributions from net investment income and net realized capital gains are determined in accordance with Federal income tax regulations which may differ from U.S. GAAP. These “book/tax” differences are either considered temporary or permanent in nature. To the extent these differences are permanent in nature, such amounts are reclassified at the end of the year within the components of net assets based on their federal tax treatment; temporary differences do not require reclassification. Dividends and distributions, which exceed earnings and profits for the full year for tax purposes, are reported as a tax return of capital.
In accordance with U.S. GAAP requirements regarding accounting for uncertainties in income taxes, management has analyzed the Fund’s tax positions taken or expected to be taken on foreign, federal and state income tax returns for all open tax years and has concluded that no provision for income tax is required in the Fund’s financial statements. The Advisor does not believe that the unrecognized tax benefits will change significantly in the next 12 months.
The Fund recognizes interest and penalties, if any, related to uncertain tax provisions as income tax expense on the Statement of Operations. For the year ended May 31, 2016, the Fund did not incur any interest or penalties.
As of May 31, 2016, the components of accumulated earnings (losses) were as follows:
| Undistributed Net Investment Income | Capital and Other Gains (Losses) | Unrealized Appreciation (Depreciation) | Total Accumulated Earnings (Losses) | |||||||||||||
| $ | 240,133,461 | $ | (362,575,595 | ) | $ | (1,399,354,292 | ) | $ | (1,521,796,426 | ) | ||||||
The tax character of dividends and distributions declared for the years ended May 31, 2016 and May 31, 2015 were as follows:
| Ordinary Income* | Long-Term Capital Gains | |||||||
2016 | $ | 400,634,790 | $ | 39,757,643 | ||||
2015 | 60,804,928 | — | ||||||
| * | For tax purposes short-term capital gain distributions are considered ordinary income distributions. |
Capital losses incurred after October 31 (“post-October losses”) within the taxable year are deemed to arise on the first business day of each Fund’s next taxable year. During the year ended May 31, 2016, the Fund incurred and elected to defer net capital losses as follows:
| Post-October Losses on Capital | ||||
| $ | 362,575,595 | |||
In order to present paid-in capital and accumulated net realized gains or losses on the Statement of Assets and Liabilities that more closely represent their tax character, certain adjustments have been made to additional paid-in capital, undistributed net investment income or loss and accumulated net realized gains or losses on investments. These differences are primarily due to recognition of certain foreign currency gain (losses) as ordinary income (loss), passive foreign investment companies (“PFICs”), redemptions-in-kind and tax equalization utilized. For the fiscal year ended May 31, 2016, the adjustments were as follows:
| Undistributed Net Investment Income (Loss) | Undistributed Capital Gains (Accumulated Losses) | Paid-in Capital | ||||||||||
| $ | (50,479,362 | ) | $ | 16,320,781 | $ | 34,158,581 | ||||||
Foreign Taxes The Fund may be subject to foreign taxes (a portion of which may be reclaimable) on income, capital gains on investments, certain foreign currency transactions or other corporate events. All foreign taxes are recorded in accordance with the applicable foreign tax regulations and rates that exist in the foreign jurisdictions in which the Fund invests. These foreign taxes, if any, are paid by the Fund and are reflected in the Statement of Operations as follows: foreign taxes withheld at source are presented as a reduction of income and foreign taxes on capital gains from sales of investments and foreign currency transactions are included in their respective net realized gain (loss) categories. Foreign taxes payable as of May 31, 2016, if any, are disclosed in the Fund’s Statement of Assets and Liabilities.
32
DBX ETF Trust
Notes to financial statements (Continued)
Foreign Currency Translations The books and records of the Fund is maintained in U.S. dollars. Investment securities and other assets and liabilities denominated in a foreign currency are translated into U.S. dollars at the prevailing exchange rates at year end. Purchases and sales of investment securities, income and expenses are translated into U.S. dollars at the prevailing exchange rates on the respective dates of the transactions.
Net realized and unrealized gains and losses on foreign currency transactions represent net gains and losses between trade and settlement dates on securities transactions, the acquisition and disposition of foreign currencies, and the difference between the amount of net investment income accrued and the U.S. dollar amount actually received. The portion of both realized and unrealized gains and losses on investments that results from fluctuations in foreign currency exchange rates is not separately disclosed, but is included with net realized and unrealized gain/appreciation and loss/depreciation on investments.
Securities Lending The Fund may lend securities to certain financial institutions under the terms of its securities lending agreement. The Fund retains benefits of owning the securities it has loaned and continues to receive interest and dividends generated by the securities and to participate in any changes in their market value. The Fund requires the borrowers of the securities to maintain collateral with the Fund consisting of either cash or liquid, unencumbered assets having a value at least equal to the value of the securities loaned. When the collateral falls below specified amounts, the lending agent will use its best effort to obtain additional collateral on the next business day to meet required amounts under the securities lending agreement. As of year end, any securities on loan were collateralized by cash. The Fund may invest the cash collateral into a joint trading account in an affiliated money market fund. During the year ended May 31, 2016 the Fund invested the cash collateral in Daily Assets Fund, an affiliated money market fund managed by Deutsche Investment Management Americas Inc. Deutsche Investment Management Americas Inc. receives a management/administration fee (0.09% annualized effective rate as of May 31, 2016) on the cash collateral Invested in Daily Assets Fund. The Fund receives compensation for lending its securities either in the form of fees or by earning interest on invested cash collateral net of borrower rebates and fees paid to a lending agent. Either the Fund or the borrower may terminate the loan at any time and the borrower, after notice, is required to return borrowed securities within a standard time period. There may be risks of delay and costs in recovery of securities or even loss of rights in the collateral should the borrower of the securities fail financially. If the Fund is not able to recover securities lent, the Fund may sell the collateral and purchase a replacement investment in the market, incurring the risk that the value of the replacement security is greater than the value of the collateral. The Fund is also subject to all investment risks associated with the reinvestment of any cash collateral received, including, but not limited to, interest rate, credit and liquidity risk associated with such investments.
As of May 31, 2016, the Fund had securities on loan, which were classified as common stock and rights in the Schedule of Investments. The value of the related collateral exceeded the value of the securities loaned at year end.
Remaining Contractual Maturity of the Agreements, as of May 31, 2016 | ||||||||||||||||||||
| Overnight and Continuous | <30 Days | Between 30 & 90 days | >90 days | Total | ||||||||||||||||
Securities Lending Transactions | ||||||||||||||||||||
Common Stocks | $ | 540,819,833 | $ | — | $ | — | $ | — | $ | 540,819,833 | ||||||||||
Rights | 188,826 | — | — | — | 188,826 | |||||||||||||||
|
|
|
|
|
|
|
|
|
| |||||||||||
Total Borrowings | $ | 541,008,659 | $ | — | $ | — | $ | — | $ | 541,008,659 | ||||||||||
|
|
|
|
|
|
|
|
|
| |||||||||||
Gross amount of recognized liabilities for securities lending transitions | $ | 541,008,659 | ||||||||||||||||||
Derivatives
Forward Foreign Currency Exchange Contracts The Fund may enter into forward foreign currency exchange contracts (“forward currency contracts”) designed to offset the Fund’s exposure to non-U.S. currencies. In addition, the Fund may enter into forward currency contracts to facilitate local securities settlements or to protect against currency exposure in connection with distributions to Shareholders.
33
DBX ETF Trust
Notes to financial statements (Continued)
A forward currency contract is a commitment to purchase or sell a foreign currency at a future date at a negotiated forward rate. For the year ended May 31, 2016, the Fund invested in forward currency contracts to hedge against changes in the value of the U.S. dollar against specified non-U.S. currencies.
The gain or loss arising from the difference between the original contract and the closing of such contract would be included in net realized gain or loss on foreign currency transactions. Risks may arise from the potential inability of a counterparty to meet the terms of a contract and from unanticipated movements in the value of a foreign currency relative to the U.S. dollar. The face or contract amount, in U.S. dollars reflects the total exposure the Fund has in that particular currency contract.
A summary of the open forward currency contracts as of May 31, 2016 is included in a table following the Fund’s Schedule of Investments. The investment in forward currency contracts short vs. U.S. dollars had a contract value generally indicative of a range of the total exposure the Fund had to the value of non U.S currencies during the year ended May 31, 2016.
Futures Contracts The Fund may enter into futures contracts. These futures contracts will be used to simulate investment in the respective Underlying Index, to facilitate trading or to reduce transaction costs. The Fund will enter into futures contracts that are traded on a U.S. or non-U.S. exchange. The Fund will not use futures for speculative purposes. Futures contracts provide for the future sale by one party and purchase by another party of a specified amount of a specific instrument or index at a specified future time and at a specified price. The Fund may enter into futures contracts in seeking performance that corresponds to its Underlying Index. To the extent required by law, liquid assets committed to futures contracts will be maintained.
At the time the Fund enters into a futures contract, the Fund deposits and maintains as collateral an initial margin with the broker, as required by the exchange on which the transaction is affected. Pursuant to the contract, the Fund agrees to receive from or pay to the broker an amount of cash equal to the daily fluctuation in the value of the contract. Such receipts or payments are known as variation margin and are recorded by the Fund as unrealized gains or losses. Risks may arise from the potential inability of a counterparty to meet the terms of the contract. The credit/counterparty risk for exchange- traded futures contracts is generally less than privately negotiated futures contracts, since the clearinghouse, which is the issuer or counterparty to each exchange-traded future, provides a guarantee of performance. The guarantee is supported by a daily payment system (i.e., margin requirements).
Use of long futures contracts subjects the Fund to risk of loss in excess of the amounts shown on the Statement of Assets and Liabilities, up to the notional value of the futures contracts. Use of short futures contracts subjects the Fund to unlimited risk of loss. Under some circumstances, futures exchanges may establish daily limits on the amount that the price of a futures contract can vary from the previous day’s settlement price, which could effectively prevent liquidation of unfavorable positions.
A summary of the open futures contracts as of May 31, 2016 is included in a table following the Fund’s Schedule of Investments.
The following table summarizes the value of the Fund’s derivative instruments held as of May 31, 2016 and the related location in the accompanying Statement of Assets and Liabilities, presented by primary underlying risk exposure:
Asset Derivatives | Liability Derivatives | |||||||||||||
Risk Type | Statement of Asset and | Fair Value | Statement of Asset and | Fair Value | ||||||||||
| Equity contracts | Unrealized appreciation on futures contracts | $ | — | Unrealized depreciation on futures contracts | $ | 157,800 | ||||||||
| Foreign exchange contracts | Unrealized appreciation on forward foreign currency exchange contracts | 384,091,524 | Unrealized depreciation on forward foreign currency exchange contracts | 39,771,992 | ||||||||||
|
|
|
| |||||||||||
| Total | $ | 384,091,524 | Total | $ | 39,929,792 | |||||||||
|
|
|
| |||||||||||
34
DBX ETF Trust
Notes to financial statements (Continued)
Additionally, the amount of realized and unrealized gains and losses on derivative instruments recognized in the Fund’s earnings during the year ended May 31, 2016 and the related location in the accompanying Statement of Operations is summarized in the following table by primary underlying risk exposure:
Net Realized Gain (Loss) on: | ||||||||||||
| Futures Contracts | Foreign Exchange Contracts | Total | ||||||||||
| $ | (33,795 | ) | $ | (220,400,678 | ) | $ | (220,434,473 | ) | ||||
Net Change in Unrealized Appreciation (Depreciation) on: | ||||||||||||
| Futures Contracts | Foreign Exchange Contracts | Total | ||||||||||
| $ | (238,100 | ) | $ | 116,460,036 | $ | 116,221,936 | ||||||
For the year ended May 31, 2016 the average monthly volume of derivatives was as follows:
| Futures Contracts (Contract Value) | Forward Foreign Currency Exchange Contracts (Market Value) | |||||||
| $ | 2,991,846 | $ | (12,840,274,870 | ) | ||||
As of May 31, 2016, the Fund has transactions subject to enforceable master netting agreements which govern the terms of certain transactions, and reduce the counterparty risk associated with such transactions. Master netting agreements allow a Fund to close out and net total exposure to a counterparty in the event of a default with respect to all of the transactions with a counterparty. For financial reporting purposes the Statement of Assets and Liabilities generally shows derivatives assets and liabilities on a gross basis, which reflects the full risks and exposures prior to netting. A reconciliation of the gross amounts on the Statement of Assets and Liabilities to the net amounts by counterparty, including any collateral exposure, is included in the following tables:
| Gross Amounts of Assets Presented in the Statement of Assets and Liabilities | Financial Instruments and Derivatives Available for Offset | Collateral Received | Net Amount of Derivatives Assets | Gross Amounts of Liabilities Presented in the Statement of Assets and Liabilities | Financial Instruments and Derivatives Available for Offset | Collateral Pledged | Net Amount of Derivatives Liabilities | |||||||||||||||||||||||||
Bank of Montreal | $ | 38,635,104 | $ | (2,007,924 | ) | $ | — | $ | 36,627,180 | $ | 2,007,924 | $ | (2,007,924 | ) | $ | — | $ | — | ||||||||||||||
Canadian Imperial Bank of Commerce | 66,656,716 | (5,528,813 | ) | — | 61,127,903 | 5,528,813 | (5,528,813 | ) | — | — | ||||||||||||||||||||||
JP Morgan & Chase Co. | 87,732,349 | (13,587,621 | ) | — | 74,144,728 | 13,587,621 | (13,587,621 | ) | — | — | ||||||||||||||||||||||
RBC Capital Markets | 32,869,867 | (2,113,698 | ) | — | 30,756,169 | 2,113,698 | (2,113,698 | ) | — | — | ||||||||||||||||||||||
State Street Bank & Trust Co. | 99,691,369 | (7,674,592 | ) | — | 92,016,777 | 7,674,592 | (7,674,592 | ) | — | — | ||||||||||||||||||||||
The Bank of New York Mellon | 14,121,658 | (4,974,303 | ) | — | 9,147,355 | 4,974,303 | (4,974,303 | ) | — | — | ||||||||||||||||||||||
The Bank of Nova Scotia | 44,384,461 | (3,885,041 | ) | — | 40,499,420 | 3,885,041 | (3,885,041 | ) | — | — | ||||||||||||||||||||||
|
|
|
|
|
|
|
|
|
|
|
|
|
|
|
| |||||||||||||||||
| $ | 384,091,524 | $ | (39,771,992 | ) | $ | — | $ | 344,319,532 | $ | 39,771,992 | $ | (39,771,992 | ) | $ | — | $ | — | |||||||||||||||
|
|
|
|
|
|
|
|
|
|
|
|
|
|
|
| |||||||||||||||||
3. Investment Advisory and Other Agreements
The Advisor has overall responsibility for the general management and administration of the Fund, subject to the supervision of the Fund’s Board of Trustees. Under an investment advisory agreement between the Trust, on behalf of the Fund, and the Advisor (the “Investment Advisory Agreement”), the Advisor is responsible for arranging sub-advisory, transfer agency, custody, fund administration, and all other non-distribution related services for the Fund to operate.
TDAM USA Inc. (“TDAM”) serves as investment sub-advisor to the Fund. TDAM is responsible for day-to-day management of the Fund, subject to the replication strategy for the Fund with regard to its underlying index and for general administration, compliance and management services as may be agreed between the Advisor and TDAM from time to time.
35
DBX ETF Trust
Notes to financial statements (Continued)
For its investment advisory services to the Fund below, the Advisor is entitled to receive a unitary management fee from the Fund based on the Fund’s daily average net assets at an annual rate equal to 0.35%.
Out of the unitary management fee, the Advisor pays substantially all expenses of the Fund, including the payments to the sub-advisor, the cost of transfer agency, custody, fund administration, legal, audit and other services, and expenses of the Independent Trustees. The Fund is responsible for the payment of interest expense, taxes, brokerage expenses and extraordinary expenses.
The Bank of New York Mellon, a wholly-owned subsidiary of The Bank of New York Mellon Corporation, serves as Administrator, Custodian, Accounting Agent, Lending Agent and Transfer Agent for the Fund.
ALPS Distributors, Inc. (the “Distributor”) serves as the distributor of Creation Units for the Fund on an agency basis. The Distributor does not maintain a secondary market in shares of the Fund.
The Board of Trustees is currently comprised of four Trustees, including three Independent Trustees. The Advisor paid retainer fees and attendance fees to each Independent Trustee and attendance fees to each member of the Audit Committee (which is comprised of all of the Fund’s Independent Trustees).
4. Transactions with Affiliates
The Advisor is an indirect wholly-owned subsidiary of Deutsche Bank AG. Therefore, Deutsche Bank AG is considered to be affiliated with the Fund. Deutsche Bank AG is owned by the Fund in proportion with Deutsche Bank AG’s representation in the DBEF index. A summary of the Funds’ transactions with Deutsche Bank AG securities during the period ended May 31, 2016 is as follows:
| Value ($) at 5/31/15 | Purchases Cost ($) | Sales Proceeds ($) | Realized Gain/(Loss) ($) | Income ($) | Value ($) at 5/31/16 | |||||||||||||||||||
| Deutsche X-trackers MSCI EAFE Hedged Equity ETF | ||||||||||||||||||||||||
Deutsche Bank AG (Common Stock) | 39,601,472 | 14,714,831 | (10,813,133 | ) | (3,569,060 | ) | — | 24,253,079 | ||||||||||||||||
5. Investment Portfolio Transactions
For the year ended May 31, 2016, the cost of investments purchased and proceeds from sale of investments (excluding in-kind transactions and short-term investments) were as follows:
| Purchases | Sales | |||||||
| $ | 1,948,944,111 | $ | 2,080,484,436 | |||||
For the year ended May 31, 2016, the cost of in-kind purchases and proceeds from in-kind sales were as follows:
| Purchases | Sales | |||||||
| $ | 3,671,731,695 | $ | 2,036,712,794 | |||||
6. Fund Share Transactions
As of May 31, 2016, there were unlimited Fund shares, no par value authorized by the Trust. Fund shares are issued and redeemed by the Fund only in Creation Units or multiples thereof. Except when aggregated in Creation Units, shares of the Fund are not redeemable. Transactions in capital shares for the Fund are disclosed in detail in the Statement of Changes in Net Assets. The consideration for the purchase of Creation Units of the Fund generally consists of the in-kind contribution of a designated portfolio of securities constituting a portfolio sampling representation of the securities included in the Fund’s Underlying Index and an amount of cash, which under certain circumstances may include cash in lieu of portfolio securities. Investors purchasing and redeeming Creation Units pay a purchase transaction fee and a redemption transaction fee to offset transfer and other transaction costs associated with the issuance and redemption of Creation Units.
36
DBX ETF Trust
Report of independent registered public accounting firm
To Board of Trustees and Shareholders of
DBX ETF Trust:
We have audited the accompanying statement of assets and liabilities of Deutsche X-trackers MSCI EAFE Hedged Equity ETF (the “Fund” within DBX ETF Trust), including the schedule of investments, as of May 31, 2016, the related statement of operations for the year then ended, the statement of changes in net assets for each of the two years in the period then ended and the financial highlights for each of the periods indicated therein. These financial statements and financial highlights are the responsibility of the Fund’s management. Our responsibility is to express an opinion on these financial statements and financial highlights based on our audits.
We conducted our audits in accordance with the standards of the Public Company Accounting Oversight Board (United States). Those standards require that we plan and perform the audit to obtain reasonable assurance about whether the financial statements and financial highlights are free of material misstatement. We were not engaged to perform an audit of the Fund’s internal control over financial reporting. Our audits included consideration of internal control over financial reporting as a basis for designing audit procedures that are appropriate in the circumstances, but not for the purpose of expressing an opinion on the effectiveness of the Fund’s internal control over financial reporting. Accordingly, we express no such opinion. An audit also includes examining, on a test basis, evidence supporting the amounts and disclosures in the financial statements and financial highlights, assessing the accounting principles used and significant estimates made by management, and evaluating the overall financial statement presentation. Our procedures included confirmation of securities owned as of May 31, 2016 by correspondence with the custodian and brokers or by other appropriate auditing procedures where replies from brokers were not received. We believe that our audits provide a reasonable basis for our opinion.
In our opinion, the financial statements and financial highlights referred to above present fairly, in all material respects, the financial position of Deutsche X-trackers MSCI EAFE Hedged Equity ETF at May 31, 2016, the results of its operations for the year then ended, the changes in its net assets for each of the two years in the period then ended and the financial highlights for each of the periods indicated therein in conformity with U.S. generally accepted accounting principles.

New York, New York
July 26, 2016
37
DBX ETF Trust
Trustees and officers (Unaudited)
| Name, Year of Birth and Address | Position(s) Held with Fund | Terms of Office Time Served | Principal Occupation(s) During Past 5 Years | Number of Portfolios in Fund Complex Overseen by Trustee | Other Directorships held by Trustee During Past 5 Years | |||||
Independent Trustees | ||||||||||
J. David Officer (1948) 345 Park Avenue New York, New York 10154 | Trustee, Chairman of the Nominating Committee and Member of the Audit Committee | Since 2011 (Chairman | Independent Director (2010-present); formerly, Vice Chairman, the Dreyfus Corporation (2006-2009); President, The Dreyfus Family of Funds, Inc. (2006-2009). | 36 | Ilex Partners (Asia), LLC; Old Westbury Funds; MAN Long/Short Fund; GLG Investment Series Trust. | |||||
Stephen R. Byers (1953) 345 Park Avenue New York, New York 10154 | Lead Independent Trustee, Member of the Audit and Nominating Committees | Since 2011 (Trustee and | Independent Consultant (2014-present). | 36 | The Arbitrage Funds; Sierra Income Corporation; College of William and Mary, Graduate School of Business; Lighthouse Growth Advisors LLC; Founders Asset Management, LLC. | |||||
George O. Elston (1964) 345 Park Avenue New York, New York 10154 | Trustee, Chairman of the Audit Committee and Member of the Nominating Committee | Since 2011 (Chairman | Senior Vice President and Chief Financial Officer, Juniper Pharmaceuticals, Inc. (2014-present); Senior Vice President and Chief Financial Officer, KBI BioPharma Inc. (2013-2014); Managing Partner, Chatham Street Partners (2010-2013). | 36 | Celldex Therapeutics, Inc. | |||||
38
DBX ETF Trust
Trustees and officers (Unaudited) (Continued)
Name, Year of Birth | Position(s) Held with Fund | Terms of Office and Length of Time Served | Principal | Number of Portfolios in Fund Complex Overseen by Trustee | Other Directorships | |||||
Interested Trustee | ||||||||||
Alex Depetris (1980) 345 Park Avenue New York, New York 10154 | Trustee, Chairman of the Board, President and Chief Executive Officer | Since 2010 | Director in the Deutsche Asset Management Passive Asset Management Group at Deutsche Bank AG (2008-present); Manager and Chief Operating Officer of the Adviser (2012-present); Associate, Arnold & Porter (2006-2008). | 36 | Director, Chairman of the Board of db-X Exchange Traded Funds Inc. | |||||
| Name, Year of Birth and Address | Position(s) Held with Fund | Terms of Office Time Served | Principal Occupation(s) During Past 5 Years | |||||||
Officers | ||||||||||
Michael Gilligan (1966) 60 Wall Street New York, New York 10005 | Treasurer, Chief Financial Officer and Controller | Since 2010 | Director in the Finance Division at Deutsche Bank AG (2008-present); Manager and Chief Financial Officer of the Adviser (2010-present); Chief Financial Officer of Global Passive Asset Management Platform (2012-present). | |||||||
Fiona Bassett (1974) 345 Park Avenue New York, New York 10154 | Chief Operating Officer | Since 2014 | Managing Director in the Deutsche Asset Management Passive Asset Management Group at Deutsche Bank AG and Head of Passive Americas Asset Management Platform (2014-present); Manager and Chief Executive Officer and Chief Investment Officer of the Adviser (2014-present); Managing Director, COO Global Key Projects and Integration at Deutsche Asset Management, (2012-2014); Managing Director at Deutsche Bank AG (2004-2012). | |||||||
Frank Gecsedi (1967) 60 Wall Street New York, New York 10005 | Chief Compliance Officer | Since 2010 | Director in the Deutsche Asset Management Compliance Department (2016-present), Vice President in the Deutsche Asset Management Compliance Department (2013-2016) and Chief Compliance Officer of the Adviser (2010-present); Vice President in Deutsche Bank’s Global Markets Legal, Risk and Capital Division (2010-2012). | |||||||
Leslie Lowenbraun (1953) 60 Wall Street New York, New York 10005 | Secretary | Since 2016 | Vice President in U.S. Retail Passive Legal of Deutsche Asset Management (2014-present); Counsel at Skadden, Arps, Slate, Meagher & Flom LLP (2005-2014). | |||||||
Each Trustee serves until his or her successor is duly elected or appointed and qualified. Each officer serves until he or she resigns, is removed, dies, retires or becomes disqualified.
The Fund’s SAI includes additional information about the Fund’s Trustees and is available by calling 855-329-3837, or on the Company’s website at www.dbxus.com.
39
DBX ETF Trust
Board considerations in approval of investment advisory and sub-advisory contracts (Unaudited)
Deutsche X-trackers MSCI EAFE Hedged Equity ETF
After discussions at meetings of the Board of Trustees (“Board” or “Trustees”) held on February 25, 2016 and February 28, 2016, at the February 28 meeting the Trustees, including the Independent Trustees (those not affiliated with DBX ETF Trust (the “Trust”) or its service providers), unanimously approved the continuance of the Investment Advisory Agreement and the Sub-Advisory Agreement with respect to Deutsche X-trackers MSCI EAFE Hedged Equity ETF (the “Fund”). The Independent Trustees were advised throughout the review and meetings by Independent Trustee Counsel.
In reaching this decision with respect to the Investment Advisory Agreement, the Board considered all factors it believed relevant, including (1) the nature, extent and quality of the services provided to the Fund and its shareholders; (2) the financial resources of DBX Advisors LLC (“DBX” or the “Adviser”) and its resulting ability to perform its obligations under the Investment Advisory Agreement; (3) the competitiveness of the advisory fee; (4) the total cost of the services provided by and the profits realized by the Adviser from its relationship with the Fund; and (5) the extent to which economies of scale have been realized, and if the Fund’s shareholders have benefitted from those economies.
In reaching this decision with respect to the Sub-Advisory Agreement, the Board considered all factors it believed relevant, including (1) the nature, extent and quality of the services provided to the Fund and its shareholders; (2) the performance of TDAM USA Inc. (“TDAM” or “Sub-Adviser”) with respect to its management of the Fund, as well as TDAM’s financial resources and its resulting ability to perform its obligations under the Sub-Advisory Agreement; (3) the total cost of the services provided by and the profits realized by TDAM from its relationship with the Fund; and (4) the extent to which economies of scale have been realized, and if the Fund’s shareholders have benefitted from those economies.
The Board reached a determination, with the assistance of Trust Counsel and through the exercise of its business judgment, that approval of the Investment Advisory Agreement and the Sub-Advisory Agreement and the compensation to be received thereunder is in the best interests of the Fund and its shareholders as well as consistent with the Board’s duties under state and federal law. The Board reached this conclusion based on multiple factors.
The Board considered the following in determining whether to approve the Investment Advisory Agreement:
Nature, Extent and Quality of Services. The Board reviewed in detail the nature, extent and quality of services provided by the Adviser under the Investment Advisory Agreement. The Board noted that these services include, among other things, furnishing a continuous investment program for the Fund, including arranging for, or implementing, the purchase and sale of portfolio securities, the provision of general corporate services such as portfolio management compliance services and the preparation and filing of certain reports on behalf of the Trust. The Board also considered, among other things, the professional experience and qualifications of the senior management and key professional personnel of the Adviser, including those individuals responsible for portfolio management. The Board considered that the Adviser provides, at its own expense, office facilities and equipment for use by the Fund and supervisory persons responsible for supervising and monitoring the Trust’s service providers. The Board also considered that the Adviser pays for the compensation of officers of the Trust who are also officers or employees of the Adviser, except as may otherwise be determined by the Board. The Board also considered that the Adviser arranges for the provision of transfer agency, custody, fund administration and accounting, and other non-distribution services necessary for the Fund’s operation. The Board also considered the role played by the Adviser in working with TDAM to manage the Fund’s portfolio, noting that the Adviser provides oversight of day-to-day operations, including monitoring tracking error, providing services in connection with the creation and redemption of creation units and assistance in meeting legal and regulatory requirements applicable to the Fund.
Based on its review, the Board concluded that the nature, extent, and quality of services provided by the Adviser under the Investment Advisory Agreement are reasonable and appropriate in relation to the fees paid to the Adviser, taking special consideration of the fact that the advisory fee is a unitary fee and, as a result, a portion of the unitary advisory fee will be used to compensate the Fund’s service providers. The Board considered the
40
DBX ETF Trust
Board considerations in approval of investment advisory and sub-advisory contracts (Unaudited) (Continued)
staffing of the Adviser, including the training, qualifications and experience of investment personnel in managing the Fund. The Board also considered the expertise of the Adviser in supervising third party service providers to the Fund, such as the administrator and custodian. The Board further considered the compliance program of the Adviser which supports the Fund’s compliance program.
Adviser’s Financial Resources. In connection with the assessment of the ability of the Adviser to perform its duties under the Investment Advisory Agreement, the Board considered the Adviser’s financial condition and whether it had the resources necessary to carry out its functions. The Board concluded that the Adviser had the financial resources necessary to perform its obligations under the Investment Advisory Agreement.
Reasonableness of Advisory Fee. The Board compared the Fund’s advisory fee to that of other exchange-traded funds (“ETFs”), and noted that the Fund’s fee is competitive with the fees of its respective peer group. The Board noted that the fee for the Fund is a unitary fee pursuant to which the Adviser pays all of the Fund’s costs. The Board also noted that the Fund’s portfolio is managed on a day-to-day basis by the Sub-Adviser, which receives a fee from the Adviser. The Board considered the allocation of responsibilities between the Adviser and Sub-Adviser and noted that the Adviser provides oversight of day-to-day operations, including monitoring tracking error, providing services in connection with creation and redemption units and assistance in meeting legal and regulatory requirements applicable to the Fund. Based on its review, the Board concluded that the advisory fee is reasonable in light of the services provided.
Costs of Services and Profitability. The Board considered the expenses of the Adviser in developing and rendering services to the Fund, and the information provided by the Adviser to the Board regarding the Fund’s profitability. The Board noted that the Adviser had provided extensive information about the Adviser’s profitability and the Adviser’s methodology in determining profitability. The Board also noted that while the Adviser had provided information about the Adviser’s expenses relating to marketing the Fund, the Board considered the Adviser’s profitability without accounting for such expenses. The Board determined that the Adviser’s profitability with respect to the Fund was not excessive. The Board also noted that since the fee paid by the Adviser to the Sub-Adviser under the Sub-Advisory Agreement contained breakpoints, the Adviser could experience increased profitability as the Fund’s assets increased. The Board considered whether the Adviser would benefit in other ways from its relationships with the Fund, and concluded that there were no material fall-out benefits likely to accrue to the Adviser related to the operation of the Funds.
Economies of Scale. The Board noted that while the Fund had experienced dramatic asset inflows during 2015, it was too early to determine whether the Fund was realizing economies of scale and determined to evaluate economies of scale on an ongoing basis as a result of asset growth of the Fund.
Given all the information available to it and considering all material factors, the Board concluded that the Investment Advisory Agreement was fair and reasonable and it was unanimously approved.
The Board considered the following in determining whether to approve the Sub-Advisory Agreement:
Nature, Extent and Quality of Services. In considering the nature, extent and quality of services that TDAM provides to the Fund, the Board reviewed in detail the nature, extent and quality of services provided by TDAM under the Sub-Advisory Agreement. The Board noted that these services include, among other things, furnishing a continuous investment program for the Fund, including arranging for, or implementing, the purchase and sale of portfolio securities.
The Board also considered TDAM’s operational capabilities and resources. The Board considered the professional experience and qualifications of TDAM’s senior management and key professional personnel, as well as TDAM’s depth and breadth of experience in managing investment portfolios consisting of U.S. and non-U.S. equity securities. The Board gave special consideration to TDAM’s experience and capabilities in implementing currency hedging strategies, and their techniques for implementing such strategies while minimizing index tracking error. In addition, the Board considered TDAM’s operational capabilities and resources, and TDAM’s experience in managing index funds covering various asset classes.
41
DBX ETF Trust
Board considerations in approval of investment advisory and sub-advisory contracts (Unaudited) (Continued)
Based on its review, the Board concluded that the nature, extent, and quality of services provided by TDAM under the Sub-Advisory Agreement are reasonable and appropriate in relation to the fees paid to TDAM, taking special consideration of the fact that the fees paid to TDAM are payable by the Adviser and not the Fund.
Performance of TDAM; TDAM’s Financial Resources. The Board considered TDAM’s performance in managing the Fund and its ability to minimize tracking error. The Board concluded that, given TDAM’s capabilities and experience in managing the Fund, TDAM had generally been able to keep the Fund’s tracking error within acceptable ranges.
The Board also considered TDAM’s financial condition and whether it had the resources necessary to carry out its functions. The Board concluded that TDAM had the financial resources necessary to perform its obligations under the Sub-Advisory Agreement.
Reasonableness of Sub-Advisory Fee. The Board noted that the fee paid to TDAM in respect of the Fund would be paid by the Adviser and not the Fund. The Board further noted that the fee for the Fund was a unitary fee pursuant to which the Adviser would pay all of the Fund’s costs, and thus was not directly affected by the amount of the sub-advisory fee paid to TDAM. Based on its review, the Board concluded that the sub-advisory fee was reasonable in light of the services provided.
Costs of Services and Profitability. The Board noted that the fees paid by the Adviser to TDAM under the Sub-Advisory Agreement contain breakpoints. The Board further noted that specific information about TDAM’s profitability with respect to its services provided to the Fund was not available because TDAM does not calculate the profitability of its sub-advisory services on a per-Fund level. The Board also noted that the overall fees paid by the Fund remained reasonable.
The Board also considered whether TDAM would benefit in other ways from its relationship with the Fund. The Board discussed TDAM’s practices regarding the selection and compensation of brokers and dealers that execute portfolio transactions for the Fund and the brokers’ and dealers’ provision of brokerage services to TDAM. The Board discussed the potential benefits TDAM might derive from the Fund’s soft dollar arrangements, whereby brokers provide brokerage services to the Fund or TDAM in return for allocating fund brokerage.
Economies of Scale. The Board noted that while the Fund had experienced dramatic asset inflows during 2015, it was too early to determine whether the Fund was realizing economies of scale and determined to evaluate economies of scale on an ongoing basis as a result of asset growth of the Fund.
Given all the information available to it and considering all material factors, the Board concluded that the Sub-Advisory Agreement was fair and reasonable and it was unanimously approved.
42
DBX ETF Trust
Additional information (Unaudited)
Proxy Voting Policies and Procedures
The Fund’s policies and procedures for voting proxies for portfolio securities and information about how the Fund voted proxies related to its portfolio securities during the 12-month period ended June 30 are available on our Web site — www.deutsche-etfs.com (click on “proxy voting” at the bottom of the page) — or on the SEC’s Web site — www.sec.gov. To obtain a written copy of the Fund’s policies and procedures without charge, upon request, call us toll free at (855) 329-3837.
Quarterly Portfolio Disclosure
The Fund is required to file their complete schedule of portfolio holdings with the SEC for their first and third fiscal quarters on Form N-Q. Copies of the filings are available without charge, upon request on the SEC’s website at www.sec.gov and are available by calling the Company at 855-329-3837. You can also obtain copies of Form N-Q by (i) visiting the SEC’s Public Reference Room in Washington, DC (information on the operation of the Public Reference Room may be obtained by calling 800-SEC-0330); (ii) sending your request and a duplicating fee to the SEC’s Public Reference Room, Washington, DC 20549-0102; or (iii) sending your request electronically to publicinfo@sec.gov.
Information about the Fund’s portfolio holdings is available daily at www.deutsche-etfs.com.
Discount & Premium Information
Information regarding how often shares of the Fund traded on NYSE Arca at a price above (i.e., at a premium) or below (i.e., at a discount) the Net Asset Value of the Fund can be found at www.deutsche-etfs.com.
Tax Information
Form 1099-DIV and other year-end tax information provide shareholders with actual calendar year amounts that should be included in their tax returns. Shareholders should consult their tax advisors.
The Fund designates the following amounts or, if subsequently determined to be different, the maximum amount allowable for its fiscal year ended May 31, 2016.
| Qualified Divided Income* | ||||
Deutsche X-trackers MSCI EAFE Hedged Equity ETF | 53% | |||
* The above percentage is based on ordinary income dividends paid to shareholders during the Fund’s fiscal year.
The Fund intends to elect to pass through to shareholders the credit for taxes paid to foreign countries. The gross foreign source income and foreign taxes paid are as follows:
| Gross Foreign Income | Foreign Taxes Paid | |||||||
Deutsche X-trackers MSCI EAFE Hedged Equity ETF | $432,800,266 | $21,771,289 | ||||||
43
DBX ETF Trust
Privacy policy notice (Unaudited)
DBX Advisors LLC (“Advisors”) collects non-public information about you from the following sources: (i) information received from you on applications or other forms; and (ii) information about your transactions with the Advisors, Advisors’ affiliates and third-party service providers and vendors. Advisors does not disclose any non-public personal information about you to anyone, other than as set forth below, as permitted by applicable law and regulation. Advisors may disclose non-public personal information about you to the funds in which you invest, to Advisors’ affiliates, and to non-affiliated companies that work with Advisors to service your account(s), or to provide services or process transactions that you have requested. Advisors may disclose non-public personal information in situations that may include, but are not limited to, in response to legal and/or regulatory inquiries and the proposed or actual sale, assignment merger or other transfer of all or a portion of Advisors’ business to another business entity. Advisors may also disclose non-public personal information about you to parties representing you, such as your investment representative, your accountant, your tax adviser, or to other third parties at your direction/consent. Advisors will not sell, rent, license or trade your personal and financial information to or with third parties for their own direct marketing use unless you give us general or specific consent to do so. If you decide to close your account(s) or become an inactive customer, Advisors will adhere to the privacy policies and practices as described in this notice. Advisors restricts access to your personal and account information to those employees who need to know that information to provide products and services to you. Advisors maintains reasonable and customary physical, electronic and procedural safeguards to guard your non-public personal information.
Advisors reserves the right, at their discretion, to change, modify, add, or remove portions of this Privacy Policy Notice, and any of the policies described herein, at any time. Advisors will indicate any such changes to the Privacy Policy Notice at the privacy link which can be found at www.deutsche-etfs.com. At all times, you are bound by the then-current version of the Privacy Policy and all applicable laws. Advisors highly recommends that you review this Privacy Policy Notice from time to time to ensure that you are familiar with the most recent version. The examples contained in this Privacy Policy Notice are illustrations; they are not intended to be exclusive.
44
DBX ETF Trust
This report is intended for the shareholders of DBX ETF Trust.
Carefully consider a Fund’s investment objectives, risk factors and charges and expenses before investing. This and other information can be found in the Fund’s prospectus, which may be obtained by calling 1-855-DBX-ETFS (1-855-329-3837), or by viewing or downloading a prospectus at www.deutsche-etfs.com. Read the prospectus carefully before investing.
Investing involves risk, including the possible loss of principal. Stocks may decline in value. Foreign investing involves greater and different risks than investing in US companies, including currency fluctuations, less liquidity, less developed or less efficient trading markets, lack of comprehensive company information, political instability and differing auditing and legal standards. The Fund’s use of forward currency contracts may not be successful in hedging currency exchange rates changes and could eliminate some or all of the benefit of an increase in the value of a foreign currency versus the US dollar. Funds investing in a single industry, country or in a limited geographic region generally are more volatile than more diversified funds. Investing in derivatives entails special risks relating to liquidity, leverage and credit that may reduce returns and/or increase volatility. Performance of the Fund may diverge from that of the Underlying Index due to operating expenses, transaction costs, cash flows, use of sampling strategies or operational inefficiencies. An investment in the Fund should be considered only as a supplement to a complete investment program for those investors willing to accept the risks associated with the fund. See the prospectus for details.
Shares of the Funds are bought and sold at market price (not NAV) throughout the day on the New York Stock Exchange. Transactions in Fund shares may result in brokerage commissions and may generate tax consequences. There can be no assurance that an active trading market for shares of a fund will develop or be maintained.
DBX ETF Trust Funds are distributed by ALPS Distributors, Inc. The Funds are managed by DBX Advisors LLC which is not affiliated with ALPS.
Deutsche Asset Management is the brand name for the asset management activities conducted by Deutsche Bank AG or any of its subsidiaries. Clients will be provided Deutsche Asset Management products or services by one or more legal entities that will be identified to clients pursuant to the contracts, agreements, offering materials or other documentation relevant to such products or services.
The funds or securities referred to herein are not sponsored, endorsed, or promoted by MSCI, and MSCI bears no liability with respect to any such funds or securities or any index on which such funds or securities are based. The prospectus contains a more detailed description of the limited relationship MSCI has with DBX and any related funds.
Copyright © 2016 Deutsche Bank AG. All rights reserved. Deutsche X-trackers® is a registered trademark of Deutsche Bank AG. All other trademarks, servicemarks or registered trademarks are the property of their respective owners.
Not FDIC Insured | No Bank Guarantee | May Lose Value
DBX ETF Trust
Investment advisor DBX Advisors LLC 60 Wall Street New York, NY 10005 | Investment sub-advisor TDAM USA Inc. 161 Bay Street, 35th Floor TD Canada Trust Tower Toronto, Ontario Canada M5J 2T2 | Administrator, custodian, fund accountant, lending agent & transfer agent The Bank of New York Mellon 101 Barclay Street New York, NY 10286 | ||
Distributor ALPS Distributors, Inc. 1290 Broadway Suite 1100 Denver, CO 80203 | Independent registered public accounting firm Ernst & Young LLP 5 Times Square New York, NY 10036 | Legal counsel Dechert LLP 1095 Avenue of the Americas New York, NY 10036 | ||
R-38753-2 (7/16) DBX 002024 (7/17)

May 31, 2016
Annual Report
DBX ETF Trust
Deutsche X-trackers Emerging Markets Bond — Interest Rate Hedged ETF (EMIH)
Deutsche X-trackers High Yield Corporate Bond — Interest Rate Hedged ETF (HYIH)
Deutsche X-trackers Investment Grade Bond — Interest Rate Hedged ETF (IGIH)
Deutsche X-trackers Municipal Infrastructure Revenue Bond ETF (RVNU)
Deutsche X-trackers MSCI All World ex US High Dividend Yield Hedged Equity ETF (HDAW)
Deutsche X-trackers MSCI EAFE High Dividend Yield Hedged Equity ETF (HDEF)
Deutsche X-trackers MSCI Emerging Markets High Dividend Yield Hedged Equity ETF (HDEE)
Deutsche X-trackers MSCI Eurozone High Dividend Yield Hedged Equity ETF (HDEZ)

DBX ETF Trust
To our shareholders: (Unaudited)
Dear Shareholder,
We are pleased to provide this annual report for our eight ETFs tracking the fixed income and equity dividend markets for the period ended May 31, 2016.
The world economy has witnessed many significant events punctuated by central bank actions in the past 12 months. While Greece garnered a bailout, fears over slowing growth in China adversely impacted markets across the world. In the US, the Federal Reserve Board (FRB) finally opted to hike rates in December and as a result, equities mostly negated the gains from the previous quarter. By the turn of the year, the Bank of Japan (BoJ) announced an unexpected negative interest rate move and the European Central Bank (ECB) followed suit in March 2016, cutting its deposit rate to -0.40%.
Global Equities, as measured by the MSCI ACWI Index1, posted negative returns for the reporting period. While equities fell to multi-year lows at the start of 2016 on concerns over the global economy, they charted a V-shaped recovery, aided by supportive central bank actions, along with a revival in crude oil prices. While Emerging Market (EM) equities also rallied in the first quarter, it has started to underperform Developed Markets (DM), due to the rebound in USD.
Fixed Income experienced mixed performance, impacted by a risk-off attitude from investors. As expected in FRB tightening cycles, the US Treasury yield curve flattened. Diverging monetary policies of central banks drove bond markets, leading to an overall increase in yields. With oil prices plunging to 12-year lows, Treasury yields also fell as investors flocked to safe havens, while High Yield (HY) corporate bonds and EM debt came under selling pressure. As a result, HY bonds underperformed Investment Grade (IG) bonds and ended in losses. The ECB’s stimulus measures, announced in March, resulted in US and European firms aggressively issuing bonds in order to benefit from lower borrowing costs.
Municipal bond markets experienced strong performance and inflows. Municipal yields fell relative to Treasuries, given a large increase demand for municipal bonds. The overall default rate remains low, notwithstanding the default of Puerto Rican bonds. Recently the federal government has shown support to allow Puerto Rico to restructure its debt.
Our team appreciates your trust and looks forward to serving your investment needs through innovative index-driven strategies.
Sincerely,
/s/ Alex N. Depetris
Alex N. Depetris
Chairman, President and Chief Executive Officer
1 MSCI ACWI Index captures large and mid cap representation across 23 Developed Markets (DM) and 23 Emerging Markets (EM) countries. With 2,476 constituents, the index covers approximately 85% of the global investable equity opportunity set.
Assumptions, estimates and opinions contained in this document constitute our judgment as of the date of the document and are subject to change without notice. Any projections are based on a number of assumptions as to market conditions and there can be no guarantee that any projected results will be achieved. Past performance is not a guarantee of future results.
1
This Page is Intentionally Left Blank
2
DBX ETF Trust
Management’s discussion of fund performance (Unaudited)
Deutsche X-trackers Emerging Markets Bond — Interest Rate Hedged ETF
The Deutsche X-trackers Emerging Markets Bond — Interest Rate Hedged ETF (EMIH) seeks to track the performance, before fees and expenses, of the Solactive Emerging Markets Bond — Interest Rate Hedged Index (the EMIH Index). The EMIH Index provides exposure to USD-denominated emerging market bonds, while mitigating any interest rate risk. For the 12-month period ended May 31, 2016, EMIH returned 1.22% compared with the EMIH Index return of 0.90%.
Most countries in the Fund contributed positive returns with the exception of a few Latin American countries such as Brazil and Uruguay. The most significant positive contribution to Fund performance came from its exposure to Ukraine sovereign debt. About 40% of the portfolio remained invested in medium-grade bonds (Baa series), according to Moody’s ratings, and delivered positive returns.
Deutsche X-trackers High Yield Corporate Bond — Interest Rate Hedged ETF
The Deutsche X-trackers High Yield Corporate Bond — Interest Rate Hedged ETF (HYIH) seeks to track the performance, before fees and expenses, of the Solactive High Yield Corporate Bond — Interest Rate Hedged Index (the HYIH Index). The HYIH Index provides exposure to a basket of liquid USD-denominated high-yield corporate bonds, while mitigating any interest rate risk. For the 12-month period ended May 31, 2016, HYIH returned -4.06% compared with the HYIH Index return of -3.18%.
The high-yield bond basket fell for the period as it was hampered by crude oil price volatility. Most of the Fund losses were due to its exposure to the Energy sector; bonds in the Consumer Cyclical and Financials sectors posted maximum positive gains.
Deutsche X-trackers Investment Grade Bond — Interest Rate Hedged ETF
The Deutsche X-trackers Investment Grade Bond — Interest Rate Hedged ETF (IGIH) seeks to track the performance, before fees and expenses, of the Solactive Investment Grade Bond — Interest Rate Hedged Index (the IGIH Index). The IGIH Index provides exposure to a basket of liquid USD-denominated Investment Grade corporate bonds, while mitigating any interest rate risk. For the 12-month period ended May 31, 2016, IGIH returned -0.04% compared with the IGIH Index return of -0.02%.
Almost all sectors in the corporate bond portfolio gave positive returns for the period, however the interest rate hedge in the portfolio negated most of these positive returns. Financials and Communications sectors, which together make up about a half of the portfolio, gave the highest returns. At the individual security level, Comcast bonds provided the maximum contribution to returns.
Deutsche X-trackers Municipal Infrastructure Revenue Bond ETF
The Deutsche X-trackers Municipal Infrastructure Revenue Bond ETF (RVNU) seeks investment results that correspond generally to the performance, before fees and expenses, of the Solactive Municipal Infrastructure Revenue Bond Index (the RVNU Index). The RVNU Index is designed to track returns of the segment of the US long-term tax-exempt bond market that consists of infrastructure revenue bonds. For the 12-month period ended May 31, 2016, the fund returned 9.89% compared with the RVNU Index return of 10.25%.
The overall municipal bond market was healthy, despite the precarious debt situation in Puerto Rico and Atlantic City, to which RVNU did not have any exposure. Bonds classified as medium grade (Baa-rated) according to Moody’s ratings, provided most of the positive contribution driven by the quality-asset allocation strategy. With respect to sector performance, relative overweight to the transportation revenue sector provided positive outperformance versus the index for the period. RVNU was slightly underweight to the 10-15 year maturity range, leading to an underperformance for the period.
Deutsche X-trackers MSCI All World ex US High Dividend Yield Hedged Equity ETF
Deutsche X-trackers MSCI All World ex US High Dividend Yield Hedged Equity ETF (HDAW) seeks investment results that correspond generally to the performance, before fees and expenses, of the MSCI ACWI ex USA High Dividend Yield US Dollar Hedged Index (the HDAW Index). The HDAW Index is designed to give investors exposure to high-quality international equities across developed and emerging market countries (excluding the US), and provide an alternative, potentially reliable income stream on a currency-hedged basis. For
3
DBX ETF Trust
Management’s discussion of fund performance (Unaudited) (Continued)
the period August 12, 2015 (commencement of operations) to May 31, 2016, HDAW shares returned -6.67% compared with the HDAW Index return of -6.51%.
While Canada and Italy delivered the most positive returns, the UK and China performed poorly, ending in losses. Moreover, as the Energy and Financials sectors also ended in losses, Consumer Staples and Utilities posted meager gains.
Deutsche X-trackers MSCI EAFE High Dividend Yield Hedged Equity ETF
The Deutsche X-trackers MSCI EAFE High Dividend Yield Hedged Equity ETF (HDEF) seeks investment results that correspond generally to the performance, before fees and expenses, of the MSCI EAFE High Dividend Yield US Dollar Hedged Index (the HDEF Index). The HDEF Index is designed to give investors exposure to high-quality international equities across developed market countries (outside the US and Canada), and provide an alternative, potentially reliable income stream on a currency-hedged basis. For the period August 12, 2015 (commencement of operations) to May 31, 2016, HDEF shares returned -5.08% compared with the HDEF Index return of -4.87%.
Italy and New Zealand provided positive returns, while the UK and France ended in losses for the period. Financials, Healthcare, and Materials sectors returned negative, while Consumer Staples and Utilities posted positive returns for the period.
Deutsche X-trackers MSCI Emerging Markets High Dividend Yield Hedged Equity ETF
The Deutsche X-trackers MSCI Emerging Markets High Dividend Yield Hedged Equity ETF (HDEE) seeks investment results that correspond generally to the performance, before fees and expenses, of the MSCI Emerging Markets High Dividend Yield US Dollar Hedged Index (the HDEE Index). The HDEE index is designed to give investors exposure to high-quality international equities across emerging market countries, and provide an alternative, potentially reliable income stream on a currency-hedged basis. For the period August 12, 2015 (commencement of operations) to May 31, 2016, HDEE shares returned -11.67% compared with the HDEE Index return of -12.09%.
Geographically, the portfolio had its maximum exposure to China and South Africa, both of which performed poorly for the period, while Korea and Russia delivered the most positive returns. All sectors posted losses for the period, with Financials and Telecom sectors performing the worst.
Deutsche X-trackers MSCI Eurozone High Dividend Yield Hedged Equity ETF
The Deutsche X-trackers MSCI Eurozone High Dividend Yield Hedged Equity ETF (HDEZ) seeks investment results that correspond generally to the performance, before fees and expenses, of the MSCI EMU High Dividend Yield US Dollar Hedged Index (the HDEZ Index). The HDEZ Index is designed to give investors exposure to high-quality international equities across the Eurozone, and provide an alternative, potentially reliable income stream on a currency-hedged basis. For the period August 12, 2015 (commencement of operations) to May 31, 2016, HDEZ shares returned -2.52% compared with the HDEZ Index return of -2.66%.
While Italy and Austria managed to yield positive returns, France and Germany ended in losses for the period. With respect to sector performance, Financials and Consumer Discretionary fared poorly, whereas Utilities and Materials gave the highest returns.
Terms to know
Credit quality measures a bond issuer’s ability to repay interest and principal in a timely manner. Rating agencies assign letter designations, such as AAA, AA and so forth. The lower the rating the higher the probability of default. Credit quality does not remove market risk and is subject to change.
*************************
Performance data quoted represents past performance and does not guarantee future results. Investment returns and principal value of an investment will fluctuate so that an investor’s shares, when sold or redeemed, may be worth more or less than their original cost. Current performance may be lower or higher than the performance data quoted. To obtain the most recent month-end performance data visit www.deutsche-etfs.com. Returns assume that dividends and capital gains distributions have been reinvested. See pages 6-21 of this report for additional performance information, including performance data based on market value.
4
DBX ETF Trust
Management’s discussion of fund performance (Unaudited) (Continued)
The views expressed in this report reflect those of the portfolio management team only through the end of the period of the report as stated on the cover. The management team’s views are subject to change at any time based on market and other conditions and should not be construed as a recommendation. Current and future portfolio holdings are subject to risk.
5
DBX ETF Trust
Performance summary (Unaudited)
Deutsche X-trackers Emerging Markets Bond — Interest Rate Hedged ETF (EMIH)
The Deutsche X-trackers Emerging Markets Bond — Interest Rate Hedged ETF (the “Fund”) seeks investment results that correspond generally to the performance, before fees and expenses, of the Solactive Emerging Markets Bond — Interest Rate Hedged Index (name changed from DBIQ USD Emerging Markets Bond — Interest Rate Hedged Index effective August 10, 2015) (the “Underlying Index”). The Underlying Index is designed to track the performance of a basket of U.S. dollar denominated emerging markets bonds and is comprised of (a) long positions in U.S. dollar-denominated emerging markets bonds and (b) short positions in U.S. Treasury Securities of, in aggregate, approximate equivalent duration to the emerging markets bonds. It is not possible to invest directly into an index.
Performance as of 5/31/16
| Average Annual Total Return | ||||||||
| Net Asset Value | Market Value | Solactive Emerging Markets Bond — Interest Rate Hedged Index | Solactive Emerging Markets Bond Index (Long only component) | |||||
One Year | 1.22% | 1.03% | 0.90% | 5.11% | ||||
Since Inception1 | 1.71% | 1.94% | 1.35% | 4.90% | ||||
| Cumulative Total Returns | ||||||||
| Net Asset Value | Market Value | Solactive Emerging Markets Bond — Interest Rate Hedged Index | Solactive Emerging Markets Bond Index (Long only component) | |||||
One Year | 1.22% | 1.03% | 0.90% | 5.11% | ||||
Since Inception1 | 2.13% | 2.43% | 1.68% | 6.15% | ||||
1 Total returns are calculated based on the commencement of operations, 3/3/15 (“Inception”).
Past performance is no guarantee of future results. Current performance may be lower or higher than the performance data quoted. Performance data current to the most recent month-end is available at www.deutsche-etfs.com. Performance results assume reinvestment of all dividends and capital gain distributions and do not reflect the deduction of taxes that a shareholder would pay on fund distributions or on the sale of fund shares or redemption of fund creation units. The investment return and principal value of shares will vary with changes in market conditions. Shares may be worth more or less than their original cost when they are sold in the market or redeemed. The estimated operating expense ratio as disclosed in the most recent prospectus dated September 30, 2015, was 0.50%.
Net asset value or “NAV” is the value of one share of a fund as calculated in accordance with the standard formula for valuing mutual fund shares. The price used to calculate market return (“Market Price”) is determined by using the midpoint between the highest bid and the lowest offer on the primary stock exchange on which shares of a fund are listed for trading, as of the time that such fund’s NAV is calculated. Since shares of a fund may not have traded in the secondary market until after the fund’s inception, for the period from inception to the first day of secondary trading, the NAV of the fund is used as a proxy for the Market Price to calculate market returns. Market and NAV returns assume that dividends and capital gain distributions have been reinvested at Market Price and NAV, respectively.
An index is a statistical composite that tracks a specified financial market or sector. Unlike a fund, an index does not actually hold a portfolio of securities and therefore does not incur the expenses incurred by a fund. These expenses negatively impact fund performance. Also, market returns do not include brokerage commissions that may be payable on secondary market transactions. If brokerage commissions were included, market returns would be lower.
6
DBX ETF Trust
Performance summary (Unaudited)
Deutsche X-trackers Emerging Markets Bond — Interest Rate Hedged ETF (EMIH) (Continued)
Growth of an Assumed $10,000 Investment
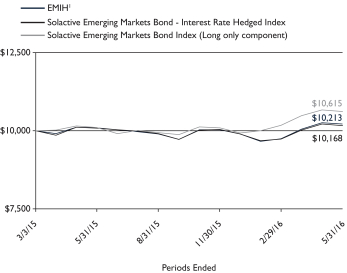
1 Based on Net Asset Value from commencement of operations, 3/3/15.
Country Diversification* as of 5/31/16
Russia | 6.4% | |||
Hungary | 6.2% | |||
Poland | 6.1% | |||
Brazil | 6.1% | |||
Peru | 5.7% | |||
Colombia | 5.6% | |||
South Africa | 5.5% | |||
Uruguay | 5.4% | |||
Qatar | 4.8% | |||
Philippines | 4.6% | |||
Mexico | 4.6% | |||
Indonesia | 4.5% | |||
Turkey | 4.1% | |||
Panama | 4.0% | |||
Ukraine | 3.9% | |||
Croatia | 3.8% | |||
Ecuador | 3.5% | |||
Kazakhstan | 3.4% | |||
Romania | 3.3% | |||
Lithuania | 2.1% | |||
Other | 6.4% | |||
|
| |||
Total | 100.0% |
Modified duration as of 5/31/16: 0.0 years
Modified duration is an approximate measure of a fund’s sensitivity to movements in interest rates based on the current rate environment.
Quality* as of 5/31/16
| Description | % of Market Value | |||
AAA | 3.0% | |||
AA | 4.7% | |||
A | 17.9% | |||
BBB | 39.2% | |||
BB | 22.3% | |||
B | 11.4% | |||
CCC | 1.5% | |||
|
| |||
Total | 100.0% | |||
The quality ratings represent the higher of Moody’s Investor Services, Inc. (“Moody’s”) or Standard & Poor’s Corporation (S&P) credit ratings. The ratings of Moody’s and S&P represent their opinions as to the quality of the securities they rate. Credit quality measures a bond issuer’s ability to repay interest and principal in a timely manner and is measured on a scale that ranges from AAA (highest) to D (lowest). Ratings are relative and subjective and are not absolute standards of quality. Credit quality does not remove market risk and is subject to change.
* As a percent of total investments.
Portfolio holdings and characteristics are subject to change. For more complete details about the Fund’s investment portfolio see page 24.
7
DBX ETF Trust
Performance summary (Unaudited)
Deutsche X-trackers High Yield Corporate Bond — Interest Rate Hedged ETF (HYIH)
The Deutsche X-trackers High Yield Corporate Bond — Interest Rate Hedged ETF (the “Fund”) seeks investment results that correspond generally to the performance, before fees and expenses, of the Solactive High Yield Corporate Bond — Interest Rate Hedged Index (name changed from DBIQ USD High Yield Corporate Bond — Interest Rate Hedged Index effective August 10, 2015) (the “Underlying Index”). The Underlying Index is designed to track the performance of a basket of U.S. dollar-denominated high yield liquid corporate bonds and is comprised of (a) long positions in U.S. dollar denominated high yield corporate bonds and (b) short positions in U.S. Treasury notes or bonds (“Treasury Securities”) of, in aggregate, approximate equivalent duration to the high yield bonds. It is not possible to invest directly into an index.
Performance as of 5/31/16
| Average Annual Total Return | ||||||||
| Net Asset Value | Market Value | Solactive High Yield Corporate Bond — Interest Rate Hedged Index | Solactive High Yield Corporate Bond Index | |||||
One Year | -4.06% | -4.67% | -3.18% | -0.74% | ||||
Since Inception1 | -3.94% | -3.80% | -2.89% | -0.17% | ||||
| Cumulative Total Returns | ||||||||
| Net Asset Value | Market Value | Solactive High Yield Corporate Bond — Interest Rate Hedged Index | Solactive High Yield Corporate Bond Index | |||||
One Year | -4.06% | -4.67% | -3.18% | -0.74% | ||||
Since Inception1 | -4.89% | -4.72% | -3.60% | -0.22% | ||||
1 Total returns are calculated based on the commencement of operations, 3/3/15 (“Inception”).
Past performance is no guarantee of future results. Current performance may be lower or higher than the performance data quoted. Performance data current to the most recent month-end is available at www.deutsche-etfs.com. Performance results assume reinvestment of all dividends and capital gain distributions and do not reflect the deduction of taxes that a shareholder would pay on fund distributions or on the sale of fund shares or redemption of fund creation units. The investment return and principal value of shares will vary with changes in market conditions. Shares may be worth more or less than their original cost when they are sold in the market or redeemed. The estimated operating expense ratio as disclosed in the most recent prospectus dated September 30, 2015, was 0.45%.
Net asset value or “NAV” is the value of one share of a fund as calculated in accordance with the standard formula for valuing mutual fund shares. The price used to calculate market return (“Market Price”) is determined by using the midpoint between the highest bid and the lowest offer on the primary stock exchange on which shares of a fund are listed for trading, as of the time that such fund’s NAV is calculated. Since shares of a fund may not have traded in the secondary market until after the fund’s inception, for the period from inception to the first day of secondary trading, the NAV of the fund is used as a proxy for the Market Price to calculate market returns. Market and NAV returns assume that dividends and capital gain distributions have been reinvested at Market Price and NAV, respectively.
An index is a statistical composite that tracks a specified financial market or sector. Unlike a fund, an index does not actually hold a portfolio of securities and therefore does not incur the expenses incurred by a fund. These expenses negatively impact fund performance. Also, market returns do not include brokerage commissions that may be payable on secondary market transactions. If brokerage commissions were included, market returns would be lower.
8
DBX ETF Trust
Performance summary (Unaudited)
Deutsche X-trackers High Yield Corporate Bond — Interest Rate Hedged ETF (HYIH) (Continued)
Growth of an Assumed $10,000 Investment
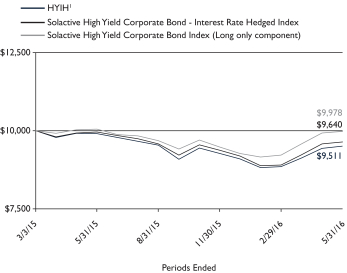
1 Based on Net Asset Value from commencement of operations, 3/3/15.
Sector Diversification* as of 5/31/16
Communications | 24.3% | |||
Consumer, Non-cyclical | 15.8% | |||
Consumer, Cyclical | 15.5% | |||
Energy | 12.7% | |||
Financial | 9.7% | |||
Industrial | 8.1% | |||
Technology | 5.3% | |||
Basic Materials | 5.0% | |||
Utilities | 3.6% | |||
|
| |||
Total | 100.0% |
Modified duration as of 5/31/16: 0.1 years
Modified duration is an approximate measure of a fund’s sensitivity to movements in interest rates based on the current rate environment.
Quality* as of 5/31/16
| % of Market Value | ||||
AAA | 5.4% | |||
BBB | 7.6% | |||
BB | 49.6% | |||
B | 30.5% | |||
CCC | 6.9% | |||
|
| |||
Total | 100% | |||
The quality ratings represent the higher of Moody’s Investor Services, Inc. (“Moody’s”) or Standard & Poor’s Corporation (S&P) credit ratings. The ratings of Moody’s and S&P represent their opinions as to the quality of the securities they rate. Credit quality measures a bond issuer’s ability to repay interest and principal in a timely manner and is measured on a scale that ranges from AAA (highest) to D (lowest). Ratings are relative and subjective and are not absolute standards of quality. Credit quality does not remove market risk and is subject to change.
Country Diversification* as of 5/31/16
United States | 94.1% | |||
Canada | 2.8% | |||
United Kingdom | 2.0% | |||
Luxumberg | 1.1% | |||
|
| |||
Total | 100.0% |
* As a percent of total investments excluding securities lending collateral.
Portfolio holdings and characteristics are subject to change. For more complete details about the Fund’s investment portfolio see page 27.
9
DBX ETF Trust
Performance summary (Unaudited)
Deutsche X-trackers Investment Grade Bond — Interest Rate Hedged ETF (IGIH)
The Deutsche X-trackers Investment Grade Bond — Interest Rate Hedged ETF (the “Fund”) seeks investment results that correspond generally to the performance, before fees and expenses, of the Solactive Investment Grade Bond — Interest Rate Hedged Index (name changed from DBIQ USD Investment Grade Bond — Interest Rate Hedged Index effective August 10, 2015) (the “Underlying Index”). The Underlying Index is designed to track the performance of a basket of U.S. dollar denominated investment grade liquid corporate bonds. The Underlying Index is comprised of (a) long positions in U.S. dollar denominated investment-grade corporate bonds and (b) short positions in U.S. Treasury Securities of, in aggregate, approximate equivalent duration to the investment-grade corporate bonds. It is not possible to invest directly into an index.
Performance as of 5/31/16
| Average Annual Total Return | ||||||||
| Net Asset Value | Market Value | Solactive Investment Grade Bond — Interest Rate Hedged Index | Solactive (Long only component) | |||||
One Year | -0.04% | -0.16% | -0.02% | 4.72% | ||||
Since Inception1 | -0.86% | -0.63% | -0.71% | 3.10% | ||||
| Cumulative Total Returns | ||||||||
| Net Asset Value | Market Value | Solactive Investment Grade Bond — Interest Rate Hedged Index | Solactive (Long only component) | |||||
One Year | -0.04% | -0.16% | -0.02% | 4.72% | ||||
Since Inception1 | -1.07% | -0.79% | -0.88% | 3.89% | ||||
1 Total returns are calculated based on the commencement of operations, 3/3/15 (“Inception”).
Past performance is no guarantee of future results. Current performance may be lower or higher than the performance data quoted. Performance data current to the most recent month-end is available at www.deutsche-etfs.com. Performance results assume reinvestment of all dividends and capital gain distributions and do not reflect the deduction of taxes that a shareholder would pay on fund distributions or on the sale of fund shares or redemption of fund creation units. The investment return and principal value of shares will vary with changes in market conditions. Shares may be worth more or less than their original cost when they are sold in the market or redeemed. The estimated operating expense ratio as disclosed in the most recent prospectus dated September 30, 2015, was 0.25%.
Net asset value or “NAV” is the value of one share of a fund as calculated in accordance with the standard formula for valuing mutual fund shares. The price used to calculate market return (“Market Price”) is determined by using the midpoint between the highest bid and the lowest offer on the primary stock exchange on which shares of a fund are listed for trading, as of the time that such fund’s NAV is calculated. Since shares of a fund may not have traded in the secondary market until after the fund’s inception, for the period from inception to the first day of secondary trading, the NAV of the fund is used as a proxy for the Market Price to calculate market returns. Market and NAV returns assume that dividends and capital gain distributions have been reinvested at Market Price and NAV, respectively.
An index is a statistical composite that tracks a specified financial market or sector. Unlike a fund, an index does not actually hold a portfolio of securities and therefore does not incur the expenses incurred by a fund. These expenses negatively impact fund performance. Also, market returns do not include brokerage commissions that may be payable on secondary market transactions. If brokerage commissions were included, market returns would be lower.
10
DBX ETF Trust
Performance summary (Unaudited)
Deutsche X-trackers Investment Grade Bond — Interest Rate Hedged ETF (IGIH) (Continued)
Growth of an Assumed $10,000 Investment
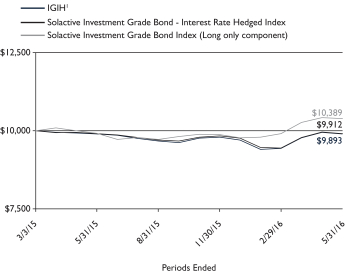
1 Based on Net Asset Value from commencement of operations, 3/3/15.
Sector Diversification* as of 5/31/16
Financial | 32.4% | |||
Consumer, Non-cyclical | 19.5% | |||
Communications | 14.2% | |||
Energy | 10.8% | |||
Technology | 7.3% | |||
Consumer, Cyclical | 6.2% | |||
Industrial | 5.6% | |||
Basic Materials | 2.7% | |||
Utilities | 1.3% | |||
|
| |||
Total | 100.0% |
Modified duration as of 5/31/16: 0.0 years
Modified duration is an approximate measure of a fund’s sensitivity to movements in interest rates based on the current rate environment.
Quality* as of 5/31/16
| Description | % of Market Value | |||
AAA | 6.7% | |||
AA | 19.1% | |||
A | 42.2% | |||
BBB | 32.0% | |||
|
| |||
Total | 100% | |||
The quality ratings represent the higher of Moody’s Investor Services, Inc. (“Moody’s”) or Standard & Poor’s Corporation (S&P) credit ratings. The ratings of Moody’s and S&P represent their opinions as to the quality of the securities they rate. Credit quality measures a bond issuer’s ability to repay interest and principal in a timely manner and is measured on a scale that ranges from AAA (highest) to D (lowest). Ratings are relative and subjective and are not absolute standards of quality. Credit quality does not remove market risk and is subject to change.
Country Diversification* as of 5/31/16
United States | 83.4% | |||
United Kingdom | 6.8% | |||
Netherlands | 3.2% | |||
France | 2.5% | |||
Canada | 2.3% | |||
Luxembourg | 1.2% | |||
Australia | 0.6% | |||
|
| |||
Total | 100.0% |
* As a percent of total investments excluding securities lending collateral.
Portfolio holdings and characteristics are subject to change. For more complete details about the Fund’s investment portfolio see page 31.
11
DBX ETF Trust
Performance summary (Unaudited)
Deutsche X-trackers Municipal Infrastructure Revenue Bond ETF (RVNU)
The Deutsche X-trackers Municipal Infrastructure Revenue Bond ETF (the “Fund”) seeks investment results that correspond generally to the performance, before fees and expenses, of the Solactive Municipal Infrastructure Revenue Bond Index (name changed from DBIQ Municipal Infrastructure Revenue Bond Index effective August 10, 2015) (the “Underlying Index”). The Underlying Index is designed to track the returns of the segment of the U.S. long term tax-exempt bond market, consisting of infrastructure revenue bonds. It is not possible to invest directly into an index.
Performance as of 5/31/16
| Average Annual Total Return | ||||||
| Net Asset Value | Market Value | Solactive Municipal Bond Index | ||||
One Year | 9.89% | 10.28% | 10.25% | |||
Since Inception1 | 6.06% | 6.26% | 6.16% | |||
| Cumulative Total Returns | ||||||
| Net Asset Value | Market Value | Solactive Municipal Bond Index | ||||
One Year | 9.89% | 10.28% | 10.25% | |||
Since Inception1 | 19.24% | 19.96% | 19.59% | |||
1 Total returns are calculated based on the commencement of operations, 6/4/13 (“Inception”).
Past performance is no guarantee of future results. Current performance may be lower or higher than the performance data quoted. Performance data current to the most recent month-end is available at www.deutsche-etfs.com. Performance results assume reinvestment of all dividends and capital gain distributions and do not reflect the deduction of taxes that a shareholder would pay on fund distributions or on the sale of fund shares or redemption of fund creation units. The investment return and principal value of shares will vary with changes in market conditions. Shares may be worth more or less than their original cost when they are sold in the market or redeemed. The estimated operating expense ratio as disclosed in the most recent prospectus dated September 30, 2015, was 0.30%.
Net asset value or “NAV” is the value of one share of a fund as calculated in accordance with the standard formula for valuing mutual fund shares. The price used to calculate market return (“Market Price”) is determined by using the midpoint between the highest bid and the lowest offer on the primary stock exchange on which shares of a fund are listed for trading, as of the time that such fund’s NAV is calculated. Since shares of a fund may not have traded in the secondary market until after the fund’s inception, for the period from inception to the first day of secondary trading, the NAV of the fund is used as a proxy for the Market Price to calculate market returns. Market and NAV returns assume that dividends and capital gain distributions have been reinvested at Market Price and NAV, respectively.
An index is a statistical composite that tracks a specified financial market or sector. Unlike a fund, an index does not actually hold a portfolio of securities and therefore does not incur the expenses incurred by a fund. These expenses negatively impact fund performance. Also, market returns do not include brokerage commissions that may be payable on secondary market transactions. If brokerage commissions were included, market returns would be lower.
12
DBX ETF Trust
Performance summary (Unaudited)
Deutsche X-trackers Municipal Infrastructure Revenue Bond ETF (RVNU) (Continued)
Growth of an Assumed $10,000 Investment
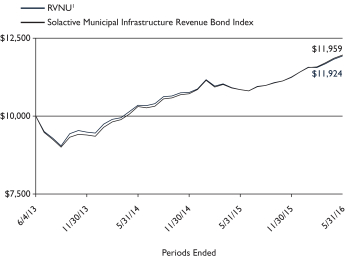
1 Based on Net Asset Value from commencement of operations, 6/4/13.
Sector Diversification* as of 5/31/16
Transportation | 36.4% | |||
General | 20.0% | |||
Water | 14.2% | |||
Airport | 11.0% | |||
Power | 11.0% | |||
Development | 3.5% | |||
Utilities | 2.6% | |||
Education | 1.3% | |||
|
| |||
| 100.0% |
Modified duration as of 5/31/16: 6.5 years
Modified duration is an approximate measure of a fund’s sensitivity to movements in interest rates based on the current rate environment.
Quality* as of 5/31/16
| Description | % of Market Value | |||
AAA | 13.7% | |||
AA | 43.4% | |||
A | 37.9% | |||
BBB | 5.0% | |||
|
| |||
Total | 100% | |||
The quality ratings represent the higher of Moody’s Investor Services, Inc. (“Moody’s”) or Standard & Poor’s Corporation (S&P) credit ratings. The ratings of Moody’s and S&P represent their opinions as to the quality of the securities they rate. Credit quality measures a bond issuer’s ability to repay interest and principal in a timely manner and is measured on a scale that ranges from AAA (highest) to D (lowest). Ratings are relative and subjective and are not absolute standards of quality. Credit quality does not remove market risk and is subject to change.
* As a percent of total investments.
Portfolio holdings and characteristics are subject to change. For more complete details about the Fund’s investment portfolio see page 35.
13
DBX ETF Trust
Performance summary (Unaudited)
Deutsche X-trackers MSCI All World ex US High Dividend Yield Hedged Equity ETF (HDAW)
The Deutsche X-trackers MSCI All World ex US High Dividend Yield Hedged Equity ETF (the “Fund”) seeks investment results that correspond generally to the performance, before fees and expenses, of the MSCI ACWI ex US High Dividend Yield US Dollar Hedged Index (the “Underlying Index”). The Underlying Index is designed to provide exposure to equity securities in developed and emerging stock markets (excluding the United States) in its parent index, the MSCI ACWI ex USA Index, with higher dividend income and quality characteristics than average dividend yields of equities in the parent index, where such higher dividend income and quality characteristics are both sustainable and persistent, while at the same time mitigating exposure to fluctuations between the value of the U.S. dollar and selected non-U.S. currencies. It is not possible to invest directly into an index.
Performance as of 5/31/16
| Cumulative Total Returns | ||||||||
| Net Asset Value | Market Value | MSCI ACWI ex USA High Dividend Yield US Dollar Hedged Index | MSCI ACWI ex USA Index | |||||
Since Inception1 | -6.67% | -6.44% | -6.51% | -7.57% | ||||
1 Total returns are calculated based on the commencement of operations, 8/12/15 (“Inception”).
Past performance is no guarantee of future results. Current performance may be lower or higher than the performance data quoted. Performance data current to the most recent month-end is available at www.deutsche-etfs.com. Performance results assume reinvestment of all dividends and capital gain distributions and do not reflect the deduction of taxes that a shareholder would pay on fund distributions or on the sale of fund shares or redemption of fund creation units. The investment return and principal value of shares will vary with changes in market conditions. Shares may be worth more or less than their original cost when they are sold in the market or redeemed. The estimated operating expense ratio as disclosed in the most recent prospectus dated September 30, 2015, was 0.45%.
Net asset value or “NAV” is the value of one share of a fund as calculated in accordance with the standard formula for valuing mutual fund shares. The price used to calculate market return (“Market Price”) is determined by using the midpoint between the highest bid and the lowest offer on the primary stock exchange on which shares of a fund are listed for trading, as of the time that such fund’s NAV is calculated. Since shares of a fund may not have traded in the secondary market until after the fund’s inception, for the period from inception to the first day of secondary trading, the NAV of the fund is used as a proxy for the Market Price to calculate market returns. Market and NAV returns assume that dividends and capital gain distributions have been reinvested at Market Price and NAV, respectively.
An index is a statistical composite that tracks a specified financial market or sector. Unlike a fund, an index does not actually hold a portfolio of securities and therefore does not incur the expenses incurred by a fund. These expenses negatively impact fund performance. Also, market returns do not include brokerage commissions that may be payable on secondary market transactions. If brokerage commissions were included, market returns would be lower.
14
DBX ETF Trust
Performance summary (Unaudited)
Deutsche X-trackers MSCI All World ex US High Dividend Yield Hedged Equity ETF (HDAW) (Continued)
Growth of an Assumed $10,000 Investment
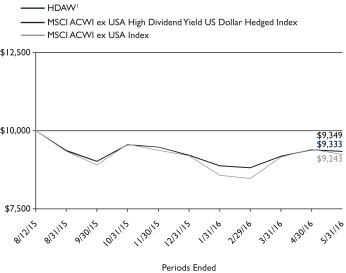
1 Based on Net Asset Value from commencement of operations, 8/12/15.
Sector Diversification* as of 5/31/16
Financials | 36.3% | |||
Health Care | 9.0% | |||
Energy | 8.9% | |||
Telecommunication Services | 8.7% | |||
Consumer Staples | 8.5% | |||
Consumer Discretionary | 7.6% | |||
Materials | 6.9% | |||
Utilities | 6.5% | |||
Information Technology | 4.7% | |||
Industrials | 2.9% | |||
|
| |||
Total | 100.0% |
Ten Largest Equity Holdings as of 5/31/16 (30.4% of Net Assets)
| Description | % of Net Assets | |||
HSBC Holdings PLC (United Kingdom) | 4.1% | |||
British American Tobacco PLC (United Kingdom) | 3.6% | |||
Total SA (France) | 3.5% | |||
GlaxoSmithKline PLC (United Kingdom) | 3.3% | |||
Sanofi (France) | 3.1% | |||
Vodafone Group PLC (United Kingdom) | 2.9% | |||
Royal Bank of Canada (Canada) | 2.8% | |||
Allianz SE (Germany) | 2.4% | |||
AstraZeneca PLC (United Kingdom) | 2.4% | |||
BASF SE (Germany) | 2.3% | |||
Country Diversification* as of 5/31/16
United Kingdom | 27.9% | |||
Canada | 10.5% | |||
France | 9.0% | |||
Germany | 8.7% | |||
China | 5.9% | |||
Australia | 5.3% | |||
Taiwan | 5.2% | |||
Hong Kong | 2.9% | |||
Switzerland | 2.7% | |||
South Africa | 2.6% | |||
Sweden | 2.4% | |||
Singapore | 2.3% | |||
Other | 14.6% | |||
|
| |||
Total | 100.0% |
* As a percent of total investments excluding securities lending collateral.
Portfolio holdings and characteristics are subject to change. For more complete details about the Fund’s investment portfolio see page 38.
15
DBX ETF Trust
Performance summary (Unaudited)
Deutsche X-trackers MSCI EAFE High Dividend Yield Hedged Equity ETF (HDEF)
The Deutsche X-trackers MSCI EAFE High Dividend Yield Hedged Equity ETF (the “Fund”) seeks investment results that correspond generally to the performance, before fees and expenses, of the MSCI EAFE High Dividend Yield US Dollar Hedged Index (the “Underlying Index”). The Underlying Index is designed to provide exposure to equity securities in developed international stock markets in its parent index, the MSCI EAFE Index, with higher dividend income and quality characteristics than average dividend yields of equities in the parent index, where such higher dividend income and quality characteristics are both sustainable and persistent, while at the same time mitigating exposure to fluctuations between the value of the U.S. dollar and selected non-U.S. currencies. It is not possible to invest directly into an index.
Performance as of 5/31/16
| Cumulative Total Returns | ||||||||
| Net Asset Value | Market Value | MSCI EAFE High Dividend Yield US Dollar Hedged Index | MSCI EAFE Index | |||||
Since Inception1 | -5.08% | -4.94% | -4.87% | -8.29% | ||||
1 Total returns are calculated based on the commencement of operations, 8/12/15 (“Inception”).
Past performance is no guarantee of future results. Current performance may be lower or higher than the performance data quoted. Performance data current to the most recent month-end is available at www.deutsche-etfs.com. Performance results assume reinvestment of all dividends and capital gain distributions and do not reflect the deduction of taxes that a shareholder would pay on fund distributions or on the sale of fund shares or redemption of fund creation units. The investment return and principal value of shares will vary with changes in market conditions. Shares may be worth more or less than their original cost when they are sold in the market or redeemed. The estimated operating expense ratio as disclosed in the most recent prospectus dated September 30, 2015, was 0.45%.
Net asset value or “NAV” is the value of one share of a fund as calculated in accordance with the standard formula for valuing mutual fund shares. The price used to calculate market return (“Market Price”) is determined by using the midpoint between the highest bid and the lowest offer on the primary stock exchange on which shares of a fund are listed for trading, as of the time that such fund’s NAV is calculated. Since shares of a fund may not have traded in the secondary market until after the fund’s inception, for the period from inception to the first day of secondary trading, the NAV of the fund is used as a proxy for the Market Price to calculate market returns. Market and NAV returns assume that dividends and capital gain distributions have been reinvested at Market Price and NAV, respectively.
An index is a statistical composite that tracks a specified financial market or sector. Unlike a fund, an index does not actually hold a portfolio of securities and therefore does not incur the expenses incurred by a fund. These expenses negatively impact fund performance. Also, market returns do not include brokerage commissions that may be payable on secondary market transactions. If brokerage commissions were included, market returns would be lower.
16
DBX ETF Trust
Performance summary (Unaudited)
Deutsche X-trackers MSCI EAFE High Dividend Yield Hedged Equity ETF (HDEF) (Continued)
Growth of an Assumed $10,000 Investment
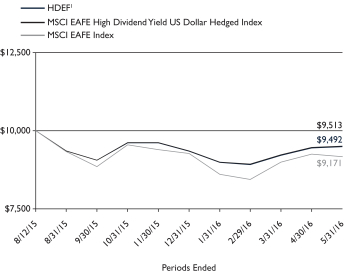
1 Based on Net Asset Value from commencement of operations, 8/12/15.
Sector Diversification* as of 5/31/16
Financials | 24.3% | |||
Health Care | 13.7% | |||
Consumer Staples | 10.4% | |||
Utilities | 10.0% | |||
Consumer Discretionary | 9.8% | |||
Materials | 8.9% | |||
Telecommunication Services | 8.7% | |||
Energy | 6.6% | |||
Industrials | 4.9% | |||
Information Technology | 2.7% | |||
|
| |||
Total | 100.0% |
Ten Largest Equity Holdings as of 5/31/16 (40.9% of Net Assets)
| Description | % of Net Assets | |||
Total SA (France) | 5.0% | |||
GlaxoSmithKline PLC (United Kingdom) | 4.9% | |||
British American Tobacco PLC (United Kingdom) | 4.9% | |||
Sanofi (France) | 4.8% | |||
Vodafone Group PLC (United Kingdom) | 4.4% | |||
Allianz SE (Germany) | 3.7% | |||
AstraZeneca PLC (United Kingdom) | 3.7% | |||
BASF SE (Germany) | 3.5% | |||
Daimler AG (Germany) | 3.3% | |||
National Grid PLC (United Kingdom) | 2.7% | |||
Country Diversification* as of 5/31/16
United Kingdom | 35.4% | |||
Germany | 14.5% | |||
France | 13.9% | |||
Australia | 10.8% | |||
Hong Kong | 4.3% | |||
Switzerland | 4.2% | |||
Finland | 2.8% | |||
Singapore | 2.7% | |||
Sweden | 2.3% | |||
Other | 9.1% | |||
|
| |||
Total | 100.0% |
* As a percent of total investments excluding securities lending collateral.
Portfolio holdings and characteristics are subject to change. For more complete details about the Fund’s investment portfolio see page 48.
17
DBX ETF Trust
Performance summary (Unaudited)
Deutsche X-trackers MSCI Emerging Markets High Dividend Yield Hedged Equity ETF (HDEE)
The Deutsche X-trackers MSCI Emerging Markets High Dividend Yield Hedged Equity ETF (the “Fund”) seeks investment results that correspond generally to the performance, before fees and expenses, of the MSCI Emerging Markets High Dividend Yield US Dollar Hedged Index (the “Underlying Index”). The Underlying Index is designed to provide exposure to equity securities in the global emerging markets in its parent index, the MSCI Emerging Markets Index, with higher dividend income and quality characteristics than average dividend yields of equities in the parent index, where such higher dividend income and quality characteristics are both sustainable and persistent, while at the same time mitigating exposure to fluctuations between the value of the U.S. dollar and selected emerging market currencies. It is not possible to invest directly into an index.
Performance as of 5/31/16
| Cumulative Total Returns | ||||||||
| Net Asset Value | Market Value | MSCI Emerging Markets High Dividend Yield US Dollar Hedged Index | MSCI Emerging Markets Index | |||||
Since Inception1 | -11.67 | -11.47 | -12.09 | -6.78 | ||||
1 Total returns are calculated based on the commencement of operations, 8/12/15 (“Inception”).
Past performance is no guarantee of future results. Current performance may be lower or higher than the performance data quoted. Performance data current to the most recent month-end is available at www.deutsche-etfs.com. Performance results assume reinvestment of all dividends and capital gain distributions and do not reflect the deduction of taxes that a shareholder would pay on fund distributions or on the sale of fund shares or redemption of fund creation units. The investment return and principal value of shares will vary with changes in market conditions. Shares may be worth more or less than their original cost when they are sold in the market or redeemed. The estimated operating expense ratio as disclosed in the most recent prospectus dated September 30, 2015, was 0.65%.
Net asset value or “NAV” is the value of one share of a fund as calculated in accordance with the standard formula for valuing mutual fund shares. The price used to calculate market return (“Market Price”) is determined by using the midpoint between the highest bid and the lowest offer on the primary stock exchange on which shares of a fund are listed for trading, as of the time that such fund’s NAV is calculated. Since shares of a fund may not have traded in the secondary market until after the fund’s inception, for the period from inception to the first day of secondary trading, the NAV of the fund is used as a proxy for the Market Price to calculate market returns. Market and NAV returns assume that dividends and capital gain distributions have been reinvested at Market Price and NAV, respectively.
An index is a statistical composite that tracks a specified financial market or sector. Unlike a fund, an index does not actually hold a portfolio of securities and therefore does not incur the expenses incurred by a fund. These expenses negatively impact fund performance. Also, market returns do not include brokerage commissions that may be payable on secondary market transactions. If brokerage commissions were included, market returns would be lower.
18
DBX ETF Trust
Performance summary (Unaudited)
Deutsche X-trackers MSCI Emerging Markets High Dividend Yield Hedged Equity ETF (HDEE) (Continued)
Growth of an Assumed $10,000 Investment
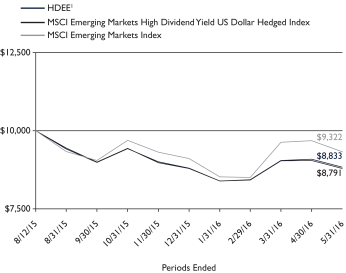
1 Based on Net Asset Value from commencement of operations, 8/12/15.
Sector Diversification* as of 5/31/16
Financials | 39.6% | |||
Energy | 17.4% | |||
Information Technology | 16.0% | |||
Telecommunication Services | 11.7% | |||
Consumer Staples | 5.8% | |||
Consumer Discretionary | 3.1% | |||
Materials | 3.0% | |||
Industrials | 2.0% | |||
Utilities | 1.0% | |||
Health Care | 0.4% | |||
|
| |||
Total | 100.0% |
Ten Largest Equity Holdings as of 5/31/16 (38.3% of Net Assets)
| Description | % of Net Assets | |||
China Construction Bank Corp. (China) | 5.1% | |||
Hon Hai Precision Industry Co. Ltd. (Taiwan) | 5.1% | |||
Industrial & Commercial Bank of China Ltd. (China) | 5.0% | |||
Bank of China Ltd. (China) | 4.8% | |||
Ambev SA (Brazil) | 3.9% | |||
CNOOC Ltd. (China) | 3.6% | |||
Sasol Ltd. (South Africa) | 2.9% | |||
China Petroleum & Chemical Corp. (China) | 2.8% | |||
Rosneft Oil Co. OJSC, (Russia) | 2.8% | |||
Lukoil PJSC (Russia) | 2.3% | |||
Country Diversification* as of 5/31/16
China | 25.0% | |||
Taiwan | 24.8% | |||
South Africa | 13.1% | |||
Russia | 8.4% | |||
Brazil | 7.1% | |||
Malaysia | 4.1% | |||
United Arab Emirates | 3.0% | |||
Thailand | 2.5% | |||
Poland | 2.5% | |||
Other | 9.5% | |||
|
| |||
Total | 100.0% |
* As a percent of total investments excluding securities lending collateral.
Portfolio holdings and characteristics are subject to change. For more complete details about the Fund’s investment portfolio see page 53.
19
DBX ETF Trust
Performance summary (Unaudited)
Deutsche X-trackers MSCI Eurozone High Dividend Yield Hedged Equity ETF (HDEZ)
The Deutsche X-trackers MSCI Eurozone High Dividend Yield Hedged Equity ETF (the “Fund”) seeks investment results that correspond generally to the performance, before fees and expenses, of the MSCI EMU High Dividend Yield US Dollar Hedged Index (the “Underlying Index”). Underlying Index is designed to provide exposure to equity securities from countries in the European Monetary Union (the “EMU”), or the “Eurozone”, in its parent index, the MSCI EMU Index, with higher dividend income and quality characteristics than average dividend yields of equities in the parent index, where such higher dividend income and quality characteristics are both sustainable and persistent, while at the same time mitigating exposure to fluctuations between the value of the U.S. dollar and the euro. It is not possible to invest directly into an index.
Performance as of 5/31/16
| Cumulative Total Returns | ||||||||
| Net Asset Value | Market Value | MSCI EMU High Dividend Yield US Dollar Hedged Index | MSCI EMU Index | |||||
Since Inception1 | -2.52% | -2.26% | -2.66% | -9.67% | ||||
1 Total returns are calculated based on the commencement of operations, 8/12/15 (“Inception”).
Past performance is no guarantee of future results. Current performance may be lower or higher than the performance data quoted. Performance data current to the most recent month-end is available at www.deutsche-etfs.com. Performance results assume reinvestment of all dividends and capital gain distributions and do not reflect the deduction of taxes that a shareholder would pay on fund distributions or on the sale of fund shares or redemption of fund creation units. The investment return and principal value of shares will vary with changes in market conditions. Shares may be worth more or less than their original cost when they are sold in the market or redeemed. The estimated operating expense ratio as disclosed in the most recent prospectus dated September 30, 2015, was 0.45%.
Net asset value or “NAV” is the value of one share of a fund as calculated in accordance with the standard formula for valuing mutual fund shares. The price used to calculate market return (“Market Price”) is determined by using the midpoint between the highest bid and the lowest offer on the primary stock exchange on which shares of a fund are listed for trading, as of the time that such fund’s NAV is calculated. Since shares of a fund may not have traded in the secondary market until after the fund’s inception, for the period from inception to the first day of secondary trading, the NAV of the fund is used as a proxy for the Market Price to calculate market returns. Market and NAV returns assume that dividends and capital gain distributions have been reinvested at Market Price and NAV, respectively.
An index is a statistical composite that tracks a specified financial market or sector. Unlike a fund, an index does not actually hold a portfolio of securities and therefore does not incur the expenses incurred by a fund. These expenses negatively impact fund performance. Also, market returns do not include brokerage commissions that may be payable on secondary market transactions. If brokerage commissions were included, market returns would be lower.
20
DBX ETF Trust
Performance summary (Unaudited)
Deutsche X-trackers MSCI Eurozone High Dividend Yield Hedged Equity ETF (HDEZ) (Continued)
Growth of an Assumed $10,000 Investment
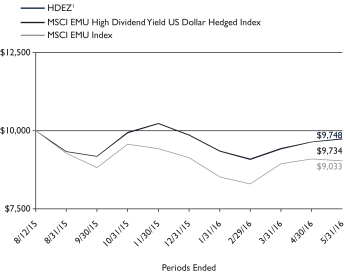
1 Based on Net Asset Value from commencement of operations, 8/12/15.
Sector Diversification* as of 5/31/16
Financials | 28.1% | |||
Consumer Discretionary | 22.3% | |||
Utilities | 21.4% | |||
Industrials | 14.6% | |||
Materials | 5.4% | |||
Energy | 5.0% | |||
Telecommunication Services | 1.9% | |||
Health Care | 1.3% | |||
|
| |||
Total | 100.0% |
Ten Largest Equity Holdings as of 5/31/16 (48.6% of Net Assets)
| Description | % of Net Assets | |||
AXA SA (France) | 5.2% | |||
Allianz SE (Germany) | 5.2% | |||
Bayerische Motoren Werke AG (Germany) | 5.2% | |||
Daimler AG (Germany) | 5.2% | |||
Muenchener Rueckversicherungs-Gesellschaft AG (Germany) | 5.1% | |||
Total SA (France) | 5.0% | |||
Sampo OYJ (Finland) | 4.9% | |||
Snam SpA (Italy) | 4.8% | |||
Atlantia SpA (Italy) | 4.0% | |||
ProSiebenSat.1 Media SE (Germany) | 4.0% | |||
Country Diversification* as of 5/31/16
Germany | 27.3% | |||
France | 19.9% | |||
Finland | 18.3% | |||
Italy | 12.6% | |||
Spain | 12.5% | |||
Belgium | 2.9% | |||
Portugal | 2.8% | |||
Luxembourg | 2.6% | |||
Netherlands | 1.1% | |||
|
| |||
Total | 100.0% |
* As a percent of total investments excluding securities lending collateral.
Portfolio holdings and characteristics are subject to change. For more complete details about the Fund’s investment portfolio see page 58.
21
DBX ETF Trust
As a shareholder of one or more of the funds, you incur two types of costs: (1) transaction costs, including brokerage commissions paid on purchases and sales of fund shares, and (2) ongoing costs, including management fees and other Fund expenses. The expense examples below are intended to help you understand your ongoing costs (in dollars) of investing in the Funds and to compare these costs with the ongoing costs of investing in other funds.
The examples in the table are based on an investment of $1,000 invested at the beginning of the six month period and held for the entire period (December 1, 2015 to May 31, 2016).
Actual expenses
The first line in the following tables provides information about actual account values and actual expenses. You may use the information in this line, together with the amount you invested, to estimate the expenses that you paid over the period. Simply divide your account value by $1,000 (for example, an $8,600 account value divided by $1,000 = 8.6), then multiply the result by the number in the first line under the heading “Expenses Paid During the Period” to estimate the expenses you paid on your account during this period.
Hypothetical example for comparison purposes
The second line in the following tables provides information about hypothetical account values and hypothetical expenses based on the Funds’ actual expense ratios and an assumed rate of return of 5% per year before expenses (which is not the Funds’ actual return). The hypothetical account values and expenses may not be used to estimate the actual ending account balance or expenses you paid for the period. You may use this information to compare the ongoing costs of investing in the Fund and other funds. To do so, compare this 5% hypothetical example with the 5% hypothetical examples that appear in the shareholder reports of the other funds.
Please note that the expenses shown in the tables are meant to highlight your ongoing costs only, and do not reflect any transactional costs. Therefore the second line in the table is useful in comparing ongoing costs only, and will not help you determine the relative total costs of owning different funds. In addition, if these transactional costs were included, your costs would have been higher.
| Beginning Account Value December 1, 2015 | Ending Account Value May 31, 2016 | Annualized Expense Ratio | Expenses Paid During the Period Per $1,000(1) | |||||||||||||
| Deutsche X-trackers Emerging Markets Bond—Int Rate Hedged ETF | ||||||||||||||||
Actual | $ | 1,000.00 | $ | 1,017.80 | 0.50 | % | $ | 2.52 | ||||||||
Hypothetical (5% return before expenses) | $ | 1,000.00 | $ | 1,022.50 | 0.50 | % | $ | 2.53 | ||||||||
| Deutsche X-trackers High Yield Corp Bond—Int Rate Hedged ETF | ||||||||||||||||
Actual | $ | 1,000.00 | $ | 1,025.80 | 0.45 | % | $ | 2.28 | ||||||||
Hypothetical (5% return before expenses) | $ | 1,000.00 | $ | 1,022.75 | 0.45 | % | $ | 2.28 | ||||||||
| Deutsche X-trackers Investment Grade Bond—Int Rate Hedged ETF | ||||||||||||||||
Actual | $ | 1,000.00 | $ | 1,010.10 | 0.25 | % | $ | 1.26 | ||||||||
Hypothetical (5% return before expenses) | $ | 1,000.00 | $ | 1,023.75 | 0.25 | % | $ | 1.26 | ||||||||
| Deutsche X-trackers Municipal Infrastructure Revenue Bond ETF | ||||||||||||||||
Actual | $ | 1,000.00 | $ | 1,060.50 | 0.30 | % | $ | 1.55 | ||||||||
Hypothetical (5% return before expenses) | $ | 1,000.00 | $ | 1,023.50 | 0.30 | % | $ | 1.52 | ||||||||
| Deutsche X-trackers MSCI All World ex US High Dividend Yield Hedged Equity ETF | ||||||||||||||||
Actual | $ | 1,000.00 | $ | 984.50 | 0.45 | % | $ | 2.23 | ||||||||
Hypothetical (5% return before expenses) | $ | 1,000.00 | $ | 1,022.75 | 0.45 | % | $ | 2.28 | ||||||||
22
DBX ETF Trust
Fees and expenses (Unaudited) (Continued)
| Beginning Account Value December 1, 2015 | Ending Account Value May 31, 2016 | Annualized Expense Ratio | Expenses Paid During the Period Per $1,000(1) | |||||||||||||
| Deutsche X-trackers MSCI EAFE High Dividend Yield Hedged Equity ETF | ||||||||||||||||
Actual | $ | 1,000.00 | $ | 987.50 | 0.45 | % | $ | 2.24 | ||||||||
Hypothetical (5% return before expenses) | $ | 1,000.00 | $ | 1,022.75 | 0.45 | % | $ | 2.28 | ||||||||
| Deutsche X-trackers MSCI Emerging Markets High Dividend Yield Hedged Equity ETF | ||||||||||||||||
Actual | $ | 1,000.00 | $ | 980.40 | 0.65 | % | $ | 3.22 | ||||||||
Hypothetical (5% return before expenses) | $ | 1,000.00 | $ | 1,021.75 | 0.65 | % | $ | 3.29 | ||||||||
| Deutsche X-trackers MSCI Eurozone High Dividend Yield Hedged Equity ETF | ||||||||||||||||
Actual | $ | 1,000.00 | $ | 953.00 | 0.45 | % | $ | 2.20 | ||||||||
Hypothetical (5% return before expenses) | $ | 1,000.00 | $ | 1,022.75 | 0.45 | % | $ | 2.28 | ||||||||
(1) Expenses are equal to each Fund’s annualized expense ratio, multiplied by the average account value over the period, multiplied by 183 (the number of days in the most recent six-month period), then divided by 366.
23
DBX ETF Trust
Deutsche X-trackers Emerging Markets Bond — Interest Rate Hedged ETF
May 31, 2016
Principal | Value | |||||||
| SOVEREIGN BONDS — 95.9% | ||||||||
| Brazil — 5.8% | ||||||||
Brazilian Government International Bond | $ | 110,000 | $ | 111,375 | ||||
10.125%, 5/15/27 | 30,000 | 40,950 | ||||||
8.25%, 1/20/34 | 35,000 | 39,025 | ||||||
5.00%, 1/27/45 | 200,000 | 157,000 | ||||||
|
| |||||||
| 348,350 | ||||||||
|
| |||||||
| Colombia — 5.4% | ||||||||
Colombia Government International Bond | 200,000 | 184,500 | ||||||
8.125%, 5/21/24 | 25,000 | 31,281 | ||||||
6.125%, 1/18/41 | 100,000 | 105,500 | ||||||
|
| |||||||
| 321,281 | ||||||||
|
| |||||||
| Croatia — 3.6% | ||||||||
Croatia Government International Bond, 144A | 100,000 | 109,303 | ||||||
6.625%, 7/14/20 | 100,000 | 109,135 | ||||||
|
| |||||||
| 218,438 | ||||||||
|
| |||||||
| Ecuador — 3.4% | ||||||||
Ecuador Government International Bond, 144A | 200,000 | 201,500 | ||||||
|
| |||||||
| Egypt — 1.7% | ||||||||
Egypt Government International Bond, 144A 5.75%, 4/29/20 | 100,000 | 100,849 | ||||||
|
| |||||||
| El Salvador — 0.4% | ||||||||
El Salvador Government International Bond, 144A | 30,000 | 26,025 | ||||||
|
| |||||||
| Hungary — 6.0% | ||||||||
Hungary Government International Bond | 110,000 | 125,045 | ||||||
5.75%, 11/22/23 | 70,000 | 79,216 | ||||||
5.375%, 3/25/24 | 106,000 | 117,586 | ||||||
7.625%, 3/29/41 | 26,000 | 36,585 | ||||||
|
| |||||||
| 358,432 | ||||||||
|
| |||||||
| Indonesia — 4.3% | ||||||||
Indonesia Government International Bond, 144A | 100,000 | 138,936 | ||||||
6.625%, 2/17/37 | 100,000 | 118,506 | ||||||
|
| |||||||
| 257,442 | ||||||||
|
| |||||||
| Kazakhstan — 3.3% | ||||||||
Kazakhstan Government International Bond, 144A | 200,000 | 196,282 | ||||||
|
| |||||||
| Lebanon — 0.8% | ||||||||
Lebanon Government International Bond GMTN, 6.375%, 3/09/20 | 50,000 | 51,063 | ||||||
|
| |||||||
Principal | Value | |||||||
| Lithuania — 2.0% | ||||||||
Lithuania Government International Bond, 144A | $ | 100,000 | $ | 118,283 | ||||
|
| |||||||
| Mexico — 4.4% | ||||||||
Mexico Government International Bond | 100,000 | 103,500 | ||||||
4.00%, 10/02/23 | 30,000 | 31,350 | ||||||
Series A MTN, 6.75%, 9/27/34 | 10,000 | 12,850 | ||||||
MTN, 4.75%, 3/08/44 | 60,000 | 59,700 | ||||||
5.55%, 1/21/45 | 35,000 | 39,069 | ||||||
5.75%, 10/12/10 | 20,000 | 20,200 | ||||||
|
| |||||||
| 266,669 | ||||||||
|
| |||||||
| Panama — 3.8% | ||||||||
Panama Government International Bond | 100,000 | 109,400 | ||||||
6.70%, 1/26/36 | 95,000 | 119,700 | ||||||
|
| |||||||
| 229,100 | ||||||||
|
| |||||||
| Peru — 5.5% | ||||||||
Peruvian Government International Bond | 100,000 | 132,125 | ||||||
8.75%, 11/21/33 | 75,000 | 111,937 | ||||||
5.625%, 11/18/50 | 75,000 | 85,500 | ||||||
|
| |||||||
| 329,562 | ||||||||
|
| |||||||
| Philippines — 4.5% | ||||||||
Philippine Government International Bond | 75,000 | 122,661 | ||||||
9.50%, 2/02/30 | 85,000 | 144,344 | ||||||
|
| |||||||
| 267,005 | ||||||||
|
| |||||||
| Poland — 5.9% | ||||||||
Poland Government International Bond | 90,000 | 102,206 | ||||||
5.125%, 4/21/21 | 70,000 | 78,467 | ||||||
5.00%, 3/23/22 | 50,000 | 56,027 | ||||||
3.00%, 3/17/23 | 40,000 | 40,409 | ||||||
4.00%, 1/22/24 | 70,000 | 74,949 | ||||||
|
| |||||||
| 352,058 | ||||||||
|
| |||||||
| Qatar — 4.6% | ||||||||
Qatar Government International Bond, 144A | 90,000 | 146,498 | ||||||
6.40%, 1/20/40 | 100,000 | 128,500 | ||||||
|
| |||||||
| 274,998 | ||||||||
|
| |||||||
| Romania — 3.2% | ||||||||
Romanian Government International Bond, 144A | 10,000 | 10,579 | ||||||
4.875%, 1/22/24 | 86,000 | 93,751 | ||||||
6.125%, 1/22/44 | 70,000 | 84,753 | ||||||
|
| |||||||
| 189,083 | ||||||||
|
| |||||||
| See Notes to Financial Statements. | 24 |
DBX ETF Trust
Schedule of investments
Deutsche X-trackers Emerging Markets Bond — Interest Rate Hedged ETF (Continued)
May 31, 2016
Principal | Value | |||||||
| Russia — 6.1% | ||||||||
Russian Foreign Bond — Eurobond, 144A | $ | 200,000 | $ | 212,360 | ||||
12.75%, 6/24/28 | 90,000 | 154,977 | ||||||
|
| |||||||
| 367,337 | ||||||||
|
| |||||||
| South Africa — 5.3% | ||||||||
South Africa Government International Bond | ||||||||
6.875%, 5/27/19 | 100,000 | 110,060 | ||||||
5.50%, 3/09/20 | 100,000 | 105,563 | ||||||
4.665%, 1/17/24 | 100,000 | 99,528 | ||||||
|
| |||||||
| 315,151 | ||||||||
|
| |||||||
| Sri Lanka — 1.7% | ||||||||
Sri Lanka Government International Bond, 144A | 100,000 | 100,611 | ||||||
|
| |||||||
| Turkey — 3.9% | ||||||||
Turkey Government International Bond | 20,000 | 22,460 | ||||||
7.375%, 2/05/25 | 55,000 | 65,374 | ||||||
11.875%, 1/15/30 | 20,000 | 33,722 | ||||||
8.00%, 2/14/34 | 80,000 | 102,810 | ||||||
7.25%, 3/05/38 | 10,000 | 12,083 | ||||||
|
| |||||||
| 236,449 | ||||||||
|
| |||||||
Principal | Value | |||||||
| Ukraine — 3.8% | ||||||||
Ukraine Government International Bond, 144A | $ | 120,000 | $ | 115,050 | ||||
7.75%, 9/01/24 | 120,000 | 111,600 | ||||||
|
| |||||||
| 226,650 | ||||||||
|
| |||||||
| Uruguay — 5.1% | ||||||||
Uruguay Government International Bond | 35,000 | 37,100 | ||||||
7.625%, 3/21/36 | 90,000 | 116,888 | ||||||
5.10%, 6/18/50 | 165,000 | 154,275 | ||||||
|
| |||||||
| 308,263 | ||||||||
|
| |||||||
| Venezuela — 1.4% | ||||||||
Venezuela Government International Bond | 200,000 | 85,500 | ||||||
|
| |||||||
TOTAL SOVEREIGN BONDS | 5,746,381 | |||||||
|
| |||||||
TOTAL INVESTMENTS — 95.9% (Cost $5,773,896)† | $ | 5,746,381 | ||||||
Other assets and liabilities, net — 4.1% | 243,664 | |||||||
|
| |||||||
NET ASSETS — 100.0% | $ | 5,990,045 | ||||||
|
| |||||||
| † | The cost for federal income tax purposes was $5,842,219. At May 31, 2016, net unrealized depreciation for all securities based on tax cost was $95,838. This consisted of aggregate gross unrealized appreciation for all securities in which there was an excess of value over tax cost of $102,255 and aggregate gross unrealized depreciation for all securities in which there was an excess of tax cost over value of $198,093. |
| GMTN: | Global Medium Term Note |
| MTN: | Medium Term Note |
| 144A: | Security exempt from registration under Rule 144A of the Securities Act of 1933. These securities may be resold in transactions exempt from registration, normally to qualified institutional buyers. |
At May 31, 2016, open futures contracts sold were as follows:
Contract Description | Number of Contracts | Contract Value | Expiration Date | Unrealized Appreciation (Depreciation) | ||||||||||||
2-Year U.S. Treasury Note | 1 | $ | 217,906 | 9/30/2016 | $ | (198 | ) | |||||||||
5-Year U.S. Treasury Note | 16 | 1,921,875 | 9/30/2016 | (4,374 | ) | |||||||||||
10-Year Ultra U.S. Treasury Note | 5 | 705,078 | 9/21/2016 | (2,422 | ) | |||||||||||
10-Year U.S. Treasury Note | 11 | 1,426,562 | 9/21/2016 | (4,641 | ) | |||||||||||
Ultra Long U.S. Treasury Bond | 1 | 175,125 | 9/21/2016 | (1,273 | ) | |||||||||||
U.S. Treasury Long Bond | 7 | 1,143,188 | 9/21/2016 | (8,968 | ) | |||||||||||
|
|
|
| |||||||||||||
| $ | 5,589,734 | $ | (21,876 | ) | ||||||||||||
|
|
|
| |||||||||||||
For information on the Fund’s policy and additional disclosures regarding open futures contracts, please refer to the Derivatives section of Note 2 in the accompanying Notes to Financial Statements.
| See Notes to Financial Statements. | 25 |
DBX ETF Trust
Schedule of investments
Deutsche X-trackers Emerging Markets Bond — Interest Rate Hedged ETF (Continued)
May 31, 2016
Fair Value Measurements
Various inputs are used in determining the value of the Fund’s investments. These inputs are summarized in three broad levels. Level 1 includes quoted prices in active markets for identical securities. Level 2 includes other significant observable inputs (including quoted prices for similar securities, interest rates, prepayment speeds and credit risk). Level 3 includes significant unobservable inputs (including the Fund’s own assumptions in determining the fair value of investments). The level assigned to the securities valuations may not be an indication of the risk or liquidity associated with investing in those securities.
The following is a summary of the inputs used as of May 31, 2016 in valuing the Fund’s investments. For information on Fund’s policy regarding the valuation of investments, please refer to the Security Valuation section of Note 2 in the accompanying Notes to Financial Statements.
Assets | Level 1 | Level 2 | Level 3 | Total | ||||||||||||
Sovereign Bonds (a) | $ | — | $ | 5,746,381 | $ | — | $ | 5,746,381 | ||||||||
|
|
|
|
|
|
|
| |||||||||
Total | $ | — | $ | 5,746,381 | $ | — | $ | 5,746,381 | ||||||||
|
|
|
|
|
|
|
| |||||||||
Liabilities | Level 1 | Level 2 | Level 3 | Total | ||||||||||||
Derivatives (b) | ||||||||||||||||
Futures Contracts | $ | (21,876 | ) | $ | — | $ | — | $ | (21,876 | ) | ||||||
|
|
|
|
|
|
|
| |||||||||
Total | $ | (21,876 | ) | $ | — | $ | — | $ | (21,876 | ) | ||||||
|
|
|
|
|
|
|
| |||||||||
| (a) | See Schedule of investments for additional detailed categorizations. |
| (b) | Derivatives include unrealized appreciation (depreciation) on open futures contracts. |
There have been no transfers between fair value measurement levels during the period ended May 31, 2016.
| See Notes to Financial Statements. | 26 |
DBX ETF Trust
Schedule of investments
Deutsche X-trackers High Yield Corporate Bond — Interest Rate Hedged ETF
May 31, 2016
Principal | Value | |||||||
| CORPORATE BONDS — 93.9% | ||||||||
| Basic Materials — 4.7% | ||||||||
| Chemicals — 2.5% | ||||||||
Hexion, Inc. | $ | 129,000 | $ | 110,295 | ||||
Huntsman International LLC | 106,000 | 108,385 | ||||||
|
| |||||||
| 218,680 | ||||||||
|
| |||||||
| Mining — 2.2% | ||||||||
Alcoa, Inc. | 93,000 | 90,181 | ||||||
Freeport-McMoRan, Inc. | 115,000 | 105,441 | ||||||
|
| |||||||
| 195,622 | ||||||||
|
| |||||||
| Communications — 22.8% | ||||||||
| Advertising — 0.6% | ||||||||
Lamar Media Corp. | 50,000 | 52,500 | ||||||
|
| |||||||
| Internet — 1.0% | ||||||||
Netflix, Inc. | 80,000 | 84,200 | ||||||
|
| |||||||
| Media — 10.6% | ||||||||
Cablevision Systems Corp. | 133,000 | 141,978 | ||||||
CCO Holdings LLC / CCO Holdings Capital Corp. | 80,000 | 81,400 | ||||||
5.75%, 2/15/26, 144A | 40,000 | 41,100 | ||||||
Clear Channel Worldwide Holdings, Inc. | 60,000 | 58,800 | ||||||
CSC Holdings LLC | 111,000 | 114,385 | ||||||
DISH DBS Corp. | 155,000 | 141,438 | ||||||
iHeartCommunications, Inc. | 97,000 | 76,509 | ||||||
Nexstar Broadcasting, Inc. | 164,000 | 172,200 | ||||||
Nielsen Finance LLC / Nielsen Finance Co., 144A | 21,000 | 21,551 | ||||||
Sirius XM Radio, Inc. | 35,000 | 36,750 | ||||||
5.375%, 7/15/26, 144A | 30,000 | 29,925 | ||||||
Univision Communications, Inc., 144A | 28,000 | 29,295 | ||||||
|
| |||||||
| 945,331 | ||||||||
|
| |||||||
| Telecommunications — 10.6% | ||||||||
Avaya, Inc., 144A | 222,000 | 162,060 | ||||||
CenturyLink, Inc. | 65,000 | 63,619 | ||||||
CommScope Technologies Finance LLC, 144A | 26,000 | 26,585 | ||||||
Frontier Communications Corp. | 23,000 | 20,642 | ||||||
11.00%, 9/15/25, 144A | 60,000 | 61,275 | ||||||
Principal | Value | |||||||
| Telecommunications (Continued) | ||||||||
Level 3 Communications, Inc. | $ | 151,000 | $ | 154,775 | ||||
Sprint Communications, Inc. | 231,000 | 198,780 | ||||||
T-Mobile USA, Inc. | 244,000 | 257,420 | ||||||
|
| |||||||
| 945,156 | ||||||||
|
| |||||||
| Consumer, Cyclical — 14.5% | ||||||||
| Airlines — 1.1% | ||||||||
American Airlines Group, Inc., 144A | 95,000 | 96,128 | ||||||
|
| |||||||
| Auto Manufacturers — 2.6% | ||||||||
General Motors Co. | 133,000 | 141,526 | ||||||
General Motors Financial Co., Inc. | 88,000 | 87,746 | ||||||
|
| |||||||
| 229,272 | ||||||||
|
| |||||||
| Auto Parts & Equipment — 1.7% | ||||||||
ZF North America Capital, Inc., 144A | 150,000 | 150,563 | ||||||
|
| |||||||
| Distribution/Wholesale — 0.3% | ||||||||
HD Supply, Inc. | 28,000 | 29,610 | ||||||
|
| |||||||
| Entertainment — 2.1% | ||||||||
GLP Capital LP / GLP Financing II, Inc. | 90,000 | 94,612 | ||||||
Regal Entertainment Group | 88,000 | 91,080 | ||||||
|
| |||||||
| 185,692 | ||||||||
|
| |||||||
| Lodging — 2.8% | ||||||||
Hilton Worldwide Finance LLC / Hilton Worldwide Finance Corp. | 151,000 | 156,520 | ||||||
Wynn Las Vegas LLC / Wynn Las Vegas Capital Corp., 144A | 99,000 | 95,906 | ||||||
|
| |||||||
| 252,426 | ||||||||
|
| |||||||
| Retail — 3.9% | ||||||||
1011778 BC ULC / New Red Finance, Inc., 144A | 21,000 | 21,814 | ||||||
Dollar Tree, Inc., 144A | 98,000 | 104,002 | ||||||
L Brands, Inc. | 111,000 | 118,770 | ||||||
Rite Aid Corp., 144A | 99,000 | 105,064 | ||||||
|
| |||||||
| 349,650 | ||||||||
|
| |||||||
| Consumer, Non-cyclical — 14.9% | ||||||||
| Commercial Services — 2.3% | ||||||||
ADT Corp. | 41,000 | 37,823 | ||||||
| See Notes to Financial Statements. | 27 |
DBX ETF Trust
Schedule of investments
Deutsche X-trackers High Yield Corporate Bond—Interest Rate Hedged ETF (Continued)
May 31, 2016
Principal | Value | |||||||
| Commercial Services (Continued) | ||||||||
Hertz Corp. | $ | 55,000 | $ | 55,845 | ||||
RR Donnelley & Sons Co. | 45,000 | 40,275 | ||||||
United Rentals North America, Inc. | 71,000 | 69,935 | ||||||
|
| |||||||
| 203,878 | ||||||||
|
| |||||||
| Cosmetics/Personal Care — 0.2% | ||||||||
Edgewell Personal Care Co. | 18,000 | 18,803 | ||||||
|
| |||||||
| Food — 2.0% | ||||||||
Post Holdings, Inc. | 83,000 | 87,980 | ||||||
Smithfield Foods, Inc. | 80,000 | 85,280 | ||||||
|
| |||||||
| 173,260 | ||||||||
|
| |||||||
| Healthcare-Products — 1.3% | ||||||||
Hologic, Inc., 144A | 20,000 | 21,000 | ||||||
Mallinckrodt International Finance SA / Mallinckrodt CB LLC, 144A | 105,000 | 95,288 | ||||||
|
| |||||||
| 116,288 | ||||||||
|
| |||||||
| Healthcare-Services — 6.2% | ||||||||
CHS/Community Health Systems, Inc. | 87,000 | 75,202 | ||||||
DaVita HealthCare Partners, Inc. | 40,000 | 39,750 | ||||||
Fresenius Medical Care US Finance II, Inc., 144A | 155,000 | 171,275 | ||||||
HCA, Inc. | 133,000 | 151,121 | ||||||
Tenet Healthcare Corp. | 80,000 | 80,900 | ||||||
6.75%, 6/15/23 | 35,000 | 33,031 | ||||||
|
| |||||||
| 551,279 | ||||||||
|
| |||||||
| Pharmaceuticals — 2.9% | ||||||||
Endo Finance LLC, 144A | 83,000 | 74,907 | ||||||
Valeant Pharmaceuticals International, 144A 6.375%, 10/15/20 | 204,000 | 182,580 | ||||||
|
| |||||||
| 257,487 | ||||||||
|
| |||||||
| Energy — 11.9% | ||||||||
| Energy-Alternate Sources — 0.4% | ||||||||
TerraForm Power Operating LLC, 144A | 44,000 | 39,160 | ||||||
|
| |||||||
| Oil & Gas — 8.6% | ||||||||
Antero Resources Corp. | 102,000 | 99,960 | ||||||
California Resources Corp. | 26,000 | 14,170 | ||||||
8.00%, 12/15/22, 144A | 68,000 | 49,725 | ||||||
Principal | Value | |||||||
| Oil & Gas (Continued) | ||||||||
Cenovus Energy, Inc. | $ | 65,000 | $ | 66,554 | ||||
Chesapeake Energy Corp., 144A | 67,000 | 54,019 | ||||||
Concho Resources, Inc. | 106,000 | 106,530 | ||||||
Denbury Resources, Inc. | 93,000 | 66,495 | ||||||
EP Energy LLC / Everest Acquisition Finance, Inc. | 88,000 | 56,980 | ||||||
Marathon Oil Corp. | 30,000 | 31,026 | ||||||
Range Resources Corp. | 89,000 | 83,215 | ||||||
Whiting Petroleum Corp. | 91,000 | 77,577 | ||||||
WPX Energy, Inc. | 55,000 | 54,038 | ||||||
|
| |||||||
| 760,289 | ||||||||
|
| |||||||
| Pipelines — 2.9% | ||||||||
Energy Transfer Equity LP | 21,000 | 19,582 | ||||||
Sabine Pass Liquefaction LLC | 100,000 | 101,000 | ||||||
5.625%, 3/01/25 | 26,000 | 26,098 | ||||||
Targa Resources Partners LP / Targa Resources Partners Finance Corp. | 45,000 | 44,100 | ||||||
Williams Cos., Inc. | 80,000 | 70,200 | ||||||
|
| |||||||
| 260,980 | ||||||||
|
| |||||||
| Financial — 9.1% | ||||||||
| Banks — 2.7% | ||||||||
CIT Group, Inc. | 40,000 | 40,288 | ||||||
5.00%, 8/15/22 | 39,000 | 40,024 | ||||||
Royal Bank of Scotland Group PLC | 155,000 | 165,054 | ||||||
|
| |||||||
| 245,366 | ||||||||
|
| |||||||
| Diversified Financial Services — 3.3% | ||||||||
Ally Financial, Inc. | 85,000 | 85,000 | ||||||
4.125%, 2/13/22 | 40,000 | 39,950 | ||||||
International Lease Finance Corp. | 45,000 | 48,712 | ||||||
4.625%, 4/15/21 | 35,000 | 36,225 | ||||||
Navient Corp. | 94,000 | 80,840 | ||||||
|
| |||||||
| 290,727 | ||||||||
|
| |||||||
| Real Estate — 0.4% | ||||||||
Howard Hughes Corp., 144A |
| 40,000 |
|
| 40,800 |
| ||
|
| |||||||
| See Notes to Financial Statements. | 28 |
DBX ETF Trust
Schedule of investments
Deutsche X-trackers High Yield Corporate Bond — Interest Rate Hedged ETF (Continued)
May 31, 2016
Principal | Value | |||||||
| Real Estate Investment Trusts — 2.7% | ||||||||
DuPont Fabros Technology LP | $ | 60,000 | $ | 63,300 | ||||
Equinix, Inc. | 82,000 | 84,768 | ||||||
Iron Mountain, Inc. | 88,000 | 88,440 | ||||||
|
| |||||||
| 236,508 | ||||||||
|
| |||||||
| Industrial — 7.6% | ||||||||
| Aerospace/Defense — 0.2% | ||||||||
TransDigm, Inc. | 20,000 | 20,450 | ||||||
|
| |||||||
| Building Materials — 0.7% | ||||||||
Masco Corp. | 40,000 | 46,100 | ||||||
Standard Industries Inc/NJ, 144A | 18,000 | 18,495 | ||||||
|
| |||||||
| 64,595 | ||||||||
|
| |||||||
| Engineering & Construction — 1.4% | ||||||||
AECOM | 119,000 | 123,463 | ||||||
|
| |||||||
| Environmental Control — 0.5% | ||||||||
Covanta Holding Corp. | 40,000 | 40,000 | ||||||
|
| |||||||
| Machinery-Diversified — 0.6% | ||||||||
CNH Industrial Capital LLC | 55,000 | 55,275 | ||||||
|
| |||||||
| Miscellaneous Manufacturing — 1.0% | ||||||||
Gates Global LLC / Gates Global Co., 144A | 105,000 | 92,636 | ||||||
|
| |||||||
| Packaging & Containers — 2.5% | ||||||||
Berry Plastics Corp. | 62,000 | 61,690 | ||||||
Crown Americas LLC / Crown Americas Capital Corp. IV | 18,000 | 18,292 | ||||||
Reynolds Group Issuer, Inc. / Reynolds Group Issuer LLC | 133,000 | 137,489 | ||||||
|
| |||||||
| 217,471 | ||||||||
|
| |||||||
Principal | Value | |||||||
| Transportation — 0.7% | ||||||||
XPO Logistics, Inc., 144A | $ | 60,000 | $ | 57,900 | ||||
|
| |||||||
| Technology — 5.0% | ||||||||
| Computers — 1.0% | ||||||||
NCR Corp. | 84,000 | 85,746 | ||||||
|
| |||||||
| Semiconductors — 0.5% | ||||||||
Micron Technology, Inc. | 55,000 | 46,337 | ||||||
|
| |||||||
| Software — 3.5% | ||||||||
BMC Software Finance, Inc., 144A | 110,000 | 81,675 | ||||||
First Data Corp., 144A | 82,000 | 86,438 | ||||||
Open Text Corp., 144A | 142,000 | 143,775 | ||||||
|
| |||||||
| 311,888 | ||||||||
|
| |||||||
| Utilities — 3.4% | ||||||||
| Electric — 3.4% | ||||||||
AES Corp. | 119,000 | 136,255 | ||||||
Calpine Corp. | 60,000 | 58,275 | ||||||
FirstEnergy Corp. | 102,000 | 105,487 | ||||||
|
| |||||||
| 300,017 | ||||||||
|
| |||||||
TOTAL CORPORATE BONDS | 8,345,433 | |||||||
|
| |||||||
Number | ||||||||
| SECURITIES LENDING COLLATERAL — 6.1% | ||||||||
Daily Assets Fund “Capital Shares”, 0.48% (b)(c) | 544,146 | 544,146 | ||||||
|
| |||||||
TOTAL INVESTMENTS — 100.0% | $ | 8,889,579 | ||||||
Other assets and liabilities, net — 0.0% | 1,073 | |||||||
|
| |||||||
NET ASSETS — 100.0% | $ | 8,890,652 | ||||||
|
| |||||||
| † | The cost for federal income tax purposes was $9,363,961. At May 31, 2016, net unrealized depreciation for all securities based on tax cost was $474,382. This consisted of aggregate gross unrealized appreciation for all securities in which there was an excess of value over tax cost of $96,881 and aggregate gross unrealized depreciation for all securities in which there was an excess of tax cost over value of $571,263. |
| (a) | All or a portion of these securities were on loan. In addition, “Other Assets and Liabilities, Net” may include pending sales that are also on loan. The value of securities loaned at May 31, 2016 amounted to $529,049, which is 6.0% of net assets. |
| (b) | Affiliated fund managed by Deutsche Investment Management Americas Inc. The rate shown is the annualized seven-day yield at period end. |
| (c) | Represents collateral held in connection with securities lending. Income earned by the Fund is net of borrower rebates. |
| 144A: | Security exempt from registration under Rule 144A of the Securities Act of 1933. These securities may be resold in transactions exempt from registration, normally to qualified institutional buyers. |
| See Notes to Financial Statements. | 29 |
DBX ETF Trust
Schedule of investments
Deutsche X-trackers High Yield Corporate Bond — Interest Rate Hedged ETF (Continued)
May 31, 2016
At May 31, 2016, open futures contracts sold were as follows:
Contract Description | Number of Contracts | Contract Value | Expiration Date | Unrealized Appreciation (Depreciation) | ||||||||||||
2-Year U.S. Treasury Note | 5 | $ | 1,089,531 | 9/30/2016 | $ | (989 | ) | |||||||||
5-Year U.S. Treasury Note | 35 | 4,204,101 | 9/30/2016 | (9,569 | ) | |||||||||||
10-Year Ultra U.S. Treasury Note | 1 | 141,016 | 9/21/2016 | (484 | ) | |||||||||||
10-Year U.S. Treasury Note | 20 | 2,593,750 | 9/21/2016 | (8,438 | ) | |||||||||||
|
|
|
| |||||||||||||
| $ | 8,028,398 | $ | (19,480 | ) | ||||||||||||
|
|
|
| |||||||||||||
For information on the Fund’s policy and additional disclosures regarding open future contracts, please refer to the Derivatives section of Note 2 in the accompanying Notes to Financial Statements.
Fair Value Measurements
Various inputs are used in determining the value of the Fund’s investments. These inputs are summarized in three broad levels. Level 1 includes quoted prices in active markets for identical securities. Level 2 includes other significant observable inputs (including quoted prices for similar securities, interest rates, prepayment speeds and credit risk). Level 3 includes significant unobservable inputs (including the Fund’s own assumptions in determining the fair value of investments). The level assigned to the securities valuations may not be an indication of the risk or liquidity associated with investing in those securities.
The following is a summary of the inputs used as of May 31, 2016 in valuing the Fund’s investments. For information on Fund’s policy regarding the valuation of investments, please refer to the Security Valuation section of Note 2 in the accompanying Notes to Financial Statements.
Assets | Level 1 | Level 2 | Level 3 | Total | ||||||||||||
Corporate Bonds (d) | $ | — | $ | 8,345,433 | $ | — | $ | 8,345,433 | ||||||||
Short-Term Investments | 544,146 | — | — | 544,146 | ||||||||||||
|
|
|
|
|
|
|
| |||||||||
Total | $ | 544,146 | $ | 8,345,433 | $ | — | $ | 8,889,579 | ||||||||
|
|
|
|
|
|
|
| |||||||||
Liabilities | Level 1 | Level 2 | Level 3 | Total | ||||||||||||
Derivatives (e) | ||||||||||||||||
Futures Contracts | $ | (19,480 | ) | $ | — | $ | — | $ | (19,480 | ) | ||||||
|
|
|
|
|
|
|
| |||||||||
Total | $ | (19,480 | ) | $ | — | $ | — | $ | (19,480 | ) | ||||||
|
|
|
|
|
|
|
| |||||||||
| (d) | See Schedule of investments for additional detailed categorizations. |
| (e) | Derivatives include unrealized appreciation (depreciation) on open futures contracts. |
There have been no transfers between fair value measurement levels during the period ended May 31, 2016
| See Notes to Financial Statements. | 30 |
DBX ETF Trust
Schedule of investments
Deutsche X-trackers Investment Grade Bond — Interest Rate Hedged ETF
May 31, 2016
Principal | Value | |||||||
| CORPORATE BONDS — 95.9% | ||||||||
| Basic Materials — 2.6% | ||||||||
| Chemicals — 0.9% | ||||||||
CF Industries, Inc. | $ | 45,000 | $ | 44,341 | ||||
|
| |||||||
| Mining — 1.7% | ||||||||
BHP Billiton Finance USA Ltd. | 25,000 | 26,615 | ||||||
Rio Tinto Finance USA PLC | 50,000 | 51,086 | ||||||
|
| |||||||
| 77,701 | ||||||||
|
| |||||||
| Communications — 13.7% | ||||||||
| Internet — 2.5% | ||||||||
Amazon.com, Inc. | 45,000 | 51,078 | ||||||
eBay, Inc. | 65,000 | 65,448 | ||||||
|
| |||||||
| 116,526 | ||||||||
|
| |||||||
| Media — 3.9% | ||||||||
Comcast Corp. | 95,000 | 101,161 | ||||||
Time Warner Cable, Inc. | 45,000 | 45,541 | ||||||
Walt Disney Co., MTN | 40,000 | 40,810 | ||||||
|
| |||||||
| 187,512 | ||||||||
|
| |||||||
| Telecommunications — 7.3% | ||||||||
AT&T, Inc. | 18,000 | 18,073 | ||||||
3.40%, 5/15/25 | 18,000 | 18,064 | ||||||
4.80%, 6/15/44 | 45,000 | 45,086 | ||||||
Cisco Systems, Inc. | 40,000 | 50,991 | ||||||
Motorola Solutions, Inc. | ||||||||
3.75%, 5/15/22 | 40,000 | 39,326 | ||||||
Verizon Communications, Inc. | 40,000 | 43,937 | ||||||
4.40%, 11/01/34 | 75,000 | 76,302 | ||||||
Vodafone Group PLC | 55,000 | 54,502 | ||||||
|
| |||||||
| 346,281 | ||||||||
|
| |||||||
| Consumer, Cyclical — 6.0% | ||||||||
| Auto Manufacturers — 1.6% | ||||||||
Ford Motor Co. | 50,000 | 51,308 | ||||||
Toyota Motor Credit Corp., MTN | 25,000 | 25,412 | ||||||
|
| |||||||
| 76,720 | ||||||||
|
| |||||||
| Retail — 4.4% | ||||||||
CVS Health Corp. | 45,000 | 48,490 | ||||||
Target Corp. | 75,000 | 77,716 | ||||||
Principal | Value | |||||||
| Retail (Continued) | ||||||||
Wal-Mart Stores, Inc. | $ | 59,000 | $ | 80,979 | ||||
|
| |||||||
| 207,185 | ||||||||
|
| |||||||
| Consumer, Non-cyclical — 18.7% | ||||||||
| Agriculture — 1.5% | ||||||||
Altria Group, Inc. | 65,000 | 71,342 | ||||||
|
| |||||||
| Beverages — 2.8% | ||||||||
Anheuser-Busch InBev Finance, Inc. | 40,000 | 40,737 | ||||||
3.65%, 2/01/26 | 27,000 | 28,112 | ||||||
4.625%, 2/01/44 | 40,000 | 43,890 | ||||||
PepsiCo, Inc. | 10,000 | 10,166 | ||||||
4.45%, 4/14/46 | 10,000 | 11,030 | ||||||
|
| |||||||
| 133,935 | ||||||||
|
| |||||||
| Biotechnology — 1.5% | ||||||||
Amgen, Inc. | 40,000 | 45,456 | ||||||
Gilead Sciences, Inc. | 25,000 | 26,819 | ||||||
|
| |||||||
| 72,275 | ||||||||
|
| |||||||
| Food — 1.0% | ||||||||
Kraft Heinz Foods Co. | 35,000 | 44,961 | ||||||
|
| |||||||
| Healthcare-Products — 1.6% | ||||||||
Medtronic, Inc. | 50,000 | 53,676 | ||||||
Zimmer Biomet Holdings, Inc. | 20,000 | 20,120 | ||||||
|
| |||||||
| 73,796 | ||||||||
|
| |||||||
| Healthcare-Services — 3.3% | ||||||||
Anthem, Inc. | 90,000 | 90,747 | ||||||
Laboratory Corp. of America Holdings | 65,000 | 66,536 | ||||||
|
| |||||||
| 157,283 | ||||||||
|
| |||||||
| Pharmaceuticals — 7.0% | ||||||||
AbbVie, Inc. | 75,000 | 76,787 | ||||||
Express Scripts Holding Co. | 50,000 | 50,438 | ||||||
GlaxoSmithKline Capital PLC | 40,000 | 41,494 | ||||||
GlaxoSmithKline Capital, Inc. | 60,000 | 61,797 | ||||||
Johnson & Johnson | 45,000 | 63,547 | ||||||
Pfizer, Inc. | 40,000 | 40,735 | ||||||
|
| |||||||
| 334,798 | ||||||||
|
| |||||||
| See Notes to Financial Statements. | 31 |
DBX ETF Trust
Schedule of investments
Deutsche X-trackers Investment Grade Bond — Interest Rate Hedged ETF (Continued)
May 31, 2016
Principal | Value | |||||||
| Energy — 10.3% | ||||||||
| Oil & Gas — 6.1% | ||||||||
Apache Corp. | $ | 40,000 | $ | 40,037 | ||||
BP Capital Markets PLC | 40,000 | 42,087 | ||||||
Phillips 66 | 60,000 | 64,357 | ||||||
Shell International Finance BV | 65,000 | 68,004 | ||||||
Total Capital International SA | 70,000 | 74,561 | ||||||
|
| |||||||
| 289,046 | ||||||||
|
| |||||||
| Oil & Gas Services — 1.1% | ||||||||
Schlumberger Investment SA | 50,000 | 52,742 | ||||||
|
| |||||||
| Pipelines — 3.1% | ||||||||
Enbridge, Inc. | 55,000 | 53,940 | ||||||
Enterprise Products Operating LLC | 45,000 | 45,926 | ||||||
Williams Partners LP / ACMP Finance Corp. | 55,000 | 49,822 | ||||||
|
| |||||||
| 149,688 | ||||||||
|
| |||||||
| Financial — 31.0% | ||||||||
| Banks — 25.1% | ||||||||
Bank of America Corp., MTN | 140,000 | 142,739 | ||||||
Bank of New York Mellon Corp., MTN | 72,000 | 73,365 | ||||||
Bank of Nova Scotia | 25,000 | 25,777 | ||||||
BNP Paribas SA, MTN | 40,000 | 41,545 | ||||||
Capital One Financial Corp. | 36,000 | 35,730 | ||||||
Citigroup, Inc. | 40,000 | 40,285 | ||||||
5.30%, 5/06/44 | 40,000 | 42,139 | ||||||
Cooperatieve Rabobank UA | 70,000 | 77,204 | ||||||
Goldman Sachs Group, Inc. | 50,000 | 50,663 | ||||||
5.95%, 1/15/27 | 35,000 | 39,983 | ||||||
MTN, 4.80%, 7/08/44 | 40,000 | 42,886 | ||||||
HSBC Holdings PLC | 75,000 | 82,419 | ||||||
4.00%, 3/30/22 | 40,000 | 42,093 | ||||||
JPMorgan Chase & Co. | 45,000 | 45,211 | ||||||
3.125%, 1/23/25 | 37,000 | 37,359 | ||||||
5.60%, 7/15/41 | 45,000 | 55,999 | ||||||
Morgan Stanley | 45,000 | 46,523 | ||||||
GMTN, 4.35%, 9/08/26 | 40,000 | 41,345 | ||||||
4.30%, 1/27/45 | 40,000 | 40,886 | ||||||
Principal | Value | |||||||
| Banks (Continued) | ||||||||
PNC Funding Corp. | $ | 30,000 | $ | 31,725 | ||||
Royal Bank of Canada, MTN | 22,000 | 22,365 | ||||||
US Bancorp, MTN | 12,000 | 13,202 | ||||||
Wells Fargo & Co. MTN, | 40,000 | 40,360 | ||||||
4.125%, 8/15/23 | 40,000 | 42,612 | ||||||
5.606%, 1/15/44 | 35,000 | 41,189 | ||||||
|
| |||||||
| 1,195,604 | ||||||||
|
| |||||||
| Diversified Financial Services — 1.5% | ||||||||
Synchrony Financial | 40,000 | 41,441 | ||||||
Visa, Inc. | 30,000 | 31,126 | ||||||
|
| |||||||
| 72,567 | ||||||||
|
| |||||||
| Insurance — 2.2% | ||||||||
American International Group, Inc. | 50,000 | 47,849 | ||||||
Berkshire Hathaway, Inc. | 55,000 | 56,235 | ||||||
|
| |||||||
| 104,084 | ||||||||
|
| |||||||
| Real Estate Investment Trusts — 2.2% | ||||||||
American Tower Corp. | 40,000 | 44,268 | ||||||
HCP, Inc. | 55,000 | 60,757 | ||||||
|
| |||||||
| 105,025 | ||||||||
|
| |||||||
| Industrial — 5.4% | ||||||||
| Aerospace/Defense — 1.4% | ||||||||
United Technologies Corp. | 65,000 | 68,236 | ||||||
|
| |||||||
| Machinery-Construction & Mining — 0.4% | ||||||||
Caterpillar, Inc. | 20,000 | 19,363 | ||||||
|
| |||||||
| Miscellaneous Manufacturing — 2.7% | ||||||||
General Electric Co. | 40,000 | 41,287 | ||||||
MTN, 5.875%, 1/14/38 | 65,000 | 85,450 | ||||||
|
| |||||||
| 126,737 | ||||||||
|
| |||||||
| Transportation — 0.9% | ||||||||
United Parcel Service, Inc. | 40,000 | 42,604 | ||||||
|
| |||||||
| Technology — 7.0% | ||||||||
| Computers — 2.7% | ||||||||
Apple, Inc. | 17,000 | 17,324 | ||||||
3.20%, 5/13/25 | 17,000 | 17,715 | ||||||
4.375%, 5/13/45 | 18,000 | 19,111 | ||||||
| See Notes to Financial Statements. | 32 |
DBX ETF Trust
Schedule of investments
Deutsche X-trackers Investment Grade Bond—Interest Rate Hedged ETF (Continued)
May 31, 2016
Principal | Value | |||||||
| Transportation (Continued) | ||||||||
HP, Inc. | $ | 70,000 | $ | 73,435 | ||||
|
| |||||||
| 127,585 | ||||||||
|
| |||||||
| Semiconductors — 0.9% | ||||||||
Intel Corp. | 40,000 | 43,772 | ||||||
|
| |||||||
| Software — 3.4% | ||||||||
Microsoft Corp. | 85,000 | 85,851 | ||||||
Oracle Corp. | 73,000 | 78,047 | ||||||
|
| |||||||
| 163,898 | ||||||||
|
| |||||||
| Utilities — 1.2% | ||||||||
| Electric — 1.2% | ||||||||
Pacific Gas & Electric Co. | 45,000 | 59,172 | ||||||
|
| |||||||
TOTAL CORPORATE BONDS | 4,564,779 | |||||||
|
| |||||||
Number | Value | |||||||
| SECURITIES LENDING COLLATERAL — 1.7% | ||||||||
Daily Assets Fund “Capital Shares”, | 82,800 | $ | 82,800 | |||||
|
| |||||||
TOTAL INVESTMENTS — 97.6% (Cost $4,632,113)† | $ | 4,647,579 | ||||||
Other assets and liabilities, net — 2.4% | 109,979 | |||||||
|
| |||||||
NET ASSETS — 100.0% | $ | 4,757,558 | ||||||
|
| |||||||
| † | The cost for federal income tax purposes was $4,651,890. At May 31, 2016, net unrealized depreciation for all securities based on tax cost was $4,311. This consisted of aggregate gross unrealized appreciation for all securities in which there was an excess of value over tax cost of $52,607 and aggregate gross unrealized depreciation for all securities in which there was an excess of tax cost over value of $56,918. |
| (a) | All or a portion of these securities were on loan. In addition, “Other Assets and Liabilities, Net” may include pending sales that are also on loan. The value of securities loaned at May 31, 2016 amounted to $79,730, which is 1.7% of net assets. |
| (b) | Affiliated fund managed by Deutsche Investment Management Americas Inc. The rate shown is the annualized seven-day yield at period end. |
| (c) | Represents collateral held in connection with securities lending. Income earned by the Fund is net of borrower rebates. |
| GMTN: | Global Medium Term Note |
| MTN: | Medium Term Note |
At May 31, 2016, open futures contracts sold were as follows:
Contract Description | Number of Contracts | Contract Value | Expiration Date | Unrealized Appreciation (Depreciation) | ||||||||||||
5-Year U.S. Treasury Note | 10 | $ | 1,201,172 | 9/30/2016 | $ | (2,734 | ) | |||||||||
10-Year Ultra Long U.S. Treasury Note | 4 | 564,062 | 9/21/2016 | (1,938 | ) | |||||||||||
10-Year U.S. Treasury Note | 8 | 1,037,500 | 9/21/2016 | (3,375 | ) | |||||||||||
Ultra Long U.S. Treasury Bond | 3 | 525,375 | 9/21/2016 | (3,820 | ) | |||||||||||
U.S. Treasury Long Bond | 6 | 979,875 | 9/21/2016 | (7,687 | ) | |||||||||||
|
|
|
| |||||||||||||
| $ | 4,307,984 | $ | (19,554 | ) | ||||||||||||
|
|
|
| |||||||||||||
For information on the Fund’s policy and additional disclosures regarding open futures contracts please refer to the Derivatives section of Note 2 in the accompanying Notes to Financial Statements.
Fair Value Measurements
Various inputs are used in determining the value of the Fund’s investments. These inputs are summarized in three broad levels. Level 1 includes quoted prices in active markets for identical securities. Level 2 includes other significant observable inputs (including quoted prices for similar securities, interest rates, prepayment speeds and credit risk). Level 3 includes significant unobservable inputs (including the Fund’s own assumptions in determining the fair value of investments). The level assigned to the securities valuations may not be an indication of the risk or liquidity associated with investing in those securities.
| See Notes to Financial Statements. | 33 |
DBX ETF Trust
Schedule of investments
Deutsche X-trackers Investment Grade Bond — Interest Rate Hedged ETF (Continued)
May 31, 2016
The following is a summary of the inputs used as of May 31, 2016 in valuing the Fund’s investments. For information on Fund’s policy regarding the valuation of investments, please refer to the Security Valuation section of Note 2 in the accompanying Notes to Financial Statements.
Assets | Level 1 | Level 2 | Level 3 | Total | ||||||||||||
Corporate Bonds (d) | $ | — | $ | 4,564,779 | $ | — | $ | 4,564,779 | ||||||||
Short-Term Investments | 82,800 | — | — | 82,800 | ||||||||||||
|
|
|
|
|
|
|
| |||||||||
Total | $ | 82,800 | $ | 4,564,779 | $ | — | $ | 4,647,579 | ||||||||
|
|
|
|
|
|
|
| |||||||||
Liabilities | Level 1 | Level 2 | Level 3 | Total | ||||||||||||
Derivatives (e) | ||||||||||||||||
Futures Contracts | $ | (19,554 | ) | $ | — | $ | — | $ | (19,554 | ) | ||||||
|
|
|
|
|
|
|
| |||||||||
Total | $ | (19,554 | ) | $ | — | $ | — | $ | (19,554 | ) | ||||||
|
|
|
|
|
|
|
| |||||||||
| (d) | See Schedule of investments for additional detailed categorizations. |
| (e) | Derivatives include unrealized appreciation (depreciation) on open futures contracts. |
There have been no transfers between fair value measurement levels during the period ended May 31, 2016.
| See Notes to Financial Statements. | 34 |
DBX ETF Trust
Schedule of investments
Deutsche X-trackers Municipal Infrastructure Revenue Bond ETF
May 31, 2016
Principal | Value | |||||||
| MUNICIPAL BONDS — 96.6% | ||||||||
| Arizona — 0.3% | ||||||||
Arizona Department of Transportation State Highway Fund, Fuel Sales Tax Revenue, Sub-Series A, | $ | 100,000 | $ | 120,696 | ||||
|
| |||||||
| California — 9.0% | ||||||||
Bay Area Toll Authority, | 1,100,000 | 1,294,656 | ||||||
City of San Francisco Public Utilities Commission, Water Revenue, | 100,000 | 118,564 | ||||||
M-S-R Energy Authority, Natural Gas Revenue, | ||||||||
Series B, 6.125%, 11/01/29 | 100,000 | 131,315 | ||||||
Series A, 6.50%, 11/01/39 | 500,000 | 721,010 | ||||||
San Diego County Regional Airport Authority, Private Airport & Marina Revenue, Series B, AMT, | 600,000 | 677,682 | ||||||
Southern California Public Power Authority, Natural Gas Revenue, Project No. 1, Series A, | 300,000 | 372,579 | ||||||
|
| |||||||
| 3,315,806 | ||||||||
|
| |||||||
| Colorado — 0.5% | ||||||||
City & County of Denver Airport System, Private Airport & Marina Revenue, Series B, | 100,000 | 118,650 | ||||||
Regional Transportation District, Sales Tax Revenue, Fastracks Project, Series A, | 50,000 | 60,832 | ||||||
|
| |||||||
| 179,482 | ||||||||
|
| |||||||
| Florida — 8.6% | ||||||||
Central Florida Expressway Authority | 200,000 | 235,394 | ||||||
County of Miami-Dade Aviation, Private Airport & Marina Revenue, Series A, AMT, | 50,000 | 58,013 | ||||||
5.00%, 10/01/36 | 700,000 | 805,308 | ||||||
County of Miami-Dade FL Transit System, Sales Tax Revenue, | 1,200,000 | 1,398,972 | ||||||
County of Miami-Dade Transit System, Sales Tax Revenue, | 50,000 | 58,427 | ||||||
County of Miami-Dade Water & Sewer System, Water Revenue, INS: AGM, | 500,000 | 570,770 | ||||||
|
| |||||||
| 3,126,884 | ||||||||
|
| |||||||
| Georgia — 4.9% | ||||||||
City of Atlanta GA Water & Wastewater Revenue | 1,100,000 | 1,307,911 | ||||||
Principal | Value | |||||||
| Georgia (Continued) | ||||||||
County of DeKalb Water & Sewerage, Water Revenue, Series A, | $ | 110,000 | $ | 129,581 | ||||
Metropolitan Atlanta Rapid Transit Authority, Sales Tax Revenue, 3rd Series, | 300,000 | 334,359 | ||||||
|
| |||||||
| 1,771,851 | ||||||||
|
| |||||||
| Indiana — 6.1% | ||||||||
Indiana Finance Authority, Sewer Revenue, Series A, | 700,000 | 810,705 | ||||||
Indiana Municipal Power Agency | 1,200,000 | 1,427,016 | ||||||
|
| |||||||
| 2,237,721 | ||||||||
|
| |||||||
| Louisiana — 3.7% | ||||||||
New Orleans Aviation Board, Series A, 5.00%, 1/01/45 | 1,200,000 | 1,363,860 | ||||||
|
| |||||||
| Massachusetts — 10.7% | ||||||||
Commonwealth of Massachusetts Transportation Fund Revenue, Series A | 1,100,000 | 1,309,693 | ||||||
Massachusetts Bay Transportation Authority, Sales Tax Revenue, Series A, | 750,000 | 957,142 | ||||||
Massachusetts School Building Authority, Sales Tax Revenue, Series A, | 750,000 | 913,147 | ||||||
Series A, 5.00%, 8/15/26 | 200,000 | 243,132 | ||||||
Series B, 5.00%, 8/15/28 | 400,000 | 484,736 | ||||||
|
| |||||||
| 3,907,850 | ||||||||
|
| |||||||
| New Jersey — 5.8% | ||||||||
New Jersey State Turnpike Authority, Highway Tolls Revenue, Series A | 700,000 | 810,586 | ||||||
New Jersey State Turnpike Authority, Highway Tolls Revenue, Series E | 1,125,000 | 1,313,584 | ||||||
|
| |||||||
| 2,124,170 | ||||||||
|
| |||||||
| New York — 20.5% | ||||||||
Hudson Yards Infrastructure Corp., Miscellaneous Tax Revenue, | ||||||||
Series A, 5.25%, 2/15/47 | 200,000 | 228,854 | ||||||
Series A, 5.75%, 2/15/47 | 55,000 | 64,704 | ||||||
Long Island Power Authority, | 700,000 | 816,081 | ||||||
Metropolitan Transportation Authority, New York Transit Revenue, Series A, | 100,000 | 118,108 | ||||||
5.00%, 11/15/45 | 1,300,000 | 1,533,038 | ||||||
New York City Transitional Finance Authority, Future Tax Secured Revenue, Series F-1, | 350,000 | 412,374 | ||||||
| See Notes to Financial Statements. | 35 |
DBX ETF Trust
Schedule of investments
Deutsche X-trackers Municipal Infrastructure Revenue Bond ETF (Continued)
May 31, 2016
Principal | Value | |||||||
| New York (Continued) | ||||||||
New York City Water & Sewer System, Water Revenue, | ||||||||
Series GG, 5.00%, 6/15/43 | $ | 100,000 | $ | 115,786 | ||||
Series FF, 5.00%, 6/15/45 | 300,000 | 349,098 | ||||||
Series BB, 5.00%, 6/15/47 | 450,000 | 527,841 | ||||||
New York Liberty Development Corp., Class 1, | 530,000 | 623,784 | ||||||
New York State Thruway Authority, | 1,000,000 | 1,211,800 | ||||||
Triborough Bridge & Tunnel Authority, New York Highway Tolls Revenue, Series B | 200,000 | 245,228 | ||||||
Utility Debt Securitization Authority, New York Restructuring, Series TE, | 1,100,000 | 1,319,637 | ||||||
|
| |||||||
| 7,566,333 | ||||||||
|
| |||||||
| Pennsylvania — 1.7% | ||||||||
Pennsylvania Turnpike Commission, Highway Tolls Revenue, Series C, | 520,000 | 606,861 | ||||||
|
| |||||||
| South Carolina — 3.1% | ||||||||
South Carolina State Public Service Authority, Series E, | 1,000,000 | 1,142,810 | ||||||
|
| |||||||
| Texas — 15.5% | ||||||||
Central Texas Regional Mobility Authority, Series A | 1,000,000 | 1,158,830 | ||||||
City of Houston TX Combined Utility System Revenue, Series B | 1,000,000 | 1,229,790 | ||||||
Principal | Value | |||||||
| Texas (Continued) | ||||||||
Dallas Area Rapid Transit, Series A | $ | 1,100,000 | $ | 1,318,911 | ||||
Dallas/Fort Worth International Airport, Private Airport & Marina Revenue, Series E, AMT, 5.00%, 11/01/35 | 200,000 | 225,990 | ||||||
Series H, AMT, 5.00%, 11/01/37 | 300,000 | 339,228 | ||||||
Series C, 5.00%, 11/01/45 | 350,000 | 397,099 | ||||||
Texas Transportation Commission, Highway Tolls Revenue, Series A, | 900,000 | 1,034,136 | ||||||
|
| |||||||
| 5,703,984 | ||||||||
|
| |||||||
| Virginia — 1.6% | ||||||||
Virginia Small Business Financing Authority, Highway Tolls Revenue, Elizabeth River Crossings, AMT, 6.00%, 1/01/37 | 500,000 | 595,070 | ||||||
|
| |||||||
| Washington — 4.6% | ||||||||
Central Puget Sound Regional Transit Authority, Series S1 | 1,000,000 | 1,201,150 | ||||||
Port of Seattle, Private Airport & Marina Revenue, Series A, | 400,000 | 471,572 | ||||||
|
| |||||||
| 1,672,722 | ||||||||
|
| |||||||
TOTAL MUNICIPAL BONDS | 35,436,100 | |||||||
|
| |||||||
TOTAL INVESTMENTS — 96.6% (Cost $33,453,688)† | $ | 35,436,100 | ||||||
Other assets and liabilities, net — 3.4% | 1,238,063 | |||||||
|
| |||||||
NET ASSETS — 100.0% | $ | 36,674,163 | ||||||
|
| |||||||
| † | The cost for federal income tax purposes was $33,453,688. At May 31, 2016, net unrealized appreciation for all securities based on tax cost was $1,982,412. This consisted of aggregate gross unrealized appreciation for all securities in which there was an excess of value over tax cost of $1,992,976 and aggregate gross unrealized depreciation for all securities in which there was an excess of tax cost over value of $10,564. |
| AGM: | Assured Guaranty Municipal Corp |
| AMT: | Alternative Minimum Tax |
| INS: | Insured |
Fair Value Measurements
Various inputs are used in determining the value of the Fund’s investments. These inputs are summarized in three broad levels. Level 1 includes quoted prices in active markets for identical securities. Level 2 includes other significant observable inputs (including quoted prices for similar securities, interest rates, prepayment speeds and credit risk). Level 3 includes significant unobservable inputs (including the Fund’s own assumptions in determining the fair value of investments). The level assigned to the securities valuations may not be an indication of the risk or liquidity associated with investing in those securities.
| See Notes to Financial Statements. | 36 |
DBX ETF Trust
Schedule of investments
Deutsche X-trackers Municipal Infrastructure Revenue Bond ETF (Continued)
May 31, 2016
The following is a summary of the inputs used as of May 31, 2016 in valuing the Fund’s investments. For information on Fund’s policy regarding the valuation of investments, please refer to the Security Valuation section of Note 2 in the accompanying Notes to Financial Statements.
Assets | Level 1 | Level 2 | Level 3 | Total | ||||||||||||
Municipal Bonds (a) | $ | — | $ | 35,436,100 | $ | — | $ | 35,436,100 | ||||||||
|
|
|
|
|
|
|
| |||||||||
Total | $ | — | $ | 35,436,100 | $ | — | $ | 35,436,100 | ||||||||
|
|
|
|
|
|
|
| |||||||||
| (a) | See Schedule of investments for additional detailed categorizations. |
There have been no transfers between fair value measurement levels during the year ended May 31, 2016.
| See Notes to Financial Statements. | 37 |
DBX ETF Trust
Schedule of investments
Deutsche X-trackers MSCI All World ex US High Dividend Yield Hedged Equity ETF
May 31, 2016
Number | Value | |||||||
| COMMON STOCKS — 99.2% | ||||||||
| Australia — 5.2% | ||||||||
Amcor Ltd. | 1,287 | $ | 15,143 | |||||
ASX Ltd. | 230 | 7,399 | ||||||
Aurizon Holdings Ltd. | 2,478 | 8,077 | ||||||
Bendigo and Adelaide Bank Ltd. | 507 | 3,752 | ||||||
Crown Resorts Ltd. | 434 | 3,777 | ||||||
Flight Centre Travel Group Ltd. | 68 | 1,554 | ||||||
Harvey Norman Holdings Ltd. | 611 | 2,014 | ||||||
Insurance Australia Group Ltd. | 2,706 | 11,500 | ||||||
LendLease Group (a) | 596 | 5,785 | ||||||
Platinum Asset Management Ltd. | 308 | 1,465 | ||||||
Sonic Healthcare Ltd. | 467 | 7,223 | ||||||
Suncorp Group Ltd. | 1,485 | 13,931 | ||||||
Tatts Group Ltd. | 1,694 | 4,824 | ||||||
Telstra Corp. Ltd. | 4,849 | 19,591 | ||||||
Wesfarmers Ltd. | 1,239 | 36,384 | ||||||
Woodside Petroleum Ltd. | 804 | 15,922 | ||||||
Woolworths Ltd. | 1,395 | 22,302 | ||||||
|
| |||||||
| 180,643 | ||||||||
|
| |||||||
| Brazil — 1.4% | ||||||||
Ambev SA | 5,357 | 28,330 | ||||||
BB Seguridade Participacoes SA | 777 | 5,861 | ||||||
BM&FBovespa SA | 1,866 | 8,221 | ||||||
CCR SA | 1,043 | 4,401 | ||||||
CETIP SA — Mercados Organizados | 117 | 1,376 | ||||||
Tractebel Energia SA | 73 | 717 | ||||||
Transmissora Alianca de Energia Eletrica SA | 28 | 146 | ||||||
|
| |||||||
| 49,052 | ||||||||
|
| |||||||
| Canada — 10.5% | ||||||||
Bank of Montreal | 698 | 43,806 | ||||||
Bank of Nova Scotia | 1,303 | 63,732 | ||||||
BCE, Inc. | 149 | 6,868 | ||||||
Canadian Imperial Bank of Commerce | 387 | 30,028 | ||||||
CI Financial Corp. | 338 | 7,397 | ||||||
Great-West Lifeco, Inc. | 298 | 8,031 | ||||||
IGM Financial, Inc. | 89 | 2,606 | ||||||
Peyto Exploration & Development Corp. | 169 | 4,431 | ||||||
Potash Corp. of Saskatchewan, Inc. | 894 | 14,589 | ||||||
Power Corp. of Canada | 398 | 8,978 | ||||||
Power Financial Corp. | 298 | 7,213 | ||||||
Rogers Communications, Inc., Class B | 383 | 14,603 | ||||||
Royal Bank of Canada | 1,592 | 95,701 | ||||||
Shaw Communications, Inc., Class B | 500 | 9,563 | ||||||
TELUS Corp. | 283 | 8,971 | ||||||
TransCanada Corp. | 814 | 33,731 | ||||||
|
| |||||||
| 360,248 | ||||||||
|
| |||||||
| Chile — 0.3% | ||||||||
Banco de Chile | 41,227 | 4,150 | ||||||
Banco Santander Chile | 119,338 | 5,365 | ||||||
|
| |||||||
| 9,515 | ||||||||
|
| |||||||
Number | Value | |||||||
| China — 5.9% | ||||||||
Agricultural Bank of China Ltd., Class H | 26,223 | $ | 9,584 | |||||
Anhui Conch Cement Co. Ltd., Class H | 1,566 | 3,789 | ||||||
Bank of China Ltd., Class H | 84,786 | 34,478 | ||||||
China Construction Bank Corp., Class H | 88,364 | 56,971 | ||||||
China Petroleum & Chemical Corp., Class H | 29,751 | 20,291 | ||||||
CNOOC Ltd. | 21,194 | 25,310 | ||||||
Country Garden Holdings Co. Ltd. (b) | 5,562 | 2,226 | ||||||
Industrial & Commercial Bank of China Ltd., Class H | 78,540 | 41,641 | ||||||
Jiangsu Expressway Co. Ltd., Class H | 1,352 | 1,851 | ||||||
Sinopec Engineering Group Co. Ltd., Class H | 1,581 | 1,388 | ||||||
Zhejiang Expressway Co. Ltd., Class H | 1,855 | 1,738 | ||||||
Zijin Mining Group Co. Ltd., Class H | 7,593 | 2,189 | ||||||
|
| |||||||
| 201,456 | ||||||||
|
| |||||||
| Czech Republic — 0.2% | ||||||||
Komercni Banka AS | 139 | 5,466 | ||||||
|
| |||||||
| Denmark — 0.1% | ||||||||
Tryg A/S | 130 | 2,563 | ||||||
|
| |||||||
| Finland — 1.8% | ||||||||
Elisa OYJ | 154 | 5,867 | ||||||
Fortum OYJ (b) | 448 | 6,719 | ||||||
Metso OYJ | 122 | 2,865 | ||||||
Nokian Renkaat OYJ (b) | 137 | 4,837 | ||||||
Orion OYJ, Class B | 103 | 3,696 | ||||||
Sampo OYJ, Class A | 457 | 20,375 | ||||||
Stora Enso OYJ, Class R | 595 | 5,101 | ||||||
UPM-Kymmene OYJ | 582 | 11,196 | ||||||
|
| |||||||
| 60,656 | ||||||||
|
| |||||||
| France — 8.9% | ||||||||
AXA SA | 2,111 | 53,036 | ||||||
Bouygues SA | 231 | 7,505 | ||||||
CNP Assurances | 147 | 2,494 | ||||||
Edenred | 223 | 4,131 | ||||||
Eutelsat Communications SA | 181 | 3,609 | ||||||
Rexel SA | 340 | 5,200 | ||||||
Sanofi | 1,287 | 105,522 | ||||||
SCOR SE | 162 | 5,417 | ||||||
Total SA | 2,457 | 119,397 | ||||||
|
| |||||||
| 306,311 | ||||||||
|
| |||||||
| Germany — 8.6% | ||||||||
Allianz SE | 511 | 83,408 | ||||||
Axel Springer SE | 56 | 3,185 | ||||||
BASF SE | 1,024 | 79,105 | ||||||
Daimler AG | 1,080 | 73,770 | ||||||
Muenchener Rueckversicherungs-Gesellschaft AG | 184 | 34,568 | ||||||
ProSiebenSat.1 Media SE*(c) | 265 | 13,323 | �� | |||||
TUI AG | 571 | 8,741 | ||||||
|
| |||||||
| 296,100 | ||||||||
|
| |||||||
| See Notes to Financial Statements. | 38 |
DBX ETF Trust
Schedule of investments
Deutsche X-trackers MSCI All World ex US High Dividend Yield Hedged Equity ETF (Continued)
May 31, 2016
Number | Value | |||||||
| Hong Kong — 2.9% | ||||||||
BOC Hong Kong (Holdings) Ltd. | 4,009 | $ | 12,330 | |||||
China Everbright Ltd. | 907 | 1,742 | ||||||
China Power International Development Ltd. | 4,623 | 1,951 | ||||||
China Resources Power Holdings Co. Ltd. | 2,488 | 3,906 | ||||||
CLP Holdings Ltd. | 1,665 | 15,706 | ||||||
Hang Lung Properties Ltd. | 2,666 | 5,091 | ||||||
Hang Seng Bank Ltd. | 806 | 14,303 | ||||||
HKT Trust and HKT Ltd. (a) | 2,497 | 3,618 | ||||||
New World Development Co. Ltd. | 6,896 | 6,514 | ||||||
NWS Holdings Ltd. | 1,770 | 2,793 | ||||||
PCCW Ltd. | 3,958 | 2,582 | ||||||
Power Assets Holdings Ltd. | 1,456 | 14,118 | ||||||
Shimao Property Holdings Ltd. | 971 | 1,230 | ||||||
Sino Land Co. Ltd. | 3,369 | 5,159 | ||||||
Swire Pacific Ltd., Class A | 575 | 6,201 | ||||||
Yue Yuen Industrial (Holdings) Ltd. | 788 | 2,971 | ||||||
|
| |||||||
| 100,215 | ||||||||
|
| |||||||
| Indonesia — 0.1% | ||||||||
PT Adaro Energy Tbk | 17,555 | 913 | ||||||
PT Indocement Tunggal Prakarsa Tbk | 1,642 | 2,001 | ||||||
PT United Tractors Tbk | 1,652 | 1,717 | ||||||
|
| |||||||
| 4,631 | ||||||||
|
| |||||||
| Ireland — 0.2% | ||||||||
James Hardie Industries PLC CDI | 509 | 7,755 | ||||||
|
| |||||||
| Italy — 0.8% | ||||||||
Snam SpA | 2,576 | 14,747 | ||||||
Terna Rete Elettrica Nazionale SpA | 1,511 | 8,379 | ||||||
UnipolSai SpA | 1,499 | 2,997 | ||||||
|
| |||||||
| 26,123 | ||||||||
|
| |||||||
| Japan — 1.1% | ||||||||
Canon, Inc. | 1,200 | 34,807 | ||||||
Sony Financial Holdings, Inc. | 300 | 3,671 | ||||||
|
| |||||||
| 38,478 | ||||||||
|
| |||||||
| Luxembourg — 0.2% | ||||||||
SES SA FDR | 359 | 8,041 | ||||||
|
| |||||||
| Macau — 0.3% | ||||||||
Sands China Ltd. | 2,762 | 10,592 | ||||||
|
| |||||||
| Malaysia — 0.7% | ||||||||
Alliance Financial Group Bhd | 1,400 | 1,373 | ||||||
AMMB Holdings Bhd | 2,300 | 2,401 | ||||||
Astro Malaysia Holdings Bhd | 2,500 | 1,671 | ||||||
British American Tobacco Malaysia Bhd | 200 | 2,425 | ||||||
DiGi.Com Bhd | 4,500 | 4,883 | ||||||
Malayan Banking Bhd | 3,900 | 7,707 | ||||||
Maxis Bhd | 2,600 | 3,463 | ||||||
|
| |||||||
| 23,923 | ||||||||
|
| |||||||
| Mexico — 0.2% | ||||||||
Kimberly-Clark de Mexico SAB de CV, Class A | 2,777 | 6,596 | ||||||
|
| |||||||
Number | Value | |||||||
| Netherlands — 0.4% | ||||||||
Aegon NV (b) | 2,092 | $ | 10,754 | |||||
Koninklijke Boskalis Westminster NV | 107 | 3,875 | ||||||
|
| |||||||
| 14,629 | ||||||||
|
| |||||||
| New Zealand — 0.3% | ||||||||
Contact Energy Ltd. | 596 | 2,174 | ||||||
Fletcher Building Ltd. | 639 | 3,869 | ||||||
Spark New Zealand Ltd. | 1,708 | 4,276 | ||||||
|
| |||||||
| 10,319 | ||||||||
|
| |||||||
| Norway — 1.2% | ||||||||
Gjensidige Forsikring ASA | 264 | 4,554 | ||||||
Orkla ASA | 948 | 8,578 | ||||||
Statoil ASA | 1,292 | 20,603 | ||||||
Yara International ASA (b) | 205 | 7,393 | ||||||
|
| |||||||
| 41,128 | ||||||||
|
| |||||||
| Poland — 0.5% | ||||||||
Bank Pekao SA | 152 | 5,749 | ||||||
Bank Zachodni WBK SA | 147 | 9,617 | ||||||
Powszechny Zaklad Ubezpieczen SA | 345 | 2,731 | ||||||
|
| |||||||
| 18,097 | ||||||||
|
| |||||||
| Portugal — 0.3% | ||||||||
EDP — Energias de Portugal SA | 2,728 | 9,091 | ||||||
|
| |||||||
| Qatar — 0.1% | ||||||||
Barwa Real Estate Co. | 117 | 974 | ||||||
Masraf Al Rayan QSC | 304 | 2,743 | ||||||
Qatar Islamic Bank SAQ | 37 | 940 | ||||||
|
| |||||||
| 4,657 | ||||||||
|
| |||||||
| Russia — 1.7% | ||||||||
Gazprom PAO, ADR | 3,376 | 14,760 | ||||||
Lukoil PJSC, ADR | 448 | 17,136 | ||||||
MegaFon PJSC, GDR | 807 | 9,038 | ||||||
PhosAgro OAO, GDR | 700 | 10,500 | ||||||
Severstal PAO, GDR | 800 | 8,360 | ||||||
|
| |||||||
| 59,794 | ||||||||
|
| |||||||
| Singapore — 2.3% | ||||||||
Oversea-Chinese Banking Corp. Ltd. | 3,300 | 20,657 | ||||||
Singapore Exchange Ltd. | 900 | 5,065 | ||||||
Singapore Press Holdings Ltd. | 1,500 | 4,205 | ||||||
Singapore Technologies Engineering Ltd. | 1,700 | 3,987 | ||||||
Singapore Telecommunications Ltd. | 8,800 | 24,730 | ||||||
StarHub Ltd. | 400 | 1,025 | ||||||
United Overseas Bank Ltd. | 1,400 | 18,523 | ||||||
|
| |||||||
| 78,192 | ||||||||
|
| |||||||
| South Africa — 2.6% | ||||||||
Barclays Africa Group Ltd. | 495 | 4,597 | ||||||
Coronation Fund Managers Ltd. | 162 | 700 | ||||||
FirstRand Ltd. | 3,877 | 10,484 | ||||||
Foschini Group Ltd. (b) | 237 | 2,111 | ||||||
Imperial Holdings Ltd. | 174 | 1,550 | ||||||
Investec Ltd. | 208 | 1,404 | ||||||
Investec PLC | 667 | 4,529 | ||||||
| See Notes to Financial Statements. | 39 |
DBX ETF Trust
Schedule of investments
Deutsche X-trackers MSCI All World ex US High Dividend Yield Hedged Equity ETF (Continued)
May 31, 2016
Number | Value | |||||||
| South Africa (Continued) | ||||||||
Liberty Holdings Ltd. | 106 | $ | 803 | |||||
MMI Holdings Ltd. | 969 | 1,387 | ||||||
MTN Group Ltd. | 1,848 | 14,404 | ||||||
Nedbank Group Ltd. | 244 | 2,748 | ||||||
RMB Holdings Ltd. | 777 | 2,614 | ||||||
Sasol Ltd. | 706 | 21,428 | ||||||
Standard Bank Group Ltd. | 1,471 | 11,607 | ||||||
Truworths International Ltd. | 506 | 3,027 | ||||||
Vodacom Group Ltd. (b) | 464 | 4,854 | ||||||
|
| |||||||
| 88,247 | ||||||||
|
| |||||||
| South Korea — 0.1% | ||||||||
SK Telecom Co. Ltd. | 26 | 4,843 | ||||||
|
| |||||||
| Spain — 1.1% | ||||||||
Enagas SA | 245 | 7,344 | ||||||
Endesa SA | 363 | 7,464 | ||||||
Gas Natural SDG SA | 405 | 8,016 | ||||||
Mapfre SA | 1,291 | 3,272 | ||||||
Red Electrica Corp. SA | 118 | 10,509 | ||||||
|
| |||||||
| 36,605 | ||||||||
|
| |||||||
| Sweden — 2.4% | ||||||||
Hennes & Mauritz AB, Class B | 1,053 | 32,317 | ||||||
Industrivarden AB, Class C | 192 | 3,246 | ||||||
Skanska AB, Class B | 401 | 8,807 | ||||||
Telefonaktiebolaget LM Ericsson, Class B | 3,238 | 24,960 | ||||||
Telia Co. AB | 2,986 | 13,993 | ||||||
|
| |||||||
| 83,323 | ||||||||
|
| |||||||
| Switzerland — 2.6% | ||||||||
Swiss Prime Site AG | 80 | 6,857 | ||||||
Swiss Re AG | 349 | 31,354 | ||||||
Swisscom AG | 29 | 13,818 | ||||||
Zurich Insurance Group AG | 162 | 39,196 | ||||||
|
| |||||||
| 91,225 | ||||||||
|
| |||||||
| Taiwan — 5.2% | ||||||||
Advanced Semiconductor Engineering, Inc. | 7,091 | 8,023 | ||||||
Asia Cement Corp. | 3,914 | 2,982 | ||||||
Asustek Computer, Inc. | 784 | 6,731 | ||||||
Cathay Financial Holding Co. Ltd. | 8,580 | 9,919 | ||||||
Cheng Shin Rubber Industry Co. Ltd. | 2,208 | 4,536 | ||||||
Chicony Electronics Co. Ltd. | 588 | 1,417 | ||||||
Chunghwa Telecom Co. Ltd. | 4,311 | 14,541 | ||||||
CTBC Financial Holding Co. Ltd. | 16,326 | 8,560 | ||||||
Delta Electronics, Inc. | 2,160 | 9,935 | ||||||
Far EasTone Telecommunications Co. Ltd. | 1,917 | 4,414 | ||||||
First Financial Holding Co. Ltd. | 9,265 | 4,688 | ||||||
Fubon Financial Holding Co. Ltd. | 6,895 | 8,140 | ||||||
Hon Hai Precision Industry Co. Ltd. | 15,446 | 37,937 | ||||||
Inventec Corp. | 2,692 | 1,791 | ||||||
MediaTek, Inc. | 1,681 | 11,340 | ||||||
Merida Industry Co. Ltd. | 289 | 1,219 | ||||||
Nanya Technology Corp. | 900 | 1,096 | ||||||
Novatek Microelectronics Corp. | 683 | 2,272 | ||||||
Phison Electronics Corp. | 174 | 1,430 | ||||||
Number | Value | |||||||
| Taiwan (Continued) | ||||||||
Quanta Computer, Inc. | 3,082 | $ | 5,481 | |||||
Realtek Semiconductor Corp. | 500 | 1,355 | ||||||
Ruentex Development Co. Ltd. | 681 | 788 | ||||||
Ruentex Industries Ltd. | 721 | 1,060 | ||||||
Siliconware Precision Industries Co. Ltd. | 2,426 | 3,943 | ||||||
Simplo Technology Co. Ltd. | 318 | 1,068 | ||||||
Synnex Technology International Corp. | 1,598 | 1,588 | ||||||
Taiwan Cement Corp. | 4,712 | 4,342 | ||||||
Taiwan Fertilizer Co. Ltd. | 1,438 | 1,894 | ||||||
Taiwan Mobile Co. Ltd. | 1,967 | 6,725 | ||||||
Teco Electric & Machinery Co. Ltd. | 2,580 | 2,069 | ||||||
Transcend Information, Inc. | 237 | 677 | ||||||
Vanguard International Semiconductor Corp. | 992 | 1,627 | ||||||
WPG Holdings Ltd. | 1,590 | 1,748 | ||||||
Yuanta Financial Holding Co. Ltd. | 4,795 | 1,617 | ||||||
Zhen Ding Technology Holding Ltd. | 519 | 977 | ||||||
|
| |||||||
| 177,930 | ||||||||
|
| |||||||
| Thailand — 0.5% | ||||||||
Krung Thai Bank PCL, NVDR | 15,900 | 7,611 | ||||||
Siam Commercial Bank PCL, NVDR | 2,600 | 9,752 | ||||||
|
| |||||||
| 17,363 | ||||||||
|
| |||||||
| Turkey — 0.3% | ||||||||
Eregli Demir ve Celik Fabrikalari TAS | 1,243 | 1,735 | ||||||
TAV Havalimanlari Holding AS | 87 | 446 | ||||||
Tupras Turkiye Petrol Rafinerileri AS | 366 | 8,257 | ||||||
|
| |||||||
| 10,438 | ||||||||
|
| |||||||
| United Arab Emirates — 0.5% | ||||||||
Abu Dhabi Commercial Bank PJSC | 2,304 | 3,739 | ||||||
Dubai Islamic Bank PJSC | 1,168 | 1,622 | ||||||
Emirates Telecommunications Group Co. PJSC | 1,539 | 7,416 | ||||||
First Gulf Bank PJSC | 1,278 | 4,123 | ||||||
|
| |||||||
| 16,900 | ||||||||
|
| |||||||
| United Kingdom — 27.7% | ||||||||
Aberdeen Asset Management PLC (b) | 1,021 | 4,127 | ||||||
Admiral Group PLC | 229 | 6,527 | ||||||
AstraZeneca PLC | 1,385 | 80,800 | ||||||
BAE Systems PLC | 3,532 | 24,739 | ||||||
Berkeley Group Holdings PLC | 146 | 6,925 | ||||||
British American Tobacco PLC | 2,036 | 123,793 | ||||||
Centrica PLC | 6,040 | 17,829 | ||||||
Direct Line Insurance Group PLC | 1,518 | 8,251 | ||||||
G4S PLC | 1,661 | 4,496 | ||||||
GlaxoSmithKline PLC | 5,342 | 111,801 | ||||||
HSBC Holdings PLC | 21,691 | 139,818 | ||||||
ICAP PLC | 624 | 3,904 | ||||||
IMI PLC | 302 | 4,396 | ||||||
Imperial Brands PLC | 1,048 | 57,087 | ||||||
Inmarsat PLC | 523 | 5,450 | ||||||
ITV PLC | 4,026 | 12,525 | ||||||
Legal & General Group PLC | 6,421 | 22,264 | ||||||
Marks & Spencer Group PLC | 1,759 | 9,673 | ||||||
| See Notes to Financial Statements. | 40 |
DBX ETF Trust
Schedule of investments
Deutsche X-trackers MSCI All World ex US High Dividend Yield Hedged Equity ETF (Continued)
May 31, 2016
Number | Value | |||||||
| United Kingdom (Continued) | ||||||||
National Grid PLC | 4,166 | $ | 60,761 | |||||
Old Mutual PLC | 5,366 | 13,842 | ||||||
Pearson PLC | 929 | 11,282 | ||||||
Persimmon PLC | 331 | 10,077 | ||||||
Provident Financial PLC | 166 | 7,001 | ||||||
Rio Tinto Ltd. | 472 | 15,246 | ||||||
Rio Tinto PLC | 1,374 | 38,657 | ||||||
Rolls-Royce Holdings PLC — Entitlement* | 133,409 | 193 | ||||||
Severn Trent PLC | 256 | 8,498 | ||||||
Smiths Group PLC | 444 | 7,215 | ||||||
SSE PLC | 1,115 | 24,741 | ||||||
Standard Life PLC | 2,135 | 10,486 | ||||||
Tate & Lyle PLC | 501 | 4,561 | ||||||
Vodafone Group PLC | 29,393 | 98,276 | ||||||
|
| |||||||
| 955,241 | ||||||||
|
| |||||||
TOTAL COMMON STOCKS | 3,416,386 | |||||||
|
| |||||||
Number | Value | |||||||
| PREFERRED STOCKS — 0.2% | ||||||||
| South Korea — 0.2% | ||||||||
Hyundai Motor Co. | 34 | $ | 2,827 | |||||
Hyundai Motor Co. — 2nd Preferred | 50 | 4,405 | ||||||
|
| |||||||
| 7,232 | ||||||||
|
| |||||||
TOTAL PREFERRED STOCKS | 7,232 | |||||||
|
| |||||||
| RIGHTS — 0.0% | ||||||||
| United Arab Emirates — 0.0% | ||||||||
Dubai Islamic Bank PJSC*, expires 7/31/16 | 311 | 158 | ||||||
|
| |||||||
| SECURITIES LENDING COLLATERAL — 1.4% | ||||||||
Daily Assets Fund “Capital Shares”, | 49,313 | 49,313 | ||||||
|
| |||||||
TOTAL INVESTMENTS — 100.8% (Cost $3,657,011)† | $ | 3,473,089 | ||||||
Other assets and liabilities, net — (0.8%) | (28,535 | ) | ||||||
|
| |||||||
NET ASSETS — 100.0% | $ | 3,444,554 | ||||||
|
| |||||||
| * | Non-income producing security. |
| † | The cost for federal income tax purposes was $3,665,230. At May 31, 2016, net unrealized depreciation for all securities based on tax cost was $192,141. This consisted of aggregate gross unrealized appreciation for all securities in which there was an excess of value over tax cost of $73,633 and aggregate gross unrealized depreciation for all securities in which there was an excess of tax cost over value of $265,774. |
| (a) | Stapled Security — A security contractually bound to one or more other securities to form a single saleable unit which cannot be sold separately. |
| (b) | All or a portion of these securities were on loan. In addition, “Other Assets and Liabilities, Net” may include pending sales that are also on loan. The value of securities loaned at May 31, 2016 amounted to $32,870, which is 1.0% of net assets. |
| (c) | Company declared its annual dividend during the 12-month period ended May 31, 2016, the scheduled payment date was subsequent to May 31, 2016. |
| (d) | Affiliated fund managed by Deutsche Investment Management Americas Inc. The rate shown is the annualized seven-day yield at period end. |
| (e) | Represents collateral held in connection with securities lending. Income earned by the Fund is net of borrower rebates. |
| ADR: | American Depositary Receipt |
| CDI: | Chess Depositary Interest |
| FDR: | Fiduciary Depositary Receipt |
| GDR: | Global Depositary Receipt |
| NVDR: | Non Voting Depositary Receipt |
| PJSC: | Private Joint Stock Company |
As of May 31, 2016, the Fund had the following forward foreign currency exchange contracts outstanding:
Counterparty | Settlement Date | Currency To Deliver | Currency To Receive | Unrealized Appreciation (Depreciation) | ||||||||||||||
RBC Capital Markets | 6/2/2016 | AED | 47,000 | USD | 12,794 | $ | (2 | ) | ||||||||||
The Bank of New York Mellon | 6/2/2016 | AED | 1,200 | USD | 327 | 0 | ||||||||||||
The Bank of New York Mellon | 6/2/2016 | AED | 16,900 | USD | 4,600 | (1 | ) | |||||||||||
Bank of Montreal | 6/2/2016 | AUD | 219,397 | USD | 167,220 | 8,650 | ||||||||||||
RBC Capital Markets | 6/2/2016 | AUD | 29,000 | USD | 22,104 | 1,144 | ||||||||||||
RBC Capital Markets | 6/2/2016 | AUD | 24,000 | USD | 18,293 | 947 | ||||||||||||
State Street Bank & Trust Co. | 6/2/2016 | AUD | 73,000 | USD | 55,640 | 2,879 | ||||||||||||
Bank of Montreal | 6/2/2016 | CHF | 68,500 | USD | 71,553 | 2,639 | ||||||||||||
| See Notes to Financial Statements. | 41 |
DBX ETF Trust
Schedule of investments
Deutsche X-trackers MSCI All World ex US High Dividend Yield Hedged Equity ETF (Continued)
May 31, 2016
Counterparty | Settlement Date | Currency To Deliver | Currency To Receive | Unrealized Appreciation (Depreciation) | ||||||||||||||
Bank of Montreal | 6/2/2016 | CHF | 300 | USD | 302 | $ | 0 | |||||||||||
RBC Capital Markets | 6/2/2016 | CHF | 8,000 | USD | 8,356 | 308 | ||||||||||||
State Street Bank & Trust Co. | 6/2/2016 | CHF | 21,500 | USD | 22,459 | 829 | ||||||||||||
The Bank of New York Mellon | 6/2/2016 | CHF | 600 | USD | 619 | 15 | ||||||||||||
The Bank of New York Mellon | 6/2/2016 | CZK | 429,600 | USD | 18,202 | 513 | ||||||||||||
Bank of Montreal | 6/2/2016 | DKK | 21,500 | USD | 3,311 | 95 | ||||||||||||
State Street Bank & Trust Co. | 6/2/2016 | DKK | 16,500 | USD | 2,541 | 73 | ||||||||||||
Bank of Montreal | 6/2/2016 | EUR | 10,300 | USD | 11,466 | 6 | ||||||||||||
Bank of Montreal | 6/2/2016 | EUR | 397,929 | USD | 456,151 | 13,397 | ||||||||||||
RBC Capital Markets | 6/2/2016 | EUR | 85,000 | USD | 97,436 | 2,862 | ||||||||||||
RBC Capital Markets | 6/2/2016 | EUR | 25,000 | USD | 28,657 | 841 | ||||||||||||
RBC Capital Markets | 6/2/2016 | EUR | 7,000 | USD | 8,013 | 224 | ||||||||||||
State Street Bank & Trust Co. | 6/2/2016 | EUR | 140,636 | USD | 161,214 | 4,736 | ||||||||||||
The Bank of New York Mellon | 6/2/2016 | EUR | 1,400 | USD | 1,587 | 29 | ||||||||||||
Bank of Montreal | 6/2/2016 | GBP | 507,061 | USD | �� | 742,832 | 8,429 | |||||||||||
Bank of Montreal | 6/2/2016 | GBP | 500 | USD | 728 | 4 | ||||||||||||
RBC Capital Markets | 6/2/2016 | GBP | 158,000 | USD | 231,467 | 2,627 | ||||||||||||
RBC Capital Markets | 6/2/2016 | GBP | 4,000 | USD | 5,849 | 56 | ||||||||||||
RBC Capital Markets | 6/2/2016 | GBP | 23,000 | USD | 33,696 | 383 | ||||||||||||
State Street Bank & Trust Co. | 6/2/2016 | GBP | 103,526 | USD | 151,664 | 1,722 | ||||||||||||
The Bank of New York Mellon | 6/2/2016 | GBP | 8,500 | USD | 12,365 | 54 | ||||||||||||
The Bank of New York Mellon | 6/2/2016 | GBP | 2,200 | USD | 3,168 | (19 | ) | |||||||||||
RBC Capital Markets | 6/2/2016 | HKD | 903,000 | USD | 116,439 | 234 | ||||||||||||
The Bank of New York Mellon | 6/2/2016 | HKD | 5,200 | USD | 670 | 1 | ||||||||||||
The Bank of New York Mellon | 6/2/2016 | HKD | 5,105,000 | USD | 658,270 | 1,319 | ||||||||||||
Bank of Montreal | 6/2/2016 | HUF | 1,801,000 | USD | 6,616 | 226 | ||||||||||||
RBC Capital Markets | 6/2/2016 | HUF | 62,400 | USD | 222 | 0 | ||||||||||||
RBC Capital Markets | 6/2/2016 | HUF | 1,316,000 | USD | 4,834 | 165 | ||||||||||||
State Street Bank & Trust Co. | 6/2/2016 | HUF | 468,000 | USD | 1,719 | 59 | ||||||||||||
Bank of Montreal | 6/2/2016 | NOK | 292,700 | USD | 36,344 | 1,355 | ||||||||||||
RBC Capital Markets | 6/2/2016 | NOK | 89,000 | USD | 11,051 | 412 | ||||||||||||
State Street Bank & Trust Co. | 6/2/2016 | NOK | 67,500 | USD | 8,381 | 313 | ||||||||||||
The Bank of New York Mellon | 6/2/2016 | NOK | 20,400 | USD | 2,533 | 94 | ||||||||||||
Bank of Montreal | 6/2/2016 | NZD | 7,500 | USD | 5,236 | 161 | ||||||||||||
State Street Bank & Trust Co. | 6/2/2016 | NZD | 2,500 | USD | 1,745 | 54 | ||||||||||||
The Bank of New York Mellon | 6/2/2016 | PLN | 103,700 | USD | 27,130 | 834 | ||||||||||||
The Bank of New York Mellon | 6/2/2016 | PLN | 4,300 | USD | 1,106 | 16 | ||||||||||||
The Bank of New York Mellon | 6/2/2016 | PLN | 5,400 | USD | 1,413 | 44 | ||||||||||||
RBC Capital Markets | 6/2/2016 | SEK | 178,000 | USD | 22,210 | 871 | ||||||||||||
The Bank of New York Mellon | 6/2/2016 | SEK | 973,900 | USD | 121,522 | 4,766 | ||||||||||||
The Bank of New York Mellon | 6/2/2016 | TRY | 48,800 | USD | 17,319 | 788 | ||||||||||||
The Bank of New York Mellon | 6/2/2016 | TRY | 1,000 | USD | 354 | 15 | ||||||||||||
Bank of Montreal | 6/2/2016 | USD | 139,020 | AUD | 191,897 | (326 | ) | |||||||||||
Bank of Montreal | 6/2/2016 | USD | 20,960 | AUD | 27,500 | (1,084 | ) | |||||||||||
Bank of Montreal | 6/2/2016 | USD | 10,655 | CHF | 10,200 | (393 | ) | |||||||||||
Bank of Montreal | 6/2/2016 | USD | 58,640 | CHF | 58,300 | 12 | ||||||||||||
Bank of Montreal | 6/2/2016 | USD | 2,649 | DKK | 17,700 | (1 | ) | |||||||||||
Bank of Montreal | 6/2/2016 | USD | 585 | DKK | 3,800 | (17 | ) | |||||||||||
Bank of Montreal | 6/2/2016 | USD | 89,527 | EUR | 78,100 | (2,629 | ) | |||||||||||
Bank of Montreal | 6/2/2016 | USD | 356,050 | EUR | 319,829 | (194 | ) | |||||||||||
Bank of Montreal | 6/2/2016 | USD | 738,027 | GBP | 507,061 | (3,625 | ) | |||||||||||
Bank of Montreal | 6/2/2016 | USD | 6,846 | HUF | 1,863,400 | (234 | ) | |||||||||||
Bank of Montreal | 6/2/2016 | USD | 34,999 | NOK | 292,700 | (10 | ) | |||||||||||
Bank of Montreal | 6/2/2016 | USD | 4,817 | NZD | 6,900 | (148 | ) | |||||||||||
Bank of Montreal | 6/2/2016 | USD | 406 | NZD | 600 | 0 | ||||||||||||
RBC Capital Markets | 6/2/2016 | USD | 12,796 | AED | 47,000 | (1 | ) | |||||||||||
| See Notes to Financial Statements. | 42 |
DBX ETF Trust
Schedule of investments
Deutsche X-trackers MSCI All World ex US High Dividend Yield Hedged Equity ETF (Continued)
May 31, 2016
Counterparty | Settlement Date | Currency To Deliver | Currency To Receive | Unrealized Appreciation (Depreciation) | ||||||||||||||
RBC Capital Markets | 6/2/2016 | USD | 38,396 | AUD | 53,000 | $ | (90 | ) | ||||||||||
RBC Capital Markets | 6/2/2016 | USD | 8,047 | CHF | 8,000 | 2 | ||||||||||||
RBC Capital Markets | 6/2/2016 | USD | 130,250 | EUR | 117,000 | (71 | ) | |||||||||||
RBC Capital Markets | 6/2/2016 | USD | 269,268 | GBP | 185,000 | (1,322 | ) | |||||||||||
RBC Capital Markets | 6/2/2016 | USD | 108,134 | HKD | 840,000 | (36 | ) | |||||||||||
RBC Capital Markets | 6/2/2016 | USD | 8,123 | HKD | 63,000 | (16 | ) | |||||||||||
RBC Capital Markets | 6/2/2016 | USD | 4,672 | HUF | 1,316,000 | (2 | ) | |||||||||||
RBC Capital Markets | 6/2/2016 | USD | 10,642 | NOK | 89,000 | (3 | ) | |||||||||||
RBC Capital Markets | 6/2/2016 | USD | 16,760 | SEK | 140,000 | 24 | ||||||||||||
RBC Capital Markets | 6/2/2016 | USD | 4,742 | SEK | 38,000 | (186 | ) | |||||||||||
State Street Bank & Trust Co. | 6/2/2016 | USD | 52,885 | AUD | 73,000 | (124 | ) | |||||||||||
State Street Bank & Trust Co. | 6/2/2016 | USD | 21,625 | CHF | 21,500 | 4 | ||||||||||||
State Street Bank & Trust Co. | 6/2/2016 | USD | 2,469 | DKK | 16,500 | (1 | ) | |||||||||||
State Street Bank & Trust Co. | 6/2/2016 | USD | 156,564 | EUR | 140,636 | (85 | ) | |||||||||||
State Street Bank & Trust Co. | 6/2/2016 | USD | 38,507 | GBP | 26,285 | (437 | ) | |||||||||||
State Street Bank & Trust Co. | 6/2/2016 | USD | 112,424 | GBP | 77,241 | (552 | ) | |||||||||||
State Street Bank & Trust Co. | 6/2/2016 | USD | 1,661 | HUF | 468,000 | (1 | ) | |||||||||||
State Street Bank & Trust Co. | 6/2/2016 | USD | 8,071 | NOK | 67,500 | (2 | ) | |||||||||||
State Street Bank & Trust Co. | 6/2/2016 | USD | 1,691 | NZD | 2,500 | 0 | ||||||||||||
The Bank of New York Mellon | 6/2/2016 | USD | 1,715 | AED | 6,300 | 0 | ||||||||||||
The Bank of New York Mellon | 6/2/2016 | USD | 3,213 | AED | 11,800 | 0 | ||||||||||||
The Bank of New York Mellon | 6/2/2016 | USD | 945 | CHF | 900 | (40 | ) | |||||||||||
The Bank of New York Mellon | 6/2/2016 | USD | 5,998 | CZK | 145,600 | (3 | ) | |||||||||||
The Bank of New York Mellon | 6/2/2016 | USD | 6,016 | CZK | 142,000 | (169 | ) | |||||||||||
The Bank of New York Mellon | 6/2/2016 | USD | 6,016 | CZK | 142,000 | (169 | ) | |||||||||||
The Bank of New York Mellon | 6/2/2016 | USD | 6,915 | EUR | 6,000 | (239 | ) | |||||||||||
The Bank of New York Mellon | 6/2/2016 | USD | 6,520 | EUR | 5,700 | (177 | ) | |||||||||||
The Bank of New York Mellon | 6/2/2016 | USD | 16,238 | GBP | 11,200 | (16 | ) | |||||||||||
The Bank of New York Mellon | 6/2/2016 | USD | 292,643 | HKD | 2,269,500 | (586 | ) | |||||||||||
The Bank of New York Mellon | 6/2/2016 | USD | 174,529 | HKD | 1,353,500 | (350 | ) | |||||||||||
The Bank of New York Mellon | 6/2/2016 | USD | 191,448 | HKD | 1,487,200 | (64 | ) | |||||||||||
The Bank of New York Mellon | 6/2/2016 | USD | 2,439 | NOK | 20,400 | (1 | ) | |||||||||||
The Bank of New York Mellon | 6/2/2016 | USD | 9,941 | PLN | 38,000 | (306 | ) | |||||||||||
The Bank of New York Mellon | 6/2/2016 | USD | 9,482 | PLN | 37,400 | 1 | ||||||||||||
The Bank of New York Mellon | 6/2/2016 | USD | 9,941 | PLN | 38,000 | (306 | ) | |||||||||||
The Bank of New York Mellon | 6/2/2016 | USD | 22,772 | SEK | 182,500 | (893 | ) | |||||||||||
The Bank of New York Mellon | 6/2/2016 | USD | 75,767 | SEK | 632,900 | 108 | ||||||||||||
The Bank of New York Mellon | 6/2/2016 | USD | 19,777 | SEK | 158,500 | (776 | ) | |||||||||||
The Bank of New York Mellon | 6/2/2016 | USD | 6,211 | TRY | 17,500 | (283 | ) | |||||||||||
The Bank of New York Mellon | 6/2/2016 | USD | 6,211 | TRY | 17,500 | (283 | ) | |||||||||||
The Bank of New York Mellon | 6/2/2016 | USD | 5,013 | TRY | 14,800 | 1 | ||||||||||||
RBC Capital Markets | 6/3/2016 | BRL | 19,000 | USD | 5,434 | 181 | ||||||||||||
The Bank of New York Mellon | 6/3/2016 | BRL | 146,548 | USD | 42,003 | 1,486 | ||||||||||||
The Bank of New York Mellon | 6/3/2016 | BRL | 2,034 | USD | 582 | 20 | ||||||||||||
Bank of Montreal | 6/3/2016 | CAD | 7,700 | USD | 5,886 | 14 | ||||||||||||
Bank of Montreal | 6/3/2016 | CAD | 237,729 | USD | 189,793 | 8,508 | ||||||||||||
RBC Capital Markets | 6/3/2016 | CAD | 9,000 | USD | 7,185 | 322 | ||||||||||||
RBC Capital Markets | 6/3/2016 | CAD | 120,000 | USD | 95,803 | 4,295 | ||||||||||||
State Street Bank & Trust Co. | 6/3/2016 | CAD | 95,160 | USD | 75,971 | 3,405 | ||||||||||||
Bank of Montreal | 6/3/2016 | CLP | 122,000 | USD | 185 | 9 | ||||||||||||
RBC Capital Markets | 6/3/2016 | CLP | 7,364,000 | USD | 11,137 | 512 | ||||||||||||
State Street Bank & Trust Co. | 6/3/2016 | CLP | 122,000 | USD | 184 | 8 | ||||||||||||
Bank of Montreal | 6/3/2016 | IDR | 7,257,500 | USD | 548 | 17 | ||||||||||||
RBC Capital Markets | 6/3/2016 | IDR | 57,515,000 | USD | 4,337 | 130 | ||||||||||||
State Street Bank & Trust Co. | 6/3/2016 | IDR | 7,257,500 | USD | 548 | 17 | ||||||||||||
Bank of Montreal | 6/3/2016 | JPY | 6,419,400 | USD | 60,032 | 2,054 | ||||||||||||
| See Notes to Financial Statements. | 43 |
DBX ETF Trust
Schedule of investments
Deutsche X-trackers MSCI All World ex US High Dividend Yield Hedged Equity ETF (Continued)
May 31, 2016
Counterparty | Settlement Date | Currency To Deliver | Currency To Receive | Unrealized Appreciation (Depreciation) | ||||||||||||||
RBC Capital Markets | 6/3/2016 | JPY | 1,631,000 | USD | 15,253 | $ | 522 | |||||||||||
Bank of Montreal | 6/3/2016 | KRW | 13,816,000 | USD | 11,605 | 13 | ||||||||||||
RBC Capital Markets | 6/3/2016 | KRW | 5,238,000 | USD | 4,584 | 189 | ||||||||||||
State Street Bank & Trust Co. | 6/3/2016 | KRW | 23,368,000 | USD | 20,450 | 844 | ||||||||||||
Bank of Montreal | 6/3/2016 | MXN | 82,000 | USD | 4,772 | 331 | ||||||||||||
State Street Bank & Trust Co. | 6/3/2016 | MXN | 16,000 | USD | 931 | 65 | ||||||||||||
Bank of Montreal | 6/3/2016 | MYR | 26,500 | USD | 6,776 | 359 | ||||||||||||
RBC Capital Markets | 6/3/2016 | MYR | 103,000 | USD | 26,349 | 1,410 | ||||||||||||
State Street Bank & Trust Co. | 6/3/2016 | MYR | 26,500 | USD | 6,777 | 361 | ||||||||||||
State Street Bank & Trust Co. | 6/3/2016 | RUB | 2,573,002 | USD | 39,512 | 959 | ||||||||||||
The Bank of New York Mellon | 6/3/2016 | RUB | 1,054,000 | USD | 16,126 | 334 | ||||||||||||
The Bank of New York Mellon | 6/3/2016 | RUB | 32,590 | USD | 492 | 4 | ||||||||||||
Bank of Montreal | 6/3/2016 | SGD | 44,400 | USD | 33,007 | 767 | ||||||||||||
RBC Capital Markets | 6/3/2016 | SGD | 38,000 | USD | 28,249 | 656 | ||||||||||||
State Street Bank & Trust Co. | 6/3/2016 | SGD | 1,500 | USD | 1,115 | 26 | ||||||||||||
The Bank of New York Mellon | 6/3/2016 | SGD | 3,600 | USD | 2,649 | 35 | ||||||||||||
The Bank of New York Mellon | 6/3/2016 | SGD | 4,650 | USD | 3,457 | 80 | ||||||||||||
Bank of Montreal | 6/3/2016 | THB | 59,000 | USD | 1,689 | 38 | ||||||||||||
State Street Bank & Trust Co. | 6/3/2016 | THB | 59,000 | USD | 1,690 | 38 | ||||||||||||
The Bank of New York Mellon | 6/3/2016 | THB | 735,000 | USD | 21,026 | 453 | ||||||||||||
Bank of Montreal | 6/3/2016 | TWD | 1,833,200 | USD | 56,545 | 330 | ||||||||||||
RBC Capital Markets | 6/3/2016 | TWD | 1,385,000 | USD | 42,944 | 473 | ||||||||||||
State Street Bank & Trust Co. | 6/3/2016 | TWD | 5,607,840 | USD | 173,967 | 2,002 | ||||||||||||
Bank of Montreal | 6/3/2016 | USD | 181,734 | CAD | 237,729 | (449 | ) | |||||||||||
Bank of Montreal | 6/3/2016 | USD | 177 | CLP | 122,000 | (1 | ) | |||||||||||
Bank of Montreal | 6/3/2016 | USD | 532 | IDR | 7,257,500 | (1 | ) | |||||||||||
Bank of Montreal | 6/3/2016 | USD | 20,523 | JPY | 2,276,000 | 33 | ||||||||||||
Bank of Montreal | 6/3/2016 | USD | 13,344 | JPY | 1,426,900 | (457 | ) | |||||||||||
Bank of Montreal | 6/3/2016 | USD | 25,404 | JPY | 2,716,500 | (869 | ) | |||||||||||
Bank of Montreal | 6/3/2016 | USD | 12,092 | KRW | 13,816,000 | (500 | ) | |||||||||||
Bank of Montreal | 6/3/2016 | USD | 3,687 | MXN | 67,900 | (9 | ) | |||||||||||
Bank of Montreal | 6/3/2016 | USD | 821 | MXN | 14,100 | (57 | ) | |||||||||||
Bank of Montreal | 6/3/2016 | USD | 6,446 | MYR | 26,500 | (30 | ) | |||||||||||
Bank of Montreal | 6/3/2016 | USD | 32,251 | SGD | 44,400 | (11 | ) | |||||||||||
Bank of Montreal | 6/3/2016 | USD | 1,652 | THB | 59,000 | 0 | ||||||||||||
Bank of Montreal | 6/3/2016 | USD | 56,842 | TWD | 1,833,200 | (627 | ) | |||||||||||
Bank of Montreal | 6/3/2016 | USD | 29,277 | ZAR | 460,550 | 8 | ||||||||||||
Bank of Montreal | 6/3/2016 | USD | 15,570 | ZAR | 222,150 | (1,444 | ) | |||||||||||
RBC Capital Markets | 6/3/2016 | USD | 5,273 | BRL | 19,000 | (19 | ) | |||||||||||
RBC Capital Markets | 6/3/2016 | USD | 98,615 | CAD | 129,000 | (243 | ) | |||||||||||
RBC Capital Markets | 6/3/2016 | USD | 10,678 | CLP | 7,364,000 | (53 | ) | |||||||||||
RBC Capital Markets | 6/3/2016 | USD | 4,223 | IDR | 57,515,000 | (16 | ) | |||||||||||
RBC Capital Markets | 6/3/2016 | USD | 10,351 | JPY | 1,148,000 | 17 | ||||||||||||
RBC Capital Markets | 6/3/2016 | USD | 4,517 | JPY | 483,000 | (155 | ) | |||||||||||
RBC Capital Markets | 6/3/2016 | USD | 4,403 | KRW | 5,238,000 | (9 | ) | |||||||||||
RBC Capital Markets | 6/3/2016 | USD | 25,087 | MYR | 103,000 | (147 | ) | |||||||||||
RBC Capital Markets | 6/3/2016 | USD | 27,602 | SGD | 38,000 | (9 | ) | |||||||||||
RBC Capital Markets | 6/3/2016 | USD | 31,031 | TWD | 1,011,000 | (29 | ) | |||||||||||
RBC Capital Markets | 6/3/2016 | USD | 11,596 | TWD | 374,000 | (128 | ) | |||||||||||
RBC Capital Markets | 6/3/2016 | USD | 28,415 | ZAR | 447,000 | 8 | ||||||||||||
State Street Bank & Trust Co. | 6/3/2016 | USD | 15,328 | CAD | 19,200 | (687 | ) | |||||||||||
State Street Bank & Trust Co. | 6/3/2016 | USD | 58,068 | CAD | 75,960 | (143 | ) | |||||||||||
State Street Bank & Trust Co. | 6/3/2016 | USD | 177 | CLP | 122,000 | (1 | ) | |||||||||||
State Street Bank & Trust Co. | 6/3/2016 | USD | 533 | IDR | 7,257,500 | (2 | ) | |||||||||||
State Street Bank & Trust Co. | 6/3/2016 | USD | 19,645 | KRW | 23,368,000 | (38 | ) | |||||||||||
State Street Bank & Trust Co. | 6/3/2016 | USD | 869 | MXN | 16,000 | (3 | ) | |||||||||||
| See Notes to Financial Statements. | 44 |
DBX ETF Trust
Schedule of investments
Deutsche X-trackers MSCI All World ex US High Dividend Yield Hedged Equity ETF (Continued)
May 31, 2016
Counterparty | Settlement Date | Currency To Deliver | Currency To Receive | Unrealized Appreciation (Depreciation) | ||||||||||||||
State Street Bank & Trust Co. | 6/3/2016 | USD | 6,449 | MYR | 26,500 | $ | (33 | ) | ||||||||||
State Street Bank & Trust Co. | 6/3/2016 | USD | 38,915 | RUB | 2,573,002 | (362 | ) | |||||||||||
State Street Bank & Trust Co. | 6/3/2016 | USD | 1,090 | SGD | 1,500 | 0 | ||||||||||||
State Street Bank & Trust Co. | 6/3/2016 | USD | 1,654 | THB | 59,000 | (2 | ) | |||||||||||
State Street Bank & Trust Co. | 6/3/2016 | USD | 172,125 | TWD | 5,607,840 | (160 | ) | |||||||||||
State Street Bank & Trust Co. | 6/3/2016 | USD | 21,550 | ZAR | 339,000 | 6 | ||||||||||||
The Bank of New York Mellon | 6/3/2016 | USD | 41,261 | BRL | 148,581 | (182 | ) | |||||||||||
The Bank of New York Mellon | 6/3/2016 | USD | 1,939 | CAD | 2,500 | (33 | ) | |||||||||||
The Bank of New York Mellon | 6/3/2016 | USD | 4,100 | CAD | 5,200 | (135 | ) | |||||||||||
The Bank of New York Mellon | 6/3/2016 | USD | 16,694 | RUB | 1,086,590 | (413 | ) | |||||||||||
The Bank of New York Mellon | 6/3/2016 | USD | 5,992 | SGD | 8,250 | (2 | ) | |||||||||||
The Bank of New York Mellon | 6/3/2016 | USD | 20,573 | THB | 735,000 | 0 | ||||||||||||
The Bank of New York Mellon | 6/3/2016 | USD | 515 | ZAR | 8,100 | 0 | ||||||||||||
Bank of Montreal | 6/3/2016 | ZAR | 682,700 | USD | 47,849 | 4,439 | ||||||||||||
RBC Capital Markets | 6/3/2016 | ZAR | 447,000 | USD | 31,331 | 2,908 | ||||||||||||
State Street Bank & Trust Co. | 6/3/2016 | ZAR | 339,000 | USD | 23,762 | 2,206 | ||||||||||||
The Bank of New York Mellon | 6/3/2016 | ZAR | 8,100 | USD | 513 | (2 | ) | |||||||||||
The Bank of New York Mellon | 6/6/2016 | QAR | 12,800 | USD | 3,516 | 1 | ||||||||||||
The Bank of New York Mellon | 6/6/2016 | QAR | 4,900 | USD | 1,345 | 0 | ||||||||||||
The Bank of New York Mellon | 6/6/2016 | QAR | 32,050 | USD | 8,797 | (6 | ) | |||||||||||
The Bank of New York Mellon | 6/6/2016 | QAR | 1,500 | USD | 412 | 0 | ||||||||||||
The Bank of New York Mellon | 6/6/2016 | USD | 14,076 | QAR | 51,250 | 0 | ||||||||||||
Bank of Montreal | 7/5/2016 | AUD | 191,897 | USD | 138,847 | 343 | ||||||||||||
RBC Capital Markets | 7/5/2016 | AUD | 53,000 | USD | 38,349 | 96 | ||||||||||||
State Street Bank & Trust Co. | 7/5/2016 | AUD | 73,000 | USD | 52,821 | 132 | ||||||||||||
Bank of Montreal | 7/5/2016 | CHF | 58,300 | USD | 58,729 | (23 | ) | |||||||||||
RBC Capital Markets | 7/5/2016 | CHF | 5,000 | USD | 5,037 | (2 | ) | |||||||||||
RBC Capital Markets | 7/5/2016 | CHF | 8,000 | USD | 8,059 | (3 | ) | |||||||||||
State Street Bank & Trust Co. | 7/5/2016 | CHF | 21,500 | USD | 21,659 | (8 | ) | |||||||||||
Bank of Montreal | 7/5/2016 | DKK | 17,700 | USD | 2,652 | 1 | ||||||||||||
State Street Bank & Trust Co. | 7/5/2016 | DKK | 16,500 | USD | 2,472 | 1 | ||||||||||||
Bank of Montreal | 7/5/2016 | EUR | 319,829 | USD | 356,452 | 125 | ||||||||||||
RBC Capital Markets | 7/5/2016 | EUR | 117,000 | USD | 130,397 | 45 | ||||||||||||
State Street Bank & Trust Co. | 7/5/2016 | EUR | 140,636 | USD | 156,743 | 58 | ||||||||||||
Bank of Montreal | 7/5/2016 | GBP | 507,061 | USD | 738,182 | 3,581 | ||||||||||||
RBC Capital Markets | 7/5/2016 | GBP | 185,000 | USD | 269,325 | 1,307 | ||||||||||||
State Street Bank & Trust Co. | 7/5/2016 | GBP | 77,241 | USD | 112,449 | 547 | ||||||||||||
RBC Capital Markets | 7/5/2016 | HKD | 840,000 | USD | 108,182 | 29 | ||||||||||||
The Bank of New York Mellon | 7/5/2016 | HKD | 1,487,200 | USD | 191,532 | 49 | ||||||||||||
RBC Capital Markets | 7/5/2016 | HUF | 1,316,000 | USD | 4,669 | 2 | ||||||||||||
State Street Bank & Trust Co. | 7/5/2016 | HUF | 468,000 | USD | 1,661 | 1 | ||||||||||||
Bank of Montreal | 7/5/2016 | JPY | 2,276,000 | USD | 20,545 | (35 | ) | |||||||||||
RBC Capital Markets | 7/5/2016 | JPY | 1,148,000 | USD | 10,363 | (18 | ) | |||||||||||
Bank of Montreal | 7/5/2016 | MXN | 67,900 | USD | 3,674 | 10 | ||||||||||||
State Street Bank & Trust Co. | 7/5/2016 | MXN | 16,000 | USD | 866 | 3 | ||||||||||||
Bank of Montreal | 7/5/2016 | NOK | 292,700 | USD | 34,995 | 10 | ||||||||||||
RBC Capital Markets | 7/5/2016 | NOK | 89,000 | USD | 10,641 | 3 | ||||||||||||
State Street Bank & Trust Co. | 7/5/2016 | NOK | 67,500 | USD | 8,070 | 2 | ||||||||||||
The Bank of New York Mellon | 7/5/2016 | NOK | 20,400 | USD | 2,439 | 1 | ||||||||||||
Bank of Montreal | 7/5/2016 | NZD | 600 | USD | 405 | 0 | ||||||||||||
State Street Bank & Trust Co. | 7/5/2016 | NZD | 2,500 | USD | 1,688 | 0 | ||||||||||||
The Bank of New York Mellon | 7/5/2016 | PLN | 37,400 | USD | 9,474 | (1 | ) | |||||||||||
RBC Capital Markets | 7/5/2016 | SEK | 140,000 | USD | 16,782 | (27 | ) | |||||||||||
The Bank of New York Mellon | 7/5/2016 | SEK | 632,900 | USD | 75,868 | (123 | ) | |||||||||||
Bank of Montreal | 7/5/2016 | SGD | 44,400 | USD | 32,231 | 9 | ||||||||||||
RBC Capital Markets | 7/5/2016 | SGD | 38,000 | USD | 27,586 | 8 | ||||||||||||
| See Notes to Financial Statements. | 45 |
DBX ETF Trust
Schedule of investments
Deutsche X-trackers MSCI All World ex US High Dividend Yield Hedged Equity ETF (Continued)
May 31, 2016
Counterparty | Settlement Date | Currency To Deliver | Currency To Receive | Unrealized Appreciation (Depreciation) | ||||||||||||||
State Street Bank & Trust Co. | 7/5/2016 | SGD | 1,500 | USD | 1,089 | $ | 0 | |||||||||||
The Bank of New York Mellon | 7/5/2016 | SGD | 8,250 | USD | 5,989 | 2 | ||||||||||||
Bank of Montreal | 7/5/2016 | USD | 302 | CHF | 300 | 0 | ||||||||||||
Bank of Montreal | 7/5/2016 | USD | 11,479 | EUR | 10,300 | (4 | ) | |||||||||||
Bank of Montreal | 7/5/2016 | USD | 728 | GBP | 500 | (4 | ) | |||||||||||
RBC Capital Markets | 7/5/2016 | USD | 10,031 | EUR | 9,000 | (4 | ) | |||||||||||
RBC Capital Markets | 7/5/2016 | USD | 5,806 | GBP | 4,000 | (11 | ) | |||||||||||
RBC Capital Markets | 7/5/2016 | USD | 26,206 | GBP | 18,000 | (128 | ) | |||||||||||
RBC Capital Markets | 7/5/2016 | USD | 8,501 | HKD | 66,000 | (3 | ) | |||||||||||
RBC Capital Markets | 7/5/2016 | USD | 221 | HUF | 62,400 | 0 | ||||||||||||
Bank of Montreal | 7/5/2016 | ZAR | 460,550 | USD | 29,088 | 5 | ||||||||||||
RBC Capital Markets | 7/5/2016 | ZAR | 447,000 | USD | 28,231 | 4 | ||||||||||||
State Street Bank & Trust Co. | 7/5/2016 | ZAR | 339,000 | USD | 21,411 | 4 | ||||||||||||
The Bank of New York Mellon | 7/5/2016 | ZAR | 8,100 | USD | 512 | 0 | ||||||||||||
RBC Capital Markets | 7/6/2016 | BRL | 19,000 | USD | 5,224 | 24 | ||||||||||||
The Bank of New York Mellon | 7/6/2016 | BRL | 148,581 | USD | 40,858 | 193 | ||||||||||||
Bank of Montreal | 7/6/2016 | CAD | 237,729 | USD | 181,736 | 453 | ||||||||||||
RBC Capital Markets | 7/6/2016 | CAD | 7,000 | USD | 5,351 | 13 | ||||||||||||
RBC Capital Markets | 7/6/2016 | CAD | 129,000 | USD | 98,616 | 246 | ||||||||||||
State Street Bank & Trust Co. | 7/6/2016 | CAD | 75,960 | USD | 58,068 | 144 | ||||||||||||
Bank of Montreal | 7/6/2016 | CLP | 122,000 | USD | 176 | 1 | ||||||||||||
RBC Capital Markets | 7/6/2016 | CLP | 7,364,000 | USD | 10,641 | 48 | ||||||||||||
State Street Bank & Trust Co. | 7/6/2016 | CLP | 122,000 | USD | 176 | 1 | ||||||||||||
RBC Capital Markets | 7/6/2016 | KRW | 5,238,000 | USD | 4,394 | 2 | ||||||||||||
State Street Bank & Trust Co. | 7/6/2016 | KRW | 23,368,000 | USD | 19,630 | 37 | ||||||||||||
State Street Bank & Trust Co. | 7/6/2016 | RUB | 2,573,002 | USD | 38,558 | 358 | ||||||||||||
State Street Bank & Trust Co. | 7/6/2016 | RUB | 1,064,960 | USD | 16,000 | 189 | ||||||||||||
RBC Capital Markets | 7/6/2016 | TWD | 1,011,000 | USD | 30,994 | (30 | ) | |||||||||||
State Street Bank & Trust Co. | 7/6/2016 | TWD | 5,607,840 | USD | 171,941 | (147 | ) | |||||||||||
Bank of Montreal | 7/6/2016 | USD | 5,886 | CAD | 7,700 | (15 | ) | |||||||||||
Bank of Montreal | 7/6/2016 | USD | 11,595 | KRW | 13,816,000 | (11 | ) | |||||||||||
Bank of Montreal | 7/6/2016 | USD | 56,510 | TWD | 1,833,200 | (255 | ) | |||||||||||
RBC Capital Markets | 7/6/2016 | USD | 4,399 | BRL | 16,000 | (20 | ) | |||||||||||
The Bank of New York Mellon | 7/6/2016 | USD | 488 | RUB | 32,590 | (4 | ) | |||||||||||
The Bank of New York Mellon | 7/7/2016 | CZK | 145,600 | USD | 6,002 | 0 | ||||||||||||
Bank of Montreal | 7/7/2016 | THB | 59,000 | USD | 1,651 | 1 | ||||||||||||
State Street Bank & Trust Co. | 7/7/2016 | THB | 59,000 | USD | 1,652 | 2 | ||||||||||||
The Bank of New York Mellon | 7/7/2016 | THB | 735,000 | USD | 20,556 | (5 | ) | |||||||||||
Bank of Montreal | 7/8/2016 | MYR | 26,500 | USD | 6,441 | 40 | ||||||||||||
RBC Capital Markets | 7/8/2016 | MYR | 103,000 | USD | 25,040 | 161 | ||||||||||||
State Street Bank & Trust Co. | 7/8/2016 | MYR | 26,500 | USD | 6,443 | 42 | ||||||||||||
The Bank of New York Mellon | 7/8/2016 | TRY | 14,800 | USD | 4,965 | 1 | ||||||||||||
RBC Capital Markets | 7/11/2016 | AED | 47,000 | USD | 12,794 | 0 | ||||||||||||
The Bank of New York Mellon | 7/11/2016 | AED | 11,800 | USD | 3,212 | 0 | ||||||||||||
The Bank of New York Mellon | 7/11/2016 | QAR | 51,250 | USD | 14,059 | (6 | ) | |||||||||||
Bank of Montreal | 7/12/2016 | IDR | 7,257,500 | USD | 530 | 3 | ||||||||||||
RBC Capital Markets | 7/12/2016 | IDR | 57,515,000 | USD | 4,190 | 11 | ||||||||||||
State Street Bank & Trust Co. | 7/12/2016 | IDR | 7,257,500 | USD | 530 | 3 | ||||||||||||
|
| |||||||||||||||||
Total net unrealized appreciation | $ | 89,958 | ||||||||||||||||
|
| |||||||||||||||||
| See Notes to Financial Statements. | 46 |
DBX ETF Trust
Schedule of investments
Deutsche X-trackers MSCI All World ex US High Dividend Yield Hedged Equity ETF (Continued)
May 31, 2016
Currency Abbreviations
| AED | Arab Emirates Dirham |
| AUD | Australian Dollar |
| BRL | Brazilian Real |
| CAD | Canadian Dollar |
| CHF | Swiss Franc |
| CLP | Chilean Peso |
| CZK | Czech Koruna |
| DKK | Danish Krone |
| EUR | Euro |
| GBP | Pound Sterling |
| HKD | Hong Kong Dollar |
| HUF | Hungarian Forint |
| IDR | Indonesian Rupiah |
| JPY | Japanese Yen |
| KRW | South Korean Won |
| MXN | Mexican Peso |
| MYR | Malaysian Ringgit |
| NOK | Norwegian Krone |
| NZD | New Zealand Dollar |
| PLN | Polish Zloty |
| QAR | Qatari Rial |
| RUB | Russian Ruble |
| SEK | Swedish Krona |
| SGD | Singapore Dollar |
| THB | Thai Baht |
| TRY | Turkish New Lira |
| TWD | New Taiwan Dollar |
| USD | U.S. Dollar |
| ZAR | South African Rand |
For information on the Fund’s policy and additional disclosures regarding forward foreign exchange currency contracts, please refer to the Derivatives section of Note 2 in the accompanying Notes to Financial Statements.
Fair Value Measurements
Various inputs are used in determining the value of the Fund’s investments. These inputs are summarized in three broad levels. Level 1 includes quoted prices in active markets for identical securities. Level 2 includes other significant observable inputs (including quoted prices for similar securities, interest rates, prepayment speeds and credit risk). Level 3 includes significant unobservable inputs (including the Fund’s own assumptions in determining the fair value of investments). The level assigned to the securities valuations may not be an indication of the risk or liquidity associated with investing in those securities.
The following is a summary of the inputs used as of May 31, 2016 in valuing the Fund’s investments. For information on Fund’s policy regarding the valuation of investments, please refer to the Security Valuation section of Note 2 in the accompanying Notes to Financial Statements.
Assets | Level 1 | Level 2 | Level 3 | Total | ||||||||||||
Common Stocks (f) | $ | 3,416,386 | $ | — | $ | — | $ | 3,416,386 | ||||||||
Preferred Stocks | 7,232 | — | — | 7,232 | ||||||||||||
Rights | 158 | — | — | 158 | ||||||||||||
Short-Term Investments | 49,313 | — | — | 49,313 | ||||||||||||
Derivatives (g) | ||||||||||||||||
Forward Foreign Currency Exchange Contracts | — | 114,585 | — | 114,585 | ||||||||||||
|
|
|
|
|
|
|
| |||||||||
Total | $ | 3,473,089 | $ | 114,585 | $ | — | $ | 3,587,674 | ||||||||
|
|
|
|
|
|
|
| |||||||||
Liabilities | Level 1 | Level 2 | Level 3 | Total | ||||||||||||
Derivatives (g) | ||||||||||||||||
Forward Foreign Currency Exchange Contracts | $ | — | $ | (24,627 | ) | $ | — | $ | (24,627 | ) | ||||||
|
|
|
|
|
|
|
| |||||||||
Total | $ | — | $ | (24,627 | ) | $ | — | $ | (24,627 | ) | ||||||
|
|
|
|
|
|
|
| |||||||||
| (f) | See Schedule of investments for additional detailed categorizations. |
| (g) | Derivatives include unrealized appreciation (depreciation) on forward foreign currency exchange contracts. |
There have been no transfers between fair value measurement levels during the period ended May 31, 2016.
| See Notes to Financial Statements. | 47 |
DBX ETF Trust
Schedule of investments
Deutsche X-trackers MSCI EAFE High Dividend Yield Hedged Equity ETF
May 31, 2016
Number | Value | |||||||
| COMMON STOCKS — 99.3% | ||||||||
| Australia — 10.8% | ||||||||
ASX Ltd. | 443 | $ | 14,251 | |||||
Aurizon Holdings Ltd. | 4,827 | 15,734 | ||||||
Australia & New Zealand Banking Group Ltd. | 6,723 | 123,809 | ||||||
Bendigo and Adelaide Bank Ltd. | 1,048 | 7,756 | ||||||
BHP Billiton PLC | 4,873 | 58,086 | ||||||
Flight Centre Travel Group Ltd. | 119 | 2,719 | ||||||
Harvey Norman Holdings Ltd. | 1,185 | 3,905 | ||||||
Insurance Australia Group Ltd. | 5,602 | 23,807 | ||||||
LendLease Group (a) | 1,272 | 12,347 | ||||||
Platinum Asset Management Ltd. (b) | 498 | 2,368 | ||||||
Suncorp Group Ltd. | 2,970 | 27,863 | ||||||
Tatts Group Ltd. | 3,374 | 9,608 | ||||||
Telstra Corp. Ltd. | 9,868 | 39,869 | ||||||
Wesfarmers Ltd. | 2,597 | 76,262 | ||||||
Woodside Petroleum Ltd. | 1,707 | 33,804 | ||||||
Woolworths Ltd. | 2,933 | 46,891 | ||||||
|
| |||||||
| 499,079 | ||||||||
|
| |||||||
| Denmark — 0.1% | ||||||||
Tryg A/S | 246 | 4,850 | ||||||
|
| |||||||
| Finland — 2.8% | ||||||||
Elisa OYJ | 329 | 12,534 | ||||||
Fortum OYJ (b) | 1,022 | 15,328 | ||||||
Metso OYJ | 239 | 5,614 | ||||||
Nokian Renkaat OYJ | 254 | 8,967 | ||||||
Orion OYJ, Class B | 227 | 8,145 | ||||||
Sampo OYJ, Class A | 1,038 | 46,278 | ||||||
Stora Enso OYJ, Class R | 1,270 | 10,888 | ||||||
UPM-Kymmene OYJ | 1,234 | 23,739 | ||||||
|
| |||||||
| 131,493 | ||||||||
|
| |||||||
| France — 13.8% | ||||||||
AXA SA | 4,480 | 112,553 | ||||||
Bouygues SA | 482 | 15,660 | ||||||
CNP Assurances | 364 | 6,176 | ||||||
Edenred | 473 | 8,763 | ||||||
Eutelsat Communications SA | 406 | 8,095 | ||||||
Rexel SA | 693 | 10,598 | ||||||
Sanofi | 2,714 | 222,523 | ||||||
SCOR SE | 382 | 12,772 | ||||||
Suez | 754 | 12,672 | ||||||
Total SA (b) | 4,749 | 230,777 | ||||||
|
| |||||||
| 640,589 | ||||||||
|
| |||||||
| Germany — 14.2% | ||||||||
Allianz SE | 1,059 | 172,855 | ||||||
Axel Springer SE | 94 | 5,347 | ||||||
BASF SE | 2,117 | 163,540 | ||||||
Bayerische Motoren Werke AG | 770 | 65,018 | ||||||
Daimler AG | 2,220 | 151,638 | ||||||
Muenchener Rueckversicherungs-Gesellschaft AG | 391 | 73,457 | ||||||
ProSiebenSat.1 Media SE*(f) | 504 | 25,338 | ||||||
|
| |||||||
| 657,193 | ||||||||
|
| |||||||
Number | Value | |||||||
| Hong Kong — 4.3% | ||||||||
BOC Hong Kong (Holdings) Ltd. | 8,528 | $ | 26,229 | |||||
CLP Holdings Ltd. | 3,939 | 37,156 | ||||||
Hang Lung Properties Ltd. | 5,181 | 9,894 | ||||||
Hang Seng Bank Ltd. | 1,760 | 31,233 | ||||||
HKT Trust and HKT Ltd. (a) | 6,103 | 8,843 | ||||||
New World Development Co. Ltd. | 12,817 | 12,107 | ||||||
NWS Holdings Ltd. | 3,506 | 5,532 | ||||||
PCCW Ltd. | 9,658 | 6,301 | ||||||
Power Assets Holdings Ltd. | 3,197 | 31,000 | ||||||
Sino Land Co. Ltd. | 7,044 | 10,787 | ||||||
Swire Pacific Ltd., Class A | 1,245 | 13,426 | ||||||
Yue Yuen Industrial (Holdings) Ltd. | 1,708 | 6,440 | ||||||
|
| |||||||
| 198,948 | ||||||||
|
| |||||||
| Ireland — 0.3% | ||||||||
James Hardie Industries PLC CDI (c) | 1,021 | 15,556 | ||||||
|
| |||||||
| Italy — 1.8% | ||||||||
Atlantia SpA | 959 | 25,865 | ||||||
Snam SpA | 5,649 | 32,338 | ||||||
Terna Rete Elettrica Nazionale SpA | 3,474 | 19,265 | ||||||
UnipolSai SpA (b) | 2,371 | 4,740 | ||||||
|
| |||||||
| 82,208 | ||||||||
|
| |||||||
| Japan — 1.7% | ||||||||
Aozora Bank Ltd. | 2,730 | 9,295 | ||||||
Canon, Inc. | 2,459 | 71,326 | ||||||
|
| |||||||
| 80,621 | ||||||||
|
| |||||||
| Luxembourg — 0.4% | ||||||||
SES SA FDR | 753 | 16,865 | ||||||
|
| |||||||
| Macau — 0.4% | ||||||||
Sands China Ltd. | 5,580 | 21,399 | ||||||
|
| |||||||
| Netherlands — 0.2% | ||||||||
Koninklijke Boskalis Westminster NV | 210 | 7,606 | ||||||
|
| |||||||
| New Zealand — 0.6% | ||||||||
Contact Energy Ltd. | 1,564 | 5,704 | ||||||
Fletcher Building Ltd. | 1,588 | 9,616 | ||||||
Mighty River Power Ltd. | 1,487 | 2,988 | ||||||
Spark New Zealand Ltd. | 4,220 | 10,565 | ||||||
|
| |||||||
| 28,873 | ||||||||
|
| |||||||
| Norway — 1.4% | ||||||||
Gjensidige Forsikring ASA | 455 | 7,848 | ||||||
Statoil ASA | 2,578 | 41,109 | ||||||
Yara International ASA (b) | 413 | 14,895 | ||||||
|
| |||||||
| 63,852 | ||||||||
|
| |||||||
| Portugal — 0.4% | ||||||||
EDP — Energias de Portugal SA | 5,337 | 17,785 | ||||||
|
| |||||||
| Singapore — 2.7% | ||||||||
Singapore Exchange Ltd. | 1,850 | 10,411 | ||||||
Singapore Press Holdings Ltd. (b) | 3,680 | 10,315 | ||||||
Singapore Technologies Engineering Ltd. | 3,590 | 8,421 | ||||||
Singapore Telecommunications Ltd. | 18,370 | 51,624 | ||||||
| See Notes to Financial Statements. | 48 |
DBX ETF Trust
Schedule of investments
Deutsche X-trackers MSCI EAFE High Dividend Yield Hedged Equity ETF (Continued)
May 31, 2016
Number | Value | |||||||
| Singapore (Continued) | ||||||||
StarHub Ltd. | 1,200 | $ | 3,076 | |||||
United Overseas Bank Ltd. | 2,990 | 39,560 | ||||||
|
| |||||||
| 123,407 | ||||||||
|
| |||||||
| Spain — 1.7% | ||||||||
Abertis Infraestructuras SA | 1,254 | 19,199 | ||||||
Enagas SA | 526 | 15,766 | ||||||
Gas Natural SDG SA | 811 | 16,053 | ||||||
Mapfre SA | 2,290 | 5,804 | ||||||
Red Electrica Corp. SA | 249 | 22,175 | ||||||
|
| |||||||
| 78,997 | ||||||||
|
| |||||||
| Sweden — 2.3% | ||||||||
Industrivarden AB, Class C | 348 | 5,883 | ||||||
Skanska AB, Class B | 772 | 16,955 | ||||||
Telefonaktiebolaget LM Ericsson, Class B | 7,016 | 54,083 | ||||||
Telia Co. AB | 5,991 | 28,076 | ||||||
|
| |||||||
| 104,997 | ||||||||
|
| |||||||
| Switzerland — 4.2% | ||||||||
Swiss Prime Site AG | 164 | 14,057 | ||||||
Swiss Re AG | 768 | 68,996 | ||||||
Swisscom AG | 54 | 25,729 | ||||||
Zurich Insurance Group AG | 349 | 84,441 | ||||||
|
| |||||||
| 193,223 | ||||||||
|
| |||||||
| United Kingdom — 35.2% | ||||||||
Aberdeen Asset Management PLC (b) | 2,120 | 8,570 | ||||||
Admiral Group PLC | 487 | 13,881 | ||||||
AstraZeneca PLC | 2,917 | 170,177 | ||||||
BAE Systems PLC | 7,303 | 51,152 | ||||||
Berkeley Group Holdings PLC | 300 | 14,230 | ||||||
British American Tobacco PLC | 3,750 | 228,007 | ||||||
Centrica PLC | 12,505 | 36,911 | ||||||
Direct Line Insurance Group PLC | 3,174 | 17,253 | ||||||
G4S PLC | 3,568 | 9,658 | ||||||
GlaxoSmithKline PLC | 10,908 | 228,290 | ||||||
ICAP PLC | 1,269 | 7,940 | ||||||
IMI PLC | 620 | 9,025 | ||||||
Imperial Brands PLC | 2,210 | 120,384 | ||||||
Inmarsat PLC | 1,040 | 10,838 | ||||||
Number | Value | |||||||
| United Kingdom (Continued) | ||||||||
ITV PLC | 8,365 | $ | 26,024 | |||||
Legal & General Group PLC | 13,711 | 47,541 | ||||||
Marks & Spencer Group PLC | 3,741 | 20,573 | ||||||
National Grid PLC | 8,631 | 125,882 | ||||||
Old Mutual PLC | 11,358 | 29,298 | ||||||
Pearson PLC | 1,899 | 23,062 | ||||||
Persimmon PLC | 713 | 21,707 | ||||||
Rio Tinto Ltd. | 982 | 31,718 | ||||||
Rio Tinto PLC | 2,851 | 80,211 | ||||||
Rolls-Royce Holdings PLC — Entitlement* | 265,327 | 384 | ||||||
Severn Trent PLC | 539 | 17,893 | ||||||
Smiths Group PLC | 913 | 14,837 | ||||||
SSE PLC | 2,324 | 51,567 | ||||||
Tate & Lyle PLC | 1,074 | 9,776 | ||||||
Vodafone Group PLC | 61,198 | 204,617 | ||||||
|
| |||||||
| 1,631,406 | ||||||||
|
| |||||||
TOTAL COMMON STOCKS | 4,598,947 | |||||||
|
| |||||||
| PREFERRED STOCK — 0.2% | ||||||||
| Germany — 0.2% | ||||||||
Bayerische Motoren Werke AG | 130 | 9,561 | ||||||
|
| |||||||
| RIGHTS — 0.0% | ||||||||
| Spain — 0.0% | ||||||||
Abertis Infraestructuras SA*, expires 6/30/16 | 1,054 | 808 | ||||||
|
| |||||||
| SECURITIES LENDING COLLATERAL — 5.7% | ||||||||
Daily Assets Fund “Capital Shares”, | 264,645 | 264,645 | ||||||
|
| |||||||
TOTAL INVESTMENTS — 105.2% (Cost $5,103,122)† | $ | 4,873,961 | ||||||
Other assets and liabilities, net — (5.2%) | (242,145 | ) | ||||||
|
| |||||||
NET ASSETS — 100.0% | $ | 4,631,816 | ||||||
|
| |||||||
| * | Non-income producing security. |
| † | The cost for federal income tax purposes was $5,131,552. At May 31, 2016, net unrealized depreciation for all securities based on tax cost was $257,591. This consisted of aggregate gross unrealized appreciation for all securities in which there was an excess of value over tax cost of $81,655 and aggregate gross unrealized depreciation for all securities in which there was an excess of tax cost over value of $339,246. |
| (a) | Stapled Security — A security contractually bound to one or more other securities to form a single saleable unit which cannot be sold separately. |
| (b) | All or a portion of these securities were on loan. In addition, “Other Assets and Liabilities, Net” may include pending sales that are also on loan. The value of securities loaned at May 31, 2016 amounted to $243,120, which is 5.2% of net assets. |
| (c) | Security is listed in country of domicile. Significant business activities of company are in Australia, New Zealand and the United States. |
| (d) | Affiliated fund managed by Deutsche Investment Management Americas Inc. The rate shown is the annualized seven-day yield at period end. |
| (e) | Represents collateral held in connection with securities lending. Income earned by the Fund is net of borrower rebates. |
| (f) | Company declared its annual dividend during the 12-month period ended May 31, 2016, the scheduled payment date was subsequent to May 31, 2016. |
| CDI: | Chess Depositary Interest |
| FDR: | Fiduciary Depositary Receipt |
| See Notes to Financial Statements. | 49 |
DBX ETF Trust
Schedule of investments
Deutsche X-trackers MSCI EAFE High Dividend Yield Hedged Equity ETF (Continued)
May 31, 2016
As of May 31, 2016, the Fund had the following forward foreign currency exchange contracts outstanding:
Counterparty | Settlement Date | Currency To Deliver | Currency To Receive | Unrealized Appreciation (Depreciation) | ||||||||||||||
Bank of Montreal | 6/2/2016 | AUD | 222,235 | USD | 169,383 | $ | 8,762 | |||||||||||
RBC Capital Markets | 6/2/2016 | AUD | 456,000 | USD | 347,562 | 17,987 | ||||||||||||
RBC Capital Markets | 6/2/2016 | AUD | 55,000 | USD | 41,922 | 2,171 | ||||||||||||
The Bank of New York Mellon | 6/2/2016 | AUD | 1,900 | USD | 1,386 | 13 | ||||||||||||
The Bank of New York Mellon | 6/2/2016 | AUD | 28,800 | USD | 21,951 | 1,136 | ||||||||||||
Bank of Montreal | 6/2/2016 | CHF | 48,000 | USD | 50,139 | 1,849 | ||||||||||||
RBC Capital Markets | 6/2/2016 | CHF | 5,000 | USD | 5,223 | 192 | ||||||||||||
RBC Capital Markets | 6/2/2016 | CHF | 120,000 | USD | 125,345 | 4,621 | ||||||||||||
RBC Capital Markets | 6/2/2016 | CHF | 1,900 | USD | 1,911 | 0 | ||||||||||||
The Bank of New York Mellon | 6/2/2016 | CHF | 1,700 | USD | 1,742 | 32 | ||||||||||||
Bank of Montreal | 6/2/2016 | DKK | 29,000 | USD | 4,466 | 128 | ||||||||||||
RBC Capital Markets | 6/2/2016 | DKK | 75,800 | USD | 11,674 | 335 | ||||||||||||
The Bank of New York Mellon | 6/2/2016 | DKK | 3,000 | USD | 462 | 13 | ||||||||||||
Bank of Montreal | 6/2/2016 | EUR | 315,215 | USD | 361,335 | 10,612 | ||||||||||||
RBC Capital Markets | 6/2/2016 | EUR | 879,000 | USD | 1,007,606 | 29,592 | ||||||||||||
RBC Capital Markets | 6/2/2016 | EUR | 26,200 | USD | 29,167 | 16 | ||||||||||||
RBC Capital Markets | 6/2/2016 | EUR | 15,000 | USD | 17,170 | 480 | ||||||||||||
RBC Capital Markets | 6/2/2016 | EUR | 53,000 | USD | 60,753 | 1,783 | ||||||||||||
Bank of Montreal | 6/2/2016 | GBP | 320,411 | USD | 469,395 | 5,326 | ||||||||||||
RBC Capital Markets | 6/2/2016 | GBP | 7,000 | USD | 10,189 | 50 | ||||||||||||
RBC Capital Markets | 6/2/2016 | GBP | 42,000 | USD | 61,531 | 700 | ||||||||||||
RBC Capital Markets | 6/2/2016 | GBP | 6,000 | USD | 8,774 | 84 | ||||||||||||
RBC Capital Markets | 6/2/2016 | GBP | 928,440 | USD | 1,360,144 | 15,436 | ||||||||||||
The Bank of New York Mellon | 6/2/2016 | GBP | 4,500 | USD | 6,481 | (37 | ) | |||||||||||
The Bank of New York Mellon | 6/2/2016 | GBP | 900 | USD | 1,296 | (8 | ) | |||||||||||
Bank of Montreal | 6/2/2016 | HKD | 382,000 | USD | 49,257 | 98 | ||||||||||||
RBC Capital Markets | 6/2/2016 | HKD | 1,089,000 | USD | 140,423 | 282 | ||||||||||||
The Bank of New York Mellon | 6/2/2016 | HKD | 10,100 | USD | 1,301 | 2 | ||||||||||||
The Bank of New York Mellon | 6/2/2016 | HKD | 76,500 | USD | 9,864 | 20 | ||||||||||||
Bank of Montreal | 6/2/2016 | NOK | 225,000 | USD | 27,938 | 1,042 | ||||||||||||
RBC Capital Markets | 6/2/2016 | NOK | 609,800 | USD | 75,717 | 2,823 | ||||||||||||
Bank of Montreal | 6/2/2016 | NZD | 5,000 | USD | 3,491 | 107 | ||||||||||||
RBC Capital Markets | 6/2/2016 | NZD | 16,000 | USD | 11,170 | 344 | ||||||||||||
The Bank of New York Mellon | 6/2/2016 | NZD | 2,000 | USD | 1,396 | 43 | ||||||||||||
Bank of Montreal | 6/2/2016 | SEK | 287,000 | USD | 35,809 | 1,403 | ||||||||||||
RBC Capital Markets | 6/2/2016 | SEK | 731,000 | USD | 91,212 | 3,576 | ||||||||||||
The Bank of New York Mellon | 6/2/2016 | SEK | 58,500 | USD | 7,300 | 286 | ||||||||||||
Bank of Montreal | 6/2/2016 | USD | 160,998 | AUD | 222,235 | (377 | ) | |||||||||||
Bank of Montreal | 6/2/2016 | USD | 48,280 | CHF | 48,000 | 10 | ||||||||||||
Bank of Montreal | 6/2/2016 | USD | 4,340 | DKK | 29,000 | (2 | ) | |||||||||||
Bank of Montreal | 6/2/2016 | USD | 350,914 | EUR | 315,215 | (191 | ) | |||||||||||
Bank of Montreal | 6/2/2016 | USD | 466,359 | GBP | 320,411 | (2,290 | ) | |||||||||||
Bank of Montreal | 6/2/2016 | USD | 49,175 | HKD | 382,000 | (16 | ) | |||||||||||
Bank of Montreal | 6/2/2016 | USD | 26,904 | NOK | 225,000 | (8 | ) | |||||||||||
Bank of Montreal | 6/2/2016 | USD | 3,383 | NZD | 5,000 | 0 | ||||||||||||
Bank of Montreal | 6/2/2016 | USD | 34,358 | SEK | 287,000 | 49 | ||||||||||||
RBC Capital Markets | 6/2/2016 | USD | 370,194 | AUD | 511,000 | (868 | ) | |||||||||||
RBC Capital Markets | 6/2/2016 | USD | 3,134 | CHF | 3,000 | (116 | ) | |||||||||||
RBC Capital Markets | 6/2/2016 | USD | 122,712 | CHF | 122,000 | 25 | ||||||||||||
RBC Capital Markets | 6/2/2016 | USD | 11,344 | DKK | 75,800 | (5 | ) | |||||||||||
RBC Capital Markets | 6/2/2016 | USD | 29,142 | EUR | 25,423 | (856 | ) | |||||||||||
RBC Capital Markets | 6/2/2016 | USD | 1,025,946 | EUR | 921,577 | (558 | ) | |||||||||||
RBC Capital Markets | 6/2/2016 | USD | 1,417,824 | GBP | 974,115 | (6,963 | ) | |||||||||||
RBC Capital Markets | 6/2/2016 | USD | 3,407 | GBP | 2,325 | (39 | ) | |||||||||||
RBC Capital Markets | 6/2/2016 | USD | 140,188 | HKD | 1,089,000 | (47 | ) | |||||||||||
RBC Capital Markets | 6/2/2016 | USD | 70,595 | NOK | 590,400 | (21 | ) | |||||||||||
| See Notes to Financial Statements. | 50 |
DBX ETF Trust
Schedule of investments
Deutsche X-trackers MSCI EAFE High Dividend Yield Hedged Equity ETF (Continued)
May 31, 2016
Counterparty | Settlement Date | Currency To Deliver | Currency To Receive | Unrealized Appreciation (Depreciation) | ||||||||||||||
RBC Capital Markets | 6/2/2016 | USD | 2,409 | NOK | 19,400 | $ | (90 | ) | ||||||||||
RBC Capital Markets | 6/2/2016 | USD | 10,825 | NZD | 16,000 | 1 | ||||||||||||
RBC Capital Markets | 6/2/2016 | USD | 78,652 | SEK | 657,000 | 112 | ||||||||||||
RBC Capital Markets | 6/2/2016 | USD | 9,234 | SEK | 74,000 | (363 | ) | |||||||||||
The Bank of New York Mellon | 6/2/2016 | USD | 18,763 | AUD | 25,900 | (44 | ) | |||||||||||
The Bank of New York Mellon | 6/2/2016 | USD | 3,594 | AUD | 4,800 | (125 | ) | |||||||||||
The Bank of New York Mellon | 6/2/2016 | USD | 3,780 | CHF | 3,600 | (158 | ) | |||||||||||
The Bank of New York Mellon | 6/2/2016 | USD | 449 | DKK | 3,000 | 0 | ||||||||||||
The Bank of New York Mellon | 6/2/2016 | USD | 2,277 | EUR | 2,000 | (51 | ) | |||||||||||
The Bank of New York Mellon | 6/2/2016 | USD | 10,427 | EUR | 9,200 | (190 | ) | |||||||||||
The Bank of New York Mellon | 6/2/2016 | USD | 5,878 | EUR | 5,100 | (203 | ) | |||||||||||
The Bank of New York Mellon | 6/2/2016 | USD | 11,403 | EUR | 9,900 | (388 | ) | |||||||||||
The Bank of New York Mellon | 6/2/2016 | USD | 1,018 | GBP | 700 | (4 | ) | |||||||||||
The Bank of New York Mellon | 6/2/2016 | USD | 16,963 | GBP | 11,700 | (17 | ) | |||||||||||
The Bank of New York Mellon | 6/2/2016 | USD | 11,148 | HKD | 86,600 | (4 | ) | |||||||||||
The Bank of New York Mellon | 6/2/2016 | USD | 1,353 | NZD | 2,000 | 0 | ||||||||||||
The Bank of New York Mellon | 6/2/2016 | USD | 7,003 | SEK | 58,500 | 10 | ||||||||||||
Bank of Montreal | 6/3/2016 | JPY | 4,376,749 | USD | 40,930 | 1,401 | ||||||||||||
RBC Capital Markets | 6/3/2016 | JPY | 3,050,000 | USD | 28,523 | 976 | ||||||||||||
Bank of Montreal | 6/3/2016 | SGD | 37,000 | USD | 27,506 | 639 | ||||||||||||
RBC Capital Markets | 6/3/2016 | SGD | 104,000 | USD | 77,312 | 1,795 | ||||||||||||
The Bank of New York Mellon | 6/3/2016 | SGD | 45,400 | USD | 33,750 | 784 | ||||||||||||
Bank of Montreal | 6/3/2016 | USD | 39,438 | JPY | 4,373,749 | 64 | ||||||||||||
Bank of Montreal | 6/3/2016 | USD | 28 | JPY | 3,000 | (1 | ) | |||||||||||
Bank of Montreal | 6/3/2016 | USD | 26,876 | SGD | 37,000 | (9 | ) | |||||||||||
RBC Capital Markets | 6/3/2016 | USD | 23,380 | JPY | 2,593,000 | 39 | ||||||||||||
RBC Capital Markets | 6/3/2016 | USD | 4,274 | JPY | 457,000 | (147 | ) | |||||||||||
RBC Capital Markets | 6/3/2016 | USD | 75,542 | SGD | 104,000 | (25 | ) | |||||||||||
The Bank of New York Mellon | 6/3/2016 | USD | 32,976 | SGD | 45,400 | (10 | ) | |||||||||||
Bank of Montreal | 7/5/2016 | AUD | 222,235 | USD | 160,798 | 398 | ||||||||||||
RBC Capital Markets | 7/5/2016 | AUD | 12,000 | USD | 8,683 | 22 | ||||||||||||
RBC Capital Markets | 7/5/2016 | AUD | 511,000 | USD | 369,747 | 927 | ||||||||||||
RBC Capital Markets | 7/5/2016 | AUD | 7,000 | USD | 5,064 | 12 | ||||||||||||
The Bank of New York Mellon | 7/5/2016 | AUD | 25,900 | USD | 18,740 | 47 | ||||||||||||
Bank of Montreal | 7/5/2016 | CHF | 48,000 | USD | 48,353 | (19 | ) | |||||||||||
RBC Capital Markets | 7/5/2016 | CHF | 122,000 | USD | 122,898 | (48 | ) | |||||||||||
RBC Capital Markets | 7/5/2016 | CHF | 9,000 | USD | 9,066 | (3 | ) | |||||||||||
Bank of Montreal | 7/5/2016 | DKK | 29,000 | USD | 4,345 | 1 | ||||||||||||
RBC Capital Markets | 7/5/2016 | DKK | 75,800 | USD | 11,357 | 3 | ||||||||||||
The Bank of New York Mellon | 7/5/2016 | DKK | 3,000 | USD | 449 | 0 | ||||||||||||
Bank of Montreal | 7/5/2016 | EUR | 315,215 | USD | 351,309 | 123 | ||||||||||||
RBC Capital Markets | 7/5/2016 | EUR | 921,577 | USD | 1,027,098 | 355 | ||||||||||||
Bank of Montreal | 7/5/2016 | GBP | 320,411 | USD | 466,456 | 2,263 | ||||||||||||
RBC Capital Markets | 7/5/2016 | GBP | 974,115 | USD | 1,418,126 | 6,884 | ||||||||||||
Bank of Montreal | 7/5/2016 | HKD | 382,000 | USD | 49,196 | 12 | ||||||||||||
RBC Capital Markets | 7/5/2016 | HKD | 1,089,000 | USD | 140,251 | 37 | ||||||||||||
The Bank of New York Mellon | 7/5/2016 | HKD | 86,600 | USD | 11,153 | 3 | ||||||||||||
Bank of Montreal | 7/5/2016 | JPY | 4,373,749 | USD | 39,481 | (68 | ) | |||||||||||
RBC Capital Markets | 7/5/2016 | JPY | 2,593,000 | USD | 23,406 | (41 | ) | |||||||||||
Bank of Montreal | 7/5/2016 | NOK | 225,000 | USD | 26,901 | 8 | ||||||||||||
RBC Capital Markets | 7/5/2016 | NOK | 590,400 | USD | 70,589 | 21 | ||||||||||||
Bank of Montreal | 7/5/2016 | NZD | 5,000 | USD | 3,377 | 0 | ||||||||||||
RBC Capital Markets | 7/5/2016 | NZD | 16,000 | USD | 10,806 | 1 | ||||||||||||
The Bank of New York Mellon | 7/5/2016 | NZD | 2,000 | USD | 1,351 | 0 | ||||||||||||
Bank of Montreal | 7/5/2016 | SEK | 287,000 | USD | 34,403 | (56 | ) | |||||||||||
RBC Capital Markets | 7/5/2016 | SEK | 657,000 | USD | 78,757 | (128 | ) | |||||||||||
The Bank of New York Mellon | 7/5/2016 | SEK | 58,500 | USD | 7,013 | (11 | ) | |||||||||||
| See Notes to Financial Statements. | 51 |
DBX ETF Trust
Schedule of investments
Deutsche X-trackers MSCI EAFE High Dividend Yield Hedged Equity ETF (Continued)
May 31, 2016
Counterparty | Settlement Date | Currency To Deliver | Currency To Receive | Unrealized Appreciation (Depreciation) | ||||||||||||||
Bank of Montreal | 7/5/2016 | SGD | 37,000 | USD | 26,859 | $ | 7 | |||||||||||
RBC Capital Markets | 7/5/2016 | SGD | 104,000 | USD | 75,498 | 23 | ||||||||||||
The Bank of New York Mellon | 7/5/2016 | SGD | 45,400 | USD | 32,958 | 10 | ||||||||||||
RBC Capital Markets | 7/5/2016 | USD | 1,914 | CHF | 1,900 | 1 | ||||||||||||
RBC Capital Markets | 7/5/2016 | USD | 18,948 | EUR | 17,000 | (8 | ) | |||||||||||
RBC Capital Markets | 7/5/2016 | USD | 29,200 | EUR | 26,200 | (10 | ) | |||||||||||
RBC Capital Markets | 7/5/2016 | USD | 36,397 | GBP | 25,000 | (178 | ) | |||||||||||
RBC Capital Markets | 7/5/2016 | USD | 10,191 | GBP | 7,000 | (49 | ) | |||||||||||
RBC Capital Markets | 7/5/2016 | USD | 8,709 | GBP | 6,000 | (16 | ) | |||||||||||
|
| |||||||||||||||||
Total net unrealized appreciation | $ | 113,541 | ||||||||||||||||
|
| |||||||||||||||||
Currency Abbreviations
| AUD | Australian Dollar |
| CHF | Swiss Franc |
| DKK | Danish Krone |
| EUR | Euro |
| GBP | Pound Sterling |
| HKD | Hong Kong Dollar |
| JPY | Japanese Yen |
| NOK | Norwegian Krone |
| NZD | New Zealand Dollar |
| SEK | Swedish Krona |
| SGD | Singapore Dollar |
| USD | U.S. Dollar |
For information on the Fund’s policy and additional disclosures regarding forward foreign exchange currency contracts, please refer to the Derivatives section of Note 2 in the accompanying Notes to Financial Statements.
Fair Value Measurements
Various inputs are used in determining the value of the Fund’s investments. These inputs are summarized in three broad levels. Level 1 includes quoted prices in active markets for identical securities. Level 2 includes other significant observable inputs (including quoted prices for similar securities, interest rates, prepayment speeds and credit risk). Level 3 includes significant unobservable inputs (including the Fund’s own assumptions in determining the fair value of investments). The level assigned to the securities valuations may not be an indication of the risk or liquidity associated with investing in those securities.
The following is a summary of the inputs used as of May 31, 2016 in valuing the Fund’s investments. For information on Fund’s policy regarding the valuation of investments, please refer to the Security Valuation section of Note 2 in the accompanying Notes to Financial Statements.
Assets | Level 1 | Level 2 | Level 3 | Total | ||||||||||||
Common Stocks (g) | $ | 4,598,947 | $ | — | $ | — | $ | 4,598,947 | ||||||||
Preferred Stocks | 9,561 | — | — | 9,561 | ||||||||||||
Rights | 808 | — | — | 808 | ||||||||||||
Short-Term Investments | 264,645 | — | — | 264,645 | ||||||||||||
Derivatives (h) | ||||||||||||||||
Forward Foreign Currency Exchange Contracts | — | 128,407 | — | 128,407 | ||||||||||||
|
|
|
|
|
|
|
| |||||||||
Total | $ | 4,873,961 | $ | 128,407 | $ | — | $ | 5,002,368 | ||||||||
|
|
|
|
|
|
|
| |||||||||
Liabilities | Level 1 | Level 2 | Level 3 | Total | ||||||||||||
Derivatives (h) | ||||||||||||||||
Forward Foreign Currency Exchange Contracts | $ | — | $ | (14,866 | ) | $ | — | $ | (14,866 | ) | ||||||
|
|
|
|
|
|
|
| |||||||||
Total | $ | — | $ | (14,866 | ) | $ | — | $ | (14,866 | ) | ||||||
|
|
|
|
|
|
|
| |||||||||
| (g) | See Schedule of investments for additional detailed categorizations. |
| (h) | Derivatives include unrealized appreciation (depreciation) on forward foreign currency exchange contracts. |
There have been no transfers between fair value measurement levels during the period ended May 31, 2016.
| See Notes to Financial Statements. | 52 |
DBX ETF Trust
Schedule of investments
Deutsche X-trackers MSCI Emerging Markets High Dividend Yield Hedged Equity ETF
May 31, 2016
Number | Value | |||||||
| COMMON STOCKS — 98.9% | ||||||||
| Brazil — 7.1% | ||||||||
Ambev SA | 15,797 | $ | 83,540 | |||||
BB Seguridade Participacoes SA | 2,345 | 17,690 | ||||||
BM&FBovespa SA | 5,490 | 24,187 | ||||||
CCR SA | 3,248 | 13,707 | ||||||
CETIP SA — Mercados Organizados | 498 | 5,856 | ||||||
Tractebel Energia SA | 443 | 4,349 | ||||||
Transmissora Alianca de Energia Eletrica SA | 354 | 1,847 | ||||||
|
| |||||||
| 151,176 | ||||||||
|
| |||||||
| Chile — 0.7% | ||||||||
Banco de Chile | 154,413 | 15,544 | ||||||
|
| |||||||
| China — 25.0% | ||||||||
Agricultural Bank of China Ltd., Class H | 78,709 | 28,766 | ||||||
Anhui Conch Cement Co. Ltd., Class H | 4,475 | 10,826 | ||||||
Bank of China Ltd., Class H | 253,108 | 102,927 | ||||||
China Construction Bank Corp., Class H | 168,569 | 108,681 | ||||||
China Petroleum & Chemical Corp., Class H | 88,798 | 60,564 | ||||||
China Vanke Co. Ltd., Class H | 4,209 | 10,031 | ||||||
CNOOC Ltd. | 63,430 | 75,750 | ||||||
Country Garden Holdings Co. Ltd. (a) | 17,899 | 7,164 | ||||||
Industrial & Commercial Bank of China Ltd., Class H | 201,177 | 106,663 | ||||||
Jiangsu Expressway Co. Ltd., Class H | 4,737 | 6,486 | ||||||
Sino-Ocean Land Holdings Ltd. | 9,531 | 3,864 | ||||||
Sinopec Engineering Group Co. Ltd., Class H | 4,730 | 4,151 | ||||||
Zhejiang Expressway Co. Ltd., Class H | 5,584 | 5,231 | ||||||
|
| |||||||
| 531,104 | ||||||||
|
| |||||||
| Czech Republic — 0.7% | ||||||||
Komercni Banka AS | 357 | 14,039 | ||||||
|
| |||||||
| Hong Kong — 1.5% | ||||||||
China Everbright Ltd. | 2,890 | 5,549 | ||||||
China Power International Development Ltd. | 11,940 | 5,040 | ||||||
China Resources Power Holdings Co. Ltd. | 6,838 | 10,735 | ||||||
Shimao Property Holdings Ltd. | 3,984 | 5,045 | ||||||
Sun Art Retail Group Ltd. | 7,377 | 4,642 | ||||||
|
| |||||||
| 31,011 | ||||||||
|
| |||||||
| Hungary — 0.7% | ||||||||
MOL Hungarian Oil and Gas PLC | 260 | 14,300 | ||||||
|
| |||||||
| Indonesia — 1.2% | ||||||||
PT Indocement Tunggal Prakarsa Tbk | 5,777 | 7,042 | ||||||
PT Indofood Sukses Makmur Tbk | 10,737 | 5,443 | ||||||
PT Semen Indonesia Persero Tbk | 9,842 | 6,484 | ||||||
PT United Tractors Tbk | 6,299 | 6,548 | ||||||
|
| |||||||
| 25,517 | ||||||||
|
| |||||||
| Malaysia — 4.1% | ||||||||
Alliance Financial Group Bhd | 3,200 | 3,139 | ||||||
AMMB Holdings Bhd | 5,000 | 5,219 | ||||||
Axiata Group Bhd | 10,200 | 12,895 | ||||||
Number | Value | |||||||
| Malaysia (Continued) | ||||||||
British American Tobacco Malaysia Bhd | 400 | $ | 4,849 | |||||
DiGi.Com Bhd | 13,600 | 14,756 | ||||||
Malayan Banking Bhd | 12,400 | 24,506 | ||||||
Maxis Bhd | 6,300 | 8,392 | ||||||
MISC Bhd | 2,900 | 5,422 | ||||||
Telekom Malaysia Bhd | 4,800 | 7,824 | ||||||
|
| |||||||
| 87,002 | ||||||||
|
| |||||||
| Mexico — 0.8% | ||||||||
Kimberly-Clark de Mexico SAB de CV, Class A | 7,177 | 17,047 | ||||||
|
| |||||||
| Philippines — 0.2% | ||||||||
Globe Telecom, Inc. | 100 | 5,154 | ||||||
|
| |||||||
| Poland — 2.4% | ||||||||
Bank Pekao SA | 413 | 15,620 | ||||||
Polskie Gornictwo Naftowe i Gazownictwo SA | 21,366 | 28,660 | ||||||
Powszechny Zaklad Ubezpieczen SA | 998 | 7,901 | ||||||
|
| |||||||
| 52,181 | ||||||||
|
| |||||||
| Qatar — 0.7% | ||||||||
Barwa Real Estate Co. | 310 | 2,580 | ||||||
Masraf Al Rayan QSC | 917 | 8,275 | ||||||
Qatar Electricity & Water Co. QSC | 8 | 438 | ||||||
Qatar Islamic Bank SAQ | 147 | 3,735 | ||||||
|
| |||||||
| 15,028 | ||||||||
|
| |||||||
| Russia — 8.4% | ||||||||
Gazprom PAO, ADR | 9,200 | 40,222 | ||||||
Lukoil PJSC, ADR | 1,299 | 49,687 | ||||||
MegaFon PJSC, GDR | 2,543 | 28,482 | ||||||
Rosneft Oil Co. OJSC, GDR | 12,500 | 60,475 | ||||||
|
| |||||||
| 178,866 | ||||||||
|
| |||||||
| South Africa — 13.1% | ||||||||
Barclays Africa Group Ltd. | 1,399 | 12,992 | ||||||
Coronation Fund Managers Ltd. | 775 | 3,347 | ||||||
FirstRand Ltd. | 11,520 | 31,153 | ||||||
Foschini Group Ltd. (a) | 702 | 6,253 | ||||||
Imperial Holdings Ltd. | 494 | 4,401 | ||||||
Liberty Holdings Ltd. | 388 | 2,939 | ||||||
Life Healthcare Group Holdings Ltd. | 3,241 | 7,919 | ||||||
MMI Holdings Ltd. | 2,624 | 3,757 | ||||||
MTN Group Ltd. | 5,297 | 41,287 | ||||||
Nedbank Group Ltd. | 735 | 8,278 | ||||||
RMB Holdings Ltd. | 2,458 | 8,270 | ||||||
Sanlam Ltd. | 4,749 | 18,804 | ||||||
Sasol Ltd. | 2,005 | 60,853 | ||||||
SPAR Group Ltd. | 554 | 7,132 | ||||||
Standard Bank Group Ltd. | 4,296 | 33,898 | ||||||
Truworths International Ltd. | 1,488 | 8,902 | ||||||
Tsogo Sun Holdings Ltd. | 1,509 | 2,588 | ||||||
Vodacom Group Ltd. (a) | 1,560 | 16,318 | ||||||
|
| |||||||
| 279,091 | ||||||||
|
| |||||||
| See Notes to Financial Statements. | 53 |
DBX ETF Trust
Schedule of investments
Deutsche X-trackers MSCI Emerging Markets High Dividend Yield Hedged Equity ETF (Continued)
May 31, 2016
Number | Value | |||||||
| South Korea — 0.7% | ||||||||
SK Telecom Co. Ltd. | 77 | $ | 14,343 | |||||
|
| |||||||
| Taiwan — 24.7% | ||||||||
Advanced Semiconductor Engineering, Inc. | 21,736 | 24,593 | ||||||
Asia Cement Corp. | 13,683 | 10,426 | ||||||
Asustek Computer, Inc. | 2,457 | 21,095 | ||||||
Cathay Financial Holding Co. Ltd. | 24,925 | 28,813 | ||||||
Cheng Shin Rubber Industry Co. Ltd. | 6,501 | 13,356 | ||||||
Chicony Electronics Co. Ltd. | 1,965 | 4,736 | ||||||
Chunghwa Telecom Co. Ltd. | 12,868 | 43,403 | ||||||
CTBC Financial Holding Co. Ltd. | 47,612 | 24,965 | ||||||
Delta Electronics, Inc. | 6,251 | 28,751 | ||||||
Far EasTone Telecommunications Co. Ltd. | 5,915 | 13,621 | ||||||
Fubon Financial Holding Co. Ltd. | 19,536 | 23,063 | ||||||
Hon Hai Precision Industry Co. Ltd. | 44,247 | 108,676 | ||||||
Hua Nan Financial Holdings Co. Ltd. | 20,306 | 10,118 | ||||||
Inventec Corp. | 8,913 | 5,930 | ||||||
MediaTek, Inc. | 4,999 | 33,723 | ||||||
Merida Industry Co. Ltd. | 873 | 3,681 | ||||||
Nanya Technology Corp. | 2,300 | 2,800 | ||||||
Novatek Microelectronics Corp. | 2,141 | 7,123 | ||||||
Phison Electronics Corp. | 568 | 4,668 | ||||||
Quanta Computer, Inc. | 9,503 | 16,901 | ||||||
Realtek Semiconductor Corp. | 1,736 | 4,706 | ||||||
Ruentex Development Co. Ltd. | 363 | 420 | ||||||
Ruentex Industries Ltd. | 2,014 | 2,961 | ||||||
Siliconware Precision Industries Co. Ltd. | 6,866 | 11,158 | ||||||
Simplo Technology Co. Ltd. | 1,121 | 3,764 | ||||||
Synnex Technology International Corp. | 5,380 | 5,345 | ||||||
Taiwan Cement Corp. | 14,847 | 13,680 | ||||||
Taiwan Fertilizer Co. Ltd. | 4,044 | 5,326 | ||||||
Taiwan Mobile Co. Ltd. | 5,973 | 20,421 | ||||||
Teco Electric & Machinery Co. Ltd. | 6,668 | 5,347 | ||||||
Transcend Information, Inc. | 911 | 2,603 | ||||||
Vanguard International Semiconductor Corp. | 3,164 | 5,190 | ||||||
WPG Holdings Ltd. | 5,429 | 5,968 | ||||||
Yuanta Financial Holding Co. Ltd. | 21,319 | 7,191 | ||||||
Zhen Ding Technology Holding Ltd. | 1,195 | 2,250 | ||||||
|
| |||||||
| 526,772 | ||||||||
|
| |||||||
| Thailand — 2.5% | ||||||||
Krung Thai Bank PCL, NVDR | 45,200 | 21,635 | ||||||
Siam Commercial Bank PCL, NVDR | 8,500 | 31,883 | ||||||
|
| |||||||
| 53,518 | ||||||||
|
| |||||||
Number | Value | |||||||
| Turkey — 1.4% | ||||||||
Eregli Demir ve Celik Fabrikalari TAS | 6,580 | $ | 9,183 | |||||
TAV Havalimanlari Holding AS | 653 | 3,349 | ||||||
Tofas Turk Otomobil Fabrikasi AS | 629 | 4,717 | ||||||
Tupras Turkiye Petrol Rafinerileri AS | 569 | 12,837 | ||||||
|
| |||||||
| 30,086 | ||||||||
|
| |||||||
| United Arab Emirates — 3.0% | ||||||||
Abu Dhabi Commercial Bank PJSC | 6,751 | 10,954 | ||||||
Aldar Properties PJSC | 10,293 | 7,370 | ||||||
Dubai Islamic Bank PJSC | 4,854 | 6,740 | ||||||
Emaar Malls Group PJSC | 3,877 | 2,881 | ||||||
Emirates Telecommunications Group Co. PJSC | 4,312 | 20,779 | ||||||
First Gulf Bank PJSC | 4,613 | 14,882 | ||||||
|
| |||||||
| 63,606 | ||||||||
|
| |||||||
TOTAL COMMON STOCKS | 2,105,385 | |||||||
|
| |||||||
| PREFERRED STOCKS — 0.9% | ||||||||
| South Korea — 0.9% | ||||||||
Hyundai Motor Co. | 84 | 6,985 | ||||||
Hyundai Motor Co. — 2nd Preferred | 132 | 11,629 | ||||||
|
| |||||||
| 18,614 | ||||||||
|
| |||||||
TOTAL PREFERRED STOCKS | 18,614 | |||||||
|
| |||||||
| RIGHTS — 0.0% | ||||||||
| United Arab Emirates — 0.0% | ||||||||
Dubai Islamic Bank PJSC*, expires 7/31/16 | 1,213 | 615 | ||||||
|
| |||||||
| SECURITIES LENDING COLLATERAL — 1.4% | ||||||||
Daily Assets Fund “Capital Shares”, | 29,682 | 29,682 | ||||||
|
| |||||||
TOTAL INVESTMENTS — 101.2% (Cost $2,412,460)† | $ | 2,154,296 | ||||||
Other assets and liabilities, net — (1.2%) | (25,886 | ) | ||||||
|
| |||||||
NET ASSETS — 100.0% | $ | 2,128,410 | ||||||
|
| |||||||
| * | Non-income producing security. |
| † | The cost for federal income tax purposes was $2,423,947. At May 31, 2016, net unrealized depreciation for all securities based on tax cost was $269,651. This consisted of aggregate gross unrealized appreciation for all securities in which there was an excess of value over tax cost of $42,091 and aggregate gross unrealized depreciation for all securities in which there was an excess of tax cost over value of $311,742. |
| (a) | All or a portion of these securities were on loan. In addition, “Other Assets and Liabilities, Net” may include pending sales that are also on loan. The value of securities loaned at May 31, 2016 amounted to $27,799, which is 1.3% of net assets. |
| (b) | Affiliated fund managed by Deutsche Investment Management Americas Inc. The rate shown is the annualized seven-day yield at period end. |
| (c) | Represents collateral held in connection with securities lending. Income earned by the Fund is net of borrower rebates. |
| See Notes to Financial Statements. | 54 |
DBX ETF Trust
Schedule of investments
Deutsche X-trackers MSCI Emerging Markets High Dividend Yield Hedged Equity ETF (Continued)
May 31, 2016
| ADR: | American Depositary Receipt |
| GDR: | Global Depositary Receipt |
| NVDR: | Non Voting Depositary Receipt |
| OJSC: | Open Joint Stock Company |
| PJSC: | Private Joint Stock Company |
As of May 31, 2016, the Fund had the following forward foreign currency exchange contracts outstanding:
Counterparty | Settlement Date | Currency To Deliver | Currency To Receive | Unrealized Appreciation (Depreciation) | ||||||||||||||
RBC Capital Markets | 6/2/2016 | AED | 30,000 | USD | 8,166 | $ | (1 | ) | ||||||||||
The Bank of New York Mellon | 6/2/2016 | AED | 202,308 | USD | 55,072 | (7 | ) | |||||||||||
RBC Capital Markets | 6/2/2016 | CZK | 503,000 | USD | 21,311 | 600 | ||||||||||||
The Bank of New York Mellon | 6/2/2016 | CZK | 109,900 | USD | 4,656 | 131 | ||||||||||||
RBC Capital Markets | 6/2/2016 | HKD | 96,000 | USD | 12,378 | 24 | ||||||||||||
RBC Capital Markets | 6/2/2016 | HKD | 32,600 | USD | 4,197 | 1 | ||||||||||||
RBC Capital Markets | 6/2/2016 | HKD | 4,117,106 | USD | 530,889 | 1,068 | ||||||||||||
RBC Capital Markets | 6/2/2016 | HUF | 4,508,600 | USD | 16,563 | 565 | ||||||||||||
RBC Capital Markets | 6/2/2016 | PLN | 151,000 | USD | 39,503 | 1,213 | ||||||||||||
RBC Capital Markets | 6/2/2016 | TRY | 88,000 | USD | 31,230 | 1,421 | ||||||||||||
RBC Capital Markets | 6/2/2016 | TRY | 1,900 | USD | 644 | 0 | ||||||||||||
RBC Capital Markets | 6/2/2016 | USD | 8,168 | AED | 30,000 | (1 | ) | |||||||||||
RBC Capital Markets | 6/2/2016 | USD | 20,721 | CZK | 503,000 | (10 | ) | |||||||||||
RBC Capital Markets | 6/2/2016 | USD | 532,444 | HKD | 4,136,106 | (178 | ) | |||||||||||
RBC Capital Markets | 6/2/2016 | USD | 9,929 | HKD | 77,000 | (20 | ) | |||||||||||
RBC Capital Markets | 6/2/2016 | USD | 571 | HUF | 155,400 | (20 | ) | |||||||||||
RBC Capital Markets | 6/2/2016 | USD | 15,454 | HUF | 4,353,200 | (8 | ) | |||||||||||
RBC Capital Markets | 6/2/2016 | USD | 1,230 | PLN | 4,700 | (38 | ) | |||||||||||
RBC Capital Markets | 6/2/2016 | USD | 37,093 | PLN | 146,300 | 5 | ||||||||||||
RBC Capital Markets | 6/2/2016 | USD | 28,248 | TRY | 83,400 | 3 | ||||||||||||
RBC Capital Markets | 6/2/2016 | USD | 1,632 | TRY | 4,600 | (74 | ) | |||||||||||
The Bank of New York Mellon | 6/2/2016 | USD | 6,942 | AED | 25,500 | 1 | ||||||||||||
The Bank of New York Mellon | 6/2/2016 | USD | 681 | AED | 2,500 | 0 | ||||||||||||
The Bank of New York Mellon | 6/2/2016 | USD | 2,832 | AED | 10,400 | 0 | ||||||||||||
The Bank of New York Mellon | 6/2/2016 | USD | 44,626 | AED | 163,908 | (2 | ) | |||||||||||
The Bank of New York Mellon | 6/2/2016 | USD | 2,521 | CZK | 61,200 | (1 | ) | |||||||||||
The Bank of New York Mellon | 6/2/2016 | USD | 2,073 | CZK | 48,700 | (68 | ) | |||||||||||
The Bank of New York Mellon | 6/2/2016 | USD | 4,201 | HKD | 32,600 | (6 | ) | |||||||||||
The Bank of New York Mellon | 6/2/2016 | USD | 640 | TRY | 1,900 | 4 | ||||||||||||
RBC Capital Markets | 6/3/2016 | BRL | 7,000 | USD | 1,943 | 7 | ||||||||||||
State Street Bank & Trust Co. | 6/3/2016 | BRL | 28,085 | USD | 7,794 | 29 | ||||||||||||
The Bank of New York Mellon | 6/3/2016 | BRL | 587,854 | USD | 168,488 | 5,961 | ||||||||||||
Bank of Montreal | 6/3/2016 | CLP | 9,448,000 | USD | 14,312 | 680 | ||||||||||||
Bank of Montreal | 6/3/2016 | IDR | 330,191,000 | USD | 24,937 | 780 | ||||||||||||
Bank of Montreal | 6/3/2016 | KRW | 55,591,000 | USD | 48,653 | 2,011 | ||||||||||||
RBC Capital Markets | 6/3/2016 | MXN | 302,000 | USD | 17,575 | 1,218 | ||||||||||||
The Bank of New York Mellon | 6/3/2016 | MXN | 22,900 | USD | 1,333 | 93 | ||||||||||||
Bank of Montreal | 6/3/2016 | MYR | 529,425 | USD | 135,365 | 7,172 | ||||||||||||
RBC Capital Markets | 6/3/2016 | MYR | 43,000 | USD | 10,473 | 61 | ||||||||||||
State Street Bank & Trust Co. | 6/3/2016 | RUB | 1,484,810 | USD | 22,801 | 554 | ||||||||||||
The Bank of New York Mellon | 6/3/2016 | RUB | 8,740,119 | USD | 134,277 | 3,321 | ||||||||||||
The Bank of New York Mellon | 6/3/2016 | RUB | 947,000 | USD | 14,489 | 300 | ||||||||||||
Bank of Montreal | 6/3/2016 | THB | 3,566,043 | USD | 102,091 | 2,277 | ||||||||||||
The Bank of New York Mellon | 6/3/2016 | THB | 757,939 | USD | 21,215 | 0 | ||||||||||||
Bank of Montreal | 6/3/2016 | TWD | 10,604,880 | USD | 328,824 | 3,624 | ||||||||||||
RBC Capital Markets | 6/3/2016 | TWD | 1,257,800 | USD | 38,607 | 36 | ||||||||||||
State Street Bank & Trust Co. | 6/3/2016 | TWD | 6,223,713 | USD | 193,073 | 2,222 | ||||||||||||
Bank of Montreal | 6/3/2016 | USD | 13,676 | CLP | 9,448,000 | (44 | ) | |||||||||||
Bank of Montreal | 6/3/2016 | USD | 24,208 | IDR | 330,191,000 | (50 | ) | |||||||||||
| See Notes to Financial Statements. | 55 |
DBX ETF Trust
Schedule of investments
Deutsche X-trackers MSCI Emerging Markets High Dividend Yield Hedged Equity ETF (Continued)
May 31, 2016
Counterparty | Settlement Date | Currency To Deliver | Currency To Receive | Unrealized Appreciation (Depreciation) | ||||||||||||||
Bank of Montreal | 6/3/2016 | USD | 46,696 | KRW | 55,591,000 | $ | (54 | ) | ||||||||||
Bank of Montreal | 6/3/2016 | USD | 128,783 | MYR | 529,425 | (590 | ) | |||||||||||
Bank of Montreal | 6/3/2016 | USD | 99,819 | THB | 3,566,043 | (5 | ) | |||||||||||
Bank of Montreal | 6/3/2016 | USD | 327,109 | TWD | 10,604,880 | (1,909 | ) | |||||||||||
RBC Capital Markets | 6/3/2016 | USD | 2,002 | BRL | 7,000 | (67 | ) | |||||||||||
RBC Capital Markets | 6/3/2016 | USD | 16,409 | MXN | 302,000 | (52 | ) | |||||||||||
RBC Capital Markets | 6/3/2016 | USD | 6,907 | MYR | 27,000 | (370 | ) | |||||||||||
RBC Capital Markets | 6/3/2016 | USD | 4,093 | MYR | 16,000 | (219 | ) | |||||||||||
RBC Capital Markets | 6/3/2016 | USD | 18,505 | TWD | 596,800 | (204 | ) | |||||||||||
RBC Capital Markets | 6/3/2016 | USD | 20,495 | TWD | 661,000 | (226 | ) | |||||||||||
RBC Capital Markets | 6/3/2016 | USD | 9,297 | ZAR | 132,639 | (863 | ) | |||||||||||
RBC Capital Markets | 6/3/2016 | USD | 306,134 | ZAR | 4,815,826 | 86 | ||||||||||||
State Street Bank & Trust Co. | 6/3/2016 | USD | 8,054 | BRL | 28,085 | (289 | ) | |||||||||||
State Street Bank & Trust Co. | 6/3/2016 | USD | 22,457 | RUB | 1,484,810 | (209 | ) | |||||||||||
State Street Bank & Trust Co. | 6/3/2016 | USD | 191,029 | TWD | 6,223,713 | (178 | ) | |||||||||||
The Bank of New York Mellon | 6/3/2016 | USD | 1,149 | BRL | 4,000 | (43 | ) | |||||||||||
The Bank of New York Mellon | 6/3/2016 | USD | 8,476 | BRL | 30,000 | (181 | ) | |||||||||||
The Bank of New York Mellon | 6/3/2016 | USD | 153,806 | BRL | 553,854 | (679 | ) | |||||||||||
The Bank of New York Mellon | 6/3/2016 | USD | 1,244 | MXN | 22,900 | (4 | ) | |||||||||||
The Bank of New York Mellon | 6/3/2016 | USD | 146,360 | RUB | 9,687,119 | (1,214 | ) | |||||||||||
The Bank of New York Mellon | 6/3/2016 | USD | 21,682 | THB | 757,939 | (467 | ) | |||||||||||
The Bank of New York Mellon | 6/3/2016 | USD | 1,096 | ZAR | 16,500 | (47 | ) | |||||||||||
RBC Capital Markets | 6/3/2016 | ZAR | 243,000 | USD | 17,031 | 1,580 | ||||||||||||
RBC Capital Markets | 6/3/2016 | ZAR | 16,500 | USD | 1,049 | 0 | ||||||||||||
RBC Capital Markets | 6/3/2016 | ZAR | 4,705,464 | USD | 329,817 | 30,614 | ||||||||||||
The Bank of New York Mellon | 6/6/2016 | QAR | 111,789 | USD | 30,683 | (21 | ) | |||||||||||
The Bank of New York Mellon | 6/6/2016 | USD | 30,703 | QAR | 111,789 | 0 | ||||||||||||
RBC Capital Markets | 7/5/2016 | HKD | 4,136,106 | USD | 532,683 | 141 | ||||||||||||
RBC Capital Markets | 7/5/2016 | HUF | 4,353,200 | USD | 15,446 | 7 | ||||||||||||
RBC Capital Markets | 7/5/2016 | MXN | 302,000 | USD | 16,351 | 55 | ||||||||||||
The Bank of New York Mellon | 7/5/2016 | MXN | 22,900 | USD | 1,240 | 4 | ||||||||||||
RBC Capital Markets | 7/5/2016 | PLN | 146,300 | USD | 37,061 | (3 | ) | |||||||||||
RBC Capital Markets | 7/5/2016 | USD | 4,199 | HKD | 32,600 | (1 | ) | |||||||||||
RBC Capital Markets | 7/5/2016 | USD | 21,639 | HKD | 168,000 | (8 | ) | |||||||||||
RBC Capital Markets | 7/5/2016 | USD | 19,458 | ZAR | 308,000 | (9 | ) | |||||||||||
RBC Capital Markets | 7/5/2016 | USD | 1,042 | ZAR | 16,500 | 0 | ||||||||||||
RBC Capital Markets | 7/5/2016 | ZAR | 4,815,826 | USD | 304,154 | 43 | ||||||||||||
The Bank of New York Mellon | 7/6/2016 | BRL | 553,854 | USD | 152,304 | 719 | ||||||||||||
Bank of Montreal | 7/6/2016 | CLP | 9,448,000 | USD | 13,632 | 43 | ||||||||||||
Bank of Montreal | 7/6/2016 | KRW | 55,591,000 | USD | 46,656 | 46 | ||||||||||||
State Street Bank & Trust Co. | 7/6/2016 | RUB | 1,484,810 | USD | 22,251 | 207 | ||||||||||||
The Bank of New York Mellon | 7/6/2016 | RUB | 9,687,119 | USD | 145,017 | 1,197 | ||||||||||||
Bank of Montreal | 7/6/2016 | TWD | 10,604,880 | USD | 326,908 | 1,476 | ||||||||||||
State Street Bank & Trust Co. | 7/6/2016 | TWD | 6,223,713 | USD | 190,824 | (163 | ) | |||||||||||
RBC Capital Markets | 7/6/2016 | USD | 1,925 | BRL | 7,000 | (9 | ) | |||||||||||
RBC Capital Markets | 7/6/2016 | USD | 38,560 | TWD | 1,257,800 | 38 | ||||||||||||
RBC Capital Markets | 7/6/2016 | USD | 9,688 | TWD | 316,000 | 10 | ||||||||||||
State Street Bank & Trust Co. | 7/6/2016 | USD | 7,719 | BRL | 28,085 | (32 | ) | |||||||||||
The Bank of New York Mellon | 7/6/2016 | USD | 12,113 | RUB | 805,000 | (161 | ) | |||||||||||
RBC Capital Markets | 7/7/2016 | CZK | 503,000 | USD | 20,740 | 6 | ||||||||||||
The Bank of New York Mellon | 7/7/2016 | CZK | 61,200 | USD | 2,523 | 0 | ||||||||||||
Bank of Montreal | 7/7/2016 | THB | 3,566,043 | USD | 99,819 | 62 | ||||||||||||
The Bank of New York Mellon | 7/7/2016 | USD | 21,197 | THB | 757,939 | 5 | ||||||||||||
Bank of Montreal | 7/8/2016 | MYR | 529,425 | USD | 128,682 | 803 | ||||||||||||
RBC Capital Markets | 7/8/2016 | TRY | 83,400 | USD | 27,979 | 10 | ||||||||||||
RBC Capital Markets | 7/8/2016 | USD | 10,454 | MYR | 43,000 | (67 | ) | |||||||||||
| See Notes to Financial Statements. | 56 |
DBX ETF Trust
Schedule of investments
Deutsche X-trackers MSCI Emerging Markets High Dividend Yield Hedged Equity ETF (Continued)
May 31, 2016
Counterparty | Settlement Date | Currency To Deliver | Currency To Receive | Unrealized Appreciation (Depreciation) | ||||||||||||||
RBC Capital Markets | 7/8/2016 | USD | 5,105 | MYR | 21,000 | $ | (33 | ) | ||||||||||
RBC Capital Markets | 7/8/2016 | USD | 637 | TRY | 1,900 | 0 | ||||||||||||
RBC Capital Markets | 7/11/2016 | AED | 30,000 | USD | 8,167 | 0 | ||||||||||||
The Bank of New York Mellon | 7/11/2016 | AED | 163,908 | USD | 44,619 | 0 | ||||||||||||
The Bank of New York Mellon | 7/11/2016 | QAR | 111,789 | USD | 30,667 | (12 | ) | |||||||||||
Bank of Montreal | 7/12/2016 | IDR | 330,191,000 | USD | 24,107 | 116 | ||||||||||||
|
| |||||||||||||||||
Total net unrealized appreciation | $ | 63,733 | ||||||||||||||||
|
| |||||||||||||||||
Currency Abbreviations
| AED | Arab Emirates Dirham |
| BRL | Brazilian Real |
| CLP | Chilean Peso |
| CZK | Czech Koruna |
| HKD | Hong Kong Dollar |
| HUF | Hungarian Forint |
| IDR | Indonesian Rupiah |
| KRW | South Korean Won |
| MXN | Mexican Peso |
| MYR | Malaysian Ringgit |
| PLN | Polish Zloty |
| QAR | Qatari Rial |
| RUB | Russian Ruble |
| THB | Thai Baht |
| TRY | Turkish New Lira |
| TWD | New Taiwan Dollar |
| USD | U.S. Dollar |
| ZAR | South African Rand |
For information on the Fund’s policy and additional disclosures regarding forward foreign currency exchange contracts, please refer to the Derivatives section of Note 2 in the accompanying Notes to Financial Statements.
Fair Value Measurements
Various inputs are used in determining the value of the Fund’s investments. These inputs are summarized in three broad levels. Level 1 includes quoted prices in active markets for identical securities. Level 2 includes other significant observable inputs (including quoted prices for similar securities, interest rates, prepayment speeds and credit risk). Level 3 includes significant unobservable inputs (including the Fund’s own assumptions in determining the fair value of investments). The level assigned to the securities valuations may not be an indication of the risk or liquidity associated with investing in those securities.
The following is a summary of the inputs used as of May 31, 2016 in valuing the Fund’s investments. For information on Fund’s policy regarding the valuation of investments, please refer to the security Valuation section of Note 2 in the accompanying Notes to Financial Statements.
Assets | Level 1 | Level 2 | Level 3 | Total | ||||||||||||
Common Stocks (d) | $ | 2,105,385 | $ | — | $ | — | $ | 2,105,385 | ||||||||
Preferred Stocks | 18,614 | — | — | 18,614 | ||||||||||||
Rights | 615 | — | — | 615 | ||||||||||||
Short-Term Investments | 29,682 | — | — | 29,682 | ||||||||||||
Derivatives (e) | ||||||||||||||||
Forward Foreign Currency Exchange Contracts | — | 72,650 | — | 72,650 | ||||||||||||
|
|
|
|
|
|
|
| |||||||||
Total | $ | 2,154,296 | $ | 72,650 | $ | — | $ | 2,226,946 | ||||||||
|
|
|
|
|
|
|
| |||||||||
Liabilities | Level 1 | Level 2 | Level 3 | Total | ||||||||||||
Derivatives (e) | ||||||||||||||||
Forward Foreign Currency Exchange Contracts | $ | — | $ | (8,917 | ) | $ | — | $ | (8,917 | ) | ||||||
|
|
|
|
|
|
|
| |||||||||
Total | $ | — | $ | (8,917 | ) | $ | — | $ | (8,917 | ) | ||||||
|
|
|
|
|
|
|
| |||||||||
| (d) | See Schedule of Investments for additional detailed categorizations. |
| (e) | Derivatives include unrealized appreciation (depreciation) on forward foreign currency exchange contracts. |
There have been no transfers between fair value measurement levels during the period ended May 31, 2016.
| See Notes to Financial Statements. | 57 |
DBX ETF Trust
Schedule of investments
Deutsche X-trackers MSCI Eurozone High Dividend Yield Hedged Equity ETF
May 31, 2016
Number | Value | |||||||
| COMMON STOCKS — 99.2% | ||||||||
| Belgium — 2.9% | ||||||||
Ageas | 1,743 | $ | 70,505 | |||||
|
| |||||||
| Finland — 18.3% | ||||||||
Elisa OYJ | 1,213 | 46,212 | ||||||
Fortum OYJ | 3,843 | 57,639 | ||||||
Metso OYJ | 961 | 22,572 | ||||||
Nokian Renkaat OYJ (a) | 976 | 34,457 | ||||||
Orion OYJ, Class B | 869 | 31,182 | ||||||
Sampo OYJ, Class A | 2,671 | 119,083 | ||||||
Stora Enso OYJ, Class R | 4,766 | 40,858 | ||||||
UPM-Kymmene OYJ | 4,617 | 88,820 | ||||||
|
| |||||||
| 440,823 | ||||||||
|
| |||||||
| France — 19.9% | ||||||||
AXA SA | 4,998 | 125,567 | ||||||
Bouygues SA | 1,792 | 58,221 | ||||||
CNP Assurances | 1,462 | 24,807 | ||||||
Edenred | 1,771 | 32,809 | ||||||
Eutelsat Communications SA | 1,511 | 30,127 | ||||||
Rexel SA | 2,573 | 39,350 | ||||||
SCOR SE | 1,412 | 47,210 | ||||||
Total SA (a) | 2,474 | 120,223 | ||||||
|
| |||||||
| 478,314 | ||||||||
|
| |||||||
| Germany — 26.6% | ||||||||
Allianz SE | 765 | 124,867 | ||||||
Axel Springer SE | 378 | 21,500 | ||||||
Bayerische Motoren Werke AG | 1,288 | 108,757 | ||||||
Daimler AG | 1,816 | 124,042 | ||||||
Muenchener Rueckversicherungs-Gesellschaft AG | 656 | 123,243 | ||||||
ProSiebenSat.1 Media SE*(d) | 1,893 | 95,170 | ||||||
Volkswagen AG*(a)(d) | 281 | 43,381 | ||||||
|
| |||||||
| 640,960 | ||||||||
|
| |||||||
| Italy — 12.6% | ||||||||
Atlantia SpA | 3,572 | 96,339 | ||||||
Snam SpA | 20,276 | 116,071 | ||||||
Terna Rete Elettrica Nazionale SpA | 13,040 | 72,312 | ||||||
UnipolSai SpA (a) | 9,791 | 19,576 | ||||||
|
| |||||||
| 304,298 | ||||||||
|
| |||||||
Number | Value | |||||||
| Luxembourg — 2.6% | ||||||||
SES SA FDR | 2,824 | $ | 63,250 | |||||
|
| |||||||
| Netherlands — 1.1% | ||||||||
Koninklijke Boskalis Westminster NV | 761 | 27,561 | ||||||
|
| |||||||
| Portugal — 2.8% | ||||||||
EDP — Energias de Portugal SA | 20,031 | 66,751 | ||||||
|
| |||||||
| Spain — 12.4% | ||||||||
Abertis Infraestructuras SA | 4,712 | 72,141 | ||||||
Enagas SA | 1,962 | 58,810 | ||||||
Gas Natural SDG SA | 3,030 | 59,976 | ||||||
Mapfre SA | 9,178 | 23,262 | ||||||
Red Electrica Corp. SA | 937 | 83,445 | ||||||
|
| |||||||
| 297,634 | ||||||||
|
| |||||||
TOTAL COMMON STOCKS | 2,390,096 | |||||||
|
| |||||||
| PREFERRED STOCK — 0.7% | ||||||||
| Germany — 0.7% | ||||||||
Bayerische Motoren Werke AG | 212 | 15,592 | ||||||
|
| |||||||
| RIGHTS — 0.1% | ||||||||
| Spain — 0.1% | ||||||||
Abertis Infraestructuras SA*, expires 6/30/16 (Cost $0) | 4,421 | 3,389 | ||||||
|
| |||||||
| SECURITIES LENDING COLLATERAL — 6.7% | ||||||||
Daily Assets Fund “Capital Shares”, 0.48% (b)(c) | 160,970 | 160,970 | ||||||
|
| |||||||
TOTAL INVESTMENTS — 106.7% (Cost $2,659,059)† | $ | 2,570,047 | ||||||
Other assets and liabilities, net — (6.7%) | (160,770 | ) | ||||||
|
| |||||||
NET ASSETS — 100.0% | $ | 2,409,277 | ||||||
|
| |||||||
| * | Non-income producing security. |
| † | The cost for federal income tax purposes was $2,668,364. At May 31, 2016, net unrealized depreciation for all securities based on tax cost was $98,317. This consisted of aggregate gross unrealized appreciation for all securities in which there was an excess of value over tax cost of $53,283 and aggregate gross unrealized depreciation for all securities in which there was an excess of tax cost over value of $151,600. |
| (a) | All or a portion of these securities were on loan. In addition, “Other Assets and Liabilities, Net” may include pending sales that are also on loan. The value of securities loaned at May 31, 2016 amounted to $152,081, which is 6.3% of net assets. |
| (b) | Affiliated fund managed by Deutsche Investment Management Americas Inc. The rate shown is the annualized seven-day yield at period end. |
| (c) | Represents collateral held in connection with securities lending. Income earned by the Fund is net of borrower rebates. |
| (d) | Company declared its annual dividend during the 12-month period ended May 31, 2016, the scheduled payment date was subsequent to May 31, 2016. |
| FDR: | Fiduciary Depositary Receipt |
| See Notes to Financial Statements. | 58 |
DBX ETF Trust
Schedule of investments
Deutsche X-trackers MSCI Eurozone High Dividend Yield Hedged Equity ETF (Continued)
May 31, 2016
As of May 31, 2016, the Fund had the following forward foreign currency exchange contracts outstanding:
Counterparty | Settlement Date | Currency To Deliver | Currency To Receive | Unrealized Appreciation (Depreciation) | ||||||||||||||
Bank of Montreal | 6/2/2016 | EUR | 598,942 | USD | 686,573 | $ | 20,164 | |||||||||||
RBC Capital Markets | 6/2/2016 | EUR | 1,461,133 | USD | 1,674,911 | 49,190 | ||||||||||||
RBC Capital Markets | 6/2/2016 | EUR | 47,000 | USD | 53,875 | 1,581 | ||||||||||||
RBC Capital Markets | 6/2/2016 | EUR | 26,000 | USD | 29,761 | 833 | ||||||||||||
The Bank of New York Mellon | 6/2/2016 | EUR | 3,300 | USD | 3,803 | 132 | ||||||||||||
The Bank of New York Mellon | 6/2/2016 | EUR | 600 | USD | 683 | 15 | ||||||||||||
Bank of Montreal | 6/2/2016 | USD | 686,573 | EUR | 616,728 | (374 | ) | |||||||||||
RBC Capital Markets | 6/2/2016 | USD | 1,755,906 | EUR | 1,577,279 | (956 | ) | |||||||||||
RBC Capital Markets | 6/2/2016 | USD | 2,641 | EUR | 2,304 | (77 | ) | |||||||||||
The Bank of New York Mellon | 6/2/2016 | USD | 3,336 | EUR | 2,996 | (2 | ) | |||||||||||
The Bank of New York Mellon | 6/2/2016 | USD | 1,151 | EUR | 1,000 | (38 | ) | |||||||||||
Bank of Montreal | 7/5/2016 | EUR | 616,034 | USD | 686,573 | 240 | ||||||||||||
RBC Capital Markets | 7/5/2016 | EUR | 1,575,510 | USD | 1,755,906 | 606 | ||||||||||||
The Bank of New York Mellon | 7/5/2016 | EUR | 2,993 | USD | 3,336 | 1 | ||||||||||||
RBC Capital Markets | 7/5/2016 | USD | 32,322 | EUR | 29,000 | (13 | ) | |||||||||||
|
| |||||||||||||||||
Total net unrealized appreciation | $ | 71,302 | ||||||||||||||||
|
| |||||||||||||||||
Currency Abbreviations
| EUR | Euro |
| USD | U.S. Dollar |
For information on the Fund’s policy and additional disclosures regarding forward foreign currency exchange contracts, please refer to the Derivatives section of Note 2 in the accompanying Notes to Financial Statements.
Fair Value Measurements
Various inputs are used in determining the value of the Fund’s investments. These inputs are summarized in three broad levels. Level 1 includes quoted prices in active markets for identical securities. Level 2 includes other significant observable inputs (including quoted prices for similar securities, interest rates, prepayment speeds and credit risk). Level 3 includes significant unobservable inputs (including the Fund’s own assumptions in determining the fair value of investments). The level assigned to the securities valuations may not be an indication of the risk or liquidity associated with investing in those securities.
The following is a summary of the inputs used as of May 31, 2016 in valuing the Fund’s investments. For information on Fund’s policy regarding the valuation of investments, please refer to the Security Valuation section of Note 2 in the accompanying Notes to Financial Statements.
Assets | Level 1 | Level 2 | Level 3 | Total | ||||||||||||
Common Stocks (e) | $ | 2,390,096 | $ | — | $ | — | $ | 2,390,096 | ||||||||
Preferred Stocks | 15,592 | — | — | 15,592 | ||||||||||||
Rights | 3,389 | — | — | 3,389 | ||||||||||||
Short-Term Investments | 160,970 | — | — | 160,970 | ||||||||||||
Derivatives (f) | ||||||||||||||||
Forward Foreign Currency Exchange Contracts | — | 72,762 | — | 72,762 | ||||||||||||
|
|
|
|
|
|
|
| |||||||||
Total | $ | 2,570,047 | $ | 72,762 | $ | — | $ | 2,642,809 | ||||||||
|
|
|
|
|
|
|
| |||||||||
Liabilities | Level 1 | Level 2 | Level 3 | Total | ||||||||||||
Derivatives (f) | ||||||||||||||||
Forward Foreign Currency Exchange Contracts | $ | — | $ | (1,460 | ) | $ | — | $ | (1,460 | ) | ||||||
|
|
|
|
|
|
|
| |||||||||
Total | $ | — | $ | (1,460 | ) | $ | — | $ | (1,460 | ) | ||||||
|
|
|
|
|
|
|
| |||||||||
| (e) | See Schedule of investments for additional detailed categorizations. |
| (f) | Derivatives include unrealized appreciation (depreciation) on forward foreign currency exchange contracts. |
There have been no transfers between fair value measurement levels during the period ended May 31, 2016.
| See Notes to Financial Statements. | 59 |
DBX ETF Trust
Statements of assets and liabilities
May 31, 2016
| Deutsche X-trackers Emerging Markets Bond — Interest Rate Hedged ETF | Deutsche X-trackers High Yield Corporate Bond — Interest Rate Hedged ETF | Deutsche X-trackers Investment Grade Bond — Interest Rate Hedged ETF | ||||||||||
Assets | ||||||||||||
Investments in non-affiliated securities at value | $ | 5,746,381 | $ | 8,345,433 | $ | 4,564,779 | ||||||
Investment in Daily Assets Fund* | — | 544,146 | 82,800 | |||||||||
Cash | 92,982 | 394,067 | 81,279 | |||||||||
Deposit with broker for futures contracts | 88,725 | 81,561 | 82,420 | |||||||||
| Receivables: | ||||||||||||
Investment securities sold | — | 95,996 | — | |||||||||
Interest | 86,371 | 125,698 | 49,620 | |||||||||
Securities lending income | — | 458 | 20 | |||||||||
|
|
|
|
|
| |||||||
Total Assets | $ | 6,014,459 | $ | 9,587,359 | $ | 4,860,918 | ||||||
|
|
|
|
|
| |||||||
Liabilities | ||||||||||||
Payable upon return of securities loaned | $ | — | $ | 544,146 | $ | 82,800 | ||||||
Unrealized depreciation on futures contracts | 21,876 | 19,480 | 19,554 | |||||||||
| Payables: | ||||||||||||
Investment securities purchased | — | 129,731 | — | |||||||||
Investment advisory fees | 2,538 | 3,350 | 1,006 | |||||||||
| �� |
|
|
|
|
|
| ||||||
Total Liabilities | 24,414 | 696,707 | 103,360 | |||||||||
|
|
|
|
|
| |||||||
Net Assets, at value | $ | 5,990,045 | $ | 8,890,652 | $ | 4,757,558 | ||||||
|
|
|
|
|
| |||||||
Net Assets Consist of | ||||||||||||
Paid-in capital | $ | 6,236,855 | $ | 9,927,222 | $ | 5,036,435 | ||||||
Undistributed net investment income | 26,243 | 34,224 | 13,055 | |||||||||
Accumulated net realized gain (loss) on investments and futures | (223,662 | ) | (646,314 | ) | (287,844 | ) | ||||||
Net unrealized appreciation (depreciation) on investments and futures | (49,391 | ) | (424,480 | ) | (4,088 | ) | ||||||
|
|
|
|
|
| |||||||
Net Assets, at value | $ | 5,990,045 | $ | 8,890,652 | $ | 4,757,558 | ||||||
|
|
|
|
|
| |||||||
Number of Common Shares outstanding | 250,001 | 400,001 | 200,001 | |||||||||
|
|
|
|
|
| |||||||
Net Asset Value | $ | 23.96 | $ | 22.23 | $ | 23.79 | ||||||
|
|
|
|
|
| |||||||
Investments in non-affiliated securities at cost | $ | 5,773,896 | $ | 8,750,433 | $ | 4,549,313 | ||||||
|
|
|
|
|
| |||||||
Value of securities loaned | $ | — | $ | 529,049 | $ | 79,730 | ||||||
|
|
|
|
|
| |||||||
Investment in Daily Assets Fund at cost* | $ | — | $ | 544,146 | $ | 82,800 | ||||||
|
|
|
|
|
| |||||||
| * | Represents collateral on securities loaned. |
| See Notes to Financial Statements. | 60 |
DBX ETF Trust
Statements of assets and liabilities (Continued)
May 31, 2016
| Deutsche X-trackers Municipal Infrastructure Revenue Bond ETF | Deutsche X-trackers MSCI All World ex US High Dividend Yield Hedged Equity ETF | Deutsche X-trackers MSCI EAFE High Dividend Yield Hedged Equity ETF | ||||||||||
Assets | ||||||||||||
Investments in non-affiliated securities at value | $ | 35,436,100 | $ | 3,423,776 | $ | 4,609,316 | ||||||
Investment in Daily Assets Fund* | — | 49,313 | 264,645 | |||||||||
Cash | 803,383 | 538 | 595 | |||||||||
Foreign currency at value | — | 8,058 | 13,728 | |||||||||
Unrealized appreciation on forward foreign currency exchange contracts | — | 114,585 | 128,407 | |||||||||
| Receivables: | ||||||||||||
Investment securities sold | — | 464,870 | 612,609 | |||||||||
Dividends | — | 12,222 | 18,073 | |||||||||
Interest | 443,399 | — | — | |||||||||
Securities lending income | — | 418 | 727 | |||||||||
Foreign tax reclaim | — | 4,030 | 2,982 | |||||||||
|
|
|
|
|
| |||||||
Total Assets | $ | 36,682,882 | $ | 4,077,810 | $ | 5,651,082 | ||||||
|
|
|
|
|
| |||||||
Liabilities | ||||||||||||
Payable upon return of securities loaned | $ | — | $ | 49,313 | $ | 264,645 | ||||||
Unrealized depreciation on forward foreign currency exchange contracts | — | 24,627 | 14,866 | |||||||||
| Payables: | ||||||||||||
Investment securities purchased | — | 558,018 | 738,012 | |||||||||
Investment advisory fees | 8,719 | 1,298 | 1,743 | |||||||||
|
|
|
|
|
| |||||||
Total Liabilities | 8,719 | 633,256 | 1,019,266 | |||||||||
|
|
|
|
|
| |||||||
Net Assets, at value | $ | 36,674,163 | $ | 3,444,554 | $ | 4,631,816 | ||||||
|
|
|
|
|
| |||||||
Net Assets Consist of | ||||||||||||
Paid-in capital | $ | 34,705,325 | $ | 3,667,980 | $ | 4,824,394 | ||||||
Undistributed net investment income | 80,474 | 87,840 | 89,208 | |||||||||
Accumulated net realized gain (loss) on investments and foreign currency transactions | (94,048 | ) | (217,162 | ) | (165,914 | ) | ||||||
Net unrealized appreciation (depreciation) on investments and foreign currency translations | 1,982,412 | (94,104 | ) | (115,872 | ) | |||||||
|
|
|
|
|
| |||||||
Net Assets, at value | $ | 36,674,163 | $ | 3,444,554 | $ | 4,631,816 | ||||||
|
|
|
|
|
| |||||||
Number of Common Shares outstanding | 1,350,001 | 150,001 | 200,001 | |||||||||
|
|
|
|
|
| |||||||
Net Asset Value | $ | 27.17 | $ | 22.96 | $ | 23.16 | ||||||
|
|
|
|
|
| |||||||
Investments in non-affiliated securities at cost | $ | 33,453,688 | $ | 3,607,698 | $ | 4,838,477 | ||||||
|
|
|
|
|
| |||||||
Value of securities loaned | $ | — | $ | 32,870 | $ | 243,120 | ||||||
|
|
|
|
|
| |||||||
Investment in Daily Assets Fund at cost* | $ | — | $ | 49,313 | $ | 264,645 | ||||||
|
|
|
|
|
| |||||||
Foreign currency at cost | $ | — | $ | 8,108 | $ | 13,810 | ||||||
|
|
|
|
|
| |||||||
| * | Represents collateral on securities loaned. |
| See Notes to Financial Statements. | 61 |
DBX ETF Trust
Statements of assets and liabilities (Continued)
May 31, 2016
| Deutsche X-trackers MSCI Emerging Markets High Dividend Yield Hedged Equity ETF | Deutsche X-trackers MSCI Eurozone High Dividend Yield Hedged Equity ETF | |||||||
Assets | ||||||||
Investments in non-affiliated securities at value | $ | 2,124,614 | $ | 2,409,077 | ||||
Investment in Daily Assets Fund* | 29,682 | 160,970 | ||||||
Cash | 1,066 | 818 | ||||||
Foreign currency at value | 2,464 | 1,753 | ||||||
Unrealized appreciation on forward foreign currency exchange contracts | 72,650 | 72,762 | ||||||
| Receivables: | ||||||||
Investment securities sold | 223,304 | 404,331 | ||||||
Dividends | 3,486 | 1,395 | ||||||
Securities lending income | 24 | 662 | ||||||
Foreign tax reclaim | 291 | 4,221 | ||||||
|
|
|
| |||||
Total Assets | $ | 2,457,581 | $ | 3,055,989 | ||||
|
|
|
| |||||
Liabilities | ||||||||
Payable upon return of securities loaned | $ | 29,682 | $ | 160,970 | ||||
Unrealized depreciation on forward foreign currency exchange contracts | 8,917 | 1,460 | ||||||
| Payables: | ||||||||
Investment securities purchased | 289,411 | 483,381 | ||||||
Investment advisory fees | 1,161 | 901 | ||||||
|
|
|
| |||||
Total Liabilities | 329,171 | 646,712 | ||||||
|
|
|
| |||||
Net Assets, at value | $ | 2,128,410 | $ | 2,409,277 | ||||
|
|
|
| |||||
Net Assets Consist of | ||||||||
Paid-in capital | $ | 2,507,967 | $ | 2,495,710 | ||||
Undistributed net investment income | 12,003 | 49,143 | ||||||
Accumulated net realized gain (loss) on investments and foreign currency transactions | (197,060 | ) | (117,754 | ) | ||||
Net unrealized appreciation (depreciation) on investments and foreign currency translations | (194,500 | ) | (17,822 | ) | ||||
|
|
|
| |||||
Net Assets, at value | $ | 2,128,410 | $ | 2,409,277 | ||||
|
|
|
| |||||
Number of Common Shares outstanding | 100,001 | 100,001 | ||||||
|
|
|
| |||||
Net Asset Value | $ | 21.28 | $ | 24.09 | ||||
|
|
|
| |||||
Investments in non-affiliated securities at cost | $ | 2,382,778 | $ | 2,498,089 | ||||
|
|
|
| |||||
Value of securities loaned | $ | 27,799 | $ | 152,081 | ||||
|
|
|
| |||||
Investment in Daily Assets Fund at cost* | $ | 29,682 | $ | 160,970 | ||||
|
|
|
| |||||
Foreign currency at cost | $ | 2,475 | $ | 1,753 | ||||
|
|
|
| |||||
| * | Represents collateral on securities loaned. |
| See Notes to Financial Statements. | 62 |
DBX ETF Trust
For the Year Ended May 31, 2016
| Deutsche X-trackers Emerging Markets Bond — Interest Rate Hedged ETF | Deutsche X-trackers High Yield Corporate Bond — Interest Rate Hedged ETF | Deutsche X-trackers Investment Grade Bond — Interest Rate Hedged ETF | ||||||||||
Investment Income | ||||||||||||
Unaffiliated interest income | $ | 295,514 | $ | 480,394 | $ | 155,272 | ||||||
Affiliated interest income | — | — | 153 | |||||||||
Securities lending income, including income from Daily Assets Fund, net of borrower rebates | 691 | 2,343 | 491 | |||||||||
|
|
|
|
|
| |||||||
Total Investment Income | 296,205 | 482,737 | 155,916 | |||||||||
|
|
|
|
|
| |||||||
Expenses | ||||||||||||
Investment advisory fees | 29,923 | 41,275 | 11,986 | |||||||||
|
|
|
|
|
| |||||||
Total Expenses | 29,923 | 41,275 | 11,986 | |||||||||
|
|
|
|
|
| |||||||
Net Investment income (loss) | 266,282 | 441,462 | 143,930 | |||||||||
|
|
|
|
|
| |||||||
Realized and Unrealized Gain (Loss) | ||||||||||||
| Net realized gain (loss) from: | ||||||||||||
Investments | 43,767 | (326,293 | ) | (119,567 | ) | |||||||
Investments in affiliates | — | — | (340 | ) | ||||||||
In-kind redemptions | — | (99,279 | ) | — | ||||||||
Futures contracts | (201,840 | ) | (121,134 | ) | (163,277 | ) | ||||||
|
|
|
|
|
| |||||||
Net realized gain (loss) | (158,073 | ) | (546,706 | ) | (283,184 | ) | ||||||
| Net change in unrealized appreciation (depreciation) on: | ||||||||||||
Investments | (40,107 | ) | (296,359 | ) | 129,632 | |||||||
Futures contracts | (112 | ) | 9,173 | 4,030 | ||||||||
|
|
|
|
|
| |||||||
Net change in unrealized appreciation (depreciation) | (40,219 | ) | (287,186 | ) | 133,662 | |||||||
|
|
|
|
|
| |||||||
Net realized and unrealized gain (loss) on investments and futures | (198,292 | ) | (833,892 | ) | (149,522 | ) | ||||||
|
|
|
|
|
| |||||||
Net increase (decrease) in Net Assets Resulting from Operations | $ | 67,990 | $ | (392,430 | ) | $ | (5,592 | ) | ||||
|
|
|
|
|
| |||||||
| See Notes to Financial Statements. | 63 |
DBX ETF Trust
Statements of operations (Continued)
For the Year Ended May 31, 2016
| Deutsche X-trackers Municipal Infrastructure Revenue Bond ETF | Deutsche X-trackers MSCI All World ex US High Dividend Yield Hedged Equity ETF(1) | Deutsche X-trackers MSCI EAFE High Dividend Yield Hedged Equity ETF(1) | ||||||||||
Investment Income | ||||||||||||
Unaffiliated interest income | $ | 836,316 | $ | — | $ | — | ||||||
Unaffiliated dividend income* | — | 281,307 | 178,974 | |||||||||
Securities lending income, including income from Daily Assets Fund, net of borrower rebates | — | 6,553 | 4,487 | |||||||||
|
|
|
|
|
| |||||||
Total Investment Income | 836,316 | 287,860 | 183,461 | |||||||||
|
|
|
|
|
| |||||||
Expenses | ||||||||||||
Investment advisory fees | 74,358 | 30,301 | 15,543 | |||||||||
|
|
|
|
|
| |||||||
Total Expenses | 74,358 | 30,301 | 15,543 | |||||||||
|
|
|
|
|
| |||||||
Net Investment income (loss) | 761,958 | 257,559 | 167,918 | |||||||||
|
|
|
|
|
| |||||||
Realized and Unrealized Gain (Loss) | ||||||||||||
| Net realized gain (loss) from: | ||||||||||||
Investments | (17,995 | ) | (192,616 | ) | (148,707 | ) | ||||||
In-kind redemptions | — | (52,328 | ) | — | ||||||||
Foreign currency transactions | — | (33,732 | ) | 13,909 | ||||||||
|
|
|
|
|
| |||||||
Net realized gain (loss) | (17,995 | ) | (278,676 | ) | (134,798 | ) | ||||||
| Net change in unrealized appreciation (depreciation) on: | ||||||||||||
Investments | 1,612,257 | (183,922 | ) | (229,161 | ) | |||||||
Foreign currency translations | — | 89,818 | 113,289 | |||||||||
|
|
|
|
|
| |||||||
Net change in unrealized appreciation (depreciation) | 1,612,257 | (94,104 | ) | (115,872 | ) | |||||||
|
|
|
|
|
| |||||||
Net realized and unrealized gain (loss) on investments and foreign currency transactions | 1,594,262 | (372,780 | ) | (250,670 | ) | |||||||
|
|
|
|
|
| |||||||
Net increase (decrease) in Net Assets Resulting from Operations | $ | 2,356,220 | $ | (115,221 | ) | $ | (82,752 | ) | ||||
|
|
|
|
|
| |||||||
* Unaffiliated foreign tax withheld | $ | — | $ | 22,083 | $ | 13,719 | ||||||
| (1) | For the period August 12, 2015 (commencement of operations) through May 31, 2016. |
| See Notes to Financial Statements. | 64 |
DBX ETF Trust
Statements of operations (Continued)
For the Year Ended May 31, 2016
| Deutsche X-trackers MSCI Emerging Markets High Dividend Yield Hedged Equity ETF(1) | Deutsche X-trackers MSCI Eurozone High Dividend Yield Hedged Equity ETF(1) | |||||||
Investment Income | ||||||||
Unaffiliated dividend income* | $ | 49,658 | $ | 81,599 | ||||
Securities lending income, including income from Daily Assets Fund, net of borrower rebates | 493 | 5,086 | ||||||
|
|
|
| |||||
Total Investment Income | 50,151 | 86,685 | ||||||
|
|
|
| |||||
Expenses | ||||||||
Investment advisory fees | 11,444 | 8,854 | ||||||
Other expenses | — | 35 | ||||||
|
|
|
| |||||
Total Expenses | 11,444 | 8,889 | ||||||
|
|
|
| |||||
Net Investment income (loss) | 38,707 | 77,796 | ||||||
|
|
|
| |||||
Realized and Unrealized Gain (Loss) | ||||||||
| Net realized gain (loss) from: | ||||||||
Investments | (137,615 | ) | (50,170 | ) | ||||
In-kind redemptions | — | (38,072 | ) | |||||
Foreign currency transactions | (7,196 | ) | (70,635 | ) | ||||
|
|
|
| |||||
Net realized gain (loss) | (144,811 | ) | (158,877 | ) | ||||
| Net change in unrealized appreciation (depreciation) on: | ||||||||
Investments | (258,164 | ) | (89,012 | ) | ||||
Foreign currency translations | 63,664 | 71,190 | ||||||
|
|
|
| |||||
Net change in unrealized appreciation (depreciation) | (194,500 | ) | (17,822 | ) | ||||
|
|
|
| |||||
Net realized and unrealized gain (loss) on investments and foreign currency transactions | (339,311 | ) | (176,699 | ) | ||||
|
|
|
| |||||
Net increase (decrease) in Net Assets Resulting from Operations | $ | (300,604 | ) | $ | (98,903 | ) | ||
|
|
|
| |||||
* Unaffiliated foreign tax withheld | $ | 5,719 | $ | 13,949 | ||||
| (1) | For the period August 12, 2015 (commencement of operations) through May 31, 2016. |
| See Notes to Financial Statements. | 65 |
DBX ETF Trust
Statements of changes in net assets
| Deutsche X-trackers Emerging Markets Bond — Interest Rate Hedged ETF | Deutsche X-trackers High Yield Corporate Bond — Interest Rate Hedged ETF | |||||||||||||||
| Year Ended May 31, 2016 | For the Period March 3, 2015(1) to May 31, 2015 | Year Ended May 31, 2016 | For the Period March 3, 2015(1) to May 31, 2015 | |||||||||||||
Increase (Decrease) in Net Assets from Operations | ||||||||||||||||
Net investment income (loss) | $ | 266,282 | $ | 64,757 | $ | 441,462 | $ | 128,299 | ||||||||
Net realized gain (loss) | (158,073 | ) | 13,674 | (546,706 | ) | (94,169 | ) | |||||||||
Net change in unrealized appreciation (depreciation) | (40,219 | ) | (9,172 | ) | (287,186 | ) | (137,294 | ) | ||||||||
|
|
|
|
|
|
|
| |||||||||
Net increase (decrease) in net assets resulting from operations | 67,990 | 69,259 | (392,430 | ) | (103,164 | ) | ||||||||||
|
|
|
|
|
|
|
| |||||||||
Distributions to Shareholders from | ||||||||||||||||
Net investment income | (315,321 | ) | (48,838 | ) | (544,700 | ) | (95,774 | ) | ||||||||
Net realized gains | (19,900 | ) | — | — | — | |||||||||||
|
|
|
|
|
|
|
| |||||||||
Total distributions | (335,221 | ) | (48,838 | ) | (544,700 | ) | (95,774 | ) | ||||||||
|
|
|
|
|
|
|
| |||||||||
Fund Shares Transactions | ||||||||||||||||
Proceeds from shares sold | — | 6,236,830 | 1,110,857 | 11,254,996 | ||||||||||||
Value of shares redeemed | — | — | (2,339,158 | ) | — | |||||||||||
|
|
|
|
|
|
|
| |||||||||
Net increase (decrease) in net assets resulting from fund share transactions | — | 6,236,830 | (1,228,301 | ) | 11,254,996 | |||||||||||
|
|
|
|
|
|
|
| |||||||||
Total net increase (decrease) in Net Assets | (267,231 | ) | 6,257,251 | (2,165,431 | ) | 11,056,058 | ||||||||||
Net Assets | ||||||||||||||||
Beginning of year | 6,257,276 | 25 | 11,056,083 | 25 | ||||||||||||
|
|
|
|
|
|
|
| |||||||||
End of year | $ | 5,990,045 | $ | 6,257,276 | $ | 8,890,652 | $ | 11,056,083 | ||||||||
|
|
|
|
|
|
|
| |||||||||
Undistributed net investment income | $ | 26,243 | $ | 31,273 | $ | 34,224 | $ | 54,442 | ||||||||
|
|
|
|
|
|
|
| |||||||||
Changes in Shares Outstanding | ||||||||||||||||
Shares outstanding, beginning of year | 250,001 | 1 | 450,001 | 1 | ||||||||||||
Shares sold | — | 250,000 | 50,000 | 450,000 | ||||||||||||
Shares redeemed | — | — | (100,000 | ) | — | |||||||||||
|
|
|
|
|
|
|
| |||||||||
Shares outstanding, end of year | 250,001 | 250,001 | 400,001 | 450,001 | ||||||||||||
|
|
|
|
|
|
|
| |||||||||
| (1) | Commencement of Operations. |
| See Notes to Financial Statements. | 66 |
DBX ETF Trust
Statements of changes in net assets (Continued)
| Deutsche X-trackers Investment Grade Bond — Interest Rate Hedged ETF | Deutsche X-trackers Municipal Infrastructure Revenue Bond ETF | |||||||||||||||
| Year Ended May 31, 2016 | For the Period March 3, 2015(1) to May 31, 2015 | Year Ended May 31, | ||||||||||||||
| 2016 | 2015 | |||||||||||||||
Increase (Decrease) in Net Assets from Operations | ||||||||||||||||
Net investment income (loss) | $ | 143,930 | $ | 40,754 | $ | 761,958 | $ | 584,119 | ||||||||
Net realized gain (loss) | (283,184 | ) | 18,716 | (17,995 | ) | 106,699 | ||||||||||
Net change in unrealized appreciation (depreciation) | 133,662 | (137,750 | ) | 1,612,257 | 44,797 | |||||||||||
|
|
|
|
|
|
|
| |||||||||
Net increase (decrease) in net assets resulting from operations | (5,592 | ) | (78,280 | ) | 2,356,220 | 735,615 | ||||||||||
|
|
|
|
|
|
|
| |||||||||
Distributions to Shareholders from | ||||||||||||||||
Net investment income | (166,692 | ) | (28,313 | ) | (737,901 | ) | (573,756 | ) | ||||||||
|
|
|
|
|
|
|
| |||||||||
Total distributions | (166,692 | ) | (28,313 | ) | (737,901 | ) | (573,756 | ) | ||||||||
|
|
|
|
|
|
|
| |||||||||
Fund Shares Transactions | ||||||||||||||||
Proceeds from shares sold | — | 6,263,110 | 13,390,357 | 10,360,410 | ||||||||||||
Value of shares redeemed | (1,226,700 | ) | — | — | (5,152,537 | ) | ||||||||||
|
|
|
|
|
|
|
| |||||||||
Net increase (decrease) in net assets resulting from fund share transactions | (1,226,700 | ) | 6,263,110 | 13,390,357 | 5,207,873 | |||||||||||
|
|
|
|
|
|
|
| |||||||||
Total net increase (decrease) in Net Assets | (1,398,984 | ) | 6,156,517 | 15,008,676 | 5,369,732 | |||||||||||
Net Assets | ||||||||||||||||
Beginning of year | 6,156,542 | 25 | 21,665,487 | 16,295,755 | ||||||||||||
|
|
|
|
|
|
|
| |||||||||
End of year | $ | 4,757,558 | $ | 6,156,542 | $ | 36,674,163 | $ | 21,665,487 | ||||||||
|
|
|
|
|
|
|
| |||||||||
Undistributed net investment income | $ | 13,055 | $ | 18,067 | $ | 80,474 | $ | 56,417 | ||||||||
|
|
|
|
|
|
|
| |||||||||
Changes in Shares Outstanding | ||||||||||||||||
Shares outstanding, beginning of year | 250,001 | 1 | 850,001 | 650,001 | ||||||||||||
Shares sold | — | 250,000 | 500,000 | 400,000 | ||||||||||||
Shares redeemed | (50,000 | ) | — | — | (200,000 | ) | ||||||||||
|
|
|
|
|
|
|
| |||||||||
Shares outstanding, end of year | 200,001 | 250,001 | 1,350,001 | 850,001 | ||||||||||||
|
|
|
|
|
|
|
| |||||||||
| (1) | Commencement of Operations. |
| See Notes to Financial Statements. | 67 |
DBX ETF Trust
Statements of changes in net assets (Continued)
| Deutsche X-trackers MSCI All World ex US High Dividend Yield Hedged Equity ETF | Deutsche X-trackers MSCI EAFE High Dividend Yield Hedged Equity ETF | |||||||
| For the Period August 12, 2015(1) to May 31, 2016 | For the Period August 12, 2015(1) to May 31, 2016 | |||||||
Increase (Decrease) in Net Assets from Operations | ||||||||
Net investment income (loss) | $ | 257,559 | $ | 167,918 | ||||
Net realized gain (loss) | (278,676 | ) | (134,798 | ) | ||||
Net change in unrealized appreciation (depreciation) | (94,104 | ) | (115,872 | ) | ||||
|
|
|
| |||||
Net increase (decrease) in net assets resulting from operations | (115,221 | ) | (82,752 | ) | ||||
|
|
|
| |||||
Distributions to Shareholders from | ||||||||
Net investment income | (168,419 | ) | (75,062 | ) | ||||
Net realized gains | — | (34,764 | ) | |||||
|
|
|
| |||||
Total distributions | (168,419 | ) | (109,826 | ) | ||||
|
|
|
| |||||
Fund Shares Transactions | ||||||||
Proceeds from shares sold | 11,570,439 | 4,824,369 | ||||||
Value of shares redeemed | (7,842,270 | ) | — | |||||
|
|
|
| |||||
Net increase (decrease) in net assets resulting from fund share transactions | 3,728,169 | 4,824,369 | ||||||
|
|
|
| |||||
Total net increase (decrease) in Net Assets | 3,444,529 | 4,631,791 | ||||||
Net Assets | ||||||||
Beginning of year | 25 | 25 | ||||||
|
|
|
| |||||
End of year | $ | 3,444,554 | $ | 4,631,816 | ||||
|
|
|
| |||||
Undistributed net investment income | $ | 87,840 | $ | 89,208 | ||||
|
|
|
| |||||
Changes in Shares Outstanding | ||||||||
Shares outstanding, beginning of year | 1 | 1 | ||||||
Shares sold | 500,000 | 200,000 | ||||||
Shares redeemed | (350,000 | ) | — | |||||
|
|
|
| |||||
Shares outstanding, end of year | 150,001 | 200,001 | ||||||
|
|
|
| |||||
| (1) | Commencement of Operations. |
| See Notes to Financial Statements. | 68 |
DBX ETF Trust
Statements of changes in net assets (Continued)
| Deutsche X-trackers MSCI Emerging Markets High Dividend Yield Hedged Equity ETF | Deutsche X-trackers MSCI Eurozone High Dividend Yield Hedged Equity ETF | |||||||
| For the Period August 12, 2015(1) to May 31, 2016 | For the Period August 12, 2015(1) to May 31, 2016 | |||||||
Increase (Decrease) in Net Assets from Operations | ||||||||
Net investment income (loss) | $ | 38,707 | $ | 77,796 | ||||
Net realized gain (loss) | (144,811 | ) | (158,877 | ) | ||||
Net change in unrealized appreciation (depreciation) | (194,500 | ) | (17,822 | ) | ||||
|
|
|
| |||||
Net increase (decrease) in net assets resulting from operations | (300,604 | ) | (98,903 | ) | ||||
|
|
|
| |||||
Distributions to Shareholders from | ||||||||
Net investment income | (26,794 | ) | (27,770 | ) | ||||
Net realized gains | (52,159 | ) | — | |||||
|
|
|
| |||||
Total distributions | (78,953 | ) | (27,770 | ) | ||||
|
|
|
| |||||
Fund Shares Transactions | ||||||||
Proceeds from shares sold | 2,507,942 | 3,670,465 | ||||||
Value of shares redeemed | — | (1,134,540 | ) | |||||
|
|
|
| |||||
Net increase (decrease) in net assets resulting from fund share transactions | 2,507,942 | 2,535,925 | ||||||
|
|
|
| |||||
Total net increase (decrease) in Net Assets | 2,128,385 | 2,409,252 | ||||||
Net Assets | ||||||||
Beginning of year | 25 | 25 | ||||||
|
|
|
| |||||
End of year | $ | 2,128,410 | $ | 2,409,277 | ||||
|
|
|
| |||||
Undistributed net investment income | $ | 12,003 | $ | 49,143 | ||||
|
|
|
| |||||
Changes in Shares Outstanding | ||||||||
Shares outstanding, beginning of year | 1 | 1 | ||||||
Shares sold | 100,000 | 150,000 | ||||||
Shares redeemed | — | (50,000 | ) | |||||
|
|
|
| |||||
Shares outstanding, end of year | 100,001 | 100,001 | ||||||
|
|
|
| |||||
| (1) | Commencement of Operations. |
| See Notes to Financial Statements. | 69 |
DBX ETF Trust
| Deutsche X-trackers Emerging Markets Bond — Interest Rate Hedged ETF | Year Ended 5/31/2016 | Period Ended 5/31/2015(a) | ||||||
Selected Per Share Data | ||||||||
Net Asset Value, beginning of period | $ | 25.03 | $ | 25.00 | ||||
|
|
|
| |||||
| Income (loss) from investment operations: | ||||||||
Net investment income (loss) (b) | 1.07 | 0.27 | ||||||
Net realized and unrealized gain (loss) | (0.80 | ) | (0.04 | )(c) | ||||
|
|
|
| |||||
Total from investment operations | 0.27 | 0.23 | ||||||
|
|
|
| |||||
| Less distributions from: | ||||||||
Net investment income | (1.26 | ) | (0.20 | ) | ||||
Net realized gains | (0.08 | ) | — | |||||
|
|
|
| |||||
Total distributions | (1.34 | ) | (0.20 | ) | ||||
|
|
|
| |||||
Net Asset Value, end of period | $ | 23.96 | $ | 25.03 | ||||
|
|
|
| |||||
Total Return (%) | 1.22 | 0.90 | ** | |||||
Ratios to Average Net Assets and Supplemental Data | ||||||||
Net assets, end of period ($ millions) | 6 | 6 | ||||||
Ratio of expenses (%) | 0.50 | 0.50 | * | |||||
Ratio of net investment income (loss) (%) | 4.45 | 4.35 | * | |||||
Portfolio turnover rate (%) (d) | 15 | 1 | ** | |||||
| Deutsche X-trackers High Yield Corporate Bond — Interest Rate Hedged ETF | Year Ended 5/31/2016 | Period Ended 5/31/2015(a) | ||||||
Selected Per Share Data | ||||||||
Net Asset Value, beginning of period | $ | 24.57 | $ | 25.00 | ||||
|
|
|
| |||||
Income (loss) from investment operations: | ||||||||
Net investment income (loss) (b) | 1.08 | 0.29 | ||||||
Net realized and unrealized gain (loss) | (2.10 | ) | (0.51 | ) | ||||
|
|
|
| |||||
Total from investment operations | (1.02 | ) | (0.22 | ) | ||||
|
|
|
| |||||
Less distributions from: | ||||||||
Net investment income | (1.32 | ) | (0.21 | ) | ||||
|
|
|
| |||||
Total distributions | (1.32 | ) | (0.21 | ) | ||||
|
|
|
| |||||
Net Asset Value, end of period | $ | 22.23 | $ | 24.57 | ||||
|
|
|
| |||||
Total Return (%) | (4.06 | ) | (0.87 | )** | ||||
Ratios to Average Net Assets and Supplemental Data | ||||||||
Net assets, end of period ($ millions) | 9 | 11 | ||||||
Ratio of expenses (%) | 0.45 | 0.45 | * | |||||
Ratio of net investment income (loss) (%) | 4.81 | 4.75 | * | |||||
Portfolio turnover rate (%) (d) | 35 | 13 | ** | |||||
| (a) | For the period March 3, 2015 (commencement of operations) through May 31, 2015. |
| (b) | Based on average shares outstanding during the period. |
| (c) | Because of the timing of subscriptions and redemptions in relation to fluctuating markets at value, the amount shown may not agree with the change in aggregate gains and losses. |
| (d) | Portfolio turnover rate does not include securities received or delivered from processing creations or redemptions. |
| * | Annualized. |
| ** | Not Annualized. |
| See Notes to Financial Statements. | 70 |
DBX ETF Trust
Financial highlights (Continued)
| Deutsche X-trackers Investment Grade Bond — Interest Rate Hedged ETF | Year Ended 5/31/2016 | Period Ended 5/31/2015(a) | ||||||||||
Selected Per Share Data | ||||||||||||
Net Asset Value, beginning of period | $ | 24.63 | $ | 25.00 | ||||||||
|
|
|
| |||||||||
| Income (loss) from investment operations: | ||||||||||||
Net investment income (loss) (c) | 0.71 | 0.17 | ||||||||||
Net realized and unrealized gain (loss) | (0.73 | ) | (0.43 | ) | ||||||||
|
|
|
| |||||||||
Total from investment operations | (0.02 | ) | (0.26 | ) | ||||||||
|
|
|
| |||||||||
| Less distributions from: | ||||||||||||
Net investment income | (0.82 | ) | (0.11 | ) | ||||||||
|
|
|
| |||||||||
Total distributions | (0.82 | ) | (0.11 | ) | ||||||||
|
|
|
| |||||||||
Net Asset Value, end of period | $ | 23.79 | $ | 24.63 | ||||||||
|
|
|
| |||||||||
Total Return (%) | (0.04 | ) | (1.03 | )** | ||||||||
Ratios to Average Net Assets and Supplemental Data | ||||||||||||
Net assets, end of period ($ millions) | 5 | 6 | ||||||||||
Ratio of expenses (%) | 0.25 | 0.25 | * | |||||||||
Ratio of net investment income (loss) (%) | 3.00 | 2.72 | * | |||||||||
Portfolio turnover rate (%) (d) | 14 | 7 | ** | |||||||||
| Deutsche X-trackers Municipal Infrastructure Revenue Bond ETF | Year Ended 5/31/2016 | Year Ended 5/31/2015 | Period Ended 5/31/2014(b) | |||||||||
Selected Per Share Data | ||||||||||||
Net Asset Value, beginning of period | $ | 25.49 | $ | 25.07 | $ | 25.00 | ||||||
|
|
|
|
|
| |||||||
| Income (loss) from investment operations: | ||||||||||||
Net investment income (loss) (c) | 0.80 | 0.81 | 0.81 | |||||||||
Net realized and unrealized gain (loss) | 1.67 | 0.40 | 0.00 | (e) | ||||||||
|
|
|
|
|
| |||||||
Total from investment operations | 2.47 | 1.21 | 0.81 | |||||||||
|
|
|
|
|
| |||||||
| Less distributions from: | ||||||||||||
Net investment income | (0.79 | ) | (0.79 | ) | (0.74 | ) | ||||||
|
|
|
|
|
| |||||||
Total distributions | (0.79 | ) | (0.79 | ) | (0.74 | ) | ||||||
|
|
|
|
|
| |||||||
Net Asset Value, end of period | $ | 27.17 | $ | 25.49 | $ | 25.07 | ||||||
|
|
|
|
|
| |||||||
Total Return (%) | 9.89 | 4.88 | 3.46 | **(f) | ||||||||
Ratios to Average Net Assets and Supplemental Data | ||||||||||||
Net assets, end of period ($ millions) | 37 | 22 | 16 | |||||||||
Ratio of expenses before fee waiver (%) | 0.30 | 0.30 | 0.32 | * | ||||||||
Ratio of expenses after fee waiver (%) | 0.30 | 0.30 | 0.30 | * | ||||||||
Ratio of net investment income (loss) (%) | 3.07 | 3.16 | 3.48 | * | ||||||||
Portfolio turnover rate (%) (d) | 13 | 4 | 5 | ** | ||||||||
| (a) | For the period March 3, 2015 (commencement of operations) through May 31, 2015. |
| (b) | For the period June 4, 2013 (commencement of operations) through May 31, 2014. |
| (c) | Based on average shares outstanding during the period. |
| (d) | Portfolio turnover rate does not include securities received or delivered from processing creations or redemptions. |
| (e) | Less than 0.005. |
| (f) | The Total Return would have been lower if certain fees had not been reimbursed by the Advisor. |
| * | Annualized. |
| ** | Not Annualized. |
| See Notes to Financial Statements. | 71 |
DBX ETF Trust
Financial highlights (Continued)
| Deutsche X-trackers MSCI All World ex US High Dividend Yield Hedged Equity ETF | Period Ended 5/31/2016(a) | |||
Selected Per Share Data | ||||
Net Asset Value, beginning of period | $ | 25.00 | ||
|
| |||
| Income (loss) from investment operations: | ||||
Net investment income (loss) (b) | 0.70 | |||
Net realized and unrealized gain (loss) | (2.38 | ) | ||
|
| |||
Total from investment operations | (1.68 | ) | ||
|
| |||
| Less distributions from: | ||||
Net investment income | (0.36 | ) | ||
|
| |||
Total distributions | (0.36 | ) | ||
|
| |||
Net Asset Value, end of period | $ | 22.96 | ||
|
| |||
Total Return (%) | (6.67 | )** | ||
Ratios to Average Net Assets and Supplemental Data | ||||
Net assets, end of period ($ millions) | 3 | |||
Ratio of expenses (%) | 0.45 | * | ||
Ratio of net investment income (loss) (%) | 3.83 | * | ||
Portfolio turnover rate (%) (c) | 33 | ** | ||
| Deutsche X-trackers MSCI EAFE High Dividend Yield Hedged Equity ETF | Period Ended 5/31/2016(a) | |||
Selected Per Share Data | ||||
Net Asset Value, beginning of period | $ | 25.00 | ||
|
| |||
| Income (loss) from investment operations: | ||||
Net investment income (loss) (b) | 0.88 | |||
Net realized and unrealized gain (loss) | (2.17 | ) | ||
|
| |||
Total from investment operations | (1.29 | ) | ||
|
| |||
| Less distributions from: | ||||
Net investment income | (0.38 | ) | ||
Net realized gains | (0.17 | ) | ||
|
| |||
Total distributions | (0.55 | ) | ||
|
| |||
Net Asset Value, end of period | $ | 23.16 | ||
|
| |||
Total Return (%) | (5.08 | )** | ||
Ratios to Average Net Assets and Supplemental Data | ||||
Net assets, end of period ($ millions) | 5 | |||
Ratio of expenses (%) | 0.45 | * | ||
Ratio of net investment income (loss) (%) | 4.86 | * | ||
Portfolio turnover rate (%) (c) | 33 | ** | ||
| (a) | For the period August 12, 2015 (commencement of operations) through May 31, 2016. |
| (b) | Based on average shares outstanding during the period. |
| (c) | Portfolio turnover rate does not include securities received or delivered from processing creations or redemptions. |
| * | Annualized. |
| ** | Not Annualized. |
| See Notes to Financial Statements. | 72 |
DBX ETF Trust
Financial highlights (Continued)
| Deutsche X-trackers MSCI Emerging Markets High Dividend Yield Hedged Equity ETF | Period Ended 5/31/2016(a) | |||
Selected Per Share Data | ||||
Net Asset Value, beginning of period | $ | 25.00 | ||
|
| |||
| Income (loss) from investment operations: | ||||
Net investment income (loss) (b) | 0.39 | |||
Net realized and unrealized gain (loss) | (3.32 | ) | ||
|
| |||
Total from investment operations | (2.93 | ) | ||
|
| |||
| Less distributions from: | ||||
Net investment income | (0.27 | ) | ||
Net realized gains | (0.52 | ) | ||
|
| |||
Total distributions | (0.79 | ) | ||
|
| |||
Net Asset Value, end of period | $ | 21.28 | ||
|
| |||
Total Return (%) | (11.67 | )** | ||
Ratios to Average Net Assets and Supplemental Data | ||||
Net assets, end of period ($ millions) | 2 | |||
Ratio of expenses (%) | 0.65 | * | ||
Ratio of net investment income (loss) (%) | 2.20 | * | ||
Portfolio turnover rate (%) (c) | 39 | ** | ||
| Deutsche X-trackers MSCI Eurozone High Dividend Yield Hedged Equity ETF | Period Ended 5/31/2016(a) | |||
Selected Per Share Data | ||||
Net Asset Value, beginning of period | $ | 25.00 | ||
|
| |||
| Income (loss) from investment operations: | ||||
Net investment income (loss) (b) | 0.75 | |||
Net realized and unrealized gain (loss) | (1.38 | ) | ||
|
| |||
Total from investment operations | (0.63 | ) | ||
|
| |||
| Less distributions from: | ||||
Net investment income | (0.28 | ) | ||
|
| |||
Total distributions | (0.28 | ) | ||
|
| |||
Net Asset Value, end of period | $ | 24.09 | ||
|
| |||
Total Return (%) | (2.52 | )** | ||
Ratios to Average Net Assets and Supplemental Data | ||||
Net assets, end of period ($ millions) | 2 | |||
Ratio of expenses (%) | 0.45 | * | ||
Ratio of net investment income (loss) (%) | 3.95 | * | ||
Portfolio turnover rate (%) (c) | 46 | ** | ||
| (a) | For the period August 12, 2015 (commencement of operations) through May 31, 2016. |
| (b) | Based on average shares outstanding during the period. |
| (c) | Portfolio turnover rate does not include securities received or delivered from processing creations or redemptions. |
| * | Annualized. |
| ** | Not Annualized. |
| See Notes to Financial Statements. | 73 |
DBX ETF Trust
1. Organization
DBX ETF Trust (the “Trust”) is registered under the Investment Company Act of 1940, as amended (the “Act”), as an open-end registered management investment company organized as a Delaware statutory trust.
As of May 31, 2016, the Trust consists of thirty-six investment series of exchange-traded funds (“ETFs”) (each a “Fund” and collectively, the “Funds”) in operation and trading. These financial statements report on the Funds listed below:
| Deutsche X-trackers Emerging Markets Bond — Interest Rate Hedged ETF |
| Deutsche X-trackers High Yield Corporate Bond — Interest Rate Hedged ETF |
| Deutsche X-trackers Investment Grade Bond — Interest Rate Hedged ETF |
| Deutsche X-trackers Municipal Infrastructure Revenue Bond ETF |
| Deutsche X-trackers MSCI All World ex US High Dividend Yield Hedged Equity ETF |
| Deutsche X-trackers MSCI EAFE High Dividend Yield Hedged Equity ETF |
| Deutsche X-trackers MSCI Emerging Markets High Dividend Yield Hedged Equity ETF |
| Deutsche X-trackers MSCI Eurozone High Dividend Yield Hedged Equity ETF |
DBX Advisors LLC (“DBX” or the “Advisor”), an indirect, wholly owned subsidiary of Deutsche Bank AG, serves as investment advisor to the Funds and has overall responsibility for the general management and administration of the Funds, subject to the supervision of the Funds’ Board of Trustees.
Each Fund offers shares that are listed and traded on the NYSE Arca, Inc. (“NYSE Arca”). Effective June 9, 2016, the Deutsche X-trackers Emerging Markets Bond — Interest Rate Hedged ETF, Deutsche X-trackers High Yield Corporate Bond — Interest Rate Hedged ETF, Deutsche X-trackers Investment Grade Bond — Interest Rate Hedged ETF transferred their primary listings to BATS Exchange, Inc. and are no longer listed or traded on the NYSE Arca, Inc. Unlike conventional mutual funds, each Fund issues and redeems shares on a continuous basis, at net asset value, only in large specified lots consisting of 50,000 shares, each called a “Creation Unit”, to authorized participants who have entered into agreements with the Funds’ distributor. Shares are not individually redeemable securities of the Funds, and owners of shares may acquire those shares from the Funds, or tender such shares for redemption to the Funds, in Creation Units only.
The investment objective of each Fund is to track the performance, before fees and expenses, of a particular index (the “Underlying Index”). The underlying indices for the Funds are:
Fund | Underlying Index | |
| Deutsche X-trackers Emerging Markets Bond — Interest Rate Hedged ETF | Solactive Emerging Markets Bond — Interest Rate Hedged Index | |
| Deutsche X-trackers High Yield Corporate Bond — Interest Rate Hedged ETF | Solactive High Yield Corporate Bond — Interest Rate Hedged Index | |
| Deutsche X-trackers Investment Grade Bond — Interest Rate Hedged ETF | Solactive Investment Grade Bond — Interest Rate Hedged Index | |
| Deutsche X-trackers Municipal Infrastructure Revenue Bond ETF | Solactive Municipal Infrastructure Revenue Bond Index | |
| Deutsche X-trackers MSCI All World ex US High Dividend Yield Hedged Equity ETF | MSCI ACWI ex USA High Dividend Yield US Dollar Hedged Index | |
| Deutsche X-trackers MSCI EAFE High Dividend Yield Hedged Equity ETF | MSCI EAFE High Dividend Yield US Dollar Hedged Index | |
| Deutsche X-trackers MSCI Emerging Markets High Dividend Yield Hedged Equity ETF | MSCI Emerging Markets High Dividend Yield US Dollar Hedged Index | |
| Deutsche X-trackers MSCI Eurozone High Dividend Yield Hedged Equity ETF | MSCI EMU High Dividend Yield US Dollar Hedged Index |
The Solactive Emerging Markets Bond-Interest Rate Hedged Index is designed to track the performance of a basket of U.S. dollar-denominated emerging markets bonds. The Underlying Index is comprised of (a) long positions in U.S. dollar denominated emerging markets bonds and (b) short positions in U.S. Treasury notes or bonds of, in aggregate, approximate equivalent duration to the emerging markets bonds. The Solactive High Yield Corporate Bond-Interest Rate Hedged Index is designed to track the performance of a basket of U.S. dollar-denominated high yield liquid corporate bonds. The Underlying Index is comprised of (a) long positions in U.S.
74
DBX ETF Trust
Notes to financial statements (Continued)
dollar-denominated high yield corporate bonds and (b) short positions in U.S. Treasury notes or bonds of, in aggregate, approximate equivalent duration to the high yield bonds. The Solactive Investment Grade Bond-Interest Rate Hedged Index is designed to track the performance of a basket of U.S. dollar-denominated investment grade liquid corporate bonds. The Underlying Index is comprised of (a) long positions in U.S. dollar-denominated investment-grade corporate bonds and (b) short positions in U.S. Treasury notes or bonds of, in aggregate, approximate equivalent duration to the investment-grade corporate bonds. The Solactive Municipal Infrastructure Revenue Bond Index is designed to track the returns of the segment of the U.S. long term tax-exempt bond market, consisting of infrastructure revenue bonds. It is comprised of tax-exempt municipal securities issued by states, cities, counties, districts, their respective agencies and other tax-exempt issuers. The Underlying Index is intended to track bonds that have been issued with the intention of funding federal, state and local infrastructure projects such as water and sewer systems, public power systems, toll roads, bridges, tunnels and many other public use projects. It is designed to only hold bonds issued by state and local municipalities where the interest and principal repayments are generated from dedicated revenue streams or a double-barreled revenue stream (pledged revenue stream and a general obligation pledge). The Solactive Indexes are rebalanced monthly on the last business day of each month.
The MSCI ACWI ex USA High Dividend Yield US Dollar Hedged Index is designed to track the performance of equity securities in developed and emerging stock markets (excluding the United States) in its parent index, the MSCI ACWI ex USA Index, with higher dividend income and quality characteristics than average dividend yields of equities in the parent index, where such higher dividend income and quality characteristics are both sustainable and persistent, while mitigating exposure to fluctuations between the value of the U.S. dollar and the currencies of the countries included in the Underlying Index. The MSCI EAFE High Dividend Yield US Dollar Hedged Index is designed to provide exposure to equity securities in developed international stock markets (excluding the U.S. and Canada) in its parent index, the MSCI EAFE Index, with higher dividend income and quality characteristics than average dividend yields of equities in the parent index, where such higher dividend income and quality characteristics are both sustainable and persistent, while mitigating exposure to fluctuations between the value of the U.S. dollar and the currencies of the countries included in the Underlying Index. The MSCI Emerging Markets High Dividend Yield US Dollar Hedged Index is designed to provide exposure to equity securities in global emerging markets in its parent index, the MSCI Emerging Markets Index, with higher dividend income and quality characteristics than average dividend yields of equities in the parent index, where such higher dividend income and quality characteristics are both sustainable and persistent, while mitigating exposure to fluctuations between the value of the U.S. dollar and the currencies of the countries included in the Underlying Index. The MSCI EMU High Dividend Yield US Dollar Hedged Index is designed to provide exposure to equity securities from countries in the European Monetary Union (the “EMU”) in its parent index, the MSCI EMU Index, with higher dividend income and quality characteristics than average dividend yields of equities in the parent index, where such higher dividend income and quality characteristics are both sustainable and persistent, while seeking to mitigate exposure to fluctuations between the value of the U.S. dollar and the euro.
The MSCI Hedged Indices are rebalanced monthly on the last trading day of the month, when the index will take into account the effect of rolling into new 1-month forward contracts based on the newly determined weights of currency to be sold for the next month’s index calculation. The currency weights are determined as of the close of two business days before the first calendar day of the following month and remain constant intra month. This means that no changes in the weights are made during the month to account for changes in the indexes due to price movement of securities, corporate events, additions, deletions or any other changes. The daily calculation of MSCI Hedged Indices marks to market the one-month forward contracts on a daily basis by using an equal and offsetting forward position.
Each Fund is entitled to use its respective Underlying Index pursuant to a licensing agreement between each Index Provider and DBX. There is no charge to the Funds in connection with these licensing agreements.
Each Fund is non-diversified and is not limited by the Act with regard to the percentage of its assets that may be invested in the securities of a single issuer. The securities of a particular issuer (or securities of issuers in particular industries) may dominate the underlying index of such a fund and, consequently, the fund’s investment portfolio. This may adversely affect the fund’s performance or subject the fund’s shares to greater price volatility than that experienced by more diversified investment companies.
75
DBX ETF Trust
Notes to financial statements (Continued)
Pursuant to the Trust’s organizational documents, the Trust’s officers and trustees are indemnified against certain liabilities that may arise out of the performance of their duties to the Funds. Additionally, in the normal course of business the Trust enters into contracts that contain a variety of representations that provide indemnification for certain liabilities. The Trust’s maximum exposure under these arrangements is unknown, as this would involve future claims that may be made against the Funds that have not yet occurred. However, the Trust expects the risk of loss to be remote.
2. Significant Accounting Policies
The financial statements have been prepared in conformity with U.S. generally accepted accounting principles (“U.S. GAAP”), which require management to make certain estimates and assumptions that affect the reported amounts and disclosures in the financial statements. Actual results could differ from those estimates. The following is a summary of significant accounting policies followed by the Funds.
Security Valuation The Net Asset Value (“NAV”), of each Fund’s shares is calculated each business day as of the close of regular trading on the New York Stock Exchange, generally 4:00 p.m. Eastern Time. NAV per share is calculated by dividing a Fund’s net assets by the number of Fund shares outstanding.
Various inputs are used in determining the value of the Funds’ investments. These inputs are summarized in three broad levels. Level 1 includes quoted prices in active markets for identical securities. Level 2 includes other significant observable inputs (including quoted prices for similar securities, interest rates, prepayment speeds, and credit risk). Level 3 includes significant unobservable inputs (including the Fund’s own assumptions in determining the fair value of investments). The level assigned to the securities valuations may not be an indication of the risk or liquidity associated with investing in those securities.
Municipal debt securities are valued at prices supplied by independent pricing services approved by the Funds’ Board. Such services may use various pricing techniques which take into account appropriate factors such as yield, quality, coupon rate, maturity, type of issue, trading characteristics and other data, as well as broker quotes. If the pricing services are unable to provide valuations, securities are valued at the mean between the bid and ask quotations or evaluated prices, as applicable, obtained from broker-dealers. These securities are generally categorized as Level 2.
Corporate and sovereign debt securities are valued at prices supplied by independent pricing services approved by the Funds’ Board. Such services may use various pricing techniques which take into account appropriate factors such as yield, quality, coupon rate, maturity, type of issue, trading characteristics and other data, as well as broker quotes. If the pricing services are unable to provide valuations, securities are valued at the mean between the bid and ask quotations or evaluated prices, as applicable, obtained from broker dealers. These securities are generally categorized as Level 2.
Futures contracts are generally valued at the settlement prices established each day on the exchange on which they are traded and are categorized as Level 1.
Forward currency contracts are valued at the prevailing forward exchange rate of the underlying currencies and are categorized as Level 2.
Securities and other assets for which market quotations are not readily available or for which the above valuation procedures are deemed not to reflect fair value are valued in a manner that is intended to reflect their fair value as determined in accordance with procedures approved by the Board and are generally categorized as Level 3. In accordance with the Fund’s valuation procedures, factors considered in determining value may include, but are not limited to, the type of the security; the size of the holding; the initial cost of the security; the existence of any contractual restrictions on the security’s disposition; the price and extent of public trading in similar securities of the issuer or of comparable companies; quotations or evaluated prices from broker-dealers and/or pricing services; information obtained from the issuer, analysts, and/or the appropriate stock exchange (for exchange- traded securities); an analysis of the company’s or issuer’s financial statements; an evaluation of the forces that influence the issuer and the market(s) in which the security is purchased and sold; and with respect to debt securities, the maturity, coupon, creditworthiness, currency denomination and the movement of the market in which the security is normally traded. The value determined under these procedures may differ from published values for the same securities.
76
DBX ETF Trust
Notes to financial statements (Continued)
Fair value pricing could result in a difference between the prices used to calculate a Fund’s net asset value and the prices used by the Fund’s underlying index, which in turn could result in a difference between the Fund’s performance and the performance of the Fund’s underlying index.
Disclosure about the classification of the fair value measurements is included in a table following each Fund’s Schedule of Investments.
Cash Cash consists of cash held at banks and is on deposit with major financial institutions.
Investment Transactions and Investment Income Investment transactions are recorded as of the date that the securities are purchased or sold (trade date). Realized gains and losses from the sale or disposition of securities are calculated on the identified cost-method. Dividend income is net of any foreign taxes withheld at source. Certain dividends from foreign securities may be recorded subsequent to the ex-dividend date as soon as the fund is informed of such dividends. Interest income is recorded on the accrual basis. All premiums and discounts are amortized/accreted over the lives of the respective security for financial reporting purposes.
Tax Information and Dividends and Distributions to Shareholders It is each Fund’s policy to comply with all requirements of the Internal Revenue Code of 1986, as amended (“the Code”). Each Fund intends to qualify for and to elect treatment as a separate Regulated Investment Company (“RIC”) under Subchapter M of the Code. It is the policy of Deutsche X-trackers Emerging Markets Bond — Interest Rate Hedged ETF, Deutsche X-trackers High Yield Corporate Bond — Interest Rate Hedged ETF, Deutsche X-trackers Investment Grade Bond — Interest Rate Hedged ETF and Deutsche X-trackers Municipal Infrastructure Revenue Bond ETF to pay out dividends from net investment income monthly and Deutsche X-trackers MSCI All World ex US High Dividend Yield Hedged Equity ETF, Deutsche X-trackers MSCI EAFE High Dividend Yield Hedged Equity ETF, Deutsche X-trackers MSCI Emerging Markets High Dividend Yield Hedged Equity ETF and Deutsche X-trackers MSCI Eurozone High Dividend Yield Hedged Equity ETF to pay out dividends from net investment income quarterly; sufficient to relieve it from all or substantially all Federal income and excise taxes. Taxable net realized gains from investment transactions, reduced by capital loss carryforwards, if any, are declared and distributed to shareholders at least annually. The capital loss carryforward amount, if any, is available to offset future net capital gains. The Funds may occasionally be required to make supplemental distributions at some other time during the year. The Funds reserve the right to declare special distributions if, in their reasonable discretion, such action is necessary or advisable to preserve the status of each Fund as a RIC or to avoid imposition of income or excise taxes on undistributed income. Dividends and distributions to shareholders, if any, are recorded on the ex-dividend date. The amount of dividends and distributions from net investment income and net realized capital gains are determined in accordance with Federal income tax regulations which may differ from U.S. GAAP. These “book/tax” differences are either considered temporary or permanent in nature. To the extent these differences are permanent in nature, such amounts are reclassified at the end of the year within the components of net assets based on their federal tax treatment; temporary differences do not require reclassification. Dividends and distributions, which exceed earnings and profits for the full year for tax purposes, are reported as a tax return of capital.
In accordance with U.S. GAAP requirements regarding accounting for uncertainties in income taxes, management has analyzed the Funds’ tax positions taken or expected to be taken on foreign, federal and state income tax returns for all open tax years and has concluded that no provision for income tax is required in the Funds’ financial statements. The Advisor does not believe that the unrecognized tax benefits will change significantly in the next 12 months.
The Funds’ recognize interest and penalties, if any, related to uncertain tax provisions as income tax expense on the Statements of Operations. For the period ended May 31, 2016, the Funds did not incur any interest or penalties.
77
DBX ETF Trust
Notes to financial statements (Continued)
As of May 31, 2016, the components of accumulated earnings (losses) were as follows:
| Undistributed Net Investment Income | Capital and Other Gains (Losses) | Unrealized Appreciation (Depreciation) | Total Accumulated Earnings (Losses) | |||||||||||||
Deutsche X-trackers Emerging Markets Bond — Interest Rate Hedged ETF | $ | 26,243 | $ | (177,215 | ) | $ | (95,838 | ) | $ | (246,810 | ) | |||||
Deutsche X-trackers High Yield Corp Bond — Interest Rate Hedged ETF | 34,224 | (596,412 | ) | (474,382 | ) | (1,036,570 | ) | |||||||||
Deutsche X-trackers Investment Grade Bond — Interest Rate Hedged ETF | 13,055 | (287,621 | ) | (4,311 | ) | (278,877 | ) | |||||||||
Deutsche X-trackers Municipal Infrastructure Revenue Bond ETF | 80,474 | (94,048 | ) | 1,982,412 | 1,968,838 | |||||||||||
Deutsche X-trackers MSCI All World ex US High Dividend Yield Hedged Equity ETF | 87,840 | (125,430 | ) | (185,836 | ) | (223,426 | ) | |||||||||
Deutsche X-trackers MSCI EAFE High Dividend Yield Hedged Equity ETF | 89,208 | (27,497 | ) | (254,289 | ) | (192,578 | ) | |||||||||
Deutsche X-trackers MSCI Emerging Markets High Dividend Yield Hedged Equity ETF | 12,003 | (136,998 | ) | (254,562 | ) | (379,557 | ) | |||||||||
Deutsche X-trackers MSCI Eurozone High Dividend Yield Hedged Equity ETF | 49,143 | (36,649 | ) | (98,927 | ) | (86,433 | ) | |||||||||
The tax character of dividends and distributions declared for the periods ended May 31, 2016 and May 31, 2015 were as follows:
| Period Ended May 31, 2016 | ||||||||||||
| Ordinary Income* | Tax — Exempt | Long Term Capital Gain | ||||||||||
Deutsche X-trackers Emerging Markets Bond — Interest Rate Hedged ETF | $ | 335,221 | $ | — | $ | — | ||||||
Deutsche X-trackers High Yield Corp Bond — Interest Rate Hedged ETF | 544,700 | — | — | |||||||||
Deutsche X-trackers Investment Grade Bond — Interest Rate Hedged ETF | 166,692 | — | — | |||||||||
Deutsche X-trackers Municipal Infrastructure Revenue Bond ETF | — | 737,901 | — | |||||||||
Deutsche X-trackers MSCI All World ex US High Dividend Yield Hedged Equity ETF | 168,419 | — | — | |||||||||
Deutsche X-trackers MSCI EAFE High Dividend Yield Hedged Equity ETF | 89,371 | — | 20,455 | |||||||||
Deutsche X-trackers MSCI Emerging Markets High Dividend Yield Hedged Equity ETF | 57,321 | — | 21,632 | |||||||||
Deutsche X-trackers MSCI Eurozone High Dividend Yield Hedged Equity ETF | 27,770 | — | — | |||||||||
| Period Ended May 31, 2015 | ||||||||
| Ordinary Income* | Tax — Exempt | |||||||
Deutsche X-trackers Emerging Markets Bond — Interest Rate Hedged ETF | $ | 48,838 | $ | — | ||||
Deutsche X-trackers High Yield Corp Bond — Interest Rate Hedged ETF | 95,774 | — | ||||||
Deutsche X-trackers Investment Grade Bond — Interest Rate Hedged ETF | 28,313 | — | ||||||
Deutsche X-trackers Municipal Infrastructure Revenue Bond ETF | — | 573,756 | ||||||
78
DBX ETF Trust
Notes to financial statements (Continued)
| * | for tax purposes short-term capital gain distributions are considered ordinary income distributions |
At May 31, 2016, for Federal income tax purposes, the Funds have capital loss carryforwards available as shown in the table below, to the extent provided by regulations, to offset future capital gains for an unlimited period. To the extent that these capital loss carryforwards are used to offset future capital gains, it is probable that the capital gains so offset will not be distributed to shareholders.
| Short-Term | Long-Term | Total Amount | ||||||||||
Deutsche X-trackers High Yield Corp Bond — Interest Rate Hedged ETF | $ | 102,688 | $ | 68,499 | $ | 171,187 | ||||||
Deutsche X-trackers Investment Grade Bond — Interest Rate Hedged ETF | 76,059 | 4,111 | 80,170 | |||||||||
Deutsche X-trackers Municipal Infrastructure Revenue Bond ETF | 94,048 | — | 94,048 | |||||||||
Deutsche X-trackers MSCI All World ex US High Dividend Yield Hedged Equity ETF | — | 38,372 | 38,372 | |||||||||
Deutsche X-trackers MSCI Eurozone High Dividend Yield Hedged Equity ETF | 781 | 1,184 | 1,965 | |||||||||
Capital losses incurred after October 31 (“post-October losses”) within the taxable year are deemed to arise on the first business day of each Fund’s next taxable year. During the period ended May 31, 2016, the Funds incurred and elected to defer net capital losses as follows:
| Post-October Losses on Capital | ||||
Deutsche X-trackers Emerging Markets Bond — Interest Rate Hedged ETF | $ | 177,215 | ||
Deutsche X-trackers High Yield Corp Bond — Interest Rate Hedged ETF | 425,225 | |||
Deutsche X-trackers Investment Grade Bond — Interest Rate Hedged ETF | 207,451 | |||
Deutsche X-trackers MSCI All World ex US High Dividend Yield Hedged Equity ETF | 87,058 | |||
Deutsche X-trackers MSCI EAFE High Dividend Yield Hedged Equity ETF | 27,497 | |||
Deutsche X-trackers MSCI Emerging Markets High Dividend Yield Hedged Equity ETF | 136,998 | |||
Deutsche X-trackers MSCI Eurozone High Dividend Yield Hedged Equity ETF | 34,684 | |||
In order to present paid-in capital accumulated net realized gains or losses on the Statements of Assets and Liabilities that more closely represent their tax character, certain adjustments have been made to additional paid-in capital, undistributed net investment income or loss and accumulated net realized gains or losses on investments. These differences are primarily due to investments in futures, accretion of market discount on municipal debt securities, premium amortization on corporate debt securities, redemptions-in-kind, Distribution re-class, Net operating loss, Foreign currency, Passive foreign investment companies and Non-deductible excise. For the period ended May 31, 2016, the adjustments were as follows:
| Undistributed Net Investment Income (Loss) | Undistributed Capital Gains (Accumulated Losses) | Paid-In Capital | ||||||||||
Deutsche X-trackers Emerging Markets Bond — Interest Rate Hedged ETF | $ | 44,009 | $ | (44,009 | ) | $ | — | |||||
Deutsche X-trackers High Yield Corp Bond — Interest Rate Hedged ETF | 83,020 | 16,478 | (99,498 | ) | ||||||||
Deutsche X-trackers Investment Grade Bond — Interest Rate Hedged ETF | 17,750 | (17,750 | ) | — | ||||||||
Deutsche X-trackers MSCI All World ex US High Dividend Yield Hedged Equity ETF | (1,300 | ) | 61,514 | (60,214 | ) | |||||||
Deutsche X-trackers MSCI EAFE High Dividend Yield Hedged Equity ETF | (3,648 | ) | 3,648 | — | ||||||||
Deutsche X-trackers MSCI Emerging Markets High Dividend Yield Hedged Equity ETF | 90 | (90 | ) | — | ||||||||
Deutsche X-trackers MSCI Eurozone High Dividend Yield Hedged Equity ETF | (883 | ) | 41,123 | (40,240 | ) | |||||||
79
DBX ETF Trust
Notes to financial statements (Continued)
Foreign Taxes The Funds may be subject to foreign taxes (a portion of which may be reclaimable) on income, capital gains on investments, certain foreign currency transactions or other corporate events. All foreign taxes are recorded in accordance with the applicable foreign tax regulations and rates that exist in the foreign jurisdictions in which the Funds invest. These foreign taxes, if any, are paid by the Funds and are reflected in their Statements of Operations as follows: foreign taxes withheld at source are presented as a reduction of income, and foreign taxes on capital gains from sales of investments and foreign currency transactions are included in their respective net realized gain (loss) categories. Foreign taxes payable as of May 31, 2016, if any, are disclosed in the Funds’ Statements of Assets and Liabilities.
Foreign Currency Translations The books and records of the Fund are maintained in U.S. dollars. Investment securities and other assets and liabilities denominated in a foreign currency are translated into U.S. dollars at the prevailing exchange rates at period end. Purchases and sales of investment securities, income and expenses are translated into U.S. dollars at the prevailing exchange rates on the respective dates of the transactions.
Net realized and unrealized gains and losses on foreign currency transactions represent net gains and losses between trade and settlement dates on securities transactions, the acquisition and disposition of foreign currencies, and the difference between the amount of net investment income accrued and the U.S. dollar amount actually received. The portion of both realized and unrealized gains and losses on investments that results from fluctuations in foreign currency exchange rates is not separately disclosed, but is included with net realized and unrealized gain/appreciation and loss/depreciation on investments.
Securities Lending The Funds, except the Deutsche X-trackers Municipal Infrastructure Revenue Bond ETF, may lend securities to certain financial institutions under the terms of their securities lending agreement. The Funds retain the benefits of owning securities it has loaned and continues to receive interest and dividends generated by the securities and to participate in any changes in their market value. The Funds require the borrowers of the securities to maintain collateral with the Funds consisting of either cash or liquid, unencumbered assets having a value at least equal to the value of the securities loaned. When the collateral falls below specified amounts, the lending agent will use its best effort to obtain additional collateral on the next business day to meet required amounts under the securities lending agreement. As of period end, any securities on loan were collateralized by cash. The Funds may invest the cash collateral into a joint trading account in an affiliated money market fund. During the period ended May 31, 2016, the Funds invested the cash collateral in Daily Assets Fund, an affiliated money market fund managed by Deutsche Investment Management Americas Inc. Deutsche Investment Management Americas Inc. receives a management/administration fee (0.09% annualized effective rate as of May 31, 2016) on the cash collateral invested in Daily Assets Fund. The Funds receive compensation for lending its securities either in the form of fees or by earning interest on invested cash collateral net of borrower rebates and fees paid to a lending agent. Either the Fund or the borrower may terminate the loan at any time and the borrower, after notice, is required to return borrowed securities within a standard time period. There may be risks of delay and costs in recovery of securities or even loss of rights in the collateral should the borrower of the securities fail financially. If the Funds are not able to recover securities lent, the Funds may sell the collateral and purchase a replacement investment in the market, incurring the risk that the value of the replacement security is greater than the value of the collateral. The Funds are also subject to all investment risks associated with the reinvestment of any cash collateral received, including, but not limited to, interest rate, credit and liquidity risk associated with such investments.
As of May 31, 2016, the Funds listed below had securities on loan, which were classified as bonds in the Schedule of Investments. The value of the related collateral exceeded the value of the securities loaned at period end.
| Deutsche X-trackers High Yield Corporate Bond — Interest Rate Hedged ETF |
| Deutsche X-trackers Investment Grade Bond — Interest Rate Hedged ETF |
As of May 31, 2016, the Funds listed below had securities on loan, all of which were classified as common stock in the Schedule of Investments. The value of the related collateral exceeded the value of the securities loaned at period end.
| Deutsche X-trackers MSCI All World ex US High Dividend Yield Hedged Equity ETF |
| Deutsche X-trackers MSCI EAFE High Dividend Yield Hedged Equity ETF |
| Deutsche X-trackers MSCI Emerging Markets High Dividend Yield Hedged Equity ETF |
| Deutsche X-trackers MSCI Eurozone High Dividend Yield Hedged Equity ETF |
80
DBX ETF Trust
Notes to financial statements (Continued)
As of May 31, 2016, Deutsche X-trackers Emerging Markets Bond — Interest Rate Hedged ETF had no securities on loan.
Derivatives
Forward Foreign Currency Exchange Contracts Deutsche X-trackers MSCI All World ex US High Dividend Yield Hedged Equity ETF, Deutsche X-trackers MSCI EAFE High Dividend Yield Hedged Equity ETF, Deutsche X-trackers MSCI Emerging Markets High Dividend Yield Hedged Equity ETF and Deutsche X-trackers MSCI Eurozone High Dividend Yield Hedged Equity ETF enter into forward foreign currency exchange contracts (“forward currency contracts”) designed to offset the Fund’s exposure to non-U.S. currencies. In addition, the Funds may enter into forward currency contracts to facilitate local securities settlements or to protect against currency exposure in connection with distributions to Shareholders.
A forward currency contract is a commitment to purchase or sell a foreign currency at a future date at a negotiated forward rate. For the period ended May 31, 2016, the Funds invested in forward currency contracts to hedge against changes in the value of the U.S. dollar against specified non-U.S. currencies.
The gain or loss arising from the difference between the original contract and the closing of such contract would be included in net realized gain or loss on foreign currency transactions. Risks may arise from the potential inability of a counterparty to meet the terms of a contract and from unanticipated movements in the value of a foreign currency relative to the U.S. dollar. The face or contract amount, in U.S. dollars reflects the total exposure the Fund has in that particular currency contract.
A summary of the open forward currency contracts as of May 31, 2016 is included in a table following the Fund’s Schedule of Investments. The investment in forward currency contracts short vs. U.S. dollars had a contract value generally indicative of a range of the total exposure the respective Funds had to the value of non U.S currencies during the period ended May 31, 2016.
Futures Contracts Each Fund may enter into futures contracts. Each Fund will enter into futures contracts that are traded on a U.S. or non-U.S. exchange. No Fund will use futures for speculative purposes. Futures contracts provide for the future sale by one party and purchase by another party of a specified amount of a specific instrument or index at a specified future time and at a specified price. Deutsche X-trackers Emerging Markets Bond — Interest Rate Hedged ETF, Deutsche X-trackers High Yield Corporate Bond — Interest Rate Hedged ETF and Deutsche X-trackers Investment Grade Bond — Interest Rate Hedged ETF enter into short U.S. Treasury futures contracts to seek to mitigate the potential negative impact of rising Treasury interest rates on the performance of each Fund’s long bond investments. To the extent required by law, liquid assets committed to futures contracts will be maintained.
At the time each Fund enters into a futures contract, each Fund deposits and maintains as collateral an initial margin with the broker, as required by the exchange on which the transaction is affected. Pursuant to the contract, each Fund agrees to receive from or pay to the broker an amount of cash equal to the daily fluctuation in the value of the contract. Such receipts or payments are known as variation margin and are recorded by each Fund as unrealized gains or losses. Risks may arise from the potential inability of a counterparty to meet the terms of the contract. The credit/counterparty risk for exchange-traded futures contracts is generally less than privately negotiated futures contracts, since the clearinghouse, which is the issuer or counterparty to each exchange-traded future, provides a guarantee of performance. The guarantee is supported by a daily payment system (i.e., margin requirements).
Use of long futures contracts subjects each Fund to risk of loss in excess of the amounts shown on the Statement of Assets and Liabilities, up to the notional value of the futures contracts. Use of short futures contracts subjects each Fund to unlimited risk of loss. Under some circumstances, futures exchanges may establish daily limits on the amount that the price of a futures contract can vary from the previous day’s settlement price, which could effectively prevent liquidation of unfavorable positions.
A summary of the open futures contracts as of May 31, 2016 is included in a table following the Funds’ Schedule of Investments.
81
DBX ETF Trust
Notes to financial statements (Continued)
The following tables summarize the value of the Funds’ derivative instruments held as of May 31, 2016 and the related location in the accompanying Statement of Assets and Liabilities, presented by primary underlying risk exposure:
Asset Derivatives | Liability Derivatives | |||||||||||||||
Risk Type | Statement of Asset and | Fair Value | Statement of Asset and | Fair Value | ||||||||||||
| Deutsche X-trackers Emerging Markets Bond — Interest Rate Hedged ETF | ||||||||||||||||
| Interest rate contracts | Unrealized appreciation on futures contracts | $ | — | Unrealized depreciation on futures contracts | $ | 21,876 | ||||||||||
|
|
|
| |||||||||||||
| Total | $ | — | Total | $ | 21,876 | |||||||||||
|
|
|
| |||||||||||||
| Deutsche X-trackers High Yield Corp Bond — Interest Rate Hedged ETF | ||||||||||||||||
| Interest rate contracts | Unrealized appreciation on futures contracts | $ | — | Unrealized depreciation on futures contracts | $ | 19,480 | ||||||||||
|
|
|
| |||||||||||||
| Total | $ | — | Total | $ | 19,480 | |||||||||||
|
|
|
| |||||||||||||
| Deutsche X-trackers Investment Grade Bond — Interest Rate Hedged ETF | ||||||||||||||||
| Interest rate contracts | Unrealized appreciation on futures contracts | $ | — | Unrealized depreciation on futures contracts | $ | 19,554 | ||||||||||
|
|
|
| |||||||||||||
| Total | $ | — | Total | $ | 19,554 | |||||||||||
|
|
|
| |||||||||||||
| Deutsche X-trackers MSCI All World ex US High Dividend Yield Hedged Equity ETF | ||||||||||||||||
| Foreign exchange contracts | Unrealized appreciation on forward foreign currency exchange contracts | $ | 114,585 | Unrealized depreciation on forward foreign currency exchange contracts | $ | 24,627 | ||||||||||
|
|
|
| |||||||||||||
| Total | $ | 114,585 | Total | $ | 24,627 | |||||||||||
|
|
|
| |||||||||||||
| Deutsche X-trackers MSCI EAFE High Dividend Yield Hedged Equity ETF | ||||||||||||||||
| Foreign exchange contracts | Unrealized appreciation on forward foreign currency exchange contracts | $ | 128,407 | Unrealized depreciation on forward foreign currency exchange contracts | $ | 14,866 | ||||||||||
|
|
|
| |||||||||||||
| Total | $ | 128,407 | Total | $ | 14,866 | |||||||||||
|
|
|
| |||||||||||||
| Deutsche X-trackers MSCI Emerging Markets High Dividend Yield Hedged Equity ETF | ||||||||||||||||
| Foreign exchange contracts | Unrealized appreciation on forward foreign currency exchange contracts | $ | 72,650 | Unrealized depreciation on forward foreign currency exchange contracts | $ | 8,917 | ||||||||||
|
|
|
| |||||||||||||
| Total | $ | 72,650 | Total | $ | 8,917 | |||||||||||
|
|
|
| |||||||||||||
| Deutsche X-trackers MSCI Eurozone High Dividend Yield Hedged Equity ETF | ||||||||||||||||
| Foreign exchange contracts | Unrealized appreciation on forward foreign currency exchange contracts | $ | 72,762 | Unrealized depreciation on forward foreign currency exchange contracts | $ | 1,460 | ||||||||||
|
|
|
| |||||||||||||
| Total | $ | 72,762 | Total | $ | 1,460 | |||||||||||
|
|
|
| |||||||||||||
82
DBX ETF Trust
Notes to financial statements (Continued)
Additionally, the amount of realized and unrealized gains and losses on derivative instruments recognized in the Funds’ earnings during the period ended May 31, 2016 and the related location in the accompanying Statement of Operations is summarized in the following tables by primary underlying risk exposure:
Net Realized Gain (Loss) on: | ||||||||||||
| Interest Rate Contracts | Foreign Exchange Contracts | Total | ||||||||||
Deutsche X-trackers Emerging Markets Bond — Interest Rate Hedged ETF | $ | (201,840 | ) | $ | — | $ | (201,840 | ) | ||||
Deutsche X-trackers High Yield Corp Bond — Interest Rate Hedged ETF | (121,134 | ) | — | (121,134 | ) | |||||||
Deutsche X-trackers Investment Grade Bond — Interest Rate Hedged ETF | (163,277 | ) | — | (163,277 | ) | |||||||
Deutsche X-trackers MSCI All World ex US High Dividend Yield Hedged Equity ETF | — | 1,680 | 1,680 | |||||||||
Deutsche X-trackers MSCI EAFE High Dividend Yield Hedged Equity ETF | — | 22,093 | 22,093 | |||||||||
Deutsche X-trackers MSCI Emerging Markets High Dividend Yield Hedged Equity ETF | — | (8,040 | ) | (8,040 | ) | |||||||
Deutsche X-trackers MSCI Eurozone High Dividend Yield Hedged Equity ETF | — | (53,701 | ) | (53,701 | ) | |||||||
Net Change in Unrealized Appreciation (Depreciation) on: | ||||||||||||
| Interest Rate Contracts | Foreign Exchange Contracts | Total | ||||||||||
Deutsche X-trackers Emerging Markets Bond —Interest Rate Hedged ETF | $ | (112 | ) | $ | — | $ | (112 | ) | ||||
Deutsche X-trackers High Yield Corp Bond — Interest Rate Hedged ETF | 9,173 | — | 9,173 | |||||||||
Deutsche X-trackers Investment Grade Bond —Interest Rate Hedged ETF | 4,030 | — | 4,030 | |||||||||
Deutsche X-trackers MSCI All World ex US High Dividend Yield Hedged Equity ETF | — | 89,958 | 89,958 | |||||||||
Deutsche X-trackers MSCI EAFE High Dividend Yield Hedged Equity ETF | — | 113,541 | 113,541 | |||||||||
Deutsche X-trackers MSCI Emerging Markets High Dividend Yield Hedged Equity ETF | — | 63,733 | 63,733 | |||||||||
Deutsche X-trackers MSCI Eurozone High Dividend Yield Hedged Equity ETF | — | 71,302 | 71,302 | |||||||||
83
DBX ETF Trust
Notes to financial statements (Continued)
For the period ended May 31, 2016 the average monthly volume of derivatives was as follows:
| Futures Contracts (Contract Value) | Forward Foreign Currency Exchange Contracts (Market Value) | |||||||
Deutsche X-trackers Emerging Markets Bond — Interest Rate Hedged ETF | $ | (5,587,814 | ) | $ | — | |||
Deutsche X-trackers High Yield Corp Bond — Interest Rate Hedged ETF | (8,528,384 | ) | — | |||||
Deutsche X-trackers Investment Grade Bond — Interest Rate Hedged ETF | (4,488,982 | ) | — | |||||
Deutsche X-trackers MSCI All World ex US High Dividend Yield Hedged Equity ETF | — | (8,246,203 | ) | |||||
Deutsche X-trackers MSCI EAFE High Dividend Yield Hedged Equity ETF | — | (4,336,337 | ) | |||||
Deutsche X-trackers MSCI Emerging Markets High Dividend Yield Hedged Equity ETF | — | (2,163,059 | ) | |||||
Deutsche X-trackers MSCI Eurozone High Dividend Yield Hedged Equity ETF | — | (2,479,679 | ) | |||||
As of May 31, 2016, the Funds have transactions subject to enforceable master netting agreements which govern the terms of certain transactions, and reduce the counterparty risk associated with such transactions. Master netting agreements allow a Fund to close out and net total exposure to a counterparty in the event of a default with respect to all of the transactions with a counterparty. For financial reporting purposes the Statement of Assets and Liabilities generally shows derivatives assets and liabilities on a gross basis, which reflects the full risks and exposures prior to netting. A reconciliation of the gross amounts on the Statement of Assets and Liabilities to the net amounts by counterparty, including any collateral exposure, is included in the following tables:
| Gross Amounts of Assets Presented in the Statements of Assets and Liabilities | Financial Instruments and Derivatives Available for Offset | Collateral Received | Net Amount of Derivatives Assets | Gross Amounts of Liabilities Presented in the Statements of Assets and Liabilities | Financial Instruments and Derivatives Available for Offset | Collateral Pledged | Net Amount of Derivatives Liabilities | |||||||||||||||||||||||||
Deutsche X-trackers MSCI All World ex US High Dividend Yield Hedged Equity ETF |
| |||||||||||||||||||||||||||||||
RBC Capital Markets | $ | 24,722 | $ | (2,783 | ) | $ | — | $ | 21,939 | $ | 2,783 | $ | (2,783 | ) | $ | — | $ | — | ||||||||||||||
The Bank of New York Mellon | 11,257 | (5,593 | ) | — | 5,664 | 5,593 | (5,593 | ) | — | — | ||||||||||||||||||||||
Bank of Montreal | 56,476 | (13,463 | ) | — | 43,013 | 13,463 | (13,463 | ) | — | — | ||||||||||||||||||||||
State Street Bank & Trust Co. | 22,130 | (2,788 | ) | — | 19,342 | 2,788 | (2,788 | ) | — | — | ||||||||||||||||||||||
|
|
|
|
|
|
|
|
|
|
|
|
|
|
|
| |||||||||||||||||
| $ | 114,585 | $ | (24,627 | ) | $ | — | $ | 89,958 | $ | 24,627 | $ | (24,627 | ) | $ | — | $ | — | |||||||||||||||
|
|
|
|
|
|
|
|
|
|
|
|
|
|
|
| |||||||||||||||||
Deutsche X-trackers MSCI EAFE High Dividend Yield Hedged Equity ETF |
| |||||||||||||||||||||||||||||||
RBC Capital Markets | $ | 91,705 | $ | (10,579 | ) | $ | — | $ | 81,126 | $ | 10,579 | $ | (10,579 | ) | $ | — | $ | — | ||||||||||||||
The Bank of New York Mellon | 2,399 | (1,250 | ) | — | 1,149 | 1,250 | (1,250 | ) | — | — | ||||||||||||||||||||||
Bank of Montreal | 34,303 | (3,037 | ) | — | 31,266 | 3,037 | (3,037 | ) | — | — | ||||||||||||||||||||||
|
|
|
|
|
|
|
|
|
|
|
|
|
|
|
| |||||||||||||||||
| $ | 128,407 | $ | (14,866 | ) | $ | — | $ | 113,541 | $ | 14,866 | $ | (14,866 | ) | $ | — | $ | — | |||||||||||||||
|
|
|
|
|
|
|
|
|
|
|
|
|
|
|
| |||||||||||||||||
84
DBX ETF Trust
Notes to financial statements (Continued)
| Gross Amounts of Assets Presented in the Statements of Assets and Liabilities | Financial Instruments and Derivatives Available for Offset | Collateral Received | Net Amount of Derivatives Assets | Gross Amounts of Liabilities Presented in the Statements of Assets and Liabilities | Financial Instruments and Derivatives Available for Offset | Collateral Pledged | Net Amount of Derivatives Liabilities | |||||||||||||||||||||||||
Deutsche X-trackers MSCI Emerging Markets High Dividend Yield Hedged Equity ETF |
| |||||||||||||||||||||||||||||||
RBC Capital Markets | $ | 38,812 | $ | (2,481 | ) | $ | — | $ | 36,331 | $ | 2,481 | $ | (2,481 | ) | $ | — | $ | — | ||||||||||||||
The Bank of New York Mellon | 11,736 | (2,913 | ) | — | 8,823 | 2,913 | (2,913 | ) | — | — | ||||||||||||||||||||||
State Street Bank & Trust Co. | 3,012 | (871 | ) | — | 2,141 | 871 | (871 | ) | — | — | ||||||||||||||||||||||
Bank of Montreal | 19,090 | (2,652 | ) | — | 16,438 | 2,652 | (2,652 | ) | — | — | ||||||||||||||||||||||
|
|
|
|
|
|
|
|
|
|
|
|
|
|
|
| |||||||||||||||||
| $ | 72,650 | $ | (8,917 | ) | $ | — | $ | 63,733 | $ | 8,917 | $ | (8,917 | ) | $ | — | $ | — | |||||||||||||||
|
|
|
|
|
|
|
|
|
|
|
|
|
|
|
| |||||||||||||||||
Deutsche X-trackers MSCI Eurozone High Dividend Yield Hedged Equity ETF |
| |||||||||||||||||||||||||||||||
Bank of Montreal | $ | 20,404 | $ | (374 | ) | $ | — | $ | 20,030 | $ | 374 | $ | (374 | ) | $ | — | $ | — | ||||||||||||||
RBC Capital Markets | 52,210 | (1,046 | ) | — | 51,164 | 1,046 | (1,046 | ) | — | — | ||||||||||||||||||||||
The Bank of New York Mellon | 148 | (40 | ) | — | 108 | 40 | (40 | ) | — | — | ||||||||||||||||||||||
|
|
|
|
|
|
|
|
|
|
|
|
|
|
|
| |||||||||||||||||
| $ | 72,762 | $ | (1,460 | ) | $ | — | $ | 71,302 | $ | 1,460 | $ | (1,460 | ) | $ | — | $ | — | |||||||||||||||
|
|
|
|
|
|
|
|
|
|
|
|
|
|
|
| |||||||||||||||||
3. Investment Advisory and Other Agreements
The Advisor has overall responsibility for the general management and administration of the Funds, subject to the supervision of the Funds’ Board of Trustees. Under an investment advisory agreement between the Trust, on behalf of the Funds, and the Advisor (the “Investment Advisory Agreement”), the Advisor is responsible for arranging sub-advisory, transfer agency, custody, fund administration, and all other non-distribution related services for the Funds to operate.
TDAM USA Inc. (“TDAM”) serves as investment sub-advisor to Deutsche X-trackers Emerging Markets Bond — Interest Rate Hedged ETF, Deutsche X-trackers High Yield Corporate Bond — Interest Rate Hedged ETF, Deutsche X-trackers Investment Grade Bond — Interest Rate Hedged ETF, Deutsche X-trackers MSCI All World ex US High Dividend Yield Hedged Equity ETF, Deutsche X-trackers MSCI EAFE High Dividend Yield Hedged Equity ETF, Deutsche X-trackers MSCI Emerging Markets High Dividend Yield Hedged Equity ETF and Deutsche X-trackers MSCI Eurozone High Dividend Yield Hedged Equity ETF pursuant to a Sub-Advisory Agreement. Deutsche Investment Management Americas Inc. (“DIMA”) serves as investment sub-advisor to Deutsche X-trackers Municipal Infrastructure Revenue Bond ETF pursuant to a Sub-Advisory Agreement.
For its investment advisory services to the Funds below, the Advisor is entitled to receive a unitary management fee from each Fund based on each Fund’s average daily net assets at an annual rate equal to:
Fund | Unitary Management Fee | |||
Deutsche X-trackers Emerging Markets Bond — Interest Rate Hedged ETF | 0.50 | % | ||
Deutsche X-trackers High Yield Corporate Bond — Interest Rate Hedged ETF | 0.45 | % | ||
Deutsche X-trackers Investment Grade Bond — Interest Rate Hedged ETF | 0.25 | % | ||
Deutsche X-trackers Municipal Infrastructure Revenue Bond ETF | 0.30 | % | ||
Deutsche X-trackers MSCI All World ex US High Dividend Yield Hedged Equity ETF | 0.45 | % | ||
Deutsche X-trackers MSCI EAFE High Dividend Yield Hedged Equity ETF | 0.45 | % | ||
Deutsche X-trackers MSCI Emerging Markets High Dividend Yield Hedged Equity ETF | 0.65 | % | ||
Deutsche X-trackers MSCI Eurozone High Dividend Yield Hedged Equity ETF | 0.45 | % | ||
85
DBX ETF Trust
Notes to financial statements (Continued)
Out of the unitary management fee, the Advisor pays substantially all expenses of each Fund, including the payments to the sub-advisors, the cost of transfer agency, custody, fund administration, legal, audit and other services, and expenses of the Independent Trustees. Each Fund is responsible for the payment of interest expense, taxes, brokerage expenses and extraordinary expenses.
The Bank of New York Mellon, a wholly-owned subsidiary of The Bank of New York Mellon Corporation, serves as Administrator, Custodian, Accounting Agent, Lending Agent and Transfer Agent for each Fund.
ALPS Distributors, Inc. (the “Distributor”) serves as the distributor of Creation Units for each Fund on an agency basis. The Distributor does not maintain a secondary market in shares of the Funds.
The Board of Trustees is currently comprised of four Trustees, including three Independent Trustees. The Advisor paid retainer fees and attendance fees to each independent Trustee and attendance fees to each member of the Audit Committee (which is comprised of all of the Funds’ Independent Trustees).
4. Transactions with Affiliates
The Advisor is an indirect wholly-owned subsidiary of Deutsche Bank AG. Therefore, Deutsche Bank AG is considered to be affiliated with the Fund. The table below shows the transactions in and earnings from investments in Deutsche Bank AG securities for the twelve months ended May 31, 2016.
| Value ($) at 5/31/15 | Purchases Cost ($) | Sales Proceeds ($) | Realized Gain/(Loss) ($) | Income ($) | Value ($) at 5/31/16 | |||||||||||||||||||
Deutsche X-trackers Investment Grade Bond — Interest Rate Hedged ETF | ||||||||||||||||||||||||
Deutsche Bank AG 2.50%, 2/13/19 | 10,156 | — | (9,803 | ) | (340 | ) | 153 | — | ||||||||||||||||
5. Investment Portfolio Transactions
For the period ended May 31, 2016, the cost of investments purchased and proceeds from sale of investments (excluding in-kind transactions and short-term investments) were as follows:
| Purchases | Sales | |||||||
Deutsche X-trackers Emerging Markets Bond — Interest Rate Hedged ETF | $ | 835,386 | $ | 936,570 | ||||
Deutsche X-trackers High Yield Corporate Bond — Interest Rate Hedged ETF | 3,029,059 | 3,292,919 | ||||||
Deutsche X-trackers Investment Grade Bond — Interest Rate Hedged ETF | 654,558 | 1,849,839 | ||||||
Deutsche X-trackers Municipal Infrastructure Revenue Bond ETF | 13,612,083 | 3,241,878 | ||||||
Deutsche X-trackers MSCI All World ex US High Dividend Yield Hedged Equity ETF (1) | 5,812,016 | 2,557,311 | ||||||
Deutsche X-trackers MSCI EAFE High Dividend Yield Hedged Equity ETF (1) | 4,058,151 | 1,385,828 | ||||||
Deutsche X-trackers MSCI Emerging Markets High Dividend Yield Hedged Equity ETF (1) | 3,375,827 | 855,435 | ||||||
Deutsche X-trackers MSCI Eurozone High Dividend Yield Hedged Equity ETF (1) | 3,689,963 | 1,143,894 | ||||||
86
DBX ETF Trust
Notes to financial statements (Continued)
For the period ended May 31, 2016, the cost of in-kind purchases and proceeds from in-kind sales were as follows:
| Purchases | Sales | |||||||
Deutsche X-trackers High Yield Corporate Bond — Interest Rate Hedged ETF | $ | 120,385 | $ | 1,146,161 | ||||
Deutsche X-trackers Municipal Infrastructure Revenue Bond ETF | 2,447,179 | — | ||||||
Deutsche X-trackers MSCI All World ex US High Dividend Yield Hedged Equity ETF (1) | 7,671,315 | 7,073,378 | ||||||
Deutsche X-trackers MSCI EAFE High Dividend Yield Hedged Equity ETF (1) | 2,314,860 | — | ||||||
Deutsche X-trackers MSCI Eurozone High Dividend Yield Hedged Equity ETF (1) | 1,170,986 | 1,130,724 | ||||||
| (1) | For the period from August 12, 2015 (commencement of operations) to May 31, 2016. |
6. Fund Share Transactions
As of May 31, 2016, there were unlimited Fund shares, no par value authorized by the Trust. Fund shares are issued and redeemed by each Fund only in Creation Units or multiples thereof. Except when aggregated in Creation Units, shares of each Fund are not redeemable. Transactions in capital shares for each Fund are disclosed in detail in the Statements of Changes in Net Assets. The consideration for the purchase of Creation Units of a Fund generally consists of the in-kind contribution of a designated portfolio of securities constituting a portfolio sampling representation of the securities included in the respective Fund’s underlying index and an amount of cash, which under certain circumstances may include cash in lieu of portfolio securities. Investors purchasing and redeeming Creation Units pay a purchase transaction fee and a redemption transaction fee to offset transfer and other transaction costs associated with the issuance and redemption of Creation Units.
7. Line of Credit
The Trust has entered into a senior unsecured credit facility with a syndication of banks which allows the Deutsche X-trackers MSCI All World ex US High Dividend Yield Hedged Equity ETF, Deutsche X-trackers MSCI Emerging Markets High Dividend Yield Hedged Equity ETF and certain other funds managed by the Advisor to borrow up to $130 million. Each Fund may borrow money under this credit facility to the extent necessary for temporary or emergency purposes, including the funding of shareholder redemption requests, trade settlements, and as necessary to distribute to shareholders any income necessary to maintain each Fund’s status as a regulated investment company. Borrowings are charged an interest rate of 1.25% per annum plus the greater of the Federal Funds Effective Rate or the one-month LIBOR Rate. Each Fund may borrow up to a maximum of 33 percent of its net assets as permitted by the Act. The Funds had no outstanding loans at May 31, 2016.
8. Concentration of Ownership
From time to time, the Funds may have a concentration of several shareholder accounts holding a significant percentage of shares outstanding. Investment activities of these shareholders could have a material impact on the Fund. At May 31, 2016, there was one affiliated shareholder account for each of the funds listed below holding a significant percentage of the shares outstanding:
Fund Name | Approximate Percent of Outstanding Shares Held | |||
Deutsche X-trackers Emerging Markets Bond — Interest Rate Hedged ETF | 62 | % | ||
Deutsche X-trackers High Yield Corporate Bond — Interest Rate Hedged ETF | 92 | % | ||
Deutsche X-trackers Investment Grade Bond — Interest Rate Hedged ETF | 41 | % | ||
Deutsche X-trackers MSCI All World ex US High Dividend Yield Hedged Equity ETF | 47 | % | ||
Deutsche X-trackers MSCI EAFE High Dividend Yield Hedged Equity ETF | 30 | % | ||
Deutsche X-trackers MSCI Emerging Markets High Dividends Yield Hedged Equity ETF | 97 | % | ||
Deutsche X-trackers MSCI Eurozone High Dividend Yield Hedged Equity ETF | 75 | % | ||
87
DBX ETF Trust
Notes to financial statements (Continued)
9. Investing in Emerging Markets
Investment in emerging markets subjects a Fund to a greater risk of loss than investments in a developed market. This is due to, among other things, (i) greater market volatility, (ii) lower trading volume, (iii) political and economic instability, (iv) high levels of inflations, deflation or currency devaluation, (v) greater risk of market shut down, (vi) more governmental limitations on foreign investments and limitations on repatriation of invested capital than those typically found in a developed market, and (vii) the risk that companies may be held to lower disclosure, corporate governance, auditing and financial reporting standards than companies in more developed markets.
10. Investing in High-Yield Debt Securities
High-yield debt securities or junk bonds are generally regarded as speculative with respect to the issuer’s continuing ability to meet principal and interest payments. A fund’s performance could be hurt if an issuer of a debt security suffers an adverse change in financial condition that results in the issuer not making timely payments of interest or principal, a security downgrade or an inability to meet a financial obligation. High-yield debt securities’ total return and yield may generally be expected to fluctuate more than the total return and yield of investment-grade debt securities. A real or perceived economic downturn or an increase in market interest rates could cause a decline in the value of high-yield debt securities, result in increased redemptions and/or result in increased portfolio turnover, which could result in a decline in net asset value of a fund, reduce liquidity for certain investments and/or increase costs. High-yield debt securities are often thinly traded and can be more difficult to sell and value accurately than investment-grade debt securities as there may be no established secondary market. Investments in high-yield debt securities could increase liquidity risk for a fund. In addition, the market for high-yield debt securities can experience sudden and sharp volatility which is generally associated more with investments in stocks.
88
DBX ETF Trust
Report of independent registered public accounting firm
To Board of Trustees and Shareholders of
DBX ETF Trust:
We have audited the accompanying statements of assets and liabilities of Deutsche X-trackers Emerging Markets Bond — Interest Rate Hedged ETF, Deutsche X-trackers High Yield Corporate Bond — Interest Rate Hedged ETF, Deutsche X-trackers Investment Grade Bond — Interest Rate Hedged ETF, Deutsche X-trackers Municipal Infrastructure Revenue Bond ETF, Deutsche X-trackers MSCI All World ex US High Dividend Yield Hedged Equity ETF, Deutsche X-trackers MSCI EAFE High Dividend Yield Hedged Equity ETF, Deutsche X-trackers MSCI Emerging Markets High Dividend Yield Hedged Equity ETF and Deutsche X-trackers MSCI Eurozone High Dividend Yield Hedged Equity ETF (the “Funds” within DBX ETF Trust), including the schedules of investments, as of May 31, 2016, and the related statements of operations and changes in net assets and the financial highlights for each of the periods indicated therein. These financial statements and financial highlights are the responsibility of the Funds’ management. Our responsibility is to express an opinion on these financial statements and financial highlights based on our audits.
We conducted our audits in accordance with the standards of the Public Company Accounting Oversight Board (United States). Those standards require that we plan and perform the audit to obtain reasonable assurance about whether the financial statements and financial highlights are free of material misstatement. We were not engaged to perform an audit of the Funds’ internal control over financial reporting. Our audits included consideration of internal control over financial reporting as a basis for designing audit procedures that are appropriate in the circumstances, but not for the purpose of expressing an opinion on the effectiveness of the Funds’ internal control over financial reporting. Accordingly, we express no such opinion. An audit also includes examining, on a test basis, evidence supporting the amounts and disclosures in the financial statements and financial highlights, assessing the accounting principles used and significant estimates made by management, and evaluating the overall financial statement presentation. Our procedures included confirmation of securities owned as of May 31, 2016 by correspondence with the custodian and brokers or by other appropriate auditing procedures where replies from brokers were not received. We believe that our audits provide a reasonable basis for our opinion.
In our opinion, the financial statements and financial highlights referred to above present fairly, in all material respects, the financial position of Deutsche X-trackers Emerging Markets Bond — Interest Rate Hedged ETF, Deutsche X-trackers High Yield Corporate Bond — Interest Rate Hedged ETF, Deutsche X-trackers Investment Grade Bond — Interest Rate Hedged ETF, Deutsche X-trackers Municipal Infrastructure Revenue Bond ETF, Deutsche X-trackers MSCI All World ex US High Dividend Yield Hedged Equity ETF, Deutsche X-trackers MSCI EAFE High Dividend Yield Hedged Equity ETF, Deutsche X-trackers MSCI Emerging Markets High Dividend Yield Hedged Equity ETF and Deutsche X-trackers MSCI Eurozone High Dividend Yield Hedged Equity ETF at May 31, 2016, the results of their operations and changes in their net assets and the financial highlights for each of the periods indicated therein in conformity with U.S. generally accepted accounting principles.

New York, New York
July 26, 2016
89
DBX ETF Trust
Trustees and officers (Unaudited)
| Name, Year of Birth and Address | Position(s) Held with Fund | Terms of Office Time Served | Principal Occupation(s) | Number of Portfolios in Fund Complex Overseen by Trustee | Other Directorships held by Trustee During Past 5 Years | |||||
Independent Trustees | ||||||||||
J. David Officer (1948) 345 Park Avenue New York, New York 10154 | Trustee, Chairman of the Nominating Committee and Member of the Audit Committee | Since 2011 (Chairman of the Nominating Committee since 2015) | Independent Director (2010-present); formerly, Vice Chairman, the Dreyfus Corporation (2006-2009); President, The Dreyfus Family of Funds, Inc. (2006-2009). | 36 | Ilex Partners (Asia), LLC; Old Westbury Funds; MAN Long/Short Fund; GLG Investment Series Trust. | |||||
Stephen R. Byers (1953) 345 Park Avenue New York, New York 10154 | Lead Independent Trustee, Member of the Audit and Nominating Committees | Since 2011 (Trustee and Member of Committees) (Lead | Independent Consultant (2014-present). | 36 | The Arbitrage Funds; Sierra Income Corporation; College of William and Mary, Graduate School of Business; Lighthouse Growth Advisors LLC; Founders Asset Management, LLC. | |||||
George O. Elston (1964) 345 Park Avenue New York, New York 10154 | Trustee, Chairman of the Audit Committee and Member of the Nominating Committee | Since 2011 (Chairman | Senior Vice President and Chief Financial Officer, Juniper Pharmaceuticals, Inc. (2014-present); Senior Vice President and Chief Financial Officer, KBI BioPharma Inc. (2013-2014); Managing Partner, Chatham Street Partners (2010-2013). | 36 | Celldex Therapeutics, Inc. | |||||
90
DBX ETF Trust
Trustees and officers (Unaudited) (Continued)
| Name, Year of Birth and Address | Position(s) Held with Fund | Terms of Office Time Served | Principal Occupation(s) | Number of Portfolios in Fund Complex Overseen by Trustee | Other Directorships held by Trustee During Past 5 Years | |||||
Interested Trustee | ||||||||||
Alex Depetris (1980) 345 Park Avenue New York, New York 10154 | Trustee, Chairman of the Board, President and Chief Executive Officer | Since 2010 | Director in the Deutsche Asset Management Passive Asset Management Group at Deutsche Bank AG (2008-present); Manager and Chief Operating Officer of the Adviser (2012-present); Associate, Arnold & Porter (2006-2008). | 36 | Director, Chairman of the Board of db-X Exchange Traded Funds Inc. | |||||
| Name, Year of Birth and Address | Position(s) Held with Fund | Terms of Office Time Served | Principal Occupation(s) During Past 5 Years | |||||||
Officers | ||||||||||
Michael Gilligan (1966) 60 Wall Street New York, New York 10005 | Treasurer, Chief Financial Officer and Controller | Since 2010 | Director in the Finance Division at Deutsche Bank AG (2008-present); Manager and Chief Financial Officer of the Adviser (2010-present); Chief Financial Officer of Global Passive Asset Management Platform (2012-present). | |||||||
Fiona Bassett (1974) 345 Park Avenue New York, New York 10154 | Chief Operating Officer | Since 2014 | Managing Director in the Deutsche Asset Management Passive Asset Management Group at Deutsche Bank AG and Head of Passive Americas Asset Management Platform (2014-present); Manager and Chief Executive Officer and Chief Investment Officer of the Adviser (2014-present); Managing Director, COO Global Key Projects and Integration at Deutsche Asset Management, (2012-2014); Managing Director at Deutsche Bank AG (2004-2012). | |||||||
Frank Gecsedi (1967) 60 Wall Street New York, New York 10005 | Chief Compliance Officer | Since 2010 | Director in the Deutsche Asset Management Compliance Department (2016-present), Vice President in the Deutsche Asset Management Compliance Department (2013-2016) and Chief Compliance Officer of the Adviser (2010-present); Vice President in Deutsche Bank’s Global Markets Legal, Risk and Capital Division (2010-2012). | |||||||
91
DBX ETF Trust
Trustees and officers (Unaudited) (Continued)
| Name, Year of Birth and Address | Position(s) Held with Fund | Terms of Office Time Served | Principal Occupation(s) During Past 5 Years | |||||||
Leslie Lowenbraun (1953) 60 Wall Street New York, New York 10005 | Secretary | Since 2016 | Vice President in U.S. Retail Passive Legal of Deutsche Asset Management (2014-present); Counsel at Skadden, Arps, Slate, Meagher & Flom LLP (2005-2014). | |||||||
Each Trustee serves until his or her successor is duly elected or appointed and qualified. Each officer serves until he or she resigns, is removed, dies, retires or become disqualified.
The Funds’ SAI includes additional information about the Funds’ Trustees and is available by calling 855-329-3837, or on the Company’s website at www.dbxus.com.
92
DBX ETF Trust
Board considerations in approval of investment advisory and sub-advisory contracts (Unaudited)
Deutsche X-trackers Investment Grade Bond — Interest Rate Hedged ETF, Deutsche X-trackers High Yield Corporate Bond — Interest Rate Hedged ETF, Deutsche X-trackers Emerging Markets Bond — Interest Rate Hedged ETF, Deutsche X-trackers MSCI EAFE High Dividend Yield Hedged Equity ETF, Deutsche X-trackers MSCI Emerging Markets High Dividend Yield Hedged Equity ETF, Deutsche X-trackers MSCI Eurozone High Dividend Yield Hedged Equity ETF and Deutsche X-trackers MSCI All World ex US High Dividend Yield Hedged Equity ETF
After discussions at meetings of the Board of Trustees (“Board” or “Trustees”) held on February 25, 2016 and February 28, 2016, at the February 28 meeting the Trustees, including the Independent Trustees (those not affiliated with DBX ETF Trust (the “Trust”) or its service providers), unanimously approved the continuance of the Investment Advisory Agreement and the Sub-Advisory Agreement with respect to Deutsche X-trackers Investment Grade Bond — Interest Rate Hedged ETF, Deutsche X-trackers High Yield Corporate Bond — Interest Rate Hedged ETF, Deutsche X-trackers Emerging Markets Bond — Interest Rate Hedged ETF, Deutsche X-trackers MSCI All World ex US High Dividend Yield Hedged Equity ETF, Deutsche X-trackers MSCI EAFE High Dividend Yield Hedged Equity ETF, Deutsche X-trackers MSCI Emerging Markets High Dividend Yield Hedged Equity ETF and Deutsche X-trackers MSCI Eurozone High Dividend Yield Hedged Equity ETF (the “Funds”). The Independent Trustees were advised throughout the review and meetings by Independent Trustee Counsel.
In reaching this decision with respect to the Investment Advisory Agreement, the Board considered all factors it believed relevant, including (1) the nature, extent and quality of the services provided to the Funds and their shareholders; (2) the financial resources of DBX Advisors LLC (“DBX” or the “Adviser”) and its resulting ability to perform its obligations under the Investment Advisory Agreement; (3) the competitiveness of the advisory fee; (4) the total cost of the services provided by and the profits realized by the Adviser from its relationship with the Funds; and (5) the extent to which economies of scale have been realized, and if the Funds’ shareholders have benefitted from those economies.
In reaching this decision with respect to the Sub-Advisory Agreement, the Board considered all factors it believed relevant, including (1) the nature, extent and quality of the services provided to the Funds and their shareholders; (2) the performance of TDAM USA Inc. (“TDAM” or “Sub-Adviser”) with respect to its management of the Funds, as well as TDAM’s financial resources and its resulting ability to perform its obligations under the Sub-Advisory Agreement; (3) the total cost of the services provided by and the profits realized by TDAM from its relationship with the Funds; and (4) the extent to which economies of scale have been realized, and if the Funds’ shareholders have benefitted from those economies.
The Board reached a determination, with the assistance of Trust Counsel and through the exercise of its business judgment, that approval of the Investment Advisory Agreement and the Sub-Advisory Agreement and the compensation to be received thereunder is in the best interests of each Fund and its shareholders as well as consistent with the Board’s duties under state and federal law. The Board reached this conclusion based on multiple factors.
The Board considered the following in determining whether to approve the Investment Advisory Agreement:
Nature, Extent and Quality of Services. The Board reviewed in detail the nature, extent and quality of services provided by the Adviser under the Investment Advisory Agreement. The Board noted that these services include, among other things, furnishing a continuous investment program for the Funds, including arranging for, or implementing, the purchase and sale of portfolio securities, the provision of general corporate services such as portfolio management compliance services and the preparation and filing of certain reports on behalf of the Trust. The Board also considered, among other things, the professional experience and qualifications of the senior management and key professional personnel of the Adviser, including those individuals responsible for portfolio management. The Board considered that the Adviser provides, at its own expense, office facilities and equipment for use by the Funds and supervisory persons responsible for supervising and monitoring the Trust’s service providers. The Board also considered that the Adviser pays for the compensation of officers of the Trust who are also officers or employees of the Adviser, except as may otherwise be determined by the Board. The Board also considered that the Adviser arranges for the provision of transfer agency, custody, fund administration and accounting, and other non-distribution services necessary for the Funds’ operation. The Board also considered the role played by the Adviser in working with TDAM to manage the Funds’ portfolios, noting that the Adviser
93
DBX ETF Trust
Board considerations in approval of investment advisory and sub-advisory contracts (Unaudited) (Continued)
provides oversight of day-to-day operations, including monitoring tracking error, providing services in connection with the creation and redemption of creation units and assistance in meeting legal and regulatory requirements applicable to the Funds.
Based on its review, the Board concluded that the nature, extent, and quality of services provided by the Adviser under the Investment Advisory Agreement are reasonable and appropriate in relation to the fees paid to the Adviser, taking special consideration of the fact that the advisory fee is a unitary fee and, as a result, a portion of the unitary advisory fee will be used to compensate the Funds’ service providers. The Board considered the staffing of the Adviser, including the training, qualifications and experience of investment personnel in managing the Funds. The Board also considered the expertise of the Adviser in supervising third party service providers to the Funds, such as the administrator and custodian. The Board further considered the compliance program of the Adviser which supports the Funds’ compliance program.
Adviser’s Financial Resources. In connection with the assessment of the ability of the Adviser to perform its duties under the Investment Advisory Agreement, the Board considered the Adviser’s financial condition and whether it had the resources necessary to carry out its functions. The Board concluded that the Adviser had the financial resources necessary to perform its obligations under the Investment Advisory Agreement.
Reasonableness of Advisory Fee. The Board compared each Fund’s advisory fee to that of other exchange-traded funds (“ETFs”), and noted that each Fund’s fee is competitive with the fees of its respective peer group. The Board noted that the fee for the Funds is a unitary fee pursuant to which the Adviser pays all of the Funds’ costs. The Board also noted that the Funds’ portfolios are managed on a day-to-day basis by the Sub-Adviser, which receives a fee from the Adviser. The Board considered the allocation of responsibilities between the Adviser and Sub-Adviser and noted that the Adviser provides oversight of day-to-day operations, including monitoring tracking error, providing services in connection with creation and redemption units and assistance in meeting legal and regulatory requirements applicable to the Funds. Based on its review, the Board concluded that the advisory fee is reasonable in light of the services provided.
Costs of Services and Profitability. The Board considered the expenses of the Adviser in developing and rendering services to the Funds, and the information provided by the Adviser to the Board regarding the Funds’ profitability. The Board noted that the Adviser had provided extensive information about the Adviser’s profitability and the Adviser’s methodology in determining profitability. The Board also noted that while the Adviser had provided information about the Adviser’s expenses relating to marketing the Funds, the Board considered the Adviser’s profitability without accounting for such expenses. The Board determined that the Adviser’s profitability with respect to each Fund was not excessive. The Board also noted that since the fee paid by the Adviser to the Sub-Adviser under the Sub-Advisory Agreement contained breakpoints, the Adviser could experience increased profitability as the Funds’ assets increased. The Board considered whether the Adviser would benefit in other ways from its relationships with the Funds, and concluded that there were no material fall-out benefits likely to accrue to the Adviser related to the operation of the Funds.
Economies of Scale. The Board noted that the Funds were not experiencing economies of scale at this time and determined to evaluate economies of scale on an ongoing basis as a result of asset growth of the Funds.
Given all the information available to it and considering all material factors, the Board concluded that the Investment Advisory Agreement was fair and reasonable and it was unanimously approved.
The Board considered the following in determining whether to approve the Sub-Advisory Agreement:
Nature, Extent and Quality of Services. In considering the nature, extent and quality of services that TDAM provides to the Funds, the Board reviewed in detail the nature, extent and quality of services provided by TDAM under the Sub-Advisory Agreement. The Board noted that these services include, among other things, furnishing a continuous investment program for the Funds, including arranging for, or implementing, the purchase and sale of portfolio securities.
The Board also considered TDAM’s operational capabilities and resources. The Board considered the professional experience and qualifications of TDAM’s senior management and key professional personnel, as well
94
DBX ETF Trust
Board considerations in approval of investment advisory and sub-advisory contracts (Unaudited) (Continued)
as TDAM’s depth and breadth of experience in managing investment portfolios consisting of U.S. and non-U.S. equity securities. The Board gave special consideration to TDAM’s experience and capabilities in implementing currency hedging strategies, and their techniques for implementing such strategies while minimizing index tracking error. In addition, the Board considered TDAM’s operational capabilities and resources, and TDAM’s experience in managing index funds covering various asset classes.
Based on its review, the Board concluded that the nature, extent, and quality of services provided by TDAM under the Sub-Advisory Agreement are reasonable and appropriate in relation to the fees paid to TDAM, taking special consideration of the fact that the fees paid to TDAM are payable by the Adviser and not the Funds.
Performance of TDAM; TDAM’s Financial Resources. The Board considered TDAM’s performance in managing the Funds and its ability to minimize tracking error. The Board concluded that, given TDAM’s capabilities and experience in managing the Funds, TDAM had generally been able to keep the Funds’ tracking error within acceptable ranges.
The Board also considered TDAM’s financial condition and whether it had the resources necessary to carry out its functions. The Board concluded that TDAM had the financial resources necessary to perform its obligations under the Sub-Advisory Agreement.
Reasonableness of Sub-Advisory Fee. The Board noted that the fee paid to TDAM in respect of the Funds would be paid by the Adviser and not the Funds. The Board further noted that the fee for the Funds was a unitary fee pursuant to which the Adviser would pay all of the Funds’ costs, and thus was not directly affected by the amount of the sub-advisory fee paid to TDAM. Based on its review, the Board concluded that the sub-advisory fee was reasonable in light of the services provided.
Costs of Services and Profitability. The Board noted that the fees paid by the Adviser to TDAM under the Sub-Advisory Agreement contain breakpoints. The Board further noted that specific information about TDAM’s profitability with respect to its services provided to the Funds was not available because TDAM does not calculate the profitability of its sub-advisory services on a per-Fund level. The Board also noted that the overall fees paid by each Fund remained reasonable.
The Board also considered whether TDAM would benefit in other ways from its relationship with the Funds. The Board discussed TDAM’s practices regarding the selection and compensation of brokers and dealers that execute portfolio transactions for the Funds and the brokers’ and dealers’ provision of brokerage services to TDAM. The Board discussed the potential benefits TDAM might derive from the Funds’ soft dollar arrangements, whereby brokers provide brokerage services to the Funds or TDAM in return for allocating fund brokerage.
Economies of Scale. The Board noted that the Funds were not experiencing economies of scale at this time and determined to evaluate economies of scale on an ongoing basis as a result of asset growth of the Funds.
Given all the information available to it and considering all material factors, the Board concluded that the Sub-Advisory Agreement was fair and reasonable and it was unanimously approved.
Deutsche X-trackers Municipal Infrastructure Revenue Bond ETF
After discussions at meetings of the Board of Trustees (“Board” or “Trustees”) held on February 25, 2016 and February 28, 2016, at the February 28 meeting the Trustees, including the Independent Trustees (those not affiliated with DBX ETF Trust (the “Trust”) or its service providers), unanimously approved the continuance of the Investment Advisory Agreement and Sub-Advisory Agreement with respect to Deutsche X-trackers Municipal Infrastructure Revenue Bond ETF (the “Fund”). The Independent Trustees were advised throughout the review and meetings by Independent Trustee Counsel.
In reaching this decision with respect to the Investment Advisory Agreement, the Board considered all factors it believed relevant, including (1) the nature, extent and quality of the services provided to the Fund and its shareholders; (2) the financial resources of DBX Advisors LLC (“DBX” or the “Adviser”) and its resulting ability to perform its obligations under the Investment Advisory Agreement; (3) the competitiveness of the advisory fee; (4) the total cost of the services provided by and the profits realized by the Adviser from its relationship with the
95
DBX ETF Trust
Board considerations in approval of investment advisory and sub-advisory contracts (Unaudited) (Continued)
Fund; and (5) the extent to which economies of scale have been realized, and if the Fund’s shareholders have benefitted from those economies.
In reaching this decision with respect to the Sub-Advisory Agreement, the Board considered all factors it believed relevant, including (1) the nature, extent and quality of the services provided to the Fund and its shareholders; (2) the performance of Deutsche Investment Management Americas Inc. (“DIMA” or “Sub-Adviser”) with respect to its management of the Fund, as well as DIMA’s financial resources and its resulting ability to perform its obligations under the Sub-Advisory Agreement; (3) the total cost of the services provided by and the profits realized by DIMA from its relationship with the Fund; and (4) the extent to which economies of scale have been realized, and if the Fund’s shareholders have benefitted from those economies.
The Board reached a determination, with the assistance of Trust Counsel and through the exercise of its business judgment, that approval of the Investment Advisory Agreement and the Sub-Advisory Agreement and the compensation to be received thereunder is in the best interests of each Fund and its shareholders as well as consistent with the Board’s duties under state and federal law. The Board reached this conclusion based on multiple factors.
The Board considered the following in determining whether to approve the Investment Advisory Agreement:
Nature, Extent and Quality of Services. The Board reviewed in detail the nature, extent and quality of services provided by the Adviser under the Investment Advisory Agreement. The Board noted that these services include, among other things, furnishing a continuous investment program for the Fund, including arranging for, or implementing, the purchase and sale of portfolio securities, the provision of general corporate services such as portfolio management compliance services and the preparation and filing of certain reports on behalf of the Trust. The Board also considered, among other things, the professional experience and qualifications of the senior management and key professional personnel of the Adviser, including those individuals responsible for portfolio management. The Board considered that the Adviser provides, at its own expense, office facilities and equipment for use by the Fund and supervisory persons responsible for supervising and monitoring the Trust’s service providers. The Board also considered that the Adviser pays for the compensation of officers of the Trust who are also officers or employees of the Adviser, except as may otherwise be determined by the Board. The Board also considered that the Adviser arranges for the provision of transfer agency, custody, fund administration and accounting, and other non-distribution services necessary for the Fund’s operation. The Board also considered the role played by the Adviser in working with DIMA to manage the Fund’s portfolio, noting that the Adviser provides oversight of day-to-day operations, including monitoring tracking error, providing services in connection with the creation and redemption of creation units and assistance in meeting legal and regulatory requirements applicable to the Fund.
Based on its review, the Board concluded that the nature, extent, and quality of services provided by the Adviser under the Investment Advisory Agreement are reasonable and appropriate in relation to the fees paid to the Adviser, taking special consideration of the fact that the advisory fee is a unitary fee and, as a result, a portion of the unitary advisory fee will be used to compensate the Fund’s service providers. The Board considered the staffing of the Adviser, including the training, qualifications and experience of investment personnel in managing the Fund. The Board also considered the expertise of the Adviser in supervising third party service providers to the Fund, such as the administrator and the custodian. The Board further considered the compliance program of the Adviser which supports the Fund’s compliance program.
Adviser’s Financial Resources. In connection with the assessment of the ability of the Adviser to perform its duties under the Investment Advisory Agreement, the Board considered the Adviser’s financial condition and whether it had the resources necessary to carry out its functions. The Board concluded that the Adviser had the financial resources necessary to perform its obligations under the Investment Advisory Agreement.
Reasonableness of Advisory Fee. The Board compared the Fund’s advisory fee to that of other exchange-traded funds (“ETFs”), and noted that the Fund’s fee is competitive with the fees of its respective peer group. The Board noted that the fee for the Fund is a unitary fee pursuant to which the Adviser pays all of the Fund’s costs. The Board also noted that the Fund’s portfolio is managed on a day-to-day basis by the Sub-Adviser, which is an
96
DBX ETF Trust
Board considerations in approval of investment advisory and sub-advisory contracts (Unaudited) (Continued)
affiliate of the Adviser and receives a fee from the Adviser. The Board considered the allocation of responsibilities between the Adviser and Sub-Adviser and noted that the Adviser provides oversight of day-to-day operations, including monitoring tracking error, providing services in connection with creation and redemption units and assistance in meeting legal and regulatory requirements applicable to the Fund. Based on its review, the Board concluded that the advisory fee is reasonable in light of the services provided.
Costs of Services and Profitability. The Board considered the expenses of the Adviser in developing and rendering services to the Fund, and the information provided by the Adviser to the Board regarding the Fund’s profitability. The Board noted that the Adviser had provided extensive information about the Adviser’s profitability and the Adviser’s methodology in determining profitability. The Board also noted that while the Adviser had provided information about the Adviser’s expenses relating to marketing the Fund, the Board considered the Adviser’s profitability without accounting for such expenses. The Board determined that the Adviser’s profitability with respect to the Fund was not excessive. The Board also noted that since the fee paid by the Adviser to the Sub-Adviser under the Sub-Advisory Agreement contained breakpoints, the Adviser could experience increased profitability as the Fund’s assets increased. The Board considered whether the Adviser would benefit in other ways from its relationships with the Fund, and concluded that there were no material fall-out benefits likely to accrue to the Adviser related to the operation of the Fund.
Economies of Scale. The Board noted that the Fund was not experiencing economies of scale at this time and determined to evaluate economies of scale on an ongoing basis as a result of asset growth of the Fund.
Given all the information available to it and considering all material factors, the Board concluded that the Investment Advisory Agreement was fair and reasonable and it was unanimously approved.
The Board considered the following in determining whether to approve the Sub-Advisory Agreement:
Nature, Extent and Quality of Services. In considering the nature, extent and quality of services that DIMA provides to the Fund, the Board reviewed in detail the nature, extent and quality of services provided by DIMA under the Sub-Advisory Agreement. The Board noted that these services include, among other things, furnishing a continuous investment program for the Fund, including arranging for, or implementing, the purchase and sale of portfolio securities.
The Board also considered DIMA’s operational capabilities and resources, and its experience in serving as investment adviser or sub-adviser to other funds. The Board considered the professional experience and qualifications of DIMA’s senior management and key professional personnel, as well as DIMA’s depth and breadth of experience in managing investment portfolios consisting of fixed income securities. The Board gave special consideration to DIMA’s experience and capabilities in managing investment portfolios consisting of bonds, and their techniques for tracking an index while minimizing index tracking error. In addition, the Board considered DIMA’s operational capabilities and resources, and DIMA’s experience in managing bond funds. The Board noted that DIMA manages its index-based portfolios using both full replication and sampling techniques and maintains strict discipline in the implementation of its indexing strategies. To that end, the Board noted that when there are changes to a benchmark index, DIMA closely monitors any such changes to devise strategies to realign its portfolios at the lowest possible cost while tracking the respective benchmark index. The Board also noted DIMA’s processes to minimize the cost of trading.
Based on its review, the Board concluded that the nature, extent, and quality of services provided by DIMA under the Sub-Advisory Agreement are reasonable and appropriate in relation to the fees paid to DIMA, taking special consideration of the fact that the fees paid to DIMA are payable by the Adviser and not the Fund.
Performance of DIMA; DIMA’s Financial Resources. The Board considered DIMA’s performance in managing the Fund and its ability to minimize tracking error. The Board concluded that, given DIMA’s capabilities, DIMA had generally been able to keep the Fund’s tracking error within acceptable ranges.
The Board also considered DIMA’s financial condition and whether it had the resources necessary to carry out its functions. The Board concluded that DIMA had the financial resources necessary to perform its obligations under the Sub-Advisory Agreement.
97
DBX ETF Trust
Board considerations in approval of investment advisory and sub-advisory contracts (Unaudited) (Continued)
Reasonableness of Sub-Advisory Fee. The Board noted that the fee paid to DIMA in respect of the Fund would be paid by the Adviser and not the Fund. The Board further noted that the fee for the Fund was a unitary fee pursuant to which the Adviser would pay all of the Fund’s costs, and thus was not directly affected by the amount of the sub-advisory fee paid to DIMA. Based on its review, the Board concluded that the sub-advisory fee was reasonable in light of the services provided.
Costs of Services and Profitability. The Board noted that the fees paid by the Adviser to DIMA under the Sub-Advisory Agreement contain breakpoints. The Board further noted that specific information about DIMA’s profitability with respect to its services provided to the Fund was not available because DIMA does not calculate the profitability of its sub-advisory services on a per-fund level. The Board also noted that the overall fees paid by the Fund remained reasonable.
The Board also considered whether DIMA would benefit in other ways from its relationship with the Fund. The Board discussed DIMA’s practices regarding the selection and compensation of brokers and dealers that execute portfolio transactions for the Fund and the brokers’ and dealers’ provision of brokerage services to DIMA. The Board discussed the potential benefits DIMA might derive from the Fund’s soft dollar arrangements, whereby brokers provide brokerage services to the Fund or DIMA in return for allocating fund brokerage.
Economies of Scale. The Board noted that the Fund was not experiencing economies of scale at this time and determined to evaluate economies of scale on an ongoing basis as a result of asset growth of the Fund.
Given all the information available to it and considering all material factors, the Board concluded that the Sub-Advisory Agreement was fair and reasonable and it was unanimously approved.
98
DBX ETF Trust
Additional information (Unaudited)
Proxy Voting Policies and Procedures
The Funds’ policies and procedures for voting proxies for portfolio securities and information about how each Fund voted proxies related to its portfolio securities during the 12-month period ended May 31 are available on our Web site — www.deutsche-etfs.com (click on “Resources” “proxy voting” and at the top of the page) — or on the SEC’s Web site — www.sec.gov. To obtain a written copy of the Funds’ policies and procedures without charge, upon request, call us toll free at 855-329-3837.
Quarterly Portfolio Disclosure
The Funds are required to file their complete schedule of portfolio holdings with the SEC for their first and third fiscal quarters on Form N-Q. Copies of the filings are available without charge, upon request on the SEC’s website at www.sec.gov and are available by calling the Company at 855-329-3837. You can also obtain copies of Form N-Q by (i) visiting the SEC’s Public Reference Room in Washington, DC (information on the operation of the Public Reference Room may be obtained by calling 800-SEC-0330); (ii) sending your request and a duplicating fee to the SEC’s Public Reference Room, Washington, DC 20549-0102; or (iii) sending your request electronically to publicinfo@sec.gov.
Information about each Fund’s portfolio holdings is available daily at www.deutsche-etfs.com.
Discount/Premium Information
Information regarding how often shares of each Fund traded on NYSE Arca at a price above (i.e., at a premium) or below (i.e., at a discount) the Net Asset Value of the Fund during the past calendar year, when available can be found at www.deutsche-etfs.com.
Tax Information
Form 1099-DIV and other year-end tax information provide shareholders with actual calendar year amounts that should be included in their tax returns. Shareholders should consult their tax advisors.
Each Fund designates the following amounts or, if subsequently determined to be different, the maximum amount allowable for its fiscal year ended May 31, 2016.
| Qualified Dividend Income* | ||||
Deutsche X-trackers MSCI All World ex US High Dividend Yield Hedged Equity ETF | 81% | |||
Deutsche X-trackers MSCI EAFE High Dividend Yield Hedged Equity ETF | 78% | |||
Deutsche X-trackers MSCI Emerging Markets High Dividend Yield Hedged Equity ETF | 41% | |||
Deutsche X-trackers MSCI Eurozone High Dividend Yield Hedged Equity ETF | 61% | |||
* The above percentage is based on ordinary income dividends paid to shareholders during each Fund’s fiscal year.
Each Fund intends to elect to pass through to shareholders the credit for taxes paid to foreign countries. The gross foreign source income and foreign taxes paid are as follows:
| Gross Foreign Income | Foreign Taxes Paid | |||||||
Deutsche X-trackers MSCI All World ex US High Dividend Yield Hedged Equity ETF | $303,527 | $16,945 | ||||||
Deutsche X-trackers MSCI EAFE High Dividend Yield Hedged Equity ETF | 192,671 | 8,384 | ||||||
Deutsche X-trackers MSCI Emerging Markets High Dividend Yield Hedged Equity ETF | 55,387 | 4,663 | ||||||
Deutsche X-trackers MSCI Eurozone High Dividend Yield Hedged Equity ETF | 95,398 | 7,551 | ||||||
Of the dividends paid from net investment income for the fiscal year ended May 31, 2016 for Deutsche X-trackers Municipal Infrastructure Revenue Bond ETF, 100% are designated as exempt interest dividends for federal income tax purposes.
99
DBX ETF Trust
Privacy policy notice (Unaudited)
DBX Advisors LLC (“Advisors”) collects non-public information about you from the following sources: (i) information received from you on applications or other forms; and (ii) information about your transactions with the Advisors, Advisors’ affiliates and third-party service providers and vendors. Advisors does not disclose any non-public personal information about you to anyone, other than as set forth below, as permitted by applicable law and regulation. Advisors may disclose non-public personal information about you to the funds in which you invest, to Advisors’ affiliates, and to non-affiliated companies that work with Advisors to service your account(s), or to provide services or process transactions that you have requested. Advisors may disclose non-public personal information in situations that may include, but are not limited to, in response to legal and/or regulatory inquiries and the proposed or actual sale, assignment merger or other transfer of all or a portion of Advisors’ business to another business entity. Advisors may also disclose non-public personal information about you to parties representing you, such as your investment representative, your accountant, your tax adviser, or to other third parties at your direction/consent. Advisors will not sell, rent, license or trade your personal and financial information to or with third parties for their own direct marketing use unless you give us general or specific consent to do so. If you decide to close your account(s) or become an inactive customer, Advisors will adhere to the privacy policies and practices as described in this notice. Advisors restricts access to your personal and account information to those employees who need to know that information to provide products and services to you. Advisors maintains reasonable and customary physical, electronic and procedural safeguards to guard your non-public personal information.
Advisors reserves the right, at their discretion, to change, modify, add, or remove portions of this Privacy Policy Notice, and any of the policies described herein, at any time. Advisors will indicate any such changes to the Privacy Policy Notice at the privacy link which can be found at www.deutsche-etfs.com. At all times, you are bound by the then-current version of the Privacy Policy and all applicable laws. Advisors highly recommends that you review this Privacy Policy Notice from time to time to ensure that you are familiar with the most recent version. The examples contained in this Privacy Policy Notice are illustrations; they are not intended to be exclusive.
100
DBX ETF Trust
This report is intended for the shareholders of DBX ETF Trust.
Carefully consider a Fund’s investment objectives, risk factors and charges and expenses before investing. This and other information can be found in the Fund’s prospectus, which may be obtained by calling 1-855-DBX-ETFS (1-855-329-3837), or by viewing or downloading a prospectus at www.deutsche-etfs.com. Read the prospectus carefully before investing.
Investing involves risk, including possible loss of principal. Bond investments are subject to interest-rate, credit, liquidity and market risks to varying degrees. When interest rates rise, bond prices generally fall. Credit risk refers to the ability of an issuer to make timely payments of principal and interest. Funds investing in a single industry, country or in a limited geographic region generally are more volatile than more diversified funds. In certain situations, it may be difficult or impossible to sell an investment at an acceptable price. Foreign investing involves greater and different risks than investing in US companies, including currency fluctuations, less liquidity, less developed or less efficient trading markets, lack of comprehensive company information, political instability and differing auditing and legal standards. Emerging markets tend to be more volatile and less liquid than the markets of more mature economies, and generally have less diverse and less mature economic structures and less stable political systems than those of developed countries. Investments in lower-quality (“junk bonds”) and non-rated securities present greater risk of loss than investments in higher-quality securities. Municipal securities are subject to the risk that litigation, legislation or other political events, local business or economic conditions or the bankruptcy of the issuer could have a significant effect on an issuer’s ability to make payments of principal and/or interest. The market for municipal bonds may be less liquid than for taxable bonds and there may be less information available on the financial condition of issuers of municipal securities than for public corporations. Income from municipal bonds may be subject to state and local taxes and at times the alternative minimum tax. EMIH, HYIH and IGIH seek to mitigate the potential negative impact of rising Treasury interest rates by taking short positions in U.S. Treasury notes or bonds, or futures relating to those instruments. These short positions are not intended to mitigate credit risk or other factors that may have a greater impact on performance than rising or falling interest rates. The short positions may limit the potential positive impact of falling interest rates and there is no guarantee that the short positions will completely eliminate the interest rate risk of the long positions. The Funds’ use of forward currency contracts may not be successful in hedging currency exchange rates changes and could eliminate some or all of the benefit of an increase in the value of a foreign currency versus the U.S. dollar. Investing in derivatives entails special risks relating to liquidity, leverage and credit that may reduce returns and/or increase volatility. Stocks may decline in value. Dividends are not guaranteed. If the dividend-paying stocks held by the Fund reduce or stop paying dividends, the Fund’s ability to generate income may be adversely affected. Performance of the Funds may diverge from that of the Underlying Index due to operating expenses, transaction costs, cash flows, use of sampling strategies or operational inefficiencies. An investment in these Funds should be considered only as a supplement to a complete investment program for those investors willing to accept the risks associated with the Funds. See the prospectus for details.
Shares of the Funds are bought and sold at market price (not NAV) throughout the day on the New York Stock Exchange. Transactions in Fund shares may result in brokerage commissions and may generate tax consequences. There can be no assurance that an active trading market for shares of a fund will develop or be maintained.
DBX ETF Trust Funds are distributed by ALPS Distributors, Inc. The Funds are managed by DBX Advisors LLC which is not affiliated with ALPS.
Deutsche Asset Management is the brand name for the asset management activities conducted by Deutsche Bank AG or any of its subsidiaries. Clients will be provided Deutsche Asset Management products or services by one or more legal entities that will be identified to clients pursuant to the contracts, agreements, offering materials or other documentation relevant to such products or services.
EMIH, HYIH, IGIH and RVNU are not sponsored, promoted, sold or supported in any other manner by Solactive AG (the “Licensor”) nor does the trade mark or the Index Price at any time or in any other respect.
The funds or securities referred to herein are not sponsored, endorsed, or promoted by MSCI, and MSCI bears no liability with respect to any such funds or securities or any index on which such funds or securities are based. The prospectus contains a more detailed description of the limited relationship MSCI has with DBX and any related funds.
Copyright © 2016 Deutsche Bank AG. All rights reserved. Deutsche X-trackers® is a registered trademark of Deutsche Bank AG. All other trademarks, servicemarks or registered trademarks are the property of their respective owners.
Not FDIC Insured | No Bank Guarantee | May Lose Value
DBX ETF Trust
Investment advisor DBX Advisors LLC 345 Park Ave New York, New York 10154 | Investment sub-advisors TDAM USA Inc. 161 Bay Street, 35th Floor TD Canada Trust Tower Toronto, Ontario Canada M5J 2T2 | Administrator, custodian, The Bank of New York Mellon 101 Barclay Street New York, NY 10286 | ||
Distributor ALPS Distributors, Inc. 1290 Broadway Suite 1100 Denver, CO 80203 | Independent registered public accounting firm Ernst & Young LLP 5 Times Square New York, NY 10036 | Legal counsel Dechert LLP 1095 Avenue of the Americas New York, NY 10036 | ||
R-35362-3 (7/16) DBX 002027 (7/17)

May 31, 2016
Annual Report
DBX ETF Trust
Deutsche X-trackers CSI 300 China A-Shares Hedged Equity ETF (ASHX)
Deutsche X-trackers Harvest CSI 300 China A-Shares ETF (ASHR)
Deutsche X-trackers Harvest CSI 500 China A-Shares Small Cap ETF (ASHS)
Deutsche X-trackers MSCI All China Equity ETF (CN)

DBX ETF Trust
To our shareholders: (Unaudited)
Dear Shareholder,
We are pleased to provide this annual report for our flagship ETFs tracking China’s equity market for the period ended May 31, 2016.
In light of a stabilizing US economy and a slowly recovering Europe, China remained at the front of global investor concerns. China experienced sharp capital outflows, mainly due to slow growth, low interest rates and currency devaluation fears. Chinese equities finished marginally down during the reporting period, but there was reason for optimism as Chinese exports rebounded strongly.
In August 2015, the Peoples Bank of China (PBoC) moved to devalue the Renminbi (RMB) against the USD, prompting a sell-off in international equity markets. Chinese equities continued their descent in the following months. Weak macroeconomic data also weighed on sentiment. The volatile Chinese market continued to spark concerns in the beginning of 2016, as heavy market falls triggered the new circuit-breaking mechanism, which was later suspended. Since then, growth in a number of headline economic indicators has moderated. The International Monetary Fund announced the inclusion of RMB in the Special Drawing Rights (SDR) basket, a move that should push the PBoC to allow the currency exchange rate to be more market driven. As a result, in the short term, RMB volatility is likely to remain elevated. In the longer term, the RMB could become a more international currency, thereby encouraging global central banks to increase their holdings.
China’s attempt to manage growth while dealing with high debt levels was seen as the key macro challenge in the global landscape. The PBoC continued its monetary easing policy as it cut the reserve requirement ratio in February. However, Gross Domestic Product growth slowed to 6.7% in Q1 2016 — the slowest quarterly growth in seven years. On the brighter side, a rebound in property investment supported growth. Export data has been mixed; the official manufacturing Purchasing Managers’ Index (PMI) has been stable. China‘s central bank is caught in an uneasy balancing act as it is pursuing three conflicting objectives: lower interest rates, a steady foreign exchange rate and a stable capital account. The Chinese government’s efforts to reduce excess capacity in a number of industry sectors and put more emphasis on market mechanisms may slow growth rates; however, we do not expect a hard landing. Pockets of growth in private consumption and public spending continue to exist, despite periods of volatility.
The hope of China’s government rests on successful structural reforms and recovering growth rates in the coming years. Weak global demand and high private debt levels would be the main risks to growth. However, the recent rebound in government spending and a resurgent property market offer reasons to be optimistic about near-term growth in China.
Our team appreciates your trust and looks forward to serving your investment needs through innovative index-driven strategies.
Sincerely,
/s/ Alex N. Depetris
Alex N. Depetris
Chairman, President and Chief Executive Officer
Assumptions, estimates and opinions contained in this document constitute our judgment as of the date of the document and are subject to change without notice. Any projections are based on a number of assumptions as to market conditions and there can be no guarantee that any projected results will be achieved. Past performance is not a guarantee of future results.
1
This Page is Intentionally Left Blank
2
DBX ETF Trust
Management’s discussion of fund performance (Unaudited)
Deutsche X-trackers CSI 300 China A-Shares Hedged Equity ETF
The Deutsche X-trackers CSI 300 China A-Shares Hedged Equity ETF (ASHX) seeks investment results that correspond generally to the performance, before fees and expenses, of the CSI 300 USD Hedged Index (ASHX Index). The ASHX Index is designed to provide direct access to China A-Share equities while mitigating exposure to fluctuations between the value of the Chinese RMB and the USD. For the period October 20, 2015 (commencement of operations) to May 31, 2016, ASHX shares returned -10.01% compared with the ASHX Index return of -11.95%.
All sectors in the ASHX Index contributed negatively to performance, in particular the Financial and Industrial sectors.
Deutsche X-trackers Harvest CSI 300 China A-Shares ETF
The Deutsche X-trackers Harvest CSI 300 China A-Shares ETF (ASHR) seeks investment results that correspond generally to the performance, before fees and expenses, of the CSI 300 Index (ASHR Index). The ASHR Index, which is composed of the 300 largest and most liquid stocks in the China A-Share market, is designed to reflect the price fluctuation and performance of the China A-Share market. For the 12-month period ended May 31, 2016, ASHR returned -38.10% compared with the ASHR Index return of -37.47%.
China’s economy experienced a challenging 12 months during the fiscal year of the Fund, driven primarily by weaker exports, RMB’s depreciation, and weak economic data. All sectors in the ASHR Index contributed negatively to performance, in particular the Financial and Industrial sectors.
Deutsche X-trackers Harvest CSI 500 China A-Shares Small Cap ETF
The Deutsche X-trackers Harvest CSI 500 China A-Shares Small Cap ETF (ASHS) seeks investment results that correspond generally to the performance, before fees and expenses, of the CSI 500 Index (ASHS Index). The ASHS Index tracks 500 small-cap companies listed on the Shanghai and Shenzhen stock exchanges. For the 12-month period ended May 31, 2016, ASHS returned -45.37% compared with the ASHS Index return of -43.52%.
Significant headwinds arising from a general slowdown in the Chinese economy posed challenges to all sectors in the ASHS index, in particular the Industrial, Materials, and Information Technology sectors.
Deutsche X-trackers MSCI All China Equity ETF
The Deutsche X-trackers MSCI All China Equity ETF (CN) seeks investment results that correspond generally to the performance, before fees and expenses, of the MSCI China All Shares Index (CN Index). The CN Index is intended to give investors a means of tracking the overall performance of equity securities that are a representative sample of the entire Chinese investment universe and is comprised of A-Shares, H-Shares, B-Shares, Red chips and P chips share classes. CN, using a passive approach, attempts to approximate the performance of the CN Index. CN gains exposure to China A-Share components of the CN Index by investing in the Deutsche X-trackers Harvest CSI 300 China A-Shares ETF (ASHR) and the Deutsche X-trackers Harvest CSI 500 China A-Shares Small Cap ETF (ASHS). For the 12-month period ended May 31, 2016, CN returned -29.80% compared with the CN Index return of -34.76%.
All sectors in the CN index contributed negatively to performance, in particular the Financial, Information Technology, Industrials, and Consumer Discretionary sectors.
Terms to Know
Chinese Securities: A-Shares are issued by companies incorporated in mainland China and are traded in RMB on the Shenzhen and Shanghai Stock Exchanges. H-Shares are equity securities issued by companies incorporated in mainland China and are denominated and traded in Hong Kong dollars (“HKD”) on the Hong Kong Stock Exchange and other foreign exchanges. B-Shares are equity securities issued by companies incorporated in China and are denominated and traded in U.S. dollars and HKD on the Shanghai and Shenzhen Stock Exchanges, respectively. Red chips and P chips are equity securities issued by companies incorporated outside of mainland China and listed on the Hong Kong Stock Exchange.
*************************
3
DBX ETF Trust
Management’s discussion of fund performance (Unaudited) (Continued)
Performance data quoted represents past performance and does not guarantee future results. Investment returns and principal value of an investment will fluctuate so that an investor’s shares, when sold or redeemed, may be worth more or less than their original cost. Current performance may be lower or higher than the performance data quoted. To obtain the most recent month-end performance data visit www.deutsche-etfs.com. Returns assume that dividends and capital gains distributions have been reinvested. See pages 6-13 of this report for additional performance information, including performance data based on market value.
The views expressed in this report reflect those of the portfolio management team only through the end of the period of the report as stated on the cover. The management team’s views are subject to change at any time based on market and other conditions and should not be construed as a recommendation. Current and future portfolio holdings are subject to risk.
4
This Page is Intentionally Left Blank
5
DBX ETF Trust
Performance summary (Unaudited)
Deutsche X-trackers CSI 300 China A-Shares Hedged Equity ETF (ASHX)
The Deutsche X-trackers CSI 300 China A-Shares Hedged Equity ETF (ASHX) seeks investment results that correspond generally to the performance, before fees and expenses, of the CSI 300 USD Hedged Index (the “Underlying Index”). The Underlying Index is designed to reflect the price fluctuation and performance of the China A-Share market and is composed of the 300 largest and most liquid stocks in the China A-Share market, while mitigating exposure to fluctuations between the value of the renmimbi (“RMB”) and the U.S. dollar. The Fund, using a “passive” or indexing approach, attempts to approximate the investment performance of the Underlying Index. ASHX expects to gain exposure to the China A-share market of the Underlying Index by investing in Deutsche X-trackers Harvest CSI 300 China A-Shares ETF (ASHR), an affiliated fund subadvised by Harvest Global Investments Limited. It is not possible to invest directly into an index.
Performance as of 5/31/16
| Cumulative Total Returns | ||||||||
| Net Asset Value | Market Value | CSI 300 USD Hedged Index | CSI 300 Index | |||||
Since Inception1 | -10.01% | -10.13% | -11.95% | -13.15% | ||||
1 Total returns are calculated based on the commencement of operations, 10/20/15 (“Inception”).
Past performance is no guarantee of future results. Current performance may be lower or higher than the performance data quoted. Performance data current to the most recent month-end is available at www.deutsche-etfs.com. Performance results assume reinvestment of all dividends and capital gain distributions and do not reflect the deduction of taxes that a shareholder would pay on fund distributions or on the sale of fund shares or redemption of fund creation units. The investment return and principal value of shares will vary with changes in market conditions. Shares may be worth more or less than their original cost when they are sold in the market or redeemed. Performance for certain funds may reflect a waiver of a portion of investment management fees. Without such waiver, performance would have been lower. The estimated operating expense ratio as disclosed in the most recent prospectus dated September 4, 2015, was 1.65%. This expense ratio includes net expenses of the affiliated funds in which ASHX invests.
Net asset value or “NAV” is the value of one share of a fund as calculated in accordance with the standard formula for valuing mutual fund shares. The price used to calculate market return (“Market Price”) is determined by using the midpoint between the highest bid and the lowest offer on the primary stock exchange on which shares of a fund are listed for trading, as of the time that such fund’s NAV is calculated. Since shares of a fund may not have traded in the secondary market until after the fund’s inception, for the period from inception to the first day of secondary trading, the NAV of the fund is used as a proxy for the Market Price to calculate market returns. Market and NAV returns assume that dividends and capital gain distributions have been reinvested at Market Price and NAV, respectively.
An index is a statistical composite that tracks a specified financial market or sector. Unlike a fund, an index does not actually hold a portfolio of securities and therefore does not incur the expenses incurred by a fund. These expenses negatively impact fund performance. Also, market returns do not include brokerage commissions that may be payable on secondary market transactions. If brokerage commissions were included, market returns would be lower.
6
DBX ETF Trust
Performance summary (Unaudited)
Deutsche X-trackers CSI 300 China A-Shares Hedged Equity ETF (ASHX) (Continued)
Growth of an Assumed $10,000 Investment
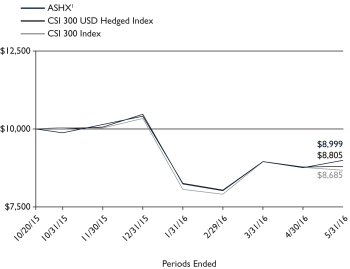
1 Based on Net Asset Value from commencement of operations, 10/20/15.
Sector Diversification* as of 5/31/16
Financials | 41.5% | |||
Industrials | 14.8% | |||
Consumer Discretionary | 10.8% | |||
Information Technology | 7.7% | |||
Consumer Staples | 6.0% | |||
Materials | 5.9% | |||
Health Care | 5.6% | |||
Utilities | 4.3% | |||
Energy | 2.7% | |||
Telecommunication Services | 0.7% | |||
|
| |||
Total | 100.0% |
* As a percent of total investments excluding securities lending collateral.
Portfolio holdings and characteristics are subject to change. For more complete details about the Fund’s investment portfolio see page 16.
7
DBX ETF Trust
Performance summary (Unaudited)
Deutsche X-trackers Harvest CSI 300 China A-Shares ETF (ASHR)
The Deutsche X-trackers Harvest CSI 300 China A-Shares ETF (ASHR) seeks investment results that correspond generally to the performance, before fees and expenses, of the CSI 300 Index (the “Underlying Index”). The Underlying Index is designed to reflect the price fluctuation and performance of the China A-Share market and is composed of the 300 largest and most liquid stocks in the China A-Share market. The Fund, using a “passive” or indexing approach, attempts to approximate the investment performance of the Underlying Index. It is not possible to invest directly into an index.
Performance as of 5/31/16
| Average Annual Total Return | ||||||
| Net Asset Value | Market Value | CSI 300 Index | ||||
One Year | -38.10% | -37.16% | -37.47% | |||
Since Inception1 | 8.73% | 9.36% | 10.16% | |||
| Cumulative Total Returns | ||||||
| Net Asset Value | Market Value | CSI 300 Index | ||||
One Year | -38.10% | -37.16% | -37.47% | |||
Since Inception1 | 23.98% | 25.86% | 28.25% | |||
1 Total returns are calculated based on the commencement of operations, 11/6/13 (“Inception”).
Past performance is no guarantee of future results. Current performance may be lower or higher than the performance data quoted. Performance data current to the most recent month-end is available at www.deutsche-etfs.com. Performance results assume reinvestment of all dividends and capital gain distributions and do not reflect the deduction of taxes that a shareholder would pay on fund distributions or on the sale of fund shares or redemption of fund creation units. The investment return and principal value of shares will vary with changes in market conditions. Shares may be worth more or less than their original cost when they are sold in the market or redeemed. The estimated operating expense ratio as disclosed in the most recent prospectus dated September 30, 2015, was 0.80%.
Net asset value or “NAV” is the value of one share of a fund as calculated in accordance with the standard formula for valuing mutual fund shares. The price used to calculate market return (“Market Price”) is determined by using the midpoint between the highest bid and the lowest offer on the primary stock exchange on which shares of a fund are listed for trading, as of the time that such fund’s NAV is calculated. Since shares of a fund may not have traded in the secondary market until after the fund’s inception, for the period from inception to the first day of secondary trading, the NAV of the fund is used as a proxy for the Market Price to calculate market returns. Market and NAV returns assume that dividends and capital gain distributions have been reinvested at Market Price and NAV, respectively.
An index is a statistical composite that tracks a specified financial market or sector. Unlike a fund, an index does not actually hold a portfolio of securities and therefore does not incur the expenses incurred by a fund. These expenses negatively impact fund performance. Also, market returns do not include brokerage commissions that may be payable on secondary market transactions. If brokerage commissions were included, market returns would be lower.
8
DBX ETF Trust
Performance summary (Unaudited)
Deutsche X-trackers Harvest CSI 300 China A-Shares ETF (ASHR) (Continued)
Growth of an Assumed $10,000 Investment
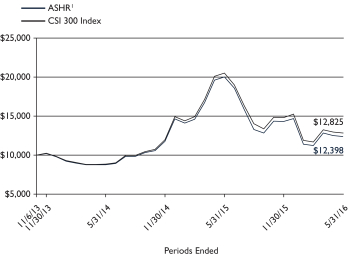
1 Based on Net Asset Value from commencement of operations, 11/6/13.
Sector Diversification* as of 5/31/16
Financials | 41.5% | |||
Industrials | 14.8% | |||
Consumer Discretionary | 10.8% | |||
Information Technology | 7.7% | |||
Consumer Staples | 6.0% | |||
Materials | 5.9% | |||
Health Care | 5.6% | |||
Utilities | 4.3% | |||
Energy | 2.7% | |||
Telecommunication Services | 0.7% | |||
|
| |||
Total | 100.0% |
Ten Largest Equity Holdings as of 5/31/16 (22.2% of Net Assets)
| Description | % of Net Assets | |||
Ping An Insurance Group Co. of China Ltd. | 4.2% | |||
China Minsheng Banking Corp. Ltd. | 3.2% | |||
Industrial Bank Co. Ltd. | 2.6% | |||
China Merchants Bank Co. Ltd. | 2.2% | |||
Shanghai Pudong Development Bank Co. Ltd. | 2.1% | |||
China Vanke Co. Ltd. | 1.7% | |||
Kweichow Moutai Co. Ltd. | 1.6% | |||
CITIC Securities Co. Ltd. | 1.6% | |||
Bank of Communications Co. Ltd. | 1.5% | |||
Haitong Securities Co. Ltd. | 1.5% | |||
* As a percent of total investments.
Portfolio holdings and characteristics are subject to change. For more complete details about the Fund’s investment portfolio see page 18.
9
DBX ETF Trust
Performance summary (Unaudited)
Deutsche X-trackers Harvest CSI 500 China A-Shares Small Cap ETF (ASHS)
The Deutsche X-trackers Harvest CSI 500 China A-Shares Small Cap ETF (ASHS) seeks investment results that correspond generally to the performance, before fees and expenses, of the CSI 500 Index (the “Underlying Index”). The Underlying Index is designed to reflect the price fluctuation and performance of small cap companies in the China A-Share market and is composed of the 500 smallest and most liquid stocks in the China A-Share market. The Fund, using a “passive” or indexing investment approach, attempts to approximate the investment performance of the Underlying Index. It is not possible to invest directly into an index.
Performance as of 5/31/16
| Average Annual Total Return | ||||||
| Net Asset Value | Market Value | CSI 500 Index | ||||
One Year | -45.37% | -44.58% | -43.52% | |||
Since Inception1 | 19.58% | 20.44% | 23.56% | |||
| Cumulative Total Returns | ||||||
| Net Asset Value | Market Value | CSI 500 Index | ||||
One Year | -45.37% | -44.58% | -43.52% | |||
Since Inception1 | 43.75% | 45.94% | 53.73% | |||
1 Total returns are calculated based on the commencement of operations, 5/21/14 (“Inception”).
Past performance is no guarantee of future results. Current performance may be lower or higher than the performance data quoted. Performance data current to the most recent month-end is available at www.deutsche-etfs.com. Performance results assume reinvestment of all dividends and capital gain distributions and do not reflect the deduction of taxes that a shareholder would pay on fund distributions or on the sale of fund shares or redemption of fund creation units. The investment return and principal value of shares will vary with changes in market conditions. Shares may be worth more or less than their original cost when they are sold in the market or redeemed. The estimated operating expense ratio as disclosed in the most recent prospectus dated September 30, 2015, was 0.80%.
Net asset value or “NAV” is the value of one share of a fund as calculated in accordance with the standard formula for valuing mutual fund shares. The price used to calculate market return (“Market Price”) is determined by using the midpoint between the highest bid and the lowest offer on the primary stock exchange on which shares of a fund are listed for trading, as of the time that such fund’s NAV is calculated. Since shares of a fund may not have traded in the secondary market until after the fund’s inception, for the period from inception to the first day of secondary trading, the NAV of the fund is used as a proxy for the Market Price to calculate market returns. Market and NAV returns assume that dividends and capital gain distributions have been reinvested at Market Price and NAV, respectively.
An index is a statistical composite that tracks a specified financial market or sector. Unlike a fund, an index does not actually hold a portfolio of securities and therefore does not incur the expenses incurred by a fund. These expenses negatively impact fund performance. Also, market returns do not include brokerage commissions that may be payable on secondary market transactions. If brokerage commissions were included, market returns would be lower.
10
DBX ETF Trust
Performance summary (Unaudited)
Deutsche X-trackers Harvest CSI 500 China A-Shares Small Cap ETF (ASHS) (Continued)
Growth of an Assumed $10,000 Investment
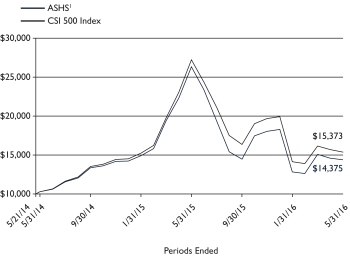
1 Based on Net Asset Value from commencement of operations, 5/21/14.
Sector Diversification* as of 5/31/16
Industrials | 22.0% | |||
Information Technology | 15.9% | |||
Materials | 15.6% | |||
Consumer Discretionary | 15.1% | |||
Health Care | 12.7% | |||
Financials | 8.2% | |||
Consumer Staples | 5.8% | |||
Utilities | 2.9% | |||
Energy | 1.8% | |||
|
| |||
Total | 100.0% |
Ten Largest Equity Holdings as of 5/31/16 (5.6% of Net Assets)
| Description | % of Net Assets | |||
Tianqi Lithium Industries, Inc. | 0.8% | |||
Suning Universal Co. Ltd. | 0.6% | |||
Jiangsu Hongtu High Technology Co. Ltd. | 0.6% | |||
NavInfo Co. Ltd. | 0.6% | |||
Hengkang Medical Group Co. Ltd. | 0.5% | |||
Beijing SPC Environmental Protection Tech Co. Ltd. | 0.5% | |||
Jiangsu Zhongtian Technology Co. Ltd. | 0.5% | |||
China Security & Fire Co. Ltd. | 0.5% | |||
Jinyu Bio-Technology Co. Ltd. | 0.5% | |||
Beijing Sanju Environmental Protection and New Material Co. Ltd. | 0.5% | |||
* As a percent of total investments.
Portfolio holdings and characteristics are subject to change. For more complete details about the Fund’s investment portfolio see page 24.
11
DBX ETF Trust
Performance summary (Unaudited)
Deutsche X-trackers MSCI All China Equity ETF (CN)
The Deutsche X-trackers MSCI All China Equity ETF (CN) seeks investment results that correspond generally to the performance, before fees and expenses, of the MSCI China All Shares Index. The MSCI China All Shares Index is intended to give investors a means of tracking the overall performance of equity securities that are a representative sample of the entire Chinese investment universe and is composed of A-shares, H-shares, B-shares, Red chips, and P chips share classes. On November 30, 2015 the MSCI China All Shares Index replaced the MSCI All China Index as the comparative broad-based securities market index because the Advisor believes the MSCI China All Shares Index more closely reflects the Fund’s investment strategy. The MSCI China All Shares Index captures large and mid-cap representation across China A-shares, B-shares, H-shares, Red-chips, and P-chips. The index aims to reflect the opportunity set of China share classes listed in Hong Kong, Shanghai and Shenzhen. It is based on the concept of the integrated MSCI China equity universe with China A-shares included. The Fund, using a passive approach or indexing approach, attempts to approximate the performance of the MSCI China All Shares Index. The Fund expects to gain exposure to the China A-share components of the Index by investing in Deutsche X-trackers Harvest CSI 300 China A-Shares ETF and Deutsche X-trackers Harvest CSI 500 China A-Shares Small Cap ETF, affiliated funds subadvised by Harvest Global Investments Limited. It is not possible to invest directly into an index.
Performance as of 5/31/16
| Average Annual Total Return | ||||||||
| Net Asset Value | Market Value | MSCI China All Shares Index | MSCI All China Index | |||||
One Year | -29.80% | -30.10% | -34.76% | -35.44% | ||||
Since Inception1 | 13.70% | 13.44% | 7.04% | 9.87% | ||||
| Cumulative Total Returns | ||||||||
| Net Asset Value | Market Value | MSCI China All Shares Index | MSCI All China Index | |||||
One Year | -29.80% | -30.10% | -34.76% | -35.44% | ||||
Since Inception1 | 30.75% | 30.16% | 15.28% | 21.75% | ||||
1 Total returns are calculated based on the commencement of operations, 4/30/14 (“Inception”).
Effective November 30, 2015 the Fund’s investment objective changed. All returns prior to November 30, 2015 were achieved under the previous objective.
Past performance is no guarantee of future results. Current performance may be lower or higher than the performance data quoted. Performance data current to the most recent month-end is available at www.deutsche-etfs.com. Performance results assume reinvestment of all dividends and capital gain distributions and do not reflect the deduction of taxes that a shareholder would pay on fund distributions or on the sale of fund shares or redemption of fund creation units. The investment return and principal value of shares will vary with changes in market conditions. Shares may be worth more or less than their original cost when they are sold in the market or redeemed. Performance for certain funds may reflect a waiver of a portion of investment management fees. Without such waiver, performance would have been lower. The estimated operating expense ratio as disclosed in the most recent prospectus dated September 30, 2015, was 1.05%. This expense ratio includes net expenses of the affiliated funds in which CN invests.
Net asset value or “NAV” is the value of one share of a fund as calculated in accordance with the standard formula for valuing mutual fund shares. The price used to calculate market return (“Market Price”) is determined by using the midpoint between the highest bid and the lowest offer on the primary stock exchange on which shares of a fund are listed for trading, as of the time that such fund’s NAV is calculated. Since shares of a fund may not have traded in the secondary market until after the fund’s inception, for the period from inception to the first day of secondary trading, the NAV of the fund is used as a proxy for the Market Price to calculate market returns. Market and NAV returns assume that dividends and capital gain distributions have been reinvested at Market Price and NAV, respectively.
An index is a statistical composite that tracks a specified financial market or sector. Unlike a fund, an index does not actually hold a portfolio of securities and therefore does not incur the expenses incurred by a fund. These expenses negatively impact fund performance. Also, market returns do not include brokerage commissions that may be payable on secondary market transactions. If brokerage commissions were included, market returns would be lower.
12
DBX ETF Trust
Performance summary (Unaudited)
Deutsche X-trackers MSCI All China Equity ETF (CN) (Continued)
Growth of an Assumed $10,000 Investment
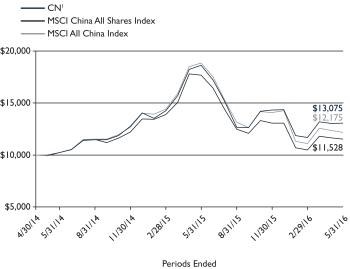
1 Based on Net Asset Value from commencement of operations, 4/30/14.
Sector Diversification* as of 5/31/16
Financials | 31.3% | |||
Information Technology | 21.5% | |||
Industrials | 11.1% | |||
Consumer Discretionary | 9.8% | |||
Telecommunication Services | 5.1% | |||
Energy | 4.8% | |||
Materials | 4.3% | |||
Consumer Staples | 4.2% | |||
Health Care | 4.1% | |||
Utilities | 3.8% | |||
|
| |||
Total | 100.0% |
Ten Largest Equity and ETF Holdings as of 5/31/16 (70.2% of Net Assets)
| Description | % of Net Assets | |||
Deutsche X-trackers Harvest CSI 300 China A-Shares ETF | 36.8% | |||
Deutsche X-trackers Harvest CSI 500 China A-Shares Small Cap ETF | 7.3% | |||
Tencent Holdings Ltd. | 6.9% | |||
Alibaba Group Holding Ltd. | 4.5% | |||
China Mobile Ltd. | 3.9% | |||
China Construction Bank Corp. | 2.9% | |||
Baidu, Inc. | 2.7% | |||
Industrial & Commercial Bank of China Ltd. | 2.2% | |||
Bank of China Ltd. | 1.8% | |||
CNOOC Ltd. | 1.2% | |||
* As a percent of total investments excluding securities lending collateral.
Portfolio holdings and characteristics are subject to change. For more complete details about the Fund’s investment portfolio see page 33.
13
DBX ETF Trust
As a shareholder of one or more of the funds, you incur two types of costs: (1) transaction costs, including brokerage commissions paid on purchases and sales of fund shares, and (2) ongoing costs, including management fees and other fund expenses. In addition to the ongoing expenses which each Fund bears directly, the Deutsche X-trackers MSCI All China Equity ETF shareholders indirectly bear the expenses of Deutsche X-trackers Harvest CSI 300 China A-Shares ETF and Deutsche X-trackers Harvest CSI 500 China A-Shares Small Cap ETF (the “Underlying Funds”) in which the Deutsche X-trackers MSCI All China Equity ETF invests. The Deutsche X-trackers CSI 300 China A-Shares Hedged Equity ETF shareholders indirectly bear the expenses of Deutsche X-trackers Harvest CSI 300 China A-Shares ETF (the “Underlying Fund”) in which the Deutsche X-trackers CSI 300 China A-Shares Hedged Equity ETF invests. These expenses are not included in Deutsche X-trackers MSCI All China Equity ETF’s and Deutsche X-trackers CSI 300 China A-Shares Hedged Equity ETF’s annualized expense ratios used to calculate the expense estimate in the tables. In the most recent six-month period Deutsche X-trackers CSI 300 China A-Shares Hedged Equity ETF and Deutsche X-trackers MSCI All China Equity ETF limited these expenses; had they not done so, expenses would have been higher. The expense examples below are intended to help you understand your ongoing costs (in dollars) of investing in the Funds and to compare these costs with the ongoing costs of investing in other funds.
The examples in the table are based on an investment of $1,000 invested at the beginning of the six month period and held for the entire period (December 1, 2015 to May 31, 2016).
Actual expenses
The first line in the following tables provides information about actual account values and actual expenses. You may use the information in this line, together with the amount you invested, to estimate the expenses that you paid over the period. Simply divide your account value by $1,000 (for example, an $8,600 account value divided by $1,000 = 8.6), then multiply the result by the number in the first line under the heading “Expenses Paid During the Period” to estimate the expenses you paid on your account during this period.
Hypothetical example for comparison purposes
The second line in the following tables provides information about hypothetical account values and hypothetical expenses based on the Funds’ actual expense ratios and an assumed rate of return of 5% per year before expenses (which is not the Funds’ actual return). The hypothetical account values and expenses may not be used to estimate the actual ending account balance or expenses you paid for the period. You may use this information to compare the ongoing costs of investing in the Fund and other funds. To do so, compare this 5% hypothetical example with the 5% hypothetical examples that appear in the shareholder reports of the other funds.
Please note that the expenses shown in the tables are meant to highlight your ongoing costs only, and do not reflect any transactional costs. Therefore the second line in the table is useful in comparing ongoing costs only, and will not help you determine the relative total costs of owning different funds. In addition, if these transactional costs were included, your costs would have been higher.
| Beginning Account Value December 1, 2015 | Ending Account Value May 31, 2016 | Annualized Expense Ratio | Expenses Paid During the Period Per $1,000(1) | |||||||||||||
| Deutsche X-trackers CSI 300 China A-Shares Hedged Equity ETF (2) | ||||||||||||||||
Actual | $ | 1,000.00 | $ | 886.70 | 0.45 | % | $ | 2.12 | ||||||||
Hypothetical (5% return before expenses) | $ | 1,000.00 | $ | 1,022.75 | 0.45 | % | $ | 2.28 | ||||||||
| Deutsche X-trackers Harvest CSI 300 China A-Shares ETF | ||||||||||||||||
Actual | $ | 1,000.00 | $ | 867.40 | 0.80 | % | $ | 3.73 | ||||||||
Hypothetical (5% return before expenses) | $ | 1,000.00 | $ | 1,021.00 | 0.80 | % | $ | 4.04 | ||||||||
| Deutsche X-trackers Harvest CSI 500 China A-Shares Small Cap ETF | ||||||||||||||||
Actual | $ | 1,000.00 | $ | 797.00 | 0.80 | % | $ | 3.59 | ||||||||
Hypothetical (5% return before expenses) | $ | 1,000.00 | $ | 1,021.00 | 0.80 | % | $ | 4.04 | ||||||||
14
DBX ETF Trust
Fees and expenses (Unaudited) (Continued)
| Beginning Account Value December 1, 2015 | Ending Account Value May 31, 2016 | Annualized Expense Ratio | Expenses Paid During the Period Per $1,000(1) | |||||||||||||
| Deutsche X-trackers MSCI All China Equity ETF (2) | ||||||||||||||||
Actual | $ | 1,000.00 | $ | 911.80 | 0.32 | % | $ | 1.53 | ||||||||
Hypothetical (5% return before expenses) | $ | 1,000.00 | $ | 1,023.40 | 0.32 | % | $ | 1.62 | ||||||||
(1) Expenses are equal to each Fund’s annualized expense ratio, multiplied by the average account value over the period, multiplied by 183 (the number of days in the most recent six-month period), then divided by 366.
(2) The Fund invests in other ETFs and indirectly bears its proportionate share of fees and expenses incurred by the Underlying Funds in which the Fund is invested. This ratio does not include these indirect fees and expenses.
15
DBX ETF Trust
Deutsche X-trackers CSI 300 China A-Shares Hedged Equity ETF
May 31, 2016
Number | Value | |||||||
| EXCHANGE-TRADED FUND — 99.9% | ||||||||
Deutsche X-trackers Harvest CSI 300 China A-Shares ETF (a)(b) | 90,134 | $ | 2,183,045 | |||||
|
| |||||||
| SECURITIES LENDING COLLATERAL — 43.0% | ||||||||
Daily Assets Fund “Capital Shares”, 0.48% (c)(d) | 940,622 | 940,622 | ||||||
|
| |||||||
TOTAL INVESTMENTS — 142.9% | $ | 3,123,667 | ||||||
Other assets and liabilities, net — (42.9%) | (937,709 | ) | ||||||
|
| |||||||
NET ASSETS — 100.0% | $ | 2,185,958 | ||||||
|
| |||||||
| † | The cost for federal income tax purposes was $3,455,750. At May 31, 2016, net unrealized depreciation for all securities based on tax cost was $332,083. This consisted of aggregate gross unrealized appreciation for all securities in which there was an excess of value over tax cost of $0 and aggregate gross unrealized depreciation for all securities in which there was an excess of tax cost over value of $332,083. |
| (a) | All or a portion of these securities were on loan. In addition, “Other Assets and Liabilities, Net” may include pending sales that are also on loan. The value of securities loaned at May 31, 2016 amounted to $963,254, which is 44.1% of net assets. |
| (b) | Affiliated fund advised by DBX Advisors LLC. |
| (c) | Affiliated fund managed by Deutsche Investment Management Americas Inc. The rate shown is the annualized seven-day yield at period end. |
| (d) | Represents collateral held in connection with securities lending. Income earned by the Fund is net of borrower rebates. |
As of May 31, 2016, the Fund had the following forward foreign currency exchange contracts outstanding:
Counterparty | Settlement Date | Currency To Deliver | Currency To Receive | Unrealized Appreciation (Depreciation) | ||||||||||||||
State Street Bank & Trust Co. | 6/3/2016 | CNH | 13,775,697 | USD | 2,121,815 | $ | 30,708 | |||||||||||
State Street Bank & Trust Co. | 6/3/2016 | USD | 3,542 | CNH | 23,000 | (51 | ) | |||||||||||
State Street Bank & Trust Co. | 6/3/2016 | USD | 2,088,171 | CNH | 13,752,697 | (556 | ) | |||||||||||
State Street Bank & Trust Co. | 7/6/2016 | CNH | 13,755,000 | USD | 2,086,172 | 924 | ||||||||||||
State Street Bank & Trust Co. | 7/6/2016 | CNH | 87,000 | USD | 13,192 | 3 | ||||||||||||
|
| |||||||||||||||||
Total net unrealized appreciation | $ | 31,028 | ||||||||||||||||
|
| |||||||||||||||||
Currency Abbreviations
| CNH | Chinese Offshore Yuan |
| USD | U.S. Dollar |
For information on the Fund’s policy and additional disclosures regarding forward foreign currency exchange contracts, please refer to the Derivatives section of Note 2 in the accompanying Notes to Financial Statements.
| See Notes to Financial Statements. | 16 |
DBX ETF Trust
Schedule of investments
Deutsche X-trackers CSI 300 China A-Shares Hedged Equity ETF (Continued)
May 31, 2016
Fair Value Measurements
Various inputs are used in determining the value of the Fund’s investments. These inputs are summarized in three broad levels. Level 1 includes quoted prices in active markets for identical securities. Level 2 includes other significant observable inputs (including quoted prices for similar securities, interest rates, prepayment speeds and credit risk). Level 3 includes significant unobservable inputs (including the Fund’s own assumptions in determining the fair value of investments). The level assigned to the securities valuations may not be an indication of the risk or liquidity associated with investing in those securities.
The following is a summary of the inputs used as of May 31, 2016 in valuing the Fund’s investments. For information on Fund’s policy regarding the valuation of investments, please refer to the Security Valuation section of Note 2 in the accompanying Notes to Financial Statements.
| Assets | Level 1 | Level 2 | Level 3 | Total | ||||||||||||
Exchange-Traded Fund | $ | 2,183,045 | $ | — | $ | — | $ | 2,183,045 | ||||||||
Short-Term Investments | 940,622 | — | — | 940,622 | ||||||||||||
Derivatives (e) | ||||||||||||||||
Forward Foreign Currency Exchange Contracts | — | 31,635 | — | 31,635 | ||||||||||||
|
|
|
|
|
|
|
| |||||||||
Total | $ | 3,123,667 | $ | 31,635 | $ | — | $ | 3,155,302 | ||||||||
|
|
|
|
|
|
|
| |||||||||
| Liabilities | Level 1 | Level 2 | Level 3 | Total | ||||||||||||
Derivatives (e) | ||||||||||||||||
Forward Foreign Currency Exchange Contracts | $ | — | $ | (607 | ) | $ | — | $ | (607 | ) | ||||||
|
|
|
|
|
|
|
| |||||||||
Total | $ | — | $ | (607 | ) | $ | — | $ | (607 | ) | ||||||
|
|
|
|
|
|
|
| |||||||||
| (e) | Derivatives include unrealized appreciation (depreciation) on forward foreign currency exchange contracts. |
There have been no transfers between fair value measurement levels during the period ended May 31, 2016.
| See Notes to Financial Statements. | 17 |
DBX ETF Trust
Schedule of investments
Deutsche X-trackers Harvest CSI 300 China A-Shares ETF
May 31, 2016
Number | Value | |||||||
| COMMON STOCKS — 99.2% | ||||||||
| Consumer Discretionary — 10.7% | ||||||||
Alpha Group, Class A | 128,362 | $ | 613,846 | |||||
Beijing Enlight Media Co. Ltd., Class A | 225,400 | 411,996 | ||||||
Beiqi Foton Motor Co. Ltd., Class A | 423,700 | 348,634 | ||||||
Byd Co. Ltd., Class A* | 160,101 | 1,453,475 | ||||||
China International Travel Service Corp. Ltd., Class A | 97,677 | 655,135 | ||||||
China South Publishing & Media Group Co. Ltd., Class A | 180,151 | 483,812 | ||||||
Chinese Universe Publishing and Media Co. Ltd., Class A | 140,658 | 448,218 | ||||||
Chongqing Changan Automobile Co. Ltd., Class A | 570,788 | 1,256,479 | ||||||
FAW CAR Co. Ltd., Class A | 206,487 | 415,983 | ||||||
Fuyao Glass Industry Group Co. Ltd., Class A* | 356,317 | 794,099 | ||||||
Great Wall Motor Co. Ltd., Class A | 299,956 | 389,801 | ||||||
Gree Electric Appliances, Inc. of Zhuhai, Class A | 1,344,778 | 3,989,113 | ||||||
Guangzhou Automobile Group Co. Ltd., Class A | 139,733 | 503,608 | ||||||
Heilan Home Co. Ltd., Class A | 335,541 | 570,527 | ||||||
Hisense Electric Co. Ltd., Class A | 200,451 | 488,118 | ||||||
Huawen Media Investment Corp., Class A | 418,144 | 631,628 | ||||||
Huayi Brothers Media Corp., Class A | 494,342 | 1,119,718 | ||||||
Huayu Automotive Systems Co. Ltd., Class A | 320,674 | 716,125 | ||||||
Hunan TV & Broadcast Intermediary Co. Ltd., Class A | 359,892 | 959,579 | ||||||
Jiangsu Broadcasting Cable Information Network Corp. Ltd., Class A | 150,400 | 319,204 | ||||||
Jiangsu Phoenix Publishing & Media Corp. Ltd., Class A | 194,757 | 321,392 | ||||||
Liaoning Cheng Da Co. Ltd., Class A | 313,277 | 764,763 | ||||||
Midea Group Co. Ltd., Class A | 856,198 | 2,829,262 | ||||||
Pang Da Automobile Trade Co. Ltd., Class A* | 818,302 | 341,632 | ||||||
Qingdao Haier Co. Ltd., Class A | 779,370 | 1,082,622 | ||||||
SAIC Motor Corp. Ltd., Class A | 847,212 | 2,609,675 | ||||||
Shanghai Oriental Pearl Media Co. Ltd., Class A* | 470,612 | 1,787,568 | ||||||
Shenzhen Overseas Chinese Town Co. Ltd., Class A | 841,750 | 845,967 | ||||||
Sichuan Changhong Electric Co. Ltd., Class A* | 933,911 | 704,652 | ||||||
Songcheng Performance Development Co. Ltd., Class A | 146,282 | 557,191 | ||||||
Suning Commerce Group Co. Ltd., Class A | 1,124,855 | 1,881,874 | ||||||
TCL Corp., Class A | 2,177,680 | 1,124,049 | ||||||
Wanda Cinema Line Co. Ltd., Class A | 35,300 | 433,255 | ||||||
Wanxiang Qianchao Co. Ltd., Class A | 291,424 | 653,459 | ||||||
Wasu Media Holding Co. Ltd., Class A* | 33,301 | 96,713 | ||||||
Weifu High-Technology Group Co. Ltd., Class A | 127,328 | 340,018 | ||||||
Youngor Group Co. Ltd., Class A | 400,200 | 925,314 | ||||||
Number | Value | |||||||
| Consumer Discretionary (Continued) | ||||||||
Zhe Jiang Daily Media Group Co. Ltd., Class A* | 154,200 | $ | 356,530 | |||||
Zhejiang Huace Film & TV Co. Ltd., Class A | 178,101 | 420,715 | ||||||
Zhejiang Yasha Decoration Co. Ltd., Class A | 168,345 | 294,163 | ||||||
|
| |||||||
| 34,939,912 | ||||||||
|
| |||||||
| Consumer Staples — 6.0% | ||||||||
Beijing Dabeinong Technology Group Co. Ltd., Class A | 625,139 | 786,762 | ||||||
Beijing Yanjing Brewery Co. Ltd., Class A | 349,258 | 424,709 | ||||||
By-health Co. Ltd., Class A | 153,700 | 325,507 | ||||||
Foshan Haitian Flavouring & Food Co. Ltd., Class A | 70,702 | 320,289 | ||||||
Henan Shuanghui Investment & Development Co. Ltd., Class A | 253,044 | 824,016 | ||||||
Inner Mongolia Yili Industrial Group Co. Ltd., Class A | 1,541,047 | 3,605,213 | ||||||
Jiangsu Yanghe Brewery Joint-Stock Co. Ltd., Class A | 154,540 | 1,603,115 | ||||||
Kweichow Moutai Co. Ltd., Class A | 127,329 | 5,112,297 | ||||||
Luzhou Laojiao Co. Ltd., Class A | 178,328 | 664,364 | ||||||
MeiHua Holdings Group Co. Ltd., Class A | 477,557 | 498,799 | ||||||
New Hope Liuhe Co. Ltd., Class A | 271,767 | 710,052 | ||||||
Shanghai Bailian Group Co. Ltd., Class A | 196,646 | 372,275 | ||||||
Shanghai Jahwa United Co. Ltd., Class A* | 137,175 | 578,730 | ||||||
Shenzhen Agricultural Products Co. Ltd., Class A | 217,519 | 418,395 | ||||||
Tsingtao Brewery Co. Ltd., Class A | 69,730 | 313,663 | ||||||
Wuliangye Yibin Co. Ltd., Class A | 486,688 | 2,218,801 | ||||||
Yonghui Superstores Co. Ltd., Class A | 514,832 | 676,074 | ||||||
|
| |||||||
| 19,453,061 | ||||||||
|
| |||||||
| Energy — 2.7% | ||||||||
China Coal Energy Co. Ltd., Class A | 466,574 | 339,288 | ||||||
China Merchants Energy Shipping Co. Ltd., Class A | 356,200 | 264,433 | ||||||
China Merchants Energy Shipping Co. Ltd., Class A* | 184,000 | 136,596 | ||||||
China Oilfield Services Ltd., Class A | 153,476 | 292,879 | ||||||
China Petroleum & Chemical Corp., Class A | 2,677,215 | 1,963,102 | ||||||
China Shenhua Energy Co. Ltd., Class A | 510,142 | 1,080,382 | ||||||
Guanghui Energy Co. Ltd., Class A | 785,034 | 507,704 | ||||||
Jizhong Energy Resources Co. Ltd., Class A | 269,955 | 218,030 | ||||||
Offshore Oil Engineering Co. Ltd., Class A | 560,949 | 614,855 | ||||||
PetroChina Co. Ltd., Class A | 1,243,421 | 1,391,227 | ||||||
Shaanxi Coal Industry Co. Ltd., | 507,308 | 341,183 | ||||||
Shanxi Lu’an Environmental Energy Development Co. Ltd., Class A | 305,616 | 297,403 | ||||||
Shanxi Xishan Coal & Electricity Power Co. Ltd., Class A | 400,304 | 449,104 | ||||||
Wintime Energy Co. Ltd., Class A | 844,042 | 529,208 | ||||||
| See Notes to Financial Statements. | 18 |
DBX ETF Trust
Schedule of investments
Deutsche X-trackers Harvest CSI 300 China A-Shares ETF (Continued)
May 31, 2016
Number | Value | |||||||
| Energy (Continued) | ||||||||
Yantai Jereh Oilfield Services Group Co. Ltd., Class A | 118,723 | $ | 345,337 | |||||
Yanzhou Coal Mining Co. Ltd., Class A | 96,438 | 136,304 | ||||||
|
| |||||||
| 8,907,035 | ||||||||
|
| |||||||
| Financials — 41.2% | ||||||||
Agricultural Bank of China Ltd., Class A | 9,745,870 | 4,719,801 | ||||||
AVIC Capital Co. Ltd., Class A | 543,145 | 962,274 | ||||||
Bank of Beijing Co. Ltd., Class A | 2,575,505 | 4,207,140 | ||||||
Bank of China Ltd., Class A | 5,354,000 | 2,731,052 | ||||||
Bank of Communications Co. Ltd., Class A | 6,005,841 | 5,042,099 | ||||||
Bank of Nanjing Co. Ltd., Class A | 514,281 | 1,396,764 | ||||||
Bank of Ningbo Co. Ltd., Class A | 497,302 | 1,124,913 | ||||||
Bohai Financial Investment Holding Co. Ltd., Class A | 478,100 | 539,323 | ||||||
Changjiang Securities Co. Ltd., Class A | 845,227 | 1,292,157 | ||||||
China CITIC Bank Corp. Ltd., Class A* | 778,776 | 685,730 | ||||||
China Construction Bank Corp., Class A | 1,709,470 | 1,266,466 | ||||||
China Everbright Bank Co. Ltd., Class A | 4,087,558 | 2,302,238 | ||||||
China Fortune Land Development Co. Ltd., Class A | 227,547 | 853,259 | ||||||
China Life Insurance Co. Ltd., Class A | 423,358 | 1,389,555 | ||||||
China Merchants Bank Co. Ltd., Class A | 2,620,521 | 7,160,980 | ||||||
China Merchants Securities Co. Ltd., Class A | 745,267 | 1,874,765 | ||||||
China Merchants Shekou Industrial Zone Holdings Co. Ltd., Class A* | 603,409 | 1,298,974 | ||||||
China Minsheng Banking Corp. Ltd., Class A | 7,567,856 | 10,443,572 | ||||||
China Pacific Insurance Group Co. Ltd., Class A | 802,535 | 3,324,910 | ||||||
China Vanke Co. Ltd., Class A | 1,641,301 | 5,391,301 | ||||||
CITIC Securities Co. Ltd., Class A | 1,999,026 | 5,095,437 | ||||||
Dongxing Securities Co. Ltd., Class A | 125,000 | 460,377 | ||||||
Everbright Securities Co. Ltd., Class A | 296,169 | 762,567 | ||||||
Financial Street Holdings Co. Ltd., Class A* | 375,428 | 569,383 | ||||||
Founder Securities Co. Ltd., Class A* | 1,052,570 | 1,180,885 | ||||||
Gemdale Corp., Class A | 577,431 | 977,433 | ||||||
GF Securities Co. Ltd., Class A | 760,770 | 1,899,904 | ||||||
Guosen Securities Co. Ltd., Class A | 314,800 | 747,453 | ||||||
Guotai Junan Securities Co. Ltd., Class A | 251,300 | 701,595 | ||||||
Guotai Junan Securities Co. Ltd., Class A* | 137,200 | 383,044 | ||||||
Guoyuan Securities Co. Ltd., Class A | 295,801 | 768,804 | ||||||
Haitong Securities Co. Ltd., Class A | 2,055,425 | 4,945,876 | ||||||
Huatai Securities Co. Ltd., Class A* | 838,200 | 2,351,591 | ||||||
Huaxia Bank Co. Ltd., Class A | 1,371,768 | 2,124,189 | ||||||
Industrial & Commercial Bank of China Ltd., Class A | 5,479,026 | 3,626,621 | ||||||
Industrial Bank Co. Ltd., Class A* | 3,388,059 | 8,332,558 | ||||||
Industrial Securities Co. Ltd., Class A | 1,373,648 | 1,703,766 | ||||||
New China Life Insurance Co. Ltd., Class A | 157,972 | 1,013,976 | ||||||
Northeast Securities Co. Ltd., Class A | 360,224 | 680,855 | ||||||
Oceanwide Holdings Co. Ltd., Class A | 395,898 | 602,832 | ||||||
Orient Securities Co. Ltd., Class A | 268,287 | 721,324 | ||||||
Pacific Securities Co. Ltd., Class A | 1,176,589 | 1,146,759 | ||||||
Ping An Bank Co. Ltd., Class A* | 1,453,732 | 2,328,355 | ||||||
Number | Value | |||||||
| Financials (Continued) | ||||||||
Ping An Insurance Group Co. of China Ltd., Class A | 2,774,097 | $ | 13,779,938 | |||||
Poly Real Estate Group Co. Ltd., Class A | 1,638,861 | 2,112,331 | ||||||
RiseSun Real Estate Development Co. Ltd., Class A | 333,220 | 344,501 | ||||||
Sealand Securities Co. Ltd., Class A | 537,049 | 624,532 | ||||||
Shanghai Lujiazui Finance & Trade Zone Development Co. Ltd., Class A | 96,542 | 607,509 | ||||||
Shanghai Pudong Development Bank Co. Ltd., Class A | 2,496,800 | 6,932,818 | ||||||
Shanghai SMI Holding Co. Ltd., Class A | 379,647 | 842,636 | ||||||
Shanghai Zhangjiang High-Tech Park Development Co. Ltd., Class A | 198,300 | 571,689 | ||||||
Shanxi Securities Co. Ltd., Class A | 287,300 | 644,211 | ||||||
Shenwan Hongyuan Group Co. Ltd., Class A* | 1,133,486 | 1,469,557 | ||||||
Sinolink Securities Co. Ltd., Class A* | 461,068 | 919,756 | ||||||
SooChow Securities Co. Ltd., Class A | 541,693 | 1,037,827 | ||||||
Southwest Securities Co. Ltd., Class A | 720,532 | 887,128 | ||||||
Western Securities Co. Ltd., Class A | 285,763 | 1,043,358 | ||||||
Xinhu Zhongbao Co. Ltd., Class A | 695,157 | 415,807 | ||||||
Zhejiang China Commodities City Group Co. Ltd., Class A | 449,098 | 442,485 | ||||||
Zhejiang China Commodities City Group Co. Ltd., Class A* | 244,185 | 240,589 | ||||||
Zhongtian Urban Development Group Co. Ltd., Class A | 478,600 | 465,740 | ||||||
|
| |||||||
| 134,515,269 | ||||||||
|
| |||||||
| Health Care — 5.6% | ||||||||
Aier Eye Hospital Group Co. Ltd., Class A | 101,032 | 505,237 | ||||||
Beijing SL Pharmaceutical Co. Ltd., Class A | 103,476 | 448,338 | ||||||
Beijing Tongrentang Co. Ltd., Class A | 176,277 | 735,938 | ||||||
China Resources Sanjiu Medical & Pharmaceutical Co. Ltd., Class A | 98,064 | 340,179 | ||||||
Dong-E-E-Jiao Co. Ltd., Class A | 134,919 | 949,779 | ||||||
Guangxi Wuzhou Zhongheng Group Co. Ltd., Class A | 690,748 | 464,553 | ||||||
Guangzhou Baiyunshan Pharmaceutical Holdings Co. Ltd., Class A | 136,173 | 493,464 | ||||||
Huadong Medicine Co. Ltd., Class A | 62,906 | 627,627 | ||||||
Hualan Biological Engineering, Inc., Class A | 73,102 | 550,901 | ||||||
Jiangsu Hengrui Medicine Co. Ltd., Class A | 301,049 | 2,099,619 | ||||||
Jilin Aodong Pharmaceutical Group Co. Ltd., Class A | 180,235 | 694,453 | ||||||
Jointown Pharmaceutical Group Co. Ltd., Class A* | 82,629 | 221,281 | ||||||
Kangmei Pharmaceutical Co. Ltd., Class A | 789,048 | 1,790,841 | ||||||
Lepu Medical Technology Beijing Co. Ltd., Class A | 111,283 | 609,886 | ||||||
Searainbow Holding Corp., Class A | 182,498 | 1,097,149 | ||||||
Shanghai Fosun Pharmaceutical Group Co. Ltd., Class A | 289,564 | 847,547 | ||||||
| See Notes to Financial Statements. | 19 |
DBX ETF Trust
Schedule of investments
Deutsche X-trackers Harvest CSI 300 China A-Shares ETF (Continued)
May 31, 2016
Number | Value | |||||||
| Health Care (Continued) | ||||||||
Shanghai Pharmaceuticals Holding Co. Ltd., Class A | 296,359 | $ | 829,194 | |||||
Shanghai RAAS Blood Products Co. Ltd., Class A | 140,430 | 799,899 | ||||||
Shenzhen Hepalink Pharmaceutical Co. Ltd., Class A | 62,213 | 262,471 | ||||||
Shenzhen Salubris Pharmaceuticals Co. Ltd., Class A | 79,719 | 319,505 | ||||||
Sichuan Kelun Pharmaceutical Co. Ltd., Class A | 220,031 | 493,375 | ||||||
Tasly Pharmaceutical Group Co. Ltd., Class A | 165,304 | 912,974 | ||||||
Tonghua Dongbao Pharmaceutical Co. Ltd., Class A* | 203,367 | 769,380 | ||||||
Yunnan Baiyao Group Co. Ltd., Class A | 133,143 | 1,261,695 | ||||||
|
| |||||||
| 18,125,285 | ||||||||
|
| |||||||
| Industrials — 14.7% | ||||||||
Air China Ltd., Class A | 651,119 | 689,966 | ||||||
AVIC Aero-Engine Controls Co. Ltd., Class A | 117,716 | 446,059 | ||||||
AVIC Aircraft Co. Ltd., Class A | 281,078 | 741,206 | ||||||
Avic Aviation Engine Corp. PLC, Class A | 198,723 | 1,018,505 | ||||||
AVIC Helicopter Co. Ltd., Class A | 60,161 | 360,217 | ||||||
Beijing Originwater Technology Co. Ltd., Class A | 386,899 | 904,546 | ||||||
BlueFocus Communication Group Co. Ltd., Class A | 391,738 | 578,657 | ||||||
China Avionics Systems Co. Ltd., Class A | 133,977 | 380,758 | ||||||
China Baoan Group Co. Ltd., Class A | 323,800 | 630,198 | ||||||
China Communications Construction Co. Ltd., Class A | 389,023 | 649,651 | ||||||
China COSCO Holdings Co. Ltd., Class A* | 777,206 | 626,532 | ||||||
China CSSC Holdings Ltd., Class A* | 177,164 | 608,926 | ||||||
China Eastern Airlines Corp. Ltd., Class A* | 864,015 | 882,772 | ||||||
China First Heavy Industries, Class A | 668,983 | 556,555 | ||||||
China Gezhouba Group Co. Ltd., Class A | 701,912 | 628,705 | ||||||
China International Marine Containers Group Co. Ltd., Class A | 193,861 | 421,450 | ||||||
China National Chemical Engineering Co. Ltd., Class A | 502,980 | 417,686 | ||||||
China Railway Construction Corp. Ltd., Class A | 882,270 | 1,354,144 | ||||||
China Railway Group Ltd., Class A | 1,415,387 | 1,557,850 | ||||||
China Shipbuilding Industry Co. Ltd., Class A | 2,332,434 | 2,177,694 | ||||||
China Shipping Container Lines Co. Ltd., Class A* | 807,500 | 530,814 | ||||||
China Southern Airlines Co. Ltd., Class A | 901,920 | 936,562 | ||||||
China Spacesat Co. Ltd., Class A | 152,140 | 735,178 | ||||||
China State Construction Engineering Corp. Ltd., Class A | 3,809,924 | 3,175,419 | ||||||
China XD Electric Co. Ltd., Class A | 523,090 | 427,239 | ||||||
CITIC Heavy Industries Co. Ltd., Class A | 331,000 | 277,382 | ||||||
CRRC Corp. Ltd., Class A | 2,347,620 | 3,457,099 | ||||||
Daqin Railway Co. Ltd., Class A | 1,513,560 | 1,493,569 | ||||||
Dongfang Electric Corp. Ltd., Class A | 305,229 | 466,625 | ||||||
Number | Value | |||||||
| Industrials (Continued) | ||||||||
Guangshen Railway Co. Ltd., Class A | 861,350 | $ | 532,214 | |||||
Hainan Airlines Co. Ltd., Class A | 1,492,100 | 727,135 | ||||||
Han’s Laser Technology Industry Group Co. Ltd., Class A | 213,477 | 745,403 | ||||||
Jihua Group Corp. Ltd., Class A | 393,600 | 463,094 | ||||||
Juneyao Airlines Co. Ltd., Class A | 36,600 | 148,301 | ||||||
Luxshare Precision Industry Co. Ltd., Class A | 127,093 | 550,087 | ||||||
Metallurgical Corp. of China Ltd., Class A | 1,239,500 | 705,651 | ||||||
NARI Technology Co. Ltd., Class A | 370,676 | 755,195 | ||||||
Ningbo Port Co. Ltd., Class A* | 985,800 | 820,128 | ||||||
Power Construction Corp. of China Ltd., Class A | 1,072,406 | 978,467 | ||||||
Sany Heavy Industry Co. Ltd., Class A | 969,044 | 748,814 | ||||||
Shandong Hi-speed Co. Ltd., Class A | 165,600 | 134,502 | ||||||
Shanghai Construction Group Co. Ltd., Class A | 539,682 | 321,171 | ||||||
Shanghai Electric Group Co. Ltd., Class A | 750,900 | 889,178 | ||||||
Shanghai International Airport Co. Ltd., Class A | 245,353 | 1,032,144 | ||||||
Shanghai International Port Group Co. Ltd., Class A* | 831,453 | 661,426 | ||||||
Shanghai Tunnel Engineering Co. Ltd., Class A | 400,233 | 524,368 | ||||||
Shanghai Waigaoqiao Free Trade Zone Group Co. Ltd., Class A | 95,674 | 268,125 | ||||||
Shenzhen Inovance Technology Co. Ltd., Class A | 241,336 | 675,243 | ||||||
Siasun Robot & Automation Co. Ltd., Class A | 277,653 | 1,077,818 | ||||||
Spring Airlines Co. Ltd., Class A | 61,358 | 466,403 | ||||||
Suzhou Gold Mantis Construction Decoration Co. Ltd., Class A | 225,830 | 519,748 | ||||||
TBEA Co. Ltd., Class A | 654,156 | 843,143 | ||||||
Tianjin Port Co. Ltd., Class A | 211,092 | 286,498 | ||||||
Weichai Power Co. Ltd., Class A | 616,109 | 742,661 | ||||||
XCMG Construction Machinery Co. Ltd., Class A | 1,065,172 | 519,083 | ||||||
Xiamen C & D, Inc., Class A | 958,812 | 1,427,316 | ||||||
Xinjiang Goldwind Science & Technology Co. Ltd., Class A | 402,369 | 922,388 | ||||||
XJ Electric Co. Ltd., Class A | 156,093 | 343,134 | ||||||
Yingkou Port Liability Co. Ltd., Class A | 495,200 | 261,621 | ||||||
Zhengzhou Yutong Bus Co. Ltd., Class A | 338,606 | 1,007,542 | ||||||
Zoomlion Heavy Industry Science and Technology Co. Ltd., Class A | 1,117,122 | 705,515 | ||||||
|
| |||||||
| 47,935,480 | ||||||||
|
| |||||||
| Information Technology — 7.6% | ||||||||
Aisino Co. Ltd., Class A | 286,350 | 1,099,407 | ||||||
Beijing Shiji Information Technology Co. Ltd., Class A | 83,112 | 336,889 | ||||||
Beijing Ultrapower Software Co. Ltd., Class A | 303,064 | 403,963 | ||||||
Beijing Xinwei Telecom Technology Group Co. Ltd., Class A | 284,576 | 766,847 | ||||||
BOE Technology Group Co. Ltd., Class A | 6,046,358 | 2,175,477 | ||||||
| See Notes to Financial Statements. | 20 |
DBX ETF Trust
Schedule of investments
Deutsche X-trackers Harvest CSI 300 China A-Shares ETF (Continued)
May 31, 2016
Number | Value | |||||||
| Information Technology (Continued) | ||||||||
DHC Software Co. Ltd., Class A | 157,533 | $ | 492,602 | |||||
Dongxu Optoelectronic Technology Co. Ltd., Class A | 456,000 | 548,280 | ||||||
East Money Information Co. Ltd., Class A | 540,283 | 1,803,677 | ||||||
Glodon Software Co. Ltd., Class A* | 172,711 | 339,549 | ||||||
GoerTek, Inc., Class A | 236,284 | 972,829 | ||||||
Guangzhou Haige Communication Group, Inc. Co., Class A | 438,940 | 776,325 | ||||||
Hangzhou Hikvision Digital Technology Co. Ltd., Class A | 466,746 | 1,495,826 | ||||||
Hundsun Technologies, Inc., Class A | 125,542 | 1,165,842 | ||||||
Iflytek Co. Ltd., Class A | 230,979 | 1,017,963 | ||||||
Leshi Internet Information & Technology Corp. Beijing, Class A | 289,127 | 2,215,963 | ||||||
Neusoft Corp., Class A | 222,713 | 612,655 | ||||||
Ourpalm Co. Ltd., Class A* | 405,900 | 658,116 | ||||||
People.cn Co. Ltd., Class A | 139,239 | 359,142 | ||||||
Sanan Optoelectronics Co. Ltd., Class A | 327,036 | 1,009,359 | ||||||
Shanghai 2345 Network Holding Group Co. Ltd., Class A* | 72,600 | 285,903 | ||||||
Shenzhen O-film Tech Co. Ltd., Class A | 185,946 | 823,729 | ||||||
Tianjin Zhonghuan Semiconductor Co. Ltd., Class A* | 421,127 | 549,434 | ||||||
Tsinghua Tongfang Co. Ltd., Class A | 446,844 | 1,030,448 | ||||||
Universal Scientific Industrial Shanghai Co. Ltd., Class A | 83,296 | 125,697 | ||||||
Wangsu Science & Technology Co., Ltd., Class A | 122,152 | 1,243,588 | ||||||
Yonyou Network Technology Co. Ltd., Class A | 154,099 | 444,962 | ||||||
Zhejiang Dahua Technology Co. Ltd., Class A | 446,657 | 901,180 | ||||||
ZTE Corp., Class A | 597,398 | 1,249,756 | ||||||
|
| |||||||
| 24,905,408 | ||||||||
|
| |||||||
| Materials — 5.8% | ||||||||
Aluminum Corp. of China Ltd., Class A* | 1,398,052 | 872,323 | ||||||
Angang Steel Co. Ltd., Class A | 459,662 | 270,061 | ||||||
Anhui Conch Cement Co. Ltd., Class A | 506,023 | 1,169,991 | ||||||
Baoshan Iron & Steel Co. Ltd., Class A* | 1,258,036 | 1,010,325 | ||||||
BBMG Corp., Class A | 318,014 | 385,267 | ||||||
China Hainan Rubber Industry Group Co. Ltd., Class A | 289,600 | 243,129 | ||||||
China Minmetals Rare Earth Co. Ltd., Class A* | 176,225 | 428,590 | ||||||
China Molybdenum Co. Ltd., Class A | 660,005 | 386,764 | ||||||
China Northern Rare Earth Group High-Tech Co. Ltd., Class A* | 555,293 | 1,267,893 | ||||||
Hainan Mining Co. Ltd., Class A | 51,800 | 87,054 | ||||||
Hebei Iron & Steel Co. Ltd., Class A* | 1,077,278 | 456,294 | ||||||
Inner Mongolia Junzheng Energy & Chemical Industry Group Co. Ltd., Class A | 320,684 | 360,264 | ||||||
Inner Mongolian Baotou Steel Union Co. Ltd., Class A* | 2,500,548 | 1,157,837 | ||||||
Jiangsu Kangde Xin Composite Material Co. Ltd., Class A* | 330,201 | 1,653,261 | ||||||
Jiangxi Copper Co. Ltd., Class A | 207,634 | 420,186 | ||||||
Number | Value | |||||||
| Materials (Continued) | ||||||||
Jinduicheng Molybdenum Co. Ltd., Class A* | 246,104 | $ | 312,347 | |||||
Kingenta Ecological Engineering Group Co. Ltd., Class A | 307,102 | 355,263 | ||||||
Luxin Venture Capital Group Co. Ltd., Class A | 74,992 | 256,387 | ||||||
Pangang Group Vanadium Titanium & Resources Co. Ltd., Class A* | 1,093,200 | 414,195 | ||||||
Qinghai Salt Lake Industry Co. Ltd., Class A | 190,106 | 533,925 | ||||||
Shandong Gold Mining Co. Ltd., Class A | 180,122 | 809,414 | ||||||
Shanxi Taigang Stainless Steel Co. Ltd., Class A* | 568,800 | 274,599 | ||||||
Shenzhen Zhongjin Lingnan Nonfemet Co. Ltd., Class A | 334,638 | 499,391 | ||||||
Sinopec Shanghai Petrochemical Co. Ltd., Class A* | 569,532 | 532,612 | ||||||
Tongling Nonferrous Metals Group Co. Ltd., Class A | 959,020 | 375,629 | ||||||
Wanhua Chemical Group Co. Ltd., Class A | 274,003 | 661,401 | ||||||
Wuhan Iron & Steel Co. Ltd., Class A | 1,027,500 | 457,048 | ||||||
Xiamen Tungsten Co. Ltd., Class A* | 113,782 | 463,108 | ||||||
Xinxing Ductile Iron Pipes Co. Ltd., Class A | 556,700 | 426,801 | ||||||
Zhejiang Longsheng Group Co. Ltd., Class A | 580,088 | 766,170 | ||||||
Zhongjin Gold Corp. Ltd., Class A | 444,771 | 653,618 | ||||||
Zijin Mining Group Co. Ltd., Class A | 2,435,351 | 1,131,346 | ||||||
|
| |||||||
| 19,092,493 | ||||||||
|
| |||||||
| Telecommunication Services — 0.6% | ||||||||
China United Network Communications Ltd., Class A | 2,164,715 | 1,314,538 | ||||||
Dr Peng Telcom & Media Group Co. Ltd., Class A | 287,471 | 811,744 | ||||||
|
| |||||||
| 2,126,282 | ||||||||
|
| |||||||
| Utilities — 4.3% | ||||||||
Beijing Capital Co. Ltd., Class A | 472,968 | 287,213 | ||||||
Beijing Jingneng Power Co. Ltd., Class A | 355,702 | 237,063 | ||||||
CECEP Wind-Power Corp., Class A | 51,200 | 78,895 | ||||||
Chengdu Xingrong Environment Co. Ltd., Class A | 454,900 | 370,854 | ||||||
China National Nuclear Power Co. Ltd., Class A* | 1,199,800 | 1,262,276 | ||||||
China Yangtze Power Co. Ltd., Class A | 1,662,905 | 3,145,558 | ||||||
Chongqing Water Group Co. Ltd., Class A* | 140,100 | 144,843 | ||||||
Datang International Power Generation Co. Ltd., Class A | 763,565 | 464,839 | ||||||
GD Power Development Co. Ltd., Class A | 2,510,900 | 1,124,511 | ||||||
Guangdong Electric Power Development Co. Ltd., Class A | 219,500 | 175,613 | ||||||
Guangdong Golden Dragon Development, Inc., Class A | 120,500 | 352,701 | ||||||
Huadian Power International Corp. Ltd., Class A | 618,359 | 495,664 | ||||||
Huaneng Power International, Inc., Class A | 1,069,761 | 1,219,660 | ||||||
| See Notes to Financial Statements. | 21 |
DBX ETF Trust
Schedule of investments
Deutsche X-trackers Harvest CSI 300 China A-Shares ETF (Continued)
May 31, 2016
Number | Value | |||||||
| Utilities (Continued) | ||||||||
Hubei Energy Group Co. Ltd., Class A | 527,468 | $ | 378,765 | |||||
Inner Mongolia MengDian HuaNeng Thermal Power Corp. Ltd., Class A | 739,950 | 347,115 | ||||||
SDIC Power Holdings Co. Ltd., Class A | 863,775 | 870,725 | ||||||
Shanghai Electric Power Co. Ltd., Class A | 212,600 | 340,831 | ||||||
Shenergy Co. Ltd., Class A | 580,444 | 509,332 | ||||||
Shenzhen Energy Group Co. Ltd., Class A | 302,600 | 299,063 | ||||||
Sichuan Chuantou Energy Co. Ltd., Class A | 558,870 | 724,571 | ||||||
Tus-Sound Environmental Resources Co. Ltd., Class A | 130,406 | 596,696 | ||||||
Number | Value | |||||||
| Utilities (Continued) | ||||||||
Zhejiang Zheneng Electric Power Co. Ltd., Class A | 684,490 | $ | 552,830 | |||||
|
| |||||||
| 13,979,618 | ||||||||
|
| |||||||
TOTAL COMMON STOCKS | 323,979,843 | |||||||
|
| |||||||
TOTAL INVESTMENTS — 99.2% | $ | 323,979,843 | ||||||
Other assets and liabilities, net — 0.8% | 2,487,982 | |||||||
|
| |||||||
NET ASSETS — 100.0% | $ | 326,467,825 | ||||||
|
| |||||||
| * | Non-income producing security. |
| † | The cost for federal income tax purposes was $342,919,942. At May 31, 2016, net unrealized depreciation for all securities based on tax cost was $18,940,099. This consisted of aggregate gross unrealized appreciation for all securities in which there was an excess of value over tax cost of $53,675,503 and aggregate gross unrealized depreciation for all securities in which there was an excess of tax cost over value of $72,615,602. |
Fair Value Measurements
Various inputs are used in determining the value of the Fund’s investments. These inputs are summarized in three broad levels. Level 1 includes quoted prices in active markets for identical securities. Level 2 includes other significant observable inputs (including quoted prices for similar securities, interest rates, prepayment speeds and credit risk). Level 3 includes significant unobservable inputs (including the Fund’s own assumptions in determining the fair value of investments). The level assigned to the securities valuations may not be an indication of the risk or liquidity associated with investing in those securities.
The following is a summary of the inputs used as of May 31, 2016 in valuing the Fund’s investments. For information on Fund’s policy regarding the valuation of investments, please refer to the security Valuation section of Note 2 in the accompanying Notes to Financial Statements.
| Level 1 | Level 2 | Level 3 | Total | |||||||||||||
Assets | ||||||||||||||||
Common Stocks (a) | $ | 304,738,500 | $ | — | $ | 19,241,343 | $ | 323,979,843 | ||||||||
|
|
|
|
|
|
|
| |||||||||
Total | $ | 304,738,500 | $ | — | $ | 19,241,343 | $ | 323,979,843 | ||||||||
|
|
|
|
|
|
|
| |||||||||
| (a) | See Schedule of Investments for additional detailed categorizations. |
The following is a reconcilation of the Fund’s Level 3 investments for which significant unobservable inputs were used in determining value:
Balance at May 31, 2015 | $ | 82,552,492 | ||
Purchases | 37,441,286 | |||
Sales | (80,100,647 | ) | ||
Realized gain (loss) | 13,756,790 | |||
Change in unrealized gain (loss) | (28,268,480 | ) | ||
Transfers into Level 3 (b) | 55,373,249 | |||
Transfer out of Level 3 (b) | (61,513,347 | ) | ||
Balance at May 31, 2016 | 19,241,343 | |||
Change in unrealized gain (loss) related to Investments still held at May 31, 2016 | (21,367,959 | ) |
| (b) | During the year ended May 31, 2016, the amount of transfers between Level 1 and Level 3 was $55,373,249 and between Level 3 and Level 1 was $61,513,347. Investments were transferred from Level 1 to Level 3 as a result of a halt in trading on a securities exchange. Investments were transferred from Level 3 to Level 1 as a result of the resumption of trading on a securities exchange. |
| See Notes to Financial Statements. | 22 |
DBX ETF Trust
Schedule of investments
Deutsche X-trackers Harvest CSI 300 China A-Shares ETF (Continued)
May 31, 2016
Transfers between price levels are recognized at the beginning of the reporting period.
Qualitative Disclosure About Unobservable Inputs
Significant unobservable inputs developed by the Pricing Committee and used in the fair value measurement of the Fund’s equity investments include the last traded price on the Exchange for securities suspended from trading adjusted for proxy (the movement in the applicable sector index) with a range of -43% to 9% with a weighted average range of approximately -8%. A significant change between last traded price, adjusted for proxy, and the price of a security once it resumes trading on the securities exchange could result in a material change in the fair value measurement.
Asset Class | Fair Value at 5/31/2016 | Valuation | Unobservable Input | |||||
Common Stock: Materials | $ | 414,195 | Market Approach | Last traded price adjusted for proxy. | ||||
Common Stock: Industrials | 1,427,315 | Market Approach | Last traded price adjusted for proxy. | |||||
Common Stock: Information Technology | 3,257,999 | Market Approach | Last traded price adjusted for proxy. | |||||
Common Stock: Financials | 5,930,624 | Market Approach | Last traded price adjusted for proxy. | |||||
Common Stock: Consumer Discretionary | 8,211,210 | Market Approach | Last traded price adjusted for proxy. | |||||
| See Notes to Financial Statements. | 23 |
DBX ETF Trust
Schedule of investments
Deutsche X-trackers Harvest CSI 500 China A-Shares Small Cap ETF
May 31, 2016
Number | Value | |||||||
| COMMON STOCKS — 99.6% | ||||||||
| Consumer Discretionary — 15.1% | ||||||||
Anhui Jianghuai Automobile Co. Ltd., Class A | 36,000 | $ | 61,321 | |||||
Anhui Xinhua Media Co. Ltd., Class A | 6,900 | 25,486 | ||||||
Anhui Zhongding Sealing Parts Co. Ltd., Class A | 25,700 | 82,909 | ||||||
Beijing Dahao Technology Corp. Ltd., Class A | 1,700 | 8,362 | ||||||
Beijing HualuBaina Film & TV Co. Ltd., Class A* | 14,600 | 53,196 | ||||||
Besttone Holdings Co. Ltd., Class A | 9,500 | 23,100 | ||||||
Central China Land Media Co. Ltd., Class A | 4,000 | 8,593 | ||||||
Changjiang Publishing & Media Co. Ltd., Class A | 24,000 | 32,938 | ||||||
Chengdu B-Ray Media Co. Ltd., Class A* | 31,900 | 42,714 | ||||||
China Automotive Engineering Research Institute Co. Ltd., Class A* | 14,900 | 18,639 | ||||||
China CYTS Tours Holding Co. Ltd., Class A | 24,100 | 72,699 | ||||||
China Shipbuilding Industry Group Power Co. Ltd., Class A | 15,300 | 73,260 | ||||||
China Television Media Ltd., Class A | 5,000 | 18,521 | ||||||
Chongqing Department Store Co. Ltd., Class A | 9,500 | 30,042 | ||||||
Chongqing Zongshen Power Machinery Co. Ltd., Class A* | 28,700 | 44,268 | ||||||
Dashang Group Co. Ltd., Class A | 12,300 | 73,777 | ||||||
DMG Entertainment and Media Co. Ltd., Class A | 9,300 | 33,885 | ||||||
Dongfeng Automobile Co. Ltd., Class A | 33,300 | 31,950 | ||||||
Eastern Gold Jade Co. Ltd., Class A* | 27,500 | 36,113 | ||||||
Elec-Tech International Co. Ltd., Class A | 40,700 | 35,466 | ||||||
Fangda Special Steel Technology Co. Ltd., Class A | 20,200 | 15,088 | ||||||
FAWER Automotive Parts Co. Ltd., Class A | 19,300 | 21,184 | ||||||
Fujian Funeng Co. Ltd., Class A | 10,100 | 16,729 | ||||||
Fujian Septwolves Industry Co. Ltd., Class A | 19,000 | 28,325 | ||||||
Guangdong Advertising Group Co. Ltd., Class A | 38,480 | 78,631 | ||||||
Guangdong Chj Industry Co. Ltd., Class A | 17,800 | 26,726 | ||||||
Guangzhou Pearl River Piano Group Co. Ltd., Class A | 8,000 | 14,513 | ||||||
Guirenniao Co. Ltd., Class A | 4,700 | 18,216 | ||||||
Haima Automobile Group Co. Ltd., Class A* | 48,300 | 37,103 | ||||||
Hang Zhou Great Star Industrial Co. Ltd., Class A | 22,653 | 72,186 | ||||||
Hangzhou Robam Appliances Co. Ltd., Class A* | 9,865 | 76,650 | ||||||
Hefei Department Store Group Co. Ltd., Class A | 22,800 | 27,102 | ||||||
Hisense Kelon Electrical Holdings Co. Ltd., Class A* | 13,199 | 16,291 | ||||||
Number | Value | |||||||
| Consumer Discretionary (Continued) | ||||||||
Hunan Friendship & Apollo Cmmericial Co. Ltd., Class A | 14,900 | $ | 26,240 | |||||
Jiangling Motors Corp. Ltd., Class A | 8,800 | 32,237 | ||||||
Jiangsu Hongtu High Technology Co. Ltd., Class A | 57,900 | 133,505 | ||||||
Jiangsu Sunshine Co. Ltd., Class A* | 58,600 | 36,831 | ||||||
Jinzhou Cihang Group Co. Ltd., Class A* | 17,200 | 38,228 | ||||||
Jishi Media Co. Ltd., Class A | 88,300 | 55,766 | ||||||
Joyoung Co. Ltd., Class A | 12,800 | 35,056 | ||||||
KingClean Electric Co. Ltd., Class A | 1,700 | 9,559 | ||||||
Lifan Industry Group Co. Ltd., Class A | 15,800 | 23,866 | ||||||
Loncin Motor Co. Ltd., Class A | 17,600 | 47,374 | ||||||
Luolai Lifestyle Technology Co. Ltd., Class A | 10,655 | 20,834 | ||||||
Luthai Textile Co. Ltd., Class A | 17,900 | 30,653 | ||||||
Markor International Home Furnishings Co. Ltd., Class A | 14,900 | 27,393 | ||||||
Materials Industry Zhongda Group Co. Ltd., Class A | 27,100 | 50,192 | ||||||
Nanjing Central Emporium, Class A | 22,000 | 22,110 | ||||||
NavInfo Co. Ltd., Class A* | 25,000 | 121,641 | ||||||
Ningbo Huaxiang Electronic Co. Ltd., Class A | 17,300 | 54,419 | ||||||
Ningbo Joyson Electronic Corp., Class A | 14,200 | 79,009 | ||||||
Ningbo Shanshan Co. Ltd., Class A | 12,000 | 54,836 | ||||||
Rainbow Department Store Co. Ltd., Class A | 9,100 | 17,366 | ||||||
Rastar Group, Class A* | 29,800 | 58,262 | ||||||
Shaanxi Broadcast & TV Network Intermediary Co. Ltd., Class A | 15,500 | 29,508 | ||||||
Shanghai Haixin Group Co., Class A | 30,300 | 67,251 | ||||||
Shanghai Jinjiang International Hotels Development Co. Ltd., Class A | 8,188 | 45,906 | ||||||
Shanghai Metersbonwe Fashion & Accessories Co. Ltd., Class A* | 53,850 | 38,914 | ||||||
Shanghai New World Co. Ltd., Class A | 17,642 | 32,274 | ||||||
Shanghai Xinhua Media Co. Ltd., Class A | 19,900 | 23,837 | ||||||
Shanghai Yuyuan Tourist Mart Co. Ltd., Class A | 42,000 | 69,564 | ||||||
Shenzhen Fenda Technology Co. Ltd., Class A | 15,800 | 36,292 | ||||||
Shenzhen Fuanna Bedding and Furnishing Co. Ltd., Class A* | 16,200 | 20,118 | ||||||
Shenzhen Topway Video Communication Co. Ltd., Class A | 5,875 | 15,234 | ||||||
Sichuan Chengfei Integration Technology Corp., Class A | 8,000 | 42,898 | ||||||
Sinomach Automobile Co. Ltd., Class A | 10,950 | 20,680 | ||||||
Sou Yu Te Fashion Co. Ltd., Class A | 16,862 | 31,435 | ||||||
Time Publishing and Media Co. Ltd., Class A* | 7,900 | 22,823 | ||||||
Visual China Group Co. Ltd., Class A* | 11,600 | 40,944 | ||||||
Wangfujing Group Co. Ltd., Class A | 11,100 | 34,950 | ||||||
Wenfeng Great World Chain Development Corp., Class A* | 36,050 | 29,006 | ||||||
Wuhan Department Store Group Co. Ltd., Class A* | 12,561 | 30,091 | ||||||
| See Notes to Financial Statements. | 24 |
DBX ETF Trust
Schedule of investments
Deutsche X-trackers Harvest CSI 500 China A-Shares Small Cap ETF (Continued)
May 31, 2016
Number | Value | |||||||
| Consumer Discretionary (Continued) | ||||||||
Wuxi Little Swan Co. Ltd., Class A | 9,405 | $ | 42,549 | |||||
Yantai Tayho Advanced Materials Co. Ltd., Class A | 17,800 | 38,156 | ||||||
Yihua Lifestyle Technology Co. Ltd., Class A | 48,900 | 84,110 | ||||||
Yotrio Group Co. Ltd., Class A | 44,940 | 51,442 | ||||||
Zhejiang Aokang Shoes Co. Ltd., Class A | 4,600 | 14,330 | ||||||
Zhejiang Orient Holdings Co., Class A | 18,200 | 50,330 | ||||||
Zhejiang Wanfeng Auto Wheel Co. Ltd., Class A | 37,400 | 91,640 | ||||||
|
| |||||||
| 3,235,642 | ||||||||
|
| |||||||
| Consumer Staples — 5.7% | ||||||||
Angel Yeast Co. Ltd., Class A | 21,300 | 49,119 | ||||||
Anhui Gujing Distillery Co. Ltd., Class A | 4,700 | 30,425 | ||||||
Anhui Kouzi Distillery Co. Ltd., Class A* | 2,300 | 12,322 | ||||||
Beijing Sanyuan Foods Co. Ltd., Class A* | 19,000 | 24,085 | ||||||
Beijing Shunxin Agriculture Co. Ltd., Class A | 16,300 | 55,109 | ||||||
Better Life Commercial Chain Share Co. Ltd., Class A | 14,830 | 26,994 | ||||||
Bright Dairy & Food Co. Ltd., Class A* | 25,300 | 46,897 | ||||||
China Animal Husbandry Industry Co. Ltd., Class A | 8,100 | 22,295 | ||||||
Chongqing Brewery Co. Ltd., Class A | 9,200 | 23,227 | ||||||
Chuying Agro-pastoral Group Co. Ltd., Class A* | 21,900 | 58,482 | ||||||
Fujian Sunner Development Co. Ltd., Class A* | 18,600 | 73,756 | ||||||
Gansu Yasheng Industrial Group Co. Ltd., Class A | 64,400 | 49,373 | ||||||
Guangdong Haid Group Co. Ltd., Class A | 25,100 | 64,589 | ||||||
Guangzhou Zhujiang Brewery Co. Ltd., Class A | 7,300 | 13,044 | ||||||
Hebei Chengde Lolo Co., Class A | 24,541 | 37,480 | ||||||
Hunan Dakang International Food & Agriculture Co. Ltd., Class A* | 35,800 | 38,598 | ||||||
Jiangsu King’s Luck Brewery JSC Ltd., Class A | 21,377 | 40,340 | ||||||
Jonjee High-Tech Industrial and Commercial Holding Co. Ltd., Class A | 23,400 | 42,843 | ||||||
Laobaixing Pharmacy Chain JSC, Class A* | 3,500 | 25,005 | ||||||
Muyuan Foodstuff Co. Ltd., Class A | 6,600 | 52,193 | ||||||
Qinghai Huzhu Barley Wine Co. Ltd., Class A | 6,900 | 21,034 | ||||||
Sanquan Food Co. Ltd., Class A | 13,100 | 16,049 | ||||||
Shandong Denghai Seeds Co. Ltd., Class A | 13,550 | 30,918 | ||||||
Shanghai Bairun Investment Holding Group Co. Ltd., Class A | 11,100 | 38,017 | ||||||
Shanghai Feilo Acoustics Co. Ltd., Class A | 28,425 | 47,943 | ||||||
Shanghai Maling Aquarius Co. Ltd., Class A | 19,700 | 37,115 | ||||||
Shanxi Xinghuacun Fen Wine Factory Co. Ltd., Class A* | 11,000 | 34,902 | ||||||
Number | Value | |||||||
| Consumer Staples (Continued) | ||||||||
V V Food & Beverage Co. Ltd., Class A | 32,300 | $ | 30,353 | |||||
Xinjiang Guannong Fruit & Antler Group Co. Ltd., Class A* | 18,400 | 21,034 | ||||||
Yantai Changyu Pioneer Wine Co. Ltd., Class A | 5,400 | 31,300 | ||||||
Yuan Longping High-tech Agriculture Co. Ltd., Class A | 26,400 | 75,829 | ||||||
Yunnan Hongxiang Yixintang Pharmaceutical Co. Ltd., Class A | 8,800 | 29,912 | ||||||
Zhejiang Guyuelongshan Shaoxing Wine Co. Ltd., Class A | 20,460 | 29,322 | ||||||
|
| |||||||
| 1,229,904 | ||||||||
|
| |||||||
| Energy — 1.8% | ||||||||
Anhui Hengyuan Coal Industry and Electricity Power Co. Ltd., Class A* | 19,000 | 15,663 | ||||||
Anyuan Coal Industry Group Co. Ltd., Class A* | 26,600 | 17,647 | ||||||
Beijing Haohua Energy Resource Co. Ltd., Class A | 18,500 | 18,031 | ||||||
Changzheng Engineering Co. Ltd., Class A | 2,900 | 11,530 | ||||||
Datong Coal Industry Co. Ltd., Class A | 34,600 | 27,450 | ||||||
Gansu Jingyuan Coal Industry and Electricity Power Co. Ltd., Class A | 19,000 | 10,240 | ||||||
Geo-Jade Petroleum Corp., Class A* | 46,940 | 59,076 | ||||||
Guizhou Panjiang Refined Coal Co. Ltd., Class A | 27,400 | 35,690 | ||||||
Huolinhe Opencut Coal Industry Corp. Ltd. of Inner Mongolia, Class A | 12,500 | 13,796 | ||||||
Oriental Energy Co. Ltd., Class A | 28,600 | 42,247 | ||||||
PetroChina Jinhong Energy Investment Co. Ltd., Class A | 10,100 | 24,809 | ||||||
Pingdingshan Tianan Coal Mining Co. Ltd., Class A | 49,485 | 30,501 | ||||||
Shanxi Guoxin Energy Corp. Ltd., Class A | 11,300 | 19,883 | ||||||
Sinopec Oilfield Equipment Corp., Class A* | 5,700 | 13,136 | ||||||
Yang Quan Coal Industry Group Co. Ltd., Class A* | 50,400 | 47,362 | ||||||
|
| |||||||
| 387,061 | ||||||||
|
| |||||||
| Financials — 8.2% | ||||||||
Anxin Trust Co. Ltd., Class A | 36,253 | 92,353 | ||||||
Beijing Capital Development Co. Ltd., Class A* | 46,400 | 72,485 | ||||||
Beijing Centergate Technologies (Holding) Co. Ltd., Class A* | 20,700 | 25,643 | ||||||
Beijing Homyear Capital Holdings Co. Ltd., Class A | 35,830 | 52,600 | ||||||
China Sports Industry Group Co. Ltd., Class A | 28,101 | 81,227 | ||||||
Cinda Real Estate Co. Ltd., Class A | 29,200 | 22,254 | ||||||
Citychamp Dartong Co. Ltd., Class A | 43,200 | 43,154 | ||||||
COFCO Property Group Co. Ltd., Class A | 37,200 | 53,595 | ||||||
Deluxe Family Co. Ltd., Class A | 52,400 | 69,527 | ||||||
Greattown Holdings Ltd., Class A | 44,900 | 64,688 | ||||||
| See Notes to Financial Statements. | 25 |
DBX ETF Trust
Schedule of investments
Deutsche X-trackers Harvest CSI 500 China A-Shares Small Cap ETF (Continued)
May 31, 2016
Number | Value | |||||||
| Financials (Continued) | ||||||||
Guangdong Highsun Group Co. Ltd., Class A | 47,070 | $ | 36,944 | |||||
Haining China Leather Market Co. Ltd., Class A | 23,300 | 34,029 | ||||||
Hangzhou Binjiang Real Estate Group Co. Ltd., Class A | 38,300 | 39,887 | ||||||
HNA Investment Group Co. Ltd., Class A | 60,000 | 48,459 | ||||||
Huafa Industrial Co. Ltd. Zhuhai, Class A* | 29,100 | 48,330 | ||||||
Huayuan Property Co. Ltd., Class A | 27,900 | 20,119 | ||||||
Hubei Fuxing Science And Technology Co. Ltd., Class A | 23,800 | 40,648 | ||||||
Jinke Properties Group Co. Ltd., Class A | 101,000 | 56,426 | ||||||
Macrolink Real Estate Co. Ltd., Class A* | 22,100 | 24,693 | ||||||
Myhome Real Estate Development Group Co. Ltd., Class A | 84,600 | 46,365 | ||||||
Nanjing Gaoke Co. Ltd., Class A* | 22,725 | 51,509 | ||||||
Shaanxi International Trust Co. Ltd., Class A | 50,400 | 43,154 | ||||||
Shanghai AJ Group Co. Ltd., Class A* | 47,580 | 67,755 | ||||||
Shanghai Industrial Development Co. Ltd., Class A | 16,500 | 24,473 | ||||||
Shanghai Jinqiao Export Processing Zone Development Co. Ltd., Class A | 9,800 | 34,338 | ||||||
Shanghai Shimao Co. Ltd., Class A | 24,000 | 36,034 | ||||||
Shenzhen Huaqiang Industry Co. Ltd., Class A | 8,700 | 33,746 | ||||||
Shenzhen World Union Properties Consultancy, Inc., Class A | 33,110 | 38,503 | ||||||
Shenzhen Zhenye Group Co. Ltd., Class A | 39,300 | 44,031 | ||||||
Shunfa Hengye Corp., Class A | 34,242 | 26,200 | ||||||
Suning Universal Co. Ltd., Class A | 77,090 | 135,023 | ||||||
Sunshine City Group Co. Ltd., Class A | 50,750 | 46,536 | ||||||
Suzhou New District Hi-Tech Industrial Co. Ltd., Class A | 29,400 | 39,188 | ||||||
Thaihot Group Co. Ltd., Class A | 15,400 | 45,824 | ||||||
Tianjin Jinbin Development Co. Ltd., Class A* | 51,000 | 31,048 | ||||||
Tibet Urban Development and Investment Co. Ltd., Class A | 11,200 | 27,426 | ||||||
Zhejiang China Light & Textile Industrial City Group Co. Ltd., Class A* | 28,340 | 25,771 | ||||||
Zhonghong Holding Co. Ltd., Class A* | 76,880 | 32,447 | ||||||
|
| |||||||
| 1,756,432 | ||||||||
|
| |||||||
| Health Care — 12.6% | ||||||||
Beijing Tiantan Biological Products Corp. Ltd., Class A* | 10,900 | 47,641 | ||||||
Changchun High & New Technology Industries, Inc., Class A | 5,700 | 79,265 | ||||||
China National Accord Medicines Corp. Ltd., Class A | 5,100 | 50,481 | ||||||
China National Medicines Corp. Ltd., Class A | 12,400 | 51,678 | ||||||
China Resources Double Crane Pharmaceutical Co. Ltd., Class A* | 15,000 | 41,673 | ||||||
Chongqing Zhifei Biological Products Co. Ltd., Class A | 26,200 | 55,089 | ||||||
Number | Value | |||||||
| Health Care (Continued) | ||||||||
Da An Gene Co. Ltd. of Sun Yat-Sen University, Class A | 18,720 | $ | 80,484 | |||||
Guangdong Zhongsheng Pharmaceutical Co. Ltd., Class A | 17,300 | 28,680 | ||||||
Guizhou Xinbang Pharmaceutical Co. Ltd., Class A* | 28,450 | 38,872 | ||||||
Guizhou Yibai Pharmaceutical Co. Ltd., Class A | 25,900 | 60,906 | ||||||
Hainan Haiyao Co. Ltd., Class A | 35,600 | 57,180 | ||||||
Haisco Pharmaceutical Group Co. Ltd., Class A | 13,600 | 33,241 | ||||||
Harbin Gloria Pharmaceuticals Co. Ltd., Class A* | 11,650 | 49,310 | ||||||
Harbin Pharmaceutical Group Co. Ltd., Class A | 61,120 | 76,365 | ||||||
HeiLongJiang ZBD Pharmaceutical Co. Ltd., Class A* | 3,100 | 22,755 | ||||||
Hengkang Medical Group Co. Ltd., Class A* | 55,762 | 114,588 | ||||||
Hubei Jumpcan Pharmaceutical Co. Ltd., Class A | 9,700 | 34,680 | ||||||
Humanwell Healthcare Group Co. Ltd., Class A | 36,700 | 92,488 | ||||||
Hunan Er-Kang Pharmaceutical Co. Ltd., Class A | 25,800 | 57,969 | ||||||
Hybio Pharmaceutical Co. Ltd., Class A* | 18,700 | 53,287 | ||||||
Jiangsu Kanion Pharmaceutical Co. Ltd., Class A | 15,040 | 40,049 | ||||||
Jiangsu Yuyue Medical Equipment & Supply Co. Ltd., Class A | 11,790 | 57,455 | ||||||
Jiangzhong Pharmaceutical Co. Ltd., Class A | 6,906 | 31,840 | ||||||
Jilin Zixin Pharmaceutical Industrial Co. Ltd., Class A* | 10,000 | 21,087 | ||||||
Jinling Pharmaceutical Co. Ltd., Class A | 11,500 | 22,923 | ||||||
Jinyu Bio-Technology Co. Ltd., Class A* | 23,434 | 98,297 | ||||||
Joincare Pharmaceutical Group Industry Co. Ltd., Class A | 33,000 | 45,890 | ||||||
KPC Pharmaceuticals, Inc., Class A | 22,598 | 44,977 | ||||||
Livzon Pharmaceutical Group, Inc., Class A | 4,940 | 32,271 | ||||||
Mayinglong Pharmaceutical Group Co. Ltd., Class A | 12,500 | 37,062 | ||||||
North China Pharmaceutical Co. Ltd., Class A* | 34,200 | 33,333 | ||||||
Renhe Pharmacy Co. Ltd., Class A* | 35,525 | 40,503 | ||||||
Shanghai Dingli Technology Development Group Co. Ltd., Class A | 28,600 | 35,749 | ||||||
Shanghai Kaibao Pharmaceutical Co. Ltd., Class A | 21,080 | 31,138 | ||||||
Shanghai Kehua Bio-Engineering Co. Ltd., Class A | 17,000 | 49,242 | ||||||
Shenzhen Neptunus Bioengineering Co. Ltd., Class A* | 61,750 | 69,840 | ||||||
Shijiazhuang Yiling Pharmaceutical Co. Ltd., Class A* | 18,800 | 44,239 | ||||||
| See Notes to Financial Statements. | 26 |
DBX ETF Trust
Schedule of investments
Deutsche X-trackers Harvest CSI 500 China A-Shares Small Cap ETF (Continued)
May 31, 2016
Number | Value | |||||||
| Health Care (Continued) | ||||||||
Shinva Medical Instrument Co. Ltd., Class A | 11,869 | $ | 43,065 | |||||
Tianjin Chase Sun Pharmaceutical Co. Ltd., Class A | 16,900 | 36,407 | ||||||
Tianjin ZhongXin Pharmaceutical Group Corp. Ltd., Class A | 8,662 | 22,040 | ||||||
Winning Health Technology Group Co. Ltd., Class A | 23,910 | 81,672 | ||||||
Xiangxue Pharmaceutical Co. Ltd., Class A* | 19,210 | 41,295 | ||||||
Yabao Pharmaceutical Group Co. Ltd., Class A* | 22,980 | 35,585 | ||||||
Zhangzhou Pientzehuang Pharmaceutical Co. Ltd., Class A | 12,450 | 71,804 | ||||||
Zhejiang Conba Pharmaceutical Co. Ltd., Class A | 27,760 | 40,416 | ||||||
Zhejiang Dian Diagnostics Co. Ltd., Class A | 13,640 | 65,208 | ||||||
Zhejiang Hisun Pharmaceutical Co. Ltd., Class A | 23,700 | 41,485 | ||||||
Zhejiang Huahai Pharmaceutical Co. Ltd., Class A* | 19,833 | 95,206 | ||||||
Zhejiang Medicine Co. Ltd., Class A | 27,030 | 55,151 | ||||||
Zhejiang NHU Co. Ltd., Class A | 22,800 | 69,539 | ||||||
Zhejiang Xianju Pharmaceutical Co. Ltd., Class A | 14,500 | 22,982 | ||||||
Zhongyuan Union Cell & Gene Engineering Corp. Ltd., Class A* | 13,100 | 75,831 | ||||||
Zhuhai Hokai Medical Instruments Co. Ltd., Class A* | 19,540 | 47,671 | ||||||
|
| |||||||
| 2,707,884 | ||||||||
|
| |||||||
| Industrials — 22.0% | ||||||||
Anhui Heli Co. Ltd., Class A | 16,380 | 24,121 | ||||||
Anhui Wanjiang Logistics Group Co. Ltd., Class A* | 45,500 | 31,291 | ||||||
Apex Technology Co. Ltd., Class A | 7,200 | 52,992 | ||||||
AVIC Electromechanical Systems Co. Ltd., Class A | 17,690 | 48,717 | ||||||
Avic Heavy Machinery Co. Ltd., Class A | 19,300 | 41,870 | ||||||
Baotou Beifang Chuangye Co. Ltd., Class A | 27,000 | 42,260 | ||||||
Beibuwan Port Co. Ltd., Class A* | 3,600 | 9,107 | ||||||
Beijing New Building Materials PLC, Class A | 22,300 | 30,198 | ||||||
Beijing Shouhang Resources Saving Co. Ltd., Class A | 41,255 | 50,293 | ||||||
Beijing Sifang Automation Co. Ltd., Class A* | 16,000 | 23,294 | ||||||
Beijing SPC Environmental Protection Tech Co. Ltd., Class A* | 40,300 | 112,696 | ||||||
Black Peony Group Co. Ltd., Class A | 12,100 | 14,714 | ||||||
Camel Group Co. Ltd., Class A | 17,900 | 47,474 | ||||||
CCS Supply Chain Management Co. Ltd., Class A* | 12,673 | 27,474 | ||||||
Changjiang & Jinggong Steel Building Group Co. Ltd., Class A* | 44,300 | 28,717 | ||||||
Number | Value | |||||||
| Industrials (Continued) | ||||||||
Changyuan Group Ltd., Class A | 35,500 | $ | 87,901 | |||||
Chengdu Huaze Cobalt & Nickel Material Co. Ltd., Class A* | 11,200 | 22,692 | ||||||
China Aerospace Times Electronics Co. Ltd., Class A | 33,600 | 69,985 | ||||||
China CAMC Engineering Co. Ltd., Class A | 12,900 | 44,691 | ||||||
China Meheco Co. Ltd., Class A | 21,300 | 49,669 | ||||||
China Railway Erju Co. Ltd., Class A | 30,100 | 51,728 | ||||||
China Railway Tielong Container Logistics Co. Ltd., Class A* | 38,300 | 36,806 | ||||||
China Shipping Development Co. Ltd., Class A | 57,100 | 54,092 | ||||||
Citic Offshore Helicopter Co. Ltd., Class A* | 17,901 | 36,960 | ||||||
CMST Development Co. Ltd., Class A* | 45,000 | 51,579 | ||||||
CNHTC Jinan Truck Co. Ltd., Class A | 11,320 | 15,673 | ||||||
COSCO Shipping Co. Ltd., Class A | 35,800 | 32,121 | ||||||
Dalian Huarui Heavy Industry Group Co. Ltd., Class A | 14,976 | 18,530 | ||||||
Dalian Port PDA Co. Ltd., Class A | 56,500 | 47,605 | ||||||
Dazhong Transportation Group Co. Ltd., Class A | 34,300 | 56,030 | ||||||
Dongjiang Environmental Co. Ltd., Class A | 16,700 | 45,179 | ||||||
East China Engineering Science and Technology Co. Ltd., Class A | 6,800 | 18,985 | ||||||
Fangda Carbon New Material Co. Ltd., Class A* | 42,200 | 55,993 | ||||||
Far East Smarter Energy Co. Ltd., Class A* | 26,100 | 33,601 | ||||||
Foshan Electrical and Lighting Co. Ltd., Class A | 28,340 | 44,186 | ||||||
Fujian Longking Co. Ltd., Class A | 35,100 | 66,555 | ||||||
Gem-Year Industrial Co. Ltd., Class A | 18,300 | 22,448 | ||||||
Guangdong Guangzhou Daily Media Co. Ltd., Class A | 17,980 | 23,911 | ||||||
Guangxi Liugong Machinery Co. Ltd., Class A | 30,600 | 30,753 | ||||||
Guangzhou Baiyun International Airport Co. Ltd., Class A | 19,233 | 35,739 | ||||||
Guangzhou Guangri Stock Co. Ltd., Class A* | 17,500 | 37,752 | ||||||
Guizhou Changzheng Tiancheng Holding Co. Ltd., Class A | 15,600 | 25,862 | ||||||
Guizhou Space Appliance Co. Ltd., Class A | 10,870 | 34,902 | ||||||
Hangzhou Hangyang Co. Ltd., Class A | 9,500 | 10,586 | ||||||
Harbin Boshi Automation Co. Ltd., Class A | 7,870 | 21,852 | ||||||
Henan Pinggao Electric Co. Ltd., Class A | 28,100 | 61,515 | ||||||
Henan Senyuan Electric Co. Ltd., Class A | 13,300 | 36,041 | ||||||
Hongfa Technology Co. Ltd., Class A | 10,680 | 47,117 | ||||||
Huadian Heavy Industries Co. Ltd., Class A | 9,600 | 13,452 | ||||||
Hunan Corun New Energy Co. Ltd., Class A* | 39,747 | 68,307 | ||||||
| See Notes to Financial Statements. | 27 |
DBX ETF Trust
Schedule of investments
Deutsche X-trackers Harvest CSI 500 China A-Shares Small Cap ETF (Continued)
May 31, 2016
Number | Value | |||||||
| Industrials (Continued) | ||||||||
Hunan Jiangnan Red Arrow Co. Ltd., Class A | 21,147 | $ | 36,663 | |||||
Ingenious Ene-Carbon New Materials Co. Ltd., Class A* | 54,700 | 72,443 | ||||||
Jangho Group Co. Ltd., Class A | 18,200 | 30,421 | ||||||
Jiangsu Nonghua Intelligent Agricultural Technology Co. Ltd., Class A | 47,300 | 42,008 | ||||||
Jiangsu Sunrain Solar Energy Co. Ltd., Class A* | 12,900 | 16,607 | ||||||
Jiangsu Yueda Investment Co. Ltd., Class A | 28,400 | 35,570 | ||||||
Jiangsu Zhongnan Construction Group Co. Ltd., Class A | 18,600 | 49,331 | ||||||
Jiangsu Zhongtian Technology Co. Ltd., Class A | 30,000 | 103,431 | ||||||
Jiangsu Zongyi Co. Ltd., Class A* | 32,800 | 60,750 | ||||||
Jiangxi Hongdu Aviation Industry Co. Ltd., Class A | 17,600 | 49,297 | ||||||
Keda Clean Energy Co. Ltd., Class A* | 23,200 | 51,317 | ||||||
Lanzhou LS Heavy Equipment Co. Ltd., Class A* | 8,200 | 15,486 | ||||||
MeiDu Energy Corp., Class A* | 51,271 | 37,050 | ||||||
Mesnac Co. Ltd., Class A* | 27,100 | 45,585 | ||||||
Minmetals Development Co. Ltd., Class A | 17,400 | 48,631 | ||||||
Neway Valve Suzhou Co. Ltd., Class A | 8,700 | 22,176 | ||||||
North Navigation Control Technology Co. Ltd., Class A | 15,300 | 51,379 | ||||||
Orient Group, Inc., Class A | 54,984 | 56,846 | ||||||
Palm Eco-Town Development Co. Ltd., Class A | 33,350 | 53,870 | ||||||
Pubang Landscape Architecture Co. Ltd., Class A | 33,319 | 36,229 | ||||||
Qingdao Hanhe Cable Co. Ltd., Class A | 54,900 | 36,922 | ||||||
Rizhao Port Co. Ltd., Class A | 75,750 | 48,530 | ||||||
Shandong Himile Mechanical Science & Technology Co. Ltd., Class A | 20,200 | 64,584 | ||||||
Shanghai Lansheng Corp., Class A | 8,300 | 33,682 | ||||||
Shanghai M&G Stationery, Inc., Class A | 5,000 | 14,362 | ||||||
Shanghai Mechanical and Electrical Industry Co. Ltd., Class A | 13,600 | 40,344 | ||||||
Shanghai Pudong Road & Bridge Construction Co. Ltd., Class A | 23,199 | 37,227 | ||||||
Shanghai Zhenhua Heavy Industries Co. Ltd., Class A* | 69,500 | 45,264 | ||||||
Shanghai Zhixin Electric Co. Ltd., Class A | 27,460 | 37,102 | ||||||
Shantui Construction Machinery Co. Ltd., Class A* | 41,300 | 32,102 | ||||||
Shanxi Coal International Energy Group Co. Ltd., Class A* | 39,700 | 18,563 | ||||||
Shenzhen Desay Battery Technology Co., Class A | 4,800 | 28,638 | ||||||
Shenzhen Glory Medical Co. Ltd., Class A | 9,218 | 31,431 | ||||||
Shenzhen Grandland Decoration Group Co. Ltd., Class A | 10,500 | 30,956 | ||||||
Shenzhen Hifuture Electric Co. Ltd., Class A* | 32,400 | 64,092 | ||||||
Number | Value | |||||||
| Industrials (Continued) | ||||||||
Shenzhen Hongtao Decoration Co. Ltd., Class A | 29,050 | $ | 44,984 | |||||
Shenzhen Tagen Group Co. Ltd., Class A | 17,300 | 32,987 | ||||||
Shenzhen Yan Tian Port Holding Co. Ltd., Class A | 30,700 | 29,782 | ||||||
Shuangliang Eco-Energy Systems Co. Ltd., Class A | 32,400 | 28,431 | ||||||
Sichuan Road & Bridge Co. Ltd., Class A | 75,800 | 44,419 | ||||||
Sieyuan Electric Co. Ltd., Class A | 21,680 | 34,296 | ||||||
Sinochem International Corp., Class A | 43,700 | 59,775 | ||||||
Sinoma International Engineering Co. Ltd., Class A | 42,750 | 41,471 | ||||||
Sinotrans Air Transportation Development Co. Ltd., Class A | 15,100 | 39,772 | ||||||
SUFA Technology Industry Co. Ltd. CNNC, Class A | 12,520 | 42,405 | ||||||
Sungrow Power Supply Co. Ltd., Class A | 16,500 | 54,633 | ||||||
Suzhou Anjie Technology Co. Ltd., Class A | 6,000 | 33,612 | ||||||
Suzhou Dongshan Precision Manufacturing Co. Ltd., Class A* | 13,900 | 40,094 | ||||||
Taiyuan Heavy Industry Co. Ltd., Class A* | 69,900 | 42,341 | ||||||
TangShan Port Group Co. Ltd., Class A | 66,780 | 40,046 | ||||||
Tianjin Benefo Tejing Electric Co. Ltd., Class A* | 7,600 | 15,760 | ||||||
Tianjin Capital Environmental Protection Group Co. Ltd., Class A | 16,600 | 19,405 | ||||||
Tianjin TEDA Co. Ltd., Class A | 41,100 | 29,139 | ||||||
Tianjin Tianhai Investment Co. Ltd., Class A* | 12,600 | 11,734 | ||||||
Tianma Bearing Group Co. Ltd., Class A | 22,400 | 21,594 | ||||||
Wolong Electric Group Co. Ltd., Class A | 21,665 | 34,535 | ||||||
Xiamen ITG Group Corp. Ltd., Class A | 48,448 | 57,958 | ||||||
Xi’an Shaangu Power Co. Ltd., Class A* | 27,350 | 26,491 | ||||||
Xiandai Investment Co. Ltd., Class A | 29,500 | 30,409 | ||||||
Xiangtan Electric Manufacturing Co. Ltd., Class A | 15,500 | 26,449 | ||||||
Xinjiang Urban Construction Group Co. Ltd., Class A | 20,700 | 22,458 | ||||||
Zhefu Holding Group Co. Ltd., Class A | 57,400 | 47,944 | ||||||
Zhejiang Dun’an Artificial Environment Co. Ltd., Class A* | 23,100 | 35,911 | ||||||
Zhejiang Kaishan Compressor Co. Ltd., Class A | 18,000 | 39,800 | ||||||
Zhejiang Sanhua Co. Ltd., Class A | 36,980 | 51,481 | ||||||
Zhejiang Wanma Co. Ltd., Class A | 23,062 | 67,187 | ||||||
Zhejiang Weiming Environment Protection Co. Ltd., Class A* | 1,700 | 8,377 | ||||||
Zhengzhou Coal Mining Machinery Group Co. Ltd., Class A | 40,100 | 34,944 | ||||||
Zhongli Science and Technology Group Co. Ltd., Class A | 11,800 | 30,669 | ||||||
Zhongshan Broad Ocean Motor Co. Ltd., Class A | 7,800 | 12,789 | ||||||
|
| |||||||
| 4,708,987 | ||||||||
|
| |||||||
| See Notes to Financial Statements. | 28 |
DBX ETF Trust
Schedule of investments
Deutsche X-trackers Harvest CSI 500 China A-Shares Small Cap ETF (Continued)
May 31, 2016
Number | Value | |||||||
| Information Technology — 15.8% | ||||||||
Accelink Technologies Co. Ltd., Class A | 3,100 | $ | 28,162 | |||||
Addsino Co. Ltd., Class A* | 33,900 | 78,928 | ||||||
Beijing Jetsen Technology Co. Ltd., Class A | 21,400 | 56,075 | ||||||
Beijing Jingyuntong Technology Co. Ltd., Class A | 22,900 | 22,424 | ||||||
Beijing Sevenstar Electronics Co. Ltd., Class A* | 7,200 | 32,846 | ||||||
Beijing Teamsun Technology Co. Ltd., Class A | 36,060 | 59,397 | ||||||
Beijing Zhong Ke San Huan High-Tech Co. Ltd., Class A | 35,500 | 87,362 | ||||||
Bright Oceans Inter-Telecom Corp., Class A* | 18,400 | 37,878 | ||||||
China Aviation Optical-Electrical Technology Co. Ltd., Class A | 12,510 | 75,550 | ||||||
China Greatwall Computer Shenzhen Co. Ltd., Class A* | 27,500 | 45,882 | ||||||
China National Software & Service Co. Ltd., Class A | 11,900 | 42,654 | ||||||
China Security & Fire Co. Ltd., Class A | 32,509 | 98,816 | ||||||
China TransInfo Technology Co. Ltd., Class A | 21,800 | 53,614 | ||||||
China Wafer Level CSP Co. Ltd., Class A | 3,900 | 19,728 | ||||||
Dalian Zeus Entertainment Group Co. Ltd., Class A | 2,300 | 30,706 | ||||||
Datang Telecom Technology Co. Ltd., Class A* | 21,900 | 58,914 | ||||||
Dawning Information Industry Co. Ltd., Class A | 7,600 | 42,725 | ||||||
Eastern Communications Co. Ltd., Class A | 15,392 | 18,157 | ||||||
EGing Photovoltaic Technology Co. Ltd., Class A | 23,920 | 26,436 | ||||||
Fiberhome Telecommunication Technologies Co. Ltd., Class A* | 21,300 | 77,704 | ||||||
Focus Technology Co. Ltd., Class A | 1,600 | 15,303 | ||||||
Founder Technology Group Corp., Class A | 92,300 | 60,253 | ||||||
Fujian Newland Computer Co. Ltd., Class A* | 28,940 | 80,481 | ||||||
Fujian Star-net Communication Co. Ltd., Class A* | 13,700 | 39,413 | ||||||
Greatwall Information Industry Co. Ltd., Class A* | 27,600 | 73,955 | ||||||
Guangdong Ellington Electronics Technology Co. Ltd., Class A | 5,500 | 24,473 | ||||||
Guangdong Fenghua Advanced Technology Holding Co. Ltd., Class A | 20,700 | 30,329 | ||||||
Guomai Technologies, Inc., Class A | 16,700 | 28,243 | ||||||
Hangzhou First PV Material Co. Ltd., Class A | 2,300 | 13,132 | ||||||
Hangzhou Silan Microelectronics Co. Ltd., Class A* | 29,380 | 32,159 | ||||||
Hengdian Group DMEGC Magnetics Co. Ltd., Class A | 17,600 | 40,186 | ||||||
Hengtong Optic-electric Co. Ltd., Class A* | 35,900 | 65,892 | ||||||
Number | Value | |||||||
| Information Technology (Continued) | ||||||||
Holitech Technology Co. Ltd., Class A | 23,700 | $ | 52,423 | |||||
Huagong Tech Co. Ltd., Class A | 26,300 | 74,584 | ||||||
Insigma Technology Co. Ltd., Class A* | 30,600 | 52,401 | ||||||
Invengo Information Technology Co. Ltd., Class A | 24,500 | 53,002 | ||||||
Jiangsu Changjiang Electronics Technology Co. Ltd., Class A* | 30,400 | 87,088 | ||||||
Jiangsu Protruly Vision Technology Group Co. Ltd., Class A* | 37,100 | 79,190 | ||||||
Julong Co. Ltd., Class A | 11,495 | 37,171 | ||||||
MLS Co. Ltd., Class A | 1,700 | 8,220 | ||||||
Ningbo Yunsheng Group Co. Ltd., Class A | 15,700 | 61,280 | ||||||
North Electro-Optic Co. Ltd., Class A | 6,400 | 22,026 | ||||||
Shanghai Aerospace Automobile Electromechanical Co., Class A | 36,300 | 58,415 | ||||||
Shanghai Belling Co. Ltd., Class A | 22,500 | 53,048 | ||||||
Shanghai East China Computer Co. Ltd., Class A | 5,000 | 27,182 | ||||||
Shengyi Technology Co. Ltd., Class A* | 30,100 | 43,822 | ||||||
Shenzhen Everwin Precision Technology Co. Ltd., Class A | 18,880 | 62,370 | ||||||
Shenzhen Infogem Technologies Co. Ltd., Class A | 11,070 | 54,165 | ||||||
Shenzhen Kaifa Technology Co. Ltd., Class A | 30,700 | 39,942 | ||||||
Shenzhen Laibao Hi-tech Co. Ltd., Class A | 20,400 | 36,731 | ||||||
Shenzhen Tat Fook Technology Co. Ltd., Class A | 11,040 | 50,096 | ||||||
Sinodata Co. Ltd., Class A* | 7,100 | 58,130 | ||||||
Taiji Computer Corp. Ltd., Class A | 8,600 | 45,187 | ||||||
Telling Telecommunication Holding Co. Ltd., Class A* | 27,500 | 54,900 | ||||||
Tianma Microelectronics Co. Ltd., Class A | 23,200 | 74,492 | ||||||
Tongfang Guoxin Electronics Co. Ltd., Class A | 10,000 | 62,305 | ||||||
United Electronics Co. Ltd., Class A | 7,100 | 40,970 | ||||||
Venustech Group, Inc., Class A* | 25,400 | 92,474 | ||||||
Vtron Technologies Ltd., Class A | 23,900 | 55,877 | ||||||
Wuhan Fingu Electronic Technology Co. Ltd., Class A | 8,500 | 14,208 | ||||||
Wuhan Guide Infrared Co. Ltd., Class A | 10,100 | 34,086 | ||||||
Wuhu Token Science Co. Ltd., Class A | 34,400 | 73,845 | ||||||
WUS Printed Circuit Kunshan Co. Ltd., Class A* | 49,340 | 45,168 | ||||||
Xiamen Faratronic Co. Ltd., Class A | 5,800 | 40,038 | ||||||
Xi’an LONGi Silicon Materials Co. Ltd., Class A | 43,300 | 79,146 | ||||||
YGSOFT, Inc., Class A | 19,907 | 40,769 | ||||||
Youzu Interactive Co. Ltd., Class A | 13,700 | 65,016 | ||||||
Zhejiang Crystal-Optech Co. Ltd., Class A | 18,750 | 68,146 | ||||||
|
| |||||||
| 3,395,690 | ||||||||
|
| |||||||
| Materials — 15.5% | ||||||||
Advanced Technology & Materials Co. Ltd., Class A* | 24,804 | 56,898 | ||||||
Baoji Titanium Industry Co. Ltd., Class A | 8,200 | 20,590 | ||||||
| See Notes to Financial Statements. | 29 |
DBX ETF Trust
Schedule of investments
Deutsche X-trackers Harvest CSI 500 China A-Shares Small Cap ETF (Continued)
May 31, 2016
Number | Value | |||||||
| Materials (Continued) | ||||||||
Befar Group Co. Ltd., Class A | 31,800 | $ | 23,607 | |||||
Beijing Lier High-temperature Materials Co. Ltd., Class A | 23,000 | 17,424 | ||||||
Beijing Oriental Yuhong Waterproof Technology Co. Ltd., Class A | 23,808 | 57,469 | ||||||
Beijing Sanju Environmental Protection and New Material Co. Ltd., Class A | 23,884 | 97,900 | ||||||
China Jushi Co. Ltd., Class A | 40,440 | 57,035 | ||||||
China Nonferrous Metal Industry’s Foreign Engineering and Construction Co. Ltd., Class A | 24,800 | 60,918 | ||||||
Chongqing Iron & Steel Co. Ltd., Class A* | 82,300 | 31,611 | ||||||
Cofco Biochemical Co. Ltd., Class A | 39,385 | 64,695 | ||||||
CSG Holding Co. Ltd., Class A | 43,200 | 72,470 | ||||||
ENN Energy Chemicals Co. Ltd., Class A | 12,600 | 25,039 | ||||||
FSPG Hi-Tech Co. Ltd., Class A* | 31,950 | 40,792 | ||||||
Gansu Qilianshan Cement Group Co. Ltd., Class A | 23,800 | 23,811 | ||||||
GEM Co. Ltd., Class A* | 41,151 | 88,212 | ||||||
Guangdong Guanhao High-Tech Co. Ltd., Class A | 31,645 | 44,006 | ||||||
Guangdong Hec Technology Holding Co. Ltd., Class A | 70,605 | 69,779 | ||||||
Guangdong Tapai Group Co. Ltd., Class A | 13,800 | 17,179 | ||||||
Henan Shenhuo Coal & Power Co. Ltd., Class A* | 47,600 | 29,267 | ||||||
Hengyi Petrochemical Co. Ltd., Class A* | 16,600 | 24,672 | ||||||
Huapont Life Sciences Co. Ltd., Class A* | 51,550 | 72,391 | ||||||
Huaxin Cement Co. Ltd., Class A | 8,280 | 8,209 | ||||||
Hubei Kaile Science & Technology Co. Ltd., Class A* | 18,500 | 38,056 | ||||||
Hubei Xingfa Chemicals Group Co. Ltd., Class A | 12,100 | 19,306 | ||||||
Hunan Gold Corp. Ltd., Class A* | 28,500 | 51,055 | ||||||
Inner Mongolia Xingye Mining Co. Ltd., Class A | 25,300 | 23,775 | ||||||
Jiangsu Wuzhong Industrial Co., Class A | 22,800 | 59,060 | ||||||
Jiangsu Yabang Dyestuff Co. Ltd., Class A* | 14,700 | 39,188 | ||||||
Jiaozuo Wanfang Aluminum Manufacturing Co. Ltd., Class A* | 35,000 | 33,442 | ||||||
Jilin Yatai Group Co. Ltd., Class A* | 76,653 | 57,138 | ||||||
Juli Sling Co. Ltd., Class A | 31,800 | 27,614 | ||||||
Kailuan Energy Chemical Co. Ltd., Class A | 25,200 | 19,971 | ||||||
Kingfa Sci & Tech Co. Ltd., Class A | 63,800 | 60,342 | ||||||
Lianhe Chemical Technology Co. Ltd., Class A | 24,359 | 50,515 | ||||||
Luxi Chemical Group Co. Ltd., Class A | 39,600 | 27,775 | ||||||
Maanshan Iron & Steel Co. Ltd., Class A* | 123,400 | 46,085 | ||||||
Nanjing Iron & Steel Co. Ltd., Class A* | 80,800 | 29,440 | ||||||
Nanjing Redsun Co. Ltd., Class A* | 9,700 | 18,731 | ||||||
ORG Packaging Co. Ltd., Class A | 57,850 | 76,232 | ||||||
Rising Nonferrous Metals Share Co. Ltd., Class A* | 5,400 | 55,008 | ||||||
Number | Value | |||||||
| Materials (Continued) | ||||||||
Rongsheng Petro Chemical Co. Ltd., Class A | 9,500 | $ | 17,610 | |||||
Shaanxi Ligeance Mineral Resources Co. Ltd., Class A | 18,800 | 61,934 | ||||||
Shandong Chenming Paper Holdings Ltd., Class A | 36,400 | 45,590 | ||||||
Shandong Hualu Hengsheng Chemical Co. Ltd., Class A | 27,900 | 49,049 | ||||||
Shandong Humon Smelting Co. Ltd., Class A* | 22,800 | 38,352 | ||||||
Shandong Iron and Steel Co. Ltd., Class A* | 70,300 | 26,041 | ||||||
Shandong Jinjing Science & Technology Co. Ltd., Class A* | 42,800 | 28,004 | ||||||
Shandong Nanshan Aluminum Co. Ltd., Class A | 84,100 | 88,224 | ||||||
Shandong Sun Paper Industry JSC Ltd., Class A | 40,100 | 29,647 | ||||||
Shanghai Chlor-Alkali Chemical Co. Ltd., Class A* | 8,600 | 17,926 | ||||||
Shantou Dongfeng Printing Co. Ltd., Class A | 12,600 | 20,563 | ||||||
Shengda Mining Co. Ltd., Class A* | 12,200 | 28,245 | ||||||
Shenghe Resources Holding Co. Ltd., Class A | 19,600 | 57,399 | ||||||
Shenzhen Jinjia Color Printing Group Co. Ltd., Class A* | 37,200 | 56,761 | ||||||
Sichuan Hebang Biotechnology Co. Ltd., Class A* | 41,600 | 28,925 | ||||||
Stanley Fertilizer Co. Ltd., Class A | 19,800 | 37,003 | ||||||
Tangshan Jidong Cement Co. Ltd., Class A | 24,300 | 38,212 | ||||||
Tangshan Sanyou Chemical Industries Co. Ltd., Class A | 38,700 | 38,071 | ||||||
Tianqi Lithium Industries, Inc., Class A | 24,320 | 164,299 | ||||||
Tibet Mineral Development Co. Ltd., Class A* | 17,500 | 67,747 | ||||||
TongKun Group Co. Ltd., Class A | 16,300 | 28,878 | ||||||
Western Mining Co. Ltd., Class A | 84,100 | 85,782 | ||||||
Xinjiang Qingsong Building Materials and Chemicals Group Co. Ltd., Class A | 34,600 | 23,060 | ||||||
Xinjiang Tianshan Cement Co. Ltd., Class A | 23,300 | 21,825 | ||||||
Xinjiang Zhongtai Chemical Co. Ltd., Class A | 44,100 | 55,502 | ||||||
Yintai Resources Co. Ltd., Class A | 26,100 | 56,068 | ||||||
Yunnan Chihong Zinc & Germanium Co. Ltd., Class A | 35,300 | 50,053 | ||||||
Yunnan Lincang Xinyuan Germanium Industrial Co. Ltd., Class A | 18,500 | 41,398 | ||||||
Zhejiang Hailiang Co. Ltd., Class A | 19,100 | 20,153 | ||||||
Zhejiang Huafeng Spandex Co. Ltd., Class A | 48,200 | 32,929 | ||||||
Zhejiang Juhua Co. Ltd., Class A | 37,000 | 56,452 | ||||||
Zhejiang Runtu Co. Ltd., Class A | 19,200 | 44,101 | ||||||
Zhejiang Satellite Petrochemical Co. Ltd., Class A* | 9,400 | 12,458 | ||||||
| See Notes to Financial Statements. | 30 |
DBX ETF Trust
Schedule of investments
Deutsche X-trackers Harvest CSI 500 China A-Shares Small Cap ETF (Continued)
May 31, 2016
Number | Value | |||||||
| Materials (Continued) | ||||||||
Zhejiang Xinan Chemical Industrial Group Co. Ltd., Class A | 21,100 | $ | 23,576 | |||||
Zhongfu Straits Pingtan Development Co. Ltd., Class A* | 24,300 | 47,847 | ||||||
Zhuzhou Times New Material Technology Co. Ltd., Class A | 16,900 | 32,943 | ||||||
Zibo Qixiang Tengda Chemical Co. Ltd., Class A | 12,325 | 22,753 | ||||||
|
| |||||||
| 3,332,087 | ||||||||
|
| |||||||
| Utilities — 2.9% | ||||||||
An Hui Wenergy Co. Ltd., Class A | 45,130 | 46,589 | ||||||
Beijing Water Business Doctor Co. Ltd., Class A* | 25,400 | 68,677 | ||||||
Chongqing Gas Group Corp. Ltd., Class A | 6,700 | 9,948 | ||||||
CPI Yuanda Environmental-Protection Group Co. Ltd., Class A | 15,682 | 30,616 | ||||||
Guangdong Baolihua New Energy Stock Co. Ltd., Class A* | 54,300 | 56,963 | ||||||
Guangxi Guiguan Electric Power Co. Ltd., Class A | 28,900 | 30,931 | ||||||
Harbin Hatou Investment Co. Ltd., Class A | 13,700 | 24,314 | ||||||
Heilongjiang Interchina Water Treatment Co. Ltd., Class A* | 59,700 | 42,235 | ||||||
Number | Value | |||||||
| Utilities (Continued) | ||||||||
Jointo Energy Investment Co. Ltd. Hebei, Class A | 29,900 | $ | 41,307 | |||||
Kaidi Ecological and Environmental Technology Co. Ltd., Class A | 31,300 | 37,111 | ||||||
Shaan Xi Provincial Natural Gas Co. Ltd., Class A | 12,500 | 19,470 | ||||||
Shanghai Dazhong Public Utilities Group Co. Ltd., Class A | 80,850 | 75,854 | ||||||
Shenzhen Gas Corp. Ltd., Class A | 16,700 | 19,902 | ||||||
Top Energy Co. Ltd., Class A | 17,500 | 13,656 | ||||||
Xinjiang Tianfu Energy Co. Ltd., Class A | 20,759 | 22,597 | ||||||
Zhejiang Fuchunjiang Environmental Thermoelectric Co. Ltd., Class A | 20,000 | 32,549 | ||||||
Zhongshan Public Utilities Group Co. Ltd., Class A | 24,660 | 40,021 | ||||||
|
| |||||||
| 612,740 | ||||||||
|
| |||||||
TOTAL COMMON STOCKS | 21,366,427 | |||||||
|
| |||||||
TOTAL INVESTMENTS — 99.6% | $ | 21,366,427 | ||||||
Other assets and liabilities, net — 0.4% | 85,209 | |||||||
|
| |||||||
NET ASSETS — 100.0% | $ | 21,451,636 | ||||||
|
| |||||||
| * | Non-income producing security. |
| † | The cost for federal income tax purposes was $23,765,137. At May 31, 2016, net unrealized depreciation for all securities based on tax cost was $2,398,710. This consisted of aggregate gross unrealized appreciation for all securities in which there was an excess of value over tax cost of $2,409,098 and aggregate gross unrealized depreciation for all securities in which there was an excess of tax cost over value of $4,807,808. |
Fair Value Measurements
Various inputs are used in determining the value of the Fund’s investments. These inputs are summarized in three broad levels. Level 1 includes quoted prices in active markets for identical securities. Level 2 includes other significant observable inputs (including quoted prices for similar securities, interest rates, prepayment speeds and credit risk). Level 3 includes significant unobservable inputs (including the Fund’s own assumptions in determining the fair value of investments). The level assigned to the securities valuations may not be an indication of the risk or liquidity associated with investing in those securities.
The following is a summary of the inputs used as of May 31, 2016 in valuing the Fund’s investments. For information on Fund’s policy regarding the valuation of investments, please refer to the security Valuation section of Note 2 in the accompanying Notes to Financial Statements.
| Level 1 | Level 2 | Level 3 | Total | |||||||||||||
| Assets | ||||||||||||||||
Common Stocks (a) | $ | 19,477,158 | $ | — | $ | 1,889,269 | $ | 21,366,427 | ||||||||
|
|
|
|
|
|
|
| |||||||||
Total | $ | 19,477,158 | $ | — | $ | 1,889,269 | $ | 21,366,427 | ||||||||
|
|
|
|
|
|
|
| |||||||||
| (a) | See Schedule of Investments for additional detailed categorizations. |
| See Notes to Financial Statements. | 31 |
DBX ETF Trust
Schedule of investments
Deutsche X-trackers Harvest CSI 500 China A-Shares Small Cap ETF (Continued)
May 31, 2016
The following is a reconcilation of the Fund’s Level 3 investments for which significant unobservable inputs were used in determining value:
Balance at May 31, 2015 | $ | 8,929,221 | ||
Purchases | 5,148,019 | |||
Sales | (6,342,462 | ) | ||
Realized gain (loss) | (700,959 | ) | ||
Change in unrealized gain (loss) | (2,025,210 | ) | ||
Transfers into Level 3 (b) | 3,496,823 | |||
Transfer out of Level 3 (b) | (6,616,163 | ) | ||
Balance at May 31, 2016 | 1,889,269 | |||
Change in unrealized gain (loss) related to investments still held at May 31, 2016 | (1,641,367 | ) |
| (b) | During the year ended May 31, 2016, the amount of transfers between Level 1 and Level 3 was $3,496,823 and between Level 3 and Level 1 was $6,616,163. Investments were transferred from Level 1 to Level 3 as a result of a halt in trading on a securities exchange. Investments were transferred from Level 3 to Level 1 as a result of the resumption of trading on a securities exchange. |
Transfers between price levels are recognized at the beginning of the reporting period.
Qualitative Disclosure About Unobservable Inputs
Significant unobservable inputs developed by the Pricing Committee and used in the fair value measurement of the Fund’s equity investments include the last traded price on the Exchange for securities suspended from trading adjusted for proxy (the movement in the applicable sector index) with a range of -22% to 12% with a weighted average range of approximately -1%. A significant change between last traded price, adjusted for proxy, and the price of a security once it resumes trading on the securities exchange could result in a material change in the fair value measurement.
Asset Class | Fair Value at 5/31/2016 | Valuation Technique | Unobservable Input | |||||
Common Stock: Energy | $ | 27,450 | Market Approach | Last traded price adjusted for proxy. | ||||
Common Stock: Materials | 329,324 | Market Approach | Last traded price adjusted for proxy. | |||||
Common Stock: Industrials | 307,586 | Market Approach | Last traded price adjusted for proxy. | |||||
Common Stock: Information Technology | 465,348 | Market Approach | Last traded price adjusted for proxy. | |||||
Common Stock: Financials | 135,023 | Market Approach | Last traded price adjusted for proxy. | |||||
Common Stock: Consumer Discretionary | 308,094 | Market Approach | Last traded price adjusted for proxy. | |||||
Common Stock: Health Care | 277,846 | Market Approach | Last traded price adjusted for proxy. | |||||
Common Stock: Consumer Staples | 38,598 | Market Approach | Last traded price adjusted for proxy. | |||||
| See Notes to Financial Statements. | 32 |
DBX ETF Trust
Schedule of investments
Deutsche X-trackers MSCI All China Equity ETF
May 31, 2016
Number | Value | |||||||
| COMMON STOCKS — 55.5% | ||||||||
| Consumer Discretionary — 4.7% | ||||||||
Alibaba Pictures Group Ltd.*(a) | 48,568 | $ | 11,442 | |||||
Anta Sports Products Ltd. | 4,162 | 9,055 | ||||||
Belle International Holdings Ltd. | 25,697 | 15,084 | ||||||
Brilliance China Automotive Holdings Ltd. (a) | 13,120 | 12,752 | ||||||
Byd Co. Ltd., Class H* | 2,963 | 17,145 | ||||||
China Travel International Investment Hong Kong Ltd. | 12,390 | 3,653 | ||||||
Ctrip.com International, Ltd., ADR*(a) | 1,360 | 62,234 | ||||||
Dongfeng Motor Group Co. Ltd., Class H | 10,749 | 11,983 | ||||||
Fuyao Glass Industry Group Co. Ltd., Class H, 144A* | 1,756 | 4,096 | ||||||
Geely Automobile Holdings Ltd. | 21,031 | 11,127 | ||||||
GOME Electrical Appliances Holding Ltd. (a) | 54,384 | 6,511 | ||||||
Great Wall Motor Co. Ltd., Class H | 12,719 | 9,791 | ||||||
Guangzhou Automobile Group Co. Ltd., Class H | 8,053 | 9,216 | ||||||
Haier Electronics Group Co. Ltd. | 5,638 | 9,116 | ||||||
Intime Retail Group Co. Ltd. | 6,757 | 6,132 | ||||||
JD.com, Inc., ADR*(a) | 2,383 | 58,646 | ||||||
Minth Group Ltd. | 2,627 | 7,727 | ||||||
New Oriental Education & Technology Group, Inc., ADR | 581 | 24,547 | ||||||
Qunar Cayman Islands Ltd., ADR* | 175 | 5,684 | ||||||
Shenzhou International Group Holdings Ltd. | 2,286 | 11,506 | ||||||
Skyworth Digital Holdings Ltd. | 7,020 | 4,238 | ||||||
TAL Education Group, ADR* | 74 | 3,953 | ||||||
Vipshop Holdings Ltd., ADR* | 1,690 | 19,722 | ||||||
|
| |||||||
| 335,360 | ||||||||
|
| |||||||
| Consumer Staples — 1.6% | ||||||||
China Agri-Industries Holdings Ltd.* | 10,267 | 3,436 | ||||||
China Huishan Dairy Holdings Co. Ltd. | 16,281 | 6,413 | ||||||
China Mengniu Dairy Co. Ltd. | 11,292 | 18,694 | ||||||
China Resources Beer Holdings Co. Ltd. | 4,830 | 10,471 | ||||||
Hengan International Group Co. Ltd. (a) | 2,949 | 26,612 | ||||||
Sun Art Retail Group Ltd. | 10,487 | 6,601 | ||||||
Tingyi Cayman Islands Holding Corp. (a) | 9,011 | 8,190 | ||||||
Tsingtao Brewery Co. Ltd., Class H | 1,905 | 6,854 | ||||||
Uni-President China Holdings Ltd. | 5,746 | 5,222 | ||||||
Want Want China Holdings Ltd. (a) | 24,129 | 17,084 | ||||||
|
| |||||||
| 109,577 | ||||||||
|
| |||||||
| Energy — 3.7% | ||||||||
China Coal Energy Co. Ltd., Class H | 10,465 | 4,702 | ||||||
China Oilfield Services Ltd., Class H | 8,111 | 6,171 | ||||||
China Petroleum & Chemical Corp., Class H | 104,678 | 71,419 | ||||||
China Shenhua Energy Co. Ltd., Class H | 14,304 | 22,722 | ||||||
CNOOC Ltd. | 70,002 | 83,626 | ||||||
Kunlun Energy Co. Ltd. | 12,840 | 10,512 | ||||||
PetroChina Co. Ltd., Class H | 87,301 | 60,013 | ||||||
Yanzhou Coal Mining Co. Ltd., Class H | 8,711 | 4,687 | ||||||
|
| |||||||
| 263,852 | ||||||||
|
| |||||||
Number | Value | |||||||
| Financials — 15.4% | ||||||||
Agile Property Holdings Ltd. | 4,514 | $ | 2,226 | |||||
Agricultural Bank of China Ltd., Class H | 92,260 | 33,730 | ||||||
Bank of China Ltd., Class H | 309,237 | 125,794 | ||||||
Bank of Communications Co. Ltd., Class H* | 24,378 | 15,095 | ||||||
China Cinda Asset Management Co. Ltd., Class H | 31,323 | 10,242 | ||||||
China CITIC Bank Corp. Ltd., Class H | 33,113 | 19,438 | ||||||
China Construction Bank Corp., Class H | 316,273 | 203,977 | ||||||
China Everbright Bank Co. Ltd., Class H* | 16,383 | 7,044 | ||||||
China Everbright Ltd. | 3,582 | 6,880 | ||||||
China Galaxy Securities Co. Ltd., Class H (a) | 12,402 | 10,936 | ||||||
China International Capital Corp. Ltd., Class H, 144A* | 2,605 | 4,038 | ||||||
China Jinmao Holdings Group Ltd. | 16,726 | 4,823 | ||||||
China Life Insurance Co. Ltd., Class H | 29,462 | 65,917 | ||||||
China Merchants Bank Co. Ltd., Class H | 15,465 | 31,734 | ||||||
China Overseas Land & Investment Ltd. | 15,824 | 47,565 | ||||||
China Pacific Insurance Group Co. Ltd., Class H* | 10,917 | 37,312 | ||||||
China Resources Land Ltd. | 11,617 | 27,786 | ||||||
China Taiping Insurance Holdings Co. Ltd.* | 6,832 | 13,227 | ||||||
China Vanke Co. Ltd., Class H | 5,564 | 13,265 | ||||||
Chongqing Rural Commercial Bank Co. Ltd., Class H | 4,090 | 2,095 | ||||||
CITIC Securities Co. Ltd., Class H (a) | 4,737 | 10,269 | ||||||
Country Garden Holdings Co. Ltd. (a) | 21,923 | 8,777 | ||||||
Dalian Wanda Commercial Properties Co. Ltd., Class H, 144A | 2,453 | 15,552 | ||||||
Evergrande Real Estate Group Ltd. | 16,171 | 10,825 | ||||||
Far East Horizon Ltd. | 6,844 | 5,189 | ||||||
Fullshare Holdings Ltd. | 20,204 | 7,543 | ||||||
GF Securities Co. Ltd., Class H* | 5,871 | 13,604 | ||||||
Guangzhou R&F Properties Co. Ltd., Class H | 3,392 | 4,506 | ||||||
Haitong Securities Co. Ltd., Class H (a) | 5,531 | 9,043 | ||||||
Huatai Securities Co. Ltd., Class H, | 5,442 | 11,419 | ||||||
Industrial & Commercial Bank of China Ltd., Class H | 297,076 | 157,560 | ||||||
KWG Property Holding Ltd. | 3,673 | 2,307 | ||||||
Longfor Properties Co. Ltd. | 6,366 | 8,605 | ||||||
New China Life Insurance Co. Ltd., Class H | 4,078 | 13,964 | ||||||
New World China Land Ltd. | 10,338 | 10,652 | ||||||
People’s Insurance Co. (Group) of China Ltd., Class H | 27,243 | 10,907 | ||||||
PICC Property & Casualty Co. Ltd., Class H | 17,739 | 32,381 | ||||||
Ping An Insurance Group Co. of China Ltd., Class H | 9,476 | 42,329 | ||||||
Shenzhen Investment Ltd. (a) | 11,228 | 4,538 | ||||||
Shimao Property Holdings Ltd. | 5,059 | 6,408 | ||||||
Shui On Land Ltd. | 12,109 | 3,055 | ||||||
Sino-Ocean Land Holdings Ltd. | 14,043 | 5,694 | ||||||
Soho China Ltd. | 8,845 | 3,883 | ||||||
| See Notes to Financial Statements. | 33 |
DBX ETF Trust
Schedule of investments
Deutsche X-trackers MSCI All China Equity ETF (Continued)
May 31, 2016
Number | Value | |||||||
| Financials (Continued) | ||||||||
Sunac China Holdings Ltd. | 7,965 | $ | 4,952 | |||||
Yuexiu Property Co. Ltd. | 27,319 | 3,482 | ||||||
|
| |||||||
| 1,090,568 | ||||||||
|
| |||||||
| Health Care — 1.1% | ||||||||
3SBio, Inc., 144A* | 3,751 | 3,655 | ||||||
China Medical System Holdings Ltd. | 3,693 | 5,287 | ||||||
China Traditional Chinese Medicine Co. Ltd.* | 6,803 | 3,091 | ||||||
CSPC Pharmaceutical Group Ltd.* | 15,102 | 13,764 | ||||||
Luye Pharma Group Ltd.* | 5,635 | 3,482 | ||||||
Shandong Weigao Group Medical Polymer Co. Ltd., Class H | 7,374 | 4,234 | ||||||
Shanghai Fosun Pharmaceutical Group Co. Ltd., Class H | 1,076 | 2,798 | ||||||
Shanghai Pharmaceuticals Holding Co. Ltd., Class H | 2,164 | 4,674 | ||||||
Sihuan Pharmaceutical Holdings Group Ltd. | 16,393 | 3,524 | ||||||
Sino Biopharmaceutical Ltd. | 16,476 | 11,178 | ||||||
Sinopharm Group Co. Ltd., Class H | 4,555 | 21,109 | ||||||
Tong Ren Tang Technologies Co. Ltd., Class H | 814 | 1,325 | ||||||
|
| |||||||
| 78,121 | ||||||||
|
| |||||||
| Industrials — 4.0% | ||||||||
Air China Ltd., Class H | 6,116 | 4,047 | ||||||
AviChina Industry & Technology Co. Ltd., Class H | 9,472 | 6,658 | ||||||
Beijing Capital International Airport Co. Ltd., Class H | 6,082 | 6,553 | ||||||
Beijing Enterprises Holdings Ltd. | 2,176 | 11,317 | ||||||
CAR, Inc.* | 4,192 | 4,020 | ||||||
China Communications Construction Co. Ltd., Class H | 17,368 | 19,675 | ||||||
China Conch Venture Holdings Ltd.* | 5,750 | 11,592 | ||||||
China COSCO Holdings Co. Ltd., Class H* | 14,696 | 5,278 | ||||||
China Eastern Airlines Corp. Ltd., Class H* | 9,593 | 5,125 | ||||||
China Everbright International Ltd. | 11,207 | 12,018 | ||||||
China International Marine Containers Group Co. Ltd., Class H | 2,737 | 3,463 | ||||||
China Merchants Holdings International Co. Ltd. | 5,024 | 14,358 | ||||||
China Railway Construction Corp. Ltd., Class H | 9,091 | 11,363 | ||||||
China Railway Group Ltd., Class H | 21,169 | 16,269 | ||||||
China Shipping Container Lines Co. Ltd., Class H* | 23,466 | 5,105 | ||||||
China Shipping Development Co. Ltd., Class H | 3,505 | 2,197 | ||||||
China Southern Airlines Co. Ltd., Class H | 7,685 | 4,511 | ||||||
China State Construction International Holdings Ltd. | 7,688 | 9,847 | ||||||
CITIC Ltd. | 17,683 | 25,677 | ||||||
COSCO Pacific Ltd. | 5,520 | 5,585 | ||||||
CRRC Corp. Ltd., Class H (a) | 22,622 | 21,521 | ||||||
Number | Value | |||||||
| Industrials (Continued) | ||||||||
Fosun International Ltd. | 10,707 | $ | 15,217 | |||||
Haitian International Holdings Ltd. | 3,052 | 4,903 | ||||||
Jiangsu Expressway Co. Ltd., Class H | 4,366 | 5,980 | ||||||
Metallurgical Corp. of China Ltd., Class H | 20,145 | 5,705 | ||||||
Shanghai Electric Group Co. Ltd., Class H*(a) | 14,739 | 6,337 | ||||||
Shanghai Industrial Holdings Ltd. | 1,131 | 2,551 | ||||||
Shenzhen International Holdings Ltd. | 3,525 | 5,355 | ||||||
Sinopec Engineering Group Co. Ltd., Class H | 4,867 | 4,273 | ||||||
Sinotrans Ltd., Class H | 9,953 | 4,292 | ||||||
Weichai Power Co. Ltd., Class H | 3,609 | 4,218 | ||||||
Xinjiang Goldwind Science & Technology Co. Ltd., Class H (a) | 1,601 | 2,486 | ||||||
Zhejiang Expressway Co. Ltd., Class H | 5,529 | 5,182 | ||||||
Zhuzhou CRRC Times Electric Co. Ltd. | 2,334 | 13,070 | ||||||
|
| |||||||
| 285,748 | ||||||||
|
| |||||||
| Information Technology — 17.2% | ||||||||
58.com, Inc., ADR* | 220 | 11,891 | ||||||
AAC Technologies Holdings, Inc. | 3,000 | 24,292 | ||||||
Alibaba Group Holding Ltd., ADR* | 3,871 | 317,422 | ||||||
Autohome, Inc., ADR* | 248 | 6,148 | ||||||
Baidu, Inc., ADR* | 1,066 | 190,324 | ||||||
Bitauto Holdings Ltd., ADR* | 162 | 3,287 | ||||||
GCL-Poly Energy Holdings Ltd. | 57,027 | 8,149 | ||||||
Hanergy Thin Film Power Group Ltd.* | 56,247 | — | ||||||
Kingboard Chemical Holdings Ltd. | 1,883 | 3,878 | ||||||
Kingsoft Corp. Ltd. | 3,547 | 6,776 | ||||||
Lenovo Group Ltd. (a) | 30,664 | 18,829 | ||||||
NetEase, Inc., ADR | 286 | 50,862 | ||||||
Qihoo 360 Technology Co. Ltd., ADR* | 299 | 22,216 | ||||||
Semiconductor Manufacturing International Corp.* | 120,575 | 10,089 | ||||||
SINA Corp.* | 265 | 14,313 | ||||||
SouFun Holdings Ltd., ADR* | 1,467 | 7,966 | ||||||
Sunny Optical Technology Group Co. Ltd. | 3,030 | 10,473 | ||||||
Tencent Holdings Ltd. | 21,995 | 490,687 | ||||||
TravelSky Technology Ltd., Class H | 4,184 | 7,928 | ||||||
Xinyi Solar Holdings Ltd. (a) | 12,203 | 4,948 | ||||||
YY, Inc., ADR* | 160 | 6,952 | ||||||
ZTE Corp., Class H | 3,010 | 3,952 | ||||||
|
| |||||||
| 1,221,382 | ||||||||
|
| |||||||
| Materials — 1.0% | ||||||||
Aluminum Corp. of China Ltd., Class H* | 22,383 | 6,771 | ||||||
Anhui Conch Cement Co. Ltd., Class H | 5,321 | 12,877 | ||||||
BBMG Corp., Class H | 14,560 | 4,611 | ||||||
China Hongqiao Group Ltd.* | 6,396 | 4,586 | ||||||
China National Building Material Co. Ltd., Class H | 10,507 | 4,775 | ||||||
China Resources Cement Holdings Ltd. | 10,044 | 3,297 | ||||||
China Zhongwang Holdings Ltd. | 7,161 | 3,365 | ||||||
Jiangxi Copper Co. Ltd., Class H | 8,023 | 8,624 | ||||||
Lee & Man Paper Manufacturing Ltd. | 5,040 | 3,335 | ||||||
Nine Dragons Paper Holdings Ltd. | 6,407 | 4,635 | ||||||
| See Notes to Financial Statements. | 34 |
DBX ETF Trust
Schedule of investments
Deutsche X-trackers MSCI All China Equity ETF (Continued)
May 31, 2016
Number | Value | |||||||
| Materials (Continued) | ||||||||
Sinopec Shanghai Petrochemical Co. Ltd., Class H* | 15,967 | $ | 7,811 | |||||
Zijin Mining Group Co. Ltd., Class H | 27,290 | 7,869 | ||||||
|
| |||||||
| 72,556 | ||||||||
|
| |||||||
| Telecommunication Services — 4.8% | ||||||||
Alibaba Health Information Technology Ltd.* | 14,458 | 10,553 | ||||||
China Communications Services Corp. Ltd., Class H | 7,608 | 3,575 | ||||||
China Mobile Ltd. | 23,954 | 273,209 | ||||||
China Telecom Corp. Ltd., Class H | 54,886 | 25,577 | ||||||
China Unicom (Hong Kong) Ltd. | 23,937 | 25,853 | ||||||
|
| |||||||
| 338,767 | ||||||||
|
| |||||||
| Utilities — 2.0% | ||||||||
Beijing Enterprises Water Group Ltd. | 18,745 | 12,041 | ||||||
CGN Power Co. Ltd., Class H, 144A | 47,220 | 14,346 | ||||||
China Gas Holdings Ltd. | 7,191 | 10,183 | ||||||
China Longyuan Power Group Corp. Ltd., Class H | 13,840 | 9,514 | ||||||
China Power International Development Ltd. | 13,538 | 5,716 | ||||||
China Resources Gas Group Ltd. | 3,702 | 10,365 | ||||||
China Resources Power Holdings Co. Ltd. | 7,997 | 12,559 | ||||||
Datang International Power Generation Co. Ltd., Class H | 9,604 | 2,572 | ||||||
ENN Energy Holdings Ltd. | 3,108 | 15,424 | ||||||
Guangdong Investment Ltd. | 11,765 | 16,599 | ||||||
Huadian Fuxin Energy Corp. Ltd., Class H | 12,201 | 2,686 | ||||||
Number | Value | |||||||
| Utilities (Continued) | ||||||||
Huadian Power International Corp. Ltd., Class H* | 10,997 | $ | 5,833 | |||||
Huaneng Power International, Inc., Class H | 16,502 | 11,280 | ||||||
Huaneng Renewables Corp. Ltd., Class H | 17,822 | 5,414 | ||||||
Towngas China Co. Ltd.* | 5,804 | 3,168 | ||||||
|
| |||||||
| 137,700 | ||||||||
|
| |||||||
TOTAL COMMON STOCKS | 3,933,631 | |||||||
|
| |||||||
| EXCHANGE-TRADED FUNDS — 44.1% | ||||||||
Deutsche X-trackers Harvest CSI 300 China A-Shares ETF (a)(b) | 107,700 | 2,608,494 | ||||||
Deutsche X-trackers Harvest CSI 500 China A-Shares Small Cap ETF (a)(b) | 15,587 | 519,514 | ||||||
|
| |||||||
TOTAL EXCHANGE-TRADED FUNDS | 3,128,008 | |||||||
|
| |||||||
| SECURITIES LENDING COLLATERAL — 45.9% | ||||||||
Daily Assets Fund “Capital Shares”, 0.48% (c)(d) | 3,257,313 | 3,257,313 | ||||||
|
| |||||||
TOTAL INVESTMENTS — 145.5% | $ | 10,318,952 | ||||||
Other assets and liabilities, net — (45.5%) | (3,229,360 | ) | ||||||
|
| |||||||
NET ASSETS — 100.0% | $ | 7,089,592 | ||||||
|
| |||||||
| * | Non-income producing security. |
| † | The cost for federal income tax purposes was $13,157,902. At May 31, 2016, net unrealized depreciation for all securities based on tax cost was $2,838,950. This consisted of aggregate gross unrealized appreciation for all securities in which there was an excess of value over tax cost of $111,211 and aggregate gross unrealized depreciation for all securities in which there was an excess of tax cost over value of $2,950,161. |
| (a) | All or a portion of these securities were on loan. In addition, “Other Assets and Liabilities, Net” may include pending sales that are also on loan. The value of securities loaned at May 31, 2016 amounted to $3,284,970, which is 46.3% of net assets. |
| (b) | Affiliated fund advised by DBX Advisors LLC. |
| (c) | Affiliated fund managed by Deutsche Investment Management Americas Inc. The rate shown is the annualized seven-day yield at period end. |
| (d) | Represents collateral held in connection with securities lending. Income earned by the Fund is net of borrower rebates. |
| ADR: | American Depositary Receipt |
| 144A: | Security exempt from registration under Rule 144A of the Securities Act of 1933. These securities may be resold in transactions exempt from registration, normally to qualified institutional buyers. |
| See Notes to Financial Statements. | 35 |
DBX ETF Trust
Schedule of investments
Deutsche X-trackers MSCI All China Equity ETF (Continued)
May 31, 2016
Fair Value Measurements
Various inputs are used in determining the value of the Fund’s investments. These inputs are summarized in three broad levels. Level 1 includes quoted prices in active markets for identical securities. Level 2 includes other significant observable inputs (including quoted prices for similar securities, interest rates, prepayment speeds and credit risk). Level 3 includes significant unobservable inputs (including the Fund’s own assumptions in determining the fair value of investments). The level assigned to the securities valuations may not be an indication of the risk or liquidity associated with investing in those securities.
The following is a summary of the inputs used as of May 31, 2016 in valuing the Fund’s investments. For information on Fund’s policy regarding the valuation of investments, please refer to the Security Valuation section of Note 2 in the accompanying Notes to Financial Statements.
| Level 1 | Level 2 | Level 3 | Total | |||||||||||||
| Assets | ||||||||||||||||
Common Stocks (e) | $ | 3,922,979 | $ | — | $ | 10,652 | $ | 3,933,631 | ||||||||
Exchange-Traded Funds | 3,128,008 | — | – | 3,128,008 | ||||||||||||
Short-Term Investments | 3,257,313 | — | – | 3,257,313 | ||||||||||||
|
|
|
|
|
|
|
| |||||||||
Total | $ | 10,308,300 | $ | — | $ | 10,652 | $ | 10,318,952 | ||||||||
|
|
|
|
|
|
|
| |||||||||
| (e) | See Schedule of investments for additional detailed categorizations. |
During the year ended May 31, 2016, the amount of transfers between Level 1 and Level 3 was $9,204 and between Level 3 and Level 1 was $67,129. Investments were transferred from Level 1 to Level 3 as a result of a halt in trading on a securities exchange. Investments were
transferred from Level 3 to Level 1 as a result of the resumption of trading on a securities exchange.
Transfers between price levels are recognized at the beginning of the reporting period.
| See Notes to Financial Statements. | 36 |
This Page is Intentionally Left Blank
37
DBX ETF Trust
Statements of assets and liabilities
May 31, 2016
| Deutsche X-trackers CSI 300 China A-Shares Hedged Equity ETF | Deutsche X-trackers Harvest CSI 300 China A-Shares ETF | Deutsche X-trackers Harvest CSI 500 China A-Shares Small Cap ETF | Deutsche X-trackers MSCI All China Equity ETF | |||||||||||||
Assets | ||||||||||||||||
Investments in non-affiliated securities at value | $ | — | $ | 323,979,843 | $ | 21,366,427 | $ | 3,933,631 | ||||||||
Investment in affiliated securities at value | 2,183,045 | — | — | 3,128,008 | ||||||||||||
Investment in Daily Assets Fund* | 940,622 | — | — | 3,257,313 | ||||||||||||
Cash | 3,019 | 34,460,389 | — | — | ||||||||||||
Foreign currency at value | — | 1,430,316 | † | 106,453 | † | 1,772 | ||||||||||
Unrealized appreciation on forward foreign currency exchange contracts | 31,635 | — | — | — | ||||||||||||
| Receivables: | ||||||||||||||||
Investment securities sold | — | — | — | 218,513 | ||||||||||||
Capital shares | — | 14,014 | — | — | ||||||||||||
Dividends | — | 53 | 107 | 8,575 | ||||||||||||
Securities lending income | 1,679 | — | — | 16,312 | ||||||||||||
|
|
|
|
|
|
|
| |||||||||
Total Assets | $ | 3,160,000 | $ | 359,884,615 | $ | 21,472,987 | $ | 10,564,124 | ||||||||
|
|
|
|
|
|
|
| |||||||||
Liabilities | ||||||||||||||||
Due to custodian | $ | — | $ | — | $ | 5,748 | $ | 1,391 | ||||||||
Payable upon return of securities loaned | 940,622 | — | — | 3,257,313 | ||||||||||||
Unrealized depreciation on forward foreign currency exchange contracts | 607 | — | — | — | ||||||||||||
| Payables: | ||||||||||||||||
Investment securities purchased | 32,710 | — | — | 213,916 | ||||||||||||
Capital shares | — | 3,462,004 | — | — | ||||||||||||
Investment advisory fees | 103 | 244,509 | 15,603 | 1,912 | ||||||||||||
Due to authorized participant | — | 29,710,277 | — | — | ||||||||||||
|
|
|
|
|
|
|
| |||||||||
Total Liabilities | 974,042 | 33,416,790 | 21,351 | 3,474,532 | ||||||||||||
|
|
|
|
|
|
|
| |||||||||
Net Assets, at value | $ | 2,185,958 | $ | 326,467,825 | $ | 21,451,636 | $ | 7,089,592 | ||||||||
|
|
|
|
|
|
|
| |||||||||
Net Assets Consist of | ||||||||||||||||
Paid-in capital | $ | 2,222,884 | $ | 348,523,252 | $ | 33,341,025 | $ | 10,800,024 | ||||||||
Distributions in excess of net investment income | — | (2,333,186 | ) | (178,422 | ) | — | ||||||||||
Undistributed net investment income | 265,176 | — | — | 324,953 | ||||||||||||
Accumulated net realized gain (loss) on investments and foreign currency transactions | (13,248 | ) | (67,742,955 | ) | (11,983,020 | ) | (1,411,434 | ) | ||||||||
Net unrealized appreciation (depreciation) on investments and foreign currency translations | (288,854 | ) | 48,020,714 | 272,053 | (2,623,951 | ) | ||||||||||
|
|
|
|
|
|
|
| |||||||||
Net Assets, at value | $ | 2,185,958 | $ | 326,467,825 | $ | 21,451,636 | $ | 7,089,592 | ||||||||
|
|
|
|
|
|
|
| |||||||||
Number of Common Shares outstanding | 100,001 | 13,750,001 | 650,001 | 250,001 | ||||||||||||
|
|
|
|
|
|
|
| |||||||||
Net Asset Value | $ | 21.86 | $ | 23.74 | $ | 33.00 | $ | 28.36 | ||||||||
|
|
|
|
|
|
|
| |||||||||
Investments in non-affiliated securities at cost | $ | — | $ | 275,865,625 | $ | 21,091,915 | $ | 4,729,789 | ||||||||
|
|
|
|
|
|
|
| |||||||||
Investments in affiliated securities at cost | $ | 2,502,927 | $ | — | $ | — | $ | 4,955,786 | ||||||||
|
|
|
|
|
|
|
| |||||||||
Value of securities loaned | $ | 963,254 | $ | — | $ | — | $ | 3,284,970 | ||||||||
|
|
|
|
|
|
|
| |||||||||
Investment in Daily Assets Fund at cost* | $ | 940,622 | $ | — | $ | — | $ | 3,257,313 | ||||||||
|
|
|
|
|
|
|
| |||||||||
Foreign currency at cost | $ | — | $ | 1,429,993 | $ | 106,819 | $ | 1,772 | ||||||||
|
|
|
|
|
|
|
| |||||||||
| * | Represents collateral on securities loaned. |
| † | Included in foreign currency at value is $17,538 and $6,277 respectively which represents foreign investor minimum settlement reserve funds required by China Securities Depository and Clearing Corporation Limited. |
| See Notes to Financial Statements. | 38 |
DBX ETF Trust
For the Year Ended May 31, 2016
| Deutsche X-trackers CSI 300 China A-Shares Hedged Equity ETF(1) | Deutsche X-trackers Harvest CSI 300 China A-Shares ETF | Deutsche X-trackers Harvest CSI 500 China A-Shares Small Cap ETF | Deutsche X-trackers MSCI All China Equity ETF | |||||||||||||
Investment Income | ||||||||||||||||
Unaffiliated interest income | $ | — | $ | 70,794 | $ | 6,752 | $ | — | ||||||||
Unaffiliated dividend income* | — | 10,980,932 | 255,863 | 139,521 | ||||||||||||
Income distributions from affiliated funds | 11,555 | — | — | 52,101 | ||||||||||||
Securities lending income, including income from Daily Assets Fund, net of borrower rebates | 33,410 | — | — | 624,985 | ||||||||||||
|
|
|
|
|
|
|
| |||||||||
Total Investment Income | 44,965 | 11,051,726 | 262,615 | 816,607 | ||||||||||||
|
|
|
|
|
|
|
| |||||||||
Expenses | ||||||||||||||||
Investment advisory fees | 10,541 | 4,269,544 | 302,360 | 72,889 | ||||||||||||
Excise Tax Expense | 8,136 | — | — | — | ||||||||||||
Interest Expense | — | 4,247 | 319 | — | ||||||||||||
|
|
|
|
|
|
|
| |||||||||
Total Expenses | 18,677 | 4,273,791 | 302,679 | 72,889 | ||||||||||||
Less fees waived (See Note 3): | ||||||||||||||||
Waiver | (9,873 | ) | — | — | (41,071 | ) | ||||||||||
|
|
|
|
|
|
|
| |||||||||
Net Expenses | 8,804 | 4,273,791 | 302,679 | 31,818 | ||||||||||||
|
|
|
|
|
|
|
| |||||||||
Net Investment income (loss) | 36,161 | 6,777,935 | (40,064 | ) | 784,789 | |||||||||||
|
|
|
|
|
|
|
| |||||||||
Realized and Unrealized Gain (Loss) | ||||||||||||||||
| Net realized gain (loss) from: | ||||||||||||||||
Investments | — | 224,608,676 | (11,089,536 | ) | (550,723 | ) | ||||||||||
Investments in affiliates | (32,081 | ) | — | — | (1,455,148 | ) | ||||||||||
In-kind redemptions | — | — | — | (91,994 | ) | |||||||||||
In-kind redemptions in affiliates | 22,896 | — | — | (165,261 | ) | |||||||||||
Foreign currency transactions | 2,221 | (5,304,343 | ) | (239,736 | ) | 759 | ||||||||||
Capital gain distributions from affiliated funds | 285,262 | — | — | 1,252,367 | ||||||||||||
|
|
|
|
|
|
|
| |||||||||
Net realized gain (loss) | 278,298 | 219,304,333 | (11,329,272 | ) | (1,010,000 | ) | ||||||||||
| Net change in unrealized appreciation (depreciation) on: | ||||||||||||||||
Investments | (319,882 | ) | (544,374,153 | )** | (25,461,525 | )** | (5,390,624 | ) | ||||||||
Foreign currency translations | 31,028 | (50,579 | ) | (4,650 | ) | (489 | ) | |||||||||
|
|
|
|
|
|
|
| |||||||||
Net change in unrealized appreciation (depreciation) | (288,854 | ) | (544,424,732 | ) | (25,466,175 | ) | (5,391,113 | ) | ||||||||
|
|
|
|
|
|
|
| |||||||||
Net realized and unrealized gain (loss) on investments and foreign currency transactions | (10,556 | ) | (325,120,399 | ) | (36,795,447 | ) | (6,401,113 | ) | ||||||||
|
|
|
|
|
|
|
| |||||||||
Net Increase (Decrease) in Net Assets Resulting from Operations | $ | 25,605 | $ | (318,342,464 | ) | $ | (36,835,511 | ) | $ | (5,616,324 | ) | |||||
|
|
|
|
|
|
|
| |||||||||
* Unaffiliated foreign tax withheld | $ | — | $ | 1,292,209 | $ | 33,004 | $ | 11,238 | ||||||||
** Net decrease in deferred foreign taxes | $ | — | $ | 508,847 | $ | 27,216 | $ | — | ||||||||
| (1) | For the period October 20, 2015 (commencement of operations) through May 31, 2016. |
| See Notes to Financial Statements. | 39 |
DBX ETF Trust
| Deutsche X-trackers Harvest CSI 500 China A-Shares Small Cap ETF | ||||
| Year ended May 31, 2016 | ||||
Increase (Decrease) in Cash: | ||||
Cash Flows from Operating Activities | ||||
Net increase (decrease) in net assets resulting from operations | $ | (36,835,511 | ) | |
|
| |||
| Adjustments to reconcile net increase (decrease) in net assets resulting from operations to net cash provided (used) by operating activities: | ||||
Purchases of long-term investments | (79,922,277 | ) | ||
Proceeds from sales and maturities of long-term investments | 100,513,533 | |||
(Increase) decrease in dividends receivable | 1,350 | |||
Increase (decrease) in investment advisory fees | (23,952 | ) | ||
(Increase) decrease in deferred foreign taxes | 28,872 | |||
Change in unrealized (appreciation) depreciation on investments | 25,435,988 | |||
Net realized (gain) loss from investments | 11,089,536 | |||
|
| |||
Cash provided (used) by operating activities | 20,287,539 | |||
|
| |||
Cash Flows from Financing Activities | ||||
Increase (decrease) in due to custodian | 5,748 | |||
Proceeds from shares sold | 60,339,888 | |||
Value of shares redeemed | (81,058,569 | ) | ||
Distributions paid | (2,767,123 | ) | ||
|
| |||
Cash provided (used) by financing activities | (23,480,056 | ) | ||
|
| |||
Increase (decrease) in cash | (3,192,517 | ) | ||
Cash at beginning of period (including foreign currency) | 3,298,970 | |||
|
| |||
Cash at end of period (including foreign currency) | $ | 106,453 | ||
|
| |||
| See Notes to Financial Statements. | 40 |
DBX ETF Trust
Statements of changes in net assets
| Deutsche X-trackers CSI 300 China A-Shares Hedged Equity ETF | Deutsche X-trackers Harvest CSI 300 China A-Shares ETF | |||||||||||
| For the Period October 20, 2015(1) to May 31, 2016 | Year Ended May 31, | |||||||||||
| 2016 | 2015 | |||||||||||
Increase (Decrease) in Net Assets from Operations | ||||||||||||
Net investment income (loss) | $ | 36,161 | $ | 6,777,935 | $ | 1,868,446 | ||||||
Net realized gain (loss) | 278,298 | 219,304,333 | 29,264,178 | |||||||||
Net change in unrealized appreciation (depreciation) | (288,854 | ) | (544,424,732 | ) | 609,959,020 | |||||||
|
|
|
|
|
| |||||||
Net increase (decrease) in net assets resulting from operations | 25,605 | (318,342,464 | ) | 641,091,644 | ||||||||
|
|
|
|
|
| |||||||
Distributions to Shareholders from | ||||||||||||
Net investment income | (37,029 | ) | (3,938,040 | ) | (2,530,476 | ) | ||||||
Net realized gains | — | (97,209,728 | ) | — | ||||||||
|
|
|
|
|
| |||||||
Total distributions | (37,029 | ) | (101,147,768 | ) | (2,530,476 | ) | ||||||
|
|
|
|
|
| |||||||
Fund Shares Transactions | ||||||||||||
Proceeds from shares sold | 3,505,824 | 758,999,152 | 969,607,417 | |||||||||
Value of shares redeemed | (1,308,467 | ) | (1,423,452,453 | ) | (350,563,989 | ) | ||||||
Payments by Affiliates (See Note 10) | — | 14,225 | — | |||||||||
|
|
|
|
|
| |||||||
Net increase (decrease) in net assets resulting from fund share transactions | 2,197,357 | (664,439,076 | ) | 619,043,428 | ||||||||
|
|
|
|
|
| |||||||
Total net increase (decrease) in Net Assets | 2,185,933 | (1,083,929,308 | ) | 1,257,604,596 | ||||||||
Net Assets | ||||||||||||
Beginning of year | 25 | 1,410,397,133 | 152,792,537 | |||||||||
|
|
|
|
|
| |||||||
End of year | $ | 2,185,958 | $ | 326,467,825 | $ | 1,410,397,133 | ||||||
|
|
|
|
|
| |||||||
Distributions in excess of net investment income | $ | — | $ | (2,333,186 | ) | $ | — | |||||
|
|
|
|
|
| |||||||
Undistributed net investment income | $ | 265,176 | $ | — | $ | — | ||||||
|
|
|
|
|
| |||||||
Changes in Shares Outstanding | ||||||||||||
Shares outstanding, beginning of year | 1 | 28,250,001 | 6,950,001 | |||||||||
Shares sold | 150,000 | 22,750,000 | 31,350,000 | |||||||||
Shares redeemed | (50,000 | ) | (37,250,000 | ) | (10,050,000 | ) | ||||||
|
|
|
|
|
| |||||||
Shares outstanding, end of year | 100,001 | 13,750,001 | 28,250,001 | |||||||||
|
|
|
|
|
| |||||||
| (1) | Commencement of Operations. |
| See Notes to Financial Statements. | 41 |
DBX ETF Trust
Statements of changes in net assets (Continued)
| Deutsche X-trackers Harvest CSI 500 China A-Shares Small Cap ETF | Deutsche X-trackers MSCI All China Equity ETF | |||||||||||||||
| Year Ended May 31, | Year Ended May 31, | |||||||||||||||
| 2016 | 2015 | 2016 | 2015 | |||||||||||||
Increase (Decrease) in Net Assets from Operations | ||||||||||||||||
Net investment income (loss) | $ | (40,064 | ) | $ | (73,420 | ) | $ | 784,789 | $ | 68,609 | ||||||
Net realized gain (loss) | (11,329,272 | ) | 2,754,980 | (1,010,000 | ) | 1,928,813 | ||||||||||
Net change in unrealized appreciation (depreciation) | (25,466,175 | ) | 25,545,008 | (5,391,113 | ) | 2,689,959 | ||||||||||
|
|
|
|
|
|
|
| |||||||||
Net increase (decrease) in net assets resulting from operations | (36,835,511 | ) | 28,226,568 | (5,616,324 | ) | 4,687,381 | ||||||||||
|
|
|
|
|
|
|
| |||||||||
Distributions to Shareholders from | ||||||||||||||||
Net investment income | (134,904 | ) | (30,280 | ) | (1,736,120 | ) | (70,374 | ) | ||||||||
Net realized gains | (2,632,219 | ) | (134,976 | ) | — | (9,598 | ) | |||||||||
|
|
|
|
|
|
|
| |||||||||
Total distributions | (2,767,123 | ) | (165,256 | ) | (1,736,120 | ) | (79,972 | ) | ||||||||
|
|
|
|
|
|
|
| |||||||||
Fund Shares Transactions | ||||||||||||||||
Proceeds from shares sold | 60,339,888 | 77,518,004 | — | 16,983,988 | ||||||||||||
Value of shares redeemed | (81,058,569 | ) | (31,516,705 | ) | (3,963,691 | ) | (8,288,839 | ) | ||||||||
Payments by Affiliates (See Note 10) | — | — | 515 | — | ||||||||||||
|
|
|
|
|
|
|
| |||||||||
Net increase (decrease) in net assets resulting from fund share transactions | (20,718,681 | ) | 46,001,299 | (3,963,176 | ) | 8,695,149 | ||||||||||
|
|
|
|
|
|
|
| |||||||||
Total net increase (decrease) in Net Assets | (60,321,315 | ) | 74,062,611 | (11,315,620 | ) | 13,302,558 | ||||||||||
Net Assets | ||||||||||||||||
Beginning of year | 81,772,951 | 7,710,340 | 18,405,212 | 5,102,654 | ||||||||||||
|
|
|
|
|
|
|
| |||||||||
End of year | $ | 21,451,636 | $ | 81,772,951 | $ | 7,089,592 | $ | 18,405,212 | ||||||||
|
|
|
|
|
|
|
| |||||||||
Distributions in excess of net investment income | $ | (178,422 | ) | $ | — | $ | — | $ | — | |||||||
|
|
|
|
|
|
|
| |||||||||
Undistributed net investment income | $ | — | $ | 236,358 | $ | 324,953 | $ | 28,257 | ||||||||
|
|
|
|
|
|
|
| |||||||||
Changes in Shares Outstanding | ||||||||||||||||
Shares outstanding, beginning of year | 1,250,001 | 300,001 | 400,001 | 200,001 | ||||||||||||
Shares sold | 1,100,000 | 1,650,000 | — | 450,000 | ||||||||||||
Shares redeemed | (1,700,000 | ) | (700,000 | ) | (150,000 | ) | (250,000 | ) | ||||||||
|
|
|
|
|
|
|
| |||||||||
Shares outstanding, end of year | 650,001 | 1,250,001 | 250,001 | 400,001 | ||||||||||||
|
|
|
|
|
|
|
| |||||||||
| See Notes to Financial Statements. | 42 |
DBX ETF Trust
Deutsche X-trackers CSI 300 China A-Shares Hedged Equity ETF Selected Per Share Data | Period Ended 5/31/2016(a) | |||||||||||
Net Asset Value, beginning of period | $ | 25.00 | ||||||||||
|
| |||||||||||
| Income (loss) from Investment Operations: | ||||||||||||
Net investment income (loss)(c) | 0.40 | |||||||||||
Net realized and unrealized gain (loss) | (2.80 | ) | ||||||||||
|
| |||||||||||
Total from investment operations | (2.40 | ) | ||||||||||
|
| |||||||||||
| Less distributions from: | ||||||||||||
Net investment income | (0.74 | ) | ||||||||||
|
| |||||||||||
Total distributions | (0.74 | ) | ||||||||||
|
| |||||||||||
Net Asset Value, end of period | $ | 21.86 | ||||||||||
|
| |||||||||||
Total Return (%) | (10.01 | )**(d) | ||||||||||
Ratios to Average Net Assets and Supplimental Data | ||||||||||||
Net assets, end of period ($ millions) | 2 | |||||||||||
Ratio of expenses before fee waiver (%)(f) | 1.25 | * | ||||||||||
Ratio expenses after fee waiver (%)(f) | 0.45 | * | ||||||||||
Ratio of net investment income (loss) (%) | 2.92 | * | ||||||||||
Portfolio turnover rate (%)(e) | 4 | ** | ||||||||||
| Deutsche X-trackers Harvest CSI 300 China A-Shares ETF Selected Per Share Data | Year Ended 5/31/2016 | Year Ended 5/31/2015 | Period Ended 5/31/2014(b) | |||||||||
Net Asset Value, beginning of period | $ | 49.93 | $ | 21.98 | $ | 25.00 | ||||||
|
|
|
|
|
| |||||||
Income (loss) from Investment Operations: | ||||||||||||
Net investment income (loss)(c) | 0.43 | 0.09 | (0.05 | ) | ||||||||
Net realized and unrealized gain (loss) | (18.19 | ) | 27.96 | (2.97 | ) | |||||||
|
|
|
|
|
| |||||||
Total from investment operations | (17.76 | ) | 28.05 | (3.02 | ) | |||||||
|
|
|
|
|
| |||||||
| Less distributions from: | ||||||||||||
Net investment income | (0.33 | ) | (0.10 | ) | — | |||||||
Net realized gains | (8.10 | ) | — | — | ||||||||
|
|
|
|
|
| |||||||
Total distributions | (8.43 | ) | (0.10 | ) | — | |||||||
|
|
|
|
|
| |||||||
Net Asset Value, end of period | $ | 23.74 | $ | 49.93 | $ | 21.98 | ||||||
|
|
|
|
|
| |||||||
Total Return (%) | (38.10 | ) | 127.82 | (12.08 | )**(d) | |||||||
Ratios to Average Net Assets and Supplemental Data | ||||||||||||
Net assets, end of period ($ millions) | 326 | 1,410 | 153 | |||||||||
Ratio of expenses before fee waiver (%) | 0.80 | 0.80 | 0.96 | * | ||||||||
Ratio of expenses after fee waiver (%) | 0.80 | 0.80 | 0.92 | * | ||||||||
Ratio of net investment income (loss) (%) | 1.27 | 0.26 | (0.38 | )* | ||||||||
Portfolio turnover rate (%)(e) | 159 | 58 | 42 | ** | ||||||||
| (a) | For the period October 20, 2015 (commencement of operations) through May 31, 2016. |
| (b) | For the period November 6, 2013 (commencement of operations) through May 31, 2014. |
| (c) | Based on average shares outstanding during the period. |
| (d) | The Total Return would have been lower if certain fees had not been reimbursed by the Advisor. |
| (e) | Portfolio turnover rate does not include securities received or delivered from processing creations or redemptions. |
| (f) | The Fund invests in other ETFs and indirectly bears its proportionate shares of fees and expenses incurred by the Underlying Funds in which the Fund is invested. This ratio does not included these indirect fees and expenses. |
| * | Annualized. |
| ** | Not Annualized. |
| See Notes to Financial Statements. | 43 |
DBX ETF Trust
Financial highlights (Continued)
Deutsche X-trackers Harvest CSI 500 China A-Shares Small Cap ETF Selected Per Share Data | Year Ended 5/31/2016 | Year Ended 5/31/2015 | Period Ended 5/31/2014(a) | |||||||||
Net Asset Value, beginning of period | $ | 65.42 | $ | 25.70 | $ | 25.00 | ||||||
|
|
|
|
|
| |||||||
| Income (loss) from Investment Operations: | ||||||||||||
Net investment income (loss)(c) | (0.05 | ) | (0.12 | ) | 0.02 | |||||||
Net realized and unrealized gain (loss) | (28.91 | ) | 40.05 | 0.68 | ||||||||
|
|
|
|
|
| |||||||
Total from investment operations | (28.96 | ) | 39.93 | 0.70 | ||||||||
|
|
|
|
|
| |||||||
| Less distributions from: | ||||||||||||
Net investment income | (0.17 | ) | (0.04 | ) | – | |||||||
Net realized gains | (3.29 | ) | (0.17 | ) | – | |||||||
|
|
|
|
|
| |||||||
Total distributions | (3.46 | ) | (0.21 | ) | – | |||||||
|
|
|
|
|
| |||||||
Net Asset Value, end of period | $ | 33.00 | $ | 65.42 | $ | 25.70 | ||||||
|
|
|
|
|
| |||||||
Total Return (%) | (45.37 | ) | 155.99 | 2.80 | ** | |||||||
Ratios to Average Net Assets and Supplimental Data | ||||||||||||
Net assets, end of period ($ millions) | 21 | 82 | 8 | |||||||||
Ratio of expenses (%) | 0.80 | 0.80 | 0.80 | * | ||||||||
Ratio of net investment income (loss) (%) | (0.11 | ) | (0.30 | ) | 2.57 | * | ||||||
Portfolio turnover rate (%)(e) | 215 | 131 | 0 | ** | ||||||||
Deutsche X-trackers MSCI All China Equity ETF Selected Per Share Data | Year Ended 5/31/2016 | Year Ended 5/31/2015 | Period Ended 5/31/2014(b) | |||||||||
Net Asset Value, beginning of period | $ | 46.01 | $ | 25.51 | $ | 25.00 | ||||||
|
|
|
|
|
| |||||||
| Income (loss) from Investment Operations: | ||||||||||||
Net investment income (loss)(c) | 2.15 | 0.32 | 0.06 | |||||||||
Net realized and unrealized gain (loss) | (15.46 | ) | 20.58 | 0.45 | ||||||||
|
|
|
|
|
| |||||||
Total from investment operations | (13.31 | ) | 20.90 | 0.51 | ||||||||
|
|
|
|
|
| |||||||
Less distributions from: | ||||||||||||
Net investment income | (4.34 | ) | (0.35 | ) | — | |||||||
Net realized gains | — | (0.05 | ) | — | ||||||||
|
|
|
|
|
| |||||||
Total distributions | (4.34 | ) | (0.40 | ) | — | |||||||
|
|
|
|
|
| |||||||
Net Asset Value, end of period | $ | 28.36 | $ | 46.01 | $ | 25.51 | ||||||
|
|
|
|
|
| |||||||
Total Return (%)(d) | (29.80 | ) | 82.48 | 2.04 | ** | |||||||
Ratios to Average Net Assets and Supplimental Data | ||||||||||||
Net assets, end of period ($ millions) | 7 | 18 | 5 | |||||||||
Ratio of expenses before fee waiver (%)(f) | 0.60 | 0.60 | 0.60 | * | ||||||||
Ratio of expenses after fee waiver (%)(f) | 0.26 | 0.26 | 0.30 | * | ||||||||
Ratio of net investment income (loss) (%) | 6.46 | 0.94 | 2.73 | * | ||||||||
Portfolio turnover rate (%)(e) | 36 | 20 | 2 | ** | ||||||||
| (a) | For the period May 21, 2014 (commencement of operations) through May 31, 2014. |
| (b) | For the period April 30, 2014 (commencement of operations) through May 31, 2014. |
| (c) | Based on average shares outstanding during the period. |
| (d) | The Total Return would have been lower if certain fees had not been reimbursed by the Advisor. |
| (e) | Portfolio turnover rate does not include securities received or delivered from processing creations or redemptions. |
| (f) | The Fund invests in other ETFs and indirectly bears its proportionate shares of fees and expenses incurred by the Underlying Funds in which the Fund is invested. This ratio does not included these indirect fees and expenses. |
| * | Annualized. |
| ** | Not Annualized. |
| See Notes to Financial Statements. | 44 |
DBX ETF Trust
1. Organization
DBX ETF Trust (the “Trust”) is registered under the Investment Company Act of 1940, as amended (the “Act”), as an open-end registered management investment company organized as a Delaware statutory trust.
As of May 31, 2016, the Trust consists of thirty-six investment series of exchange-traded funds (“ETFs”) (each a “Fund” and collectively, the “Funds”) in operation and trading. These financial statements report on the Funds listed below:
| Deutsche X-trackers CSI 300 China A-Shares Hedged Equity ETF (ASHX) |
| Deutsche X-trackers Harvest CSI 300 China A-Shares ETF (ASHR) |
| Deutsche X-trackers Harvest CSI 500 China A-Shares Small Cap ETF (ASHS) |
| Deutsche X-trackers MSCI All China Equity ETF (CN) |
DBX Advisors LLC (“DBX” or the “Advisor”), an indirect, wholly owned subsidiary of Deutsche Bank AG, serves as investment advisor to the Funds and has overall responsibility for the general management and administration of the Funds, subject to the supervision of the Funds’ Board of Trustees.
Each Fund offers shares that are listed and traded on the NYSE Arca, Inc. (“NYSE Arca”). Unlike conventional mutual funds, each Fund issues and redeems shares on a continuous basis, at net asset value, only in large specified lots consisting of 50,000 shares each called a “Creation Unit”, to authorized participants who have entered into agreements with the Funds’ distributor. Shares are not individually redeemable securities of the Funds, and owners of the shares may acquire those shares from the Funds, or tender such shares for redemption to the Funds, in Creation Units only.
The investment objective of each Fund is to track the performance, before fees and expenses, of a particular index (the “Underlying Index”). The Underlying Index for each Fund is:
Fund | Underlying Index | |
| Deutsche X-trackers CSI 300 China A-Shares Hedged Equity ETF | CSI 300 USD Hedged Index | |
| Deutsche X-trackers Harvest CSI 300 China A-Shares ETF | CSI 300 Index | |
| Deutsche X-trackers Harvest CSI 500 China A-Shares Small Cap ETF | CSI 500 Index | |
| Deutsche X-trackers MSCI All China Equity ETF | MSCI China All Shares Index |
CSI 300 USD Hedged Index is calculated and maintained by China Securities Index Co., Ltd. It is a modified free-float market capitalization weighted index composed of the largest and most liquid stocks in the Chinese A-Share market. The Underlying Index hedges the currency exposure of the securities in the CSI 300 Index by taking long positions in foreign currency forwards. Constituent stocks for the Underlying Index must have been listed on either the Shanghai Stock Exchange or the Shenzhen Stock Exchange. The composition of the Underlying Index is rebalanced every six-months.
CSI 300 Index is calculated and maintained by China Securities Index Co., Ltd. It is a modified free-float market capitalization weighted index composed of the largest and most liquid stocks in the Chinese A-Share market. Constituent stocks for the Underlying Index must have been listed on either the Shanghai Stock Exchange or the Shenzhen Stock Exchange. The composition of the Underlying Index is rebalanced every six-months.
CSI 500 Index is calculated and maintained by China Securities Index Co., Ltd. It is a modified free-float market capitalization weighted index composed of the 500 smallest and most liquid stocks in the Chinese A-Share market. Constituent stocks for the Underlying Index must have been listed on either the Shanghai Stock Exchange or the Shenzhen Stock Exchange. The composition of the Underlying Index is rebalanced every six-months.
MSCI is the creator of the MSCI China All Shares Index. The MSCI China All Shares Indexes is constructed by applying the MSCI Global Investable Market Indexes (GIMI) Methodology on the integrated MSCI China equity universe comprising A-shares, B-shares, H-shares, Red-chips, and P-chips. The Emerging Markets investability requirements and Global Minimum Size Reference for the Standard size-segments are applied. The index constituents are weighted by the security free-float adjusted market capitalization calculated based on the Foreign Inclusion Factor (FIF) and subject to Foreign Ownership Limits (FOLs). For the China A-share constituents, an Inclusion Factor (IF) of 100% is applied to their security free-float adjusted market capitalization in deriving their final weight in the index. The MSCI China All Shares Index is rebalanced simultaneously with the MSCI Global Investable Market Indexes, using the same price and data cut-off dates. The MSCI China All Shares Index is rebalanced on a quarterly basis.
45
DBX ETF Trust
Notes to financial statements (Continued)
Each Fund is entitled to use its respective Underlying Index pursuant to a licensing agreement between each Index Provider and DBX. There is no charge to the Funds in connection with these licensing agreements.
Each Fund is non-diversified and is not limited by the Act with regard to the percentage of its assets that may be invested in the securities of a single issuer. The securities of a particular issuer (or securities of issuers in particular industries) may dominate the underlying index of such a fund and, consequently, the fund’s investment portfolio. This may adversely affect the fund’s performance or subject the fund’s Shares to greater price volatility than that experienced by more diversified investment companies.
Pursuant to the Trust’s organizational documents, the Trust’s officers and trustees are indemnified against certain liabilities that may arise out of the performance of their duties to the Funds. Additionally, in the normal course of business the Trust enters into contracts that contain a variety of representations that provide indemnification for certain liabilities. The Trust’s maximum exposure under these arrangements is unknown, as this would involve future claims that may be made against the Funds that have not yet occurred. However, the Trust expects the risk of loss to be remote.
2. Significant Accounting Policies
The financial statements have been prepared in conformity with U.S. generally accepted accounting principles (“U.S. GAAP”), which require management to make certain estimates and assumptions that affect the reported amounts and disclosures in the financial statements. Actual results could differ from those estimates. The following is a summary of significant accounting policies followed by the Funds.
Security Valuation The Net Asset Value (“NAV”), of each Fund’s shares is calculated each business day as of the close of regular trading on the New York Stock Exchange, generally 4:00 p.m. Eastern Time. NAV per share is calculated by dividing a Fund’s net assets by the number of Fund shares outstanding.
Various inputs are used in determining the value of the Funds’ investments. These inputs are summarized in three broad levels. Level 1 includes quoted prices in active markets for identical securities. Level 2 includes other significant observable inputs (including quoted prices for similar securities, interest rates, prepayment speeds, and credit risk). Level 3 includes significant unobservable inputs (including the Fund’s own assumptions in determining the fair value of investments). The level assigned to the securities valuations may not be an indication of the risk or liquidity associated with investing in those securities.
Equity securities and ETFs are valued at the most recent sale price or official closing price reported on the exchange (U.S. or foreign) or over-the-counter market on which they trade. Securities or ETFs for which no sales are reported are valued at the calculated mean between the most recent bid and asked quotations on the relevant market or, if a mean cannot be determined, at the most recent bid quotation. Equity securities and ETFs are generally categorized as Level 1.
Forward currency contracts are valued at the prevailing forward exchange rate of the underlying currencies and are categorized as Level 2.
Securities and other assets for which market quotations are not readily available or for which the above valuation procedures are deemed not to reflect fair value are valued in a manner that is intended to reflect their fair value as determined in accordance with procedures approved by the Board and are generally categorized as Level 3. In accordance with the Fund’s valuation procedures, factors considered in determining value may include, but are not limited to, the type of the security; the size of the holding; the initial cost of the security; the existence of any contractual restrictions on the security’s disposition; the price and extent of public trading in similar securities of the issuer or of comparable companies; quotations or evaluated prices from broker-dealers and/or pricing services; information obtained from the issuer, analysts, and/or the appropriate stock exchange (for exchange- traded securities); an analysis of the company’s or issuer’s financial statements; an evaluation of the forces that influence the issuer and the market(s) in which the security is purchased and sold; movement in the security’s proxy index; and with respect to debt securities, the maturity, coupon, creditworthiness, currency denomination and the movement of the market in which the security is normally traded. The value determined under these procedures may differ from published values for the same securities.
46
DBX ETF Trust
Notes to financial statements (Continued)
Fair value pricing could result in a difference between the prices used to calculate a Fund’s net asset value and the prices used by the Fund’s underlying index, which in turn could result in a difference between the Fund’s performance and the performance of the Fund’s underlying index.
Disclosure about the classification of the fair value measurements is included in a table following the Fund’s Schedule of Investments.
Cash Cash consists of cash held at banks and is on deposit with major financial institutions.
Investment Transactions and Investment Income Investment transactions are recorded as of the date that the securities are purchased or sold (trade date). Realized gains and losses from the sale or disposition of securities are calculated on the identified cost-method. Dividend income is net of any foreign taxes withheld at source. Certain dividends from foreign securities may be recorded subsequent to the ex-dividend date as soon as the fund is informed of such dividends. Distributions of income and capital gains from investments in affiliated funds are recorded on the ex-dividend date. Interest income is recorded on the accrual basis.
Tax Information and Dividends and Distributions to Shareholders It is each Fund’s policy to comply with all requirements of the Internal Revenue Code of 1986, as amended (“the Code”). Each fund intends to qualify for and to elect treatment as a separate Regulated Investment Company (“RIC”) under Subchapter M of the Code. It is the policy of each Fund to pay out dividends from its net investment income, if any, to investors annually sufficient to relieve it from all, or substantially all, Federal income and excise taxes. Taxable net realized gains from investment transactions, reduced by capital loss carryforwards, if any, are declared and distributed to shareholders at least annually. The capital loss carryforward amount, if any, is available to offset future net capital gains. The Funds may occasionally be required to make supplemental distributions at some other time during the year. The Funds reserve the right to declare special distributions if, in their reasonable discretion, such action is necessary or advisable to preserve the status of each Fund as a RIC or to avoid imposition of income or excise taxes on undistributed income.
Dividends and distributions to shareholders, if any, are recorded on the ex-dividend date. The amount of dividends and distributions from net investment income and net realized capital gains are determined in accordance with Federal income tax regulations which may differ from U.S. GAAP. These “book/tax” differences are either considered temporary or permanent in nature. To the extent these differences are permanent in nature, such amounts are reclassified at the end of the year within the components of net assets based on their federal tax treatment; temporary differences do not require reclassification. Dividends and distributions, which exceed earnings and profits for the full year for tax purposes, are reported as a tax return of capital.
In accordance with U.S. GAAP requirements regarding accounting for uncertainties in income taxes, management has analyzed the Funds’ tax positions taken or expected to be taken on foreign, federal and state income tax returns for all open tax years and has concluded that no provision for income tax is required in the Funds’ financial statements. The Advisor does not believe that the unrecognized tax benefits will change significantly in the next 12 months.
The Funds’ recognize interest and penalties, if any, related to uncertain tax provisions as income tax expense on the Statements of Operations. For the period ended May 31, 2016, the Funds did not incur any interest or penalties.
As of May 31, 2016, the components of accumulated earnings (losses) were as follows:
| Undistributed Net Investment Income | Undistributed Long-Term Capital Gains | Capital and Other Gains (Losses) | Unrealized Appreciation (Depreciation) | Total Accumulated Earnings (Losses) | ||||||||||||||||
Deutsche X-trackers CSI 300 China A-Shares Hedged Equity ETF | $ | 265,176 | $ | 29,610 | $ | — | $ | (331,712 | ) | $ | (36,926 | ) | ||||||||
Deutsche X-trackers Harvest CSI 300 China A-Shares ETF | — | — | (3,021,824 | ) | (19,033,603 | ) | (22,055,427 | ) | ||||||||||||
Deutsche X-trackers Harvest CSI 500 China A-Shares Small Cap ETF | — | — | (9,488,220 | ) | (2,401,169 | ) | (11,889,389 | ) | ||||||||||||
Deutsche X-trackers MSCI All China Equity ETF | 324,953 | — | (1,196,420 | ) | (2,838,965 | ) | (3,710,432 | ) | ||||||||||||
47
DBX ETF Trust
Notes to financial statements (Continued)
The tax character of dividends and distributions declared for the periods ended May 31, 2016 and May 31, 2015 were as follows:
| Period Ended May 31, 2016 | ||||||||
| Ordinary Income* | Long-Term Capital Gain | |||||||
Deutsche X-trackers CSI 300 China A-Shares Hedged Equity ETF | $ | 37,029 | $ | — | ||||
Deutsche X-trackers Harvest CSI 300 China A-Shares ETF | 85,050,247 | 16,097,521 | ||||||
Deutsche X-trackers Harvest CSI 500 China A-Shares Small Cap ETF | 2,767,123 | — | ||||||
Deutsche X-trackers MSCI All China Equity ETF | 1,736,120 | — | ||||||
| Period Ended May 31, 2015 | ||||
| Ordinary Income* | ||||
Deutsche X-trackers Harvest CSI 300 China A-Shares ETF | $ | 2,530,476 | ||
Deutsche X-trackers Harvest CSI 500 China A-Shares Small Cap ETF | 165,256 | |||
Deutsche X-trackers MSCI All China Equity ETF | 79,972 | |||
| * | For tax purposes short-term capital gain distributions are considered ordinary income distributions |
At May 31, 2016, for Federal income tax purposes, the Funds have capital loss carryforwards available as shown in the table below, to the extent provided by regulations, to offset future capital gains for an unlimited period. To the extent that these capital loss carryforwards are used to offset future capital gains, it is probable that the capital gains so offset will not be distributed to shareholders.
| Short-Term | Long-Term | Total Amount | ||||||||||
Deutsche X-trackers Harvest CSI 500 China A-Shares Small Cap ETF | $ | 4,159,340 | $ | — | $ | 4,159,340 | ||||||
Deutsche X-trackers MSCI All China Equity ETF | 65,695 | 4,085 | 69,780 | |||||||||
Capital losses incurred after October 31 (“post-October capital losses”) and late year ordinary losses incurred after December 31 within the taxable year are deemed to arise on the first business day of each Fund’s next taxable year. During the fiscal year ended May 31, 2016, the following Funds incurred and will elect to defer post-October capital losses and late year ordinary losses as follows:
| Late Year Ordinary Losses | Post-October Losses on Capital | |||||||
Deutsche X-trackers Harvest CSI 300 China A-Shares ETF | $ | 2,333,186 | $ | 688,638 | ||||
Deutsche X-trackers Harvest CSI 500 China A-Shares Small Cap ETF | 178,422 | 5,150,458 | ||||||
Deutsche X-trackers MSCI All China Equity ETF | — | 1,126,640 | ||||||
In order to present paid-in capital and accumulated net realized gains or losses on the Statement of Assets and Liabilities that more closely represent their tax character, certain adjustments have been made to additional paid-in capital, undistributed net investment income or loss and accumulated net realized gains or losses on investments. These differences are primarily due to the recognition of certain foreign currency gain (losses) as ordinary income (loss), passive foreign investment companies (“PFICs”), net operating losses, redemptions-in-kind, excise tax paid, equalization used, and long-term capital gain distribution received on securities out on loan. For the period ended May 31, 2016, the adjustments were as follows:
| Undistributed Net Investment Income (Loss) | Undistributed Capital Gains (Accumulated Losses) | Paid-In Capital | ||||||||||
Deutsche X-trackers CSI 300 China A-Shares Hedged Equity ETF | $ | 266,044 | $ | (291,546 | ) | $ | 25,502 | |||||
Deutsche X-trackers Harvest CSI 300 China A-Shares ETF | (5,173,081 | ) | (210,004,259 | ) | 215,177,340 | |||||||
Deutsche X-trackers Harvest CSI 500 China A-Shares Small Cap ETF | (239,812 | ) | (306,123 | ) | 545,935 | |||||||
Deutsche X-trackers MSCI All China Equity ETF | 1,248,027 | (304,506 | ) | (943,521 | ) | |||||||
48
DBX ETF Trust
Notes to financial statements (Continued)
Foreign Taxes The Funds may be subject to foreign taxes (a portion of which may be reclaimable) on income, capital gains on investments, certain foreign currency transactions or other corporate events. All foreign taxes are recorded in accordance with the applicable foreign tax regulations and rates that exist in the foreign jurisdictions in which the Funds invest. These foreign taxes, if any, are paid by the Funds and are reflected in their Statements of Operations as follows: foreign taxes withheld at source are presented as a reduction of income, and foreign taxes on capital gains from sales of investments and foreign currency transactions are included in their respective net realized gain (loss) categories. Foreign taxes payable as of May 31, 2016, if any, are disclosed in the Funds’ Statements of Assets and Liabilities.
The Funds’ direct investments in China A-Shares will be subject to a number of Chinese tax rules and the application of many of those rules is evolving. Chinese taxes that may apply to the Funds’ direct investments in A-Shares include withholding income tax (WHT) on dividends, WHT on bank interest, WHT on capital gains realized from the disposal of equity investments prior to 17 November 2014 and stamp tax. China imposes WHT at a rate of 10% on dividends on shares and interest income derived by non PRC enterprises including Qualified Foreign Institutional Investors (“QFII”) and Renminbi Qualified Foreign Institutional Investors (“RQFII”) from PRC resident issuers, subject to any lower rate provided by an applicable tax treaty.
With the approval from the PRC State Council, the PRC State Administration of Taxation, the PRC Ministry of Finance and the China Securities Regulatory Commission jointly issued Caishui [2014] 79 (Circular 79) on November 14, 2014. According to Circular 79, RQFIIs are temporarily exempt from WHT with respect to gains derived from the trading of equity investments (including shares in PRC enterprises) effective from November 17, 2014. With respect to gains derived from equity investments prior to November 17, 2014, RQFIIs are subject to WHT at a rate of 10% on such gains on a gross basis, subject to any lower rate provided by an applicable tax treaty. The above WHT treatment applies to RQFIIs which do not have a permanent establishment (“PE”) in the PRC. The Funds do not have PEs in the PRC, therefore, the Funds are only subject to WHT at 10% with respect to gross realized gains derived from the disposal of land-rich A-Share companies and exempt from WHT with respect to gross realized gains derived from non land-rich A-Share companies prior to November 17, 2014. Land-rich enterprises are companies whose value of immovable property in the PRC is greater than 50% of their value of total assets. The WHT relating to the realized gains from shares in land-rich companies prior to November 17, 2014 has been paid by the Deutsche X-trackers Harvest CSI 300 China A-Shares ETF and Deutsche X-trackers Harvest CSI 500 China A-Shares Small Cap ETF, respectively; while realized gains from shares in non land-rich companies prior to November 17, 2014 were granted treaty relief pursuant to the PRC-US Double Taxation Arrangement.
The PRC rules for taxation of RQFIIs (and QFIIs) are evolving and the tax regulations to be issued by the PRC State Administration of Taxation and/or PRC Ministry of Finance, as well as the practices adopted by the local PRC authorities, may apply retroactively which may adversely affect the Fund and its shareholders.
Foreign Currency Translations The books and records of the Funds are maintained in U.S. dollars. Investment securities and other assets and liabilities denominated in a foreign currency are translated into U.S. dollars at the prevailing exchange rates at year end. Purchases and sales of investment securities, income and expenses are translated into U.S. dollars at the prevailing exchange rates on the respective dates of the transactions.
Net realized and unrealized gains and losses on foreign currency transactions represent net gains and losses between trade and settlement dates on securities transactions, the acquisition and disposition of foreign currencies, and the difference between the amount of net investment income accrued and the U.S. dollar amount actually received. The portion of both realized and unrealized gains and losses on investments that results from fluctuations in foreign currency exchange rates is not separately disclosed, but is included with net realized and unrealized gain/appreciation and loss/depreciation on investments.
Securities Lending The Deutsche X-trackers CSI 300 China A-Shares Hedged Equity ETF and the Deutsche X-trackers MSCI All China Equity ETF may lend securities to certain financial institutions under the terms of their securities lending agreement. The Funds retain benefits of owning securities they have loaned and continue to receive interest and dividends generated by the securities and to participate in any changes in their market value. The Funds require the borrowers of the securities to maintain collateral with the Funds consisting of either cash or liquid, unencumbered assets having a value at least equal to the value of the securities loaned. When the
49
DBX ETF Trust
Notes to financial statements (Continued)
collateral falls below specified amounts, the lending agent will use its best effort to obtain additional collateral on the next business day to meet required amounts under the securities lending agreement. As of year-end, any securities on loan were collateralized by cash. The Funds may invest the cash collateral into a joint trading account in an affiliated money market fund. During the year ended May 31, 2016 the Funds invested the cash collateral in Daily Assets Fund, an affiliated money market fund managed by Deutsche Investment Management Americas Inc. Deutsche Investment Management Americas Inc. receives a management/administration fee (0.09% annualized effective rate as of May 31, 2016) on the cash collateral invested in Daily Assets Fund. The Funds receive compensation for lending their securities either in the form of fees or by earning interest on invested cash collateral net of borrower rebates and fees paid to a lending agent. Either the Fund or the borrower may terminate the loan at any time and the borrower, after notice, is required to return borrowed securities within a standard time period. There may be risks of delay and costs in recovery of securities or even loss of rights in the collateral should the borrower of the securities fail financially. If the Funds are not able to recover securities lent, the Funds may sell the collateral and purchase a replacement investment in the market, incurring the risk that the value of the replacement security is greater than the value of the collateral. The Funds are also subject to all investment risks associated with the reinvestment of any cash collateral received, including, but not limited to, interest rate, credit and liquidity risk associated with such investments.
As of May 31, 2016, Deutsche X-trackers CSI 300 China A-Shares Hedged Equity ETF had securities on loan, which were classified as Exchange Traded Funds in the Schedule of Investments. Due to the increased market values of securities on loan on May 31, 2016, the value of the related collateral was less than the value of securities on loan at year end. On the next business day, additional collateral was received, and the value of collateral exceeded the value of the securities on loan.
As of May 31, 2016, the Deutsche X-trackers MSCI All China Equity ETF had securities on loan, which were classified as Common Stock and Exchange Traded Funds in the Schedule of Investments. Due to the increased market values of securities on loan on May 31, 2016, the value of the related collateral was less than the value of securities on loan at year end. On the next business day, additional collateral was received, and the value of collateral exceeded the value of the securities on loan.
Remaining Contractual Maturity of the Agreements, as of May 31, 2016 | ||||||||||||||||||||
| Overnight and Continuous | <30 Days | Between 30 & 90 days | >90 days | Total | ||||||||||||||||
| Securities Lending Transactions | ||||||||||||||||||||
Common Stocks | $ | 269,125 | $ | — | $ | — | $ | — | $ | 269,125 | ||||||||||
Exchange Traded Funds | 2,988,188 | — | — | — | 2,988,188 | |||||||||||||||
|
|
|
|
|
|
|
|
|
| |||||||||||
Total Borrowings | $ | 3,257,313 | $ | — | $ | — | $ | — | $ | 3,257,313 | ||||||||||
|
|
|
|
|
|
|
|
|
| |||||||||||
Gross amount of recognized liabilities for securities lending transitions |
| $ | 3,257,313 | |||||||||||||||||
Derivatives
Forward Foreign Currency Exchange Contracts The Deutsche X-trackers CSI 300 China A-Shares Hedged Equity ETF may enter into forward foreign currency exchange contracts (“forward currency contracts”) designed to offset the Fund’s exposure to non-U.S. currencies.
A forward currency contract is a commitment to purchase or sell a foreign currency at a future date at a negotiated forward rate. For the period ended May 31, 2016, the Fund invested in forward currency contracts to hedge against changes in the value of the U.S. dollar against the renminbi.
The gain or loss arising from the difference between the original contract and the closing of such contract would be included in net realized gain or loss on foreign currency transactions. Risks may arise from the potential inability of a counterparty to meet the terms of a contract and from unanticipated movements in the value of a foreign currency relative to the U.S. dollar. The face or contract amount, in U.S. dollars reflects the total exposure the Fund has in that particular currency contract.
50
DBX ETF Trust
Notes to financial statements (Continued)
A summary of the open forward currency contracts as of May 31, 2016 is included in a table following the Fund’s Schedule of Investments. The investment in forward currency contracts short vs. U.S. dollars had a contract value generally indicative of a range of the total exposure the Fund had to the value of non U.S currencies during the period ended May 31, 2016.
The following table summarizes the value of the Fund’s derivative instruments held as of May 31, 2016 and the related location in the accompanying Statement of Assets and Liabilities, presented by primary underlying risk exposure:
Asset Derivatives | Liability Derivatives | |||||||||||||
Risk Type | Statement of Asset and | Fair Value | Statement of Asset and | Fair Value | ||||||||||
| Deutsche X-trackers CSI 300 China A-Shares Hedged Equity ETF | ||||||||||||||
| Foreign exchange contracts | Unrealized appreciation on forward foreign currency exchange contracts | $ | 31,635 | Unrealized depreciation on forward foreign currency exchange contracts | $ | 607 | ||||||||
|
|
|
| |||||||||||
| Total | $ | 31,635 | Total | $ | 607 | |||||||||
|
|
|
| |||||||||||
Additionally, the amount of unrealized and realized gains and losses on derivative instruments recognized in the Fund’s earnings during the period ended May 31, 2016 and the related location in the accompanying Statement of Operations is summarized in the following tables by primary underlying risk exposure:
Net Realized Gain (Loss) on: | ||||
| Forward Foreign Currency Exchange Contracts | ||||
Deutsche X-trackers CSI 300 China A-Shares Hedged Equity ETF | $ | 2,221 | ||
Net Change in Unrealized Appreciation (Depreciation) on: | ||||
| Forward Foreign Currency Exchange Contracts | ||||
Deutsche X-trackers CSI 300 China A-Shares Hedged Equity ETF | $ | 31,028 | ||
For the period ended May 31, 2016 the average monthly volume of derivatives was as follows:
| Forward Foreign Currency Contracts (Market Value) | ||||
Deutsche X-trackers CSI 300 China A-Shares Hedged Equity ETF | $ | (1,940,297 | ) | |
As of May 31, 2016, the Fund has transactions subject to enforceable master netting agreements which govern the terms of certain transactions, and reduce the counterparty risk associated with such transactions. Master netting agreements allow the Fund to close out and net total exposure to a counterparty in the event of a default with respect to all of the transactions with a counterparty. For financial reporting purposes the Statement of Assets and Liabilities generally shows derivatives assets and liabilities on a gross basis, which reflects the full risks and exposures prior to netting. A reconciliation of the gross amounts on the Statement of Assets and Liabilities to the net amounts by counterparty, including any collateral exposure, is included in the following table:
| Gross Amounts of Assets Presented in the Statement of Assets and Liabilities | Financial Instruments and Derivatives Available for Offset | Collateral Received | Net Amount of Derivatives Assets | Gross Amounts of Liabilities Presented in the Statement of Assets and Liabilities | Financial Instruments and Derivatives Available for Offset | Collateral Pledged | Net Amount of Derivatives Liabilities | |||||||||||||||||||||||||
| Deutsche X-trackers CSI 300 China A-Shares Hedged Equity ETF | ||||||||||||||||||||||||||||||||
State Street Bank & Trust Co. | $ | 31,635 | $ | (607 | ) | $ | — | $ | 31,028 | $ | 607 | $ | (607 | ) | $ | — | $ | — | ||||||||||||||
|
|
|
|
|
|
|
|
|
|
|
|
|
|
|
| |||||||||||||||||
| $ | 31,635 | $ | (607 | ) | $ | — | $ | 31,028 | $ | 607 | $ | (607 | ) | $ | — | $ | — | |||||||||||||||
|
|
|
|
|
|
|
|
|
|
|
|
|
|
|
| |||||||||||||||||
51
DBX ETF Trust
Notes to financial statements (Continued)
3. Investment Advisory and Other Agreements
The Advisor has overall responsibility for the general management and administration of the Funds, subject to the supervision of the Funds’ Board of Trustees. Under an investment advisory agreement between the Trust, on behalf of the ETFs, and the Advisor (the “Investment Advisory Agreement”), the Advisor is responsible for arranging sub-advisory, transfer agency, custody, fund administration, and all other non-distribution related services for the Funds to operate.
Harvest Global Investments Ltd. serves as investment sub-advisor (the “Sub-Advisor”) to the Deutsche X-trackers Harvest CSI 300 China A-Shares ETF and the Deutsche X-trackers Harvest CSI 500 China A-Shares Small Cap ETF. The Sub-Advisor is responsible for day-to-day management of each Fund, subject to supervision of the Advisor.
For its investment advisory services to the Funds below, the Advisor is entitled to receive a unitary management fee from each Fund based on each Fund’s average daily net assets at an annual rate equal to:
Fund | Unitary Management Fee | |
| Deutsche X-trackers CSI 300 China A-Shares Hedged Equity ETF | 0.85% | |
| Deutsche X-trackers Harvest CSI 300 China A-Shares ETF | 0.80% | |
| Deutsche X-trackers Harvest CSI 500 China A-Shares Small Cap ETF | 0.80% | |
| Deutsche X-trackers MSCI All China Equity ETF | 0.60% |
Out of the unitary management fee, the Advisor is responsible for substantially all expenses of each Fund, including the payments to the Sub-Advisor, the cost of transfer agency, custody, fund administration, legal, audit and other services and expenses of the Independent Trustees except for interest expense, acquired fund fees and expenses, taxes, brokerage expenses, distribution fees or expenses and other extraordinary expenses.
The Advisor for the Deutsche X-trackers CSI 300 China A-Shares Hedged Equity ETF has contractually agreed to waive a portion of its management fees in an amount equal to the acquired fund’s fees and expenses attributable to the Fund’s investments in the underlying fund, if any (the “Expense Limit”). For the period from October 20, 2015 (commencement of operations) to May 31, 2016, the Advisor waived $9,873 of expenses to the Fund. The Expense Limit will remain in effect until at least October 1, 2018.
The Advisor for the Deutsche X-trackers MSCI All China Equity ETF has contractually agreed to waive a portion of its management fees in an amount equal to the Fund’s management fee attributable to the Fund’s assets invested in an affiliated fund, if any (the “Expense Limit”). For the year ended May 31, 2016, the Advisor waived $41,071 of expenses to the Fund. The Expense Limit will remain in effect until at least October 1, 2018.
The Bank of New York Mellon, a wholly-owned subsidiary of The Bank of New York Mellon Corporation, serves as Administrator, Custodian, Accounting Agent, Lending Agent and Transfer Agent for each Fund.
ALPS Distributors, Inc. (the “Distributor”) serves as the distributor of Creation Units for each Fund on an agency basis. The Distributor does not maintain a secondary market in shares of the Funds.
The Board of Trustees is currently comprised of four Trustees, including three Independent Trustees. The Advisor paid retainer fees and attendance fees to each Independent Trustee and attendance fees to each member of the Audit Committee (which is comprised of all of the Funds’ Independent Trustees).
52
DBX ETF Trust
Notes to financial statements (Continued)
4. Transactions with Affiliates
The Deutsche X-trackers Harvest CSI 300 China A-Shares ETF and Deutsche X-trackers Harvest CSI 500 China A-Shares Small Cap ETF in which the Deutsche X-trackers CSI 300 China A-Shares Hedged Equity ETF and the Deutsche X-trackers MSCI All China Equity ETF invest are considered to be affiliated investments. The table below shows the transactions in and earnings from each Fund’s investments in Deutsche X-trackers Harvest CSI 300 China A-Shares ETF and Deutsche X-trackers Harvest CSI 500 China A-Shares Small Cap ETF for the period ended May 31, 2016.
| Value at 5/31/15 | Purchases Cost | Sales Proceeds | Realized Gain/(Loss) | Income Distributions | Capital Gain Distributions | Value at 5/31/16 | ||||||||||||||||||||||
| Deutsche X-trackers CSI 300 China A-Shares Hedged Equity ETF1 | ||||||||||||||||||||||||||||
Deutsche X-trackers Harvest CSI 300 China A-Shares ETF | $ | — | $ | 3,869,344 | $ | (1,357,230 | ) | $ | (9,185 | ) | $ | 11,555 | $ | 285,262 | $ | 2,183,045 | ||||||||||||
| Deutsche X-trackers MSCI All China Equity ETF | ||||||||||||||||||||||||||||
Deutsche X-trackers Harvest CSI 300 China A-Shares ETF | 8,759,229 | 1,257,774 | (3,366,659 | ) | (961,145 | ) | 45,578 | 1,125,090 | 2,608,494 | |||||||||||||||||||
Deutsche X-trackers Harvest CSI 500 China A-Shares Small Cap ETF | 3,073,688 | 467,481 | (1,581,807 | ) | (659,264 | ) | 6,523 | 127,277 | 519,514 | |||||||||||||||||||
|
|
|
|
|
|
|
|
|
|
|
|
|
| |||||||||||||||
| $ | 11,832,917 | $ | 1,725,255 | $ | (4,948,466 | ) | $ | (1,620,409 | ) | $ | 52,101 | $ | 1,252,367 | $ | 3,128,008 | |||||||||||||
|
|
|
|
|
|
|
|
|
|
|
|
|
| |||||||||||||||
| 1 | For the period from October 20, 2015 (commencement of operations) to May 31, 2016. |
5. Investment Portfolio Transactions
For the year ended May 31, 2016, the cost of investments purchased and proceeds from sale of investments (excluding in-kind transactions and short-term investments) were as follows:
| Purchases | Sales | |||||||
Deutsche X-trackers CSI 300 China A-Shares Hedged Equity ETF1 | $ | 2,861,540 | $ | 80,008 | ||||
Deutsche X-trackers Harvest CSI 300 China A-Shares ETF | 881,516,742 | 1,632,729,429 | ||||||
Deutsche X-trackers Harvest CSI 500 China A-Shares Small Cap ETF | 79,922,277 | 100,513,533 | ||||||
Deutsche X-trackers MSCI All China Equity ETF | 4,695,186 | 4,368,826 | ||||||
For the year ended May 31, 2016, the cost of in-kind purchases and proceeds from in-kind sale were as follows:
| Purchases | Sales | |||||||
Deutsche X-trackers CSI 300 China A-Shares Hedged Equity ETF1 | $ | 1,007,804 | $ | 1,277,222 | ||||
Deutsche X-trackers MSCI All China Equity ETF | — | 3,971,512 | ||||||
| 1 | For the period from October 20, 2015 (commencement of operations) to May 31, 2016. |
6. Fund Share Transactions
As of May 31, 2016 there were unlimited Fund shares, no par value authorized by the Trust. Fund shares are issued and redeemed by each Fund only in Creation Units or multiples thereof. Except when aggregated in Creation Units, shares of each Fund are not redeemable. Transactions in capital shares for each Fund are disclosed in detail in the Statements of Changes in Net Assets. The consideration for the purchase of Creation Units of Deutsche X-trackers CSI 300 China A-Shares Hedged Equity ETF and Deutsche X-trackers MSCI All China Equity ETF generally consists of the in-kind contribution of a designated portfolio of securities constituting a portfolio sampling representation of the securities included in the respective Fund’s underlying index and an amount of cash, which under certain circumstances may include cash in lieu of portfolio securities. The purchase of Creation Units for Deutsche X-trackers Harvest CSI 300 China A-Shares ETF and Deutsche X-trackers Harvest CSI 500 China A-Shares Small Cap ETF are generally issued in exchange for a specific amount of cash totaling the NAV of the Creation Units. Investors purchasing and redeeming Creation Units pay a purchase transaction fee and
53
DBX ETF Trust
Notes to financial statements (Continued)
a redemption transaction fee to offset transfer and other transaction costs associated with the issuance and redemption of Creation Units.
7. Investing in China
Investing in securities of Chinese issuers involves certain risks and considerations not typically associated with investing in securities of U.S. issuers, including, among others; the small size of the market for Chinese securities and the low volume of trading, resulting in lack of liquidity and in price volatility; currency devaluations and other currency exchange rate fluctuations or blockage; the nature and extent of intervention by the Chinese government in the Chinese securities markets, whether such intervention will continue and the impact of such intervention or its discontinuation; the risk of nationalization or expropriation of assets; the risk that the Chinese government may decide not to continue to support economic reform programs; limitations on the use of brokers; higher rates of inflation; greater political, economic and social uncertainty; market volatility caused by any potential regional territorial conflicts or natural disasters; the risk of increased trade tariffs, embargoes and other trade limitations; and custody risks associated with investing through a RQFII.
8. Line of Credit
The Trust has entered into a senior unsecured credit facility with a syndication of banks which allows the Deutsche X-trackers Harvest CSI 300 China A-Shares ETF, Deutsche X-trackers Harvest CSI 500 China A-Shares Small Cap ETF and certain other funds managed by the Advisor to borrow up to $130 million. Each Fund may borrow money under this credit facility to the extent necessary for temporary or emergency purposes, including the funding of shareholder redemption requests, trade settlements, and as necessary to distribute to shareholders any income necessary to maintain each Fund’s status as a regulated investment company. Borrowings are charged an interest rate of 1.25% per annum plus the greater of the Federal Funds Effective Rate or the one-month LIBOR Rate. Each Fund may borrow up to a maximum of 33 percent of its net assets as permitted by the Act.
Under the Credit Facility, during the year ended May 31, 2016, the Deutsche X-trackers Harvest CSI 300 China A-Shares ETF had an average loan balanced of $52,600,000, with an average interest rate of 1.453%, with a loan outstanding for 2 days. The Deutsche X-trackers Harvest CSI 500 China A-Shares Small Cap ETF had an average loan balance of $2,616,667 with an average interest rate of 1.506%, with a loan outstanding for 3 days. The Funds had no outstanding loans at May 31, 2016.
9. Developments in the China Market
In response to the volatility that occurred in the China Stock Market, the Chinese Authorities employed measures in an effort to stabilize the market and enhance liquidity. These measures included cutting interest rates, suspending new issuances and restricting certain sales for insiders and significant shareholders. The result of these measures is uncertain. Please refer to Note 7, which further discusses the risks and considerations around investing in China.
10. Payments by Affiliates
During the year ended May 31, 2016, the Advisor agreed to reimburse Deutsche X-trackers CSI 300 China A-Shares ETF and Deutsche X-trackers MSCI All China Equity ETF $14,225 and $515, respectively, for the diluting effect of accounting adjustments related to certain investments held by the Funds. The amounts reimbursed were less than 0.01% of the Funds’ average net assets, thus having no impact on the Funds’ total returns.
54
DBX ETF Trust
Report of independent registered public accounting firm
To Board of Trustees and Shareholders of
DBX ETF Trust:
We have audited the accompanying statements of assets and liabilities of Deutsche X-trackers CSI 300 China A-Shares Hedged Equity ETF, Deutsche X-trackers Harvest CSI 300 China A-Shares ETF, Deutsche X-trackers Harvest CSI 500 China A-Shares Small Cap ETF and Deutsche X-trackers MSCI All China Equity ETF (the “Funds” within DBX ETF Trust), including the schedules of investments, as of May 31, 2016, and the related statements of operations and cash flows (for Deutsche X-trackers Harvest CSI 500 China A-Shares Small Cap ETF), statements of changes in net assets and the financial highlights for each of the periods indicated therein. These financial statements and financial highlights are the responsibility of the Funds’ management. Our responsibility is to express an opinion on these financial statements and financial highlights based on our audits.
We conducted our audits in accordance with the standards of the Public Company Accounting Oversight Board (United States). Those standards require that we plan and perform the audit to obtain reasonable assurance about whether the financial statements and financial highlights are free of material misstatement. We were not engaged to perform an audit of the Funds’ internal control over financial reporting. Our audits included consideration of internal control over financial reporting as a basis for designing audit procedures that are appropriate in the circumstances, but not for the purpose of expressing an opinion on the effectiveness of the Funds’ internal control over financial reporting. Accordingly, we express no such opinion. An audit also includes examining, on a test basis, evidence supporting the amounts and disclosures in the financial statements and financial highlights, assessing the accounting principles used and significant estimates made by management, and evaluating the overall financial statement presentation. Our procedures included confirmation of securities owned as of May 31, 2016 by correspondence with the custodian and brokers or by other appropriate auditing procedures where replies from brokers were not received. We believe that our audits provide a reasonable basis for our opinion.
In our opinion, the financial statements and financial highlights referred to above present fairly, in all material respects, the financial position of Deutsche X-trackers CSI 300 China A-Shares Hedged Equity ETF, Deutsche X-trackers Harvest CSI 300 China A-Shares ETF, Deutsche X-trackers Harvest CSI 500 China A-Shares Small Cap ETF and Deutsche X-trackers MSCI All China Equity ETF at May 31, 2016, the results of their operations and cash flows (for Deutsche X-trackers Harvest CSI 500 China A-Shares Small Cap ETF), changes in their net assets and the financial highlights for each of the periods indicated therein in conformity with U.S. generally accepted accounting principles.

New York, New York
July 26, 2016
55
DBX ETF Trust
Trustees and officers (Unaudited)
| Name, Year of Birth and Address | Position(s) Held with Fund | Terms of Office and Length of Time Served | Principal Occupation(s) During Past 5 Years | Number of Portfolios in Fund Complex Overseen by Trustee | Other Directorships held by Trustee During Past 5 Years | |||||
Independent Trustees | ||||||||||
J. David Officer (1948) 345 Park Avenue New York, New York 10154 | Trustee, Chairman of the Nominating Committee and Member of the Audit Committee | Since 2011 (Chairman | Independent Director (2010-present); formerly, Vice Chairman, the Dreyfus Corporation (2006-2009); President, The Dreyfus Family of Funds, Inc. (2006-2009). | 36 | Ilex Partners (Asia), LLC; Old Westbury Funds; MAN Long/Short Fund; GLG Investment Series Trust. | |||||
Stephen R. Byers (1953) 345 Park Avenue New York, New York 10154 | Lead Independent Trustee, Member of the Audit and Nominating Committees | Since 2011 (Trustee and Member of Committees) (Lead | Independent Consultant (2014-present). | 36 | The Arbitrage Funds; Sierra Income Corporation; College of William and Mary, Graduate School of Business; Lighthouse Growth Advisors LLC; Founders Asset Management, LLC. | |||||
George O. Elston (1964) 345 Park Avenue New York, New York 10154 | Trustee, Chairman of the Audit Committee and Member of the Nominating Committee | Since 2011 (Chairman | Senior Vice President and Chief Financial Officer, Juniper Pharmaceuticals, Inc. (2014-present); Senior Vice President and Chief Financial Officer, KBI BioPharma Inc. (2013-2014); Managing Partner, Chatham Street Partners (2010-2013). | 36 | Celldex Therapeutics, Inc. | |||||
56
DBX ETF Trust
Trustees and officers (Unaudited) (Continued)
| Name, Year of Birth and Address | Position(s) Held with Fund | Terms of Office and Length of Time Served | Principal Occupation(s) During Past 5 Years | Number of Portfolios in Fund Complex Overseen by Trustee | Other Directorships held by Trustee During Past 5 Years | |||||
Interested Trustee | ||||||||||
Alex Depetris (1980) 345 Park Avenue New York, New York 10154 | Trustee, Chairman of the Board, President and Chief Executive Officer | Since 2010 | Director in the Deutsche Asset Management Passive Asset Management Group at Deutsche Bank AG (2008-present); Manager and Chief Operating Officer of the Adviser (2012-present); Associate, Arnold & Porter (2006-2008). | 36 | Director, Chairman of the Board of db-X Exchange Traded Funds Inc. | |||||
| Name, Year of Birth and Address | Position(s) Held with Fund | Terms of Office Time Served | Principal Occupation(s) During Past 5 Years | |||||||
Officers | ||||||||||
Michael Gilligan (1966) 60 Wall Street New York, New York 10005 | Treasurer, Chief Financial Officer and Controller | Since 2010 | Director in the Finance Division at Deutsche Bank AG (2008-present); Manager and Chief Financial Officer of the Adviser (2010-present); Chief Financial Officer of Global Passive Asset Management Platform (2012-present). | |||||||
Fiona Bassett (1974) 345 Park Avenue New York, New York 10154 | Chief Operating Officer | Since 2014 | Managing Director in the Deutsche Asset Management Passive Asset Management Group at Deutsche Bank AG and Head of Passive Americas Asset Management Platform (2014-present); Manager and Chief Executive Officer and Chief Investment Officer of the Adviser (2014-present); Managing Director, COO Global Key Projects and Integration at Deutsche Asset Management, (2012-2014); Managing Director at Deutsche Bank AG (2004-2012). | |||||||
Frank Gecsedi (1967) 60 Wall Street New York, New York 10005 | Chief Compliance Officer | Since 2010 | Director in the Deutsche Asset Management Compliance Department (2016-present), Vice President in the Deutsche Asset Management Compliance Department (2013-2016) and Chief Compliance Officer of the Adviser (2010-present); Vice President in Deutsche Bank’s Global Markets Legal, Risk and Capital Division (2010-2012). | |||||||
Leslie Lowenbraun (1953) 60 Wall Street New York, New York 10005 | Secretary | Since 2016 | Vice President in U.S. Retail Passive Legal of Deutsche Asset Management (2014-present); Counsel at Skadden, Arps, Slate, Meagher & Flom LLP (2005-2014). | |||||||
Each Trustee serves until his or her successor is duly elected or appointed and qualified. Each officer serves until he or she resigns, is removed, dies, retires or becomes disqualified.
The Funds’ SAI includes additional information about the Funds’ Trustees and is available by calling 855-329-3837, or on the Company’s website at www.dbxus.com.
57
DBX ETF Trust
Board considerations in approval of investment advisory and
sub-advisory contracts (Unaudited)
Deutsche X-trackers CSI 300 China A-Shares Hedged Equity ETF and Deutsche X-trackers MCSI All China Equity ETF
After discussions at meetings of the Board of Trustees (“Board” or “Trustees”) held on February 25, 2016 and February 28, 2016, at the February 28 meeting the Trustees, including the Independent Trustees (those not affiliated with DBX ETF Trust (the “Trust”) or its service providers), unanimously approved the continuance of the Investment Advisory Agreement with respect to Deutsche X-trackers MSCI All China Equity ETF and Deutsche X-trackers CSI 300 China A-Shares Hedged Equity ETF (each a “Fund,” and collectively, the “Funds”). The Independent Trustees were advised throughout the review and meetings by Independent Trustee Counsel.
In reaching this decision, the Board considered all factors it believed relevant, including (1) the nature, extent and quality of the services provided to the Funds and their shareholders; (2) the financial resources of DBX Advisors LLC (“DBX” or the “Adviser”) and its resulting ability to perform its obligations under the Investment Advisory Agreement; (3) the competitiveness of the advisory fee; (4) the total cost of the services provided by and the profits realized by the Adviser from its relationship with the Funds; and (5) the extent to which economies of scale have been realized, and if the Funds’ shareholders have benefitted from those economies.
The Board reached a determination, with the assistance of Trust Counsel and through the exercise of its business judgment, that approval of the Investment Advisory Agreement and the compensation to be received thereunder is in the best interests of each Fund and its shareholders as well as consistent with the Board’s duties under state and federal law. The Board reached this conclusion based on multiple factors.
Nature, Extent and Quality of Services. The Board reviewed in detail the nature, extent and quality of services provided by the Adviser under the Investment Advisory Agreement. The Board noted that these services include, among other things, furnishing a continuous investment program for the Funds, including arranging for, or implementing, the purchase and sale of portfolio securities, the provision of general corporate services such as portfolio management compliance services and the preparation and filing of certain reports on behalf of the Trust. The Board also considered, among other things, the professional experience and qualifications of the senior management and key professional personnel of the Adviser, including those individuals responsible for portfolio management. The Board considered that the Adviser provides, at its own expense, office facilities and equipment for use by the Funds and supervisory persons responsible for supervising and monitoring the Trust’s service providers. The Board also considered that the Adviser pays for the compensation of officers of the Trust who are also officers or employees of the Adviser, except as may otherwise be determined by the Board. The Board also considered that the Adviser arranges for the provision of transfer agency, custody, fund administration and accounting, and other non-distribution services necessary for the Funds’ operations. The Board also noted that in addition to managing the Funds’ portfolios directly, the Adviser provides oversight of day-to-day operations, including monitoring tracking error, providing services in connection with the creation and redemption of creation units and assistance in meeting legal and regulatory requirements applicable to the Funds.
Based on its review, the Board concluded that the nature, extent, and quality of services provided by the Adviser under the Investment Advisory Agreement are reasonable and appropriate in relation to the fees paid to the Adviser, taking special consideration of the fact that the advisory fee is a unitary fee and, as a result, a portion of the unitary advisory fee will be used to compensate the Funds’ service providers. The Board considered the staffing of the Adviser, including the training, qualifications and experience of investment personnel in managing the Funds. The Board also considered the expertise of the Adviser in supervising third party service providers to the Funds, such as the administrator and the custodian. The Board further considered the compliance program of the Adviser which supports the Funds’ compliance program.
Adviser’s Financial Resources. In connection with the assessment of the ability of the Adviser to perform its duties under the Investment Advisory Agreement, the Board considered the Adviser’s financial condition and whether it had the resources necessary to carry out its functions. The Board concluded that the Adviser had the financial resources necessary to perform its obligations under the Investment Advisory Agreement.
Reasonableness of Advisory Fee. The Board compared each Fund’s advisory fee to that of other exchange-traded funds (“ETFs”), and noted that each Fund’s fee is competitive with the fees of its respective peer group. The Board noted that the fee for each of the Funds is a unitary fee pursuant to which the Adviser pays all of the
58
DBX ETF Trust
Board considerations in approval of investment advisory and
sub-advisory contracts (Unaudited) (Continued)
Fund’s costs. The Board also noted that each Fund’s portfolio is managed on a day-to-day basis by the Adviser, and that the Adviser also provides oversight of day-to-day operations, including monitoring tracking error, providing services in connection with creation and redemption units and assistance in meeting legal and regulatory requirements applicable to the Funds. Based on its review, the Board concluded that the advisory fee for each Fund is reasonable in light of the services provided.
Costs of Services and Profitability. The Board considered the expenses of the Adviser in developing and rendering services provided to the Funds, and the information provided by the Adviser to the Board regarding the Funds’ profitability. The Board noted that the Adviser had provided extensive information about the Adviser’s profitability and the Adviser’s methodology in determining profitability. The Board also noted that while the Adviser had provided information about the Adviser’s expenses relating to marketing the Funds, the Board considered the Adviser’s profitability without accounting for such expenses. The Board determined that the Adviser’s profitability with respect to each Fund was not excessive. The Board considered whether the Adviser would benefit in other ways from its relationships with the Funds, and concluded that there were no material fall-out benefits likely to accrue to the Adviser related to the operation of the Funds.
Economies of Scale. The Board noted that the Funds were not experiencing economies of scale at this time and determined to revisit this matter after the Funds had attracted more assets.
Given all the information available to it and considering all material factors, the Board concluded that the Investment Advisory Agreement was fair and reasonable and it was unanimously approved.
Deutsche X-trackers Harvest CSI 300 China A-Shares ETF and Deutsche X-trackers Harvest CSI 500 China A-Shares Small Cap ETF
After discussions at meetings of the Board of Trustees (“Board” or “Trustees”) held on February 25, 2016 and February 28, 2016, at the February 28 meeting the Trustees, including the Independent Trustees (those not affiliated with DBX ETF Trust (the “Trust”) or its service providers), unanimously approved the continuance of the Investment Advisory Agreement and Investment Sub-Advisory Agreement with respect to Deutsche X-trackers Harvest CSI 300 China A-Shares ETF and Deutsche X-trackers Harvest CSI 500 China A-Shares Small Cap ETF (the “Funds”). The Independent Trustees were advised throughout the review and meetings by Independent Trustee Counsel.
In reaching this decision with respect to the Investment Advisory Agreement, the Board considered all factors it believed relevant, including (1) the nature, extent and quality of the services provided to the Funds and their shareholders; (2) the financial resources of DBX Advisors LLC (“DBX” or the “Adviser”) and its resulting ability to perform its obligations under the Investment Advisory Agreement; (3) the competitiveness of the advisory fee; (4) the total cost of the services provided by and the profits realized by the Adviser from its relationship with the Funds; and (5) the extent to which economies of scale have been realized, and if the Funds’ shareholders have benefitted from those economies.
In reaching this decision with respect to the Investment Sub-Advisory Agreement, the Board considered all factors it believed relevant, including (1) the nature, extent and quality of the services provided to the Funds and their shareholders; (2) the performance of Harvest Global Investments Limited (“Harvest” or “Sub-Adviser”) with respect to its management of the Funds, as well as Harvest’s financial resources and its resulting ability to perform its obligations under the Investment Sub-Advisory Agreement; (3) the total cost of the services provided by and the profits realized by Harvest from its relationship with the Funds; and (4) the extent to which economies of scale have been realized, and if the Funds’ shareholders have benefitted from those economies.
The Board reached a determination, with the assistance of Trust Counsel and through the exercise of its business judgment, that approval of the Investment Advisory Agreement and the Investment Sub-Advisory Agreement and the compensation to be received thereunder is in the best interests of each Fund and its shareholders as well as consistent with the Board’s duties under state and federal law. The Board reached this conclusion based on multiple factors.
59
DBX ETF Trust
Board considerations in approval of investment advisory and
sub-advisory contracts (Unaudited) (Continued)
The Board considered the following in determining whether to approve the Investment Advisory Agreement:
Nature, Extent and Quality of Services. The Board reviewed in detail the nature, extent and quality of services provided by the Adviser under the Investment Advisory Agreement. The Board noted that these services include, among other things, furnishing a continuous investment program for the Funds, including arranging for, or implementing, the purchase and sale of portfolio securities, the provision of general corporate services such as portfolio management compliance services and the preparation and filing of certain reports on behalf of the Trust. The Board also considered, among other things, the professional experience and qualifications of the senior management and key professional personnel of the Adviser, including those individuals responsible for portfolio management. The Board considered that the Adviser provides, at its own expense, office facilities and equipment for use by the Funds and supervisory persons responsible for supervising and monitoring the Trust’s service providers. The Board also considered that the Adviser pays for the compensation of officers of the Trust who are also officers or employees of the Adviser, except as may otherwise be determined by the Board. The Board also considered that the Adviser arranges for the provision of transfer agency, custody, fund administration and accounting, and other non-distribution services necessary for the Funds’ operation. The Board also considered the role played by the Adviser in working with Harvest to manage the Funds’ portfolios, noting that the Adviser provides oversight of day-to-day operations, including monitoring tracking error, providing services in connection with the creation and redemption of creation units and assistance in meeting legal and regulatory requirements applicable to the Funds.
Based on its review, the Board concluded that the nature, extent, and quality of services provided by the Adviser under the Investment Advisory Agreement are reasonable and appropriate in relation to the fees paid to the Adviser, taking special consideration of the fact that the advisory fee is a unitary fee and, as a result, a portion of the unitary advisory fee will be used to compensate the Funds’ service providers. The Board considered the staffing of the Adviser, including the training, qualifications and experience of investment personnel in managing the Funds. The Board also considered the expertise of the Adviser in supervising third party service providers to the Funds, such as the administrator and the custodian. The Board further considered the compliance program of the Adviser which supports the Funds’ compliance program.
Adviser’s Financial Resources. In connection with the assessment of the ability of the Adviser to perform its duties under the Investment Advisory Agreement, the Board considered the Adviser’s financial condition and whether it had the resources necessary to carry out its functions. The Board concluded that the Adviser had the financial resources necessary to perform its obligations under the Investment Advisory Agreement.
Reasonableness of Advisory Fee. The Board compared each Fund’s advisory fee to that of other exchange-traded funds (“ETFs”), and noted that each Fund’s fee is competitive with the fees of its respective peer group. The Board noted that while each Fund’s advisory fees were higher than certain other ETFs in the Funds’ peer group, those other ETFs did not invest directly in A-Shares. The Board noted that the fee for the Funds is a unitary fee pursuant to which the Adviser pays all of the Funds’ costs. The Board also noted that the Funds’ portfolios are managed on a day-to-day basis by the Sub-Adviser, which receives a fee from the Adviser. The Board considered the allocation of responsibilities between the Adviser and Sub-Adviser and noted that the Adviser provides oversight of day-to-day operations, including monitoring tracking error, providing services in connection with creation and redemption units and assistance in meeting legal and regulatory requirements applicable to the Funds. Based on its review, the Board concluded that the advisory fee is reasonable in light of the services provided.
Costs of Services and Profitability. The Board considered the expenses of the Adviser in developing and rendering services to the Funds, and the information provided by the Adviser to the Board regarding the Funds’ profitability. The Board noted that the Adviser had provided extensive information about the Adviser’s profitability and the Adviser’s methodology in determining profitability. The Board also noted that while the Adviser had provided information about the Adviser’s expenses relating to marketing the Funds, the Board considered the Adviser’s profitability without accounting for such expenses. The Board determined that the Adviser’s profitability with respect to each Fund was not excessive. The Board also noted that since the fee paid by the Adviser to the Sub-Adviser under the Investment Sub-Advisory Agreement contained breakpoints, the
60
DBX ETF Trust
Board considerations in approval of investment advisory and
sub-advisory contracts (Unaudited) (Continued)
Adviser could experience increased profitability as the Funds’ assets increased. The Board considered whether the Adviser would benefit in other ways from its relationships with the Funds, and concluded that there were no material fall-out benefits likely to accrue to the Adviser related to the operation of the Funds.
Economies of Scale. The Board noted that the Funds were not experiencing economies of scale at this time and determined to evaluate the economies of scale on an ongoing basis as a result of asset growth of the Funds.
Given all the information available to it and considering all material factors, the Board concluded that the Investment Advisory Agreement was fair and reasonable and it was unanimously approved.
The Board considered the following in determining whether to approve the Investment Sub-Advisory Agreement:
Nature, Extent and Quality of Services. In considering the nature, extent and quality of services that Harvest provides to the Funds, the Board reviewed in detail the nature, extent and quality of services provided by Harvest under the Investment Sub-Advisory Agreement. The Board noted that these services include, among other things, furnishing a continuous investment program for the Funds, including arranging for, or implementing, the purchase and sale of portfolio securities.
The Board also considered Harvest’s operational capabilities and resources, and its experience in serving as investment sub-adviser to the Funds. The Board considered the professional experience and qualifications of Harvest’s senior management and key professional personnel, as well as Harvest’s depth and breadth of experience in managing investment portfolios consisting of China A-Shares, and their techniques for implementing such strategies while minimizing index tracking error. In addition, the Board considered Harvest’s operational capabilities and resources, and Harvest’s experience in managing index funds covering various asset classes. The Board noted that Harvest manages its index-based portfolios using both full replication and sampling techniques and maintains strict discipline in the implementation of its indexing strategies. To that end, the Board noted that when there are changes to a benchmark index, Harvest closely monitors any such changes to devise strategies to realign its portfolios at the lowest possible cost while tracking the respective benchmark index. The Board also noted Harvest’s processes to minimize the cost of trading.
Based on its review, the Board concluded that the nature, extent, and quality of services provided by Harvest under the Investment Sub-Advisory Agreement are reasonable and appropriate in relation to the fees paid to Harvest, taking special consideration of the fact that the fees paid to Harvest are payable by the Adviser and not the Funds.
Performance of Harvest; Harvest’s Financial Resources. The Board considered Harvest’s performance in managing the Funds and its ability to minimize tracking error. The Board concluded that, given Harvest’s capabilities and experience in managing the Funds, Harvest had generally been able to keep the Funds’ tracking error within acceptable ranges.
The Board also considered Harvest’s financial condition and whether it had the resources necessary to carry out its functions. The Board concluded that Harvest had the financial resources necessary to perform its obligations under the Investment Sub-Advisory Agreement.
Reasonableness of Sub-Advisory Fee. The Board noted that the fee paid to Harvest in respect of the Funds would be paid by the Adviser and not the Funds. The Board further noted that the fee for the Funds was a unitary fee pursuant to which the Adviser would pay all of the Funds’ costs, and thus was not directly affected by the amount of the sub-advisory fee paid to Harvest. Based on its review, the Board concluded that the sub-advisory fee was reasonable in light of the services provided.
Costs of Services and Profitability. The Board noted that the fees paid by the Adviser to Harvest under the Investment Sub-Advisory Agreement contain breakpoints. The Board further noted that specific information about Harvest’s profitability with respect to its services provided to the Funds was not available because Harvest does not calculate the profitability of its sub-advisory services on a per-Fund level. The Board also noted that the overall fees paid by each Fund remained reasonable.
61
DBX ETF Trust
Board considerations in approval of investment advisory and
sub-advisory contracts (Unaudited) (Continued)
The Board also considered whether Harvest would benefit in other ways from its relationship with the Funds. The Board discussed Harvest’s practices regarding the selection and compensation of brokers and dealers that execute portfolio transactions for the Funds and the brokers’ and dealers’ provision of brokerage services to Harvest. The Board discussed the potential benefits Harvest might derive from the Funds’ soft dollar arrangements, whereby brokers provide brokerage services to the Funds or Harvest in return for allocating fund brokerage.
Economies of Scale. The Board noted that the Funds were not experiencing economies of scale at this time and determined to evaluate the economies of scale on an ongoing basis as a result of asset growth of the Funds.
Given all the information available to it and considering all material factors, the Board concluded that the Investment Sub-Advisory Agreement was fair and reasonable and it was unanimously approved.
62
DBX ETF Trust
Additional information (Unaudited)
Proxy Voting Policies and Procedures
The Funds’ policies and procedures for voting proxies for portfolio securities and information about how each Fund voted proxies related to its portfolio securities during the 12-month period ended June 30 are available on our Web site — www.deutsche-etfs.com (click on “proxy voting” at the bottom of the page) — or on the SEC’s Web site — www.sec.gov. To obtain a written copy of the Funds’ policies and procedures without charge, upon request, call us toll free at (855) 329-3837.
Quarterly Portfolio Disclosure
The Funds are required to file their complete schedule of portfolio holdings with the SEC for their first and third fiscal quarters on Form N-Q. Copies of the filings are available without charge, upon request on the SEC’s website at www.sec.gov and are available by calling the Company at 855-329-3837. You can also obtain copies of Form N-Q by (i) visiting the SEC’s Public Reference Room in Washington, DC (information on the operation of the Public Reference Room may be obtained by calling 800-SEC-0330); (ii) sending your request and a duplicating fee to the SEC’s Public Reference Room, Washington, DC 20549-0102; or (iii) sending your request electronically to publicinfo@sec.gov.
Information about each Fund’s portfolio holdings is available daily at www.deutsche-etfs.com.
Discount & Premium Information
Information regarding how often shares of each Fund traded on NYSE Arca at a price above (i.e., at a premium) or below (i.e., at a discount) the Net Asset Value of the Fund can be found at www.deutsche-etfs.com.
Tax Information
Form 1099-DIV and other year-end tax information provide shareholders with actual calendar year amounts that should be included in their tax returns. Shareholders should consult their tax advisors.
Each Fund designates the following amounts or, if subsequently determined to be different, the maximum allowable for its fiscal year ended May 31, 2016.
| Qualified Dividend Income* | ||||
Deutsche X-trackers Harvest CSI 300 China A-Shares ETF | 12% | |||
Deutsche X-trackers Harvest CSI 500 China A-Shares Small Cap ETF | 4% | |||
Deutsche X-trackers MSCI All China Equity ETF | 8% | |||
* The above percentage is based on ordinary income paid to shareholders during each Fund’s fiscal year.
Each Fund intends to elect to pass through to shareholders the credit for taxed paid to foreign countries. The gross foreign source income and foreign taxes paid are as follows:
| Gross Foreign Income | Foreign Taxes Paid | |||||||
Deutsche X-trackers Harvest CSI 300 China A-Shares ETF | $12,856,674 | $1,292,209 | ||||||
Deutsche X-trackers MSCI All China Equity ETF | 1,269,861 | 11,238 | ||||||
63
DBX ETF Trust
Privacy policy notice (Unaudited)
DBX Advisors LLC (“Advisors”) collects non-public information about you from the following sources: (i) information received from you on applications or other forms; and (ii) information about your transactions with the Advisors, Advisors’ affiliates and third-party service providers and vendors. Advisors does not disclose any non-public personal information about you to anyone, other than as set forth below, as permitted by applicable law and regulation. Advisors may disclose non-public personal information about you to the funds in which you invest, to Advisors’ affiliates, and to non-affiliated companies that work with Advisors to service your account(s), or to provide services or process transactions that you have requested. Advisors may disclose non-public personal information in situations that may include, but are not limited to, in response to legal and/or regulatory inquiries and the proposed or actual sale, assignment merger or other transfer of all or a portion of Advisors’ business to another business entity. Advisors may also disclose non-public personal information about you to parties representing you, such as your investment representative, your accountant, your tax adviser, or to other third parties at your direction/consent. Advisors will not sell, rent, license or trade your personal and financial information to or with third parties for their own direct marketing use unless you give us general or specific consent to do so. If you decide to close your account(s) or become an inactive customer, Advisors will adhere to the privacy policies and practices as described in this notice. Advisors restricts access to your personal and account information to those employees who need to know that information to provide products and services to you. Advisors maintains reasonable and customary physical, electronic and procedural safeguards to guard your non-public personal information.
Advisors reserves the right, at their discretion, to change, modify, add, or remove portions of this Privacy Policy Notice, and any of the policies described herein, at any time. Advisors will indicate any such changes to the Privacy Policy Notice at the privacy link which can be found at www.deutsche-etfs.com. At all times, you are bound by the then-current version of the Privacy Policy and all applicable laws. Advisors highly recommends that you review this Privacy Policy Notice from time to time to ensure that you are familiar with the most recent version. The examples contained in this Privacy Policy Notice are illustrations; they are not intended to be exclusive.
64
DBX ETF Trust
This report is intended for the shareholders of DBX ETF Trust.
Carefully consider a Fund’s investment objectives, risk factors and charges and expenses before investing. This and other information can be found in the Fund’s prospectus, which may be obtained by calling 1-855-DBX-ETFS (1-855-329-3837), or by viewing or downloading a prospectus at www.deutsche-etfs.com. Read the prospectus carefully before investing.
Investing involves risk, including possible loss of principal. Stocks may decline in value. Foreign investing involves greater and different risks than investing in US companies, including currency fluctuations, less liquidity, less developed or less efficient trading markets, lack of comprehensive company information, political instability and differing auditing and legal standards. Funds investing in a single industry, country or in a limited geographic region generally are more volatile than more diversified funds. Emerging markets tend to be more volatile and less liquid than the markets of more mature economies, and generally have less diverse and less mature economic structures and less stable political systems than those of developed countries. Special risks associated with investments in Chinese companies include exposure to currency fluctuations, less liquidity, less developed or less efficient trading markets, lack of comprehensive company information, political instability and differing auditing and legal standards the nature and extent of intervention by the Chinese government in the Chinese securities markets, and the potential unavailability of A shares. Uncertainties in the Chinese tax rules governing taxation of income and gains from investments in A-shares could result in unexpected tax liabilities for the Funds which may reduce Fund returns. Any reduction or elimination of access to A-shares will have a material adverse effect on the ability of the Funds to achieve its investment objective. The Deutsche X-trackers CSI 300 China A-Shares Hedged Equity ETF use of forward currency contracts may not be successful in hedging currency exchange rates changes and could eliminate some or all of the benefit of an increase in the value of a foreign currency vs. the U.S. dollar. The Deutsche X-trackers CSI 300 China A-Shares Hedged Equity ETF aims to hedge the currency exposure by entering into forward transactions linked to the CNH/USD exchange rate. The equity shares included in the CSI 300 index may be valued using the CNY/USD exchange rate. The difference between the CNH/USD and CNH/USD exchange rates may lead to tracking errors in the fund. Performance of the Funds may diverge from that of the Underlying Index due to operating expenses, transaction costs, cash flows, use of sampling strategies or operational inefficiencies. An investment in these Funds should be considered only as a supplement to a complete investment program for those investors willing to accept the risks associated with the Funds. See the prospectus for details.
Shares of the Funds are bought and sold at market price (not NAV) throughout the day on the New York Stock Exchange. Transactions in Fund shares may result in brokerage commissions and may generate tax consequences. There can be no assurance that an active trading market for shares of a fund will develop or be maintained.
DBX ETF Trust Funds are distributed by ALPS Distributors, Inc. The Funds are managed by DBX Advisors LLC which is not affiliated with ALPS.
Deutsche Asset Management is the brand name for the asset management activities conducted by Deutsche Bank AG or any of its subsidiaries. Clients will be provided Deutsche Asset Management products or services by one or more legal entities that will be identified to clients pursuant to the contracts, agreements, offering materials or other documentation relevant to such products or services.
The CSI Indexes are calculated by China Securities Index Co., Ltd. (CSI). CSI does not make any warranties, express or implied, to its customers or any other party regarding the accuracy or completeness of any data related to the Index. All information is provided for information purposes only. CSI accepts no liability for any errors or any loss arising from the use of information it provides.
The funds or securities referred to herein are not sponsored, endorsed, or promoted by MSCI, and MSCI bears no liability with respect to any such funds or securities or any index on which such funds or securities are based. The prospectus contains a more detailed description of the limited relationship MSCI has with DBX and any related funds.
Copyright © 2016 Deutsche Bank AG. All rights reserved. Deutsche X-trackers® is a registered trademark of Deutsche Bank AG. All other trademarks, servicemarks or registered trademarks are the property of their respective owners.
Not FDIC Insured | No Bank Guarantee | May Lose Value
DBX ETF Trust
Investment advisor DBX Advisors LLC 345 Park Ave. New York, NY 10154 | Investment sub-advisor Harvest Global Investments Limited 31/F, One Exchange Square 8 Connaught Place Central, Hong Kong | Administrator, custodian, The Bank of New York Mellon 101 Barclay Street New York, NY 10286 | ||
Distributor ALPS Distributors, Inc. 1290 Broadway Suite 1100 Denver, CO 80203 | Independent registered public accounting firm Ernst & Young LLP 5 Times Square New York, NY 10036 | Legal counsel Dechert LLP 1095 Avenue of the Americas New York, NY 10036 | ||
R-35360-3 (7/16) DBX 002026 (7/17)

May 31, 2016
Annual Report
DBX ETF Trust
Deutsche X-trackers Dow Jones Hedged International Real Estate ETF (DBRE)
Deutsche X-trackers Japan JPX-Nikkei 400 Equity ETF (JPN)
Deutsche X-trackers Japan JPX-Nikkei 400 Hedged Equity ETF (JPNH)
Deutsche X-trackers MSCI Australia Hedged Equity ETF (DBAU)
Deutsche X-trackers MSCI EAFE Small Cap Hedged Equity ETF (DBES)
Deutsche X-trackers MSCI Italy Hedged Equity ETF (DBIT)
Deutsche X-trackers MSCI Southern Europe Hedged Equity ETF (DBSE)
Deutsche X-trackers MSCI Spain Hedged Equity ETF (DBSP)
Deutsche X-trackers S&P Hedged Global Infrastructure ETF (DBIF)

DBX ETF Trust
| Page | ||||
| 1 | ||||
| 3 | ||||
Deutsche X-trackers Dow Jones Hedged International Real Estate ETF | 6 | |||
| 8 | ||||
| 10 | ||||
| 12 | ||||
| 14 | ||||
| 16 | ||||
| 18 | ||||
| 20 | ||||
| 22 | ||||
| 24 | ||||
Deutsche X-trackers Dow Jones Hedged International Real Estate ETF | 26 | |||
| 34 | ||||
| 38 | ||||
| 42 | ||||
| 45 | ||||
| 56 | ||||
| 58 | ||||
| 60 | ||||
| 62 | ||||
| 68 | ||||
| 71 | ||||
| 74 | ||||
| 77 | ||||
| 82 | ||||
| 96 | ||||
| 97 | ||||
Board Considerations in Approval of Investment Advisory and Sub-Advisory Contracts (Unaudited) | 99 | |||
| 102 | ||||
| 103 | ||||
To our shareholders: (Unaudited)
Dear Shareholder,
We are pleased to provide this annual report for the period ended May 31, 2016.
Global financial markets witnessed increased volatility mainly due to the slowdown in China, falling commodity prices and divergent central bank policies. With increasing downside risks to growth and inflation persistently below target, the European Central Bank (ECB) and Bank of Japan (BoJ) pursued policy accommodation by easing monetary policies. The Federal Reserve Board (FRB) hiked rates in December on the back of improving labor market conditions and strong macroeconomic growth. Commodity prices remained low on the back of abundant supply and weak demand.
Real estate market performance across much of the Asia Pacific region has been relatively attractive in light of strong capital markets and strengthening leasing markets. The US has become a popular infrastructure investment option, driven by its overall economic position, low-risk environment and strong financial sector. The US commercial real estate market performed well, driven by robust rental income growth and improving labor markets. Real estate investment in Japan remained resilient, owing to a healthy corporate sector, increasing number of inbound tourists and improving leasing markets. Japan’s government recently announced the roll out of a USD 200 billion plan to promote high-quality infrastructure development around the world. This is an extension to the existing USD 110 billion plan announced over a year ago.
The Eurozone economy sustained its growth momentum in Q1 2016, despite weaker Chinese data and a continued slump in oil prices. Its recovery is supported by improving labor conditions and less austere fiscal positions. However, external sector data continues to be weak. Market dynamics in Japan were dominated by the BoJ’s unexpected move to a negative interest rate policy, which appeared to have repercussions throughout the financial system. Economic growth in Spain was underpinned by increased consumer spending, robust domestic demand, subdued oil prices and revenues from tourism. Meanwhile, in Italy, household consumption, fixed investment and net exports were the main drivers of growth. The Australian economy continued to rebalance since the latter half of 2015 following the mining investment boom. The Reserve Bank of Australia cut cash rates on unexpectedly low inflation data, in addition to a challenging external environment.
The global real estate market is expected to grow on the back of stable inflationary policy and decreasing unemployment, which continue to benefit asset prices, thereby potentially increasing demand for real estate. Demand for private capital in the infrastructure spectrum is expected to grow due to significant gaps in government budgets.
Our team appreciates your trust and looks forward to serving your investment needs through innovative index-driven strategies.
Sincerely,
/s/ Alex N. Depetris
Alex N. Depetris
Chairman, President and Chief Executive Officer
Assumptions, estimates and opinions contained in this document constitute our judgment as of the date of the document and are subject to change without notice. Any projections are based on a number of assumptions as to market conditions and there can be no guarantee that any projected results will be achieved. Past performance is not a guarantee of future results.
1
This Page is Intentionally Left Blank
2
DBX ETF Trust
Management’s discussion of fund performance (Unaudited)
Deutsche X-trackers Dow Jones Hedged International Real Estate ETF
The Deutsche X-trackers Dow Jones Hedged International Real Estate ETF (DBRE) seeks investment results that correspond generally to the performance, before fees and expenses, of the Dow Jones Global ex-U.S. Select Real Estate Securities Total Return Net Index (USD) Hedged (the DBRE Index). The DBRE Index seeks exposure to an alternative income source via a broad range of international residential real estate investment trusts (REITs) and real estate operating companies (REOCs), while mitigating exposure to fluctuations between the value of the USD and 17 non-US currencies. For the 12-month period ended May 31, 2016, DBRE shares returned -0.96% compared with the DBRE Index return of -0.61%.
Australia, Japan and France contributed positively to Index performance. Meanwhile, the UK and Hong Kong were the main contributors to negative performance.
The Deutsche X-trackers Japan JPX-Nikkei 400 Equity ETF
The Deutsche X-trackers Japan JPX-Nikkei 400 Equity ETF (JPN) seeks to track, before fees and expenses, the JPX-Nikkei 400 Net Total Return Index, a benchmark consisting of 400 Japanese securities that pass a rigorous screening process. The index uses indicators such as return on equity, cumulative operating profit, and market capitalization to select high-quality, capitally efficient Japanese companies. For the period June 24, 2015 (commencement of operations) to May 31, 2016, JPN shares returned -6.78% compared with the JPN Index return of -16.25%.
Telecom Services and Healthcare were the major positive contributors to Index performance. Meanwhile, Financials, Consumer Discretionary and Information Technology contributed negatively to performance.
Deutsche X-trackers Japan JPX-Nikkei 400 Hedged Equity ETF
The Deutsche X-trackers Japan JPX-Nikkei 400 Hedged Equity ETF (JPNH) seeks investment results, before fees and expenses, of the JPX-Nikkei 400 Total Return USD Hedged Index, a new standard benchmark consisting of 400 Japanese securities selected through a rigorous screening process. The index uses indicators such as return on equity, cumulative operating profit, and market capitalization to select a series of high-quality, capitally efficient Japanese companies, with a goal of potentially minimizing any currency risk brought on by fluctuations between the value of the USD and the JPY. For the period August 19, 2015 (commencement of operations) to May 31, 2016, JPNH shares returned -16.06% compared with the JPNH Index return of -15.98%.
Financials, Consumer Discretionary and Information Technology contributed negatively to performance. Meanwhile, Telecom Services and Healthcare were the major positive contributors to Index performance.
Deutsche X-trackers MSCI Australia Hedged Equity ETF
The Deutsche X-trackers MSCI Australia Hedged Equity ETF (DBAU) seeks investment results that correspond generally to the performance, before fees and expenses, of the MSCI Australia US Dollar Hedged Index. DBAU is designed to offer investors access to Australian equities, while mitigating exposure to fluctuations between the value of the USD and the AUD. For the period August 19, 2015 (commencement of operations) to May 31, 2016, DBAU shares returned 2.98% compared with the DBAU Index return of 3.35%.
Energy and Materials contributed negatively to Index returns. Meanwhile, Financials, Industrials and Healthcare sectors in Australia were the major positive contributors to performance.
Deutsche X-trackers MSCI EAFE Small Cap Hedged Equity ETF
The Deutsche X-trackers MSCI EAFE Small Cap Hedged Equity ETF (DBES) seeks investment results that correspond generally to the performance, before fees and expenses, of the MSCI EAFE Small Cap US Dollar Hedged Index. DBES offers investors access to small-cap developed market equities, while seeking to mitigate exposure to fluctuations between the value of the USD and select foreign currencies. For the period August 19, 2015 (commencement of operations) to May 31, 2016, DBES shares returned -1.96% compared with the DBES Index return of -0.78%.
Financials, Consumer Discretionary and Energy sectors contributed negatively to performance. However, Consumer Staples and Information Technology were the positive contributors to Index performance. Japan and Australia contributed positively to Index performance.
3
DBX ETF Trust
Management’s discussion of fund performance (Unaudited) (Continued)
Deutsche X-trackers MSCI Italy Hedged Equity ETF
The Deutsche X-trackers MSCI Italy Hedged Equity ETF (DBIT) seeks investment results that correspond generally to the performance, before fees and expenses, of the MSCI Italy 25/50 US Dollar Hedged Index. DBIT offers investors access to large- and mid-cap Italian equities, while seeking to mitigate exposure to fluctuations between the value of the USD and the EUR. For the period August 19, 2015 (commencement of operations) to May 31, 2016, DBIT shares returned -21.29% compared with the DBIT Index return of -21.33%.
The Financials sector was a significant negative contributor to Index performance whereas Utilities sector was the only positive contributor among all sectors.
Deutsche X-trackers MSCI Southern Europe Hedged Equity ETF
The Deutsche X-trackers MSCI Southern Europe Hedged Equity ETF (DBSE) seeks investment results that correspond generally to the performance, before fees and expenses, of the MSCI Southern Europe US Dollar Hedged Index. DBSE offers investors access to large- and mid-cap equities across Italy, Portugal, and Spain, while seeking to mitigate exposure to fluctuations between the value of the USD and the EUR. For the period August 19, 2015 (commencement of operations) to May 31, 2016, DBSE shares returned -17.94% compared with the DBSE Index return of -17.85%.
Financials and Telecom Services contributed negatively to Index performance. Information Technology and Utilities were the major positive contributors to performance.
Deutsche X-trackers MSCI Spain Hedged Equity ETF
The Deutsche X-trackers MSCI Spain Hedged Equity ETF (DBSP) seeks investment results that correspond generally to the performance, before fees and expenses, of the MSCI Spain 25/50 US Dollar Hedged Index. DBSP offers investors access to large- and mid-cap Spanish equities, while seeking to mitigate exposure to fluctuations between the value of the USD and the EUR. For the period August 19, 2015 (commencement of operations) to May 31, 2016, DBSP shares returned -15.10% compared with the DBSP Index return of -14.89%.
Financials and Telecom Services contributed negatively to Index performance. Information Technology and Industrials were the major positive contributors to performance.
Deutsche X-trackers S&P Hedged Global Infrastructure ETF
The Deutsche X-trackers S&P Hedged Global Infrastructure ETF (DBIF) seeks investment results that correspond generally to the performance, before fees and expenses, of the S&P Global Infrastructure Index (USD) (Hedged) (Net TR) (the DBIF Index). The DBIF Index seeks exposure to an alternative income source via diversified exposure to the global infrastructure industry, while mitigating exposure to fluctuations between the value of the USD and non-US currencies. For the 12-month period ended May 31, 2016, DBIF returned -4.24% compared with the DBIF Index return of -4.21%.
Utilities and Industrials were the primary contributors to positive performance. Energy contributed negatively to Index returns. The US, China and Japan contributed negatively, whereas Australia and Spain were the major positive contributors.
*************************
Performance data quoted represents past performance and does not guarantee future results. Investment returns and principal value of an investment will fluctuate so that an investor’s shares, when sold or redeemed, may be worth more or less than their original cost. Current performance may be lower or higher than the performance data quoted. To obtain the most recent month-end performance data visit www.deutsche-etfs.com. Returns assume that dividends and capital gains distributions have been reinvested. See pages 6-23 of this report for additional performance information, including performance data based on market value.
The views expressed in this report reflect those of the portfolio management team only through the end of the period of the report as stated on the cover. The management team’s views are subject to change at any time based on market and other conditions and should not be construed as a recommendation. Current and future portfolio holdings are subject to risk.
4
This Page is Intentionally Left Blank
5
DBX ETF Trust
Performance summary (Unaudited)
Deutsche X-trackers Dow Jones Hedged International Real Estate ETF (DBRE)
The Deutsche X-trackers Dow Jones Hedged International Real Estate ETF (the “Fund”) seeks investment results that correspond generally to the performance, before fees and expenses, of the Dow Jones Global ex-U.S. Select Real Estate Securities Total Return Net Index (USD) Hedged (the “Underlying Index”). The Underlying Index is constructed to track the performance of publicly traded real estate securities in countries other than the United States, while mitigating exposure to fluctuations between the value of the U.S. dollar and the currencies of the countries included in the Underlying Index. It is not possible to invest directly into an index.
Performance as of 5/31/16
| Average Annual Total Return | ||||||||
| Net Asset Value | Market Value | Dow Jones Global ex- Total Return Net Index | Dow Jones Global ex- U.S. Select Real Estate Securities Net TR Index | |||||
One Year | -0.96% | -1.48% | -0.61% | -0.77% | ||||
Since Inception1 | -2.89% | -3.29% | -2.53% | -2.80% | ||||
| Cumulative Total Returns | ||||||||
| Net Asset Value | Market Value | Dow Jones Global ex- U.S. Select Real Estate Securities Total Return Net Index (USD) Hedged | Dow Jones Global ex- U.S. Select Real Estate Securities Net TR Index | |||||
One Year | -0.96% | -1.48% | -0.61% | -0.77% | ||||
Since Inception1 | -3.30% | -3.76% | -2.90% | -3.21% | ||||
1 Total returns are calculated based on the commencement of operations, 4/9/15 (“Inception”).
Past performance is no guarantee of future results. Current performance may be lower or higher than the performance data quoted. Performance data current to the most recent month-end is available at www.deutsche-etfs.com. Performance results assume reinvestment of all dividends and capital gain distributions and do not reflect the deduction of taxes that a shareholder would pay on fund distributions or on the sale of fund shares or redemption of fund creation units. The investment return and principal value of shares will vary with changes in market conditions. Shares may be worth more or less than their original cost when they are sold in the market or redeemed. Performance for certain funds may reflect a waiver of a portion of investment management fees. Without such waiver, performance would have been lower. The estimated operating expense ratio as disclosed in the most recent prospectus dated September 30, 2015, was 0.48%.
Net asset value or “NAV” is the value of one share of a fund as calculated in accordance with the standard formula for valuing mutual fund shares. The price used to calculate market return (“Market Price”) is determined by using the midpoint between the highest bid and the lowest offer on the primary stock exchange on which shares of a fund are listed for trading, as of the time that such fund’s NAV is calculated. Since shares of a fund may not have traded in the secondary market until after the fund’s inception, for the period from inception to the first day of secondary trading, the NAV of the fund is used as a proxy for the Market Price to calculate market returns. Market and NAV returns assume that dividends and capital gain distributions have been reinvested at Market Price and NAV, respectively.
An index is a statistical composite that tracks a specified financial market or sector. Unlike a fund, an index does not actually hold a portfolio of securities and therefore does not incur the expenses incurred by a fund. These expenses negatively impact fund performance. Also, market returns do not include brokerage commissions that may be payable on secondary market transactions. If brokerage commissions were included, market returns would be lower.
6
DBX ETF Trust
Performance summary (Unaudited)
Deutsche X-trackers Dow Jones Hedged International Real Estate ETF (DBRE) (Continued)
Growth of an Assumed $10,000 Investment
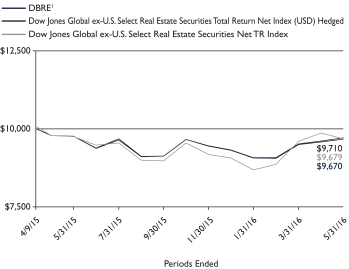
1 Based on Net Asset Value from commencement of operations, 4/9/15.
Sector Diversification* as of 5/31/16
Diversified | 35.3% | |||
Real Estate Operations/ Development | 25.0% | |||
Shopping Centers | 18.8% | |||
Office Property | 11.0% | |||
Real Estate Management/Services | 7.8% | |||
Apartments | 1.0% | |||
Storage | 0.4% | |||
Hotels | 0.3% | |||
Warehouse/Industry | 0.3% | |||
Property Trust | 0.1% | |||
|
| |||
Total | 100.0% |
Ten Largest Equity Holdings as of 5/31/16 (39.3% of Net Assets)
| Description | % of Net Assets | |||
Brookfield Asset Management, Inc. (Canada) | 7.1% | |||
Unibail-Rodamco SE (France) | 6.2% | |||
Mitsui Fudosan Co. Ltd. (Japan) | 5.3% | |||
Scentre Group (Australia) | 4.2% | |||
Westfield Corp. (Australia) | 3.5% | |||
Link REIT (Hong Kong) | 3.2% | |||
Land Securities Group PLC (United Kingdom) | 3.2% | |||
British Land Co. PLC (United Kingdom) | 2.6% | |||
Klepierre (France) | 2.0% | |||
Nippon Building Fund, Inc. (Japan) | 2.0% | |||
Country Diversification* as of 5/31/16
Japan | 23.0% | |||
United Kingdom | 14.2% | |||
Australia | 13.9% | |||
Canada | 10.6% | |||
France | 10.5% | |||
Hong Kong | 7.8% | |||
Singapore | 6.4% | |||
Philippines | 2.7% | |||
Switzerland | 2.3% | |||
Other | 8.6% | |||
|
| |||
Total | 100.0% |
* As a percent of total investments excluding securities lending collateral.
Portfolio holdings and characteristics are subject to change. For more complete details about the Fund’s investment portfolio see page 26.
7
DBX ETF Trust
Performance summary (Unaudited)
Deutsche X-trackers Japan JPX-Nikkei 400 Equity ETF (JPN)
The Deutsche X-trackers Japan JPX-Nikkei 400 Equity ETF (the “Fund”) seeks investment results that correspond generally to the performance, before fees and expenses, of the JPX-Nikkei 400 Net Total Return Index (the “Underlying Index”). The Underlying Index is designed to track the performance of equity securities of issuers who are primarily listed on the JASDAQ Stock Exchange (“JASDAQ”) or the following sections of the Tokyo Stock Exchange (“TSE”): the first section (for large companies), the second section (for middle-sized companies) and the “Mothers” (for high-growth and emerging stocks). It is not possible to invest directly into an index.
Performance as of 5/31/16
| Cumulative Total Returns | ||||||
| Net Asset Value | Market Value | JPX-Nikkei 400 Net Total Return Index | ||||
Since Inception1 | -6.78% | -7.51% | -16.25% | |||
1 Total returns are calculated based on the commencement of operations, 6/24/15 (“Inception”).
Past performance is no guarantee of future results. Current performance may be lower or higher than the performance data quoted. Performance data current to the most recent month-end is available at www.deutsche-etfs.com. Performance results assume reinvestment of all dividends and capital gain distributions and do not reflect the deduction of taxes that a shareholder would pay on fund distributions or on the sale of fund shares or redemption of fund creation units. The investment return and principal value of shares will vary with changes in market conditions. Shares may be worth more or less than their original cost when they are sold in the market or redeemed. The estimated operating expense ratio as disclosed in the most recent prospectus dated September 30, 2015, was 0.40%.
Net asset value or “NAV” is the value of one share of a fund as calculated in accordance with the standard formula for valuing mutual fund shares. The price used to calculate market return (“Market Price”) is determined by using the midpoint between the highest bid and the lowest offer on the primary stock exchange on which shares of a fund are listed for trading, as of the time that such fund’s NAV is calculated. Since shares of a fund may not have traded in the secondary market until after the fund’s inception, for the period from inception to the first day of secondary trading, the NAV of the fund is used as a proxy for the Market Price to calculate market returns. Market and NAV returns assume that dividends and capital gain distributions have been reinvested at Market Price and NAV, respectively.
An index is a statistical composite that tracks a specified financial market or sector. Unlike a fund, an index does not actually hold a portfolio of securities and therefore does not incur the expenses incurred by a fund. These expenses negatively impact fund performance. Also, market returns do not include brokerage commissions that may be payable on secondary market transactions. If brokerage commissions were included, market returns would be lower.
8
DBX ETF Trust
Performance summary (Unaudited)
Deutsche X-trackers Japan JPX-Nikkei 400 Equity ETF (JPN) (Continued)
Growth of an Assumed $10,000 Investment
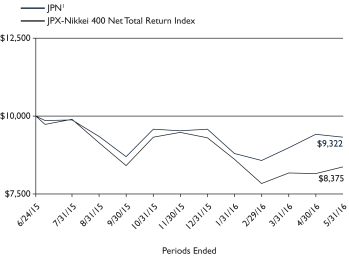
1 Based on Net Asset Value from commencement of operations, 6/24/15.
Sector Diversification* as of 5/31/16
Industrials | 20.2% | |||
Financials | 18.1% | |||
Consumer Discretionary | 17.8% | |||
Health Care | 10.5% | |||
Information Technology | 9.3% | |||
Consumer Staples | 9.1% | |||
Telecommunication Services | 6.9% | |||
Materials | 6.7% | |||
Utilities | 0.9% | |||
Energy | 0.5% | |||
|
| |||
Total | 100.0% |
Ten Largest Equity Holdings as of 5/31/16 (16.3% of Net Assets)
| Description | % of Net Assets | |||
KDDI Corp. | 2.0% | |||
Mitsui Fudosan Co. Ltd. | 2.0% | |||
Nippon Telegraph & Telephone Corp. | 1.9% | |||
Japan Tobacco, Inc. | 1.7% | |||
NTT DOCOMO, Inc. | 1.5% | |||
SMC Corp. | 1.5% | |||
Mitsubishi Estate Co. Ltd. | 1.5% | |||
Central Japan Railway Co. | 1.4% | |||
SoftBank Group Corp. | 1.4% | |||
Toyota Motor Corp. | 1.4% | |||
* As a percent of total investments excluding securities lending collateral.
Portfolio holdings and characteristics are subject to change. For more complete details about the Fund’s investment portfolio see page 34.
9
DBX ETF Trust
Performance summary (Unaudited)
Deutsche X-trackers Japan JPX-Nikkei 400 Hedged Equity ETF (JPNH)
The Deutsche X-trackers Japan JPX-Nikkei 400 Hedged Equity ETF (the “Fund”) seeks investment results that correspond generally to the performance, before fees and expenses, of the JPX-Nikkei 400 Net Total Return USD Hedged Index (the “Underlying Index”). The Underlying Index is designed to track the performance of equity securities of issuers who are primarily listed on the JASDAQ Stock Exchange (“JASDAQ”) or the following sections of the Tokyo Stock Exchange (“TSE”): the first section (for large companies), the second section (for middle-sized companies) and the “Mothers” (for high-growth and emerging stocks) while mitigating exposure to fluctuations between the value of the Japanese yen and the U.S. dollar. It is not possible to invest directly into an index.
Performance as of 5/31/16
| Cumulative Total Returns | ||||||||
| Net Asset Value | Market Value | JPX-Nikkei 400 Net Total Return USD Hedged Index | JPX-Nikkei 400 Net Total Return Index | |||||
Since Inception1 | -16.06% | -16.72% | -15.98% | -15.92% | ||||
1 Total returns are calculated based on the commencement of operations, 8/19/15 (“Inception”).
Past performance is no guarantee of future results. Current performance may be lower or higher than the performance data quoted. Performance data current to the most recent month-end is available at www.deutsche-etfs.com. Performance results assume reinvestment of all dividends and capital gain distributions and do not reflect the deduction of taxes that a shareholder would pay on fund distributions or on the sale of fund shares or redemption of fund creation units. The investment return and principal value of shares will vary with changes in market conditions. Shares may be worth more or less than their original cost when they are sold in the market or redeemed. Performance for certain funds may reflect a waiver of a portion of investment management fees. Without such waiver, performance would have been lower. The estimated operating expense ratio as disclosed in the most recent prospectus dated September 30, 2015, was 0.45%.
Net asset value or “NAV” is the value of one share of a fund as calculated in accordance with the standard formula for valuing mutual fund shares. The price used to calculate market return (“Market Price”) is determined by using the midpoint between the highest bid and the lowest offer on the primary stock exchange on which shares of a fund are listed for trading, as of the time that such fund’s NAV is calculated. Since shares of a fund may not have traded in the secondary market until after the fund’s inception, for the period from inception to the first day of secondary trading, the NAV of the fund is used as a proxy for the Market Price to calculate market returns. Market and NAV returns assume that dividends and capital gain distributions have been reinvested at Market Price and NAV, respectively.
An index is a statistical composite that tracks a specified financial market or sector. Unlike a fund, an index does not actually hold a portfolio of securities and therefore does not incur the expenses incurred by a fund. These expenses negatively impact fund performance. Also, market returns do not include brokerage commissions that may be payable on secondary market transactions. If brokerage commissions were included, market returns would be lower.
10
DBX ETF Trust
Performance summary (Unaudited)
Deutsche X-trackers Japan JPX-Nikkei 400 Hedged Equity ETF (JPNH) (Continued)
Growth of an Assumed $10,000 Investment
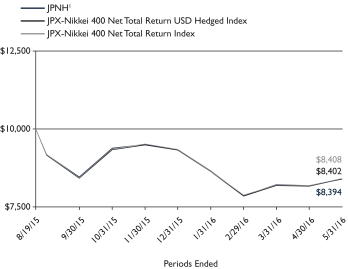
1 Based on Net Asset Value from commencement of operations, 8/19/15.
Sector Diversification* as of 5/31/16
Industrials | 21.0% | |||
Consumer Discretionary | 17.9% | |||
Financials | 16.7% | |||
Information Technology | 10.5% | |||
Health Care | 10.1% | |||
Consumer Staples | 9.8% | |||
Telecommunication Services | 6.8% | |||
Materials | 5.9% | |||
Utilities | 0.8% | |||
Energy | 0.5% | |||
|
| |||
Total | 100.0% |
Ten Largest Equity Holdings as of 5/31/16 (15.3% of Net Assets)
| Description | % of Net Assets | |||
Japan Tobacco, Inc. | 2.0% | |||
KDDI Corp. | 1.9% | |||
Nippon Telegraph & Telephone Corp. | 1.9% | |||
SoftBank Group Corp. | 1.5% | |||
NTT DOCOMO, Inc. | 1.4% | |||
Takeda Pharmaceutical Co. Ltd. | 1.4% | |||
Honda Motor Co. Ltd. | 1.4% | |||
East Japan Railway Co. | 1.3% | |||
Seven & i Holdings Co. Ltd. | 1.3% | |||
Canon, Inc. | 1.2% | |||
* As a percent of total investments excluding securities lending collateral.
Portfolio holdings and characteristics are subject to change. For more complete details about the Fund’s investment portfolio see page 38.
11
DBX ETF Trust
Performance summary (Unaudited)
Deutsche X-trackers MSCI Australia Hedged Equity ETF (DBAU)
The Deutsche X-trackers MSCI Australia Hedged Equity ETF (the “Fund”) seeks investment results that correspond generally to the performance, before fees and expenses, of the MSCI Australia US Dollar Hedged Index (the “Underlying Index”). The Underlying Index is designed to track the performance of the Australian equity market, while mitigating exposure to fluctuations between the value of the U.S. dollar and the Australian dollar. It is not possible to invest directly into an index.
Performance as of 5/31/16
| Cumulative Total Returns | ||||||||
| Net Asset Value | Market Value | MSCI Australia US Dollar Hedged Index | MSCI Australia Net Return USD Index | |||||
Since Inception1 | 2.98% | 2.65% | 3.35% | 2.82% | ||||
1 Total returns are calculated based on the commencement of operations, 8/19/15 (“Inception”).
Past performance is no guarantee of future results. Current performance may be lower or higher than the performance data quoted. Performance data current to the most recent month-end is available at www.deutsche-etfs.com. Performance results assume reinvestment of all dividends and capital gain distributions and do not reflect the deduction of taxes that a shareholder would pay on fund distributions or on the sale of fund shares or redemption of fund creation units. The investment return and principal value of shares will vary with changes in market conditions. Shares may be worth more or less than their original cost when they are sold in the market or redeemed. Performance for certain funds may reflect a waiver of a portion of investment management fees. Without such waiver, performance would have been lower. The estimated operating expense ratio as disclosed in the most recent prospectus dated September 30, 2015, was 0.45%.
Net asset value or “NAV” is the value of one share of a fund as calculated in accordance with the standard formula for valuing mutual fund shares. The price used to calculate market return (“Market Price”) is determined by using the midpoint between the highest bid and the lowest offer on the primary stock exchange on which shares of a fund are listed for trading, as of the time that such fund’s NAV is calculated. Since shares of a fund may not have traded in the secondary market until after the fund’s inception, for the period from inception to the first day of secondary trading, the NAV of the fund is used as a proxy for the Market Price to calculate market returns. Market and NAV returns assume that dividends and capital gain distributions have been reinvested at Market Price and NAV, respectively.
An index is a statistical composite that tracks a specified financial market or sector. Unlike a fund, an index does not actually hold a portfolio of securities and therefore does not incur the expenses incurred by a fund. These expenses negatively impact fund performance. Also, market returns do not include brokerage commissions that may be payable on secondary market transactions. If brokerage commissions were included, market returns would be lower.
12
DBX ETF Trust
Performance summary (Unaudited)
Deutsche X-trackers MSCI Australia Hedged Equity ETF (DBAU) (Continued)
Growth of an Assumed $10,000 Investment
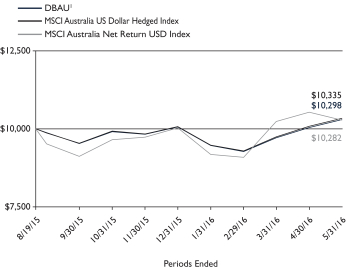
1 Based on Net Asset Value from commencement of operations, 8/19/15.
Sector Diversification* as of 5/31/16
Financials | 52.3% | |||
Materials | 13.2% | |||
Consumer Staples | 7.4% | |||
Health Care | 7.2% | |||
Industrials | 6.6% | |||
Energy | 4.7% | |||
Telecommunication Services | 2.8% | |||
Consumer Discretionary | 2.8% | |||
Utilities | 2.6% | |||
Information Technology | 0.4% | |||
|
| |||
Total | 100.0% |
Ten Largest Equity Holdings as of 5/31/16 ( 52.6% of Net Assets)
| Description | % of Net Assets | |||
Commonwealth Bank of Australia | 11.2% | |||
Westpac Banking Corp. | 8.7% | |||
Australia & New Zealand Banking Group Ltd. | 6.3% | |||
National Australia Bank Ltd. | 6.1% | |||
BHP Billiton Ltd. | 5.2% | |||
CSL Ltd. | 4.6% | |||
Wesfarmers Ltd. | 3.9% | |||
Woolworths Ltd. | 2.4% | |||
Scentre Group | 2.1% | |||
Transurban Group | 2.1% | |||
* As a percent of total investments excluding securities lending collateral.
Portfolio holdings and characteristics are subject to change. For more complete details about the Fund’s investment portfolio see page 42.
13
DBX ETF Trust
Performance summary (Unaudited)
Deutsche X-trackers MSCI EAFE Small Cap Hedged Equity ETF (DBES)
The Deutsche X-trackers MSCI EAFE Small Cap Hedged Equity ETF (the “Fund”) seeks investment results that correspond generally to the performance, before fees and expenses, of the MSCI EAFE Small Cap US Dollar Hedged Index (the “Underlying Index”). The Underlying Index is designed to provide exposure to small cap equity securities in developed stock markets outside of the Americas, while mitigating exposure to fluctuations between the value of the U.S. dollar and the currencies of the countries included in the Underlying Index. It is not possible to invest directly into an index.
Performance as of 5/31/16
| Cumulative Total Returns | ||||||||
| Net Asset Value | Market Value | MSCl EAFE Small Cap US Dollar Hedged Index | MSCI EAFE Small Cap Net Return USD Index | |||||
Since Inception1 | -1.96% | -1.41% | -0.78% | -6.92% | ||||
1 Total returns are calculated based on the commencement of operations, 08/19/15 (“Inception”).
Past performance is no guarantee of future results. Current performance may be lower or higher than the performance data quoted. Performance data current to the most recent month-end is available at www.deutsche-etfs.com. Performance results assume reinvestment of all dividends and capital gain distributions and do not reflect the deduction of taxes that a shareholder would pay on fund distributions or on the sale of fund shares or redemption of fund creation units. The investment return and principal value of shares will vary with changes in market conditions. Shares may be worth more or less than their original cost when they are sold in the market or redeemed. Performance for certain funds may reflect a waiver of a portion of investment management fees. Without such waiver, performance would have been lower. The estimated operating expense ratio as disclosed in the most recent prospectus dated September 30, 2015, was 0.45%.
Net asset value or “NAV” is the value of one share of a fund as calculated in accordance with the standard formula for valuing mutual fund shares. The price used to calculate market return (“Market Price”) is determined by using the midpoint between the highest bid and the lowest offer on the primary stock exchange on which shares of a fund are listed for trading, as of the time that such fund’s NAV is calculated. Since shares of a fund may not have traded in the secondary market until after the fund’s inception, for the period from inception to the first day of secondary trading, the NAV of the fund is used as a proxy for the Market Price to calculate market returns. Market and NAV returns assume that dividends and capital gain distributions have been reinvested at Market Price and NAV, respectively.
An index is a statistical composite that tracks a specified financial market or sector. Unlike a fund, an index does not actually hold a portfolio of securities and therefore does not incur the expenses incurred by a fund. These expenses negatively impact fund performance. Also, market returns do not include brokerage commissions that may be payable on secondary market transactions. If brokerage commissions were included, market returns would be lower.
14
DBX ETF Trust
Performance summary (Unaudited)
Deutsche X-trackers MSCI EAFE Small Cap Hedged Equity ETF (DBES) (Continued)
Growth of an Assumed $10,000 Investment
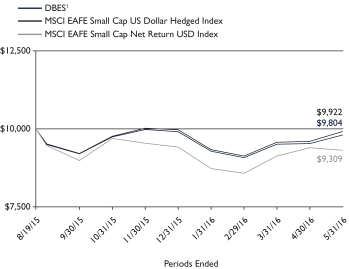
1 Based on Net Asset Value from commencement of operations, 8/19/15.
Sector Diversification* as of 5/31/16
Industrials | 22.8% | |||
Financials | 22.5% | |||
Consumer Discretionary | 14.9% | |||
Information Technology | 10.3% | |||
Materials | 8.8% | |||
Health Care | 8.3% | |||
Consumer Staples | 6.8% | |||
Energy | 2.7% | |||
Utilities | 1.8% | |||
Telecommunication Services | 1.1% | |||
|
| |||
Total | 100.0% |
Ten Largest Equity Holdings as of 5/31/16 (3.1% of Net Assets)
| Description | % of Net Assets | |||
Fingerprint Cards AB (Sweden) | 0.4% | |||
Smurfit Kappa Group PLC (Ireland) | 0.3% | |||
Rightmove PLC (United Kingdom) | 0.3% | |||
Nibe Industrier AB (Sweden) | 0.3% | |||
Sawai Pharmaceutical Co. Ltd. (Japan) | 0.3% | |||
Fisher & Paykel Healthcare Corp. Ltd. (New Zealand) | 0.3% | |||
ITO EN Ltd. (Japan) | 0.3% | |||
Gamesa Corp. Tecnologica SA (Spain) | 0.3% | |||
Teleperformance (France) | 0.3% | |||
Kiwi Property Group Ltd. (New Zealand) | 0.3% | |||
Country Diversification* as of 5/31/16
Japan | 31.0% | |||
United Kingdom | 18.1% | |||
Germany | 5.8% | |||
Australia | 5.7% | |||
Sweden | 5.3% | |||
Switzerland | 4.4% | |||
Italy | 4.0% | |||
France | 3.9% | |||
Spain | 2.4% | |||
Hong Kong | 2.3% | |||
Belgium | 2.1% | |||
Netherlands | 2.0% | |||
Other | 13.0% | |||
|
| |||
Total | 100.0% |
* As a percent of total investments excluding securities lending collateral.
Portfolio holdings and characteristics are subject to change. For more complete details about the Fund’s investment portfolio see page 45.
15
DBX ETF Trust
Performance summary (Unaudited)
Deutsche X-trackers MSCI Italy Hedged Equity ETF (DBIT)
The Deutsche X-trackers MSCI Italy Hedged Equity ETF (the “Fund”) seeks investment results that correspond generally to the performance, before fees and expenses, of the MSCI Italy 25/50 US Dollar Hedged Index (the “Underlying Index”). The Underlying Index is designed to track the performance of the Italian equity market, while mitigating exposure to fluctuations between the value of the U.S. dollar and the euro. It is not possible to invest directly into an index.
Performance as of 5/31/16
| Cumulative Total Returns | ||||||||
| Net Asset Value | Market Value | MSCl Italy 25/50 US Dollar Hedged Index | MSCl Italy 25/50 USD NETR | |||||
Since Inception1 | -21.29% | -20.98% | -21.33% | -21.20% | ||||
1 Total returns are calculated based on the commencement of operations, 8/19/15 (“Inception”).
Past performance is no guarantee of future results. Current performance may be lower or higher than the performance data quoted. Performance data current to the most recent month-end is available at www.deutsche-etfs.com. Performance results assume reinvestment of all dividends and capital gain distributions and do not reflect the deduction of taxes that a shareholder would pay on fund distributions or on the sale of fund shares or redemption of fund creation units. The investment return and principal value of shares will vary with changes in market conditions. Shares may be worth more or less than their original cost when they are sold in the market or redeemed. Performance for certain funds may reflect a waiver of a portion of investment management fees. Without such waiver, performance would have been lower. The estimated operating expense ratio as disclosed in the most recent prospectus dated September 30, 2015, was 0.45%.
Net asset value or “NAV” is the value of one share of a fund as calculated in accordance with the standard formula for valuing mutual fund shares. The price used to calculate market return (“Market Price”) is determined by using the midpoint between the highest bid and the lowest offer on the primary stock exchange on which shares of a fund are listed for trading, as of the time that such fund’s NAV is calculated. Since shares of a fund may not have traded in the secondary market until after the fund’s inception, for the period from inception to the first day of secondary trading, the NAV of the fund is used as a proxy for the Market Price to calculate market returns. Market and NAV returns assume that dividends and capital gain distributions have been reinvested at Market Price and NAV, respectively.
An index is a statistical composite that tracks a specified financial market or sector. Unlike a fund, an index does not actually hold a portfolio of securities and therefore does not incur the expenses incurred by a fund. These expenses negatively impact fund performance. Also, market returns do not include brokerage commissions that may be payable on secondary market transactions. If brokerage commissions were included, market returns would be lower.
16
DBX ETF Trust
Performance summary (Unaudited)
Deutsche X-trackers MSCI Italy Hedged Equity ETF (DBIT) (Continued)
Growth of an Assumed $10,000 Investment
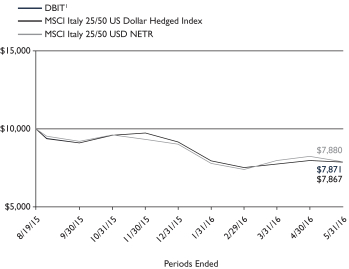
1 Based on Net Asset Value from commencement of operations, 8/19/15.
Sector Diversification* as of 5/31/16
Financials | 32.7% | |||
Utilities | 20.7% | |||
Energy | 18.2% | |||
Industrials | 13.6% | |||
Consumer Discretionary | 10.2% | |||
Telecommunication Services | 4.6% | |||
|
| |||
Total | 100.0% |
Ten Largest Equity Holdings as of 5/31/16 (70.0% of Net Assets)
| Description | % of Net Assets | |||
Eni SpA | 14.0% | |||
Intesa Sanpaolo SpA | 12.6% | |||
Enel SpA | 11.9% | |||
UniCredit SpA | 5.2% | |||
Telecom Italia SpA | 4.6% | |||
Snam SpA | 4.6% | |||
Atlantia SpA | 4.5% | |||
Assicurazioni Generali SpA | 4.5% | |||
Terna Rete Elettrica Nazionale SpA | 4.1% | |||
Luxottica Group SpA | 4.0% | |||
* As a percent of total investments excluding securities lending collateral.
Portfolio holdings and characteristics are subject to change. For more complete details about the Fund’s investment portfolio see page 56.
17
DBX ETF Trust
Performance summary (Unaudited)
Deutsche X-trackers MSCI Southern Europe Hedged Equity ETF (DBSE)
The Deutsche X-trackers MSCI Southern Europe Hedged Equity ETF (the “Fund”) seeks investment results that correspond generally to the performance, before fees and expenses, of the MSCI Southern Europe US Dollar Hedged Index (the “Underlying Index”). The Underlying Index is designed to track the performance of the Italian, Portuguese and Spanish equity markets, while mitigating exposure to fluctuations between the value of the U.S. dollar and the euro. It is not possible to invest directly into an index.
Performance as of 5/31/16
| Cumulative Total Returns | ||||||||
| Net Asset Value | Market Value | MSCI Southern Europe US Dollar Hedged Index | MSCI Southern Europe Net Return USD Index | |||||
Since Inception1 | -17.94% | -17.92% | -17.85% | -17.67% | ||||
1 Total returns are calculated based on the commencement of operations, 8/19/15 (“Inception”).
Past performance is no guarantee of future results. Current performance may be lower or higher than the performance data quoted. Performance data current to the most recent month-end is available at www.deutsche-etfs.com. Performance results assume reinvestment of all dividends and capital gain distributions and do not reflect the deduction of taxes that a shareholder would pay on fund distributions or on the sale of fund shares or redemption of fund creation units. The investment return and principal value of shares will vary with changes in market conditions. Shares may be worth more or less than their original cost when they are sold in the market or redeemed. Performance for certain funds may reflect a waiver of a portion of investment management fees. Without such waiver, performance would have been lower. The estimated operating expense ratio as disclosed in the most recent prospectus dated September 30, 2015, was 0.45%.
Net asset value or “NAV” is the value of one share of a fund as calculated in accordance with the standard formula for valuing mutual fund shares. The price used to calculate market return (“Market Price”) is determined by using the midpoint between the highest bid and the lowest offer on the primary stock exchange on which shares of a fund are listed for trading, as of the time that such fund’s NAV is calculated. Since shares of a fund may not have traded in the secondary market until after the fund’s inception, for the period from inception to the first day of secondary trading, the NAV of the fund is used as a proxy for the Market Price to calculate market returns. Market and NAV returns assume that dividends and capital gain distributions have been reinvested at Market Price and NAV, respectively.
An index is a statistical composite that tracks a specified financial market or sector. Unlike a fund, an index does not actually hold a portfolio of securities and therefore does not incur the expenses incurred by a fund. These expenses negatively impact fund performance. Also, market returns do not include brokerage commissions that may be payable on secondary market transactions. If brokerage commissions were included, market returns would be lower.
18
DBX ETF Trust
Performance summary (Unaudited)
Deutsche X-trackers MSCI Southern Europe Hedged Equity ETF (DBSE) (Continued)
Growth of an Assumed $10,000 Investment
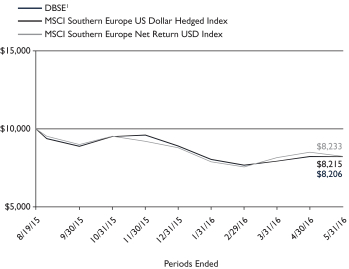
1 Based on Net Asset Value from commencement of operations, 8/19/15.
Sector Diversification* as of 5/31/16
Financials | 35.5% | |||
Utilities | 20.3% | |||
Industrials | 10.9% | |||
Energy | 10.4% | |||
Telecommunication Services | 9.4% | |||
Consumer Discretionary | 8.1% | |||
Information Technology | 3.1% | |||
Consumer Staples | 1.2% | |||
Health Care | 1.1% | |||
|
| |||
Total | 100.0% |
Ten Largest Equity Holdings as of 5/31/16 (57.5% of Net Assets)
| Description | % of Net Assets | |||
Banco Santander SA (Spain) | 10.6% | |||
Telefonica SA (Spain) | 7.2% | |||
Banco Bilbao Vizcaya Argentaria SA (Spain) | 6.7% | |||
Eni SpA (Italy) | 6.0% | |||
Iberdrola SA (Spain) | 5.7% | |||
Intesa Sanpaolo SpA (Italy) | 5.4% | |||
Enel SpA (Italy) | 5.3% | |||
Industria de Diseno Textil SA (Spain) | 4.9% | |||
Amadeus IT Holding SA (Spain) | 3.1% | |||
Assicurazioni Generali SpA (Italy) | 2.6% | |||
Country Diversification* as of 5/31/16
Spain | 57.0% | |||
Italy | 36.1% | |||
United Kingdom | 3.1% | |||
Portugal | 2.8% | |||
Luxembourg | 1.0% | |||
|
| |||
Total | 100.0% |
* As a percent of total investments excluding securities lending collateral.
Portfolio holdings and characteristics are subject to change. For more complete details about the Fund’s investment portfolio see page 58.
19
DBX ETF Trust
Performance summary (Unaudited)
Deutsche X-trackers MSCI Spain Hedged Equity ETF (DBSP)
The Deutsche X-trackers MSCI Spain Hedged Equity ETF (the “Fund”) seeks investment results that correspond generally to the performance, before fees and expenses, of the MSCI Spain 25/50 US Dollar Hedged Index (the “Underlying Index”). The Underlying Index is designed to track the performance of the Spanish equity market, while mitigating exposure to fluctuations between the value of the U.S. dollar and the euro. It is not possible to invest directly into an index.
Performance as of 5/31/16
| Cumulative Total Returns | ||||||||
| Net Asset Value | Market Value | MSCI Spain 25/50 US Dollar Hedged Index | MSCI Spain 25/50 USD NETR | |||||
Since Inception1 | -15.10% | -15.37% | -14.89% | -14.70% | ||||
1 Total returns are calculated based on the commencement of operations, 8/19/15 (“Inception”).
Past performance is no guarantee of future results. Current performance may be lower or higher than the performance data quoted. Performance data current to the most recent month-end is available at www.deutsche-etfs.com. Performance results assume reinvestment of all dividends and capital gain distributions and do not reflect the deduction of taxes that a shareholder would pay on fund distributions or on the sale of fund shares or redemption of fund creation units. The investment return and principal value of shares will vary with changes in market conditions. Shares may be worth more or less than their original cost when they are sold in the market or redeemed. Performance for certain funds may reflect a waiver of a portion of investment management fees. Without such waiver, performance would have been lower. The estimated operating expense ratio as disclosed in the most recent prospectus dated September 30, 2015, was 0.45%.
Net asset value or “NAV” is the value of one share of a fund as calculated in accordance with the standard formula for valuing mutual fund shares. The price used to calculate market return (“Market Price”) is determined by using the midpoint between the highest bid and the lowest offer on the primary stock exchange on which shares of a fund are listed for trading, as of the time that such fund’s NAV is calculated. Since shares of a fund may not have traded in the secondary market until after the fund’s inception, for the period from inception to the first day of secondary trading, the NAV of the fund is used as a proxy for the Market Price to calculate market returns. Market and NAV returns assume that dividends and capital gain distributions have been reinvested at Market Price and NAV, respectively.
An index is a statistical composite that tracks a specified financial market or sector. Unlike a fund, an index does not actually hold a portfolio of securities and therefore does not incur the expenses incurred by a fund. These expenses negatively impact fund performance. Also, market returns do not include brokerage commissions that may be payable on secondary market transactions. If brokerage commissions were included, market returns would be lower.
20
DBX ETF Trust
Performance summary (Unaudited)
Deutsche X-trackers MSCI Spain Hedged Equity ETF (DBSP) (Continued)
Growth of an Assumed $10,000 Investment
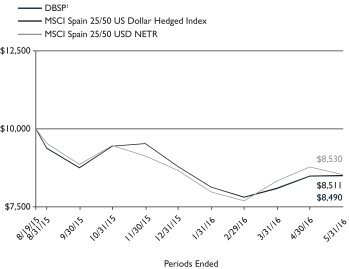
1 Based on Net Asset Value from commencement of operations, 8/19/15.
Sector Diversification* as of 5/31/16
Financials | 36.0% | |||
Utilities | 18.1% | |||
Industrials | 16.7% | |||
Telecommunication Services | 9.1% | |||
Consumer Discretionary | 6.3% | |||
Information Technology | 4.7% | |||
Energy | 4.6% | |||
Health Care | 2.7% | |||
Consumer Staples | 1.8% | |||
|
| |||
Total | 100.0% |
Ten Largest Equity Holdings as of 5/31/16 (64.7% of Net Assets)
| Description | % of Net Assets | |||
Banco Santander SA | 15.0% | |||
Telefonica SA | 9.1% | |||
Banco Bilbao Vizcaya Argentaria SA | 8.2% | |||
Iberdrola SA | 6.5% | |||
Industria de Diseno Textil SA | 6.3% | |||
Amadeus IT Holding SA | 4.7% | |||
Repsol SA | 4.6% | |||
Red Electrica Corp. SA | 3.5% | |||
Ferrovial SA | 3.4% | |||
Aena SA | 3.4% | |||
* As a percent of total investments excluding securities lending collateral.
Portfolio holdings and characteristics are subject to change. For more complete details about the Fund’s investment portfolio see page 60.
21
DBX ETF Trust
Performance summary (Unaudited)
Deutsche X-trackers S&P Hedged Global Infrastructure ETF (DBIF)
The Deutsche X-trackers S&P Hedged Global Infrastructure ETF (the “Fund”) seeks investment results that correspond generally to the performance, before fees and expenses, of the S&P Global Infrastructure Index (USD)(Hedged)(Net TR) (the “Underlying Index”). The Underlying Index is designed to track the performance of equity securities of infrastructure issuers in developed markets, while mitigating exposure to fluctuations between the value of the U.S. dollar and the currencies of the countries in the Underlying Index. It is not possible to invest directly into an index.
Performance as of 5/31/16
| Average Annual Total Return | ||||||||
| Net Asset Value | Market Value | S&P Global Infrastructure Index (USD) (Hedged) (Net TR) | S&P Global Infrastructure Index | |||||
One Year | -4.24% | -4.70% | -4.21% | -4.74% | ||||
Since Inception1 | -3.61% | -3.87% | -3.61% | -3.75% | ||||
| Cumulative Total Returns | ||||||||
| Net Asset Value | Market Value | S&P Global Infrastructure Index (USD) (Hedged) (Net TR) | S&P Global Infrastructure Index | |||||
One Year | -4.24% | -4.70% | -4.21% | -4.74% | ||||
Since Inception1 | -4.13% | -4.44% | -4.13% | -4.29% | ||||
1 Total returns are calculated based on the commencement of operations, 4/9/15 (“Inception”).
Past performance is no guarantee of future results. Current performance may be lower or higher than the performance data quoted. Performance data current to the most recent month-end is available at www.deutsche-etfs.com. Performance results assume reinvestment of all dividends and capital gain distributions and do not reflect the deduction of taxes that a shareholder would pay on fund distributions or on the sale of fund shares or redemption of fund creation units. The investment return and principal value of shares will vary with changes in market conditions. Shares may be worth more or less than their original cost when they are sold in the market or redeemed. Performance for certain funds may reflect a waiver of a portion of investment management fees. Without such waiver, performance would have been lower. The estimated operating expense ratio as disclosed in the most recent prospectus dated September 30, 2015, was 0.45%.
Net asset value or “NAV” is the value of one share of a fund as calculated in accordance with the standard formula for valuing mutual fund shares. The price used to calculate market return (“Market Price”) is determined by using the midpoint between the highest bid and the lowest offer on the primary stock exchange on which shares of a fund are listed for trading, as of the time that such fund’s NAV is calculated. Since shares of a fund may not have traded in the secondary market until after the fund’s inception, for the period from inception to the first day of secondary trading, the NAV of the fund is used as a proxy for the Market Price to calculate market returns. Market and NAV returns assume that dividends and capital gain distributions have been reinvested at Market Price and NAV, respectively.
An index is a statistical composite that tracks a specified financial market or sector. Unlike a fund, an index does not actually hold a portfolio of securities and therefore does not incur the expenses incurred by a fund. These expenses negatively impact fund performance. Also, market returns do not include brokerage commissions that may be payable on secondary market transactions. If brokerage commissions were included, market returns would be lower.
22
DBX ETF Trust
Performance summary (Unaudited)
Deutsche X-trackers S&P Hedged Global Infrastructure ETF (DBIF) (Continued)
Growth of an Assumed $10,000 Investment
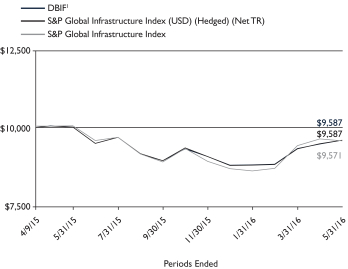
1 Based on Net Asset Value from commencement of operations, 4/9/15.
Sector Diversification * as of 5/31/16
Industrials | 39.9% | |||
Utilities | 39.2% | |||
Energy | 20.9% | |||
|
| |||
Total | 100.0% |
Ten Largest Equity Holdings as of 5/31/16 (35.0% of Net Assets)
| Description | % of Net Assets | |||
Transurban Group (Australia) | 5.0% | |||
Atlantia SpA (Italy) | 4.0% | |||
Enbridge, Inc. (Canada) | 3.8% | |||
Aena SA (Spain) | 3.6% | |||
Kinder Morgan, Inc. (United States) | 3.4% | |||
National Grid PLC (United Kingdom) | 3.3% | |||
NextEra Energy, Inc. (United States) | 3.2% | |||
Duke Energy Corp. (United States) | 3.1% | |||
TransCanada Corp. (Canada) | 3.0% | |||
Abertis Infraestructuras SA (Spain) | 2.6% | |||
Country Diversification* as of 5/31/16
United States | 38.8% | |||
Canada | 9.5% | |||
Spain | 8.7% | |||
Australia | 8.2% | |||
Italy | 6.5% | |||
United Kingdom | 5.5% | |||
France | 5.4% | |||
Hong Kong | 3.5% | |||
Japan | 3.0% | |||
Mexico | 2.4% | |||
Other | 8.5% | |||
|
| |||
Total | 100.0% |
* As a percent of total investments excluding securities lending collateral.
Portfolio holdings and characteristics are subject to change. For more complete details about the Fund’s investment portfolio see page 62.
23
DBX ETF Trust
As a shareholder of one or more of the funds, you incur two types of costs: (1) transaction costs, including brokerage commissions paid on purchases and sales of fund shares, and (2) ongoing costs, including management fees and other Fund expenses. The expense examples below are intended to help you understand your ongoing costs (in dollars) of investing in the Funds and to compare these costs with the ongoing costs of investing in other funds.
The examples in the table are based on an investment of $1,000 invested at the beginning of the six month period and held for the entire period (December 1, 2015 to May 31, 2016).
Actual expenses
The first line in the following tables provides information about actual account values and actual expenses. You may use the information in this line, together with the amount you invested, to estimate the expenses that you paid over the period. Simply divide your account value by $1,000 (for example, an $8,600 account value divided by $1,000 = 8.6), then multiply the result by the number in the first line under the heading “Expenses Paid During the Period” to estimate the expenses you paid on your account during this period.
Hypothetical example for comparison purposes
The second line in the following tables provides information about hypothetical account values and hypothetical expenses based on the Funds’ actual expense ratios and an assumed rate of return of 5% per year before expenses (which is not the Funds’ actual return). The hypothetical account values and expenses may not be used to estimate the actual ending account balance or expenses you paid for the period. You may use this information to compare the ongoing costs of investing in the Fund and other funds. To do so, compare this 5% hypothetical example with the 5% hypothetical examples that appear in the shareholder reports of the other funds.
Please note that the expenses shown in the tables are meant to highlight your ongoing costs only, and do not reflect any transactional costs. Therefore the second line in the table is useful in comparing ongoing costs only, and will not help you determine the relative total costs of owning different funds. In addition, if these transactional costs were included, your costs would have been higher.
| Beginning Account Value December 1, 2015 | Ending Account Value May 31, 2016 | Annualized Expense Ratio | Expenses Paid During the Period Per $1,000(1) | |||||||||||||
| Deutsche X-trackers Dow Jones Hedged International Real Estate ETF | ||||||||||||||||
Actual | $ | 1,000.00 | $ | 1,023.90 | 0.48 | % | $ | 2.43 | ||||||||
Hypothetical (5% return before expenses) | $ | 1,000.00 | $ | 1,022.60 | 0.48 | % | $ | 2.43 | ||||||||
| Deutsche X-trackers Japan JPX-Nikkei 400 Equity ETF | ||||||||||||||||
Actual | $ | 1,000.00 | $ | 978.30 | 0.40 | % | $ | 1.98 | ||||||||
Hypothetical (5% return before expenses) | $ | 1,000.00 | $ | 1,023.00 | 0.40 | % | $ | 2.02 | ||||||||
| Deutsche X-trackers Japan JPX-Nikkei 400 Hedged Equity ETF | ||||||||||||||||
Actual | $ | 1,000.00 | $ | 882.50 | 0.45 | % | $ | 2.12 | ||||||||
Hypothetical (5% return before expenses) | $ | 1,000.00 | $ | 1,022.75 | 0.45 | % | $ | 2.28 | ||||||||
| Deutsche X-trackers MSCI Australia Hedged Equity ETF | ||||||||||||||||
Actual | $ | 1,000.00 | $ | 1,048.20 | 0.45 | % | $ | 2.30 | ||||||||
Hypothetical (5% return before expenses) | $ | 1,000.00 | $ | 1,022.75 | 0.45 | % | $ | 2.28 | ||||||||
| Deutsche X-trackers MSCI EAFE Small Cap Hedged Equity ETF | ||||||||||||||||
Actual | $ | 1,000.00 | $ | 982.40 | 0.45 | % | $ | 2.23 | ||||||||
Hypothetical (5% return before expenses) | $ | 1,000.00 | $ | 1,022.75 | 0.45 | % | $ | 2.28 | ||||||||
24
DBX ETF Trust
Fees and expenses (Unaudited) (Continued)
| Beginning Account Value December 1, 2015 | Ending Account Value May 31, 2016 | Annualized Expense Ratio | Expenses Paid During the Period Per $1,000(1) | |||||||||||||
| Deutsche X-trackers MSCI Italy Hedged Equity ETF | ||||||||||||||||
Actual | $ | 1,000.00 | $ | 809.50 | 0.45 | % | $ | 2.04 | ||||||||
Hypothetical (5% return before expenses) | $ | 1,000.00 | $ | 1,022.75 | 0.45 | % | $ | 2.28 | ||||||||
| Deutsche X-trackers MSCI Southern Europe Hedged Equity ETF | ||||||||||||||||
Actual | $ | 1,000.00 | $ | 855.20 | 0.45 | % | $ | 2.09 | ||||||||
Hypothetical (5% return before expenses) | $ | 1,000.00 | $ | 1,022.75 | 0.45 | % | $ | 2.28 | ||||||||
| Deutsche X-trackers MSCI Spain Hedged Equity ETF | ||||||||||||||||
Actual | $ | 1,000.00 | $ | 890.70 | 0.45 | % | $ | 2.13 | ||||||||
Hypothetical (5% return before expenses) | $ | 1,000.00 | $ | 1,022.75 | 0.45 | % | $ | 2.28 | ||||||||
| Deutsche X-trackers S&P Hedged Global Infrastructure ETF | ||||||||||||||||
Actual | $ | 1,000.00 | $ | 1,057.30 | 0.45 | % | $ | 2.31 | ||||||||
Hypothetical (5% return before expenses) | $ | 1,000.00 | $ | 1,022.75 | 0.45 | % | $ | 2.28 | ||||||||
(1) Expenses are equal to each Fund’s annualized expense ratio, multiplied by the average account value over the period, multiplied by 183 (the number of days in the most recent six-month period), then divided by 366.
25
DBX ETF Trust
Deutsche X-trackers Dow Jones Hedged International Real Estate ETF
May 31, 2016
Number | Value | |||||||
| COMMON STOCKS — 99.0% | ||||||||
| Australia — 13.8% | ||||||||
Astro Japan Property Group REIT | 396 | $ | 2,003 | |||||
BWP Trust REIT | 3,981 | 10,416 | ||||||
Charter Hall Retail REIT | 2,704 | 9,381 | ||||||
Dexus Property Group REIT | 7,974 | 49,910 | ||||||
Gateway Lifestyle (a) | 2,307 | 4,785 | ||||||
Goodman Group REIT | 13,102 | 67,328 | ||||||
GPT Group REIT | 14,915 | 57,996 | ||||||
Investa Office Fund REIT | 5,066 | 15,561 | ||||||
Scentre Group REIT | 44,277 | 149,126 | ||||||
Westfield Corp. REIT | 15,909 | 123,261 | ||||||
|
| |||||||
| 489,767 | ||||||||
|
| |||||||
| Austria — 1.0% | ||||||||
BUWOG AG* | 419 | 9,021 | ||||||
CA Immobilien Anlagen AG | 606 | 10,782 | ||||||
Immofinanz AG* | 7,298 | 16,922 | ||||||
|
| |||||||
| 36,725 | ||||||||
|
| |||||||
| Belgium — 0.9% | ||||||||
Befimmo SA REIT | 170 | 11,287 | ||||||
Cofinimmo SA/NV REIT | 168 | 20,468 | ||||||
|
| |||||||
| 31,755 | ||||||||
|
| |||||||
| Brazil — 0.4% | ||||||||
BR Malls Participacoes SA | 5,000 | 15,981 | ||||||
|
| |||||||
| Canada — 10.5% | ||||||||
Artis Real Estate Investment Trust REIT | 563 | 5,693 | ||||||
Boardwalk Real Estate Investment Trust REIT | 189 | 7,655 | ||||||
Brookfield Asset Management, Inc., Class A | 7,204 | 252,814 | ||||||
Canadian Apartment Properties REIT | 524 | 12,136 | ||||||
Canadian Real Estate Investment Trust REIT | 297 | 10,346 | ||||||
Crombie Real Estate Investment Trust REIT | 315 | 3,522 | ||||||
Dream Office Real Estate Investment Trust REIT | 439 | 6,320 | ||||||
First Capital Realty, Inc. | 936 | 15,003 | ||||||
H&R Real Estate Investment Trust REIT | 1,139 | 18,431 | ||||||
RioCan Real Estate Investment Trust REIT | 1,309 | 27,381 | ||||||
Smart Real Estate Investment Trust REIT | 523 | 13,759 | ||||||
|
| |||||||
| 373,060 | ||||||||
|
| |||||||
| France — 10.4% | ||||||||
Fonciere des Regions REIT | 361 | 32,262 | ||||||
Gecina SA REIT | 299 | 42,234 | ||||||
Klepierre REIT | 1,566 | 71,630 | ||||||
Mercialys SA REIT | 151 | 3,285 | ||||||
Unibail-Rodamco SE REIT | 814 | 219,087 | ||||||
|
| |||||||
| 368,498 | ||||||||
|
| |||||||
| Hong Kong — 7.7% | ||||||||
Champion REIT | 18,049 | 9,453 | ||||||
Hang Lung Properties Ltd. | 17,528 | 33,474 | ||||||
Hongkong Land Holdings Ltd. | 9,800 | 59,192 | ||||||
Hysan Development Co. Ltd. | 5,130 | 22,116 | ||||||
Number | Value | |||||||
| Hong Kong (Continued) | ||||||||
Link REIT | 18,694 | $ | 114,871 | |||||
Prosperity REIT | 9,374 | 3,619 | ||||||
Wheelock & Co. Ltd. | 6,741 | 30,362 | ||||||
|
| |||||||
| 273,087 | ||||||||
|
| |||||||
| Italy — 0.2% | ||||||||
Beni Stabili SpA SIIQ REIT* | 8,754 | 6,467 | ||||||
Immobiliare Grande Distribuzione SIIQ SpA REIT | 2,758 | 2,486 | ||||||
|
| |||||||
| 8,953 | ||||||||
|
| |||||||
| Japan — 22.8% | ||||||||
Activia Properties, Inc. REIT | 5 | 25,556 | ||||||
AEON Mall Co. Ltd. | 900 | 11,890 | ||||||
AEON REIT Investment Corp. REIT | 9 | 11,476 | ||||||
Daibiru Corp. | 400 | 3,739 | ||||||
Daiwa Office Investment Corp. REIT | 3 | 17,853 | ||||||
Frontier Real Estate Investment Corp. REIT | 4 | 19,578 | ||||||
Fukuoka REIT Corp. REIT | 5 | 9,184 | ||||||
Global One Real Estate Investment Corp. REIT | 1 | 3,888 | ||||||
Hankyu REIT, Inc. | 5 | 6,055 | ||||||
Heiwa Real Estate Co. Ltd. | 300 | 3,693 | ||||||
Hoshino Resorts REIT, Inc. | 1 | 12,011 | ||||||
Hulic Co. Ltd. | 3,700 | 36,721 | ||||||
Hulic REIT, Inc. | 7 | 11,998 | ||||||
Japan Excellent, Inc. REIT | 10 | 13,492 | ||||||
Japan Prime Realty Investment Corp. REIT | 7 | 29,995 | ||||||
Japan Real Estate Investment Corp. REIT | 11 | 64,469 | ||||||
Japan Rental Housing Investments, Inc. REIT | 13 | 10,120 | ||||||
Japan Retail Fund Investment Corp. REIT | 21 | 48,871 | ||||||
Kenedix Office Investment Corp. REIT | 3 | 17,068 | ||||||
Kenedix Residential Investment Corp. REIT | 3 | 7,992 | ||||||
Kenedix Retail REIT Corp. REIT | 3 | 7,778 | ||||||
MCUBS MidCity Investment Corp. REIT | 2 | 6,791 | ||||||
Mitsui Fudosan Co. Ltd. | 7,721 | 189,757 | ||||||
Mori Hills REIT Investment Corp. REIT | 11 | 16,470 | ||||||
MORI TRUST Sogo Reit, Inc. REIT | 8 | 15,272 | ||||||
Nippon Building Fund, Inc. REIT | 12 | 71,414 | ||||||
NTT Urban Development Corp. | 800 | 8,019 | ||||||
Orix JREIT, Inc. REIT | 20 | 31,661 | ||||||
Premier Investment Corp. REIT | 9 | 11,484 | ||||||
Tokyu Fudosan Holdings Corp. | 4,200 | 27,764 | ||||||
TOKYU REIT, Inc. REIT | 7 | 9,653 | ||||||
Top REIT, Inc. | 3 | 12,015 | ||||||
United Urban Investment Corp. REIT | 23 | 36,348 | ||||||
|
| |||||||
| 810,075 | ||||||||
|
| |||||||
| Malaysia — 0.1% | ||||||||
KLCCP Stapled Group (a) | 2,700 | 4,806 | ||||||
|
| |||||||
| Netherlands — 1.4% | ||||||||
Atrium European Real Estate Ltd.* | 1,395 | 5,898 | ||||||
Eurocommercial Properties NV | 401 | 18,864 | ||||||
Vastned Retail NV REIT | 158 | 6,985 | ||||||
Wereldhave NV REIT | 334 | 17,007 | ||||||
|
| |||||||
| 48,754 | ||||||||
|
| |||||||
| See Notes to Financial Statements. | 26 |
DBX ETF Trust
Schedule of investments
Deutsche X-trackers Dow Jones Hedged International Real Estate ETF (Continued)
May 31, 2016
Number | Value | |||||||
| New Zealand — 0.9% | ||||||||
Argosy Property Ltd. | 6,566 | $ | 5,331 | |||||
Goodman Property Trust REIT | 8,581 | 7,838 | ||||||
Kiwi Property Group Ltd. | 10,563 | 10,613 | ||||||
Precinct Properties New Zealand Ltd. | 8,247 | 7,310 | ||||||
|
| |||||||
| 31,092 | ||||||||
|
| |||||||
| Philippines — 2.7% | ||||||||
Ayala Land, Inc. | 48,800 | 37,253 | ||||||
Robinsons Land Corp. | 13,200 | 8,186 | ||||||
SM Prime Holdings, Inc. | 95,785 | 49,157 | ||||||
|
| |||||||
| 94,596 | ||||||||
|
| |||||||
| Poland — 0.1% | ||||||||
Echo Investment SA | 1,850 | 3,157 | ||||||
|
| |||||||
| Singapore — 6.3% | ||||||||
Ascendas Real Estate Investment Trust REIT | 18,800 | 31,263 | ||||||
Cambridge Industrial Trust REIT | 8,100 | 3,147 | ||||||
CapitaLand Commercial Trust REIT | 16,700 | 16,856 | ||||||
CapitaLand Ltd. | 20,900 | 45,379 | ||||||
CapitaLand Mall Trust REIT | 22,100 | 32,578 | ||||||
Frasers Commercial Trust REIT | 4,600 | 4,292 | ||||||
Global Logistic Properties Ltd. | 25,200 | 33,122 | ||||||
GuocoLand Ltd. | 2,000 | 2,745 | ||||||
Keppel REIT | 14,500 | 10,898 | ||||||
Mapletree Logistics Trust REIT | 12,300 | 8,708 | ||||||
Starhill Global REIT | 11,200 | 6,303 | ||||||
Suntec Real Estate Investment Trust REIT | 21,000 | 25,390 | ||||||
United Industrial Corp. Ltd. | 1,600 | 3,207 | ||||||
|
| |||||||
| 223,888 | ||||||||
|
| |||||||
| South Africa — 1.2% | ||||||||
Growthpoint Properties Ltd. REIT | 18,228 | 27,256 | ||||||
Hyprop Investments Ltd. REIT | 1,736 | 13,027 | ||||||
SA Corporate Real Estate Fund Nominees Pty Ltd. REIT | 14,040 | 4,342 | ||||||
|
| |||||||
| 44,625 | ||||||||
|
| |||||||
| Sweden — 1.6% | ||||||||
Castellum AB | 2,142 | 29,197 | ||||||
Fabege AB | 1,170 | 18,964 | ||||||
Kungsleden AB (b) | 1,302 | 9,209 | ||||||
|
| |||||||
| 57,370 | ||||||||
|
| |||||||
Number | Value | |||||||
| Switzerland — 2.3% | ||||||||
PSP Swiss Property AG | 335 | $ | 31,377 | |||||
Swiss Prime Site AG* | 578 | 49,543 | ||||||
|
| |||||||
| 80,920 | ||||||||
|
| |||||||
| Thailand — 0.5% | ||||||||
Central Pattana PCL | 10,600 | 17,135 | ||||||
|
| |||||||
| Turkey — 0.1% | ||||||||
Is Gayrimenkul Yatirim Ortakligi AS REIT | 4,035 | 2,324 | ||||||
|
| |||||||
| United Kingdom — 14.1% | ||||||||
Big Yellow Group PLC REIT | 1,229 | 14,845 | ||||||
British Land Co. PLC REIT | 8,492 | 91,016 | ||||||
Capital & Counties Properties PLC | 6,167 | 30,574 | ||||||
Derwent London PLC REIT | 919 | 43,818 | ||||||
Grainger PLC | 3,443 | 12,177 | ||||||
Great Portland Estates PLC REIT | 2,852 | 31,021 | ||||||
Hammerson PLC REIT | 6,508 | 54,576 | ||||||
Intu Properties PLC REIT | 6,779 | 29,426 | ||||||
Land Securities Group PLC REIT | 6,649 | 112,287 | ||||||
Segro PLC REIT | 6,158 | 39,056 | ||||||
Shaftesbury PLC REIT | 2,304 | 30,634 | ||||||
Workspace Group PLC REIT | 975 | 12,250 | ||||||
|
| |||||||
| 501,680 | ||||||||
|
| |||||||
TOTAL COMMON STOCKS | 3,518,248 | |||||||
|
| |||||||
| RIGHTS — 0.1% | ||||||||
| Sweden — 0.1% | ||||||||
Castellum AB*, expires 07/31/16 | 1,357 | 2,994 | ||||||
|
| |||||||
| SECURITIES LENDING COLLATERAL — 0.2% | ||||||||
Daily Assets Fund “Capital Shares”, 0.48% (c)(d) | 8,292 | 8,292 | ||||||
|
| |||||||
TOTAL INVESTMENTS — 99.3% | $ | 3,529,534 | ||||||
Other assets and liabilities, net — 0.7% | 24,882 | |||||||
|
| |||||||
NET ASSETS — 100.0% | $ | 3,554,416 | ||||||
|
| |||||||
| * | Non-income producing security. |
| † | The cost for federal income tax purposes was $3,638,742. At May 31, 2016, net unrealized depreciation for all securities based on tax cost was $109,208. This consisted of aggregate gross unrealized appreciation for all securities in which there was an excess of value over tax cost of $8,314 and aggregate gross unrealized depreciation for all securities in which there was an excess of tax cost over value of $117,522. |
| (a) | Stapled Security — A security contractually bound to one or more other securities to form a single saleable unit which cannot be sold separately. |
| (b) | All or a portion of these securities were on loan. In addition, “Other Assets and Liabilities, Net” may include pending sales that are also on loan. The value of securities loaned at May 31, 2016 amounted to $7,894, which is 0.2% of net assets. |
| (c) | Affiliated fund managed by Deutsche Investment Management Americas Inc. The rate shown is the annualized seven-day yield at period end. |
| (d) | Represents collateral held in connection with securities lending. Income earned by the Fund is net of borrower rebates. |
| REIT: | Real Estate Investment Trust |
| See Notes to Financial Statements. | 27 |
DBX ETF Trust
Schedule of investments
Deutsche X-trackers Dow Jones Hedged International Real Estate ETF (Continued)
May 31, 2016
As of May 31, 2016, the Fund had the following forward foreign currency exchange contracts outstanding:
Counterparty | Settlement Date | Currency To Deliver | Currency To Receive | Unrealized Appreciation (Depreciation) | ||||||||||||||
Canadian Imperial Bank of Commerce | 6/2/2016 | AUD | 750,560 | USD | 572,066 | $ | 29,597 | |||||||||||
State Street Bank & Trust Co. | 6/2/2016 | AUD | 28,599 | USD | 21,000 | 330 | ||||||||||||
State Street Bank & Trust Co. | 6/2/2016 | AUD | 51,000 | USD | 38,871 | 2,010 | ||||||||||||
State Street Bank & Trust Co. | 6/2/2016 | AUD | 756,825 | USD | 576,848 | 29,851 | ||||||||||||
The Bank of New York Mellon | 6/2/2016 | AUD | 1,900 | USD | 1,369 | (4 | ) | |||||||||||
The Bank of New York Mellon | 6/2/2016 | AUD | 432,000 | USD | 312,044 | (185 | ) | |||||||||||
Canadian Imperial Bank of Commerce | 6/2/2016 | CHF | 49,500 | USD | 51,706 | 1,907 | ||||||||||||
JP Morgan & Chase Co. | 6/2/2016 | CHF | 2,000 | USD | 2,089 | 77 | ||||||||||||
State Street Bank & Trust Co. | 6/2/2016 | CHF | 8,000 | USD | 8,356 | 308 | ||||||||||||
State Street Bank & Trust Co. | 6/2/2016 | CHF | 136,233 | USD | 142,308 | 5,252 | ||||||||||||
The Bank of New York Mellon | 6/2/2016 | CHF | 29,000 | USD | 29,169 | (6 | ) | |||||||||||
The Bank of New York Mellon | 6/2/2016 | CHF | 51,000 | USD | 51,681 | 373 | ||||||||||||
Canadian Imperial Bank of Commerce | 6/2/2016 | EUR | 282,300 | USD | 323,602 | 9,503 | ||||||||||||
State Street Bank & Trust Co. | 6/2/2016 | EUR | 13,000 | USD | 14,883 | 419 | ||||||||||||
State Street Bank & Trust Co. | 6/2/2016 | EUR | 781,932 | USD | 896,344 | 26,332 | ||||||||||||
The Bank of New York Mellon | 6/2/2016 | EUR | 1,700 | USD | 1,905 | 13 | ||||||||||||
The Bank of New York Mellon | 6/2/2016 | EUR | 151,200 | USD | 168,323 | 92 | ||||||||||||
The Bank of New York Mellon | 6/2/2016 | EUR | 276,000 | USD | 309,785 | 2,695 | ||||||||||||
Canadian Imperial Bank of Commerce | 6/2/2016 | GBP | 249,900 | USD | 366,046 | 4,103 | ||||||||||||
State Street Bank & Trust Co. | 6/2/2016 | GBP | 4,000 | USD | 5,850 | 56 | ||||||||||||
State Street Bank & Trust Co. | 6/2/2016 | GBP | 31,000 | USD | 45,413 | 514 | ||||||||||||
State Street Bank & Trust Co. | 6/2/2016 | GBP | 548,650 | USD | 803,766 | 9,128 | ||||||||||||
State Street Bank & Trust Co. | 6/2/2016 | GBP | 4,850 | USD | 7,000 | (25 | ) | |||||||||||
The Bank of New York Mellon | 6/2/2016 | GBP | 600 | USD | 866 | (3 | ) | |||||||||||
The Bank of New York Mellon | 6/2/2016 | GBP | 217,000 | USD | 316,656 | 2,364 | ||||||||||||
The Bank of New York Mellon | 6/2/2016 | GBP | 120,300 | USD | 175,097 | 860 | ||||||||||||
JP Morgan & Chase Co. | 6/2/2016 | HKD | 139,000 | USD | 17,923 | 36 | ||||||||||||
State Street Bank & Trust Co. | 6/2/2016 | HKD | 1,479,509 | USD | 190,779 | 385 | ||||||||||||
State Street Bank & Trust Co. | 6/2/2016 | HKD | 199,000 | USD | 25,659 | 50 | ||||||||||||
The Bank of New York Mellon | 6/2/2016 | HKD | 1,018,000 | USD | 131,120 | 116 | ||||||||||||
The Bank of New York Mellon | 6/2/2016 | HKD | 2,094,900 | USD | 270,129 | 541 | ||||||||||||
The Bank of New York Mellon | 6/2/2016 | HKD | 28,388 | USD | 3,654 | 1 | ||||||||||||
The Bank of New York Mellon | 6/2/2016 | HKD | 1,590,500 | USD | 204,746 | 69 | ||||||||||||
Canadian Imperial Bank of Commerce | 6/2/2016 | NZD | 27,300 | USD | 19,052 | 580 | ||||||||||||
State Street Bank & Trust Co. | 6/2/2016 | NZD | 73,479 | USD | 51,296 | 1,580 | ||||||||||||
The Bank of New York Mellon | 6/2/2016 | NZD | 30,000 | USD | 20,194 | (104 | ) | |||||||||||
The Bank of New York Mellon | 6/2/2016 | NZD | 16,700 | USD | 11,298 | (1 | ) | |||||||||||
Canadian Imperial Bank of Commerce | 6/2/2016 | PLN | 10,000 | USD | 2,535 | 0 | ||||||||||||
Canadian Imperial Bank of Commerce | 6/2/2016 | PLN | 25,300 | USD | 6,621 | 206 | ||||||||||||
State Street Bank & Trust Co. | 6/2/2016 | PLN | 3,000 | USD | 785 | 24 | ||||||||||||
The Bank of New York Mellon | 6/2/2016 | PLN | 8,000 | USD | 2,038 | 9 | ||||||||||||
The Bank of New York Mellon | 6/2/2016 | PLN | 1,000 | USD | 262 | 8 | ||||||||||||
Canadian Imperial Bank of Commerce | 6/2/2016 | SEK | 268,300 | USD | 33,487 | 1,322 | ||||||||||||
State Street Bank & Trust Co. | 6/2/2016 | SEK | 705,855 | USD | 88,076 | 3,455 | ||||||||||||
State Street Bank & Trust Co. | 6/2/2016 | SEK | 24,456 | USD | 3,000 | 68 | ||||||||||||
The Bank of New York Mellon | 6/2/2016 | SEK | 142,700 | USD | 17,083 | (24 | ) | |||||||||||
The Bank of New York Mellon | 6/2/2016 | SEK | 50,000 | USD | 6,000 | 6 | ||||||||||||
The Bank of New York Mellon | 6/2/2016 | SEK | 264,000 | USD | 31,635 | (15 | ) | |||||||||||
Canadian Imperial Bank of Commerce | 6/2/2016 | TRY | 6,902 | USD | 2,451 | 113 | ||||||||||||
State Street Bank & Trust Co. | 6/2/2016 | TRY | 5,500 | USD | 1,952 | 89 | ||||||||||||
The Bank of New York Mellon | 6/2/2016 | TRY | 100 | USD | 35 | 2 | ||||||||||||
The Bank of New York Mellon | 6/2/2016 | TRY | 4,000 | USD | 1,332 | (23 | ) | |||||||||||
The Bank of New York Mellon | 6/2/2016 | TRY | 1,000 | USD | 339 | 0 | ||||||||||||
Canadian Imperial Bank of Commerce | 6/2/2016 | USD | 71,764 | AUD | 99,060 | (168 | ) | |||||||||||
Canadian Imperial Bank of Commerce | 6/2/2016 | USD | 475,975 | AUD | 651,500 | (5,102 | ) | |||||||||||
Canadian Imperial Bank of Commerce | 6/2/2016 | USD | 80,914 | CHF | 78,500 | (1,941 | ) | |||||||||||
| See Notes to Financial Statements. | 28 |
DBX ETF Trust
Schedule of investments
Deutsche X-trackers Dow Jones Hedged International Real Estate ETF (Continued)
May 31, 2016
Counterparty | Settlement Date | Currency To Deliver | Currency To Receive | Unrealized Appreciation (Depreciation) | ||||||||||||||
Canadian Imperial Bank of Commerce | 6/2/2016 | USD | 493,722 | EUR | 433,500 | $ | (11,391 | ) | ||||||||||
Canadian Imperial Bank of Commerce | 6/2/2016 | USD | 493,488 | GBP | 342,500 | 2,573 | ||||||||||||
Canadian Imperial Bank of Commerce | 6/2/2016 | USD | 40,574 | GBP | 27,700 | (455 | ) | |||||||||||
Canadian Imperial Bank of Commerce | 6/2/2016 | USD | 204,930 | HKD | 1,590,500 | (252 | ) | |||||||||||
Canadian Imperial Bank of Commerce | 6/2/2016 | USD | 29,752 | NZD | 44,000 | 18 | ||||||||||||
Canadian Imperial Bank of Commerce | 6/2/2016 | USD | 3,119 | PLN | 12,300 | 0 | ||||||||||||
Canadian Imperial Bank of Commerce | 6/2/2016 | USD | 3,337 | PLN | 13,000 | (41 | ) | |||||||||||
Canadian Imperial Bank of Commerce | 6/2/2016 | USD | 50,379 | SEK | 411,000 | (1,106 | ) | |||||||||||
Canadian Imperial Bank of Commerce | 6/2/2016 | USD | 136 | TRY | 402 | 0 | ||||||||||||
Canadian Imperial Bank of Commerce | 6/2/2016 | USD | 2,194 | TRY | 6,500 | 8 | ||||||||||||
JP Morgan & Chase Co. | 6/2/2016 | USD | 2,012 | CHF | 2,000 | 0 | ||||||||||||
JP Morgan & Chase Co. | 6/2/2016 | USD | 17,894 | HKD | 139,000 | (6 | ) | |||||||||||
State Street Bank & Trust Co. | 6/2/2016 | USD | 8,000 | AUD | 10,969 | (72 | ) | |||||||||||
State Street Bank & Trust Co. | 6/2/2016 | USD | 36,280 | AUD | 47,600 | (1,878 | ) | |||||||||||
State Street Bank & Trust Co. | 6/2/2016 | USD | 475,936 | AUD | 651,500 | (5,063 | ) | |||||||||||
State Street Bank & Trust Co. | 6/2/2016 | USD | 91,538 | AUD | 126,355 | (215 | ) | |||||||||||
State Street Bank & Trust Co. | 6/2/2016 | USD | 54,147 | CHF | 53,833 | 11 | ||||||||||||
State Street Bank & Trust Co. | 6/2/2016 | USD | 80,905 | CHF | 78,500 | (1,931 | ) | |||||||||||
State Street Bank & Trust Co. | 6/2/2016 | USD | 12,431 | CHF | 11,900 | (459 | ) | |||||||||||
State Street Bank & Trust Co. | 6/2/2016 | USD | 347,108 | EUR | 311,797 | (189 | ) | |||||||||||
State Street Bank & Trust Co. | 6/2/2016 | USD | 493,690 | EUR | 433,500 | (11,359 | ) | |||||||||||
State Street Bank & Trust Co. | 6/2/2016 | USD | 12,609 | EUR | 11,000 | (370 | ) | |||||||||||
State Street Bank & Trust Co. | 6/2/2016 | USD | 10,000 | EUR | 8,785 | (225 | ) | |||||||||||
State Street Bank & Trust Co. | 6/2/2016 | USD | 34,218 | EUR | 29,850 | (1,005 | ) | |||||||||||
State Street Bank & Trust Co. | 6/2/2016 | USD | 493,460 | GBP | 342,500 | 2,600 | ||||||||||||
State Street Bank & Trust Co. | 6/2/2016 | USD | 358,054 | GBP | 246,001 | (1,759 | ) | |||||||||||
State Street Bank & Trust Co. | 6/2/2016 | USD | 204,920 | HKD | 1,590,500 | (242 | ) | |||||||||||
State Street Bank & Trust Co. | 6/2/2016 | USD | 15,000 | HKD | 116,397 | (21 | ) | |||||||||||
State Street Bank & Trust Co. | 6/2/2016 | USD | 29,753 | NZD | 44,000 | 17 | ||||||||||||
State Street Bank & Trust Co. | 6/2/2016 | USD | 19,944 | NZD | 29,479 | 1 | ||||||||||||
State Street Bank & Trust Co. | 6/2/2016 | USD | 3,337 | PLN | 13,000 | (41 | ) | |||||||||||
State Street Bank & Trust Co. | 6/2/2016 | USD | 2,034 | SEK | 16,300 | (80 | ) | |||||||||||
State Street Bank & Trust Co. | 6/2/2016 | USD | 50,375 | SEK | 411,000 | (1,103 | ) | |||||||||||
State Street Bank & Trust Co. | 6/2/2016 | USD | 36,275 | SEK | 303,011 | 52 | ||||||||||||
State Street Bank & Trust Co. | 6/2/2016 | USD | 2,194 | TRY | 6,500 | 8 | ||||||||||||
The Bank of New York Mellon | 6/2/2016 | USD | 6,713 | AUD | 9,300 | 9 | ||||||||||||
The Bank of New York Mellon | 6/2/2016 | USD | 291,374 | AUD | 402,200 | (683 | ) | |||||||||||
The Bank of New York Mellon | 6/2/2016 | USD | 16,475 | AUD | 22,400 | (286 | ) | |||||||||||
The Bank of New York Mellon | 6/2/2016 | USD | 48,079 | CHF | 47,800 | 10 | ||||||||||||
The Bank of New York Mellon | 6/2/2016 | USD | 1,515 | CHF | 1,500 | (5 | ) | |||||||||||
The Bank of New York Mellon | 6/2/2016 | USD | 1,757 | CHF | 1,700 | (46 | ) | |||||||||||
The Bank of New York Mellon | 6/2/2016 | USD | 1,134 | EUR | 1,000 | (21 | ) | |||||||||||
The Bank of New York Mellon | 6/2/2016 | USD | 16,712 | EUR | 14,500 | (578 | ) | |||||||||||
The Bank of New York Mellon | 6/2/2016 | USD | 284,324 | EUR | 255,400 | (155 | ) | |||||||||||
The Bank of New York Mellon | 6/2/2016 | USD | 1,029 | EUR | 900 | (28 | ) | |||||||||||
The Bank of New York Mellon | 6/2/2016 | USD | 6,615 | EUR | 5,900 | (51 | ) | |||||||||||
The Bank of New York Mellon | 6/2/2016 | USD | 5,952 | GBP | 4,100 | (13 | ) | |||||||||||
The Bank of New York Mellon | 6/2/2016 | USD | 8,699 | GBP | 6,000 | (9 | ) | |||||||||||
The Bank of New York Mellon | 6/2/2016 | USD | 292,556 | GBP | 201,000 | (1,437 | ) | |||||||||||
The Bank of New York Mellon | 6/2/2016 | USD | 2,023 | GBP | 1,400 | 5 | ||||||||||||
The Bank of New York Mellon | 6/2/2016 | USD | 7,419 | GBP | 5,100 | (32 | ) | |||||||||||
The Bank of New York Mellon | 6/2/2016 | USD | 6,149 | HKD | 47,700 | (11 | ) | |||||||||||
The Bank of New York Mellon | 6/2/2016 | USD | 389,552 | HKD | 3,026,100 | (130 | ) | |||||||||||
The Bank of New York Mellon | 6/2/2016 | USD | 2,977 | HKD | 23,100 | (4 | ) | |||||||||||
The Bank of New York Mellon | 6/2/2016 | USD | 2,060 | HKD | 16,000 | (1 | ) | |||||||||||
The Bank of New York Mellon | 6/2/2016 | USD | 19,079 | NZD | 28,200 | 1 | ||||||||||||
The Bank of New York Mellon | 6/2/2016 | USD | 1,217 | NZD | 1,800 | 1 | ||||||||||||
| See Notes to Financial Statements. | 29 |
DBX ETF Trust
Schedule of investments
Deutsche X-trackers Dow Jones Hedged International Real Estate ETF (Continued)
May 31, 2016
Counterparty | Settlement Date | Currency To Deliver | Currency To Receive | Unrealized Appreciation (Depreciation) | ||||||||||||||
The Bank of New York Mellon | 6/2/2016 | USD | 2,282 | PLN | 9,000 | $ | 0 | |||||||||||
The Bank of New York Mellon | 6/2/2016 | USD | 27,031 | SEK | 225,800 | 39 | ||||||||||||
The Bank of New York Mellon | 6/2/2016 | USD | 1,079 | SEK | 9,000 | 0 | ||||||||||||
The Bank of New York Mellon | 6/2/2016 | USD | 3,599 | SEK | 29,200 | (99 | ) | |||||||||||
The Bank of New York Mellon | 6/2/2016 | USD | 1,389 | TRY | 4,100 | 0 | ||||||||||||
State Street Bank & Trust Co. | 6/3/2016 | BRL | 17,000 | USD | 4,875 | 175 | ||||||||||||
State Street Bank & Trust Co. | 6/3/2016 | BRL | 16,000 | USD | 4,588 | 165 | ||||||||||||
The Bank of New York Mellon | 6/3/2016 | BRL | 120,765 | USD | 34,613 | 1,225 | ||||||||||||
The Bank of New York Mellon | 6/3/2016 | BRL | 37,288 | USD | 10,313 | 3 | ||||||||||||
Canadian Imperial Bank of Commerce | 6/3/2016 | CAD | 607,469 | USD | 485,053 | 21,815 | ||||||||||||
State Street Bank & Trust Co. | 6/3/2016 | CAD | 12,925 | USD | 10,000 | 143 | ||||||||||||
State Street Bank & Trust Co. | 6/3/2016 | CAD | 535,455 | USD | 427,480 | 19,157 | ||||||||||||
The Bank of New York Mellon | 6/3/2016 | CAD | 305,000 | USD | 234,086 | 1,502 | ||||||||||||
Canadian Imperial Bank of Commerce | 6/3/2016 | JPY | 112,655,510 | USD | 1,053,599 | 36,135 | ||||||||||||
State Street Bank & Trust Co. | 6/3/2016 | JPY | 3,015,000 | USD | 28,233 | 1,003 | ||||||||||||
State Street Bank & Trust Co. | 6/3/2016 | JPY | 986,863 | USD | 9,000 | 87 | ||||||||||||
State Street Bank & Trust Co. | 6/3/2016 | JPY | 108,606,615 | USD | 1,015,687 | 34,792 | ||||||||||||
The Bank of New York Mellon | 6/3/2016 | JPY | 1,280,100 | USD | 11,584 | 22 | ||||||||||||
The Bank of New York Mellon | 6/3/2016 | JPY | 58,760,000 | USD | 533,258 | 2,560 | ||||||||||||
Canadian Imperial Bank of Commerce | 6/3/2016 | MYR | 6,500 | USD | 1,604 | 30 | ||||||||||||
Canadian Imperial Bank of Commerce | 6/3/2016 | MYR | 13,000 | USD | 3,148 | 1 | ||||||||||||
State Street Bank & Trust Co. | 6/3/2016 | MYR | 6,500 | USD | 1,593 | 19 | ||||||||||||
State Street Bank & Trust Co. | 6/3/2016 | MYR | 63,106 | USD | 16,140 | 859 | ||||||||||||
Canadian Imperial Bank of Commerce | 6/3/2016 | PHP | 1,452,500 | USD | 30,977 | (78 | ) | |||||||||||
Canadian Imperial Bank of Commerce | 6/3/2016 | PHP | 2,682,000 | USD | 57,351 | 10 | ||||||||||||
JP Morgan & Chase Co. | 6/3/2016 | PHP | 61,000 | USD | 1,306 | 2 | ||||||||||||
State Street Bank & Trust Co. | 6/3/2016 | PHP | 1,452,500 | USD | 31,050 | (5 | ) | |||||||||||
State Street Bank & Trust Co. | 6/3/2016 | PHP | 10,067,104 | USD | 214,194 | (1,041 | ) | |||||||||||
Canadian Imperial Bank of Commerce | 6/3/2016 | SGD | 210,000 | USD | 156,148 | 3,662 | ||||||||||||
State Street Bank & Trust Co. | 6/3/2016 | SGD | 11,000 | USD | 8,176 | 189 | ||||||||||||
State Street Bank & Trust Co. | 6/3/2016 | SGD | 549,910 | USD | 408,796 | 9,493 | ||||||||||||
State Street Bank & Trust Co. | 6/3/2016 | SGD | 8,259 | USD | 6,000 | 3 | ||||||||||||
The Bank of New York Mellon | 6/3/2016 | SGD | 114,600 | USD | 83,239 | 25 | ||||||||||||
The Bank of New York Mellon | 6/3/2016 | SGD | 199,000 | USD | 143,969 | (530 | ) | |||||||||||
Canadian Imperial Bank of Commerce | 6/3/2016 | THB | 198,000 | USD | 5,557 | 15 | ||||||||||||
Canadian Imperial Bank of Commerce | 6/3/2016 | THB | 77,500 | USD | 2,169 | 0 | ||||||||||||
Canadian Imperial Bank of Commerce | 6/3/2016 | THB | 335,000 | USD | 9,584 | 207 | ||||||||||||
State Street Bank & Trust Co. | 6/3/2016 | THB | 1,004,037 | USD | 28,758 | 655 | ||||||||||||
State Street Bank & Trust Co. | 6/3/2016 | THB | 198,000 | USD | 5,554 | 12 | ||||||||||||
Canadian Imperial Bank of Commerce | 6/3/2016 | USD | 20,880 | CAD | 26,150 | (939 | ) | |||||||||||
Canadian Imperial Bank of Commerce | 6/3/2016 | USD | 93,127 | CAD | 121,819 | (231 | ) | |||||||||||
Canadian Imperial Bank of Commerce | 6/3/2016 | USD | 354,554 | CAD | 459,500 | (4,152 | ) | |||||||||||
Canadian Imperial Bank of Commerce | 6/3/2016 | USD | 756,292 | JPY | 81,917,000 | (16,448 | ) | |||||||||||
Canadian Imperial Bank of Commerce | 6/3/2016 | USD | 66,395 | JPY | 7,099,251 | (2,277 | ) | |||||||||||
Canadian Imperial Bank of Commerce | 6/3/2016 | USD | 213,149 | JPY | 23,639,259 | 352 | ||||||||||||
Canadian Imperial Bank of Commerce | 6/3/2016 | USD | 4,863 | MYR | 19,500 | (141 | ) | |||||||||||
Canadian Imperial Bank of Commerce | 6/3/2016 | USD | 87,355 | PHP | 4,134,500 | 1,041 | ||||||||||||
Canadian Imperial Bank of Commerce | 6/3/2016 | USD | 10,856 | SGD | 14,600 | (255 | ) | |||||||||||
Canadian Imperial Bank of Commerce | 6/3/2016 | USD | 226,120 | SGD | 310,000 | (1,021 | ) | |||||||||||
Canadian Imperial Bank of Commerce | 6/3/2016 | USD | 17,384 | THB | 610,500 | (296 | ) | |||||||||||
Canadian Imperial Bank of Commerce | 6/3/2016 | USD | 45,085 | ZAR | 687,000 | (1,401 | ) | |||||||||||
Canadian Imperial Bank of Commerce | 6/3/2016 | USD | 3,381 | ZAR | 48,200 | (316 | ) | |||||||||||
JP Morgan & Chase Co. | 6/3/2016 | USD | 1,296 | PHP | 61,000 | 8 | ||||||||||||
State Street Bank & Trust Co. | 6/3/2016 | USD | 9,158 | BRL | 33,000 | (34 | ) | |||||||||||
State Street Bank & Trust Co. | 6/3/2016 | USD | 22,352 | CAD | 28,000 | (1,000 | ) | |||||||||||
State Street Bank & Trust Co. | 6/3/2016 | USD | 5,000 | CAD | 6,453 | (79 | ) | |||||||||||
State Street Bank & Trust Co. | 6/3/2016 | USD | 41,608 | CAD | 54,428 | (103 | ) | |||||||||||
| See Notes to Financial Statements. | 30 |
DBX ETF Trust
Schedule of investments
Deutsche X-trackers Dow Jones Hedged International Real Estate ETF (Continued)
May 31, 2016
Counterparty | Settlement Date | Currency To Deliver | Currency To Receive | Unrealized Appreciation (Depreciation) | ||||||||||||||
State Street Bank & Trust Co. | 6/3/2016 | USD | 354,529 | CAD | 459,500 | $ | (4,128 | ) | ||||||||||
State Street Bank & Trust Co. | 6/3/2016 | USD | 30,000 | JPY | 3,278,154 | (393 | ) | |||||||||||
State Street Bank & Trust Co. | 6/3/2016 | USD | 756,226 | JPY | 81,917,000 | (16,381 | ) | |||||||||||
State Street Bank & Trust Co. | 6/3/2016 | USD | 247,183 | JPY | 27,413,324 | 404 | ||||||||||||
State Street Bank & Trust Co. | 6/3/2016 | USD | 4,348 | MYR | 17,000 | (232 | ) | |||||||||||
State Street Bank & Trust Co. | 6/3/2016 | USD | 4,810 | MYR | 19,500 | (88 | ) | |||||||||||
State Street Bank & Trust Co. | 6/3/2016 | USD | 8,057 | MYR | 33,106 | (41 | ) | |||||||||||
State Street Bank & Trust Co. | 6/3/2016 | USD | 87,299 | PHP | 4,134,500 | 1,096 | ||||||||||||
State Street Bank & Trust Co. | 6/3/2016 | USD | 6,000 | PHP | 279,600 | (22 | ) | |||||||||||
State Street Bank & Trust Co. | 6/3/2016 | USD | 4,766 | PHP | 224,000 | 23 | ||||||||||||
State Street Bank & Trust Co. | 6/3/2016 | USD | 147,324 | PHP | 6,881,504 | (198 | ) | |||||||||||
State Street Bank & Trust Co. | 6/3/2016 | USD | 13,000 | SGD | 17,804 | (72 | ) | |||||||||||
State Street Bank & Trust Co. | 6/3/2016 | USD | 175,314 | SGD | 241,365 | (53 | ) | |||||||||||
State Street Bank & Trust Co. | 6/3/2016 | USD | 226,110 | SGD | 310,000 | (1,011 | ) | |||||||||||
State Street Bank & Trust Co. | 6/3/2016 | USD | 17,322 | THB | 610,500 | (234 | ) | |||||||||||
State Street Bank & Trust Co. | 6/3/2016 | USD | 16,580 | THB | 591,537 | (23 | ) | |||||||||||
State Street Bank & Trust Co. | 6/3/2016 | USD | 45,080 | ZAR | 687,000 | (1,396 | ) | |||||||||||
State Street Bank & Trust Co. | 6/3/2016 | USD | 47,987 | ZAR | 754,894 | 14 | ||||||||||||
The Bank of New York Mellon | 6/3/2016 | USD | 10,184 | BRL | 36,672 | (45 | ) | |||||||||||
The Bank of New York Mellon | 6/3/2016 | USD | 34,631 | BRL | 121,382 | (1,072 | ) | |||||||||||
The Bank of New York Mellon | 6/3/2016 | USD | 4,338 | CAD | 5,700 | 8 | ||||||||||||
The Bank of New York Mellon | 6/3/2016 | USD | 22,079 | CAD | 28,000 | (727 | ) | |||||||||||
The Bank of New York Mellon | 6/3/2016 | USD | 2,863 | CAD | 3,700 | (41 | ) | |||||||||||
The Bank of New York Mellon | 6/3/2016 | USD | 204,569 | CAD | 267,600 | (505 | ) | |||||||||||
The Bank of New York Mellon | 6/3/2016 | USD | 54,685 | JPY | 5,829,400 | (2,036 | ) | |||||||||||
The Bank of New York Mellon | 6/3/2016 | USD | 111,604 | JPY | 12,104,700 | (2,279 | ) | |||||||||||
The Bank of New York Mellon | 6/3/2016 | USD | 351,867 | JPY | 39,022,600 | 571 | ||||||||||||
The Bank of New York Mellon | 6/3/2016 | USD | 26,590 | JPY | 2,904,000 | (362 | ) | |||||||||||
The Bank of New York Mellon | 6/3/2016 | USD | 1,646 | JPY | 179,400 | (25 | ) | |||||||||||
The Bank of New York Mellon | 6/3/2016 | USD | 136,117 | SGD | 187,400 | (41 | ) | |||||||||||
The Bank of New York Mellon | 6/3/2016 | USD | 3,401 | SGD | 4,700 | 12 | ||||||||||||
The Bank of New York Mellon | 6/3/2016 | USD | 5,075 | SGD | 6,900 | (64 | ) | |||||||||||
The Bank of New York Mellon | 6/3/2016 | USD | 1,532 | ZAR | 23,100 | (63 | ) | |||||||||||
The Bank of New York Mellon | 6/3/2016 | USD | 24,124 | ZAR | 379,500 | 7 | ||||||||||||
The Bank of New York Mellon | 6/3/2016 | USD | 2,769 | ZAR | 41,400 | (136 | ) | |||||||||||
Canadian Imperial Bank of Commerce | 6/3/2016 | ZAR | 300,100 | USD | 21,050 | 1,968 | ||||||||||||
State Street Bank & Trust Co. | 6/3/2016 | ZAR | 1,441,894 | USD | 101,067 | 9,382 | ||||||||||||
State Street Bank & Trust Co. | 6/3/2016 | ZAR | 435,100 | USD | 27,659 | (8 | ) | |||||||||||
The Bank of New York Mellon | 6/3/2016 | ZAR | 444,000 | USD | 27,868 | (364 | ) | |||||||||||
Canadian Imperial Bank of Commerce | 7/5/2016 | AUD | 99,060 | USD | 71,675 | 177 | ||||||||||||
State Street Bank & Trust Co. | 7/5/2016 | AUD | 15,000 | USD | 10,853 | 27 | ||||||||||||
State Street Bank & Trust Co. | 7/5/2016 | AUD | 126,355 | USD | 91,426 | 229 | ||||||||||||
State Street Bank & Trust Co. | 7/5/2016 | AUD | 6,000 | USD | 4,340 | 9 | ||||||||||||
The Bank of New York Mellon | 7/5/2016 | AUD | 402,200 | USD | 291,020 | 728 | ||||||||||||
JP Morgan & Chase Co. | 7/5/2016 | CHF | 2,000 | USD | 2,015 | (1 | ) | |||||||||||
State Street Bank & Trust Co. | 7/5/2016 | CHF | 53,833 | USD | 54,232 | (19 | ) | |||||||||||
The Bank of New York Mellon | 7/5/2016 | CHF | 47,800 | USD | 48,153 | (18 | ) | |||||||||||
State Street Bank & Trust Co. | 7/5/2016 | EUR | 11,000 | USD | 12,261 | 5 | ||||||||||||
State Street Bank & Trust Co. | 7/5/2016 | EUR | 311,797 | USD | 347,507 | 129 | ||||||||||||
The Bank of New York Mellon | 7/5/2016 | EUR | 255,400 | USD | 284,650 | 105 | ||||||||||||
State Street Bank & Trust Co. | 7/5/2016 | GBP | 246,001 | USD | 358,133 | 1,741 | ||||||||||||
State Street Bank & Trust Co. | 7/5/2016 | GBP | 9,000 | USD | 13,103 | 65 | ||||||||||||
The Bank of New York Mellon | 7/5/2016 | GBP | 201,000 | USD | 292,620 | 1,423 | ||||||||||||
JP Morgan & Chase Co. | 7/5/2016 | HKD | 139,000 | USD | 17,901 | 4 | ||||||||||||
The Bank of New York Mellon | 7/5/2016 | HKD | 3,026,100 | USD | 389,723 | 100 | ||||||||||||
Canadian Imperial Bank of Commerce | 7/5/2016 | JPY | 23,639,259 | USD | 213,389 | (368 | ) | |||||||||||
State Street Bank & Trust Co. | 7/5/2016 | JPY | 27,413,324 | USD | 247,468 | (416 | ) | |||||||||||
| See Notes to Financial Statements. | 31 |
DBX ETF Trust
Schedule of investments
Deutsche X-trackers Dow Jones Hedged International Real Estate ETF (Continued)
May 31, 2016
Counterparty | Settlement Date | Currency To Deliver | Currency To Receive | Unrealized Appreciation (Depreciation) | ||||||||||||||
The Bank of New York Mellon | 7/5/2016 | JPY | 39,022,600 | USD | 352,261 | $ | (599 | ) | ||||||||||
State Street Bank & Trust Co. | 7/5/2016 | NZD | 29,479 | USD | 19,910 | 2 | ||||||||||||
The Bank of New York Mellon | 7/5/2016 | NZD | 28,200 | USD | 19,046 | 1 | ||||||||||||
Canadian Imperial Bank of Commerce | 7/5/2016 | PLN | 12,300 | USD | 3,116 | 0 | ||||||||||||
The Bank of New York Mellon | 7/5/2016 | PLN | 9,000 | USD | 2,280 | 0 | ||||||||||||
State Street Bank & Trust Co. | 7/5/2016 | SEK | 303,011 | USD | 36,323 | (59 | ) | |||||||||||
The Bank of New York Mellon | 7/5/2016 | SEK | 225,800 | USD | 27,068 | (44 | ) | |||||||||||
State Street Bank & Trust Co. | 7/5/2016 | SGD | 241,365 | USD | 175,223 | 59 | ||||||||||||
The Bank of New York Mellon | 7/5/2016 | SGD | 187,400 | USD | 136,042 | 42 | ||||||||||||
Canadian Imperial Bank of Commerce | 7/5/2016 | USD | 2,533 | PLN | 10,000 | 0 | ||||||||||||
State Street Bank & Trust Co. | 7/5/2016 | USD | 19,218 | JPY | 2,129,000 | 33 | ||||||||||||
State Street Bank & Trust Co. | 7/5/2016 | USD | 12,344 | SGD | 17,000 | (6 | ) | |||||||||||
State Street Bank & Trust Co. | 7/5/2016 | USD | 27,481 | ZAR | 435,100 | (5 | ) | |||||||||||
The Bank of New York Mellon | 7/5/2016 | USD | 29,214 | CHF | 29,000 | 11 | ||||||||||||
The Bank of New York Mellon | 7/5/2016 | USD | 168,516 | EUR | 151,200 | (62 | ) | |||||||||||
The Bank of New York Mellon | 7/5/2016 | USD | 175,135 | GBP | 120,300 | (852 | ) | |||||||||||
The Bank of New York Mellon | 7/5/2016 | USD | 204,836 | HKD | 1,590,500 | (52 | ) | |||||||||||
The Bank of New York Mellon | 7/5/2016 | USD | 3,656 | HKD | 28,388 | (1 | ) | |||||||||||
The Bank of New York Mellon | 7/5/2016 | USD | 11,279 | NZD | 16,700 | (1 | ) | |||||||||||
The Bank of New York Mellon | 7/5/2016 | USD | 17,106 | SEK | 142,700 | 28 | ||||||||||||
The Bank of New York Mellon | 7/5/2016 | USD | 83,193 | SGD | 114,600 | (25 | ) | |||||||||||
State Street Bank & Trust Co. | 7/5/2016 | ZAR | 754,894 | USD | 47,679 | 8 | ||||||||||||
The Bank of New York Mellon | 7/5/2016 | ZAR | 379,500 | USD | 23,965 | 0 | ||||||||||||
State Street Bank & Trust Co. | 7/6/2016 | BRL | 33,000 | USD | 9,070 | 38 | ||||||||||||
The Bank of New York Mellon | 7/6/2016 | BRL | 36,672 | USD | 10,084 | 48 | ||||||||||||
Canadian Imperial Bank of Commerce | 7/6/2016 | CAD | 121,819 | USD | 93,127 | 233 | ||||||||||||
State Street Bank & Trust Co. | 7/6/2016 | CAD | 54,428 | USD | 41,608 | 103 | ||||||||||||
State Street Bank & Trust Co. | 7/6/2016 | CAD | 27,000 | USD | 20,641 | 52 | ||||||||||||
The Bank of New York Mellon | 7/6/2016 | CAD | 267,600 | USD | 204,570 | 508 | ||||||||||||
State Street Bank & Trust Co. | 7/7/2016 | PHP | 6,881,504 | USD | 147,041 | 191 | ||||||||||||
State Street Bank & Trust Co. | 7/7/2016 | THB | 591,537 | USD | 16,566 | 19 | ||||||||||||
Canadian Imperial Bank of Commerce | 7/7/2016 | USD | 57,351 | PHP | 2,682,000 | (117 | ) | |||||||||||
Canadian Imperial Bank of Commerce | 7/7/2016 | USD | 2,168 | THB | 77,500 | 0 | ||||||||||||
JP Morgan & Chase Co. | 7/7/2016 | USD | 1,304 | PHP | 61,000 | (2 | ) | |||||||||||
State Street Bank & Trust Co. | 7/8/2016 | MYR | 33,106 | USD | 8,049 | 53 | ||||||||||||
Canadian Imperial Bank of Commerce | 7/8/2016 | TRY | 402 | USD | 135 | 0 | ||||||||||||
The Bank of New York Mellon | 7/8/2016 | TRY | 4,100 | USD | 1,375 | 0 | ||||||||||||
Canadian Imperial Bank of Commerce | 7/8/2016 | USD | 3,146 | MYR | 13,000 | (6 | ) | |||||||||||
The Bank of New York Mellon | 7/8/2016 | USD | 335 | TRY | 1,000 | 0 | ||||||||||||
|
| |||||||||||||||||
Total net unrealized appreciation | $ | 179,327 | ||||||||||||||||
|
| |||||||||||||||||
Currency Abbreviations
| AUD | Australian Dollar |
| BRL | Brazilian Real |
| CAD | Canadian Dollar |
| CHF | Swiss Franc |
| EUR | Euro |
| GBP | Pound Sterling |
| HKD | Hong Kong Dollar |
| JPY | Japanese Yen |
| MYR | Malaysian Ringgit |
| NZD | New Zealand Dollar |
| PHP | Philippine Peso |
| PLN | Polish Zloty |
| SEK | Swedish Krona |
| SGD | Singapore Dollar |
| See Notes to Financial Statements. | 32 |
DBX ETF Trust
Schedule of investments
Deutsche X-trackers Dow Jones Hedged International Real Estate ETF (Continued)
May 31, 2016
| THB | Thai Baht |
| TRY | Turkish New Lira |
| USD | U.S. Dollar |
| ZAR | South African Rand |
For information on the Fund’s policy and additional disclosures regarding forward foreign currency exchange contracts, please refer to the Derivatives section of Note 2 in the accompanying Notes to Financial Statements.
Fair Value Measurements
Various inputs are used in determining the value of the Fund’s investments. These inputs are summarized in three broad levels. Level 1 includes quoted prices in active markets for identical securities. Level 2 includes other significant observable inputs (including quoted prices for similar securities, interest rates, prepayment speeds and credit risk). Level 3 includes significant unobservable inputs (including the Fund’s own assumptions in determining the fair value of investments). The level assigned to the securities valuations may not be an indication of the risk or liquidity associated with investing in those securities.
The following is a summary of the inputs used as of May 31, 2016 in valuing the Fund’s investments. For information on Fund’s policy regarding the valuation of investments, please refer to the Security Valuation section of Note 2 in the accompanying Notes to Financial Statements.
Assets | Level 1 | Level 2 | Level 3 | Total | ||||||||||||
Common Stocks (e) | $ | 3,518,248 | $ | — | $ | — | $ | 3,518,248 | ||||||||
Rights | 2,994 | — | — | 2,994 | ||||||||||||
Short-Term Investments | 8,292 | — | — | 8,292 | ||||||||||||
Derivatives (f) | ||||||||||||||||
Forward Foreign Currency Exchange Contracts | — | 294,820 | — | 294,820 | ||||||||||||
|
|
|
|
|
|
|
| |||||||||
TOTAL | $ | 3,529,534 | $ | 294,820 | $ | — | $ | 3,824,354 | ||||||||
|
|
|
|
|
|
|
| |||||||||
Liabilities | Level 1 | Level 2 | Level 3 | Total | ||||||||||||
Derivatives (f) | ||||||||||||||||
Forward Foreign Currency Exchange Contracts | $ | — | $ | (115,493 | ) | $ | — | $ | (115,493 | ) | ||||||
|
|
|
|
|
|
|
| |||||||||
TOTAL | $ | — | $ | (115,493 | ) | $ | — | $ | (115,493 | ) | ||||||
|
|
|
|
|
|
|
| |||||||||
| (e) | See Schedule of investments for additional detailed categorizations. |
| (f) | Derivatives include unrealized appreciation (depreciation) on forward foreign currency exchange contracts. |
There have been no transfers between fair value measurement levels during the year ended May 31, 2016.
| See Notes to Financial Statements. | 33 |
DBX ETF Trust
Schedule of investments
Deutsche X-trackers Japan JPX-Nikkei 400 Equity ETF
May 31, 2016
Number of Shares | Value | |||||||
| COMMON STOCKS — 99.3% | ||||||||
| Consumer Discretionary — 17.6% | ||||||||
AISIN SEIKI Co. Ltd. | 1,600 | $ | 66,002 | |||||
AOKI Holdings, Inc. | 100 | 1,067 | ||||||
ASICS Corp. | 1,600 | 36,370 | ||||||
Bandai Namco Holdings, Inc. | 1,600 | 39,616 | ||||||
Benesse Holdings, Inc. | 1,400 | 30,927 | ||||||
Bridgestone Corp. | 4,800 | 165,590 | ||||||
Casio Computer Co. Ltd. | 1,600 | 24,886 | ||||||
CyberAgent, Inc. | 100 | 4,770 | ||||||
Daihatsu Motor Co. Ltd. | 1,600 | 21,900 | ||||||
DAIICHIKOSHO Co. Ltd. | 100 | 3,814 | ||||||
DENSO Corp. | 3,200 | 126,061 | ||||||
Dentsu, Inc. | 1,600 | 80,934 | ||||||
Don Quijote Holdings Co. Ltd. | 1,400 | 44,939 | ||||||
Eagle Industry Co. Ltd. | 100 | 1,278 | ||||||
EXEDY Corp. | 400 | 9,248 | ||||||
Fast Retailing Co. Ltd. | 100 | 26,946 | ||||||
Fuji Heavy Industries Ltd. | 4,800 | 179,613 | ||||||
Fuji Media Holdings, Inc. | 1,600 | 19,447 | ||||||
Geo Holdings Corp. | 600 | 8,256 | ||||||
Hakuhodo DY Holdings, Inc. | 1,700 | 21,337 | ||||||
Haseko Corp. | 1,600 | 17,601 | ||||||
Heiwa Corp. | 100 | 1,994 | ||||||
Hikari Tsushin, Inc. | 100 | 8,151 | ||||||
HIS Co. Ltd. | 100 | 2,728 | ||||||
Honda Motor Co. Ltd. | 8,000 | 227,294 | ||||||
Iida Group Holdings Co. Ltd. (a) | 900 | 18,843 | ||||||
Isetan Mitsukoshi Holdings Ltd. | 1,700 | 16,601 | ||||||
Isuzu Motors Ltd. | 4,800 | 57,822 | ||||||
Izumi Co. Ltd. | 100 | 3,846 | ||||||
J. Front Retailing Co. Ltd. | 1,600 | 19,159 | ||||||
Koito Manufacturing Co. Ltd. | 1,400 | 66,020 | ||||||
K’S HOLDINGS Corp. | 200 | 3,168 | ||||||
Mazda Motor Corp. | 3,300 | 56,862 | ||||||
Misawa Homes Co. Ltd. | 100 | 728 | ||||||
MITSUBA Corp. | 100 | 1,572 | ||||||
Mitsubishi Motors Corp. | 4,900 | 25,581 | ||||||
NGK Spark Plug Co. Ltd. | 1,600 | 31,003 | ||||||
NHK Spring Co. Ltd. | 1,600 | 13,763 | ||||||
Nifco, Inc. | 200 | 10,297 | ||||||
Nikon Corp. | 1,700 | 23,866 | ||||||
Nippon Television Holdings, Inc. | 1,600 | 28,262 | ||||||
Nissan Motor Co. Ltd. | 19,300 | 195,776 | ||||||
Nitori Holdings Co. Ltd. | 1,300 | 131,987 | ||||||
NOK Corp. | 100 | 1,793 | ||||||
Oriental Land Co. Ltd. | 1,600 | 105,200 | ||||||
Panasonic Corp. | 17,600 | 163,693 | ||||||
Pressance Corp. | 100 | 3,629 | ||||||
Rakuten, Inc. | 6,400 | 68,931 | ||||||
Resorttrust, Inc. | 100 | 2,103 | ||||||
Rinnai Corp. | 100 | 8,710 | ||||||
Ryohin Keikaku Co. Ltd. | 100 | 23,020 | ||||||
Sanrio Co. Ltd. | 100 | 1,846 | ||||||
Sega Sammy Holdings, Inc. | 1,600 | 19,505 | ||||||
Sekisui Chemical Co. Ltd. | 1,800 | 23,469 | ||||||
Sekisui House Ltd. | 4,800 | 85,955 | ||||||
Seria Co. Ltd. | 100 | 6,510 | ||||||
Number of Shares | Value | |||||||
| Consumer Discretionary (Continued) | ||||||||
Shimano, Inc. | 1,300 | $ | 202,669 | |||||
Stanley Electric Co. Ltd. | 200 | 4,240 | ||||||
Start Today Co. Ltd. | 1,300 | 59,312 | ||||||
Sumitomo Electric Industries Ltd. | 4,900 | 69,344 | ||||||
Sumitomo Forestry Co. Ltd. | 1,300 | 17,723 | ||||||
Sumitomo Rubber Industries Ltd. | 1,300 | 19,106 | ||||||
Suzuki Motor Corp. | 3,200 | 82,204 | ||||||
Toho Co. Ltd. | 100 | 2,732 | ||||||
TOKAI RIKA Co. Ltd. | 100 | 1,772 | ||||||
Toyo Tire & Rubber Co. Ltd. | 200 | 2,436 | ||||||
Toyoda Gosei Co. Ltd. | 200 | 3,922 | ||||||
Toyota Boshoku Corp. | 100 | 1,996 | ||||||
Toyota Industries Corp. | 1,600 | 69,321 | ||||||
Toyota Motor Corp. | 4,800 | 250,290 | ||||||
TS TECH Co. Ltd. | 200 | 5,150 | ||||||
Unipres Corp. | 100 | 1,947 | ||||||
United Arrows Ltd. | 100 | 2,985 | ||||||
USEN Corp.* | 100 | 325 | ||||||
USS Co. Ltd. | 1,600 | 25,319 | ||||||
VT HOLDINGS Co. Ltd. | 500 | 2,362 | ||||||
Yamaha Corp. | 300 | 9,089 | ||||||
Yamaha Motor Co. Ltd. | 1,700 | 30,074 | ||||||
Yokohama Rubber Co. Ltd. | 1,300 | 19,962 | ||||||
|
| |||||||
| 3,274,569 | ||||||||
|
| |||||||
| Consumer Staples — 9.0% | ||||||||
Aeon Co. Ltd. | 4,900 | 74,380 | ||||||
Ain Holdings, Inc. | 100 | 6,420 | ||||||
Ajinomoto Co., Inc. | 1,500 | 36,186 | ||||||
Asahi Group Holdings Ltd. | 3,200 | 108,893 | ||||||
Calbee, Inc. | 100 | 3,688 | ||||||
Ci:z Holdings Co. Ltd. | 1,500 | 31,297 | ||||||
FamilyMart Co. Ltd. | 1,400 | 73,468 | ||||||
ITO EN Ltd. | 300 | 10,090 | ||||||
Japan Tobacco, Inc. | 8,000 | 317,533 | ||||||
Kao Corp. | 3,300 | 181,537 | ||||||
Kewpie Corp. | 200 | 5,365 | ||||||
Kirin Holdings Co. Ltd. | 6,400 | 107,566 | ||||||
Kobayashi Pharmaceutical Co. Ltd. | 200 | 16,320 | ||||||
Kose Corp. | 200 | 17,961 | ||||||
Lawson, Inc. | 200 | 15,815 | ||||||
Matsumotokiyoshi Holdings Co. Ltd. | 100 | 5,464 | ||||||
MEIJI Holdings Co. Ltd. | 1,700 | 153,438 | ||||||
Nissin Foods Holdings Co. Ltd. | 100 | 5,013 | ||||||
Pigeon Corp. | 1,500 | 40,846 | ||||||
Seven & i Holdings Co. Ltd. | 4,900 | 209,599 | ||||||
Shiseido Co. Ltd. | 1,900 | 50,102 | ||||||
Sugi Holdings Co. Ltd. | 100 | 5,230 | ||||||
Sundrug Co. Ltd. | 100 | 8,268 | ||||||
Toyo Suisan Kaisha Ltd. | 1,300 | 50,345 | ||||||
TSURUHA HOLDINGS, Inc. | 100 | 10,396 | ||||||
Unicharm Corp. | 3,200 | 62,569 | ||||||
Valor Holdings Co. Ltd. | 100 | 2,710 | ||||||
Welcia Holdings Co. Ltd. | 100 | 5,618 | ||||||
Yakult Honsha Co. Ltd. | 1,300 | 63,766 | ||||||
|
| |||||||
| 1,679,883 | ||||||||
|
| |||||||
| See Notes to Financial Statements. | 34 |
DBX ETF Trust
Schedule of investments
Deutsche X-trackers Japan JPX-Nikkei 400 Equity ETF (Continued)
May 31, 2016
Number of Shares | Value | |||||||
| Energy — 0.5% | ||||||||
INPEX Corp. | 8,100 | $ | 66,652 | |||||
NIPPON GAS Co. Ltd. | 100 | 2,237 | ||||||
Showa Shell Sekiyu KK | 1,600 | 16,216 | ||||||
|
| |||||||
| 85,105 | ||||||||
|
| |||||||
| Financials — 18.0% | ||||||||
Acom Co. Ltd.*(a) | 3,100 | 17,079 | ||||||
AEON Financial Service Co. Ltd. | 100 | 2,206 | ||||||
AEON Mall Co. Ltd. | 100 | 1,319 | ||||||
Aozora Bank Ltd. | 15,000 | 50,990 | ||||||
Chiba Bank Ltd. | 14,000 | 73,468 | ||||||
Chugoku Bank Ltd. | 1,600 | 18,163 | ||||||
Concordia Financial Group Ltd.* | 1,500 | 6,983 | ||||||
Credit Saison Co. Ltd. | 1,500 | 28,565 | ||||||
Dai-ichi Life Insurance Co. Ltd. | 8,100 | 106,668 | ||||||
Daikyo, Inc. | 1,000 | 1,533 | ||||||
Daito Trust Construction Co. Ltd. | 1,300 | 188,662 | ||||||
Daiwa House Industry Co. Ltd. | 4,800 | 139,233 | ||||||
Daiwa Securities Group, Inc. | 16,000 | 93,226 | ||||||
Fukuoka Financial Group, Inc. | 15,000 | 54,641 | ||||||
Hiroshima Bank Ltd. | 1,000 | 3,769 | ||||||
Hitachi Capital Corp. | 100 | 2,244 | ||||||
Hokuhoku Financial Group, Inc. | 1,000 | 1,226 | ||||||
Hulic Co. Ltd. | 1,700 | 16,846 | ||||||
Iyo Bank Ltd. | 1,700 | 11,312 | ||||||
Japan Exchange Group, Inc. | 3,400 | 46,292 | ||||||
Joyo Bank Ltd. | 15,000 | 55,453 | ||||||
Leopalace21 Corp. | 1,600 | 10,084 | ||||||
Matsui Securities Co. Ltd. | 100 | 901 | ||||||
Mitsubishi Estate Co. Ltd. | 14,000 | 270,078 | ||||||
Mitsubishi UFJ Financial Group, Inc. | 43,100 | 215,218 | ||||||
Mitsubishi UFJ Lease & Finance Co. Ltd. | 3,200 | 13,763 | ||||||
Mitsui Fudosan Co. Ltd. | 14,900 | 365,631 | ||||||
Mizuho Financial Group, Inc. | 145,600 | 228,959 | ||||||
MS&AD Insurance Group Holdings, Inc. | 3,300 | 94,086 | ||||||
Nihon M&A Center, Inc. | 100 | 6,095 | ||||||
Nishi-Nippon City Bank Ltd. | 1,000 | 1,894 | ||||||
Nomura Holdings, Inc. | 25,400 | 110,024 | ||||||
Nomura Real Estate Holdings, Inc. | 1,500 | 26,928 | ||||||
NTT Urban Development Corp. | 100 | 1,001 | ||||||
Okasan Securities Group, Inc. | 1,000 | 5,248 | ||||||
ORIX Corp. | 9,600 | 133,303 | ||||||
Relo Holdings, Inc. | 100 | 13,687 | ||||||
Resona Holdings, Inc. | 16,100 | 61,174 | ||||||
SBI Holdings, Inc. | 200 | 2,087 | ||||||
Seven Bank Ltd. | 4,800 | 17,658 | ||||||
Shinsei Bank Ltd. | 16,000 | 25,680 | ||||||
Shizuoka Bank Ltd. | 13,000 | 97,173 | ||||||
Sompo Japan Nipponkoa Holdings, Inc. | 3,000 | 84,559 | ||||||
Sony Financial Holdings, Inc. | 1,600 | 19,548 | ||||||
Sumitomo Mitsui Financial Group, Inc. | 6,400 | 208,726 | ||||||
Sumitomo Mitsui Trust Holdings, Inc. | 32,000 | 111,288 | ||||||
Sumitomo Real Estate Sales Co. Ltd. | 100 | 1,958 | ||||||
Suruga Bank Ltd. | 1,600 | 35,793 | ||||||
T&D Holdings, Inc. | 4,800 | 47,890 | ||||||
Takara Leben Co. Ltd. | 1,600 | 11,094 | ||||||
Tokai Tokyo Financial Holdings, Inc. | 1,600 | 7,964 | ||||||
Tokio Marine Holdings, Inc. | 4,900 | 169,615 | ||||||
Number of Shares | Value | |||||||
| Financials (Continued) | ||||||||
Tokyu Fudosan Holdings Corp. | 3,300 | $ | 21,781 | |||||
|
| |||||||
| 3,340,766 | ||||||||
|
| |||||||
| Health Care — 10.5% | ||||||||
Alfresa Holdings Corp. | 1,600 | 33,715 | ||||||
Astellas Pharma, Inc. | 16,100 | 220,222 | ||||||
Chugai Pharmaceutical Co. Ltd. | 1,600 | 56,192 | ||||||
Daiichi Sankyo Co. Ltd. | 4,800 | 111,512 | ||||||
Eisai Co. Ltd. | 1,600 | 99,227 | ||||||
Hisamitsu Pharmaceutical Co., Inc. | 1,500 | 80,204 | ||||||
Hoya Corp. | 4,400 | 155,005 | ||||||
Kaken Pharmaceutical Co. Ltd. | 100 | 5,672 | ||||||
KYORIN Holdings, Inc. | 200 | 3,868 | ||||||
Kyowa Hakko Kirin Co. Ltd. | 1,500 | 27,321 | ||||||
M3, Inc. | 1,600 | 45,949 | ||||||
Medipal Holdings Corp. | 1,600 | 27,772 | ||||||
Miraca Holdings, Inc. | 100 | 4,224 | ||||||
Mitsubishi Tanabe Pharma Corp. | 1,600 | 26,877 | ||||||
Nihon Kohden Corp. | 100 | 2,885 | ||||||
Olympus Corp. | 1,600 | 67,734 | ||||||
Ono Pharmaceutical Co. Ltd. | 4,900 | 217,552 | ||||||
Otsuka Holdings Co. Ltd. | 3,200 | 130,706 | ||||||
Rohto Pharmaceutical Co. Ltd. | 1,100 | 17,050 | ||||||
Santen Pharmaceutical Co. Ltd. | 1,700 | 25,016 | ||||||
Sawai Pharmaceutical Co. Ltd. | 100 | 7,123 | ||||||
Shionogi & Co. Ltd. | 1,700 | 95,603 | ||||||
Ship Healthcare Holdings, Inc. | 1,400 | 39,953 | ||||||
Sysmex Corp. | 1,500 | 109,553 | ||||||
Taisho Pharmaceutical Holdings Co. Ltd. | 100 | 9,314 | ||||||
Takeda Pharmaceutical Co. Ltd. | 4,900 | 211,941 | ||||||
Terumo Corp. | 1,700 | 71,431 | ||||||
Toho Holdings Co. Ltd. | 1,300 | 31,918 | ||||||
Tsumura & Co. | 200 | 4,716 | ||||||
|
| |||||||
| 1,940,255 | ||||||||
|
| |||||||
| Industrials — 20.1% | ||||||||
Aeon Delight Co. Ltd. | 100 | 2,890 | ||||||
Aica Kogyo Co. Ltd. | 1,500 | 33,718 | ||||||
ANA Holdings, Inc. | 32,000 | 93,457 | ||||||
Asahi Glass Co. Ltd. | 1,000 | 6,059 | ||||||
Central Japan Railway Co. | 1,500 | 265,497 | ||||||
COMSYS Holdings Corp. | 100 | 1,650 | ||||||
Daikin Industries Ltd. | 1,700 | 145,559 | ||||||
East Japan Railway Co. | 1,700 | 155,354 | ||||||
EBARA Corp. | 1,000 | 5,121 | ||||||
FANUC Corp. | 1,600 | 244,966 | ||||||
Fuji Electric Co. Ltd. | 1,000 | 4,039 | ||||||
Hankyu Hanshin Holdings, Inc. | 2,000 | 13,723 | ||||||
Hazama Ando Corp. | 1,600 | 9,002 | ||||||
Hino Motors Ltd. | 1,700 | 17,413 | ||||||
Hitachi Construction Machinery Co. Ltd. | 100 | 1,544 | ||||||
Hoshizaki Electric Co. Ltd. | 100 | 9,567 | ||||||
IHI Corp. | 13,000 | 33,524 | ||||||
ITOCHU Corp. | 11,300 | 141,779 | ||||||
JTEKT Corp. | 1,600 | 22,145 | ||||||
Kajima Corp. | 1,000 | 6,808 | ||||||
Kanamoto Co. Ltd. | 100 | 2,286 | ||||||
Kanematsu Corp. | 1,000 | 1,605 | ||||||
| See Notes to Financial Statements. | 35 |
DBX ETF Trust
Schedule of investments
Deutsche X-trackers Japan JPX-Nikkei 400 Equity ETF (Continued)
May 31, 2016
Number of Shares | Value | |||||||
| Industrials (Continued) | ||||||||
Kawasaki Heavy Industries Ltd. | 15,000 | $ | 46,662 | |||||
Keihan Holdings Co. Ltd. | 1,000 | 6,744 | ||||||
Keio Corp. | 1,000 | 8,566 | ||||||
Keisei Electric Railway Co. Ltd. | 1,000 | 13,417 | ||||||
Kintetsu Group Holdings Co. Ltd. | 16,000 | 64,343 | ||||||
Kintetsu World Express, Inc. | 1,700 | 21,674 | ||||||
Komatsu Ltd. | 6,500 | 112,089 | ||||||
Kubota Corp. | 13,000 | 191,123 | ||||||
KYOWA EXEO Corp. | 100 | 1,208 | ||||||
Makita Corp. | 100 | 6,474 | ||||||
Marubeni Corp. | 11,300 | 54,297 | ||||||
Minebea Co. Ltd. | 800 | 6,413 | ||||||
MISUMI Group, Inc. | 1,700 | 26,074 | ||||||
Mitsubishi Corp. | 9,700 | 172,038 | ||||||
Mitsubishi Electric Corp. | 16,000 | 193,246 | ||||||
Mitsubishi Heavy Industries Ltd. | 17,000 | 68,932 | ||||||
Mitsui & Co. Ltd. | 11,300 | 136,022 | ||||||
Mitsui Engineering & Shipbuilding Co. Ltd. | 3,000 | 4,815 | ||||||
MonotaRO Co. Ltd. | 200 | 6,916 | ||||||
Nabtesco Corp. | 100 | 2,542 | ||||||
Nagoya Railroad Co. Ltd. | 1,000 | 5,031 | ||||||
Namura Shipbuilding Co. Ltd. | 600 | 3,830 | ||||||
Nankai Electric Railway Co. Ltd. | 1,000 | 5,248 | ||||||
NGK Insulators Ltd. | 1,000 | 21,992 | ||||||
Nidec Corp. | 1,600 | 123,450 | ||||||
Nippon Express Co. Ltd. | 14,000 | 60,340 | ||||||
Nippon Steel & Sumikin Bussan Corp. | 1,000 | 3,535 | ||||||
Nippon Yusen KK | 14,000 | 26,509 | ||||||
Nishi-Nippon Railroad Co. Ltd. | 2,000 | 10,387 | ||||||
NSK Ltd. | 3,200 | 28,421 | ||||||
Obayashi Corp. | 1,500 | 15,784 | ||||||
Odakyu Electric Railway Co. Ltd. | 13,000 | 141,130 | ||||||
OSG Corp. | 100 | 1,817 | ||||||
Park24 Co. Ltd. | 100 | 2,858 | ||||||
Pilot Corp. | 100 | 4,391 | ||||||
Sankyo Tateyama, Inc. | 100 | 1,397 | ||||||
Sanwa Holdings Corp. | 100 | 873 | ||||||
Secom Co. Ltd. | 1,600 | 125,296 | ||||||
Shimizu Corp. | 1,000 | 8,945 | ||||||
SMC Corp. | 1,100 | 280,195 | ||||||
Sohgo Security Services Co. Ltd. | 100 | 4,923 | ||||||
Sojitz Corp. | 9,400 | 21,020 | ||||||
Sotetsu Holdings, Inc. | 1,000 | 5,942 | ||||||
Sumitomo Corp. | 8,000 | 82,052 | ||||||
Sumitomo Heavy Industries Ltd. | 1,000 | 4,860 | ||||||
Sumitomo Mitsui Construction Co. Ltd. | 5,300 | 4,731 | ||||||
Taisei Corp. | 15,000 | 111,176 | ||||||
Temp Holdings Co. Ltd. | 900 | 14,347 | ||||||
THK Co. Ltd. | 100 | 1,891 | ||||||
Tobu Railway Co. Ltd. | 1,000 | 5,076 | ||||||
Tokyu Corp. | 1,000 | 8,566 | ||||||
TOTO Ltd. | 1,400 | 53,145 | ||||||
Toyota Tsusho Corp. | 1,600 | 37,798 | ||||||
West Japan Railway Co. | 1,600 | 100,035 | ||||||
Yamato Holdings Co. Ltd. (a) | 1,700 | 34,512 | ||||||
|
| |||||||
| 3,722,804 | ||||||||
|
| |||||||
Number of Shares | Value | |||||||
| Information Technology — 9.3% | ||||||||
Alps Electric Co. Ltd. | 1,300 | $ | 26,280 | |||||
Anritsu Corp. | 1,700 | 9,657 | ||||||
Brother Industries Ltd. | 1,600 | 19,173 | ||||||
Canon, Inc. | 8,000 | 231,694 | ||||||
COOKPAD, Inc. | 100 | 1,331 | ||||||
DeNA Co. Ltd. | 200 | 4,018 | ||||||
DISCO Corp. | 100 | 9,513 | ||||||
FUJIFILM Holdings Corp. | 3,200 | 129,899 | ||||||
Fujitsu Ltd. | 16,000 | 64,632 | ||||||
GMO internet, Inc. | 1,400 | 16,587 | ||||||
Gree, Inc.* | 1,500 | 8,656 | ||||||
GungHo Online Entertainment, Inc. (a) | 4,000 | 11,614 | ||||||
Hamamatsu Photonics KK | 1,600 | 43,569 | ||||||
Hirose Electric Co. Ltd. | 100 | 12,407 | ||||||
Hitachi High-Technologies Corp. | 100 | 2,912 | ||||||
Hitachi Ltd. | 32,000 | 147,730 | ||||||
Horiba Ltd. | 200 | 8,548 | ||||||
Itochu Techno-Solutions Corp. | 100 | 2,215 | ||||||
Kakaku.com, Inc. (a) | 200 | 3,787 | ||||||
Keyence Corp. | 100 | 63,478 | ||||||
Konica Minolta, Inc. | 3,300 | 28,446 | ||||||
Kyocera Corp. | 1,700 | 84,919 | ||||||
Mixi, Inc. | 100 | 3,859 | ||||||
Murata Manufacturing Co. Ltd. | 1,600 | 186,827 | ||||||
NEC Corp. | 9,000 | 21,180 | ||||||
Nexon Co. Ltd. | 1,300 | 21,369 | ||||||
Nomura Research Institute Ltd. | 1,120 | 42,263 | ||||||
NTT Data Corp. | 1,200 | 61,891 | ||||||
Obic Co. Ltd. | 200 | 10,874 | ||||||
Oki Electric Industry Co. Ltd. | 15,000 | 22,046 | ||||||
Omron Corp. | 1,600 | 51,503 | ||||||
Oracle Corp. Japan | 100 | 5,311 | ||||||
OTSUKA Corp. | 100 | 4,734 | ||||||
Ricoh Co. Ltd. | 3,300 | 28,743 | ||||||
SCSK Corp. | 200 | 7,538 | ||||||
Seiko Epson Corp. | 1,700 | 30,596 | ||||||
TDK Corp. | 1,400 | 81,800 | ||||||
Tokyo Electron Ltd. | 1,400 | 103,790 | ||||||
Topcon Corp. | 100 | 1,019 | ||||||
Trend Micro, Inc. | 200 | 7,249 | ||||||
Wacom Co. Ltd. | 3,000 | 11,091 | ||||||
Yahoo Japan Corp. | 9,700 | 43,556 | ||||||
Yaskawa Electric Corp. | 1,700 | 21,521 | ||||||
Yokogawa Electric Corp. | 1,600 | 18,466 | ||||||
|
| |||||||
| 1,718,291 | ||||||||
|
| |||||||
| Materials — 6.6% | ||||||||
Asahi Kasei Corp. | 15,000 | 100,478 | ||||||
Daicel Corp. | 1,700 | 21,215 | ||||||
Denka Co. Ltd. | 1,000 | 4,382 | ||||||
DIC Corp. | 15,000 | 35,571 | ||||||
Hitachi Chemical Co. Ltd. | 100 | 1,871 | ||||||
Hitachi Metals Ltd. | 1,000 | 10,730 | ||||||
JFE Holdings, Inc. | 3,300 | 44,380 | ||||||
JSR Corp. | 1,600 | 23,516 | ||||||
Kobe Steel Ltd. | 15,000 | 13,525 | ||||||
Kuraray Co. Ltd. | 1,700 | 22,563 | ||||||
Mitsubishi Chemical Holdings Corp. | 9,600 | 48,855 | ||||||
| See Notes to Financial Statements. | 36 |
DBX ETF Trust
Schedule of investments
Deutsche X-trackers Japan JPX-Nikkei 400 Equity ETF (Continued)
May 31, 2016
Number of Shares | Value | |||||||
| Materials (Continued) | ||||||||
Mitsubishi Materials Corp. | 15,000 | $ | 43,280 | |||||
Mitsui Mining & Smelting Co. Ltd. | 1,000 | 1,758 | ||||||
Nihon Parkerizing Co. Ltd. | 100 | 1,023 | ||||||
Nippon Paint Holdings Co. Ltd. | 1,500 | 42,739 | ||||||
Nippon Steel & Sumitomo Metal Corp. | 6,400 | 132,149 | ||||||
Nissan Chemical Industries Ltd. | 1,500 | 44,092 | ||||||
Nitto Denko Corp. | 1,500 | 98,584 | ||||||
Oji Holdings Corp. | 14,000 | 57,563 | ||||||
Shin-Etsu Chemical Co. Ltd. | 1,700 | 99,144 | ||||||
Sumitomo Chemical Co. Ltd. | 13,000 | 59,546 | ||||||
Sumitomo Metal Mining Co. Ltd. | 13,000 | 133,980 | ||||||
Taiheiyo Cement Corp. | 15,000 | 39,493 | ||||||
Taiyo Nippon Sanso Corp. | 1,600 | 14,384 | ||||||
Toray Industries, Inc. | 15,000 | 129,719 | ||||||
Tosoh Corp. | 1,000 | 4,923 | ||||||
Ube Industries Ltd. | 1,000 | 1,876 | ||||||
|
| |||||||
| 1,231,339 | ||||||||
|
| |||||||
| Telecommunication Services — 6.8% | ||||||||
KDDI Corp. (a) | 12,700 | 370,677 | ||||||
Nippon Telegraph & Telephone Corp. | 8,100 | 354,587 | ||||||
NTT DOCOMO, Inc. | 11,200 | 280,644 | ||||||
Number of Shares | Value | |||||||
| Telecommunication Services (Continued) | ||||||||
SoftBank Group Corp. | 4,600 | $ | 258,318 | |||||
|
| |||||||
| 1,264,226 | ||||||||
|
| |||||||
| Utilities — 0.9% | ||||||||
Electric Power Development Co. Ltd. | 1,500 | 38,831 | ||||||
Osaka Gas Co. Ltd. | 16,000 | 60,015 | ||||||
Tokyo Gas Co. Ltd. | 16,000 | 64,617 | ||||||
|
| |||||||
| 163,463 | ||||||||
|
| |||||||
TOTAL COMMON STOCKS | 18,420,701 | |||||||
|
| |||||||
| SECURITIES LENDING COLLATERAL — 0.3% | ||||||||
Daily Assets Fund “Capital Shares”, 0.48% (b)(c) | 57,097 | 57,097 | ||||||
|
| |||||||
TOTAL INVESTMENTS — 99.6% | $ | 18,477,798 | ||||||
Other assets and liabilities, net — 0.4% | 73,149 | |||||||
|
| |||||||
NET ASSETS — 100.0% | $ | 18,550,947 | ||||||
|
| |||||||
| * | Non-income producing security. |
| † | The cost for federal income tax purposes was $18,617,521. At May 31, 2016, net unrealized depreciation for all securities based on tax cost was $139,723. This consisted of aggregate gross unrealized appreciation for all securities in which there was an excess of value over tax cost of $885,798 and aggregate gross unrealized depreciation for all securities in which there was an excess of tax cost over value of $1,025,521. |
| (a) | All or a portion of these securities were on loan. In addition, “Other Assets and Liabilities, Net” may include pending sales that are also on loan. The value of securities loaned at May 31, 2016 amounted to $54,447, which is 0.3% of net assets. |
| (b) | Affiliated fund managed by Deutsche Investment Management Americas Inc. The rate shown is the annualized seven-day yield at period end. |
| (c) | Represents collateral held in connection with securities lending. Income earned by the Fund is net of borrower rebates. |
Fair Value Measurements
Various inputs are used in determining the value of the Fund’s investments. These inputs are summarized in three broad levels. Level 1 includes quoted prices in active markets for identical securities. Level 2 includes other significant observable inputs (including quoted prices for similar securities, interest rates, prepayment speeds and credit risk). Level 3 includes significant unobservable inputs (including the Fund’s own assumptions in determining the fair value of investments). The level assigned to the securities valuations may not be an indication of the risk or liquidity associated with investing in those securities.
The following is a summary of the inputs used as of May 31, 2016 in valuing the Fund’s investments. For information on Fund’s policy regarding the valuation of investments, please refer to the Security Valuation section of Note 2 in the accompanying Notes to Financial Statements.
Assets | Level 1 | Level 2 | Level 3 | Total | ||||||||||||
Common Stocks (d) | $ | 18,420,701 | $ | — | $ | — | $ | 18,420,701 | ||||||||
Short-Term Investments | 57,097 | — | — | 57,097 | ||||||||||||
|
|
|
|
|
|
|
| |||||||||
TOTAL | $ | 18,477,798 | $ | — | $ | — | $ | 18,477,798 | ||||||||
|
|
|
|
|
|
|
| |||||||||
| (d) | See Schedule of investments for additional detailed categorizations. |
There have been no transfers between fair value measurement levels during the period ended May 31, 2016.
| See Notes to Financial Statements. | 37 |
DBX ETF Trust
Schedule of investments
Deutsche X-trackers Japan JPX-Nikkei 400 Hedged Equity ETF
May 31, 2016
Number | Value | |||||||
| COMMON STOCKS — 98.4% | ||||||||
| Consumer Discretionary — 17.7% | ||||||||
AISIN SEIKI Co. Ltd. | 299 | $ | 12,353 | |||||
ASICS Corp. | 299 | 6,807 | ||||||
Bandai Namco Holdings, Inc. | 299 | 7,415 | ||||||
Benesse Holdings, Inc. | 50 | 1,106 | ||||||
Bridgestone Corp. | 797 | 27,537 | ||||||
Casio Computer Co. Ltd. (a) | 299 | 4,658 | ||||||
CyberAgent, Inc. | 50 | 2,389 | ||||||
Daihatsu Motor Co. Ltd. | 299 | 4,099 | ||||||
DENSO Corp. | 598 | 23,594 | ||||||
Dentsu, Inc. | 299 | 15,148 | ||||||
Don Quijote Holdings Co. Ltd. | 250 | 8,037 | ||||||
Fuji Heavy Industries Ltd. | 797 | 29,869 | ||||||
Fuji Media Holdings, Inc. | 199 | 2,422 | ||||||
Hakuhodo DY Holdings, Inc. | 449 | 5,644 | ||||||
Haseko Corp. | 399 | 4,396 | ||||||
HIS Co. Ltd. | 50 | 1,366 | ||||||
Honda Motor Co. Ltd. | 1,495 | 42,541 | ||||||
Iida Group Holdings Co. Ltd. (a) | 250 | 5,242 | ||||||
Isetan Mitsukoshi Holdings Ltd. | 649 | 6,347 | ||||||
Isuzu Motors Ltd. | 797 | 9,616 | ||||||
J. Front Retailing Co. Ltd. | 499 | 5,984 | ||||||
Koito Manufacturing Co. Ltd. | 150 | 7,084 | ||||||
Mazda Motor Corp. | 748 | 12,908 | ||||||
Mitsubishi Motors Corp. | 997 | 5,213 | ||||||
NGK Spark Plug Co. Ltd. | 299 | 5,803 | ||||||
NHK Spring Co. Ltd. | 299 | 2,576 | ||||||
Nikon Corp. | 449 | 6,313 | ||||||
Nippon Television Holdings, Inc. | 299 | 5,290 | ||||||
Nissan Motor Co. Ltd. | 3,238 | 32,896 | ||||||
Nitori Holdings Co. Ltd. | 150 | 15,253 | ||||||
NOK Corp. | 150 | 2,693 | ||||||
Oriental Land Co. Ltd. | 299 | 19,689 | ||||||
Panasonic Corp. | 2,640 | 24,592 | ||||||
Rakuten, Inc. | 1,246 | 13,441 | ||||||
Resorttrust, Inc. | 150 | 3,159 | ||||||
Sega Sammy Holdings, Inc. | 299 | 3,651 | ||||||
Sekisui House Ltd. | 997 | 17,881 | ||||||
Seria Co. Ltd. | 50 | 3,260 | ||||||
Shimano, Inc. | 150 | 23,421 | ||||||
Stanley Electric Co. Ltd. | 150 | 3,185 | ||||||
Start Today Co. Ltd. | 150 | 6,854 | ||||||
Sumitomo Electric Industries Ltd. | 1,047 | 14,840 | ||||||
Sumitomo Forestry Co. Ltd. | 350 | 4,779 | ||||||
Sumitomo Rubber Industries Ltd. | 299 | 4,401 | ||||||
Suzuki Motor Corp. | 398 | 10,240 | ||||||
Toho Co. Ltd. | 250 | 6,841 | ||||||
Toyo Tire & Rubber Co. Ltd. | 150 | 1,830 | ||||||
Toyoda Gosei Co. Ltd. | 150 | 2,946 | ||||||
Toyota Industries Corp. | 199 | 8,635 | ||||||
Toyota Motor Corp. | 547 | 28,566 | ||||||
United Arrows Ltd. | 50 | 1,494 | ||||||
USS Co. Ltd. | 499 | 7,908 | ||||||
Yamaha Corp. | 250 | 7,586 | ||||||
Yamaha Motor Co. Ltd. | 399 | 7,069 | ||||||
Yokohama Rubber Co. Ltd. | 150 | 2,307 | ||||||
|
| |||||||
| 551,174 | ||||||||
|
| |||||||
Number | Value | |||||||
| Consumer Staples — 9.6% | ||||||||
Aeon Co. Ltd. | 1,047 | $ | 15,917 | |||||
Asahi Group Holdings Ltd. | 498 | 16,973 | ||||||
Calbee, Inc. | 150 | 5,540 | ||||||
Ci:z Holdings Co. Ltd. | 150 | 3,134 | ||||||
FamilyMart Co. Ltd. | 150 | 7,884 | ||||||
ITO EN Ltd. | 150 | 5,053 | ||||||
Japan Tobacco, Inc. | 1,545 | 61,418 | ||||||
Kao Corp. | 648 | 35,702 | ||||||
Kewpie Corp. | 150 | 4,030 | ||||||
Kirin Holdings Co. Ltd. | 1,096 | 18,449 | ||||||
Lawson, Inc. | 150 | 11,880 | ||||||
MEIJI Holdings Co. Ltd. | 200 | 18,079 | ||||||
Nissin Foods Holdings Co. Ltd. | 150 | 7,531 | ||||||
Pigeon Corp. | 150 | 4,091 | ||||||
Seven & i Holdings Co. Ltd. | 947 | 40,570 | ||||||
Shiseido Co. Ltd. | 549 | 14,499 | ||||||
Toyo Suisan Kaisha Ltd. | 150 | 5,818 | ||||||
Unicharm Corp. | 498 | 9,752 | ||||||
Valor Holdings Co. Ltd. | 150 | 4,071 | ||||||
Welcia Holdings Co. Ltd. | 50 | 2,813 | ||||||
Yakult Honsha Co. Ltd. | 150 | 7,369 | ||||||
|
| |||||||
| 300,573 | ||||||||
|
| |||||||
| Energy — 0.4% | ||||||||
INPEX Corp. | 1,296 | 10,681 | ||||||
Showa Shell Sekiyu KK | 299 | 3,035 | ||||||
|
| |||||||
| 13,716 | ||||||||
|
| |||||||
| Financials — 16.5% | ||||||||
Acom Co. Ltd.* | 649 | 3,581 | ||||||
AEON Financial Service Co. Ltd. | 150 | 3,315 | ||||||
AEON Mall Co. Ltd. | 150 | 1,982 | ||||||
Aozora Bank Ltd. | 1,495 | 5,090 | ||||||
Chiba Bank Ltd. | 495 | 2,602 | ||||||
Chugoku Bank Ltd. | 199 | 2,262 | ||||||
Concordia Financial Group Ltd.* | 1,495 | 6,970 | ||||||
Credit Saison Co. Ltd. | 250 | 4,768 | ||||||
Dai-ichi Life Insurance Co. Ltd. | 1,445 | 19,058 | ||||||
Daikyo, Inc. | 1,495 | 2,295 | ||||||
Daito Trust Construction Co. Ltd. | 150 | 21,802 | ||||||
Daiwa House Industry Co. Ltd. | 997 | 28,964 | ||||||
Daiwa Securities Group, Inc. | 1,990 | 11,613 | ||||||
Fukuoka Financial Group, Inc. | 1,495 | 5,454 | ||||||
Hiroshima Bank Ltd. | 495 | 1,868 | ||||||
Hitachi Capital Corp. | 150 | 3,372 | ||||||
Hokuhoku Financial Group, Inc. | 1,495 | 1,836 | ||||||
Hulic Co. Ltd. | 598 | 5,935 | ||||||
Iyo Bank Ltd. | 299 | 1,993 | ||||||
Japan Exchange Group, Inc. | 798 | 10,882 | ||||||
Joyo Bank Ltd. | 495 | 1,833 | ||||||
Leopalace21 Corp. | 499 | 3,150 | ||||||
Matsui Securities Co. Ltd. | 250 | 2,255 | ||||||
Mitsubishi Estate Co. Ltd. | 1,495 | 28,885 | ||||||
Mitsubishi UFJ Financial Group, Inc. | 6,571 | 32,862 | ||||||
Mitsubishi UFJ Lease & Finance Co. Ltd. | 598 | 2,576 | ||||||
Mitsui Fudosan Co. Ltd. | 1,495 | 36,742 | ||||||
Mizuho Financial Group, Inc. | 23,561 | 37,107 | ||||||
| See Notes to Financial Statements. | 38 |
DBX ETF Trust
Schedule of investments
Deutsche X-trackers Japan JPX-Nikkei 400 Hedged Equity ETF (Continued)
May 31, 2016
Number | Value | |||||||
| Financials (Continued) | ||||||||
MS&AD Insurance Group Holdings, Inc. | 598 | $ | 17,076 | |||||
Nishi-Nippon City Bank Ltd. | 1,495 | 2,835 | ||||||
Nomura Holdings, Inc. | 4,100 | 17,787 | ||||||
Nomura Real Estate Holdings, Inc. | 250 | 4,495 | ||||||
NTT Urban Development Corp. | 150 | 1,504 | ||||||
ORIX Corp. | 1,594 | 22,168 | ||||||
Resona Holdings, Inc. | 2,990 | 11,378 | ||||||
SBI Holdings, Inc. | 350 | 3,657 | ||||||
Seven Bank Ltd. | 897 | 3,305 | ||||||
Shinsei Bank Ltd. | 2,990 | 4,806 | ||||||
Shizuoka Bank Ltd. | 495 | 3,706 | ||||||
Sompo Japan Nipponkoa Holdings, Inc. | 549 | 15,498 | ||||||
Sony Financial Holdings, Inc. | 299 | 3,659 | ||||||
Sumitomo Mitsui Financial Group, Inc. | 1,096 | 35,799 | ||||||
Sumitomo Mitsui Trust Holdings, Inc. | 4,981 | 17,349 | ||||||
Sumitomo Real Estate Sales Co. Ltd. | 150 | 2,942 | ||||||
Suruga Bank Ltd. | 299 | 6,699 | ||||||
T&D Holdings, Inc. | 897 | 8,963 | ||||||
Takara Leben Co. Ltd. | 549 | 3,813 | ||||||
Tokai Tokyo Financial Holdings, Inc. | 399 | 1,989 | ||||||
Tokio Marine Holdings, Inc. | 847 | 29,364 | ||||||
Tokyu Fudosan Holdings Corp. | 748 | 4,945 | ||||||
|
| |||||||
| 514,789 | ||||||||
|
| |||||||
| Health Care — 9.9% | ||||||||
Alfresa Holdings Corp. | 299 | 6,310 | ||||||
Astellas Pharma, Inc. | 2,690 | 36,851 | ||||||
Chugai Pharmaceutical Co. Ltd. | 299 | 10,517 | ||||||
Daiichi Sankyo Co. Ltd. | 897 | 20,871 | ||||||
Eisai Co. Ltd. | 299 | 18,572 | ||||||
Hisamitsu Pharmaceutical Co., Inc. | 150 | 8,033 | ||||||
Hoya Corp. | 498 | 17,571 | ||||||
KYORIN Holdings, Inc. | 150 | 2,906 | ||||||
M3, Inc. | 199 | 5,724 | ||||||
Medipal Holdings Corp. | 299 | 5,198 | ||||||
Mitsubishi Tanabe Pharma Corp. | 299 | 5,030 | ||||||
Nihon Kohden Corp. | 150 | 4,335 | ||||||
Olympus Corp. | 399 | 16,917 | ||||||
Ono Pharmaceutical Co. Ltd. | 550 | 24,457 | ||||||
Otsuka Holdings Co. Ltd. | 498 | 20,372 | ||||||
Rohto Pharmaceutical Co. Ltd. | 150 | 2,328 | ||||||
Santen Pharmaceutical Co. Ltd. | 449 | 6,617 | ||||||
Shionogi & Co. Ltd. | 349 | 19,657 | ||||||
Ship Healthcare Holdings, Inc. | 50 | 1,429 | ||||||
Sysmex Corp. | 150 | 10,972 | ||||||
Takeda Pharmaceutical Co. Ltd. | 996 | 43,146 | ||||||
Terumo Corp. | 349 | 14,687 | ||||||
Toho Holdings Co. Ltd. | 150 | 3,688 | ||||||
Tsumura & Co. | 150 | 3,542 | ||||||
|
| |||||||
| 309,730 | ||||||||
|
| |||||||
| Industrials — 20.7% | ||||||||
Aeon Delight Co. Ltd. | 150 | 4,341 | ||||||
Aica Kogyo Co. Ltd. | 150 | 3,377 | ||||||
ANA Holdings, Inc. | 4,485 | 13,119 | ||||||
Asahi Glass Co. Ltd. | 1,495 | 9,072 | ||||||
Central Japan Railway Co. | 199 | 35,277 | ||||||
Number | Value | |||||||
| Industrials (Continued) | ||||||||
COMSYS Holdings Corp. | 250 | $ | 4,132 | |||||
Daikin Industries Ltd. | 349 | 29,928 | ||||||
East Japan Railway Co. | 449 | 41,095 | ||||||
FANUC Corp. | 199 | 30,514 | ||||||
Hankyu Hanshin Holdings, Inc. | 1,495 | 10,274 | ||||||
Hazama Ando Corp. | 350 | 1,972 | ||||||
Hino Motors Ltd. | 399 | 4,093 | ||||||
Hitachi Construction Machinery Co. Ltd. | 250 | 3,865 | ||||||
Hoshizaki Electric Co. Ltd. | 50 | 4,791 | ||||||
IHI Corp. | 2,495 | 6,444 | ||||||
ITOCHU Corp. | 1,993 | 25,044 | ||||||
JTEKT Corp. | 299 | 4,145 | ||||||
Kajima Corp. | 1,495 | 10,193 | ||||||
Kawasaki Heavy Industries Ltd. | 2,495 | 7,773 | ||||||
Keihan Holdings Co. Ltd. | 495 | 3,344 | ||||||
Kintetsu Group Holdings Co. Ltd. | 2,990 | 12,043 | ||||||
Komatsu Ltd. | 1,246 | 21,520 | ||||||
Kubota Corp. | 1,295 | 19,068 | ||||||
Makita Corp. | 150 | 9,726 | ||||||
Marubeni Corp. | 2,343 | 11,275 | ||||||
MISUMI Group, Inc. | 299 | 4,593 | ||||||
Mitsubishi Corp. | 1,744 | 30,979 | ||||||
Mitsubishi Electric Corp. | 2,990 | 36,168 | ||||||
Mitsubishi Heavy Industries Ltd. | 4,485 | 18,214 | ||||||
Mitsui & Co. Ltd. | 2,093 | 25,233 | ||||||
MonotaRO Co. Ltd. | 100 | 3,463 | ||||||
Nabtesco Corp. | 250 | 6,364 | ||||||
Nagoya Railroad Co. Ltd. | 1,495 | 7,533 | ||||||
Nidec Corp. | 299 | 23,105 | ||||||
Nippon Express Co. Ltd. | 1,495 | 6,453 | ||||||
NSK Ltd. | 598 | 5,319 | ||||||
Odakyu Electric Railway Co. Ltd. | 495 | 5,382 | ||||||
OSG Corp. | 150 | 2,730 | ||||||
Park24 Co. Ltd. | 150 | 4,294 | ||||||
Secom Co. Ltd. | 299 | 23,451 | ||||||
SMC Corp. | 50 | 12,756 | ||||||
Sohgo Security Services Co. Ltd. | 150 | 7,396 | ||||||
Sojitz Corp. | 2,094 | 4,690 | ||||||
Sumitomo Corp. | 1,495 | 15,357 | ||||||
Sumitomo Heavy Industries Ltd. | 495 | 2,409 | ||||||
Sumitomo Mitsui Construction Co. Ltd. | 3,197 | 2,858 | ||||||
Taisei Corp. | 1,495 | 11,098 | ||||||
THK Co. Ltd. | 250 | 4,734 | ||||||
Tobu Railway Co. Ltd. | 1,495 | 7,601 | ||||||
Tokyu Corp. | 1,495 | 12,826 | ||||||
Toyota Tsusho Corp. | 299 | 7,074 | ||||||
West Japan Railway Co. | 299 | 18,723 | ||||||
Yamato Holdings Co. Ltd. (a) | 449 | 9,129 | ||||||
|
| |||||||
| 646,357 | ||||||||
|
| |||||||
| Information Technology — 10.3% | ||||||||
Alps Electric Co. Ltd. | 250 | 5,062 | ||||||
Brother Industries Ltd. | 499 | 5,989 | ||||||
Canon, Inc. | 1,346 | 39,042 | ||||||
DeNA Co. Ltd. | 150 | 3,018 | ||||||
FUJIFILM Holdings Corp. | 598 | 24,312 | ||||||
Fujitsu Ltd. | 1,990 | 8,051 | ||||||
| See Notes to Financial Statements. | 39 |
DBX ETF Trust
Schedule of investments
Deutsche X-trackers Japan JPX-Nikkei 400 Hedged Equity ETF (Continued)
May 31, 2016
Number | Value | |||||||
| Information Technology (Continued) | ||||||||
GMO internet, Inc. | 199 | $ | 2,361 | |||||
GungHo Online Entertainment, Inc. (a) | 598 | 1,739 | ||||||
Hamamatsu Photonics KK | 250 | 6,818 | ||||||
Hitachi High-Technologies Corp. | 150 | 4,375 | ||||||
Hitachi Ltd. | 5,981 | 27,654 | ||||||
Horiba Ltd. | 150 | 6,421 | ||||||
Itochu Techno-Solutions Corp. | 50 | 1,109 | ||||||
Kakaku.com, Inc. (a) | 150 | 2,845 | ||||||
Konica Minolta, Inc. | 798 | 6,889 | ||||||
Kyocera Corp. | 449 | 22,463 | ||||||
Murata Manufacturing Co. Ltd. | 299 | 34,967 | ||||||
NEC Corp. | 4,000 | 9,428 | ||||||
Nexon Co. Ltd. | 250 | 4,116 | ||||||
Nomura Research Institute Ltd. | 165 | 6,236 | ||||||
NTT Data Corp. | 150 | 7,748 | ||||||
Obic Co. Ltd. | 150 | 8,168 | ||||||
Oki Electric Industry Co. Ltd. | 3,095 | 4,556 | ||||||
Omron Corp. | 299 | 9,640 | ||||||
Oracle Corp. Japan | 50 | 2,659 | ||||||
Ricoh Co. Ltd. | 848 | 7,398 | ||||||
Seiko Epson Corp. | 499 | 8,994 | ||||||
TDK Corp. | 150 | 8,778 | ||||||
Tokyo Electron Ltd. | 199 | 14,776 | ||||||
Trend Micro, Inc. | 150 | 5,445 | ||||||
Wacom Co. Ltd. | 550 | 2,036 | ||||||
Yahoo Japan Corp. | 1,794 | 8,068 | ||||||
Yaskawa Electric Corp. | 499 | 6,327 | ||||||
Yokogawa Electric Corp. | 399 | 4,612 | ||||||
|
| |||||||
| 322,100 | ||||||||
|
| |||||||
| Materials — 5.8% | ||||||||
Asahi Kasei Corp. | 1,495 | 10,030 | ||||||
Daicel Corp. | 449 | 5,612 | ||||||
DIC Corp. | 1,495 | 3,551 | ||||||
Hitachi Chemical Co. Ltd. | 150 | 2,811 | ||||||
Hitachi Metals Ltd. | 299 | 3,213 | ||||||
JFE Holdings, Inc. | 648 | 8,728 | ||||||
JSR Corp. | 299 | 4,401 | ||||||
Kobe Steel Ltd. | 4,990 | 4,506 | ||||||
Kuraray Co. Ltd. | 449 | 5,969 | ||||||
Mitsubishi Chemical Holdings Corp. | 1,745 | 8,894 | ||||||
Mitsubishi Materials Corp. | 1,495 | 4,320 | ||||||
Number | Value | |||||||
| Materials (Continued) | ||||||||
Nihon Parkerizing Co. Ltd. | 250 | $ | 2,560 | |||||
Nippon Paint Holdings Co. Ltd. (a) | 199 | 5,679 | ||||||
Nippon Steel & Sumitomo Metal Corp. | 1,096 | 22,665 | ||||||
Nissan Chemical Industries Ltd. | 250 | 7,360 | ||||||
Nitto Denko Corp. | 150 | 9,874 | ||||||
Oji Holdings Corp. | 1,495 | 6,156 | ||||||
Shin-Etsu Chemical Co. Ltd. | 449 | 26,226 | ||||||
Sumitomo Chemical Co. Ltd. | 1,495 | 6,858 | ||||||
Sumitomo Metal Mining Co. Ltd. | 495 | 5,109 | ||||||
Taiheiyo Cement Corp. | 1,495 | 3,942 | ||||||
Taiyo Nippon Sanso Corp. | 299 | 2,692 | ||||||
Toray Industries, Inc. | 1,495 | 12,949 | ||||||
Tosoh Corp. | 495 | 2,441 | ||||||
Ube Industries Ltd. | 2,495 | 4,686 | ||||||
|
| |||||||
| 181,232 | ||||||||
|
| |||||||
| Telecommunication Services — 6.7% | ||||||||
KDDI Corp. (a) | 2,042 | 59,692 | ||||||
Nippon Telegraph & Telephone Corp. | 1,345 | 58,969 | ||||||
NTT DOCOMO, Inc. | 1,744 | 43,767 | ||||||
SoftBank Group Corp. | 848 | 47,694 | ||||||
|
| |||||||
| 210,122 | ||||||||
|
| |||||||
| Utilities — 0.8% | ||||||||
Electric Power Development Co. Ltd. | 250 | 6,482 | ||||||
Osaka Gas Co. Ltd. | 2,990 | 11,232 | ||||||
Tokyo Gas Co. Ltd. | 1,990 | 8,049 | ||||||
|
| |||||||
| 25,763 | ||||||||
|
| |||||||
TOTAL COMMON STOCKS | 3,075,556 | |||||||
|
| |||||||
| SECURITIES LENDING COLLATERAL — 2.8% | ||||||||
Daily Assets Fund “Capital Shares”, 0.48% (b)(c) | 88,468 | 88,468 | ||||||
|
| |||||||
TOTAL INVESTMENTS — 101.2% (Cost $3,261,127)† | $ | 3,164,024 | ||||||
Other assets and liabilities, net — (1.2%) | (39,897 | ) | ||||||
|
| |||||||
NET ASSETS — 100.0% | $ | 3,124,127 | ||||||
|
| |||||||
| * | Non-income producing security. |
| † | The cost for federal income tax purposes was $3,271,116. At May 31, 2016, net unrealized depreciation for all securities based on tax cost was $107,092. This consisted of aggregate gross unrealized appreciation for all securities in which there was an excess of value over tax cost of $167,985 and aggregate gross unrealized depreciation for all securities in which there was an excess of tax cost over value of $275,077. |
| (a) | All or a portion of these securities were on loan. In addition, “Other Assets and Liabilities, Net” may include pending sales that are also on loan. The value of securities loaned at May 31, 2016 amounted to $84,474, which is 2.7% of net assets. |
| (b) | Affiliated fund managed by Deutsche Investment Management Americas Inc. The rate shown is the annualized seven-day yield at period end. |
| (c) | Represents collateral held in connection with securities lending. Income earned by the Fund is net of borrower rebates. |
| See Notes to Financial Statements. | 40 |
DBX ETF Trust
Schedule of investments
Deutsche X-trackers Japan JPX-Nikkei 400 Hedged Equity ETF (Continued)
May 31, 2016
As of May 31, 2016, the Fund had the following forward foreign currency exchange contracts outstanding:
Counterparty | Settlement Date | Currency To Deliver | Currency To Receive | Unrealized Appreciation (Depreciation) | ||||||||||||||
Canadian Imperial Bank of Commerce | 6/3/2016 | JPY | 190,494,169 | USD | 1,781,576 | $ | 61,103 | |||||||||||
RBC Capital Markets | 6/3/2016 | JPY | 4,765,000 | USD | 44,564 | 1,528 | ||||||||||||
RBC Capital Markets | 6/3/2016 | JPY | 137,895,749 | USD | 1,289,565 | 44,141 | ||||||||||||
The Bank of New York Mellon | 6/3/2016 | JPY | 687,447 | USD | 6,429 | 220 | ||||||||||||
Canadian Imperial Bank of Commerce | 6/3/2016 | USD | 1,781,576 | JPY | 197,585,734 | 2,945 | ||||||||||||
RBC Capital Markets | 6/3/2016 | USD | 32,734 | JPY | 3,500,000 | (1,123 | ) | |||||||||||
RBC Capital Markets | 6/3/2016 | USD | 1,301,395 | JPY | 144,331,236 | 2,152 | ||||||||||||
The Bank of New York Mellon | 6/3/2016 | USD | 5,877 | JPY | 651,810 | 10 | ||||||||||||
The Bank of New York Mellon | 6/3/2016 | USD | 551 | JPY | 60,000 | (9 | ) | |||||||||||
Canadian Imperial Bank of Commerce | 7/5/2016 | JPY | 197,363,037 | USD | 1,781,576 | (3,071 | ) | |||||||||||
RBC Capital Markets | 7/5/2016 | JPY | 520,000 | USD | 4,704 | 2 | ||||||||||||
RBC Capital Markets | 7/5/2016 | JPY | 710,000 | USD | 6,409 | (11 | ) | |||||||||||
RBC Capital Markets | 7/5/2016 | JPY | 144,170,513 | USD | 1,301,395 | (2,261 | ) | |||||||||||
The Bank of New York Mellon | 7/5/2016 | JPY | 651,080 | USD | 5,877 | (10 | ) | |||||||||||
|
| |||||||||||||||||
Total net unrealized appreciation | $ | 105,616 | ||||||||||||||||
|
| |||||||||||||||||
Currency Abbreviations
| JPY | Japanese Yen |
| USD | U.S. Dollar |
For information on the Fund’s policy and additional disclosures regarding forward foreign currency exchange contracts, please refer to the Derivatives section of Note 2 in the accompanying Notes to Financial Statements.
Fair Value Measurements
Various inputs are used in determining the value of the Fund’s investments. These inputs are summarized in three broad levels. Level 1 includes quoted prices in active markets for identical securities. Level 2 includes other significant observable inputs (including quoted prices for similar securities, interest rates, prepayment speeds and credit risk). Level 3 includes significant unobservable inputs (including the Fund’s own assumptions in determining the fair value of investments). The level assigned to the securities valuations may not be an indication of the risk or liquidity associated with investing in those securities.
The following is a summary of the inputs used as of May 31, 2016 in valuing the Fund’s investments. For information on Fund’s policy regarding the valuation of investments, please refer to the Security Valuation section of Note 2 in the accompanying Notes to Financial Statements.
Assets | Level 1 | Level 2 | Level 3 | Total | ||||||||||||
Common Stocks (d) | $ | 3,075,556 | $ | — | $ | — | $ | 3,075,556 | ||||||||
Short-Term Investments | 88,468 | — | — | 88,468 | ||||||||||||
Derivatives (e) | ||||||||||||||||
Forward Foreign Currency Exchange Contracts | — | 112,101 | — | 112,101 | ||||||||||||
|
|
|
|
|
|
|
| |||||||||
TOTAL | $ | 3,164,024 | $ | 112,101 | $ | — | $ | 3,276,125 | ||||||||
|
|
|
|
|
|
|
| |||||||||
Liabilities | Level 1 | Level 2 | Level 3 | Total | ||||||||||||
Derivatives (e) | ||||||||||||||||
Forward Foreign Currency Exchange Contracts | $ | — | $ | (6,485 | ) | $ | — | $ | (6,485 | ) | ||||||
|
|
|
|
|
|
|
| |||||||||
TOTAL | $ | — | $ | (6,485 | ) | $ | — | $ | (6,485 | ) | ||||||
|
|
|
|
|
|
|
| |||||||||
| (d) | See Schedule of investments for additional detailed categorizations. |
| (e) | Derivatives include unrealized appreciation (depreciation) on forward foreign currency exchange contracts. |
There have been no transfers between fair value measurement levels during the period ended May 31, 2016.
| See Notes to Financial Statements. | 41 |
DBX ETF Trust
Schedule of investments
Deutsche X-trackers MSCI Australia Hedged Equity ETF
May 31, 2016
Number | Value | |||||||
| COMMON STOCKS — 99.7% | ||||||||
| Consumer Discretionary — 2.7% | ||||||||
Aristocrat Leisure Ltd. | 2,370 | $ | 22,028 | |||||
Crown Resorts Ltd. | 1,594 | 13,871 | ||||||
Domino’s Pizza Enterprises Ltd. | 270 | 13,439 | ||||||
Flight Centre Travel Group Ltd. | 238 | 5,437 | ||||||
Harvey Norman Holdings Ltd. | 2,431 | 8,012 | ||||||
REA Group Ltd. | 231 | 9,348 | ||||||
Tabcorp Holdings Ltd. | 3,638 | 11,622 | ||||||
Tatts Group Ltd. | 6,408 | 18,248 | ||||||
|
| |||||||
| 102,005 | ||||||||
|
| |||||||
| Consumer Staples — 7.4% | ||||||||
Coca-Cola Amatil Ltd. | 2,506 | 16,084 | ||||||
Treasury Wine Estates Ltd. | 3,230 | 24,139 | ||||||
Wesfarmers Ltd. | 4,927 | 144,683 | ||||||
Woolworths Ltd. | 5,561 | 88,905 | ||||||
|
| |||||||
| 273,811 | ||||||||
|
| |||||||
| Energy — 4.7% | ||||||||
Caltex Australia Ltd. | 1,182 | 27,953 | ||||||
Oil Search Ltd. | 5,996 | 29,425 | ||||||
Origin Energy Ltd. | 7,656 | 31,596 | ||||||
Santos Ltd. | 6,951 | 22,758 | ||||||
Woodside Petroleum Ltd. | 3,245 | 64,262 | ||||||
|
| |||||||
| 175,994 | ||||||||
|
| |||||||
| Financials — 52.2% | ||||||||
AMP Ltd. | 12,940 | 52,748 | ||||||
ASX Ltd. | 847 | 27,248 | ||||||
Australia & New Zealand Banking Group Ltd. | 12,764 | 235,058 | ||||||
Bank of Queensland Ltd. | 1,646 | 13,836 | ||||||
Bendigo and Adelaide Bank Ltd. | 1,999 | 14,795 | ||||||
Challenger Ltd. | 2,497 | 17,271 | ||||||
Commonwealth Bank of Australia | 7,471 | 418,097 | ||||||
Dexus Property Group REIT | 4,235 | 26,507 | ||||||
Goodman Group REIT | 7,780 | 39,980 | ||||||
GPT Group REIT | 7,862 | 30,571 | ||||||
Insurance Australia Group Ltd. | 10,637 | 45,205 | ||||||
LendLease Group (a) | 2,416 | 23,451 | ||||||
Macquarie Group Ltd. | 1,340 | 72,511 | ||||||
Medibank Pvt Ltd. | 12,049 | 27,867 | ||||||
Mirvac Group REIT | 16,193 | 22,763 | ||||||
National Australia Bank Ltd. | 11,541 | 226,466 | ||||||
Platinum Asset Management Ltd. | 953 | 4,532 | ||||||
QBE Insurance Group Ltd. | 6,000 | 53,946 | ||||||
Scentre Group REIT | 23,293 | 78,451 | ||||||
Stockland REIT | 10,465 | 34,263 | ||||||
Suncorp Group Ltd. | 5,629 | 52,807 | ||||||
Vicinity Centres REIT | 14,721 | 34,685 | ||||||
Westfield Corp. REIT | 8,637 | 66,919 | ||||||
Westpac Banking Corp. | 14,594 | 323,819 | ||||||
|
| |||||||
| 1,943,796 | ||||||||
|
| |||||||
| Health Care — 7.2% | ||||||||
Cochlear Ltd. | 251 | 21,891 | ||||||
CSL Ltd. | 2,025 | 169,424 | ||||||
Healthscope Ltd. | 7,591 | 16,459 | ||||||
Number | Value | |||||||
| Health Care (Continued) | ||||||||
Ramsay Health Care Ltd. | 619 | $ | 32,547 | |||||
Sonic Healthcare Ltd. | 1,718 | 26,572 | ||||||
|
| |||||||
| 266,893 | ||||||||
|
| |||||||
| Industrials — 6.6% | ||||||||
Asciano Ltd. | 2,607 | 16,751 | ||||||
Aurizon Holdings Ltd. | 9,159 | 29,855 | ||||||
Brambles Ltd. | 6,908 | 64,157 | ||||||
CIMIC Group Ltd. | 440 | 11,893 | ||||||
Qantas Airways Ltd.* | 2,135 | 4,753 | ||||||
Seek Ltd. | 1,432 | 16,870 | ||||||
Sydney Airport (a) | 4,780 | 24,460 | ||||||
Transurban Group (a) | 8,906 | 77,564 | ||||||
|
| |||||||
| 246,303 | ||||||||
|
| |||||||
| Information Technology — 0.4% | ||||||||
Computershare Ltd. | 2,040 | 15,835 | ||||||
|
| |||||||
| Materials — 13.2% | ||||||||
Alumina Ltd. (b) | 10,655 | 10,897 | ||||||
Amcor Ltd. | 5,067 | 59,620 | ||||||
BHP Billiton Ltd. | 14,051 | 193,765 | ||||||
Boral Ltd. | 3,254 | 15,993 | ||||||
Fortescue Metals Group Ltd. (b) | 6,812 | 14,672 | ||||||
Incitec Pivot Ltd. | 7,382 | 18,407 | ||||||
James Hardie Industries PLC CDI | 1,949 | 29,694 | ||||||
Newcrest Mining Ltd.* | 3,354 | 46,228 | ||||||
Orica Ltd. | 1,634 | 16,061 | ||||||
Rio Tinto Ltd. | 1,856 | 59,948 | ||||||
South32 Ltd.* | 23,291 | 26,260 | ||||||
|
| |||||||
| 491,545 | ||||||||
|
| |||||||
| Telecommunication Services — 2.7% | ||||||||
Telstra Corp. Ltd. | 18,720 | 75,632 | ||||||
TPG Telecom Ltd. | 1,485 | 13,223 | ||||||
Vocus Communications Ltd. | 1,979 | 13,459 | ||||||
|
| |||||||
| 102,314 | ||||||||
|
| |||||||
| Utilities — 2.6% | ||||||||
AGL Energy Ltd. | 2,952 | 39,663 | ||||||
APA Group (a) | 4,875 | 30,900 | ||||||
AusNet Services | 7,739 | 8,810 | ||||||
DUET Group (a) | 10,155 | 17,248 | ||||||
|
| |||||||
| 96,621 | ||||||||
|
| |||||||
TOTAL COMMON STOCKS | 3,715,117 | |||||||
|
| |||||||
| SECURITIES LENDING COLLATERAL — 0.7% | ||||||||
Daily Assets Fund “Capital Shares”, 0.48% (c)(d) | 24,873 | 24,873 | ||||||
|
| |||||||
TOTAL INVESTMENTS — 100.4% (Cost $3,672,199)† | $ | 3,739,990 | ||||||
Other assets and liabilities, | (15,179 | ) | ||||||
|
| |||||||
NET ASSETS — 100.0% | $ | 3,724,811 | ||||||
|
| |||||||
| See Notes to Financial Statements. | 42 |
DBX ETF Trust
Schedule of investments
Deutsche X-trackers MSCI Australia Hedged Equity ETF (Continued)
May 31, 2016
| * | Non-income producing security. |
| † | The cost for federal income tax purposes was $3,729,815. At May 31, 2016, net unrealized appreciation for all securities based on tax cost was $10,175. This consisted of aggregate gross unrealized appreciation for all securities in which there was an excess of value over tax cost of $190,658 and aggregate gross unrealized depreciation for all securities in which there was an excess of tax cost over value of $180,483. |
| (a) | Stapled Security—A security contractually bound to one or more other securities to form a single saleable unit which cannot be sold separately. |
| (b) | All or a portion of these securities were on loan. In addition, “Other Assets and Liabilities, Net” may include pending sales that are also on loan. The value of securities loaned at May 31, 2016 amounted to $23,503, which is 0.6% of net assets. |
| (c) | Affiliated fund managed by Deutsche Investment Management Americas Inc. The rate shown is the annualized seven-day yield at period end. |
| (d) | Represents collateral held in connection with securities lending. Income earned by the Fund is net of borrower rebates. |
| CDI: | Chess Depositary Interest |
| REIT: | Real Estate Investment Trust |
As of May 31, 2016, the Fund had the following forward foreign currency exchange contracts outstanding:
Counterparty | Settlement Date | Currency To Deliver | Currency To Receive | Unrealized Appreciation (Depreciation) | ||||||||||||||
Canadian Imperial Bank of Commerce | 6/2/2016 | AUD | 2,017 | USD | 1,461 | $ | 3 | |||||||||||
Canadian Imperial Bank of Commerce | 6/2/2016 | AUD | 1,512,986 | USD | 1,153,175 | 59,661 | ||||||||||||
RBC Capital Markets | 6/2/2016 | AUD | 209,000 | USD | 159,303 | 8,248 | ||||||||||||
RBC Capital Markets | 6/2/2016 | AUD | 3,021,097 | USD | 2,302,671 | 119,166 | ||||||||||||
The Bank of New York Mellon | 6/2/2016 | AUD | 2,200 | USD | 1,679 | 89 | ||||||||||||
Canadian Imperial Bank of Commerce | 6/2/2016 | USD | 1,153,175 | AUD | 1,591,794 | (2,702 | ) | |||||||||||
RBC Capital Markets | 6/2/2016 | USD | 2,461,210 | AUD | 3,397,350 | (5,768 | ) | |||||||||||
RBC Capital Markets | 6/2/2016 | USD | 764 | AUD | 1,002 | (39 | ) | |||||||||||
The Bank of New York Mellon | 6/2/2016 | USD | 3,140 | AUD | 4,200 | (104 | ) | |||||||||||
Canadian Imperial Bank of Commerce | 7/5/2016 | AUD | 1,593,774 | USD | 1,153,175 | 2,851 | ||||||||||||
RBC Capital Markets | 7/5/2016 | AUD | 45,000 | USD | 32,556 | 76 | ||||||||||||
RBC Capital Markets | 7/5/2016 | AUD | 3,401,458 | USD | 2,461,210 | 6,170 | ||||||||||||
RBC Capital Markets | 7/5/2016 | AUD | 188,000 | USD | 136,029 | 338 | ||||||||||||
Canadian Imperial Bank of Commerce | 7/5/2016 | USD | 1,461 | AUD | 2,019 | (4 | ) | |||||||||||
|
| |||||||||||||||||
Total net unrealized appreciation | $ | 187,985 | ||||||||||||||||
|
| |||||||||||||||||
Currency Abbreviations
| AUD | Australian Dollar |
| USD | U.S. Dollar |
For information on the Fund’s policy and additional disclosures regarding forward foreign currency exchange contracts, please refer to the Derivatives section of Note 2 in the accompanying Notes to Financial Statements.
Fair Value Measurements
Various inputs are used in determining the value of the Fund’s investments. These inputs are summarized in three broad levels. Level 1 includes quoted prices in active markets for identical securities. Level 2 includes other significant observable inputs (including quoted prices for similar securities, interest rates, prepayment speeds and credit risk). Level 3 includes significant unobservable inputs (including the Fund’s own assumptions in determining the fair value of investments). The level assigned to the securities valuations may not be an indication of the risk or liquidity associated with investing in those securities.
| See Notes to Financial Statements. | 43 |
DBX ETF Trust
Schedule of investments
Deutsche X-trackers MSCI Australia Hedged Equity ETF (Continued)
May 31, 2016
The following is a summary of the inputs used as of May 31, 2016 in valuing the Fund’s investments. For information on Fund’s policy regarding the valuation of investments, please refer to the Security Valuation section of Note 2 in the accompanying Notes to Financial Statements.
Assets | Level 1 | Level 2 | Level 3 | Total | ||||||||||||
Common Stocks (e) | $ | 3,715,117 | $ | — | $ | — | $ | 3,715,117 | ||||||||
Short-Term Investments | 24,873 | — | — | 24,873 | ||||||||||||
Derivatives (f) | ||||||||||||||||
Forward Foreign Currency Exchange Contracts | — | 196,602 | — | 196,602 | ||||||||||||
|
|
|
|
|
|
|
| |||||||||
TOTAL | $ | 3,739,990 | $ | 196,602 | $ | — | $ | 3,936,592 | ||||||||
|
|
|
|
|
|
|
| |||||||||
Liabilities | Level 1 | Level 2 | Level 3 | Total | ||||||||||||
Derivatives (f) | ||||||||||||||||
Forward Foreign Currency Exchange Contracts | $ | — | $ | (8,617 | ) | $ | — | $ | (8,617 | ) | ||||||
|
|
|
|
|
|
|
| |||||||||
TOTAL | $ | — | $ | (8,617 | ) | $ | — | $ | (8,617 | ) | ||||||
|
|
|
|
|
|
|
| |||||||||
| (e) | See Schedule of investments for additional detailed categorizations. |
| (f) | Derivatives include unrealized appreciation (depreciation) on forward foreign currency exchange contracts. |
There have been no transfers between fair value measurement levels during the period ended May 31, 2016.
| See Notes to Financial Statements. | 44 |
DBX ETF Trust
Schedule of investments
Deutsche X-trackers MSCI EAFE Small Cap Hedged Equity ETF
May 31, 2016
Number | Value | |||||||
| COMMON STOCKS — 97.8% | ||||||||
| Australia — 5.6% | ||||||||
Adelaide Brighton Ltd. | 988 | $ | 4,056 | |||||
ALS Ltd. | 951 | 2,784 | ||||||
Ansell Ltd. | 254 | 3,508 | ||||||
APN Outdoor Group Ltd. | 400 | 1,977 | ||||||
Australian Pharmaceutical Industries Ltd. | 1,444 | 1,946 | ||||||
AWE Ltd.* | 2,337 | 1,470 | ||||||
BlueScope Steel Ltd. | 964 | 4,362 | ||||||
Burson Group Ltd. | 653 | 2,506 | ||||||
BWP Trust REIT | 822 | 2,151 | ||||||
carsales.com Ltd. | 516 | 4,744 | ||||||
Charter Hall Group REIT | 337 | 1,284 | ||||||
Charter Hall Retail REIT | 732 | 2,539 | ||||||
Cromwell Property Group REIT | 1,556 | 1,181 | ||||||
CSR Ltd. | 1,219 | 3,163 | ||||||
Downer EDI Ltd. | 1,185 | 3,349 | ||||||
DuluxGroup Ltd. | 820 | 3,817 | ||||||
Evolution Mining Ltd. | 1,827 | 2,681 | ||||||
Fairfax Media Ltd. | 4,999 | 3,324 | ||||||
GrainCorp Ltd., Class A | 387 | 2,489 | ||||||
Iluka Resources Ltd. | 505 | 2,354 | ||||||
Investa Office Fund REIT | 557 | 1,711 | ||||||
InvoCare Ltd. | 412 | 3,823 | ||||||
IOOF Holdings Ltd. (a) | 337 | 2,009 | ||||||
IRESS Ltd. | 436 | 3,930 | ||||||
JB Hi-Fi Ltd. (a) | 277 | 4,669 | ||||||
Karoon Gas Australia Ltd.* | 976 | 1,016 | ||||||
Link Administration Holdings Ltd.* | 400 | 2,507 | ||||||
Liquefied Natural Gas Ltd.* | 3,054 | 1,302 | ||||||
Macquarie Atlas Roads Group (b) | 1,105 | 4,185 | ||||||
Magellan Financial Group Ltd. | 201 | 3,585 | ||||||
Mayne Pharma Group Ltd.* | 1,623 | 1,865 | ||||||
Metcash Ltd.* | 1,726 | 2,557 | ||||||
Northern Star Resources Ltd. | 938 | 2,922 | ||||||
Orora Ltd. | 2,264 | 4,516 | ||||||
OZ Minerals Ltd. | 388 | 1,531 | ||||||
Pacific Brands Ltd. | 3,386 | 2,790 | ||||||
Paladin Energy Ltd.* | 8,136 | 1,294 | ||||||
Perpetual Ltd. | 83 | 2,613 | ||||||
Primary Health Care Ltd. | 1,076 | 3,017 | ||||||
Qube Holdings Ltd. | 1,411 | 2,407 | ||||||
Regis Resources Ltd. | 753 | 1,589 | ||||||
Shopping Centres Australasia Property Group REIT | 1,508 | 2,463 | ||||||
Sirtex Medical Ltd. | 119 | 2,709 | ||||||
Spark Infrastructure Group (b) | 2,356 | 3,916 | ||||||
Spotless Group Holdings Ltd. | 2,615 | 2,192 | ||||||
St Barbara Ltd.* | 1,502 | 2,855 | ||||||
Star Entertainment Group Ltd. | 1,309 | 5,345 | ||||||
Super Retail Group Ltd. | 462 | 3,079 | ||||||
Whitehaven Coal Ltd.* | 1,931 | 1,179 | ||||||
|
| |||||||
| 135,261 | ||||||||
|
| |||||||
| Austria — 0.9% | ||||||||
ams AG (a) | 115 | 3,164 | ||||||
BUWOG AG* | 151 | 3,251 | ||||||
CA Immobilien Anlagen AG* | 159 | 2,829 | ||||||
Number | Value | |||||||
| Austria (Continued) | ||||||||
Immofinanz AG* | 1,483 | $ | 3,438 | |||||
Oesterreichische Post AG* | 79 | 2,830 | ||||||
UNIQA Insurance Group AG | 263 | 1,892 | ||||||
Wienerberger AG | 222 | 3,993 | ||||||
|
| |||||||
| 21,397 | ||||||||
|
| |||||||
| Belgium — 2.1% | ||||||||
Ackermans & van Haaren NV | 20 | 2,595 | ||||||
Agfa Gevaert NV* | 580 | 2,119 | ||||||
Befimmo SA REIT | 49 | 3,253 | ||||||
Bekaert SA | 74 | 3,294 | ||||||
bpost SA | 140 | 3,690 | ||||||
Cofinimmo SA/NV REIT | 31 | 3,777 | ||||||
Compagnie d’Entreprises CFE SA | 17 | 1,615 | ||||||
D’ieteren SA | 64 | 3,024 | ||||||
Elia System Operator SA | 75 | 3,787 | ||||||
Euronav NV | 230 | 2,376 | ||||||
Galapagos NV* | 61 | 3,514 | ||||||
Ion Beam Applications | 45 | 1,974 | ||||||
KBC Ancora | 58 | 2,253 | ||||||
Melexis NV | 37 | 2,239 | ||||||
Ontex Group NV* | 128 | 4,165 | ||||||
Tessenderlo Chemie NV* | 72 | 2,558 | ||||||
Warehouses De Pauw Comm. VA REIT | 39 | 3,706 | ||||||
|
| |||||||
| 49,939 | ||||||||
|
| |||||||
| Bermuda — 0.2% | ||||||||
Frontline Ltd. | 152 | 1,294 | ||||||
Hiscox Ltd. | 293 | 4,174 | ||||||
|
| |||||||
| 5,468 | ||||||||
|
| |||||||
| Denmark — 1.7% | ||||||||
Bavarian Nordic A/S* | 64 | 2,446 | ||||||
DFDS A/S | 50 | 2,477 | ||||||
FlSmidth & Co. A/S (a) | 92 | 3,316 | ||||||
GN Store Nord A/S | 235 | 4,802 | ||||||
Jyske Bank A/S | 96 | 3,856 | ||||||
NKT Holding A/S | 57 | 3,131 | ||||||
Rockwool International A/S, Class B | 19 | 3,633 | ||||||
Royal Unibrew A/S | 98 | 4,527 | ||||||
SimCorp A/S | 79 | 4,184 | ||||||
Spar Nord Bank A/S | 309 | 2,681 | ||||||
Sydbank A/S | 115 | 3,279 | ||||||
Topdanmark A/S* | 111 | 3,050 | ||||||
|
| |||||||
| 41,382 | ||||||||
|
| |||||||
| Faroe Islands — 0.2% | ||||||||
Bakkafrost P/F | 108 | 4,187 | ||||||
|
| |||||||
| Finland — 1.3% | ||||||||
Amer Sports OYJ | 130 | 3,873 | ||||||
Cargotec OYJ, Class B | 65 | 2,517 | ||||||
Caverion Corp. | 228 | 1,563 | ||||||
Citycon OYJ | 347 | 830 | ||||||
Huhtamaki OYJ | 118 | 4,933 | ||||||
Kemira OYJ | 190 | 2,292 | ||||||
Kesko OYJ, Class B | 77 | 3,087 | ||||||
Konecranes OYJ | 99 | 2,738 | ||||||
Metsa Board OYJ | 344 | 1,921 | ||||||
| See Notes to Financial Statements. | 45 |
DBX ETF Trust
Schedule of investments
Deutsche X-trackers MSCI EAFE Small Cap Hedged Equity ETF (Continued)
May 31, 2016
Number | Value | |||||||
| Finland (Continued) | ||||||||
Outokumpu OYJ* | 456 | $ | 1,908 | |||||
Outotec OYJ* | 459 | 1,788 | ||||||
Tieto OYJ | 74 | 2,030 | ||||||
Valmet OYJ | 222 | 2,742 | ||||||
|
| |||||||
| 32,222 | ||||||||
|
| |||||||
| France — 3.8% | ||||||||
ABC Arbitrage | 450 | 3,320 | ||||||
Alten SA | 68 | 4,400 | ||||||
Altran Technologies SA* | 268 | 3,979 | ||||||
DBV Technologies SA* | 43 | 2,874 | ||||||
Elior Participations SCA, 144A | 111 | 2,490 | ||||||
Elis SA | 150 | 2,854 | ||||||
Euler Hermes Group | 9 | 774 | ||||||
Faurecia | 95 | 3,779 | ||||||
Gaztransport Et Technigaz SA | 70 | 2,374 | ||||||
Havas SA | 211 | 1,778 | ||||||
Ipsen SA* | 50 | 3,154 | ||||||
Korian SA | 72 | 2,345 | ||||||
Mercialys SA REIT | 122 | 2,654 | ||||||
Metropole Television SA | 126 | 2,312 | ||||||
Neopost SA | 96 | 2,318 | ||||||
Nexans SA* | 65 | 3,345 | ||||||
Nexity SA* | 62 | 3,342 | ||||||
Orpea | 46 | 3,843 | ||||||
Plastic Omnium SA | 100 | 3,335 | ||||||
Rubis SCA | 56 | 4,244 | ||||||
Saft Groupe SA | 88 | 3,588 | ||||||
SEB SA | 29 | 3,567 | ||||||
Societe Television Francaise 1 (a) | 189 | 2,387 | ||||||
Sopra Steria Group | 30 | 3,925 | ||||||
Technicolor SA | 553 | 3,673 | ||||||
Teleperformance | 75 | 6,541 | ||||||
Ubisoft Entertainment SA* | 155 | 5,717 | ||||||
Vicat SA | 32 | 2,098 | ||||||
Virbac SA | 11 | 1,896 | ||||||
|
| |||||||
| 92,906 | ||||||||
|
| |||||||
| Germany — 5.3% | ||||||||
Aareal Bank AG | 124 | 4,551 | ||||||
alstria office REIT-AG REIT* | 201 | 2,627 | ||||||
AURELIUS SE & Co. KGaA | 59 | 3,545 | ||||||
Aurubis AG | 43 | 2,246 | ||||||
Bechtle AG | 36 | 3,997 | ||||||
Bilfinger SE* | 64 | 2,718 | ||||||
CTS Eventim AG & Co. KGaA | 52 | 1,794 | ||||||
Deutsche Euroshop AG | 63 | 2,887 | ||||||
DMG Mori AG*(a) | 74 | 3,404 | ||||||
Drillisch AG | 95 | 3,890 | ||||||
Duerr AG | 44 | 3,417 | ||||||
Freenet AG | 182 | 5,017 | ||||||
Gerresheimer AG | 57 | 4,537 | ||||||
Indus Holding AG | 65 | 3,407 | ||||||
KION Group AG | 86 | 4,759 | ||||||
Krones AG | 19 | 2,264 | ||||||
KUKA AG | 39 | 4,600 | ||||||
LEG Immobilien AG* | 58 | 5,176 | ||||||
Number | Value | |||||||
| Germany (Continued) | ||||||||
Leoni AG | 62 | $ | 2,067 | |||||
MorphoSys AG*(a) | 47 | 2,636 | ||||||
MTU Aero Engines AG | 58 | 5,478 | ||||||
Nordex SE*(a) | 122 | 3,468 | ||||||
Norma Group SE* | 73 | 3,626 | ||||||
Rational AG | 4 | 1,889 | ||||||
Rheinmetall AG | 69 | 4,738 | ||||||
Rhoen-Klinikum AG | 102 | 3,130 | ||||||
Salzgitter AG | 75 | 2,394 | ||||||
Software AG* | 89 | 3,456 | ||||||
STADA Arzneimittel AG | 105 | 5,591 | ||||||
Stroeer SE & Co KGaA | 49 | 2,665 | ||||||
Suedzucker AG | 166 | 3,253 | ||||||
TAG Immobilien AG (a) | 237 | 3,238 | ||||||
TLG Immobilien AG | 234 | 5,113 | ||||||
Wacker Chemie AG | 23 | 2,160 | ||||||
Wincor Nixdorf AG* | 68 | 3,871 | ||||||
Wirecard AG (a) | 136 | 6,047 | ||||||
|
| |||||||
| 129,656 | ||||||||
|
| |||||||
| Hong Kong — 2.3% | ||||||||
Brightoil Petroleum Holdings Ltd. | 6,070 | 1,836 | ||||||
Cafe de Coral Holdings Ltd. | 1,039 | 2,895 | ||||||
Champion REIT | 3,470 | 1,817 | ||||||
China Strategic Holdings Ltd.* | 74,081 | 1,973 | ||||||
Dah Sing Financial Holdings Ltd. | 327 | 2,180 | ||||||
Digital Domain Holdings Ltd.* | 18,317 | 1,367 | ||||||
Esprit Holdings Ltd.* | 3,191 | 2,575 | ||||||
Freeman Financial Corp. Ltd.* | 14,017 | 812 | ||||||
Global Brands Group Holding Ltd.* | 13,721 | 1,360 | ||||||
HKBN Ltd. | 1,891 | 2,217 | ||||||
Hopewell Holdings Ltd. | 1,149 | 3,689 | ||||||
Hybrid Kinetic Group Ltd.* | 59,670 | 1,820 | ||||||
Johnson Electric Holdings Ltd. | 961 | 2,345 | ||||||
Landing International Development Ltd.* | 53,487 | 1,521 | ||||||
Man Wah Holdings Ltd. | 1,322 | 1,851 | ||||||
Melco International Development Ltd. | 1,564 | 1,844 | ||||||
NewOcean Energy Holdings Ltd. | 4,349 | 1,539 | ||||||
Orient Overseas International Ltd. | 331 | 1,284 | ||||||
Pacific Textiles Holdings Ltd. | 1,975 | 2,381 | ||||||
Playmates Toys Ltd. | 7,480 | 2,002 | ||||||
Sincere Watch Hong Kong Ltd.* | 28,674 | 1,882 | ||||||
Suncorp Technologies Ltd.* | 112,586 | 1,724 | ||||||
Television Broadcasts Ltd. | 706 | 2,399 | ||||||
Town Health International Medical Group Ltd. | 8,362 | 1,560 | ||||||
Value Partners Group Ltd. | 1,749 | 1,740 | ||||||
VTech Holdings Ltd. | 304 | 3,329 | ||||||
Xinyi Glass Holdings Ltd. | 3,889 | 2,707 | ||||||
|
| |||||||
| 54,649 | ||||||||
|
| |||||||
| Ireland — 1.4% | ||||||||
C&C Group PLC | 741 | 3,408 | ||||||
Glanbia PLC | 229 | 4,255 | ||||||
Grafton Group PLC | 292 | 3,125 | ||||||
Greencore Group PLC | 712 | 3,555 | ||||||
Hibernia REIT PLC REIT | 2,254 | 3,260 | ||||||
| See Notes to Financial Statements. | 46 |
DBX ETF Trust
Schedule of investments
Deutsche X-trackers MSCI EAFE Small Cap Hedged Equity ETF (Continued)
May 31, 2016
Number | Value | |||||||
| Ireland (Continued) | ||||||||
Kingspan Group PLC | 180 | $ | 5,058 | |||||
Smurfit Kappa Group PLC | 284 | 7,748 | ||||||
UDG Healthcare PLC | 395 | 3,387 | ||||||
|
| |||||||
| 33,796 | ||||||||
|
| |||||||
| Isle of Man — 0.5% | ||||||||
GVC Holdings PLC | 345 | 3,008 | ||||||
Paysafe Group PLC* | 711 | 4,243 | ||||||
Playtech PLC | 299 | 3,679 | ||||||
|
| |||||||
| 10,930 | ||||||||
|
| |||||||
| Israel — 1.1% | ||||||||
CaesarStone Sdot Yam Ltd.* | 30 | 1,184 | ||||||
Cellcom Israel Ltd.* | 379 | 3,154 | ||||||
CyberArk Software Ltd.* | 26 | 1,181 | ||||||
Elbit Systems Ltd. | 52 | 4,895 | ||||||
Frutarom Industries Ltd. | 80 | 3,897 | ||||||
Gazit-Globe Ltd. | 340 | 2,886 | ||||||
Israel Discount Bank Ltd., Class A* | 3,120 | 5,183 | ||||||
Partner Communications Co. Ltd.* | 544 | 2,907 | ||||||
Tower Semiconductor Ltd.* | 152 | 2,032 | ||||||
|
| |||||||
| 27,319 | ||||||||
|
| |||||||
| Italy — 3.9% | ||||||||
A2A SpA | 2,734 | 3,897 | ||||||
Anima Holding SpA, 144A | 418 | 2,565 | ||||||
Ansaldo STS SpA | 443 | 5,057 | ||||||
Autogrill SpA* | 303 | 2,598 | ||||||
Azimut Holding SpA | 185 | 4,067 | ||||||
Banca Carige SpA*(a) | 2,605 | 1,623 | ||||||
Banca Generali SpA | 76 | 1,991 | ||||||
Banca Mediolanum SpA | 253 | 2,121 | ||||||
Banca Monte dei Paschi di Siena SpA* | 2,550 | 1,768 | ||||||
Banca Popolare dell’Emilia Romagna SC | 717 | 3,628 | ||||||
Banca Popolare di Milano Scarl | 6,670 | 3,844 | ||||||
Banca Popolare di Sondrio Scarl | 851 | 2,788 | ||||||
Brembo SpA | 61 | 3,519 | ||||||
Buzzi Unicem SpA | 135 | 2,683 | ||||||
Credito Valtellinese SC | 3,299 | 2,059 | ||||||
Davide Campari-Milano SpA | 472 | 4,561 | ||||||
De’ Longhi | 96 | 2,575 | ||||||
DiaSorin SpA | 45 | 2,724 | ||||||
EI Towers SpA* | 56 | 3,224 | ||||||
Hera SpA | 1,270 | 3,674 | ||||||
Interpump Group SpA | 211 | 3,362 | ||||||
Italcementi SpA* | 346 | 4,035 | ||||||
Mediaset SpA | 1,090 | 4,863 | ||||||
Moncler SpA | 195 | 3,252 | ||||||
Recordati SpA | 148 | 4,370 | ||||||
Salini Impregilo SpA | 561 | 1,929 | ||||||
Salvatore Ferragamo SpA | 87 | 1,861 | ||||||
Societa Cattolica DI Assicurazioni Scrl | 374 | 2,568 | ||||||
Tod’s SpA (a) | 31 | 1,866 | ||||||
Unipol Gruppo Finanziario SpA | 709 | 2,619 | ||||||
Yoox Net-A-Porter Group SpA* | 105 | 2,948 | ||||||
|
| |||||||
| 94,639 | ||||||||
|
| |||||||
Number | Value | |||||||
| Japan — 30.5% | ||||||||
Adastria Co. Ltd. | 100 | $ | 3,305 | |||||
ADEKA Corp. | 300 | 4,113 | ||||||
Advance Residence Investment Corp. REIT | 1 | 2,533 | ||||||
AEON REIT Investment Corp. REIT | 4 | 5,101 | ||||||
Aica Kogyo Co. Ltd. | 200 | 4,503 | ||||||
AIFUL Corp.* | 800 | 2,716 | ||||||
Anritsu Corp. | 700 | 3,983 | ||||||
Aoyama Trading Co. Ltd. | 100 | 3,576 | ||||||
Asahi Intecc Co. Ltd. | 100 | 5,057 | ||||||
AUTOBACS SEVEN Co. Ltd. | 300 | 4,584 | ||||||
Awa Bank Ltd. | 1,000 | 5,680 | ||||||
Azbil Corp. | 200 | 5,590 | ||||||
Broadleaf Co. Ltd. | 300 | 2,958 | ||||||
Capcom Co. Ltd. | 200 | 4,732 | ||||||
Century Tokyo Leasing Corp. | 100 | 3,481 | ||||||
Coca-Cola East Japan Co. Ltd. | 200 | 3,858 | ||||||
Coca-Cola West Co. Ltd. | 200 | 5,572 | ||||||
COMSYS Holdings Corp. | 300 | 4,958 | ||||||
COOKPAD, Inc. | 200 | 2,666 | ||||||
CyberAgent, Inc. | 100 | 4,777 | ||||||
Daido Steel Co. Ltd. | 1,000 | 3,513 | ||||||
Daifuku Co. Ltd. | 300 | 5,204 | ||||||
DAIICHIKOSHO Co. Ltd. | 100 | 3,820 | ||||||
Daishi Bank Ltd. | 1,000 | 3,405 | ||||||
Daiwa House REIT Investment Corp. REIT | 1 | 5,409 | ||||||
Daiwa House Residential Investment Corp. REIT | 1 | 2,456 | ||||||
DeNA Co. Ltd. | 200 | 4,024 | ||||||
Denka Co. Ltd. | 1,000 | 4,389 | ||||||
DIC Corp. | 2,000 | 4,750 | ||||||
DMG MORI Co. Ltd. | 300 | 3,703 | ||||||
EBARA Corp. | 1,000 | 5,129 | ||||||
EZAKI GLICO Co. Ltd. | 100 | 5,391 | ||||||
Frontier Real Estate Investment Corp. REIT | 1 | 4,895 | ||||||
Fujikura Ltd. | 1,000 | 5,220 | ||||||
Fukuoka REIT Corp. | 2 | 3,674 | ||||||
Funai Electric Co. Ltd. | 200 | 1,631 | ||||||
Funai Soken Holdings, Inc. | 200 | 2,828 | ||||||
Furukawa Electric Co. Ltd. | 2,000 | 4,822 | ||||||
GLORY Ltd. | 200 | 5,825 | ||||||
GLP J-Reit REIT | 2 | 2,301 | ||||||
GMO internet, Inc. | 200 | 2,373 | ||||||
GS Yuasa Corp. | 1,000 | 4,226 | ||||||
H2O RETAILING Corp. | 200 | 3,036 | ||||||
Haseko Corp. | 500 | 5,509 | ||||||
Hazama Ando Corp. | 600 | 3,381 | ||||||
Heiwa Corp. | 200 | 3,993 | ||||||
HIS Co. Ltd. | 100 | 2,732 | ||||||
Hitachi Capital Corp. | 100 | 2,248 | ||||||
Hokkaido Electric Power Co., Inc. | 400 | 3,461 | ||||||
Hokkoku Bank Ltd. | 1,000 | 2,872 | ||||||
Horiba Ltd. | 100 | 4,281 | ||||||
Hosiden Corp. | 300 | 2,073 | ||||||
House Foods Group, Inc. | 100 | 1,981 | ||||||
Hyakugo Bank Ltd. | 1,000 | 3,712 | ||||||
Industrial & Infrastructure Fund Investment Corp. REIT | 1 | 5,166 | ||||||
| See Notes to Financial Statements. | 47 |
DBX ETF Trust
Schedule of investments
Deutsche X-trackers MSCI EAFE Small Cap Hedged Equity ETF (Continued)
May 31, 2016
Number | Value | |||||||
| Japan (Continued) | ||||||||
Ines Corp. | 400 | $ | 4,118 | |||||
Invincible Investment Corp. REIT | 7 | 4,823 | ||||||
IT Holdings Corp. | 200 | 4,851 | ||||||
ITO EN Ltd. | 200 | 6,737 | ||||||
Iwatani Corp. | 1,000 | 5,707 | ||||||
Izumi Co. Ltd. | 100 | 3,852 | ||||||
JAFCO Co. Ltd. | 100 | 2,994 | ||||||
Japan Display, Inc.* | 600 | 1,203 | ||||||
Japan Excellent, Inc. REIT | 3 | 4,048 | ||||||
Japan Hotel REIT Investment Corp. REIT | 5 | 4,348 | ||||||
Japan Logistics Fund, Inc. REIT | 1 | 2,207 | ||||||
Japan Petroleum Exploration Co. Ltd. | 100 | 2,231 | ||||||
Japan Rental Housing Investments, Inc. REIT | 6 | 4,671 | ||||||
Japan Steel Works Ltd. | 1,000 | 4,262 | ||||||
Juroku Bank Ltd. | 1,000 | 2,781 | ||||||
JVC Kenwood Corp. | 800 | 1,943 | ||||||
Kagome Co. Ltd. | 200 | 4,822 | ||||||
Kaken Pharmaceutical Co. Ltd. | 50 | 2,840 | ||||||
Kawasaki Kisen Kaisha Ltd. | 2,000 | 4,353 | ||||||
Keiyo Bank Ltd. | 1,000 | 3,739 | ||||||
Kenedix Office Investment Corp., REIT | 1 | 5,689 | ||||||
Kewpie Corp. | 200 | 5,373 | ||||||
KINDEN Corp. | 300 | 3,511 | ||||||
Kiyo Bank Ltd. | 300 | 3,874 | ||||||
K’S HOLDINGS Corp. | 200 | 3,173 | ||||||
Kumagai Gumi Co. Ltd. | 1,000 | 2,800 | ||||||
Laox Co. Ltd.* | 2,000 | 1,860 | ||||||
Leopalace21 Corp. | 700 | 4,419 | ||||||
LINTEC Corp. | 200 | 3,957 | ||||||
Lion Corp. | 200 | 2,930 | ||||||
Matsui Securities Co. Ltd. | 300 | 2,706 | ||||||
Matsumotokiyoshi Holdings Co. Ltd. | 100 | 5,473 | ||||||
MEITEC Corp. | 100 | 3,558 | ||||||
MISUMI Group, Inc. | 400 | 6,144 | ||||||
Mitsui Engineering & Shipbuilding Co. Ltd. | 3,000 | 4,822 | ||||||
Mitsui High-Tec, Inc. | 600 | 4,091 | ||||||
Mitsui Mining & Smelting Co. Ltd. | 2,000 | 3,522 | ||||||
Mitsumi Electric Co. Ltd.* | 400 | 1,889 | ||||||
MonotaRO Co. Ltd. | 100 | 3,463 | ||||||
Mori Hills REIT Investment Corp. REIT | 2 | 2,995 | ||||||
MORI TRUST Sogo Reit, Inc. REIT | 1 | 1,909 | ||||||
Musashino Bank Ltd. | 100 | 2,520 | ||||||
NAGASE & Co. Ltd. | 300 | 3,422 | ||||||
Nankai Electric Railway Co. Ltd. | 1,000 | 5,256 | ||||||
Nichi-iko Pharmaceutical Co. Ltd. | 100 | 2,212 | ||||||
Nifco, Inc. | 100 | 5,156 | ||||||
Nihon Kohden Corp. | 200 | 5,780 | ||||||
Nihon M&A Center, Inc. | 100 | 6,105 | ||||||
Nikkon Holdings Co. Ltd. | 300 | 6,155 | ||||||
Nippon Accommodations Fund, Inc. REIT | 1 | 4,127 | ||||||
Nippon Kayaku Co. Ltd. | 300 | 2,958 | ||||||
Nippon Paper Industries Co. Ltd. | 300 | 5,248 | ||||||
Nippon Shinyaku Co. Ltd. | 100 | 5,301 | ||||||
Nippon Suisan Kaisha Ltd. | 500 | 2,854 | ||||||
Nipro Corp. | 500 | 5,644 | ||||||
Nishimatsu Construction Co. Ltd. | 1,000 | 4,199 | ||||||
Number | Value | |||||||
| Japan (Continued) | ||||||||
Nishi-Nippon City Bank Ltd. | 1,000 | $ | 1,896 | |||||
Nishi-Nippon Railroad Co. Ltd. | 1,000 | 5,202 | ||||||
Nissan Chemical Industries Ltd. | 200 | 5,888 | ||||||
NISSAN SHATAI Co. Ltd. | 300 | 3,411 | ||||||
Nisshinbo Holdings, Inc. | 300 | 3,091 | ||||||
North Pacific Bank Ltd. | 800 | 2,269 | ||||||
NTN Corp. | 1,000 | 3,468 | ||||||
Ogaki Kyoritsu Bank Ltd. | 1,000 | 2,935 | ||||||
Okamoto Industries, Inc. | 100 | 971 | ||||||
Oki Electric Industry Co. Ltd. | 3,000 | 4,416 | ||||||
OncoTherapy Science, Inc.* | 600 | 1,642 | ||||||
Orix JREIT, Inc. REIT | 2 | 3,166 | ||||||
OSG Corp. | 200 | 3,639 | ||||||
Penta-Ocean Construction Co. Ltd. | 1,100 | 5,622 | ||||||
PeptiDream, Inc.* | 100 | 5,879 | ||||||
Pigeon Corp. | 200 | 5,454 | ||||||
Pilot Corp. | 100 | 4,398 | ||||||
Premier Investment Corp. REIT | 5 | 6,380 | ||||||
Qol Co. Ltd. | 200 | 2,738 | ||||||
Resorttrust, Inc. | 200 | 4,212 | ||||||
Rohto Pharmaceutical Co. Ltd. | 200 | 3,105 | ||||||
Sangetsu Co. Ltd. | 200 | 3,724 | ||||||
Sankyu, Inc. | 1,000 | 5,364 | ||||||
Sanwa Holdings Corp. | 500 | 4,371 | ||||||
SAPPORO HOLDINGS Ltd. | 1,000 | 5,418 | ||||||
Sawai Pharmaceutical Co. Ltd. | 100 | 7,134 | ||||||
SCREEN Holdings Co. Ltd. | 200 | 1,976 | ||||||
SCSK Corp. | 100 | 3,775 | ||||||
Seino Holdings Co. Ltd. | 400 | 3,825 | ||||||
Sekisui House SI Residential Investment Corp. REIT | 4 | 4,335 | ||||||
Senshu Ikeda Holdings, Inc. | 1,300 | 4,942 | ||||||
Seria Co. Ltd. | 100 | 6,520 | ||||||
Sharp Corp.* | 2,000 | 2,709 | ||||||
Shiga Bank Ltd. (a) | 1,000 | 4,335 | ||||||
Shimachu Co. Ltd. | 200 | 4,448 | ||||||
Shinko Plantech Co. Ltd. | 500 | 3,937 | ||||||
Ship Healthcare Holdings, Inc. | 200 | 5,716 | ||||||
Showa Denko KK | 4,000 | 4,118 | ||||||
Skylark Co. Ltd. | 300 | 3,573 | ||||||
Sojitz Corp. | 2,400 | 5,375 | ||||||
SQUARE ENIX HOLDINGS Co. Ltd. | 200 | 6,330 | ||||||
Sugi Holdings Co. Ltd. | 100 | 5,238 | ||||||
Sumco Corp. | 400 | 2,832 | ||||||
Sumitomo Forestry Co. Ltd. | 400 | 5,462 | ||||||
Sumitomo Mitsui Construction Co. Ltd. | 5,400 | 4,828 | ||||||
Sumitomo Osaka Cement Co. Ltd. | 1,000 | 4,073 | ||||||
Taiyo Yuden Co. Ltd. | 300 | 3,270 | ||||||
Takara Holdings, Inc. | 500 | 4,434 | ||||||
Temp Holdings Co. Ltd. | 300 | 4,790 | ||||||
Toda Corp. | 1,000 | 4,533 | ||||||
Toho Holdings Co. Ltd. | 200 | 4,918 | ||||||
TOKAI RIKA Co. Ltd. | 200 | 3,549 | ||||||
Tokai Tokyo Financial Holdings, Inc. | 500 | 2,492 | ||||||
TOKYO OHKA KOGYO Co. Ltd. | 100 | 2,616 | ||||||
TOKYU REIT, Inc. REIT | 4 | 5,516 | ||||||
Topcon Corp. | 200 | 2,041 | ||||||
| See Notes to Financial Statements. | 48 |
DBX ETF Trust
Schedule of investments
Deutsche X-trackers MSCI EAFE Small Cap Hedged Equity ETF (Continued)
May 31, 2016
Number | Value | |||||||
| Japan (Continued) | ||||||||
Tosoh Corp. | 1,000 | $ | 4,931 | |||||
Toyo Corp./Chuo-Ku | 400 | 3,927 | ||||||
Toyo Kanetsu KK | 1,300 | 2,336 | ||||||
Toyo Tire & Rubber Co. Ltd. | 200 | 2,440 | ||||||
TOYOBO Co. Ltd. | 3,000 | 5,581 | ||||||
Toyota Boshoku Corp. | 200 | 3,999 | ||||||
TS TECH Co. Ltd. | 200 | 5,158 | ||||||
Tsumura & Co. | 200 | 4,723 | ||||||
Ube Industries Ltd. | 3,000 | 5,635 | ||||||
Ulvac, Inc. | 100 | 3,350 | ||||||
UNY Group Holdings Co. Ltd. | 700 | 5,101 | ||||||
USHIO, Inc. | 300 | 3,644 | ||||||
Valor Holdings Co. Ltd. | 200 | 5,427 | ||||||
Wacoal Holdings Corp. | 100 | 1,057 | ||||||
Yokohama Reito Co. Ltd. | 600 | 5,716 | ||||||
Zenkoku Hosho Co. Ltd. | 100 | 3,296 | ||||||
ZEON Corp. | 200 | 1,510 | ||||||
|
| |||||||
| 738,931 | ||||||||
|
| |||||||
| Jersey Island — 0.2% | ||||||||
Centamin PLC | 1,963 | 2,740 | ||||||
Phoenix Group Holdings | 262 | 3,339 | ||||||
|
| |||||||
| 6,079 | ||||||||
|
| |||||||
| Luxembourg — 0.6% | ||||||||
APERAM SA | 84 | 3,348 | ||||||
Eurofins Scientific SE | 13 | 5,041 | ||||||
Grand City Properties SA | 154 | 3,241 | ||||||
Regus PLC | 880 | 4,023 | ||||||
|
| |||||||
| 15,653 | ||||||||
|
| |||||||
| Malta — 0.2% | ||||||||
Unibet Group PLC SDR | 393 | 4,490 | ||||||
|
| |||||||
| Netherlands — 1.9% | ||||||||
Aalberts Industries NV (a) | 126 | 4,445 | ||||||
Arcadis NV | 141 | 2,350 | ||||||
ASM International NV (a) | 71 | 2,866 | ||||||
Corbion NV | 121 | 3,009 | ||||||
Delta Lloyd NV | 412 | 2,075 | ||||||
Eurocommercial Properties NV | 74 | 3,481 | ||||||
Euronext NV, 144A | 92 | 3,865 | ||||||
Fugro NV* | 102 | 1,818 | ||||||
IMCD Group NV (a) | 88 | 3,649 | ||||||
Koninklijke BAM Groep NV | 494 | 2,323 | ||||||
PostNL NV* | 853 | 3,756 | ||||||
SBM Offshore NV (a) | 274 | 3,238 | ||||||
TKH Group NV | 71 | 2,755 | ||||||
TomTom NV* | 186 | 1,651 | ||||||
USG People NV* | 130 | 2,527 | ||||||
Wereldhave NV REIT | 55 | 2,801 | ||||||
|
| |||||||
| 46,609 | ||||||||
|
| |||||||
| New Zealand — 1.4% | ||||||||
a2 Milk Co. Ltd.* | 1,400 | 1,497 | ||||||
Air New Zealand Ltd. | 2,275 | 3,463 | ||||||
Fisher & Paykel Healthcare Corp. Ltd. | 983 | 6,950 | ||||||
Infratil Ltd. | 2,185 | 4,989 | ||||||
Kiwi Property Group Ltd. | 6,493 | 6,524 | ||||||
Number | Value | |||||||
| New Zealand (Continued) | ||||||||
SKY Network Television Ltd. | 1,250 | $ | 3,806 | |||||
SKYCITY Entertainment Group Ltd. | 1,820 | 5,948 | ||||||
|
| |||||||
| 33,177 | ||||||||
|
| |||||||
| Norway — 0.8% | ||||||||
Aker Solutions ASA* | 435 | 1,518 | ||||||
Det Norske Oljeselskap ASA* | 271 | 2,532 | ||||||
DNO ASA*(a) | 1,860 | 1,947 | ||||||
Norwegian Air Shuttle ASA* | 69 | 2,821 | ||||||
Petroleum Geo-Services ASA*(a) | 544 | 1,563 | ||||||
Prosafe SE (a) | 2,592 | 939 | ||||||
Storebrand ASA* | 950 | 4,145 | ||||||
TGS Nopec Geophysical Co ASA | 244 | 3,672 | ||||||
|
| |||||||
| 19,137 | ||||||||
|
| |||||||
| Portugal — 0.4% | ||||||||
Banco Comercial Portugues SA, | 49,261 | 1,677 | ||||||
CTT-Correios de Portugal SA | 471 | 4,236 | ||||||
NOS SGPS SA | 322 | 2,392 | ||||||
Sonae SGPS SA | 2,020 | 2,079 | ||||||
|
| |||||||
| 10,384 | ||||||||
|
| |||||||
| Singapore — 1.6% | ||||||||
Keppel REIT | 5,700 | 4,284 | ||||||
Mapletree Commercial Trust REIT | 4,600 | 4,793 | ||||||
Mapletree Greater China Commercial Trust REIT | 7,100 | 5,053 | ||||||
Mapletree Industrial Trust REIT | 4,800 | 5,612 | ||||||
Mapletree Logistics Trust REIT | 6,000 | 4,248 | ||||||
Midas Holdings Ltd. | 13,200 | 2,588 | ||||||
SATS Ltd. | 1,400 | 4,229 | ||||||
Singapore Post Ltd. | 3,100 | 3,602 | ||||||
Venture Corp. Ltd. | 900 | 5,437 | ||||||
|
| |||||||
| 39,846 | ||||||||
|
| |||||||
| South Africa — 0.1% | ||||||||
Petra Diamonds Ltd. | 1,206 | 2,026 | ||||||
|
| |||||||
| Spain — 2.4% | ||||||||
Acciona SA | 40 | 3,043 | ||||||
Acerinox SA | 248 | 2,870 | ||||||
Almirall SA | 117 | 1,849 | ||||||
Applus Services SA | 272 | 2,324 | ||||||
Atresmedia Corp. de Medios de Comunicacion SA | 124 | 1,617 | ||||||
Bolsas y Mercados Espanoles SHMSF SA | 111 | 3,527 | ||||||
Ebro Foods SA | 152 | 3,563 | ||||||
Fomento de Construcciones y Contratas | 325 | 2,737 | ||||||
Gamesa Corp. Tecnologica SA | 334 | 6,654 | ||||||
Grupo Catalana Occidente SA | 36 | 1,124 | ||||||
Hispania Activos Inmobiliarios SA* | 240 | 3,186 | ||||||
Indra Sistemas SA* | 226 | 2,577 | ||||||
Inmobiliaria Colonial SA* | 3,768 | 2,972 | ||||||
Mediaset Espana Comunicacion SA | 181 | 2,415 | ||||||
Melia Hotels International SA | 146 | 1,782 | ||||||
Merlin Properties Socimi SA REIT | 281 | 3,093 | ||||||
NH Hotel Group SA* | 386 | 1,963 | ||||||
Prosegur Compania de Seguridad SA | 342 | 2,070 | ||||||
| See Notes to Financial Statements. | 49 |
DBX ETF Trust
Schedule of investments
Deutsche X-trackers MSCI EAFE Small Cap Hedged Equity ETF (Continued)
May 31, 2016
Number | Value | |||||||
| Spain (Continued) | ||||||||
Sacyr SA | 866 | $ | 1,760 | |||||
Tecnicas Reunidas SA | 76 | 2,390 | ||||||
Viscofan SA | 83 | 4,638 | ||||||
|
| |||||||
| 58,154 | ||||||||
|
| |||||||
| Sweden — 5.2% | ||||||||
AAK AB | 57 | 4,274 | ||||||
Axfood AB | 110 | 2,026 | ||||||
Betsson AB* | 205 | 2,703 | ||||||
Betsson AB — Redemption Shares* | 205 | 110 | ||||||
BillerudKorsnas AB | 229 | 3,506 | ||||||
Castellum AB | 214 | 2,917 | ||||||
Com Hem Holding AB | 329 | 2,848 | ||||||
Elekta AB, Class B | 471 | 3,713 | ||||||
Evolution Gaming Group AB, 144A | 48 | 1,631 | ||||||
Fabege AB | 134 | 2,172 | ||||||
Fastighets AB Balder, Class B*(a) | 141 | 3,644 | ||||||
Fingerprint Cards AB, Class B* | 777 | 10,368 | ||||||
Hemfosa Fastigheter AB | 303 | 3,142 | ||||||
Hexpol AB | 348 | 3,509 | ||||||
Holmen AB, Class B | 91 | 3,114 | ||||||
Hufvudstaden AB, Class A | 147 | 2,275 | ||||||
Indutrade AB | 204 | 4,089 | ||||||
Intrum Justitia AB | 123 | 4,304 | ||||||
Investment AB Oresund | 159 | 2,411 | ||||||
JM AB | 108 | 3,050 | ||||||
Kungsleden AB (a) | 444 | 3,140 | ||||||
L E Lundbergforetagen AB, Class B | 37 | 2,135 | ||||||
Loomis AB, Class B | 117 | 3,091 | ||||||
Meda AB, Class A | 348 | 6,175 | ||||||
Modern Times Group MTG AB, | 109 | 3,088 | ||||||
NCC AB, Class B | 117 | 4,308 | ||||||
NetEnt AB* | 336 | 3,827 | ||||||
Nibe Industrier AB, Class B | 797 | 7,338 | ||||||
Nobia AB | 197 | 2,057 | ||||||
Peab AB | 364 | 3,002 | ||||||
Ratos AB, Class B | 472 | 2,557 | ||||||
Saab AB, Class B | 121 | 4,023 | ||||||
SSAB AB, Class A*(a) | 432 | 1,123 | ||||||
SSAB AB, Class B* | 603 | 1,307 | ||||||
Swedish Orphan Biovitrum AB* | 225 | 3,010 | ||||||
Trelleborg AB, Class B | 274 | 5,118 | ||||||
Wallenstam AB, Class B | 280 | 2,383 | ||||||
Wihlborgs Fastigheter AB | 165 | 3,355 | ||||||
|
| |||||||
| 126,843 | ||||||||
|
| |||||||
| Switzerland — 4.3% | ||||||||
Allreal Holding AG* | 23 | 3,151 | ||||||
Basilea Pharmaceutica Ltd.* | 26 | 2,060 | ||||||
Bucher Industries AG | 17 | 3,922 | ||||||
Burckhardt Compression Holding AG | 8 | 2,927 | ||||||
Cembra Money Bank AG* | 72 | 4,853 | ||||||
Clariant AG* | 344 | 6,146 | ||||||
dorma+kaba Holding AG | 6 | 3,942 | ||||||
Flughafen Zuerich AG | 35 | 6,137 | ||||||
Forbo Holding AG* | 2 | 2,473 | ||||||
GAM Holding AG* | 266 | 3,345 | ||||||
Number | Value | |||||||
| Switzerland (Continued) | ||||||||
Gategroup Holding AG* | 46 | $ | 2,360 | |||||
Georg Fischer AG | 7 | 5,588 | ||||||
Helvetia Holding AG | 4 | 2,155 | ||||||
Leonteq AG* | 23 | 1,391 | ||||||
Logitech International SA | 285 | 4,387 | ||||||
Mobimo Holding AG* | 17 | 3,855 | ||||||
OC Oerlikon Corp. AG* | 370 | 3,294 | ||||||
Oriflame Holding AG* | 71 | 1,674 | ||||||
Panalpina Welttransport Holding | 29 | 3,475 | ||||||
PSP Swiss Property AG | 53 | 4,964 | ||||||
SFS Group AG* | 42 | 3,006 | ||||||
Straumann Holding AG | 16 | 6,121 | ||||||
Sunrise Communications Group AG, 144A* | 63 | 3,784 | ||||||
Tecan Group AG | 24 | 3,549 | ||||||
Temenos Group AG* | 96 | 5,331 | ||||||
U-Blox AG* | 14 | 2,851 | ||||||
Valiant Holding AG | 40 | 4,278 | ||||||
Vontobel Holding AG | 64 | 2,846 | ||||||
|
| |||||||
| 103,865 | ||||||||
|
| |||||||
| United Kingdom — 17.8% | ||||||||
AA PLC | 811 | 3,383 | ||||||
Abcam PLC | 309 | 2,867 | ||||||
Allied Minds PLC*(a) | 375 | 1,796 | ||||||
Amec Foster Wheeler PLC | 395 | 2,499 | ||||||
Ashmore Group PLC | 608 | 2,560 | ||||||
ASOS PLC* | 79 | 4,000 | ||||||
AVEVA Group PLC | 114 | 2,665 | ||||||
Balfour Beatty PLC* | 1,087 | 3,901 | ||||||
BBA Aviation PLC (a) | 1,293 | 3,794 | ||||||
Beazley PLC | 582 | 3,078 | ||||||
Bellway PLC | 149 | 5,898 | ||||||
Berendsen PLC | 213 | 3,727 | ||||||
BGEO Group PLC | 115 | 4,187 | ||||||
Big Yellow Group PLC REIT | 218 | 2,633 | ||||||
Bodycote PLC | 362 | 3,196 | ||||||
Booker Group PLC | 2,108 | 5,557 | ||||||
Bovis Homes Group PLC | 198 | 2,896 | ||||||
Brewin Dolphin Holdings PLC | 640 | 2,392 | ||||||
Britvic PLC | 409 | 4,002 | ||||||
BTG PLC* | 532 | 5,232 | ||||||
Cairn Energy PLC* | 1,057 | 2,984 | ||||||
Capital & Counties Properties PLC | 623 | 3,089 | ||||||
Card Factory PLC | 683 | 3,671 | ||||||
Carillion PLC | 686 | 2,755 | ||||||
Cineworld Group PLC | 219 | 1,787 | ||||||
Clinigen Group PLC | 216 | 1,736 | ||||||
Close Brothers Group PLC | 189 | 3,663 | ||||||
Countrywide PLC | 417 | 2,235 | ||||||
Crest Nicholson Holdings PLC | 362 | 3,083 | ||||||
CYBG PLC* | 634 | 2,548 | ||||||
Daily Mail & General Trust PLC, Class A | 331 | 3,284 | ||||||
Dairy Crest Group PLC | 386 | 3,078 | ||||||
Debenhams PLC | 2,441 | 2,614 | ||||||
Derwent London PLC REIT | 84 | 4,005 | ||||||
Dialog Semiconductor PLC* | 107 | 3,397 | ||||||
| See Notes to Financial Statements. | 50 |
DBX ETF Trust
Schedule of investments
Deutsche X-trackers MSCI EAFE Small Cap Hedged Equity ETF (Continued)
May 31, 2016
Number | Value | |||||||
| United Kingdom (Continued) | ||||||||
Dignity PLC | 70 | $ | 2,576 | |||||
Diploma PLC | 225 | 2,431 | ||||||
Domino’s Pizza Group PLC | 258 | 3,942 | ||||||
Drax Group PLC | 711 | 3,182 | ||||||
DS Smith PLC | 1,134 | 6,384 | ||||||
Dunelm Group PLC | 180 | 2,488 | ||||||
Electrocomponents PLC | 849 | 3,490 | ||||||
Elementis PLC | 887 | 2,707 | ||||||
Essentra PLC | 362 | 4,352 | ||||||
esure Group PLC | 623 | 2,564 | ||||||
Fevertree Drinks PLC | 174 | 1,840 | ||||||
Firstgroup PLC* | 2,163 | 3,387 | ||||||
Galliford Try PLC | 128 | 2,571 | ||||||
Genus PLC | 116 | 2,545 | ||||||
Go-Ahead Group PLC | 83 | 3,083 | ||||||
Grainger PLC | 828 | 2,929 | ||||||
Great Portland Estates PLC REIT | 313 | 3,405 | ||||||
Greene King PLC | 290 | 3,747 | ||||||
Greggs PLC | 178 | 2,905 | ||||||
GW Pharmaceuticals PLC* | 406 | 3,181 | ||||||
Halfords Group PLC | 479 | 3,043 | ||||||
Halma PLC | 411 | 5,643 | ||||||
Hansteen Holdings PLC REIT | 1,269 | 1,924 | ||||||
Hays PLC | 1,911 | 3,767 | ||||||
Henderson Group PLC | 1,485 | 5,766 | ||||||
Home Retail Group PLC | 1,343 | 3,215 | ||||||
HomeServe PLC | 447 | 3,172 | ||||||
Howden Joinery Group PLC | 783 | 5,750 | ||||||
Hunting PLC | 317 | 1,422 | ||||||
IG Group Holdings PLC | 302 | 3,497 | ||||||
Imagination Technologies Group PLC* | 613 | 1,567 | ||||||
Inchcape PLC | 502 | 4,951 | ||||||
Indivior PLC | 1,131 | 2,816 | ||||||
Informa PLC | 497 | 4,895 | ||||||
Intermediate Capital Group PLC | 442 | 4,273 | ||||||
International Personal Finance PLC (a) | 591 | 2,380 | ||||||
Interserve PLC | 318 | 1,539 | ||||||
J D Wetherspoon PLC | 178 | 1,934 | ||||||
John Wood Group PLC | 522 | 4,657 | ||||||
Jupiter Fund Management PLC | 574 | 3,676 | ||||||
Just Eat PLC* | 636 | 4,188 | ||||||
Keller Group PLC | 191 | 2,639 | ||||||
Kier Group PLC | 152 | 2,719 | ||||||
Ladbrokes PLC | 1,872 | 3,677 | ||||||
Laird PLC | 534 | 2,734 | ||||||
Lancashire Holdings Ltd. (a) | 275 | 2,264 | ||||||
LondonMetric Property PLC REIT | 876 | 2,087 | ||||||
Man Group PLC | 2,142 | 4,092 | ||||||
Marston’s PLC | 813 | 1,798 | ||||||
Michael Page International PLC | 431 | 2,478 | ||||||
Micro Focus International PLC | 226 | 5,335 | ||||||
Mitchells & Butlers PLC | 395 | 1,661 | ||||||
Mitie Group PLC | 607 | 2,477 | ||||||
Moneysupermarket.com Group PLC | 538 | 2,577 | ||||||
Morgan Advanced Materials PLC | 622 | 2,249 | ||||||
National Express Group PLC | 774 | 3,803 | ||||||
Northgate PLC | 414 | 2,365 | ||||||
Number | Value | |||||||
| United Kingdom (Continued) | ||||||||
Ocado Group PLC* | 745 | $ | 2,919 | |||||
Ophir Energy PLC* | 1,022 | 1,061 | ||||||
Paragon Group of Cos. PLC | 588 | 2,633 | ||||||
Pennon Group PLC | 416 | 5,200 | ||||||
Pets at Home Group PLC | 667 | 2,560 | ||||||
Poundland Group PLC | 704 | 1,769 | ||||||
Premier Oil PLC* | 1,487 | 1,556 | ||||||
QinetiQ Group PLC | 962 | 3,426 | ||||||
Redrow PLC | 400 | 2,438 | ||||||
Renishaw PLC | 75 | 2,127 | ||||||
Rentokil Initial PLC | 1,918 | 5,003 | ||||||
Restaurant Group PLC | 281 | 1,490 | ||||||
Rightmove PLC | 120 | 7,341 | ||||||
Rotork PLC | 1,398 | 3,983 | ||||||
RPC Group PLC | 342 | 3,990 | ||||||
Safestore Holdings PLC REIT | 567 | 2,869 | ||||||
Savills PLC | 220 | 2,477 | ||||||
Senior PLC | 782 | 2,463 | ||||||
Serco Group PLC* | 1,922 | 2,973 | ||||||
Shaftesbury PLC REIT | 116 | 1,542 | ||||||
SIG PLC | 1,189 | 2,311 | ||||||
Spectris PLC | 168 | 4,083 | ||||||
Spirax-Sarco Engineering PLC | 72 | 3,598 | ||||||
Spire Healthcare Group PLC, 144A | 482 | 2,448 | ||||||
SSP Group PLC | 562 | 2,580 | ||||||
St. Modwen Properties PLC | 357 | 1,688 | ||||||
Stagecoach Group PLC | 641 | 2,397 | ||||||
Subsea 7 SA*(a) | 344 | 3,055 | ||||||
SuperGroup PLC | 118 | 2,382 | ||||||
SVG Capital PLC* | 421 | 3,277 | ||||||
Synthomer PLC | 486 | 2,553 | ||||||
TalkTalk Telecom Group PLC | 754 | 2,623 | ||||||
Ted Baker PLC | 47 | 1,658 | ||||||
Telecom Plus PLC | 167 | 2,496 | ||||||
Thomas Cook Group PLC* | 2,264 | 2,505 | ||||||
Tullett Prebon PLC | 505 | 2,458 | ||||||
Tullow Oil PLC* | 1,204 | 4,020 | ||||||
UBM PLC | 511 | 4,359 | ||||||
Ultra Electronics Holdings PLC | 109 | 2,736 | ||||||
UNITE Group PLC | 277 | 2,634 | ||||||
Vectura Group PLC* | 892 | 2,124 | ||||||
Vesuvius PLC | 506 | 2,527 | ||||||
Victrex PLC | 129 | 2,696 | ||||||
Virgin Money Holdings (UK) PLC (a) | 413 | 2,205 | ||||||
WH Smith PLC | 184 | 4,666 | ||||||
Workspace Group PLC REIT | 90 | 1,131 | ||||||
WS Atkins PLC | 148 | 2,881 | ||||||
|
| |||||||
| 430,842 | ||||||||
|
| |||||||
| United States — 0.1% | ||||||||
Sims Metal Management Ltd. | 359 | 2,120 | ||||||
|
| |||||||
TOTAL COMMON STOCKS | 2,371,907 | |||||||
|
| |||||||
| See Notes to Financial Statements. | 51 |
DBX ETF Trust
Schedule of investments
Deutsche X-trackers MSCI EAFE Small Cap Hedged Equity ETF (Continued)
May 31, 2016
Number | Value | |||||||
| PREFERRED STOCKS — 0.4% | ||||||||
| Germany — 0.4% | ||||||||
Jungheinrich AG | 43 | $ | 4,097 | |||||
Sartorius AG | 18 | 4,972 | ||||||
|
| |||||||
| 9,069 | ||||||||
|
| |||||||
TOTAL PREFERRED STOCKS | 9,069 | |||||||
|
| |||||||
| RIGHTS — 0.0% | ||||||||
| New Zealand — 0.0% | ||||||||
SKYCITY Entertainment Group Ltd.*, expires 06/30/16 | 182 | 53 | ||||||
|
| |||||||
| Sweden — 0.0% | ||||||||
Castellum AB*, expires 07/31/16 | 197 | 434 | ||||||
SSAB AB*, expires 06/30/16 | 435 | 510 | ||||||
|
| |||||||
| 944 | ||||||||
|
| |||||||
TOTAL RIGHTS | 997 | |||||||
|
| |||||||
Number | Value | |||||||
| SECURITIES LENDING COLLATERAL — 3.4% | ||||||||
Daily Assets Fund “Capital Shares”, 0.48% (c)(d) | 81,845 | $ | 81,845 | |||||
|
| |||||||
TOTAL INVESTMENTS — 101.6% | 2,463,818 | |||||||
Other assets and liabilities, net — (1.6%) | (38,723 | ) | ||||||
|
| |||||||
NET ASSETS — 100.0% | $ | 2,425,095 | ||||||
|
| |||||||
| * | Non-income producing security. |
| † | The cost for federal income tax purposes was $2,559,172. At May 31, 2016, net unrealized depreciation for all securities based on tax cost was $95,354. This consisted of aggregate gross unrealized appreciation for all securities in which there was an excess of value over tax cost of $136,458 and aggregate gross unrealized depreciation for all securities in which there was an excess of tax cost over value of $231,812. |
| (a) | All or a portion of these securities were on loan. In addition, “Other Assets and Liabilities, Net” may include pending sales that are also on loan. The value of securities loaned at May 31, 2016 amounted to $77,071, which is 3.2% of net assets. |
| (b) | Stapled Security — A security contractually bound to one or more other securities to form a single saleable unit which cannot be sold separately. |
| (c) | Affiliated fund managed by Deutsche Investment Management Americas Inc. The rate shown is the annualized seven-day yield at period end. |
| (d) | Represents collateral held in connection with securities lending. Income earned by the Fund is net of borrower rebates. |
| REIT: | Real Estate Investment Trust |
| SDR: | Swedish Depositary Receipt |
| 144A: | Security exempt from registration under Rule 144A of the Securities Act of 1933. These securities may be resold in transactions exempt from registration, normally to qualified institutional buyers. |
As of May 31, 2016, the Fund had the following forward foreign currency exchange contracts outstanding:
Counterparty | Settlement Date | Currency To Deliver | Currency To Receive | Unrealized Appreciation (Depreciation) | ||||||||||||||
Canadian Imperial Bank of Commerce | 6/2/2016 | AUD | 2,900 | USD | 2,101 | $ | 5 | |||||||||||
Canadian Imperial Bank of Commerce | 6/2/2016 | AUD | 86,800 | USD | 66,158 | 3,423 | ||||||||||||
RBC Capital Markets | 6/2/2016 | AUD | 94,384 | USD | 71,939 | 3,723 | ||||||||||||
RBC Capital Markets | 6/2/2016 | AUD | 7,000 | USD | 5,336 | 276 | ||||||||||||
The Bank of New York Mellon | 6/2/2016 | AUD | 800 | USD | 575 | (3 | ) | |||||||||||
Canadian Imperial Bank of Commerce | 6/2/2016 | CHF | 49,300 | USD | 51,497 | 1,899 | ||||||||||||
Canadian Imperial Bank of Commerce | 6/2/2016 | CHF | 4,400 | USD | 4,426 | (1 | ) | |||||||||||
RBC Capital Markets | 6/2/2016 | CHF | 55,000 | USD | 57,450 | 2,118 | ||||||||||||
Canadian Imperial Bank of Commerce | 6/2/2016 | DKK | 94,900 | USD | 14,616 | 419 | ||||||||||||
RBC Capital Markets | 6/2/2016 | DKK | 166,000 | USD | 25,566 | 733 | ||||||||||||
Canadian Imperial Bank of Commerce | 6/2/2016 | EUR | 12,100 | USD | 13,470 | 7 | ||||||||||||
Canadian Imperial Bank of Commerce | 6/2/2016 | EUR | 262,700 | USD | 301,134 | 8,843 | ||||||||||||
RBC Capital Markets | 6/2/2016 | EUR | 7,000 | USD | 8,024 | 235 | ||||||||||||
RBC Capital Markets | 6/2/2016 | EUR | 6,000 | USD | 6,868 | 192 | ||||||||||||
RBC Capital Markets | 6/2/2016 | EUR | 250,639 | USD | 287,310 | 8,438 | ||||||||||||
| See Notes to Financial Statements. | 52 |
DBX ETF Trust
Schedule of investments
Deutsche X-trackers MSCI EAFE Small Cap Hedged Equity ETF (Continued)
May 31, 2016
Counterparty | Settlement Date | Currency To Deliver | Currency To Receive | Unrealized Appreciation (Depreciation) | ||||||||||||||
Canadian Imperial Bank of Commerce | 6/2/2016 | GBP | 170,600 | USD | 249,890 | $ | 2,801 | |||||||||||
Canadian Imperial Bank of Commerce | 6/2/2016 | GBP | 5,000 | USD | 7,278 | 36 | ||||||||||||
RBC Capital Markets | 6/2/2016 | GBP | 3,434 | USD | 5,000 | 26 | ||||||||||||
RBC Capital Markets | 6/2/2016 | GBP | 162,734 | USD | 238,402 | 2,706 | ||||||||||||
The Bank of New York Mellon | 6/2/2016 | GBP | 500 | USD | 720 | (4 | ) | |||||||||||
Canadian Imperial Bank of Commerce | 6/2/2016 | HKD | 218,000 | USD | 28,110 | 56 | ||||||||||||
RBC Capital Markets | 6/2/2016 | HKD | 182,000 | USD | 23,468 | 47 | ||||||||||||
The Bank of New York Mellon | 6/2/2016 | HKD | 22,723 | USD | 2,930 | 6 | ||||||||||||
Canadian Imperial Bank of Commerce | 6/2/2016 | ILS | 37,000 | USD | 9,917 | 314 | ||||||||||||
RBC Capital Markets | 6/2/2016 | ILS | 25,192 | USD | 6,751 | 212 | ||||||||||||
The Bank of New York Mellon | 6/2/2016 | ILS | 2,000 | USD | 521 | 1 | ||||||||||||
The Bank of New York Mellon | 6/2/2016 | ILS | 19,900 | USD | 5,333 | 168 | ||||||||||||
Canadian Imperial Bank of Commerce | 6/2/2016 | NOK | 121,200 | USD | 15,054 | 567 | ||||||||||||
RBC Capital Markets | 6/2/2016 | NOK | 131,000 | USD | 16,266 | 607 | ||||||||||||
The Bank of New York Mellon | 6/2/2016 | NOK | 4,200 | USD | 511 | 9 | ||||||||||||
The Bank of New York Mellon | 6/2/2016 | NOK | 10,200 | USD | 1,244 | 25 | ||||||||||||
The Bank of New York Mellon | 6/2/2016 | NOK | 20,400 | USD | 2,533 | 94 | ||||||||||||
Canadian Imperial Bank of Commerce | 6/2/2016 | NZD | 19,000 | USD | 13,259 | 404 | ||||||||||||
RBC Capital Markets | 6/2/2016 | NZD | 19,000 | USD | 13,264 | 409 | ||||||||||||
The Bank of New York Mellon | 6/2/2016 | NZD | 2,750 | USD | 1,920 | 59 | ||||||||||||
The Bank of New York Mellon | 6/2/2016 | NZD | 1,100 | USD | 738 | (6 | ) | |||||||||||
Canadian Imperial Bank of Commerce | 6/2/2016 | SEK | 427,000 | USD | 53,295 | 2,104 | ||||||||||||
RBC Capital Markets | 6/2/2016 | SEK | 461,000 | USD | 57,522 | 2,255 | ||||||||||||
The Bank of New York Mellon | 6/2/2016 | SEK | 5,000 | USD | 600 | 1 | ||||||||||||
The Bank of New York Mellon | 6/2/2016 | SEK | 79,150 | USD | 9,876 | 387 | ||||||||||||
The Bank of New York Mellon | 6/2/2016 | SEK | 5,900 | USD | 724 | 17 | ||||||||||||
Canadian Imperial Bank of Commerce | 6/2/2016 | USD | 57,811 | AUD | 79,800 | (135 | ) | |||||||||||
Canadian Imperial Bank of Commerce | 6/2/2016 | USD | 5,335 | AUD | 7,000 | (276 | ) | |||||||||||
Canadian Imperial Bank of Commerce | 6/2/2016 | USD | 48,702 | CHF | 48,419 | 10 | ||||||||||||
Canadian Imperial Bank of Commerce | 6/2/2016 | USD | 920 | CHF | 881 | (34 | ) | |||||||||||
Canadian Imperial Bank of Commerce | 6/2/2016 | USD | 1,463 | DKK | 9,500 | (42 | ) | |||||||||||
Canadian Imperial Bank of Commerce | 6/2/2016 | USD | 12,781 | DKK | 85,400 | (6 | ) | |||||||||||
Canadian Imperial Bank of Commerce | 6/2/2016 | USD | 284,903 | EUR | 255,920 | (155 | ) | |||||||||||
Canadian Imperial Bank of Commerce | 6/2/2016 | USD | 7,772 | EUR | 6,780 | (228 | ) | |||||||||||
Canadian Imperial Bank of Commerce | 6/2/2016 | USD | 248,308 | GBP | 170,600 | (1,219 | ) | |||||||||||
Canadian Imperial Bank of Commerce | 6/2/2016 | USD | 28,063 | HKD | 218,000 | (9 | ) | |||||||||||
Canadian Imperial Bank of Commerce | 6/2/2016 | USD | 9,608 | ILS | 37,000 | (5 | ) | |||||||||||
Canadian Imperial Bank of Commerce | 6/2/2016 | USD | 14,492 | NOK | 121,200 | (4 | ) | |||||||||||
Canadian Imperial Bank of Commerce | 6/2/2016 | USD | 12,854 | NZD | 19,000 | 1 | ||||||||||||
Canadian Imperial Bank of Commerce | 6/2/2016 | USD | 51,118 | SEK | 427,000 | 73 | ||||||||||||
RBC Capital Markets | 6/2/2016 | USD | 73,448 | AUD | 101,384 | (172 | ) | |||||||||||
RBC Capital Markets | 6/2/2016 | USD | 55,321 | CHF | 55,000 | 11 | ||||||||||||
RBC Capital Markets | 6/2/2016 | USD | 24,844 | DKK | 166,000 | (11 | ) | |||||||||||
RBC Capital Markets | 6/2/2016 | USD | 293,496 | EUR | 263,639 | (160 | ) | |||||||||||
RBC Capital Markets | 6/2/2016 | USD | 233,270 | GBP | 160,268 | (1,146 | ) | |||||||||||
RBC Capital Markets | 6/2/2016 | USD | 8,643 | GBP | 5,900 | (98 | ) | |||||||||||
RBC Capital Markets | 6/2/2016 | USD | 23,429 | HKD | 182,000 | (8 | ) | |||||||||||
RBC Capital Markets | 6/2/2016 | USD | 6,542 | ILS | 25,192 | (3 | ) | |||||||||||
RBC Capital Markets | 6/2/2016 | USD | 15,664 | NOK | 131,000 | (5 | ) | |||||||||||
RBC Capital Markets | 6/2/2016 | USD | 12,854 | NZD | 19,000 | 1 | ||||||||||||
RBC Capital Markets | 6/2/2016 | USD | 55,188 | SEK | 461,000 | 79 | ||||||||||||
The Bank of New York Mellon | 6/2/2016 | USD | 2,133 | AUD | 2,900 | (37 | ) | |||||||||||
The Bank of New York Mellon | 6/2/2016 | USD | 1,575 | CHF | 1,500 | (66 | ) | |||||||||||
The Bank of New York Mellon | 6/2/2016 | USD | 1,032 | CHF | 1,000 | (26 | ) | |||||||||||
The Bank of New York Mellon | 6/2/2016 | USD | 1,917 | CHF | 1,900 | (5 | ) | |||||||||||
The Bank of New York Mellon | 6/2/2016 | USD | 4,031 | EUR | 3,500 | (137 | ) | |||||||||||
The Bank of New York Mellon | 6/2/2016 | USD | 1,892 | EUR | 1,700 | (1 | ) | |||||||||||
The Bank of New York Mellon | 6/2/2016 | USD | 1,372 | EUR | 1,200 | (37 | ) | |||||||||||
The Bank of New York Mellon | 6/2/2016 | USD | 8,529 | EUR | 7,400 | (295 | ) | |||||||||||
The Bank of New York Mellon | 6/2/2016 | USD | 7,948 | GBP | 5,500 | 18 | ||||||||||||
| See Notes to Financial Statements. | 53 |
DBX ETF Trust
Schedule of investments
Deutsche X-trackers MSCI EAFE Small Cap Hedged Equity ETF (Continued)
May 31, 2016
Counterparty | Settlement Date | Currency To Deliver | Currency To Receive | Unrealized Appreciation (Depreciation) | ||||||||||||||
The Bank of New York Mellon | 6/2/2016 | USD | 1,755 | GBP | 1,200 | $ | (17 | ) | ||||||||||
The Bank of New York Mellon | 6/2/2016 | USD | 2,925 | HKD | 22,723 | (1 | ) | |||||||||||
The Bank of New York Mellon | 6/2/2016 | USD | 5,168 | ILS | 19,900 | (2 | ) | |||||||||||
The Bank of New York Mellon | 6/2/2016 | USD | 2,415 | NOK | 20,200 | (1 | ) | |||||||||||
The Bank of New York Mellon | 6/2/2016 | USD | 1,784 | NOK | 14,600 | (39 | ) | |||||||||||
The Bank of New York Mellon | 6/2/2016 | USD | 1,861 | NZD | 2,750 | 0 | ||||||||||||
The Bank of New York Mellon | 6/2/2016 | USD | 7,416 | SEK | 61,950 | 11 | ||||||||||||
The Bank of New York Mellon | 6/2/2016 | USD | 2,847 | SEK | 23,100 | (78 | ) | |||||||||||
Canadian Imperial Bank of Commerce | 6/3/2016 | JPY | 45,546,493 | USD | 425,969 | 14,610 | ||||||||||||
RBC Capital Markets | 6/3/2016 | JPY | 1,366,800 | USD | 12,324 | (20 | ) | |||||||||||
RBC Capital Markets | 6/3/2016 | JPY | 1,122,000 | USD | 10,493 | 360 | ||||||||||||
RBC Capital Markets | 6/3/2016 | JPY | 36,111,081 | USD | 337,701 | 11,559 | ||||||||||||
The Bank of New York Mellon | 6/3/2016 | JPY | 322,800 | USD | 2,956 | 40 | ||||||||||||
The Bank of New York Mellon | 6/3/2016 | JPY | 303,600 | USD | 2,747 | 5 | ||||||||||||
Canadian Imperial Bank of Commerce | 6/3/2016 | SGD | 29,600 | USD | 22,009 | 516 | ||||||||||||
RBC Capital Markets | 6/3/2016 | SGD | 3,100 | USD | 2,252 | 1 | ||||||||||||
RBC Capital Markets | 6/3/2016 | SGD | 32,000 | USD | 23,788 | 552 | ||||||||||||
Canadian Imperial Bank of Commerce | 6/3/2016 | USD | 7,790 | JPY | 832,900 | (267 | ) | |||||||||||
Canadian Imperial Bank of Commerce | 6/3/2016 | USD | 403,170 | JPY | 44,713,593 | 667 | ||||||||||||
Canadian Imperial Bank of Commerce | 6/3/2016 | USD | 21,500 | SGD | 29,600 | (7 | ) | |||||||||||
RBC Capital Markets | 6/3/2016 | USD | 327,696 | JPY | 36,343,081 | 542 | ||||||||||||
RBC Capital Markets | 6/3/2016 | USD | 8,324 | JPY | 890,000 | (286 | ) | |||||||||||
RBC Capital Markets | 6/3/2016 | USD | 22,299 | SGD | 30,700 | (7 | ) | |||||||||||
RBC Capital Markets | 6/3/2016 | USD | 966 | SGD | 1,300 | (22 | ) | |||||||||||
The Bank of New York Mellon | 6/3/2016 | USD | 18,698 | JPY | 1,993,200 | (696 | ) | |||||||||||
The Bank of New York Mellon | 6/3/2016 | USD | 2,280 | SGD | 3,100 | (29 | ) | |||||||||||
Canadian Imperial Bank of Commerce | 7/5/2016 | AUD | 79,800 | USD | 57,739 | 143 | ||||||||||||
RBC Capital Markets | 7/5/2016 | AUD | 101,384 | USD | 73,359 | 184 | ||||||||||||
Canadian Imperial Bank of Commerce | 7/5/2016 | CHF | 48,419 | USD | 48,776 | (19 | ) | |||||||||||
RBC Capital Markets | 7/5/2016 | CHF | 55,000 | USD | 55,405 | (22 | ) | |||||||||||
Canadian Imperial Bank of Commerce | 7/5/2016 | DKK | 85,400 | USD | 12,795 | 3 | ||||||||||||
RBC Capital Markets | 7/5/2016 | DKK | 166,000 | USD | 24,871 | 6 | ||||||||||||
Canadian Imperial Bank of Commerce | 7/5/2016 | EUR | 255,920 | USD | 285,225 | 101 | ||||||||||||
RBC Capital Markets | 7/5/2016 | EUR | 263,639 | USD | 293,826 | 101 | ||||||||||||
RBC Capital Markets | 7/5/2016 | EUR | 8,000 | USD | 8,917 | 4 | ||||||||||||
Canadian Imperial Bank of Commerce | 7/5/2016 | GBP | 170,600 | USD | 248,361 | 1,206 | ||||||||||||
RBC Capital Markets | 7/5/2016 | GBP | 3,000 | USD | 4,368 | 21 | ||||||||||||
RBC Capital Markets | 7/5/2016 | GBP | 160,268 | USD | 233,320 | 1,133 | ||||||||||||
Canadian Imperial Bank of Commerce | 7/5/2016 | HKD | 218,000 | USD | 28,076 | 7 | ||||||||||||
RBC Capital Markets | 7/5/2016 | HKD | 182,000 | USD | 23,440 | 6 | ||||||||||||
The Bank of New York Mellon | 7/5/2016 | HKD | 22,723 | USD | 2,926 | 1 | ||||||||||||
Canadian Imperial Bank of Commerce | 7/5/2016 | ILS | 37,000 | USD | 9,612 | 2 | ||||||||||||
RBC Capital Markets | 7/5/2016 | ILS | 25,192 | USD | 6,544 | 1 | ||||||||||||
The Bank of New York Mellon | 7/5/2016 | ILS | 19,900 | USD | 5,170 | 1 | ||||||||||||
Canadian Imperial Bank of Commerce | 7/5/2016 | JPY | 44,713,593 | USD | 403,625 | (696 | ) | |||||||||||
RBC Capital Markets | 7/5/2016 | JPY | 36,343,081 | USD | 328,061 | (570 | ) | |||||||||||
Canadian Imperial Bank of Commerce | 7/5/2016 | NOK | 121,200 | USD | 14,491 | 4 | ||||||||||||
RBC Capital Markets | 7/5/2016 | NOK | 131,000 | USD | 15,662 | 5 | ||||||||||||
The Bank of New York Mellon | 7/5/2016 | NOK | 20,200 | USD | 2,415 | 1 | ||||||||||||
Canadian Imperial Bank of Commerce | 7/5/2016 | NZD | 19,000 | USD | 12,832 | 1 | ||||||||||||
RBC Capital Markets | 7/5/2016 | NZD | 19,000 | USD | 12,833 | 1 | ||||||||||||
The Bank of New York Mellon | 7/5/2016 | NZD | 2,750 | USD | 1,857 | 0 | ||||||||||||
Canadian Imperial Bank of Commerce | 7/5/2016 | SEK | 427,000 | USD | 51,186 | (83 | ) | |||||||||||
RBC Capital Markets | 7/5/2016 | SEK | 48,000 | USD | 5,754 | (9 | ) | |||||||||||
RBC Capital Markets | 7/5/2016 | SEK | 461,000 | USD | 55,262 | (90 | ) | |||||||||||
The Bank of New York Mellon | 7/5/2016 | SEK | 61,950 | USD | 7,426 | (12 | ) | |||||||||||
Canadian Imperial Bank of Commerce | 7/5/2016 | SGD | 29,600 | USD | 21,488 | 7 | ||||||||||||
RBC Capital Markets | 7/5/2016 | SGD | 30,700 | USD | 22,286 | 7 | ||||||||||||
Canadian Imperial Bank of Commerce | 7/5/2016 | USD | 2,098 | AUD | 2,900 | (5 | ) | |||||||||||
Canadian Imperial Bank of Commerce | 7/5/2016 | USD | 4,432 | CHF | 4,400 | 2 | ||||||||||||
| See Notes to Financial Statements. | 54 |
DBX ETF Trust
Schedule of investments
Deutsche X-trackers MSCI EAFE Small Cap Hedged Equity ETF (Continued)
May 31, 2016
Counterparty | Settlement Date | Currency To Deliver | Currency To Receive | Unrealized Appreciation (Depreciation) | ||||||||||||||
Canadian Imperial Bank of Commerce | 7/5/2016 | USD | 13,486 | EUR | 12,100 | $ | (5 | ) | ||||||||||
Canadian Imperial Bank of Commerce | 7/5/2016 | USD | 7,279 | GBP | 5,000 | (35 | ) | |||||||||||
RBC Capital Markets | 7/5/2016 | USD | 12,338 | JPY | 1,366,800 | 21 | ||||||||||||
RBC Capital Markets | 7/5/2016 | USD | 2,250 | SGD | 3,100 | (1 | ) | |||||||||||
|
| |||||||||||||||||
Total net unrealized appreciation | $ | 68,294 | ||||||||||||||||
|
| |||||||||||||||||
Currency Abbreviations
| AUD | Australian Dollar |
| CHF | Swiss Franc |
| DKK | Danish Krone |
| EUR | Euro |
| GBP | Pound Sterling |
| HKD | Hong Kong Dollar |
| ILS | Israeli New Sheqel |
| JPY | Japanese Yen |
| NOK | Norwegian Krone |
| NZD | New Zealand Dollar |
| SEK | Swedish Krona |
| SGD | Singapore Dollar |
| USD | U.S. Dollar |
For information on the Fund’s policy and additional disclosures regarding forward foreign currency exchange contracts, please refer to the Derivatives section of Note 2 in the accompanying Notes to Financial Statements.
Fair Value Measurements
Various inputs are used in determining the value of the Fund’s investments. These inputs are summarized in three broad levels. Level 1 includes quoted prices in active markets for identical securities. Level 2 includes other significant observable inputs (including quoted prices for similar securities, interest rates, prepayment speeds and credit risk). Level 3 includes significant unobservable inputs (including the Fund’s own assumptions in determining the fair value of investments). The level assigned to the securities valuations may not be an indication of the risk or liquidity associated with investing in those securities.
The following is a summary of the inputs used as of May 31, 2016 in valuing the Fund’s investments. For information on Fund’s policy regarding the valuation of investments, please refer to the Security Valuation section of Note 2 in the accompanying Notes to Financial Statements.
Assets | Level 1 | Level 2 | Level 3 | Total | ||||||||||||
Common Stocks (e) | $ | 2,371,907 | $ | — | $ | — | $ | 2,371,907 | ||||||||
Preferred Stocks | 9,069 | — | — | 9,069 | ||||||||||||
Rights (e) | 997 | — | — | 997 | ||||||||||||
Short-Term Investments | 81,845 | — | — | 81,845 | ||||||||||||
Derivatives (f) | ||||||||||||||||
Forward Foreign Currency Exchange Contracts | — | 75,647 | — | 75,647 | ||||||||||||
|
|
|
|
|
|
|
| |||||||||
TOTAL | $ | 2,463,818 | $ | 75,647 | $ | — | $ | 2,539,465 | ||||||||
|
|
|
|
|
|
|
| |||||||||
Liabilities | Level 1 | Level 2 | Level 3 | Total | ||||||||||||
Derivatives (f) | ||||||||||||||||
Forward Foreign Currency Exchange Contracts | $ | — | $ | (7,353 | ) | $ | — | $ | (7,353 | ) | ||||||
|
|
|
|
|
|
|
| |||||||||
TOTAL | $ | — | $ | (7,353 | ) | $ | — | $ | (7,353 | ) | ||||||
|
|
|
|
|
|
|
| |||||||||
| (e) | See Schedule of investments for additional detailed categorizations. |
| (f) | Derivatives include unrealized appreciation (depreciation) on forward foreign currency exchange contracts. |
There have been no transfers between fair value measurement levels during the period ended May 31, 2016.
| See Notes to Financial Statements. | 55 |
DBX ETF Trust
Schedule of investments
Deutsche X-trackers MSCI Italy Hedged Equity ETF
May 31, 2016
Number | Value | |||||||
| COMMON STOCKS — 100.0% | ||||||||
| Consumer Discretionary — 10.2% | ||||||||
Ferrari NV | 1,325 | $ | 56,169 | |||||
Fiat Chrysler Automobiles NV | 9,183 | 65,545 | ||||||
Luxottica Group SpA | 1,426 | 77,253 | ||||||
|
| |||||||
| 198,967 | ||||||||
|
| |||||||
| Energy — 18.2% | ||||||||
Eni SpA | 17,877 | 273,100 | ||||||
Saipem SpA* | 40,940 | 16,758 | ||||||
Tenaris SA | 4,863 | 64,443 | ||||||
|
| |||||||
| 354,301 | ||||||||
|
| |||||||
| Financials — 32.7% | ||||||||
Assicurazioni Generali SpA | 6,087 | 88,248 | ||||||
EXOR SpA | 1,271 | 48,209 | ||||||
Intesa Sanpaolo SpA | 88,805 | 228,050 | ||||||
Intesa Sanpaolo SpA-RSP (a) | 6,826 | 16,557 | ||||||
Mediobanca SpA | 6,375 | 49,439 | ||||||
Poste Italiane SpA, 144A* | 4,500 | 34,447 | ||||||
UniCredit SpA | 31,624 | 101,195 | ||||||
Unione di Banche Italiane SpA (a) | 10,738 | 39,905 | ||||||
UnipolSai SpA (a) | 15,794 | 31,579 | ||||||
|
| |||||||
| 637,629 | ||||||||
|
| |||||||
| Industrials — 13.6% | ||||||||
Atlantia SpA | 3,283 | 88,544 | ||||||
CNH Industrial NV (United Kingdom) | 10,029 | 70,746 | ||||||
Number | Value | |||||||
| Industrials (Continued) | ||||||||
Leonardo-Finmeccanica SpA*(a) | 4,426 | $ | 52,398 | |||||
Prysmian SpA | 2,156 | 52,751 | ||||||
|
| |||||||
| 264,439 | ||||||||
|
| |||||||
| Telecommunication Services — 4.6% | ||||||||
Telecom Italia SpA* | 67,734 | 64,134 | ||||||
Telecom Italia SpA-RSP | 34,045 | 26,270 | ||||||
|
| |||||||
| 90,404 | ||||||||
|
| |||||||
| Utilities — 20.7% | ||||||||
Enel SpA | 51,311 | 232,588 | ||||||
Snam SpA | 15,624 | 89,440 | ||||||
Terna Rete Elettrica Nazionale SpA | 14,484 | 80,320 | ||||||
|
| |||||||
| 402,348 | ||||||||
|
| |||||||
TOTAL COMMON STOCKS | 1,948,088 | |||||||
|
| |||||||
| SECURITIES LENDING COLLATERAL — 6.9% | ||||||||
Daily Assets Fund “Capital Shares”, 0.48% (b)(c) | 134,262 | 134,262 | ||||||
|
| |||||||
TOTAL INVESTMENTS — 106.9% (Cost $2,488,645)† | $ | 2,082,350 | ||||||
Other assets and liabilities, net — (6.9%) | (133,598 | ) | ||||||
|
| |||||||
NET ASSETS — 100.0% | $ | 1,948,752 | ||||||
|
| |||||||
| * | Non-income producing security. |
| † | The cost for federal income tax purposes was $2,521,680. At May 31, 2016, net unrealized depreciation for all securities based on tax cost was $439,330. This consisted of aggregate gross unrealized appreciation for all securities in which there was an excess of value over tax cost of $26,132 and aggregate gross unrealized depreciation for all securities in which there was an excess of tax cost over value of $465,462. |
| (a) | All or a portion of these securities were on loan. In addition, “Other Assets and Liabilities, Net” may include pending sales that are also on loan. The value of securities loaned at May 31, 2016 amounted to $124,656, which is 6.4% of net assets. |
| (b) | Affiliated fund managed by Deutsche Investment Management Americas Inc. The rate shown is the annualized seven-day yield at period end. |
| (c) | Represents collateral held in connection with securities lending. Income earned by the Fund is net of borrower rebates. |
| RSP: | Risparmio (Convertible Savings Shares) |
| 144A: | Security exempt from registration under Rule 144A of the Securities Act of 1933. These securities may be resold in transactions exempt from registration, normally to qualified institutional buyers. |
| See Notes to Financial Statements. | 56 |
DBX ETF Trust
Schedule of investments
Deutsche X-trackers MSCI Italy Hedged Equity ETF (Continued)
May 31, 2016
As of May 31, 2016, the Fund had the following forward foreign currency exchange contracts outstanding:
Counterparty | Settlement Date | Currency To Deliver | Currency To Receive | Unrealized Appreciation (Depreciation) | ||||||||||||||
RBC Capital Markets | 6/2/2015 | EUR | 623,968 | USD | 715,261 | $ | 21,007 | |||||||||||
RBC Capital Markets | 6/2/2015 | EUR | 21,000 | USD | 24,038 | 672 | ||||||||||||
RBC Capital Markets | 6/2/2015 | EUR | 49,000 | USD | 56,168 | 1,648 | ||||||||||||
The Bank of New York Mellon | 6/2/2015 | EUR | 130 | USD | 149 | 4 | ||||||||||||
Canadian Imperial Bank of Commerce | 6/2/2016 | EUR | 1,079,858 | USD | 1,237,847 | 36,349 | ||||||||||||
Canadian Imperial Bank of Commerce | 6/2/2016 | USD | 1,237,847 | EUR | 1,111,921 | (674 | ) | |||||||||||
RBC Capital Markets | 6/2/2016 | USD | 795,466 | EUR | 714,544 | (433 | ) | |||||||||||
The Bank of New York Mellon | 6/2/2016 | USD | 149 | EUR | 134 | 0 | ||||||||||||
Canadian Imperial Bank of Commerce | 7/5/2016 | EUR | 1,110,664 | USD | 1,237,847 | 438 | ||||||||||||
RBC Capital Markets | 7/5/2016 | EUR | 713,743 | USD | 795,466 | 275 | ||||||||||||
The Bank of New York Mellon | 7/5/2016 | EUR | 134 | USD | 149 | 0 | ||||||||||||
RBC Capital Markets | 7/5/2016 | USD | 62,416 | EUR | 56,000 | (25 | ) | |||||||||||
|
| |||||||||||||||||
Total net unrealized appreciation | $ | 59,261 | ||||||||||||||||
|
| |||||||||||||||||
Currency Abbreviations
| EUR | Euro |
| USD | U.S.Dollar |
For information on the Fund’s policy and additional disclosures regarding forward foreign currency exchange contracts, please refer to the Derivatives section of Note 2 in the accompanying Notes to Financial Statements.
Fair Value Measurements
Various inputs are used in determining the value of the Fund’s investments. These inputs are summarized in three broad levels. Level 1 includes quoted prices in active markets for identical securities. Level 2 includes other significant observable inputs (including quoted prices for similar securities, interest rates, prepayment speeds and credit risk). Level 3 includes significant unobservable inputs (including the Fund’s own assumptions in determining the fair value of investments). The level assigned to the securities valuations may not be an indication of the risk or liquidity associated with investing in those securities.
The following is a summary of the inputs used as of May 31, 2016 in valuing the Fund’s investments. For information on Fund’s policy regarding the valuation of investments, please refer to the Security Valuation section of Note 2 in the accompanying Notes to Financial Statements.
Assets | Level 1 | Level 2 | Level 3 | Total | ||||||||||||
Common Stocks (d) | $ | 1,948,088 | $ | — | $ | — | $ | 1,948,088 | ||||||||
Short-Term Investments | 134,262 | — | — | 134,262 | ||||||||||||
Derivatives (e) | ||||||||||||||||
Forward Foreign Currency Exchange Contracts | — | 60,393 | — | 60,393 | ||||||||||||
|
|
|
|
|
|
|
| |||||||||
TOTAL | $ | 2,082,350 | $ | 60,393 | $ | — | $ | 2,142,743 | ||||||||
|
|
|
|
|
|
|
| |||||||||
Liabilities | Level 1 | Level 2 | Level 3 | Total | ||||||||||||
Derivatives (e) | ||||||||||||||||
Forward Foreign Currency Exchange Contracts | $ | — | $ | (1,132 | ) | $ | — | $ | (1,132 | ) | ||||||
|
|
|
|
|
|
|
| |||||||||
TOTAL | $ | — | $ | (1,132 | ) | $ | — | $ | (1,132 | ) | ||||||
|
|
|
|
|
|
|
| |||||||||
| (d) | See Schedule of investments for additional detailed categorizations. |
| (e) | Derivatives include unrealized appreciation (depreciation) on forward foreign currency exchange contracts. |
There have been no transfers between fair value measurement levels during the period ended May 31, 2016.
| See Notes to Financial Statements. | 57 |
DBX ETF Trust
Schedule of investments
Deutsche X-trackers MSCI Southern Europe Hedged Equity ETF
May 31, 2016
Number | Value | |||||||
| COMMON STOCKS — 99.7% | ||||||||
| Italy — 36.1% | ||||||||
Assicurazioni Generali SpA | 3,647 | $ | 52,873 | |||||
Atlantia SpA | 1,290 | 34,792 | ||||||
Enel SpA | 23,811 | 107,933 | ||||||
Eni SpA | 7,944 | 121,357 | ||||||
EXOR SpA | 347 | 13,162 | ||||||
Ferrari NV* | 384 | 16,279 | ||||||
Intesa Sanpaolo SpA | 39,621 | 101,746 | ||||||
Intesa Sanpaolo SpA-RSP (a) | 2,912 | 7,063 | ||||||
Leonardo-Finmeccanica SpA*(a) | 1,264 | 14,964 | ||||||
Luxottica Group SpA | 529 | 28,658 | ||||||
Mediobanca SpA | 1,768 | 13,711 | ||||||
Poste Italiane SpA, 144A* | 1,700 | 13,014 | ||||||
Prysmian SpA | 610 | 14,925 | ||||||
Saipem SpA* | 19,018 | 7,785 | ||||||
Snam SpA | 7,653 | 43,810 | ||||||
Telecom Italia SpA* | 31,618 | 29,938 | ||||||
Telecom Italia SpA-RSP | 18,824 | 14,525 | ||||||
Terna Rete Elettrica Nazionale SpA | 4,708 | 26,108 | ||||||
UniCredit SpA | 15,839 | 50,684 | ||||||
Unione di Banche Italiane SpA (a) | 2,816 | 10,465 | ||||||
UnipolSai SpA (a) | 3,515 | 7,028 | ||||||
|
| |||||||
| 730,820 | ||||||||
|
| |||||||
| Luxembourg — 1.0% | ||||||||
Tenaris SA | 1,475 | 19,546 | ||||||
|
| |||||||
| Portugal — 2.7% | ||||||||
EDP—Energias de Portugal SA | 7,232 | 24,100 | ||||||
Galp Energia SGPS SA | 1,445 | 18,940 | ||||||
Jeronimo Martins SGPS SA | 787 | 12,749 | ||||||
|
| |||||||
| 55,789 | ||||||||
|
| |||||||
| Spain — 56.8% | ||||||||
Abertis Infraestructuras SA | 1,620 | 24,802 | ||||||
ACS Actividades de Construccion y Servicios SA | 601 | 19,827 | ||||||
Aena SA, 144A* | 211 | 28,489 | ||||||
Amadeus IT Holding SA, Class A | 1,371 | 63,511 | ||||||
Banco Bilbao Vizcaya Argentaria SA | 20,314 | 134,732 | ||||||
Banco de Sabadell SA | 16,611 | 28,389 | ||||||
Banco Popular Espanol SA | 5,404 | 8,899 | ||||||
Banco Santander SA | 45,075 | 215,204 | ||||||
Bankia SA | 14,387 | 12,502 | ||||||
Bankinter SA | 2,106 | 16,018 | ||||||
CaixaBank SA | 8,314 | 22,729 | ||||||
Distribuidora Internacional de Alimentacion SA* | 1,944 | 11,626 | ||||||
Number | Value | |||||||
| Spain (Continued) | ||||||||
Enagas SA | 709 | $ | 21,252 | |||||
Endesa SA | 992 | 20,397 | ||||||
Ferrovial SA | 1,487 | 31,485 | ||||||
Gas Natural SDG SA | 1,094 | 21,655 | ||||||
Grifols SA | 932 | 21,118 | ||||||
Iberdrola SA | 16,981 | 115,177 | ||||||
Industria de Diseno Textil SA | 2,923 | 98,739 | ||||||
Mapfre SA | 3,366 | 8,531 | ||||||
Red Electrica Corp. SA | 338 | 30,101 | ||||||
Repsol SA | 3,377 | 43,492 | ||||||
Telefonica SA (a) | 13,983 | 146,106 | ||||||
Zardoya Otis SA | 561 | 5,817 | ||||||
|
| |||||||
| 1,150,598 | ||||||||
|
| |||||||
| United Kingdom — 3.1% | ||||||||
CNH Industrial NV | 3,175 | 22,397 | ||||||
Fiat Chrysler Automobiles NV | 2,809 | 20,049 | ||||||
International Consolidated Airlines Group SA | 2,527 | 19,752 | ||||||
|
| |||||||
| 62,198 | ||||||||
|
| |||||||
TOTAL COMMON STOCKS | 2,018,951 | |||||||
|
| |||||||
| RIGHTS — 0.2% | ||||||||
| Spain — 0.2% | ||||||||
Abertis Infraestructuras SA*, expires 06/30/16 | 1,566 | 1,201 | ||||||
Banco Popular Espanol SA*, expires 06/30/16 | 5,221 | 1,301 | ||||||
Ferrovial SA*, expires 07/30/16 | 1,436 | 513 | ||||||
|
| |||||||
| 3,015 | ||||||||
|
| |||||||
TOTAL RIGHTS | 3,015 | |||||||
|
| |||||||
| SECURITIES LENDING COLLATERAL — 8.6% | ||||||||
Daily Assets Fund “Capital Shares”, 0.48% (b)(c) | 173,151 | 173,151 | ||||||
|
| |||||||
TOTAL INVESTMENTS — 108.5% (Cost $2,595,349)† | $ | 2,195,117 | ||||||
Other assets and liabilities, net — (8.5%) | (170,420 | ) | ||||||
|
| |||||||
NET ASSETS — 100.0% | $ | 2,024,697 | ||||||
|
| |||||||
| * | Non-income producing security. |
| † | The cost for federal income tax purposes was $2,636,562. At May 31, 2016, net unrealized depreciation for all securities based on tax cost was $441,445. This consisted of aggregate gross unrealized appreciation for all securities in which there was an excess of value over tax cost of $27,375 and aggregate gross unrealized depreciation for all securities in which there was an excess of tax cost over value of $468,820. |
| (a) | All or a portion of these securities were on loan. In addition, “Other Assets and Liabilities, Net” may include pending sales that are also on loan. The value of securities loaned at May 31, 2016 amounted to $160,782, which is 7.9% of net assets. |
| (b) | Affiliated fund managed by Deutsche Investment Management Americas Inc. The rate shown is the annualized seven-day yield at period end. |
| See Notes to Financial Statements. | 58 |
DBX ETF Trust
Schedule of investments
Deutsche X-trackers MSCI Southern Europe Hedged Equity ETF (Continued)
May 31, 2016
| (c) | Represents collateral held in connection with securities lending. Income earned by the Fund is net of borrower rebates. |
| RSP: | Risparmio (Convertible Savings Shares) |
| 144A: | Security exempt from registration under Rule 144A of the Securities Act of 1933. These securities may be resold in transactions exempt from registration, normally to qualified institutional buyers. |
As of May 31, 2016, the Fund had the following forward foreign currency exchange contracts outstanding:
Counterparty | Settlement Date | Currency To Deliver | Currency To Receive | Unrealized Appreciation (Depreciation) | ||||||||||||||
Canadian Imperial Bank of Commerce | 6/2/2016 | EUR | 1,076,008 | USD | 1,233,434 | $ | 36,219 | |||||||||||
RBC Capital Markets | 6/2/2016 | EUR | 22,000 | USD | 25,183 | 704 | ||||||||||||
RBC Capital Markets | 6/2/2016 | EUR | 663,064 | USD | 760,077 | 22,323 | ||||||||||||
RBC Capital Markets | 6/2/2016 | EUR | 74,000 | USD | 84,825 | 2,489 | ||||||||||||
The Bank of New York Mellon | 6/2/2016 | EUR | 1,410 | USD | 1,616 | 48 | ||||||||||||
Canadian Imperial Bank of Commerce | 6/2/2016 | USD | 1,233,434 | EUR | 1,107,957 | (671 | ) | |||||||||||
RBC Capital Markets | 6/2/2016 | USD | 870,085 | EUR | 781,572 | (474 | ) | |||||||||||
The Bank of New York Mellon | 6/2/2016 | USD | 1,616 | EUR | 1,452 | (1 | ) | |||||||||||
Canadian Imperial Bank of Commerce | 7/5/2016 | EUR | 1,106,705 | USD | 1,233,434 | 437 | ||||||||||||
RBC Capital Markets | 7/5/2016 | EUR | 780,695 | USD | 870,085 | 300 | ||||||||||||
The Bank of New York Mellon | 7/5/2016 | EUR | 1,450 | USD | 1,616 | 1 | ||||||||||||
RBC Capital Markets | 7/5/2016 | USD | 56,843 | EUR | 51,000 | (23 | ) | |||||||||||
|
| |||||||||||||||||
Total net unrealized appreciation | $ | 61,352 | ||||||||||||||||
|
| |||||||||||||||||
Currency Abbreviations
| EUR | Euro |
| USD | U.S. Dollar |
For information on the Fund’s policy and additional disclosures regarding forward foreign currency contracts, please refer to the Derivatives section of Note 2 in the accompanying Notes to Financial Statements.
Fair Value Measurements
Various inputs are used in determining the value of the Fund’s investments. These inputs are summarized in three broad levels. Level 1 includes quoted prices in active markets for identical securities. Level 2 includes other significant observable inputs (including quoted prices for similar securities, interest rates, prepayment speeds and credit risk). Level 3 includes significant unobservable inputs (including the Fund’s own assumptions in determining the fair value of investments). The level assigned to the securities valuations may not be an indication of the risk or liquidity associated with investing in those securities.
The following is a summary of the inputs used as of May 31, 2016 in valuing the Fund’s investments. For information on Fund’s policy regarding the valuation of investments, please refer to the security Valuation section of Note 2 in the accompanying Notes to Financial Statements.
Assets | Level 1 | Level 2 | Level 3 | Total | ||||||||||||
Common Stocks (d) | $ | 2,018,951 | $ | — | $ | — | $ | 2,018,951 | ||||||||
Rights | 3,015 | — | — | 3,015 | ||||||||||||
Short-Term Investments | 173,151 | — | — | 173,151 | ||||||||||||
Derivatives (e) | ||||||||||||||||
Forward Foreign Currency Exchange Contracts | — | 62,521 | — | 62,521 | ||||||||||||
|
|
|
|
|
|
|
| |||||||||
TOTAL | $ | 2,195,117 | $ | 62,521 | $ | — | $ | 2,257,638 | ||||||||
|
|
|
|
|
|
|
| |||||||||
Liabilities | Level 1 | Level 2 | Level 3 | Total | ||||||||||||
Derivatives (e) | ||||||||||||||||
Forward Foreign Currency Exchange Contracts | $ | — | $ | (1,169 | ) | $ | — | $ | (1,169 | ) | ||||||
|
|
|
|
|
|
|
| |||||||||
TOTAL | $ | — | $ | (1,169 | ) | $ | — | $ | (1,169 | ) | ||||||
|
|
|
|
|
|
|
| |||||||||
| (d) | See Schedule of Investments for additional detailed categorizations. |
| (e) | Derivatives include unrealized appreciation (depreciation) on forward foreign currency exchange contracts. |
There have been no transfers between fair value measurement levels during the period ended May 31, 2016.
| See Notes to Financial Statements. | 59 |
DBX ETF Trust
Schedule of investments
Deutsche X-trackers MSCI Spain Hedged Equity ETF
May 31, 2016
Number | Value | |||||||
| COMMON STOCKS — 99.5% | ||||||||
| Consumer Discretionary — 6.3% | ||||||||
Industria de DisenoTextil SA | 3,891 | $ | 131,438 | |||||
|
| |||||||
| Consumer Staples — 1.9% | ||||||||
Distribuidora Internacional de Alimentacion SA* | 6,515 | 38,963 | ||||||
|
| |||||||
| Energy — 4.6% | ||||||||
Repsol SA | 7,445 | 95,883 | ||||||
|
| |||||||
| Financials — 35.8% | ||||||||
Banco Bilbao Vizcaya Argentaria SA | 25,701 | 170,461 | ||||||
Banco de Sabadell SA | 40,115 | 68,557 | ||||||
Banco Popular Espanol SA | 15,558 | 25,619 | ||||||
Banco Santander SA | 65,408 | 312,281 | ||||||
Bankia SA | 34,966 | 30,385 | ||||||
Bankinter SA | 6,473 | 49,234 | ||||||
CaixaBank SA | 20,464 | 55,944 | ||||||
Mapfre SA | 13,636 | 34,562 | ||||||
|
| |||||||
| 747,043 | ||||||||
|
| |||||||
| Health Care — 2.7% | ||||||||
Grifols SA | 2,479 | 56,172 | ||||||
|
| |||||||
| Industrials — 16.4% | ||||||||
Abertis Infraestructuras SA | 4,277 | 65,481 | ||||||
ACS Actividades de Construccion y Servicios SA | 1,670 | 55,093 | ||||||
Aena SA, 144A* | 521 | 70,345 | ||||||
Ferrovial SA | 3,400 | 71,990 | ||||||
International Consolidated Airlines Group SA | 6,755 | 52,799 | ||||||
Zardoya Otis SA | 2,706 | 28,061 | ||||||
|
| |||||||
| 343,769 | ||||||||
|
| |||||||
| Information Technology — 4.7% | ||||||||
Amadeus IT Holding SA, Class A | 2,115 | 97,977 | ||||||
|
| |||||||
Number | Value | |||||||
| Telecommunication Services — 9.1% | ||||||||
Telefonica SA (a) | 18,168 | $ | 189,835 | |||||
|
| |||||||
| Utilities — 18.0% | ||||||||
Enagas SA | 1,830 | 54,854 | ||||||
Endesa SA | 2,741 | 56,359 | ||||||
Gas Natural SDG SA | 2,907 | 57,541 | ||||||
Iberdrola SA | 19,918 | 135,097 | ||||||
Red Electrica Corp. SA | 821 | 73,115 | ||||||
|
| |||||||
| 376,966 | ||||||||
|
| |||||||
TOTAL COMMON STOCKS | 2,078,046 | |||||||
|
| |||||||
| RIGHTS — 0.4% | ||||||||
| Financials — 0.2% | ||||||||
Banco Popular Espanol SA*, expires 6/30/16 | 14,936 | 3,722 | ||||||
|
| |||||||
| Industrials — 0.2% | ||||||||
Abertis Infraestructuras SA*, expires 6/30/16 | 3,948 | 3,027 | ||||||
Ferrovial SA*, expires 7/30/16 | 3,254 | 1,162 | ||||||
|
| |||||||
| 4,189 | ||||||||
|
| |||||||
TOTAL RIGHTS | 7,911 | |||||||
|
| |||||||
| SECURITIES LENDING COLLATERAL — 8.5% | ||||||||
Daily Assets Fund “Capital Shares”, 0.48% (b)(c) | 178,099 | 178,099 | ||||||
|
| |||||||
TOTAL INVESTMENTS — 108.4% (Cost $2,623,568)† | $ | 2,264,056 | ||||||
Other assets and liabilities, net — (8.4%) | (175,267 | ) | ||||||
|
| |||||||
NET ASSETS — 100.0% | $ | 2,088,789 | ||||||
|
| |||||||
| * | Non-income producing security. |
| † | The cost for federal income tax purposes was $2,658,640. At May 31, 2016, net unrealized depreciation for all securities based on tax cost was $394,584. This consisted of aggregate gross unrealized appreciation for all securities in which there was an excess of value over tax cost of $31,871 and aggregate gross unrealized depreciation for all securities in which there was an excess of tax cost over value of $426,455. |
| (a) | All or a portion of these securities were on loan. In addition, “Other Assets and Liabilities, Net” may include pending sales that are also on loan. The value of securities loaned at May 31, 2016 amounted to $165,416, which is 7.9% of net assets. |
| (b) | Affiliated fund managed by Deutsche Investment Management Americas Inc. The rate shown is the annualized seven-day yield at period end. |
| (c) | Represents collateral held in connection with securities lending. Income earned by the Fund is net of borrower rebates. |
| 144A: | Security exempt from registration under Rule 144A of the Securities Act of 1933. These securities may be resold in transactions exempt from registration, normally to qualified institutional buyers. |
| See Notes to Financial Statements. | 60 |
DBX ETF Trust
Schedule of investments
Deutsche X-trackers MSCI Spain Hedged Equity ETF (Continued)
May 31, 2016
As of May 31, 2016, the Fund had the following forward foreign currency exchange contracts outstanding:
Counterparty | Settlement Date | Currency To Deliver | Currency To Receive | Unrealized Appreciation (Depreciation) | ||||||||||||||
Canadian Imperial Bank of Commerce | 6/2/2016 | EUR | 1,074,077 | USD | 1,231,220 | $ | 36,154 | |||||||||||
RBC Capital Markets | 6/2/2016 | EUR | 23,000 | USD | 26,327 | 736 | ||||||||||||
RBC Capital Markets | 6/2/2016 | EUR | 696,367 | USD | 798,252 | 23,444 | ||||||||||||
RBC Capital Markets | 6/2/2016 | EUR | 97,000 | USD | 111,189 | 3,263 | ||||||||||||
The Bank of New York Mellon | 6/2/2016 | EUR | 1,019 | USD | 1,168 | 34 | ||||||||||||
Canadian Imperial Bank of Commerce | 6/2/2016 | USD | 1,231,220 | EUR | 1,105,969 | (670 | ) | |||||||||||
RBC Capital Markets | 6/2/2016 | USD | 935,769 | EUR | 840,574 | (509 | ) | |||||||||||
The Bank of New York Mellon | 6/2/2016 | USD | 1,168 | EUR | 1,049 | (1 | ) | |||||||||||
Canadian Imperial Bank of Commerce | 7/5/2016 | EUR | 1,104,718 | USD | 1,231,220 | 436 | ||||||||||||
RBC Capital Markets | 7/5/2016 | EUR | 839,631 | USD | 935,769 | 323 | ||||||||||||
The Bank of New York Mellon | 7/5/2016 | EUR | 1,048 | USD | 1,168 | 1 | ||||||||||||
RBC Capital Markets | 7/5/2016 | USD | 57,957 | EUR | 52,000 | (23 | ) | |||||||||||
|
| |||||||||||||||||
Total net unrealized appreciation | $ | 63,188 | ||||||||||||||||
|
| |||||||||||||||||
Currency Abbreviations
| EUR | Euro |
| USD | U.S. Dollar |
For information on the Fund’s policy and additional disclosures regarding forward foreign currency exchange contracts, please refer to the Derivatives section of Note 2 in the accompanying Notes to Financial Statements.
Fair Value Measurements
Various inputs are used in determining the value of the Fund’s investments. These inputs are summarized in three broad levels. Level 1 includes quoted prices in active markets for identical securities. Level 2 includes other significant observable inputs (including quoted prices for similar securities, interest rates, prepayment speeds and credit risk). Level 3 includes significant unobservable inputs (including the Fund’s own assumptions in determining the fair value of investments). The level assigned to the securities valuations may not be an indication of the risk or liquidity associated with investing in those securities.
The following is a summary of the inputs used as of May 31, 2016 in valuing the Fund’s investments. For information on Fund’s policy regarding the valuation of investments, please refer to the Security Valuation section of Note 2 in the accompanying Notes to Financial Statements.
Assets | Level 1 | Level 2 | Level 3 | Total | ||||||||||||
Common Stocks (d) | $ | 2,078,046 | $ | — | $ | — | $ | 2,078,046 | ||||||||
Rights (d) | 7,911 | — | — | 7,911 | ||||||||||||
Short-Term Investments | 178,099 | — | — | 178,099 | ||||||||||||
Derivatives (e) | ||||||||||||||||
Forward Foreign Currency Exchange Contracts | — | 64,391 | — | 64,391 | ||||||||||||
|
|
|
|
|
|
|
| |||||||||
TOTAL | $ | 2,264,056 | $ | 64,391 | $ | — | $ | 2,328,447 | ||||||||
|
|
|
|
|
|
|
| |||||||||
Liabilities | Level 1 | Level 2 | Level 3 | Total | ||||||||||||
Derivatives (e) | ||||||||||||||||
Forward Foreign Currency Exchange Contracts | $ | — | $ | (1,203 | ) | $ | — | $ | (1,203 | ) | ||||||
|
|
|
|
|
|
|
| |||||||||
TOTAL | $ | — | $ | (1,203 | ) | $ | — | $ | (1,203 | ) | ||||||
|
|
|
|
|
|
|
| |||||||||
| (d) | See Schedule of investments for additional detailed categorizations. |
| (e) | Derivatives include unrealized appreciation (depreciation) on forward foreign currency exchange contracts. |
There have been no transfers between fair value measurement levels during the period ended May 31, 2016
| See Notes to Financial Statements. | 61 |
DBX ETF Trust
Schedule of investments
Deutsche X-trackers S&P Hedged Global Infrastructure ETF
May 31, 2016
Number | Value | |||||||
| COMMON STOCKS — 99.5% | ||||||||
| Australia — 8.2% | ||||||||
Macquarie Atlas Roads Group (a) | 5,000 | $ | 18,936 | |||||
Qube Holdings Ltd. | 12,326 | 21,024 | ||||||
Sydney Airport (a) | 13,755 | 70,386 | ||||||
Transurban Group (a) | 20,118 | 175,211 | ||||||
|
| |||||||
| 285,557 | ||||||||
|
| |||||||
| Brazil — 1.0% | ||||||||
CPFL Energia SA, ADR (b) | 624 | 6,290 | ||||||
Ultrapar Participacoes SA, ADR | 1,523 | 28,891 | ||||||
|
| |||||||
| 35,181 | ||||||||
|
| |||||||
| Canada — 9.4% | ||||||||
AltaGas Ltd. | 515 | 11,903 | ||||||
Enbridge, Inc. | 3,311 | 132,001 | ||||||
Inter Pipeline Ltd. | 1,183 | 24,042 | ||||||
Pembina Pipeline Corp. | 1,337 | 39,222 | ||||||
TransCanada Corp. | 2,516 | 104,259 | ||||||
Veresen, Inc. | 1,049 | 8,207 | ||||||
Westshore Terminals Investment Corp. | 736 | 10,243 | ||||||
|
| |||||||
| 329,877 | ||||||||
|
| |||||||
| Chile — 0.5% | ||||||||
Empresa Nacional de Electricidad SA, ADR | 216 | 5,607 | ||||||
Endesa Americas SA, ADR | 216 | 2,711 | ||||||
Enersis Americas SA, ADR | 757 | 5,783 | ||||||
Enersis Chile SA, ADR | 757 | 4,300 | ||||||
|
| |||||||
| 18,401 | ||||||||
|
| |||||||
| China — 0.3% | ||||||||
CGN Power Co. Ltd., Class H, 144A | 20,109 | 6,107 | ||||||
Huaneng Power International, Inc., ADR (b) | 189 | 5,185 | ||||||
|
| |||||||
| 11,292 | ||||||||
|
| |||||||
| France — 5.4% | ||||||||
Aeroports de Paris | 415 | 49,430 | ||||||
Engie SA | 3,254 | 50,127 | ||||||
Groupe Eurotunnel SE | 6,964 | 89,843 | ||||||
|
| |||||||
| 189,400 | ||||||||
|
| |||||||
| Germany — 1.9% | ||||||||
E.ON SE* | 4,028 | 39,596 | ||||||
Fraport AG Frankfurt Airport Services Worldwide | 458 | 26,219 | ||||||
|
| |||||||
| 65,815 | ||||||||
|
| |||||||
| Hong Kong — 3.5% | ||||||||
Beijing Enterprises Water Group Ltd. | 9,648 | 6,196 | ||||||
China Gas Holdings Ltd. | 4,200 | 5,945 | ||||||
China Merchants Holdings International Co. Ltd. | 22,378 | 63,931 | ||||||
China Resources Gas Group Ltd. | 1,584 | 4,434 | ||||||
China Resources Power Holdings Co. Ltd. | 3,520 | 5,526 | ||||||
COSCO Pacific Ltd. | 20,993 | 21,234 | ||||||
Guangdong Investment Ltd. | 5,575 | 7,863 | ||||||
Hopewell Highway Infrastructure Ltd. | 12,639 | 6,246 | ||||||
|
| |||||||
| 121,375 | ||||||||
|
| |||||||
Number | Value | |||||||
| Italy — 6.5% | ||||||||
Ansaldo STS SpA | 1,494 | $ | 17,055 | |||||
Atlantia SpA | 5,124 | 138,197 | ||||||
Enel SpA | 14,195 | 64,345 | ||||||
Societa Iniziative Autostradali e Servizi SpA | 850 | 8,303 | ||||||
|
| |||||||
| 227,900 | ||||||||
|
| |||||||
| Japan — 3.0% | ||||||||
Japan Airport Terminal Co. Ltd. | 920 | 31,820 | ||||||
Kamigumi Co. Ltd. | 3,230 | 29,577 | ||||||
Mitsubishi Logistics Corp. | 2,250 | 31,718 | ||||||
Sumitomo Warehouse Co. Ltd. | 2,000 | 10,421 | ||||||
|
| |||||||
| 103,536 | ||||||||
|
| |||||||
| Mexico — 2.4% | ||||||||
Grupo Aeroportuario del Pacifico SAB de CV, ADR | 412 | 41,575 | ||||||
Grupo Aeroportuario del Sureste SAB de CV, ADR* | 260 | 40,921 | ||||||
|
| |||||||
| 82,496 | ||||||||
|
| |||||||
| Netherlands — 0.3% | ||||||||
Koninklijke Vopak NV | 234 | 12,193 | ||||||
|
| |||||||
| New Zealand — 1.4% | ||||||||
Auckland International Airport Ltd. | 11,761 | 49,655 | ||||||
|
| |||||||
| Singapore — 1.8% | ||||||||
Hutchison Port Holdings Trust, Class U | 67,000 | 28,810 | ||||||
SATS Ltd. | 8,020 | 24,227 | ||||||
SIA Engineering Co. Ltd. | 3,200 | 8,807 | ||||||
|
| |||||||
| 61,844 | ||||||||
|
| |||||||
| Spain — 8.6% | ||||||||
Abertis Infraestructuras SA | 5,974 | 91,462 | ||||||
Aena SA, 144A* | 931 | 125,703 | ||||||
Iberdrola SA | 12,100 | 82,070 | ||||||
|
| |||||||
| 299,235 | ||||||||
|
| |||||||
| Switzerland — 1.2% | ||||||||
Flughafen Zuerich AG | 245 | 42,961 | ||||||
|
| |||||||
| United Kingdom — 5.5% | ||||||||
BBA Aviation PLC (b) | 11,156 | 32,736 | ||||||
National Grid PLC | 7,893 | 115,118 | ||||||
SSE PLC | 1,987 | 44,089 | ||||||
|
| |||||||
| 191,943 | ||||||||
|
| |||||||
| United States — 38.6% | ||||||||
American Electric Power Co., Inc. | 988 | 63,953 | ||||||
Cheniere Energy, Inc.* | 826 | 26,539 | ||||||
Columbia Pipeline Group, Inc. | 1,430 | 36,522 | ||||||
Consolidated Edison, Inc. | 598 | 43,809 | ||||||
Dominion Resources, Inc. | 1,206 | 87,134 | ||||||
Duke Energy Corp. | 1,387 | 108,505 | ||||||
Edison International | 662 | 47,419 | ||||||
Exelon Corp. | 1,854 | 63,537 | ||||||
Kinder Morgan, Inc. | 6,546 | 118,352 | ||||||
Macquarie Infrastructure Corp. | 950 | 68,030 | ||||||
NextEra Energy, Inc. | 927 | 111,351 | ||||||
| See Notes to Financial Statements. | 62 |
DBX ETF Trust
Schedule of investments
Deutsche X-trackers S&P Hedged Global Infrastructure ETF (Continued)
May 31, 2016
Number | Value | |||||||
| United States (Continued) | ||||||||
ONEOK, Inc. | 737 | $ | 31,875 | |||||
PG&E Corp. | 1,001 | 60,140 | ||||||
PPL Corp. | 1,357 | 52,299 | ||||||
Public Service Enterprise Group, Inc. | 1,019 | 45,600 | ||||||
Sempra Energy | 475 | 50,882 | ||||||
Southern Co. | 1,838 | 90,871 | ||||||
Spectra Energy Corp. | 2,404 | 76,591 | ||||||
Targa Resources Corp. | 571 | 24,456 | ||||||
WEC Energy Group, Inc. | 624 | 37,527 | ||||||
Wesco Aircraft Holdings, Inc.* | 713 | 10,046 | ||||||
Williams Cos., Inc. | 2,441 | 54,093 | ||||||
Xcel Energy, Inc. | 1,029 | 42,570 | ||||||
|
| |||||||
| 1,352,101 | ||||||||
|
| |||||||
TOTAL COMMON STOCKS | 3,480,762 | |||||||
|
| |||||||
Number | Value | |||||||
| RIGHTS — 0.1% | ||||||||
| Spain — 0.1% | ||||||||
Abertis Infraestructuras SA*, expires 06/30/16 | 5,844 | $ | 4,480 | |||||
|
| |||||||
| SECURITIES LENDING COLLATERAL — 1.2% | ||||||||
Daily Assets Fund “Capital Shares”, 0.48% (c)(d) | 42,184 | 42,184 | ||||||
|
| |||||||
TOTAL INVESTMENTS — 100.8% (Cost $3,759,128)† | $ | 3,527,426 | ||||||
Other assets and liabilities, net — (0.8%) | (29,465 | ) | ||||||
|
| |||||||
NET ASSETS — 100.0% | $ | 3,497,961 | ||||||
|
| |||||||
| * | Non-income producing security. |
| † | The cost for federal income tax purposes was $3,776,018. At May 31, 2016, net unrealized depreciation for all securities based on tax cost was $248,592. This consisted of aggregate gross unrealized appreciation for all securities in which there was an excess of value over tax cost of $203,261 and aggregate gross unrealized depreciation for all securities in which there was an excess of tax cost over value of $451,853. |
| (a) | Stapled Security — A security contractually bound to one or more other securities to form a single saleable unit which cannot be sold separately. |
| (b) | All or a portion of these securities were on loan. In addition, “Other Assets and Liabilities, Net” may include pending sales that are also on loan. The value of securities loaned at May 31, 2016 amounted to $40,338, which is 1.2% of net assets. |
| (c) | Affiliated fund managed by Deutsche Investment Management Americas Inc. The rate shown is the annualized seven-day yield at period end. |
| (d) | Represents collateral held in connection with securities lending. Income earned by the Fund is net of borrower rebates. |
| ADR: | American Depositary Receipt |
| 144A: | Security exempt from registration under Rule 144A of the Securities Act of 1933. These securities may be resold in transactions exempt from registration, normally to qualified institutional buyers. |
As of May 31, 2016, the Fund had the following forward foreign currency exchange contracts outstanding:
Counterparty | Settlement Date | Currency To Deliver | Currency To Receive | Unrealized Appreciation (Depreciation) | ||||||||||||||
Bank of Montreal | 6/2/2016 | AUD | 310,036 | USD | 236,303 | $ | 12,224 | |||||||||||
Bank of Montreal | 6/2/2016 | AUD | 15,000 | USD | 11,432 | 591 | ||||||||||||
JP Morgan & Chase Co. | 6/2/2016 | AUD | 115,500 | USD | 88,017 | 4,539 | ||||||||||||
JP Morgan & Chase Co. | 6/2/2016 | AUD | 2,300 | USD | 1,666 | 4 | ||||||||||||
Bank of Montreal | 6/2/2016 | CHF | 10,000 | USD | 10,446 | 385 | ||||||||||||
JP Morgan & Chase Co. | 6/2/2016 | CHF | 13,900 | USD | 14,519 | 535 | ||||||||||||
JP Morgan & Chase Co. | 6/2/2016 | CHF | 1,200 | USD | 1,207 | 0 | ||||||||||||
RBC Capital Markets | 6/2/2016 | CHF | 19,524 | USD | 20,394 | 752 | ||||||||||||
Bank of Montreal | 6/2/2016 | EUR | 9,000 | USD | 10,302 | 288 | ||||||||||||
Bank of Montreal | 6/2/2016 | EUR | 41,000 | USD | 46,999 | 1,380 | ||||||||||||
Bank of Montreal | 6/2/2016 | EUR | 35,000 | USD | 40,120 | 1,177 | ||||||||||||
JP Morgan & Chase Co. | 6/2/2016 | EUR | 4,300 | USD | 4,787 | 3 | ||||||||||||
JP Morgan & Chase Co. | 6/2/2016 | EUR | 260,225 | USD | 298,289 | 8,752 | ||||||||||||
RBC Capital Markets | 6/2/2016 | EUR | 407,595 | USD | 467,230 | 13,722 | ||||||||||||
Bank of Montreal | 6/2/2016 | GBP | 12,000 | USD | 17,580 | 199 | ||||||||||||
JP Morgan & Chase Co. | 6/2/2016 | GBP | 57,000 | USD | 83,502 | 946 | ||||||||||||
RBC Capital Markets | 6/2/2016 | GBP | 91,359 | USD | 133,840 | 1,519 | ||||||||||||
Bank of Montreal | 6/2/2016 | HKD | 40,000 | USD | 5,158 | 10 | ||||||||||||
Bank of Montreal | 6/2/2016 | HKD | 369,084 | USD | 47,592 | 95 | ||||||||||||
| See Notes to Financial Statements. | 63 |
DBX ETF Trust
Schedule of investments
Deutsche X-trackers S&P Hedged Global Infrastructure ETF (Continued)
May 31, 2016
Counterparty | Settlement Date | Currency To Deliver | Currency To Receive | Unrealized Appreciation (Depreciation) | ||||||||||||||
JP Morgan & Chase Co. | 6/2/2016 | HKD | 16,800 | USD | 2,163 | $ | 1 | |||||||||||
JP Morgan & Chase Co. | 6/2/2016 | HKD | 736,572 | USD | 94,977 | 189 | ||||||||||||
Bank of Montreal | 6/2/2016 | NZD | 22,159 | USD | 15,469 | 476 | ||||||||||||
JP Morgan & Chase Co. | 6/2/2016 | NZD | 21,000 | USD | 14,659 | 450 | ||||||||||||
RBC Capital Markets | 6/2/2016 | NZD | 35,751 | USD | 24,958 | 769 | ||||||||||||
Bank of Montreal | 6/2/2016 | USD | 188,311 | AUD | 259,936 | (441 | ) | |||||||||||
Bank of Montreal | 6/2/2016 | USD | 49,618 | AUD | 65,100 | (2,567 | ) | |||||||||||
Bank of Montreal | 6/2/2016 | USD | 6,639 | CHF | 6,600 | 1 | ||||||||||||
Bank of Montreal | 6/2/2016 | USD | 3,552 | CHF | 3,400 | (131 | ) | |||||||||||
Bank of Montreal | 6/2/2016 | USD | 30,101 | EUR | 26,259 | (884 | ) | |||||||||||
Bank of Montreal | 6/2/2016 | USD | 65,394 | EUR | 58,741 | (36 | ) | |||||||||||
Bank of Montreal | 6/2/2016 | USD | 17,466 | GBP | 12,000 | (86 | ) | |||||||||||
Bank of Montreal | 6/2/2016 | USD | 52,662 | HKD | 409,084 | (18 | ) | |||||||||||
Bank of Montreal | 6/2/2016 | USD | 9,579 | NZD | 14,159 | 1 | ||||||||||||
Bank of Montreal | 6/2/2016 | USD | 5,585 | NZD | 8,000 | (172 | ) | |||||||||||
JP Morgan & Chase Co. | 6/2/2016 | USD | 83,674 | AUD | 115,500 | (196 | ) | |||||||||||
JP Morgan & Chase Co. | 6/2/2016 | USD | 13,981 | CHF | 13,900 | 3 | ||||||||||||
JP Morgan & Chase Co. | 6/2/2016 | USD | 289,695 | EUR | 260,225 | (158 | ) | |||||||||||
JP Morgan & Chase Co. | 6/2/2016 | USD | 44,681 | GBP | 30,500 | (506 | ) | |||||||||||
JP Morgan & Chase Co. | 6/2/2016 | USD | 38,571 | GBP | 26,500 | (189 | ) | |||||||||||
JP Morgan & Chase Co. | 6/2/2016 | USD | 12,482 | HKD | 96,800 | (25 | ) | |||||||||||
JP Morgan & Chase Co. | 6/2/2016 | USD | 82,358 | HKD | 639,772 | (28 | ) | |||||||||||
JP Morgan & Chase Co. | 6/2/2016 | USD | 14,208 | NZD | 21,000 | 1 | ||||||||||||
RBC Capital Markets | 6/2/2016 | USD | 19,638 | CHF | 19,524 | 4 | ||||||||||||
RBC Capital Markets | 6/2/2016 | USD | 453,755 | EUR | 407,595 | (247 | ) | |||||||||||
RBC Capital Markets | 6/2/2016 | USD | 132,974 | GBP | 91,359 | (653 | ) | |||||||||||
RBC Capital Markets | 6/2/2016 | USD | 24,187 | NZD | 35,751 | 2 | ||||||||||||
The Bank of New York Mellon | 6/2/2016 | USD | 1,722 | AUD | 2,300 | (60 | ) | |||||||||||
The Bank of New York Mellon | 6/2/2016 | USD | 1,260 | CHF | 1,200 | (53 | ) | |||||||||||
The Bank of New York Mellon | 6/2/2016 | USD | 1,844 | EUR | 1,600 | (64 | ) | |||||||||||
The Bank of New York Mellon | 6/2/2016 | USD | 3,087 | EUR | 2,700 | (82 | ) | |||||||||||
The Bank of New York Mellon | 6/2/2016 | USD | 2,165 | HKD | 16,800 | (3 | ) | |||||||||||
Bank of Montreal | 6/3/2016 | CAD | 193,119 | USD | 154,178 | 6,911 | ||||||||||||
Bank of Montreal | 6/3/2016 | CAD | 17,000 | USD | 13,572 | 609 | ||||||||||||
JP Morgan & Chase Co. | 6/3/2016 | CAD | 120,000 | USD | 95,802 | 4,294 | ||||||||||||
The Bank of New York Mellon | 6/3/2016 | CAD | 90,000 | USD | 71,852 | 3,220 | ||||||||||||
JP Morgan & Chase Co. | 6/3/2016 | JPY | 5,413,400 | USD | 50,619 | 1,727 | ||||||||||||
RBC Capital Markets | 6/3/2016 | JPY | 6,936,711 | USD | 64,870 | 2,220 | ||||||||||||
RBC Capital Markets | 6/3/2016 | JPY | 366,300 | USD | 3,303 | (5 | ) | |||||||||||
The Bank of New York Mellon | 6/3/2016 | JPY | 602,700 | USD | 5,529 | 85 | ||||||||||||
Bank of Montreal | 6/3/2016 | SGD | 8,000 | USD | 5,947 | 138 | ||||||||||||
JP Morgan & Chase Co. | 6/3/2016 | SGD | 17,000 | USD | 12,637 | 292 | ||||||||||||
RBC Capital Markets | 6/3/2016 | SGD | 23,498 | USD | 17,468 | 406 | ||||||||||||
Bank of Montreal | 6/3/2016 | USD | 160,627 | CAD | 210,119 | (397 | ) | |||||||||||
Bank of Montreal | 6/3/2016 | USD | 5,811 | SGD | 8,000 | (2 | ) | |||||||||||
JP Morgan & Chase Co. | 6/3/2016 | USD | 91,735 | CAD | 120,000 | (227 | ) | |||||||||||
JP Morgan & Chase Co. | 6/3/2016 | USD | 48,811 | JPY | 5,413,400 | 81 | ||||||||||||
JP Morgan & Chase Co. | 6/3/2016 | USD | 12,348 | SGD | 17,000 | (4 | ) | |||||||||||
RBC Capital Markets | 6/3/2016 | USD | 3,731 | JPY | 399,000 | (128 | ) | |||||||||||
RBC Capital Markets | 6/3/2016 | USD | 58,949 | JPY | 6,537,711 | 97 | ||||||||||||
RBC Capital Markets | 6/3/2016 | USD | 10,894 | SGD | 14,998 | (3 | ) | |||||||||||
RBC Capital Markets | 6/3/2016 | USD | 6,319 | SGD | 8,500 | (147 | ) | |||||||||||
The Bank of New York Mellon | 6/3/2016 | USD | 544 | CAD | 700 | (10 | ) | |||||||||||
The Bank of New York Mellon | 6/3/2016 | USD | 67,196 | CAD | 87,900 | (166 | ) | |||||||||||
The Bank of New York Mellon | 6/3/2016 | USD | 1,104 | CAD | 1,400 | (36 | ) | |||||||||||
The Bank of New York Mellon | 6/3/2016 | USD | 9,090 | JPY | 969,000 | (338 | ) | |||||||||||
Bank of Montreal | 7/5/2016 | AUD | 16,000 | USD | 11,577 | 28 | ||||||||||||
| See Notes to Financial Statements. | 64 |
DBX ETF Trust
Schedule of investments
Deutsche X-trackers S&P Hedged Global Infrastructure ETF (Continued)
May 31, 2016
Counterparty | Settlement Date | Currency To Deliver | Currency To Receive | Unrealized Appreciation (Depreciation) | ||||||||||||||
Bank of Montreal | 7/5/2016 | AUD | 259,936 | USD | 188,077 | $ | 465 | |||||||||||
JP Morgan & Chase Co. | 7/5/2016 | AUD | 115,500 | USD | 83,572 | 209 | ||||||||||||
Bank of Montreal | 7/5/2016 | CHF | 6,600 | USD | 6,649 | (3 | ) | |||||||||||
JP Morgan & Chase Co. | 7/5/2016 | CHF | 13,900 | USD | 14,002 | (6 | ) | |||||||||||
RBC Capital Markets | 7/5/2016 | CHF | 19,524 | USD | 19,668 | (8 | ) | |||||||||||
Bank of Montreal | 7/5/2016 | EUR | 58,741 | USD | 65,467 | 23 | ||||||||||||
JP Morgan & Chase Co. | 7/5/2016 | EUR | 260,225 | USD | 290,011 | 91 | ||||||||||||
RBC Capital Markets | 7/5/2016 | EUR | 407,595 | USD | 454,265 | 157 | ||||||||||||
Bank of Montreal | 7/5/2016 | GBP | 12,000 | USD | 17,470 | 85 | ||||||||||||
JP Morgan & Chase Co. | 7/5/2016 | GBP | 26,500 | USD | 38,579 | 187 | ||||||||||||
RBC Capital Markets | 7/5/2016 | GBP | 91,359 | USD | 133,002 | 646 | ||||||||||||
Bank of Montreal | 7/5/2016 | HKD | 409,084 | USD | 52,684 | 13 | ||||||||||||
JP Morgan & Chase Co. | 7/5/2016 | HKD | 639,772 | USD | 82,392 | 19 | ||||||||||||
JP Morgan & Chase Co. | 7/5/2016 | JPY | 5,413,400 | USD | 48,864 | (86 | ) | |||||||||||
RBC Capital Markets | 7/5/2016 | JPY | 6,537,711 | USD | 59,014 | (102 | ) | |||||||||||
Bank of Montreal | 7/5/2016 | NZD | 14,159 | USD | 9,563 | 1 | ||||||||||||
JP Morgan & Chase Co. | 7/5/2016 | NZD | 21,000 | USD | 14,183 | 1 | ||||||||||||
RBC Capital Markets | 7/5/2016 | NZD | 35,751 | USD | 24,146 | 2 | ||||||||||||
Bank of Montreal | 7/5/2016 | SGD | 8,000 | USD | 5,807 | 2 | ||||||||||||
JP Morgan & Chase Co. | 7/5/2016 | SGD | 17,000 | USD | 12,342 | 4 | ||||||||||||
RBC Capital Markets | 7/5/2016 | SGD | 14,998 | USD | 10,888 | 3 | ||||||||||||
Bank of Montreal | 7/5/2016 | USD | 10,031 | EUR | 9,000 | (4 | ) | |||||||||||
Bank of Montreal | 7/5/2016 | USD | 7,985 | HKD | 62,000 | (2 | ) | |||||||||||
JP Morgan & Chase Co. | 7/5/2016 | USD | 1,664 | AUD | 2,300 | (4 | ) | |||||||||||
JP Morgan & Chase Co. | 7/5/2016 | USD | 1,209 | CHF | 1,200 | 1 | ||||||||||||
JP Morgan & Chase Co. | 7/5/2016 | USD | 4,792 | EUR | 4,300 | (1 | ) | |||||||||||
JP Morgan & Chase Co. | 7/5/2016 | USD | 2,164 | HKD | 16,800 | 0 | ||||||||||||
RBC Capital Markets | 7/5/2016 | USD | 3,307 | JPY | 366,300 | 6 | ||||||||||||
Bank of Montreal | 7/6/2016 | CAD | 210,119 | USD | 160,629 | 401 | ||||||||||||
Bank of Montreal | 7/6/2016 | CAD | 11,000 | USD | 8,409 | 21 | ||||||||||||
JP Morgan & Chase Co. | 7/6/2016 | CAD | 120,000 | USD | 91,737 | 230 | ||||||||||||
The Bank of New York Mellon | 7/6/2016 | CAD | 87,900 | USD | 67,196 | 167 | ||||||||||||
|
| |||||||||||||||||
Total net unrealized appreciation | $ | 63,582 | ||||||||||||||||
|
| |||||||||||||||||
Currency Abbreviations
| AUD | Australian Dollar |
| CAD | Canadian Dollar |
| CHF | Swiss Franc |
| EUR | Euro |
| GBP | Pound Sterling |
| HKD | Hong Kong Dollar |
| JPY | Japanese Yen |
| NZD | New Zealand Dollar |
| SGD | Singapore Dollar |
| USD | U.S. Dollar |
For information on the Fund’s policy and additional disclosures regarding forward foreign currency exchange contracts, please refer to the Derivatives section of Note 2 in the accompanying Notes to Financial Statements.
Fair Value Measurements
Various inputs are used in determining the value of the Fund’s investments. These inputs are summarized in three broad levels. Level 1 includes quoted prices in active markets for identical securities. Level 2 includes other significant observable inputs (including quoted prices for similar securities, interest rates, prepayment speeds and credit risk). Level 3 includes significant unobservable inputs (including the Fund’s own assumptions in determining the fair value of investments). The level assigned to the securities valuations may not be an indication of the risk or liquidity associated with investing in those securities.
| See Notes to Financial Statements. | 65 |
DBX ETF Trust
Schedule of investments
Deutsche X-trackers S&P Hedged Global Infrastructure ETF (Continued)
May 31, 2016
The following is a summary of the inputs used as of May 31, 2016 in valuing the Fund’s investments. For information on Fund’s policy regarding the valuation of investments, please refer to the Security Valuation section of Note 2 in the accompanying Notes to Financial Statements.
Assets | Level 1 | Level 2 | Level 3 | Total | ||||||||||||
Common Stocks (e) | $ | 3,480,762 | $ | — | $ | — | $ | 3,480,762 | ||||||||
Rights | 4,480 | — | — | 4,480 | ||||||||||||
Short-Term Investments | 42,184 | — | — | 42,184 | ||||||||||||
Derivatives (f) | ||||||||||||||||
Forward Foreign Currency Exchange Contracts | — | 71,860 | — | 71,860 | ||||||||||||
|
|
|
|
|
|
|
| |||||||||
TOTAL | $ | 3,527,426 | $ | 71,860 | $ | — | $ | 3,599,286 | ||||||||
|
|
|
|
|
|
|
| |||||||||
Liabilities | Level 1 | Level 2 | Level 3 | Total | ||||||||||||
Derivatives (f) | ||||||||||||||||
Forward Foreign Currency Exchange Contracts | $ | — | $ | (8,278 | ) | $ | — | $ | (8,278 | ) | ||||||
|
|
|
|
|
|
|
| |||||||||
TOTAL | $ | — | $ | (8,278 | ) | $ | — | $ | (8,278 | ) | ||||||
|
|
|
|
|
|
|
| |||||||||
| (e) | See Schedule of investments for additional detailed categorizations. |
| (f) | Derivatives include unrealized appreciation (depreciation) on forward foreign currency exchange contracts. |
There have been no transfers between fair value measurement levels during the year ended May 31, 2016.
| See Notes to Financial Statements. | 66 |
This Page is Intentionally Left Blank
67
DBX ETF Trust
Statements of assets and liabilities
May 31, 2016
| Deutsche X-trackers Dow Jones Hedged International Real Estate ETF | Deutsche X-trackers Japan JPX-Nikkei 400 Equity ETF | Deutsche X-trackers Japan JPX-Nikkei 400 Hedged Equity ETF | ||||||||||
Assets | ||||||||||||
Investments in non-affiliated securities at value | $ | 3,521,242 | $ | 18,420,701 | $ | 3,075,556 | ||||||
Investment in Daily Assets Fund* | 8,292 | 57,097 | 88,468 | |||||||||
Cash | 3,622 | 47,529 | 51 | |||||||||
Foreign currency at value | 4,550 | 9,949 | 5,622 | |||||||||
Cash held as collateral for in-kind redemptions | — | 2,623,146 | — | |||||||||
Unrealized appreciation on forward foreign currency exchange contracts | 294,820 | — | 112,101 | |||||||||
| Receivables: | ||||||||||||
Investment securities sold | — | 2,259,306 | — | |||||||||
Dividends | 12,040 | 95,026 | 23,918 | |||||||||
Securities lending income | 41 | 200 | 44 | |||||||||
Foreign tax reclaim | 4,523 | 6,162 | 1,501 | |||||||||
|
|
|
|
|
| |||||||
Total Assets | $ | 3,849,130 | $ | 23,519,116 | $ | 3,307,261 | ||||||
|
|
|
|
|
| |||||||
Liabilities | ||||||||||||
Payable upon return of securities loaned | $ | 8,292 | $ | 57,097 | $ | 88,468 | ||||||
Payable upon return of collateral for in-kind redemptions | — | 2,623,146 | — | |||||||||
Unrealized depreciation on forward foreign currency exchange contracts | 115,493 | — | 6,485 | |||||||||
| Payables: | ||||||||||||
Investment securities purchased | 169,157 | — | 87,033 | |||||||||
Capital shares | — | 2,280,997 | — | |||||||||
Investment advisory fees | 1,772 | 6,929 | 1,148 | |||||||||
|
|
|
|
|
| |||||||
Total Liabilities | 294,714 | 4,968,169 | 183,134 | |||||||||
|
|
|
|
|
| |||||||
Net Assets, at value | $ | 3,554,416 | $ | 18,550,947 | $ | 3,124,127 | ||||||
|
|
|
|
|
| |||||||
Net Assets Consist of | ||||||||||||
Paid-in capital | $ | 3,790,841 | $ | 18,608,725 | $ | 3,594,256 | ||||||
Undistributed net investment income | 147,999 | 90,448 | 17,702 | |||||||||
Accumulated net realized gain (loss) on investments and foreign currency transactions | (506,082 | ) | (51,035 | ) | (496,689 | ) | ||||||
Net unrealized appreciation (depreciation) on investments and foreign currency translations | 121,658 | (97,191 | ) | 8,858 | ||||||||
|
|
|
|
|
| |||||||
Net Assets, at value | $ | 3,554,416 | $ | 18,550,947 | $ | 3,124,127 | ||||||
|
|
|
|
|
| |||||||
Number of Common Shares outstanding | 150,001 | 800,001 | 150,001 | |||||||||
|
|
|
|
|
| |||||||
Net Asset Value | $ | 23.70 | $ | 23.19 | $ | 20.83 | ||||||
|
|
|
|
|
| |||||||
Investments in non-affiliated securities at cost | $ | 3,578,963 | $ | 18,519,857 | $ | 3,172,659 | ||||||
|
|
|
|
|
| |||||||
Value of securities loaned | $ | 7,894 | $ | 54,447 | $ | 84,474 | ||||||
|
|
|
|
|
| |||||||
Investment in Daily Assets Fund at cost* | $ | 8,292 | $ | 57,097 | $ | 88,468 | ||||||
|
|
|
|
|
| |||||||
Foreign currency at cost | $ | 4,555 | $ | 10,028 | $ | 5,672 | ||||||
|
|
|
|
|
| |||||||
| * | Represents collateral on securities loaned. |
| See Notes to Financial Statements. | 68 |
DBX ETF Trust
Statements of assets and liabilities (Continued)
May 31, 2016
| Deutsche X-trackers MSCI Australia Hedged Equity ETF | Deutsche X-trackers MSCI EAFE Small Cap Hedged Equity ETF | Deutsche X-trackers MSCI Italy Hedged Equity ETF | ||||||||||
Assets | ||||||||||||
Investments in non-affiliated securities at value | $ | 3,715,117 | $ | 2,381,973 | $ | 1,948,088 | ||||||
Investment in Daily Assets Fund* | 24,873 | 81,845 | 134,262 | |||||||||
Cash | 501 | 1,495 | 3,197 | |||||||||
Foreign currency at value | 490 | — | 532 | |||||||||
Unrealized appreciation on forward foreign currency exchange contracts | 196,602 | 75,647 | 60,393 | |||||||||
| Receivables: | ||||||||||||
Investment securities sold | 8,091 | 68,665 | 28,970 | |||||||||
Dividends | 26,943 | 8,841 | — | |||||||||
Securities lending income | 24 | 184 | 227 | |||||||||
Foreign tax reclaim | — | 408 | — | |||||||||
|
|
|
|
|
| |||||||
Total Assets | $ | 3,972,641 | $ | 2,619,058 | $ | 2,175,669 | ||||||
|
|
|
|
|
| |||||||
Liabilities | ||||||||||||
Payable upon return of securities loaned | $ | 24,873 | $ | 81,845 | $ | 134,262 | ||||||
Unrealized depreciation on forward foreign currency exchange contracts | 8,617 | 7,353 | 1,132 | |||||||||
| Payables: | ||||||||||||
Investment securities purchased | 212,933 | 101,962 | 90,794 | |||||||||
Investment advisory fees | 1,407 | 899 | 729 | |||||||||
Due to foreign custodian | — | 1,904 | — | |||||||||
|
|
|
|
|
| |||||||
Total Liabilities | 247,830 | 193,963 | 226,917 | |||||||||
|
|
|
|
|
| |||||||
Net Assets, at value | $ | 3,724,811 | $ | 2,425,095 | $ | 1,948,752 | ||||||
|
|
|
|
|
| |||||||
Net Assets Consist of | ||||||||||||
Paid-in capital | $ | 3,709,780 | $ | 2,504,618 | $ | 2,503,573 | ||||||
Undistributed net investment income | 39,450 | 41,638 | 36,031 | |||||||||
Accumulated net realized gain (loss) on investments and foreign currency transactions | (279,849 | ) | (117,497 | ) | (243,819 | ) | ||||||
Net unrealized appreciation (depreciation) on investments and foreign currency translations | 255,430 | (3,664 | ) | (347,033 | ) | |||||||
|
|
|
|
|
| |||||||
Net Assets, at value | $ | 3,724,811 | $ | 2,425,095 | $ | 1,948,752 | ||||||
|
|
|
|
|
| |||||||
Number of Common Shares outstanding | 150,001 | 100,001 | 100,001 | |||||||||
|
|
|
|
|
| |||||||
Net Asset Value | $ | 24.83 | $ | 24.25 | $ | 19.49 | ||||||
|
|
|
|
|
| |||||||
Investments in non-affiliated securities at cost | $ | 3,647,326 | $ | 2,453,993 | $ | 2,354,383 | ||||||
|
|
|
|
|
| |||||||
Value of securities loaned | $ | 23,503 | $ | 77,071 | $ | 124,656 | ||||||
|
|
|
|
|
| |||||||
Investment in Daily Assets Fund at cost* | $ | 24,873 | $ | 81,845 | $ | 134,262 | ||||||
|
|
|
|
|
| |||||||
Foreign currency at cost | $ | 490 | $ | (1,888 | ) | $ | 531 | |||||
|
|
|
|
|
| |||||||
| * | Represents collateral on securities loaned. |
| See Notes to Financial Statements. | 69 |
DBX ETF Trust
Statements of assets and liabilities (Continued)
May 31, 2016
| Deutsche X-trackers MSCI Southern Europe Hedged Equity ETF | Deutsche X-trackers MSCI Spain Hedged Equity ETF | Deutsche X-trackers S&P Hedged Global Infrastructure ETF | ||||||||||
Assets | ||||||||||||
Investments in non-affiliated securities at value | $ | 2,021,966 | $ | 2,085,957 | $ | 3,485,242 | ||||||
Investment in Daily Assets Fund* | 173,151 | 178,099 | 42,184 | |||||||||
Cash | 348 | 420 | 4,195 | |||||||||
Foreign currency at value | 4,466 | 3,611 | 4,668 | |||||||||
Unrealized appreciation on forward foreign currency exchange contracts | 62,521 | 64,391 | 71,860 | |||||||||
| Receivables: | ||||||||||||
Investment securities sold | 24,836 | 4,867 | — | |||||||||
Dividends | 400 | 707 | 9,478 | |||||||||
Securities lending income | 390 | 391 | 25 | |||||||||
Foreign tax reclaim | 495 | 173 | 1,327 | |||||||||
|
|
|
|
|
| |||||||
Total Assets | $ | 2,288,573 | $ | 2,338,616 | $ | 3,618,979 | ||||||
|
|
|
|
|
| |||||||
Liabilities | ||||||||||||
Payable upon return of securities loaned | $ | 173,151 | $ | 178,099 | $ | 42,184 | ||||||
Unrealized depreciation on forward foreign currency exchange contracts | 1,169 | 1,203 | 8,278 | |||||||||
| Payables: | ||||||||||||
Investment securities purchased | 88,802 | 69,747 | 69,236 | |||||||||
Investment advisory fees | 754 | 778 | 1,320 | |||||||||
|
|
|
|
|
| |||||||
Total Liabilities | 263,876 | 249,827 | 121,018 | |||||||||
|
|
|
|
|
| |||||||
Net Assets, at value | $ | 2,024,697 | $ | 2,088,789 | $ | 3,497,961 | ||||||
|
|
|
|
|
| |||||||
Net Assets Consist of | ||||||||||||
Paid-in capital | $ | 2,502,254 | $ | 2,501,326 | $ | 3,740,922 | ||||||
Undistributed net investment income | 36,819 | 30,295 | 34,263 | |||||||||
Accumulated net realized gain (loss) on investments and foreign currency transactions | (175,507 | ) | (146,492 | ) | (109,068 | ) | ||||||
Net unrealized appreciation (depreciation) on investments and foreign currency translations | (338,869 | ) | (296,340 | ) | (168,156 | ) | ||||||
|
|
|
|
|
| |||||||
Net Assets, at value | $ | 2,024,697 | $ | 2,088,789 | $ | 3,497,961 | ||||||
|
|
|
|
|
| |||||||
Number of Common Shares outstanding | 100,001 | 100,001 | 150,001 | |||||||||
|
|
|
|
|
| |||||||
Net Asset Value | $ | 20.25 | $ | 20.89 | $ | 23.32 | ||||||
|
|
|
|
|
| |||||||
Investments in non-affiliated securities at cost | $ | 2,422,198 | $ | 2,445,469 | $ | 3,716,944 | ||||||
|
|
|
|
|
| |||||||
Value of securities loaned | $ | 160,782 | $ | 165,416 | $ | 40,338 | ||||||
|
|
|
|
|
| |||||||
Investment in Daily Assets Fund at cost* | $ | 173,151 | $ | 178,099 | $ | 42,184 | ||||||
|
|
|
|
|
| |||||||
Foreign currency at cost | $ | 4,469 | $ | 3,624 | $ | 4,682 | ||||||
|
|
|
|
|
| |||||||
| * | Represents collateral on securities loaned. |
| See Notes to Financial Statements. | 70 |
DBX ETF Trust
For the Year Ended May 31, 2016
| Deutsche X-trackers Dow Jones Hedged International Real Estate ETF | Deutsche X-trackers Japan JPX-Nikkei 400 Equity ETF(1) | Deutsche X-trackers Japan JPX-Nikkei 400 Hedged Equity ETF(2) | ||||||||||
Investment Income | ||||||||||||
Unaffiliated dividend income* | $ | 148,490 | $ | 179,224 | $ | 55,041 | ||||||
Securities lending income, including income from Daily Assets Fund, net of borrower rebates | 439 | 805 | 215 | |||||||||
|
|
|
|
|
| |||||||
Total Investment Income | 148,929 | 180,029 | 55,256 | |||||||||
|
|
|
|
|
| |||||||
Expenses | ||||||||||||
Investment advisory fees | 21,589 | 42,193 | 11,193 | |||||||||
Other expenses | — | 64 | 12 | |||||||||
|
|
|
|
|
| |||||||
Total Expenses | 21,589 | 42,257 | 11,205 | |||||||||
|
|
|
|
|
| |||||||
Net Investment income (loss) | 127,340 | 137,772 | 44,051 | |||||||||
|
|
|
|
|
| |||||||
Realized and Unrealized Gain (Loss) | ||||||||||||
Net realized gain (loss) from: | ||||||||||||
Investments | (49,022 | ) | (40,932 | ) | (58,925 | ) | ||||||
In-kind redemptions | 338,465 | 287,755 | — | |||||||||
Foreign currency transactions | (334,916 | ) | 1,597 | (438,365 | ) | |||||||
|
|
|
|
|
| |||||||
Net realized gain (loss) | (45,473 | ) | 248,420 | (497,290 | ) | |||||||
Net change in unrealized appreciation (depreciation) on: | ||||||||||||
Investments | 14,178 | (99,156 | ) | (97,103 | ) | |||||||
Foreign currency translations | 130,817 | 1,965 | 105,961 | |||||||||
|
|
|
|
|
| |||||||
Net change in unrealized appreciation (depreciation) | 144,995 | (97,191 | ) | 8,858 | ||||||||
|
|
|
|
|
| |||||||
Net realized and unrealized gain (loss) on investments and foreign currency transactions | 99,522 | 151,229 | (488,432 | ) | ||||||||
|
|
|
|
|
| |||||||
Net increase (decrease) in Net Assets Resulting from Operations | $ | 226,862 | $ | 289,001 | $ | (444,381 | ) | |||||
|
|
|
|
|
| |||||||
* Unaffiliated foreign tax withheld | $ | 19,395 | $ | 25,243 | $ | 8,197 | ||||||
| (1) | For the period June 24, 2015 (commencement of operations) through May 31, 2016. |
| (2) | For the period August 19, 2015 (commencement of operations) through May 31, 2016. |
| See Notes to Financial Statements. | 71 |
DBX ETF Trust
Statements of operations (Continued)
For the Year Ended May 31, 2016
| Deutsche X-trackers MSCI Australia Hedged Equity ETF(1) | Deutsche X-trackers MSCI EAFE Small Cap Hedged Equity ETF(1) | Deutsche X-trackers MSCI Italy Hedged Equity ETF(1) | ||||||||||
Investment Income | ||||||||||||
Unaffiliated dividend income* | $ | 150,251 | $ | 46,977 | $ | 52,051 | ||||||
Securities lending income, including income from Daily Assets Fund, net of borrower rebates | 324 | 1,016 | 1,277 | |||||||||
|
|
|
|
|
| |||||||
Total Investment Income | 150,575 | 47,993 | 53,328 | |||||||||
|
|
|
|
|
| |||||||
Expenses | ||||||||||||
Investment advisory fees | 12,425 | 8,281 | 7,486 | |||||||||
|
|
|
|
|
| |||||||
Total Expenses | 12,425 | 8,281 | 7,486 | |||||||||
|
|
|
|
|
| |||||||
Net Investment income (loss) | 138,150 | 39,712 | 45,842 | |||||||||
|
|
|
|
|
| |||||||
Realized and Unrealized Gain (Loss) | ||||||||||||
Net realized gain (loss) from: | ||||||||||||
Investments | (33,674 | ) | 18,822 | (174,565 | ) | |||||||
Foreign currency transactions | (217,769 | ) | (108,612 | ) | (57,521 | ) | ||||||
|
|
|
|
|
| |||||||
Net realized gain (loss) | (251,443 | ) | (89,790 | ) | (232,086 | ) | ||||||
Net change in unrealized appreciation (depreciation) on: | ||||||||||||
Investments | 67,791 | (72,020 | ) | (406,295 | ) | |||||||
Foreign currency translations | 187,639 | 68,356 | 59,262 | |||||||||
|
|
|
|
|
| |||||||
Net change in unrealized appreciation (depreciation) | 255,430 | (3,664 | ) | (347,033 | ) | |||||||
|
|
|
|
|
| |||||||
Net realized and unrealized gain (loss) on investments and foreign currency transactions | 3,987 | (93,454 | ) | (579,119 | ) | |||||||
|
|
|
|
|
| |||||||
Net increase (decrease) in Net Assets Resulting from Operations | $ | 142,137 | $ | (53,742 | ) | $ | (533,277 | ) | ||||
|
|
|
|
|
| |||||||
* Unaffiliated foreign tax withheld | $ | 1,564 | $ | 5,424 | $ | 8,348 | ||||||
| (1) | For the period August 19, 2015 (commencement of operations) through May 31, 2016. |
| See Notes to Financial Statements. | 72 |
DBX ETF Trust
Statements of operations (Continued)
For the Year Ended May 31, 2016
| Deutsche X-trackers MSCI Southern Europe Hedged Equity ETF(1) | Deutsche X-trackers MSCI Spain Hedged Equity ETF(1) | Deutsche X-trackers S&P Hedged Global Infrastructure ETF | ||||||||||
Investment Income | ||||||||||||
Unaffiliated dividend income* | $ | 58,979 | $ | 57,678 | $ | 121,964 | ||||||
Securities lending income, including income from Daily Assets Fund, net of borrower rebates | 1,525 | 2,510 | 687 | |||||||||
|
|
|
|
|
| |||||||
Total Investment Income | 60,504 | 60,188 | 122,651 | |||||||||
|
|
|
|
|
| |||||||
Expenses | ||||||||||||
Investment advisory fees | 7,505 | 7,544 | 15,228 | |||||||||
Other expenses | 8 | 23 | — | |||||||||
|
|
|
|
|
| |||||||
Total Expenses | 7,513 | 7,567 | 15,228 | |||||||||
|
|
|
|
|
| |||||||
Net Investment income (loss) | 52,991 | 52,621 | 107,423 | |||||||||
|
|
|
|
|
| |||||||
Realized and Unrealized Gain (Loss) | ||||||||||||
Net realized gain (loss) from: | ||||||||||||
Investments | (104,590 | ) | (73,896 | ) | (74,809 | ) | ||||||
Foreign currency transactions | (58,133 | ) | (59,597 | ) | 5,813 | |||||||
|
|
|
|
|
| |||||||
Net realized gain (loss) | (162,723 | ) | (133,493 | ) | (68,996 | ) | ||||||
Net change in unrealized appreciation (depreciation) on: | ||||||||||||
Investments | (400,232 | ) | (359,512 | ) | (219,379 | ) | ||||||
Foreign currency translations | 61,363 | 63,172 | 15,445 | |||||||||
|
|
|
|
|
| |||||||
Net change in unrealized appreciation (depreciation) | (338,869 | ) | (296,340 | ) | (203,934 | ) | ||||||
|
|
|
|
|
| |||||||
Net realized and unrealized gain (loss) on investments and foreign currency transactions | (501,592 | ) | (429,833 | ) | (272,930 | ) | ||||||
|
|
|
|
|
| |||||||
Net increase (decrease) in Net Assets Resulting from Operations | $ | (448,601 | ) | $ | (377,212 | ) | $ | (165,507 | ) | |||
|
|
|
|
|
| |||||||
* Unaffiliated foreign tax withheld | $ | 8,688 | $ | 8,675 | $ | 8,497 | ||||||
| (1) | For the period August 19, 2015 (commencement of operations) through May 31, 2016. |
| See Notes to Financial Statements. | 73 |
DBX ETF Trust
Statements of changes in net assets
| Deutsche X-trackers Dow Jones Hedged International Real Estate ETF | Deutsche X-trackers Japan JPX-Nikkei 400 Equity ETF | Deutsche X-trackers Japan JPX-Nikkei 400 Hedged Equity ETF | ||||||||||||||
| Year Ended May 31, 2016 | For the Period April 9, 2015(1) to May 31, 2015 | For the Period June 24, 2015(1) to May 31, 2016 | For the Period August 19, 2015(1) to May 31, 2016 | |||||||||||||
Increase (Decrease) in Net Assets from Operations | ||||||||||||||||
Net investment income (loss) | $ | 127,340 | $ | 12,612 | $ | 137,772 | $ | 44,051 | ||||||||
Net realized gain (loss) | (45,473 | ) | (52,459 | ) | 248,420 | (497,290 | ) | |||||||||
Net change in unrealized appreciation (depreciation) | 144,995 | (23,337 | ) | (97,191 | ) | 8,858 | ||||||||||
|
|
|
|
|
|
|
| |||||||||
Net increase (decrease) in net assets resulting from operations | 226,862 | (63,184 | ) | 289,001 | (444,381 | ) | ||||||||||
|
|
|
|
|
|
|
| |||||||||
Distributions to Shareholders from |
| |||||||||||||||
Net investment income | (69,795 | ) | — | (63,333 | ) | (25,760 | ) | |||||||||
Net realized gains | (19,032 | ) | — | — | — | |||||||||||
|
|
|
|
|
|
|
| |||||||||
Total distributions | (88,827 | ) | — | (63,333 | ) | (25,760 | ) | |||||||||
|
|
|
|
|
|
|
| |||||||||
Fund Shares Transactions | ||||||||||||||||
Proceeds from shares sold | 8,065,673 | 2,504,120 | 21,675,862 | 3,594,243 | ||||||||||||
Value of shares redeemed | (7,090,253 | ) | — | (3,350,608 | ) | — | ||||||||||
|
|
|
|
|
|
|
| |||||||||
Net increase (decrease) in net assets resulting from fund share transactions | 975,420 | 2,504,120 | 18,325,254 | 3,594,243 | ||||||||||||
|
|
|
|
|
|
|
| |||||||||
Total net increase (decrease) in Net Assets | 1,113,455 | 2,440,936 | 18,550,922 | 3,124,102 | ||||||||||||
Net Assets | ||||||||||||||||
Beginning of year | 2,440,961 | 25 | 25 | 25 | ||||||||||||
|
|
|
|
|
|
|
| |||||||||
End of year | $ | 3,554,416 | $ | 2,440,961 | $ | 18,550,947 | $ | 3,124,127 | ||||||||
|
|
|
|
|
|
|
| |||||||||
Undistributed net investment income | $ | 147,999 | $ | 21,642 | $ | 90,448 | $ | 17,702 | ||||||||
|
|
|
|
|
|
|
| |||||||||
Changes in Shares Outstanding | ||||||||||||||||
Shares outstanding, beginning of year | 100,001 | 1 | 1 | 1 | ||||||||||||
Shares sold | 350,000 | 100,000 | 950,000 | 150,000 | ||||||||||||
Shares redeemed | (300,000 | ) | — | (150,000 | ) | — | ||||||||||
|
|
|
|
|
|
|
| |||||||||
Shares outstanding, end of year | 150,001 | 100,001 | 800,001 | 150,001 | ||||||||||||
|
|
|
|
|
|
|
| |||||||||
| (1) | Commencement of Operations. |
| See Notes to Financial Statements. | 74 |
DBX ETF Trust
Statements of changes in net assets (Continued)
| Deutsche X-trackers MSCI Australia Hedged Equity ETF | Deutsche X-trackers MSCI EAFE Small Cap Hedged Equity ETF | Deutsche X-trackers MSCI Italy Hedged Equity ETF | ||||||||||
| For the Period August 19, 2015(1) to May 31, 2016 | For the Period August 19, 2015(1) to May 31, 2016 | For the Period August 19, 2015(1) to May 31, 2016 | ||||||||||
Increase (Decrease) in Net Assets from Operations | ||||||||||||
Net investment income (loss) | $ | 138,150 | $ | 39,712 | $ | 45,842 | ||||||
Net realized gain (loss) | (251,443 | ) | (89,790 | ) | (232,086 | ) | ||||||
Net change in unrealized appreciation (depreciation) | 255,430 | (3,664 | ) | (347,033 | ) | |||||||
|
|
|
|
|
| |||||||
Net increase (decrease) in net assets resulting from operations | 142,137 | (53,742 | ) | (533,277 | ) | |||||||
|
|
|
|
|
| |||||||
Distributions to Shareholders from | ||||||||||||
Net investment income | (79,799 | ) | (25,781 | ) | (21,544 | ) | ||||||
Net realized gains | (47,307 | ) | — | — | ||||||||
|
|
|
|
|
| |||||||
Total distributions | (127,106 | ) | (25,781 | ) | (21,544 | ) | ||||||
|
|
|
|
|
| |||||||
Fund Shares Transactions | ||||||||||||
Proceeds from shares sold | 3,709,755 | 2,504,593 | 2,503,548 | |||||||||
|
|
|
|
|
| |||||||
Net increase (decrease) in net assets resulting from fund share transactions | 3,709,755 | 2,504,593 | 2,503,548 | |||||||||
|
|
|
|
|
| |||||||
Total net increase (decrease) in Net Assets | 3,724,786 | 2,425,070 | 1,948,727 | |||||||||
Net Assets | ||||||||||||
Beginning of year | 25 | 25 | 25 | |||||||||
|
|
|
|
|
| |||||||
End of year | $ | 3,724,811 | $ | 2,425,095 | $ | 1,948,752 | ||||||
|
|
|
|
|
| |||||||
Undistributed net investment income | $ | 39,450 | $ | 41,638 | $ | 36,031 | ||||||
|
|
|
|
|
| |||||||
Changes in Shares Outstanding | ||||||||||||
Shares outstanding, beginning of year | 1 | 1 | 1 | |||||||||
Shares sold | 150,000 | 100,000 | 100,000 | |||||||||
Shares redeemed | — | — | — | |||||||||
|
|
|
|
|
| |||||||
Shares outstanding, end of year | 150,001 | 100,001 | 100,001 | |||||||||
|
|
|
|
|
| |||||||
| (1) | Commencement of Operations. |
| See Notes to Financial Statements. | 75 |
DBX ETF Trust
Statements of changes in net assets (Continued)
| Deutsche X-trackers MSCI Southern Europe Hedged Equity ETF | Deutsche X-trackers MSCI Spain Hedged Equity ETF | Deutsche X-trackers S&P Hedged Global Infrastructure ETF | ||||||||||||||
| For the Period August 19, 2015(1) to May 31, 2016 | For the Period August 19, 2015(1) to May 31, 2016 | Year Ended May 31, 2016 | For the Period April 9, 2015(1) to May 31, 2015 | |||||||||||||
Increase (Decrease) in Net Assets from Operations | ||||||||||||||||
Net investment income (loss) | $ | 52,991 | $ | 52,621 | $ | 107,423 | $ | 20,642 | ||||||||
Net realized gain (loss) | (162,723 | ) | (133,493 | ) | (68,996 | ) | (42,646 | ) | ||||||||
Net change in unrealized appreciation (depreciation) | (338,869 | ) | (296,340 | ) | (203,934 | ) | 35,778 | |||||||||
|
|
|
|
|
|
|
| |||||||||
Net increase (decrease) in net assets resulting from operations | (448,601 | ) | (377,212 | ) | (165,507 | ) | 13,774 | |||||||||
|
|
|
|
|
|
|
| |||||||||
Distributions to Shareholders from | ||||||||||||||||
Net investment income | (28,964 | ) | (35,348 | ) | (84,640 | ) | — | |||||||||
Net realized gains | — | — | (6,588 | ) | — | |||||||||||
|
|
|
|
|
|
|
| |||||||||
Total distributions | (28,964 | ) | �� | (35,348 | ) | (91,228 | ) | — | ||||||||
|
|
|
|
|
|
|
| |||||||||
Fund Shares Transactions | ||||||||||||||||
Proceeds from shares sold | 2,502,237 | 2,501,324 | — | 3,740,897 | ||||||||||||
|
|
|
|
|
|
|
| |||||||||
Net increase (decrease) in net assets resulting from fund share transactions | 2,502,237 | 2,501,324 | — | 3,740,897 | ||||||||||||
|
|
|
|
|
|
|
| |||||||||
Total net increase (decrease) in Net Assets | 2,024,672 | 2,088,764 | (256,735 | ) | 3,754,671 | |||||||||||
Net Assets | ||||||||||||||||
Beginning of year | 25 | 25 | 3,754,696 | 25 | ||||||||||||
|
|
|
|
|
|
|
| |||||||||
End of year | $ | 2,024,697 | $ | 2,088,789 | $ | 3,497,961 | $ | 3,754,696 | ||||||||
|
|
|
|
|
|
|
| |||||||||
Undistributed net investment income | $ | 36,819 | $ | 30,295 | $ | 34,263 | $ | 20,200 | ||||||||
|
|
|
|
|
|
|
| |||||||||
Changes in Shares Outstanding | ||||||||||||||||
Shares outstanding, beginning of year | 1 | 1 | 150,001 | 1 | ||||||||||||
Shares sold | 100,000 | 100,000 | — | 150,000 | ||||||||||||
Shares redeemed | — | — | — | — | ||||||||||||
|
|
|
|
|
|
|
| |||||||||
Shares outstanding, end of year | 100,001 | 100,001 | 150,001 | 150,001 | ||||||||||||
|
|
|
|
|
|
|
| |||||||||
| (1) | Commencement of Operations. |
| See Notes to Financial Statements. | 76 |
DBX ETF Trust
| Deutsche X-trackers Dow Jones Hedged International Real Estate ETF | Year Ended 5/31/2016 | Period Ended 5/31/2015(a) | ||||||
| Selected Per Share Data | ||||||||
Net Asset Value, beginning of period | $ | 24.41 | $ | 25.00 | ||||
|
|
|
| |||||
| Income (loss) from investment operations: | ||||||||
Net investment income (loss) (c) | 0.65 | 0.13 | ||||||
Net realized and unrealized gain (loss) | (0.91 | )(d) | (0.72 | ) | ||||
|
|
|
| |||||
Total from investment operations | (0.26 | ) | (0.59 | ) | ||||
|
|
|
| |||||
Less distributions from: | ||||||||
Net investment income | (0.39 | ) | — | |||||
Net realized gains | (0.06 | ) | — | |||||
|
|
|
| |||||
Total distributions | (0.45 | ) | — | |||||
|
|
|
| |||||
Net Asset Value, end of period | $ | 23.70 | $ | 24.41 | ||||
|
|
|
| |||||
Total Return (%) | (0.96 | ) | (2.36 | )** | ||||
Ratios to Average Net Assets and Supplemental Data | ||||||||
Net assets, end of period ($ millions) | 4 | 2 | ||||||
Ratio of expenses (%) | 0.48 | 0.48 | * | |||||
Ratio of net investment income (loss) (%) | 2.83 | 3.53 | * | |||||
Portfolio turnover rate (%) (e) | 27 | 2 | ** | |||||
| Deutsche X-trackers Japan JPX-Nikkei 400 Equity ETF | Period Ended 5/31/2016(b) | |||||||
| Selected Per Share Data | ||||||||
Net Asset Value, beginning of period | $ | 25.00 | ||||||
|
| |||||||
| Income (loss) from investment operations: | ||||||||
Net investment income (loss) (c) | 0.28 | |||||||
Net realized and unrealized gain (loss) | (1.97 | )(d) | ||||||
|
| |||||||
Total from investment operations | (1.69 | ) | ||||||
|
| |||||||
| Less distributions from: | ||||||||
Net investment income | (0.12 | ) | ||||||
|
| |||||||
Total distributions | (0.12 | ) | ||||||
|
| |||||||
Net Asset Value, end of period | $ | 23.19 | ||||||
|
| |||||||
Total Return (%) | (6.78 | )** | ||||||
Ratios to Average Net Assets and Supplemental Data | ||||||||
Net assets, end of period ($ millions) | 19 | |||||||
Ratio of expenses (%) | 0.40 | * | ||||||
Ratio of net investment income (loss) (%) | 1.31 | * | ||||||
Portfolio turnover rate (%) (e) | 8 | ** | ||||||
| (a) | For the period April 9, 2015 (commencement of operations) through May 31, 2015. |
| (b) | For the period June 24, 2015 (commencement of operations) through May 31, 2016. |
| (c) | Based on average shares outstanding during the period. |
| (d) | Because of the timing of subscriptions and redemptions in relation to fluctuating markets at value, the amount shown may not agree with the change in aggregate gains and losses. |
| (e) | Portfolio turnover rate does not include securities received or delivered from processing creations or redemptions. |
| * | Annualized. |
| ** | Not Annualized. |
| See Notes to Financial Statements. | 77 |
DBX ETF Trust
Financial highlights (Continued)
| Deutsche X-trackers Japan JPX-Nikkei 400 Hedged Equity ETF | Period Ended 5/31/2016(a) | |||
| Selected Per Share Data | ||||
Net Asset Value, beginning of period | $ | 25.00 | ||
|
| |||
| Income (loss) from investment operations: | ||||
Net investment income (loss) (b) | 0.30 | |||
Net realized and unrealized gain (loss) | (4.30 | ) | ||
|
| |||
Total from investment operations | (4.00 | ) | ||
|
| |||
| Less distributions from: | ||||
Net investment income | (0.17 | ) | ||
|
| |||
Total distributions | (0.17 | ) | ||
|
| |||
Net Asset Value, end of period | $ | 20.83 | ||
|
| |||
Total Return (%) | (16.06 | )** | ||
Ratios to Average Net Assets and Supplemental Data | ||||
Net assets, end of period ($ millions) | 3 | |||
Ratio of expenses (%) | 0.45 | * | ||
Ratio of net investment income (loss) (%) | 1.77 | * | ||
Portfolio turnover rate (%) (c) | 26 | ** | ||
| Deutsche X-trackers MSCI Australia Hedged Equity ETF | Period Ended 5/31/2016(a) | |||
| Selected Per Share Data | ||||
Net Asset Value, beginning of period | $ | 25.00 | ||
|
| |||
| Income (loss) from investment operations: | ||||
Net investment income (loss) (b) | 0.94 | |||
Net realized and unrealized gain (loss) | (0.26 | )(d) | ||
|
| |||
Total from investment operations | 0.68 | |||
|
| |||
| Less distributions from: | ||||
Net investment income | (0.53 | ) | ||
Net realized gains | (0.32 | ) | ||
|
| |||
Total distributions | (0.85 | ) | ||
|
| |||
Net Asset Value, end of period | $ | 24.83 | ||
|
| |||
Total Return (%) | 2.98 | ** | ||
Ratios to Average Net Assets and Supplemental Data | ||||
Net assets, end of period ($ millions) | 4 | |||
Ratio of expenses (%) | 0.45 | * | ||
Ratio of net investment income (loss) (%) | 5.00 | * | ||
Portfolio turnover rate (%) (c) | 22 | ** | ||
| (a) | For the period August 19, 2015 (commencement of operations) through May 31, 2016. |
| (b) | Based on average shares outstanding during the period. |
| (c) | Portfolio turnover rate does not include securities received or delivered from processing creations or redemptions. |
| (d) | Because of the timing of subscriptions and redemptions in relation to fluctuating markets at value, the amount shown may not agree with the change in aggregate gains and losses. |
| * | Annualized. |
| ** | Not Annualized. |
| See Notes to Financial Statements. | 78 |
DBX ETF Trust
Financial highlights (Continued)
| Deutsche X-trackers MSCI EAFE Small Cap Hedged Equity ETF | Period Ended 5/31/2016(a) | |||
| Selected Per Share Data | ||||
Net Asset Value, beginning of period | $ | 25.00 | ||
|
| |||
Income (loss) from investment operations: | ||||
Net investment income (loss) (b) | 0.40 | |||
Net realized and unrealized gain (loss) | (0.89 | ) | ||
|
| |||
Total from investment operations | (0.49 | ) | ||
|
| |||
| Less distributions from: | ||||
Net investment income | (0.26 | ) | ||
|
| |||
Total distributions | (0.26 | ) | ||
|
| |||
Net Asset Value, end of period | $ | 24.25 | ||
|
| |||
Total Return (%) | (1.96 | )** | ||
Ratios to Average Net Assets and Supplemental Data | ||||
Net assets, end of period ($ millions) | 2 | |||
Ratio of expenses (%) | 0.45 | * | ||
Ratio of net investment income (loss) (%) | 2.16 | * | ||
Portfolio turnover rate (%) (c) | 23 | ** | ||
| Deutsche X-trackers MSCI Italy Hedged Equity ETF | Period Ended 5/31/2016(a) | |||
| Selected Per Share Data | ||||
Net Asset Value, beginning of period | $ | 25.00 | ||
|
| |||
| Income (loss) from investment operations: | ||||
Net investment income (loss) (b) | 0.46 | |||
Net realized and unrealized gain (loss) | (5.75 | ) | ||
|
| |||
Total from investment operations | (5.29 | ) | ||
|
| |||
| Less distributions from: | ||||
Net investment income | (0.22 | ) | ||
|
| |||
Total distributions | (0.22 | ) | ||
|
| |||
Net Asset Value, end of period | $ | 19.49 | ||
|
| |||
Total Return (%) | (21.29 | )** | ||
Ratios to Average Net Assets and Supplemental Data | ||||
Net assets, end of period ($ millions) | 2 | |||
Ratio of expenses (%) | 0.45 | * | ||
Ratio of net investment income (loss) (%) | 2.76 | * | ||
Portfolio turnover rate (%) (c) | 29 | ** | ||
| (a) | For the period August 19, 2015 (commencement of operations) through May 31, 2016. |
| (b) | Based on average shares outstanding during the period. |
| (c) | Portfolio turnover rate does not include securities received or delivered from processing creations or redemptions. |
| * | Annualized. |
| ** | Not Annualized. |
| See Notes to Financial Statements. | 79 |
DBX ETF Trust
Financial highlights (Continued)
| Deutsche X-trackers MSCI Southern Europe Hedged Equity ETF | Period Ended 5/31/2016(a) | |||
| Selected Per Share Data | ||||
Net Asset Value, beginning of period | $ | 25.00 | ||
|
| |||
| Income (loss) from investment operations: | ||||
Net investment income (loss) (b) | 0.53 | |||
Net realized and unrealized gain (loss) | (4.99 | ) | ||
|
| |||
Total from investment operations | (4.46 | ) | ||
|
| |||
| Less distributions from: | ||||
Net investment income | (0.29 | ) | ||
|
| |||
Total distributions | (0.29 | ) | ||
|
| |||
Net Asset Value, end of period | $ | 20.25 | ||
|
| |||
Total Return (%) | (17.94 | )** | ||
Ratios to Average Net Assets and Supplemental Data | ||||
Net assets, end of period ($ millions) | 2 | |||
Ratio of expenses (%) | 0.45 | * | ||
Ratio of net investment income (loss) (%) | 3.18 | * | ||
Portfolio turnover rate (%) (c) | 20 | ** | ||
| Deutsche X-trackers MSCI Spain Hedged Equity ETF | Period Ended 5/31/2016(a) | |||
| Selected Per Share Data | ||||
Net Asset Value, beginning of period | $ | 25.00 | ||
|
| |||
| Income (loss) from investment operations: | ||||
Net investment income (loss) (b) | 0.53 | |||
Net realized and unrealized gain (loss) | (4.29 | ) | ||
|
| |||
Total from investment operations | (3.76 | ) | ||
|
| |||
| Less distributions from: | ||||
Net investment income | (0.35 | ) | ||
|
| |||
Total distributions | (0.35 | ) | ||
|
| |||
Net Asset Value, end of period | $ | 20.89 | ||
|
| |||
Total Return (%) | (15.10 | )** | ||
Ratios to Average Net Assets and Supplemental Data | ||||
Net assets, end of period ($ millions) | 2 | |||
Ratio of expenses (%) | 0.45 | * | ||
Ratio of net investment income (loss) (%) | 3.14 | * | ||
Portfolio turnover rate (%) (c) | 23 | ** | ||
| (a) | For the period August 19, 2015 (commencement of operations) through May 31, 2016. |
| (b) | Based on average shares outstanding during the period. |
| (c) | Portfolio turnover rate does not include securities received or delivered from processing creations or redemptions. |
| * | Annualized. |
| ** | Not Annualized. |
| See Notes to Financial Statements. | 80 |
DBX ETF Trust
Financial highlights (Continued)
| Deutsche X-trackers S&P Hedged Global Infrastructure ETF | Year Ended 5/31/2016 | Period Ended 5/31/2015(a) | ||||||
| Selected Per Share Data | ||||||||
Net Asset Value, beginning of period | $ | 25.03 | $ | 25.00 | ||||
|
|
|
| |||||
Income (loss) from investment operations: | ||||||||
Net investment income (loss) (b) | 0.72 | 0.18 | ||||||
Net realized and unrealized gain (loss) | (1.83 | ) | (0.15 | ) | ||||
|
|
|
| |||||
Total from investment operations | (1.11 | ) | 0.03 | |||||
|
|
|
| |||||
| Less distributions from: | ||||||||
Net investment income | (0.56 | ) | — | |||||
Net realized gains | (0.04 | ) | — | |||||
|
|
|
| |||||
Total distributions | (0.60 | ) | — | |||||
|
|
|
| |||||
Net Asset Value, end of period | $ | 23.32 | $ | 25.03 | ||||
|
|
|
| |||||
Total Return (%) | (4.24 | ) | 12 | ** | ||||
Ratios to Average Net Assets and Supplemental Data | ||||||||
Net assets, end of period ($ millions) | 3 | 4 | ||||||
Ratio of expenses (%) | 0.45 | 0.45 | * | |||||
Ratio of net investment income (loss) (%) | 3.17 | 4.84 | * | |||||
Portfolio turnover rate (%) (c) | 22 | 1 | ** | |||||
| (a) | For the period April 9, 2015 (commencement of operations) through May 31, 2015. |
| (b) | Based on average shares outstanding during the period. |
| (c) | Portfolio turnover rate does not include securities received or delivered from processing creations or redemptions. |
| * | Annualized. |
| ** | Not Annualized. |
| See Notes to Financial Statements. | 81 |
DBX ETF Trust
1. Organization
DBX ETF Trust (the “Trust”) is registered under the Investment Company Act of 1940, as amended (the “Act”), as an open-end registered management investment company organized as a Delaware statutory trust.
As of May 31, 2016, the Trust consists of thirty-six investment series of exchange-traded funds (“ETFs”) (each a “Fund” and collectively, the “Funds”) in operation and trading. These financial statements report on the Funds listed below:
| Deutsche X-trackers Dow Jones Hedged International Real Estate ETF |
| Deutsche X-trackers Japan JPX-Nikkei 400 Equity ETF |
| Deutsche X-trackers Japan JPX-Nikkei 400 Hedged Equity ETF |
| Deutsche X-trackers MSCI Australia Hedged Equity ETF |
| Deutsche X-trackers MSCI EAFE Small Cap Hedged Equity ETF |
| Deutsche X-trackers MSCI Italy Hedged Equity ETF |
| Deutsche X-trackers MSCI Southern Europe Hedged Equity ETF |
| Deutsche X-trackers MSCI Spain Hedged Equity ETF |
| Deutsche X-trackers S&P Hedged Global Infrastructure ETF |
DBX Advisors LLC (“DBX” or the “Advisor”), an indirect, wholly owned subsidiary of Deutsche Bank AG, serves as investment advisor to the Funds and has overall responsibility for the general management and administration of the Funds, subject to the supervision of the Funds’ Board of Trustees.
Each Fund offers shares that are listed and traded on the NYSE Arca, Inc. (“NYSE Arca”). Unlike conventional mutual funds, each Fund issues and redeems shares on a continuous basis, at net asset value, only in large specified lots consisting of 50,000 shares, each called a “Creation Unit”, to authorized participants who have entered into agreements with the Funds’ distributor. Shares are not individually redeemable securities of the Funds, and owners of shares may acquire those shares from the Funds, or tender such shares for redemption to the Funds, in Creation Units only.
The investment objective of each Fund is to track the performance, before fees and expenses, of a particular index (the “Underlying Index”). The underlying indices for the Funds are:
Fund | Underlying Index | |
| Deutsche X-trackers Dow Jones Hedged International Real Estate ETF | Dow Jones Global ex-U.S. Select Real Estate Securities Total Return Net Index (USD) Hedged | |
| Deutsche X-trackers Japan JPX-Nikkei 400 Equity ETF | JPX-Nikkei 400 Net Total Return Index | |
| Deutsche X-trackers Japan JPX-Nikkei 400 Hedged Equity ETF | JPX-Nikkei 400 Net Total Return USD Hedged Index | |
| Deutsche X-trackers MSCI Australia Hedged Equity ETF | MSCI Australia US Dollar Hedged Index | |
| Deutsche X-trackers MSCI EAFE Small Cap Hedged Equity ETF | MSCI EAFE Small Cap US Dollar Hedged Index | |
| Deutsche X-trackers MSCI Italy Hedged Equity ETF | MSCI Italy 25/50 US Dollar Hedged Index | |
| Deutsche X-trackers MSCI Southern Europe Hedged Equity ETF | MSCI Southern Europe US Dollar Hedged Index | |
| Deutsche X-trackers MSCI Spain Hedged Equity ETF | MSCI Spain 25/50 US Dollar Hedged Index | |
| Deutsche X-trackers S&P Hedged Global Infrastructure ETF | S&P Global Infrastructure Index (USD) (Hedged) (Net TR) |
The Dow Jones Global ex-U.S. Select Real Estate Securities Total Return Net Index (USD) Hedged is designed to track the performance of publicly traded real estate securities in countries other than the United States, while mitigating exposure to fluctuations between the value of the U.S. dollar and the currencies of the countries included in the Underlying Index. It is comprised of global real estate securities that represent the ownership and operation of commercial or residential real estate investment trusts (“REITs”) and real estate operating companies (“REOCs”) that meet the following criteria: (i) the company must be both an equity owner and operator of commercial and/or residential real estate; (ii) the company must have a minimum total market capitalization of at least $200 million at the time of its inclusion; (iii) at least 75% of the company’s total revenue must be derived from the ownership and operation of real estate assets; and (iv) the liquidity of the company’s stock must be commensurate with that of other institutionally held real estate securities. The Dow Jones Global
82
DBX ETF Trust
Notes to financial statements (Continued)
ex-U.S. Select Real Estate Securities Total Return Net Index (USD) Hedged is rebalanced monthly on the last business day of each month.
The JPX-Nikkei Index 400 Net Total Return Index is designed to track the performance of equity securities of issuers who are primarily listed on the JASDAQ Stock Exchange (“JASDAQ”) or the following sections of the Tokyo Stock Exchange (“TSE”): the first section (for large companies), the second section (for middle-sized companies) and the “Mothers” (for high-growth and emerging stocks). The Fund uses a representative sampling indexing strategy in seeking to track the Underlying Index, meaning it generally will invest in a sample of securities in the index whose risk, return and other characteristics resemble the risk, return and other characteristics of the Underlying Index as a whole. The Underlying Index is comprised of the equity securities of the 400 highest scoring issuers listed on the JASDAQ and TSE, as measured in return on equity, cumulative operating profit and current market value. The Fund will invest at least 80% of its total assets (but typically far more) in component securities (including depositary receipts in respect of such securities) of the Underlying Index. The JPX-Nikkei Index 400 is rebalanced annually.
The JPX-Nikkei 400 Net Total Return USD Hedged Index is designed to track the performance of equity securities of issuers who are primarily listed on the JASDAQ Stock Exchange (“JASDAQ”) or the following sections of the Tokyo Stock Exchange (“TSE”): the first section (for large companies), the second section (for middle-sized companies) and the “Mothers” (for high-growth and emerging stocks) while mitigating exposure to fluctuations between the value of the Japanese yen and the U.S. dollar. The Fund may achieve its investment objective by investing a substantial portion of its assets in the Underlying Fund, though the Fund may also invest directly in the stocks included in its Underlying Index. The Fund is subject to the principal risks noted below, any of which may adversely affect the Fund’s net asset value (“NAV”), trading price, yield, total return and ability to meet its investment objective, as well as numerous other risks. The JPX-Nikkei 400 Net Total Return USD Hedged Index is rebalanced monthly on the last business day of the month.
The MSCI Australia US Dollar Hedged Index is designed to track the performance of the Australian equity market, while mitigating exposure to fluctuations between the value of the U.S. dollar and the Australian dollar. The Fund uses a representative sampling indexing strategy in seeking to track the Underlying Index, meaning it generally will invest in a sample of securities in the index whose risk, return and other characteristics resemble the risk, return and other characteristics of the Underlying Index as a whole. The Fund will invest at least 80% of its total assets (but typically far more) in component securities (including depositary receipts in respect of such securities) of the Underlying Index. The MSCI Australia US Dollar Hedged Index is rebalanced monthly on the last business day of each month.
The MSCI EAFE Small Cap US Dollar Hedged Index is designed to provide exposure to small cap equity securities in developed stock markets outside of the Americas, while mitigating exposure to fluctuations between the value of the U.S. dollar and the currencies of the countries included in the Underlying Index. The Fund uses a representative sampling indexing strategy in seeking to track the Underlying Index, meaning it generally will invest in a sample of securities in the index whose risk, return and other characteristics resemble the risk, return and other characteristics of the Underlying Index as a whole. The Fund will invest at least 80% of its total assets (but typically far more) in component securities (including depositary receipts in respect of such securities) of the Underlying Index. The MSCI EAFE Small Cap US Dollar Hedged Index is rebalanced monthly on the last business day of each month.
The MSCI Italy 25/50 US Dollar Hedged Index is designed to track the performance of the Italian equity market, while mitigating exposure to fluctuations between the value of the U.S. dollar and the euro. The Fund uses a representative sampling indexing strategy in seeking to track the Underlying Index, meaning it generally will invest in a sample of securities in the index whose risk, return and other characteristics resemble the risk, return and other characteristics of the Underlying Index as a whole. The Fund will invest at least 80% of its total assets (but typically far more) in component securities (including depositary receipts in respect of such securities) of the Underlying Index. The MSCI Italy 25/50 US Dollar Hedged Index is rebalanced quarterly.
The MSCI Southern Europe US Dollar Hedged Index is designed to track the performance the Italian, Portuguese and Spanish equity markets, while mitigating exposure to fluctuations between the value of the U.S. dollar and the euro. The Fund uses a representative sampling indexing strategy in seeking to track the Underlying Index, meaning it generally will invest in a sample of securities in the index whose risk, return and other characteristics
83
DBX ETF Trust
Notes to financial statements (Continued)
resemble the risk, return and other characteristics of the Underlying Index as a whole. The Fund will invest at least 80% of its total assets (but typically far more) in component securities (including depositary receipts in respect of such securities) of the Underlying Index. The MSCI Southern Europe US Dollar Hedged Index is rebalanced monthly on the last business day of each month.
The MSCI Spain 25/50 US Dollar Hedged Index is designed to track the performance of the Spanish equity market, while mitigating exposure to fluctuations between the value of the U.S. dollar and the euro. The Fund uses a representative sampling indexing strategy in seeking to track the Underlying Index, meaning it generally will invest in a sample of securities in the index whose risk, return and other characteristics resemble the risk, return and other characteristics of the Underlying Index as a whole. The Fund will invest at least 80% of its total assets (but typically far more) in component securities (including depositary receipts in respect of such securities) of the Underlying Index. The MSCI Spain 25/50 US Dollar Hedged Index is rebalanced quarterly.
S&P Global Infrastructure Index (USD) (Hedged) (Net TR) (the “Underlying Index”) is designed to track the performance of equity securities of infrastructure issuers in developed markets, while mitigating exposure to fluctuations between the value of the U.S. dollar and the currencies of the countries included in the Underlying Index. It consists of companies involved in utilities, energy and transportation infrastructure. The Underlying Index is comprised of a minimum market capitalization of approximately $585 million from issuers in the following countries: Australia, Austria, Brazil, Canada, Chile, China, France, Germany, Hong Kong, Italy, Japan, Mexico, the Netherlands, New Zealand, Singapore, Spain, Switzerland, the United Kingdom and the United States. The S&P Global Infrastructure Index (USD) (Hedged) (Net TR) is rebalanced monthly on the last business day of each month.
Each Fund is entitled to use its respective Underlying Index pursuant to a licensing agreement between each Index Provider and DBX. There is no charge to the Funds in connection with these licensing agreements.
Each Fund is non-diversified and is not limited by the Act with regard to the percentage of its assets that may be invested in the securities of a single issuer. The securities of a particular issuer (or securities of issuers in particular industries) may dominate the underlying index of such a fund and, consequently, the fund’s investment portfolio. This may adversely affect the fund’s performance or subject the fund’s shares to greater price volatility than that experienced by more diversified investment companies.
Pursuant to the Trust’s organizational documents, the Trust’s officers and trustees are indemnified against certain liabilities that may arise out of the performance of their duties to the Funds. Additionally, in the normal course of business the Trust enters into contracts that contain a variety of representations that provide indemnification for certain liabilities. The Trust’s maximum exposure under these arrangements is unknown, as this would involve future claims that may be made against the Funds that have not yet occurred. However, the Trust expects the risk of loss to be remote.
2. Significant Accounting Policies
The financial statements have been prepared in conformity with U.S. generally accepted accounting principles (“U.S. GAAP”), which require management to make certain estimates and assumptions that affect the reported amounts and disclosures in the financial statements. Actual results could differ from those estimates. The following is a summary of significant accounting policies followed by the Funds.
Security Valuation The Net Asset Value (“NAV”), of each Fund’s shares is calculated each business day as of the close of regular trading on the New York Stock Exchange, generally 4:00 p.m. Eastern Time. NAV per share is calculated by dividing a Fund’s net assets by the number of Fund shares outstanding.
Various inputs are used in determining the value of the Funds’ investments. These inputs are summarized in three broad levels. Level 1 includes quoted prices in active markets for identical securities. Level 2 includes other significant observable inputs (including quoted prices for similar securities, interest rates, prepayment speeds, and credit risk). Level 3 includes significant unobservable inputs (including the Fund’s own assumptions in determining the fair value of investments). The level assigned to the securities valuations may not be an indication of the risk or liquidity associated with investing in those securities.
84
DBX ETF Trust
Notes to financial statements (Continued)
Equity securities are valued at the most recent sale price or official closing price reported on the exchange (U.S. or foreign) or over-the-counter market on which they trade. Securities for which no sales are reported are valued at the calculated mean between the most recent bid and asked quotations on the relevant market or, if a mean cannot be determined, at the most recent bid quotation. Equity securities are generally categorized as Level 1.
Forward currency contracts are valued at the prevailing forward exchange rate of the underlying currencies and are categorized as Level 2.
Securities and other assets for which market quotations are not readily available or for which the above valuation procedures are deemed not to reflect fair value are valued in a manner that is intended to reflect their fair value as determined in accordance with procedures approved by the Board and are generally categorized as Level 3. In accordance with the Fund’s valuation procedures, factors considered in determining value may include, but are not limited to, the type of the security; the size of the holding; the initial cost of the security; the existence of any contractual restrictions on the security’s disposition; the price and extent of public trading in similar securities of the issuer or of comparable companies; quotations or evaluated prices from broker-dealers and/or pricing services; information obtained from the issuer, analysts, and/or the appropriate stock exchange (for exchange- traded securities); an analysis of the company’s or issuer’s financial statements; an evaluation of the forces that influence the issuer and the market(s) in which the security is purchased and sold; and with respect to debt securities, the maturity, coupon, creditworthiness, currency denomination and the movement of the market in which the security is normally traded. The value determined under these procedures may differ from published values for the same securities.
Fair value pricing could result in a difference between the prices used to calculate a Fund’s net asset value and the prices used by the Fund’s underlying index, which in turn could result in a difference between the Fund’s performance and the performance of the Fund’s Underlying Index.
Disclosure about the classification of the fair value measurements is included in a table following the Fund’s Schedule of Investments.
Cash Cash consists of cash held at banks and is on deposit with major financial institutions.
Investment Transactions and Investment Income Investment transactions are recorded as of the date that the securities are purchased or sold (trade date). Realized gains and losses from the sale or disposition of securities are calculated on the identified cost-method. Dividend income is net of any foreign taxes withheld at source. Certain dividends from foreign securities may be recorded subsequent to the ex-dividend date as soon as the fund is informed of such dividends. Interest income is recorded on the accrual basis. Distributions received from foreign domiciled corporations, generally determined to be passive foreign investment companies for tax reporting purposes, are included in dividend income.
Tax Information and Dividends and Distributions to Shareholders It is each Fund’s policy to comply with all requirements of the Internal Revenue Code of 1986, as amended (“the Code”). Each fund intends to qualify for and to elect treatment as a separate Regulated Investment Company (“RIC”) under Subchapter M of the Code. It is the policy of Deutsche X-trackers Dow Jones Hedged International Real Estate ETF Fund to pay out dividends from net investment income quarterly and Deutsche X-trackers Japan JPX-Nikkei 400 Equity ETF, Deutsche X-trackers Japan JPX-Nikkei 400 Hedged Equity ETF, Deutsche X-trackers MSCI Australia Hedged Equity ETF, Deutsche X-trackers MSCI EAFE Small Cap Hedged Equity ETF, Deutsche X-trackers MSCI Italy Hedged Equity ETF, Deutsche X-trackers MSCI Southern Europe Hedged Equity ETF, Deutsche X-trackers MSCI Spain Hedged Equity ETF, Deutsche X-trackers S&P Hedged Global Infrastructure ETF to pay out dividends from net investment income semiannually; sufficient to relieve it from all or substantially all Federal income and excise taxes. Taxable net realized gains from investment transactions, reduced by capital loss carryforwards, if any, are declared and distributed to shareholders at least annually. The capital loss carryforward amount, if any, is available to offset future net capital gains. The Funds may occasionally be required to make supplemental distributions at some other time during the year. The Funds reserve the right to declare special distributions if, in their reasonable discretion, such action is necessary or advisable to preserve the status of each Fund as a RIC or to avoid imposition of income or excise taxes on undistributed income. Dividends and distributions to shareholders, if any, are recorded on the ex-dividend date. The amount of dividends and distributions from net investment income and net realized capital gains are determined in accordance with Federal income tax regulations which may differ
85
DBX ETF Trust
Notes to financial statements (Continued)
from U.S. GAAP. These “book/tax” differences are either considered temporary or permanent in nature. To the extent these differences are permanent in nature, such amounts are reclassified at the end of the year within the components of net assets based on their federal tax treatment; temporary differences do not require reclassification. Dividends and distributions, which exceed earnings and profits for the full year for tax purposes, are reported as a tax return of capital.
In accordance with U.S. GAAP requirements regarding accounting for uncertainties in income taxes, management has analyzed the Funds’ tax positions taken or expected to be taken on foreign, federal and state income tax returns for all open tax years and has concluded that no provision for income tax is required in the Funds’ financial statements. The Advisor does not believe that the unrecognized tax benefits will change significantly in the next 12 months.
The Funds recognize interest and penalties, if any, related to uncertain tax provisions as income tax expense on the Statements of Operations. For the period ended May 31, 2016, the Funds did not incur any interest or penalties.
As of May 31, 2016, the components of accumulated earnings (losses) were as follows:
| Undistributed Net Investment Income | Capital and Other Gains (Losses) | Unrealized Appreciation (Depreciation) | Total Accumulated Earnings (Losses) | |||||||||||||
Deutsche X-trackers Dow Jones Hedged International Real Estate ETF | $ | 147,999 | $ | (288,090 | ) | $ | (96,334 | ) | $ | (236,425 | ) | |||||
Deutsche X-trackers Japan JPX-Nikkei 400 Equity ETF | 90,448 | (10,468 | ) | (137,758 | ) | (57,778 | ) | |||||||||
Deutsche X-trackers Japan JPX-Nikkei 400 Hedged Equity ETF | 17,702 | (380,840 | ) | (106,991 | ) | (470,129 | ) | |||||||||
Deutsche X-trackers MSCI Australia Hedged Equity ETF | 39,450 | (35,213 | ) | 10,794 | 15,031 | |||||||||||
Deutsche X-trackers MSCI EAFE Small Cap Hedged Equity ETF | 41,638 | (27,868 | ) | (93,293 | ) | (79,523 | ) | |||||||||
Deutsche X-trackers MSCI Italy Hedged Equity ETF | 36,031 | (151,104 | ) | (439,748 | ) | (554,821 | ) | |||||||||
Deutsche X-trackers MSCI Southern Europe Hedged Equity ETF | 36,819 | (72,511 | ) | (441,865 | ) | (477,557 | ) | |||||||||
Deutsche X-trackers MSCI Spain Hedged Equity ETF | 30,295 | (47,788 | ) | (395,044 | ) | (412,537 | ) | |||||||||
Deutsche X-trackers S&P Hedged Global Infrastructure ETF | 34,263 | (29,436 | ) | (247,788 | ) | (242,961 | ) | |||||||||
86
DBX ETF Trust
Notes to financial statements (Continued)
The tax character of dividends and distributions declared for the period ended May 31, 2016 was as follows:
| Period Ended May 31, 2016 | ||||||||
| Ordinary Income* | Long-Term Capital Gains | |||||||
Deutsche X-trackers Dow Jones Hedged International Real Estate ETF | $ | 72,830 | $ | 15,997 | ||||
Deutsche X-trackers Japan JPX-Nikkei 400 Equity ETF | 63,333 | — | ||||||
Deutsche X-trackers Japan JPX-Nikkei 400 Hedged Equity ETF | 25,760 | — | ||||||
Deutsche X-trackers MSCI Australia Hedged Equity ETF | 98,974 | 28,132 | ||||||
Deutsche X-trackers MSCI EAFE Small Cap Hedged Equity ETF | 25,781 | — | ||||||
Deutsche X-trackers MSCI Italy Hedged Equity ETF | 21,544 | — | ||||||
Deutsche X-trackers MSCI Southern Europe Hedged Equity ETF | 28,964 | — | ||||||
Deutsche X-trackers MSCI Spain Hedged Equity ETF | 35,348 | — | ||||||
Deutsche X-trackers S&P Hedged Global Infrastructure ETF | 87,245 | 3,983 | ||||||
| * | for tax purposes short-term capital gain distributions are considered ordinary income distributions |
At May 31, 2016, for Federal income tax purposes, the Funds have capital loss carryforwards available as shown in the table below, to the extent provided by regulations, to offset future capital gains for an unlimited period. To the extent that these capital loss carryforwards are used to offset future capital gains, it is probable that the capital gains so offset will not be distributed to shareholders.
| Short-Term | Long-Term | Total Amount | ||||||||||
Deutsche X-trackers Japan JPX-Nikkei 400 Equity ETF | $ | 5,766 | $ | — | $ | 5,766 | ||||||
Deutsche X-trackers Japan JPX-Nikkei 400 Hedged Equity ETF | 34,973 | 42,844 | 77,817 | |||||||||
Deutsche X-trackers MSCI EAFE Small Cap Hedged Equity ETF | 7,784 | 7,250 | 15,034 | |||||||||
Deutsche X-trackers MSCI Italy Hedged Equity ETF | 10,136 | 5,248 | 15,384 | |||||||||
Deutsche X-trackers MSCI Southern Europe Hedged Equity ETF | 3,850 | 5,331 | 9,181 | |||||||||
Deutsche X-trackers MSCI Spain Hedged Equity ETF | 10,084 | 5,348 | 15,432 | |||||||||
Deutsche X-trackers S&P Hedged Global Infrastructure ETF | 11,766 | — | 11,766 | |||||||||
Capital losses incurred after October 31 (“post-October losses”) within the taxable year are deemed to arise on the first business day of each Fund’s next taxable year. During the period ended May 31, 2016, the Funds incurred and elected to defer net capital losses as follows:
| Post-October Losses on Capital | ||||
Deutsche X-trackers Dow Jones Hedged International Real Estate ETF | $ | 288,090 | ||
Deutsche X-trackers Japan JPX-Nikkei 400 Equity ETF | 4,702 | |||
Deutsche X-trackers Japan JPX-Nikkei 400 Hedged Equity ETF | 303,023 | |||
Deutsche X-trackers MSCI Australia Hedged Equity ETF | 35,213 | |||
Deutsche X-trackers MSCI EAFE Small Cap Hedged Equity ETF | 12,834 | |||
Deutsche X-trackers MSCI Italy Hedged Equity ETF | 135,720 | |||
Deutsche X-trackers MSCI Southern Europe Hedged Equity ETF | 63,330 | |||
Deutsche X-trackers MSCI Spain Hedged Equity ETF | 32,356 | |||
Deutsche X-trackers S&P Hedged Global Infrastructure ETF | 17,670 | |||
87
DBX ETF Trust
Notes to financial statements (Continued)
In order to present paid-in capital accumulated net realized gains or losses on the Statements of Assets and Liabilities that more closely represent their tax character, certain adjustments have been made to additional paid-in capital, undistributed net investment income or loss and accumulated net realized gains or losses on investments. These differences are primarily due to recognition of certain foreign currency gains (losses) as ordinary income (loss), return of capital distributions received, non-deductible excise tax paid, distribution re-classes, redemptions-in-kind, and passive foreign investment companies (“PFICs”). For the period ended May 31, 2016, the adjustments were as follows:
| Undistributed Net Investment Income (Loss) | Undistributed Capital Gains (Accumulated Losses) | Paid-in Capital | ||||||||||
Deutsche X-trackers Dow Jones Hedged International Real Estate ETF | $ | 68,812 | $ | (380,088 | ) | $ | 311,276 | |||||
Deutsche X-trackers Japan JPX-Nikkei 400 Equity ETF | 16,009 | (299,455 | ) | 283,446 | ||||||||
Deutsche X-trackers Japan JPX-Nikkei 400 Hedged Equity ETF | (589 | ) | 601 | (12 | ) | |||||||
Deutsche X-trackers MSCI Australia Hedged Equity ETF | (18,901 | ) | 18,901 | — | ||||||||
Deutsche X-trackers MSCI EAFE Small Cap Hedged Equity ETF | 27,707 | (27,707 | ) | — | ||||||||
Deutsche X-trackers MSCI Italy Hedged Equity ETF | 11,733 | (11,733 | ) | — | ||||||||
Deutsche X-trackers MSCI Southern Europe Hedged Equity ETF | 12,792 | (12,784 | ) | (8 | ) | |||||||
Deutsche X-trackers MSCI Spain Hedged Equity ETF | 13,022 | (12,999 | ) | (23 | ) | |||||||
Deutsche X-trackers S&P Hedged Global Infrastructure ETF | (8,720 | ) | 8,720 | — | ||||||||
Foreign Taxes The Funds may be subject to foreign taxes (a portion of which may be reclaimable) on income, capital gains on investments, certain foreign currency transactions or other corporate events. All foreign taxes are recorded in accordance with the applicable foreign tax regulations and rates that exist in the foreign jurisdictions in which the Funds invest. These foreign taxes, if any, are paid by the Funds and are reflected in their Statements of Operations as follows: foreign taxes withheld at source are presented as a reduction of income, and foreign taxes on capital gains from sales of investments and foreign currency transactions are included in their respective net realized gain (loss) categories. Foreign taxes payable as of May 31, 2016, if any, are disclosed in the Funds’ Statements of Assets and Liabilities.
Foreign Currency Translation The books and records of the Funds are maintained in U.S. dollars. Investment securities and other assets and liabilities denominated in a foreign currency are translated into U.S. dollars at the prevailing exchange rates at period end. Purchases and sales of investment securities, income and expenses are translated into U.S. dollars at the prevailing exchange rates on the respective dates of the transactions.
Net realized and unrealized gains and losses on foreign currency transactions represent net gains and losses between trade and settlement dates on securities transactions, the acquisition and disposition of foreign currencies, and the difference between the amount of net investment income accrued and the U.S. dollar amount actually received. The portion of both realized and unrealized gains and losses on investments that results from fluctuations in foreign currency exchange rates is not separately disclosed, but is included with net realized and unrealized gain/appreciation and loss/depreciation on investments.
Securities Lending The Funds may lend securities to certain financial institutions under the terms of their securities lending agreement. The Funds retain the benefits of owning securities it has loaned and continues to receive interest and dividends generated by the securities and to participate in any changes in their market value. The Funds require the borrowers of the securities to maintain collateral with the Funds consisting of either cash or liquid, unencumbered assets having a value at least equal to the value of the securities loaned. When the collateral falls below specified amounts, the lending agent will use its best effort to obtain additional collateral on the next business day to meet required amounts under the securities lending agreement. As of period end, any securities on loan were collateralized by cash. The Funds may invest the cash collateral into a joint trading
88
DBX ETF Trust
Notes to financial statements (Continued)
account in an affiliated money market fund. During the period ended May 31, 2016, the Funds invested the cash collateral in Daily Assets Fund, an affiliated money market fund managed by Deutsche Investment Management Americas Inc. Deutsche Investment Management Americas Inc. receives a management/administration fee (0.09% annualized effective rate as of May 31, 2016) on the cash collateral invested in Daily Assets Fund. The Funds receive compensation for lending its securities either in the form of fees or by earning interest on invested cash collateral net of borrower rebates and fees paid to a lending agent. Either the Fund or the borrower may terminate the loan at any time and the borrower, after notice, is required to return borrowed securities within a standard time period. There may be risks of delay and costs in recovery of securities or even loss of rights in the collateral should the borrower of the securities fail financially. If the Funds are not able to recover securities lent, the Funds may sell the collateral and purchase a replacement investment in the market, incurring the risk that the value of the replacement security is greater than the value of the collateral. The Funds are also subject to all investment risks associated with the reinvestment of any cash collateral received, including, but not limited to, interest rate, credit and liquidity risk associated with such investments.
As of May 31, 2016, each Fund had securities on loan, which were classified as common stock in the Schedule of Investments. The value of the related collateral exceeded the value of the securities loaned at period end.
Derivatives
Forward Foreign Currency Exchange Contracts Each Fund, except Deutsche X-trackers Japan JPX-Nikkei 400 Equity ETF, may enter into forward foreign currency exchange contracts (“forward currency contracts”) designed to offset a Fund’s exposure to non-U.S. currencies. In addition, the Funds may enter into forward currency contracts to facilitate local securities settlements or to protect against currency exposure in connection with distributions to Shareholders.
A forward currency contract is a commitment to purchase or sell a foreign currency at a future date at a negotiated forward rate. For the period ended May 31, 2016, the Deutsche X-trackers Dow Jones Hedged International Real Estate ETF, Deutsche X-trackers MSCI EAFE Small Cap Hedged Equity ETF, and Deutsche X-trackers S&P Hedged Global Infrastructure ETF invested in forward currency contracts to hedge against changes in the value of the U.S. dollar against specified non-U.S. currencies. Similarly, Deutsche X-trackers Japan JPX-Nikkei 400 Hedged Equity ETF, Deutsche X-trackers MSCI Australia Hedged Equity ETF, Deutsche X-trackers MSCI Italy Hedged Equity ETF, Deutsche X-trackers MSCI Southern Europe Hedged Equity ETF, and Deutsche X-trackers MSCI Spain Hedged Equity ETF each invested in forward currency contracts to hedge against changes in the value of the U.S dollar against the Japanese Yen, the Australian Dollar, the Euro, Euro and Euro, respectively.
The gain or loss arising from the difference between the original contract and the closing of such contract would be included in net realized gain or loss on foreign currency transactions. Risks may arise from the potential inability of a counterparty to meet the terms of a contract and from unanticipated movements in the value of a foreign currency relative to the U.S. dollar. The face or contract amount, in U.S. dollars reflects the total exposure the respective Fund has in that particular currency contract.
A summary of the open forward currency contracts as of May 31, 2016 is included in a table following each Fund’s Schedule of Investments. The investment in forward currency contracts short vs. U.S. dollars had a contract value generally indicative of a range of the total exposure the respective Fund had to the value of non U.S currencies during the period ended May 31, 2016.
89
DBX ETF Trust
Notes to financial statements (Continued)
The following tables summarize the value of the Funds’ derivative instruments held as of May 31, 2016 and the related location in the accompanying Statement of Assets and Liabilities, presented by primary underlying risk exposure:
Asset Derivatives | Liability Derivatives | |||||||||||||
Risk Type | Statement of Asset and | Fair Value | Statement of Asset and | Fair Value | ||||||||||
| Deutsche X-trackers Dow Jones Hedged International Real Estate ETF | ||||||||||||||
| Foreign exchange contracts | Unrealized appreciation on forward foreign currency exchange contracts | $ | 294,820 | Unrealized depreciation on forward foreign currency exchange contracts | $ | 115,493 | ||||||||
|
|
|
| |||||||||||
| Total | $ | 294,820 | Total | $ | 115,493 | |||||||||
|
|
|
| |||||||||||
| Deutsche X-trackers Japan JPX-Nikkei 400 Hedged Equity ETF | ||||||||||||||
| Foreign exchange contracts | Unrealized appreciation on forward foreign currency exchange contracts | $ | 112,101 | Unrealized depreciation on forward foreign currency exchange contracts | $ | 6,485 | ||||||||
|
|
|
| |||||||||||
| Total | $ | 112,101 | Total | $ | 6,485 | |||||||||
|
|
|
| |||||||||||
| Deutsche X-trackers MSCI Australia Hedged Equity ETF | ||||||||||||||
| Foreign exchange contracts | Unrealized appreciation on forward foreign currency exchange contracts | $ | 196,602 | Unrealized depreciation on forward foreign currency exchange contracts | $ | 8,617 | ||||||||
|
|
|
| |||||||||||
| Total | $ | 196,602 | Total | $ | 8,617 | |||||||||
|
|
|
| |||||||||||
| Deutsche X-trackers MSCI EAFE Small Cap Hedged Equity ETF | ||||||||||||||
| Foreign exchange contracts | Unrealized appreciation on forward foreign currency exchange contracts | $ | 75,647 | Unrealized depreciation on forward foreign currency exchange contracts | $ | 7,353 | ||||||||
|
|
|
| |||||||||||
| Total | $ | 75,647 | Total | $ | 7,353 | |||||||||
|
|
|
| |||||||||||
| Deutsche X-trackers MSCI Italy Hedged Equity ETF | ||||||||||||||
| Foreign exchange contracts | Unrealized appreciation on forward foreign currency exchange contracts | $ | 60,393 | Unrealized depreciation on forward foreign currency exchange contracts | $ | 1,132 | ||||||||
|
|
|
| |||||||||||
| Total | $ | 60,393 | Total | $ | 1,132 | |||||||||
|
|
|
| |||||||||||
| Deutsche X-trackers MSCI Southern Europe Hedged Equity ETF | ||||||||||||||
| Foreign exchange contracts | Unrealized appreciation on forward foreign currency exchange contracts | $ | 62,521 | Unrealized depreciation on forward foreign currency exchange contracts | $ | 1,169 | ||||||||
|
|
|
| |||||||||||
| Total | $ | 62,521 | Total | $ | 1,169 | |||||||||
|
|
|
| |||||||||||
| Deutsche X-trackers MSCI Spain Hedged Equity ETF | ||||||||||||||
| Foreign exchange contracts | Unrealized appreciation on forward foreign currency exchange contracts | $ | 64,391 | Unrealized depreciation on forward foreign currency exchange contracts | $ | 1,203 | ||||||||
|
|
|
| |||||||||||
| Total | $ | 64,391 | Total | $ | 1,203 | |||||||||
|
|
|
| |||||||||||
| Deutsche X-trackers S&P Hedged Global Infrastructure ETF | ||||||||||||||
| Foreign exchange contracts | Unrealized appreciation on forward foreign currency exchange contracts | $ | 71,860 | Unrealized depreciation on forward foreign currency exchange contracts | $ | 8,278 | ||||||||
|
|
|
| |||||||||||
| Total | $ | 71,860 | Total | $ | 8,278 | |||||||||
|
|
|
| |||||||||||
90
DBX ETF Trust
Notes to financial statements (Continued)
Additionally, the amount of realized and unrealized gains and losses on derivative instruments recognized in the Funds’ earnings during the period ended May 31, 2016 and the related location in the accompanying Statement of Operations is summarized in the following tables by primary underlying risk exposure:
Net Realized Gain (Loss) on: | ||||
| Foreign Exchange Contracts | ||||
Deutsche X-trackers Dow Jones Hedged International Real Estate ETF | $ | (334,486 | ) | |
Deutsche X-trackers Japan JPX-Nikkei 400 Hedged Equity ETF | (436,939 | ) | ||
Deutsche X-trackers MSCI Australia Hedged Equity ETF | (217,037 | ) | ||
Deutsche X-trackers MSCI EAFE Small Cap Hedged Equity ETF | (108,847 | ) | ||
Deutsche X-trackers MSCI Italy Hedged Equity ETF | (55,717 | ) | ||
Deutsche X-trackers MSCI Southern Europe Hedged Equity ETF | (56,884 | ) | ||
Deutsche X-trackers MSCI Spain Hedged Equity ETF | (58,186 | ) | ||
Deutsche X-trackers S&P Hedged Global Infrastructure ETF | 7,692 | |||
Net Change in Unrealized Appreciation (Depreciation) on: | ||||
| Foreign Exchange Contracts | ||||
Deutsche X-trackers Dow Jones Hedged International Real Estate ETF | $ | 130,702 | ||
Deutsche X-trackers Japan JPX-Nikkei 400 Hedged Equity ETF | 105,616 | |||
Deutsche X-trackers MSCI Australia Hedged Equity ETF | 187,985 | |||
Deutsche X-trackers MSCI EAFE Small Cap Hedged Equity ETF | 68,294 | |||
Deutsche X-trackers MSCI Italy Hedged Equity ETF | 59,261 | |||
Deutsche X-trackers MSCI Southern Europe Hedged Equity ETF | 61,352 | |||
Deutsche X-trackers MSCI Spain Hedged Equity ETF | 63,188 | |||
Deutsche X-trackers S&P Hedged Global Infrastructure ETF | 15,392 | |||
For the period ended May 31, 2016, the average monthly volume of derivatives was as follows:
| Forward Foreign Currency Exchange Contracts (Market Value) | ||||
Deutsche X-trackers Dow Jones Hedged International Real Estate ETF | $ | (4,350,325 | ) | |
Deutsche X-trackers Japan JPX-Nikkei 400 Hedged Equity ETF | (3,201,376 | ) | ||
Deutsche X-trackers MSCI Australia Hedged Equity ETF | (3,455,010 | ) | ||
Deutsche X-trackers MSCI EAFE Small Cap Hedged Equity ETF | (2,366,130 | ) | ||
Deutsche X-trackers MSCI Italy Hedged Equity ETF | (2,152,330 | ) | ||
Deutsche X-trackers MSCI Southern Europe Hedged Equity ETF | (2,016,118 | ) | ||
Deutsche X-trackers MSCI Spain Hedged Equity ETF | (2,160,601 | ) | ||
Deutsche X-trackers S&P Hedged Global Infrastructure ETF | (2,005,418 | ) | ||
91
DBX ETF Trust
Notes to financial statements (Continued)
As of May 31, 2016, the Funds have transactions subject to enforceable master netting agreements which govern the terms of certain transactions, and reduce the counterparty risk associated with such transactions. Master netting agreements allow a Fund to close out and net total exposure to a counterparty in the event of a default with respect to all of the transactions with a counterparty. For financial reporting purposes the Statement of Assets and Liabilities generally shows derivatives assets and liabilities on a gross basis, which reflects the full risks and exposures prior to netting. A reconciliation of the gross amounts on the Statement of Assets and Liabilities to the net amounts by counterparty, including any collateral exposure, is included in the following tables:
| Gross Amounts of Assets Presented in the Statements of Assets and Liabilities | Financial Instruments and Derivatives Available for Offset | Collateral Received | Net Amount of Derivatives Assets | Gross Amounts of Liabilities Presented in the Statements of Assets and Liabilities | Financial Instruments and Derivatives Available for Offset | Collateral Pledged | Net Amount of Derivatives Liabilities | |||||||||||||||||||||||||
Deutsche X-trackers Dow Jones Hedged International Real Estate ETF |
| |||||||||||||||||||||||||||||||
Canadian Imperial Bank of Commerce | $ | 115,576 | $ | (48,502 | ) | $ | — | $ | 67,074 | $ | 48,502 | $ | (48,502 | ) | $ | — | $ | — | ||||||||||||||
State Street Bank & Trust Co. | 162,974 | (53,084 | ) | — | 109,890 | 53,084 | (53,084 | ) | — | — | ||||||||||||||||||||||
The Bank of New York Mellon | 16,143 | (13,898 | ) | — | 2,245 | 13,898 | (13,898 | ) | — | — | ||||||||||||||||||||||
JP Morgan & Chase Co. | 127 | (9 | ) | — | 118 | 9 | (9 | ) | — | — | ||||||||||||||||||||||
|
|
|
|
|
|
|
|
|
|
|
|
|
|
|
| |||||||||||||||||
| $ | 294,820 | $ | (115,493 | ) | $ | — | $ | 179,327 | $ | 115,493 | $ | (115,493 | ) | $ | — | $ | — | |||||||||||||||
|
|
|
|
|
|
|
|
|
|
|
|
|
|
|
| |||||||||||||||||
Deutsche X-trackers Japan JPX-Nikkei 400 Hedged Equity ETF |
| |||||||||||||||||||||||||||||||
Canadian Imperial Bank of Commerce | $ | 64,048 | $ | (3,071 | ) | $ | — | $ | 60,977 | $ | 3,071 | $ | (3,071 | ) | $ | — | $ | — | ||||||||||||||
RBC Capital Markets | 47,823 | (3,395 | ) | — | 44,428 | 3,395 | (3,395 | ) | — | — | ||||||||||||||||||||||
The Bank of New York Mellon | 230 | (19 | ) | — | 211 | 19 | (19 | ) | — | — | ||||||||||||||||||||||
|
|
|
|
|
|
|
|
|
|
|
|
|
|
|
| |||||||||||||||||
| $ | 112,101 | $ | (6,485 | ) | $ | — | $ | 105,616 | $ | 6,485 | $ | (6,485 | ) | $ | — | $ | — | |||||||||||||||
|
|
|
|
|
|
|
|
|
|
|
|
|
|
|
| |||||||||||||||||
Deutsche X-trackers MSCI Australia Hedged Equity ETF |
| |||||||||||||||||||||||||||||||
Canadian Imperial Bank of Commerce | $ | 62,515 | $ | (2,706 | ) | $ | — | $ | 59,809 | $ | 2,706 | $ | (2,706 | ) | $ | — | $ | — | ||||||||||||||
RBC Capital Markets | 133,998 | (5,807 | ) | — | 128,191 | 5,807 | (5,807 | ) | — | — | ||||||||||||||||||||||
The Bank of New York Mellon | 89 | (89 | ) | — | — | 104 | (89 | ) | — | 15 | ||||||||||||||||||||||
|
|
|
|
|
|
|
|
|
|
|
|
|
|
|
| |||||||||||||||||
| $ | 196,602 | $ | (8,602 | ) | $ | — | $ | 188,000 | $ | 8,617 | $ | (8,602 | ) | $ | — | $ | 15 | |||||||||||||||
|
|
|
|
|
|
|
|
|
|
|
|
|
|
|
| |||||||||||||||||
Deutsche X-trackers MSCI EAFE Small Cap Hedged Equity ETF |
| |||||||||||||||||||||||||||||||
Canadian Imperial Bank of Commerce | $ | 38,231 | $ | (3,231 | ) | $ | — | $ | 35,000 | $ | 3,231 | $ | (3,231 | ) | $ | — | $ | — | ||||||||||||||
RBC Capital Markets | 36,571 | (2,630 | ) | — | 33,941 | 2,630 | (2,630 | ) | — | — | ||||||||||||||||||||||
The Bank of New York Mellon | 845 | (845 | ) | — | — | 1,492 | (845 | ) | — | 647 | ||||||||||||||||||||||
|
|
|
|
|
|
|
|
|
|
|
|
|
|
|
| |||||||||||||||||
| $ | 75,647 | $ | (6,706 | ) | $ | — | $ | 68,941 | $ | 7,353 | $ | (6,706 | ) | $ | — | $ | 647 | |||||||||||||||
|
|
|
|
|
|
|
|
|
|
|
|
|
|
|
| |||||||||||||||||
Deutsche X-trackers MSCI Italy Hedged Equity ETF |
| |||||||||||||||||||||||||||||||
RBC Capital Markets | $ | 23,602 | $ | (458 | ) | $ | — | $ | 23,144 | $ | 458 | $ | (458 | ) | $ | — | $ | — | ||||||||||||||
The Bank of New York Mellon | 4 | — | — | 4 | — | — | — | — | ||||||||||||||||||||||||
Canadian Imperial Bank of Commerce | 36,787 | (674 | ) | — | 36,113 | 674 | (674 | ) | — | — | ||||||||||||||||||||||
|
|
|
|
|
|
|
|
|
|
|
|
|
|
|
| |||||||||||||||||
| $ | 60,393 | $ | (1,132 | ) | $ | — | $ | 59,261 | $ | 1,132 | $ | (1,132 | ) | $ | — | $ | — | |||||||||||||||
|
|
|
|
|
|
|
|
|
|
|
|
|
|
|
| |||||||||||||||||
Deutsche X-trackers MSCI Southern Europe Hedged Equity ETF |
| |||||||||||||||||||||||||||||||
Canadian Imperial Bank of Commerce | $ | 36,656 | $ | (671 | ) | $ | — | $ | 35,985 | $ | 671 | $ | (671 | ) | $ | — | $ | — | ||||||||||||||
RBC Capital Markets | 25,816 | (497 | ) | — | 25,319 | 497 | (497 | ) | — | — | ||||||||||||||||||||||
The Bank of New York Mellon | 49 | (1 | ) | — | 48 | 1 | (1 | ) | — | — | ||||||||||||||||||||||
|
|
|
|
|
|
|
|
|
|
|
|
|
|
|
| |||||||||||||||||
| $ | 62,521 | $ | (1,169 | ) | $ | — | $ | 61,352 | $ | 1,169 | $ | (1,169 | ) | $ | — | $ | — | |||||||||||||||
|
|
|
|
|
|
|
|
|
|
|
|
|
|
|
| |||||||||||||||||
92
DBX ETF Trust
Notes to financial statements (Continued)
| Gross Amounts of Assets Presented in the Statements of Assets and Liabilities | Financial Instruments and Derivatives Available for Offset | Collateral Received | Net Amount of Derivatives Assets | Gross Amounts of Liabilities Presented in the Statements of Assets and Liabilities | Financial Instruments and Derivatives Available for Offset | Collateral Pledged | Net Amount of Derivatives Liabilities | |||||||||||||||||||||||||
Deutsche X-trackers MSCI Spain Hedged Equity ETF |
| |||||||||||||||||||||||||||||||
Canadian Imperial Bank of Commerce | $ | 36,590 | $ | (670 | ) | $ | — | $ | 35,920 | $ | 670 | $ | (670 | ) | $ | — | $ | — | ||||||||||||||
RBC Capital Markets | 27,766 | (532 | ) | — | 27,234 | 532 | (532 | ) | — | — | ||||||||||||||||||||||
The Bank of New York Mellon | 35 | (1 | ) | — | 34 | 1 | (1 | ) | — | — | ||||||||||||||||||||||
|
|
|
|
|
|
|
|
|
|
|
|
|
|
|
| |||||||||||||||||
| $ | 64,391 | $ | (1,203 | ) | $ | — | $ | 63,188 | $ | 1,203 | $ | (1,203 | ) | $ | — | $ | — | |||||||||||||||
|
|
|
|
|
|
|
|
|
|
|
|
|
|
|
| |||||||||||||||||
Deutsche X-trackers S&P Hedged Global Infrastructure ETF |
| |||||||||||||||||||||||||||||||
Bank of Montreal | $ | 25,524 | $ | (4,743 | ) | $ | — | $ | 20,781 | $ | 4,743 | $ | (4,743 | ) | $ | — | $ | — | ||||||||||||||
JP Morgan & Chase Co. | 22,559 | (1,430 | ) | — | 21,129 | 1,430 | (1,430 | ) | — | — | ||||||||||||||||||||||
RBC Capital Markets | 20,305 | (1,293 | ) | — | 19,012 | 1,293 | (1,293 | ) | — | — | ||||||||||||||||||||||
The Bank of New York Mellon | 3,472 | (812 | ) | — | 2,660 | 812 | (812 | ) | — | — | ||||||||||||||||||||||
|
|
|
|
|
|
|
|
|
|
|
|
|
|
|
| |||||||||||||||||
| $ | 71,860 | $ | (8,278 | ) | $ | — | $ | 63,582 | $ | 8,278 | $ | (8,278 | ) | $ | — | $ | — | |||||||||||||||
|
|
|
|
|
|
|
|
|
|
|
|
|
|
|
| |||||||||||||||||
3. Investment Advisory and Other Agreements
The Advisor has overall responsibility for the general management and administration of the Funds, subject to the supervision of the Funds’ Board of Trustees. Under an investment advisory agreement between the Trust, on behalf of the Funds, and the Advisor (the “Investment Advisory Agreement”), the Advisor is responsible for arranging sub-advisory, transfer agency, custody, fund administration, and all other non-distribution related services for the Funds to operate.
TDAM USA Inc. (“TDAM”) serves as investment sub-advisor to each Fund. TDAM is responsible for day-to-day management of the Funds, subject to the replication strategy for each Fund with regard to its underlying index and for general administration, compliance and management services as may be agreed between the Advisor and sub-advisor from time to time.
For its investment advisory services to the Funds below, the Advisor is entitled to receive a unitary management fee from each Fund based on each Fund’s daily average net assets at an annual rate equal to:
Fund | Unitary Management Fee | |||
Deutsche X-trackers Dow Jones Hedged International Real Estate ETF | 0.48 | % | ||
Deutsche X-trackers JPX-Nikkei 400 Equity ETF | 0.40 | % | ||
Deutsche X-trackers Japan JPX-Nikkei 400 Hedged Equity ETF | 0.45 | % | ||
Deutsche X-trackers MSCI Australia Hedged Equity ETF | 0.45 | % | ||
Deutsche X-trackers MSCI EAFE Small Cap Hedged Equity ETF | 0.45 | % | ||
Deutsche X-trackers MSCI Italy Hedged Equity ETF | 0.45 | % | ||
Deutsche X-trackers MSCI Southern Europe Hedged Equity ETF | 0.45 | % | ||
Deutsche X-trackers MSCI Spain Hedged Equity ETF | 0.45 | % | ||
Deutsche X-trackers S&P Hedged Global Infrastructure ETF | 0.45 | % | ||
Out of the unitary management fee, the Advisor pays substantially all expenses of each Fund, including the payments to the sub-advisors, the cost of transfer agency, custody, fund administration, legal, audit and other services and expenses of the Independent Trustees. Each Fund is responsible for the payment of, interest expense, taxes, brokerage expenses, and extraordinary expenses.
The Bank of New York Mellon, a wholly-owned subsidiary of The Bank of New York Mellon Corporation, serves as Administrator, Custodian, Accounting Agent, Lending Agent and Transfer Agent for each Fund.
93
DBX ETF Trust
Notes to financial statements (Continued)
ALPS Distributors, Inc. (the “Distributor”) serves as the distributor of Creation Units for each Fund on an agency basis. The Distributor does not maintain a secondary market in shares of the Funds.
The Board of Trustees is currently comprised of four Trustees, including three Independent Trustees. The Advisor paid retainer fees and attendance fees to each Independent Trustee and attendance fees to each member of the Audit Committee (which is comprised of all of the Funds’ Independent Trustees).
4. Investment Portfolio Transactions
For the period ended May 31, 2016, the cost of investments purchased and proceeds from sale of investments (excluding in-kind transactions and short-term investments) was as follows:
| Purchases | Sales | |||||||
Deutsche X-trackers Dow Jones Hedged International Real Estate ETF | $ | 3,274,900 | $ | 1,207,637 | ||||
Deutsche X-trackers Japan JPX-Nikkei 400 Equity ETF (1) | 3,403,732 | 803,696 | ||||||
Deutsche X-trackers Japan JPX-Nikkei 400 Hedged Equity ETF (2) | 2,960,364 | 799,958 | ||||||
Deutsche X-trackers MSCI Australia Hedged Equity ETF (2) | 3,247,968 | 741,673 | ||||||
Deutsche X-trackers MSCI EAFE Small Cap Hedged Equity ETF (2) | 2,977,707 | 543,457 | ||||||
Deutsche X-trackers MSCI Italy Hedged Equity ETF (2) | 3,167,695 | 633,610 | ||||||
Deutsche X-trackers MSCI Southern Europe Hedged Equity ETF (2) | 2,957,385 | 429,570 | ||||||
Deutsche X-trackers MSCI Spain Hedged Equity ETF (2) | 3,026,737 | 509,039 | ||||||
Deutsche X-trackers S&P Hedged Global Infrastructure ETF | 777,428 | 733,563 | ||||||
For the period ended May 31, 2016, the cost of in-kind purchases and proceeds from in-kind sales was as follows:
| Purchases | Sales | |||||||
Deutsche X-trackers Dow Jones Hedged International Real Estate ETF | $ | 5,477,648 | $ | 6,763,372 | ||||
Deutsche X-trackers Japan JPX-Nikkei 400 Equity ETF (1) | 19,001,114 | 3,328,116 | ||||||
Deutsche X-trackers Japan JPX-Nikkei 400 Hedged Equity ETF (2) | 1,071,179 | — | ||||||
Deutsche X-trackers MSCI Australia Hedged Equity ETF (2) | 1,180,006 | — | ||||||
| (1) | For the period from June 24, 2015 (commencement of operations) to May 31, 2016. |
| (2) | For the period from August 19, 2015 (commencement of operations) to May 31, 2016. |
5. Fund Share Transactions
As of May 31, 2016, there were unlimited Fund shares authorized by the Trust. Fund shares are issued and redeemed by each Fund only in Creation Units or multiples thereof. Except when aggregated in Creation Units, shares of each Fund are not redeemable. Transactions in capital shares for each Fund are disclosed in detail in the Statements of Changes in Net Assets. The consideration for the purchase of Creation Units of a Fund generally consists of the in-kind contribution of a designated portfolio of securities constituting a portfolio sampling representation of the securities included in the respective Fund’s underlying index and an amount of cash, which under certain circumstances may include cash in lieu of portfolio securities. Investors purchasing and redeeming Creation Units pay a purchase transaction fee and a redemption transaction fee to offset transfer and other transaction costs associated with the issuance and redemption of Creation Units.
At May 31, 2016, the Deutsche X-trackers Japan JPX-Nikkei 400 Equity ETF held cash of $2,623,146 as collateral for unsettled in-kind redemptions. The in-kind redemptions settled on June 1, 2016.
6. Concentration of Ownership
From time to time, the Funds may have a concentration of several shareholder accounts holding a significant percentage of shares outstanding. Investment activities of these shareholders could have a material impact on the
94
DBX ETF Trust
Notes to financial statements (Continued)
Fund. At May 31, 2016, there was one affiliated shareholder account for each fund listed below holding a significant percentage of the shares outstanding:
Fund Name | Approximate Percent of Outstanding Shares Held | |||
Deutsche X-trackers Dow Jones Hedged International Real Estate ETF | 67 | % | ||
Deutsche X-trackers Japan JPX-Nikkei 400 Hedged Equity ETF | 67 | % | ||
Deutsche X-trackers MSCI Australia Hedged Equity ETF | 67 | % | ||
Deutsche X-trackers MSCI EAFE Small Cap Hedged Equity ETF | 85 | % | ||
Deutsche X-trackers MSCI Italy Hedged Equity ETF | 95 | % | ||
Deutsche X-trackers MSCI Southern Europe Hedged Equity ETF | 95 | % | ||
Deutsche X-trackers MSCI Spain Hedged Equity ETF | 95 | % | ||
Deutsche X-trackers S&P Hedged Global Infrastructure ETF | 47 | % | ||
95
DBX ETF Trust
Report of independent registered public accounting firm
To Board of Trustees and Shareholders of
DBX ETF Trust:
We have audited the accompanying statements of assets and liabilities of Deutsche X-trackers Dow Jones Hedged International Real Estate ETF, Deutsche X-trackers Japan JPX-Nikkei 400 Equity ETF, Deutsche X-trackers Japan JPX-Nikkei 400 Hedged Equity ETF, Deutsche X-trackers MSCI Australia Hedged Equity ETF, Deutsche X-trackers MSCI EAFE Small Cap Hedged Equity ETF, Deutsche X-trackers MSCI Italy Hedged Equity ETF, Deutsche X-trackers MSCI Southern Europe Hedged Equity ETF, Deutsche X-trackers MSCI Spain Hedged Equity ETF and Deutsche X-trackers S&P Hedged Global Infrastructure ETF (the “Funds” within DBX ETF Trust), including the schedules of investments, as of May 31, 2016, and the related statements of operations and changes in net assets and the financial highlights for each of the periods indicated therein. These financial statements and financial highlights are the responsibility of the Funds’ management. Our responsibility is to express an opinion on these financial statements and financial highlights based on our audits.
We conducted our audits in accordance with the standards of the Public Company Accounting Oversight Board (United States). Those standards require that we plan and perform the audit to obtain reasonable assurance about whether the financial statements and financial highlights are free of material misstatement. We were not engaged to perform an audit of the Funds’ internal control over financial reporting. Our audits included consideration of internal control over financial reporting as a basis for designing audit procedures that are appropriate in the circumstances, but not for the purpose of expressing an opinion on the effectiveness of the Funds’ internal control over financial reporting. Accordingly, we express no such opinion. An audit also includes examining, on a test basis, evidence supporting the amounts and disclosures in the financial statements and financial highlights, assessing the accounting principles used and significant estimates made by management, and evaluating the overall financial statement presentation. Our procedures included confirmation of securities owned as of May 31, 2016 by correspondence with the custodian and brokers or by other appropriate auditing procedures where replies from brokers were not received. We believe that our audits provide a reasonable basis for our opinion.
In our opinion, the financial statements and financial highlights referred to above present fairly, in all material respects, the financial position of Deutsche X-trackers Dow Jones Hedged International Real Estate ETF, Deutsche X-trackers Japan JPX-Nikkei 400 Equity ETF, Deutsche X-trackers Japan JPX-Nikkei 400 Hedged Equity ETF, Deutsche X-trackers MSCI Australia Hedged Equity ETF, Deutsche X-trackers MSCI EAFE Small Cap Hedged Equity ETF, Deutsche X-trackers MSCI Italy Hedged Equity ETF, Deutsche X-trackers MSCI Southern Europe Hedged Equity ETF, Deutsche X-trackers MSCI Spain Hedged Equity ETF and Deutsche X-trackers S&P Hedged Global Infrastructure ETF at May 31, 2016, the results of their operations and changes in their net assets and the financial highlights for each of the periods indicated therein in conformity with U.S. generally accepted accounting principles.

New York, New York
July 26, 2016
96
DBX ETF Trust
Trustees and officers (Unaudited)
| Name, Year of Birth and Address | Position(s) Held with Fund | Terms of Office Time Served | Principal Occupation(s) During Past 5 Years | Number of Portfolios in Fund Complex Overseen by Trustee | Other Directorships held by Trustee During Past 5 Years | |||||
Independent Trustees | ||||||||||
J. David Officer (1948) 345 Park Avenue New York, New York 10154 | Trustee, Chairman of the Nominating Committee and Member of the Audit Committee | Since 2011 (Chairman | Independent Director (2010-present); formerly, Vice Chairman, the Dreyfus Corporation (2006-2009); President, The Dreyfus Family of Funds, Inc. (2006-2009). | 36 | Ilex Partners (Asia), LLC; Old Westbury Funds; MAN Long/Short Fund; GLG Investment Series Trust. | |||||
Stephen R. Byers (1953) 345 Park Avenue New York, New York 10154 | Lead Independent Trustee, Member of the Audit and Nominating Committees | Since 2011 (Trustee and Member of Committees) (Lead | Independent Consultant (2014-present). | 36 | The Arbitrage Funds; Sierra Income Corporation; College of William and Mary, Graduate School of Business; Lighthouse Growth Advisors LLC; Founders Asset Management, LLC. | |||||
George O. Elston (1964) 345 Park Avenue New York, New York 10154 | Trustee, Chairman of the Audit Committee and Member of the Nominating Committee | Since 2011 (Chairman | Senior Vice President and Chief Financial Officer, Juniper Pharmaceuticals, Inc. (2014-present); Senior Vice President and Chief Financial Officer, KBI BioPharma Inc. (2013-2014); Managing Partner, Chatham Street Partners (2010-2013). | 36 | Celldex Therapeutics, Inc. | |||||
97
DBX ETF Trust
Trustees and officers (Unaudited) (Continued)
| Name, Year of Birth and Address | Position(s) Held with Fund | Terms of Office Time Served | Principal Occupation(s) During Past 5 Years | Number of Portfolios in Fund Complex Overseen by Trustee | Other Directorships held by Trustee During Past 5 Years | |||||
Interested Trustee | ||||||||||
Alex Depetris (1980) 345 Park Avenue New York, New York 10154 | Trustee, Chairman of the Board, President and Chief Executive Officer | Since 2010 | Director in the Deutsche Asset Management Passive Asset Management Group at Deutsche Bank AG (2008-present); Manager and Chief Operating Officer of the Adviser (2012-present); Associate, Arnold & Porter (2006-2008). | 36 | Director, Chairman of the Board of db-X Exchange Traded Funds Inc. | |||||
| Name, Year of Birth and Address | Position(s) Held with Fund | Terms of Office Time Served | Principal Occupation(s) | |||||||
Officers | ||||||||||
Michael Gilligan (1966) 60 Wall Street New York, New York 10005 | Treasurer, Chief Financial Officer and Controller | Since 2010 | Director in the Finance Division at Deutsche Bank AG (2008-present); Manager and Chief Financial Officer of the Adviser (2010-present); Chief Financial Officer of Global Passive Asset Management Platform (2012-present). | |||||||
Fiona Bassett (1974) 345 Park Avenue New York, New York 10154 | Chief Operating Officer | Since 2014 | Managing Director in the Deutsche Asset Management Passive Asset Management Group at Deutsche Bank AG and Head of Passive Americas Asset Management Platform (2014-present); Manager and Chief Executive Officer and Chief Investment Officer of the Adviser (2014-present); Managing Director, COO Global Key Projects and Integration at Deutsche Asset Management, (2012-2014); Managing Director at Deutsche Bank AG (2004-2012). | |||||||
Frank Gecsedi (1967) 60 Wall Street New York, New York 10005 | Chief Compliance Officer | Since 2010 | Director in the Deutsche Asset Management Compliance Department (2016-present), Vice President in the Deutsche Asset Management Compliance Department (2013-2016) and Chief Compliance Officer of the Adviser (2010-present); Vice President in Deutsche Bank’s Global Markets Legal, Risk and Capital Division (2010-2012). | |||||||
Leslie Lowenbraun (1953) 60 Wall Street New York, New York 10005 | Secretary | Since 2016 | Vice President in U.S. Retail Passive Legal of Deutsche Asset Management (2014-present); Counsel at Skadden, Arps, Slate, Meagher & Flom LLP (2005-2014). | |||||||
Each Trustee serves until his or her successor is duly elected or appointed and qualified. Each officer serves until he or she resigns, is removed, dies, retires or becomes disqualified.
The Funds’ SAI includes additional information about the Funds’ Trustees and is available by calling 855-329-3837, or on the Company’s website at www.dbxus.com.
98
DBX ETF Trust
Board considerations in approval of investment advisory and sub-advisory contracts (Unaudited)
Deutsche X-trackers Dow Jones Hedged International Real Estate ETF, Deutsche X-trackers S&P Hedged Global Infrastructure ETF, Deutsche X-trackers MSCI Australia Hedged Equity ETF, Deutsche X-trackers MSCI EAFE Small Cap Hedged Equity ETF, Deutsche X-trackers MSCI Italy Hedged Equity ETF, Deutsche X-trackers MSCI Southern Europe Hedged Equity ETF, Deutsche X-trackers MSCI Spain Hedged Equity ETF, Deutsche X-trackers MSCI Japan JPX-Nikkei 400 Hedged Equity ETF and Deutsche X-trackers MSCI Japan JPX-Nikkei 400 Equity ETF
After discussions at meetings of the Board of Trustees (“Board” or “Trustees”) held on February 25, 2016 and February 28, 2016, at the February 28 meeting the Trustees, including the Independent Trustees (those not affiliated with DBX ETF Trust (the “Trust”) or its service providers), unanimously approved the continuance of the Investment Advisory Agreement and the Sub-Advisory Agreement with respect to Deutsche X-trackers MSCI EAFE Small Cap Hedged Equity ETF, Deutsche X-trackers MSCI Australia Hedged Equity ETF, Deutsche X-trackers MSCI Southern Europe Hedged Equity ETF, Deutsche X-trackers MSCI Spain Hedged Equity ETF, Deutsche X-trackers MSCI Italy Hedged Equity ETF, Deutsche X-trackers Japan JPX-Nikkei 400 Hedged Equity ETF, Deutsche X-trackers S&P Hedged Global Infrastructure ETF, Deutsche X-trackers Dow Jones Hedged International Real Estate ETF and Deutsche X-trackers Japan JPX-Nikkei 400 Equity ETF (the “Funds”). The Independent Trustees were advised throughout the review and meetings by Independent Trustee Counsel.
In reaching this decision with respect to the Investment Advisory Agreement, the Board considered all factors it believed relevant, including (1) the nature, extent and quality of the services provided to the Funds and their shareholders; (2) the financial resources of DBX Advisors LLC (“DBX” or the “Adviser”) and its resulting ability to perform its obligations under the Investment Advisory Agreement; (3) the competitiveness of the advisory fee; (4) the total cost of the services provided by and the profits realized by the Adviser from its relationship with the Funds; and (5) the extent to which economies of scale have been realized, and if the Funds’ shareholders have benefitted from those economies.
In reaching this decision with respect to the Sub-Advisory Agreement, the Board considered all factors it believed relevant, including (1) the nature, extent and quality of the services provided to the Funds and their shareholders; (2) the performance of TDAM USA Inc. (“TDAM” or “Sub-Adviser”) with respect to its management of the Funds, as well as TDAM’s financial resources and its resulting ability to perform its obligations under the Sub-Advisory Agreement; (3) the total cost of the services provided by and the profits realized by TDAM from its relationship with the Funds; and (4) the extent to which economies of scale have been realized, and if the Funds’ shareholders have benefitted from those economies.
The Board reached a determination, with the assistance of Trust Counsel and through the exercise of its business judgment, that approval of the Investment Advisory Agreement and the Sub-Advisory Agreement and the compensation to be received thereunder is in the best interests of each Fund and its shareholders as well as consistent with the Board’s duties under state and federal law. The Board reached this conclusion based on multiple factors.
The Board considered the following in determining whether to approve the Investment Advisory Agreement:
Nature, Extent and Quality of Services. The Board reviewed in detail the nature, extent and quality of services provided by the Adviser under the Investment Advisory Agreement. The Board noted that these services include, among other things, furnishing a continuous investment program for the Funds, including arranging for, or implementing, the purchase and sale of portfolio securities, the provision of general corporate services such as portfolio management compliance services and the preparation and filing of certain reports on behalf of the Trust. The Board also considered, among other things, the professional experience and qualifications of the senior management and key professional personnel of the Adviser, including those individuals responsible for portfolio management. The Board considered that the Adviser provides, at its own expense, office facilities and equipment for use by the Funds and supervisory persons responsible for supervising and monitoring the Trust’s service providers. The Board also considered that the Adviser pays for the compensation of officers of the Trust who are also officers or employees of the Adviser, except as may otherwise be determined by the Board. The Board also considered that the Adviser arranges for the provision of transfer agency, custody, fund administration and accounting, and other non-distribution services necessary for the Funds’ operation. The Board also considered the role played by the Adviser in working with TDAM to manage the Funds’ portfolios, noting that the Adviser
99
DBX ETF Trust
Board considerations in approval of investment advisory and sub-advisory contracts (Unaudited) (Continued)
provides oversight of day-to-day operations, including monitoring tracking error, providing services in connection with the creation and redemption of creation units and assistance in meeting legal and regulatory requirements applicable to the Funds.
Based on its review, the Board concluded that the nature, extent, and quality of services provided by the Adviser under the Investment Advisory Agreement are reasonable and appropriate in relation to the fees paid to the Adviser, taking special consideration of the fact that the advisory fee is a unitary fee and, as a result, a portion of the unitary advisory fee will be used to compensate the Funds’ service providers. The Board considered the staffing of the Adviser, including the training, qualifications and experience of investment personnel in managing the Funds. The Board also considered the expertise of the Adviser in supervising third party service providers to the Funds, such as the administrator and custodian. The Board further considered the compliance program of the Adviser which supports the Funds’ compliance program.
Adviser’s Financial Resources. In connection with the assessment of the ability of the Adviser to perform its duties under the Investment Advisory Agreement, the Board considered the Adviser’s financial condition and whether it had the resources necessary to carry out its functions. The Board concluded that the Adviser had the financial resources necessary to perform its obligations under the Investment Advisory Agreement.
Reasonableness of Advisory Fee. The Board compared each Fund’s advisory fee to that of other exchange-traded funds (“ETFs”), and noted that each Fund’s fee is competitive with the fees of its respective peer group. The Board noted that the fee for the Funds is a unitary fee pursuant to which the Adviser pays all of the Funds’ costs. The Board also noted that the Funds’ portfolios are managed on a day-to-day basis by the Sub-Adviser, which receives a fee from the Adviser. The Board considered the allocation of responsibilities between the Adviser and Sub-Adviser and noted that the Adviser provides oversight of day-to-day operations, including monitoring tracking error, providing services in connection with creation and redemption units and assistance in meeting legal and regulatory requirements applicable to the Funds. Based on its review, the Board concluded that the advisory fee is reasonable in light of the services provided.
Costs of Services and Profitability. The Board considered the expenses of the Adviser in developing and rendering services to the Funds, and the information provided by the Adviser to the Board regarding the Funds’ profitability. The Board noted that the Adviser had provided extensive information about the Adviser’s profitability and the Adviser’s methodology in determining profitability. The Board also noted that while the Adviser had provided information about the Adviser’s expenses relating to marketing the Funds, the Board considered the Adviser’s profitability without accounting for such expenses. The Board determined that the Adviser’s profitability with respect to each Fund was not excessive. The Board also noted that since the fee paid by the Adviser to the Sub-Adviser under the Sub-Advisory Agreement contained breakpoints, the Adviser could experience increased profitability as the Funds’ assets increased. The Board considered whether the Adviser would benefit in other ways from its relationships with the Funds, and concluded that there were no material fall-out benefits likely to accrue to the Adviser related to the operation of the Funds.
Economies of Scale. The Board noted that the Funds were not experiencing economies of scale at this time and determined to evaluate economies of scale on an ongoing basis as a result of asset growth of the Funds.
Given all the information available to it and considering all material factors, the Board concluded that the Investment Advisory Agreement was fair and reasonable and it was unanimously approved.
The Board considered the following in determining whether to approve the Sub-Advisory Agreement:
Nature, Extent and Quality of Services. In considering the nature, extent and quality of services that TDAM provides to the Funds, the Board reviewed in detail the nature, extent and quality of services provided by TDAM under the Sub-Advisory Agreement. The Board noted that these services include, among other things, furnishing a continuous investment program for the Funds, including arranging for, or implementing, the purchase and sale of portfolio securities.
The Board also considered TDAM’s operational capabilities and resources. The Board considered the professional experience and qualifications of TDAM’s senior management and key professional personnel, as well
100
DBX ETF Trust
Board considerations in approval of investment advisory and sub-advisory contracts (Unaudited) (Continued)
as TDAM’s depth and breadth of experience in managing investment portfolios consisting of U.S. and non-U.S. equity securities. The Board gave special consideration to TDAM’s experience and capabilities in implementing currency hedging strategies, and their techniques for implementing such strategies while minimizing index tracking error. In addition, the Board considered TDAM’s operational capabilities and resources, and TDAM’s experience in managing index funds covering various asset classes.
Based on its review, the Board concluded that the nature, extent, and quality of services provided by TDAM under the Sub-Advisory Agreement are reasonable and appropriate in relation to the fees paid to TDAM, taking special consideration of the fact that the fees paid to TDAM are payable by the Adviser and not the Funds.
Performance of TDAM; TDAM’s Financial Resources. The Board considered TDAM’s performance in managing the Funds and its ability to minimize tracking error. The Board concluded that, given TDAM’s capabilities and experience in managing the Funds, TDAM had generally been able to keep the Funds’ tracking error within acceptable ranges.
The Board also considered TDAM’s financial condition and whether it had the resources necessary to carry out its functions. The Board concluded that TDAM had the financial resources necessary to perform its obligations under the Sub-Advisory Agreement.
Reasonableness of Sub-Advisory Fee. The Board noted that the fee paid to TDAM in respect of the Funds would be paid by the Adviser and not the Funds. The Board further noted that the fee for the Funds was a unitary fee pursuant to which the Adviser would pay all of the Funds’ costs, and thus was not directly affected by the amount of the sub-advisory fee paid to TDAM. Based on its review, the Board concluded that the sub-advisory fee was reasonable in light of the services provided.
Costs of Services and Profitability. The Board noted that the fees paid by the Adviser to TDAM under the Sub-Advisory Agreement contain breakpoints. The Board further noted that specific information about TDAM’s profitability with respect to its services provided to the Funds was not available because TDAM does not calculate the profitability of its sub-advisory services on a per-Fund level. The Board also noted that the overall fees paid by each Fund remained reasonable.
The Board also considered whether TDAM would benefit in other ways from its relationship with the Funds. The Board discussed TDAM’s practices regarding the selection and compensation of brokers and dealers that execute portfolio transactions for the Funds and the brokers’ and dealers’ provision of brokerage services to TDAM. The Board discussed the potential benefits TDAM might derive from the Funds’ soft dollar arrangements, whereby brokers provide brokerage services to the Funds or TDAM in return for allocating fund brokerage.
Economies of Scale. The Board noted that the Funds were not experiencing economies of scale at this time and determined to evaluate economies of scale on an ongoing basis as a result of asset growth of the Funds.
Given all the information available to it and considering all material factors, the Board concluded that the Sub-Advisory Agreement was fair and reasonable and it was unanimously approved.
101
DBX ETF Trust
Additional information (Unaudited)
Proxy Voting Policies and Procedures
The Funds’ policies and procedures for voting proxies for portfolio securities and information about how each Fund voted proxies related to its portfolio securities during the 12-month period ended May 31 are available on our Web site — www.deutsche-etfs.com (click on “proxy voting” at the bottom of the page) — or on the SEC’s Web site — www.sec.gov. To obtain a written copy of the Funds’ policies and procedures without charge, upon request, call us toll free at (855) 329-3837.
Quarterly Portfolio Disclosure
The Funds are required to file their complete schedule of portfolio holdings with the SEC for their first and third fiscal quarters on Form N-Q. Copies of the filings are available without charge, upon request on the SEC’s website at www.sec.gov and are available by calling the Company at 855-329-3837. You can also obtain copies of Form N-Q by (i) visiting the SEC’s Public Reference Room in Washington, DC (information on the operation of the Public Reference Room may be obtained by calling 800-SEC-0330); (ii) sending your request and a duplicating fee to the SEC’s Public Reference Room, Washington, DC 20549-0102; or (iii) sending your request electronically to publicinfo@sec.gov.
Information about each Fund’s portfolio holdings is available daily at www.deutsche-etfs.com.
Discount & Premium Information
Information regarding how often shares of each Fund traded on NYSE Arca at a price above (i.e., at a premium) or below (i.e., at a discount) the Net Asset Value of the Fund can be found at www.deutsche-etfs.com.
Tax Information
Form 1099-DIV and other year-end tax information provide shareholders with actual calendar year amounts that should be included in their tax returns. Shareholders should consult their tax advisors.
Each Fund designates the following amounts or, if subsequently determined to be different, the maximum amount allowable for its fiscal year ended May 31, 2016.
| Qualified Dividend Income* | Dividends Received Deduction* | |||||||
Deutsche X-trackers Dow Jones Hedged International Real Estate ETF | 62% | —% | ||||||
Deutsche X-trackers Japan JPX-Nikkei 400 Equity ETF | 100% | —% | ||||||
Deutsche X-trackers Japan JPX-Nikkei 400 Hedged Equity ETF | 100% | —% | ||||||
Deutsche X-trackers MSCI Australia Hedged Equity ETF | 100% | —% | ||||||
Deutsche X-trackers MSCI EAFE Small Cap Hedged Equity ETF | 71% | —% | ||||||
Deutsche X-trackers MSCI Italy Hedged Equity ETF | 71% | —% | ||||||
Deutsche X-trackers MSCI Southern Europe Hedged Equity ETF | 75% | —% | ||||||
Deutsche X-trackers MSCI Spain Hedged Equity ETF | 71% | —% | ||||||
Deutsche X-trackers S&P Hedged Global Infrastructure ETF | 100% | 33% | ||||||
* The above percentage is based on ordinary income dividends paid to shareholders during the Fund’s fiscal year.
Each Fund intends to elect to pass through to shareholders the credit for taxes paid to foreign countries. The gross foreign source income and foreign taxes paid are as follows:
| Gross Foreign Income | Foreign Taxes Paid | |||||||
Deutsche X-trackers Dow Jones Hedged International Real Estate ETF | $ | 167,852 | $ | 14,027 | ||||
Deutsche X-trackers Japan JPX-Nikkei 400 Equity ETF | 204,472 | 25,226 | ||||||
Deutsche X-trackers Japan JPX-Nikkei 400 Hedged Equity ETF | 63,241 | 8,190 | ||||||
Deutsche X-trackers MSCI Australia Hedged Equity ETF | 151,823 | 1,526 | ||||||
Deutsche X-trackers MSCI EAFE Small Cap Hedged Equity ETF | 52,409 | 4,985 | ||||||
Deutsche X-trackers MSCI Italy Hedged Equity ETF | 60,407 | 5,732 | ||||||
Deutsche X-trackers MSCI Southern Europe Hedged Equity ETF | 67,754 | 5,917 | ||||||
Deutsche X-trackers MSCI Spain Hedged Equity ETF | 66,366 | 5,527 | ||||||
Deutsche X-trackers S&P Hedged Global Infrastructure ETF | 80,233 | 8,446 | ||||||
102
DBX ETF Trust
Privacy policy notice (Unaudited)
DBX Advisors LLC (“Advisors”) collects non-public information about you from the following sources: (i) information received from you on applications or other forms; and (ii) information about your transactions with the Advisors, Advisors’ affiliates and third-party service providers and vendors. Advisors does not disclose any non-public personal information about you to anyone, other than as set forth below, as permitted by applicable law and regulation. Advisors may disclose non-public personal information about you to the funds in which you invest, to Advisors’ affiliates, and to non-affiliated companies that work with Advisors to service your account(s), or to provide services or process transactions that you have requested. Advisors may disclose non-public personal information in situations that may include, but are not limited to, in response to legal and/or regulatory inquiries and the proposed or actual sale, assignment merger or other transfer of all or a portion of Advisors’ business to another business entity. Advisors may also disclose non-public personal information about you to parties representing you, such as your investment representative, your accountant, your tax adviser, or to other third parties at your direction/consent. Advisors will not sell, rent, license or trade your personal and financial information to or with third parties for their own direct marketing use unless you give us general or specific consent to do so. If you decide to close your account(s) or become an inactive customer, Advisors will adhere to the privacy policies and practices as described in this notice. Advisors restricts access to your personal and account information to those employees who need to know that information to provide products and services to you. Advisors maintains reasonable and customary physical, electronic and procedural safeguards to guard your non-public personal information.
Advisors reserves the right, at their discretion, to change, modify, add, or remove portions of this Privacy Policy Notice, and any of the policies described herein, at any time. Advisors will indicate any such changes to the Privacy Policy Notice at the privacy link which can be found at www.deutsche-etfs.com. At all times, you are bound by the then-current version of the Privacy Policy and all applicable laws. Advisors highly recommends that you review this Privacy Policy Notice from time to time to ensure that you are familiar with the most recent version. The examples contained in this Privacy Policy Notice are illustrations; they are not intended to be exclusive.
��
103
DBX ETF Trust
This report is intended for the shareholders of DBX ETF Trust.
Carefully consider a Fund’s investment objectives, risk factors and charges and expenses before investing. This and other information can be found in the Fund’s prospectus, which may be obtained by calling 1-855-DBX-ETFS (1-855-329-3837), or by viewing or downloading a prospectus at www.deutsche-etfs.com. Read the prospectus carefully before investing.
Investing involves risk, including possible loss of principal. Stocks may decline in value. Funds investing in a single industry, country or in a limited geographic region generally are more volatile than more diversified funds. Any fund that concentrates in a segment of the market will generally be more volatile than a fund that invests more broadly. Investing in foreign securities, particularly those of emerging markets, presents certain risks, such as currency fluctuations, political and economic changes, and market risks. The European financial markets have recently experienced volatility and adverse trends in recent years due to concerns about economic downturns or rising government debt levels in several European countries, including Greece, Ireland, Italy, Portugal and Spain. A default or debt restructuring by any European country would adversely impact holders of that country’s debt, and sellers of credit default swaps linked to that country’s creditworthiness (which may be located in countries other than those listed in the previous sentence). These events have adversely affected the exchange rate of the euro, the common currency of certain EU countries, and may continue to significantly affect every country in Europe, including countries that do not use the euro. Italy, Portugal and Spain currently have high levels of debt and public spending, which may stifle economic growth, contribute to prolonged periods of recession or lower sovereign debt ratings and adversely impact investments in the Fund. Companies in the infrastructure, transportation, energy and utility industries may be affected by a variety of factors, including, but not limited to, high interest costs, energy prices, high degrees of leverage, environmental and other government regulations, the level of government spending on infrastructure projects, intense competition and other factors. There are special risks associated with an investment in real estate, including REITS. These risks include credit risk, interest rate fluctuations and the impact of varied economic conditions. The Funds’ use of forward currency contracts may not be successful in hedging currency exchange rates and could eliminate some or all of the benefit of an increase in the value of a foreign currency versus the U.S. dollar. Investing in derivatives entails special risks relating to liquidity, leverage and credit that may reduce returns and/or increase volatility. Performance of the Funds may diverge from that of the underlying index due to operating expenses, transaction costs, cash flows, use of sampling strategies or operational inefficiencies. An investment in these Funds should be considered only as a supplement to a complete investment program for those investors willing to accept the risks associated with the Funds. See the prospectus for details.
Shares of the Funds are bought and sold at market price (not NAV) throughout the day on the New York Stock Exchange. Transactions in Fund shares may result in brokerage commissions and may generate tax consequences. There can be no assurance that an active trading market for shares of a fund will develop or be maintained.
DBX ETF Trust Funds are distributed by ALPS Distributors, Inc. The Funds are managed by DBX Advisors LLC which is not affiliated with ALPS.
Deutsche Asset Management is the brand name for the asset management activities conducted by Deutsche Bank AG or any of its subsidiaries. Clients will be provided Deutsche Asset Management products or services by one or more legal entities that will be identified to clients pursuant to the contracts, agreements, offering materials or other documentation relevant to such products or services.
DBX ETF Trust (Continued)
The Dow Jones Global ex-U.S. Select Real Estate Securities Total Return Net Index (USD) Hedged and the S&P Global Infrastructure Index (USD) (Hedged) (Net TR) are products of S&P Dow Jones Indices LLC or its affiliates (“SPDJI”) and have been licensed for use by DBRE and DBIF. Standard & Poor’s® and S&P® are registered trademarks of Standard & Poor’s Financial Services LLC (“S&P”); Dow Jones® is a registered trademark of Dow Jones Trademark Holdings LLC (“Dow Jones”); and these trademarks have been licensed for use by SPDJI and sublicensed for certain purposes by DBRE and DBIF. The Funds are not sponsored, endorsed, sold or promoted by SPDJI, Dow Jones, S&P, or their respective affiliates, or third party licensors, and none of such parties make any representation regarding the advisability of investing in such product(s) nor do they have any liability for any errors, omissions, or interruptions of the Dow Jones Global ex-U.S. Select Real Estate Securities Total Return Net Index (USD) Hedged and the S&P Global Infrastructure Index (USD) (Hedged) (Net TR).
The “JPX-Nikkei Index 400” and “JPX-Nikkei 400 Total Return Index” (hereinafter collectively referred to as the “Index”) are copyrightable works calculated using such methodology independently developed by Japan Exchange Group, Inc. and Tokyo Stock Exchange, Inc. (hereinafter collectively called “JPX Group”) and Nikkei Inc. (hereinafter called “Nikkei”). JPX Group and Nikkei jointly own copyrights and any other intellectual property rights subsisting in “Index” itself and the methodology to calculate “Index”. JPN and JPNH are not in any way sponsored, endorsed or promoted by JPX Group and Nikkei. JPX Group and Nikkei do not make any warranty or representation. JPX Group and Nikkei have no obligation to publish “Index” continuously and shall not be liable for any errors, delays or suspensions of the publication of “Index”. The currency hedge used for JPNH is provided solely by the Licensee. JPX Group and/or Nikkei assume no responsibility for such hedging, including, but not limited to, the tracking errors due to such hedging.
The funds or securities referred to herein are not sponsored, endorsed, or promoted by MSCI, and MSCI bears no liability with respect to any such funds or securities or any index on which such funds or securities are based. The prospectus contains a more detailed description of the limited relationship MSCI has with DBX and any related funds.
Copyright © 2016 Deutsche Bank AG. All rights reserved. Deutsche X-trackers® is a registered trademark of Deutsche Bank AG. All other trademarks, servicemarks or registered trademarks are the property of their respective owners.
Not FDIC Insured | No Bank Guarantee | May Lose Value
DBX ETF Trust
Investment advisor DBX Advisors LLC 345 Park Ave. New York, NY 10154 | Investment sub-advisor TDAM USA Inc. 161 Bay Street, 35th Floor TD Canada Trust Tower Toronto, Ontario Canada M5J 2T2 | Administrator, custodian, The Bank of New York Mellon 101 Barclay Street New York, NY 10286 | ||
Distributor ALPS Distributors, Inc. 1290 Broadway Suite 1100 Denver, CO 80203 | Independent registered public accounting firm Ernst & Young LLP 5 Times Square New York, NY 10036 | Legal counsel Dechert LLP 1095 Avenue of the Americas New York, NY 10036 | ||
R-38754-2 (7/16) DBX 002028 (7/17)
Item 2. Code of Ethics.
| (a) | The registrant, as of the end of the period covered by this report, has adopted a code of ethics that applies to the registrant’s principal executive officer, principal financial officer, principal accounting officer or controller, or persons performing similar functions, regardless of whether these individuals are employed by the registrant or a third party. |
| (c) | There have been no amendments, during the period covered by this report, to a provision of the code of ethics that applies to the registrant’s principal executive officer, principal financial officer, principal accounting officer or controller, or persons performing similar functions, regardless of whether these individuals are employed by the registrant or a third party, and that relates to any element of the code of ethics description. |
| (d) | The registrant has not granted any waivers, including an implicit waiver, from a provision of the code of ethics that applies to the registrant’s principal executive officer, principal financial officer, principal accounting officer or controller, or persons performing similar functions, regardless of whether these individuals are employed by the registrant or a third party, that relates to one or more of the items set forth in paragraph (b) of this item’s instructions. |
Item 3. Audit Committee Financial Expert.
Stephen R. Byers, George O. Elston, and J. David Officer are the designated financial experts on the Audit Committee of DBX ETF Trust. With respect to DBX ETF Trust, Stephen Byers, George O. Elston, and J. David Officer are not “interested persons” as such terms are defined by Section 2(a)(19) of the Act (15 U.S.C. 80a-2(a)(19)).
Item 4. Principal Accountant Fees and Services.
Audit Fees
| (a) | The aggregate fees billed for each of the last two fiscal years for professional services rendered by the principal accountant for the audit of the registrant’s annual financial statements or services that are normally provided by the accountant in connection with statutory and regulatory filings or engagements for those fiscal years are $771,600 for 2016 and $511,500 for 2015. |
Audit-Related Fees
| (b) | The aggregate fees billed in each of the last two fiscal years for assurance and related services by the principal accountant that are reasonably related to the performance of the audit of the registrant’s financial statements and are not reported under paragraph (a) of this Item are $105,000 for 2016 and $30,000 for 2015. |
Tax Fees
| (c) | The aggregate fees billed in each of the last two fiscal years for professional services rendered by the principal accountant for tax compliance, tax advice, and tax planning are $475,463 for 2016 and $86,115 for 2015. |
All Other Fees
| (d) | The aggregate fees billed in each of the last two fiscal years for products and services provided by the principal accountant, other than the services reported in paragraphs (a) through (c) of this Item are $0 for 2016 and $0 for 2015. | |
| (e)(1) | Disclose the audit committee’s pre-approval policies and procedures described in paragraph (c)(7) of Rule 2-01 of Regulation S-X. | |
In accordance with Rule 2-01(c)(7)(A), the Audit Committee pre-approves all of the audit and permissible non-audit services of the Registrant. | ||
(e)(2) |
All of the services described in paragraphs (b) through (d) above were approved by the Audit Committee in accordance with paragraph (c) (7) (i) (c) of Rule 2-01 of Regulation S-X. | |
(f) |
Not Applicable. | |
(g) |
The aggregate non-audit fees billed by the registrant’s accountant for services rendered to the registrant, and rendered to the registrant’s investment adviser (not including any sub-adviser whose role is primarily portfolio management and is subcontracted with or overseen by another investment adviser), and any entity controlling, controlled by, or under common control with the adviser that provides ongoing services to the registrant for each of the last two fiscal years of the registrant was $468,970 for 2016 and $4,810,386 for 2015. | |
(h) |
The registrant’s audit committee of the board of directors has considered whether the provision of non-audit services that were rendered to the registrant’s investment adviser (not including any sub-adviser whose role is primarily portfolio management and is subcontracted with or overseen by another investment adviser), and any entity controlling, controlled by, or under common control with the investment adviser that provides ongoing services to the registrant that were not pre-approved pursuant to paragraph (c)(7)(ii) of Rule 2-01 of Regulation S-X is compatible with maintaining the principal accountant’s independence. | |
Other
1.) In various communications, EY advised the Funds’ Audit Committee that EY had identified the following matters that it determined to be inconsistent with the SEC’s and PCOAB’s auditor independence rules.
| ● | EY advised the Funds’ Audit Committee of financial relationships held by covered persons within EY and its affiliates that were in violation of the Rule 2-01(c)(1) of Regulation S-X. In assessing this matter, EY indicated that upon detection the breaches were corrected promptly and that none of the breaches (i) related to financial relationships directly in the Funds, (ii) involved professionals who were part of the audit engagement team for the Funds or in a position to influence the audit engagement team, or (iii) were for services directly for the Funds. |
| ● | EY advised the Funds’ Audit Committee that, in 2016, a pension plan for the Ernst & Young Global Limited (“EYG”) member firm in Germany (“EY Germany”), through one of its investment advisors, purchased an investment in an entity that may be deemed to be under common control with the Funds. EY informed the Audit Committee that this investment was inconsistent with Rule 2-01(c)(1)(i) of Regulation S-X. In assessing this matter, EY noted a number of factors, including that the purchase was by EY Germany’s investment advisor without EY Germany’s permission, authorization or knowledge and EY Germany instructed its investment advisor to sell the shares of the entity that may be deemed to be under common control with the Funds immediately upon detection of the purchase and the breach did not involve any professionals who were part of the audit engagement team for the Funds or in a position to influence the audit engagement team. |
| ● | EY advised the Funds’ Audit Committee that, in 2014, the EYG member firm in Spain (“EY Spain”) completed an acquisition of a small consulting firm that had a deposit account with an overdraft line of credit at the time of the acquisition with Deutsche Bank SA Espanola, which EY Spain acquired. EY informed the Audit Committee that having this line of credit with an entity that may be deemed to be under common control with the Funds was inconsistent with Rule 2-01(c)(1)(ii) of Regulation S-X. In assessing this matter, EY noted a number of factors, including that the credit line was terminated and the breach did not involve any professionals who were part of the audit engagement team for the Funds or in a position to influence the audit engagement team. |
| ● | EY advised the Funds’ Audit Committee that personal tax services were provided to an individual after being promoted into a financial reporting oversight role (“FROR”). EY informed the Audit Committee that providing tax services for a employee in an FROR was inconsistent with PCAOB Rule 3523. EY’s internal independence procedures timely identified that the employee had recently been promoted into an FROR and notification to cease all tax services for this person occurred prior to the PCAOB transition period. However, subsequent to the communication to cease providing tax services, services related to the preparation and e-filing of a single informational foreign bank account reporting form were performed. The estimated amount of time for EY US to prepare the form was approximately four hours. No further services were performed and the expatriate employee has transitioned to another tax service provider. |
| ● | EY advised the Funds’ Audit Committee of a pre-approval breach related to permissible audit services provided by an EYG member firm in China (“EY China”) for two funds. Fees associated with these audit services have been between CNY 52,000 and CNY |
55,000 per year (approximately $7,900- $8,400).Audit committee pre-approval is required for all audit and non-audit services in accordance with Rule 2-01(c)(7) of Regulation S-X. Approval of the permissible audit services was subsequently obtained from the Audit Committee Chair on March 25, 2016. |
EY advised the Audit Committee that after consideration of the facts and circumstances and the applicable independence rules, EY concluded that the independence breaches did not and do not impair EY’s ability to exercise objective and impartial judgment in connection with the audits of the financial statements of the Funds and that a reasonable investor would reach the same conclusion. In reaching this conclusion, EY noted that, in addition to the above noted factors, the independence breaches did not (i) create a mutual or conflicting interest with the Funds, (ii) place EY in the position of auditing its own work, (iii) result in EY acting as management or an employee of the Funds, or (iv) place EY in a position of being an advocate of the Funds.
In its required communications to the Audit Committee on July 26, 2016, EY stated its belief that the above described matters, individually and in the aggregate, do not and will not impair EY’s ability to exercise objective and impartial judgment in connection with the audits of the financial statements for the Funds and a reasonable investor with knowledge of all relevant facts and circumstances would conclude that EY has been and is capable of objective and impartial judgment on all issues encompassed within EY’s audit engagements.
Further, in its annual letter to the Audit Committee pursuant to Rule 3526 of the Public Company Accounting Oversight Board dated July 26, 2016, EY stated that, relating to EY’s audit of the financial statements of the Funds as of the year ended May 31, 2016, EY can continue to act as the Independent Registered Public Accounting Firm.
Management and the Audit Committee considered these matters and, based solely upon EY’s description of the facts and representations made by EY, believe that: (1) these matters did not impact EY’s application of objective and impartial judgment with respect to all issues encompassed within EY’s audit engagements; and (2) a reasonable investor with knowledge of all relevant facts and circumstances would reach the same conclusion.
2.) In various communications beginning on June 30, 2016, EY also informed the Audit Committee that EY had identified independence breaches where EY and covered persons maintain lending relationships with owners of greater than 10% of the shares of certain Funds. EY informed the Audit Committee that these lending relationships are inconsistent with Rule 2-01(c)(l)(ii)(A) of Regulation S-X (referred to as the “Loan Rule”).
The Loan Rule specifically provides that an accounting firm would not be independent if it receives a loan from a lender that is a record or beneficial owner of more than ten percent of an audit client’s equity securities. For purposes of the Loan Rule, audit clients include the Funds as well as all other series of the registered investment company advised by DBX Advisors LLC (the “Adviser”), the Funds’ investment adviser, and its affiliates, including other subsidiaries of the Adviser’s parent company, Deutsche Bank AG (collectively, the “Deutsche/DBX Funds Complex”). EY’s lending relationships are applicable to EY’s independence under the Loan Rule with respect to all investment companies in the Deutsche/DBX Funds Complex.
EY informed the Audit Committee that, after evaluating the facts and circumstances and the applicable independence rules, EY has concluded that the lending relationships described above do not and will not impair EY’s ability to exercise objective and impartial judgment in connection with the
audits of the financial statements for the Funds and a reasonable investor with knowledge of all relevant facts and circumstances would conclude that EY has been and is capable of objective and impartial judgment on all issues encompassed within EY’s audit engagements. EY informed the Audit Committee that its conclusion was based on a number of factors, including, among others, EY’s belief that the lenders are not able to impact the impartiality of EY or assert any influence over the investment companies in the Deutsche/DBX Funds Complex whose shares the lenders own or the applicable investment company’s investment adviser. In addition, the individuals at EY who arranged EY’s lending relationships have no oversight of, or ability to influence, the individuals at EY who conducted the audits of the Funds’ financial statements. The Audit Committee has not reached a different conclusion with regard to EY’s objectivity and impartiality.
On June 20, 2016, the SEC Staff issued a “no-action” letter to another mutual fund complex (see Fidelity Management & Research Company et al., No-Action Letter) related to similar Loan Rule issues as those described above. In that letter, the SEC Staff confirmed that it would not recommend enforcement action against an investment company that relied on the audit services performed by an audit firm that was not in compliance with the Loan Rule in certain specified circumstances. The circumstances described in the no-action letter appear to be substantially similar to the circumstances that affected EY’s independence under the Loan Rule with respect to the Funds. EY confirmed to the Audit Committee that it meets all the conditions of the no-action letter. In the no-action letter, the SEC Staff stated that the relief under the letter is temporary and will expire 18 months after the issuance of the letter.
Item 5. Audit Committee of Listed Registrants.
The Registrant is a listed issuer as defined in Rule 10A-3 under the Exchange Act and has a separately-designated standing audit committee established in accordance with Section 3(a)(58)(A) of the Exchange Act. The Registrant’s audit committee members are Stephen R. Byers, George O. Elston, and J. David Officer.
Item 6. Investments.
| (a) | Schedule of Investments in securities of unaffiliated issuers as of the close of the reporting period is included as part of the report to shareholders filed under Item 1 of this form. |
| (b) | Not applicable. |
| Item 7. | Disclosure of Proxy Voting Policies and Procedures for Closed-End Management Investment Companies. |
Not applicable.
| Item 8. | Portfolio Managers of Closed-End Management Investment Companies. |
Not applicable.
| Item 9. | Purchases of Equity Securities by Closed-End Management Investment Company and Affiliated Purchasers. |
Not applicable.
Item 10. Submission of Matters to a Vote of Security Holders.
There were no material changes to the procedures by which shareholders may recommend nominees to the Registrant’s Board of Trustees.
Item 11. Controls and Procedures.
| (a) | The Chief Executive and Financial Officers concluded that the Registrant’s Disclosure Controls and Procedures are effective based on the evaluation of the Disclosure Controls and Procedures as of a date within 90 days of the filing date of this report. |
| (b) | There have been no changes in the registrant’s internal control over financial reporting that occurred during the second fiscal quarter of the period covered by this report that has materially affected, or is reasonably likely to materially affect, the registrant’s internal controls over financial reporting. |
Item 12. Exhibits.
(a)(1) | Code of ethics, or any amendment thereto, that is the subject of disclosure required by Item 2 is attached hereto. | |
(a)(2) | Certifications pursuant to Rule 30a-2(a) under the 1940 Act and Section 302 of the Sarbanes-Oxley Act of 2002 are attached hereto. | |
(a)(3) | Not applicable. | |
(b) | Certifications pursuant to Rule 30a-2(b) under the 1940 Act and Section 906 of the Sarbanes-Oxley Act of 2002 are attached hereto. | |
(12.other) | Not applicable. | |
SIGNATURES
Pursuant to the requirements of the Securities Exchange Act of 1934 and the Investment Company Act of 1940, the registrant has duly caused this report to be signed on its behalf by the undersigned, thereunto duly authorized.
| (Registrant) | DBX ETF Trust |
| By (Signature and Title)* | /s/ Alex Depetris | |||
| Alex Depetris | ||||
| President and Chief Executive Officer | ||||
| Date | 8/4/16 | |||
Pursuant to the requirements of the Securities Exchange Act of 1934 and the Investment Company Act of 1940, this report has been signed below by the following persons on behalf of the registrant and in the capacities and on the dates indicated.
| By (Signature and Title)* | /s/ Alex Depetris | |||
Alex Depetris President and Chief Executive Officer |
| Date | 8/4/16 | |||
| By (Signature and Title)* | /s/ Michael Gilligan | |||
| Michael Gilligan | ||||
| Treasurer, Chief Financial Officer and Controller |
| Date | 8/4/16 | |||
* Print the name and title of each signing officer under his or her signature.